1st quarter financial results fy ending march 2021...2020/07/31 · medium-term management plan...
TRANSCRIPT

Medium-term Management Plan 2023 ―― Transform and Grow ――
1st Quarter Financial Results FY Ending March 2021
July 31, 2020Mitsui & Co., Ltd.
A Cautionary Note on Forward-Looking Statements: This material contains statements (including figures) regarding Mitsui & Co., Ltd. (“Mitsui”)’s corporate strategies, objectives, and views of future developments that are forward-looking in nature and are not simply reiterations of historical facts. These statements are presented to inform stakeholders of the views of Mitsui’s management but should not be relied on solely in making investment and other decisions. You should be aware that a number of known or unknown risks, uncertainties and other factors could lead to outcomes that differ materially from those presented in such forward-looking statements. These risks, uncertainties and other factors referred to above include, but are not limited to, those contained in Mitsui’s latest Annual Securities Report and Quarterly Securities Report, and Mitsui undertakes no obligation to publicly update or revise any forward-looking statements.

COPYRIGHT © MITSUI & CO., LTD. ALL RIGHTS RESERVED.
Contents
Review of Medium-term Management Plan
Operating Results
Supplementary Information
Segment Data
1
2
3
4
1

COPYRIGHT © MITSUI & CO., LTD. ALL RIGHTS RESERVED.
Review of Medium-term Management Plan1
2

COPYRIGHT © MITSUI & CO., LTD. ALL RIGHTS RESERVED.
3
FY Mar/2020
Q1
FY Mar/2021
Q1Change FY Mar/2021
forecasts Progress
Core Operating Cash Flow* 142.4 110.8 -31.6 400.0 28%
Profit for the year/period 125.0 62.6 -62.4 180.0 35%
Operating results decreased compared to the same period of the previous year as the effects of commodityprice stagnation and stalled economic activity due to the spread of COVID-19 became evident
Steady progress to plan as a result of iron ore prices remaining high, strong oil and LNG trading, andFVTPL gains
For some affiliated companies that were impacted by COVID-19, the full scale of the impact will bereflected in the consolidated results from Q2 onwardsUncertainties around mobility, healthcare services and materials continue
* Cash flow from operating activities (FY Mar/2021 Q1: ¥164.0bn) minus cash flow from changes in working capital (FY Mar/2021 Q1: ¥37.4bn)minus outflows for repayment of lease liability (FY Mar/2021 Q1: ¥15.8bn)
Summary of Operating Results
(Unit: ¥billion)

COPYRIGHT © MITSUI & CO., LTD. ALL RIGHTS RESERVED.
4
Core Operating Cash Flow Profit for the year/period
FY Mar/2021 Q1 Result Forecast Progress FY Mar/2021
Q1 Result Forecast Progress
Resources & Energy 78.3 250.0 31% 35.7 120.0 30%
Machinery & Infrastructure 12.9 60.0 22% 18.5 35.0 53%
Chemicals 15.7 45.0 35% 6.3 20.0 32%
Core Businesses Total 106.9 355.0 30% 60.5 175.0 35%
Company Total 110.8 400.0 28% 62.6 180.0 35%
Resources & Energy: Steady progress as a result of iron ore prices remaining high. Oil and LNG trading strong Machinery & Infrastructure: Progressed largely in line with forecasts due to contribution from asset recycling,
though paying close attention to results from Q2 onwards, when the effects of COVID-19 will be fully reflected Chemicals: Despite the spread of COVID-19, progressed largely in line with forecasts, with steady performances
in basic chemicals trading and agricultural supply businesses
Strengthen profitability of core businesses and take on challenges in new businesses
Corporate Strategy
Core businesses
Business restructuring and reorganization in our existing businesses
(Unit: ¥billion)
Lifestyle: Consolidation of four subsidiaries with intermediary distribution functions for retailers and restaurantsEstablished a new subsidiary to aggregate import/export businesses
Innovation & Corporate Development: Discussion on merger of 2 ICT related subsidiaries (announced Mar 2020) Chemicals: Decision to sell out of San-ei Sucrochemical (announced Jul 2020)
COPYRIGHT © MITSUI & CO., LTD. ALL RIGHTS RESERVED.
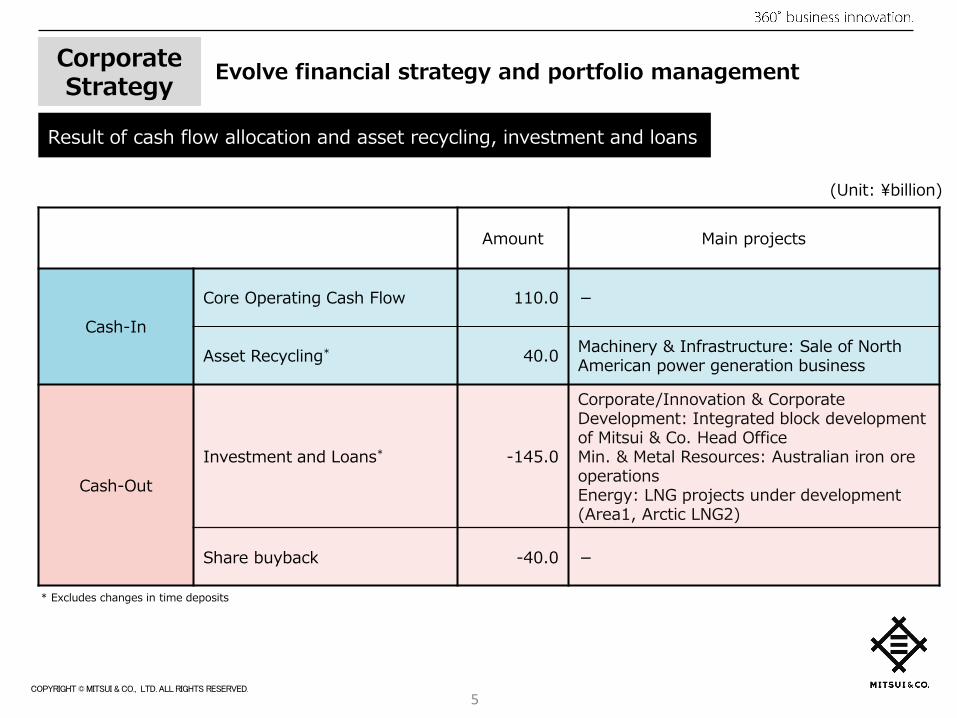
Result of cash flow allocation and asset recycling, investment and loans
5
Corporate Strategy
* Excludes changes in time deposits
Evolve financial strategy and portfolio management
(Unit: ¥billion)
Amount Main projects
Cash-InCore Operating Cash Flow 110.0 -
Asset Recycling* 40.0 Machinery & Infrastructure: Sale of North American power generation business
Cash-OutInvestment and Loans* -145.0
Corporate/Innovation & Corporate Development: Integrated block development of Mitsui & Co. Head OfficeMin. & Metal Resources: Australian iron ore operations Energy: LNG projects under development (Area1, Arctic LNG2)
Share buyback -40.0 -

COPYRIGHT © MITSUI & CO., LTD. ALL RIGHTS RESERVED.
7.7
3.8
0.3 3.9
4.9
2.4
0.3
7.7
3.8
4.9
2.84.1
Balance sheet
6
Corporate Strategy
Main balances/changes from March 2020
Current assets
Other liabilities
Long- and short-term
debt*1
Non-current assets
Shareholder equity*2
total
Non-controlling interests
Total assets 11.8Shareholder equity 3.8Net DER 0.91x
Jun/2020Mar/2020
(3.5)
Current assets
Other liabilities
Long- and short-term
debt*1
Shareholder equity*2
total
Non-controlling interests
Non-current assets
(3.5)
Total assets 11.5Shareholder equity 3.9Net DER 0.91x
Evolve financial strategy and portfolio management
(Unit: ¥trillion)
Interest-bearing debt*3 ¥4.6tn (up ¥30.8bn)Net interest-bearing debt*4 ¥3.5tn (up ¥48.2bn)
Shareholder equity*2 ¥3.9tn (up ¥53.0bn)・ Profit for the period:・ Foreign currency translation adjustments:・ Financial assets measured at FVTOCI:・ Dividend payments:・ Share buyback:・ Other:
+¥62.6bn+¥58.9bn+¥70.0bn-¥68.3bn-¥39.1bn-¥31.1bn
*1. Figures in brackets are “net interest-bearing debt”*2. In these presentation materials, “Shareholders’ equity” means
total equity attributable to owners of the parent*3. Interest-bearing debt is calculated by excluding
lease liability from short-term debt and long-term debt. *4. Net interest-bearing debt is interest-bearing debt*3 minus cash and
cash equivalents, and time deposits

COPYRIGHT © MITSUI & CO., LTD. ALL RIGHTS RESERVED.
Launch of commercialoperations at Fukushima gasfired power plant in April2020
Investment in US firmFirstElement Fuel, Inc.
Power generation andelectricity distribution business,with LNG supplied by Mitsui
Largest hydrogen stationdeveloper/operator in the U.S.
Stable supply of electricity withlow environmental impact, utilizingadvanced facilities and LNGsupplied from Mitsui's portfolio
Develop new business models,including hydrogen infrastructureand hydrogen supply services
Promotion of integrated telemedicine in the hospital business
Expanding virtual consultationand medical services in multiple regions to meet needs for avoiding contact with patients
Contribute to COVID-19 measures and develop new business models
Progress of AI technologyutilization at BAF (Indonesia)
Development and applicationof credit/collection scoringsystem based on hugecustomer data via motorcyclesales financing business
Strengthen risk responsecapabilities to support businessexpansion of affiliates
Creation of new AI solutionbusiness utilizing Mitsui’s businessbase and expertise
7
Strategic Focus
Progress Business description Objective
1
2
3
Energy Solutions
Healthcare/ Nutrition
Market Asia
Corporate Strategy

COPYRIGHT © MITSUI & CO., LTD. ALL RIGHTS RESERVED.
Segment Assumed impact at start of quarter Q1 and post-Q1 forecasts
Mineral & Metal Resources
Decline in operation rate of mining business, decline in trading business
Price of iron ore remains high, price of coal declines/stagnates Implement thorough measures to prevent infection, continue operations largely as normal
EnergySlump in oil and gas prices, concerns overdecline in operation rate of upstream businesses, decline in demand for transport and industrial fuel
Crude oil prices in higher range than initially expected Continue operations largely as normal in upstream businesses
Machinery & Infrastructure
Decline in demand in automotive (manufacture, sale, financing), rail, and aircraft areas, decline in operation rate
Impact on multiple business areas such as logistics related infrastructure in addition tothose listed left
Continuing grounds for concern over prolonged impact in South America, India etc. Lag in incorporating results from some businesses, with true impact becoming visible from
Q2 onwards
ChemicalsDecline in commodity prices and demand for raw materials etc. for automotive, decline in operating ratio at factories etc.
Decline in commodity prices, impact of fall in demand centered on raw materials for theautomotive industry and decline operation rate at factories etc.
Continued concerns over prolonged periods of market downturn
Iron & SteelProducts
Decline in demand for steel, decline in operation rate at factories etc.
Decline in demand for steel materials, impact of decline in operating rate at factories etc. Lag in incorporating results from some businesses, with true impact becoming visible from
Q2 onwards
Lifestyle
Decline in operation rate due to decline in demand for medical tourism and from patients with minor illnesses etc., decline in demand in fashion-related business and business-use foodstuffs for food services industry due restrictions on people being able to leave their homes
Negative Impact in hospital business partially offset by PCR testing contracts and costcutting. Significant impact of event cancellations in domestic service business
Decline in fashion-related demand due to closure of department stores and brick and mortarstores
While demand for foodstuffs is in decline, expect partial contribution from “stay at home”demand
Innovation & Corporate Development
Decline in operation rate and demand for electrical materials, increase in credit risk
Decline in electrical materials-related demand, firm demand for digital security, tailwinds forsome businesses from “stay at home” demand
GeneralIPOs and sales of assets delayed due to decline in activity in financial markets, cost cutting
Possibility of delays to some IPOs and sales of assets Reduction of corporate expenses including travel and project incubation fees
8
No change to full-year forecasts as business environment remains highly uncertain Despite good progress in 1Q, possibility remain in subsequent periods for the followings; delayed consolidation of
the impact of COVID-19 for some affiliated companies with different reporting periods, heightened credit risk,changes to the business plans, etc.
Impact of COVID-19

COPYRIGHT © MITSUI & CO., LTD. ALL RIGHTS RESERVED.
Operating Results2
9

COPYRIGHT © MITSUI & CO., LTD. ALL RIGHTS RESERVED.
-2.1 -14.0-4.2
12.77.4
3.60.2
1.66.5
15.718.2
12.9
58.7 36.4
57.7
41.9
YoY segment comparisonCore Operating Cash Flow
Main factors(YoY change)
■ Mineral & Metal Resources ¥41.9bn (-¥15.8bn)・Decrease in sales price and volume of coal at Australian coal mining
operations
■ Energy ¥36.4bn (-¥22.3bn)・Decline in oil and gas prices and production volumes
■ Machinery & Infrastructure ¥12.9bn (-¥5.3bn)・Decrease in dividends from equity method affiliated companies
■ Chemicals ¥15.7bn (+¥9.2bn)・One-time factor at overseas affiliated company
■ Iron & Steel Products ¥1.6bn (+¥1.4bn)
■ Lifestyle ¥3.6bn (-¥3.8bn)・Decline in dining out and purchasing demand at affiliated companies
in retail, food and fashion
■ Innovation & Corporate Development ¥12.7bn (+¥14.8bn)・FVTPL profit and absence of FVTPL loss from same period of
previous fiscal year・Commodities trading strong
■ Others -¥14.0bn (-¥9.8bn)・Expenses, interest, taxes, etc. not allocated to business segments
142.4
Core operating cash flow: ¥110.8bn, down ¥31.6bn
(Unit: ¥billion)
Jun/2020Jun/2019*
10* Revised to reflect deduction for repayment of lease liability
110.8

COPYRIGHT © MITSUI & CO., LTD. ALL RIGHTS RESERVED.
3.0
-1.5
2.110.5
7.6
-5.6
1.5
-1.3
4.1 6.3
17.3 18.5
40.4
3.5
49.0
32.2
Main factors(YoY change)
■ Mineral & Metal Resources ¥32.2bn (-¥16.8bn)・Decrease in sales price and volume of coal at Australian coaloperations
・Impairment loss at Mozambique coal business
■Energy ¥3.5bn (-¥36.9bn)・Absence of deferred tax asset for Mozambique Area 1 recorded insame period of previous fiscal year
・Decline in oil and gas prices and production volumes
■Machinery & Infrastructure ¥18.5bn (+¥1.2bn)・Profit on sale of power generation business in North America・Absence of one-time profit from conclusion of arbitration related toBrazilian gas supply business in same period of previous fiscal year
■Chemicals ¥6.3bn (+¥2.2bn)・Trading business strong
■Iron & Steel Products -¥1.3bn (-¥2.8bn)・Decline in demand for steel materials for automotive industry anddecline in operation rate
■Lifestyle -¥5.6bn (-¥13.2bn)・Decline in dining out and purchasing demand at affiliated companiesin retail, food and fashion
・Decline in demand for hospital and service related businesses
■Innovation & Corporate Development ¥10.5bn (+¥8.4bn)・FVTPL profit and absence of FVTPL loss in same period of previousfiscal year
・Commodities trading strong
■Others -¥1.5bn (-¥4.5bn)・Expenses, interest, taxes, etc. not allocated to business segments
YoY segment comparisonQ1 Profit
(Unit: ¥billion)
Jun/2020
Q1 profit: ¥62.6bn, down ¥62.4bn
125.0
Jun/201911
62.6

COPYRIGHT © MITSUI & CO., LTD. ALL RIGHTS RESERVED.
• Absence of factors fromprevious Q1
• Total current periodMozambique coalbusinessEtc.
Forex breakdown
・Min. & Metal Resources :・Energy :・Other :
Resource-relatedcosts/volume
Commodityprices/ForexBase profit Valuation
gain/lossAsset recycling
Jun/2019
125.0 Resource-related costs/volume
Base profit
-18.0
-1.0-26.0
-10.0
Jun/2020
62.6
-4.0-1.00.0
-3.0 -1.0-1.0 0.00.0 0.0
-7.0
• CostsMin. & Metal
Iron ore CoalCopper, other
Energy
-1.00.00.0
-1.0+1.0-1.0
• VolumeMin. & Metal
Iron oreCoalCopper, other
Energy
-6.00.0
+1.0-2.0
+1.0-6.0
• Absence of factorsfrom previous Q1
• Total currentperiod
-6.0
+5.0
<Negative factors>• COVID-19 (mainly
non-resources)
• Decrease in LNGdividends
<Positive factors>• FVTPLAbsence of factors from previous Q1Current period
• Head Office LNGtrading
• MBC• METS
-16.0
+6.0
+3.0+3.0
+3.0+2.0
12
• Min. & MetalIron oreCoalCopper, other
• Oil, gas
• Forex(Yen vs.Functional currency -4.0)(Functional currency vs.revenue currencies -1.0)
-10.0+1.0-8.0-3.0
-11.0
-5.0
YoY factor comparisonQ1 Profit
(Unit: ¥billion)
Asset recycling Commodity prices/Forex
Valuation gain/lossspecial factors
Yen vs. Functional Currency
Functional Currency vs. Revenue Currencies
-11.0-7.0
-5.0

COPYRIGHT © MITSUI & CO., LTD. ALL RIGHTS RESERVED.
3
13
Supplementary Information
COPYRIGHT © MITSUI & CO., LTD. ALL RIGHTS RESERVED.
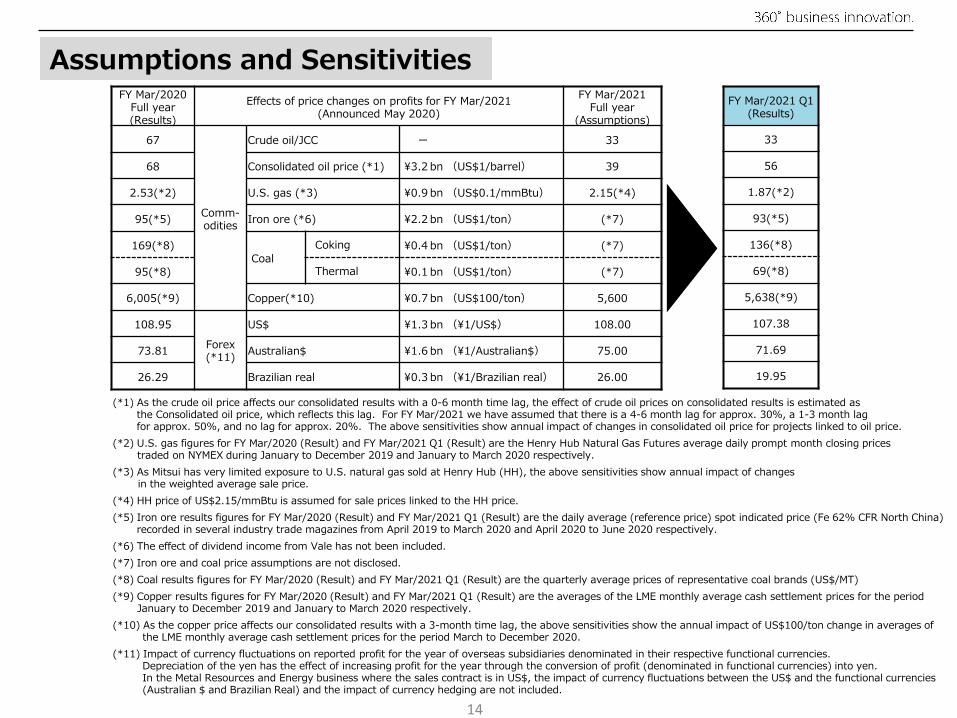
(*1) As the crude oil price affects our consolidated results with a 0-6 month time lag, the effect of crude oil prices on consolidated results is estimated as the Consolidated oil price, which reflects this lag. For FY Mar/2021 we have assumed that there is a 4-6 month lag for approx. 30%, a 1-3 month lag for approx. 50%, and no lag for approx. 20%. The above sensitivities show annual impact of changes in consolidated oil price for projects linked to oil price.
(*2) U.S. gas figures for FY Mar/2020 (Result) and FY Mar/2021 Q1 (Result) are the Henry Hub Natural Gas Futures average daily prompt month closing prices traded on NYMEX during January to December 2019 and January to March 2020 respectively.
(*3) As Mitsui has very limited exposure to U.S. natural gas sold at Henry Hub (HH), the above sensitivities show annual impact of changes in the weighted average sale price.
(*4) HH price of US$2.15/mmBtu is assumed for sale prices linked to the HH price.(*5) Iron ore results figures for FY Mar/2020 (Result) and FY Mar/2021 Q1 (Result) are the daily average (reference price) spot indicated price (Fe 62% CFR North China)
recorded in several industry trade magazines from April 2019 to March 2020 and April 2020 to June 2020 respectively.(*6) The effect of dividend income from Vale has not been included.(*7) Iron ore and coal price assumptions are not disclosed.(*8) Coal results figures for FY Mar/2020 (Result) and FY Mar/2021 Q1 (Result) are the quarterly average prices of representative coal brands (US$/MT)(*9) Copper results figures for FY Mar/2020 (Result) and FY Mar/2021 Q1 (Result) are the averages of the LME monthly average cash settlement prices for the period
January to December 2019 and January to March 2020 respectively.(*10) As the copper price affects our consolidated results with a 3-month time lag, the above sensitivities show the annual impact of US$100/ton change in averages of
the LME monthly average cash settlement prices for the period March to December 2020.(*11) Impact of currency fluctuations on reported profit for the year of overseas subsidiaries denominated in their respective functional currencies.
Depreciation of the yen has the effect of increasing profit for the year through the conversion of profit (denominated in functional currencies) into yen. In the Metal Resources and Energy business where the sales contract is in US$, the impact of currency fluctuations between the US$ and the functional currencies (Australian $ and Brazilian Real) and the impact of currency hedging are not included.
FY Mar/2020 Full year (Results)
Effects of price changes on profits for FY Mar/2021(Announced May 2020)
FY Mar/2021 Full year
(Assumptions)
67
Comm-odities
Crude oil/JCC ― 33
68 Consolidated oil price (*1) ¥3.2 bn (US$1/barrel) 39
2.53(*2) U.S. gas (*3) ¥0.9 bn (US$0.1/mmBtu) 2.15(*4)
95(*5) Iron ore (*6) ¥2.2 bn (US$1/ton) (*7)
169(*8)Coal
Coking ¥0.4 bn (US$1/ton) (*7)
95(*8) Thermal ¥0.1 bn (US$1/ton) (*7)
6,005(*9) Copper(*10) ¥0.7 bn (US$100/ton) 5,600
108.95
Forex(*11)
US$ ¥1.3 bn (¥1/US$) 108.00
73.81 Australian$ ¥1.6 bn (¥1/Australian$) 75.00
26.29 Brazilian real ¥0.3 bn (¥1/Brazilian real) 26.00
FY Mar/2021 Q1 (Results)
33
56
1.87(*2)
93(*5)
136(*8)
69(*8)
5,638(*9)
107.38
71.69
19.95
Assumptions and Sensitivities
14
COPYRIGHT © MITSUI & CO., LTD. ALL RIGHTS RESERVED.
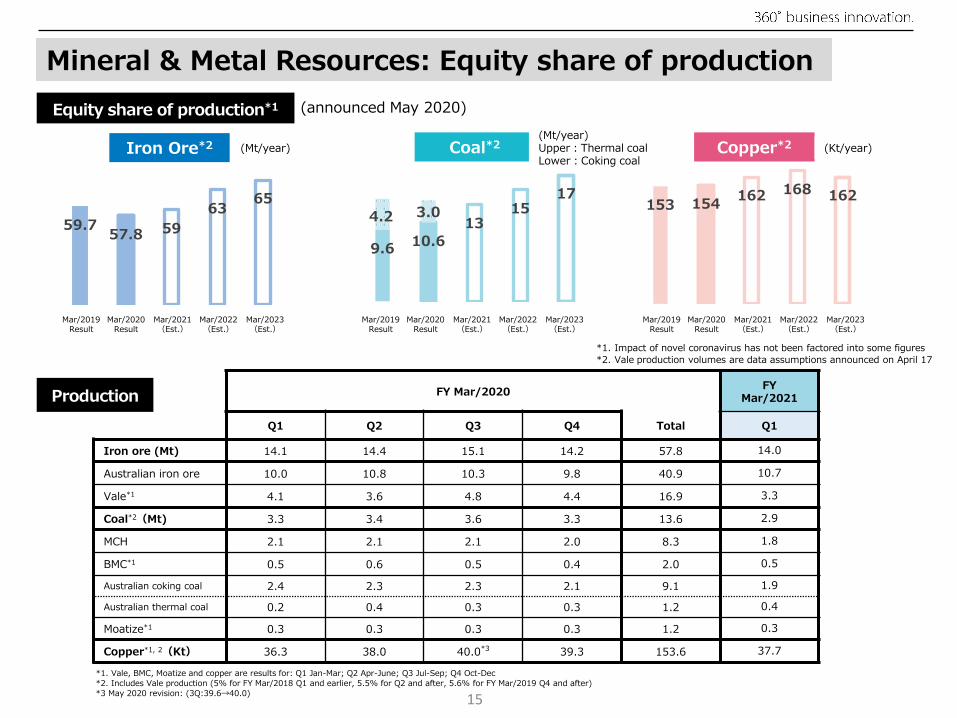
Equity share of production*1
Production
(announced May 2020)
FY Mar/2020 FY Mar/2021
Q1 Q2 Q3 Q4 Total Q1
Iron ore (Mt) 14.1 14.4 15.1 14.2 57.8 14.0
Australian iron ore 10.0 10.8 10.3 9.8 40.9 10.7
Vale*1 4.1 3.6 4.8 4.4 16.9 3.3
Coal*2(Mt) 3.3 3.4 3.6 3.3 13.6 2.9
MCH 2.1 2.1 2.1 2.0 8.3 1.8
BMC*1 0.5 0.6 0.5 0.4 2.0 0.5
Australian coking coal 2.4 2.3 2.3 2.1 9.1 1.9
Australian thermal coal 0.2 0.4 0.3 0.3 1.2 0.4
Moatize*1 0.3 0.3 0.3 0.3 1.2 0.3
Copper*1, 2(Kt) 36.3 38.0 40.0*3 39.3 153.6 37.7
Mineral & Metal Resources: Equity share of production
153 154 162 168 162
9.6 10.613
1517
4.2 3.0
Iron Ore*2 Coal*2 Copper*2
59.7 57.8 5963 65
*1. Impact of novel coronavirus has not been factored into some figures*2. Vale production volumes are data assumptions announced on April 17
15
(Mt/year) (Kt/year)(Mt/year)Upper:Thermal coalLower:Coking coal
Mar/2019Result
Mar/2020Result
Mar/2021(Est.)
Mar/2022(Est.)
Mar/2023(Est.)
Mar/2019Result
Mar/2020Result
Mar/2021(Est.)
Mar/2022(Est.)
Mar/2023(Est.)
Mar/2019Result
Mar/2020Result
Mar/2021(Est.)
Mar/2022(Est.)
Mar/2023(Est.)
*1. Vale, BMC, Moatize and copper are results for: Q1 Jan-Mar; Q2 Apr-June; Q3 Jul-Sep; Q4 Oct-Dec*2. Includes Vale production (5% for FY Mar/2018 Q1 and earlier, 5.5% for Q2 and after, 5.6% for FY Mar/2019 Q4 and after)*3 May 2020 revision: (3Q:39.6→40.0)
COPYRIGHT © MITSUI & CO., LTD. ALL RIGHTS RESERVED.
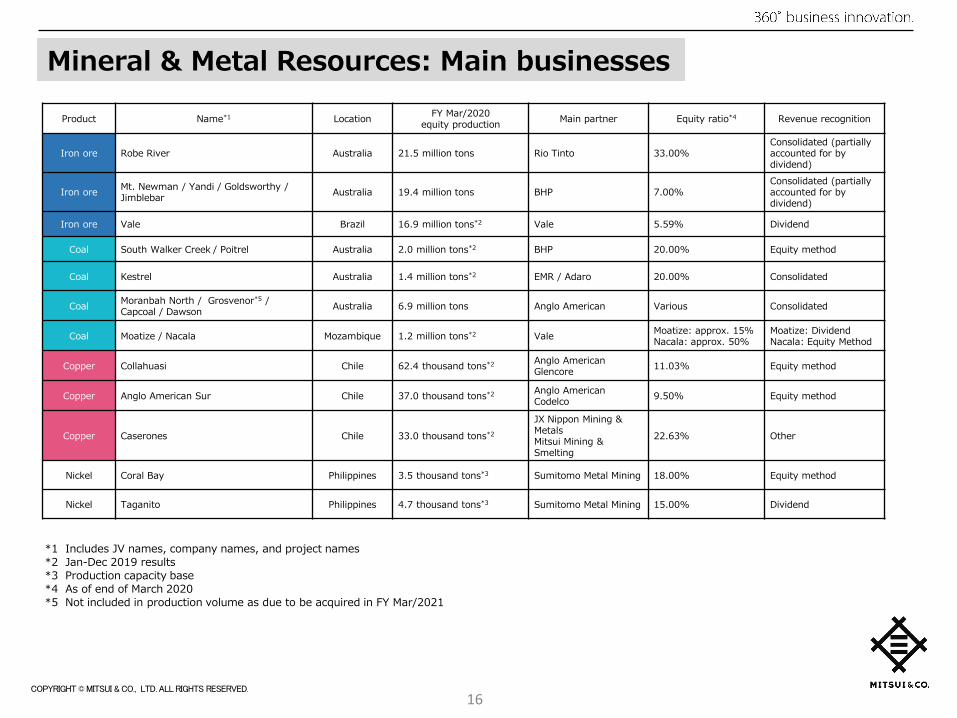
Mineral & Metal Resources: Main businesses
Product Name*1 Location FY Mar/2020equity production Main partner Equity ratio*4 Revenue recognition
Iron ore Robe River Australia 21.5 million tons Rio Tinto 33.00%Consolidated (partially accounted for by dividend)
Iron ore Mt. Newman / Yandi / Goldsworthy / Jimblebar Australia 19.4 million tons BHP 7.00%
Consolidated (partially accounted for by dividend)
Iron ore Vale Brazil 16.9 million tons*2 Vale 5.59% Dividend
Coal South Walker Creek / Poitrel Australia 2.0 million tons*2 BHP 20.00% Equity method
Coal Kestrel Australia 1.4 million tons*2 EMR / Adaro 20.00% Consolidated
Coal Moranbah North / Grosvenor*5 / Capcoal / Dawson Australia 6.9 million tons Anglo American Various Consolidated
Coal Moatize / Nacala Mozambique 1.2 million tons*2 Vale Moatize: approx. 15%Nacala: approx. 50%
Moatize: DividendNacala: Equity Method
Copper Collahuasi Chile 62.4 thousand tons*2 Anglo AmericanGlencore 11.03% Equity method
Copper Anglo American Sur Chile 37.0 thousand tons*2 Anglo AmericanCodelco 9.50% Equity method
Copper Caserones Chile 33.0 thousand tons*2
JX Nippon Mining & MetalsMitsui Mining & Smelting
22.63% Other
Nickel Coral Bay Philippines 3.5 thousand tons*3 Sumitomo Metal Mining 18.00% Equity method
Nickel Taganito Philippines 4.7 thousand tons*3 Sumitomo Metal Mining 15.00% Dividend
16
*1 Includes JV names, company names, and project names*2 Jan-Dec 2019 results*3 Production capacity base*4 As of end of March 2020*5 Not included in production volume as due to be acquired in FY Mar/2021

COPYRIGHT © MITSUI & CO., LTD. ALL RIGHTS RESERVED.
Production*1*2 Reserves*1*3
Energy: Crude oil & gas – Equity share of production & reserves
71.2 67.3 78 93 100 84
172.6 185.0 181 173 180
137ガス原油
243.8 252.3 259 266 280
3.0 2.9 2.8
7.46.6 6.0
ガス原油
10.49.5
221 8.8
17
(announced Oct 2019)(100m barrels)
(announced May 2020)(KBoE/day)
Gas
Crude Oil
GasCrude Oil
Mar/2018Result
Mar/2019Result
Mar/2020Forecast
Mar/2021(Est.)
Mar/2022(Est.)
Mar/2023(Est.)
Mar/2017Result
Mar/2018Result
Mar/2019Result
*1. Oil equivalentMitsui’s equity share of interests of consolidated subsidiaries, affiliates, and non-consolidated interests
*2. Mitsui’s share of sales is applied to certain projects(Est.) assumes that the impact of the novel coronavirus has not been factored into some figures
*3. According to Mitsui’s assessment standards

COPYRIGHT © MITSUI & CO., LTD. ALL RIGHTS RESERVED.
Energy: Main businesses
18
Product Project name Shareholder composition/Interest holders*= operator, Blue text= Mitsui participating entity
LNG: Production capacityE&P: Production (FY Mar/2020 results)
Accounting Period Revenue recognition
LNG Abu Dhabi *ADNOC (70%), Mitsui (15%), BP (10%), Total (5%) LNG:5.80 million tons/year NA Dividend income
LNG Qatargas1 *QP (65%), Total (10%), EM (10%), MILNED (7.5%), Marubeni (7.5%) LNG:9.60 million tons/year Mar. Dividend income
LNG Qatargas3 *QP (68.5%), Conoco Phillips (30%), Mitsui (1.5%) LNG:7.80 million tons/year Mar. Dividend income
LNG Oman *MOG(51%), Shell(30%), Mitsui (2.77%), others LNG:7.10 million tons/year NA Dividend income
LNG Equatorial Guinea *Marathon (60%), Sonagas (25%), Mitsui (8.5%), Marubeni (6.5%) LNG:3.70 million tons/year NA Dividend income
LNG SakhalinⅡ *Gazprom (50%+1 share), Shell (27.5%-1 share), Mitsui (12.5%), Mitsubishi Corp(10%) LNG:9.60 million tons/year Dec. Dividend income
LNG North West Shelf(NWS)
*Woodside, MIMI [Mitsui/Mitsubishi Corp=50:50], Shell, BP, BHP, Chevron (16.7%each)
LNG:16.90 million tons/yearLPG:0.46 million tons/yearCrude oil/condensate:97thousand BD
Dec. Equity method profit
LNG Tangguh*BP(40.2%), KI Berau[Mitsubishi Corp/INPEX=56:44](16.3%), KG Berau[JOGMEC/Mitsui/Mitsubishi Corp/INPEX/JX=49.2:20.1:16.5:14.2](8.6%), KGWiriagar[Mitsui](1.4%), others
LNG:7.60 million tons/yearCrude oil/condensate: 6 thousand B/D
Dec. Equity method profit/Gross profit
LNG Cameron *Sempra (50.2%), Mitsui, Total, [Mitsubishi Corp/NYK] (16.6% each) LNG:12.00 million tons/year Dec. Equity method profit
E&P MOECO/Thai offshore *Chevron, *PTTEP, MOECO (17.2%) Gas/crude oil/condensate:452 thousand B/D Mar.
Gross profit/Equity method profit/Dividend income
E&P MEPME/Block9 *Occidental (50%), OOCEP (45%), MEPME (5%) NA Dec. Gross profit
E&P MEPME/Block27 *Occidental (65%), MEPME (35%) NA Dec. Gross profit
E&P MEPME/Block3&4 *CCED (50%), Tethys (30%), MEPME (20%) NA Dec. Gross profit
E&P MEPUK/Alba *Chevron (23.4%), MEPUK (13.3%), others Crude oil: 10 thousand B/D Dec. Gross profit
E&P MEPIT/Tempa Rossa *Total (50%), Shell (25%), MEPIT (25%) NA Dec. Gross profit
E&P MEPAU/Greater Enfield *Woodside (60%), MEPAU (40%) NA Dec. Gross profit
E&P MEPAU/Kipper *EM (32.5%), BHP (32.5%), MEPAU (35%) NA Dec. Gross profit
E&P MEPAU&AWE/Casino, Henry, Netherby *Cooper (50%), AWE (25%), MEPAU (25%) Gas/condensate: 6 thousand B/D Dec. Gross profit
E&P MEPAU/Meridian *WestSide (51%), MEPAU (49%) Gas: 7 thousand B/D Dec. Gross profit
E&P MOEX North America/Kaikias *Shell (80%), MOEX NA (20%) NA Dec. Gross profit
E&P MEPTX/Eagle Ford *Mesquite (25%), Blackstone (25%), KNOC(25%), Venado (12.5%), MEPTX (12.5%) Gas/condensate/NGL: 113 thousand B/D Dec. Gross profit
E&P MEPUSA/Marcellus *Chesapeake (32.5%), ALTA (32.5%), Equinor (15.5%), MEPUSA (12%), others Gas: 375 thousand B/D Dec. Gross profit

COPYRIGHT © MITSUI & CO., LTD. ALL RIGHTS RESERVED.
Machinery & Infrastructure: Power generation portfolio
Gas68%
Coal18%
Renewable Energy14%
Net generation capacity (Mitsui’s share): 11.1GW(Gross generation capacity: 40GW)
40%
32%
28%Americas
Asia, AustraliaBy
Region
Europe, Middle East, Africa
Merchant/Contracted
Contracted96%
Merchant4%
By Energy Source
19
As of end of March 2020

COPYRIGHT © MITSUI & CO., LTD. ALL RIGHTS RESERVED.
20
FY Mar/2020 Q1 Q2 Q3 Q4 Full yearMineral & Metal Resources
Moatize/Nacala impairment -17.7 -17.7Others 0.0
Total 0.0 0.0 -17.7 0.0 -17.7Energy
MEPMOZ/Recorded DTA 13.2 13.2MEPTX/Eagle Ford impairment -18.0 -18.0MEPAU/Greater Enfield impairment -13.8 -13.8MEPIT/Tempa Rossa impairment -12.5 -12.5MOECO/Kaikias impairment -3.2 -3.2Others 1.0 -0.2 0.4 0.1 1.3
Total 14.2 -0.2 0.4 -47.4 -33.0Machinery & Infrastructure
Drillship comprehensive allowance -0.9 -0.1 -0.2 -1.2IPP-related: Market values of power contracts -0.2 -0.3 -0.7 -0.3 -1.5Moatize/Nacala impairment -4.4 -4.4Overseas railway impairment -3.7 -3.7Others -0.1 0.2 -0.6 -3.0 -3.5
Total -1.2 -0.2 -5.7 -7.2 -14.3Chemicals
Others -1.7 -0.4 6.5 2.2 6.6Total -1.7 -0.4 6.5 2.2 6.6
Iron & Steel ProductsOthers -0.1 -0.1
Total 0.0 0.0 0.0 -0.1 -0.1Lifestyle
Accountable impairment -5.6 -0.8 -6.4XINGU fixed asset impairment -9.3 -9.3Others 0.1 -0.8 -1.0 -0.5 -2.2
Total 0.1 -0.8 -6.6 -10.6 -17.9Innovation & Corporate Development
Others -0.9 -1.1 -1.0 -3.4 -6.4Total -0.9 -1.1 -1.0 -3.4 -6.4
FY Mar/2021 1Q 2Q 3Q 4Q Full yearMineral & Metal Resources
Moatize impairment -4.1 -4.1Others 0.0
Total -4.1 0.0 0.0 0.0 -4.1Energy
Others -1.2 -1.2Total -1.2 0.0 0.0 0.0 -1.2
Machinery & InfrastructureMoatize impairment -1.0 -1.0IPP-related: Market values of power contracts -0.4 -0.4
Total -1.4 0.0 0.0 0.0 -1.4Chemicals
Others 1.9 1.9Total 1.9 0.0 0.0 0.0 1.9
Iron & Steel ProductsOthers 0.0
Total 0.0 0.0 0.0 0.0 0.0Lifestyle
IHH ops in India: goodwill impairment -2.5 -2.5Others 0.8 0.8
Total -1.7 0.0 0.0 0.0 -1.7Innovation & Corporate Development
Others 0.0Total 0.0 0.0 0.0 0.0 0.0
Breakdown of Valuation gain/loss special factors

COPYRIGHT © MITSUI & CO., LTD. ALL RIGHTS RESERVED.
Segment Data4
21
COPYRIGHT © MITSUI & CO., LTD. ALL RIGHTS RESERVED.
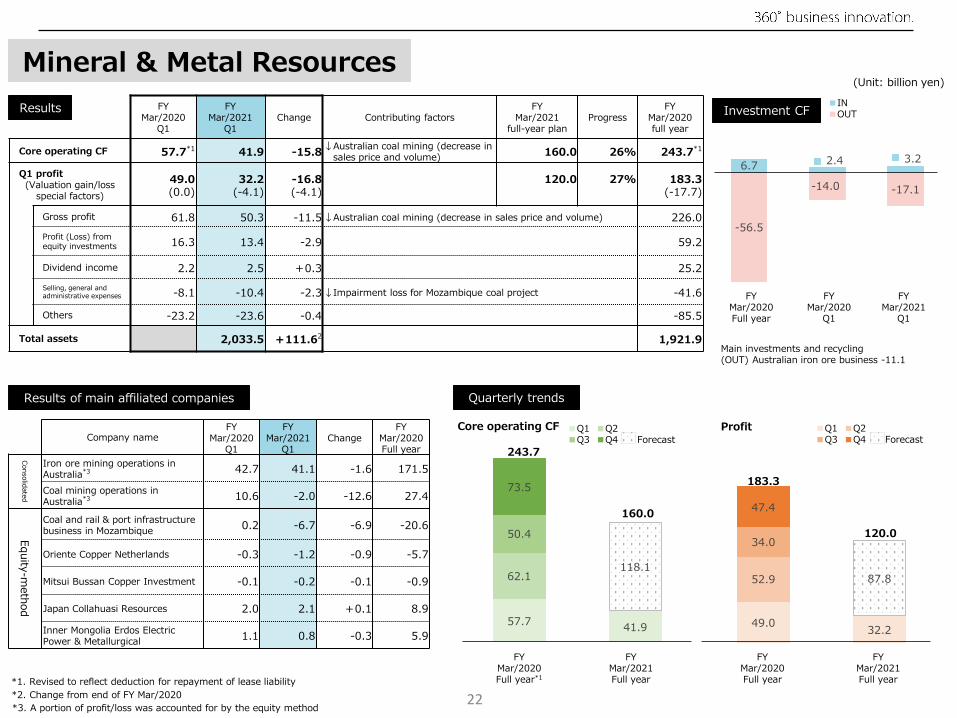
Main investments and recycling (OUT) Australian iron ore business -11.1
FY Mar/2020
Q1
FY Mar/2021
Q1Change Contributing factors
FY Mar/2021
full-year planProgress
FY Mar/2020 full year
Core operating CF 57.7*1 41.9 -15.8 ↓Australian coal mining (decrease in sales price and volume) 160.0 26% 243.7*1
Q1 profit(Valuation gain/loss
special factors)49.0(0.0)
32.2(-4.1)
-16.8(-4.1)
120.0 27% 183.3(-17.7)
Gross profit 61.8 50.3 -11.5 ↓Australian coal mining (decrease in sales price and volume) 226.0Profit (Loss) from equity investments 16.3 13.4 -2.9 59.2
Dividend income 2.2 2.5 +0.3 25.2Selling, general and administrative expenses -8.1 -10.4 -2.3 ↓Impairment loss for Mozambique coal project -41.6
Others -23.2 -23.6 -0.4 -85.5
Total assets 2,033.5 +111.62 1,921.9
49.0 32.2
52.9
34.0
47.4
87.8
Mineral & Metal Resources
-56.5
-14.0 -17.1
6.7 2.4 3.2
■IN■OUT
183.3
120.0
*2. Change from end of FY Mar/2020
Company nameFY
Mar/2020 Q1
FY Mar/2021
Q1Change
FY Mar/2020 Full year
Consolidated
Iron ore mining operations in Australia*3 42.7 41.1 -1.6 171.5
Coal mining operations in Australia*3 10.6 -2.0 -12.6 27.4
Equity-method
Coal and rail & port infrastructure business in Mozambique 0.2 -6.7 -6.9 -20.6
Oriente Copper Netherlands -0.3 -1.2 -0.9 -5.7
Mitsui Bussan Copper Investment -0.1 -0.2 -0.1 -0.9
Japan Collahuasi Resources 2.0 2.1 +0.1 8.9
Inner Mongolia Erdos Electric Power & Metallurgical 1.1 0.8 -0.3 5.9
基礎営業CF
57.7 41.9
62.1
50.4
73.5
118.1
243.7
160.0
*1. Revised to reflect deduction for repayment of lease liability
Quarterly trends
Results Investment CF
Results of main affiliated companies
(Unit: billion yen)
Core operating CF Profit
FYMar/2020Full year
FY Mar/2020
Q1
FY Mar/2021
Q1
FYMar/2020Full year
FY Mar/2021Full year
FYMar/2020Full year*1
FY Mar/2021Full year
*3. A portion of profit/loss was accounted for by the equity method
■Q1 ■Q2■Q3 ■Q4 Forecast
■Q1 ■Q2■Q3 ■Q4 Forecast
22

COPYRIGHT © MITSUI & CO., LTD. ALL RIGHTS RESERVED.
58.736.4
57.7
67.7
22.4
53.6
Main investments and recycling (OUT) LNG projects under development
(Area1, Arctic LNG2)
FY Mar/2020
Q1
FY Mar/2021
Q1Change Contributing factors
FY Mar/2021
full-year planProgress
FY Mar/2020 full year
Core operating CF 58.7*1,2 36.4 -22.3 ↓Decrease in oil and gas prices, decrease in external dividends 90.0 40% 206.5*1,2
Q1 profit(Valuation gain/loss
special factors)40.4*2
(14.2)3.5
(-1.2)-36.9
(-15.4)0.0 100% 57.8*2
(-33.0)
Gross profit 34.3 25.6 -8.7 ↓Decrease in oil and gas prices and production volume↑Strong trading performance 141.1
Profit (Loss) from equity investments 22.1 5.7 -16.4 ↓Absence of deferred tax asset for MEPMOZ included in FY
Mar/2020 45.2
Dividend income 12.9 2.1 -10.8 ↓Decrease in dividends from six LNG projects 52.7Selling, general and administrative expenses -11.0 -11.1 -0.1 -44.5
Others -17.9 -18.8 -0.9 -136.7
Total assets 2,331.3 -235.0*3 2,566.3
40.4 3.524.231.5
-38.3
-120.8
-24.0 -29.313.7 2.5 0.7
■IN■OUT
57.8
206.5
90.0
Energy
Company nameFY
Mar/2020 Q1
FY Mar/2021
Q1Change
FY Mar/2020 Full year
Consolidated
Mitsui Oil Exploration*4 7.1 2.0 -5.1 22.0
Mitsui E&P Australia -1.3 -2.6 -1.3 -14.2
AWE -1.1 -0.3 +0.8 -4.5
Mitsui E&P USA 3.3 0.2 -3.1 5.0
MEP Texas Holdings 1.1 0.0 -1.1 -17.7
Mitsui & Co. Energy Trading Singapore 4.5 6.5 +2.0 7.2
Equity-method
Mitsui E&P Mozambique Area 1 12.0 0.1 -11.9 11.2
Japan Australia LNG (MIMI)*5 - - - -
Japan Arctic LNG 0.0 -1.6 -1.6 4.1
*4. A portion of profit/loss was accounted for by the equity method*5. Results not disclosed due to non-disclosure agreement
*3. Change from end of FY Mar/2020*1. Revised to reflect deduction for repayment of lease liability *2. After reflecting modifications associated with structural reorganization in April 2020
Quarterly trends
Results Investment CF
Results of main affiliated companies
(Unit: billion yen)
Core operating CF Profit
FYMar/2020Full year*2
FY Mar/2020
Q1*2
FY Mar/2021
Q1
FY Mar/2020Full year *2
FY Mar/2021Full year
FYMar/2020
Full year*1,2
FY Mar/2021Full year
■Q1 ■Q2■Q3 ■Q4 Forecast
■Q1 ■Q2■Q3 ■Q4 Forecast
23

COPYRIGHT © MITSUI & CO., LTD. ALL RIGHTS RESERVED.
■Q1 ■Q2■Q3 ■Q4 Forecast
Main investments and recycling (IN) Sale of power generation business in
North America
FY Mar/2020
Q1
FY Mar/2021
Q1Change Contributing factors
FY Mar/2021
full-year planProgress
FY Mar/2020 full year
Core operating CF 18.2*1,2 12.9 -5.3 ↓Decrease in dividends from equity-method affiliates 60.0 22% 86.8*1,2
Q1 profit(Valuation gain/loss
special factors)17.3*2
(-1.2)18.5
(-1.4)+1.2(-0.2)
35.0 53% 89.4*2
(-14.3)
Gross profit 30.1 26.7 -3.4 134.6
Profit (Loss) from equity investments 25.8 17.3 -8.5
↓Absence of service tax redemption associated with settlement of arbitration at Brazilian gas distribution company included in FY Mar/2020
88.4
Dividend income 1.7 1.6 -0.1 5.1Selling, general and administrative expenses -31.7 -29.2 +2.5 -133.4
Others -8.6 +2.1 +10.7 ↑Profit on sale of power generation business in North America -5.3
Total assets 2,218.6 -141.7*3 2,360.3
17.3 18.5
19.7
24.2
28.2
16.5
-118.1-35.8 -8.8
73.43.8 24.0
■IN■OUT
89.4
35.0
18.2 12.9
19.6
22.1
26.9
47.1
86.8
60.0
Machinery & Infrastructure
Company nameFY
Mar/2020 Q1
FY Mar/2021
Q1Change
FY Mar/2020 Full year
Consolidated
Mitsui & Co. Plant Systems 0.2 0.2 0.0 3.6
Rolling stock leasing businesses*4 0.7 0.1 -0.6 2.8Construction & industrial machinery businesses*4 1.1 2.4 +1.3 6.0
Equity-method
IPP businesses 6.0 2.0 -4.0 27.6
FPSO/FSO leasing businesses 1.8 2.0 +0.2 3.9
Gas distribution companies 4.5 1.1 -3.4 11.3
Penske Automotive Group 1.8 0.9 -0.9 7.7
Truck leasing and rental businesses 1.5 0.5 -1.0 9.0
Asian motor vehicle businesses 1.6 1.7 +0.1 7.2
VLI -0.1 -0.4 -0.3 -1.0
*4. A portion of profit/loss was accounted for by the equity method
*1. Revised to reflect deduction for repayment of lease liability
Quarterly trends
Results Investment CF
Results of main affiliated companies
(Unit: billion yen)
Core operating CF Profit
FYMar/2020Full year*2
FY Mar/2020
Q1*2
FY Mar/2021
Q1
FY Mar/2020Full year *2
FY Mar/2021Full year
FYMar/2020
Full year*1,2
FY Mar/2021Full year
■Q1 ■Q2■Q3 ■Q4 Forecast
*2. After reflecting modifications associated with structural reorganization in April 2020 *3. Change from end of FY Mar/202024

COPYRIGHT © MITSUI & CO., LTD. ALL RIGHTS RESERVED.
Main investments and recycling -
FY Mar/2020
Q1
FY Mar/2021
Q1Change Contributing factors
FY Mar/2021
full-year planProgress
FY Mar/2020 full year
Core operating CF 6.5*1 15.7 +9.2↑Previous fiscal year tax refund at
overseas affiliate company↑Recorded insurance proceeds at
a business in North America45.0 35% 35.8*1
Q1 profit(Valuation gain/loss
special factors)4.1
(-1.7)6.3
(1.9)+2.2
(+3.6)20.0 32% 22.3
(6.6)
Gross profit 31.8 29.9 -1.9 116.8Profit (Loss) from equity investments 3.5 0.9 -2.6 11.5
Dividend income 1.4 1.1 -0.3 2.7Selling, general and administrative expenses -25.8 -23.4 +2.4 -101.9
Others -6.8 -2.2 +4.6 ↑Recorded insurance proceeds at a business in North America -6.8
Total assets 1,193.2 -24.5*2 1,217.7
4.1 6.30.611.9
5.7
13.7
-29.2
-7.1 -5.4
12.8 0.9 6.9
■IN■OUT
22.3 20.0
*2. Change from end of FY Mar/2020
6.515.76.8
14.0
8.5 29.3
35.8
45.0
*1. Revised to reflect deduction for repayment of lease liability
Chemicals
Company nameFY
Mar/2020 Q1
FY Mar/2021
Q1Change
FY Mar/2020 Full year
Consolidated
MMTX 1.7 0.0 -1.7 1.6
MITSUI & CO. PLASTICS 0.9 0.7 -0.2 3.4
Novus International -1.0 -0.8 +0.2 -2.2
Mitsui AgriScience(EU/Americas) 0.8 1.5 +0.7 2.4
Equity-m
ethod Japan-Arabia Methanol Co. 0.5 0.3 -0.2 1.3
Quarterly trends
Results Investment CF
Results of main affiliated companies
(Unit: billion yen)
Core operating CF Profit
FYMar/2020Full year
FY Mar/2020
Q1
FY Mar/2021
Q1
FY Mar/2020Full year
FY Mar/2021Full year
FYMar/2020Full year*1
FY Mar/2021Full year
■Q1 ■Q2■Q3 ■Q4 Forecast
■Q1 ■Q2■Q3 ■Q4 Forecast
25

COPYRIGHT © MITSUI & CO., LTD. ALL RIGHTS RESERVED.
1.5
-1.3
1.2
0.8
1.2
6.3
Main investments and recycling -
FY Mar/2020
Q1
FY Mar/2021
Q1Change Contributing factors
FY Mar/2021
full-year planProgress
FY Mar/2020 full year
Core operating CF 0.2*1 1.6 +1.4 0.0 100% 2.2*1
Q1 profit(Valuation gain/loss
special factors)1.5
(0.0)-1.3(0.0)
-2.8(0.0)
5.0 0% 4.7(-0.1)
Gross profit 6.4 5.4 -1.0 24.6Profit (Loss) from equity investments 2.9 -1.9 -4.8 ↓Decrease in demand for steel for automotive industry 13.1
Dividend income 1.0 0.7 -0.3 1.9Selling, general and administrative expenses -6.7 -5.6 +1.1 -27.2
Others -2.1 0.1 +2.2 -7.7
Total assets 525.9 -13.7*2 539.6
-1.3 -0.5 -0.1
8.8
0.0 2.3
■IN■OUT
4.7
5.0
*2. Change from end of FY Mar/2020
0.21.6
-0.6
1.6
1.0
2.2
*1. Revised to reflect deduction for repayment of lease liability
Iron & Steel Products
Company nameFY
Mar/2020 Q1
FY Mar/2021
Q1Change
FY Mar/2020 Full year
Consolidated Mitsui & Co. Steel 1.1 1.1 0.0 3.8
Equity-method
NIPPON STEEL TRADING*3 1.2 - - 4.5
Game Changer Holdings 0.3 -0.3 -0.6 1.4
Gestamp companies 0.6 -2.3 -2.9 2.4
Quarterly trends
Results Investment CF
Results of main affiliated companies
(Unit: billion yen)
Core operating CF Profit
FYMar/2020Full year
FYMar/2020
Q1
FY Mar/2021
Q1
FY Mar/2020Full year
FY Mar/2021Full year
FYMar/2020Full year*1
FY Mar/2021Full year
*3. Business results undisclosed as the earnings of listed companies not yet announced
■Q1 ■Q2■Q3 ■Q4 Forecast
■Q1 ■Q2■Q3 ■Q4 Forecast
26

COPYRIGHT © MITSUI & CO., LTD. ALL RIGHTS RESERVED.
Main investments and recycling -
FY Mar/2020
Q1
FY Mar/2021
Q1Change Contributing factors
FY Mar/2021
full-year planProgress
FY Mar/2020 full year
Core operating CF 7.4*1 3.6 -3.8 ↓Decrease in fashion, food, andretail related subsidiaries 15.0 24% 20.5*1
Q1 profit(Valuation gain/loss
special factors)
7.6(0.1)
-5.6(-1.7)
-13.2(-1.8)
5.0 0% 32.0(-17.9)
Gross profit 36.6 27.8 -8.8 ↓Decrease in fashion, food and retail related subsidiaries 134.9Profit (Loss) from equity investments 4.5 -3.8 -8.3 ↓Decrease in food, fashion and service related affiliated companies
↓IHH impairment of goodwill over subsidiary in India 35.0
Dividend income 2.3 2.2 -0.1 4.2Selling, general and administrative expenses -36.4 -31.7 +4.7 -139.3
Others 0.6 -0.1 -0.7 -2.8
Total assets 1,903.8 -3.8*2 1,907.6
7.6
-5.6
9.3
1.2
13.9
10.6
-57.6-27.8 -5.0
105.3
6.9 1.2
■IN■OUT
32.0
5.0
*3. Business results undisclosed as the earnings of listed companies not yet announced, or results not disclosed due to non-disclosure agreement
7.43.6
-5.1
8.4
9.8
11.4
20.5
15.0
Lifestyle
Company nameFY
Mar/2020 Q1
FY Mar/2021
Q1Change
FY Mar/2020 Full year
Consolidated
Domestic food & retail management businesses 0.6 -0.1 -0.7 4.4
Equity-method
Mitsui Sugar*3 0.5 - - 1.2
WILSEY FOODS 1.2 -0.3 -1.5 3.9
IHH Healthcare 0.4 -2.2 -2.6 4.9
PHC Holdings*3 - - - -
AIM SERVICES 0.8 -0.3 -1.1 2.4
Quarterly trends
Results Investment CF
Results of main affiliated companies
(Unit: billion yen)
Core operating CF Profit
FYMar/2020Full year
FY Mar/2020
Q1
FY Mar/2021
Q1
FY Mar/2020Full year
FY Mar/2021Full year
FYMar/2020Full year*1
FY Mar/2021Full year
■Q1 ■Q2■Q3 ■Q4 Forecast
■Q1 ■Q2■Q3 ■Q4 Forecast
*2. Change from end of FY Mar/2020*1. Revised to reflect deduction for repayment of lease liability
27

COPYRIGHT © MITSUI & CO., LTD. ALL RIGHTS RESERVED.
Main investments and recycling -
FY Mar/2020
Q1
FY Mar/2021
Q1Change Contributing factors
FY Mar/2021
full-year planProgress
FY Mar/2020 full year
Core operating CF -2.1*1 12.7 +14.8↑Absence of FVTPL valuation loss
included in FY Mar/2020↑FVTPL valuation gain
15.0 85% 3.9*1
Q1 profit(Valuation gain/loss
special factors)2.1
(-0.9)10.5(0.0)
+8.4(+0.9)
15.0 70% 14.6(-6.4)
Gross profit 8.4 23.2 +14.8 ↑Absence of FVTPL valuation loss included in FY Mar/2020↑FVTPL valuation gain 60.1
Profit (Loss) from equity investments 3.5 2.3 -1.2 17.0
Dividend income 2.5 3.1 +0.6 3.3Selling, general and administrative expenses -16.5 -16.1 +0.4 -64.5
Others 4.2 -2.0 -6.2 ↓Absence of valuation gain on derivatives included in FY Mar/2020 -1.3
Total assets 1,130.8 -67.5*2 1,198.3
2.1
10.5
-0.5
4.4
8.64.5
■Q1 ■Q2■Q3 ■Q4 Forecast
Quarterly trends
Results
-49.7
-9.1
-40.7
49.8
1.6 0.2
FYMar/2020Full year
FY Mar/2020
Q1
FY Mar/2021
Q1
Investment CF
Results of main affiliated companies
■IN■OUT
14.6 15.0
FY Mar/2020Full year
FY Mar/2021Full year
Core operating CF
-3.6
12.7
-2.1
4.8
4.8
2.3
FYMar/2020Full year*1
FY Mar/2021Full year
Profit
3.9
15.0
Innovation & Corporate Development
Company nameFY
Mar/2020 Q1
FY Mar/2021
Q1Change
FY Mar/2020 Full year
Consolidated
MITSUI KNOWLEDGE INDUSTRY 0.5 1.2 +0.7 4.2
Mitsui & Co. Global Logistics, Ltd. 1.4 0.7 -0.7 2.9
Mitsui Bussan Commodities -0.5 3.1 +3.6 2.0
Mitsui & Co. Asset Management Holdings 0.3 0.5 +0.2 1.9
Mitsui & Co. Real Estate 0.0 0.0 0.0 1.5
Overseas Real Estate Businesses 1.4 -0.1 -1.5 4.6
Equity-m
ethod
QVC Japan*3 - - - 5.4
JA Mitsui Leasing 0.8 0.1 -0.7 3.9
SABRE INVESTMENTS*3 - - - -
(Unit: billion yen)
*3. Results not disclosed due to non-disclosure agreement*2. Change from end of FY Mar/2020*1. Revised to reflect deduction for repayment of lease liability
■Q1 ■Q2■Q3 ■Q4 Forecast
28
