Dr. René Kim, Tias van Moorsel and Prof. Ethan B. KapsteinReport 2013
The National and Regional Socio-Economic Impact of Newmont Ghana's Ahafo Mine

Dr. René Kim, Tias van Moorsel and Prof. Ethan B. KapsteinReport 2013
The National and Regional Socio-Economic Impact of Newmont Ghana's Ahafo Mine
The National and Regional Socio-Economic Impact of Newmont Ghana's Ahafo Mine 54
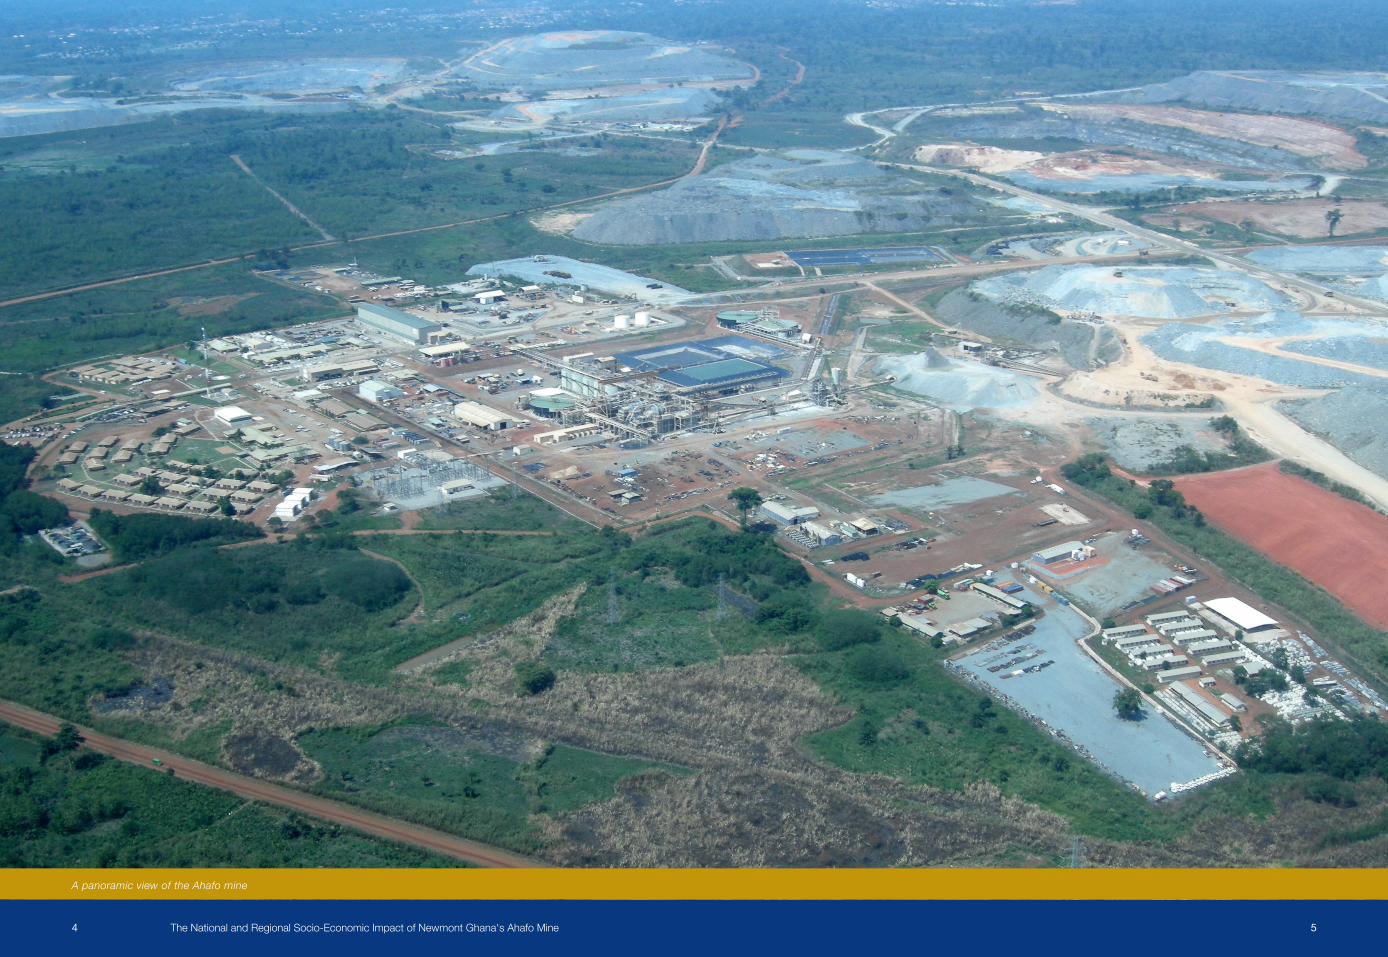
A panoramic view of the Ahafo mine
The National and Regional Socio-Economic Impact of Newmont Ghana's Ahafo Mine 76
Table of ContentsABOUT THE AUTHORS 9
EXECUTIVE SUMMARY 10
1. INTRODUCTION AND OBJECTIVES 13 1.1 Introduction 13 1.2 Objectives 13 1.3 Scope 13
2. GHANA’S ECONOMY 15 2.1Nationalandregionaleconomicprofile 15 2.2 The Brong-Ahafo region 17 2.3 The mining sector in Ghana 17 2.4 Newmont Ghana’s operations 19
3. ECONOMIC MODELING & METHODS 21 3.1 Modeling of value added and employment impacts 21 3.2 Household survey 22
4. NGGL’S SOCIO-ECONOMIC IMPACT ON THE NATIONAL LEVEL 24 4.1 NGGL’s expenditures in Ghana 24 4.2 Value added 27 4.3 Employment 31 4.4 Comparison with the 2009 Report 34
5. NGGL’S SOCIO-ECONOMIC IMPACT ON THE BRONG-AHAFO REGION AND ASUTIFI DISTRICT 36
5.1NGGL’sexpendituresinBrong-Ahafo 36 5.2Valueadded 37 5.3Employment 39 5.4ComparisonofNGGL’simpactatthenational,regionalanddistrictlevels 41
6. IMPACT ON THE HOUSEHOLD LEVEL 43 6.1Migration 44 6.2Householdspending 45 6.3Businessactivities 46 6.4Education 48 6.5Accesstowaterandelectricity 50 6.6Overallchange 50
7. CONCLUSIONS AND RECOMMENDATIONS 55 7.1Conclusions 55 7.2Recommendations 55
LITERATURE 57
APPENDIX A: METHODOLOGY BACKGROUND 59 A.1Inputs 59 A.2Output 59 A.3Outcome 62
APPENDIX B: COMPARISON OF RESULTS WITH THE 2009 REPORT 63
APPENDIX C: SECTOR BREAKDOWN 66

The National and Regional Socio-Economic Impact of Newmont Ghana's Ahafo Mine 98
About the AuthorsCompanyProfileStewardRedqueenisastrategyconsultancyfirmthataimstomakebusinessworkforsociety.Asspecialistssince2000,StewardRedqueenfocusesonintegratingsustainability,quantifyingimpact and facilitating change.
Clientsappreciateourrigorousanalysis,ourabilitytosolvecomplexproblems,andbeingaheadofthecurve.Weworkformultinationalcorporations,(development)financialinstitutionsand public sector organizations.
Socio-EconomicImpactAssessments(SEIA)Thecostsandbenefitsofforeigndirectinvestmentareoftencontestedbyvariousstakeholders.Thesedebates,however,arenotalwaysconductedonthebasisofallthefacts.ThepurposeofourSocio-EconomicImpactAssessments(SEIAs)istoprovidestakeholderswithadeeperunderstanding of the ways in which corporate operations contribute to value-added and employment generation in countries around the world. Using the best available modeling and data,weestablishafactualbasisforunderstandingtheimpactsofinvestmentdecisions.
Dr. René KimDr.RenéKimisfounderandpartnerofStewardRedqueen.Hehasworkedwithmanymultinationalcompaniesandprivateequityfundsinbothdevelopedandemergingmarkets.Previously,heworkedforTheBostonConsultingGroupinAmsterdamandasanacademicat the Massachusetts Institute of Technology. He has a PhD cum laude in Hydrology and Meteorology and is the author of many academic articles.
Prof. Ethan B. KapsteinProfessorEthanB.Kapstein,associatepartnerStewardRedqueen,iscurrentlyVisitingFellowat the Center for Global Development; Senior Advisor at the U.S. Institute of Peace; and Senior DirectorforResearchattheMcCainInstituteforInternationalLeadership,aWashington,DCthink-tankassociatedwithArizonaStateUniversity.ThisindependentReport,however,does not represent the views of these organizations. Previously he held the INSEAD Chair in PoliticalEconomyatINSEAD.HehasalsoservedinvariouspositionsatHarvardUniversity,theUniversity of Minnesota and the Organization for Economic Cooperation and Development. A formerinternationalbankerandnavalofficer,Prof.Kapsteinprovideseconomicandstrategyadvice to government agencies and many of the world’s leading multinational corporations. His latestbooksareAIDSDrugsforAll:SocialMovementsandMarketTransformations;EconomicJusticeinanUnfairWorld;andTheFateofYoungDemocracies.
TheauthorswereassistedbyTiasvanMoorsel,MSc,ofStewardRedqueen.ThesupplierandhouseholdsurveyswereconductedbyPABDevelopmentConsultantsLimitedinTema,Ghana.
Socio-EconomicImpactAssessmentTrackRecordSince2006,StewardRedqueenhascompletedmorethan50socio-economicimpactstudiesformultinationalminingcompanies,developmentfinanceinstitutions,multinationalfood&beveragefirms,banksandrecreationalorganizations,inAfrica,Asia,LatinAmericaandEurope.
Formoreinformation,pleasevisit: www.stewardredqueen.comA demonstration of agricultural success in a host community

The National and Regional Socio-Economic Impact of Newmont Ghana's Ahafo Mine 1110
Executive SummaryGoldminingremainsamongthemostsignificanteconomicactivitiesforGhana,acountryonceknownastheGoldCoast.Notonlyistheminingsectorthelargesttaxcontributorofthecountry,italsoaccountsforabout40%ofmechanizedexports,whileattractingUSD780millionofinvestmentin2011andemployingover14,000peopledirectly.
Despitetheseimpressivestatistics,manystakeholdersinGhanastillholdunfavorableopinionsaboutthegoldminingsectoranddonotthinkithasapositiveimpactontheGhanaianeconomy. Some people believe that the sector operates as an “enclave” with few positive “spillover”effects,meaningthatfewwithinGhanabenefitfromgoldmining,whilemostoftheprofitsgooffshore.Unfortunately,thesecontroversiesoverminingareoftendebatedwithoutasolid foundation of empirical research.
Itwaswithinthiscontextthat,in2009,StewardRedqueencarriedoutasocio-economicimpactassessmentofNewmontGhanaGoldLimited’s(NGGL)operationsinGhana(theAhafomine).Makinguseofrigorousacademicmethodsincombinationwithmacro-economicandcompanydata,StewardRedqueenwasabletogenerateestimatesofthemine’seffectsonsuchmacro-economicvariablesasvalueadded(intermsofhouseholdincome,profits&savingsandtaxpayments)andemployment(intermsoffull-timeequivalentjobs).
Subsequently,severalstakeholderswhowereinvolvedinthisstudy,includingthePresident’sOfficeandvariousMinistries,theRegionalGovernment,theAsantehene(AshantiKing),theDistrictChiefExecutivesandGhanaiancivilsocietyorganizations,expressedaninterestinresults that not only captured the impact of the mine on the national but also on the regional level.ThatiswhyfromMarch2012uptoApril2013,StewardRedqueenexecutedthisfollow-up study which focuses on the national and regional impacts of the Ahafo Mine.
The national and regional results presented in this Report were obtained using an economic modelwhichisbasedoninput-outputanalysis,NGGL’s2011financialsandasurveyoflocalsupplierstotheAhafomine.Twoaspectsofeconomicimpactsarecentralinthisreport:valueadded,i.e.thesumofsalaries,profitsandtaxesinGhana,andjobs.Althoughmuchofthe value added and many of the jobs described in this report are to a considerable extent supportedbyNewmont,theyarenotcreatedbyNewmontalone.
Inadditiontothedevelopedeconomic,ahouseholdsurveywasconductedtoassesstheimpacttheminehashadonelementssuchasmigration,housing,income,educationandaccess to utilities for households living in its vicinity.
ThisReportshowsthatNGGLonanationallevel: • SupportsUSD360millionvalueaddedintermsofeconomicactivity(0.95%ofGDPfor
Ghana),ofwhichUSD230millionisdirectlyattributabletoNGGL(0.60%ofGDPforGhana);
• ContributesdirectlyUSD160milliontogovernmenttaxincome(2.56%ofnationaltaxrevenuesofGhana),USD39milliontohouseholdincomesandUSD31millionascarriedinterestincometothegovernment(tobepaidwhendividendsaredeclaredbyNGGL);
• Supports41,000jobs(0.39%ofthetotallaborforceinGhana),ofwhich1,921jobsaredirectlyattributabletoNGGL(0.02%ofthetotallaborforceinGhana);
• Valueaddedhasgrownby135%since2009butthenumberofjobsdeclinedby15%; • FromavisualimpressionofthepathwaysthroughwhichNGGL’sspendingtrickles
throughtheeconomy,weconcludethatforamine,itisrelativelydeeplyconnectedtotheGhanaian economy.
ApartofthiseconomicimpactiscreatedintheBrong-Ahaforegion(theregionwithinwhichtheAhafomineislocated),whichishometo10%oftheGhanaianpopulationandcontributesapproximately10%toGhana’sGDP.ThisReportshowsthatNGGLonaregionallevel: • SupportsUSD31millionvalueadded(0.78%ofregionalGDP),ofwhichUSD15million
isdirectlyattributabletoNGGL(0.38%ofregionalGDP); • Contributes directly USD 3 million in tax payments and USD 12 million in household
incomes in 2011; • Supports8,700jobs(0.86%oftheregionallaborforce).
TheimpactofNGGLintheAsutifidistrictoftheBrong-AhaforegionwheretheAhafoMineislocatedismuchlarger;approximately8%ofthedistrict’s(estimated)GDPand10%of(estimated)employment.TheNewmontAhafoDevelopmentFoundation(NADeF)amplifiesthiseconomiceffectwithanother23%intermsofvalueadded.
ThemainconclusionsregardingNGGL’slocalimpactonhouseholdsare: • NGGL’spresenceanditsneedforskilledlaborhascausedin-migrationofpeoplefrom
outsidetheregioninsearchofworkatthemine,leadingtohigherpricesforproductsand services in the region;
• NGGL’seconomicimpacthastranslatedintohigherdisposableincomeforitsemployees,who spend almost twice as much as people outside NGGL’s catchment area. HouseholdswithoutmembersthatworkdirectlyforNGGL(includingNGGL’scontractors)andwhomresideinthecatchmentareahave11%moretospendthanhouseholdsoutside the catchment area;
• Inevitably,butneverthelesssomewhatworrying,theminehascreatedacertaindependence of people within the catchment area of the mine as they are less engaged in other economic activities than people outside the catchment area;
• A majority of people in the catchment area believe that the overall situation has improved sinceNGGL’sarrival,withpeopleemployedbyNGGLholdingfavorableopinionsbutthepeoplewhowereresettledmostlynegativeones.Toacertainextent,theNewmontAhafoDevelopmentFoundationhascontributedtothisoverallimprovementbydeliveringinfrastructuralandsocialamenitiesincludingcommunitylibraries,teachers’andnurses’quarters,ICTcentersandschoolbuildingsforthecommunities.
ThemainrecommendationsforNGGLarethecontinuation,andwherepossible,intensificationof local sourcing and business activities. Although the low-hanging fruit may already have been picked,wethinktherearestillareaswhereNGGLtogetherwithitssuppliersandcontractorscan bring about positive changes. We also recommend that NGGL conveys its most successful

The National and Regional Socio-Economic Impact of Newmont Ghana's Ahafo Mine 1312
programstotheAkyemmineinordertoreproducethepositiveimpactsthatarecurrentlygenerated at the Ahafo mine.
ConsideringGhana’sincreaseddependencyonresource-relatedincome,werecommendthattheGovernmentdevelopplansforeconomicdiversificationtohelpitprepareforleanertimeswhen commodity prices are lower or resources become depleted. The Government may wish toemphasizetheneedfordiversificationinregionswheredependencyonminingisgreatest.Inmanyminingregions,forexample,agriculturehasalsobeenatraditionaloccupationoflocalresidents.
Investing in increasing the productivity of agricultural lands—including the development of a stronger property rights regime and access to credit and inputs for farmers—could be among the policies that the Government might contemplate.
1. Introduction and Objectives1.1 IntroductionIn2011,NewmontGhanaGoldLimited(NGGL)launcheditssocio-economicimpactstudyoftheAhafominingoperationinGhana’sBrong-AhaforegionandAsutifidistrict.Thekeyfindings,whichwerebasedonNGGL’s2009financialdataalongwiththemostrecenteconomicinformationonGhana(priortotherevisionsofGDPthatweresubsequentlymadebytheGhanaStatisticalService(GSS)),indicatedthat: 1. NGGLisamajorcontributortoGhana’seconomy,generatingnearly10%ofthenation’s
totalexports;4.5%ofitstotalforeigndirectinvestmentand1.3%ofGDP; 2. NGGLdirectlyandindirectlysupportedsome48,000jobsinGhana; 3. NGGLplayedasignificantdevelopmentalroleinthecommunitiesaroundtheAhafoMine
andin2009aloneprovided99regionalcompanieswithnearlyUSD6millionincontracts,supportingmorethan400jobs,notincludingdirectemployment.
Subsequently,severalstakeholderswhowereinvolvedinthisstudy,includingthePresident’sOfficeandvariousMinistries,theRegionalGovernment,theAsantehene(AshantiKing),theDistrictChiefExecutivesandGhanaiancivilsocietyorganizations,expressedaninterestinresults that not only captured the impact of the Mine on the national but also on the regional level.
1.2 ObjectivesNGGL therefore requested this follow-up Report to quantify the economic impact of its activities onGhana,theBrong-AhaforegionandtheAsutifidistrictinwhichitoperatestheAhafomine.ThefollowingquestionsareaddressedinthisReport: • Whatisthetotalsocio-economicimpactofNGGLinGhanaintermsofsalaries,taxes,
profitsandemployment? • HowmuchofthatimpactisachievedintheBrong-AhaforegionandtheAsutifidistrict? • What has changed for the households in the vicinity of the Ahafo mine since the start of
production? • IsGhanamakinggooduseofitsgoldwealthtoaidintheprocessofregional
development? • IsNGGLaneffectivepartnerineconomicdevelopmentintheregionanddistrict?
1.3 ScopeTheReportdistinguishesbetweenthedirect,indirectandinducedsocio-economicimpactofNGGLinGhana.Thesocio-economicimpactiscapturedbyvalueadded(householdincome,profits&savingsandgovernmentincome)intermsofadditionaleconomicactivityandjobssupportedaswellasbasedonmorequalitativefindingsfromthesurveysconducted.Intermsofgeographicfocus,theresultsareshownonthenational(Ghana),regional(Brong-Ahafo)anddistrict(Asutifi)level.
The Ahafo Mine

The National and Regional Socio-Economic Impact of Newmont Ghana's Ahafo Mine 1514
The important question regarding the social and health/environmental impacts of mining is notpartofthisReport.Thisomissionisintentionalasthequantificationoftheseimpactswouldinvolveadifferenttypeofanalysis.Althoughsomeworkhasbeendonetoexpressenvironmentalimpactsinfinancialterms,thesocio-economicandenvironmentalimpactsarenotdirectlycomparable.Yetbothareimportant.ThisReporthoweverfocusesonjobsandeconomicimpactonthenational,regionalanddistrictlevelandnotontheenvironmentalimpacts. In recognition of the importance of the social and health/environmental impacts of the mine,NGGLcommissionedseparateindependentstudiesonthesetwoareasalongsidethisstudy on jobs and economic impact.
ThisReportisdividedintosevensections.Followingthisintroduction,Section2describesGhana’sandBrong-Ahafo’seconomy,theminingsectorandNewmontGhana’soperations.Section 3 summarizes the methodology and economic model used and after that Section 4 focusesonthesocio-economicimpactatthenationallevelandcomparesthefindingswiththepreviousReport.Section5thendescribesNGGL’ssocio-economicimpactontheBrong-AhaforegionwhileSection6outlinesNGGL’simpactsonthehouseholdsresidingintheregionand district where the Ahafo mine is operating. Section 7 concludes this report and gives recommendations.
2. Ghana’s Economy2.1 NationalandRegionalEconomicProfileWithanaverageeconomicgrowthrateof6.9%overthelast10yearsand14.4%in2011,Ghana’s economy has been growing more rapidly than the Sub-Saharan continent as a whole. UnlikemanyotherSub-Saharaneconomiesthatdependheavilyuponasinglecommodity,Ghanaisrelativelydiversifiedamongagriculture,industry,commodities,andservices.Table1showsthat23.9%ofGDPoriginatesfromagriculture,24.1%fromindustriesand45.3%fromservices.The6.3%ofGDPthatstemsfromcrudeoiloftheJubileefieldcouldtilttheeconomicbalance more towards commodities. This is a source of concern as resource dependence can translate into the so-called “resource curse.”
Ghana’stradedeficithasbeenstableataround13%ofGDP(seeExhibit1)asimports,mainlycapitalequipment,petroleumandfoodproducts,increasedasfastasexports.Thisdeficitmaydecreasewhenoilexportsrise,butofcoursethatwillalsobeafunctionofthepriceofcrudeoilonglobalmarkets.Goldcontributesmosttothecountry’sexportsamountingtoUSD4.9billion(almost34%oftotalexports)andwithits2.8%shareofworld-wideproductionGhanaistheworld’s10thlargestgoldproducer.However,duetothepricedeclinein2013,goldwilllikelycontribute less to export revenues.
Inrecentyears,Ghanahastakenimportantstridestoimproveitsbusinessclimate,encouraginggreater foreign direct investment and private sector participation in the economy. The World Bank’s“DoingBusiness2013”rankingputsGhana64th,downonepositionfromlastyear.Whilethissuggeststhatmoreneedstobedonetomakethecountryanattractiveplacetodobusinessonaglobalscale,therecentimprovementshaveplacedthecountryamongAfrica’sleading reformers.
Theincreasingforeigndirectinvestments(FDI),showninExhibit2,confirmthisalthoughmuchoftheFDIwastotheminingandoil&gassectors.Grosscapitalformation,i.e.theinvestmentinfixedassetsownedbyhouseholdsandcompaniesfluctuatesbuttrendsslightlydownward.Considering the current oil boom there is a strong economic rationale for more investment however. Constraints to further development mentioned by companies areaccesstofinanceandelectricity(intermsofavailabilityandreasonableprice).
Aseconomicgrowthoutstrippedpopulationgrowth,GrossNationalIncome(GNI)percapitahassteadilyincreased(Exhibit3)butinequalityislarge.AlthougharelativelybrightspotinSub-SaharanAfrica,Ghana’srankingontheHumanDevelopmentIndex(135outof187)remindsusthatthecountry’ssocialwelfaremustcontinuetoadvanceforthebenefitofallGhanaians.
High rise buildings in a business district in Ghana

The National and Regional Socio-Economic Impact of Newmont Ghana's Ahafo Mine 1716
TABLE1: Key indicators of the Ghanaian economy 20111
GHANA BRONG-AHAFOREGIONA
Population (estimated) 25.3million 2.4 million
Labor force (estimated) 10.6million 1.0 million
Gross Domestic Product USD38.1billion USD 3.9 billion
GDP per capita USD1,507 USD1,653
GDP growth 14.4%
GDP by economic activity:
Agriculture 23.9% 46.1%
Industry 24.1% 15.0%
Mining 1.6%B 3.0%
Oil 6.3% -
Services 45.3% 32.2%
Indirect tax revenue 6.7% 6.7%
GDP by expenditureC:
Household consumption 77.8%
Government consumption 12.5%
Investments 24.5%
Exports 38.4%
Imports 51.7%
Tax Revenue USD6.3billion
Government Budget:
Revenue USD7.5billion
Expenditure USD8.6billion
Ease of doing businessD 64
Human Development IndexE 135outof187
1 GhanaStatisticalServices,BankofGhana,WorldBank,EaseofDoingBusinessIndex,HumanDevelopmentIndex,OxfordPovertyandHumanDevelopmentInitiative.
A Blanksindicatenoregionaldataisavailable.B Thefigureof1.6%appearsverylow.Taxespaidbytheminingsectoralreadyrepresent2.5%ofGDP.When
includingsalariesweestimatethattheGDPcontributionisaround3%insteadofthe1.6%.C ReportedaspercentageofGDP.Thisbreakdowndoesnotaddupduetostatisticaldiscrepanciesreportedby
the Ghana Statistical Service. This is not uncommon with African statistics and does not impact the validity of the results in this Report.
D The Ease of Doing Business Index provides measures of business regulations and their enforcement across 185economiesthatindicateifitiseasytodobusinessinaspecificcountry(http://www.doingbusiness.org/).This is for the year 2013.
E TheHumanDevelopmentIndex(http://hdr.undp.org/en/humandev/)isanindexthatmeasureslong-termprogressinthreebasicdimensions:long/healthylife,accesstoknowledgeanddecentstandardofliving.Thisis for the year 2012.
2.2 The Brong-Ahafo RegionBrong-AhafoissituatedinthemiddleofGhanaandishometo10%ofGhana’spopulation.Theregionformsthetransitionbetweenthewealthier(Southern)andpoorer(Northern)partsofthecountry.ItisnotsurprisingthereforethatTable1showsthatmacro-economically,theregionisnottoodissimilarfromGhanaoverall:GDPpercapitaisslightlyhigher,butsoistheincidenceofpoverty.Themaindifferenceisthattheregion’seconomyrelieson(subsistence)agricultureto a much greater extent than the rest of Ghana.
2.3 The Mining Sector in GhanaAsshowninTable1,theextractiveindustries,oilandmining,makeupabout8%ofGhana’sGDP.2011wasthefirstfullyearinwhichGhanabenefitedfromoilproduction,whichthereforewasresponsibleformostofGhana’seconomicgrowth.Theminingsub-sector,dominatedbygold,grewby14.3%in2011,thehighestgrowthaftertheoilandconstructionsectors.Themain driver of this growth was the average price of gold which increased from on average USD 1,129perouncein2010toUSD1,583perouncein20112. This increase in the price of gold morethanmadeupforthedeclineinproduction,whichfellby2%from2.97millionouncesin2010 to 2.92 million in 2011. Although it is not a measure of the all-in sustaining cost of mining onaperouncebasis,theaveragecashcostofUSD751perouncewasabout17%higherthantheglobalaverageofUSD643,largelyduetoexpensiveelectricpower,laboranddiesel.Nevertheless,investmentintheminingsectorwentupslightlyfromUSD770millionin2010toUSD780millionin2011.
2 Factoid2011,ChamberofMines.
EXHIBIT1:ImportsandexportsofgoodsandservicesandGhana’stradedeficitaspercentageofGDP.Source:WorldBankDatabase80%
60%
40%
20%
0%
-20%
-40%
1995 1997 1999 2001 2003 2005 2009 2011
Imports(%ofGDP) Exports(%ofGDP) TradeDeficit(%ofGDP)

The National and Regional Socio-Economic Impact of Newmont Ghana's Ahafo Mine 1918
In2011,theminingsectormaintaineditspositionasthelargesttaxcontributor,withtotaltaxpaymentsofapproximatelyUSD640million3. Higher gold royalty payments and the fact that more mining companies are now paying corporate income tax has led to a growth in tax payments which will increase in 2012 due to the average increase of gold prices but also due tothedecisionoftheGovernmentofGhanatochangefiscalpoliciesfortheminingindustry,includinganincreaseinthecorporatetaxratefrom25%to35%.
Theminingsectoremploys14,257personsdirectly(ofwhich235areexpatriates)4. Compared to2009,thisisareductionof17.6%,whereasgoldproductionincreasedby0.8%.Notincludedintheabovefiguresaretheillegalandinformalmining(Galamsey)activitiesthatcontinued to grow in 2011. These activities do not only harm other miners who have to protect theirownconcessions,butalsopolluteanddestroypubliclandandwaterbodies.
3 Factoid2011,ChamberofMines.4 Factoid2011,ChamberofMines.
EXHIBIT2:Gross Capital Formation(GCF)andForeignDirectInvestment(FDI)as percentage of GDP. (Source:WorldBankDatabase)
EXHIBIT3:Growth of real Gross National Income(GNI)percapita in current USD.(Source:WorldBankDatabase)
2.4 Newmont Ghana’s OperationsMiningatAhafocommencedin2006andNGGLcurrentlyoperates4openpits.Theminingleasecovers774squarekilometersbuttheactualminingarea,locatedintheAsutifidistrictsouthofSunyani(Exhibit4),coverslessthan2%ofthelease.Inadditiontotheopenpits,NGGL is investigating the viability of a potential underground mine. The process plant consists of a conventional mill and carbon-in-leach circuit. The expansion of the mill is being considered andthecosteffectivenessofbringingtheexpansionforwardiscurrentlybeinginvestigated,but it could be delayed with the current low gold prices. Ahafo’s proven and probable gold reserves,asof31December,2011,wereestimatedat12millionounces.5
In2011,theAhafoMineproduced566,000ouncesofgold,equivalentto19.4%ofGhana’stotalproduction.Thisis21,000ouncesmorethanthepreviousyearand34,000ouncesmorethanin2009.NGGL’srevenueswereUSD869millionor18.8%oftotalgoldrevenueofthecountry.NewmontGhanaemployed2,229peopledirectly,1,729ofwhichworkattheAhafosite,192inAccraand308inAkyem.NGGL’ssistercompany,NewmontGoldenRidgeLimited(NGRL),constructedanopenpitmineinAkyemanditpoureditsfirstgoldinOctober2013.
5 2011ReservesandNon-ReserveMineralization,Disclosesin2011AnnualReportofNewmont
Workers of NGGL at the mine1995 1997 1999 2001 2003 2005 2009 2011
35%
30%
25%
20%
15%
10%
5%
0%
ForeignDirectInvestment,NetInflow(%ofGDP)GrossCapitalFormation(%ofGDP)
1995 1997 1999 2001 2003 2005 2009 2011
2000
1800
1600
1400
1200
1000
800
600
400
200
0
GNIpercapita(currentUSD)GNIpercapita,AtlasMethod(currentUSD)

The National and Regional Socio-Economic Impact of Newmont Ghana's Ahafo Mine 2120
EXHIBIT4:Map of Ghana with the red stars indicatingthelocationsoftheAhafo(nearSunyani)andAkyem(nearKoforidua)Mines.
EXHIBIT5:MapoftheBrong-AhaforegionandtheAsutifidistrictwith the red star indicating the location of the Ahafo Mine.
3. Economic Modeling & Methods3.1 Modeling of Value Added and Employment ImpactsTo assess the socio-economic impact of NGGL’s operations on the national and regional level,wemakeuseofinput-outputmodeling.Simplystated,aninput-outputmodelprovidesa‘roadmap’ofaneconomy,showingtheinter-linkagesbetweenvarioussectors.WedriveNGGL’sfinancialdatathroughthemodelinordertounderstandhowNGGL’srevenuesandexpendituresimpactonothereconomicagents,includingthegovernmentviataxpaymentsand other receipts such as royalties.
EXHIBIT6:Overview of the modeling approach
Company Financials Allocation of P&L items to 13 Economic Sectors
National and Regional Social Accounting Matrix for 13 Sectors (SAM)
Estimated Expenses and Value Added for NGGL on National and Regional Level
Value Added and Employment Multipliers per Sector
Direct and Indirect Effects NGGL on Value
Added and Employment in Ghana and Brong-Ahafo
Employment intensities for 13 Economic Sectors
Supplier Survey
Household Survey
GTAP Data on 57 Economic Sectors
Employment Data for 13 Economic Sectors
INPUT OUTPUT OUTCOME FINAL RESULT
Exhibit6summarizesourapproachinwhichwecombineNGGL’sfinancialswithmacro-economic data to come up with results in terms of value added and employment impact of NGGL on Ghana and Brong-Ahafo. Appendix A discusses the modeling approach in more detail as well as the assumptions made.

The National and Regional Socio-Economic Impact of Newmont Ghana's Ahafo Mine 2322
EXHIBIT 7:Direct,indirectandinducedeffectsonvalueaddedandemploymentdividedintofour rounds
EXHIBIT8:TheAsutifidistrictintheBrong-Ahaforegion(numbersinsidethefiguresindicatethenumberofhouseholdsinterviewed)
Exhibit 7 shows the rounds of impact that we distinguish in this Report. The rounds of impacts are(i)NGGL’sdirectimpact,(ii)thevaluechainimpact(includingsuppliers)and(iii)thetotalimpact(includingimpactsinducedbythere-spendingofsalaries).Withrespecttovalueadded,inducedresultsarenotincludedasitwouldconstituteadoublecounting(i.e.salariesarecountedtwice;oncewhentheyareearnedandoncewhentheyarespent).Inducedemploymentdoesnotsufferfrom double counting and is therefore included throughout this Report.
3.2 Household SurveyAhouseholdsurveywasconductedtoenrichtheeconomicmodelwithmorespecificandreliable household expenditure data as well as to get a more qualitative picture of how the householdsintheregionasawholeandintheAsutifiandTanoNorthdistrictsinparticular,havebeenaffectedbytheAhafoMine.Inco-operationwiththeGhanaianconsultingfirmPABDevelopmentConsultantsLimited(PAB),the survey was structured such that more detailed information about the impact of NGGL’s presence at the household level could be obtained. This was done through interviews with a representativesampleof284householdsinthreesub-groups: • 100householdsthathaveatleast1personworkingforNGGLandthataresituatedin
the catchment area of the Mine; • 94householdswithoutmembersthatworkforNGGL,butwhicharelocatedinthe
catchmentareaoftheMine(ofwhich30wereresettled); • 90householdswithoutmembersthatworkforNGGLandarelocatedoutsidethe
catchment area of the Mine.
Direct (0th Round) Impact - NGGL:Effects directly related to local expenditures of NGGL
Indirect (1st Round) Impact - Direct Suppliers and Trade:Effects arising at suppliers and retailers in the value chain of NGGL.
Indirect (2nd Round) Impact - Suppliers’ suppliers:Effects that come about as suppliers inside the original value chain of NGGL procure goods and services from suppliers outside the original value chain of NGGL.
Indirect (3rd Round) Impact - Re-Spending of Salaries:Effects caused by the re-spending of salaries throughout the economy by employees of NGGL, its trade partners and suppliers’ suppliers whose jobs are directly or indirectly supported by NGGL. The effects of re-spending of salaries are only captured in terms of employment.
Direct
Value Chain
NG
GL’s Total Im
pact
Forpracticalpurposes,thecatchmentareaoftheAhafoMinewasdefinedasthosecommunitiesthataredirectlyaffectedbytheMine,mostofwhicharelocatedtheAsutifiandTanoNorthdistrictsinBrong-Ahafo(Exhibit5).Exhibit8showsthelocationofthehouseholds,how many people have been surveyed and the three distinct groups in order to more clearly delineatetheimpactofNGGL.IncollaborationwithNGGLandPAB,thehouseholdsinthesample were chosen such that they were representative of the population from which they wereselected.Thesizeofthesamplesizeissuchthatwithaconfidencelevelof95%theerrormarginoftheresponsesisplusorminus5%.
The National and Regional Socio-Economic Impact of Newmont Ghana's Ahafo Mine 2524
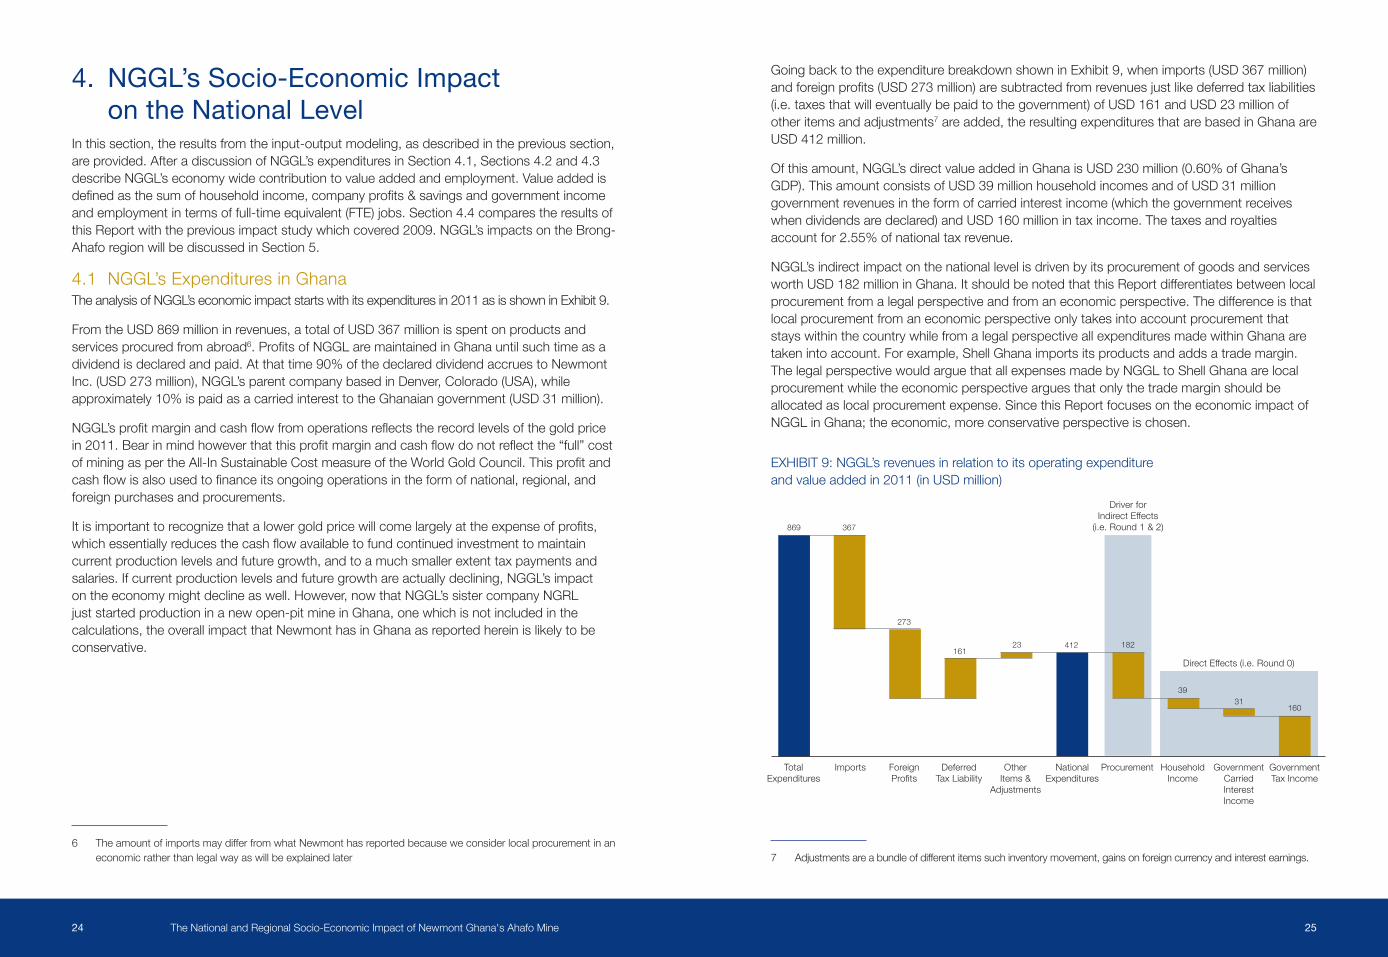
GoingbacktotheexpenditurebreakdownshowninExhibit9,whenimports(USD367million)andforeignprofits(USD273million)aresubtractedfromrevenuesjustlikedeferredtaxliabilities(i.e.taxesthatwilleventuallybepaidtothegovernment)ofUSD161andUSD23millionofother items and adjustments7areadded,theresultingexpendituresthatarebasedinGhanaareUSD 412 million.
Ofthisamount,NGGL’sdirectvalueaddedinGhanaisUSD230million(0.60%ofGhana’sGDP).ThisamountconsistsofUSD39millionhouseholdincomesandofUSD31milliongovernmentrevenuesintheformofcarriedinterestincome(whichthegovernmentreceiveswhendividendsaredeclared)andUSD160millionintaxincome.Thetaxesandroyaltiesaccountfor2.55%ofnationaltaxrevenue.
NGGL’s indirect impact on the national level is driven by its procurement of goods and services worthUSD182millioninGhana.ItshouldbenotedthatthisReportdifferentiatesbetweenlocalprocurementfromalegalperspectiveandfromaneconomicperspective.Thedifferenceisthatlocalprocurementfromaneconomicperspectiveonlytakesintoaccountprocurementthatstays within the country while from a legal perspective all expenditures made within Ghana are takenintoaccount.Forexample,ShellGhanaimportsitsproductsandaddsatrademargin.The legal perspective would argue that all expenses made by NGGL to Shell Ghana are local procurement while the economic perspective argues that only the trade margin should be allocated as local procurement expense. Since this Report focuses on the economic impact of NGGLinGhana;theeconomic,moreconservativeperspectiveischosen.
7 Adjustmentsareabundleofdifferentitemssuchinventorymovement,gainsonforeigncurrencyandinterestearnings.
4. NGGL’s Socio-Economic Impact on the National Level
Inthissection,theresultsfromtheinput-outputmodeling,asdescribedintheprevioussection,areprovided.AfteradiscussionofNGGL’sexpendituresinSection4.1,Sections4.2and4.3describe NGGL’s economy wide contribution to value added and employment. Value added is definedasthesumofhouseholdincome,companyprofits&savingsandgovernmentincomeandemploymentintermsoffull-timeequivalent(FTE)jobs.Section4.4comparestheresultsofthis Report with the previous impact study which covered 2009. NGGL’s impacts on the Brong-AhaforegionwillbediscussedinSection5.
4.1 NGGL’s Expenditures in GhanaThe analysis of NGGL’s economic impact starts with its expenditures in 2011 as is shown in Exhibit 9.
FromtheUSD869millioninrevenues,atotalofUSD367millionisspentonproductsandservices procured from abroad6.ProfitsofNGGLaremaintainedinGhanauntilsuchtimeasadividendisdeclaredandpaid.Atthattime90%ofthedeclareddividendaccruestoNewmontInc.(USD273million),NGGL’sparentcompanybasedinDenver,Colorado(USA),whileapproximately10%ispaidasacarriedinteresttotheGhanaiangovernment(USD31million).
NGGL’sprofitmarginandcashflowfromoperationsreflectstherecordlevelsofthegoldpricein2011.Bearinmindhoweverthatthisprofitmarginandcashflowdonotreflectthe“full”costofminingaspertheAll-InSustainableCostmeasureoftheWorldGoldCouncil.Thisprofitandcashflowisalsousedtofinanceitsongoingoperationsintheformofnational,regional,andforeign purchases and procurements.
Itisimportanttorecognizethatalowergoldpricewillcomelargelyattheexpenseofprofits,whichessentiallyreducesthecashflowavailabletofundcontinuedinvestmenttomaintaincurrentproductionlevelsandfuturegrowth,andtoamuchsmallerextenttaxpaymentsandsalaries.Ifcurrentproductionlevelsandfuturegrowthareactuallydeclining,NGGL’simpactontheeconomymightdeclineaswell.However,nowthatNGGL’ssistercompanyNGRLjuststartedproductioninanewopen-pitmineinGhana,onewhichisnotincludedinthecalculations,theoverallimpactthatNewmonthasinGhanaasreportedhereinislikelytobeconservative.
6 TheamountofimportsmaydifferfromwhatNewmonthasreportedbecauseweconsiderlocalprocurementinaneconomic rather than legal way as will be explained later
EXHIBIT9:NGGL’s revenues in relation to its operating expenditure andvalueaddedin2011(inUSDmillion)
Total Expenditures
Imports Foreign Profits
Deferred Tax Liability
Other Items&
Adjustments
National Expenditures
Procurement Household Income
Government Carried Interest Income
Government Tax Income
869 367
Driver for IndirectEffects
(i.e.Round1&2)
DirectEffects(i.e.Round0)
273
16123 412 182
3931
160

The National and Regional Socio-Economic Impact of Newmont Ghana's Ahafo Mine 2726
4.2 Value AddedExhibit10showsabreakdownoftotalvalueaddedsupportedbyNGGLintheGhanaianeconomy:householdincomes,companyprofits&savingsandgovernmentincome.Together,thesecomponentsadduptoUSD360million8,whichisequalto0.95%ofthetotalGhanaianeconomy.Thisisanincreaseof107%comparedtothe2009totalvalueaddedsupported(formoredetailsseeAppendixB)andadecreaseof6%intermsofcontributiontoGhana’sGDP9. TheUSD208milliongovernmentincome(USD191millionofcarriedinterestincomeandtaxincomepaidbyNGGLdirectlyandUSD18millionpaidbyitssuppliers)constitutesthebiggestvalueaddedcomponent;followedbytheUSD135millionofsalariespaidbyNGGLanditssupplierstoGhanaianhouseholds.Profits&savingsoflocalsuppliersareasmallcomponentwithUSD17million(notethatNGGL’sprofitsaccruetoitsparentcompanyabroad).OftheUSD360milliontotalvalueadded,USD230millionisgenerateddirectlybyNGGL,largelyinthe form of royalties and taxes.
8 Maynotsumupduetorounding.9 ThesignificantincreaseinGhana’sGDP(60%)isthereasonwhyNGGL’srelativecontributiontoGDPdeclined.
ThissignificantincreaseinGhana’sGDPestimateisduetoarevisioninthemethodologythatestimatesGhana’sGDP(SeeJerven&Duncan,2012).
A local signage vendor of NGGL in Ahafo
EXHIBIT10:Directandindirecteffectsonvalueadded(inUSDmillion)
Household Income
Private Sector Profit&Savings
Government Carried Interest Income
Government Tax Income
Total
0.60% of GDP
0.95%of GDP
39
62
33
31
160
47
83
230
13517
31
178 360
2ndRound:Suppliers’Suppliers1stRound:DirectSuppliersandTrade0thRound:NGGL

The National and Regional Socio-Economic Impact of Newmont Ghana's Ahafo Mine 2928
Exhibit 12 shows the sectors where the value added is created. Apart from NGGL’s direct value contribution,mostvalueaddedisfoundintheconstructionsectorduetothenatureofthebusiness which requires the company to hire contractors for construction and maintenance of itsinfrastructure.Withtheexceptionofagriculture,thevalueaddedisfairlyevenlyspreadoverthe other economic sectors. The reason for this is that Newmont procures goods and services fromquiteanumberofdifferentsectorswhichthensourceaportionoftheirsuppliesfromwithinGhana,reflectingtherelativediversifiednatureofGhana’seconomy.
Exhibit11showsadetailedbreakdownoftheUSD178milliontotaltaxpaymentstothegovernment.Thelion’sshareofthesetaxesamountingtoUSD160million,arepaiddirectlybyNGGLitself.AnotherUSD18millionisgeneratedbyNGGL’ssuppliers,ofwhichUSD7millionis actually paid by NGGL as withholding tax. The withholding tax enables the government tomoreeffectivelycollecttaxessinceNGGLiseasytofindincomparisontoallthe(smaller)suppliersofNGGL.ThefactthatNGGLpaysover90%ofthetaxesofitsentirevaluechainunderscoresGhana’srelativelysmalltaxbaseandthedifficultyofcollectingtaxesfrominformalcompanies10.ThetotaltaxpaymentsofNGGL’svaluechainmakeupslightlylessthan3%ofGhana’stotaltaxrevenues.TheUSD160milliontaxespaidbyNGGLalonerepresentabout25%ofthetotaltaxespaidbytheminingsectorinGhana.11
10 NGGLprocuresitsgoodsandservicesfromtheformalsector,butthesuppliersofNGGL’ssuppliershaveahigherprobability of operating in the informal sector and thereby foregoing tax payments.
11 Factoid2011,ChamberofMines.TheChamberofMinesestimatesthataboutGH¢1billionorUSD640millionispaid by the mining sector to the government in the form of taxes.
EXHIBIT12:DirectandindirecteffectsofNGGLonvalueaddedpersector(inUSDmillion)
EXHIBIT11:Directandindirecteffectsontaxes(inUSDmillion)F
F TheNationalFiscalStabilizationLevy(NFSL)isanadditional5%onaccountingprofitsofspecifiedcompaniesandinstitutionsinGhanainordertoreduceGhana’sgrowingdeficit.
2ndRound:Suppliers’Suppliers1stRound:DirectSuppliersandTrade0thRound:NGGL
2.56%ofnational tax
revenue
2.84%ofnational tax
revenue
178737
16092
21
32
12
3
SocialSecurity
Payroll Taxes
Royalties NFSL Income Tax
Total Tax Payments
NGGL
Witholding Tax Paid by NGGL On Behalf of Suppliers
Taxes Paid by
Suppliers
Taxes Paid by
Suppliers’ Suppliers
Total Supported
Tax Payments
2ndRound:Suppliers’Suppliers1stRound:DirectSuppliersandTrade0thRound:NGGL
Agriculture Mining Manufacturing Utilities Construction Services NGGL Transportation Trade Total
412
1914
2819
23016
17 360
47
83
230
The National and Regional Socio-Economic Impact of Newmont Ghana's Ahafo Mine 3130
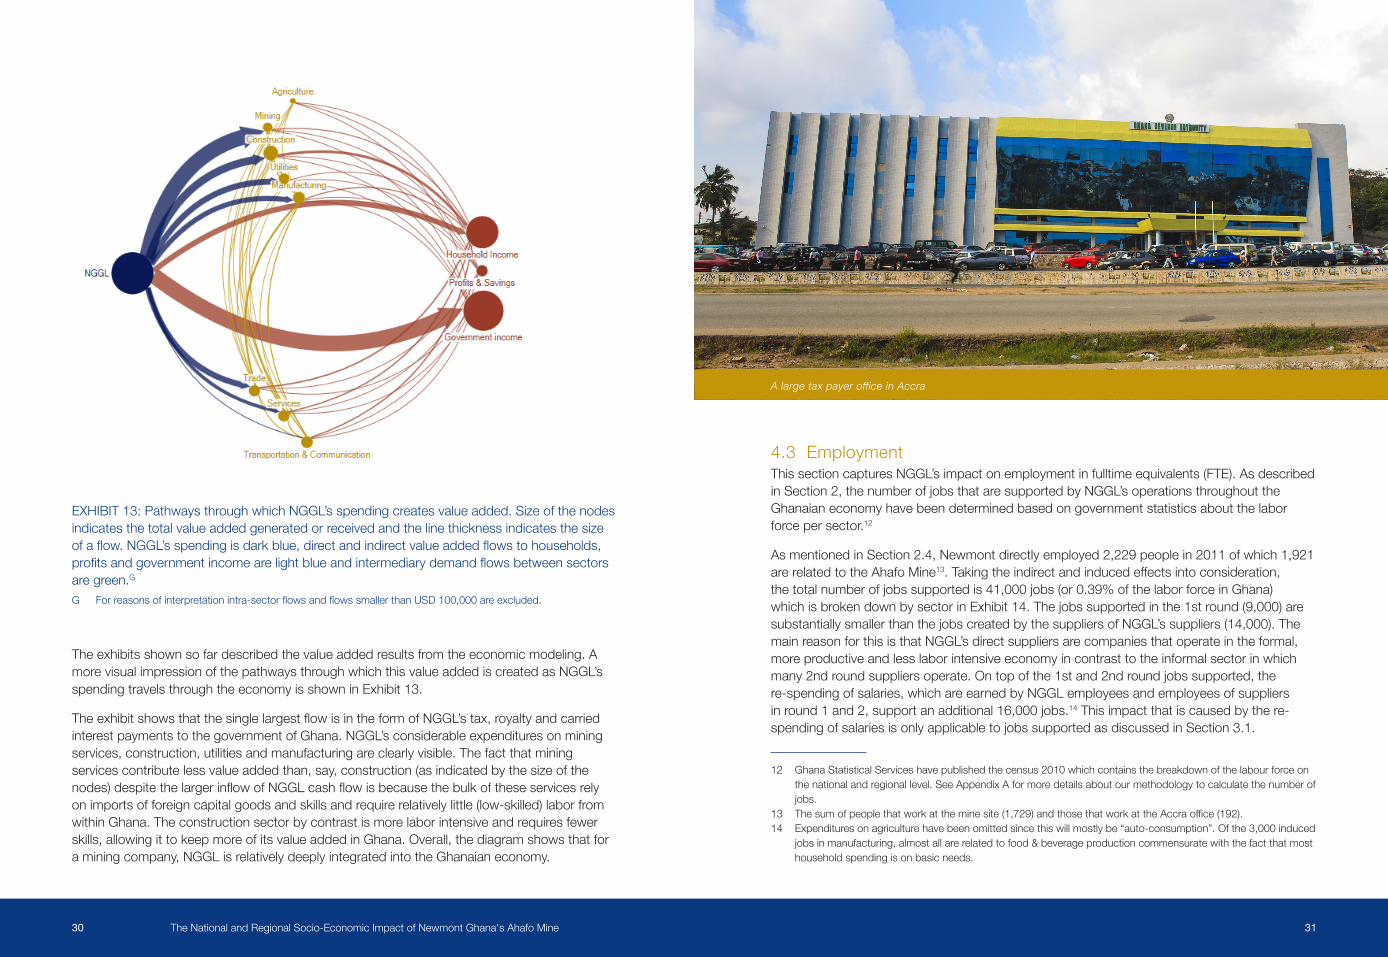
EXHIBIT13: Pathways through which NGGL’s spending creates value added. Size of the nodes indicatesthetotalvalueaddedgeneratedorreceivedandthelinethicknessindicatesthesizeofaflow.NGGL’sspendingisdarkblue,directandindirectvalueaddedflowstohouseholds,profitsandgovernmentincomearelightblueandintermediarydemandflowsbetweensectorsare green.G
G Forreasonsofinterpretationintra-sectorflowsandflowssmallerthanUSD100,000areexcluded.
4.3 Employment ThissectioncapturesNGGL’simpactonemploymentinfulltimeequivalents(FTE).AsdescribedinSection2,thenumberofjobsthataresupportedbyNGGL’soperationsthroughouttheGhanaian economy have been determined based on government statistics about the labor force per sector.12
AsmentionedinSection2.4,Newmontdirectlyemployed2,229peoplein2011ofwhich1,921are related to the Ahafo Mine13.Takingtheindirectandinducedeffectsintoconsideration,thetotalnumberofjobssupportedis41,000jobs(or0.39%ofthelaborforceinGhana)whichisbrokendownbysectorinExhibit14.Thejobssupportedinthe1stround(9,000)aresubstantiallysmallerthanthejobscreatedbythesuppliersofNGGL’ssuppliers(14,000).ThemainreasonforthisisthatNGGL’sdirectsuppliersarecompaniesthatoperateintheformal,more productive and less labor intensive economy in contrast to the informal sector in which many2ndroundsuppliersoperate.Ontopofthe1stand2ndroundjobssupported,there-spendingofsalaries,whichareearnedbyNGGLemployeesandemployeesofsuppliersinround1and2,supportanadditional16,000jobs.14 This impact that is caused by the re-spending of salaries is only applicable to jobs supported as discussed in Section 3.1.
12 GhanaStatisticalServiceshavepublishedthecensus2010whichcontainsthebreakdownofthelabourforceonthe national and regional level. See Appendix A for more details about our methodology to calculate the number of jobs.
13 Thesumofpeoplethatworkattheminesite(1,729)andthosethatworkattheAccraoffice(192).14 Expendituresonagriculturehavebeenomittedsincethiswillmostlybe“auto-consumption”.Ofthe3,000induced
jobsinmanufacturing,almostallarerelatedtofood&beverageproductioncommensuratewiththefactthatmosthousehold spending is on basic needs.
A large tax payer office in Accra
The exhibits shown so far described the value added results from the economic modeling. A more visual impression of the pathways through which this value added is created as NGGL’s spending travels through the economy is shown in Exhibit 13.
TheexhibitshowsthatthesinglelargestflowisintheformofNGGL’stax,royaltyandcarriedinterest payments to the government of Ghana. NGGL’s considerable expenditures on mining services,construction,utilitiesandmanufacturingareclearlyvisible.Thefactthatminingservicescontributelessvalueaddedthan,say,construction(asindicatedbythesizeofthenodes)despitethelargerinflowofNGGLcashflowisbecausethebulkoftheseservicesrelyonimportsofforeigncapitalgoodsandskillsandrequirerelativelylittle(low-skilled)laborfromwithin Ghana. The construction sector by contrast is more labor intensive and requires fewer skills,allowingittokeepmoreofitsvalueaddedinGhana.Overall,thediagramshowsthatforaminingcompany,NGGLisrelativelydeeplyintegratedintotheGhanaianeconomy.

The National and Regional Socio-Economic Impact of Newmont Ghana's Ahafo Mine 3332
Exhibit15putsemploymentassociatedwithNGGLincontextintermsoftheirquality.Inthisgraph,valueaddedperjobsupportedisusedasanindicatorforthequalityofjobs.15 Although manyjobsareinthetradeandmanufacturingsectors,thesearegenerallylessproductiveor‘lowerqualityjobs’(intheinformalsector).ThequalityofjobswithinNGGLisparticularlyhighwithavalueaddedperjobofUSD119,000,whichis34timeshigherthantheGhanaianaverage.16ThehighcapitalintensityofNGGL’soperationsisthekeydriverhere.Overallonecanconclude that most jobs associated with Newmont’s presence in Ghana are above average in terms of value added.
15 Exhibit15showsthevalueaddedperemployee,whichconsistsofhouseholdincome,profits&savingsandtaxpayments. A direct comparison with the average annual salary therefore does not hold.
16 TheGhanaianaverageisestimatedbydividingGDPbylabourforce;USD38.1billion/10.6million=USD3,578per person in the labour force.
EXHIBIT14:Direct,indirectandinducedeffectsonemploymentpersector(in‘000jobs)
Newmont Ghana is proud to be associated with quality jobs.
H Exhibit15excludestheinducedeffectsonjobssupportedbecausetheinducedeffectisnottakeninto account when calculating the value added.
EXHIBIT15:Valueaddedperdirect&indirectjobsupportedbyNGGL(inUSD‘000)H
0thRound:NGGL1stRound:DirectSuppliersandTrade2ndRound:Suppliers’Suppliers3ndRound:Re-spendingofsalaries
6 1
8 12
72
2
12 41
4
3
3
3
4
7 16
14
9
2
0.39%of labor force0.02%of
labor force
Agriculture Mining Manufacturing Utilities Construction Services NGGL Transportation Trade Total
Jobs (in ‘000)
Value Added per Job (in ‘000 USD)
120,000
118,000
0.0 2.0 4.0 6.0 8.0 10.0 12.0 14.0 16.0 18.0 20.0 22.0 24.0 26.0
16,000
14,000
12,000
10,000
8,000
6,000
4,000
2,000
0
NGGL
Construction
Utilities
TransportationMining
Services
ManufacturingTrade
Ghanaian Average
Agriculture

The National and Regional Socio-Economic Impact of Newmont Ghana's Ahafo Mine 3534
48.2 + 0.2 - 22.4
41.1+15.0
Estimate 2009 DirectEmployment:
More Direct Employment
Correction Labour Productivity
Increase Local Procurement
IndirectEmployment: IndirectEmployment: Estimate 2011
1 2 3
Changes in employment are caused by:1. NGGL directly employing about 200 more people;2. Significantincreaseinlabourproductivityduetotheeconomybeing2.5xlargerwhile
employment increased by just 1.03x since 2009;3. Increaseoflocalprocurement(USD43million)andbetterinsightsinhowthatmoneyis
spentwithintheGhanaianeconomy(duetointerviewinginternationalandlocalcontractors)
4.4 Comparison with the 2009 ReportIn2010,StewardRedqueenperformedasocio-economicimpactassessmentforNGGLbasedonits2009financials.AdetailedcomparisonisincludedinAppendixB.Overall,theresultsatthe national level shown above correspond well with the results of the previous study. The main differencesare: 1. NGGL’srevenueshaveincreasedbyUSD341million(+65%)drivenbythehighergold
price and somewhat higher production volume; 2. Mostofthesehigherrevenuestranslatedintoincreasedprofitsfromoperations;from
USD128milliontoUSD273million.Thiswillultimatelyresultinincreasedincometothegovernment due to its carried interest once dividends are declared;
3. InGhana,procurementincreasedbyUSD43milliontoUSD182million; 4. NGGL’sdirectvalueaddedinGhanaincreasedbyUSD174millionfromUSD56million
to USD 230 million; 5. USD152millionofthishighervalueaddedaccruedtothegovernmentbecausetax
paymentsand(deferred)carriedinterestincomeshareincreasedalmostfivefoldfromUSD39milliontoUSD191million,largelybecauseNGGLstartedtopaytaxesonitsprofits17;
6. HouseholdincomefromsalariespaidbyNGGLrosebyUSD22milliontoUSD39million,reflectingNGGL’slargerworkforceandincreaseofunitlaborcosts.
7. Whenincludingthelargerindirecteffects(comingfromthelargerin-Ghanaprocurement),totalvalueaddedinGhanaincreasedmorethantwicefromUSD153milliontoUSD360million;
8. AsapercentageofGhana’sGDP,NGGL’scontributionissubstantiallysmaller(0.95%comparedto1.30%)astheeconomyin2011wastwoandahalftimeslargerthanin2009becauseoffasteconomicgrowthandtherebasingofGDPmeasurementin2010,whichresultedina60%largereconomy.18
9. The total number of jobs that can be attributed to NGGL’s presence declined by about 7,100(-15%).Exhibit16explainsthesechangesinmoredetail.Thedecreaseinthenumber of jobs supported is solely due to revision of country statistics and has nothing to dowiththemethodologyusedortheperformanceofNGGL(whichactuallyimprovedintermsofdirectemploymentandlocalprocurementexpenditures).
17 ThereasonthatNewmontdidnotpaytaxesonprofitsuntil2010isnotthatminingcompaniesareexemptedduringthefirst5yearsofoperationsasoftenisassumedbutratherthatfavorabledepreciationschemesandthecarryforwardoflossesareallowed.OverthelifeofthemineNewmontthuspaystaxesoverallofitsprofits.Inlieuofsuchafavorableregime,capitalintensiveinvestmentswouldbemuchlessattractive.
18 Jerven.M,&Duncan.M.E.(2012).RevisingGDPestimatesinSub-SaharanAfrica:LessonsfromGhana.AfricanStatisticalJournal,15.
EXHIBIT16: Change in employment supported by NGGL over the period 2009-2011 (in‘000jobs)

The National and Regional Socio-Economic Impact of Newmont Ghana's Ahafo Mine 3736
5. NGGL’s Socio-Economic Impact on the Brong-Ahafo Region and Asutifi District
Inthissection,NGGL’sdirectimpactintermsofvalueadded,i.e.thesumofsalaries,taxesandprofits,andjobsareshownaswellastheindirectimpactthatstemsfromtheprocurementexpenses that are done within Brong-Ahafo. After a discussion of NGGL’s expenditures in Section5.1,Section5.2willdiscussthevalueaddedthatissupportedwithinBrong-Ahafo.Section5.3discussesthejobssupportedandSection5.4comparestheregionalanddistrictimpact with the national impact.
5.1 NGGL’sExpendituresinBrong-AhafoTheanalysisofNGGL’seconomicimpactstartswithitsexpendituresasshowninExhibit17,forwhich the starting point is the USD 412 million in National expenditures from Exhibit 9.
NGGL’snationalexpenditureshavebeenbrokendownintoRestofGhana(RoG)andBrong-Ahafo(BA)procurementandvalueadded.InordertoassessNGGL’simpactonBrong-AhafoonlytheBAprocurement(USD18million)andvalueadded(USD12millionofhouseholdincomes and USD 3 million of government income19)havebeenusedtoestimatetheimpactonthe Brong-Ahafo region.
19 USD 3 million in government income are royalties that accrue to the local government. It is estimated by NGGL’s taxdepartmentthat9%ofroyaltypaymentsaccruetotheAhaforegionofwhich55%goestothedistrictauthorities,25%tolandownersand20%tothelocalchiefs.
EXHIBIT17:NGGL’s revenues in relation to its expenditures and value added in Brong-Ahafo (BA)andtheRestofGhana(RoG)in2011(inUSDmillion) 5.2 ValueAdded
Exhibit18showsabreakdownoftotalvalueaddedwhichissupportedintheBrong-Ahafoeconomy:householdincomes,profits&savingsfordirectandindirectsuppliersandgovernmentincome.ThesesumuptoUSD30.5million,whichrepresents0.78%ofthetotalGDP for the Brong-Ahafo economy. The reason that NGGL’s share of Brong-Ahafo’s GDP (0.38%)islowerthantheshareofnationalGDP(0.60%,seeExhibit10)isthatNGGL’staxand royalty payments largely accrue to the national government.20Inaddition,duetothesimpleandopennatureofBrong-Ahafo’seconomymuchofthemoneyflowsoutoftheregionratherquicklyi.e.justasmallpartofNGGL’sdemandcanactuallybeprocuredregionallyandthereforespillovereffects(round1&2)aresmaller.
TheUSD15.4millionofindirectvalueadded(1stand2ndround)arethespillovereffectsfromtheUSD18millionoflocalspendingdonebyNGGL(seeExhibit17),halfofwhichwaspartoftheAhafoLinkagesProgram21.Exhibit18alsoshowsthatmostoftotalvalueaddedgoesassalaries to households and about half of the value added is generated directly by NGGL.
20 See footnote 30. 21 TheAhafoLinkagesProgramwassetupinconjunctionwiththeInternationalFinanceCorporation.Asan
indication,localpurchasingundertheprogramhasincreasedfromUSD1.7m(with25suppliers)toUSD9.0m(with143suppliers)in2010.
A panoramic view of Ahafo Mine
National Expenditures
RoG Procurement
RoGProfits RoG Household
Income
RoG Government
Income
BA Expenditure BA Procurement BA Household Income
BA Government Income
412
30
164
27157
33 1812 3
Driver for IndirectEffects
(i.e.Round1&2)
DirectEffects(i.e.Round0)

The National and Regional Socio-Economic Impact of Newmont Ghana's Ahafo Mine 3938
EXHIBIT18:Directandindirecteffectsonvalueadded(inUSDmillion)
EXHIBIT19:Directandindirecteffectsonvalueaddedpersector(inUSDmillion)
Exhibit 19 shows in which sectors the value added is created. Apart from NGGL’s direct contribution,mostvalueaddedcanbefoundintheminingsector.Withintheminingsector,USD4.4millionofthetotalUSD4.5millionindirectvalueaddedrelatestocontractorshiredbyNGGL,e.g.fortheconstructionoftheundergroundmine.Inaddition,constructionandotherservices(e.g.thecateringandlodgingservicesprovidedonsite)respectivelyaddUSD3.9million and USD 3.2 million to Brong-Ahafo’s GDP.
NGGL’simpactontheAsutifidistrictisofcoursemanytimeslargerthantheimpactonthewholeBAregion.Itisrealistictoassumethatabout55%oftheUSD27.6million22 Brong-Ahafo householdincomeandprofits&savingsaregeneratedintheAsutifidistrictsinceabout55%oftheNewmontemployeeslivethere.ThisUSD15.2millionvalueaddedinAsutifiisabout8%ofthedistrict'sGDPasitrepresentsabout5%ofBrong-Ahafo’sGDP.
5.3 EmploymentAsmentionedinSection2.4,NGGLemployed2,229peoplein2011inGhana,ofwhich1,729peoplewereemployedinBrong-Ahafo.Whenincludingtheindirectandinducedeffects,thetotalemploymentthatissupportedsumsupto8,700jobswhicharebrokendownbysectorinExhibit20.The1,300jobssupportedbysuppliersinthe1stroundaresmallerinnumberthanthe3,200jobssupportedbythesuppliersofNGGL’ssuppliers.ThemainreasonforthisisthatNGGL’sdirectsuppliersareconsideredtobecompaniesthatoperateintheformal,moreproductive and less labor intensive economy vis-à-vis the informal sector in which many 2nd roundsuppliersoperate.In2011,onaverage,4,139ofNGGL’scontractoremployeesworkedonsitewhichisabout92%ofNGGL’s4,500indirectemployment(1,3001stroundjobsand3,2002ndroundjobs).Ontopoftheindirecteffects(the1stand2ndroundjobssupported),the re-spending of salaries that are earned by NGGL employees and by employees in round 1and2supportanadditional2,400jobs.Mostofthesejobs,arejobsintheagriculturalandtrade sectors.
22 TheregionalgovernmentincomeofUSD2.9millionhasbeenexcludedfromthetotalimpactofUSD30.5millionbecauseitcan’tbeattributedtotheAsutifidistrict,whilehouseholdincomeandprofits&savingscan.
Household Income Profit&Savings Government Income Total
25.7
1.9
2.9 30.5
3.0
2.9 3.8
11.6
15.0
10.6
12.2
2ndRound:Suppliers’Suppliers1stRound:DirectSuppliersandTrade0thRound:NGGL
0.78%of regional GDP
0.38%of regional GDP
Agriculture Mining Manufacturing Utilities Construction Services NGGL Transportation Trade Total
1.4
4.5 0.7 0.1
3.8
2.9
15.0 0.41.6 30.5
1.4
4.4
3.7
2.7
3.8
11.6
15.0
1.62ndRound:Suppliers’Suppliers1stRound:DirectSuppliersandTrade0thRound:NGGL
EXHIBIT20:Direct,indirectandinducedeffectsonemploymentpersector(in‘000jobs)
0thRound:NGGL1stRound:DirectSuppliersandTrade2ndRound:Suppliers’Suppliers3ndRound:Re-spendingofsalaries
1.40.5
0.4 0.00.2
1.1
1.7 0.1
3.3 8.7
0.9
0.5
0.5
2.7
2.5
0.7
2.4
3.2
1.3
1.7
0.5
0.5
0.17%ofregional labor
force
0.86%ofregional labor
force
Agriculture Mining Manufacturing Utilities Construction Services NGGL Transportation Trade Total

The National and Regional Socio-Economic Impact of Newmont Ghana's Ahafo Mine 4140
EXHIBIT21:Valueaddedperdirect/indirectjobsupportedbyNGGL(inUSD‘000)
5.4 ComparisonofNGGL’sImpactattheNational,RegionalandDistrict Levels
NGGL’srelativeeconomicimpactatthenational,regionalanddistrictlevelsasdescribedinSections4and5issummarizedinTable2.NGGL’svalueaddedimpactlargelyaccruesatthenationallevelinabsoluteterms,butinrelativetermstheimpactismoreorlesscomparableatthenationalandregionallevel.BecausethebulkofitsoperationsareintherelativelysmallerAsutifidistrict,itsvalueaddedimpactthereisanorderofmagnitudelarger.Asexpected,NGGL’semploymentimpactislargestinAsutifiandsmallestatthenationallevel.
TABLE2:Summary of NGGL’s direct and total impact on value added and employment at the national,regionalanddistrictlevel
IMPACT GHANA BRONG-AHAFOREGION ASUTIFIDISTRICTDirect Value added 0.60% 0.38% ~4%Total Value Added 0.95% 0.78% ~8%Value Added multiplier 1.6x 2.0x ~ 2xDirect Employment 0.02% 0.17% ~1.5%Total Employment 0.39% 0.86% ~10%Employment multiplier 21x 5x ~6x
A female employee at work at the Ahafo Mine
Jobs (in real terms)
Value Added per Job (in USD)
00 1,000 2,000 3,000 4,000 5,000 6,000
1,0002,0003,0004,0005,0006,0007,0008,0009,000
10,00011,00012,00013,00014,00015,00016,00017,000 Construction
Utilities
MiningNGGL
Transportation
Services
ManufacturingAgriculture
Trade
Brong-Ahafo Average
The8,700jobsinBrong-Ahaforepresent0.86%ofBrong-Ahafo’sworkforce.Giventheassumptionthat55%oftheworkforcelivesintheAsutifidistrict,whichaccountsfor5%ofBrong-Ahafo’spopulation,itfollowsthatabout10%ofAsutifi’semployablepopulationisdirectlyorindirectlyrelatedtoNGGL’spresence.Takingintoaccountthesubstantialunemploymentand underemployment present in Brong-Ahafo23,NGGL’sshareoftheemployedworkforceisprobably much bigger.
Exhibit 21 shows that value added per NGGL employee in Brong-Ahafo is not nearly as high asatthenationallevel(seeExhibit15).ThemainreasonforthisisthatthelargestportionofvalueaddedbyNGGL,namelythetaxpayments,accruesnearlyinitsentiretytothenationalgovernment. The value added per jobs in the other sectors is comparable to the national figures,exceptforthetradesectorwhichisinformaltoamuchgreaterextent.
The reason that value added per job for the construction and mining sector is higher in comparisontoNGGL’svalueaddedperjobisduetothespecifichighvalueaddedservicesthesesectordelivertoNGGL(e.g.undergroundminingservices).Theutilitieshighvalueaddedperjobisacommonfindingasthenatureofthissectoristhatitismorecapitalthanlaborintensive.
23 Unfortunately no reliable data about unemployment is available.

The National and Regional Socio-Economic Impact of Newmont Ghana's Ahafo Mine 4342
Exhibit 22 combines NGGL’s absolute and relative economic impact in one image showing that althoughverylargeattheAsutifidistrictlevel,NGGL’sabsolutevalueaddedisfarlargeratthenational level.
EXHIBIT22:VisualimpressionofNGGL’snational,regionalanddistrictleveleconomicfootprintintermsoftotalvalueadded(Table2).Surfaceareasofthenational,regionalanddistrictlevelsand NGGL’s value added are proportional to GDP and value added
Ghana
Newmont
Asutifi
Brong Ahafo
6. Impact on the Household LevelWhen NGGL signed its investment agreement with the Government of Ghana in December 2003,itwasclearthatalotofcapitalwouldflowintoaregionthatispredominantlyoccupiedwithsubsistenceagriculture.Interestingly,theactualcapitalthatflowedinwasmuchlargerthanoriginallyanticipatedbyNewmontandthegovernment.Thisinflowofcapitaldidnotonlyalterthestructureoftheregionaleconomybutalsoinfluencedthepeople’straditionalwayofliving.Inthissection,weelaborateonwhathasactuallychangedforhouseholdsinthisregionbasedon a household survey that was conducted as part of this assessment.
The households that were interviewed were chosen such that three groups can be distinguished(seealsoSection3.2): • Households within the Ahafo Mine’s economic catchment area24 with at least one
memberworkingforNGGL; • HouseholdswithintheAhafoMine’scatchmentareabutwithoutmembersthatworkfor
NGGL; • HouseholdsoutsidetheAhafoMine’scatchmentareawithoutmembersworkingforNGGL.ThisdivisionallowsustodeterminetheimpactofbeingemployedbyNGGL(firstandsecondgroups)aswellasthemoregeneralimpactsoftheMinebecausethethirdgroupisakindof‘control’ group.
TheresultsfromthissurveyarecomparedwithfindingsfromtheExternalStakeholderPerception Survey 2013 done by the Bureau of Integrated Rural Development of the Kwame NkrumahUniversityofScienceandTechnology(KNUST).Themaindifferencebetweenthetwosurveysisthesampleselection.WhereasthisReportdistinguishesthreesub-groups,KNUSTdoesnotmakeadistinctionbetweenhouseholdsthatareandaren’taffectedbytheAhafoMine.Thisledtosomeopposingfindings,butthesehavebeenaddressedaccordingly.
The results of the household survey carried out for this assessment will be discussed in detail belowbutareheresummarizedasfollows: • ThepresenceoftheMineledtoaninfluxofpeopletotheregion; • The household spending power of NGGL employees in the region is on average twice as
high as the average households in the region; • Households inside the economic catchment area of the Mine are less entrepreneurial
than households outside the catchment area; • Households of NGGL employees are on average better educated than other households
in the region; • AccesstowaterandelectricityhasnotimprovedsignificantlysinceNGGLstartedits
operations; • Households report that their economic situation has improved since NGGL started its
operations.
24 ThecatchmentareaoftheAhafomineisdefinedastheAsutifiandTano-NorthdistrictinBrong-Ahafo.Exhibit8inSection 3.2 shows the location of the households and how many people have been surveyed.

The National and Regional Socio-Economic Impact of Newmont Ghana's Ahafo Mine 4544
6.1 MigrationHouseholdsthatareeconomicallyclosertotheMine(i.e.employedbyNGGLorlivinginthevicinityoftheAhafoMine)aremorelikelytohavemigratedintotheareafromoutside.Table3showsthatfromthehouseholdswithNGGLemployeesonly64%oftheirmemberswerebornwithintheregion.ForhouseholdslivingclosetotheMinethisis82%andforthehouseholdslivingoutsidethecatchmentareathisis87%.
TABLE3:Placeofbirth(%oftotalhouseholdssurveyed)pergroupofhouseholds
BORN IN THE REGIONNGGL Employees 64%
Households inside catchment area 82%
Households outside catchment area 87%
Table4alsoshowsthatNGGLemployeesarelesslikelytoownahouseintheregion.Infact,more NGGL employees still own a house outside the region than inside indicating that they havemigratedintothearea.Otherhouseholdsinsidethecatchmentareaareagainlesslikelytoownahousethanhouseholdsoutsidethecatchmentarea,whichexplainsthehighdemandand consequently the high price for housing.
TABLE4:TheownershipofahouseinsidetheregionorsomewhereelseinGhana(%ofhouseholdssurveyedintheirrespectivegroup)pergroupofhouseholds25
OWNERSHIP OF A HOUSE IN
BRONG-AHAFO
OWNERSHIP OF A HOUSE IN THE REST OF GHANA
NGGL Employees 30% 36%
Households inside catchment area 45% 18%
Households outside catchment area 64% 19%
6.2 HouseholdSpendingItisnotsurprisingthatNGGL’spresencehasledtoaninfluxofpeopleintotheregionconsidering that the Mine’s employees are able to spend on average twice as much as other households in the region. Exhibit 23 shows that the annual spending of NGGL employees isalmostGH¢12,000(approximatelyUSD7,700)whereastheaverageexpendituresofhouseholdsinthecatchmentareaareGH¢6,800(approximatelyUSD4,400).Outsideofthecatchmentarea,theaverageannualfigureisGH¢6,000(approximatelyUSD3,900).ThesefindingsareinagreementwithKNUST’sconclusionthatthecombinationofin-migrationandhigherhouseholdexpendituresleadtolessaffordablegoodsandservicesinthecommunities,especiallythatofhousing.Inadditiontothispriceeffect,peoplelivinginsidethecatchmentareamay have developed a somewhat more expensive lifestyle.
25 Ownership of a house in Brong-Ahafo does not exclude ownership of a house in the Rest of Ghana.
EXHIBIT23:Averagehouseholdexpenditure(inGH¢onannualbasis)pergroupofhouseholds
An aerial view of Ntotroso, a community in Ahafo
11,965
+76%
+12%
6,804
6,065
4,858
3,893
1,727
428
2,143 1,879
1,474
2,350
3,839
1,487
Newmont Employees Inside Catchment Area
OutsideCatchment Area
FoodOther Living ExpensesBusiness ActivitiesEducation

The National and Regional Socio-Economic Impact of Newmont Ghana's Ahafo Mine 4746
6.3BusinessActivitiesExhibit24showsthathouseholdsinsidethecatchmentarea(butwithnomembersemployedbyNGGL)spendabout6%oftheirincomeonbusinessactivitieswhereashouseholdsoutsideofthecatchmentareaspend31%.ApartialexplanationforthisisshowninExhibit25whichshowsthatnon-agriculturalself-employment(e.g.daylabourortrade)asasourceofemployment,issignificantlymoreimportantthanagriculture,whichtypicallyrequiresmoreinputsand(self)financing.26Inthatsense,thepresenceoftheMineseemstohavemadepeopleinsidethecatchmentmoredependentonemploymentbytheMineandtobelessactiveinagriculture,whichisthemainstayoftheeconomyintheregion.Inaddition,KNUSTconcludedthatthecompensationpaymentsmadetothosewholosttheirland,andtherebytheirmainsourceofincome,werenotusedtomakemeaningfulinvestments(inassetsorskills)butinsteaditledtoamore luxurious life style.
KNUSTcontinuedtoconcludethatNGGLprogramsliketheAgriculturalImprovementandLandAccessProgram(AILAP)wereunderutilized.AILAP,setupincooperationbetweentheMinistryofFoodandAgricultureandNGGL,helpstodevelopagricultureinthecommunitiesmostaffectedbyNGGL.From2006until2012,NGGLspentUSD5.4millionontheinputs(seeds,fertilizerandherbicides)andtraining27.Apartfromanincreaseintheamountoflandundercultivation,yieldshaveincreasedby65%forplantainand80%formaize.Inshort,forthosewhomadeuseofit,the program helped achieve substantial improvements but further improvements are possible andinfactneeded.ATS,NGGL’ssupplierofcampandhospitalityservices,isabletosourceonlyabout60%ofitsagriculturalproductslocally.ThemainreasonforthisisthatthedemandfromATSismorediversethanwhatislocallyproduced.Byallreasonablestandards,thediversificationofagriculturalproductionoughttobepossibleinafertileregionlikeBrong-Ahafo.
26 KNUST reports agriculture to be the major source of income for households inside the catchment area and incomefromnon-agriculturalself-employmentasthesecondbiggestsourceofincome.Wethinkbasedonthesurveyresultsthatthereismorenon-agriculturalemploymentinsidethecatchmentareathanoutside.Wecannot,however,concludethatitismoreimportantthanagricultureastheresultsindicate.
27 The fact that NGGL supplies agricultural inputs may also partly explain why households in the catchment area spend less on business activities.
EXHIBIT24:Averagehouseholdexpenditure(%breakdown)pergroupofhouseholds
EXHIBIT25:Sourceofincome(%oftotalhouseholdincome)pergroupofhouseholds
FoodOther Living ExpensesBusiness ActivitiesEducation
100% 100% 100%
12%6% 6%
31%
24%
39%
31%
56%
6%
14%
33%
41%
Newmont Employees Inside Catchment Area
OutsideCatchment Area
Wage IncomeIncome from AgricultureIncome from Non-Agricultural Self-EmploymentOther Income
100% 100% 100%
Newmont Employees Inside Catchment Area
OutsideCatchment Area
8% 11%4%
13%
51%
31%
39%
30%
21%
7%
83%
The National and Regional Socio-Economic Impact of Newmont Ghana's Ahafo Mine 4948
consistent with the fact that the better educated invest more in their children’s education.
Inadditiontothesefindingsfromthesurvey,itshouldbementionedthatNGGLprovidesworkplacesafetytrainingforitsemployeesandcontractorstoensuresafeandefficientminingoperations.In2011,atotalof2,068NGGLemployeesreceivedanaverageof208hours(26workingdays)oftrainingand7,190contractoremployeesreceived22hoursoftrainingonaverage,withsafetybeingamajortopic.Whenpeoplemoveontootherjobs,theytaketheirimprovedskillswiththem.Becausethenumberofcontractorswhoreceivedtrainingin2011was70%higherthanthe4,139contractorsemployedasperyearend2011,thisshowsthatskillsinstilledbyNGGLdiffuseintothewidereconomy.
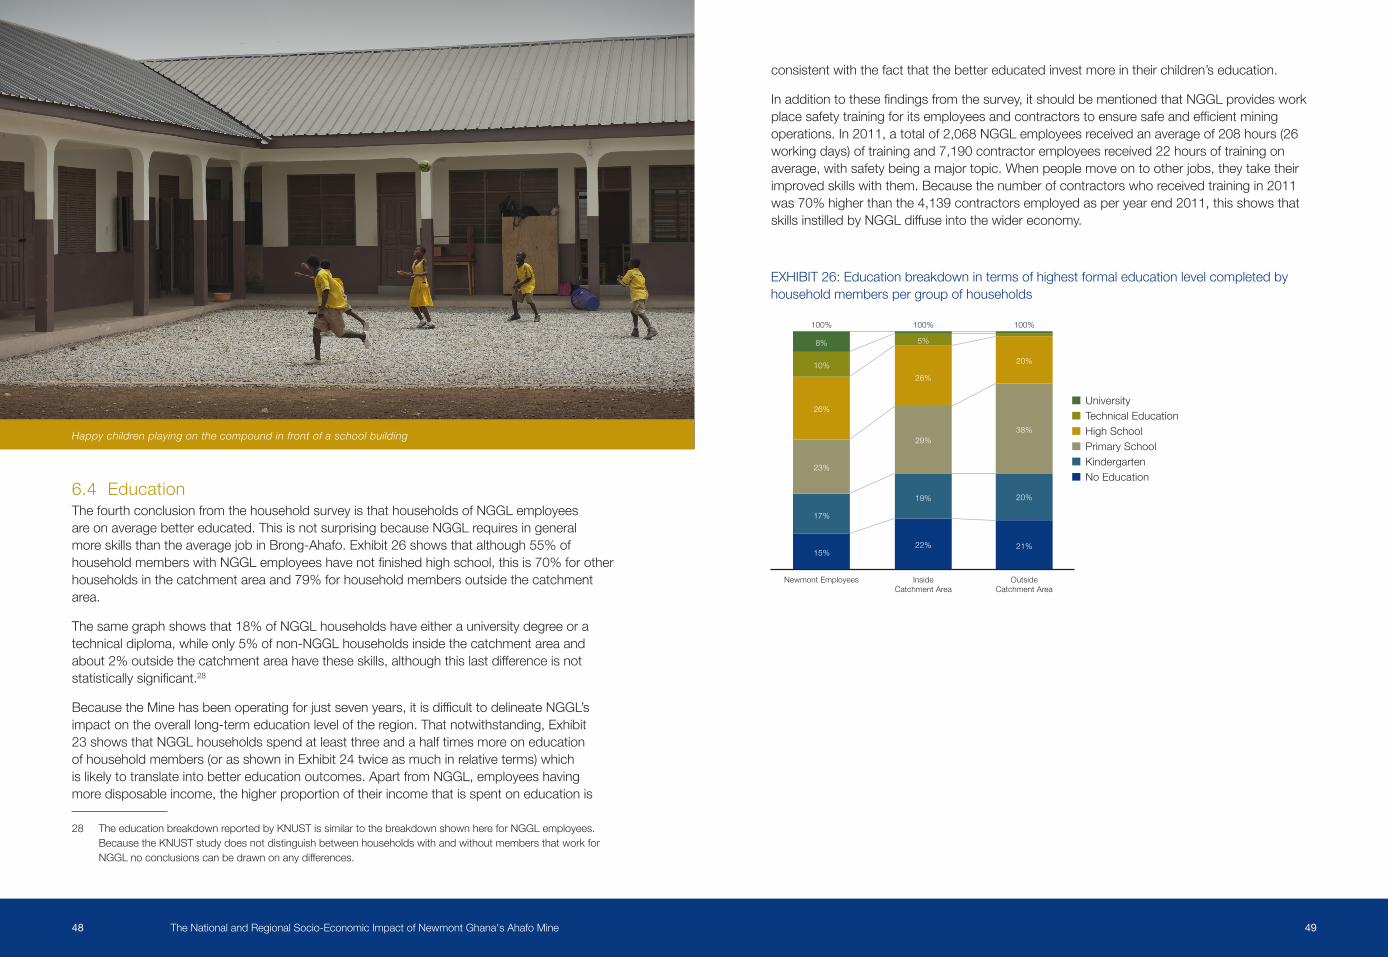
EXHIBIT26:Educationbreakdownintermsofhighestformaleducationlevelcompletedbyhousehold members per group of households
6.4 EducationThe fourth conclusion from the household survey is that households of NGGL employees are on average better educated. This is not surprising because NGGL requires in general moreskillsthantheaveragejobinBrong-Ahafo.Exhibit26showsthatalthough55%ofhouseholdmemberswithNGGLemployeeshavenotfinishedhighschool,thisis70%forotherhouseholdsinthecatchmentareaand79%forhouseholdmembersoutsidethecatchmentarea.
Thesamegraphshowsthat18%ofNGGLhouseholdshaveeitherauniversitydegreeoratechnicaldiploma,whileonly5%ofnon-NGGLhouseholdsinsidethecatchmentareaandabout2%outsidethecatchmentareahavetheseskills,althoughthislastdifferenceisnotstatisticallysignificant.28
BecausetheMinehasbeenoperatingforjustsevenyears,itisdifficulttodelineateNGGL’simpactontheoveralllong-termeducationleveloftheregion.Thatnotwithstanding,Exhibit23 shows that NGGL households spend at least three and a half times more on education ofhouseholdmembers(orasshowninExhibit24twiceasmuchinrelativeterms)whichislikelytotranslateintobettereducationoutcomes.ApartfromNGGL,employeeshavingmoredisposableincome,thehigherproportionoftheirincomethatisspentoneducationis
28 TheeducationbreakdownreportedbyKNUSTissimilartothebreakdownshownhereforNGGLemployees.BecausetheKNUSTstudydoesnotdistinguishbetweenhouseholdswithandwithoutmembersthatworkforNGGLnoconclusionscanbedrawnonanydifferences.
Happy children playing on the compound in front of a school building
Newmont Employees Inside Catchment Area
OutsideCatchment Area
100% 100% 100%
8%
10%
26%
23%
17%
15%22%
19%
29%
26%
5%
20%
38%
20%
21%
No EducationKindergartenPrimary SchoolHigh SchoolTechnical EducationUniversity
The National and Regional Socio-Economic Impact of Newmont Ghana's Ahafo Mine 5150
6.5 AccesstoWaterandElectricitySincethestartofminingoperations,thehouseholdsurveyshowsthataccesstowaterhasnotchangedsignificantly.29Surprisingly,howeveristhattheavailabilityofelectricityhasreportedlygottenworse.BeforethestartoftheMine,respectively64%and72%ofthehouseholdsinsideandoutsidethecatchmentareaindicatedthattheywerecutofffromelectricityatleastonceaweek.Now,respectively91%and94%ofthosehouseholdsindicatesuchcuts.The main reason for the worsening situation lies with the mismatch in national demand and supplyofenergyratherthanthepresenceofNGGL,whichinactualfacthasmadesignificantinvestments in the transmission and electricity supply infrastructure in the region and district. National demand for electricity far outweighs actual supply and therefore it is no surprise that electricityshortageshaveledtonationwidepowercutsandblackouts.30
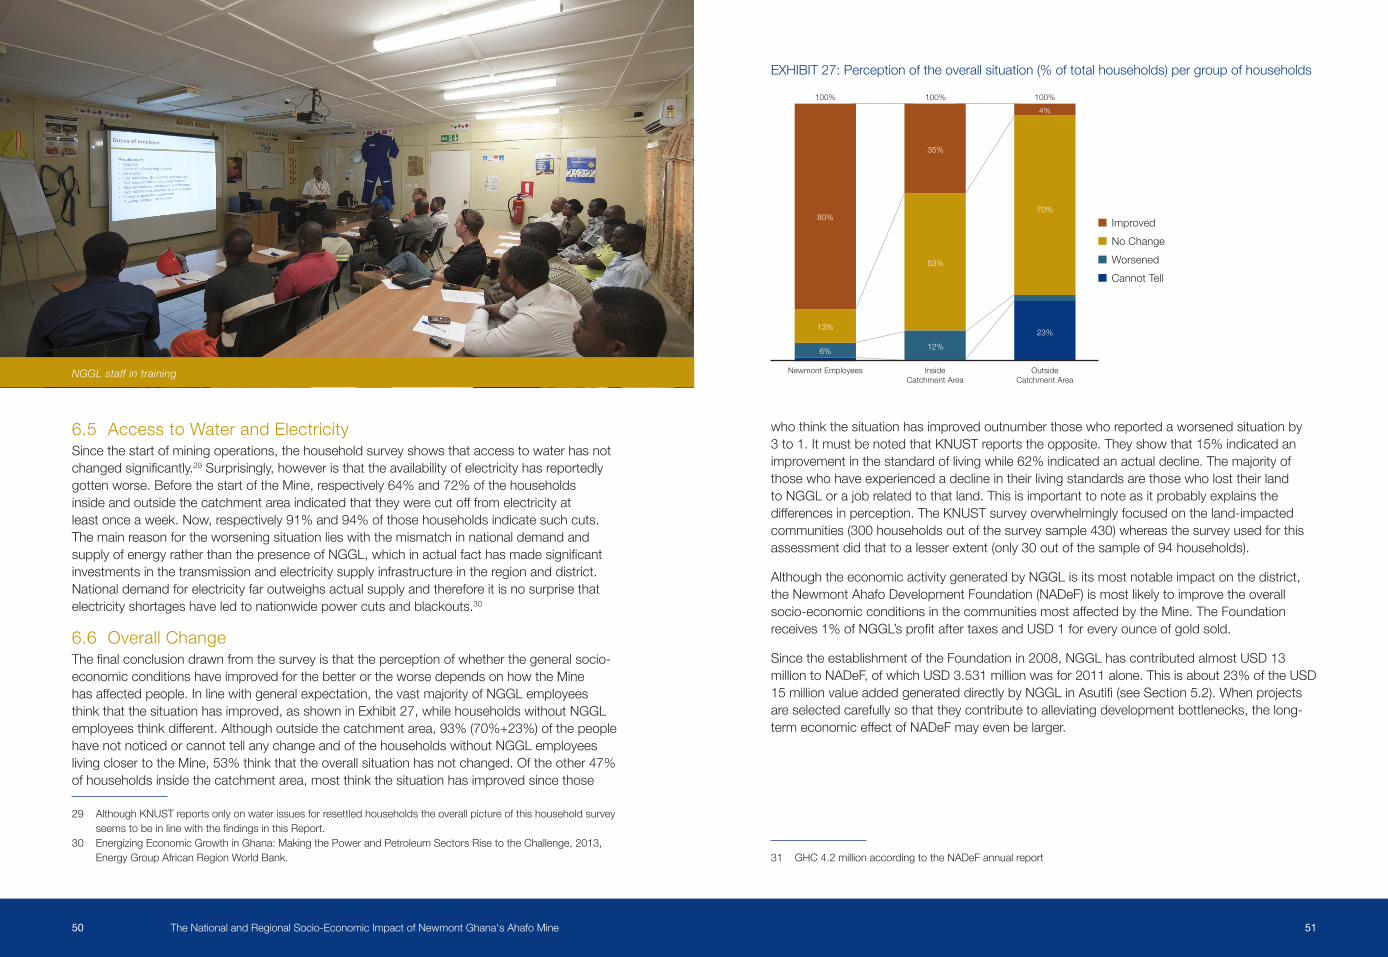
6.6 OverallChangeThefinalconclusiondrawnfromthesurveyisthattheperceptionofwhetherthegeneralsocio-economic conditions have improved for the better or the worse depends on how the Mine hasaffectedpeople.Inlinewithgeneralexpectation,thevastmajorityofNGGLemployeesthinkthatthesituationhasimproved,asshowninExhibit27,whilehouseholdswithoutNGGLemployeesthinkdifferent.Althoughoutsidethecatchmentarea,93%(70%+23%)ofthepeoplehave not noticed or cannot tell any change and of the households without NGGL employees livingclosertotheMine,53%thinkthattheoverallsituationhasnotchanged.Oftheother47%ofhouseholdsinsidethecatchmentarea,mostthinkthesituationhasimprovedsincethose
29 Although KNUST reports only on water issues for resettled households the overall picture of this household survey seemstobeinlinewiththefindingsinthisReport.
30 EnergizingEconomicGrowthinGhana:MakingthePowerandPetroleumSectorsRisetotheChallenge,2013,EnergyGroupAfricanRegionWorldBank.
EXHIBIT27:Perceptionoftheoverallsituation(%oftotalhouseholds)pergroupofhouseholds
whothinkthesituationhasimprovedoutnumberthosewhoreportedaworsenedsituationby3to1.ItmustbenotedthatKNUSTreportstheopposite.Theyshowthat15%indicatedanimprovementinthestandardoflivingwhile62%indicatedanactualdecline.Themajorityofthose who have experienced a decline in their living standards are those who lost their land to NGGL or a job related to that land. This is important to note as it probably explains the differencesinperception.TheKNUSTsurveyoverwhelminglyfocusedontheland-impactedcommunities(300householdsoutofthesurveysample430)whereasthesurveyusedforthisassessmentdidthattoalesserextent(only30outofthesampleof94households).
AlthoughtheeconomicactivitygeneratedbyNGGLisitsmostnotableimpactonthedistrict,theNewmontAhafoDevelopmentFoundation(NADeF)ismostlikelytoimprovetheoverallsocio-economicconditionsinthecommunitiesmostaffectedbytheMine.TheFoundationreceives1%ofNGGL’sprofitaftertaxesandUSD1foreveryounceofgoldsold.
SincetheestablishmentoftheFoundationin2008,NGGLhascontributedalmostUSD13milliontoNADeF,ofwhichUSD3.531millionwasfor2011alone.Thisisabout23%oftheUSD15millionvalueaddedgenerateddirectlybyNGGLinAsutifi(seeSection5.2).Whenprojectsareselectedcarefullysothattheycontributetoalleviatingdevelopmentbottlenecks,thelong-termeconomiceffectofNADeFmayevenbelarger.
31 GHC4.2millionaccordingtotheNADeFannualreport
NGGL staff in training Newmont Employees Inside Catchment Area
OutsideCatchment Area
Cannot TellWorsenedNo ChangeImproved
100% 100% 100%
80%
13%
6% 12%
53%
35%
4%
70%
23%

The National and Regional Socio-Economic Impact of Newmont Ghana's Ahafo Mine 5352
Accordingtoitscharter,NADeFputs10%ofNGGL’scontributionsintoacapitalendowment(currentlyaboutUSD1.2million)andtheremainderisspentonhumanresourcesdevelopment,infrastructure,socialamenities,economicempowerment,naturalresourcemanagement,andculturalheritage&sportactivities32,subjecttoapprovalbytheBoardofTrustees33. So far the foundationhasspentaboutUSD9milliononscholarshipsandprojectslikethebuildingofschools,communityhouses,boreholesandthedeliveryoftoolsandequipment.ThisimpliesthatthefoundationhasspentUSD3millionlessthanintendedduetothelackofsufficientlyrobust projects34,whichincreasesthefoundation’s‘drypowder’forsupportingfutureprojects.
FromapuredevelopmenteconomicsstandpointwewouldarguethatNADeF’scharteristoomuchfocusedon‘oneoff’projectsandthatamoreinvestment-drivenapproachwouldbebetter.Althoughachangeofthecharterwouldneedtobeapprovedbythecommunities,thefoundationisfortunatelymovinginthatdirectionandhas,forexample,setuparevolvingfundforprovidingmicrocredittowomen.Investmentsintonewlivelihoodsources,e.g.agribusinessandtextileprocessing,wouldalsobehighlyrecommendable.
Forexample,NGGLanditscontractorscannotsourcetheirworkclotheslocallybecausethereisnolocaltailorwiththerequiredproductioncapacity.Anotherexampleisthedifficultyof procuring eggs and poultry locally. We would also advocate that the contributions to the endowmentwouldbelargersothatitcanultimatelybeusedasaneconomicshockabsorberwhen the Mine closes.
32 These areas do not have equal share of funds. 33 Theboardoftrusteesconsistofthefollowingpeople:KwameSaarah-Mensah,KojoBedu-Addo,EdwinAllotey-
Acquaye,ImoniAkpofure,RandyBarnes,JacobNtim-Agyei,YawOfosu-Kusi,MaxwellBadu, Joseph Osei Manu
34 TheExternalStakeholderPerceptionSurvey2013mentionsthatcommunitiesexpectthatthefundsthatarenotbeing used should be allocated to those sectors that are in need of infrastructural and social development.
Members of Ahafo Sustainable Development Committee in a meeting
A collage of NADeF projects

The National and Regional Socio-Economic Impact of Newmont Ghana's Ahafo Mine 5554
7 Conclusions and Recommendations 7.1 ConclusionsTheconclusionsthatcanbedrawnfromthiseconomicimpactstudyareasfollows: 1.NGGLiseconomicallyimportantforGhana.Specifically,thecompanysupports0.95%
ofGhana’sGDP,generates2.84%ofthecountry’stotaltaxrevenuesandcreatesemploymentfor0.39%oftheGhanaianworkforce;
2. NGGL’s regional economic impact is somewhat smaller than its national impact on an absolute level due to the fact that taxes and royalties are paid at the national level. Specifically,NGGLgenerates0.78%oftheBrong-AhafoGDPandemploys0.86%oftheregion’sworkforce;
3.NGGL’seconomicfootprintattheAsutifidistrictlevelissignificant,generatingabout8%ofvalueaddedandemployingabout10%oftheworkforce;
4.NGGL’spresenceandneedforskilledlaborhasattractedpeoplefromoutsidetheareatomigratetoBrong-AhafoandtheAsutifidistrict;
5. NGGL’s economic impact has translated into higher disposable income for especially itsemployees,whospendalmosttwiceasmuchaspeopleoutsideNGGL’scatchmentarea.HouseholdswithoutmembersthatworkforNGGLbutthatarelocatedinthecatchmentareaoftheAhafoMinespend11%morethanpeopleoutside;
6. The Mine has created a certain dependence of people not employed by it inside its catchment area. These people are thereby less able to pursue more sustainable means of livelihood;
7. A majority of people in the catchment area believe that the overall situation has improved sinceNGGL’sarrival.TheNewmontAhafoDevelopmentFoundationislikelytohavecontributed to this.
7.2 RecommendationsBasedonthefindingsofthisstudy,ourrecommendationsfocusonthenecessitytocreatealargerandmorevibrantprivatesectorinAsutifiandBrong-Ahafo.WethinkthereareampleopportunitiesforamoreconcertedeffortamongNGGL,itsdevelopmentfoundation,itssuppliersandthe(regionalandnational)government.Specifically: 1.AlthoughtheAhafoLinkagesprogramhascometoanend,wewouldadviseNGGL
tocontinueandifpossibleexpandit.Specifically,NGGLcouldembarkonadetailedassessment of its suppliers’ spending on items that ought to be produced in the district orregion.TogetherwiththeNewmontAhafoDevelopmentFoundation,acoordinatedeffortcanthenbemadetostart(aportfolioof)companiestofillthisneed;
2.AstheremaininglifeoftheMineshortens,thereisaneedfortheprivatesectorinthedistrict and region to diversify economic activities by pursuing alternative livelihoods and gradually but steadily moving away from mining-related activities. The presence of the Mine represents a window of economic opportunity during which private sector activity canbeincubated.Withfinancebeingamajordevelopmentconstraint,NGGLandtheregionalgovernmentcanactivelylookforwaysinwhichthefinancialcontributionsto
Kwasi Asamoah - AILAP Beneficiary and 2011 National Plantain Best Farmer

The National and Regional Socio-Economic Impact of Newmont Ghana's Ahafo Mine 5756
NADeFcancatalyzeother(debt/equity)capital,beitpublicorprivate,toflowtotheregion. This may also help to reduce the dependence on the Mine by households in the catchment area.
3.Similarly,theAgriculturalImprovementandLandAccessProgramandespeciallyAhafoAgribusinessGrowthInitiativeshouldbecontinuedasamoreeffectiveandproductiveagricultural sector is a prerequisite for the private sector to grow. It may be worthwhile that the program explores cooperation with NGGL supplier ATS to substantially increase its local sourcing;
4. NGGL’sabilitytotrainpeopleandhonebusinessskillsremainsimportanttoimprovepeople’sskillsandhelpbusinessprovidehighervalueaddedproductsandservices.AccesstoaneducatedworkforceisanimportantconstraintasmentionedinSection2.1;
5.Accesstopowerisanotherlargebottleneckfortheprivatesectorandoughttobeprovidedbythegovernment.Thehouseholdsurveyresults(seemto)indicatethattheaccess to utilities has not improved since NGGL came to the region. If this is indeed thecase,werecommendNGGLtouseitsinfluencewiththenationalandregionalgovernment to advocate improvement. It may be worthwhile to explore opportunities for retaining more of NGGL’s tax payments within the region;
6.AsNewmontisbuildingasecondmineinAkyemwerecommendthatitreplicatesitssuccessfullinkagesprogram.WhenAkyemproducesatcapacity(andwiththeplannedmillexpansionforAhafo)NewmontwillbethelargestgoldminerinGhanabysomedistance.Inourview,itisimportantthatthislargerscaleenablesitsnationalandlocalsuppliers to scale up as well;
7.ConsideringGhana’sincreaseddependencyonresource-relatedincome,werecommendthattheGovernmentdevelopplansforeconomicdiversificationtohelpitprepareforleaner times when commodity prices are lower or resources become depleted. The Governmentmaywishtoemphasizetheneedfordiversificationinregionswheredependencyonminingisgreatest.Inmanyminingregions,forexample,agriculturehas also been a traditional occupation of local residents. Investing in increasing the productivity of agricultural lands—including the development of a stronger property rights regime and access to credit and inputs for farmers—could be among the policies that the Government might contemplate.
Literature2010PopulationandHousingCensus,GhanaStatisticalOffice.http://www.census-ghana.net/index.html
2011ReservesandNon-ReserveMineralization,Disclosedin2011Annual Report of Newmont. http://www.newmont.com/sites/default/files/u87/NEM_2011%20Attributable%20Reserves%20and%20NRM.PDF
R.Khan(2012).AfricanEconomicOverview&theRoleofthePrivateSector.StandardChartered public presentation.
CIA,TheWorldFactBook.https://www.cia.gov/library/publications/the-world-factbook/geos/gh.html#
EaseofDoingBusiness(2012).“EaseofDoingBusinessinGhana”,EaseofDoingBusinessIndex,IFCandWorldBank.http://www.doingbusiness.org/data/exploreeconomies/ghana/
EnergizingEconomicGrowthinGhana:MakingthePowerandPetroleumSectorsRisetotheChallenge,2013,EnergyGroupAfricanRegionWorldBank.http://documents.worldbank.org/curated/en/2013/06/18027411/energizing-economic-growth-ghana-making-power-petroleum-sectors-rise-challenge
EnterpriseSurveys.“GhanaCountryProfile2007”,EnterpriseSurveys,IFCandWorldBank.http://www.enterprisesurveys.org/~/media/FPDKM/EnterpriseSurveys/Documents/Profiles/English/Ghana-2007
Factoid2011,ChamberofMines.http://ghanachamberofmines.org/en/our-publications.php
Fofana,I.,Lemelin,A.&Cockburn,J.,(2005).BalancingaSocial-AccountingMatrix:Theoryand Application.
GDPNewSeries(ExpenditureApproach),GhanaStatisticalServices.http://www.statsghana.gov.gh/docfiles/GDP/statsghana%20GDP_E%20TimeSeries%20NA2_xlsx.pdf
Ghana2012,AfricanEconomicOutlook,AfDB.http://www.afdb.org/fileadmin/uploads/afdb/Documents/Publications/Ghana%20Full%20PDF%20Country%20Note.pdf
GTAP8DataBase,CenterforGlobalTradeAnalysis,PurdueUniversity.
HumanDevelopmentIndex(2011).“Ghana–CountryProfile”,InternationalHumanDevelopmentIndicators,UNDP.http://hdrstats.undp.org/en/countries/profiles/GHA.html

The National and Regional Socio-Economic Impact of Newmont Ghana's Ahafo Mine 5958
Jerven.M.,&Duncan.M.E.,(2012).RevisingGDPEstimatesinSub-SaharanAfrica:LessonsfromGhana.AfricanStatisticalJournal,15.http://www.afdb.org/fileadmin/uploads/afdb/Documents/Publications/ASJ15%20Section1%20Eng.pdf
Kuhar,A.,GolemanovaKuhar,A.,Erjavec,E.,&Cor,T.(2009).RegionalizationoftheSocialAccountingMatrix–MethodologicalReview.CommonAgriculturalPolicyRegionalImpact–TheRuralDevelopmentDimension,ProjectNo.226195.http://www.ilr.uni-bonn.de/agpo/rsrch/capri-rd/docs/d2.2.1.pdf
OxfordPovertyandHumanDevelopmentInitiative(2013),“GhanaCountryBriefing,MultidimensionalPovertyIndexDataBank.OPHI,UniversityofOxford.www.ophi.org.uk/wp-content/uploads/ophi-wp-59.pdf
PerformanceoftheMiningIndustry2011,ChamberofMines.http://ghanachamberofmines.org/en/our-publications.php
RevisedGDPfor2012,GhanaStatisticalServices.http://www.statsghana.gov.gh/docfiles/GDP/revised_gdp_2012.pdf
Schneider,F.,Buehn,A.,&Montenegro,C.E.(2010).NewEstimatesfortheShadowEconomiesallovertheWorld.InternationalEconomicJournal,24(4),443-461.http://www.econ.jku.at/members/Schneider/files/publications/2011/IEJ_NewEstimates_ShadEc_World.pdf
StatisticalBulletin2012,BankofGhana.http://www.bog.gov.gh/index.php?option=com_content&view=category&layout=blog&id=117&Itemid=232https://www.gtap.agecon.purdue.edu/
WorldBank,WorldBankDevelopmentIndicators.http://data.worldbank.org/
Appendix A: Methodology BackgroundThemodelingapproachoutlinedinExhibit6isdiscussedinmoredetailinthisAppendix.
A.1 InputsCompany Financials The2011auditedProfit&LossstatementandBalancesheetofNGGLhavebeenused.
Supplier SurveyFivebigsuppliersofNGGLaswellas17regionalsuppliersofNGGLhavebeeninterviewedin order to get a better insight of their spending pattern. The following suppliers have beeninterviewedbyStewardRedqueen:AUMS,ATS,Mantrac,Toyota,andWBHO.PABDevelopment Consultants Ltd. has surveyed the 17 regional suppliers that reside in Brong-Ahafoandthatareeitheractiveinconstruction,trade,transportationorprovideservices.
Household Survey284householdshavebeeninterviewedbyPABConsultinginordertoassesstheimpactNGGL’s operations have on the households as well as to get a better insight of the spending patternofhouseholdsinBrong-Ahafo(seeSection5.3formoredetails).
GTAP DataForGhana,themostrecentSocialAccountingMatrix(SAM)datesbackto2007andhasbeentakenfromGTAP8database.35 The SAM will be explained in more detail in the next section.
Employment DataThe 2010 population and housing census from the Ghana Statistical Services has provided us withanemploymentbreakdownbyeconomicactivityonthenationalandregionallevel.36
A.2 OutputAllocation of P&L ItemsAsinputforthisstudy,theauditedP&LaccountofNGGLhasbeendisaggregatedandaggregatedbasedontheeconomicrecipientsintheGhanaianEconomy.Here,acleardivisionismadebetweenregionalrecipients(i.e.farmers,traders,transporters,householdsandgovernmentinBrong-Ahafo),nationalrecipients(i.e.serviceproviders,householdsandgovernmentinGhana)andrecipientsabroad(i.e.importsofgoodsandservices).Inaddition,thebiggest(multinational)contractorshavebeenidentifiedandtheircostshavebeenallocatedaccordingly(seesuppliersurveyforfurtherexplanationontheallocationoftheseexpenses).
35 GlobalTradeAnalysisProject,GTAP8.36 GhanaStatisticalServices,2010PopulationandHousingCensus.http://www.census-ghana.net/index.html

The National and Regional Socio-Economic Impact of Newmont Ghana's Ahafo Mine 6160
National and Regional SAMThekeyfactoroftheinput-outputmodelistheSocialAccountingMatrix(SAM).TheSAMdescribesthefinancialflowsofalleconomictransactionsthattakeplacewithintheGhanaianeconomy.AsshowninExhibitA-1,intheSAM,thenumberofcolumnsandrowsareequalbecauseallsectorsoreconomicactors(industrysectors,households,governmentandtheforeignsector)arebothbuyersandsellers.Columnsrepresentbuyers(expenditures)androwsrepresentsellers(receipts).Finalconsumptioninducesproduction,whichleadstofinancialtransfersbetweenthevarioussectors,whichsubsequentlygenerateincomesforhouseholds,governments(taxes)andprofits(dividendsandsavings).
The SAM is a statistical and static representation of the economic and social structure of Ghana andsinceeconomiesaresubjecttochange,SAMsshouldpreferablybeupdatedperiodically.ForGhana,themostrecentSocialAccountingMatrixdatesbackto2007andhasbeentakenfromGTAP8database.37UsingdatafromtheGhanaStatisticalServicesandtheBankofGhana,theSocialAccountingMatrixhasbeenupdatedto2011usingtheRASmethod.38
The 2011 SAM concerns the national level. In order to get better estimates on the impact onBrong-Ahafo,aregionalSAMisnecessary.We‘regionalized’theSAMusingahybridmethodologyinwhichwecombinenon-survey(top-down)andsurvey(bottom-up)techniques.39Thetop-downapproachmakesuseofthesametechniquewhenupdatingthenationalSAMfrom2007to2011,respectivelythroughtheRASmethod.TheonlydifferencehereisthatregionalGDPfiguresareusedinsteadofthenationalfigures.
37 GlobalTradeAnalysisProject,GTAP8.38 Balancingasocial-accountingmatrix:Theoryandapplication,Fofana,I.etal,200539 Hybridmethodsassurethebestcompromisebetweenaccuracyandrequiredresources(Kuhar,Golemanova
Kuhar,Erjavec,Kozar,Cor;2009).
Thebottom-upapproachmakesuseofdatacollectedfromthehouseholdsurvey(seeSection5.3formoredetails)andthesuppliersurvey(seeSectionA.1).Fromthosesurveysthespendingpatternsofhouseholdsaswellasoftheconstruction,trade,transportationandservices sector have been derived and are incorporated in the SAM to derive at a regional SAM.
The main assumption of an input-output analysis is that an increase in demand can be met by anincreaseofproductionatconstantpricesinallaffectedsectorsoftheeconomy.Inrealityhowever,therearesectorsthatwillnot“feel”theeffectofanincreaseddemandfortheproductandthereforewillnotexperienceanincreaseofproduction.Alternatively,therecanalsobesectorsthatareunabletoincreaseproductionatconstantpricesbecauseofshortagesin,forexample,labor,rawmaterialsandproductioncapacity.Withthepossibleexceptionofskilledlabor,duetounemploymentinGhanathisdoesnotseemtobeanissue.
Sincemanyhouseholdsarefarmersaswell,theirso-calledauto-consumption(consumptionofself-producedproducts)isunlikelytobeaffected.Inourmodelthereforeallhouseholdexpendituresonfoodcropsandlivestockbyagriculturalhouseholdshavebeenexcluded.AnexceptionhasbeenmadeforNGGLemployees,forwhichhouseholdexpendituresonfoodcropsandlivestockareinlinewiththespendingpatternsderivedfromthehouseholdsurvey.Whereasofteninducedemploymenteffectsaresignificantlyoverestimated,thisapproachleadsto a much more robust and realistic estimation of them.
Employment intensitiesBecausethisReportfocuseson2011results,theemploymentbreakdownfromthe2010HousingandPopulationcensushasbeenadaptedusingthebestcorrectionfiguresavailable:average growth of population over the last 10 years40.
Makinguseofthe2011employmentdataandtheoutputthatwederivedfromthenationalandregionalSAMs,employmentintensitiescanbecalculated.Theemploymentintensityshowsthenumber of jobs per one unit of output and that intensity is multiplied by the amount of output that is supported by NGGL’s activities in order to estimate the total number of jobs supported. ThisReportdifferentiatesbetweenformalandinformaljobs.Theseemploymentintensitieshavebeen determined using data on the formal and informal output and employment per sector. Datagapshavebeencompensatedusingthefollowingassumptions:
• InlinewithfindingspresentedbyKhan(2012)41andSchneider,Buehn&Montenegro(2010)42wehaveassumedthatabout65%ofnationaloutputisformaland35%isinformal.
• Followingthereasoningthatmoreagricultural,lessdevelopedeconomiestendtobemoreinformalwehaveassumedthatabout50%ofBrong-Ahafo’sinputisformalandtheother50%isinformal.
• Inlinewithfindingsfromthe2010HousingandPopulationCensusfromtheGhanaStatisticalServicesweassumethatabout15%isformallyemployedandtheother85%isworkingintheinformalsector.
40 AveragingthepopulationgrowthfiguresfromtheWorldBankoverthelast10yearsresultsina2.4%increaseofpopulation.
41 http://fr.slideshare.net/AsiaHouse/1-razia-khan-standard-chartered-bank42 http://www.econ.jku.at/members/Schneider/files/publications/2011/IEJ_NewEstimates_ShadEc_World.pdf
Households
Taxes… … …
…
……
Manufacturing
Manufacturing
NG
GL
NGGL
Non marketIncomes
ConsumptionTransfers
Agriculture
Retail
Household consum
Export
Investments
Agriculture
Retail
TaxesImports
Dividends / savings
FromTo
Rows indicate how each sector / stakeholderreceives money
Columns indicate how each sector /Stakeholder spends money
Consumption induces production leading to
Transfers of money between sectors leading to
Incomes for households and governments
EXHIBITA-1:Social Accounting Matrix

The National and Regional Socio-Economic Impact of Newmont Ghana's Ahafo Mine 6362
Appendix B: Comparison of Results with the 2009 Report ThissectionexplainsthedifferencesbetweenNGGL’ssocio-economicimpactin2009and2011.43
ExhibitB-1showsthattotalexpenditureshaveincreasedbyalmost65%fromUSD528millionin2009toUSD869million.In2011,importslikewiseincreasedbyalmost65%andonlyprocurementinGhanadidnotincreasethatmuch.Themoststrikingdifferenceofallisthe adjustments. The main reason for these adjustments is that NGGL already anticipated for (higher)taxpaymentsinthenearfuture.44
TheremainderisthevalueaddedcreatedbyNGGL,respectivelyUSD184millionin2009andUSD503millionin2011.Becauseofthehighergoldpricecomparedto2009,profitsfromoperationsthataccruetoNewmont’sshareholders,andthegovernmentforitscarriedinterest,haveincreaseddrastically.BecauseweassumethatNGGL’sshareholdersareforeign,thisprofitfromoperationsisnotattributedtothevalueaddedcreatedwithinGhana.ValueaddedinGhanaincreasedfromUSD56millionin2009toUSD230millionin2011.Thisincreasecanbelargely attributed to the increase in government tax and carried interest income. This increase in government income is because the higher gold price boosted revenues and therefore also carriedinterestandincometax(seeExhibit12).
43 ThefiguresrepresentedintheExhibits11and12areinnominalterms.Forafaircomparison,figuresshouldbepresentedinrealterms,butthiswouldleadtotoomanyassumptionstobemeaningful.
44 Inaccountingterms,itiscalledadeferredtaxliability.
• Followingthesamereasoningasinpointtwo,weassumetheinformalsectortobebiggerinBrong-Ahafocomparedtothenationalaverage.Thereforeweassumeonly10%oftheemployedpeopletobeworkingintheformalsector.
• Breakdownoftheaverageandformaloutputandemploymentfiguresoverthedifferentindustries has been done using information from Ghana Statistical Services as well as insightsfromPABConsulting,NGGLandStewardRedqueen.
A.3 OutcomeValue-added and employment multipliersMakinguseofthenationalandregionalSAM,value-addedandemploymentmultiplierscanbecalculated.Thesemultipliersareusedtocalculatetheimpactondifferentdimensionssuchasimpactperround,perindustryandpervalueaddcomponent.
EXHIBITB-1:NGGL’s revenues in relation to its expenditure and value added in 2009 and 2011 (inUSDmillion).
TotalExpenditures
TotalExpenditures
Imports
Imports
Ghanaian Procurement
Ghanaian Procurement
Adjustments
Adjustments
Value Added Newmont
Value Added Newmont
ForeignProfits
ForeignProfits
NationalValue Added
NationalValue Added
Household Income
Household Income
Government Income
Government Income
528
869
202
367
139
182
3
183
184
503
128
273
56
230
17
39
39
191
2009 Financials
2011 Financials

The National and Regional Socio-Economic Impact of Newmont Ghana's Ahafo Mine 6564
TheindirectvalueaddedthatissupportedbyNGGLhasalsoincreased(seeExhibitB-2).This Report assumes that productivity and thus value added in Ghana has increased over thelasttwoyears,buttheincreaseinNGGL’sGhanaianprocurementisprobablythemaindriverbehindtheincreaseinvalueaddedfromUSD99million(USD60millioninthe1stroundandUSD39millioninthe2ndround)in2009toUSD130millionin2011.Whereas1stand2ndroundprofitsfromoperationsandtaxincomeremainedstableovertheyears,householdincomehasincreasedfromUSD65million(USD39millionthe1stroundandUSD26millioninthe2ndround)in2009toUSD105millionin2011.
ExhibitB-3showsthattotaljobssupportedbyNGGLdeclinedby7,100toatotalof41,100in2011.ThisdeclineinjobssupportediscounterintuitivewhentakingintoconsiderationtheincreaseofGhanaianprocurementbyNGGL(USD43millionsince2009).Thereareseveralreasonsforthechangesinjobs: • NGGL directly employing about 200 more people; • Significantincreaseinlaborproductivitysince2009duetotheeconomybeing2.5xlarger
while employment increased by just 1.03x; • Ghana’sGDPincreasedbymorethan60%in2010duetoarevisionofthemethodology
that estimates Ghana’s GDP45; • Increaseoflocalprocurement(USD43million)andbetterinsightsinhowthatmoneyis
spentwithintheGhanaianeconomy(duetointerviewinginternational&localcontractors).
45 Jerven.M,&Duncan.M.E.(2012).RevisingGDPestimatesinSub-SaharanAfrica:LessonsfromGhana.AfricanStatisticalJournal,15.
EXHIBITB-3:Direct,indirectandinducedeffectsonemploymentpersectorin2009and2011(in‘000jobs)
EXHIBITB-2:Directandindirecteffectsonvalueaddedin2009and2011(inUSDmillion)
Household Income
Household Income
Profits&Savings
Profits&Savings
Government Income
Government Income
Total Total
8117
55
15317
208 360
153
2009 Financials 2011 Financials
26
3839
33
62
39
191
47
83
23060
5539
17
0thRound:NGGL1stRound:DirectSuppliersandTrade2ndRound:Suppliers’Suppliers
10.1
5.7 1.1
8.4 1.2 1.97.0 1.9 2.1
11.9 41.1
0.1
10.5 0.4 0.76.1 1.8 2.6
15.8
11.9
48.3
12.5
28.9
5.18.0
Agriculture
Agriculture
Mining
Mining
Manufacturing
Manufacturing
Utilities
Utilities
Construction
Construction
Services
Services
Newmont
Newmont
Transportation
Transportation
Trade
Trade
Total
Total
6.7 16.2
14.0
8.9
2009 Financials
2011 Financials
0thRound:NGGL1stRound:DirectSuppliersandTrade2ndRound:Suppliers’Suppliers3ndRound:Re-spendingofsalaries

The National and Regional Socio-Economic Impact of Newmont Ghana's Ahafo Mine 6766
Appendix C: Sector breakdownAgriculturePaddy riceWheatOther grainsVegetables,fruit,nutsOil seedsSugarcane,sugarbeetPlant-basedfibersOther cropsCattleOther animal productsRawmilkWool,silk-wormcocoonsForestryFishing
ManufacturingCattle MeatOther meatVegetable oils and fatsDairy productsProcessed riceSugarFoodproductsBeverages and tobacco productsTextilesWearing apparelLeather productsWood productsPaperproducts,publishingPetroleum,coalproductsChemical,rubber,plasticproductsMineral productsNon-metallic mineralsIron&SteelNon-FerrousmetalFabricatedMetalproductsMotor vehicles and partsTransport equipmentElectronic equipmentOther Machinery and equipmentOther Manufacturing
MiningCoalOilGasOther mining
UtilitiesElectricityGasmanufacture,distributionWater
ConstructionConstruction
TradeAll retail salesRepairs of motor vehicles and personal and household goodsRetail sale of automotive fuelWholesale trade and commission tradeHotels and Restaurants
TransportationTransportWater transportAir transportCommunication
ServicesOtherfinancialintermediationInsuranceOther business servicesRecreation&OtherservicesOther Governmental servicesDwellings

www.newmont.com
Designed&PrintedbyStratcommAfrica


