changing socio-economic condition and livelihood of
TRANSCRIPT
i
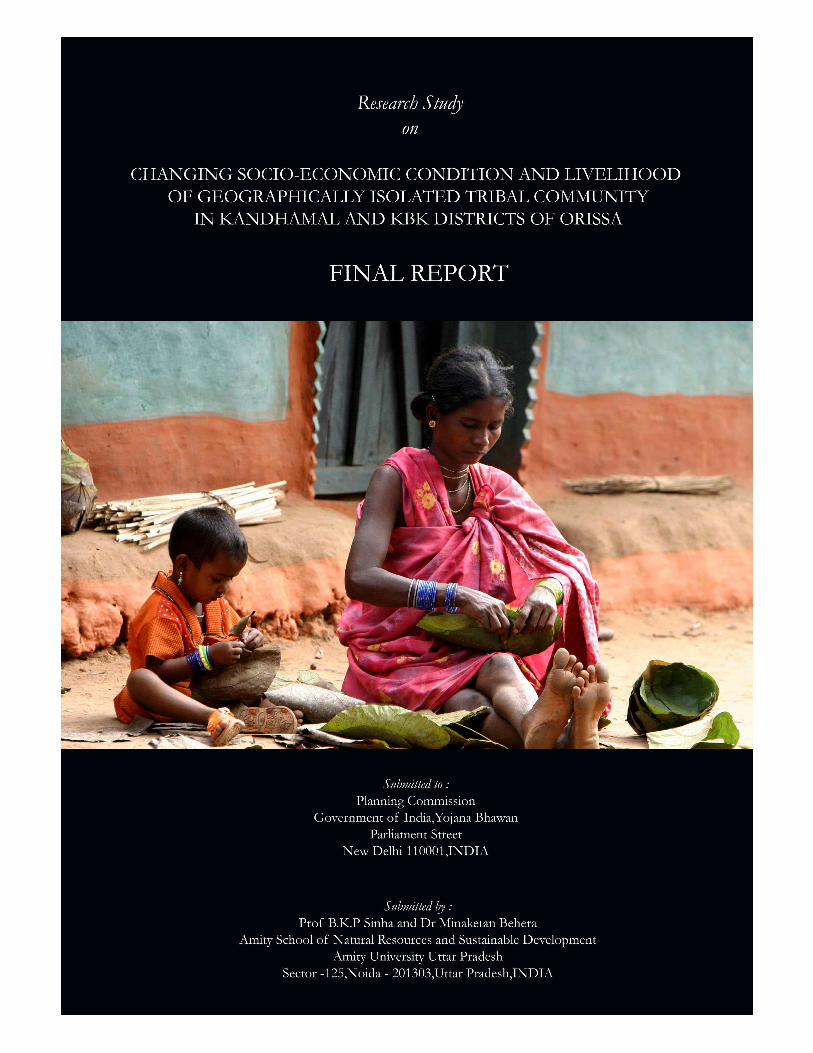
Research Study
on
CHANGING SOCIO-ECONOMIC CONDITION AND LIVELIHOOD OF GEOGRAPHICALLY ISOLATED TRIBAL COMMUNITY IN KANDHAMAL AND KBK
DISTRICTS OF ORISSA
SUBMITTED TO
Planning Commission
Government of India, Yojana Bhawan Parliament Street
New Delhi – 110 001, INDIA
SUBMITTED BY
Prof. B.K.P. Sinha & Dr. Minaketan Behera Amity School of Natural Resources & Sustainable Development
Amity University Uttar Pradesh Sector-125, Noida - 201 303, Uttar Pradesh, INDIA
ii
RESEARCH TEAM
Principal Investigators
Prof. B.K.P. Sinha
Co-Principal Investigators
Dr. Minaketan Behera
External Experts
Mr. J.P. Rout and Prof. C. Satapathy
Research Associate
Mr. Ghanashyam Sahu
Research Assistants
Mr. Jayanta Kumar Sahoo
Mr. Hirasigh Mandal
Mr. Birendra Kumar Senapati
Mr. Manoranjan Gouda
Mr. Rajesh Kumar Prusty
Mr. Judhistir Sahu
Computer Assistance
Mr. Debendra Maharana
iii
FOREWARD
The Primitive Tribal Groups (PTGs) of Orissa assume special
significance because of their being one of the most marginalised
community of the country. Living in the far flung areas these tribal
groups are the first to be hit by vagaries of nature, such as
drought, heat stroke, infectious diseases, economic and cultural displacement, etc.
Special attention and care is required in the development process and also in view of
the Prime Minister’s initiatives on inclusive growth.
Orissa has the distinction of having thirteen Primitive Tribal Communities spread over
twelve districts of the state. Ever since the Fifth Five Year Plan when the concept of
PTG was introduced by Government of India, a number of special development
interventions are being extended for this vulnerable section through specially set up
Micro Projects for effective implementation and all round development of PTGs. It is
very essential to understand the socio-economic and cultural characteristics of these
primitive tribes distinctively as they differ from each in extent and character to
formulate scientific and realistic plans for their development.
It gives me great pleasure to see this study report prepared by Amity School of
Natural Resources and Sustainable Development for making an attempt to understand
the “Changing Socio-Economic Condition and Livelihood of Geographically Isolated
Primitive Tribal Communities in Kandhamal and KBK Districts of Orissa”. The study
report has well brought out the changes in socio-economic condition of the most
underprivileged communities i.e. Primitive Tribal Groups of Orissa. The Primitive Tribal
Groups of Orissa have so far not been studied in their diverse dimensions. As such it is
in many respects an unique endeavour with due emphasis based on wide consultations
among various stakeholders in the field.
Amity University is grateful to the Planning Commission for considering us for this
unique study.
I hope that this study has immense importance from policy point of view.
(Dr. Ashok K. Chauhan)
President, Amity School of Natural Resources & Sustainable Development (ASNRSD) & Founder President, Ritnand Balved Education Foundation (RBEF)
(The Foundation of Amity Institutions and the Sponsoring Body of Amity Universities)
iv
ACKNOWLEDGEMENT
On behalf of the Amity School of Natural Resources and Sustainable Development (ASNRSD), Noida, we express our gratitude to our Founder President Dr. Ashok K. Chauhan and Mr. Aseem Chauhan, Additional President, Ritnand Balved Education Foundation (RBEF) for their support, inspiration and encouragement that enabled us to carry out this study. Our special thanks to Prof. A.B. Ota, Director, SCSTRTI, Bhubaneswar, Orissa; Prof. C. Satapathy, Former Dean of Extension Education, OUAT, Bhubaneswar and Director, AMITY Bhubaneswar; Prof. Bhaskar Majumdar, Professor (Economics), G.B. Pant Social Science Institute and Faculty Members, AMITY Bhubaneswar; Dr. Dibakara Nayak, Director, Economic and Extension Education, OUAT, Bhubaneswar; Mr. Trilochan Sahoo, Research Officer, SCSTRTI, Bhubaneswar; Mr. Madan Gupta and Mr. Sandeep Jaswal of GPSSI, and Research Personnel of Vasundhara, Bhubaneswar for providing their valuable feedback and guidance to the present study. We sincerely thank BDOs and WEOs of Muniguda, Bissam Cuttack, Gunupur and Tumudibandha for their help and valuable suggestions from time to time. We also thank Special officers, MPWs and Field staffs of DKDA, LSDA and KKDA, Community Mobilisers of Local Voluntary Organisations, PRI members and other key personnel of the community for their cooperation during the study. We extend our thanks to the CDPOs of Muniguda and Bissam Cuttack, Vital Statistician of PHC Tumudibandha and Jaganathpur, for their cooperation. Our heartfelt gratitude goes to community members of Dongria Kandha, Lanjia Saora and Kutia Kandha who gave us their valuable time, knowledge, inputs and willingness to share information greatly beneficial for this study. We would like to thank Mr. I.P. Popli, Faculties and Staff Members of ASNRSD for their help in various stages of work. Our sincere thanks are due to the research personnel who conducted fieldwork in difficulty and helped to bring out the report. Lastly, we shall like to put on record our deep sense of gratitude to Planning Commission, Government of India for giving us this opportunity that enabled us to carry out this study.
(Prof. B.K.P. Sinha) (Dr. Minaketan Behera) Principal Investigator Co-Principal Investigator
v
CONTENTS
Acronyms xii
List of Tables xiv
List of Figures xxi
List of Maps xxii
Executive Summery xxiii
Chapter 1: CHANGING SOCIO-ECONOMIC STATUS OF TRIBAL COMMUNITIES IN INDIA
1-36
1.1 Meaning of Tribe 1
1.2 Main Features of Tribes 2
1.3 Classification of Indian Tribes 3
1.4 Distribution of Tribes in Different Geo-Physical Zone 6
1.5 Tribal Condition before Independence 8
1.6 Safeguards for Scheduled Tribes in Constitution 9
1.7 The Constitution and Schedule Areas 11
1.8 Distribution of Scheduled Tribes and Major Scheduled Tribes in India
15
1.9 Tribal Population in India 17
1.10 Sex Ratio of Scheduled Tribe 24
1.11 Changes in Educational Status of Schedule Tribes 25
1.12 Changes in Health Indicator of Scheduled Tribes 28
1.13 Changes in Occupation Pattern of Scheduled Tribes 28
1.14 Changes in Poverty Scenario of Scheduled Tribes 29
1.15 Schemes for the Development of Scheduled Tribes 30
Chapter 2: OBJECTIVE AND STUDY DESIGN 37-46
2.1 Statement of Problem 37
2.2 Objectives of the Study 38
vi
2.3 Methodology 38
2.4 The Operational Methodology Adopted for This Study 38
2.5 Sources of Data 43
2.6 Proper Tools and Methods Tools of Data Collections 43
2.7 Frame Work of Data Analysis 44
2.8 Report Presentation 45
2.9 Limitation of the Study 46
Chapter 3: TRIBES OF ORISSA AND THEIR DEVELOPMENT STRATEGY IN DIFFERENT PLAN PERIODS
47-80
3.1 Tribes of Orissa 47
3.2 Distribution of Scheduled Tribes Different Geo-Physical Zone 49
3.3 Scheduled Areas of Orissa 51
3.4 Schedule Tribe Population in Orissa 55
3.5 Sex Composition of ST Population 59
3.6 Literacy of Scheduled Tribes in Orissa 60
3.7 Occupation Pattern of Scheduled Tribes of Orissa 64
3.8 Poverty and Scheduled Tribes of Orissa 64
3.9 Birth Rate, Death Rate and Infant Mortality Rate of Orissa 66
3.10 Tribal Development Strategy in Different Plan Periods in Orissa 67
3.11 Schemes for the Development of Scheduled Tribes in Orissa 73
Chapter 4: PRIMITIVE TRIBAL GROUPS OF ORISSA 81-100
4.1 Development of Primitive Tribal Groups (PTGs) 81
4.2 The Concept of Primitive Tribe 81
4.3 The Criteria for Classification and Identification of PTGs 82
4.4 PTGs in India 82
4.5 Primitive Tribal Communities of Orissa 83
4.6 Distinguished Socio-Cultural Features 85
vii
4.7 Distribution of PTGs in Orissa 92
4.8 Socio Economic Condition of PTGs in Orissa 92
4.9 Literacy of PTGs 94
4.10 Economic Existence of PTGs in Orissa 94
4.11 Traditional Skills, Art and Craft of PTGs 95
4.12 Primitive Tribal Groups and Core Programs in Orissa 96
4.13 Health Status of PTGs 98
Chapter 5: CHANGING SCENARIO OF PRIMITIVE TRIBAL GROUPs: FINDINGS FROM FIELD STUDY
101-228
5.1 Dongria Kandha (PTG) 101-148
5.1.1 Study Area 101
5.1.2 Climate 102
5.1.3 Soil and Vegetation 102
5.1.4 Drainage 103
5.1.5 Flora and Fauna 103
5.1.6 Origin of Dongria Kandha 105
5.1.7 Language 106
5.1.8 Settlement Pattern 106
5.1.9 House Type 108
5.1.10 Economic Organization 109
5.1.11 Social Organization 113
5.1.12 Religious Beliefs and Practices 118
5.1.13 Political Organization 120
5.1.14 Changing Scenario of Dongria Kandha : Finding from Field Study
122
5.1.15 Changes in Demographic Profile of Sample Villages of Dongria Kandha
123
5.1.16 Demographic Profile of the Sample Households 124
viii
5.1.17 Housing Conditions of Sample Households 128
5.1.18 Drinking Water Facilities in Selected Villages 129
5.1.19 Number of Household under Self Help Groups 131
5.1.20 Literacy in Sample Households 131
5.1.21 Size and Distribution of Land Holding of Sample Households
133
5.1.22 Occupational Pattern of Sample Households 134
5.1.23 Economic Activities and Annual Income of Households 135
5.1.24 Annual Household Expenditure 137
5.1.25 Loan of Sample Households 137
5.1.26 Saving of Households 139
5.1.27 Total Asset of Dongria Kandha Households 140
5.1.28 Health Status of Dongria Kandha 140
5.1.29 Livestock Census of Sample Household 142
5.1.30 Access to Basic Amenities of Selected Villages of Dongria Kandha
143
5.1.31 Areas of Changes as Perceived by Key Personnel 146
5.1.32 Factor for Changes 148
5.2 Lanjia Saora (PTG) 149-192
5.2.1 Study Area 149
5.2.2 Climate 151
5.2.3 Soil and Vegetation 151
5.2.4 Drainage 153
5.2.5 Flora and Fauna 153
5.2.6 Origin of the Lanjia Saora 154
5.2.7 Language 154
5.2.8 Village Settlement 155
ix
5.2.9 House Type 156
5.2.10 Economic Organization 157
5.2.11 Food and Food Habits 161
5.2.12 Social Organization 162
5.2.13 Religious Beliefs and Practices 163
5.2.14 Political Organization 165
5.2.15 Changing Scenario of Lanjia Saora Development Agency: Findings from Field Study
166
5.2.16 Changes in Demographic Profile of Sample Villages of Lanjia Saora
167
5.2.17 Demographic Profile of the Sample Households 168
5.2.18 Housing Conditions of Sample Households 172
5.2.19 Drinking water Facilities in Study Villages 173
5.2.20 Literacy in Sample Households 174
5.2.21 Size and Distribution of Land Holding of Sample Households
176
5.2.22 Occupational Pattern of Sample Households 177
5.2.23 Economic Activities and Annual Income of Households 178
5.2.24 Annual Household Expenditure of Lanjia Saora 180
5.2.25 Loan of Sample Households of Lanjia Saora 180
5.2.26 Saving of Households of Lanjia Saora 182
5.2.27 Total Asset of Lanjia Saora Households 183
5.2.28 Health Status of Lanjia Saora 183
5.2.29 Changes in Intensity of Diseases 184
5.2.30 Livestock of Sample Household of Lanjia Saora 187
5.2.31 Access to Basic Amenities of the Selected Villages of Lanjia Saora
188
5.2.32 Perception of Key Personnel of the Village 190
x
5.2.33 Factors for Changes 192
5.3 Kutia Kandha (PTG) 193-228
5.3.1 Study Area 193
5.3.2 Climate 193
5.3.3 Soil and Vegetation 194
5.3.4 Origin of Kutia Kandha 194
5.3.5 Language 196
5.3.6 Village Settlement 196
5.3.7 House Type 197
5.3.8 Economic Organization 197
5.3.9 Social Organization 200
5.3.10 Religious Beliefs and Practices 202
5.3.11 Political Organization 202
5.3.12 Changing Scenario of Kutia Kandha Development Agency: Findings from Field Study
204
5.3.13 Changes in Demographic Profile of Sample Villages 205
5.3.14 Demographic Profile of Sample Households 206
5.3.15 Housing Conditions of Sample Households 209
5.3.16 Drinking Water Facilities in Selected Villages 210
5.3.17 Number of Household under Self Help Groups 211
5.3.18 Literacy in Sample Households 211
5.3.19 Size and Distribution of Land Holding of Sample Households
214
5.3.20 Occupational Pattern of Sample Households 215
5.3.21 Economic Activities and Annual Income of Households 216
5.3.22 Annual Household Expenditure of Kutia Kandha 217
5.3.23 Loan of Sample Households of Kutia Kandha 218
xi
5.3.24 Saving of Households of Kutia Kandha 220
5.3.25 Total Asset of Kutia Kandha Households 220
5.3.26 Health Status of Kutia Kandha 221
5.3.27 Livestock of Sample Household of Kutia Kandha 223
5.3.28 Access to Basic Amenities of the Selected Villages of Kutia Kandha
224
5.3.29 Perception of Key Personal of the Villages (Refer: Table 34)
226
5.3.30 Factors for Changes 228
Chapter 6: COMPARATIVE ANALYSIS OF KUTIA KANDHA, DONGRIA KANDHA AND LANJIA SAORA
229-236
Chapter 7: IMPACT OF DEVELOPMENTAL INTERVENTIONS ON STUDY PRIMITIVE TRIBAL GROUPS
237-266
7.1 Development of PTGs during XI Years Plan 237
7.2 Financial Assistance for the Development of PTGs 238
7.3 Impact of Development Intervention of DKDA, Chatikona on Different Aspects
239
7.4 Reaction of the Head of the Households towards Development Intervention of DKDA, Chartikona, Rayagada
241
7.5 Reaction of Key Personal of the Villages towards Development Intervention of Dongria Kandha (a)
242
7.6 Reaction of Key personal of the Villages towards Important of Development Intervention of Dongria Kandha (b)
242
7.7 Success Stories and Activities under SCA to TSP during the Year 2007-08
243
7.8 Some of the Success Stories and Activities under CCD Plan for the Year 2007-08
245
7.9 Some of the Success Stories and Activities under SCA to TSP for the Year 2008-09
247
7.10 Some of the The Success Stories and Activities under CCD Plan for the Year 2008-09
248
xii
7.11 Impact of Development Intervention of KKDA, Belghar, Kandhamal, 2007-08
250
7.12 Reaction of the Household Heads toward Development Intervention of KKDA, Belghar, Kandhamal
251
7.13 Reaction of Key Personal of the Villages towards Development Intervention of Kutia Kundha Development Agency, Belghar
252
7.14 Success Stories and Activities under SCA to TSP for the Year 2007-08
253
7.15 Success Stories and Activities under CCD Plan for the Year 2007-08
255
7.16 Success Stories under SCA to TSP for the Year 2008-09 256
7.17 Success Stories and Activities under CCD Plan for the Year 2008-09
257
7.18 Impact of Development Intervention of LSDA, Puttasing, Rayagada on Different Aspects
259
7.19 Success Stories and Activities under SCA to TSP for the Year 2007-08
262
7.20 Some of the Success Stories and Activities under CCD Plan for the Year 2007-08
264
7.21 Some of the Success Stories and Activities under SCA to TSP Plan for the Year 2008-09
266
7.22 Some of the Success Stories and Activities under CCD Plan for the Year 2008-09
266
Chapter 8: CONCLUSION AND RECOMMENDATION 267-278
REFERENCES 279-282
Annexure i - v
Appendix 1-26
xiii
ACRONYMS
ADP Area Development Approach
ABE Agro Based Economy
AEO Agriculture Extension Officer
ANM Auxiliary Nurse Midwife
BPL Below Poverty Line
CBR Crude Birth Rate
CCDP Conservation -Cum -Development Plan
CDA Community Development Approach
CDR Crude Death Rate
CEA Corrected Excluded Areas
CED Chronic Energy Deficiency
CP Cluster Pockets
DKDA Dongria Kandha Development Agency
DRDA District Rural Development Agency
DTDP Dispersed Tribal Development Programme
EDR Earner Dependency Ratio
EMRSs Ekalavya Model Residential Schools
FEP Fully Excluded Areas
FGD Focus Group Discussion
FOIGS Family Oriented Income Generating Schemes
GoI Government of India
GoO Government of Orissa
GP Gram Panchayat
GRMS Girl Residential Model School
HDI Human Development Index
HH Households
HHI Household Industry
HSD Household Suffered from Diseases.
IAY Indira Awas Yojana
ICMR Indian Council for Medical Research
ID Institutional Delivery
IDP Infrastructure Development Programmes
IGS Income Generating Scheme
IMR Infant Mortality rate
ITDA Integrated Tribal Development Agency
ITDP Integrated Tribal Development Program
JBY Janashree Bima Yojana
xiv
JSY Janani Surakhya Yojana
KBK Koraput, Bolangir and Kalahandi
KKDA Kutia Kandha Development Agency
LE Life Expectancy
LIC Life Insurances Corporation of India
LSDA Lanjia Saora Development Agency
MADA Modify Area Development Approach
Max Maximum
Min Minimum
MMR Maternal Mortality Rate
MMTD Maharashtra Model of the Tribal Development
MoTA Ministry of Tribal Affair
NGO Non Government Organization
NNMB National Nutrition Monitoring Bureau
NREGS National Rural Employment Guarantee Scheme
NRHM National Rural Health Mission
NSTFDC National Scheduled Tribes Finance and Development Corporation
NTFPs Non-Timber Forest Products
PHC Primary Health Centre
PMGSY Pradhan Mantri Gram Sadak Yojana
PRA Participatory Rural Appraisal
PRI Panchayati Raj Institutions
PTGs Particularly Vulnerable Tribal Groups
RMRCB Regional Medical Research Centre Bhubaneswar
SC Scheduled Caste
SCA Special Central Assistant
SCSTRTI Scheduled Tribes and Scheduled Caste Research and Training Institute
SHGs Self Help Groups
SMRD Special Multipurpose Tribal Development
SSA Sarva Sikhaya Abhiyan
ST Scheduled Tribes
T HHs Total Households
TPDS Targeted Public Distribution System
TSP Tribal Sub Plan
TSPD Tribal Sub Plan Districts
TWS Tank Water Supply
WPR Work Participation Rate
xv
List of Tables
Table 1 State wise Percentage of Scheduled Tribe Population under Fifth Schedule
15
Table 2 State wise Percentage of Scheduled Tribe Population under Sixth Scheduled
15
Table 3 The Major Tribes in India 16
Table 4 Distribution of STs Population in different States/Uts 17
Table 5 Number of Scheduled tribes Notified in States and union Territories, 1991
19
Table 6 Distribution ST Population from 1951 to 2001 20
Table 7 Concentration of ST population across districts 21
Table 8 No of Districts State-wise having more than 50 per cent ST Population 21
Table 9 Percentage of Scheduled Tribe population by India/state 23
Table 10 Decennial growth rate of literacy among STs and General Category 26
Table 11 Dropout rates of Scheduled tribes at various stages of education 27
Table 12 Occupational classification of main workers (%) 29
Table 13 Percentage of People living below Poverty Line (%) 30
Table 14 Total Plan outlay for tribal development 31
Table 15 Samples in Details 41
Table 16 Sample size of Dongria Kandha 41
Table 17 Sample size of Kutia Kandha 42
Table 18 Sample size of Lanjia Saora 42
Table 19 Major Tribes and their area in Orissa 49
Table 20 Change in Scheduled Tribe population in Orissa 55
Table 21 Decennial growth of Tribal population in Orissa 56
Table 22 District wise Total population, and ST Population 58
Table 23 Comparative Sex ratio during different decades 60
Table 24 Literacy rate of Schedule Tribe population in Orissa during 1971-2001 61
Table 25 Literacy Rate of General and ST Population in different Decades 61
xvi
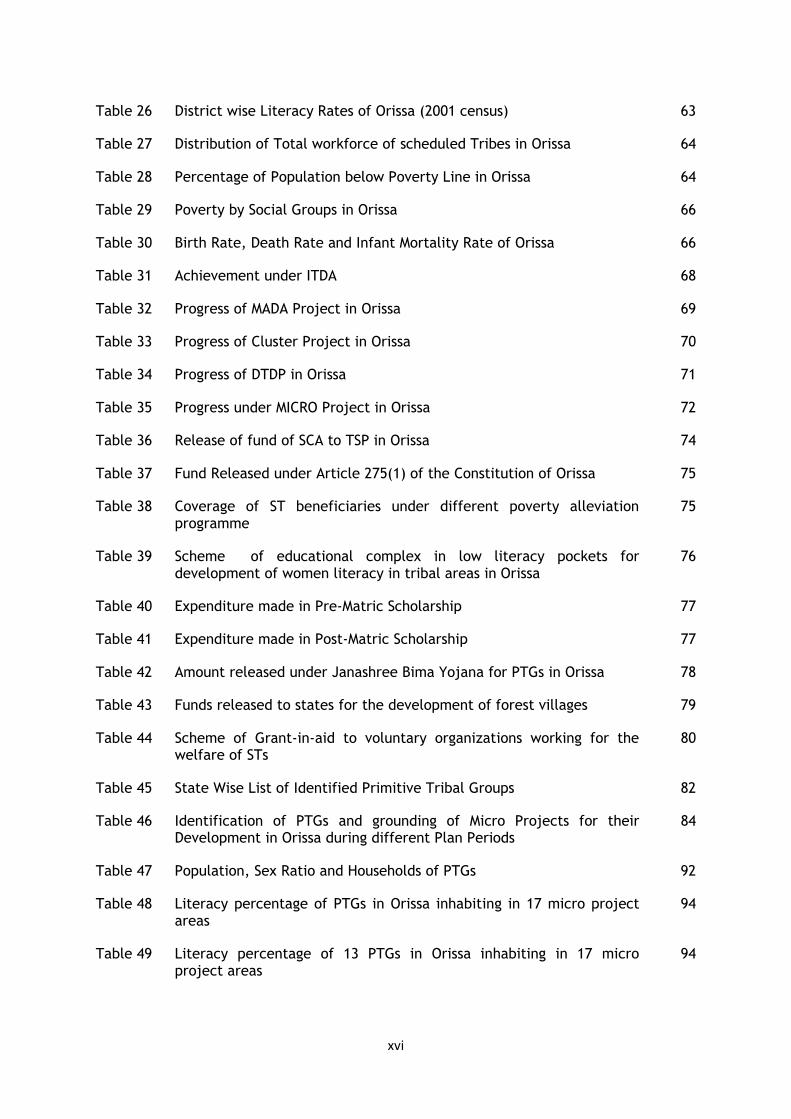
Table 26 District wise Literacy Rates of Orissa (2001 census) 63
Table 27 Distribution of Total workforce of scheduled Tribes in Orissa 64
Table 28 Percentage of Population below Poverty Line in Orissa 64
Table 29 Poverty by Social Groups in Orissa 66
Table 30 Birth Rate, Death Rate and Infant Mortality Rate of Orissa 66
Table 31 Achievement under ITDA 68
Table 32 Progress of MADA Project in Orissa 69
Table 33 Progress of Cluster Project in Orissa 70
Table 34 Progress of DTDP in Orissa 71
Table 35 Progress under MICRO Project in Orissa 72
Table 36 Release of fund of SCA to TSP in Orissa 74
Table 37 Fund Released under Article 275(1) of the Constitution of Orissa 75
Table 38 Coverage of ST beneficiaries under different poverty alleviation programme
75
Table 39 Scheme of educational complex in low literacy pockets for development of women literacy in tribal areas in Orissa
76
Table 40 Expenditure made in Pre-Matric Scholarship 77
Table 41 Expenditure made in Post-Matric Scholarship 77
Table 42 Amount released under Janashree Bima Yojana for PTGs in Orissa 78
Table 43 Funds released to states for the development of forest villages 79
Table 44 Scheme of Grant-in-aid to voluntary organizations working for the welfare of STs
80
Table 45 State Wise List of Identified Primitive Tribal Groups 82
Table 46 Identification of PTGs and grounding of Micro Projects for their Development in Orissa during different Plan Periods
84
Table 47 Population, Sex Ratio and Households of PTGs 92
Table 48 Literacy percentage of PTGs in Orissa inhabiting in 17 micro project areas
94
Table 49 Literacy percentage of 13 PTGs in Orissa inhabiting in 17 micro project areas
94
xvii
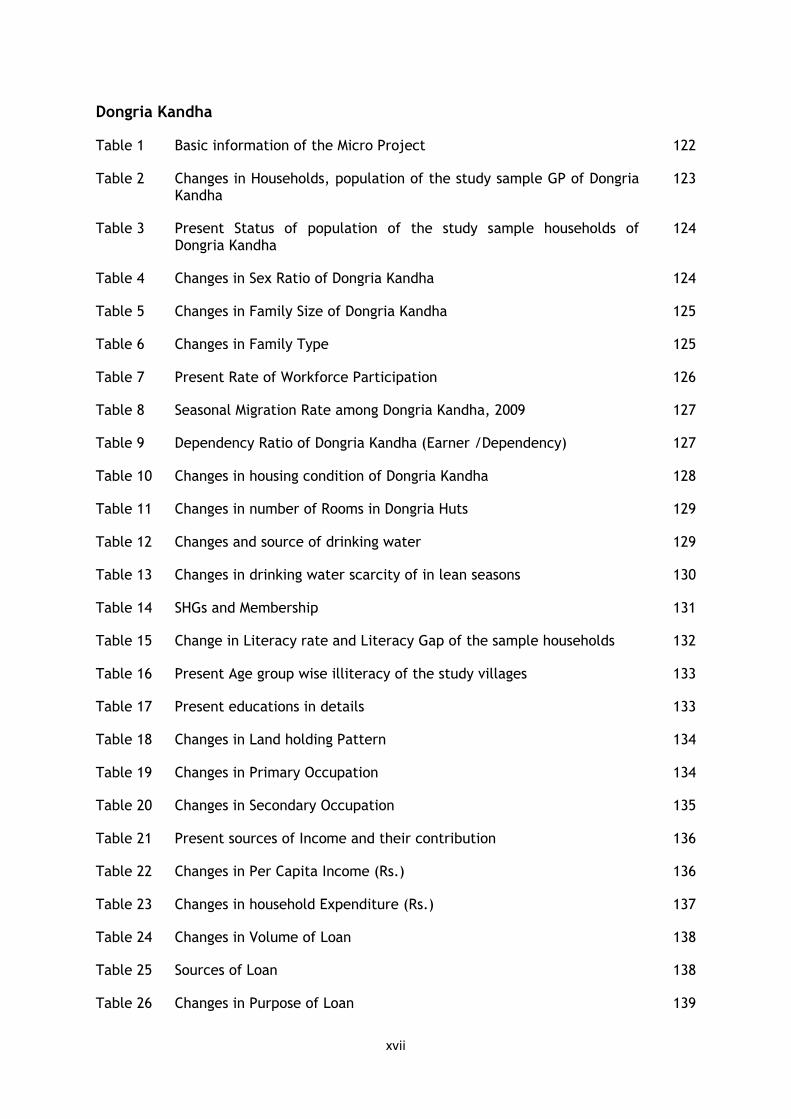
Dongria Kandha
Table 1 Basic information of the Micro Project 122
Table 2 Changes in Households, population of the study sample GP of Dongria Kandha
123
Table 3 Present Status of population of the study sample households of Dongria Kandha
124
Table 4 Changes in Sex Ratio of Dongria Kandha 124
Table 5 Changes in Family Size of Dongria Kandha 125
Table 6 Changes in Family Type 125
Table 7 Present Rate of Workforce Participation 126
Table 8 Seasonal Migration Rate among Dongria Kandha, 2009 127
Table 9 Dependency Ratio of Dongria Kandha (Earner /Dependency) 127
Table 10 Changes in housing condition of Dongria Kandha 128
Table 11 Changes in number of Rooms in Dongria Huts 129
Table 12 Changes and source of drinking water 129
Table 13 Changes in drinking water scarcity of in lean seasons 130
Table 14 SHGs and Membership 131
Table 15 Change in Literacy rate and Literacy Gap of the sample households 132
Table 16 Present Age group wise illiteracy of the study villages 133
Table 17 Present educations in details 133
Table 18 Changes in Land holding Pattern 134
Table 19 Changes in Primary Occupation 134
Table 20 Changes in Secondary Occupation 135
Table 21 Present sources of Income and their contribution 136
Table 22 Changes in Per Capita Income (Rs.) 136
Table 23 Changes in household Expenditure (Rs.) 137
Table 24 Changes in Volume of Loan 138
Table 25 Sources of Loan 138
Table 26 Changes in Purpose of Loan 139
xviii
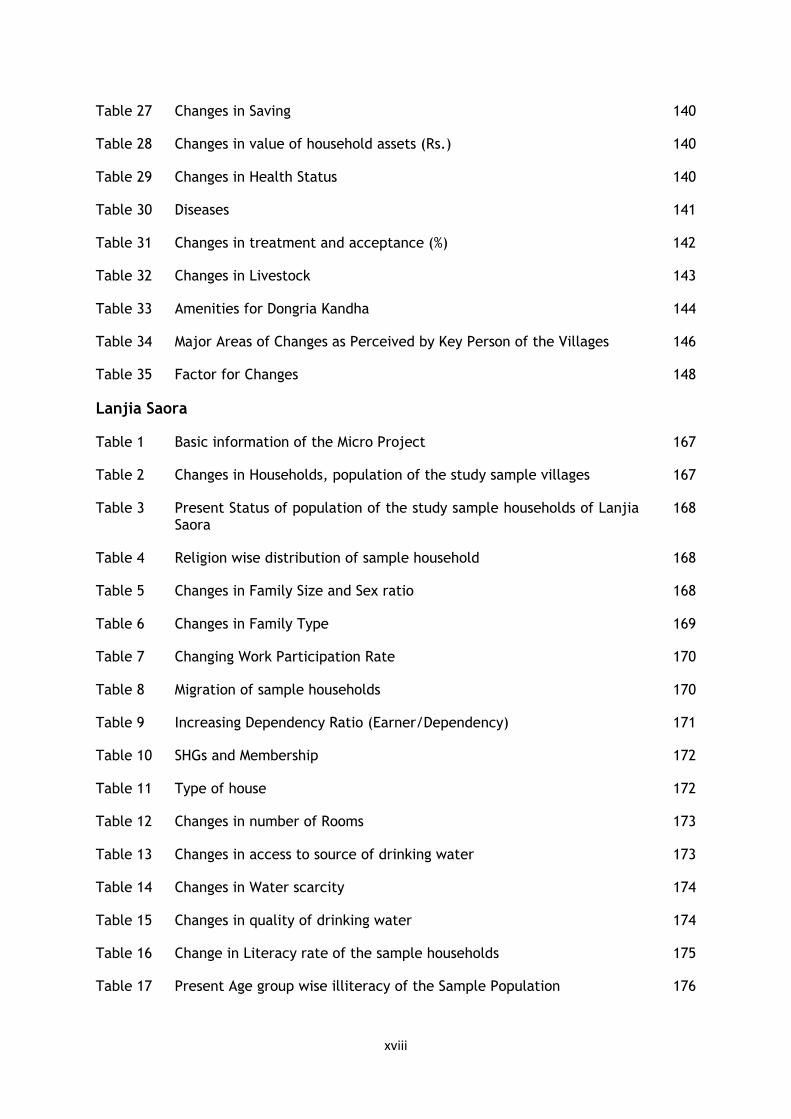
Table 27 Changes in Saving 140
Table 28 Changes in value of household assets (Rs.) 140
Table 29 Changes in Health Status 140
Table 30 Diseases 141
Table 31 Changes in treatment and acceptance (%) 142
Table 32 Changes in Livestock 143
Table 33 Amenities for Dongria Kandha 144
Table 34 Major Areas of Changes as Perceived by Key Person of the Villages 146
Table 35 Factor for Changes 148
Lanjia Saora
Table 1 Basic information of the Micro Project 167
Table 2 Changes in Households, population of the study sample villages 167
Table 3 Present Status of population of the study sample households of Lanjia Saora
168
Table 4 Religion wise distribution of sample household 168
Table 5 Changes in Family Size and Sex ratio 168
Table 6 Changes in Family Type 169
Table 7 Changing Work Participation Rate 170
Table 8 Migration of sample households 170
Table 9 Increasing Dependency Ratio (Earner/Dependency) 171
Table 10 SHGs and Membership 172
Table 11 Type of house 172
Table 12 Changes in number of Rooms 173
Table 13 Changes in access to source of drinking water 173
Table 14 Changes in Water scarcity 174
Table 15 Changes in quality of drinking water 174
Table 16 Change in Literacy rate of the sample households 175
Table 17 Present Age group wise illiteracy of the Sample Population 176
xix
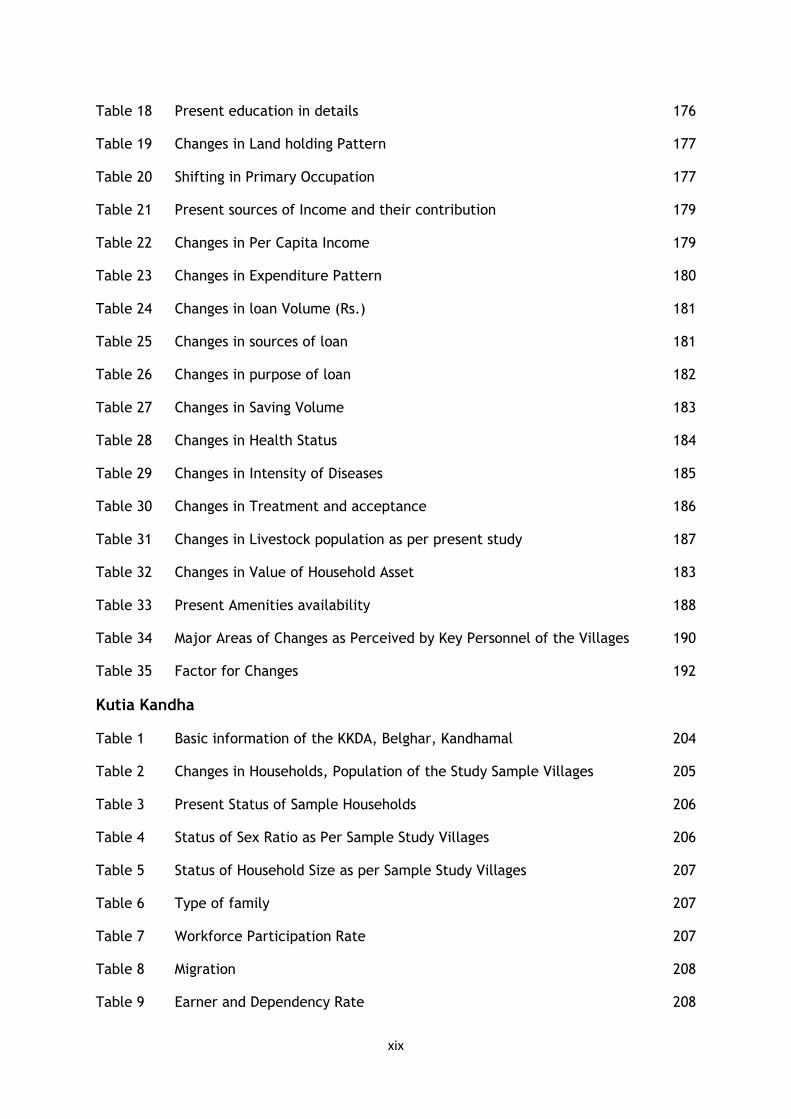
Table 18 Present education in details 176
Table 19 Changes in Land holding Pattern 177
Table 20 Shifting in Primary Occupation 177
Table 21 Present sources of Income and their contribution 179
Table 22 Changes in Per Capita Income 179
Table 23 Changes in Expenditure Pattern 180
Table 24 Changes in loan Volume (Rs.) 181
Table 25 Changes in sources of loan 181
Table 26 Changes in purpose of loan 182
Table 27 Changes in Saving Volume 183
Table 28 Changes in Health Status 184
Table 29 Changes in Intensity of Diseases 185
Table 30 Changes in Treatment and acceptance 186
Table 31 Changes in Livestock population as per present study 187
Table 32 Changes in Value of Household Asset 183
Table 33 Present Amenities availability 188
Table 34 Major Areas of Changes as Perceived by Key Personnel of the Villages 190
Table 35 Factor for Changes 192
Kutia Kandha
Table 1 Basic information of the KKDA, Belghar, Kandhamal 204
Table 2 Changes in Households, Population of the Study Sample Villages 205
Table 3 Present Status of Sample Households 206
Table 4 Status of Sex Ratio as Per Sample Study Villages 206
Table 5 Status of Household Size as per Sample Study Villages 207
Table 6 Type of family 207
Table 7 Workforce Participation Rate 207
Table 8 Migration 208
Table 9 Earner and Dependency Rate 208
xx
Table 10 House Type of Kutia Kandha 209
Table 11 Number of Room 209
Table 12 Main Source of Drinking Water 210
Table 13 Water Scarcity 211
Table 14 Number of household under SHGs 211
Table 15 Distribution of Literate Population 213
Table 16 Age Group wise Illiterate Person 213
Table 17 Distribution of population by education level 213
Table 18 Land Distribution of the Households in the Study Villages 214
Table 19 Major occupations of the sample households 215
Table 20 Minor occupations of the sample households 216
Table 21 Annual income from different sources 216
Table 22 Average income of Household and Per Capita Income (in Rupees) 217
Table 23 Household Expenditure 218
Table 24 Loan/indebt amount of Kutia Kandha 219
Table 25 Sources of Loan 219
Table 26 Utilization of Loan 219
Table 27 Saving of Kutia Kandha Households 220
Table 28 Value of the Asset of sample households 221
Table 29 Health Status of Kutia Kandha 222
Table 30 Major Diseases and their intensity 222
Table 31 Treatment acceptance of Kutia Kandha 223
Table 32 Livestock Population of sample household 224
Table 33 Access to basic amenities 225
Table 34 Major Areas of Change as Perceived bsy Key Persons of the Villages 227
Table 35 Factors for Changes as perceived by Village Eminent Persons 228
Comparative Analysis
Table 1 General Information 229
xxi
Table 2 Demography 230
Table 3 Education 231
Table 4 Health 231
Table 5 Occupation 232
Table 6 Income 234
Table 7 Loan and Borrowing 234
Table 8 Expenditures 234
Table 9 Infrastructures 235
Impact of Government Intervention
Table 1 Budgetary allocation under SCA to TSP and CCD scheme during 2007–08
239
Table 2 Development Intervention of DKDA, Chatikona, Rayagada 2007-08 240
Table 3 Projects under SCA to TSP (2007-08) 240
Table 4 Project under CCD Plan (2007-08) 240
Table 5 Highlights the activities of KKDA, Belghar, Kandhamal, 2007-08 250
Table 6 Project under SCA to TSP (2007-08) 250
Table 7 Projects under CCD plan (2007-08) 251
Table 8 Importance of the Development Intervention 253
Table 9 Highlights the activities of L.S.D.A, Puttasing, Rayagada 259
Table 10 Status of the Projects under SCA to TSP (2007- 08) 259
Table 11 Status of the Project under CCD (2007-08) 260
Table 12 Reaction of Household Heads towards Development Intervention of LSDA, Rayagada
260
Table 13 Reaction of the Village Key Personnel towards the Development Intervention of Lanjia Saora Development Agency, Puttasing (a)
261
Table 14 Reaction of Village eminent persons on Development Intervention Meant for Lanjia Saora (b)
262
xxii
List of Figures
Figure I Distribution of STs Population in different States/UTs 18
Figure II Decennial growth of General Population and ST Population from 1961-71 to 1991-2001
24
Figure III Sex Ratio of Scheduled Tribes and Total population 25
Figure IV Literacy rate of STs and Total population (1971-2001) 26
Figure V Female literacy rates of STs and total population 27
Figure VI Birth Rate, Death Rate and Infant Mortality Rate of India 28
Figure VII Work Participation Rate (1961-2001) 29
Figure VIII Change in Scheduled Tribe population in Orissa 55
Figure IX Decennial growth of tribal Population in Orissa 56
Figure X Gender wise demographic profile of total population and ST population during 1991-2001, a comparative analysis
59
Figure XI Sex Ratio of General category and ST from 1961-2001 60
Figure XII Literacy rate of Schedule Tribe population in Orissa during 1971-2001
61
Figure XIII Literacy Rate of General and ST population in different decades 62
Figure XIV Percentage of Population below Poverty Line in Orissa 65
Figure XV Birth Rate, Death Rate and Infant Mortality Rate of Orissa 67
Figure XVI No. of family covered under ITDA 68
Figure XVII No. of families covered under MADA 69
Figure XVIII Amount Sanctioned and no of families covered under Micro Project in Orissa
73
Figure XIX Release of fund of SCA to TSA in Orissa 74
Figure XX Fund Released under Article 275 (1) of the constitution to Orissa 75
Figure XXI Scheme of educational complex in low literacy pockets for development of women literacy in tribal areas in Orissa
77
Figure XXII No. of beneficiaries covered under JBY in Orissa 78
xxiii
Figure XXIII Grant-in-aid to voluntary organizations working for the welfare of STs
80
Figure XXIV Health Status of PTGs 99
List of Maps
Map 1 Map of India indicating States under Fifth and Sixth Scheduled 14
Map 2 State wise Percentage of STs Population in India as per 2001 Census 22
Map 3 Geophysical Map of Orissa 52
Map 4 Scheduled Areas of Orissa 54
Map 5 District wise percentage of ST Population in Orissa (as per 2001 Census)
57
Map 6 Map of Orissa showing ITDAs and Micro Projects 93
Map 7 Map of Dongria Kandha Development Agency Chartikona 104
Map 8 Map of Lanjia Saora Development Agency Puttasing 152
Map 9 Maps of Kutia Kandha Development Agency Belghar 195
xxiv
EXECUTIVE SUMMARY
The study, “Changing Socio-Economic condition and livelihood of Geographically
Isolated Primitive Tribal Communities in Kandhamal and KBK Districts of Orissa” was
sponsored by the Planning Commission, Government of India in February 2009. The report
is the outcome of intensive fieldwork (consultation with primary and secondary
stakeholder, walking interviews, group discussions) analysis of collected data and data
from secondary sources. The study also derives from answers of questionnaires and
consultation carried out with the Primitive Tribal Communities (PTGs) in 22 villages of
Kutia Kandha (289 households), 17 villages of Dongria Kandha (311 households) and 6
villages of Lanjia Saora (200 households).
The total tribal population of India has been estimated as 84,326,240 that constitutes
about 8.2 per cent of the total population of the country (Census 2001). The tribal
communities are spread over 15 per cent of the geographical areas in various ecological
and geo climatic conditions varying from forest, hills, plateau and plains. They are still
living with primitive agricultural practices with stagnant population, lowest literacy rates
and are at the lowest rung of human index. 75 groups/sub groups of tribal communities
have been identified as Primitive Tribal Groups (PTGs) on the basis of criteria adopted by
the Planning Commission. Out of 62 tribal communities of Orissa, 13 have been identified
as PTGs. The State of Orissa has also the distinction of having largest number of both tribe
and PTGs in the country. PTGs are small group in pockets confined to far-flung
inaccessible areas with precarious living conditions. By and large they have maintained
their cultural group identity with their distinctive living pattern. From the Five Year Plan,
a number of micro projects have been launched by the Government to ameliorate their
living conditions and bring them in the main stream of development. In the State of Orissa
alone, 17 micro projects have been set up exclusively for 13 PTGs, both in the demarcated
Tribal Sub Plan and Non-Tribal Sub Plan areas with 100% assistance from Government of
India. The micro projects have covered 537 villages with about 14,000 beneficiary
households and 61,240 population. Both Central and State Government have so far
allocated substantial sums to bring about changes in their living conditions for upliftment
of their socio-economic life. Their schemes have been targeted to bring improvement at
household level, primarily towards improvement of their food security. The notable
schemes targeting them are Income Generating Scheme (IGS), Infrastructure Development
Schemes and Human Resources Development Schemes. But unfortunately these changes
are slow and do not match with the allocations made. The literacy level, income and living
condition of the primitive tribes in comparison with other tribes are much discouraging. In
xxv
order to get a clear view of this issue, this study attempts to examine the changing socio-
economic condition of the Kutia Kandha, Dongria Kandha and Lanjia Saora, Primitive
Tribes of Orissa and impacts of various tribal developmental schemes implemented among
them.
In the context of the above, the main objectives of the present study were as under:
� To Find out the different sources of livelihood of the selected primitive tribal
groups and how does it vary amongst the Primitive tribal households in the study
area
� To find out the change in socio-economic condition of the primitive tribal groups in
last five years
� To find out the impact of developmental intervention on the selected primitive
tribal community in the study area.
� To provide suggestions to alleviate poverty and take the Primitive tribal
community to the main stream
The present study was confined to three Primitive Tribal Groups (PTGs) namely; Kutia
Kandha, Dongria Kandha, and Lanjia Saora in Kandhamal and undivided KBK districts of
Orissa. A sample of 800 respondents was drawn from the universe. The study is based on
both quantitative and qualitative data collected from households, Villages eminent
persons and published documents of Government etc. Primary data was collected from the
selected households of PTGs through Schedule, Interview, Participatory Rural Appraisal
(PRA) and Focus Group Discussion (FGD). The secondary data were collected from
published and unpublished documents of government Departments and private agencies
such as, Census Report, Statistical Abstract of Orissa, District Statistical Hand Book,
District at a Glance, District Census Handbook, District Gazetteer, and information
collected from offices like District Collectors, Blocks of district, Panchayat offices etc.
These data were based on the socio-economic condition and livelihood condition of
selected PTG since the onset of Micro Project. The collected data was edited and
processing and analysis of data was carried out with the help of Statistical Package for
Social Science Software. Main findings of the study in respect of selected primitive tribal
groups can be succinctly summarised as below:-
Dongria Kandha
� The household and population of the selected revenue villages were increased 108
(17.94%) and 216 (7.96%) respectively from 2001 to 2007.
xxvi
� The sex ratio is 1086 female per 1000 male in 2009 as compared to the sex Ratio of
1222 female per 1000 male in 2001.
� The average size of household is 5.4 in 2009 as compared to 4.48 in 2001.
� Work Participation Rate of Dongria Kandha is 54.50 per cent.
� 63.34 per cent households were having fire proof houses in 2009 as compared to
33.76 per cent in 2001. Only 0.64 per cent of the total households had Pacca house
in 2001 which is increased to 1.29 per cent in 2009.
� Overall literacy percentage has increased by 7.08% from 2001 to 2009.
� The female literacy rate is 12.21 per cent in 2009 as compared to 3.25 per cent in
2001. .
� Percentage of landless household has marginally decreased by 4 per cent i.e. from
91 per cent to 87 per cent during the period 2001 to 2009.
� In 2009, 83.30 per cent of total households are dependent on shifting cultivation as
their primary occupation where as it was 97.51 per cent in 2001. The second
primary occupation is forest produce collection which is 8.40 per cent (26
households). The third primary occupation is wage earning which is 6.40 per cent
(20 household).
� Average annual income per household is Rs.23,157 in 2009 as compared to Rs.12,
255 in 2001.
� Per capita income was Rs.2, 691 in 2001 which has increased to Rs.4,320 in 2009.
� Average annual expenditure per household is Rs.20,454 in 2009 as against Rs.12,055
during 2001.
� Annual expenditure on food items per household is Rs.7,615 in 2009 as compared to
Rs.4,154 (37.23%) in 2001 i.e. increased by Rs.3,461.
� The percentage of indebted household has decreased from 54 per cent to 36 per
cent from 2004 to 2009.
� Percentage of household’s loan from SHGs has increased by 48 per cent, Sources of
loan from money lenders and relatives have decreased by 38.11 per cent and 4.88
per cent respectively.
� The Infant Mortality Rate (IMR) among Dongria Kandha in 2003-04 was 129 per 1000
live birth as against 117 during 2008-09.
� The Institutional Delivery has increased from 13 to 27 from 2003-04 to 2008-09.
xxvii
� Life Expectancy at birth has increased from 50 years 8 months in 2003-2004 to 53
years 6 months during 2008-09
� Intensity of Malaria is high among Dongria Kandha
� Average livestock per household has been reduced from 8.6 to 7.1 since last 15
years.
Lanjia Saora
� The household and population of the selected revenue villages has been increased
19.88 per cent (67) and 24.71 per cent (495) respectively during the period 2001 to
2009.
� The surveyed sample households constitute 4 per cent Hindu and remaining 96 per
cent are Christian.
� The average size of household for all selected settlement together was 5.94 in
2001, which increased to 6.17 in 2009.
� The sex Ratio was 1009 per 1000 male in 2001 as compared 1052 female per 1000
male in 2009.
� The Work Participation Rate of Lanjia Saora is 58.39 in 2009 as against the 50.87
per cent during 2000-2001.
� Earner -Dependency Ratio has increased from 1:0.77 to 1:0.99 from 2001 to 2009.
� Only 1 per cent of the total household had Pacca house in 2001 which has increased
to 2.5 per cent in 2009. 7 per cent households were having fire proof houses, which
increased to 64% by the end of June 2009.
� Access to tube well water was only 11 per cent during 2001, which has increased to
39 per cent in 2009. Consumption of water from pond and stream has reduced by 1
per cent and 24 per cent respectively from 2001 to 2009.
� 13 per cent of households are facing drinking water scarcity for 2 to 3 month
(between April to June) in 2009, which was 11 per cent in 2001.
� The Overall literacy of Lanjia Saora is 35.85 per cent.
� The percentage of overall literacy has increased by 3.15 per cent from 2001 to
2009.
� The female literacy has increased from 24.16 per cent in 2001 to 26.74 per cent in
2009.
� Dependency rate on Shifting Cultivation and forest produces collection has reduced
from 13 per cent to 7 per cent during the period 2001 to 2009.
xxviii
� Average annual income per household is Rs.24,491 in 2009 as compared to
Rs.16,667 in 2001.
� Per capita income was Rs.2804 in 2001 which is reported Rs.3978 in 2009.
� In the year 2001 the total annual expenditure per household was Rs.14,978, which
has increased by Rs.2,045 and reached to Rs.17,023 in 2009. But the expenditure
on food items is decreased by 15.76 per cent (i.e. from 51.04% to 35.28%) between
2001 and 2009.
� The value of household assets on an average is Rs.48,781 in 2009 against Rs.44,667
in 2001
� Out of total household, only 7.5 per cent (15) household had a saving amounting
Rs.76,087 in 2001, which is increased to Rs.2, 47,634 covering 118 (59%) household
in 2009.
� During the year 2001 average saving volume per saving household was higher i.e.
Rs.5,072 to Rs.2,099 in 2009.
� The average saving of the total household has increased from Rs.380 to Rs.1,238
from 2001 to 2009.
� IMR under 5 years was 97 in 2001 which has decreased to 71 in 2009.
Kutia Kandha
� The households and corresponding population of the selected revenue villages have
increased 16.70 per cent (97) and 6.39 per cent (169) respectively from 2001 to
2009.
� The sex Ratio of Kutia Kandha was 1080 per 1000 male in 2001 as compare to 981
female per 1000 male in 2009.
� The average size of household for all selected settlement together was 4.6 in 2001,
which increased to 5.6 in 2009.
� Workforce Participation Rate is 58 per cent as per the present study.
� The EDR has been decreased from 1:1.05 to 1:0.95 between 2001 and 2009.
� There was no Pacca house in 2001 which is increased to 7 (2.24 %) in 2009.
� Dependency on stream water for drinking purpose has decreased to 29.29
per cent from the year 2001 to 2009. Access to tube well water increased
to 28.70 per cent during 2001-2009.
� Out of the 289 household, 261 (90.3 %) of the household are covered under SHGs
fold.
xxix
� The overall literacy rate of the sample population is 29.89 percent. Male literacy
is 39.34 percent of total population and female literacy is 20.25 percent. The
percentage of overall literacy has increased by 13.45 per cent from 2001 to 2009.
� Percentage of landless household has marginally decreased by 6.99 per cent i.e.
from 20.07 per cent to 13.08 per cent during the period of 2001 to 2009.
� 64.22 percent of total households depend on agriculture as their primary
occupation where as 21.52 percent as casual labour.
� The share of agriculture (including shifting cultivation) to the total income of Kutia
Kandha is reported 43.58 per cent.
� Average Annual income per household increased 101 per cent from 2001 to 2009
i.e. from Rs.8531 to Rs.18230.
� Per capital income was Rs.1873 in 2001 which is reported Rs.3240 in 2009.
� The average annual expenditure per household was Rs.8417 in 2001 as compared to
Rs.18,206 in 2009.
� The average annual expenditure on food items per household was 6238 in 2001
which has increased to Rs.7601 in 2009.
� Per capita annual expenditure on both food and non-food items has increased by
Rs.1388 from 2001 to 2009. The value of household assets on an average is
Rs.21709 in 2009 against Rs.18586 in 2001.
� Out of the total sample only 27.34 per cent (79 out of 289) had access to loan in
2001 which has decreased to 10.72 per cent (31 out of 289) in 2009.
� Average loan volume per household has increased from Rs.230 to Rs.356 during the
period 2003-2009. The per capita loan has increased by Rs.14 i.e. from Rs.25 to 39.
� The Infant Mortality Rate (IMR) among Kutia Kandha in 2003-2004 was 113 per 1000
live birth
� The Institutional Delivery has increased from 9 to 14 from 2003-04 to 2008-09. Life
Expectancy at birth has increased from 50 years 8 month in 2003-2004 to 53 years 6
month during 2008-09
� Malaria, Skin diseases; Diarrhea and Malnutrition are major disease
� Average livestock per household has reduced to 7.47 (including 3.24 poultry birds
per households). At present 84 per cent households have owned livestock.
xxx
Recommendations
• The staff required to run the Micro Project is inadequate particularly for technical
hands. So much so that Kutia Kandha Development Agency, Belghar, does not have
Special Officer. The Special Officer of Baliguda ITDA is in charge of the Micro
Project rarely visits the project area. One field assistant and one peon are
managing the Micro Project as the study team observed during the field study. The
ratio between villages and staff is 1:.029 in Kutia Kandha Development Agency.
The study strongly recommends that no post should lie vacant and the Micro
Project personnel must be made accountable for the failure of the programme they
are implementing.
• Despite State Government’s continued efforts for the development of PTGs right
from Fifth Five Year Plan, there are villages among the Kutia Kandha, Lanjia
Saora and Dongria Kandha that have not been covered under micro project. The
conditions of such villages are worse even as on date. It is suggested that these
left out villages may be taken under micro project.
• During the study it was found that some villages under the Micro Projects are
developed and their livelihood condition is much better than before and some
villages are not developed because of lack of communication facilities, lack of
health consciousness and inadequate educational facilities. Due to the above
development intervention is very slow in these villages since the inception of the
Micro Projects. Therefore, the study suggests that special attention and proper
planning is required for these lagging villages.
• Since the literacy, and educational status is very low among the selected PTGs in
general and Dongria Kandha and Kutia Kandha in particular. The chronic problem of
teacher absenteeism needs priority attention. This aspect has to be addressed to
with all the sincerity of efforts so that the teaching – learning situation is improved
among the Kandha. Thus emphasis should be given on priority basis for promotion
of education. Necessary infrastructure and the appointment of teacher belonging
to the community should be encouraged. If no such teacher is available, others
with a positive attitude and understanding about tribal community should be
employed in the area. Adult literacy programmes should be promoted to bring the
illiterate persons who have dropped out or never enrolled for schooling.
• The textbooks should have local specific contents, contexts and narration by which
the children can relate learning to their real life situation.
xxxi
• The children should be provided text books in their own language in initial stages
of their schooling and gradually they should be exposed to standard textbooks in
state language at a later stage.
• To save the selected PTGs from the clutches of the money lenders and traders, the
establishment of grain banks, arrangement for micro credit should be explored.
• Due to poor marketing knowledge and bargaining power of Kutia Kandha, they are
not able to get a remunerative price of the Siali leaves. On the other hand Dongria
Kandha are frequently cheated in selling of fruits and NTFPs when they come down
to the plain area. It is difficult for Dongria Kandha to take these items back as a
result they sell same at a lower price. The micro project should address this issue
of creating proper marketing arrangement, market information systems, storage
space and minimum processing facilities at the local level. Simple processing
activities such as broom making, leaf plate-making, tamarind processing, mat and
rope making should be encouraged in the household/cottage sector.
• Land is the major physical resource available to PTG households. Most of the
available land is poor in quality, and there is not very much of it. Agricultural
intervention in the form of promoting locally relevant crops, drought resistant crop
mix along with the agro forestry should be encouraged. Similarly, horticulture and
Small irrigation schemes should be encouraged.
• The modern medical treatment is accepted if they are efficacious and are available
and accessible to PTGs. Actually their resources do not permit them to avail the
expensive treatment at distant places. As such the study suggests the strengthening
of the local Sub-centre and ANMs centres to provide for immediate preventive
measures at the household level.
• People’s participation in the execution of development programmes have not been
taken into consideration in most cases, though the project development works
have been approved in the Gram Sabha. The inadequate participation of PTGs in
the activities/programmes is low due to factors like; rigidity of social and cultural
values prevailing among them, low level of literacy etc. As a result variation is
found between planning and implementation of the project. The most important
problem lies at the implementation stage at the Micro-Project level. It is suggested
that more emphasis should be given at implementation stage to reduce the gap
between planning and implementation.
xxxii
• Awareness among the PTGs about the various developmental programmes being
implemented for them should be encouraged.
1
Chapter-1:
CHANGING SOCIO-ECONOMIC STATUS OF TRIBAL COMMUNITIES IN INDIA
1.1 Meaning of Tribe
he tribal population is identified as the aboriginal inhabitants of our country.
They are most vulnerable section of our society living in natural and unpolluted
surrounding far away from civilization with their traditional values, customs and
beliefs. There has been a long and enduring debate among the social scientists to define
a tribe. Notwithstanding the academic exercise, for the purpose of development and
administration, the definition given by the Constitution serves our objective. The
definition is practically an administrative definition. According to the Constitution “Any
tribe or tribal community or part of or group within any tribe or tribal community as
deemed under article 342 are Scheduled Tribes for the purpose of the Constitution”.
Thus, the groups which are in the Scheduled list of the President of India are defined as
Scheduled Tribes. There is a procedure for including tribal groups in the Scheduled list.
The President may, after consulting with the governor of a state, by public notification,
specify the tribes which would deem to be Scheduled Tribes in relation to that State.
Communities are notified as Scheduled Tribe under Article 342 of the Constitution based
on the Characteristics such as -Primitive Traits, Geographically Isolated, Distinct Culture,
and Shyness of contact with community at large, and Economically Backward. The
Imperial Gazetteer of India, 1911, defines a tribe as a “collection of families bearing a
common name, speaking a common dialect, occupying or professing to occupy a common
territory and is not usually endogamous though originally it might have been so”. Another
definition of a tribe by D.N. Majumdar is that “a tribe is a collection of families or group
of families bearing a common name, members of which occupy the same territory, speak
the same language and observe certain taboos regarding marriage, profession or
occupation and have developed a well-assessed system of reciprocity and mutuality of
obligations”. According to L.P. Vidyarthi; the tribe is a social group with definite
territory, common name, common district, common culture, behavior of an endogamous
group, common taboos, and existence of distinctive social & political system, full faith in
leaders and self-sufficiency in their distinct economy. P.G. Krishnan defines “tribe is a
social group of simple and kind, the members of which speak a common dialect, have a
T
2
single government act together for common purposes and have a common name, a
contiguous territory, a relatively uniform culture or way of life and a tradition of
common descent.”
A.B. Bardhan defines the tribe as “course of socio-cultural entity at a definite historical
stage of development. It is a single, endogamous community with a cultural and
psychological make up.” Kamala Devi Chatopadhyaya defines “a tribe ordinarily has an
ancestor or patron deity. The families or groups composing the larger units are linked
through religions and socio-economic functions.”
Thus in Indian context, they are commonly designated as Adivasi (original settlers),
Girijan (hill dwellers), Vanya jati (forest caste men), Adimjati (Primitive castes), and
Anusuchit Janjati (Scheduled tribes). The tribes of India who are unable to defend them
and were gradually forced to recede before the invading hoards of such people, as the
Dravidian, Indo-Aryans and Mongolians coming from the West, North West and North
East. These people took shelter in the forest and mountain ranges. Those who were left
behind in the plains generally disappeared either by absorption or by acculturalization.
The number of Scheduled Tribes has always been increasing over the years. It was 212 in
the year 1950. Today the number has swelled to 573 (1919 Census), constituting over 84
million population in the country.
1.2 Main Features of Tribes The original tribes in India have been divided and sub-divided into large number of sub-
tribes. They are mutually exclusive, each having the endogenous and exogamous clan
with their own names and culture, customs, locational practice and lifestyle. A well
established criterion being followed is based on certain attributes such as:
• Geographical isolation: They live in cloister, exclusive remote and inhospitable
areas like hills and forests
• Backwardness: Livelihood based on primitive agriculture, low cost closed
economy based on low level of technology which caused of poverty. They have a
low level of literacy and poor health
• Distinctive culture, language and religion: They have developed community wise
their own distinctive culture, language and religion
• Shyness of contact: They have margin degree of contact with other cultures and
people
3
The Commissioner of Scheduled Castes and Scheduled Tribes, in its reports (1952) has
listed eight features of the tribal groups in India:
� They live always away from the civilized world and are found in the inaccessible
parts lying in the forest and hills.
� They generally belong to three stocks such as Negritos, Australoids and
Mangoloids.
� They speak the same tribal dialect. � They prefer primitive occupations such as gleaning, hunting and gathering of
forest produce.
� They are mostly carnivorous. � They live and prefer to be naked and semi-naked. � They have nomadic habit and are fond of drinking and dancing. � They prefer primitive religion known as “Animist” in which they worship ghost and
spirits as the most important elements.
All the qualities are related to great extent, in a particular groups and villages of tribal
India. But the qualities present in them differ in degree.
Like other societies, tribal society is also not static, rather is quite dynamic, but the rate
of change in tribal society is very slow. That is why they have been backward and poor in
comparison to other people. Since they have been materially backward and economically
poor, attempts have been made by the Government to develop them. Today the
Government of all places of the world is paying special attention towards the
development of the tribal, i.e., one finds the existence of induced or planned change in
tribal society.
1.3 Classification of Indian Tribes In India the tribes have been designated as “Scheduled Tribes” under the Constitution.
They have been classified in various categories. On the basis of language, area of
inhabitation, occupation, cultural contact, and by the Tribal Welfare Committee, we may
classify and group the Indian tribes into the following heads.
I. Linguistically Classified Groups: On the basis of language, Indian tribes have
been classified into the following categories.
1. Austro-Asiatic Family: This group consists of Munds of central and eastern
India, Khasis of Assam and Nicobaries of Nicobar Islands.
4
2. Dravidian Family: This group is popular in the central and southern India
and includes Gonds, Badaga, Toda, Yarava, Korwa etc.
3. The Tibeto-Chinese Family: This group includes the tribes, which belong
to the Southern slopes of Himalayas from the Northern Punjab to Bhutan
and Assam. Nagas, Kui, Khasi etc.
II. Geographically Classified Group: From the point of geographical distribution of
the tribes in India, three zones have been identified, such as southern zone
(between 80 to 200 north latitudes and 750 to 850 east longitudes), the central zone
(between 210 to 250 north latitudes and 730 to 900 east longitude) and north and
north-eastern zone (between 260 and 350 north latitudes and 730 to 970 east
longitudes). The southern zone forms of peninsular India. This zone appears to be
the most ancient inhabitants of India and is now represented by the Todas,
Paniyars, Kurumbas, Kotas, Soligas, Malayalees and Chenchus etc. The central
zone represented by the Jurigas, Baiga, Gonda, Ho, Bill etc. The north and north-
eastern zone consists with Nagas, Charse, Khasis, Limbus, Abors etc as tribes.
The geographical distribution of Indian tribes, Vidyarthi (1977) proposed five fold
geographical regions on the basis of ecological, social, economic, administrative,
ethnic and racial factors. These tribal regions are as follows:
1. Himalayan Region: With three sub regions;
(a) North-Eastern Himalayan region
(b) Central Himalayan region
(c) North-Western Himalayan region
2. Middle Indian Region: It comprises Bihar, West Bengal, Orissa and Madhya
Pradesh where more than 55 percent tribal people of India live.
3. Western-Indian Region: It includes Rajasthan, Gujurat, Maharashtra, Goa,
Dadra and Nagar Haveli with about one crore tribal population.
4. South India Region: It comprises Andhra Pradesh, Tamil Nadu, Karnataka,
and Kerala constituting approximately one-sixth of tribal population.
5. The Island Region: The Islands of Andaman and Nicobar in the Bay of
Bengal and Lakshadweep in the Arabian Sea.
III. Economically Classified Group: We may also classify the tribes on the basis of
their occupation and distinctive economy. This classification is based on the level
of economic development from food gathering/hunting stages to shifting and
5
settled cultivation. Majumdar and Madan (1970) made the six-fold economic
classification which includes:
1. Food gathering tribes
2. Agricultural tribes
3. Tribes who practise shifting cultivation
4. Tribes who maintain their livelihood on the basis of their handicrafts
5. Tribes who practise pastoralism
6. Tribes who are industrial labour
Vidyarthi discussed on several occasions tribal economy in India and there after a
typology of eight types was finalized. Thus the economic typology of the Indian
tribes as proposed by Vidyarthi (1977, p-116) is given below.
1. The forest hunting tribe
2. The Hill cultivation type
3. The plain agriculture type
4. The simple Artisan type
5. The pastoral and cattle Herder type
6. The folk artist type
7. The agricultural and non-agricultural type (The tribe working in
manufacturing industry)
8. The skilled white collar Job and Traders type (some individuals of the
families of the tribal communities are working in the State and Central
Government services owing the facilities of reservation for the tribes and
so on.
IV. Classification on the basis of cultural contact: Apart from the above
classification, we may also classify the Indian tribes on the basis of their culture
and contact. According to Prof. Elwin, the aboriginal population is distributed
into four cultural divisions. In the first group, they are living in the most
primitive stage, Ex: Hill mariyas, Gadabas. These tribes are isolated from the
people of plains. The main characteristics of these tribes are as follows,
(a) All the members lead a community life
(b) All the members share a common economic structure
(c) All the members are concentrated around a peculiar form of agriculture
(d) They are honest, simple, and innocent and are very shy before the
strangers
6
In the second and third group, they have more or less contact with the outsides.
On one side, these groups are linked with their own traditions and on the other
side they are breaking the traditional links. Ex: Bhumias, Binijware and Gaigas.
The chief characteristics of these tribes are as follows,
(a) They lead an individualistic village life
(b) Non participation in the common affairs
(c) Absence of primitive simplicity
In the fourth group, they represent the ancient aristocracy of this country. For
example Bhilas, Nagas, Gonds and Santhals. These tribes retain their old tribal
names and practise their tribal religion. But apart from this, they have also
adopted the faiths of modern Hinduism and modern mode of living.
V. Classification by the Tribal Welfare Committee: The tribal welfare committee
constituted by the Indian conference of social work has divided the Indian tribes
into the following.
1. Tribal Communities: They are confined with the forests and distinctive in
their pattern of life. Therefore these may be termed as “Tribal
Communities.”
2. Semi Tribal Communities: These tribes are settled in rural areas and
practise agriculture and other allied occupations.
3. Acculturated Tribal Communities: These tribes have migrated to urban
and rural areas. They are engaged in industrial and other vocational
activities and have adopted the culture of the people of migrated area.
4. Assimilated Tribes: These tribes are totally assimilated. They have lost
the original traits of their own culture. In this regard the social reforms
and Christian missionaries have played a very important role.
1.4 Distribution of Tribes in Different Geo-Physical Zone India has the largest concentration of tribal people anywhere in the world except perhaps
in Africa. The tribal are children of nature and their lifestyle is conditioned by the Eco-
system. India, with a variety of Eco-system, presents a varied tribal population
throughout its length and breadth.
The tribal communities invariably lead an isolated life remote from the general
habitation. But inside their group, they are in most part independent, free and self
7
managing. They inhabit in (i) North and North Eastern mountains and Terai region (ii)
Central India and (iii) South India
In North and North-Eastern zone which include the Himalayan belt, North and North-
Eastern parts covering frontiers, Tista valley and Brahmaputra basin. The area roughly
extends over 310.7’’ to 350.0’’ north latitude to the west 230.30’’ and 280.0’’ North latitudes
with the east and 770.33’’ least 900.0’’ east longitude. The main states include are eastern
portion of Kashmir, Himachal Pradesh, Northern U.P., Assam , Arunachal, Nagaland,
Meghalaya, Mizoram, Manipur and Tripura.
In Central India the areas cover between 200.0’’ to 250.0’’ north latitude and 730.0’’ to
900.0’’ east latitude. The undivided Madhya Pradesh, Andhra Pradesh, Southern
Rajasthan, Southern Uttar Pradesh, Gujarat, Undivided Bihar and Orissa are the seats of
tribal habitations. The tribes inhabited in Bastar areas are the most known groups who
had fought with Indian Government.
The South India tribal zone is extending over the strip between Vindhay to Kanyakumari.
It lies between 80 to 200 north latitude and 750 east longitudes. A portion of Andhra
Pradesh, Karnataka, Kerala and Tamilnadu are in this range. The conversion of the tribes
to Christianity by tactful allurement in very large scale and even by force during the
British rule led to diminution of tribal population in India. Even after the independence
the conversion continued unchanged in the Eastern and Southern India.
The tribal communities are generally settled in the problem areas and the resource bases
in these are weak. Most of the areas are drought prone, remote with lack of
communication facilities, rocky and high degree of soil erosion due to shifting or Jhoom
cultivation, forested and high hostile climate. Most of the tribal communities are
devoted to the avocation like hunting, fishing etc as combined with raising of crop from
their land. These areas are low populated tracts. Due to the long continued war against
the frequent interruption by intruders in their former settlements in the fertile lands,
the tribal communities are said to have fled to remoter inaccessible area.
Therefore the richer resources base had been snatched from them in remote history. It is
also believed that those tribal communities failed to compete with the move proficient
peasantry and in order to save their independence and honour; they took shelter in the
areas featured by a hostile climate. Even in the difficult environment they developed
very commendable arts, crafts, culture and the skills to struggle against the wild life. It
8
is true that their new habitat was poor in respect of land availability and the possibilities
of irrigation on such lands. The scanty arable land continued shrinking due to erosion on
the one hand (Practicing Jhoom Cultivation) and also due to over exploitation on the
other hand. As the population grew the per capita of land got still smaller. Deforestation,
over lopping and excess pruning of trees for fodder and fuel and also for construction of
huts and making of wooden apparatus for crafts and animal husbandry altogether
reduced the resources base. The tribal lands and their resources were taken away
forcibly by the traders & forest contractors in the broad day light. The middleman usually
from among the Scheduled Caste communities and the officials making use of their weak
economic power reduced them to still worse state. It was difficult on their part to
manage two meals a day. The land under the tribal dominated tracks requires large scale
investments on resource development.
1.5 Tribal Condition before Independence The tribal people living in their remote hills and forests for many centuries led a life of
their own. During the region of the British people, the entry of the missionaries into
these areas leads the officers of British Government paying attention to them. But this
contact was superficial and prompted them to come to some equally superficial policies.
This simply led to isolate the tribal people from rest of their country men and to separate
the tribal areas from the purview of the normal administration.
The British policy of isolating the tribal communities resulted in exploitation by
zamindars, landlords and contractors. These contacts with the mainlanders or so to say
the non-tribal were none too welcome to the tribal communities. They added to the
strain of fighting alone some battle against ruthless nature, soil erosion, denudation of
forests and erratic rivers. For centuries past the conservation and preservation of forests
resulted in a progressive encroachment on the rights enjoyed by these tribal communities
for the use of fuel and timber, exploitation of minor forest produce and hunting. They
did not take kindly to the policy of intrusion which shook their last foothold of
sustenance. The British Government could not control the Zamindars and Jagirdars in the
management of their private forests and this in turn intensified the tribal communities’
suspicion. The desire for protection was good, but unfortunately the policy was entirely
negative. In overall what these tribal people needed was not isolation but planned
contact on the basis of positive policy of economic progress. The forest constitutes an
equally important source of livelihood of the tribal people. It has a symbiotic relation.
9
The tribals in their forest at their will and were the sole beneficiaries of the forest
produce.
The efforts made by the British Government to meet these two primary requirements of
land & forest reveal that since they proceeded from a policy of isolation and status quo;
the tribesmen had to remain at the mercy of the officers and nothing positive by way of
rehabilitation and development was achieved. The ruling British people in India were to
support its supporters. These vested interests were shrewd enough to benefit from every
act of commission or omission of their foreign rulers.
The condition of tribal communities before independence goes to show that the “Policy
of Isolation” and drift meant nothing more than maintenance of the status quo. It
resulted in reducing them to a state of penury in most part of India. Except in few tribal
areas (where missionary activities were functioning), the other tribal belt were at the
lowest level of literacy. The agricultural lands were heavily encumbered and a good
portion of these had already been taken away by the Non-tribal. Their traditional rights
on forests were encroached upon. On many an occasion the tribal people rose in revolt
and on many an occasion reforms were ordered but all proved futile.
1.6 Safeguards for Scheduled Tribes in Constitution With the dawn of independence and adoption of the Constitution of free India, the British
policy of isolation and non-interference was replaced by a policy of integration through
development. The Constitution of India has provided many safeguards for the welfare and
development of the tribals. The relevant articles can be classified under four major
heads: (a) Protective Provisions (Arts. 15, 16, 19, 46, 146, 342, etc.); (b) Developmental
Provisions (Arts. 46, 275, etc.); (c) Administrative Provisions (Arts. 244 & 275) and (d)
Reservation Provisions (Arts. 330, 332, 334, 335, 340, etc.). The Protective Provisions
safeguard tribal people from social injustices and all forms of exploitation, while the
Developmental Provisions promote with special care of educational and economic
interests of the weaker sections like the Scheduled Tribes and Scheduled Castes. The
Administrative Provisions under the Fifth and Sixth Schedules give special powers to the
States for the protection and governance of tribal areas and the Reservation
Provisions ensure due representation of the Scheduled tribes and Scheduled castes in
legislative bodies and government jobs. The salient provisions of different articles are:
• Article 244(1): Provisions as to the administration and control of Scheduled Areas
and Scheduled Tribes.
10
• Article 244(2): Provisions as to the administration of Tribal Areas.
• Article 339: Control of the Union over the administration of Scheduled Areas and
the welfare of the Scheduled Tribes.
• Article 275(1): Provision for payment of grant-in-aid to enable the States to meet
the cost of such schemes of development as may be undertaken by the States with
the approval of the Government of India for the purpose of promoting the welfare
of the Scheduled Tribes in that State or raising the level of administration of the
Scheduled Areas there in to that of the administration of the rest of the areas of
that State.
• Article 342: Specifying the tribes or tribal communities as Scheduled Tribes.
• Article 330: Reservation of seats for the Scheduled Tribes in the House of the
People.
• Article 332: Reservation of seats for the Scheduled Tribes in the State Legislative
Assemblies.
• Article 334: Reservation of seats and special representation to cease after sixty
years.
• Article 164(1): In the States of Bihar, Madhya Pradesh and Orissa, there shall be a
Minister in charge of tribal welfare who may in addition be in charge of the
welfare of the Scheduled Castes and Backward Classes or any other work. (Now
applicable to Chhattisgarh, Jharkhand, Madhya Pradesh and Orissa).
• Article 338: There shall be a National Commission for the Scheduled Tribes and
Scheduled Castes to be appointed by the Honourable President of India. (Since
bifurcated into two, one for Scheduled Tribes and the other for Scheduled
Castes).
• Article 335: Claims of Scheduled Tribes to services and posts.
• Article 46 Promotion of educational and economic interests of the Scheduled
tribes, Scheduled castes and other weaker sections.
• Article 371A: Special provision with reference to Nagaland.
• Fifth Schedule: Provisions as to the Administration and control of Scheduled
Areas.
• Sixth Schedule: Provisions as to the Administration of Tribal Areas.
11
In addition to the above constitutional provisions, there are numbers of laws both Central
and State, which provide protection and safeguards for the interest of the Scheduled
tribes. These Acts and Regulations emanate from various constitutional provisions. Some
of the important central Acts are as follows;
1. Protection of civil right Act,1955 2. Forest Conservation Act, 1980 3. Bonded Labour (Prohibition and Regulation) Act, 1986 4. Child Labour (Prohibition and Regulation) Act, 1986 5. Scheduled Castes and Scheduled Tribes (Prevention of Atrocities) Act, 1989 6. The Provisions of the PESA (Panchayat Extension to Scheduled Areas) Act, 1996 7. The Schedule Tribes and other Traditional Forest Dwellers (Recognition of Forest
Rights) Act, 2006
Similarly, State Governments safeguard for Tribal Development are related to the
prevention of alienation and restoration of tribal land, money lending, reservations and
so on.
1.7 The Constitution and Scheduled Areas The tribal people live in contiguous areas unlike other communities. It is, therefore,
much simpler to have an area approach for development activities as well as regulatory
provisions to protect their interests. In order to protect their interests; with regard to
land and other social issues, various provisions have been enshrined in the Fifth Schedule
of the Constitution. The Fifth Schedule under Article 244 (1) of the Constitution defines
“Scheduled Areas’ as such areas as the “President may by order declare to be Scheduled
Areas after consultation with the Governor of that State”. The concept of Scheduled
Area emerged during Fifth Five Year plan which is defined under Article 244(1) and
Article 244(2). The Scheduled Area has been framed to protect the interest of Scheduled
Tribes with regard to their land and other social issues. The history of Scheduled Area is
very old and goes back to pre-British rule.
• The history of Scheduled Areas can be traced from 1874, in which the British
Government had introduced Scheduled District Act to provide administration in
Scheduled districts.
• According to the Scheduled District Act, Special Officers were appointed in the
Scheduled Districts to look into the matter related to civil and criminal cases and
to provide justice to the inhabitants of the area.
12
• Attempt was made to collect taxes for providing better administration in the
area.
• In this Act, there was provision to extend the Scheduled Areas.
• In the year 1919, the British Government introduced another Act, the tribal areas
coming under the jurisdiction of Scheduled District Areas, were made free from
legal boundary.
• The tribal areas coming under Scheduled District areas were divided into two
categories: (i) Fully Excluded Areas and (ii) Corrected Excluded Areas
• Again through the Act 1935, Tribal areas were brought under the rule of Governor,
appointed by the Honourable President of India and these areas were not brought
under the rule of Parliament & State Assemblies.
• At the time of Independence, the Constituent Assembly had paid special attention
towards the problem of tribal communities and the tribal areas.
• Therefore, the Scheduled Areas are nothing but another name of “Excluded and
Partially Excluded Areas”.
Creation of Scheduled Areas: For creating Scheduled Areas, the following objectives were kept in mind:
• To assist the tribes with average interference and through small processor.
• To develop the Scheduled Areas and to protect the interest of the tribes in the
Areas.
Schedule Area Administration: According to 5th Schedule, the administration of Scheduled Areas as per Article 244 of
the Constitution consists of following parts: a) Special Privilege to Governors b) Reports
of Governors to the President of India and c) Tribes Advisory Council (TAC)
According to Section “C” Para X of 5th Scheduled, the Scheduled Areas include those
areas which have been ‘Scheduled’ by Hon’ble President of India. The President may
amend the Scheduled Areas after discussing the problems with the concerned Governor
of the State. The Parliament may also make amendment of the Schedule Areas, but this
will not be understood as Constitutional amendment.
13
The Scheduled Areas are contagious areas traditionally conforming territorial units. In
order to protect the interest of the Scheduled tribes and give them a special treatment,
some of them have been put under the 5th Scheduled of the Constitution of India.
The criteria for declaring any Scheduled Areas, which have a viable administrative entity
such as; District, Block or Taluk and is the economy backwardness of the area.
The States covered under the 5th Scheduled Areas are 1) Orissa, 2) Andhra Pradesh, 3)
Himachal Pradesh, 4) Gujarat, 5) Rajasthan 6) Maharashtra, 7) Bihar (now Jharkhand has
been declared after being separated from Bihar State), 8) Madhya Pradesh and 9)
Chhattisgarh (earlier Chhattisgarh was a part of undivided Madhya Pradesh State)
The 6th Scheduled Areas under Article 244 (2) and 275 of the Constitution are those areas
in the North-Eastern States like: 1) Assam, 2) Meghalaya, 3) Mizoram, 4) Arunachal
Pradesh, 5) Manipur, 6) Nagaland and 7) Tripura, which have been declared as Tribal
Areas where provisions are made for the administration through Autonomous Districts/
Regional Councils.
Comparative status of Scheduled Areas of different states under Fifth Scheduled: The Scheduled Areas in the composite State of Bihar were originally specified by the
Scheduled Areas (part A State) Order, 1950, (Constitution Order, 9) dated 23.01.1950 and
there after they had been re-specified by the Scheduled Areas (State of Bihar, Gujarat,
Madhya Pradesh and Orissa) Order 1977 (Constitution Order, 109) dated 31.12.1977 after
rescinding the Order cited first so far as that related to the State of Bihar.
Consequent upon formation of new State of Jharkhand vide Bihar Reorganization Act,
2000, the Scheduled Areas which were specified in relation to the composite State of
Bihar stood transferred to the newly formed State of Jharkhand.
The Scheduled Areas of Jharkhand have been specified by the Scheduled Areas (State
of Chhattisgarh, Jharkhand, and Madhya Pradesh) dated 20.2.2003 after receiving the
Order dated 31.12.77 so far that related to the State of Bihar. The Scheduled Areas of
Jharkhand specified with Scheduled Areas (State of Chhattisgarh, Jharkhand, and Madhya
Pradesh) Order, 2003 (Constitution Order, 192) have rescinded vide Scheduled Areas
(State of Jharkhand) Order, 2007(C.O.229) dated 11.4.2007.
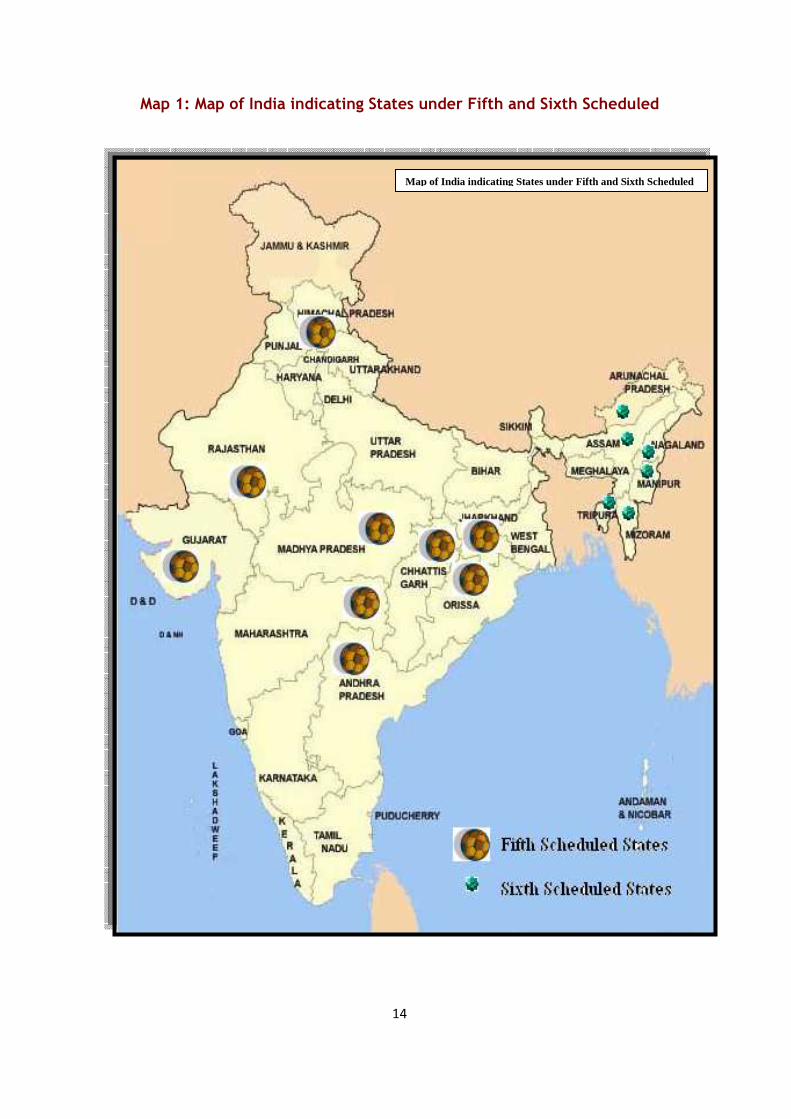
14
Map 1: Map of India indicating States under Fifth and Sixth Scheduled
Map of India indicating States under Fifth and Sixth Scheduled
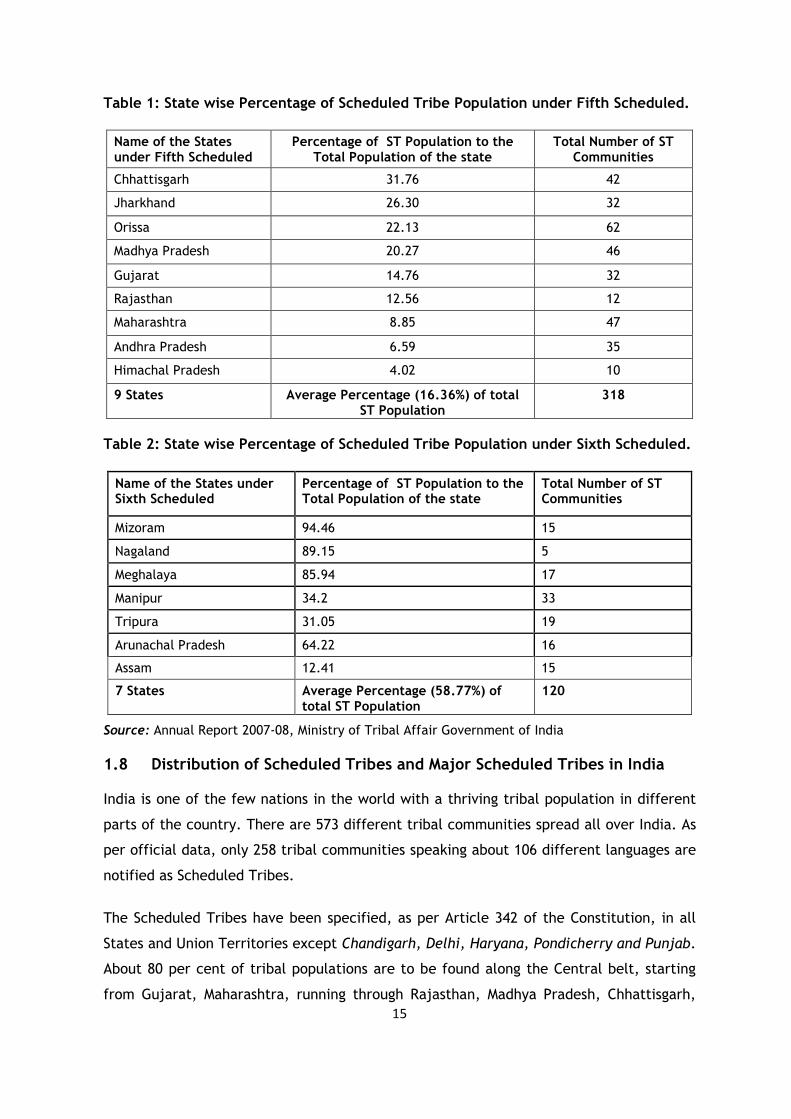
15
Table 1: State wise Percentage of Scheduled Tribe Population under Fifth Scheduled.
Name of the States under Fifth Scheduled
Percentage of ST Population to the Total Population of the state
Total Number of ST Communities
Chhattisgarh 31.76 42
Jharkhand 26.30 32
Orissa 22.13 62
Madhya Pradesh 20.27 46
Gujarat 14.76 32
Rajasthan 12.56 12
Maharashtra 8.85 47
Andhra Pradesh 6.59 35
Himachal Pradesh 4.02 10
9 States Average Percentage (16.36%) of total ST Population
318
Table 2: State wise Percentage of Scheduled Tribe Population under Sixth Scheduled.
Name of the States under Sixth Scheduled
Percentage of ST Population to the Total Population of the state
Total Number of ST Communities
Mizoram 94.46 15
Nagaland 89.15 5
Meghalaya 85.94 17
Manipur 34.2 33
Tripura 31.05 19
Arunachal Pradesh 64.22 16
Assam 12.41 15
7 States Average Percentage (58.77%) of total ST Population
120
Source: Annual Report 2007-08, Ministry of Tribal Affair Government of India
1.8 Distribution of Scheduled Tribes and Major Scheduled Tribes in India India is one of the few nations in the world with a thriving tribal population in different
parts of the country. There are 573 different tribal communities spread all over India. As
per official data, only 258 tribal communities speaking about 106 different languages are
notified as Scheduled Tribes.
The Scheduled Tribes have been specified, as per Article 342 of the Constitution, in all
States and Union Territories except Chandigarh, Delhi, Haryana, Pondicherry and Punjab.
About 80 per cent of tribal populations are to be found along the Central belt, starting
from Gujarat, Maharashtra, running through Rajasthan, Madhya Pradesh, Chhattisgarh,
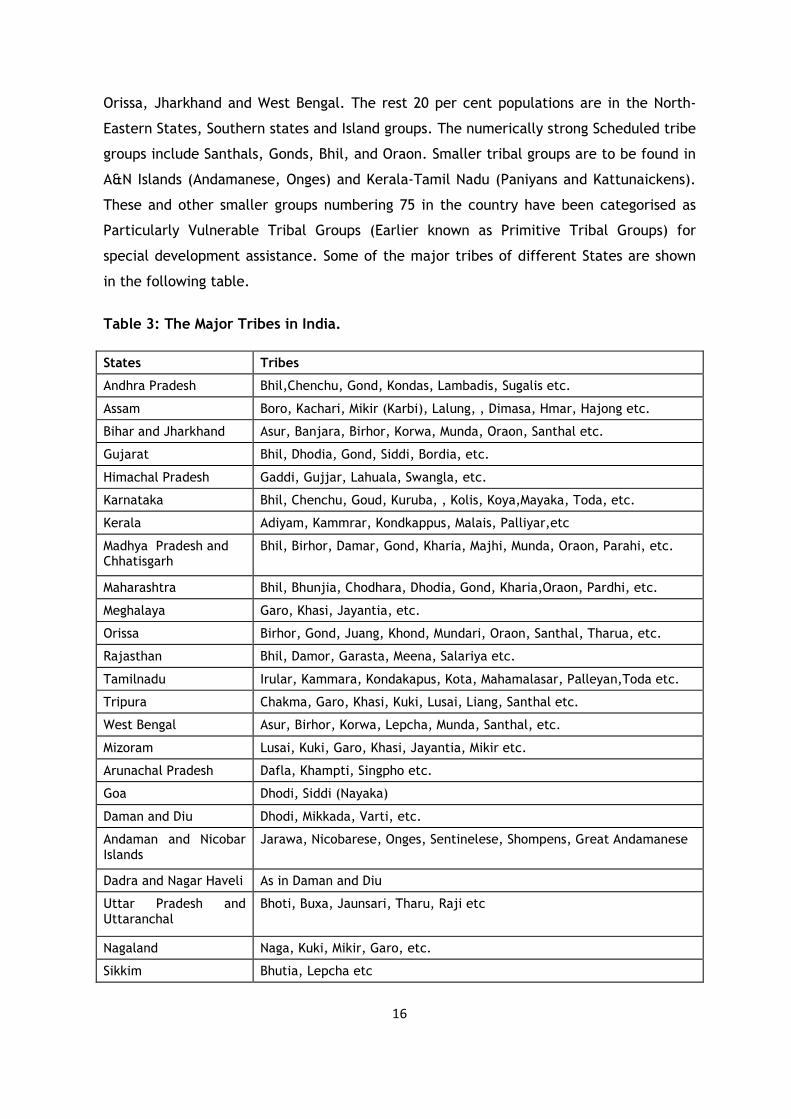
16
Orissa, Jharkhand and West Bengal. The rest 20 per cent populations are in the North-
Eastern States, Southern states and Island groups. The numerically strong Scheduled tribe
groups include Santhals, Gonds, Bhil, and Oraon. Smaller tribal groups are to be found in
A&N Islands (Andamanese, Onges) and Kerala-Tamil Nadu (Paniyans and Kattunaickens).
These and other smaller groups numbering 75 in the country have been categorised as
Particularly Vulnerable Tribal Groups (Earlier known as Primitive Tribal Groups) for
special development assistance. Some of the major tribes of different States are shown
in the following table.
Table 3: The Major Tribes in India.
States Tribes
Andhra Pradesh Bhil,Chenchu, Gond, Kondas, Lambadis, Sugalis etc.
Assam Boro, Kachari, Mikir (Karbi), Lalung, , Dimasa, Hmar, Hajong etc.
Bihar and Jharkhand Asur, Banjara, Birhor, Korwa, Munda, Oraon, Santhal etc.
Gujarat Bhil, Dhodia, Gond, Siddi, Bordia, etc.
Himachal Pradesh Gaddi, Gujjar, Lahuala, Swangla, etc.
Karnataka Bhil, Chenchu, Goud, Kuruba, , Kolis, Koya,Mayaka, Toda, etc.
Kerala Adiyam, Kammrar, Kondkappus, Malais, Palliyar,etc
Madhya Pradesh and Chhatisgarh
Bhil, Birhor, Damar, Gond, Kharia, Majhi, Munda, Oraon, Parahi, etc.
Maharashtra Bhil, Bhunjia, Chodhara, Dhodia, Gond, Kharia,Oraon, Pardhi, etc.
Meghalaya Garo, Khasi, Jayantia, etc.
Orissa Birhor, Gond, Juang, Khond, Mundari, Oraon, Santhal, Tharua, etc.
Rajasthan Bhil, Damor, Garasta, Meena, Salariya etc.
Tamilnadu Irular, Kammara, Kondakapus, Kota, Mahamalasar, Palleyan,Toda etc.
Tripura Chakma, Garo, Khasi, Kuki, Lusai, Liang, Santhal etc.
West Bengal Asur, Birhor, Korwa, Lepcha, Munda, Santhal, etc.
Mizoram Lusai, Kuki, Garo, Khasi, Jayantia, Mikir etc.
Arunachal Pradesh Dafla, Khampti, Singpho etc.
Goa Dhodi, Siddi (Nayaka)
Daman and Diu Dhodi, Mikkada, Varti, etc.
Andaman and Nicobar Islands
Jarawa, Nicobarese, Onges, Sentinelese, Shompens, Great Andamanese
Dadra and Nagar Haveli As in Daman and Diu
Uttar Pradesh and Uttaranchal
Bhoti, Buxa, Jaunsari, Tharu, Raji etc
Nagaland Naga, Kuki, Mikir, Garo, etc.
Sikkim Bhutia, Lepcha etc
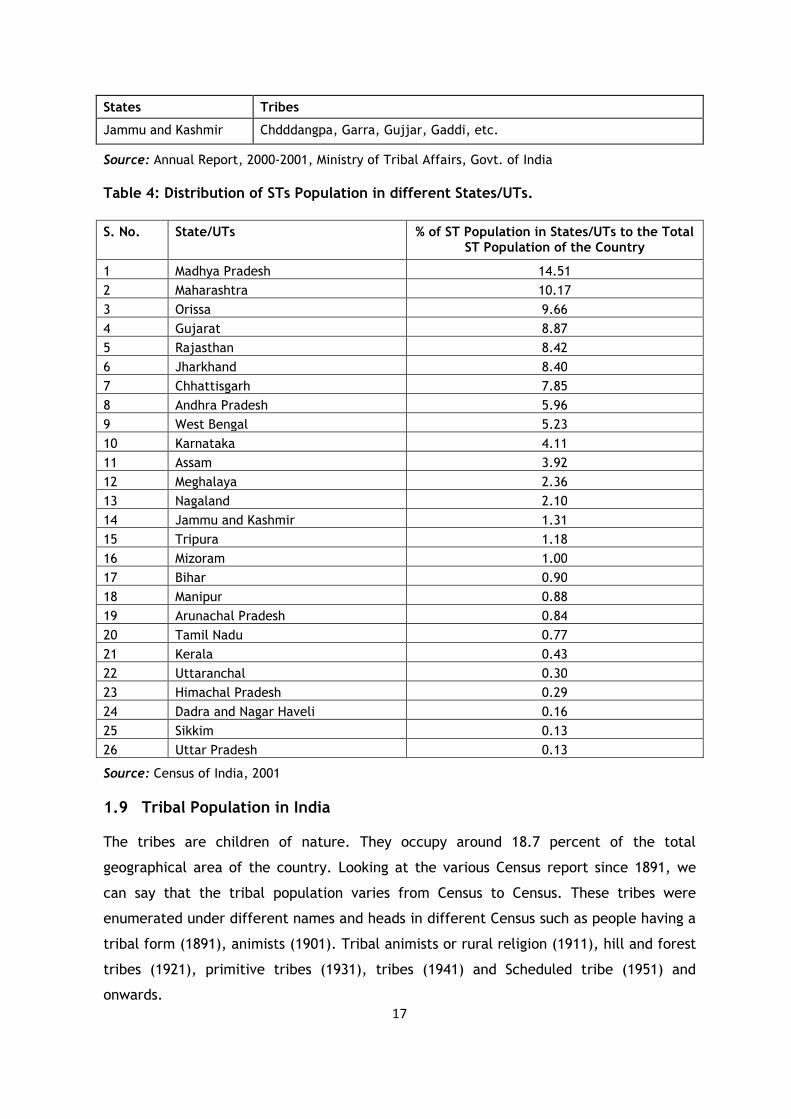
17
States Tribes
Jammu and Kashmir Chdddangpa, Garra, Gujjar, Gaddi, etc.
Source: Annual Report, 2000-2001, Ministry of Tribal Affairs, Govt. of India
Table 4: Distribution of STs Population in different States/UTs.
S. No. State/UTs % of ST Population in States/UTs to the Total ST Population of the Country
1 Madhya Pradesh 14.51
2 Maharashtra 10.17
3 Orissa 9.66
4 Gujarat 8.87
5 Rajasthan 8.42
6 Jharkhand 8.40
7 Chhattisgarh 7.85
8 Andhra Pradesh 5.96
9 West Bengal 5.23
10 Karnataka 4.11
11 Assam 3.92
12 Meghalaya 2.36
13 Nagaland 2.10
14 Jammu and Kashmir 1.31
15 Tripura 1.18
16 Mizoram 1.00
17 Bihar 0.90
18 Manipur 0.88
19 Arunachal Pradesh 0.84
20 Tamil Nadu 0.77
21 Kerala 0.43
22 Uttaranchal 0.30
23 Himachal Pradesh 0.29
24 Dadra and Nagar Haveli 0.16
25 Sikkim 0.13
26 Uttar Pradesh 0.13
Source: Census of India, 2001
1.9 Tribal Population in India The tribes are children of nature. They occupy around 18.7 percent of the total
geographical area of the country. Looking at the various Census report since 1891, we
can say that the tribal population varies from Census to Census. These tribes were
enumerated under different names and heads in different Census such as people having a
tribal form (1891), animists (1901). Tribal animists or rural religion (1911), hill and forest
tribes (1921), primitive tribes (1931), tribes (1941) and Scheduled tribe (1951) and
onwards.
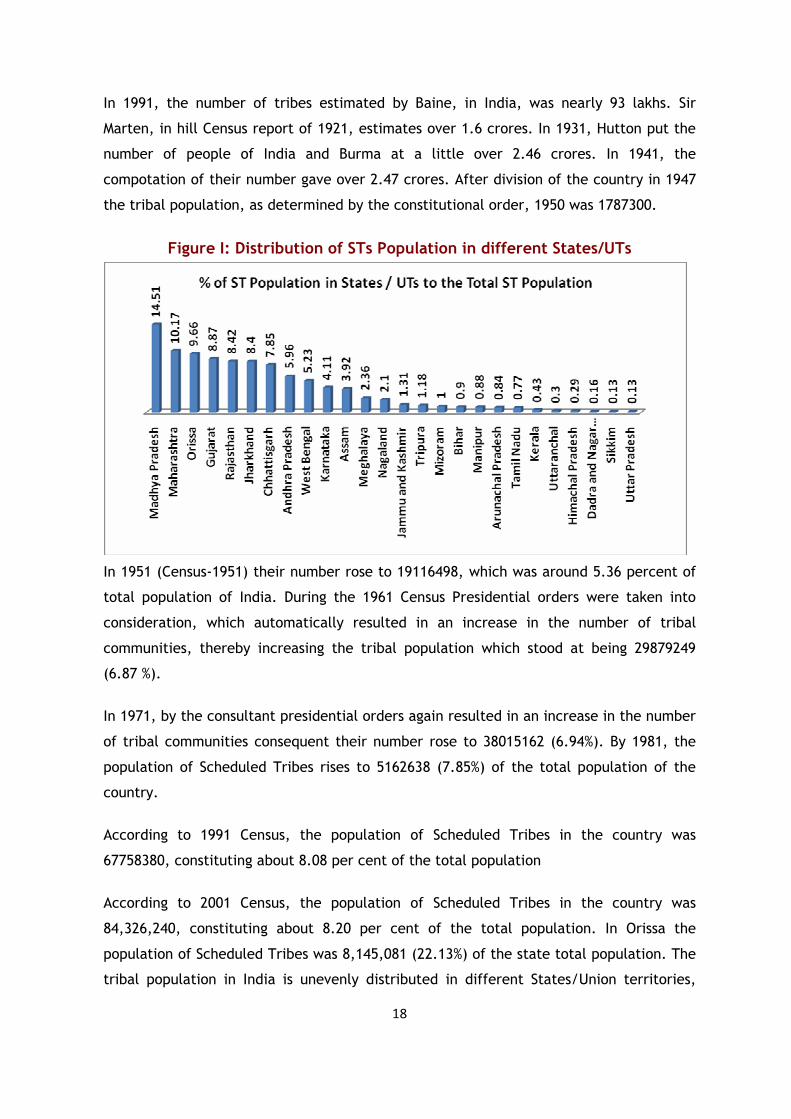
18
In 1991, the number of tribes estimated by Baine, in India, was nearly 93 lakhs. Sir
Marten, in hill Census report of 1921, estimates over 1.6 crores. In 1931, Hutton put the
number of people of India and Burma at a little over 2.46 crores. In 1941, the
compotation of their number gave over 2.47 crores. After division of the country in 1947
the tribal population, as determined by the constitutional order, 1950 was 1787300.
Figure I: Distribution of STs Population in different States/UTs
In 1951 (Census-1951) their number rose to 19116498, which was around 5.36 percent of
total population of India. During the 1961 Census Presidential orders were taken into
consideration, which automatically resulted in an increase in the number of tribal
communities, thereby increasing the tribal population which stood at being 29879249
(6.87 %).
In 1971, by the consultant presidential orders again resulted in an increase in the number
of tribal communities consequent their number rose to 38015162 (6.94%). By 1981, the
population of Scheduled Tribes rises to 5162638 (7.85%) of the total population of the
country.
According to 1991 Census, the population of Scheduled Tribes in the country was
67758380, constituting about 8.08 per cent of the total population
According to 2001 Census, the population of Scheduled Tribes in the country was
84,326,240, constituting about 8.20 per cent of the total population. In Orissa the
population of Scheduled Tribes was 8,145,081 (22.13%) of the state total population. The
tribal population in India is unevenly distributed in different States/Union territories,
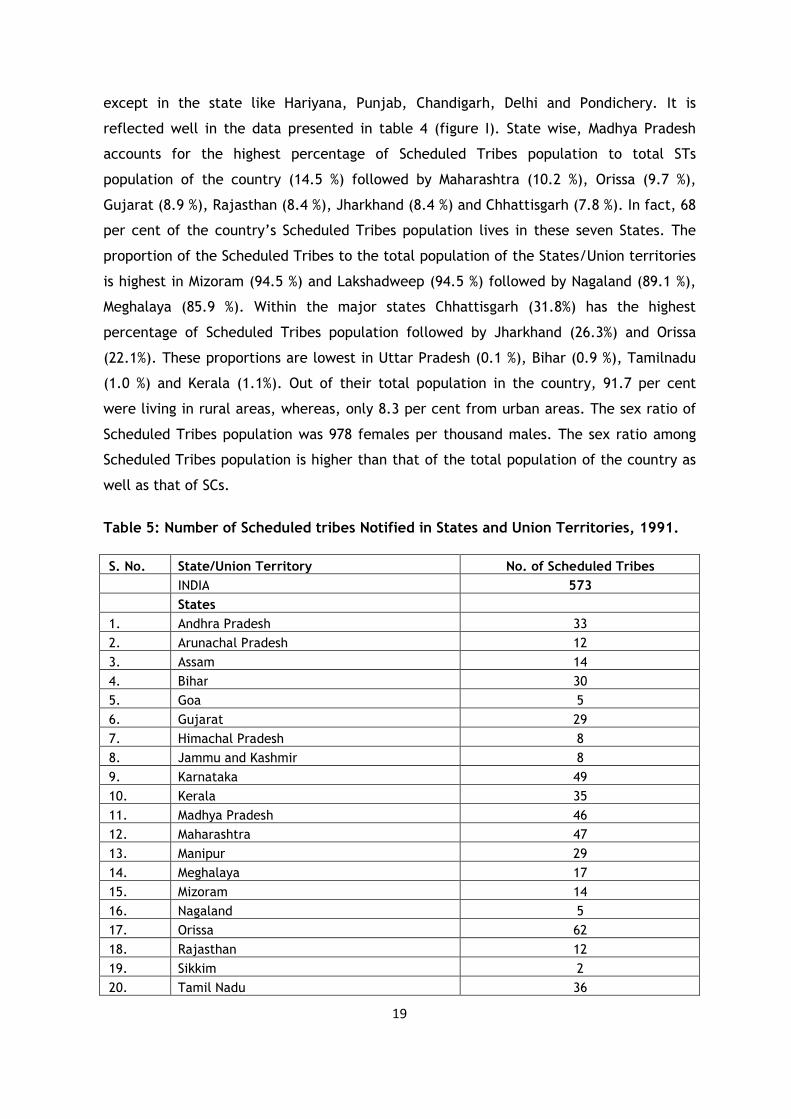
19
except in the state like Hariyana, Punjab, Chandigarh, Delhi and Pondichery. It is
reflected well in the data presented in table 4 (figure I). State wise, Madhya Pradesh
accounts for the highest percentage of Scheduled Tribes population to total STs
population of the country (14.5 %) followed by Maharashtra (10.2 %), Orissa (9.7 %),
Gujarat (8.9 %), Rajasthan (8.4 %), Jharkhand (8.4 %) and Chhattisgarh (7.8 %). In fact, 68
per cent of the country’s Scheduled Tribes population lives in these seven States. The
proportion of the Scheduled Tribes to the total population of the States/Union territories
is highest in Mizoram (94.5 %) and Lakshadweep (94.5 %) followed by Nagaland (89.1 %),
Meghalaya (85.9 %). Within the major states Chhattisgarh (31.8%) has the highest
percentage of Scheduled Tribes population followed by Jharkhand (26.3%) and Orissa
(22.1%). These proportions are lowest in Uttar Pradesh (0.1 %), Bihar (0.9 %), Tamilnadu
(1.0 %) and Kerala (1.1%). Out of their total population in the country, 91.7 per cent
were living in rural areas, whereas, only 8.3 per cent from urban areas. The sex ratio of
Scheduled Tribes population was 978 females per thousand males. The sex ratio among
Scheduled Tribes population is higher than that of the total population of the country as
well as that of SCs.
Table 5: Number of Scheduled tribes Notified in States and Union Territories, 1991.
S. No. State/Union Territory No. of Scheduled Tribes
INDIA 573
States
1. Andhra Pradesh 33
2. Arunachal Pradesh 12
3. Assam 14
4. Bihar 30
5. Goa 5
6. Gujarat 29
7. Himachal Pradesh 8
8. Jammu and Kashmir 8
9. Karnataka 49
10. Kerala 35
11. Madhya Pradesh 46
12. Maharashtra 47
13. Manipur 29
14. Meghalaya 17
15. Mizoram 14
16. Nagaland 5
17. Orissa 62
18. Rajasthan 12
19. Sikkim 2
20. Tamil Nadu 36
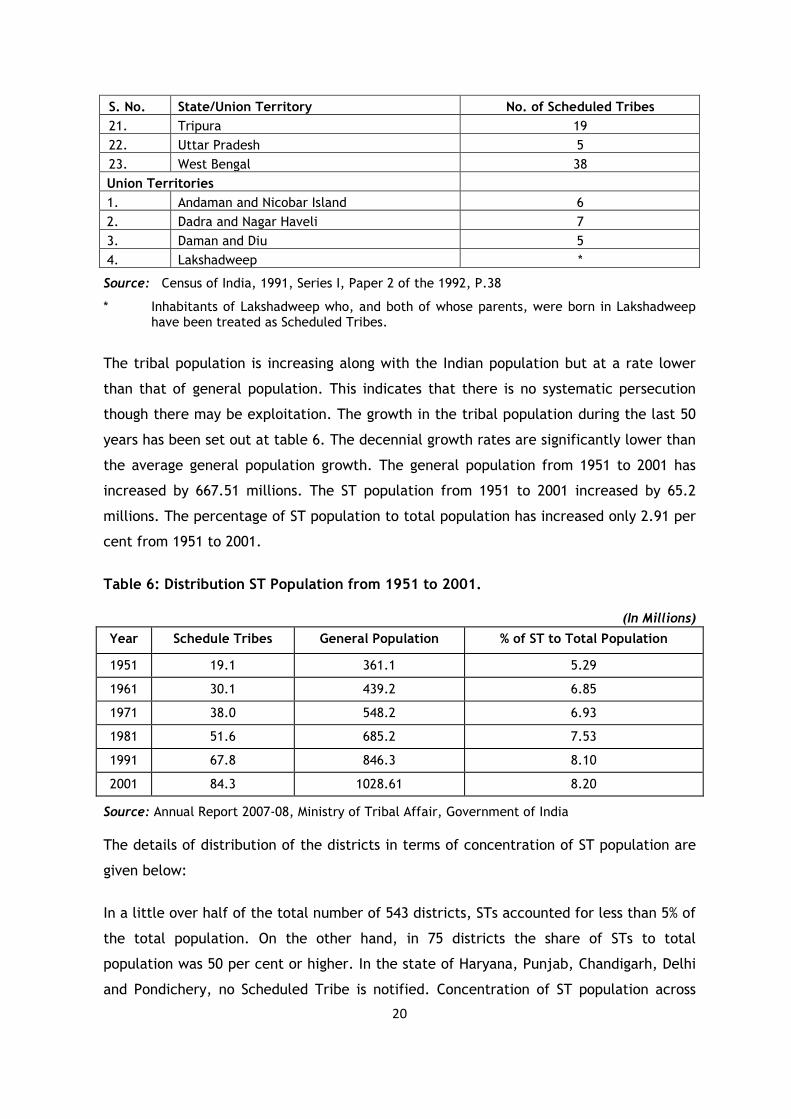
20
S. No. State/Union Territory No. of Scheduled Tribes
21. Tripura 19
22. Uttar Pradesh 5
23. West Bengal 38
Union Territories
1. Andaman and Nicobar Island 6
2. Dadra and Nagar Haveli 7
3. Daman and Diu 5
4. Lakshadweep *
Source: Census of India, 1991, Series I, Paper 2 of the 1992, P.38
* Inhabitants of Lakshadweep who, and both of whose parents, were born in Lakshadweep have been treated as Scheduled Tribes.
The tribal population is increasing along with the Indian population but at a rate lower
than that of general population. This indicates that there is no systematic persecution
though there may be exploitation. The growth in the tribal population during the last 50
years has been set out at table 6. The decennial growth rates are significantly lower than
the average general population growth. The general population from 1951 to 2001 has
increased by 667.51 millions. The ST population from 1951 to 2001 increased by 65.2
millions. The percentage of ST population to total population has increased only 2.91 per
cent from 1951 to 2001.
Table 6: Distribution ST Population from 1951 to 2001.
(In Millions)
Year Schedule Tribes General Population % of ST to Total Population
1951 19.1 361.1 5.29
1961 30.1 439.2 6.85
1971 38.0 548.2 6.93
1981 51.6 685.2 7.53
1991 67.8 846.3 8.10
2001 84.3 1028.61 8.20
Source: Annual Report 2007-08, Ministry of Tribal Affair, Government of India
The details of distribution of the districts in terms of concentration of ST population are
given below:
In a little over half of the total number of 543 districts, STs accounted for less than 5% of
the total population. On the other hand, in 75 districts the share of STs to total
population was 50 per cent or higher. In the state of Haryana, Punjab, Chandigarh, Delhi
and Pondichery, no Scheduled Tribe is notified. Concentration of ST population across
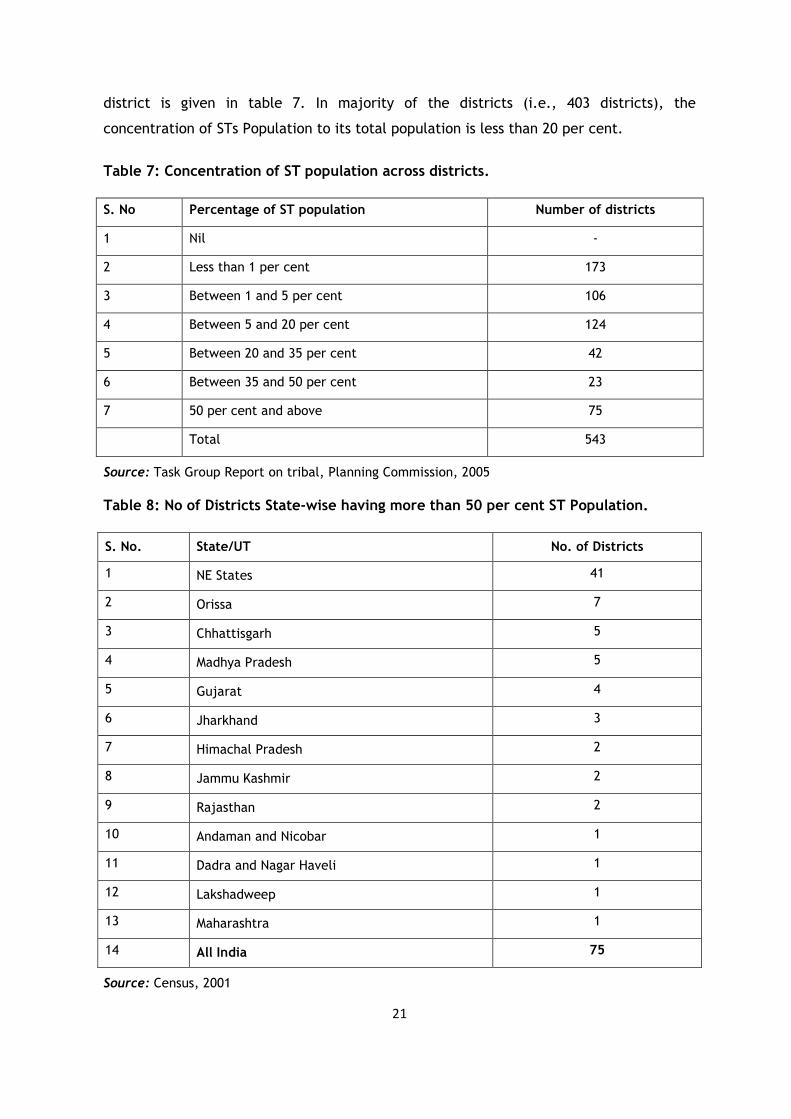
21
district is given in table 7. In majority of the districts (i.e., 403 districts), the
concentration of STs Population to its total population is less than 20 per cent.
Table 7: Concentration of ST population across districts.
S. No Percentage of ST population Number of districts
1 Nil -
2 Less than 1 per cent 173
3 Between 1 and 5 per cent 106
4 Between 5 and 20 per cent 124
5 Between 20 and 35 per cent 42
6 Between 35 and 50 per cent 23
7 50 per cent and above 75
Total 543
Source: Task Group Report on tribal, Planning Commission, 2005
Table 8: No of Districts State-wise having more than 50 per cent ST Population.
S. No. State/UT No. of Districts
1 NE States 41
2 Orissa 7
3 Chhattisgarh 5
4 Madhya Pradesh 5
5 Gujarat 4
6 Jharkhand 3
7 Himachal Pradesh 2
8 Jammu Kashmir 2
9 Rajasthan 2
10 Andaman and Nicobar 1
11 Dadra and Nagar Haveli 1
12 Lakshadweep 1
13 Maharashtra 1
14 All India 75
Source: Census, 2001
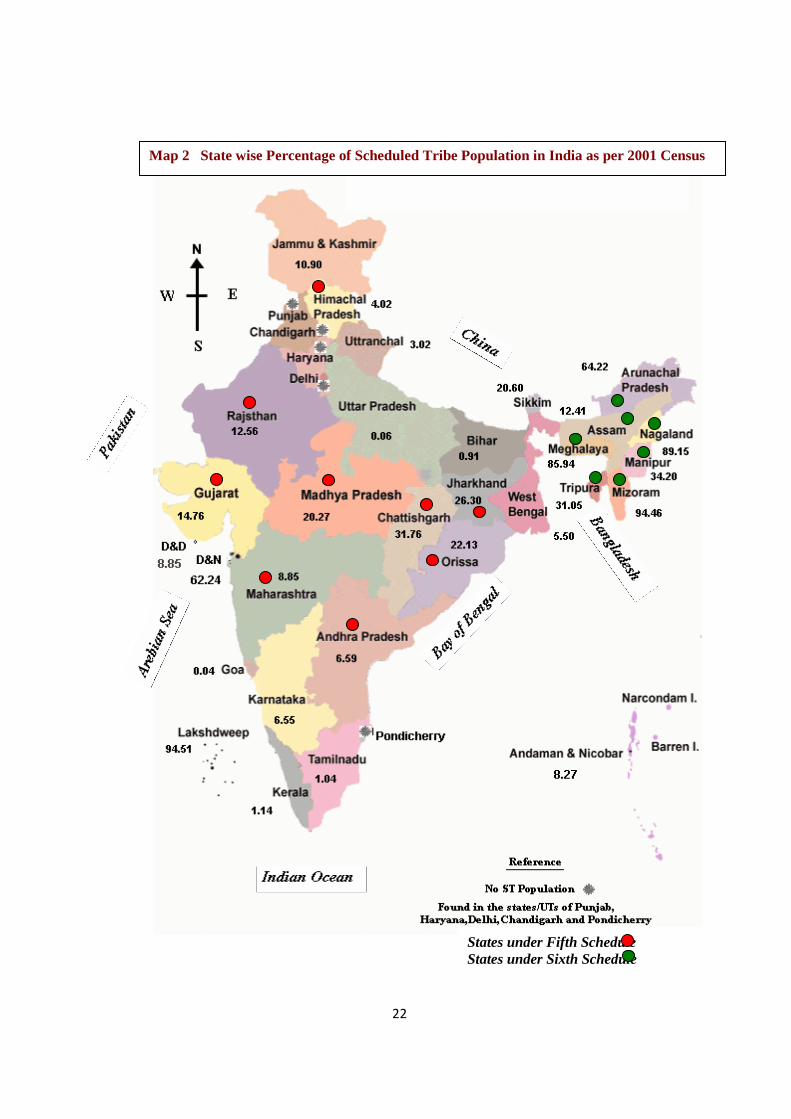
22
Map 2 State wise Percentage of Scheduled Tribe Population in India as per 2001 Census
States under Fifth Schedule States under Sixth Schedule
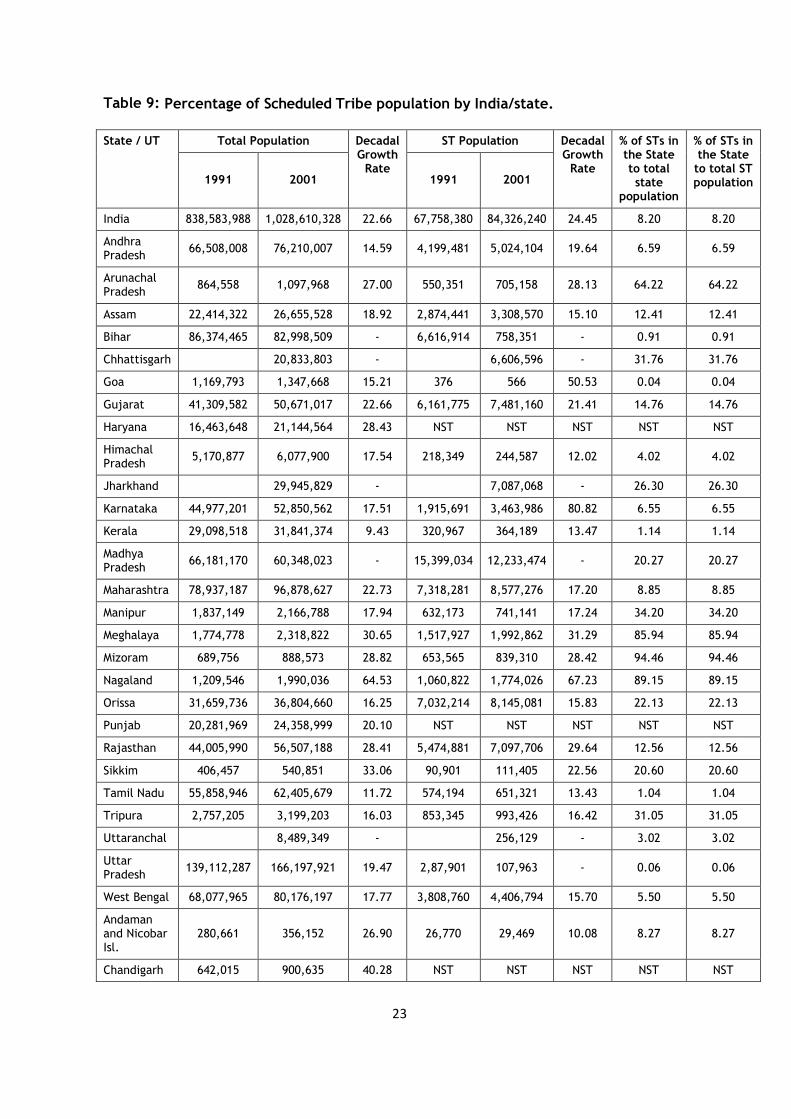
23
Table 9: Percentage of Scheduled Tribe population by India/state.
Total Population ST Population State / UT
1991 2001
Decadal Growth Rate
1991 2001
Decadal Growth Rate
% of STs in the State to total state
population
% of STs in the State to total ST population
India 838,583,988 1,028,610,328 22.66 67,758,380 84,326,240 24.45 8.20 8.20
Andhra Pradesh
66,508,008 76,210,007 14.59 4,199,481 5,024,104 19.64 6.59 6.59
Arunachal Pradesh
864,558 1,097,968 27.00 550,351 705,158 28.13 64.22 64.22
Assam 22,414,322 26,655,528 18.92 2,874,441 3,308,570 15.10 12.41 12.41
Bihar 86,374,465 82,998,509 - 6,616,914 758,351 - 0.91 0.91
Chhattisgarh 20,833,803 - 6,606,596 - 31.76 31.76
Goa 1,169,793 1,347,668 15.21 376 566 50.53 0.04 0.04
Gujarat 41,309,582 50,671,017 22.66 6,161,775 7,481,160 21.41 14.76 14.76
Haryana 16,463,648 21,144,564 28.43 NST NST NST NST NST
Himachal Pradesh
5,170,877 6,077,900 17.54 218,349 244,587 12.02 4.02 4.02
Jharkhand 29,945,829 - 7,087,068 - 26.30 26.30
Karnataka 44,977,201 52,850,562 17.51 1,915,691 3,463,986 80.82 6.55 6.55
Kerala 29,098,518 31,841,374 9.43 320,967 364,189 13.47 1.14 1.14
Madhya Pradesh
66,181,170 60,348,023 - 15,399,034 12,233,474 - 20.27 20.27
Maharashtra 78,937,187 96,878,627 22.73 7,318,281 8,577,276 17.20 8.85 8.85
Manipur 1,837,149 2,166,788 17.94 632,173 741,141 17.24 34.20 34.20
Meghalaya 1,774,778 2,318,822 30.65 1,517,927 1,992,862 31.29 85.94 85.94
Mizoram 689,756 888,573 28.82 653,565 839,310 28.42 94.46 94.46
Nagaland 1,209,546 1,990,036 64.53 1,060,822 1,774,026 67.23 89.15 89.15
Orissa 31,659,736 36,804,660 16.25 7,032,214 8,145,081 15.83 22.13 22.13
Punjab 20,281,969 24,358,999 20.10 NST NST NST NST NST
Rajasthan 44,005,990 56,507,188 28.41 5,474,881 7,097,706 29.64 12.56 12.56
Sikkim 406,457 540,851 33.06 90,901 111,405 22.56 20.60 20.60
Tamil Nadu 55,858,946 62,405,679 11.72 574,194 651,321 13.43 1.04 1.04
Tripura 2,757,205 3,199,203 16.03 853,345 993,426 16.42 31.05 31.05
Uttaranchal 8,489,349 - 256,129 - 3.02 3.02
Uttar Pradesh
139,112,287 166,197,921 19.47 2,87,901 107,963 - 0.06 0.06
West Bengal 68,077,965 80,176,197 17.77 3,808,760 4,406,794 15.70 5.50 5.50
Andaman and Nicobar Isl.
280,661 356,152 26.90 26,770 29,469 10.08 8.27 8.27
Chandigarh 642,015 900,635 40.28 NST NST NST NST NST
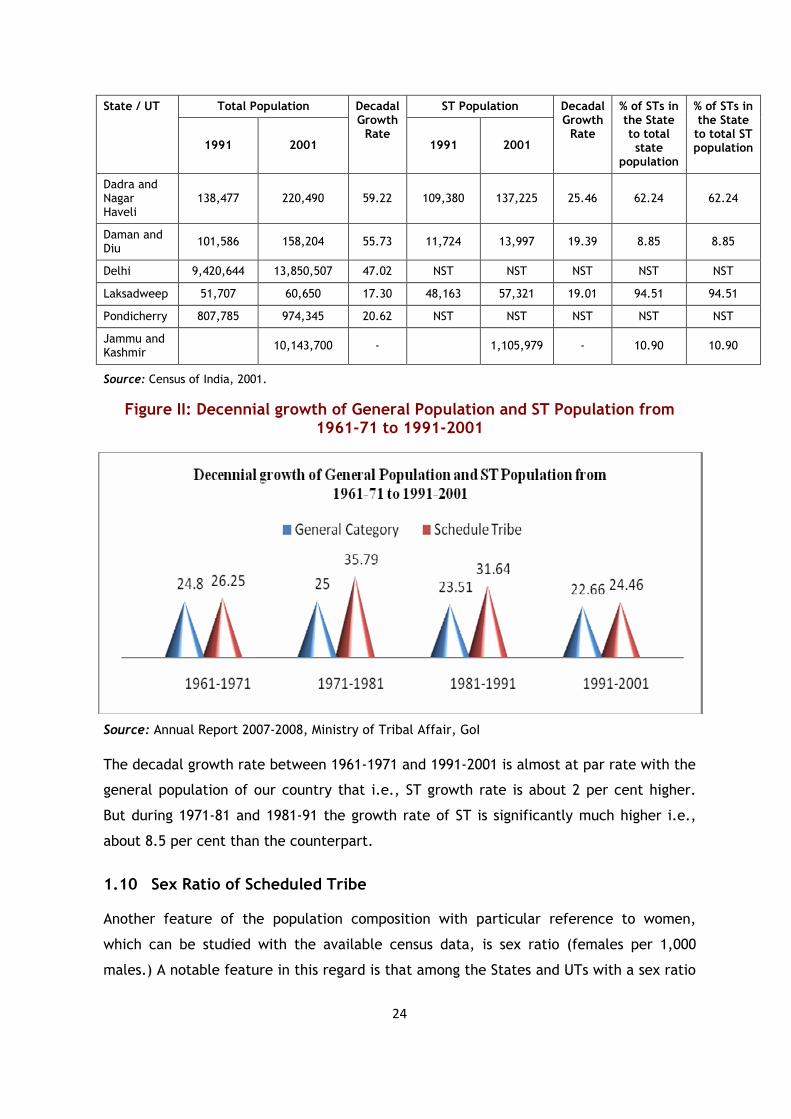
24
Total Population ST Population State / UT
1991 2001
Decadal Growth Rate
1991 2001
Decadal Growth Rate
% of STs in the State to total state
population
% of STs in the State to total ST population
Dadra and Nagar Haveli
138,477 220,490 59.22 109,380 137,225 25.46 62.24 62.24
Daman and Diu
101,586 158,204 55.73 11,724 13,997 19.39 8.85 8.85
Delhi 9,420,644 13,850,507 47.02 NST NST NST NST NST
Laksadweep 51,707 60,650 17.30 48,163 57,321 19.01 94.51 94.51
Pondicherry 807,785 974,345 20.62 NST NST NST NST NST
Jammu and Kashmir
10,143,700 - 1,105,979 - 10.90 10.90
Source: Census of India, 2001.
Figure II: Decennial growth of General Population and ST Population from 1961-71 to 1991-2001
Source: Annual Report 2007-2008, Ministry of Tribal Affair, GoI
The decadal growth rate between 1961-1971 and 1991-2001 is almost at par rate with the
general population of our country that i.e., ST growth rate is about 2 per cent higher.
But during 1971-81 and 1981-91 the growth rate of ST is significantly much higher i.e.,
about 8.5 per cent than the counterpart.
1.10 Sex Ratio of Scheduled Tribe Another feature of the population composition with particular reference to women,
which can be studied with the available census data, is sex ratio (females per 1,000
males.) A notable feature in this regard is that among the States and UTs with a sex ratio
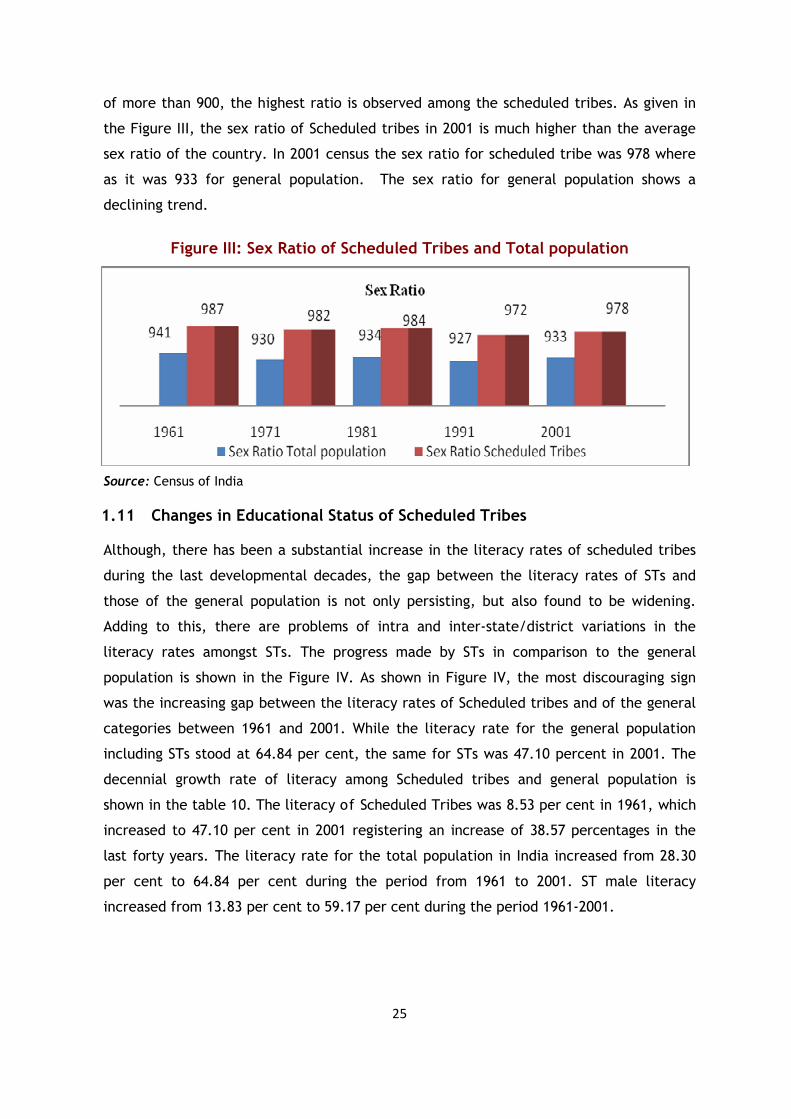
25
of more than 900, the highest ratio is observed among the scheduled tribes. As given in
the Figure III, the sex ratio of Scheduled tribes in 2001 is much higher than the average
sex ratio of the country. In 2001 census the sex ratio for scheduled tribe was 978 where
as it was 933 for general population. The sex ratio for general population shows a
declining trend.
Figure III: Sex Ratio of Scheduled Tribes and Total population
Source: Census of India
1.11 Changes in Educational Status of Scheduled Tribes Although, there has been a substantial increase in the literacy rates of scheduled tribes
during the last developmental decades, the gap between the literacy rates of STs and
those of the general population is not only persisting, but also found to be widening.
Adding to this, there are problems of intra and inter-state/district variations in the
literacy rates amongst STs. The progress made by STs in comparison to the general
population is shown in the Figure IV. As shown in Figure IV, the most discouraging sign
was the increasing gap between the literacy rates of Scheduled tribes and of the general
categories between 1961 and 2001. While the literacy rate for the general population
including STs stood at 64.84 per cent, the same for STs was 47.10 percent in 2001. The
decennial growth rate of literacy among Scheduled tribes and general population is
shown in the table 10. The literacy of Scheduled Tribes was 8.53 per cent in 1961, which
increased to 47.10 per cent in 2001 registering an increase of 38.57 percentages in the
last forty years. The literacy rate for the total population in India increased from 28.30
per cent to 64.84 per cent during the period from 1961 to 2001. ST male literacy
increased from 13.83 per cent to 59.17 per cent during the period 1961-2001.
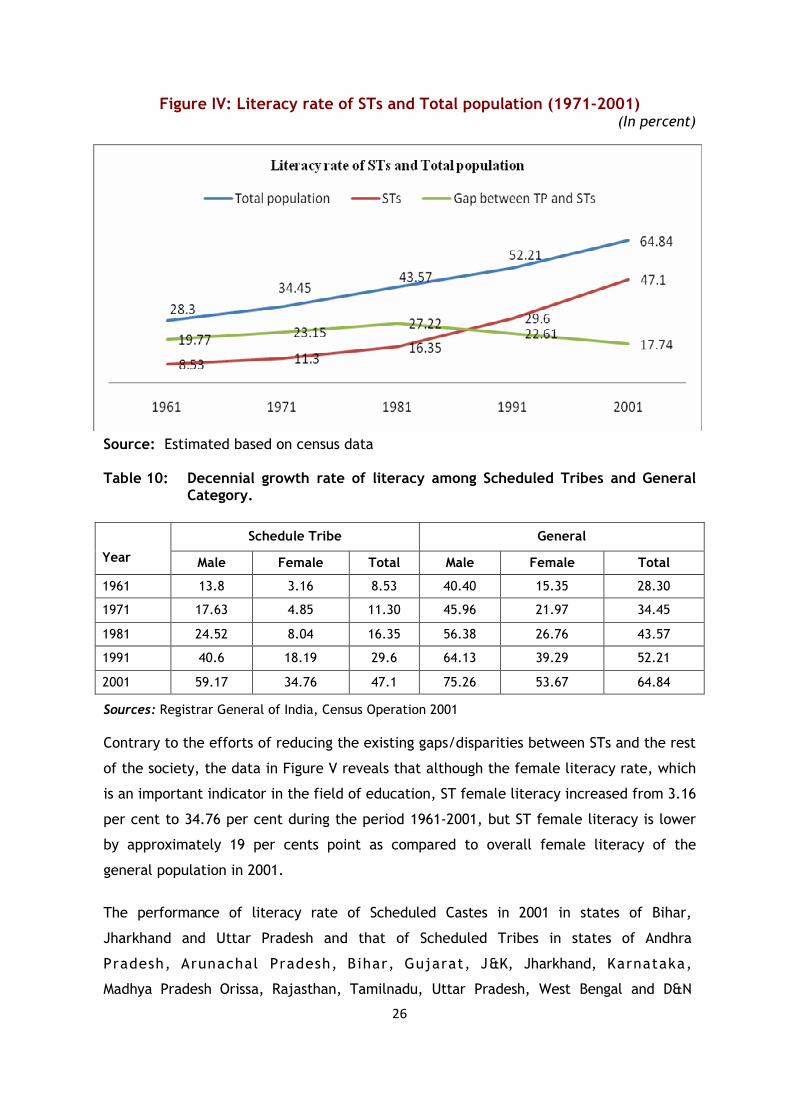
26
Figure IV: Literacy rate of STs and Total population (1971-2001) (In percent)
Source: Estimated based on census data Table 10: Decennial growth rate of literacy among Scheduled Tribes and General
Category.
Schedule Tribe General
Year Male Female Total Male Female Total
1961 13.8 3.16 8.53 40.40 15.35 28.30
1971 17.63 4.85 11.30 45.96 21.97 34.45
1981 24.52 8.04 16.35 56.38 26.76 43.57
1991 40.6 18.19 29.6 64.13 39.29 52.21
2001 59.17 34.76 47.1 75.26 53.67 64.84
Sources: Registrar General of India, Census Operation 2001
Contrary to the efforts of reducing the existing gaps/disparities between STs and the rest
of the society, the data in Figure V reveals that although the female literacy rate, which
is an important indicator in the field of education, ST female literacy increased from 3.16
per cent to 34.76 per cent during the period 1961-2001, but ST female literacy is lower
by approximately 19 per cents point as compared to overall female literacy of the
general population in 2001.
The performance of literacy rate of Scheduled Castes in 2001 in states of Bihar,
Jharkhand and Uttar Pradesh and that of Scheduled Tribes in states of Andhra
Pradesh, Arunachal Pradesh, Bihar, Gujarat, J&K, Jharkhand, Karnataka,
Madhya Pradesh Orissa, Rajasthan, Tamilnadu, Uttar Pradesh, West Bengal and D&N
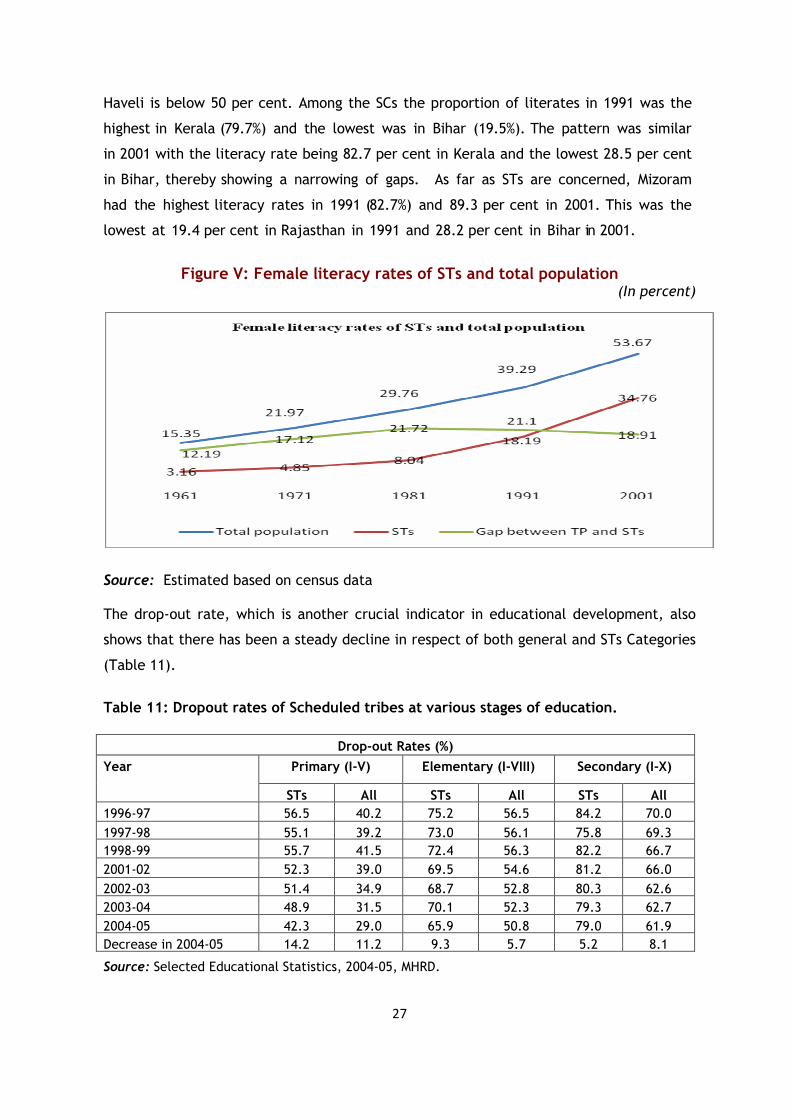
27
Haveli is below 50 per cent. Among the SCs the proportion of literates in 1991 was the
highest in Kerala (79.7%) and the lowest was in Bihar (19.5%). The pattern was similar
in 2001 with the literacy rate being 82.7 per cent in Kerala and the lowest 28.5 per cent
in Bihar, thereby showing a narrowing of gaps. As far as STs are concerned, Mizoram
had the highest literacy rates in 1991 (82.7%) and 89.3 per cent in 2001. This was the
lowest at 19.4 per cent in Rajasthan in 1991 and 28.2 per cent in Bihar in 2001.
Figure V: Female literacy rates of STs and total population (In percent)
Source: Estimated based on census data The drop-out rate, which is another crucial indicator in educational development, also
shows that there has been a steady decline in respect of both general and STs Categories
(Table 11).
Table 11: Dropout rates of Scheduled tribes at various stages of education.
Drop-out Rates (%)
Primary (I-V) Elementary (I-VIII) Secondary (I-X) Year
STs All STs All STs All
1996-97 56.5 40.2 75.2 56.5 84.2 70.0
1997-98 55.1 39.2 73.0 56.1 75.8 69.3
1998-99 55.7 41.5 72.4 56.3 82.2 66.7
2001-02 52.3 39.0 69.5 54.6 81.2 66.0
2002-03 51.4 34.9 68.7 52.8 80.3 62.6
2003-04 48.9 31.5 70.1 52.3 79.3 62.7
2004-05 42.3 29.0 65.9 50.8 79.0 61.9
Decrease in 2004-05 14.2 11.2 9.3 5.7 5.2 8.1
Source: Selected Educational Statistics, 2004-05, MHRD.
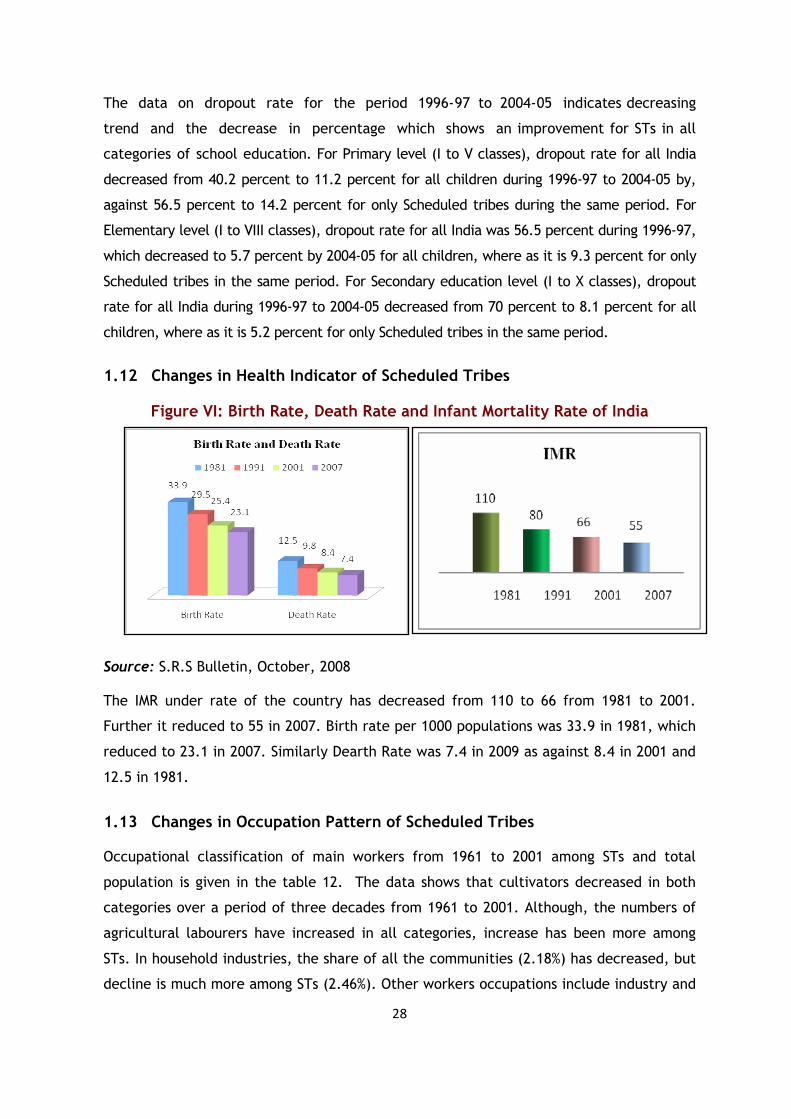
28
The data on dropout rate for the period 1996-97 to 2004-05 indicates decreasing
trend and the decrease in percentage which shows an improvement for STs in all
categories of school education. For Primary level (I to V classes), dropout rate for all India
decreased from 40.2 percent to 11.2 percent for all children during 1996-97 to 2004-05 by,
against 56.5 percent to 14.2 percent for only Scheduled tribes during the same period. For
Elementary level (I to VIII classes), dropout rate for all India was 56.5 percent during 1996-97,
which decreased to 5.7 percent by 2004-05 for all children, where as it is 9.3 percent for only
Scheduled tribes in the same period. For Secondary education level (I to X classes), dropout
rate for all India during 1996-97 to 2004-05 decreased from 70 percent to 8.1 percent for all
children, where as it is 5.2 percent for only Scheduled tribes in the same period.
1.12 Changes in Health Indicator of Scheduled Tribes
Figure VI: Birth Rate, Death Rate and Infant Mortality Rate of India
Source: S.R.S Bulletin, October, 2008 The IMR under rate of the country has decreased from 110 to 66 from 1981 to 2001.
Further it reduced to 55 in 2007. Birth rate per 1000 populations was 33.9 in 1981, which
reduced to 23.1 in 2007. Similarly Dearth Rate was 7.4 in 2009 as against 8.4 in 2001 and
12.5 in 1981.
1.13 Changes in Occupation Pattern of Scheduled Tribes Occupational classification of main workers from 1961 to 2001 among STs and total
population is given in the table 12. The data shows that cultivators decreased in both
categories over a period of three decades from 1961 to 2001. Although, the numbers of
agricultural labourers have increased in all categories, increase has been more among
STs. In household industries, the share of all the communities (2.18%) has decreased, but
decline is much more among STs (2.46%). Other workers occupations include industry and

29
services sector. The number of other workers has witnessed an increase in all sections of
the main workers though the increase in general categories has been much more than
amongst ST.
On the other hand Work Participation Rate of ST has increased by 7.8% as against 3.8 per
cent to the total for the period 1961 to 2001. It is also important to note that the WPR
decreased significantly during 1961-71among all section as reflected in the Figure VII.
Table 12: Occupational classification of main workers (%).
Total ST Main workers
1961 1971 1981 1991 2001 1961 1971 1981 1991 2001
Cultivators 52.78 43.38 41.53 39.74 31.7 68.18 57.56 54.43 54.50 44.7
Agricultural Labourers
16.71 26.32 25.16 19.66 26.5 19.71 33.04 32.67 32.69 36.9
Household Industry
6.38 3.55 3.99 2.56 4.2 2.47 1.03 1.42 1.05 2.1
Other Workers 24.13 26.75 29.32 38.04 37.6 9.64 8.37 11.48 11.76 16.3
Source: Census of India, 2001
Figure VII: Work Participation Rate (1961-2001)
Source: Census of India- 2001
1.14 Changes in Poverty Scenario of Scheduled Tribes The strategy of promoting employment-cum-income generating activities to alleviate
poverty amongst STs has proved to be effective in raising a large number of ST families
above the Poverty Line during the period between 1993-94 and 2004-2005, as quantified
at table 13. Along with the general population, the percentage of ST families living
below the poverty line has also shown a declining trend between 1993-94 and 2004-2005.
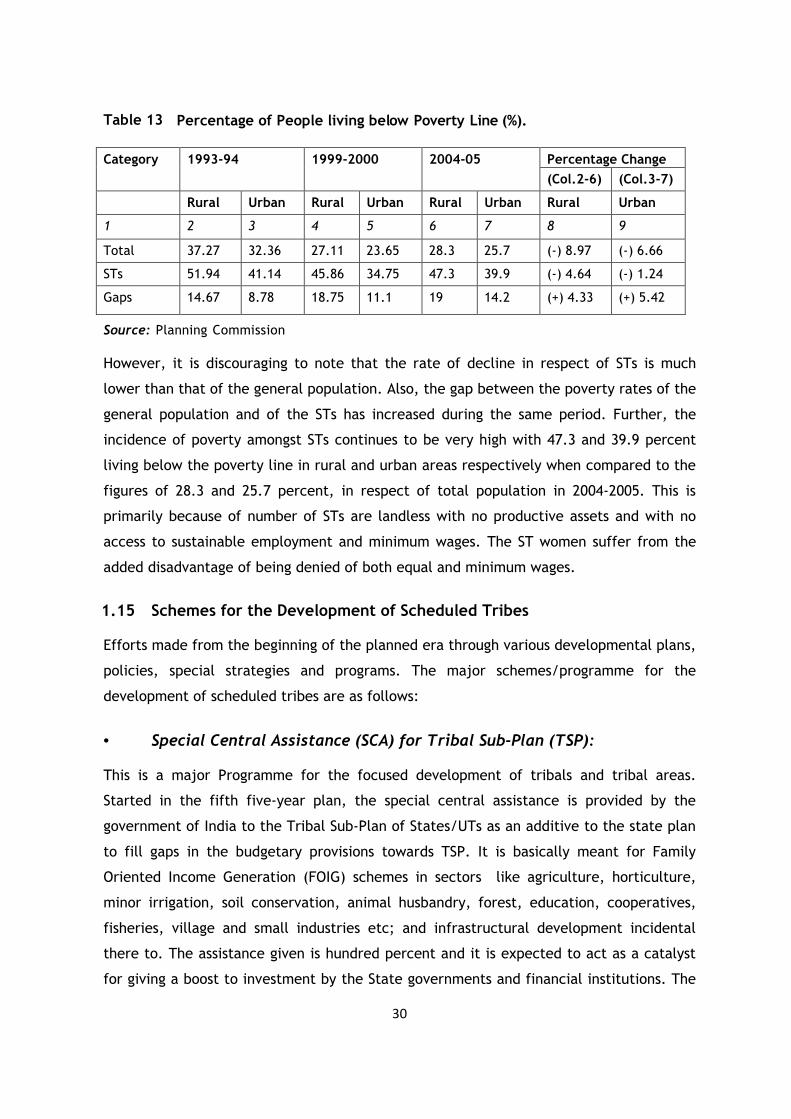
30
Table 13 Percentage of People living below Poverty Line (%).
Percentage Change Category 1993-94 1999-2000 2004-05
(Col.2-6) (Col.3-7)
Rural Urban Rural Urban Rural Urban Rural Urban
1 2 3 4 5 6 7 8 9
Total 37.27 32.36 27.11 23.65 28.3 25.7 (-) 8.97 (-) 6.66
STs 51.94 41.14 45.86 34.75 47.3 39.9 (-) 4.64 (-) 1.24
Gaps 14.67 8.78 18.75 11.1 19 14.2 (+) 4.33 (+) 5.42
Source: Planning Commission
However, it is discouraging to note that the rate of decline in respect of STs is much
lower than that of the general population. Also, the gap between the poverty rates of the
general population and of the STs has increased during the same period. Further, the
incidence of poverty amongst STs continues to be very high with 47.3 and 39.9 percent
living below the poverty line in rural and urban areas respectively when compared to the
figures of 28.3 and 25.7 percent, in respect of total population in 2004-2005. This is
primarily because of number of STs are landless with no productive assets and with no
access to sustainable employment and minimum wages. The ST women suffer from the
added disadvantage of being denied of both equal and minimum wages.
1.15 Schemes for the Development of Scheduled Tribes Efforts made from the beginning of the planned era through various developmental plans,
policies, special strategies and programs. The major schemes/programme for the
development of scheduled tribes are as follows:
• Special Central Assistance (SCA) for Tribal Sub-Plan (TSP): This is a major Programme for the focused development of tribals and tribal areas.
Started in the fifth five-year plan, the special central assistance is provided by the
government of India to the Tribal Sub-Plan of States/UTs as an additive to the state plan
to fill gaps in the budgetary provisions towards TSP. It is basically meant for Family
Oriented Income Generation (FOIG) schemes in sectors like agriculture, horticulture,
minor irrigation, soil conservation, animal husbandry, forest, education, cooperatives,
fisheries, village and small industries etc; and infrastructural development incidental
there to. The assistance given is hundred percent and it is expected to act as a catalyst
for giving a boost to investment by the State governments and financial institutions. The
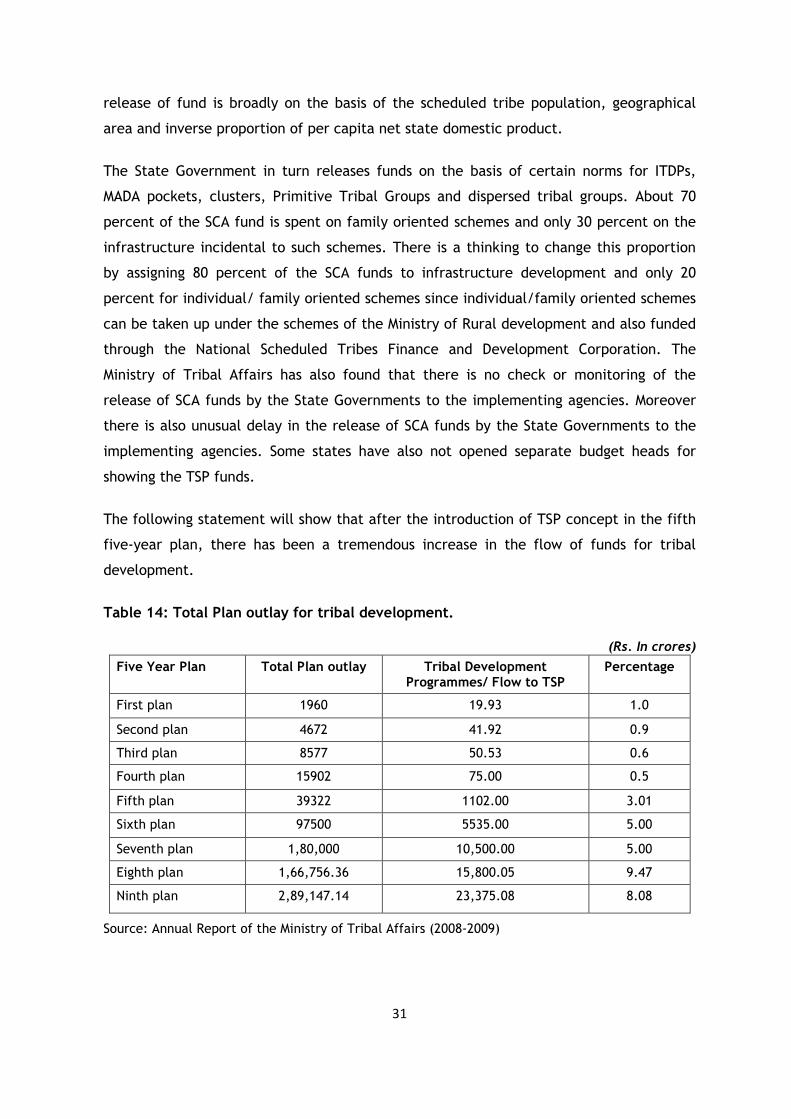
31
release of fund is broadly on the basis of the scheduled tribe population, geographical
area and inverse proportion of per capita net state domestic product.
The State Government in turn releases funds on the basis of certain norms for ITDPs,
MADA pockets, clusters, Primitive Tribal Groups and dispersed tribal groups. About 70
percent of the SCA fund is spent on family oriented schemes and only 30 percent on the
infrastructure incidental to such schemes. There is a thinking to change this proportion
by assigning 80 percent of the SCA funds to infrastructure development and only 20
percent for individual/ family oriented schemes since individual/family oriented schemes
can be taken up under the schemes of the Ministry of Rural development and also funded
through the National Scheduled Tribes Finance and Development Corporation. The
Ministry of Tribal Affairs has also found that there is no check or monitoring of the
release of SCA funds by the State Governments to the implementing agencies. Moreover
there is also unusual delay in the release of SCA funds by the State Governments to the
implementing agencies. Some states have also not opened separate budget heads for
showing the TSP funds.
The following statement will show that after the introduction of TSP concept in the fifth
five-year plan, there has been a tremendous increase in the flow of funds for tribal
development.
Table 14: Total Plan outlay for tribal development.
(Rs. In crores)
Five Year Plan Total Plan outlay Tribal Development Programmes/ Flow to TSP
Percentage
First plan 1960 19.93 1.0
Second plan 4672 41.92 0.9
Third plan 8577 50.53 0.6
Fourth plan 15902 75.00 0.5
Fifth plan 39322 1102.00 3.01
Sixth plan 97500 5535.00 5.00
Seventh plan 1,80,000 10,500.00 5.00
Eighth plan 1,66,756.36 15,800.05 9.47
Ninth plan 2,89,147.14 23,375.08 8.08
Source: Annual Report of the Ministry of Tribal Affairs (2008-2009)
32
• Grants under Article 275(1) of the Constitution: Every year, funds are released to the State Governments to meet the cost of such
schemes of development as may be undertaken by them for promoting the welfare of
Scheduled Tribes and for raising the level of administration of the Scheduled Areas to
that of the rest of the state. The objective is to promote the welfare of Scheduled Tribes
and better administration of Scheduled Areas. The scheme covers all Tribal Sub-Plan and
tribal majority states of the country. This is a central sector scheme and 100 percent
grants are provided by the Ministry of Tribal Affairs to the State Governments. The grants
are provided on the basis of Scheduled Tribe population percentage of the state. The
Ministry, which earlier used to release the funds without identifying the projects, has
now decided to release funds to the State Governments against specific infrastructure
development and welfare projects from 2000-2001.
• Boys’ and Girls’ Hostels for Scheduled Tribe Students: This is a centrally sponsored scheme launched in the year 1961-62 with central assistance
limited to 50 percent of funds provided by the State Governments. This is given for
construction of hostel building and extension of existing hostels. In the case of Union
territories, the Central Government releases 100 percent as assistance. The maintenance
of these hostels and their buildings are the responsibility of the State Governments/UTs.
This is a useful scheme for enabling the Scheduled Tribe students to study in hospitable
environments and promoting literacy among tribal girls and boys who have many
handicaps due to poor socio-economic condition.
Since the land for the building is to be provided by the State Governments free of cost
and moreover, 50 percent of funds are to be provided by them, there has been poor
demand for the construction of the new hostels. The State Government has also to bear
the recurring and non-recurring cost of running and maintenance of these hostels.
• Ashram Schools in TSP Areas This is a centrally sponsored scheme launched during 1990-91 with an objective to extend
educational facilities like establishing residential schools for Scheduled Tribes in an
environment conducive to learning. The funds under the scheme are given to the states
on a matching basis i.e. 50.-50 while100 percent assistance is given to the UTs. The
scheme provides funds for the construction of school building from the primary standard
33
to the senior secondary stage of education. It also allows for up-gradation of existing
primary level Ashram schools.
Under this scheme, besides the school building, the construction of hostels for students
and staff quarters are also undertaken. The State Government has to provide land free of
cost for such constructions. Grant is provided for other non-recurring items of
expenditure like purchase of furniture, equipments, and sets of books for school and
hostel library. A sum of Rs.44.86 crores was earmarked for this Programme in the Ninth
five year plan. This scheme suffers from the same ailment namely the failure of the state
governments to provide 50 percent fund out of their own budgets.
• Scheme for Educational Complex in low Literacy Pockets for Development of Female Literacy:
It is known that the literacy level among females in the Scheduled Tribes is abysmally
low. This scheme is meant to tackle this problem through identification of 134 districts in
the country, which have below 10 percent literacy rate among Scheduled Tribe females.
The scheme is implemented through NGOs, corporative societies and State Governments.
The primary objective of the scheme is promotion of education among tribal girls in the
identified low-literacy districts of the country. The secondary objective is to improve the
socio-economic condition of the poor and illiterate tribal population. It is a central sector
scheme and the government of India provides 100 percent funds. The educational
complexes are established in the rural areas of the notified districts and have classes
from I to V with provision for up-gradation up to XII provided they have sufficient
accommodation for class rooms, hostels, kitchen, and gardening and for sports. These
educational complexes impart not only formal education to tribal girls but also train the
students in agriculture, animal husbandry and other vocations and crafts which will make
them skilled for ,leading a better life. The teaching from class I to III is done in the tribal
dialects of the area and women having proficiency in tribal dialects are engaged as
teachers.
Though the strength of students in each class has been fixed at 30, a maximum of 10
more students, if available in the locality, are admitted as day scholars. The recurring
grants provided to run the educational complexes is Rs.9000/- per student per year. This
includes expenses on accommodation, food, clothing, payment of salary to teachers etc.
The students are provided two sets of uniform, one set of school books besides free food
and medicine. Besides the above, the student’s parents are given the incentive of Rs.
34
50/- per month. A sum of Rs.1000 per student is also given as a non-recurring grant for
purchase of cots, mattresses, utensils, etc. Under this scheme, 128 Educational
complexes have been established from the year 1995- 96 to 2000-01.
• Scheme for Vocational Training in Tribal Areas Realizing the need for skill up-gradation and to equip the tribal youths for self-
employment, this scheme was introduced in 1992-93 and is continuing since then.
The main aim of the scheme is to develop the skill of the tribal youths for a variety of
trades and prepare them for new job opportunities as well as self-employment in area
close to their villages as well as outside. The secondary aim is to improve the socio-
economic condition of tribal youths by enhancing their earnings.
This scheme covers all the states and union territories and 100 percent grants under the
schemes are provided to states/UTs and other organizations implementing the scheme.
These organizations can either be set up by the Government as autonomous bodies under
State or Central Government or NGOs registered under the Societies Registration Act,
1960.
• Scheme for Development of Particularly Vulnerable Tribal Groups
(PTGs) These groups practicing primitive agricultural practices and having low level of literacy
and stagnant or diminishing population face various problems in their progress and
development. To cater to the need of such group, a separate scheme was introduced in
the year 1998-99 which mainly focuses on ensuring food security and the protection and
development of PTGs.
The objective and purpose of this scheme is that funds under the central sector scheme
for the development of PTGs will be available only for those items/ activities which
though very crucial for the survival, protection and development of PTGs are not
specifically catered to by any existing scheme. The activities under the scheme may
include measures such as awareness generation and confidence building, training for skill
development, improvement in agriculture technology, housing, education and health
standards.
The scheme covers 75 PTGs spread over 18 states and one UT. 100 percent funds are
provided by the Ministry of Tribal Affairs for the programmes mentioned above. Those
35
activities which focus on helping the beneficiaries to cope up with extreme adverse
conditions threatening their survival are taken up on priority basis.
• Educational Development of Scheduled Tribes: For the promotion of education among the Scheduled Tribes, the following schemes are
in operation:
(a) Centrally sponsored scheme of post-matric scholarship.
(b) National overseas scholarship scheme for higher studies abroad.
(c) Book bank scheme.
(d) Scheme of up-gradation of merit.
(e) Coaching for competitive examinations.
• Promotion of Voluntary Efforts: The roles of voluntary Non-Governmental Organizations become important as many of
them have been rendering yeoman services in the tribal communities of the area. For this
purpose the Ministry of Tribal Affairs supports many welfare programmes especially in the
field of education and medical care run by the NGOs through the scheme of grant-in-aid
to the voluntary organizations working for the welfare of Scheduled Tribes.
This scheme is in operation since 1953-54 but its scope has been increased from the year
1998-99. The schemes run through NGOs include residential school, hostels, medical
centres, and computer training centres, shorthand and typing units, balwadis, libraries
and audio-visual units. 90 percent of the fund for a Programme is given by the Ministry
and 10 percent is to be contributed by the NGOs. From the year 1999-2000, 100 percent
fund is also available to the NGOs working in the Scheduled areas.
The main objective of the scheme is to provide for an over-all improvement and
development of the Scheduled Tribes through voluntary efforts in the field of educations,
health and sanitation, environment, drinking water, legal redressed service and those
need-based socio-economic upliftment efforts having direct beneficial impact on the
target groups.
• Schemes for the Financial Assistance to Scheduled Tribes A new National Finance and Development Corporation meant for the economic
development of Scheduled Tribes has been started in the year 2001 after bifurcation of
the National SC and ST Finance and Development Corporation. This Corporation would
36
provide financial assistance at concessional rates for income generation activities and
training in skill development to STs whose annual income is below double the poverty
line. This assistance for self-employment purposes would be available up to Rs.10 lakhs
through the State channelizing agencies which are in many cases the state Scheduled
Tribes Finance and Development Corporation. The projects undertaken under this
Programme should be technically feasible and financially viable. The Corporation would
provide term loan, seed capital, bridge loan etc. at concessional rates of interest. The
maximum amount available would be 85 per cent of the project cost with 10 percent
coming from the State Corporations and 5 per cent from the beneficiary concerned. It
provides finance in the sectors of agriculture, horticulture, animal husbandry and dairy,
minor irrigation, small industries, small trade and transport services. This scheme will
also help in removing indebtedness among tribal and provide finance at concessional
rates which the commercial banks have so far failed to provide.
37
Chapter-2:
OBJECTIVE AND STUDY DESIGN
2.1 Statement of Problem The tribal population of the country as per 2001 census is 84 millions, constituting 8.2
per cent of the total population of the country. There are 573 tribals found in India
(census 1991). Out of the 573 tribal groups, the Government of India has identified 75
Particularly Vulnerable Tribal Groups (PTGs) characterised by pre-agricultural level of
technology, low level of literacy and declining or stagnant population. In the country, the
state of Orissa has the distinction of having both the largest number of tribes (62) and
largest number of Primitive Tribal Groups (13) in comparison to other states/UTs.
Development of tribal population of our country is a constitutional obligation of the
state. But, how to develop these tribals? This has been the vexed question baffling the
country’s policymakers, planners, administrators and all those concerned with the
welfare and development of the tribal people. Laws have been made with regard to the
protection, safeguard, and development of tribals; and these have been put into practice
too. Right from independence, a large number of programmes have been undertaken by
the Government of India for the development of the tribals and tribals areas to ensure a
better quality of life for them and also to protect them from exploitation. Thousand of
millions of rupees have been spent for developing a few millions of people. But the result
shows that the quality and quantum of development achieved is far from being
satisfactory. Tribals are still facing the problems of hunger, malnutrition, poverty, poor
literacy, poor health facility and deprivation from Natural Resources. The condition of
the primitive tribes is comparatively worse. Though Government of India provides special
attention for the development of Primitive Tribal Groups, yet the literacy level, income
and living condition of the primitive tribes in comparison with other tribes are much
discouraging. This may be due to many reasons. In order to get clear view of these issues
this study attempts to examine the changing socio-economic conditions and livelihood of
the Kutia Kandha, Dongria Kandha and Lanjia Saora, Primitive Tribes of Orissa and impact
of various tribal developmental schemes implemented among them. This study would
provide valuable information to planners and administrators in their future pursuit for
sustainable development of PTGs.
38
2.2 Objectives of the Study The study was undertaken with the following major objectives:
� To find out the different sources of livelihood of the selected Primitive Tribal
Groups and how does it vary amongst the Primitive tribal households in the study
area.
� To find out the change in socio-economic conditions of the Primitive Tribal Groups
in last five years.
� To find out the impact of developmental intervention on the selected Primitive
tribal community in the study area.
� To provide suggestions to alleviate poverty and to take the Primitive tribal
community to the main stream.
2.3 Methodology The study entitled “Changing socio-economic condition and livelihood of Geographically
Isolated Primitive Tribal Group in Kandhamal and KBK districts of Orissa’ was conducted
in Kandhamal and undivided KBK districts of Orissa covering three Primitive tribal
communities i.e. Kutia Kandha, Dongria Kandha and Lanjia Saora covering 800,
households.
2.4 The Operational Methodology Adopted for this Study
2.4.1 Selection of Districts The study was confined to Kandhamal and KBK districts of Orissa. India. Out of thirty
districts of Orissa, two districts namely Kandhamal and Rayagada districts were
purposively selected with following indicators:
1. Districts having more than 50 per cent tribal population to total population.
Koraput (49.62%, Rank-8) Malkangiri (57.43%, Rank-1), Nawarangpur (55.03%,
Rank-4), Rayagada (55.76%, Rank-3), Bolangir (20.63%, Rank-15), Sonepur
(9.78%, Rank-21), Kalahandi (28.65%, Rank-14), Nuapada (34.71%, Rank-10) and
Kandhamal (51.96%, Rank-5) against the average percentage of state tribal
population i.e. 22.13 per cent.
2. Backward districts of Orissa on the basis of Human Development Report : Koraput
(HDI-0.431, Rank-27) Malkangiri(HDI- 0.370, Rank-30), Nawarangpur (HDI-0.436,
Rank-26), Rayagada (HDI-.0443, Rank-25), Bolangir(HDI-0.546, Rank-21), Sonepur
39
(HDI-0.566,Rank-16), Kandhamal (0.389,Rank-29) and Nuapada(0.581,Rank-14)
against the State average value of 0.404.
3. Both Kandhamal and Rayagada districts come under Scheduled Area and Tribal
Sub Plan Districts (TSP).
4. The Primitive tribal communities selected for the study are highly concentrated in
the districts. I.e. 70.16 per cent Dongria Kandha (6036 out of 8603 identified
Dongria Kandha) in Rayagada, 68.43 per cent Kutia Kandha (5524 out of 8073
identified Kutia Kandha) in Kandhamal, 51.48 per cent (5774 out of 11215
identified Lanjia Saora) in Rayagada.
5. Level of literacy: Overall literacy of Kutia Kandha , Dongria Kandha and Lanjia
Saora are 25.83 per cent, 16.23 per cent and 32.99 per cent respectively against
52.68 per cent in Kandhamal districts, 36.15 per cent in Rayagada and 63.63 per
cent State average and 65.38% of National average where as female literacy
among Kutia Kandha, Dongria Kandha and Lanjia Saora are 14.58 per cent, 6.02
per cent, and 25.33 per cent respectively against female literacy of 35.9 per cent
in Kandhamal district, 24.6 per cent in Rayagada districts and 50.97 per cent of
state average and 54.16 per cent of National average.
2.4.2 Selection of Primitive Tribal Groups (PTGs) Out of 13 PTGs in Orissa three PTGs namely Kutia Kandha, Dongria Kandha, Lanjia Saora
were selected purposively keeping in view the concentration of PTGs in KBK and
Kandhamal District of Orissa.
2.4.3 Selection of Micro Project Out of 17 Micro Projects six are meant for the selected PTGs under the study, i.e.
Dongria Kandha Development Agency, Kurli and Dongria Kandha Development Agency,
Parsali for Dongria Kandha, Kutia Kandha Development Agency, Belghar & Kutia Kandha
Development Agency, Lanjigarh for Kutia Kandha, Lanjia Saora Development Agency,
Seranga and Lanjia Saora Development Agency, Puttasing for Lanjia Saora. One Micro
Project was selected from each of selected PTG on the basic of the following
parameters:
� Micro Projects come under either Kandhamal or undivided KBK districts.
� Oldest Micro project as compared to other Micro Project functioning in the area
for same PTG.
40
� Highest Geographical Area: KKDA, Belghar (300 Sq. KM), DKDA, Kurli (115 sq.
KM), and LSDA, Puttasing (35 sq. KM).
� Highest households concentration: DKDA, Kurli 1430 (69.93%), KKDA, Belghar
1325 (69.15%), and LSDA, Puttasing 919 (41.55%).
� Highest percentage of BPL households as compare to other Micro Project
functioning for the same PTG: Dongria Kandha (DKDA, Kurli has 87.97% BPL
household where as DKDA, Parsali has 87.80%), Lanjia Saora (LSDA, Puttasing has
63% BPL household where as LSDA, Seranga has 48.96%) Kutia Kandha (KKDA,
Belghar has 60.15% BPL household where as KKDA, Lanjigarh has 48.73%).
� Highest percentage of Landless Household: DKDA, Kurli (88.11%), KKDA, Belghar
(22.57%), and LSDA, Puttasing (10.55%).
2.4.4 Selection of Villages
� Only revenue Villages, were covered under the study, separate hamlets were not
considered as a sample village under the study.
� Villages more than average households were selected: Kutia Kandha (19), Dongria
Kandha (23) and Lanjia Saora (40)1.
2.4.5 Criteria for Selection of Sample, The universe and Sample size Both purposive (Selection of District and PTGs) and stratified random sampling (villages
and households) were used in the study. The present study constitutes 2 categories of
sample. They are: i) Head of the household and ii) village eminent persons. Where the
head of the family is unable to answer his/her dependents were interviewed. A total of
800 households (21.77% of the total household from each PTG, a proportionate of each
PTG) were selected for direct interview to serve the purpose of the study.
The village eminent persons include local community leaders, teachers of the villages,
president/ secretary of SHGs, local NGOs workers, community legal advisors and
former/present PRI members and ANMs etc.
So far as the sample is concerned the study has chosen 45 villages keeping in view above
mentioned criteria. Apart from this the study includes 225 village elite persons (Five from
each village).
1 Figure show in the parentheses indicated the average household of revenue villages of selected PTGs
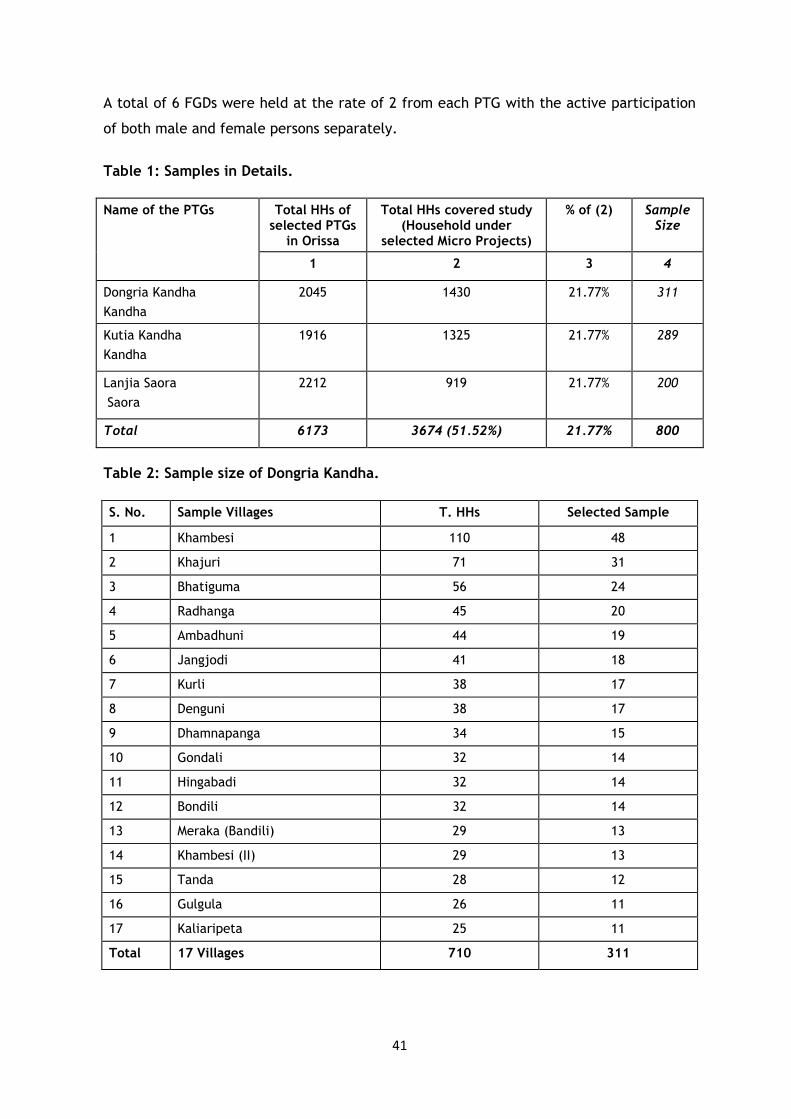
41
A total of 6 FGDs were held at the rate of 2 from each PTG with the active participation
of both male and female persons separately.
Table 1: Samples in Details.
Total HHs of selected PTGs
in Orissa
Total HHs covered study (Household under
selected Micro Projects)
% of (2)
Sample Size
Name of the PTGs
1 2 3 4
Dongria Kandha
Kandha
2045 1430 21.77% 311
Kutia Kandha
Kandha
1916 1325 21.77% 289
Lanjia Saora
Saora
2212 919 21.77% 200
Total 6173 3674 (51.52%) 21.77% 800
Table 2: Sample size of Dongria Kandha.
S. No. Sample Villages T. HHs Selected Sample
1 Khambesi 110 48
2 Khajuri 71 31
3 Bhatiguma 56 24
4 Radhanga 45 20
5 Ambadhuni 44 19
6 Jangjodi 41 18
7 Kurli 38 17
8 Denguni 38 17
9 Dhamnapanga 34 15
10 Gondali 32 14
11 Hingabadi 32 14
12 Bondili 32 14
13 Meraka (Bandili) 29 13
14 Khambesi (II) 29 13
15 Tanda 28 12
16 Gulgula 26 11
17 Kaliaripeta 25 11
Total 17 Villages 710 311
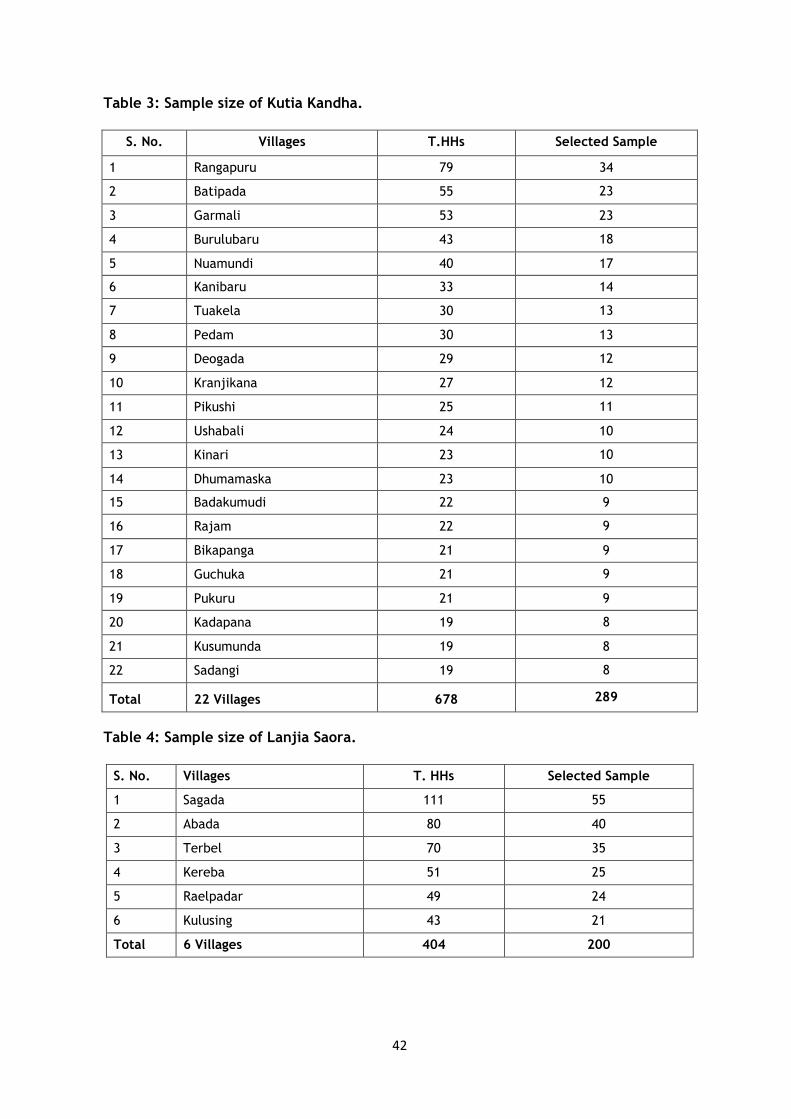
42
Table 3: Sample size of Kutia Kandha.
S. No. Villages T.HHs Selected Sample
1 Rangapuru 79 34
2 Batipada 55 23
3 Garmali 53 23
4 Burulubaru 43 18
5 Nuamundi 40 17
6 Kanibaru 33 14
7 Tuakela 30 13
8 Pedam 30 13
9 Deogada 29 12
10 Kranjikana 27 12
11 Pikushi 25 11
12 Ushabali 24 10
13 Kinari 23 10
14 Dhumamaska 23 10
15 Badakumudi 22 9
16 Rajam 22 9
17 Bikapanga 21 9
18 Guchuka 21 9
19 Pukuru 21 9
20 Kadapana 19 8
21 Kusumunda 19 8
22 Sadangi 19 8
Total 22 Villages 678 289
Table 4: Sample size of Lanjia Saora.
S. No. Villages T. HHs Selected Sample
1 Sagada 111 55
2 Abada 80 40
3 Terbel 70 35
4 Kereba 51 25
5 Raelpadar 49 24
6 Kulusing 43 21
Total 6 Villages 404 200
43
2.5 Sources of Data The study used both the primary as well as secondary source data in its findings. The
secondary data were collected from published and unpublished documents of
Government Departments and private agencies such as, Census report, Statistical
Abstract of Orissa, District Statistical Hand Book, District at a Glance, District Gazetteer,
and information collected from offices like District collectors, Blocks of district,
Panchayat offices etc. Besides this, secondary data were collected from monographic,
research reports, research papers, journals, books and from Internet. The secondary data
were ratified during field data collections.
Primary data was collected from the selected household of selected PTGs in the selected
districts of Kandhamal and KBK districts through Interview Schedule, Participatory Rural
Appraisal (PRA) and Focus Group Discussion (FGD). Three Sets of Schedule were used for
the said purpose. The household schedule was meant for head of the family to find out
the changes in their socio-economic condition. The Village schedule was used to get
overall picture of the villages. The village eminent persons schedule was used to bring
out the opinion of eminent person regarding the changes occurred in the field of
education, participation of woman in public decision making, community ownership over
resources etc.
2.6 Proper Tools and Methods Tools of Data Collections An appropriate tool had to be designed for data collection before setting out for
fieldwork. Keeping in view the composition of the population, Village Schedule,
Household Schedule, FGDs and observation techniques were used as the main tools of
data collection. The Schedules were drafted on the basis of major variables, parameters
and objectives of the study. Along with the Interview Schedule the investigators were
also provided with observation sheets to record relevant and useful observations with a
view to strengthen and cross-check the information gathered through other tools.
The following tools and techniques were used for data collection:
(i) Household schedule (Appendix I): A household schedule inquiring about details of
households under study was employed. This schedule consists of both close and
open ended questions. Most of the data have been obtained in pre-designed table
form. The household schedule is divided into two parts. The first part deals with
socio-economic information in regard to occupation, income, family size, age,
gender, literacy and marital status of members, health and sanitations, Loan and
44
borrowing, monthly consumption, households assets etc. The second part is
related to changes in socio-economic condition of the PTGs. For this purpose, a
three point Scale was used to record the information of household over a period
to check the reliability of baseline survey data 2001.
(ii) Village Schedule (Appendix II): The village schedule was designed to have a pen
picture of the village with reference to communications, roads and railways,
markets, health care facilities, availability of water resources, the other physical
resources in the village and adjoining areas, educational facility, credit
institutions, NGOs, electricity facilities, crop pattern and development
intervention in the village.
(iii) Schedule for Key personnel (Appendix III): It has three section including Major
changes in the village, factors responsible for the changes and reaction about
government programmes for PTGs.
(iv) Focus Group Discussions (FGD) (Appendix IV): Focus group discussions were
conducted among a homogeneous group of the targeted people comprising 8 to 10
members per group. These are very useful in enriching our understanding to
explore facts pertaining to different problems in villages.
(v) Field Notes: Field notes of interviews and discussions with people, interesting
experiences and situation relevant to the variable under investigation were
recorded in diaries on the spot and also at the end of each day during the
fieldwork.
(vi) Photographs: Some field information was recorded in camera with a view to
present the observation through photographs.
2.7 Frame Work of Data Analysis The data collected form primary and secondary sources were carefully scrutinized and
transcribed before the commencement of data tabulation and interpreted through
statistical tools. Comparative analysis between 2001 and 2009 has been done by using the
data of study villages released by SCSTRTI, Bhubaneswar in the baseline survey, 20012.
Descriptive statistical tools like frequency, percentage, mean, and ratio are used to
analyze the primary data. The analyzed data were presented in the form of tables,
2 Data of the sample villages has reflected only in the study for analysis. i.e. literacy rate of Lanjia Saora during 2001 presented in analysis indicates the literacy rate of the six sample village only, which is calculated from the Baseline Survey, 2001 published by SCSTRTI, Government of Orissa.
45
diagram, Pie charts, flow charts and texts. The Statistical Package for Social Science
(SPSS) software and Microsoft excel tools was used to process the data.
2.8 Report Presentation The research work along with data processing and analysis including the introduction and
conclusion is covered under following chapters:
� Chapter 1: Changing Socio-economic status of Scheduled tribes of India -
Chapter one attempts to highlight the tribal phenomenon like definition,
characteristics, distribution of tribal population, constitutional and legislative
provisions, reservation policies, their distribution, their classification, major
tribal communities in India, State-wise distribution of tribal population, growth
rate, list of Primitive Tribal Groups, development strategies, tribals occupation,
characteristics, languages, tribal education and development programmes for the
benefit of tribals.
� Chapter 2: Objectives and Study design - The chapter deals with the objectives
and study design, consisting of the statement of problem, objectives, sampling
variables, tools and methods of data collection, analysis of framework and
limitations of the study.
� Chapter 3: Tribes of Orissa and their development strategy in different plans
periods - This chapter deals with the development strategies adopted by
Government for tribal development in different plan period and their results.
Special attention has been given to the “Need Based Action Plan” prepared during
10th five year Plan and Conservation-Cum-Development Plan prepared during 11th
Plan Period.
� Chapter 4: Primitive Tribal Groups of Orissa - The chapter two has been allotted
to the PTGs of Orissa. It covers the distribution of PTGs in different regions,
number of PTGs, and its demography.
� Chapter 5: Changing Scenario of Primitive Tribal Groups: Finding from field
survey - This chapter has analyzed the changes in the socio-economic and
livelihood condition of the PTGs based on data collected from the field. Focus is
given on village settlement, house types, Social Organization, Political
Organization & Economic Organization and their changes.
� Chapter 6: A Comparative analyses of Kutia Kandha, Dongria Kandha and Lanjia
Saora - This chapter highlights the present socio-economic status of selected
46
PTGs. Major eight variables are taken for inter tribe’s analysis such as;
Demography, Education, Health, Occupation, Income, Loan and Borrowing,
Expenditures Infrastructures etc.
� Chapter 7: Impact of developmental intervention on primitive tribal groups
under study - This chapter has focused on the Plan Development Intervention and
activities of the Micro Projects for faster development of the PTGs. Activities
under SCA to TSP and CCD Plan for the years 2007-08 and 2008-09 have been
presented. Reaction of the household heads and reaction of the key persons of
the villages towards development intervention meant for them also presented in
this chapter.
� Chapter 8: Conclusions and Recommendations - Chapter eight includes
conclusions and recommendations followed by appendices and bibliography.
2.9 Limitation of the Study
1. The study included only selected PTGs who are covered under Micro Projects. The
villages outside Micro Projects are not included which could have enabled to draw
better inference about the selected PTGs.
2. The study is location specific characterized by local economic and livelihood
condition thus it may not have same application in other location.
3. It may so happen that the growth rate of the population may differ from the
growth rate of the sample due to possible error in expression of the opinion by the
sample.
4. Data is perfect to the extent to being honest response of the sample. The recall
method of data collection for some variables may not be very much perfect.
5. The opinion of the sample may not fully reflect the opinion of the same PTGs of
other district.
47
Chapter-3:
TRIBES OF ORISSA AND THEIR DEVELOPMENT STRATEGY IN DIFFERENT PLAN PERIODS
3.1 Tribes of Orissa Orissa occupies a special position in the demographic map of India. Out of the 573 tribal
communities in India, Orissa alone has 62 groups of tribes and, as such, it provides one of
the largest home for Indian tribes. According to 2001 census, Orissa accommodates
about 81,45,081 scheduled tribes which is 22.13 per cent of the state population and
9.66% of the total tribal population of the country. In the hierarchy of distribution of
tribal population Orissa comes third in position, the first two being Madhya Pradesh and
Maharashtra, constituting about 22.73 and 10.80 percent respectively. According to the
constitutional provision (Article 342) Orissa, has as many as 62 groups categorized as
scheduled viz., Scheduled Tribes. Of these, 13 are declared as Primitive Tribal Groups.
These are (1) Bagata, (2) Baiga, (3) Banjara, Banjari, (4) Bathudi, (5) Bhattoda, Dhotada,
(6) Bhuiya, Bhuyan, (7) Bhumia, (8) Bhumij, (9) Bhunijia, (10) Binjhal, (11) Binjhia,
Binjhoa, (12) Biror, (13) Bondo Poraja, (14) Chenchu, (15) Dal, (16) Desua, Bhumij, (17)
Dharua, (18) Didayi, (19) Gadaba, (20) Gandia, (21) Ghara, (22) Gond, Gondo, (23) Ho,
(24) Holva, (25) Jatapu, (26) Juang, (27) Kandha, Gauda, (28) Kawar, (29) Kharia,
Kharian, (30) Kharwar, (31) Khond, Kond, Kandha, Nanguli Kandh - Sitha Kandha, (32)
Kisan, (33) Kol, (34) Kolah, Loharas, Kol Lohras, (35) Kolha, (36) Koli, Malhar, (37)
Kondadora, (38) Kora, (39) Korua, (40) Kotia, (41) Koya, (42) Kolis, (43) Lodha, (44)
Madia, (45) Mahali, (46) Mankidi, (47) Mankirdia, (48)Matya, (49) Mirdhas, (50) Munda,
Munda Lohra, Munda Mahalis, (51) Mundari, (52) Omantya, (53) Oraon, (54) Parenga, (55)
Paroja, (56) Pentia, (57) Raiuar, (58) Santal, (59) Saora, Savar, Saira, Sahara, (60)
Shabar, Lodha, (61) Sounti, and (62) Tharua (Taradutt, 2001).
The tribes of Orissa are ethno-linguistically classified into three categories, namely (i)
Austro-Asiatic (Mundari), (ii) Dravidian, and (iii) Indo-Aryan. Tribal communities
belonging to the Austro-Asiatic category mainly inhabit North Orissa, excepting Bada
Gadaba, Bonda, Didayi, Parenga and Saora who inhabit South Orissa. The tribal
communities of the Dravidian category are mostly confined to South Orissa, except
Oraon, who inhabit North Orissa. And the tribal communities of the Indo-Aryan category
48
are scattered all over the state. The important tribal communities of the Austro-Asiatic
category in Orissa are: Bada Gadaba, Birhor, Bonda, Bhumija, Didayi, Juang, Ho/Kol,
Kharia, Munda, Parenga, Santal and Saora. The Dravidian group includes: Gond, Kisan,
Kondha, Koya, Ollar Gadaba, and Oraon. The Indo-Aryan category contains among others
Bathudi, Bhuiyan, Bhumija and Saunti. Among the tribes of Orissa, the numerically
superior ones are: Bathudi, Bhottada, Bhuinya, Bhumija, Gond, Kharia, Kondha, Kisan,
Kolha, Munda, Oraon, Paroja, Santal, Saora and Shabar. Whereas the tribes that are
peculiar or special to Orissa are the Didayi, Bonda, Juang, Kotia and Dongria Kondha.
Tribal communities belonging to Austro-Asiatic and Dravidian language families have their
own spoken languages; whereas tribal communities of the Indo-Aryan category speak
various regional dialects, which are variants of the standard Oriya. Among the Austro-
Asiatic tribal communities nine different languages are spoken, namely, Sora (Sora),
Gorum (Parenga), Gutab (Gadaba), Remo (Bonda), Kharia (Kharia/Mirdha), Juang
(Juang), Santali (Santal), Mundari (Munda/Bhumija) and Ho(Ho/Kol). Among the tribal
communities of the Dravidian language family eight different oral languages are spoken,
such as, Konda (Koraput Kondha), Koya (Koya), Kui (Phulbani Kondha), Kuvi (Rayagada
kondha), Madi (Madia), Ollari (Ollar Gadaba), Parji (Paraja) and Pengu (Pengo Paraja).
Various regional dialects spoken by the Indo-Aryan category of tribal communities
include- Desia, Jharia, Matia, Bhatri, Halbi, Bhunjia, (all these are spoken in southern
Orissa), bathudi bhuiyan, Kurmali, Saunti (all these are spoken in Northern Orissa), Sadri,
Lasia, Bhulia, Aghria, Binjhia and Banjara (all these are spoken in Western Orissa). Except
the Ho, Kondh, Santal and Saora who have in recent years developed their scripts, all
other tribes do not have scripts of their own and thus possesses only spoken languages in
the unwritten form.
The tribal communities in Orissa are among the poorest, most vulnerable and exploited
group. Most of them are confined to the more hilly and remote area of the state. The
tribals mostly inhabitant in the western hilly reigns of the state, mainly in or in close
proximity to forest. Out of the total tribal population in Orissa, 68.09 per cent of the
tribal population lives in the Scheduled Area and the remaining outside the Scheduled
areas. The Tribal Sub Plan area comprises 118 Panchayat Samities and 1902 Gram
Panchayats of 12 districts. Of the districts, 5 districts are located in KBK Region
(Economic Survey of Orissa, 2009).
These areas have been the habitat for some tribes for centuries, where as the others
have been slowly driven out of the more fertile plains by the non-tribals in recent times.
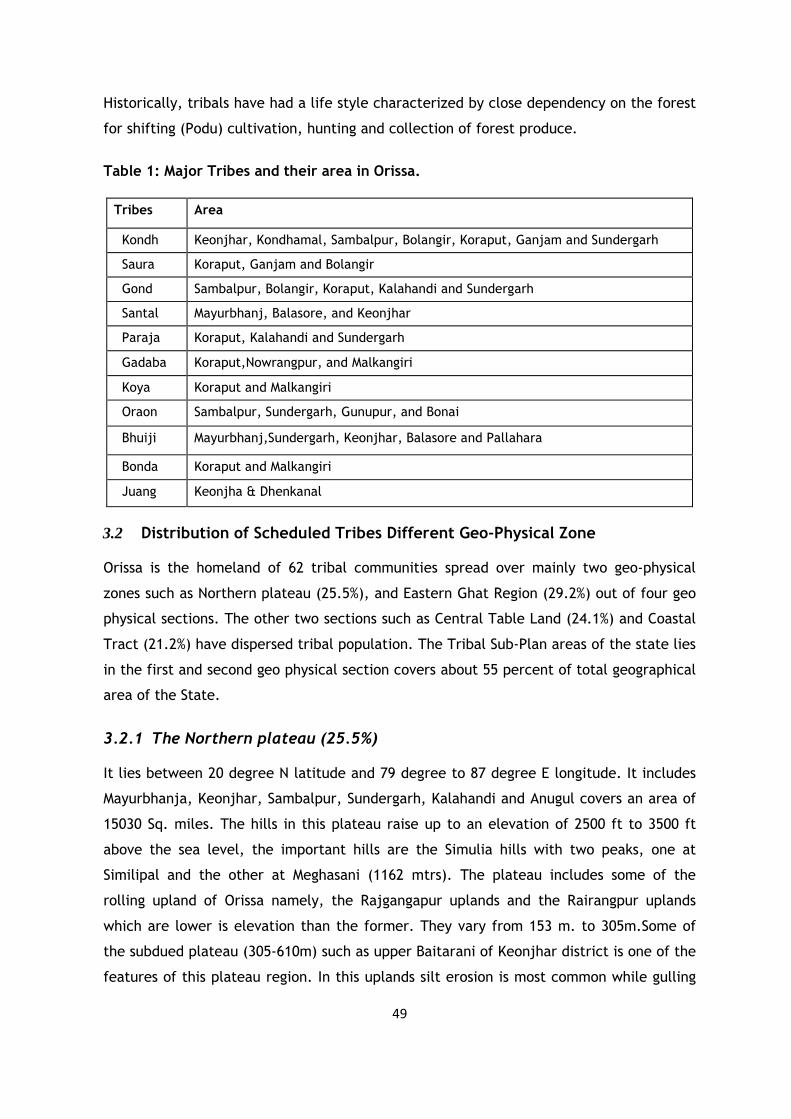
49
Historically, tribals have had a life style characterized by close dependency on the forest
for shifting (Podu) cultivation, hunting and collection of forest produce.
Table 1: Major Tribes and their area in Orissa.
Tribes Area
Kondh Keonjhar, Kondhamal, Sambalpur, Bolangir, Koraput, Ganjam and Sundergarh
Saura Koraput, Ganjam and Bolangir
Gond Sambalpur, Bolangir, Koraput, Kalahandi and Sundergarh
Santal Mayurbhanj, Balasore, and Keonjhar
Paraja Koraput, Kalahandi and Sundergarh
Gadaba Koraput,Nowrangpur, and Malkangiri
Koya Koraput and Malkangiri
Oraon Sambalpur, Sundergarh, Gunupur, and Bonai
Bhuiji Mayurbhanj,Sundergarh, Keonjhar, Balasore and Pallahara
Bonda Koraput and Malkangiri
Juang Keonjha & Dhenkanal
3.2 Distribution of Scheduled Tribes Different Geo-Physical Zone Orissa is the homeland of 62 tribal communities spread over mainly two geo-physical
zones such as Northern plateau (25.5%), and Eastern Ghat Region (29.2%) out of four geo
physical sections. The other two sections such as Central Table Land (24.1%) and Coastal
Tract (21.2%) have dispersed tribal population. The Tribal Sub-Plan areas of the state lies
in the first and second geo physical section covers about 55 percent of total geographical
area of the State.
3.2.1 The Northern plateau (25.5%) It lies between 20 degree N latitude and 79 degree to 87 degree E longitude. It includes
Mayurbhanja, Keonjhar, Sambalpur, Sundergarh, Kalahandi and Anugul covers an area of
15030 Sq. miles. The hills in this plateau raise up to an elevation of 2500 ft to 3500 ft
above the sea level, the important hills are the Simulia hills with two peaks, one at
Similipal and the other at Meghasani (1162 mtrs). The plateau includes some of the
rolling upland of Orissa namely, the Rajgangapur uplands and the Rairangpur uplands
which are lower is elevation than the former. They vary from 153 m. to 305m.Some of
the subdued plateau (305-610m) such as upper Baitarani of Keonjhar district is one of the
features of this plateau region. In this uplands silt erosion is most common while gulling
50
is confined to river valleys. The Plateau region is rich in iron ore, limestone and coal
deposits and therefore has great potentialities for industrial development. The Northern
Plateau is characterized by humid forest found in region at 3000-4000 ft altitude. Semi
evergreen species are predominant in the region. Below 3000ft., Sal is most common.
• Predominant Tribal Communities found in this zone are: Santal, Kolha, Munda,
Bhuiyan, Oraon, Gond, Kisan& Bhumij.
• ITDA Covers: Baripada, Karanjia, Kaptipada, Rairangpur, Kuchinda, Sundergarh,
Panposh, Bonai, Keonjhar and Champua
• Primitive Tribal Groups: Juang, Hill Kharia, Mankirdia, Lodha, Birhor,Paudi
Bhuiyan
3.2.2 Eastern Ghats Region (29.2%) This geo-physical region consisting of Gondwana system, khondalite which are highly
metamorphosed sediments found in Kandhamal region, Gneisses and schists are found in
Kalahandi and Charnochite rocks are found in Paralakhemundi areas. Koraput and
Pottangi areas consisting of alternating bands of Charnochite and Khondalite rocks The
Charnochite rocks furnish good building stone.The Jeypore and Nawarangpur plateau
consisting of a series of Metamorphous sediments which has been intruded by Granites,
Charnochite and Dobrites. High altitude, good drainage system and duration of low
temperature period have favored the growth of oranges and pineapples in
Parlakhemundi, Lanjigarh and Pottangi valleys. The soils of Eastern Ghat region are
mainly laterites. The high level laterites caps are found at 3000-4000ft. plateau in
Paralakhemundi and Rayagada areas. Sal is the dominant species. The original forest
cover is being lost in the Eastern Ghat regions due to intensive shifting cultivation
practiced by the tribals.
• Predominant Tribal Communities: Kondh, Saora, Paraja, Koya, Gond, Gadaba
• ITDA Covered: Thuamul Rampur, Nawarangpur, Koraput, Jeypore, Malkangiri,
Rayagada, Gunupur, Paralakhemundi, Baliguda, Phulbani and Nilagiri
• Primitive Tribal Groups: Bondo, Didayi, Kutia Kondh, Dongria Kondh, Saora,
Lanjia Saora, Chuktia Bhunjia.
51
3.2.3 Central Table Land (24.1percent) This geographical section covers whole of the Brahmini and the Mahanadi basins. This
belt does cover neither under the Scheduled Areas nor under the TSP areas of the State.
The major rivers flows in this area are Mahanadi, Brahmani, Tel and their tributaries. The
famous Gandhamardan hill is bounded by Bolangir in Northwest, Sambalpur in South, and
Kalahandi in South west.
• Predominant Tribal Communities: Gond, Kisan, Desia Kandha, Sabar.
• ITDA Covered: No ITDA is operating in this belt. The Modified Area Development
Approach (MADA) pockets are present.
• Primitive Tribal Groups: Paudi- Bhuiyan Development Agency is located at
Ruguda kudar of Sonepur district.
3.2.4 Coastal Tract (21.2 percent) The sea bound track is stretching from Rushikulya to Subarnarekha River. Seven districts
fully or partly come under this geo-physical zone. The main and important rivers flowing
in the area are Mahanadi, Brahmani, Baitarani, Birupa, Kathajodi, Kuakhai, Daya, and
Salandi. The soil of this geo-physical zone is favorable for rice, pulses, vegetable
cultivation. People of this tract depend upon irrigation source from the water of the
rivers. This tract is the most advanced in compare to other geophysical zones. All the
important places of the state lie in the state capital. The tribal concentration in this belt
is not adequate like the Northern plateau and Eastern Ghats.
Generally the tribal inhabitants in this zone had come from the districts like
Mayurbhanja, Keonjhar, Sundergarh, Koraput, Gajapati, and Kandhamal. They are Santal,
Ho, Munda, Sabar, and Kandha. Their main occupation is in the construction and road
work, earth work, Rickshaw pulling and as industrial labour.
• Predominant Tribe:- Mixed Tribal Communities as mentioned above
• ITDA Covered-No ITDA exists and MADA and Cluster Pockets are operating.
• Primitive Tribal Communities-Nil.
3.3 Scheduled Areas of Orissa Given this significant tribal presence and to safeguard their interests, certain areas enjoy
special administrative privileges under the Fifth Schedule of the Indian constitution.
Accordingly, Orissa has 7 districts (full) and 6 districts (partial) designated as ‘Scheduled
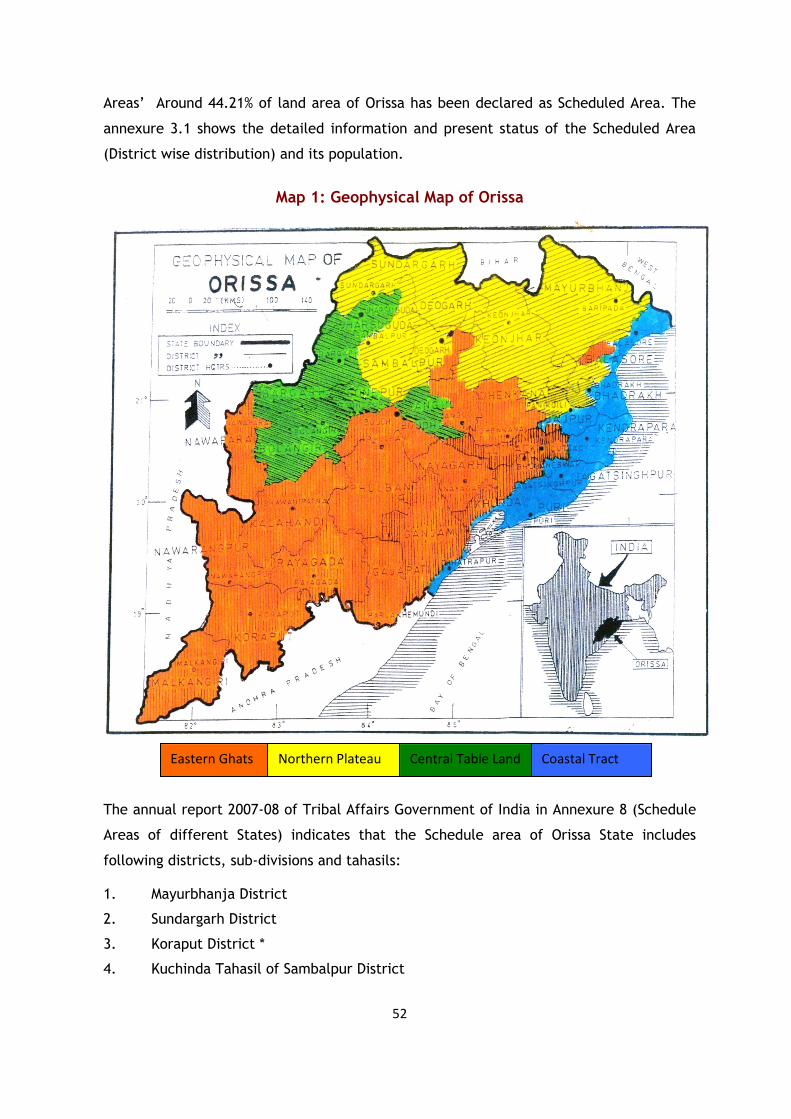
52
Areas’ Around 44.21% of land area of Orissa has been declared as Scheduled Area. The
annexure 3.1 shows the detailed information and present status of the Scheduled Area
(District wise distribution) and its population.
Map 1: Geophysical Map of Orissa
The annual report 2007-08 of Tribal Affairs Government of India in Annexure 8 (Schedule
Areas of different States) indicates that the Schedule area of Orissa State includes
following districts, sub-divisions and tahasils:
1. Mayurbhanja District
2. Sundargarh District
3. Koraput District *
4. Kuchinda Tahasil of Sambalpur District
Northern Plateau Central Table Land Coastal Tract Eastern Ghats
53
5. Keonjhar and Telkoi tahasils of Keonjhar Sub-division and Champua and Barbil
tahasils of Champua Sub-division in Keonjhar District.
6. Khandmals tahasil of Khandmals Sub-division, Baliguda and G.udayagiri tahasils of
Baliguda Sub-division in * Boud- Khandamal District.
7. * R.Udayagiri tahasil and Guma and Rayagada blocks of Parlakhemundi tahasil of
Parlakhemundi Sub-division, Surada tahasil excluding Gazalbadi & Gocha gram
panchayat of Ghumusar Sub-division of Ganjam District.
8. Thuamul Rampur block of Kalahandi tahasil, Lanjigarh block falling in both
Lanjigarh and Kalahandi tahasil of Kalahandi District.
9. Nilagiri CD block of Nilagiri tahasil in Nilagiri Sub-division of Balasore District.
Observations
a) The reorganization of districts took place in the state of Orissa and was notified
during the year 1992 in phased manner from 13 to 30 districts.
b) Out of 13 districts, 9 (nine) districts were included in the Scheduled Areas as per
Order 1977(C.O. 109) issued on 31.12.1977.
c) In the meanwhile Koraput district is divided into 3 more districts, such as
Rayagada, Malkangiri and Nabarangpur as per the area and administration is
concerned. Ganjam district has been divided into Ganjam and Gajapati.
d) Now the Scheduled Area of Orissa includes 13 districts instead of 9 districts as
mentioned in the report of MOTA, GoI.
e) It is regretted that till now the state of Orissa has not been notified in the
reorganization of the Scheduled Area of the State after reorganization of the
newly created districts.
f) Each newly formed district has the geographical area of their own and those are
within the administrative jurisdiction and control under respective District
Collector. The district collectors of Rayagada, Nabarangpur, Malkangiri & Gajapati
have to give the detail information of developmental programmes and
administrative arrangement to the Honourable Governor of Orissa separately.
But not through the collectors of Koraput and Ganjam (since new districts have
already been constituted). Moreover Honourable Governor of Orissa is the
administrative head of the Scheduled Area as per the Fifth Scheduled of the
Constitution.
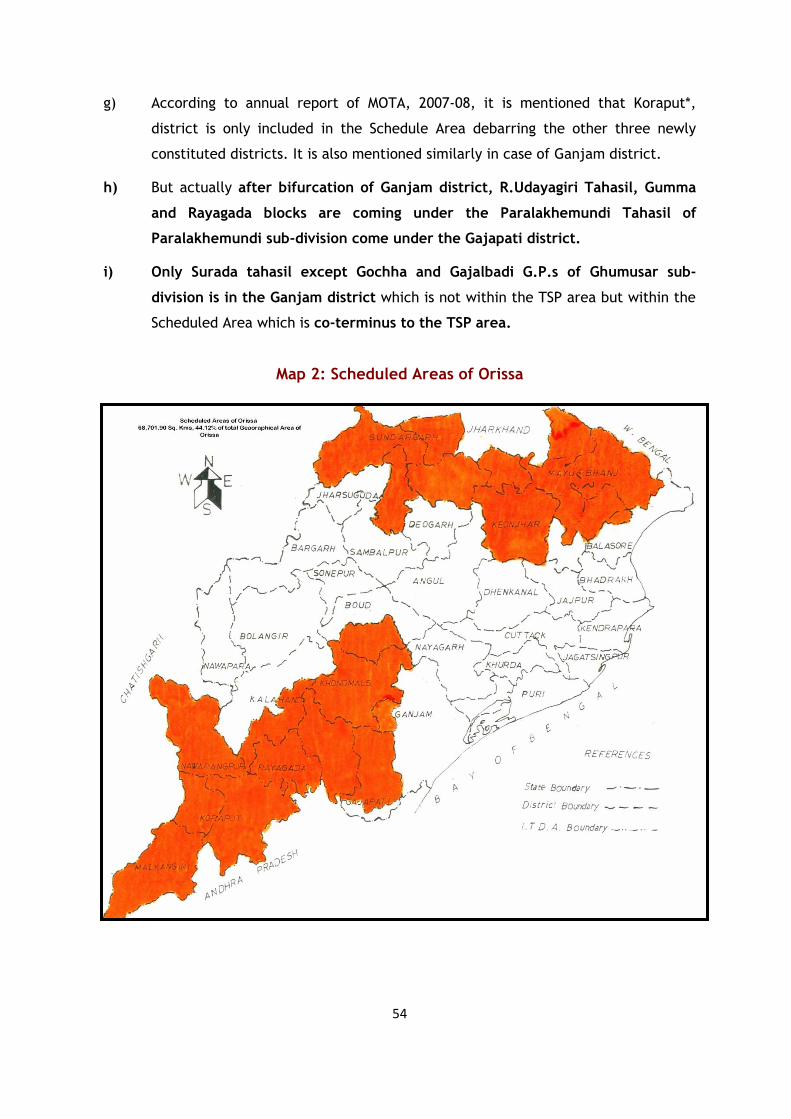
54
g) According to annual report of MOTA, 2007-08, it is mentioned that Koraput*,
district is only included in the Schedule Area debarring the other three newly
constituted districts. It is also mentioned similarly in case of Ganjam district.
h) But actually after bifurcation of Ganjam district, R.Udayagiri Tahasil, Gumma
and Rayagada blocks are coming under the Paralakhemundi Tahasil of
Paralakhemundi sub-division come under the Gajapati district.
i) Only Surada tahasil except Gochha and Gajalbadi G.P.s of Ghumusar sub-
division is in the Ganjam district which is not within the TSP area but within the
Scheduled Area which is co-terminus to the TSP area.
Map 2: Scheduled Areas of Orissa
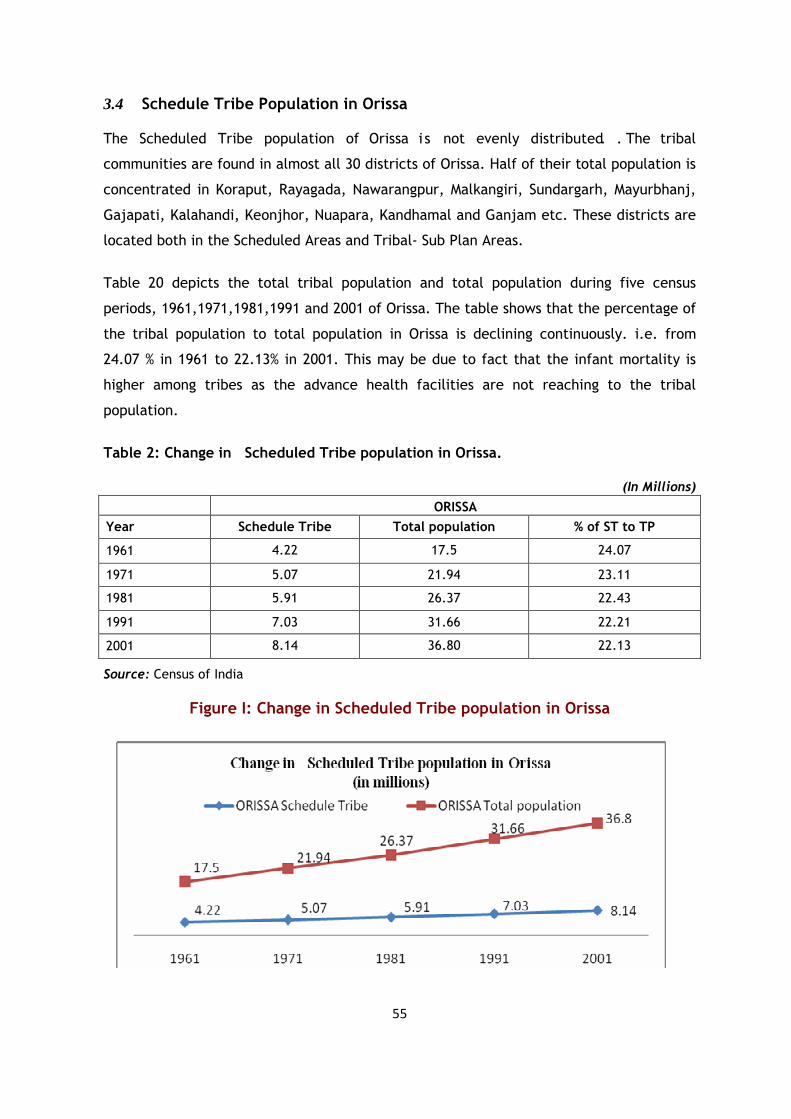
55
3.4 Schedule Tribe Population in Orissa The Scheduled Tribe population of Orissa i s not evenly distributed. . The tribal
communities are found in almost all 30 districts of Orissa. Half of their total population is
concentrated in Koraput, Rayagada, Nawarangpur, Malkangiri, Sundargarh, Mayurbhanj,
Gajapati, Kalahandi, Keonjhor, Nuapara, Kandhamal and Ganjam etc. These districts are
located both in the Scheduled Areas and Tribal- Sub Plan Areas.
Table 20 depicts the total tribal population and total population during five census
periods, 1961,1971,1981,1991 and 2001 of Orissa. The table shows that the percentage of
the tribal population to total population in Orissa is declining continuously. i.e. from
24.07 % in 1961 to 22.13% in 2001. This may be due to fact that the infant mortality is
higher among tribes as the advance health facilities are not reaching to the tribal
population.
Table 2: Change in Scheduled Tribe population in Orissa.
(In Millions)
ORISSA
Year Schedule Tribe Total population % of ST to TP
1961 4.22 17.5 24.07
1971 5.07 21.94 23.11
1981 5.91 26.37 22.43
1991 7.03 31.66 22.21
2001 8.14 36.80 22.13
Source: Census of India
Figure I: Change in Scheduled Tribe population in Orissa
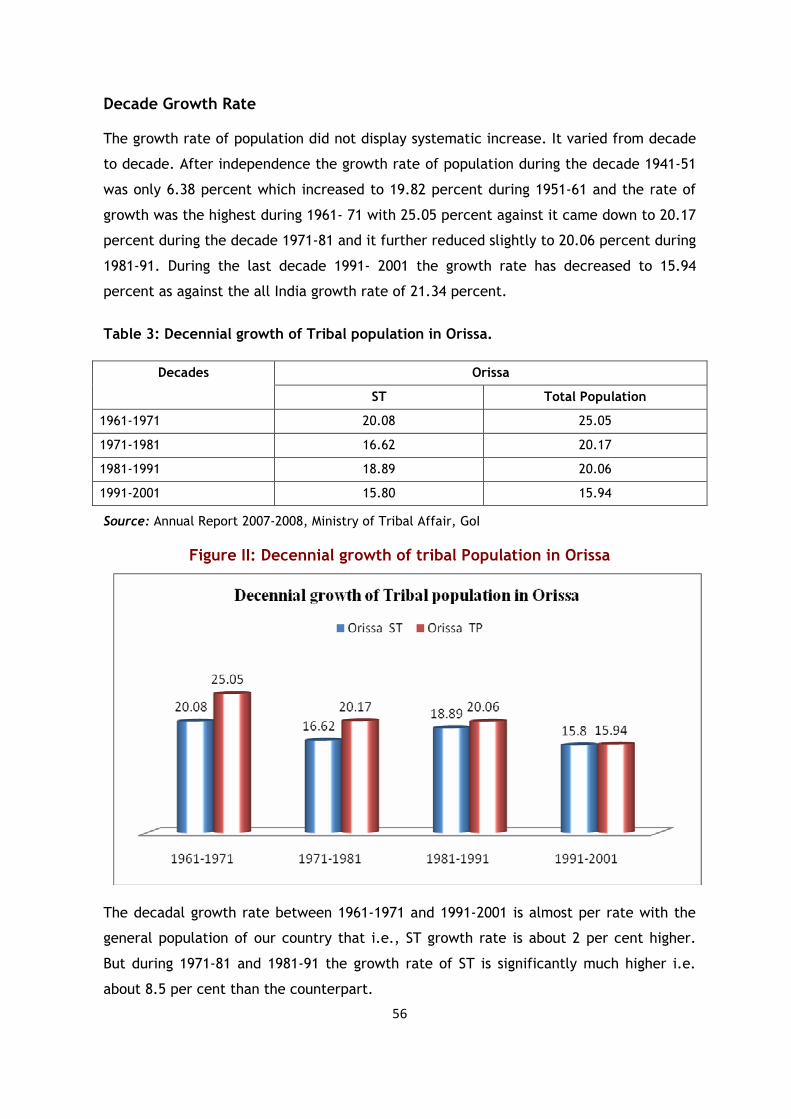
56
Decade Growth Rate The growth rate of population did not display systematic increase. It varied from decade
to decade. After independence the growth rate of population during the decade 1941-51
was only 6.38 percent which increased to 19.82 percent during 1951-61 and the rate of
growth was the highest during 1961- 71 with 25.05 percent against it came down to 20.17
percent during the decade 1971-81 and it further reduced slightly to 20.06 percent during
1981-91. During the last decade 1991- 2001 the growth rate has decreased to 15.94
percent as against the all India growth rate of 21.34 percent.
Table 3: Decennial growth of Tribal population in Orissa.
Orissa Decades
ST Total Population
1961-1971 20.08 25.05
1971-1981 16.62 20.17
1981-1991 18.89 20.06
1991-2001 15.80 15.94
Source: Annual Report 2007-2008, Ministry of Tribal Affair, GoI
Figure II: Decennial growth of tribal Population in Orissa
The decadal growth rate between 1961-1971 and 1991-2001 is almost per rate with the
general population of our country that i.e., ST growth rate is about 2 per cent higher.
But during 1971-81 and 1981-91 the growth rate of ST is significantly much higher i.e.
about 8.5 per cent than the counterpart.
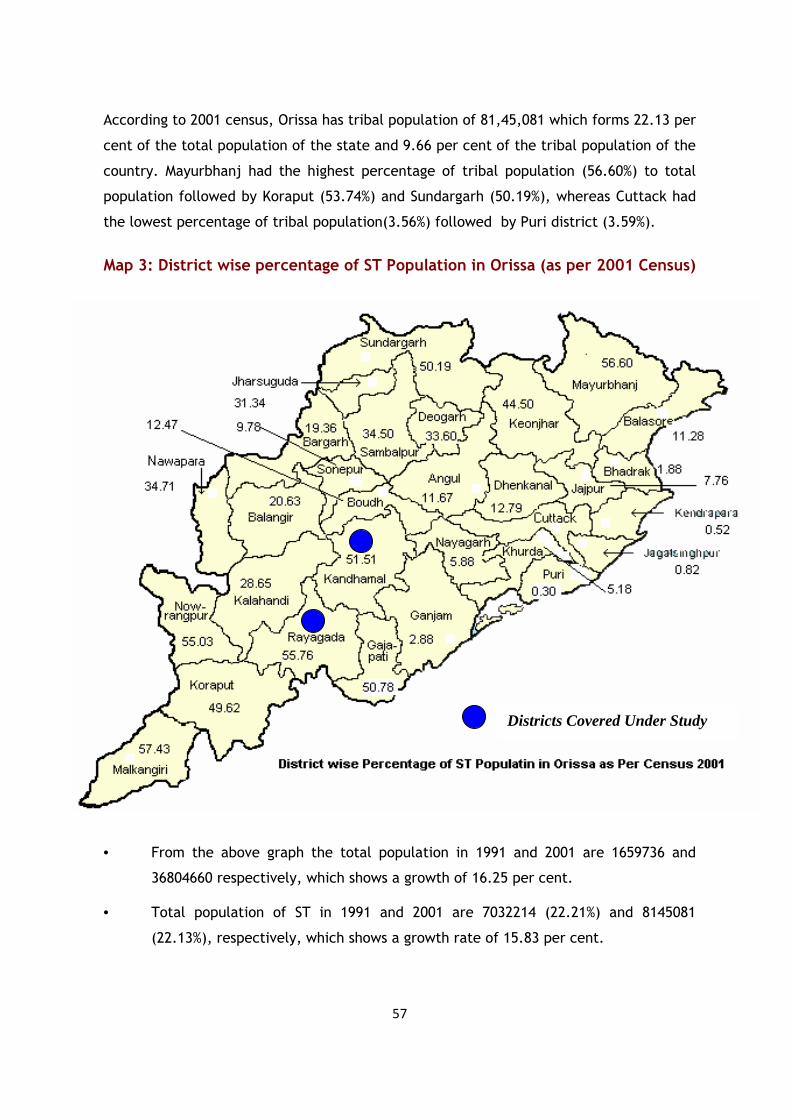
57
According to 2001 census, Orissa has tribal population of 81,45,081 which forms 22.13 per
cent of the total population of the state and 9.66 per cent of the tribal population of the
country. Mayurbhanj had the highest percentage of tribal population (56.60%) to total
population followed by Koraput (53.74%) and Sundargarh (50.19%), whereas Cuttack had
the lowest percentage of tribal population(3.56%) followed by Puri district (3.59%).
Map 3: District wise percentage of ST Population in Orissa (as per 2001 Census)
• From the above graph the total population in 1991 and 2001 are 1659736 and
36804660 respectively, which shows a growth of 16.25 per cent.
• Total population of ST in 1991 and 2001 are 7032214 (22.21%) and 8145081
(22.13%), respectively, which shows a growth rate of 15.83 per cent.
Districts Covered Under Study
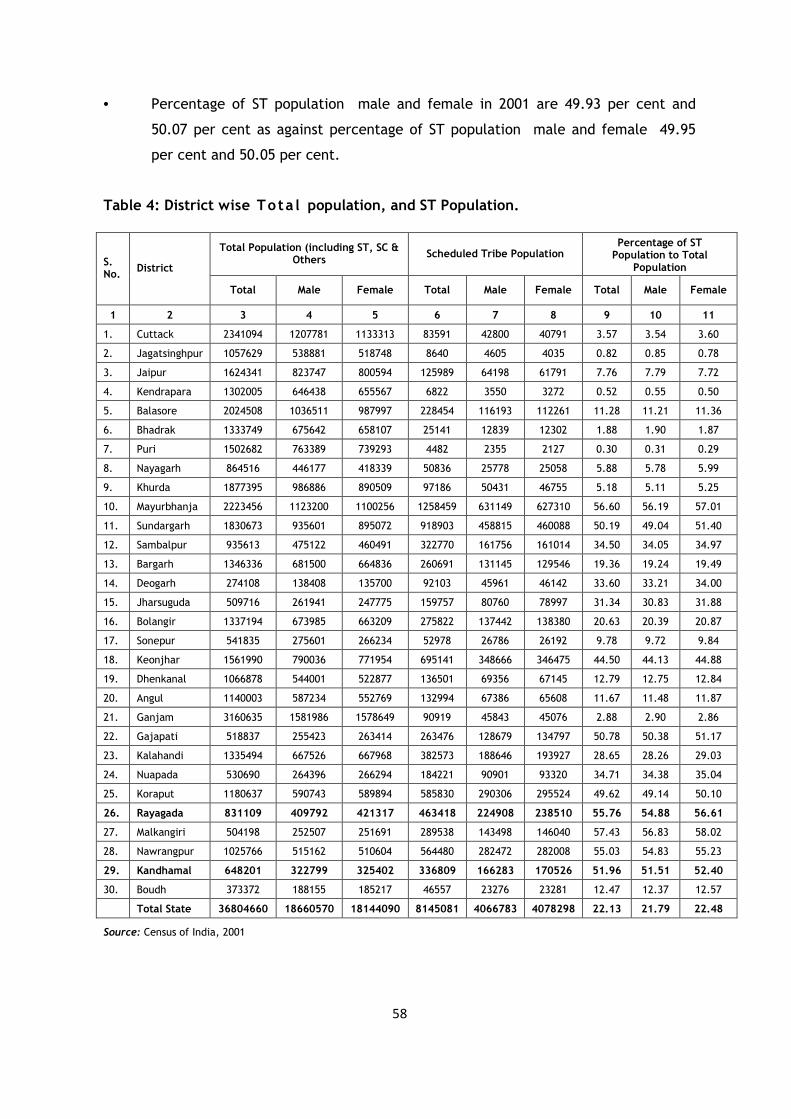
58
• Percentage of ST population male and female in 2001 are 49.93 per cent and
50.07 per cent as against percentage of ST population male and female 49.95
per cent and 50.05 per cent.
Table 4: District wise Tota l population, and ST Population.
Total Population (including ST, SC & Others
Scheduled Tribe Population Percentage of ST
Population to Total Population
S. No.
District
Total Male Female Total Male Female Total Male Female
1 2 3 4 5 6 7 8 9 10 11
1. Cuttack 2341094 1207781 1133313 83591 42800 40791 3.57 3.54 3.60
2. Jagatsinghpur 1057629 538881 518748 8640 4605 4035 0.82 0.85 0.78
3. Jaipur 1624341 823747 800594 125989 64198 61791 7.76 7.79 7.72
4. Kendrapara 1302005 646438 655567 6822 3550 3272 0.52 0.55 0.50
5. Balasore 2024508 1036511 987997 228454 116193 112261 11.28 11.21 11.36
6. Bhadrak 1333749 675642 658107 25141 12839 12302 1.88 1.90 1.87
7. Puri 1502682 763389 739293 4482 2355 2127 0.30 0.31 0.29
8. Nayagarh 864516 446177 418339 50836 25778 25058 5.88 5.78 5.99
9. Khurda 1877395 986886 890509 97186 50431 46755 5.18 5.11 5.25
10. Mayurbhanja 2223456 1123200 1100256 1258459 631149 627310 56.60 56.19 57.01
11. Sundargarh 1830673 935601 895072 918903 458815 460088 50.19 49.04 51.40
12. Sambalpur 935613 475122 460491 322770 161756 161014 34.50 34.05 34.97
13. Bargarh 1346336 681500 664836 260691 131145 129546 19.36 19.24 19.49
14. Deogarh 274108 138408 135700 92103 45961 46142 33.60 33.21 34.00
15. Jharsuguda 509716 261941 247775 159757 80760 78997 31.34 30.83 31.88
16. Bolangir 1337194 673985 663209 275822 137442 138380 20.63 20.39 20.87
17. Sonepur 541835 275601 266234 52978 26786 26192 9.78 9.72 9.84
18. Keonjhar 1561990 790036 771954 695141 348666 346475 44.50 44.13 44.88
19. Dhenkanal 1066878 544001 522877 136501 69356 67145 12.79 12.75 12.84
20. Angul 1140003 587234 552769 132994 67386 65608 11.67 11.48 11.87
21. Ganjam 3160635 1581986 1578649 90919 45843 45076 2.88 2.90 2.86
22. Gajapati 518837 255423 263414 263476 128679 134797 50.78 50.38 51.17
23. Kalahandi 1335494 667526 667968 382573 188646 193927 28.65 28.26 29.03
24. Nuapada 530690 264396 266294 184221 90901 93320 34.71 34.38 35.04
25. Koraput 1180637 590743 589894 585830 290306 295524 49.62 49.14 50.10
26. Rayagada 831109 409792 421317 463418 224908 238510 55.76 54.88 56.61
27. Malkangiri 504198 252507 251691 289538 143498 146040 57.43 56.83 58.02
28. Nawrangpur 1025766 515162 510604 564480 282472 282008 55.03 54.83 55.23
29. Kandhamal 648201 322799 325402 336809 166283 170526 51.96 51.51 52.40
30. Boudh 373372 188155 185217 46557 23276 23281 12.47 12.37 12.57
Total State 36804660 18660570 18144090 8145081 4066783 4078298 22.13 21.79 22.48
Source: Census of India, 2001
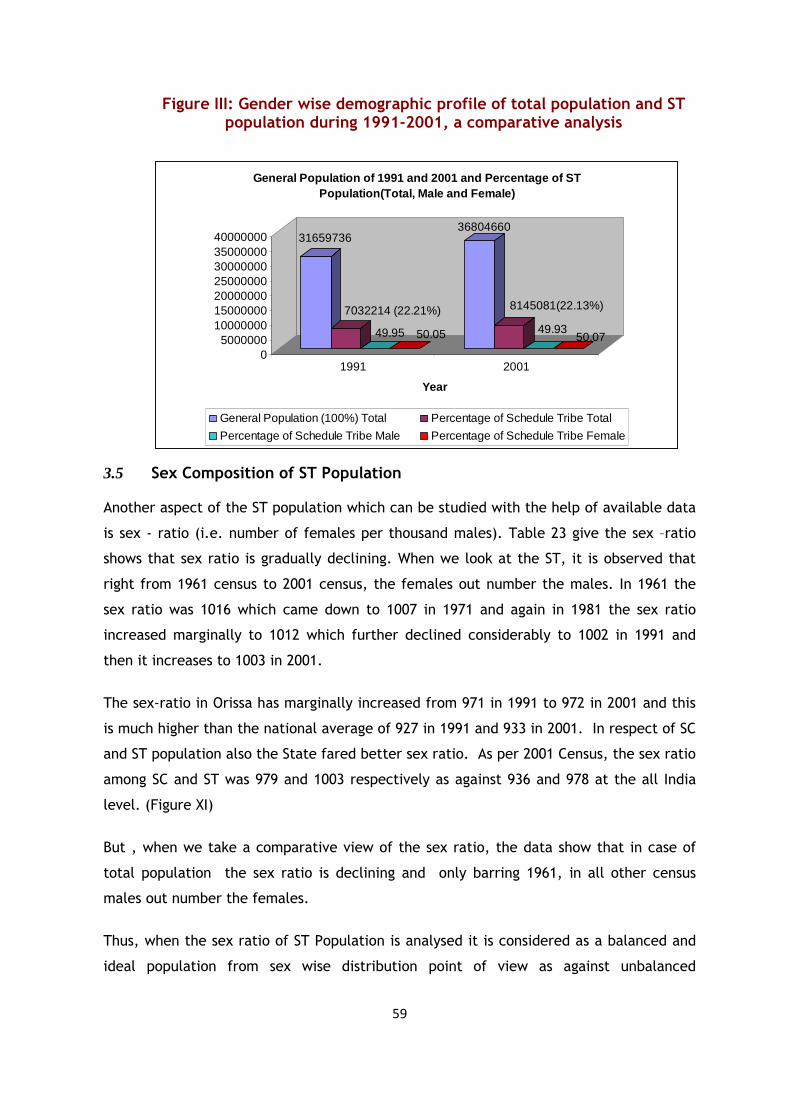
59
31659736
7032214 (22.21%)
49.95 50.05
36804660
8145081(22.13%)
49.9350.07
05000000
10000000150000002000000025000000300000003500000040000000
1991 2001
Year
General Population of 1991 and 2001 and Percentage of ST Population(Total, Male and Female)
General Population (100%) Total Percentage of Schedule Tribe Total
Percentage of Schedule Tribe Male Percentage of Schedule Tribe Female
Figure III: Gender wise demographic profile of total population and ST population during 1991-2001, a comparative analysis
3.5 Sex Composition of ST Population Another aspect of the ST population which can be studied with the help of available data
is sex - ratio (i.e. number of females per thousand males). Table 23 give the sex –ratio
shows that sex ratio is gradually declining. When we look at the ST, it is observed that
right from 1961 census to 2001 census, the females out number the males. In 1961 the
sex ratio was 1016 which came down to 1007 in 1971 and again in 1981 the sex ratio
increased marginally to 1012 which further declined considerably to 1002 in 1991 and
then it increases to 1003 in 2001.
The sex-ratio in Orissa has marginally increased from 971 in 1991 to 972 in 2001 and this
is much higher than the national average of 927 in 1991 and 933 in 2001. In respect of SC
and ST population also the State fared better sex ratio. As per 2001 Census, the sex ratio
among SC and ST was 979 and 1003 respectively as against 936 and 978 at the all India
level. (Figure XI)
But , when we take a comparative view of the sex ratio, the data show that in case of
total population the sex ratio is declining and only barring 1961, in all other census
males out number the females.
Thus, when the sex ratio of ST Population is analysed it is considered as a balanced and
ideal population from sex wise distribution point of view as against unbalanced
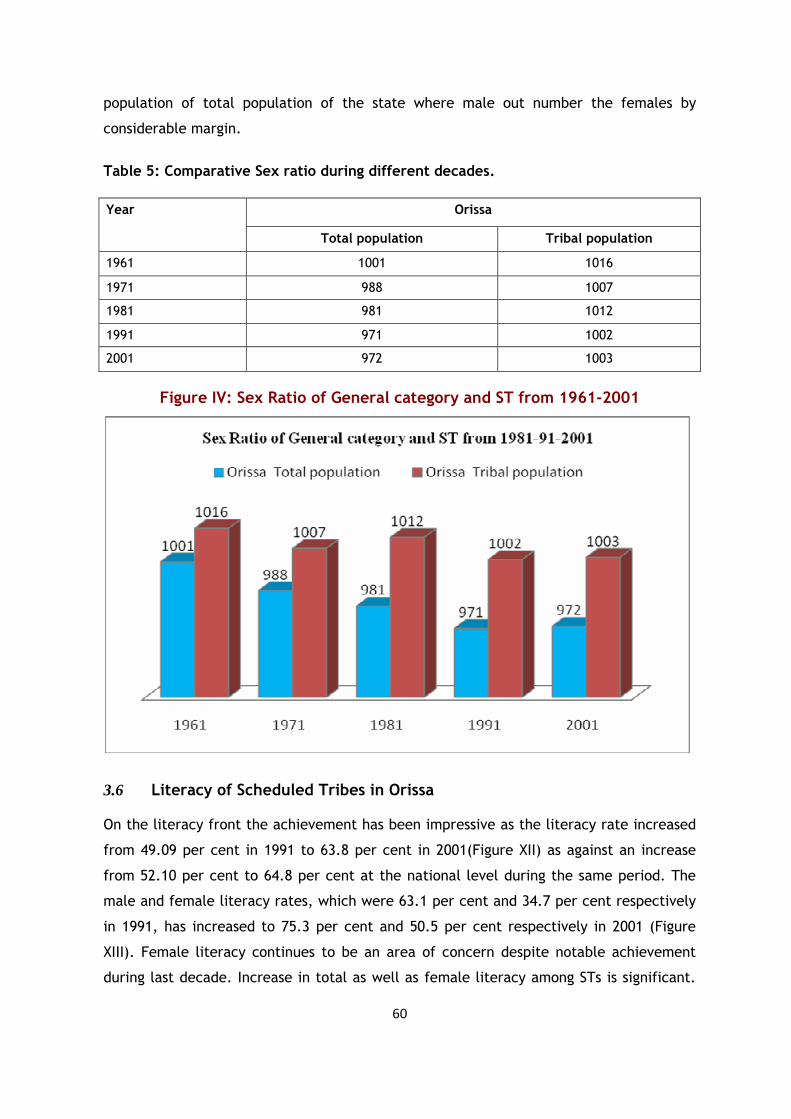
60
population of total population of the state where male out number the females by
considerable margin.
Table 5: Comparative Sex ratio during different decades.
Orissa Year
Total population Tribal population
1961 1001 1016
1971 988 1007
1981 981 1012
1991 971 1002
2001 972 1003
Figure IV: Sex Ratio of General category and ST from 1961-2001
3.6 Literacy of Scheduled Tribes in Orissa On the literacy front the achievement has been impressive as the literacy rate increased
from 49.09 per cent in 1991 to 63.8 per cent in 2001(Figure XII) as against an increase
from 52.10 per cent to 64.8 per cent at the national level during the same period. The
male and female literacy rates, which were 63.1 per cent and 34.7 per cent respectively
in 1991, has increased to 75.3 per cent and 50.5 per cent respectively in 2001 (Figure
XIII). Female literacy continues to be an area of concern despite notable achievement
during last decade. Increase in total as well as female literacy among STs is significant.
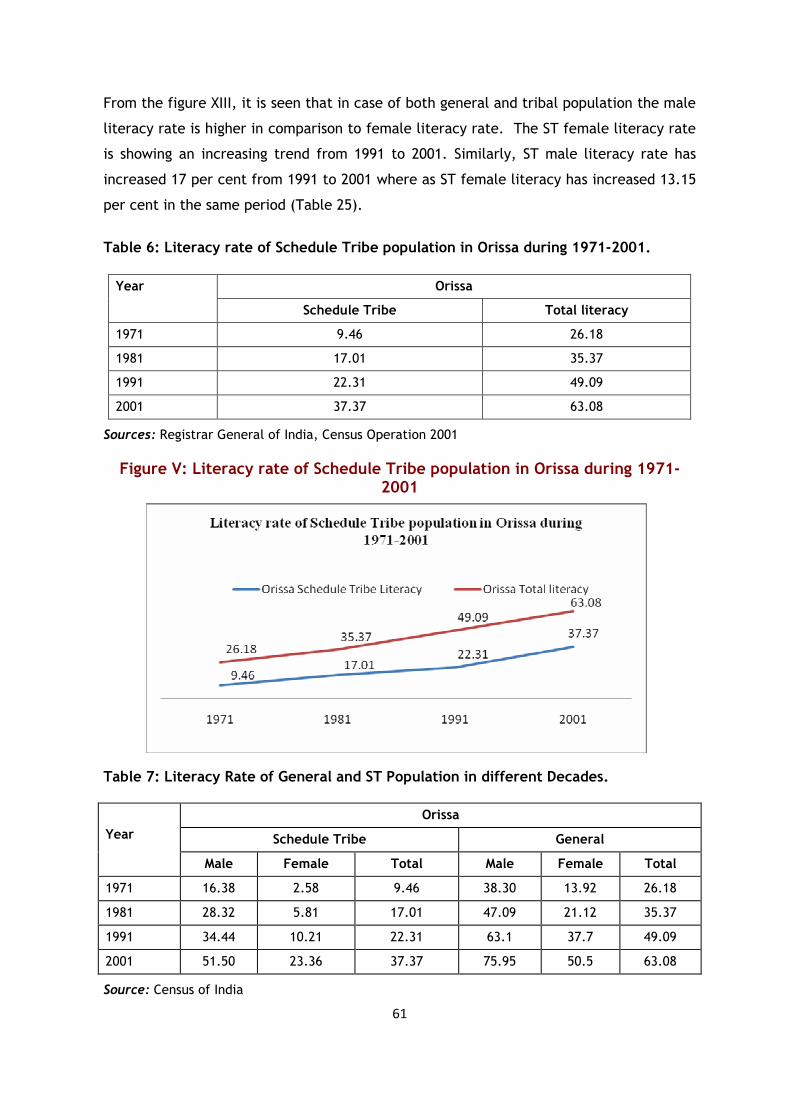
61
From the figure XIII, it is seen that in case of both general and tribal population the male
literacy rate is higher in comparison to female literacy rate. The ST female literacy rate
is showing an increasing trend from 1991 to 2001. Similarly, ST male literacy rate has
increased 17 per cent from 1991 to 2001 where as ST female literacy has increased 13.15
per cent in the same period (Table 25).
Table 6: Literacy rate of Schedule Tribe population in Orissa during 1971-2001.
Orissa Year
Schedule Tribe Total literacy
1971 9.46 26.18
1981 17.01 35.37
1991 22.31 49.09
2001 37.37 63.08
Sources: Registrar General of India, Census Operation 2001
Figure V: Literacy rate of Schedule Tribe population in Orissa during 1971-2001
Table 7: Literacy Rate of General and ST Population in different Decades.
Orissa
Schedule Tribe General
Year
Male Female Total Male Female Total
1971 16.38 2.58 9.46 38.30 13.92 26.18
1981 28.32 5.81 17.01 47.09 21.12 35.37
1991 34.44 10.21 22.31 63.1 37.7 49.09
2001 51.50 23.36 37.37 75.95 50.5 63.08
Source: Census of India
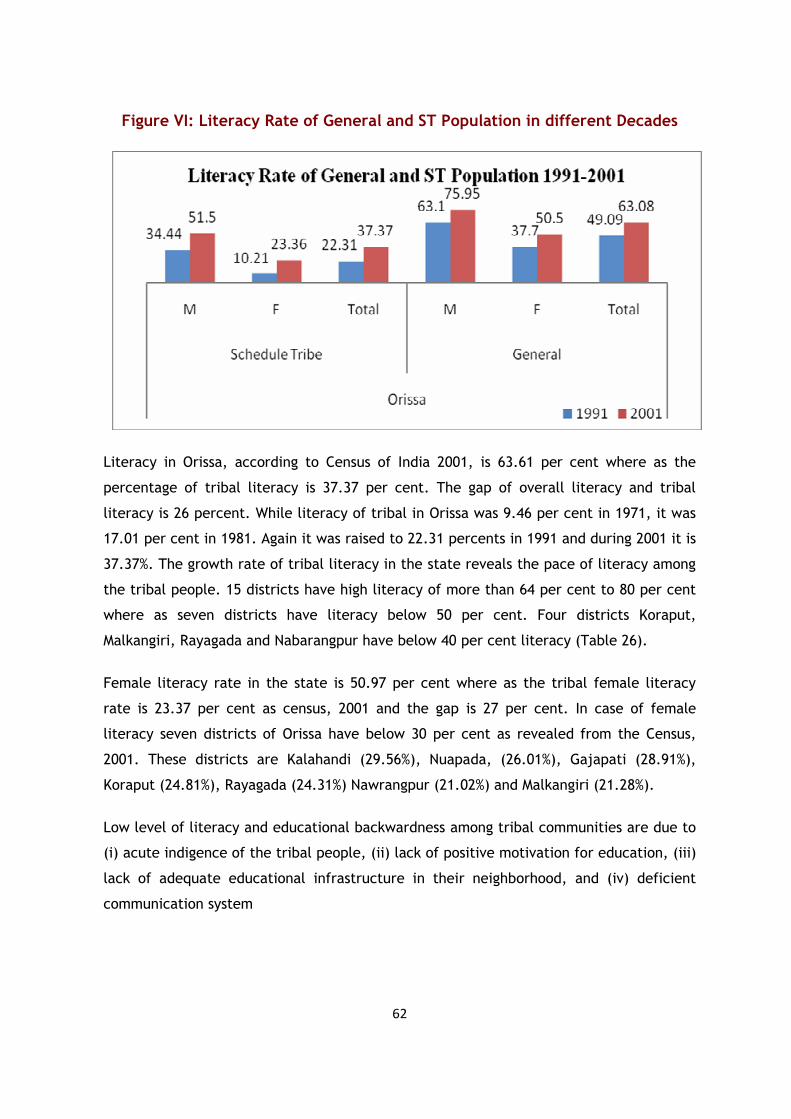
62
Figure VI: Literacy Rate of General and ST Population in different Decades
Literacy in Orissa, according to Census of India 2001, is 63.61 per cent where as the
percentage of tribal literacy is 37.37 per cent. The gap of overall literacy and tribal
literacy is 26 percent. While literacy of tribal in Orissa was 9.46 per cent in 1971, it was
17.01 per cent in 1981. Again it was raised to 22.31 percents in 1991 and during 2001 it is
37.37%. The growth rate of tribal literacy in the state reveals the pace of literacy among
the tribal people. 15 districts have high literacy of more than 64 per cent to 80 per cent
where as seven districts have literacy below 50 per cent. Four districts Koraput,
Malkangiri, Rayagada and Nabarangpur have below 40 per cent literacy (Table 26).
Female literacy rate in the state is 50.97 per cent where as the tribal female literacy
rate is 23.37 per cent as census, 2001 and the gap is 27 per cent. In case of female
literacy seven districts of Orissa have below 30 per cent as revealed from the Census,
2001. These districts are Kalahandi (29.56%), Nuapada, (26.01%), Gajapati (28.91%),
Koraput (24.81%), Rayagada (24.31%) Nawrangpur (21.02%) and Malkangiri (21.28%).
Low level of literacy and educational backwardness among tribal communities are due to
(i) acute indigence of the tribal people, (ii) lack of positive motivation for education, (iii)
lack of adequate educational infrastructure in their neighborhood, and (iv) deficient
communication system
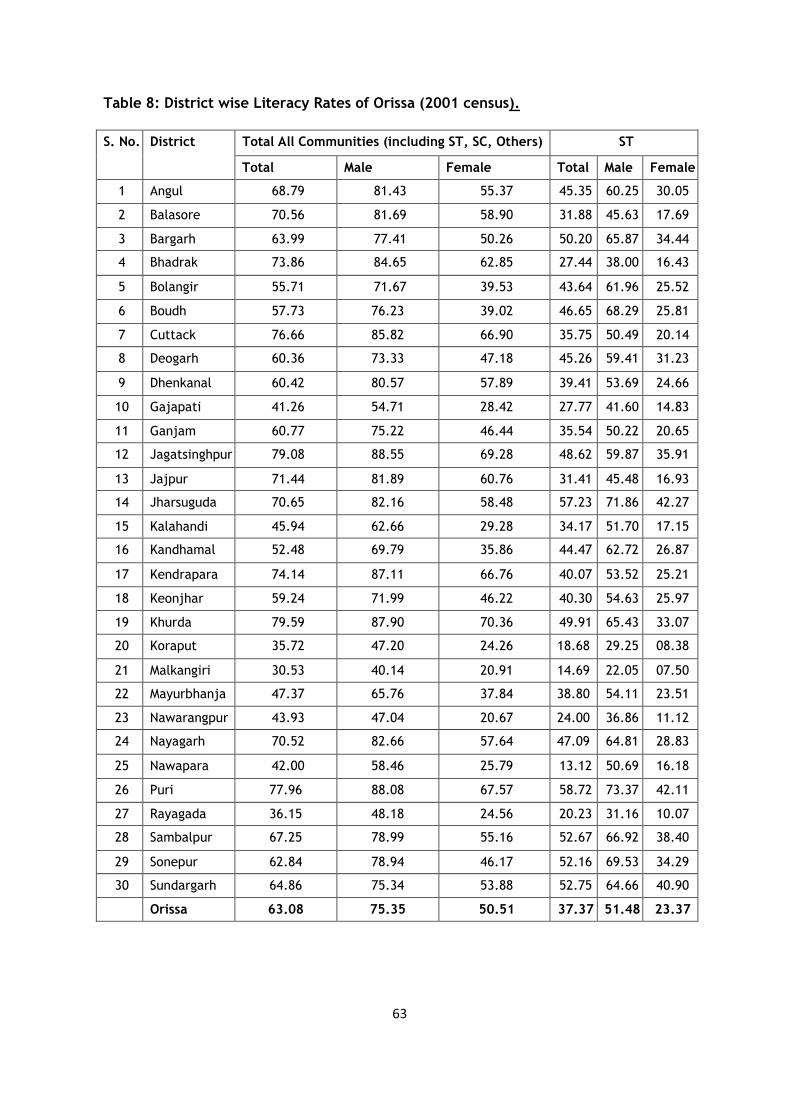
63
Table 8: District wise Literacy Rates of Orissa (2001 census).
Total All Communities (including ST, SC, Others) ST S. No. District
Total Male Female Total Male Female
1 Angul 68.79 81.43 55.37 45.35 60.25 30.05
2 Balasore 70.56 81.69 58.90 31.88 45.63 17.69
3 Bargarh 63.99 77.41 50.26 50.20 65.87 34.44
4 Bhadrak 73.86 84.65 62.85 27.44 38.00 16.43
5 Bolangir 55.71 71.67 39.53 43.64 61.96 25.52
6 Boudh 57.73 76.23 39.02 46.65 68.29 25.81
7 Cuttack 76.66 85.82 66.90 35.75 50.49 20.14
8 Deogarh 60.36 73.33 47.18 45.26 59.41 31.23
9 Dhenkanal 60.42 80.57 57.89 39.41 53.69 24.66
10 Gajapati 41.26 54.71 28.42 27.77 41.60 14.83
11 Ganjam 60.77 75.22 46.44 35.54 50.22 20.65
12 Jagatsinghpur 79.08 88.55 69.28 48.62 59.87 35.91
13 Jajpur 71.44 81.89 60.76 31.41 45.48 16.93
14 Jharsuguda 70.65 82.16 58.48 57.23 71.86 42.27
15 Kalahandi 45.94 62.66 29.28 34.17 51.70 17.15
16 Kandhamal 52.48 69.79 35.86 44.47 62.72 26.87
17 Kendrapara 74.14 87.11 66.76 40.07 53.52 25.21
18 Keonjhar 59.24 71.99 46.22 40.30 54.63 25.97
19 Khurda 79.59 87.90 70.36 49.91 65.43 33.07
20 Koraput 35.72 47.20 24.26 18.68 29.25 08.38
21 Malkangiri 30.53 40.14 20.91 14.69 22.05 07.50
22 Mayurbhanja 47.37 65.76 37.84 38.80 54.11 23.51
23 Nawarangpur 43.93 47.04 20.67 24.00 36.86 11.12
24 Nayagarh 70.52 82.66 57.64 47.09 64.81 28.83
25 Nawapara 42.00 58.46 25.79 13.12 50.69 16.18
26 Puri 77.96 88.08 67.57 58.72 73.37 42.11
27 Rayagada 36.15 48.18 24.56 20.23 31.16 10.07
28 Sambalpur 67.25 78.99 55.16 52.67 66.92 38.40
29 Sonepur 62.84 78.94 46.17 52.16 69.53 34.29
30 Sundargarh 64.86 75.34 53.88 52.75 64.66 40.90
Orissa 63.08 75.35 50.51 37.37 51.48 23.37
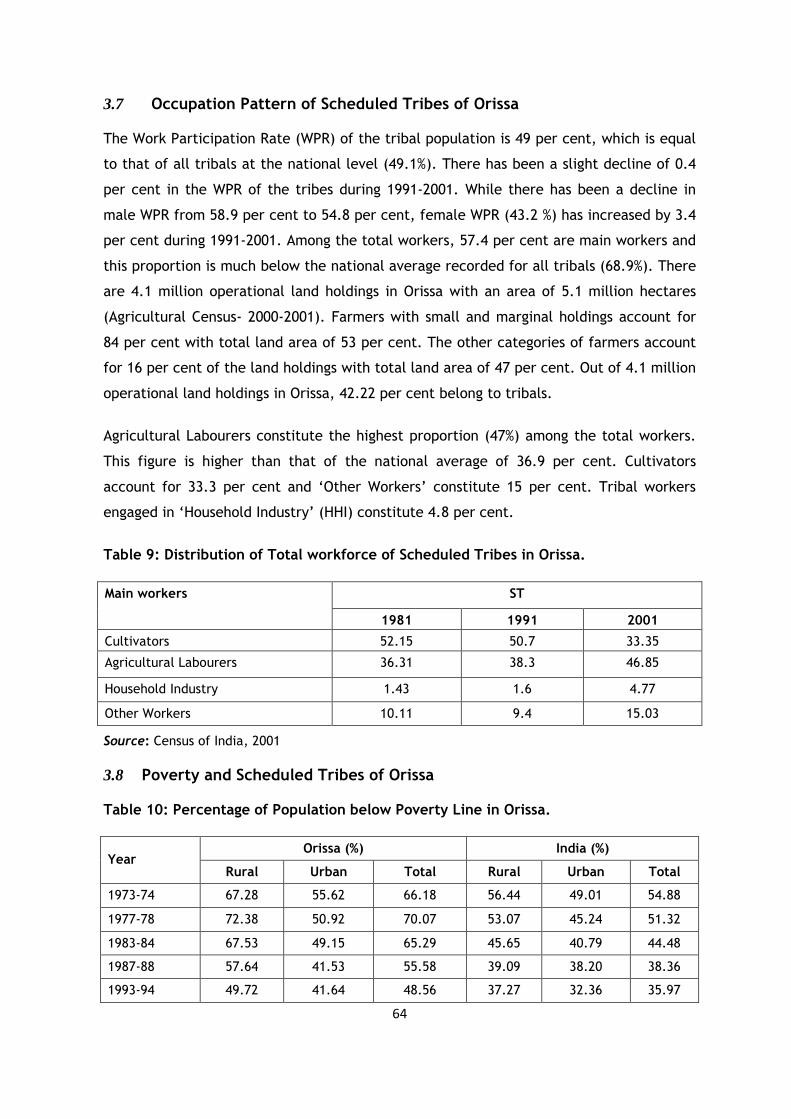
64
3.7 Occupation Pattern of Scheduled Tribes of Orissa The Work Participation Rate (WPR) of the tribal population is 49 per cent, which is equal
to that of all tribals at the national level (49.1%). There has been a slight decline of 0.4
per cent in the WPR of the tribes during 1991-2001. While there has been a decline in
male WPR from 58.9 per cent to 54.8 per cent, female WPR (43.2 %) has increased by 3.4
per cent during 1991-2001. Among the total workers, 57.4 per cent are main workers and
this proportion is much below the national average recorded for all tribals (68.9%). There
are 4.1 million operational land holdings in Orissa with an area of 5.1 million hectares
(Agricultural Census- 2000-2001). Farmers with small and marginal holdings account for
84 per cent with total land area of 53 per cent. The other categories of farmers account
for 16 per cent of the land holdings with total land area of 47 per cent. Out of 4.1 million
operational land holdings in Orissa, 42.22 per cent belong to tribals.
Agricultural Labourers constitute the highest proportion (47%) among the total workers.
This figure is higher than that of the national average of 36.9 per cent. Cultivators
account for 33.3 per cent and ‘Other Workers’ constitute 15 per cent. Tribal workers
engaged in ‘Household Industry’ (HHI) constitute 4.8 per cent.
Table 9: Distribution of Total workforce of Scheduled Tribes in Orissa.
ST Main workers
1981 1991 2001
Cultivators 52.15 50.7 33.35
Agricultural Labourers 36.31 38.3 46.85
Household Industry 1.43 1.6 4.77
Other Workers 10.11 9.4 15.03
Source: Census of India, 2001
3.8 Poverty and Scheduled Tribes of Orissa Table 10: Percentage of Population below Poverty Line in Orissa.
Orissa (%) India (%) Year
Rural Urban Total Rural Urban Total
1973-74 67.28 55.62 66.18 56.44 49.01 54.88
1977-78 72.38 50.92 70.07 53.07 45.24 51.32
1983-84 67.53 49.15 65.29 45.65 40.79 44.48
1987-88 57.64 41.53 55.58 39.09 38.20 38.36
1993-94 49.72 41.64 48.56 37.27 32.36 35.97
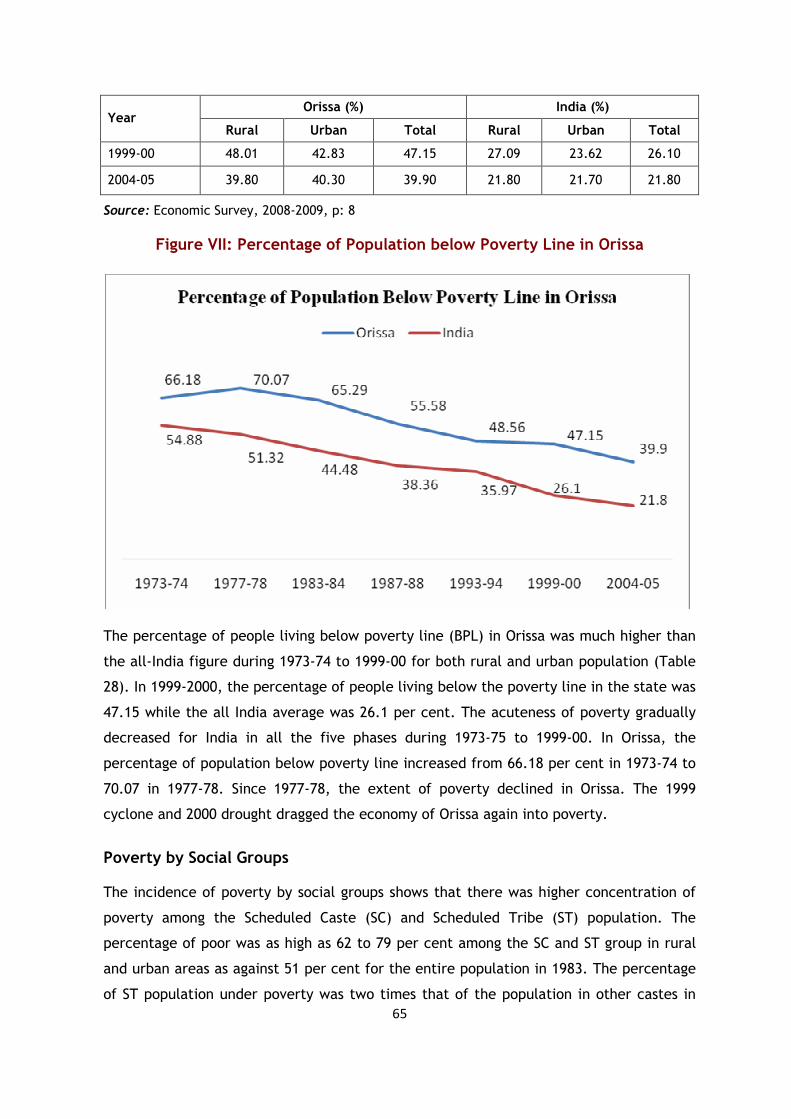
65
Orissa (%) India (%) Year
Rural Urban Total Rural Urban Total
1999-00 48.01 42.83 47.15 27.09 23.62 26.10
2004-05 39.80 40.30 39.90 21.80 21.70 21.80
Source: Economic Survey, 2008-2009, p: 8
Figure VII: Percentage of Population below Poverty Line in Orissa
The percentage of people living below poverty line (BPL) in Orissa was much higher than
the all-India figure during 1973-74 to 1999-00 for both rural and urban population (Table
28). In 1999-2000, the percentage of people living below the poverty line in the state was
47.15 while the all India average was 26.1 per cent. The acuteness of poverty gradually
decreased for India in all the five phases during 1973-75 to 1999-00. In Orissa, the
percentage of population below poverty line increased from 66.18 per cent in 1973-74 to
70.07 in 1977-78. Since 1977-78, the extent of poverty declined in Orissa. The 1999
cyclone and 2000 drought dragged the economy of Orissa again into poverty.
Poverty by Social Groups The incidence of poverty by social groups shows that there was higher concentration of
poverty among the Scheduled Caste (SC) and Scheduled Tribe (ST) population. The
percentage of poor was as high as 62 to 79 per cent among the SC and ST group in rural
and urban areas as against 51 per cent for the entire population in 1983. The percentage
of ST population under poverty was two times that of the population in other castes in
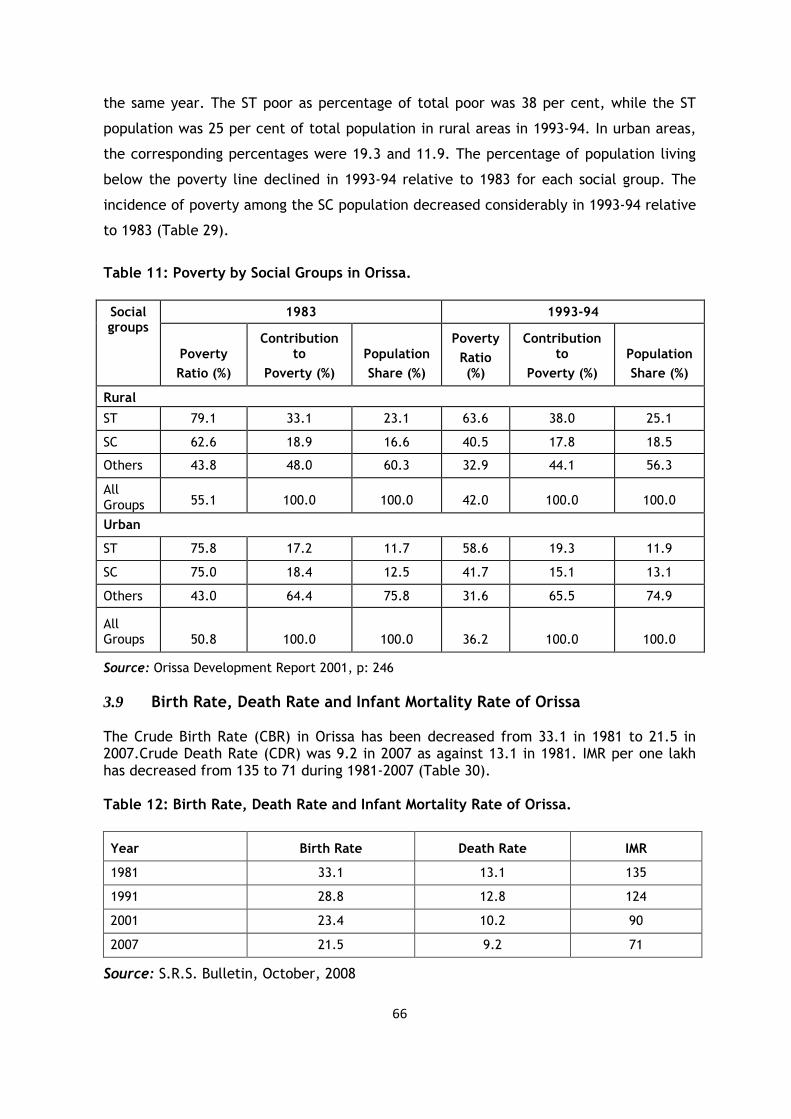
66
the same year. The ST poor as percentage of total poor was 38 per cent, while the ST
population was 25 per cent of total population in rural areas in 1993-94. In urban areas,
the corresponding percentages were 19.3 and 11.9. The percentage of population living
below the poverty line declined in 1993-94 relative to 1983 for each social group. The
incidence of poverty among the SC population decreased considerably in 1993-94 relative
to 1983 (Table 29).
Table 11: Poverty by Social Groups in Orissa.
1983 1993-94 Social groups
Poverty
Ratio (%)
Contribution to
Poverty (%)
Population
Share (%)
Poverty
Ratio (%)
Contribution to
Poverty (%)
Population
Share (%)
Rural
ST 79.1 33.1 23.1 63.6 38.0 25.1
SC 62.6 18.9 16.6 40.5 17.8 18.5
Others 43.8 48.0 60.3 32.9 44.1 56.3
All Groups 55.1 100.0 100.0 42.0 100.0 100.0
Urban
ST 75.8 17.2 11.7 58.6 19.3 11.9
SC 75.0 18.4 12.5 41.7 15.1 13.1
Others 43.0 64.4 75.8 31.6 65.5 74.9
All Groups 50.8 100.0 100.0 36.2 100.0 100.0
Source: Orissa Development Report 2001, p: 246
3.9 Birth Rate, Death Rate and Infant Mortality Rate of Orissa The Crude Birth Rate (CBR) in Orissa has been decreased from 33.1 in 1981 to 21.5 in 2007.Crude Death Rate (CDR) was 9.2 in 2007 as against 13.1 in 1981. IMR per one lakh has decreased from 135 to 71 during 1981-2007 (Table 30). Table 12: Birth Rate, Death Rate and Infant Mortality Rate of Orissa.
Year Birth Rate Death Rate IMR
1981 33.1 13.1 135
1991 28.8 12.8 124
2001 23.4 10.2 90
2007 21.5 9.2 71
Source: S.R.S. Bulletin, October, 2008
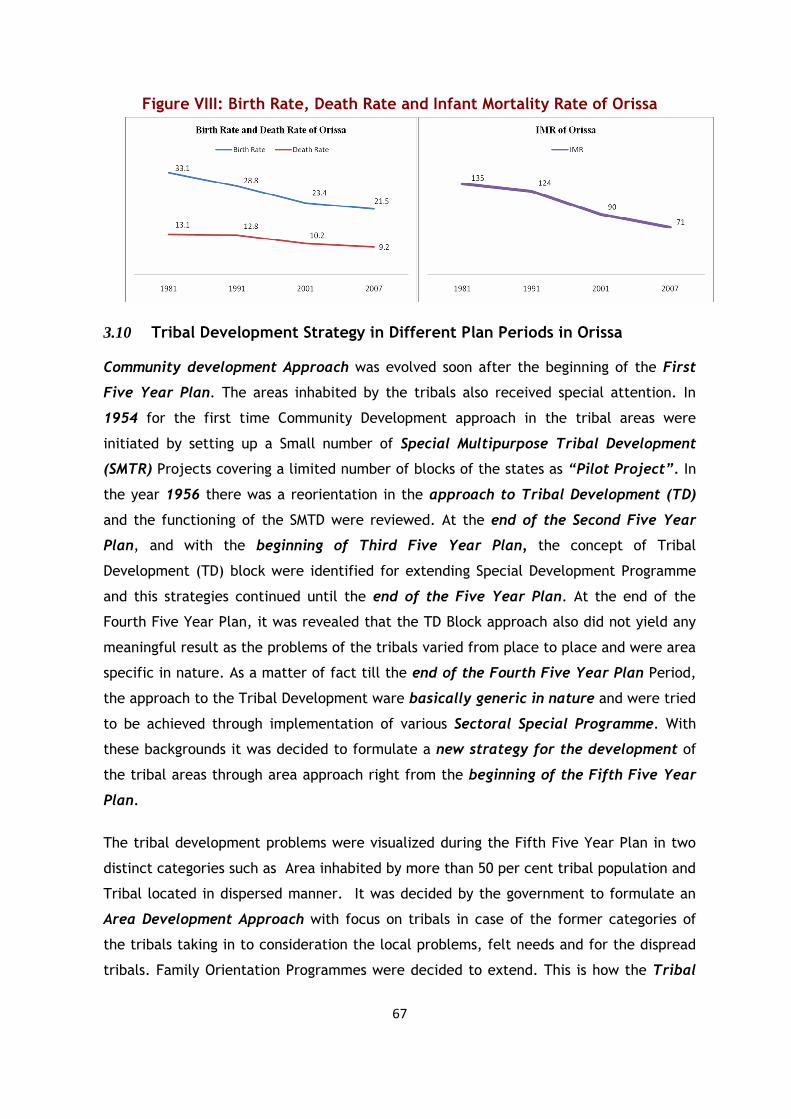
67
Figure VIII: Birth Rate, Death Rate and Infant Mortality Rate of Orissa
3.10 Tribal Development Strategy in Different Plan Periods in Orissa Community development Approach was evolved soon after the beginning of the First
Five Year Plan. The areas inhabited by the tribals also received special attention. In
1954 for the first time Community Development approach in the tribal areas were
initiated by setting up a Small number of Special Multipurpose Tribal Development
(SMTR) Projects covering a limited number of blocks of the states as “Pilot Project”. In
the year 1956 there was a reorientation in the approach to Tribal Development (TD)
and the functioning of the SMTD were reviewed. At the end of the Second Five Year
Plan, and with the beginning of Third Five Year Plan, the concept of Tribal
Development (TD) block were identified for extending Special Development Programme
and this strategies continued until the end of the Five Year Plan. At the end of the
Fourth Five Year Plan, it was revealed that the TD Block approach also did not yield any
meaningful result as the problems of the tribals varied from place to place and were area
specific in nature. As a matter of fact till the end of the Fourth Five Year Plan Period,
the approach to the Tribal Development ware basically generic in nature and were tried
to be achieved through implementation of various Sectoral Special Programme. With
these backgrounds it was decided to formulate a new strategy for the development of
the tribal areas through area approach right from the beginning of the Fifth Five Year
Plan.
The tribal development problems were visualized during the Fifth Five Year Plan in two
distinct categories such as Area inhabited by more than 50 per cent tribal population and
Tribal located in dispersed manner. It was decided by the government to formulate an
Area Development Approach with focus on tribals in case of the former categories of
the tribals taking in to consideration the local problems, felt needs and for the dispread
tribals. Family Orientation Programmes were decided to extend. This is how the Tribal
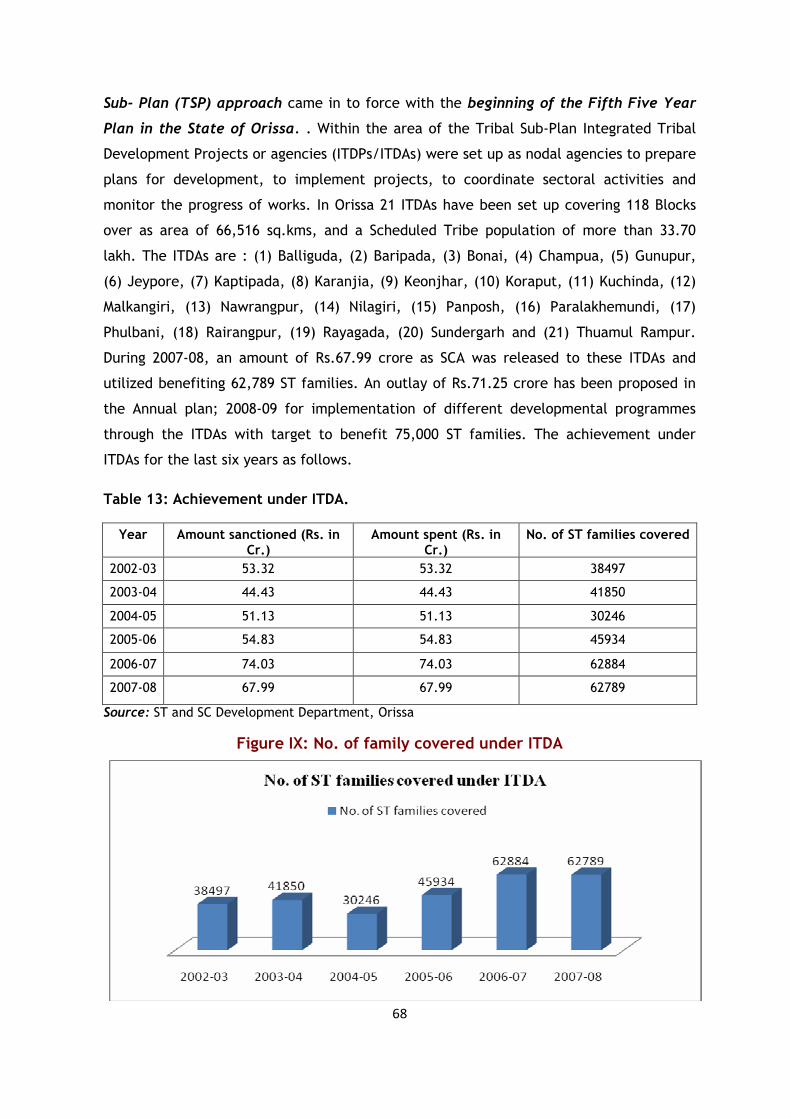
68
Sub- Plan (TSP) approach came in to force with the beginning of the Fifth Five Year
Plan in the State of Orissa. . Within the area of the Tribal Sub-Plan Integrated Tribal
Development Projects or agencies (ITDPs/ITDAs) were set up as nodal agencies to prepare
plans for development, to implement projects, to coordinate sectoral activities and
monitor the progress of works. In Orissa 21 ITDAs have been set up covering 118 Blocks
over as area of 66,516 sq.kms, and a Scheduled Tribe population of more than 33.70
lakh. The ITDAs are : (1) Balliguda, (2) Baripada, (3) Bonai, (4) Champua, (5) Gunupur,
(6) Jeypore, (7) Kaptipada, (8) Karanjia, (9) Keonjhar, (10) Koraput, (11) Kuchinda, (12)
Malkangiri, (13) Nawrangpur, (14) Nilagiri, (15) Panposh, (16) Paralakhemundi, (17)
Phulbani, (18) Rairangpur, (19) Rayagada, (20) Sundergarh and (21) Thuamul Rampur.
During 2007-08, an amount of Rs.67.99 crore as SCA was released to these ITDAs and
utilized benefiting 62,789 ST families. An outlay of Rs.71.25 crore has been proposed in
the Annual plan; 2008-09 for implementation of different developmental programmes
through the ITDAs with target to benefit 75,000 ST families. The achievement under
ITDAs for the last six years as follows.
Table 13: Achievement under ITDA.
Year Amount sanctioned (Rs. in Cr.)
Amount spent (Rs. in Cr.)
No. of ST families covered
2002-03 53.32 53.32 38497
2003-04 44.43 44.43 41850
2004-05 51.13 51.13 30246
2005-06 54.83 54.83 45934
2006-07 74.03 74.03 62884
2007-08 67.99 67.99 62789
Source: ST and SC Development Department, Orissa
Figure IX: No. of family covered under ITDA
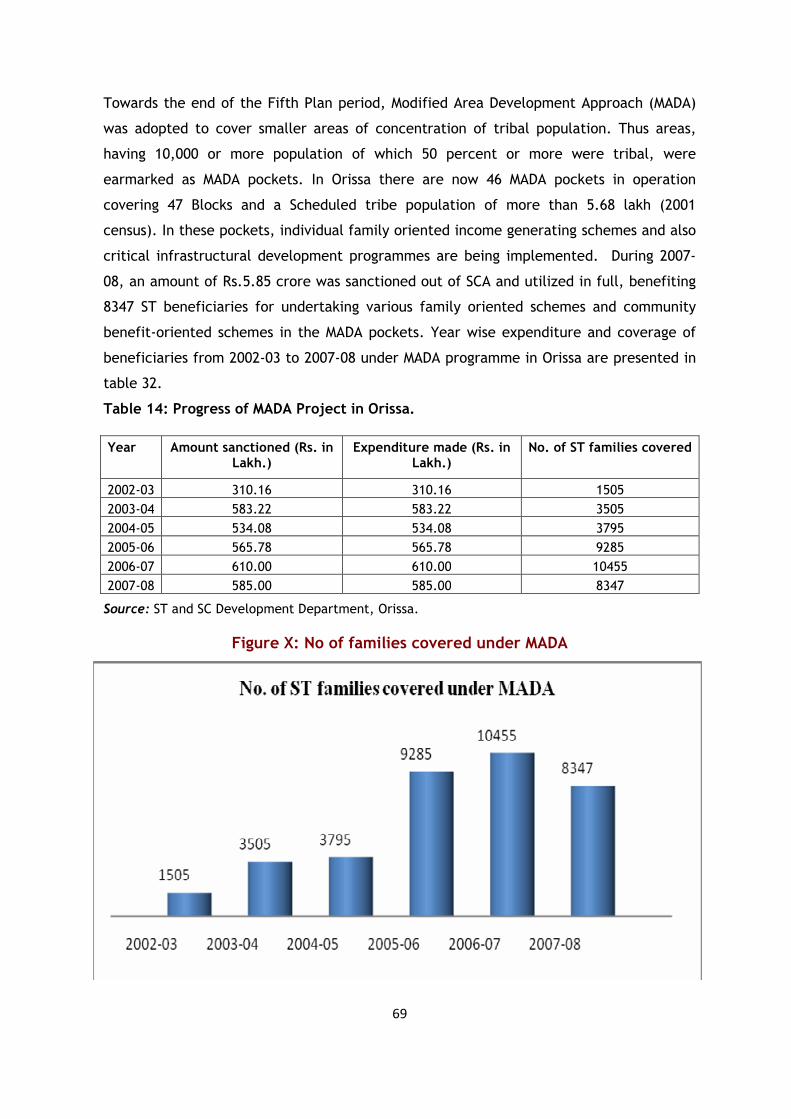
69
Towards the end of the Fifth Plan period, Modified Area Development Approach (MADA)
was adopted to cover smaller areas of concentration of tribal population. Thus areas,
having 10,000 or more population of which 50 percent or more were tribal, were
earmarked as MADA pockets. In Orissa there are now 46 MADA pockets in operation
covering 47 Blocks and a Scheduled tribe population of more than 5.68 lakh (2001
census). In these pockets, individual family oriented income generating schemes and also
critical infrastructural development programmes are being implemented. During 2007-
08, an amount of Rs.5.85 crore was sanctioned out of SCA and utilized in full, benefiting
8347 ST beneficiaries for undertaking various family oriented schemes and community
benefit-oriented schemes in the MADA pockets. Year wise expenditure and coverage of
beneficiaries from 2002-03 to 2007-08 under MADA programme in Orissa are presented in
table 32.
Table 14: Progress of MADA Project in Orissa.
Year Amount sanctioned (Rs. in Lakh.)
Expenditure made (Rs. in Lakh.)
No. of ST families covered
2002-03 310.16 310.16 1505
2003-04 583.22 583.22 3505
2004-05 534.08 534.08 3795
2005-06 565.78 565.78 9285
2006-07 610.00 610.00 10455
2007-08 585.00 585.00 8347
Source: ST and SC Development Department, Orissa.
Figure X: No of families covered under MADA
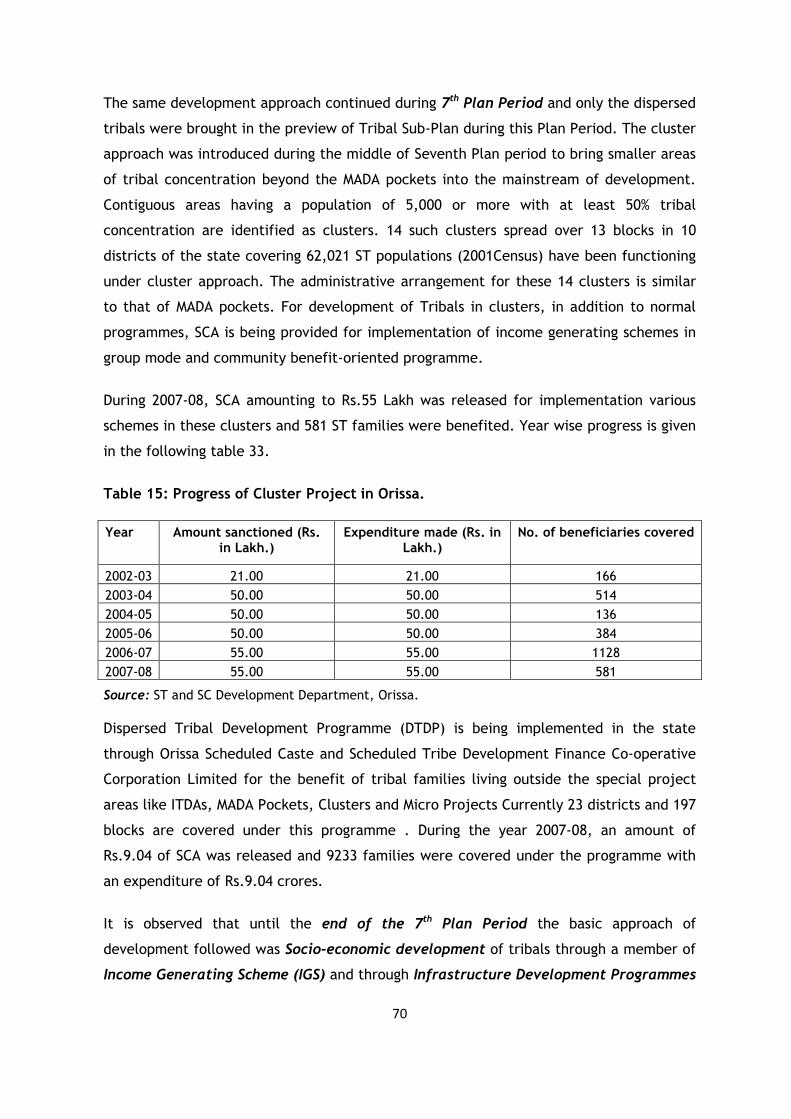
70
The same development approach continued during 7th Plan Period and only the dispersed
tribals were brought in the preview of Tribal Sub-Plan during this Plan Period. The cluster
approach was introduced during the middle of Seventh Plan period to bring smaller areas
of tribal concentration beyond the MADA pockets into the mainstream of development.
Contiguous areas having a population of 5,000 or more with at least 50% tribal
concentration are identified as clusters. 14 such clusters spread over 13 blocks in 10
districts of the state covering 62,021 ST populations (2001Census) have been functioning
under cluster approach. The administrative arrangement for these 14 clusters is similar
to that of MADA pockets. For development of Tribals in clusters, in addition to normal
programmes, SCA is being provided for implementation of income generating schemes in
group mode and community benefit-oriented programme.
During 2007-08, SCA amounting to Rs.55 Lakh was released for implementation various
schemes in these clusters and 581 ST families were benefited. Year wise progress is given
in the following table 33.
Table 15: Progress of Cluster Project in Orissa.
Year Amount sanctioned (Rs. in Lakh.)
Expenditure made (Rs. in Lakh.)
No. of beneficiaries covered
2002-03 21.00 21.00 166
2003-04 50.00 50.00 514
2004-05 50.00 50.00 136
2005-06 50.00 50.00 384
2006-07 55.00 55.00 1128
2007-08 55.00 55.00 581
Source: ST and SC Development Department, Orissa.
Dispersed Tribal Development Programme (DTDP) is being implemented in the state
through Orissa Scheduled Caste and Scheduled Tribe Development Finance Co-operative
Corporation Limited for the benefit of tribal families living outside the special project
areas like ITDAs, MADA Pockets, Clusters and Micro Projects Currently 23 districts and 197
blocks are covered under this programme . During the year 2007-08, an amount of
Rs.9.04 of SCA was released and 9233 families were covered under the programme with
an expenditure of Rs.9.04 crores.
It is observed that until the end of the 7th Plan Period the basic approach of
development followed was Socio-economic development of tribals through a member of
Income Generating Scheme (IGS) and through Infrastructure Development Programmes
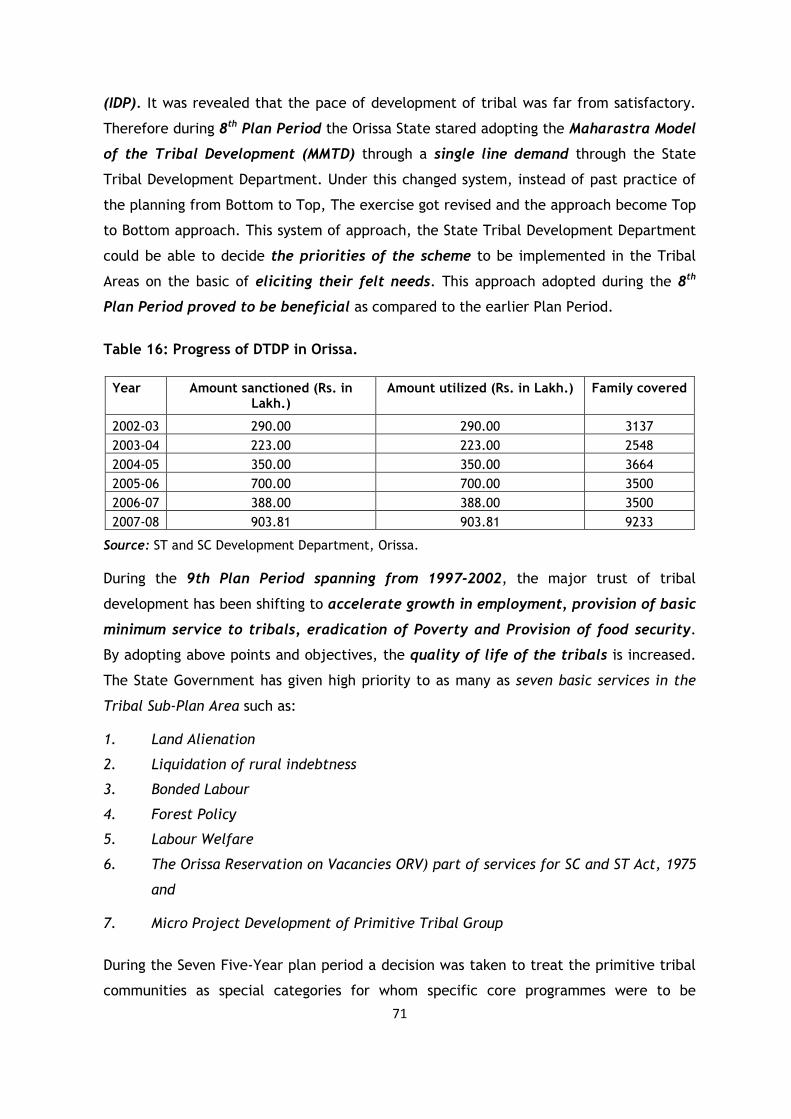
71
(IDP). It was revealed that the pace of development of tribal was far from satisfactory.
Therefore during 8th Plan Period the Orissa State stared adopting the Maharastra Model
of the Tribal Development (MMTD) through a single line demand through the State
Tribal Development Department. Under this changed system, instead of past practice of
the planning from Bottom to Top, The exercise got revised and the approach become Top
to Bottom approach. This system of approach, the State Tribal Development Department
could be able to decide the priorities of the scheme to be implemented in the Tribal
Areas on the basic of eliciting their felt needs. This approach adopted during the 8th
Plan Period proved to be beneficial as compared to the earlier Plan Period.
Table 16: Progress of DTDP in Orissa.
Year Amount sanctioned (Rs. in Lakh.)
Amount utilized (Rs. in Lakh.) Family covered
2002-03 290.00 290.00 3137
2003-04 223.00 223.00 2548
2004-05 350.00 350.00 3664
2005-06 700.00 700.00 3500
2006-07 388.00 388.00 3500
2007-08 903.81 903.81 9233
Source: ST and SC Development Department, Orissa.
During the 9th Plan Period spanning from 1997-2002, the major trust of tribal
development has been shifting to accelerate growth in employment, provision of basic
minimum service to tribals, eradication of Poverty and Provision of food security.
By adopting above points and objectives, the quality of life of the tribals is increased.
The State Government has given high priority to as many as seven basic services in the
Tribal Sub-Plan Area such as:
1. Land Alienation
2. Liquidation of rural indebtness
3. Bonded Labour
4. Forest Policy
5. Labour Welfare
6. The Orissa Reservation on Vacancies ORV) part of services for SC and ST Act, 1975
and
7. Micro Project Development of Primitive Tribal Group
During the Seven Five-Year plan period a decision was taken to treat the primitive tribal
communities as special categories for whom specific core programmes were to be
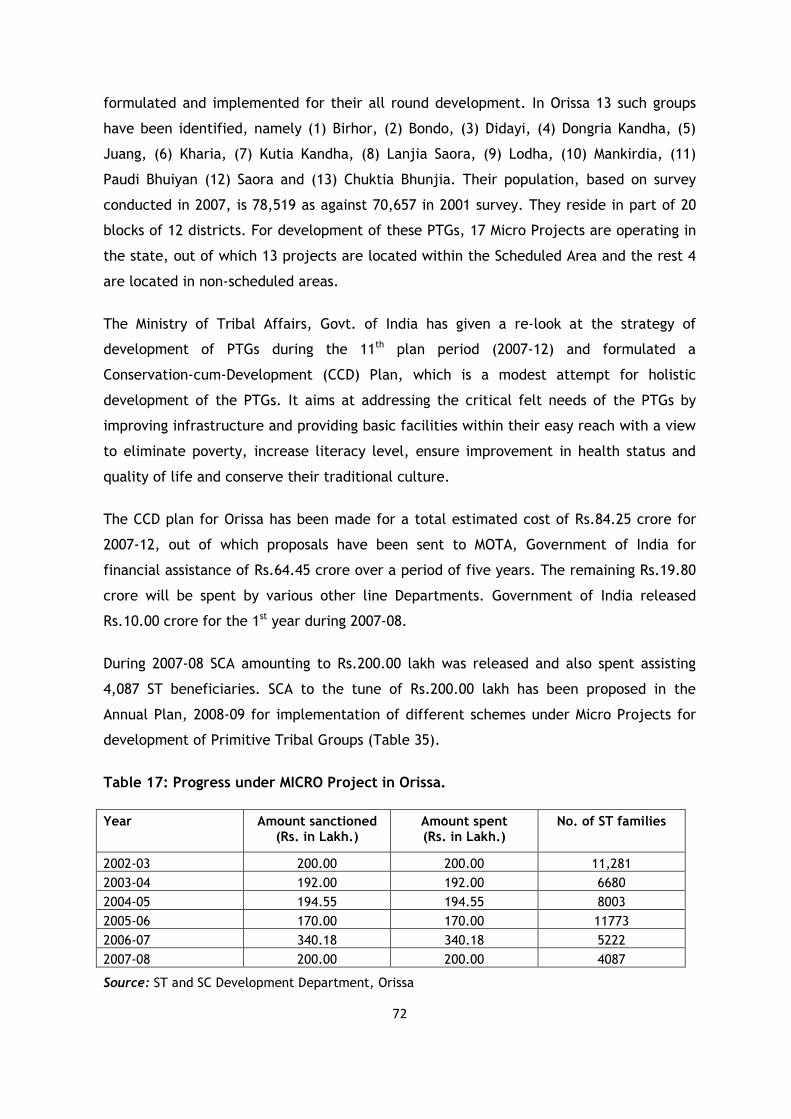
72
formulated and implemented for their all round development. In Orissa 13 such groups
have been identified, namely (1) Birhor, (2) Bondo, (3) Didayi, (4) Dongria Kandha, (5)
Juang, (6) Kharia, (7) Kutia Kandha, (8) Lanjia Saora, (9) Lodha, (10) Mankirdia, (11)
Paudi Bhuiyan (12) Saora and (13) Chuktia Bhunjia. Their population, based on survey
conducted in 2007, is 78,519 as against 70,657 in 2001 survey. They reside in part of 20
blocks of 12 districts. For development of these PTGs, 17 Micro Projects are operating in
the state, out of which 13 projects are located within the Scheduled Area and the rest 4
are located in non-scheduled areas.
The Ministry of Tribal Affairs, Govt. of India has given a re-look at the strategy of
development of PTGs during the 11th plan period (2007-12) and formulated a
Conservation-cum-Development (CCD) Plan, which is a modest attempt for holistic
development of the PTGs. It aims at addressing the critical felt needs of the PTGs by
improving infrastructure and providing basic facilities within their easy reach with a view
to eliminate poverty, increase literacy level, ensure improvement in health status and
quality of life and conserve their traditional culture.
The CCD plan for Orissa has been made for a total estimated cost of Rs.84.25 crore for
2007-12, out of which proposals have been sent to MOTA, Government of India for
financial assistance of Rs.64.45 crore over a period of five years. The remaining Rs.19.80
crore will be spent by various other line Departments. Government of India released
Rs.10.00 crore for the 1st year during 2007-08.
During 2007-08 SCA amounting to Rs.200.00 lakh was released and also spent assisting
4,087 ST beneficiaries. SCA to the tune of Rs.200.00 lakh has been proposed in the
Annual Plan, 2008-09 for implementation of different schemes under Micro Projects for
development of Primitive Tribal Groups (Table 35).
Table 17: Progress under MICRO Project in Orissa.
Year Amount sanctioned (Rs. in Lakh.)
Amount spent (Rs. in Lakh.)
No. of ST families
2002-03 200.00 200.00 11,281
2003-04 192.00 192.00 6680
2004-05 194.55 194.55 8003
2005-06 170.00 170.00 11773
2006-07 340.18 340.18 5222
2007-08 200.00 200.00 4087
Source: ST and SC Development Department, Orissa
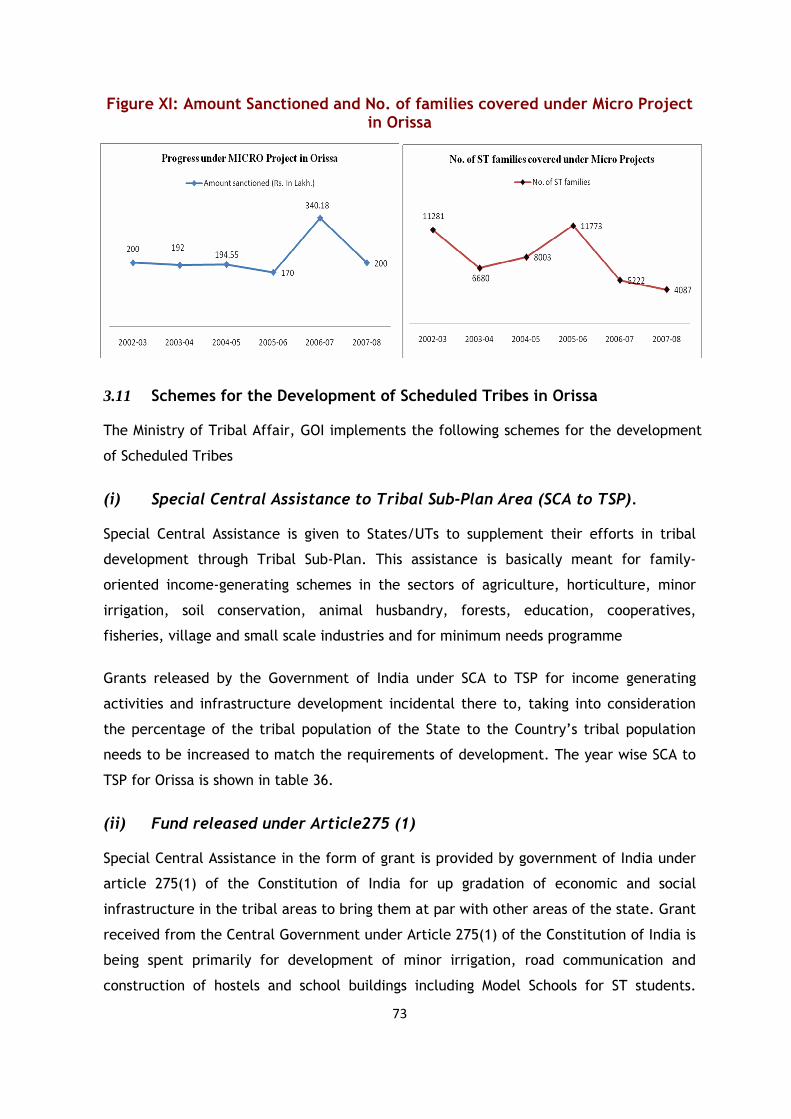
73
Figure XI: Amount Sanctioned and No. of families covered under Micro Project in Orissa
3.11 Schemes for the Development of Scheduled Tribes in Orissa The Ministry of Tribal Affair, GOI implements the following schemes for the development
of Scheduled Tribes
(i) Special Central Assistance to Tribal Sub-Plan Area (SCA to TSP). Special Central Assistance is given to States/UTs to supplement their efforts in tribal
development through Tribal Sub-Plan. This assistance is basically meant for family-
oriented income-generating schemes in the sectors of agriculture, horticulture, minor
irrigation, soil conservation, animal husbandry, forests, education, cooperatives,
fisheries, village and small scale industries and for minimum needs programme
Grants released by the Government of India under SCA to TSP for income generating
activities and infrastructure development incidental there to, taking into consideration
the percentage of the tribal population of the State to the Country’s tribal population
needs to be increased to match the requirements of development. The year wise SCA to
TSP for Orissa is shown in table 36.
(ii) Fund released under Article275 (1) Special Central Assistance in the form of grant is provided by government of India under
article 275(1) of the Constitution of India for up gradation of economic and social
infrastructure in the tribal areas to bring them at par with other areas of the state. Grant
received from the Central Government under Article 275(1) of the Constitution of India is
being spent primarily for development of minor irrigation, road communication and
construction of hostels and school buildings including Model Schools for ST students.
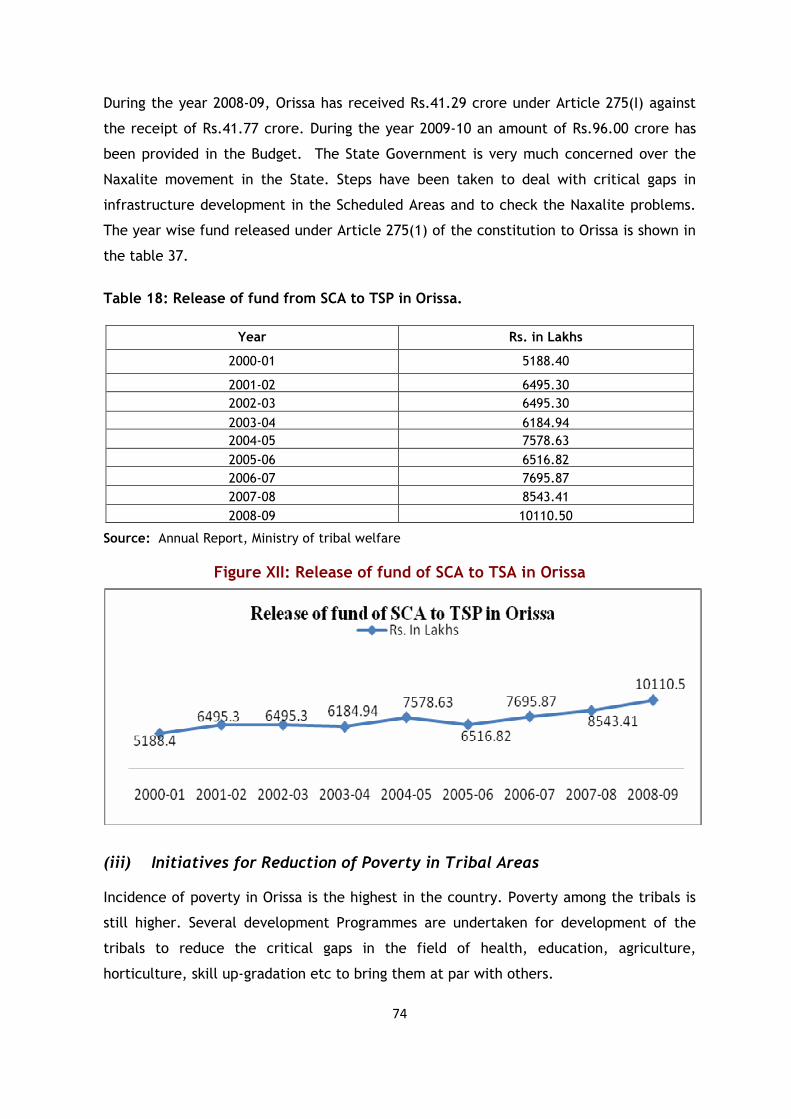
74
During the year 2008-09, Orissa has received Rs.41.29 crore under Article 275(I) against
the receipt of Rs.41.77 crore. During the year 2009-10 an amount of Rs.96.00 crore has
been provided in the Budget. The State Government is very much concerned over the
Naxalite movement in the State. Steps have been taken to deal with critical gaps in
infrastructure development in the Scheduled Areas and to check the Naxalite problems.
The year wise fund released under Article 275(1) of the constitution to Orissa is shown in
the table 37.
Table 18: Release of fund from SCA to TSP in Orissa.
Year Rs. in Lakhs
2000-01 5188.40
2001-02 6495.30
2002-03 6495.30
2003-04 6184.94
2004-05 7578.63
2005-06 6516.82
2006-07 7695.87
2007-08 8543.41
2008-09 10110.50
Source: Annual Report, Ministry of tribal welfare
Figure XII: Release of fund of SCA to TSA in Orissa
(iii) Initiatives for Reduction of Poverty in Tribal Areas Incidence of poverty in Orissa is the highest in the country. Poverty among the tribals is
still higher. Several development Programmes are undertaken for development of the
tribals to reduce the critical gaps in the field of health, education, agriculture,
horticulture, skill up-gradation etc to bring them at par with others.
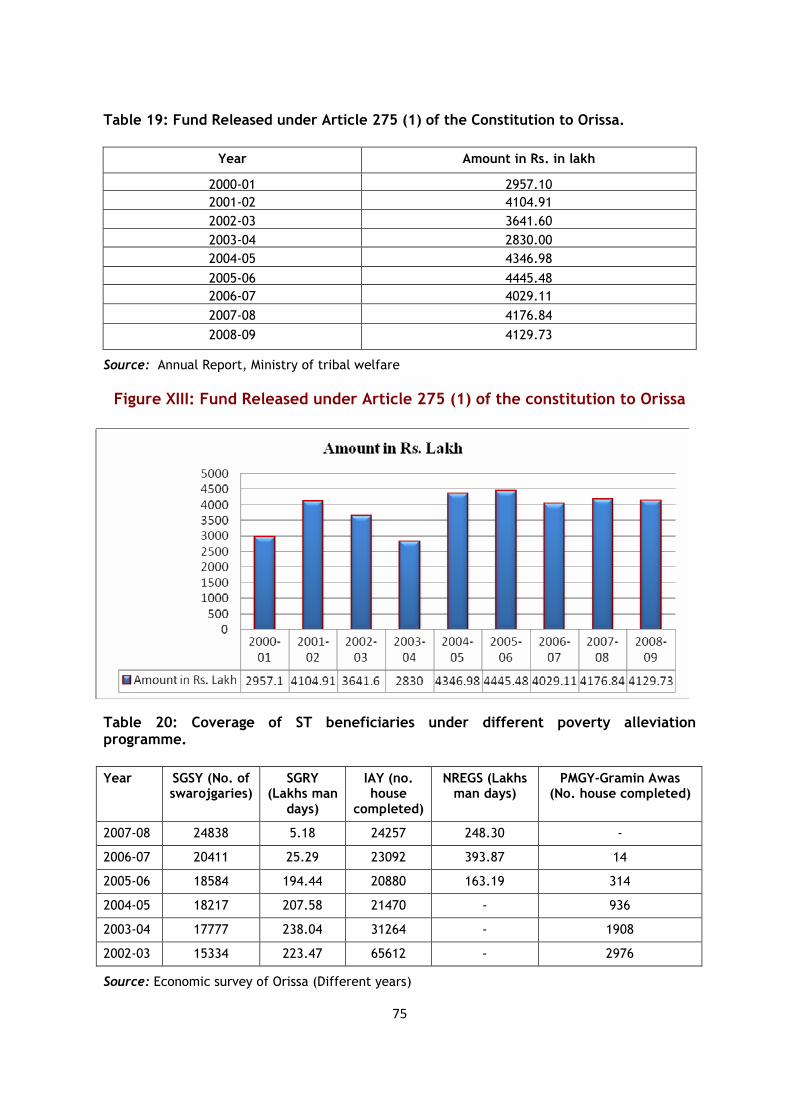
75
Table 19: Fund Released under Article 275 (1) of the Constitution to Orissa.
Year Amount in Rs. in lakh
2000-01 2957.10
2001-02 4104.91
2002-03 3641.60
2003-04 2830.00
2004-05 4346.98
2005-06 4445.48
2006-07 4029.11
2007-08 4176.84
2008-09 4129.73
Source: Annual Report, Ministry of tribal welfare
Figure XIII: Fund Released under Article 275 (1) of the constitution to Orissa
Table 20: Coverage of ST beneficiaries under different poverty alleviation programme.
Year SGSY (No. of swarojgaries)
SGRY (Lakhs man
days)
IAY (no. house
completed)
NREGS (Lakhs man days)
PMGY-Gramin Awas (No. house completed)
2007-08 24838 5.18 24257 248.30 -
2006-07 20411 25.29 23092 393.87 14
2005-06 18584 194.44 20880 163.19 314
2004-05 18217 207.58 21470 - 936
2003-04 17777 238.04 31264 - 1908
2002-03 15334 223.47 65612 - 2976
Source: Economic survey of Orissa (Different years)
76
(iv) Initiatives for Reduction of illiteracy in Tribal Areas Literacy is one of the main indicators of progress and prosperity of a society. Illiteracy is
very high among tribals. The literacy rate of STs in Orissa as per 2001 census is 37.37 per
cent, (male 51.48% and female 23.37%) in comparison to the total literacy of 63.08 per
cent (75.35% male and 50.51% female). The drop-out and forced outage rate of tribal
children is very high. The state government have undertaken various measures like
providing free education, scholarships, and Hostel facilities, free distributions of text
books, garments and imparting special coaching to prepare them for requirement to state
and all India services as well as for seeking admission to engineering/medical courses. In
order to increase the enrolment and reduce the drop out rate at primary school level,
mid-day medal scheme has been introduced. At present 246 Residential High schools, 109
Ashram Schools, 37 Kanyashram, 143 residential Sevasharam are operating under SC/ST
development department of Orissa (Economic Survey of Orissa 2006). Eleven Ekalavya
Model Residential Schools (EMRSs) are functioning for providing quality education to the
ST students in Orissa. 1548 primary school hostels (40 seated each) in TDP areas and 400
hostels for tribal girls in KBK districts for operating to check drop out rate and to
promote ST girl education.
Table 21: Scheme of educational complex in low literacy pockets for development of
women literacy in tribal areas in Orissa.
Year Rs. in Lakh
2002-03 150.27
2003-04 101.65
2004-05 144.32
2005-06 110.90
2006-07 299.99
2007-08 99.66
Source: Annual Report, Ministry of Tribal welfare
Pre-matric scholarship is being paid @ Rs.400 and Rs.425 per month for 10 months in year
for boys and girls boarders respectively for pursuing their studies from class I to x in the
schools/hostels managed by ST and SC development department. Besides, the day-
scholars are paid @ Rs.100-p.m for boys and @ Rs.150 for girls per month. The year wise
achievement made under Pre-matric scholarship is shown in the table 40.
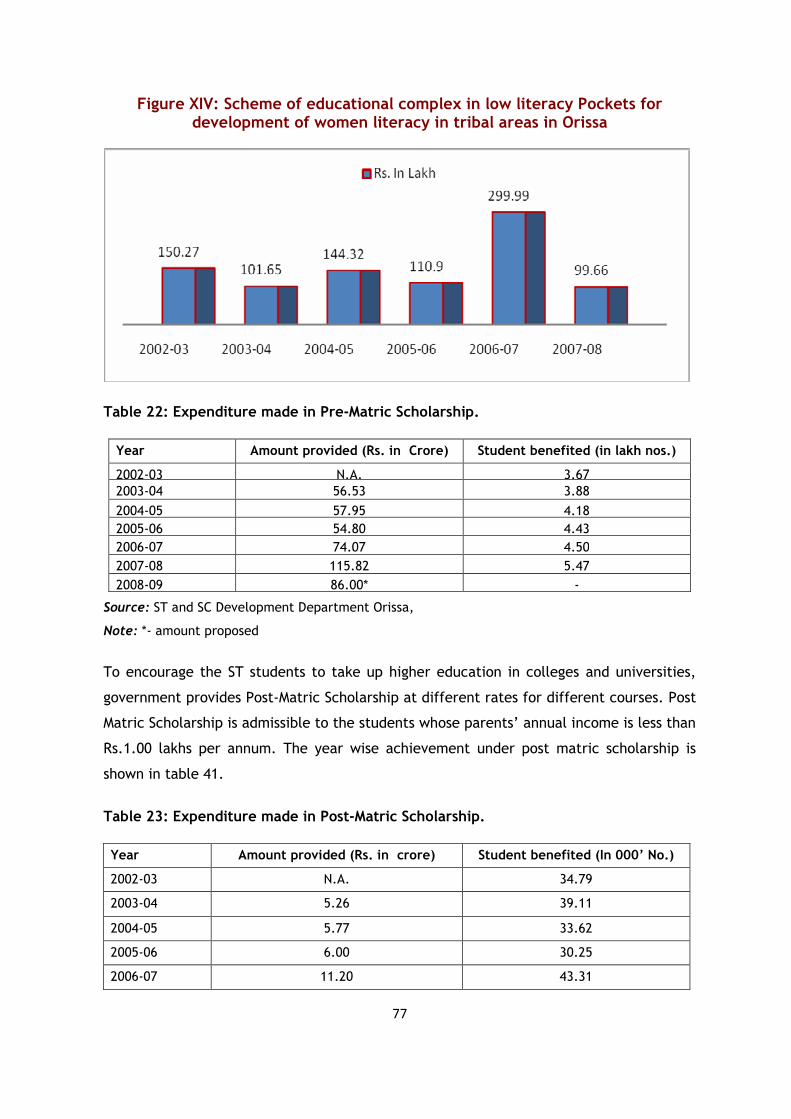
77
Figure XIV: Scheme of educational complex in low literacy Pockets for development of women literacy in tribal areas in Orissa
Table 22: Expenditure made in Pre-Matric Scholarship.
Source: ST and SC Development Department Orissa,
Note: *- amount proposed
To encourage the ST students to take up higher education in colleges and universities,
government provides Post-Matric Scholarship at different rates for different courses. Post
Matric Scholarship is admissible to the students whose parents’ annual income is less than
Rs.1.00 lakhs per annum. The year wise achievement under post matric scholarship is
shown in table 41.
Table 23: Expenditure made in Post-Matric Scholarship.
Year Amount provided (Rs. in crore) Student benefited (In 000’ No.)
2002-03 N.A. 34.79
2003-04 5.26 39.11
2004-05 5.77 33.62
2005-06 6.00 30.25
2006-07 11.20 43.31
Year Amount provided (Rs. in Crore) Student benefited (in lakh nos.)
2002-03 N.A. 3.67
2003-04 56.53 3.88
2004-05 57.95 4.18
2005-06 54.80 4.43
2006-07 74.07 4.50
2007-08 115.82 5.47
2008-09 86.00* -
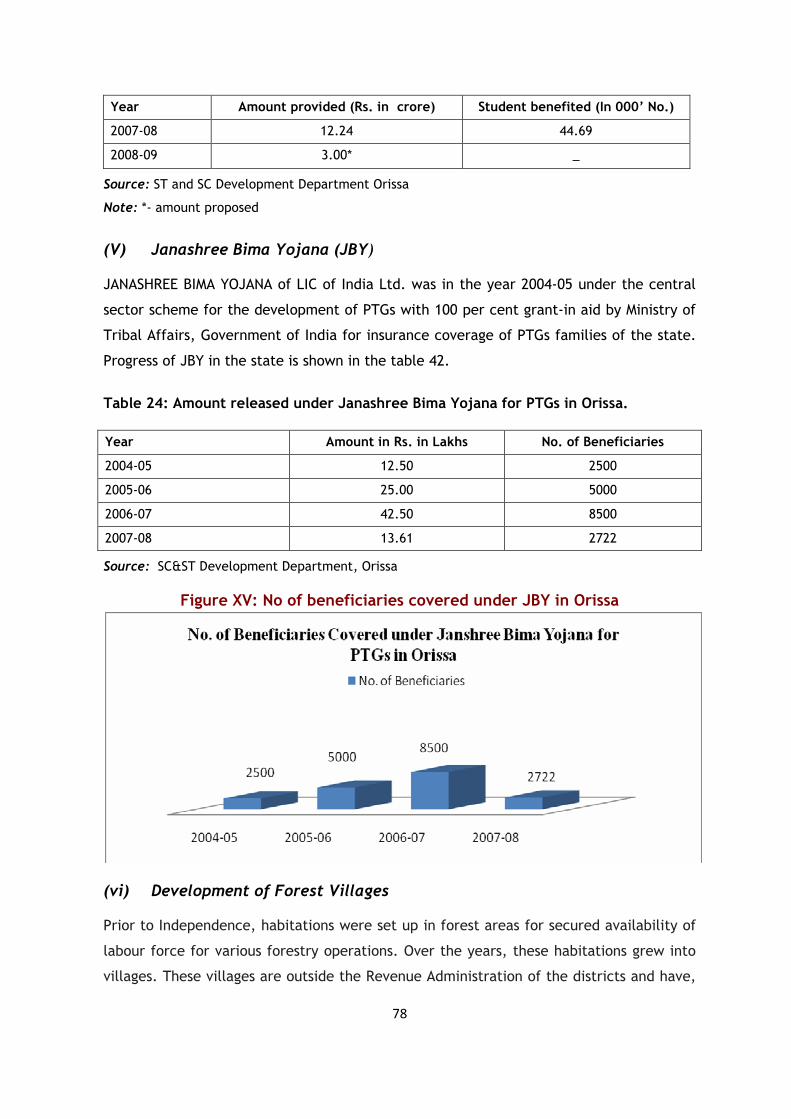
78
Year Amount provided (Rs. in crore) Student benefited (In 000’ No.)
2007-08 12.24 44.69
2008-09 3.00* _
Source: ST and SC Development Department Orissa
Note: *- amount proposed
(V) Janashree Bima Yojana (JBY) JANASHREE BIMA YOJANA of LIC of India Ltd. was in the year 2004-05 under the central
sector scheme for the development of PTGs with 100 per cent grant-in aid by Ministry of
Tribal Affairs, Government of India for insurance coverage of PTGs families of the state.
Progress of JBY in the state is shown in the table 42.
Table 24: Amount released under Janashree Bima Yojana for PTGs in Orissa.
Year Amount in Rs. in Lakhs No. of Beneficiaries
2004-05 12.50 2500
2005-06 25.00 5000
2006-07 42.50 8500
2007-08 13.61 2722
Source: SC&ST Development Department, Orissa
Figure XV: No of beneficiaries covered under JBY in Orissa
(vi) Development of Forest Villages Prior to Independence, habitations were set up in forest areas for secured availability of
labour force for various forestry operations. Over the years, these habitations grew into
villages. These villages are outside the Revenue Administration of the districts and have,
79
therefore, missed the fruits of development. A process of conversion of these forest
villages into revenue villages is underway. However, there are about 2,690 such forest
villages in 13 States, which are still managed by State Forest Departments. Most of the
inhabitants in these villages are tribals. The level of development in these villages is not
at par with rest of the areas in the State. There are 20 forest villages in Orissa. The
amount released for their development is shown in table 21.
Table 25: Funds released to states for the development of forest villages.
Year Amount in Rs. Lakh
2002-03 0.00
2003-04 0.00
2004-05 0.00
2005-06 157.14
2006-07 133.46
2007-08 0.00
2008-09 180.00
Source: Annual Report, 2008-09 Ministry of tribal welfare
(vii) Grant-in-aid to voluntary organizations working for welfare of scheduled tribes
The prime objective of the scheme is to enhance the reach of welfare schemes of
Government and fill the gaps in service deficient tribal areas, in the sectors such as
education, health, drinking water, agro-horticultural productivity, social security net etc.
through the efforts of voluntary organizations (VOs)/non-governmental organizations
(NGOs), and to provide an environment for socio-economic upliftment and overall
development of the Scheduled Tribes (STs). Any other innovative activity having direct
impact on the socio-economic development or livelihood generation of STs may also be
considered through voluntary efforts.
Under this scheme 90% grant is provided by the Ministry and 10% cost is required to be
borne by the non-governmental organizations from their own resources, except in
Scheduled Areas where the Government bears100% cost. The scheme provides a list of
categories of projects viz. residential school, non-residential schools, 10 or more bedded
hospitals, mobile dispensaries, computer training centers, etc., which could be covered
under the scheme, and also prescribes fixed financial norms. The scheme does not
provide any construction cost.
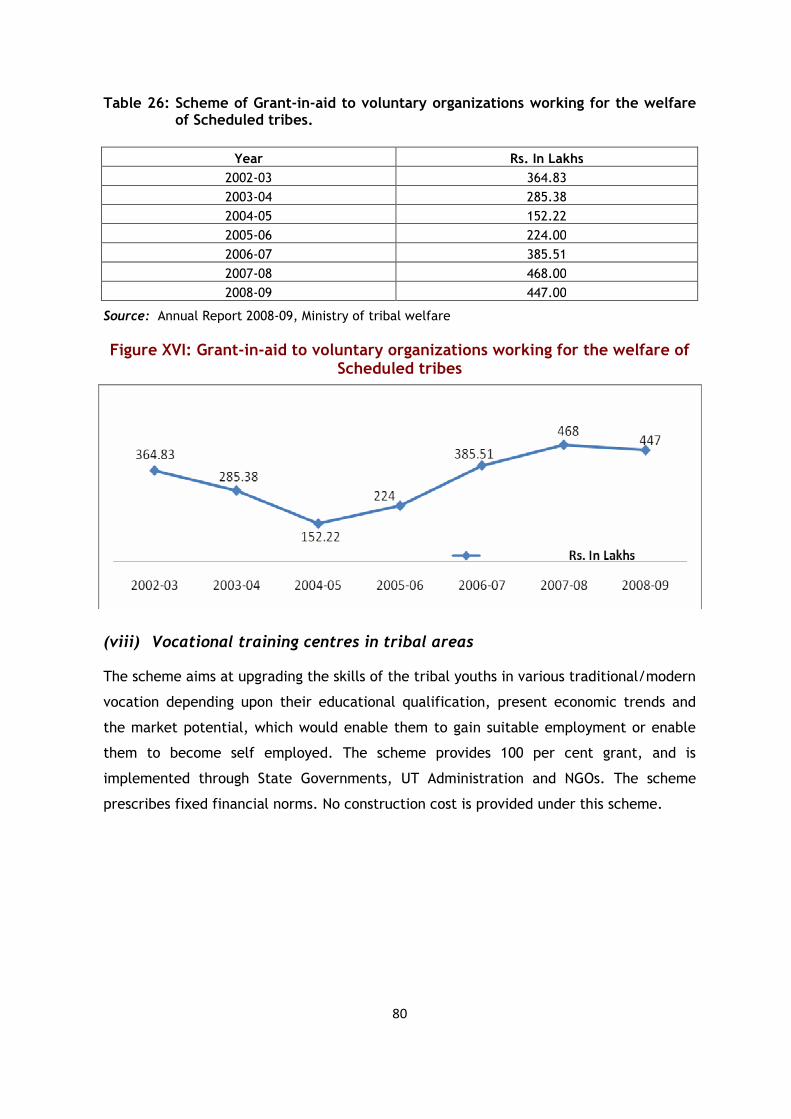
80
Table 26: Scheme of Grant-in-aid to voluntary organizations working for the welfare of Scheduled tribes.
Year Rs. In Lakhs
2002-03 364.83
2003-04 285.38
2004-05 152.22
2005-06 224.00
2006-07 385.51
2007-08 468.00
2008-09 447.00
Source: Annual Report 2008-09, Ministry of tribal welfare
Figure XVI: Grant-in-aid to voluntary organizations working for the welfare of Scheduled tribes
(viii) Vocational training centres in tribal areas The scheme aims at upgrading the skills of the tribal youths in various traditional/modern
vocation depending upon their educational qualification, present economic trends and
the market potential, which would enable them to gain suitable employment or enable
them to become self employed. The scheme provides 100 per cent grant, and is
implemented through State Governments, UT Administration and NGOs. The scheme
prescribes fixed financial norms. No construction cost is provided under this scheme.
81
Chapter-4:
PRIMITIVE TRIBAL GROUPS OF ORISSA
4.1 Development of Primitive Tribal Groups (PTGs) Among the hundreds of Tribal Communities living across the length and breadth of the
Country, there are some groups who are relatively more isolated, archaic, vulnerable,
deprived and backward. They have been identified and designed as Primitive Tribal Groups
(PTGs) for the purpose of receiving special attention for protection against exploitation
and for their development. The questions of tackling problems of more backward tribal
communities have received the attention of all. Dhebar Commission (1961) outlined the
PTGs as a class of tribal in an extremely underdeveloped stage occupying the lowest layer
and suggested for their special protection and development. Shilu Ao Team (1969) found
the PTGs as extremely backward and in the primitive food gathering stage and suggested
for separate central schemes for education and economic upliftment with special
provisions in the plan. Further as per the recommendation of workshops on Primitive
Tribal Communities, 1975 and Conference of Tribal Commissioners and State Chief
Ministers the Ministry of Home Affairs detailed guidelines for identification of PTGs issued
during the year 1976. On the lines of the above suggestions identification of the extremely
backward tribal groups namely PTG or the vulnerable groups was made and special
programmes of Development with 100 percent finance by Ministry of Home Affairs (now
Ministry of Tribal Affairs) have been taken up since the 5th Five Year Plan Period.
Since 5th Five Year Plan Period concerted efforts have been made by Government of India
as well as States/Union Territories to ameliorate the plights of the PTGs and to bring
about their total development primarily by utilizing funds out of Special Central Assistance
(SCA) on cent percent subsidy basis. The Government of India has been generous in
funding for their planned development, but the results achieved so far fall short of
expectation.
4.2 The Concept of Primitive Tribe In common Parlance the term primitive means simpleness and antiquity. The commonly
arranged characteristics of primitive people are (1) homogenous, (2) small population, (3)
relative physical isolation, (4) social institutions cast in a simple mould, (5) absence of
written language, (6) relatively simple technology and (7) a slower rate of change. In the
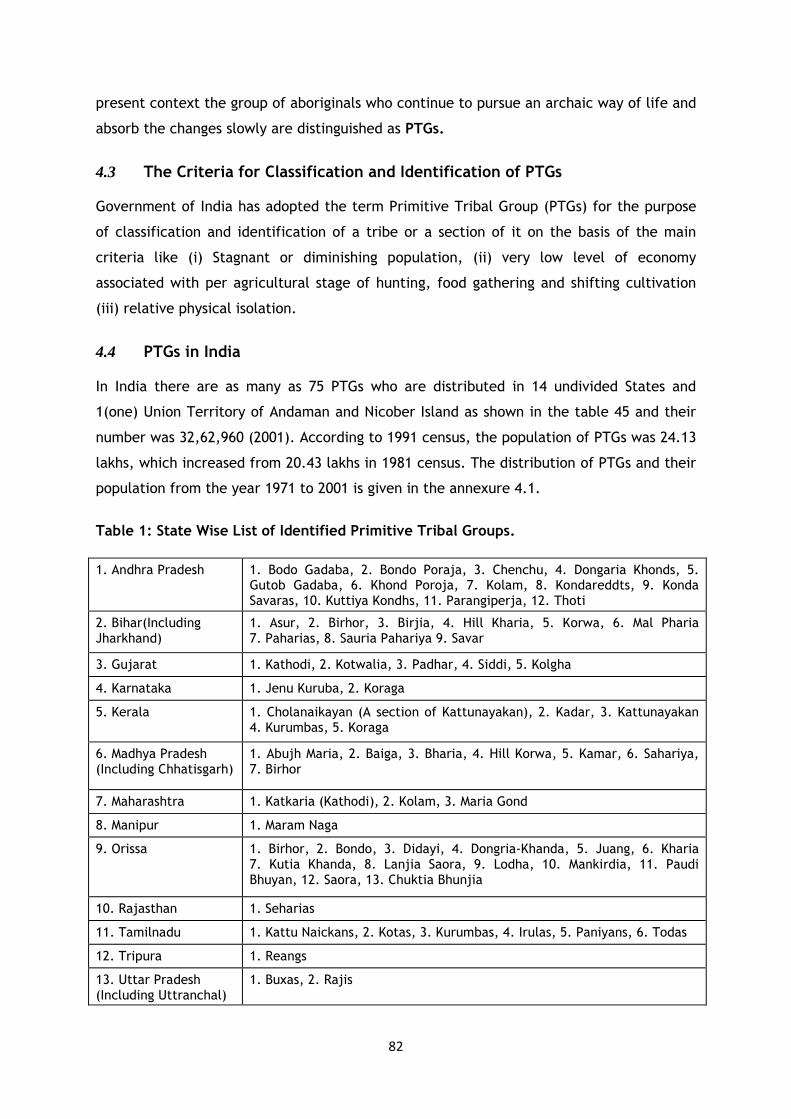
82
present context the group of aboriginals who continue to pursue an archaic way of life and
absorb the changes slowly are distinguished as PTGs.
4.3 The Criteria for Classification and Identification of PTGs Government of India has adopted the term Primitive Tribal Group (PTGs) for the purpose
of classification and identification of a tribe or a section of it on the basis of the main
criteria like (i) Stagnant or diminishing population, (ii) very low level of economy
associated with per agricultural stage of hunting, food gathering and shifting cultivation
(iii) relative physical isolation.
4.4 PTGs in India In India there are as many as 75 PTGs who are distributed in 14 undivided States and
1(one) Union Territory of Andaman and Nicober Island as shown in the table 45 and their
number was 32,62,960 (2001). According to 1991 census, the population of PTGs was 24.13
lakhs, which increased from 20.43 lakhs in 1981 census. The distribution of PTGs and their
population from the year 1971 to 2001 is given in the annexure 4.1.
Table 1: State Wise List of Identified Primitive Tribal Groups.
1. Andhra Pradesh 1. Bodo Gadaba, 2. Bondo Poraja, 3. Chenchu, 4. Dongaria Khonds, 5. Gutob Gadaba, 6. Khond Poroja, 7. Kolam, 8. Kondareddts, 9. Konda Savaras, 10. Kuttiya Kondhs, 11. Parangiperja, 12. Thoti
2. Bihar(Including Jharkhand)
1. Asur, 2. Birhor, 3. Birjia, 4. Hill Kharia, 5. Korwa, 6. Mal Pharia 7. Paharias, 8. Sauria Pahariya 9. Savar
3. Gujarat 1. Kathodi, 2. Kotwalia, 3. Padhar, 4. Siddi, 5. Kolgha
4. Karnataka 1. Jenu Kuruba, 2. Koraga
5. Kerala
1. Cholanaikayan (A section of Kattunayakan), 2. Kadar, 3. Kattunayakan 4. Kurumbas, 5. Koraga
6. Madhya Pradesh (Including Chhatisgarh)
1. Abujh Maria, 2. Baiga, 3. Bharia, 4. Hill Korwa, 5. Kamar, 6. Sahariya, 7. Birhor
7. Maharashtra
1. Katkaria (Kathodi), 2. Kolam, 3. Maria Gond
8. Manipur 1. Maram Naga
9. Orissa
1. Birhor, 2. Bondo, 3. Didayi, 4. Dongria-Khanda, 5. Juang, 6. Kharia 7. Kutia Khanda, 8. Lanjia Saora, 9. Lodha, 10. Mankirdia, 11. Paudi Bhuyan, 12. Saora, 13. Chuktia Bhunjia
10. Rajasthan 1. Seharias
11. Tamilnadu 1. Kattu Naickans, 2. Kotas, 3. Kurumbas, 4. Irulas, 5. Paniyans, 6. Todas
12. Tripura 1. Reangs
13. Uttar Pradesh (Including Uttranchal)
1. Buxas, 2. Rajis
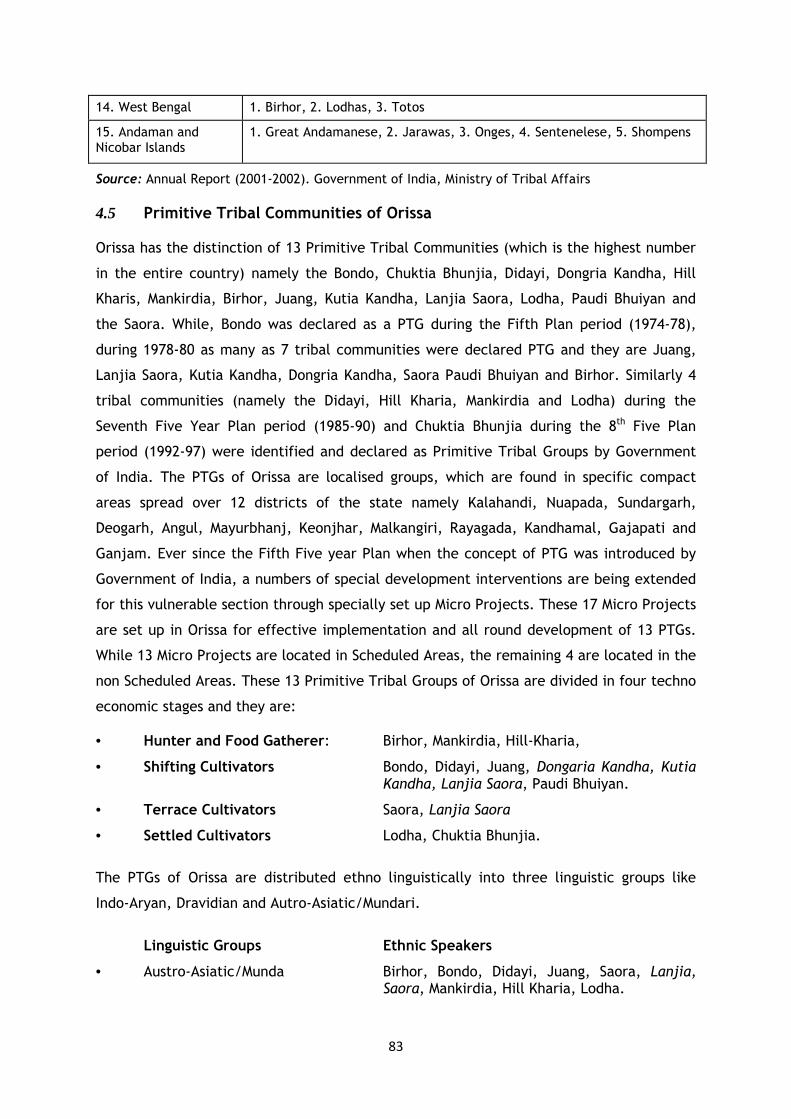
83
14. West Bengal 1. Birhor, 2. Lodhas, 3. Totos
15. Andaman and Nicobar Islands
1. Great Andamanese, 2. Jarawas, 3. Onges, 4. Sentenelese, 5. Shompens
Source: Annual Report (2001-2002). Government of India, Ministry of Tribal Affairs
4.5 Primitive Tribal Communities of Orissa Orissa has the distinction of 13 Primitive Tribal Communities (which is the highest number
in the entire country) namely the Bondo, Chuktia Bhunjia, Didayi, Dongria Kandha, Hill
Kharis, Mankirdia, Birhor, Juang, Kutia Kandha, Lanjia Saora, Lodha, Paudi Bhuiyan and
the Saora. While, Bondo was declared as a PTG during the Fifth Plan period (1974-78),
during 1978-80 as many as 7 tribal communities were declared PTG and they are Juang,
Lanjia Saora, Kutia Kandha, Dongria Kandha, Saora Paudi Bhuiyan and Birhor. Similarly 4
tribal communities (namely the Didayi, Hill Kharia, Mankirdia and Lodha) during the
Seventh Five Year Plan period (1985-90) and Chuktia Bhunjia during the 8th Five Plan
period (1992-97) were identified and declared as Primitive Tribal Groups by Government
of India. The PTGs of Orissa are localised groups, which are found in specific compact
areas spread over 12 districts of the state namely Kalahandi, Nuapada, Sundargarh,
Deogarh, Angul, Mayurbhanj, Keonjhar, Malkangiri, Rayagada, Kandhamal, Gajapati and
Ganjam. Ever since the Fifth Five year Plan when the concept of PTG was introduced by
Government of India, a numbers of special development interventions are being extended
for this vulnerable section through specially set up Micro Projects. These 17 Micro Projects
are set up in Orissa for effective implementation and all round development of 13 PTGs.
While 13 Micro Projects are located in Scheduled Areas, the remaining 4 are located in the
non Scheduled Areas. These 13 Primitive Tribal Groups of Orissa are divided in four techno
economic stages and they are:
• Hunter and Food Gatherer: Birhor, Mankirdia, Hill-Kharia,
• Shifting Cultivators Bondo, Didayi, Juang, Dongaria Kandha, Kutia Kandha, Lanjia Saora, Paudi Bhuiyan.
• Terrace Cultivators Saora, Lanjia Saora
• Settled Cultivators Lodha, Chuktia Bhunjia.
The PTGs of Orissa are distributed ethno linguistically into three linguistic groups like
Indo-Aryan, Dravidian and Autro-Asiatic/Mundari.
Linguistic Groups Ethnic Speakers
• Austro-Asiatic/Munda Birhor, Bondo, Didayi, Juang, Saora, Lanjia, Saora, Mankirdia, Hill Kharia, Lodha.
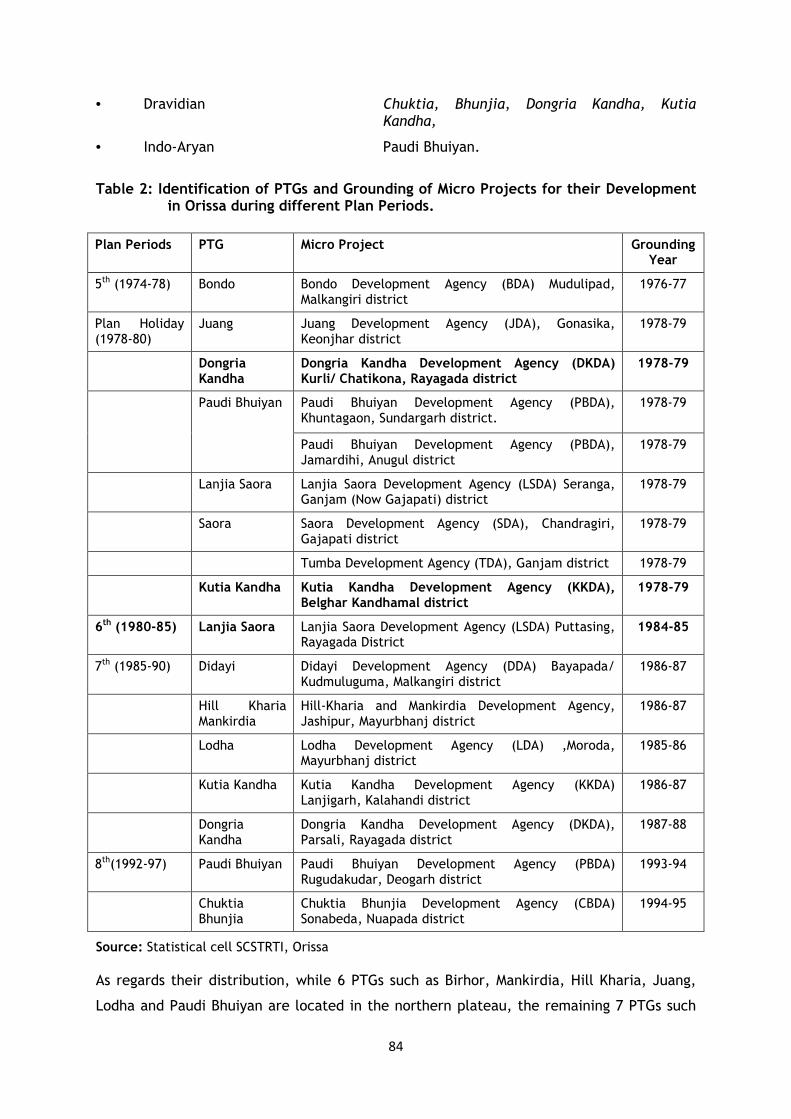
84
• Dravidian Chuktia, Bhunjia, Dongria Kandha, Kutia Kandha,
• Indo-Aryan Paudi Bhuiyan.
Table 2: Identification of PTGs and Grounding of Micro Projects for their Development
in Orissa during different Plan Periods.
Plan Periods PTG Micro Project Grounding Year
5th (1974-78) Bondo Bondo Development Agency (BDA) Mudulipad, Malkangiri district
1976-77
Plan Holiday (1978-80)
Juang Juang Development Agency (JDA), Gonasika, Keonjhar district
1978-79
Dongria Kandha
Dongria Kandha Development Agency (DKDA) Kurli/ Chatikona, Rayagada district
1978-79
Paudi Bhuiyan Development Agency (PBDA), Khuntagaon, Sundargarh district.
1978-79 Paudi Bhuiyan
Paudi Bhuiyan Development Agency (PBDA), Jamardihi, Anugul district
1978-79
Lanjia Saora Lanjia Saora Development Agency (LSDA) Seranga, Ganjam (Now Gajapati) district
1978-79
Saora Saora Development Agency (SDA), Chandragiri, Gajapati district
1978-79
Tumba Development Agency (TDA), Ganjam district 1978-79
Kutia Kandha Kutia Kandha Development Agency (KKDA), Belghar Kandhamal district
1978-79
6th (1980-85) Lanjia Saora Lanjia Saora Development Agency (LSDA) Puttasing, Rayagada District
1984-85
7th (1985-90) Didayi Didayi Development Agency (DDA) Bayapada/ Kudmuluguma, Malkangiri district
1986-87
Hill Kharia Mankirdia
Hill-Kharia and Mankirdia Development Agency, Jashipur, Mayurbhanj district
1986-87
Lodha Lodha Development Agency (LDA) ,Moroda, Mayurbhanj district
1985-86
Kutia Kandha Kutia Kandha Development Agency (KKDA) Lanjigarh, Kalahandi district
1986-87
Dongria Kandha
Dongria Kandha Development Agency (DKDA), Parsali, Rayagada district
1987-88
8th(1992-97) Paudi Bhuiyan Paudi Bhuiyan Development Agency (PBDA) Rugudakudar, Deogarh district
1993-94
Chuktia Bhunjia
Chuktia Bhunjia Development Agency (CBDA) Sonabeda, Nuapada district
1994-95
Source: Statistical cell SCSTRTI, Orissa
As regards their distribution, while 6 PTGs such as Birhor, Mankirdia, Hill Kharia, Juang,
Lodha and Paudi Bhuiyan are located in the northern plateau, the remaining 7 PTGs such
85
as Bondo, Chuktia Bhunjia, Dongria Kandha, Kutia Kandha, Didayi, Lanjia Saora and Saora
reside in the Eastern Ghat region of the state. The PTGs live in their remote mountainous
habitats in a state of relative isolation- that has helped them to preserve their cultural
identities manifested in their diverse languages, unique style of personal adornments,
subsistence activities, magico-religious beliefs and practices, social organisation and
colourful folk traditions of arts, crafts, songs, dance and music. On the other side, their
pace of change has remained slower and their level of development, lower than the rest
of their brethren belonging to their tribal communities. This situation calls for special
attention in respect of their development. When the geographical distribution of the PTGs
are further analysed on the basis of different geographical regions, it is observed that the
PTG are distributed in 5 districts of Western Orissa (Kalahandi, Nuapada, Sundargarh,
Deogarh and Angul); 2 districts of Northern Orissa such as Mayurbhanj and Keonjhar, five
districts of Southern Orissa such as Malkangiri, Rayagada, Kandhamal, Gajapati and
Ganjam. The analysis of the PTGs on the basis of their distribution in TSP and Non-TSP
areas further reveals that while only one PTG namely Chuktia Bhunjia reside in Non TSP
area and two PTGs namely Paudi Bhuiyan and Saora inhabit in both TSP and Non TSP areas,
the remaining 10 PTGs are found to be distributed in TSP areas. When the state is taken as
a whole, the PTGs are observed to be distributed in 547 villages covering 69 GPs, 20
blocks, 10 ITDAs and 12 districts. The identification of PTGs in Orissa in different plan
periods is shown in the Table 46.
4.6 Distinguished Socio-Cultural Features The Government of India recognized Bondo Paraja, Chuktia Bhunjia, Didayi,
Dongaria Kandha, Hill Kharia, Mankirdia, also known as Birhor, Juang, Kutia Kandha,
Lanjia Saora, Lodha, Paudi Bhuiyan and Saora as primitive tribes of Orissa. Each of
these tribal communities is rich in social institutions, socio-cultural profile and ethnic
identity (Panigrah N, 2005, Patanik, N, 2005), as noted below:
BIRHOR: The meaning of the term Birhor in their language is Bir (forest) and Hor (men)
i.e. men of the forest. They are dark-skinned, short-statured, long-headed, wavy-haired
and broad-nosed people. They are two types of Birhors- the Uthal i.e.nomadic Birhor and
Jagi, i.e. settled Birhors. They are traditionally semi-nomadic and hunter-gatherers and
their economy is subsistence-oriented. In Orissa, Birhors are mainly distributed in the
districts of Sambalpur, Sundargarh, Balasore, Cuttack and Ganjam. The wandering group
has a temporary habitation, known as the Kumbha, made of twigs and leaves and a cluster
of Kumbhas for 10-15 households, giving rise to a temporary camp-site, known as the
Tanda. The forest and the Birhor are inter-connected since time immemorial, as their
86
basic survival is dependent upon the forest eco-system. Their social organisation popularly
known as Tanda is multi-clan, and does not have any restriction for marriage within a
Tanda. Each Tanda has a headman who plays simultaneously secular and sacerdotal roles.
The Birhors are polytheists as they believe in and perform rituals for a number of deities
and spirits, both benevolent and malevolent. They worship ancestral cults at regular
intervals for their safety and social security. The main occupation of the Birhors is the
making of ropes out of the barks of Siali creepers, which is used for different purposes.
They also make small basket ( Tupa) out the siali barks. The animals and birds which the
Birhors are fond of keeping at homes are goats and chickens. They keep these animals and
birds to sell in the market for cash and to offer them to their deities on ritual occasions.
The Birhor are interchangeably known as the Mankirdia (in Sambalpur and Mayurbhanj
districts), and Mankidi (in Kalahandi and Sundargarh), as they are expert monkey catchers.
BONDO: The Bondo are only found in Orissa State. The Bondo belongs to Proto-Australoid
racial stock and speaks 'Remo language which belongs to south Munda group of Austro-
Asiatic language family. There are three sub-groups: the Bondo highlanders, Lower Bondo
and the Gadaba-Bondo group. The Bondo villages are found in hilltops and hill slopes. The
house of Bondo is of gabled type with slopes on four sides. It has two rooms- the bigger of
the two is used for sleeping and cooking food while another is used as granary. The
economic life of Bondos revolves round agriculture. They practice three types of
agriculture- shifting cultivation in the hill slopes, upland cultivation at the foot-hills and
paddy cultivation in irrigated terraced lands. Their social organization consists of such
social institutions as clans, lineage groups, extended families and nuclear families. There
are a number of village functionaries, both secular and sacerdotal, namely the priest,
medicine man, and shaman, to look after the politico-jural and religious functions in their
society. The Patkhanda Maha-pravu is their presiding deity and a number of deities and
spirits are also worshipped from time to time. Although liquor is prohibited for use in
various religious rituals, animal sacrifice is not tabooed.
The Bondos are very much individualistic and go by their own individualistic views. The
Bondo observe number of rituals and ceremonies throughout the year. They use scanty
clothes and especially the womenfolk traditionally use locally weaved ringa made from
kerang fibre. They wear a number of coloured bead necklaces hanging from the neck to
the navel, and in addition there are bangles, neck and head-bands, anklets, and rings. The
Bondo, both men and women, have shown positive interest in participating in the ongoing
development processes.
87
CHUKTIA BHUNJIA: The Chuktia Bhunjia are members of the Bhunjia tribal groups,
concentrated in the Sonabeda plateau of Nuapada district. The area is distinguished by
high and undulating hill ranges, streams and dense forest. It is a sparsely populated area
with small, dispersed villages and hamlets. The Chuktia Bhunjia villages are generally of
linear pattern in which there may be on main street with one or more small lanes
branching out of it. The individual houses are located on either side of the village street.
The bhunjias depend upon shifting cultivation and low land paddy cultivation for their
livelihood. Food gathering and hunting, animal husbandry, fishing and wage earning are
supplementary sources of income.
The Chuktia section of the Bhunjia is more conservative, tradition-bound and inward-
looking. They have a number of exogamous units or clans, which regulate their marriage.
A simple/nuclear family with a monogamous form of marriage is found in their society.
Their kitchen shed is considered most sacred and the entry of married daughters and
outsiders into the kitchen is strictly forbidden. Traditionally, the socio-political system
recognizes the village council with elderly members as the basic unit and there existes the
inter-village council at the apex. The Bhunjias worship the Sunadei as their supreme deity
and the Pujari performs the priestly functions. Besides this, a large number of deities are
propitiated for the tribe's well-being and prosperity, prevention and cure from diseases,
and good crops. Both the region and the community attract tourists during winter. At
present the Sonabeda plateau has been declared as a sanctuary by the Forest department.
DIDAYI: The Didayi are found only in the Malkanagiri district of the Orissa state. They are
confined to the Konda Kamberu hill ranges along the river Machhkund. Their habitat
constitutes riverine plains, undulating plateau and rugged mountainous terrain.
Economically, they are mostly subsistence-oriented, attuned to the environment, and they
earn their livelihood through food-gathering, hunting, fishing, domestication of animals,
cultivation (both settled and shifting), and wage-earning. The prinicipal food of the Didayi
is rice and ragi. In their politico-jural arrangements, the Naik officiates as the secular
chief of the traditional village Panchayat. They believe in a large number of gods and
goddesses, demi-gods and spirits and the palasi is their sacred Chief. The Didayis are
patriarchal, patrilineal and patrilocal and their social organisation comprises of clans,
which are characteristically totemistic and include lineage, consisting of a number of
families. Although monogamy is the rule, polygamous unions are practiced, as per need
and the cross-cousin marriage is a preferential form of marriage among them. Also
prevalent are marriage by mutual consent and elopement (udlia), marriage by capture
88
(cubboi), marriage by intrusion (gaisamuddi) and marriage by service (garijya). The bride
price, although not uniform in all cases of marriages, is paid to the bride's parents.
Divorce is socially permissible and remarriages of widow/widower, divorcee/separated are
also allowed.
DONGRIA KANDHA: The Dongria Kandha, members of the Kandha tribe of Orissa, are
found in the Niyamgiri hill ranges of the Eastern Ghats and particularly in the Rayagada
and Koraput districts. Dongria Kandhas speak a language, called the kuvi, which is of
Dravidian linguistic ancestry. A Dongria Kandha village is situated in a gentile slope at the
foot hills or in shelf in the steep hills. The houses are built close to one another or either
side of the village street. They are expert horticulturists and grow jackfruit, mango,
pineapple, banana, citrus fruits, ginger, and turmeric. Besides horticulture, they earn
their livelihood through shifting cultivation along hill slopes, collection of materials from
forests, animal husbandry and wage-earning. The Dongria Kandhas are patrilineal and
patriarchal; they have nuclear families, extended families, lineage and clans. Although
marriage by negotiation appears to be more prestigious, they too have other ways of
acquiring marriage partners, such as the marriage by capture, exchange, or service. Their
economies centre round the dongar - hill slopes of shifting cultivation and the dongar is
the abode of their deities and supernatural beings. It provides them also with a metaphor
for their worldview.
The secular and sacerdotal chieftainship continues to enjoy confidence and esteem. The
Bismajhi, Barika, Pujari, Disari, Bejuni, Jhateni and Gouda are the other village
functionaries who play specific roles in various contexts. The theological pantheon of the
Dongria Kandha has the 'Dharni penu', the earth goddess, at the apex and in addition there
are a large number of village deities, ancestral cults, household deities, and spirits (both
benevolent and malevolent). Deities and spirits are propitiated for their blessings, and
rituals and ceremonies are observed throughout the year. Dongria Kandhas employ
traditional knowledge of the causes and cure of diseases and ailments, and consult their
Disari, the medicine man, at times of need.
JUANG: The Juang are found only in Orissa State, concentrated in the districts of Keonjhar
(the Thaniya section) and Dhenkanal (the Bhagudiya section). Gonasika, which is situated
in Keonihar district, is the principal seat of the tribe. The Gonasika area constitutes
sedentary landscape with hills, slopes, ridges, and valleys. The vegetative cover in the
area ranges from barren to thin forest, within a sub-tropical monsoon climate. The
Gonasika (meaning 'cow's nostril') marks the origin of the river Baitarani. The Juang speak
89
a language classified under the Mundari, belonging to the Austric subfamily of the Austro-
Asiatic language family. The Juang villages are generally located in the hill slopes, at the
upper reaches of the valleys. The Juang house is rectangular in ground plan. A door is
provided in front which serves as both entrance and exit and there is no window in any
house.
They have patrilineal and totemistic septs/clans, which have two broad divisions, namely
the Kutumb/Bhai septs (non-intermarrying/consanguineous) and the Bandbu septs
(intermarrying/affinal). Their secular and sacerdotal chiefs are the Pradhan and
Nagam/Boita, respectively. They are polytheists and the two principal deities are the
Dharam Debta/Mahapuru and the Dharti Mata/Basuki. The Rushi (benefactor) and the
Rushain (benefactoress) are considered as the deified tribal heroes (Elwin 1948). There
are also deities presiding over villages, hills, rivers, and forest. Ancestral cults are also in
evidence. Interestingly, there is an absence of the practice of witchcraft and sorcery.
They observe a number of rituals, ceremonies and festivals throughout the year. The
Juang consider the neighboring tribal group, the Bhuiyan, as their brothers.
KHARIA: The Pahari/Hill Kharia, members of Kharia tribe, are considered the most
'backward' insofar as their economic status is concerned. The Hill Kharias are the
autochthonous inhabitants of the Similipal hill ranges of Mayurbhanj district. They live in
small villages consisting of roughly 20 to 30 households and their villages are found
scattered on hilltops, hill slopes and foothills. The Kharia villages are situated in the
forests or in place close to the forests. The subsistence economy of the Hill Kharia centres
on the collection of minor forest produce, such as resin, honey, bees' wax, lac, tusser
cocoon, and hunting. The Kharia family is patrilineal, patriarchal and patrilocal and there
is a preponderance of nuclear families. As with the other tribes, marriage by negotiation is
preferred. Bride price is practiced; and widow remarriage and divorce are socially
allowed. The Hill Kharias consider the earth goddess, Thakurani, as their supreme deity.
They also believe in a number of deities and spirits, propitiating them through
performance of rituals. The Pradhan heads the traditional socio-political organisation; and
both village-level and inter-village level councils attend to the internal and external
affairs of the community.
KUTIA KANDHA: The Kutia Kandha is a sub-section of the Kandha tribal group of Orissa
and they are mainly concentrated in Belghar area of the Balliguda subdivision in
Kandhamal district. Their habitat is located in the north-eastern fringe of the Eastern
Ghats and contains hills, rivers and streams. The Kutia villages are situated in the foot-
90
hills or in the valleys surrounded by densely forested high hills. Patrilineality, patriarchy
and patrilocality prevail in Kutia Kandha villages. They have nuclear and extended
families, lineage, clans and clan exogamy regulates marriage. The secular functionaries
are the Mutha Majhi, Pat Majhi, Bis Majhi and Chhatia; while the Jani is the sacerdotal
head. The Kutia Kandhas are polytheists and believe in a large number of deities, spirits,
supernatural elements, both benevolent and malevolent. They propitiate their deities and
spirits through performance of rituals for their blessings. They observe various ceremonies
and festivals throughout the year and perform magico-religious rituals as per the
prescription of the Jani.
The techno-economic base of the Kutia Kandha is centred on the sylvan forest eco-system.
They practice slash-and-burn cultivation, otherwise known as 'podu chas', , horticultural
plantations, animal husbandry and wage-earning and also grow crops in wet land for their
livelihood. The Kutia Kandha women play a significant role in socio-economic, socio-
religious and socio-cultural system maintenance.
LODHA: In Orissa, the Lodhas are concentrated in two areas, namely Morada and
Suliapada in the Sadar subdivision of Mayurbhanj district. They are originally a Mundari
speaking tribe. Their economy is subsistence-oriented and depends upon the collection of
minor forest produce, wage-earning and agricultural labour. The Lodha social organization
is characterized by Patrilineal and totemistic clans, and most of the families are nuclear.
Their marriages are usually post-pubescent and monogamous, although polygynous unions
are not totally ruled out. Divorce and remarriage are socially permissible. In the socio-
political domain, the Mukhia/Sardar plays the role of headman and the traditional village
Panchayat is called Desh. The Lodhas are polytheists. Like other tribes, they have village
deities, tutelary deities, ancestral cults, benevolent and malevolent spirits, and all of
them constitute the supernatural constellation. The Lodhas observe a number of rituals
and festivals throughout the year to gain the favour of spirits and the blessings of deities
for their overall well-being.
PAUDI BHUYAN: The Bhuyan is one of the major tribes of Orissa. They are found in the
districts of Keonjhar, Sundargarh, Mayurbhanj and Deogada and are chiefly concentrated
in the Bhuyan pirha of Keonjhar district and Bonai subdivision of Sundargarh district. Their
habitat constitutes hilly terrain and valleys.
They practice a slash-and-burn type of cultivation (Kamani) on hill slopes, settled
cultivation on wetlands and vegetable cultivation in kitchen gardens. They also collect
food materials, fuel wood, honey, resin Iac, medicinal plants and herbs from the forest.
91
Monogamy is the norm and marriage by negotiation is preferred but not always adhered
to. There is the prevalence of a bride price, which is paid to the bride's father in cash
and/or kind. Their family, which is the smallest social unit, is characterized by patriarchy,
patrilocality and patrilineality. The tribe functions according to lineage and clans. The
village head is called the Naik/Padhan, who presides over the village assembly, or Darbar;
and the inter-village traditional political organisation is known as the Bar in the
Sundargarh district and Pirh in the Keonjhar district. The Dharam Devta and Basukimata,
who represent Sun and Earth, respectively, are at the apex of their pantheon. The Dihuri
is the sacerdotal chief, who performs all rituals connected with worship of deities. When
sickness arises, the tribe applies magico-religious methods through Raulia, the witch
doctor, and utilizes medicinal plants and herbs.
SAORA: The Saora is one of the major tribes of Orissa and they speak a language, Sora,
which can be classified under the Austro-Asiatic language family. They are found in almost
all districts of the State, but are chiefly concentrated in Gajapati, Rayagada and Ganjam
districts. The Saoras have been classified into various groups. The Lanjia Saoras are the
more 'primitive' group and the Sudha Saoras are a Hinduised acculturated group (Mohanty
1990: 249-50).
The Saora family is patriarchal, patrilocal and patrilineal. Unlike other tribal groups, the
Saora do not have a clan system. Instead, they have another institution, called the
Birinda, a patrilineage that performs the functions of the clan. Moreover, the Birinda is
exogamous and regulates marriage, inheritance and succession. A Saora woman's Birinda
does not change after her marriage and after the death of a woman; her Birinda members
have the right to perform her death rituals.
Although monogamy is the rule, polygynous unions are also prevalent. Besides marriage by
negotiation, marriage by ceremonial capture also occurs. Various life-cycle rituals are
observed as per their customs and the Guar ceremony as a death ritual is significant
among them. The Saoras practice shifting, terrace and settled cultivation, collect minor
forest produce, pursue animal husbandry, horticulture, and wage earning. The Saoras are
noted for their iconography, craftsmanship and their rich cultural heritage.
In Orissa there are 13 Identified PTGS. However, Birhor and Mankirdia are culturally
the same. The same way, Lanjia Saora and Saora have identical Cultural features.
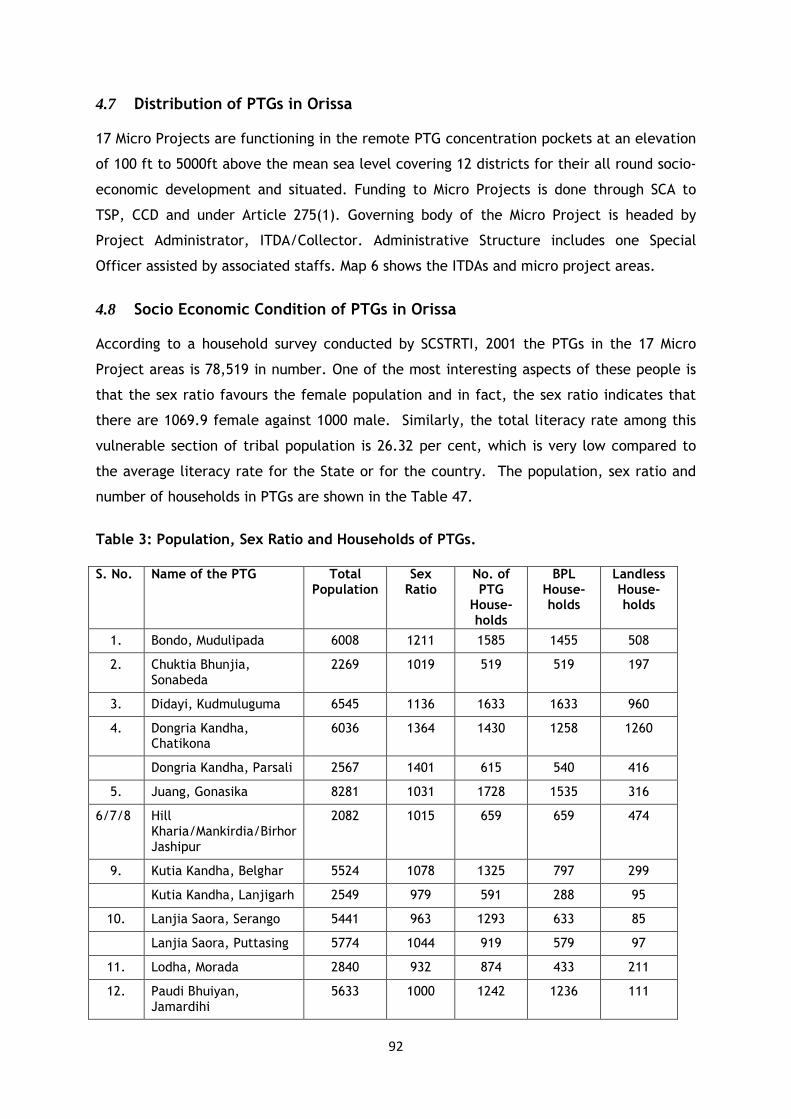
92
4.7 Distribution of PTGs in Orissa
17 Micro Projects are functioning in the remote PTG concentration pockets at an elevation
of 100 ft to 5000ft above the mean sea level covering 12 districts for their all round socio-
economic development and situated. Funding to Micro Projects is done through SCA to
TSP, CCD and under Article 275(1). Governing body of the Micro Project is headed by
Project Administrator, ITDA/Collector. Administrative Structure includes one Special
Officer assisted by associated staffs. Map 6 shows the ITDAs and micro project areas.
4.8 Socio Economic Condition of PTGs in Orissa According to a household survey conducted by SCSTRTI, 2001 the PTGs in the 17 Micro
Project areas is 78,519 in number. One of the most interesting aspects of these people is
that the sex ratio favours the female population and in fact, the sex ratio indicates that
there are 1069.9 female against 1000 male. Similarly, the total literacy rate among this
vulnerable section of tribal population is 26.32 per cent, which is very low compared to
the average literacy rate for the State or for the country. The population, sex ratio and
number of households in PTGs are shown in the Table 47.
Table 3: Population, Sex Ratio and Households of PTGs.
S. No. Name of the PTG Total Population
Sex Ratio
No. of PTG
House-holds
BPL House-holds
Landless House-holds
1. Bondo, Mudulipada 6008 1211 1585 1455 508
2. Chuktia Bhunjia, Sonabeda
2269 1019 519 519 197
3. Didayi, Kudmuluguma 6545 1136 1633 1633 960
4. Dongria Kandha, Chatikona
6036 1364 1430 1258 1260
Dongria Kandha, Parsali 2567 1401 615 540 416
5. Juang, Gonasika 8281 1031 1728 1535 316
6/7/8 Hill Kharia/Mankirdia/Birhor Jashipur
2082 1015 659 659 474
9. Kutia Kandha, Belghar 5524 1078 1325 797 299
Kutia Kandha, Lanjigarh 2549 979 591 288 95
10. Lanjia Saora, Serango 5441 963 1293 633 85
Lanjia Saora, Puttasing 5774 1044 919 579 97
11. Lodha, Morada 2840 932 874 433 211
12. Paudi Bhuiyan, Jamardihi
5633 1000 1242 1236 111
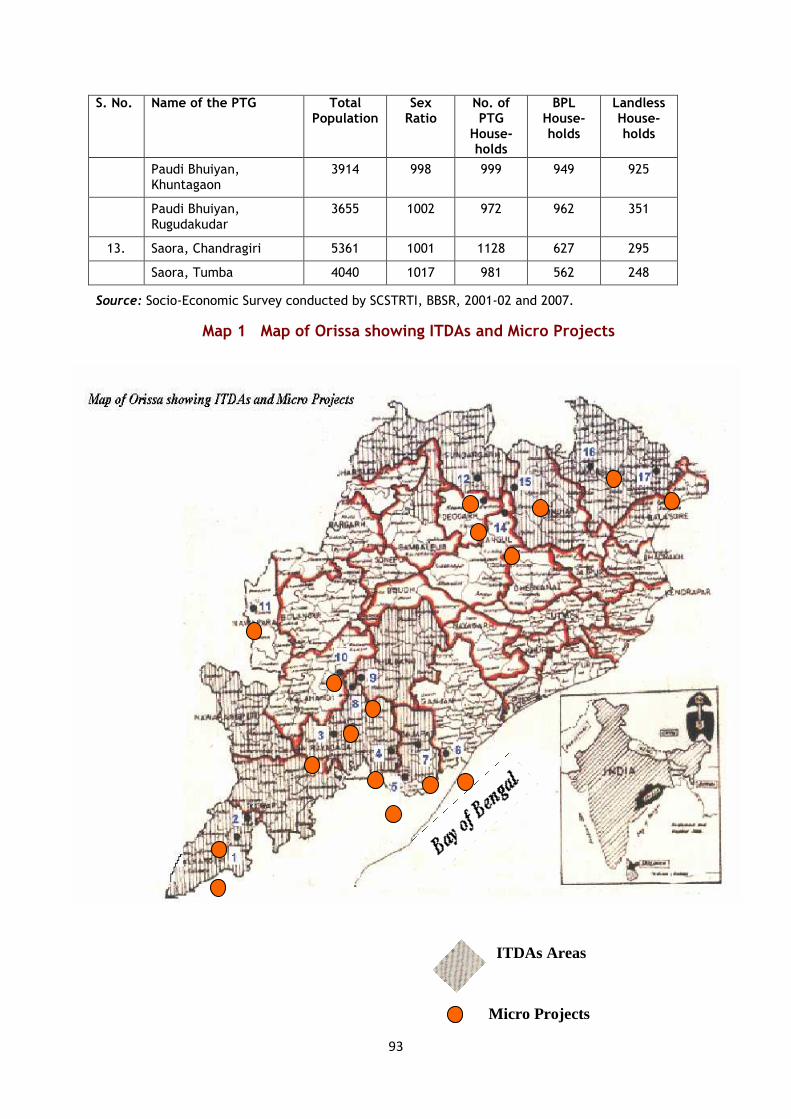
93
S. No. Name of the PTG Total Population
Sex Ratio
No. of PTG
House-holds
BPL House-holds
Landless House-holds
Paudi Bhuiyan, Khuntagaon
3914 998 999 949 925
Paudi Bhuiyan, Rugudakudar
3655 1002 972 962 351
13. Saora, Chandragiri 5361 1001 1128 627 295
Saora, Tumba 4040 1017 981 562 248
Source: Socio-Economic Survey conducted by SCSTRTI, BBSR, 2001-02 and 2007.
Map 1 Map of Orissa showing ITDAs and Micro Projects
ITDAs Areas
Micro Projects
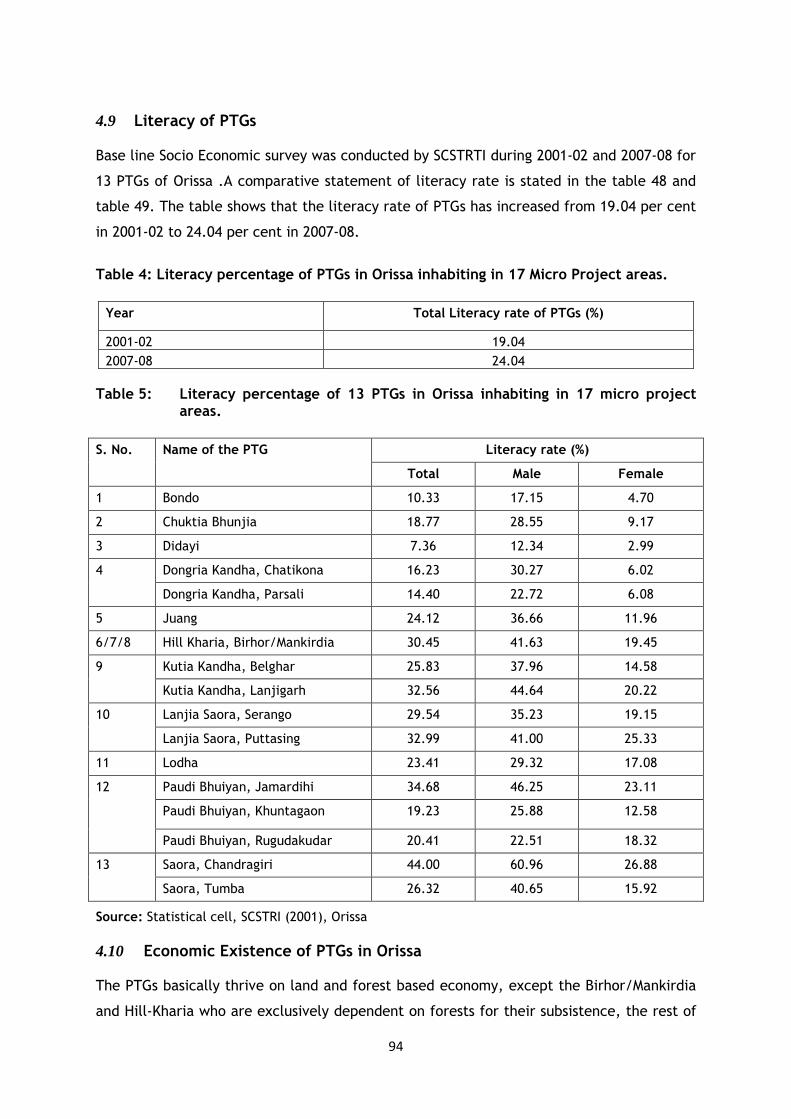
94
4.9 Literacy of PTGs Base line Socio Economic survey was conducted by SCSTRTI during 2001-02 and 2007-08 for
13 PTGs of Orissa .A comparative statement of literacy rate is stated in the table 48 and
table 49. The table shows that the literacy rate of PTGs has increased from 19.04 per cent
in 2001-02 to 24.04 per cent in 2007-08.
Table 4: Literacy percentage of PTGs in Orissa inhabiting in 17 Micro Project areas.
Year Total Literacy rate of PTGs (%)
2001-02 19.04
2007-08 24.04
Table 5: Literacy percentage of 13 PTGs in Orissa inhabiting in 17 micro project
areas.
Literacy rate (%) S. No. Name of the PTG
Total Male Female
1 Bondo 10.33 17.15 4.70
2 Chuktia Bhunjia 18.77 28.55 9.17
3 Didayi 7.36 12.34 2.99
Dongria Kandha, Chatikona 16.23 30.27 6.02 4
Dongria Kandha, Parsali 14.40 22.72 6.08
5 Juang 24.12 36.66 11.96
6/7/8 Hill Kharia, Birhor/Mankirdia 30.45 41.63 19.45
Kutia Kandha, Belghar 25.83 37.96 14.58 9
Kutia Kandha, Lanjigarh 32.56 44.64 20.22
Lanjia Saora, Serango 29.54 35.23 19.15 10
Lanjia Saora, Puttasing 32.99 41.00 25.33
11 Lodha 23.41 29.32 17.08
Paudi Bhuiyan, Jamardihi 34.68 46.25 23.11
Paudi Bhuiyan, Khuntagaon 19.23 25.88 12.58
12
Paudi Bhuiyan, Rugudakudar 20.41 22.51 18.32
Saora, Chandragiri 44.00 60.96 26.88 13
Saora, Tumba 26.32 40.65 15.92
Source: Statistical cell, SCSTRI (2001), Orissa
4.10 Economic Existence of PTGs in Orissa The PTGs basically thrive on land and forest based economy, except the Birhor/Mankirdia
and Hill-Kharia who are exclusively dependent on forests for their subsistence, the rest of
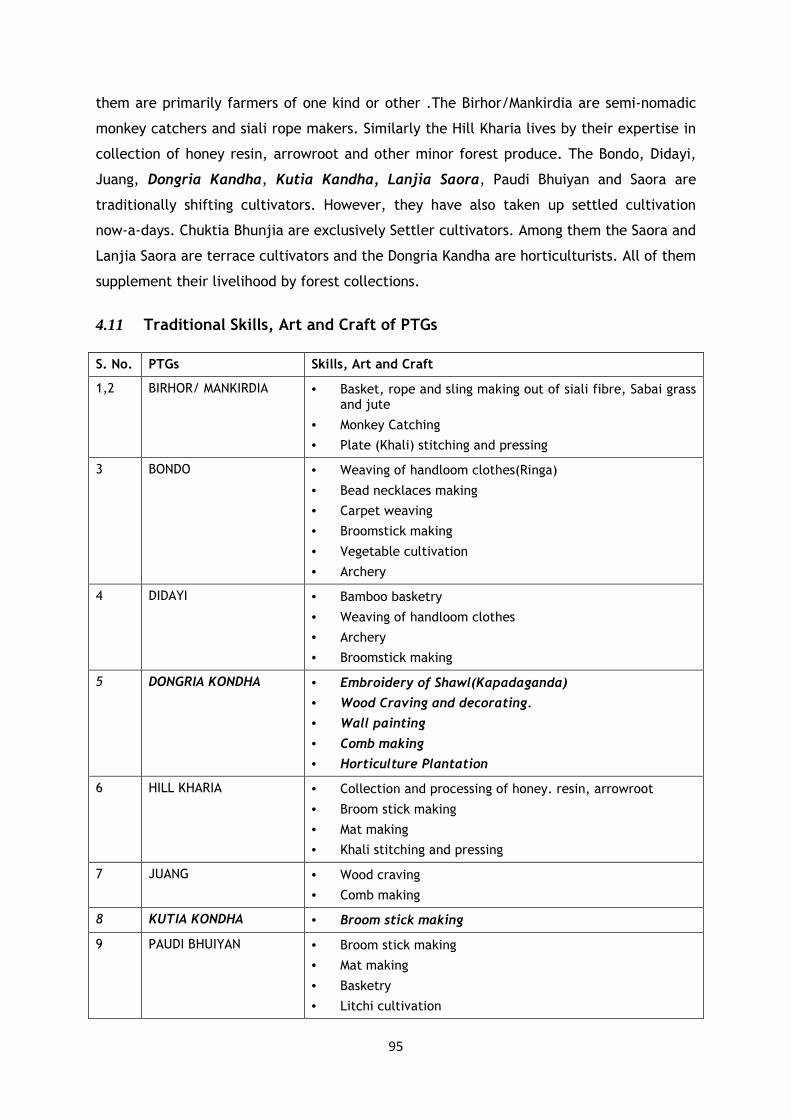
95
them are primarily farmers of one kind or other .The Birhor/Mankirdia are semi-nomadic
monkey catchers and siali rope makers. Similarly the Hill Kharia lives by their expertise in
collection of honey resin, arrowroot and other minor forest produce. The Bondo, Didayi,
Juang, Dongria Kandha, Kutia Kandha, Lanjia Saora, Paudi Bhuiyan and Saora are
traditionally shifting cultivators. However, they have also taken up settled cultivation
now-a-days. Chuktia Bhunjia are exclusively Settler cultivators. Among them the Saora and
Lanjia Saora are terrace cultivators and the Dongria Kandha are horticulturists. All of them
supplement their livelihood by forest collections.
4.11 Traditional Skills, Art and Craft of PTGs
S. No. PTGs Skills, Art and Craft
1,2 BIRHOR/ MANKIRDIA • Basket, rope and sling making out of siali fibre, Sabai grass and jute
• Monkey Catching
• Plate (Khali) stitching and pressing
3 BONDO • Weaving of handloom clothes(Ringa)
• Bead necklaces making
• Carpet weaving
• Broomstick making
• Vegetable cultivation
• Archery
4 DIDAYI • Bamboo basketry
• Weaving of handloom clothes
• Archery
• Broomstick making
5 DONGRIA KONDHA • Embroidery of Shawl(Kapadaganda)
• Wood Craving and decorating.
• Wall painting
• Comb making
• Horticulture Plantation
6 HILL KHARIA • Collection and processing of honey. resin, arrowroot
• Broom stick making
• Mat making
• Khali stitching and pressing
7 JUANG • Wood craving
• Comb making
8 KUTIA KONDHA • Broom stick making
9
PAUDI BHUIYAN • Broom stick making
• Mat making
• Basketry
• Litchi cultivation
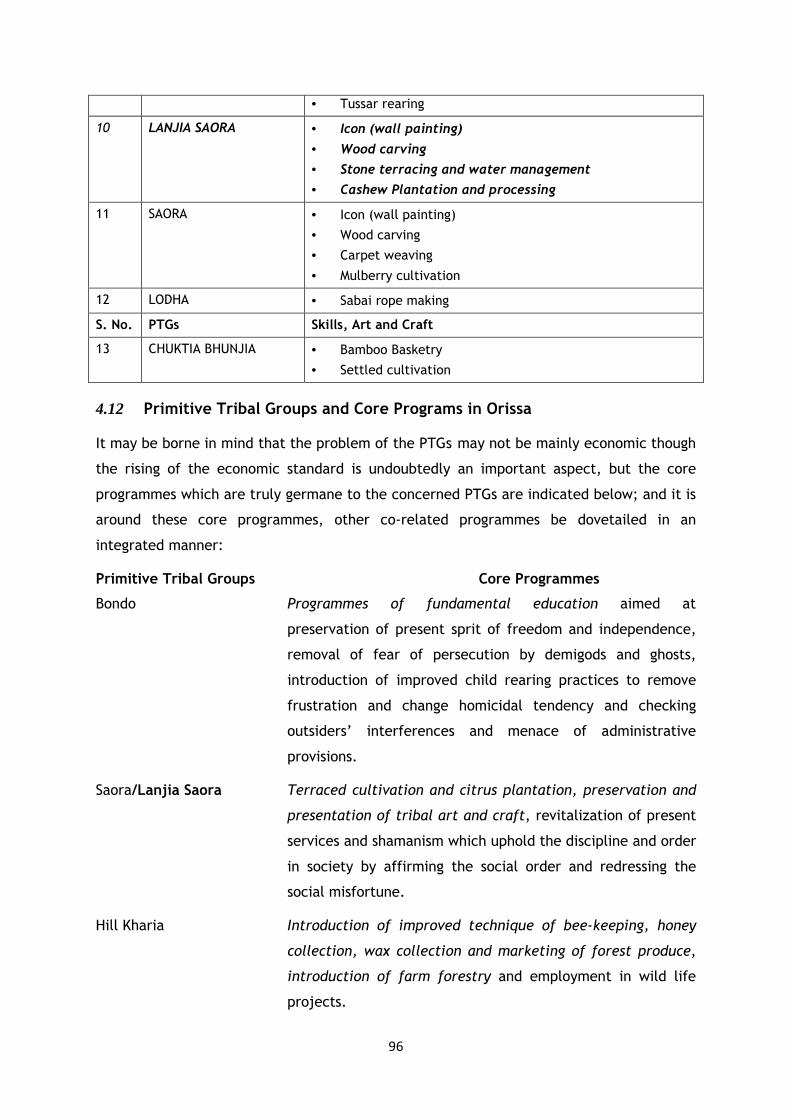
96
• Tussar rearing
10 LANJIA SAORA • Icon (wall painting)
• Wood carving
• Stone terracing and water management
• Cashew Plantation and processing
11 SAORA • Icon (wall painting)
• Wood carving
• Carpet weaving
• Mulberry cultivation
12 LODHA • Sabai rope making
S. No. PTGs Skills, Art and Craft
13 CHUKTIA BHUNJIA • Bamboo Basketry
• Settled cultivation
4.12 Primitive Tribal Groups and Core Programs in Orissa It may be borne in mind that the problem of the PTGs may not be mainly economic though
the rising of the economic standard is undoubtedly an important aspect, but the core
programmes which are truly germane to the concerned PTGs are indicated below; and it is
around these core programmes, other co-related programmes be dovetailed in an
integrated manner:
Primitive Tribal Groups Core Programmes
Bondo Programmes of fundamental education aimed at
preservation of present sprit of freedom and independence,
removal of fear of persecution by demigods and ghosts,
introduction of improved child rearing practices to remove
frustration and change homicidal tendency and checking
outsiders’ interferences and menace of administrative
provisions.
Saora/Lanjia Saora Terraced cultivation and citrus plantation, preservation and
presentation of tribal art and craft, revitalization of present
services and shamanism which uphold the discipline and order
in society by affirming the social order and redressing the
social misfortune.
Hill Kharia Introduction of improved technique of bee-keeping, honey
collection, wax collection and marketing of forest produce,
introduction of farm forestry and employment in wild life
projects.
97
Mankirdia/Birhor The Mankirdias are excellent monkey catches and there is a
great demand in medical researches for the Indian Rhesus
monkeys. Nearly all the medical tests for human beings are
carried out on the Rhesus Monkeys. There is a worldwide
market for such monkeys. The monkey catching skill of the
Mankirdias/Birhors is utilized for their benefits. The
Mankirdias are best rope makers and there is demand for
ropes in neighboring peasant communities. This particular
skill of rope making is utilized for their economic
development.
Kutia Kandha Counseling of genetic abnormalities like Sickle-cell anemia
and G-6-PD deficiently, attention to acute nutrition
imbalance, curative treatment for leprosy, supply of safe
drinking water, strict enforcement of legal provisions to stop
exploitation, illegal money lending, debt bondage etc.
Dongria Kandha Utilization and encouragement of fruit growing skill for
economic development, introduction of modern fruit
breeding and improved horticultural practices without
disturbing eco-system, marketing of the fruits grown by the
tribe, development of the fruit processing industry in the
central place, elimination of middleman system in purchase
and sale of fruits and other forest produce, Government’s
monopoly in buying fruits and forest produce from the tribes,
settings up of sound corporative societies manned by Dongria
Kandha to carry on business in fruits and forest produce.
Juang and Paudi Bhuiyan Revitalization of Mandaghara or Darbarghara and all
educational recreational Co-operative functions,
encouragement of paddy and wheat cultivation in bottom up
to 30 degree slope, development of terrace through 100%
help from Government in slope between 3 degree to 8 -
degree, development of Taungya cultivation with plantation
of fruit growing tree in second year taila land in slope
between 8 degree to 12 dergee, development pasturage in
slope beyond 12 degree, afforestation of hill-top and
preservation of forests, rehabilitation of few Juang families
98
in one or two colonies where good flat lands are available
close to their habitat and strict enforcement of protective
legislations.
Lodha Plantation of Asan trees and introduction of Terser rearing,
supply of Sabai grass for making ropes on Co-operative basis,
reclamation of land for settled cultivation, establishment of
well equipped and better staffed schools.
4.13 Health Status of PTGs Health problems of any community are influenced by interplay of various factors including
social, economic and political ones. The common beliefs, customs, practices related to
health and disease in turn influence the health seeking behaviour of the community. There
is a consensus agreement that the health status of the tribal population is very poor and
worst among the primitive tribes because of their isolation, remoteness and being largely
unaffected by developmental processes.
Studies undertaken in the country indicate that the primitive tribes have distinct health
problems, mainly governed by multidimensional factors like their habitat, different
terrain, ecological variable niches, illiteracy, poverty, isolation, superstition and
deforestation.
Orissa health strategy 2003 had advocated for improving the health status of tribal
population by reducing mortality and morbidity. It indicates that the tribal people suffer
disproportionately from malaria, tuberculosis, genetic disorders like G6PD deficiently,
sickle cell anaemia as also nutritional deficiency diseases. These are some of the special
health problems attributed to primitive tribal communities. The situation analysis of
health indicates of the tribal population in Orissa are worse than the national average;
Infract mortality rate is (84.2%), under 5years old Mortality rate (126.6%), children
underweight (55.9%), anaemia in children (79.8%), children with acute respiratory
infection (22.4%), children with diarrhea (21.1%) women with ammonia 64.9 per 1000.
Orissa is one of the ten states in the country covered under the National Nutrition
Monitoring Bureau (NNMB).According to the report of NNMB (2000-2001); Orissa is the
second highest level of under nutrition among the ten states. When compared with the
aggregate figure for Chronic Energy Deficiency (BMI<18.5) in adult men and women in the
state, the level is higher in Orissa. The prevalence of Chronic Energy deficiency in adult
men in the state is 38.6 per cent compared to aggregate of 37.04 per cent, where as the
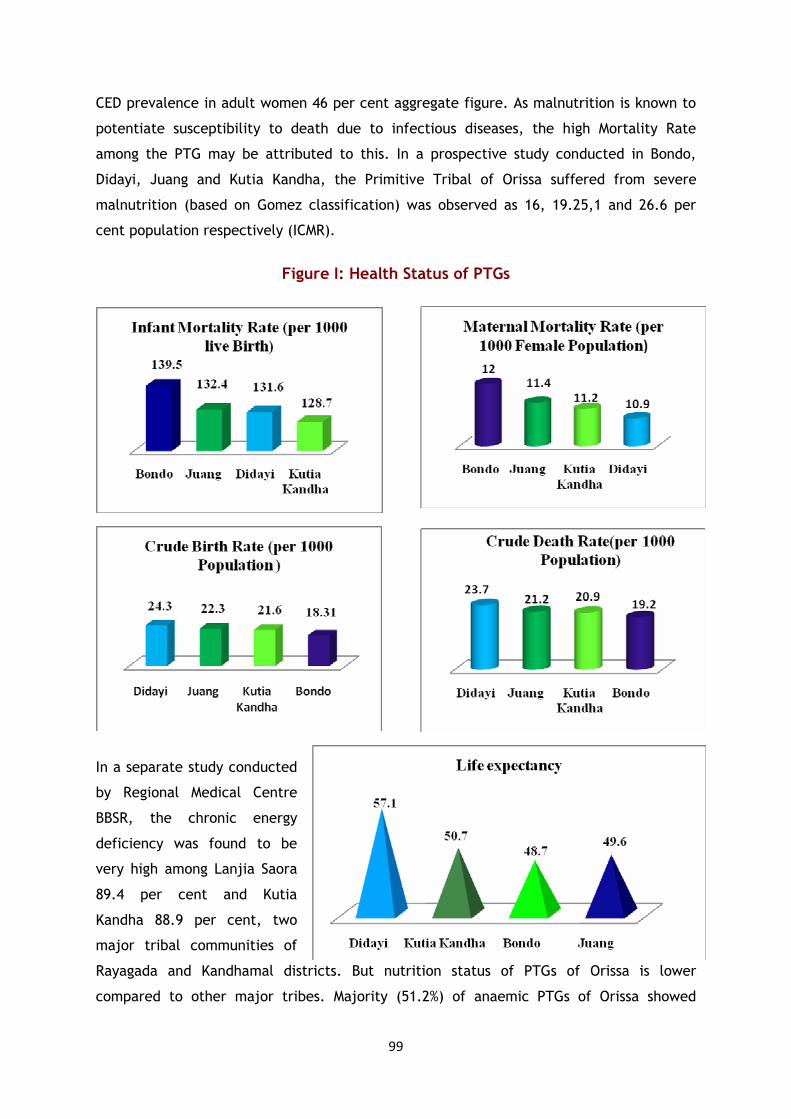
99
CED prevalence in adult women 46 per cent aggregate figure. As malnutrition is known to
potentiate susceptibility to death due to infectious diseases, the high Mortality Rate
among the PTG may be attributed to this. In a prospective study conducted in Bondo,
Didayi, Juang and Kutia Kandha, the Primitive Tribal of Orissa suffered from severe
malnutrition (based on Gomez classification) was observed as 16, 19.25,1 and 26.6 per
cent population respectively (ICMR).
Figure I: Health Status of PTGs
In a separate study conducted
by Regional Medical Centre
BBSR, the chronic energy
deficiency was found to be
very high among Lanjia Saora
89.4 per cent and Kutia
Kandha 88.9 per cent, two
major tribal communities of
Rayagada and Kandhamal districts. But nutrition status of PTGs of Orissa is lower
compared to other major tribes. Majority (51.2%) of anaemic PTGs of Orissa showed
100
microcytic hypochromic blood picture suggestive of iron deficiency anaemia. Statistical
analysis reveals a positive co-relation between hookworm’s infestation and anaemia
possible due to indiscriminate defecation, bare food and lack of health awareness.
The demographic data as per recent survey conducted by RMRC, Bhubaneswar amongst
four PTGs of Orissa, revealed an Infant Mortality rate (per 1000 live birth) of 139.5 in
Bondo, 131.6 in Didayi,132.4 in Juang and 128.7 in Kutia Kandha. A Maternal Mortality
Rate (per 1000 female population) of 12 in Bondo, 10.9 in Didayi,11.4 in Juang and 11.2 in
Kutia Kandha. The Life Expectancy of 48.7 years in Bondo, 57.1 years in Didayi, 49.6 years
in Juang and 50.7 years in Kutia Kandha. The Crude Birth Rate(CBR) per 1000 population of
18.31 in Bondo, 24.3 in Didayi, 22.3 in Juang and 21.6 in Kutia Kandha where as the Crude
Death Rate (CDR) per 1000 population of 19.2 in Bondo, 23.7 in Didayi, 21.2 in Juang and
20.9 in Kutia Kandha.
The unhygienic living condition and traditional health care practices were found mainly
responsible for high maternal mortality. It was observed that among Kutia Kandha the
delivery was conducted by the mother herself in a half squatting position, holding a rope
tied down from the roof of the house. This helped her in applying pressure to give birth of
the child. This complicated labour obviously might lead to maternal as well as child
mortality.
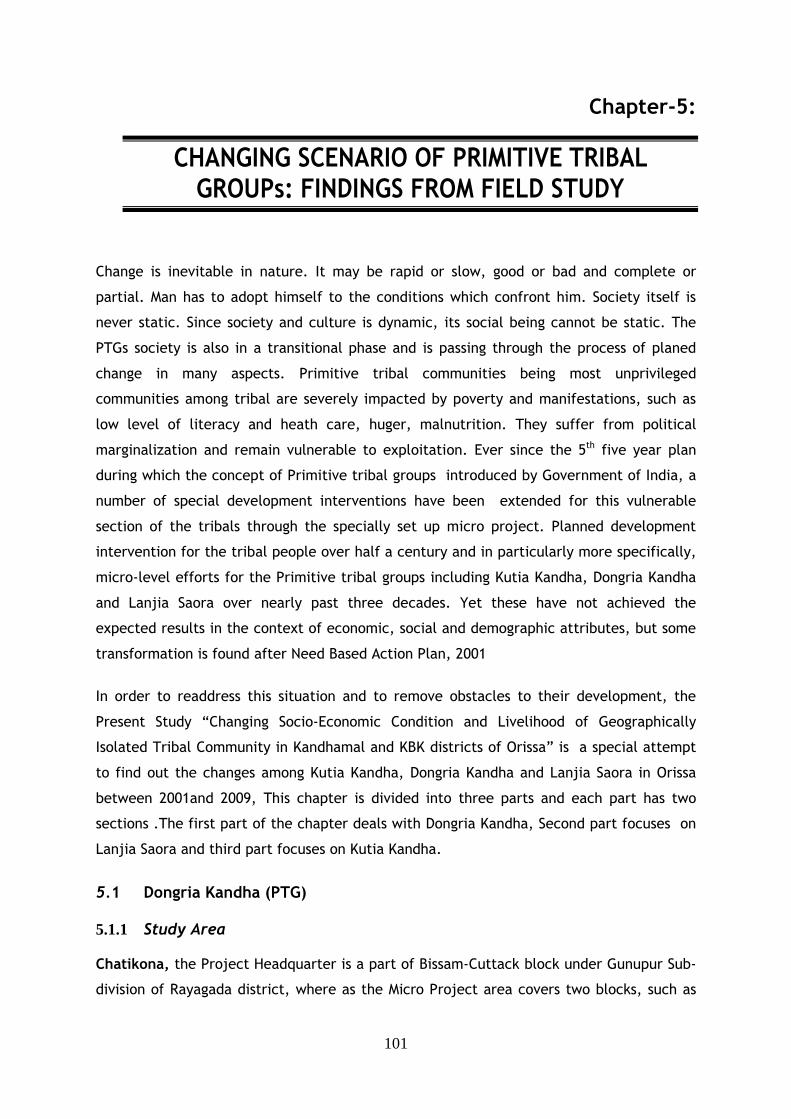
101
Chapter-5:
CHANGING SCENARIO OF PRIMITIVE TRIBAL GROUPs: FINDINGS FROM FIELD STUDY
Change is inevitable in nature. It may be rapid or slow, good or bad and complete or
partial. Man has to adopt himself to the conditions which confront him. Society itself is
never static. Since society and culture is dynamic, its social being cannot be static. The
PTGs society is also in a transitional phase and is passing through the process of planed
change in many aspects. Primitive tribal communities being most unprivileged
communities among tribal are severely impacted by poverty and manifestations, such as
low level of literacy and heath care, huger, malnutrition. They suffer from political
marginalization and remain vulnerable to exploitation. Ever since the 5th five year plan
during which the concept of Primitive tribal groups introduced by Government of India, a
number of special development interventions have been extended for this vulnerable
section of the tribals through the specially set up micro project. Planned development
intervention for the tribal people over half a century and in particularly more specifically,
micro-level efforts for the Primitive tribal groups including Kutia Kandha, Dongria Kandha
and Lanjia Saora over nearly past three decades. Yet these have not achieved the
expected results in the context of economic, social and demographic attributes, but some
transformation is found after Need Based Action Plan, 2001
In order to readdress this situation and to remove obstacles to their development, the
Present Study “Changing Socio-Economic Condition and Livelihood of Geographically
Isolated Tribal Community in Kandhamal and KBK districts of Orissa” is a special attempt
to find out the changes among Kutia Kandha, Dongria Kandha and Lanjia Saora in Orissa
between 2001and 2009, This chapter is divided into three parts and each part has two
sections .The first part of the chapter deals with Dongria Kandha, Second part focuses on
Lanjia Saora and third part focuses on Kutia Kandha.
5.1 Dongria Kandha (PTG) 5.1.1 Study Area Chatikona, the Project Headquarter is a part of Bissam-Cuttack block under Gunupur Sub-
division of Rayagada district, where as the Micro Project area covers two blocks, such as
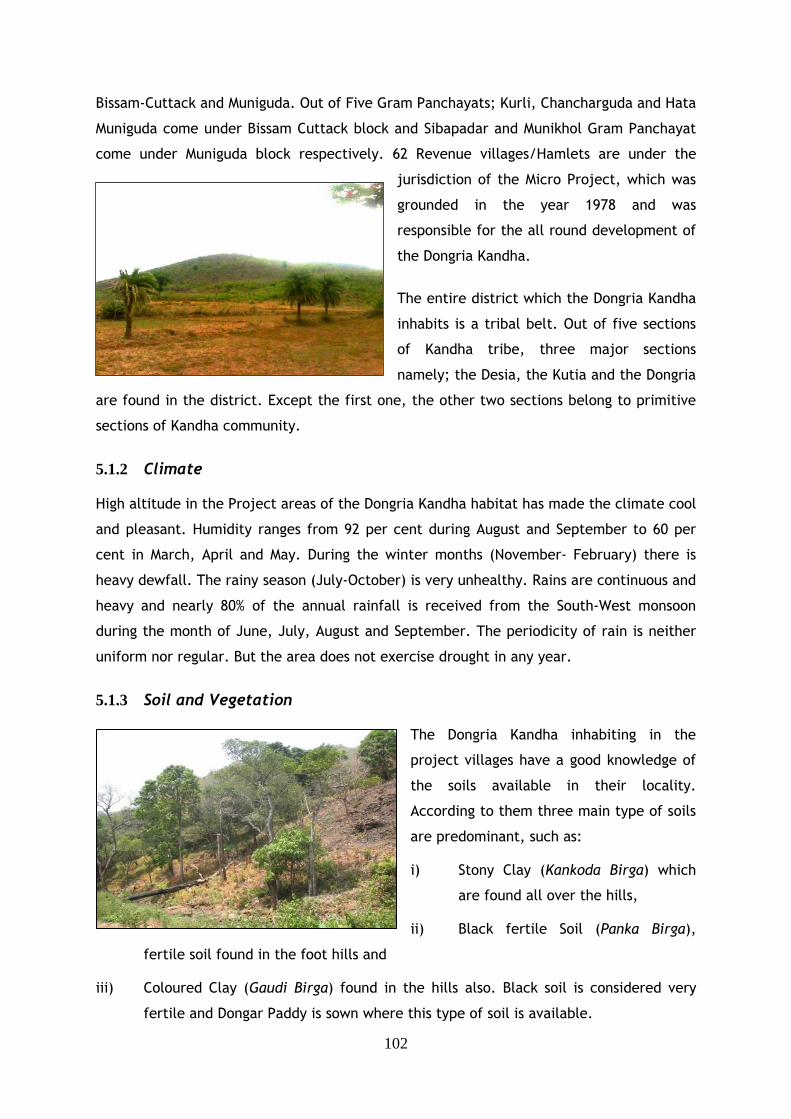
102
Bissam-Cuttack and Muniguda. Out of Five Gram Panchayats; Kurli, Chancharguda and Hata
Muniguda come under Bissam Cuttack block and Sibapadar and Munikhol Gram Panchayat
come under Muniguda block respectively. 62 Revenue villages/Hamlets are under the
jurisdiction of the Micro Project, which was
grounded in the year 1978 and was
responsible for the all round development of
the Dongria Kandha.
The entire district which the Dongria Kandha
inhabits is a tribal belt. Out of five sections
of Kandha tribe, three major sections
namely; the Desia, the Kutia and the Dongria
are found in the district. Except the first one, the other two sections belong to primitive
sections of Kandha community.
5.1.2 Climate High altitude in the Project areas of the Dongria Kandha habitat has made the climate cool
and pleasant. Humidity ranges from 92 per cent during August and September to 60 per
cent in March, April and May. During the winter months (November- February) there is
heavy dewfall. The rainy season (July-October) is very unhealthy. Rains are continuous and
heavy and nearly 80% of the annual rainfall is received from the South-West monsoon
during the month of June, July, August and September. The periodicity of rain is neither
uniform nor regular. But the area does not exercise drought in any year.
5.1.3 Soil and Vegetation
The Dongria Kandha inhabiting in the
project villages have a good knowledge of
the soils available in their locality.
According to them three main type of soils
are predominant, such as:
i) Stony Clay (Kankoda Birga) which
are found all over the hills,
ii) Black fertile Soil (Panka Birga),
fertile soil found in the foot hills and
iii) Coloured Clay (Gaudi Birga) found in the hills also. Black soil is considered very
fertile and Dongar Paddy is sown where this type of soil is available.
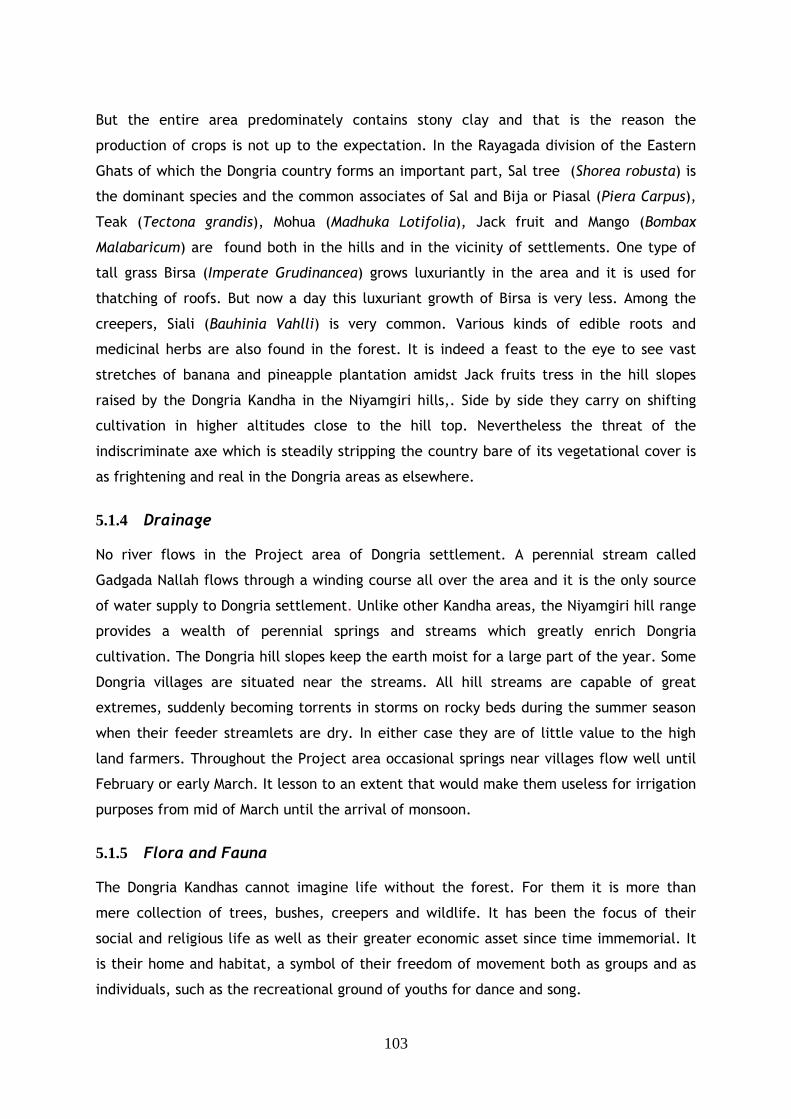
103
But the entire area predominately contains stony clay and that is the reason the
production of crops is not up to the expectation. In the Rayagada division of the Eastern
Ghats of which the Dongria country forms an important part, Sal tree (Shorea robusta) is
the dominant species and the common associates of Sal and Bija or Piasal (Piera Carpus),
Teak (Tectona grandis), Mohua (Madhuka Lotifolia), Jack fruit and Mango (Bombax
Malabaricum) are found both in the hills and in the vicinity of settlements. One type of
tall grass Birsa (Imperate Grudinancea) grows luxuriantly in the area and it is used for
thatching of roofs. But now a day this luxuriant growth of Birsa is very less. Among the
creepers, Siali (Bauhinia Vahlli) is very common. Various kinds of edible roots and
medicinal herbs are also found in the forest. It is indeed a feast to the eye to see vast
stretches of banana and pineapple plantation amidst Jack fruits tress in the hill slopes
raised by the Dongria Kandha in the Niyamgiri hills,. Side by side they carry on shifting
cultivation in higher altitudes close to the hill top. Nevertheless the threat of the
indiscriminate axe which is steadily stripping the country bare of its vegetational cover is
as frightening and real in the Dongria areas as elsewhere.
5.1.4 Drainage No river flows in the Project area of Dongria settlement. A perennial stream called
Gadgada Nallah flows through a winding course all over the area and it is the only source
of water supply to Dongria settlement. Unlike other Kandha areas, the Niyamgiri hill range
provides a wealth of perennial springs and streams which greatly enrich Dongria
cultivation. The Dongria hill slopes keep the earth moist for a large part of the year. Some
Dongria villages are situated near the streams. All hill streams are capable of great
extremes, suddenly becoming torrents in storms on rocky beds during the summer season
when their feeder streamlets are dry. In either case they are of little value to the high
land farmers. Throughout the Project area occasional springs near villages flow well until
February or early March. It lesson to an extent that would make them useless for irrigation
purposes from mid of March until the arrival of monsoon.
5.1.5 Flora and Fauna The Dongria Kandhas cannot imagine life without the forest. For them it is more than
mere collection of trees, bushes, creepers and wildlife. It has been the focus of their
social and religious life as well as their greater economic asset since time immemorial. It
is their home and habitat, a symbol of their freedom of movement both as groups and as
individuals, such as the recreational ground of youths for dance and song.
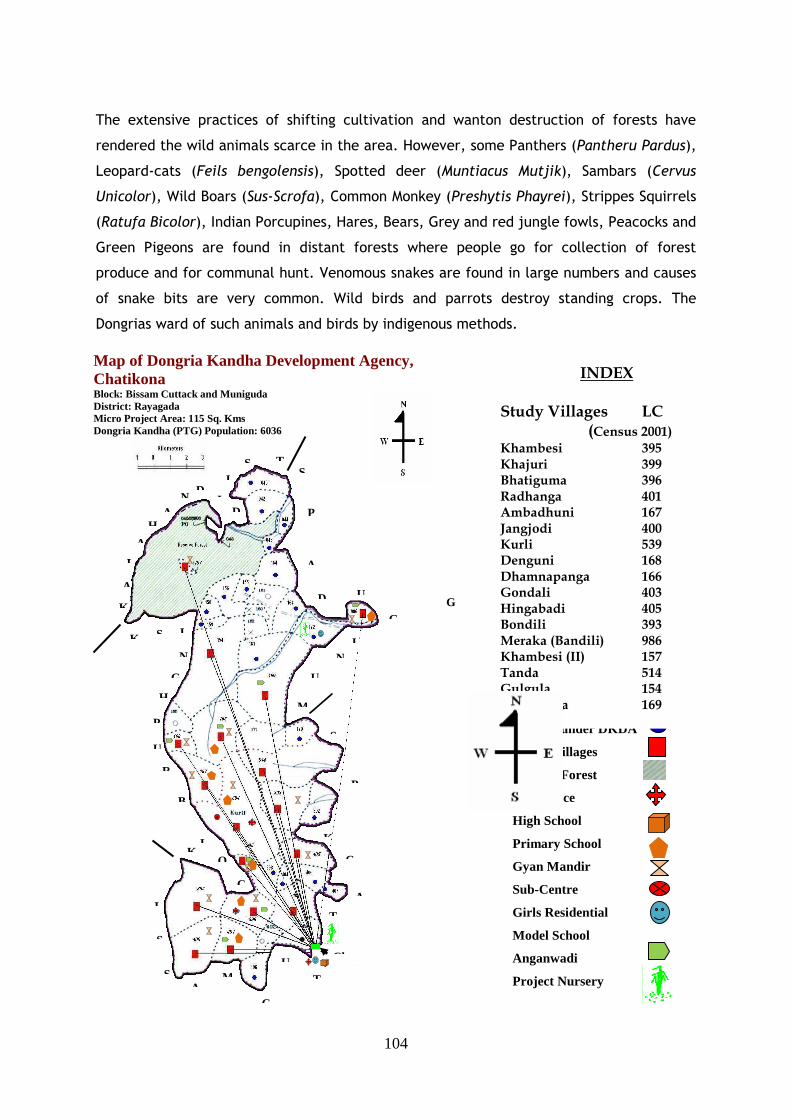
104
B
The extensive practices of shifting cultivation and wanton destruction of forests have
rendered the wild animals scarce in the area. However, some Panthers (Pantheru Pardus),
Leopard-cats (Feils bengolensis), Spotted deer (Muntiacus Mutjik), Sambars (Cervus
Unicolor), Wild Boars (Sus-Scrofa), Common Monkey (Preshytis Phayrei), Strippes Squirrels
(Ratufa Bicolor), Indian Porcupines, Hares, Bears, Grey and red jungle fowls, Peacocks and
Green Pigeons are found in distant forests where people go for collection of forest
produce and for communal hunt. Venomous snakes are found in large numbers and causes
of snake bits are very common. Wild birds and parrots destroy standing crops. The
Dongrias ward of such animals and birds by indigenous methods.
A
I
N
U
G
Map of Dongria Kandha Development Agency, Chatikona Block: Bissam Cuttack and Muniguda District: Rayagada Micro Project Area: 115 Sq. Kms Dongria Kandha (PTG) Population: 6036
Cha
S
P
MU
T
A
S
I
T
C
A
C
K
S
A
D
I N
U
U
G
S
P
S
I D
N A
H
A
L
A
K
T S I
D
D
U
MP
S I
N
K
H
G
R
L
C
O
B
U
K
Project Boundary
Village Boundary
Project Headquarter
Villages under DKDA
Study Villages
Reserve Forest
Post Office
High School
Primary School
Gyan Mandir
Sub-Centre
Girls Residential
Model School
Anganwadi
Project Nursery
References
INDEX Study Villages LC (Census 2001) Khambesi 395 Khajuri 399 Bhatiguma 396 Radhanga 401 Ambadhuni 167 Jangjodi 400 Kurli 539 Denguni 168 Dhamnapanga 166 Gondali 403 Hingabadi 405 Bondili 393 Meraka (Bandili) 986 Khambesi (II) 157 Tanda 514 Gulgula 154 Kaliaripeta 169
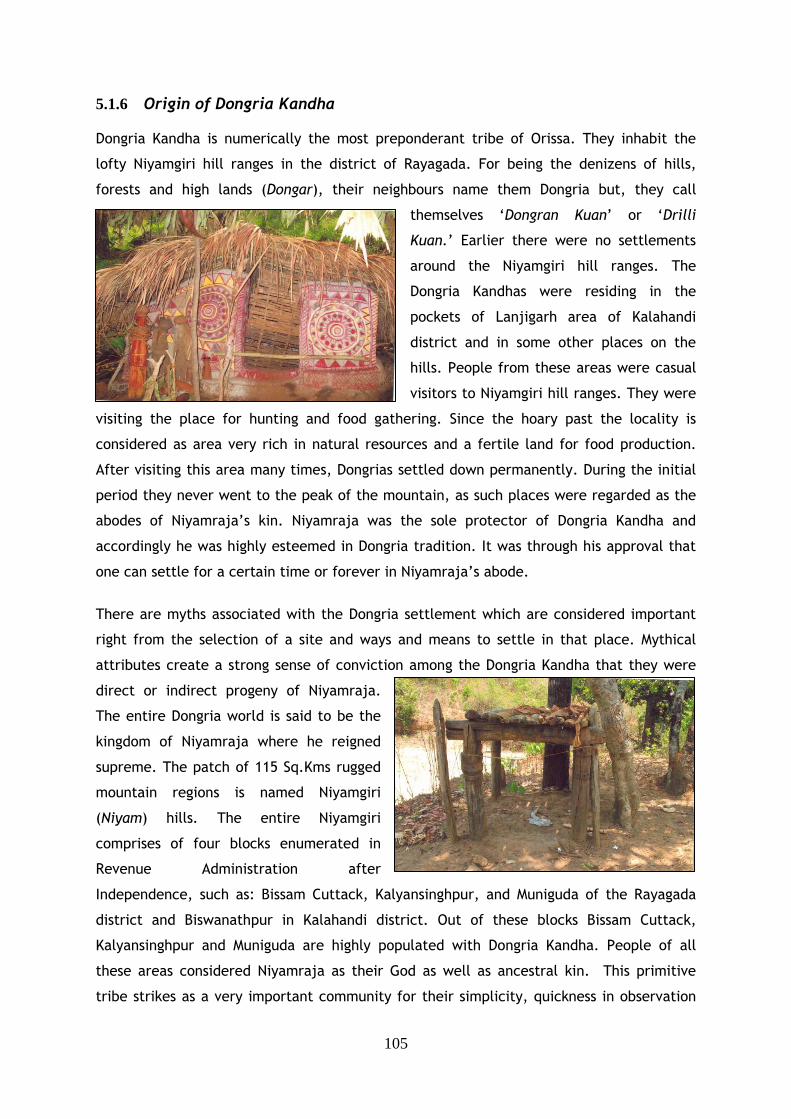
105
5.1.6 Origin of Dongria Kandha Dongria Kandha is numerically the most preponderant tribe of Orissa. They inhabit the
lofty Niyamgiri hill ranges in the district of Rayagada. For being the denizens of hills,
forests and high lands (Dongar), their neighbours name them Dongria but, they call
themselves ‘Dongran Kuan’ or ‘Drilli
Kuan.’ Earlier there were no settlements
around the Niyamgiri hill ranges. The
Dongria Kandhas were residing in the
pockets of Lanjigarh area of Kalahandi
district and in some other places on the
hills. People from these areas were casual
visitors to Niyamgiri hill ranges. They were
visiting the place for hunting and food gathering. Since the hoary past the locality is
considered as area very rich in natural resources and a fertile land for food production.
After visiting this area many times, Dongrias settled down permanently. During the initial
period they never went to the peak of the mountain, as such places were regarded as the
abodes of Niyamraja’s kin. Niyamraja was the sole protector of Dongria Kandha and
accordingly he was highly esteemed in Dongria tradition. It was through his approval that
one can settle for a certain time or forever in Niyamraja’s abode.
There are myths associated with the Dongria settlement which are considered important
right from the selection of a site and ways and means to settle in that place. Mythical
attributes create a strong sense of conviction among the Dongria Kandha that they were
direct or indirect progeny of Niyamraja.
The entire Dongria world is said to be the
kingdom of Niyamraja where he reigned
supreme. The patch of 115 Sq.Kms rugged
mountain regions is named Niyamgiri
(Niyam) hills. The entire Niyamgiri
comprises of four blocks enumerated in
Revenue Administration after
Independence, such as: Bissam Cuttack, Kalyansinghpur, and Muniguda of the Rayagada
district and Biswanathpur in Kalahandi district. Out of these blocks Bissam Cuttack,
Kalyansinghpur and Muniguda are highly populated with Dongria Kandha. People of all
these areas considered Niyamraja as their God as well as ancestral kin. This primitive
tribe strikes as a very important community for their simplicity, quickness in observation
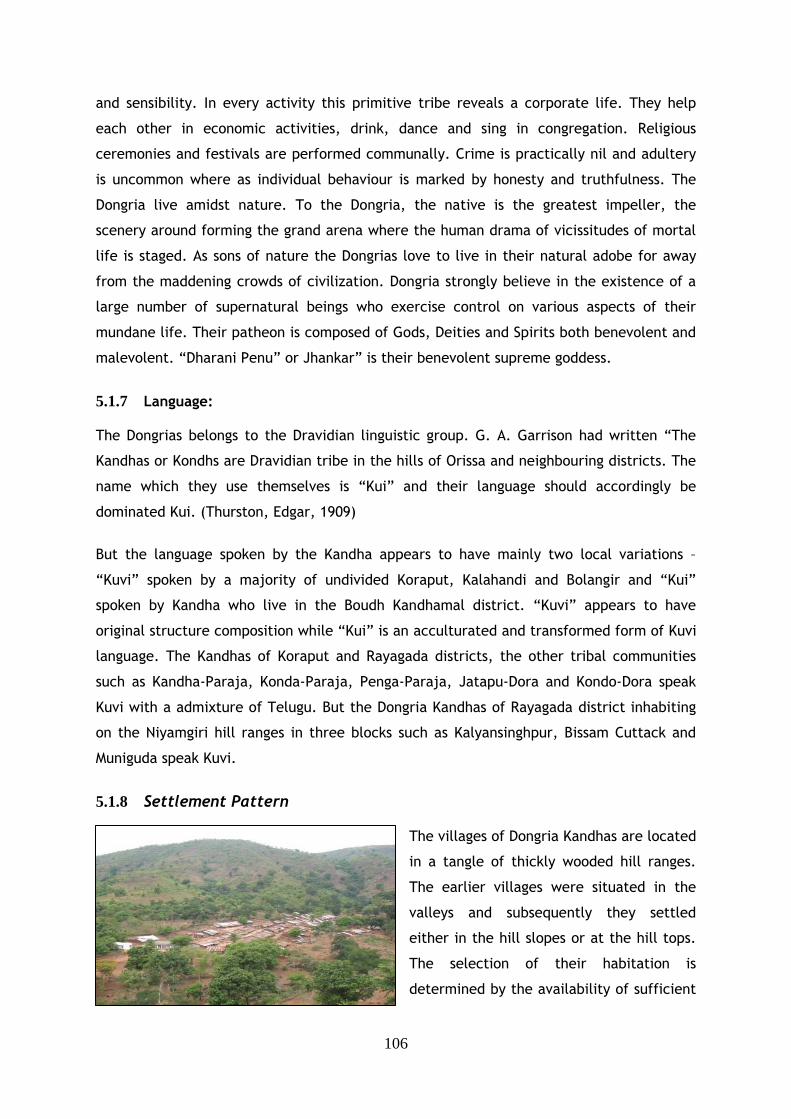
106
and sensibility. In every activity this primitive tribe reveals a corporate life. They help
each other in economic activities, drink, dance and sing in congregation. Religious
ceremonies and festivals are performed communally. Crime is practically nil and adultery
is uncommon where as individual behaviour is marked by honesty and truthfulness. The
Dongria live amidst nature. To the Dongria, the native is the greatest impeller, the
scenery around forming the grand arena where the human drama of vicissitudes of mortal
life is staged. As sons of nature the Dongrias love to live in their natural adobe for away
from the maddening crowds of civilization. Dongria strongly believe in the existence of a
large number of supernatural beings who exercise control on various aspects of their
mundane life. Their patheon is composed of Gods, Deities and Spirits both benevolent and
malevolent. “Dharani Penu” or Jhankar” is their benevolent supreme goddess.
5.1.7 Language: The Dongrias belongs to the Dravidian linguistic group. G. A. Garrison had written “The
Kandhas or Kondhs are Dravidian tribe in the hills of Orissa and neighbouring districts. The
name which they use themselves is “Kui” and their language should accordingly be
dominated Kui. (Thurston, Edgar, 1909)
But the language spoken by the Kandha appears to have mainly two local variations –
“Kuvi” spoken by a majority of undivided Koraput, Kalahandi and Bolangir and “Kui”
spoken by Kandha who live in the Boudh Kandhamal district. “Kuvi” appears to have
original structure composition while “Kui” is an acculturated and transformed form of Kuvi
language. The Kandhas of Koraput and Rayagada districts, the other tribal communities
such as Kandha-Paraja, Konda-Paraja, Penga-Paraja, Jatapu-Dora and Kondo-Dora speak
Kuvi with a admixture of Telugu. But the Dongria Kandhas of Rayagada district inhabiting
on the Niyamgiri hill ranges in three blocks such as Kalyansinghpur, Bissam Cuttack and
Muniguda speak Kuvi.
5.1.8 Settlement Pattern The villages of Dongria Kandhas are located
in a tangle of thickly wooded hill ranges.
The earlier villages were situated in the
valleys and subsequently they settled
either in the hill slopes or at the hill tops.
The selection of their habitation is
determined by the availability of sufficient
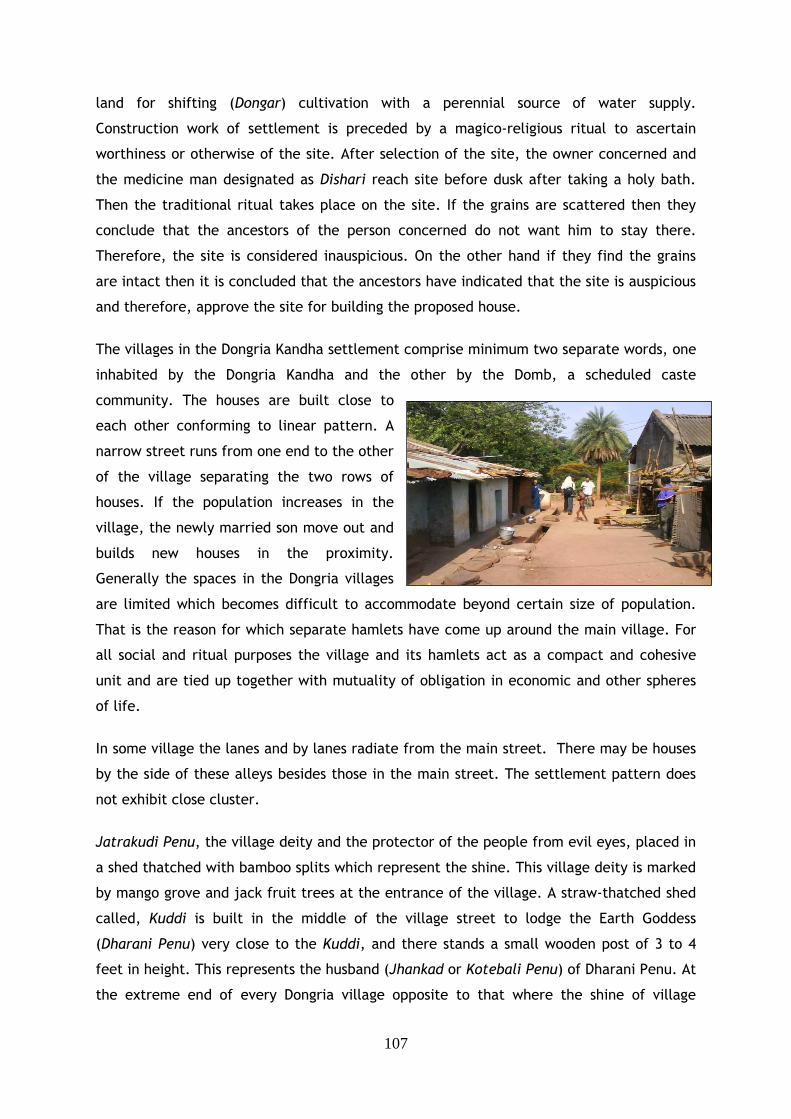
107
land for shifting (Dongar) cultivation with a perennial source of water supply.
Construction work of settlement is preceded by a magico-religious ritual to ascertain
worthiness or otherwise of the site. After selection of the site, the owner concerned and
the medicine man designated as Dishari reach site before dusk after taking a holy bath.
Then the traditional ritual takes place on the site. If the grains are scattered then they
conclude that the ancestors of the person concerned do not want him to stay there.
Therefore, the site is considered inauspicious. On the other hand if they find the grains
are intact then it is concluded that the ancestors have indicated that the site is auspicious
and therefore, approve the site for building the proposed house.
The villages in the Dongria Kandha settlement comprise minimum two separate words, one
inhabited by the Dongria Kandha and the other by the Domb, a scheduled caste
community. The houses are built close to
each other conforming to linear pattern. A
narrow street runs from one end to the other
of the village separating the two rows of
houses. If the population increases in the
village, the newly married son move out and
builds new houses in the proximity.
Generally the spaces in the Dongria villages
are limited which becomes difficult to accommodate beyond certain size of population.
That is the reason for which separate hamlets have come up around the main village. For
all social and ritual purposes the village and its hamlets act as a compact and cohesive
unit and are tied up together with mutuality of obligation in economic and other spheres
of life.
In some village the lanes and by lanes radiate from the main street. There may be houses
by the side of these alleys besides those in the main street. The settlement pattern does
not exhibit close cluster.
Jatrakudi Penu, the village deity and the protector of the people from evil eyes, placed in
a shed thatched with bamboo splits which represent the shine. This village deity is marked
by mango grove and jack fruit trees at the entrance of the village. A straw-thatched shed
called, Kuddi is built in the middle of the village street to lodge the Earth Goddess
(Dharani Penu) very close to the Kuddi, and there stands a small wooden post of 3 to 4
feet in height. This represents the husband (Jhankad or Kotebali Penu) of Dharani Penu. At
the extreme end of every Dongria village opposite to that where the shine of village
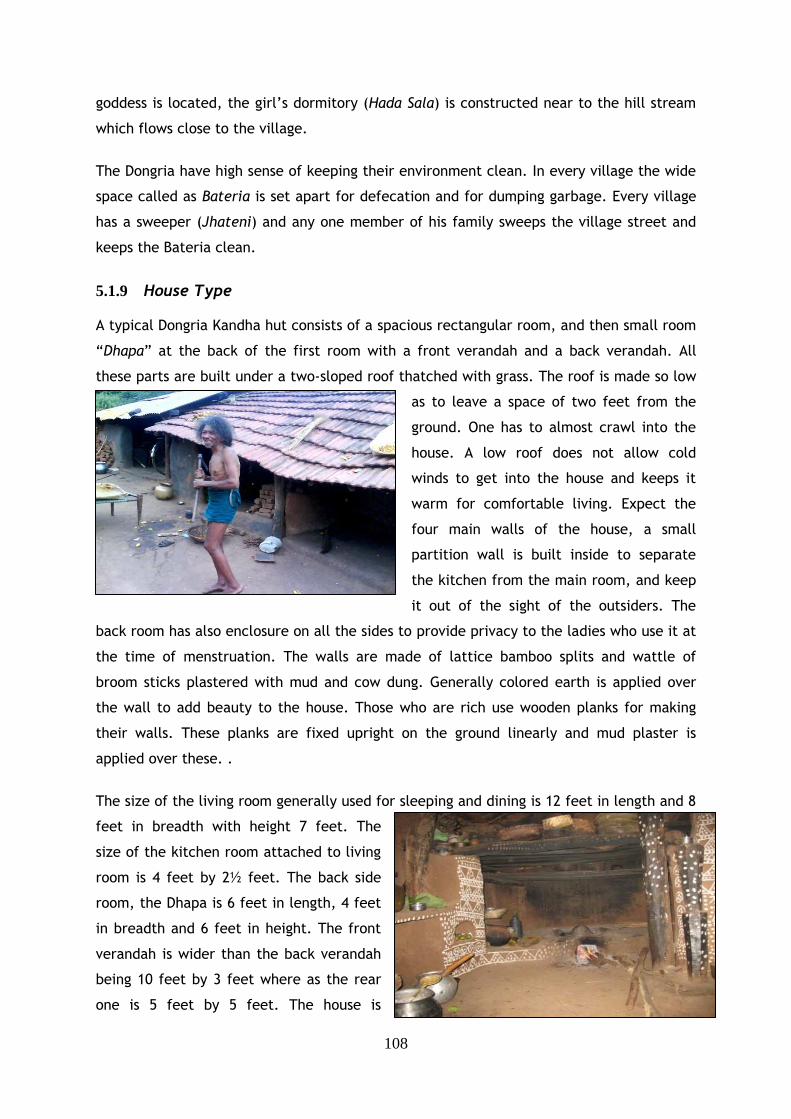
108
goddess is located, the girl’s dormitory (Hada Sala) is constructed near to the hill stream
which flows close to the village.
The Dongria have high sense of keeping their environment clean. In every village the wide
space called as Bateria is set apart for defecation and for dumping garbage. Every village
has a sweeper (Jhateni) and any one member of his family sweeps the village street and
keeps the Bateria clean.
5.1.9 House Type A typical Dongria Kandha hut consists of a spacious rectangular room, and then small room
“Dhapa” at the back of the first room with a front verandah and a back verandah. All
these parts are built under a two-sloped roof thatched with grass. The roof is made so low
as to leave a space of two feet from the
ground. One has to almost crawl into the
house. A low roof does not allow cold
winds to get into the house and keeps it
warm for comfortable living. Expect the
four main walls of the house, a small
partition wall is built inside to separate
the kitchen from the main room, and keep
it out of the sight of the outsiders. The
back room has also enclosure on all the sides to provide privacy to the ladies who use it at
the time of menstruation. The walls are made of lattice bamboo splits and wattle of
broom sticks plastered with mud and cow dung. Generally colored earth is applied over
the wall to add beauty to the house. Those who are rich use wooden planks for making
their walls. These planks are fixed upright on the ground linearly and mud plaster is
applied over these. .
The size of the living room generally used for sleeping and dining is 12 feet in length and 8
feet in breadth with height 7 feet. The
size of the kitchen room attached to living
room is 4 feet by 2½ feet. The back side
room, the Dhapa is 6 feet in length, 4 feet
in breadth and 6 feet in height. The front
verandah is wider than the back verandah
being 10 feet by 3 feet where as the rear
one is 5 feet by 5 feet. The house is
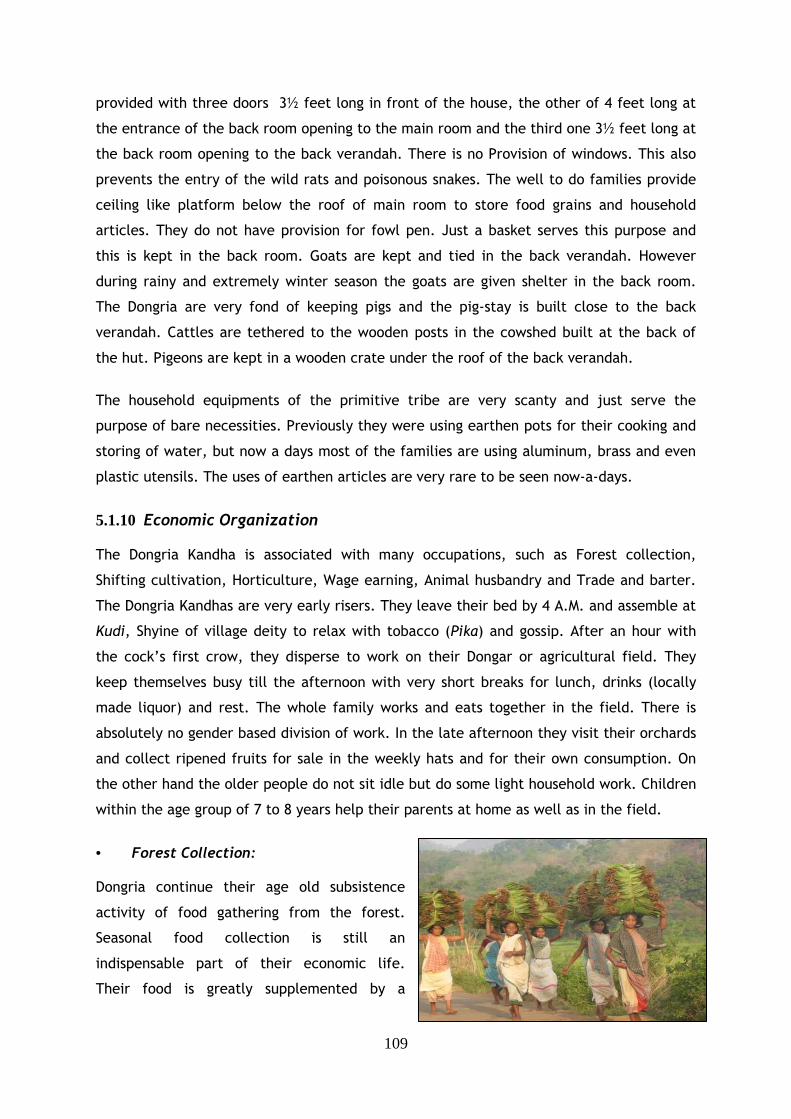
109
provided with three doors 3½ feet long in front of the house, the other of 4 feet long at
the entrance of the back room opening to the main room and the third one 3½ feet long at
the back room opening to the back verandah. There is no Provision of windows. This also
prevents the entry of the wild rats and poisonous snakes. The well to do families provide
ceiling like platform below the roof of main room to store food grains and household
articles. They do not have provision for fowl pen. Just a basket serves this purpose and
this is kept in the back room. Goats are kept and tied in the back verandah. However
during rainy and extremely winter season the goats are given shelter in the back room.
The Dongria are very fond of keeping pigs and the pig-stay is built close to the back
verandah. Cattles are tethered to the wooden posts in the cowshed built at the back of
the hut. Pigeons are kept in a wooden crate under the roof of the back verandah.
The household equipments of the primitive tribe are very scanty and just serve the
purpose of bare necessities. Previously they were using earthen pots for their cooking and
storing of water, but now a days most of the families are using aluminum, brass and even
plastic utensils. The uses of earthen articles are very rare to be seen now-a-days.
5.1.10 Economic Organization The Dongria Kandha is associated with many occupations, such as Forest collection,
Shifting cultivation, Horticulture, Wage earning, Animal husbandry and Trade and barter.
The Dongria Kandhas are very early risers. They leave their bed by 4 A.M. and assemble at
Kudi, Shyine of village deity to relax with tobacco (Pika) and gossip. After an hour with
the cock’s first crow, they disperse to work on their Dongar or agricultural field. They
keep themselves busy till the afternoon with very short breaks for lunch, drinks (locally
made liquor) and rest. The whole family works and eats together in the field. There is
absolutely no gender based division of work. In the late afternoon they visit their orchards
and collect ripened fruits for sale in the weekly hats and for their own consumption. On
the other hand the older people do not sit idle but do some light household work. Children
within the age group of 7 to 8 years help their parents at home as well as in the field.
• Forest Collection: Dongria continue their age old subsistence
activity of food gathering from the forest.
Seasonal food collection is still an
indispensable part of their economic life.
Their food is greatly supplemented by a
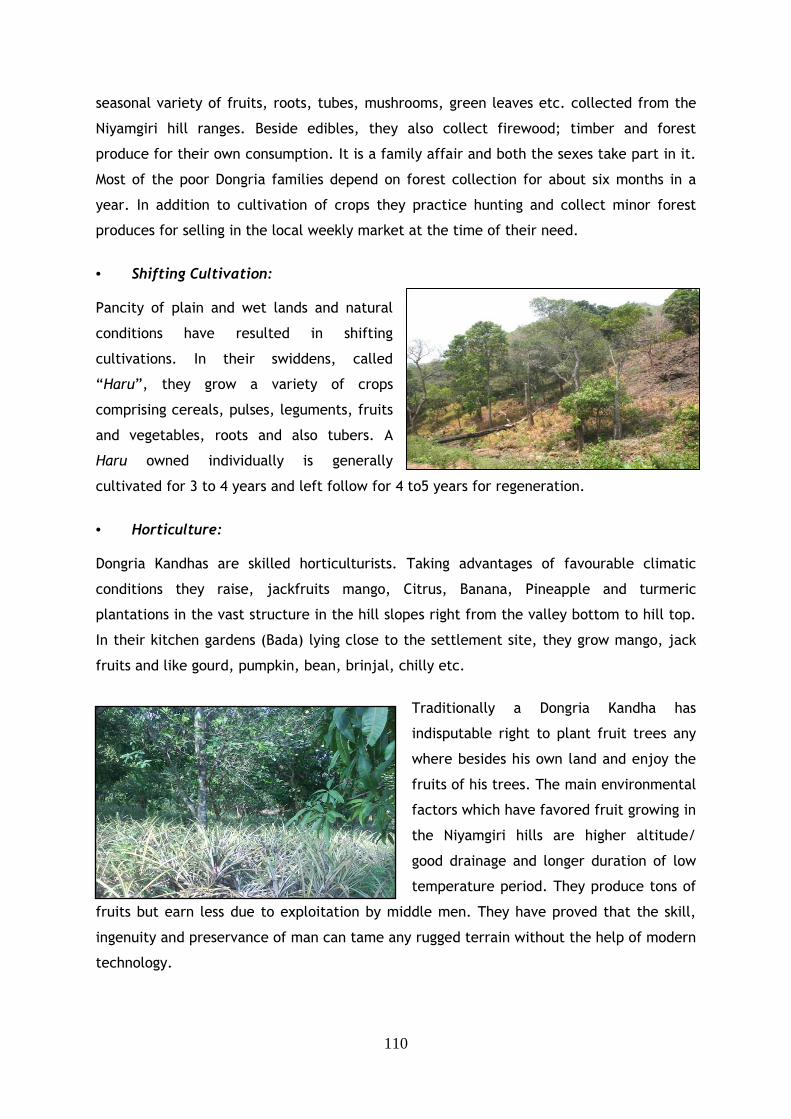
110
seasonal variety of fruits, roots, tubes, mushrooms, green leaves etc. collected from the
Niyamgiri hill ranges. Beside edibles, they also collect firewood; timber and forest
produce for their own consumption. It is a family affair and both the sexes take part in it.
Most of the poor Dongria families depend on forest collection for about six months in a
year. In addition to cultivation of crops they practice hunting and collect minor forest
produces for selling in the local weekly market at the time of their need.
• Shifting Cultivation: Pancity of plain and wet lands and natural
conditions have resulted in shifting
cultivations. In their swiddens, called
“Haru”, they grow a variety of crops
comprising cereals, pulses, leguments, fruits
and vegetables, roots and also tubers. A
Haru owned individually is generally
cultivated for 3 to 4 years and left follow for 4 to5 years for regeneration.
• Horticulture: Dongria Kandhas are skilled horticulturists. Taking advantages of favourable climatic
conditions they raise, jackfruits mango, Citrus, Banana, Pineapple and turmeric
plantations in the vast structure in the hill slopes right from the valley bottom to hill top.
In their kitchen gardens (Bada) lying close to the settlement site, they grow mango, jack
fruits and like gourd, pumpkin, bean, brinjal, chilly etc.
Traditionally a Dongria Kandha has
indisputable right to plant fruit trees any
where besides his own land and enjoy the
fruits of his trees. The main environmental
factors which have favored fruit growing in
the Niyamgiri hills are higher altitude/
good drainage and longer duration of low
temperature period. They produce tons of
fruits but earn less due to exploitation by middle men. They have proved that the skill,
ingenuity and preservance of man can tame any rugged terrain without the help of modern
technology.
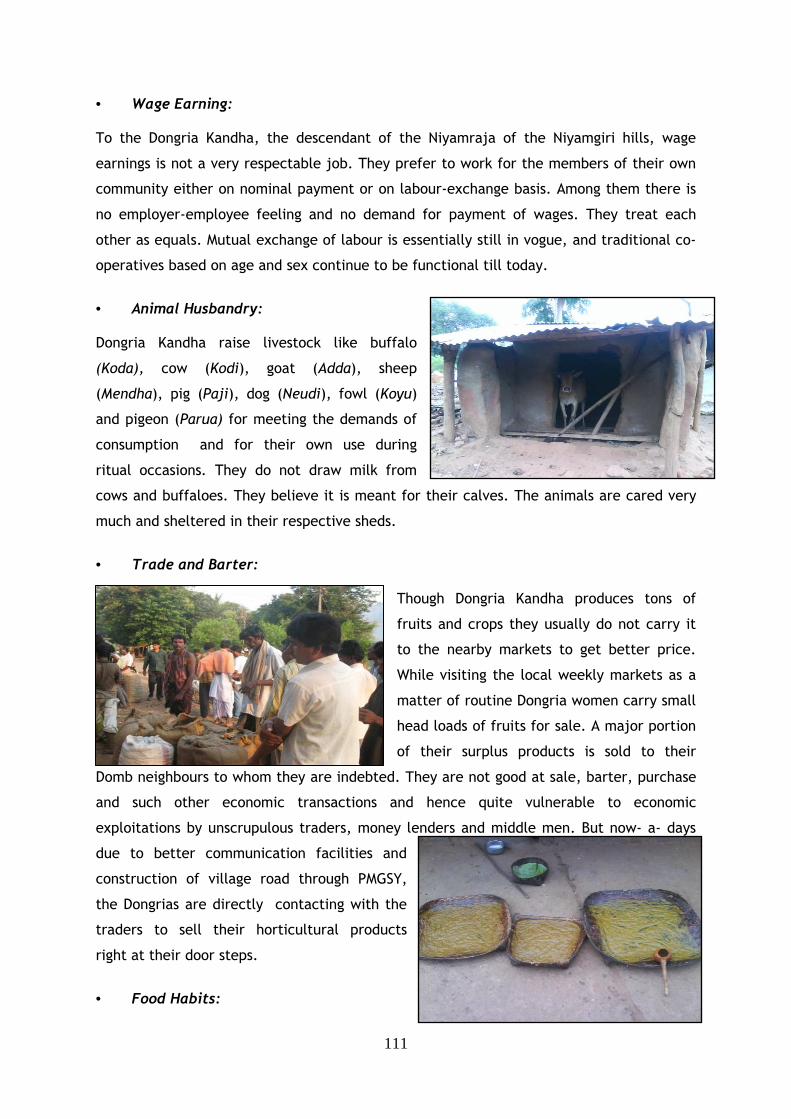
111
• Wage Earning: To the Dongria Kandha, the descendant of the Niyamraja of the Niyamgiri hills, wage
earnings is not a very respectable job. They prefer to work for the members of their own
community either on nominal payment or on labour-exchange basis. Among them there is
no employer-employee feeling and no demand for payment of wages. They treat each
other as equals. Mutual exchange of labour is essentially still in vogue, and traditional co-
operatives based on age and sex continue to be functional till today.
• Animal Husbandry: Dongria Kandha raise livestock like buffalo
(Koda), cow (Kodi), goat (Adda), sheep
(Mendha), pig (Paji), dog (Neudi), fowl (Koyu)
and pigeon (Parua) for meeting the demands of
consumption and for their own use during
ritual occasions. They do not draw milk from
cows and buffaloes. They believe it is meant for their calves. The animals are cared very
much and sheltered in their respective sheds.
• Trade and Barter: Though Dongria Kandha produces tons of
fruits and crops they usually do not carry it
to the nearby markets to get better price.
While visiting the local weekly markets as a
matter of routine Dongria women carry small
head loads of fruits for sale. A major portion
of their surplus products is sold to their
Domb neighbours to whom they are indebted. They are not good at sale, barter, purchase
and such other economic transactions and hence quite vulnerable to economic
exploitations by unscrupulous traders, money lenders and middle men. But now- a- days
due to better communication facilities and
construction of village road through PMGSY,
the Dongrias are directly contacting with the
traders to sell their horticultural products
right at their door steps.
• Food Habits:
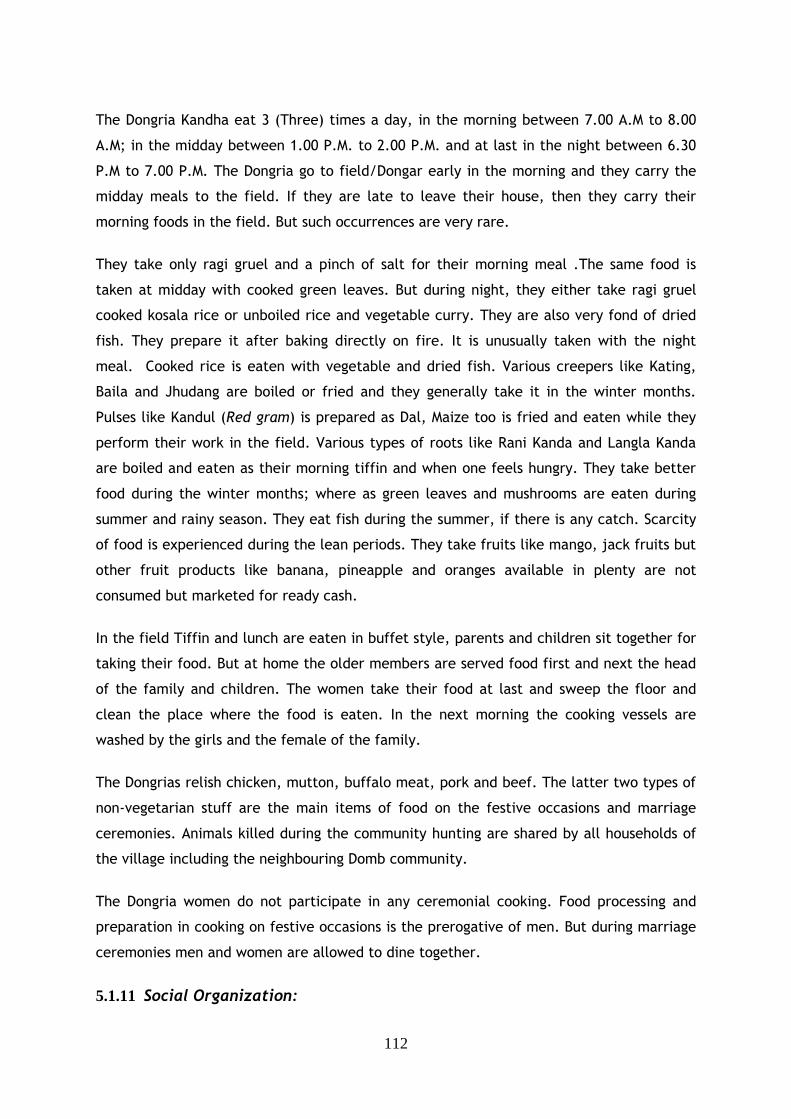
112
The Dongria Kandha eat 3 (Three) times a day, in the morning between 7.00 A.M to 8.00
A.M; in the midday between 1.00 P.M. to 2.00 P.M. and at last in the night between 6.30
P.M to 7.00 P.M. The Dongria go to field/Dongar early in the morning and they carry the
midday meals to the field. If they are late to leave their house, then they carry their
morning foods in the field. But such occurrences are very rare.
They take only ragi gruel and a pinch of salt for their morning meal .The same food is
taken at midday with cooked green leaves. But during night, they either take ragi gruel
cooked kosala rice or unboiled rice and vegetable curry. They are also very fond of dried
fish. They prepare it after baking directly on fire. It is unusually taken with the night
meal. Cooked rice is eaten with vegetable and dried fish. Various creepers like Kating,
Baila and Jhudang are boiled or fried and they generally take it in the winter months.
Pulses like Kandul (Red gram) is prepared as Dal, Maize too is fried and eaten while they
perform their work in the field. Various types of roots like Rani Kanda and Langla Kanda
are boiled and eaten as their morning tiffin and when one feels hungry. They take better
food during the winter months; where as green leaves and mushrooms are eaten during
summer and rainy season. They eat fish during the summer, if there is any catch. Scarcity
of food is experienced during the lean periods. They take fruits like mango, jack fruits but
other fruit products like banana, pineapple and oranges available in plenty are not
consumed but marketed for ready cash.
In the field Tiffin and lunch are eaten in buffet style, parents and children sit together for
taking their food. But at home the older members are served food first and next the head
of the family and children. The women take their food at last and sweep the floor and
clean the place where the food is eaten. In the next morning the cooking vessels are
washed by the girls and the female of the family.
The Dongrias relish chicken, mutton, buffalo meat, pork and beef. The latter two types of
non-vegetarian stuff are the main items of food on the festive occasions and marriage
ceremonies. Animals killed during the community hunting are shared by all households of
the village including the neighbouring Domb community.
The Dongria women do not participate in any ceremonial cooking. Food processing and
preparation in cooking on festive occasions is the prerogative of men. But during marriage
ceremonies men and women are allowed to dine together.
5.1.11 Social Organization:
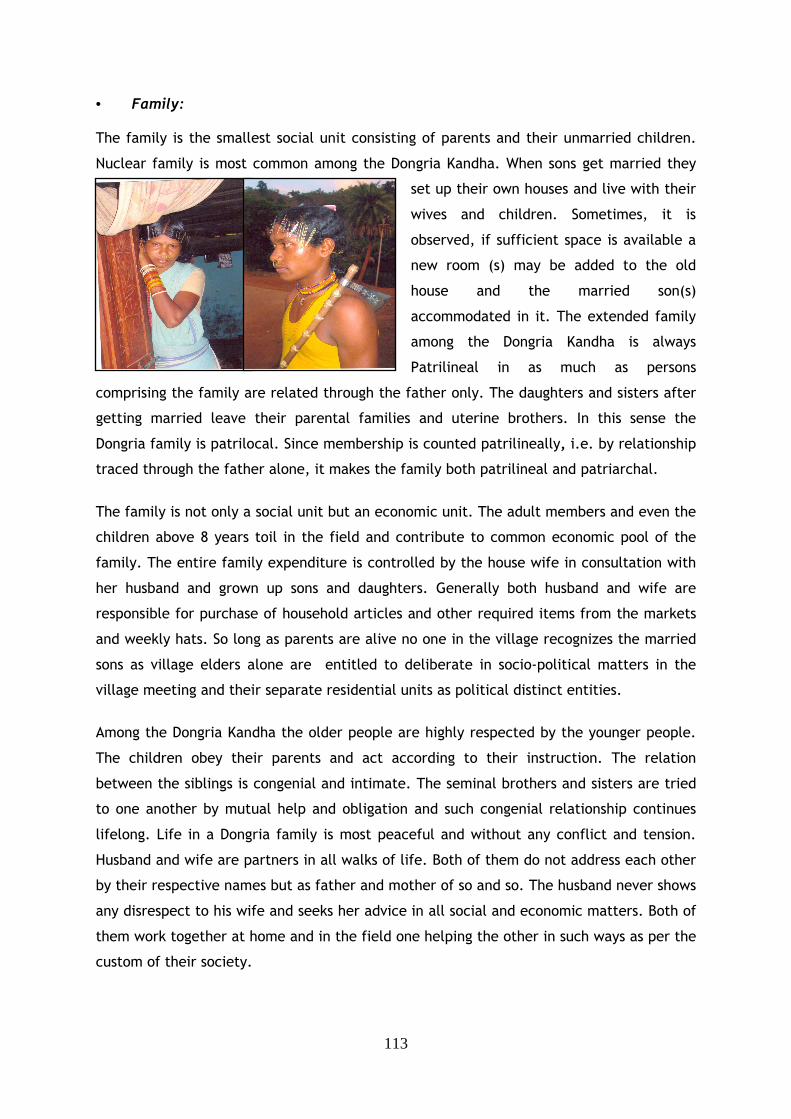
113
• Family: The family is the smallest social unit consisting of parents and their unmarried children.
Nuclear family is most common among the Dongria Kandha. When sons get married they
set up their own houses and live with their
wives and children. Sometimes, it is
observed, if sufficient space is available a
new room (s) may be added to the old
house and the married son(s)
accommodated in it. The extended family
among the Dongria Kandha is always
Patrilineal in as much as persons
comprising the family are related through the father only. The daughters and sisters after
getting married leave their parental families and uterine brothers. In this sense the
Dongria family is patrilocal. Since membership is counted patrilineally, i.e. by relationship
traced through the father alone, it makes the family both patrilineal and patriarchal.
The family is not only a social unit but an economic unit. The adult members and even the
children above 8 years toil in the field and contribute to common economic pool of the
family. The entire family expenditure is controlled by the house wife in consultation with
her husband and grown up sons and daughters. Generally both husband and wife are
responsible for purchase of household articles and other required items from the markets
and weekly hats. So long as parents are alive no one in the village recognizes the married
sons as village elders alone are entitled to deliberate in socio-political matters in the
village meeting and their separate residential units as political distinct entities.
Among the Dongria Kandha the older people are highly respected by the younger people.
The children obey their parents and act according to their instruction. The relation
between the siblings is congenial and intimate. The seminal brothers and sisters are tried
to one another by mutual help and obligation and such congenial relationship continues
lifelong. Life in a Dongria family is most peaceful and without any conflict and tension.
Husband and wife are partners in all walks of life. Both of them do not address each other
by their respective names but as father and mother of so and so. The husband never shows
any disrespect to his wife and seeks her advice in all social and economic matters. Both of
them work together at home and in the field one helping the other in such ways as per the
custom of their society.
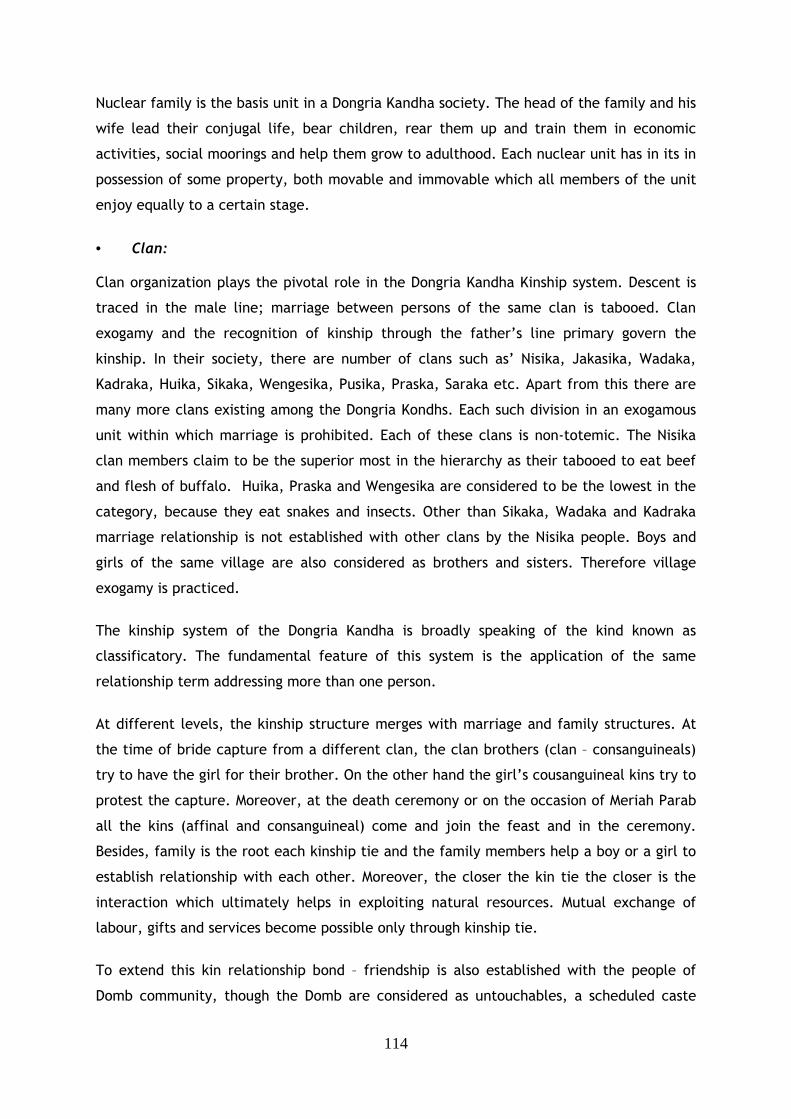
114
Nuclear family is the basis unit in a Dongria Kandha society. The head of the family and his
wife lead their conjugal life, bear children, rear them up and train them in economic
activities, social moorings and help them grow to adulthood. Each nuclear unit has in its in
possession of some property, both movable and immovable which all members of the unit
enjoy equally to a certain stage.
• Clan: Clan organization plays the pivotal role in the Dongria Kandha Kinship system. Descent is
traced in the male line; marriage between persons of the same clan is tabooed. Clan
exogamy and the recognition of kinship through the father’s line primary govern the
kinship. In their society, there are number of clans such as’ Nisika, Jakasika, Wadaka,
Kadraka, Huika, Sikaka, Wengesika, Pusika, Praska, Saraka etc. Apart from this there are
many more clans existing among the Dongria Kondhs. Each such division in an exogamous
unit within which marriage is prohibited. Each of these clans is non-totemic. The Nisika
clan members claim to be the superior most in the hierarchy as their tabooed to eat beef
and flesh of buffalo. Huika, Praska and Wengesika are considered to be the lowest in the
category, because they eat snakes and insects. Other than Sikaka, Wadaka and Kadraka
marriage relationship is not established with other clans by the Nisika people. Boys and
girls of the same village are also considered as brothers and sisters. Therefore village
exogamy is practiced.
The kinship system of the Dongria Kandha is broadly speaking of the kind known as
classificatory. The fundamental feature of this system is the application of the same
relationship term addressing more than one person.
At different levels, the kinship structure merges with marriage and family structures. At
the time of bride capture from a different clan, the clan brothers (clan – consanguineals)
try to have the girl for their brother. On the other hand the girl’s cousanguineal kins try to
protest the capture. Moreover, at the death ceremony or on the occasion of Meriah Parab
all the kins (affinal and consanguineal) come and join the feast and in the ceremony.
Besides, family is the root each kinship tie and the family members help a boy or a girl to
establish relationship with each other. Moreover, the closer the kin tie the closer is the
interaction which ultimately helps in exploiting natural resources. Mutual exchange of
labour, gifts and services become possible only through kinship tie.
To extend this kin relationship bond – friendship is also established with the people of
Domb community, though the Domb are considered as untouchables, a scheduled caste
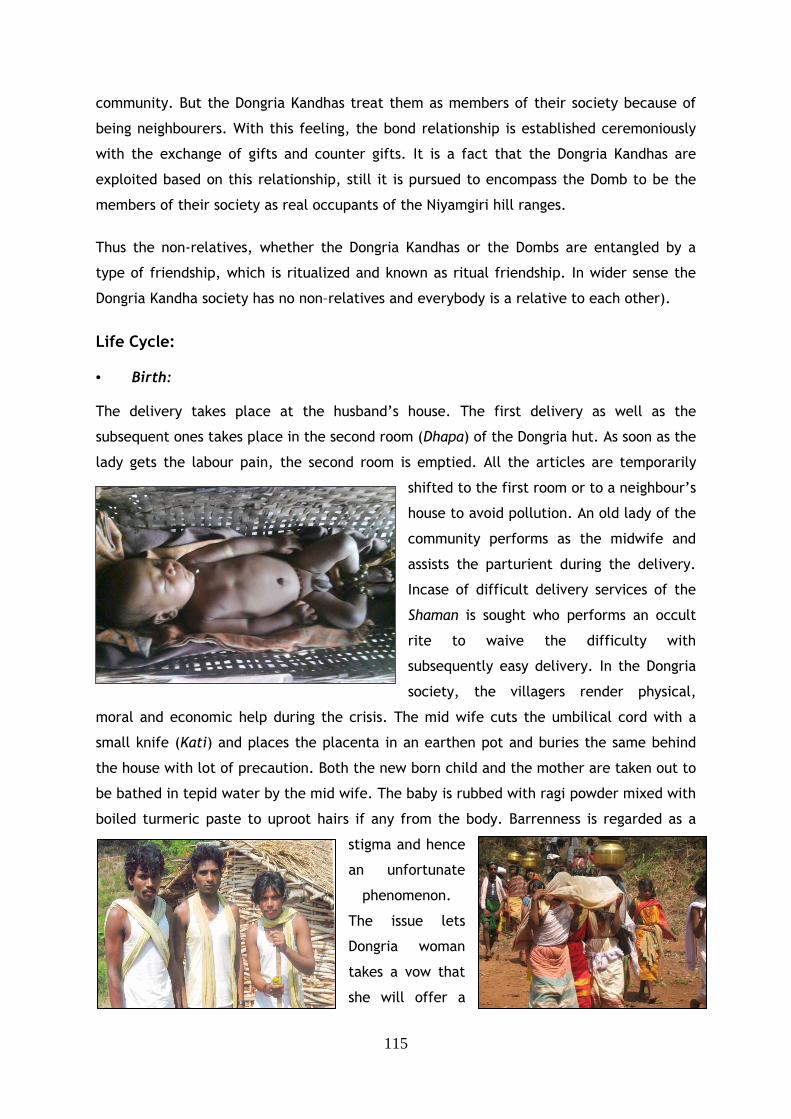
115
community. But the Dongria Kandhas treat them as members of their society because of
being neighbourers. With this feeling, the bond relationship is established ceremoniously
with the exchange of gifts and counter gifts. It is a fact that the Dongria Kandhas are
exploited based on this relationship, still it is pursued to encompass the Domb to be the
members of their society as real occupants of the Niyamgiri hill ranges.
Thus the non-relatives, whether the Dongria Kandhas or the Dombs are entangled by a
type of friendship, which is ritualized and known as ritual friendship. In wider sense the
Dongria Kandha society has no non–relatives and everybody is a relative to each other).
Life Cycle:
• Birth: The delivery takes place at the husband’s house. The first delivery as well as the
subsequent ones takes place in the second room (Dhapa) of the Dongria hut. As soon as the
lady gets the labour pain, the second room is emptied. All the articles are temporarily
shifted to the first room or to a neighbour’s
house to avoid pollution. An old lady of the
community performs as the midwife and
assists the parturient during the delivery.
Incase of difficult delivery services of the
Shaman is sought who performs an occult
rite to waive the difficulty with
subsequently easy delivery. In the Dongria
society, the villagers render physical,
moral and economic help during the crisis. The mid wife cuts the umbilical cord with a
small knife (Kati) and places the placenta in an earthen pot and buries the same behind
the house with lot of precaution. Both the new born child and the mother are taken out to
be bathed in tepid water by the mid wife. The baby is rubbed with ragi powder mixed with
boiled turmeric paste to uproot hairs if any from the body. Barrenness is regarded as a
stigma and hence
an unfortunate
phenomenon.
The issue lets
Dongria woman
takes a vow that
she will offer a
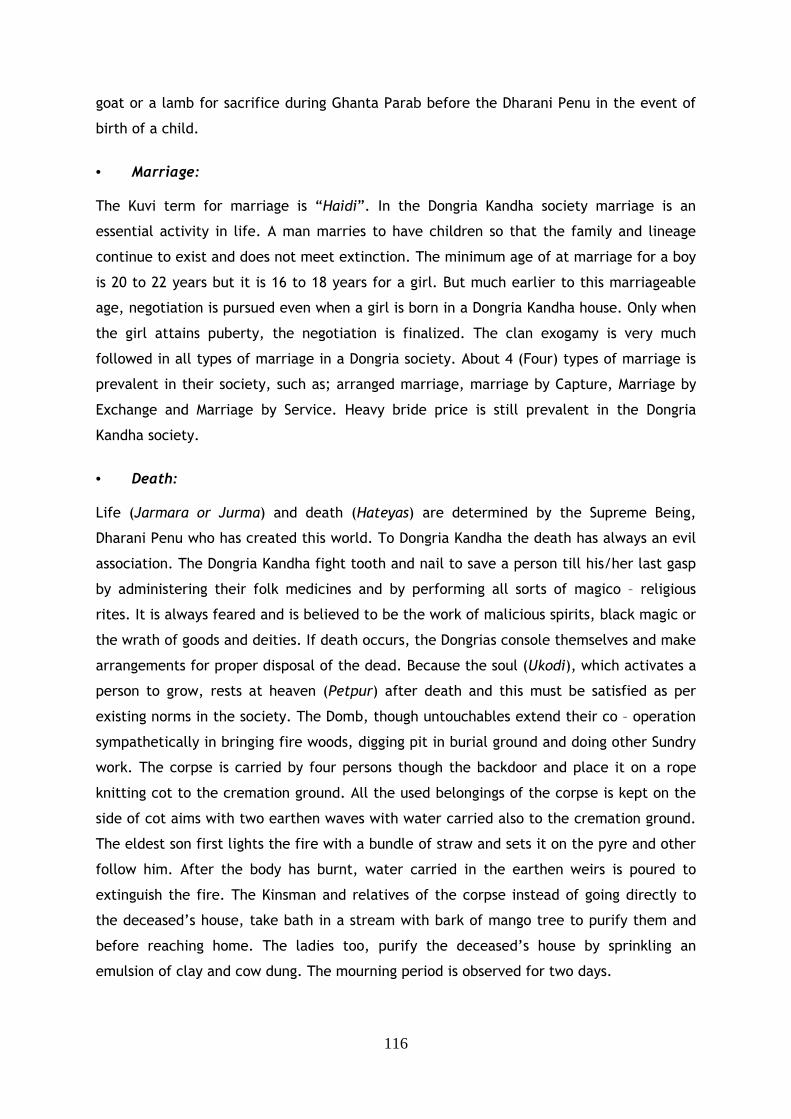
116
goat or a lamb for sacrifice during Ghanta Parab before the Dharani Penu in the event of
birth of a child.
• Marriage: The Kuvi term for marriage is “Haidi”. In the Dongria Kandha society marriage is an
essential activity in life. A man marries to have children so that the family and lineage
continue to exist and does not meet extinction. The minimum age of at marriage for a boy
is 20 to 22 years but it is 16 to 18 years for a girl. But much earlier to this marriageable
age, negotiation is pursued even when a girl is born in a Dongria Kandha house. Only when
the girl attains puberty, the negotiation is finalized. The clan exogamy is very much
followed in all types of marriage in a Dongria society. About 4 (Four) types of marriage is
prevalent in their society, such as; arranged marriage, marriage by Capture, Marriage by
Exchange and Marriage by Service. Heavy bride price is still prevalent in the Dongria
Kandha society.
• Death: Life (Jarmara or Jurma) and death (Hateyas) are determined by the Supreme Being,
Dharani Penu who has created this world. To Dongria Kandha the death has always an evil
association. The Dongria Kandha fight tooth and nail to save a person till his/her last gasp
by administering their folk medicines and by performing all sorts of magico – religious
rites. It is always feared and is believed to be the work of malicious spirits, black magic or
the wrath of goods and deities. If death occurs, the Dongrias console themselves and make
arrangements for proper disposal of the dead. Because the soul (Ukodi), which activates a
person to grow, rests at heaven (Petpur) after death and this must be satisfied as per
existing norms in the society. The Domb, though untouchables extend their co – operation
sympathetically in bringing fire woods, digging pit in burial ground and doing other Sundry
work. The corpse is carried by four persons though the backdoor and place it on a rope
knitting cot to the cremation ground. All the used belongings of the corpse is kept on the
side of cot aims with two earthen waves with water carried also to the cremation ground.
The eldest son first lights the fire with a bundle of straw and sets it on the pyre and other
follow him. After the body has burnt, water carried in the earthen weirs is poured to
extinguish the fire. The Kinsman and relatives of the corpse instead of going directly to
the deceased’s house, take bath in a stream with bark of mango tree to purify them and
before reaching home. The ladies too, purify the deceased’s house by sprinkling an
emulsion of clay and cow dung. The mourning period is observed for two days.
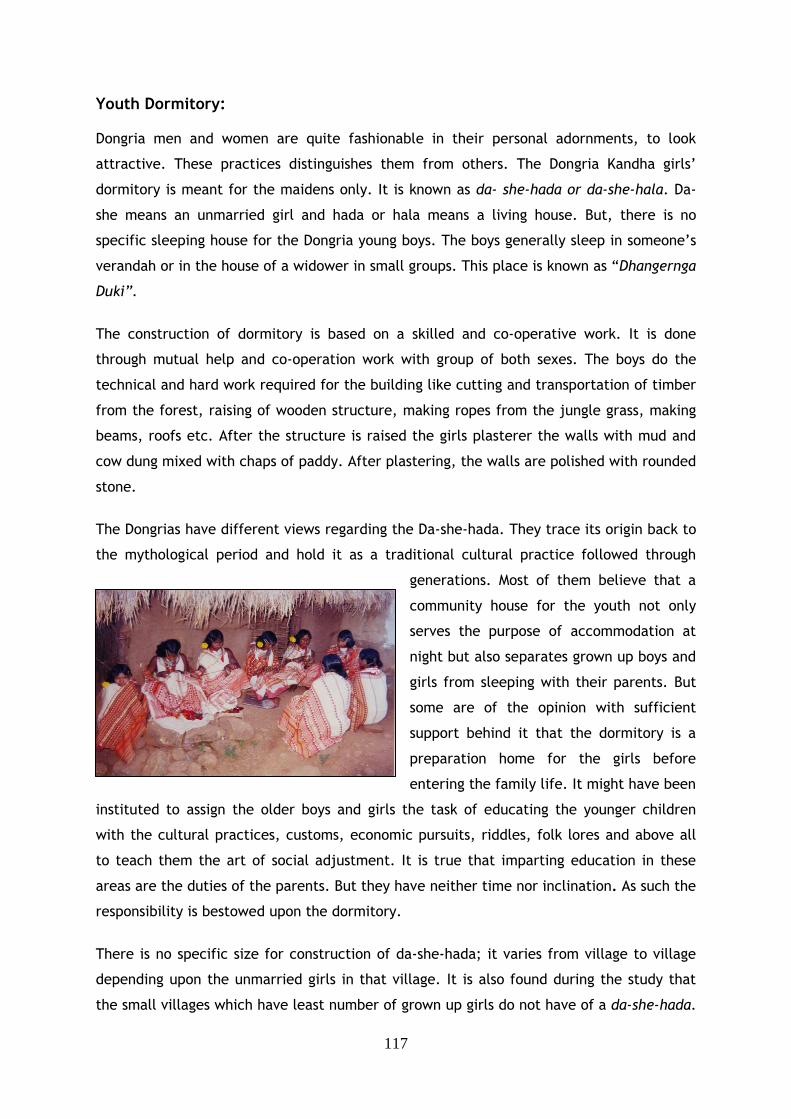
117
Youth Dormitory: Dongria men and women are quite fashionable in their personal adornments, to look
attractive. These practices distinguishes them from others. The Dongria Kandha girls’
dormitory is meant for the maidens only. It is known as da- she-hada or da-she-hala. Da-
she means an unmarried girl and hada or hala means a living house. But, there is no
specific sleeping house for the Dongria young boys. The boys generally sleep in someone’s
verandah or in the house of a widower in small groups. This place is known as “Dhangernga
Duki”.
The construction of dormitory is based on a skilled and co-operative work. It is done
through mutual help and co-operation work with group of both sexes. The boys do the
technical and hard work required for the building like cutting and transportation of timber
from the forest, raising of wooden structure, making ropes from the jungle grass, making
beams, roofs etc. After the structure is raised the girls plasterer the walls with mud and
cow dung mixed with chaps of paddy. After plastering, the walls are polished with rounded
stone.
The Dongrias have different views regarding the Da-she-hada. They trace its origin back to
the mythological period and hold it as a traditional cultural practice followed through
generations. Most of them believe that a
community house for the youth not only
serves the purpose of accommodation at
night but also separates grown up boys and
girls from sleeping with their parents. But
some are of the opinion with sufficient
support behind it that the dormitory is a
preparation home for the girls before
entering the family life. It might have been
instituted to assign the older boys and girls the task of educating the younger children
with the cultural practices, customs, economic pursuits, riddles, folk lores and above all
to teach them the art of social adjustment. It is true that imparting education in these
areas are the duties of the parents. But they have neither time nor inclination. As such the
responsibility is bestowed upon the dormitory.
There is no specific size for construction of da-she-hada; it varies from village to village
depending upon the unmarried girls in that village. It is also found during the study that
the small villages which have least number of grown up girls do not have of a da-she-hada.
118
In some villages the da-she-hada has ceased to function for some reason or other. But
those young girls sleep separately in groups in a small room called “Dhapas”.
A dormitory member or a matured girl is known by name da-she and the group of them as
da-she-sika and where as on the counter part it is known as da-we-yu and the group of
them da-we-ga. The local term da-she means dhangudi (young girl) and the term da-we-yu
as dhanguda (young boy). A dormitory may be composed of girls belonging to one clan
group or member of clan groups. In the past the villages were unit clan in nature, for
which membership in the dormitory was restricted to one clan only. But at present with
the increase of population and immigration, dormitories have accommodated multi clan
groups. Generally in the Dongria village the age of the girls staying in the dormitories
varies from 10 to 40 years or even little above. The spinsters, discovers and widows
without children are allowed to visit the dormitory. Selection of dormitory member is
based on their mutual understanding and friendship. A girl after attaining puberty is
eligible to enter the dormitory. But there is no taboo on the younger girls to attend it,
though they are not allowed to sleep at night. Admission into the dormitory does not
require any special rites and rituals. There is no initiation ceremony observed. However a
young boy becomes a dhanguda only after he develops mustache.
The oldest member of a dormitory acts as the head and is known by the name Kajari.
Every member of that dormitory is expected to obey her. The Kajari selects the Dhangudas
for distribution of works on the festive occasions, fixed dance expeditions. Both male and
female Shamans (Beju and Bejuni) do not visit the dormitory as a customary prohibition.
5.1.12 Religious Beliefs and Practices The social, economic and political life of Dongria Kandha is pervaded by their religion.
Their religion is consists of regular propitiation of gods, spirits and manes of performance
of rituals. Propitiation is done through appropriate rites and sacrifices, charms and spells.
They strongly believe in the existence of a large number of supernatural beings who
exercise control on various aspects of their mundane life. Their pantheon is composed of
gods, deities and spirit benevolent and malevolent.
Pantheon: The Supreme deity: Goddess, mother earth called Dharani Penu or Jhankar is their
benevolent. Supreme goddess, enshrined in every village street a hut called “Kudi”
represented by three elevated stones. The name of deities, month of worship and purpose
of worship of Dongria Kandha are as follows:
119
Name of the Deity Month of worship Purposes
Village Deities (Kotebali Penu) Worshipped on various occasions
to keep constant watch on the villagers and protect them from any mishap
Jatrakudi Penu, a deity who caused drought and other natural calamities to the village
Throughout the year To cool down his temper Shaman worships him each month with adequate sacrifice.
Hira Penu Whenever required She inflects pain and tortures the children if she is neglected
Takarani Penu November (Panda-Lenju) with elaborate rituals and sacrifices.
responsible for occurrence of infectious diseases, accidents and small pox, cholera etc. in the village and animal diseases
Niyamgiri-Raja Penu October (Dasara and Jura Parab)
He saves the people from unusual deaths and accidents
Lati Penu or Dangar Penu April-May (Baisakh Lenju)
worshipped with adequate scarifies
After felling of trees ceremony (Khotle- Perpa) in the Dangar land
Lada Penu May (Sarua) Before onset of communal hunting.
he protects the people from attack of wild animals and grants them success in hunting
Household Spirits (Duma) represents the “Ancestor Spirits”.
Placed in every one household inside the sleeping room
who can be dreadful if nor appeased properly
Lia Penu September (Dola Lenju) who brings prosperity from the house if worshipped properly
Sita Penu Full moon day of December (Push) after harvest of all crops.
To bring wealth and prosperity
Danda Penu September (Dela – Lanju) Granaries are replastered and grains like Kosla and Ragi are kept.
Chhatar Penu during the Meriahhh festival Against diseases if not properly appeased. To please the spirit a buffalo is sacrified.
Bhairo Penu who caused accidental deaths in the family if not appeased with the sacrifice of a cow
during the Meriahhh festival For saving household members from odds and evils.
Religious Functionaries: Dongria Kandha has many kinds of religious and magico-religious functionaries and
specialists who act as people’s representatives to mediate between humans and super
naturals.
120
Jani: Is the ritual head of the village. The post is hereditary. He performs all village
rituals and gets a special share of sacrificial animals.
Lamba: The specialist Jani who belongs to Nishka Mutha and officiates in the rituals of
Meriah festival.
Ichan Jani: The Jani’s assistant who scarifies animals, arranges puja items and
participates with the Jani in the recitation of the incarnations.
Pujari: Plays the special role in the Meriah Puja. He prepares an umbrella out of a bamboo
collected from the forest in the dead of night, unnoticed by anybody. He strikes at the
head of the Meriah animal first and then others follow. In other religious functions, he also
presides along with Jani and Ichan Jani.
Beju/Bejuni (Shamans and Shamamins): is the Shaman who performs divinations through
trance and recitation of incarnation so as to decipher the supernatural agencies
responsible for malady of disease or death. She is also the sorcerer and witchcraft
persons. Her services are needed in individual family and communal festival to ward off
the evil spirit. In a village there might be one or more Bejuni. The head of the Bejuni in a
village is called as “Pat Bejuni”.
Dishari: The medicine man, who practice herbal medicines backed by magical power.
5.1.13 Political Organization The position of leaders in a Dongria society is very important. The leaders not only enjoy
status and high prestige in the society, but also exercise considerable authority in getting
things done in the most correct manner. Their opinion in setting quarrels and conflicts is
decisive. The leaders are classified as traditional and modern depending on the antiquity
of their respective offices or on their roles. The Dongria community at large is composed
of families and this is more or less based on kinship ties, each family acts in conformity
with accepted mode. This mode, though authoritative is guarded by custom. These
authorities are exercised at four levels i.e. family, lineage, village and Mutha. The
traditional leadership is based hereditary status and position. The status is described
rather than achieved. These vest upon the formal arrangement of the society.
Each village is a political unit having its own set of officers. These officers are in an
informal ways leader of the village and they do not have the voice in the village affairs
than other. The leaders are of two types, such as: Sacerdotal and Secular. Certain matter
like land and boundary dispute between villages, divorce and desertion, bride captured
121
etc. are refer to Mutha Council, which can not be decided by village council. Land dispute
are very intricate problem which can not be decided easily with out the meeting of the
Mandal. Similarly, as marriage partner normally belong to two different clans, members of
which inhabit two villages, divorce or dissertation cases can not be settled without the
intervention of the Mandal. Thus in all inter village dispute Mutha meting is summoned,
which is presided over by the Mandal. The post of Mandal is hereditary and honourary.
“Mutha” is an important feature of social and political organization of the Dongria Kandha.
It consists of groups of adjoining villages and treated as an administrative cum- social unit.
It is led by a head designed as Mandal. The entire Dongria Kandha area has been divided
into 21 Muthas. The organization had received recognition from the ex- feudatory set up.
Every Dongria village had and still continues to have its own traditional council as part of
Political Organization. With the abolition of feudal system in Orissa, the Mutha system of
administration which was in vogue in the whole estate of the then Jeypore, of which a
Dongria area is a part was replaced by an elective system. Under this arrangement
statutory village council where established in villages in place of traditional political
institution.
In the case of Dongria villages the traditional Panchayat is still affective and runs along
democratic principle as before and serve the people well in the matter of maintaining
social control and enforcing social function.
During 1996, with the change in Panchayat Raj system and reformation of local self -
government, a new dimension in the administration is in effect as PESA (Panchayat
Extension Scheduled Area) Act was implemented. At the Gram Panchayat level, the
chairman of the Panchayat Samiti leads the Panchayat, assisted by sub-ordinates like
Sarapanch, Samiti Savya, Naib Sarapanch and the Ward Member at the grass root level.
Special power was given to the Gram Sabha to prepare the Action Plan for all round
development of the village and hamlets within the Gram Panchayat in the Scheduled area.
The allying political structure like statutory Gram Panchayat not understood by which the
Dongria appears to be an unnecessary super imposition having no stake in Dongria political
system.
Mandal is the highest secular headmen acts as the head of confederacy of a group of
villages. Important matters such as boundary disputes, witchcraft and adultery are
referred to him for arbitration.
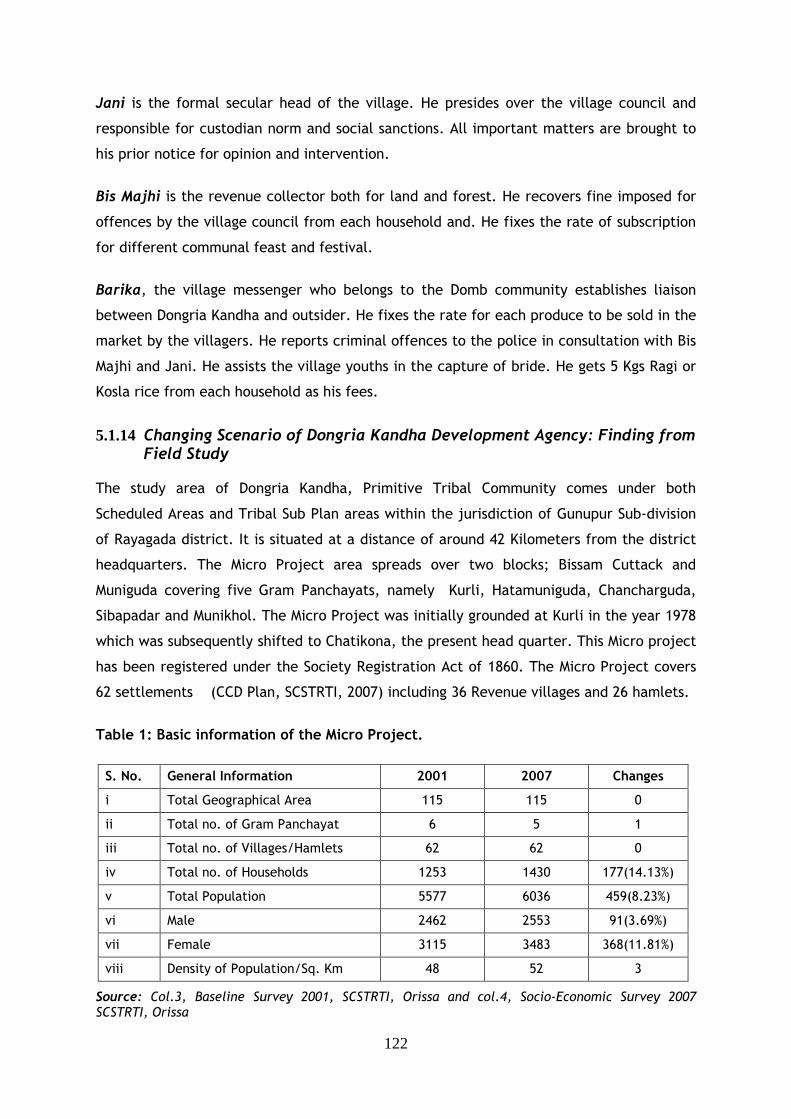
122
Jani is the formal secular head of the village. He presides over the village council and
responsible for custodian norm and social sanctions. All important matters are brought to
his prior notice for opinion and intervention.
Bis Majhi is the revenue collector both for land and forest. He recovers fine imposed for
offences by the village council from each household and. He fixes the rate of subscription
for different communal feast and festival.
Barika, the village messenger who belongs to the Domb community establishes liaison
between Dongria Kandha and outsider. He fixes the rate for each produce to be sold in the
market by the villagers. He reports criminal offences to the police in consultation with Bis
Majhi and Jani. He assists the village youths in the capture of bride. He gets 5 Kgs Ragi or
Kosla rice from each household as his fees.
5.1.14 Changing Scenario of Dongria Kandha Development Agency: Finding from Field Study
The study area of Dongria Kandha, Primitive Tribal Community comes under both
Scheduled Areas and Tribal Sub Plan areas within the jurisdiction of Gunupur Sub-division
of Rayagada district. It is situated at a distance of around 42 Kilometers from the district
headquarters. The Micro Project area spreads over two blocks; Bissam Cuttack and
Muniguda covering five Gram Panchayats, namely Kurli, Hatamuniguda, Chancharguda,
Sibapadar and Munikhol. The Micro Project was initially grounded at Kurli in the year 1978
which was subsequently shifted to Chatikona, the present head quarter. This Micro project
has been registered under the Society Registration Act of 1860. The Micro Project covers
62 settlements (CCD Plan, SCSTRTI, 2007) including 36 Revenue villages and 26 hamlets.
Table 1: Basic information of the Micro Project.
Source: Col.3, Baseline Survey 2001, SCSTRTI, Orissa and col.4, Socio-Economic Survey 2007 SCSTRTI, Orissa
S. No. General Information 2001 2007 Changes
i Total Geographical Area 115 115 0
ii Total no. of Gram Panchayat 6 5 1
iii Total no. of Villages/Hamlets 62 62 0
iv Total no. of Households 1253 1430 177(14.13%)
v Total Population 5577 6036 459(8.23%)
vi Male 2462 2553 91(3.69%)
vii Female 3115 3483 368(11.81%)
viii Density of Population/Sq. Km 48 52 3
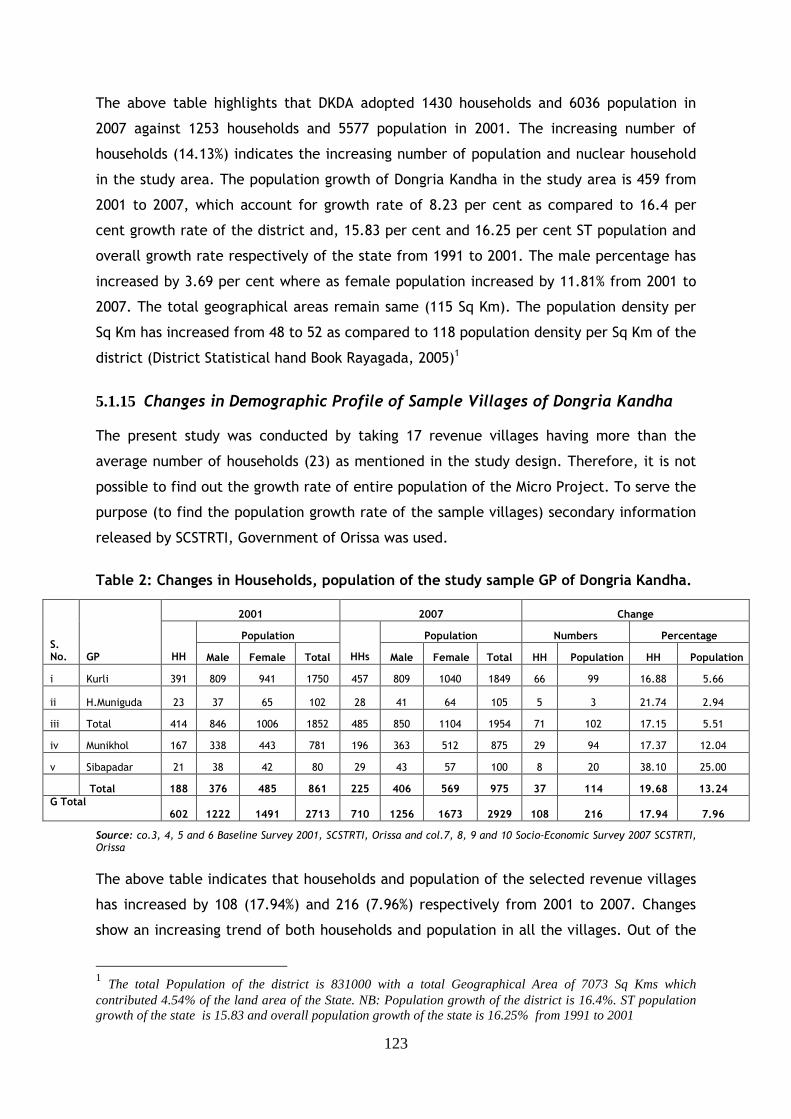
123
The above table highlights that DKDA adopted 1430 households and 6036 population in
2007 against 1253 households and 5577 population in 2001. The increasing number of
households (14.13%) indicates the increasing number of population and nuclear household
in the study area. The population growth of Dongria Kandha in the study area is 459 from
2001 to 2007, which account for growth rate of 8.23 per cent as compared to 16.4 per
cent growth rate of the district and, 15.83 per cent and 16.25 per cent ST population and
overall growth rate respectively of the state from 1991 to 2001. The male percentage has
increased by 3.69 per cent where as female population increased by 11.81% from 2001 to
2007. The total geographical areas remain same (115 Sq Km). The population density per
Sq Km has increased from 48 to 52 as compared to 118 population density per Sq Km of the
district (District Statistical hand Book Rayagada, 2005)1
5.1.15 Changes in Demographic Profile of Sample Villages of Dongria Kandha The present study was conducted by taking 17 revenue villages having more than the
average number of households (23) as mentioned in the study design. Therefore, it is not
possible to find out the growth rate of entire population of the Micro Project. To serve the
purpose (to find the population growth rate of the sample villages) secondary information
released by SCSTRTI, Government of Orissa was used.
Table 2: Changes in Households, population of the study sample GP of Dongria Kandha.
Source: co.3, 4, 5 and 6 Baseline Survey 2001, SCSTRTI, Orissa and col.7, 8, 9 and 10 Socio-Economic Survey 2007 SCSTRTI, Orissa
The above table indicates that households and population of the selected revenue villages
has increased by 108 (17.94%) and 216 (7.96%) respectively from 2001 to 2007. Changes
show an increasing trend of both households and population in all the villages. Out of the
1 The total Population of the district is 831000 with a total Geographical Area of 7073 Sq Kms which contributed 4.54% of the land area of the State. NB: Population growth of the district is 16.4%. ST population growth of the state is 15.83 and overall population growth of the state is 16.25% from 1991 to 2001
2001 2007 Change
Population Population Numbers Percentage S. No. GP HH Male Female Total HHs Male Female Total HH Population HH Population
i Kurli 391 809 941 1750 457 809 1040 1849 66 99 16.88 5.66
ii H.Muniguda 23 37 65 102 28 41 64 105 5 3 21.74 2.94
iii Total 414 846 1006 1852 485 850 1104 1954 71 102 17.15 5.51
iv Munikhol 167 338 443 781 196 363 512 875 29 94 17.37 12.04
v Sibapadar 21 38 42 80 29 43 57 100 8 20 38.10 25.00
Total 188 376 485 861 225 406 569 975 37 114 19.68 13.24 G Total 602 1222 1491 2713 710 1256 1673 2929 108 216 17.94 7.96
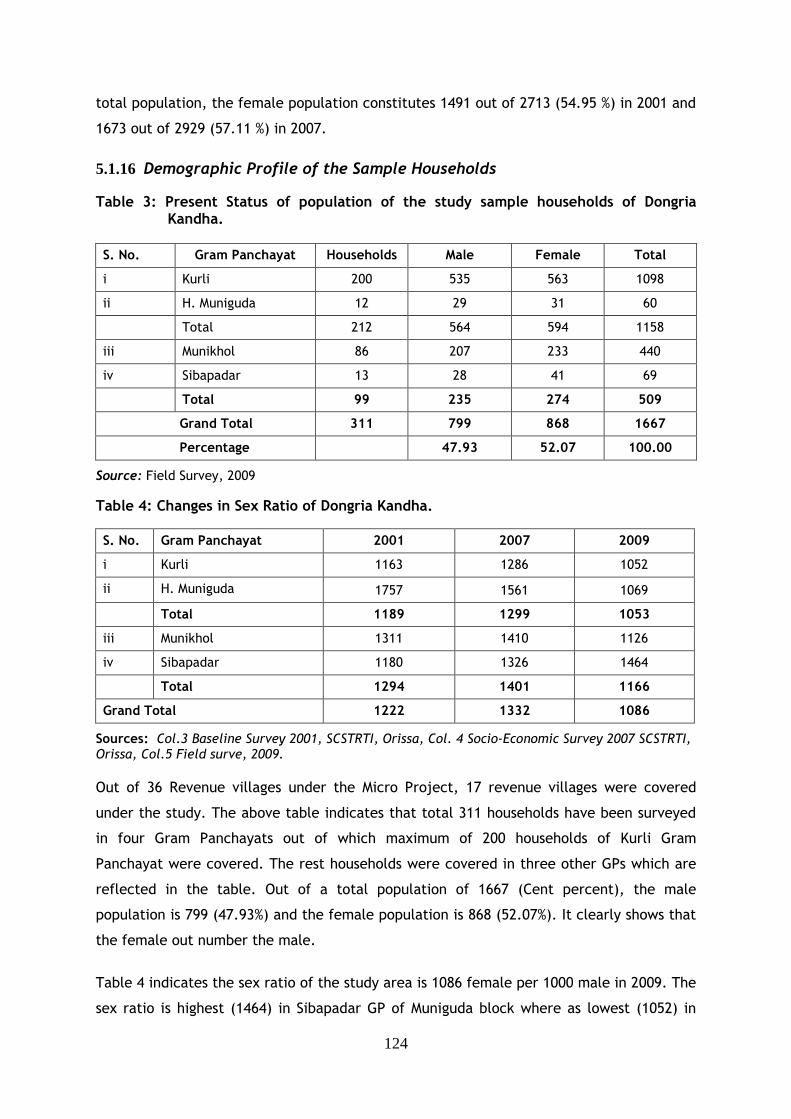
124
total population, the female population constitutes 1491 out of 2713 (54.95 %) in 2001 and
1673 out of 2929 (57.11 %) in 2007.
5.1.16 Demographic Profile of the Sample Households
Table 3: Present Status of population of the study sample households of Dongria Kandha.
S. No. Gram Panchayat Households Male Female Total
i Kurli 200 535 563 1098
ii H. Muniguda 12 29 31 60
Total 212 564 594 1158
iii Munikhol 86 207 233 440
iv Sibapadar 13 28 41 69
Total 99 235 274 509
Grand Total 311 799 868 1667
Percentage 47.93 52.07 100.00
Source: Field Survey, 2009
Table 4: Changes in Sex Ratio of Dongria Kandha.
S. No. Gram Panchayat 2001 2007 2009
i Kurli 1163 1286 1052
ii H. Muniguda 1757 1561 1069
Total 1189 1299 1053
iii Munikhol 1311 1410 1126
iv Sibapadar 1180 1326 1464
Total 1294 1401 1166
Grand Total 1222 1332 1086
Sources: Col.3 Baseline Survey 2001, SCSTRTI, Orissa, Col. 4 Socio-Economic Survey 2007 SCSTRTI, Orissa, Col.5 Field surve, 2009.
Out of 36 Revenue villages under the Micro Project, 17 revenue villages were covered
under the study. The above table indicates that total 311 households have been surveyed
in four Gram Panchayats out of which maximum of 200 households of Kurli Gram
Panchayat were covered. The rest households were covered in three other GPs which are
reflected in the table. Out of a total population of 1667 (Cent percent), the male
population is 799 (47.93%) and the female population is 868 (52.07%). It clearly shows that
the female out number the male.
Table 4 indicates the sex ratio of the study area is 1086 female per 1000 male in 2009. The
sex ratio is highest (1464) in Sibapadar GP of Muniguda block where as lowest (1052) in
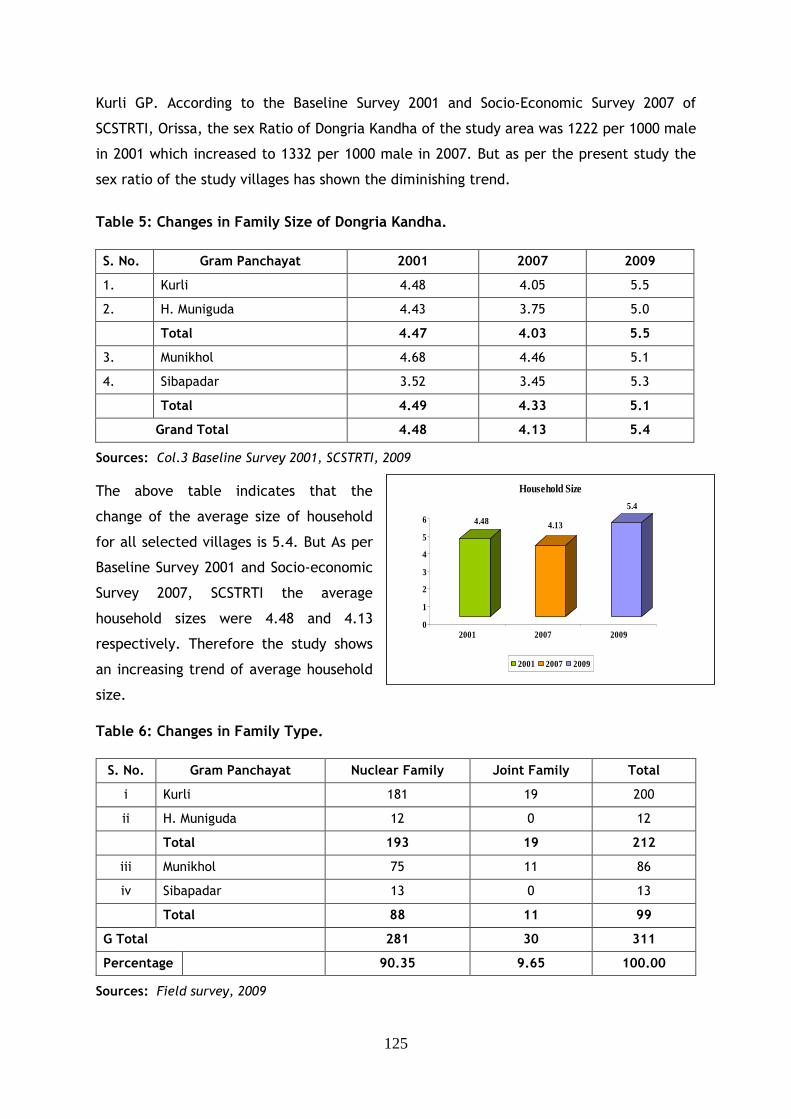
125
4.48 4.13
5.4
0
1
2
3
4
5
6
2001 2007 2009
Household Size
2001 2007 2009
Kurli GP. According to the Baseline Survey 2001 and Socio-Economic Survey 2007 of
SCSTRTI, Orissa, the sex Ratio of Dongria Kandha of the study area was 1222 per 1000 male
in 2001 which increased to 1332 per 1000 male in 2007. But as per the present study the
sex ratio of the study villages has shown the diminishing trend.
Table 5: Changes in Family Size of Dongria Kandha.
S. No. Gram Panchayat 2001 2007 2009
1. Kurli 4.48 4.05 5.5
2. H. Muniguda 4.43 3.75 5.0
Total 4.47 4.03 5.5
3. Munikhol 4.68 4.46 5.1
4. Sibapadar 3.52 3.45 5.3
Total 4.49 4.33 5.1
Grand Total 4.48 4.13 5.4
Sources: Col.3 Baseline Survey 2001, SCSTRTI, 2009
The above table indicates that the
change of the average size of household
for all selected villages is 5.4. But As per
Baseline Survey 2001 and Socio-economic
Survey 2007, SCSTRTI the average
household sizes were 4.48 and 4.13
respectively. Therefore the study shows
an increasing trend of average household
size.
Table 6: Changes in Family Type.
S. No. Gram Panchayat Nuclear Family Joint Family Total
i Kurli 181 19 200
ii H. Muniguda 12 0 12
Total 193 19 212
iii Munikhol 75 11 86
iv Sibapadar 13 0 13
Total 88 11 99
G Total 281 30 311
Percentage 90.35 9.65 100.00
Sources: Field survey, 2009
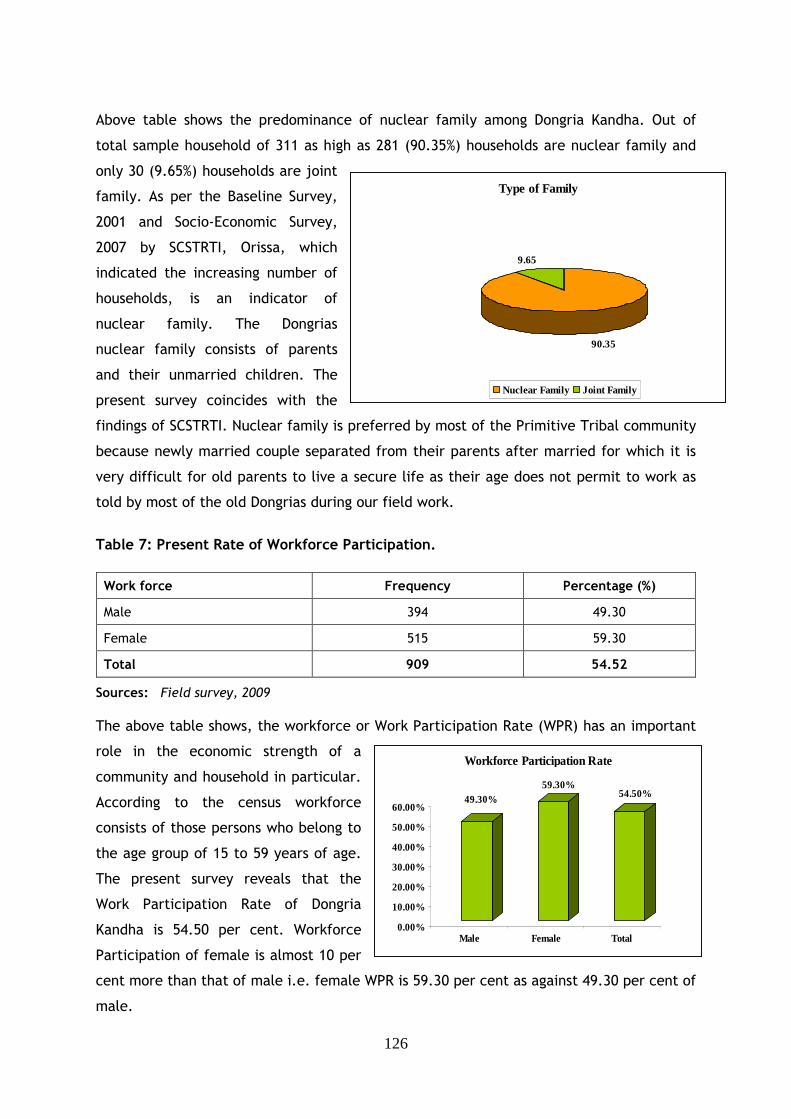
126
Type of Family
90.35
9.65
Nuclear Family Joint Family
49.30%59.30%
54.50%
0.00%
10.00%
20.00%
30.00%
40.00%
50.00%
60.00%
Male Female Total
Workforce Participation Rate
Above table shows the predominance of nuclear family among Dongria Kandha. Out of
total sample household of 311 as high as 281 (90.35%) households are nuclear family and
only 30 (9.65%) households are joint
family. As per the Baseline Survey,
2001 and Socio-Economic Survey,
2007 by SCSTRTI, Orissa, which
indicated the increasing number of
households, is an indicator of
nuclear family. The Dongrias
nuclear family consists of parents
and their unmarried children. The
present survey coincides with the
findings of SCSTRTI. Nuclear family is preferred by most of the Primitive Tribal community
because newly married couple separated from their parents after married for which it is
very difficult for old parents to live a secure life as their age does not permit to work as
told by most of the old Dongrias during our field work.
Table 7: Present Rate of Workforce Participation.
Work force Frequency Percentage (%)
Male 394 49.30
Female 515 59.30
Total 909 54.52
Sources: Field survey, 2009
The above table shows, the workforce or Work Participation Rate (WPR) has an important
role in the economic strength of a
community and household in particular.
According to the census workforce
consists of those persons who belong to
the age group of 15 to 59 years of age.
The present survey reveals that the
Work Participation Rate of Dongria
Kandha is 54.50 per cent. Workforce
Participation of female is almost 10 per
cent more than that of male i.e. female WPR is 59.30 per cent as against 49.30 per cent of
male.
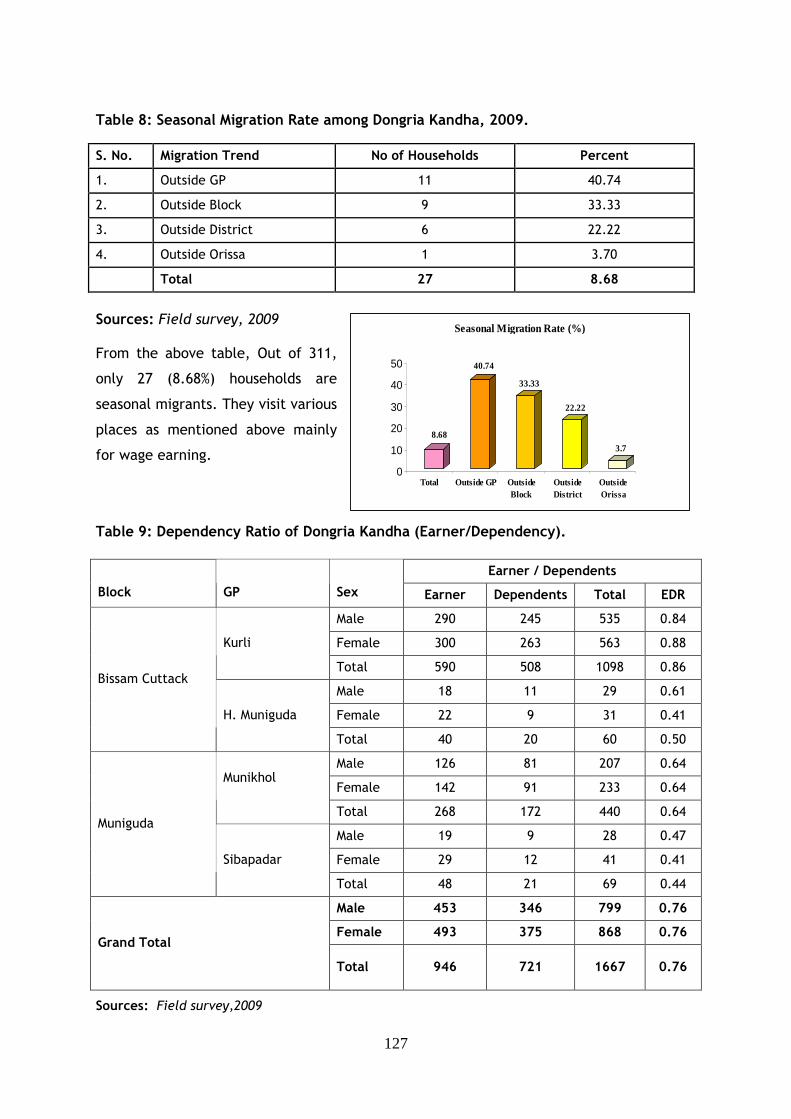
127
8.68
40.74
33.33
22.22
3.7
0
10
20
30
40
50
Total Outside GP OutsideBlock
OutsideDistrict
OutsideOrissa
Seasonal Migration Rate (%)
Table 8: Seasonal Migration Rate among Dongria Kandha, 2009.
Sources: Field survey, 2009 From the above table, Out of 311,
only 27 (8.68%) households are
seasonal migrants. They visit various
places as mentioned above mainly
for wage earning.
Table 9: Dependency Ratio of Dongria Kandha (Earner/Dependency).
Earner / Dependents
Block
GP
Sex Earner Dependents Total EDR
Male 290 245 535 0.84
Female 300 263 563 0.88 Kurli
Total 590 508 1098 0.86
Male 18 11 29 0.61
Female 22 9 31 0.41
Bissam Cuttack
H. Muniguda
Total 40 20 60 0.50
Male 126 81 207 0.64
Female 142 91 233 0.64 Munikhol
Total 268 172 440 0.64
Male 19 9 28 0.47
Female 29 12 41 0.41
Muniguda
Sibapadar
Total 48 21 69 0.44
Male 453 346 799 0.76
Female 493 375 868 0.76 Grand Total
Total 946 721 1667 0.76
Sources: Field survey,2009
S. No. Migration Trend No of Households Percent
1. Outside GP 11 40.74
2. Outside Block 9 33.33
3. Outside District 6 22.22
4. Outside Orissa 1 3.70
Total 27 8.68
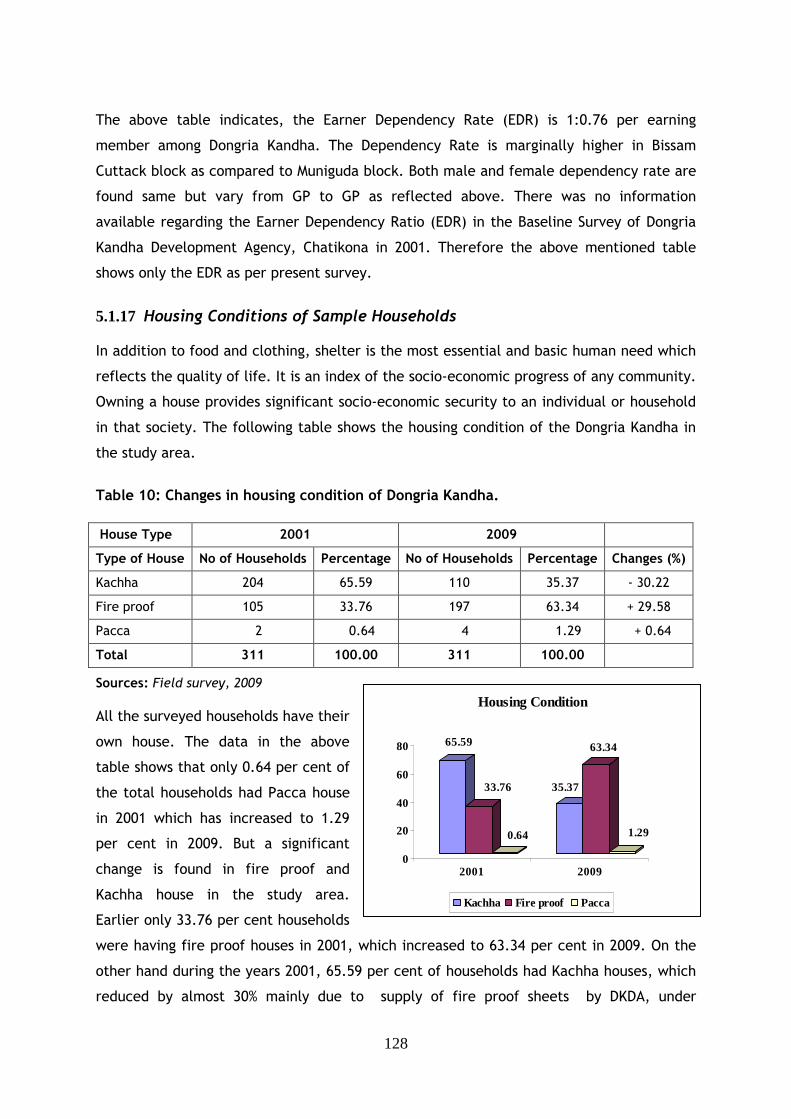
128
65.59
33.76
0.64
35.37
63.34
1.29
0
20
40
60
80
2001 2009
Housing Condition
Kachha Fire proof Pacca
The above table indicates, the Earner Dependency Rate (EDR) is 1:0.76 per earning
member among Dongria Kandha. The Dependency Rate is marginally higher in Bissam
Cuttack block as compared to Muniguda block. Both male and female dependency rate are
found same but vary from GP to GP as reflected above. There was no information
available regarding the Earner Dependency Ratio (EDR) in the Baseline Survey of Dongria
Kandha Development Agency, Chatikona in 2001. Therefore the above mentioned table
shows only the EDR as per present survey.
5.1.17 Housing Conditions of Sample Households In addition to food and clothing, shelter is the most essential and basic human need which
reflects the quality of life. It is an index of the socio-economic progress of any community.
Owning a house provides significant socio-economic security to an individual or household
in that society. The following table shows the housing condition of the Dongria Kandha in
the study area.
Table 10: Changes in housing condition of Dongria Kandha.
House Type 2001 2009
Type of House No of Households Percentage No of Households Percentage Changes (%)
Kachha 204 65.59 110 35.37 - 30.22
Fire proof 105 33.76 197 63.34 + 29.58
Pacca 2 0.64 4 1.29 + 0.64
Total 311 100.00 311 100.00
Sources: Field survey, 2009
All the surveyed households have their
own house. The data in the above
table shows that only 0.64 per cent of
the total households had Pacca house
in 2001 which has increased to 1.29
per cent in 2009. But a significant
change is found in fire proof and
Kachha house in the study area.
Earlier only 33.76 per cent households
were having fire proof houses in 2001, which increased to 63.34 per cent in 2009. On the
other hand during the years 2001, 65.59 per cent of households had Kachha houses, which
reduced by almost 30% mainly due to supply of fire proof sheets by DKDA, under
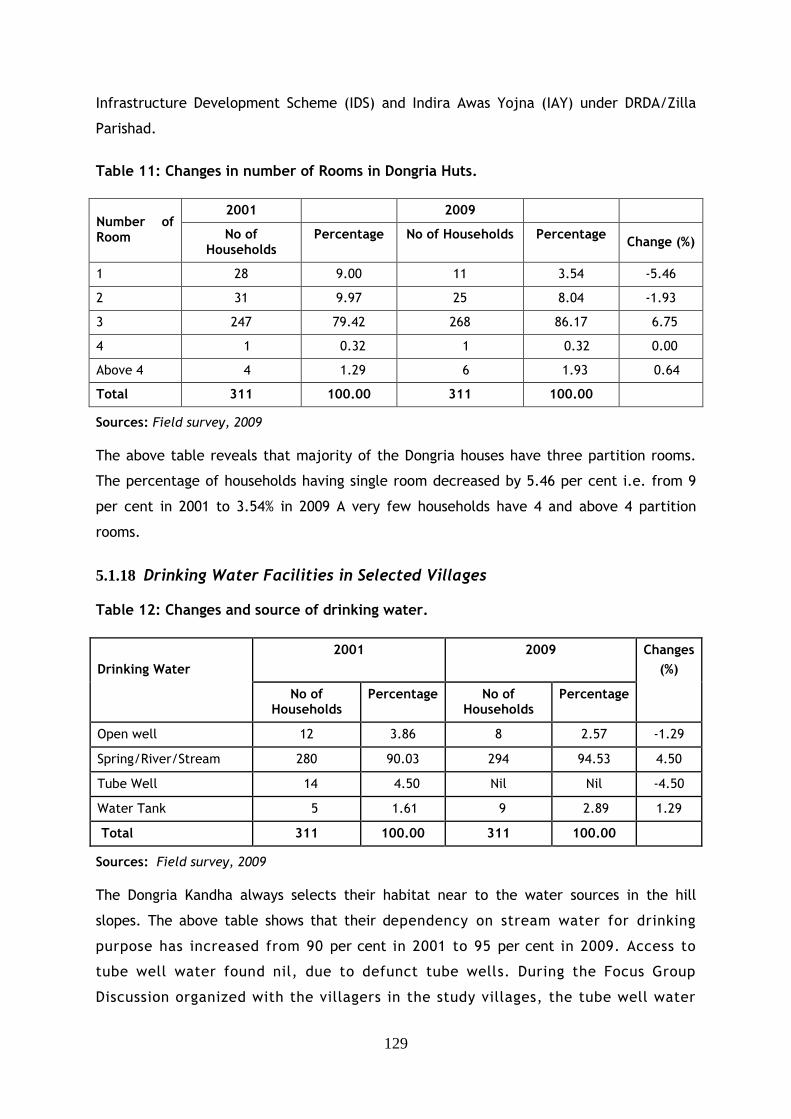
129
Infrastructure Development Scheme (IDS) and Indira Awas Yojna (IAY) under DRDA/Zilla
Parishad.
Table 11: Changes in number of Rooms in Dongria Huts.
2001 2009
Number of Room No of
Households Percentage No of Households Percentage
Change (%)
1 28 9.00 11 3.54 -5.46
2 31 9.97 25 8.04 -1.93
3 247 79.42 268 86.17 6.75
4 1 0.32 1 0.32 0.00
Above 4 4 1.29 6 1.93 0.64
Total 311 100.00 311 100.00
Sources: Field survey, 2009
The above table reveals that majority of the Dongria houses have three partition rooms.
The percentage of households having single room decreased by 5.46 per cent i.e. from 9
per cent in 2001 to 3.54% in 2009 A very few households have 4 and above 4 partition
rooms.
5.1.18 Drinking Water Facilities in Selected Villages Table 12: Changes and source of drinking water.
2001
2009
Drinking Water
No of Households
Percentage No of Households
Percentage
Changes
(%)
Open well 12 3.86 8 2.57 -1.29
Spring/River/Stream 280 90.03 294 94.53 4.50
Tube Well 14 4.50 Nil Nil -4.50
Water Tank 5 1.61 9 2.89 1.29
Total 311 100.00 311 100.00
Sources: Field survey, 2009
The Dongria Kandha always selects their habitat near to the water sources in the hill
slopes. The above table shows that their dependency on stream water for drinking
purpose has increased from 90 per cent in 2001 to 95 per cent in 2009. Access to
tube well water found nil, due to defunct tube wells. During the Focus Group
Discussion organized with the villagers in the study villages, the tube well water
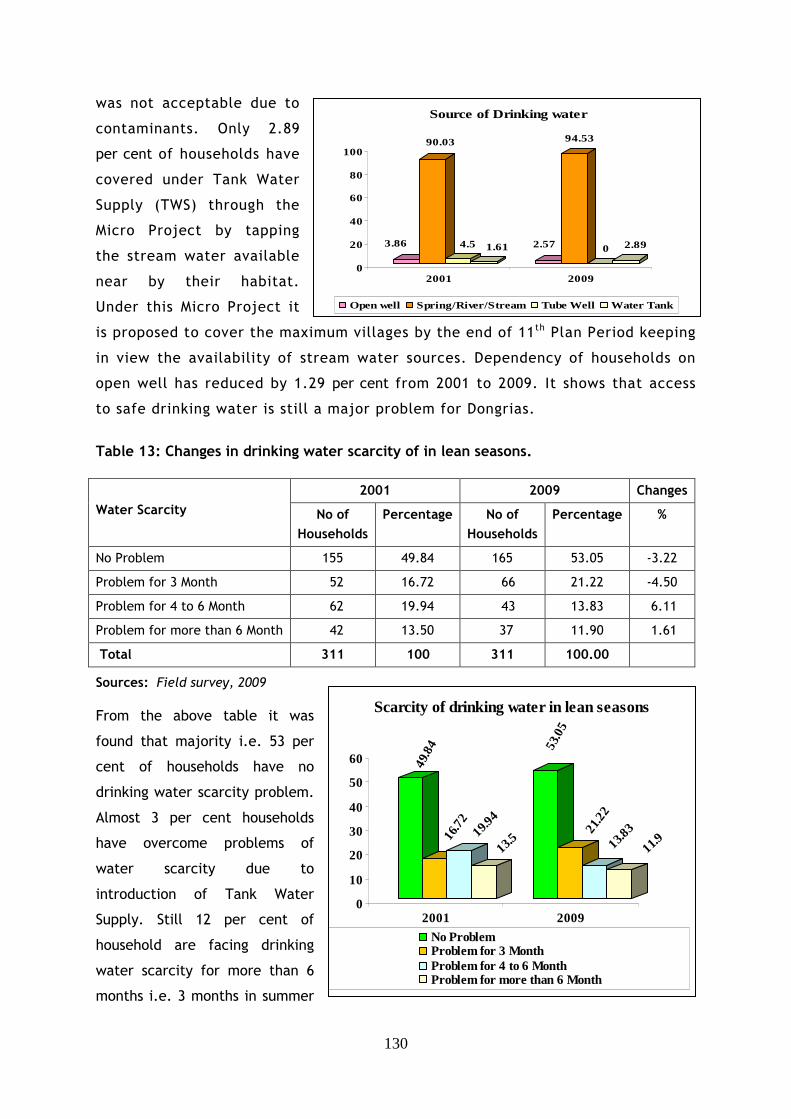
130
3.86
90.03
4.5 1.61 2.57
94.53
0 2.89
0
20
40
60
80
100
2001 2009
Source of Drinking water
Open well Spring/River/Stream Tube Well Water Tank
49.8
416
.72
19.94
13.5
53.0
5
21.2
2
13.83
11.9
0
10
20
30
40
50
60
2001 2009
Scarcity of drinking water in lean seasons
No ProblemProblem for 3 MonthProblem for 4 to 6 MonthProblem for more than 6 Month
was not acceptable due to
contaminants. Only 2.89
per cent of households have
covered under Tank Water
Supply (TWS) through the
Micro Project by tapping
the stream water available
near by their habitat.
Under this Micro Project it
is proposed to cover the maximum villages by the end of 11th Plan Period keeping
in view the availability of stream water sources. Dependency of households on
open well has reduced by 1.29 per cent from 2001 to 2009. It shows that access
to safe drinking water is still a major problem for Dongrias.
Table 13: Changes in drinking water scarcity of in lean seasons.
2001 2009 Changes
Water Scarcity No of
Households
Percentage No of
Households
Percentage %
No Problem 155 49.84 165 53.05 -3.22
Problem for 3 Month 52 16.72 66 21.22 -4.50
Problem for 4 to 6 Month 62 19.94 43 13.83 6.11
Problem for more than 6 Month 42 13.50 37 11.90 1.61
Total 311 100 311 100.00
Sources: Field survey, 2009
From the above table it was
found that majority i.e. 53 per
cent of households have no
drinking water scarcity problem.
Almost 3 per cent households
have overcome problems of
water scarcity due to
introduction of Tank Water
Supply. Still 12 per cent of
household are facing drinking
water scarcity for more than 6
months i.e. 3 months in summer
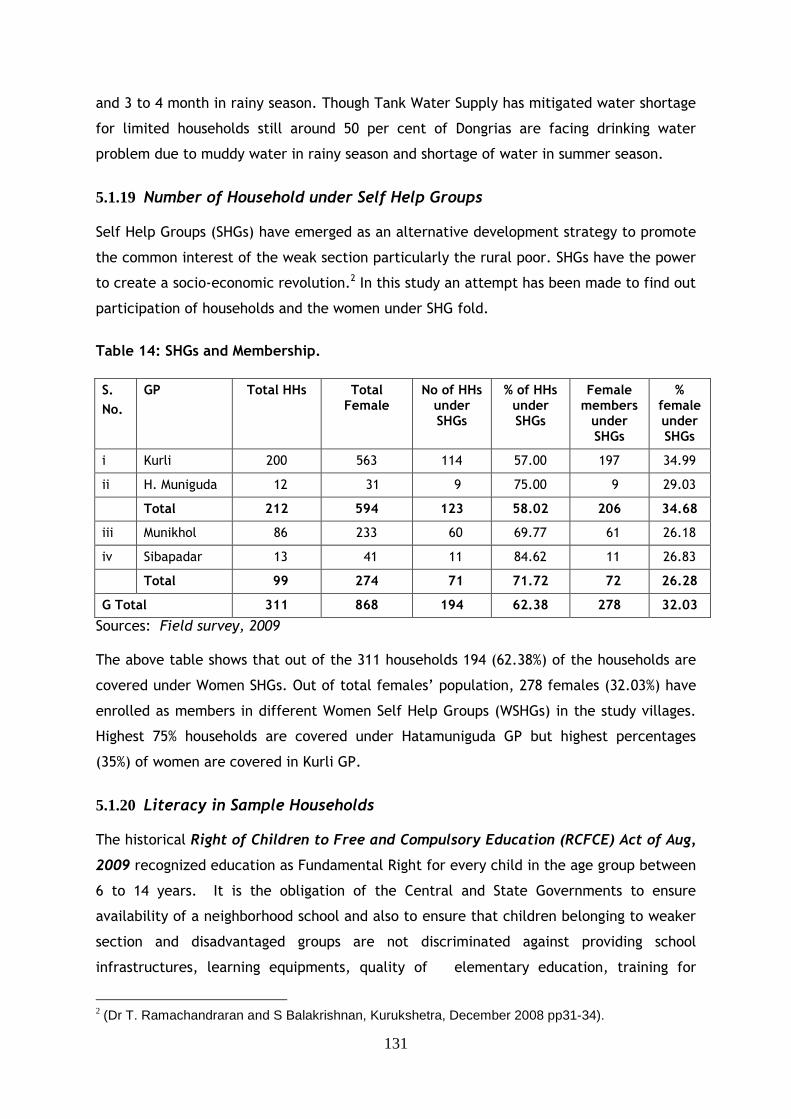
131
and 3 to 4 month in rainy season. Though Tank Water Supply has mitigated water shortage
for limited households still around 50 per cent of Dongrias are facing drinking water
problem due to muddy water in rainy season and shortage of water in summer season.
5.1.19 Number of Household under Self Help Groups Self Help Groups (SHGs) have emerged as an alternative development strategy to promote
the common interest of the weak section particularly the rural poor. SHGs have the power
to create a socio-economic revolution.2 In this study an attempt has been made to find out
participation of households and the women under SHG fold.
Table 14: SHGs and Membership.
S.
No.
GP Total HHs Total Female
No of HHs under SHGs
% of HHs under SHGs
Female members under SHGs
% female under SHGs
i Kurli 200 563 114 57.00 197 34.99
ii H. Muniguda 12 31 9 75.00 9 29.03
Total 212 594 123 58.02 206 34.68
iii Munikhol 86 233 60 69.77 61 26.18
iv Sibapadar 13 41 11 84.62 11 26.83
Total 99 274 71 71.72 72 26.28
G Total 311 868 194 62.38 278 32.03
Sources: Field survey, 2009 The above table shows that out of the 311 households 194 (62.38%) of the households are
covered under Women SHGs. Out of total females’ population, 278 females (32.03%) have
enrolled as members in different Women Self Help Groups (WSHGs) in the study villages.
Highest 75% households are covered under Hatamuniguda GP but highest percentages
(35%) of women are covered in Kurli GP.
5.1.20 Literacy in Sample Households The historical Right of Children to Free and Compulsory Education (RCFCE) Act of Aug,
2009 recognized education as Fundamental Right for every child in the age group between
6 to 14 years. It is the obligation of the Central and State Governments to ensure
availability of a neighborhood school and also to ensure that children belonging to weaker
section and disadvantaged groups are not discriminated against providing school
infrastructures, learning equipments, quality of elementary education, training for
2 (Dr T. Ramachandraran and S Balakrishnan, Kurukshetra, December 2008 pp31-34).
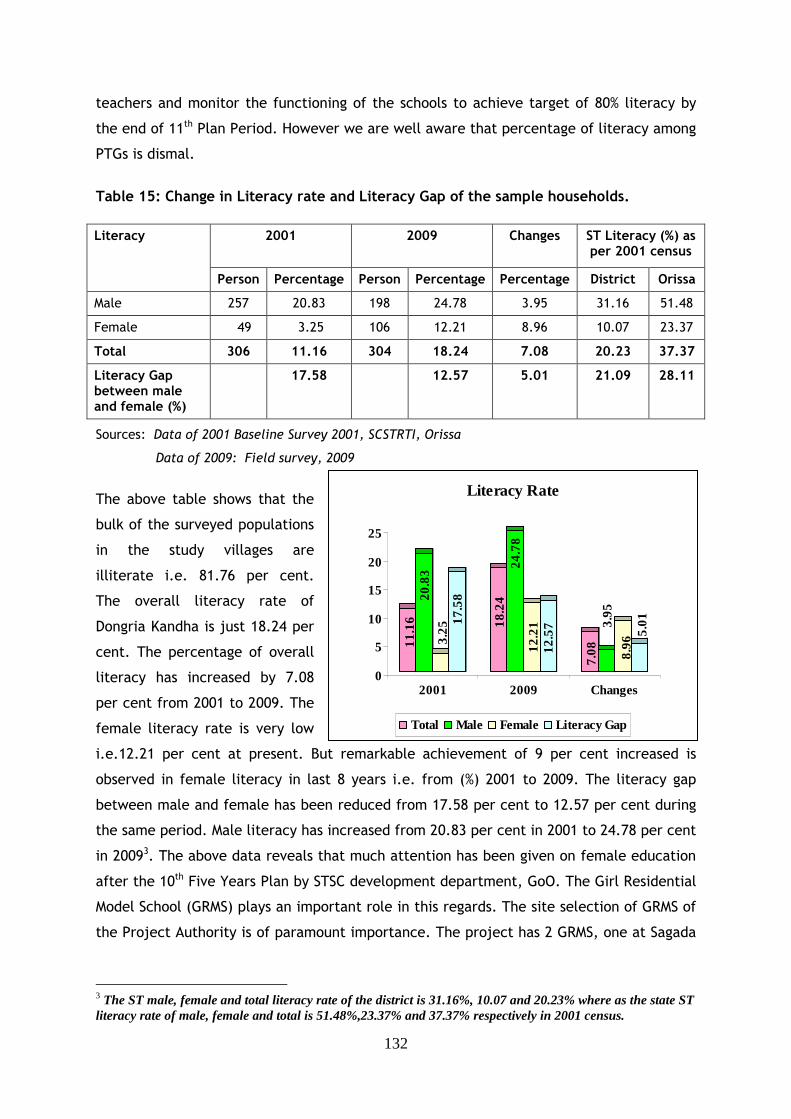
132
11.1
620
.83
3.25
17.5
8
18.2
424
.78
12.2
112
.57
7.08
3.95
8.96
5.01
0
5
10
15
20
25
2001 2009 Changes
Literacy Rate
Total Male Female Literacy Gap
teachers and monitor the functioning of the schools to achieve target of 80% literacy by
the end of 11th Plan Period. However we are well aware that percentage of literacy among
PTGs is dismal.
Table 15: Change in Literacy rate and Literacy Gap of the sample households.
2001
2009
Changes ST Literacy (%) as per 2001 census
Literacy
Person Percentage Person Percentage Percentage District Orissa
Male 257 20.83 198 24.78 3.95 31.16 51.48
Female 49 3.25 106 12.21 8.96 10.07 23.37
Total 306 11.16 304 18.24 7.08 20.23 37.37
Literacy Gap between male and female (%)
17.58 12.57 5.01 21.09 28.11
Sources: Data of 2001 Baseline Survey 2001, SCSTRTI, Orissa
Data of 2009: Field survey, 2009
The above table shows that the
bulk of the surveyed populations
in the study villages are
illiterate i.e. 81.76 per cent.
The overall literacy rate of
Dongria Kandha is just 18.24 per
cent. The percentage of overall
literacy has increased by 7.08
per cent from 2001 to 2009. The
female literacy rate is very low
i.e.12.21 per cent at present. But remarkable achievement of 9 per cent increased is
observed in female literacy in last 8 years i.e. from (%) 2001 to 2009. The literacy gap
between male and female has been reduced from 17.58 per cent to 12.57 per cent during
the same period. Male literacy has increased from 20.83 per cent in 2001 to 24.78 per cent
in 20093. The above data reveals that much attention has been given on female education
after the 10th Five Years Plan by STSC development department, GoO. The Girl Residential
Model School (GRMS) plays an important role in this regards. The site selection of GRMS of
the Project Authority is of paramount importance. The project has 2 GRMS, one at Sagada
3 The ST male, female and total literacy rate of the district is 31.16%, 10.07 and 20.23% where as the state ST literacy rate of male, female and total is 51.48%,23.37% and 37.37% respectively in 2001 census.
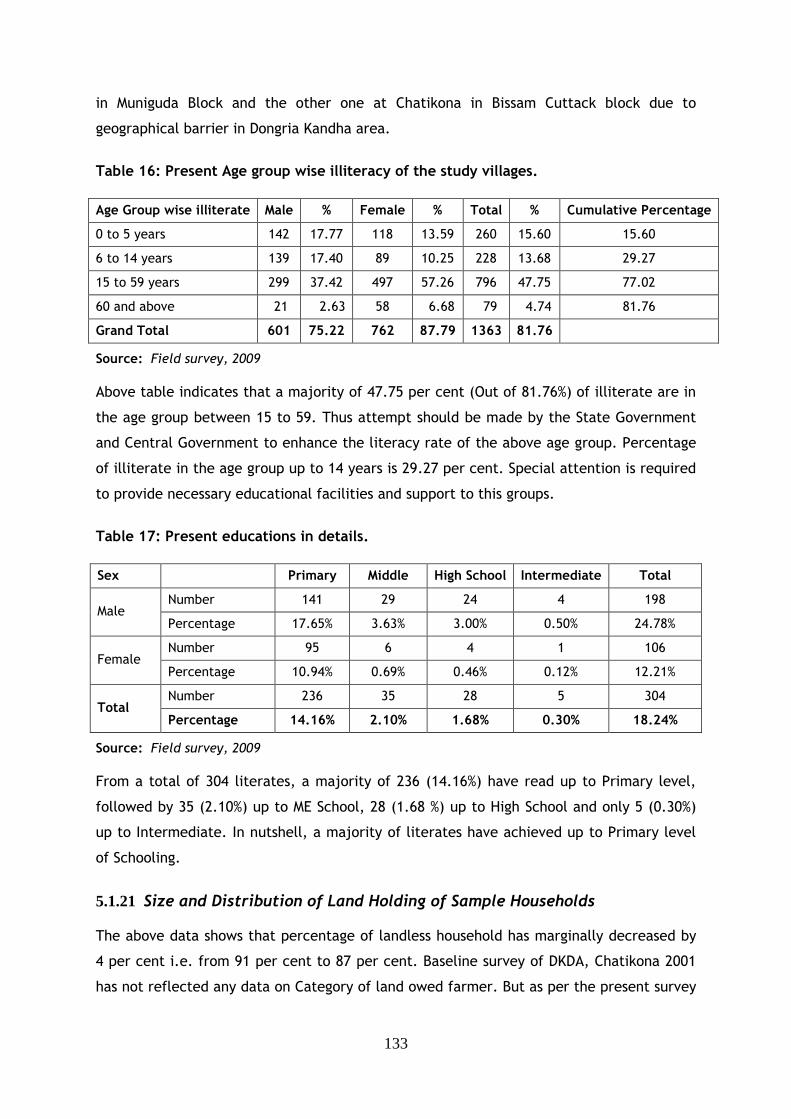
133
in Muniguda Block and the other one at Chatikona in Bissam Cuttack block due to
geographical barrier in Dongria Kandha area.
Table 16: Present Age group wise illiteracy of the study villages.
Age Group wise illiterate Male % Female % Total % Cumulative Percentage
0 to 5 years 142 17.77 118 13.59 260 15.60 15.60
6 to 14 years 139 17.40 89 10.25 228 13.68 29.27
15 to 59 years 299 37.42 497 57.26 796 47.75 77.02
60 and above 21 2.63 58 6.68 79 4.74 81.76
Grand Total 601 75.22 762 87.79 1363 81.76
Source: Field survey, 2009
Above table indicates that a majority of 47.75 per cent (Out of 81.76%) of illiterate are in
the age group between 15 to 59. Thus attempt should be made by the State Government
and Central Government to enhance the literacy rate of the above age group. Percentage
of illiterate in the age group up to 14 years is 29.27 per cent. Special attention is required
to provide necessary educational facilities and support to this groups.
Table 17: Present educations in details.
Sex Primary Middle High School Intermediate Total
Number 141 29 24 4 198 Male
Percentage 17.65% 3.63% 3.00% 0.50% 24.78%
Number 95 6 4 1 106 Female
Percentage 10.94% 0.69% 0.46% 0.12% 12.21%
Number 236 35 28 5 304 Total
Percentage 14.16% 2.10% 1.68% 0.30% 18.24%
Source: Field survey, 2009
From a total of 304 literates, a majority of 236 (14.16%) have read up to Primary level,
followed by 35 (2.10%) up to ME School, 28 (1.68 %) up to High School and only 5 (0.30%)
up to Intermediate. In nutshell, a majority of literates have achieved up to Primary level
of Schooling.
5.1.21 Size and Distribution of Land Holding of Sample Households The above data shows that percentage of landless household has marginally decreased by
4 per cent i.e. from 91 per cent to 87 per cent. Baseline survey of DKDA, Chatikona 2001
has not reflected any data on Category of land owed farmer. But as per the present survey
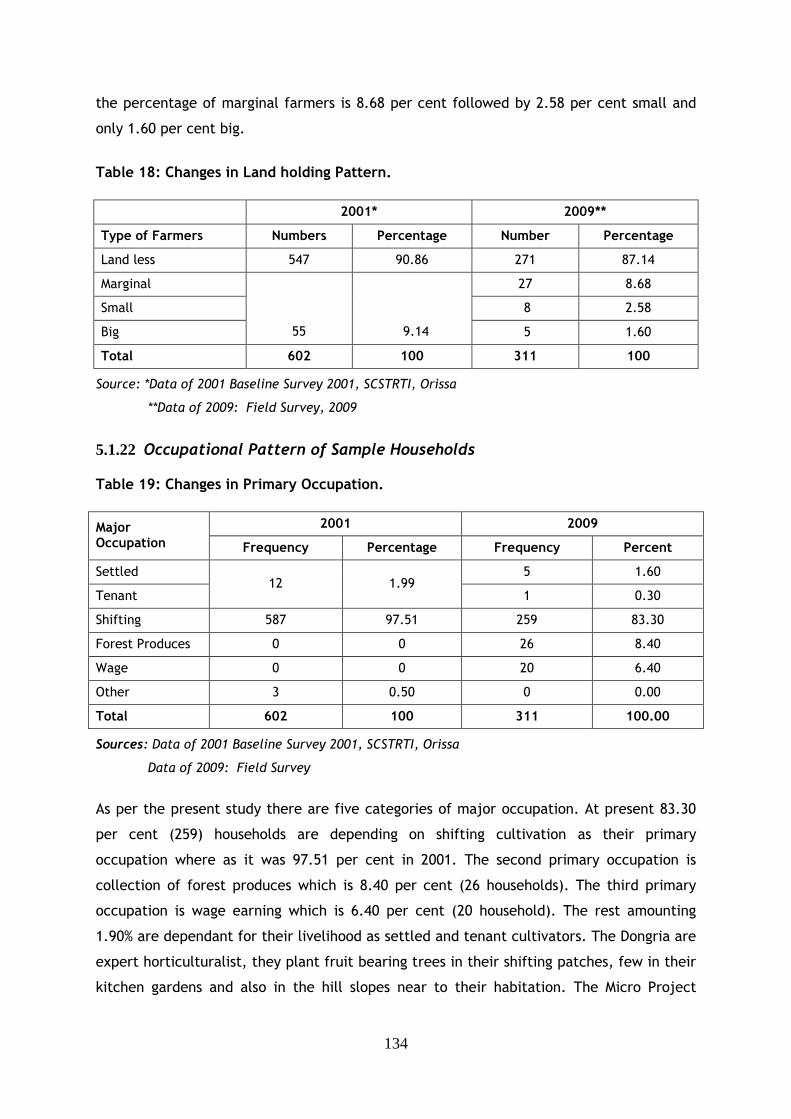
134
the percentage of marginal farmers is 8.68 per cent followed by 2.58 per cent small and
only 1.60 per cent big.
Table 18: Changes in Land holding Pattern.
2001* 2009**
Type of Farmers Numbers Percentage Number Percentage
Land less 547 90.86 271 87.14
Marginal 27 8.68
Small 8 2.58
Big 55 9.14 5 1.60
Total 602 100 311 100
Source: *Data of 2001 Baseline Survey 2001, SCSTRTI, Orissa
**Data of 2009: Field Survey, 2009
5.1.22 Occupational Pattern of Sample Households Table 19: Changes in Primary Occupation.
2001 2009 Major
Occupation Frequency Percentage Frequency Percent
Settled 5 1.60
Tenant 12 1.99
1 0.30
Shifting 587 97.51 259 83.30
Forest Produces 0 0 26 8.40
Wage 0 0 20 6.40
Other 3 0.50 0 0.00
Total 602 100 311 100.00
Sources: Data of 2001 Baseline Survey 2001, SCSTRTI, Orissa
Data of 2009: Field Survey
As per the present study there are five categories of major occupation. At present 83.30
per cent (259) households are depending on shifting cultivation as their primary
occupation where as it was 97.51 per cent in 2001. The second primary occupation is
collection of forest produces which is 8.40 per cent (26 households). The third primary
occupation is wage earning which is 6.40 per cent (20 household). The rest amounting
1.90% are dependant for their livelihood as settled and tenant cultivators. The Dongria are
expert horticulturalist, they plant fruit bearing trees in their shifting patches, few in their
kitchen gardens and also in the hill slopes near to their habitation. The Micro Project
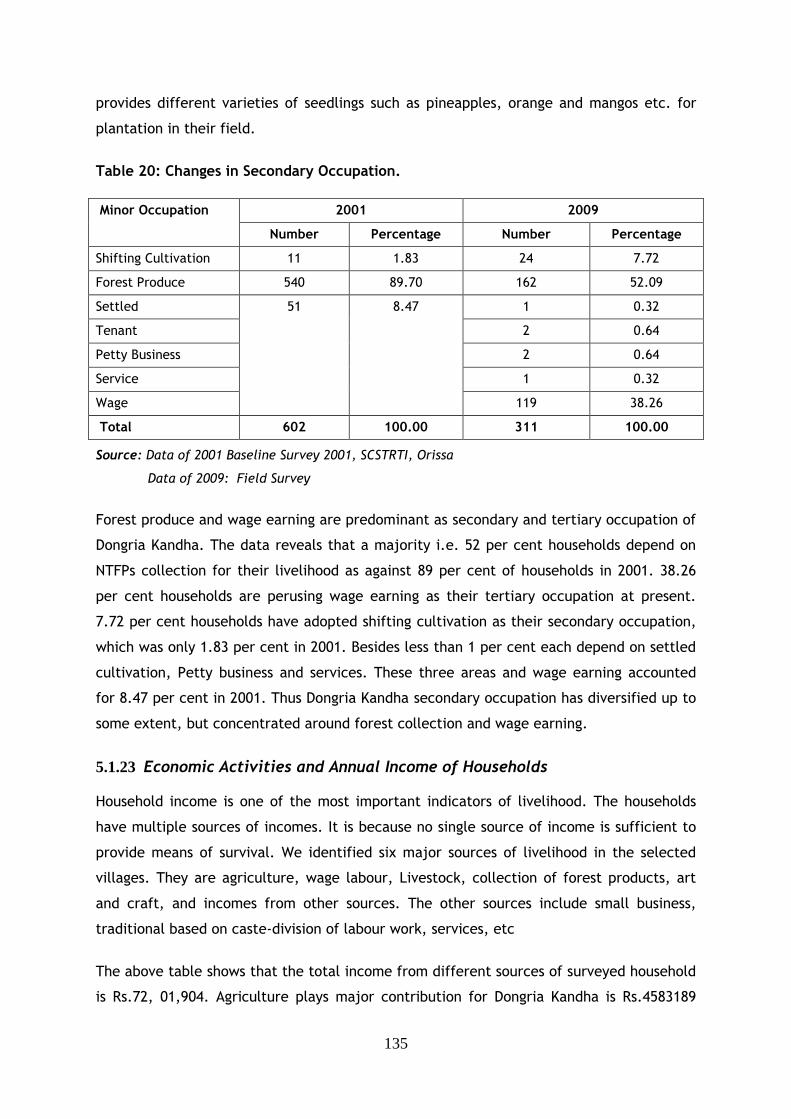
135
provides different varieties of seedlings such as pineapples, orange and mangos etc. for
plantation in their field.
Table 20: Changes in Secondary Occupation.
2001 2009 Minor Occupation
Number Percentage Number Percentage
Shifting Cultivation 11 1.83 24 7.72
Forest Produce 540 89.70 162 52.09
Settled 1 0.32
Tenant 2 0.64
Petty Business 2 0.64
Service 1 0.32
Wage
51 8.47
119 38.26
Total 602 100.00 311 100.00
Source: Data of 2001 Baseline Survey 2001, SCSTRTI, Orissa
Data of 2009: Field Survey
Forest produce and wage earning are predominant as secondary and tertiary occupation of
Dongria Kandha. The data reveals that a majority i.e. 52 per cent households depend on
NTFPs collection for their livelihood as against 89 per cent of households in 2001. 38.26
per cent households are perusing wage earning as their tertiary occupation at present.
7.72 per cent households have adopted shifting cultivation as their secondary occupation,
which was only 1.83 per cent in 2001. Besides less than 1 per cent each depend on settled
cultivation, Petty business and services. These three areas and wage earning accounted
for 8.47 per cent in 2001. Thus Dongria Kandha secondary occupation has diversified up to
some extent, but concentrated around forest collection and wage earning.
5.1.23 Economic Activities and Annual Income of Households Household income is one of the most important indicators of livelihood. The households
have multiple sources of incomes. It is because no single source of income is sufficient to
provide means of survival. We identified six major sources of livelihood in the selected
villages. They are agriculture, wage labour, Livestock, collection of forest products, art
and craft, and incomes from other sources. The other sources include small business,
traditional based on caste-division of labour work, services, etc
The above table shows that the total income from different sources of surveyed household
is Rs.72, 01,904. Agriculture plays major contribution for Dongria Kandha is Rs.4583189
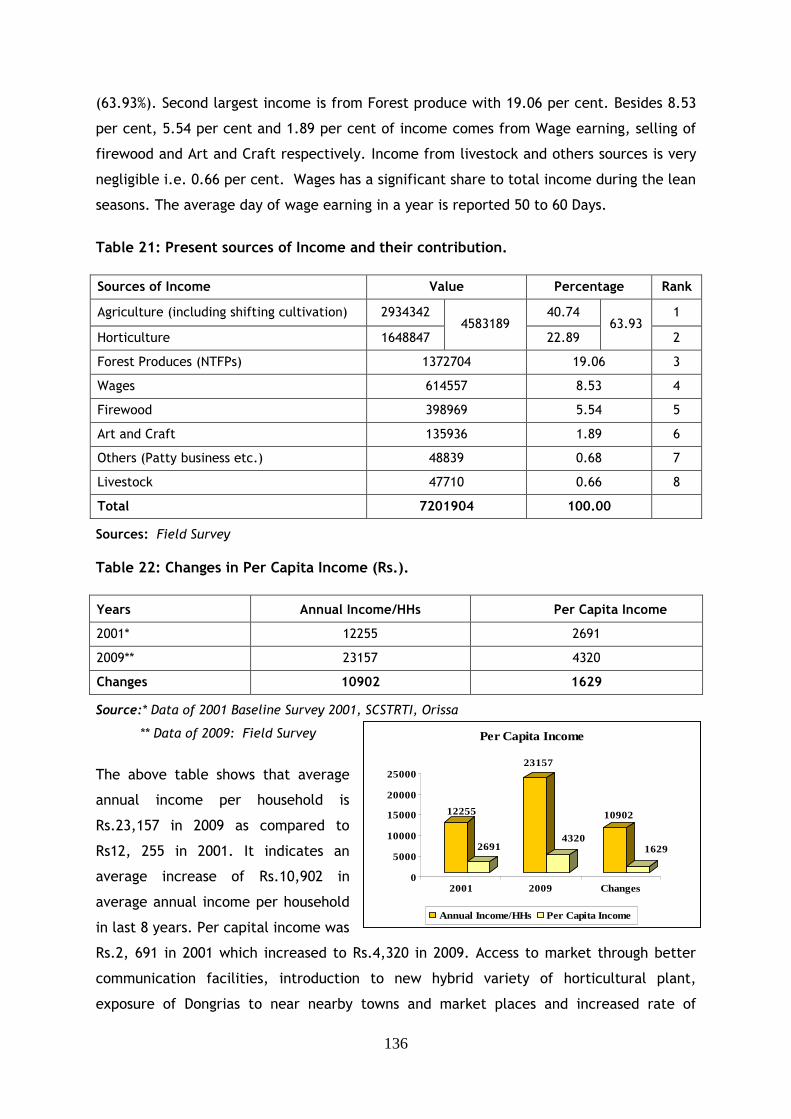
136
12255
2691
23157
4320
10902
1629
0
5000
10000
15000
20000
25000
2001 2009 Changes
Per Capita Income
Annual Income/HHs Per Capita Income
(63.93%). Second largest income is from Forest produce with 19.06 per cent. Besides 8.53
per cent, 5.54 per cent and 1.89 per cent of income comes from Wage earning, selling of
firewood and Art and Craft respectively. Income from livestock and others sources is very
negligible i.e. 0.66 per cent. Wages has a significant share to total income during the lean
seasons. The average day of wage earning in a year is reported 50 to 60 Days.
Table 21: Present sources of Income and their contribution.
Sources of Income Value Percentage Rank
Agriculture (including shifting cultivation) 2934342 40.74 1
Horticulture 1648847 4583189
22.89 63.93
2
Forest Produces (NTFPs) 1372704 19.06 3
Wages 614557 8.53 4
Firewood 398969 5.54 5
Art and Craft 135936 1.89 6
Others (Patty business etc.) 48839 0.68 7
Livestock 47710 0.66 8
Total 7201904 100.00
Sources: Field Survey
Table 22: Changes in Per Capita Income (Rs.).
Years Annual Income/HHs Per Capita Income
2001* 12255 2691
2009** 23157 4320
Changes 10902 1629
Source:* Data of 2001 Baseline Survey 2001, SCSTRTI, Orissa
** Data of 2009: Field Survey
The above table shows that average
annual income per household is
Rs.23,157 in 2009 as compared to
Rs12, 255 in 2001. It indicates an
average increase of Rs.10,902 in
average annual income per household
in last 8 years. Per capital income was
Rs.2, 691 in 2001 which increased to Rs.4,320 in 2009. Access to market through better
communication facilities, introduction to new hybrid variety of horticultural plant,
exposure of Dongrias to near nearby towns and market places and increased rate of
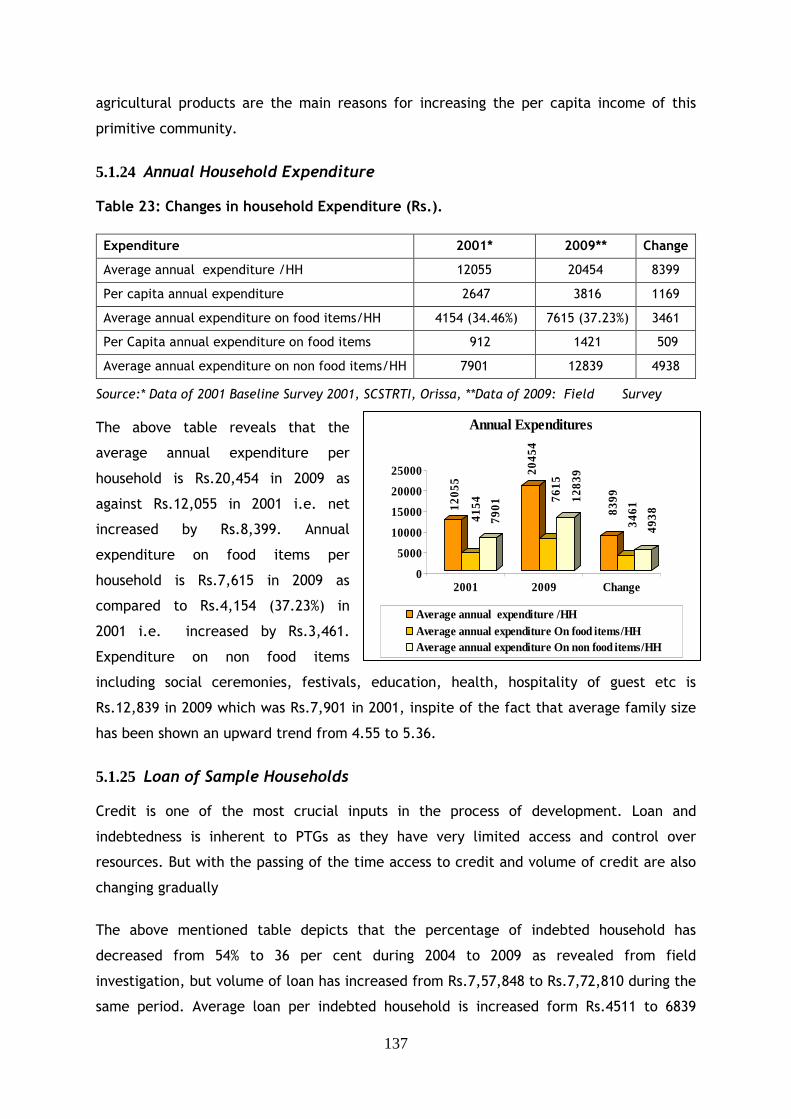
137
1205
5
4154
7901
2045
4
7615
1283
9
8399
3461
4938
0
5000
10000
15000
20000
25000
2001 2009 Change
Annual Expenditures
Average annual expenditure /HH Average annual expenditure On food items/HHAverage annual expenditure On non food items/HH
agricultural products are the main reasons for increasing the per capita income of this
primitive community.
5.1.24 Annual Household Expenditure Table 23: Changes in household Expenditure (Rs.).
Expenditure 2001* 2009** Change
Average annual expenditure /HH 12055 20454 8399
Per capita annual expenditure 2647 3816 1169
Average annual expenditure on food items/HH 4154 (34.46%) 7615 (37.23%) 3461
Per Capita annual expenditure on food items 912 1421 509
Average annual expenditure on non food items/HH 7901 12839 4938
Source:* Data of 2001 Baseline Survey 2001, SCSTRTI, Orissa, **Data of 2009: Field Survey
The above table reveals that the
average annual expenditure per
household is Rs.20,454 in 2009 as
against Rs.12,055 in 2001 i.e. net
increased by Rs.8,399. Annual
expenditure on food items per
household is Rs.7,615 in 2009 as
compared to Rs.4,154 (37.23%) in
2001 i.e. increased by Rs.3,461.
Expenditure on non food items
including social ceremonies, festivals, education, health, hospitality of guest etc is
Rs.12,839 in 2009 which was Rs.7,901 in 2001, inspite of the fact that average family size
has been shown an upward trend from 4.55 to 5.36.
5.1.25 Loan of Sample Households Credit is one of the most crucial inputs in the process of development. Loan and
indebtedness is inherent to PTGs as they have very limited access and control over
resources. But with the passing of the time access to credit and volume of credit are also
changing gradually
The above mentioned table depicts that the percentage of indebted household has
decreased from 54% to 36 per cent during 2004 to 2009 as revealed from field
investigation, but volume of loan has increased from Rs.7,57,848 to Rs.7,72,810 during the
same period. Average loan per indebted household is increased form Rs.4511 to 6839
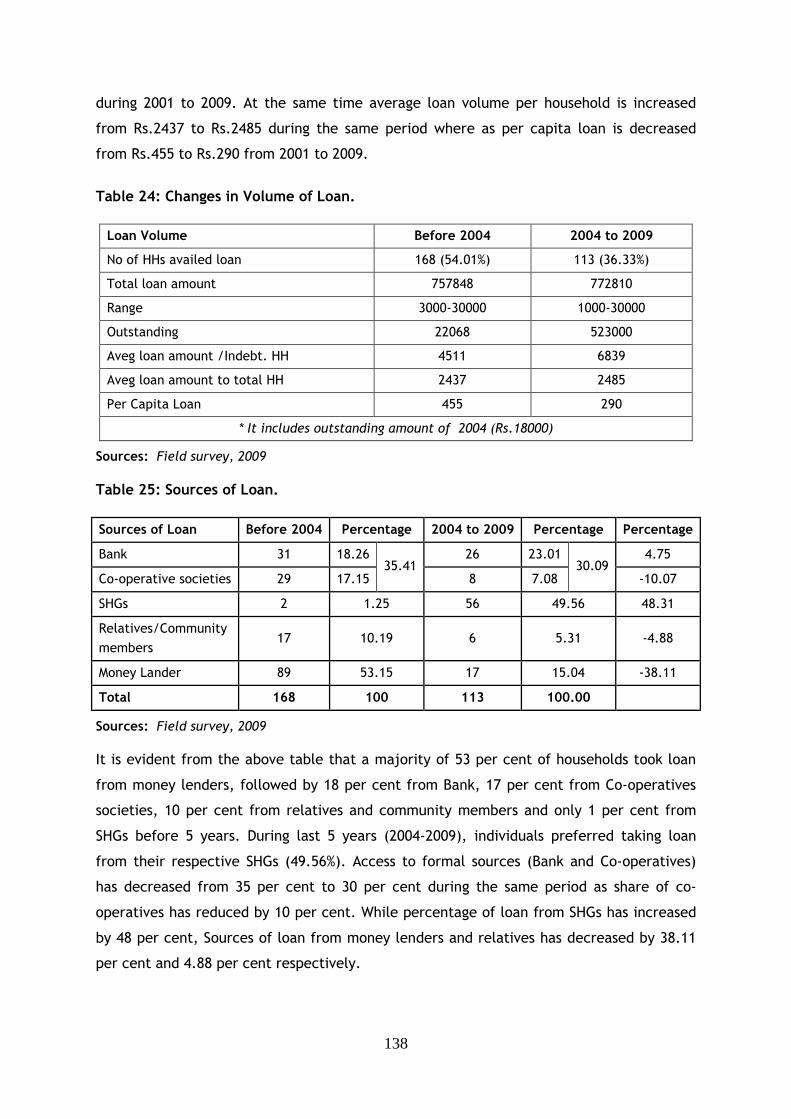
138
during 2001 to 2009. At the same time average loan volume per household is increased
from Rs.2437 to Rs.2485 during the same period where as per capita loan is decreased
from Rs.455 to Rs.290 from 2001 to 2009.
Table 24: Changes in Volume of Loan.
Loan Volume Before 2004 2004 to 2009
No of HHs availed loan 168 (54.01%) 113 (36.33%)
Total loan amount 757848 772810
Range 3000-30000 1000-30000
Outstanding 22068 523000
Aveg loan amount /Indebt. HH 4511 6839
Aveg loan amount to total HH 2437 2485
Per Capita Loan 455 290
* It includes outstanding amount of 2004 (Rs.18000)
Sources: Field survey, 2009
Table 25: Sources of Loan.
Sources of Loan Before 2004 Percentage 2004 to 2009 Percentage Percentage
Bank 31 18.26 26 23.01 4.75
Co-operative societies 29 17.15 35.41
8 7.08 30.09
-10.07
SHGs 2 1.25 56 49.56 48.31
Relatives/Community
members 17 10.19 6 5.31 -4.88
Money Lander 89 53.15 17 15.04 -38.11
Total 168 100 113 100.00
Sources: Field survey, 2009
It is evident from the above table that a majority of 53 per cent of households took loan
from money lenders, followed by 18 per cent from Bank, 17 per cent from Co-operatives
societies, 10 per cent from relatives and community members and only 1 per cent from
SHGs before 5 years. During last 5 years (2004-2009), individuals preferred taking loan
from their respective SHGs (49.56%). Access to formal sources (Bank and Co-operatives)
has decreased from 35 per cent to 30 per cent during the same period as share of co-
operatives has reduced by 10 per cent. While percentage of loan from SHGs has increased
by 48 per cent, Sources of loan from money lenders and relatives has decreased by 38.11
per cent and 4.88 per cent respectively.
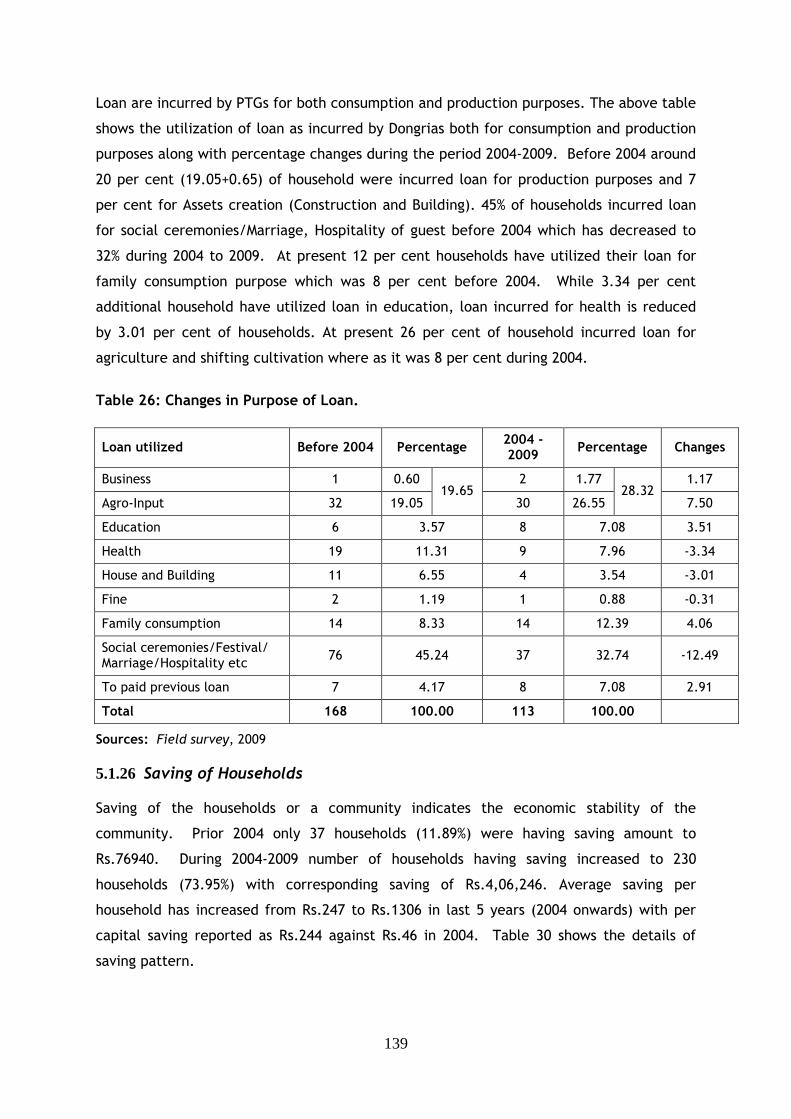
139
Loan are incurred by PTGs for both consumption and production purposes. The above table
shows the utilization of loan as incurred by Dongrias both for consumption and production
purposes along with percentage changes during the period 2004-2009. Before 2004 around
20 per cent (19.05+0.65) of household were incurred loan for production purposes and 7
per cent for Assets creation (Construction and Building). 45% of households incurred loan
for social ceremonies/Marriage, Hospitality of guest before 2004 which has decreased to
32% during 2004 to 2009. At present 12 per cent households have utilized their loan for
family consumption purpose which was 8 per cent before 2004. While 3.34 per cent
additional household have utilized loan in education, loan incurred for health is reduced
by 3.01 per cent of households. At present 26 per cent of household incurred loan for
agriculture and shifting cultivation where as it was 8 per cent during 2004.
Table 26: Changes in Purpose of Loan.
Loan utilized Before 2004 Percentage 2004 -2009
Percentage Changes
Business 1 0.60 2 1.77 1.17
Agro-Input 32 19.05 19.65
30 26.55 28.32
7.50
Education 6 3.57 8 7.08 3.51
Health 19 11.31 9 7.96 -3.34
House and Building 11 6.55 4 3.54 -3.01
Fine 2 1.19 1 0.88 -0.31
Family consumption 14 8.33 14 12.39 4.06
Social ceremonies/Festival/ Marriage/Hospitality etc
76 45.24 37 32.74 -12.49
To paid previous loan 7 4.17 8 7.08 2.91
Total 168 100.00 113 100.00
Sources: Field survey, 2009
5.1.26 Saving of Households Saving of the households or a community indicates the economic stability of the
community. Prior 2004 only 37 households (11.89%) were having saving amount to
Rs.76940. During 2004-2009 number of households having saving increased to 230
households (73.95%) with corresponding saving of Rs.4,06,246. Average saving per
household has increased from Rs.247 to Rs.1306 in last 5 years (2004 onwards) with per
capital saving reported as Rs.244 against Rs.46 in 2004. Table 30 shows the details of
saving pattern.
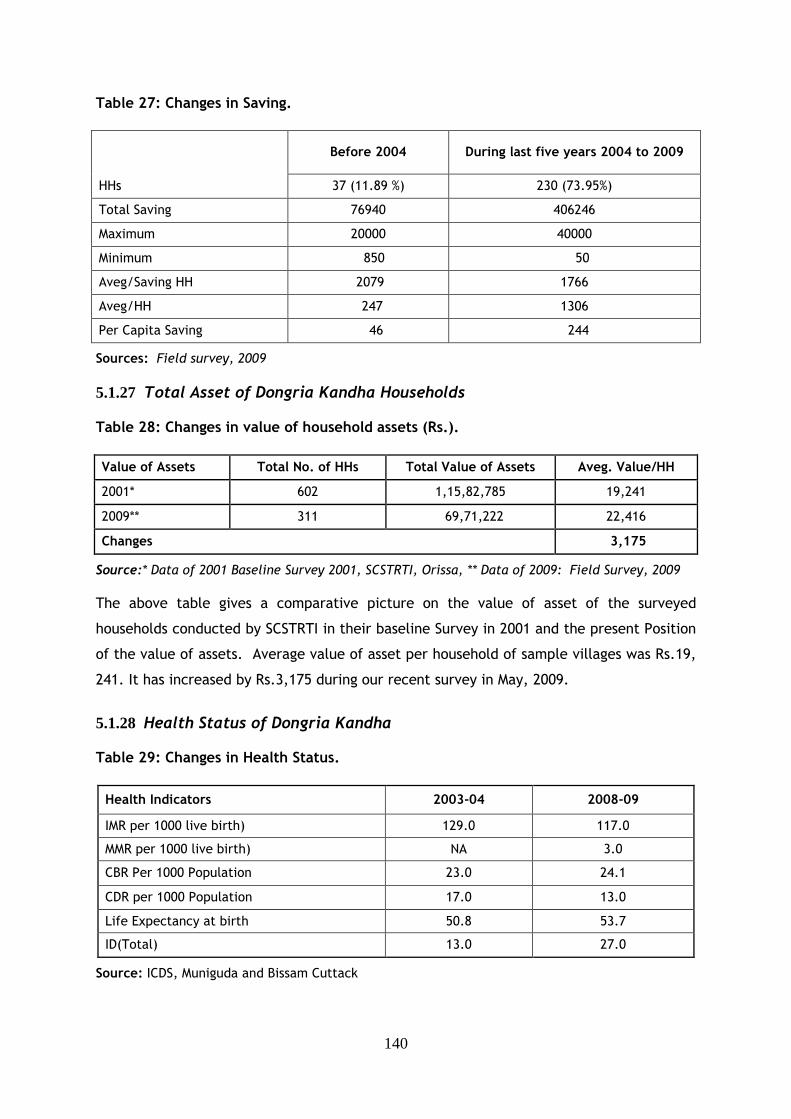
140
Table 27: Changes in Saving.
Before 2004 During last five years 2004 to 2009
HHs 37 (11.89 %) 230 (73.95%)
Total Saving 76940 406246
Maximum 20000 40000
Minimum 850 50
Aveg/Saving HH 2079 1766
Aveg/HH 247 1306
Per Capita Saving 46 244
Sources: Field survey, 2009
5.1.27 Total Asset of Dongria Kandha Households Table 28: Changes in value of household assets (Rs.).
Value of Assets Total No. of HHs Total Value of Assets Aveg. Value/HH
2001* 602 1,15,82,785 19,241
2009** 311 69,71,222 22,416
Changes 3,175
Source:* Data of 2001 Baseline Survey 2001, SCSTRTI, Orissa, ** Data of 2009: Field Survey, 2009
The above table gives a comparative picture on the value of asset of the surveyed
households conducted by SCSTRTI in their baseline Survey in 2001 and the present Position
of the value of assets. Average value of asset per household of sample villages was Rs.19,
241. It has increased by Rs.3,175 during our recent survey in May, 2009.
5.1.28 Health Status of Dongria Kandha Table 29: Changes in Health Status.
Health Indicators 2003-04 2008-09
IMR per 1000 live birth) 129.0 117.0
MMR per 1000 live birth) NA 3.0
CBR Per 1000 Population 23.0 24.1
CDR per 1000 Population 17.0 13.0
Life Expectancy at birth 50.8 53.7
ID(Total) 13.0 27.0
Source: ICDS, Muniguda and Bissam Cuttack
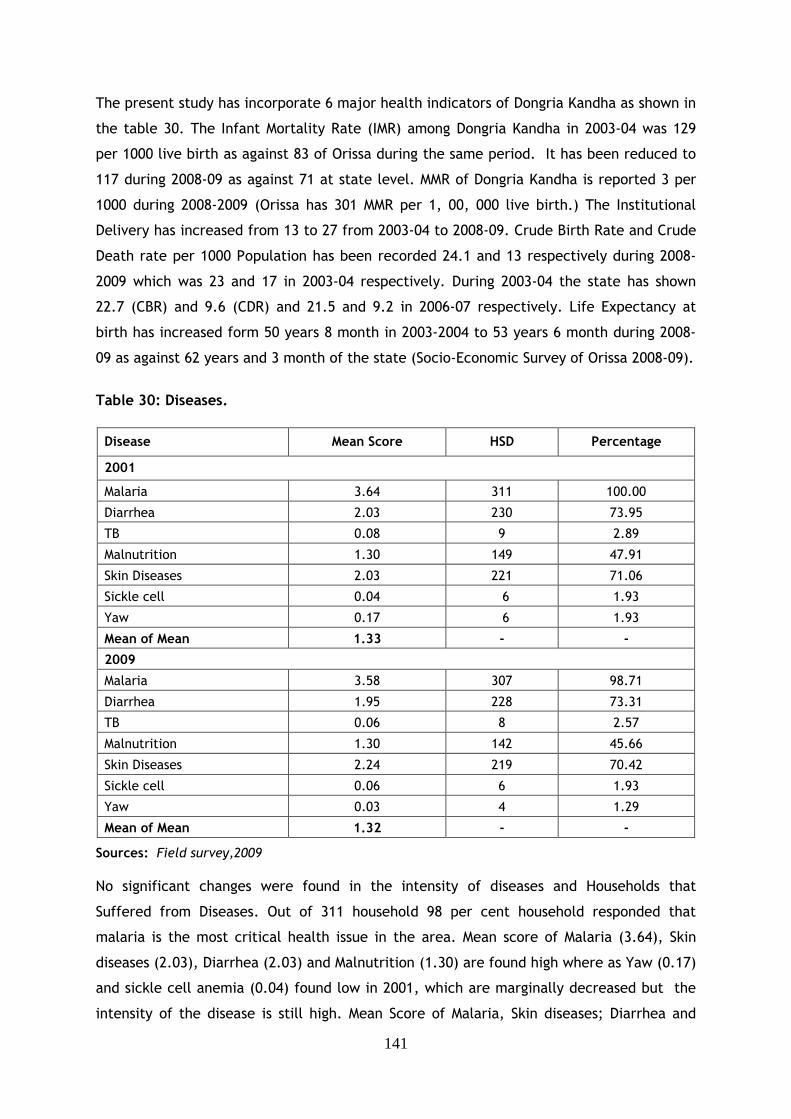
141
The present study has incorporate 6 major health indicators of Dongria Kandha as shown in
the table 30. The Infant Mortality Rate (IMR) among Dongria Kandha in 2003-04 was 129
per 1000 live birth as against 83 of Orissa during the same period. It has been reduced to
117 during 2008-09 as against 71 at state level. MMR of Dongria Kandha is reported 3 per
1000 during 2008-2009 (Orissa has 301 MMR per 1, 00, 000 live birth.) The Institutional
Delivery has increased from 13 to 27 from 2003-04 to 2008-09. Crude Birth Rate and Crude
Death rate per 1000 Population has been recorded 24.1 and 13 respectively during 2008-
2009 which was 23 and 17 in 2003-04 respectively. During 2003-04 the state has shown
22.7 (CBR) and 9.6 (CDR) and 21.5 and 9.2 in 2006-07 respectively. Life Expectancy at
birth has increased form 50 years 8 month in 2003-2004 to 53 years 6 month during 2008-
09 as against 62 years and 3 month of the state (Socio-Economic Survey of Orissa 2008-09).
Table 30: Diseases.
Disease Mean Score HSD Percentage
2001
Malaria 3.64 311 100.00
Diarrhea 2.03 230 73.95
TB 0.08 9 2.89
Malnutrition 1.30 149 47.91
Skin Diseases 2.03 221 71.06
Sickle cell 0.04 6 1.93
Yaw 0.17 6 1.93
Mean of Mean 1.33 - -
2009
Malaria 3.58 307 98.71
Diarrhea 1.95 228 73.31
TB 0.06 8 2.57
Malnutrition 1.30 142 45.66
Skin Diseases 2.24 219 70.42
Sickle cell 0.06 6 1.93
Yaw 0.03 4 1.29
Mean of Mean 1.32 - -
Sources: Field survey,2009
No significant changes were found in the intensity of diseases and Households that
Suffered from Diseases. Out of 311 household 98 per cent household responded that
malaria is the most critical health issue in the area. Mean score of Malaria (3.64), Skin
diseases (2.03), Diarrhea (2.03) and Malnutrition (1.30) are found high where as Yaw (0.17)
and sickle cell anemia (0.04) found low in 2001, which are marginally decreased but the
intensity of the disease is still high. Mean Score of Malaria, Skin diseases; Diarrhea and
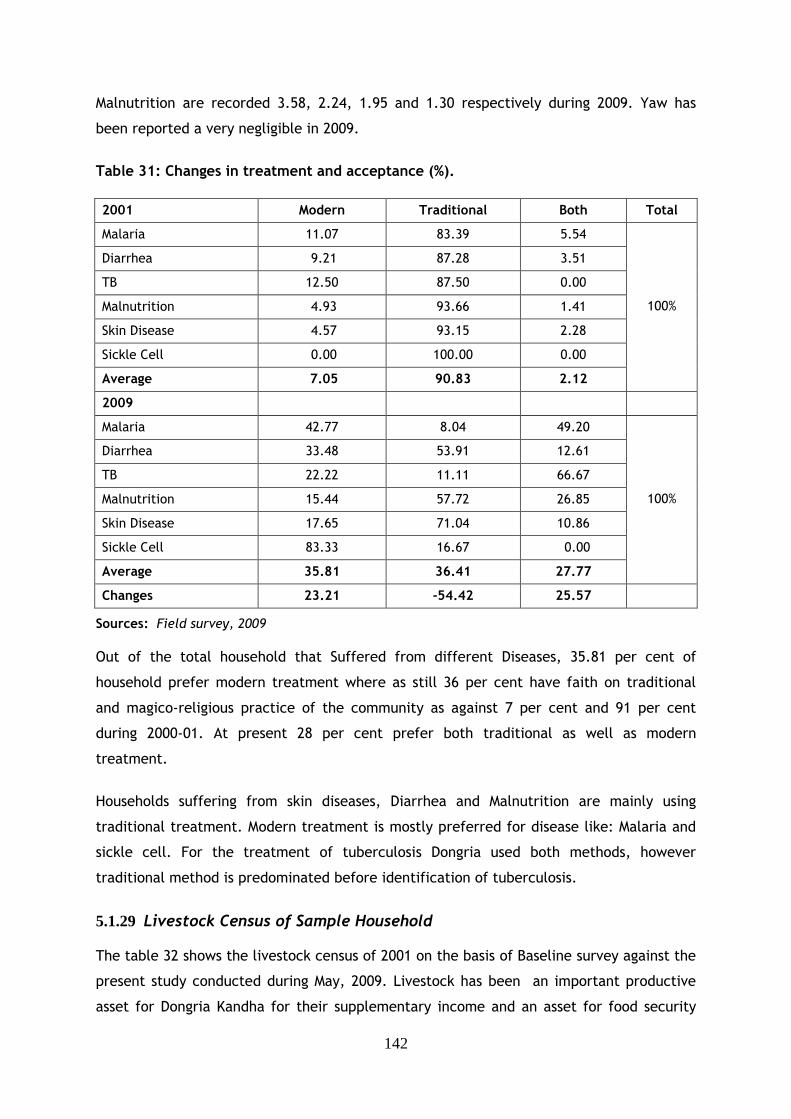
142
Malnutrition are recorded 3.58, 2.24, 1.95 and 1.30 respectively during 2009. Yaw has
been reported a very negligible in 2009.
Table 31: Changes in treatment and acceptance (%).
2001 Modern Traditional Both Total
Malaria 11.07 83.39 5.54
Diarrhea 9.21 87.28 3.51
TB 12.50 87.50 0.00
Malnutrition 4.93 93.66 1.41
Skin Disease 4.57 93.15 2.28
Sickle Cell 0.00 100.00 0.00
Average 7.05 90.83 2.12
100%
2009
Malaria 42.77 8.04 49.20
Diarrhea 33.48 53.91 12.61
TB 22.22 11.11 66.67
Malnutrition 15.44 57.72 26.85
Skin Disease 17.65 71.04 10.86
Sickle Cell 83.33 16.67 0.00
Average 35.81 36.41 27.77
100%
Changes 23.21 -54.42 25.57
Sources: Field survey, 2009
Out of the total household that Suffered from different Diseases, 35.81 per cent of
household prefer modern treatment where as still 36 per cent have faith on traditional
and magico-religious practice of the community as against 7 per cent and 91 per cent
during 2000-01. At present 28 per cent prefer both traditional as well as modern
treatment.
Households suffering from skin diseases, Diarrhea and Malnutrition are mainly using
traditional treatment. Modern treatment is mostly preferred for disease like: Malaria and
sickle cell. For the treatment of tuberculosis Dongria used both methods, however
traditional method is predominated before identification of tuberculosis.
5.1.29 Livestock Census of Sample Household The table 32 shows the livestock census of 2001 on the basis of Baseline survey against the
present study conducted during May, 2009. Livestock has been an important productive
asset for Dongria Kandha for their supplementary income and an asset for food security
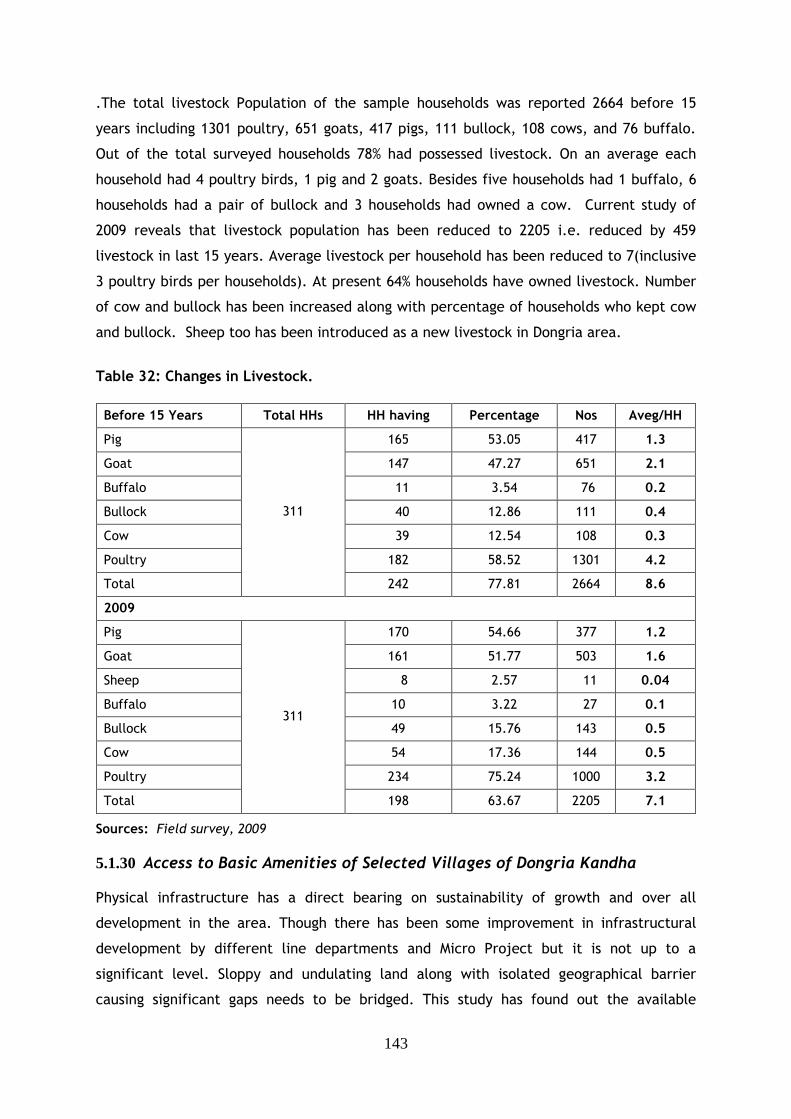
143
.The total livestock Population of the sample households was reported 2664 before 15
years including 1301 poultry, 651 goats, 417 pigs, 111 bullock, 108 cows, and 76 buffalo.
Out of the total surveyed households 78% had possessed livestock. On an average each
household had 4 poultry birds, 1 pig and 2 goats. Besides five households had 1 buffalo, 6
households had a pair of bullock and 3 households had owned a cow. Current study of
2009 reveals that livestock population has been reduced to 2205 i.e. reduced by 459
livestock in last 15 years. Average livestock per household has been reduced to 7(inclusive
3 poultry birds per households). At present 64% households have owned livestock. Number
of cow and bullock has been increased along with percentage of households who kept cow
and bullock. Sheep too has been introduced as a new livestock in Dongria area.
Table 32: Changes in Livestock.
Before 15 Years Total HHs HH having Percentage Nos Aveg/HH
Pig 165 53.05 417 1.3
Goat 147 47.27 651 2.1
Buffalo 11 3.54 76 0.2
Bullock 40 12.86 111 0.4
Cow 39 12.54 108 0.3
Poultry 182 58.52 1301 4.2
Total
311
242 77.81 2664 8.6
2009
Pig 170 54.66 377 1.2
Goat 161 51.77 503 1.6
Sheep 8 2.57 11 0.04
Buffalo 10 3.22 27 0.1
Bullock 49 15.76 143 0.5
Cow 54 17.36 144 0.5
Poultry 234 75.24 1000 3.2
Total
311
198 63.67 2205 7.1
Sources: Field survey, 2009
5.1.30 Access to Basic Amenities of Selected Villages of Dongria Kandha Physical infrastructure has a direct bearing on sustainability of growth and over all
development in the area. Though there has been some improvement in infrastructural
development by different line departments and Micro Project but it is not up to a
significant level. Sloppy and undulating land along with isolated geographical barrier
causing significant gaps needs to be bridged. This study has found out the available
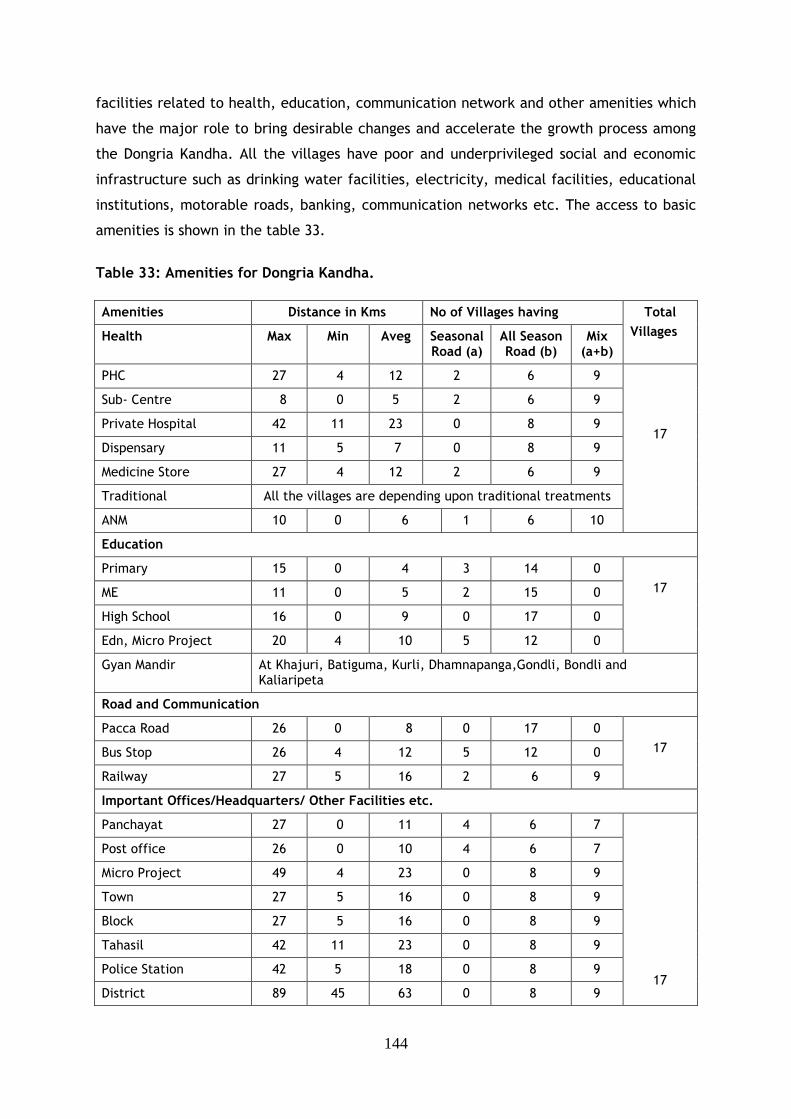
144
facilities related to health, education, communication network and other amenities which
have the major role to bring desirable changes and accelerate the growth process among
the Dongria Kandha. All the villages have poor and underprivileged social and economic
infrastructure such as drinking water facilities, electricity, medical facilities, educational
institutions, motorable roads, banking, communication networks etc. The access to basic
amenities is shown in the table 33.
Table 33: Amenities for Dongria Kandha.
Amenities Distance in Kms No of Villages having
Health Max Min Aveg Seasonal Road (a)
All Season Road (b)
Mix (a+b)
Total
Villages
PHC 27 4 12 2 6 9
Sub- Centre 8 0 5 2 6 9
Private Hospital 42 11 23 0 8 9
Dispensary 11 5 7 0 8 9
Medicine Store 27 4 12 2 6 9
Traditional All the villages are depending upon traditional treatments
ANM 10 0 6 1 6 10
17
Education
Primary 15 0 4 3 14 0
ME 11 0 5 2 15 0
High School 16 0 9 0 17 0
Edn, Micro Project 20 4 10 5 12 0
17
Gyan Mandir At Khajuri, Batiguma, Kurli, Dhamnapanga,Gondli, Bondli and Kaliaripeta
Road and Communication
Pacca Road 26 0 8 0 17 0
Bus Stop 26 4 12 5 12 0
Railway 27 5 16 2 6 9
17
Important Offices/Headquarters/ Other Facilities etc.
Panchayat 27 0 11 4 6 7
Post office 26 0 10 4 6 7
Micro Project 49 4 23 0 8 9
Town 27 5 16 0 8 9
Block 27 5 16 0 8 9
Tahasil 42 11 23 0 8 9
Police Station 42 5 18 0 8 9
District 89 45 63 0 8 9
17
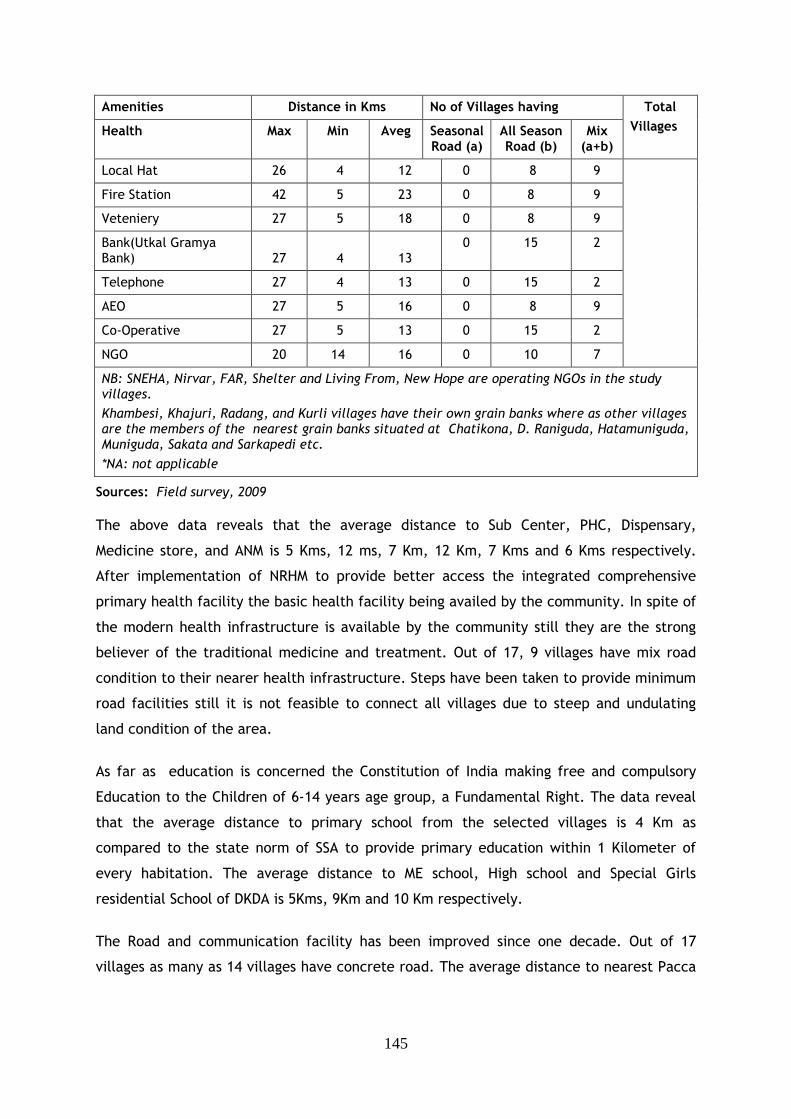
145
Amenities Distance in Kms No of Villages having
Health Max Min Aveg Seasonal Road (a)
All Season Road (b)
Mix (a+b)
Total
Villages
Local Hat 26 4 12 0 8 9
Fire Station 42 5 23 0 8 9
Veteniery 27 5 18 0 8 9
Bank(Utkal Gramya Bank) 27 4 13
0 15 2
Telephone 27 4 13 0 15 2
AEO 27 5 16 0 8 9
Co-Operative 27 5 13 0 15 2
NGO 20 14 16 0 10 7
NB: SNEHA, Nirvar, FAR, Shelter and Living From, New Hope are operating NGOs in the study villages.
Khambesi, Khajuri, Radang, and Kurli villages have their own grain banks where as other villages are the members of the nearest grain banks situated at Chatikona, D. Raniguda, Hatamuniguda, Muniguda, Sakata and Sarkapedi etc.
*NA: not applicable
Sources: Field survey, 2009
The above data reveals that the average distance to Sub Center, PHC, Dispensary,
Medicine store, and ANM is 5 Kms, 12 ms, 7 Km, 12 Km, 7 Kms and 6 Kms respectively.
After implementation of NRHM to provide better access the integrated comprehensive
primary health facility the basic health facility being availed by the community. In spite of
the modern health infrastructure is available by the community still they are the strong
believer of the traditional medicine and treatment. Out of 17, 9 villages have mix road
condition to their nearer health infrastructure. Steps have been taken to provide minimum
road facilities still it is not feasible to connect all villages due to steep and undulating
land condition of the area.
As far as education is concerned the Constitution of India making free and compulsory
Education to the Children of 6-14 years age group, a Fundamental Right. The data reveal
that the average distance to primary school from the selected villages is 4 Km as
compared to the state norm of SSA to provide primary education within 1 Kilometer of
every habitation. The average distance to ME school, High school and Special Girls
residential School of DKDA is 5Kms, 9Km and 10 Km respectively.
The Road and communication facility has been improved since one decade. Out of 17
villages as many as 14 villages have concrete road. The average distance to nearest Pacca
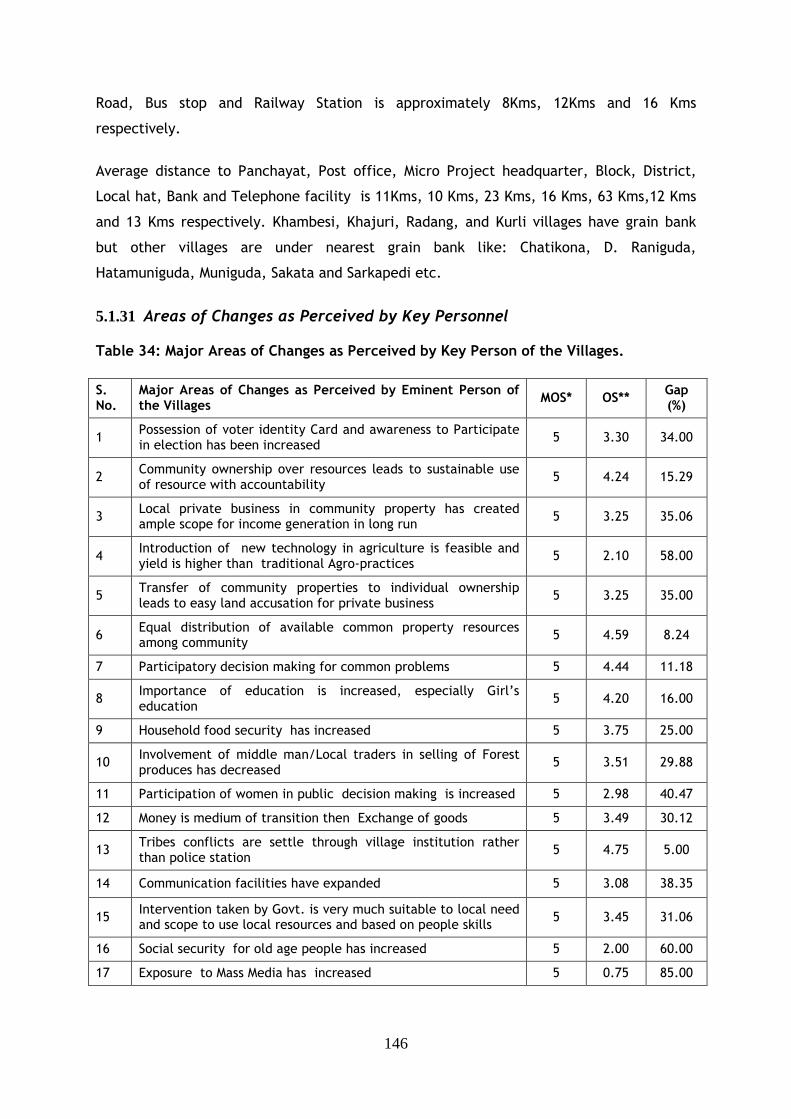
146
Road, Bus stop and Railway Station is approximately 8Kms, 12Kms and 16 Kms
respectively.
Average distance to Panchayat, Post office, Micro Project headquarter, Block, District,
Local hat, Bank and Telephone facility is 11Kms, 10 Kms, 23 Kms, 16 Kms, 63 Kms,12 Kms
and 13 Kms respectively. Khambesi, Khajuri, Radang, and Kurli villages have grain bank
but other villages are under nearest grain bank like: Chatikona, D. Raniguda,
Hatamuniguda, Muniguda, Sakata and Sarkapedi etc.
5.1.31 Areas of Changes as Perceived by Key Personnel
Table 34: Major Areas of Changes as Perceived by Key Person of the Villages.
S. No.
Major Areas of Changes as Perceived by Eminent Person of the Villages
MOS* OS** Gap (%)
1 Possession of voter identity Card and awareness to Participate in election has been increased
5 3.30 34.00
2 Community ownership over resources leads to sustainable use of resource with accountability
5 4.24 15.29
3 Local private business in community property has created ample scope for income generation in long run
5 3.25 35.06
4 Introduction of new technology in agriculture is feasible and yield is higher than traditional Agro-practices
5 2.10 58.00
5 Transfer of community properties to individual ownership leads to easy land accusation for private business
5 3.25 35.00
6 Equal distribution of available common property resources among community
5 4.59 8.24
7 Participatory decision making for common problems 5 4.44 11.18
8 Importance of education is increased, especially Girl’s education
5 4.20 16.00
9 Household food security has increased 5 3.75 25.00
10 Involvement of middle man/Local traders in selling of Forest produces has decreased
5 3.51 29.88
11 Participation of women in public decision making is increased 5 2.98 40.47
12 Money is medium of transition then Exchange of goods 5 3.49 30.12
13 Tribes conflicts are settle through village institution rather than police station
5 4.75 5.00
14 Communication facilities have expanded 5 3.08 38.35
15 Intervention taken by Govt. is very much suitable to local need and scope to use local resources and based on people skills
5 3.45 31.06
16 Social security for old age people has increased 5 2.00 60.00
17 Exposure to Mass Media has increased 5 0.75 85.00
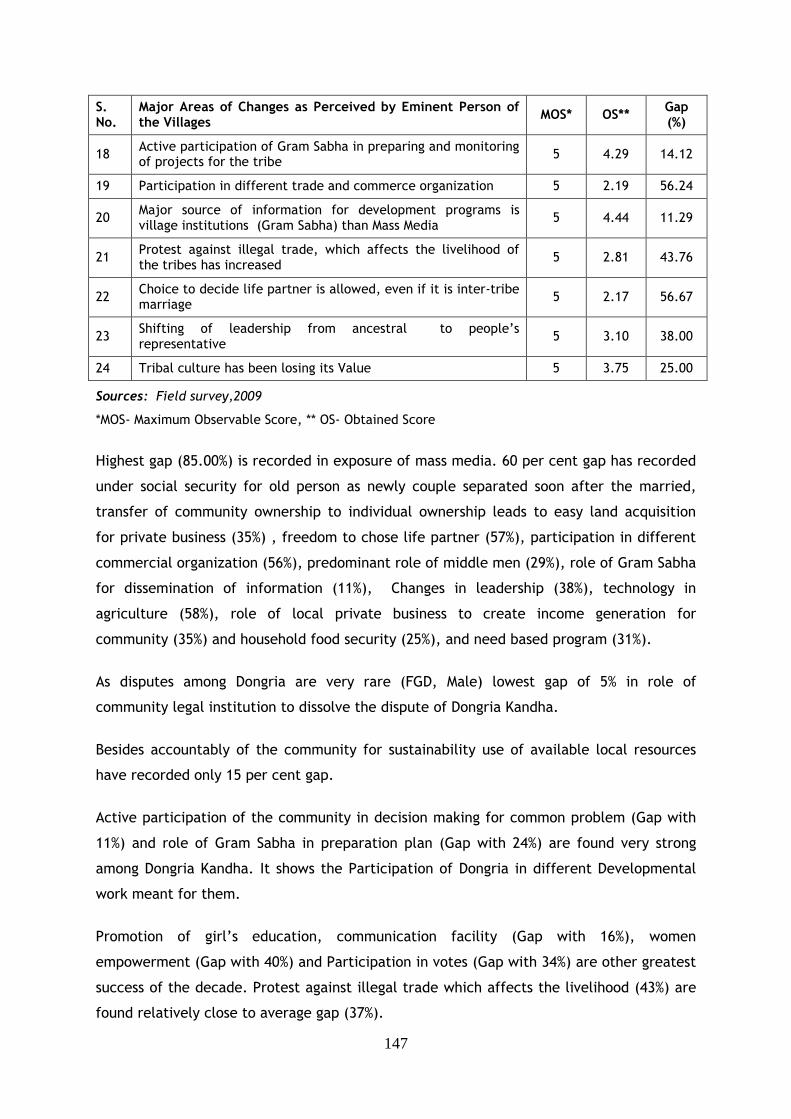
147
S. No.
Major Areas of Changes as Perceived by Eminent Person of the Villages
MOS* OS** Gap (%)
18 Active participation of Gram Sabha in preparing and monitoring of projects for the tribe
5 4.29 14.12
19 Participation in different trade and commerce organization 5 2.19 56.24
20 Major source of information for development programs is village institutions (Gram Sabha) than Mass Media
5 4.44 11.29
21 Protest against illegal trade, which affects the livelihood of the tribes has increased
5 2.81 43.76
22 Choice to decide life partner is allowed, even if it is inter-tribe marriage
5 2.17 56.67
23 Shifting of leadership from ancestral to people’s representative
5 3.10 38.00
24 Tribal culture has been losing its Value 5 3.75 25.00
Sources: Field survey,2009
*MOS- Maximum Observable Score, ** OS- Obtained Score
Highest gap (85.00%) is recorded in exposure of mass media. 60 per cent gap has recorded
under social security for old person as newly couple separated soon after the married,
transfer of community ownership to individual ownership leads to easy land acquisition
for private business (35%) , freedom to chose life partner (57%), participation in different
commercial organization (56%), predominant role of middle men (29%), role of Gram Sabha
for dissemination of information (11%), Changes in leadership (38%), technology in
agriculture (58%), role of local private business to create income generation for
community (35%) and household food security (25%), and need based program (31%).
As disputes among Dongria are very rare (FGD, Male) lowest gap of 5% in role of
community legal institution to dissolve the dispute of Dongria Kandha.
Besides accountably of the community for sustainability use of available local resources
have recorded only 15 per cent gap.
Active participation of the community in decision making for common problem (Gap with
11%) and role of Gram Sabha in preparation plan (Gap with 24%) are found very strong
among Dongria Kandha. It shows the Participation of Dongria in different Developmental
work meant for them.
Promotion of girl’s education, communication facility (Gap with 16%), women
empowerment (Gap with 40%) and Participation in votes (Gap with 34%) are other greatest
success of the decade. Protest against illegal trade which affects the livelihood (43%) are
found relatively close to average gap (37%).
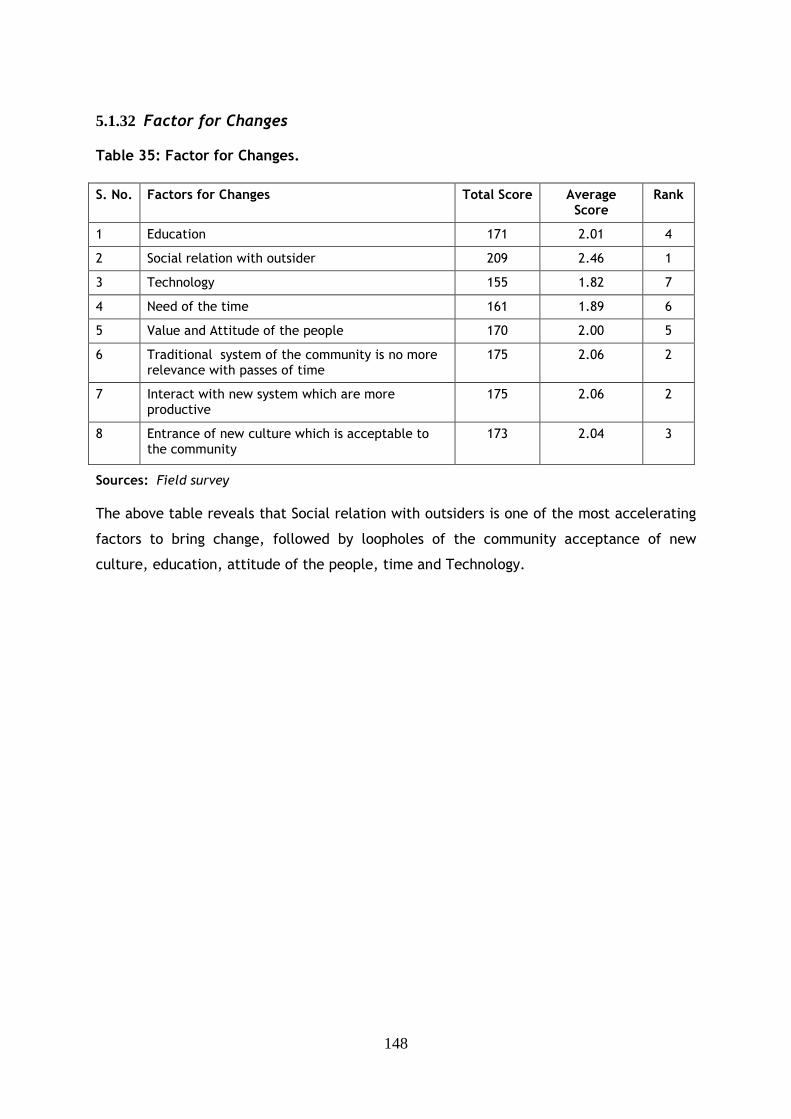
148
5.1.32 Factor for Changes Table 35: Factor for Changes.
S. No. Factors for Changes Total Score Average
Score Rank
1 Education 171 2.01 4
2 Social relation with outsider 209 2.46 1
3 Technology 155 1.82 7
4 Need of the time 161 1.89 6
5 Value and Attitude of the people 170 2.00 5
6 Traditional system of the community is no more relevance with passes of time
175 2.06 2
7 Interact with new system which are more productive
175 2.06 2
8 Entrance of new culture which is acceptable to the community
173 2.04 3
Sources: Field survey
The above table reveals that Social relation with outsiders is one of the most accelerating
factors to bring change, followed by loopholes of the community acceptance of new
culture, education, attitude of the people, time and Technology.
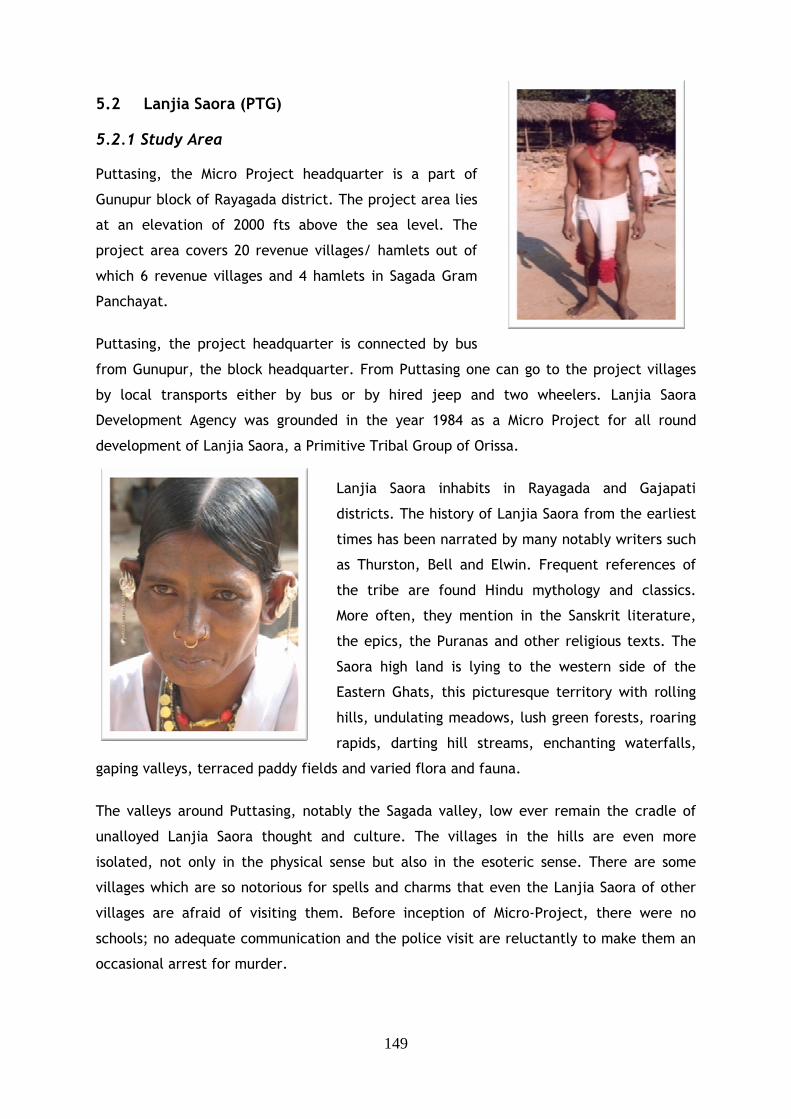
149
5.2 Lanjia Saora (PTG)
5.2.1 Study Area Puttasing, the Micro Project headquarter is a part of
Gunupur block of Rayagada district. The project area lies
at an elevation of 2000 fts above the sea level. The
project area covers 20 revenue villages/ hamlets out of
which 6 revenue villages and 4 hamlets in Sagada Gram
Panchayat.
Puttasing, the project headquarter is connected by bus
from Gunupur, the block headquarter. From Puttasing one can go to the project villages
by local transports either by bus or by hired jeep and two wheelers. Lanjia Saora
Development Agency was grounded in the year 1984 as a Micro Project for all round
development of Lanjia Saora, a Primitive Tribal Group of Orissa.
Lanjia Saora inhabits in Rayagada and Gajapati
districts. The history of Lanjia Saora from the earliest
times has been narrated by many notably writers such
as Thurston, Bell and Elwin. Frequent references of
the tribe are found Hindu mythology and classics.
More often, they mention in the Sanskrit literature,
the epics, the Puranas and other religious texts. The
Saora high land is lying to the western side of the
Eastern Ghats, this picturesque territory with rolling
hills, undulating meadows, lush green forests, roaring
rapids, darting hill streams, enchanting waterfalls,
gaping valleys, terraced paddy fields and varied flora and fauna.
The valleys around Puttasing, notably the Sagada valley, low ever remain the cradle of
unalloyed Lanjia Saora thought and culture. The villages in the hills are even more
isolated, not only in the physical sense but also in the esoteric sense. There are some
villages which are so notorious for spells and charms that even the Lanjia Saora of other
villages are afraid of visiting them. Before inception of Micro-Project, there were no
schools; no adequate communication and the police visit are reluctantly to make them an
occasional arrest for murder.
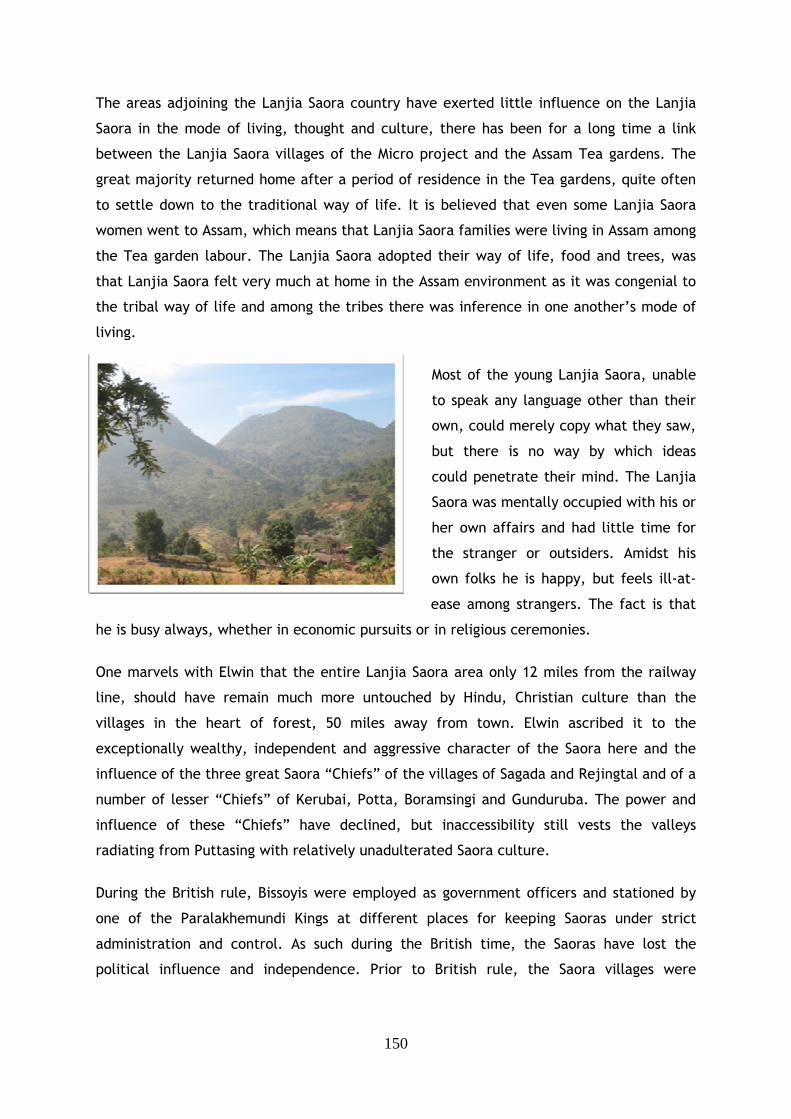
150
The areas adjoining the Lanjia Saora country have exerted little influence on the Lanjia
Saora in the mode of living, thought and culture, there has been for a long time a link
between the Lanjia Saora villages of the Micro project and the Assam Tea gardens. The
great majority returned home after a period of residence in the Tea gardens, quite often
to settle down to the traditional way of life. It is believed that even some Lanjia Saora
women went to Assam, which means that Lanjia Saora families were living in Assam among
the Tea garden labour. The Lanjia Saora adopted their way of life, food and trees, was
that Lanjia Saora felt very much at home in the Assam environment as it was congenial to
the tribal way of life and among the tribes there was inference in one another’s mode of
living.
Most of the young Lanjia Saora, unable
to speak any language other than their
own, could merely copy what they saw,
but there is no way by which ideas
could penetrate their mind. The Lanjia
Saora was mentally occupied with his or
her own affairs and had little time for
the stranger or outsiders. Amidst his
own folks he is happy, but feels ill-at-
ease among strangers. The fact is that
he is busy always, whether in economic pursuits or in religious ceremonies.
One marvels with Elwin that the entire Lanjia Saora area only 12 miles from the railway
line, should have remain much more untouched by Hindu, Christian culture than the
villages in the heart of forest, 50 miles away from town. Elwin ascribed it to the
exceptionally wealthy, independent and aggressive character of the Saora here and the
influence of the three great Saora “Chiefs” of the villages of Sagada and Rejingtal and of a
number of lesser “Chiefs” of Kerubai, Potta, Boramsingi and Gunduruba. The power and
influence of these “Chiefs” have declined, but inaccessibility still vests the valleys
radiating from Puttasing with relatively unadulterated Saora culture.
During the British rule, Bissoyis were employed as government officers and stationed by
one of the Paralakhemundi Kings at different places for keeping Saoras under strict
administration and control. As such during the British time, the Saoras have lost the
political influence and independence. Prior to British rule, the Saora villages were
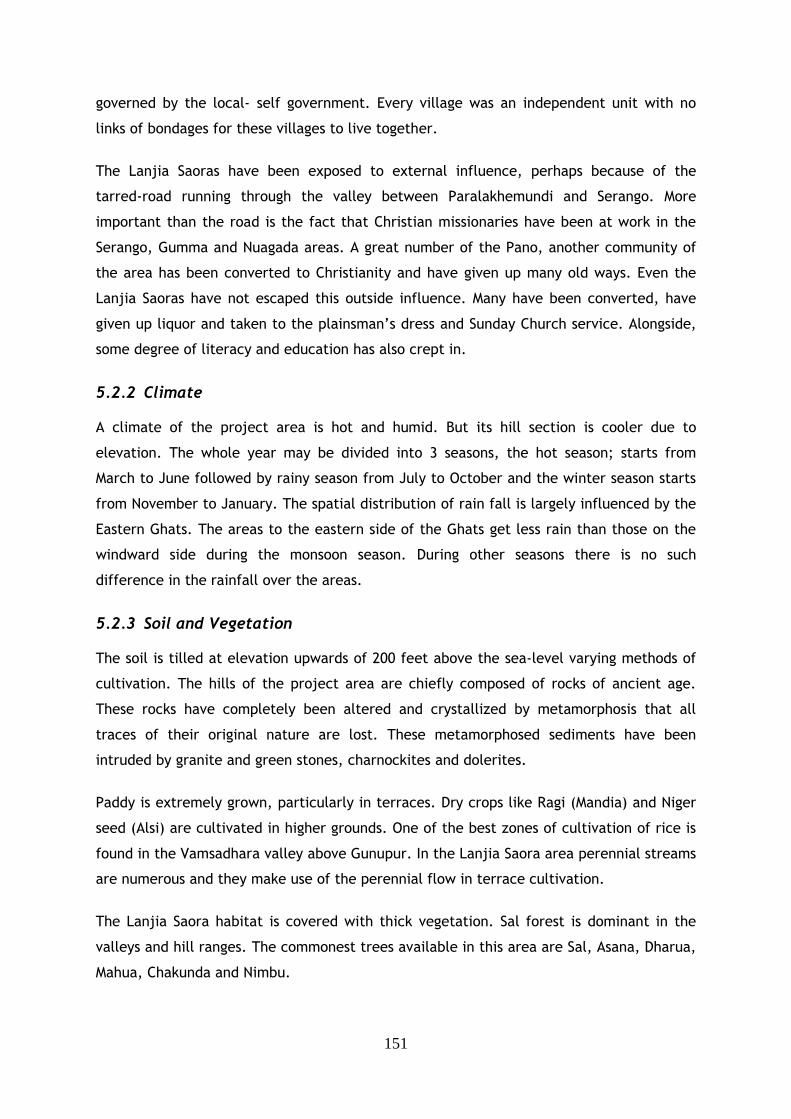
151
governed by the local- self government. Every village was an independent unit with no
links of bondages for these villages to live together.
The Lanjia Saoras have been exposed to external influence, perhaps because of the
tarred-road running through the valley between Paralakhemundi and Serango. More
important than the road is the fact that Christian missionaries have been at work in the
Serango, Gumma and Nuagada areas. A great number of the Pano, another community of
the area has been converted to Christianity and have given up many old ways. Even the
Lanjia Saoras have not escaped this outside influence. Many have been converted, have
given up liquor and taken to the plainsman’s dress and Sunday Church service. Alongside,
some degree of literacy and education has also crept in.
5.2.2 Climate A climate of the project area is hot and humid. But its hill section is cooler due to
elevation. The whole year may be divided into 3 seasons, the hot season; starts from
March to June followed by rainy season from July to October and the winter season starts
from November to January. The spatial distribution of rain fall is largely influenced by the
Eastern Ghats. The areas to the eastern side of the Ghats get less rain than those on the
windward side during the monsoon season. During other seasons there is no such
difference in the rainfall over the areas.
5.2.3 Soil and Vegetation The soil is tilled at elevation upwards of 200 feet above the sea-level varying methods of
cultivation. The hills of the project area are chiefly composed of rocks of ancient age.
These rocks have completely been altered and crystallized by metamorphosis that all
traces of their original nature are lost. These metamorphosed sediments have been
intruded by granite and green stones, charnockites and dolerites.
Paddy is extremely grown, particularly in terraces. Dry crops like Ragi (Mandia) and Niger
seed (Alsi) are cultivated in higher grounds. One of the best zones of cultivation of rice is
found in the Vamsadhara valley above Gunupur. In the Lanjia Saora area perennial streams
are numerous and they make use of the perennial flow in terrace cultivation.
The Lanjia Saora habitat is covered with thick vegetation. Sal forest is dominant in the
valleys and hill ranges. The commonest trees available in this area are Sal, Asana, Dharua,
Mahua, Chakunda and Nimbu.
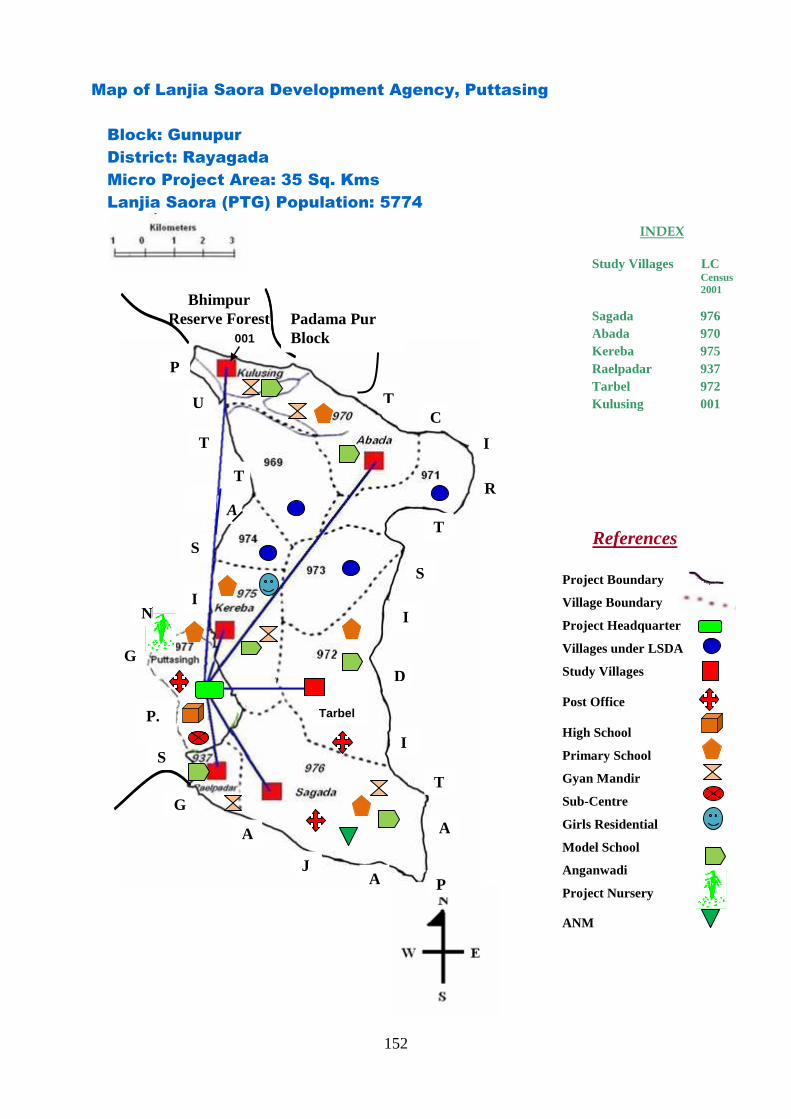
152
Map of Lanjia Saora Development Agency, Puttasing
Block: Gunupur
District: Rayagada
Micro Project Area: 35 Sq. Kms
Lanjia Saora (PTG) Population: 5774
A
Bhimpur Reserve Forest
T
P
U
T
S
I N
A
J A P
A
D
G
T
S
I
I
R
T C
P.
S
A
T
P
U
S
I
A
G
P.
N
G
N
T
P
U
S
I
S
P.
T
I
Padama Pur Block 001
INDEX
Study Villages LC Census 2001
Sagada 976 Abada 970 Kereba 975 Raelpadar 937 Tarbel 972 Kulusing 001
References
Project Boundary
Village Boundary
Project Headquarter
Villages under LSDA
Study Villages
Post Office
High School
Primary School
Gyan Mandir
Sub-Centre
Girls Residential
Model School
Anganwadi
Project Nursery
ANM
Tarbel
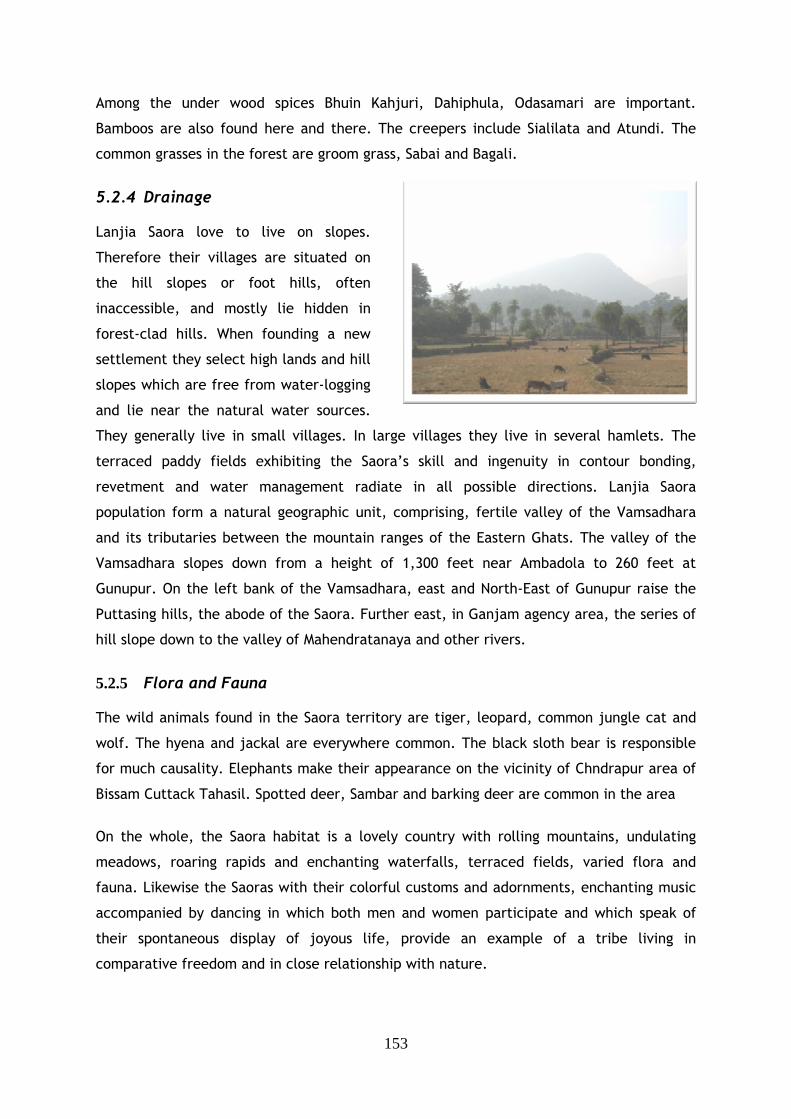
153
Among the under wood spices Bhuin Kahjuri, Dahiphula, Odasamari are important.
Bamboos are also found here and there. The creepers include Sialilata and Atundi. The
common grasses in the forest are groom grass, Sabai and Bagali.
5.2.4 Drainage Lanjia Saora love to live on slopes.
Therefore their villages are situated on
the hill slopes or foot hills, often
inaccessible, and mostly lie hidden in
forest-clad hills. When founding a new
settlement they select high lands and hill
slopes which are free from water-logging
and lie near the natural water sources.
They generally live in small villages. In large villages they live in several hamlets. The
terraced paddy fields exhibiting the Saora’s skill and ingenuity in contour bonding,
revetment and water management radiate in all possible directions. Lanjia Saora
population form a natural geographic unit, comprising, fertile valley of the Vamsadhara
and its tributaries between the mountain ranges of the Eastern Ghats. The valley of the
Vamsadhara slopes down from a height of 1,300 feet near Ambadola to 260 feet at
Gunupur. On the left bank of the Vamsadhara, east and North-East of Gunupur raise the
Puttasing hills, the abode of the Saora. Further east, in Ganjam agency area, the series of
hill slope down to the valley of Mahendratanaya and other rivers.
5.2.5 Flora and Fauna The wild animals found in the Saora territory are tiger, leopard, common jungle cat and
wolf. The hyena and jackal are everywhere common. The black sloth bear is responsible
for much causality. Elephants make their appearance on the vicinity of Chndrapur area of
Bissam Cuttack Tahasil. Spotted deer, Sambar and barking deer are common in the area
On the whole, the Saora habitat is a lovely country with rolling mountains, undulating
meadows, roaring rapids and enchanting waterfalls, terraced fields, varied flora and
fauna. Likewise the Saoras with their colorful customs and adornments, enchanting music
accompanied by dancing in which both men and women participate and which speak of
their spontaneous display of joyous life, provide an example of a tribe living in
comparative freedom and in close relationship with nature.
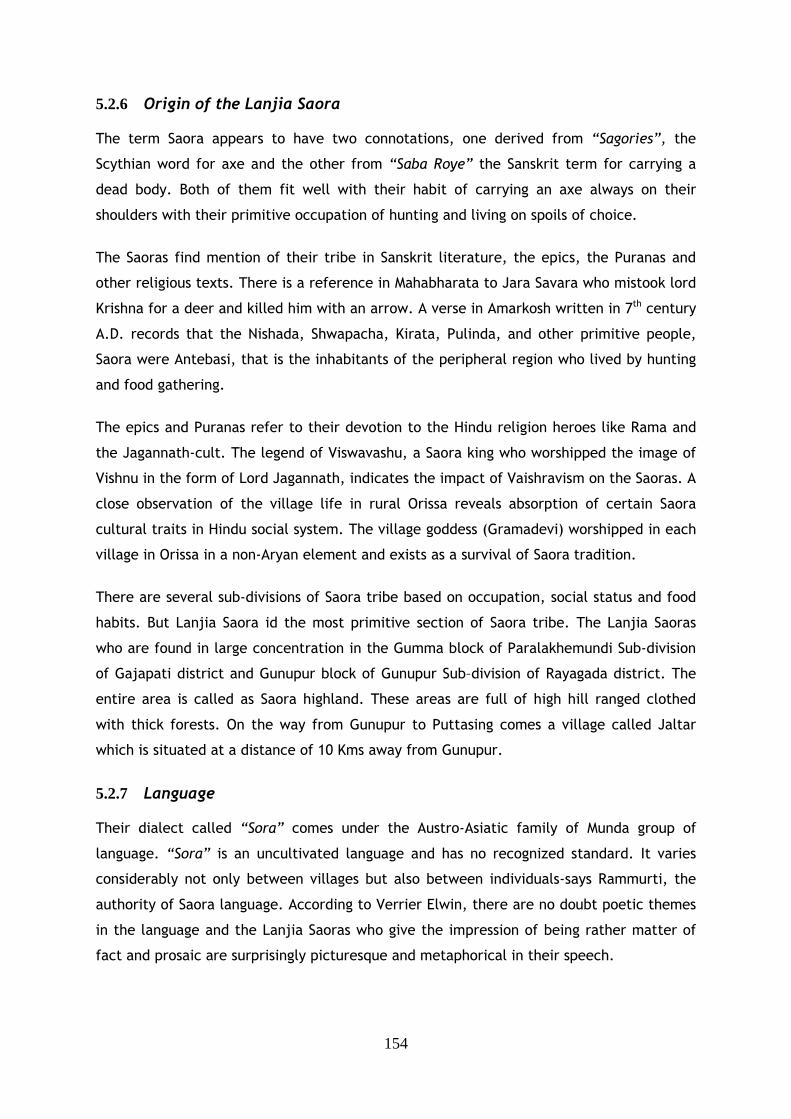
154
5.2.6 Origin of the Lanjia Saora The term Saora appears to have two connotations, one derived from “Sagories”, the
Scythian word for axe and the other from “Saba Roye” the Sanskrit term for carrying a
dead body. Both of them fit well with their habit of carrying an axe always on their
shoulders with their primitive occupation of hunting and living on spoils of choice.
The Saoras find mention of their tribe in Sanskrit literature, the epics, the Puranas and
other religious texts. There is a reference in Mahabharata to Jara Savara who mistook lord
Krishna for a deer and killed him with an arrow. A verse in Amarkosh written in 7th century
A.D. records that the Nishada, Shwapacha, Kirata, Pulinda, and other primitive people,
Saora were Antebasi, that is the inhabitants of the peripheral region who lived by hunting
and food gathering.
The epics and Puranas refer to their devotion to the Hindu religion heroes like Rama and
the Jagannath-cult. The legend of Viswavashu, a Saora king who worshipped the image of
Vishnu in the form of Lord Jagannath, indicates the impact of Vaishravism on the Saoras. A
close observation of the village life in rural Orissa reveals absorption of certain Saora
cultural traits in Hindu social system. The village goddess (Gramadevi) worshipped in each
village in Orissa in a non-Aryan element and exists as a survival of Saora tradition.
There are several sub-divisions of Saora tribe based on occupation, social status and food
habits. But Lanjia Saora id the most primitive section of Saora tribe. The Lanjia Saoras
who are found in large concentration in the Gumma block of Paralakhemundi Sub-division
of Gajapati district and Gunupur block of Gunupur Sub–division of Rayagada district. The
entire area is called as Saora highland. These areas are full of high hill ranged clothed
with thick forests. On the way from Gunupur to Puttasing comes a village called Jaltar
which is situated at a distance of 10 Kms away from Gunupur.
5.2.7 Language Their dialect called “Sora” comes under the Austro-Asiatic family of Munda group of
language. “Sora” is an uncultivated language and has no recognized standard. It varies
considerably not only between villages but also between individuals-says Rammurti, the
authority of Saora language. According to Verrier Elwin, there are no doubt poetic themes
in the language and the Lanjia Saoras who give the impression of being rather matter of
fact and prosaic are surprisingly picturesque and metaphorical in their speech.
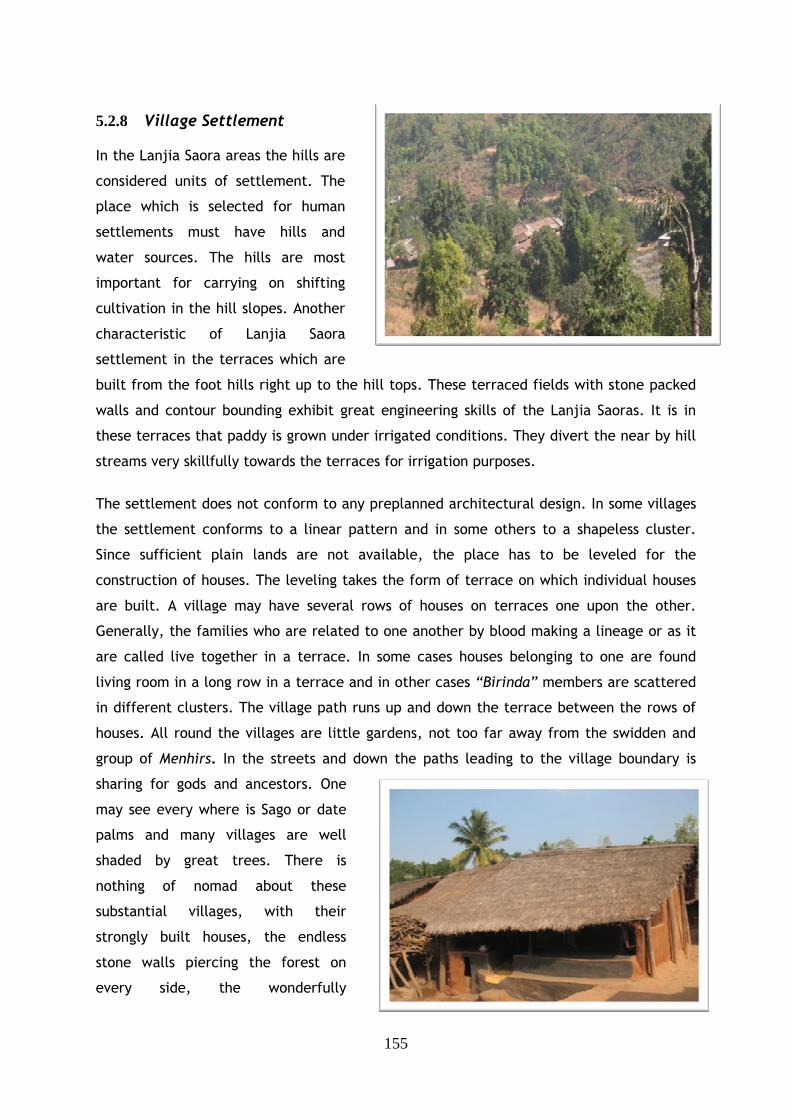
155
5.2.8 Village Settlement In the Lanjia Saora areas the hills are
considered units of settlement. The
place which is selected for human
settlements must have hills and
water sources. The hills are most
important for carrying on shifting
cultivation in the hill slopes. Another
characteristic of Lanjia Saora
settlement in the terraces which are
built from the foot hills right up to the hill tops. These terraced fields with stone packed
walls and contour bounding exhibit great engineering skills of the Lanjia Saoras. It is in
these terraces that paddy is grown under irrigated conditions. They divert the near by hill
streams very skillfully towards the terraces for irrigation purposes.
The settlement does not conform to any preplanned architectural design. In some villages
the settlement conforms to a linear pattern and in some others to a shapeless cluster.
Since sufficient plain lands are not available, the place has to be leveled for the
construction of houses. The leveling takes the form of terrace on which individual houses
are built. A village may have several rows of houses on terraces one upon the other.
Generally, the families who are related to one another by blood making a lineage or as it
are called live together in a terrace. In some cases houses belonging to one are found
living room in a long row in a terrace and in other cases “Birinda” members are scattered
in different clusters. The village path runs up and down the terrace between the rows of
houses. All round the villages are little gardens, not too far away from the swidden and
group of Menhirs. In the streets and down the paths leading to the village boundary is
sharing for gods and ancestors. One
may see every where is Sago or date
palms and many villages are well
shaded by great trees. There is
nothing of nomad about these
substantial villages, with their
strongly built houses, the endless
stone walls piercing the forest on
every side, the wonderfully
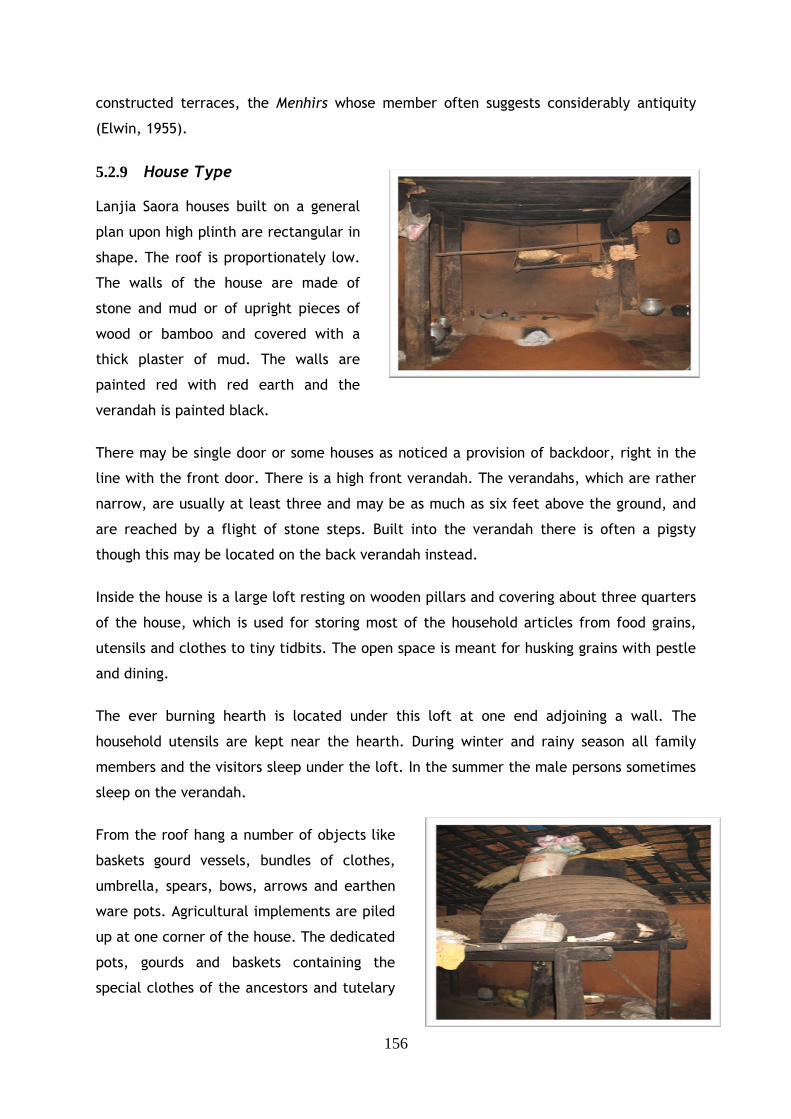
156
constructed terraces, the Menhirs whose member often suggests considerably antiquity
(Elwin, 1955).
5.2.9 House Type Lanjia Saora houses built on a general
plan upon high plinth are rectangular in
shape. The roof is proportionately low.
The walls of the house are made of
stone and mud or of upright pieces of
wood or bamboo and covered with a
thick plaster of mud. The walls are
painted red with red earth and the
verandah is painted black.
There may be single door or some houses as noticed a provision of backdoor, right in the
line with the front door. There is a high front verandah. The verandahs, which are rather
narrow, are usually at least three and may be as much as six feet above the ground, and
are reached by a flight of stone steps. Built into the verandah there is often a pigsty
though this may be located on the back verandah instead.
Inside the house is a large loft resting on wooden pillars and covering about three quarters
of the house, which is used for storing most of the household articles from food grains,
utensils and clothes to tiny tidbits. The open space is meant for husking grains with pestle
and dining.
The ever burning hearth is located under this loft at one end adjoining a wall. The
household utensils are kept near the hearth. During winter and rainy season all family
members and the visitors sleep under the loft. In the summer the male persons sometimes
sleep on the verandah.
From the roof hang a number of objects like
baskets gourd vessels, bundles of clothes,
umbrella, spears, bows, arrows and earthen
ware pots. Agricultural implements are piled
up at one corner of the house. The dedicated
pots, gourds and baskets containing the
special clothes of the ancestors and tutelary
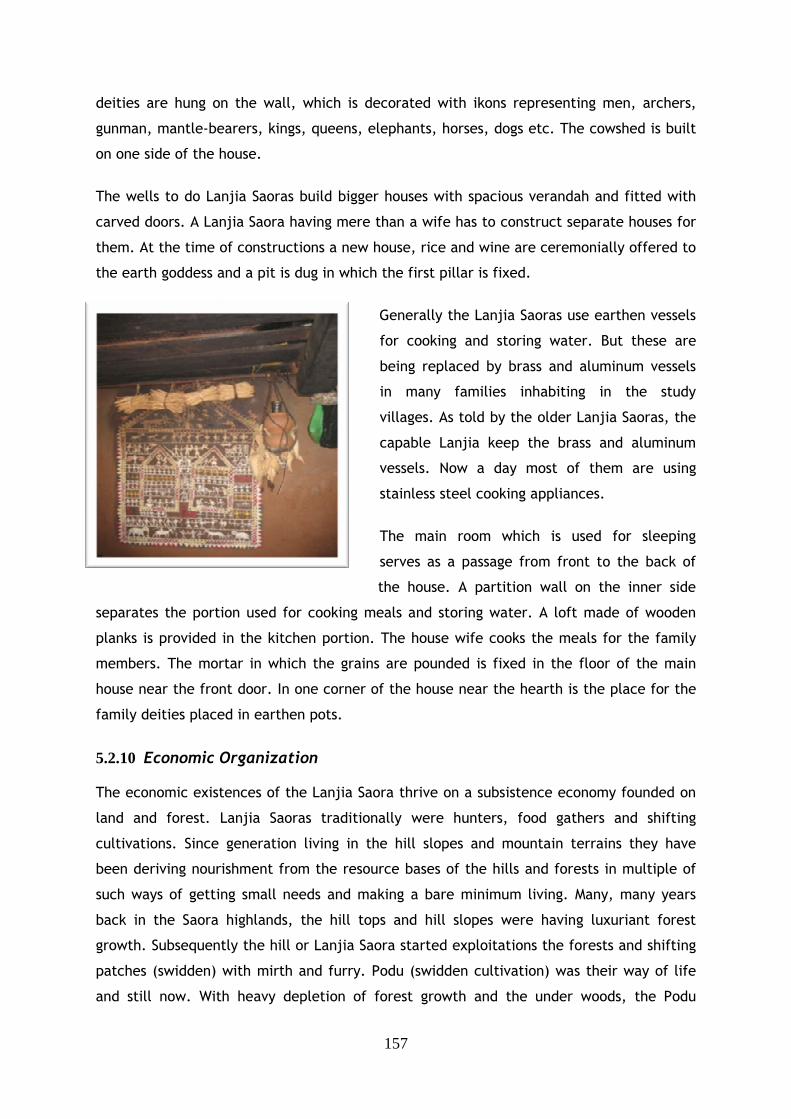
157
deities are hung on the wall, which is decorated with ikons representing men, archers,
gunman, mantle-bearers, kings, queens, elephants, horses, dogs etc. The cowshed is built
on one side of the house.
The wells to do Lanjia Saoras build bigger houses with spacious verandah and fitted with
carved doors. A Lanjia Saora having mere than a wife has to construct separate houses for
them. At the time of constructions a new house, rice and wine are ceremonially offered to
the earth goddess and a pit is dug in which the first pillar is fixed.
Generally the Lanjia Saoras use earthen vessels
for cooking and storing water. But these are
being replaced by brass and aluminum vessels
in many families inhabiting in the study
villages. As told by the older Lanjia Saoras, the
capable Lanjia keep the brass and aluminum
vessels. Now a day most of them are using
stainless steel cooking appliances.
The main room which is used for sleeping
serves as a passage from front to the back of
the house. A partition wall on the inner side
separates the portion used for cooking meals and storing water. A loft made of wooden
planks is provided in the kitchen portion. The house wife cooks the meals for the family
members. The mortar in which the grains are pounded is fixed in the floor of the main
house near the front door. In one corner of the house near the hearth is the place for the
family deities placed in earthen pots.
5.2.10 Economic Organization The economic existences of the Lanjia Saora thrive on a subsistence economy founded on
land and forest. Lanjia Saoras traditionally were hunters, food gathers and shifting
cultivations. Since generation living in the hill slopes and mountain terrains they have
been deriving nourishment from the resource bases of the hills and forests in multiple of
such ways of getting small needs and making a bare minimum living. Many, many years
back in the Saora highlands, the hill tops and hill slopes were having luxuriant forest
growth. Subsequently the hill or Lanjia Saora started exploitations the forests and shifting
patches (swidden) with mirth and furry. Podu (swidden cultivation) was their way of life
and still now. With heavy depletion of forest growth and the under woods, the Podu
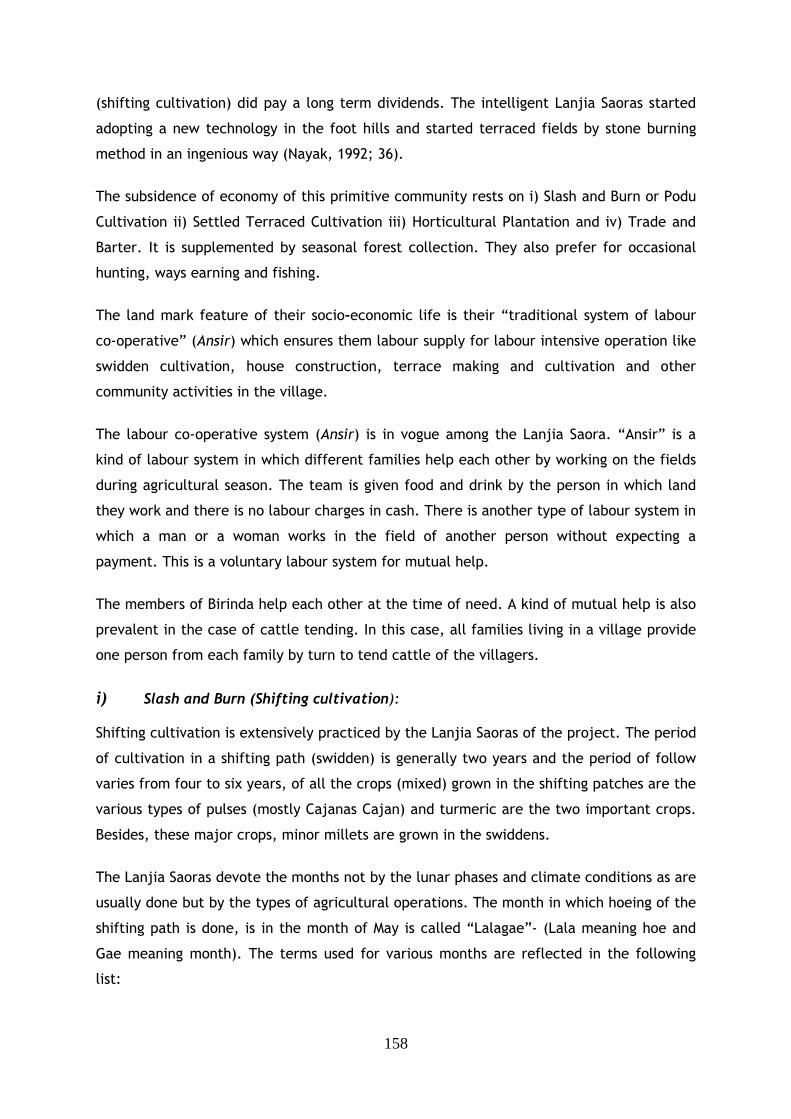
158
(shifting cultivation) did pay a long term dividends. The intelligent Lanjia Saoras started
adopting a new technology in the foot hills and started terraced fields by stone burning
method in an ingenious way (Nayak, 1992; 36).
The subsidence of economy of this primitive community rests on i) Slash and Burn or Podu
Cultivation ii) Settled Terraced Cultivation iii) Horticultural Plantation and iv) Trade and
Barter. It is supplemented by seasonal forest collection. They also prefer for occasional
hunting, ways earning and fishing.
The land mark feature of their socio-economic life is their “traditional system of labour
co-operative” (Ansir) which ensures them labour supply for labour intensive operation like
swidden cultivation, house construction, terrace making and cultivation and other
community activities in the village.
The labour co-operative system (Ansir) is in vogue among the Lanjia Saora. “Ansir” is a
kind of labour system in which different families help each other by working on the fields
during agricultural season. The team is given food and drink by the person in which land
they work and there is no labour charges in cash. There is another type of labour system in
which a man or a woman works in the field of another person without expecting a
payment. This is a voluntary labour system for mutual help.
The members of Birinda help each other at the time of need. A kind of mutual help is also
prevalent in the case of cattle tending. In this case, all families living in a village provide
one person from each family by turn to tend cattle of the villagers.
i) Slash and Burn (Shifting cultivation): Shifting cultivation is extensively practiced by the Lanjia Saoras of the project. The period
of cultivation in a shifting path (swidden) is generally two years and the period of follow
varies from four to six years, of all the crops (mixed) grown in the shifting patches are the
various types of pulses (mostly Cajanas Cajan) and turmeric are the two important crops.
Besides, these major crops, minor millets are grown in the swiddens.
The Lanjia Saoras devote the months not by the lunar phases and climate conditions as are
usually done but by the types of agricultural operations. The month in which hoeing of the
shifting path is done, is in the month of May is called “Lalagae”- (Lala meaning hoe and
Gae meaning month). The terms used for various months are reflected in the following
list:
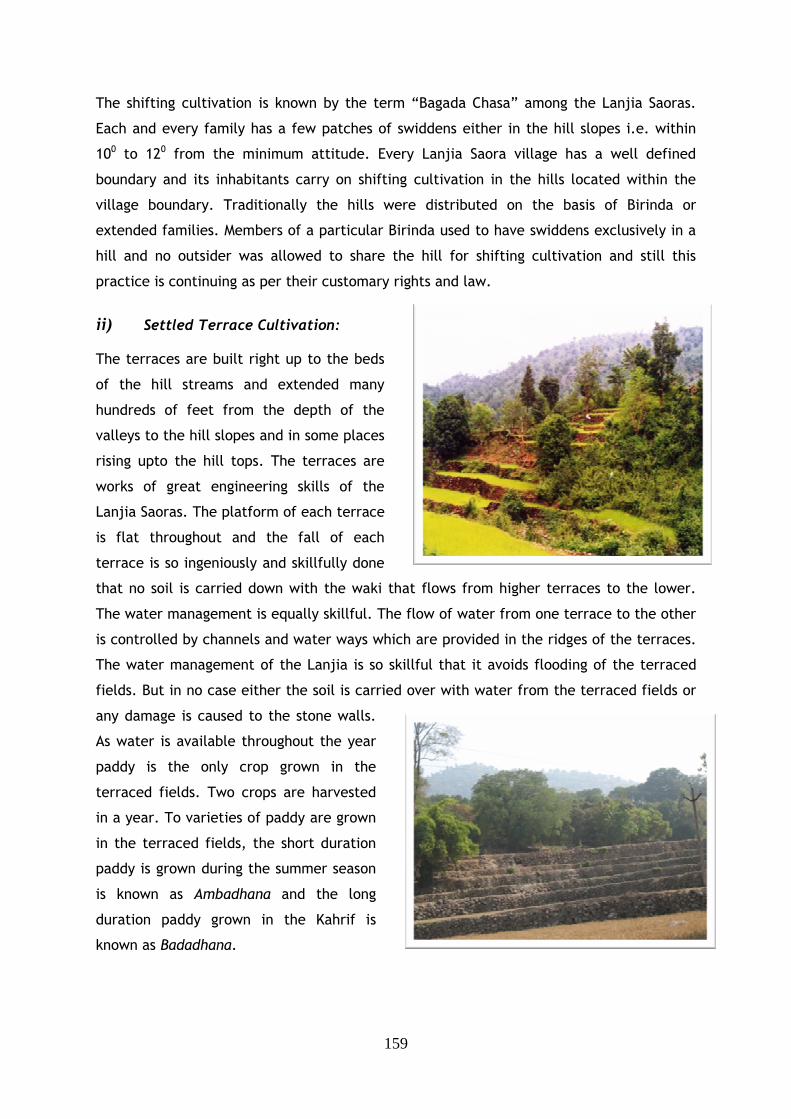
159
The shifting cultivation is known by the term “Bagada Chasa” among the Lanjia Saoras.
Each and every family has a few patches of swiddens either in the hill slopes i.e. within
100 to 120 from the minimum attitude. Every Lanjia Saora village has a well defined
boundary and its inhabitants carry on shifting cultivation in the hills located within the
village boundary. Traditionally the hills were distributed on the basis of Birinda or
extended families. Members of a particular Birinda used to have swiddens exclusively in a
hill and no outsider was allowed to share the hill for shifting cultivation and still this
practice is continuing as per their customary rights and law.
ii) Settled Terrace Cultivation: The terraces are built right up to the beds
of the hill streams and extended many
hundreds of feet from the depth of the
valleys to the hill slopes and in some places
rising upto the hill tops. The terraces are
works of great engineering skills of the
Lanjia Saoras. The platform of each terrace
is flat throughout and the fall of each
terrace is so ingeniously and skillfully done
that no soil is carried down with the waki that flows from higher terraces to the lower.
The water management is equally skillful. The flow of water from one terrace to the other
is controlled by channels and water ways which are provided in the ridges of the terraces.
The water management of the Lanjia is so skillful that it avoids flooding of the terraced
fields. But in no case either the soil is carried over with water from the terraced fields or
any damage is caused to the stone walls.
As water is available throughout the year
paddy is the only crop grown in the
terraced fields. Two crops are harvested
in a year. To varieties of paddy are grown
in the terraced fields, the short duration
paddy is grown during the summer season
is known as Ambadhana and the long
duration paddy grown in the Kahrif is
known as Badadhana.
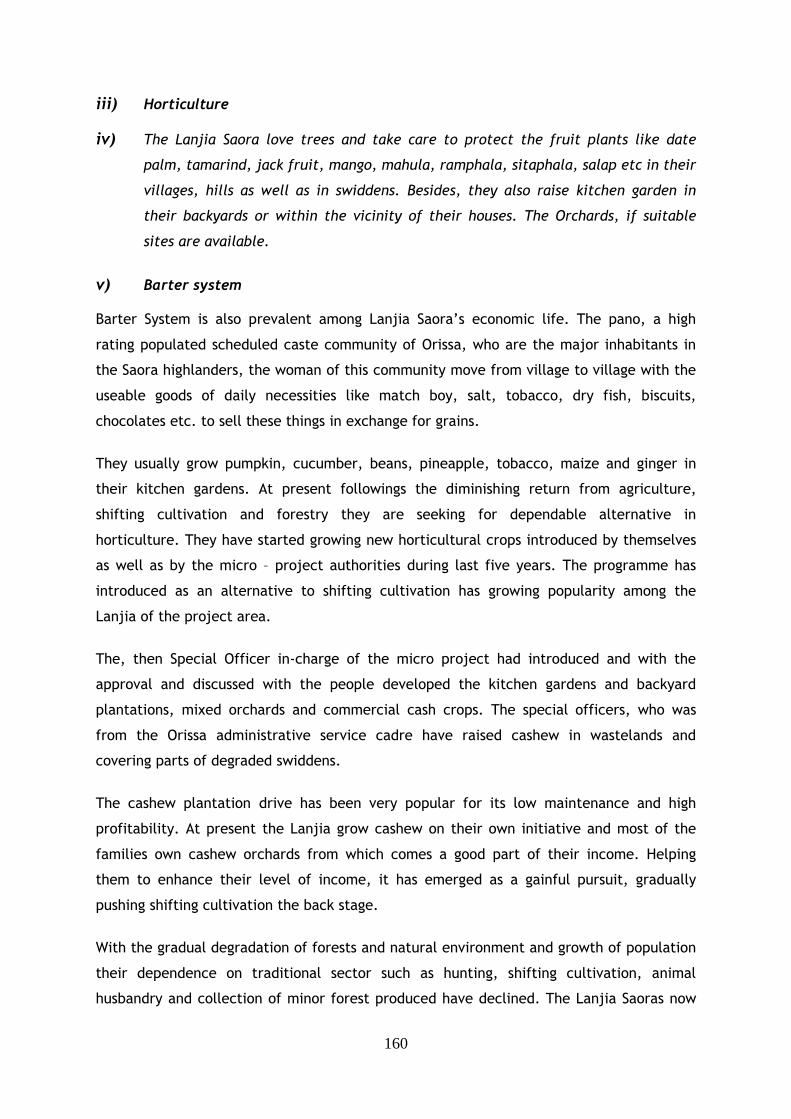
160
iii) Horticulture
iv) The Lanjia Saora love trees and take care to protect the fruit plants like date
palm, tamarind, jack fruit, mango, mahula, ramphala, sitaphala, salap etc in their
villages, hills as well as in swiddens. Besides, they also raise kitchen garden in
their backyards or within the vicinity of their houses. The Orchards, if suitable
sites are available.
v) Barter system Barter System is also prevalent among Lanjia Saora’s economic life. The pano, a high
rating populated scheduled caste community of Orissa, who are the major inhabitants in
the Saora highlanders, the woman of this community move from village to village with the
useable goods of daily necessities like match boy, salt, tobacco, dry fish, biscuits,
chocolates etc. to sell these things in exchange for grains.
They usually grow pumpkin, cucumber, beans, pineapple, tobacco, maize and ginger in
their kitchen gardens. At present followings the diminishing return from agriculture,
shifting cultivation and forestry they are seeking for dependable alternative in
horticulture. They have started growing new horticultural crops introduced by themselves
as well as by the micro – project authorities during last five years. The programme has
introduced as an alternative to shifting cultivation has growing popularity among the
Lanjia of the project area.
The, then Special Officer in-charge of the micro project had introduced and with the
approval and discussed with the people developed the kitchen gardens and backyard
plantations, mixed orchards and commercial cash crops. The special officers, who was
from the Orissa administrative service cadre have raised cashew in wastelands and
covering parts of degraded swiddens.
The cashew plantation drive has been very popular for its low maintenance and high
profitability. At present the Lanjia grow cashew on their own initiative and most of the
families own cashew orchards from which comes a good part of their income. Helping
them to enhance their level of income, it has emerged as a gainful pursuit, gradually
pushing shifting cultivation the back stage.
With the gradual degradation of forests and natural environment and growth of population
their dependence on traditional sector such as hunting, shifting cultivation, animal
husbandry and collection of minor forest produced have declined. The Lanjia Saoras now
161
have not taken up pursuits like settled cultivation, horticultural plantation and wage
labour. At present the Lanjia Saoras are exhibiting a trend of temporary seasonal
migration in the lean seasons. They got to for off states like Maharashtra, Assam and
Arunachal Pradesh to earn better and higher wages by their engagement in carpentry,
masonry, plumbing, machine operation and auto driving. They also work as a labour in the
tea gardens and construction works in Assam and Arunachal Pradesh. The return back to
their native places before the onset of agricultural season. They bring new ideas and
acquired modern skills as well as accumulated savings out of the incomes.
5.2.11 Food and Food Habits The principal food of the Lanjia Saora is gruel (Peja and Jau) prepared out of rice (Oryza
Satva) or Ragi (Elucine Coracana) and Jana besides, they also take vegetables grown in
their kitchen garden. Rice is no doubt considered idea food but paddy harvested by an
average Lanjia Saora family hardly lasts for 4 to 6 months maximum. The rest of the year
they take minor millets. During the rainy season, the food scarcity is generally noticed and
during these months they gather from the forests. Mango and tamarind seeds are the main
food taken during the summer season. Pulses which are harvested from the swiddens are
taken during the spring and winter season. Depending upon the availability, the quality as
well as the quality of food taken by the Lanjia Saoras varies from season to season. It was
noticed that among the various items of food consumed, gruel is taken throughout the
year where as the other items are seasonal as well as occasional.
An ordinary meal of the Lanjia Saora consists of gruel prepared out of Ragi, Janha,
Ghantia, or rice with salt and chilly. An adult Lanjia Saora takes food thrice in a day but
the children take more in a day. The first meal is generally taken at 6.00 A.M. before they
proceed to the field. They return from the field at 2.00 P.M. and they usually take the
gruel. Those who do not come back during the lunch time, they carry the gruel with them
and they consume in the field. In the evening at 7.00 P.M. they take their dinner before
going to bed. Food is first served to the children and the other male members. Then the
females take their respective share. There is no special food prepared for the children.
The non-vegetarian food is much more relished than the vegetarian food. The quests are
always entertained by non-vegetarian food in the festival occasions as well as when
relatives visit. Salap liquor, an alcoholic drink is most favorites among the Lanjia Saora.
They also take Mahua liquor and rice beer. Both men and women irrespective of age drink
liquor during the ceremony, social and ritual functions observed by them. The Lanjia
162
Saoras are inveterate smokers. They rill some tobacco and a piece of dried Sal leaf and
smoke it.
5.2.12 Social Organization
• Family Family is the smallest social unit of the Lanjia Saora society, the extended family is called
Birinda formed of the descendants of a common ancestor four or five years back. Marriage
is prohibited within a “Birinda” as they are treated blood brothers and sisters. The nuclear
family type is most common and also most numerous. A family comprises parents and
unmarried children. These may be old grandparents or widow sisters in the family. Among
the Lanjia Saoras, the family is male dominated. The senior -most male member of the
family is head of the household. It is therefore patriarchal.
The Lanjia Saoras have no exogamous totemic clans, no phratries and no moieties. The
main exogamous unit is the extended family, the members of which believe to have
descended from a common ancestor. This unit is called ‘Birinda’ which is based upon
patrilineage. A woman does not change her Birinda membership even after her marriage.
A person’s mother’s Birinda plays an important role in his or her affairs. But normally the
sisters after marriage leave their parents and go to live with their parent-in-laws in other
villages.
The ownership of property always goes to the male members on hereditary basis. Though
women play a great role in managing the property, they are not given any right to own any
property of their parents. In the matter of property inheritance, the sons enjoy greater
rights than the daughters. After the husband’s death, if the wife does not have son then
she is not entitled to get the property of her husband. The property goes to the nearest
Birinda member who given the widow’s daughter to marry and provide the former
livelihood till death. The assets of a woman which she has brought her fathers’ house on
her marriage are recognized as her own belongings and her husband has no right over her
property.
• Clan The Lanjia Saoras are unique due to their lack of any clan or sub-organization of the sort
common to most tribal societies of the country. Without a clan they lack the
complementary institutions of totemic and taboos in marriage relationship. Instead there
are extended families called “Birinda”. The Birinda is not a well defined structure, but
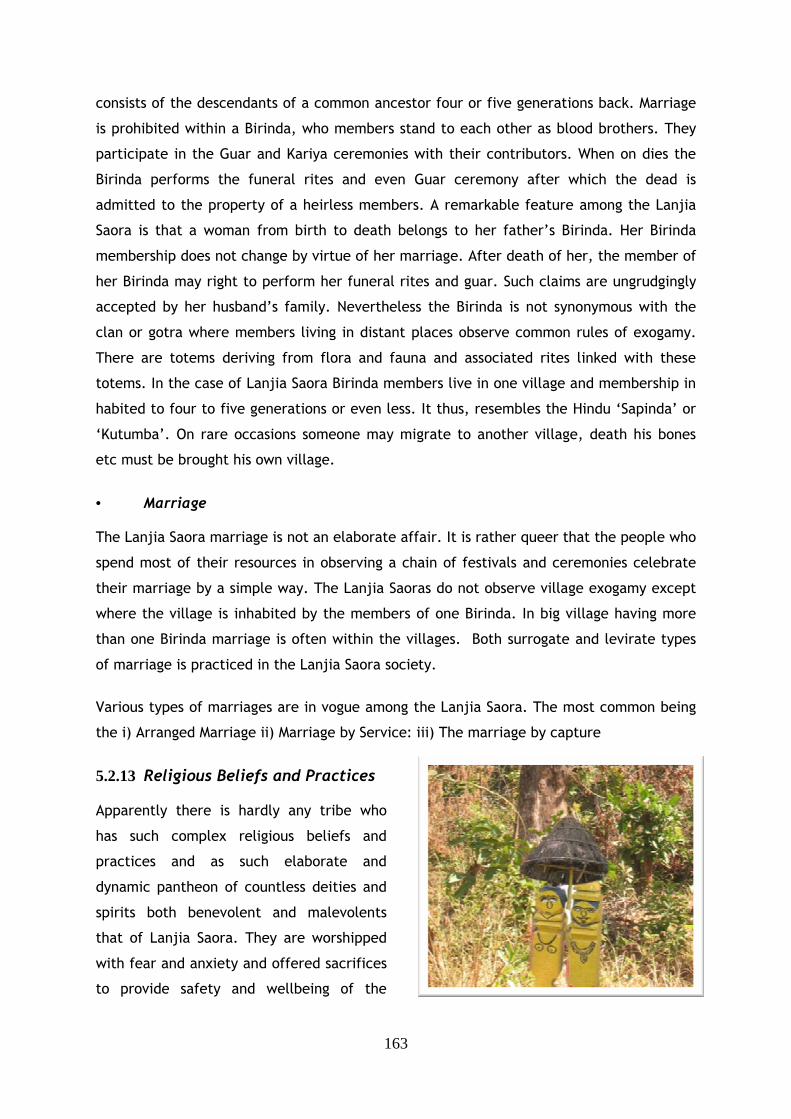
163
consists of the descendants of a common ancestor four or five generations back. Marriage
is prohibited within a Birinda, who members stand to each other as blood brothers. They
participate in the Guar and Kariya ceremonies with their contributors. When on dies the
Birinda performs the funeral rites and even Guar ceremony after which the dead is
admitted to the property of a heirless members. A remarkable feature among the Lanjia
Saora is that a woman from birth to death belongs to her father’s Birinda. Her Birinda
membership does not change by virtue of her marriage. After death of her, the member of
her Birinda may right to perform her funeral rites and guar. Such claims are ungrudgingly
accepted by her husband’s family. Nevertheless the Birinda is not synonymous with the
clan or gotra where members living in distant places observe common rules of exogamy.
There are totems deriving from flora and fauna and associated rites linked with these
totems. In the case of Lanjia Saora Birinda members live in one village and membership in
habited to four to five generations or even less. It thus, resembles the Hindu ‘Sapinda’ or
‘Kutumba’. On rare occasions someone may migrate to another village, death his bones
etc must be brought his own village.
• Marriage The Lanjia Saora marriage is not an elaborate affair. It is rather queer that the people who
spend most of their resources in observing a chain of festivals and ceremonies celebrate
their marriage by a simple way. The Lanjia Saoras do not observe village exogamy except
where the village is inhabited by the members of one Birinda. In big village having more
than one Birinda marriage is often within the villages. Both surrogate and levirate types
of marriage is practiced in the Lanjia Saora society.
Various types of marriages are in vogue among the Lanjia Saora. The most common being
the i) Arranged Marriage ii) Marriage by Service: iii) The marriage by capture
5.2.13 Religious Beliefs and Practices Apparently there is hardly any tribe who
has such complex religious beliefs and
practices and as such elaborate and
dynamic pantheon of countless deities and
spirits both benevolent and malevolents
that of Lanjia Saora. They are worshipped
with fear and anxiety and offered sacrifices
to provide safety and wellbeing of the
164
people. Religious permeates all aspects their life.
The concept of a supreme god is almost non-existing among the Lanjia Saoras. Sonnu or
Sunnam is the general name for the Saora deities and spirits. The Lanjia Saora gods differ
from one another in composition, function, character and nature. Some are benevolent;
some are neutral and some others malevolent. Moreover, there can be no standard
catalogue for these gods, for the list continuously changes as new ones are introduced and
old ones are forgotten. But all the varied aspects of their environment are associated with
some god or other. All these gods and spirits make constant demands on the living. Those
who die in the house appear in dreams and demand certain offerings. Sometimes devil
spirits enter cattle sheds and make cows and oxen ill in order to make their displeasure
known. If their demands are not met, they may cause harm. Therefore, malevolent spirits
are more cared for than the benevolent ones. When their depredations become
unbearable the benevolent gods are approached. They are not so narrow minded and
destow their blessings irrespective of how they are treated lavishly or austerely.
The deities are called in different names such as Labosum, Rudedum and Karunisum, etc.
Sitapati has recorded the order of deities:
Name of the deity
Their Importance
Sonnumanji This is an important order which contains maximum number of deities
Bonadanji This is a order of spirits which included Guests Jnod, Kusath Jnod and Panosi Jnod etc
Manninji and Sunninji
This order includes a large number of deities and spirits who reside in the hills and these deities are very docile and benevolent
Badonganji Deities of this order also reside on the high hills
Kittunganji This order includes a number of demi gods in human form.
Karni Chodara This is terrific devil. Even relations are afraid of going near those attacked by this devil. To please this devil, pigs are sacrificed since goat is not useful for this purpose. These devils are supported to stay around big trees and the offerings are made outside the village.
Sodang, Gosbad, Eddana
These deities are responsible for fevers, carbuncles. To satisfy these spirits goats, toddy and clothes are offered.
Gadejung, Sandra, Bhullu
These are sky devils connected with the man and the sun. Due to their influence, headache and pain occur. Goats, hen, toddy and clothes are the prescribed offerings.
Ratuna, Sonum, Pull Bhutham
These devils are supposedly responsible for neck pains and other ailments. He buffalo and toddy are offered to satisfy these devils.
Gagir-a- bullu This devils is responsible for creating ailments at the tome of delivery in the case of a woman. Hen, goat, pig and clothes are offered to satisfy this devil.
Illasoman Due to effect of this devil women face abortions. Those pregnant women who desire to avoid abortion should make offering to this evil This responsible for small pox and other dreadful diseases. The people are terribly afraid of this devil.devil.
165
In this mystic domain of “man-nature and spirit complex”, there are very important
intermediates between humans and supernatural. They are shamans both male and
female, called Kudan and Kudan Boi respectively. They act as diviner – cum – medics who
can establish direct communication with the unseen world in a trance and cure illness and
ward off mishaps and misfortunes caused by the wroth of evil spirits. Interestingly every
Shaman has a female tutelary and every Shamanin has a male tutelary. The relationship
between them and their respective tutelary is the same as that between husband and
wife.
5.2.14 Political Organization Every Lanjia Saora village has well established political organization. Each village
politically is an autonomous and locally self supporting. The Lanjia Saoras have no
indigenous centralized political authority or politically confederacies. Among them each
village has a secular headman called as Gomango who is a man of his prestige. Equally
important is the village religious headman who is known as Buya.
The offices of secular and religious headman are hereditary and the rule of primogeniture
regulates succession. In addition to these offices which are indigenous, there is in some
villages as astrologer called as Disari and this post is achieved not ascribed like the
religious and secular headman ship. In many villages there are village Shamans (sorcerers).
There are diviner – shamans and doctor –shamans and they are of either sex. In most
villages there is a post called as Barika who acts as a village messenger. Invariably he
belongs to either Domb or Pano from scheduled caste community.
It is in their customary law that allotment of land on the hill slopes among the villagers for
shifting cultivation is made in the common village meeting attended by all adult male
members. This custom is now rarely followed since the swidden patches do not change
hands and the villagers continue to carry on shifting cultivation year after year in the
patches which were allotted to them long ago. Even though no one has any legal right
ownership over the swidden patches but every cultivator feels to have ownership rights
notionally over the patches which are in his possession for years.
Annual cycle of festivals and days and times of holding are decided unanimously in village
meetings. Cases relating to the partition of property, sale and mortgage of lands, cases of
divorce and many social matters are decided in the village Gomango had to preside,
initiate discussions and make public unanimously arrived decisions.
166
The relationship in the Lanjia Saora community is multi-mix and it acts like an organism in
which every individual acts in accordance with the wishes of others of the community
because of social harmony and face to face relationship. All decisions whether social and
political are arrived at not by the majority vote by consensus. Real political democracy is
at work in Lanjia Saora villages. The implementation of statutory gram Panchayat in the
Lanjia Saora villages serves nothing but creates conflict between the indigenous political
institution and the emerging new membership.
During 1996, with the change in Panchayat Raj system and reformation of local self -
government, a new dimension in the administration is being from and PESA (Panchayat
Extension Scheduled Area) Act was implemented. At the Gram Panchayat level, the
chairman of the Panchayat Samiti leads the Panchayat, assisted by sub-ordinates like
Sarapanch, Samiti Savya, Naib Sarapanch and the Ward Member at the grass root level.
Special power was given to the Gram Sabha and to prepare the action plan for all round
development of the village and hamlets within the Gram Panchayat in the Scheduled area.
In modern times, exposure e to Christianity, the changing socio-cultural, political and
economic climate as well as the external modern world have influenced the Lanjia Saora
way of life.
5.2.15 Changing Scenario of Lanjia Saora Development Agency: Findings from Field Study
The study area of Lanjia Saora, one of the Primitive Tribal Communities comes under both
Scheduled Area and Tribal Sub Plan (TSP) area under the jurisdiction of Gunupur Sub-
division of Rayagada district and lying at a distance of around 100 Kilometers from the
district headquarter and 25 Km from Sub-division headquarter. Its area is spread over
Sagada Gram Panchayat of Gunupur block. The Lanjia Saora Development Agency (LSDA)
was grounded on 1st April 1984 with it’s headquarter at Puttasing. This Micro project has
been registered under Society Registration Act of 1860. The project covered 20
settlements (Conservation-Cum-Development Plan of SCSTRTI, Orissa 2007) consisting 8
revenue villages and 12 hamlets.
The above table highlights the Basic information of LSDA and the changes. It reveals that
the project adopted 20 villages comprising 919 households and 5774 population in 2007 as
against 21villages 767 households and 4547 population in 2001, but the total geographical
areas remain same i.e. 35 Sq Km. Only one village (Podusing) had deserted the settlement
and moved to village Kurudi. Population of Lanjia Saora has increased by 26.98% from 2001
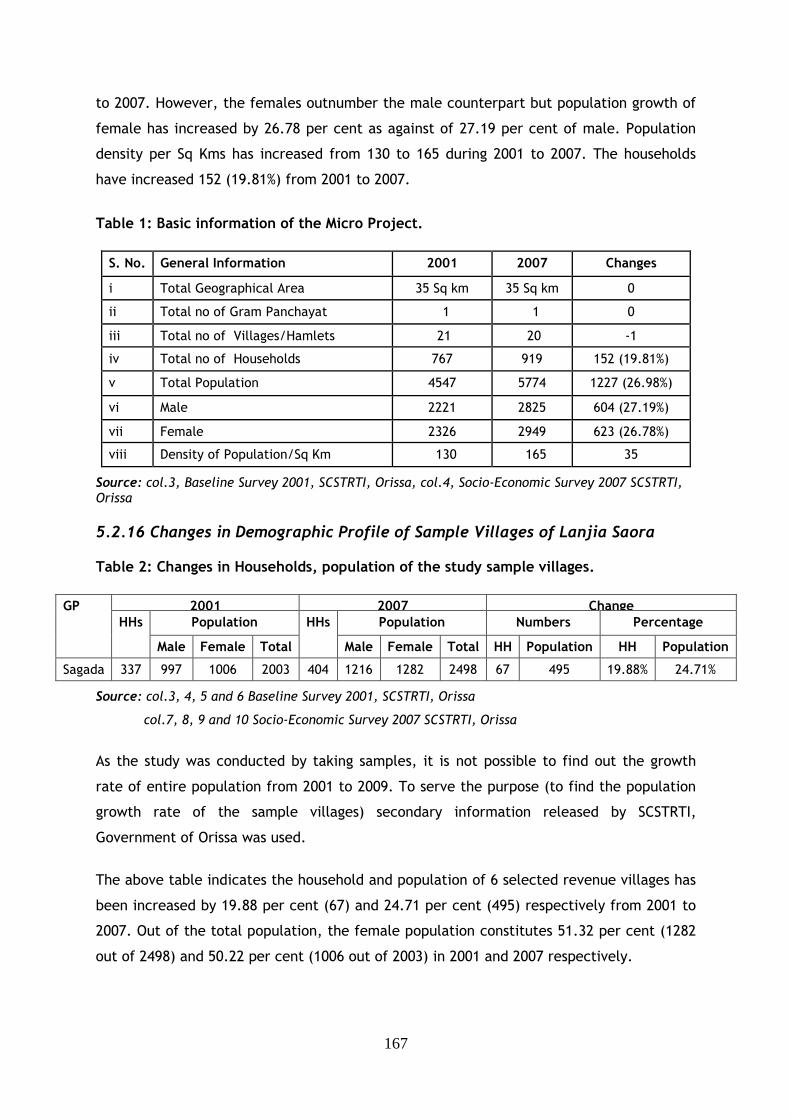
167
to 2007. However, the females outnumber the male counterpart but population growth of
female has increased by 26.78 per cent as against of 27.19 per cent of male. Population
density per Sq Kms has increased from 130 to 165 during 2001 to 2007. The households
have increased 152 (19.81%) from 2001 to 2007.
Table 1: Basic information of the Micro Project.
S. No. General Information 2001 2007 Changes
i Total Geographical Area 35 Sq km 35 Sq km 0
ii Total no of Gram Panchayat 1 1 0
iii Total no of Villages/Hamlets 21 20 -1
iv Total no of Households 767 919 152 (19.81%)
v Total Population 4547 5774 1227 (26.98%)
vi Male 2221 2825 604 (27.19%)
vii Female 2326 2949 623 (26.78%)
viii Density of Population/Sq Km 130 165 35
Source: col.3, Baseline Survey 2001, SCSTRTI, Orissa, col.4, Socio-Economic Survey 2007 SCSTRTI, Orissa
5.2.16 Changes in Demographic Profile of Sample Villages of Lanjia Saora Table 2: Changes in Households, population of the study sample villages.
2001 2007 Change
Population Population Numbers Percentage
GP
HHs
Male Female Total
HHs
Male Female Total HH Population HH Population
Sagada 337 997 1006 2003 404 1216 1282 2498 67 495 19.88% 24.71%
Source: col.3, 4, 5 and 6 Baseline Survey 2001, SCSTRTI, Orissa
col.7, 8, 9 and 10 Socio-Economic Survey 2007 SCSTRTI, Orissa
As the study was conducted by taking samples, it is not possible to find out the growth
rate of entire population from 2001 to 2009. To serve the purpose (to find the population
growth rate of the sample villages) secondary information released by SCSTRTI,
Government of Orissa was used.
The above table indicates the household and population of 6 selected revenue villages has
been increased by 19.88 per cent (67) and 24.71 per cent (495) respectively from 2001 to
2007. Out of the total population, the female population constitutes 51.32 per cent (1282
out of 2498) and 50.22 per cent (1006 out of 2003) in 2001 and 2007 respectively.
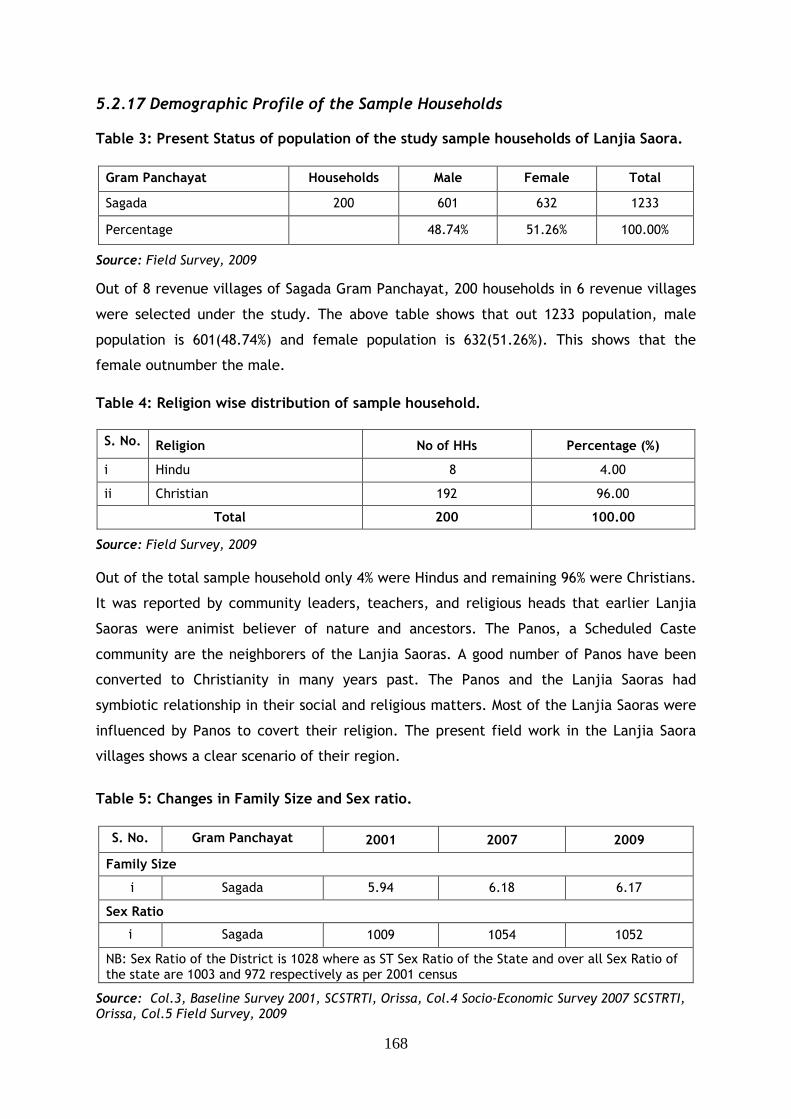
168
5.2.17 Demographic Profile of the Sample Households Table 3: Present Status of population of the study sample households of Lanjia Saora.
Gram Panchayat Households Male Female Total
Sagada 200 601 632 1233
Percentage 48.74% 51.26% 100.00%
Source: Field Survey, 2009
Out of 8 revenue villages of Sagada Gram Panchayat, 200 households in 6 revenue villages
were selected under the study. The above table shows that out 1233 population, male
population is 601(48.74%) and female population is 632(51.26%). This shows that the
female outnumber the male.
Table 4: Religion wise distribution of sample household.
S. No. Religion No of HHs Percentage (%)
i Hindu 8 4.00
ii Christian 192 96.00
Total 200 100.00
Source: Field Survey, 2009
Out of the total sample household only 4% were Hindus and remaining 96% were Christians.
It was reported by community leaders, teachers, and religious heads that earlier Lanjia
Saoras were animist believer of nature and ancestors. The Panos, a Scheduled Caste
community are the neighborers of the Lanjia Saoras. A good number of Panos have been
converted to Christianity in many years past. The Panos and the Lanjia Saoras had
symbiotic relationship in their social and religious matters. Most of the Lanjia Saoras were
influenced by Panos to covert their religion. The present field work in the Lanjia Saora
villages shows a clear scenario of their region.
Table 5: Changes in Family Size and Sex ratio.
S. No. Gram Panchayat 2001 2007 2009
Family Size
i Sagada 5.94 6.18 6.17
Sex Ratio
i Sagada 1009 1054 1052
NB: Sex Ratio of the District is 1028 where as ST Sex Ratio of the State and over all Sex Ratio of the state are 1003 and 972 respectively as per 2001 census
Source: Col.3, Baseline Survey 2001, SCSTRTI, Orissa, Col.4 Socio-Economic Survey 2007 SCSTRTI, Orissa, Col.5 Field Survey, 2009
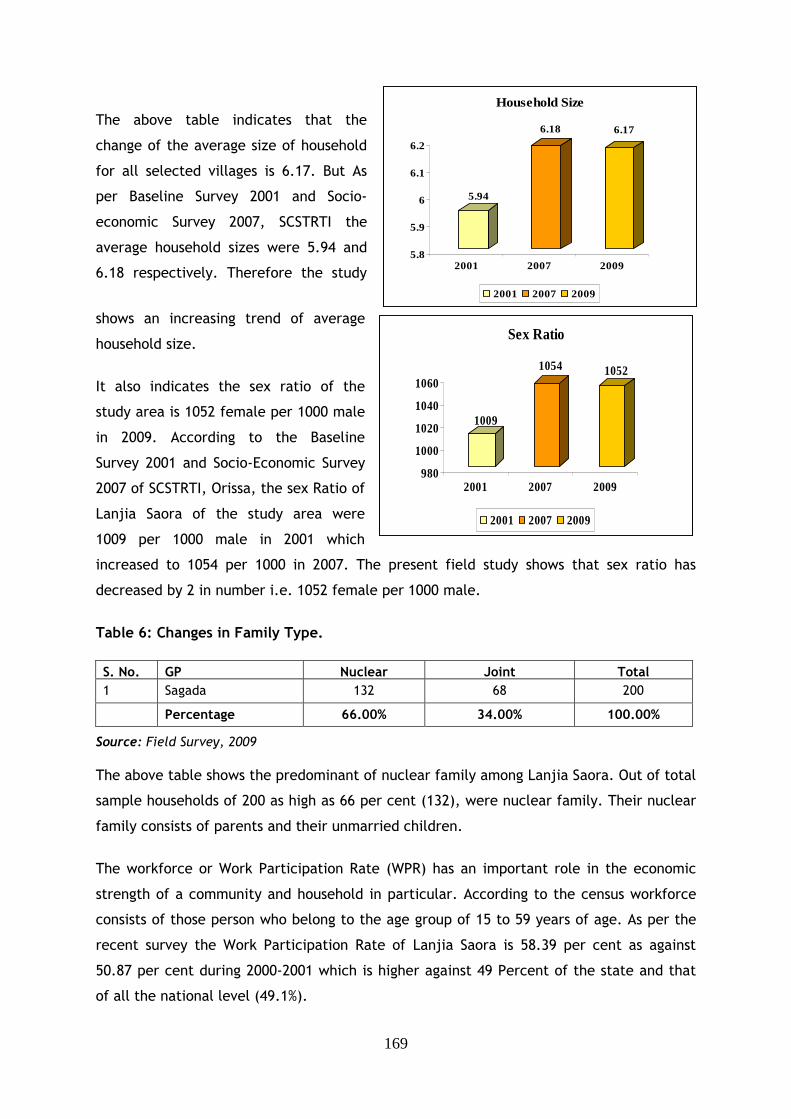
169
5.94
6.18 6.17
5.8
5.9
6
6.1
6.2
2001 2007 2009
Household Size
2001 2007 2009
1009
1054 1052
980
1000
1020
1040
1060
2001 2007 2009
Sex Ratio
2001 2007 2009
The above table indicates that the
change of the average size of household
for all selected villages is 6.17. But As
per Baseline Survey 2001 and Socio-
economic Survey 2007, SCSTRTI the
average household sizes were 5.94 and
6.18 respectively. Therefore the study
shows an increasing trend of average
household size.
It also indicates the sex ratio of the
study area is 1052 female per 1000 male
in 2009. According to the Baseline
Survey 2001 and Socio-Economic Survey
2007 of SCSTRTI, Orissa, the sex Ratio of
Lanjia Saora of the study area were
1009 per 1000 male in 2001 which
increased to 1054 per 1000 in 2007. The present field study shows that sex ratio has
decreased by 2 in number i.e. 1052 female per 1000 male.
Table 6: Changes in Family Type.
S. No. GP Nuclear Joint Total
1 Sagada 132 68 200
Percentage 66.00% 34.00% 100.00%
Source: Field Survey, 2009
The above table shows the predominant of nuclear family among Lanjia Saora. Out of total
sample households of 200 as high as 66 per cent (132), were nuclear family. Their nuclear
family consists of parents and their unmarried children.
The workforce or Work Participation Rate (WPR) has an important role in the economic
strength of a community and household in particular. According to the census workforce
consists of those person who belong to the age group of 15 to 59 years of age. As per the
recent survey the Work Participation Rate of Lanjia Saora is 58.39 per cent as against
50.87 per cent during 2000-2001 which is higher against 49 Percent of the state and that
of all the national level (49.1%).
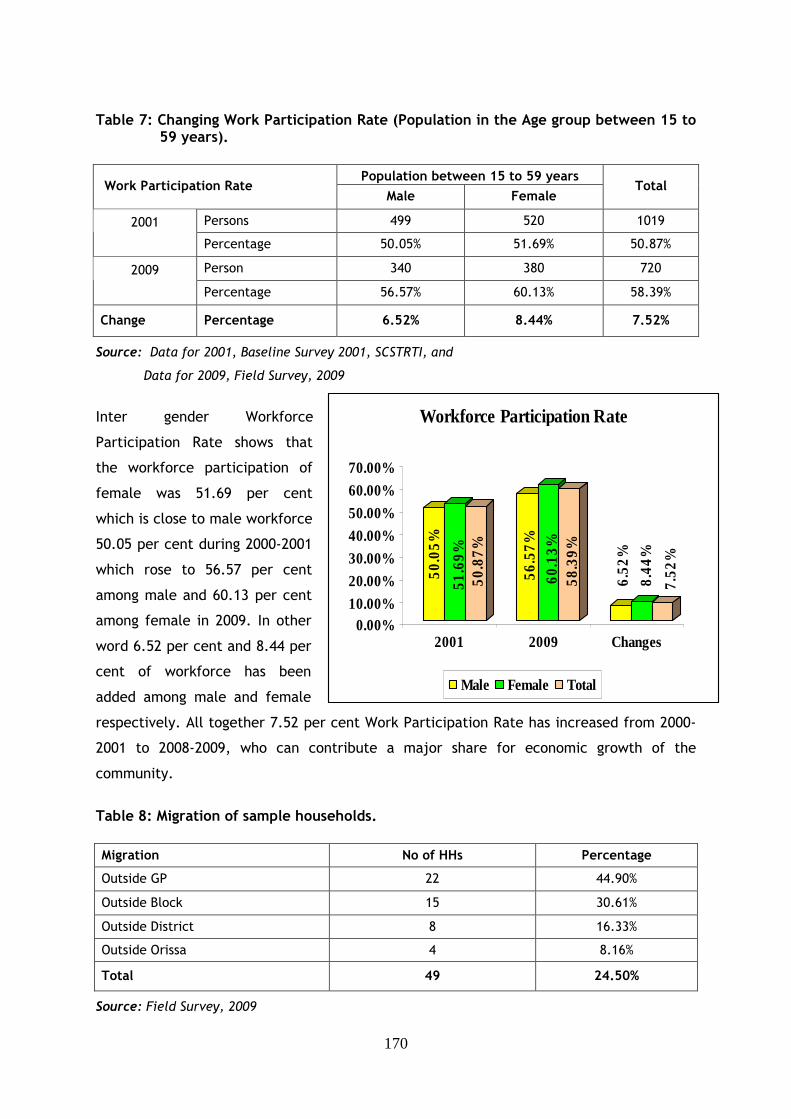
170
50.0
5%
51.6
9%50
.87%
56.5
7%60
.13%
58.3
9%
6.52
%
8.44
%
7.52
%
0.00%10.00%
20.00%
30.00%
40.00%
50.00%
60.00%
70.00%
2001 2009 Changes
Workforce Participation Rate
Male Female Total
Table 7: Changing Work Participation Rate (Population in the Age group between 15 to
59 years).
Population between 15 to 59 years
Work Participation Rate Male Female
Total
Persons 499 520 1019 2001
Percentage 50.05% 51.69% 50.87%
Person 340 380 720 2009
Percentage 56.57% 60.13% 58.39%
Change Percentage 6.52% 8.44% 7.52%
Source: Data for 2001, Baseline Survey 2001, SCSTRTI, and
Data for 2009, Field Survey, 2009
Inter gender Workforce
Participation Rate shows that
the workforce participation of
female was 51.69 per cent
which is close to male workforce
50.05 per cent during 2000-2001
which rose to 56.57 per cent
among male and 60.13 per cent
among female in 2009. In other
word 6.52 per cent and 8.44 per
cent of workforce has been
added among male and female
respectively. All together 7.52 per cent Work Participation Rate has increased from 2000-
2001 to 2008-2009, who can contribute a major share for economic growth of the
community.
Table 8: Migration of sample households.
Migration No of HHs Percentage
Outside GP 22 44.90%
Outside Block 15 30.61%
Outside District 8 16.33%
Outside Orissa 4 8.16%
Total 49 24.50%
Source: Field Survey, 2009
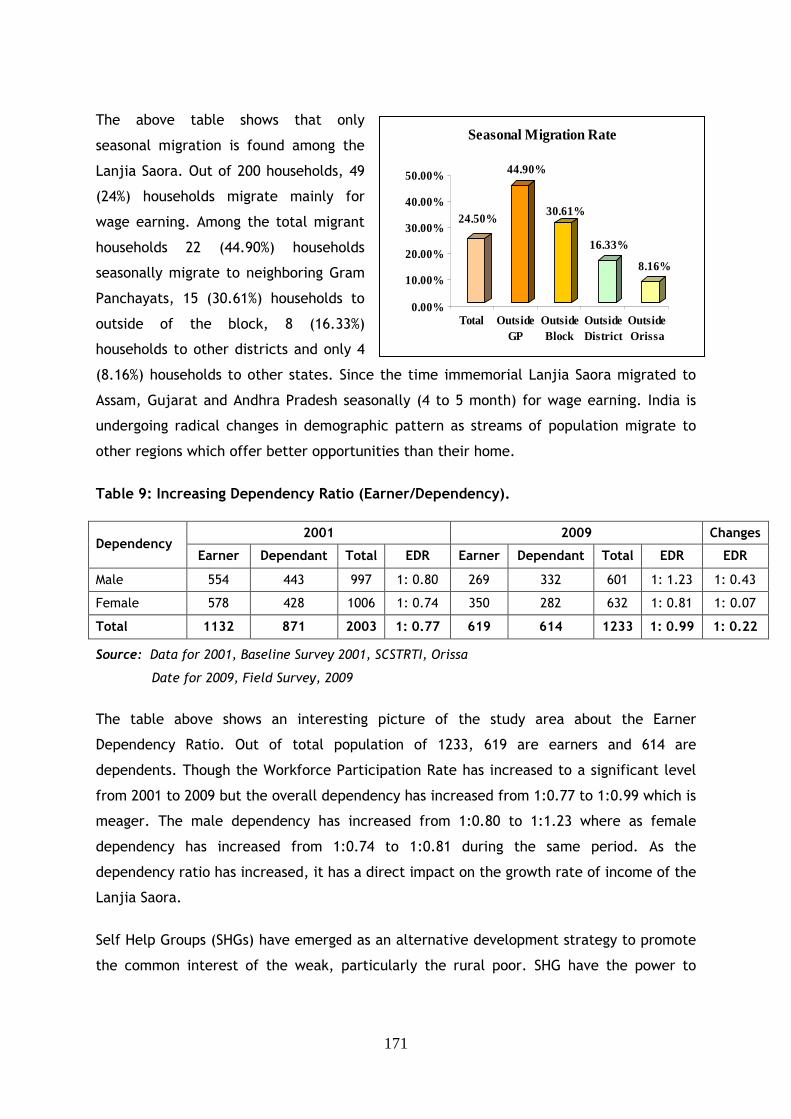
171
24.50%
44.90%
30.61%
16.33%
8.16%
0.00%
10.00%
20.00%
30.00%
40.00%
50.00%
Total OutsideGP
OutsideBlock
OutsideDistrict
OutsideOrissa
Seasonal Migration Rate
The above table shows that only
seasonal migration is found among the
Lanjia Saora. Out of 200 households, 49
(24%) households migrate mainly for
wage earning. Among the total migrant
households 22 (44.90%) households
seasonally migrate to neighboring Gram
Panchayats, 15 (30.61%) households to
outside of the block, 8 (16.33%)
households to other districts and only 4
(8.16%) households to other states. Since the time immemorial Lanjia Saora migrated to
Assam, Gujarat and Andhra Pradesh seasonally (4 to 5 month) for wage earning. India is
undergoing radical changes in demographic pattern as streams of population migrate to
other regions which offer better opportunities than their home.
Table 9: Increasing Dependency Ratio (Earner/Dependency).
2001 2009 Changes
Dependency Earner Dependant Total EDR Earner Dependant Total EDR EDR
Male 554 443 997 1: 0.80 269 332 601 1: 1.23 1: 0.43
Female 578 428 1006 1: 0.74 350 282 632 1: 0.81 1: 0.07
Total 1132 871 2003 1: 0.77 619 614 1233 1: 0.99 1: 0.22
Source: Data for 2001, Baseline Survey 2001, SCSTRTI, Orissa
Date for 2009, Field Survey, 2009
The table above shows an interesting picture of the study area about the Earner
Dependency Ratio. Out of total population of 1233, 619 are earners and 614 are
dependents. Though the Workforce Participation Rate has increased to a significant level
from 2001 to 2009 but the overall dependency has increased from 1:0.77 to 1:0.99 which is
meager. The male dependency has increased from 1:0.80 to 1:1.23 where as female
dependency has increased from 1:0.74 to 1:0.81 during the same period. As the
dependency ratio has increased, it has a direct impact on the growth rate of income of the
Lanjia Saora.
Self Help Groups (SHGs) have emerged as an alternative development strategy to promote
the common interest of the weak, particularly the rural poor. SHG have the power to
172
create a socio-economic revolution.1 In this study an attempt has been made to find out
participation of women under SHG fold. The data shows that out of the 200 households 94
(47%) households are covered under SHGs platform. Out of 632 females, 102 (16.14 %) are
under different SHGs.
Table 10: SHGs and Membership.
Source: Field Study 2009
5.2.18 Housing Conditions of Sample Households In addition to food and clothing, shelter is the most essential and basic human need which
denotes an important constituent of the quality of life. It is an index of the socio-
economic progress of any community. Owning a house provides significant socio-economic
security to an individual or household in society.
Table 11: Type of house.
2001 2009
Type of House No of Households Percentage No of Households Percentage Changes (%)
Kachha 183 91.50% 67 33.50% -58.00%
Fire Proof 15 7.50% 128 64.00% +56.50%
Pacca 2 1.00% 5 2.50% +1.50%
Total 200 100.00% 200 100.00%
Source: Field Survey, 2009
All surveyed households have their own house. The data show that only 1 per cent
households had Pacca house in 2001 which has increased to 2.5 per cent in 2009. But
significant changes are observed in fire proof and Kachha house in the study area.
Similarly only 7 per cent household were having fire proof houses, which increased to 64
per cent by the end of June 2009. On the other hand during the years 2001 more than 90
per cent of household had Kachha houses which are reduced by almost 60 per cent mainly
due to supply of fire proof houses by LSDA, under Infrastructure Development Scheme
(IDS) and Indira Awas Yojna (IAY) by DRDA/Zilla Parishad.
1 (Dr T. Ramachandraran and S Balakrishnan, Kurukshetra, December 2008 pp31-34).
S. No.
GP Total HHs Total Female
No of HHs under SHGs
% of HHs under SHGs
Total female members under SHGs
% female under SHGs
i Sagada 200 632 94 47.00% 102 16.14%
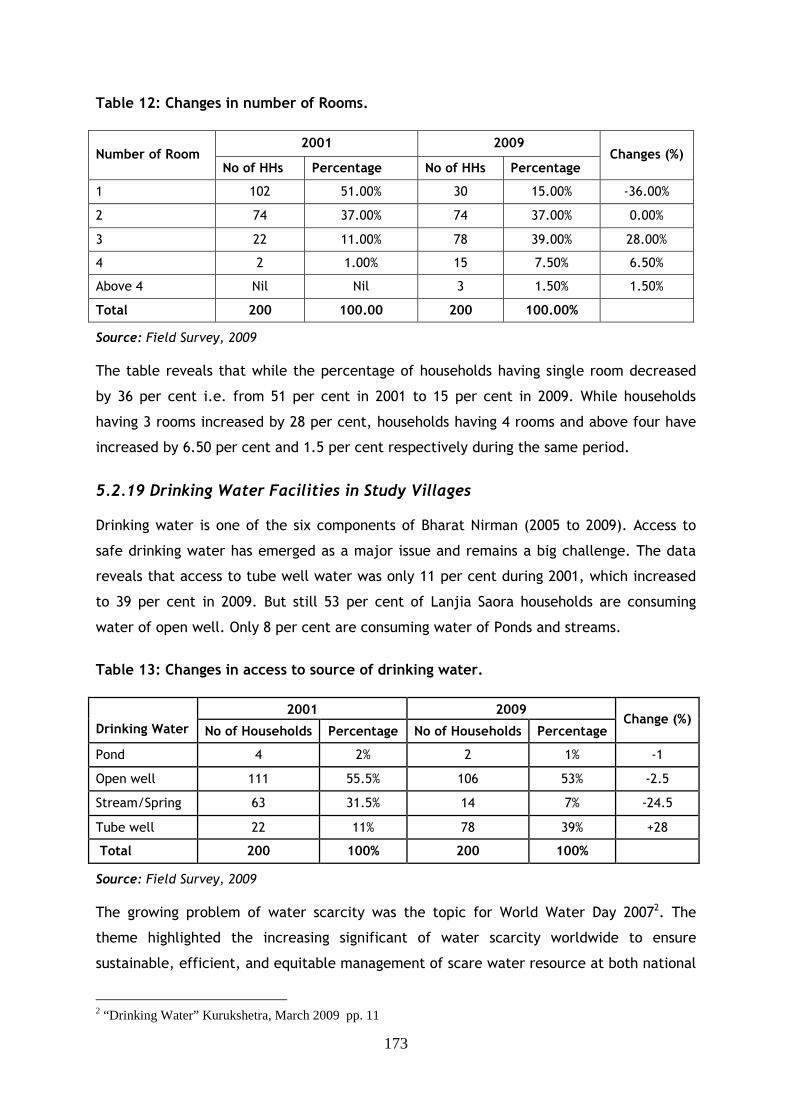
173
Table 12: Changes in number of Rooms.
2001 2009
Number of Room No of HHs
Percentage No of HHs
Percentage Changes (%)
1 102 51.00% 30 15.00% -36.00%
2 74 37.00% 74 37.00% 0.00%
3 22 11.00% 78 39.00% 28.00%
4 2 1.00% 15 7.50% 6.50%
Above 4 Nil Nil 3 1.50% 1.50%
Total 200 100.00 200 100.00%
Source: Field Survey, 2009
The table reveals that while the percentage of households having single room decreased
by 36 per cent i.e. from 51 per cent in 2001 to 15 per cent in 2009. While households
having 3 rooms increased by 28 per cent, households having 4 rooms and above four have
increased by 6.50 per cent and 1.5 per cent respectively during the same period.
5.2.19 Drinking Water Facilities in Study Villages Drinking water is one of the six components of Bharat Nirman (2005 to 2009). Access to
safe drinking water has emerged as a major issue and remains a big challenge. The data
reveals that access to tube well water was only 11 per cent during 2001, which increased
to 39 per cent in 2009. But still 53 per cent of Lanjia Saora households are consuming
water of open well. Only 8 per cent are consuming water of Ponds and streams.
Table 13: Changes in access to source of drinking water.
2001 2009
Drinking Water No of Households
Percentage No of Households
Percentage Change (%)
Pond 4 2% 2 1% -1
Open well 111 55.5% 106 53% -2.5
Stream/Spring 63 31.5% 14 7% -24.5
Tube well 22 11% 78 39% +28
Total 200 100% 200 100%
Source: Field Survey, 2009
The growing problem of water scarcity was the topic for World Water Day 20072. The
theme highlighted the increasing significant of water scarcity worldwide to ensure
sustainable, efficient, and equitable management of scare water resource at both national
2 “Drinking Water” Kurukshetra, March 2009 pp. 11
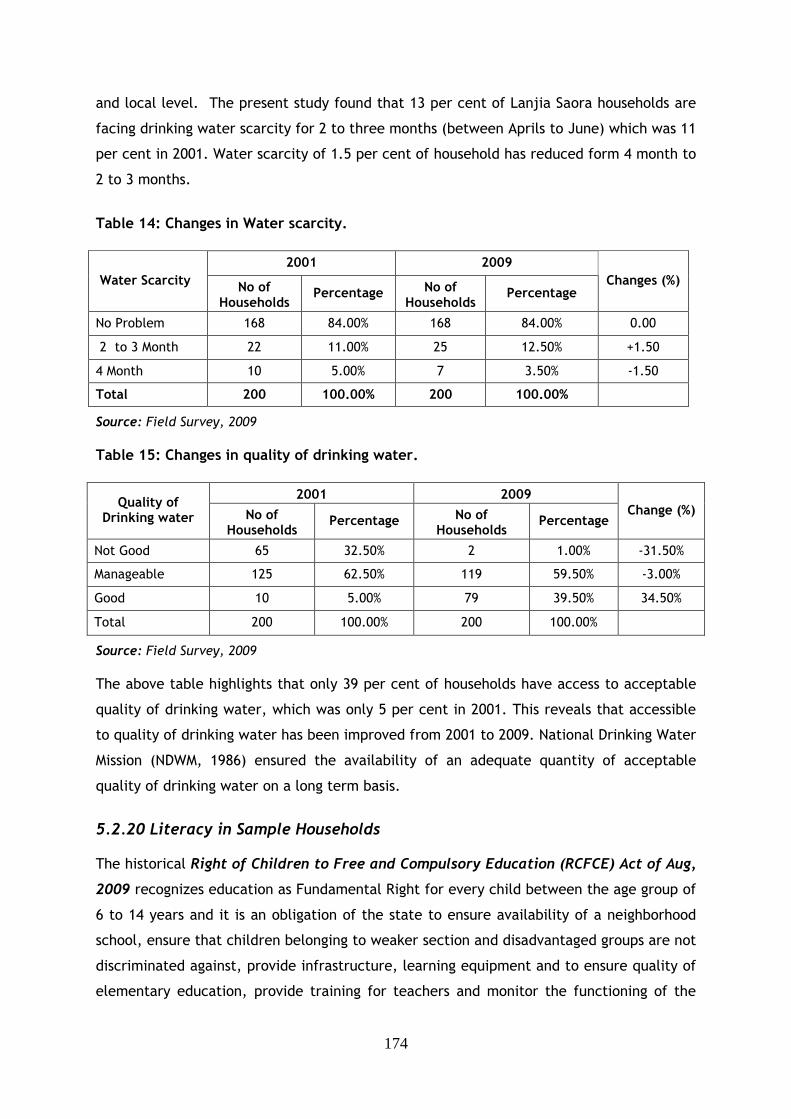
174
and local level. The present study found that 13 per cent of Lanjia Saora households are
facing drinking water scarcity for 2 to three months (between Aprils to June) which was 11
per cent in 2001. Water scarcity of 1.5 per cent of household has reduced form 4 month to
2 to 3 months.
Table 14: Changes in Water scarcity.
2001
2009
Water Scarcity No of
Households Percentage No of
Households Percentage
Changes (%)
No Problem 168 84.00% 168 84.00% 0.00
2 to 3 Month 22 11.00% 25 12.50% +1.50
4 Month 10 5.00% 7 3.50% -1.50
Total 200 100.00% 200 100.00%
Source: Field Survey, 2009
Table 15: Changes in quality of drinking water.
2001 2009
Quality of Drinking water No of
Households Percentage No of
Households Percentage
Change (%)
Not Good 65 32.50% 2 1.00% -31.50%
Manageable 125 62.50% 119 59.50% -3.00%
Good 10 5.00% 79 39.50% 34.50%
Total 200 100.00% 200 100.00%
Source: Field Survey, 2009
The above table highlights that only 39 per cent of households have access to acceptable
quality of drinking water, which was only 5 per cent in 2001. This reveals that accessible
to quality of drinking water has been improved from 2001 to 2009. National Drinking Water
Mission (NDWM, 1986) ensured the availability of an adequate quantity of acceptable
quality of drinking water on a long term basis.
5.2.20 Literacy in Sample Households The historical Right of Children to Free and Compulsory Education (RCFCE) Act of Aug,
2009 recognizes education as Fundamental Right for every child between the age group of
6 to 14 years and it is an obligation of the state to ensure availability of a neighborhood
school, ensure that children belonging to weaker section and disadvantaged groups are not
discriminated against, provide infrastructure, learning equipment and to ensure quality of
elementary education, provide training for teachers and monitor the functioning of the
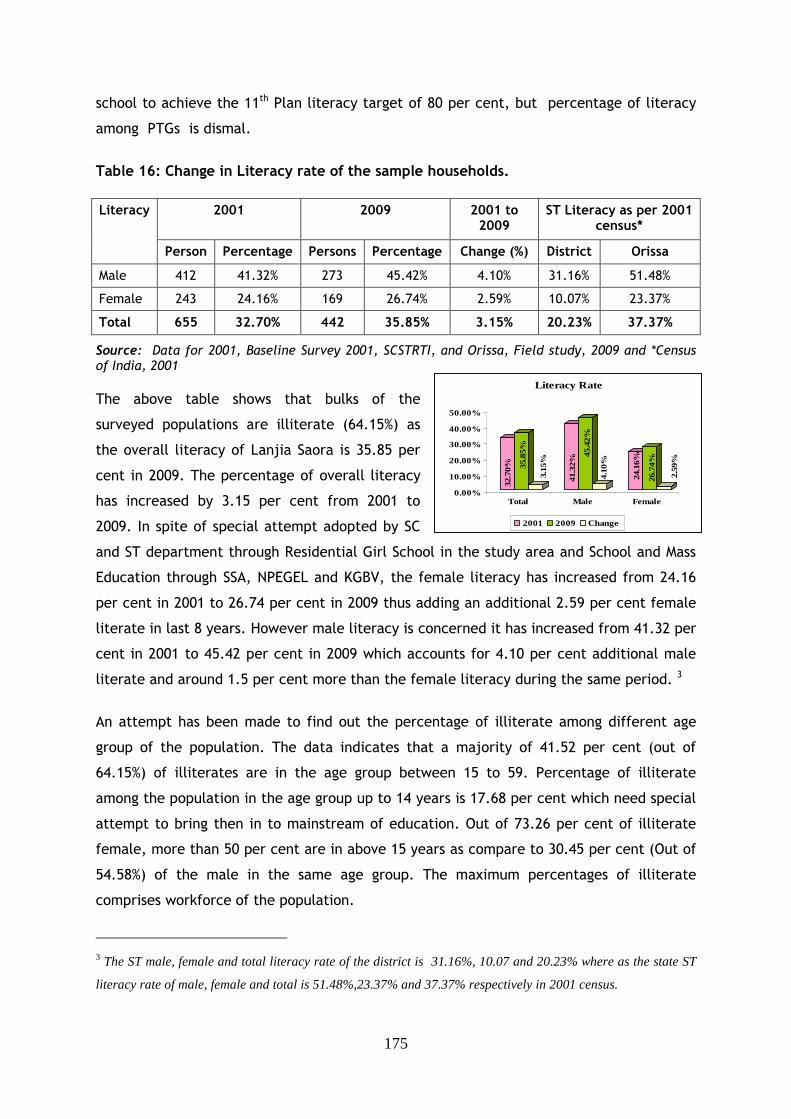
175
32.7
0% 35.8
5%
3.15
%
41.3
2%
45.4
2%
4.10
%
24.1
6%
26.7
4%
2.59
%
0.00%
10.00%
20.00%
30.00%
40.00%
50.00%
Total Male Female
Literacy Rate
2001 2009 Change
school to achieve the 11th Plan literacy target of 80 per cent, but percentage of literacy
among PTGs is dismal.
Table 16: Change in Literacy rate of the sample households.
2001 2009 2001 to
2009 ST Literacy as per 2001
census* Literacy
Person Percentage Persons Percentage Change (%) District Orissa
Male 412 41.32% 273 45.42% 4.10% 31.16% 51.48%
Female 243 24.16% 169 26.74% 2.59% 10.07% 23.37%
Total 655 32.70% 442 35.85% 3.15% 20.23% 37.37%
Source: Data for 2001, Baseline Survey 2001, SCSTRTI, and Orissa, Field study, 2009 and *Census of India, 2001
The above table shows that bulks of the
surveyed populations are illiterate (64.15%) as
the overall literacy of Lanjia Saora is 35.85 per
cent in 2009. The percentage of overall literacy
has increased by 3.15 per cent from 2001 to
2009. In spite of special attempt adopted by SC
and ST department through Residential Girl School in the study area and School and Mass
Education through SSA, NPEGEL and KGBV, the female literacy has increased from 24.16
per cent in 2001 to 26.74 per cent in 2009 thus adding an additional 2.59 per cent female
literate in last 8 years. However male literacy is concerned it has increased from 41.32 per
cent in 2001 to 45.42 per cent in 2009 which accounts for 4.10 per cent additional male
literate and around 1.5 per cent more than the female literacy during the same period. 3
An attempt has been made to find out the percentage of illiterate among different age
group of the population. The data indicates that a majority of 41.52 per cent (out of
64.15%) of illiterates are in the age group between 15 to 59. Percentage of illiterate
among the population in the age group up to 14 years is 17.68 per cent which need special
attempt to bring then in to mainstream of education. Out of 73.26 per cent of illiterate
female, more than 50 per cent are in above 15 years as compare to 30.45 per cent (Out of
54.58%) of the male in the same age group. The maximum percentages of illiterate
comprises workforce of the population.
3 The ST male, female and total literacy rate of the district is 31.16%, 10.07 and 20.23% where as the state ST
literacy rate of male, female and total is 51.48%,23.37% and 37.37% respectively in 2001 census.
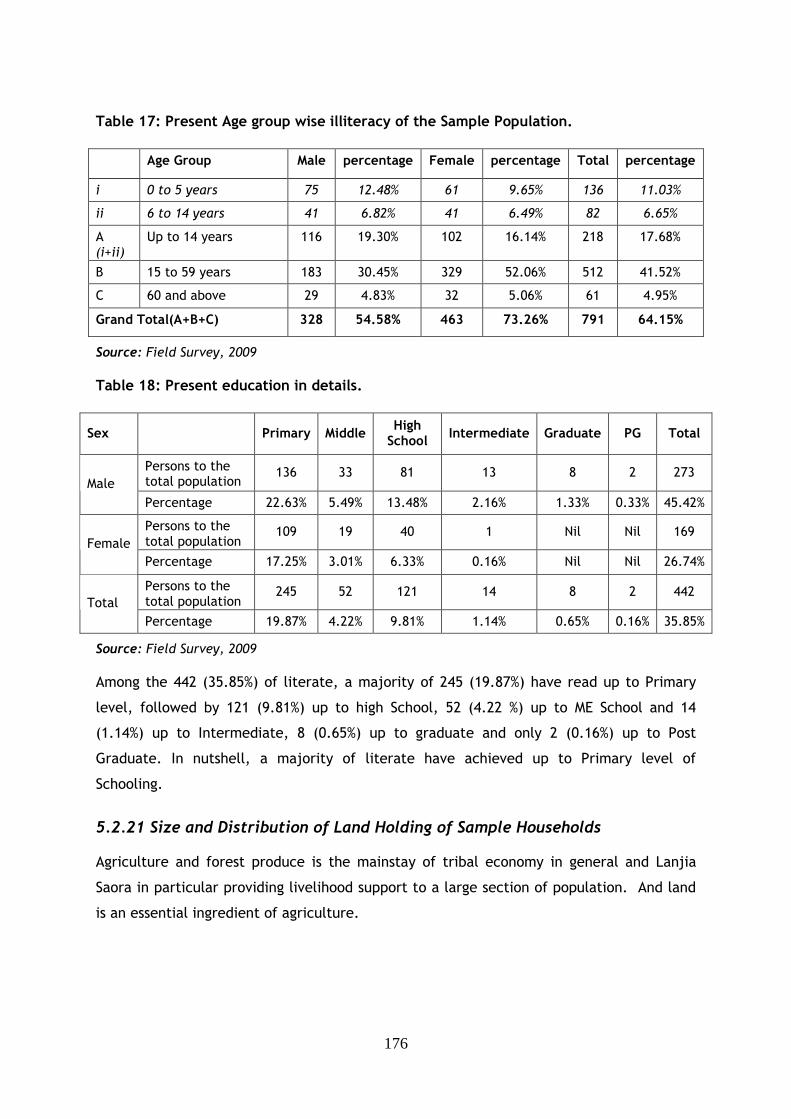
176
Table 17: Present Age group wise illiteracy of the Sample Population.
Age Group Male percentage Female percentage Total percentage
i 0 to 5 years 75 12.48% 61 9.65% 136 11.03%
ii 6 to 14 years 41 6.82% 41 6.49% 82 6.65%
A (i+ii)
Up to 14 years 116 19.30% 102 16.14% 218 17.68%
B 15 to 59 years 183 30.45% 329 52.06% 512 41.52%
C 60 and above 29 4.83% 32 5.06% 61 4.95%
Grand Total(A+B+C) 328 54.58% 463 73.26% 791 64.15%
Source: Field Survey, 2009
Table 18: Present education in details.
Sex Primary Middle High School
Intermediate Graduate PG Total
Persons to the total population
136 33 81 13 8 2 273 Male
Percentage 22.63% 5.49% 13.48% 2.16% 1.33% 0.33% 45.42%
Persons to the total population
109 19 40 1 Nil Nil 169 Female
Percentage 17.25% 3.01% 6.33% 0.16% Nil Nil 26.74%
Persons to the total population
245 52 121 14 8 2 442 Total
Percentage 19.87% 4.22% 9.81% 1.14% 0.65% 0.16% 35.85%
Source: Field Survey, 2009
Among the 442 (35.85%) of literate, a majority of 245 (19.87%) have read up to Primary
level, followed by 121 (9.81%) up to high School, 52 (4.22 %) up to ME School and 14
(1.14%) up to Intermediate, 8 (0.65%) up to graduate and only 2 (0.16%) up to Post
Graduate. In nutshell, a majority of literate have achieved up to Primary level of
Schooling.
5.2.21 Size and Distribution of Land Holding of Sample Households Agriculture and forest produce is the mainstay of tribal economy in general and Lanjia
Saora in particular providing livelihood support to a large section of population. And land
is an essential ingredient of agriculture.
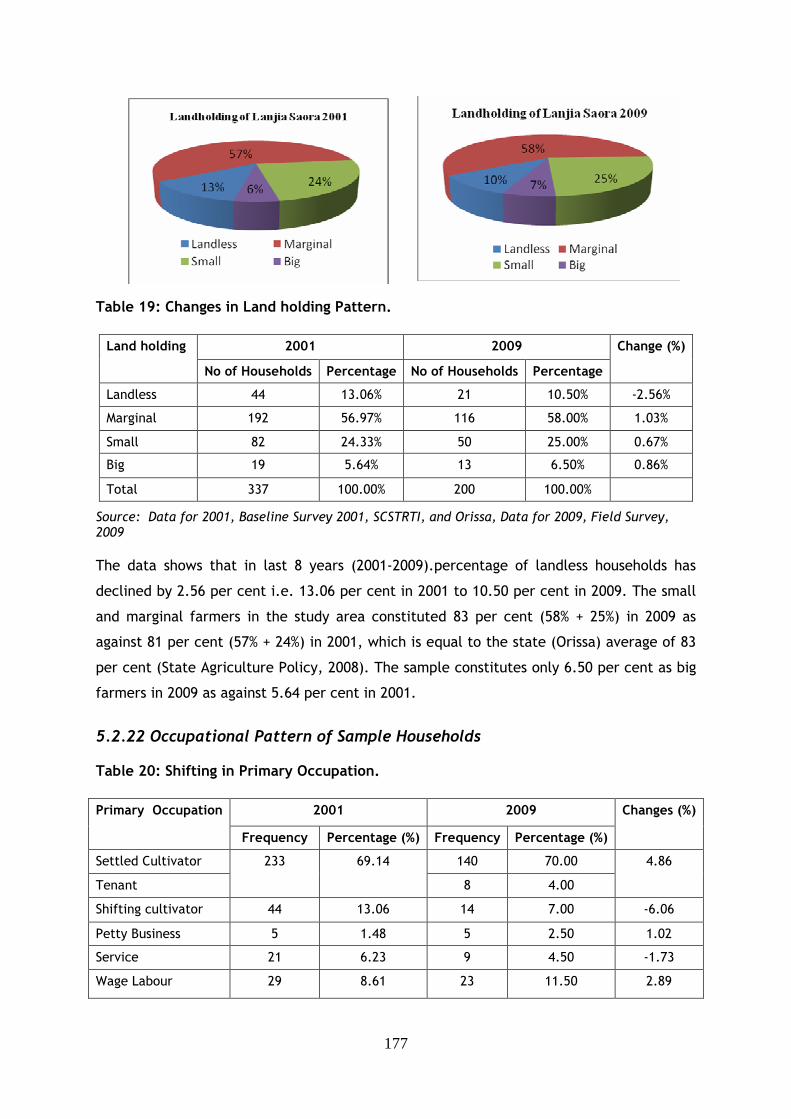
177
Table 19: Changes in Land holding Pattern.
2001 2009 Land holding
No of Households Percentage No of Households Percentage
Change (%)
Landless 44 13.06% 21 10.50% -2.56%
Marginal 192 56.97% 116 58.00% 1.03%
Small 82 24.33% 50 25.00% 0.67%
Big 19 5.64% 13 6.50% 0.86%
Total 337 100.00% 200 100.00%
Source: Data for 2001, Baseline Survey 2001, SCSTRTI, and Orissa, Data for 2009, Field Survey, 2009
The data shows that in last 8 years (2001-2009).percentage of landless households has
declined by 2.56 per cent i.e. 13.06 per cent in 2001 to 10.50 per cent in 2009. The small
and marginal farmers in the study area constituted 83 per cent (58% + 25%) in 2009 as
against 81 per cent (57% + 24%) in 2001, which is equal to the state (Orissa) average of 83
per cent (State Agriculture Policy, 2008). The sample constitutes only 6.50 per cent as big
farmers in 2009 as against 5.64 per cent in 2001.
5.2.22 Occupational Pattern of Sample Households Table 20: Shifting in Primary Occupation.
2001 2009 Primary Occupation
Frequency Percentage (%) Frequency Percentage (%)
Changes (%)
Settled Cultivator 140 70.00
Tenant
233 69.14
8 4.00
4.86
Shifting cultivator 44 13.06 14 7.00 -6.06
Petty Business 5 1.48 5 2.50 1.02
Service 21 6.23 9 4.50 -1.73
Wage Labour 29 8.61 23 11.50 2.89
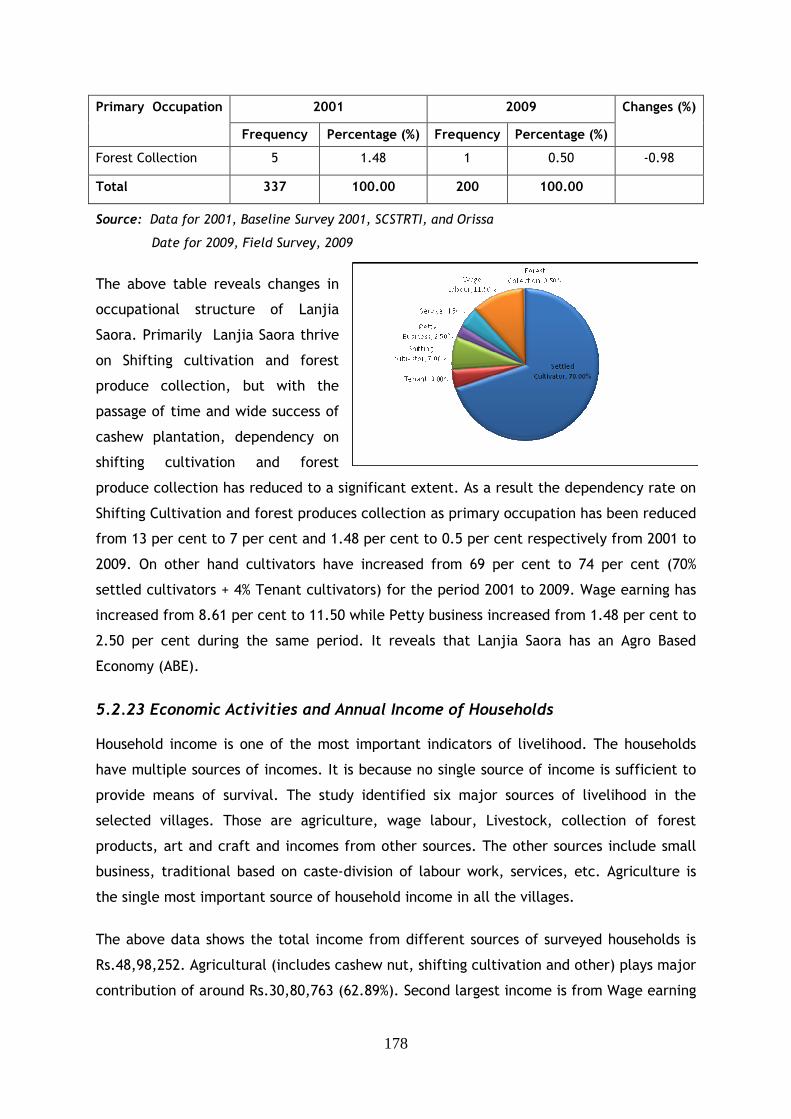
178
2001 2009 Primary Occupation
Frequency Percentage (%) Frequency Percentage (%)
Changes (%)
Forest Collection 5 1.48 1 0.50 -0.98
Total 337 100.00 200 100.00
Source: Data for 2001, Baseline Survey 2001, SCSTRTI, and Orissa
Date for 2009, Field Survey, 2009
The above table reveals changes in
occupational structure of Lanjia
Saora. Primarily Lanjia Saora thrive
on Shifting cultivation and forest
produce collection, but with the
passage of time and wide success of
cashew plantation, dependency on
shifting cultivation and forest
produce collection has reduced to a significant extent. As a result the dependency rate on
Shifting Cultivation and forest produces collection as primary occupation has been reduced
from 13 per cent to 7 per cent and 1.48 per cent to 0.5 per cent respectively from 2001 to
2009. On other hand cultivators have increased from 69 per cent to 74 per cent (70%
settled cultivators + 4% Tenant cultivators) for the period 2001 to 2009. Wage earning has
increased from 8.61 per cent to 11.50 while Petty business increased from 1.48 per cent to
2.50 per cent during the same period. It reveals that Lanjia Saora has an Agro Based
Economy (ABE).
5.2.23 Economic Activities and Annual Income of Households Household income is one of the most important indicators of livelihood. The households
have multiple sources of incomes. It is because no single source of income is sufficient to
provide means of survival. The study identified six major sources of livelihood in the
selected villages. Those are agriculture, wage labour, Livestock, collection of forest
products, art and craft and incomes from other sources. The other sources include small
business, traditional based on caste-division of labour work, services, etc. Agriculture is
the single most important source of household income in all the villages.
The above data shows the total income from different sources of surveyed households is
Rs.48,98,252. Agricultural (includes cashew nut, shifting cultivation and other) plays major
contribution of around Rs.30,80,763 (62.89%). Second largest income is from Wage earning
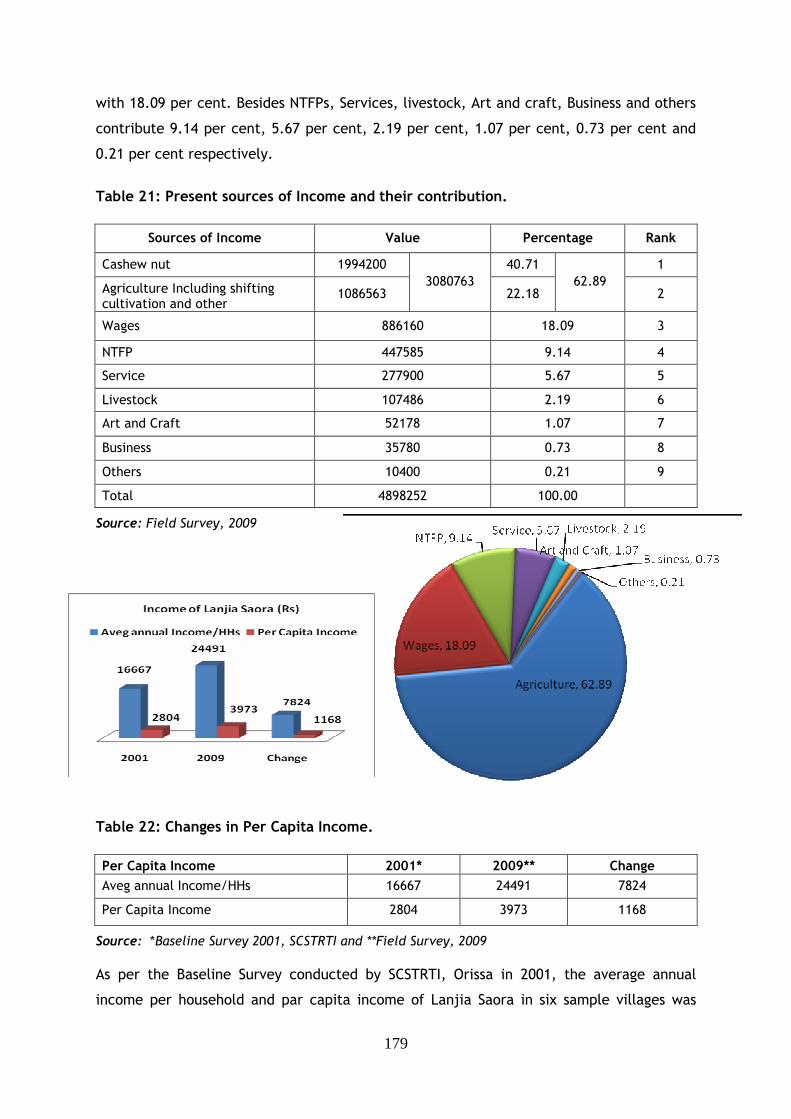
179
with 18.09 per cent. Besides NTFPs, Services, livestock, Art and craft, Business and others
contribute 9.14 per cent, 5.67 per cent, 2.19 per cent, 1.07 per cent, 0.73 per cent and
0.21 per cent respectively.
Table 21: Present sources of Income and their contribution.
Sources of Income Value Percentage Rank
Cashew nut 1994200 40.71 1
Agriculture Including shifting cultivation and other
1086563 3080763
22.18 62.89
2
Wages 886160 18.09 3
NTFP 447585 9.14 4
Service 277900 5.67 5
Livestock 107486 2.19 6
Art and Craft 52178 1.07 7
Business 35780 0.73 8
Others 10400 0.21 9
Total 4898252 100.00
Source: Field Survey, 2009
Table 22: Changes in Per Capita Income.
Per Capita Income 2001* 2009** Change
Aveg annual Income/HHs 16667 24491 7824
Per Capita Income 2804 3973 1168
Source: *Baseline Survey 2001, SCSTRTI and **Field Survey, 2009
As per the Baseline Survey conducted by SCSTRTI, Orissa in 2001, the average annual
income per household and par capita income of Lanjia Saora in six sample villages was
180
16,667 and 2,804 respectively which has increased to 24,491 and 3,973 in 2009, the
present survey conducted by AMITY School of Natural Resources and Sustainable
Development, Noida. Further it is to be observed that per capita income is higher in spite
of the fact that average household size increased from 5.94 to 6.17 for those
corresponding years shown an upward trend. Thus, an additional Rs.7824(46.94%) and
Rs.1168 (41.65%) are increased in household income and per capita income of Lanjia Saora
from 2001 to 2009.
5.2.24 Annual Household Expenditure of Lanjia Saora Table 23: Changes in Expenditure Pattern.
Expenditure (Rs.) 2001 2009
Total annual expenditure /HH 14,978 17,023
Per capita annual expenditure 2,520 2,761
Annual Average expenditure on food items/HH 7,644 (51.04%) 6007 (35.28%)
Per Capita annual expenditure on food items 1,286 974
Annual Average expenditure on non food items/HH 7,334 11,016
Source: *Baseline Survey 2001, SCSTRTI, Orissa, **Field Survey, 2009,
The above table reveals that the average annual expenditure per household is Rs.17,023 in
2009 as against Rs.14,978 in 2001 i.e. net increase by Rs.2,045. Annual expenditure on
food items per household is Rs.6007 (35.28% of the total expenditure) in 2009 as compared
to, Rs.7,644 in 2001 i.e. decreased by Rs.1,637. Expenditure on non food items including
social ceremonies, festivals, education, health, hospitality of guest etc is Rs.11,016 in
2009 which was Rs.7,334 in 2001. Thus the community as a whole has been spending less
on food items. There is appreciable increase (around 50%) in average expenditure on non-
food items.
5.2.25 Loan of Sample Households of Lanjia Saora Credit is one of the most crucial inputs in the process of development. Loan and debt is
inherent to PTGs as they have very limited access and control over resources. But with the
passing of the time access to credit and volume of credit are also changing gradually.
Table 25 reveals that out of the total sample, only 6 per cent (12 out of 200 households)
had access to loan in 2001 which is increased to 29 per cent (58 out of 200 households) in
2009. The total loan amount was only Rs.70,000 which increased remarkably to Rs.4,
96,600. Out of the total loan amount, Rs.18000 (25.71%) was outstanding in 2004. Average
loan per indebted household is increased form Rs.5,833 to 8,562 during 2001 to 2009. At
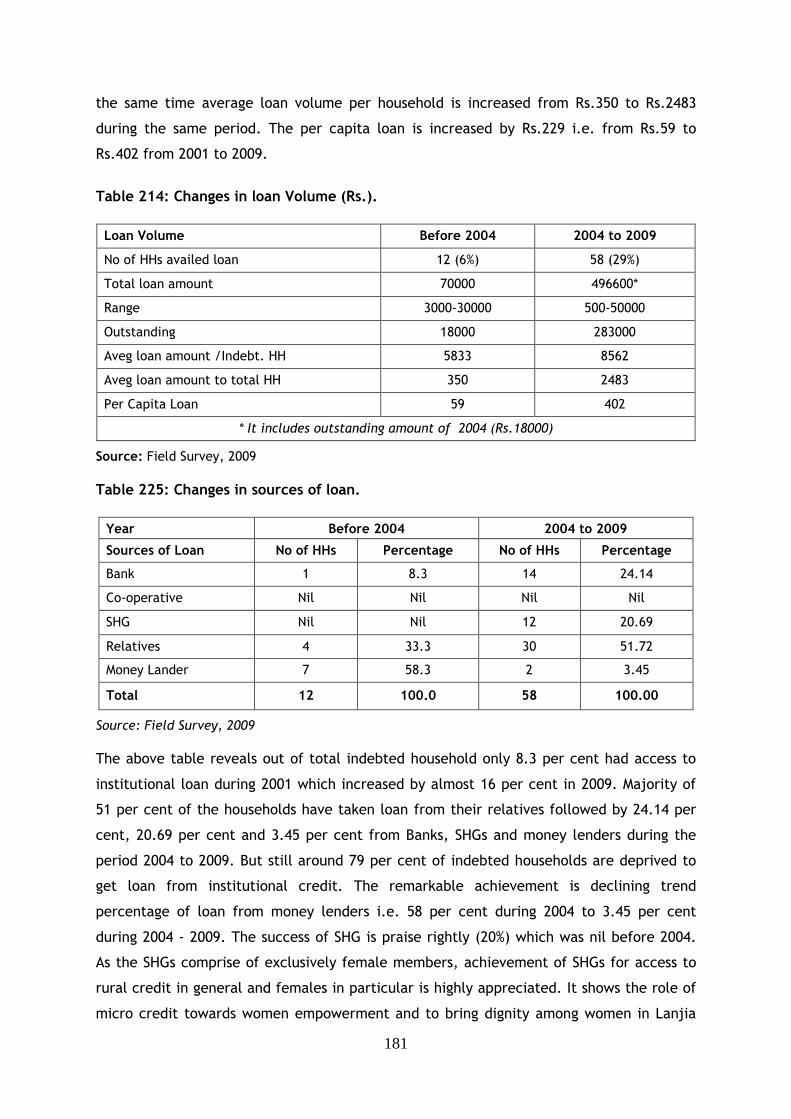
181
the same time average loan volume per household is increased from Rs.350 to Rs.2483
during the same period. The per capita loan is increased by Rs.229 i.e. from Rs.59 to
Rs.402 from 2001 to 2009.
Table 214: Changes in loan Volume (Rs.).
Loan Volume Before 2004 2004 to 2009
No of HHs availed loan 12 (6%) 58 (29%)
Total loan amount 70000 496600*
Range 3000-30000 500-50000
Outstanding 18000 283000
Aveg loan amount /Indebt. HH 5833 8562
Aveg loan amount to total HH 350 2483
Per Capita Loan 59 402
* It includes outstanding amount of 2004 (Rs.18000)
Source: Field Survey, 2009
Table 225: Changes in sources of loan.
Year Before 2004 2004 to 2009
Sources of Loan No of HHs Percentage No of HHs Percentage
Bank 1 8.3 14 24.14
Co-operative Nil Nil Nil Nil
SHG Nil Nil 12 20.69
Relatives 4 33.3 30 51.72
Money Lander 7 58.3 2 3.45
Total 12 100.0 58 100.00
Source: Field Survey, 2009
The above table reveals out of total indebted household only 8.3 per cent had access to
institutional loan during 2001 which increased by almost 16 per cent in 2009. Majority of
51 per cent of the households have taken loan from their relatives followed by 24.14 per
cent, 20.69 per cent and 3.45 per cent from Banks, SHGs and money lenders during the
period 2004 to 2009. But still around 79 per cent of indebted households are deprived to
get loan from institutional credit. The remarkable achievement is declining trend
percentage of loan from money lenders i.e. 58 per cent during 2004 to 3.45 per cent
during 2004 - 2009. The success of SHG is praise rightly (20%) which was nil before 2004.
As the SHGs comprise of exclusively female members, achievement of SHGs for access to
rural credit in general and females in particular is highly appreciated. It shows the role of
micro credit towards women empowerment and to bring dignity among women in Lanjia
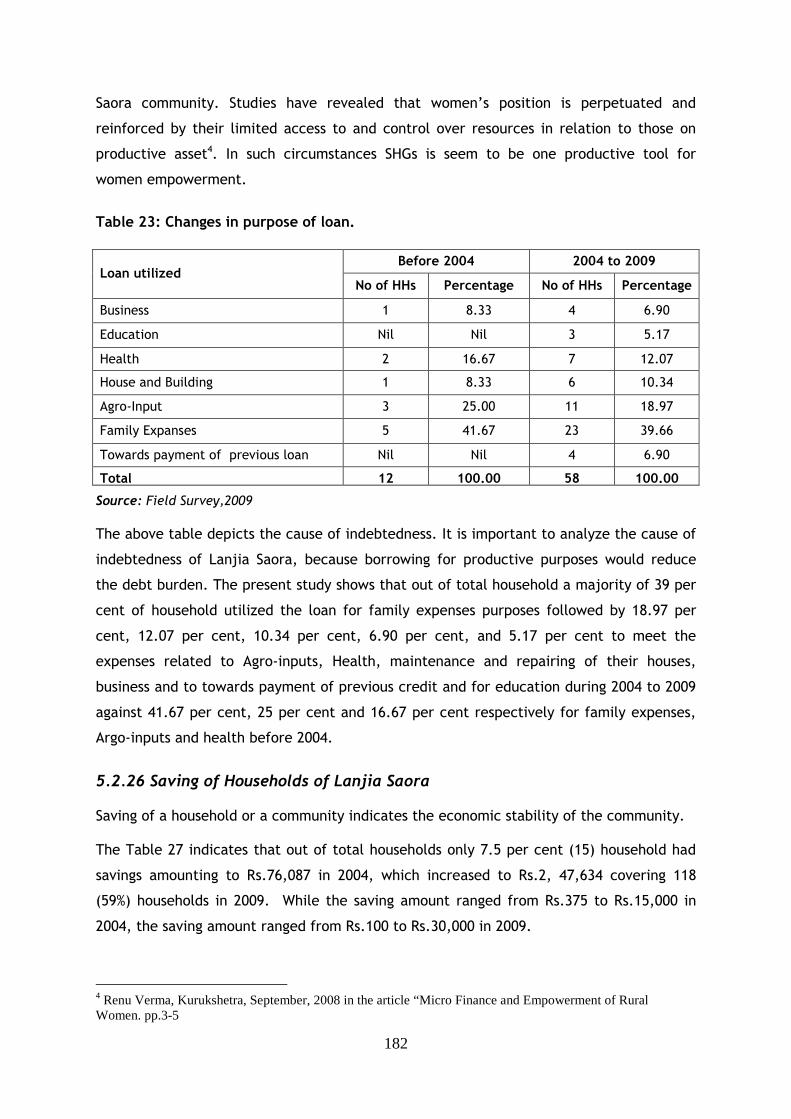
182
Saora community. Studies have revealed that women’s position is perpetuated and
reinforced by their limited access to and control over resources in relation to those on
productive asset4. In such circumstances SHGs is seem to be one productive tool for
women empowerment.
Table 23: Changes in purpose of loan.
Before 2004 2004 to 2009
Loan utilized No of HHs Percentage No of HHs Percentage
Business 1 8.33 4 6.90
Education Nil Nil 3 5.17
Health 2 16.67 7 12.07
House and Building 1 8.33 6 10.34
Agro-Input 3 25.00 11 18.97
Family Expanses 5 41.67 23 39.66
Towards payment of previous loan Nil Nil 4 6.90
Total 12 100.00 58 100.00
Source: Field Survey,2009
The above table depicts the cause of indebtedness. It is important to analyze the cause of
indebtedness of Lanjia Saora, because borrowing for productive purposes would reduce
the debt burden. The present study shows that out of total household a majority of 39 per
cent of household utilized the loan for family expenses purposes followed by 18.97 per
cent, 12.07 per cent, 10.34 per cent, 6.90 per cent, and 5.17 per cent to meet the
expenses related to Agro-inputs, Health, maintenance and repairing of their houses,
business and to towards payment of previous credit and for education during 2004 to 2009
against 41.67 per cent, 25 per cent and 16.67 per cent respectively for family expenses,
Argo-inputs and health before 2004.
5.2.26 Saving of Households of Lanjia Saora Saving of a household or a community indicates the economic stability of the community. The Table 27 indicates that out of total households only 7.5 per cent (15) household had
savings amounting to Rs.76,087 in 2004, which increased to Rs.2, 47,634 covering 118
(59%) households in 2009. While the saving amount ranged from Rs.375 to Rs.15,000 in
2004, the saving amount ranged from Rs.100 to Rs.30,000 in 2009.
4 Renu Verma, Kurukshetra, September, 2008 in the article “Micro Finance and Empowerment of Rural Women. pp.3-5
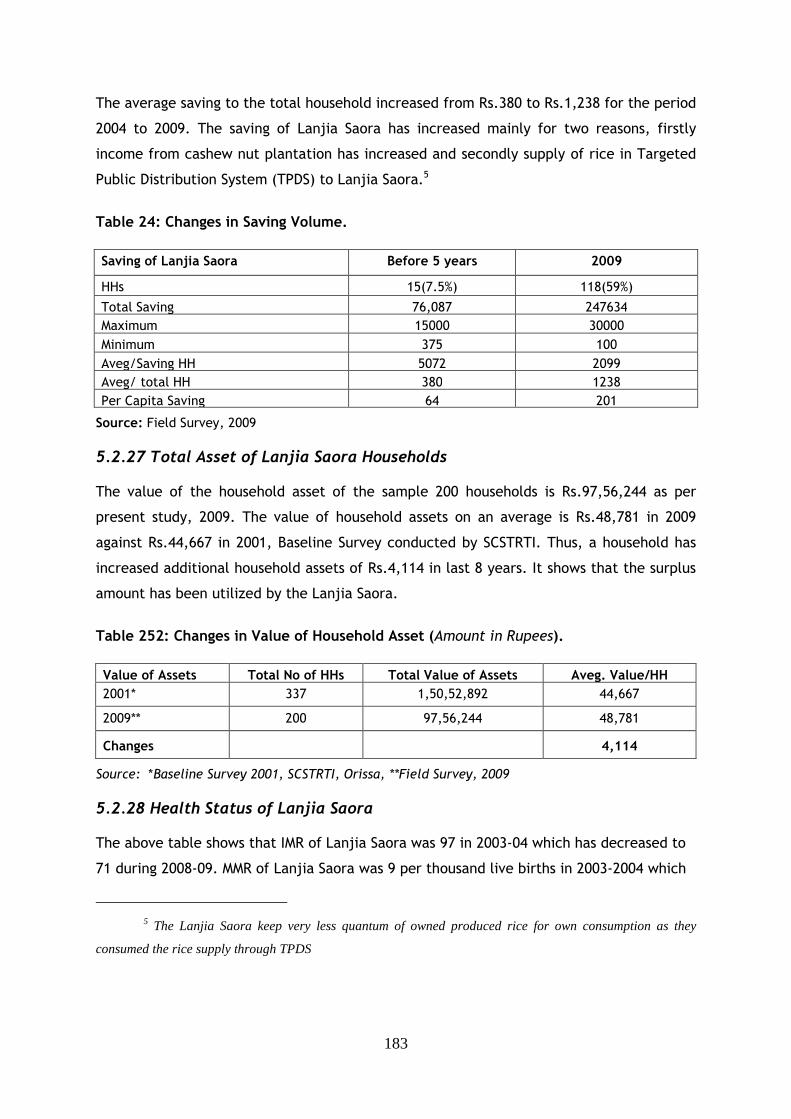
183
The average saving to the total household increased from Rs.380 to Rs.1,238 for the period
2004 to 2009. The saving of Lanjia Saora has increased mainly for two reasons, firstly
income from cashew nut plantation has increased and secondly supply of rice in Targeted
Public Distribution System (TPDS) to Lanjia Saora.5
Table 24: Changes in Saving Volume.
Saving of Lanjia Saora Before 5 years 2009
HHs 15(7.5%) 118(59%)
Total Saving 76,087 247634
Maximum 15000 30000
Minimum 375 100
Aveg/Saving HH 5072 2099
Aveg/ total HH 380 1238
Per Capita Saving 64 201
Source: Field Survey, 2009
5.2.27 Total Asset of Lanjia Saora Households The value of the household asset of the sample 200 households is Rs.97,56,244 as per
present study, 2009. The value of household assets on an average is Rs.48,781 in 2009
against Rs.44,667 in 2001, Baseline Survey conducted by SCSTRTI. Thus, a household has
increased additional household assets of Rs.4,114 in last 8 years. It shows that the surplus
amount has been utilized by the Lanjia Saora.
Table 252: Changes in Value of Household Asset (Amount in Rupees).
Value of Assets Total No of HHs Total Value of Assets Aveg. Value/HH
2001* 337 1,50,52,892 44,667
2009** 200 97,56,244 48,781
Changes 4,114
Source: *Baseline Survey 2001, SCSTRTI, Orissa, **Field Survey, 2009
5.2.28 Health Status of Lanjia Saora The above table shows that IMR of Lanjia Saora was 97 in 2003-04 which has decreased to
71 during 2008-09. MMR of Lanjia Saora was 9 per thousand live births in 2003-2004 which
5 The Lanjia Saora keep very less quantum of owned produced rice for own consumption as they
consumed the rice supply through TPDS
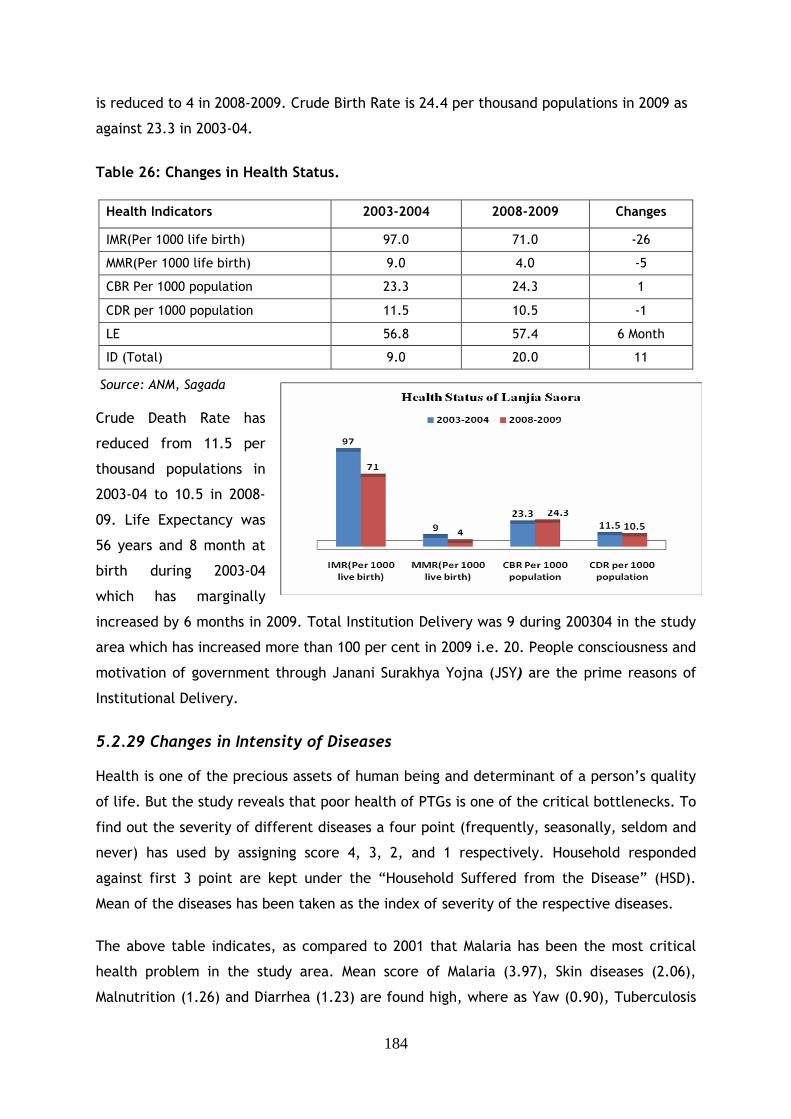
184
is reduced to 4 in 2008-2009. Crude Birth Rate is 24.4 per thousand populations in 2009 as
against 23.3 in 2003-04.
Table 26: Changes in Health Status.
Health Indicators 2003-2004 2008-2009 Changes
IMR(Per 1000 life birth) 97.0 71.0 -26
MMR(Per 1000 life birth) 9.0 4.0 -5
CBR Per 1000 population 23.3 24.3 1
CDR per 1000 population 11.5 10.5 -1
LE 56.8 57.4 6 Month
ID (Total) 9.0 20.0 11
Source: ANM, Sagada
Crude Death Rate has
reduced from 11.5 per
thousand populations in
2003-04 to 10.5 in 2008-
09. Life Expectancy was
56 years and 8 month at
birth during 2003-04
which has marginally
increased by 6 months in 2009. Total Institution Delivery was 9 during 200304 in the study
area which has increased more than 100 per cent in 2009 i.e. 20. People consciousness and
motivation of government through Janani Surakhya Yojna (JSY) are the prime reasons of
Institutional Delivery.
5.2.29 Changes in Intensity of Diseases Health is one of the precious assets of human being and determinant of a person’s quality
of life. But the study reveals that poor health of PTGs is one of the critical bottlenecks. To
find out the severity of different diseases a four point (frequently, seasonally, seldom and
never) has used by assigning score 4, 3, 2, and 1 respectively. Household responded
against first 3 point are kept under the “Household Suffered from the Disease” (HSD).
Mean of the diseases has been taken as the index of severity of the respective diseases.
The above table indicates, as compared to 2001 that Malaria has been the most critical
health problem in the study area. Mean score of Malaria (3.97), Skin diseases (2.06),
Malnutrition (1.26) and Diarrhea (1.23) are found high, where as Yaw (0.90), Tuberculosis
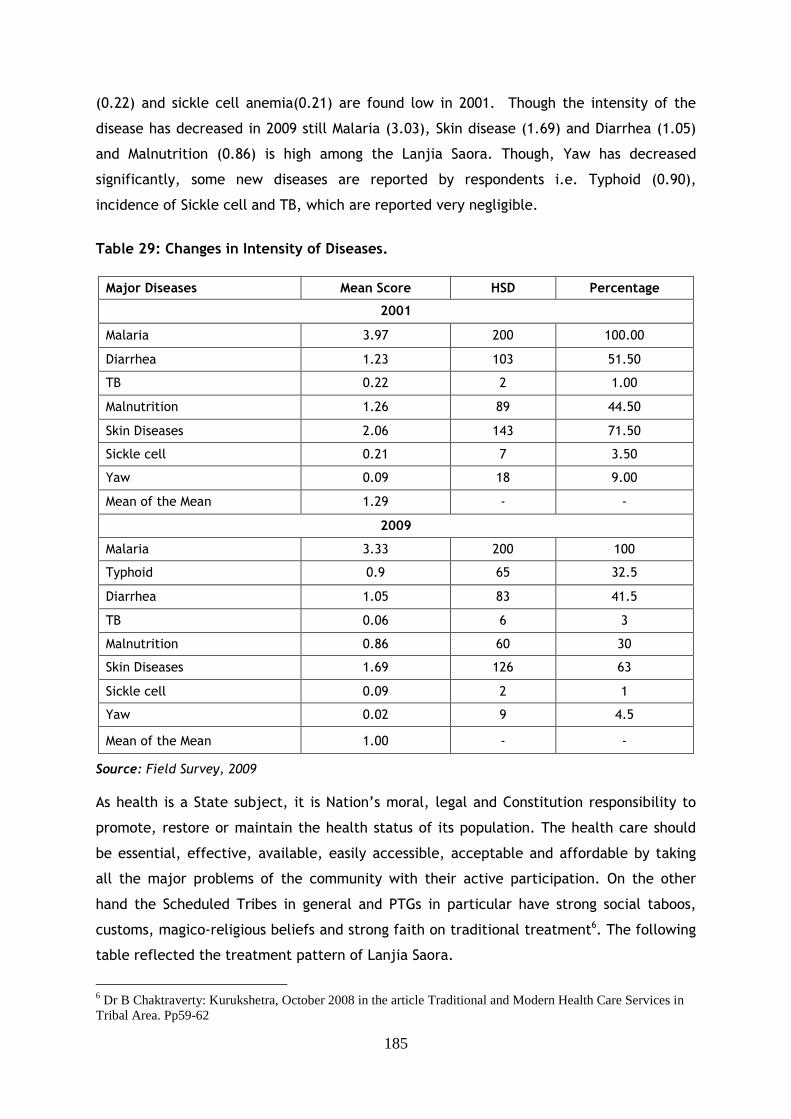
185
(0.22) and sickle cell anemia(0.21) are found low in 2001. Though the intensity of the
disease has decreased in 2009 still Malaria (3.03), Skin disease (1.69) and Diarrhea (1.05)
and Malnutrition (0.86) is high among the Lanjia Saora. Though, Yaw has decreased
significantly, some new diseases are reported by respondents i.e. Typhoid (0.90),
incidence of Sickle cell and TB, which are reported very negligible.
Table 29: Changes in Intensity of Diseases.
Major Diseases Mean Score HSD Percentage
2001
Malaria 3.97 200 100.00
Diarrhea 1.23 103 51.50
TB 0.22 2 1.00
Malnutrition 1.26 89 44.50
Skin Diseases 2.06 143 71.50
Sickle cell 0.21 7 3.50
Yaw 0.09 18 9.00
Mean of the Mean 1.29 - -
2009
Malaria 3.33 200 100
Typhoid 0.9 65 32.5
Diarrhea 1.05 83 41.5
TB 0.06 6 3
Malnutrition 0.86 60 30
Skin Diseases 1.69 126 63
Sickle cell 0.09 2 1
Yaw 0.02 9 4.5
Mean of the Mean 1.00 - -
Source: Field Survey, 2009
As health is a State subject, it is Nation’s moral, legal and Constitution responsibility to
promote, restore or maintain the health status of its population. The health care should
be essential, effective, available, easily accessible, acceptable and affordable by taking
all the major problems of the community with their active participation. On the other
hand the Scheduled Tribes in general and PTGs in particular have strong social taboos,
customs, magico-religious beliefs and strong faith on traditional treatment6. The following
table reflected the treatment pattern of Lanjia Saora.
6 Dr B Chaktraverty: Kurukshetra, October 2008 in the article Traditional and Modern Health Care Services in Tribal Area. Pp59-62
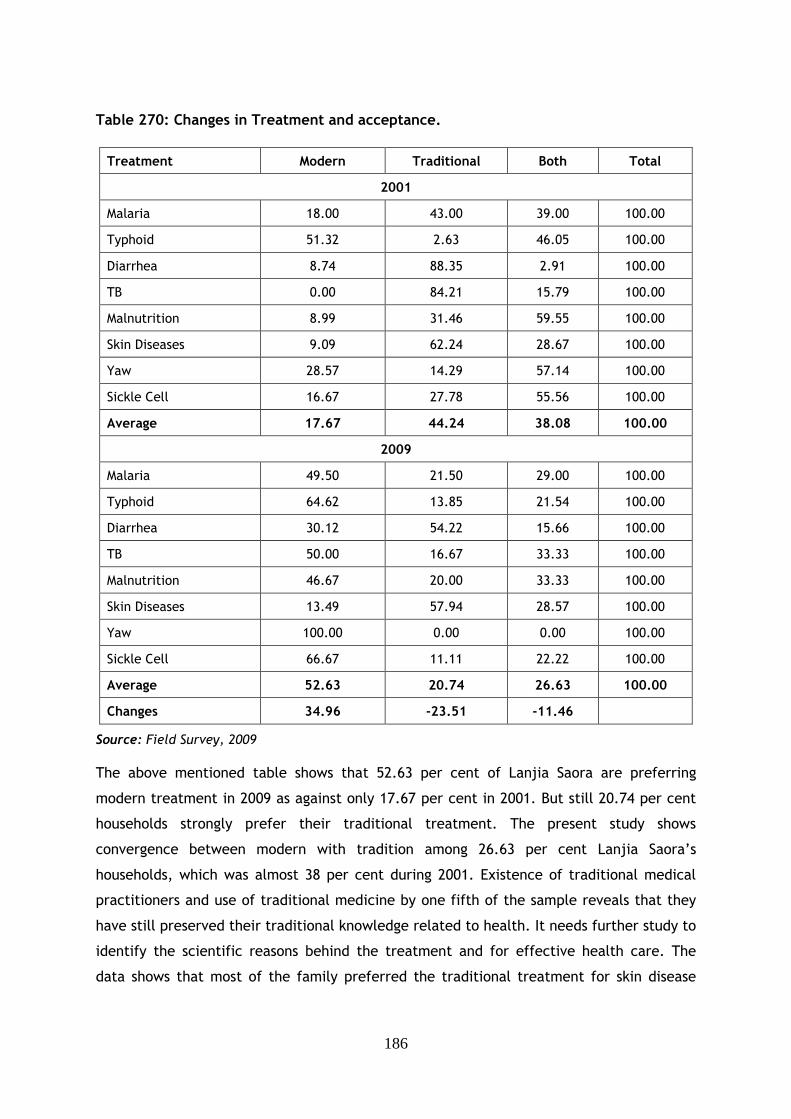
186
Table 270: Changes in Treatment and acceptance.
Treatment Modern Traditional Both Total
2001
Malaria 18.00 43.00 39.00 100.00
Typhoid 51.32 2.63 46.05 100.00
Diarrhea 8.74 88.35 2.91 100.00
TB 0.00 84.21 15.79 100.00
Malnutrition 8.99 31.46 59.55 100.00
Skin Diseases 9.09 62.24 28.67 100.00
Yaw 28.57 14.29 57.14 100.00
Sickle Cell 16.67 27.78 55.56 100.00
Average 17.67 44.24 38.08 100.00
2009
Malaria 49.50 21.50 29.00 100.00
Typhoid 64.62 13.85 21.54 100.00
Diarrhea 30.12 54.22 15.66 100.00
TB 50.00 16.67 33.33 100.00
Malnutrition 46.67 20.00 33.33 100.00
Skin Diseases 13.49 57.94 28.57 100.00
Yaw 100.00 0.00 0.00 100.00
Sickle Cell 66.67 11.11 22.22 100.00
Average 52.63 20.74 26.63 100.00
Changes 34.96 -23.51 -11.46
Source: Field Survey, 2009
The above mentioned table shows that 52.63 per cent of Lanjia Saora are preferring
modern treatment in 2009 as against only 17.67 per cent in 2001. But still 20.74 per cent
households strongly prefer their traditional treatment. The present study shows
convergence between modern with tradition among 26.63 per cent Lanjia Saora’s
households, which was almost 38 per cent during 2001. Existence of traditional medical
practitioners and use of traditional medicine by one fifth of the sample reveals that they
have still preserved their traditional knowledge related to health. It needs further study to
identify the scientific reasons behind the treatment and for effective health care. The
data shows that most of the family preferred the traditional treatment for skin disease
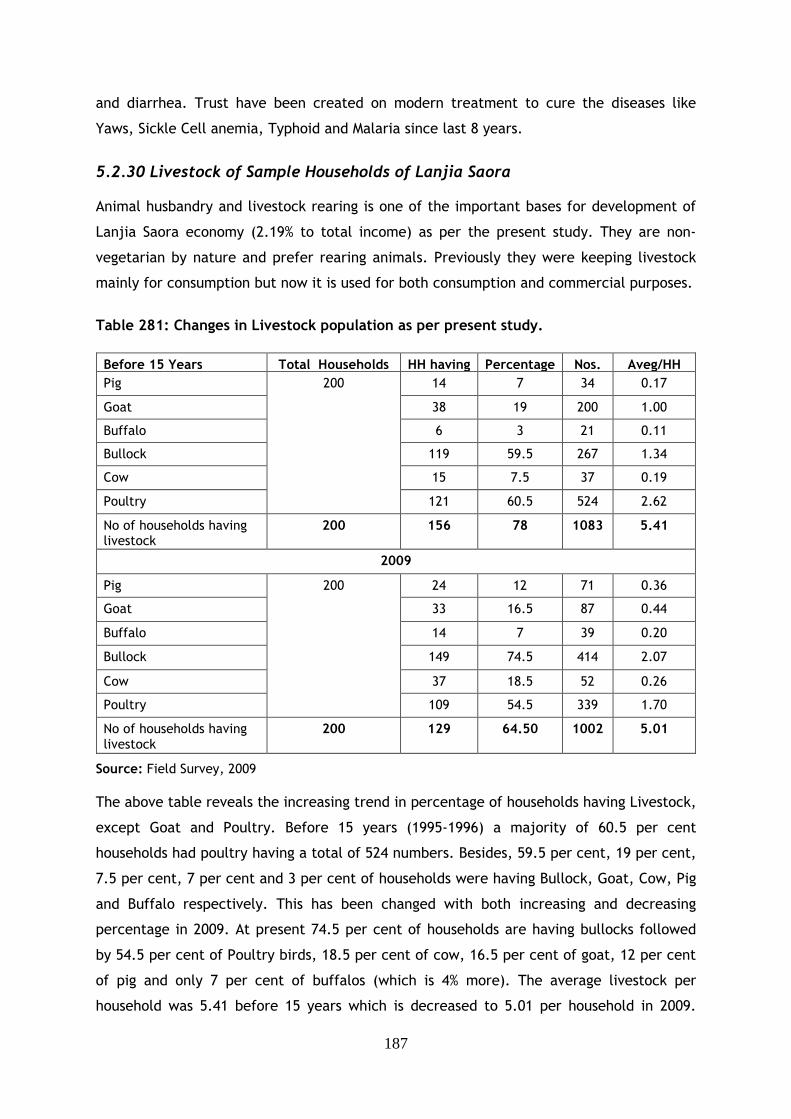
187
and diarrhea. Trust have been created on modern treatment to cure the diseases like
Yaws, Sickle Cell anemia, Typhoid and Malaria since last 8 years.
5.2.30 Livestock of Sample Households of Lanjia Saora Animal husbandry and livestock rearing is one of the important bases for development of
Lanjia Saora economy (2.19% to total income) as per the present study. They are non-
vegetarian by nature and prefer rearing animals. Previously they were keeping livestock
mainly for consumption but now it is used for both consumption and commercial purposes.
Table 281: Changes in Livestock population as per present study.
Before 15 Years Total Households HH having Percentage Nos. Aveg/HH
Pig 14 7 34 0.17
Goat 38 19 200 1.00
Buffalo 6 3 21 0.11
Bullock 119 59.5 267 1.34
Cow 15 7.5 37 0.19
Poultry
200
121 60.5 524 2.62
No of households having livestock
200 156 78 1083 5.41
2009
Pig 24 12 71 0.36
Goat 33 16.5 87 0.44
Buffalo 14 7 39 0.20
Bullock 149 74.5 414 2.07
Cow 37 18.5 52 0.26
Poultry
200
109 54.5 339 1.70
No of households having livestock
200 129 64.50 1002 5.01
Source: Field Survey, 2009
The above table reveals the increasing trend in percentage of households having Livestock,
except Goat and Poultry. Before 15 years (1995-1996) a majority of 60.5 per cent
households had poultry having a total of 524 numbers. Besides, 59.5 per cent, 19 per cent,
7.5 per cent, 7 per cent and 3 per cent of households were having Bullock, Goat, Cow, Pig
and Buffalo respectively. This has been changed with both increasing and decreasing
percentage in 2009. At present 74.5 per cent of households are having bullocks followed
by 54.5 per cent of Poultry birds, 18.5 per cent of cow, 16.5 per cent of goat, 12 per cent
of pig and only 7 per cent of buffalos (which is 4% more). The average livestock per
household was 5.41 before 15 years which is decreased to 5.01 per household in 2009.
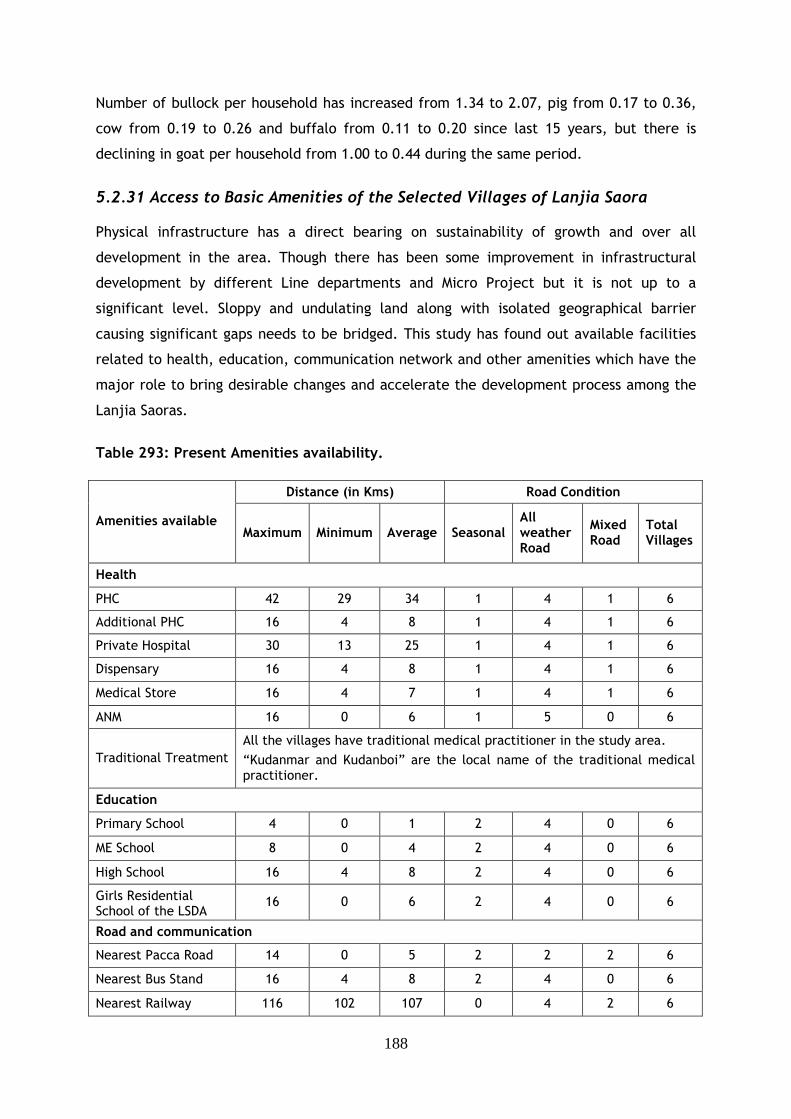
188
Number of bullock per household has increased from 1.34 to 2.07, pig from 0.17 to 0.36,
cow from 0.19 to 0.26 and buffalo from 0.11 to 0.20 since last 15 years, but there is
declining in goat per household from 1.00 to 0.44 during the same period.
5.2.31 Access to Basic Amenities of the Selected Villages of Lanjia Saora Physical infrastructure has a direct bearing on sustainability of growth and over all
development in the area. Though there has been some improvement in infrastructural
development by different Line departments and Micro Project but it is not up to a
significant level. Sloppy and undulating land along with isolated geographical barrier
causing significant gaps needs to be bridged. This study has found out available facilities
related to health, education, communication network and other amenities which have the
major role to bring desirable changes and accelerate the development process among the
Lanjia Saoras.
Table 293: Present Amenities availability.
Distance (in Kms) Road Condition
Amenities available Maximum Minimum Average Seasonal
All weather Road
Mixed Road
Total Villages
Health
PHC 42 29 34 1 4 1 6
Additional PHC 16 4 8 1 4 1 6
Private Hospital 30 13 25 1 4 1 6
Dispensary 16 4 8 1 4 1 6
Medical Store 16 4 7 1 4 1 6
ANM 16 0 6 1 5 0 6
Traditional Treatment
All the villages have traditional medical practitioner in the study area.
“Kudanmar and Kudanboi” are the local name of the traditional medical practitioner.
Education
Primary School 4 0 1 2 4 0 6
ME School 8 0 4 2 4 0 6
High School 16 4 8 2 4 0 6
Girls Residential School of the LSDA
16 0 6 2 4 0 6
Road and communication
Nearest Pacca Road 14 0 5 2 2 2 6
Nearest Bus Stand 16 4 8 2 4 0 6
Nearest Railway 116 102 107 0 4 2 6
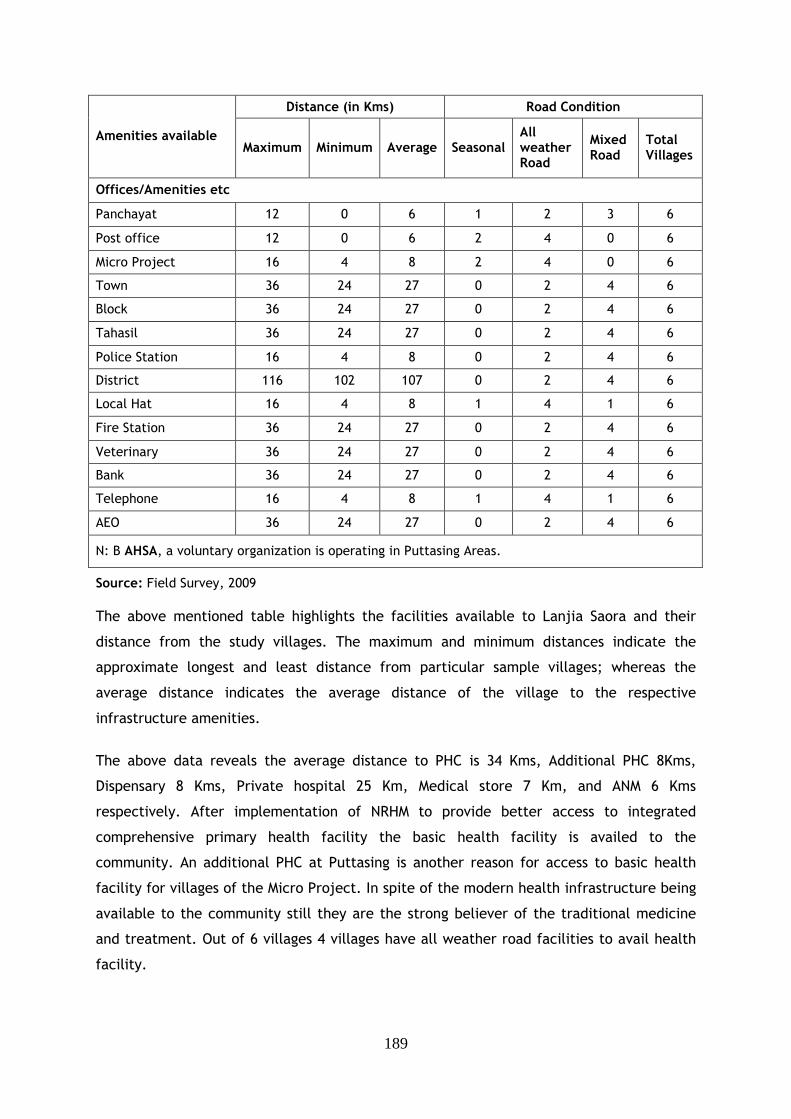
189
Distance (in Kms) Road Condition
Amenities available Maximum Minimum Average Seasonal
All weather Road
Mixed Road
Total Villages
Offices/Amenities etc
Panchayat 12 0 6 1 2 3 6
Post office 12 0 6 2 4 0 6
Micro Project 16 4 8 2 4 0 6
Town 36 24 27 0 2 4 6
Block 36 24 27 0 2 4 6
Tahasil 36 24 27 0 2 4 6
Police Station 16 4 8 0 2 4 6
District 116 102 107 0 2 4 6
Local Hat 16 4 8 1 4 1 6
Fire Station 36 24 27 0 2 4 6
Veterinary 36 24 27 0 2 4 6
Bank 36 24 27 0 2 4 6
Telephone 16 4 8 1 4 1 6
AEO 36 24 27 0 2 4 6
N: B AHSA, a voluntary organization is operating in Puttasing Areas.
Source: Field Survey, 2009
The above mentioned table highlights the facilities available to Lanjia Saora and their
distance from the study villages. The maximum and minimum distances indicate the
approximate longest and least distance from particular sample villages; whereas the
average distance indicates the average distance of the village to the respective
infrastructure amenities.
The above data reveals the average distance to PHC is 34 Kms, Additional PHC 8Kms,
Dispensary 8 Kms, Private hospital 25 Km, Medical store 7 Km, and ANM 6 Kms
respectively. After implementation of NRHM to provide better access to integrated
comprehensive primary health facility the basic health facility is availed to the
community. An additional PHC at Puttasing is another reason for access to basic health
facility for villages of the Micro Project. In spite of the modern health infrastructure being
available to the community still they are the strong believer of the traditional medicine
and treatment. Out of 6 villages 4 villages have all weather road facilities to avail health
facility.
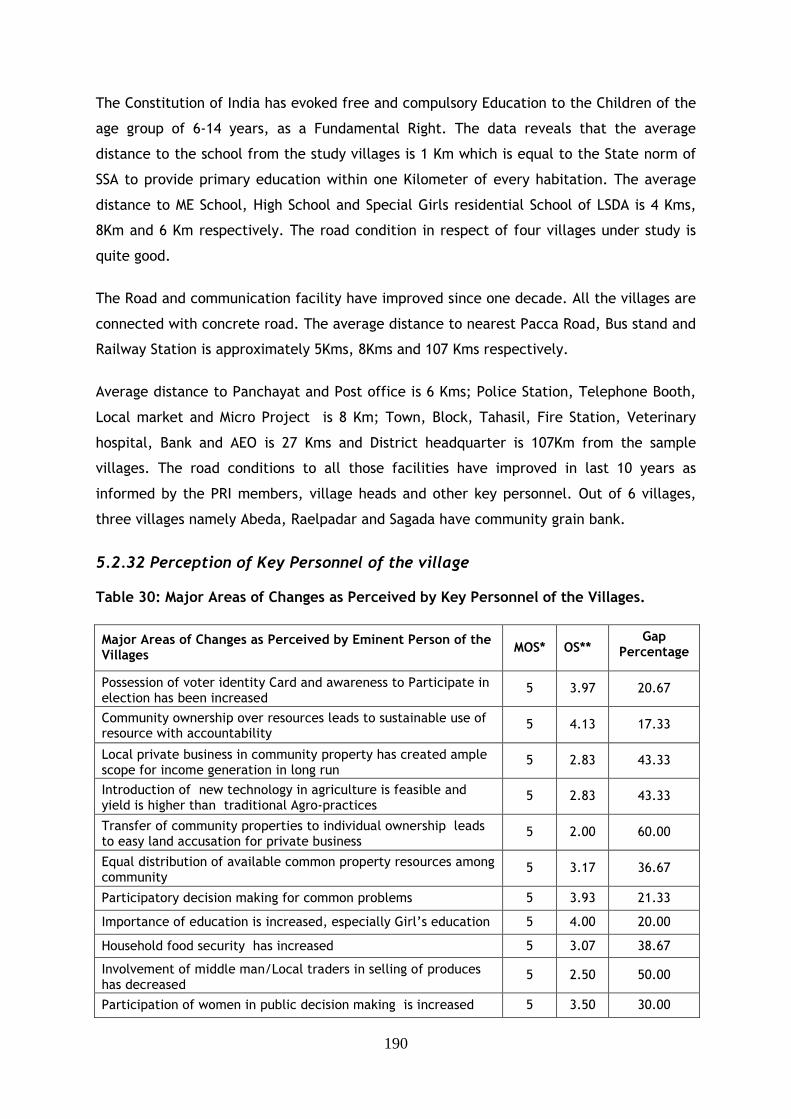
190
The Constitution of India has evoked free and compulsory Education to the Children of the
age group of 6-14 years, as a Fundamental Right. The data reveals that the average
distance to the school from the study villages is 1 Km which is equal to the State norm of
SSA to provide primary education within one Kilometer of every habitation. The average
distance to ME School, High School and Special Girls residential School of LSDA is 4 Kms,
8Km and 6 Km respectively. The road condition in respect of four villages under study is
quite good.
The Road and communication facility have improved since one decade. All the villages are
connected with concrete road. The average distance to nearest Pacca Road, Bus stand and
Railway Station is approximately 5Kms, 8Kms and 107 Kms respectively.
Average distance to Panchayat and Post office is 6 Kms; Police Station, Telephone Booth,
Local market and Micro Project is 8 Km; Town, Block, Tahasil, Fire Station, Veterinary
hospital, Bank and AEO is 27 Kms and District headquarter is 107Km from the sample
villages. The road conditions to all those facilities have improved in last 10 years as
informed by the PRI members, village heads and other key personnel. Out of 6 villages,
three villages namely Abeda, Raelpadar and Sagada have community grain bank.
5.2.32 Perception of Key Personnel of the village Table 30: Major Areas of Changes as Perceived by Key Personnel of the Villages.
Major Areas of Changes as Perceived by Eminent Person of the Villages
MOS* OS** Gap
Percentage
Possession of voter identity Card and awareness to Participate in election has been increased
5 3.97 20.67
Community ownership over resources leads to sustainable use of resource with accountability
5 4.13 17.33
Local private business in community property has created ample scope for income generation in long run
5 2.83 43.33
Introduction of new technology in agriculture is feasible and yield is higher than traditional Agro-practices
5 2.83 43.33
Transfer of community properties to individual ownership leads to easy land accusation for private business
5 2.00 60.00
Equal distribution of available common property resources among community
5 3.17 36.67
Participatory decision making for common problems 5 3.93 21.33
Importance of education is increased, especially Girl’s education 5 4.00 20.00
Household food security has increased 5 3.07 38.67
Involvement of middle man/Local traders in selling of produces has decreased
5 2.50 50.00
Participation of women in public decision making is increased 5 3.50 30.00
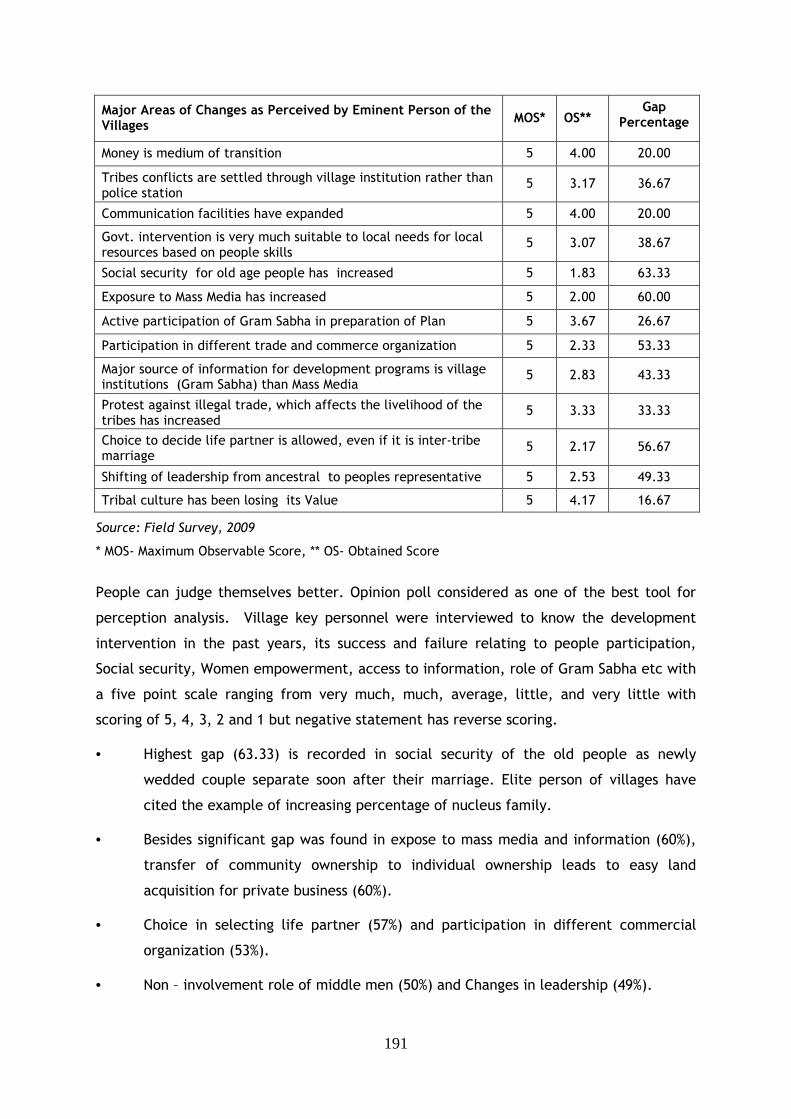
191
Major Areas of Changes as Perceived by Eminent Person of the Villages
MOS* OS** Gap
Percentage
Money is medium of transition 5 4.00 20.00
Tribes conflicts are settled through village institution rather than police station
5 3.17 36.67
Communication facilities have expanded 5 4.00 20.00
Govt. intervention is very much suitable to local needs for local resources based on people skills
5 3.07 38.67
Social security for old age people has increased 5 1.83 63.33
Exposure to Mass Media has increased 5 2.00 60.00
Active participation of Gram Sabha in preparation of Plan 5 3.67 26.67
Participation in different trade and commerce organization 5 2.33 53.33
Major source of information for development programs is village institutions (Gram Sabha) than Mass Media
5 2.83 43.33
Protest against illegal trade, which affects the livelihood of the tribes has increased
5 3.33 33.33
Choice to decide life partner is allowed, even if it is inter-tribe marriage
5 2.17 56.67
Shifting of leadership from ancestral to peoples representative 5 2.53 49.33
Tribal culture has been losing its Value 5 4.17 16.67
Source: Field Survey, 2009
* MOS- Maximum Observable Score, ** OS- Obtained Score
People can judge themselves better. Opinion poll considered as one of the best tool for
perception analysis. Village key personnel were interviewed to know the development
intervention in the past years, its success and failure relating to people participation,
Social security, Women empowerment, access to information, role of Gram Sabha etc with
a five point scale ranging from very much, much, average, little, and very little with
scoring of 5, 4, 3, 2 and 1 but negative statement has reverse scoring.
• Highest gap (63.33) is recorded in social security of the old people as newly
wedded couple separate soon after their marriage. Elite person of villages have
cited the example of increasing percentage of nucleus family.
• Besides significant gap was found in expose to mass media and information (60%),
transfer of community ownership to individual ownership leads to easy land
acquisition for private business (60%).
• Choice in selecting life partner (57%) and participation in different commercial
organization (53%).
• Non – involvement role of middle men (50%) and Changes in leadership (49%).
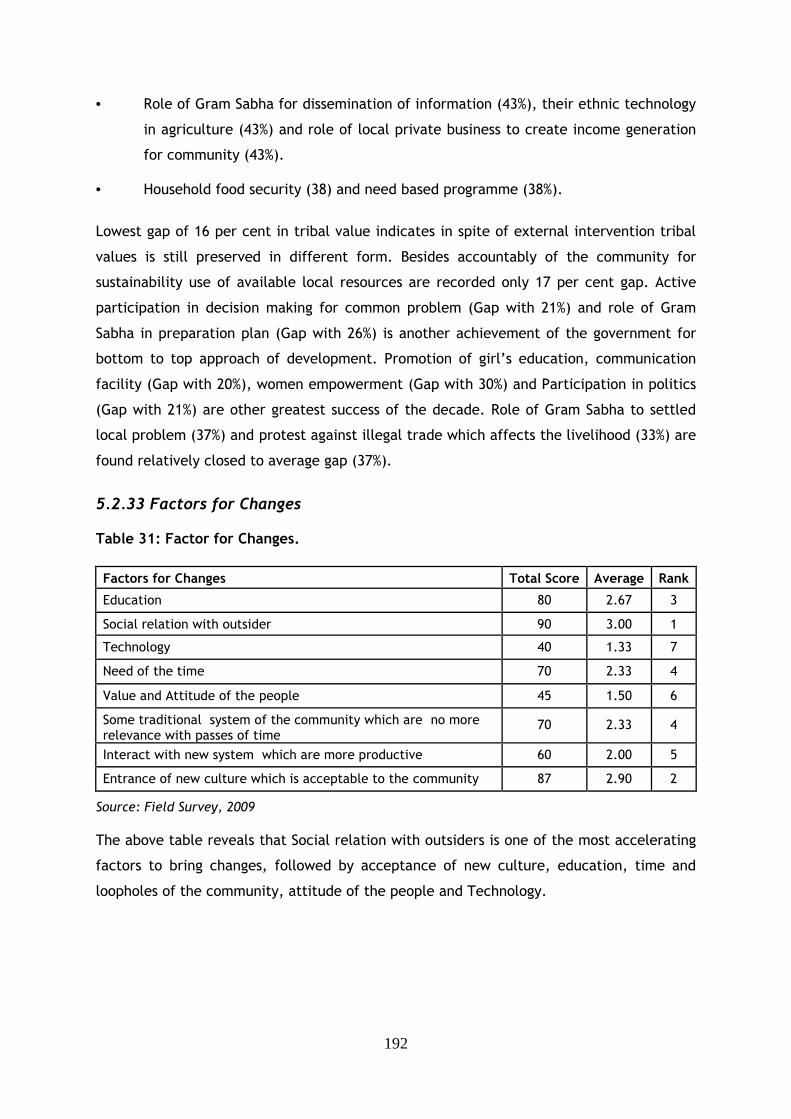
192
• Role of Gram Sabha for dissemination of information (43%), their ethnic technology
in agriculture (43%) and role of local private business to create income generation
for community (43%).
• Household food security (38) and need based programme (38%).
Lowest gap of 16 per cent in tribal value indicates in spite of external intervention tribal
values is still preserved in different form. Besides accountably of the community for
sustainability use of available local resources are recorded only 17 per cent gap. Active
participation in decision making for common problem (Gap with 21%) and role of Gram
Sabha in preparation plan (Gap with 26%) is another achievement of the government for
bottom to top approach of development. Promotion of girl’s education, communication
facility (Gap with 20%), women empowerment (Gap with 30%) and Participation in politics
(Gap with 21%) are other greatest success of the decade. Role of Gram Sabha to settled
local problem (37%) and protest against illegal trade which affects the livelihood (33%) are
found relatively closed to average gap (37%).
5.2.33 Factors for Changes Table 31: Factor for Changes.
Factors for Changes Total Score Average
Score Rank
Education 80 2.67 3
Social relation with outsider 90 3.00 1
Technology 40 1.33 7
Need of the time 70 2.33 4
Value and Attitude of the people 45 1.50 6
Some traditional system of the community which are no more relevance with passes of time
70 2.33 4
Interact with new system which are more productive 60 2.00 5
Entrance of new culture which is acceptable to the community 87 2.90 2
Source: Field Survey, 2009
The above table reveals that Social relation with outsiders is one of the most accelerating
factors to bring changes, followed by acceptance of new culture, education, time and
loopholes of the community, attitude of the people and Technology.
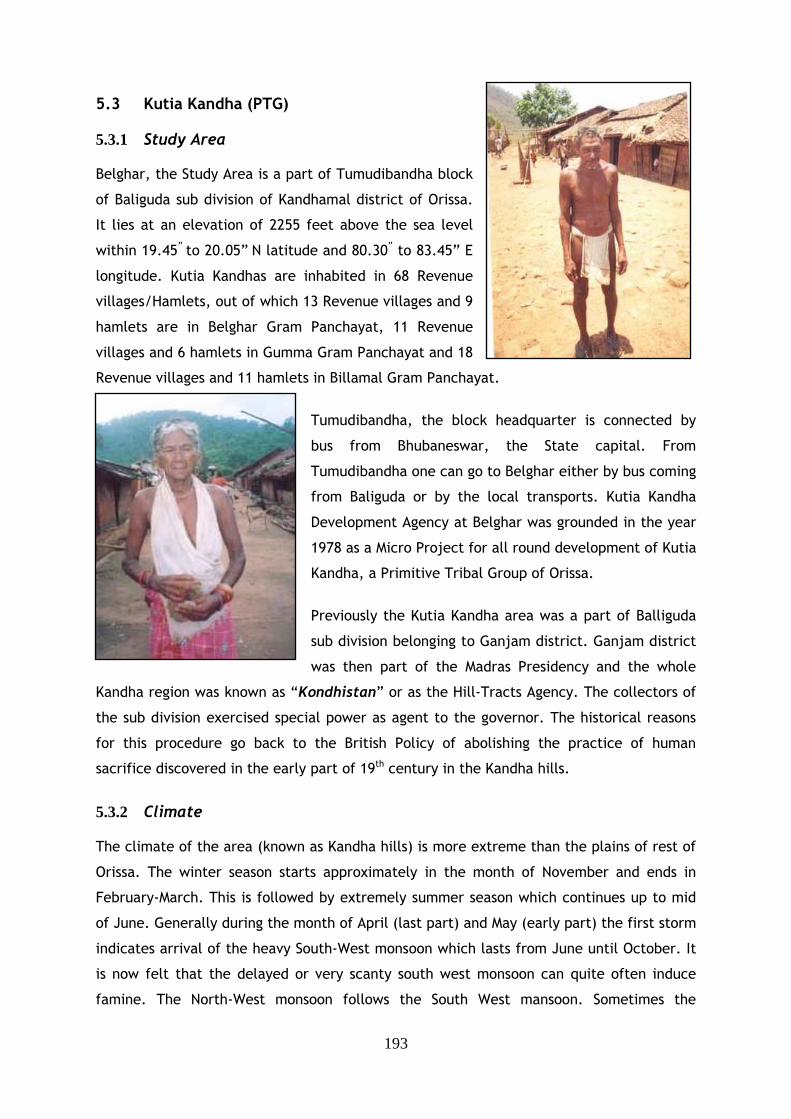
193
5.3 Kutia Kandha (PTG)
5.3.1 Study Area Belghar, the Study Area is a part of Tumudibandha block
of Baliguda sub division of Kandhamal district of Orissa.
It lies at an elevation of 2255 feet above the sea level
within 19.45” to 20.05” N latitude and 80.30” to 83.45” E
longitude. Kutia Kandhas are inhabited in 68 Revenue
villages/Hamlets, out of which 13 Revenue villages and 9
hamlets are in Belghar Gram Panchayat, 11 Revenue
villages and 6 hamlets in Gumma Gram Panchayat and 18
Revenue villages and 11 hamlets in Billamal Gram Panchayat.
Tumudibandha, the block headquarter is connected by
bus from Bhubaneswar, the State capital. From
Tumudibandha one can go to Belghar either by bus coming
from Baliguda or by the local transports. Kutia Kandha
Development Agency at Belghar was grounded in the year
1978 as a Micro Project for all round development of Kutia
Kandha, a Primitive Tribal Group of Orissa.
Previously the Kutia Kandha area was a part of Balliguda
sub division belonging to Ganjam district. Ganjam district
was then part of the Madras Presidency and the whole
Kandha region was known as “Kondhistan” or as the Hill-Tracts Agency. The collectors of
the sub division exercised special power as agent to the governor. The historical reasons
for this procedure go back to the British Policy of abolishing the practice of human
sacrifice discovered in the early part of 19th century in the Kandha hills.
5.3.2 Climate The climate of the area (known as Kandha hills) is more extreme than the plains of rest of
Orissa. The winter season starts approximately in the month of November and ends in
February-March. This is followed by extremely summer season which continues up to mid
of June. Generally during the month of April (last part) and May (early part) the first storm
indicates arrival of the heavy South-West monsoon which lasts from June until October. It
is now felt that the delayed or very scanty south west monsoon can quite often induce
famine. The North-West monsoon follows the South West mansoon. Sometimes the
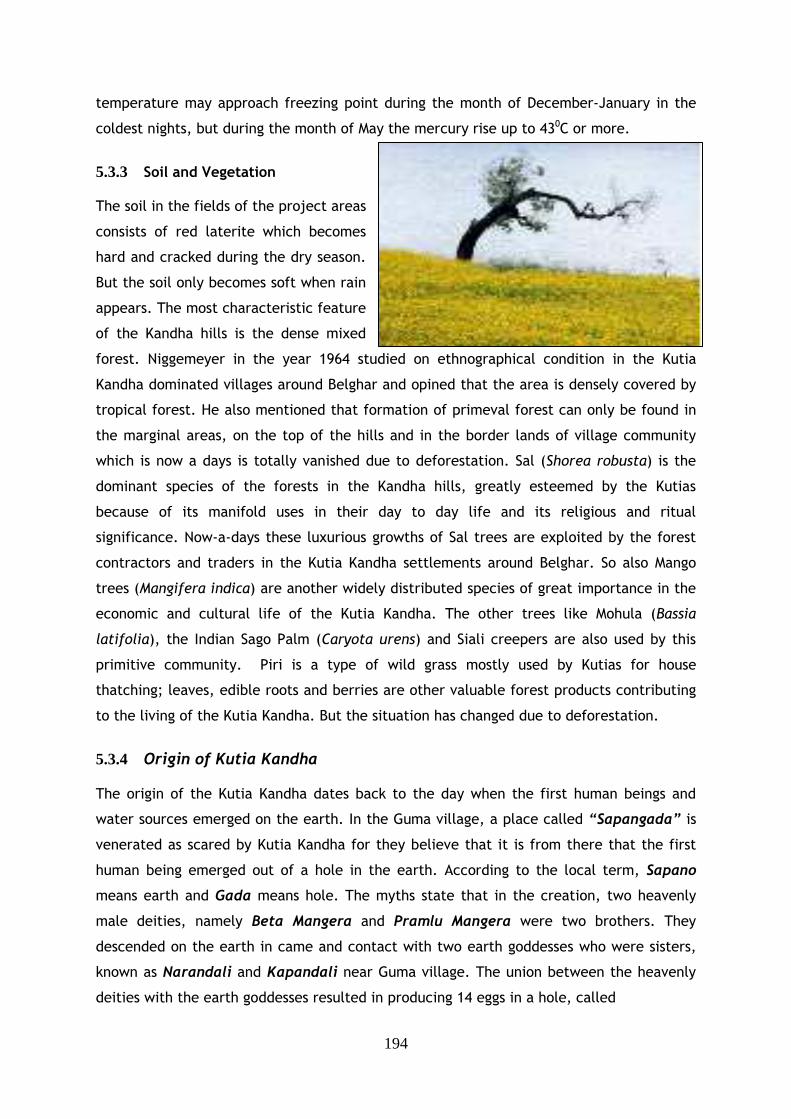
194
temperature may approach freezing point during the month of December-January in the
coldest nights, but during the month of May the mercury rise up to 430C or more.
5.3.3 Soil and Vegetation The soil in the fields of the project areas
consists of red laterite which becomes
hard and cracked during the dry season.
But the soil only becomes soft when rain
appears. The most characteristic feature
of the Kandha hills is the dense mixed
forest. Niggemeyer in the year 1964 studied on ethnographical condition in the Kutia
Kandha dominated villages around Belghar and opined that the area is densely covered by
tropical forest. He also mentioned that formation of primeval forest can only be found in
the marginal areas, on the top of the hills and in the border lands of village community
which is now a days is totally vanished due to deforestation. Sal (Shorea robusta) is the
dominant species of the forests in the Kandha hills, greatly esteemed by the Kutias
because of its manifold uses in their day to day life and its religious and ritual
significance. Now-a-days these luxurious growths of Sal trees are exploited by the forest
contractors and traders in the Kutia Kandha settlements around Belghar. So also Mango
trees (Mangifera indica) are another widely distributed species of great importance in the
economic and cultural life of the Kutia Kandha. The other trees like Mohula (Bassia
latifolia), the Indian Sago Palm (Caryota urens) and Siali creepers are also used by this
primitive community. Piri is a type of wild grass mostly used by Kutias for house
thatching; leaves, edible roots and berries are other valuable forest products contributing
to the living of the Kutia Kandha. But the situation has changed due to deforestation.
5.3.4 Origin of Kutia Kandha The origin of the Kutia Kandha dates back to the day when the first human beings and
water sources emerged on the earth. In the Guma village, a place called “Sapangada” is
venerated as scared by Kutia Kandha for they believe that it is from there that the first
human being emerged out of a hole in the earth. According to the local term, Sapano
means earth and Gada means hole. The myths state that in the creation, two heavenly
male deities, namely Beta Mangera and Pramlu Mangera were two brothers. They
descended on the earth in came and contact with two earth goddesses who were sisters,
known as Narandali and Kapandali near Guma village. The union between the heavenly
deities with the earth goddesses resulted in producing 14 eggs in a hole, called
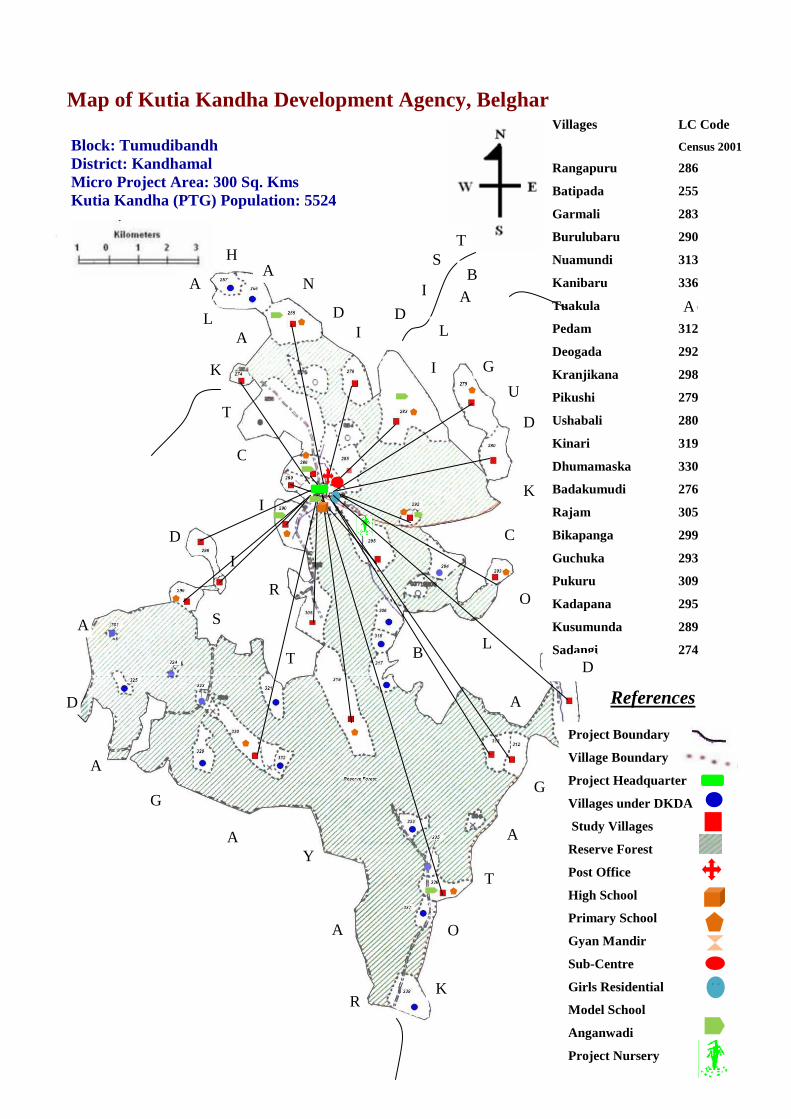
195
Map of Kutia Kandha Development Agency, Belghar
Block: Tumudibandh District: Kandhamal Micro Project Area: 300 Sq. Kms Kutia Kandha (PTG) Population: 5524
Villages LC Code
Census 2001
Rangapuru 286
Batipada 255
Garmali 283
Burulubaru 290
Nuamundi 313
Kanibaru 336
Tuakula 285
Pedam 312
Deogada 292
Kranjikana 298
Pikushi 279
Ushabali 280
Kinari 319
Dhumamaska 330
Badakumudi 276
Rajam 305
Bikapanga 299
Guchuka 293
Pukuru 309
Kadapana 295
Kusumunda 289
Sadangi 274
K
A
G
A
D
T
O
A
B L
O
C
K
R
A
Y A
G
A
D
A
D
S
T
I
R
I
C
T
K
A L
A
H A
N
D I
D
I
S T
B A
L
I G
U
D
A
Project Boundary
Village Boundary
Project Headquarter
Villages under DKDA
Study Villages
Reserve Forest
Post Office
High School
Primary School
Gyan Mandir
Sub-Centre
Girls Residential
Model School
Anganwadi
Project Nursery
References
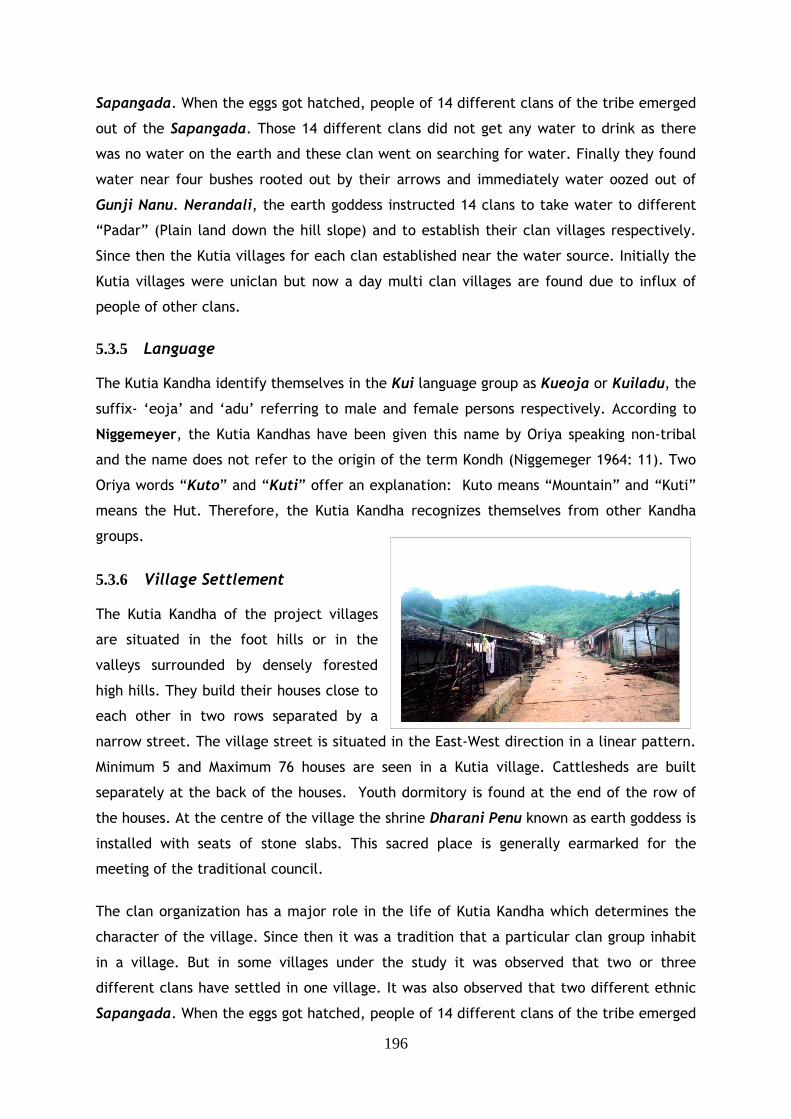
196
Sapangada. When the eggs got hatched, people of 14 different clans of the tribe emerged
out of the Sapangada. Those 14 different clans did not get any water to drink as there
was no water on the earth and these clan went on searching for water. Finally they found
water near four bushes rooted out by their arrows and immediately water oozed out of
Gunji Nanu. Nerandali, the earth goddess instructed 14 clans to take water to different
“Padar” (Plain land down the hill slope) and to establish their clan villages respectively.
Since then the Kutia villages for each clan established near the water source. Initially the
Kutia villages were uniclan but now a day multi clan villages are found due to influx of
people of other clans.
5.3.5 Language The Kutia Kandha identify themselves in the Kui language group as Kueoja or Kuiladu, the
suffix- ‘eoja’ and ‘adu’ referring to male and female persons respectively. According to
Niggemeyer, the Kutia Kandhas have been given this name by Oriya speaking non-tribal
and the name does not refer to the origin of the term Kondh (Niggemeger 1964: 11). Two
Oriya words “Kuto” and “Kuti” offer an explanation: Kuto means “Mountain” and “Kuti”
means the Hut. Therefore, the Kutia Kandha recognizes themselves from other Kandha
groups.
5.3.6 Village Settlement The Kutia Kandha of the project villages
are situated in the foot hills or in the
valleys surrounded by densely forested
high hills. They build their houses close to
each other in two rows separated by a
narrow street. The village street is situated in the East-West direction in a linear pattern.
Minimum 5 and Maximum 76 houses are seen in a Kutia village. Cattlesheds are built
separately at the back of the houses. Youth dormitory is found at the end of the row of
the houses. At the centre of the village the shrine Dharani Penu known as earth goddess is
installed with seats of stone slabs. This sacred place is generally earmarked for the
meeting of the traditional council.
The clan organization has a major role in the life of Kutia Kandha which determines the
character of the village. Since then it was a tradition that a particular clan group inhabit
in a village. But in some villages under the study it was observed that two or three
different clans have settled in one village. It was also observed that two different ethnic
Sapangada. When the eggs got hatched, people of 14 different clans of the tribe emerged
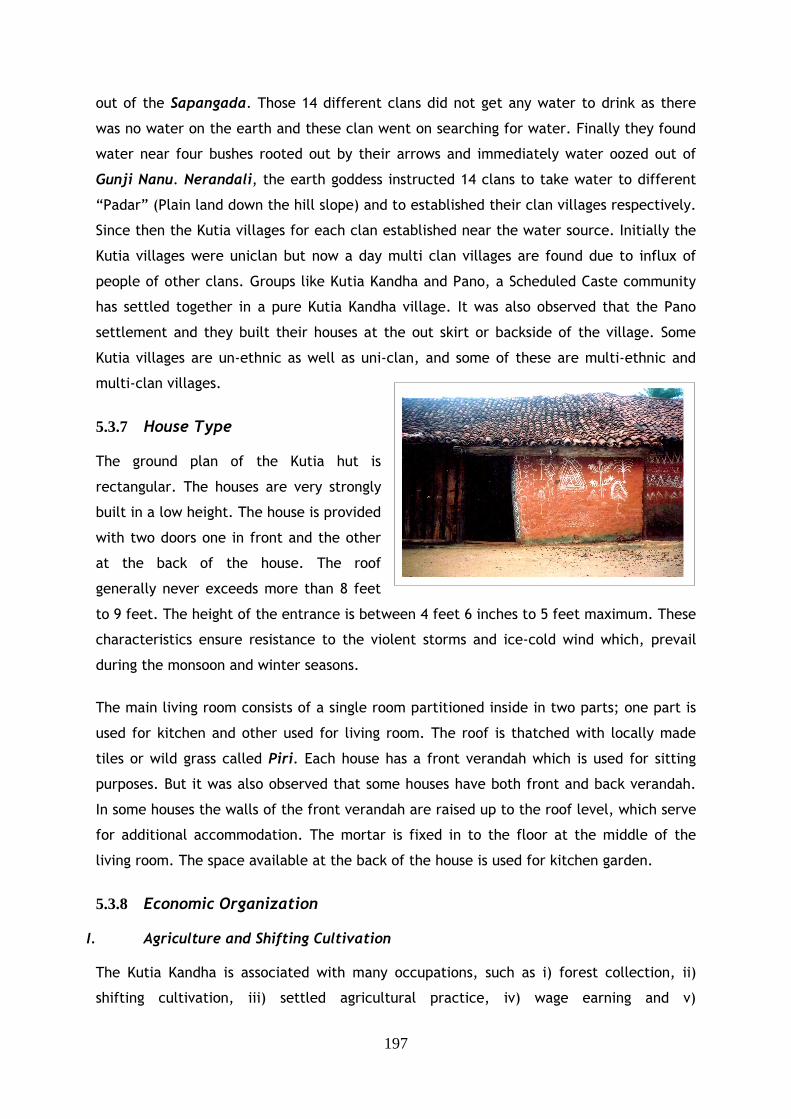
197
out of the Sapangada. Those 14 different clans did not get any water to drink as there
was no water on the earth and these clan went on searching for water. Finally they found
water near four bushes rooted out by their arrows and immediately water oozed out of
Gunji Nanu. Nerandali, the earth goddess instructed 14 clans to take water to different
“Padar” (Plain land down the hill slope) and to established their clan villages respectively.
Since then the Kutia villages for each clan established near the water source. Initially the
Kutia villages were uniclan but now a day multi clan villages are found due to influx of
people of other clans. Groups like Kutia Kandha and Pano, a Scheduled Caste community
has settled together in a pure Kutia Kandha village. It was also observed that the Pano
settlement and they built their houses at the out skirt or backside of the village. Some
Kutia villages are un-ethnic as well as uni-clan, and some of these are multi-ethnic and
multi-clan villages.
5.3.7 House Type The ground plan of the Kutia hut is
rectangular. The houses are very strongly
built in a low height. The house is provided
with two doors one in front and the other
at the back of the house. The roof
generally never exceeds more than 8 feet
to 9 feet. The height of the entrance is between 4 feet 6 inches to 5 feet maximum. These
characteristics ensure resistance to the violent storms and ice-cold wind which, prevail
during the monsoon and winter seasons.
The main living room consists of a single room partitioned inside in two parts; one part is
used for kitchen and other used for living room. The roof is thatched with locally made
tiles or wild grass called Piri. Each house has a front verandah which is used for sitting
purposes. But it was also observed that some houses have both front and back verandah.
In some houses the walls of the front verandah are raised up to the roof level, which serve
for additional accommodation. The mortar is fixed in to the floor at the middle of the
living room. The space available at the back of the house is used for kitchen garden.
5.3.8 Economic Organization
I. Agriculture and Shifting Cultivation The Kutia Kandha is associated with many occupations, such as i) forest collection, ii)
shifting cultivation, iii) settled agricultural practice, iv) wage earning and v)
198
domestication of animal care. Inter dependence and cooperation of male and female are
based on all economic pursuits from production to consumption.
The economy of Kutia Kandha community has the following characteristic features:
• They have a meager possession of settled cultivable land. Generally, the average
settled land for household comes to 1 acre or slightly more.
• They have an economy based simple division of labour based an age and sex.
• Barter economy is still prevailing in Kutia Kandha society.
• The indigenous implements used being simple in nature is produced lowly.
• The Kutias have a very simple traditional technology outlook which results in lower
productivity.
The saving from various sources affects due to low rate of productivity. The surplus
savings of a family is spent during the time of new born baby, occurrence of death ritual,
wedding and various religious ceremonies. Over expenditure on social ceremonies has
caused indebtedness for most of the households. The degree of indebtedness from the
local Money lenders (Sahukars) is predominantly found in most of the Kutia families.
Annual out-put of goods and services of Kutia economy are not sufficient to give a descent
living rather it is mostly a substances economy of hand to mouth existences.
The main occupation of the Kutia Kandha is shifting cultivation and settled agriculture. All
types of minor millets are used only as food stuff where as some crops are sold in the
market for money to buy their daily necessities like kerosene, salt, tobacco, match box
etc. Similarly, all vegetables grown in the kitchen garden are consumed at home. But oil
seeds like mustards and til are sold in the local market for cash. They practice hunting and
collect minor forest produce which they sell in the market.
Type of Land (For Cultivation) The cultivated land in the Kutia Kandha area is divided into five categories, i) Kitchen
garden (backyard plantation), ii) Bada land (Plain land adjutants to the village boundary)
iii) Up land: The land lying at the foot hills are called Bata (Up lands), iv) Wet land or
low land: The low lands are called as paddy lands. Locally this type of land is known as
‘mera’. v) Shifting cultivation land or patches locally called as ‘Nella’.
II. Wage Earning Wage earning is one of the important components in their economy. Both male and female
in a Kutia society go for daily wage earning. They work as wage laborers for other
199
peasants, government agencies like Forest, Rural Development, work and Panchayati Raj
Department as also for private contractors. But they are paid less than the minimum wage
rate fixed by the government. Very few of them are engaged in technical trades
(Vocational trades). According to the age group the boys and girls perform various jobs.
But in case of grown up persons, they shoulder the heavy and strenuous work. The women
are generally given much lighter work in comparison to their male counterpart.
III. Forest Produces Collection of minor forest produces is an integral aspect of Kutia kandha economy. Earlier
forest produces did support their livelihood for 3 to 4 months. But the trend has been
changed. Siali leaves, hill brooms, tamarinds, mahua flower, mahua seeds, Jhuna and
honey are the major forest produces in the Kutia Kandha areas. Collection of Siali leaves
has increased since last 10 years as it fetches good price in the local market. Due to
deforestation (shifting cultivation) and promotion of commercial trees by the forest
department the locally forest produces has reduced over a period of time.
IV. Animal Husbandry The Kutia Kandha domesticates cow, bullock, buffalo, pig, goat, chicken and pigeon. Cow
as well as bullocks are used for ploughing and cart driving. Goat and poultry were kept for
commercial purposes previously and ritual sacrifices. Kutia Kandha do not milch cow. Now
a days some Kutia families who are well educated and staying outside their locality milk
the cows for commercial purpose.
V. Trade and Barter
Panos, a Schedule Caste community act as the co-coordinator between the Kutia and other
non-tribal traders as they are well versed in both Oriya and Kui language. The Panos carry
their trading with the Kutia Kandha round the year. They supply liquor and household
articles to Kutia Kandha.
Barter system is still in vogue in the Kutia society. Panos charge 3 to 5 Kgs of Paddy in
exchange of a bottle of liquor, which is thrice more than the actual value of a bottle of
liquor. During the lean period when Kutias face scarcity of food, they borrow money from
local money lender through Panos and promise to pay back the loan in crop after the
harvest. The traders purchase the crop at a very low price. Kutia sell their produces like
oil seeds and forest produces at a very lower price in the Belghar Market In fact this sale
price is one and half time less than that of Tumudibandha and Ambodola market, two
markets situated at a distance of 23Kms and 10 Kms from the local market (Belghar).
200
VI. Food Habits Kutia Kandhas have very irregular food habits. They do not have any fixed timings of
eating. They eat when ever food is available. Staple foods taken by them vary with the
different seasons. Diet of Kutia Kandha is based on the availability of food. They take
cereals like Rice, Maize and millets. Generally Ragi was the staple diet taken throughout
the year and in the winter season Rice is consumed along with Ragi. But now a day they
take Rice and Ragi as their staple food. In the summer season they take mango seeds as
their staple diet along with. Kueri, a cereal product is being taken by the Kutia almost
through out the year. The intake of milk and milk products is almost nil. Consumption of
tea by the Kutias is very rare. They consume different types of pulses grown in their
shifting land. They also consume vegetables like pumpkin, tomatoes, and beans etc. They
collect and store different tubres available near by the forest which support their
livelihood in the time of food scarcity. They rarely prepared curries using vegetable oil,
very occasionally they used oil purchased from local market. Previously, they did not
consume sugar on molasses but now a days they do take same.
Non veg is consumed by Kutias during special occasions like marriages, births, deaths and
in rituals and festivals. They take the meat of the chicken, pigeon, buffalo, goat and the
meat of the wild animals which they hunt in the deep jungles.
Kutia Kandha grows different tropical fruits like Mango, Guava, Papaya, Orange, Mahua
fruit and wild fruits like Kundu, Bihi, and Bhatqui etc. They take these fruits during the
summer season. The Kutia Kandha consumes a lot of country liquor prepared from Mahua
flower and Sago palm. They consume liquor during the festivities and in their leisure time.
It was observed during the field work that in the weekly hats, the Kutia consumed liquor
when they come back to their villages and in the hats liquor sellers get a good amount by
selling locally prepared liquor.
5.3.9 Social Organization
I. Family Family is the basic social unit of the Kutia Kandha and it is the foundation of their social
organization. Since it is the basic unit, it controls the social behavior of the members as
also the use of cultivated land and its possession. In Kutia Kandha society generally the
nuclear family type is predominant. Joint family system is practically nil where as
polygynous families are found in many villages. Nuclear family consists of parents and
their unmarried children. Their society permits and it is customary that the older widow’s
201
parents stay with the youngest son irrespective of his marital status. The father/husband
is the formal representative of the family and considered as head of the household, where
as in the family consisting of old parents and the youngest son, the youngest son becomes
the head of the household. The Kutia Kandha family is both patriarchal and patrilineal.
The head of the family takes socio-cultural decisions in consultation with other adult
members of the family. But in case of economic matters, the head of the family consults
his wife before taking the final decision. In this primitive community the property is
distributed equally among the sons expect the youngest son. The daughters do not get any
share from the parental property. Any family without a child can adopt son from others.
But the first preference is given to own brother’s Son- in- law. They call Ghar-join-
sachenje.
II. Clans
The next higher social unit is clan. Kutia Kandha clans in the past lived in separate villages
(Niggemeyer). However, these homogenous clan’s villages split up and the clan’s members
moved apart and went away in different directions. Now a day the village communities are
composed of families of different clans, but in most cases a dominant clans found within
the village community. The clan exogamy is still maintained. As per the rule, members of
same village are not allowed to marry if they belong to different clans. It is seen and the
rule has been imposed that the boys and girls from the same village do not normally dance
together. There are some instances that the marriage between a boy and a girl of the
same village is performed, but in those cases one spouse must be from ‘Jani’ clans and
the other from ‘Majhi’ clans.
Kutia Kandha is divided with a number of social groups, known as Gochhi or Bansa. The
Gochhi includes persons unilianally descended from a common ancestor. Every Kutia
Kandha is recognized as a member of his patrineal exogamous Gochhi or clans. Each
Gochhi is given a distinct name which further emphasized their distinct identity. Gochhis
distinction serves as an important aspect for mate selection in their society. It is believed
that all members of clans have descended from a common ancestor and are therefore
brothers and sisters. Clan exogamy is strictly enforced by the Kutia Kandha society.
Though they are divided into a member of Gochhi but these Gochhis are non-totemic.
Therefore, they do not observe any taboo relating to totems. The prominent clans groups
are a) Nundruka b) Saraka c) Timka d) Sukbicha or Sukbichaka e) Adanga f) Rodamaka g)
Urlaka and h) Kadraka.
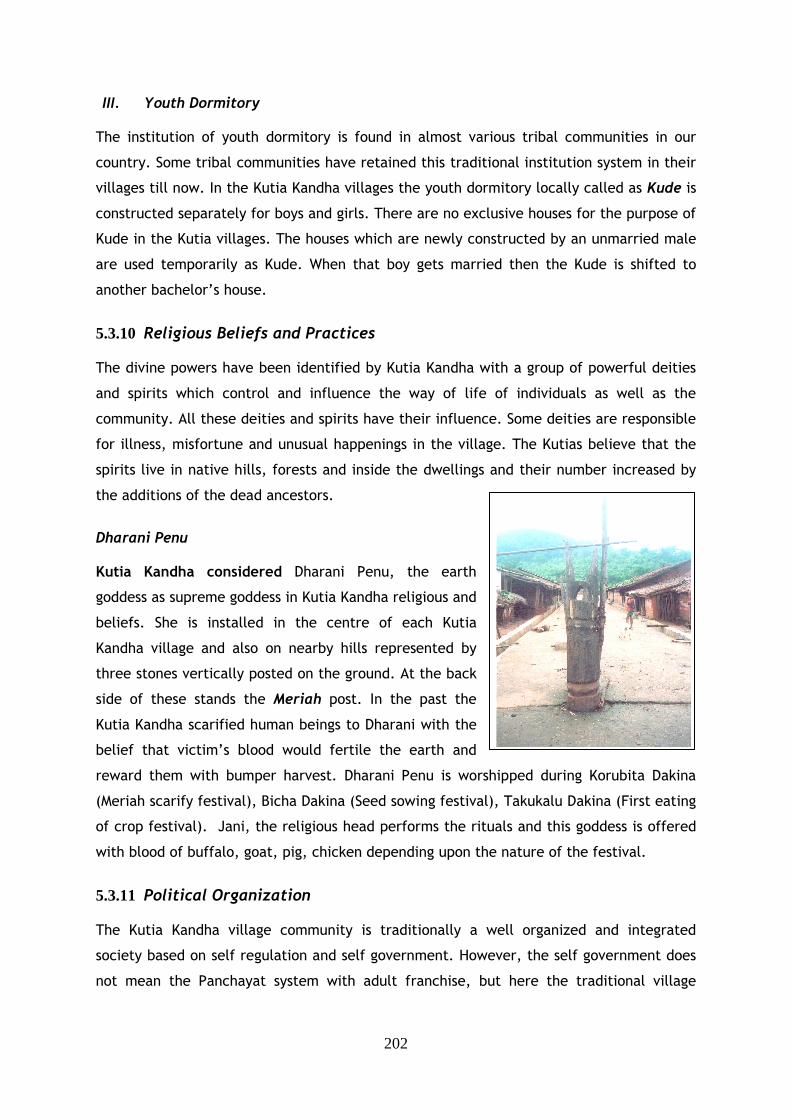
202
III. Youth Dormitory The institution of youth dormitory is found in almost various tribal communities in our
country. Some tribal communities have retained this traditional institution system in their
villages till now. In the Kutia Kandha villages the youth dormitory locally called as Kude is
constructed separately for boys and girls. There are no exclusive houses for the purpose of
Kude in the Kutia villages. The houses which are newly constructed by an unmarried male
are used temporarily as Kude. When that boy gets married then the Kude is shifted to
another bachelor’s house.
5.3.10 Religious Beliefs and Practices The divine powers have been identified by Kutia Kandha with a group of powerful deities
and spirits which control and influence the way of life of individuals as well as the
community. All these deities and spirits have their influence. Some deities are responsible
for illness, misfortune and unusual happenings in the village. The Kutias believe that the
spirits live in native hills, forests and inside the dwellings and their number increased by
the additions of the dead ancestors.
Dharani Penu Kutia Kandha considered Dharani Penu, the earth
goddess as supreme goddess in Kutia Kandha religious and
beliefs. She is installed in the centre of each Kutia
Kandha village and also on nearby hills represented by
three stones vertically posted on the ground. At the back
side of these stands the Meriah post. In the past the
Kutia Kandha scarified human beings to Dharani with the
belief that victim’s blood would fertile the earth and
reward them with bumper harvest. Dharani Penu is worshipped during Korubita Dakina
(Meriah scarify festival), Bicha Dakina (Seed sowing festival), Takukalu Dakina (First eating
of crop festival). Jani, the religious head performs the rituals and this goddess is offered
with blood of buffalo, goat, pig, chicken depending upon the nature of the festival.
5.3.11 Political Organization The Kutia Kandha village community is traditionally a well organized and integrated
society based on self regulation and self government. However, the self government does
not mean the Panchayat system with adult franchise, but here the traditional village
203
officialsform the village council. The traditional village leaderships are based on the status
with community obligations and duties.
It is said that, many years back the Raja of Sanakhemundi ruled the Kutia Kandha areas.
But the Raja faced difficulties to rule as he was not conversant to speak Kui language. The
Raja appointed some local people as the local chiefs who could both speak Kui and Oriya
language. Those local chiefs were from Gond and Paika communities. The Kutias did not
resent as they were unable to represent themselves before the king in Oriya language.
During those times the Kutias only spoke in Kui language. The Raja of Sanakhemundi
divided the entire Kutia Kandha dominated highlands of Belghar in three administrative
units. Each administrative units being called as “Mutha”, was located at Belghar, Guma
and Jhinipani. All these Mutha heads were assisted by a member of officers designated as
Karjee who was in charge of judicial matters, the Bebhari was in charge of Revenue
collection, and the Dalei was in charge of army of the Mutha administration. The Dalei
was selected from Paika community.
During the British Period Mutha administration was recognized by further dividing Mutha
into several Muthas in order to establish better control over the Kutia Kandha. These sub-
Muthas were kept in charge by the Kutia Kandha community who were known as Mutha
Majhi or Mandal Majhi.
Village is the unit in the Mutha organization and at the village level, the traditional village
council was formed. The headman of the village is designated as Majhi and he belonged to
the Kutia Kandha community. In the hierarchy next to Majhi, Jani was the sacerdotal head
of the village. The traditional sorceror of the village was the Kutaka. All the above
designated persons in each Kutia village were the active members of village council. The
Majhi was assisted by Ganda or Pesuni who was selected from the pano, a scheduled
caste community. All these official posts of village organization were hereditary.
During 1996, with the change in Panchayat Raj system and reformation of local self -
government, a new dimension in the administration is being formed and PESA (Panchayat
Extension Scheduled Area) Act was implemented. At the Gram Panchayat level, the
chairman of the Panchayat Samiti leads the Panchayat, assisted by sub-ordinates like
Sarapanch, Samiti Savya, Naib Sarapanch and the Ward Member at the grass root level.
The modern statutory Panchayati Raj System has not brought much change in the
indigenous village organization though traditional Mutha Organization has dwindled away
because of revenue and police administration. In most of the Kutia Village in the project
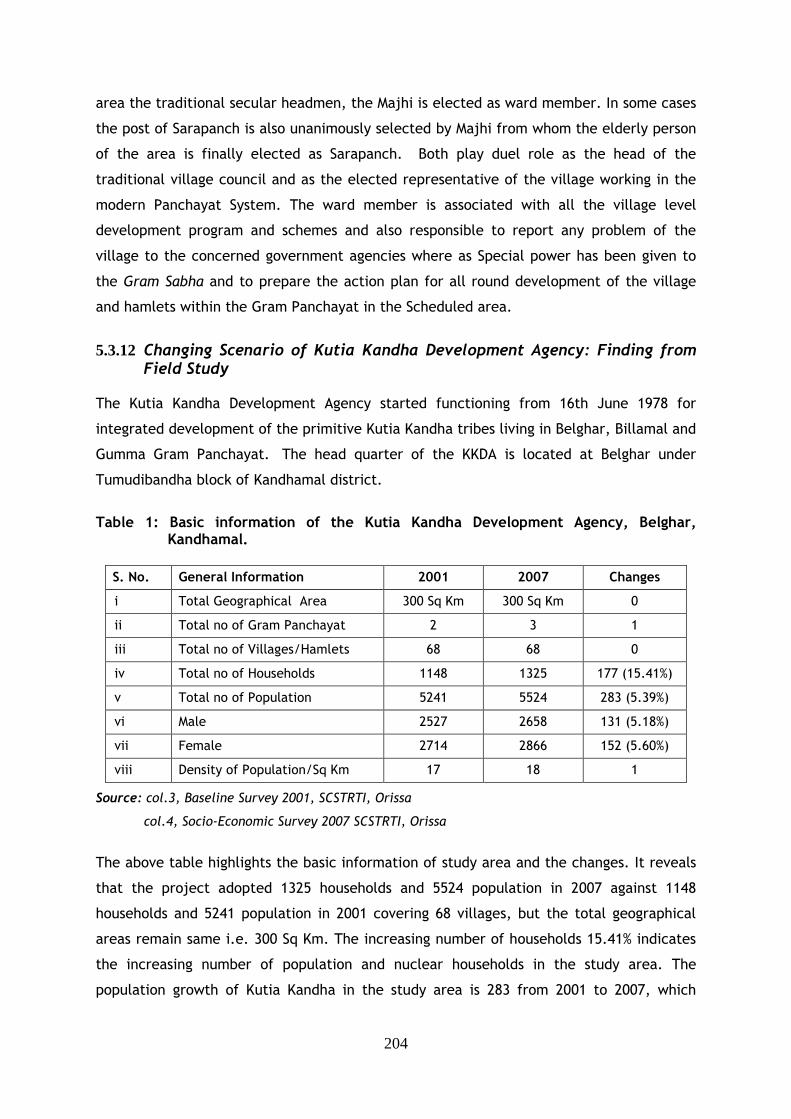
204
area the traditional secular headmen, the Majhi is elected as ward member. In some cases
the post of Sarapanch is also unanimously selected by Majhi from whom the elderly person
of the area is finally elected as Sarapanch. Both play duel role as the head of the
traditional village council and as the elected representative of the village working in the
modern Panchayat System. The ward member is associated with all the village level
development program and schemes and also responsible to report any problem of the
village to the concerned government agencies where as Special power has been given to
the Gram Sabha and to prepare the action plan for all round development of the village
and hamlets within the Gram Panchayat in the Scheduled area.
5.3.12 Changing Scenario of Kutia Kandha Development Agency: Finding from Field Study
The Kutia Kandha Development Agency started functioning from 16th June 1978 for
integrated development of the primitive Kutia Kandha tribes living in Belghar, Billamal and
Gumma Gram Panchayat. The head quarter of the KKDA is located at Belghar under
Tumudibandha block of Kandhamal district.
Table 1: Basic information of the Kutia Kandha Development Agency, Belghar,
Kandhamal.
S. No. General Information 2001 2007 Changes
i Total Geographical Area 300 Sq Km 300 Sq Km 0
ii Total no of Gram Panchayat 2 3 1
iii Total no of Villages/Hamlets 68 68 0
iv Total no of Households 1148 1325 177 (15.41%)
v Total no of Population 5241 5524 283 (5.39%)
vi Male 2527 2658 131 (5.18%)
vii Female 2714 2866 152 (5.60%)
viii Density of Population/Sq Km 17 18 1
Source: col.3, Baseline Survey 2001, SCSTRTI, Orissa
col.4, Socio-Economic Survey 2007 SCSTRTI, Orissa
The above table highlights the basic information of study area and the changes. It reveals
that the project adopted 1325 households and 5524 population in 2007 against 1148
households and 5241 population in 2001 covering 68 villages, but the total geographical
areas remain same i.e. 300 Sq Km. The increasing number of households 15.41% indicates
the increasing number of population and nuclear households in the study area. The
population growth of Kutia Kandha in the study area is 283 from 2001 to 2007, which
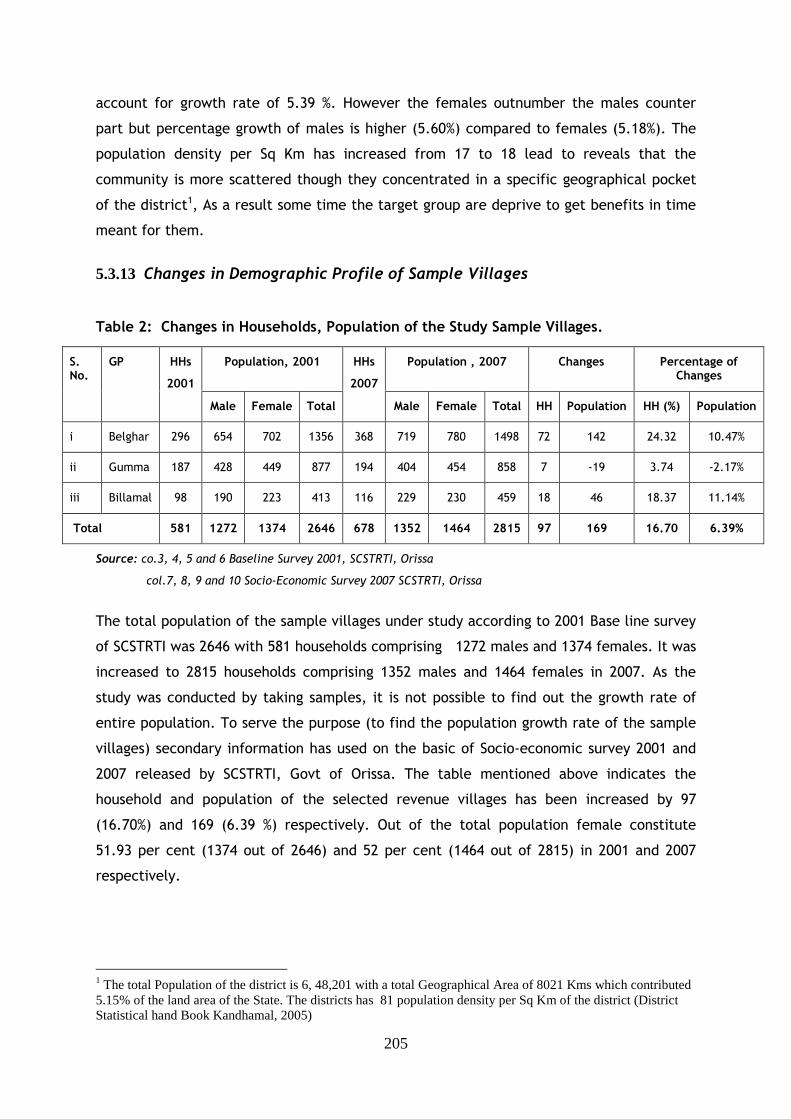
205
account for growth rate of 5.39 %. However the females outnumber the males counter
part but percentage growth of males is higher (5.60%) compared to females (5.18%). The
population density per Sq Km has increased from 17 to 18 lead to reveals that the
community is more scattered though they concentrated in a specific geographical pocket
of the district1, As a result some time the target group are deprive to get benefits in time
meant for them.
5.3.13 Changes in Demographic Profile of Sample Villages
Table 2: Changes in Households, Population of the Study Sample Villages.
Source: co.3, 4, 5 and 6 Baseline Survey 2001, SCSTRTI, Orissa
col.7, 8, 9 and 10 Socio-Economic Survey 2007 SCSTRTI, Orissa
The total population of the sample villages under study according to 2001 Base line survey
of SCSTRTI was 2646 with 581 households comprising 1272 males and 1374 females. It was
increased to 2815 households comprising 1352 males and 1464 females in 2007. As the
study was conducted by taking samples, it is not possible to find out the growth rate of
entire population. To serve the purpose (to find the population growth rate of the sample
villages) secondary information has used on the basic of Socio-economic survey 2001 and
2007 released by SCSTRTI, Govt of Orissa. The table mentioned above indicates the
household and population of the selected revenue villages has been increased by 97
(16.70%) and 169 (6.39 %) respectively. Out of the total population female constitute
51.93 per cent (1374 out of 2646) and 52 per cent (1464 out of 2815) in 2001 and 2007
respectively.
1 The total Population of the district is 6, 48,201 with a total Geographical Area of 8021 Kms which contributed 5.15% of the land area of the State. The districts has 81 population density per Sq Km of the district (District Statistical hand Book Kandhamal, 2005)
Population, 2001 Population , 2007 Changes Percentage of Changes
S. No.
GP HHs
2001
Male Female Total
HHs
2007
Male Female Total HH Population HH (%) Population
i Belghar 296 654 702 1356 368 719 780 1498 72 142 24.32 10.47%
ii Gumma 187 428 449 877 194 404 454 858 7 -19 3.74 -2.17%
iii Billamal 98 190 223 413 116 229 230 459 18 46 18.37 11.14%
Total 581 1272 1374 2646 678 1352 1464 2815 97 169 16.70 6.39%
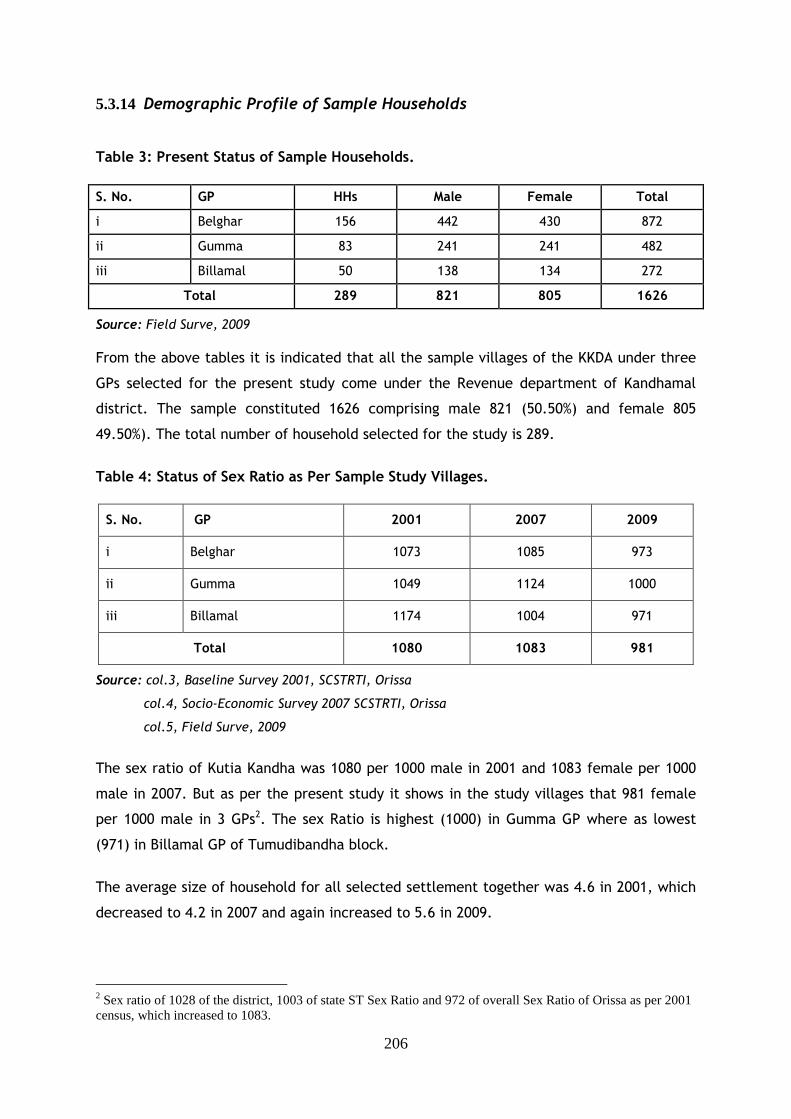
206
5.3.14 Demographic Profile of Sample Households
Table 3: Present Status of Sample Households.
S. No. GP HHs Male Female Total
i Belghar 156 442 430 872
ii Gumma 83 241 241 482
iii Billamal 50 138 134 272
Total 289 821 805 1626
Source: Field Surve, 2009
From the above tables it is indicated that all the sample villages of the KKDA under three
GPs selected for the present study come under the Revenue department of Kandhamal
district. The sample constituted 1626 comprising male 821 (50.50%) and female 805
49.50%). The total number of household selected for the study is 289.
Table 4: Status of Sex Ratio as Per Sample Study Villages.
S. No. GP 2001 2007 2009
i Belghar 1073 1085 973
ii Gumma 1049 1124 1000
iii Billamal 1174 1004 971
Total 1080 1083 981
Source: col.3, Baseline Survey 2001, SCSTRTI, Orissa
col.4, Socio-Economic Survey 2007 SCSTRTI, Orissa
col.5, Field Surve, 2009
The sex ratio of Kutia Kandha was 1080 per 1000 male in 2001 and 1083 female per 1000
male in 2007. But as per the present study it shows in the study villages that 981 female
per 1000 male in 3 GPs2. The sex Ratio is highest (1000) in Gumma GP where as lowest
(971) in Billamal GP of Tumudibandha block.
The average size of household for all selected settlement together was 4.6 in 2001, which
decreased to 4.2 in 2007 and again increased to 5.6 in 2009.
2 Sex ratio of 1028 of the district, 1003 of state ST Sex Ratio and 972 of overall Sex Ratio of Orissa as per 2001 census, which increased to 1083.
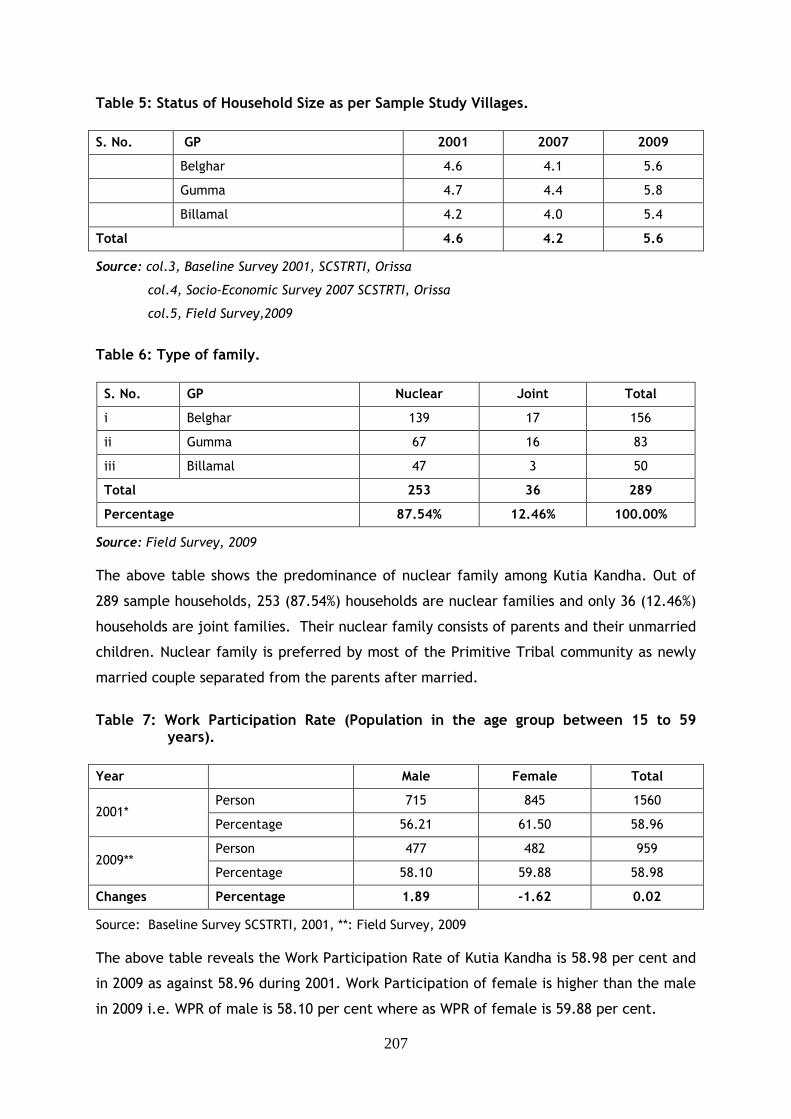
207
Table 5: Status of Household Size as per Sample Study Villages.
S. No. GP 2001 2007 2009
Belghar 4.6 4.1 5.6
Gumma 4.7 4.4 5.8
Billamal 4.2 4.0 5.4
Total 4.6 4.2 5.6
Source: col.3, Baseline Survey 2001, SCSTRTI, Orissa
col.4, Socio-Economic Survey 2007 SCSTRTI, Orissa
col.5, Field Survey,2009
Table 6: Type of family.
S. No. GP Nuclear Joint Total
i Belghar 139 17 156
ii Gumma 67 16 83
iii Billamal 47 3 50
Total 253 36 289
Percentage 87.54% 12.46% 100.00%
Source: Field Survey, 2009
The above table shows the predominance of nuclear family among Kutia Kandha. Out of
289 sample households, 253 (87.54%) households are nuclear families and only 36 (12.46%)
households are joint families. Their nuclear family consists of parents and their unmarried
children. Nuclear family is preferred by most of the Primitive Tribal community as newly
married couple separated from the parents after married.
Table 7: Work Participation Rate (Population in the age group between 15 to 59
years).
Year Male Female Total
Person 715 845 1560 2001*
Percentage 56.21 61.50 58.96
Person 477 482 959 2009**
Percentage 58.10 59.88 58.98
Changes Percentage 1.89 -1.62 0.02
Source: Baseline Survey SCSTRTI, 2001, **: Field Survey, 2009
The above table reveals the Work Participation Rate of Kutia Kandha is 58.98 per cent and
in 2009 as against 58.96 during 2001. Work Participation of female is higher than the male
in 2009 i.e. WPR of male is 58.10 per cent where as WPR of female is 59.88 per cent.
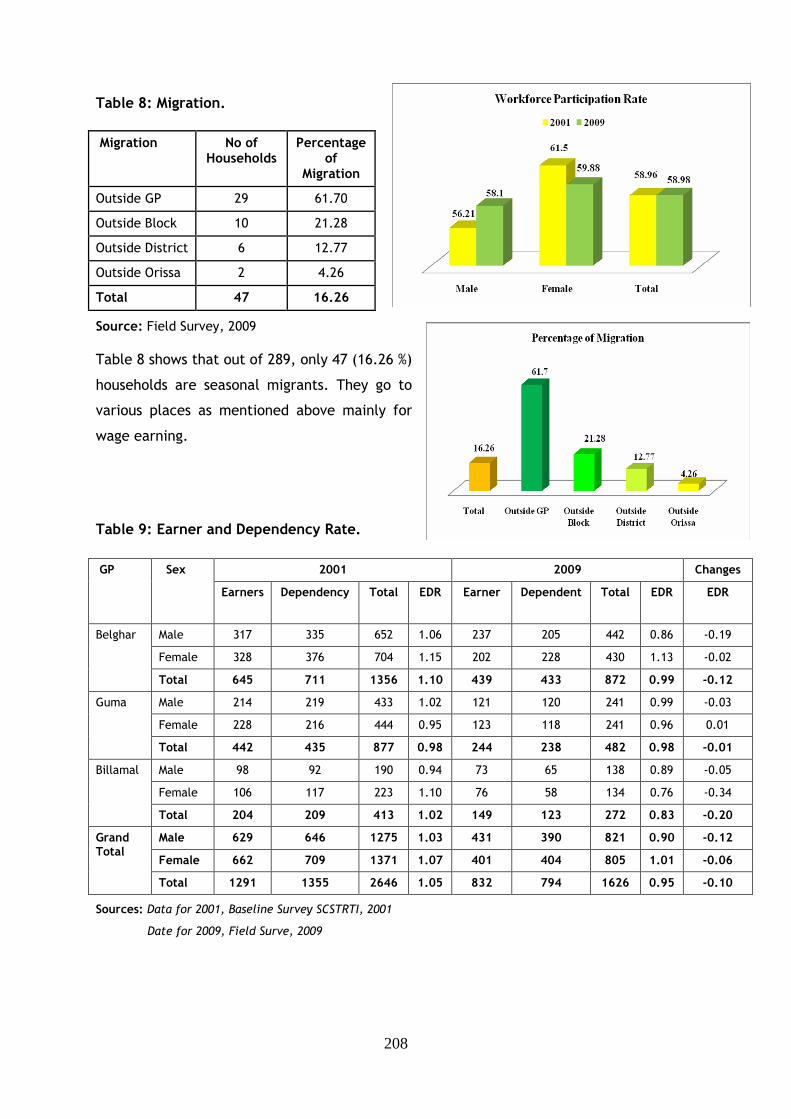
208
Table 8: Migration.
Migration No of
Households Percentage
of Migration
Outside GP 29 61.70
Outside Block 10 21.28
Outside District 6 12.77
Outside Orissa 2 4.26
Total 47 16.26
Source: Field Survey, 2009
Table 8 shows that out of 289, only 47 (16.26 %)
households are seasonal migrants. They go to
various places as mentioned above mainly for
wage earning.
Table 9: Earner and Dependency Rate.
Sources: Data for 2001, Baseline Survey SCSTRTI, 2001
Date for 2009, Field Surve, 2009
2001 2009 Changes GP Sex
Earners Dependency Total EDR Earner Dependent Total EDR EDR
Male 317 335 652 1.06 237 205 442 0.86 -0.19
Female 328 376 704 1.15 202 228 430 1.13 -0.02
Belghar
Total 645 711 1356 1.10 439 433 872 0.99 -0.12
Male 214 219 433 1.02 121 120 241 0.99 -0.03
Female 228 216 444 0.95 123 118 241 0.96 0.01
Guma
Total 442 435 877 0.98 244 238 482 0.98 -0.01
Male 98 92 190 0.94 73 65 138 0.89 -0.05
Female 106 117 223 1.10 76 58 134 0.76 -0.34
Billamal
Total 204 209 413 1.02 149 123 272 0.83 -0.20
Male 629 646 1275 1.03 431 390 821 0.90 -0.12
Female 662 709 1371 1.07 401 404 805 1.01 -0.06
Grand Total
Total 1291 1355 2646 1.05 832 794 1626 0.95 -0.10
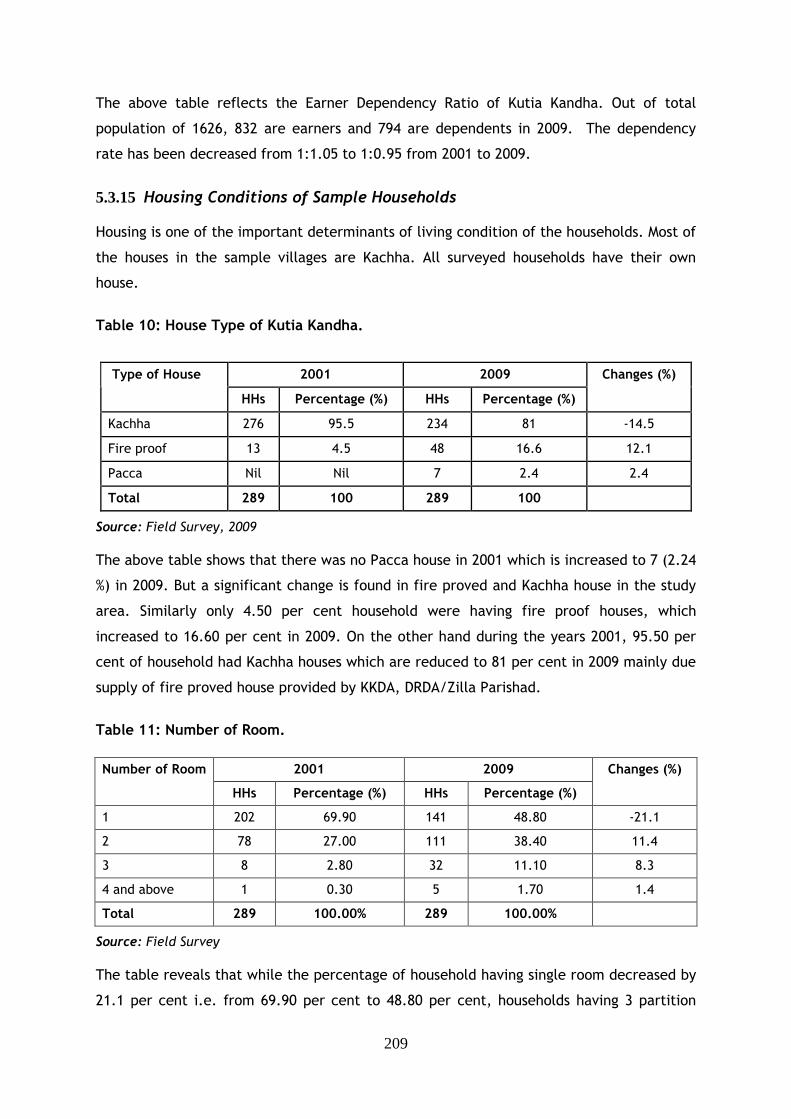
209
The above table reflects the Earner Dependency Ratio of Kutia Kandha. Out of total
population of 1626, 832 are earners and 794 are dependents in 2009. The dependency
rate has been decreased from 1:1.05 to 1:0.95 from 2001 to 2009.
5.3.15 Housing Conditions of Sample Households Housing is one of the important determinants of living condition of the households. Most of
the houses in the sample villages are Kachha. All surveyed households have their own
house.
Table 10: House Type of Kutia Kandha.
Source: Field Survey, 2009
The above table shows that there was no Pacca house in 2001 which is increased to 7 (2.24
%) in 2009. But a significant change is found in fire proved and Kachha house in the study
area. Similarly only 4.50 per cent household were having fire proof houses, which
increased to 16.60 per cent in 2009. On the other hand during the years 2001, 95.50 per
cent of household had Kachha houses which are reduced to 81 per cent in 2009 mainly due
supply of fire proved house provided by KKDA, DRDA/Zilla Parishad.
Table 11: Number of Room.
2001 2009 Number of Room
HHs Percentage (%) HHs Percentage (%)
Changes (%)
1 202 69.90 141 48.80 -21.1
2 78 27.00 111 38.40 11.4
3 8 2.80 32 11.10 8.3
4 and above 1 0.30 5 1.70 1.4
Total 289 100.00% 289 100.00%
Source: Field Survey
The table reveals that while the percentage of household having single room decreased by
21.1 per cent i.e. from 69.90 per cent to 48.80 per cent, households having 3 partition
2001 2009 Type of House
HHs Percentage (%) HHs Percentage (%)
Changes (%)
Kachha 276 95.5 234 81 -14.5
Fire proof 13 4.5 48 16.6 12.1
Pacca Nil Nil 7 2.4 2.4
Total 289 100 289 100
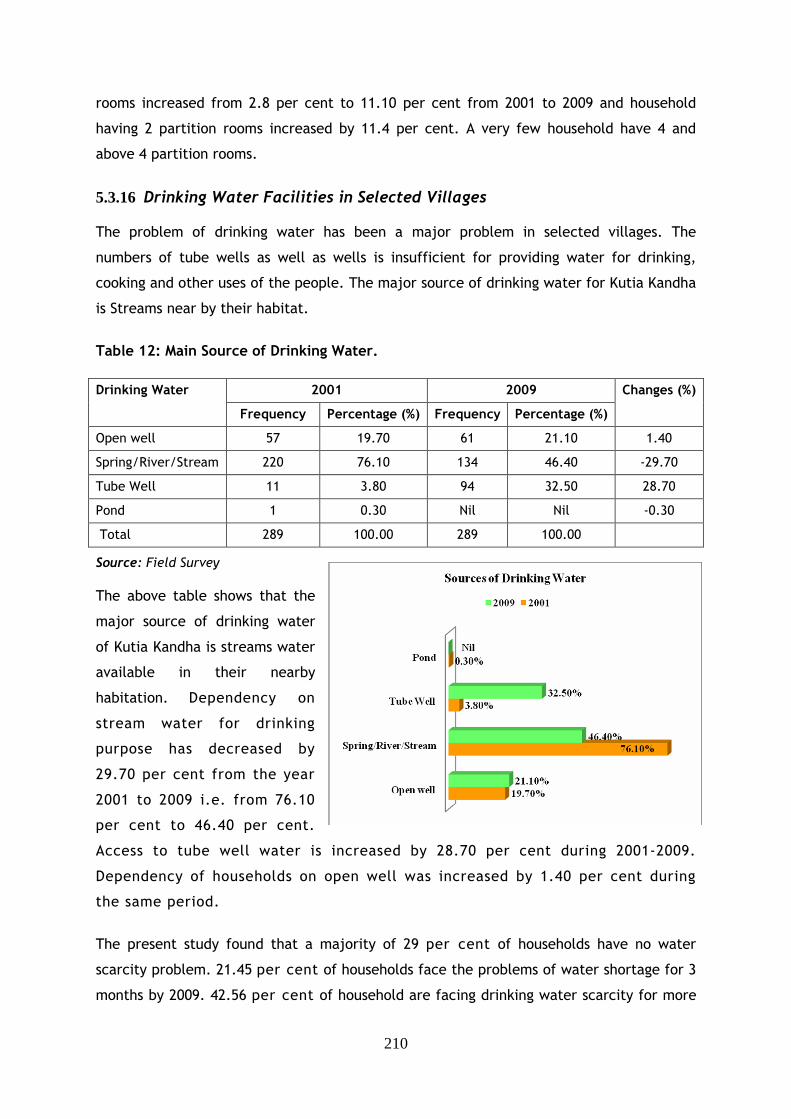
210
rooms increased from 2.8 per cent to 11.10 per cent from 2001 to 2009 and household
having 2 partition rooms increased by 11.4 per cent. A very few household have 4 and
above 4 partition rooms.
5.3.16 Drinking Water Facilities in Selected Villages
The problem of drinking water has been a major problem in selected villages. The
numbers of tube wells as well as wells is insufficient for providing water for drinking,
cooking and other uses of the people. The major source of drinking water for Kutia Kandha
is Streams near by their habitat.
Table 12: Main Source of Drinking Water.
2001 2009 Drinking Water
Frequency Percentage (%) Frequency Percentage (%)
Changes (%)
Open well 57 19.70 61 21.10 1.40
Spring/River/Stream 220 76.10 134 46.40 -29.70
Tube Well 11 3.80 94 32.50 28.70
Pond 1 0.30 Nil Nil -0.30
Total 289 100.00 289 100.00
Source: Field Survey
The above table shows that the
major source of drinking water
of Kutia Kandha is streams water
available in their nearby
habitation. Dependency on
stream water for drinking
purpose has decreased by
29.70 per cent from the year
2001 to 2009 i.e. from 76.10
per cent to 46.40 per cent.
Access to tube well water is increased by 28.70 per cent during 2001-2009.
Dependency of households on open well was increased by 1.40 per cent during
the same period.
The present study found that a majority of 29 per cent of households have no water
scarcity problem. 21.45 per cent of households face the problems of water shortage for 3
months by 2009. 42.56 per cent of household are facing drinking water scarcity for more
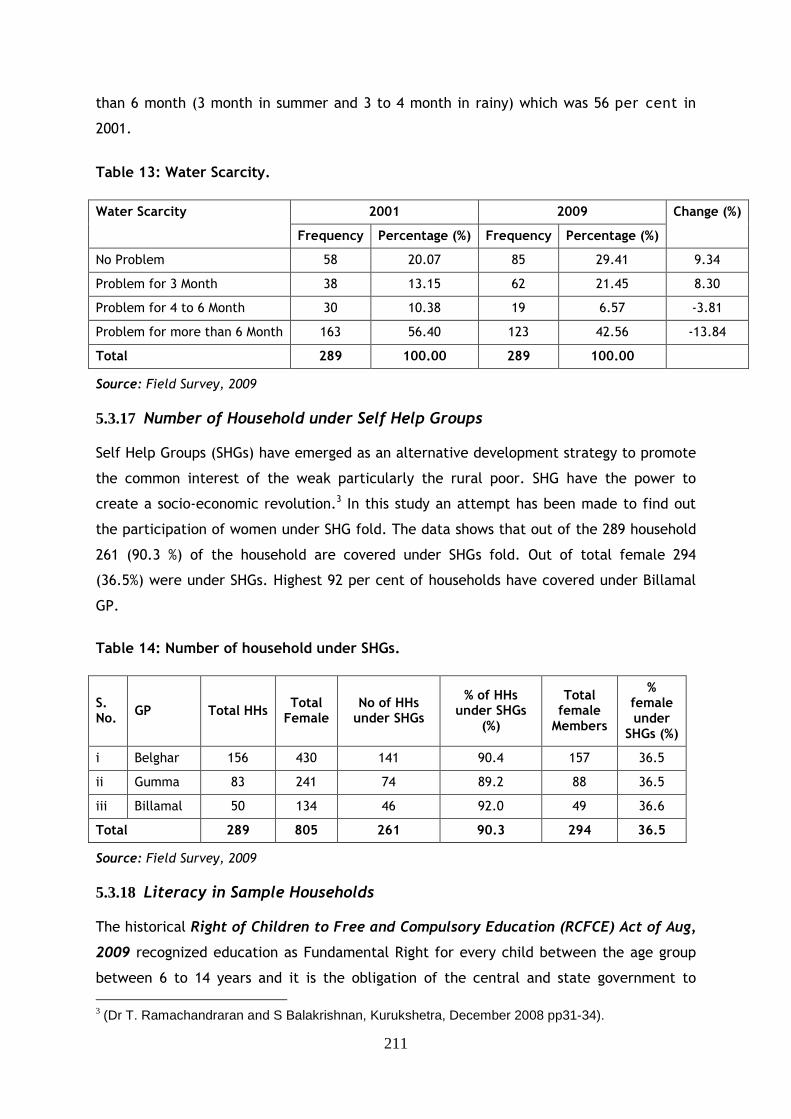
211
than 6 month (3 month in summer and 3 to 4 month in rainy) which was 56 per cent in
2001.
Table 13: Water Scarcity.
2001 2009 Water Scarcity
Frequency Percentage (%) Frequency Percentage (%)
Change (%)
No Problem 58 20.07 85 29.41 9.34
Problem for 3 Month 38 13.15 62 21.45 8.30
Problem for 4 to 6 Month 30 10.38 19 6.57 -3.81
Problem for more than 6 Month 163 56.40 123 42.56 -13.84
Total 289 100.00 289 100.00
Source: Field Survey, 2009
5.3.17 Number of Household under Self Help Groups Self Help Groups (SHGs) have emerged as an alternative development strategy to promote
the common interest of the weak particularly the rural poor. SHG have the power to
create a socio-economic revolution.3 In this study an attempt has been made to find out
the participation of women under SHG fold. The data shows that out of the 289 household
261 (90.3 %) of the household are covered under SHGs fold. Out of total female 294
(36.5%) were under SHGs. Highest 92 per cent of households have covered under Billamal
GP.
Table 14: Number of household under SHGs.
S. No.
GP Total HHs Total
Female No of HHs
under SHGs
% of HHs under SHGs
(%)
Total female
Members
% female under
SHGs (%)
i Belghar 156 430 141 90.4 157 36.5
ii Gumma 83 241 74 89.2 88 36.5
iii Billamal 50 134 46 92.0 49 36.6
Total 289 805 261 90.3 294 36.5
Source: Field Survey, 2009
5.3.18 Literacy in Sample Households The historical Right of Children to Free and Compulsory Education (RCFCE) Act of Aug,
2009 recognized education as Fundamental Right for every child between the age group
between 6 to 14 years and it is the obligation of the central and state government to
3 (Dr T. Ramachandraran and S Balakrishnan, Kurukshetra, December 2008 pp31-34).
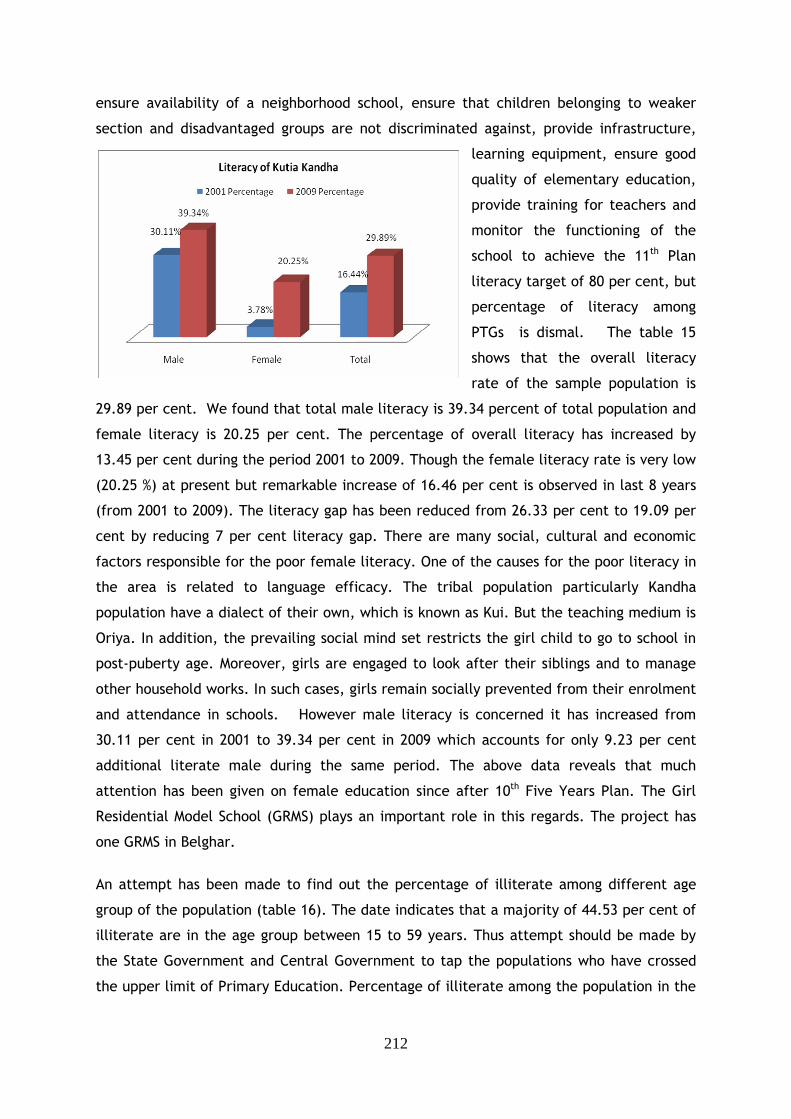
212
ensure availability of a neighborhood school, ensure that children belonging to weaker
section and disadvantaged groups are not discriminated against, provide infrastructure,
learning equipment, ensure good
quality of elementary education,
provide training for teachers and
monitor the functioning of the
school to achieve the 11th Plan
literacy target of 80 per cent, but
percentage of literacy among
PTGs is dismal. The table 15
shows that the overall literacy
rate of the sample population is
29.89 per cent. We found that total male literacy is 39.34 percent of total population and
female literacy is 20.25 per cent. The percentage of overall literacy has increased by
13.45 per cent during the period 2001 to 2009. Though the female literacy rate is very low
(20.25 %) at present but remarkable increase of 16.46 per cent is observed in last 8 years
(from 2001 to 2009). The literacy gap has been reduced from 26.33 per cent to 19.09 per
cent by reducing 7 per cent literacy gap. There are many social, cultural and economic
factors responsible for the poor female literacy. One of the causes for the poor literacy in
the area is related to language efficacy. The tribal population particularly Kandha
population have a dialect of their own, which is known as Kui. But the teaching medium is
Oriya. In addition, the prevailing social mind set restricts the girl child to go to school in
post-puberty age. Moreover, girls are engaged to look after their siblings and to manage
other household works. In such cases, girls remain socially prevented from their enrolment
and attendance in schools. However male literacy is concerned it has increased from
30.11 per cent in 2001 to 39.34 per cent in 2009 which accounts for only 9.23 per cent
additional literate male during the same period. The above data reveals that much
attention has been given on female education since after 10th Five Years Plan. The Girl
Residential Model School (GRMS) plays an important role in this regards. The project has
one GRMS in Belghar.
An attempt has been made to find out the percentage of illiterate among different age
group of the population (table 16). The date indicates that a majority of 44.53 per cent of
illiterate are in the age group between 15 to 59 years. Thus attempt should be made by
the State Government and Central Government to tap the populations who have crossed
the upper limit of Primary Education. Percentage of illiterate among the population in the
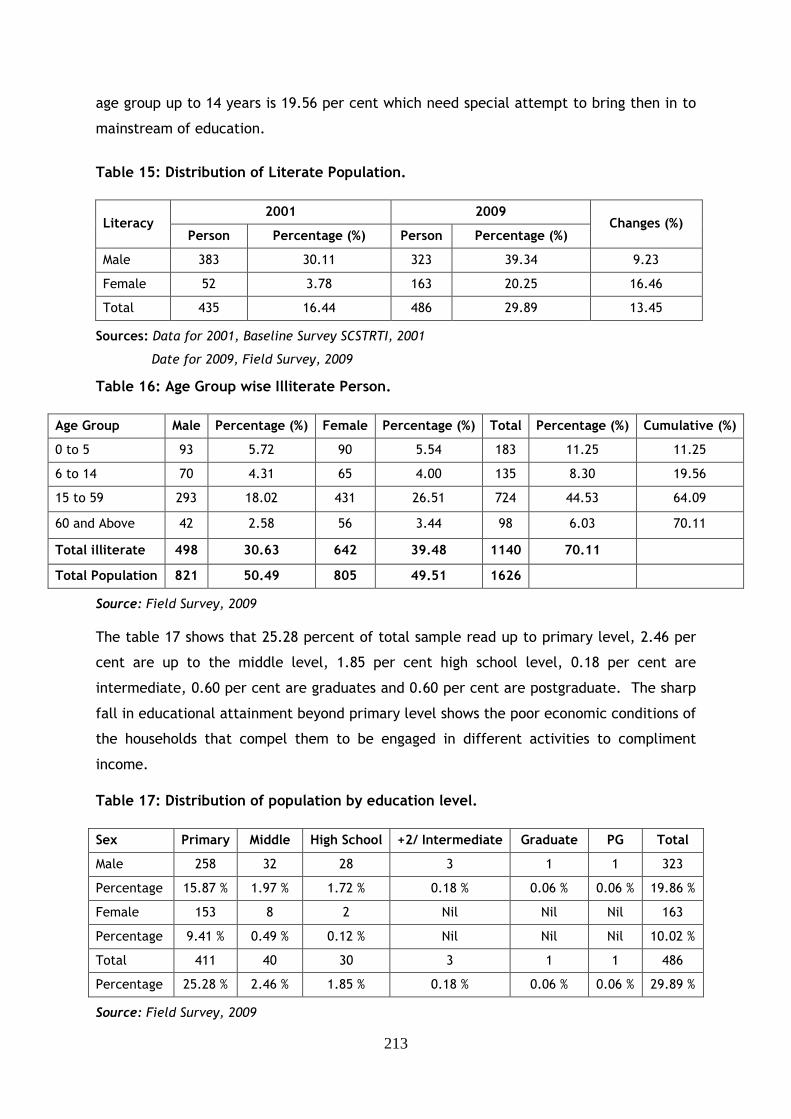
213
age group up to 14 years is 19.56 per cent which need special attempt to bring then in to
mainstream of education.
Table 15: Distribution of Literate Population.
2001 2009
Literacy Person Percentage (%) Person Percentage (%)
Changes (%)
Male 383 30.11 323 39.34 9.23
Female 52 3.78 163 20.25 16.46
Total 435 16.44 486 29.89 13.45
Sources: Data for 2001, Baseline Survey SCSTRTI, 2001
Date for 2009, Field Survey, 2009
Table 16: Age Group wise Illiterate Person.
Age Group Male Percentage (%) Female Percentage (%) Total Percentage (%) Cumulative (%)
0 to 5 93 5.72 90 5.54 183 11.25 11.25
6 to 14 70 4.31 65 4.00 135 8.30 19.56
15 to 59 293 18.02 431 26.51 724 44.53 64.09
60 and Above 42 2.58 56 3.44 98 6.03 70.11
Total illiterate 498 30.63 642 39.48 1140 70.11
Total Population 821 50.49 805 49.51 1626
Source: Field Survey, 2009
The table 17 shows that 25.28 percent of total sample read up to primary level, 2.46 per
cent are up to the middle level, 1.85 per cent high school level, 0.18 per cent are
intermediate, 0.60 per cent are graduates and 0.60 per cent are postgraduate. The sharp
fall in educational attainment beyond primary level shows the poor economic conditions of
the households that compel them to be engaged in different activities to compliment
income.
Table 17: Distribution of population by education level.
Sex Primary Middle High School +2/ Intermediate Graduate PG Total
Male 258 32 28 3 1 1 323
Percentage 15.87 % 1.97 % 1.72 % 0.18 % 0.06 % 0.06 % 19.86 %
Female 153 8 2 Nil Nil Nil 163
Percentage 9.41 % 0.49 % 0.12 % Nil Nil Nil 10.02 %
Total 411 40 30 3 1 1 486
Percentage 25.28 % 2.46 % 1.85 % 0.18 % 0.06 % 0.06 % 29.89 %
Source: Field Survey, 2009
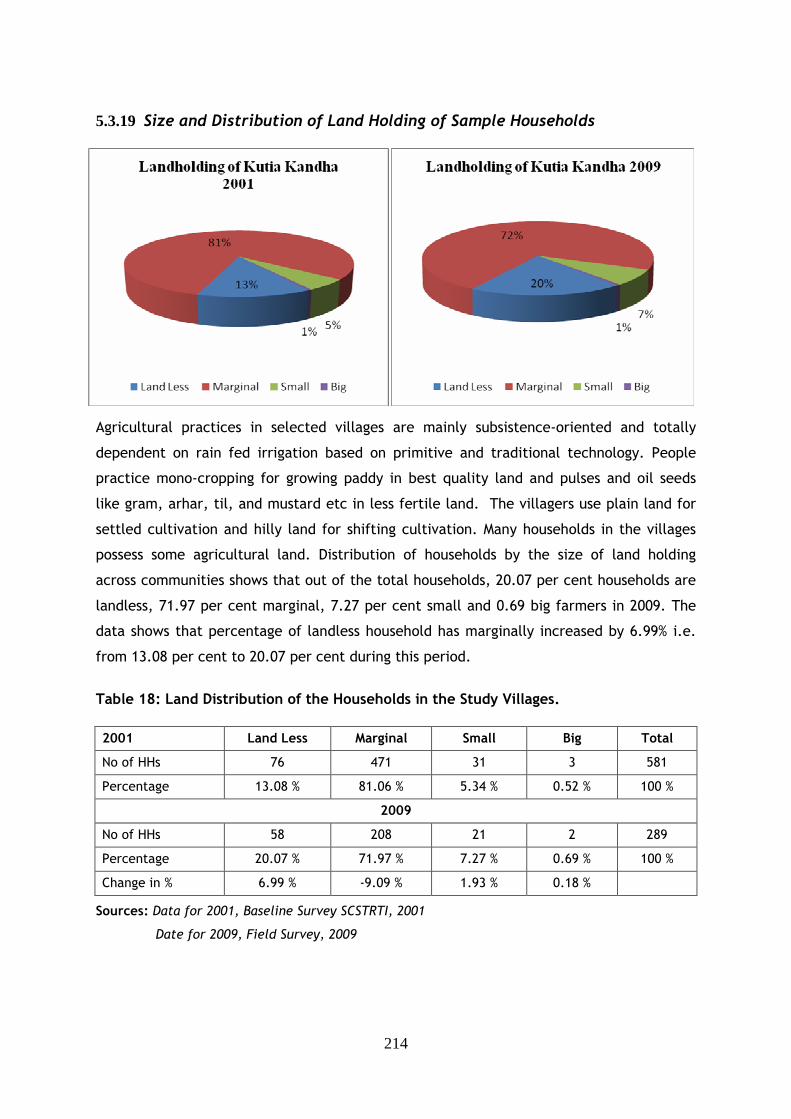
214
5.3.19 Size and Distribution of Land Holding of Sample Households
Agricultural practices in selected villages are mainly subsistence-oriented and totally
dependent on rain fed irrigation based on primitive and traditional technology. People
practice mono-cropping for growing paddy in best quality land and pulses and oil seeds
like gram, arhar, til, and mustard etc in less fertile land. The villagers use plain land for
settled cultivation and hilly land for shifting cultivation. Many households in the villages
possess some agricultural land. Distribution of households by the size of land holding
across communities shows that out of the total households, 20.07 per cent households are
landless, 71.97 per cent marginal, 7.27 per cent small and 0.69 big farmers in 2009. The
data shows that percentage of landless household has marginally increased by 6.99% i.e.
from 13.08 per cent to 20.07 per cent during this period.
Table 18: Land Distribution of the Households in the Study Villages.
2001 Land Less Marginal Small Big Total
No of HHs 76 471 31 3 581
Percentage 13.08 % 81.06 % 5.34 % 0.52 % 100 %
2009
No of HHs 58 208 21 2 289
Percentage 20.07 % 71.97 % 7.27 % 0.69 % 100 %
Change in % 6.99 % -9.09 % 1.93 % 0.18 %
Sources: Data for 2001, Baseline Survey SCSTRTI, 2001
Date for 2009, Field Survey, 2009
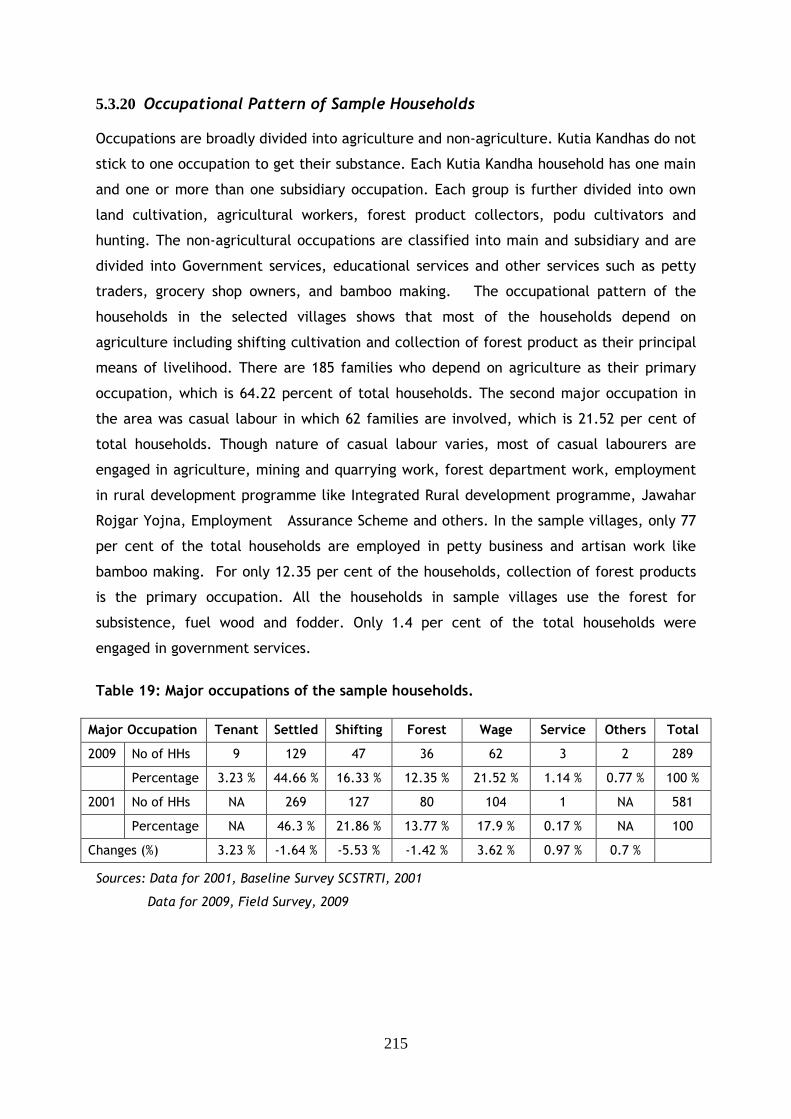
215
5.3.20 Occupational Pattern of Sample Households Occupations are broadly divided into agriculture and non-agriculture. Kutia Kandhas do not
stick to one occupation to get their substance. Each Kutia Kandha household has one main
and one or more than one subsidiary occupation. Each group is further divided into own
land cultivation, agricultural workers, forest product collectors, podu cultivators and
hunting. The non-agricultural occupations are classified into main and subsidiary and are
divided into Government services, educational services and other services such as petty
traders, grocery shop owners, and bamboo making. The occupational pattern of the
households in the selected villages shows that most of the households depend on
agriculture including shifting cultivation and collection of forest product as their principal
means of livelihood. There are 185 families who depend on agriculture as their primary
occupation, which is 64.22 percent of total households. The second major occupation in
the area was casual labour in which 62 families are involved, which is 21.52 per cent of
total households. Though nature of casual labour varies, most of casual labourers are
engaged in agriculture, mining and quarrying work, forest department work, employment
in rural development programme like Integrated Rural development programme, Jawahar
Rojgar Yojna, Employment Assurance Scheme and others. In the sample villages, only 77
per cent of the total households are employed in petty business and artisan work like
bamboo making. For only 12.35 per cent of the households, collection of forest products
is the primary occupation. All the households in sample villages use the forest for
subsistence, fuel wood and fodder. Only 1.4 per cent of the total households were
engaged in government services.
Table 19: Major occupations of the sample households.
Major Occupation Tenant Settled Shifting Forest Wage Service Others Total
2009 No of HHs 9 129 47 36 62 3 2 289
Percentage 3.23 % 44.66 % 16.33 % 12.35 % 21.52 % 1.14 % 0.77 % 100 %
2001 No of HHs NA 269 127 80 104 1 NA 581
Percentage NA 46.3 % 21.86 % 13.77 % 17.9 % 0.17 % NA 100
Changes (%) 3.23 % -1.64 % -5.53 % -1.42 % 3.62 % 0.97 % 0.7 %
Sources: Data for 2001, Baseline Survey SCSTRTI, 2001
Data for 2009, Field Survey, 2009
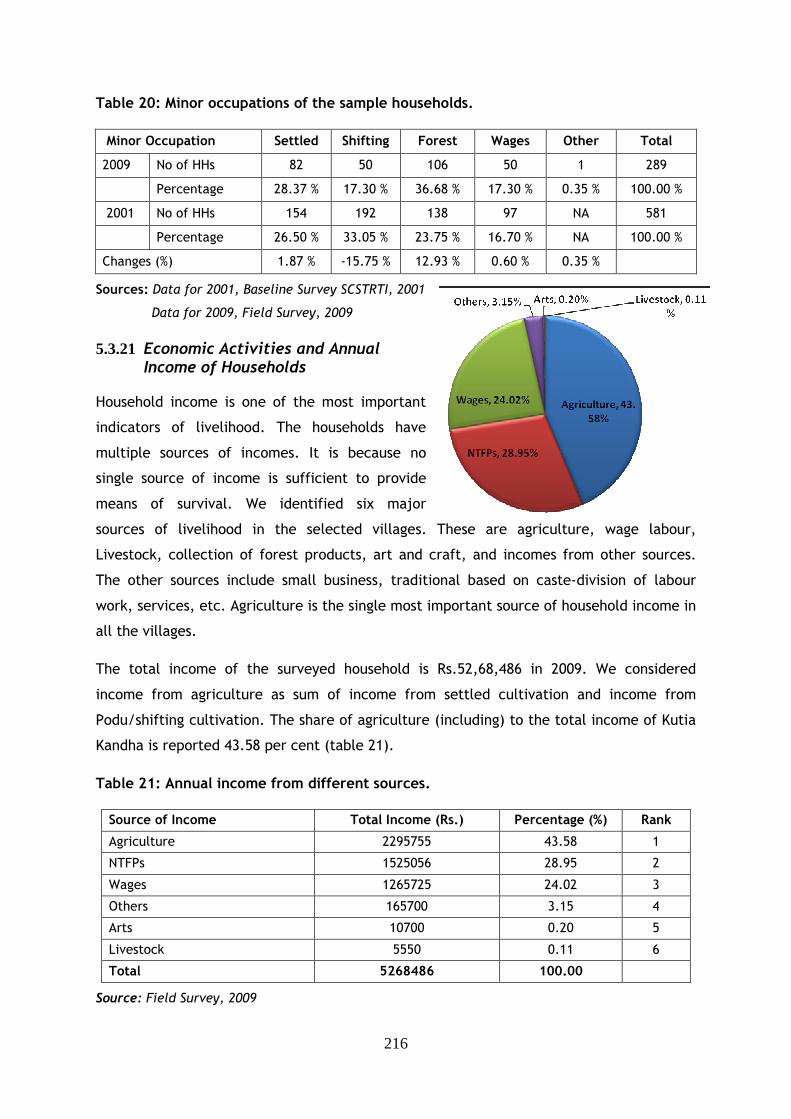
216
Table 20: Minor occupations of the sample households.
Minor Occupation Settled Shifting Forest Wages Other Total
2009 No of HHs 82 50 106 50 1 289
Percentage 28.37 % 17.30 % 36.68 % 17.30 % 0.35 % 100.00 %
2001 No of HHs 154 192 138 97 NA 581
Percentage 26.50 % 33.05 % 23.75 % 16.70 % NA 100.00 %
Changes (%) 1.87 % -15.75 % 12.93 % 0.60 % 0.35 %
Sources: Data for 2001, Baseline Survey SCSTRTI, 2001
Data for 2009, Field Survey, 2009
5.3.21 Economic Activities and Annual Income of Households
Household income is one of the most important
indicators of livelihood. The households have
multiple sources of incomes. It is because no
single source of income is sufficient to provide
means of survival. We identified six major
sources of livelihood in the selected villages. These are agriculture, wage labour,
Livestock, collection of forest products, art and craft, and incomes from other sources.
The other sources include small business, traditional based on caste-division of labour
work, services, etc. Agriculture is the single most important source of household income in
all the villages.
The total income of the surveyed household is Rs.52,68,486 in 2009. We considered
income from agriculture as sum of income from settled cultivation and income from
Podu/shifting cultivation. The share of agriculture (including) to the total income of Kutia
Kandha is reported 43.58 per cent (table 21).
Table 21: Annual income from different sources.
Source of Income Total Income (Rs.) Percentage (%) Rank
Agriculture 2295755 43.58 1
NTFPs 1525056 28.95 2
Wages 1265725 24.02 3
Others 165700 3.15 4
Arts 10700 0.20 5
Livestock 5550 0.11 6
Total 5268486 100.00
Source: Field Survey, 2009
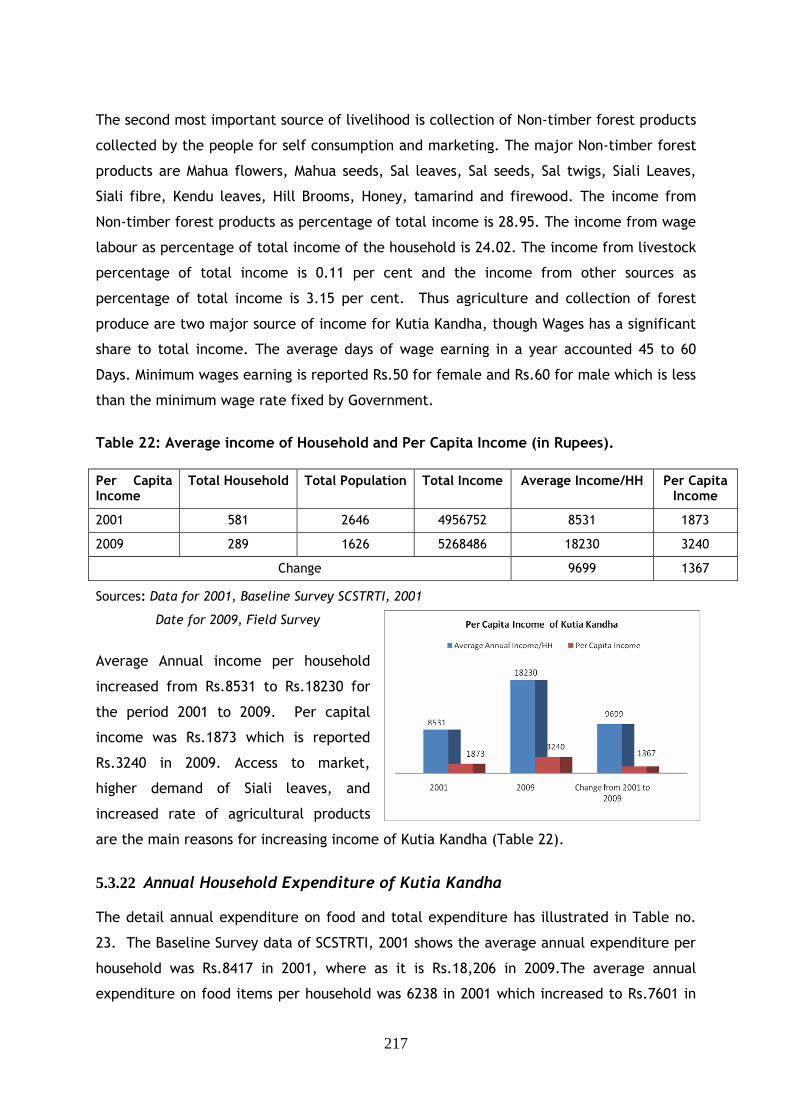
217
The second most important source of livelihood is collection of Non-timber forest products
collected by the people for self consumption and marketing. The major Non-timber forest
products are Mahua flowers, Mahua seeds, Sal leaves, Sal seeds, Sal twigs, Siali Leaves,
Siali fibre, Kendu leaves, Hill Brooms, Honey, tamarind and firewood. The income from
Non-timber forest products as percentage of total income is 28.95. The income from wage
labour as percentage of total income of the household is 24.02. The income from livestock
percentage of total income is 0.11 per cent and the income from other sources as
percentage of total income is 3.15 per cent. Thus agriculture and collection of forest
produce are two major source of income for Kutia Kandha, though Wages has a significant
share to total income. The average days of wage earning in a year accounted 45 to 60
Days. Minimum wages earning is reported Rs.50 for female and Rs.60 for male which is less
than the minimum wage rate fixed by Government.
Table 22: Average income of Household and Per Capita Income (in Rupees).
Per Capita Income
Total Household Total Population Total Income Average Income/HH Per Capita Income
2001 581 2646 4956752 8531 1873
2009 289 1626 5268486 18230 3240
Change 9699 1367
Sources: Data for 2001, Baseline Survey SCSTRTI, 2001
Date for 2009, Field Survey
Average Annual income per household
increased from Rs.8531 to Rs.18230 for
the period 2001 to 2009. Per capital
income was Rs.1873 which is reported
Rs.3240 in 2009. Access to market,
higher demand of Siali leaves, and
increased rate of agricultural products
are the main reasons for increasing income of Kutia Kandha (Table 22).
5.3.22 Annual Household Expenditure of Kutia Kandha The detail annual expenditure on food and total expenditure has illustrated in Table no.
23. The Baseline Survey data of SCSTRTI, 2001 shows the average annual expenditure per
household was Rs.8417 in 2001, where as it is Rs.18,206 in 2009.The average annual
expenditure on food items per household was 6238 in 2001 which increased to Rs.7601 in
218
2009. Per capita annual expenditure (both food and non-food items) has increased by
Rs.1388 from 2001 to 2009.
Table 23: Household Expenditure.
Expenditure 2001 2009 Changes
Average annual expenditure per HH 8417 18206 9789
Per capita annual expenditure 1848 3236 1388
Average Annual expenditure on food items/HH 6328 (75.18%) 7061 (38.78) 733
Per Capita annual expenditure on Food items 1389 1255 -134
Average Annual expenditure on non food items/HH 2889 11145 -8256
Sources: Data for 2001, Baseline Survey SCSTRTI, 2001
Date for 2009, Field Survey, 2009
5.3.23 Loan of Sample Households of Kutia Kandha Credit is one of the most crucial inputs in the process of development. Loan and debt is
inherent to PTGs as they have very limited access and control over resources. But with the
passing of the time access to credit and volume of credit are also changing gradually. The
table 24 reveals that Out of the total sample only 27.34 per cent (79 out of 289) had
access to loan in 2001 which decreased to 10.72 per cent (31 out of 289) in 2009. The
total loan amount was only Rs.66,580 in 2001; which increased to Rs.102800 in 2009. Out
of the total loan amount Rs.27975 have been paid and Rs.74825 remains outstanding. The
loan amount ranged from Rs.150 to 10,000 in 2009 as compared to Rs.100 to Rs.3850 in
2001. Average loan per indebted household has increased from Rs.843 to 3,316 during 2001
to 2009. At the same time average loan volume per household is increased from Rs.230 to
Rs.356 during the same period. The per capita loan is increased by Rs.14 i.e. from Rs.25 to
39, which is a good indicator how as far as access to loan is concerned.
Table 25 before 2004, a majority of 35.44 per cent of households took loan from money
lenders followed by 29.11 per cent from relatives, 22.78 per cent from SHGs, 5.6 per cent
from Bank, and 2.53 per cent from Co-operatives. During last 5 years (2004-2009) SHGs
(70.97%) is highly acceptable by the community for immediate credit need without
mortgage. Access to Formal sources (Bank and Co-operatives) has increased from 7.9 per
cent to 12.91 per cent. While percentage of loan from SHGs has increased by 48.19 per
cent, Sources of loan from money lenders and relatives is showing downward trend by
16.09 per cent and 19.43 per cent respectively.
219
Table 24: Loan/indebt amount of Kutia Kandha.
Loan Volume Before 2004 2004 to 2009
No of HHs availed loan 79 (27.34%) 31 (10.72%)
Total loan amount (Rs.) 66580 102800
Range (Rs.) 100-3850 150-10000
Outstanding (Rs.) 20800 74825
Aveg loan amount/Indebt. HH (Rs.) 843 3316
Aveg loan amount/total HH (Rs.) 230 356
Per Capita Loan (Rs.) 25 39
* It includes outstanding amount of 2004 (Rs.20,800)
Source: Field Survey, 2009
Table 25: Sources of Loan.
Before 2004 2009 (2004 to 2009) Total
Sources of Loan HHs Percentage* (%) HHs Percentage** (%) HHs Percentage (%)
Bank 4 5.06 3 9.68 7 6.36
Co-Operative 2 2.53 1 3.23 3 2.73
SHG 18 22.78 22 70.97 40 36.36
Relatives 23 29.11 3 9.68 26 23.64
Money Lenders 28 35.44 6 19.35 34 30.91
NB
Two person have been taken loan from both SHG and money lenders
Four indebted HHs in 2009 have taken loan 5 years back
Source: Field Survey, 2009
The table 32 evaluates causes of indebtedness. The present study shows that out of total
household a majority of 29 per cent of households utilized the loan for family expanses
purposes followed by 25.81 per cent, 19.35 per cent, 16.13 per cent, 12.90 per cent, and
3.23 per cent, to meet the social ceremonies, Health, expanses related to Agro-input, to
paid previous loan and for education in 2009 against 24.05 per cent, 21.52 per cent, 17.72
per cent, 11.39 per cent, 10.13 per cent and 2.52 per cent respectively for the same
purposes before 2004.
Table 26: Utilization of Loan.
Before 2004 2009 (2004 to 2009) Changes* Purpose of loan
Previous Percentage (%)
Current Percentage (%)
Percentage (%)
Rank
Household consumption
19 24.05 9 29.03 4.98 1
220
Before 2004 2009 (2004 to 2009) Changes* Purpose of loan
Previous Percentage (%)
Current Percentage (%)
Percentage (%)
Rank
Social ceremonies 17 21.52 8 25.81 4.29 3
Agriculture 9 11.39 5 16.13 4.74 2
Health 14 17.72 6 19.35 1.63 5
Education 2 2.53 1 3.23 0.69 6
To paid previous loan 8 10.13 4 12.90 2.78 4
Other 6 7.59 2 6.45 -1.14 7
Total 75 94.94 35 112.90
NB Same loan has been taken to meet various needs stated above
Source: Field Survey, 2009
5.3.24 Saving of Households of Kutia Kandha Savings of a household or a community indicates the economic stability of the community.
Out of total households only 2.76 per cent (8) household had a saving amounting of
Rs.17200 in 2001, which has increased to Rs.159210 covering 232 (80.27%) household in
2009. While the saving amount ranged from Rs.600 to Rs.17,200 in 2001, the saving
amount has ranged from Rs.120 to 12,000 in 2009(table 27).
Table 27: Saving of Kutia Kandha Households.
Saving Before 2004 2004 to 2009 Total
Total HHs 289 289
No of HHs 8 (2.76%) 232 (80.27%) 232*
Amount 17200 159210 176410
Max 5000 12000 12000
Min 600 120 120
Average 2150 686 760
NB 8 person have the same saving as it was earlier
Source: Field Survey, 2009
5.3.25 Total Asset of Kutia Kandha Households The value of the household asset of the sampled, 289 households is Rs.6273869 in 2009.
The value of household assets on an average is Rs.21709 in 2009 against Rs.18586 in 2001.
Thus a household has created additional household assets of Rs.3123 in last 8 years. It
shows that the surplus amount has been utilized by the Kutia Kandha to create household
assets.
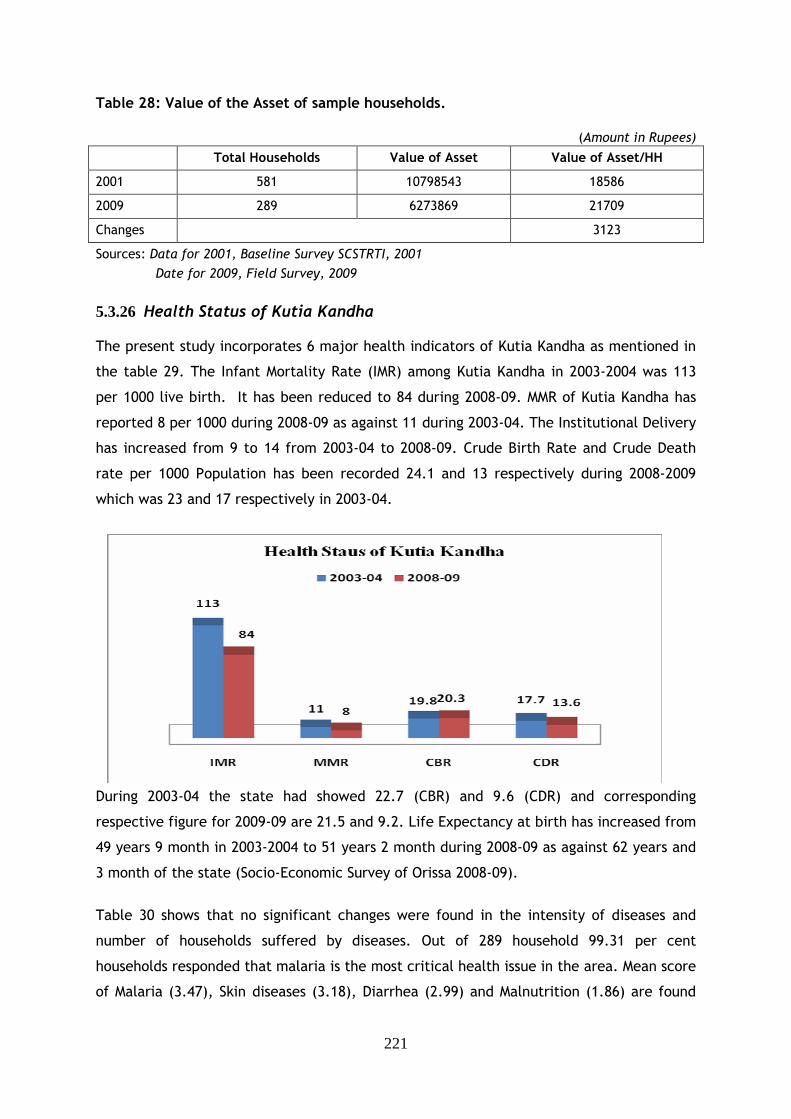
221
Table 28: Value of the Asset of sample households.
(Amount in Rupees)
Total Households Value of Asset Value of Asset/HH
2001 581 10798543 18586
2009 289 6273869 21709
Changes 3123
Sources: Data for 2001, Baseline Survey SCSTRTI, 2001
Date for 2009, Field Survey, 2009
5.3.26 Health Status of Kutia Kandha The present study incorporates 6 major health indicators of Kutia Kandha as mentioned in
the table 29. The Infant Mortality Rate (IMR) among Kutia Kandha in 2003-2004 was 113
per 1000 live birth. It has been reduced to 84 during 2008-09. MMR of Kutia Kandha has
reported 8 per 1000 during 2008-09 as against 11 during 2003-04. The Institutional Delivery
has increased from 9 to 14 from 2003-04 to 2008-09. Crude Birth Rate and Crude Death
rate per 1000 Population has been recorded 24.1 and 13 respectively during 2008-2009
which was 23 and 17 respectively in 2003-04.
During 2003-04 the state had showed 22.7 (CBR) and 9.6 (CDR) and corresponding
respective figure for 2009-09 are 21.5 and 9.2. Life Expectancy at birth has increased from
49 years 9 month in 2003-2004 to 51 years 2 month during 2008-09 as against 62 years and
3 month of the state (Socio-Economic Survey of Orissa 2008-09).
Table 30 shows that no significant changes were found in the intensity of diseases and
number of households suffered by diseases. Out of 289 household 99.31 per cent
households responded that malaria is the most critical health issue in the area. Mean score
of Malaria (3.47), Skin diseases (3.18), Diarrhea (2.99) and Malnutrition (1.86) are found
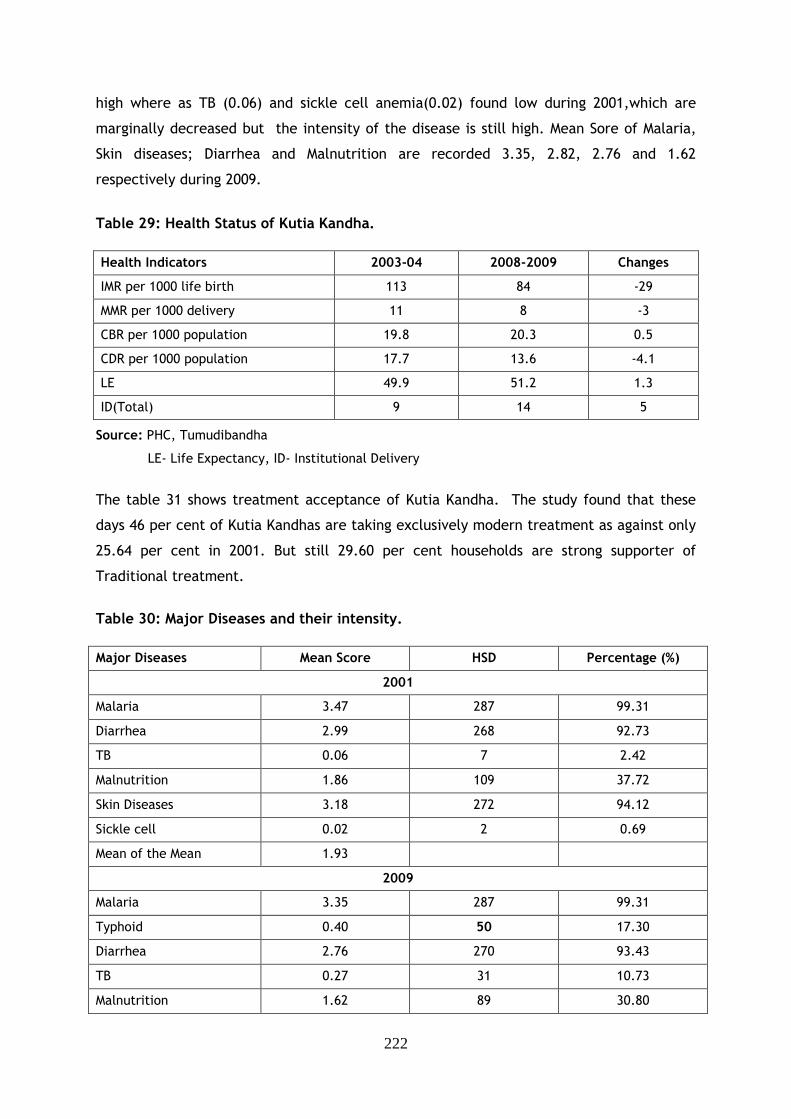
222
high where as TB (0.06) and sickle cell anemia(0.02) found low during 2001,which are
marginally decreased but the intensity of the disease is still high. Mean Sore of Malaria,
Skin diseases; Diarrhea and Malnutrition are recorded 3.35, 2.82, 2.76 and 1.62
respectively during 2009.
Table 29: Health Status of Kutia Kandha.
Health Indicators 2003-04 2008-2009 Changes
IMR per 1000 life birth 113 84 -29
MMR per 1000 delivery 11 8 -3
CBR per 1000 population 19.8 20.3 0.5
CDR per 1000 population 17.7 13.6 -4.1
LE 49.9 51.2 1.3
ID(Total) 9 14 5
Source: PHC, Tumudibandha
LE- Life Expectancy, ID- Institutional Delivery
The table 31 shows treatment acceptance of Kutia Kandha. The study found that these
days 46 per cent of Kutia Kandhas are taking exclusively modern treatment as against only
25.64 per cent in 2001. But still 29.60 per cent households are strong supporter of
Traditional treatment.
Table 30: Major Diseases and their intensity.
Major Diseases Mean Score HSD Percentage (%)
2001
Malaria 3.47 287 99.31
Diarrhea 2.99 268 92.73
TB 0.06 7 2.42
Malnutrition 1.86 109 37.72
Skin Diseases 3.18 272 94.12
Sickle cell 0.02 2 0.69
Mean of the Mean 1.93
2009
Malaria 3.35 287 99.31
Typhoid 0.40 50 17.30
Diarrhea 2.76 270 93.43
TB 0.27 31 10.73
Malnutrition 1.62 89 30.80
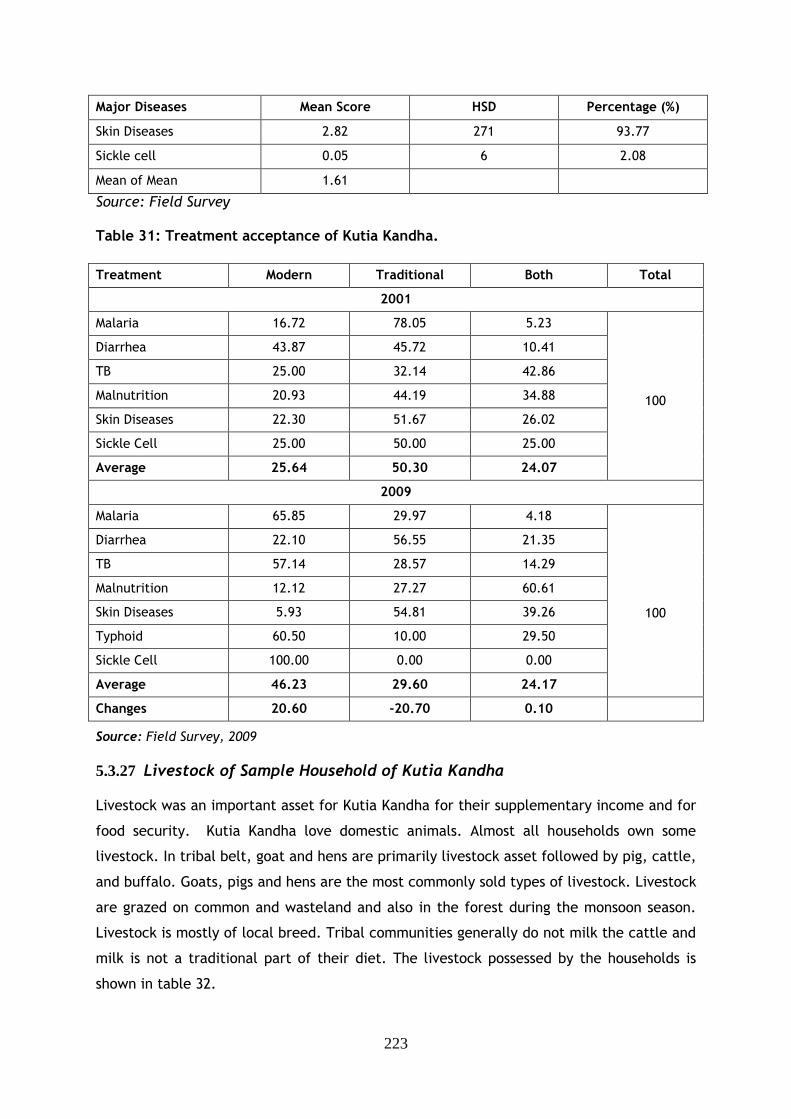
223
Major Diseases Mean Score HSD Percentage (%)
Skin Diseases 2.82 271 93.77
Sickle cell 0.05 6 2.08
Mean of Mean 1.61
Source: Field Survey
Table 31: Treatment acceptance of Kutia Kandha.
Treatment Modern Traditional Both Total
2001
Malaria 16.72 78.05 5.23
Diarrhea 43.87 45.72 10.41
TB 25.00 32.14 42.86
Malnutrition 20.93 44.19 34.88
Skin Diseases 22.30 51.67 26.02
Sickle Cell 25.00 50.00 25.00
Average 25.64 50.30 24.07
100
2009
Malaria 65.85 29.97 4.18
Diarrhea 22.10 56.55 21.35
TB 57.14 28.57 14.29
Malnutrition 12.12 27.27 60.61
Skin Diseases 5.93 54.81 39.26
Typhoid 60.50 10.00 29.50
Sickle Cell 100.00 0.00 0.00
Average 46.23 29.60 24.17
100
Changes 20.60 -20.70 0.10
Source: Field Survey, 2009
5.3.27 Livestock of Sample Household of Kutia Kandha Livestock was an important asset for Kutia Kandha for their supplementary income and for
food security. Kutia Kandha love domestic animals. Almost all households own some
livestock. In tribal belt, goat and hens are primarily livestock asset followed by pig, cattle,
and buffalo. Goats, pigs and hens are the most commonly sold types of livestock. Livestock
are grazed on common and wasteland and also in the forest during the monsoon season.
Livestock is mostly of local breed. Tribal communities generally do not milk the cattle and
milk is not a traditional part of their diet. The livestock possessed by the households is
shown in table 32.
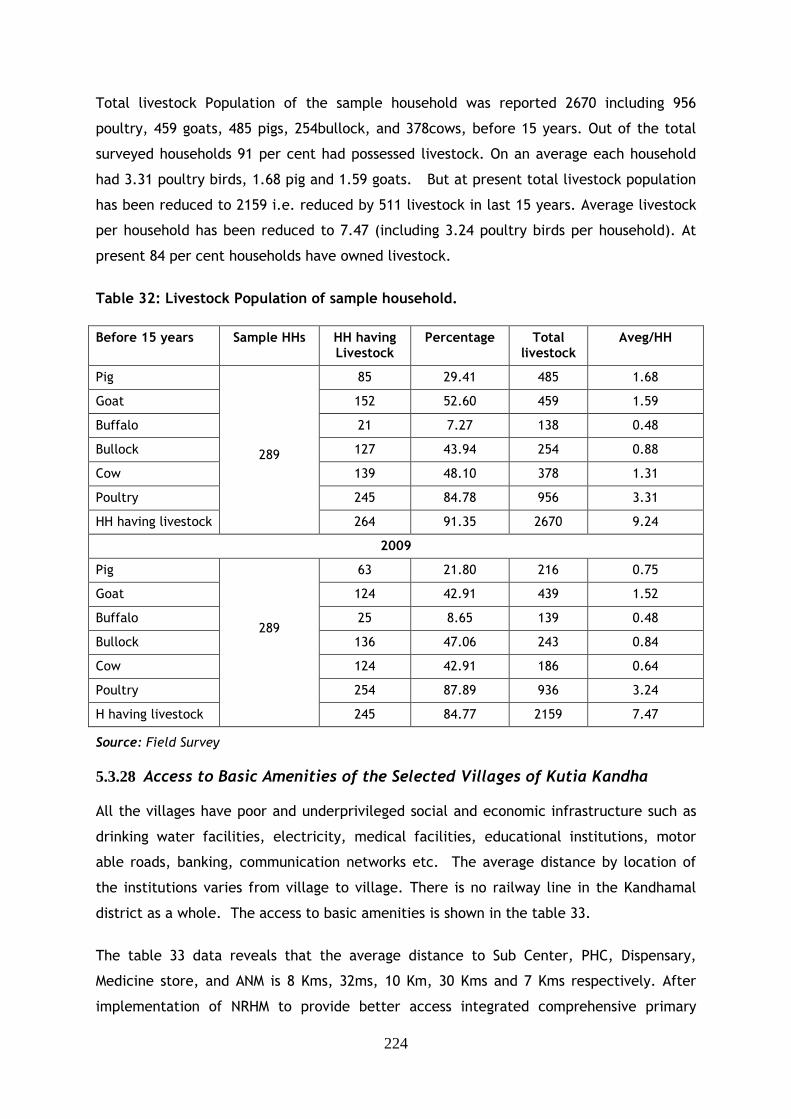
224
Total livestock Population of the sample household was reported 2670 including 956
poultry, 459 goats, 485 pigs, 254bullock, and 378cows, before 15 years. Out of the total
surveyed households 91 per cent had possessed livestock. On an average each household
had 3.31 poultry birds, 1.68 pig and 1.59 goats. But at present total livestock population
has been reduced to 2159 i.e. reduced by 511 livestock in last 15 years. Average livestock
per household has been reduced to 7.47 (including 3.24 poultry birds per household). At
present 84 per cent households have owned livestock.
Table 32: Livestock Population of sample household.
Before 15 years Sample HHs HH having
Livestock Percentage Total
livestock Aveg/HH
Pig 85 29.41 485 1.68
Goat 152 52.60 459 1.59
Buffalo 21 7.27 138 0.48
Bullock 127 43.94 254 0.88
Cow 139 48.10 378 1.31
Poultry 245 84.78 956 3.31
HH having livestock
289
264 91.35 2670 9.24
2009
Pig 63 21.80 216 0.75
Goat 124 42.91 439 1.52
Buffalo 25 8.65 139 0.48
Bullock 136 47.06 243 0.84
Cow 124 42.91 186 0.64
Poultry 254 87.89 936 3.24
H having livestock
289
245 84.77 2159 7.47
Source: Field Survey
5.3.28 Access to Basic Amenities of the Selected Villages of Kutia Kandha All the villages have poor and underprivileged social and economic infrastructure such as
drinking water facilities, electricity, medical facilities, educational institutions, motor
able roads, banking, communication networks etc. The average distance by location of
the institutions varies from village to village. There is no railway line in the Kandhamal
district as a whole. The access to basic amenities is shown in the table 33.
The table 33 data reveals that the average distance to Sub Center, PHC, Dispensary,
Medicine store, and ANM is 8 Kms, 32ms, 10 Km, 30 Kms and 7 Kms respectively. After
implementation of NRHM to provide better access integrated comprehensive primary
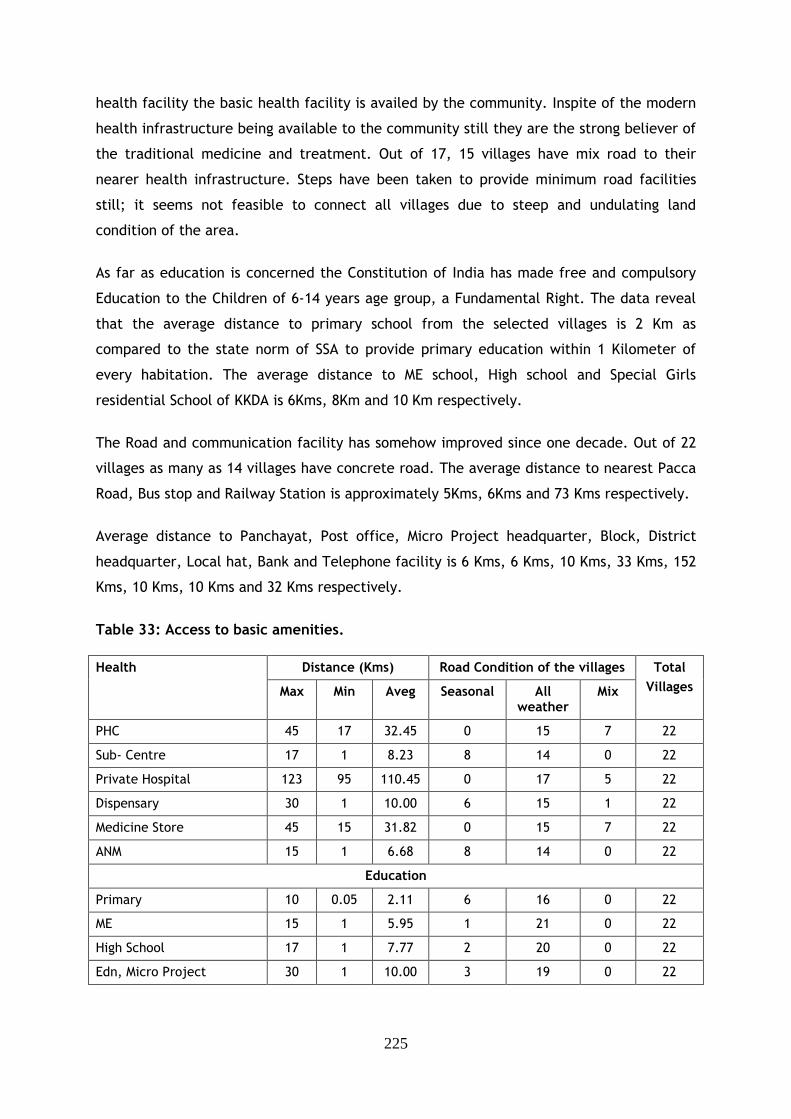
225
health facility the basic health facility is availed by the community. Inspite of the modern
health infrastructure being available to the community still they are the strong believer of
the traditional medicine and treatment. Out of 17, 15 villages have mix road to their
nearer health infrastructure. Steps have been taken to provide minimum road facilities
still; it seems not feasible to connect all villages due to steep and undulating land
condition of the area.
As far as education is concerned the Constitution of India has made free and compulsory
Education to the Children of 6-14 years age group, a Fundamental Right. The data reveal
that the average distance to primary school from the selected villages is 2 Km as
compared to the state norm of SSA to provide primary education within 1 Kilometer of
every habitation. The average distance to ME school, High school and Special Girls
residential School of KKDA is 6Kms, 8Km and 10 Km respectively.
The Road and communication facility has somehow improved since one decade. Out of 22
villages as many as 14 villages have concrete road. The average distance to nearest Pacca
Road, Bus stop and Railway Station is approximately 5Kms, 6Kms and 73 Kms respectively.
Average distance to Panchayat, Post office, Micro Project headquarter, Block, District
headquarter, Local hat, Bank and Telephone facility is 6 Kms, 6 Kms, 10 Kms, 33 Kms, 152
Kms, 10 Kms, 10 Kms and 32 Kms respectively.
Table 33: Access to basic amenities.
Distance (Kms) Road Condition of the villages Health
Max Min Aveg Seasonal All weather
Mix
Total
Villages
PHC 45 17 32.45 0 15 7 22
Sub- Centre 17 1 8.23 8 14 0 22
Private Hospital 123 95 110.45 0 17 5 22
Dispensary 30 1 10.00 6 15 1 22
Medicine Store 45 15 31.82 0 15 7 22
ANM 15 1 6.68 8 14 0 22
Education
Primary 10 0.05 2.11 6 16 0 22
ME 15 1 5.95 1 21 0 22
High School 17 1 7.77 2 20 0 22
Edn, Micro Project 30 1 10.00 3 19 0 22
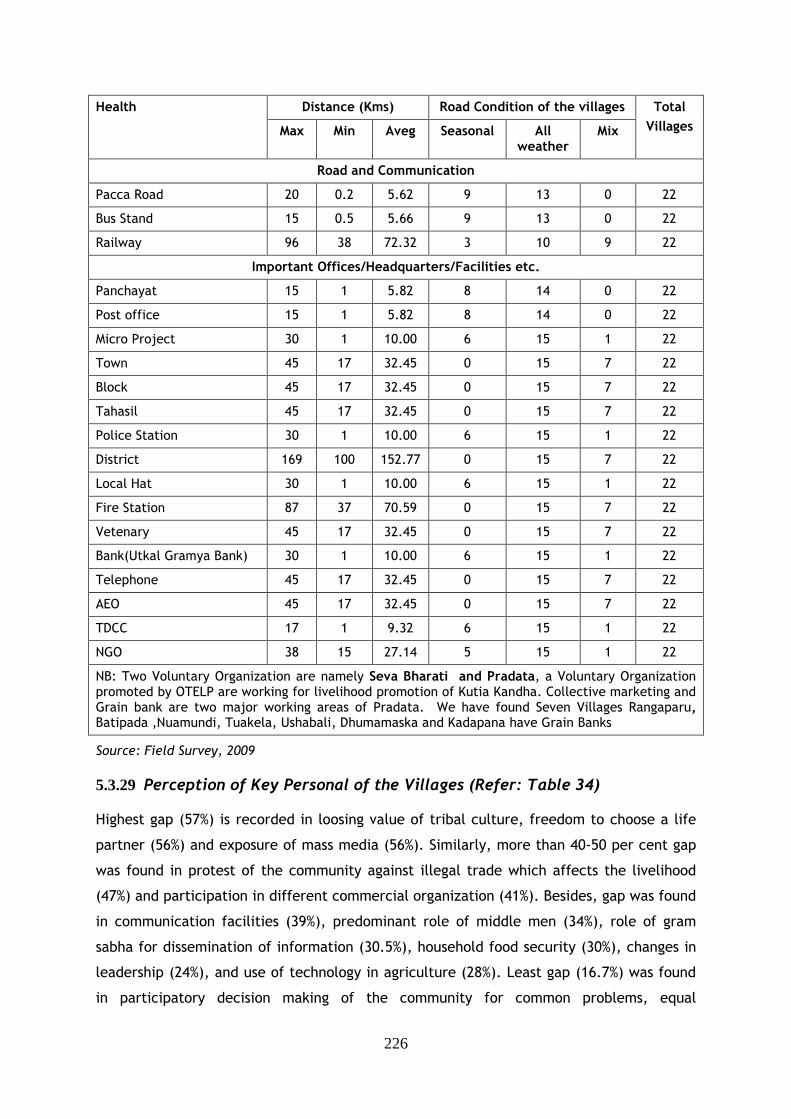
226
Distance (Kms) Road Condition of the villages Health
Max Min Aveg Seasonal All weather
Mix
Total
Villages
Road and Communication
Pacca Road 20 0.2 5.62 9 13 0 22
Bus Stand 15 0.5 5.66 9 13 0 22
Railway 96 38 72.32 3 10 9 22
Important Offices/Headquarters/Facilities etc.
Panchayat 15 1 5.82 8 14 0 22
Post office 15 1 5.82 8 14 0 22
Micro Project 30 1 10.00 6 15 1 22
Town 45 17 32.45 0 15 7 22
Block 45 17 32.45 0 15 7 22
Tahasil 45 17 32.45 0 15 7 22
Police Station 30 1 10.00 6 15 1 22
District 169 100 152.77 0 15 7 22
Local Hat 30 1 10.00 6 15 1 22
Fire Station 87 37 70.59 0 15 7 22
Vetenary 45 17 32.45 0 15 7 22
Bank(Utkal Gramya Bank) 30 1 10.00 6 15 1 22
Telephone 45 17 32.45 0 15 7 22
AEO 45 17 32.45 0 15 7 22
TDCC 17 1 9.32 6 15 1 22
NGO 38 15 27.14 5 15 1 22
NB: Two Voluntary Organization are namely Seva Bharati and Pradata, a Voluntary Organization promoted by OTELP are working for livelihood promotion of Kutia Kandha. Collective marketing and Grain bank are two major working areas of Pradata. We have found Seven Villages Rangaparu, Batipada ,Nuamundi, Tuakela, Ushabali, Dhumamaska and Kadapana have Grain Banks
Source: Field Survey, 2009
5.3.29 Perception of Key Personal of the Villages (Refer: Table 34) Highest gap (57%) is recorded in loosing value of tribal culture, freedom to choose a life
partner (56%) and exposure of mass media (56%). Similarly, more than 40-50 per cent gap
was found in protest of the community against illegal trade which affects the livelihood
(47%) and participation in different commercial organization (41%). Besides, gap was found
in communication facilities (39%), predominant role of middle men (34%), role of gram
sabha for dissemination of information (30.5%), household food security (30%), changes in
leadership (24%), and use of technology in agriculture (28%). Least gap (16.7%) was found
in participatory decision making of the community for common problems, equal
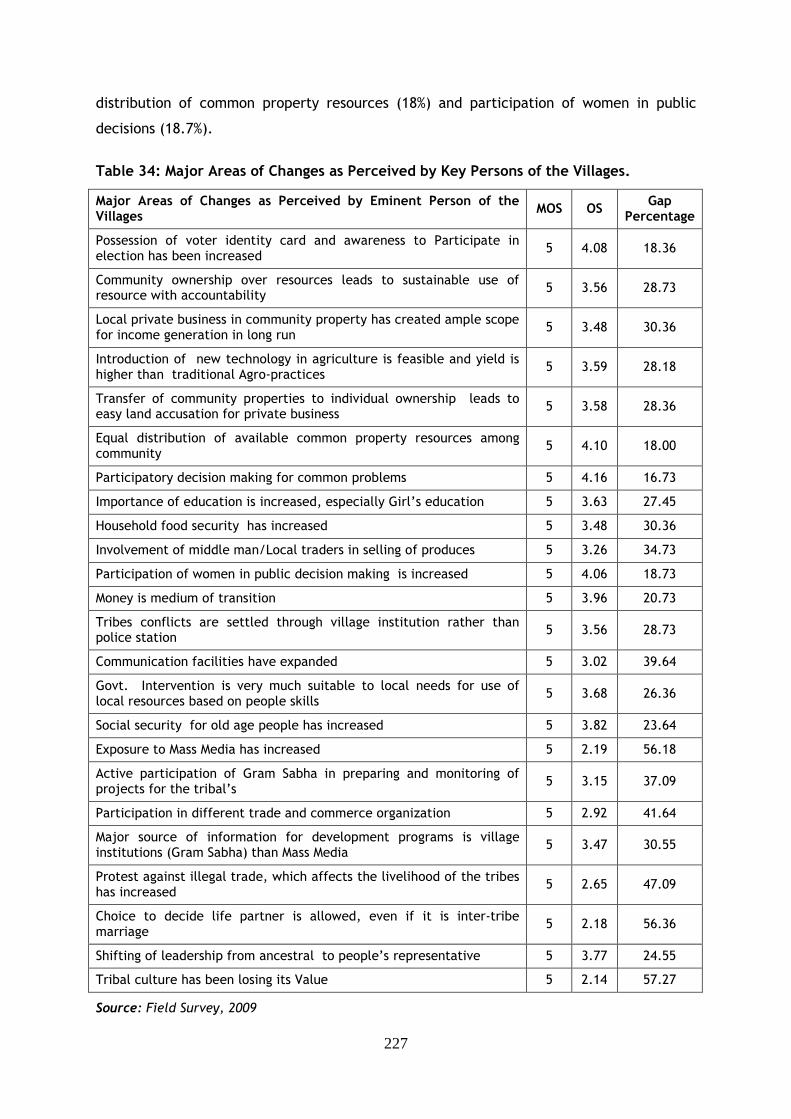
227
distribution of common property resources (18%) and participation of women in public
decisions (18.7%).
Table 34: Major Areas of Changes as Perceived by Key Persons of the Villages.
Source: Field Survey, 2009
Major Areas of Changes as Perceived by Eminent Person of the Villages
MOS OS Gap
Percentage
Possession of voter identity card and awareness to Participate in election has been increased
5 4.08 18.36
Community ownership over resources leads to sustainable use of resource with accountability
5 3.56 28.73
Local private business in community property has created ample scope for income generation in long run
5 3.48 30.36
Introduction of new technology in agriculture is feasible and yield is higher than traditional Agro-practices
5 3.59 28.18
Transfer of community properties to individual ownership leads to easy land accusation for private business
5 3.58 28.36
Equal distribution of available common property resources among community
5 4.10 18.00
Participatory decision making for common problems 5 4.16 16.73
Importance of education is increased, especially Girl’s education 5 3.63 27.45
Household food security has increased 5 3.48 30.36
Involvement of middle man/Local traders in selling of produces 5 3.26 34.73
Participation of women in public decision making is increased 5 4.06 18.73
Money is medium of transition 5 3.96 20.73
Tribes conflicts are settled through village institution rather than police station
5 3.56 28.73
Communication facilities have expanded 5 3.02 39.64
Govt. Intervention is very much suitable to local needs for use of local resources based on people skills
5 3.68 26.36
Social security for old age people has increased 5 3.82 23.64
Exposure to Mass Media has increased 5 2.19 56.18
Active participation of Gram Sabha in preparing and monitoring of projects for the tribal’s
5 3.15 37.09
Participation in different trade and commerce organization 5 2.92 41.64
Major source of information for development programs is village institutions (Gram Sabha) than Mass Media
5 3.47 30.55
Protest against illegal trade, which affects the livelihood of the tribes has increased
5 2.65 47.09
Choice to decide life partner is allowed, even if it is inter-tribe marriage
5 2.18 56.36
Shifting of leadership from ancestral to people’s representative 5 3.77 24.55
Tribal culture has been losing its Value 5 2.14 57.27
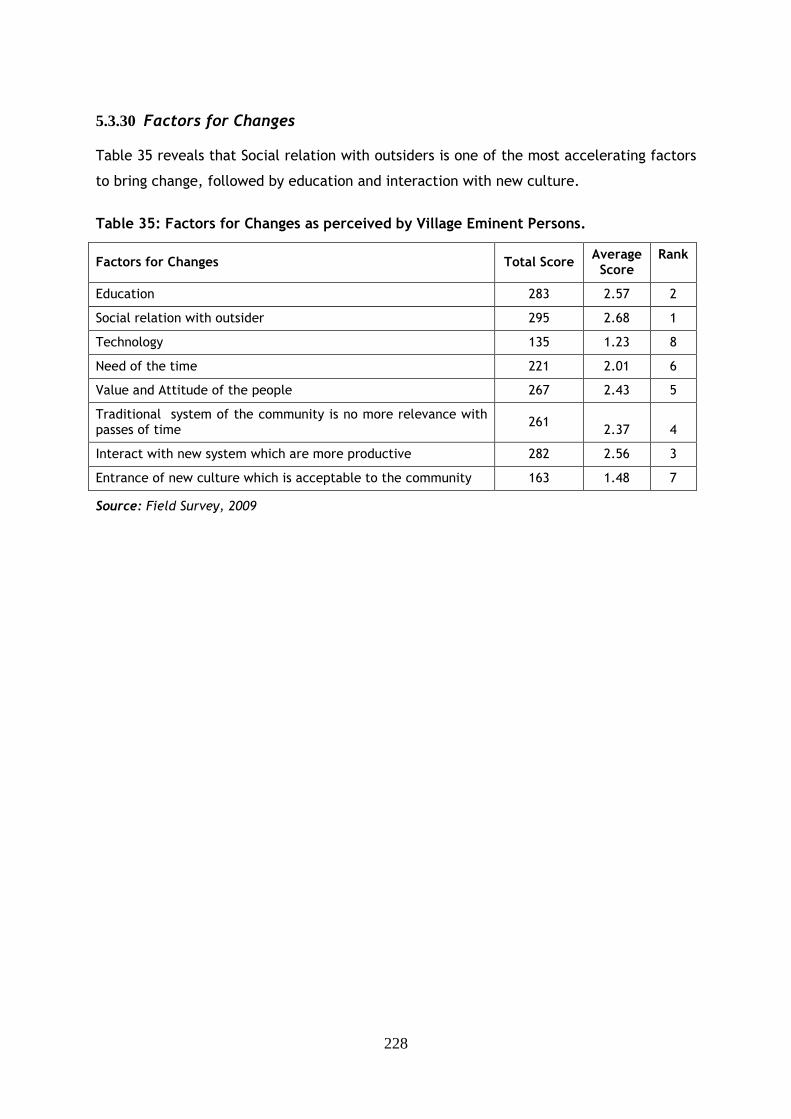
228
5.3.30 Factors for Changes Table 35 reveals that Social relation with outsiders is one of the most accelerating factors
to bring change, followed by education and interaction with new culture.
Table 35: Factors for Changes as perceived by Village Eminent Persons.
Source: Field Survey, 2009
Factors for Changes Total Score Average Score
Rank
Education 283 2.57 2
Social relation with outsider 295 2.68 1
Technology 135 1.23 8
Need of the time 221 2.01 6
Value and Attitude of the people 267 2.43 5
Traditional system of the community is no more relevance with passes of time
261 2.37 4
Interact with new system which are more productive 282 2.56 3
Entrance of new culture which is acceptable to the community 163 1.48 7
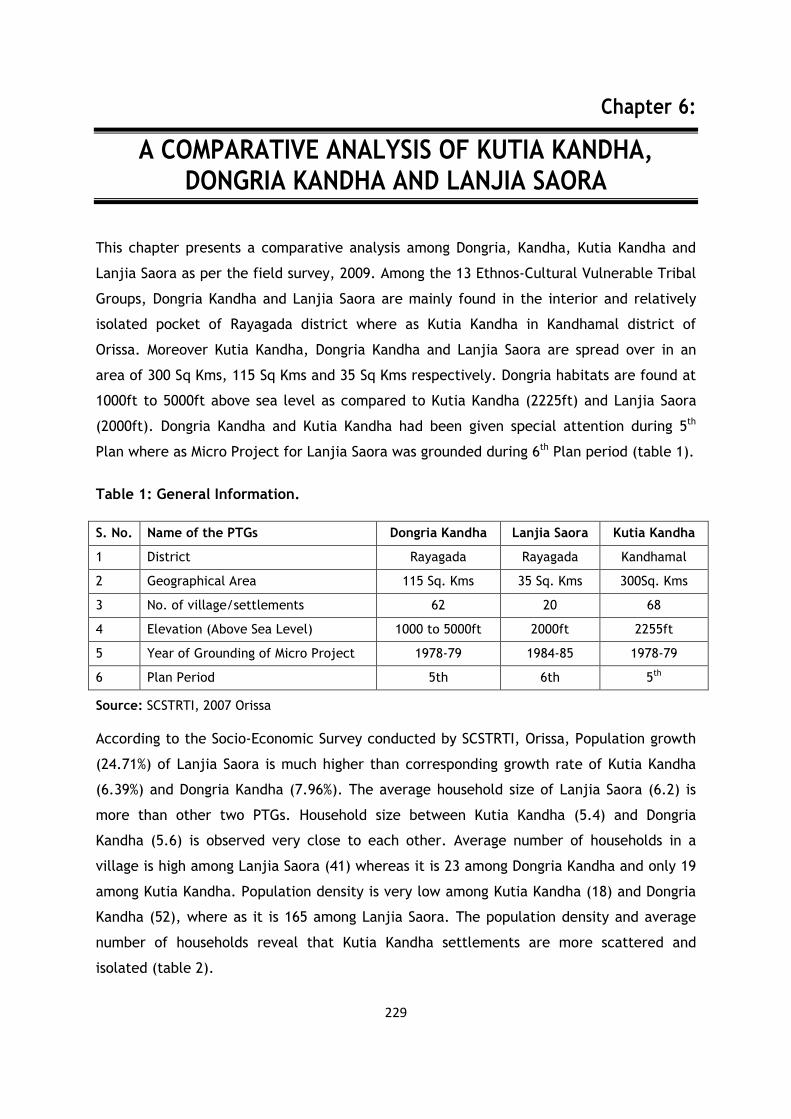
229
Chapter 6:
A COMPARATIVE ANALYSIS OF KUTIA KANDHA, DONGRIA KANDHA AND LANJIA SAORA
This chapter presents a comparative analysis among Dongria, Kandha, Kutia Kandha and
Lanjia Saora as per the field survey, 2009. Among the 13 Ethnos-Cultural Vulnerable Tribal
Groups, Dongria Kandha and Lanjia Saora are mainly found in the interior and relatively
isolated pocket of Rayagada district where as Kutia Kandha in Kandhamal district of
Orissa. Moreover Kutia Kandha, Dongria Kandha and Lanjia Saora are spread over in an
area of 300 Sq Kms, 115 Sq Kms and 35 Sq Kms respectively. Dongria habitats are found at
1000ft to 5000ft above sea level as compared to Kutia Kandha (2225ft) and Lanjia Saora
(2000ft). Dongria Kandha and Kutia Kandha had been given special attention during 5th
Plan where as Micro Project for Lanjia Saora was grounded during 6th Plan period (table 1).
Table 1: General Information.
S. No. Name of the PTGs Dongria Kandha Lanjia Saora Kutia Kandha
1 District Rayagada Rayagada Kandhamal
2 Geographical Area 115 Sq. Kms 35 Sq. Kms 300Sq. Kms
3 No. of village/settlements 62 20 68
4 Elevation (Above Sea Level) 1000 to 5000ft 2000ft 2255ft
5 Year of Grounding of Micro Project 1978-79 1984-85 1978-79
6 Plan Period 5th 6th 5th
Source: SCSTRTI, 2007 Orissa
According to the Socio-Economic Survey conducted by SCSTRTI, Orissa, Population growth
(24.71%) of Lanjia Saora is much higher than corresponding growth rate of Kutia Kandha
(6.39%) and Dongria Kandha (7.96%). The average household size of Lanjia Saora (6.2) is
more than other two PTGs. Household size between Kutia Kandha (5.4) and Dongria
Kandha (5.6) is observed very close to each other. Average number of households in a
village is high among Lanjia Saora (41) whereas it is 23 among Dongria Kandha and only 19
among Kutia Kandha. Population density is very low among Kutia Kandha (18) and Dongria
Kandha (52), where as it is 165 among Lanjia Saora. The population density and average
number of households reveal that Kutia Kandha settlements are more scattered and
isolated (table 2).
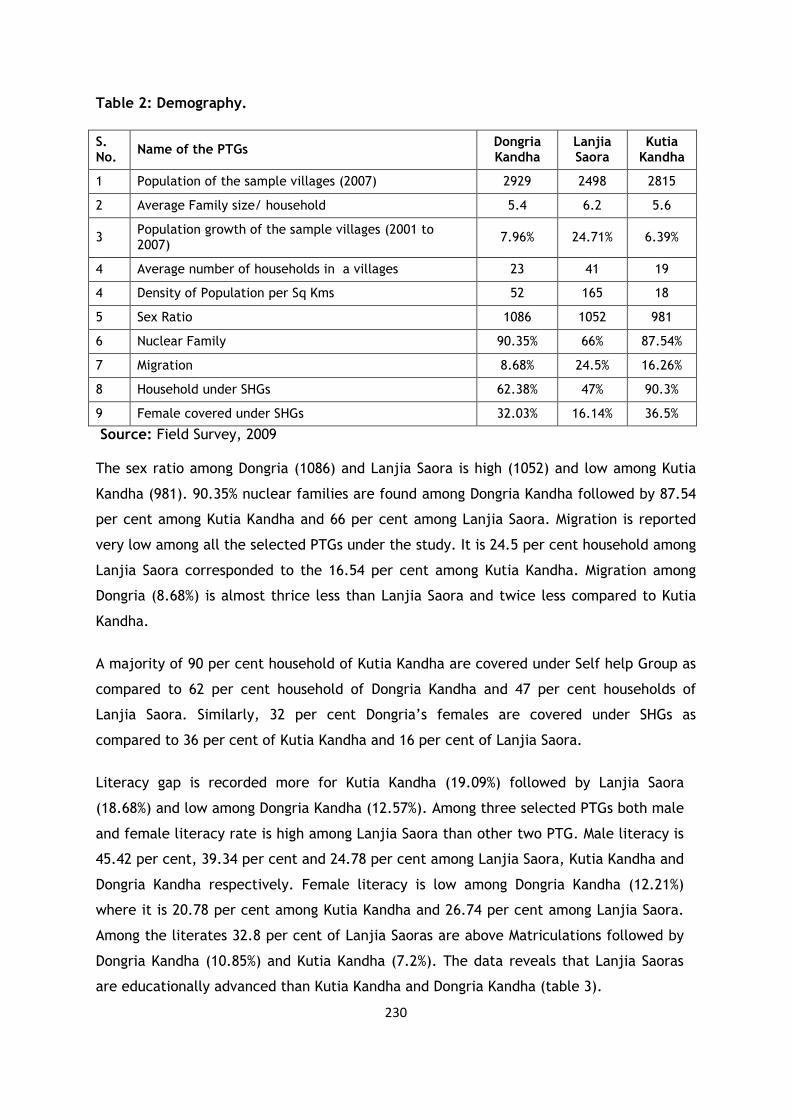
230
Table 2: Demography.
S. No.
Name of the PTGs Dongria Kandha
Lanjia Saora
Kutia Kandha
1 Population of the sample villages (2007) 2929 2498 2815
2 Average Family size/ household 5.4 6.2 5.6
3 Population growth of the sample villages (2001 to 2007)
7.96% 24.71% 6.39%
4 Average number of households in a villages 23 41 19
4 Density of Population per Sq Kms 52 165 18
5 Sex Ratio 1086 1052 981
6 Nuclear Family 90.35% 66% 87.54%
7 Migration 8.68% 24.5% 16.26%
8 Household under SHGs 62.38% 47% 90.3%
9 Female covered under SHGs 32.03% 16.14% 36.5%
Source: Field Survey, 2009 The sex ratio among Dongria (1086) and Lanjia Saora is high (1052) and low among Kutia
Kandha (981). 90.35% nuclear families are found among Dongria Kandha followed by 87.54
per cent among Kutia Kandha and 66 per cent among Lanjia Saora. Migration is reported
very low among all the selected PTGs under the study. It is 24.5 per cent household among
Lanjia Saora corresponded to the 16.54 per cent among Kutia Kandha. Migration among
Dongria (8.68%) is almost thrice less than Lanjia Saora and twice less compared to Kutia
Kandha.
A majority of 90 per cent household of Kutia Kandha are covered under Self help Group as
compared to 62 per cent household of Dongria Kandha and 47 per cent households of
Lanjia Saora. Similarly, 32 per cent Dongria’s females are covered under SHGs as
compared to 36 per cent of Kutia Kandha and 16 per cent of Lanjia Saora.
Literacy gap is recorded more for Kutia Kandha (19.09%) followed by Lanjia Saora
(18.68%) and low among Dongria Kandha (12.57%). Among three selected PTGs both male
and female literacy rate is high among Lanjia Saora than other two PTG. Male literacy is
45.42 per cent, 39.34 per cent and 24.78 per cent among Lanjia Saora, Kutia Kandha and
Dongria Kandha respectively. Female literacy is low among Dongria Kandha (12.21%)
where it is 20.78 per cent among Kutia Kandha and 26.74 per cent among Lanjia Saora.
Among the literates 32.8 per cent of Lanjia Saoras are above Matriculations followed by
Dongria Kandha (10.85%) and Kutia Kandha (7.2%). The data reveals that Lanjia Saoras
are educationally advanced than Kutia Kandha and Dongria Kandha (table 3).
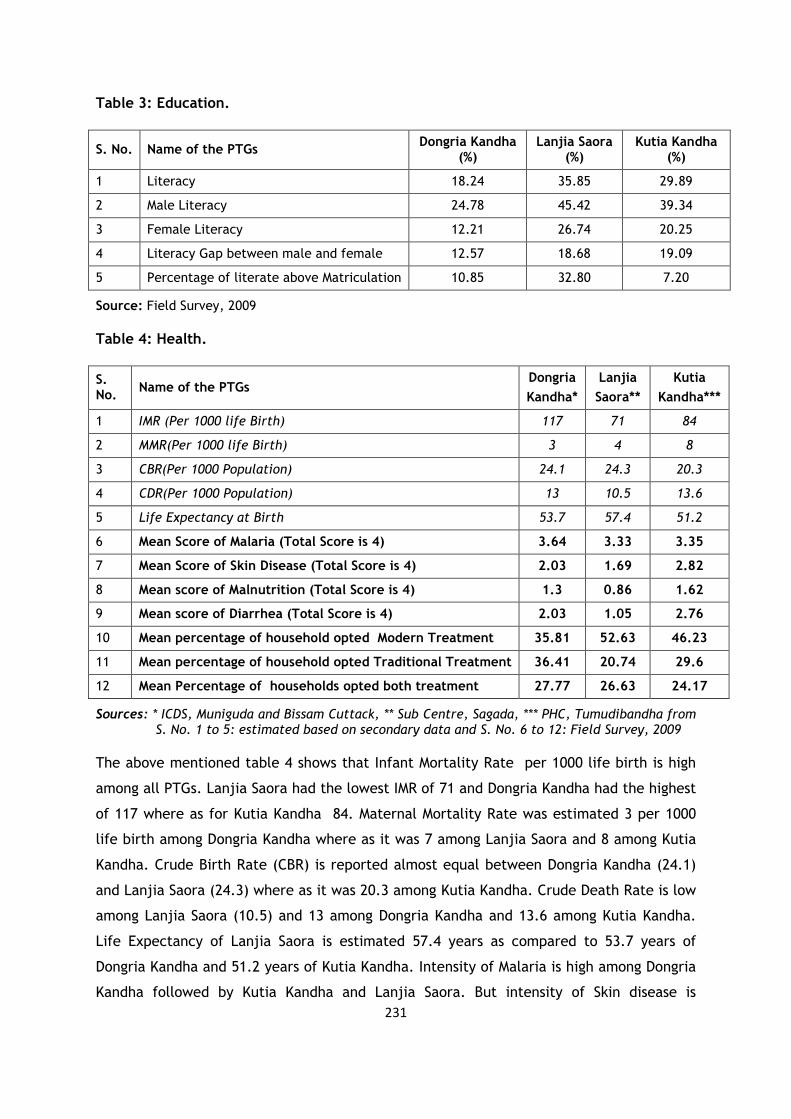
231
Table 3: Education.
S. No. Name of the PTGs Dongria Kandha
(%) Lanjia Saora
(%) Kutia Kandha
(%)
1 Literacy 18.24 35.85 29.89
2 Male Literacy 24.78 45.42 39.34
3 Female Literacy 12.21 26.74 20.25
4 Literacy Gap between male and female 12.57 18.68 19.09
5 Percentage of literate above Matriculation 10.85 32.80 7.20
Source: Field Survey, 2009
Table 4: Health.
S. No.
Name of the PTGs Dongria
Kandha*
Lanjia
Saora**
Kutia
Kandha***
1 IMR (Per 1000 life Birth) 117 71 84
2 MMR(Per 1000 life Birth) 3 4 8
3 CBR(Per 1000 Population) 24.1 24.3 20.3
4 CDR(Per 1000 Population) 13 10.5 13.6
5 Life Expectancy at Birth 53.7 57.4 51.2
6 Mean Score of Malaria (Total Score is 4) 3.64 3.33 3.35
7 Mean Score of Skin Disease (Total Score is 4) 2.03 1.69 2.82
8 Mean score of Malnutrition (Total Score is 4) 1.3 0.86 1.62
9 Mean score of Diarrhea (Total Score is 4) 2.03 1.05 2.76
10 Mean percentage of household opted Modern Treatment 35.81 52.63 46.23
11 Mean percentage of household opted Traditional Treatment 36.41 20.74 29.6
12 Mean Percentage of households opted both treatment 27.77 26.63 24.17
Sources: * ICDS, Muniguda and Bissam Cuttack, ** Sub Centre, Sagada, *** PHC, Tumudibandha from S. No. 1 to 5: estimated based on secondary data and S. No. 6 to 12: Field Survey, 2009
The above mentioned table 4 shows that Infant Mortality Rate per 1000 life birth is high
among all PTGs. Lanjia Saora had the lowest IMR of 71 and Dongria Kandha had the highest
of 117 where as for Kutia Kandha 84. Maternal Mortality Rate was estimated 3 per 1000
life birth among Dongria Kandha where as it was 7 among Lanjia Saora and 8 among Kutia
Kandha. Crude Birth Rate (CBR) is reported almost equal between Dongria Kandha (24.1)
and Lanjia Saora (24.3) where as it was 20.3 among Kutia Kandha. Crude Death Rate is low
among Lanjia Saora (10.5) and 13 among Dongria Kandha and 13.6 among Kutia Kandha.
Life Expectancy of Lanjia Saora is estimated 57.4 years as compared to 53.7 years of
Dongria Kandha and 51.2 years of Kutia Kandha. Intensity of Malaria is high among Dongria
Kandha followed by Kutia Kandha and Lanjia Saora. But intensity of Skin disease is
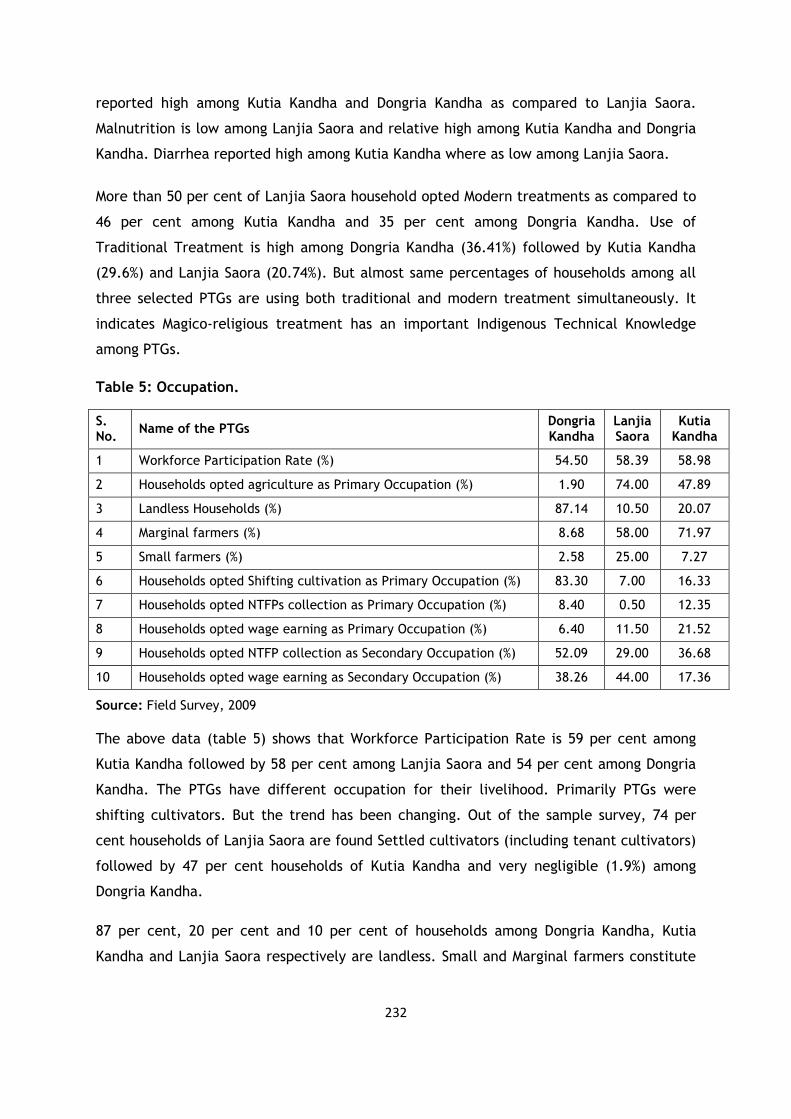
232
reported high among Kutia Kandha and Dongria Kandha as compared to Lanjia Saora.
Malnutrition is low among Lanjia Saora and relative high among Kutia Kandha and Dongria
Kandha. Diarrhea reported high among Kutia Kandha where as low among Lanjia Saora.
More than 50 per cent of Lanjia Saora household opted Modern treatments as compared to
46 per cent among Kutia Kandha and 35 per cent among Dongria Kandha. Use of
Traditional Treatment is high among Dongria Kandha (36.41%) followed by Kutia Kandha
(29.6%) and Lanjia Saora (20.74%). But almost same percentages of households among all
three selected PTGs are using both traditional and modern treatment simultaneously. It
indicates Magico-religious treatment has an important Indigenous Technical Knowledge
among PTGs.
Table 5: Occupation.
S. No.
Name of the PTGs Dongria Kandha
Lanjia Saora
Kutia Kandha
1 Workforce Participation Rate (%) 54.50 58.39 58.98
2 Households opted agriculture as Primary Occupation (%) 1.90 74.00 47.89
3 Landless Households (%) 87.14 10.50 20.07
4 Marginal farmers (%) 8.68 58.00 71.97
5 Small farmers (%) 2.58 25.00 7.27
6 Households opted Shifting cultivation as Primary Occupation (%) 83.30 7.00 16.33
7 Households opted NTFPs collection as Primary Occupation (%) 8.40 0.50 12.35
8 Households opted wage earning as Primary Occupation (%) 6.40 11.50 21.52
9 Households opted NTFP collection as Secondary Occupation (%) 52.09 29.00 36.68
10 Households opted wage earning as Secondary Occupation (%) 38.26 44.00 17.36
Source: Field Survey, 2009
The above data (table 5) shows that Workforce Participation Rate is 59 per cent among
Kutia Kandha followed by 58 per cent among Lanjia Saora and 54 per cent among Dongria
Kandha. The PTGs have different occupation for their livelihood. Primarily PTGs were
shifting cultivators. But the trend has been changing. Out of the sample survey, 74 per
cent households of Lanjia Saora are found Settled cultivators (including tenant cultivators)
followed by 47 per cent households of Kutia Kandha and very negligible (1.9%) among
Dongria Kandha.
87 per cent, 20 per cent and 10 per cent of households among Dongria Kandha, Kutia
Kandha and Lanjia Saora respectively are landless. Small and Marginal farmers constitute
233
83 per cent among Lanjia Saora and 79 per cent among Kutia Kandha and very low
percentage of 11 per cent among Dongria Kandha.
The finding of the survey indicates that nearly 83 per cent households of Dongria Kandhas
have opted shifting cultivation as their primary occupation followed by 16 per cent
households of Kutia Kandha and only 7 per cent of households of Lanjia Saora. NTFPs
collection as a primary occupation is found very negligible among Lanjia Saora (0.5%) and
high among Kutia Kandha (12.45%) where as it is 8.4 per cent among Dongria Kandha.
Wage earning reported high among Kutia Kandha (21.52%) and Lanjia Saora (11.5%) as
compared to Dongria Kandha (6.4%).
In secondary occupation NTFPs collection and Wage earning are found to be very
important as 52 per cent households of Dongria Kandha, 36.68 per cent of Kutia Kandha
and 29 per cent of Lanjia Saora have opted NTFPs collection as secondary occupation. But
majority of Lanjia Saora (44%) have opted wage earning as their secondary occupation
followed by Dongria Kandha (38%) and Kutia Kandha (17%).
It is evident from the table that dependency on shifting cultivation and NTFPs collection is
comparatively high among Dongria Kandha and Kutia Kandha (sub-section of Kandha) than
Lanjia Saora.
The annual income of a household is high among Lanjia Saora (Rs.24,491) followed by
Dongria Kandha (Rs.23,157) and Kutia Kandha (Rs.18,230). But Per Capital Income is
comparatively more among Dongria Kandha (Rs.4,320) than Lanjia Saora (Rs.3,973) and
Kutia Kandha (Rs.3,240).
Out of total income contribution of agriculture is almost same among Dongria Kandha
(64%) and Lanjia Saora (63%) and relatively less among Kutia Kandha (44%). On the other
hand NTFPs contribute about 29 per cent of income to Kutia Kandha (Mainly Siali leaves
collection) followed by Dongria Kandha (19%) and Lanjia Saora (9%). Contribution of Wage
earning is 24 per cent in case of Kutia Kandha where as it is 18 per cent for Lanjia Saora
and 9 per cent for Dongria Kandha (table 6).
Approximate value of assets per households is more than twice among Lanjia Saora (Rs.
48781) compared to that of Dongria Kandha (Rs.22416) and Kutia Kandha (Rs.21709).
The selected PTGs receive credit from different sources. The data (Table 7) reveals that
access to institutional credit (30% of indebted households) is reported among Dongria
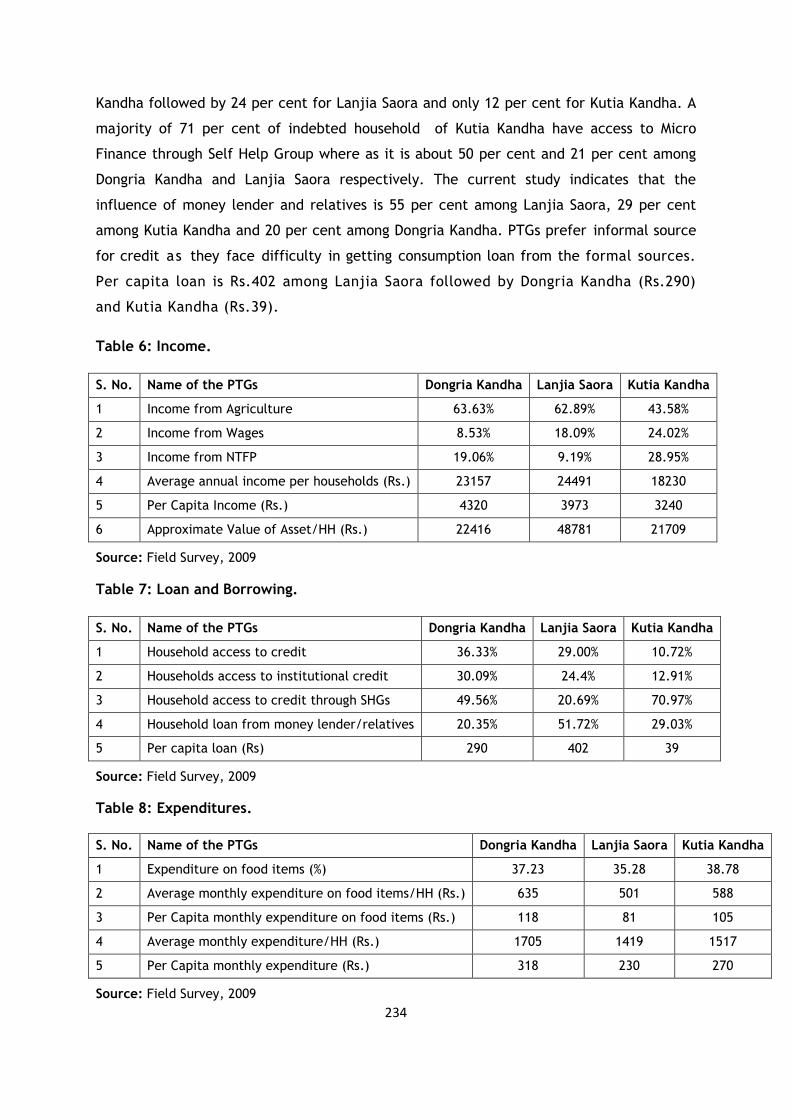
234
Kandha followed by 24 per cent for Lanjia Saora and only 12 per cent for Kutia Kandha. A
majority of 71 per cent of indebted household of Kutia Kandha have access to Micro
Finance through Self Help Group where as it is about 50 per cent and 21 per cent among
Dongria Kandha and Lanjia Saora respectively. The current study indicates that the
influence of money lender and relatives is 55 per cent among Lanjia Saora, 29 per cent
among Kutia Kandha and 20 per cent among Dongria Kandha. PTGs prefer informal source
for credit as they face difficulty in getting consumption loan from the formal sources.
Per capita loan is Rs.402 among Lanjia Saora followed by Dongria Kandha (Rs.290)
and Kutia Kandha (Rs.39).
Table 6: Income.
S. No. Name of the PTGs Dongria Kandha Lanjia Saora Kutia Kandha
1 Income from Agriculture 63.63% 62.89% 43.58%
2 Income from Wages 8.53% 18.09% 24.02%
3 Income from NTFP 19.06% 9.19% 28.95%
4 Average annual income per households (Rs.) 23157 24491 18230
5 Per Capita Income (Rs.) 4320 3973 3240
6 Approximate Value of Asset/HH (Rs.) 22416 48781 21709
Source: Field Survey, 2009
Table 7: Loan and Borrowing.
S. No. Name of the PTGs Dongria Kandha Lanjia Saora Kutia Kandha
1 Household access to credit 36.33% 29.00% 10.72%
2 Households access to institutional credit 30.09% 24.4% 12.91%
3 Household access to credit through SHGs 49.56% 20.69% 70.97%
4 Household loan from money lender/relatives 20.35% 51.72% 29.03%
5 Per capita loan (Rs) 290 402 39
Source: Field Survey, 2009
Table 8: Expenditures.
S. No. Name of the PTGs Dongria Kandha Lanjia Saora Kutia Kandha
1 Expenditure on food items (%) 37.23 35.28 38.78
2 Average monthly expenditure on food items/HH (Rs.) 635 501 588
3 Per Capita monthly expenditure on food items (Rs.) 118 81 105
4 Average monthly expenditure/HH (Rs.) 1705 1419 1517
5 Per Capita monthly expenditure (Rs.) 318 230 270
Source: Field Survey, 2009
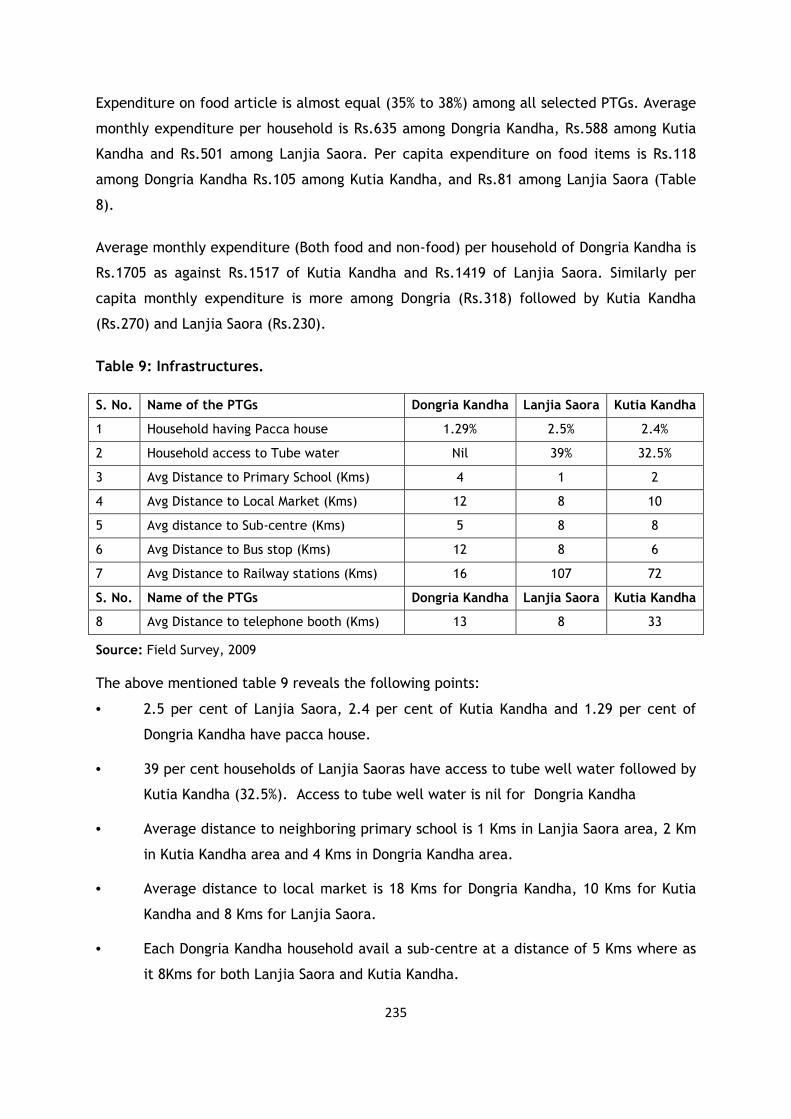
235
Expenditure on food article is almost equal (35% to 38%) among all selected PTGs. Average
monthly expenditure per household is Rs.635 among Dongria Kandha, Rs.588 among Kutia
Kandha and Rs.501 among Lanjia Saora. Per capita expenditure on food items is Rs.118
among Dongria Kandha Rs.105 among Kutia Kandha, and Rs.81 among Lanjia Saora (Table
8).
Average monthly expenditure (Both food and non-food) per household of Dongria Kandha is
Rs.1705 as against Rs.1517 of Kutia Kandha and Rs.1419 of Lanjia Saora. Similarly per
capita monthly expenditure is more among Dongria (Rs.318) followed by Kutia Kandha
(Rs.270) and Lanjia Saora (Rs.230).
Table 9: Infrastructures.
S. No. Name of the PTGs Dongria Kandha Lanjia Saora Kutia Kandha
1 Household having Pacca house 1.29% 2.5% 2.4%
2 Household access to Tube water Nil 39% 32.5%
3 Avg Distance to Primary School (Kms) 4 1 2
4 Avg Distance to Local Market (Kms) 12 8 10
5 Avg distance to Sub-centre (Kms) 5 8 8
6 Avg Distance to Bus stop (Kms) 12 8 6
7 Avg Distance to Railway stations (Kms) 16 107 72
S. No. Name of the PTGs Dongria Kandha Lanjia Saora Kutia Kandha
8 Avg Distance to telephone booth (Kms) 13 8 33
Source: Field Survey, 2009
The above mentioned table 9 reveals the following points:
• 2.5 per cent of Lanjia Saora, 2.4 per cent of Kutia Kandha and 1.29 per cent of
Dongria Kandha have pacca house.
• 39 per cent households of Lanjia Saoras have access to tube well water followed by
Kutia Kandha (32.5%). Access to tube well water is nil for Dongria Kandha
• Average distance to neighboring primary school is 1 Kms in Lanjia Saora area, 2 Km
in Kutia Kandha area and 4 Kms in Dongria Kandha area.
• Average distance to local market is 18 Kms for Dongria Kandha, 10 Kms for Kutia
Kandha and 8 Kms for Lanjia Saora.
• Each Dongria Kandha household avail a sub-centre at a distance of 5 Kms where as
it 8Kms for both Lanjia Saora and Kutia Kandha.
236
• Average distance to nearest telephone booth is only 8Kms for Lanjia Saora, 13Kms
for Dongria Kandha and 33 Kms for Kutia Kandha.
• Nearest bus stop for Kutia Kandha, Lanjia Saora and Dongria Kandha is at an
average distance of 6 Kms, 8 Kms and 12 Kms respectively.
• Railway service is available at an average distance of only 16Kms for Dongria
Kandha (Muniguda), where as it is 72 Kms for Dongria Kandha (Muniguda and Bissam
Cuttack) and 107 Km for Lanjia Saora (Rayagada).
237
Chapter-7:
IMPACT OF DEVELOPMENTAL INTERVENTIONS ON STUDY PRIMITIVE TRIBAL GROUPS
All the selected Micro Projects have various development schemes such as Income
Generating Schemes, Infrastructure Development Schemes and Human Resources
Development Scheme. Under Income Generating Schemes Agriculture, Horticulture,
Animal husbandry, Co-operation and Industry are the major sub - schemes where as
Infrastructure Development Schemes includes construction of buildings and roads,
provision for drinking water, electrification, irrigation, nursery and soil conservation.
Human Resources Development Schemes covered Education, Healthcare, Training and
Publicity. In order to assess the impact of the development schemes of the Micro Project
on the selected PTGs some case studies have developed. Besides respondents were asked
on the basic of very much, much, little, very little and Not at all with score value of
5,4,3,2, and 1 respectively against the development intervention (10th Pan onward) of
the Micro Projects. To cross check the response of the head of the household, 5 key
persons from each village were asked to give their opinion about the programme
undertake by the respective Micro Projects, meant for the selected PTGs.
7.1 Development of PTGs during XI Years Plan Although different intervention have been extended for the development of this
vulnerable section of the tribal and concerted efforts are made to bring them to the main
stream since 5th Five Year Plan Period, yet the achievement have been far from
satisfactory. Realizing this Ministry of Tribal Affairs, Government of India has envisaged in
its strategy during the 11th Plan Period to formulate five year Conservation Cum
Development plan through a consultative process with the approval of Gram Sabha
keeping the felt needs of the PTGs which are culturally appropriate and acceptable.
Besides, wide range of consultation in each village has been done and felt needs of the
community have been identified on the basis of which appropriate intervention are
suggested in the CCD plan duly approved by the Gram Sabha. The CCD plan during the 11th
plan period is a modest attempt for the holistic development of the PTGs. It aims at
addressing the critical felt needs of the PTGs by improving infrastructure and provide
basic facilities within their easy reach with a view to eliminate poverty, increase literacy
level, ensure improve health status. Overcome problem of food insecurity and about all
238
bring improvement in the quality of life and conserve their traditional culture. The basic
objectives approaches of the CCD plan are as follows:
• Total development through an integrated approach by pooling resources from
Government of India and State Government
• Bringing about Government and NGO partnership to address the development needs
of the PTGs involving Panchayatraj Institutions.
• Encourage people’s participation in the development process through the
involvement of traditional institutions, like labour cooperatives, SHGs etc.
• Provision of basic infrastructure amenities like health, education, drinking water
and also all weather roads to the Micro Project villages.
• Restoration of hill slopes ravaged by shifting cultivation by way of raising
horticultural plantations thereby protecting natural environment and providing
employment and income to the target groups.
• Assistance for conservation and promotion of traditional skill and art etc.
• Ensuring social security through the provision of fire proof houses, grain banks and
coverage of all families under Janashree Bima Yojana (JBY).
7.2 Financial Assistance for the Development of PTGs The financial support is made available for the development of Primitive Tribal Groups
(PTGs) of the state (Orissa) mainly from two sources (both from the Ministry of Tribal
Affairs, Government of India provides 100 percent financial assistance under both the
schemes. A detailed account of central assistance provided for each micro project for the
development of 3 (three) PTGs under study during 2007-08 is shown in the table 1.
I. Special Central Assistance (SCA to TSP): The Special Central Assistance to Tribal Sub Plan is additive to the State Plan. Under this
scheme, 70 percent of the allocation is utilized for Family Oriented Income Generating
Schemes (FOIGS) for PTGs which include (a) Promotion of horticulture, (b) Agriculture, (c)
Land development, (d) Small business, (e) Processing and marketing of minor forest
produce, (f) Goatery, (h) Irrigation projects etc. While C. D. works, village roads, market
yard, community irrigation projects etc are covered under the Infrastructure Development
Projects (IDP).
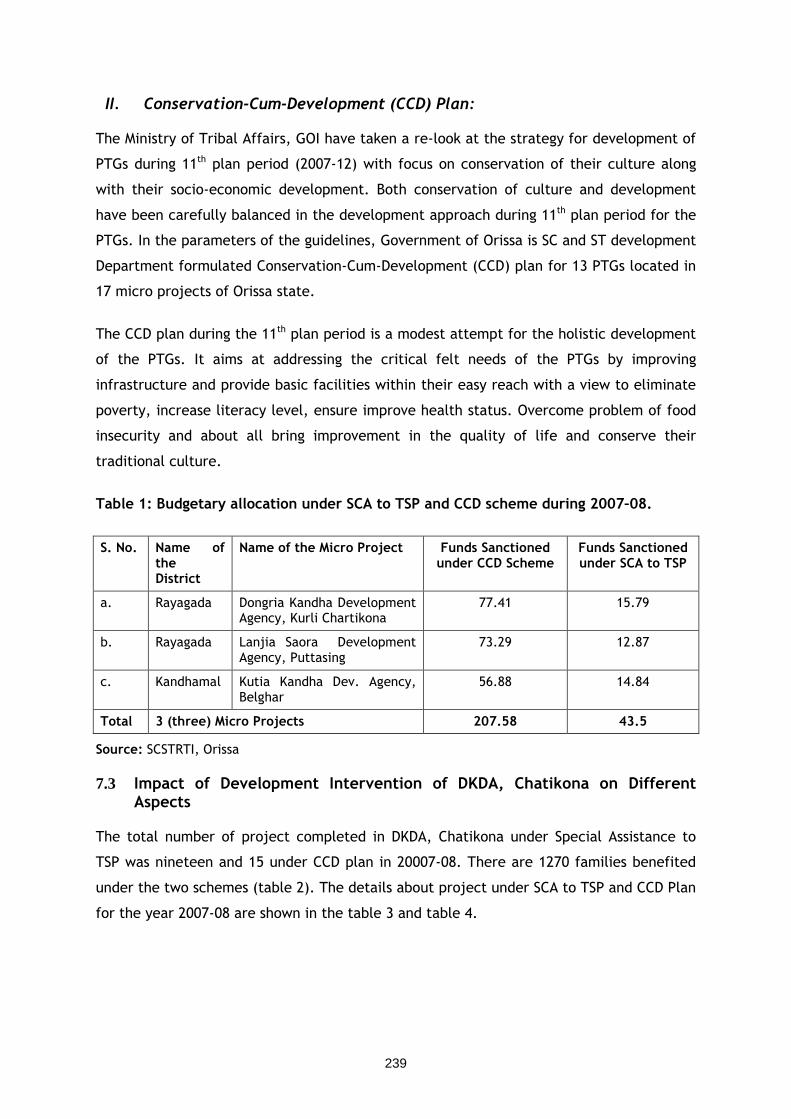
239
II. Conservation-Cum-Development (CCD) Plan: The Ministry of Tribal Affairs, GOI have taken a re-look at the strategy for development of
PTGs during 11th plan period (2007-12) with focus on conservation of their culture along
with their socio-economic development. Both conservation of culture and development
have been carefully balanced in the development approach during 11th plan period for the
PTGs. In the parameters of the guidelines, Government of Orissa is SC and ST development
Department formulated Conservation-Cum-Development (CCD) plan for 13 PTGs located in
17 micro projects of Orissa state.
The CCD plan during the 11th plan period is a modest attempt for the holistic development
of the PTGs. It aims at addressing the critical felt needs of the PTGs by improving
infrastructure and provide basic facilities within their easy reach with a view to eliminate
poverty, increase literacy level, ensure improve health status. Overcome problem of food
insecurity and about all bring improvement in the quality of life and conserve their
traditional culture.
Table 1: Budgetary allocation under SCA to TSP and CCD scheme during 2007–08.
Source: SCSTRTI, Orissa
7.3 Impact of Development Intervention of DKDA, Chatikona on Different Aspects
The total number of project completed in DKDA, Chatikona under Special Assistance to
TSP was nineteen and 15 under CCD plan in 20007-08. There are 1270 families benefited
under the two schemes (table 2). The details about project under SCA to TSP and CCD Plan
for the year 2007-08 are shown in the table 3 and table 4.
S. No. Name of the District
Name of the Micro Project Funds Sanctioned under CCD Scheme
Funds Sanctioned under SCA to TSP
a. Rayagada Dongria Kandha Development Agency, Kurli Chartikona
77.41 15.79
b. Rayagada Lanjia Saora Development Agency, Puttasing
73.29 12.87
c. Kandhamal Kutia Kandha Dev. Agency, Belghar
56.88 14.84
Total 3 (three) Micro Projects 207.58 43.5
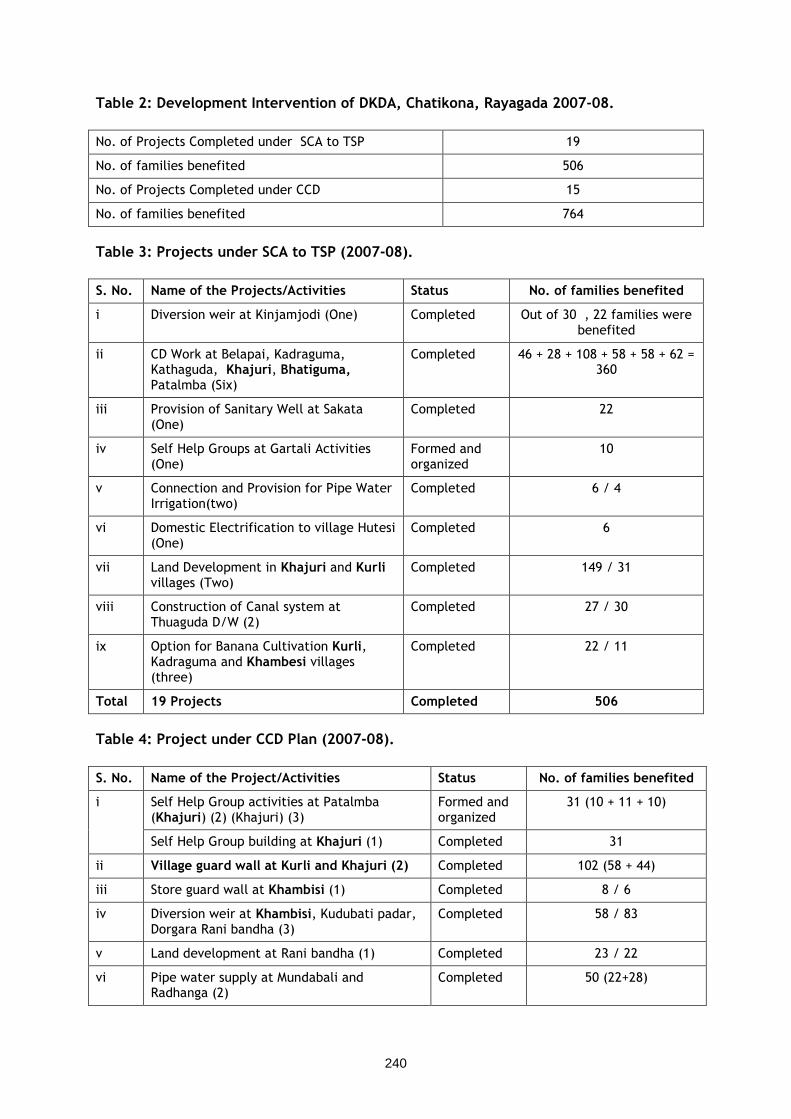
240
Table 2: Development Intervention of DKDA, Chatikona, Rayagada 2007-08.
No. of Projects Completed under SCA to TSP 19
No. of families benefited 506
No. of Projects Completed under CCD 15
No. of families benefited 764
Table 3: Projects under SCA to TSP (2007-08).
S. No. Name of the Projects/Activities Status No. of families benefited
i Diversion weir at Kinjamjodi (One) Completed Out of 30 , 22 families were benefited
ii CD Work at Belapai, Kadraguma, Kathaguda, Khajuri, Bhatiguma, Patalmba (Six)
Completed 46 + 28 + 108 + 58 + 58 + 62 = 360
iii Provision of Sanitary Well at Sakata (One)
Completed 22
iv Self Help Groups at Gartali Activities (One)
Formed and organized
10
v Connection and Provision for Pipe Water Irrigation(two)
Completed 6 / 4
vi Domestic Electrification to village Hutesi (One)
Completed 6
vii Land Development in Khajuri and Kurli villages (Two)
Completed 149 / 31
viii Construction of Canal system at Thuaguda D/W (2)
Completed 27 / 30
ix Option for Banana Cultivation Kurli, Kadraguma and Khambesi villages (three)
Completed 22 / 11
Total 19 Projects Completed 506
Table 4: Project under CCD Plan (2007-08).
S. No. Name of the Project/Activities Status No. of families benefited
Self Help Group activities at Patalmba (Khajuri) (2) (Khajuri) (3)
Formed and organized
31 (10 + 11 + 10) i
Self Help Group building at Khajuri (1) Completed 31
ii Village guard wall at Kurli and Khajuri (2) Completed 102 (58 + 44)
iii Store guard wall at Khambisi (1) Completed 8 / 6
iv Diversion weir at Khambisi, Kudubati padar, Dorgara Rani bandha (3)
Completed 58 / 83
v Land development at Rani bandha (1) Completed 23 / 22
vi Pipe water supply at Mundabali and Radhanga (2)
Completed 50 (22+28)
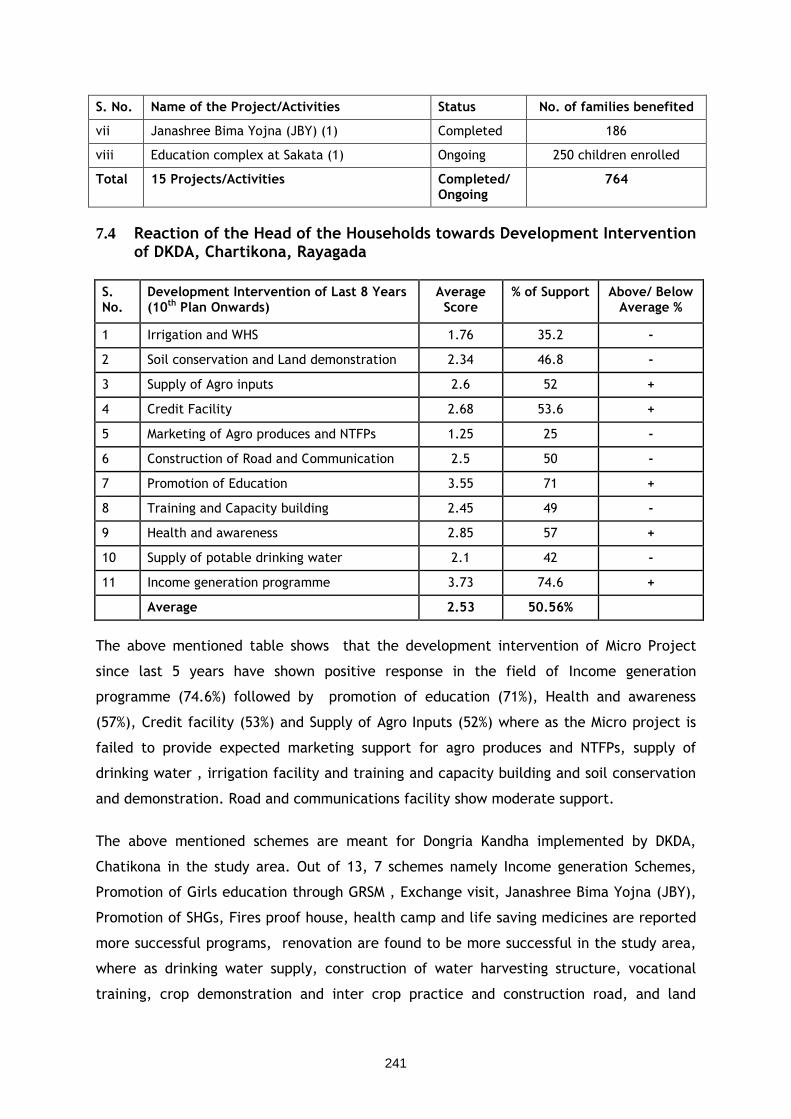
241
S. No. Name of the Project/Activities Status No. of families benefited
vii Janashree Bima Yojna (JBY) (1) Completed 186
viii Education complex at Sakata (1) Ongoing 250 children enrolled
Total 15 Projects/Activities Completed/ Ongoing
764
7.4 Reaction of the Head of the Households towards Development Intervention of DKDA, Chartikona, Rayagada
S. No.
Development Intervention of Last 8 Years (10th Plan Onwards)
Average Score
% of Support Above/ Below Average %
1 Irrigation and WHS 1.76 35.2 -
2 Soil conservation and Land demonstration 2.34 46.8 -
3 Supply of Agro inputs 2.6 52 +
4 Credit Facility 2.68 53.6 +
5 Marketing of Agro produces and NTFPs 1.25 25 -
6 Construction of Road and Communication 2.5 50 -
7 Promotion of Education 3.55 71 +
8 Training and Capacity building 2.45 49 -
9 Health and awareness 2.85 57 +
10 Supply of potable drinking water 2.1 42 -
11 Income generation programme 3.73 74.6 +
Average 2.53 50.56%
The above mentioned table shows that the development intervention of Micro Project
since last 5 years have shown positive response in the field of Income generation
programme (74.6%) followed by promotion of education (71%), Health and awareness
(57%), Credit facility (53%) and Supply of Agro Inputs (52%) where as the Micro project is
failed to provide expected marketing support for agro produces and NTFPs, supply of
drinking water , irrigation facility and training and capacity building and soil conservation
and demonstration. Road and communications facility show moderate support.
The above mentioned schemes are meant for Dongria Kandha implemented by DKDA,
Chatikona in the study area. Out of 13, 7 schemes namely Income generation Schemes,
Promotion of Girls education through GRSM , Exchange visit, Janashree Bima Yojna (JBY),
Promotion of SHGs, Fires proof house, health camp and life saving medicines are reported
more successful programs, renovation are found to be more successful in the study area,
where as drinking water supply, construction of water harvesting structure, vocational
training, crop demonstration and inter crop practice and construction road, and land
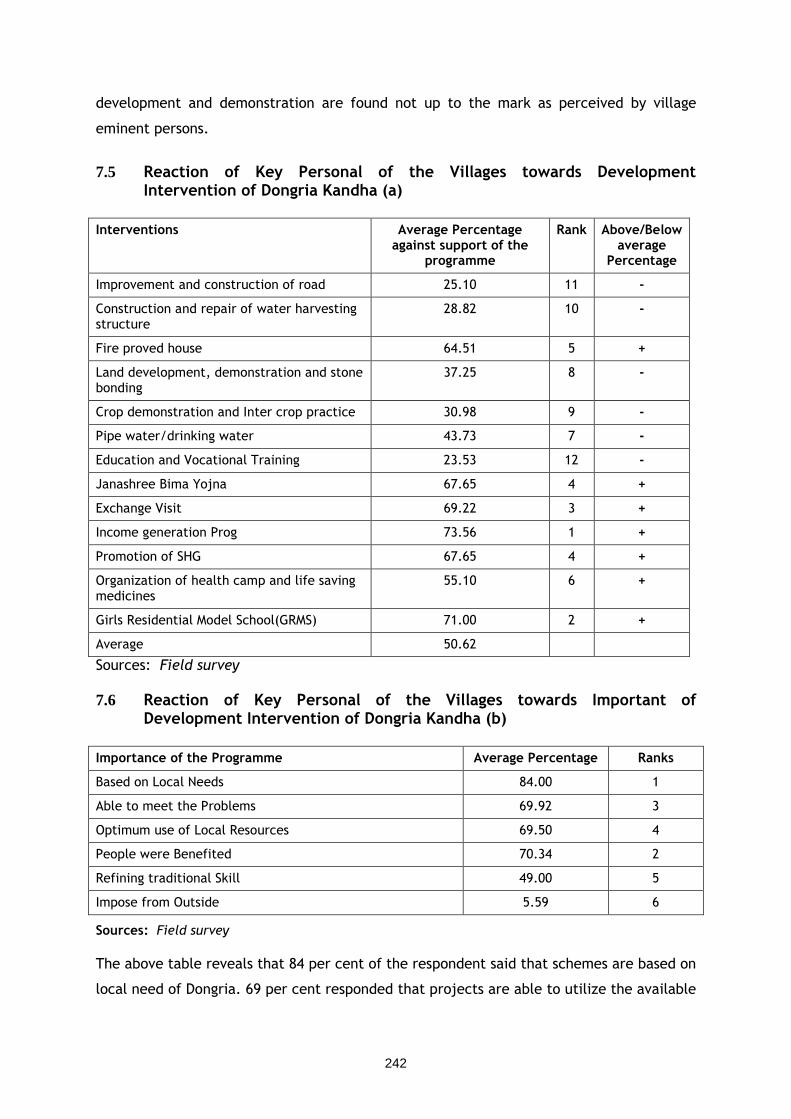
242
development and demonstration are found not up to the mark as perceived by village
eminent persons.
7.5 Reaction of Key Personal of the Villages towards Development Intervention of Dongria Kandha (a)
Interventions Average Percentage against support of the
programme
Rank Above/Below average
Percentage
Improvement and construction of road 25.10 11 -
Construction and repair of water harvesting structure
28.82 10 -
Fire proved house 64.51 5 +
Land development, demonstration and stone bonding
37.25 8 -
Crop demonstration and Inter crop practice 30.98 9 -
Pipe water/drinking water 43.73 7 -
Education and Vocational Training 23.53 12 -
Janashree Bima Yojna 67.65 4 +
Exchange Visit 69.22 3 +
Income generation Prog 73.56 1 +
Promotion of SHG 67.65 4 +
Organization of health camp and life saving medicines
55.10 6 +
Girls Residential Model School(GRMS) 71.00 2 +
Average 50.62
Sources: Field survey
7.6 Reaction of Key Personal of the Villages towards Important of Development Intervention of Dongria Kandha (b)
Importance of the Programme Average Percentage Ranks
Based on Local Needs 84.00 1
Able to meet the Problems 69.92 3
Optimum use of Local Resources 69.50 4
People were Benefited 70.34 2
Refining traditional Skill 49.00 5
Impose from Outside 5.59 6
Sources: Field survey
The above table reveals that 84 per cent of the respondent said that schemes are based on
local need of Dongria. 69 per cent responded that projects are able to utilize the available
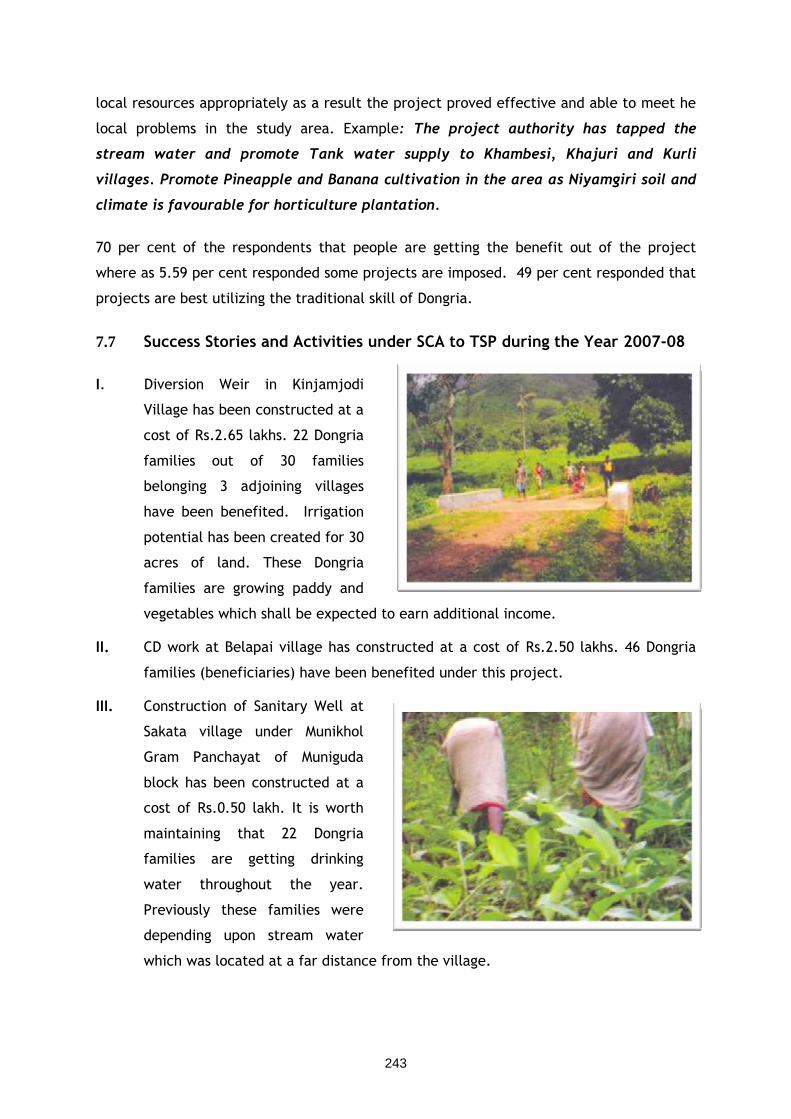
243
local resources appropriately as a result the project proved effective and able to meet he
local problems in the study area. Example: The project authority has tapped the
stream water and promote Tank water supply to Khambesi, Khajuri and Kurli
villages. Promote Pineapple and Banana cultivation in the area as Niyamgiri soil and
climate is favourable for horticulture plantation.
70 per cent of the respondents that people are getting the benefit out of the project
where as 5.59 per cent responded some projects are imposed. 49 per cent responded that
projects are best utilizing the traditional skill of Dongria.
7.7 Success Stories and Activities under SCA to TSP during the Year 2007-08
I. Diversion Weir in Kinjamjodi
Village has been constructed at a
cost of Rs.2.65 lakhs. 22 Dongria
families out of 30 families
belonging 3 adjoining villages
have been benefited. Irrigation
potential has been created for 30
acres of land. These Dongria
families are growing paddy and
vegetables which shall be expected to earn additional income.
II. CD work at Belapai village has constructed at a cost of Rs.2.50 lakhs. 46 Dongria
families (beneficiaries) have been benefited under this project.
III. Construction of Sanitary Well at
Sakata village under Munikhol
Gram Panchayat of Muniguda
block has been constructed at a
cost of Rs.0.50 lakh. It is worth
maintaining that 22 Dongria
families are getting drinking
water throughout the year.
Previously these families were
depending upon stream water
which was located at a far distance from the village.
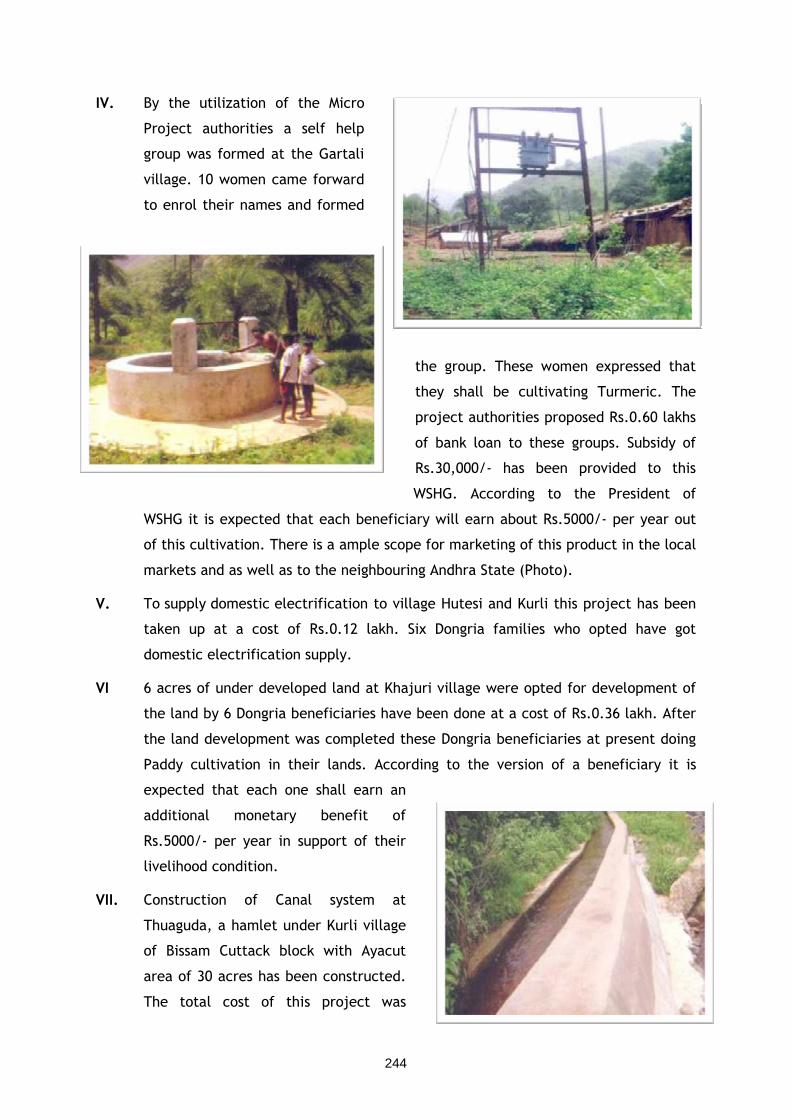
244
IV. By the utilization of the Micro
Project authorities a self help
group was formed at the Gartali
village. 10 women came forward
to enrol their names and formed
the group. These women expressed that
they shall be cultivating Turmeric. The
project authorities proposed Rs.0.60 lakhs
of bank loan to these groups. Subsidy of
Rs.30,000/- has been provided to this
WSHG. According to the President of
WSHG it is expected that each beneficiary will earn about Rs.5000/- per year out
of this cultivation. There is a ample scope for marketing of this product in the local
markets and as well as to the neighbouring Andhra State (Photo).
V. To supply domestic electrification to village Hutesi and Kurli this project has been
taken up at a cost of Rs.0.12 lakh. Six Dongria families who opted have got
domestic electrification supply.
VI 6 acres of under developed land at Khajuri village were opted for development of
the land by 6 Dongria beneficiaries have been done at a cost of Rs.0.36 lakh. After
the land development was completed these Dongria beneficiaries at present doing
Paddy cultivation in their lands. According to the version of a beneficiary it is
expected that each one shall earn an
additional monetary benefit of
Rs.5000/- per year in support of their
livelihood condition.
VII. Construction of Canal system at
Thuaguda, a hamlet under Kurli village
of Bissam Cuttack block with Ayacut
area of 30 acres has been constructed.
The total cost of this project was
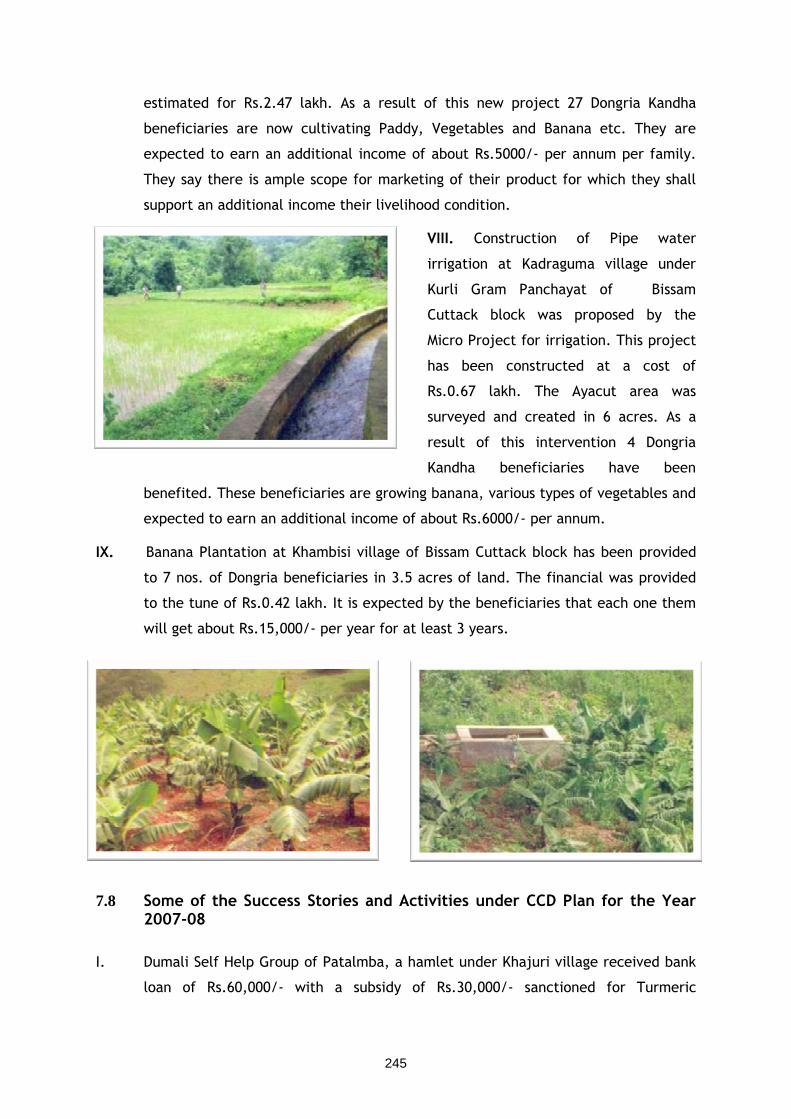
245
estimated for Rs.2.47 lakh. As a result of this new project 27 Dongria Kandha
beneficiaries are now cultivating Paddy, Vegetables and Banana etc. They are
expected to earn an additional income of about Rs.5000/- per annum per family.
They say there is ample scope for marketing of their product for which they shall
support an additional income their livelihood condition.
VIII. Construction of Pipe water
irrigation at Kadraguma village under
Kurli Gram Panchayat of Bissam
Cuttack block was proposed by the
Micro Project for irrigation. This project
has been constructed at a cost of
Rs.0.67 lakh. The Ayacut area was
surveyed and created in 6 acres. As a
result of this intervention 4 Dongria
Kandha beneficiaries have been
benefited. These beneficiaries are growing banana, various types of vegetables and
expected to earn an additional income of about Rs.6000/- per annum.
IX. Banana Plantation at Khambisi village of Bissam Cuttack block has been provided
to 7 nos. of Dongria beneficiaries in 3.5 acres of land. The financial was provided
to the tune of Rs.0.42 lakh. It is expected by the beneficiaries that each one them
will get about Rs.15,000/- per year for at least 3 years.
7.8 Some of the Success Stories and Activities under CCD Plan for the Year 2007-08
I. Dumali Self Help Group of Patalmba, a hamlet under Khajuri village received bank
loan of Rs.60,000/- with a subsidy of Rs.30,000/- sanctioned for Turmeric
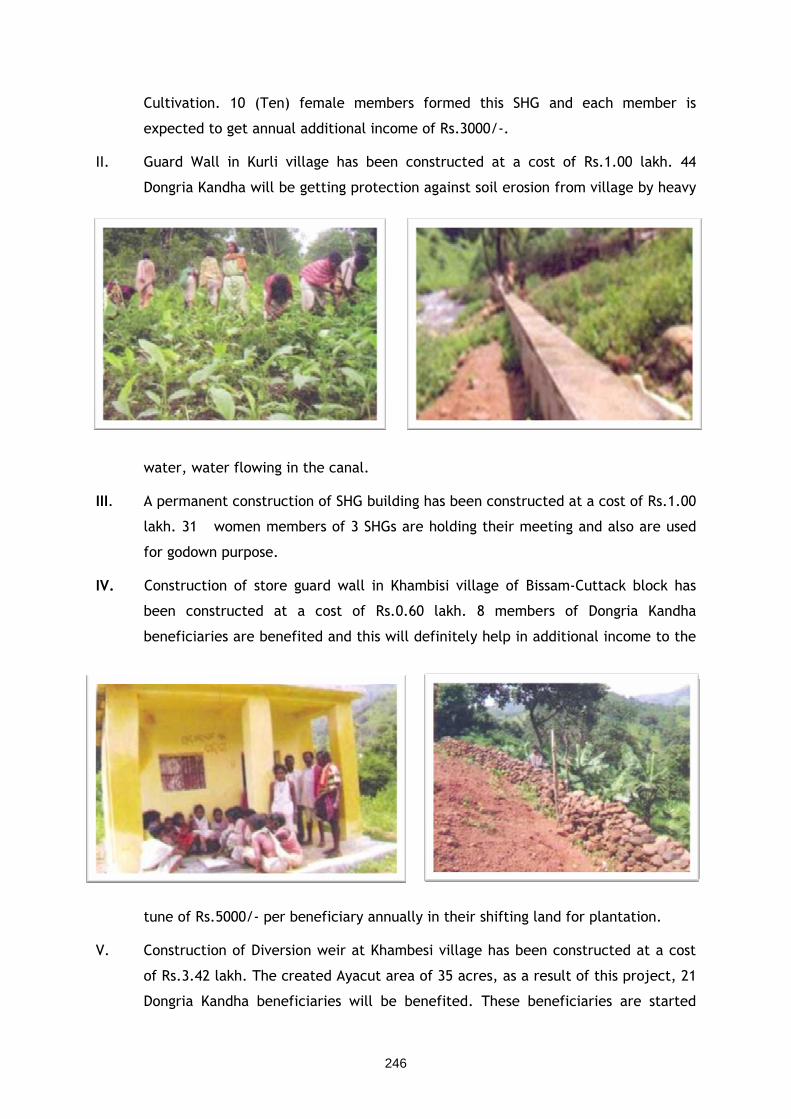
246
Cultivation. 10 (Ten) female members formed this SHG and each member is
expected to get annual additional income of Rs.3000/-.
II. Guard Wall in Kurli village has been constructed at a cost of Rs.1.00 lakh. 44
Dongria Kandha will be getting protection against soil erosion from village by heavy
water, water flowing in the canal.
III. A permanent construction of SHG building has been constructed at a cost of Rs.1.00
lakh. 31 women members of 3 SHGs are holding their meeting and also are used
for godown purpose.
IV. Construction of store guard wall in Khambisi village of Bissam-Cuttack block has
been constructed at a cost of Rs.0.60 lakh. 8 members of Dongria Kandha
beneficiaries are benefited and this will definitely help in additional income to the
tune of Rs.5000/- per beneficiary annually in their shifting land for plantation.
V. Construction of Diversion weir at Khambesi village has been constructed at a cost
of Rs.3.42 lakh. The created Ayacut area of 35 acres, as a result of this project, 21
Dongria Kandha beneficiaries will be benefited. These beneficiaries are started
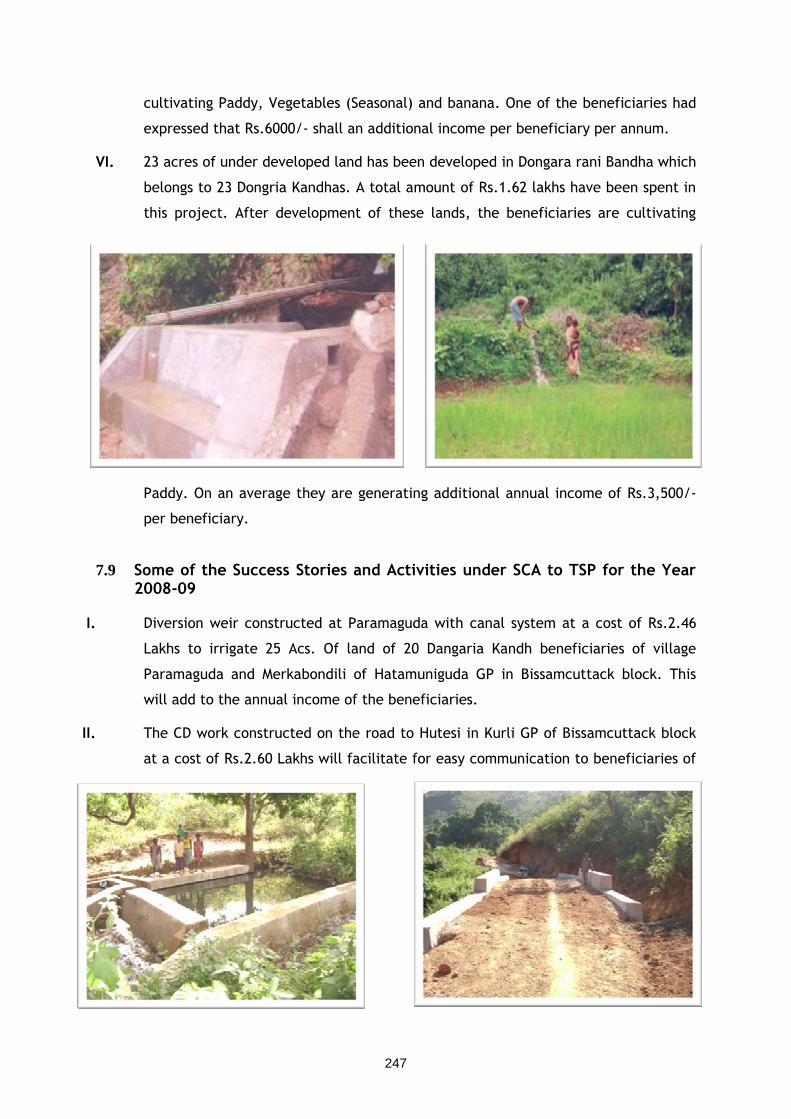
247
cultivating Paddy, Vegetables (Seasonal) and banana. One of the beneficiaries had
expressed that Rs.6000/- shall an additional income per beneficiary per annum.
VI. 23 acres of under developed land has been developed in Dongara rani Bandha which
belongs to 23 Dongria Kandhas. A total amount of Rs.1.62 lakhs have been spent in
this project. After development of these lands, the beneficiaries are cultivating
Paddy. On an average they are generating additional annual income of Rs.3,500/-
per beneficiary.
7.9 Some of the Success Stories and Activities under SCA to TSP for the Year 2008-09
I. Diversion weir constructed at Paramaguda with canal system at a cost of Rs.2.46
Lakhs to irrigate 25 Acs. Of land of 20 Dangaria Kandh beneficiaries of village
Paramaguda and Merkabondili of Hatamuniguda GP in Bissamcuttack block. This
will add to the annual income of the beneficiaries.
II. The CD work constructed on the road to Hutesi in Kurli GP of Bissamcuttack block
at a cost of Rs.2.60 Lakhs will facilitate for easy communication to beneficiaries of
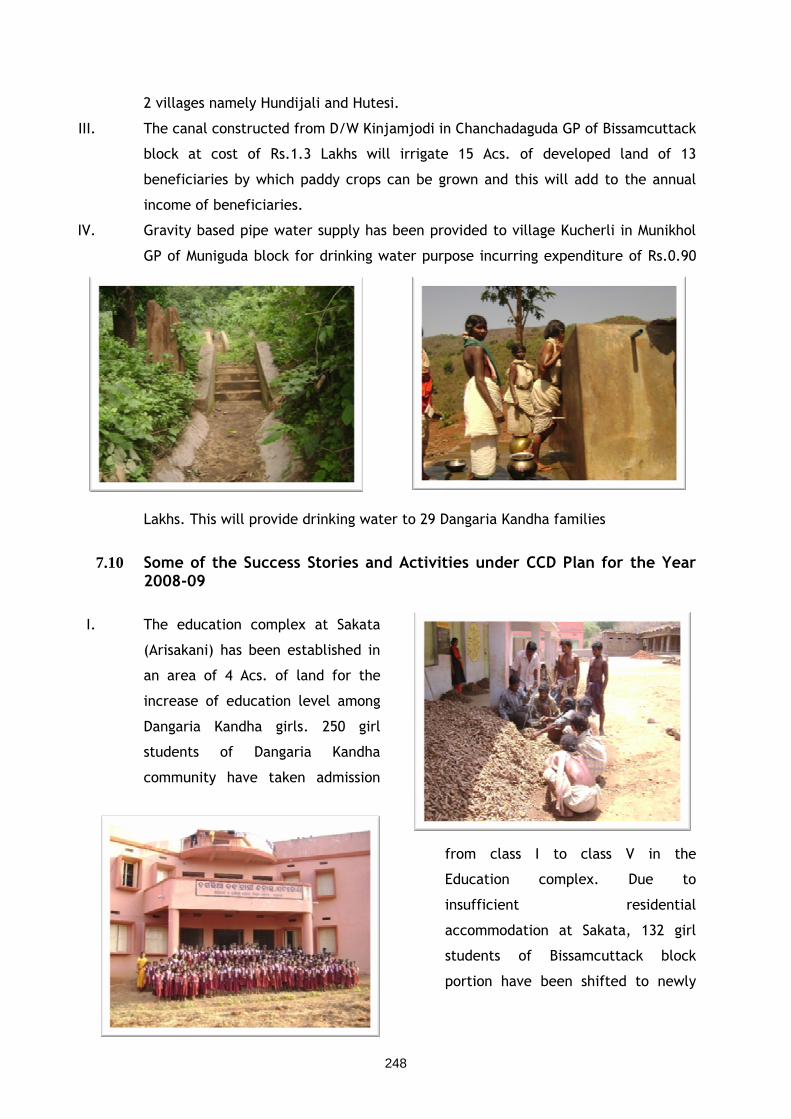
248
2 villages namely Hundijali and Hutesi.
III. The canal constructed from D/W Kinjamjodi in Chanchadaguda GP of Bissamcuttack
block at cost of Rs.1.3 Lakhs will irrigate 15 Acs. of developed land of 13
beneficiaries by which paddy crops can be grown and this will add to the annual
income of beneficiaries.
IV. Gravity based pipe water supply has been provided to village Kucherli in Munikhol
GP of Muniguda block for drinking water purpose incurring expenditure of Rs.0.90
Lakhs. This will provide drinking water to 29 Dangaria Kandha families
7.10 Some of the Success Stories and Activities under CCD Plan for the Year 2008-09
I. The education complex at Sakata
(Arisakani) has been established in
an area of 4 Acs. of land for the
increase of education level among
Dangaria Kandha girls. 250 girl
students of Dangaria Kandha
community have taken admission
from class I to class V in the
Education complex. Due to
insufficient residential
accommodation at Sakata, 132 girl
students of Bissamcuttack block
portion have been shifted to newly
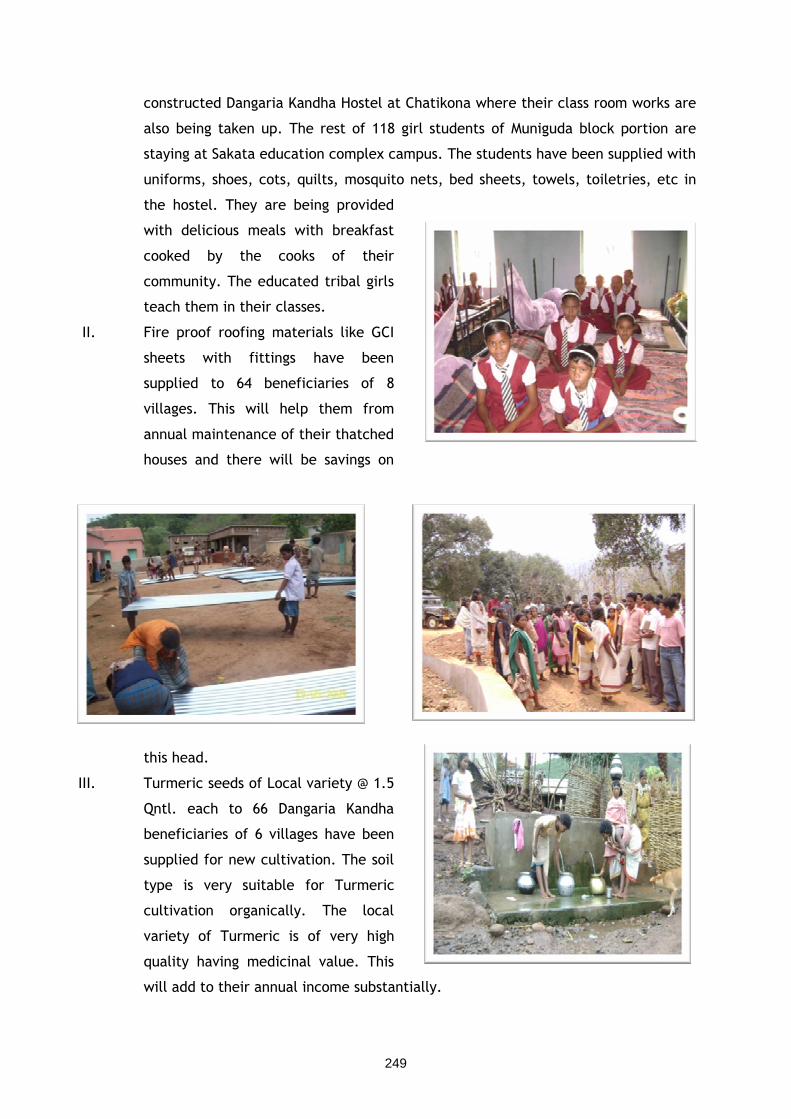
249
constructed Dangaria Kandha Hostel at Chatikona where their class room works are
also being taken up. The rest of 118 girl students of Muniguda block portion are
staying at Sakata education complex campus. The students have been supplied with
uniforms, shoes, cots, quilts, mosquito nets, bed sheets, towels, toiletries, etc in
the hostel. They are being provided
with delicious meals with breakfast
cooked by the cooks of their
community. The educated tribal girls
teach them in their classes.
II. Fire proof roofing materials like GCI
sheets with fittings have been
supplied to 64 beneficiaries of 8
villages. This will help them from
annual maintenance of their thatched
houses and there will be savings on
this head.
III. Turmeric seeds of Local variety @ 1.5
Qntl. each to 66 Dangaria Kandha
beneficiaries of 6 villages have been
supplied for new cultivation. The soil
type is very suitable for Turmeric
cultivation organically. The local
variety of Turmeric is of very high
quality having medicinal value. This
will add to their annual income substantially.
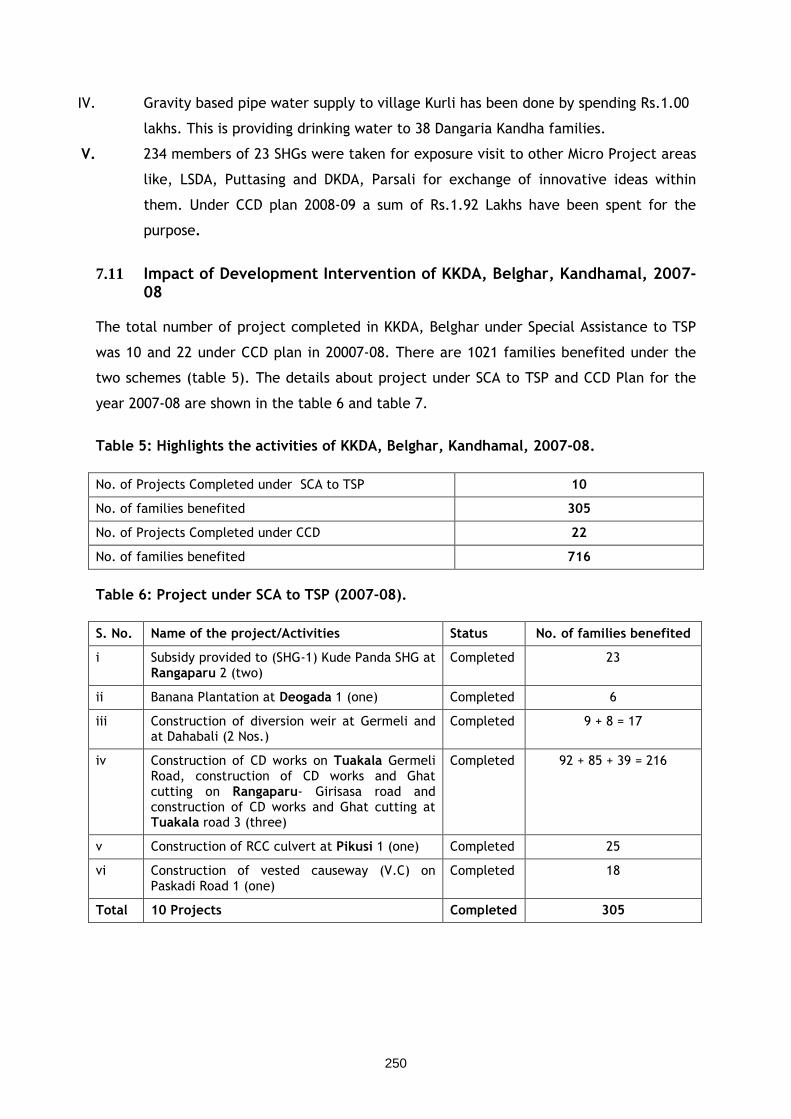
250
IV. Gravity based pipe water supply to village Kurli has been done by spending Rs.1.00
lakhs. This is providing drinking water to 38 Dangaria Kandha families.
V. 234 members of 23 SHGs were taken for exposure visit to other Micro Project areas
like, LSDA, Puttasing and DKDA, Parsali for exchange of innovative ideas within
them. Under CCD plan 2008-09 a sum of Rs.1.92 Lakhs have been spent for the
purpose.
7.11 Impact of Development Intervention of KKDA, Belghar, Kandhamal, 2007-08
The total number of project completed in KKDA, Belghar under Special Assistance to TSP
was 10 and 22 under CCD plan in 20007-08. There are 1021 families benefited under the
two schemes (table 5). The details about project under SCA to TSP and CCD Plan for the
year 2007-08 are shown in the table 6 and table 7.
Table 5: Highlights the activities of KKDA, Belghar, Kandhamal, 2007-08.
No. of Projects Completed under SCA to TSP 10
No. of families benefited 305
No. of Projects Completed under CCD 22
No. of families benefited 716
Table 6: Project under SCA to TSP (2007-08).
S. No. Name of the project/Activities Status No. of families benefited
i Subsidy provided to (SHG-1) Kude Panda SHG at Rangaparu 2 (two)
Completed 23
ii Banana Plantation at Deogada 1 (one) Completed 6
iii Construction of diversion weir at Germeli and at Dahabali (2 Nos.)
Completed 9 + 8 = 17
iv Construction of CD works on Tuakala Germeli Road, construction of CD works and Ghat cutting on Rangaparu- Girisasa road and construction of CD works and Ghat cutting at Tuakala road 3 (three)
Completed 92 + 85 + 39 = 216
v Construction of RCC culvert at Pikusi 1 (one) Completed 25
vi Construction of vested causeway (V.C) on Paskadi Road 1 (one)
Completed 18
Total 10 Projects Completed 305
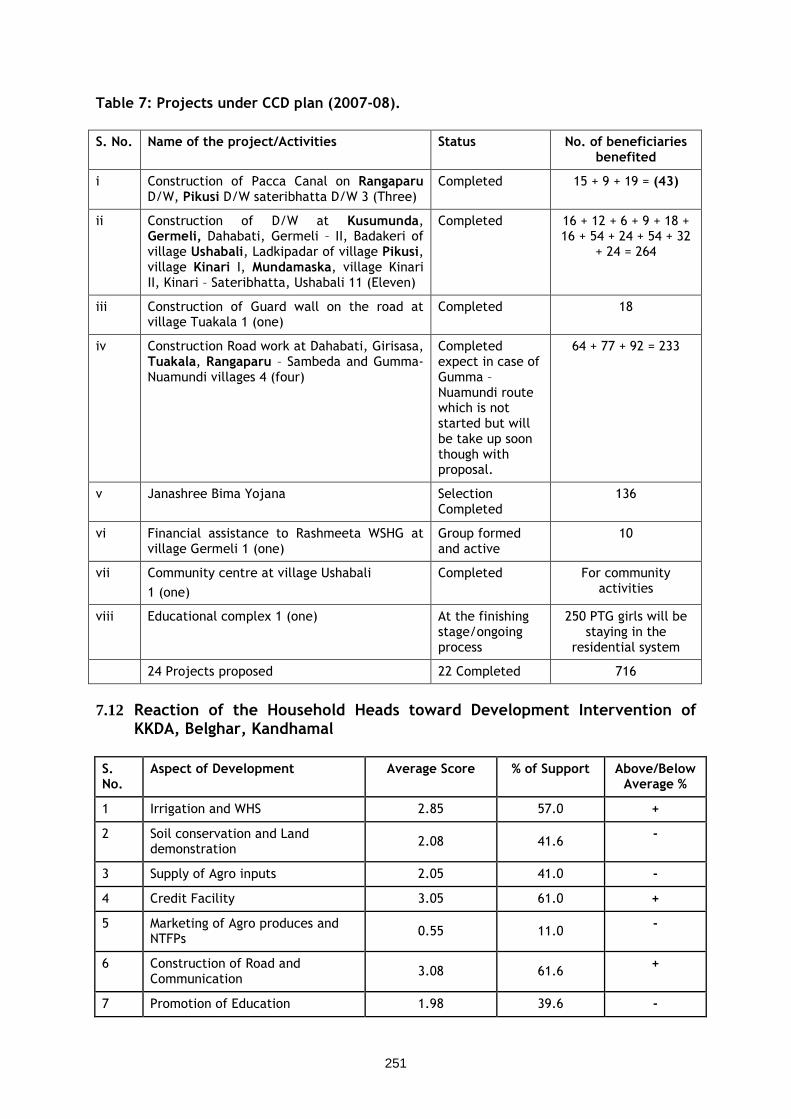
251
Table 7: Projects under CCD plan (2007-08).
S. No. Name of the project/Activities Status No. of beneficiaries benefited
i Construction of Pacca Canal on Rangaparu D/W, Pikusi D/W sateribhatta D/W 3 (Three)
Completed 15 + 9 + 19 = (43)
ii Construction of D/W at Kusumunda, Germeli, Dahabati, Germeli – II, Badakeri of village Ushabali, Ladkipadar of village Pikusi, village Kinari I, Mundamaska, village Kinari II, Kinari – Sateribhatta, Ushabali 11 (Eleven)
Completed 16 + 12 + 6 + 9 + 18 + 16 + 54 + 24 + 54 + 32
+ 24 = 264
iii Construction of Guard wall on the road at village Tuakala 1 (one)
Completed 18
iv Construction Road work at Dahabati, Girisasa, Tuakala, Rangaparu – Sambeda and Gumma- Nuamundi villages 4 (four)
Completed expect in case of Gumma – Nuamundi route which is not started but will be take up soon though with proposal.
64 + 77 + 92 = 233
v Janashree Bima Yojana Selection Completed
136
vi Financial assistance to Rashmeeta WSHG at village Germeli 1 (one)
Group formed and active
10
vii Community centre at village Ushabali
1 (one)
Completed For community activities
viii Educational complex 1 (one) At the finishing stage/ongoing process
250 PTG girls will be staying in the
residential system
24 Projects proposed 22 Completed 716
7.12 Reaction of the Household Heads toward Development Intervention of KKDA, Belghar, Kandhamal
S. No.
Aspect of Development Average Score % of Support Above/Below Average %
1 Irrigation and WHS 2.85 57.0 +
2 Soil conservation and Land demonstration
2.08 41.6 -
3 Supply of Agro inputs 2.05 41.0 -
4 Credit Facility 3.05 61.0 +
5 Marketing of Agro produces and NTFPs
0.55 11.0 -
6 Construction of Road and Communication
3.08 61.6 +
7 Promotion of Education 1.98 39.6 -
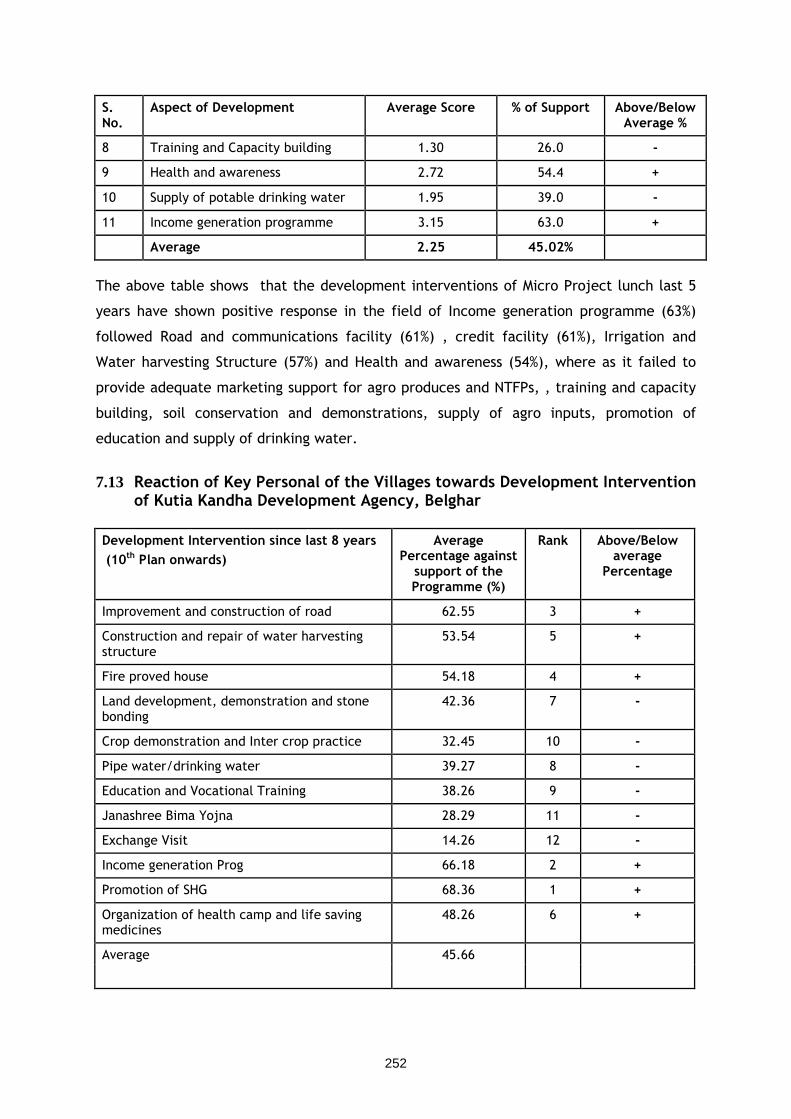
252
S. No.
Aspect of Development Average Score % of Support Above/Below Average %
8 Training and Capacity building 1.30 26.0 -
9 Health and awareness 2.72 54.4 +
10 Supply of potable drinking water 1.95 39.0 -
11 Income generation programme 3.15 63.0 +
Average 2.25 45.02%
The above table shows that the development interventions of Micro Project lunch last 5
years have shown positive response in the field of Income generation programme (63%)
followed Road and communications facility (61%) , credit facility (61%), Irrigation and
Water harvesting Structure (57%) and Health and awareness (54%), where as it failed to
provide adequate marketing support for agro produces and NTFPs, , training and capacity
building, soil conservation and demonstrations, supply of agro inputs, promotion of
education and supply of drinking water.
7.13 Reaction of Key Personal of the Villages towards Development Intervention of Kutia Kandha Development Agency, Belghar
Development Intervention since last 8 years
(10th Plan onwards)
Average Percentage against support of the Programme (%)
Rank Above/Below average
Percentage
Improvement and construction of road 62.55 3 +
Construction and repair of water harvesting structure
53.54 5 +
Fire proved house 54.18 4 +
Land development, demonstration and stone bonding
42.36 7 -
Crop demonstration and Inter crop practice 32.45 10 -
Pipe water/drinking water 39.27 8 -
Education and Vocational Training 38.26 9 -
Janashree Bima Yojna 28.29 11 -
Exchange Visit 14.26 12 -
Income generation Prog 66.18 2 +
Promotion of SHG 68.36 1 +
Organization of health camp and life saving medicines
48.26 6 +
Average 45.66
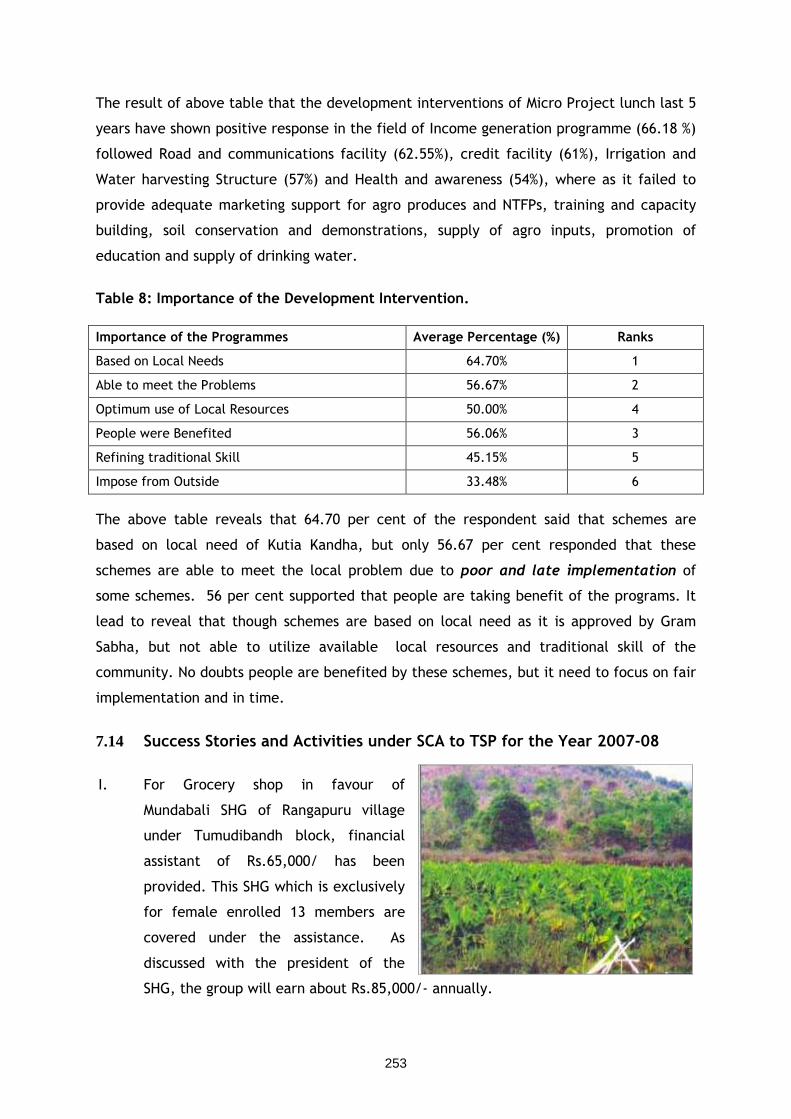
253
The result of above table that the development interventions of Micro Project lunch last 5
years have shown positive response in the field of Income generation programme (66.18 %)
followed Road and communications facility (62.55%), credit facility (61%), Irrigation and
Water harvesting Structure (57%) and Health and awareness (54%), where as it failed to
provide adequate marketing support for agro produces and NTFPs, training and capacity
building, soil conservation and demonstrations, supply of agro inputs, promotion of
education and supply of drinking water.
Table 8: Importance of the Development Intervention.
Importance of the Programmes Average Percentage (%) Ranks
Based on Local Needs 64.70% 1
Able to meet the Problems 56.67% 2
Optimum use of Local Resources 50.00% 4
People were Benefited 56.06% 3
Refining traditional Skill 45.15% 5
Impose from Outside 33.48% 6
The above table reveals that 64.70 per cent of the respondent said that schemes are
based on local need of Kutia Kandha, but only 56.67 per cent responded that these
schemes are able to meet the local problem due to poor and late implementation of
some schemes. 56 per cent supported that people are taking benefit of the programs. It
lead to reveal that though schemes are based on local need as it is approved by Gram
Sabha, but not able to utilize available local resources and traditional skill of the
community. No doubts people are benefited by these schemes, but it need to focus on fair
implementation and in time.
7.14 Success Stories and Activities under SCA to TSP for the Year 2007-08
I. For Grocery shop in favour of
Mundabali SHG of Rangapuru village
under Tumudibandh block, financial
assistant of Rs.65,000/ has been
provided. This SHG which is exclusively
for female enrolled 13 members are
covered under the assistance. As
discussed with the president of the
SHG, the group will earn about Rs.85,000/- annually.
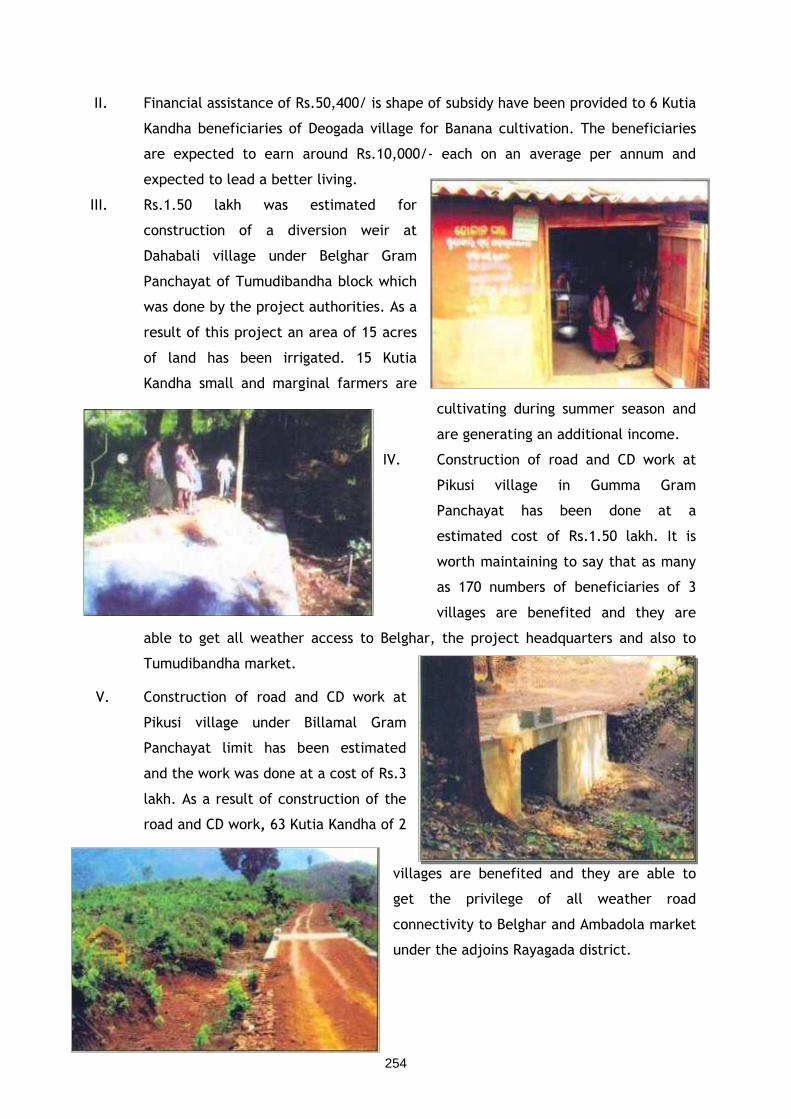
254
II. Financial assistance of Rs.50,400/ is shape of subsidy have been provided to 6 Kutia
Kandha beneficiaries of Deogada village for Banana cultivation. The beneficiaries
are expected to earn around Rs.10,000/- each on an average per annum and
expected to lead a better living.
III. Rs.1.50 lakh was estimated for
construction of a diversion weir at
Dahabali village under Belghar Gram
Panchayat of Tumudibandha block which
was done by the project authorities. As a
result of this project an area of 15 acres
of land has been irrigated. 15 Kutia
Kandha small and marginal farmers are
cultivating during summer season and
are generating an additional income.
IV. Construction of road and CD work at
Pikusi village in Gumma Gram
Panchayat has been done at a
estimated cost of Rs.1.50 lakh. It is
worth maintaining to say that as many
as 170 numbers of beneficiaries of 3
villages are benefited and they are
able to get all weather access to Belghar, the project headquarters and also to
Tumudibandha market.
V. Construction of road and CD work at
Pikusi village under Billamal Gram
Panchayat limit has been estimated
and the work was done at a cost of Rs.3
lakh. As a result of construction of the
road and CD work, 63 Kutia Kandha of 2
villages are benefited and they are able to
get the privilege of all weather road
connectivity to Belghar and Ambadola market
under the adjoins Rayagada district.
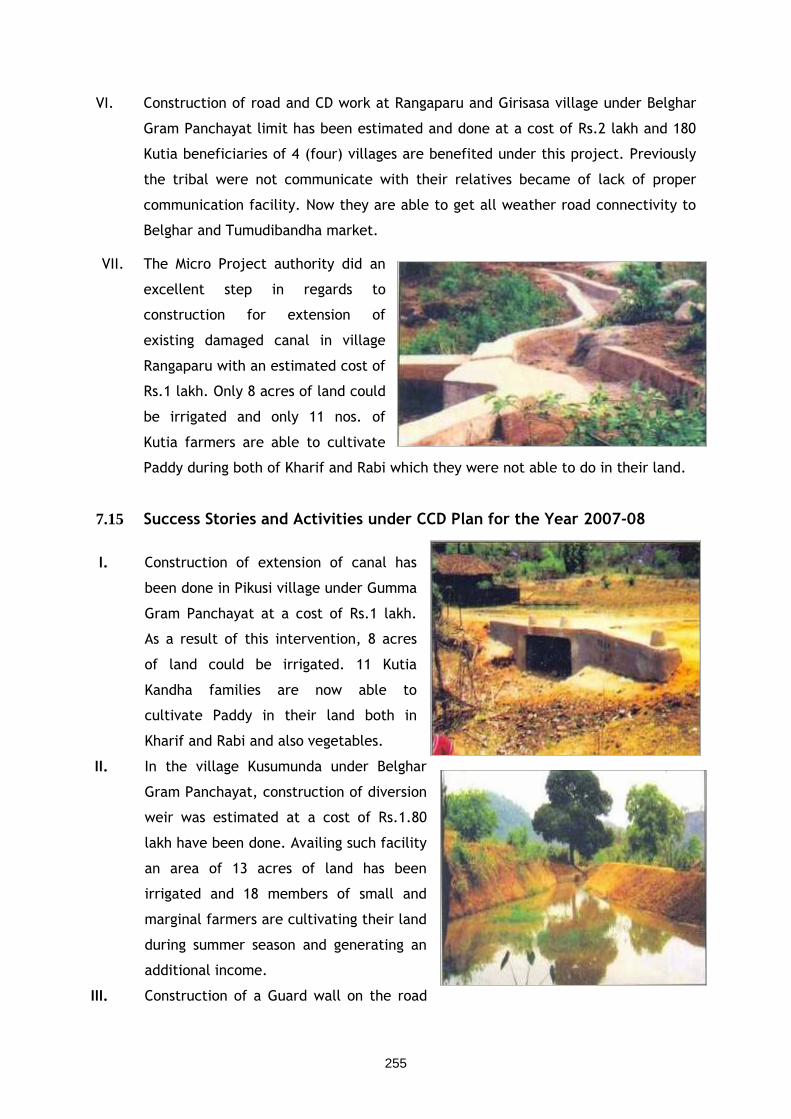
255
VI. Construction of road and CD work at Rangaparu and Girisasa village under Belghar
Gram Panchayat limit has been estimated and done at a cost of Rs.2 lakh and 180
Kutia beneficiaries of 4 (four) villages are benefited under this project. Previously
the tribal were not communicate with their relatives became of lack of proper
communication facility. Now they are able to get all weather road connectivity to
Belghar and Tumudibandha market.
VII. The Micro Project authority did an
excellent step in regards to
construction for extension of
existing damaged canal in village
Rangaparu with an estimated cost of
Rs.1 lakh. Only 8 acres of land could
be irrigated and only 11 nos. of
Kutia farmers are able to cultivate
Paddy during both of Kharif and Rabi which they were not able to do in their land.
7.15 Success Stories and Activities under CCD Plan for the Year 2007-08
I. Construction of extension of canal has
been done in Pikusi village under Gumma
Gram Panchayat at a cost of Rs.1 lakh.
As a result of this intervention, 8 acres
of land could be irrigated. 11 Kutia
Kandha families are now able to
cultivate Paddy in their land both in
Kharif and Rabi and also vegetables.
II. In the village Kusumunda under Belghar
Gram Panchayat, construction of diversion
weir was estimated at a cost of Rs.1.80
lakh have been done. Availing such facility
an area of 13 acres of land has been
irrigated and 18 members of small and
marginal farmers are cultivating their land
during summer season and generating an
additional income.
III. Construction of a Guard wall on the road
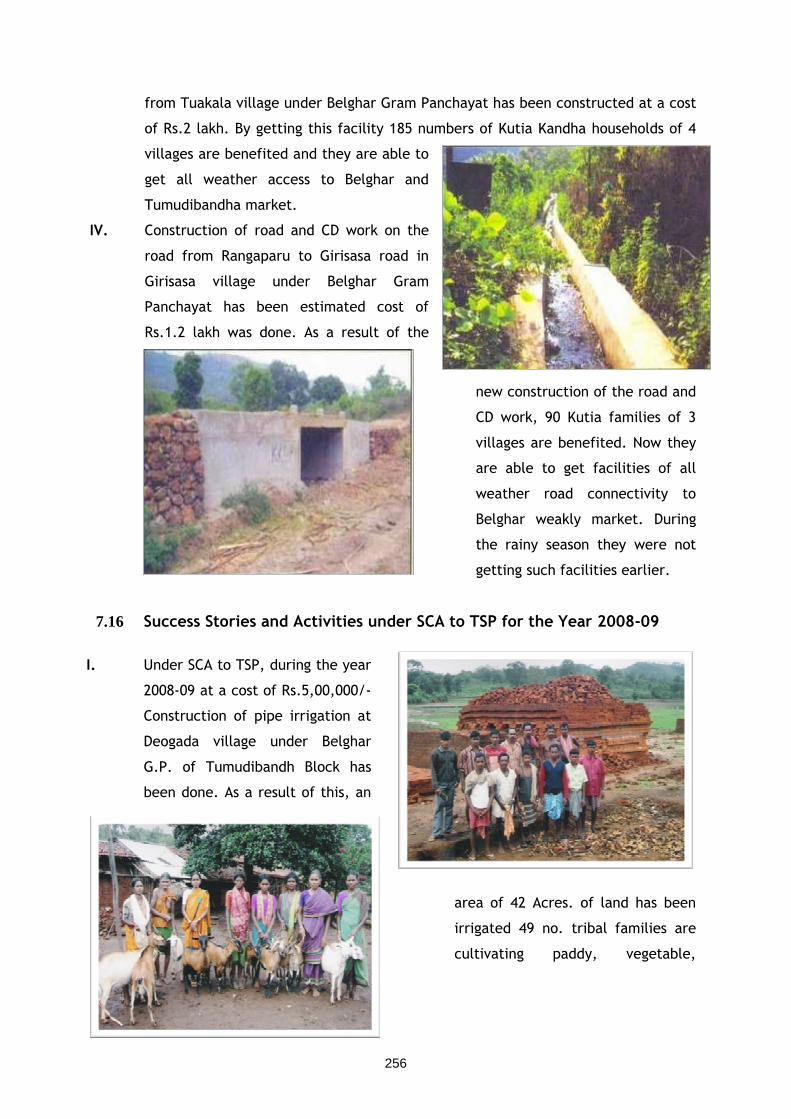
256
from Tuakala village under Belghar Gram Panchayat has been constructed at a cost
of Rs.2 lakh. By getting this facility 185 numbers of Kutia Kandha households of 4
villages are benefited and they are able to
get all weather access to Belghar and
Tumudibandha market.
IV. Construction of road and CD work on the
road from Rangaparu to Girisasa road in
Girisasa village under Belghar Gram
Panchayat has been estimated cost of
Rs.1.2 lakh was done. As a result of the
new construction of the road and
CD work, 90 Kutia families of 3
villages are benefited. Now they
are able to get facilities of all
weather road connectivity to
Belghar weakly market. During
the rainy season they were not
getting such facilities earlier.
7.16 Success Stories and Activities under SCA to TSP for the Year 2008-09
I. Under SCA to TSP, during the year
2008-09 at a cost of Rs.5,00,000/-
Construction of pipe irrigation at
Deogada village under Belghar
G.P. of Tumudibandh Block has
been done. As a result of this, an
area of 42 Acres. of land has been
irrigated 49 no. tribal families are
cultivating paddy, vegetable,
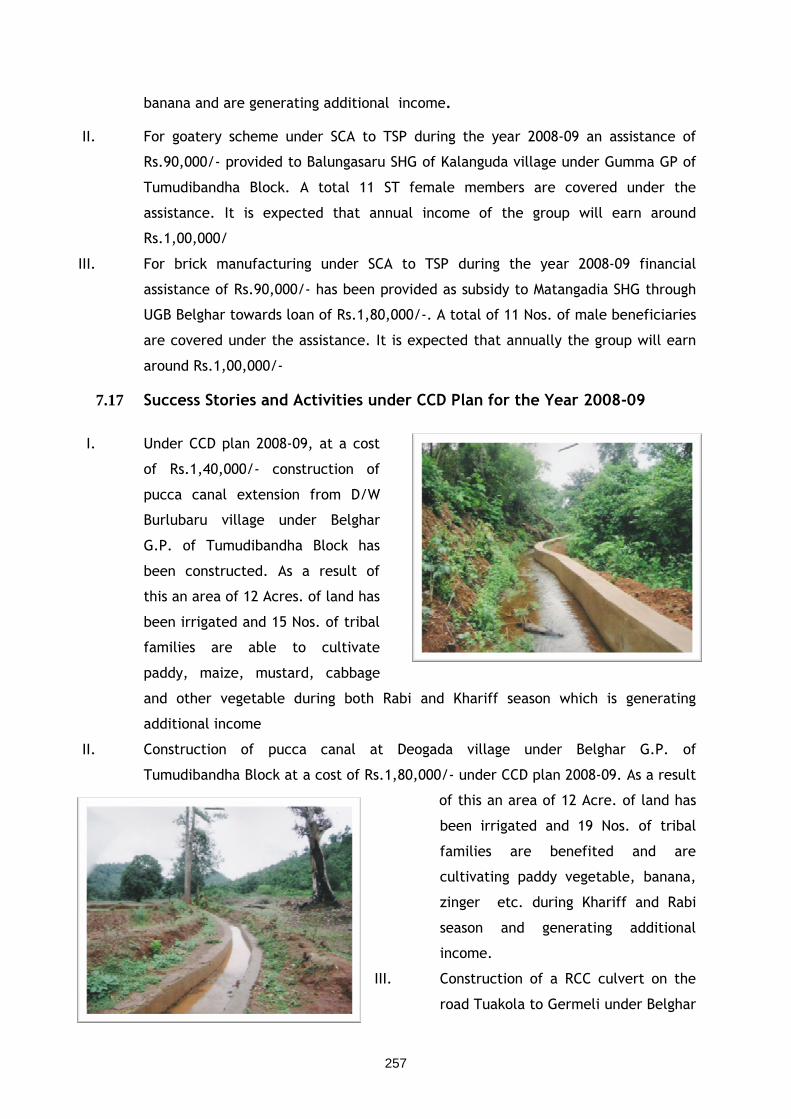
257
banana and are generating additional income.
II. For goatery scheme under SCA to TSP during the year 2008-09 an assistance of
Rs.90,000/- provided to Balungasaru SHG of Kalanguda village under Gumma GP of
Tumudibandha Block. A total 11 ST female members are covered under the
assistance. It is expected that annual income of the group will earn around
Rs.1,00,000/
III. For brick manufacturing under SCA to TSP during the year 2008-09 financial
assistance of Rs.90,000/- has been provided as subsidy to Matangadia SHG through
UGB Belghar towards loan of Rs.1,80,000/-. A total of 11 Nos. of male beneficiaries
are covered under the assistance. It is expected that annually the group will earn
around Rs.1,00,000/-
7.17 Success Stories and Activities under CCD Plan for the Year 2008-09
I. Under CCD plan 2008-09, at a cost
of Rs.1,40,000/- construction of
pucca canal extension from D/W
Burlubaru village under Belghar
G.P. of Tumudibandha Block has
been constructed. As a result of
this an area of 12 Acres. of land has
been irrigated and 15 Nos. of tribal
families are able to cultivate
paddy, maize, mustard, cabbage
and other vegetable during both Rabi and Khariff season which is generating
additional income
II. Construction of pucca canal at Deogada village under Belghar G.P. of
Tumudibandha Block at a cost of Rs.1,80,000/- under CCD plan 2008-09. As a result
of this an area of 12 Acre. of land has
been irrigated and 19 Nos. of tribal
families are benefited and are
cultivating paddy vegetable, banana,
zinger etc. during Khariff and Rabi
season and generating additional
income.
III. Construction of a RCC culvert on the
road Tuakola to Germeli under Belghar
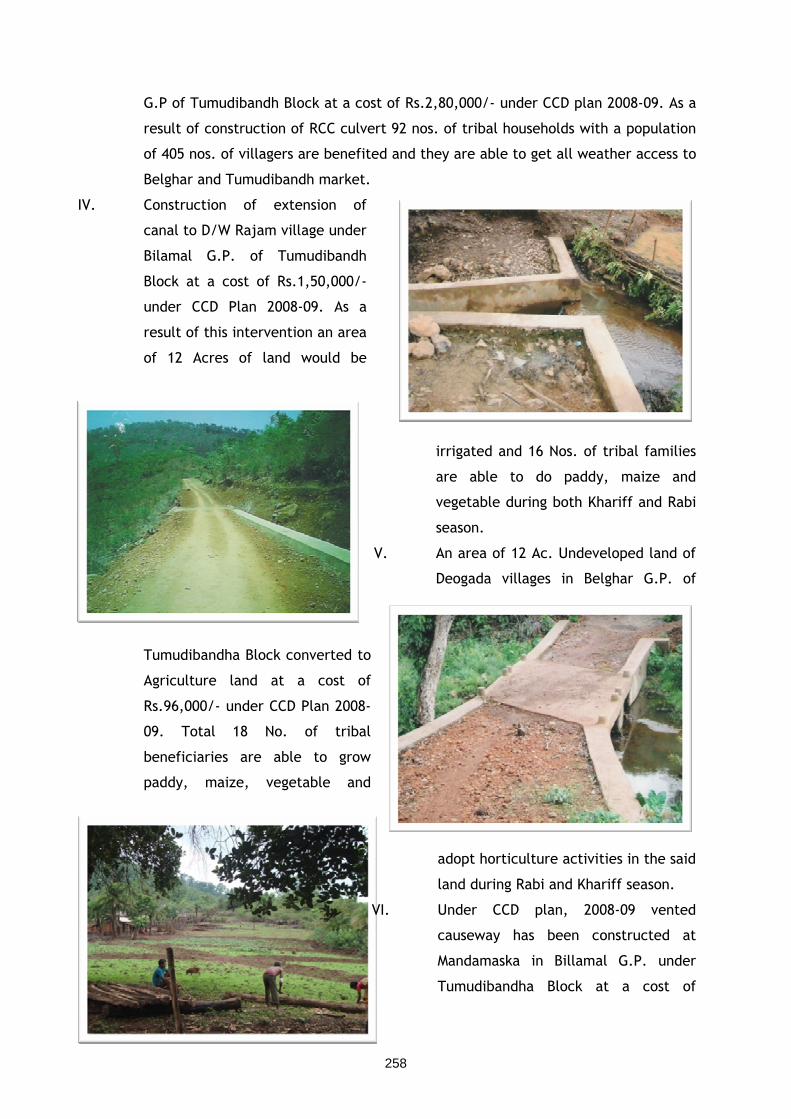
258
G.P of Tumudibandh Block at a cost of Rs.2,80,000/- under CCD plan 2008-09. As a
result of construction of RCC culvert 92 nos. of tribal households with a population
of 405 nos. of villagers are benefited and they are able to get all weather access to
Belghar and Tumudibandh market.
IV. Construction of extension of
canal to D/W Rajam village under
Bilamal G.P. of Tumudibandh
Block at a cost of Rs.1,50,000/-
under CCD Plan 2008-09. As a
result of this intervention an area
of 12 Acres of land would be
irrigated and 16 Nos. of tribal families
are able to do paddy, maize and
vegetable during both Khariff and Rabi
season.
V. An area of 12 Ac. Undeveloped land of
Deogada villages in Belghar G.P. of
Tumudibandha Block converted to
Agriculture land at a cost of
Rs.96,000/- under CCD Plan 2008-
09. Total 18 No. of tribal
beneficiaries are able to grow
paddy, maize, vegetable and
adopt horticulture activities in the said
land during Rabi and Khariff season.
VI. Under CCD plan, 2008-09 vented
causeway has been constructed at
Mandamaska in Billamal G.P. under
Tumudibandha Block at a cost of
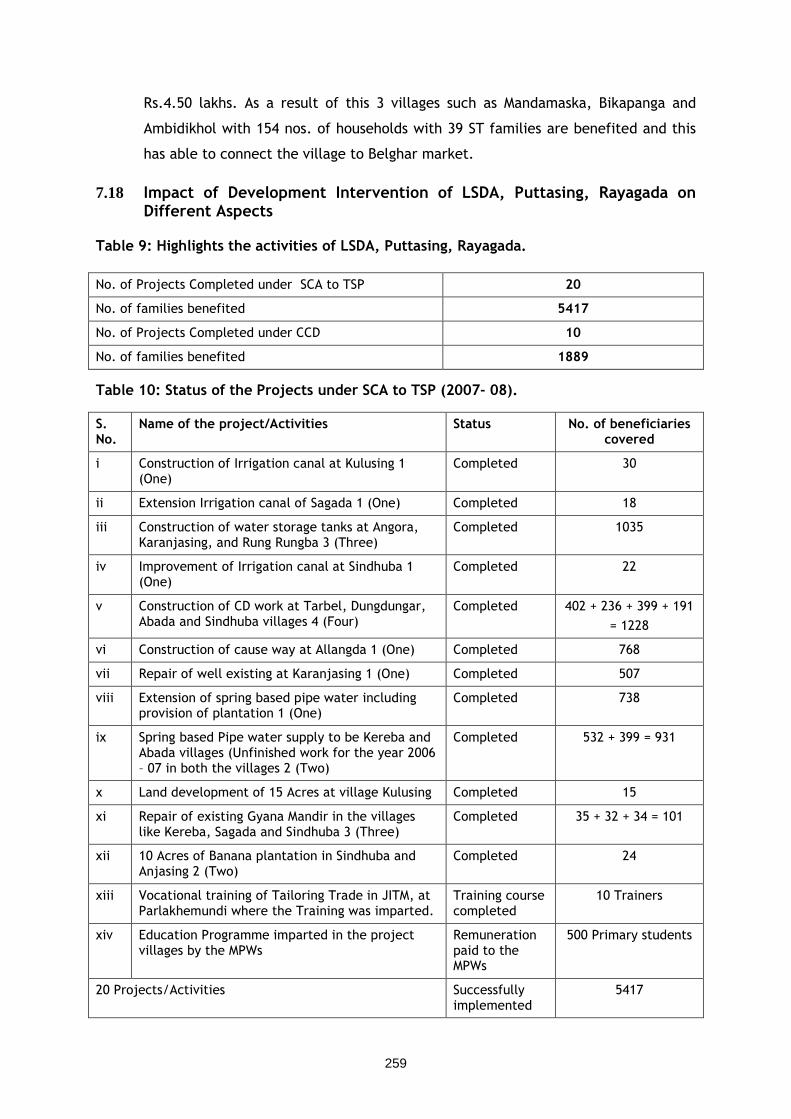
259
Rs.4.50 lakhs. As a result of this 3 villages such as Mandamaska, Bikapanga and
Ambidikhol with 154 nos. of households with 39 ST families are benefited and this
has able to connect the village to Belghar market.
7.18 Impact of Development Intervention of LSDA, Puttasing, Rayagada on Different Aspects
Table 9: Highlights the activities of LSDA, Puttasing, Rayagada.
No. of Projects Completed under SCA to TSP 20
No. of families benefited 5417
No. of Projects Completed under CCD 10
No. of families benefited 1889
Table 10: Status of the Projects under SCA to TSP (2007- 08).
S. No.
Name of the project/Activities Status No. of beneficiaries covered
i Construction of Irrigation canal at Kulusing 1 (One)
Completed 30
ii Extension Irrigation canal of Sagada 1 (One) Completed 18
iii Construction of water storage tanks at Angora, Karanjasing, and Rung Rungba 3 (Three)
Completed 1035
iv Improvement of Irrigation canal at Sindhuba 1 (One)
Completed 22
v Construction of CD work at Tarbel, Dungdungar, Abada and Sindhuba villages 4 (Four)
Completed 402 + 236 + 399 + 191
= 1228
vi Construction of cause way at Allangda 1 (One) Completed 768
vii Repair of well existing at Karanjasing 1 (One) Completed 507
viii Extension of spring based pipe water including provision of plantation 1 (One)
Completed 738
ix Spring based Pipe water supply to be Kereba and Abada villages (Unfinished work for the year 2006 – 07 in both the villages 2 (Two)
Completed 532 + 399 = 931
x Land development of 15 Acres at village Kulusing Completed 15
xi Repair of existing Gyana Mandir in the villages like Kereba, Sagada and Sindhuba 3 (Three)
Completed 35 + 32 + 34 = 101
xii 10 Acres of Banana plantation in Sindhuba and Anjasing 2 (Two)
Completed 24
xiii Vocational training of Tailoring Trade in JITM, at Parlakhemundi where the Training was imparted.
Training course completed
10 Trainers
xiv Education Programme imparted in the project villages by the MPWs
Remuneration paid to the MPWs
500 Primary students
20 Projects/Activities Successfully implemented
5417
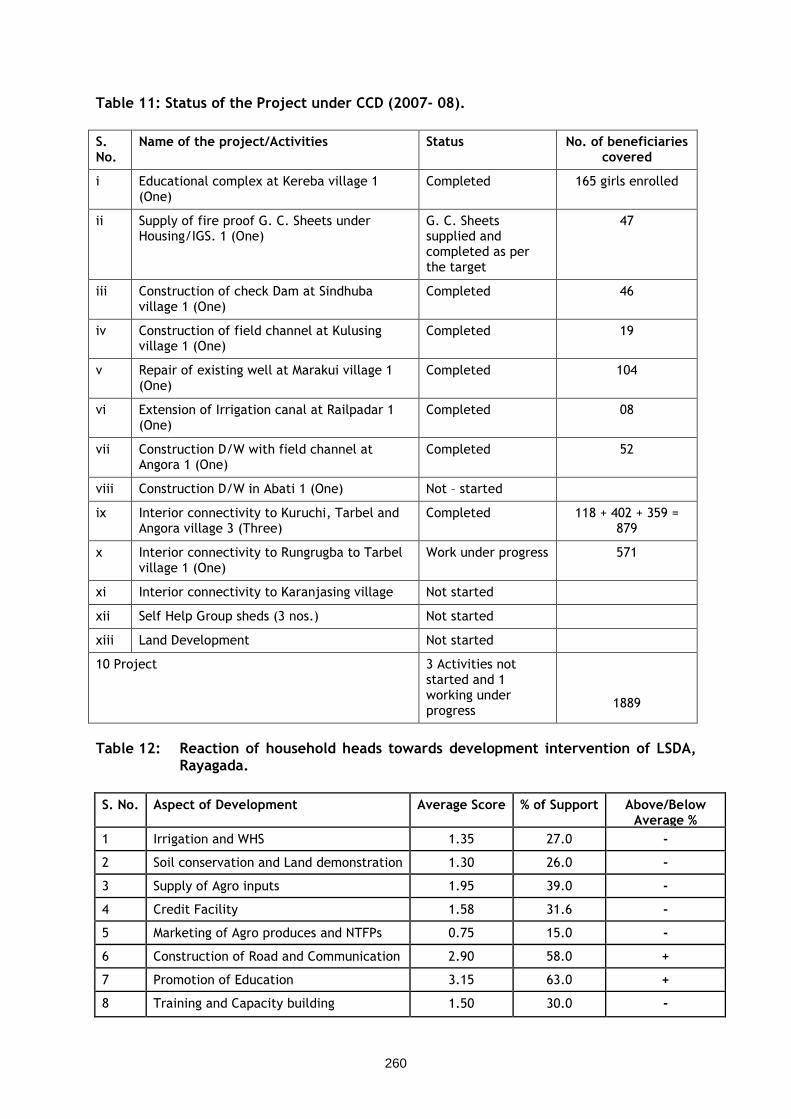
260
Table 11: Status of the Project under CCD (2007- 08).
S. No.
Name of the project/Activities Status No. of beneficiaries covered
i Educational complex at Kereba village 1 (One)
Completed 165 girls enrolled
ii Supply of fire proof G. C. Sheets under Housing/IGS. 1 (One)
G. C. Sheets supplied and completed as per the target
47
iii Construction of check Dam at Sindhuba village 1 (One)
Completed 46
iv Construction of field channel at Kulusing village 1 (One)
Completed 19
v Repair of existing well at Marakui village 1 (One)
Completed 104
vi Extension of Irrigation canal at Railpadar 1 (One)
Completed 08
vii Construction D/W with field channel at Angora 1 (One)
Completed 52
viii Construction D/W in Abati 1 (One) Not – started
ix Interior connectivity to Kuruchi, Tarbel and Angora village 3 (Three)
Completed 118 + 402 + 359 = 879
x Interior connectivity to Rungrugba to Tarbel village 1 (One)
Work under progress 571
xi Interior connectivity to Karanjasing village Not started
xii Self Help Group sheds (3 nos.) Not started
xiii Land Development Not started
10 Project 3 Activities not started and 1 working under progress
1889
Table 12: Reaction of household heads towards development intervention of LSDA,
Rayagada.
S. No. Aspect of Development Average Score % of Support Above/Below Average %
1 Irrigation and WHS 1.35 27.0 -
2 Soil conservation and Land demonstration 1.30 26.0 -
3 Supply of Agro inputs 1.95 39.0 -
4 Credit Facility 1.58 31.6 -
5 Marketing of Agro produces and NTFPs 0.75 15.0 -
6 Construction of Road and Communication 2.90 58.0 +
7 Promotion of Education 3.15 63.0 +
8 Training and Capacity building 1.50 30.0 -
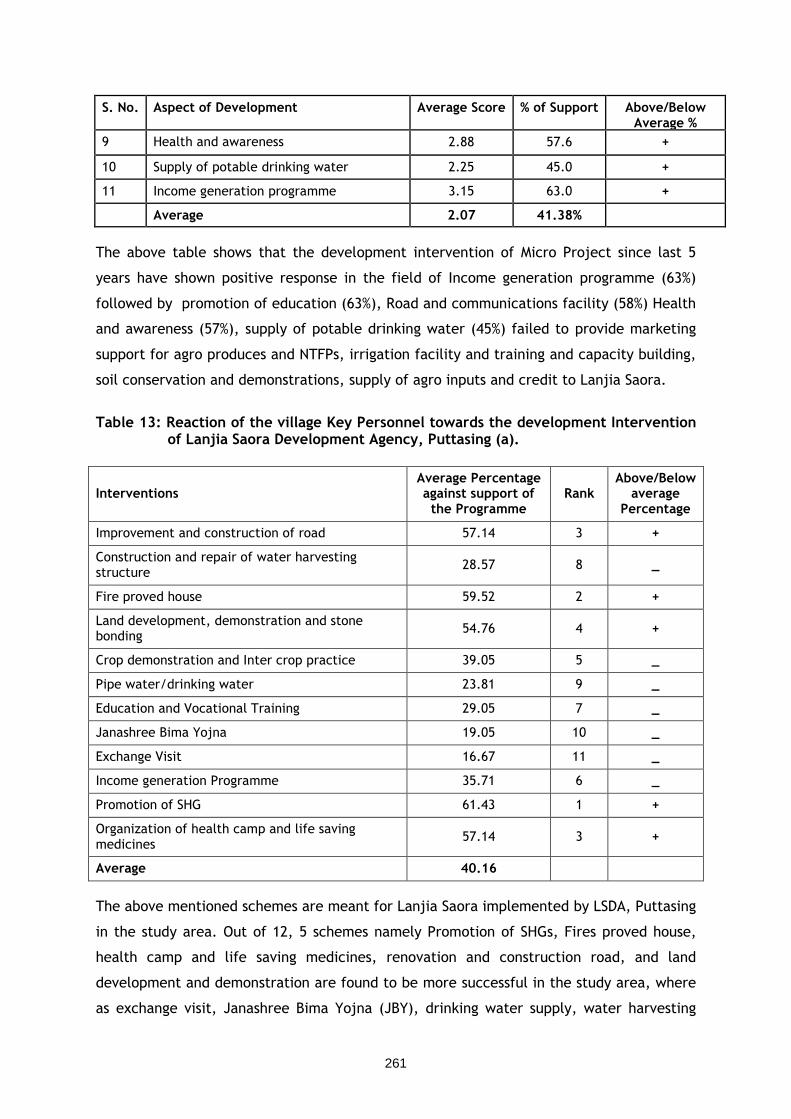
261
S. No. Aspect of Development Average Score % of Support Above/Below Average %
9 Health and awareness 2.88 57.6 +
10 Supply of potable drinking water 2.25 45.0 +
11 Income generation programme 3.15 63.0 +
Average 2.07 41.38%
The above table shows that the development intervention of Micro Project since last 5
years have shown positive response in the field of Income generation programme (63%)
followed by promotion of education (63%), Road and communications facility (58%) Health
and awareness (57%), supply of potable drinking water (45%) failed to provide marketing
support for agro produces and NTFPs, irrigation facility and training and capacity building,
soil conservation and demonstrations, supply of agro inputs and credit to Lanjia Saora.
Table 13: Reaction of the village Key Personnel towards the development Intervention
of Lanjia Saora Development Agency, Puttasing (a).
Interventions Average Percentage against support of the Programme
Rank Above/Below
average Percentage
Improvement and construction of road 57.14 3 +
Construction and repair of water harvesting structure
28.57 8 _
Fire proved house 59.52 2 +
Land development, demonstration and stone bonding
54.76 4 +
Crop demonstration and Inter crop practice 39.05 5 _
Pipe water/drinking water 23.81 9 _
Education and Vocational Training 29.05 7 _
Janashree Bima Yojna 19.05 10 _
Exchange Visit 16.67 11 _
Income generation Programme 35.71 6 _
Promotion of SHG 61.43 1 +
Organization of health camp and life saving medicines
57.14 3 +
Average 40.16
The above mentioned schemes are meant for Lanjia Saora implemented by LSDA, Puttasing
in the study area. Out of 12, 5 schemes namely Promotion of SHGs, Fires proved house,
health camp and life saving medicines, renovation and construction road, and land
development and demonstration are found to be more successful in the study area, where
as exchange visit, Janashree Bima Yojna (JBY), drinking water supply, water harvesting
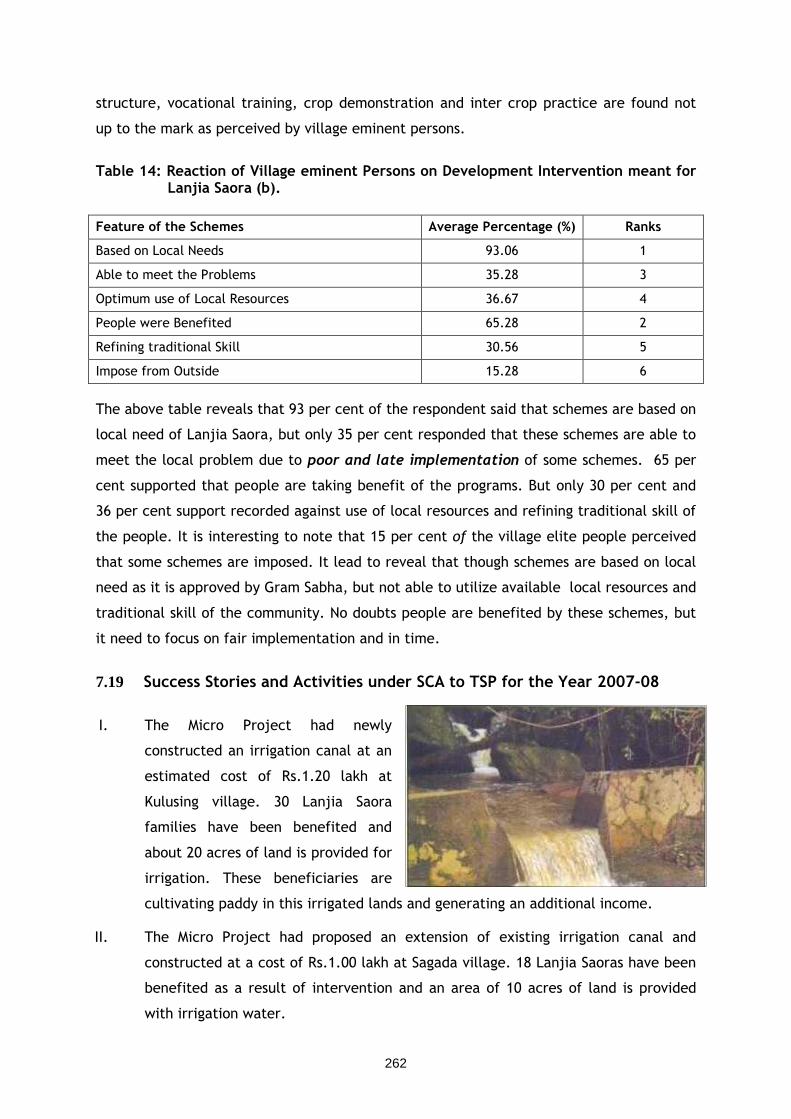
262
structure, vocational training, crop demonstration and inter crop practice are found not
up to the mark as perceived by village eminent persons.
Table 14: Reaction of Village eminent Persons on Development Intervention meant for
Lanjia Saora (b).
Feature of the Schemes Average Percentage (%) Ranks
Based on Local Needs 93.06 1
Able to meet the Problems 35.28 3
Optimum use of Local Resources 36.67 4
People were Benefited 65.28 2
Refining traditional Skill 30.56 5
Impose from Outside 15.28 6
The above table reveals that 93 per cent of the respondent said that schemes are based on
local need of Lanjia Saora, but only 35 per cent responded that these schemes are able to
meet the local problem due to poor and late implementation of some schemes. 65 per
cent supported that people are taking benefit of the programs. But only 30 per cent and
36 per cent support recorded against use of local resources and refining traditional skill of
the people. It is interesting to note that 15 per cent of the village elite people perceived
that some schemes are imposed. It lead to reveal that though schemes are based on local
need as it is approved by Gram Sabha, but not able to utilize available local resources and
traditional skill of the community. No doubts people are benefited by these schemes, but
it need to focus on fair implementation and in time.
7.19 Success Stories and Activities under SCA to TSP for the Year 2007-08
I. The Micro Project had newly
constructed an irrigation canal at an
estimated cost of Rs.1.20 lakh at
Kulusing village. 30 Lanjia Saora
families have been benefited and
about 20 acres of land is provided for
irrigation. These beneficiaries are
cultivating paddy in this irrigated lands and generating an additional income.
II. The Micro Project had proposed an extension of existing irrigation canal and
constructed at a cost of Rs.1.00 lakh at Sagada village. 18 Lanjia Saoras have been
benefited as a result of intervention and an area of 10 acres of land is provided
with irrigation water.
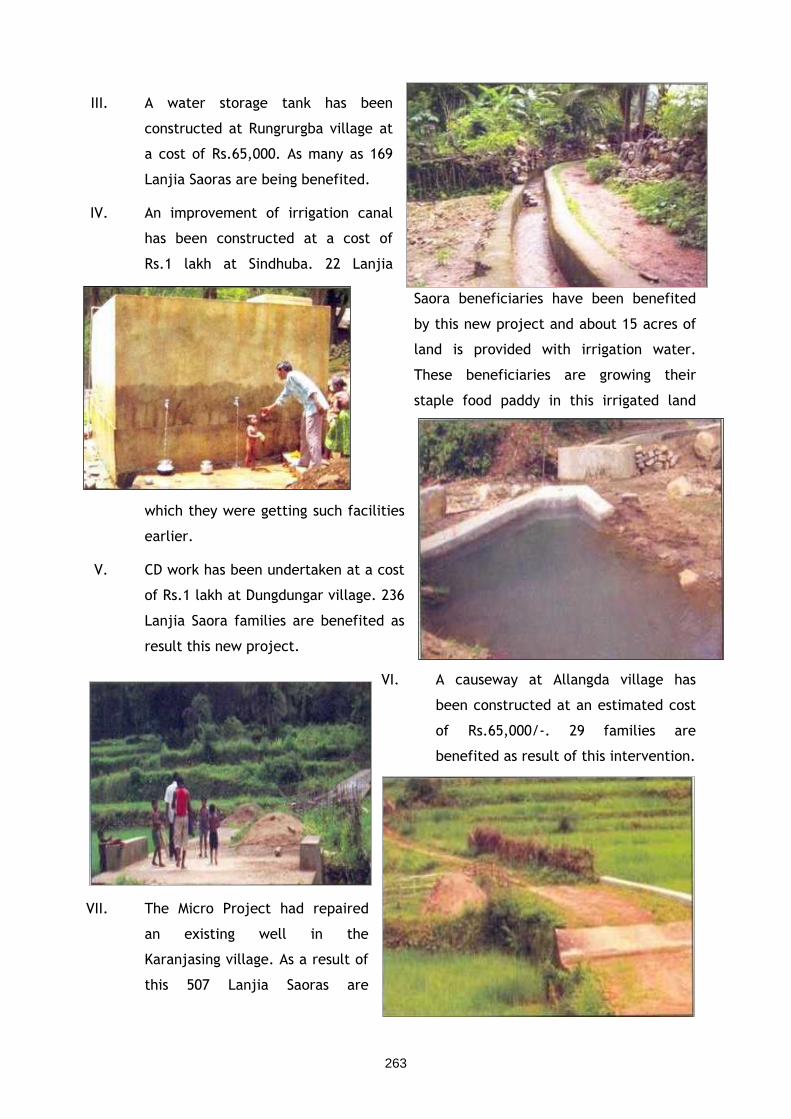
263
III. A water storage tank has been
constructed at Rungrurgba village at
a cost of Rs.65,000. As many as 169
Lanjia Saoras are being benefited.
IV. An improvement of irrigation canal
has been constructed at a cost of
Rs.1 lakh at Sindhuba. 22 Lanjia
Saora beneficiaries have been benefited
by this new project and about 15 acres of
land is provided with irrigation water.
These beneficiaries are growing their
staple food paddy in this irrigated land
which they were getting such facilities
earlier.
V. CD work has been undertaken at a cost
of Rs.1 lakh at Dungdungar village. 236
Lanjia Saora families are benefited as
result this new project.
VI. A causeway at Allangda village has
been constructed at an estimated cost
of Rs.65,000/-. 29 families are
benefited as result of this intervention.
VII. The Micro Project had repaired
an existing well in the
Karanjasing village. As a result of
this 507 Lanjia Saoras are
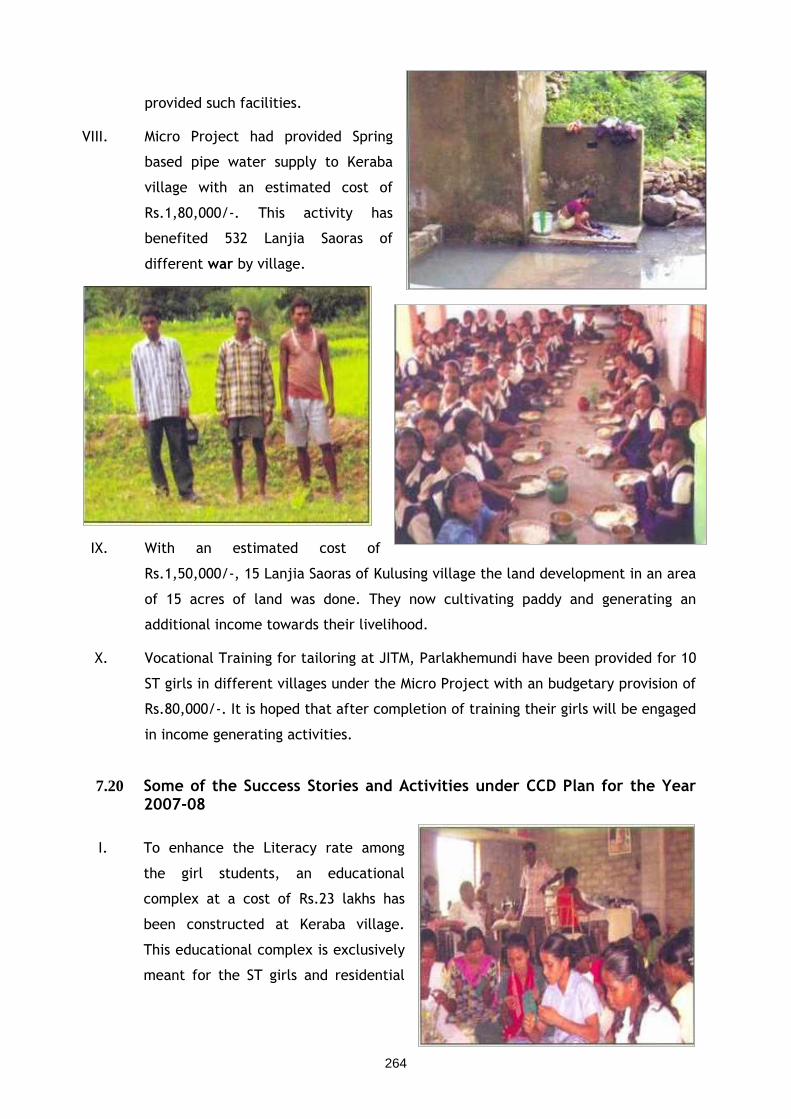
264
provided such facilities.
VIII. Micro Project had provided Spring
based pipe water supply to Keraba
village with an estimated cost of
Rs.1,80,000/-. This activity has
benefited 532 Lanjia Saoras of
different war by village.
IX. With an estimated cost of
Rs.1,50,000/-, 15 Lanjia Saoras of Kulusing village the land development in an area
of 15 acres of land was done. They now cultivating paddy and generating an
additional income towards their livelihood.
X. Vocational Training for tailoring at JITM, Parlakhemundi have been provided for 10
ST girls in different villages under the Micro Project with an budgetary provision of
Rs.80,000/-. It is hoped that after completion of training their girls will be engaged
in income generating activities.
7.20 Some of the Success Stories and Activities under CCD Plan for the Year 2007-08
I. To enhance the Literacy rate among
the girl students, an educational
complex at a cost of Rs.23 lakhs has
been constructed at Keraba village.
This educational complex is exclusively
meant for the ST girls and residential
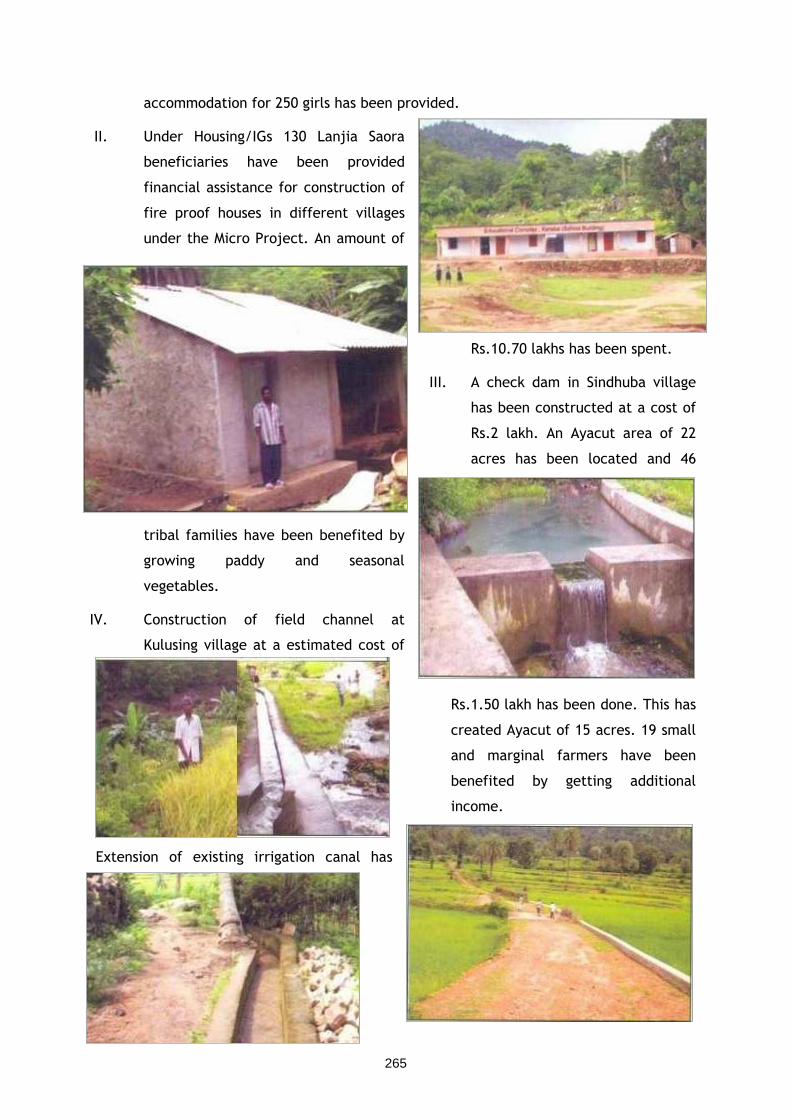
265
accommodation for 250 girls has been provided.
II. Under Housing/IGs 130 Lanjia Saora
beneficiaries have been provided
financial assistance for construction of
fire proof houses in different villages
under the Micro Project. An amount of
Rs.10.70 lakhs has been spent.
III. A check dam in Sindhuba village
has been constructed at a cost of
Rs.2 lakh. An Ayacut area of 22
acres has been located and 46
tribal families have been benefited by
growing paddy and seasonal
vegetables.
IV. Construction of field channel at
Kulusing village at a estimated cost of
Rs.1.50 lakh has been done. This has
created Ayacut of 15 acres. 19 small
and marginal farmers have been
benefited by getting additional
income.
Extension of existing irrigation canal has
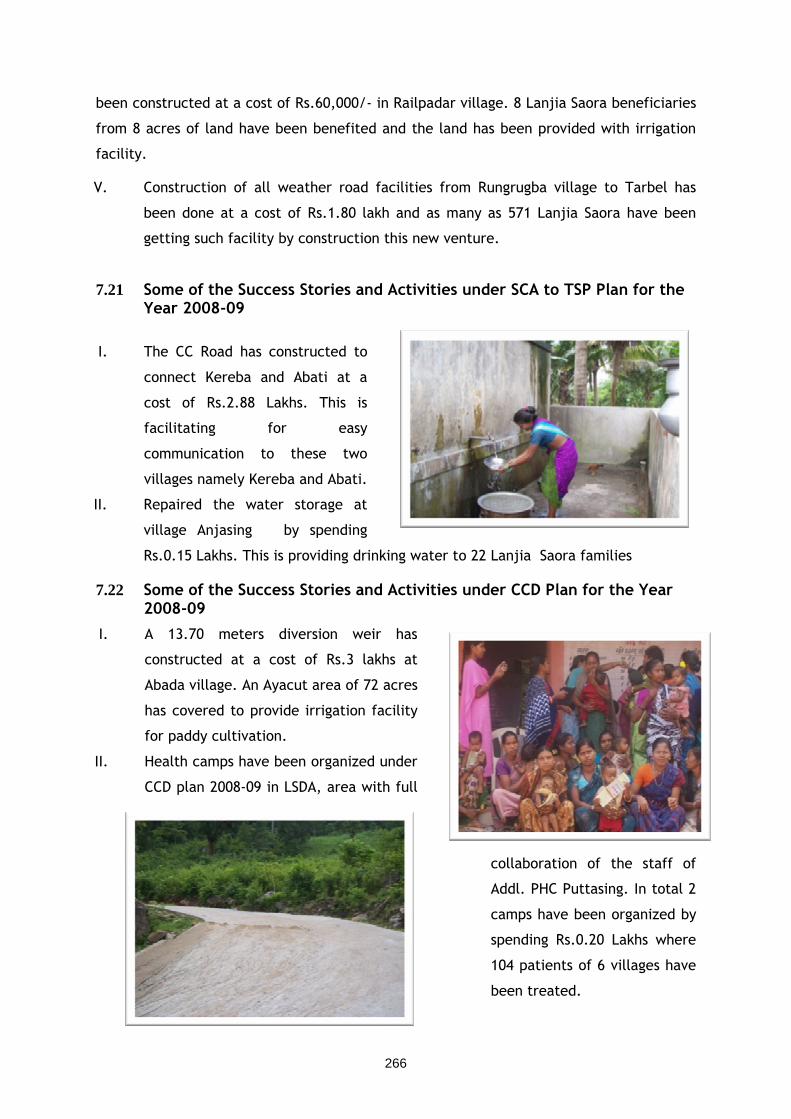
266
been constructed at a cost of Rs.60,000/- in Railpadar village. 8 Lanjia Saora beneficiaries
from 8 acres of land have been benefited and the land has been provided with irrigation
facility.
V. Construction of all weather road facilities from Rungrugba village to Tarbel has
been done at a cost of Rs.1.80 lakh and as many as 571 Lanjia Saora have been
getting such facility by construction this new venture.
7.21 Some of the Success Stories and Activities under SCA to TSP Plan for the Year 2008-09
I. The CC Road has constructed to
connect Kereba and Abati at a
cost of Rs.2.88 Lakhs. This is
facilitating for easy
communication to these two
villages namely Kereba and Abati.
II. Repaired the water storage at
village Anjasing by spending
Rs.0.15 Lakhs. This is providing drinking water to 22 Lanjia Saora families
7.22 Some of the Success Stories and Activities under CCD Plan for the Year 2008-09
I. A 13.70 meters diversion weir has
constructed at a cost of Rs.3 lakhs at
Abada village. An Ayacut area of 72 acres
has covered to provide irrigation facility
for paddy cultivation.
II. Health camps have been organized under
CCD plan 2008-09 in LSDA, area with full
collaboration of the staff of
Addl. PHC Puttasing. In total 2
camps have been organized by
spending Rs.0.20 Lakhs where
104 patients of 6 villages have
been treated.
267
Chapter-8:
CONCLUSION AND RECOMMENDATION
The tribal population is identified as the aboriginal inhabitants of our country. They
are most vulnerable section of our society living in natural and unpolluted surrounding
far away from civilization with their traditional values, customs and beliefs. As per the
census report of 2001, the total tribal population of India has been estimated as
8,43,26,240 that constitutes about 8.2 per cent of the total population of the country.
Tribal groups with pre-agricultural stage of development, diminishing stagnant
population and very low literacy rates are defined as primitive tribal groups. There are
as many as 75 PTGs who are distributed in 14 undivided States and one Union Territory
with a population of 32,62960. Out of 62 tribal communities of Orissa, 13 have been
identified as PTGs. Both Central and State Government have pumped crores of rupees
to bring desirable changes in socio-economic life and household food security of the
primitive tribal group of Orissa through different schemes and projects from time to
time. The following findings were drawn from the field study
• Tribal Sub Plan concept and Special Central Assistance to State Governments
for the socio-economic development of the Scheduled Tribes (Primitive and
Vulnerable Tribal Communities) have been in operation since the Fifth Five
Year Plan. But the schemes meant for PTGs were unable to identify their felt
need based programmes and benefits not percolating to the Primitive Tribal
Groups to the desired extent. It is seen that the progress of development of
PTGs was negligible till 10th Five Years Plan as a result achievement was not
satisfactory. But after the formulation of “Need Based Action Plan” in 2001,
the development of PTGs has accelerated to a significant level (e.g. increase
in, household income, female literacy and access to modern treatment
among Dongria Kandha and Kutia Kandha).
• The annual income of a household is high among Lanjia Saora (Rs.24,491)
followed by Dongria Kandha (Rs.23,157) and Kutia Kandha (Rs.18,230).
However, Per Capital Income is comparatively more among Dongria Kandha
(Rs.4,320) than Lanjia Saora (Rs.3,973) and Kutia Kandha (Rs.3,240). Out of
268
total income, contribution of agriculture is almost same among Dongria Kandha
(64%) and Lanjia Saora (63%). But it was relatively less among Kutia Kandha
(44%). NTFPs contribute about 29 per cent of income to Kutia Kandha (Mainly
Siali leaves collection) followed by Dongria Kandha (19%) and Lanjia Saora (9%).
Contribution of Wage earning is 24 per cent to the total income in case of Kutia
Kandha where as it is 18 per cent for Lanjia Saora and 9 per cent for Dongria
Kandha
• The study noted that as a result of developmental interventions like promotion
of Girl’s Education through Residential Girls Model Schools, economic
development through horticultural development in Dongria Kandha area,
Cashew nut plantation in Lanjia Saora area and other awareness programs; the
lifestyle of PTGs have changed considerably after 10th Plan and helped them to
join the mainstream. This needs to be continued for future action of the Micro
Projects.
• Literacy gap is recorded more for Kutia Kandha (19.09%) followed by Lanjia
Saora (18.68%) and low among Dongria Kandha (12.57%). Among the PTGs both
male and female literacy rate is high among Lanjia Saora than other two PTG.
Male literacy is 45.42 per cent, 39.34 per cent and 24.78 per cent among Lanjia
Saora, Kutia Kandha and Dongria Kandha respectively. Female literacy is low
among Dongria Kandha (12.21%) where as it is 20.78% among Kutia Kandha and
26.74 per cent among Lanjia Saora. The data reveals that Lanjia Saoras are
educationally advanced than Kutia Kandha and Dongria Kandha.
• Overlapping between identical schemes may have adverse impact on education
in Kutia Kandha Areas. For example both the Residential Model Girls School
(Meant for Kutia Kandha) and Kasturaba Gandhi Balika Vidhalaya (Promotion of
Gils education of ST including PTGs) meant for promotion of girls education
among ST, there is clash between these two schemes to fill up the targeted
seat of students.
• Expenditure on food items is almost equal ranging from 35 per cent to 38 per
cent among all selected PTGs. Average monthly expenditure per household is
Rs.635 among Dongria Kandha, Rs.588 among Kutia Kandha and Rs.501 among
269
Lanjia Saora. Per capita expenditure on food items is Rs.118 among Dongria
Kandha, Rs.105 among Kutia Kandha, and Rs.81 among Lanjia Saora.
• Average monthly expenditure (Both food and non-food) per household of
Dongria Kandha is Rs.1705 as against Rs.1517 of Kutia Kandha and Rs.1419 of
Lanjia Saora. Similarly per capita monthly expenditure is more among Dongria
(Rs.318) followed by Kutia Kandha (Rs.270) and Lanjia Saora (Rs.230).
• The Multi Purpose Workers from the local villages perform their duties sincerely
in DKDA, Chatikona. As per field observation the MPWs of this Micro Project are
providing information from the village level such as conducting awareness camp
on health and sanitation, providing information about the livelihood condition
of the households, motivating the people regarding the schemes and
development programmes, formation of women Self help groups etc. The
Special Officer of DKDA is maintaining constant touch with every Micro project
Village and has monitored the activities of the MPWs in a very satisfactory
manner. On the other hand the study team observed that there is not a single
MPW in KKDA, Belghar. Permanent posting of a Special Officer and Junior
Engineer is the need of the hour for proper implementation of development
works and for maintaining motivation and constant touch with the people. For
example, the new concepts under CCD plan to promote girls education and
opening of Educational Complexes (Girls Residential Educational Complex) in
this Micro Project under the 11th plan period are not functioning properly due
to lot of mismanagement by the local Government. It was observed that the
objectives of the Education programme as per the CCD plan and guidelines of
the Ministry have not been followed up by ST and SC Development Department,
Government of Orissa. It is indeed very pathetic to mention here that 226 girls
from Project villages with-in the age groups between 5 to 15 were admitted
and dumped in two godowns of the Micro Project. The class rooms and the
hostels are in operation in the premises. . During the study it was found that no
special class room facilities were provided by the State Government. The
environment of present Educational Complex was unhygienic and the girls were
not provided adequate boarding facilities. The asbestos roofs of the godowns
(Hostels Cum Class rooms) were damaged and the rain water seeps from the
holes causing pathetic living conditions for the girls. It was also observed that,
270
sometime they took shelter in the near by quarters and the Micro Project
Office. The proposed Education Complex Building and infrastructures have still
not been completed at Rangaparu village.
• Primitive tribal groups spend more on the occasion of marriage, festival, birth
and death ceremony and their traditional worship. In this connection, they
have to borrow from others.
• Intensity of Malaria is high among Dongria Kandha followed by Kutia Kandha
and Lanjia Saora. But intensity of Skin disease is reported high among Kutia
Kandha and Dongria Kandha as compared to Lanjia Saora. Malnutrition is low
among Lanjia Saora and relatively high among Kutia Kandha and Dongria
Kandha. Diarrhea is reported high among Kutia Kandha where as low among
Lanjia Saora.
• Acceptance and practice of democratic representative and self government was
observed at different stages among the selected PTGs. This system is widely
accepted among Lanjia Saora where as it is not acceptable to Dongria Kandha
who prefer traditional political customary system of their community. But
convergence between democratic and traditional political system was found
among Kutia Kandha
• Previously the exploitation by the Dombs/Panos was very high in the Project
Area. It is for the first time their relationships with the Lanjia Saoras were
symbiotic rather than parasitic. The Dombs were the liaison agent with the
government authorities. But after the onset of the Micro-Project for Lanjia
Saoras, it has gone down quite significantly. It was only possible when a Special
Officer with social anthropology background was posted in the Micro-Project at
the earlier stages.
• PTGs living in inaccessible hilly and forest areas (Kutia Kandha of Belghar and
Dongria Kandha of Chatikona Areas) are unaware of Central protective
measures such as SC/ST (Prevention of Atrocities) Act, 1989 and Protection of
Civil Rights Act, 1955 as a result they are constantly exploited by middle man,
contractors and money lender etc.
• Plan layouts of Indira Awas Yojna have not benefited PTGs as houses under
Indira Awas Yojna are constructed through local contractors in concurrence
271
with the local politician. It was also observed that the quality of work under
this Yojna is not satisfactory.
• It was reported by village eminent persons in Dongria Kandha areas that
Dongria Kandhas have felt threatened by mining project in the Niyamgiri hill
range. This study shows NTFPs contribute 20 per cent to the total income of
Dongria Kandha. Secondly, the climatic condition of Niyamgiri hill range is very
favorable for horticultural plantation and Dongrias are expert in horticulture.
Thirdly, as it was mentioned in the study that Dongrias are very specific in
selecting their habitat, so promotion of mining project may have adverse
impact on natural habitat of the Dongria Kandha as well as their livelihood
condition.
• Kutia Kandha forest based economy is market demand driven. Kutias are
collecting Siali leaves as it fetch good price in the local market. But the
community has no sustainable harvesting mechanism which may lead to over
exploitation of Siali leaves. Besides, they have been threatened for
environmental degradation. It was found that community rules are very strong
in equal distribution of shifting land, but no such rules are found in case of Siali
leaves collection.
• Geographically isolation and backwardness coupled with their faith and
reliance on traditional magico-religious methods are the main reason of poor
health status of all PTGs under study. Besides this, Lack of sanitation, personal
hygiene, poor living condition, including improper ventilation are other major
factors that attribute to poor health of the studied groups.
• The Infant Mortality Rate per 1000 live birth is high among all PTGs. Lanjia
Saora had the lowest IMR of 71 and Dongria Kandha had the highest of 117
where as Kutia Kandha had of 84. Maternal Mortality Rate was calculated 3 per
1000 live birth among Dongria Kandha where as it was 7 among Lanjia Saora
and 8 among Kutia Kandha. Crude Birth Rate (CBR) is reported almost equal
between Dongria Kandha (24.1) and Lanjia Saora (24.3) where as it was 20.3
among Kutia Kandha. Crude Death Rate is low among Lanjia Saora (10.5) and 13
among Dongria Kandha and 13.6 among Kutia Kandha. Life Expectancy of Lanjia
272
Saora is estimated 57.4 years as compared to 53.7 years of Dongria Kandha and
51.7 years of Kutia Kandha.
• There is no safe access to drinking water. Therefore people drink water from
the hill streams. Water of hill stream is required for multifarious purposes:
washing clothes, bathing, scrubbing of cattle and also for cooking food and
drinking. The project authority should take steps to tap the local perennial
stream and promote tank water supply after purification. It has met some
success in some villages of Dongria Kandha areas.
• The access to institutional credit (30% of indebted households) is reported
among Dongria Kandha followed by 24 per cent for Lanjia Saora and only 12 per
cent for Kutia Kandha. A majority of 71 per cent of indebted household of
Kutia Kandha have access to Micro Finance through Self Help Group where as it
is about 50 per cent and 21 per cent among Dongria Kandha and Lanjia Saora
respectively. Per capita loan is Rs.402 among Lanjia Saora followed by
Dongria Kandha (Rs.290) and Kutia Kandha (Rs.39).
RECOMMENDATIONS Broad recommendations based on the finding from the field survey of three Primitive
tribal groups are presented below for consideration:
• Despite State Government’s continued efforts for the development of PTGs
right from Fifth Five Year Plan, there are villages among the Kutia Kandha,
Lanjia Saora and Dongria Kandha that have not been covered under micro
project. The conditions of such villages are worse even as on date. It is
suggested that these left out villages may be taken under micro project.
• During the study it was found that some villages under the Micro Projects are
developed and their livelihood condition is much better than before. However,
some villages are not developed because of lack of communication facilities,
lack of health consciousness and inadequate educational facilities. Due to the
above development intervention is very slow in these villages since the
inception of the Micro Projects. Therefore, the study suggests that special
attention and proper planning is required for these lagging villages.
273
• The Micro-Project has two executing bodies, the Governing body and Micro
project authorities. The Annual Action Plan prepared by the Micro-Project
authorities is approved by the Governing Body. But the performance and the
development works done by the Micro-Project is not adequately monitored by
the Governing body and the respective line departments as per perception of
local PRIs and Villages key persons. As a result most of the sectoral
programmes have not yielded the required result1. Regular review of the
implementation of the schemes should be carried out by the governing body it
self.
• People’s participation in the execution of development programmes have not
been taken into consideration in most cases, though the project development
works are being approved by the Gram Sabha. Participation of PTGs in the
activities/programmes is low due to factors like; rigidity of social and cultural
values prevailing among them, low level of literacy etc. As a result variation is
observed between planning and implementation of the project. The most
important problem lies at the implementation stage at the Micro-Project level.
It is suggested that more emphasis should be given at implementation stage to
reduce the gap between planning and implementation.
• The staff required to run the Micro Project is inadequate as far as technical
hands are concerned. All the three Micro-Projects do not have adequate
technical staff for any programme. Moreover, Kutia Kandha Development
Agency, Belghar does not have Special Officer. The Special Officer of Baliguda
ITDA is in charge of the Micro Project who rarely visits to the project area. It
was observed that one field assistant and one peon are managing the Micro
Project. The ratio of staff between staff and villages is 1:029 in Kutia Kandha
Development Agency. The study strongly recommended that no post should lie
1. (Ministry of Tribal Affairs, GoI has specifically indicated in the district where PTGs are inhabited the
committee of four offices (preferably from Tribal development department, health department, forest
department and PWD department and a representative of a nominated local NGOs who will supervise the
implementation during each financial years and submit the progress report of their respective departments
in the Annual Action Plan for 11th Plan Period under CCD Plan.)
274
vacant and the Micro Project personnel must be accountable for the failures of
the programmes that they are responsible for.
• Most of the Special Officers are posted in this Micro-Project for very short
period which do not help in proper planning, implementation and monitoring of
the programmes. This Micro-Project was without a S.O. for a pretty long time
with resultant very slow and hap-hazard progress of developmental work. Some
policy decisions should be taken in this direction. If necessary, some incentives
may be provided to motivate officials to work in the region.
• The special officer either from the technical line such as from Agriculture,
horticulture, soil conservation departments or a sociologist who can mix with
the target group and understand their felt needs and difficulties be appointed
so that the development programmes may achieve the target.
• It was also reported that most of the field personnel working for the micro
project are not staying in the Project headquarters. It is suggested that the
district authorities should take necessary steps in this direction.
• In Belghar, forest department is promoting commercial plantation (Teak trees)
in the encroached land of Kutia Kandha where Kutia Kandha were earlier
growing different crops for sustenance of their livelihood. It is recommended
that in spite of promoting commercial plantation, Forest Department should
promote for plantation of useful trees with the active participation of Kutia
Kandha which will give support to their livelihood while conserving the
environment. Suitable agro forestry models may be considered.
• Non availability of herbal medicinal plant in near by forest due to
deforestation and establishment of Primary Health Center, are the prime
reasons for acceptance of modern treatment by the PTGs. But still these are
wider prevalence of herbal medicine and magico- religious practices in the
three study areas. Thus, the nature and value of the herbal medicines used by
PTGs should be studied, understood and analyzed in order to access their
scientific worth and efficacy. However, health care facilities for the PTGs are
grossly inadequate particularly for the groups living in remote, hilly and
inaccessible areas (mainly in the interior villages of Kutia Kandha and Dongria
Kandha where even the health department and the SC, ST development

275
department have not taken appropriate measures till now). Therefore some
strategic measures may be suggested jointly by these two departments for
development of health infrastructure at the grass root level.
• The modern medical treatment is accepted if it is efficacious and is available
and accessible to PTGs. Actually their resources do not permit them to avail
the expensive treatment at distance places. As such the study suggests the
strengthening of the local Sub -centre and ANMs centres to provide for
immediate preventive measures at the household level.
• Promotion of fire proof houses in the study areas is highly successful as the
locally available thatching grass (called Piri) is not adequately available nearly
by forest.
• The literacy and educational status is very low among the selected PTGs in
general and Dongria Kandha & Kutia Kandha in particular. The chronic problem
of teacher absenteeism needs priority attention. This aspect has to be
addressed to with all sincerity of efforts so that the teaching – learning
situation is improved among the Kandha. Thus emphasis should be given on
priority basis for promotion of education. Necessary infrastructure and the
appointment of teacher belonging to the community should be encouraged. If
no such teacher is available, others with a positive attitude and understanding
about tribal community should be employed in the area. Adult literacy
programmes should be promoted to bring the illiterate persons who have
dropped out or never enrolled for schooling.
• The schooling facility must be provided on demand of community and enough
community mentors must be mobilized to spontaneously come forward to run
and manage the school.
• The children should be provided text books in their own language in initial
stages of their schooling and gradually they should be exposed to standard
textbooks in state language at a later stage.
• The textbooks should have local specific contents, contexts and narration by
which the children can relate learning to their real life situation.
276
• The timing of the school should be as per the availability of children and
holiday calendar as per the holiday pattern of the locality.
• Moreover the education administrators should be more responsive and
responsible to the education of the children. Continuous monitoring of schools
(Academic and administrative) would definitely render insights to the
functional problems and its solution at the earliest.
• Special attention should be given on the completion of Residential Girl Model
School in Belghar Micro Projects, which should have been completed by this
time.
• Each Micro Project should have an Old Age Home (OAG) as the newly married
couples leave their parent. Thus old PTGs, who have cultivated and preserved
the rich tribal culture should be given due respect by the Society.
• With the growing participation of Households and women the project authority
should give emphasis on women entrepreneurship through a mechanism to
identify the suitable projects and budding entrepreneur keeping in view the
local resources. In order to boost the confidence of women folk it is
recommended to create awareness campaign through Government/ N.G.O
efforts. Women-related trades would require women's capacity building
through demonstration and training in each village. These women will gradually
develop their entrepreneurial skill, provided proper facilities are made
available.
• There should be special efforts for construction of a bridge in Kutia Kandha
Belghar Area over the Kanu River connecting the cut-off area with the Kutia
Kandha Development Agency.
• As electricity in the outreach habitations may not be feasible due to the
geographical obstacles, alternative energy (solar) should be exploited for
meeting local needs.
• To save the selected PTGs from the clutches of the money lenders and traders,
the establishment of grain banks and arrangement for micro credit should be
explored.
277
• Though the plantation of cashew nut has a major stake in the economy of
Lanjia Saora, yet the potentiality has not been utilized. It was reported by
some of the Lanjia Saora household that productivity has gone down due to
insect and pest attack. The Micro Project authority should take immediate
steps to sort and arrest this problem and give necessary support to the
households in this respect.
• Due to poor marketing knowledge and bargaining power of Kutia Kandha, they
are unable to get a remunerative price of the Siali leaves. On the other hand
Dongria Kandha are frequently cheated in selling of fruits and NTFPs when they
come down to the plain area. It is difficult for Dongria Kandha to take these
items back as a result they sell same at a lower price. The micro project should
address this issue of creating proper marketing arrangement, market
information systems, storage space and minimum processing facilities at the
local level. Simple processing activities such as broom making, leaf plate-
making, tamarind processing, mat and rope making should be encouraged in
the household/cottage sector.
• A revolving Fund should be created in every village with contributions made by
the individual households. It will only be possible by developing the saving
attitude of the household, which may also control the heavy expenditure on
social ceremony of the PTGs. The establishment of such a fund and entrusting
the day to day management of the fund to the villagers themselves will be of
utmost importance to free the selected exploited PTGs from various quarters
and to meet their needs in emergency.
• Training should be provided to the PTGs in different income generating
activities through setting up more training centers at micro project level,
keeping in view the availability of local raw materials as well as the
marketability of the expected produce.
• Land is the major physical resource available to PTG households. Most of the
available land is poor in quality, and there is not very much of it. Agricultural
intervention in the form of promoting locally relevant crops, drought resistant
crop mix along with the agro forestry should be encouraged. Similarly,
horticulture and Small irrigation schemes should be encouraged.
278
• Awareness among the PTGs about the various developmental programmes being
implemented for them should be encouraged.
279
REFERENCES
Bardhan A.B., 1973. “The Tribal Problem in India”, Communist Party of India Publications, New Delhi.
Bailey, F.G., 1960. “Tribe, Caste and Nation”, Oxford University Press, Bombay.
Behura, N.K and Panigrahi, N., 2006. “Tribals and the Indian Constitutions”, Rawat Publications, New Delhi.
Bakshi, S.R. and Kiran, Bala, 2000. “Social and Economic Development of Scheduled Tribes”, Deep and Deep Publication Pvt. Ltd, New Delhi.
Barman, Roy, 1971. “A Preliminary Appraisal of the Scheduled Tribes of India”, Registrar General of India, New Delhi.
Bggichi, T., 1994. “Profile of Some Indian Tribes”, Punti Pustak, Callcutta.
Bhange, N.P., 1993, “Tribal Commissions and Committees in India”, Himalaya Publishing House, Bombay.
Bhowmik, Sharit J. Kumar, 1988. “Development perspective of Tribals”, Economic and political Weekly, Vol. xxiii, No. 20, may 14.
Bose, Nirmal Kumar, 1964. “Change in Tribal Cultures Before and Fter Independence”, Man in India, Vol. xxxxiv, No. 10.
Bose, Pradip Kumar, 1981. “Stratification among Tribals in Gujurat”, Economic and Political Weekly, February 7.
Bose, Nirmal Kumar, 1997. “Some Indian Tribes”, National Book Trust, New Delhi.
Bose, Pradip Kumar, 1989. “The Political Economy of Development in India”, Oxford University Press.
Census of India, 2001, 1991, 1981, 1971 and 1961. Registrar General of Census, Government of India, New Delhi.
Chotopadhyaya, Kamala Devi, 1979. “Tribalism in India”, Vikas Publishing House, New Delhi.
Chattopadhyaya, K.P., 1949. “The Tribal problem and its solution”, Eastern Anthropology, Vol. viii, No. 1.
D.N. Majumdar, 1961. “Races and Cultures of India”, Asia Publishing House, Bombay.
Dalton. E. T., 1872. “Descriptive Ethnology of Bengal”, Government Printing Press, Calcutta.
Danda, A.K., 1991. “Tribal Economy in India”, Inter-India Publications: New Delhi.
Dash Sharma, P., 2006. “Anthropology of primitive tribes in India”, Serials publication, New Delhi.
Dutta, Tara, 2001. “Tribal Development in India”, Gyna Publishing House, Dew Delhi.
Danda, A.K., 1988. “Tribes in India”, man in India, Vol. iv.
Dixit, K.Nishi, 2006. “Tribals in India”, Vista international Publishing house, New Delhi.
Deoogankar, S.G., 1980. “Problems of Development of Tribal Areas”, Leeladevi Publications, New Delhi.
Deoogankar, S.G., 1992. “Tribal Development Plans, Implementation and Evaluation”, Concept Publishing Company.
Devendra, Thacker, 1986. “Socio-economic Development of Tribes in India”, Deep and Deep Publications, New Delhi.
Dubey, S.C., 1990. “Traditions and Development”, Vikas Publishing House, PVT. Ltd., New Delhi.
280
Dubey, S.C., 1960. “Approaches to the Tribal Problem in India”, (edited by L.P. Vidyarthi), Indian Anthropology in Action, Ranchi.
Elwin, Verrier, 1954. “Tribal Myths of Orissa”, Oxford University Press, Bombay.
Elwin, Verrier, 1960. “The Philosophy of NEFA”, The Advisor to the Government of Assam, Shillong.
Furer, Haimendorf, 1982. “Tribes of India”, Oxford University Press, Bombay.
Ghurye, G.S., 1963. “The Scheduled Tribes”, Popular Prakashan, Bombay.
Government of Orissa, 2004. “Orissa Human Development Report”, Planning and Coordination Department, Bhubaneswar, pp. 351.
Government of India, 2001. “Working group for Empowering Scheduled Tribes during the Tenth Five Year Plan”, Ministry of Tribal Affairs, New Delhi.
Government of India, 1983. “Task Force on Development of Tribal Areas”, New Delhi.
Government of Orissa, 2008. “Statistical Abstract of Orissa, Directorate of Economics and Statistics”, Orissa, Bhubaneswar.
Government of Orissa, 2005. District Statistical Hand Book, Rayagada, Directorate of Economics and Statistics”, Orissa, Bhubaneswar.
Government of Orissa, 2005. District Statistical Hand Book, Kandhamal, Directorate of Economics and Statistics”, Orissa, Bhubaneswar.
Government of Orissa, 2008. “Economic Survey of Orissa, Directorate of Economics and Statistics”, Orissa, Bhubaneswar.
Government of Orissa, 2004. “Orissa Human Development Report, Planning and Coordination Department”, Orissa, Bhubaneswar.
Hasnain, Nadeem, 1999. “Planned Development Among Tribals”, Rawat Publications, New Delhi.
Hasnain, Nadeem, 1996. “Tribal Development Schemes: An Evalluation”, Shakti Publishers, Udaipur.
Jena, M and P. Pati, 2006. “Forest Tribes of Orissa”, D. K. Print world (P) Ltd. New Delhi.
Jyoti Prakash Rout and Kalpana Patnaik, 2004. “Scheduled Areas of Orissa and Tribal”, presented in the workshop on Critical Issues and Tribal Development organized by SCSTRTI, Bhubaneswar.
Jena, Mihir Shri, Padmini Pathi, J. Dash, K.K. Patnaik and Klauss Sceland D.K., 2002. Print world, New Delhi.
Kamaluddin, M.S., 1978. “Transformation of Tribals”, Kurukshtra, Vol. xxvi, No. 15, May.
Kamala Sechadri, 1993. “Tribals and Forests”, Journal of Social Welfare, Centre Social Welfare Board, New Delhi, p. 14.
Kamaladevi, Chotopadhyaya, 1978. Tribalism in India Deep and Deep Publication, New Delhi, p. 1.
Kumar, S., 1978. “Report of the Commissioner for Scheduled Caste and Scheduled Tribes for 1977-78”, Government India Press, Delhi.
Kunhaman, M., 1989. “Development of Tribal Economy”, Classical Publishing Company, New Delhi.
Ministry of Tribal Affaires, 2008. “Annual Report 2007-08”, Government of Indian, New Delhi.
Mahapatra, L.K., 1956. “From Shifting Cultivators to Agriculturists-The Pauri Bhuiyan in Transition”, Adivasi.
Majumdar, D.N. and Madan, T.N., 1956. “An Introduction to Social Anthropology”, Asia Publishing House, Bombay.
Majumdar, D.N., 1937. “A Tribe in Transition: A Study of Cultural Pattern”, London.
Majumdar, D.N., 1937. “A Tribe in Transition: A study in Cultural Pattern”, Longmans Green and Company, London.
281
Majumdar, D.N., 1950. “Affairs of Tribe: A Study in Tribal Dynamics”, Universal Publishers, New Delhi.
Majumdar, D.N., 1961. “Races and Culture of India”, Asia Publishing House, Bombay.
Majumdar, D.N., 1963 (A). “Fortunes of Primitive Tribes”, The Universal Publishers, Ltd., Lucknow.
Mehta Prakash Chandra, 2000. “Tribal Development in 20th century”, Durga Taldar Shiva Publishers, Udaipur.
Mohanty, P.K., 2002. “Development of Primitive Tribal Groups in India”, Kalpaz Publications, Delhi.
Mishra, Himanshu Sekahr, 2006. “The Kandha of Orissa their Socio-Cultural life and Development”, SCSTRTI, Bhubaneswar.
Mohanty, B.B., 2006. “The Kandha of Orissa”, SCSTRTI, Bhubaneswar.
Mibang, Tamo and Behera, M.C., 2004. “Dynamics of Tribal Villages in Arunachal Pradesh: Emerging Realities”, Mittal publication, New Delhi.
Man Das Gupta, 1984. “Tribal unrest”, Economic and political Weekly, March 17.
N. Patnaik, 1989. “The Saora – Popular Series on Tribes – 4”, THRTI, Bhubaneswar.
Narayan, Sachindra, 2002. “The Dynamics of Tribal Development: Issues and Challenges”, Gyan Publication, New Delhi.
Ota, A.B. and S. C. Mohanty, 2007. “Lanjia Saora – Photo Handbook of PTG, Series – I”, SCSTRTI, Bhubaneswar.
Ota, A.B., and S. C. Mohanty, 2008. “Dongria Kandha”, SCSTRTI, Bhubaneswar.
Patnaik, N., 2005. “Primitive Tribes of Orissa and their development strategies”, D.K. Printworld (P) Ltd., New Delhi.
Panigrahi, N., 2005. “Development of Eco-tourism in Tribal regions of Orissa: Potential and recommendations”, Research Paper No. 11, Centre for East-West Cultural and Economic Studies, Bond University (Australia).
Prakash, Chandra Mehta, 2000. “Tribal Development in 20th Century”, Shiva Publishers and Distributors, Udaipur.
Pati, R.N. and Jagannath Dash, 2002. “Tribal and Indigenous people of India: problems and prospects”, APH publishing corporation, New Delhi.
Pati, R.N. and Dash, J., 2002. “Tribal and Indigenous People of India: Problems and Prospects”, New Delhi, APH.
Prasad, R.R., 1988. “Tribal Development in India, Strategies and Programmes”, Journal of Rural Development, Vol. vii, No. 1, January.
Remamani, V.S., 1988. “Tribal Economy Problems and Prospects”, Chough Publications, Allahabad.
Roy Burman, B.K., 1960. “Basic Concept of Tribal Welfare and Integration”, (edited by L.P. Vidyarthi), Indian Anthropology in Action, Ranchi University Press, Ranchi.
Roy Burman, B.K., 1997. “Tribal and Indigenous people: A Global Overview”, The Eastern Anthropologist, Vol. 50, No. 1, pp17-26.
Roy Burman, B.K., 1969. “Some dimensions of Transformation of Tribal Society in India”, Journal of Social Research, Vol. xi, NO. 1.
Sahay, Shushma Prasad, 1988. “Tribal Women Labours: Aspects of Economic and Physical Exploitation”, Gyan Publishing House, New Delhi.
Sahu, Chaturbhuj, 2006. “Aspects of Tribal Studies” Sarup and Sons publication, New Delhi.
Saxena, N.C., 1995. “Forests, People and Profit: New Equations for Sustainability”, Natraj Publishers, Dehradun
Sharma, B.D., 1975. “Tribal Development- A Brief Review”, Tribal Research and Development Institute, Bhopal.
282
Singh, K.S., 1994. “The Scheduled Tribes”, Vol. III. Oxford University Press, Delhi.
Singh, K., 1982. “Economics of Tribes and their Transformation”, Concept Publishing House, New Delhi.
Singh, Suresh, 1981. “Tribal Situation in India”, Biblio impex Publishers, New Delhi.
Tripathy, S.N., 1999. “Tribals in Transition”, Discovery Publishing House, New Delhi.
Vidyarthi, L.P., 1981. “Tribal Development and its Administration”, Concept Publishing Company, New Delhi.
Vidyarthi, L.P. and Rai, B.K., 2000. “The Tribal Culture of India”, Concept Publishing Company, New Delhi.
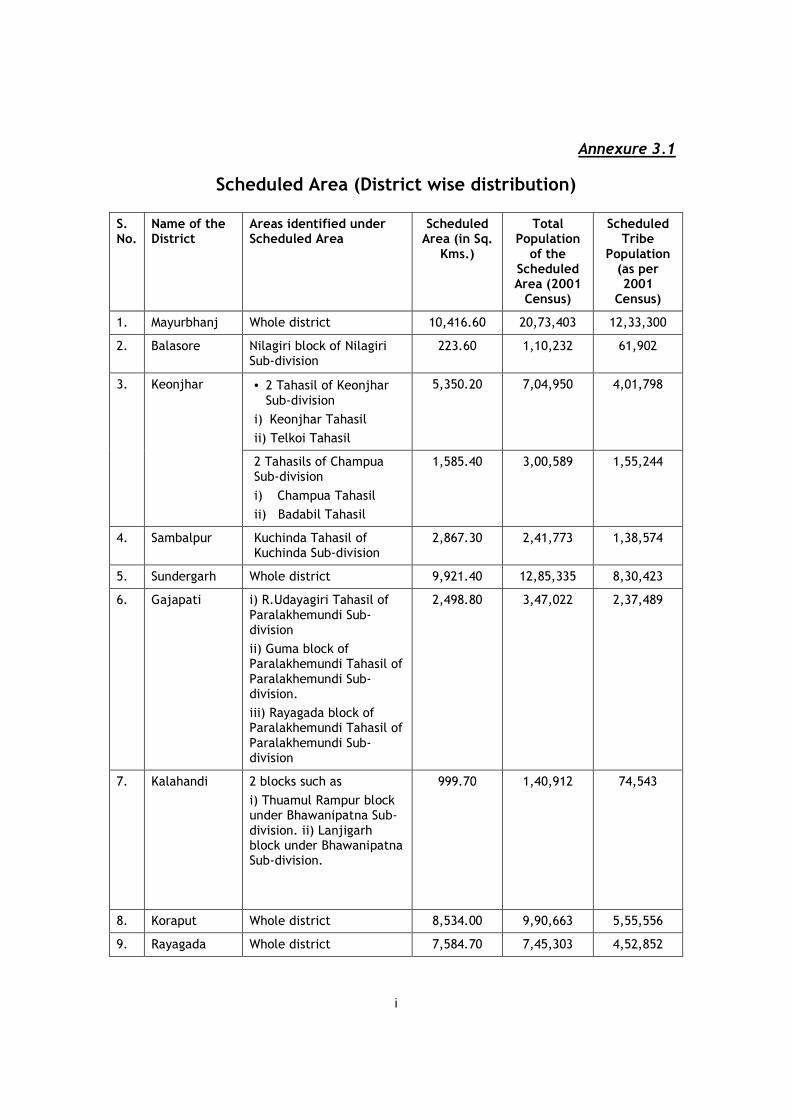
i
Annexure 3.1
Scheduled Area (District wise distribution)
S. No.
Name of the District
Areas identified under Scheduled Area
Scheduled Area (in Sq.
Kms.)
Total Population of the
Scheduled Area (2001 Census)
Scheduled Tribe
Population (as per 2001
Census)
1. Mayurbhanj Whole district 10,416.60 20,73,403 12,33,300
2. Balasore Nilagiri block of Nilagiri Sub-division
223.60 1,10,232 61,902
• 2 Tahasil of Keonjhar Sub-division
i) Keonjhar Tahasil
ii) Telkoi Tahasil
5,350.20 7,04,950 4,01,798 3. Keonjhar
2 Tahasils of Champua Sub-division
i) Champua Tahasil
ii) Badabil Tahasil
1,585.40 3,00,589 1,55,244
4. Sambalpur Kuchinda Tahasil of Kuchinda Sub-division
2,867.30 2,41,773 1,38,574
5. Sundergarh Whole district 9,921.40 12,85,335 8,30,423
6. Gajapati i) R.Udayagiri Tahasil of Paralakhemundi Sub-division
ii) Guma block of Paralakhemundi Tahasil of Paralakhemundi Sub-division.
iii) Rayagada block of Paralakhemundi Tahasil of Paralakhemundi Sub-division
2,498.80 3,47,022 2,37,489
7. Kalahandi 2 blocks such as
i) Thuamul Rampur block under Bhawanipatna Sub-division. ii) Lanjigarh block under Bhawanipatna Sub-division.
999.70 1,40,912 74,543
8. Koraput Whole district 8,534.00 9,90,663 5,55,556
9. Rayagada Whole district 7,584.70 7,45,303 4,52,852
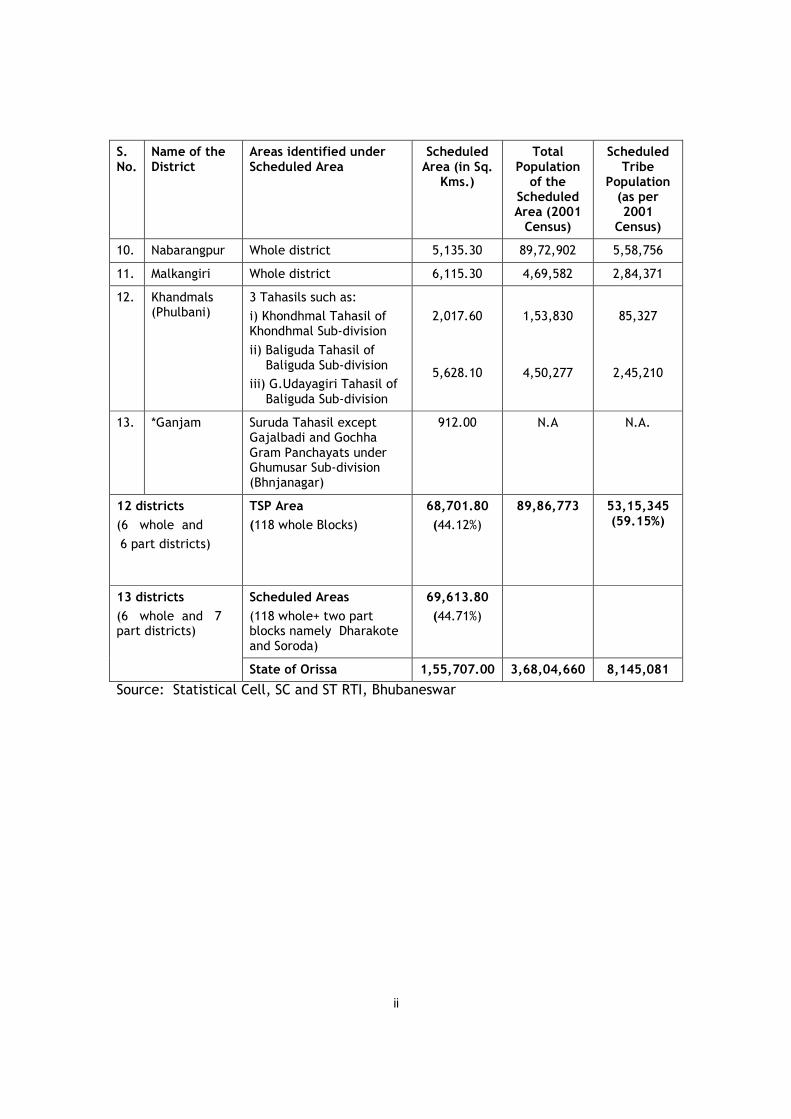
ii
S. No.
Name of the District
Areas identified under Scheduled Area
Scheduled Area (in Sq.
Kms.)
Total Population of the
Scheduled Area (2001 Census)
Scheduled Tribe
Population (as per 2001
Census)
10. Nabarangpur Whole district 5,135.30 89,72,902 5,58,756
11. Malkangiri Whole district 6,115.30 4,69,582 2,84,371
12. Khandmals (Phulbani)
3 Tahasils such as:
i) Khondhmal Tahasil of Khondhmal Sub-division
ii) Baliguda Tahasil of Baliguda Sub-division
iii) G.Udayagiri Tahasil of Baliguda Sub-division
2,017.60
5,628.10
1,53,830
4,50,277
85,327
2,45,210
13. *Ganjam Suruda Tahasil except Gajalbadi and Gochha Gram Panchayats under Ghumusar Sub-division (Bhnjanagar)
912.00 N.A N.A.
12 districts
(6 whole and
6 part districts)
TSP Area
(118 whole Blocks)
68,701.80
(44.12%)
89,86,773
53,15,345 (59.15%)
Scheduled Areas
(118 whole+ two part blocks namely Dharakote and Soroda)
69,613.80
(44.71%)
13 districts
(6 whole and 7 part districts)
State of Orissa 1,55,707.00 3,68,04,660 8,145,081
Source: Statistical Cell, SC and ST RTI, Bhubaneswar
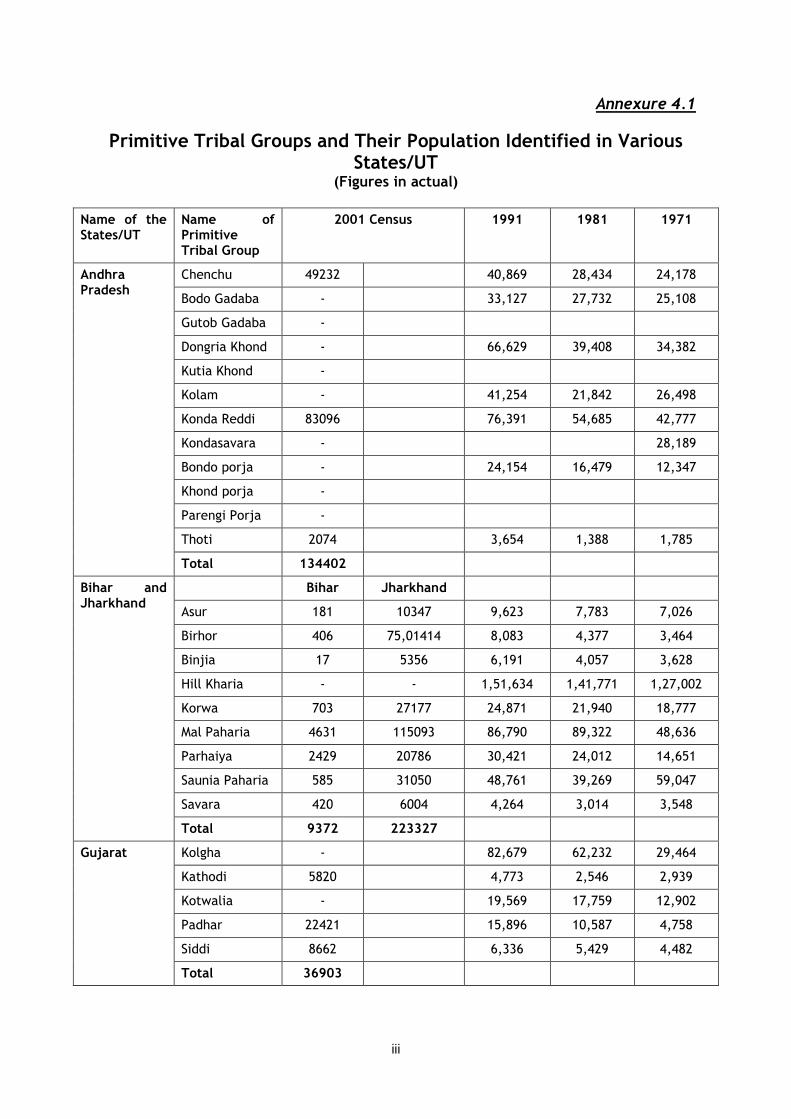
iii
Annexure 4.1
Primitive Tribal Groups and Their Population Identified in Various States/UT
(Figures in actual)
Name of the States/UT
Name of Primitive Tribal Group
2001 Census 1991 1981 1971
Chenchu 49232 40,869 28,434 24,178
Bodo Gadaba - 33,127 27,732 25,108
Gutob Gadaba -
Dongria Khond - 66,629 39,408 34,382
Kutia Khond -
Kolam - 41,254 21,842 26,498
Konda Reddi 83096 76,391 54,685 42,777
Kondasavara - 28,189
Bondo porja - 24,154 16,479 12,347
Khond porja -
Parengi Porja -
Thoti 2074 3,654 1,388 1,785
Andhra Pradesh
Total 134402
Bihar Jharkhand
Asur 181 10347 9,623 7,783 7,026
Birhor 406 75,01414 8,083 4,377 3,464
Binjia 17 5356 6,191 4,057 3,628
Hill Kharia - - 1,51,634 1,41,771 1,27,002
Korwa 703 27177 24,871 21,940 18,777
Mal Paharia 4631 115093 86,790 89,322 48,636
Parhaiya 2429 20786 30,421 24,012 14,651
Saunia Paharia 585 31050 48,761 39,269 59,047
Savara 420 6004 4,264 3,014 3,548
Bihar and Jharkhand
Total 9372 223327
Kolgha - 82,679 62,232 29,464
Kathodi 5820 4,773 2,546 2,939
Kotwalia - 19,569 17,759 12,902
Padhar 22421 15,896 10,587 4,758
Siddi 8662 6,336 5,429 4,482
Gujarat
Total 36903
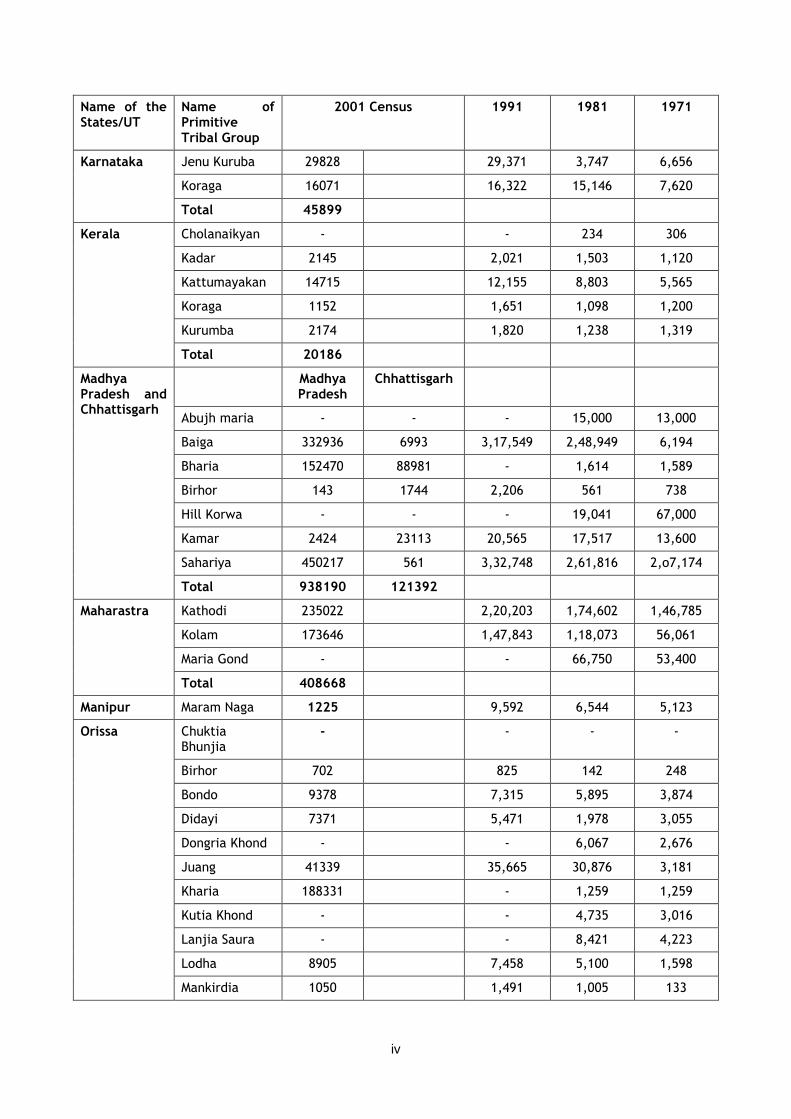
iv
Name of the States/UT
Name of Primitive Tribal Group
2001 Census 1991 1981 1971
Jenu Kuruba 29828 29,371 3,747 6,656
Koraga 16071 16,322 15,146 7,620
Karnataka
Total 45899
Cholanaikyan - - 234 306
Kadar 2145 2,021 1,503 1,120
Kattumayakan 14715 12,155 8,803 5,565
Koraga 1152 1,651 1,098 1,200
Kurumba 2174 1,820 1,238 1,319
Kerala
Total 20186
Madhya Pradesh
Chhattisgarh
Abujh maria - - - 15,000 13,000
Baiga 332936 6993 3,17,549 2,48,949 6,194
Bharia 152470 88981 - 1,614 1,589
Birhor 143 1744 2,206 561 738
Hill Korwa - - - 19,041 67,000
Kamar 2424 23113 20,565 17,517 13,600
Sahariya 450217 561 3,32,748 2,61,816 2,o7,174
Madhya Pradesh and Chhattisgarh
Total 938190 121392
Kathodi 235022 2,20,203 1,74,602 1,46,785
Kolam 173646 1,47,843 1,18,073 56,061
Maria Gond - - 66,750 53,400
Maharastra
Total 408668
Manipur Maram Naga 1225 9,592 6,544 5,123
Chuktia Bhunjia
- - - -
Birhor 702 825 142 248
Bondo 9378 7,315 5,895 3,874
Didayi 7371 5,471 1,978 3,055
Dongria Khond - - 6,067 2,676
Juang 41339 35,665 30,876 3,181
Kharia 188331 - 1,259 1,259
Kutia Khond - - 4,735 3,016
Lanjia Saura - - 8,421 4,223
Lodha 8905 7,458 5,100 1,598
Orissa
Mankirdia 1050 1,491 1,005 133
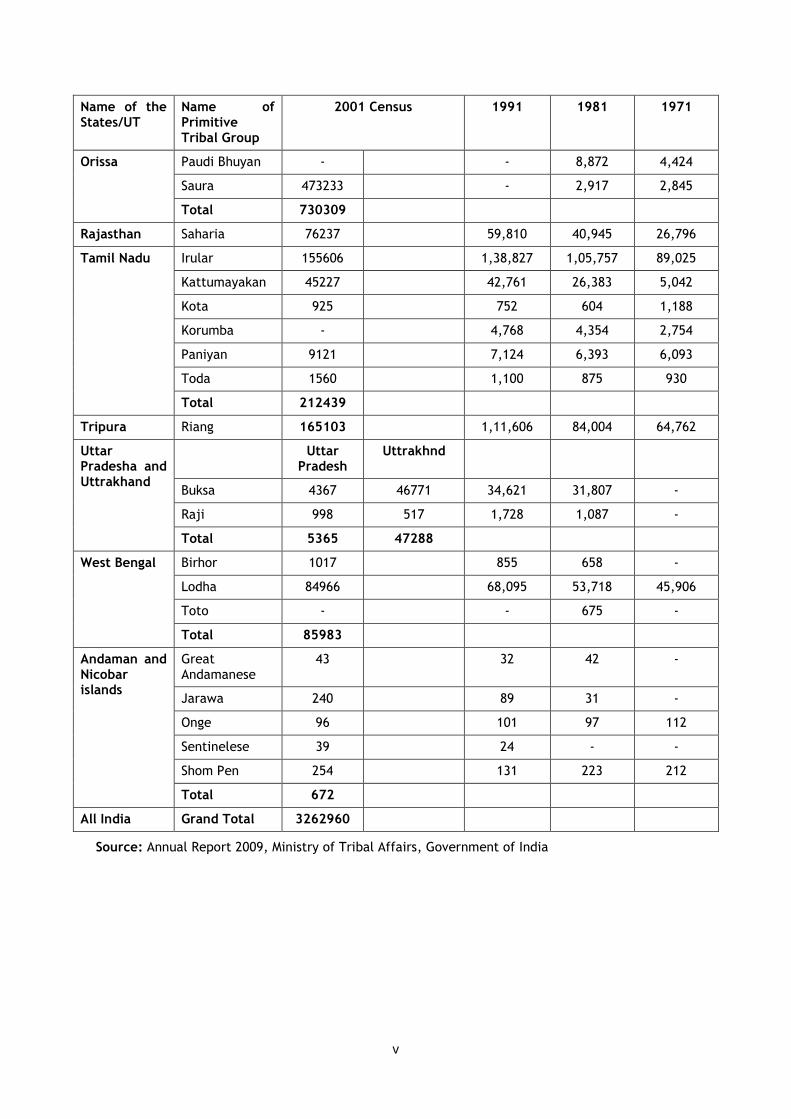
v
Name of the States/UT
Name of Primitive Tribal Group
2001 Census 1991 1981 1971
Paudi Bhuyan - - 8,872 4,424
Saura 473233 - 2,917 2,845
Orissa
Total 730309
Rajasthan Saharia 76237 59,810 40,945 26,796
Irular 155606 1,38,827 1,05,757 89,025
Kattumayakan 45227 42,761 26,383 5,042
Kota 925 752 604 1,188
Korumba - 4,768 4,354 2,754
Paniyan 9121 7,124 6,393 6,093
Toda 1560 1,100 875 930
Tamil Nadu
Total 212439
Tripura Riang 165103 1,11,606 84,004 64,762
Uttar Pradesh
Uttrakhnd
Buksa 4367 46771 34,621 31,807 -
Raji 998 517 1,728 1,087 -
Uttar Pradesha and Uttrakhand
Total 5365 47288
Birhor 1017 855 658 -
Lodha 84966 68,095 53,718 45,906
Toto - - 675 -
West Bengal
Total 85983
Great Andamanese
43 32 42 -
Jarawa 240 89 31 -
Onge 96 101 97 112
Sentinelese 39 24 - -
Shom Pen 254 131 223 212
Andaman and Nicobar islands
Total 672
All India Grand Total 3262960
Source: Annual Report 2009, Ministry of Tribal Affairs, Government of India
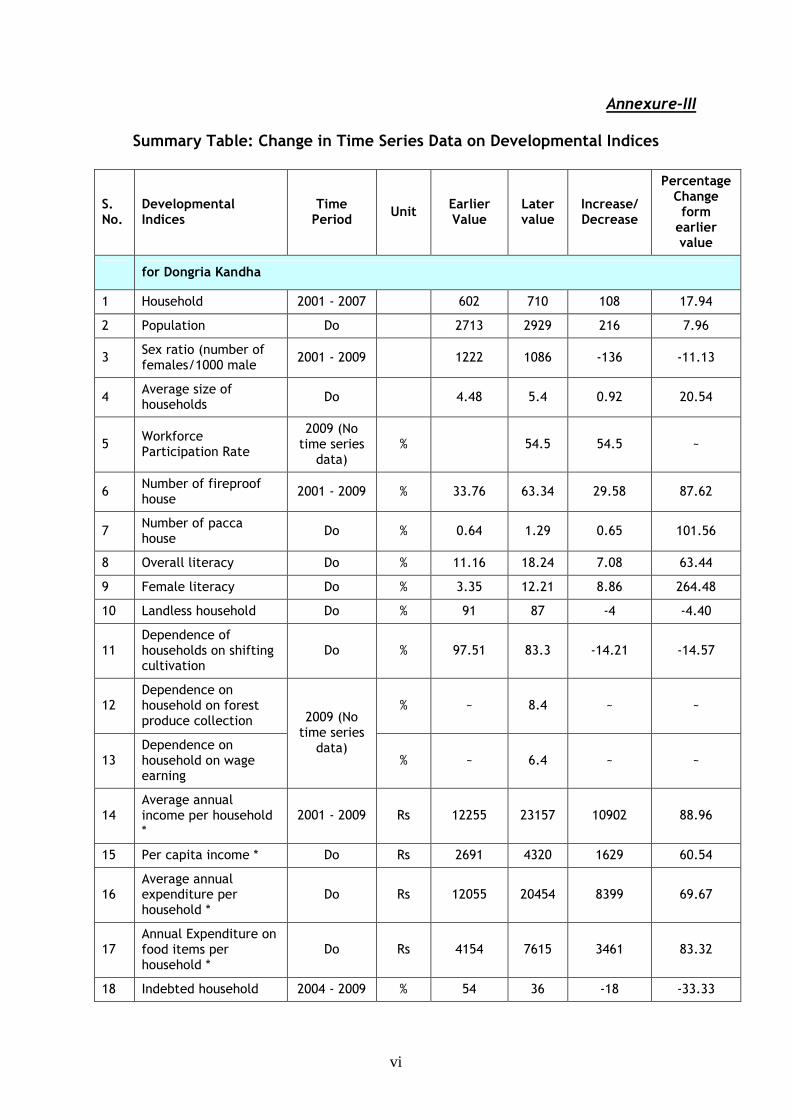
vi
Annexure-III
Summary Table: Change in Time Series Data on Developmental Indices
S. No.
Developmental Indices
Time Period
Unit Earlier Value
Later value
Increase/ Decrease
Percentage Change form earlier value
for Dongria Kandha
1 Household 2001 - 2007 602 710 108 17.94
2 Population Do 2713 2929 216 7.96
3 Sex ratio (number of females/1000 male
2001 - 2009 1222 1086 -136 -11.13
4 Average size of households
Do 4.48 5.4 0.92 20.54
5 Workforce Participation Rate
2009 (No time series data)
% 54.5 54.5 ~
6 Number of fireproof house
2001 - 2009 % 33.76 63.34 29.58 87.62
7 Number of pacca house
Do % 0.64 1.29 0.65 101.56
8 Overall literacy Do % 11.16 18.24 7.08 63.44
9 Female literacy Do % 3.35 12.21 8.86 264.48
10 Landless household Do % 91 87 -4 -4.40
11 Dependence of households on shifting cultivation
Do % 97.51 83.3 -14.21 -14.57
12 Dependence on household on forest produce collection
% ~ 8.4 ~ ~
13 Dependence on household on wage earning
2009 (No time series data)
% ~ 6.4 ~ ~
14 Average annual income per household *
2001 - 2009 Rs 12255 23157 10902 88.96
15 Per capita income * Do Rs 2691 4320 1629 60.54
16 Average annual expenditure per household *
Do Rs 12055 20454 8399 69.67
17 Annual Expenditure on food items per household *
Do Rs 4154 7615 3461 83.32
18 Indebted household 2004 - 2009 % 54 36 -18 -33.33
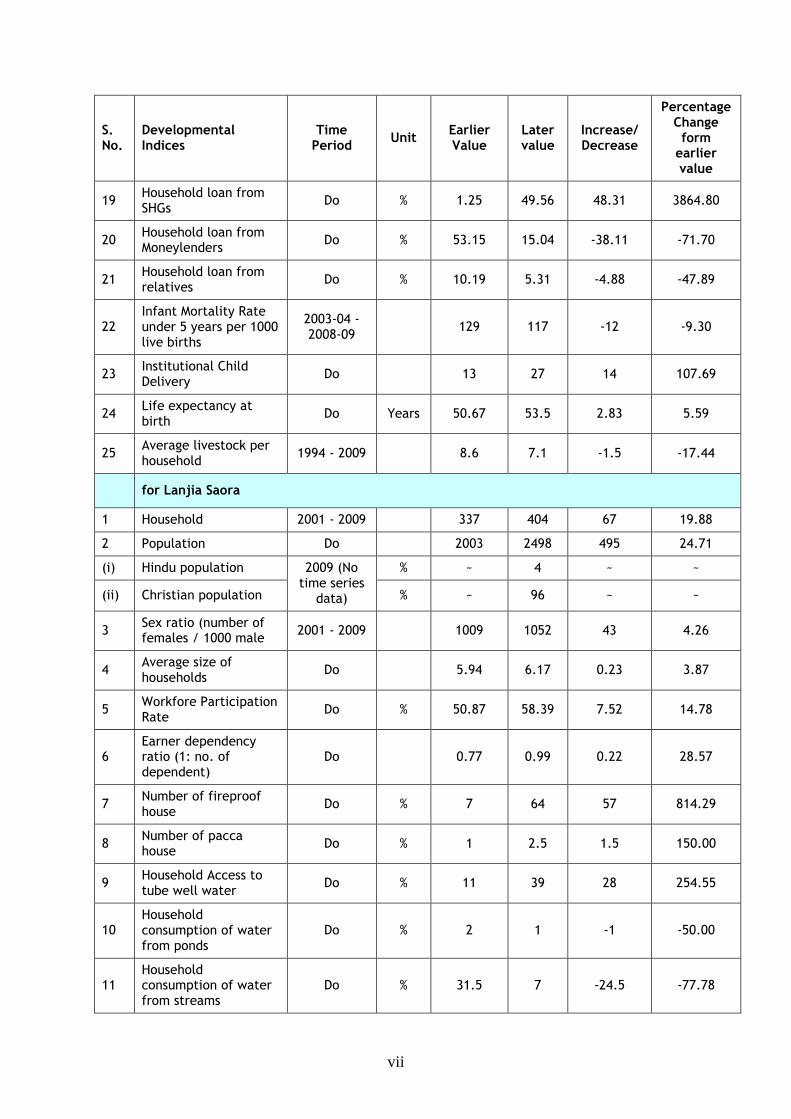
vii
S. No.
Developmental Indices
Time Period
Unit Earlier Value
Later value
Increase/ Decrease
Percentage Change form earlier value
19 Household loan from SHGs
Do % 1.25 49.56 48.31 3864.80
20 Household loan from Moneylenders
Do % 53.15 15.04 -38.11 -71.70
21 Household loan from relatives
Do % 10.19 5.31 -4.88 -47.89
22 Infant Mortality Rate under 5 years per 1000 live births
2003-04 - 2008-09
129 117 -12 -9.30
23 Institutional Child Delivery
Do 13 27 14 107.69
24 Life expectancy at birth
Do Years 50.67 53.5 2.83 5.59
25 Average livestock per household
1994 - 2009 8.6 7.1 -1.5 -17.44
for Lanjia Saora
1 Household 2001 - 2009 337 404 67 19.88
2 Population Do 2003 2498 495 24.71
(i) Hindu population % ~ 4 ~ ~
(ii) Christian population
2009 (No time series data) % ~ 96 ~ ~
3 Sex ratio (number of females / 1000 male
2001 - 2009 1009 1052 43 4.26
4 Average size of households
Do 5.94 6.17 0.23 3.87
5 Workfore Participation Rate
Do % 50.87 58.39 7.52 14.78
6 Earner dependency ratio (1: no. of dependent)
Do 0.77 0.99 0.22 28.57
7 Number of fireproof house
Do % 7 64 57 814.29
8 Number of pacca house
Do % 1 2.5 1.5 150.00
9 Household Access to tube well water
Do % 11 39 28 254.55
10 Household consumption of water from ponds
Do % 2 1 -1 -50.00
11 Household consumption of water from streams
Do % 31.5 7 -24.5 -77.78
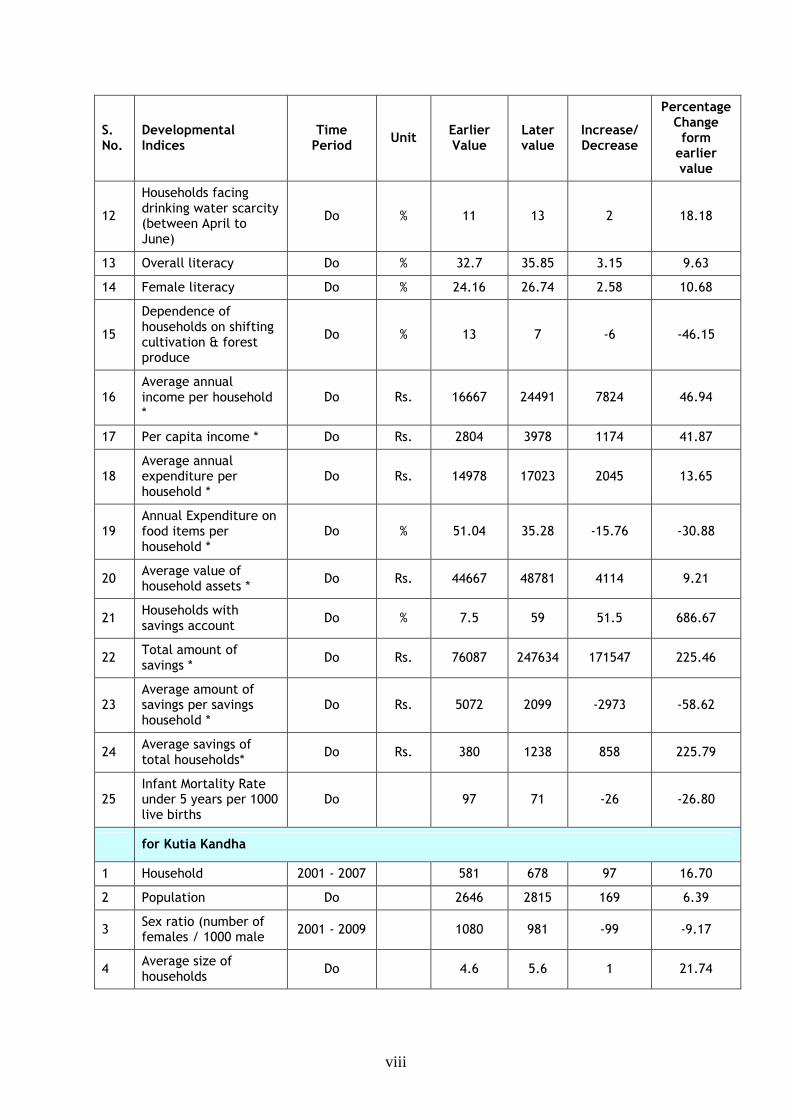
viii
S. No.
Developmental Indices
Time Period
Unit Earlier Value
Later value
Increase/ Decrease
Percentage Change form earlier value
12
Households facing drinking water scarcity (between April to June)
Do % 11 13 2 18.18
13 Overall literacy Do % 32.7 35.85 3.15 9.63
14 Female literacy Do % 24.16 26.74 2.58 10.68
15
Dependence of households on shifting cultivation & forest produce
Do % 13 7 -6 -46.15
16 Average annual income per household *
Do Rs. 16667 24491 7824 46.94
17 Per capita income * Do Rs. 2804 3978 1174 41.87
18 Average annual expenditure per household *
Do Rs. 14978 17023 2045 13.65
19 Annual Expenditure on food items per household *
Do % 51.04 35.28 -15.76 -30.88
20 Average value of household assets *
Do Rs. 44667 48781 4114 9.21
21 Households with savings account
Do % 7.5 59 51.5 686.67
22 Total amount of savings *
Do Rs. 76087 247634 171547 225.46
23 Average amount of savings per savings household *
Do Rs. 5072 2099 -2973 -58.62
24 Average savings of total households*
Do Rs. 380 1238 858 225.79
25 Infant Mortality Rate under 5 years per 1000 live births
Do 97 71 -26 -26.80
for Kutia Kandha
1 Household 2001 - 2007 581 678 97 16.70
2 Population Do 2646 2815 169 6.39
3 Sex ratio (number of females / 1000 male
2001 - 2009 1080 981 -99 -9.17
4 Average size of households
Do 4.6 5.6 1 21.74
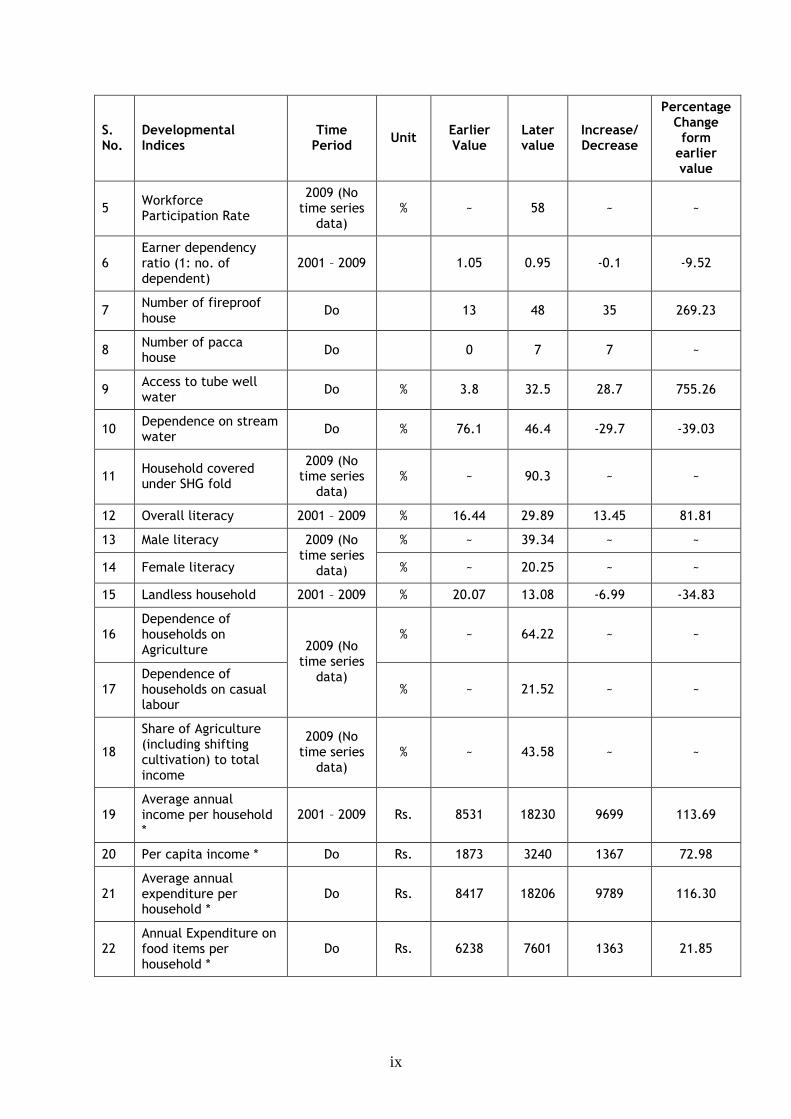
ix
S. No.
Developmental Indices
Time Period
Unit Earlier Value
Later value
Increase/ Decrease
Percentage Change form earlier value
5 Workforce Participation Rate
2009 (No time series data)
% ~ 58 ~ ~
6 Earner dependency ratio (1: no. of dependent)
2001 – 2009 1.05 0.95 -0.1 -9.52
7 Number of fireproof house
Do 13 48 35 269.23
8 Number of pacca house
Do 0 7 7 ~
9 Access to tube well water
Do % 3.8 32.5 28.7 755.26
10 Dependence on stream water
Do % 76.1 46.4 -29.7 -39.03
11 Household covered under SHG fold
2009 (No time series data)
% ~ 90.3 ~ ~
12 Overall literacy 2001 – 2009 % 16.44 29.89 13.45 81.81
13 Male literacy % ~ 39.34 ~ ~
14 Female literacy
2009 (No time series data) % ~ 20.25 ~ ~
15 Landless household 2001 – 2009 % 20.07 13.08 -6.99 -34.83
16 Dependence of households on Agriculture
% ~ 64.22 ~ ~
17 Dependence of households on casual labour
2009 (No time series data)
% ~ 21.52 ~ ~
18
Share of Agriculture (including shifting cultivation) to total income
2009 (No time series data)
% ~ 43.58 ~ ~
19 Average annual income per household *
2001 – 2009 Rs. 8531 18230 9699 113.69
20 Per capita income * Do Rs. 1873 3240 1367 72.98
21 Average annual expenditure per household *
Do Rs. 8417 18206 9789 116.30
22 Annual Expenditure on food items per household *
Do Rs. 6238 7601 1363 21.85
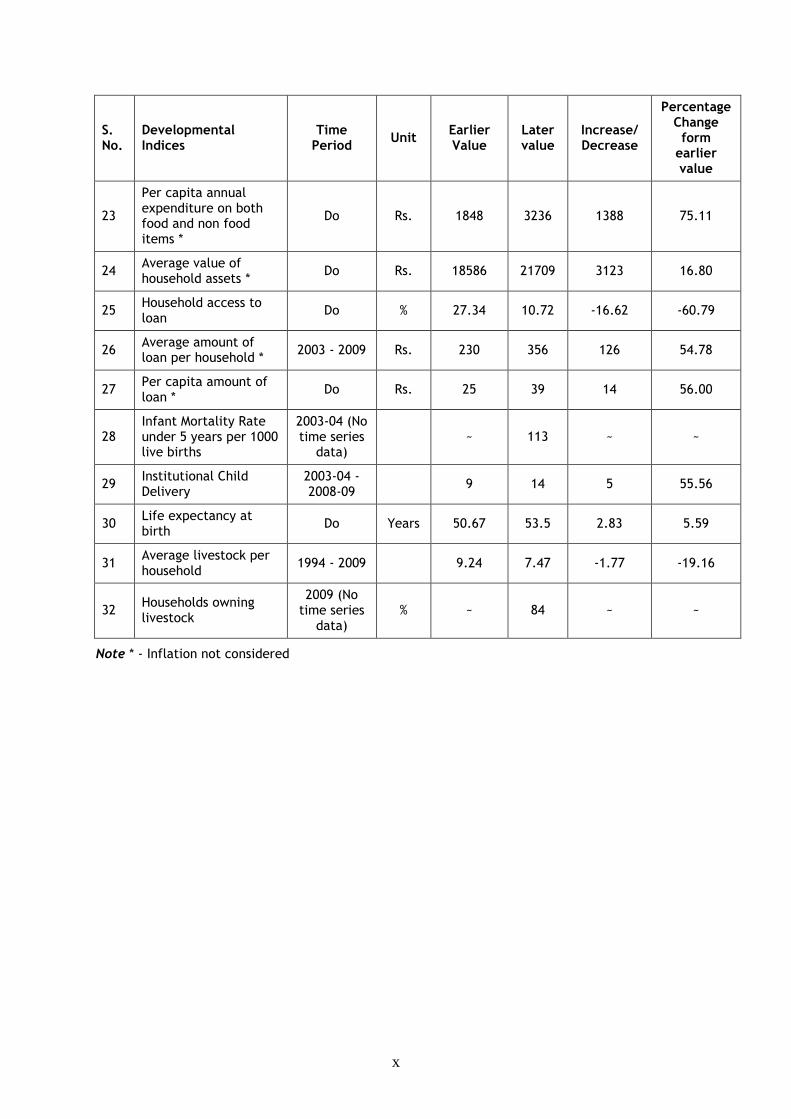
x
S. No.
Developmental Indices
Time Period
Unit Earlier Value
Later value
Increase/ Decrease
Percentage Change form earlier value
23
Per capita annual expenditure on both food and non food items *
Do Rs. 1848 3236 1388 75.11
24 Average value of household assets *
Do Rs. 18586 21709 3123 16.80
25 Household access to loan
Do % 27.34 10.72 -16.62 -60.79
26 Average amount of loan per household *
2003 - 2009 Rs. 230 356 126 54.78
27 Per capita amount of loan *
Do Rs. 25 39 14 56.00
28 Infant Mortality Rate under 5 years per 1000 live births
2003-04 (No time series data)
~ 113 ~ ~
29 Institutional Child Delivery
2003-04 - 2008-09
9 14 5 55.56
30 Life expectancy at birth
Do Years 50.67 53.5 2.83 5.59
31 Average livestock per household
1994 - 2009 9.24 7.47 -1.77 -19.16
32 Households owning livestock
2009 (No time series data)
% ~ 84 ~ ~
Note * - Inflation not considered
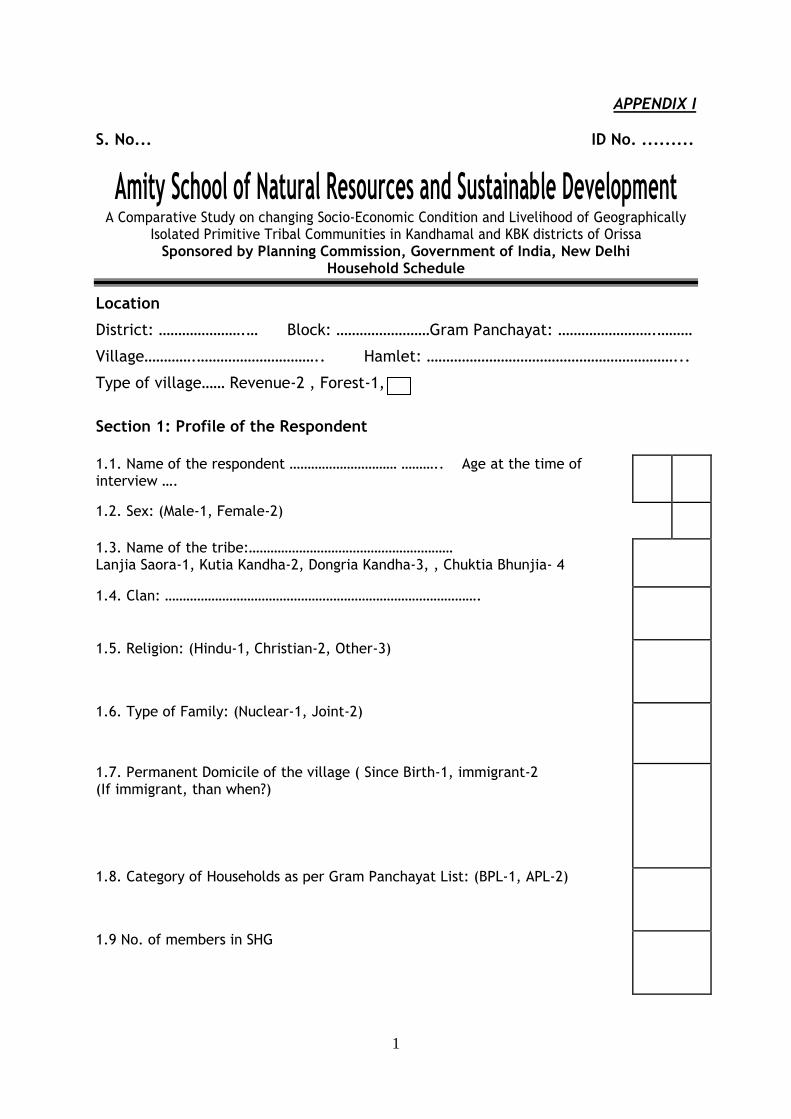
1
APPENDIX I
S. No... ID No. .........
Amity School of Natural Resources and Sustainable Development A Comparative Study on changing Socio-Economic Condition and Livelihood of Geographically
Isolated Primitive Tribal Communities in Kandhamal and KBK districts of Orissa Sponsored by Planning Commission, Government of India, New Delhi
Household Schedule
Location
District: ………………….… Block: ……………………Gram Panchayat: …………………….………
Village………….………………………….. Hamlet: ………………………………………………………...
Type of village…… Revenue-2 , Forest-1,
Section 1: Profile of the Respondent 1.1. Name of the respondent ………………………… ……….. Age at the time of interview ….
1.2. Sex: (Male-1, Female-2)
1.3. Name of the tribe:………………………………………………… Lanjia Saora-1, Kutia Kandha-2, Dongria Kandha-3, , Chuktia Bhunjia- 4
1.4. Clan: …………………………………………………………………………….
1.5. Religion: (Hindu-1, Christian-2, Other-3)
1.6. Type of Family: (Nuclear-1, Joint-2)
1.7. Permanent Domicile of the village ( Since Birth-1, immigrant-2 (If immigrant, than when?)
1.8. Category of Households as per Gram Panchayat List: (BPL-1, APL-2)
1.9 No. of members in SHG
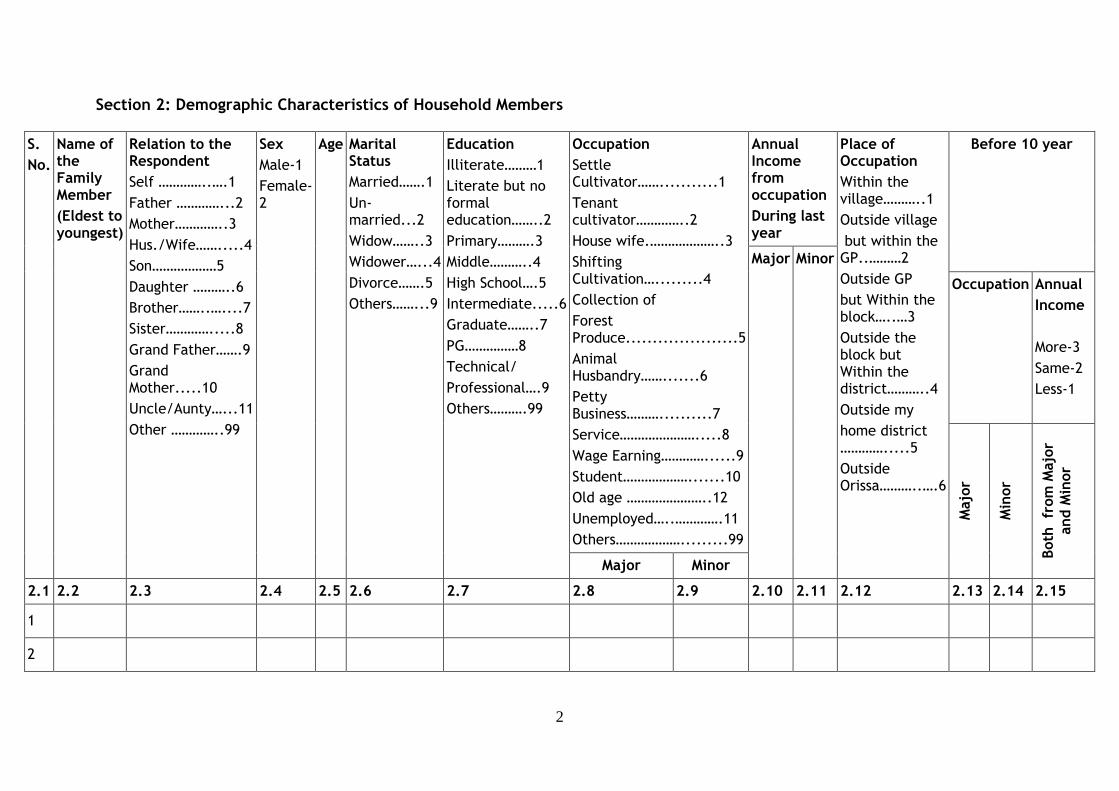
2
Section 2: Demographic Characteristics of Household Members
Annual Income from occupation
During last year
Before 10 year
Occupation Annual
Income
More-3
Same-2
Less-1
Occupation
Settle Cultivator……...........1
Tenant cultivator…………..2
House wife.………………..3
Shifting Cultivation….........4
Collection of
Forest Produce.....................5
Animal Husbandry…….......6
Petty Business………..........7
Service………………….....8
Wage Earning…………......9
Student……………….......10
Old age …………………..12
Unemployed…..………….11
Others……………….........99
S.
No.
Name of the Family Member
(Eldest to youngest)
Relation to the Respondent
Self …………..….1
Father …………...2
Mother…………..3
Hus./Wife…….....4
Son………………5
Daughter ………..6
Brother……..…....7
Sister………….....8
Grand Father…….9
Grand Mother.....10
Uncle/Aunty…...11
Other …………..99
Sex
Male-1
Female-2
Age Marital Status
Married…….1
Un-married...2
Widow……..3
Widower…...4
Divorce…….5
Others……...9
Education
Illiterate………1
Literate but no formal education……..2
Primary……….3
Middle………..4
High School….5
Intermediate.....6
Graduate……..7
PG……………8
Technical/
Professional….9
Others……….99
Major Minor
Major Minor
Place of Occupation
Within the village………..1
Outside village
but within the GP..………2
Outside GP
but Within the block…..…3
Outside the block but Within the district………..4
Outside my
home district ………….....5
Outside Orissa………..….6
Major
Minor
Both from Major
and Minor
2.1 2.2 2.3 2.4 2.5 2.6 2.7 2.8 2.9 2.10 2.11 2.12 2.13 2.14 2.15
1
2
3
3
4
5
6
7
8
9
10
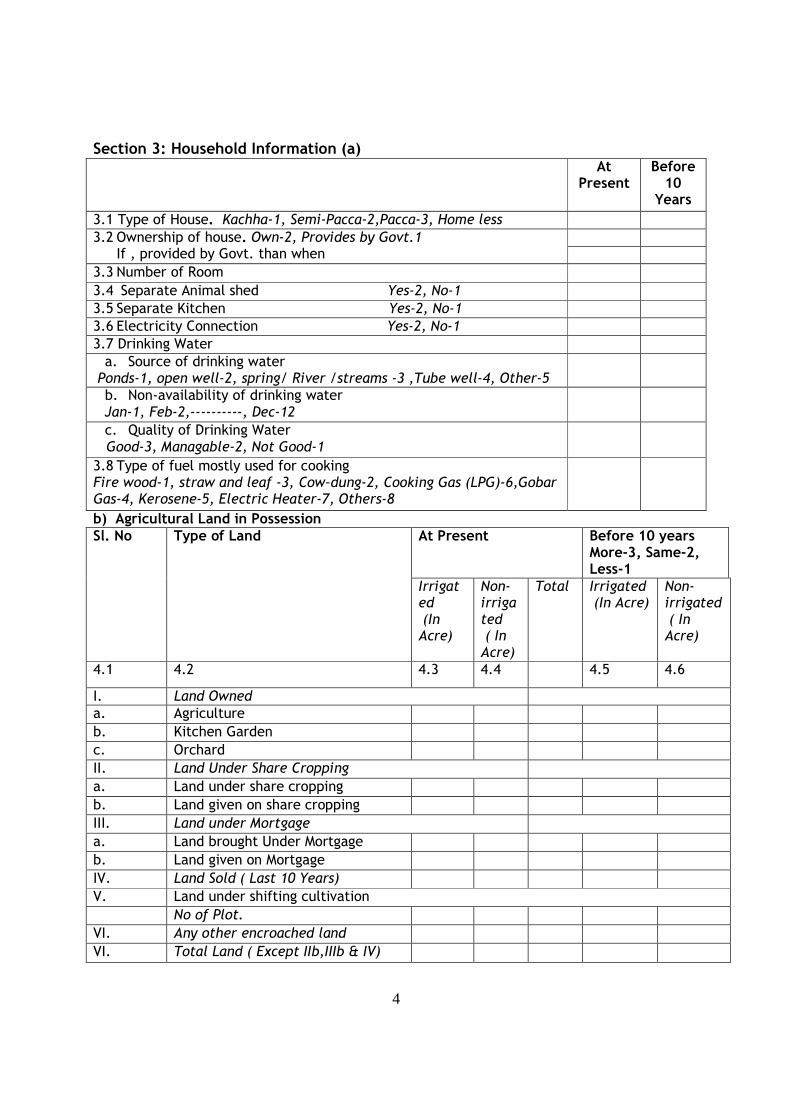
4
Section 3: Household Information (a) At
Present Before 10
Years
3.1 Type of House. Kachha-1, Semi-Pacca-2,Pacca-3, Home less
3.2 Ownership of house. Own-2, Provides by Govt.1 If , provided by Govt. than when
3.3 Number of Room
3.4 Separate Animal shed Yes-2, No-1
3.5 Separate Kitchen Yes-2, No-1
3.6 Electricity Connection Yes-2, No-1
3.7 Drinking Water
a. Source of drinking water Ponds-1, open well-2, spring/ River /streams -3 ,Tube well-4, Other-5
b. Non-availability of drinking water Jan-1, Feb-2,----------, Dec-12
c. Quality of Drinking Water Good-3, Managable-2, Not Good-1
3.8 Type of fuel mostly used for cooking Fire wood-1, straw and leaf -3, Cow–dung-2, Cooking Gas (LPG)-6,Gobar Gas-4, Kerosene-5, Electric Heater-7, Others-8
b) Agricultural Land in Possession At Present Before 10 years
More-3, Same-2, Less-1
Sl. No Type of Land
Irrigated (In Acre)
Non-irrigated ( In Acre)
Total Irrigated (In Acre)
Non-irrigated ( In Acre)
4.1 4.2 4.3 4.4 4.5 4.6
I. Land Owned
a. Agriculture
b. Kitchen Garden
c. Orchard
II. Land Under Share Cropping
a. Land under share cropping
b. Land given on share cropping
III. Land under Mortgage
a. Land brought Under Mortgage
b. Land given on Mortgage
IV. Land Sold ( Last 10 Years)
V. Land under shifting cultivation
No of Plot.
VI. Any other encroached land
VI. Total Land ( Except IIb,IIIb & IV)
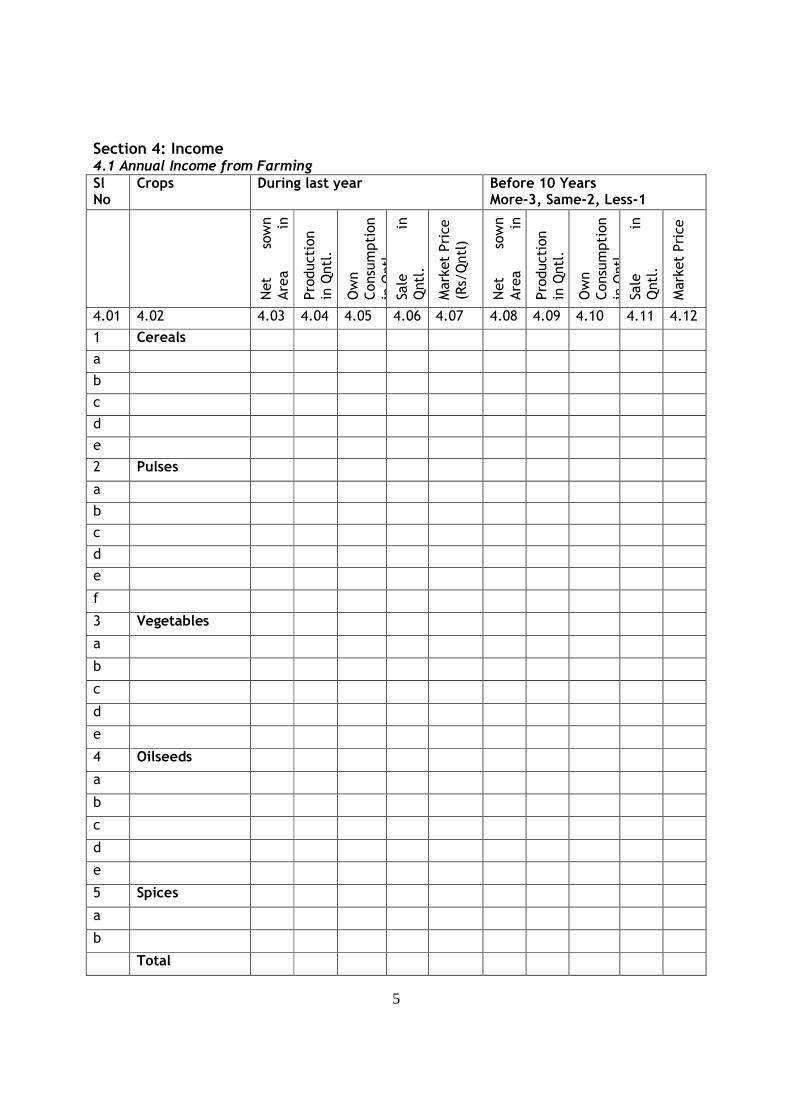
5
Section 4: Income 4.1 Annual Income from Farming Sl No
Crops During last year Before 10 Years More-3, Same-2, Less-1
Net
sown
Area
in
Acre
Production
in Qntl.
Own
Consumption
in Qntl.
Sale
in
Qntl.
Market Price
(Rs/Qntl)
Net
sown
Area
in
Acre
Production
in Qntl.
Own
Consumption
in Qntl.
Sale
in
Qntl.
Market Price
4.01 4.02 4.03 4.04 4.05 4.06 4.07 4.08 4.09 4.10 4.11 4.12
1 Cereals
a
b
c
d
e
2 Pulses
a
b
c
d
e
f
3 Vegetables
a
b
c
d
e
4 Oilseeds
a
b
c
d
e
5 Spices
a
b
Total
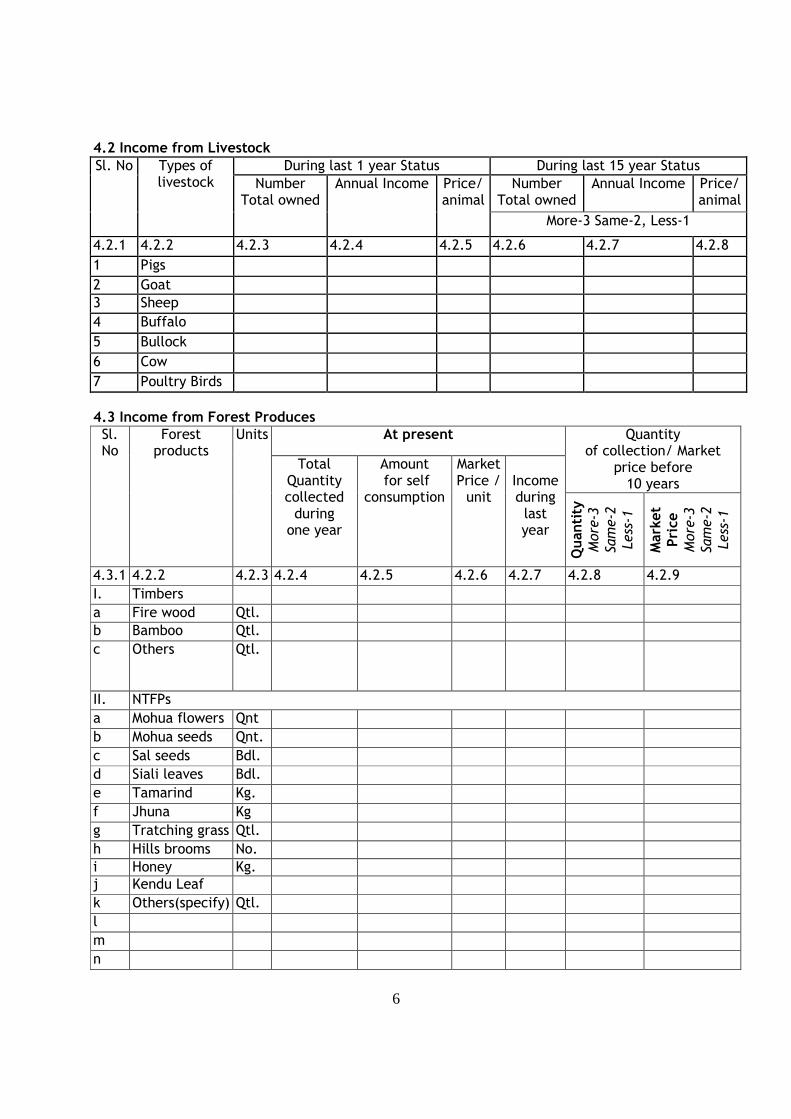
6
4.2 Income from Livestock
During last 1 year Status During last 15 year Status
Number Total owned
Annual Income
Price/ animal
Sl. No Types of livestock Number
Total owned Annual Income Price/
animal
More-3 Same-2, Less-1
4.2.1 4.2.2 4.2.3 4.2.4 4.2.5 4.2.6 4.2.7 4.2.8
1 Pigs
2 Goat
3 Sheep
4 Buffalo
5 Bullock
6 Cow
7 Poultry Birds
4.3 Income from Forest Produces
At present Quantity of collection/ Market
price before 10 years
Sl. No
Forest products
Units
Total Quantity collected during one year
Amount for self
consumption
Market Price / unit
Income during last year
Quantity
More-3
Same-2
Less-1
Market
Price
More-3
Same-2
Less-1
4.3.1 4.2.2 4.2.3 4.2.4 4.2.5 4.2.6 4.2.7 4.2.8 4.2.9
I. Timbers
a Fire wood Qtl.
b Bamboo Qtl.
c Others Qtl.
II. NTFPs
a Mohua flowers Qnt
b Mohua seeds Qnt.
c Sal seeds Bdl.
d Siali leaves Bdl.
e Tamarind Kg.
f Jhuna Kg
g Tratching grass Qtl.
h Hills brooms No.
i Honey Kg.
j Kendu Leaf
k Others(specify) Qtl.
l
m
n
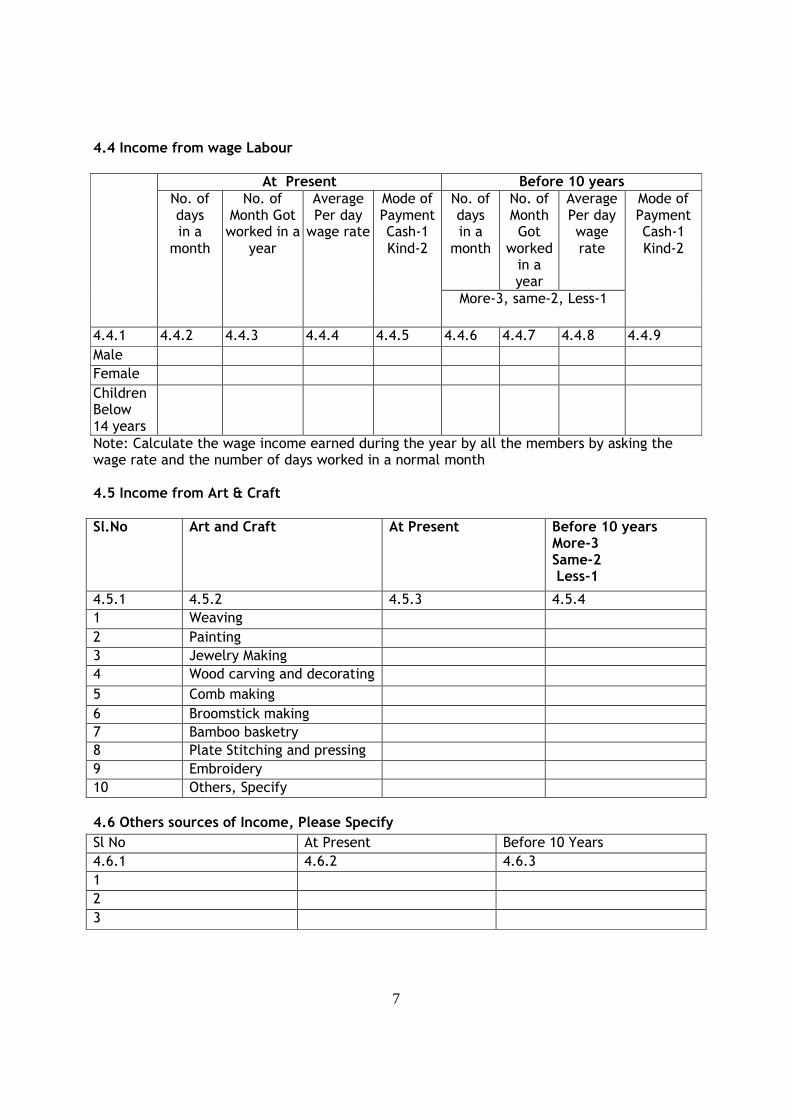
7
4.4 Income from wage Labour
At Present Before 10 years No. of days in a
month
No. of Month Got
worked in a year
Average Per day wage rate
No. of days in a
month
No. of Month Got worked in a
year
Average Per day wage rate
Mode of Payment Cash-1 Kind-2
More-3, same-2, Less-1
Mode of Payment Cash-1 Kind-2
4.4.1 4.4.2 4.4.3 4.4.4 4.4.5 4.4.6 4.4.7 4.4.8 4.4.9
Male
Female
Children Below 14 years
Note: Calculate the wage income earned during the year by all the members by asking the wage rate and the number of days worked in a normal month 4.5 Income from Art & Craft Sl.No Art and Craft At Present Before 10 years
More-3 Same-2 Less-1
4.5.1 4.5.2 4.5.3 4.5.4
1 Weaving
2 Painting
3 Jewelry Making
4 Wood carving and decorating
5 Comb making
6 Broomstick making
7 Bamboo basketry
8 Plate Stitching and pressing
9 Embroidery
10 Others, Specify
4.6 Others sources of Income, Please Specify
Sl No At Present Before 10 Years
4.6.1 4.6.2 4.6.3
1
2
3
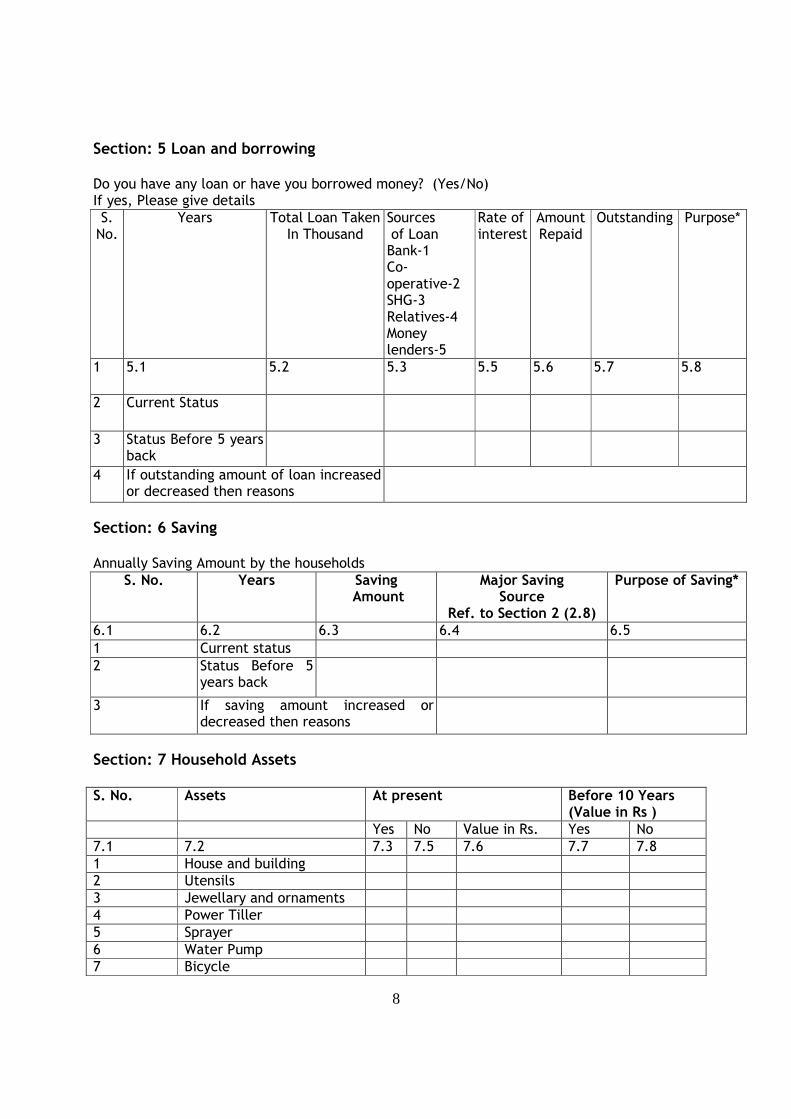
8
Section: 5 Loan and borrowing Do you have any loan or have you borrowed money? (Yes/No) If yes, Please give details
S. No.
Years Total Loan Taken In Thousand
Sources of Loan Bank-1 Co-operative-2 SHG-3 Relatives-4 Money lenders-5
Rate of interest
Amount Repaid
Outstanding Purpose*
1 5.1 5.2 5.3 5.5 5.6 5.7 5.8
2 Current Status
3 Status Before 5 years back
4 If outstanding amount of loan increased or decreased then reasons
Section: 6 Saving Annually Saving Amount by the households
S. No. Years Saving Amount
Major Saving Source
Ref. to Section 2 (2.8)
Purpose of Saving*
6.1 6.2 6.3 6.4 6.5
1 Current status
2 Status Before 5 years back
3 If saving amount increased or decreased then reasons
Section: 7 Household Assets S. No. Assets At present Before 10 Years
(Value in Rs ) Yes No Value in Rs. Yes No
7.1 7.2 7.3 7.5 7.6 7.7 7.8
1 House and building
2 Utensils
3 Jewellary and ornaments
4 Power Tiller
5 Sprayer
6 Water Pump
7 Bicycle
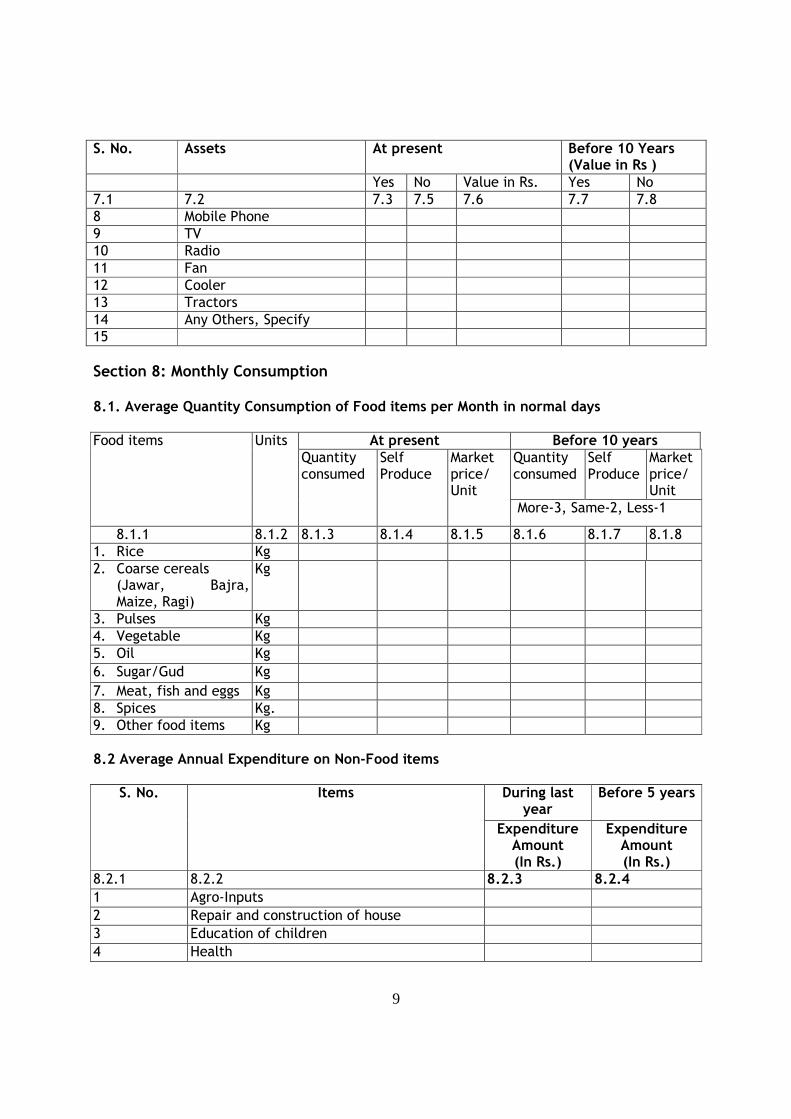
9
S. No. Assets At present Before 10 Years (Value in Rs )
Yes No Value in Rs. Yes No
7.1 7.2 7.3 7.5 7.6 7.7 7.8
8 Mobile Phone
9 TV
10 Radio
11 Fan
12 Cooler
13 Tractors
14 Any Others, Specify
15
Section 8: Monthly Consumption 8.1. Average Quantity Consumption of Food items per Month in normal days
At present Before 10 years Quantity consumed
Self Produce
Market price/ Unit
Food items Units
Quantity consumed
Self Produce
Market price/ Unit
More-3, Same-2, Less-1
8.1.1 8.1.2 8.1.3 8.1.4 8.1.5 8.1.6 8.1.7 8.1.8
1. Rice Kg
2. Coarse cereals (Jawar, Bajra, Maize, Ragi)
Kg
3. Pulses Kg
4. Vegetable Kg
5. Oil Kg
6. Sugar/Gud Kg
7. Meat, fish and eggs Kg
8. Spices Kg.
9. Other food items Kg
8.2 Average Annual Expenditure on Non-Food items
During last year
Before 5 years S. No. Items
Expenditure Amount (In Rs.)
Expenditure Amount (In Rs.)
8.2.1 8.2.2 8.2.3 8.2.4
1 Agro-Inputs
2 Repair and construction of house
3 Education of children
4 Health
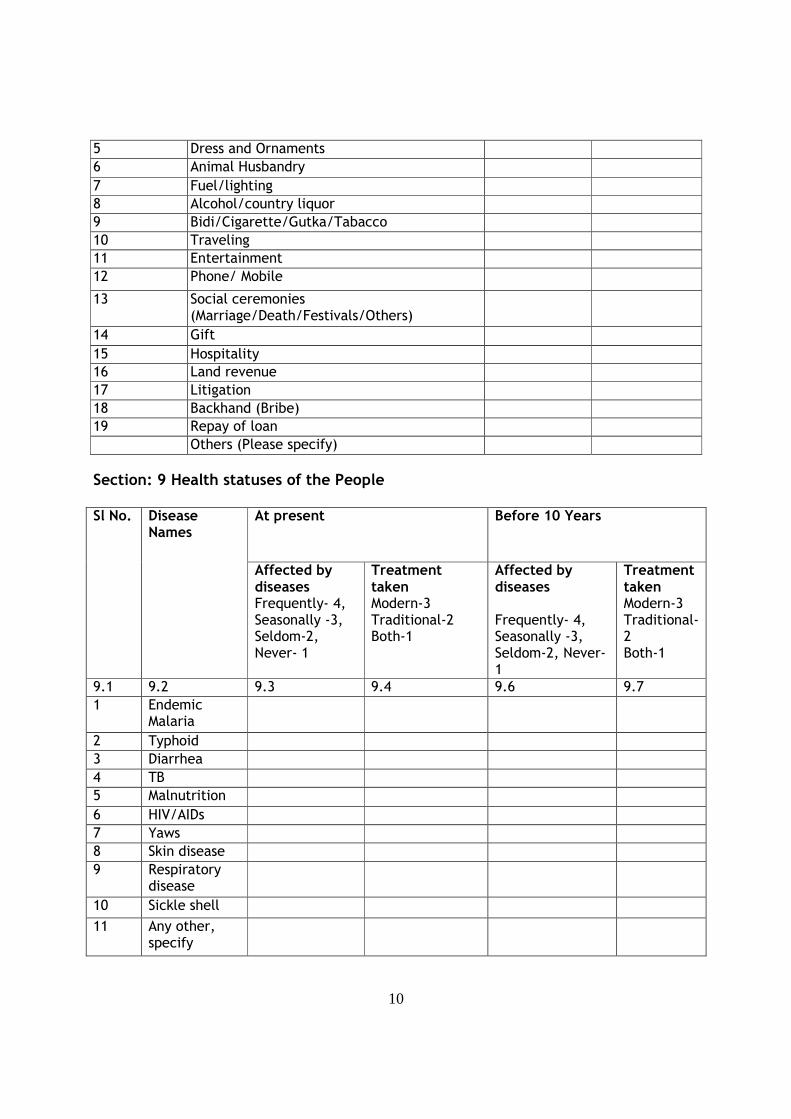
10
5 Dress and Ornaments
6 Animal Husbandry
7 Fuel/lighting
8 Alcohol/country liquor
9 Bidi/Cigarette/Gutka/Tabacco
10 Traveling
11 Entertainment
12 Phone/ Mobile
13 Social ceremonies (Marriage/Death/Festivals/Others)
14 Gift
15 Hospitality
16 Land revenue
17 Litigation
18 Backhand (Bribe)
19 Repay of loan
Others (Please specify)
Section: 9 Health statuses of the People
At present
Before 10 Years
Sl No. Disease Names
Affected by diseases Frequently- 4, Seasonally -3, Seldom-2, Never- 1
Treatment taken Modern-3 Traditional-2 Both-1
Affected by diseases Frequently- 4, Seasonally -3, Seldom-2, Never- 1
Treatment taken Modern-3 Traditional-2 Both-1
9.1 9.2 9.3 9.4 9.6 9.7
1 Endemic Malaria
2 Typhoid
3 Diarrhea
4 TB
5 Malnutrition
6 HIV/AIDs
7 Yaws
8 Skin disease
9 Respiratory disease
10 Sickle shell
11 Any other, specify
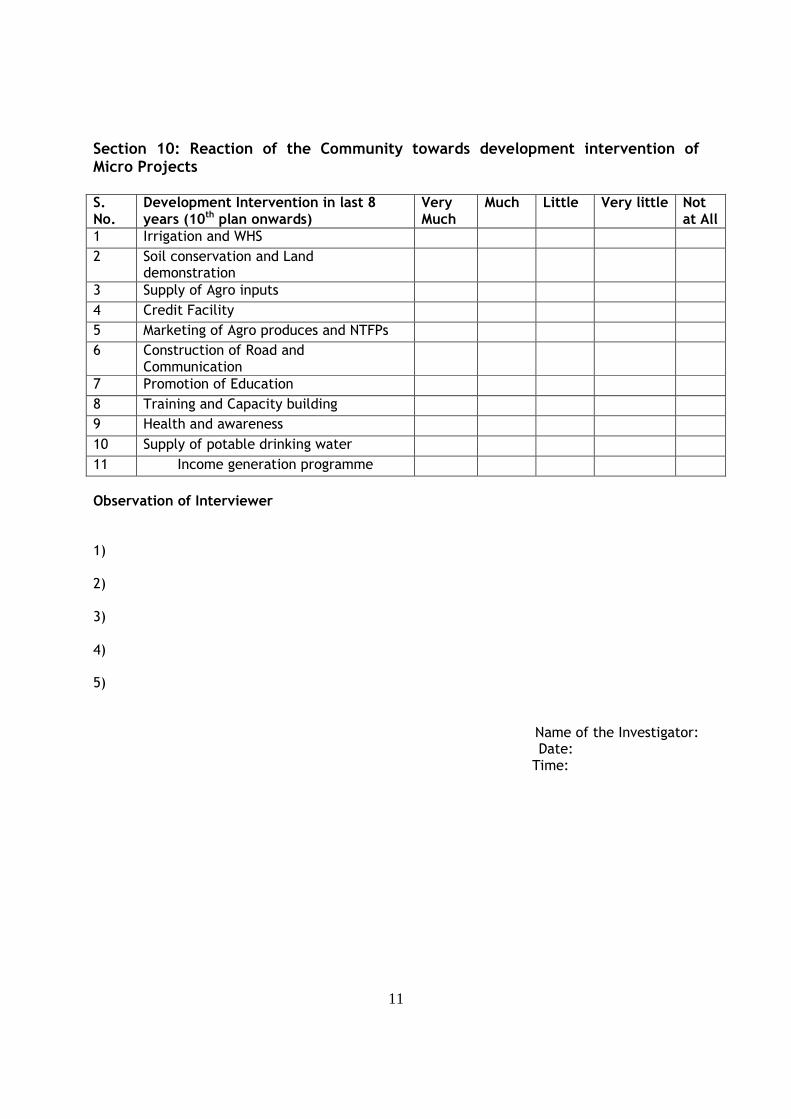
11
Section 10: Reaction of the Community towards development intervention of Micro Projects S. No.
Development Intervention in last 8 years (10th plan onwards)
Very Much
Much Little Very little Not at All
1 Irrigation and WHS
2 Soil conservation and Land demonstration
3 Supply of Agro inputs
4 Credit Facility
5 Marketing of Agro produces and NTFPs
6 Construction of Road and Communication
7 Promotion of Education
8 Training and Capacity building
9 Health and awareness
10 Supply of potable drinking water
11 Income generation programme
Observation of Interviewer 1) 2) 3) 4) 5)
Name of the Investigator: Date:
Time:
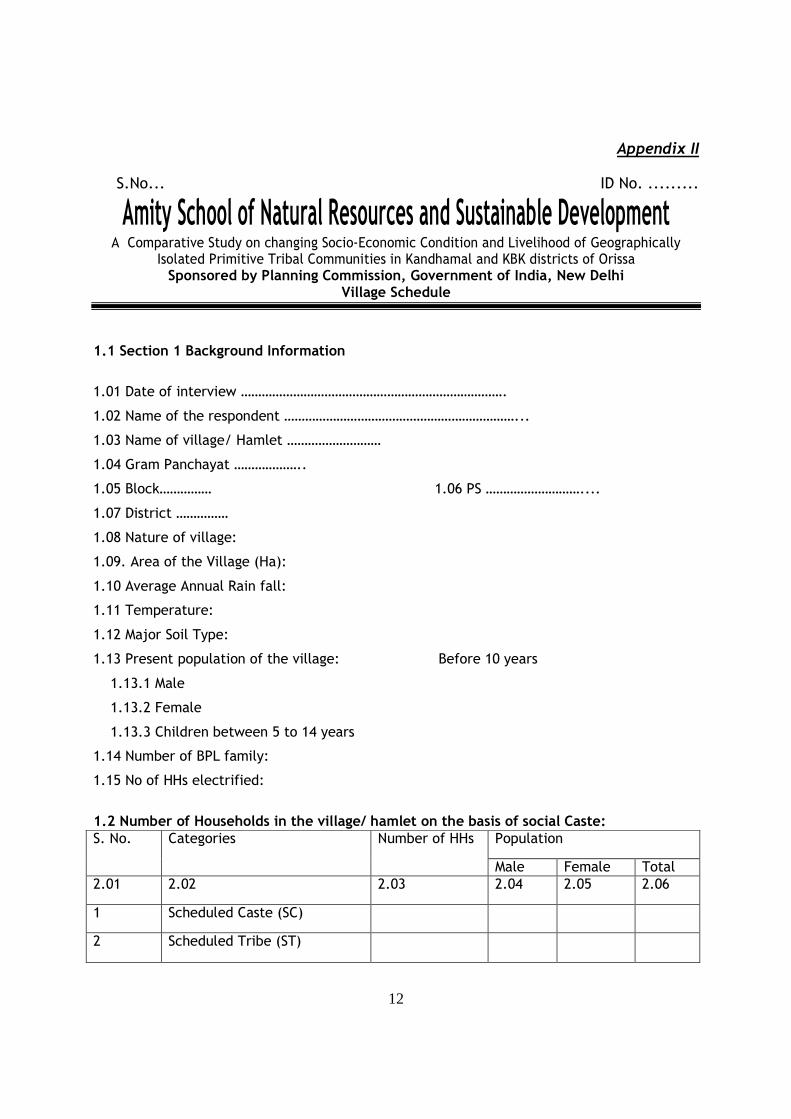
12
Appendix II
S.No... ID No. .........
Amity School of Natural Resources and Sustainable Development A Comparative Study on changing Socio-Economic Condition and Livelihood of Geographically
Isolated Primitive Tribal Communities in Kandhamal and KBK districts of Orissa Sponsored by Planning Commission, Government of India, New Delhi
Village Schedule
1.1 Section 1 Background Information
1.01 Date of interview ………………………………………………………………….
1.02 Name of the respondent …………………………………………………………...
1.03 Name of village/ Hamlet ………………………
1.04 Gram Panchayat ………………..
1.05 Block…………… 1.06 PS ………………………....
1.07 District ……………
1.08 Nature of village:
1.09. Area of the Village (Ha):
1.10 Average Annual Rain fall:
1.11 Temperature:
1.12 Major Soil Type:
1.13 Present population of the village: Before 10 years
1.13.1 Male
1.13.2 Female
1.13.3 Children between 5 to 14 years
1.14 Number of BPL family:
1.15 No of HHs electrified:
1.2 Number of Households in the village/ hamlet on the basis of social Caste:
Population S. No. Categories Number of HHs
Male Female Total
2.01 2.02 2.03 2.04 2.05 2.06
1 Scheduled Caste (SC)
2 Scheduled Tribe (ST)
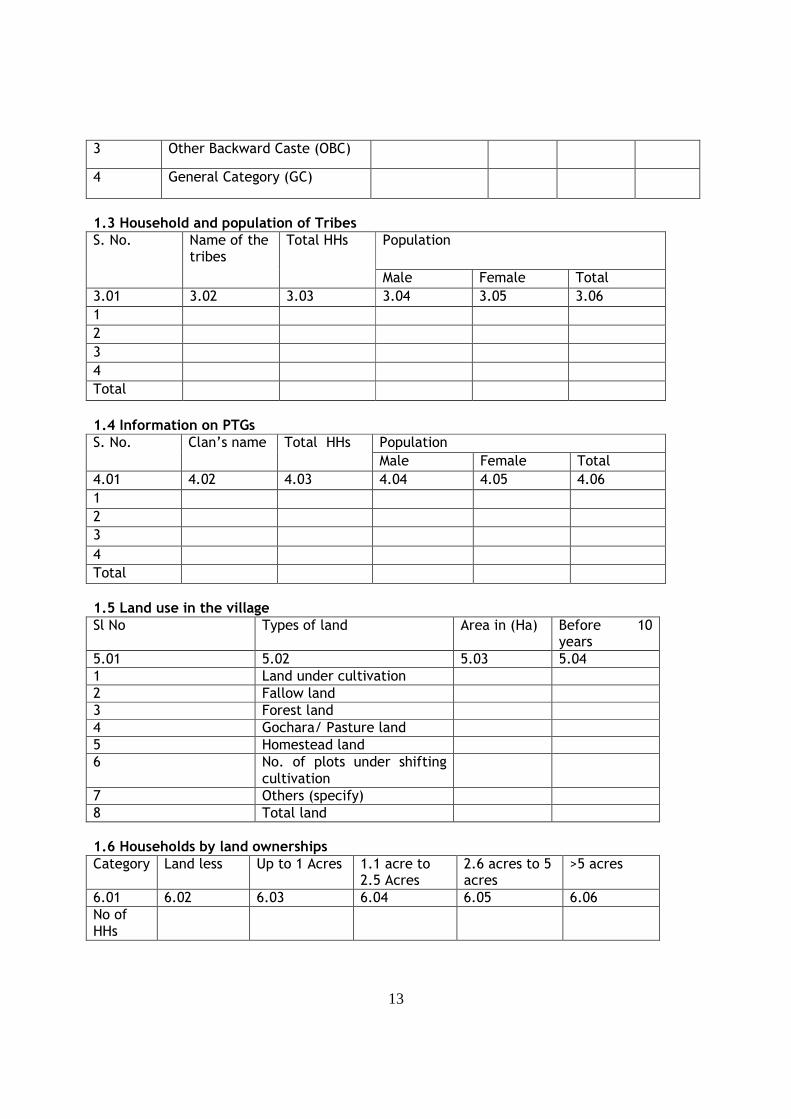
13
3 Other Backward Caste (OBC)
4 General Category (GC)
1.3 Household and population of Tribes
Population S. No. Name of the tribes
Total HHs
Male Female Total
3.01 3.02 3.03 3.04 3.05 3.06
1
2
3
4
Total
1.4 Information on PTGs
Population S. No. Clan’s name Total HHs
Male Female Total
4.01 4.02 4.03 4.04 4.05 4.06
1
2
3
4
Total
1.5 Land use in the village Sl No Types of land Area in (Ha) Before 10
years
5.01 5.02 5.03 5.04
1 Land under cultivation
2 Fallow land
3 Forest land
4 Gochara/ Pasture land
5 Homestead land
6 No. of plots under shifting cultivation
7 Others (specify)
8 Total land
1.6 Households by land ownerships Category Land less Up to 1 Acres 1.1 acre to
2.5 Acres 2.6 acres to 5 acres
>5 acres
6.01 6.02 6.03 6.04 6.05 6.06
No of HHs
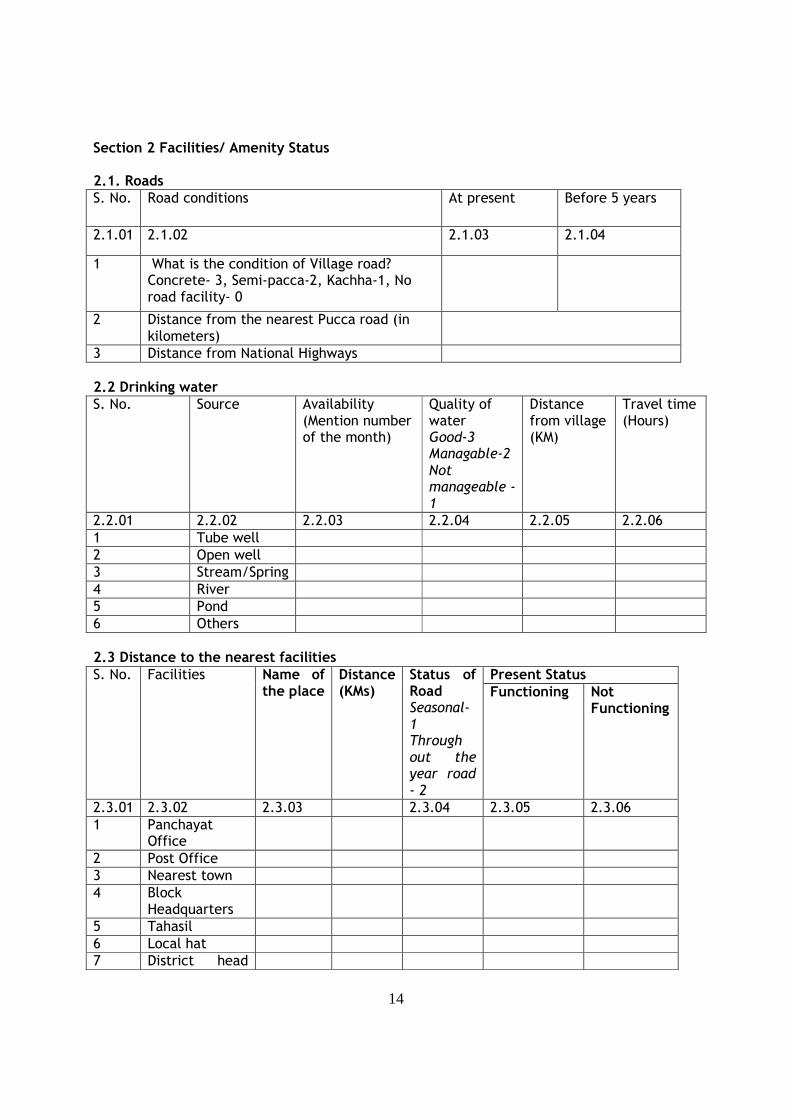
14
Section 2 Facilities/ Amenity Status 2.1. Roads S. No. Road conditions At present Before 5 years
2.1.01 2.1.02 2.1.03 2.1.04
1 What is the condition of Village road? Concrete- 3, Semi-pacca-2, Kachha-1, No road facility- 0
2 Distance from the nearest Pucca road (in kilometers)
3 Distance from National Highways
2.2 Drinking water S. No. Source Availability
(Mention number of the month)
Quality of water Good-3 Managable-2 Not manageable -1
Distance from village (KM)
Travel time (Hours)
2.2.01 2.2.02 2.2.03 2.2.04 2.2.05 2.2.06
1 Tube well
2 Open well
3 Stream/Spring
4 River
5 Pond
6 Others
2.3 Distance to the nearest facilities
Present Status S. No. Facilities Name of the place
Distance (KMs)
Status of Road Seasonal-1 Through out the year road - 2
Functioning Not Functioning
2.3.01 2.3.02 2.3.03 2.3.04 2.3.05 2.3.06
1 Panchayat Office
2 Post Office 3 Nearest town 4 Block
Headquarters
5 Tahasil 6 Local hat 7 District head
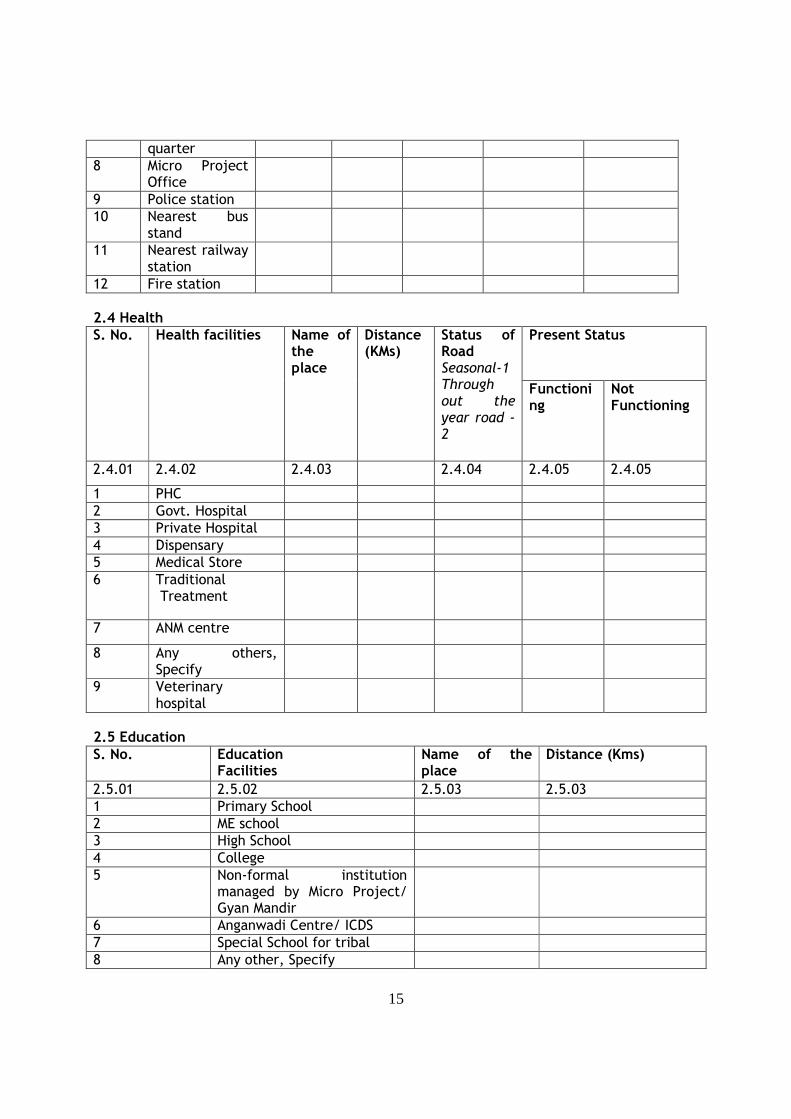
15
quarter
8 Micro Project Office
9 Police station 10 Nearest bus
stand
11 Nearest railway station
12 Fire station 2.4 Health
Present Status S. No. Health facilities Name of the place
Distance (KMs)
Status of Road Seasonal-1 Through out the year road - 2
Functioning
Not Functioning
2.4.01 2.4.02 2.4.03 2.4.04 2.4.05 2.4.05
1 PHC 2 Govt. Hospital 3 Private Hospital 4 Dispensary 5 Medical Store 6 Traditional
Treatment
7 ANM centre
8 Any others, Specify
9 Veterinary hospital
2.5 Education S. No. Education
Facilities Name of the place
Distance (Kms)
2.5.01 2.5.02 2.5.03 2.5.03
1 Primary School 2 ME school 3 High School 4 College 5 Non-formal institution
managed by Micro Project/ Gyan Mandir
6 Anganwadi Centre/ ICDS 7 Special School for tribal 8 Any other, Specify
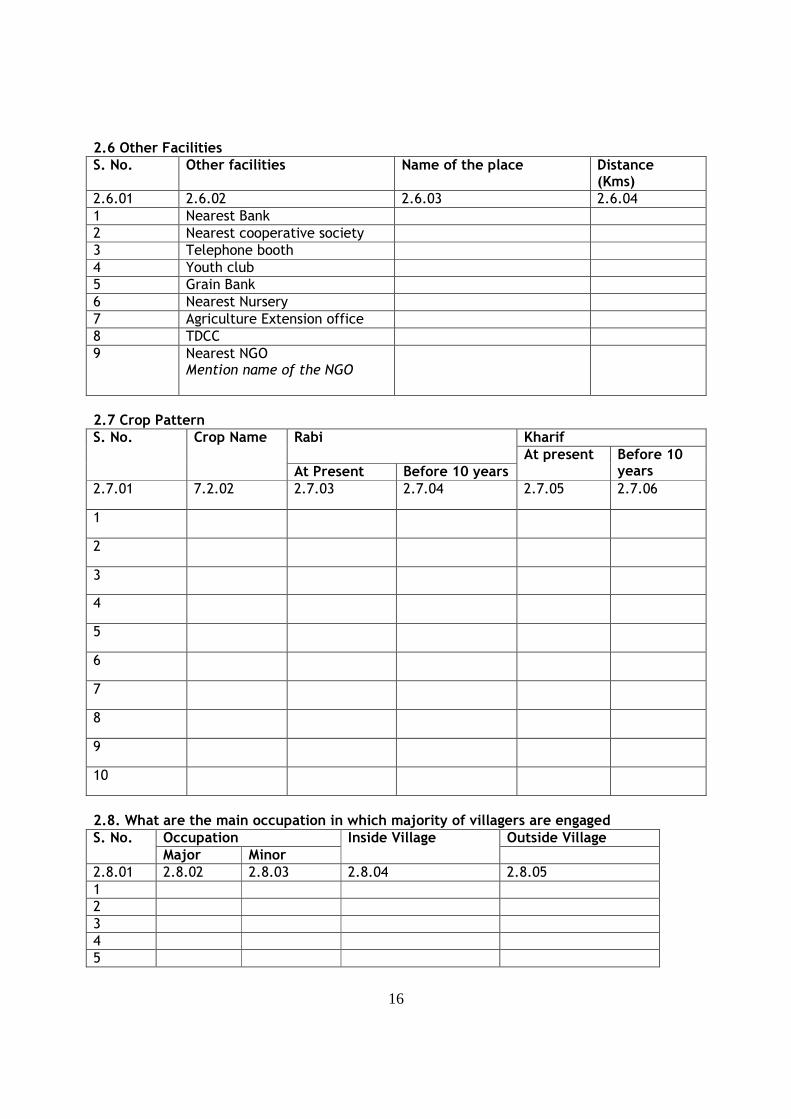
16
2.6 Other Facilities S. No. Other facilities Name of the place Distance
(Kms) 2.6.01 2.6.02 2.6.03 2.6.04
1 Nearest Bank 2 Nearest cooperative society 3 Telephone booth 4 Youth club 5 Grain Bank 6 Nearest Nursery 7 Agriculture Extension office 8 TDCC 9 Nearest NGO
Mention name of the NGO
2.7 Crop Pattern
Kharif Rabi S. No. Crop Name
At Present Before 10 years At present
Before 10 years
2.7.01 7.2.02 2.7.03 2.7.04 2.7.05 2.7.06
1
2
3
4
5
6
7
8
9
10
2.8. What are the main occupation in which majority of villagers are engaged
Occupation Outside Village S. No. Major Minor
Inside Village
2.8.01 2.8.02 2.8.03 2.8.04 2.8.05
1
2
3
4
5
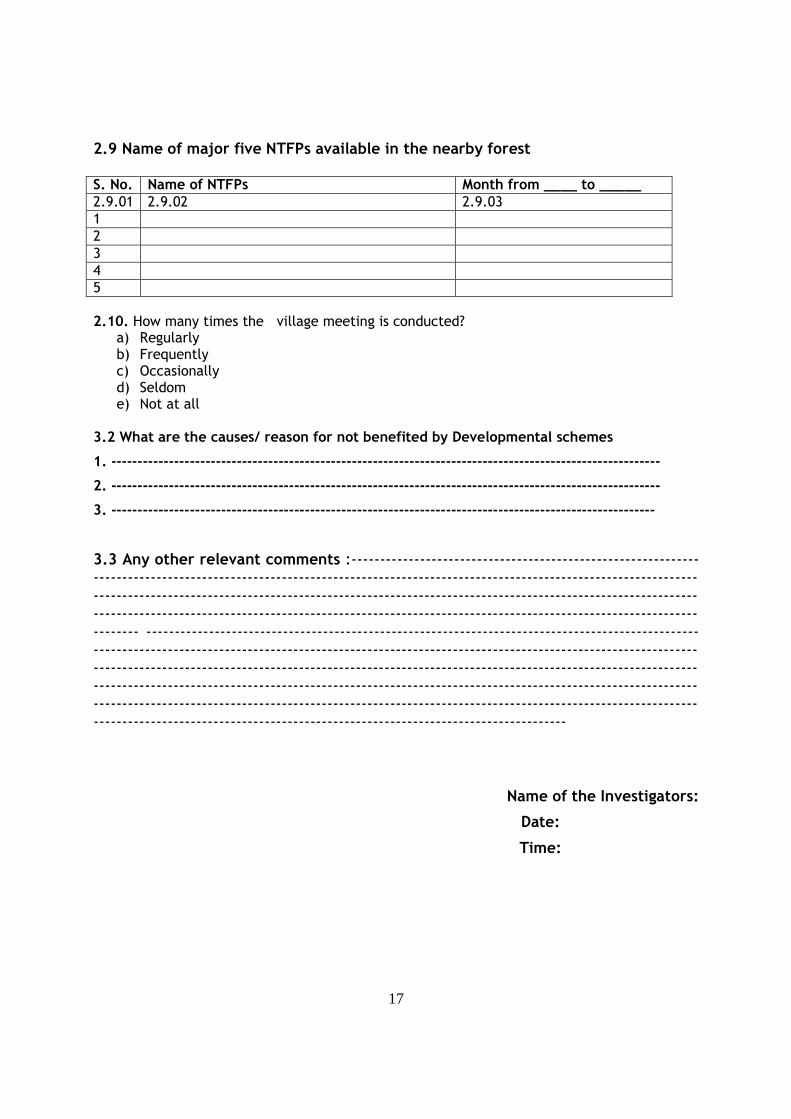
17
2.9 Name of major five NTFPs available in the nearby forest S. No. Name of NTFPs Month from ____ to _____ 2.9.01 2.9.02 2.9.03
1
2
3
4
5
2.10. How many times the village meeting is conducted?
a) Regularly b) Frequently c) Occasionally d) Seldom e) Not at all
3.2 What are the causes/ reason for not benefited by Developmental schemes
1. ---------------------------------------------------------------------------------------------------------
2. ---------------------------------------------------------------------------------------------------------
3. --------------------------------------------------------------------------------------------------------
3.3 Any other relevant comments :--------------------------------------------------------------------------------------------------------------------------------------------------------------------------------------------------------------------------------------------------------------------------------------------------------------------------------------------------------------------------------------------------- ----------------------------------------------------------------------------------------------------------------------------------------------------------------------------------------------------------------------------------------------------------------------------------------------------------------------------------------------------------------------------------------------------------------------------------------------------------------------------------------------------------------------------------------------------------------------------------------------------------------------------
Name of the Investigators:
Date:
Time:
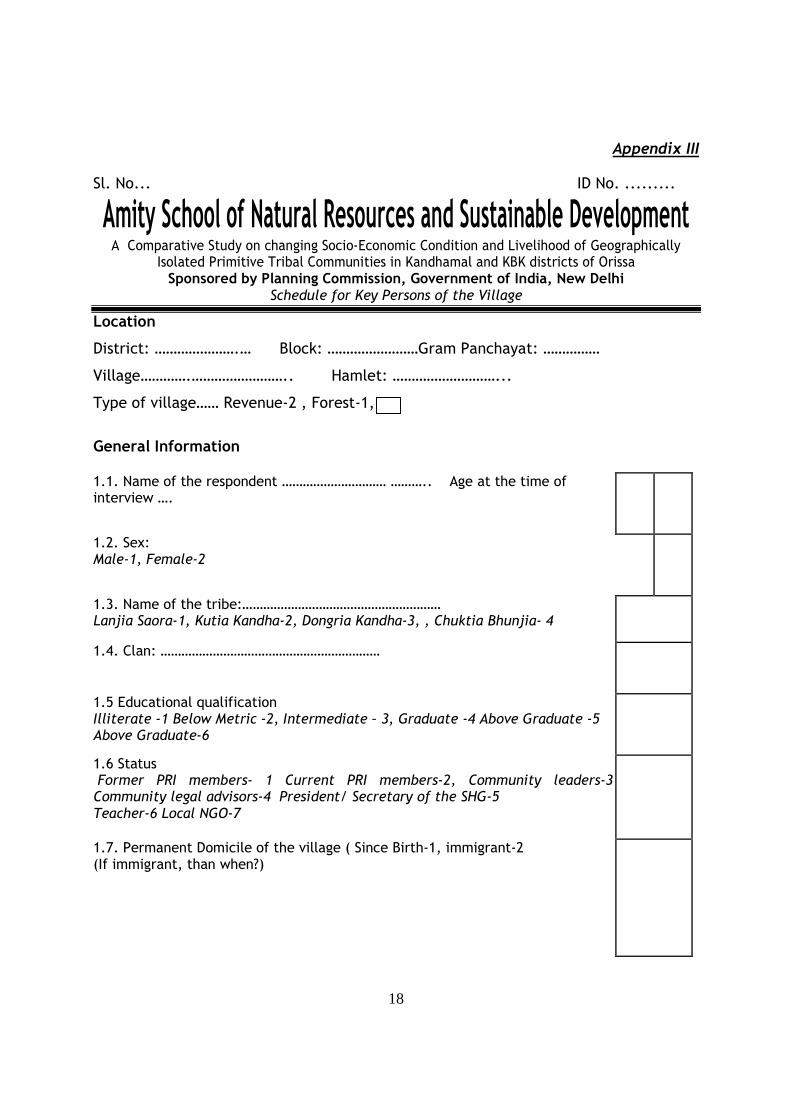
18
Appendix III
Sl. No... ID No. .........
Amity School of Natural Resources and Sustainable Development A Comparative Study on changing Socio-Economic Condition and Livelihood of Geographically
Isolated Primitive Tribal Communities in Kandhamal and KBK districts of Orissa Sponsored by Planning Commission, Government of India, New Delhi
Schedule for Key Persons of the Village
Location
District: ………………….… Block: ……………………Gram Panchayat: ……………
Village………….…………………….. Hamlet: ………………………...
Type of village…… Revenue-2 , Forest-1,
General Information
1.1. Name of the respondent ………………………… ……….. Age at the time of interview ….
1.2. Sex: Male-1, Female-2
1.3. Name of the tribe:………………………………………………… Lanjia Saora-1, Kutia Kandha-2, Dongria Kandha-3, , Chuktia Bhunjia- 4
1.4. Clan: ………………………………………………………
1.5 Educational qualification Illiterate -1 Below Metric -2, Intermediate – 3, Graduate -4 Above Graduate -5 Above Graduate-6
1.6 Status Former PRI members- 1 Current PRI members-2, Community leaders-3 Community legal advisors-4 President/ Secretary of the SHG-5 Teacher-6 Local NGO-7
1.7. Permanent Domicile of the village ( Since Birth-1, immigrant-2 (If immigrant, than when?)
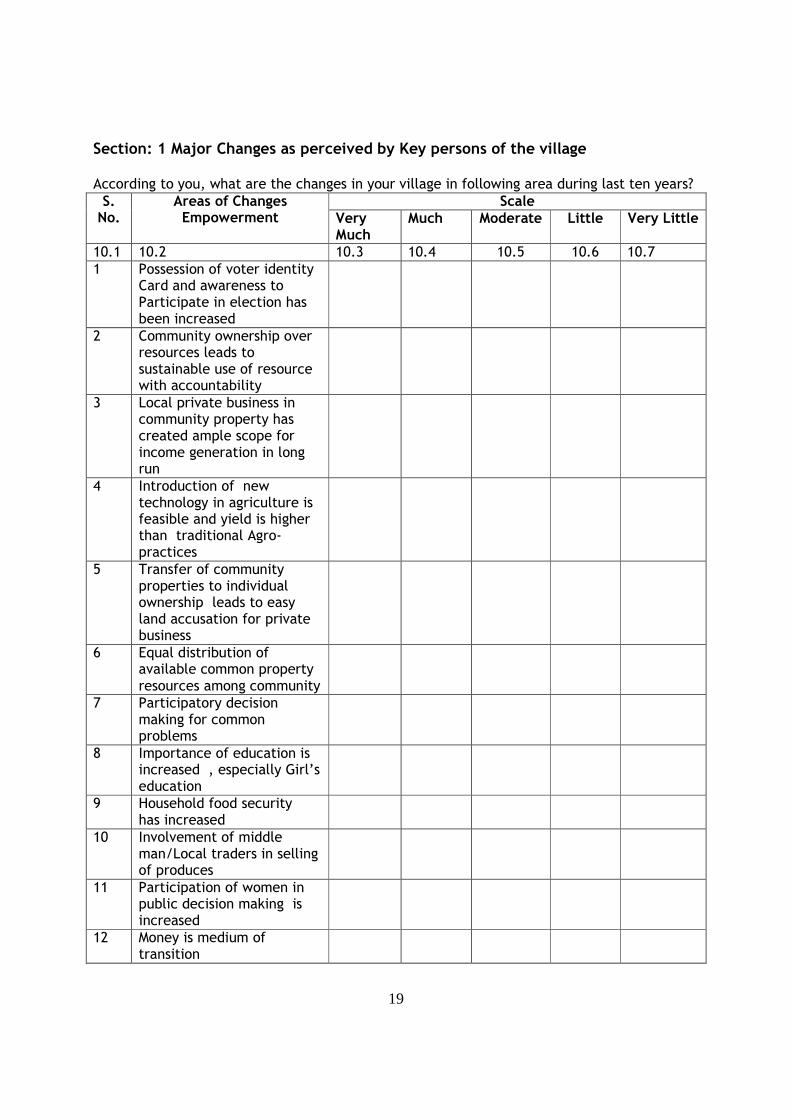
19
Section: 1 Major Changes as perceived by Key persons of the village According to you, what are the changes in your village in following area during last ten years?
Scale S. No.
Areas of Changes Empowerment Very
Much Much Moderate Little Very Little
10.1 10.2 10.3 10.4 10.5 10.6 10.7
1 Possession of voter identity Card and awareness to Participate in election has been increased
2 Community ownership over resources leads to sustainable use of resource with accountability
3 Local private business in community property has created ample scope for income generation in long run
4 Introduction of new technology in agriculture is feasible and yield is higher than traditional Agro-practices
5 Transfer of community properties to individual ownership leads to easy land accusation for private business
6 Equal distribution of available common property resources among community
7 Participatory decision making for common problems
8 Importance of education is increased , especially Girl’s education
9 Household food security has increased
10 Involvement of middle man/Local traders in selling of produces
11 Participation of women in public decision making is increased
12 Money is medium of transition
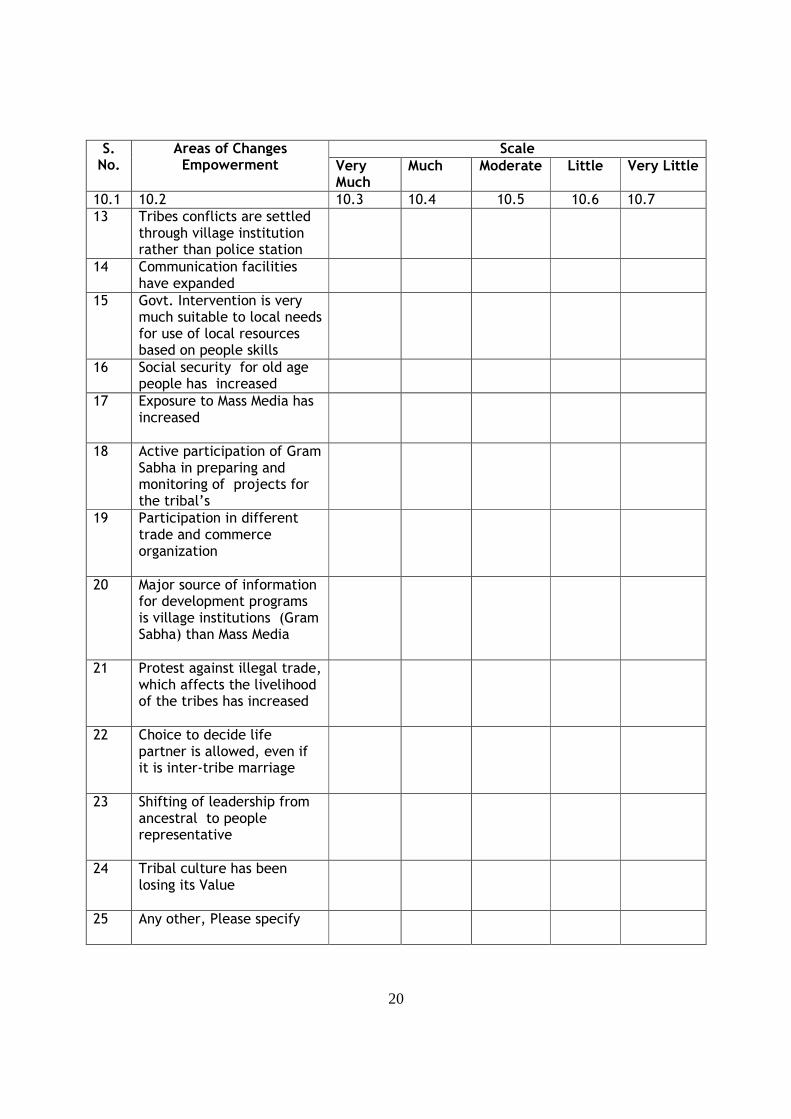
20
Scale S. No.
Areas of Changes Empowerment Very
Much Much Moderate Little Very Little
10.1 10.2 10.3 10.4 10.5 10.6 10.7
13 Tribes conflicts are settled through village institution rather than police station
14 Communication facilities have expanded
15 Govt. Intervention is very much suitable to local needs for use of local resources based on people skills
16 Social security for old age people has increased
17 Exposure to Mass Media has increased
18 Active participation of Gram Sabha in preparing and monitoring of projects for the tribal’s
19 Participation in different trade and commerce organization
20 Major source of information for development programs is village institutions (Gram Sabha) than Mass Media
21 Protest against illegal trade, which affects the livelihood of the tribes has increased
22 Choice to decide life partner is allowed, even if it is inter-tribe marriage
23 Shifting of leadership from ancestral to people representative
24 Tribal culture has been losing its Value
25 Any other, Please specify
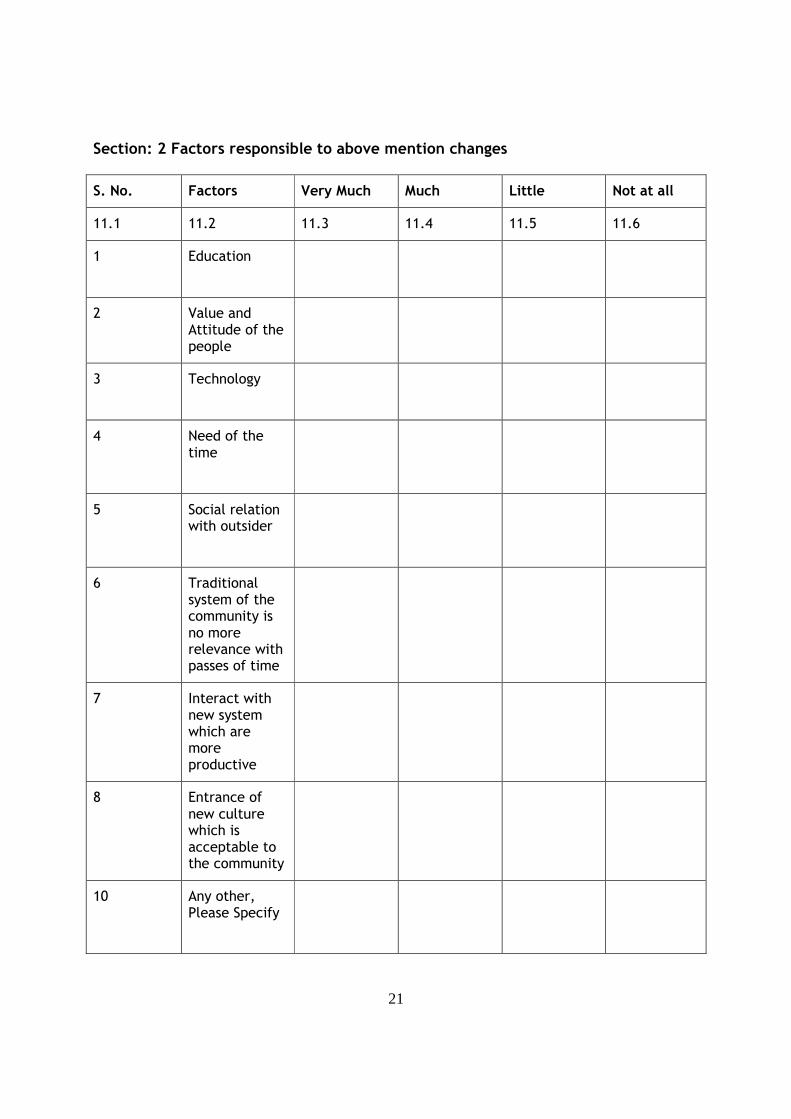
21
Section: 2 Factors responsible to above mention changes
S. No. Factors Very Much Much Little Not at all
11.1 11.2 11.3 11.4 11.5 11.6
1 Education
2 Value and Attitude of the people
3 Technology
4 Need of the time
5 Social relation with outsider
6 Traditional system of the community is no more relevance with passes of time
7 Interact with new system which are more productive
8 Entrance of new culture which is acceptable to the community
10 Any other, Please Specify
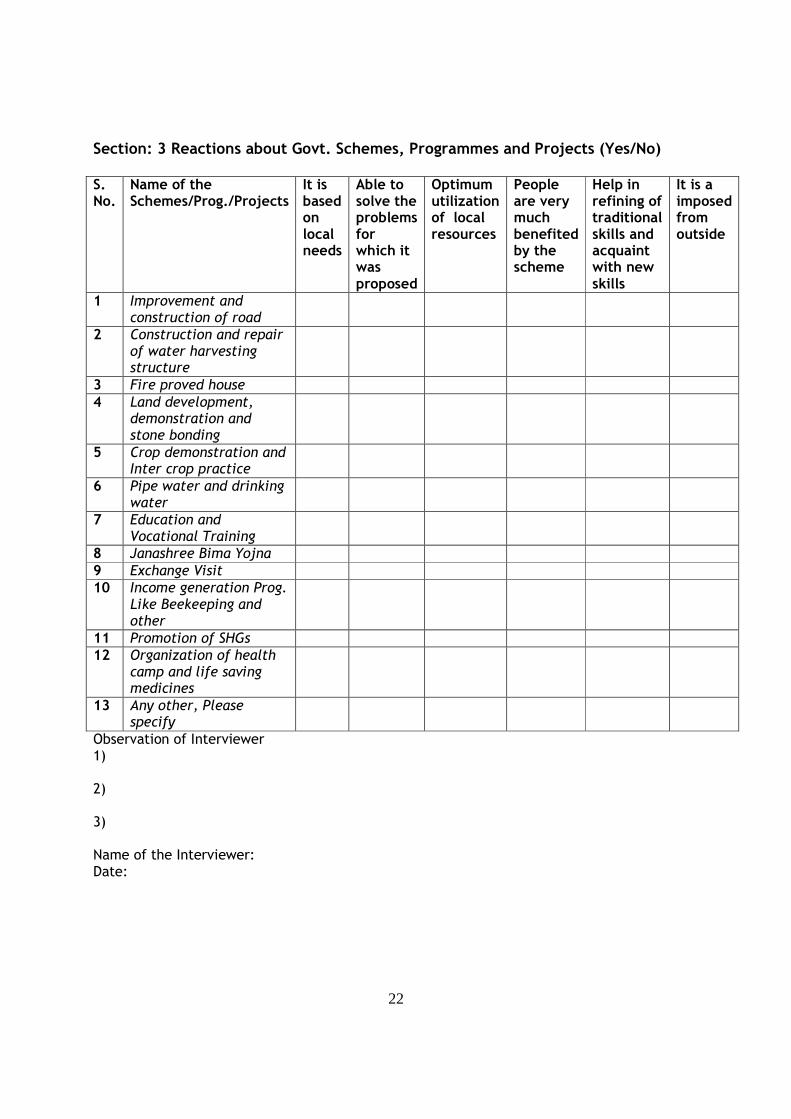
22
Section: 3 Reactions about Govt. Schemes, Programmes and Projects (Yes/No) S. No.
Name of the Schemes/Prog./Projects
It is based on local needs
Able to solve the problems for which it was proposed
Optimum utilization of local resources
People are very much benefited by the scheme
Help in refining of traditional skills and acquaint with new skills
It is a imposed from outside
1 Improvement and construction of road
2 Construction and repair of water harvesting structure
3 Fire proved house 4 Land development,
demonstration and stone bonding
5 Crop demonstration and Inter crop practice
6 Pipe water and drinking water
7 Education and Vocational Training
8 Janashree Bima Yojna 9 Exchange Visit 10 Income generation Prog.
Like Beekeeping and other
11 Promotion of SHGs 12 Organization of health
camp and life saving medicines
13 Any other, Please specify
Observation of Interviewer 1) 2) 3) Name of the Interviewer: Date:
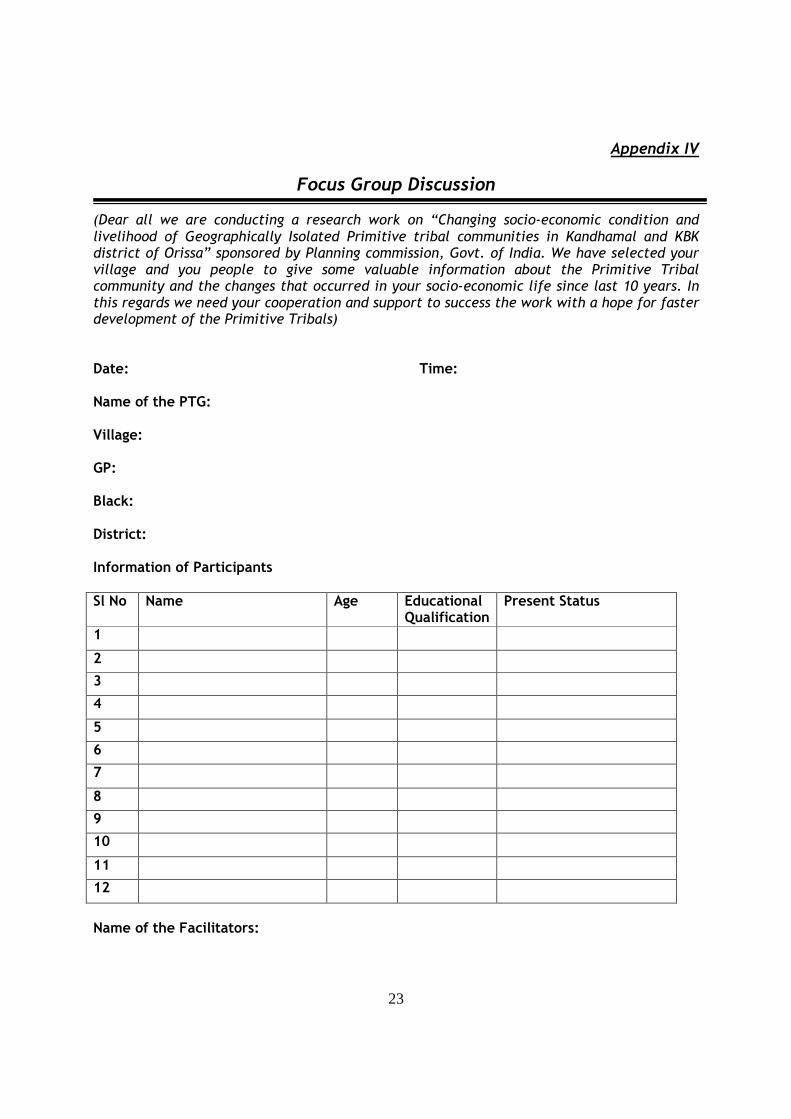
23
Appendix IV
Focus Group Discussion
(Dear all we are conducting a research work on “Changing socio-economic condition and livelihood of Geographically Isolated Primitive tribal communities in Kandhamal and KBK district of Orissa” sponsored by Planning commission, Govt. of India. We have selected your village and you people to give some valuable information about the Primitive Tribal community and the changes that occurred in your socio-economic life since last 10 years. In this regards we need your cooperation and support to success the work with a hope for faster development of the Primitive Tribals) Date: Time: Name of the PTG: Village: GP: Black: District: Information of Participants Sl No Name Age Educational
Qualification Present Status
1
2
3
4
5
6
7
8
9
10
11
12
Name of the Facilitators:
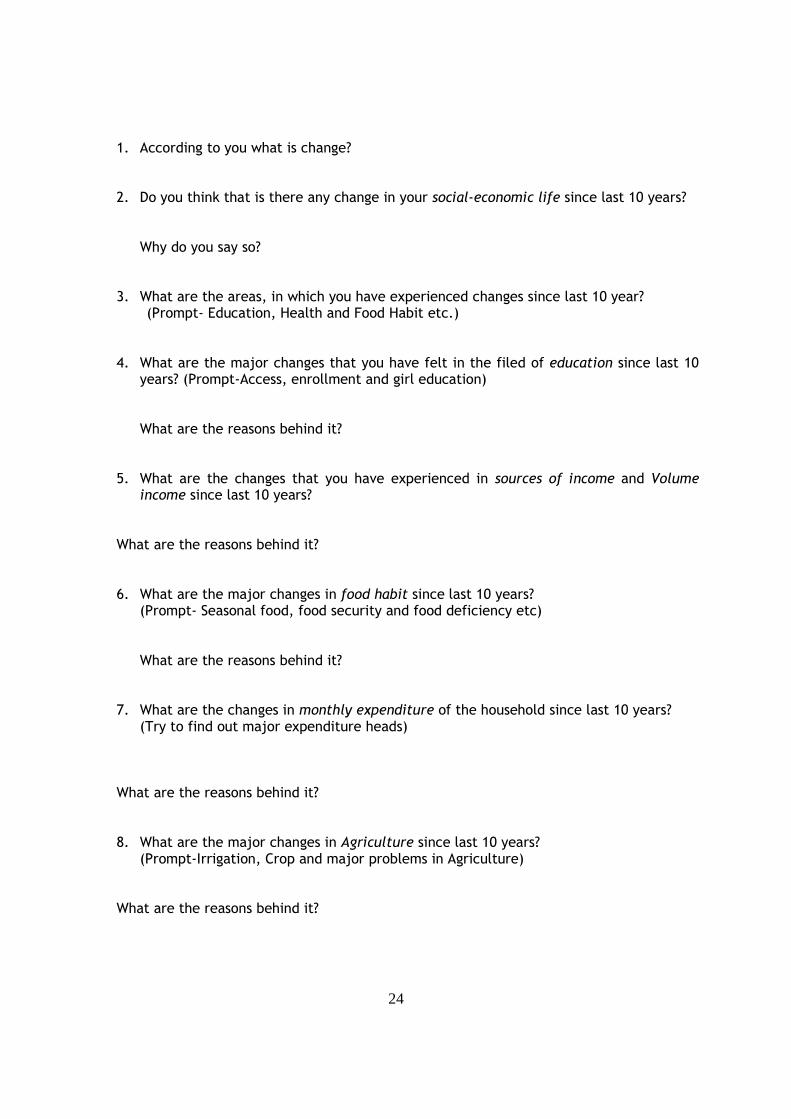
24
1. According to you what is change? 2. Do you think that is there any change in your social-economic life since last 10 years?
Why do you say so?
3. What are the areas, in which you have experienced changes since last 10 year? (Prompt- Education, Health and Food Habit etc.)
4. What are the major changes that you have felt in the filed of education since last 10 years? (Prompt-Access, enrollment and girl education)
What are the reasons behind it?
5. What are the changes that you have experienced in sources of income and Volume income since last 10 years?
What are the reasons behind it? 6. What are the major changes in food habit since last 10 years?
(Prompt- Seasonal food, food security and food deficiency etc)
What are the reasons behind it?
7. What are the changes in monthly expenditure of the household since last 10 years? (Try to find out major expenditure heads)
What are the reasons behind it?
8. What are the major changes in Agriculture since last 10 years? (Prompt-Irrigation, Crop and major problems in Agriculture)
What are the reasons behind it?
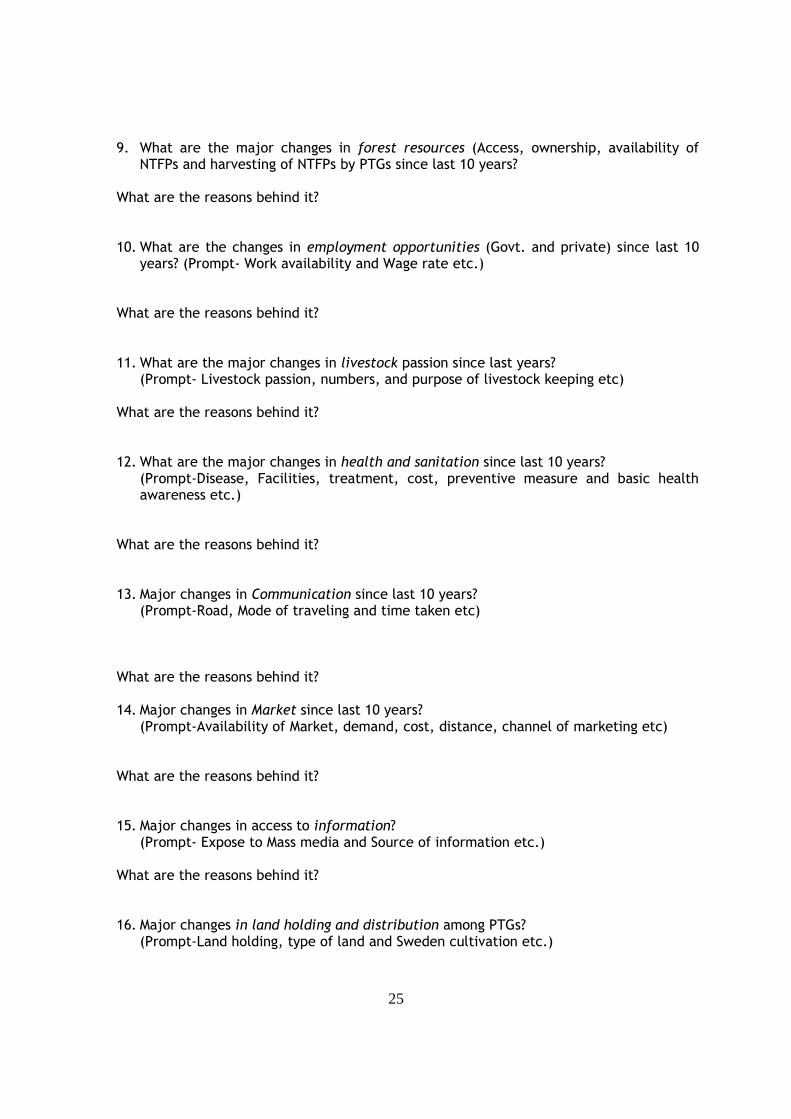
25
9. What are the major changes in forest resources (Access, ownership, availability of NTFPs and harvesting of NTFPs by PTGs since last 10 years?
What are the reasons behind it? 10. What are the changes in employment opportunities (Govt. and private) since last 10
years? (Prompt- Work availability and Wage rate etc.)
What are the reasons behind it? 11. What are the major changes in livestock passion since last years?
(Prompt- Livestock passion, numbers, and purpose of livestock keeping etc)
What are the reasons behind it? 12. What are the major changes in health and sanitation since last 10 years?
(Prompt-Disease, Facilities, treatment, cost, preventive measure and basic health awareness etc.)
What are the reasons behind it? 13. Major changes in Communication since last 10 years?
(Prompt-Road, Mode of traveling and time taken etc)
What are the reasons behind it? 14. Major changes in Market since last 10 years?
(Prompt-Availability of Market, demand, cost, distance, channel of marketing etc)
What are the reasons behind it?
15. Major changes in access to information? (Prompt- Expose to Mass media and Source of information etc.)
What are the reasons behind it?
16. Major changes in land holding and distribution among PTGs? (Prompt-Land holding, type of land and Sweden cultivation etc.)
26
What are the reasons behind it?
17. Major changes in approach in Govt. Interventions since last 10 years? What are the reasons behind it? (Prompt-Participatory, Preparing, Implementation, and monitoring etc.) 18. Major changes in Schemes and programmes to meet the local need of the PTGs?
(Prompt-Local need, able to met local problems and time etc)
What are the reasons behind it?
19. Give your suggestion to make the development programmes more effective and comprehensive?