livelihood baseline report - household economy analysis
TRANSCRIPT
Livelihood Baseline
Report
2
Acknowledgements
Funding for the Livelihoods Baseline Project was provided by Save the Children UK. The assessment was
done by Save the Children Staff, Sadia Khan, Sumera Yasmin, Muhammad Adnan Khan, Shahzad
Mukhtar, Umar Farooq, Sohail Ahmed, Sajid Khan and Ruhul Amin. Technical lead and guidance of the
assessment was provided by Daison Ngirazi. The assessment team wishes to thank the various
stakeholders that made this work possible, special mention goes to community members who afforded
their valuable time to speak to the assessment team.
3
Table of Contents
List of Figures .......................................................................................................................................... 5
List of Tables ........................................................................................................................................... 5
1 SUMMARY ...................................................................................................................................... 6
1.1 Objectives of the Study ............................................................................................................ 6
1.2 Methodology ........................................................................................................................... 6
1.3 Results ..................................................................................................................................... 6
2 Introduction .................................................................................................................................... 9
3 Methodology ................................................................................................................................ 10
4 Livelihood Zone Description .......................................................................................................... 11
4.1 Main Conclusions and Implications ........................................................................................ 11
4.2 Zone Description .................................................................................................................... 12
4.3 Markets and Trade ................................................................................................................. 13
4.4 Seasonal calendar .................................................................................................................. 13
5 Wealth Breakdown ....................................................................................................................... 14
6 Livelihood Strategies ..................................................................................................................... 15
6.1 Sources of Food ..................................................................................................................... 15
6.2 Sources of Cash ...................................................................................................................... 16
6.2.1 Seasonal Access to Cash income ..................................................................................... 17
6.3 Expenditure Patterns ............................................................................................................. 18
7 Household Total Income ............................................................................................................... 19
8 Coping Mechanisms ...................................................................................................................... 20
9 Hazards ......................................................................................................................................... 21
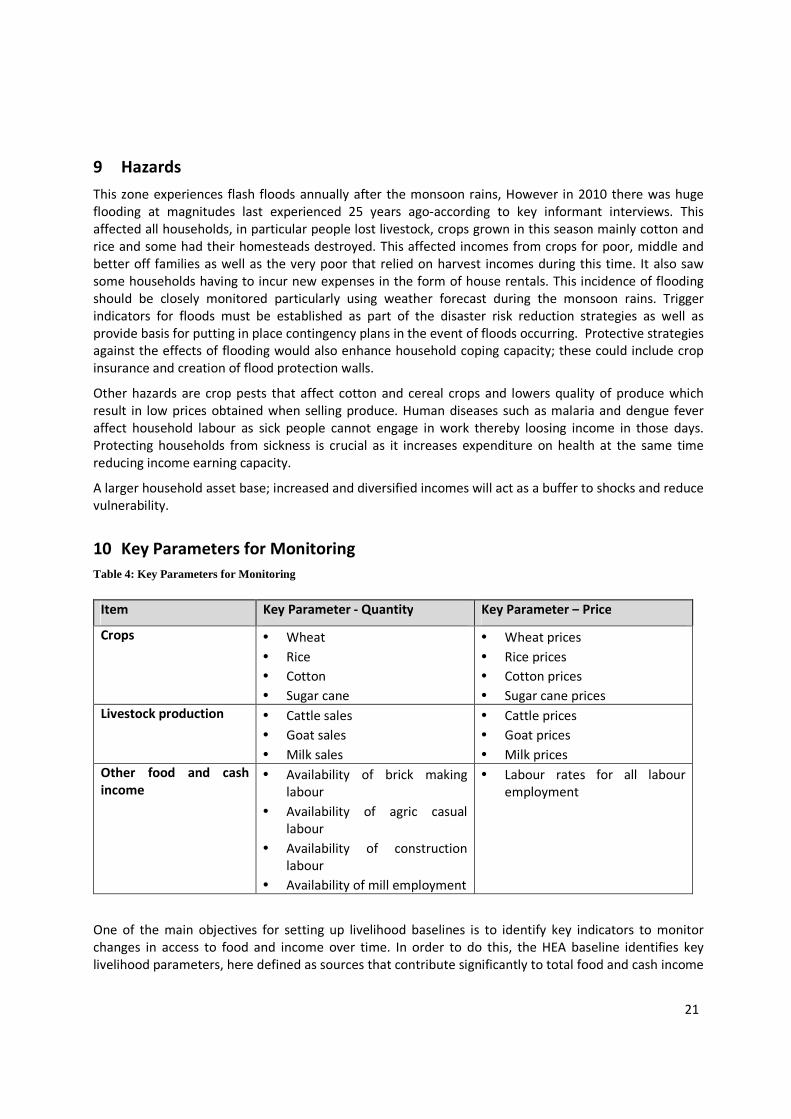
10 Key Parameters for Monitoring ..................................................................................................... 21
10.1.1 Monitoring Expenditure ................................................................................................. 22
10.1.2 Monitoring Incomes ....................................................................................................... 22
11 Using the Livelihoods Baselines for Monitoring and Program Design ............................................. 22
11.1 Comparison against thresholds........................................................................................... 22
11.2 Illustrative scenario analysis ............................................................................................... 23
11.2.1 Projecting Livelihood Outcomes December 2011 to November 2012 .............................. 23
11.2.2 Projecting livelihood outcomes ~Impact of floods ........................................................... 25
11.3 Comparisons against poverty thresholds ............................................................................ 27
12 IMPLICATIONS FOR PROGRAMMING ............................................................................................. 28
12.1 Support to Income Generating Activities ............................................................................ 28
12.2 Access to Social Services ..................................................................................................... 28
4
12.3 Social Transfers .................................................................................................................. 28
12.4 Access to land .................................................................................................................... 29
13 ANNEXES ....................................................................................................................................... 30
13.1 Annex 1: Livelihood Thresholds Details ............................................................................... 30
13.2 Annex 2: Livelihood Zone Map ............................................................................................ 30
13.3 Annex 3: Population of Livelihood Zones by Union Council ................................................. 31
13.4 Annex 4: List of Markets Visited.......................................................................................... 40
13.5 Annex 5: Baseline Prices ..................................................................................................... 41
5
List of Figures
Figure 1: Southern Punjab Livelihood Zones .......................................................................................... 12
Figure 2: Seasonal Calendar ................................................................................................................... 13
Figure 3: Household Demographics ....................................................................................................... 15
Figure 4: Contribution of food sources ~% Annual Kcal .......................................................................... 15
Figure 5: Dietary diversity ~% Annual Kcal ............................................................................................. 16
Figure 8: Very poor ~ seasonal income .................................................................................................. 17
Figure 9: Poor ~seasonal income ........................................................................................................... 17
Figure 6: Annual Income~ Thousand Rupees .......................................................................................... 17
Figure 7: Percentage Annual Income ..................................................................................................... 17
Figure 10: Middle ~ seasonal income ..................................................................................................... 18
Figure 11: Better off ~ seasonal income ................................................................................................. 18
Figure 12: Annual Expenditure ~Thousand Rupees ................................................................................ 18
Figure 13: Percentage Annual Expenditure ............................................................................................ 18
Figure 14: Total Access ~Kcal Equivalent ................................................................................................ 19
Figure 15: Total Access ~Rupee equivalent ............................................................................................ 20
Figure 16: Very poor food access outcome ............................................................................................ 23
Figure 17: Poor food access outcome .................................................................................................... 23
Figure 18: Very poor expenditure outcome ........................................................................................... 24
Figure 19: Poor expenditure outcome ................................................................................................... 24
Figure 20: Very poor total access outcome ............................................................................................ 24
Figure 21: Poor total access outcome .................................................................................................... 24
Figure 22: Very poor total access ~Flood outcome ................................................................................. 26
Figure 23: Poor total access ~ Flood outcome ........................................................................................ 26
Figure 24: Middle total access~ Flood outcome ..................................................................................... 26
Figure 25: Better off total access~ Flood outcome ................................................................................. 26
Figure 26: Comparison of total income against USD1.25 per person per day .......................................... 27
List of Tables
Table 1: Livelihood zone population ...................................................................................................... 13
Table 2: Wealth Breakdown Information ............................................................................................... 14
Table 3: Coping strategies ...................................................................................................................... 20
Table 4: Key Parameters for Monitoring ................................................................................................ 21
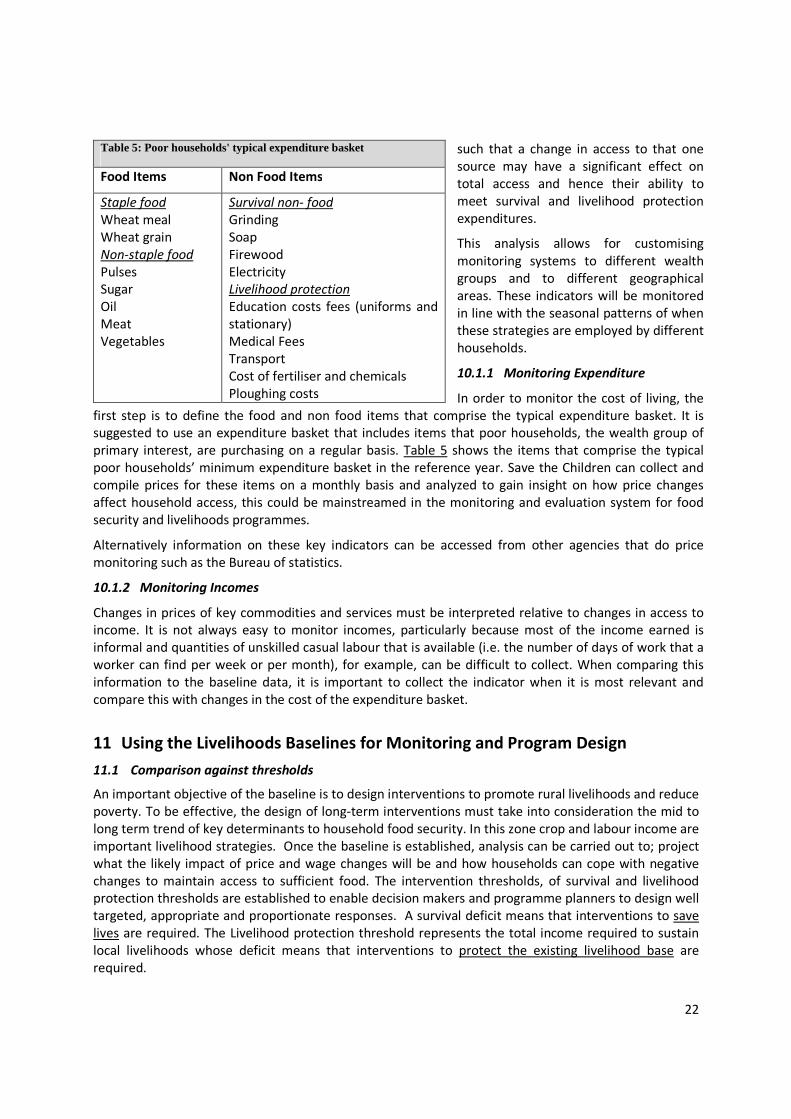
Table 5: Poor households' typical expenditure basket ............................................................................ 22
Table 6: Price problem specification baseline average and November 2011 ........................................... 23
Table 7: Price scenario analysis results .................................................................................................. 25
Table 8: Problem specification ~ Flood .................................................................................................. 25
Table 9: Flood scenario analysis results.................................................................................................. 27
Table 11: Modelling contribution of an acre of land to household income ............................................. 29
6
1 SUMMARY
1.1 Objectives of the Study
Save the Children is in the process of establishing food security and livelihoods medium to long-term
interventions to assist households recover from multiple shocks, which include macro economic
instability and floods experienced over the last few years. This assessment is part of a process to build
robust analysis to inform decision makers of appropriate interventions that enable households affected
by the 2010 monsoon floods to fully recover and build resilience against future shocks.
To inform the design of livelihood recovery interventions, community-wide livelihood baseline study was
commissioned whose findings are detailed in this report. The specific objectives of the study are the
following:
− To produce robust livelihood based analysis in one livelihood zone
− To guide the development of specific interventions in the area of food security, livelihood and,
nutrition.
− To provide essential information for subsequent Cost of Diet analysis
− To provide analysis tools and training in scenario analysis.
− To build the capacity of staff and stakeholders in Household Economy analysis
1.2 Methodology
The Household Economy Approach (HEA) was used for collecting and analyzing field-based livelihood
information on the wealth breakdown, seasonal calendar for main events and activities, and the
profiling of livelihood strategies, which include sources of food and cash income, expenditure patterns,
and household coping strategies. Livelihood strategies are the options and choices adopted by people to
make a living. It is a range or a combination of activities that people or households engage in to achieve
their livelihood goals. Livelihood strategies primarily include how people access food and income. They
also cover how people manage and preserve assets and how they respond to shocks (i.e. coping
strategies employed). This methodology allows for a holistic approach to understanding the way people
live. It provides a good starting point for objectively demonstrating change in people’s access to food
and cash due to multiple changes by allowing analysis of the impact of changes in individual livelihood
strategies as well as its contribution to total livelihood access.
1.3 Results
The local social and economic structure in the zone is largely typical of an economy dependent on crop
production, keeping of livestock and related agriculture related and dependent casual employment.
There is a range of economic activities available for different households in the zone, which generally
differ by household asset wealth, type, scale, and capital requirements. Poorer households are
dependent on a variety of labour based food and cash income sources, encumbered from diversification
into higher value trade activities by a lack of skills and capital. Where the poor are involved in trade it is
typically small-scale selling limited, very similar and cheap range of goods. Households on the higher
end of the wealth spectrum are pursuing high earning activities that require higher capital levels.
7
The poor have very limited coping mechanisms and often pursue negative livelihood strategies that pose
a risk to long-term livelihood access such as excessive selling of livestock and permanent migration. The
information presented in the baseline excludes the contribution of these high risk livelihood strategies,
because the analysis seeks to establish an information base that helps decision makers and programme
planners define trigger points for intervention, and for the design of appropriate and proportionate
interventions which prevent a resort to negative coping strategies and also take advantage of existing
opportunities.
Wealth Groups: Four wealth groups were identified in this zone. These comprise 36% very poor
households, 28% poor, 23% in the middle category and 13% considered better-off. Average household
size is the same across wealth groups averaging 8 people within each wealth group. Household size is
not a key determinant of wealth, although dependency ratios are. Among the very poor and poor
households, there are more children under the age of 5 years which puts more burden on caring
compared to the middle and better off that have less children fewer than five but more in school going
age. Although averagely there are 2 adults capable of working the better off households have more
stable economic activities compared to the poorer groups who rely on looking for casual and seasonal
employment. Access to land for production through either ownership and rental/leasing is the primary
wealth determinant as well as livestock, particularly cattle and buffalo.
Food Sources: Crop production is the major food source for the poor, middle and better off households
and households strive to produce as much to ensure household food security. Crop production comprise
62% of poor food needs, 72% and 73% of the middle and better off annual food needs. The very poor
are the only wealth group that do not depend on food production as a source of food as they do not
have access to land for production purposes. Household in this wealth group depend largely on
purchasing food and labour exchange for the food needs. Purchases contribute 80% of food needs for
the very poor households. In the reference year the very poor are the only wealth group that did not
obtain 100% of their food needs with a total of 96%. This is an indication of borderline survival and
further deterioration may result in food related malnutrition. The poor, middle and better off exceed
the minimum requirement, accessing 101%, 104% and 108% respectively over the reference year. The
very poor wealth group engage in casual work which earned them 13% of their annual energy
requirements to compliment their food needs. This makes labour availability within a household for
these groups important as well as the quality of the labour. Households with low labour units and with
chronic illness are more vulnerable as they are in no position to provide the labour required. All
households supplement their food consumption with purchases, particularly non staple food.
Dietary Diversity: Cereals are providing the vast majority of household food energy needs for all wealth
groups, 74% for very poor, and between 78% for the poor and 74% middle and 74% for better off. Milk
and Pulses and are the main dietary add-ons. Consumption of non staple oil, sugar, meat, is key a key
indicator of wealth, increasing from the very poor to the better off. The dietary intake for the very poor
is very low and has long term impact on the nutritional well being of this population. The wealthier a
household is the more adequate and diverse the diet.
Income: The bulk of the income for the very poor and poor households comes through on-farm and off-
farm casual labour activities labour. The combined contribution of these labour related activities
provide for 84% and 43% of very poor and poor households’ annual income. The middle and better off
earn most of their income from crop sales mainly cotton, sugarcane, rice and wheat crop surplus
contributing 64% and 80%. The analysis has shown that there is low diversity in the income options for
the very poor with a huge dependence on casual work. Communities indicated the labour opportunities
fluctuates and this point to the need for establishing a range of income activities that are more
predictable and stable for this lower group and reduce exposure to fluctuating labour markets. Women
8
are have limited livelihood opportunities, the predominant income labour opportunities done by women
is harvesting of wheat and cotton picking. Other activities such as embroidery are affected by absence of
a viable market. More income activities targeting women would improve household income.
Expenditure: The bulk of the very poor and poor household’s income is spent on basic survival items
such as food and essential non food items such as soap, salt and paraffin and grinding. These basic items
accounts for 83% and 47% of the annual income for the very poor and poor households respectively. In
contrast the middle and better off households spent more of their income 52% and 60% respectively on
inputs- mainly ploughing costs, fertilisers and pesticides. The very poor and poor are basically spending
most of their income for surviving a picture which indicate poverty. This situation limits the ability of
poorer households to invest in their livelihoods particularly education, health, production inputs and
improving their asset wealth consequently exacerbating their inability to break the poverty cycle.
Total income: In the baseline year all wealth groups obtained income above the livelihood protection
and indication that the form of intervention required is to promote existing livelihoods and build
household resilience to shocks.
Programming Implications
Income Generating Activities: Diversity in income sources is healthy for any population as this minimise
the risk of over reliance on few income sources, in particular in light of the over dependence of poorer
households on casual labour, there is need to improve the income portfolios for households to have
more stable self employment activities linked with value chains of main livelihood strategies and or
linked to reducing expenditure cost on non staple survival cost such as grinding. Providing capital is vital
to enable them to start up higher earning trade activities. Returns of an income generating activity are
influenced by demand and where these are promoted there is need to have a market feasibility study to
provide information on whether the products will have buyers. This is particularly important to ensure
implementation of activities that pass the feasibility analysis and reduce the challenge of failed projects.
Income generating activities should also target women who have limited income opportunities and
gender appropriate business and projects should be promoted to enhance women contribution to
household income.
Agriculture support: The most important livelihood strategy for all rural economies under study is crop
and livestock production and have a bearing on determining livelihood security. The households require
design of interventions that increase and sustain production of food and livestock. The implementation
of input subsidy is a sustainable aspect to ensure farmers access affordable inputs. The marketing
structure of crops gives low returns to farmers as middle men offer low prices as farmers do not have a
bargaining platform. Advocating for establishment of farmer associations for bulk marketing will provide
farmers power to bargain with middlemen and companies that by cotton, wheat and sugar cane, this
should also be linked market information dissemination to improve farmer negotiating skills with
buyers. One of the major costs for households is ploughing cost; this cost can be reduced through
promotion of technologies that do not require much tillage. In promoting technologies due care must be
taken to ensure that the focus of the intervention is on technology transfer as a skill not attached to
physical inputs as seed. Changing farming practises is a longer term goal which requires substantial
investment in extension and demonstrating added value of new technologies. Extension on growing of
other accepted crops such as sweet potatoes should be promoted to enhance food diversity. Vegetable
production for household consumption should be promoted to save income currently spent on
purchasing vegetables.
Social Services Support: Alternative interventions to improve the livelihoods of poor households are
assistance with education and health costs. Education fees are subsidised by government although
9
households still have to meet the costs for uniform and stationery. Expenditure on education increases
with wealth indicating the ability of wealthier households to meet costs of education. Information
collected in baseline showed a low expenditure on health with key informants indicating most
households fail to meet health cost. All wealth groups are spending about 2% of their income to meet
drug costs and user fees in local clinics and mobile clinics. However the actual amount spent on health
costs increases with wealth. Providing assistance with education, and health, improves long term
development prospects for the poor and potential to break the poverty cycle. Infrastructure
improvement is a key development priority identified by communities. The very poor and poor are not
capable of sending all their children to school particularly beyond primary education and this can form
basis for targeting access related interventions.
Social transfers: Out of 12 Union Councils (UCs) visited, none of the wealth groups in any of the UCs
reported receiving social transfers of any kind. The largest social protection programme in Pakistan is
the government-led Benazir Income Support Programme (BISP): http://bisp.gov.pk/. This aims to
provide five million families living below the poverty line with a cash transfer of Rs. 1000 per month..
The lack of access to this entitlement by UCs visited is an indication that the social protection scheme
needs to be enhanced and expanded. If cash transfers are considered, the size of the livelihood
protection deficit is an important factor in the design of this intervention. In the reference year none of
the wealth groups had a livelihood protection deficit, although the very poor are on the border line. The
important point to note is that the analysis of cash transfers and targets must be customized to specific
wealth groups. It is also important that price and income monitoring data inform the appropriate level
of transfer. Going beyond emergency needs, Save the Children is encouraged to establish development
targets/milestones and using the baseline information evaluates what level of transfer would be
required to achieve the desired targets. Such a target could be to meet all necessary health costs or
restoring viable livestock herd sizes for households that lost livestock during the floods. This information
should be taken into account both when designing transfer programmes to be implemented directly,
and when advocating for changes to existing schemes.
Access to land: Access to land is important for rural households. The study has revealed that an
estimated 36% of households do not have access to land and their survival is mainly to meet basic needs
such as food and non food stuffs. In contrast the next group in the wealth linear have a good
contribution of food and cash income from production. Providing productive land to these households
will provide a stable source of income. However, this involves changing land ownership structure a
historically engrained, culturally reinforced feudal system. This requires a firm and persuasive strategy
that seeks government commitment to land reform as an overall poverty reduction strategy.
2 Introduction
Save the children has been working in food security and livelihoods programmes, but focusing mainly on
emergency type of responses given the multiple hazards faced by rural communities in Pakistan. The
large scale emergency response in 2010 was to address immediate needs with a bias towards
consumption and protecting further deterioration. Naturally the next stage after emergency is investing
in the productive aspects of rural communities as a way of rebuilding lost livelihoods and promoting
household resilience. SC has observed the need to work with government, donor and NGO stakeholder
in moving beyond emergency response to recovery, livelihoods promotion and increasing household
ability to withstand future shocks. To be able to do this SC is promoting robust evidence base to inform
response and policy formulation outlining the nature and scale of the food security and nutrition
problem in rural Pakistan. This will improve coordinated and appropriate response planning. The
establishment of this livelihood analysis using HEA is to strengthen livelihoods programming.
10
3 Methodology
The Household Economy Approach (HEA) was used for collecting and analyzing field-based livelihood
information on livelihood zoning- defining a geographic area within which people share broadly the
same patterns of access to food and cash income, and have the same access to markets; wealth
breakdown- grouping people within a livelihood zone into wealth groups using local definitions of
wealth and quantification of their assets; historical timeline- Analysis of seasonal performance and
events that influenced livelihood access; seasonal calendar- A graphical presentation of the months in
which food and cash crop production and key food and income acquisition strategies take place and
profiling of livelihood strategies- Quantification of each wealth group’s sources of food and cash
income, , expenditure patterns, and coping strategies.
The HEA involves analysis of livelihood strategies employed by households within a defined livelihood
zone considering geography, markets and production systems as these affect how a population
constructs and maintains its livelihood. The primary focus is an investigation on the combination of the
means by which each wealth group make a living, that is, how they access food, cash income and their
expenditure patterns. This also includes the ways people manage and preserve assets and how they
cope with stress in access.
In HEA, the household is the unit of analysis and analysis focuses on households’ access to basic food
and non-food items whether through production, purchase, exchange or other means. Understanding
how households obtain their food and non-food items and how they obtain resources to buy these
things enable analysts to understand how household and local economies function. This understanding
is critical as it provides benchmarks for comparing changes to this access as a result of external shocks,
be it natural disasters or economic shocks.
The assessment was done in one livelihood zone in the Muzaffargharh in the Irrigated Mixed Agriculture
with Casual Labour (IACL) livelihood zone. The study made use of focus group interviews with
community leaders to define wealth groups using local determinants and representatives households
for the identified wealth groups (Very poor, Poor, Middle and Better off), to quantify their livelihood
strategies. A total of 12 key informant and 48 wealth group interviews covering 12 union councils in the
zone. In addition a total of 12 markets were visited to collect price information and understand market
routes for commodities in and out of the zone.
The team undertook the following steps during this study:
• Livelihood Zoning. A two day stakeholder workshop was held to define livelihood zones found in
the three districts of Muzaffargharh, Rajanpur and Dera Ghazi Khan. Following which six
livelihood zones were defined forming the bases for analysis units. The study focused on one
zone which covers a bigger portion of the three districts ~Irrigated Food and Cash Crop Farming
with casual Labor (ICCL)
• Livelihood Assessment. The baseline assessment was combined with capacity building for Save
the Children and partner staff. A total of 15 participants were trained and equipped with skills to
manage field data collection. The topics covered included: HEA framework overview, livelihood
zoning, reference year selection, wealth groups, livelihood strategies, kilocalorie calculations,
coping strategies, seasonality, ensuring high quality field information, storing and analyzing
baseline data. These trainings provided in theory and practice for participants.
11
• Data collection: The field work for the study was undertaken from October 28 to November 19.
Trained participants were deployed to carry out the assessment with guidance from
experienced HEA practitioner.
• Interviews with Community leaders. The team conducted 12 focus group discussions in the in
each relevant community selected for the study. The purpose was to gather information on the
historical timeline to determine reference year, and seasonal calendar, to establish the wealth
breakdown and identify household representatives that would be interviewed for the study four
wealth groups, this process defined four wealth groups (Very poor, Poor, middle and Better off).
These terms are used in relative terms and simply measures local wealth distribution looking at
what makes people have more than others in the same community.
• Interviews with Household Representatives. Individual household interviews were held with 48
household representatives, 12 for each wealth group. Household representatives provided
information on food, income and expenditure patterns, hazards and coping strategies. The
reference year for the study was April 2009 to March 2010. The start of the reference year was
determined by the typical start consumption month of main staple food crop harvest which
defines start of a consumption year. The household economy information was cross-checked
within and between interviews and with other sources of information (both key informant and
secondary sources).
• Market Assessment: The team visited 12 markets in the zone to collect price data and
understand market hazards
• Data analysis and livelihood baseline report compilation. Data analysis was carried out by the
team. The process involved developing a picture of household livelihood strategies for the
respective wealth groups.
The baseline outline provides a description of typical household access in the reference year of April
2009 and March 2010. This year is a year before the occurrence of floods in 2010 and was identified by
communities as a relatively average year in terms of livelihood access. This provides a very good picture
of livelihood situation before the major hazard and a perfect reference point when livelihood access was
“normal”.
4 Livelihood Zone Description
The baseline assessment1 was done in the ICCL livelihood zone and focused on understanding the
various household sources of food, income and expenditure patterns among the four wealth groups as
defined by community key informants. It also explored the issues related to household vulnerability in
case of shocks as well as the coping strategies and options they undertake during bad years.
1 Field work for the current profile was undertaken between October and November 2011. The information presented refers to
April 2009 to March 2010 consumption year, a relatively average year by local standards when judged in the context of recent
years (i.e. a year of average production and rural food security). Provided there are no fundamental and rapid shifts in the
economy, the information in this profile is expected to remain valid for approximately five years (i.e. until 2015).
4.1 Main Conclusions and Implications
Households in this zone depend mainly on irrigated food and cash crop cultivation as well as casual
employment. Land holding is for a few landlords with a majority of households depending on
12
leasing/renting. The two rain seasons are particularly important as this allows households to have year
round production. The zone has recently experienced floods that have affected household savings and
livestock holdings. This is a high potential area and current production is limited by production costs in
particular cost for ploughing, fertiliser and chemicals. Population pressure is also having an impact on the
size of productive land for crops and livestock with most households having to keep less numbers of
livestock as the crop residues from wheat and rice cannot provide enough feed year round.
This zone is categorised as a cereal surplus area in particular for wheat and rice production. In poorer
households, the number of labour units is a critical factor for household food security. The poor
households who depend on buying their food on rolling credits are highly vulnerable to food inflation
which decreases purchasing power and in turn compromise their food security.
Development priorities identified by community focus primarily on income generation and support of
existing livelihood assets. Improved agriculture technologies are essential to cut on production costs as
well as input subsidies. Due to loss of livestock in the flood and through over selling to recover livestock
restocking to restore ownership are critical to ensure animal head viability.
Expenditure on social services is low and investment in health and education are essential to enhance
livelihood options of households and health status of both adults and children.
4.2 Zone Description
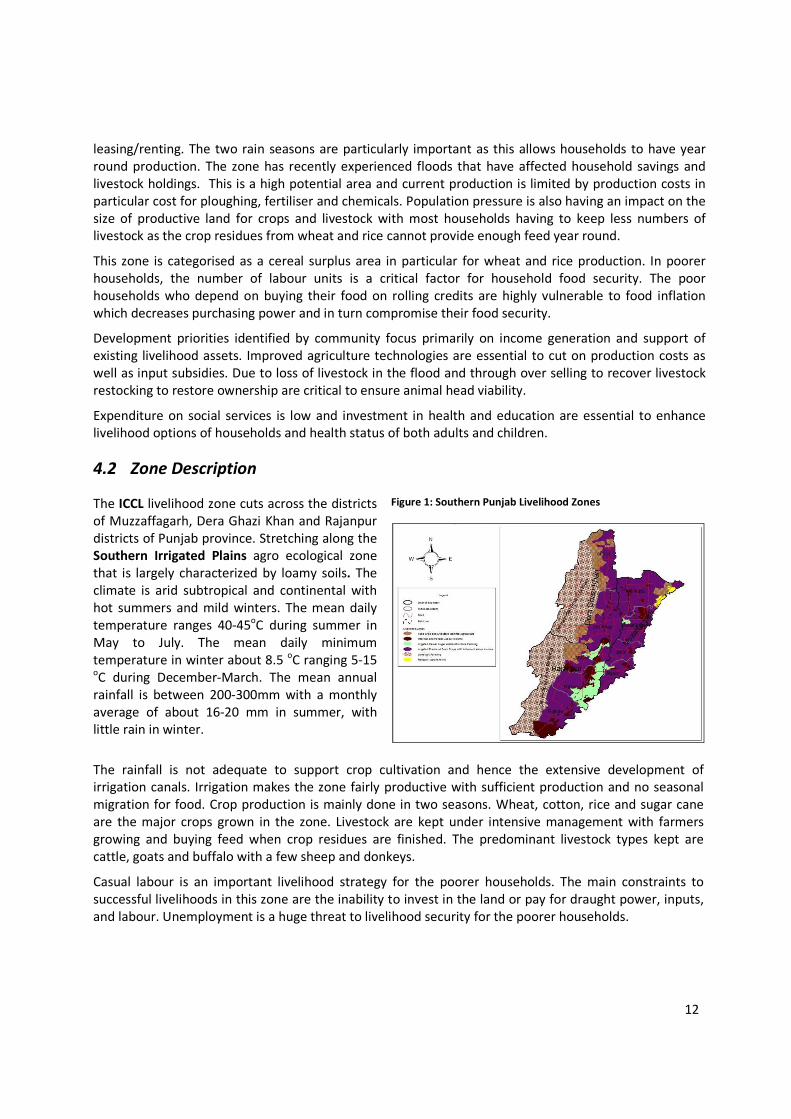
The ICCL livelihood zone cuts across the districts
of Muzzaffagarh, Dera Ghazi Khan and Rajanpur
districts of Punjab province. Stretching along the
Southern Irrigated Plains agro ecological zone
that is largely characterized by loamy soils. The
climate is arid subtropical and continental with
hot summers and mild winters. The mean daily
temperature ranges 40-45oC during summer in
May to July. The mean daily minimum
temperature in winter about 8.5 oC ranging 5-15
oC during December-March. The mean annual
rainfall is between 200-300mm with a monthly
average of about 16-20 mm in summer, with
little rain in winter.
Figure 1: Southern Punjab Livelihood Zones
The rainfall is not adequate to support crop cultivation and hence the extensive development of
irrigation canals. Irrigation makes the zone fairly productive with sufficient production and no seasonal
migration for food. Crop production is mainly done in two seasons. Wheat, cotton, rice and sugar cane
are the major crops grown in the zone. Livestock are kept under intensive management with farmers
growing and buying feed when crop residues are finished. The predominant livestock types kept are
cattle, goats and buffalo with a few sheep and donkeys.
Casual labour is an important livelihood strategy for the poorer households. The main constraints to
successful livelihoods in this zone are the inability to invest in the land or pay for draught power, inputs,
and labour. Unemployment is a huge threat to livelihood security for the poorer households.
13
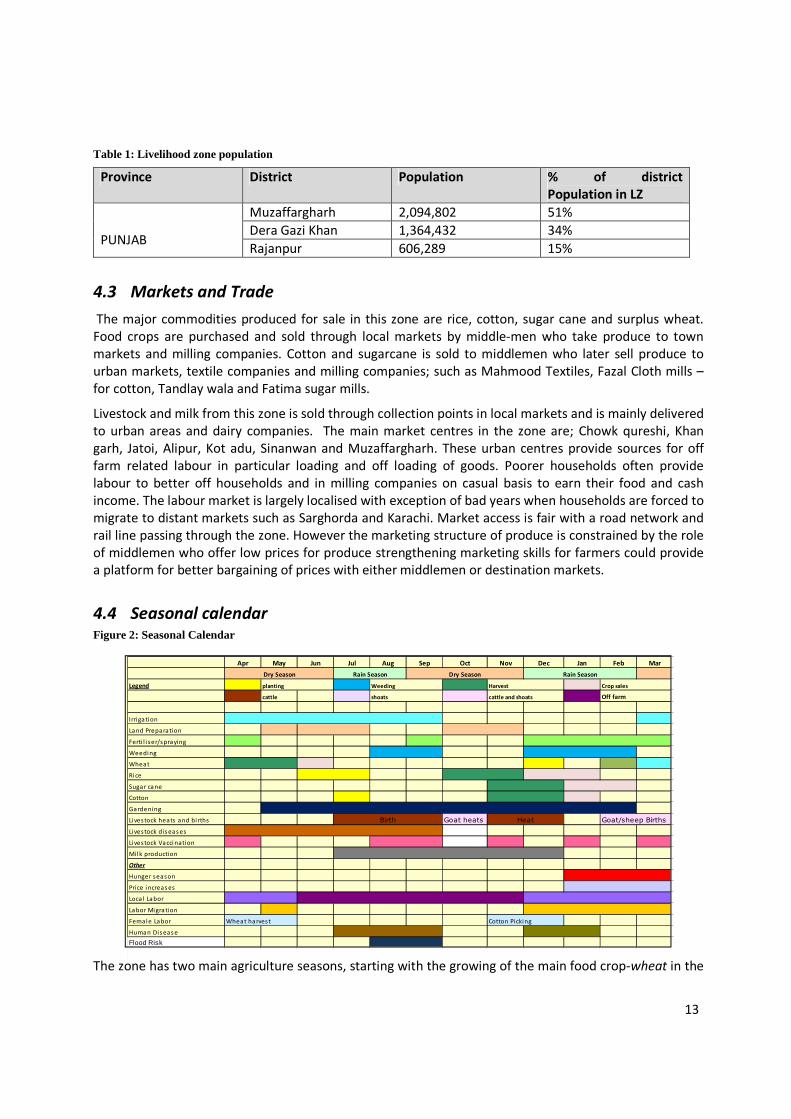
Table 1: Livelihood zone population
Province District Population % of district
Population in LZ
PUNJAB
Muzaffargharh 2,094,802 51%
Dera Gazi Khan 1,364,432 34%
Rajanpur 606,289 15%
4.3 Markets and Trade
The major commodities produced for sale in this zone are rice, cotton, sugar cane and surplus wheat.
Food crops are purchased and sold through local markets by middle-men who take produce to town
markets and milling companies. Cotton and sugarcane is sold to middlemen who later sell produce to
urban markets, textile companies and milling companies; such as Mahmood Textiles, Fazal Cloth mills –
for cotton, Tandlay wala and Fatima sugar mills.
Livestock and milk from this zone is sold through collection points in local markets and is mainly delivered
to urban areas and dairy companies. The main market centres in the zone are; Chowk qureshi, Khan
garh, Jatoi, Alipur, Kot adu, Sinanwan and Muzaffargharh. These urban centres provide sources for off
farm related labour in particular loading and off loading of goods. Poorer households often provide
labour to better off households and in milling companies on casual basis to earn their food and cash
income. The labour market is largely localised with exception of bad years when households are forced to
migrate to distant markets such as Sarghorda and Karachi. Market access is fair with a road network and
rail line passing through the zone. However the marketing structure of produce is constrained by the role
of middlemen who offer low prices for produce strengthening marketing skills for farmers could provide
a platform for better bargaining of prices with either middlemen or destination markets.
4.4 Seasonal calendar
Figure 2: Seasonal Calendar
The zone has two main agriculture seasons, starting with the growing of the main food crop-wheat in the
Apr May Jun Jul Aug Sep Oct Nov Dec Jan Feb Mar
Legend
cattle cattle and shoats
Irrigation
Land Preparation
Ferti l i ser/spraying
Weeding
Wheat
Rice
Sugar cane
Cotton
Gardeni ng
Livestock heats and births Goat heats Goat/sheep Births
Livestock dis eas es
Livestock Vacci nation
Milk production
Other
Hunger season
Price i ncreas es
Loca l Labor
Labor Migration
Female Labor
Human Dis eas e
Flood Risk
Birth Heat
Rain SeasonRain SeasonDry Season Dry Season
Crop sales
shoats
planting Weeding Harvest
Off farm
Wheat harves t Cotton Picking
14
season of December to February and the second during monsoon rains from June to August for rice and
cotton production. The zone is heavily irrigated with high production of sugar cane which is an annual
crop. Wheat planting is mainly done in November and December with harvests starting April ending in
May. Rice and Cotton are cash crops harvested in October to November. The harvesting of all crops
provides income for poor households who provide labour in better off households during the time of
harvest.
Other labour activities include brick making, masonry assistance, mill employment, mango picking and
labour migration which are pursued throughout the year with a depression during rainy seasons and
religious holidays.
Food price increases coincide with the typical hunger season from January to March just before start of
harvest. During this time households depend on credit which is repaid after harvest. This period present
major access challenges for households as income opportunities are very low. The risk of households
employing high cost coping strategies such as reducing the quantity of food intake, and excessive selling
of livestock is high during this period as households particularly the very poor struggle to make ends
meet.
The major livelihoods hazards are livestock diseases in particular haemorrhagic septicaemia, foot and
mouth, black quarters, mastitis and intestinal parasites. These diseases if not managed affect livestock
quality and milk production during this period and may result in loss through death and hence household
ability to access drugs is crucial in protecting head sizes. Human diseases such as malaria and dengue
fever affects household labour and effectively ability of household to engage in casual labour to raise
income, the analysis of labour rates indicate that a loss of a day’s work is equivalent to a loss of Rs 250.
Monsoon rains in July to August presents a risk to flooding due to high rainfall and over flows from the
rivers Indus and Chenab.
5 Wealth Breakdown
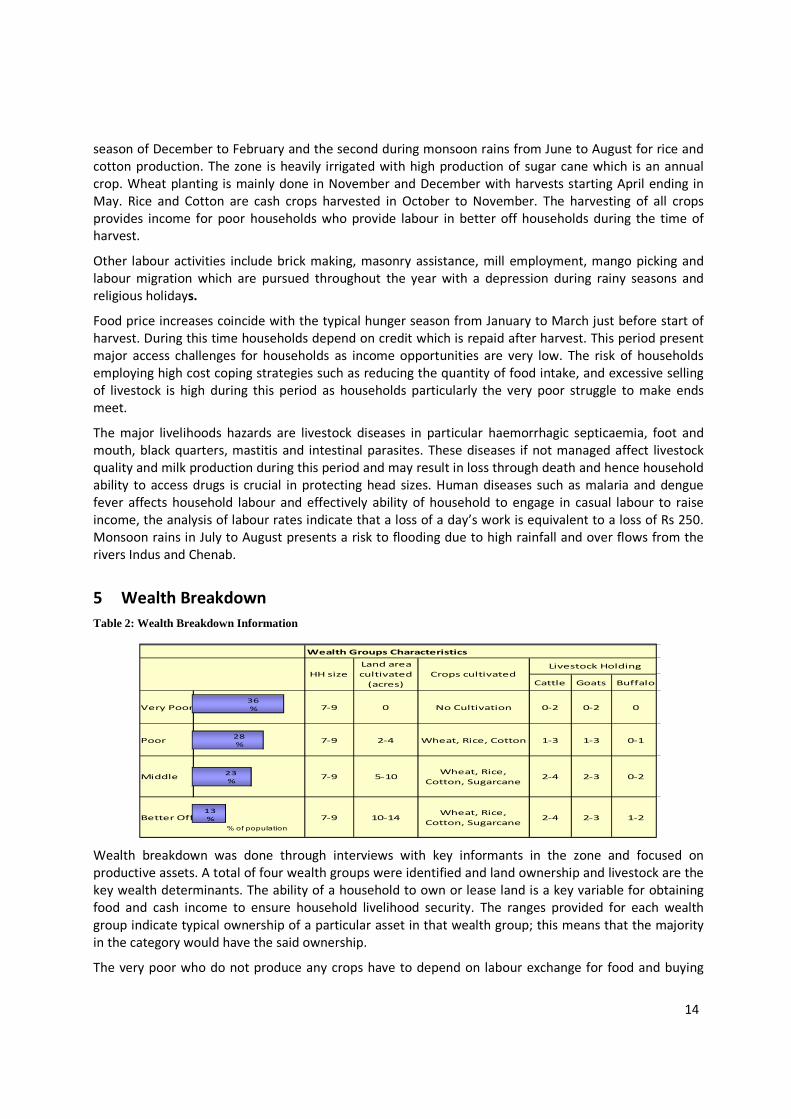
Table 2: Wealth Breakdown Information
Wealth breakdown was done through interviews with key informants in the zone and focused on
productive assets. A total of four wealth groups were identified and land ownership and livestock are the
key wealth determinants. The ability of a household to own or lease land is a key variable for obtaining
food and cash income to ensure household livelihood security. The ranges provided for each wealth
group indicate typical ownership of a particular asset in that wealth group; this means that the majority
in the category would have the said ownership.
The very poor who do not produce any crops have to depend on labour exchange for food and buying
Wealth Groups Characteristics
Cattle Goats Buffalo
Very Poor 7-9 0 No Cultivation 0-2 0-2 0
Poor 7-9 2-4 Wheat, Rice, Cotton 1-3 1-3 0-1
Middle 7-9 5-10Wheat, Rice,
Cotton, Sugarcane2-4 2-3 0-2
Better Off 7-9 10-14Wheat, Rice,
Cotton, Sugarcane2-4 2-3 1-2
Livestock HoldingHH size
Land area
cultivated
(acres)
Crops cultivated
13
%
23
%
28
%
36
%
% of population
from the market. The main reasons why the poor are poor is limited access to land and capacity to look
after large numbers of livestock in an area with limited grazing land. The poor who rent land are faced
with a challenge of the lease payments to which take most of their produce and or income.
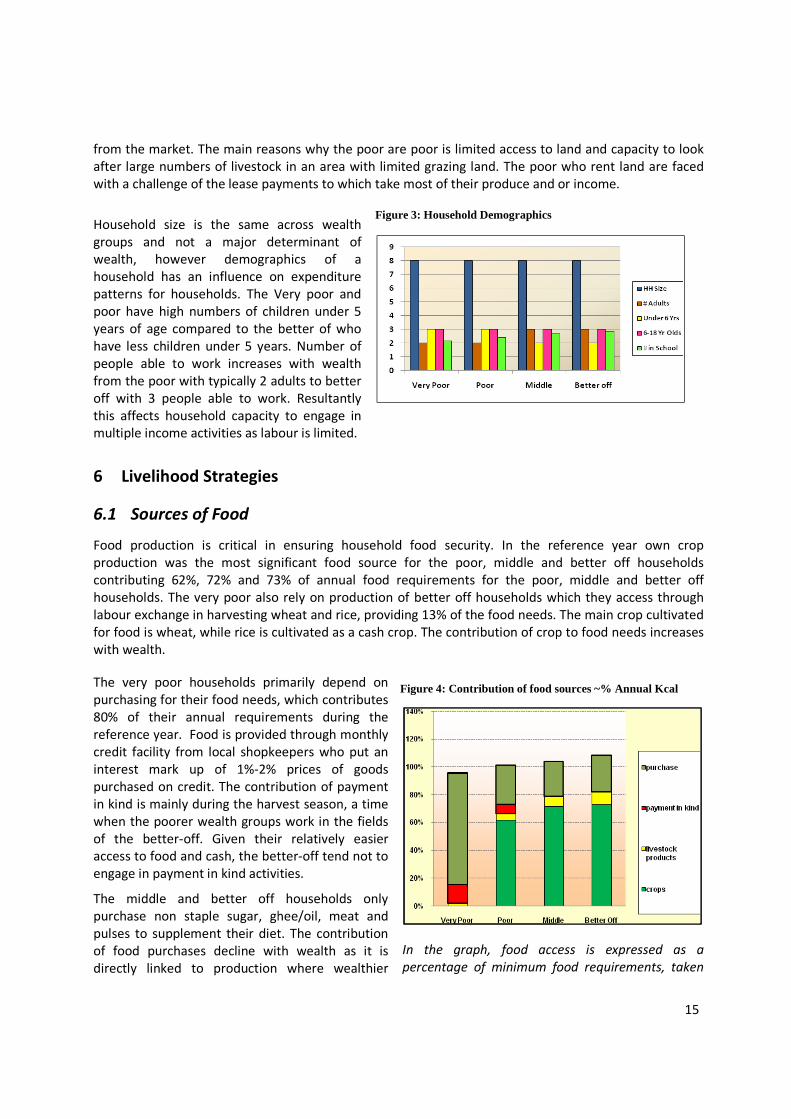
Household size is the same across wealth
groups and not a major determinan
wealth, however demographics of a
household has an influence on expenditure
patterns for households. The Very poor and
poor have high numbers of children under 5
years of age compared to the better of who
have less children under 5 years. Number of
people able to work increases with wealth
from the poor with typically 2 adults to better
off with 3 people able to work. Resultantly
this affects household capacity to engage in
multiple income activities as labour is limited.
6 Livelihood Strategies
6.1 Sources of Food
Food production is critical in ensuring household food security. In the reference year own crop
production was the most significant food source for the poor, middle and better off
contributing 62%, 72% and 73% of annual food requirements for the poor, middle and better off
households. The very poor also rely on production of better off households which they access through
labour exchange in harvesting wheat and rice, prov
for food is wheat, while rice is cultivated as a cash crop. The contribution of crop to food needs increases
with wealth.
The very poor households primarily depend on
purchasing for their food needs, which contributes
80% of their annual requirements during the
reference year. Food is provided through monthly
credit facility from local shopkeepers who put an
interest mark up of 1%-2% prices of goods
purchased on credit. The contribution of payment
in kind is mainly during the harvest season, a time
when the poorer wealth groups work in the fields
of the better-off. Given their relatively easier
access to food and cash, the better
engage in payment in kind activities.
The middle and better off households only
purchase non staple sugar, ghee/oil, meat and
pulses to supplement their diet. The contribution
of food purchases decline with wealth as it is
directly linked to production where wealthier
from the market. The main reasons why the poor are poor is limited access to land and capacity to look
umbers of livestock in an area with limited grazing land. The poor who rent land are faced
with a challenge of the lease payments to which take most of their produce and or income.
Household size is the same across wealth
groups and not a major determinant of
wealth, however demographics of a
household has an influence on expenditure
patterns for households. The Very poor and
poor have high numbers of children under 5
years of age compared to the better of who
have less children under 5 years. Number of
ople able to work increases with wealth
from the poor with typically 2 adults to better
off with 3 people able to work. Resultantly
this affects household capacity to engage in
multiple income activities as labour is limited.
Figure 3: Household Demographics
Livelihood Strategies
Food production is critical in ensuring household food security. In the reference year own crop
production was the most significant food source for the poor, middle and better off
contributing 62%, 72% and 73% of annual food requirements for the poor, middle and better off
households. The very poor also rely on production of better off households which they access through
labour exchange in harvesting wheat and rice, providing 13% of the food needs. The main crop cultivated
for food is wheat, while rice is cultivated as a cash crop. The contribution of crop to food needs increases
The very poor households primarily depend on
purchasing for their food needs, which contributes
80% of their annual requirements during the
reference year. Food is provided through monthly
credit facility from local shopkeepers who put an
2% prices of goods
purchased on credit. The contribution of payment
in kind is mainly during the harvest season, a time
when the poorer wealth groups work in the fields
off. Given their relatively easier
tter-off tend not to
engage in payment in kind activities.
The middle and better off households only
purchase non staple sugar, ghee/oil, meat and
pulses to supplement their diet. The contribution
of food purchases decline with wealth as it is
nked to production where wealthier
In the graph, food access is expressed as a
percentage of minimum food requirements, taken
Figure 4: Contribution of food sources ~%
15
from the market. The main reasons why the poor are poor is limited access to land and capacity to look
umbers of livestock in an area with limited grazing land. The poor who rent land are faced
with a challenge of the lease payments to which take most of their produce and or income.
Food production is critical in ensuring household food security. In the reference year own crop
production was the most significant food source for the poor, middle and better off households
contributing 62%, 72% and 73% of annual food requirements for the poor, middle and better off
households. The very poor also rely on production of better off households which they access through
iding 13% of the food needs. The main crop cultivated
for food is wheat, while rice is cultivated as a cash crop. The contribution of crop to food needs increases
In the graph, food access is expressed as a
percentage of minimum food requirements, taken
: Contribution of food sources ~% Annual Kcal
households do not have to buy staple. Purchases
contribute 28%, 25% and 26% of food needs of the
poor, meddle and better off households
respectively.
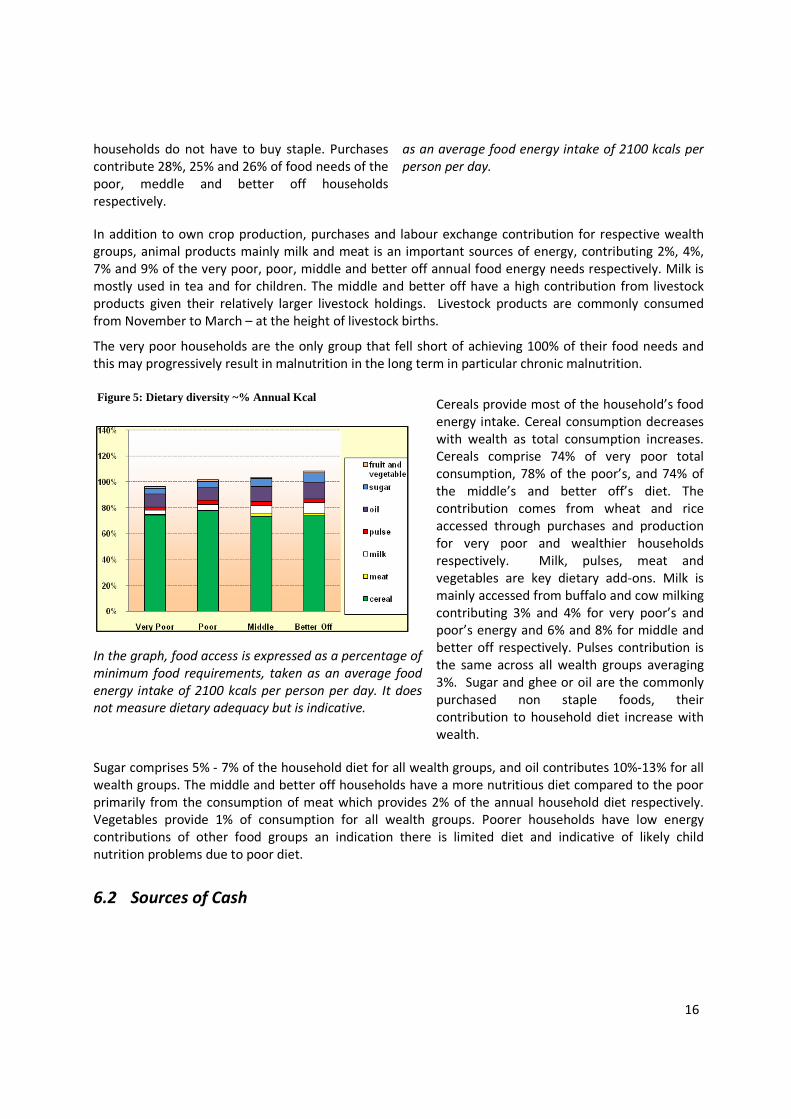
In addition to own crop production, purchases and labour exchange contribution for r
groups, animal products mainly milk and meat is an important sources of energy, contributing 2%, 4%,
7% and 9% of the very poor, poor, middle and better off annual food energy needs respectively. Milk is
mostly used in tea and for children
products given their relatively larger livestock holdings. Livestock products are commonly consumed
from November to March – at the height of livestock births.
The very poor households are the only group that fell short of achieving 100% of their food needs and
this may progressively result in malnutrition in the long term in particular chronic malnutrition.
In the graph, food access is expressed as a percentage of
minimum food requirements, taken as an average food
energy intake of 2100 kcals per person per day. It does
not measure dietary adequacy but is indicative.
Sugar comprises 5% - 7% of the household diet for all wealth groups, and oil contributes 10%
wealth groups. The middle and better off households have a more nutritious diet compared to the poor
primarily from the consumption of meat which provides 2% of the annual household diet respectively.
Vegetables provide 1% of consumption for all wealth groups. Poorer households have low energy
contributions of other food groups an indication there is limited
nutrition problems due to poor diet.
6.2 Sources of Cash
Figure 5: Dietary diversity ~% Annual Kcal
households do not have to buy staple. Purchases
contribute 28%, 25% and 26% of food needs of the
poor, meddle and better off households
as an average food energy intake of 2100 kcals per
person per day.
In addition to own crop production, purchases and labour exchange contribution for r
groups, animal products mainly milk and meat is an important sources of energy, contributing 2%, 4%,
7% and 9% of the very poor, poor, middle and better off annual food energy needs respectively. Milk is
mostly used in tea and for children. The middle and better off have a high contribution from livestock
products given their relatively larger livestock holdings. Livestock products are commonly consumed
at the height of livestock births.
are the only group that fell short of achieving 100% of their food needs and
this may progressively result in malnutrition in the long term in particular chronic malnutrition.
In the graph, food access is expressed as a percentage of
minimum food requirements, taken as an average food
energy intake of 2100 kcals per person per day. It does
not measure dietary adequacy but is indicative.
Cereals provide most of the household’s food
energy intake. Cereal consumption decreases
with wealth as total consumption increases.
Cereals comprise 74% of very poor total
consumption, 78% of the poor’s, and 74% of
the middle’s and better off’s diet. The
contribution comes from wheat and rice
accessed through purchases and production
for very poor and wealthier households
respectively. Milk, pulses, meat and
vegetables are key dietary add
mainly accessed from buffalo and cow milking
contributing 3% and 4% for very poor’s and
poor’s energy and 6% and 8% for middle and
better off respectively. Pulses contribution is
the same across all wealth groups averaging
3%. Sugar and ghee or oil are the commonly
purchased non staple foods, their
contribution to household diet increase with
wealth.
7% of the household diet for all wealth groups, and oil contributes 10%
wealth groups. The middle and better off households have a more nutritious diet compared to the poor
arily from the consumption of meat which provides 2% of the annual household diet respectively.
Vegetables provide 1% of consumption for all wealth groups. Poorer households have low energy
contributions of other food groups an indication there is limited diet and indicative of likely child
nutrition problems due to poor diet.
: Dietary diversity ~% Annual Kcal
16
as an average food energy intake of 2100 kcals per
In addition to own crop production, purchases and labour exchange contribution for respective wealth
groups, animal products mainly milk and meat is an important sources of energy, contributing 2%, 4%,
7% and 9% of the very poor, poor, middle and better off annual food energy needs respectively. Milk is
. The middle and better off have a high contribution from livestock
products given their relatively larger livestock holdings. Livestock products are commonly consumed
are the only group that fell short of achieving 100% of their food needs and
this may progressively result in malnutrition in the long term in particular chronic malnutrition.
Cereals provide most of the household’s food
energy intake. Cereal consumption decreases
with wealth as total consumption increases.
Cereals comprise 74% of very poor total
consumption, 78% of the poor’s, and 74% of
the middle’s and better off’s diet. The
contribution comes from wheat and rice
accessed through purchases and production
for very poor and wealthier households
respectively. Milk, pulses, meat and
vegetables are key dietary add-ons. Milk is
mainly accessed from buffalo and cow milking
ing 3% and 4% for very poor’s and
poor’s energy and 6% and 8% for middle and
better off respectively. Pulses contribution is
the same across all wealth groups averaging
3%. Sugar and ghee or oil are the commonly
purchased non staple foods, their
ion to household diet increase with
7% of the household diet for all wealth groups, and oil contributes 10%-13% for all
wealth groups. The middle and better off households have a more nutritious diet compared to the poor
arily from the consumption of meat which provides 2% of the annual household diet respectively.
Vegetables provide 1% of consumption for all wealth groups. Poorer households have low energy
diet and indicative of likely child
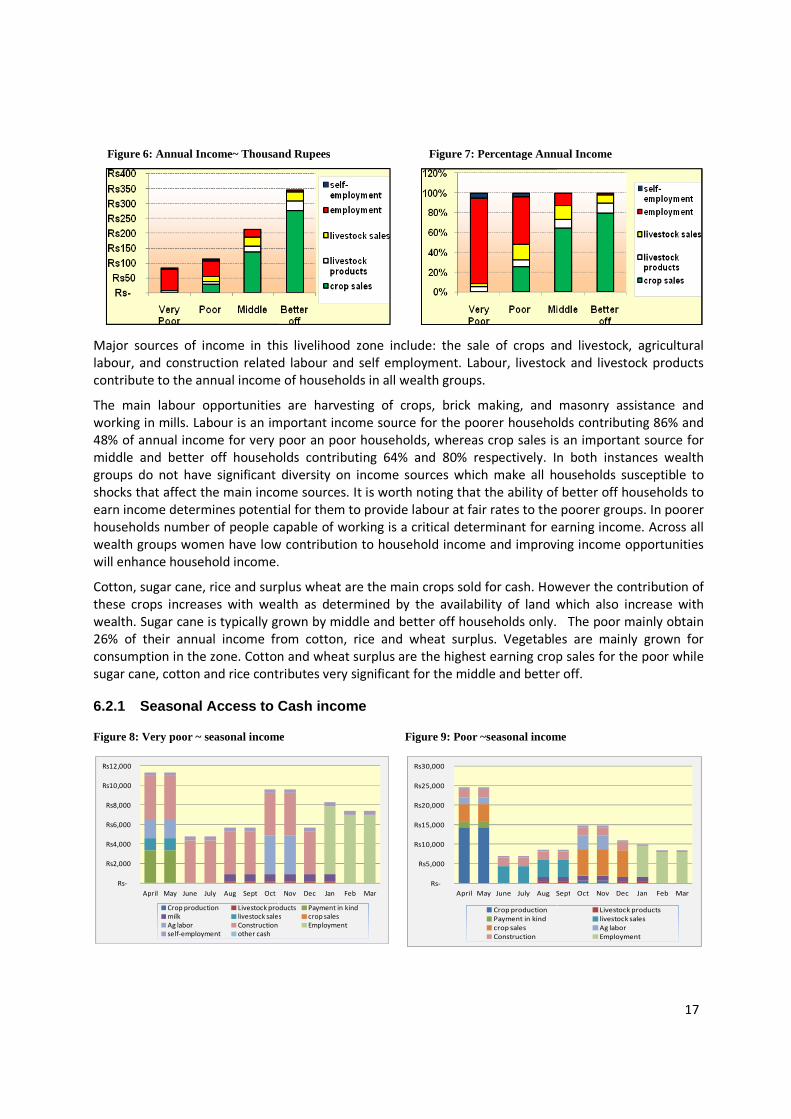
Major sources of income in this livelihood zone include: the sale of crops and livestock, agricultural
labour, and construction related labour and self employment. Labour, livestock and livestock products
contribute to the annual income of households in al
The main labour opportunities are harvesting of crops, brick making, and masonry assistance and
working in mills. Labour is an important income source for the poorer households contributing 86% and
48% of annual income for very poor an po
middle and better off households contributing 64% and 80% respectively. In both instances wealth
groups do not have significant diversity on income sources which make all households susceptible t
shocks that affect the main income sources. It is worth noting that the ability of better off households to
earn income determines potential for them to provide labour at fair rates to the poorer groups. In poorer
households number of people capable of w
wealth groups women have low contribution to household income and improving income opportunities
will enhance household income.
Cotton, sugar cane, rice and surplus wheat are the main crops so
these crops increases with wealth as determined by the availability of land which also increase with
wealth. Sugar cane is typically grown by middle and better off households only. The poor mainly obtain
26% of their annual income from cotton, rice and wheat surplus. Vegetables are mainly grown for
consumption in the zone. Cotton and wheat surplus are the highest earning crop sales for the poor while
sugar cane, cotton and rice contributes very significant for the
6.2.1 Seasonal Access to Cash income
Figure 8: Very poor ~ seasonal income
Rs-
Rs2,000
Rs4,000
Rs6,000
Rs8,000
Rs10,000
Rs12,000
April May June July Aug Sept Oct
Crop production Livestock products
milk livestock sales
Ag labor Construction
self-employment other cash
Figure 6: Annual Income~ Thousand Rupees
Major sources of income in this livelihood zone include: the sale of crops and livestock, agricultural
labour, and construction related labour and self employment. Labour, livestock and livestock products
contribute to the annual income of households in all wealth groups.
The main labour opportunities are harvesting of crops, brick making, and masonry assistance and
working in mills. Labour is an important income source for the poorer households contributing 86% and
48% of annual income for very poor an poor households, whereas crop sales is an important source for
middle and better off households contributing 64% and 80% respectively. In both instances wealth
groups do not have significant diversity on income sources which make all households susceptible t
shocks that affect the main income sources. It is worth noting that the ability of better off households to
earn income determines potential for them to provide labour at fair rates to the poorer groups. In poorer
households number of people capable of working is a critical determinant for earning income. Across all
wealth groups women have low contribution to household income and improving income opportunities
will enhance household income.
Cotton, sugar cane, rice and surplus wheat are the main crops sold for cash. However the contribution of
these crops increases with wealth as determined by the availability of land which also increase with
wealth. Sugar cane is typically grown by middle and better off households only. The poor mainly obtain
eir annual income from cotton, rice and wheat surplus. Vegetables are mainly grown for
consumption in the zone. Cotton and wheat surplus are the highest earning crop sales for the poor while
sugar cane, cotton and rice contributes very significant for the middle and better off.
Seasonal Access to Cash income
: Very poor ~ seasonal income
Figure 9: Poor ~seasonal income
Nov Dec Jan Feb Mar
Livestock products Payment in kind
livestock sales crop sales
Employment
Rs-
Rs5,000
Rs10,000
Rs15,000
Rs20,000
Rs25,000
Rs30,000
April May June July Aug Sept
Crop production
Payment in kind
crop sales
Construction
: Annual Income~ Thousand Rupees Figure 7: Percentage Annual Income
17
Major sources of income in this livelihood zone include: the sale of crops and livestock, agricultural
labour, and construction related labour and self employment. Labour, livestock and livestock products
The main labour opportunities are harvesting of crops, brick making, and masonry assistance and
working in mills. Labour is an important income source for the poorer households contributing 86% and
or households, whereas crop sales is an important source for
middle and better off households contributing 64% and 80% respectively. In both instances wealth
groups do not have significant diversity on income sources which make all households susceptible to
shocks that affect the main income sources. It is worth noting that the ability of better off households to
earn income determines potential for them to provide labour at fair rates to the poorer groups. In poorer
orking is a critical determinant for earning income. Across all
wealth groups women have low contribution to household income and improving income opportunities
ld for cash. However the contribution of
these crops increases with wealth as determined by the availability of land which also increase with
wealth. Sugar cane is typically grown by middle and better off households only. The poor mainly obtain
eir annual income from cotton, rice and wheat surplus. Vegetables are mainly grown for
consumption in the zone. Cotton and wheat surplus are the highest earning crop sales for the poor while
middle and better off.
: Poor ~seasonal income
Sept Oct Nov Dec Jan Feb Mar
Livestock products
livestock sales
Ag labor
Employment
: Percentage Annual Income
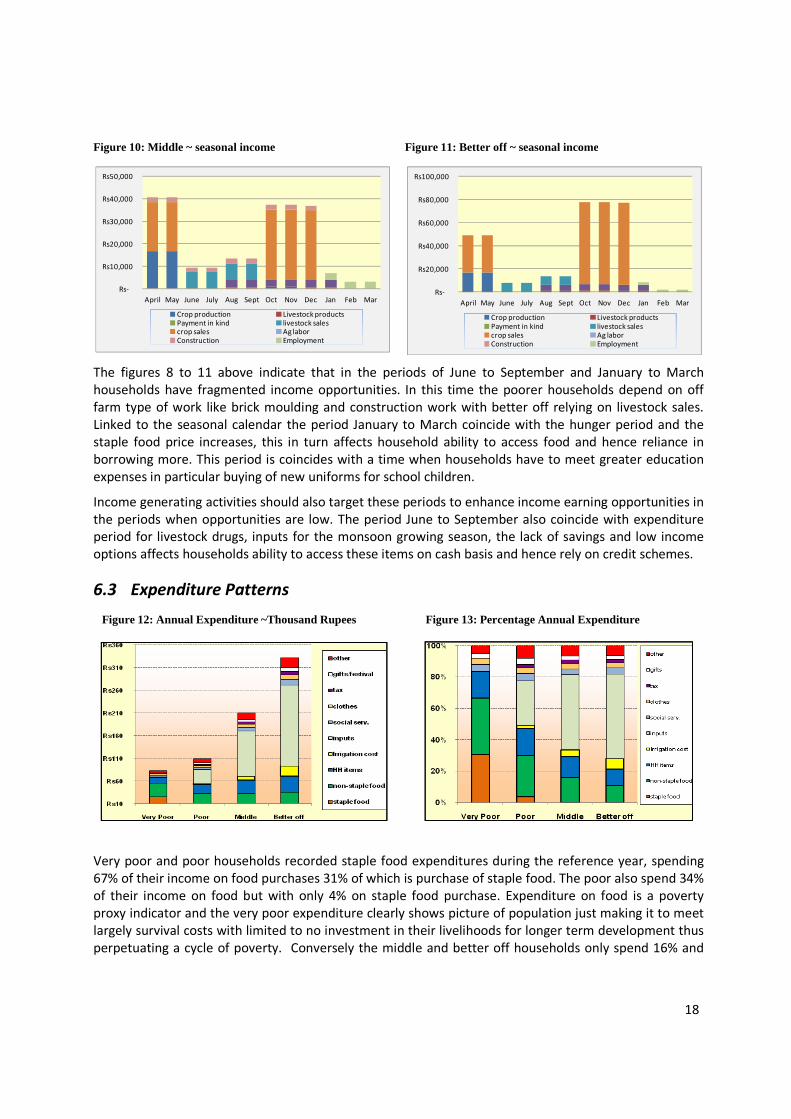
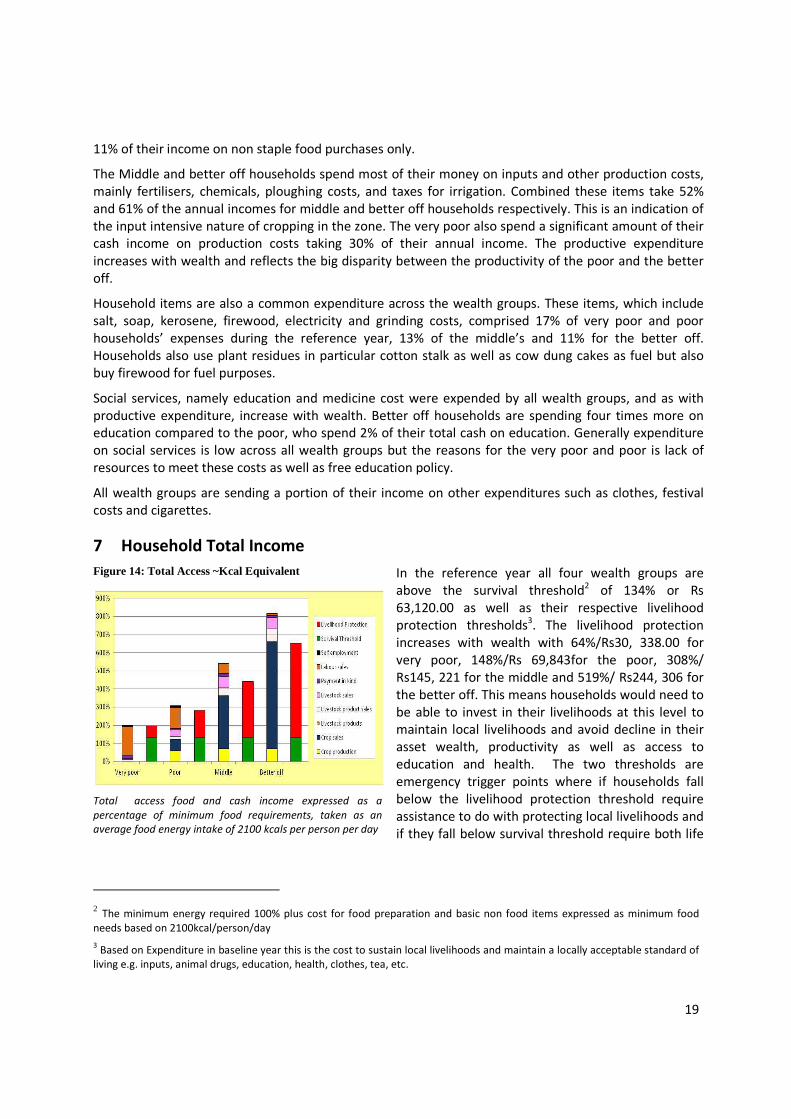
Figure 10: Middle ~ seasonal income
The figures 8 to 11 above indicate
households have fragmented income opportunities. In this time the poorer households depend on off
farm type of work like brick moulding and construction work with better off relying on livestock sales.
Linked to the seasonal calendar the period January to
staple food price increases, this in turn affects ho
borrowing more. This period is coincides with a time when households have to meet greater education
expenses in particular buying of new uniforms for school children.
Income generating activities should also target these periods to enhance income earning opportunities in
the periods when opportunities are low.
period for livestock drugs, inputs for the monsoon growing season, the lack of s
options affects households ability to access these items on cash basis and hence rely on credit schemes.
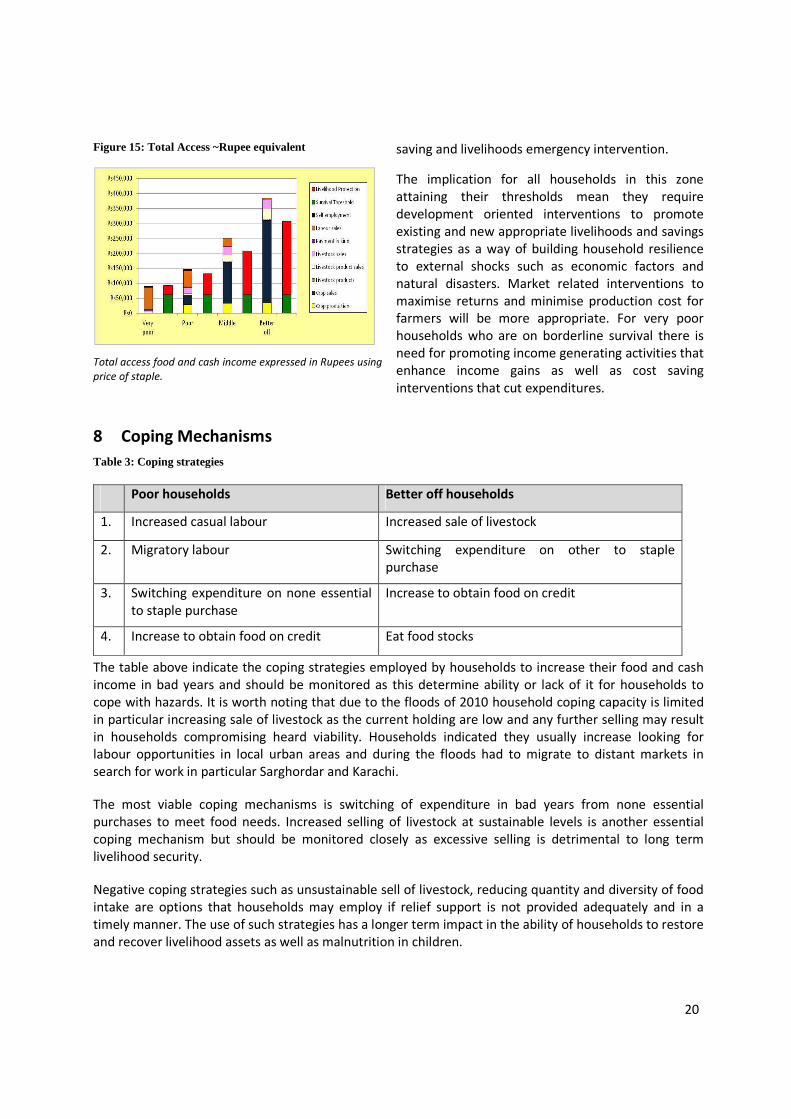
6.3 Expenditure Patterns
Very poor and poor households recorded staple food expenditures during the reference year, spending
67% of their income on food purchases 31% of which is purchase of staple food. The poor also sp
of their income on food but with only 4% on staple food purchase. Expenditure on food is a poverty
proxy indicator and the very poor expenditure clearly shows picture of population just making it to meet
largely survival costs with limited to no in
perpetuating a cycle of poverty. Conversely the middle and better off households only spend 16% and
Rs-
Rs10,000
Rs20,000
Rs30,000
Rs40,000
Rs50,000
April May June July Aug Sept Oct
Crop productionPayment in kindcrop salesConstruction
Figure 12: Annual Expenditure ~Thousand Rupees
Figure 11: Better off ~ seasonal income
indicate that in the periods of June to September and January to March
households have fragmented income opportunities. In this time the poorer households depend on off
farm type of work like brick moulding and construction work with better off relying on livestock sales.
Linked to the seasonal calendar the period January to March coincide with the hunger period and the
staple food price increases, this in turn affects household ability to access food and hence reliance in
This period is coincides with a time when households have to meet greater education
expenses in particular buying of new uniforms for school children.
should also target these periods to enhance income earning opportunities in
the periods when opportunities are low. The period June to September also coincide with expenditure
period for livestock drugs, inputs for the monsoon growing season, the lack of s
options affects households ability to access these items on cash basis and hence rely on credit schemes.
Expenditure Patterns
Very poor and poor households recorded staple food expenditures during the reference year, spending
67% of their income on food purchases 31% of which is purchase of staple food. The poor also sp
of their income on food but with only 4% on staple food purchase. Expenditure on food is a poverty
proxy indicator and the very poor expenditure clearly shows picture of population just making it to meet
largely survival costs with limited to no investment in their livelihoods for longer term development thus
perpetuating a cycle of poverty. Conversely the middle and better off households only spend 16% and
Nov Dec Jan Feb Mar
Livestock productslivestock salesAg laborEmployment
Rs-
Rs20,000
Rs40,000
Rs60,000
Rs80,000
Rs100,000
April May June July Aug
Crop production
Payment in kindcrop salesConstruction
: Annual Expenditure ~Thousand Rupees Figure 13: Percentage Annual Expenditure
18
: Better off ~ seasonal income
the periods of June to September and January to March
households have fragmented income opportunities. In this time the poorer households depend on off
farm type of work like brick moulding and construction work with better off relying on livestock sales.
arch coincide with the hunger period and the
usehold ability to access food and hence reliance in
This period is coincides with a time when households have to meet greater education
should also target these periods to enhance income earning opportunities in
The period June to September also coincide with expenditure
period for livestock drugs, inputs for the monsoon growing season, the lack of savings and low income
options affects households ability to access these items on cash basis and hence rely on credit schemes.
Very poor and poor households recorded staple food expenditures during the reference year, spending
67% of their income on food purchases 31% of which is purchase of staple food. The poor also spend 34%
of their income on food but with only 4% on staple food purchase. Expenditure on food is a poverty
proxy indicator and the very poor expenditure clearly shows picture of population just making it to meet
vestment in their livelihoods for longer term development thus
perpetuating a cycle of poverty. Conversely the middle and better off households only spend 16% and
Sept Oct Nov Dec Jan Feb Mar
Livestock products
livestock salesAg laborEmployment
: Percentage Annual Expenditure
19
2 The minimum energy required 100% plus cost for food preparation and basic non food items expressed as minimum food
needs based on 2100kcal/person/day 3 Based on Expenditure in baseline year this is the cost to sustain local livelihoods and maintain a locally acceptable standard of
living e.g. inputs, animal drugs, education, health, clothes, tea, etc.
11% of their income on non staple food purchases only.
The Middle and better off households spend most of their money on inputs and other production costs,
mainly fertilisers, chemicals, ploughing costs, and taxes for irrigation. Combined these items take 52%
and 61% of the annual incomes for middle and better off households respectively. This is an indication of
the input intensive nature of cropping in the zone. The very poor also spend a significant amount of their
cash income on production costs taking 30% of their annual income. The productive expenditure
increases with wealth and reflects the big disparity between the productivity of the poor and the better
off.
Household items are also a common expenditure across the wealth groups. These items, which include
salt, soap, kerosene, firewood, electricity and grinding costs, comprised 17% of very poor and poor
households’ expenses during the reference year, 13% of the middle’s and 11% for the better off.
Households also use plant residues in particular cotton stalk as well as cow dung cakes as fuel but also
buy firewood for fuel purposes.
Social services, namely education and medicine cost were expended by all wealth groups, and as with
productive expenditure, increase with wealth. Better off households are spending four times more on
education compared to the poor, who spend 2% of their total cash on education. Generally expenditure
on social services is low across all wealth groups but the reasons for the very poor and poor is lack of
resources to meet these costs as well as free education policy.
All wealth groups are sending a portion of their income on other expenditures such as clothes, festival
costs and cigarettes.
7 Household Total Income
Figure 14: Total Access ~Kcal Equivalent
Total access food and cash income expressed as a
percentage of minimum food requirements, taken as an
average food energy intake of 2100 kcals per person per day
In the reference year all four wealth groups are
above the survival threshold2 of 134% or Rs
63,120.00 as well as their respective livelihood
protection thresholds3. The livelihood protection
increases with wealth with 64%/Rs30, 338.00 for
very poor, 148%/Rs 69,843for the poor, 308%/
Rs145, 221 for the middle and 519%/ Rs244, 306 for
the better off. This means households would need to
be able to invest in their livelihoods at this level to
maintain local livelihoods and avoid decline in their
asset wealth, productivity as well as access to
education and health. The two thresholds are
emergency trigger points where if households fall
below the livelihood protection threshold require
assistance to do with protecting local livelihoods and
if they fall below survival threshold require both life
20
Figure 15: Total Access ~Rupee equivalent
Total access food and cash income expressed in Rupees using
price of staple.
saving and livelihoods emergency intervention.
The implication for all households in this zone
attaining their thresholds mean they require
development oriented interventions to promote
existing and new appropriate livelihoods and savings
strategies as a way of building household resilience
to external shocks such as economic factors and
natural disasters. Market related interventions to
maximise returns and minimise production cost for
farmers will be more appropriate. For very poor
households who are on borderline survival there is
need for promoting income generating activities that
enhance income gains as well as cost saving
interventions that cut expenditures.
8 Coping Mechanisms
Poor households Better off households
1. Increased casual labour Increased sale of livestock
2. Migratory labour Switching expenditure on other to staple
purchase
3. Switching expenditure on none essential
to staple purchase
Increase to obtain food on credit
4. Increase to obtain food on credit Eat food stocks
Table 3: Coping strategies
The table above indicate the coping strategies employed by households to increase their food and cash
income in bad years and should be monitored as this determine ability or lack of it for households to
cope with hazards. It is worth noting that due to the floods of 2010 household coping capacity is limited
in particular increasing sale of livestock as the current holding are low and any further selling may result
in households compromising heard viability. Households indicated they usually increase looking for
labour opportunities in local urban areas and during the floods had to migrate to distant markets in
search for work in particular Sarghordar and Karachi.
The most viable coping mechanisms is switching of expenditure in bad years from none essential
purchases to meet food needs. Increased selling of livestock at sustainable levels is another essential
coping mechanism but should be monitored closely as excessive selling is detrimental to long term
livelihood security.
Negative coping strategies such as unsustainable sell of livestock, reducing quantity and diversity of food
intake are options that households may employ if relief support is not provided adequately and in a
timely manner. The use of such strategies has a longer term impact in the ability of households to restore
and recover livelihood assets as well as malnutrition in children.
21
9 Hazards
This zone experiences flash floods annually after the monsoon rains, However in 2010 there was huge
flooding at magnitudes last experienced 25 years ago-according to key informant interviews. This
affected all households, in particular people lost livestock, crops grown in this season mainly cotton and
rice and some had their homesteads destroyed. This affected incomes from crops for poor, middle and
better off families as well as the very poor that relied on harvest incomes during this time. It also saw
some households having to incur new expenses in the form of house rentals. This incidence of flooding
should be closely monitored particularly using weather forecast during the monsoon rains. Trigger
indicators for floods must be established as part of the disaster risk reduction strategies as well as
provide basis for putting in place contingency plans in the event of floods occurring. Protective strategies
against the effects of flooding would also enhance household coping capacity; these could include crop
insurance and creation of flood protection walls.
Other hazards are crop pests that affect cotton and cereal crops and lowers quality of produce which
result in low prices obtained when selling produce. Human diseases such as malaria and dengue fever
affect household labour as sick people cannot engage in work thereby loosing income in those days.
Protecting households from sickness is crucial as it increases expenditure on health at the same time
reducing income earning capacity.
A larger household asset base; increased and diversified incomes will act as a buffer to shocks and reduce
vulnerability.
10 Key Parameters for Monitoring
Table 4: Key Parameters for Monitoring
Item Key Parameter - Quantity Key Parameter – Price
Crops • Wheat
• Rice
• Cotton
• Sugar cane
• Wheat prices
• Rice prices
• Cotton prices
• Sugar cane prices
Livestock production • Cattle sales
• Goat sales
• Milk sales
• Cattle prices
• Goat prices
• Milk prices
Other food and cash
income • Availability of brick making
labour
• Availability of agric casual
labour
• Availability of construction
labour
• Availability of mill employment
• Labour rates for all labour
employment
One of the main objectives for setting up livelihood baselines is to identify key indicators to monitor
changes in access to food and income over time. In order to do this, the HEA baseline identifies key
livelihood parameters, here defined as sources that contribute significantly to total food and cash income
22
11 Using the Livelihoods Baselines for Monitoring and Program Design
11.1 Comparison against thresholds
An important objective of the baseline is to design interventions to promote rural livelihoods and reduce
poverty. To be effective, the design of long-term interventions must take into consideration the mid to
long term trend of key determinants to household food security. In this zone crop and labour income are
important livelihood strategies. Once the baseline is established, analysis can be carried out to; project
what the likely impact of price and wage changes will be and how households can cope with negative
changes to maintain access to sufficient food. The intervention thresholds, of survival and livelihood
protection thresholds are established to enable decision makers and programme planners to design well
targeted, appropriate and proportionate responses. A survival deficit means that interventions to save
lives are required. The Livelihood protection threshold represents the total income required to sustain
local livelihoods whose deficit means that interventions to protect the existing livelihood base are
required.
such that a change in access to that one
source may have a significant effect on
total access and hence their ability to
meet survival and livelihood protection
expenditures.
This analysis allows for customising
monitoring systems to different wealth
groups and to different geographical
areas. These indicators will be monitored
in line with the seasonal patterns of when
these strategies are employed by different
households.
Table 5: Poor households' typical expenditure basket
Food Items Non Food Items
Staple food
Wheat meal
Wheat grain
Non-staple food
Pulses Sugar
Oil
Meat
Vegetables
Survival non- food
Grinding
Soap
Firewood
Electricity Livelihood protection
Education costs fees (uniforms and
stationary)
Medical Fees
Transport
Cost of fertiliser and chemicals
Ploughing costs
10.1.1 Monitoring Expenditure
In order to monitor the cost of living, the
first step is to define the food and non food items that comprise the typical expenditure basket. It is
suggested to use an expenditure basket that includes items that poor households, the wealth group of
primary interest, are purchasing on a regular basis. Table 5 shows the items that comprise the typical
poor households’ minimum expenditure basket in the reference year. Save the Children can collect and
compile prices for these items on a monthly basis and analyzed to gain insight on how price changes
affect household access, this could be mainstreamed in the monitoring and evaluation system for food
security and livelihoods programmes.
Alternatively information on these key indicators can be accessed from other agencies that do price
monitoring such as the Bureau of statistics.
10.1.2 Monitoring Incomes
Changes in prices of key commodities and services must be interpreted relative to changes in access to
income. It is not always easy to monitor incomes, particularly because most of the income earned is
informal and quantities of unskilled casual labour that is available (i.e. the number of days of work that a
worker can find per week or per month), for example, can be difficult to collect. When comparing this
information to the baseline data, it is important to collect the indicator when it is most relevant and
compare this with changes in the cost of the expenditure basket.
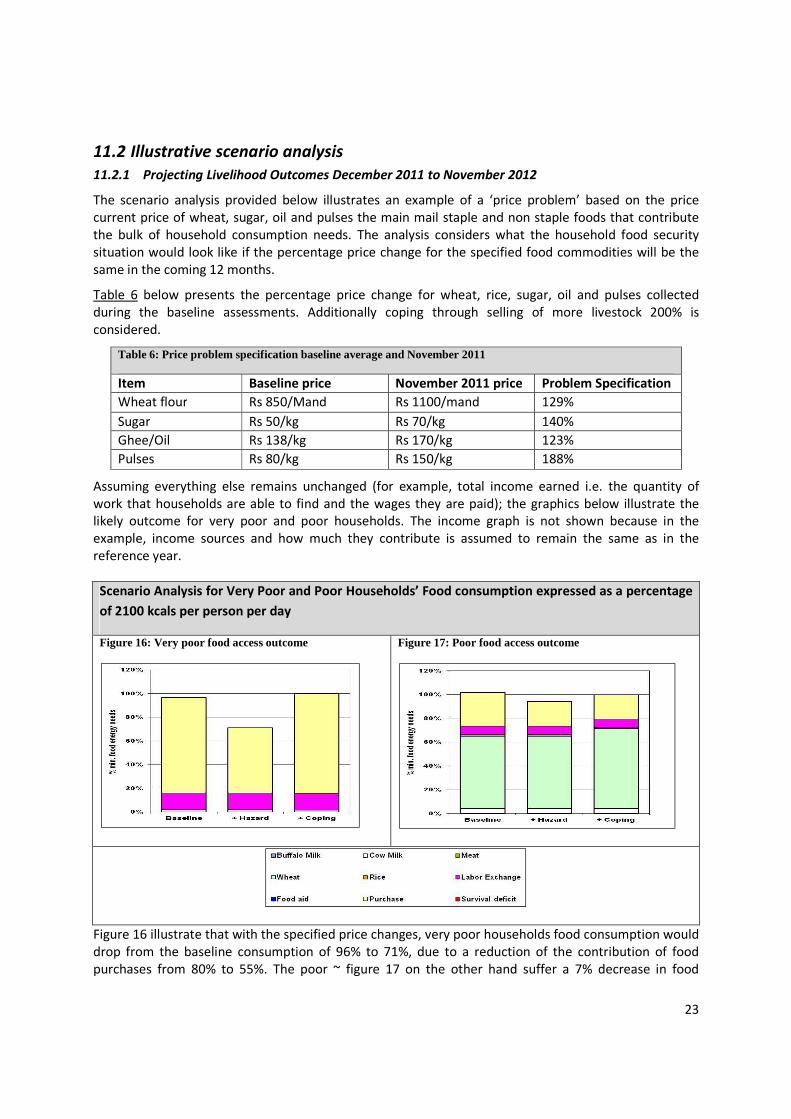
23
11.2 Illustrative scenario analysis
11.2.1 Projecting Livelihood Outcomes December 2011 to November 2012
The scenario analysis provided below illustrates an example of a ‘price problem’ based on the price
current price of wheat, sugar, oil and pulses the main mail staple and non staple foods that contribute
the bulk of household consumption needs. The analysis considers what the household food security
situation would look like if the percentage price change for the specified food commodities will be the
same in the coming 12 months.
Table 6 below presents the percentage price change for wheat, rice, sugar, oil and pulses collected
during the baseline assessments. Additionally coping through selling of more livestock 200% is
considered.
Assuming everything else remains unchanged (for example, total income earned i.e. the quantity of
work that households are able to find and the wages they are paid); the graphics below illustrate the
likely outcome for very poor and poor households. The income graph is not shown because in the
example, income sources and how much they contribute is assumed to remain the same as in the
reference year.
Figure 16 illustrate that with the specified price changes, very poor households food consumption would
drop from the baseline consumption of 96% to 71%, due to a reduction of the contribution of food
purchases from 80% to 55%. The poor ~ figure 17 on the other hand suffer a 7% decrease in food
Table 6: Price problem specification baseline average and November 2011
Item Baseline price November 2011 price Problem Specification
Wheat flour Rs 850/Mand Rs 1100/mand 129%
Sugar Rs 50/kg Rs 70/kg 140%
Ghee/Oil Rs 138/kg Rs 170/kg 123%
Pulses Rs 80/kg Rs 150/kg 188%
Scenario Analysis for Very Poor and Poor Households’ Food consumption expressed as a percentage
of 2100 kcals per person per day
Figure 16: Very poor food access outcome
Figure 17: Poor food access outcome
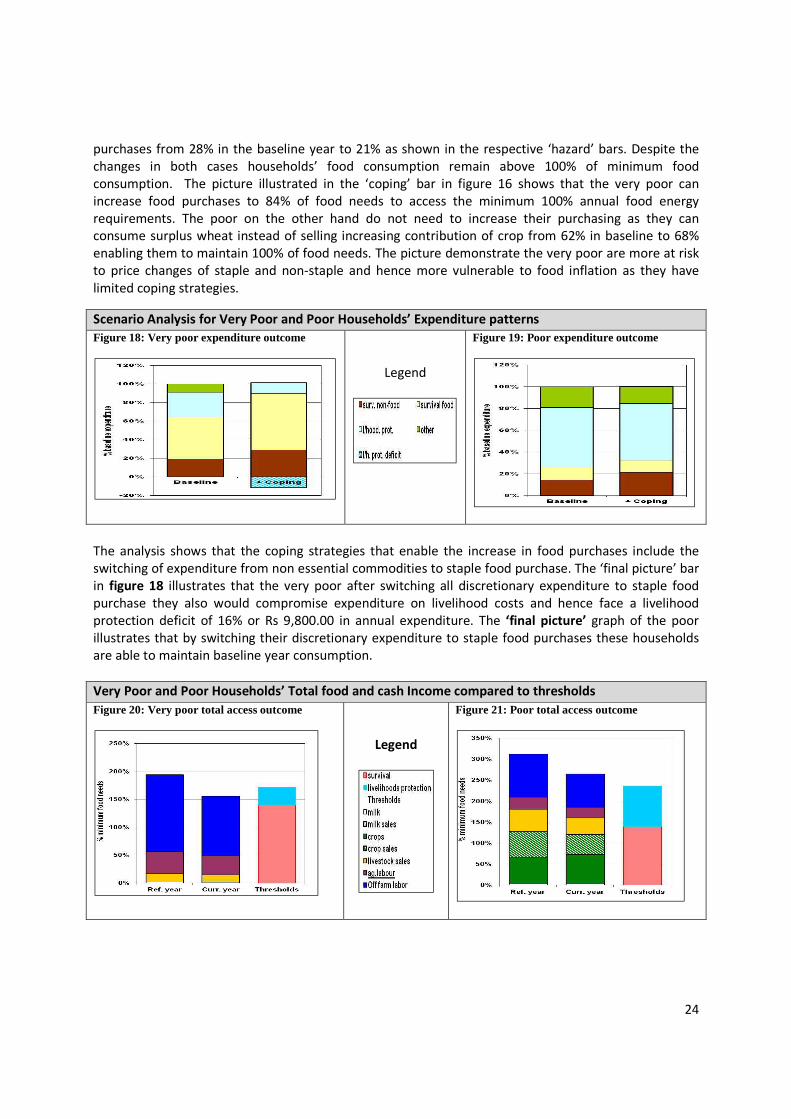
24
purchases from 28% in the baseline year to 21% as shown in the respective ‘hazard’ bars. Despite the
changes in both cases households’ food consumption remain above 100% of minimum food
consumption. The picture illustrated in the ‘coping’ bar in figure 16 shows that the very poor can
increase food purchases to 84% of food needs to access the minimum 100% annual food energy
requirements. The poor on the other hand do not need to increase their purchasing as they can
consume surplus wheat instead of selling increasing contribution of crop from 62% in baseline to 68%
enabling them to maintain 100% of food needs. The picture demonstrate the very poor are more at risk
to price changes of staple and non-staple and hence more vulnerable to food inflation as they have
limited coping strategies.
Scenario Analysis for Very Poor and Poor Households’ Expenditure patterns
Figure 18: Very poor expenditure outcome
Legend
Figure 19: Poor expenditure outcome
The analysis shows that the coping strategies that enable the increase in food purchases include the
switching of expenditure from non essential commodities to staple food purchase. The ‘final picture’ bar
in figure 18 illustrates that the very poor after switching all discretionary expenditure to staple food
purchase they also would compromise expenditure on livelihood costs and hence face a livelihood
protection deficit of 16% or Rs 9,800.00 in annual expenditure. The ‘final picture’ graph of the poor
illustrates that by switching their discretionary expenditure to staple food purchases these households
are able to maintain baseline year consumption.
Very Poor and Poor Households’ Total food and cash Income compared to thresholds
Figure 20: Very poor total access outcome
Legend
Figure 21: Poor total access outcome
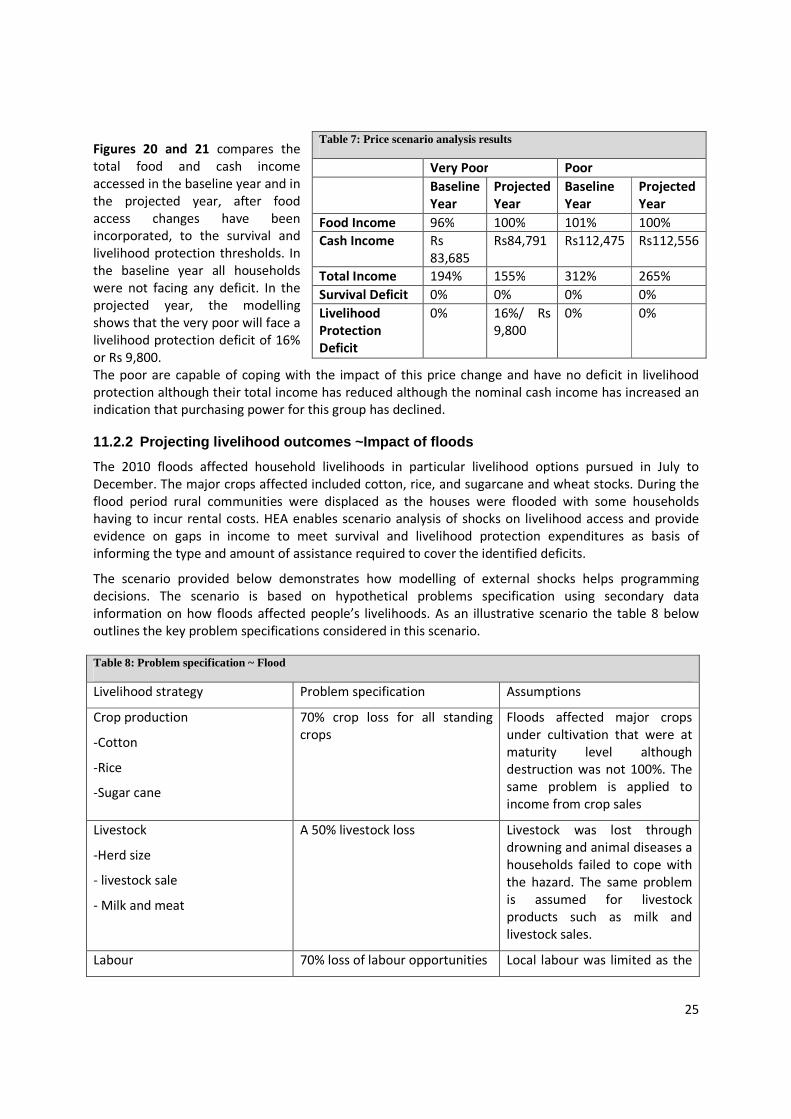
25
Figures 20 and 21 compares the
total food and cash income
accessed in the baseline year and in
the projected year, after food
access changes have been
incorporated, to the survival and
livelihood protection thresholds. In
the baseline year all households
were not facing any deficit. In the
projected year, the modelling
shows that the very poor will face a
livelihood protection deficit of 16%
or Rs 9,800.
The poor are capable of coping with the impact of this price change and have no deficit in livelihood
protection although their total income has reduced although the nominal cash income has increased an
indication that purchasing power for this group has declined.
11.2.2 Projecting livelihood outcomes ~Impact of floods
The 2010 floods affected household livelihoods in particular livelihood options pursued in July to
December. The major crops affected included cotton, rice, and sugarcane and wheat stocks. During the
flood period rural communities were displaced as the houses were flooded with some households
having to incur rental costs. HEA enables scenario analysis of shocks on livelihood access and provide
evidence on gaps in income to meet survival and livelihood protection expenditures as basis of
informing the type and amount of assistance required to cover the identified deficits.
The scenario provided below demonstrates how modelling of external shocks helps programming
decisions. The scenario is based on hypothetical problems specification using secondary data
information on how floods affected people’s livelihoods. As an illustrative scenario the table 8 below
outlines the key problem specifications considered in this scenario.
Table 8: Problem specification ~ Flood
Livelihood strategy Problem specification Assumptions
Crop production
-Cotton
-Rice
-Sugar cane
70% crop loss for all standing
crops
Floods affected major crops
under cultivation that were at
maturity level although
destruction was not 100%. The
same problem is applied to
income from crop sales
Livestock
-Herd size
- livestock sale
- Milk and meat
A 50% livestock loss Livestock was lost through
drowning and animal diseases a
households failed to cope with
the hazard. The same problem
is assumed for livestock
products such as milk and
livestock sales.
Labour 70% loss of labour opportunities Local labour was limited as the
Table 7: Price scenario analysis results
Very Poor Poor
Baseline
Year
Projected
Year
Baseline
Year
Projected
Year
Food Income 96% 100% 101% 100%
Cash Income Rs
83,685
Rs84,791 Rs112,475 Rs112,556
Total Income 194% 155% 312% 265%
Survival Deficit 0% 0% 0% 0%
Livelihood
Protection
Deficit
0% 16%/ Rs
9,800
0% 0%
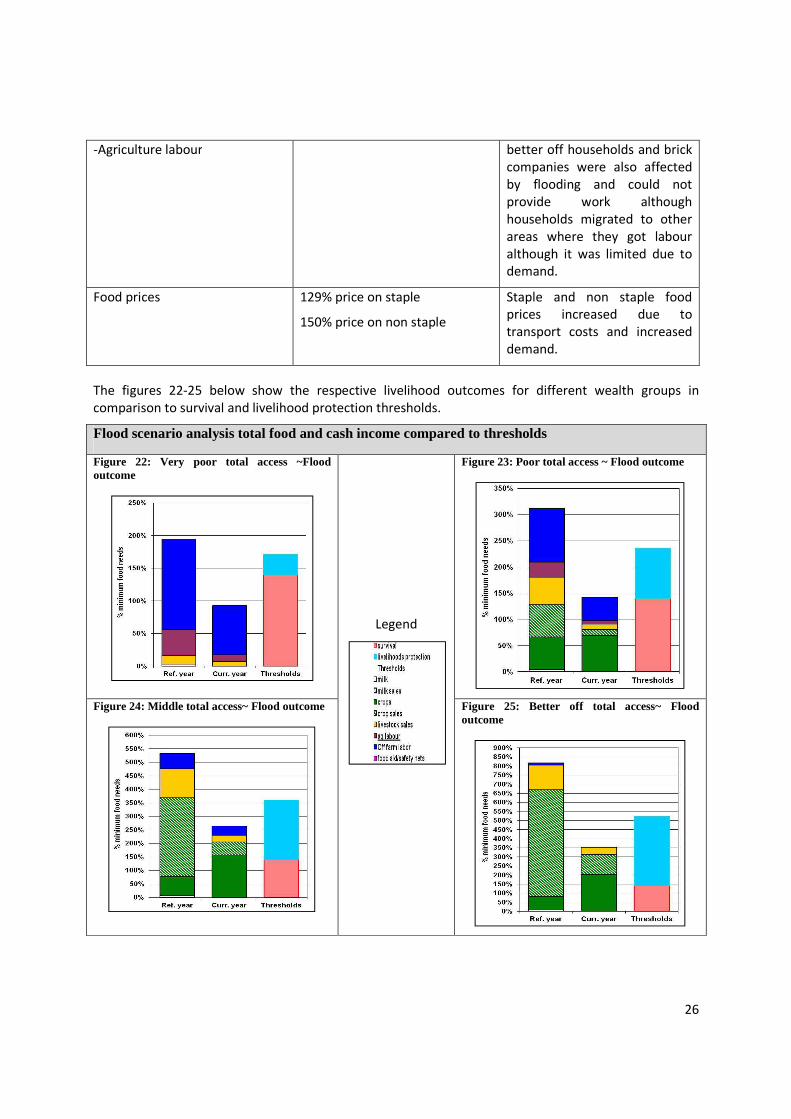
26
-Agriculture labour better off households and brick
companies were also affected
by flooding and could not
provide work although
households migrated to other
areas where they got labour
although it was limited due to
demand.
Food prices 129% price on staple
150% price on non staple
Staple and non staple food
prices increased due to
transport costs and increased
demand.
The figures 22-25 below show the respective livelihood outcomes for different wealth groups in
comparison to survival and livelihood protection thresholds.
Flood scenario analysis total food and cash income compared to thresholds
Figure 22: Very poor total access ~Flood outcome
Legend
Figure 23: Poor total access ~ Flood outcome
Figure 24: Middle total access~ Flood outcome
Figure 25: Better off total access~ Flood outcome
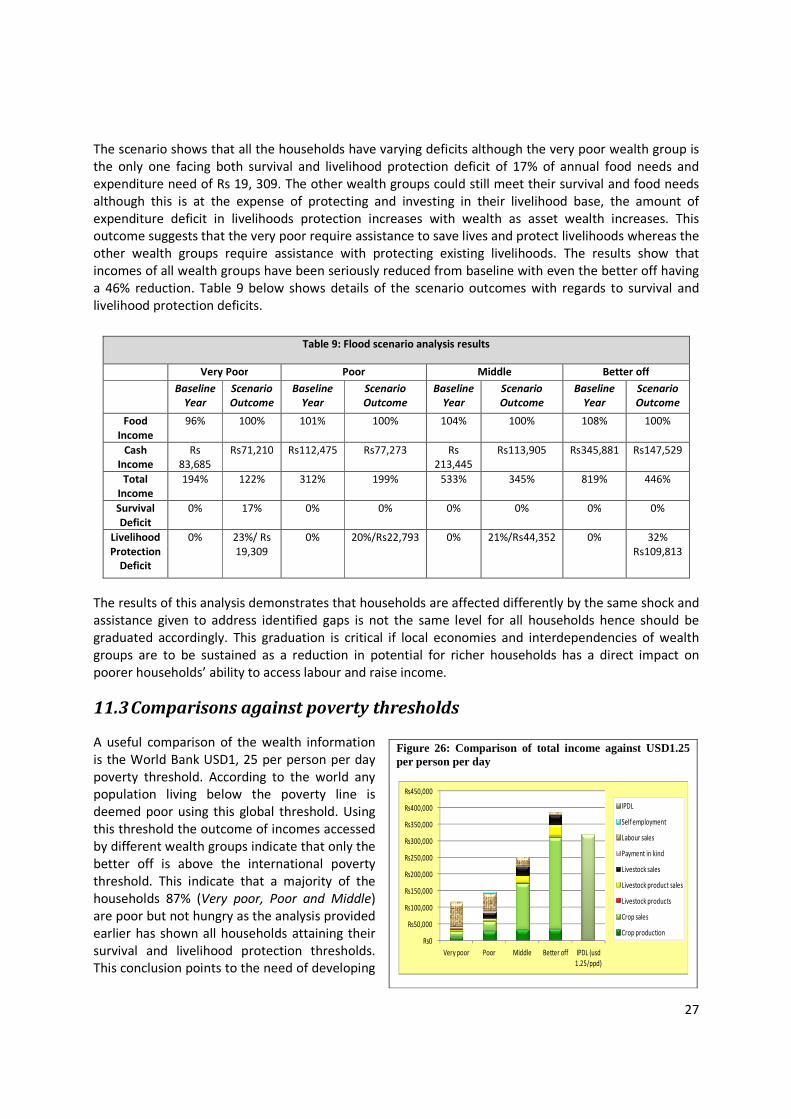
27
Figure 26: Comparison of total income against USD1.25 per person per day
Rs0
Rs50,000
Rs100,000
Rs150,000
Rs200,000
Rs250,000
Rs300,000
Rs350,000
Rs400,000
Rs450,000
Very poor Poor Middle Better off IPDL (usd
1.25/ppd)
IPDL
Self employment
Labour sales
Payment in kind
Livestock sales
Livestock product sales
Livestock products
Crop sales
Crop production
The scenario shows that all the households have varying deficits although the very poor wealth group is
the only one facing both survival and livelihood protection deficit of 17% of annual food needs and
expenditure need of Rs 19, 309. The other wealth groups could still meet their survival and food needs
although this is at the expense of protecting and investing in their livelihood base, the amount of
expenditure deficit in livelihoods protection increases with wealth as asset wealth increases. This
outcome suggests that the very poor require assistance to save lives and protect livelihoods whereas the
other wealth groups require assistance with protecting existing livelihoods. The results show that
incomes of all wealth groups have been seriously reduced from baseline with even the better off having
a 46% reduction. Table 9 below shows details of the scenario outcomes with regards to survival and
livelihood protection deficits.
The results of this analysis demonstrates that households are affected differently by the same shock and
assistance given to address identified gaps is not the same level for all households hence should be
graduated accordingly. This graduation is critical if local economies and interdependencies of wealth
groups are to be sustained as a reduction in potential for richer households has a direct impact on
poorer households’ ability to access labour and raise income.
11.3 Comparisons against poverty thresholds
A useful comparison of the wealth information
is the World Bank USD1, 25 per person per day
poverty threshold. According to the world any
population living below the poverty line is
deemed poor using this global threshold. Using
this threshold the outcome of incomes accessed
by different wealth groups indicate that only the
better off is above the international poverty
threshold. This indicate that a majority of the
households 87% (Very poor, Poor and Middle)
are poor but not hungry as the analysis provided
earlier has shown all households attaining their
survival and livelihood protection thresholds.
This conclusion points to the need of developing
Table 9: Flood scenario analysis results
Very Poor Poor Middle Better off
Baseline
Year
Scenario
Outcome
Baseline
Year
Scenario
Outcome
Baseline
Year
Scenario
Outcome
Baseline
Year
Scenario
Outcome
Food
Income
96% 100% 101% 100% 104% 100% 108% 100%
Cash
Income
Rs
83,685
Rs71,210 Rs112,475 Rs77,273 Rs
213,445
Rs113,905 Rs345,881 Rs147,529
Total
Income
194% 122% 312% 199% 533% 345% 819% 446%
Survival
Deficit
0% 17% 0% 0% 0% 0% 0% 0%
Livelihood
Protection
Deficit
0% 23%/ Rs
19,309
0% 20%/Rs22,793 0% 21%/Rs44,352 0% 32%
Rs109,813
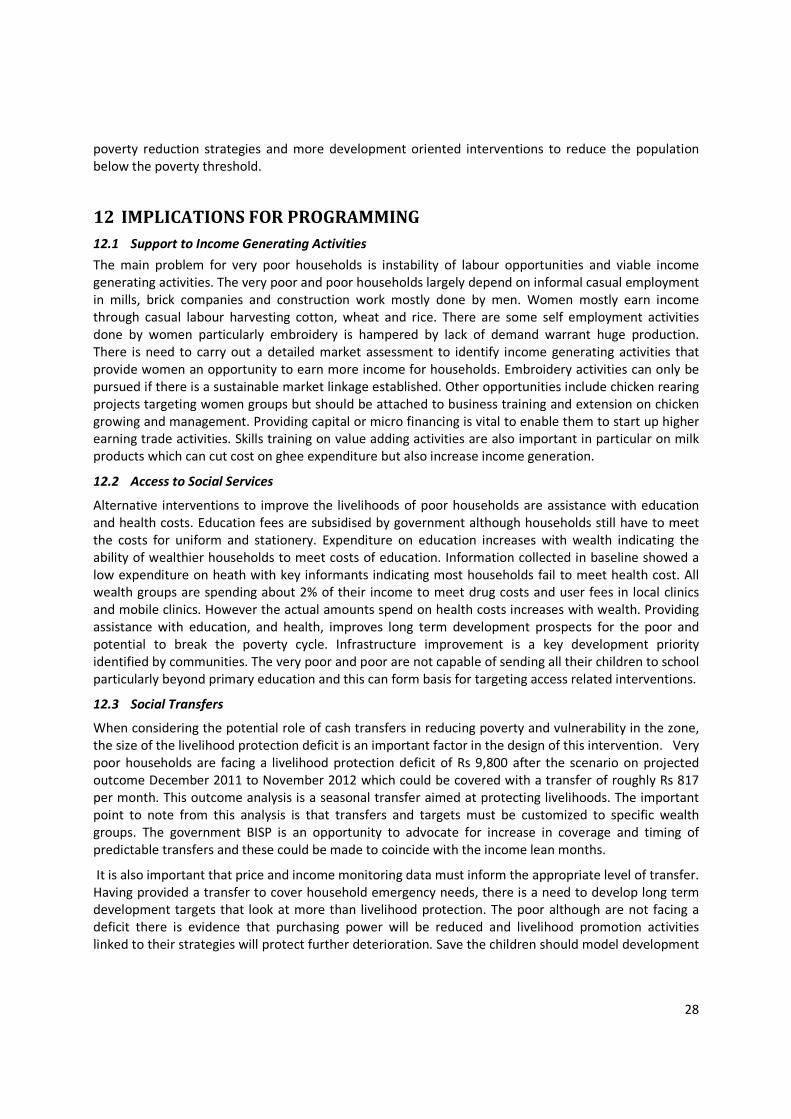
28
poverty reduction strategies and more development oriented interventions to reduce the population
below the poverty threshold.
12 IMPLICATIONS FOR PROGRAMMING
12.1 Support to Income Generating Activities
The main problem for very poor households is instability of labour opportunities and viable income
generating activities. The very poor and poor households largely depend on informal casual employment
in mills, brick companies and construction work mostly done by men. Women mostly earn income
through casual labour harvesting cotton, wheat and rice. There are some self employment activities
done by women particularly embroidery is hampered by lack of demand warrant huge production.
There is need to carry out a detailed market assessment to identify income generating activities that
provide women an opportunity to earn more income for households. Embroidery activities can only be
pursued if there is a sustainable market linkage established. Other opportunities include chicken rearing
projects targeting women groups but should be attached to business training and extension on chicken
growing and management. Providing capital or micro financing is vital to enable them to start up higher
earning trade activities. Skills training on value adding activities are also important in particular on milk
products which can cut cost on ghee expenditure but also increase income generation.
12.2 Access to Social Services
Alternative interventions to improve the livelihoods of poor households are assistance with education
and health costs. Education fees are subsidised by government although households still have to meet
the costs for uniform and stationery. Expenditure on education increases with wealth indicating the
ability of wealthier households to meet costs of education. Information collected in baseline showed a
low expenditure on heath with key informants indicating most households fail to meet health cost. All
wealth groups are spending about 2% of their income to meet drug costs and user fees in local clinics
and mobile clinics. However the actual amounts spend on health costs increases with wealth. Providing
assistance with education, and health, improves long term development prospects for the poor and
potential to break the poverty cycle. Infrastructure improvement is a key development priority
identified by communities. The very poor and poor are not capable of sending all their children to school
particularly beyond primary education and this can form basis for targeting access related interventions.
12.3 Social Transfers
When considering the potential role of cash transfers in reducing poverty and vulnerability in the zone,
the size of the livelihood protection deficit is an important factor in the design of this intervention. Very
poor households are facing a livelihood protection deficit of Rs 9,800 after the scenario on projected
outcome December 2011 to November 2012 which could be covered with a transfer of roughly Rs 817
per month. This outcome analysis is a seasonal transfer aimed at protecting livelihoods. The important
point to note from this analysis is that transfers and targets must be customized to specific wealth
groups. The government BISP is an opportunity to advocate for increase in coverage and timing of
predictable transfers and these could be made to coincide with the income lean months.
It is also important that price and income monitoring data must inform the appropriate level of transfer.
Having provided a transfer to cover household emergency needs, there is a need to develop long term
development targets that look at more than livelihood protection. The poor although are not facing a
deficit there is evidence that purchasing power will be reduced and livelihood promotion activities
linked to their strategies will protect further deterioration. Save the children should model development
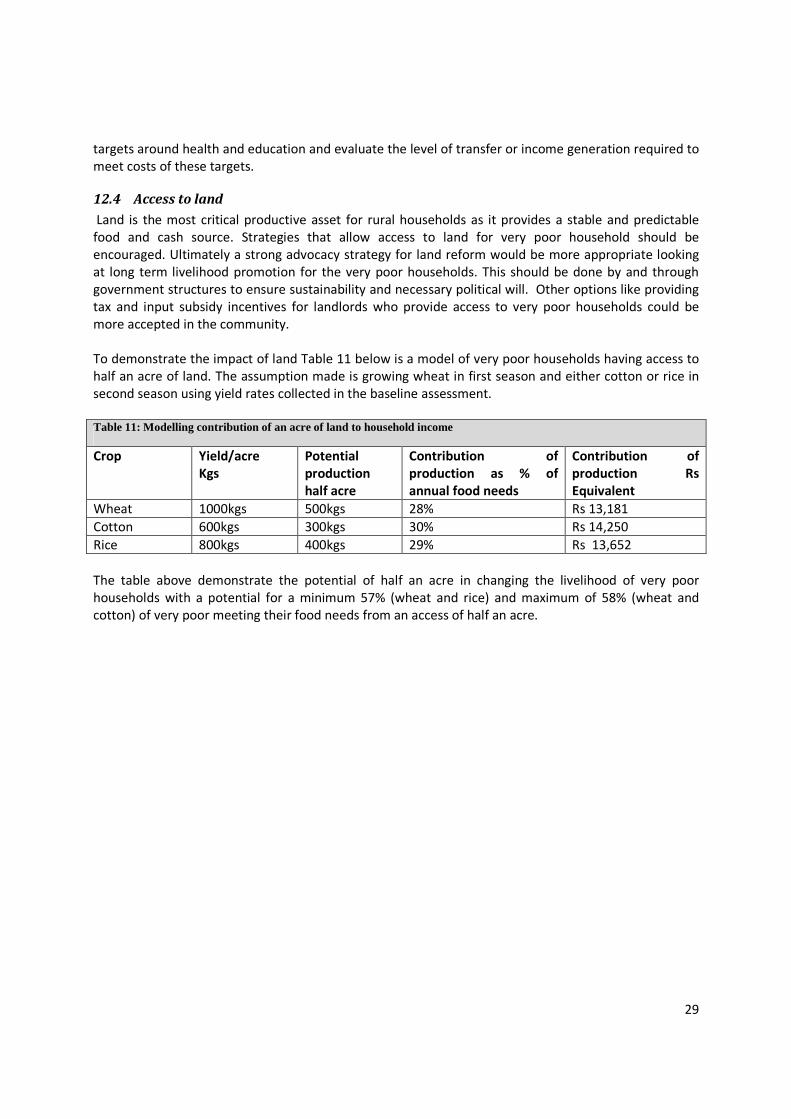
29
targets around health and education and evaluate the level of transfer or income generation required to
meet costs of these targets.
12.4 Access to land
Land is the most critical productive asset for rural households as it provides a stable and predictable
food and cash source. Strategies that allow access to land for very poor household should be
encouraged. Ultimately a strong advocacy strategy for land reform would be more appropriate looking
at long term livelihood promotion for the very poor households. This should be done by and through
government structures to ensure sustainability and necessary political will. Other options like providing
tax and input subsidy incentives for landlords who provide access to very poor households could be
more accepted in the community.
To demonstrate the impact of land Table 11 below is a model of very poor households having access to
half an acre of land. The assumption made is growing wheat in first season and either cotton or rice in
second season using yield rates collected in the baseline assessment.
Table 11: Modelling contribution of an acre of land to household income
Crop Yield/acre
Kgs
Potential
production
half acre
Contribution of
production as % of
annual food needs
Contribution of
production Rs
Equivalent
Wheat 1000kgs 500kgs 28% Rs 13,181
Cotton 600kgs 300kgs 30% Rs 14,250
Rice 800kgs 400kgs 29% Rs 13,652
The table above demonstrate the potential of half an acre in changing the livelihood of very poor
households with a potential for a minimum 57% (wheat and rice) and maximum of 58% (wheat and
cotton) of very poor meeting their food needs from an access of half an acre.
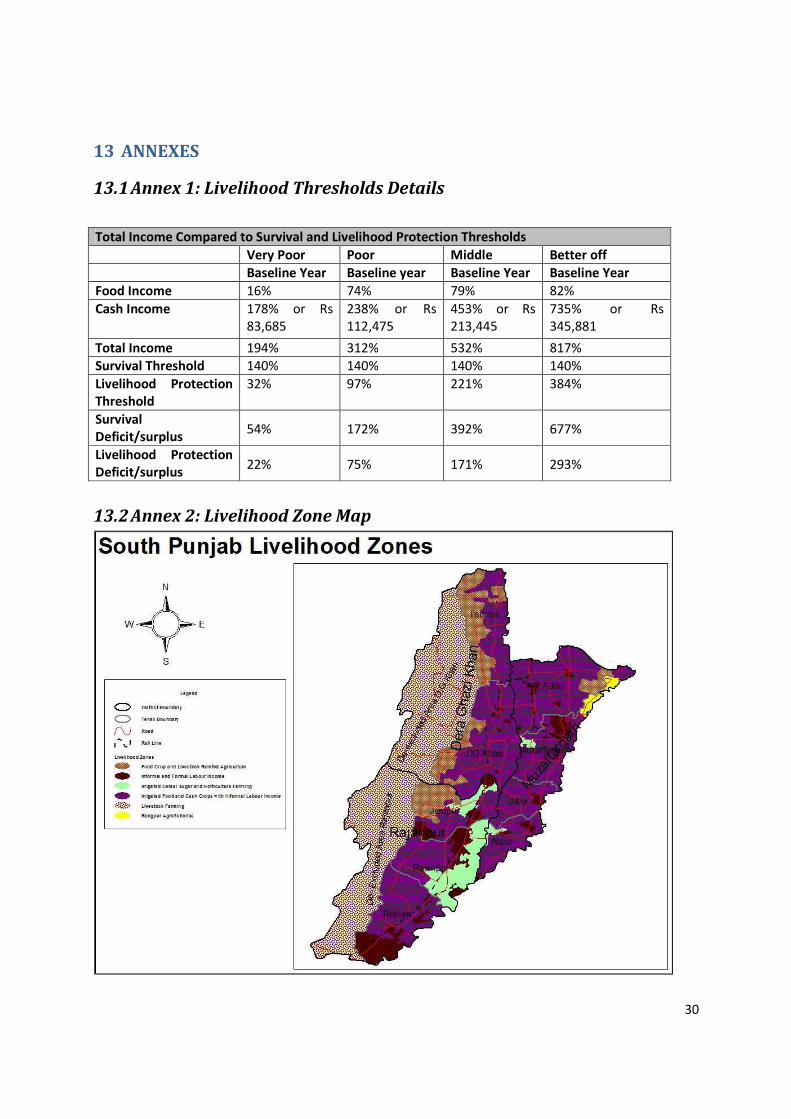
30
13 ANNEXES
13.1 Annex 1: Livelihood Thresholds Details
13.2 Annex 2: Livelihood Zone Map
Total Income Compared to Survival and Livelihood Protection Thresholds
Very Poor Poor Middle Better off
Baseline Year Baseline year Baseline Year Baseline Year
Food Income 16% 74% 79% 82%
Cash Income 178% or Rs
83,685
238% or Rs
112,475
453% or Rs
213,445
735% or Rs
345,881
Total Income 194% 312% 532% 817%
Survival Threshold 140% 140% 140% 140%
Livelihood Protection
Threshold
32% 97% 221% 384%
Survival
Deficit/surplus 54% 172% 392% 677%
Livelihood Protection
Deficit/surplus 22% 75% 171% 293%
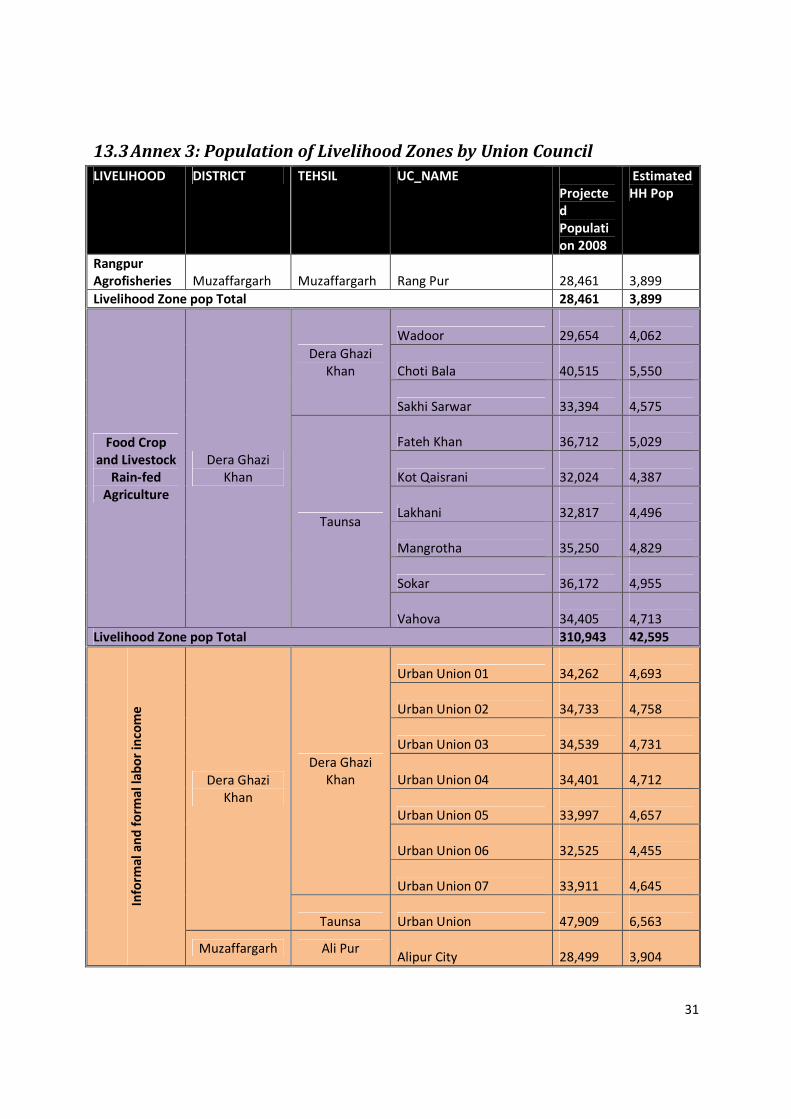
31
13.3 Annex 3: Population of Livelihood Zones by Union Council
LIVELIHOOD DISTRICT TEHSIL UC_NAME
Projecte
d
Populati
on 2008
Estimated
HH Pop
Rangpur
Agrofisheries Muzaffargarh Muzaffargarh Rang Pur
28,461
3,899
Livelihood Zone pop Total 28,461 3,899
Food Crop
and Livestock
Rain-fed
Agriculture
Dera Ghazi
Khan
Dera Ghazi
Khan
Wadoor
29,654
4,062
Choti Bala
40,515
5,550
Sakhi Sarwar
33,394
4,575
Taunsa
Fateh Khan
36,712
5,029
Kot Qaisrani
32,024
4,387
Lakhani
32,817
4,496
Mangrotha
35,250
4,829
Sokar
36,172
4,955
Vahova
34,405
4,713
Livelihood Zone pop Total 310,943 42,595
Info
rma
l a
nd
fo
rma
l la
bo
r in
com
e
Dera Ghazi
Khan
Dera Ghazi
Khan
Urban Union 01
34,262
4,693
Urban Union 02
34,733
4,758
Urban Union 03
34,539
4,731
Urban Union 04
34,401
4,712
Urban Union 05
33,997
4,657
Urban Union 06
32,525
4,455
Urban Union 07
33,911
4,645
Taunsa Urban Union
47,909
6,563
Muzaffargarh Ali Pur Alipur City
28,499
3,904
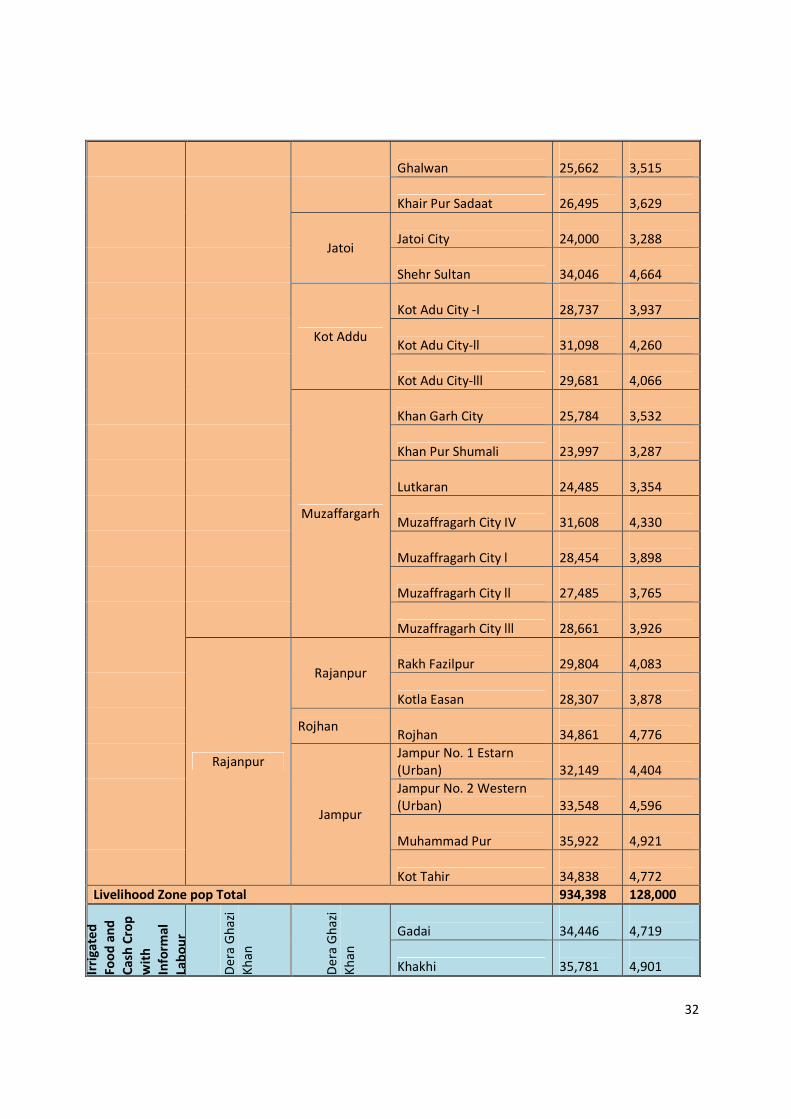
32
Ghalwan
25,662
3,515
Khair Pur Sadaat
26,495
3,629
Jatoi Jatoi City
24,000
3,288
Shehr Sultan
34,046
4,664
Kot Addu
Kot Adu City -I
28,737
3,937
Kot Adu City-ll
31,098
4,260
Kot Adu City-lll
29,681
4,066
Muzaffargarh
Khan Garh City
25,784
3,532
Khan Pur Shumali
23,997
3,287
Lutkaran
24,485
3,354
Muzaffragarh City IV
31,608
4,330
Muzaffragarh City l
28,454
3,898
Muzaffragarh City ll
27,485
3,765
Muzaffragarh City lll
28,661
3,926
Rajanpur
Rajanpur Rakh Fazilpur
29,804
4,083
Kotla Easan
28,307
3,878
Rojhan Rojhan
34,861
4,776
Jampur
Jampur No. 1 Estarn
(Urban)
32,149
4,404
Jampur No. 2 Western
(Urban)
33,548
4,596
Muhammad Pur
35,922
4,921
Kot Tahir
34,838
4,772
Livelihood Zone pop Total 934,398 128,000
Irri
ga
ted
Fo
od
an
d
Ca
sh C
rop
wit
h
Info
rma
l
Lab
ou
r
De
ra G
ha
zi
Kh
an
De
ra G
ha
zi
Kh
an
Gadai
34,446
4,719
Khakhi
35,781
4,901
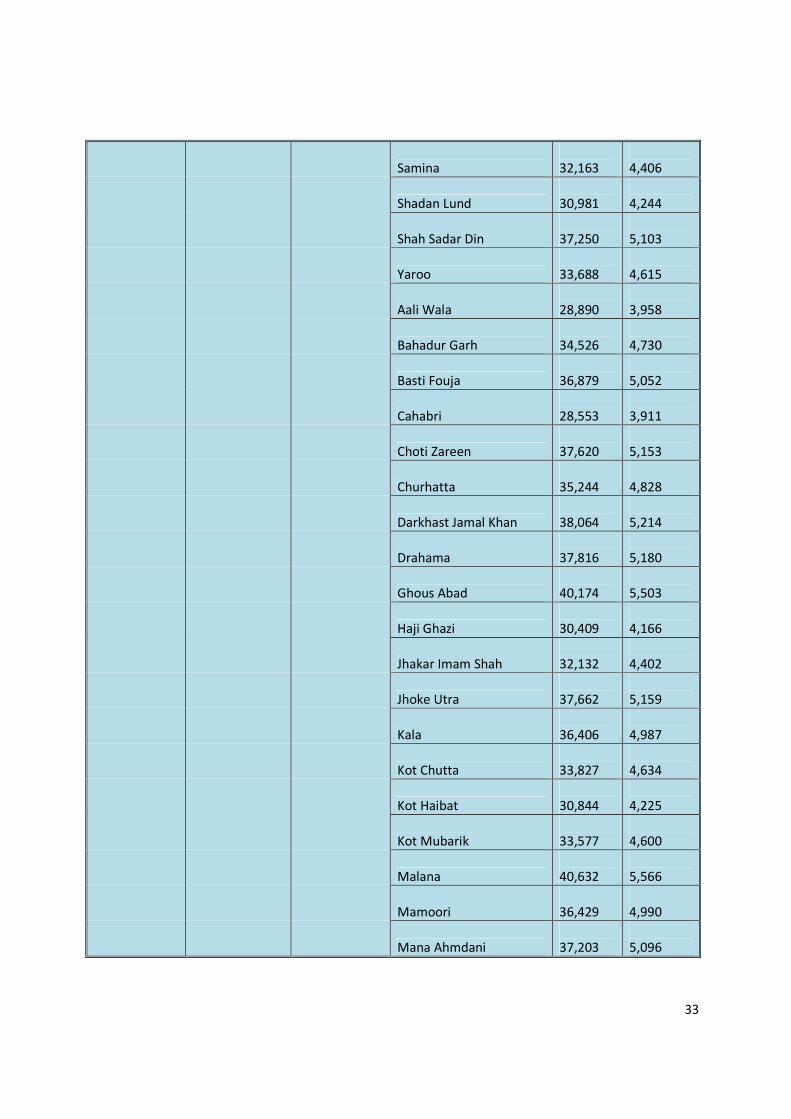
33
Samina
32,163
4,406
Shadan Lund
30,981
4,244
Shah Sadar Din
37,250
5,103
Yaroo
33,688
4,615
Aali Wala
28,890
3,958
Bahadur Garh
34,526
4,730
Basti Fouja
36,879
5,052
Cahabri
28,553
3,911
Choti Zareen
37,620
5,153
Churhatta
35,244
4,828
Darkhast Jamal Khan
38,064
5,214
Drahama
37,816
5,180
Ghous Abad
40,174
5,503
Haji Ghazi
30,409
4,166
Jhakar Imam Shah
32,132
4,402
Jhoke Utra
37,662
5,159
Kala
36,406
4,987
Kot Chutta
33,827
4,634
Kot Haibat
30,844
4,225
Kot Mubarik
33,577
4,600
Malana
40,632
5,566
Mamoori
36,429
4,990
Mana Ahmdani
37,203
5,096
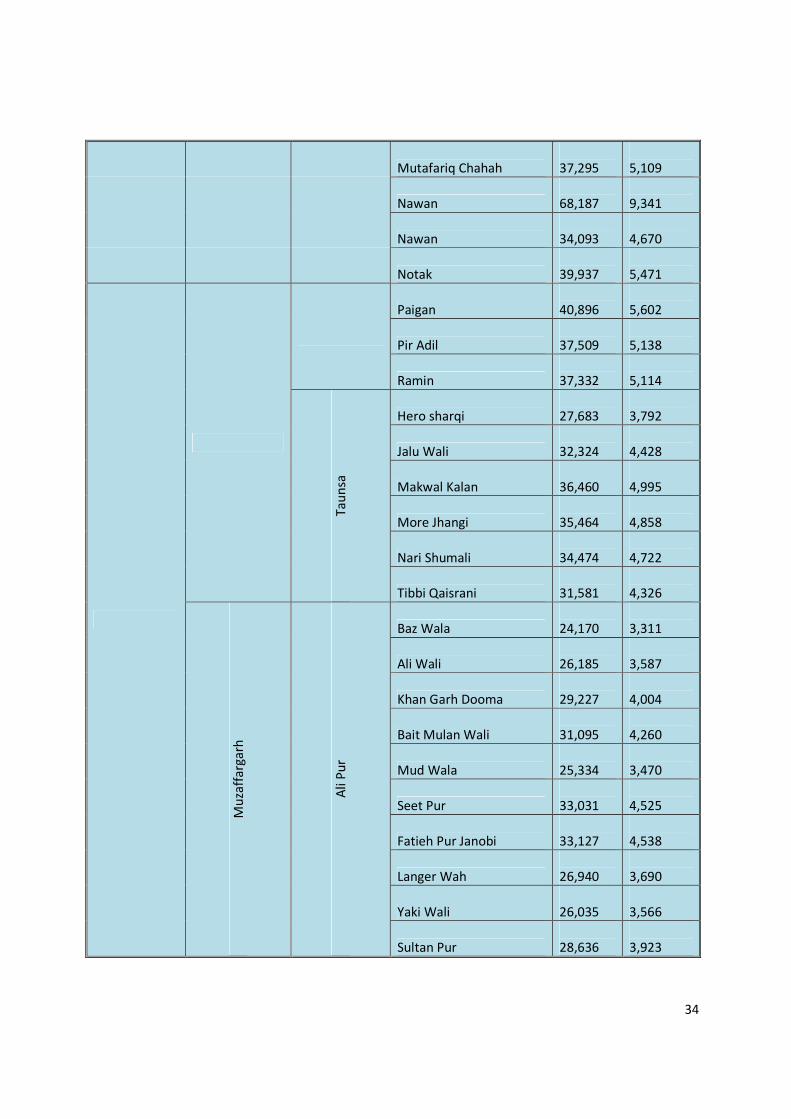
34
Mutafariq Chahah
37,295
5,109
Nawan
68,187
9,341
Nawan
34,093
4,670
Notak
39,937
5,471
Paigan
40,896
5,602
Pir Adil
37,509
5,138
Ramin
37,332
5,114
Ta
un
sa
Hero sharqi
27,683
3,792
Jalu Wali
32,324
4,428
Makwal Kalan
36,460
4,995
More Jhangi
35,464
4,858
Nari Shumali
34,474
4,722
Tibbi Qaisrani
31,581
4,326
Mu
zaff
arg
arh
Ali
Pu
r
Baz Wala
24,170
3,311
Ali Wali
26,185
3,587
Khan Garh Dooma
29,227
4,004
Bait Mulan Wali
31,095
4,260
Mud Wala
25,334
3,470
Seet Pur
33,031
4,525
Fatieh Pur Janobi
33,127
4,538
Langer Wah
26,940
3,690
Yaki Wali
26,035
3,566
Sultan Pur
28,636
3,923
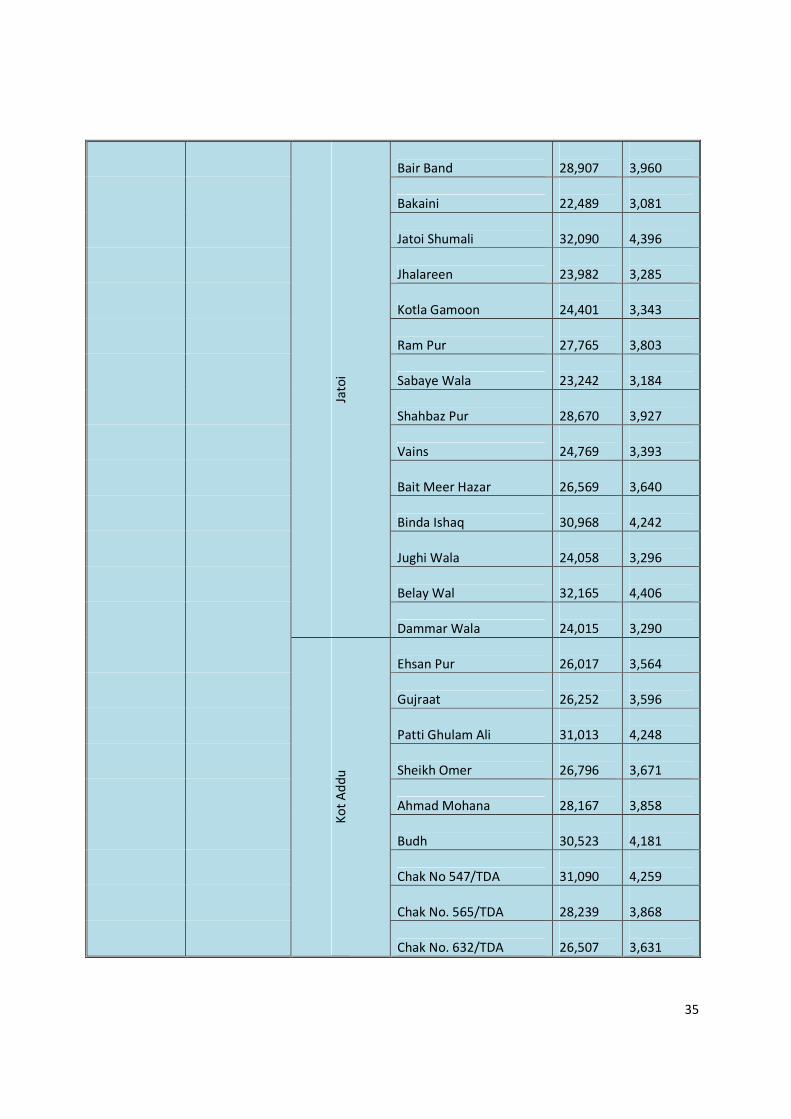
35
Jato
i
Bair Band
28,907
3,960
Bakaini
22,489
3,081
Jatoi Shumali
32,090
4,396
Jhalareen
23,982
3,285
Kotla Gamoon
24,401
3,343
Ram Pur
27,765
3,803
Sabaye Wala
23,242
3,184
Shahbaz Pur
28,670
3,927
Vains
24,769
3,393
Bait Meer Hazar
26,569
3,640
Binda Ishaq
30,968
4,242
Jughi Wala
24,058
3,296
Belay Wal
32,165
4,406
Dammar Wala
24,015
3,290
Ko
t A
dd
u
Ehsan Pur
26,017
3,564
Gujraat
26,252
3,596
Patti Ghulam Ali
31,013
4,248
Sheikh Omer
26,796
3,671
Ahmad Mohana
28,167
3,858
Budh
30,523
4,181
Chak No 547/TDA
31,090
4,259
Chak No. 565/TDA
28,239
3,868
Chak No. 632/TDA
26,507
3,631
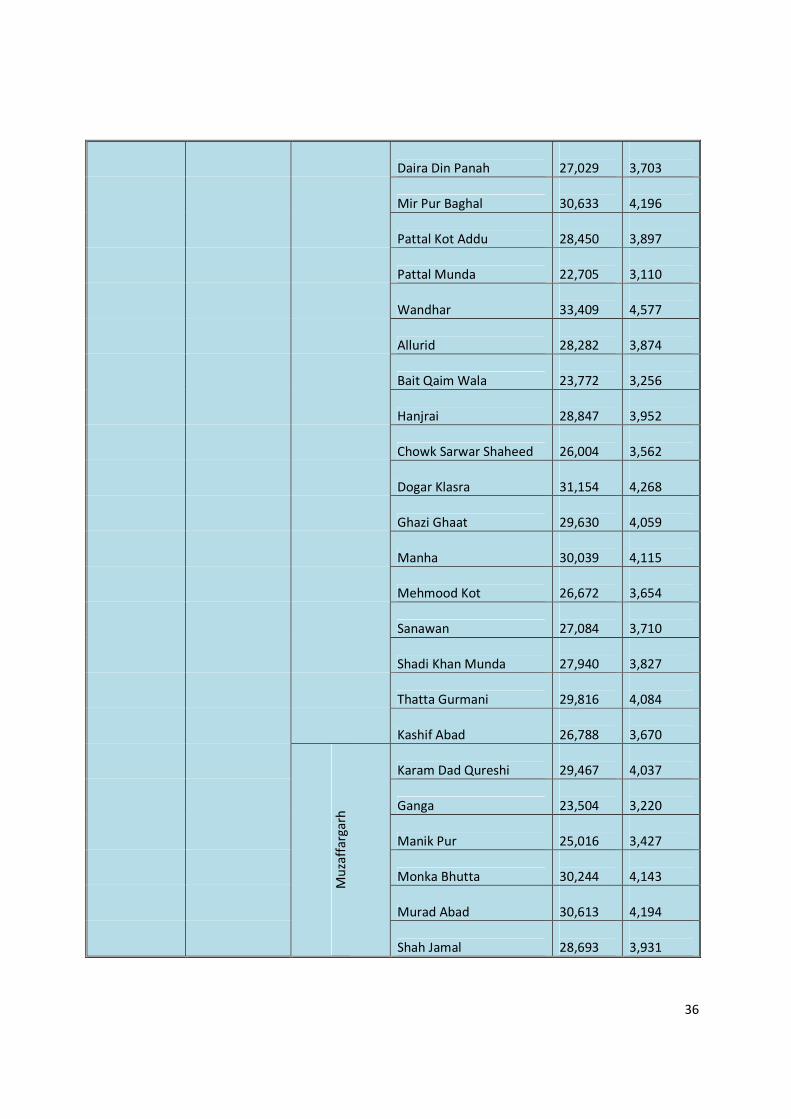
36
Daira Din Panah
27,029
3,703
Mir Pur Baghal
30,633
4,196
Pattal Kot Addu
28,450
3,897
Pattal Munda
22,705
3,110
Wandhar
33,409
4,577
Allurid
28,282
3,874
Bait Qaim Wala
23,772
3,256
Hanjrai
28,847
3,952
Chowk Sarwar Shaheed
26,004
3,562
Dogar Klasra
31,154
4,268
Ghazi Ghaat
29,630
4,059
Manha
30,039
4,115
Mehmood Kot
26,672
3,654
Sanawan
27,084
3,710
Shadi Khan Munda
27,940
3,827
Thatta Gurmani
29,816
4,084
Kashif Abad
26,788
3,670
Mu
zaff
arg
arh
Karam Dad Qureshi
29,467
4,037
Ganga
23,504
3,220
Manik Pur
25,016
3,427
Monka Bhutta
30,244
4,143
Murad Abad
30,613
4,194
Shah Jamal
28,693
3,931
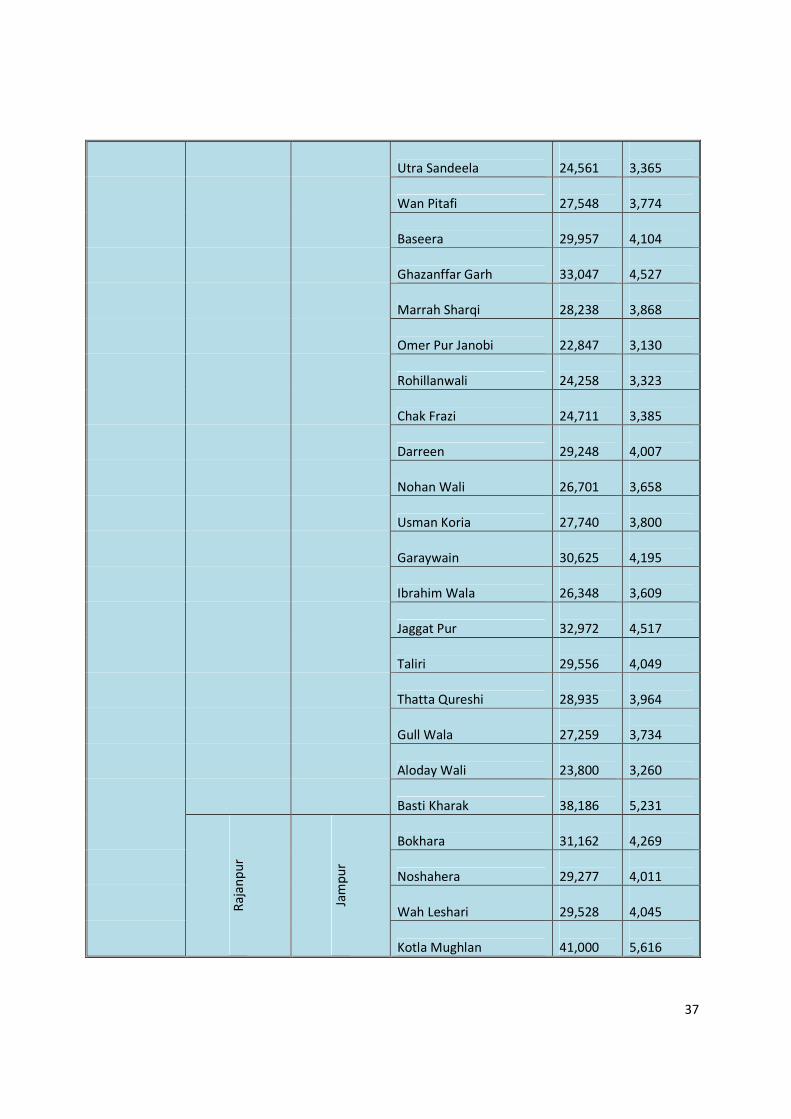
37
Utra Sandeela
24,561
3,365
Wan Pitafi
27,548
3,774
Baseera
29,957
4,104
Ghazanffar Garh
33,047
4,527
Marrah Sharqi
28,238
3,868
Omer Pur Janobi
22,847
3,130
Rohillanwali
24,258
3,323
Chak Frazi
24,711
3,385
Darreen
29,248
4,007
Nohan Wali
26,701
3,658
Usman Koria
27,740
3,800
Garaywain
30,625
4,195
Ibrahim Wala
26,348
3,609
Jaggat Pur
32,972
4,517
Taliri
29,556
4,049
Thatta Qureshi
28,935
3,964
Gull Wala
27,259
3,734
Aloday Wali
23,800
3,260
Basti Kharak
38,186
5,231
Ra
jan
pu
r
Jam
pu
r
Bokhara
31,162
4,269
Noshahera
29,277
4,011
Wah Leshari
29,528
4,045
Kotla Mughlan
41,000
5,616
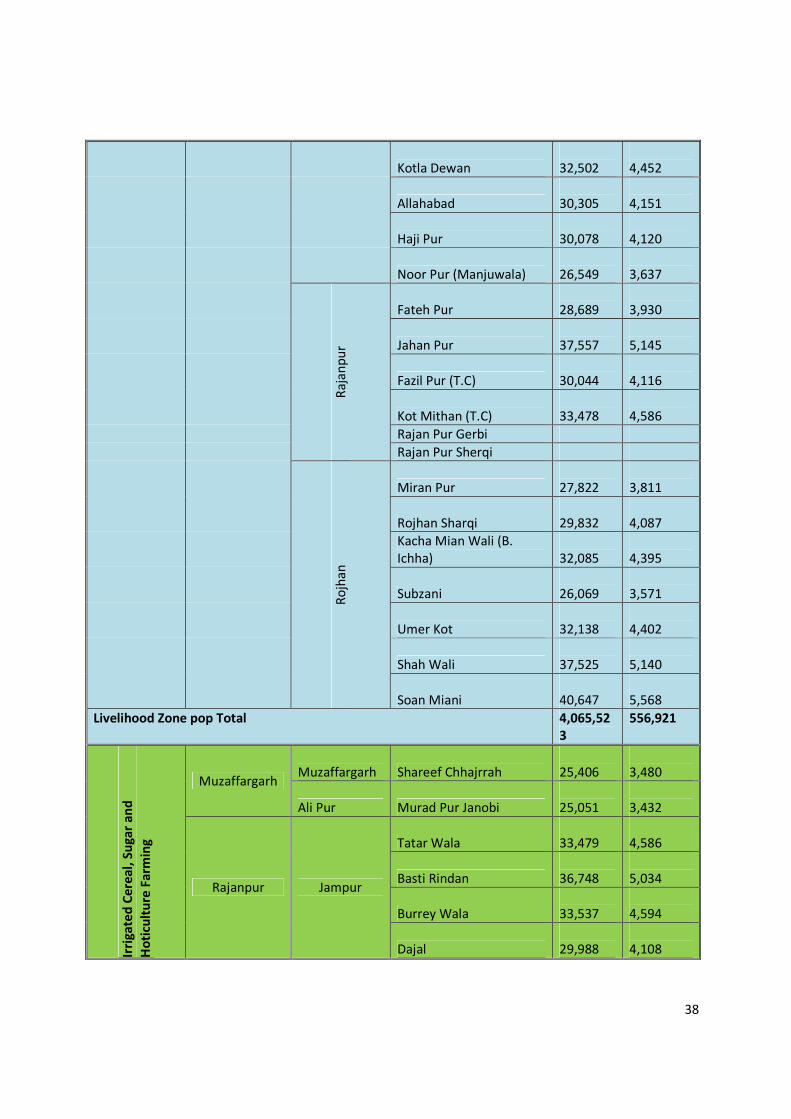
38
Kotla Dewan
32,502
4,452
Allahabad
30,305
4,151
Haji Pur
30,078
4,120
Noor Pur (Manjuwala)
26,549
3,637
Ra
jan
pu
r
Fateh Pur
28,689
3,930
Jahan Pur
37,557
5,145
Fazil Pur (T.C)
30,044
4,116
Kot Mithan (T.C)
33,478
4,586
Rajan Pur Gerbi
Rajan Pur Sherqi
Ro
jha
n
Miran Pur
27,822
3,811
Rojhan Sharqi
29,832
4,087
Kacha Mian Wali (B.
Ichha)
32,085
4,395
Subzani
26,069
3,571
Umer Kot
32,138
4,402
Shah Wali
37,525
5,140
Soan Miani
40,647
5,568
Livelihood Zone pop Total 4,065,52
3 556,921
Irri
ga
ted
Ce
rea
l, S
ug
ar
an
d
Ho
ticu
ltu
re F
arm
ing
Muzaffargarh Muzaffargarh Shareef Chhajrrah
25,406
3,480
Ali Pur Murad Pur Janobi
25,051
3,432
Rajanpur Jampur
Tatar Wala
33,479
4,586
Basti Rindan
36,748
5,034
Burrey Wala
33,537
4,594
Dajal
29,988
4,108
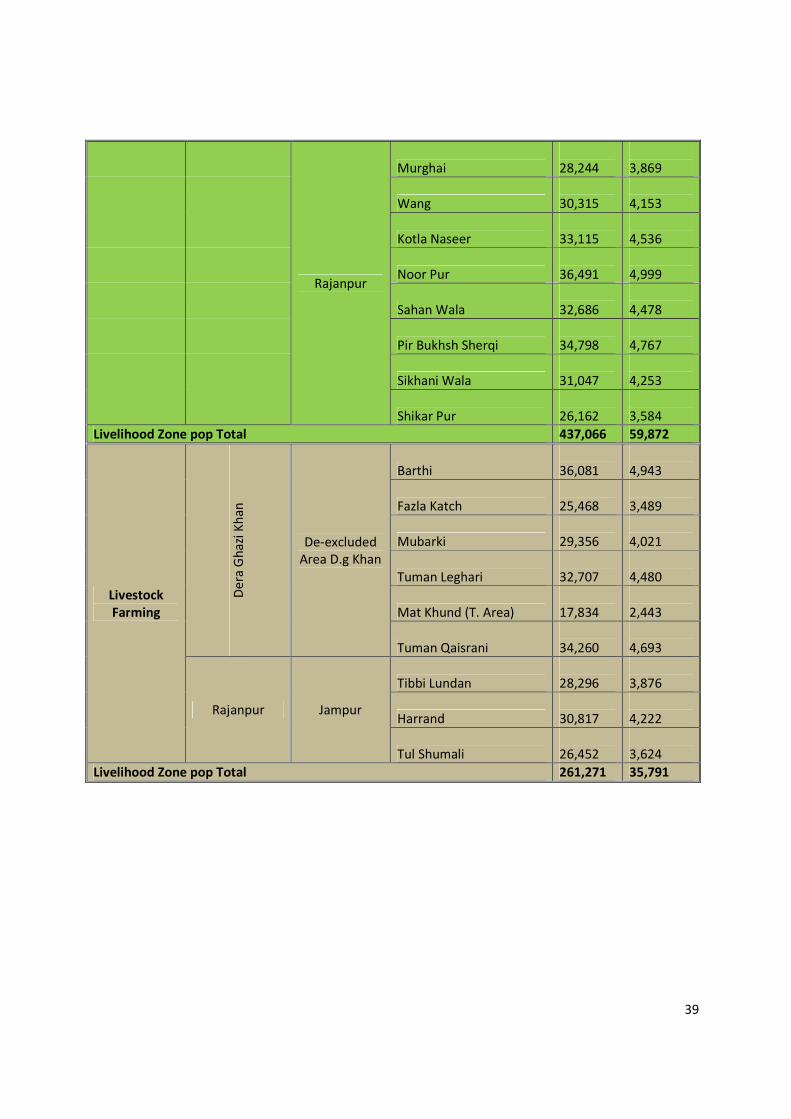
39
Rajanpur
Murghai
28,244
3,869
Wang
30,315
4,153
Kotla Naseer
33,115
4,536
Noor Pur
36,491
4,999
Sahan Wala
32,686
4,478
Pir Bukhsh Sherqi
34,798
4,767
Sikhani Wala
31,047
4,253
Shikar Pur
26,162
3,584
Livelihood Zone pop Total 437,066 59,872
Livestock
Farming
De
ra G
ha
zi K
ha
n
De-excluded
Area D.g Khan
Barthi
36,081
4,943
Fazla Katch
25,468
3,489
Mubarki
29,356
4,021
Tuman Leghari
32,707
4,480
Mat Khund (T. Area)
17,834
2,443
Tuman Qaisrani
34,260
4,693
Rajanpur Jampur
Tibbi Lundan
28,296
3,876
Harrand
30,817
4,222
Tul Shumali
26,452
3,624
Livelihood Zone pop Total 261,271 35,791
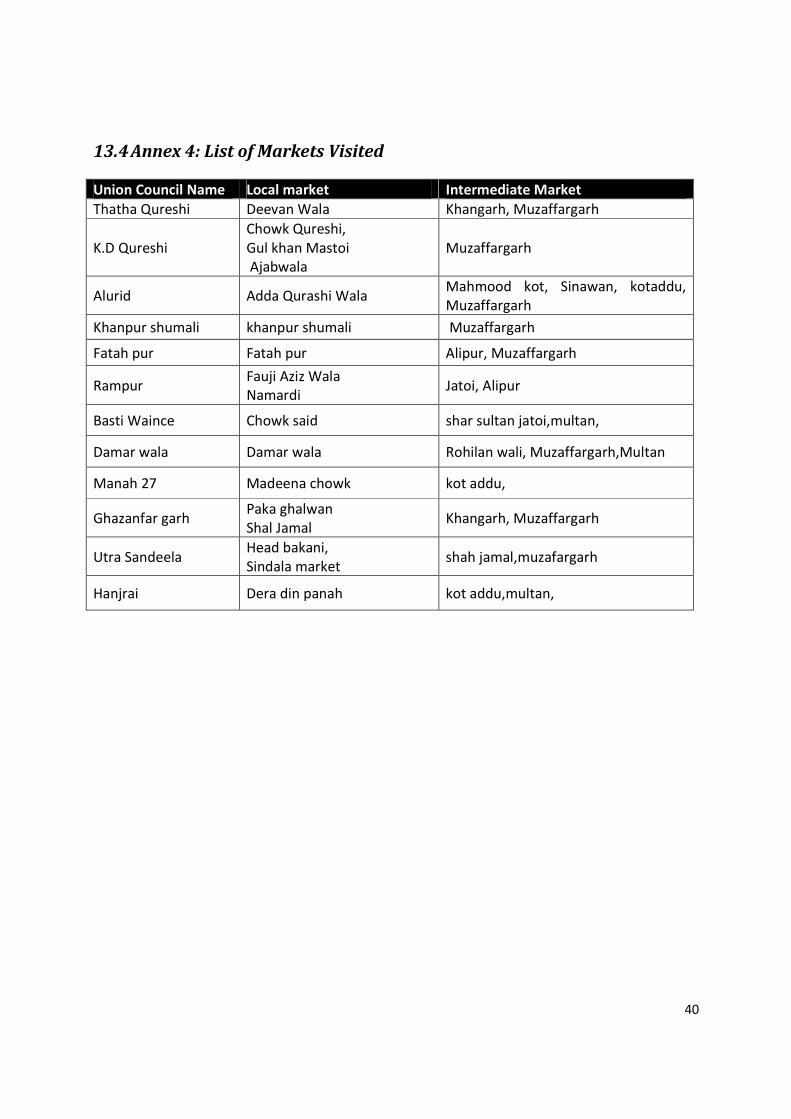
40
13.4 Annex 4: List of Markets Visited
Union Council Name Local market Intermediate Market
Thatha Qureshi Deevan Wala Khangarh, Muzaffargarh
K.D Qureshi
Chowk Qureshi,
Gul khan Mastoi
Ajabwala
Muzaffargarh
Alurid Adda Qurashi Wala Mahmood kot, Sinawan, kotaddu,
Muzaffargarh
Khanpur shumali khanpur shumali Muzaffargarh
Fatah pur Fatah pur Alipur, Muzaffargarh
Rampur Fauji Aziz Wala
Namardi Jatoi, Alipur
Basti Waince Chowk said shar sultan jatoi,multan,
Damar wala Damar wala Rohilan wali, Muzaffargarh,Multan
Manah 27 Madeena chowk kot addu,
Ghazanfar garh Paka ghalwan
Shal Jamal Khangarh, Muzaffargarh
Utra Sandeela Head bakani,
Sindala market shah jamal,muzafargarh
Hanjrai Dera din panah kot addu,multan,
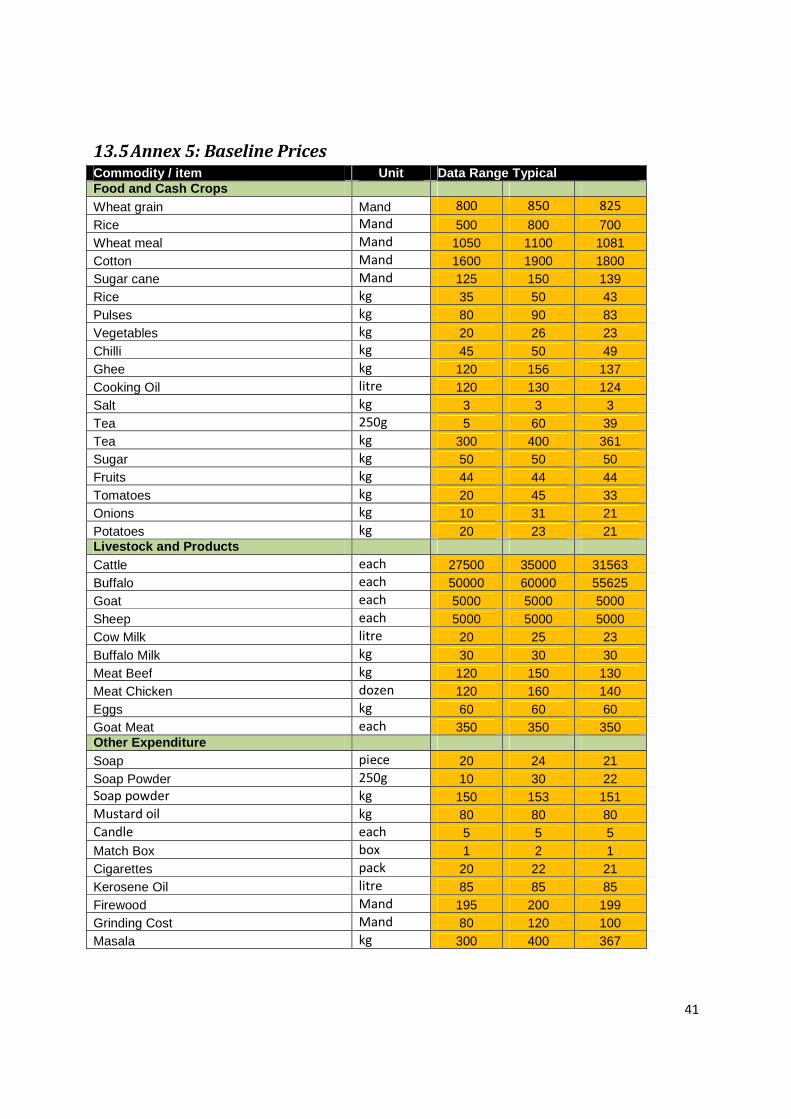
41
13.5 Annex 5: Baseline Prices Commodity / item Unit Data Range Typical Food and Cash Crops Wheat grain Mand 800 850 825
Rice Mand 500 800 700 Wheat meal Mand 1050 1100 1081 Cotton Mand 1600 1900 1800 Sugar cane Mand 125 150 139 Rice kg 35 50 43 Pulses kg 80 90 83 Vegetables kg 20 26 23 Chilli kg 45 50 49 Ghee kg 120 156 137 Cooking Oil litre 120 130 124 Salt kg 3 3 3 Tea 250g 5 60 39 Tea kg 300 400 361 Sugar kg 50 50 50 Fruits kg 44 44 44 Tomatoes kg 20 45 33 Onions kg 10 31 21 Potatoes kg 20 23 21 Livestock and Products Cattle each 27500 35000 31563 Buffalo each 50000 60000 55625 Goat each 5000 5000 5000 Sheep each 5000 5000 5000 Cow Milk litre 20 25 23 Buffalo Milk kg 30 30 30 Meat Beef kg 120 150 130 Meat Chicken dozen 120 160 140 Eggs kg 60 60 60 Goat Meat each 350 350 350 Other Expenditure Soap piece 20 24 21 Soap Powder 250g 10 30 22 Soap powder kg 150 153 151 Mustard oil kg 80 80 80 Candle each 5 5 5 Match Box box 1 2 1 Cigarettes pack 20 22 21 Kerosene Oil litre 85 85 85 Firewood Mand 195 200 199 Grinding Cost Mand 80 120 100 Masala kg 300 400 367