eramo day one keynote ceri 2015 petrochemical conference
DESCRIPTION
Ceri Presentation 2015 Petrochemical confTRANSCRIPT

Global Petrochemical Market Outlook:Impact of Energy at the ExtremesPresented to: CERI 2015 Petrochemical Conference
June 7-9, 2015 • Delta Lodge at Kananaskis • Alberta
Mark EramoVice President - Global Chemical InsightsIHS Chemical, Houston, [email protected]

Agenda
• Chemical Building Blocks• Energy At The Extremes• Investment Trends• Basic Chemical Demand &
Trade• Low Crude Impact On
Profit Cycle• Closing Thoughts
© 2015 IHS, Inc. No portion of this presentation may be reproduced, reused, or otherwise distributed in any form without prior written consent.

© 2015 IHS, Inc. No portion of this presentation may be reproduced, reused, or otherwise distributed in any form without prior written consent.
• Automotive /Transportation
• Consumer products
• Packaging
• Building & construction
• Recreation /Sport• Industrial
• Medical• Pharmaceuticals• Personal care
• Textiles• Electrical/
Electronics• Aerospace
• Business equipment
Customers of the Chemical Industry
•Oil•Gas•Coal•Minerals•Renewables
Mining, Drilling, Refining & Gas
Processing
Chemical Intermediates
Commodities
Differentiated Commodities
Technical Specialties
Olefins(ethylene, propylene,
butylene)
Aromatics(benzene, toluene,
xylenes)
Chlor-Alkali(chlorine, caustic
soda)
Others(e.g., ammonia, phosphorous)
Methanol
Basic Chemicals
• Plastics & Engineering Resins− Extruded films, pipe, profiles,
coatings, sheet, foams, sheet− Blow-molded parts− Injection molded parts− Composites
•Synthetic Fibers•Rubber Products•Paints & Coatings•Adhesives & Sealants•Lubricants•Water Treatment products•Cleaning Products• Industrial Chemicals•Flame Retardants•Many others…
Formulated Products / Performance Materials
Chemical Industry Value ChainNatural Resources
End-use Consumer Products
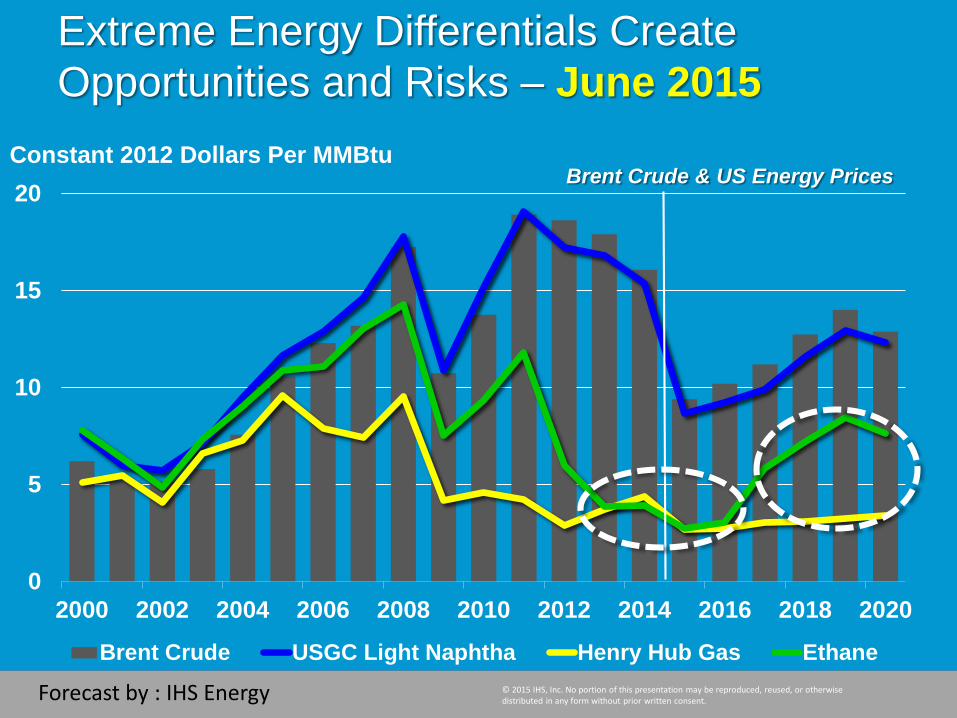
Extreme Energy Differentials Create Opportunities and Risks – June 2015
© 2015 IHS, Inc. No portion of this presentation may be reproduced, reused, or otherwise distributed in any form without prior written consent.
0
5
10
15
20
2000 2002 2004 2006 2008 2010 2012 2014 2016 2018 2020
Brent Crude USGC Light Naphtha Henry Hub Gas Ethane
Constant 2012 Dollars Per MMBtuBrent Crude & US Energy Prices
Forecast by : IHS Energy

When Energy Markets Move Chemical Will Markets Respond
• The rapid decline in crude oil pricing causes supply-chains to “pause” as buyers anticipate lower prices “tomorrow”.
• Combination of a pause in demand and the decline in costs for high-cost producers results in price decreases.
• As market prices “chase” falling costs, cash margins for high-cost producers can expand while cash margins for low cost producers will decline.
© 2015 IHS, Inc. No portion of this presentation may be reproduced, reused, or otherwise distributed in any form without prior written consent.
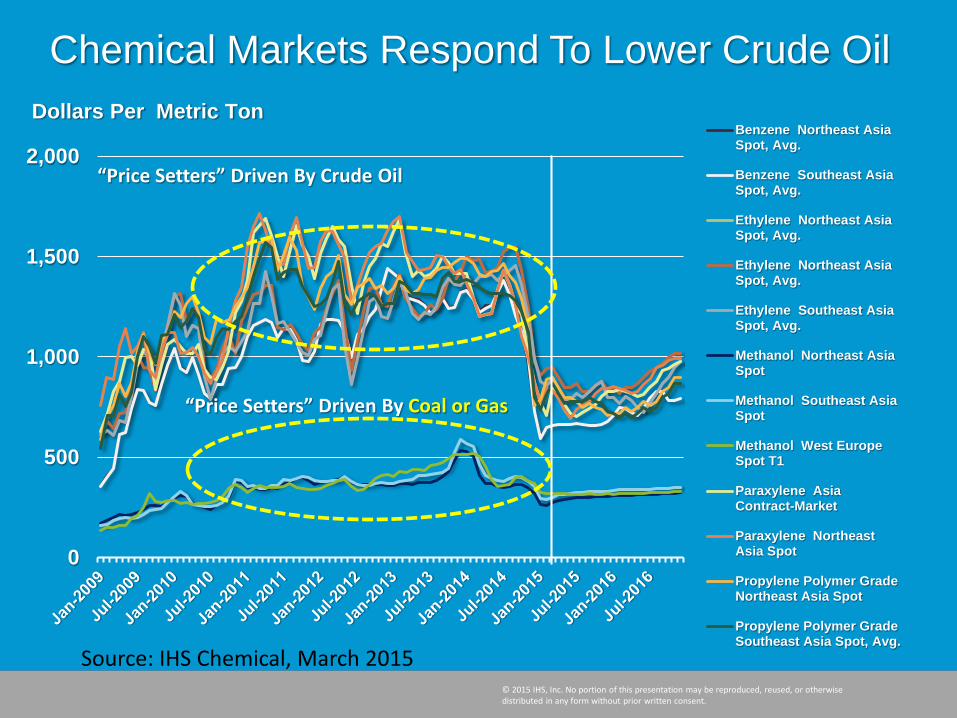
Chemical Markets Respond To Lower Crude Oil
© 2015 IHS, Inc. No portion of this presentation may be reproduced, reused, or otherwise distributed in any form without prior written consent.
0
500
1,000
1,500
2,000Benzene Northeast AsiaSpot, Avg.
Benzene Southeast AsiaSpot, Avg.
Ethylene Northeast AsiaSpot, Avg.
Ethylene Northeast AsiaSpot, Avg.
Ethylene Southeast AsiaSpot, Avg.
Methanol Northeast AsiaSpot
Methanol Southeast AsiaSpot
Methanol West EuropeSpot T1
Paraxylene AsiaContract-Market
Paraxylene NortheastAsia Spot
Propylene Polymer GradeNortheast Asia Spot
Propylene Polymer GradeSoutheast Asia Spot, Avg.
Dollars Per Metric Ton
“Price Setters” Driven By Crude Oil
“Price Setters” Driven By Coal or Gas
Source: IHS Chemical, March 2015

0
400
800
1200
1600
SaudiArabiaEthane
U.S. Ethane WesternCanada
China CTO SaudiArabia
Naphtha
NortheastAsia
Naphtha
WestEuropeNaphtha
China MTO
2011 2013 2015US$ / Metric Ton
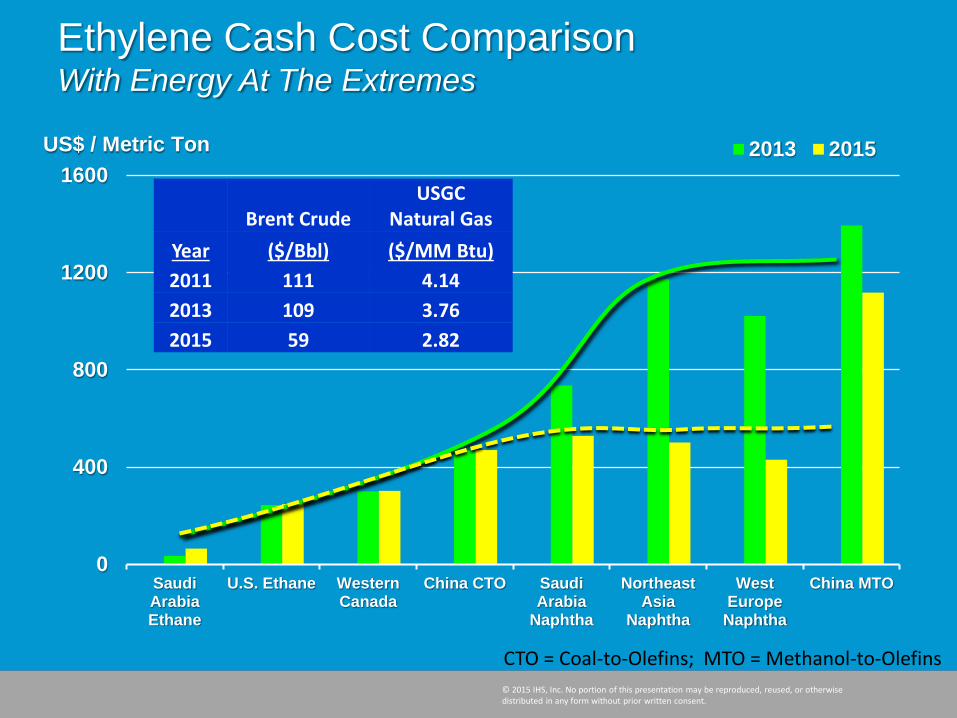
Ethylene Cash Cost Comparison With Energy At The Extremes
© 2015 IHS, Inc. No portion of this presentation may be reproduced, reused, or otherwise distributed in any form without prior written consent.
Brent CrudeUSGC
Natural GasYear ($/Bbl) ($/MM Btu)2011 111 4.142013 109 3.762015 59 2.82
CTO = Coal-to-Olefins; MTO = Methanol-to-Olefins
0
400
800
1200
1600
SaudiArabiaEthane
U.S. Ethane WesternCanada
China CTO SaudiArabia
Naphtha
NortheastAsia
Naphtha
WestEuropeNaphtha
China MTO
2011 2013 2015US$ / Metric Ton
Ethylene Cash Cost Comparison With Energy At The Extremes
© 2015 IHS, Inc. No portion of this presentation may be reproduced, reused, or otherwise distributed in any form without prior written consent.
Brent CrudeUSGC
Natural GasYear ($/Bbl) ($/MM Btu)2011 111 4.142013 109 3.762015 59 2.82
CTO = Coal-to-Olefins; MTO = Methanol-to-Olefins

Investment Drivers Vary By Region By Value Chain
• North America (USA) Leverage low cost natural gas based chemicals
into investments in ethylene, propylene and methanol based derivatives.
Invest to establish export channels to market that exceed historical norms
• Middle East (Saudi Arabia) Moderated investment pace, diversified feedslate
to support downstream market development and continued industrial expansion well beyond ethylene chemistry
• North East Asia (China) Strong domestic investment focused on reducing
import dependencies. Leverage coal to chemicals technology near term
© 2015 IHS, Inc. No portion of this presentation may be reproduced, reused, or otherwise distributed in any form without prior written consent.
Raw Material & Energy
Costs
Demand Growth & Access to Markets
Technology &
Economies of Scale
Chemical Industry Investments Seek A Sustainable Advantage

Top 5 Countries Adding Base Chemical Capacity 231 Million Tons from 2010 to 2020
© 2015 IHS, Inc. No portion of this presentation may be reproduced, reused, or otherwise distributed in any form without prior written consent.
0
20
40
60
80
100
120
China UnitedStates
SaudiArabia
S. Korea India
Chlorine Paraxylene Benzene
Methanol Propylene Ethylene
Million Metric Tons
Top five will add nearly 75% of base chemical capacity. China will dominate new
capacity, adding 45% of total
Investment capital has shifted to North America, however, the vast majority of new investment continues to accelerate in Asia/Pacific, dominated by China

© 2015 IHS, Inc. No portion of this presentation may be reproduced, reused, or otherwise distributed in any form without prior written consent.
Olefin (CTO/MTO Construction)
Olefin (Operating CTO/MTO)
Olefins
PX
MEG (Operating)
MEG (Construction)
Petrochemical Investment In China Moves West

China Unconventional Olefins Capacity Growth
© 2015 IHS, Inc. No portion of this presentation may be reproduced, reused, or otherwise distributed in any form without prior written consent.
0%
25%
50%
75%
20
40
60
80
2009 2011 2013 2015 2017 2019
Olefin-Conventional CTO MTO PDH % of Unconventional
Light Olefins Capacity(Million Metric Ton)
% of Unconventional Light Olefins Capacity

North America Ethylene Capacity Growth: 2014 – 2020Completed or Firm Projects (Thousand Metric Tons)
© 2015 IHS, Inc. No portion of this presentation may be reproduced, reused, or otherwise distributed in any form without prior written consent.
Company Location Total GrowthBASF/Total Port Arthur. TX 128ChevronPhillips Cedar Bayou, TX 1,500Dow Freeport, TX 1,500Dow Plaquemine, LA 220Eastman Longview, TX 17Equistar Various sites 1,112ExxonMobil Baytown, TX 1,500Flint Hills Port Arthur, TX 100Formosa Point Comfort, TX 1,150Oxy/Mexichem Ingleside, TX 550Shin-Etsu Plaquemine, LA 500Sasol Lake Charles, LA 1,550Westlake KY and LA sites 216Williams Geismar, LA 258Braskem Idesa Mexico 1,000Nova Sarnia 168
Total Additions 11,469
North American ethylene capacity will increase to 45+ million metric tons by 2020, driven by low-cost ethane feedstock

© 2015 IHS, Inc. No portion of this presentation may be reproduced, reused, or otherwise distributed in any form without prior written consent.
Company Location Total Growth*BASF (MTP) US Gulf Coast 475Dow Freeport, TX 750Enterprise Mont Belvieu, TX 750Ascend Alvin, TX 1,173Formosa Point Comfort, TX 600Williams Redwater, Alberta 500RexTac Odessa 400
Total Additions 4,648
N.America On-Purpose Propylene Capacity Growth: 2014 – 2020Completed or Firm Projects (Thousand Metric Tons)All are PHD Units except for BASF
* MTP = methane to propylene
15
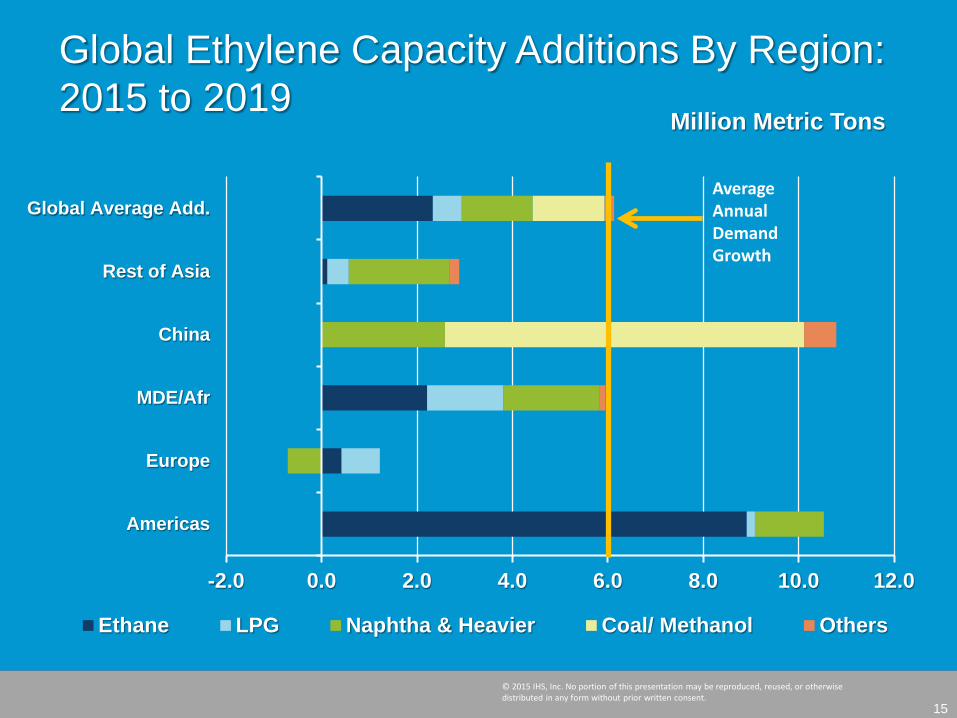
Global Ethylene Capacity Additions By Region: 2015 to 2019
Million Metric Tons
-2.0 0.0 2.0 4.0 6.0 8.0 10.0 12.0
Americas
Europe
MDE/Afr
China
Rest of Asia
Global Average Add.
Ethane LPG Naphtha & Heavier Coal/ Methanol Others
Average AnnualDemand Growth
© 2015 IHS, Inc. No portion of this presentation may be reproduced, reused, or otherwise distributed in any form without prior written consent.

Global Ethylene Supply Will Need More From Naphtha Cracking
-36%
-24%
-12%
0%
12%
24%
36%
-6.0
-4.0
-2.0
0.0
2.0
4.0
6.0
2005 2007 2009 2011 2013 2015 2017 2019 2021 2023
Ethylene Supply Growth from Naphtha
Percentages on lines are period averages
Million Metric Tons
23% 30%
11%
© 2015 IHS, Inc. No portion of this presentation may be reproduced, reused, or otherwise distributed in any form without prior written consent.

-4.0
-2.0
0.0
2.0
4.0
6.0
8.0
10.0
00 01 02 03 04 05 06 07 08 09 10 11 12 13 14 15 16 17 18 19
North America Middle East China
West Europe Others Annual Demand Increase
Global Propylene Capacity Growth To Exceed Demand Growth Near Term
© 2015 IHS, Inc. No portion of this presentation may be reproduced, reused, or otherwise distributed in any form without prior written consent.
Million Metric TonsGlobal Propylene Capacity Growth By Region

Agenda
• Chemical Building Blocks• Energy At The Extremes• Investment Trends• Basic Chemical Demand
& Trade• Low Crude Impact On The
Profit Cycle• Closing Thoughts
© 2015 IHS, Inc. No portion of this presentation may be reproduced, reused, or otherwise distributed in any form without prior written consent.

0
50
100
150
200
250
2010 2011 2012 2013 2014 2015 2016 2017 2018 2019 2020
Ethylene Methanol Propylene Chlorine Paraxylene Benzene
Million Metric Tons
Global Base Chemicals Cumulative Demand Growth2010 - 2020 = 224 Million Metric Tons
© 2015 IHS, Inc. No portion of this presentation may be reproduced, reused, or otherwise distributed in any form without prior written consent.
Total Growth
MM TonsAAGR: 2010/20
MM Tons/YrAAGR:
2010/20, %Ethylene 61.6 5.6 3.5Methanol 52.4 4.8 6.9Propylene 47.8 4.3 4.2Chlorine 28.1 2.6 3.6Paraxylene 19.4 1.8 4.5Benzene 14.7 1.3 2.3

Regional Trade Is Critical To Success
• Trade is an essential element of basic chemical supply chains
• Low cost regions such as North America and the Middle East will export increasing volumes
• On-purpose technology will change propylene trade patterns
• Significant investment in ships, ports, and infrastructure is needed to support increasing trade volumes
© 2015 IHS, Inc. No portion of this presentation may be reproduced, reused, or otherwise distributed in any form without prior written consent.
5 Countries Adding 75% of Base Chemical Capacity: 2010 to 2020 (231 MM Metric Tons)
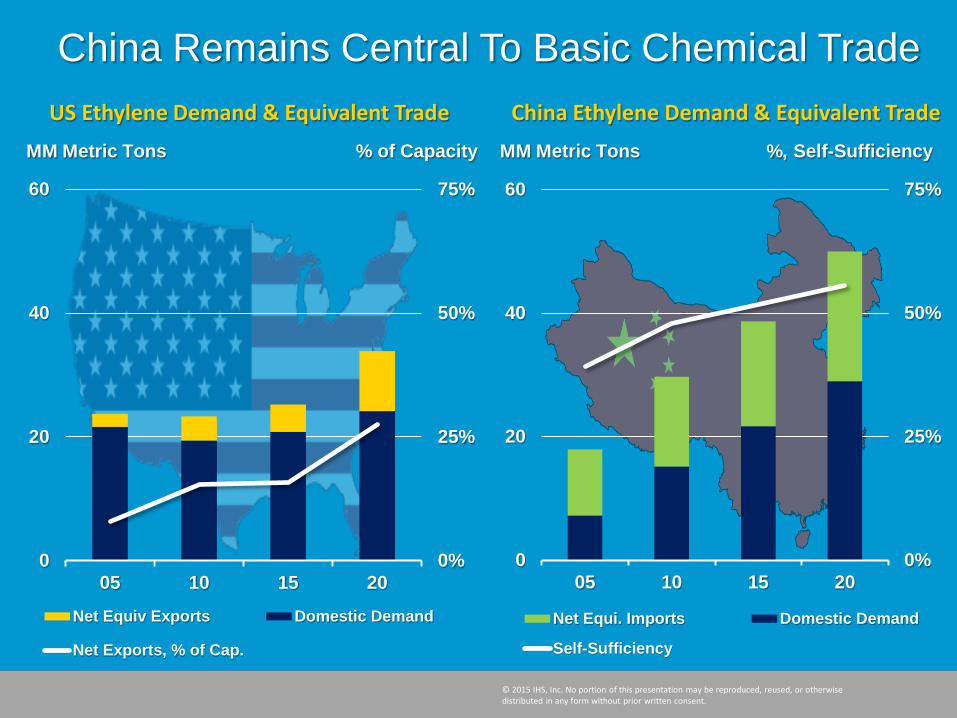
China Remains Central To Basic Chemical Trade
© 2015 IHS, Inc. No portion of this presentation may be reproduced, reused, or otherwise distributed in any form without prior written consent.
0%
25%
50%
75%
0
20
40
60
05 10 15 20
Net Equi. Imports Domestic Demand
Self-Sufficiency
MM Metric Tons %, Self-Sufficiency
0%
25%
50%
75%
0
20
40
60
05 10 15 20
Net Equiv Exports Domestic Demand
Net Exports, % of Cap.
MM Metric Tons % of Capacity
US Ethylene Demand & Equivalent Trade China Ethylene Demand & Equivalent Trade
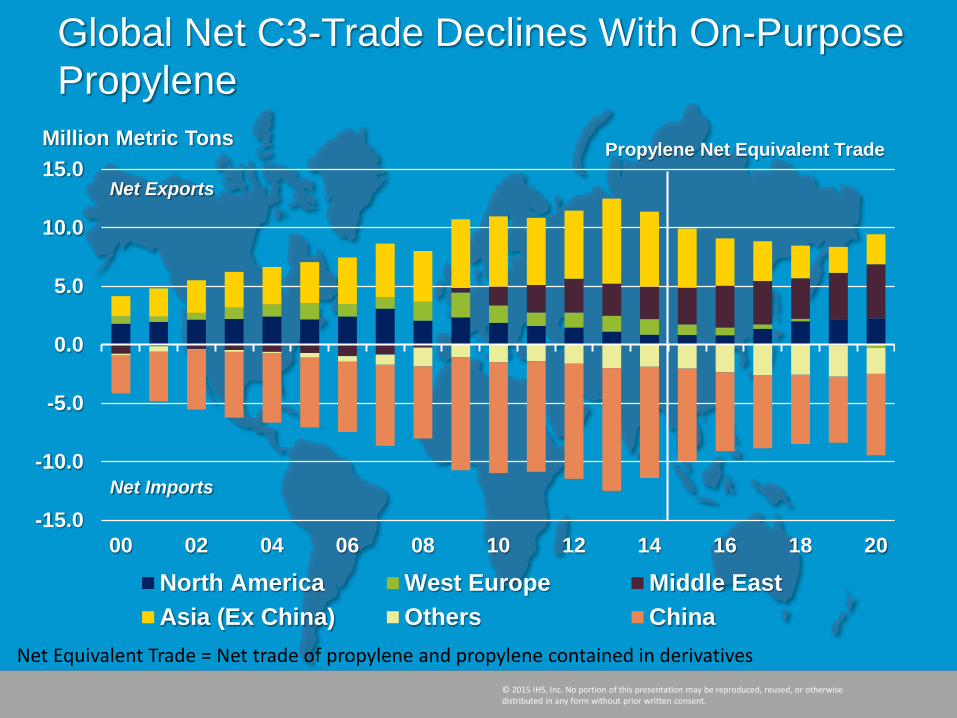
Global Net C3-Trade Declines With On-Purpose Propylene
© 2015 IHS, Inc. No portion of this presentation may be reproduced, reused, or otherwise distributed in any form without prior written consent.
-15.0
-10.0
-5.0
0.0
5.0
10.0
15.0
00 02 04 06 08 10 12 14 16 18 20
North America West Europe Middle EastAsia (Ex China) Others China
Propylene Net Equivalent Trade
Net Exports
Net Imports
Million Metric Tons
Net Equivalent Trade = Net trade of propylene and propylene contained in derivatives

Agenda
• Chemical Building Blocks• Energy At The Extremes• Investment Trends• Basic Chemical Demand &
Trade• Low Crude Impact On The
Profit Cycle• Closing Thoughts
© 2015 IHS, Inc. No portion of this presentation may be reproduced, reused, or otherwise distributed in any form without prior written consent.

-220
0
220
441
661
882
1,102
1,323
-10
0
10
20
30
40
50
60
00 02 04 06 08 10 12 14 16 18 20
US Ethane to PE Chain Margin Asia Naphtha to PE Chain Margin
Margin, Cents Per Pound Margin, Dollars Per Metric Ton
Polyethylene Integrated Cash MarginsUS Ethane Vs. Asia Naphtha
© 2015 IHS, Inc. No portion of this presentation may be reproduced, reused, or otherwise distributed in any form without prior written consent.
Ethane-based margins decline; maintain strong advantage

• Basic chemicals and derivatives markets adjust to “new energy”
• Price setters have lower cost…prices decline seeking new steady state; impact on trade
• Integrated margins for low-cost producers decline, some high-cost producer margins improve
• Approved “advantaged” projects advance; new projects may pause
• Demand declines followed by demand surge; trade patterns shift; potential upcycle in ethylene; propylene oversupply
The Impact of Energy At The Extremes…
Conclusions
© 2015 IHS, Inc. No portion of this presentation may be reproduced, reused, or otherwise distributed in any form without prior written consent.

• Availability of low-cost ethane and propane in North America to support continued investments; both domestic and international
• Developments in on-purpose technology for olefins versus traditional routes, including the use of methanol as a route to olefins.
• Impact of coal-to-chemicals and on-purpose propylene in China: private/provincial investment versus state-owned; self-sufficiency and surplus capacity impacting trade with China.
• Need for ethylene supplied from naphtha cracking: both higher operating rates for existing assets and investments in new naphtha cracking
The Impact of Energy At The Extremes…
Beyond 2020…
© 2015 IHS, Inc. No portion of this presentation may be reproduced, reused, or otherwise distributed in any form without prior written consent.

Global Petrochemical Market Outlook:Impact of Energy at the ExtremesPresented to: CERI 2015 Petrochemical Conference
June 7-9, 2015 • Delta Lodge at Kananaskis • Alberta
Mark EramoVice President - Global Chemical InsightsIHS Chemical, Houston, [email protected]
THANK YOU!