effectiveness of cold water pollution mitigation at ......effectiveness of cold water pollution...
TRANSCRIPT
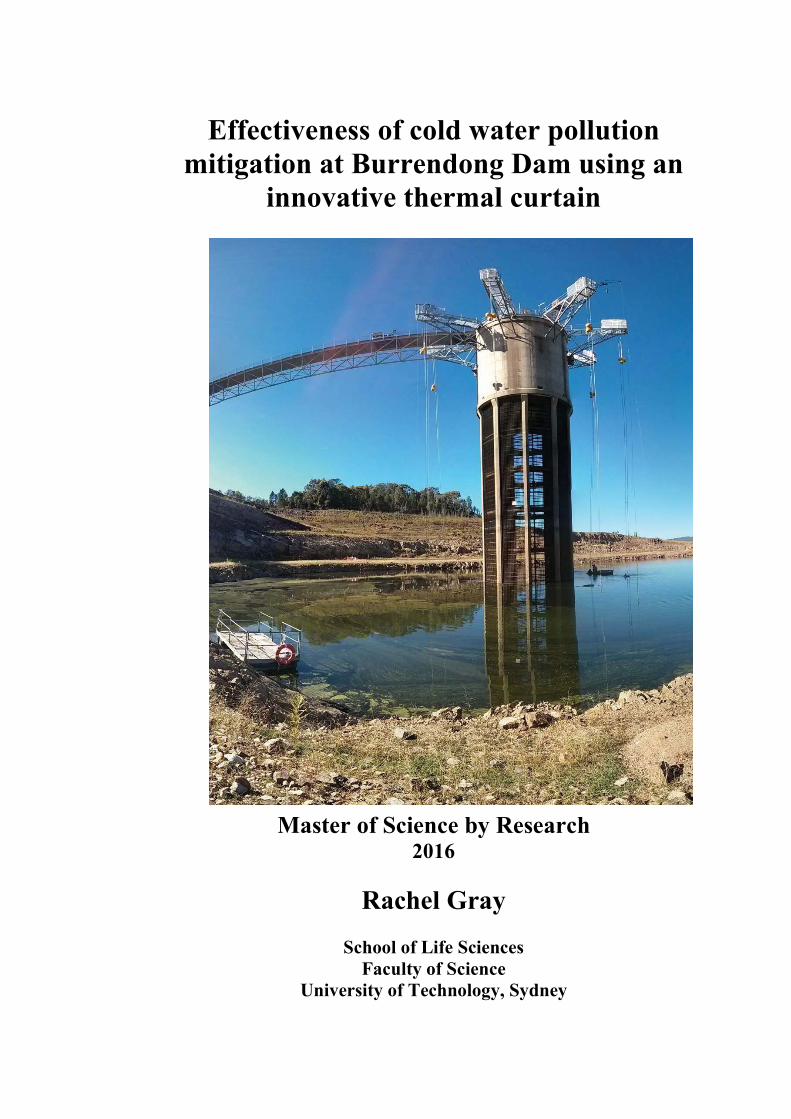
Effectiveness of cold water pollution mitigation at Burrendong Dam using an
innovative thermal curtain
Master of Science by Research201
Rachel Gray
School of Life SciencesFaculty of Science
University of Technology, Sydney

Effectiveness of cold water pollution mitigation at Burrendong Dam using an innovative thermal curtain
This thesis has been written in the style of a journal. Each chapter has been written as stand-alone chapters, in the style of journal articles so some repetition unavoidably
occurs.
i
Effectiveness of cold water pollution mitigation at Burrendong Dam using an innovative thermal curtain
Certificate of Original Authorship
I certify that the work in this thesis has not previously been submitted for a degree nor
has it been submitted as part of requirements for a degree except as fully
acknowledged within the text.
I also certify that the thesis has been written by me. Any help that I have received in
my research work and the preparation of the thesis itself has been acknowledged. In
addition, I certify that all information sources and literature used are indicated in the
thesis.
Rachel Gray
ii
Effectiveness of cold water pollution mitigation at Burrendong Dam using an innovative thermal curtain
Acknowledgements
This research was funded by Water NSW, DPI Water and NSW Fisheries. Thank you to
the Cold Water Pollution Inter-Agency Group (CWPIAG) for pioneering this project and
for their continuous support.
Sincerest thanks to my primary supervisor, Dr Simon Mitrovic from the School of Life
Sciences at the University of Technology Sydney and DPI Water for his ongoing
support, expertise and many reviews of this thesis. Also to my industry supervisor,
Lorraine Hardwick from DPI Water, for her guidance in field work and reviews of this
thesis.
Special thanks are due to Dr Hugh Jones from the NSW department of Environment
and Heritage, for his assistance and expertise in the analysis of data, modelling, and
many reviews of this thesis. Thanks also to Tony and Anne Kelly, for accommodating
me over the course of the field work portion of this research, and for the many dinners
and invaluable support and enthusiasm through the duration of the project.
Thanks to the staff at Burrendong Dam, particularly Rodney Wilson and Roger Ryan for
allowing me access to downstream sites and the use of their boat for regular sampling
runs as well as thermistor chain data. Thanks also to the Wellington Historical Society,
who granted me copies of historical photos of Burrendong Dam from the Oxley
Museum in Wellington.
I would also like to express my thanks to the various volunteers who assisted me in the
field work for the project, as well as my family and colleagues at the University of
Technology Sydney for their unwavering support, and for making this project truly
unforgettable.
iii
Effectiveness of cold water pollution mitigation at Burrendong Dam using an innovative thermal curtain
Contents Abstract ------------------------------------------------------------------------------------------------------------ 1
Chapter 1: Introduction ---------------------------------------------------------------------------------------- 3
1.1 Cold water pollution --------------------------------------------------------------------------------------- 3
1.2 Burrendong Dam and cold water pollution --------------------------------------------------------- 4
1.3 Options for CWP amelioration: The Thermal Curtain -------------------------------------------- 4
1.4 Possible downstream effects of thermal curtain use --------------------------------------------- 5
1.5 Research aims and hypotheses ------------------------------------------------------------------------- 6
Chapter 2: Literature Review ------------------------------------------------------------------------------ 10
2.1 Freshwater reservoirs ----------------------------------------------------------------------------------- 10
2.1.1 Freshwater resources on a global scale --------------------------------------------------------------------- 10
2.1.2 Freshwater resources in Australia ---------------------------------------------------------------------------- 11
2.1.3 Dams in Australia -------------------------------------------------------------------------------------------------- 11
2.2 Thermal regime ------------------------------------------------------------------------------------------- 12
2.2.1 Thermal stratification of a water body ---------------------------------------------------------------------- 12
2.2.2 Cold water pollution ---------------------------------------------------------------------------------------------- 14
2.2.3 Thermal recovery -------------------------------------------------------------------------------------------------- 15
2.3 Nutrient Dynamics --------------------------------------------------------------------------------------- 17
2.3.1 Internal reservoir dynamics ------------------------------------------------------------------------------------ 17
2.3.2 Downstream of a reservoir ------------------------------------------------------------------------------------- 18
2.4 Phytoplankton Dynamics ------------------------------------------------------------------------------- 19
2.4.1 Within reservoir dynamics -------------------------------------------------------------------------------------- 19
2.4.2 Downstream of a reservoir ------------------------------------------------------------------------------------- 19
2.5 Downstream impacts on fish -------------------------------------------------------------------------- 20
2.6 Mitigation Options for cold water pollution ------------------------------------------------------ 22
2.6.1 Destratification: Bubble plume -------------------------------------------------------------------------------- 22
iv
Effectiveness of cold water pollution mitigation at Burrendong Dam using an innovative thermal curtain
2.6.2 Partial destratification: Surface pump ----------------------------------------------------------------------- 23
2.6.3 Selective withdrawal: Multiple level off-takes ------------------------------------------------------------ 23
2.6.4 Selective withdrawal: Thermal curtain technology ------------------------------------------------------ 24
Chapter 3: Temperature ------------------------------------------------------------------------------------- 26
3.1 Introduction ----------------------------------------------------------------------------------------------- 26
3.2 Study area: The Macquarie River and Burrendong Dam -------------------------------------- 30
3.2.1 Study reservoir: Lake Burrendong ---------------------------------------------------------------------------- 31
3.2.2 The thermal curtain ----------------------------------------------------------------------------------------------- 31
3.2.3 Study sites ----------------------------------------------------------------------------------------------------------- 35
3.3 Methods ---------------------------------------------------------------------------------------------------- 36
3.3.1 Data collection and compilation ------------------------------------------------------------------------------ 36
3.3.2 Data analysis -------------------------------------------------------------------------------------------------------- 41
3.3.3 Historical cold water pollution --------------------------------------------------------------------------------- 41
3.4 Results ------------------------------------------------------------------------------------------------------- 48
3.4.1 Historical cold water pollution --------------------------------------------------------------------------------- 48
3.4.2 Seasonal dynamics of the vertical temperature profile in the reservoir --------------------------- 49
3.4.3 Effectiveness of the thermal curtain in reducing the magnitude of cold water pollution ----- 50
3.4.4 Effect of residence level and discharge volume on downstream temperature ------------------ 52
3.4.5 Upstream versus downstream water temperatures ----------------------------------------------------- 58
3.4.6 The role of discharge in the functionality of the thermal curtain ------------------------------------ 60
3.4.7 Diel range ------------------------------------------------------------------------------------------------------------ 64
3.4.8 Thermal recovery distance -------------------------------------------------------------------------------------- 66
3.4.9 Biological implications: Thermal effects on native fish-------------------------------------------------- 73
3.5 Discussion -------------------------------------------------------------------------------------------------- 74
3.5.1 Historical cold water pollution --------------------------------------------------------------------------------- 74
3.5.2 Effectiveness of the thermal curtain in reducing cold water pollution ----------------------------- 75
3.5.3 Diel range ------------------------------------------------------------------------------------------------------------ 77
3.5.4 The role of discharge in the functionality of the thermal curtain ------------------------------------ 78
3.5.5 Thermal recovery distance -------------------------------------------------------------------------------------- 80
3.5.6 Biological and ecological implications: Fish ---------------------------------------------------------------- 81
3.5.7 Biological and ecological implications: Macroinvertebrates and plankton ------------------------ 83
3.6 Conclusions ------------------------------------------------------------------------------------------------ 84
v
Effectiveness of cold water pollution mitigation at Burrendong Dam using an innovative thermal curtain
Chapter 4: Nutrients and Water Quality ---------------------------------------------------------------- 85
4.1 Introduction ----------------------------------------------------------------------------------------------- 85
4.2 Study sites -------------------------------------------------------------------------------------------------- 88
4.2 Methods ---------------------------------------------------------------------------------------------------- 89
4.2.1 Data collection and sample analyses ------------------------------------------------------------------------- 89
4.2.2 Data analysis -------------------------------------------------------------------------------------------------------- 90
4.3 Results ------------------------------------------------------------------------------------------------------- 91
4.3.1 Seasonal dissolved oxygen dynamics within Burrendong Dam --------------------------------------- 91
4.3.2 Burrendong Dam nutrient changes with depth during mixed and stratified conditions ------- 92
4.3.3 Downstream versus upstream analyte concentrations during low-level releases --------------- 94
4.3.4 Downstream analyte values during reservoir stratification: surface release versus low-level
release ------------------------------------------------------------------------------------------------------------------------ 96
4.4 Discussion -------------------------------------------------------------------------------------------------- 99
4.4.1 Nutrient dynamics within Burrendong Dam during mixing and stratification -------------------- 99
4.4.2 Low-Level versus surface level releases: Effect of the thermal curtain on internal nutrient
dynamics ------------------------------------------------------------------------------------------------------------------- 100
4.4.3 Downstream versus upstream analyte concentrations during low-level releases ------------- 101
4.4.4 Downstream analyte concentrations during stratification: surface release versus low-level
release ---------------------------------------------------------------------------------------------------------------------- 102
4.4.5 Biological implications ----------------------------------------------------------------------------------------- 104
4.5 Conclusions ----------------------------------------------------------------------------------------------- 106
Chapter 5: Phytoplankton --------------------------------------------------------------------------------- 107
5.1 Introduction ---------------------------------------------------------------------------------------------- 107
5.2 Study sites ------------------------------------------------------------------------------------------------- 110
5.3 Methods --------------------------------------------------------------------------------------------------- 110
5.3.1 Sample collection ------------------------------------------------------------------------------------------------ 110
5.3.2 Chlorophyll a extraction --------------------------------------------------------------------------------------- 111
5.3.3 Algae identification --------------------------------------------------------------------------------------------- 111
5.3.4 Data analysis ------------------------------------------------------------------------------------------------------ 112
vi
Effectiveness of cold water pollution mitigation at Burrendong Dam using an innovative thermal curtain
5.4 Results ------------------------------------------------------------------------------------------------------ 114
5.4.1 Effect of hypolimnial and epilimnial releases on outlet chlorophyll a content: Outlet
chlorophyll a versus dam profile ------------------------------------------------------------------------------------ 114
5.4.2 Effect of hypolimnial and epilimnial releases on seasonal longitudinal chlorophyll a
concentrations ----------------------------------------------------------------------------------------------------------- 116
5.4.3 Effect of hypolimnial and epilimnial releases on the phytoplankton community structure at
the outlet ------------------------------------------------------------------------------------------------------------------ 119
5.5 Discussion ------------------------------------------------------------------------------------------------- 120
5.5.1 Chlorophyll a content at the outlet: Hypolimnial and epilimnial releases ----------------------- 120
5.5.2 Effect of hypolimnial and epilimnial releases on seasonal longitudinal chlorophyll a
concentrations ----------------------------------------------------------------------------------------------------------- 123
5.5.3 Effect of hypolimnial and epilimnial releases on the phytoplankton community at the outlet
-------------------------------------------------------------------------------------------------------------------------------- 123
5.6 Management options ---------------------------------------------------------------------------------- 127
5.7 Conclusions ----------------------------------------------------------------------------------------------- 128
Chapter 6: Conclusions & Recommendations -------------------------------------------------------- 129
6.1 Summary of findings------------------------------------------------------------------------------------ 129
6.1.1 Historic CWP below Burrendong Dam --------------------------------------------------------------------- 130
6.1.2 Effect of the thermal curtain: Temperature -------------------------------------------------------------- 130
6.1.3 Effect of the thermal curtain: Nutrients ------------------------------------------------------------------- 131
6.1.4 Effect of the thermal curtain: Phytoplankton------------------------------------------------------------ 132
6.2 Management recommendations -------------------------------------------------------------------- 133
6.2.1 Thermal curtain depth: is 7 m effective? ----------------------------------------------------------------- 133
6.2.2 Problematic cyanobacteria ----------------------------------------------------------------------------------- 134
6.2.3 Nutrients ----------------------------------------------------------------------------------------------------------- 134
6.2.4 Future use of the thermal curtain -------------------------------------------------------------------------- 135
6.3 Research recommendations -------------------------------------------------------------------------- 136
6.3.1 Reservoir residence level -------------------------------------------------------------------------------------- 136
6.3.2 Phytoplankton ---------------------------------------------------------------------------------------------------- 137
6.3.3 Biological measurements for recovery -------------------------------------------------------------------- 138
References ---------------------------------------------------------------------------------------------------- 139
vii
Effectiveness of cold water pollution mitigation at Burrendong Dam using an innovative thermal curtain
List of Figures
Figure 1: Illustration of thermal stratification within a reservoir. Image sourced from EPA Victoria
(2004). ........................................................................................................................................................ 13
Figure 2: Historical photo of the Burrendong Dam off-take tower overlaid with a simplified diagram of
the thermal curtain. Original photo source: Oxley Museum, Wellington NSW. ........................................ 33
Figure 3: A detailed schematic of the thermal curtain design by AMOG. Source: AMOG Consulting
(2010). ........................................................................................................................................................ 34
Figure 4: Map of the Macquarie and Cudgegong Rivers. Sites where river temperatures were monitored
are indicated with red squares. The blue dot indicates the monitoring location within the reservoir. Site
details are given in Table 1. ........................................................................................................................ 36
Figure 5: Aerial view of Burrendong Dam wall with arrows indicating the position of the off-take tower),
thermistor chain 1 (TC1), thermistor chain 2 (TC2) and the thermal profiler (TP1). Source of image:
Google Maps .............................................................................................................................................. 38
Figure 6: An example of a gauging station shed at Downstream Burrendong gauging station (a) and the
set-up of the Hobo loggers in river sites (b). .............................................................................................. 39
Figure 7: Thermal regime of the Macquarie River at upstream site Bruinbun (green) and downstream
site Downstream Burrendong (black) over a period of 7 years. ................................................................. 49
Figure 8: Heat map showing the thermal patterns within Burrendong Dam from June 2013 to January
2015. Thermal profiles are shown over time (x-axis) with depth (m) from the surface on the y-axis. ...... 50
Figure 9: Time-series of mean daily temperature (°C) observations at various depths within the
Burrendong Dam storage compared with mean daily temperature of Downstream Burrendong gauging
station. Depths shown are 2 m (dark red), 10 m (orange), 14 m (green) and 20 m (dark green) and also
Downstream Burrendong (black) and Yarracoona (light blue). The vertical blue line indicates the point
from when the thermal curtain became operational (May, 2014). ........................................................... 52
Figure 10: Depth (m) of bottom outlet in Burrendong Dam from water surface. ...................................... 53
Figure 11: Four years of similar residence level within Burrendong Dam: a.) 2004, b.) 2007, c.) 2013 and
d.) 2014 showing mean daily temperature (°C) of releases at Downstream Burrendong gauging station
viii
Effectiveness of cold water pollution mitigation at Burrendong Dam using an innovative thermal curtain
(black lines) and daily discharge from the reservoir (ML/day) (blue dashed lines). Data is shown for the
period of October to April. .......................................................................................................................... 56
Figure 12: Comparison of daily discharge from Burrendong Dam between 2004 (blue) and 2014 (black).
.................................................................................................................................................................... 57
Figure 13: Comparison of daily mean temperatures (°C) recorded at Downstream Burrendong gauging
station between 2004 (blue) and 2014 (black). .......................................................................................... 57
Figure 14: Comparison of mean monthly temperatures (°C) recorded at Downstream Burrendong
gauging station between 2004 (black) and 2014 (white). Error bars indicate standard error. ................. 58
Figure 15: Difference in mean daily temperature (°C) between the upstream reference site (Yarracoona)
and the Outlet in the year before thermal curtain use, 2013 (blue), and while the thermal curtain was
active in 2014 (dashed red). Temperature differentials above 0°C indicate cold water pollution, while
temperature differences below 0°C indicate warm water pollution. ......................................................... 59
Figure 16: Difference in mean monthly temperature (°C) between upstream reference site Yarracoona
and the Outlet in the year before thermal curtain use, 2013 (black), and white the thermal curtain was
active in 2014 (white). Temperatures above 0°C indicate cold water pollution, while temperatures below
0°C indicate warm water pollution. Error bars indicate standard error. ................................................... 60
Figure 17: Three time-series comparing daily discharge from Burrendong Dam (ML/day), change in mean
daily temperature between the surface and bottom of the water column within the thermal curtain (a),
and temperature (°C) observations at the Outlet gauging station (c). Drops (i.) and peaks (ii.
....................... 62
Figure 18: Mean daily temperature (°C) at the Outlet and upstream reference site Yarracoona are
compared at the points of low (i.) and high (ii. and iii.) daily discharge (ML/day) identified in Figure 15. 63
Figure 19: Regression of the mean daily temperature difference between the surface and bottom of the
water column with
(October 2014 - February 2015). ................................................................................................................ 64
Figure 20: Diel range from May 2013 to May 2015 at the Outlet site, just below Burrendong Dam. The
blue line indicates the start of the use of the thermal curtain. .................................................................. 65
ix

Effectiveness of cold water pollution mitigation at Burrendong Dam using an innovative thermal curtain
Figure 21: Comparison of the mean monthly diel ranges between the upstream site Yarracoona (grey
triangles) and Burrendong Outlet (black circles) in the period prior to and after the use of the thermal
curtain. The light blue vertical line indicates the point in time from when the thermal curtain was active.
.................................................................................................................................................................... 66
Figure 22: Average of December daily mean temperatures (°C) with standard error bars for December
2013 (red triangles) and December 2014 (blue circles) at sites on the Macquarie River with distance
relative to Burrendong Dam wall. Asymptotic curves were overlayed for each year, indicating the
temperature recovery between each site. The dashed vertical line indicates the location of the dam wall
(0 km). ........................................................................................................................................................ 68
Figure 23: Daily temperature deviations in 2014 from 2013 observed at four sites with increasing
distance from the dam wall. The observations were recorded from September 2013 to April 2014 (blue)
and September 2014 to April 2015 (red dashed). The sites shown are Burrendong outlet (a), Wellington
(b), Baroona (c) and Warren weir (d). ........................................................................................................ 70
Figure 24: The residuals from the difference in temperature (°C) between the year before (2013) and
after (2014) the use of the thermal curtain, with distance from the outlet. The sites shown are
Burrendong outlet, Wellington, Baroona and Warren weir. ...................................................................... 71
Figure 25: Mean daily temperature differences between July-December of 2013 and 2014 at five sites
downstream of Burrendong Dam wall. The sites, plotted with relative distance from the dam wall, are
Burrendong outlet, Wellington, Baroona, Gin Gin and Warren weir. ........................................................ 72
Figure 26: Daily mean temperature (°C) observed at Downstream Burrendong gauging station in the
summer months of 2013 (black dashed) and 2014 (red) are overlayed on a time-series. Three horizontal
lines indicate minimum spawning temperature over the spawning period of three native fish in the
Macquarie River. ........................................................................................................................................ 74
Figure 27: Heat map showing the DO (mg/L) patterns within Burrendong Dam from June 2013 to January
2015. Oxygen profiles are shown over time (x-axis) with depth (m) from the surface (y-axis). ................ 93
Figure 28: Mean nutrient concentrations of the period of stratification are presented for upstream site,
Long Point (square) and downstream site, the outlet (circle) with standard error bars. ANZECC trigger
values are indicated by the purple “X”. The ANZECC trigger value for NOx is 0.5 mg/L. .......................... 95
x
Effectiveness of cold water pollution mitigation at Burrendong Dam using an innovative thermal curtain
Figure 29: a. – Chlorophyll a of July is shown at upstream site Long Point and immediately below the dam
outlet, Burrendong Dam Outlet. b. – A depth profile within Burrendong Dam shows the chlorophyll a
concentrations with depth at 0.25, 1, 3, 5, 10 and 20 m. In both a. and b. data is shown for 2013 and
2014, the year before and after thermal curtain operation, respectively. ............................................... 115
Figure 30: a. – Chlorophyll a of December is shown at upstream site Long Point and immediately below
the dam outlet, Burrendong Dam Outlet. b. – A depth profile within Burrendong Dam shows the
chlorophyll a concentrations with depth at 0.25, 1, 3, 5, 10 and 20 m. In both a. and b. data is shown for
2013 and 2014, the year before and after thermal curtain operation, respectively. Standard Error is
indicated with error bars. ......................................................................................................................... 116
Figure 31: Longitudinal chlorophyll a values measured at nine sites (± 95% confidence interval) along the
Macquarie River. The range of the 95% confidence interval of the two upstream sites is indicated by the
blue shaded region. Distance (km) from the dam indicated on the x-axis. Seasonal mean was calculated
for winter (June, July, August), spring (September, October, November) and summer (December, January
February). The blue line indicates the location of the dam. .................................................................... 118
Figure 32: Concentration and proportion of cyanobacteria (dark) to “other” groups (light) in
phytoplankton community. The vertical blue line indicates the point in time from when the thermal
curtain was operation. The dashed horizontal line indicates the cell count for toxic cyanobacterial
species considered unsafe for human consumption. ................................................................................ 120
xi
Effectiveness of cold water pollution mitigation at Burrendong Dam using an innovative thermal curtain
List of Tables Table 1: Temperature data availability. This is inclusive of data recorded on Hobo loggers and historical
data recorded at gauging stations through DPI Water monitoring programs (Hydstra). Grey squares
indicate a period of six months with >5 months of data available. ........................................................... 40
Table 2: Parameter estimates for the negative exponential model of water temperature with distance
downstream from Burrendong Dam. ......................................................................................................... 68
Table 3: Summary statistics (mean, median, median absolute deviation, minimum and maximum values)
for matched daily differences (time period: July-December) in mean water temperature for 5 selected
sites at increasing distances downstream of the dam wall. ....................................................................... 72
Table 4: Summary of Kolmogorov–Smirnov two-sample test comparisons of daily temperature deviations
for 2013-14 (July-December) between monitoring sites on the Macquarie River downstream of
Burrendong Dam. ....................................................................................................................................... 73
Table 5: Mean nutrient concentrations of DO, ammonia, iron, NOx, FRP, SiO2, TN, TFN, TP, and TFP, all in
mg/L. Averages (±SE) are shown for periods of mixing within the reservoir (June – October 2013) and
stratification (December 2013 – March 2014, excluding January 2014). These time frames were also
used for calculations of averages for the outlet and Long Point GS. .......................................................... 97
Table 6: Mean nutrient concentrations of DO, ammonia, iron, NOx, FRP, SiO2, TN, TFN, TP, and TFP, all in
mg/L. Averages (±SE) are shown for periods of mixing within the reservoir (July - September 2014) and
stratification (December 2014 – March 2015, excluding February 2015 due to missing data). These time
frames were also used for calculations of averages for the outlet and Long Point GS. ............................. 98
xii
Effectiveness of cold water pollution mitigation at Burrendong Dam using an innovative thermal curtain
Abstract
Many dams in Australia are known to create thermal pollution in rivers, often for
hundreds of kilometres downstream of the dam wall. Low-level releases from a
reservoir during periods of thermal stratification disrupt the downstream thermal
regime by supressing the water temperature and reducing the diel variation. Low-level
releases have also been linked to elevated nutrient concentrations and altered
phytoplankton density and community structure downstream from the dam. To
reduce the problem, Burrendong Dam has been fitted with an innovative thermal
curtain that directs warmer surface water to the low-level off-take.
This study set out to quantify the magnitude and extent of cold water pollution along
the Macquarie River downstream of Burrendong Dam before and after the curtain was
implemented. It also aimed to quantify the effect of the dam on nutrient
concentrations and phytoplankton density (indicated by chlorophyll a concentrations)
and community structure before and after thermal curtain operation. This was
achieved through analysis of time-series data from temperature loggers installed
within the impoundment, upstream and downstream in the Macquarie River, prior to
the installation of the thermal curtain. Water samples for analysis of nutrients,
phytoplankton concentrations (chlorophyll a) and community structure were collected
within the reservoir and upstream and downstream of the dam.
CWP was shown to be a long-term problem in downstream river reaches, caused by
the release of hypolimnial waters from the dam. Epilimnial releases with use of the
curtain improved the thermal regime (mean daily and mean monthly temperature, and
1
Effectiveness of cold water pollution mitigation at Burrendong Dam using an innovative thermal curtain
diel temperature range) below the dam so that it more closely resembled the
upstream thermal regime with an improvement of approximately 2°C. Fluctuations in
nutrients occurred in the hypolimnion of Burrendong Dam during thermal
stratification, probably due to the development of an oxycline and subsequently low
oxygen concentrations in the hypolimnion. Nutrient concentrations increased at the
outlet as a result of hypolimnial releases, with the concentrations breaching the trigger
values outlined by ANZECC which indicate ecological disturbance. This study found a
substantial increase in the cell count of cyanobacteria at the dam outlet, which may
lead to water quality issues in the Macquarie River downstream of the dam. The
results of this study will be useful to assist in the management routine of the thermal
curtain at Burrendong Dam, to maximise the efficiency of CWP mitigation, whilst not
compromising the downstream ecological health in terms of nutrient and
cyanobacteria concentrations.
2