evaluation of mitigation effectiveness at hydroelectric · pdf file ·...
TRANSCRIPT

EVALUATION OF MITIGATION EFFECTIVENESS
AT HYDROPOWER PROJECTS: FISH PASSAGE
Division of Hydropower Administration and Compliance
Office of Energy Projects
Federal Energy Regulatory Commission
September 2004

iii
CONTENTS
Page
LIST OF FIGURES ............................................................................................................... v LIST OF TABLES................................................................................................................. v ACKNOWLEDGMENTS ..................................................................................................... vii EXECUTIVE SUMMARY ................................................................................................... ix 1.0 INTRODUCTION ........................................................................................................... 1
1.1 BACKGROUND ................................................................................................ 1 1.1.1 Review of Previous Hydropower Mitigation Studies ........................ 1 1.1.2 Overview of Licensing Process ......................................................... 3
1.2 PURPOSE OF STUDY....................................................................................... 3 1.2.1 Measures of Effectiveness ................................................................. 3
1.2.1.1 Project-Specific Measures .................................................. 4 1.2.1.2 River-Basin Goals for Fish Restoration.............................. 6
1.2.2 Source of Information ........................................................................ 7 2.0 DATA ANALYSIS......................................................................................................... 9
2.1 SUMMARY OF PROJECTS WITH FISH PASSAGE REQUIREMENTS...... 10 2.1.1 Background........................................................................................ 10 2.1.2 Project Characteristics ....................................................................... 10
2.2 REGIONAL ASSESSMENT OF FISH PASSAGE FACILITIES..................... 13 2.2.1 Upstream Fish Passage ...................................................................... 14 2.2.2 Downstream Fish Passage.................................................................. 16
2.3 EVALUATION OF FISH PASSAGE EFFECTIVENESS ................................ 18 2.3.1 Upstream Fish Passage ...................................................................... 18
2.3.1.1 Summary of Results............................................................ 19 2.3.1.2 Assessment of Effectiveness............................................... 21
2.3.2 Downstream Fish Passage.................................................................. 25 2.3.2.1 Summary of Results............................................................ 25 2.3.2.2 Assessment of Effectiveness............................................... 28
3.0 SUMMARY AND CONCLUSIONS ............................................................................. 33 3.1 MITIGATION EFFECTIVENESS..................................................................... 33
3.1.1 Upstream Fish Passage ...................................................................... 33 3.1.2 Downstream Fish Passage.................................................................. 34
3.2 ADEQUACY OF EFFECTIVENESS STUDIES............................................... 34 3.3 RECOMMENDATIONS TO IMPROVE EFFECTIVENESS........................... 36
4.0 REFERENCES ............................................................................................................... 39 5.0 LIST OF PREPARERS................................................................................................... 45 APPENDIX A. LIST OF PROJECTS .................................................................................. 47 APPENDIX B. FISH PASSAGE AT HYDROELECTRIC DAMS ON THE
SUSQUEHANNA RIVER: A CASE STUDY......................................................... 57

v
LIST OF FIGURES
Figure Page 2-1 Geographical distribution of 269 projects (=licenses) with at least one license
article that addressed fish passage......................................................................... 9 2-2 Total number of licenses issued and the licensing years of the 269 hydropower
projects with at least one article related to fish passage (shaded area) that were reviewed in this study............................................................................................ 11
LIST OF TABLES
Table Page 2-1 Number of hydropower developments with fish passage requirements for each
of five capacity categories included in an earlier DOE mitigation study and the present FERC study .............................................................................................. 12
2-2 Regional summary of 147 developments with fish passage requirements ........... 12
2-3 Regional summary of upstream fish passage facilities for 147 hydropower
developments (i.e., dams) that have fish passage requirements............................ 15 2-4 Regional summary of downstream fish passage facilities for 147 hydropower
developments (i.e., dams) that have fish passage requirements............................ 17 2-5 Status of implementation of fish passage requirements at 304 hydropower
developments categorized by region..................................................................... 19 2-6 Results of monitoring upstream fish passage at 8 hydropower developments ..... 20 2-7 Numbers of river herring and Atlantic salmon passed at dams on East
Coast rivers (1983-2001) ...................................................................................... 22 2-8 Results of monitoring the effectiveness of downstream fish passage at
12 hydropower developments ............................................................................... 26 A-1 List of projects (by state) that were included in this study because (1) they
were licensed or relicensed between 1986 and 2002 and (2) they have at least one fish passage requirement ................................................................................ 49
B-1 Description of four hydroelectric dams on the lower Susquehanna River............ 60 B-2 Number of American shad counted and passage effectiveness (%) at four
hydroelectric dams on the lower Susquehanna River (1997-2003) ...................... 62


vii
ACKNOWLEDGMENTS
The draft report was discussed at a workshop held in November 2003 at the Alden
Research Laboratory in Holden, MA. Written comments were received from Enel North America, Inc., the Michigan Department of Natural Resources, the Pennsylvania Fish and Boat Commission, Putnam Hydro, Save Our Sebasticook, and the U.S. Fish and Wildlife Service. The authors thank those individuals and organizations who attended the workshop and/or submitted comments.


ix
EXECUTIVE SUMMARY
Hydroelectric dams can be barriers to upstream-migrating fish and a source of mortality
from turbine passage to downstream migrants. To mitigate these impacts, many projects are required to install upstream and downstream fish passage facilities, as stipulated in the articles associated with the licenses that are issued by the Federal Energy Regulatory Commission. The present study was conducted to evaluate the effectiveness of this mitigation in achieving the goal of fishery resource protection. The evaluation was based on information from fish passage effectiveness monitoring plans and annual reports which are filed with FERC by licensees and stored in the eLibrary database. Fish passage is one of several mitigation areas (others include shoreline management, water quality, and recreation) that were reviewed as part of the FERC strategic plan for meeting the intent of the Government Performance and Results Act of 1993.
The study reviewed 269 projects that had at least one license article related to fish passage and were licensed or relicensed during a 16-year period from 1987 through 2002. Projects that were exempted from licensing and those with licenses that were later amended to require fish passage mitigation were not included in this study. Consequently, the projects on the Columbia River, with one exception, were not included in this evaluation because they were licensed before 1987. The study included 157 projects that had only an article reserving authority under Section 18 of the Federal Power Act to prescribe facilities for fish passage at some time in the future. Because they did not have a specific requirement for fish passage, these 157 projects were excluded from further analysis. The remaining 112 projects, which consisted of 147 developments, constituted the database that was used to assess the effectiveness of fish passage mitigation requirements.
More than 60% of the 147 developments are located in the Northeast and 75% have a generating capacity of <10 MW. Sixty percent of the developments are required to submit effectiveness monitoring plans, which were reviewed to identify quantitative measures of performance (e.g., the percentage of fish passed). In addition to these site-specific measures, the fish management and restoration plans for several large river basins in the Northeast listed goals for the recovery of various anadromous fish stocks. However, criteria to assess the success of the fish passage mitigation were generally not available from these management and restoration plans.
Adequate data on the number of fish using upstream passage facilities were available for eight developments, but only three had sufficient data to provide a quantitative estimate of effectiveness. These three developments had a fish lift or lock. For three species (Atlantic salmon, American shad, and river herring, primarily alewives), between 45 to 67% of the available fish used the lift or lock. These estimates, which were similar to those obtained in other studies, met the passage criterion of 40 to 60% that was proposed for American shad at each successive upstream barrier on the mainstem Connecticut River. No analysis of effectiveness was possible for other upstream fish passage designs due to insufficient data. Having sufficient attraction flows at the entrance of the upstream fish passage facility was an important factor affecting passage at several projects.

x
The proportion of fish that utilized downstream fish passage facilities was estimated at 11 developments. At seven of these, radiotagging or mark-recapture techniques were used to measure the effectiveness of downstream passage for Atlantic salmon smolts. The percentages of fish that utilized downstream passage facilities, including spill, were highly variable, ranging from 6 to 100% for anadromous species and 3 to 87% for resident species. The high variability seemed to be related to the variation in flow; passage effectiveness was lowest at higher flows, when spill occurred. Surface collection systems and those that employed angled trash racks with a downstream bypass facility were the most effective, although spill at one facility achieved 100% passage. Ensuring suitable bypass flows and adequate attraction flows (relative to generating flow) are critical variables affecting downstream fish passage effectiveness.
Monitoring of fish passage facilities to assess effectiveness is important not only for
determining site-specific performance but also for evaluating potential applications to other sites. The technology available for upstream fish passage is more advanced than that available for downstream passage, especially of riverine species. Levels of effectiveness substantially exceeding 50% for the passage of downstream migrants may be difficult to achieve on a consistent, cost effective basis without also considering spill to pass fish below the dam. With no support from a major research program, advancement of the science of downstream fish passage must rely on site-specific applications and good effectiveness monitoring plans. Such plans should consider defining the duration of the monitoring period in all license articles requiring fish passage. Finally, it is the responsibility of all parties involved in a licensing action to ensure that the best technical information is used to evaluate various alternatives for fish passage, especially downstream fish passage.

1
1.0 INTRODUCTION
Mitigative measures are commonly implemented to reduce the adverse effects of construction and operation of energy production facilities on the environment. Licenses issued by the Federal Energy Regulatory Commission (FERC), which regulates nonfederal hydropower facilities, usually contain articles that condition project design or operation to protect, mitigate, and/or enhance environmental resources and to achieve nonpower benefits. The Government Performance and Results Act (GPRA) of 1993 defines how federal agencies manage their performance and requires the development of strategic plans that describe the goals and measures of progress and performance in achieving those goals. In response to GPRA, FERC implemented an initiative to evaluate the effectiveness of the environmental mitigation requirements incorporated in hydropower project licenses.
One of the most common environmental impacts caused by hydropower projects is the
barrier to upstream and downstream fish passage created by dams. This report presents the results of an evaluation of the effectiveness of fish passage mitigation measures implemented at nonfederal hydropower projects that were recently licensed or relicensed by FERC. Projects with exemption from licensing and those with licenses that were issued and later amended to require fish passage mitigation were not included in this evaluation. This report is not intended to be a comprehensive review of the alternatives for mitigating the impacts of hydropower dams as barriers to fish passage. Such reviews are provided by Sale et al. (1991) and more recently by Weigmann et al. (2003). Finally, this evaluation of fish passage effectiveness at FERC-licensed projects is one of several studies of the effectiveness of environmental mitigation requirements that were initiated in response to GPRA. Previous reports addressed shoreline management (FERC 2001a) and water quality (FERC 2003), and a draft report on recreation was issued in July 2004. 1.1 BACKGROUND
In the 1980’s, environmental protection conditions in FERC licenses were implemented based on relatively limited information that was typically collected early in the licensing process. The effects of these measures were rarely evaluated, so little was known about whether the measures provided the level of protection intended at license issuance (Cada and Sale 1993). By the early 1990’s, but especially after 1993, most FERC licenses included requirements to develop plans for assessing the effectiveness of mitigation measures, such as fish passage. These plans and the subsequent study results have been included in reports submitted to FERC by the licensees. Those reports and other compliance filings required under the various license articles and FERC orders were reviewed in this study. 1.1.1 Review of Previous Hydropower Mitigation Studies
Hydropower mitigation that provided for the maintenance of instream flows, dissolved oxygen (DO), and upstream and downstream fish passage was examined in a U.S. Department of Energy (DOE) study by Sale et al. (1991). The study used public information from FERC records and additional information obtained from a written survey of developers and state/federal resource and regulatory agencies, focusing on nonfederal hydropower projects that were licensed

2
or exempted between January 1980 and July 1990. Some overlap of information exists between the 1991 study and this one because they probably included many of the same projects. Consequently, some similarities in results are to be expected.
From a target population of 707 projects that were identified in the FERC Hydropower Licensing Compliance Tracking System as having mitigation requirements for instream flow, dissolved oxygen, and/or fish passage, specific information was obtained from the project developers of 280 projects. Of these projects, 30 (11%) and 66 (24%) had operating upstream and downstream fish passage facilities, respectively. Nationwide, of the 1825 operating nonfederal hydropower projects in the United States (FERC 1992), 10 and 13%, respectively, have installed upstream and downstream fish passage facilities (Pringle et al. 2000). Sale et al. (1991) reported that more than 70% of the upstream facilities were fish ladders. The angled bar rack, which was used at 38% of the projects with downstream passage facilities, was the most frequently required downstream passage device, especially in the Northeast.
Relatively few of the projects with passage facilities were required to monitor the effectiveness of the facilities in moving adults upstream over the dam and in bypassing juveniles (and adults of some species) downstream around the dam. Indeed, 57% of the projects with operating upstream fish passage facilities and 79% of those with operating downstream passage facilities did not conduct any biological monitoring to assess the effectiveness of the facilities. Most projects had no performance monitoring requirements for fish passage (e.g., 82% of projects with downstream fish passage facilities). Although 60% of the projects with upstream passage facilities had performance monitoring requirements, the most common performance criterion was “no obvious barriers to upstream movement.” It was the only criterion used to assess effectiveness in 17 of the 30 projects that responded to the survey question related to performance objectives.
The 1991 study concluded that the proportion of projects with environmental mitigation requirements had increased significantly during the 1980s, but little information was available on the effectiveness of that mitigation. This earlier study had to rely primarily on surveys of licensees to obtain information on the implementation of mitigation, because the availability of data to directly assess mitigation success was limited. The present study used the data from fish passage effectiveness studies that were stipulated in various articles associated with more recent FERC licenses to determine the success of fish passage measures implemented to mitigate the adverse impacts of dams as barriers to fish movement and as sources of mortality from turbine passage.
Several other trends on fish passage mitigation were noted in the DOE study by Sale et al. (1991). Downstream fish passage facilities not only were more common than upstream passage facilities, but also were installed more frequently to protect riverine than anadromous fishes. Of the projects with a downstream passage requirement, 55% were designed to protect riverine species. Thirty-eight percent of the projects with an upstream fish passage requirement were targeting migratory riverine species, and 12% targeted only riverine species. Moreover, there was a trend of increasing downstream fish passage requirements in the target population over the 10-year period (1980 to 1990) included in the study. No increase in upstream passage

3
requirements was observed over the same period. Finally, all fish passage requirements were more common in the West than in the East. 1.1.2 Overview of Licensing Process
When a license is issued for a project, the articles may contain provisions for the licensee to submit plans for the installation, operation, and maintenance of upstream and/or downstream fish passage facilities. In many cases, fish passage design drawings and effectiveness plans are required in the same or a separate article. Often, the requirement for fish passage facilities is not specified; instead, authority is reserved by the FERC under Section 18 of the Federal Power Act (FPA) to require such facilities as may be prescribed by either the Secretary of the Interior or the Secretary of Commerce, or both, at some time in the future. Moreover, the requirements for fish passage may be included in the mandatory conditioning authority under Section 4(e) or Section 18 of the FPA or under Section 401 (Water Quality Certification) of the Clean Water Act (CWA). However, if the license article stipulates that a fish passage facility be designed and installed, and its effectiveness be determined, then the licensee consults with the resource agencies and develops the appropriate plans, which are reviewed by the agencies prior to their submittal to the FERC for review and approval.
Once the plan is approved and the facility is installed, effectiveness monitoring begins. The type and frequency of monitoring is project-specific. Reports of the results with any recommendations developed in consultation with the resource agencies usually will be filed by the licensee with the resource agencies and the FERC. These reports assess the effectiveness of fish passage, identify problems encountered during the monitoring period, and propose measures to address any problems. The goal of the present study is to review these reports in order to evaluate the effectiveness of fish passage measures.
1.2 PURPOSE OF STUDY
The purpose of this study is to assess the effectiveness of fish passage facilities that are required by FERC licenses. This evaluation should assist FERC in determining whether the license requirements are achieving resource protection. Studies such as this and the other studies of shoreline management, water quality, and recreation mitigation will help guide FERC decisions regarding the need for future environmental mitigation. The findings of this study are intended to provide FERC staff and all stakeholders with information to cooperatively decide the best and most cost-effective method of meeting license objectives, thus ensuring that mitigation measures implemented at nonfederal hydropower projects are effective. 1.2.1 Measures of Effectiveness
Effectiveness refers to the adequacy to accomplish a purpose or produce an intended result, which, in this study, would be the passage of fish around dams. There are different approaches or measures that can be used to assess effectiveness in this context. For example, the effectiveness of fish passage facilities is often determined by counts of the number of fish using them. Such an evaluation of effectiveness is usually insufficient, because the number of fish that
4
did not use the fishway is not known. Another expression of effectiveness is the proportion (percentage) of the population that use a fish passage facility. License articles can require the development of monitoring plans that specify how the effectiveness of the fish passage facility will be measured. The various measures of effectiveness are described in these sections. 1.2.1.1 Project-Specific Measures
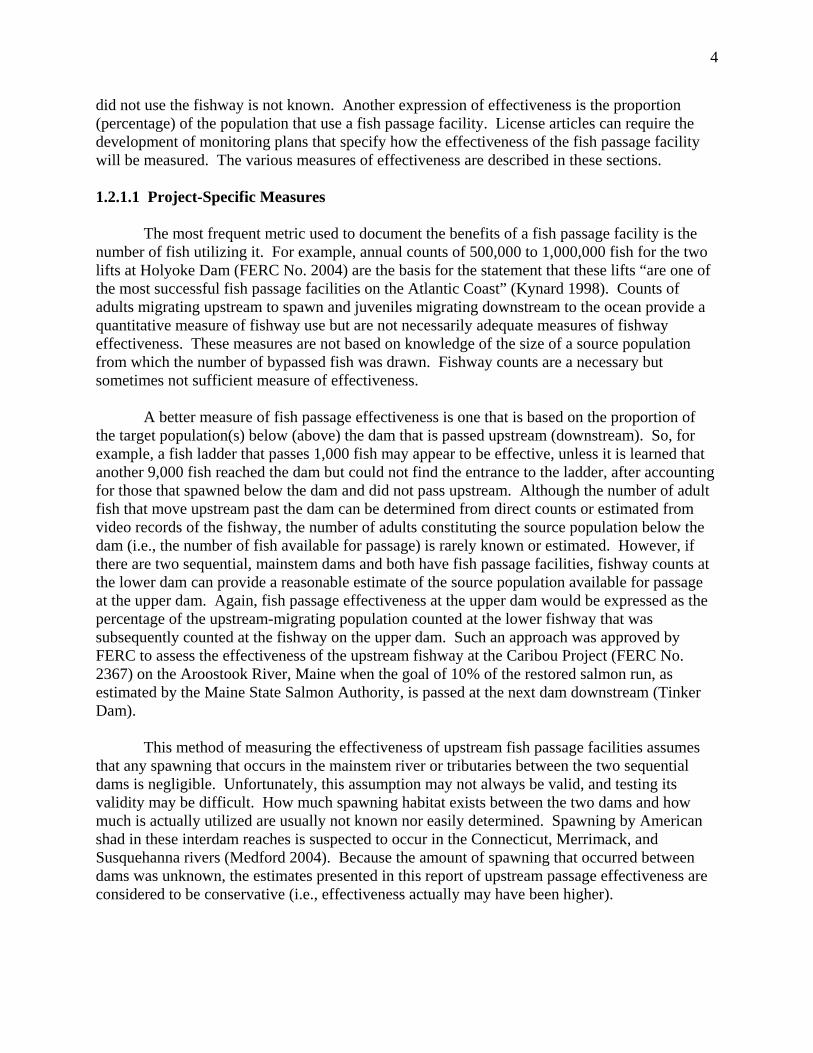
The most frequent metric used to document the benefits of a fish passage facility is the number of fish utilizing it. For example, annual counts of 500,000 to 1,000,000 fish for the two lifts at Holyoke Dam (FERC No. 2004) are the basis for the statement that these lifts “are one of the most successful fish passage facilities on the Atlantic Coast” (Kynard 1998). Counts of adults migrating upstream to spawn and juveniles migrating downstream to the ocean provide a quantitative measure of fishway use but are not necessarily adequate measures of fishway effectiveness. These measures are not based on knowledge of the size of a source population from which the number of bypassed fish was drawn. Fishway counts are a necessary but sometimes not sufficient measure of effectiveness.
A better measure of fish passage effectiveness is one that is based on the proportion of the target population(s) below (above) the dam that is passed upstream (downstream). So, for example, a fish ladder that passes 1,000 fish may appear to be effective, unless it is learned that another 9,000 fish reached the dam but could not find the entrance to the ladder, after accounting for those that spawned below the dam and did not pass upstream. Although the number of adult fish that move upstream past the dam can be determined from direct counts or estimated from video records of the fishway, the number of adults constituting the source population below the dam (i.e., the number of fish available for passage) is rarely known or estimated. However, if there are two sequential, mainstem dams and both have fish passage facilities, fishway counts at the lower dam can provide a reasonable estimate of the source population available for passage at the upper dam. Again, fish passage effectiveness at the upper dam would be expressed as the percentage of the upstream-migrating population counted at the lower fishway that was subsequently counted at the fishway on the upper dam. Such an approach was approved by FERC to assess the effectiveness of the upstream fishway at the Caribou Project (FERC No. 2367) on the Aroostook River, Maine when the goal of 10% of the restored salmon run, as estimated by the Maine State Salmon Authority, is passed at the next dam downstream (Tinker Dam).
This method of measuring the effectiveness of upstream fish passage facilities assumes that any spawning that occurs in the mainstem river or tributaries between the two sequential dams is negligible. Unfortunately, this assumption may not always be valid, and testing its validity may be difficult. How much spawning habitat exists between the two dams and how much is actually utilized are usually not known nor easily determined. Spawning by American shad in these interdam reaches is suspected to occur in the Connecticut, Merrimack, and Susquehanna rivers (Medford 2004). Because the amount of spawning that occurred between dams was unknown, the estimates presented in this report of upstream passage effectiveness are considered to be conservative (i.e., effectiveness actually may have been higher).

5
Performance measures can be used to document the benefits of fish passage. For example, some river basin plans for the restoration of anadromous species in New England coastal rivers include species-specific targets for the number of upstream migrants passed at the lower dam(s). If the passage facility is ineffective, these goals may never be reached. On the other hand, an increase in passage that results in attainment of the goal may not be associated with more effective passage but with an increase in stock abundance that is due to other factors, such as higher ocean survival, lower harvest rates, etc. While these targets are important milestones to the assessment of the status and recovery of anadromous populations, they do not provide a measure of effectiveness that can be a basis for the application of the same passage technology to other projects and species.
That the dam is not a barrier to fish movement is another performance objective that is difficult to quantify (Sale et al. 1991) and therefore, not an adequate measure of fish passage effectiveness. Upstream-migrating fish may be delayed for hours or days searching for passage at a dam before finding the fishway entrance. This delay could reduce the fitness of spawning adults or the upstream extent of their migration. Methods have been employed to minimize delays in upstream migration, such as tailrace barriers, and these are included in the present study. Even if the effectiveness of a tailrace barrier is known, that information is not sufficient to address the question of fishway effectiveness; upstream migrants may successfully avoid the tailrace yet still be delayed in their upstream migration by fishway design and operation (e.g., inadequate attraction flows).
The effectiveness of downstream fish passage facilities is easier to quantify than upstream fish passage facilities because it can be measured using a relatively simple experimental approach. For example, marked, tagged, or radiotagged juvenile salmon (e.g., smolts) can be released above the dam and collected at the downstream bypass facility. The proportion of tagged fish that used the facility can be calculated, and if radiotagging is used, the proportion of released fish that utilized other passage routes can also be directly estimated. Juvenile salmon are reared in hatcheries for release in river basins with anadromous fish restoration programs, so they are readily available in large numbers. However, caution must be exercised in the use of hatchery stocks to ensure their fitness is satisfactory and would not compromise the results of the test. Measuring downstream fish passage effectiveness for other life stages of salmon or other species is considerably more difficult than it is for smolts. The primary constraint with measuring the passage effectiveness of adult Atlantic salmon is their availability. Although the same experimental approach of radiotagging can be used to measure upstream passage effectiveness, obtaining an adequate number of adult Atlantic salmon that could provide a meaningful measure of effectiveness is usually not possible. Availability is not a constraint in testing the passage effectiveness for American shad and other clupeids, but their high susceptibility to stress from collection and handling make experimental testing with these species considerably more difficult than with salmonids.
6
1.2.1.2 River-Basin Goals for Fish Restoration
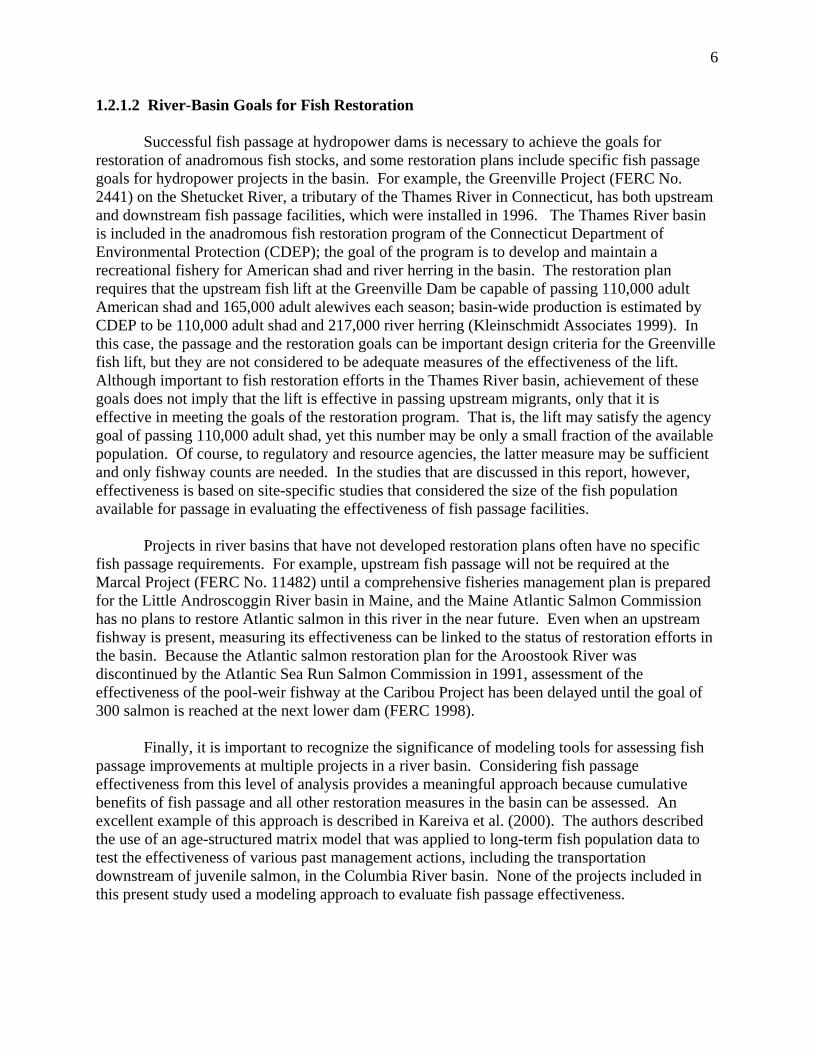
Successful fish passage at hydropower dams is necessary to achieve the goals for restoration of anadromous fish stocks, and some restoration plans include specific fish passage goals for hydropower projects in the basin. For example, the Greenville Project (FERC No. 2441) on the Shetucket River, a tributary of the Thames River in Connecticut, has both upstream and downstream fish passage facilities, which were installed in 1996. The Thames River basin is included in the anadromous fish restoration program of the Connecticut Department of Environmental Protection (CDEP); the goal of the program is to develop and maintain a recreational fishery for American shad and river herring in the basin. The restoration plan requires that the upstream fish lift at the Greenville Dam be capable of passing 110,000 adult American shad and 165,000 adult alewives each season; basin-wide production is estimated by CDEP to be 110,000 adult shad and 217,000 river herring (Kleinschmidt Associates 1999). In this case, the passage and the restoration goals can be important design criteria for the Greenville fish lift, but they are not considered to be adequate measures of the effectiveness of the lift. Although important to fish restoration efforts in the Thames River basin, achievement of these goals does not imply that the lift is effective in passing upstream migrants, only that it is effective in meeting the goals of the restoration program. That is, the lift may satisfy the agency goal of passing 110,000 adult shad, yet this number may be only a small fraction of the available population. Of course, to regulatory and resource agencies, the latter measure may be sufficient and only fishway counts are needed. In the studies that are discussed in this report, however, effectiveness is based on site-specific studies that considered the size of the fish population available for passage in evaluating the effectiveness of fish passage facilities.
Projects in river basins that have not developed restoration plans often have no specific fish passage requirements. For example, upstream fish passage will not be required at the Marcal Project (FERC No. 11482) until a comprehensive fisheries management plan is prepared for the Little Androscoggin River basin in Maine, and the Maine Atlantic Salmon Commission has no plans to restore Atlantic salmon in this river in the near future. Even when an upstream fishway is present, measuring its effectiveness can be linked to the status of restoration efforts in the basin. Because the Atlantic salmon restoration plan for the Aroostook River was discontinued by the Atlantic Sea Run Salmon Commission in 1991, assessment of the effectiveness of the pool-weir fishway at the Caribou Project has been delayed until the goal of 300 salmon is reached at the next lower dam (FERC 1998).
Finally, it is important to recognize the significance of modeling tools for assessing fish passage improvements at multiple projects in a river basin. Considering fish passage effectiveness from this level of analysis provides a meaningful approach because cumulative benefits of fish passage and all other restoration measures in the basin can be assessed. An excellent example of this approach is described in Kareiva et al. (2000). The authors described the use of an age-structured matrix model that was applied to long-term fish population data to test the effectiveness of various past management actions, including the transportation downstream of juvenile salmon, in the Columbia River basin. None of the projects included in this present study used a modeling approach to evaluate fish passage effectiveness.

7
1.2.2 Source of Information
The review of the effectiveness of fish passage mitigation measures utilized information contained in the public record for hydropower projects that were licensed or relicensed from 1987 through 2002. Fish passage effectiveness plans and reports filed with the FERC by licensees, as well as the orders issued by the FERC based on these documents, constitute the key elements of the eLibrary database used in this study. The eLibrary database contains (1) an index to all documents issued or received by the FERC since November 1981, (2) microfilm of documents submitted to and issued by the FERC for 1981-1995, (3) images of paper documents for 1995-present, and (4) documents submitted electronically through the FERC’s web-enabled filing mechanism since November 2000. The eLibrary can be accessed from the FERC website (see www.ferc.gov).
The results of the analyses presented in Section 2.0 are based primarily on data presented in effectiveness monitoring reports submitted by the licensee and included in eLibrary before March 2003. For some projects, reports were submitted to the FERC for several years following approval and implementation of monitoring, and these were included in the review. The large projects on the mainstem Columbia River in the Northwest were not included.


9
2.0 DATA ANALYSIS
The initial group consisted of 304 hydropower developments (=dams) that (1) were licensed or relicensed during the period 1987-2002 and (2) had a license article addressing fish passage. This group of developments represented 269 projects (=licenses), which were clustered in the Northeast and North Central regions of the United States (Figure 2-1). With one exception (Rock Island Project, FERC No. 943), the large projects on the mainstem Columbia River in the Northwest were not included because they were licensed prior to 1987.
Figure 2-1. Geographical distribution of 269 projects (=licenses) with at least one license article that addressed fish passage.
Of the 269 projects, 231 (86%) had a license article reserving the FERC’s authority under
Section 18 of the FPA to require construction, operation, and maintenance of fishways as may be prescribed by the U.S. Department of the Interior (Fish and Wildlife Service or FWS) or the U.S. Department of Commerce (National Oceanic and Atmospheric Administration or NOAA Fisheries). Although fish passage may not be required by FWS or NOAA Fisheries at the time of project licensing, the agencies may recommend that reservation of authority be included in the license.
A license article reserving authority under Section 18 of the FPA was the only fish passage requirement at 157 projects. After excluding these projects because they only reserved authority and did not specify the requirements for fish passage, the actual database included in the study consisted of 147 developments associated with 112 licensed projects. The greater number of developments (i.e., dams) than projects (i.e., licenses) is accounted for by 15 projects

10
that had two or more developments under the same license. In addition to Section 18, other sources of fish passage requirements that may be included in the license are (1) Settlement Agreements between the licensee and state and federal resource agencies and NGO’s, (2) 401 Water Quality Certification issued by the designated state agency, (3) FERC license articles, and (4) Section 4(e) of the FPA. 2.1 SUMMARY OF PROJECTS WITH FISH PASSAGE REQUIREMENTS 2.1.1 Background
Fish passage requirements represent measures to mitigate adverse impacts of hydropower dams, which have been well documented (e.g., see reviews by Hildebrand 1980, Turback et al. 1981, and Jungwirth et al. 1998). These dams are barriers to the upstream movement of migratory fishes, and passage by downstream migrants through the turbines or spillways can be a source of direct or delayed mortality (e.g., injuries that cause greater susceptibility to predation). The life cycle of anadromous fishes, which spend most of their adult life in the ocean but return to freshwater to spawn, is impacted in both the adult and juvenile stages; adults often must pass one or more dams in the upstream journey to their natal streams, and the progeny that migrate downstream after one or more years must pass those same dams. Several Pacific salmonid species have such a life cycle, including chinook (Oncorhynchus tshawytscha), coho (O. kisutch), and sockeye salmon (O. nerka). Unlike Pacific salmon which die after spawning, steelhead (O. mykiss), Atlantic salmon (Salmo salar), and several anadromous nonsalmonids, including American shad (Alosa sapidissima), alewife (A. pseudoharengus), and blueback herring (A. aestivalis), are repeat spawners, so the adults also encounter dams during their post-spawning, downstream migration to the ocean. Because of its declining abundance, the American eel (Anguilla rostrata), a catadromous species that rears in freshwaters of Atlantic coastal river basins but spawns in the ocean, has received increased attention from resource agencies and hydropower developers (see review by EPRI 2001). Much less is known about the impact of dams on the more localized movements of riverine fishes. 2.1.2 Project Characteristics
The hydropower developments used in this study were characterized by the year the project was licensed, the generating capacity of the development, and its geographical location. These characteristics are summarized and discussed below.
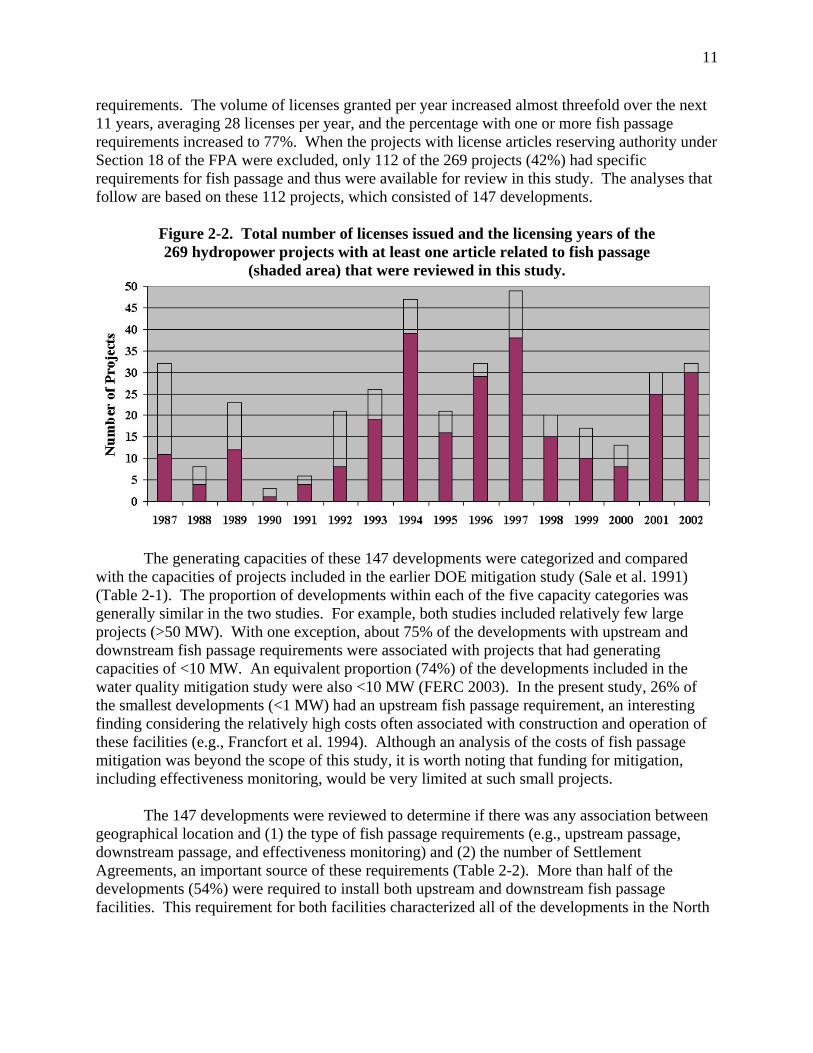
The initial database of 269 projects with a license article related to fish passage represented 75% of the total of 363 projects that were licensed or relicensed during the period 1987-2002. Of these 269 projects, 73% were licensed after 1993, and 47% were licensed during the five-year period from 1994-1998 (Figure 2-2).
Several trends were evident in the percentage of licenses with fish passage requirements over the 16-year period from 1987 to 2002. The number of licenses issued in any given year that had one or more fish passage requirements ranged from one (33%) in 1990 to 29 (91%) in 1996 (Figure 2-2). Of the 72 licenses issued from 1987 through 1991, 32 (44%) had fish passage
11
requirements. The volume of licenses granted per year increased almost threefold over the next 11 years, averaging 28 licenses per year, and the percentage with one or more fish passage requirements increased to 77%. When the projects with license articles reserving authority under Section 18 of the FPA were excluded, only 112 of the 269 projects (42%) had specific requirements for fish passage and thus were available for review in this study. The analyses that follow are based on these 112 projects, which consisted of 147 developments.
Figure 2-2. Total number of licenses issued and the licensing years of the 269 hydropower projects with at least one article related to fish passage
(shaded area) that were reviewed in this study.
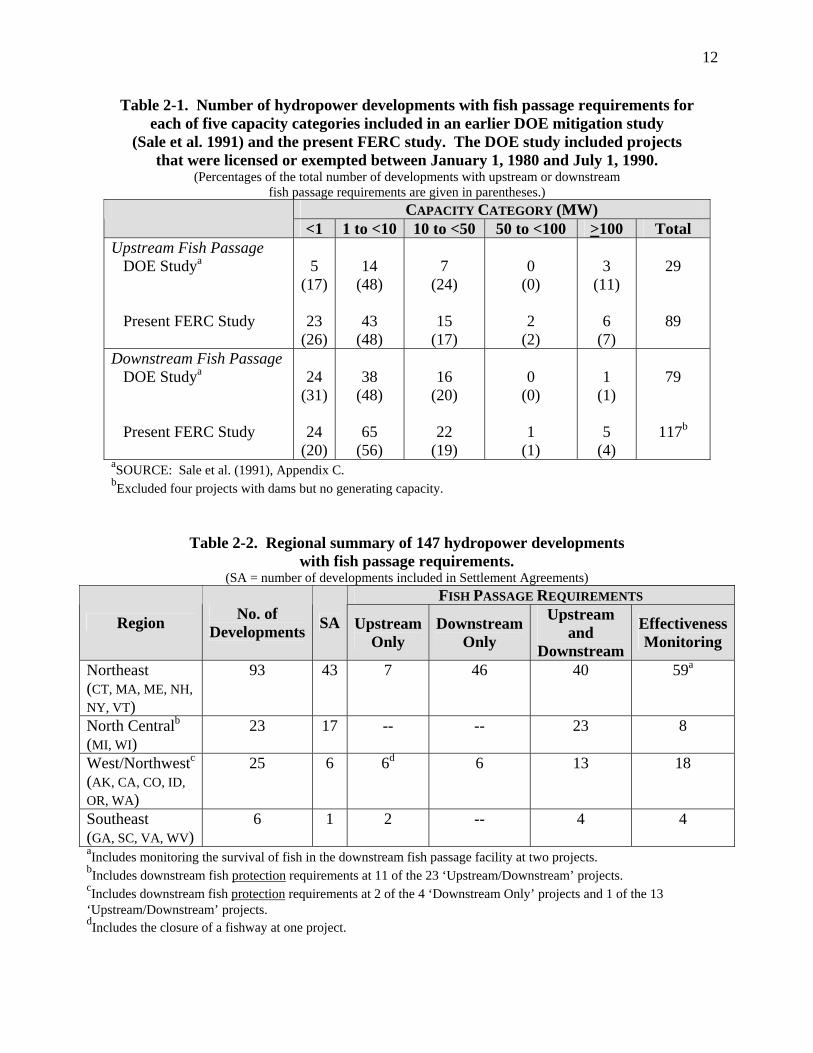
The generating capacities of these 147 developments were categorized and compared with the capacities of projects included in the earlier DOE mitigation study (Sale et al. 1991) (Table 2-1). The proportion of developments within each of the five capacity categories was generally similar in the two studies. For example, both studies included relatively few large projects (>50 MW). With one exception, about 75% of the developments with upstream and downstream fish passage requirements were associated with projects that had generating capacities of <10 MW. An equivalent proportion (74%) of the developments included in the water quality mitigation study were also <10 MW (FERC 2003). In the present study, 26% of the smallest developments (<1 MW) had an upstream fish passage requirement, an interesting finding considering the relatively high costs often associated with construction and operation of these facilities (e.g., Francfort et al. 1994). Although an analysis of the costs of fish passage mitigation was beyond the scope of this study, it is worth noting that funding for mitigation, including effectiveness monitoring, would be very limited at such small projects.
The 147 developments were reviewed to determine if there was any association between geographical location and (1) the type of fish passage requirements (e.g., upstream passage, downstream passage, and effectiveness monitoring) and (2) the number of Settlement Agreements, an important source of these requirements (Table 2-2). More than half of the developments (54%) were required to install both upstream and downstream fish passage facilities. This requirement for both facilities characterized all of the developments in the North
12
Table 2-1. Number of hydropower developments with fish passage requirements for each of five capacity categories included in an earlier DOE mitigation study
(Sale et al. 1991) and the present FERC study. The DOE study included projects that were licensed or exempted between January 1, 1980 and July 1, 1990.
(Percentages of the total number of developments with upstream or downstream fish passage requirements are given in parentheses.)
CAPACITY CATEGORY (MW) <1 1 to <10 10 to <50 50 to <100 >100 Total
Upstream Fish Passage DOE Studya
Present FERC Study
5
(17)
23 (26)
14
(48)
43 (48)
7
(24)
15 (17)
0
(0) 2
(2)
3
(11) 6
(7)
29
89
Downstream Fish Passage DOE Studya
Present FERC Study
24
(31)
24 (20)
38
(48)
65 (56)
16
(20)
22 (19)
0
(0) 1
(1)
1
(1) 5
(4)
79
117b
aSOURCE: Sale et al. (1991), Appendix C. bExcluded four projects with dams but no generating capacity.
Table 2-2. Regional summary of 147 hydropower developments with fish passage requirements.
(SA = number of developments included in Settlement Agreements) FISH PASSAGE REQUIREMENTS
Region No. of Developments SA Upstream
Only Downstream
Only
Upstream and
Downstream
Effectiveness Monitoring
Northeast (CT, MA, ME, NH, NY, VT)
93 43 7 46 40 59a
North Centralb
(MI, WI) 23 17 -- -- 23 8
West/Northwestc
(AK, CA, CO, ID, OR, WA)
25 6 6d 6 13 18
Southeast (GA, SC, VA, WV)
6 1 2 -- 4 4
aIncludes monitoring the survival of fish in the downstream fish passage facility at two projects. bIncludes downstream fish protection requirements at 11 of the 23 ‘Upstream/Downstream’ projects. cIncludes downstream fish protection requirements at 2 of the 4 ‘Downstream Only’ projects and 1 of the 13 ‘Upstream/Downstream’ projects. dIncludes the closure of a fishway at one project.

13
Central United States. Upstream passage only was a requirement at just 10% of the developments and almost exclusively at those in the Northeast and West/Northwest where anadromous fish populations are the focus of major restoration efforts. Downstream fish passage was a more common requirement than upstream passage, a trend that was also noted by Sale et al. (1991) in a study of hydropower projects that were licensed between 1980 and 1990. Indeed, all 23 developments in the North Central region and 92% of those in the Northeast had a downstream fish passage requirement.
Several factors may account for the high proportion of projects in the Northeast that had a downstream passage only requirement. In New York, for example, an upstream fish passage route is provided by a major network of navigational locks located on the Hudson, Mohawk, and Oswego rivers. In other regions of the state, hydroelectric projects were constructed on natural cataracts which served as barriers to upstream fish movements under most flow conditions. Consequently, only downstream fish passage was required at these sites. Finally, many upstream passage facilities in the Northeast were constructed and evaluated prior to 1987, and the time period of this study (1987-2002) represents a shift in emphasis to downstream fish passage.
Most of the developments also had a requirement to monitor the effectiveness of fish passage (Table 2-2). Although 89 developments (61%) had this requirement, the regions with the highest proportion of developments requiring effectiveness monitoring were the Northeast (63%) and the West/Northwest (72%), where passage of anadromous fishes around dams is a significant issue. The emphasis on determining the effectiveness of fish passage facilities has only occurred within the past 10-15 years, because most of the hydropower projects that were reviewed by Sale et al. (1991) did not have such a requirement (see Section 1.1.1).
This increasing importance of effectiveness monitoring coincided with a recent increase in the use of Settlement Agreements as a component of the FERC licensing process. Only four of the 19 Settlement Agreements that were associated with the hydropower developments reviewed in this study were negotiated before 1994. Fish passage requirements are included in many Settlement Agreements, and 65 of the 147 developments (44%), represented by 53 individual licenses, are included in these 19 Agreements. That is, almost 50% of the 112 licenses for projects reviewed in the present study are based on Settlement Agreements. Using this approach in the licensing process was especially favored in Michigan and Wisconsin, where 74% of the 23 developments were included in just two Agreements. They are an increasingly popular tool for resolving issues in hydropower relicensing proceedings in a timely and consensus-based manner (FERC 2000). The use of Settlement Agreements, which the FERC encourages, provides a mechanism for ensuring that the effectiveness of fish passage mitigation is appropriately evaluated. 2.2 REGIONAL ASSESSMENT OF FISH PASSAGE FACILITIES
The fish passage facilities at the 147 developments included in this study were reviewed to identify common characteristics and to assess regional differences. This review included developments with planned facilities as well as those with operational facilities.

14
2.2.1 Upstream Fish Passage
Generally, there are three types of facilities for moving fish upstream: (1) fish ladders; (2) fish lifts (or elevators); and (3) fish locks (Bell 1980). The most common fish ladders include the pool and weir, Ice Harbor, vertical slot, Denil, and steeppass, all of which have fish swimming up a series of successively elevated pools. The steeppass is used to pass fish around natural barriers (e.g., waterfalls) and is not common at FERC-licensed projects. Both fish lifts and fish locks crowd fish into an enclosure for transport over the dam. With fish lifts, this enclosure is a water-filled mechanical hopper; for locks, it is a chamber that fills with water, raising the fish above the dam. An important advantage of lifts and locks over fishways is that they can pass most fish species, including those that are small and those with weak swimming capabilities. They are employed for species that cannot utilize ladders or where the height of the dam is great (Weigmann et al. 2003). Fish ladders, on the other hand, are species-specific, and passage via this type of fishway may be slower (Bell 1980).
In addition to these methods of upstream passage, trap-and-truck can offer an interim option while other, more permanent alternatives are considered for passage, or in some cases, it can be a semi-permanent solution to the problem of upstream fish passage. Usually, a fish lift is used to collect fish at the dam, and a truck is used to haul them above the reservoir or above several dams farther upstream. Another method of upstream passage occurs via a breach in the dam (e.g., the Battersea Project, FERC No. 8535, on the Appomattox River in Virginia). Like the Alaska steeppass, however, it is not in common use at FERC-licensed projects.
The types of upstream fish passage facilities at the developments included in the present study are summarized, by region, in Table 2-3. Most of the upstream passage facilities are located in the Northeast, and each type was about evenly represented. The targeted species at the Northeast projects are almost exclusively anadromous clupeids, Atlantic salmon, and the catadromous American eel. It is not surprising that anadromous fishes also constituted the majority of the targeted species at projects in the West/Northwest.
A comparison among regions showed that lifts/locks and the Denil fishway are primarily used in the Northeast. Also, as a proportion of the total facilities in the region (both installed and planned), the pool-weir fishway was more common in the West/Northwest, as were tailrace barriers. Although they are not actually an upstream passage device, tailrace barriers are used to minimize delay of upstream migrants that are searching for the entrance to the fishway. The low number of facilities in the Southeast suggests that upstream fish passage may not be the significant issue it is in other regions. However, FERC expects to receive 137 relicense applications during the 10-year period from 2002 to 2012, and 26 of these projects, consisting of more than 50 developments, are located in the coastal states of North and South Carolina, Georgia, and Alabama (Hill and Murphy 2003). In Alabama and Georgia, dams operated by the U.S. Army Corps of Engineers are located downstream of many nonfederal dams, so the passage needs and fish management goals of the entire river basin could be addressed when the need for fish passage at these latter dams is considered. That is, the barriers downstream may already limit fish movements, thus requiring a basin-wide rather than site-specific approach (Bell 1980).

15
Table 2-3. Regional summary of upstream fish passage facilities for 147 hydropower developments (i.e., dams) that have fish passage requirements.
(R = riverine species; A = anadromous species; and C = catadromous species (i.e., American eel); TBD = to be determined) TYPE OF FACILITY
TARGETED SPECIES
Fish Protection Region No. of Facilities
Lift Vertical Slot
Pool-Weir Denil
Trap -n-
Truck
Eel Ladder Other TBD Tailrace
Barrier R A C
Northeast Installed Planned
27 22
7a
--
1 --
6 --
3 4
5 3
2 5c
2b
--
9
1 1
3 5
17 17
4 8
North Central Installed Planned
4 23
-- --
2 --
1 --
1 --
-- --
-- --
-- --
-- 23
-- --
3 12
4 11
-- --
West/Northwest Installed Planned
12 6
-- --
-- --
7d
2
-- --
2 1
-- --
1e
--
-- --
2 3
6 --
4 7
-- --
Southeast Installed Planned
1 4
-- 2f
-- 1
-- --
1 --
-- --
-- --
-- --
-- 1
-- --
-- --
1 3
-- 2
Total Installed Planned
43 56
aIncludes two locks at the Springs-Bradbury development (No. 2528) on the Saco River, ME. bProject shutdown. cIncludes three ladders at the Holyoke Project (No. 2004) on the Connecticut River, MA. dIncludes a fishway at the Kern River No. 3 development, CA (No. 2290) that was closed and three pool-weir fishways at the Rock Island Project on the Columbia River, WA. eOpenings were created through the stoplogs in each of the five existing vertical slots through the dam. fIncludes a refurbished navigation lock at the Stevens Creek Project (No. 2535) on the Savannah River, GA.
16
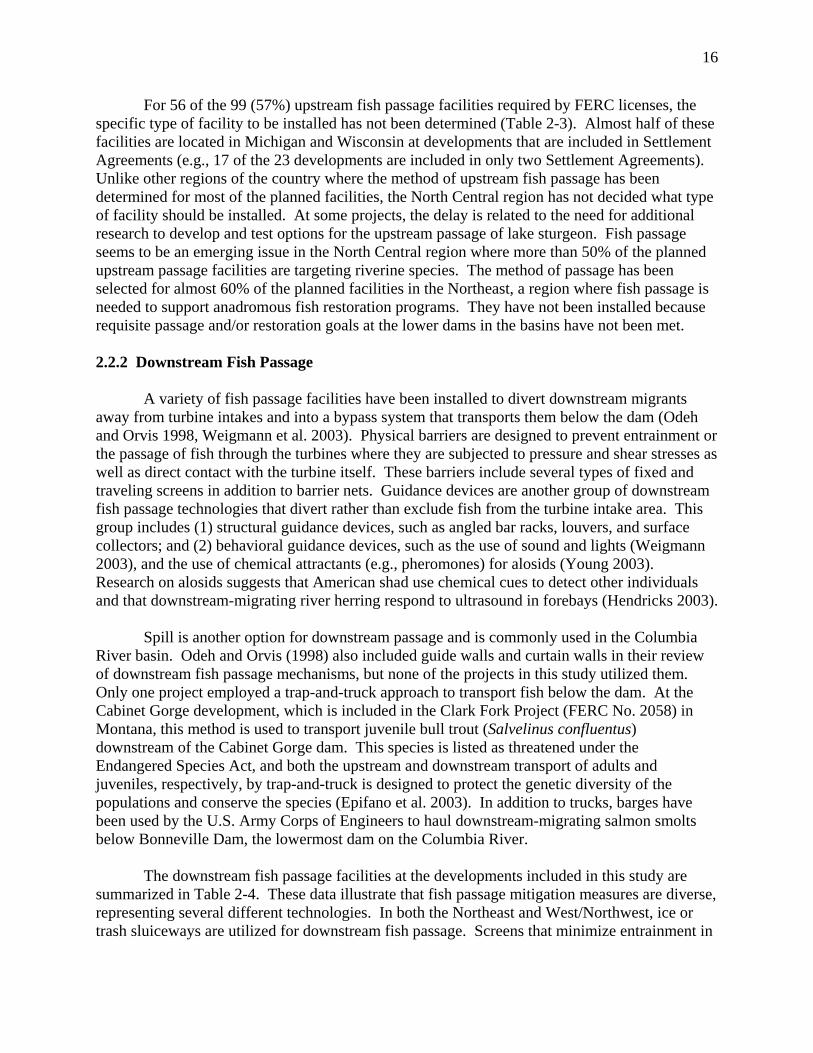
For 56 of the 99 (57%) upstream fish passage facilities required by FERC licenses, the specific type of facility to be installed has not been determined (Table 2-3). Almost half of these facilities are located in Michigan and Wisconsin at developments that are included in Settlement Agreements (e.g., 17 of the 23 developments are included in only two Settlement Agreements). Unlike other regions of the country where the method of upstream fish passage has been determined for most of the planned facilities, the North Central region has not decided what type of facility should be installed. At some projects, the delay is related to the need for additional research to develop and test options for the upstream passage of lake sturgeon. Fish passage seems to be an emerging issue in the North Central region where more than 50% of the planned upstream passage facilities are targeting riverine species. The method of passage has been selected for almost 60% of the planned facilities in the Northeast, a region where fish passage is needed to support anadromous fish restoration programs. They have not been installed because requisite passage and/or restoration goals at the lower dams in the basins have not been met. 2.2.2 Downstream Fish Passage
A variety of fish passage facilities have been installed to divert downstream migrants away from turbine intakes and into a bypass system that transports them below the dam (Odeh and Orvis 1998, Weigmann et al. 2003). Physical barriers are designed to prevent entrainment or the passage of fish through the turbines where they are subjected to pressure and shear stresses as well as direct contact with the turbine itself. These barriers include several types of fixed and traveling screens in addition to barrier nets. Guidance devices are another group of downstream fish passage technologies that divert rather than exclude fish from the turbine intake area. This group includes (1) structural guidance devices, such as angled bar racks, louvers, and surface collectors; and (2) behavioral guidance devices, such as the use of sound and lights (Weigmann 2003), and the use of chemical attractants (e.g., pheromones) for alosids (Young 2003). Research on alosids suggests that American shad use chemical cues to detect other individuals and that downstream-migrating river herring respond to ultrasound in forebays (Hendricks 2003).
Spill is another option for downstream passage and is commonly used in the Columbia River basin. Odeh and Orvis (1998) also included guide walls and curtain walls in their review of downstream fish passage mechanisms, but none of the projects in this study utilized them. Only one project employed a trap-and-truck approach to transport fish below the dam. At the Cabinet Gorge development, which is included in the Clark Fork Project (FERC No. 2058) in Montana, this method is used to transport juvenile bull trout (Salvelinus confluentus) downstream of the Cabinet Gorge dam. This species is listed as threatened under the Endangered Species Act, and both the upstream and downstream transport of adults and juveniles, respectively, by trap-and-truck is designed to protect the genetic diversity of the populations and conserve the species (Epifano et al. 2003). In addition to trucks, barges have been used by the U.S. Army Corps of Engineers to haul downstream-migrating salmon smolts below Bonneville Dam, the lowermost dam on the Columbia River.
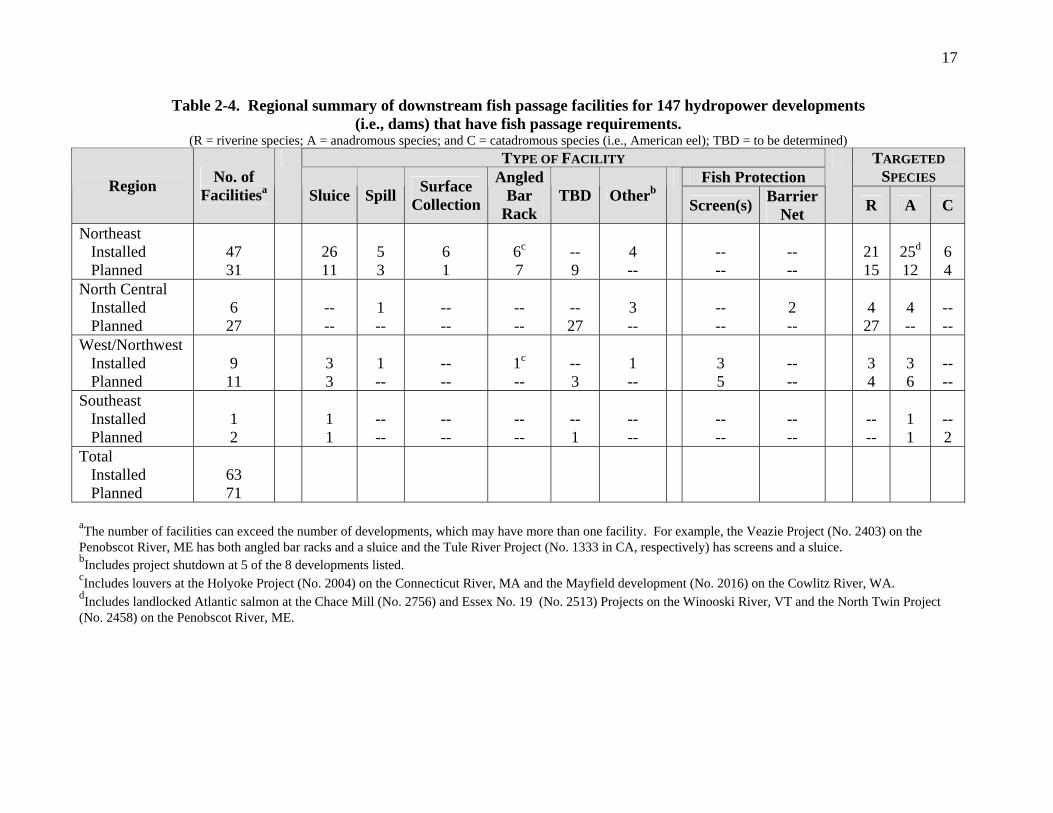
The downstream fish passage facilities at the developments included in this study are summarized in Table 2-4. These data illustrate that fish passage mitigation measures are diverse, representing several different technologies. In both the Northeast and West/Northwest, ice or trash sluiceways are utilized for downstream fish passage. Screens that minimize entrainment in
17
Table 2-4. Regional summary of downstream fish passage facilities for 147 hydropower developments (i.e., dams) that have fish passage requirements.
(R = riverine species; A = anadromous species; and C = catadromous species (i.e., American eel); TBD = to be determined) TYPE OF FACILITY
Fish Protection TARGETED
SPECIES Region No. of Facilitiesa
Sluice Spill Surface Collection
Angled Bar
Rack TBD Otherb
Screen(s) Barrier Net
R A C
Northeast Installed Planned
47 31
26 11
5 3
6 1
6c
7
-- 9
4 --
-- --
-- --
21 15
25d
12
6 4
North Central Installed Planned
6 27
-- --
1 --
-- --
-- --
-- 27
3 --
-- --
2 --
4 27
4 --
-- --
West/Northwest Installed Planned
9 11
3 3
1 --
-- --
1c
--
-- 3
1 --
3 5
-- --
3 4
3 6
-- --
Southeast Installed Planned
1 2
1 1
-- --
-- --
-- --
-- 1
-- --
-- --
-- --
-- --
1 1
-- 2
Total Installed Planned
63 71
aThe number of facilities can exceed the number of developments, which may have more than one facility. For example, the Veazie Project (No. 2403) on the Penobscot River, ME has both angled bar racks and a sluice and the Tule River Project (No. 1333 in CA, respectively) has screens and a sluice. bIncludes project shutdown at 5 of the 8 developments listed. cIncludes louvers at the Holyoke Project (No. 2004) on the Connecticut River, MA and the Mayfield development (No. 2016) on the Cowlitz River, WA. dIncludes landlocked Atlantic salmon at the Chace Mill (No. 2756) and Essex No. 19 (No. 2513) Projects on the Winooski River, VT and the North Twin Project (No. 2458) on the Penobscot River, ME.
18
the turbines were used or are planned for use at several projects in the West/Northwest. Downstream fish passage is planned for hydropower projects in the North Central region, but the type of facility has not been determined for nearly all of the developments.
Downstream fish passage facilities in the Northeast alone account for 75% of the total installed facilities that were reviewed in this study. When the facilities in the West/Northwest are included, the proportion approaches 90%. Such a trend reflects the importance of anadromous fish restoration and protection as a management goal in the major coastal river basins of the Northeast and West/Northwest. Consequently, much of what we know about methods for safe downstream passage at dams is based on studies conducted on anadromous species in these two regions of the country.
Although the majority of the installed facilities in the Northeast region are used for passage of anadromous species (and catadromous eels), a substantial number are used for riverine species (e.g., 45% and 48% of the installed and planned facilities, respectively). The number of downstream passage facilities in the West/Northwest was considerably lower, but the trend was similar; 35% of the facilities included passage for riverine species. As was found with upstream passage at hydropower projects in the North Central region (Table 2-3), the facilities planned for this region of the country will be designed primarily for the passage of riverine species. 2.3 EVALUATION OF FISH PASSAGE EFFECTIVENESS
Many of the 147 hydropower developments had no data available for assessing the effectiveness of the fish passage facilities (Table 2-5). Passage facilities have not been installed at 55% of these developments, and no effectiveness monitoring was required at another 16%. Even if the development had a monitoring requirement, data were not always available. For example, anadromous fish stocks may have been too low to meet the goals that would require the initiation of monitoring (e.g., Table 2-5, footnote ‘d’). In a few cases, an effectiveness monitoring plan was in preparation or monitoring was in progress and no report was available yet.
Fish passage monitoring data were available at 22 developments, 77% of which were located in the Northeast. At some of these developments, data were limited (i.e., the data were qualitative, anecdotal, or in other ways, too limited for meaningful analysis). After reviewing the data from reports submitted by licensees to FERC in compliance with the license article(s), the monitoring results from effectiveness studies at eight upstream passage facilities and 12 downstream facilities were analyzed in the sections that follow. 2.3.1 Upstream Fish Passage
Adequate data on the number of fish using the upstream passage facility were available for eight developments (seven projects), but only three of these had data that could be used to measure the effectiveness of the fish passage facility (Table 2-6). Two of these developments,

19
Table 2-5. Status of implementation of fish passage requirements at 304 hydropower developments categorized by region.
NUMBER OF DEVELOPMENTS Status Northeast North
Central West/
Northwest Southeast Total
Section 18, Reservation of Authoritya 41 85 4 27 157 Construction not started/in progress 2 -- 7 -- 9 Passage facilities not installed 42 19 6 5 72 Passage facilities installed — No effectiveness monitoring required 19b 3 1c -- 23 — Data not availabled 13e 1 7 -- 21 — Data available 17 -- 4 1 22 TOTAL 134 108 29 33 304
aIncludes projects with only Section 18 authority. bIncludes four projects on the Passumpsic River in Vermont, each with an article requiring downstream fish passage effectiveness monitoring but none is required to conduct formal, quantitative studies. cKern River No. 3 Project (FERC No. 2290) in California where the fishway was closed. dData not available because (1) effectiveness monitoring plan not submitted, (2) monitoring is in progress, or (3) report of results is in preparation. eIncludes two developments (Caribou and Millinocket Lake) that will not conduct upstream fish passage effectiveness studies until specific goals are reached for Atlantic salmon returns to the lower dam on the Aroostook River in Maine (FERC No. 2367) and two projects (Bonny Eagle and West Buxton) that will not conduct downstream fish passage studies until sufficient numbers of river herring and Atlantic salmon are present in the Saco River in Maine (FERC No. 2529 and 2531, respectively).
Springs-Bradbury (FERC No. 2528) and Skelton (FERC No. 2527), are located on the Saco River in Maine; they are the next dams upstream of the Cataract development (FERC No. 2528), which is the first dam encountered by upstream migrating anadromous fishes. In this case, effectiveness can be evaluated unambiguously, because the population available for passage at the upper dams is the number of fish passed at the Cataract dam, which is known.
The third development (Greenville, FERC No. 2441) is located on the Shetucket River in Connecticut and utilized an alternative approach (mark-recapture study) to measure the effectiveness of the upstream passage facility. While the approach in this case may be different, this measure of effectiveness is sufficient, because the numbers of fish available for passage at the facility were estimated.
A case study of upstream fish passage at four dams on the lower Susquehanna River is presented in Appendix B. Although the relicensing of these projects occurred before 1987, substantial efforts have been taken to evaluate fish passage in the Susquehanna River. The inclusion of these projects is intended to supplement the analyses presented here. 2.3.1.1 Summary of Results
The effectiveness of the three upstream fish passage facilities ranged from 45 to 67% (Table 2-6). Passage efficiencies were highest for river herring at the Springs-Bradbury

20 Table 2-6. Results of monitoring upstream fish passage at eight hydropower developments. Fish passage effectiveness is the percentages
of fish passed at the downstream dam that were passed at the dam noted in the table. (ND = No data available; NA = Not applicable; NT = Not tested: TNT = Trap-and-truck)
LOCATION FACILITY NUMBER OF FISH PASSED FISH PASSAGE EFFECTIVENESS (%)
RIVER BASIN RESTORATION GOALS
(Number of Fish) Development (FERC No.)
River State Dam Locationa Type Statusb
Year of Initial
Operation Year Atlantic
Salmon American
Shad River
HerringcAtlantic Salmon
American Shad
River Herring
Atlantic Salmon
American Shad Alewife
Ellsworth (2727)
Union ME 1 TNT I 1974 20002001 2002
Maximumd
8 2
11 72
ND ND ND ND
362,610 446,850 666,967 666,967
ND ND ND 250-750 NA 2,000,000
Cataracte (2528)
Saco ME 1 Lift/Denil/TNT P 1993 20002001 2002
Maximumd
50 69 47 88
ND ND ND
4,629
5,429 44,839 20,198 44,839
ND ND ND ND ND ND
Springs Bradburye (2528)
Saco ME 2 Locks I 1997 20002001 2002
Maximumd
ND ND ND ND
ND ND 557 ND
3,626 27,271
ND ND
ND ND
ND ND
61 67
ND ND ND
Skelton (2527)
Saco ME 3 Lift/TNT P 2001f 2001 2002
Maximumd
31 26
31
ND 0
0
ND 11,582
11,582
45 55
ND 0
ND 57
ND ND ND
Greenville (2441)
Shetucket CT 1 Lift P 1996g 1996 1997 1998
2 10 16
926 2,860 5,577
142 950 471
NT 55h NT NA 110,000 217,000
West Springfield (2608)
Westfield MA 1 Denil P 1996 19961997
21 39
1,413 1,009
ND ND
ND ND ND 500 15,000 NA
Fort Halifax (2552)
Sebasticook ME 1 Pump/TNT I 2000 20002001 2002
Maximumd
0 0 0 0
1 1 0 1
128,741 145,067 153,103 153,103
ND ND ND NA 725,000i 6,000,000j
Harvell (8657)
Appomattox VA 1 Denil P 1997 2001 NA 2 1,141j NA ND ND
aFirst or lowermost dam on river = 1. bI = interim; P = permanent. cIncludes alewife (primarily) and blueback herring. dMaximum number of fish passed during 15-year period (1988-2002) or since year of initial operation. eDevelopment includes two upstream fish passage facilities. fFishway was not operational until August 2001. gMonitoring initiated on May 16 and conducted through June 27 in 1996 (31 d) and from March-June in 1997 (74 d) and 1998 (83 d). hEffectiveness was based on a mark-recapture study with 120 adult shad. iAnnual production goal for Kennebec River above Augusta. j98.7% blueback herring; 27 hickory shad, another anadromous clupeid, not included.

21
development. The estimates of effectiveness at the Skelton project are somewhat lower, in part, because the counts there were compared to the first or lowermost dam on the river and not with the next dam downstream (i.e., Springs-Bradbury). The greater distance between dams 1 and 3 than between dams 2 and 3, the preferred comparison, may have increased the probability for delays during passage at the Springs-Bradbury facilities. Estimates of fish passage effectiveness from the mark-recapture study with American shad at the Greenville project were remarkably similar to those that were based on direct counts of other species using the Skelton upstream fish passage facility.
Effectiveness was not quantified at the other five developments, all of which were the lowermost dams on the river. Mark-recapture studies may represent the only quantitative method that can be used to estimate the effectiveness of upstream fish passage at dams such as these (i.e., the first dam in the basin). Nevertheless, these projects are included in this analysis because most (the exception is the Harvell Project, FERC No. 8657, in Virginia) are located in a river basin that has specific numeric goals for anadromous fish restoration (not percent passage), and the counts made at the upstream passage facility provide a measure of attainment of those goals. When the actual counts at those five developments are compared to the restoration goals for these lowermost dams, only the Ellsworth Project has passed enough fish to exceed 10% of the goal for the Union River (e.g., 14 and 33% of the goals for Atlantic salmon and alewives, respectively).
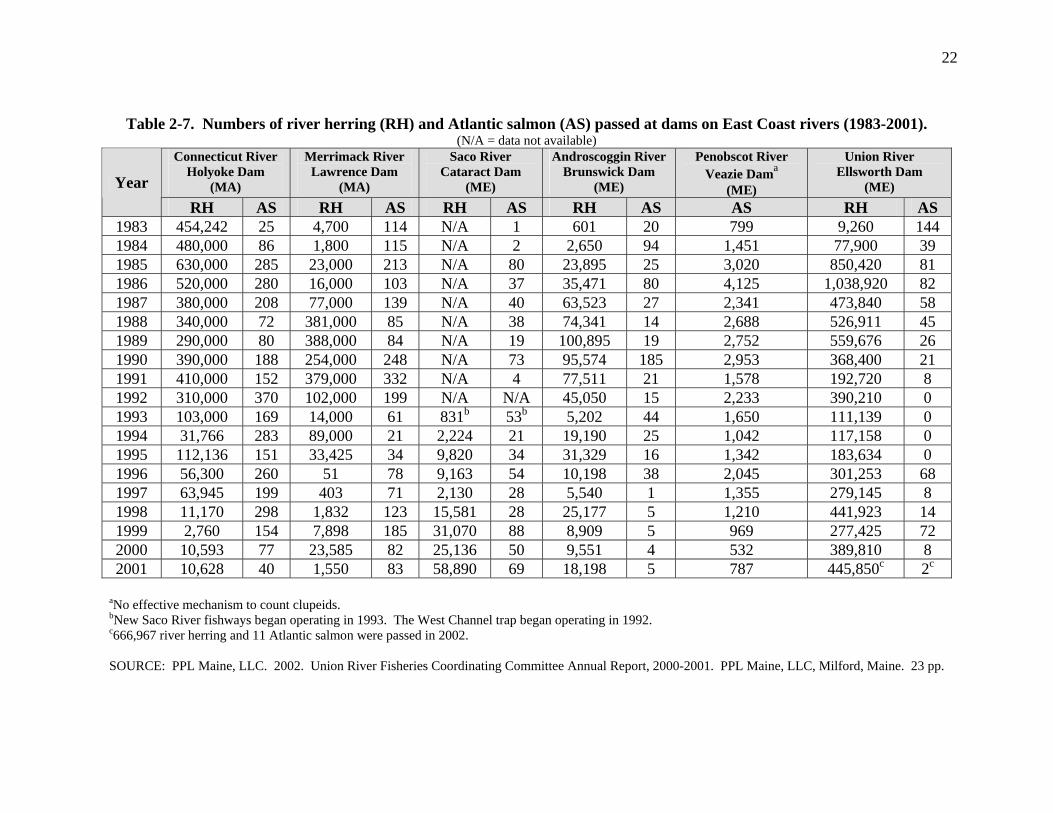
The recovery of anadromous fish stocks, especially Atlantic salmon, has been slow in many coastal river basins of the Northeast (Table 2-7). Even stocks of river herring, primarily alewives, are well below relatively recent historical levels in the Connecticut and Merrimack rivers, while populations in the Union River in Maine are recovering well. The slow recovery elsewhere may explain why 45% of the required upstream passage facilities have not been installed (Table 2-3). For those developments with installed facilities, low anadromous fish abundance also may account for the absence of monitoring data at some projects (Table 2-5).
2.3.1.2 Assessment of Effectiveness
Although most of the facilities listed in Table 2-6 were successful in passing upstream-migrating anadromous fishes, their effectiveness (expressed as the numbers of fish passed as a percent of those available, for example) was adequately measured at only a relatively few developments. Moreover, all species were not passed upstream with equal effectiveness. Design and Species Considerations
Three of the eight upstream fish passage facilities in Table 2-6 were Denil fishways, the most common fishway in the Northeast because it can pass most migratory species and all alosids (Schaefer 2003). A plan to monitor the effectiveness of the fishway at the West Springfield Project (FERC No. 2608) was submitted and approved, and monitoring was conducted for two years. After the FWS and the Massachusetts Division of Fisheries and Wildlife (MDFW) concurred that the facility was functioning effectively, the MDFW assumed responsibility for day-to-day operations, as outlined in a Memorandum of Agreement with the
22
Table 2-7. Numbers of river herring (RH) and Atlantic salmon (AS) passed at dams on East Coast rivers (1983-2001).
(N/A = data not available) Connecticut River
Holyoke Dam (MA)
Merrimack River Lawrence Dam
(MA)
Saco River Cataract Dam
(ME)
Androscoggin River Brunswick Dam
(ME)
Penobscot River Veazie Dama
(ME)
Union River Ellsworth Dam
(ME) Year RH AS RH AS RH AS RH AS AS RH AS
1983 454,242 25 4,700 114 N/A 1 601 20 799 9,260 1441984 480,000 86 1,800 115 N/A 2 2,650 94 1,451 77,900 391985 630,000 285 23,000 213 N/A 80 23,895 25 3,020 850,420 811986 520,000 280 16,000 103 N/A 37 35,471 80 4,125 1,038,920 821987 380,000 208 77,000 139 N/A 40 63,523 27 2,341 473,840 581988 340,000 72 381,000 85 N/A 38 74,341 14 2,688 526,911 451989 290,000 80 388,000 84 N/A 19 100,895 19 2,752 559,676 261990 390,000 188 254,000 248 N/A 73 95,574 185 2,953 368,400 211991 410,000 152 379,000 332 N/A 4 77,511 21 1,578 192,720 81992 310,000 370 102,000 199 N/A N/A 45,050 15 2,233 390,210 01993 103,000 169 14,000 61 831b 53b 5,202 44 1,650 111,139 01994 31,766 283 89,000 21 2,224 21 19,190 25 1,042 117,158 01995 112,136 151 33,425 34 9,820 34 31,329 16 1,342 183,634 01996 56,300 260 51 78 9,163 54 10,198 38 2,045 301,253 681997 63,945 199 403 71 2,130 28 5,540 1 1,355 279,145 81998 11,170 298 1,832 123 15,581 28 25,177 5 1,210 441,923 141999 2,760 154 7,898 185 31,070 88 8,909 5 969 277,425 722000 10,593 77 23,585 82 25,136 50 9,551 4 532 389,810 82001 10,628 40 1,550 83 58,890 69 18,198 5 787 445,850c 2c
aNo effective mechanism to count clupeids. bNew Saco River fishways began operating in 1993. The West Channel trap began operating in 1992. c666,967 river herring and 11 Atlantic salmon were passed in 2002. SOURCE: PPL Maine, LLC. 2002. Union River Fisheries Coordinating Committee Annual Report, 2000-2001. PPL Maine, LLC, Milford, Maine. 23 pp.

23
licensee. Another Denil fishway is located at one of the two dams at the Cataract development (FERC No. 2528). Because the passage data from the two dams were not presented separately, no analysis of the Denil fishway effectiveness was possible.
The Denil fishway at the Harvell Project in Virginia was evaluated in a 2001 study that showed the percentage of the target species, anadromous clupeids, using the fishway corresponded to the percentage observed from concurrent electrofishing surveys conducted 200 m below the dam. FERC approved the combination of the two datasets as the basis for estimating passage efficiency. A Compliance Order issued by FERC on March 4, 2003 required submittal of a report on the monitoring results within 60 days of the date of the Order, but the issue of fish passage at the Harvell dam has not been resolved. A vertical-slot fishway installed at the Buchanan Project (FERC No. 2551) on the St. Joseph River in 1990 was reported by Francfort et al. (1994) to pass 92% of the chinook salmon and 69% of the steelhead that migrated upstream from Lake Michigan.
A quantitative measure of fish passage effectiveness was obtained at three of the four developments with fish lifts or locks (Table 2-6). Estimates ranged from 45 to 67% across developments and species. These values are within the range of passage efficiencies given in the management plan for American shad in the Connecticut River basin (Connecticut River Atlantic Salmon Commission 1992). That plan stipulates an annual passage of 40 to 60% of the spawning run at each successive upstream barrier on the mainstem Connecticut River. Based on this comparison, the lifts/locks at these three developments (Table 2-6) can be judged successful, while recognizing that the Connecticut River criterion applies only to American shad, and the estimated effectiveness values in Table 2-6 are based on the passage of Atlantic salmon and river herring, in addition to American shad. The FWS and CDEP concur that the fish lift at the Greenville project is effective in passing the target species (shad and river herring) above the dam.
Problems with the passage of American shad were noted at the Fort Halifax Project (FERC No. 2552) and the Springs-Bradbury development (FERC No. 2528), which actually consists of two dams, each with a fish lock. Studies to improve fish passage at the Springs-Bradbury dams have been conducted since 1997, when the locks were installed. Many actions were tried, including altering flow through the deep gates and the position of the crowder gate, collecting extensive velocity measurements, installing underwater cameras, installing lighting, and other actions, which are continuing. In the interim, shad will be collected at the downstream Cataract development fish passage facilities and transported above the Springs and Bradbury dams.
The pump at the Fort Halifax Project1 on the Sebasticook River, a tributary of the Kennebec River in Maine, is an interim facility that was installed for the collection of alewives (e.g., average of 140,000 passed annually in 2000-2003). The low numbers of shad passed upstream in the pump may be due to low numbers of shad below the project, as the Licensee
1 On January 23, 2004, the Commission issued “Order Approving Surrender of License and Partial
Removal of Project Works and Dismissing Request for Rehearing.” This order granted an application filed by FPL Energy Maine Hydro, LLC for surrender of its license for the Fort Halifax Project. Further, this order authorized the partial removal of the Fort Halifax dam.

24
postulates, rather than to other factors related to facility operation. Use of the pump to pass adult shad and salmon, however, was not intended initially. Whether the cause of the low passage of shad is due to a passage or pump-related problem is not known.
The movement of radiotagged American shad was studied near the two fish lifts at Holyoke Dam (FERC No. 2004) on the Connecticut River in Massachusetts (Barry and Kynard 1986). Passage efficiencies were 42 and 50% in 1980 and 1981, respectively, and the two lifts combined passed 350,000 or more shad upstream each year from 1976 to 1983. Another study of American shad passage was conducted at a navigation lock on the Cape Fear River, North Carolina (Moser et al. 2000). Passage efficiency for 86 radiotagged shad ranged from 18 to 61% during the three-year study, and the lowest efficiency coincided with a year of high river discharge. High flow was also observed to decrease fish passage effectiveness at the Springs-Bradbury development.
The abundance of catadromous Anguillid eels has been declining throughout North America and worldwide (EPRI 2001), raising concerns about the passage of American eels at hydropower developments on coastal rivers and streams. Upstream eel passage facilities (eelways) were installed at two developments included in this study: the Millville Hydro Station (FERC No. 2343) on the Shenandoah River in West Virginia in 2002, and the Fort Halifax Project in 1999. The Millville Project had the first operating eelway in the Chesapeake Bay watershed. The estimated number of eels passed upstream at the Fort Halifax eelway ranged from 551,262 in 1999 to only 56,292 in 2002. An upstream eelway is planned for installation in 2003 at the Weston Project (FERC No. 2325) on the lower Kennebec River, and three upstream eelways are planned at the Holyoke Project. Also, an upstream eelway has been proposed at another project, Medway (FERC No. 2666), on the West Branch Penobscot River in Maine. No information is available on the effectiveness of these eel passage facilities.
Trap-and-truck has been employed at several other developments, usually as an interim measure until restoration goals are reached. At that time, permanent fish passage facilities would be installed. The Fort Halifax Project employs trap-and-truck but uses a Transvac fish pump to capture river herring. The pump has achieved interim passage goals for alewives, and the collection and transport of 153,103 river herring in 2002 was the largest number of fish collected since anadromous fish restoration efforts in the Kennebec River basin were initiated in 1986. Adequacy of Effectiveness Monitoring
One of the best measures of the effectiveness of upstream fish passage incorporates the number of fish available for passage, as well as the number that actually pass the dam, in the calculation of effectiveness. Mark-recapture or radiotagging studies are good examples of the types of effectiveness monitoring approaches that can be used at the lowermost dam on the river. Such studies were conducted at the Greenville dam on the Shetucket River, a tributary of the Thames River in Connecticut (Table 2-6) and at Holyoke Dam by Barry and Kynard (1986). Both studies focused on the upstream passage of American shad. For other dams that are farther upstream, a quantitative estimate of upstream passage effectiveness can be obtained from fish passage counts at the dam of interest and the next lower dam. In this case, effectiveness is

25
expressed as a proportion of the number of fish available for passage (i.e., those that were passed above the lower dam).
In this study, facilities were determined to be satisfactory and fish passage was judged successful by regulatory agencies based on substantially less information, such as direct observations of fish passage, conformance with design criteria, and a comparison of relative abundance of target species in fishway counts with relative abundance in the population below the dam. While the use of more rigorous, quantitative evaluations of facility performance may provide a more accurate measure of effectiveness, project economics often dictates the use of less rigorous and more qualitative measures. Fewer than half the developments in Table 2-6, all of which were required to develop effectiveness monitoring plans, utilized such an approach. 2.3.2 Downstream Fish Passage
The proportion of fish that utilized downstream fish passage facilities was estimated at 11 developments, and actual counts of downstream migrants were made at one (Table 2-8). The larger number of developments that evaluated the effectiveness of downstream compared with upstream fish passage facilities reflects both the greater number of developments with downstream fish passage requirements (Table 2-2), and a more straightforward approach that can be used to measure downstream passage effectiveness (Section 1.2.1.1). 2.3.2.1 Summary of Results
At seven of the 12 developments (58%), radiotagging was used to measure the effectiveness of downstream passage for Atlantic salmon smolts. All of these developments are located in the Northeast. A different technique was utilized at each of the other five developments; these included radiotagging, acoustic tagging, marking (Floy tags), video monitoring, and complete census by draining the facility.
The range in effectiveness of the 12 downstream fish passage facilities listed in Table 2-8 was very broad. The percentage of radiotagged or marked fish that utilized downstream bypasses (compared to other passage routes) ranged from 6 to 100% for anadromous species and from 3 to 87% for resident species. This same degree of variability was evident when only the studies that utilized radiotagged Atlantic salmon smolts were considered. High variability in effectiveness also occurred among years for the same facility and species (e.g., Atlantic salmon smolts). For example, effectiveness ranged from 17 to 63% over a four-year period at the Cavendish Project (FERC No. 2489) on the Black River in Vermont and, similarly, from 17 to 59% at the Mattaceunk Project (FERC No. 2520) on the Penobscot River in Maine. The high variability in downstream passage effectiveness between years that was observed at most of the projects may be associated with flow differences. Tests of effectiveness were generally scheduled to avoid periods of spill during high river flows. Recapture rates of marked Atlantic salmon smolts at the Cavendish Project on the Black River in Vermont were observed to be highest later in the migration season when river flows had subsided. Because of the configuration of the project, relatively low flows in the Black River can result in passage of some of the water over the spillway. The low effectiveness of the Essex 19 downstream fish bypass facility on the Winooski River in Vermont (FERC No. 2513) was attributed to unusually high
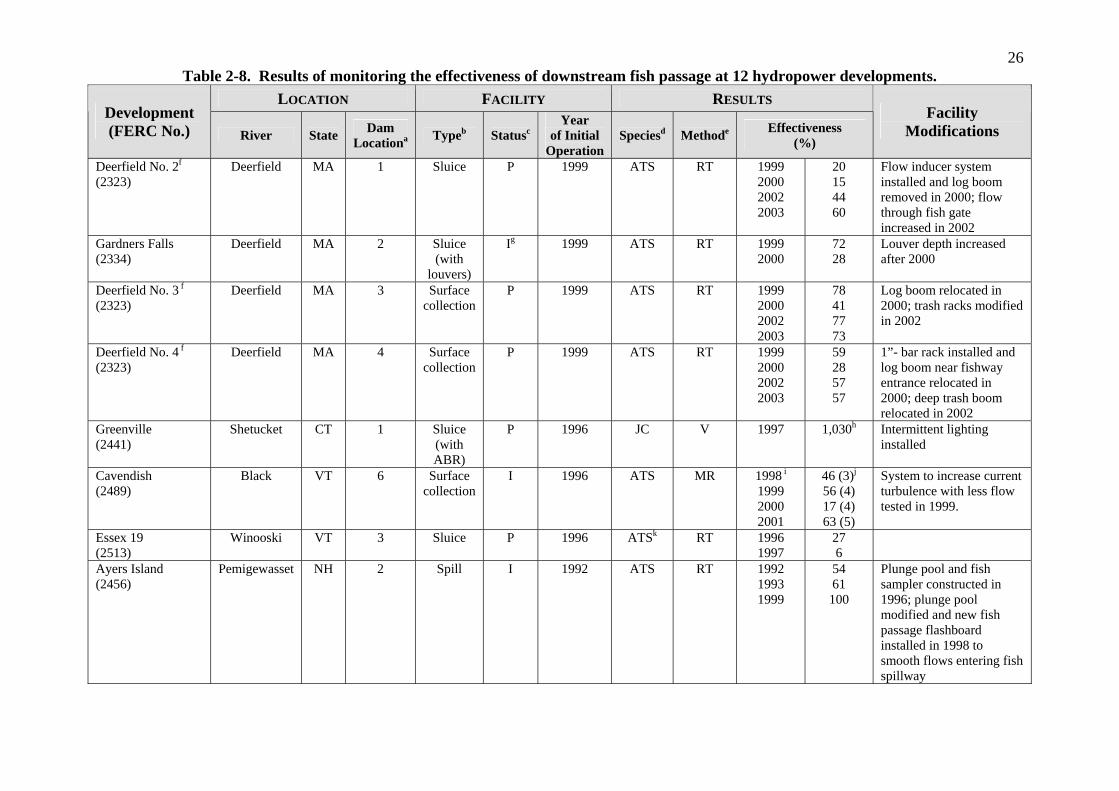
26 Table 2-8. Results of monitoring the effectiveness of downstream fish passage at 12 hydropower developments.
LOCATION FACILITY RESULTS Development (FERC No.) River State Dam
Locationa Typeb StatuscYear
of Initial Operation
Speciesd Methode Effectiveness (%)
Facility Modifications
Deerfield No. 2f
(2323) Deerfield MA 1 Sluice P 1999 ATS RT 1999
2000 2002 2003
20 15 44 60
Flow inducer system installed and log boom removed in 2000; flow through fish gate increased in 2002
Gardners Falls (2334)
Deerfield MA 2 Sluice(with
louvers)
Ig 1999 ATS RT 19992000
72 28
Louver depth increased after 2000
Deerfield No. 3 f
(2323) Deerfield MA 3 Surface
collection P 1999 ATS RT 1999
2000 2002 2003
78 41 77 73
Log boom relocated in 2000; trash racks modified in 2002
Deerfield No. 4 f
(2323) Deerfield MA 4 Surface
collection P 1999 ATS RT 1999
2000 2002 2003
59 28 57 57
1”- bar rack installed and log boom near fishway entrance relocated in 2000; deep trash boom relocated in 2002
Greenville (2441)
Shetucket CT 1 Sluice(with ABR)
P 1996 JC V 1997 1,030h Intermittent lighting installed
Cavendish (2489)
Black VT 6 Surfacecollection
I 1996 ATS MR 1998 i
1999 2000 2001
46 (3)j
56 (4) 17 (4) 63 (5)
System to increase current turbulence with less flow tested in 1999.
Essex 19 (2513)
Winooski VT 3 Sluice P 1996 ATSk RT 19961997
27 6
Ayers Island (2456)
Pemigewasset NH 2 Spill I 1992 ATS RT 19921993 1999
54 61 100
Plunge pool and fish sampler constructed in 1996; plunge pool modified and new fish passage flashboard installed in 1998 to smooth flows entering fish spillway
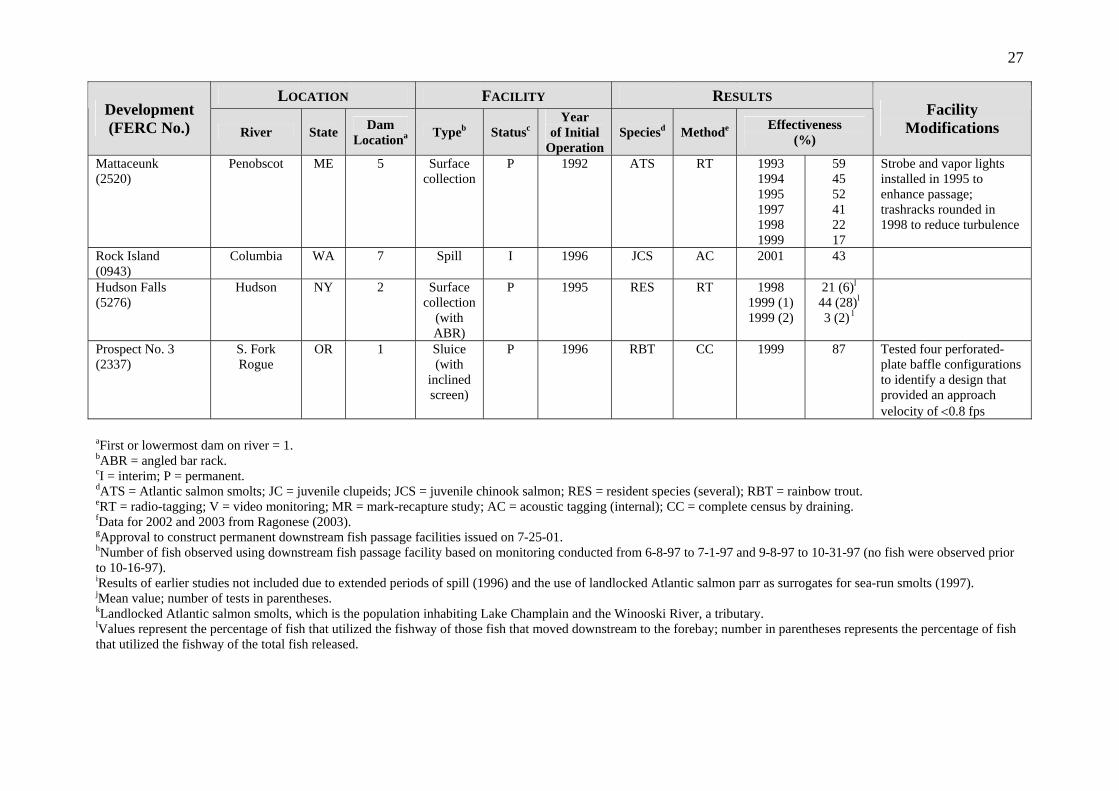
27
LOCATION FACILITY RESULTS Development (FERC No.) River State Dam
Locationa Typeb StatuscYear
of Initial Operation
Speciesd Methode Effectiveness (%)
Facility Modifications
Mattaceunk (2520)
Penobscot ME 5 Surfacecollection
P 1992 ATS RT 19931994 1995 1997 1998 1999
59 45 52 41 22 17
Strobe and vapor lights installed in 1995 to enhance passage; trashracks rounded in 1998 to reduce turbulence
Rock Island (0943)
Columbia WA 7 Spill I 1996 JCS AC 2001 43
Hudson Falls (5276)
Hudson NY 2 Surfacecollection
(with ABR)
P 1995 RES RT 19981999 (1) 1999 (2)
21 (6)l
44 (28)l
3 (2) l
Prospect No. 3 (2337)
S. Fork Rogue
OR 1 Sluice(with
inclined screen)
P 1996 RBT CC 1999 87 Tested four perforated-plate baffle configurations to identify a design that provided an approach velocity of <0.8 fps
aFirst or lowermost dam on river = 1. bABR = angled bar rack. cI = interim; P = permanent. dATS = Atlantic salmon smolts; JC = juvenile clupeids; JCS = juvenile chinook salmon; RES = resident species (several); RBT = rainbow trout. eRT = radio-tagging; V = video monitoring; MR = mark-recapture study; AC = acoustic tagging (internal); CC = complete census by draining. fData for 2002 and 2003 from Ragonese (2003). gApproval to construct permanent downstream fish passage facilities issued on 7-25-01. hNumber of fish observed using downstream fish passage facility based on monitoring conducted from 6-8-97 to 7-1-97 and 9-8-97 to 10-31-97 (no fish were observed prior to 10-16-97). iResults of earlier studies not included due to extended periods of spill (1996) and the use of landlocked Atlantic salmon parr as surrogates for sea-run smolts (1997). jMean value; number of tests in parentheses. kLandlocked Atlantic salmon smolts, which is the population inhabiting Lake Champlain and the Winooski River, a tributary. lValues represent the percentage of fish that utilized the fishway of those fish that moved downstream to the forebay; number in parentheses represents the percentage of fish that utilized the fishway of the total fish released.

28
river flows and having to conduct tests during spills. Likewise, the effectiveness tests conducted at the Deerfield Project (FERC No. 2323) were scheduled to avoid spills over the dam. Moreover, these tests showed that the probability of downstream passage via the bypass facility increased with reduced intake flows (i.e., a higher bypass: intake flow ratio). Similarly, at the Gardner Falls Project (FERC No. 2334), which is located on the Deerfield River between the Deerfield No. 2 and Deerfield No. 3 developments, bypass effectiveness was higher at lower generating flows. Finally, reduced or no generation at one of the units of the Mattaceunk Project (FERC No. 2520) on the Penobscot River in Maine may be a major factor contributing to higher bypass efficiencies. 2.3.2.2 Assessment of Effectiveness
Substantially more data are available on the effectiveness of downstream fish passage facilities than on upstream passage facilities (Section 2.3.1.1). There were 28 studies of downstream fish passage effectiveness (Table 2-8) compared to only three quantitative studies of upstream passage effectiveness (Table 2-6). The former effectiveness tests, however, exhibited considerably more variability than the upstream effectiveness studies, even though the same method and species were used in 19 of the 28 downstream passage tests. Design and Species Considerations
Of the 34 tests to assess effectiveness, 18 were conducted on Atlantic salmon smolts at downstream fish passage facilities consisting of some method of surface collection and conveyance below the dam. At the Cavendish Project (FERC No. 2489), an uncovered ogee chute served as a sluiceway to transport fish from the entrance at the side of the dam to the plunge pool below. At the Mattaceunk Project (FERC No. 2520), fish were transported from surface inlets in two of the four turbine forebays (strobe lights were used to repel fish in the other two forebays) to a collection chamber and a 42-inch, stainless steel underground fish passage pipe. At the Deerfield Project (FERC No. 2323), which has a total of eight developments, a surface entrance to a downstream bypass channel characterized the facilities at both the Deerfield No. 3 and No. 4 developments. Despite the general similarities among the above four developments in the type of downstream passage facility and the use of the same species (Atlantic salmon smolts) and experimental approach to measure effectiveness, the results were highly variable (Table 2-8). The maximum effectiveness in passing Atlantic salmon smolts downstream for each of the four passage facilities ranged from 59 to 78%, and effectiveness exceeded 50% in 10 of the 18 tests. Studies conducted on existing surface bypass systems on the Columbia River suggest that they can be very effective in passing Pacific salmon smolts around mainstem dams (Ferguson et al. 1998).
Sluices can be very similar in design to downstream passage facilities that utilize some method of surface collection. If fish tend to be oriented toward and concentrated in the upper portions of the water column, they may use surfaces or overflow areas that lead to existing ice and trash sluiceways to bypass the turbine intakes (Rainey 1985, as cited in Sale et al. 1991). Moreover, it is not uncommon to find sluiceways that incorporate a behavior guidance device, such as angled trash racks or louvers, in their design. They function to guide fish to a downstream bypass entrance. Although the data on sluice effectiveness in Table 2-8 are very
29
limited, the project that utilized such a device (louvers at Gardner Falls, FERC No. 2334) achieved a substantially higher level of effectiveness (72%) than those two that did not (maximum = 27%).
The effectiveness of angled trash racks and louvers in preventing fish passage through turbines has been evaluated in both laboratory and field studies. These devices have been installed or planned at hydroelectric projects with increasing frequency (EPRI 2003). Laboratory research suggests that 45° bar racks, most of which have targeted anadromous species, may have guidance efficiencies below 50% for riverine species and eels (Amaral 2003). However, flume experiments with 45° bar racks and yearling shortnose and pallid sturgeon resulted in guidance efficiencies of 58-80% (Kynard and Horgan 2001). Laboratory data on louvers, on the other hand, indicate that they could guide a wide range of species at efficiencies exceeding 80% (Amaral 2003).
Trash racks placed at an angle to the intake flow with one-inch spacing between bars are commonly required in the Northeast (Sale et al. 1991). Effectiveness studies of this technology were conducted at the Wadhams Project (FERC No. 9691) on the Boquet River in New York (Nettles and Gloss 1987). More than 90% of the radiotagged Atlantic salmon smolts utilized the bypass (58%) or the spillway (33%), and none were entrained through the turbine penstocks when the angled trash rack was deployed. In another study of the Lower Saranac Hydroelectric Project (FERC No. 4114) located on the Saranac River in New York, the same experimental technique (radiotagged Atlantic salmon smolts) was used with similar results (Simmons 2000). Bypass effectiveness exceeded 95% for the salmon smolts and none passed through the turbine. Steelhead trout were also tested; most of the fish that were released in the two tests used the bypass (62%) or the spillway (6%) but 9% passed through the turbine. The same system of angled trash racks and bypass was recommended for installation at three other projects in New York (FERC 1996).
Relatively few field studies of louver-bypass systems have been conducted. Two recent studies at Canadian hydroelectric projects assessed the guidance efficiencies of louvers on Atlantic salmon smolts. At a facility on the Exploits River in Newfoundland, fish guidance efficiencies increased from 25 to 65% following improvements to prevent fish losses through the louver (Scruton et al. 2002). Guidance efficiencies exceeding 85% were obtained in studies of downstream fish passage at a hydroelectric project on the LaHave River in Nova Scotia (Amiro and Jansen 2000). Finally, an important, two-year EPRI study of louvers at the Holyoke Project was initiated in 2003. The louver-bypass facility, which is one of only a few such facilities in the United States, consists of an existing 15° angled louver system and a temporary 25° structure that will be tested to determine their effectiveness in guiding riverine species and eels away from the turbine intakes and into a downstream bypass facility (EPRI 2003).
Based again on limited data, the most effective downstream passage method was spill. Following several years of continuous design modifications, the Ayers Island project (FERC No. 2456) achieved 100% effectiveness in passing radiotagged Atlantic salmon smolts downstream (Table 2-8). The project is located on the Pemigewasset River, a tributary of the Merrimack River, in New Hampshire and uses surface spill through a newly installed flashboard that was modified to pass downstream-migrating smolts. The length of the spillway section of the dam is
30
267 feet (length of dam is 699 feet) with a maximum height of 72 feet. A bypass survival study involving 33 radiotagged smolts released into the bypass flow indicated that 29 fish (91%) had moved to a monitoring station 1.6 miles downstream; the other four fish remained in the plunge pool (two fish), the reach between the dam and monitoring station (one fish), or passed undetected (one fish). Spill is also the preferred method of passage at many of the dams on the Columbia River, including Rock Island (FERC No. 943). However, a new permanent downstream bypass facility was recently installed at the 1237-MW Rocky Reach Hydroelectric Project (FERC No. 2145), which was not included in the database used in this study, at a cost of $112 million (Anonymous 2003). Because it reduces the need for spill, the facility is expected to save $400 million over a 15-year period by generating electricity with water that would otherwise have been spilled.
Another, alternative approach to mitigate the effects of dams on fish passage is modification of the turbines to reduce mortality during fish passage. The development and testing of new turbine technology is an important component of the DOE Hydropower Program (DOE 2004). Included in the Program’s large turbine field testing activity is the replacement of an existing Kaplan turbine with a minimum gap runner turbine at Wanapum Dam, a development that is part of the Priest Rapids Project (FERC No. 2114) on the Columbia River in Washington. Installation of this new, advanced-design turbine follows several years of DOE-funded research on turbine modifications to improve fish survival. An order was issued by FERC on April 30, 2004 authorizing installation of the new turbine in Unit No. 8. A subsequent order issued on July 23, 2004 authorized the replacement of the ten turbines at Wanapum and operation of Unit No. 8, subject to conditions of the State of Washington’s Water Quality Certificate and the Biological Opinion issued by NOAA Fisheries. A passage survival study will be conducted at Unit No. 8, and the results will be used as a basis for proceeding with the replacement of the nine remaining units.
Studies of the effectiveness of downstream fish passage have focused almost exclusively on salmonids, because they are the targets of major restoration programs in the Northeast and the West/Northwest. Downstream passage of other species, such as American shad, has not been addressed with equivalent experimental rigor. Effectiveness testing with juvenile clupeids, using the same experimental protocols as those used for salmon smolts, may not be feasible due to their sensitivity to stress. On the other hand, the preferred technique of counting juvenile clupeids utilizing downstream passage facilities by video monitoring does not provide a quantitative measure of effectiveness. Also, the behavioral response of fish to a guidance device is species-specific, so extrapolating the results from one species to another (e.g., Atlantic salmon smolts to juvenile shad) may not be appropriate, especially between different families of fishes, such as salmonids and clupeids. Additional research on nonsalmonids would contribute to selection of the most effective downstream fish passage facility for the targeted species.
Likewise, little is known about the effectiveness of methods for diverting riverine species away from turbine intakes and into a downstream bypass facility. Quantitative techniques were used to estimate the effectiveness of the downstream passage of riverine species at the Hudson Falls Project (FERC No. 5276) on the upper Hudson River in New York. Studies were conducted with a total of 154 radiotagged fish, including four centrarchids and three percids, that were monitored for 30 days during each of three periods of testing (fall 1998, early spring 1999,

31
and late spring 1999). Most of the fish (77%) did not pass downstream of the project, but of the 35 fish that did move downstream, 51% used the fish passage facility and 31% used the spillway. These results suggest that evaluating downstream passage effectiveness for those species that are not migratory (i.e., most movements, at least for the centrarchids, are highly localized) is difficult and will require frequent interaction with resource and regulatory agencies to select the most appropriate methodology.
Concern for the declining abundance of the catadromous American eel has resulted in the assessment of eel passage at hydropower dams. Utilization of downstream fish passage facilities by eels has been studied at the Medway Project (FERC No. 2666) on the West Branch Penobscot River in Maine. A video camera was used to monitor eel passage through the weir and flume located adjacent to the spillway. Difficulties were encountered with lighting and obscurance of the lens by insects and algal growth, so additional future monitoring is planned after resolving these problems. Plans to install an upstream eelway at the Medway project in 2004 have been developed by the licensee. Adequacy of Effectiveness Monitoring
Most of the studies of downstream fish passage reviewed in this study used an appropriate measure to determine effectiveness. The percentage of fish utilizing a downstream bypass facility from a sample of marked or radiotagged fish released above the dam is the best procedure. In this case, the problem is not with the measure of effectiveness that was used, as was the case in evaluating upstream fish passage effectiveness (Section 2.3.1.2), but with its limited application to nonsalmonid species. Most of the effectiveness monitoring of downstream fish passage has focused on salmonids, especially Atlantic salmon smolts, with highly variable results. Levels of effectiveness substantially exceeding 50% may be difficult to achieve on a consistent, cost-effective basis. High passage efficiency is dependent upon flow conditions, including the volume of flow for spills, power generation, and fish bypass as well as the apportioning of flow among these three uses.
Spill was the most effective method of bypassing downstream migrants around dams in the Northeast. However, data on the effectiveness of spill, and the mortality associated with this route of passage, are limited, and the results may not be applicable to larger projects, such as those on the Columbia River. At many hydropower developments, the costs associated with spill for the purpose of downstream fish passage will be too high and this approach will not be feasible, but at some projects, it may be practical to make better use of this route of passage.

33
3.0 SUMMARY AND CONCLUSIONS
A total of 269 hydropower projects licensed between 1987 and 2002 were reviewed to assess the effectiveness of the mitigation that was implemented to pass fish upstream and downstream around dams. The review focused on 112 projects comprising 147 developments that had specific requirements for upstream and downstream fish passage. The other 157 projects could not be evaluated for effectiveness because they had only a license article reserving authority under Section 18 of the FPA and no other fish passage requirements. 3.1 MITIGATION EFFECTIVENESS
Having well defined performance criteria would provide an unambiguous measure of the effectiveness of fish passage facilities. Such criteria were available in an earlier FERC study of the effectiveness of water quality mitigation at hydropower projects (FERC 2003). In that study, compliance with water quality criteria was used because states have established clearly defined criteria to protect aquatic ecosystems. Although no similar performance standards exist for fish passage, effectiveness can be assessed using the percentage of fish that are passed upstream or downstream. Nevertheless, the question remains regarding what passage percentage is acceptable. 3.1.1 Upstream Fish Passage
Of the 147 developments that had one or more license articles related to fish passage, 95 developments (65%) required an upstream passage facility. More than 60% of the installed facilities are located in the Northeast where they are used to support efforts to restore anadromous fish stocks in coastal river basins. Upstream passage of riverine species was required at 6 of the 12 installed facilities in the West/Northwest and will be required at 12 of the 23 upstream fish passage facilities planned at hydropower developments in the North Central United States. The technology for passing anadromous fishes upstream around dams is well developed, but its success can be difficult to measure at individual dams. Successful upstream passage of riverine fishes and catadromous eels, on the hand, will require additional research to identify the best approaches and those critical design and site-related factors that influence effectiveness.
Eight hydropower developments had quantitative data available on upstream fish passage, but only three developments in the Northeast had data that could be used to directly assess the effectiveness of the upstream passage facilities. Using the counts of fish at two dams, the number of fish passed, when expressed as a percentage of the fish available for passage, provided an objective measure of effectiveness, assuming that spawning between dams is negligible. At the three developments, passage effectiveness for three anadromous species ranged from 45 to 67%, which met the performance guideline of 40 to 60% for annual passage of American shad at each successive upstream barrier on the Connecticut River (Connecticut River Atlantic Salmon Commission 1992). Only one study used radiotagging to assess effectiveness, and that value (55%) was similar to those obtained from the comparison of direct counts between dams.

34
3.1.2 Downstream Fish Passage
Downstream fish passage was required at 132 of the 147 developments (90%) that had more than a license article reserving authority under Section 18 of the FPA. Most of these downstream passage facilities (53%), however, were not yet installed. Of the 63 facilities that have been installed, most (75%) are located in the Northeast, a trend similar to that observed with upstream fish passage. Nationwide, 55% of all the downstream passage facilities, both those in operation and those that are planned, must consider riverine fish passage.
Because an experimental approach (i.e., mark-recapture or radiotagging studies) could be used to assess effectiveness and because downstream fish passage was a more common requirement in FERC licenses, more quantitative estimates of effectiveness were available for downstream than upstream passage. The results from 34 tests at 11 hydropower developments were highly variable even though the experimental approach and species tested (Atlantic salmon smolts) were similar in most of the tests. The percentage of radiotagged or marked fish that utilized downstream passage facilities ranged from 6 to 100% and from 3 to 87% for anadromous and riverine species, respectively. This variability decreased somewhat when the test method, species, and type of facility were similar. For example, 18 of the 34 tests were conducted on Atlantic salmon smolts at four facilities that employed surface collection with conveyance below the dam. At these developments, maximum effectiveness ranged from 59 to 78% but exceeded 50% in only 10 of the 18 tests.
A major cause of the variability observed in the effectiveness of downstream fish passage was testing during periods of high flow, resulting in spill. Avoidance of such periods during testing can be difficult; the time for the outmigration of smolts often overlaps with historical peaks in the hydrograph. Also important as a factor influencing bypass effectiveness is the volume of flow used to pass downstream migrants relative to that used for power generation.
The technology that has been developed for downstream fish passage is not as effective as that for upstream fish passage. Except for spill, the variety of the physical and behavioral approaches to downstream passage has met with about the same degree of success. The technology for downstream passage of anadromous fishes is not well developed, and additional research is needed to identify suitable alternatives that have applicability across sites. Even though the data from the present study are limited, further research seems warranted to investigate the use of spill as an additional, secondary route of passage. There may be relatively minor, cost-effective modifications that can be made to enhance passage via spill whenever it occurs. Also needed are suitable measures to divert and bypass riverine species away from turbine intakes. Sixty-five percent of the planned downstream fish passage facilities will require effective passage of riverine fishes. 3.2 ADEQUACY OF EFFECTIVENESS STUDIES
Although data on effectiveness were available for less than 10% of the 269 projects (=304 developments) included in the database, enough studies of fish passage effectiveness were
35
conducted to evaluate the methods and criteria that were used to determine effectiveness. A summary of this evaluation is presented below. Importance of Effectiveness Monitoring
The process of mitigating adverse environmental impacts should include an assessment of the effectiveness of the mitigation that is implemented. A license article requiring effectiveness monitoring was included in the license for 89 of the 147 developments (61%). This percentage represents a significant increase over the percentage of projects that were required to monitor fish passage effectiveness in a survey conducted almost 15 years ago (Sale et al. 1991). In that survey, only 43 and 21% of the operating projects had monitored the performance of upstream and downstream fish passage, respectively.
The estimate of 61% of the licenses having an effectiveness monitoring requirement may be conservative. Even though a project may not have a license article that requires effectiveness monitoring, such monitoring may be required in the future when the fish passage facility plan is actually submitted. For example, effectiveness monitoring is not specifically addressed in the Settlement Agreement for 11 projects on the AuSable, Manistee, and Muskegon rivers in Michigan, but no plans for upstream or downstream fish passage have been submitted yet. These plans may include a requirement for monitoring.
Monitoring of fish passage facilities could contribute not only to determining the site-specific effectiveness of the facility but also to evaluating its potential use at other sites. Sale et al. (1991) noted the difficulty in transferring knowledge gained at one site to other sites without such monitoring. A systematic evaluation of fish passage facilities was recommended by Larinier (2001), who noted that the most significant progress in fish passage technology occurred in countries that conducted such systematic assessments of facility effectiveness. However, Cada and Sale (1993) observed that field studies to assess the effectiveness of fish passage facilities were limited.
Although studies of fish passage effectiveness occur more frequently now than 15 years ago, there remains a need for more information on effectiveness, especially of new technologies. As noted by Sale et al. (1991) but still valid today, the designs of downstream fish passage facilities are varied, and some are relatively recent. Moreover, the operating experience with downstream passage facilities is less than that with their upstream counterparts. That many are actually demonstration projects is yet another reason why studies of their effectiveness must be considered part of the planning for such facilities. Selection of Suitable Methods and Criteria
Many of the methods used by licensees to evaluate the effectiveness of fish passage requirements are appropriate measures of facility performance. For upstream fish passage, these methods include counts of the number of fish passed at the dam of interest as a function of the number available for passage, which can be obtained from fish counts at the next dam downstream, assuming spawning between dams is negligible. If no data are available for the

36
lower dam or one does not exist, then a radiotagging study to estimate the proportion of fish that are passed upstream can be an appropriate method of assessing effectiveness.
Radiotagging is also an appropriate procedure for assessing the effectiveness of downstream passage. Effectiveness studies could benefit from the advances in fish monitoring technologies, such as balloon tags (e.g., Normandeau Associates 1996) and Passive Integrated Transponder (PIT) tags, which have been used since 1993 to estimate the survival of salmon smolts passing through the hydroelectric projects on the Snake River (Skalski et al. 2001). When necessary, mark-recapture studies can be used to determine effectiveness, too. Indeed, mark-recapture techniques or hydroacoustic surveys may be the only feasible method for monitoring the downstream passage of juvenile clupeids. Counts or direct observation of the number of fish that utilize an upstream or downstream passage facility may be necessary but are usually not sufficient without some estimate of the size of the population available for passage. In addition, assuring that the facility was constructed properly and that all passage-related parameters, such as attraction flows and bypass flows, meet the design specifications is a necessary but not sufficient requirement for effective passage.
Having obtained an estimate of passage effectiveness, it is important to be able to compare it with some criterion of acceptability. What does a passage efficiency of 50% for an anadromous species mean to the restoration of the stock in that river basin? Establishing criteria for passage efficiency or effectiveness seems necessary if anadromous fish restoration efforts are to be successful. Such criteria are expected to be specific for a given species and river basin. With the exception of the 40 to 60% passage criterion developed for American shad by the Connecticut River Atlantic Salmon Commission, such criteria have not been proposed. 3.3 RECOMMENDATIONS TO IMPROVE EFFECTIVENESS
The process established by the FERC to address the problem of dams as barriers to fish passage emphasizes the importance of early interactions between the licensee, resource agencies, and other stakeholders to assess the need for mitigation. Including a good, technically sound plan to assess the effectiveness of the proposed mitigation will provide the necessary quantitative data that can be used not only for a site-specific evaluation but also for the application of the same technology to other sites. In most cases, successful mitigation is dependent upon the development of such effectiveness monitoring plans.
In addition to the recommendations included in Section 3.2, the following recommendations should be considered:
1. If cost effective, consider having license articles requiring upstream or downstream fish passage also include an effectiveness monitoring plan as part of that requirement.
2. Consider defining the duration of monitoring in the effectiveness
monitoring plans. When radiotagging is used to assess the effectiveness of upstream and downstream fish passage, the duration of monitoring could
37
be shorter than that for other methods that can produce results with inherently higher variability. Depending upon agency review and evaluation, testing, in these latter cases, may be necessary during the outmigration season for more than one year. Consideration should be given to discontinuing effectiveness monitoring if passage is judged to be satisfactory. However, the number of fish using the upstream facility should be routinely monitored and reported to FERC annually. Effectiveness should also be measured and included in these reports, if counts are available at the lower dam.
3. Obtain additional information on the most effective downstream fish
passage mitigation measures. Field applications of new technologies, including quantitative approaches to measure the success of the applications, are especially important. No existing national research program is available to develop and test innovative downstream passage technologies, so new knowledge must be gained from experience and the widespread exchange of information. It is important that the best technical information be used to evaluate various alternatives for fish passage.
These recommendations and those identified in the previous section would contribute to
the goal of implementing the most effective measures for fish passage mitigation.


39
4.0 REFERENCES Amaral, S. 2003. The use of angled bar rocks and louvers for guiding fish at FERC-licensed
projects. Presentation at FERC Fish Passage Workshop, Alden Research Laboratory, Holden, MA, November 13, 2003.
Amiro, P. G., and H. Jansen. 2000. Impact of low-head hydropower generation at Morgan Falls,
LaHave River on migrating Atlantic salmon (Salmo salar). Can. Tech. Rep. Fish. Aquat. Sci. No. 2323. Department of Fisheries and Oceans, Dartmouth, Nova Scotia.
Anonymous. 2003. Tech Briefs: Rocky Reach’s new fish bypass produces promising results.
Hydro Review 22(5):46. Barry, T., and B. Kynard. 1986. Attraction of adult American shad to fish lifts at Holyoke Dam,
Connecticut River. N. Amer. J. Fish Manage. 6:233-241. Bell, M. C. 1980. General types of fish passage facilities. pp. 39-59. IN S. Hildebrand (ed.),
Analysis of environmental issues related to small-scale hydroelectric development. II. Design considerations for passing fish upstream around dams. ORNL/TM-7396. Oak Ridge National Laboratory, Oak Ridge, TN.
Cada, G. F., and M. J. Sale. 1993. Status of fish passage facilities at nonfederal hydropower
projects. Fisheries 18(7):4-12. Cada, G. F., and J. E. Francfort. 1995. Chapter 14: Mitigation of environmental impacts at
hydroelectric power plants in the United States. pp. 223-234. IN F. S. Sterrett (ed.), Alternative Fuels and the Environment. Lewis Publishers, Boca Raton, FL.
Connecticut River Atlantic Salmon Commission. 1992. A management plan for American shad
in the Connecticut River basin. Electric Power Research Institute (EPRI). 2001. Review and documentation of research and
technologies on passage and protection of downstream migrating catadromous eels at hydroelectric facilities. Final Report. Prepared for EPRI by Versar, Inc., EPRI Report No. 1000730. Electric Power Research Institute, Palo Alto, CA.
Electric Power Research Institute (EPRI). 2003. Field evaluation of angled bar rack/louvers for
fish protection at hydropower projects and cooling water intake structures. Project Opportunity Notice. Section 316 (a) and (b) Fish Protection Issues and Hydropower Environmental Issues, June 2003. Electric Power Research Institute, Palo Alto, CA.
Epifanio, J., G. Haas, K. Pratt, B. Rieman, P. Spruell, C. Stockwell, F. Utter, and W. Young.
2003. Integrating conservation genetic considerations into conservation planning: A case study of bull trout in the Lake Pend Oreille-lower Clark Fork River system. Fisheries 28(8):10-24.
40
Federal Energy Regulatory Commission (FERC). 1990. Order approving functional design drawings and construction schedule. Conowingo Project (No. 405-027). 50 FERC 62, 209. Federal Energy Regulatory Commission, Washington, DC.
Federal Energy Regulatory Commission (FERC). 1992. Hydroelectric power resources of the
United States: Developed and undeveloped. Federal Energy Regulatory Commission, Washington, DC.
Federal Energy Regulatory Commission (FERC). 1996. Order approving trashrack/fish passage
facilities drawings and construction and monitoring schedule. Watertown Hydroelectric Project (FERC No. 2442), December 19, 1996.
Federal Energy Regulatory Commission (FERC). 1998. Order modifying and approving, in
part, upstream fishway evaluation plan. Caribou Dam Development ( FERC No. 2367), March 23, 1998.
Federal Energy Regulatory Commission (FERC). 2000. Interagency Task Force report on
agency recommendations, conditions, and prescriptions under Part I of the Federal Power Act. Prepared by the Work Group on the Coordination of Federal Mandates, Federal Energy Regulatory Commission and five other agencies. December 8, 2000.
Federal Energy Regulatory Commission (FERC). 2001a. Guidance for shoreline management
planning at hydropower projects. Office of Energy Projects, Federal Energy Regulatory Commission, Washington, DC.
Federal Energy Regulatory Commission (FERC). 2001b. Report on hydroelectric licensing
policies, procedures, and regulations: comprehensive review and recommendations pursuant to Section 603 of the Energy Act of 2000. Submitted to the U.S. Congress, May 8, 2001. Federal Energy Regulatory Commission, Washington, DC.
Federal Energy Regulatory Commission (FERC). 2003. Evaluation of mitigation effectiveness
at hydropower projects: Water quality. Office of Energy Projects, Federal Energy Regulatory Commission, Washington, DC.
Foote, P. 2003. History of the development of fish passage facilities at FERC-licensed projects
on the lower Susquehanna River. Presentation at FERC Fish Passage Workshop, Alden Research Laboratory, Holden, MA, November 13, 2003.
Francfort, J. E., G. F. Cada, D. D. Dauble, R. T. Hunt, D. W. Jones, B. N. Rinehart,
G. L. Sommers, and R. J. Costello. 1994. Environmental mitigation at hydroelectric projects, Volume II: Benefits and costs of fish passage and protection. DOE/ID-10360(V2). Idaho National Engineering Laboratory, Idaho Falls, ID.
Ferguson, J. W., T. P. Poe, and T. J. Carlson. 1998. Surface-oriented bypass systems for
juvenile salmonids on the Columbia River, USA. pp. 281-299. IN M. Jungwirth,

41
S. Schmutz, and S. Weiss (eds.). Fish Migration and Fish Bypasses. Blackwell Science Ltd., Oxford, UK.
Hendricks, M. L. 2003. Email from M. L. Hendricks, Pennsylvania Fish and Boat Commission,
State College, PA, to J. K. Novak, Federal Energy Regulatory Commission, Washington, DC, November 17, 2003.
Hildebrand, S. G. (ed.). 1980. Analysis of environmental issues related to small-scale
hydroelectric development. II. Design considerations for passing fish upstream around dams. ORNL/TM-7396. Oak Ridge National Laboratory, Oak Ridge, TN.
Hill, J., and S. C. Murphy. 2003. A review of FERC hydropower licensing: what’s ahead?
Hydro Review 2(8):32-45. Jungwirth, M., S. Schmutz, and S. Weiss (eds.). 1998. Fish Migration and Fish Bypasses.
Blackwell Science, Ltd., Oxford, UK. Kleinschmidt Associates. 1999. 1996-1998 Evaluation of upstream and downstream fish
passage facilities, Greenville Dam Project. Final Report to City of Norwich, Department of Public Utilities. Kleinschmidt Associates, Pittsfield, ME.
Kareiva, P., M. Marvier, and M. McClure. 2000. Recovery and management options for
spring/summer chinook salmon in the Columbia River basin. Science 290:977-979. Kynard, B. 1998. Twenty-two years of passing shortnose sturgeon in fish lifts on the
Connecticut River: what has been learned? pp. 255-264. IN M. Jungwirth, S. Schmutz, and S. Weiss (eds.), Fish Migration and Fish Bypasses. Blackwell Science Ltd, Oxford.
Kynard, B., and M. Horgan. 2001. Guidance of yearling shortnose and pallid sturgeon using
vertical bar rack and louver arrays. N. Amer. J. Fish. Manage. 21: 561-570. Larinier, M. 2001. Dams, fish, and fisheries: opportunities, challenges, and conflict resolution.
FAO Fisheries Technical Paper No. 419. Food and Agriculture Organization of the United Nations, Rome, Italy.
Leggett, W. C., T. F. Savoy, and C. A. Tomichek. 2004. The impact of enhancement initiatives
on the structure and dynamics of the Connecticut River population of American shad. IN P. M. Jacobson, D. A. Dixon, W. C. Leggett, B. C. Marcy, Jr., and R. R. Massengill (eds.). The Connecticut River Ecological Study (1965-1973) revisited: Ecology of the lower Connecticut River, 1973-2003. American Fisheries Society Monograph No. 9, Bethesda, MD.
Medford, S. 2004. Comments on draft report: Evaluation of mitigation at hydropower projects:
Fish passage. Attachment to email from S. Medford, Enel North America, Inc. to J. Novak, FERC, April 15, 2004.

42
Moser, M. L., A. M. Darazsdi, and J. R. Hall. 2000. Improving passage efficiency of adult American shad at low-elevation dams with navigation locks. N. Amer. J. Fish. Manage. 20:376-385.
Nettles, D. C., and S. P. Gloss. 1987. Migration of landlocked Atlantic salmon smolts and
effectiveness of a fish passage structure at a small-scale hydroelectric facility. N. Amer. J. Fish. Manage. 7:562-568.
Normandeau Associates, Inc. 1996. Fish survival investigation relative to turbine rehabilitation
at Wanapum Dam, Columbia River, Washington. Report prepared for Grant County Public Utility District No. 2, Ephrata, WA.
Odeh, M., and C. Orvis. 1998. Downstream fish passage design considerations and
developments at hydroelectric projects in the Northeast USA. pp. 267-280. IN M. Jungwirth, S. Schmutz, and S. Weiss (eds.). Fish Migration and Fish Bypasses. Blackwell Science Ltd., Oxford, UK.
Pringle, C. M., M. C. Freeman, and B. J. Freeman. 2000. Regional effects of hydrologic
alterations on riverine macrobiota in the New World: tropical-temperate comparisons. Bioscience 50:807-823.
Ragonese, J. 2003. Fish passage effectiveness – it’s not just counting fish: Studies on the
Deerfield River. Presentation at FERC Fish Passage Workshop, Alden Research Laboratory, Holden, MA, November 13, 2003.
Rainey, W. S. 1985. Considerations in the design of juvenile bypass systems. pp. 261-268. IN
Symposium on Small Hydropower and Fisheries, American Fisheries Society, Bethesda, MD.
Sale, M. J., G. F. Cada, L. H. Chang, S. W. Christensen, J. E. Francfort, S. F. Railsback,
B. N. Rinehart, and G. L. Sommers. 1991. Environmental mitigation at hydroelectric projects, Volume 1: Current practices for instream flow needs, dissolved oxygen, and fish passage. DOE/ID-10360. Idaho National Engineering and Environmental Laboratory, Idaho Falls, ID.
Schaefer, S. 2003. Efficacy of a Denil fishway on a low-head dam on a small coastal river in
central Virginia. Draft Report to Federal Energy Regulatory Commission. Virginia Commonwealth University, Richmond, VA.
Scruton, D., R. McKinley, N. Kouwen, W. Eddy, and R. Booth. 2002. Use of telemetry and
hydraulic modeling to evaluate and improve fish guidance efficiency at a louver and bypass system for downstream-migrating Atlantic salmon (Salmo solar) smolts and kelts. Hydrobiologia 483: 83-94.
Simmons, R. A. 2000. Effectiveness of a fish bypass with an angled bar rack at passing Atlantic
salmon and steelhead trout smolts at the Lower Saranac Hydroelectric Project. pp. 95-
43
102. IN M. Odeh (ed.). Advances in Fish Passage Technology: Engineering Design and Biological Evaluation. American Fisheries Society, Bethesda, MD.
Skalski, J. R., R. L. Townsend, and R. D. McDonald. 2001. Estimation of Rock Island Project
survival for yearling chinook salmon smolts in 2001 using PIT-tag release-recapture methods. Report prepared for Public Utility District No. 1 of Chelan County, Wenatchee, WA.
Susquehanna River Anadromous Fish Restoration Committee (SRAFRC). 2004. Restoration of
American Shad to the Susquehanna River. Annual Progress Report, 2003. U.S. Fish and Wildlife Service, Harrisburg, PA.
Turbak, S. C., D. R. Reichle, and C. R. Shriner. 1981. Analysis of environmental issues related
to small-scale hydroelectric development. IV. Fish mortality resulting from turbine passage. ORNL/TM-7521. Oak Ridge National Laboratory, Oak Ridge, TN.
U.S. Department of Energy (DOE). 2004. DOE Hydropower Program Annual Report for
FY 2003. DOE/NE-ID-1136. U.S. Department of Energy, Office of Energy Efficiency and Renewable Energy, Washington, DC.
U.S. General Accounting Office (GAO). 2001. Licensing hydropower projects: better time and
cost data needed to reach informed decisions about process reforms. GAO-01-499. U.S. General Accounting Office, Washington, DC.
Weigmann, D., P. Johnson, J. Kubitschek, R. Tisdale-Hein, and R. Siegle. 2003. A roadmap for
Public Interest Energy Research (PIER) research on fish passage at California hydropower facilities. Draft Report. California Energy Commission, Sacramento, CA.
Young, L. M. 2003. Comments on “Evaluation of Mitigation Effectiveness at Hydropower
Projects: Fish Passage Draft Report.” Letter from L. M. Young, Pennsylvania Boat and Fish Commission, to J. K. Novak, Federal Energy Regulatory Commission, Washington, DC, October 29, 2003.

45
5.0 LIST OF PREPARERS Federal Energy Regulatory Commission John Novak – FERC Task Monitor (Fisheries Biologist) Oak Ridge National Laboratory James Loar – Lead Author (Aquatic Ecologist) Glenn Cada – Co-author (Fisheries Biologist)


47
APPENDIX A
LIST OF PROJECTS


49
Table A-1. List of projects (by state) that were included in this study because (1) they were licensed or relicensed between 1986 and 2002 and (2) they have at least one fish passage requirement. The total of 269 projects are shown in Figure 2-1. An asterisk designates
those projects with only the reservation of authority requirement.
State Project Number
License Issued Project Name
Alabama 2407 1994 Yates* Alaska 11480 2000 Reynolds Creek 11690 2000 Old Harbor California 0137 2001 Mokelumne 1061 1992 Phoenix* 1333 1993 Tule River 1962 2001 Rock Creek-Cresta* 2290 1996 Kern River No. 3 2661 2002 Hat Creek* Colorado 8914 1987 Taylor Draw Connecticut 2441 1993 Greenville Dam 5062 1987 Quinebaug-Five Mile Pond 10822 2001 Upper Collinsville 10823 2001 Lower Collinsville 11143 1992 Glen Falls* 11168 1992 Dayville Pond* 11217 1992 Still River* 11547 1997 Hale 11574 1999 Occum Georgia 1218 1999 Flint River* 1951 1996 Sinclair* 2354 1996 North Georgia* 2535 1995 Stevens Creek Idaho 2058 2000 Cabinet Gorge 2381 1987 Ashton-St. Anthony 8436 1987 Smith Creek 9907 1987 Sunshine 11541 2002 Atlanta Power Station Illinois 2373 1993 Rockton Project* 2446 1993 Dixon Project* Indiana 2579 1996 Twin Branch* 11291 1997 Star Milling* Maine 2325 1997 Weston 2329 1997 Wyman* 2333 1994 Rumford Falls Hydro* 2367 1993 Aroostook
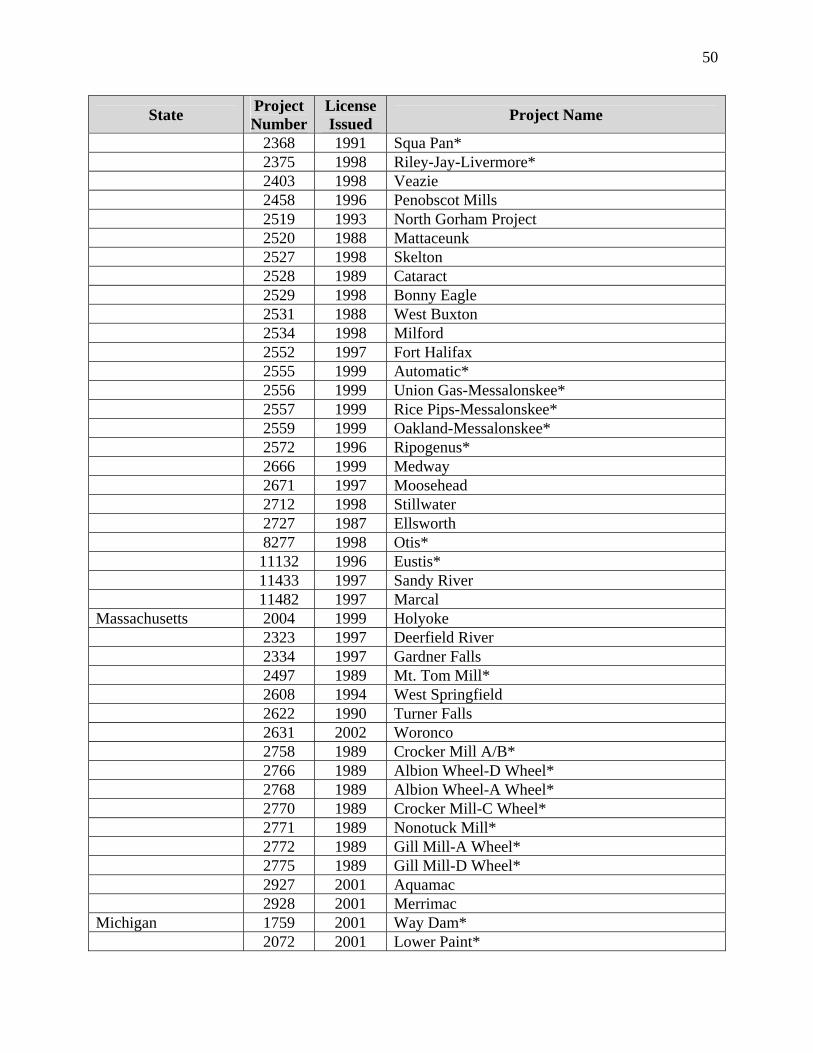
50
State Project Number
License Issued Project Name
2368 1991 Squa Pan* 2375 1998 Riley-Jay-Livermore* 2403 1998 Veazie 2458 1996 Penobscot Mills 2519 1993 North Gorham Project 2520 1988 Mattaceunk 2527 1998 Skelton 2528 1989 Cataract 2529 1998 Bonny Eagle 2531 1988 West Buxton 2534 1998 Milford 2552 1997 Fort Halifax 2555 1999 Automatic* 2556 1999 Union Gas-Messalonskee* 2557 1999 Rice Pips-Messalonskee* 2559 1999 Oakland-Messalonskee* 2572 1996 Ripogenus* 2666 1999 Medway 2671 1997 Moosehead 2712 1998 Stillwater 2727 1987 Ellsworth 8277 1998 Otis* 11132 1996 Eustis* 11433 1997 Sandy River 11482 1997 Marcal Massachusetts 2004 1999 Holyoke 2323 1997 Deerfield River 2334 1997 Gardner Falls 2497 1989 Mt. Tom Mill* 2608 1994 West Springfield 2622 1990 Turner Falls 2631 2002 Woronco 2758 1989 Crocker Mill A/B* 2766 1989 Albion Wheel-D Wheel* 2768 1989 Albion Wheel-A Wheel* 2770 1989 Crocker Mill-C Wheel* 2771 1989 Nonotuck Mill* 2772 1989 Gill Mill-A Wheel* 2775 1989 Gill Mill-D Wheel* 2927 2001 Aquamac 2928 2001 Merrimac Michigan 1759 2001 Way Dam* 2072 2001 Lower Paint*
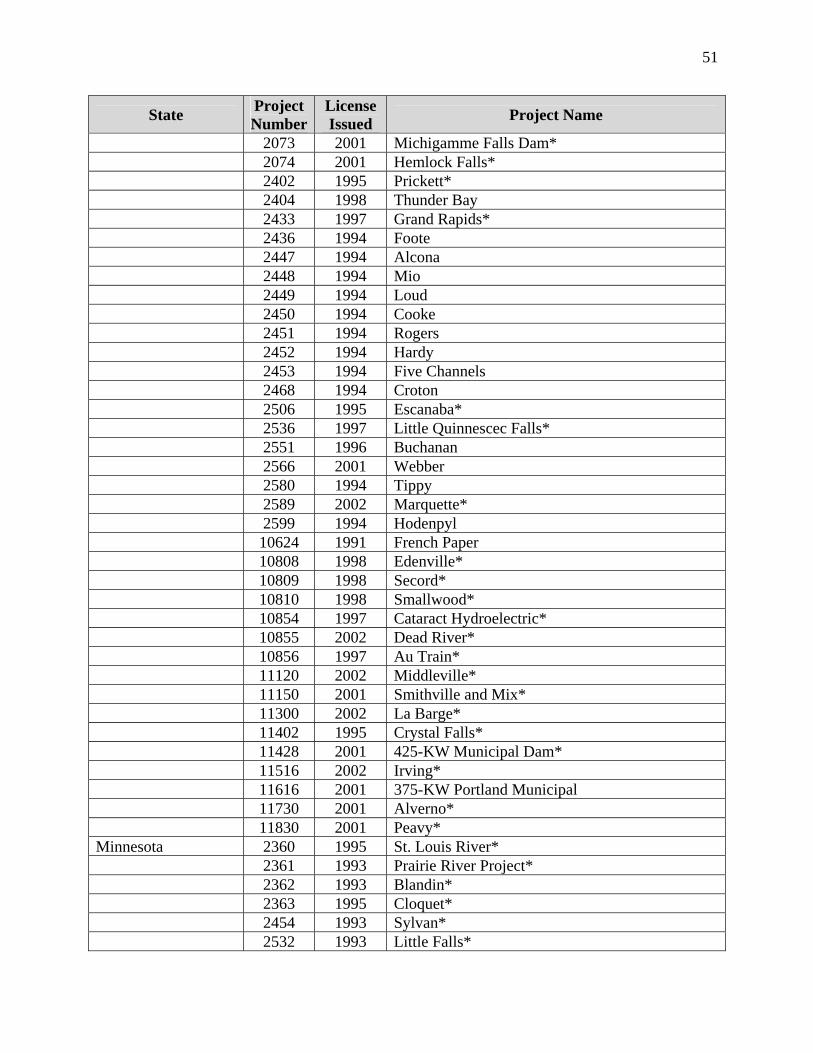
51
State Project Number
License Issued Project Name
2073 2001 Michigamme Falls Dam* 2074 2001 Hemlock Falls* 2402 1995 Prickett* 2404 1998 Thunder Bay 2433 1997 Grand Rapids* 2436 1994 Foote 2447 1994 Alcona 2448 1994 Mio 2449 1994 Loud 2450 1994 Cooke 2451 1994 Rogers 2452 1994 Hardy 2453 1994 Five Channels 2468 1994 Croton 2506 1995 Escanaba* 2536 1997 Little Quinnescec Falls* 2551 1996 Buchanan 2566 2001 Webber 2580 1994 Tippy 2589 2002 Marquette* 2599 1994 Hodenpyl 10624 1991 French Paper 10808 1998 Edenville* 10809 1998 Secord* 10810 1998 Smallwood* 10854 1997 Cataract Hydroelectric* 10855 2002 Dead River* 10856 1997 Au Train* 11120 2002 Middleville* 11150 2001 Smithville and Mix* 11300 2002 La Barge* 11402 1995 Crystal Falls* 11428 2001 425-KW Municipal Dam* 11516 2002 Irving* 11616 2001 375-KW Portland Municipal 11730 2001 Alverno* 11830 2001 Peavy* Minnesota 2360 1995 St. Louis River* 2361 1993 Prairie River Project* 2362 1993 Blandin* 2363 1995 Cloquet* 2454 1993 Sylvan* 2532 1993 Little Falls*

52
State Project Number
License Issued Project Name
2533 1993 Brainerd* 11175 1999 Crown Mill* 11546 1998 Municipal Power Project* Montana 2188 2000 Missouri-Madison* New Hampshire 2287 1994 J. Brodie Smith* 2288 1994 Gorham P.S.N.H. 2300 1994 Shelburne* 2311 1994 Gorham J.R. 2326 1994 Cross* 2327 1994 Cascade of New Hampshire* 2422 1994 Sawmill* 2423 1992 Riverside Project* 2456 1996 Ayers Island 2457 1987 Eastman Falls 11163 1997 South Berwick 11313 1995 Apthorp New York 2047 2002 Stewart’s Bridge 2060 2002 Carry Falls* 2084 2002 Upper Raquette River* 2318 2002 E.J. West* 2320 2002 Middle Raquette River* 2330 2002 Lower Raquette River* 2385 2001 Glens Falls 2438 1997 Waterloo and Seneca Falls 2442 1995 Watertown 2482 2002 Hudson River Project 2487 2000 Hoosick Falls 2538 1996 Beebee Island 2554 2002 Feeder Dam 2569 1996 Black River 2582 1996 Station 2 2583 1996 Station 5 2584 1997 Station 26 Project 2609 2000 Curtis/Palmer Falls* 2616 2002 Hoosic 2645 1996 Beaver River 4114 1987 Lower Saranac 5276 1992 Hudson Falls 5461 1992 South Glen Falls 6058 2002 Hailesboro No. 4 6059 2002 Fowler No. 7 10461 2002 West Br. St. Regis River* 10522 1991 Whittelesy

53
State Project Number
License Issued Project Name
11408 1996 Salmon River* North Carolina 2541 1994 Cascade* 2694 2002 Queens Creek* 11169 1992 Avalon* 11219 1993 Mayo* 11264 1995 South Yadkin* 11392 1994 Ramseur* 11437 1997 B. Everett Jordan* Oregon 2337 1989 Prospect No. 3 2496 1997 Leaburg-Walterville 11509 1998 City of Albany, Oregon Hydroelectric 11512 2000 McKenzie South Carolina 1267 1995 Buzzards Roost* 1895 2002 Columbia 2315 1996 Neal Shoals* 2331 1996 99 Islands* 2332 1996 Gaston Shoals* 2416 2002 Ware Shoals* 2620 1999 Lockhart* 10881 1993 Whitney Mill* 11286 1997 Abbeville* Tennessee 11351 1994 Old Columbia* Vermont 2077 2002 Fifteen Mile Falls 2392 1994 Gilman* 2396 1994 Pierce Mills 2397 1994 Gage 2399 1994 Arnold Falls 2400 1994 Passumpsic 2445 1993 Center Rutland* 2489 1994 Cavendish 2490 1994 Taftsville* 2513 1995 Essex No. 19 2731 2001 Weybridge* 2737 2001 Middlebury Lower* 2756 1988 Chase Mill 11090 1994 Turnbridge Mill Virginia 2391 1993 Warren* 2411 1994 Schoolfield* 2425 1993 Luray Newport* 2509 1993 Shenandoah* 2514 1994 Byllesby-Buck* 2901 2001 Holcomb Rock* 2902 2001 Big Island*
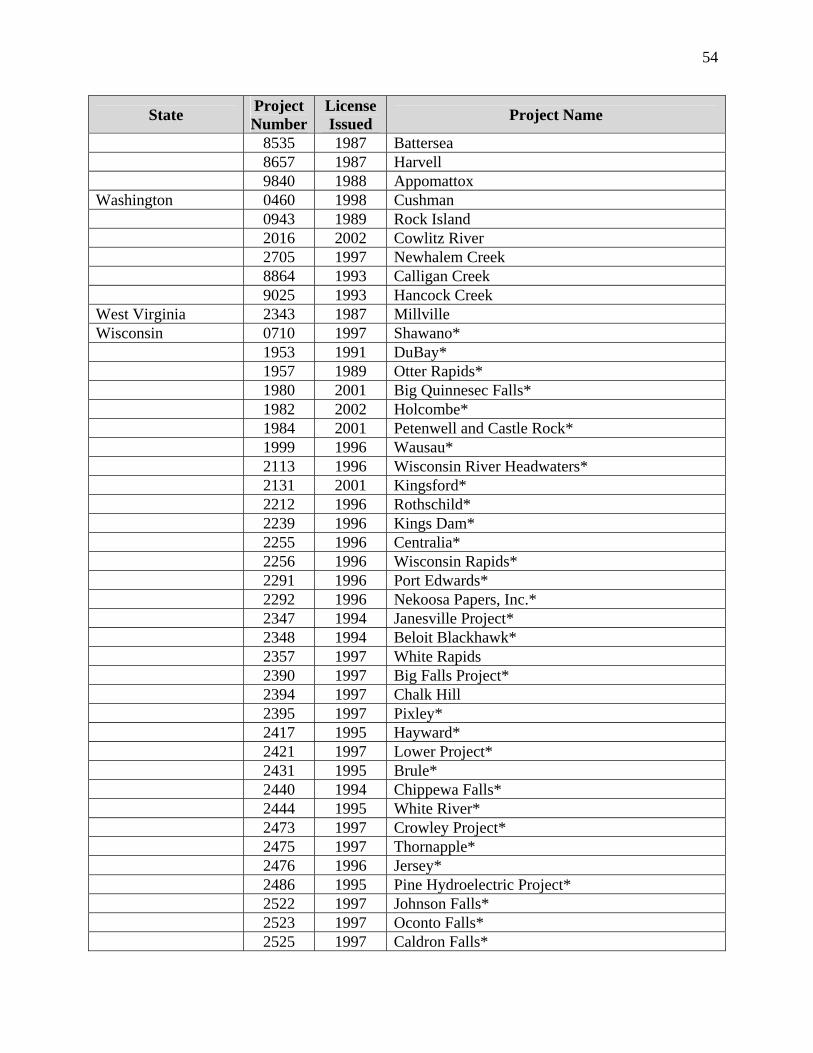
54
State Project Number
License Issued Project Name
8535 1987 Battersea 8657 1987 Harvell 9840 1988 Appomattox Washington 0460 1998 Cushman 0943 1989 Rock Island 2016 2002 Cowlitz River 2705 1997 Newhalem Creek 8864 1993 Calligan Creek 9025 1993 Hancock Creek West Virginia 2343 1987 Millville Wisconsin 0710 1997 Shawano* 1953 1991 DuBay* 1957 1989 Otter Rapids* 1980 2001 Big Quinnesec Falls* 1982 2002 Holcombe* 1984 2001 Petenwell and Castle Rock* 1999 1996 Wausau* 2113 1996 Wisconsin River Headwaters* 2131 2001 Kingsford* 2212 1996 Rothschild* 2239 1996 Kings Dam* 2255 1996 Centralia* 2256 1996 Wisconsin Rapids* 2291 1996 Port Edwards* 2292 1996 Nekoosa Papers, Inc.* 2347 1994 Janesville Project* 2348 1994 Beloit Blackhawk* 2357 1997 White Rapids 2390 1997 Big Falls Project* 2394 1997 Chalk Hill 2395 1997 Pixley* 2417 1995 Hayward* 2421 1997 Lower Project* 2431 1995 Brule* 2440 1994 Chippewa Falls* 2444 1995 White River* 2473 1997 Crowley Project* 2475 1997 Thornapple* 2476 1996 Jersey* 2486 1995 Pine Hydroelectric Project* 2522 1997 Johnson Falls* 2523 1997 Oconto Falls* 2525 1997 Caldron Falls*

55
State Project Number
License Issued Project Name
2546 1997 Sandstone Rapids* 2550 1996 Weyauwega* 2560 1997 Potato Rapids* 2567 2002 Wissota* 2581 1997 Peshtigo* 2587 1995 Superior Falls Project* 2588 2000 Little Chute* 2590 1996 Wisconsin River Drainage Project* 2595 1997 High Falls* 2640 1997 Upper Project* 2663 1998 Pillager* 2670 2002 Dells* 2689 1994 Oconto Falls* 2711 1994 Trego* 3052 2002 Black River Falls* 10805 1997 Hatfield* 11162 2002 Prairie du Sac* 11831 2001 Twin Falls*


57
APPENDIX B
FISH PASSAGE AT HYDROELECTRIC DAMS ON THE SUSQUEHANNA RIVER:
A CASE STUDY


59
Appendix B
Fish Passage at Hydroelectric Dams on the Susquehanna River:
A Case Study
The efforts to ensure passage of American shad at four hydroelectric dams on the lower Susquehanna River provides a unique dataset for assessing the effectiveness of upstream fish passage and the recovery of the population. Fish counts from all four dams are available since 2000 and for the three lower dams since 1997. In addition, both fish passage counts and estimates of the shad population in the tailrace of the lowermost dam are available since 1984. The primary sources of information that were used in the discussion that follows include a review by Foote (2003), annual progress reports of the restoration program (e.g., SRAFRC 2004), and the Pennsylvania Boat and Fish Commission and other websites. Background
The Susquehanna River basin consists of a 27,510-mi2 area in New York, Pennsylvania, and Maryland that drains into the upper Chesapeake Bay. The river is 444 mi in length from the headwaters in Otsego Lake near Cooperstown, NewYork, to its mouth at Havre de Grace, Maryland. The Susquehanna River watershed comprises 43% of the drainage area of the Chesapeake Bay, and the river provides more than 50% of the freshwater inflow to the bay. Major tributaries include the Chemung River in New York (watershed area = 2,604 mi2), and the West Branch Susquehanna River (6,992 mi2) and Juniata River (3,406 mi2) in Pennsylvania. Based on the CWA Section 305(b) report issued in 2002 for the Susquehanna River basin, 3% of the assessed stream miles (which represented 3.8% of the 31,193 named stream miles in the basin) did not support the designated uses. The primary causes of stream impairment were nutrient enrichment, siltation, and habitat destruction from agricultural runoff, acid mine drainage, and habitat alteration. Degradation of basin streams due to low pH and high metals concentrations caused by acid mine drainage from past coal mining activities is one of the most prevalent water quality problems, affecting primarily streams in the West Branch and Middle Susquehanna subbasins.
Historically, the distribution of American shad in the Susquehanna River included more than 300 miles of river north to Binghamton, New York, as well as the larger tributaries, such as the Juniata River. The commercial fishery in Pennsylvania was an estimated 2 million pounds (670,000 fish) prior to the construction in the 1830s of feeder dams for the new Pennsylvania canal system. Although fishways and shad hatcheries were constructed as mitigation for the dams, they were unsuccessful. Abandonment of the feeder dams 60 years later resulted in higher landings, which increased by about 50% to 312,000 pounds in 1908.
The recovery of the shad population was impacted during the first quarter of the 20th century by the development of hydroelectricity on the lower Susquehanna River. Four dams were constructed, beginning in 1904 (Table B-1). Mitigation included two fishways at the Holtwood Project (FERC No. 1881) and “in lieu of” payments for the Safe Harbor (FERC

60
No. 1025) and Conowingo (FERC No. 405) projects. The York Haven dam of FERC No. 1888 may have been partially passable. After conducting several studies between 1952 and 1966 on the feasibility of fish passage and the suitability of the Susquehanna River for shad restoration, the West fish lift was installed at Conowingo Dam in 1972, accompanied by the transport by truck of shad above the York Haven dam. New licenses were issued to each of the four dams in 1980, the same year that the state of Maryland closed all Chesapeake Bay fisheries for American shad. The Maryland harvest had stabilized at 1-2 million pounds for a 50-year period up to the mid-1970s when a substantial decline prompted closure of the fishery. Only 945 shad were collected at the Conowingo lift from 1972 through 1980.
Table B-1. Description of four hydroelectric dams on the lower Susquehanna River. Conowingo Holtwood Safe Harbor York Haven Construction completion 1928 1910 1930 1904 Generating capacity (MW) 548 107 417 19 Height of dam (ft) 95 55 55 6-22 Location (RM)a 10.0 24.6 32.2 56.1 Fish passage facilities Type Westb
lift East lift
Lift (2) Lift Vertical slot
Design capability (millions of adult shad)
--
1.5c
2.7c
2.5d
0.5
Cost (millions) -- 12 20 18 9 Year of operation 1972 1991 1997 1997 2000
aRiver Mile; RM 0.0 is located at the mouth of the river. bTemporary facility only for the trapping and sorting of shad for transport upstream (FERC 1990). cAlso, 10 million river herring. dAlso, 5 million river herring.
The Susquehanna River Anadromous Fish Restoration Committee (SRAFRC) established
restoration goals for the basin in 1979 of two million American shad and 10 million river herring within 25 years of fish passage development. A Settlement Agreement was reached in 1988 that provided for a permanent fish passage facility at Conowingo, and the East lift was completed in 1991. Fish passage at the other three upstream dams was addressed in a 1993 Settlement Agreement that provided for lifts at Holtwood and Safe Harbor, which were installed in 1997, and a vertical slot fishway at York Haven, which was completed in 2000. The upstream transport of shad collected by the East lift was terminated after 1996 with the completion of fish passage facilities upstream. Fish are collected at the West lift for offsite tank spawning, onsite egg collection, and age analyses; no fish were transported from the West lift for release upstream in 2003.
Shad restoration in the Susquehanna River basin is coordinated by the SRAFRC and consists of three primary approaches: (1) trapping pre-spawn adults at Conowingo Dam and transfer to upstream areas (1972-1999), (2) direct fish passage (1997-present), and (3) stocking hatchery-reared fry and fingerlings (1976-present). An average of more than 10.5 million shad fry have been stocked annually over the past 20 years, ranging from 2.5 million in 2002 to 22.3
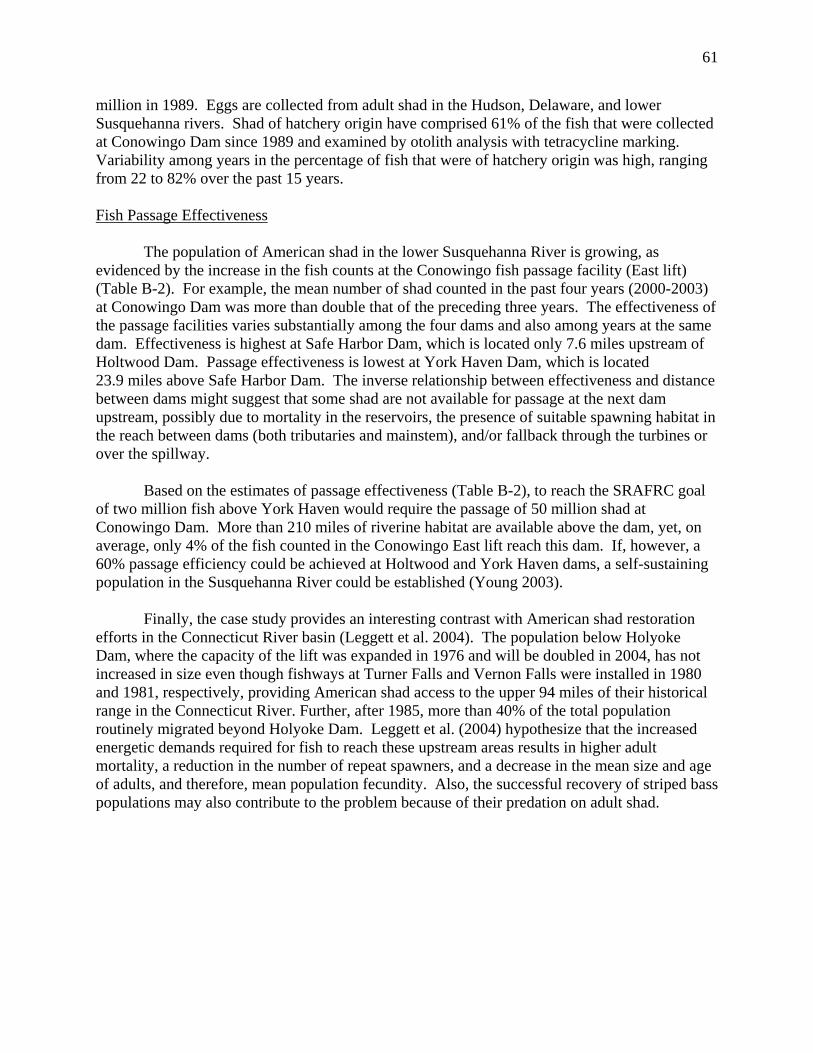
61
million in 1989. Eggs are collected from adult shad in the Hudson, Delaware, and lower Susquehanna rivers. Shad of hatchery origin have comprised 61% of the fish that were collected at Conowingo Dam since 1989 and examined by otolith analysis with tetracycline marking. Variability among years in the percentage of fish that were of hatchery origin was high, ranging from 22 to 82% over the past 15 years. Fish Passage Effectiveness
The population of American shad in the lower Susquehanna River is growing, as evidenced by the increase in the fish counts at the Conowingo fish passage facility (East lift) (Table B-2). For example, the mean number of shad counted in the past four years (2000-2003) at Conowingo Dam was more than double that of the preceding three years. The effectiveness of the passage facilities varies substantially among the four dams and also among years at the same dam. Effectiveness is highest at Safe Harbor Dam, which is located only 7.6 miles upstream of Holtwood Dam. Passage effectiveness is lowest at York Haven Dam, which is located 23.9 miles above Safe Harbor Dam. The inverse relationship between effectiveness and distance between dams might suggest that some shad are not available for passage at the next dam upstream, possibly due to mortality in the reservoirs, the presence of suitable spawning habitat in the reach between dams (both tributaries and mainstem), and/or fallback through the turbines or over the spillway.
Based on the estimates of passage effectiveness (Table B-2), to reach the SRAFRC goal of two million fish above York Haven would require the passage of 50 million shad at Conowingo Dam. More than 210 miles of riverine habitat are available above the dam, yet, on average, only 4% of the fish counted in the Conowingo East lift reach this dam. If, however, a 60% passage efficiency could be achieved at Holtwood and York Haven dams, a self-sustaining population in the Susquehanna River could be established (Young 2003).
Finally, the case study provides an interesting contrast with American shad restoration efforts in the Connecticut River basin (Leggett et al. 2004). The population below Holyoke Dam, where the capacity of the lift was expanded in 1976 and will be doubled in 2004, has not increased in size even though fishways at Turner Falls and Vernon Falls were installed in 1980 and 1981, respectively, providing American shad access to the upper 94 miles of their historical range in the Connecticut River. Further, after 1985, more than 40% of the total population routinely migrated beyond Holyoke Dam. Leggett et al. (2004) hypothesize that the increased energetic demands required for fish to reach these upstream areas results in higher adult mortality, a reduction in the number of repeat spawners, and a decrease in the mean size and age of adults, and therefore, mean population fecundity. Also, the successful recovery of striped bass populations may also contribute to the problem because of their predation on adult shad.
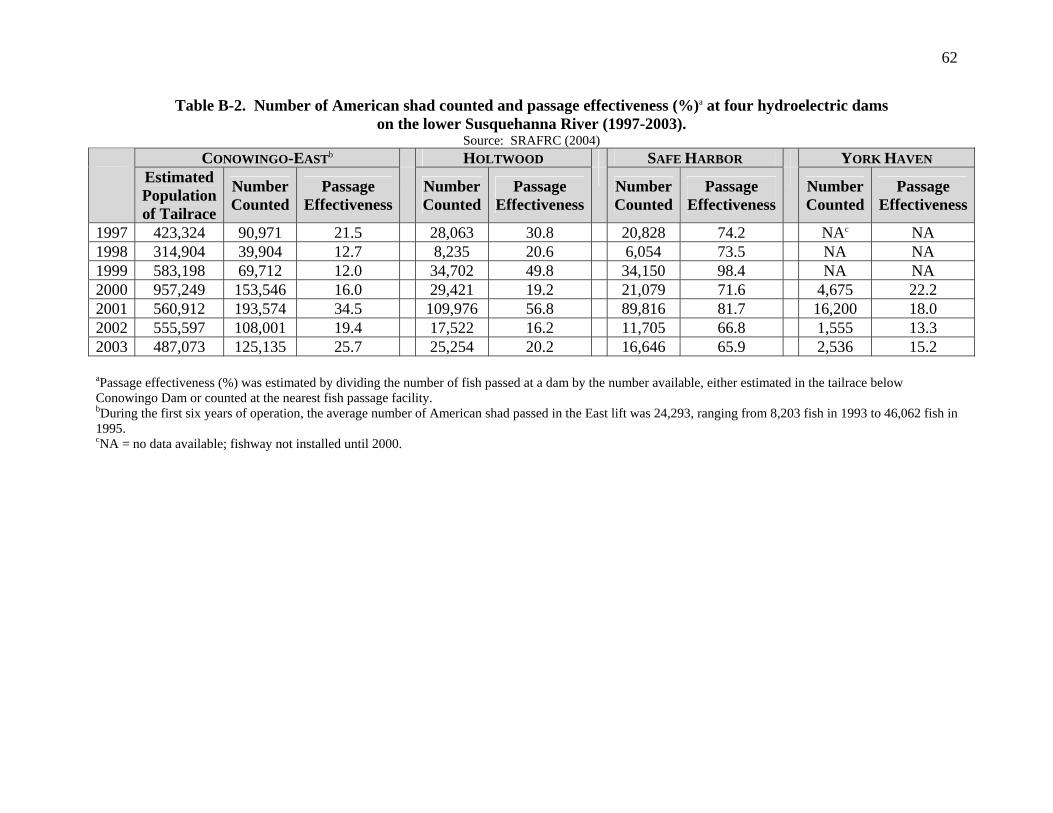
62
Table B-2. Number of American shad counted and passage effectiveness (%)a at four hydroelectric dams on the lower Susquehanna River (1997-2003).
Source: SRAFRC (2004) CONOWINGO-EASTb HOLTWOOD SAFE HARBOR YORK HAVEN
Estimated Population of Tailrace
Number Counted
Passage Effectiveness
Number Counted
Passage Effectiveness
Number Counted
Passage Effectiveness
Number Counted
Passage Effectiveness
1997 423,324 90,971 21.5 28,063 30.8 20,828 74.2 NAc NA 1998 314,904 39,904 12.7 8,235 20.6 6,054 73.5 NA NA1999 583,198 69,712 12.0 34,702 49.8 34,150 98.4 NA NA2000 957,249 153,546 16.0 29,421 19.2 21,079 71.6 4,675 22.22001 560,912 193,574 34.5 109,976 56.8 89,816 81.7 16,200 18.02002 555,597 108,001 19.4 17,522 16.2 11,705 66.8 1,555 13.32003 487,073 125,135 25.7 25,254 20.2 16,646 65.9 2,536 15.2 aPassage effectiveness (%) was estimated by dividing the number of fish passed at a dam by the number available, either estimated in the tailrace below Conowingo Dam or counted at the nearest fish passage facility. bDuring the first six years of operation, the average number of American shad passed in the East lift was 24,293, ranging from 8,203 fish in 1993 to 46,062 fish in 1995. cNA = no data available; fishway not installed until 2000.

63