educator perceptions of instructional strategies for ... with disabilities report 7 educator...
TRANSCRIPT

ELLs with Disabilities Report 7
Educator Perceptions of Instructional Strategies for Standards-based Education of English Language Learners with Disabilities
In collaboration with:
Council of Chief State School Offi cers (CCSSO)
National Association of State Directors of Special Education (NASDSE)
N A T I O N A L
C E N T E R O N
EDUCATIONAL
O U T C O M E S

ELLs with Disabilities Report 7
Educator Perceptions of Instructional Strategies for Standards-based Education of English Language Learners with Disabilities
Martha Thurlow • Deb Albus • Vitaliy Shyyan • Kristin Liu • Manuel Barrera
August 2004
All rights reserved. Any or all portions of this document may be reproduced and distributed without prior permission, provided the source is cited as:
Thurlow, M., Albus, D., Shyyan, V., Liu, K., & Barrera, M. (2004). Educator perceptions of instructional strategies for standards-based education of English language learners with disabilities (ELLs with Disabilities Report 7). Min ne ap o lis, MN: Uni ver si ty of Min ne so ta, Na tion al Center on Ed u ca tion al Out comes.
National Center on Educational OutcomesUniversity of Minnesota • 350 Elliott Hall75 East River Road • Minneapolis, MN 55455Phone 612/624-8561 • Fax 612/624-0879http://education.umn.edu/NCEO
The University of Minnesota is committed to the policy that all persons shall have equal access to its pro grams, facilities, and employment without regard to race, color, creed, religion, national origin, sex, age, marital status, disability, public assistance status, veteran status, or sexual orientation.
This document is available in alternative formats upon request.
N A T I O N A L
C E N T E R O N
EDUCATIONAL
O U T C O M E S
Jane E. MinnemaRoss MoenMichael L. MooreRachel F. QuenemoenDorene L. ScottSandra J. ThompsonMartha L. Thurlow, Director
Deb A. AlbusMichael E. AndersonAnn T. Clapper Christopher J. JohnstoneJane L. Krentz Sheryl LazarusKristi K. Liu
NCEO Core Staff
The Pathways for Promoting the Success of English Language Learners with Disabilities in Standards-based Education project is supported by a grant (#H324D010023) from the Research to Practice Division, Offi ce of Special Education Programs, U.S. Department of Education. Opinions expressed herein do not necessarily refl ect those of the U.S. Department of Education or Offi ces within it.
1NCEO
Overview
Since the 1994 reauthorization of the federal Elementary and Secondary Education Act (ESEA) of 1965, there has been focused attention on students with disabilities and English language learners in state assessment and accountability systems. The No Child Left Behind Act of 2001 (NCLB; Public Law 107-110) has added emphasis and clarity to this attention; Federal special education law and the Individuals with Disabilities Education Act (IDEA; Public Law 105-117) also confi rmed that students with disabilities are to participate in state and district-wide assess-ment systems. Although students with disabilities and English language learners have increasingly become the focus of educational improvement efforts within standards-based reform, there is perhaps an even greater need for attention to students at the cross-section of these two student populations – English language learners with disabilities.
A nationally-representative descriptive study of schools in 2001-2002 estimated that the number of students with limited English skills1 as well as disabilities was approximately 357,325 (Zehler, Fleischman, Hopstock, Pendzick, & Stephenson, 2003). This statistic indicates the estimated percentage of these students to be around 9.2 percent of all students with limited English pro-fi ciency, with the understanding that there may be under-representation of students identifi ed as having disabilities. Offi cial counts of English language learners with disabilities have been uncertain, in part, because guidelines for the identifi cation of these students are still being de-veloped. Further, the amount of time given to allow accurate identifi cation and placement can span several years because educators want to ensure that potential problems that these students may be facing are not due to language acquisition issues alone.
Regardless of whether we know the exact number of English language learners with disabilities across the nation, or in individual states, this group of students is clearly an important subgroup deserving attention in the context of standards-based educational systems. In the state of Min-nesota, for example, the population of English language learners is primarily Spanish-speaking students, Hmong students, Vietnamese students, and Somali students. These populations are not those typical of other states, such as California and Texas, which have had primarily high numbers of students from primarily Spanish language backgrounds.
The education of English language learners in Minnesota does not refl ect a lengthy history of bilingual programming, which is more likely to be the case in other states. Minnesota offers a variety of programming models for both English as a Second Language (ESL) and Bilingual Education (BE) approaches. Various models of these approaches, which include intensive, pull-out, and sheltered, are chosen to suit specifi c districts’ needs with respect to the homogeneity
1Note: We recognize that English language learner (ELL) is used elsewhere as an equivalent term for limited English profi cient (LEP) students which focuses more positively on student learning.

2 NCEO
of the population of English language learners, staffi ng resources, and district goals (Minnesota Department of Children Families and Learning, 2002).
The population of students in Minnesota and the service approaches that have been used with English language learners and with students with disabilities all have taken place within a changing context of standards-based education. Minnesota has had grade-level standards in reading, mathematics, and science, as well as in other content areas. As in many states, the content standards are revisited frequently. However, there has been a commitment to rigorous content standards and standards-based education in the state of Minnesota. This is an impor-tant context within which to examine the nature of instructional recommendations for English language learners with disabilities.
Providing educational programs for English language learners with disabilities is a growing need in states across the nation as the number of these students increases. Educators who work with these students are a viable source of information about appropriate instructional strate-gies for this population of students. Current understanding of strategies for educating English language learners with disabilities is based on these students’ need for access to grade-level curriculum by providing instruction that takes into account the demands of language learning and cognitive processing load (Gersten, Baker, & Marks, 1998). It is important to check this current understanding against the knowledge of practicing teachers.
The study reported here was conducted as part of a larger investigation designed to identify instructional strategies most benefi cial for English language learners with disabilities. Other aspects of the investigation are examining the research literature, information from parents and students, and the effects of specifi c strategies. In this study, our goal was to determine which instructional strategies are recommended for English language learners with disabilities by teachers across disciplines (special education, ESL/bilingual education, mainstream content areas). Specifi cally, we wanted to determine the teacher-identifi ed effective strategies for teach-ing grade-level reading/English language arts, mathematics, and science content to English language learners with disabilities.
To accomplish the goals of the study, we invited teachers to participate in group sessions us-ing a specifi c process to evaluate, brainstorm, and weight the importance of the strategies they thought were most effective for teaching each of the skill areas to English language learners with disabilities. Because of the varied backgrounds of the teachers, a methodology was used that would enable them to generate ideas about instruction and evaluate them in a neutral and objective manner. A process that had been used previously by the National Center on Educational Outcomes (NCEO) referred to as the Multi-Attribute Consensus Building Process (MACB) was selected because it seemed to have been useful in bringing diverse perspectives together (Vanderwood, Ysseldyke, & Thurlow, 1993; Vanderwood & Erickson, 1994). A slightly adjusted form of this process was used.

3NCEO
Method
This study was conducted in two stages. The purpose of the fi rst stage was primarily to develop the instrument for use in the second stage, with a larger number of teachers. In the following sections, each stage is described with concern to the invited participants, and activities completed toward instrument development and ultimately the collection of study data.
Stage I
Invited ParticipantsSchool districts within the state of Minnesota were targeted for inclusion in the study. The goal was to include those with suffi cient numbers of students with both limited English profi ciency and disabilities. After developing this list of districts based on state testing information, NCEO staff members sought a balance of participants with two thirds from urban districts and one third from suburban and rural districts. Due to mobility of students after the time of testing and small numbers of teachers or coordinators in areas initially chosen for participation, staff had to select additional locations.
In Stage I, 30 teachers participated from a total of fi ve schools in fi ve districts (two urban, three suburban). Stage 1 teachers were primarily general education teachers. Most teachers had more than 10 years experience and had been in their current job from 1 to 5 years. Details of these participants’ professional experience and the language groups of students taught by them are found in Appendix A.
Teachers, coordinators, and other educators were invited to participate in the Multi-Attribute Consensus Building (MACB) sessions based on certain criteria. They had to at least have expe-rience teaching or assisting through related services students with limited English profi ciency or special education students in grades 6-9. In a few cases, teachers who had taught 5th grade students were included. Participants were recruited from ESL/bilingual, mainstream content, and special education areas, with most special education teachers working with students who had high incidence disabilities (e.g., learning disabilities, speech–language impairments). For optimum interaction in the MACB sessions, small groups of 4-7 teachers were formed. One group had only three participants due to an illness.
Instrument Development ActivitiesThe purpose of the Stage I was primarily to develop the instrument. These steps included drafting the initial instrument, standardizing the defi nition of instructional strategy, and conducting the MACB process with teachers to generate, weight, and fi nally rate the strategies as to their feasibility and use.

4 NCEO
Drafting Initial Instrument Staff researched the literature for strategies to include in a core list for each content area on the initial instrument. Staff then selected approximately fi ve recommended instructional strategies from the Gersten, Baker, and Marks’ (1998)) article as a starting point for teachers to use in discussing and generating additional strategies they would recommend for use with limited English profi cient students with disabilities in content area classrooms. This initial list is provided in Table 1.
Table 1 Initial Core List of Strategies by Content Area
Reading Math Science
Use of organizational pre-
assessment strategy (e.g.,
KWL).
Curriculum Based Probe Curriculum Based Probe
Graphic organizers Reciprocal peer tutoring Graphic organizers
Cooperative Learning Graphic Organizers Peer tutoring
Direct teaching of
vocabulary
Explicit timing Short segment to teach
vocabulary
Specifi c informal
assessments
Teacher think-alouds Using response cards
during instruction
Strategy Defi nitionsIn addition to the initial core list of strategies, teachers were presented with the following defi nition of a teaching strategy to help them in their selection and contribution of strategies to the initial lists:
The teaching strategy is a purposeful activity to engage learners in acquiring new behaviors or knowledge. To be useful for our purposes, an instructional strategy should have clearly defi ned steps or a clear description of what the teacher does.
An initial glossary that included descriptions of the selected core strategies was provided to participants during the MACB process.
MACB ProcessDuring the MACB process, after discussing practice weighting examples (see Appendix B) participants were asked to weight the importance of the three content areas: Reading, Math, and Science. Then teachers contributed strategies to the initial lists for each of the three content areas. As this occurred, notes about these new strategies were taken for potential inclusion in a fi nal glossary. Participants’ comments during this process were recorded on a paper easel, or noted by individuals on study notepads provided in their folders for our information later. Following the generation of additional strategies, participants were asked to weight all of the strategies, both core and generated, for each content area.

5NCEO
Participants were given time to weight specifi c strategies, with the help of the glossary to defi ne the strategies, and then they were asked to voice their numerical weighting of each strategy, in turn, for data entry. After data entry, these weightings were projected onto a screen with the overall average for the group calculated at the end of each strategy row. These weighting results then provided the focus of a discussion guided by a facilitator, on why very high or very low weights were given to a specifi c strategy. Those participants giving the high or low weights were asked to describe why they gave the weight they did. All sessions were taped and analyzed to provide further insight into the rationale of why participants weighted specifi c strategies. Participants were allowed to change their individual weightings after discussion, although both pre- and post-discussion weightings were saved as separate documents on the computer.
Figure 1 shows the scale that was used by teachers in weighting strategies and the specifi c instructions they were given. For the weighting, participants were instructed that they had to weight at least one strategy as 100, but could also weight more than one as 100.
Figure 1. Weighting Scale
Shown on a continuum, the weighting scale looks like this:
Very
Neither
Important Nor Very
Unimportant Unimportant Unimportant Important Important
0 20 40 60 80 100
Feasibility and Use SurveysAfter the MACB process of weighting and discussing strategies, participants were asked to complete an additional survey. It asked participants to weight the feasibility of the strategies and asked them to rate how often they used each of them.
Stage II
In Stage II, the focus shifted away from instrument development to collection of data for the fi nal study. This section describes the participants in Stage II, including their professional background, types of students served, reported teaching approaches, and languages of students served. This is followed by a brief note concerning fi nal data collection activities.
Invited ParticipantsThe regional representation of districts and schools in the study was predominantly suburban. Two urban districts participated with a total of 3 schools (14 educators), and 5 suburban districts participated with 5 schools (28 educators). This second stage lacked the additional perspective of participants from "greater Minnesota" areas.

6 NCEO
Staff used the same criteria for inviting participants to participate in Stage II as in Stage I. In-formation about these teachers’ professional experience, includes data on teacher type, subjects taught, years of experience, types of students served, teaching approaches, and the language groups of students served are provided in the following tables.
Professional ExperienceOf the 42 teachers using the fi nal list, 40.5% (N=17) were ESL/bilingual teachers, 23.8% (N=10) were Special Education teachers, and 35.7% (N=15) were from other educational areas (see Figure 2).
Figure 2. Current Job Title
0%5%
10%15%20%25%30%35%
6-8
ESL
6-8
spec
ial e
duca
tion
6-8
gene
ral e
duca
tion
6-8
bilin
gual e
duca
tion
9-12
gene
ral e
duca
tion
scho
ol a
dministra
tors
othe
r
K-5
ESL
teac
hers
K-5 spe
cial e
duca
tion
9-12
spec
ial e
duca
tion
gene
ral e
duca
tion
Grade and Teacher Type
Table 2 presents information provided by the educators about what subject areas they taught. Combining the numbers of educators that reported teaching one or multiple subjects, about half of the total (22) taught reading, 9 taught mathematics, and 5 taught science. Five educators had marked other content areas that they currently taught, and six did not provide information for the question.
Table 2. Subject Areas Taught
Teacher Subject Area No. %
Reading 17 40.5
Mathematics 4 9.5
Science 3 7.1
Mathematics and Reading 5 11.9
Science and Reading 2 4.8
Other (History, Graphic Arts, etc.) 5 11.9
No response 6 14.3
Total 42 100.0
7NCEO
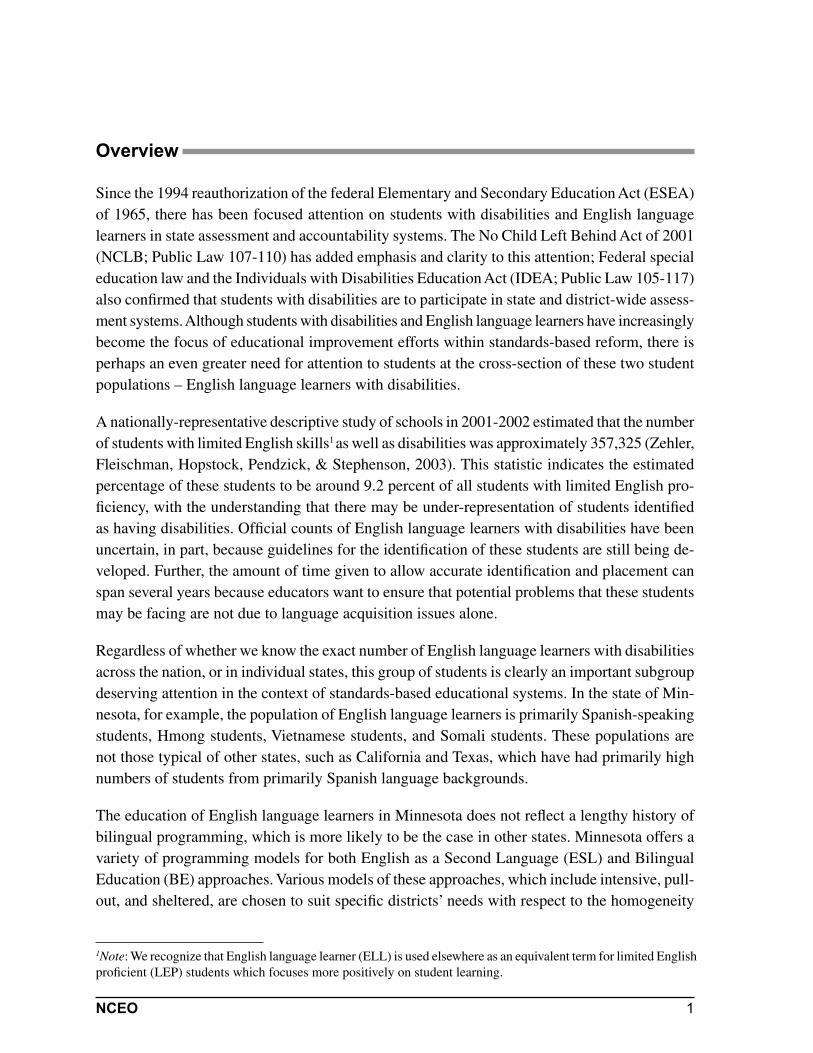
Figure 3 shows a graph of these teachers’ years of professional experience. Of the 42 teachers, 50% had over 10 years of professional experience, 29% had 5-10 years of experience, and 19% had 1-5 years experience. Only 2.4% of the participants had a year or less of teaching experi-ence.
2.40%
19.00%
28.60%
50.00%
Figure 3. Years of Professional Experience
Another characteristic that was recorded by the study demographic survey was the types of students that the educators served. The majority of educators reported working with English language learners with disabilities (N=32). The second largest group served was English language learners (N=30), followed by general education students (N=25) and students with disabilities (N=25) in equal numbers (see Figure 4).
Figure 4. Types of Students Served
Less than a year
1-5 years
5-10 years
More than 10 years
0
10
20
30
40
50
60
70
80
90
100
ELLs Reg.
Students
with IEPS
ELLs with
IEPS
General
Education
Numbers of EducatorsReported Serving Typesof Students
Participants were asked to answer several questions on teaching practices. Their responses are shown in Figure 5. Almost three-fourths of the participants (73.8%) reported that they taught alone. Only one quarter (27.5%) of the participants reported that they taught in teams. About 40% of all teachers (37.5%) stated that they taught extended content standards (e.g., breaking down a standard into smaller pieces or adapting it downward so that students with more severe learning issues can be working on them) for students with IEPs, and 42.5% of teachers said that

8 NCEO
they did not incorporate this practice. Half of the participants taught skills directly related to the completion of high standards in content being implemented in another teacher’s class. The question of teaching language found in a specifi c high standard being implemented in another teacher’s class was answered thus: 41.5% of the total practiced this approach and 51.2% did not practice it. Nearly 30% (29.3%) of all participants acted as a resource for general education teachers who were implementing high standards-based work that includes English language learners; 41.5% of teachers acted as a resource for general education teachers who were imple-menting high standards-based work that includes students with disabilities.
Figure 5. Teaching Approaches
0% 10% 20% 30% 40% 50% 60% 70% 80% 90% 100%
G
F
E
D
C
B
A
Yes No Unsure NA
A – Teaching alone B – Team teaching C – Teaching extended content standards for IEP students D – Teaching skills in another teacher’s class E – Teaching language in another teacher’s class F – Resource for teachers who teach ESL students G – Resource for teachers who teach IEP students
Figure 6 shows the number of educators who reported working with students in each language group. The “Other” category included less frequent languages reported by educators. Among these were Vietnamese, Russian, Ethiopian, and Sudanese.
Figure 6. Students’ Language Backgrounds
0
10
20
30
Cambodian Hmong Lao Spanish Somali Other
Number of Educators WhoReported Teaching StudentsSpeaking These Languages

9NCEO
Data Collection ActivitiesIn Stage II, activities shifted away from instrument development towards fi nal data collection. The results of the Stage I instrument development process produced a fi nal study instrument with a list of 28 reading strategies, 20 mathematics strategies, and 23 science strategies. These strategies, used with Stage II teachers, are listed in Appendix B.
In this second stage, 42 educators followed the same MACB process of weighting and discussing strategies and fi lling out the feasibility and use surveys as in Stage I, except that these educa-tors were working with the fi nal strategy list. No additional strategies were generated in Stage II. If educators had comments about strategies not listed, they were invited to note these on the paper provided in the study packets.
Results
The results reported in this section are only from data gathered during Stage II. Results of weightings are reported in the order in which educators encountered the questions during the MACB sessions, starting with weighting the importance of the content areas, then strategies under each content area, use and feasibility of each strategy, strategy weightings by teacher type, and fi nally a section on educators’ rationales for how they weighted strategies during the sessions.
Content Area Importance
The study results indicated that the content areas of reading and mathematics were weighted as “very important.” The Reading content area was consistently weighted the most important by educators with an average of 100 (SD = .00). The mathematics weighting was slightly lower – 90.7 (SD = 8.06), and the Science weighting was the lowest – 78.8 (SD = 11.21), which is positioned in the “important” area on the weighting scale.
Strategy Importance
Although the goal during Stage I was to generate strategies, there often seemed to be disagreement over what constituted a strategy. This occurred even though the teachers were presented with a defi nition for use as described in the Methods section. As a result, the generated "strategies" that later became part of the instrument did not always meet the specifi cs of the "strategies" defi ni-tion. This occurred despite repetition of the defi nition during MACB sessions and reminders to check that the recommended strategy was actually a strategy according to the defi nition. See the fi nal glossary of strategy defi nitions in Appendix C.
The weighting results for the top fi ve strategies for each content area are presented fi rst, with a
10 NCEO
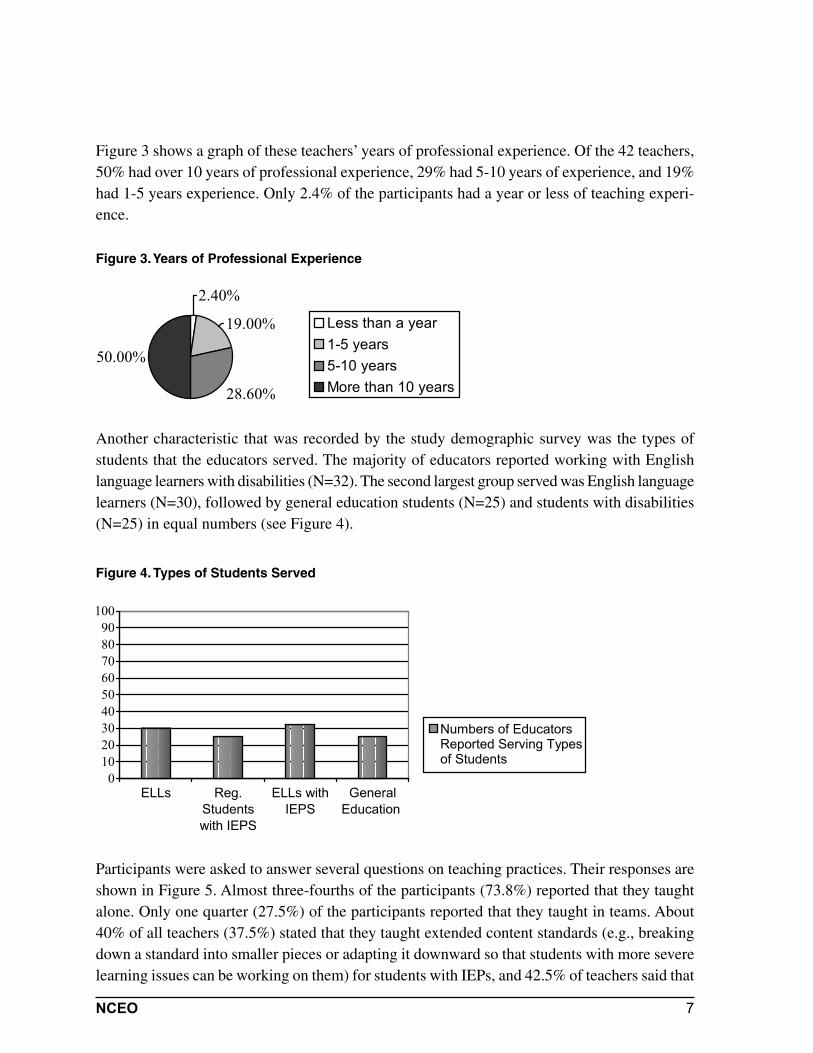
further breakdown of specifi cs by content area. As shown in Table 3, the reading strategies include direct teaching of vocabulary, teaching strategies, fl uency building, chunking and questioning, and relating reading to student experience. For math the top fi ve includes tactile concrete experiences, daily re-looping of material, problem solving instruction and task analysis strategies, and teacher and student "think alouds." Science has similar strategy foci in using visuals, pre-reading strate-gies, teacher modeling, and letting students experience active "hands-on" participation in class.
Table 3. Importance of Strategies
Content Area
Strategy
Reading
Teaching pre-, during-, and post-reading strategiesFluency building (high frequency words)Direct teaching vocabulary through listening, seeing, reading, and writing in short time segmentsRelating reading to student experiencesChunking and questioning aloud (reading mastery)
Mathematics
Tactile, concrete experiences of mathematicsDaily re-looping of previously learned materialProblem solving instruction and task analysis strategiesTeacher “think-alouds”Student “think-alouds”
Science
Hands-on, active participationUsing visualsUsing pictures to demonstrate stepsUsing pre-reading strategies in content areasModeling/teacher demonstration
Reading Strategies
Twenty-eight reading strategies, as perceived by teachers, ultimately were weighted by study participants. Of those 28, the following were considered most important: direct teaching of vocabulary through listening, seeing, reading, and writing in short time segments; teaching pre-, during, and post-reading strategies; fl uency building (high frequency words); chunking and questioning aloud (reading mastery); and relating reading to student experiences (see Table 4). Appendix D presents the entire list of strategies for reading as well as their minimum and maximum weightings, their average weightings, and the standard deviation for each strategy.

11NCEO
Table 4. Top Five Reading Strategies
Content Area
AverageWeighting
Standard Deviation
Strategy
Reading
93.88 8.42 Teaching pre-, during, and post-reading strategies90.83 9.56 Fluency building (high frequency words)90.48 10.23 Direct teaching vocabulary through listening, seeing,
reading, and writing in short time segments87.67 14.64 Chunking and questioning aloud (reading mastery)88.05 10.96 Relating reading to student experiences
Mathematics Strategies
Of the 20 “strategies” weighted for mathematics, the top fi ve are listed in Table 5. These strate-gies include the following: tactile, concrete experiences of mathematics; daily re-looping of previously learned material; problem solving instruction and task analysis strategies; teacher “think-alouds”; and student “think-alouds.” Appendix D presents the complete list of strategies for mathematics as well as minimum and maximum weightings, their average weightings, and the standard deviation for each strategy.
Table 5. Top Five Mathematics Strategies
ContentArea
AverageWeighting
Standard Deviation
Strategy
Mathematics
93.85 10.64 Tactile, concrete experiences of mathematics92.93 11.45 Daily re-looping of previously learned material92.90 10.47 Problem solving instruction and task analysis strategies87.44 16.51 Teacher “think-alouds”86.63 14.02 Student “think-alouds”
Science Strategies
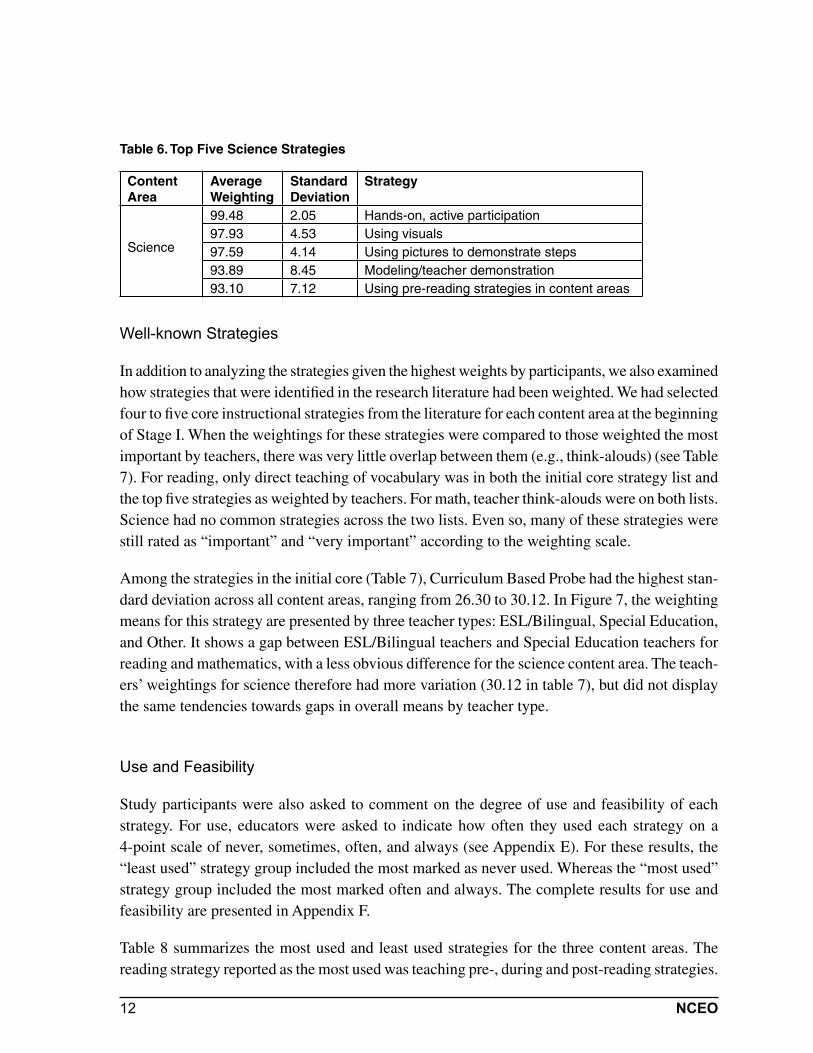
Twenty-three “strategies” were weighted for science. In Table 6, the top weighted strategies in the area of science were: hands-on, active participation; using visuals; using pictures to demon-strate steps; using pre-reading strategies in content areas; and modeling/teacher demonstration. Appendix D presents the total list of strategies for science as well as minimum and maximum weightings, their average weightings, and the standard deviation for each strategy.
12 NCEO
Table 6. Top Five Science Strategies
Content Area
AverageWeighting
Standard Deviation
Strategy
Science
99.48 2.05 Hands-on, active participation97.93 4.53 Using visuals97.59 4.14 Using pictures to demonstrate steps93.89 8.45 Modeling/teacher demonstration93.10 7.12 Using pre-reading strategies in content areas
Well-known Strategies
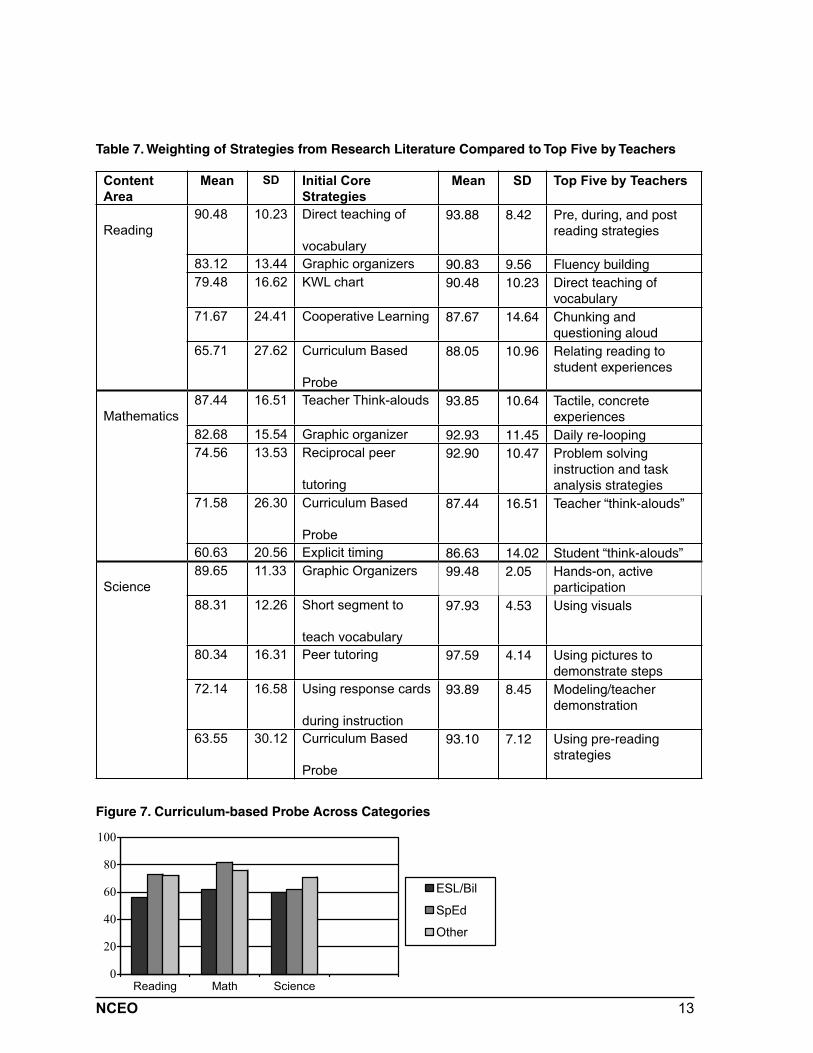
In addition to analyzing the strategies given the highest weights by participants, we also examined how strategies that were identifi ed in the research literature had been weighted. We had selected four to fi ve core instructional strategies from the literature for each content area at the beginning of Stage I. When the weightings for these strategies were compared to those weighted the most important by teachers, there was very little overlap between them (e.g., think-alouds) (see Table 7). For reading, only direct teaching of vocabulary was in both the initial core strategy list and the top fi ve strategies as weighted by teachers. For math, teacher think-alouds were on both lists. Science had no common strategies across the two lists. Even so, many of these strategies were still rated as “important” and “very important” according to the weighting scale.
Among the strategies in the initial core (Table 7), Curriculum Based Probe had the highest stan-dard deviation across all content areas, ranging from 26.30 to 30.12. In Figure 7, the weighting means for this strategy are presented by three teacher types: ESL/Bilingual, Special Education, and Other. It shows a gap between ESL/Bilingual teachers and Special Education teachers for reading and mathematics, with a less obvious difference for the science content area. The teach-ers’ weightings for science therefore had more variation (30.12 in table 7), but did not display the same tendencies towards gaps in overall means by teacher type.
Use and Feasibility
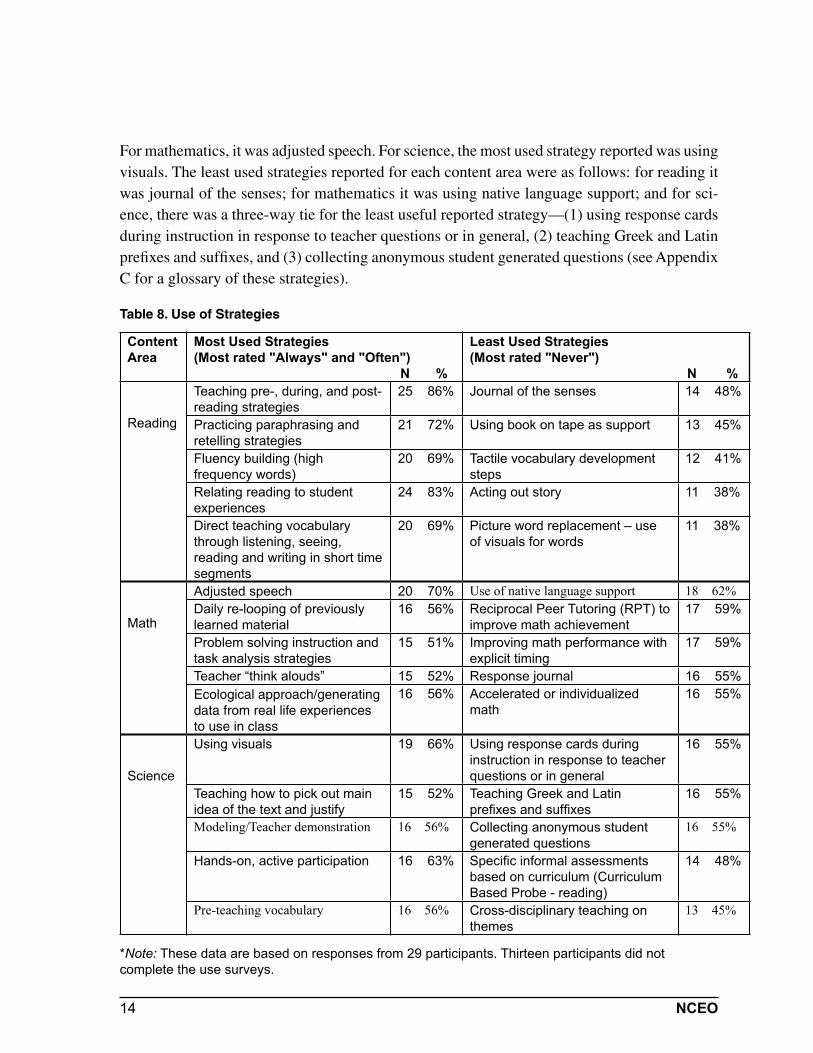
Study participants were also asked to comment on the degree of use and feasibility of each strategy. For use, educators were asked to indicate how often they used each strategy on a 4-point scale of never, sometimes, often, and always (see Appendix E). For these results, the “least used” strategy group included the most marked as never used. Whereas the “most used” strategy group included the most marked often and always. The complete results for use and feasibility are presented in Appendix F.
Table 8 summarizes the most used and least used strategies for the three content areas. The reading strategy reported as the most used was teaching pre-, during and post-reading strategies.
13NCEO
Table 7. Weighting of Strategies from Research Literature Compared to Top Five by Teachers
Content
Area
Mean SD Initial Core
Strategies
Mean SD Top Five by Teachers
Reading
90.48 10.23 Direct teaching of
vocabulary
93.88 8.42 Pre, during, and post reading strategies
83.12 13.44 Graphic organizers 90.83 9.56 Fluency building 79.48 16.62 KWL chart 90.48 10.23 Direct teaching of
vocabulary 71.67 24.41 Cooperative Learning 87.67 14.64 Chunking and
questioning aloud 65.71 27.62 Curriculum Based
Probe
88.05 10.96 Relating reading to student experiences
Mathematics
87.44 16.51 Teacher Think-alouds 93.85 10.64 Tactile, concrete experiences
82.68 15.54 Graphic organizer 92.93 11.45 Daily re-looping 74.56 13.53 Reciprocal peer
tutoring
92.90 10.47 Problem solving instruction and task analysis strategies
71.58 26.30 Curriculum Based
Probe
87.44 16.51 Teacher “think-alouds”
60.63 20.56 Explicit timing 86.63 14.02 Student “think-alouds”
Science
89.65 11.33 Graphic Organizers 99.48 2.05 Hands-on, active participation
88.31 12.26 Short segment to
teach vocabulary
97.93 4.53 Using visuals
80.34 16.31 Peer tutoring 97.59 4.14 Using pictures to demonstrate steps
72.14 16.58 Using response cards
during instruction
93.89 8.45 Modeling/teacher demonstration
63.55 30.12 Curriculum Based
Probe
93.10 7.12 Using pre-reading strategies
0
20
40
60
80
100
Reading Math Science
ESL/Bil
SpEd
Other
Figure 7. Curriculum-based Probe Across Categories
14 NCEO
For mathematics, it was adjusted speech. For science, the most used strategy reported was using visuals. The least used strategies reported for each content area were as follows: for reading it was journal of the senses; for mathematics it was using native language support; and for sci-ence, there was a three-way tie for the least useful reported strategy—(1) using response cards during instruction in response to teacher questions or in general, (2) teaching Greek and Latin prefi xes and suffi xes, and (3) collecting anonymous student generated questions (see Appendix C for a glossary of these strategies).
Table 8. Use of Strategies
Content
Area
Most Used Strategies
(Most rated "Always" and "Often")
N %
Least Used Strategies
(Most rated "Never")
N %
Reading
Teaching pre-, during, and post-
reading strategies
25 86% Journal of the senses 14 48%
Practicing paraphrasing and
retelling strategies
21 72% Using book on tape as support 13 45%
Fluency building (high
frequency words)
20 69% Tactile vocabulary development
steps
12 41%
Relating reading to student
experiences
24 83% Acting out story 11 38%
Direct teaching vocabulary
through listening, seeing,
reading and writing in short time
segments
20 69% Picture word replacement – use
of visuals for words
11 38%
Math
Adjusted speech 20 70% Use of native language support 18 62%
Daily re-looping of previously
learned material
16 56% Reciprocal Peer Tutoring (RPT) to
improve math achievement
17 59%
Problem solving instruction and
task analysis strategies
15 51% Improving math performance with
explicit timing
17 59%
Teacher “think alouds” 15 52% Response journal 16 55%
Ecological approach/generating data from real life experiences to use in class
16 56% Accelerated or individualized
math
16 55%
Science
Using visuals 19 66% Using response cards during
instruction in response to teacher
questions or in general
16 55%
Teaching how to pick out main
idea of the text and justify
15 52% Teaching Greek and Latin
prefi xes and suffi xes
16 55%
Modeling/Teacher demonstration 16 56% Collecting anonymous student
generated questions
16 55%
Hands-on, active participation 16 63% Specifi c informal assessments
based on curriculum (Curriculum
Based Probe - reading)
14 48%
Pre-teaching vocabulary 16 56% Cross-disciplinary teaching on
themes
13 45%
*Note: These data are based on responses from 29 participants. Thirteen participants did not
complete the use surveys.

15NCEO
The research participants were also asked to weight how feasible each strategy was on a scale of low, somewhat low, somewhat high, and high. The top fi ve results of these weightings are listed in Table 9. For reading, the highest weighted instructional strategy (high and somewhat high) for feasibility was relating reading to student experiences. For mathematics, it was daily re-looping of previously learned material. The science strategy weighted most highly was using visuals. In contrast, the strategies most often rated as low (low and somewhat low) in feasibil-ity for the three content areas were acting out the story and using book on tape as support for reading, use of native language support for math, and collecting anonymous student generated
questions for science.
Table 9. Feasibility of Strategies
Content Area
Most Feasible Strategies(Most rated High) N %
Least Feasible Strategies(Most rated Low) N %
Reading
Relating reading student experiences
20 69% Acting out story 8 28%
Fluency building (high frequency words)
18 62% Using book on tape as support 8 28%
Practicing paraphrasing and retelling strategies
16 55% Prediction 7 24%
Teaching pre-, during, and post-reading strategies
15 52% Picture word replacement – use of visuals for words
6 21%
Graphic organizers such as semantic mapping, story maps, concept maps
15 52% Specifi c informal assessments based on curriculum (Curriculum Based Probe)
6 21%
Math
Daily re-looping of previously learned material
20 69% Use of native language support 10 35%
Adjusted speech 16 55% Reciprocal Peer Tutoring (RPT) to improve math achievement
7 24%
Ecological approach/ generate data from real life experiences to use in class
15 52% Monitoring of progress through group and individual achievement awareness charts
7 24%
Reinforcing math skills through games
14 48% Accelerated or individualized math
7 24%
Tactile, concrete experiences of math
14 48% Specifi c informal assessments based on curriculum (Curriculum Based Probe)
5 17%
Science
Using visuals 19 66% Collecting anonymous student generated questions
8 28%
Modeling/Teacher demonstration
17 59% Specifi c informal assessments based on curriculum (Curriculum Based Probe - reading)
7 24%
Pre-teaching vocabulary 16 55% Teaching Greek and Latin prefi xes and suffi xes
7 24%
Hands-on, active participation
16 55% Using response cards during instruction in response to teacher questions or in general
7 24%
Using pre-reading strategies in content areas
15 52% Use of simplifi ed texts 6 21%

16 NCEO
Teaching Strategies by Teacher Type
The three categories of research participants (ESL/bilingual teachers, special education teachers, other educators) weighted the importance of the content areas similarly, with reading consis-tently given the highest weight (100%), followed by mathematics (88.5-93.5%) and Science (77.5-81%) across the groups (see Figure 8).
Figure 8. Content Areas by Teacher Type
0102030405060708090
100
All ESL/Bil Spec. Ed Other
Type of teacher
Ave
rag
e w
eig
htin
g
Reading
Mathemtics
Science
Figure 9 shows the top fi ve reading strategies as weighted by all educators and the three teacher categories in our sample. The top fi ve strategies were: direct teaching vocabulary through listen-ing, seeing, reading, and writing in short time segments; teaching pre, during, and post-reading strategies; fl uency building (high frequency words); chunking and questioning aloud (reading mastery); and relating reading to student experiences. The three categories of educators were rather consistent in their weightings of the fi ve strategies.
Figure 9. Reading Strategies by Teacher Type
0102030405060708090
100
Ave
rag
e w
eig
htin
g
All ESL/Bil Spec. Ed Other
Type of Teacher
vocab
strategies
fluency
chunking
relating

17NCEO
As shown in Figure 10, the fi ve top weighted mathematics strategies were: tactile, concrete experiences of mathematics; daily re-looping of previously learned material; problem solving instruction and task analysis strategies; teacher “think-alouds”; and student “think-alouds.”
Figure 10. Mathematics Strategies by Teacher Type
0102030405060708090
100
Ave
rag
e w
eig
htin
g
All ESL/Bil Spec. Ed Other
Type of Teacher
tactile
relooping
problem
teacher think
student think
Figure 11 shows the top fi ve science strategies stratifi ed into three educator categories. The strategies include: hands-on, active participation; using visuals; using pictures to demonstrate steps; using pre-reading strategies in content areas; and modeling/teacher demonstration. The strategy weightings do not differ signifi cantly across the three educator categories for this con-tent area. Again, the three groups of teachers were essentially the same in the weighting of the various strategies for teaching science.
Figure 11. Science Strategies by Teacher Type
0102030405060708090
100
Ave
rag
e w
eig
htin
g
All ESL/Bil Spec. Ed Other
Type of Teacher
active
visuals
steps
pre read
modeling
Teacher Rationales for Weighting Strategies
Analyzing teachers’ weightings was important to understand teachers’ perceptions of the ef-fectiveness of certain instructional strategies with English language learners with disabilities. Sessions with teachers were taped, with permission, in order to record potentially useful insights that teachers would give concerning their reasons for weighting the strategies as they did. In this

18 NCEO
section, we will briefl y present and discuss the teachers’ rationales for weighting instructional strategies as they did. The discussions covered a spectrum of factors: Research Data, Setting, Content, Individual Student Variables, Personal Experience, and Design of Study.
Research Data
"....[I] Haven’t heard a lot of data...not a lot of data that support the method...don’t see it applying to her situation at all."
The current emphasis on scientifi cally-based instructional methods reverberates in the back-ground of this teacher’s comment. Some teachers were thinking along the lines of research in making instructional decisions. Obviously, this does not mean that teachers always know the best or most recent data on a given strategy. Yet, what is telling about this particular quote is that the teacher is well aware that making data-based decisions not only requires data, but data that will apply to the student. The educator quoted above was responding to a particular strategy for teaching vocabulary that involves students using their hands to "write" in the air. She thought that the strategy was inappropriate for the student’s age. Although most educators and researchers are in agreement that vocabulary development is a pivotal skill of reading, the teacher is correct in her assessment that there appears to be little data on this specifi c strategy’s effectiveness.
This underlines the fact that even though the educational community may come to a consensus on the crucial pieces needed to shape profi cient readers (e.g., vocabulary development), the specifi c tools and nuances of their use have not been tested against multiple other tools, and have not been scientifi cally tested with students who have disabilities in addition to limited English profi ciency.
Educational Setting
"...Maybe I’ll have to change my answer....That our kids with English language learner needs and special education needs were actually being in cooperative groups with more traditional peers is kind of why I ranked it so high...."
"I think of a pull-out group of just special education kids."
"It depends on the situation."
"I can see [participant’s] point with her scoring perfectly. [She] absolutely is correct in that type of setting."
Some teachers appealed to the need for differentiation of educational setting or context in explain-

19NCEO
ing and discussing their different weighting of strategies. The consensus reached by the group quoted above was that they would have weighted a particular strategy the same as their peer if they were in the same context, which in this case was the difference between a mainstreaming situation and pull-out class.
The difference between teaching students with disabilities or limited English profi ciency in standards-based mainstream classes versus using pull-out methods which may or may not be standards-based, is obviously more than a decision founded on whether additional class space is available. It more than likely involves expectations of students, what they can and cannot do, with or without additional assistive resources. This same groundwork of expectation may underlie the decision to use certain strategies in "different settings"—which essentially is an indirect way of referring to the "different" students who have both the same and different needs
as their peers.
Content Area
"For like a content area, science or social studies, I would a, agree with their scoring more. In a pull-out reading situation I would stick to my guns."
"I wouldn’t choose it as one of my activities probably because it’s a time consuming
one, and you don’t have that much time. So that’s why I put 50."
Although the fi rst quote appears to include the infl uence of setting on use of strategies, it also suggests that certain strategies may be perceived to be more effective in certain content areas more than others. The second quote is a better illustration of this. This teacher did not value the strategy of writing down responses in a journal for mathematics because the cost of doing so was judged to outweigh the potential learning benefi t for the content area. In counterpoint, a mathematics teacher said it was potentially useful for students in higher levels mainstreamed with non-ESL background classmates.
Individual and Student Group Factors
"I wouldn’t feel comfortable using that in Jr. High in the sense I would think that it’s very hard to balance a 13 year old mind yearning to be an adult with a 13 year old body in many cases, or maturity level still being a child, without insulting them …. I’ve just really not found that very practical."
"With that one sentence in whatever language their native language is, …that could be the key to the whole unit."
This area covers all of the basic individual differences that teachers mentioned: a student’s age
20 NCEO
or grade, personality and learning preferences, individual strengths and weaknesses in cognitive and emotional ability, and fi rst and second language profi ciency.
Some teachers said they would use some strategies with students at different grade or maturity levels, such as writing vocabulary in the air or having students use other kinesthetic strategies. Another teacher said that the strategy of having students dramatize the story they are reading could be effective in making the story come alive for students. However, another teacher pointed out that the personality types in her class would not respond as favorably to this activity. Like-wise, short timed tests were seen as stressful for certain students but less so for others.
Although cognitive abilities and language profi ciency abilities in fi rst and second languages dif-fer at the individual level, decisions about the usefulness of strategies were sometimes applied to a group of students rather than individual student characteristics. For example, one teacher said that she preferred a verbal strategy rather than one asking an English language learner to journal for a reading task because of the language load: "kids (are) already clobbered - adding insult to injury." For some teachers, native language support was seen as benefi cial for brand new students who have minimal English skills, indicating a tendency to see the native language as a means to learning English. A few teachers saw the benefi t of students learning in their native language citing specifi c instances such as a mathematical concept that was better understood by the student when given in the native language accompanied by the English speaking teacher illustrating it by additional means. However, this attitude was more likely applied to students with lower English profi ciency levels.
Personal Experience
"So, I see the pairing of high and low is positive if the teacher is there to provide orga-nization, structure, guidance, and rules to play by. And if that’s in place, I’ve really not had a bad experience."
Teachers also gave reasons based on their experience and lack of experience with certain strategies as teachers and as learners. For example, the teacher above mentioned that she liked a certain strategy only if it was implemented well. A particular approach was implemented poorly and so the teacher had since had a negative reaction to it, even though she thought it might be worth-while. A teacher also mentioned that because she had disliked timed activities in mathematics herself that she weighted this low, thinking she did not want to raise students’ affective fi lters by what she perceived to be an uncomfortable situation. A mathematics teacher, in contrast, suggested that regular short timed quizzes could be a positive learning experience if done well and kept brief. Some teachers also expressed a lack of experience with certain strategies, which led them to weight them as neutral or lower than the other strategies.
21NCEO
Strategy Defi nitions and the Process of Weighting
"That’s the problem one for me. I really think that needs to be divided. And I chose 80….I would have gone 100 for explicit vocabulary building and 20 for random recur-rent assessments. I would have done 100 and 20."
The reasons given in this section were usually one-time comments made by teachers. For example, the teacher just quoted did not like the fact that a particular strategy combined two parts, one part which she liked and another part that she did not like (i.e., a strategy for build-ing vocabulary through recurring quizzes). In another instance a teacher mentioned that there were two strategies listed that she frequently used in combination (i.e., a think aloud procedure combined with pre-, during, and post-reading strategies) so had weighted both high even though as independent strategies she may not have. So an opposite, synergistic affect is noted here in contrast to the previous example. One other teacher also mentioned that he had weighted a strategy lower in relationship to where he had already weighted other strategies that he thought were more important, so that some anchoring of previous answers was occurring. This is not mentioned here as a weakness, but rather to note that some teachers were cognizant of the fact that their own weighting was being affected by other strategies in the MACB instrument.
Discussion
The interaction of teachers with a variety of backgrounds and experiences serves several purposes in this study. First, it helps us to know what teachers’ perceptions are regarding the effective-ness of certain strategies with this group of students. Second, bringing together teachers from several disciplines to meet and discuss instructional strategies within the context of a research study encourages staff collaboration within local schools. Third, there is the benefi t in framing the discussion of strategies within the context of standards. By asking participants to weight strategies using examples of Minnesota standards in English, mathematics, and science, set for all students, the sessions help promote these expectations for English language learners with disabilities.
Finally, expert conversations have been convened around the research literature with the purpose of distilling recommended strategies for English language learners with disabilities (Gersten et al., 1998). This study is a complement to that work by investigating what strategies educators perceive to be the most helpful for these students.
Both Stages I and II of the MACB sessions indicated that teachers do not have a common under-standing of what a teaching strategy is. Some teachers considered general approaches or specifi c curriculum packages as strategies. It may be that a lack of demarcation between approach and strategy in the instructional literature contributes to teachers using them interchangeably. This
22 NCEO
occurred despite our giving participants a defi nition of strategy and several examples.
From the data collected, it was unanimous that educators in this study saw reading as the most important content area among reading, mathematics, and science. Strategies weighted the high-est for reading were those that emphasized vocabulary/fl uency, pre-, during, and post-reading strategies, chunking and questioning aloud, and relating reading material to student experiences. For mathematics, the highest weighted strategies were: tactile/concrete experiences, daily re-looping of material, problem solving, and teacher/student think-alouds. The highest weighted strategies for science also included "hands-on" experiences as with math, including emphasis on visuals and modeling for demonstrating, combined with pre-reading strategies. It is interesting that although vocabulary was seen as very important to reading, vocabulary was not rated as
high in science, which also involves reading skills.
Educator weightings for the strategies drawn from the literature were generally not weighted as high as other strategies, except for student and teacher think-alouds, which were weighted highly for mathematics. Instead, some of these strategies (i.e., curriculum based probe and re-ciprocal peer tutoring) were weighted among the least used and the least feasible, which may be related to the lower importance weightings for these strategies by educators. This assertion is likely, as the other strategies that were weighted higher in importance were also weighted more highly in use and feasibility. Further, it was evident that teachers from an ESL/Bilingual background gave less weight to the curriculum based probe strategy than their counterparts in Special Education for reading and mathematics, shown by an average 10 point difference in means between the two teacher types. It may be that teachers’ previous training in their respec-tive fi elds infl uenced their familiarity with this strategy or their thoughts about its effectiveness with English language learners.
Overall, the data showed that teachers tended to be neutral or positive about all strategies, with little variation by teacher type as to what the primary strategies should be across content areas. Most negative reaction to strategies was from individuals, and not a solid group opinion against a specifi c strategy. Also, teachers perhaps gave more weight to strategies that they used frequently.
The "use of native language support," although not a true strategy according to our original defi nition, seemed to be less noticed as a component of useful instruction by most of the teach-ers in our study and was not mentioned as frequently. This may be due to the fact that there was fewer bilingual staff among our participants (9.5%) as shown in our teacher demograph-ics in the method section. It may also be indicative of the fact that Minnesota, as noted in the introductory context at the beginning of this report, does not have a lengthy history of bilingual education programs. Also, the wide variety of background languages represented in Minnesota could curtail teachers’ meaningful consideration of providing bilingual instruction or support due to lack of feasibility.

23NCEO
Teachers’ Reasons for Weighting
Being able to supplement the quantitative results with a description of the rationales for why strategies were chosen by the teachers was particularly benefi cial and interesting in this study
especially by highlighting the points about the context from which teachers came.
Teachers were from different school sites that had different emphases; for example, some teach-ers came from a mathematics/technology magnet school. The limited English profi cient students that these teachers worked with had higher levels of profi ciency perhaps than some of the other sites represented in our sample. Although this section discusses these and other potential infl u-ences on teachers’ weightings, overall teachers consistently appeared to have neutral to high opinions about most of the strategies with little differentiation. This is summed up in a comment made by one of the participants.
"...Too many are too important." MACB Session participant
Most well equipped teachers have diverse instructional strategies in their tool boxes to share
and pass along to their students. Therefore, the numbers of instructional strategies weighted
highly is not too surprising.
In some instances, a strategy may have particular backing from use with the general population or
from research with a sub-population of students, such as those with limited English profi ciency
or with a disability. This is not to say that good strategies for teaching vocabulary do not exist
and that educators should not use them. It may be that research will show that good teaching
really is good teaching across the majority of students. However, to draw a parallel with large
scale assessment development, where representation of diverse students is required to the rea-
sonable extent of the purpose and use of an assessment, it behooves us to extend the same care
in the promotion of instructional strategies for diverse student populations by involving them
in the formation of the conclusions we draw.
Some students may not benefi t from a particular strategy that works well with other students.
One teacher noted that she had taught students with impaired long term memory and would not
have used "randomized vocabulary quizzes" with them because of their lack of ability to recall.
However, it is important to examine the potential effects of this rationale if applied where it is
not appropriate (e.g., basing instructional decisions on a prescribed "setting" or "type" of student
that may underestimate a student’s potential abilities).
24 NCEO
Study Limitations
There are several limitations to this study. Because the study was conducted with the understand-ing that teachers may not have the most recent expert data on strategies, some might perceive the results as being less useful for informing instructional practice. We instead offer these results as a counterpart to previous studies (Gersten et al., 1998) that conducted similar groups with expert panels. This study provides valuable information about current teachers’ thinking about strategy use with this population of students, and the infl uences that shape their decisions.
Further, some teachers were asked to weight strategies for use outside their own content area. This affects our ability to gauge the overall perception of what should work well in contrast to what other teachers perceive to work well experientially. The decision to keep these teachers’ weightings was based on necessity, as there were fewer science teachers who participated in the study, another observed limitation.
Summary
The following list summarizes some of the main points of this study, derived from the quantita-tive weighting data and from the rationales provided by teachers for their weightings.
• All teachers do not have the same understanding of what a strategy is.
• Teachers tended to be neutral or positive about all strategies.
• Use of the native language was not mentioned frequently – teachers may not see it as a strategy.
• The top three strategies chosen for each content area varied little across types of teach-ers. For reading, these were pre-, during, and post-reading strategies; fl uency building; and direct teaching of vocabulary through listening, seeing, reading and writing in short time segments. For mathematics these were tactile, concrete experiences of mathematics, daily re-looping of previously learned material, and problem solving instruction and task analysis strategies. For science, these were hands-on active participation, using visuals, and using pictures to demonstrate steps.
• Teachers tended to weight what they used frequently.
• Curriculum-Based probes or Curriculum Based Measurement seemed to have the widest variability in weighting.
• Teachers were infl uenced by a variety of factors in weighting the effectiveness of strat-

25NCEO
egies, including: Research Data, Setting, Content Area, Individual Student Variables, Personal Experience, and Study Design.
It may be that future strategy research using experimental methods will not only help teach-ers choose the best strategies to fi t the population of students in their classrooms, but also to fi ne tune the implementation of strategies that will work best for students with limited English profi ciency, disabilities, or both.

26 NCEO
References
Gersten, R., Baker, S., & Marks, S. (1998). Teaching English-language learners with learning diffi culties: Guiding principles and examples from research-based practice. Reston, VA: Council for Exceptional Children. (ERIC Document Reproduction Service No. ED427448).
Minnesota Department of Children, Families, and Learning, (February, 2002). LEP Students and Service. Report to the Legislature.
Vanderwood, M., & Erickson, R. (1994). Consensus building. In J. Ysseldyke & M. Thurlow (Eds.) Educational outcomes for students with disabilities (99-113). New York, NY: The Haworth Press, Inc.
Vanderwood, M., Ysseldyke, J., & Thurlow, M. (1993). Consensus building: A process for selecting educational outcomes and indicators (Outcomes and Indicators No. 2). Minneapolis, MN: University of Minnesota, National Center on Educational Outcomes.
Zehler, A., Fleischman, H., Hopstock, P., Pendzick, M., & Stephenson, T. (2003). Descriptive study of services to LEP students and LEP students with disabilities (Special Topic Report #4). Arlington, VA: Development Associates, Inc.

27NCEO
Appendix A
Descriptive Data for Phase I, 30 Teachers
Table 1. Current Job Title of Teachers in Stage 1
Current Job Title No. %
6-8 ESL teacher 6 20.0
K-5 Special Education 1 3.3
6-8 Special Education 7 23.3
9-12 Bilingual Education 1 3.3
6-8 General Education 13 43.3
Other 2 6.7
Table 2. Years in Current Job Employment for Teachers in Stage I
Year(s) of Current Job Employment No. %
Less than one year 2 6.7
1-5 years 16 53.3
5-10 years 6 20.0
More than 10 years 6 20.0
Table 3. Professional Experience of Teachers in Stage I
Professional Experience No. %
Less than one year 1 3.3
1-5 years 7 23.3
5-10 years 3 10.0
More than 10 years 18 60.0
Figure 1. Languages Used by Students of Teachers in Stage 1
0
5
10
15
20
25
30
Cambodian Hmong Lao Spanish Somali Other
Number of educators who
reported teaching students
speaking these languages

28 NCEO
29NCEO
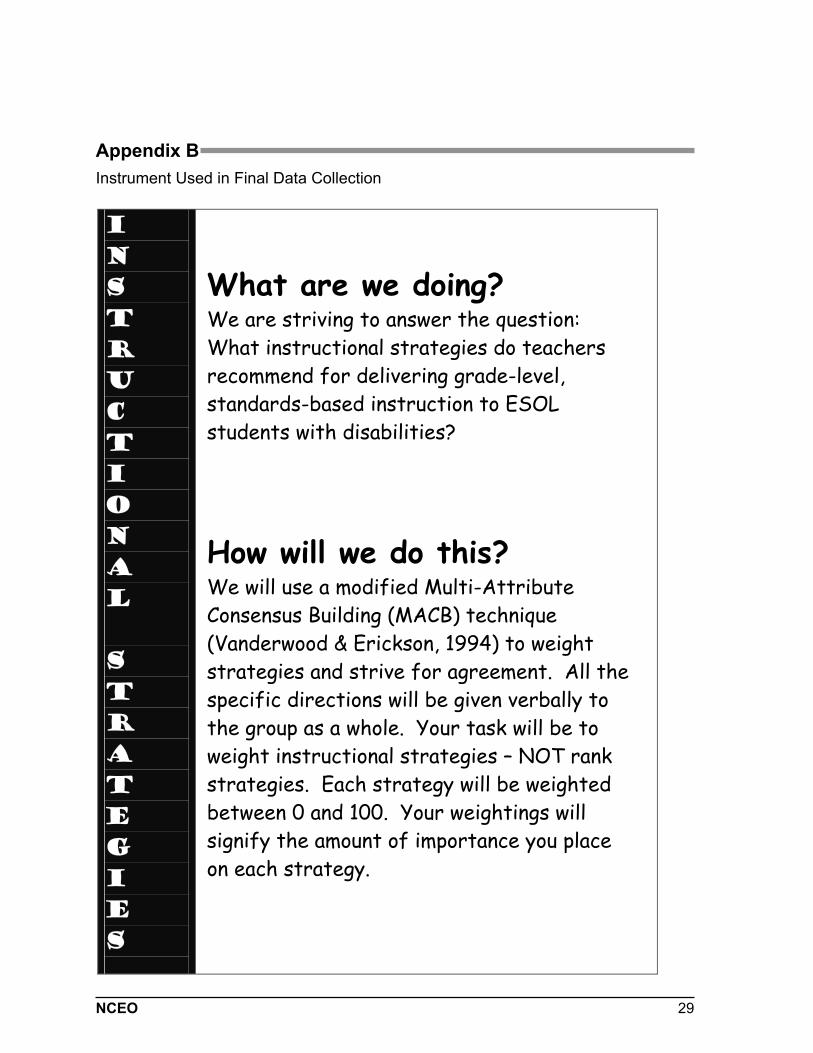
Appendix B
Instrument Used in Final Data Collection
I
N
S
T
R
U
C
T
I
O
N
A
L
S
T
R
A
T
E
G
I
E
S
What are we doing? We are striving to answer the question:
What instructional strategies do teachers
recommend for delivering grade-level,
standards-based instruction to ESOL
students with disabilities?
How will we do this? We will use a modified Multi-Attribute
Consensus Building (MACB) technique
(Vanderwood & Erickson, 1994) to weight
strategies and strive for agreement. All the
specific directions will be given verbally to
the group as a whole. Your task will be to
weight instructional strategies – NOT rank
strategies. Each strategy will be weighted
between 0 and 100. Your weightings will
signify the amount of importance you place
on each strategy.

30 NCEO
In order to have a common understanding of what the different weightings mean,
use the following scale.
Weighting Scale
0-20 Very Unimportant
21-40 Unimportant
41-60 Neither important Nor Unimportant
61-80 Important
81-100 Very Important
Shown on a continuum, the weighting scale looks like this:
Very
Neither
Important
Nor Very
Unimportant Unimportant Unimportant Important Important
0 20 40 60 80 100
For example:
Staying warm in Minnesota
Weighting Strategy
1. ________85_______
2. ________100______
3. ________85_______
1. Wear a hat
2. Dress in layers
3. Wear good boots
Thank you for your contribution to this project. Your input is critical to the success
of our research and ultimately to the instruction of ESOL students with disabilities.
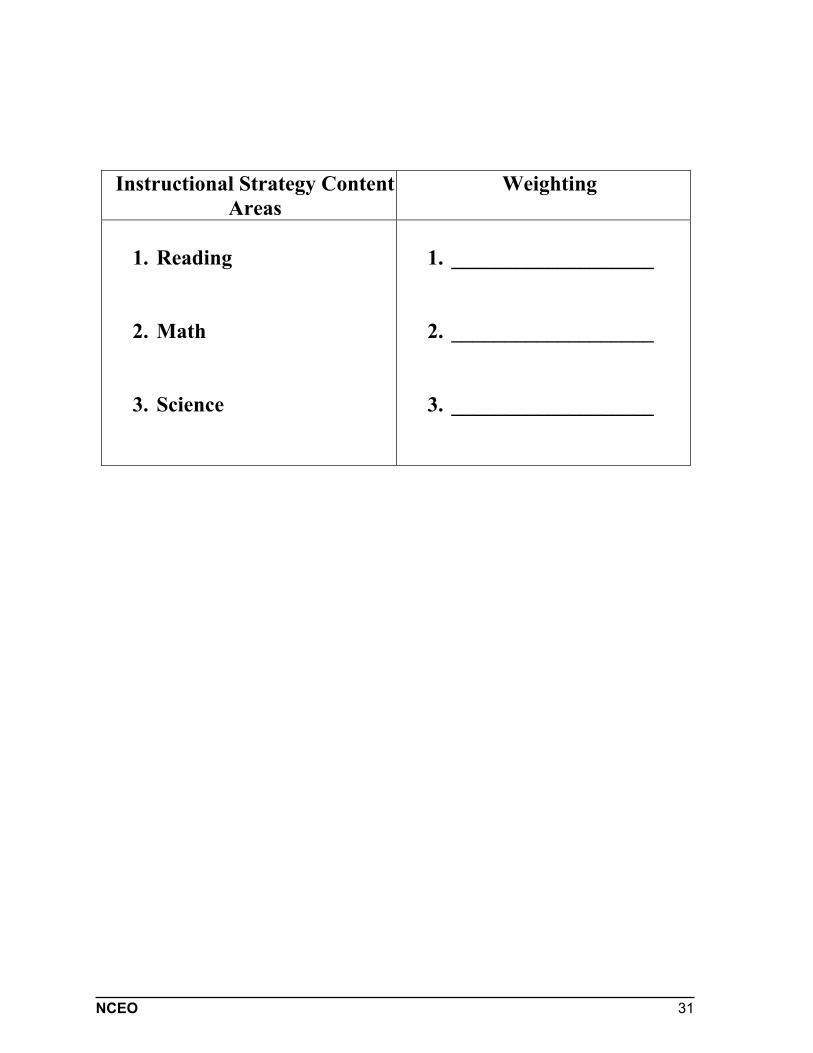
31NCEO
Instructional Strategy Content
Areas
Weighting
1. Reading
2. Math
3. Science
1. ___________________
2. ___________________
3. ___________________

32 NCEO
Reading Sample Standards:
A. Interpreting and evaluating age-appropriate nonfiction and fiction selections.
B. Comprehending information from nonfiction selections that address abstract or
complex ideas.
C. Demonstrating the ability to comprehend, interpret, and evaluate information in
fictional reading, listening, and viewing.
Weighting Instructional Strategies
1. ______ 1.Use of organized pre-assessment strategies (e.g., KWL)
2. ______ 2.Graphic organizers such as semantic mapping, story maps, concept maps
3. ______ 3.Cooperative Learning
4. ______ 4. Directly teach vocabulary through listening, seeing, reading and writing in
short time segments
5. ______ 5. Specific informal assessments based on curriculum (Curriculum Based Probe)
6. ______ 6. Recurrent, random vocabulary assessment
7. ______ 7. Tactile vocabulary development steps
8. ______ 8. Practicing paraphrasing and retelling strategies
9. ______ 9. Relate reading to student experiences
10. ______ 10. Teach and use mnemonics
11. ______ 11. Combine kinesthetic and phonemic awareness
12. ______ 12. Think Aloud used with reading
13. ______ 13. Prediction
14. ______ 14. Visualization of story (draw scene, plot, etc.)
15. ______ 15. Teaching pre-, during-, and post- reading strategies
16. ______ 16. Fluency building (high frequency words)

33NCEO
Reading (cont’d) Sample Standards:
A. Interpreting and evaluating age-appropriate nonfiction and fiction selections.
B. Comprehending information from nonfiction selections that address abstract or
complex ideas.
C. Demonstrating the ability to comprehend, interpret, and evaluate information in
fictional reading, listening, and viewing.
Weighting Instructional Strategies
17. ______ 17. Acting out story
18. ______ 18. Journal of the senses
19. ______ 19. Literature circle/Book club/Small group guided discussion
20. ______ 20. Individual conferencing with teacher
21. ______ 21. Oral sharing on related topic
22. ______ 22. Partner reading
23. ______ 23. Using book on tape as support
24. ______ 24. Use of decodable text
25. ______ 25. Explicit teaching of text structure
26. ______ 26. Repeated reading
27. ______ 27. Picture word replacement – use of visuals for words
28. ______ 28. Chunking and questioning aloud (reading mastery)

34 NCEO
Mathematics Sample Standards:
A. Describing and analyzing two and three dimensional shapes using appropriate units and measures.
B. Demonstrating an understanding of how and when to use number sense and
estimation skills.
C. Demonstrating an understanding of how to use ideas of chance and data handling
and display information in charts and graphs.
Weighting Instructional strategies
1. ______ 1. Specific informal assessments based on curriculum (Curriculum Based Probe)
2. ______ 2. Reciprocal Peer Tutoring (RPT) to improve math achievement
3. ______ 3. Graphic organizers such as semantic mapping and concept mapping in word
problems.
4. ______ 4. Improving math performance with explicit timing
5. ______ 5. Teacher “think alouds”
6. ______ 6. Tactile, concrete experiences of math
7. ______ 7. Explicit vocabulary building and random, recurrent assessments
8. ______ 8. Daily re-looping of previously learned material
9. ______ 9. Problem solving instruction and task analysis strategies
10. ______ 10. Monitoring of progress through group and individual achievement awareness
charts
11. _____ 11. Model-lead-test strategy instruction (MLT)
12. _____ 12. Ecological approach/generate data from real life experiences to use in class
13. _____ 13. Students generate word problems
14. _____ 14. Response journal
15. _____ 15. Use of native language support
16. _____ 16. Student developed glossary
17. _____ 17. Adjusted speech

35NCEO
Mathematics (cont’d) Sample Standards:
A. Describing and analyzing two and three dimensional shapes using appropriate
units and measures.
B. Demonstrating an understanding of how and when to use number sense and
estimation skills.
C. Demonstrating an understanding of how to use ideas of chance and data handling
and display information in charts and graphs.
Weighting Instructional strategies
18. ______ 18. Student “think aloud”
19. ______ 19. Reinforcing math skills through games
20. ______ 20. Accelerated or individualized math

36 NCEO
ScienceSample Standards:
A. Demonstrating a knowledge of interactions and interdependence of living systems
by understanding the human body, plants, animals, and microorganisms, and the
dynamic effect of humans interacting with the environment.
B. Demonstrating understanding of earth systems, including the geosphere,
hydrosphere, and atmosphere.
C. Demonstrating and understanding of the fundamental laws and concepts of the
physical world including properties of matter, physical and chemical changes,
transfer of energy, and force and motion.
Weighting Instructional strategies
1. ______ 1. Specific informal assessments based on curriculum (Curriculum Based Probe -
reading)
2. ______ 2. Graphic organizers such as semantic and conceptual mapping.
3. ______ 3. Peer tutoring
4. ______ 4. Use short segments (5 min) to directly teach vocabulary through listening, seeing,
reading, and writing
5. ______ 5. Using Response cards during instruction in response to teacher questions or in
general
6. ______ 6. Hands-on, active participation
7. ______ 7. Cooperative learning (high with low grouping)
8. ______ 8. Pre-teach the organization of the text/unit organizers
9. ______ 9. Modeling/Teacher demonstration
10. ______ 10. Using visuals
11. _____ 11. Pre-teach vocabulary
12. _____ 12. Using pre-reading strategies in content areas
13. _____ 13. Summarize what was learned at end of each lesson (ex: journal summary)
14. _____ 14. Cross-disciplinary teaching on themes
15. _____ 15. Teaching how to pick out main idea of the text and justify
16. _____ 16. Use of simplified texts
17. _____ 17. Use pictures to demonstrate steps
37NCEO
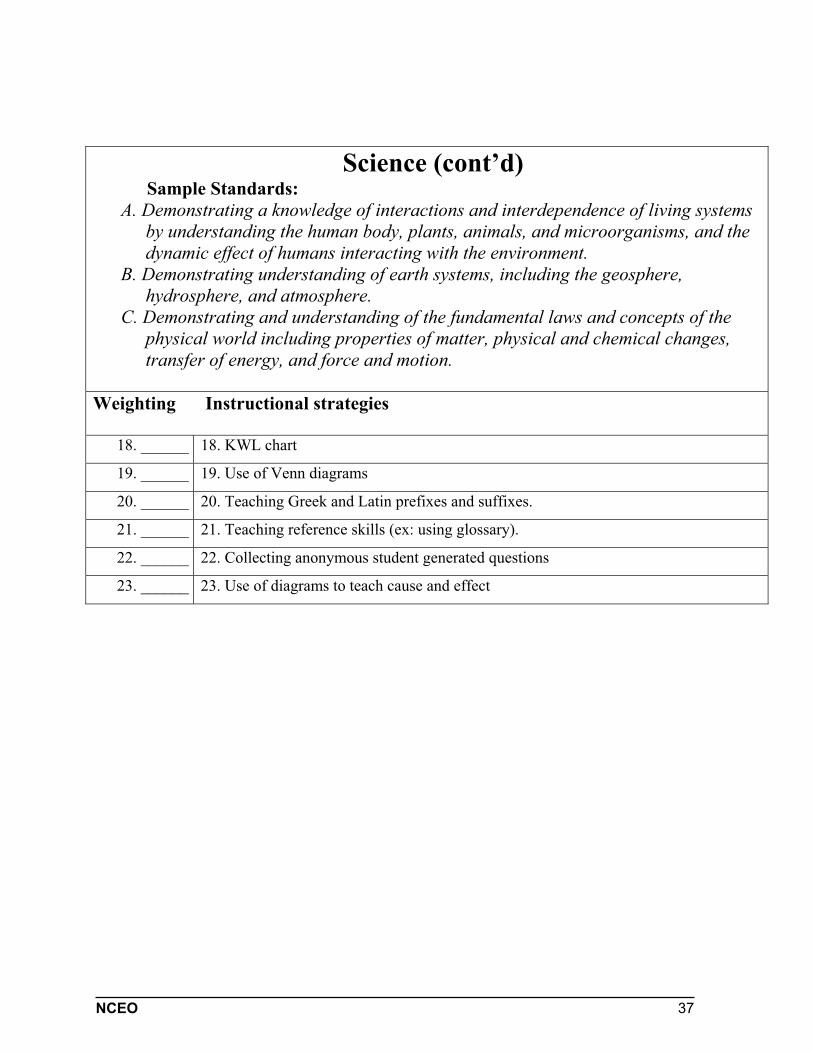
Science (cont’d) Sample Standards:
A. Demonstrating a knowledge of interactions and interdependence of living systems
by understanding the human body, plants, animals, and microorganisms, and the
dynamic effect of humans interacting with the environment.
B. Demonstrating understanding of earth systems, including the geosphere,
hydrosphere, and atmosphere.
C. Demonstrating and understanding of the fundamental laws and concepts of the
physical world including properties of matter, physical and chemical changes,
transfer of energy, and force and motion.
Weighting Instructional strategies
18. ______ 18. KWL chart
19. ______ 19. Use of Venn diagrams
20. ______ 20. Teaching Greek and Latin prefixes and suffixes.
21. ______ 21. Teaching reference skills (ex: using glossary).
22. ______ 22. Collecting anonymous student generated questions
23. ______ 23. Use of diagrams to teach cause and effect

38 NCEO
Some sources used in the development of this instrument:
Celce-Murcia, M. (Ed.). Teaching English as a second or foreign language. 3rd Ed. Boston: Heinle & Heinle.
Chamot, A.U., & O’Malley, J.M. (1994). The CALLA handbook: Implementing the cognitive academic language learning approach. New York: Addison-Wesley.
Vanderwood, M.L., & Erickson, R. (1994). Consensus building. Special Services in the Schools, 9 (2), 99-113.

39NCEO
Appendix C
Glossary of Strategies
MACB Glossary
Accelerated or individualized math: A system of having students work at different levels individually in one classroom. They progress by passing tests for each unit and move at their own pace.
Acting out a story: Having the students act out a part of a story. Using physical movement to demonstrate and improve comprehension of the story. Could also be used on a smaller scale with puppets, etc. but includes physical movement of some sort.
Adjusted speech: Teacher changes speech patterns to increase student comprehension. Includes facing the students, paraphrasing often, clearly indicating most important ideas, limiting asides, etc.
Book on tape: Using books on tape to enhance reading development in some way. Having students use the tapes to go over the story after partner reading, to make sure they have not missed a vocabulary word, etc.
Chunking and questioning aloud: The process of reading a story aloud to a group of students and stopping after certain blocks of text to ask the students specifi c questions about their com-prehension of the story and some key features of the text.
Collecting anonymous student generated questions: During, or at the end of a lesson, have students write any questions that they might have on a card. Collect the cards and answer the questions without identifying a student. Students might be more willing to ask questions they have anonymously, instead of in front of their peers.
Combine kinesthetic and phonemic awareness: Associating different movements with pho-nemes in order to anchor sounds during practice drills in order to build phonemic awareness and remembering of sounds by the students.
Cooperative learning: A range of team based learning approaches where students work together to complete a task.
Cross-disciplinary teaching on themes: Teaching similar vocabulary and themes in different classes (e.g., doing a reading on wolves in reading class while doing a unit on wolves in biol-ogy class).
Curriculum-based math probes: Having students solve 2-3 sheets of problems in a set amount

40 NCEO
of time assessing the same skill. Teacher counts the number of correctly written digits, fi nds the median correct digits per minute and then determines whether the student is at frustration, instructional, or mastery level.
Curriculum based oral reading probe: Having students read aloud three basal reader passages for 1 minute. Teacher marks the place where the student stops and then asks comprehension questions and continues to give probes until students reach frustration level as defi ned by read-ing rate and median score.
Daily re-looping of previously learned material: A process of always bringing in previously learned material to build on each day so that students have a base knowledge to start with and so that learned structures are constantly reinforced.
Decodable text: Using readings that contain only words the students can decode and build on that. Decoding is the ability to translate a word from print to speech, usually by employ-ing knowledge of sound-symbol correspondences; also, the act of deciphering a new word by sounding it out.
Directly teach vocabulary through short time segments: Teach vocabulary directly through listening, speaking, reading, and writing each used in short blocks of time. Students are exposed to vocabulary in different ways and movement of activities helps hold attention.
Ecological approach: Involves all aspects of a child’s life, including classroom, family, neigh-borhood, and community, in teaching the child useful life and educational skills.
Explicit timing: Timing math seatwork in 30-minute trials that are used to help students become more automatic in math facts and more profi cient in solving problems. Teacher compares cor-rect problem per minute rate. Used to recycle materials and concepts.
Explicit teaching of text structure: Teaching the parts of different types of text and making sure students understand the text structure before reading. This would include basics such as text in English is read from left to right, and also more sophisticated structures such as the structure of a fairy tale.
Explicit vocabulary building through random recurrent assessments: Using brief assess-ments to help students build basic subject-specifi c vocabulary and also gauge student retention of subject-specifi c vocabulary.
Fluency building: Helping students build fl uency in frequently occurring words through short assessments and exercises that give increased exposure to high-frequency words.
Graphic organizers: Visual displays to organize information into things like trees, fl owcharts,

41NCEO
webs, etc. They help students to consolidate information into meaningful whole and they are used to improve comprehension of stories, organization of writing, and understanding of dif-fi cult concepts in word problems.
Hands-on, active participation: Designing activities so that students are actively involved in the project or experiment. Hands-on participation is as important as verbal participation in the activity.
Individual conferencing: Listening to a student read, talking about a book, reading every other paragraph, one-on-one during independent reading time. Time to bond with a student. Oppor-tunity to record informal assessments about a student’s progress in reading.
Journal of the senses: Having students write down in an informal way (possibly even a form to fi ll in) what they imagine the characters in a story would see, smell, hear, taste, and feel at a certain point in the story.
K-W-L: Know, want to know, learned, routine. A form of self-monitoring where students are taught to list what they know already about a subject, what they want to know, and later what they learned.
Literature circles/book club/small group guided discussion: Students discuss portions of books in a small group. Sometimes roles are assigned for group interaction. Students at varying levels are able to share different points about the book.
Mnemonics: Association techniques used to help students remember some aspect of reading. For example: Associating a list of irregular verbs with each of the letters in a familiar name.
Model-lead-test strategy instruction (MLT): Three stage process for teaching students to in-dependently use learning strategies: (1) teacher models correct use of strategy, (2) teacher leads students to practice correct use, and (3) teacher tests’ students’ independent use of it. Once stu-dents attain a score of 80% correct on two consecutive tests, instruction on the strategy stops.
Modeling/teacher demonstration: Teacher demonstrates how to do a lab or experiment before having the students try it on their own.
Monitoring of progress through group and individual achievement awareness charts: Us-ing charts to build awareness and motivation of progress for students. The emphasis here is on progress so even students working at different levels can chart signifi cant gains.
Native language support/instruction: Providing auditory or written content input to students in their native language.

42 NCEO
Oral sharing on a related topic: Students share their written or prepared responses with the class so that students can share their answers to prompts with the class, but have had time to prepare them.
Paraphrasing: Working on specifi c skills to orally retell or summarize what happened in a story.
Partner reading: Having students work together in pairs to read a text to each other and dis-cover the main ideas of the story.
Peer tutoring: Having students working in pairs with one student tutoring the other student on a particular concept.
Picture word: Replacing key vocabulary words of a text with pictures and then adding the words back in, and also bringing in visuals of key vocabulary words in a text.
Pictures to demonstrate steps: Using a series of pictures to demonstrate the steps in a project or experiment so that students get a visual image of what they need to do.
Prediction: Having students predict what is going to happen in a story based on a title, headline, illustration, or initial sentence/paragraph.
Pre-reading strategies: Giving overview of unit, previewing main ideas, connecting subject to the background knowledge of the students, etc.
Pre-teach vocabulary: Teaching key vocabulary words prior to working with the lesson or unit.
Pre-teaching the organization of the text/unit organizers: Pointing out and getting students to discover the different parts of the text that can be used in learning: captions, headings, etc. Also familiarizing the students with the layout of the text, glossary, etc., beforehand.
Problem solving instruction: Explicit instruction in the steps to solving a mathematical or science problem including understanding the question, identifying relevant and irrelevant in-formation, choosing a plan to solve the problem, solving it, and checking answers.
Reciprocal peer tutoring (RPT) to improve math achievement: Having students pair, choose a team goal to work toward, tutor each other on math problems, and then individually work a sheet of drill problems. Students get points for correct problems and work toward a goal.
Recurrent, random vocabulary assessment: Recycling vocabulary words that have been dis-cussed in class and randomly choosing words from this list to have random assessments on so
43NCEO
as to reinforce the already "learned" vocabulary words.
Reference skills: Teaching students how to use reference items, dictionary, glossary, etc. for a certain type of text (like science).
Reinforcing math skills through games: Using games to follow-up a lesson in order to rein-force learned skills and use the skills in another context.
Relate reading to student’s experiences: Having students talk about connections in the reading to their own experiences. Sharing in a large group or small group setting. Using group experi-ences to better understand reading.
Repeated readings: The method of having students read passages orally three times in a row and each time try to achieve a faster speed and fewer disfl uencies. If comprehension is being targeted, students answer some different comprehension questions after each reading or retell the story.
Response cards: Having students write brief answers to teacher questions on cards. Teacher asks a question and all students hold up cards. Teacher can scan answers of all students for understanding. Sometimes cards just have "yes" or "no" on them and can also be prepared by the teacher.
Response journal: Students record in a journal what they learned that day or strategies they learned or questions they have. Students can share their ideas in the class, with partners, and with the teacher.
Retelling: Students verbally rehearse important story information by retelling a story to a partner, using an outline. The outline guides them to pick out important ideas and back them up with supporting information.
Simplifi ed text: Using science texts that have simplifi ed language for ELL students.
Student developed glossary: Students keep track of key content and concept words and defi ne them in a log or series of worksheets that they keep with their text to refer to.
Students generate word problems: Have students create word problems for a specifi c math skill. Through the construction of a problem the students learn what to look for when solving word problems they are assigned.
Summarize lesson: Have a summarizing activity as to what was learned in each lesson (e.g., having students summarize in their journals what was learned each day).

44 NCEO
Tactile, concrete experiences in math: Using three dimensional objects in math instruction such as geometrical shapes, coins, or blocks used to form various geometrical shapes.
Tactile vocabulary development steps: Using three-dimensional or tactile objects to help in developing students’ abilities to write words and letters. For example, writing letters in sand or tracing wood block letters.
Teaching pre-, during, and post-reading strategies: Teaching students reading strategies that they can use on their own when reading a text. Practicing these strategies in class as a group or in small groups.
Teaching Greek and Latin prefi xes and suffi xes: Teaching prefi xes and suffi xes since students will encounter them often, especially in with science content vocabulary.
Teaching main idea: Teaching students how to pick out the main idea of a paragraph or read-ing and explain why it is the main idea. Done as a class or in small groups to build consensus of what the main idea is.
Think-alouds: Using explicit explanations of the steps of problem solving through teacher modeling metacognitive thought. For example: Reading a story aloud and stopping at points to think aloud about reading strategies/processes or, in math, demonstrating the thought process used in problem solving.
Use of diagrams to teach cause and effect: Using diagrams (e.g., fi shbone diagrams) to dem-onstrate the relationship of cause and effect.
Use short segments to teach vocabulary: Teaching specifi c science vocabulary for a short period before a lesson through listening, seeing, reading, and writing.
Using visuals: Bringing two or three dimensional visuals into the classroom to enhance teacher instruction in the content area.
Visualization: Having the students draw a scene of a story, the plot, etc. to demonstrate student comprehension of the story or to have students organize ideas. May encourage students who have strong artistic talent, but emerging reading skills.
Venn Diagram: Use of a Venn diagram (interconnected circles) to demonstrate how different subjects or topics overlap and how they are unique.

45NCEO
Some of the strategies listed in this glossary were taken from the following references, others were suggested in previous MACB groups.
References:
Celce-Murcia, M. (Ed.). Teaching English as a second or foreign language. 3rd Ed. Boston: Heinle & Heinle.
Chamot, A.U., & O’Malley, J.M. (1994). The CALLA handbook: Implementing the cognitive academic language learning approach. New York: Addison-Wesley.
ERIC Digest. (1993). Teaching limited English profi cient students to understand and use mathematics. ERIC DIGEST 70. (EDO-UD-91-0). Document accessed on the Web: http:// eric.web.tc.Columbia.edu/digests/dig70.html on February 23, 2001.
Laturnau, J. (2001, June). Standards-based instruction for English language learners. PREL Briefi ng Paper (PB0102). Honolulu, HI: Pacifi c Resources for Education and Learning.
Meyen, E.L., Vergason, G.A., & Whelan, R.J. (1996). Strategies for teaching exceptional chil-dren in inclusive settings. Denver: Love Publishing Co.
Rathwon, N. (1999). Effective school interventions: strategies for enhancing academic achieve-ment and social competence. New York: The Guilford Press NYC.
Smith, T. et al. (1995). Teaching children with special needs in inclusive settings. Needham Heights: Allyn and Bacon.

46 NCEO

47NCEO
Appendix D
Data Used in the Analysis
Table 1. Content Areas
Content Area Minimum Score Maximum Score Standard Deviation Mean
Reading 100.00 100.00 .0000 100.0000Mathematics 70.00 100.00 8.0562 90.6905Science 50.00 100.00 11.2117 78.8333
Table 2. Reading Strategies
Teaching Strategy Minimum Score
Maximum Score
Standard Deviation
Mean
1.Use of organized pre-assessment strategies (e.g., KWL)
40.00 100.00 16.6224 79.4762
2.Graphic organizers such as semantic mapping, story maps, concept maps
50.00 100.00 13.4404 83.1190
3.Cooperative Learning .00 100.00 24.4118 71.66674. Directly teach vocabulary through listening, seeing, reading and writing in short time segments
60.00 100.00 10.2297 90.4762
5. Specifi c informal assessments based on curriculum (Curriculum Based Probe)
.00 100.00 27.6205 65.7143
6. Recurrent, random vocabulary assessment
30.00 100.00 16.7475 69.0952
7. Tactile vocabulary development steps .00 100.00 24.6972 62.40488. Practicing paraphrasing and retelling strategies
50.00 100.00 11.8327 85.4762
9. Relate reading to student experiences 60.00 100.00 10.9588 88.047610. Teach and use mnemonics 10.00 95.00 19.0586 67.881011. Combine kinesthetic and phonemic awareness
10.00 100.00 23.3461 67.2857
12. Think Aloud used with reading 60.00 100.00 12.2751 82.833313. Prediction 40.00 100.00 14.2368 82.261914. Visualization of story (draw scene, plot, etc.)
40.00 100.00 14.7886 84.0714
15. Teaching pre-, during-, and post- reading strategies
70.00 100.00 8.4195 93.8810
16. Fluency building (high frequency words)
60.00 100.00 9.5583 90.8333
17. Acting out story 5.00 100.00 20.6587 66.595218. Journal of the senses 5.00 100.00 18.2183 66.738119. Literature circle/Book club/Small group guided discussion
35.00 100.00 18.9701 74.5000

48 NCEO
Teaching Strategy Minimum Score
Maximum Score
Standard Deviation
Mean
20. Individual conferencing with teacher 50.00 100.00 13.2189 82.428621. Oral sharing on related topic 10.00 100.00 21.1615 74.404822. Partner reading 40.00 100.00 15.8837 76.619023. Using book on tape as support 20.00 100.00 20.2926 71.666724. Use of decodable text .00 100.00 22.7791 74.881025. Explicit teaching of text structure 40.00 100.00 19.4778 78.071426. Repeated reading 40.00 100.00 17.6412 78.761927. Picture word replacement – use of visuals for words
.00 100.00 22.3834 72.9048
28. Chunking and questioning aloud (reading mastery)
40.00 100.00 14.6432 87.6667
Table 3. Mathematics Strategies
Teaching Strategy Minimum Score
Maximum Score
Standard Deviation
Mean
1. Specifi c informal assessments based on curriculum (Curriculum Based Probe)
.00 100.00 26.3021 71.5854
2. Reciprocal Peer Tutoring (RPT) to improve mathematics achievement
50.00 100.00 13.5315 74.5610
3. Graphic organizers such as semantic mapping and concept mapping in word problems
40.00 100.00 15.5361 82.6829
4. Improving mathematics performance with explicit timing
20.00 100.00 20.5606 60.6341
5. Teacher “think-alouds” 40.00 100.00 16.5107 87.43906. Tactile, concrete experiences of mathematics
50.00 100.00 10.6432 93.8537
7. Explicit vocabulary building and random, recurrent assessments
50.00 100.00 12.8009 82.2927
8. Daily re-looping of previously learned material
50.00 100.00 11.4551 92.9268
9. Problem solving instruction and task analysis strategies
50.00 100.00 10.4709 92.9024
10. Monitoring of progress through group and individual achievement awareness charts
20.00 100.00 21.0690 67.4390
11. Model-lead-test strategy instruction (MLT)
25.00 100.00 20.7278 80.0976
12. Ecological approach/generate data from real life experiences to use in class
50.00 100.00 15.9834 85.0732

49NCEO
Teaching Strategy Minimum Score
Maximum Score
Standard Deviation
Mean
13. Students generate word problems
30.00 100.00 21.9632 67.3415
14. Response journal 10.00 100.00 23.0233 59.024415. Use of native language support 50.00 100.00 15.4288 86.585416. Student developed glossary 50.00 100.00 14.6108 84.780517. Adjusted speech 50.00 100.00 14.5375 84.902418. Student “think-alouds” 50.00 100.00 14.0174 86.634119. Reinforcing mathematics skills through games
50.00 100.00 14.9919 84.5122
20. Accelerated or individualized mathematics
50.00 100.00 15.1426 84.5854
Table 4. Science Strategies
Teaching Strategy Minimum Score
Maximum Score
Standard Deviation
Mean
1. Specifi c informal assessments based on curriculum (Curriculum Based Probe - reading)
.00 100.00 30.1207 63.5517
2. Graphic organizers such as semantic and conceptual mapping
60.00 100.00 11.3335 89.6552
3. Peer tutoring 50.00 100.00 16.3101 80.34484. Use short segments (5 min) to directly teach vocabulary through listening, seeing, reading, and writing
60.00 100.00 12.2594 88.3103
5. Using response cards during instruction in response to teacher questions or in general
40.00 100.00 16.5825 72.1379
6. Hands-on, active participation 90.00 100.00 2.0463 99.48287. Cooperative learning (high with low grouping)
25.00 100.00 18.7510 86.3793
8. Pre-teach the organization of the text/unit organizers
50.00 100.00 13.3910 87.9655
9. Modeling/Teacher demonstration 70.00 100.00 8.4488 93.896610. Using visuals 80.00 100.00 4.5350 97.931011. Pre-teach vocabulary 50.00 100.00 11.3661 90.517212. Using pre-reading strategies in content areas
80.00 100.00 7.1231 93.1034
13. Summarize what was learned at end of each lesson (ex: journal summary)
70.00 100.00 9.7372 90.2069
14. Cross-disciplinary teaching on themes
50.00 100.00 12.9155 86.8966

50 NCEO
Teaching Strategy Minimum Score
Maximum Score
Standard Deviation
Mean
15. Teaching how to pick out main idea of the text and justify
50.00 100.00 12.7741 88.9655
16. Use of simplifi ed texts 30.00 100.00 17.8233 89.793117. Using pictures to demonstrate steps
90.00 100.00 4.1449 97.5862
18. KWL chart 50.00 100.00 14.1044 83.827619. Use of Venn diagrams 35.00 100.00 18.3972 80.206920. Teaching Greek and Latin prefi xes and suffi xes
20.00 100.00 20.4320 74.4138
21. Teaching reference skills (ex: using glossary)
50.00 100.00 15.4783 88.3103
22. Collecting anonymous student generated questions
30.00 100.00 19.5094 74.7586
23. Use of diagrams to teach cause and effect
30.00 100.00 15.5221 87.3103

51NCEO
How often do you USE this strategy? (please circle one)
Instructional Strategies How FEASIBLE is this strategy? (Please circle one)
Never Some Often Always1. Use of organized pre-assessment strategies (e.g., KWL)
Low Somewhat Low
Somewhat High
High
Never Some Often Always2. Graphic organizers such as semantic mapping, story maps, concept maps
Low Somewhat Low
Somewhat High
High
Never Some Often Always3. Cooperative Learning Low Somewhat
LowSomewhat High
High
Never Some Often Always4. Directly teach vocabulary through listening, seeing, reading and writing in short time segments
Low Somewhat Low
Somewhat High
High
Never Some Often Always5. Specifi c informal assessments based on curriculum (Curriculum Based Probe)
Low Somewhat Low
Somewhat High
High
Never Some Often Always6. Recurrent, random assessments of vocabulary words
Low Somewhat Low
Somewhat High
High
Never Some Often Always7. Tactile vocabulary development steps
Low Somewhat Low
Somewhat High
High
Never Some Often Always8. Paraphrasing strategies – oral and written
Low Somewhat Low
Somewhat High
High
Never Some Often Always9. Relate self to reading Low Somewhat
LowSomewhat High
High
Never Some Often Always10. Teach and use mnemonics Low Somewhat
LowSomewhat High
High
Never Some Often Always11. Ensure kinesthetic/phonemic awareness
Low Somewhat Low
Somewhat High
High
Never Some Often Always12. Think aloud Low Somewhat
LowSomewhat High
High
Never Some Often Always13. Prediction Low Somewhat
LowSomewhat High
High
Never Some Often Always14. Visualization of story (draw scene, plot, etc.)
Low Somewhat Low
Somewhat High
High
Appendix E
(Sample Page of Content Area Survey for Reading)

52 NCEO

53NCEO
Appendix F
Use and Feasibility Data
Use: Reading
Strategy Never Some Often Always
N % N % N % N %
1. Use of organized pre-assessment
strategies
2 6.9 15 51.7 7 24.1 5 17.2
2. Graphic organizers 2 6.9 8 27.6 13 44.8 6 20.7
3. Cooperative Learning 4 13.8 8 27.6 16 55.2 1 3.4
4. Directly teaching vocabulary 3 10.3 6 20.7 9 31.0 11 37.9
5. Curriculum based probe 10 34.5 9 31.0 7 24.1 3 10.3
6. Recurrent, random vocabulary
assessment
6 20.7 11 37.9 10 34.5 2 6.9
7. Tactile vocabulary development steps 12 41.4 11 37.9 5 17.2 1 3.4
8. Practicing paraphrasing and retelling
strategies
3 10.3 5 17.2 9 31.0 12 41.4
9. Relate reading to student experiences 2 6.9 3 10.3 13 44.8 11 37.9
10. Teach and use mnemonics 9 31.0 13 44.8 6 20.7 1 3.4
11. Combine kinesthetic and phonemic
awareness
9 31.0 10 34.5 8 27.6 2 6.9
12. Think aloud used with reading 2 6.9 8 27.6 13 44.8 6 20.7
13. Prediction 2 6.9 10 34.5 9 31.0 8 27.6
14. Visualization of story (draw scene,
plot, etc.)
4 13.8 8 27.6 12 41.4 5 17.2
15. Teaching pre-, during, and post-
reading strategies
2 6.9 2 6.9 9 31.0 16 55.2
16. Fluency building (high frequency
words)
4 13.8 5 17.2 8 27.6 12 41.4
17. Acting out story 11 37.9 14 48.3 4 13.8 0 0
18. Journal of senses 14 48.3 10 34.5 5 17.2 0 0
19. Literature circle/Book club/small
group guided discussion
7 24.1 9 31.0 11 37.9 2 6.9
20. Individual conferencing with teacher 3 10.3 14 48.3 8 27.6 4 13.8
21. Oral sharing on related topic 3 10.3 6 20.7 13 44.8 7 24.1
22. Partner reading 4 13.8 11 37.9 11 37.9 3 10.3
23. Using book on tape as support 13 44.8 8 27.6 7 24.1 1 3.4
24. Use of decodable text 8 27.6 5 17.2 11 37.9 5 17.2
25. Explicit timing of text structure 3 10.3 12 41.4 7 24.1 7 24.1
26. Repeated reading 3 10.3 14 48.3 8 27.6 4 13.8
27. Picture word replacement-use of
visuals for words
11 37.9 7 24.1 9 31.0 2 6.9
28. Chunking and questioning aloud 2 6.9 10 34.5 8 27.6 9 31.0

54 NCEO
Use: Math
Strategy Never Some Often Always
N % N % N % N %
1. Curriculum based probe 14 48.3 7 24.1 7 24.1 1 3.42. Reciprocal peer tutoring 17 58.6 7 24.1 4 13.8 1 3.43. Graphic organizer 12 41.4 8 27.6 5 17.2 4 13.84. Improving math performance with
explicit timing
17 58.6 9 31.0 1 3.4 2 6.9
5. Teacher “think-alouds” 9 31.0 5 17.2 8 27.6 7 24.1
6. Tactile, concrete experiences with math 14 48.3 4 13.8 5 17.2 6 20.7
7. Explicit vocabulary building and random,
recurrent assessments
11 37.9 7 24.1 7 24.1 4 13.8
8. Daily re-looping of previously learned
material
9 31.0 4 13.8 6 20.7 10 34.5
9. Problem solving instruction and task
analysis strategies
10 34.5 4 13.8 6 20.7 9 31.0
10. Monitoring of progress through group
and individual achievement awareness
charts
13 44.8 7 24.1 4 13.8 5 17.2
11. Model-lead-test strategy instruction
(MLT)
14 48.3 4 13.8 4 13.8 7 24.1
12. Ecological approach/generate data
from real life experiences to use in class
9 31.0 4 13.8 10 34.5 6 20.7
13. Students generate word problems 15 51.7 9 31.0 2 6.9 3 10.3
14. Response journal 16 55.2 5 17.2 4 13.8 4 13.8
15. Use of native language support 18 62.1 4 13.8 2 6.9 5 17.2
16. Student developed glossary 13 44.8 5 17.2 8 27.6 3 10.3
17. Adjusted speech 8 27.6 1 3.4 10 34.5 10 34.5
18. Student “think aloud” 8 27.6 8 27.6 8 27.6 5 17.2
19. Reinforcing math skills through games 12 41.4 5 17.2 6 20.7 6 20.7
20. Accelerated or individualized math 16 55.2 5 17.2 5 17.2 3 10.3

55NCEO
Use: Science
Strategy Never Some Often Always
N % N % N % N %
1. Curriculum based probe 14 48.3 6 20.7 6 20.7 3 10.32. Graphic organizers 9 31.0 8 27.6 6 20.7 6 20.7
3. Peer tutoring 12 41.4 9 31.0 7 24.1 1 3.4
4. Use Short segments (5 min.) to directly
teach vocabulary through listening,
seeing, reading, and writing
10 34.5 7 24.1 7 24.1 5 17.2
5. Response cards during instruction in
response to teacher questions or in
general
16 55.2 6 20.7 5 17.2 2 6.9
6. Hands-on, active participation 9 31.0 2 6.9 10 34.5 8 27.6
7. Cooperative learning 9 31.0 6 20.7 12 41.4 2 6.9
8. Pre-teach the organization of the text/
unit organizers
10 34.5 3 10.3 9 31.0 7 24.1
9. Modeling/Teacher demonstration 10 34.5 3 10.3 8 27.6 8 27.6
10. Using visuals 9 31.0 1 3.4 8 27.6 11 37.9
11. Pre-teach vocabulary 8 27.6 5 17.2 8 27.6 8 27.6
12. Using pre-reading strategies in content
areas
10 34.5 4 13.8 7 24.1 8 27.6
13. Summarize what was learned at end of
each lesson (ex. Journal summary)
10 34.5 7 24.1 3 10.3 9 31.0
14. Cross-disciplinary teaching on themes 13 44.8 7 24.1 7 24.1 2 6.9
15. Teaching how to pick out main idea of
the text and justify
9 31.0 5 17.2 6 20.7 9 31.0
16. Use of simplifi ed texts 11 37.9 8 27.6 5 17.2 5 17.2
17. Use of pictures to demonstrate steps 9 31.0 5 17.2 8 27.6 7 24.1
18. KWL chart 9 31.0 10 34.5 8 27.6 2 6.9
19. Use of Venn diagrams 12 41.4 11 37.9 5 17.2 1 3.4
20. Teaching Greek and Latin prefi xes 16 55.2 9 31.0 3 10.3 1 3.4
21. Teaching reference skills (e.g., using
glossary)
9 31.0 6 20.7 7 24.1 7 24.1
22. Collecting anonymous student
generated questions
16 55.2 6 20.7 6 20.7 1 3.4
23. Use of diagrams to teach cause and
effect
10 34.5 9 31.0 7 24.1 3 10.3

56 NCEO
Feasibility: Reading
Strategy Low Somewhat
low
Somewhat
high
High
N % N % N % N %
1. Use of organized pre-assessment
strategies
1 3.4 3 10.3 12 41.4 13 44.8
2. Graphic organizers 3 10.3 9 31.0 15 51.7 27 93.1
3. Cooperative Learning 1 3.4 6 20.7 12 41.4 10 34.5
4. Directly teaching vocabulary 1 3.4 2 6.9 11 37.9 14 48.3
5. Curriculum based probe 6 20.7 9 31.0 11 37.9 3 10.3
6. Recurrent, random vocabulary
assessment
2 6.9 9 31.0 11 37.9 7 24.1
7. Tactile vocabulary development steps 2 6.9 20 69.0 6 20.7 28 96.6
8. Practicing paraphrasing and retelling
strategies
1 3.4 2 6.9 10 34.5 16 55.2
9. Relate reading to student experiences 0 0 2 6.9 7 24.1 20 69.0
10. Teach and use mnemonics 4 13.8 11 37.9 11 37.9 3 10.3
11. Combine kinesthetic and phonemic
awareness
5 17.2 10 34.5 9 31.0 5 17.2
12. Think aloud used with reading 0 0 2 6.9 15 51.7 12 41.4
13. Prediction 0 0 7 24.1 7 24.1 15 51.7
14. Visualization of story (draw scene, plot,
etc.)
2 6.9 4 13.8 12 41.4 11 37.9
15. Teaching pre-, during, and post-
reading strategies
0 0 3 10.3 11 37.9 15 51.7
16. Fluency building (high frequency
words)
0 0 4 13.8 7 24.1 18 62.1
17. Acting out story 8 27.6 12 41.4 6 20.7 3 10.3
18. Journal of senses 5 17.2 12 41.4 10 34.5 2 6.9
19. Literature circle/Book club/small group
guided discussion
1 3.4 9 31.0 11 37.9 7 24.1
20. Individual conferencing with teacher 2 6.9 12 41.4 7 24.1 8 27.6
21. Oral sharing on related topic 1 3.4 5 17.2 14 48.3 9 31.0
22. Partner reading 1 3.4 4 13.8 14 48.3 10 34.5
23. Using book on tape as support 8 27.6 6 20.7 8 27.6 7 24.1
24. Use of decodable text 5 17.2 7 24.1 8 27.6 9 31.0
25. Explicit timing of text structure 3 10.3 7 24.1 14 48.3 5 17.2
26. Repeated reading 1 3.4 9 31.0 11 37.9 8 27.6
27. Picture word replacement-use of
visuals for words
6 20.7 6 20.7 11 37.9 6 20.7
28. Chunking and questioning aloud 1 3.4 3 10.3 15 51.7 10 34.5
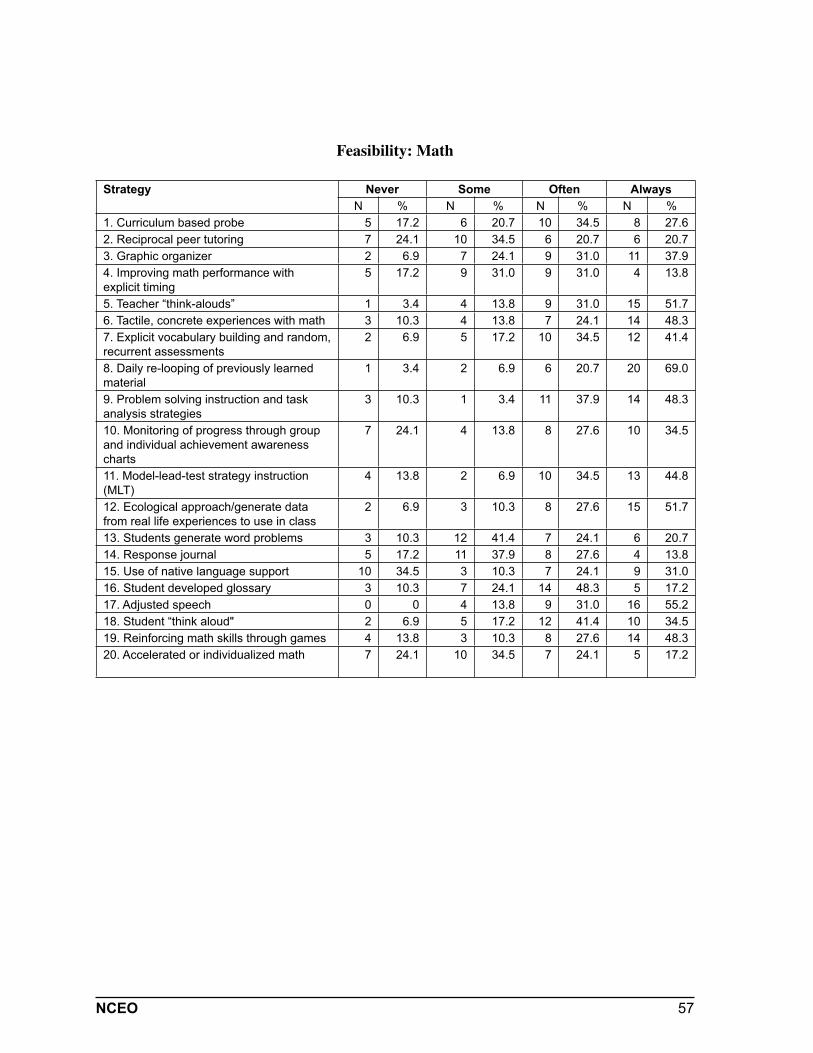
57NCEO
Feasibility: Math
Strategy Never Some Often Always
N % N % N % N %
1. Curriculum based probe 5 17.2 6 20.7 10 34.5 8 27.6
2. Reciprocal peer tutoring 7 24.1 10 34.5 6 20.7 6 20.7
3. Graphic organizer 2 6.9 7 24.1 9 31.0 11 37.9
4. Improving math performance with
explicit timing
5 17.2 9 31.0 9 31.0 4 13.8
5. Teacher “think-alouds” 1 3.4 4 13.8 9 31.0 15 51.7
6. Tactile, concrete experiences with math 3 10.3 4 13.8 7 24.1 14 48.3
7. Explicit vocabulary building and random,
recurrent assessments
2 6.9 5 17.2 10 34.5 12 41.4
8. Daily re-looping of previously learned
material
1 3.4 2 6.9 6 20.7 20 69.0
9. Problem solving instruction and task
analysis strategies
3 10.3 1 3.4 11 37.9 14 48.3
10. Monitoring of progress through group
and individual achievement awareness
charts
7 24.1 4 13.8 8 27.6 10 34.5
11. Model-lead-test strategy instruction
(MLT)
4 13.8 2 6.9 10 34.5 13 44.8
12. Ecological approach/generate data
from real life experiences to use in class
2 6.9 3 10.3 8 27.6 15 51.7
13. Students generate word problems 3 10.3 12 41.4 7 24.1 6 20.7
14. Response journal 5 17.2 11 37.9 8 27.6 4 13.8
15. Use of native language support 10 34.5 3 10.3 7 24.1 9 31.0
16. Student developed glossary 3 10.3 7 24.1 14 48.3 5 17.2
17. Adjusted speech 0 0 4 13.8 9 31.0 16 55.2
18. Student “think aloud" 2 6.9 5 17.2 12 41.4 10 34.5
19. Reinforcing math skills through games 4 13.8 3 10.3 8 27.6 14 48.3
20. Accelerated or individualized math 7 24.1 10 34.5 7 24.1 5 17.2

58 NCEO
Feasibility: Science
Strategy Never Some Often Always
N % N % N % N %
1. Curriculum based probe 7 24.1 10 34.5 4 13.8 8 27.6
2. Graphic organizers 3 10.3 8 27.6 6 20.7 12 41.4
3. Peer tutoring 5 17.2 7 24.1 10 34.5 7 24.1
4. Use Short segments (5 min.) to directly
teach vocabulary through listening,
seeing, reading, and writing
3 10.3 3 10.3 11 37.9 12 41.4
5. Response cards during instruction in
response to teacher questions or in
general
7 24.1 6 20.7 11 37.9 5 17.2
6. Hands-on, active participation 2 6.9 2 6.9 9 31.0 16 55.2
7. Cooperative learning 3 10.3 5 17.2 14 48.3 7 24.1
8. Pre-teach the organization of the text/
unit organizers
2 6.9 7 24.1 8 27.6 12 41.4
9. Modeling/Teacher demonstration 2 6.9 4 13.8 6 20.7 17 58.6
10. Using visuals 2 6.9 2 6.9 6 20.7 19 65.5
11. Pre-teach vocabulary 1 3.4 3 10.3 9 31.0 16 55.2
12. Using pre-reading strategies in content
areas
3 10.3 1 3.4 10 34.5 15 51.7
13. Summarize what was learned at end of
each lesson (e.g., Journal summary)
5 17.2 3 10.3 8 27.6 13 44.8
14. Cross-disciplinary teaching on themes 5 17.2 8 27.6 13 44.8 3 10.3
15. Teaching how to pick out main idea of
the text and justify
2 6.9 4 13.8 9 31.0 14 48.3
16. Use of simplifi ed texts 6 20.7 5 17.2 6 20.7 12 41.4
17. Use of pictures to demonstrate steps 4 13.8 5 17.2 10 34.5 10 34.5
18. KWL chart 2 6.9 3 10.3 14 48.3 10 34.5
19. Use of Venn diagrams 5 17.2 6 20.7 10 34.5 8 27.6
20. Teaching Greek and Latin prefi xes 7 24.1 8 27.6 8 27.6 6 20.7
21. Teaching reference skills (e.g., using
glossary)
2 6.9 6 20.7 7 24.1 14 48.3
22. Collecting anonymous student
generated questions
8 27.6 7 24.1 8 27.6 6 20.7
23. Use of diagrams to teach cause and
effect
3 10.3 5 17.2 12 41.4 9 31.0