student perceptions of learning and instructional ... · pdf filestudent perceptions of...
TRANSCRIPT

TM

STUDENT PERCEPTIONS OF LEARNING AND INSTRUCTIONAL EFFECTIVENESS IN COLLEGE COURSES
A VALIDITY STUDY OF SIR II
John A. Centra and Noreen B. Gaubatz
When students evaluate course instruction highly we would hope it is because the instruction has produced effective learning. This tenet is in fact the basis for many validity studies that have been conducted with student evaluations of courses and teachers. A study in the mid-1970s with the original Student Instructional Report (SIR) is a good example of a validity study that compared ratings to estimates of student learning. Final exam scores from seven courses were correlated with student ratings from the SIR (Centra, 1977). The global ratings of teaching effectiveness and value of the course to the student were the items most highly correlated with student achievement: 8 of the 14 correlations were .60 or above. In an introductory psychology class, for example, the overall rating of teaching effectiveness across 22 sections taught by 9 teachers correlated .63 with mean student achievement on the common final exam. That exam, as well as the exams in the other six courses studied, was made up by department members not teaching the course that semester. Moreover, students had generally been assigned to sections in two of the seven courses on a random basis, thereby controlling for another possible effect on the results. In addition to the high correlations of exam scores with overall teaching effectiveness and course value, ratings of Course Objectives and Organization (a four-item factor) and the quality of lectures (a single item) were also fairly well correlated. Modestly correlated with final exam scores were Teacher-Student Relationships (five items) and student effort (one item). Many additional studies during the late 1970’s and 1980’s have investigated the extent to which differences in student achievement (exam performance) in courses taught by different instructors are reflected in ratings of instruction. Referred to as multisection validity studies, meta-analyses of these studies have concluded that overall ratings of teachers or courses have a significant correlation (typically around .50) with end of course exam scores (Cohen, 1981, 1986; Feldman, 1989). Other ratings, such as for teacher-student interactions or course difficulty, typically correlate more modestly with exam scores. Student Perceptions of Learning Although final course examination scores have been the primary criterion for establishing the validity of student evaluations, the scores reflect only a limited view of student learning outcomes. More comprehensive indicators of student learning would go beyond a single exam score, which typically reflects only narrowly defined course objectives. Such indicators might include student perceptions of their increase in interest in the subject, critical thinking skills, interpersonal outcomes (e.g. cooperative abilities), intrapersonal outcomes (e.g. self-understanding) and other broad course outcomes (Koon and Murray, 1995). In fact one study found that student perceptions of learning in a course correlated much higher with student ratings of instruction than did differences in pre- and post-test scores (O’Connell and Dickinson, 1993). Ryan and Harrison (1995) and Cashin and Downey (1992, 1999) also found that student perceptions of learning were highly correlated with their overall ratings of teaching effectiveness. Another advantage of student perceptions of learning over final course examination scores is that the latter are limited to multisection courses that use a common final exam. These are typically first year introductory courses. Student perceptions of learning can be studied across a wide variety of courses, thereby making the results more generalizable.

The Course Outcomes Scale of SIR II One of the additions to the Student Instructional Report in 1995 was the scale of Course Outcomes. This scale includes five items that assesses more comprehensively student perceptions of their learning in a course, and thus can provide an excellent criteria for examining the validity of student ratings on other SIR II dimensions. Students respond to each of the five items on a five point scale ranging from “much more than most courses” to “much less than most courses” (with a “not applicable” option available). Two of the items reflect student perceptions of learning of course content: My learning increased in the course, and I made progress toward achieving course objectives. A third item asked students whether their interest in the subject area has increased, which is the kind of outcome that a final course examination usually does not assess, but yet most instructors would desire as a course outcome. Similarly, in most courses instructors hope that students have been helped to think independently about the subject matter, so a fourth item elicits this rating. The fifth item asks students the extent to which the course actively involved them in what they were learning. Given the overwhelming evidence on the importance of active learning in college courses, this last item reflects a critical instructional methodology as well as a course outcome (Bonwell and Eison, 1991). The five items on the Course Outcomes scale, therefore, reflect a broad set of learning outcomes well beyond examination performance. Purpose and Questions to Be Addressed The purpose of this study is to investigate the relationships between student perceptions of learning as assessed by the Course Outcomes scale of SIR II and other instruction-related scales and items within the instrument. Do students who rate instructors and instruction as more effective also give higher ratings to learning outcomes? What is the role of Student Effort and Involvement, another of the new scales added to SIR II, in student learning? Is the relationship between student ratings of instruction and student perceptions of learning modified by faculty and class variables (i.e. academic rank, status, gender, level of course, and class size)? How does the relationship differ by institutional type, predominant pedagogy of the instructor, and academic discipline? Answers to these and other questions will provide a better understanding of the instrument and how its items and scales relate to a broad description of student learning beyond final course examination performance. And on a more general level the study results will help illuminate the many aspects of effective college instruction.
Method
The SIR II contains 40 items that deal with various aspects of instruction, including a single overall evaluation item (see Appendix A). The first four scales are similar to those in the original SIR, although many items have been added and others deleted or changed. Also, students are asked to respond to each item as it contributed to their learning in the course. A five-point scale ranging from Very Effective to Ineffective is used; the original SIR used a four-point Agree/Disagree scale. These and the other SIR II scales were validated through a factor analysis that is described in The Development of the Student Instructional Report II (Centra, 1998). Other information about the instrument, such as scale and item reliability, is also included in the development report. Following is a description of the first four scales and the associated items. Scale A - Course Organization and Planning Students are evaluating the extent to which the instructor planned and organized the course, course materials, and class presentations, as well as the instructor’s knowledge of the content area. Questions cover: 1. the instructor’s explanation of course requirements 2. the instructor’s preparation for each class period 3. the instructor’s command of the subject matter 4. the instructor’s use of class time 5. the instructor’s way of summarizing or emphasizing important points in class
2

Scale B - Communication Students are evaluating the extent to which the instructor delivered clear and understandable instruction, as well as the instructor’s enthusiasm for the subject matter. Questions cover: 1. the instructor’s ability to make clear and understandable presentations 2. the instructor’s command of spoken English (or the language used in the course) 3. the instructor’s use of examples or illustrations to clarify course material 4. the instructor’s use of challenging questions or problems 5. the instructor’s enthusiasm for the course material Scale C - Faculty/Student Interaction Students are evaluating the extent to which the instructor was helpful, respectful, considerate, empathetic, approachable, and available for extra help. Questions cover: 1. the instructor’s helpfulness and responsiveness to students 2. the instructor’s respect for students 3. the instructor’s concern for student progress 4. the availability of extra help for this class (taking into account the size of the class) 5. the instructor’s willingness to listen to student questions and opinions Scale D - Assignments, Exams, and Grading Students are evaluating the quality of the textbook, the clarity and coverage of the exams, the quality of the instructor’s feedback, and the value of class assignments in adding to the understanding of course material. Questions cover: 1. the information given to students about how they would be graded 2. the clarity of exam questions 3. the exams’ coverage of important aspects of the course 4. the instructor’s comments on assignments and exams 5. the overall quality of the textbook(s) 6. the helpfulness of assignments in understanding course material The SIR II contains three new item categories that reflect more recent emphases in college instruction. The Course Outcomes scale, described earlier, is the dependent variable in this study. Research by Pace (1984), Astin (1985) and Pintrich (1995) have underscored the importance of student effort and involvement in their learning; hence the Student Effort and Involvement scale was added to SIR II and consists of the following three items: 1. I studied and put effort into the course. 2. I was prepared for each class (writing and reading assignments). 3. I was challenged by this course. A third category of items added to SIR II, grouped under Supplementary Instructional Methods, includes seven practices--such as laboratory exercises, case studies, collaborative learning projects, and computer-aided instruction--that instructors might use in a course and that students could evaluate as contributing to their learning. Because these do not form a scale and because these practices are used inconsistently by instructors they were excluded from the analysis in this study. A final set of three items that measure course difficulty, work load, and pace were also excluded from the analysis because their non-linear response formats did not provide an easily scaled and interpretable variable. The overall item, the final evaluation item is SIR II (item 40), asks students to: Rate the quality of instruction in this course as it contributed to your learning (Try to set aside your feelings about the course content). The five response options were: Very effective, Effective, Moderately effective, Somewhat ineffective, and Ineffective.
3

Sample The initial data pool for this study included 8,316 college classes containing a total of 138,871 students. The only data that were analyzed, however, were from classes of 10 or more students, since mean scores based on 10 or more students provide a sufficient level of reliability for research purposes (Centra, 1998). The final sample represented 6,136 classes containing a total of 116,144 students. The surveys were administered and the data collected over the course of three semesters - spring and fall semesters of 1995, and spring semester of 1996. The data were obtained from 26 institutions of higher education, including two-year and four-year colleges and universities. Additional information regarding the classes is included in Appendix B (Tables B.1 through B.5) along with the Instructor Cover Sheet. Since some instructors did not complete all items on the Instructor Cover Sheet, the data provided in Tables B.1 through B.5 do not reflect all 6,136 classes. Table B.1 examines the academic rank of the faculty members, indicating that only approximately one-third of the classes were taught by either associate or full professors. Table B.2 indicates that almost three-fourths of the faculty members had full time employment status. Table B.3 shows that three-fifths of the faculty members were male and two-fifths were female. Table B.4 indicates that almost three-fourths of the classes ranged in size from 16 to 35 students. Classes with more than 35 students comprised approximately one-tenth of the data. Table B.5 indicates that a little more than two-thirds of the classes were at the freshman/sophomore levels (i.e. primarily introductory courses). Unit of Analysis One of the essential methodological issues in validity studies on student ratings of teaching effectiveness is the question of the appropriate unit of analysis. In some studies, the student serves as the unit of analysis (i.e. “total class” approach), whereas in others, the class is used for analysis purposes (i.e. “between class” approach). The “total class” approach compares the ratings of each student, while the “between class” approach determines the mean ratings for all the students in a specific instructor’s class, and then the class means are included in the analysis process (Yunker, 1983). Much of the current validity literature argued for the use of the class as the appropriate unit of analysis. However, Dowell and Neal (1982) argued that using class means as the unit of analysis is more appropriate because it examines the overall ratings of the class relative to those of other classes as a function of the instructor’s ability. Cranton and Smith (1990) indicated that variations in student ratings reflect individual differences in the perceptions of students, when students serve as the unit of analysis. When class means are used, however, the differences in ratings reflect perceived differences among instructors. Cohen (1981) indicated that the appropriate unit of analysis is the class since it adds high internal validity to a study’s design. Furthermore, Cohen argued that the selection of the unit of analysis helps to direct the focus of a study’s research questions. For example, research designs using the student as the unit of analysis are determining whether students who learn more than other students, regardless of the class they are in, give higher ratings of teaching effectiveness. These designs are not exploring whether instructors who receive higher ratings of teaching effectiveness are also contributing more to student learning. In examining issues of validity, Cohen argued that the latter design is much more relevant. Yunker (1983) added that analysis of class means lessens the effect of extraneous student variables on the results. Thus, using class means controls for student personal characteristics, such as academic ability, that may bias the analysis. Other Class Variables The Instructor Cover Sheet, (Appendix A), that accompanied each class set of SIR II forms, provided for information to be included about the class. The information of special interest to this study included the institutional type, predominant pedagogy, and academic discipline for each of the classes. These three areas were chosen for analysis because little research exists that explores them and their relationship to students’ perceptions of learning. This study, therefore, provides insights and investigation into these previously unexplored areas. To analyze the data for the relationship between institutional type and students’ perceptions of learning, the data were collapsed into two categories: two-year colleges and four-year colleges/universities. These categories were determined based on the institution’s name as reported on the Instructor Cover Sheet. For purposes of confidentiality, a list of individual colleges and universities included in this study is not provided. Table 1 provides the grouping of classes by institutional type.
4

Table 1 - Institutional Type
Institutional Type Number of Classes Percentage of Classes 2-Year 1,790 34% 4-Year 3,512 66%
The data were also analyzed to investigate the possible relationships between predominant pedagogy used in the class and students’ perceptions of learning. The selection of pedagogies was determined by the information provided on the Instructor Cover Sheet. The pedagogies to be analyzed included: lecture, lecture and discussion, primarily discussion, lecture and laboratory, and laboratory. Table 2 provides the categorization of classes by predominant pedagogy.
Table 2 - Predominant Pedagogy
Pedagogy Number of Classes Percentage of Classes
Lecture 492 10% Lecture and Discussion 3,037 59% Discussion 296 6% Lecture and Laboratory 1,125 22% Laboratory 161 3%
A third analysis examined possible relationships between academic discipline and students’ perceptions of learning. To accommodate this analysis, the course data were collapsed into eight academic disciplines: health, business, education, social sciences, fine arts, natural sciences, technology, and humanities. (The selection of appropriate disciplines was based on what is common in institutions of higher education at the department or school level.). Table 3 indicates the breakdown of classes by academic discipline. A complete listing of the courses that were collapsed into the eight discipline groups is included as Appendix C. Table 3 - Academic Disciplines
Discipline Number of Classes Percentage of Classes
Health 308 6% Business 383 8% Education 467 9% Social Sciences 886 18% Fine Arts 273 6% Natural Sciences 967 20% Technology 388 8% Humanities 1,209 25%
5

Data Analysis As mentioned earlier, the Course Outcomes Scale (Scale F) of SIR II was designed to measure students’ perceptions of learning in the course. The mean class score for the scale served as the dependent variable for this analysis. The independent variables included the mean class score for each instructor on the following scales of the SIR II: Course Organization and Planning (Scale A), Communication (Scale B), Faculty/Student Interaction (Scale C), Assignments, Exams, and Grading (Scale D), Student Effort and Involvement (Scale G), and Overall Evaluation (Question 40). In this study, multiple regression was used to determine which components of the teaching process can be combined to determine the best prediction of student perceptions of learning. Regression models may employ forward, backward, or stepwise approaches for analysis purposes. Due to the assumed strong intercorrelation between the scales of the SIR II, stepwise regression was selected since it is the recommended method when strong correlations exist among independent variables (SPSS, 1997). Since multiple regression is based on a number of statistical assumptions, it was imperative to determine if the data qualified for analysis by this technique. The problems that occur in regression analysis are often related to the failure of the data to meet the basic assumptions of linearity, normality of errors, and constant variance of the errors. Outliers/influential points and collinearity must also be considered to assure the stability of proposed regression models. Additionally, the relationship between the sample size (n) and the number of independent variables (k) must be examined to assure maximum generalizability of the regression equation. Although often omitted from regression studies, preexamination of data for potential problems is advisable to avoid compromising the accuracy of the regression analysis (Flury and Riedwyl, 1988; Lewis-Beck, 1990; Stevens, 1986). Analysis of the data used in this study indicated that it met the basic multiple regression assumptions, both collectively and within subsets. Collinearity was of particular concern because of the high correlations among the SIR II scales (see Appendix D). Although examination of the various measures of collinearity indicated that it was not extreme, as an added security, a stepwise multiple regression was used for the analyses. This procedure selects variables one at a time and does not insert a variable into the regression equation that is highly correlated with a variable previously entered into the equation (Kvanli, Guynes, and Pavur, 1989).
Results
The first two research questions that guided this study were: 1. What is the relationship between students’ ratings of teaching effectiveness and various measures of students’ perceptions of learning? 2. How is this relationship (as established in research question 1) modified by faculty and class variables (i.e. academic rank, status, gender, level of course, and class size)? Descriptives of Data The descriptives for the data that were analyzed to create a regression model to investigate research questions 1 and 2 are included as Appendix D, which reflects the means and standard deviations for the dependent variable and for each of the continuous and categorical independent variables. The Pearson correlations for bivariate comparisons between variables are also included. Scale F (Course Outcomes) appears to have a relatively strong correlation (r = .83) with question 40 (Overall Evaluation), whereas the correlations between Course Outcomes and the other independent variables are much weaker. The correlations between a variety of the other independent variable scales are also noteworthy: Scale A (Course Organization and Planning) is highly correlated with Scale B (Communication) (r = .92), Scale D (Assignments, Exams, and Grading) (r = .84), and question 40 (Overall Evaluation) (r = .90). Scale B (Communication) is strongly correlated with Scale C (Faculty/Student Interaction) (r = .82), Scale D (Assignments, Exams, and Grading) (r = .82), and question 40 (Overall Evaluation) (r = .89). Scale C (Faculty/Student Interaction) is highly correlated with Scale D (Assignments, Exams, and Grading) (r = .81), and question 40 (Overall Evaluation) (r = .80). Scale D (Assignments, Exams, and Grading) is strongly correlated with question 40 (Overall Evaluation) (r = .83). It seems reasonable for correlations to exist among a variety of these scales as they represent dimensions of teaching. It would certainly be understandable for various components of the teaching process to be strongly related. In particular, question 40 (Overall Evaluation) would logically be correlated with the other scales.
6

Regression Model - All Classes Results of the stepwise multiple regression are indicated in Table 4, which lists only the significant predictor variables. The next predictor to enter the model was freshman/sophomore student level, but it was not statistically significant. Table 4 - Stepwise Multiple Regression for All Classes
Predictor R R2 Increase in R2 Std.Error- Estimate
Overall Evaluation 0.829 0.687 0.687 0.2768
Student Effort & Involvement 0.878 0.771 0.084 0.2367
Assignments, Exams, & Grading 0.886 0.785 0.014 0.2292
Note: n = 6,136 classes p < 0.05 Dependent Variable: Scale F R, the multiple correlation coefficient, measures the overall association of the dependent variable with several of the independent variables. It serves as a direct generalization of the simple Pearson correlation coefficient to a situation in which several independent variables are involved (Kleinbaum & Kupper, 1978). R2, the coefficient of multiple determination, is the square of the multiple correlation coefficient. It serves to assess the “goodness of fit” of a multiple regression equation, thus indicating the proportion of total variation in the dependent variable that is “explained” or “accounted for” by a set of independent variables (Lewis-Beck, 1990). The regression model for research questions 1 and 2 indicates that 69 % of the variation in the scores for Scale F (Course Outcomes) is “explained” by question 40 (Overall Evaluation). When Scale G (Student Effort and Involvement) is added to the model, 77 % of the variation is explained. Seventy-nine percent of the total variation in Scale F can be accounted by adding Scale D (Assignments, Exams, and Grading) to the model. Thus, the overall evaluation question, student effort and involvement, and assignments, exams, and grading account for 79 % of the variation in student perceptions of learning. The standard error of estimate, also reported in Table 4, represents the square root of the residual mean square and measures the spread of the residuals (or errors) about the fitted line. As is evidenced by the results of this analysis, the standard error of estimate should decrease as more variables are added to the model. Table 5 provides additional information regarding the regression model. Table 5 - Regression Coefficients for All Classes
Unstandardized Coefficients Standardized Coefficients
Predictor B Std. Error Beta t Sig.
Overall Evaluation 0.491 0.011 0.500 45.922 0.000
Student Effort & Involvement 0.385 0.008 0.327 48.813 0.000
Assignments, Exams, & Grading 0.238 0.012 0.212 20.306 0.000
Note: n = 6,136 classes p < 0.0005 Dependent Variable: Scale F
7

The beta coefficients in Table 5 are reported in both the unstandardized and standardized forms. The standardized coefficients are an attempt to make the regression coefficients more comparable, because the unstandardized values cannot be appropriately compared one to the other. The third research question was: 3. How does the relationship between students’ ratings of teaching effectiveness and various measures of students’ perceptions of learning differ by institutional type, academic discipline, and type of pedagogy? Descriptives of Data The descriptives for the data subsets that were analyzed to create regression models to explain research question 3 are included as Appendix E, which reflects the means and standard deviations for each of the independent variables. Additionally, the Pearson correlations for bivariate comparisons between variables were determined for all the data subsets, with correlations being of the same magnitude as for the data collectively (See Appendix D). Regression Models - Institutional Types The results of the stepwise multiple regression for institutional type are indicated in Tables 6 and 7, in which only the significant predictor variables are included. The next predictor to enter the two-year institutions’ model was Scale A (Course Organization and Planning); while freshman-sophomore student level entered next into the four-year institutions’ model. These were, however, not statistically significant. Table 6 - Stepwise Multiple Regression for 2-Year Institutions
Predictor R R2 Increase in R2 Std.Error- Estimate
Overall Evaluation 0.794 0.631 0.631 0.2730
Student Effort & Involvement 0.859 0.737 0.106 0.2304
Assignments, Exams, & Grading 0.869 0.755 0.018 0.2226
Note: n = 1,790 classes p < 0.05 Dependent Variable: Scale F
Table 7 - Stepwise Multiple Regression for 4-Year Institutions
Predictor R R2 Increase in R2 Std.Error- Estimate
Overall Evaluation 0.850 0.723 0.723 0.2691
Student Effort & Involvement 0.887 0.787 0.063 0.2363
Assignments, Exams, & Grading 0.894 0.800 0.013 0.2291
Note: n = 3,512 classes p < 0.05 Dependent Variable: Scale F
8
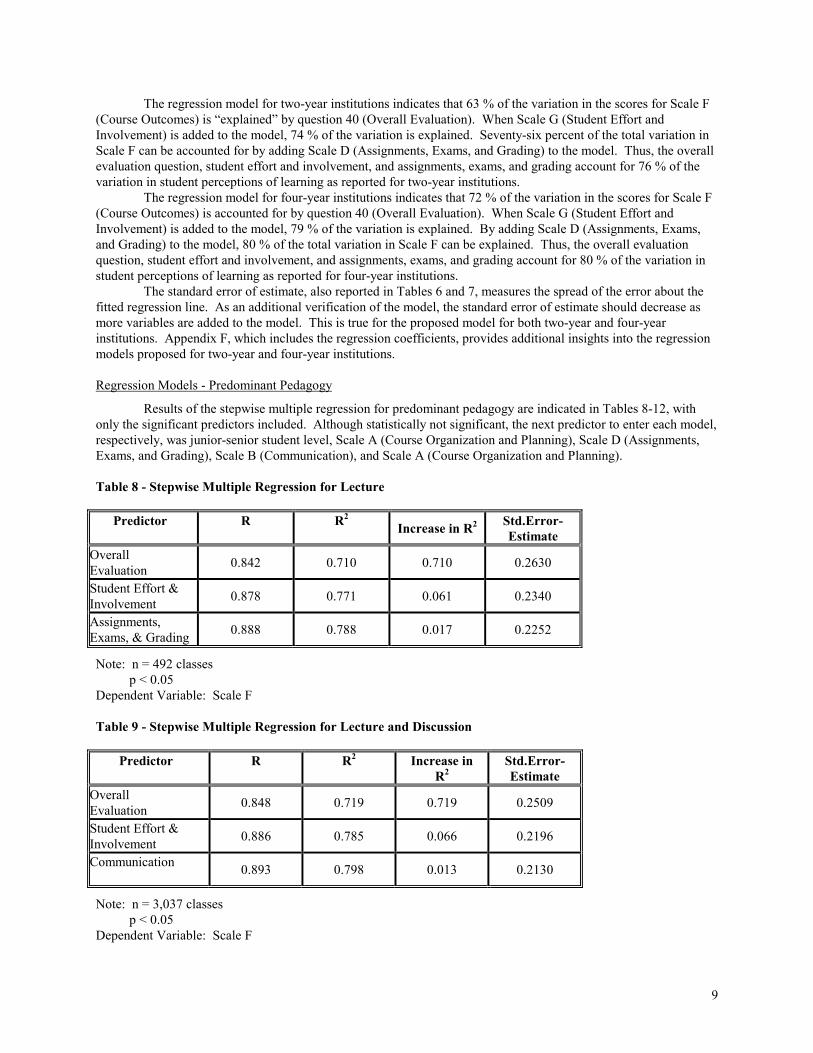
The regression model for two-year institutions indicates that 63 % of the variation in the scores for Scale F (Course Outcomes) is “explained” by question 40 (Overall Evaluation). When Scale G (Student Effort and Involvement) is added to the model, 74 % of the variation is explained. Seventy-six percent of the total variation in Scale F can be accounted for by adding Scale D (Assignments, Exams, and Grading) to the model. Thus, the overall evaluation question, student effort and involvement, and assignments, exams, and grading account for 76 % of the variation in student perceptions of learning as reported for two-year institutions. The regression model for four-year institutions indicates that 72 % of the variation in the scores for Scale F (Course Outcomes) is accounted for by question 40 (Overall Evaluation). When Scale G (Student Effort and Involvement) is added to the model, 79 % of the variation is explained. By adding Scale D (Assignments, Exams, and Grading) to the model, 80 % of the total variation in Scale F can be explained. Thus, the overall evaluation question, student effort and involvement, and assignments, exams, and grading account for 80 % of the variation in student perceptions of learning as reported for four-year institutions. The standard error of estimate, also reported in Tables 6 and 7, measures the spread of the error about the fitted regression line. As an additional verification of the model, the standard error of estimate should decrease as more variables are added to the model. This is true for the proposed model for both two-year and four-year institutions. Appendix F, which includes the regression coefficients, provides additional insights into the regression models proposed for two-year and four-year institutions. Regression Models - Predominant Pedagogy Results of the stepwise multiple regression for predominant pedagogy are indicated in Tables 8-12, with only the significant predictors included. Although statistically not significant, the next predictor to enter each model, respectively, was junior-senior student level, Scale A (Course Organization and Planning), Scale D (Assignments, Exams, and Grading), Scale B (Communication), and Scale A (Course Organization and Planning). Table 8 - Stepwise Multiple Regression for Lecture
Predictor R R2 Increase in R2 Std.Error- Estimate
Overall Evaluation 0.842 0.710 0.710 0.2630
Student Effort & Involvement 0.878 0.771 0.061 0.2340
Assignments, Exams, & Grading 0.888 0.788 0.017 0.2252 Note: n = 492 classes p < 0.05 Dependent Variable: Scale F
Table 9 - Stepwise Multiple Regression for Lecture and Discussion
Predictor R R2 Increase in R2
Std.Error- Estimate
Overall Evaluation 0.848 0.719 0.719 0.2509
Student Effort & Involvement 0.886 0.785 0.066 0.2196
Communication 0.893 0.798 0.013 0.2130 Note: n = 3,037 classes p < 0.05 Dependent Variable: Scale F
9

Table 10 - Stepwise Multiple Regression for Discussion
Predictor R R2 Increase in R2
Std.Error- Estimate
Overall Evaluation 0.865 0.749 0.749 0.2665
Student Effort & Involvement 0.905 0.819 0.070 0.2265
Communication 0.921 0.848 0.028 0.2083
Junior-Senior Level 0.929 0.864 0.016 0.1976
Note: n = 296 classes p < 0.05 Dependent Variable: Scale F
Table 11 - Stepwise Multiple Regression for Lecture and Laboratory
Predictor R R2 Increase in R2 Std.Error- Estimate
Overall Evaluation 0.806 0.650 0.650 0.2912
Student Effort & Involvement 0.854 0.729 0.079 0.2562
Assignments, Exams, & Grading 0.866 0.750 0.021 0.2463
Note: n = 1,125 classes p < 0.05 Dependent Variable: Scale F
Table 12 - Stepwise Multiple Regression for Laboratory
Predictor R R2 Increase in R2 Std.Error- Estimate
Overall Evaluation
0.743 0.552 0.552 0.3418
Student Effort & Involvement
0.870 0.757 0.205 0.2527
Assignments, Exams, & Grading
0.885 0.783 0.027 0.2392
Note: n = 161 classes p < 0.05 Dependent Variable: Scale F
10

The regression model for lecture as the predominant pedagogy indicates that 71 % of the variation in the scores for Scale F (Course Outcomes) is “explained” by question 40 (Overall Evaluation) (Table 8). When Scale G (Student Effort and Involvement) is added to the model, 77 % of the variation is explained. Finally, when Scale D (Assignments, Exams, and Grading) is added to the model, 79 % of the total variation in Scale F can be accounted for. Thus, the overall evaluation question, student effort and involvement, and assignments, exams, and grading account for 79 % of the variation reported in student perceptions of learning when the predominant pedagogy is lecture. When classes are taught with a combination pedagogy of lecture and discussion, 72 % of the variation in the scores for Scale F (Course Outcomes) is “accounted for” by question 40 (Overall Evaluation) (Table 9). When Scale G (Student Effort and Involvement) is added to the regression model, 79 % of the variance in Course Outcomes is explained. Eighty percent of the total variation in Scale F is explained by adding Scale B (Communication) to the regression model. Therefore, the overall evaluation question, student effort and involvement, and communication account for 80 % of the variation in student perceptions of learning when the class is conducted with a combination of lecture and discussion. The regression model for a discussion pedagogy indicates that 75 % of the variation in scores for Scale F (Course Outcomes) is “accounted for” by question 40 (Overall Evaluation) (Table 10). The addition of Scale G (Student Effort and Involvement) to the model explains 82 % of the variation in Scale F. With the inclusion of Scale B (Communication) in the model, 85 % of the variation in Course Outcomes is explained. With the addition of the final predictor, Junior-Senior student level, 86 % of the total variation in Scale F is accounted for. Hence, the overall evaluation question, student effort and involvement, communication, and junior-senior student level account for 86 % of the variation in student perceptions of learning when the students are immersed within a discussion pedagogy. When the pedagogy is a combination of lecture and laboratory, 65 % of the variation in the scores for Scale F (Course Outcomes) is explained by question 40 (Overall Evaluation) (Table 11). The addition of Scale G (Student Effort and Involvement) increases the explanation of the Course Outcomes variation to 73 %. When Scale D (Assignments, Exams, and Grading) is added to the regression model, 75 % of the total variation in Scale F can be accounted for. Therefore, the overall evaluation question, student effort and involvement, and assignments, exams, and grading account for 75 % of the variation in student perceptions of learning when a lecture and laboratory pedagogy is prominent. The results from a laboratory pedagogy indicate that 55 % of the variation in the scores for Scale F (Course Outcomes) is accounted for by question 40 (Overall Evaluation) (Table 12). Seventy-six percent of the variation in Course Outcomes is explained by adding Scale G (Student Effort and Involvement) to the model. When Scale D (Assignments, Exams, and Grading) is incorporated into the model, 78 % of the total variation in Scale F can be explained. Thus, the overall evaluation question, student effort and involvement, and assignments, exams, and grading account for 78 percent of the variation in student perceptions of learning when the primary pedagogy implemented is laboratory. Appendix F includes regression coefficients for each of the predominant pedagogies. Regression Models - Academic Discipline The significant predictor variables from the stepwise multiple regression for academic disciplines are indicated in Tables 13-20. The next predictor variables to enter each model, although statistically nonsignificant, are assistant professor rank (health), freshman-sophomore student level (business), graduate student level (education), Scale A - Course Organization and Planning (social studies), Scale C - Faculty/Student Interaction (fine arts), Scale B - Communication (natural sciences), freshman-sophomore student level (technology), and junior-senior student level (humanities).
11

Table 13 - Stepwise Multiple Regression for Health
Predictor R R2 Increase in R2 Std.Error- Estimate
Overall Evaluation 0.837 0.701 0.701 0.2899
Student Effort & Involvement 0.919 0.845 0.145 0.2087
Assignments, Exams, & Grading 0.924 0.853 0.008 0.2038
Note: n = 308 classes p < 0.05 Dependent Variable: Scale F
Table 14 - Stepwise Multiple Regression for Business
Predictor R R2 Increase in R2 Std.Error- Estimate
Overall Evaluation 0.848 0.719 0.719 0.2352
Student Effort & Involvement 0.875 0.765 0.045 0.2156
Assignment, Exams, & Grading 0.886 0.785 0.020 0.2064
Note: n = 383 classes p < 0.05 Dependent Variable: Scale F
Table 15 - Stepwise Multiple Regression for Education
Predictor R R2 Increase in R2 Std.Error- Estimate
Overall Evaluation 0.847 0.717 0.717 0.2352
Student Effort & Involvement 0.894 0.799 0.082 0.2137
Communication 0.900 0.810 0.011 0.2082
Note: n = 467 classes p < 0.05 Dependent Variable: Scale F
12

Table 16 - Stepwise Multiple Regression for Social Studies
Predictor R R2 Increase in R2 Std.Error- Estimate
Overall Evaluation 0.861 0.742 0.742 0.2336
Student Effort & Involvement 0.893 0.797 0.055 0.2072
Assignments, Exams, & Grading 0.901 0.812 0.015 0.1995
Note: n = 886 classes p < 0.05 Dependent Variable: Scale F
Table 17 - Stepwise Multiple Regression for Fine Arts
Predictor R R2 Increase in R2 Std.Error- Estimate
Overall Evaluation 0.822 0.676 0.676 0.2695
Student Effort & Involvement 0.916 0.838 0.162 0.1908
15 or fewer students
0.918 0.843 0.005 0.1881
Note: n = 273 classes p < 0.05 Dependent Variable: Scale F
Table 18 - Stepwise Multiple Regression for Natural Sciences
Predictor R R2 Increase in R2 Std.Error- Estimate
Overall Evaluation 0.840 0.705 0.705 0.2688 Student Effort & Involvement 0.872 0.761 0.056 0.2422
Assignments, Exams, & Grading 0.884 0.782 0.021 0.2313
Junior-Senior level
0.889 0.790 0.008 0.2273
Note: n = 967 classes p < 0.05 Dependent Variable: Scale F
13

Table 19 - Stepwise Multiple Regression for Technology
Predictor R R2 Increase in R2 Std.Error- Estimate
Overall Evaluation 0.832 0.693 0.693 0.2569
Student Effort & Involvement 0.878 0.771 0.078 0.2222
Assignments, Exams, & Grading 0.894 0.800 0.029 0.2080
Note: n = 388 classes p < 0.05 Dependent Variable: Scale F
Table 20 - Stepwise Multiple Regression for Humanities
Predictor R R2 Increase in R2 Std.Error- Estimate
Overall Evaluation 0.853 0.728 0.728 0.2483
Student Effort & Involvement 0.897 0.804 0.076 0.2110
Communication 0.908 0.824 0.020 0.2000
Note: n = 1,209 classes p < 0.05 Dependent Variable: Scale F
The regression model for Health indicates that 70 % of the variation in the scores for Scale F (Course Outcomes) is accounted for by question 40 (Overall Evaluation) (Table 13). The addition of Scale G (Student Effort and Involvement) explains 84 % of this variance. When Scale D (Assignments, Exams, and Grading) is incorporated into the model, 85 % of the variation in Scale F can be accounted for. Therefore, the overall evaluation question, student effort and involvement, and assignments, exams, and grading account for 85 % of the variation reported in student perceptions of learning in the health discipline. When business classes are explored, the model indicates that 72 % of the variation in the scores for Scale F (Course Outcomes) is explained by question 40 (Overall Evaluation) (Table 14). Seventy-seven percent of this variance can be understood by the addition of Scale G (Student Effort and Involvement) to the model. With the inclusion of Scale D (Assignments, Exams, and Grading) into the model, 79 % of the variation in Course Outcomes can be explained. Thus, the overall evaluation question, student effort and involvement, and assignments, exams, and grading account for 79 % of the variation reported in student perceptions of learning in the business discipline. In the education discipline, 72 % of the variation in the scores for Scale F (Course Outcomes) is accounted for by question 40 (Overall Evaluation) (Table 15). When Scale G (Student Effort and Involvement) is added to the model, 80 % of the variation in Scale F can be explained. Finally, 81 % of the total variation in Course Outcomes can be understood with the inclusion of Scale B (Communication) in the model. Consequently, the overall evaluation question, student effort and involvement, and communication account for 81 % of the variation reported in student perceptions of learning in the education discipline. Seventy-four percent of the variation in the scores for Scale F (Course Outcomes), within the social studies discipline, can be explained by question 40 (Overall Evaluation) (Table 16). When Scale G (Student Effort and
14

Involvement) is added to the model, 80 % of the variance in Scale F can be accounted for. Eighty-one percent of the variability can be understood when Scale D (Assignments, Exams, and Grading) is included in the model. Therefore, the overall evaluation question, student effort and involvement, and assignments, exams, and grading account for 81 % of the variation reported in student perceptions of learning within the social studies discipline. The regression model for the fine arts indicates that 68 % of the variation in the scores for Scale F (Course Outcomes) is explained by question 40 (Overall Evaluation) (Table 17). The inclusion of Scale G (Student Effort and Involvement) in the model helps to explain 84 % of the variation in Course Outcomes. With the addition of a class size predictor, class size fewer than 15 students, the model accounts for 84 % of the total variance in Scale F. Thus, the overall evaluation question, student effort and involvement, and a class size of less than 15 students account for 84 % of the variation reported in student perceptions of learning in the fine arts discipline. The natural sciences model indicates that 71 % of the variation in the scores for Scale F (Course Outcomes) is accounted for by question 40 (Overall Evaluation) (Table 18). Seventy-six percent of this variance is understood with the addition of Scale G (Student Effort and Involvement) to the model. When Scale D (Assignments, Exams, and Grading) is included in the model, 78 % of the variation in Course Outcomes is explained. Seventy-nine percent of the total variance in Scale F is accounted for when the junior-senior student level is incorporated into the model. Therefore, the overall evaluation question, student effort and involvement, assignments, exams, and grading, and the junior/senior student level account for 79 % of the variation reported in student perceptions of learning within the natural sciences discipline. Within the area of technology, 69 % of the variation in the scores for Scale F (Course Outcomes) is explained by question 40 (Overall Evaluation) (Table 19). With the inclusion of Scale G (Student Effort and Involvement) in the model, 77 % of this variation can be understood. Adding Scale D (Assignments, Exams, and Grading) to the model helps to account for 80 % of the total variance in Course Outcomes. Consequently, the overall evaluation question, student effort and involvement, and assignments, exams, and grading account for 80 % of the variation reported in student perceptions of learning within the technology discipline. The regression model for the humanities indicates that 73 % of the variation in the scores for Scale F (Course Outcomes) is accounted for by question 40 (Overall Evaluation) (Table 20). The addition of Scale G (Student Effort and Involvement) to the model helps to explain 80 % of the variance in Scale F. When Scale B (Communication) is included in the model, 82 % of the variation in Course Outcomes is understood. Thus, the overall evaluation question, student effort and involvement, and communication account for 82 % of the variation reported in student perceptions of learning within the humanities discipline. The regression coefficients and t-statistics for each discipline’s model are displayed in Appendix F.
Discussion The research presented in this study explored the relationship between students’ ratings of instructional effectiveness and various measures of student perceptions of learning (Scale F of SIR II). In addition to examining teaching effectiveness through mean scale ratings of the SIR II (Course Organization and Planning; Communication; Faculty/Student Interaction; Assignments, Exams, and Grading; Student Effort and Involvement; and Overall Evaluation), the study analyzed faculty and class variables (faculty members’ academic rank, status, and gender; level of course; and class size) for their possible role in explaining students’ perceptions of learning. Finally, the data were analyzed by institutional type, predominant classroom pedagogy, and academic discipline to more closely investigate the relationship between students’ perceptions of learning and effective teaching. In this context, therefore, instructional effectiveness was defined as students’ perceived learning. The statistically significant predictor variables, their beta coefficients, and the total variance explained by each regression model formulated in this research inquiry are summarized in Tables 21 and 22.
15

Table 21 - Beta Coefficients (All Data, Institutional Type, Pedagogy)
Sign. Predictor Variables
All Data 2-year Inst.
4-year Inst.
Lecture Lecture & Disc.
Disc. Lecture& Lab
Lab
Overall Evaluation +.491 +.461 +.536 +.547 +.464 +.347 +.442 +.387
Student Effort/Inv +.385 +.356 +.292 +.272 +.292 +.317 +.322 +.470
Assign/Ex & Grading +.238 +.231 +.203 +.238 +.258 +.295
Comm +.263 +.351
Jr.-Sr. Level +.130 Percent Variance 79% 76% 80% 79% 80% 86% 75% 78%
Table 22 - Beta Coefficients (Academic Disciplines)
Sign. Predictor Variables
Health Busi-ness
Educa-tion
Social Studies
Fine Arts
Natural Science
Tech-nology
Human-ities
Overall Evaluation +.455 +.514 +.439 +.548 +.548 +.521 +.414 +.371
Student Effort/Inv +.451 +.260 +.336 +.274 +.462 +.247 +.337 +.330
Assign/Ex & Grading +.185 +.255 +.210 +.283 +.307
Comm +.243 +.313
Class Size < 15 +.075
Jr.-Sr. Level +.089
Percent Variance 85% 79% 81% 81% 84% 79% 80% 82%
These tables indicate that of the 22 independent variables available for entry into the regression equations, only 6 entered as statistically significant. Of these six, the Overall Evaluation (question 40) and Student Effort and Involvement (Scale G) entered all 16 models as the first and second predictors, respectively. In 11 of the 16 models, Assignments, Exams, and Grading (Scale D) entered as the third predictor variable. Communication (Scale B), Junior-Senior student level, and a class size of fewer than 15 students were variables that entered pedagogy- and discipline-specific models. Overall Evaluation (question 40) was the first variable to enter all the regression models, regardless of institutional type, predominant pedagogy, or academic discipline. Students’ perceptions of learning were, therefore, largely related to the ratings provided for the overall evaluation of instructional effectiveness. These results are
16

similar to studies in which actual course learning, generally measured by a final exam score, rather than perceptions of learning, served as the dependent variable (Centra, 1977; Cohen, 1981; Feldman, 1989). A very recent study conducted by Cashin and Downey (1999) paralleled the current study in the following areas: multiinstitutional, multidisciplines, class as unit of analysis, use of a national survey (IDEA), and large sample size (n = 1,141 classes). Their results revealed that their global instructor item accounted for 53 % of the variance in the criterion variable. The students’ perception of their progress towards achieving the course objectives, as selected by the instructor, served as the criterion measure.
The data from the current SIR II study also indicated that the overall evaluation item was the principal factor contributing to students’ perceptions of learning, although the percentage accounted for was much higher (average R2 = .69, with a range of .55 to .75) than in Cashin and Downey’s (1999) IDEA study. The results of this SIR II study, therefore, also corroborate the efforts of other researchers, including Koon and Murray (1995), O’Connell and Dickinson (1993), and Smith and Cranton (1992), in verifying student perceptions of learning as a reflection of instructional effectiveness. Since similar results were obtained for studies of “actual” student learning (that is, final course exam results), it appears that learning, whether perceived or actual, plays the principal role in student ratings of overall instructional effectiveness. But since studies that used final exam scores were limited to multisection courses (largely introductory courses), these findings with perceived learning are more broadly applicable. Student Effort and Involvement (Scale G) was the second predictor variable to enter all 16 regression models. This scale includes the student’s own evaluation of individual effort, study time, preparedness for class meetings, and the challenge provided by the course. The presence of this variable in the models substantiates the literature that addresses the role and responsibility of the student in the learning process. A number of research studies on student effort made use of the College Student Experiences Questionnaire (CSEQ), which was developed by Pace (1979a). This widely used instrument assesses undergraduate programs, and is based on the belief that student growth depends on students investing time and effort in academic and social opportunities provided by the college. A 1991 in-depth review by Kuh, Schuh, Whitt, and associates made use of the CSEQ to verify a panel of experts’ nominations of 14 institutions of higher education as “involving institutions.” In characterizing these institutions, Kuh et al. noted that institutional policies and practices promoted student responsibility for and active participation in the learning process. These institutions, therefore, enabled students to accept responsibility for their own learning. Th work of Kuh et al. study embellished the work of Pace (1979b, 1984, 1988) and Astin (1979, 1985), both of whom noted the importance of student effort in accounting for academic success in college. Pace (1988) maintained that the quality of student effort is strongly related to positive academic outcomes, while Astin (1979) emphasized the expenditure of psychological energy as the key to academic achievement. Davis and Murrell (1993) built on the study of Kuh et al. (1991) by analyzing the CSEQ responses of 2,271 students representing 11 of the “involving institutions” of Kuh et al. Through the use of covariance analyses, Davis and Murrell analyzed a range of self-reported student gains to determine the role student effort played in producing positive college outcomes. The significant correlation they obtained between student effort and perceived gains in academic achievement (r = .45) helps to explain the presence of Scale G (Student Effort and Involvement) in the regression models of the current SIR II study. Because student effort and involvement are positively correlated to actual and perceived academic gains, and academic gains are significantly correlated to ratings of instructional effectiveness, the inclusion of Scale G in the regression models is understandable. Consequently, for students to maximize their learning they must be involved participants. Research on the principle of “the self-regulated learner” reinforces the importance of student effort and involvement in the educational process. Self-regulated learning is based on the premise that students regulate three components of their learning. First, self-regulated learners monitor, regulate, and adapt their behavior, motivation, and cognition in order to meet the demands of a particular learning situation. Second, a student goal serves as the standard by which performance is monitored. Third, the individual student, not a parent or teacher, is in control of her or his actions (Pintrich, 1995). An additional important aspect of self-regulated learning is self-efficacy, which refers to an individual’s belief that he or she has the ability to successfully master an academic task. This is crucial, since the extent to which students believe that they can be successful in a course guides the goals they set and the amount of effort they expend to meet those goals (Bandura, 1982, 1986; Bandura and Adams, 1978; Schunk, 1990). Students with high self-efficacy are confident in their skills and abilities, actively participate in learning activities, show greater effort and persistence, and achieve higher levels of academic performance than do students with lower self-efficacy (Pintrich and DeGroot, 1990; Schunk, 1991).
17

The third predictor variable to enter 11 of the 16 regression models was Assignments, Exams, and Grading (Scale D). This scale includes the students’ evaluation of the quality of the textbooks, assignments, and exams; the instructor’s feedback on assignments and exams; and grading procedures. The models that did not contain Scale D as a predictor variable were pedagogy and discipline specific: lecture and discussion, discussion, education, fine arts, and humanities. Ryan and Harrison (1995) examined the relative importance students place on individual teaching dimensions in determining overall instructional effectiveness. They selected the Student Evaluation of Educational Quality (SEEQ) instrument, developed by Marsh and his colleagues (Marsh, 1982), to examine teaching dimensions; several of the dimensions correspond closely to the scales of the SIR II. In analyzing the data from accounting (n = 82), education (n = 53), and geology (n = 94) students, similar results were obtained in the ordering of the SEEQ beta weights across the three groups. In each context, exam fairness (also a component of the SIR II Scale D) had the second highest beta weight, second to the dimension that measured amount learned. Interestingly, four of the five models that did not include Assignments, Exams, and Grading (Scale D) as the third predictor variable, incorporated the Communication (Scale B) instead. Two of the four models (lecture and discussion, and discussion) were pedagogy specific, and two (education and humanities) were discipline specific. Scale B reflects the instructor’s clarity of presentation, example and illustration usage, use of challenging questions and problems, and enthusiasm for the course material. The literature offers support for the selection of the Communication dimension within the disciplines of education and humanities. Cashin and Downey (1995) examined eight different academic fields to determine if students’ ratings of teaching effectiveness differed by academic discipline. Two of Cashin and Downey’s scales (Enthusiasm and Communicating Content and Purpose) are comparable to Scale B (Communication) of the SIR II. Cashin and Downey's results mirror those obtained for the current study in which Communication (Scale B) entered the regression models for the education and humanities disciplines. The inclusion of Scale B in the regression models of education and humanities may be a reflection of the predominant classroom pedagogy selected within these fields. As noted earlier, Scale B also entered the regression models for lecture and discussion classes and discussion classes. In this study, 67 % of all discussion classes and 40% of all lecture and discussion classes were within the education and humanities disciplines. A study conducted by Grasha (1992) helps to explain these findings. Self-reports from college teachers on the Teaching Style Inventory indicated that among ten disciplines, faculty in education and humanities rated among the highest on the facilitator teaching style. Grasha explained that this type of teacher guides students by asking questions, exploring options, and encouraging students to be independent thinkers, practices similar to the component items within Scale B (Communication) of the SIR II and common to the philosophy of a discussion pedagogy. Further support for Communication being important to education and humanities students in a discussion classroom environment is offered from a single university study conducted across four academic disciplines (social studies, humanities, technology-engineering, and natural sciences) by Neumann and Neumann (1985). The difference in the importance of student discussion in the social studies and humanities versus technology/engineering and natural sciences, according to Neumann and Neumann, may be related to the nature of knowledge development within each of the fields. In such areas as social studies and humanities it is necessary to discuss various schools of thought of subject knowledge and analyze similarities and differences among them. Within such areas as technology/engineering and natural sciences the content and research methods are more clearly understood, and thus the necessity for student discussion is often minimized. For the fine arts, a class size of fewer than 15 students entered the regression model as the third predictor, an understandable finding given that many classes in the fine arts (e.g. music and art studios) rely on close student-faculty contact. Feldman’s (1984) review of the relationship between class size and students’ evaluation of teaching effectiveness reported a small negative overall relationship, indicating that as class size increased, overall ratings of teaching effectiveness decreased. Some studies in Feldman’s review, however, reported a curvilinear relationship in which smaller and larger classes received higher ratings than those of medium-sized classes. For example, in one of the largest representative studies of class size effect, Centra and Creech (1976) analyzed results from 4,760 classes ranging in size from 7-10 students to more than 150 students that used the SIR. Classes with 7-10 students received the highest mean rating of teaching effectiveness while those in the 36-99 range generally received the lowest student ratings. Additionally, classes of 100 or more students were rated about the same as classes in the 16-35 range, probably because of special attention given to large classes, such as who teaches the course and the quality of instructional materials.
18

In addition to examining the effect of class size on the overall teaching effectiveness ratings, Feldman’s (1984) review revealed substantial correlations between class size and specific instructional dimensions, especially interaction with students. An analysis of data from the current study indicated that class size correlated only modestly with all the scales and the overall evaluation question. Correlations ranged from -.08 to -.15, with smaller classes, especially class sizes of less than 15, rated as slightly more effective, (see Appendix D). Additionally, two of the 16 models incorporated a significant fourth predictor variable. Student perceptions of learning in natural science classes and discussion classes were related to the junior/senior student level. Smith and Cranton (1992) also analyzed differences across student levels using class means of student ratings of teaching effectiveness from 2,816 classes. Their regression analysis indicated that the perception of learning (i.e. teaching effectiveness) did vary across student levels. Juniors and seniors most strongly related their perceptions of learning to “student interest and involvement in class activities," but freshmen and sophomores’ perceptions were correlated most highly with “class organization and presentation clarity.” The researchers argued that this was to be expected, as younger, less-experienced students have a greater requirement for structure in the learning experience. In addition to the discussion pedagogy, junior/senior student level was a significant contributor to students’ perceptions of learning in the natural sciences. The literature indicated that courses within the natural sciences are taught differently depending on the student level, thus explaining why student level was a significant factor in explaining students’ perceptions of learning within this discipline. Cashin (1990) analyzed aggregate data from the IDEA and the SIR two- and four- year institutions' comparative data and noted that introductory courses (i.e. those taken by freshmen and sophomores) often serve to “screen out” weak students and “select” students for continuation into the upper level courses of the discipline. He indicated that this was particularly true within the natural sciences, noting that screening occurred at the underclass level for the various premedical programs. These courses were often intentionally designed to be more difficult, with little emphasis placed on helping students learn and succeed. By contrast, juniors and seniors within the natural sciences perceived much more learning than they experienced as freshmen and sophomores because their focus was no longer on “making it” and the associated stress. With increased self-confidence from having passing through the “check gate,” students at the junior and senior levels in the natural sciences perceived greater learning than the underclassmen. Cashin noted that this phenomenon is uniquely associated with the natural sciences, thus offering an explanation for the inclusion of this student-level variable in the model for this discipline only.
Conclusions and Implications The findings of this study add to the current research on the validity of student ratings of instruction when student perceptions of learning are used as the criterion. The strong correlation between question 40 on SIR II (overall evaluation of instruction) and students’ ratings of Course Outcomes was clearly evident in all the regression models - all data, institutional type, predominant pedagogy, and academic discipline. When a student rates overall instruction as effective, there is a correspondingly high perception of learning, as well as “actual” learning as measured by course exams (Centra, 1977; Cohen, 1981; Feldman, 1989; Frey, 1978; Marsh, 1987). The high correlations between perceived learning (Course Outcomes) and the overall evaluation of instruction (question 40) may be due in part to the wording of the overall item. Students are asked to rate instruction as it contributed to their learning. The focus is on learning for this item as well as for items in the Course Outcomes scale. In fact, because most of the items in the SIR II ask students to rate instruction as it contributed to their learning, a relationship with learning, however measured, would be expected. What are the implications of these findings for the use of SIR II in tenure/promotion decisions (summative) or course/instruction improvement (formative) purposes? Many institutions rely heavily on the overall evaluation question (# 40) in making judgments of teacher effectiveness. In fact, the SIR II guidelines suggest that institutions and faculty members start with that item in reviewing results and then go on to the other scales and items in order to get a more complete picture of instruction. This study and previous studies that use course examination results support the emphasis on the overall evaluation item at both two- and four- year institutions. In addition, the Course Outcomes scale itself should be emphasized for both summative and formative purposes because it reflects what students say they have learned in the course. Depending on an instructor’s approach to teaching, responses to the other scales and items in SIR II should also be reviewed, including those in the Supplementary Instructional Methods section. The Assignments, Exams, and Grading scale and the Communication scale were particularly related to Course Outcomes; previous studies have shown the high correlation of Course Organization and Planning to end of course exam performance.
19

Finally, this study indicates that student learning is highly influenced by the effort students put forward. Although an instructor can do much to facilitate learning and can certainly provide some motivation, ultimately students themselves must take some responsibility for their learning in a course.
20

APPENDIX A
SIR II QUESTIONNAIRE
21

22

SIR II INSTRUCTOR'S COVER SHEET
23

24

APPENDIX B
CLASS DESCRIPTIVES
Table B.1 - Academic Rank of Faculty Member
Rank Number of Classes Percentage of Classes
Teaching Assistant 45 0.9% Instructor 2,040 39% Assistant Professor 1,222 24% Associate Professor 1,026 20% Professor 834 16%
Table B.2 - Status of Faculty Member
Status Number of Classes Percentage of Classes
Full time 3,880 72% Part time 1,502 28%
Table B.3 - Gender of Faculty Member
Gender Number of Classes Percentage of Classes
Female 2,103 41% Male 3,070 59%
Table B.4 - Class Size
Size (Number of Students) Number of Classes Percentage of Classes
< 15 1,076 20% 16 - 35 3,842 71% 36 - 100 505 9% > 100 9 0.2%
Table B.5 - Level of Course
Level Number of Classes Percentage of Classes
Freshman/Sophomore 3,662 71% Junior/Senior 1,234 24% Graduate 267 5%
25

APPENDIX C
COURSE COMPOSITION OF ACADEMIC DISCIPLINES
Health Allied Health and Health Sciences Health Services Nursing Rehabilitation Services Other Business Business and Management Accounting Administrative Support Banking and Finance Business Administration and Management Marketing Other Education Education Elementary Education Secondary Education Physical and Health Education Special Education Other Social Studies Psychology Criminal Justice Law Enforcement Anthropology or Archeology Criminology Economics Geography History International Relations Political Science and Government Sociology Other
Fine Arts Visual and Performing Arts Art History Dramatic Arts Film Arts Fine Arts Music Other Natural Sciences Life Sciences Mathematics and Statistics Parks and Recreation Agriculture and Natural Resources Physical Sciences Chemistry Geological Sciences Physics Other Technology Architecture and Environmental Design Computer and Information Sciences Engineering Technologies Trade and Industrial Technologies Humanities Communications Spanish French English Language and Literature Speech Philosophy, Religion, and Theology Letters and Humanities Interdisciplinary Studies Law and Legal Services Other
26

APPENDIX D
DESCRIPTIVE STATISTICS AND PEARSON CORRELATIONS:
ALL DATA
3.7177 .4895 50164.2719 .4299 50164.3111 .4109 50164.2986 .4672 50164.0660 .4308 50163.6847 .4196 50164.0396 .4898 5016
.009 .09 5016.38 .49 5016.22 .42 5016.19 .39 5016.15 .36 5016.28 .45 5016.72 .45 5016.19 .40 5016.71 .45 5016.09 .29 5016
.002 .04 5016
.69 .46 5016
.23 .42 5016
.05 .22 5016
.59 .49 5016
.41 .49 5016
Scale FScale AScale BScale CScale DScale GQuestion 40Teaching AssistantInstructorAssistant ProfessorAssociate ProfessorProfessorPart timeFull time<= 15 students16-35 students36-100 studentsOver 100 studentsFreshman-SophomoreLevelJunior-Senior LevelGraduate LevelMale InstructorFemale Instructor
MeanStd.
Deviation N
Descriptive Statistics - All Data
27

28

29

30

Correlations between Four Categories of Class Size and SIR II Ratings
Class Size
Pearson Scale A -.079 Correlation Scale B -.094 Scale C -.117 Scale D -.106 Scale F -.149 Scale G -.130 Question 40 -.109
The four categories ranged from less than 15 students in the class to over 100 students. In the previous tables of this Appendix correlations are between each class size vs. the other three groups collapsed into one. Note that in those tables class sizes of less than 15 had slightly positive correlations.
31

APPENDIX E
DESCRIPTIVE STATISTICS:
INSTITUTIONAL TYPE
PREDOMINANT PEDAGOGY
ACADEMIC DISCIPLINE
3.7486 .4479 16494.2822 .4212 16494.3086 .4031 16494.3193 .4493 16494.1224 .4043 16493.7594 .3796 16494.0585 .4516 1649.0006 .02 1649
.47 .50 1649
.17 .38 1649
.21 .41 1649
.11 .31 1649
.31 .46 1649
.69 .46 1649
.21 .41 1649
.71 .45 1649
.08 .27 1649.0006 .02 1649
.81 .40 1649
.10 .31 1649
.02 .13 1649
.55 .50 1649
.45 .50 1649
Scale FScale AScale BScale CScale DScale GQuestion 40Teaching AssistantInstructorAssistant ProfessorAssociate ProfessorProfessorPart timeFull time<= 15 students16-35 students36-100 studentsOver 100 studentsFreshman-SophomoreLevelJunior-Senior LevelGraduate LevelMale InstructorFemale Instructor
MeanStd.
Deviation N
Descriptive Statistics - 2-Year Institutions
32

3.6944 .5061 30694.2671 .4318 30694.3139 .4130 30694.2870 .4736 30694.0322 .4426 30693.6414 .4336 30694.0265 .5083 3069
0.1 .12 3069.28 .45 3069.27 .44 3069.19 .39 3069.19 .39 3069.26 .44 3069.74 .44 3069.18 .39 3069.72 .45 30690.9 .29 3069
.002 .05 3069
.60 .49 3069
.32 .46 3069
.07 .25 3069
.62 .49 3069
.38 .49 3069
Scale FScale AScale BScale CScale DScale GQuestion 40Teaching AssistantInstructorAssistant ProfessorAssociate ProfessorProfessorPart timeFull time<= 15 students16-35 students36-100 studentsOver 100 studentsFreshman-SophomoreLevelJunior-Senior LevelGraduate LevelMale InstructorFemale Instructor
MeanStd.
Deviation N
Descriptive Statistics - 4-Year Institutions
3.4996 .4966 4574.2256 .4246 4574.1810 .4375 4574.1627 .4974 4573.9522 .4145 4573.6250 .4236 4573.9114 .5160 457
.004 .07 457.26 .44 457.24 .43 457.22 .41 457.25 .43 457.20 .40 457.80 .40 457.12 .33 457.63 .48 457.23 .42 457.01 .11 457
.71 .45 457
.23 .42 457
.03 .17 457
.72 .45 457
.28 .45 457
Scale FScale AScale BScale CScale DScale GQuestion 40Teaching AssistantInstructorAssistant ProfessorAssociate ProfessorProfessorPart timeFull time<= 15 students16-35 students36-100 studentsOver 100 studentsFreshman-SophomoreLevelJunior-Senior LevelGraduate LevelMale InstructorFemale Instructor
MeanStd.
Deviation N
Descriptive Statistics - Lecture
33

3.6955 .4706 28364.2813 .4277 28364.3265 .4034 28364.3128 .4490 28364.0716 .4251 28363.6526 .4033 28364.0440 .4843 2836
.006 .07 2836.38 .49 2836.22 .41 2836.20 .40 2836.15 .36 2836.28 .45 2836.72 .45 2836.15 .36 2836.76 .43 2836.09 .29 2836
.0004 .02 2836
.67 .47 2836
.25 .43 2836
.05 .22 2836
.59 .49 2836
.41 .49 2836
Scale FScale AScale BScale CScale DScale GQuestion 40Teaching AssistantInstructorAssistant ProfessorAssociate ProfessorProfessorPart timeFull time<= 15 students16-35 students36-100 studentsOver 100 studentsFreshman-SophomoreLevelJunior-Senior LevelGraduate LevelMale InstructorFemale Instructor
MeanStd.
Deviation N
Descriptive Statistics - Lecture/Discussion
3.7385 .5350 2794.2450 .4705 2794.3503 .4338 2794.3198 .5203 2794.0150 .4892 2793.6528 .4349 2794.0470 .5450 279
.02 .15 279
.22 .41 279
.29 .46 279
.18 .39 279
.24 .43 279
.20 .40 279
.80 .40 279
.28 .45 279
.69 .46 279
.03 .17 279
.00 .00 279
.57 .50 279
.32 .47 279
.10 .30 279
.60 .49 279
.40 .49 279
Scale FScale AScale BScale CScale DScale GQuestion 40Teaching AssistantInstructorAssistant ProfessorAssociate ProfessorProfessorPart timeFull time<= 15 students16-35 students36-100 studentsOver 100 studentsFreshman-SophomoreLevelJunior-Senior LevelGraduate LevelMale InstructorFemale Instructor
MeanStd.
Deviation N
Descriptive Statistics - Discussion
34

3.8287 .4858 10434.2699 .4186 10434.3074 .3991 10434.3102 .4589 10434.1005 .4196 10433.7776 .4263 10434.0710 .4767 1043
.01 .11 1043
.49 .50 1043
.20 .40 1043
.16 .36 1043
.11 .31 1043
.33 .47 1043
.67 .47 1043
.27 .45 1043
.67 .47 1043
.06 .23 1043.001 .03 1043
.74 .44 1043
.18 .38 1043
.04 .19 1043
.58 .49 1043
.42 .49 1043
Scale FScale AScale BScale CScale DScale GQuestion 40Teaching AssistantInstructorAssistant ProfessorAssociate ProfessorProfessorPart timeFull time<= 15 students16-35 students36-100 studentsOver 100 studentsFreshman-SophomoreLevelJunior-Senior LevelGraduate LevelMale InstructorFemale Instructor
MeanStd.
Deviation N
Descriptive Statistics - Lecture/Laboratory
35

3.8024 .5024 1464.2692 .4722 1464.3021 .4346 1464.2549 .5638 1464.0524 .4664 1463.7684 .4609 1464.0443 .4809 146
.007 .08 146.38 .49 146.19 .40 146.20 .40 146.12 .32 146.28 .45 146.72 .45 146.34 .47 146.58 .49 146.08 .28 146.00 .00 146
.82 .39 146
.15 .36 146
.03 .18 146
.50 .50 146
.50 .50 146
Scale FScale AScale BScale CScale DScale GQuestion 40Teaching AssistantInstructorAssistant ProfessorAssociate ProfessorProfessorPart timeFull time<= 15 students16-35 students36-100 studentsOver 100 studentsFreshman-SophomoreLevelJunior-Senior LevelGraduate LevelMale InstructorFemale Instructor
MeanStd.
Deviation N
Descriptive Statistics - Laboratory
3.9722 .5297 2914.2488 .5346 2914.3384 .4667 2914.2529 .5958 2914.0648 .5098 2913.9762 .5011 2914.0825 .5503 291
.003 .06 291.51 .50 291.25 .44 291.19 .39 291.03 .17 291.18 .38 291.82 .38 291.22 .41 291.48 .50 291.30 .46 291.00 .00 291
.66 .48 291
.20 .40 291
.09 .28 291
.18 .38 291
.82 .38 291
Scale FScale AScale BScale CScale DScale GQuestion 40Teaching AssistantInstructorAssistant ProfessorAssociate ProfessorProfessorPart timeFull time<= 15 students16-35 students36-100 studentsOver 100 studentsFreshman-SophomoreLevelJunior-Senior LevelGraduate LevelMale InstructorFemale Instructor
MeanStd.
Deviation N
Descriptive Statistics - Health
36

3.7159 .4427 3434.2645 .4253 3434.2837 .4211 3434.3140 .4607 3434.1057 .4272 3433.6819 .4137 3434.0249 .4771 343
.009 .09 343.39 .49 343.14 .35 343.28 .45 343.15 .36 343.24 .43 343.76 .43 343.25 .44 343.68 .47 343.06 .25 343.00 .00 343
.58 .49 343
.36 .48 343
.03 .18 343
.53 .50 343
.47 .50 343
Scale FScale AScale BScale CScale DScale GQuestion 40Teaching AssistantInstructorAssistant ProfessorAssociate ProfessorProfessorPart timeFull time<= 15 students16-35 students36-100 studentsOver 100 studentsFreshman-SophomoreLevelJunior-Senior LevelGraduate LevelMale InstructorFemale Instructor
MeanStd.
Deviation N
Descriptive Statistics - Business
3.8998 .4760 4214.3698 .4144 4214.4652 .3480 4214.4517 .4132 4214.2015 .4142 4213.7099 .4904 4214.1444 .4696 421
.00 .00 421
.39 .49 421
.25 .43 421
.19 .39 421
.12 .32 421
.31 .46 421
.69 .46 421
.17 .37 421
.77 .42 421
.06 .24 421
.00 .00 421
.42 .49 421
.26 .44 421
.29 .45 421
.46 .50 421
.54 .50 421
Scale FScale AScale BScale CScale DScale GQuestion 40Teaching AssistantInstructorAssistant ProfessorAssociate ProfessorProfessorPart timeFull time<= 15 students16-35 students36-100 studentsOver 100 studentsFreshman-SophomoreLevelJunior-Senior LevelGraduate LevelMale InstructorFemale Instructor
MeanStd.
Deviation N
Descriptive Statistics - Education
37

3.6659 .4612 8164.2851 .3870 8164.3190 .3701 8164.2777 .4218 8164.0169 .4100 8163.5665 .3644 8164.0392 .4534 816
.001 .04 816.28 .45 816.22 .41 816.20 .40 816.24 .43 816.27 .44 816.73 .44 816.13 .33 816.75 .43 816.12 .32 816
.001 .04 816
.66 .47 816
.28 .45 816
.04 .19 816
.75 .43 816
.25 .43 816
Scale FScale AScale BScale CScale DScale GQuestion 40Teaching AssistantInstructorAssistant ProfessorAssociate ProfessorProfessorPart timeFull time<= 15 students16-35 students36-100 studentsOver 100 studentsFreshman-SophomoreLevelJunior-Senior LevelGraduate LevelMale InstructorFemale Instructor
MeanStd.
Deviation N
Descriptive Statistics - Social Studies
3.8557 .4803 2494.3117 .3680 2494.3848 .3243 2494.3309 .4039 2494.1014 .4058 2493.6690 .4776 2494.0780 .4303 249
.004 .06 249.39 .49 249.23 .42 249.16 .37 249.18 .39 249.31 .46 249.69 .46 249.29 .46 249.60 .49 249.11 .31 249.00 .00 249
.71 .45 249
.22 .42 249
.02 .13 249
.54 .50 249
.46 .50 249
Scale FScale AScale BScale CScale DScale GQuestion 40Teaching AssistantInstructorAssistant ProfessorAssociate ProfessorProfessorPart timeFull time<= 15 students16-35 students36-100 studentsOver 100 studentsFreshman-SophomoreLevelJunior-Senior LevelGraduate LevelMale InstructorFemale Instructor
MeanStd.
Deviation N
Descriptive Statistics - Fine Arts
38

3.5221 .4854 9044.2274 .4406 9044.2227 .4382 9044.2228 .4810 9043.9959 .4303 9043.7355 .3854 9043.9456 .5197 904
.003 .06 904.35 .48 904.24 .43 904.19 .39 904.18 .39 904.24 .43 904.76 .43 904.17 .37 904.70 .46 904.12 .33 904
.007 .08 904
.81 .40 904
.15 .35 904
.01 .10 904
.70 .46 904
.30 .46 904
Scale FScale AScale BScale CScale DScale GQuestion 40Teaching AssistantInstructorAssistant ProfessorAssociate ProfessorProfessorPart timeFull time<= 15 students16-35 students36-100 studentsOver 100 studentsFreshman-SophomoreLevelJunior-Senior LevelGraduate LevelMale InstructorFemale Instructor
MeanStd.
Deviation N
Descriptive Statistics - Natural Sciences
3.7767 .4655 3534.1741 .4682 3534.1977 .4452 3534.2495 .4984 3534.0423 .4457 3533.6900 .3943 3533.9806 .5155 353
.02 .13 353
.54 .50 353
.14 .35 353
.20 .40 353
.07 .26 353
.37 .48 353
.63 .48 353
.27 .44 353
.71 .46 353
.03 .16 353
.00 .00 353
.73 .44 353
.16 .36 353
.07 .26 353
.69 .46 353
.31 .46 353
Scale FScale AScale BScale CScale DScale GQuestion 40Teaching AssistantInstructorAssistant ProfessorAssociate ProfessorProfessorPart timeFull time<= 15 students16-35 students36-100 studentsOver 100 studentsFreshman-SophomoreLevelJunior-Senior LevelGraduate LevelMale InstructorFemale Instructor
MeanStd.
Deviation N
Descriptive Statistics - Technology
39

3.7214 .4744 11044.3058 .4228 11044.3572 .3999 11044.3385 .4544 11044.0977 .4185 11043.6589 .3916 11044.0873 .4829 1104
.02 .14 1104
.39 .49 1104
.25 .44 1104
.14 .35 1104
.15 .36 1104
.31 .46 1104
.69 .46 1104
.16 .36 1104
.79 .41 1104
.05 .22 1104
.00 .00 1104
.74 .44 1104
.24 .43 1104
.01 .11 1104
.51 .50 1104
.49 .50 1104
Scale FScale AScale BScale CScale DScale GQuestion 40Teaching AssistantInstructorAssistant ProfessorAssociate ProfessorProfessorPart timeFull time<= 15 students16-35 students36-100 studentsOver 100 studentsFreshman-SophomoreLevelJunior-Senior LevelGraduate LevelMale InstructorFemale Instructor
MeanStd.
Deviation N
Descriptive Statistics - Humanities
40

APPENDIX F
REGRESSION COEFFICIENTS:
INSTITUTIONAL TYPE
PREDOMINANT PEDAGOGY
ACADEMIC DISCIPLINE
Table F.1 - Regression Coefficients for 2-Year Institutions
Unstandardized Coefficients Standardized Coefficients
Predictor B Std. Error Beta t Sig.
Overall Evaluation 0.454 0.021 0.461 22.065 0.000 Student Effort & Involvement 0.422 0.015 0.356 27.750 0.000
Assignments, Exams, & Grading 0.255 0.022 0.231 11.396 0.000
Note: n = 1,790 classes p < 0.0005 Dependent Variable: Scale F
Table F.2 - Regression Coefficients for 4-Year Institutions
Unstandardized Coefficients Standardized Coefficients
Predictor B Std. Error Beta t Sig.
Overall Evaluation 0.532 0.014 0.536 37.519 0.000 Student Effort & Involvement 0.341 0.010 0.292 33.398 0.000
Assignments, Exams, & Grading 0.232 0.016 0.203 14.925 0.000
Note: n = 3,512 classes p < 0.0005 Dependent Variable: Scale F
Table F.3 - Regression Coefficients for Lecture
Unstandardized Coefficients Standardized Coefficients
Predictor B Std. Error Beta t Sig.
Overall Evaluation 0.523 0.037 0.547 14.100 0.000 Student Effort & Involvement 0.314 0.026 0.272 12.186 0.000
Assignments, Exams, and Grading 0.284 0.045 0.238 6.308 0.000
Note: n = 492 classes p < 0.0005 Dependent Variable: Scale F
41

Table F.4 - Regression Coefficients for Lecture and Discussion
Unstandardized Coefficients Standardized Coefficients
Predictor B Std. Error Beta t Sig.
Overall Evaluation 0.450 0.019 0.464 23.859 0.000 Student Effort & Involvement 0.343 0.011 0.292 30.998 0.000
Communication 0.308 0.022 0.263 13.847 0.000
Note: n = 3,037 classes p < 0.0005 Dependent Variable: Scale F
Table F.5 - Regression Coefficients for Discussion
Unstandardized Coefficients Standardized Coefficients
Predictor B Std. Error Beta t Sig.
Overall Evaluation 0.340 0.055 0.347 6.206 0.000 Student Effort & Involvement 0.387 0.032 0.317 11.977 0.000
Communication 0.434 0.067 0.351 6.503 0.000
Junior-Senior Level 0.148 0.025 0.130 5.802 0.000 Note: n = 296 classes p < 0.0005 Dependent Variable: Scale F
Table F.6 - Regression Coefficients for Lecture and Laboratory
Unstandardized Coefficients Standardized Coefficients
Predictor B Std. Error Beta t Sig.
Overall Evaluation 0.446 0.028 0.442 15.798 0.000 Student Effort & Involvement 0.374 0.020 0.322 19.060 0.000
Assignments, Exams,& Grading 0.295 0.031 0.258 9.645 0.000
Note: n = 1,125 classes p < 0.0005 Dependent Variable: Scale F
42

Table F.7 - Regression Coefficients for Laboratory
Unstandardized Coefficients Standardized Coefficients
Predictor B Std. Error Beta t Sig.
Overall Evaluation 0.405 0.071 0.387 5.687 0.000 Student Effort & Involvement 0.519 0.042 0.470 12.299 0.000
Assignments, Exams,& Grading 0.317 0.072 0.295 4.390 0.000
Note: n = 161 classes p < 0.0005 Dependent Variable: Scale F
Table F.8 - Regression Coefficients for Health
Unstandardized Coefficients Standardized Coefficients
Predictor B Std. Error Beta t Sig.
Overall Evaluation 0.440 0.048 0.455 9.137 0.000 Student Effort & Involvement 0.477 0.027 0.451 17.708 0.000
Assignments, Exams, & Grading 0.192 0.049 0.185 3.950 0.000
Note: n = 308 classes p < 0.0005 Dependent Variable: Scale F
Table F.9 - Regression Coefficients for Business
Unstandardized Coefficients Standardized Coefficients
Predictor B Std. Error Beta t Sig.
Overall Evaluation 0.478 0.042 0.514 11.257 0.000 Student Effort & Involvement 0.282 0.029 0.260 9.560 0.000
Assignments, Exams, & Grading 0.264 0.044 0.255 5.974 0.000
Note: n = 383 classes p < 0.0005 Dependent Variable: Scale F
43

Table F.10 - Regression Coefficients for Education
Unstandardized Coefficients Standardized Coefficients
Predictor B Std. Error Beta t Sig.
Overall Evaluation 0.449 0.050 0.439 8.951 0.000 Student Effort & Involvement 0.322 0.023 0.336 13.689 0.000
Communication 0.335 0.066 0.243 5.062 0.000
Note: n = 467 classes p < 0.0005 Dependent Variable: Scale F
Table F.11 - Regression Coefficients for Social Studies
Unstandardized Coefficients Standardized Coefficients
Predictor B Std. Error Beta t Sig.
Overall Evaluation 0.551 0.027 0.548 20.610 0.000 Student Effort & Involvement 0.346 0.022 0.274 16.062 0.000
Assignments, Exams, & Grading 0.235 0.028 0.210 8.372 0.000
Note: n = 886 classes p < 0.0005 Dependent Variable: Scale F
Table F.12 - Regression Coefficients for Fine Arts
Unstandardized Coefficients Standardized Coefficients
Predictor B Std. Error Beta t Sig.
Overall Evaluation 0.612 0.033 0.548 18.779 0.000 Student Effort & Involvement 0.470 0.031 0.462 15.197 0.000
15 or fewer students 0.077 0.026 0.075 2.943 0.004
Note: n = 273 classes p < 0.0005 for Overall Evaluation and Student Effort and Involvement Dependent Variable: Scale F
44
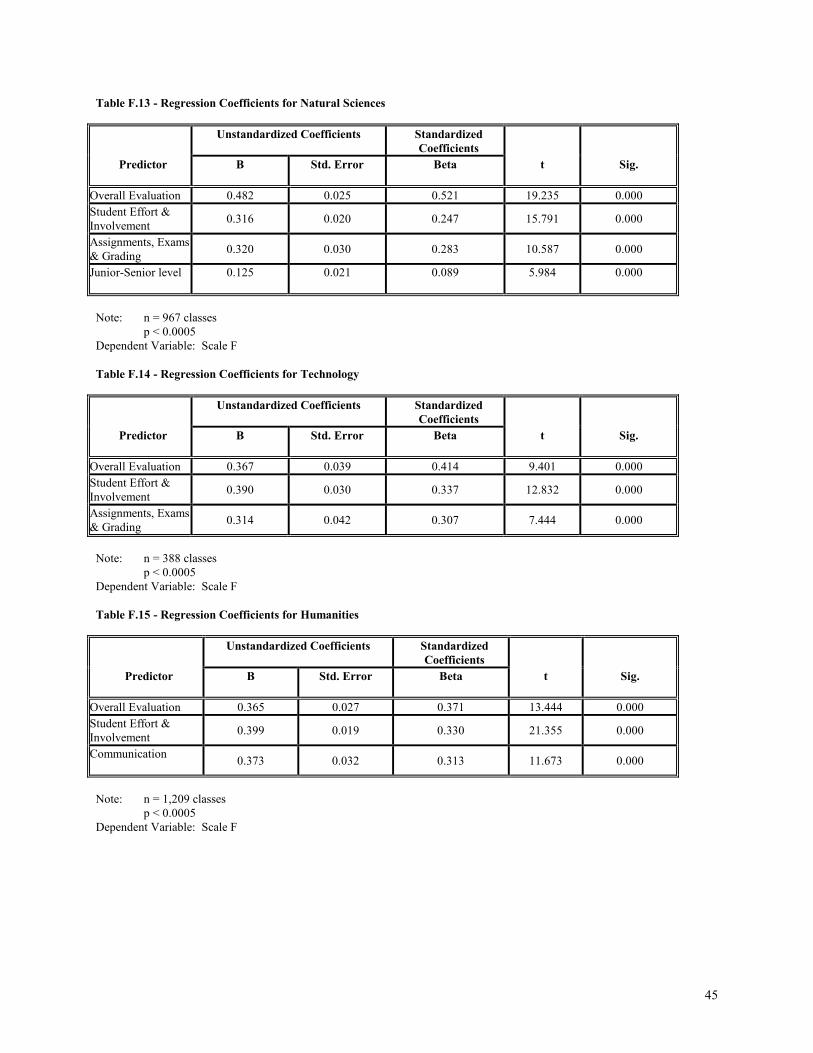
Table F.13 - Regression Coefficients for Natural Sciences
Unstandardized Coefficients Standardized Coefficients
Predictor B Std. Error Beta t Sig.
Overall Evaluation 0.482 0.025 0.521 19.235 0.000 Student Effort & Involvement 0.316 0.020 0.247 15.791 0.000
Assignments, Exams,& Grading 0.320 0.030 0.283 10.587 0.000
Junior-Senior level 0.125 0.021 0.089 5.984 0.000
Note: n = 967 classes p < 0.0005 Dependent Variable: Scale F
Table F.14 - Regression Coefficients for Technology
Unstandardized Coefficients Standardized Coefficients
Predictor B Std. Error Beta t Sig.
Overall Evaluation 0.367 0.039 0.414 9.401 0.000 Student Effort & Involvement 0.390 0.030 0.337 12.832 0.000
Assignments, Exams,& Grading 0.314 0.042 0.307 7.444 0.000
Note: n = 388 classes p < 0.0005 Dependent Variable: Scale F
Table F.15 - Regression Coefficients for Humanities
Unstandardized Coefficients Standardized Coefficients
Predictor B Std. Error Beta t Sig.
Overall Evaluation 0.365 0.027 0.371 13.444 0.000 Student Effort & Involvement 0.399 0.019 0.330 21.355 0.000
Communication 0.373 0.032 0.313 11.673 0.000
Note: n = 1,209 classes p < 0.0005 Dependent Variable: Scale F
45

46

References
Astin, A. W. (1979). Student-oriented management: A proposal for change. In A. Astin, H. Bowen, & C. Chambers (Eds.), Evaluating educational quality: A conference summary (pp. 3-18). Washington, DC. The Council on Postsecondary Accreditation. Astin, A. W. (1985). Achieving educational excellence: A critical assessment of priorities and practices in higher education. San Francisco. Jossey-Bass. Bandura, A. (1982). Self-efficacy mechanism in personal agency. American Psychologist, 37, 122-148. Bandura, A. (1986). Social foundations of thought and action: A social cognitive theory. Englewood Cliffs, NJ. Prentice-Hall. Bandura, A., & Adams, N. E. (1978). Analysis of self-efficacy theory of behavioral change. Cognitive Therapy and Research, 1, 287-310. Bonwell, C. C. & Eison, J. A. (1991). Active learning: Creating excitement in the classroom. ASHE-ERIC Higher Education Report, no. 1. Washington DC. School of Education and Human Development, George Washington University. Cashin, W. E. (1990). Students do rate different academic fields differently. In M. Theall & J. Franklin (Eds.), New Directions For Teaching and Learning-Student ratings of Instruction: Issues for improving practice (no. 43). San Francisco. Jossey-Bass. Cashin, W. E., & Downey, R. G. (1992). Using global student rating items for summative evaluation. Journal of Educational Psychology, 84(4), 563-572. Cashin, W. E., & Downey, R. G. (1995). Disciplinary differences in what is taught and in students’ perceptions of what they learn and of how they are taught. In M. Theall & J. Franklin (Eds.), New Directions For Teaching and Learning (no. 64). San Francisco. Jossey-Bass. Cashin, W. E., & Downey, R. G. (1999, April). Using global student rating items for summative evaluation: Convergence with a second criterion. Paper presented at the annual meeting of the American Educational Research Association, Montreal, Quebec, Canada. Centra, J. A. (1977). Student ratings of instruction and their relationship to student learning. American Educational Research Journal, 14 (1), 17-24. Centra, J. A. (1998). Development of Student Instructional Report II. Princeton, NJ. Educational Testing Service. Centra, J. A., & Creech, F. R. (1976). The relationship between student teachers and course characteristics and student ratings of teacher effectiveness (Project Report 76-1). Princeton, NJ. Educational Testing Service. Cohen, P. A. (1981). Student ratings of instruction and student achievement: A meta-analysis of multisection validity studies. Review of Educational Research, 51 (3), 281-309. Cohen, P. A. (1986, April). An updated and expanded meta-analysis of multisection student rating validity studies. Paper presented at the annual meeting of the American Educational Research Association, San Francisco. Cranton, P., & Smith, R. (1990). Reconsidering the unit of analysis: A model of student ratings of instruction. Journal of Educational Psychology, 82 (2), 207-212. Davis, T. M., & Murrell, P. H. (1993). A structured model of perceived academic, personal, and vocational gains related to college student responsibility. Research in Higher Education, 34 (3), 267-289. Dowell, D. A., & Neal, J. A. (1982). A selective review of the validity of student ratings of teaching. Journal of Higher Education, 53 (1), 51-62. Feldman, K. A. (1984). Class size and college students’ evaluations of teachers and courses: A closer look. Research in Higher Education, 21, 45-115. Feldman, K. A. (1989). The association between student ratings of specific instructional dimensions and student achievement: Refining and extending the synthesis of data from multisection validity studies. Research in Higher Education, 30, 583-645. Flury, B., & Riedwyl, H. (1988). Multivariate statistics: A practical approach. New York. Chapman and Hall. Frey, P. W. (1978). A two-dimensional analysis of student ratings of instruction. Research in Higher Education, 9, 69-91.
47

Grasha, A. F. (1992). A matter of style: The teacher as expert, formal authority, personal model, facilitator, and delegator. College Teaching, 42(4), 142-149. Kleinbaum, D. G., & Kupper, L. L. (1978). Applied regression analysis and other multivariate methods. Belmont, CA. Wadsworth Publishing Company. Koon, J., & Murray, H. G. (1995). Using multiple outcomes to validate student ratings of overall teacher effectiveness. Journal of Higher Education, 66(1), 61-81. Kuh, G., Schuh, J., Whitt, E., & Associates. (1991). Involving colleges. San Francisco. Jossey-Bass. Kvanli, A. H., Guynes, C. S., & Pavur, R. J. (1989). Introduction to business statistics: A computer integrated approach. St. Paul, MN. West Publishing Company. Lewis-Beck, M. S. (1990). Applied regression: An introduction. Sage University Paper Series on Quantitative Applications in the Social Sciences (Series No. 07-022). Newbury Park, CA. Sage Publications. Marsh, H. W. (1982). SEEQ: A reliable, valid, and useful instrument for collecting students’ evaluations of university teaching. British Journal of Educational Psychology, 52(1), 77-95. Marsh, H. W. (1987). Students’ evaluations of university teaching: Research findings, methodological issues, and directions for future research. International Journal of Educational Research, 11(3), 253-388. Neumann, L., & Neumann, Y. (1985). Determinants of students’ instructional evaluation: A comparison of four levels of academic areas. Journal of Educational Research, 78(3), 152-158. O’Connell, D. Q., & Dickinson, D. J. (1993). Student ratings of instruction as a function of testing conditions and perceptions of amount learned. Journal of Research and Development in Education, 27(1), 18-23. Pace, R. (1979a). College student experiences. Los Angeles. UCLA Laboratory for Research on Higher Education. Pace, R. (1979b). Measuring outcomes of college. San Francisco. Jossey-Bass. Pace, R. (1984). Measuring the quality of college student experiences. Los Angeles. UCLA Center for the Study of Evaluation. Pace, R. (1988). Measuring the quality of college student experiences: An account of the development and use of the College Student Experiences Questionnaire. Los Angeles. Center for the Study of Evaluation. Pintrich, P. R. (1995). Understanding self-regulated learning. In M. Theall & F. Franklin (Eds.), New Directions For Teaching and Learning (no. 63, pp. 3-12). San Francisco. Jossey-Bass. Pintrich, P. R., & DeGroot, E. (1990). Motivational and self-regulated learning components of classroom academic performance. Journal of Educational Psychology, 82, 33-40. Ryan, J., & Harrison, P. (1995). The relationship between individual instructional characteristics and the overall assessment of teaching effectiveness across different instructional contexts. Research in Higher Education, 36(5), 577-594. Schunk, D. H. (1990). Goal setting and self-efficacy during self-regulated learning. Educational Psychologist, 25, 71-86. Schunk, D. H. (1991). Self-efficacy and academic motivation. Educational Psychologist, 25, 71-86. Smith, R. A., & Cranton, P. A. (1992). Students’ perceptions of teaching skills and overall effectiveness across instructional settings. Research in Higher Education, 33(6), 747-764. SPSS, Inc. (1997). SPSS base 7.5 applications guide. Chicago. SPSS, Inc. Stevens, J. (1986). Applied multivariate statistics for the social sciences. Hillsdale, NJ. Lawrence Erlbaum Associates. Yunker, J. A. (1983). Validity research on student evaluations of teaching effectiveness: Individual student observations versus class mean observations. Research in Higher Education, 19(3), 363-379.
48