eda-based estimation of visual attention by observation of eye blink frequency … ·...
TRANSCRIPT

EDA-BASED ESTIMATION OF VISUAL ATTENTION BY
OBSERVATION OF EYE BLINK FREQUENCY
Tsugunosuke Sakai1, Haruya Tamaki
1, Yosuke Ota
1, Ryohei Egusa
2, 3,
Shigenori Inagaki3, Fusako Kusunoki
4, Masanori Sugimoto
5, Hiroshi Mizoguchi
1
1Department of Mechanical Engineering,
Tokyo University of Science, 2641 Yamazaki, Noda-shi, Chiba, Japan 2JSPS Research Fellow, 5-3-1, Kojimachi, Chiyoda-ku, Tokyo, Japan
3Graduate School of Human Development and Environment,
Kobe University, 3-11 Tsurukabuto, Nada-ku, Kobe-shi, Hyogo, Japan 4Department of Information Design,
Tama Art University, 2-1723, Yarimizu, Hachioji-shi, Tokyo, Japan 5Graduate School of Information Science and Technology,
Hokkaido University, Kita 14, Nishi 9, Kita-ku, Sapporo-shi, Hokkaido, Japan
Emails: [email protected], [email protected], [email protected],
[email protected], [email protected], [email protected], [email protected],
Submitted: Jan. 14, 2017 Accepted: Apr. 8, 2017 Published: June 1, 2017
Abstract- This paper describes the relationship between visual attention and eye blink frequency. In an
experiment, we prompted the activation of a subject’s visual attention and examined the influence of
visual attention (as measured using electrodermal activity (EDA), which is meaningfully correlated
with visual attention) on the subject’s eye blink frequency. Experimental results show that engagement
of visual attention decreased eye blink frequency and that when visual attention was not activated, eye
blink frequency increased. Knowledge of this relationship provides a technique using EDA to
objectively determining a subject’s visual attention status.
Index terms: Electrodermal activity (EDA), visual attention, eye blink, skin conductance response (SCR),
index of physiological psychology, pre-cueing technique.
INTERNATIONAL JOURNAL ON SMART SENSING AND INTELLIGENT SYSTEMS VOL. 10, NO. 2, JUNE 2017
296

I. INTRODUCTION
A decline in attention is a causative factor in many accidents including traffic accidents and
misoperation of machine tools. To prevent such accidents, an index from physiopsychology is
thought to be useful for estimating a mental state of a human [1, 2, 3, 4]. The eye blink rate is one
such index and is effective for estimating attentiveness. The eye blink rate can be easily measured
without physical contact by the use of tools such as video cameras [5, 6, 7]. In addition, it has
been found that eye blink activity changes in response to psychological factors, and various
relationships between the eye blink rate and attention have been proposed [8, 9].
In related research, experimenters gave subjects tasks and investigated the relationship between
the eye blink rate and attention by observing the eye blink [10]. In this method, there is an
assumption that the subject’s attention is engaged while he or she works on the task. However,
this method does not take into account such influencing factors as the subject’s motivation and
will. That is, a subject may not actually have exercised his or her attention even though he or she
has worked on the task. Therefore, in order to assess the relationship between attention and
blinking, a method for objectively measuring attention is needed.
We therefore focus on electrodermal activity (EDA), which is an electrical phenomenon from the
glandular release of sweat that is caused by mental excitement or strain. In psychology, EDA is
used as an index to measure degrees of affect such as stress, strain, and excitement [11, 12]. EDA
has been shown to have a meaningful relationship to visual attention [13]. In this study, we use
EDA as a means of objectively measuring visual attention to elucidate the relationship between
visual attention and blinking. We herein describe the experiment we conducted based on EDA
and the results that verify this relationship.
II. EDA-BASED ESTIMATION OF VISUAL ATTENTION
a. Summary of EDA
Electrodermal activity is a change in the electrical characteristics of the skin, especially the palm
and the sole of the foot, due to sweating caused by mental exertion. There are two methods of
measuring EDA: electrification and potentiodynamics. With electrification, the change in
Tsugunosuke Sakai, Haruya Tamaki, Yosuke Ota, Ryohei Egusa, Shigenori Inagaki, Fusako Kusunoki, Masanori Sugimoto, Hiroshi Mizoguchi, EDA-BASED ESTIMATION OF VISUAL ATTENTION BY OBSERVATION OF EYE BLINK FREQUENCY
297

apparent skin resistance or impedance is measured by electrifying the skin from outside the body;
potentiodynamics is a method that measures the variation in skin potential directly. The change
measured via electrification is called the “skin conductance change (SCC),” and the change
measured by potentiodynamics is called the “skin potential activity (SPA).”
Both SCC and SPA are phenomena that overlay steep transient changes against the general
background level. The general background level for SCC is called the “skin conductance level
(SCL),” and that for SPA is called the “skin potential level (SPL).” The transient SCCs are called
the “skin conductance response (SCR),” and changes in SPA are called the “skin potential
response (SPR).” SCR and SPR are collectively called the “galvanic skin response (GSR).”
Figure 1 shows a diagram of these relationships.
In this study, we used electrification to measure EDA; therefore, the SCL and SCR data were
able to be obtained. Figure 2 shows an example of the measurement of SCL and SCR. As shown
in the figure, the SCL reaction is measured by changes over a relatively long time period,
whereas SCR is measured by changes over a relatively short period.
Figure 1. Classification of electrodermal activity (EDA) measurement terminology
INTERNATIONAL JOURNAL ON SMART SENSING AND INTELLIGENT SYSTEMS VOL. 10, NO. 2, JUNE 2017
298

Figure 2. Example of skin conductance level (SCL) and skin conductance response (SCR)
measurement
b. Relationship between visual attention and EDA
Figure 3. Relationship between visual attention and EDA
There is a significant relationship between EDA and visual attention. We performed a
psychological experiment in which the subject’s visual attention was exercised, and we verified
the relationship between visual attention and the eye blink rate. As shown in Figure 3, it was
confirmed that an SCR, reflecting transient changes in EDA, occurs when visual attention is
engaged. In addition, our results indicated that the quantity of SCRs fluctuates according to the
degree of visual attention engaged [8].
Based on these findings, we can determine whether a subject’s visual attention is engaged in the
following manner:
1. We have subjects devote themselves to a task that exercises their visual attention.
Tsugunosuke Sakai, Haruya Tamaki, Yosuke Ota, Ryohei Egusa, Shigenori Inagaki, Fusako Kusunoki, Masanori Sugimoto, Hiroshi Mizoguchi, EDA-BASED ESTIMATION OF VISUAL ATTENTION BY OBSERVATION OF EYE BLINK FREQUENCY
299

2. We measure the EDA of subjects while they are immersed in the task.
3. If an SCR occurs while a subject is attending to the task, we conclude that the subject’s
visual attention is engaged.
The relationship between visual attention and eye blink rate was verified after the engagement of
visual attention was confirmed on the basis of EDA as described above. Thereby, it becomes
possible to evaluate the relationship more objectively.
III. EXPERIMENT
a. Method
In this experiment, the situation in which the subject’s visual attention was engaged was
established by a pre-cueing technique. Each subject was presented with a task during which
he/she pushed a reaction switch as soon as a target stimulus was displayed in his/her field of
vision. To engage the subject’s visual attention, a cue was presented before the target stimulus
was displayed, as the pre-cueing technique. Figure 4 shows the target stimulus, the cues used in
the experiment, and the task flow. The red circle was used as the target stimulus. Three cues were
employed. A condition in which the cue indicates the true position of the target stimulus is called
a “valid condition.” Conversely, a condition in which the cue indicates a position that is not the
true position of the target stimulus is called an “invalid condition.” A condition involving neither
of these situations is called a “neutral condition.”
Figure 5 shows the time period that the subject works on the task. The time period of the task was
defined as the time from the moment the subject pushed the switch to begin the task to the
moment the switch was pushed again when the subject identified the target stimulus. Figure 6
shows the respective time periods before, during, and after the task; the periods were of equal
length. If the subject’s visual attention was engaged during the task, EDA fluctuated more than in
the other periods because an SCR occurred. For this study, the mean value of the fluctuation in
EDA per unit time is given by
T
gG
(1)
where ΔG is the mean value of the fluctuation in EDA per unit time (μΩ-1
/s), Δg is the increase or
decrease in EDA (μΩ-1
) over a short time interval, and T is the time elapsed during which the
INTERNATIONAL JOURNAL ON SMART SENSING AND INTELLIGENT SYSTEMS VOL. 10, NO. 2, JUNE 2017
300

Figure 4. Pre-cueing technique
Figure 5. The time period during the task
subject worked on the task. Mean values for the fluctuation in EDA per unit time were
respectively calculated for the periods before and during the task to determine whether the
subject’s visual attention was engaged. If they differed significantly according to the t-test, it was
determined that the subject’s visual attention was engaged during the task, and for these cases,
Tsugunosuke Sakai, Haruya Tamaki, Yosuke Ota, Ryohei Egusa, Shigenori Inagaki, Fusako Kusunoki, Masanori Sugimoto, Hiroshi Mizoguchi, EDA-BASED ESTIMATION OF VISUAL ATTENTION BY OBSERVATION OF EYE BLINK FREQUENCY
301

Figure 6. The respective time periods before, during, and after the task
the number of blinks per minute (blink rate) was calculated for each period. The average of all
the subjects’ blink rates was assessed with Tukey’s multiple comparison procedure.
b. Experimental setup
The subjects were 19 men and 2 women between the ages of 21 and 25. As shown in Figure 7,
each subject was seated in a chair and pushed the switch with the right hand. An electrode was
attached to a fingertip on the left hand. The task was shown on a display. The state of the subject
was recorded with a video camera installed under the display to observe blinking. The subject
was directed to push the switch when he/she identified the target stimulus. The task was initiated
after the subject was given a signal to begin, when the subject pushed the switch. The subject
engaged in the task five times; each time, a different cue was used. For each subject, EDA and
blinking were simultaneously measured from the moment the task was initiated.
Figure 8 shows the hardware configuration used in the experiment. We used a biological
amplifier (Biolog, S&ME) to measure EDA; it was measured at 500 Hz in a sampling period and
was expressed in units of μΩ-1
. Blinking was observed from images obtained by camera at 30 Hz
in a sampling period. The switch signal was sent to the biological amplifier to be synchronized
with the EDA.
INTERNATIONAL JOURNAL ON SMART SENSING AND INTELLIGENT SYSTEMS VOL. 10, NO. 2, JUNE 2017
302

Figure 7. Experimental environment
Figure 8. Hardware configuration
Tsugunosuke Sakai, Haruya Tamaki, Yosuke Ota, Ryohei Egusa, Shigenori Inagaki, Fusako Kusunoki, Masanori Sugimoto, Hiroshi Mizoguchi, EDA-BASED ESTIMATION OF VISUAL ATTENTION BY OBSERVATION OF EYE BLINK FREQUENCY
303
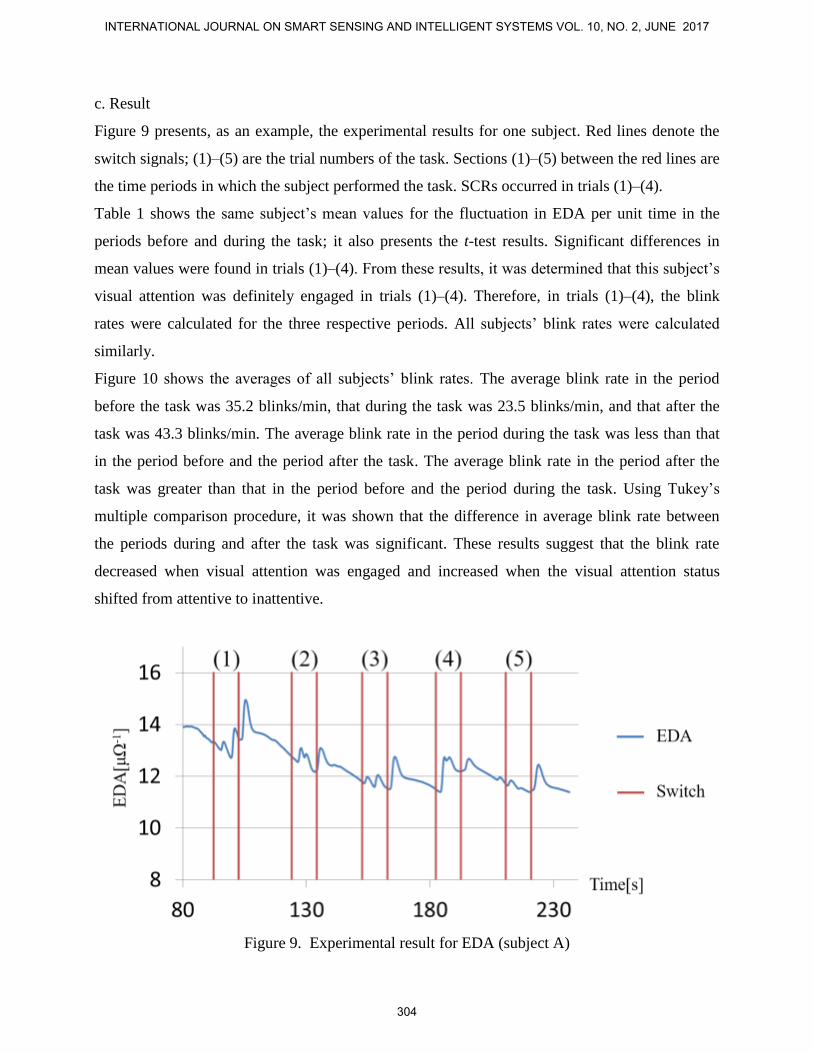
c. Result
Figure 9 presents, as an example, the experimental results for one subject. Red lines denote the
switch signals; (1)–(5) are the trial numbers of the task. Sections (1)–(5) between the red lines are
the time periods in which the subject performed the task. SCRs occurred in trials (1)–(4).
Table 1 shows the same subject’s mean values for the fluctuation in EDA per unit time in the
periods before and during the task; it also presents the t-test results. Significant differences in
mean values were found in trials (1)–(4). From these results, it was determined that this subject’s
visual attention was definitely engaged in trials (1)–(4). Therefore, in trials (1)–(4), the blink
rates were calculated for the three respective periods. All subjects’ blink rates were calculated
similarly.
Figure 10 shows the averages of all subjects’ blink rates. The average blink rate in the period
before the task was 35.2 blinks/min, that during the task was 23.5 blinks/min, and that after the
task was 43.3 blinks/min. The average blink rate in the period during the task was less than that
in the period before and the period after the task. The average blink rate in the period after the
task was greater than that in the period before and the period during the task. Using Tukey’s
multiple comparison procedure, it was shown that the difference in average blink rate between
the periods during and after the task was significant. These results suggest that the blink rate
decreased when visual attention was engaged and increased when the visual attention status
shifted from attentive to inattentive.
Figure 9. Experimental result for EDA (subject A)
INTERNATIONAL JOURNAL ON SMART SENSING AND INTELLIGENT SYSTEMS VOL. 10, NO. 2, JUNE 2017
304

Table 1: Comparison of the mean values of the fluctuation in EDA before (ΔGB) and during
(ΔGT) the task (subject A)
Trial (1) (2) (3) (4) (5)
ΔGB[μΩ-1
/s] 0.072 0.081 0.061 0.039 0.074
ΔGT[μΩ-1
/s] 0.279 0.198 0.165 0.226 0.079
t[-] 1.07 × 10⁻⁹
2.07 × 10⁻¹⁰
9.59 × 10⁻¹⁴
5.11 × 10⁻⁷
0.22
Significant?
(t < 0.01) * * * * -
Figure 10. Average eye blink rates for all 21 subjects
Tsugunosuke Sakai, Haruya Tamaki, Yosuke Ota, Ryohei Egusa, Shigenori Inagaki, Fusako Kusunoki, Masanori Sugimoto, Hiroshi Mizoguchi, EDA-BASED ESTIMATION OF VISUAL ATTENTION BY OBSERVATION OF EYE BLINK FREQUENCY
305

IV. CONCLUSION
In this paper, we described an experiment using EDA to verify the relationship between visual
attention and blinking. In the experiment, the state of the subject’s visual attention and blinking
were observed. The visual attention status (engaged or not engaged) was determined by EDA.
The blink rate during the period when visual attention was definitely engaged was calculated and
compared with those in periods when visual attention was not engaged. The experimental results
showed that blink rate decreased when visual attention was activated and increased when the
visual attention status shifted from attentive to inattentive. These findings enable a more
objective evaluation of the relationship between visual attention and blinking when using EDA to
determine whether visual attention is engaged.
ACKNOWLEDGMENT
This work was supported by JSPS KAKENHI Grant Numbers JP26560129 and JP15H02936.
REFERENCES
[1] W. Torch, C. Cardillo, “Oculometric measures as an index of driver distraction, inattention,
drowsiness and sleep onset,” Driver Distraction and Inattention Conference, A72-P, 2009.
[2] R. HariKumar, T. Vijayakumar, “Performance analysis of patient specific elman-chaotic
optimization model for fuzzy based epilepsy risk level classification rom eeg signals”,
International Journal on Smart Sensing and Intelligent System, Vol. 2, No. 4, pp. 612-635, 2009.
[3] Y. Wang, C. Wang, L. Liang, “Sparse representation theory and its application for face
recognition”, International Journal on Smart Sensing and Intelligent System, Vol. 8, No. 1, pp.
107-124, 2015.
[4] S. Zhu, Y. Xiao, “Intelligent detection of facial expression based on image”, International
Journal on Smart Sensing and Intelligent System, Vol. 8, No. 1, pp. 581-601, 2015.
[5] J.B. Ryu, H.S. Yang, Y.-H. Seo, “Real time eye blinking detection using local ternary pattern
and SVM,” Eighth International Conference on Broadband and Wireless Computing,
Communication and Applications, pp. 598-601, 2013.
INTERNATIONAL JOURNAL ON SMART SENSING AND INTELLIGENT SYSTEMS VOL. 10, NO. 2, JUNE 2017
306

[6] D. Kim, S. Choi, S. Park, K. Sohn, “Stereoscopic visual fatigue measurement based on
fusional response curve and eye-blinks,” 17th International Conference on Digital Signal
Processing, pp. 1-6, 2011.
[7] H. Kurniawan, A.V. Maslov, M. Pechenizkiy, “Stress detection from speech and galvanic
skin response signals,” 26th IEEE International Symposium on Computer-Based Medical
Systems, pp. 209-214, 2013.
[8] M.K. Holland, G. Tarlow, “Blinking and thinking,” Perceptual and Motor Skills, Vol. 41, No.
2, pp. 403-406, 1975.
[9] J.G. Wood, J. Hassett, “Eyeblinking during problem solving: the effect of problem difficulty
and internally vs externally directed attention,” Psychophysiology, Vol. 20, No. 1, pp. 18-20,
1983.
[10] V. Weistroffer, A. Paljic, L. Callebert, P. Fuchs, “A methodology to assess the acceptability
of human-robot collaboration using virtual reality,” 19th ACM Symposium on Virtual Reality
Software and Technology, pp. 39-48, 2013.
[11] R. Yoshida, T. Nakayama, T. Ogitsu, H. Takemura, H. Mizoguchi, E. Yamaguchi, S.
Inagaki, Y. Takeda, M. Namatame, M. Sugimoto, F. Kusunoki, “Feasibility study on estimating
visual attention using electrodermal activity,” Eighth International Conference on Sensing
Technology, pp. 589-592, 2014.
[12] M.J. Herrmann, M.M. Plichta, A.C. Ehlis, A.J. Fallgatter, “Optical topography during a Go-
NoGo task assessed with multichannel near-infrared spectroscopy,” Behavioural Brain Research,
Vol. 160, No. 1, pp. 135-140, 2005.
[13] M.I. Posner, C.R. Snyder, B.J. Davidson, “Attention and the detection of signals,” Journal of
Experimental Psychology: General, Vol. 109, No. 2, pp. 160-174, 1980.
Tsugunosuke Sakai, Haruya Tamaki, Yosuke Ota, Ryohei Egusa, Shigenori Inagaki, Fusako Kusunoki, Masanori Sugimoto, Hiroshi Mizoguchi, EDA-BASED ESTIMATION OF VISUAL ATTENTION BY OBSERVATION OF EYE BLINK FREQUENCY
307