downloaded on 2017-02-12t11:08:31z · pdf file · 2017-02-121.4 reduction...
TRANSCRIPT

Title Assessment of dietary background exposure of the Irish adult populationto dioxins and PCBs particularly taking into account additional exposuredue to the 2008 Irish dioxin food contamination incident
Author(s) Tlustos, Christina L. T.
Publication date 2014
Original citation Tlustos C. L. T. 2014. Assessment of dietary background exposure ofthe Irish adult population to dioxins and PCBs particularly taking intoaccount additional exposure due to the 2008 Irish dioxin foodcontamination incident. PhD Thesis, University College Cork.
Type of publication Doctoral thesis
Rights © 2014, Christina L. T. Tlustoshttp://creativecommons.org/licenses/by-nc-nd/3.0/
Embargo information No embargo required
Item downloadedfrom
http://hdl.handle.net/10468/1682
Downloaded on 2017-02-12T11:08:31Z
THE NATIONAL UNIVERSITY OF IRELAND, CORK
UNIVERSITY COLLEGE CORK
SCHOOL OF FOOD & NUTRITIONAL SCIENCES
Head of School: Professor Yrjo Roos
Supervisor: Professor Albert Flynn
Assessment of dietary background exposure of the Irish
Adult Population to Dioxins and PCBs particularly
taking into account additional exposure due to the 2008
Irish dioxin food contamination incident
THESIS
Presented by
Christina Tlustos, MSc
For the degree of
PHD - DOCTOR OF PHILOSOPHY
In Food & Nutritional Sciences
October, 2013

2
Table of Contents
1 Introduction ..................................................................................................................... 16 1.1 Structure of chlorinated dioxins, furans and biphenyls ........................................................ 16 1.2 Sources and Environmental Fate ........................................................................................... 17 1.3 Toxicity .................................................................................................................................. 19 1.3.1 Dioxins and dioxin-like substances (PCDD/Fs and DL-PCBs) ................................................. 19 1.3.2 NDL-PCBs .............................................................................................................................. 29 1.4 Reduction Strategies and Legislative Measures .................................................................... 31 1.5 Dietary Sources and human exposure ................................................................................... 35 1.5.1 Breast milk as an indicator of human exposure ................................................................... 38 1.6 POPs contamination incidents............................................................................................... 41 1.6.1 The 2008 Dioxin Contamination of Irish Pork ....................................................................... 41 2 Collation of occurrence data of dioxins and PCBs in food in Ireland ................................. 46 2.1 Methodologies ...................................................................................................................... 48 2.1.1 FSAI Monitoring Programme ................................................................................................ 48 2.1.2 Animal Health Surveillance Scheme (AHSS) in County Cork ................................................. 49 2.1.3 EPA National milk surveys .................................................................................................... 50 2.1.4 Teagasc Food Research Centre Monitoring .......................................................................... 50 2.1.5 96/23 DAFM Residue Monitoring Program .......................................................................... 51 2.1.6 MI Bivalve Molluscs and Fish Landings Monitoring .............................................................. 51 2.1.7 DAFM Infant Formula and Follow on Formula Monitoring .................................................. 51 2.1.8 BIM Ad hoc salmon survey ................................................................................................... 52 2.2 Results and Discussion .......................................................................................................... 52 2.2.1 FSAI Monitoring Programme ................................................................................................ 52 2.2.2 Animal Health Surveillance Scheme (AHSS) in County Cork ................................................. 61 2.2.3 EPA National milk surveys .................................................................................................... 62 2.2.4 Teagasc Monitoring 1998 and 2000 ..................................................................................... 63 2.2.5 96/23 DAFM Residue Monitoring Program .......................................................................... 63 2.2.6 MI Bivalve Molluscs and Fish Landings Monitoring Program ............................................... 65 2.2.7 DAFM Infant Formula and Follow on Formula Monitoring Program ................................... 66 2.2.8 BIM Ad hoc salmon survey ................................................................................................... 66 3 Dietary Background Exposure of the Irish Population to Dioxins and PCBs ...................... 67
3.1 Overview of exposure estimate based on North/South Ireland Food Consumption Survey (NSIFCS) 1997 - 1999 ................................................................................................. 67
3.1.1 Food Consumption Database ............................................................................................... 67 3.1.2 Concentration Data .............................................................................................................. 67 3.1.3 Exposure Model .................................................................................................................... 68 3.1.4 Results and Discussion .......................................................................................................... 68 3.2 Exposure estimate based on National Adult Nutrition Survey (NANS) 2008 - 2010 ............. 69 3.2.1 Food Consumption Database ............................................................................................... 69 3.2.2 Modification of the Food Consumption Database ............................................................... 70 3.2.3 Exposure assessment methodology ..................................................................................... 73 3.2.4 Concentration Data .............................................................................................................. 75 3.2.5 Presence Probability ............................................................................................................. 75 3.3 Results and Discussion .......................................................................................................... 75 3.3.1 Number of Iterations required ............................................................................................. 75 3.3.2 Concentration Data .............................................................................................................. 76 3.3.3 Exposure Estimates .............................................................................................................. 80 3.3.4 Uncertainty Analysis ........................................................................................................... 103 4 The 2008 Dioxin Contamination of Irish Pork ................................................................. 105 4.1 Introduction ......................................................................................................................... 105 4.1.1 Discovery of the contamination ......................................................................................... 105 4.1.2 Source of contamination .................................................................................................... 105

3
4.1.3 Tracing of contaminated produce and onset of contamination ......................................... 106 4.1.4 The Recall ........................................................................................................................... 108 4.1.5 Initial Risk Assessment ........................................................................................................ 108 4.2 Materials and Methods ....................................................................................................... 109 4.3 Results ................................................................................................................................. 110 4.3.1 Feed .................................................................................................................................... 110 4.3.2 Porcine Fat .......................................................................................................................... 110 4.3.3 Bovine Fat ........................................................................................................................... 111 4.3.4 Fuel Oil ................................................................................................................................ 112 4.4 Discussion ............................................................................................................................ 116 4.4.1 Feed .................................................................................................................................... 116 4.4.2 Porcine fat .......................................................................................................................... 116 4.4.3 Bovine fat............................................................................................................................ 117 4.4.4 Fuel oil ................................................................................................................................ 120 4.5 Conclusion ........................................................................................................................... 121
5 Impact of the 2008 dioxin contamination of Irish pork on exposure of the Irish Population to Dioxins and PCBs ..................................................................................... 123
5.1 Food Consumption Database .............................................................................................. 123 5.2 Exposure assessment methodology .................................................................................... 123 5.2.1 Concentration Data ............................................................................................................ 124 5.2.2 Presence Probability ........................................................................................................... 125 5.3 Results and Discussion ........................................................................................................ 125 5.3.1 Number of Iterations .......................................................................................................... 125 5.3.2 Incident Concentration data used in the exposure model ................................................. 126 5.3.3 Presence Probability ........................................................................................................... 130 5.3.4 Exposure Estimates ............................................................................................................ 137 5.3.5 Uncertainty Analysis ........................................................................................................... 150 6 Summary and Conclusion ............................................................................................... 151 6.1 Estimated background exposure ......................................................................................... 152 6.1.1 Background exposure to Total WHO TEQ PCDD/Fs & DL-PCBs .......................................... 152 6.1.2 Background exposure to Sum of 6 Marker PCBs ................................................................ 153 6.1.3 Use of breast milk data as biomarker for exposure to dioxins and PCBs ........................... 153 6.1.4 Overall conclusions on background exposure of the Irish adult population to dioxins
and PCBs ............................................................................................................................. 154 6.2 Estimated additional post incident exposure ...................................................................... 155 6.2.1 The exposure model ........................................................................................................... 155 6.2.2 Additional post incident exposure to Total WHO TEQ PCDD/F & DL-PCBs ........................ 156 6.2.3 Additional post incident exposure to Sum of 6 Marker PCBs ............................................. 157 6.2.4 Additional considerations ................................................................................................... 158 6.2.5 Overall conclusions on additional post incident exposure of the Irish adult
population to dioxins and PCBs .......................................................................................... 159 7 Annex I .......................................................................................................................... 160 7.1 Food Categorisation used to estimate exposure to dioxins from the diet .......................... 160 7.2 FSAI Monitoring Data (2000 - 2010) for sum of 6 Marker PCBs and Total TEQ (PCDD/F
& DL-PCBs) (1998 & 2005) expressed as N (number of samples) and range (min - max) ... 163 7.3 Chemical Concentration Data used in probabilistic modelling ........................................... 170 7.4 Results expressed on WHO-TEQ (1998) basis ..................................................................... 185 7.4.1 Background exposure ......................................................................................................... 185 7.4.2 Incident exposure (1998 TOTTEQ) ...................................................................................... 187 8 References ..................................................................................................................... 189

4
Table of Tables
TABLE 1 TOXIC EQUIVALENCY FACTORS FOR DIOXINS AND DL-PCBS ................................................................... 23
TABLE 2 OVERVIEW OF PIVOTAL STUDIES USED IN THE DERIVATION OF TOLERABLE INTAKE LEVELS BY WHO
ECEH/IPCS, JECFA AND SCF ...................................................................................................... 27
TABLE 3 MAXIMUM LEVELS ESTABLISHED IN COMMISSION REGULATION 1881/2006 FOR PCDD/FS, AND SUM OF
PCDD/FS AND DL-PCBS AND SUM OF ICES 6 PCBS (EC, 2006C) ...................................................... 34
TABLE 4 FOOD GROUP SPECIFIC MEANS FOR SUM OF PCDD/F&DL-PCBS (TOTAL WHO TEQ (2005)) USING
LOWER AND UPPER BOUND CONCENTRATIONS (ADAPTED FROM EFSA (EFSA, 2012)) ............................. 35
TABLE 5 OVERVIEW OF DIETARY INTAKE OF DIOXINS (PG TOTAL TEQ (1998)/KG BW/D) REPORTED FOR EUROPEAN
COUNTRIES BETWEEN 2003 AND 2011 ........................................................................................... 37
TABLE 6 NATIONAL EXPOSURE ESTIMATES AVAILABLE FOR ADULTS IN THE EUROPEAN UNION ................................... 38
TABLE 7 OVERVIEW OF RECENT DIOXIN AND PCB FOOD/FEED CONTAMINATION INCIDENTS ..................................... 41
TABLE 8 BREAKDOWN OF ROUTINE MONITORING SAMPLES TAKEN IN IRELAND BETWEEN 1991 - 2010 FOR DIOXIN
ANALYSIS ................................................................................................................................... 47
TABLE 9 NUMBER OF SAMPLES AND RESULTS EXPRESSED AS LB AND UB MEAN TOTAL TEQ (1998) FAT WEIGHT
COVERED BY FSAI MONITORING PROGRAMS 2001 - 2010.................................................................. 55
TABLE 10 NUMBER OF SAMPLES AND RESULTS EXPRESSED AS LB AND UB MEAN OF SUM OF 6 MARKER PCBS IN
µG/KG FAT WEIGHT COVERED BY FSAI MONITORING PROGRAMS 2001 - 2010 ....................................... 58
TABLE 11 MEAN TOTAL WHO TEQ (1998) NG/KG FAT WEIGHT (UPPERBOUND) MEASURED IN COW’S MILK
SAMPLES TAKEN FROM SENTINEL HERDS BETWEEN 2000 – 2009 ......................................................... 62
TABLE 12 NUMBER OF ANALYSES FOR 7 MARKER PCBS PERFORMED UNDER THE 96/23 RESIDUE MONITORING
PROGRAM, INCLUDING INFORMATION ON SAMPLES DETECTED ABOVE THE REPORTING LIMIT ...................... 64
TABLE 13 ANALYSES FOR 7 MARKER PCBS CARRIED OUT IN FISH UNDER THE 96/23 RESIDUE MONITORING
PROGRAM .................................................................................................................................. 64
TABLE 14 ANALYSES FOR MARKER PCBS CARRIED OUT IN PORT LANDINGS AND SHELLFISH....................................... 65
TABLE 15 OVERVIEW OF RESULTS OF 2004 BIM STUDY ON THE EFFECTS OF COOKING AND SKIN REMOVAL ON
CONTAMINANT CONCENTRATION IN FARMED SALMON, EXPRESSED AS TOTAL WHO TEQ PG/G WHOLE
WEIGHT AND SUM OF 6 MARKER PCBS IN NG/G WHOLE WEIGHT(WW) .................................................. 66
TABLE 16 ESTIMATED EXPOSURE OF THE IRISH ADULT POPULATION TO TOTAL WHO TEQ IN PG/KG BW PER MONTH
FOR PCDD/FS & DL-PCBS FROM INTAKE OF FISH, MEAT, OFFAL, DAIRY PRODUCTS, VEGETABLE OILS, BIVALVE MOLLUSCS AND EGGS PRODUCED IN IRELAND ........................................................................ 68
TABLE 17 EXAMPLE OF DISAGGREGATED COMPOSITE FOOD ............................................................................... 71
TABLE 18 EXAMPLE OF RECIPE WITH RECORDED WEIGHT LOSS FACTOR ................................................................. 72
TABLE 19 OVERVIEW OF CONCENTRATION DATA USED TO ESTIMATE BACKGROUND EXPOSURE EXPRESSED IN NG/KG
FAT FOR TOTAL WHO TEQ AND µG/KG FOR THE SUM OF 6 MARKER PCBS ............................................ 78
TABLE 20 AMOUNT OF CONSUMERS OF TOTAL POPULATION (N=1500) IN EACH FOOD GROUP SELECTED ................... 80
TABLE 21 MEAN AND HIGH PERCENTILE INTAKES OF FAT FROM SIX FOOD GROUPS, EXPRESSED AS G/KG BW/D ............. 85
TABLE 22 LIFETIME ESTIMATE OF MEAN AND HIGH PERCENTILE INTAKES OF FAT FROM SIX FOOD GROUPS, EXPRESSED
AS G/KG BW/D ............................................................................................................................ 87
TABLE 23 OVERALL TOTAL EXPOSURE TO TOTAL TEQ (PCDD/F&DL-PCB) WHO (2005) PG/KG BW/D .................. 89
TABLE 24 RANGE OF LB - UB SUMMARY STATISTICS OF EXPOSURE TO TOTAL WHO TEQ (2005) EXPRESSED AS
PG/KG BW/D AND % CONTRIBUTION TO THE TOTAL MEAN AVERAGE DAILY INTAKE ................................... 91
TABLE 25 LIFETIME ESTIMATE OF UB SUMMARY STATISTICS OF EXPOSURE TO TOTAL WHO TEQ (2005) EXPRESSED
AS PG/KG BW/D .......................................................................................................................... 93
TABLE 26 OVERALL TOTAL EXPOSURE TO SUM OF 6 MARKER PCBS NG/KG BW/D .................................................. 95
TABLE 27 ESTIMATED BODY BURDEN BASED ON NDL-PCBS IN BREAST MILK ........................................................ 97
TABLE 28 RANGE OF LB - UB SUMMARY STATISTICS OF EXPOSURE TO SUM OF 6 MARKER PCBS EXPRESSED AS NG/KG
BW/D AND % CONTRIBUTION TO THE TOTAL MEAN AVERAGE DAILY INTAKE ............................................. 99
TABLE 29 LIFETIME ESTIMATE OF UB SUMMARY STATISTICS OF EXPOSURE TO SUM OF 6 MARKER PCBS EXPRESSED AS
NG/KG BW/D............................................................................................................................ 101
TABLE 30 QUALITATIVE EVALUATION OF INFLUENCE OF UNCERTAINTIES ON THE EXPOSURE ESTIMATE OF DIOXIN FROM
BACKGROUND CONTAMINATION OF THE IRISH ADULT POPULATION ..................................................... 103

5
TABLE 31 NUMBER OF BOVINE AND PORCINE FAT SAMPLES AND ANIMAL FEED SAMPLES ANALYSED ......................... 109
TABLE 32 DIOXIN AND PCB DISTRIBUTION IN PORCINE FAT TAKEN FROM 12 PIG HERDS ....................................... 113
TABLE 33 DIOXIN AND PCB DISTRIBUTION IN BOVINE FAT TAKEN FROM 30 CATTLE HERDS ................................... 114
TABLE 34 SUMMARY STATISTICS OF INCIDENT CONCENTRATION DATA USED FOR EXPOSURE ASSESSMENT .................. 129
TABLE 35 ESTIMATION OF CONTRIBUTION OF FACTORY SLAUGHTER AND IMPORTS TO TOTAL DOMESTIC
CONSUMPTION ......................................................................................................................... 133
TABLE 36 UB SUMMARY STATISTICS OF POST INCIDENT EXPOSURE TO TOTAL WHO TEQ (2005) FROM ALL FOOD
GROUPS (PG/KG BW/D) .............................................................................................................. 137
TABLE 37 DIFFERENCE IN SUMMARY STATISTICS BETWEEN BACKGROUND CONCENTRATION AND POST INCIDENT
CONCENTRATION IN TOTAL WHO TEQ (2005) PG/KG BW ............................................................... 141
TABLE 38 CONTAMINATION IMPACT - UB MEAN, MEDIAN AND HIGHER PERCENTILE EXPOSURE TO TOTAL WHO
TEQ (2005) EXPRESSED AS PG/KG BW/D AND % CONTRIBUTION TO THE TOTAL MEAN AVERAGE DAILY
INTAKE .................................................................................................................................... 142
TABLE 39 UB SUMMARY STATISTICS OF POST INCIDENT EXPOSURE TO SUM OF 6 MARKER PCBS FROM ALL FOOD
GROUPS (NG/KG BW/D) ............................................................................................................. 144
TABLE 40 ESTIMATED ADDITIONAL EXPOSURE TO SUM OF 6 MARKER PCBS (NG/KG BW/D) DUE TO THE
CONTAMINATION INCIDENT ......................................................................................................... 146
TABLE 41 CONTAMINATION IMPACT: RANGE OF LB - UB MEAN, MEDIAN AND HIGHER PERCENTILE EXPOSURE TO
SUM OF 6 MARKER PCBS EXPRESSED AS NG/KG BW/D AND % CONTRIBUTION TO THE TOTAL MEAN
AVERAGE DAILY INTAKE ............................................................................................................... 148
TABLE 42 QUALITATIVE EVALUATION OF INFLUENCE OF UNCERTAINTIES ON THE EXPOSURE ESTIMATE OF DIOXIN
CONTAMINATION OF THE IRISH ADULT POPULATION......................................................................... 150
TABLE 43 NUMBER OF SAMPLES FOR THE ANALYSIS OF 6 MARKER PCBS, TOTAL TEQ (1998) AND TOTAL TEQ
(2005) COVERED BY FSAI MONITORING PROGRAMS 2001 - 2010 .................................................... 163
TABLE 44 RANGE OF SUM OF 6 MARKER PCBS COVERED BY FSAI MONITORING PROGRAMS 2001 - 2010 .............. 164
TABLE 45 LB AND UB RANGE OF TOTAL TEQ (1998) COVERED BY FSAI MONITORING PROGRAMS 2001 - 2010 ..... 166
TABLE 46 LB AND UB RANGE OF TOTAL TEQ (2005) COVERED BY FSAI MONITORING PROGRAMS 2001 - 2010 ..... 168
TABLE 47 CREME DATA ENTRY BACKGROUND CONCENTRATION ...................................................................... 170
TABLE 48 CRÈME DATA ENTRY FOR CONTAMINATED BEEF AND PORK ................................................................ 180
TABLE 49 RANGE OF LB - UB SUMMARY STATISTICS OF EXPOSURE TO TOTAL WHO TEQ (1998) EXPRESSED AS
PG/KG BW/D AND % CONTRIBUTION TO THE TOTAL MEAN AVERAGE DAILY INTAKE ................................. 185
TABLE 50 CONTAMINATION IMPACT – UB MEAN, MEDIAN AND HIGHER PERCENTILE EXPOSURE TO TOTAL WHO
TEQ (1998) EXPRESSED AS PG/KG BW/D AND % CONTRIBUTION TO THE TOTAL MEAN AVERAGE DAILY
INTAKE .................................................................................................................................... 187

6
Table of Figures
FIGURE 1 STRUCTURE OF PCDD/FS AND PCBS............................................................................................... 17 FIGURE 2 RANGE OF PCDD/FS (PG/G FAT) IN HUMAN BREAST MILK IN EUROPEAN COUNTRIES PARTICIPATING IN THE
3RD
WHO ROUND (NUMBER DISPLAYED SHOWS THE MEDIAN) .............................................................. 40 FIGURE 3 RANGE OF SUM OF 6 MARKER PCBS (NG/G FAT) IN HUMAN BREAST MILK IN EUROPEAN COUNTRIES
PARTICIPATING IN THE 3RD
WHO ROUND (NUMBER DISPLAYED SHOWS THE MEDIAN) ................................ 40 FIGURE 4 TYPE OF QUERIES RECEIVED BY THE FOOD SAFETY AUTHORITY ............................................................... 45 FIGURE 5 TOTAL TEQ NG/KG FAT WEIGHT (UPPERBOUND) MEASURED IN COW’S MILK SAMPLES TAKEN FROM TARGET
AND CONTROL HERDS BETWEEN 1991 – 2009 UNDER THE AHSS SCHEME ............................................. 62 FIGURE 6 CHANGE OF P99+/- ERROR AND 95 % CONFIDENCE INTERVAL OVER INCREASING ITERATIONS .................... 76 FIGURE 7 CHANGE OF ERROR OF MEAN, MEDIAN, P95 AND P99 OVER INCREASING ITERATIONS ............................. 76 FIGURE 8 BOXPLOT OF TOTAL POPULATION AND CONSUMER ONLY FAT INTAKE FROM FOOD CATEGORIES INCLUDED IN
THE EXPOSURE ASSESSMENT, EXPRESSED AS G FAT/KG BW/ .................................................................. 82 FIGURE 9 COMPARISON OF SUMMARY STATISTICS FOR CONSUMPTION OF G FAT/KG BW/D DERIVED USING AVERAGE
DAILY INTAKE (DA) VERSUS LIFETIME ESTIMATES (LIFE) ...................................................................... 84 FIGURE 10 TOTAL POPULATION DISTRIBUTION OF EXPOSURE TO TOTAL WHO TEQ FROM SIX FOOD GROUPS ............. 89 FIGURE 11 TOTAL POPULATION DISTRIBUTION OF EXPOSURE TO SUM OF 6 MARKER PCBS FROM SIX FOOD GROUPS .... 95 FIGURE 12 RESULTS OF ANALYSIS OF ARCHIVE FEED SAMPLES (13AUG – 3 DEC) ................................................ 107 FIGURE 13 CONGENER PATTERN FOR PCDD/FS AND DL-PCBS, EXPRESSED ON A % OF MASS AND % OF TEQ
(1998) BASIS ........................................................................................................................... 118 FIGURE 14 CONGENER PATTERN FOR SUM OF 6 AND SUM OF 7 MARKER PCBS, EXPRESSED ON A % OF MASS BASIS .. 119 FIGURE 15 PERCENT CONTRIBUTION OF DL-PCBS AND 7 MARKER PCBS TO TOTAL MASS IN COMMERCIAL AROCLOR
MIXTURES AND IN FUEL OIL .......................................................................................................... 120 FIGURE 16 CORRELATION OF PCB COMPOSITION (MG/KG) IN FUEL OIL AND PCB COMPOSITION (% MOL) IN
AROCLOR 1260 COMMERCIAL PCB MIXTURE ................................................................................. 121 FIGURE 17 CHANGE OF P99 +/- ERROR AND 95 % CONFIDENCE INTERVAL OVER INCREASING ITERATIONS ................ 125 FIGURE 18 CHANGE % ERROR OF P98.9, P99 AND P99.9 OVER INCREASING ITERATIONS .................................... 126 FIGURE 19 BOXPLOT OF 23 PORCINE FAT AND 20 BOVINE FAT RESULTS FOR TOTAL WHO TEQ (1998) USED IN THE
EXPOSURE ASSESSMENT .............................................................................................................. 128 FIGURE 20 BEEF PRODUCTION STATISTICS 2008 (TONNES CARCASE WEIGHT EQUIVALENTS (CWE)) .......................... 134 FIGURE 21 PORK PRODUCTION STATISTICS 2008 (TONNES CARCASE WEIGHT EQUIVALENTS (CWE)) ......................... 135 FIGURE 22 MOVEMENT OF CONTAMINATED CATTLE AND PIGS DURING THE INCIDENT TIME-FRAME (SEPT – MID DEC),
EXPRESSED IN NUMBER OF ANIMALS ............................................................................................. 136 FIGURE 23 TOTAL POPULATION DISTRIBUTION OF EXPOSURE TO TOTAL WHO TEQ FROM SIX FOOD GROUPS (CHART
TRUNCATED AT P99) ................................................................................................................. 137 FIGURE 24 PLOTTING OF BACKGROUND VERSUS POST INCIDENT DISTRIBUTION FOR TOTAL WHO TEQ (2005) ......... 138 FIGURE 25 TOTAL POPULATION DISTRIBUTION OF EXPOSURE TO SUM OF 6 MARKER PCBS FROM SIX FOOD GROUPS
(CHART TRUNCATED AT P99) ...................................................................................................... 144 FIGURE 26 PLOTTING OF BACKGROUND VERSUS POST INCIDENT DISTRIBUTION FOR SUM OF 6 MARKER PCBS ........... 145

7
Declaration
The thesis submitted is my own work and has not been submitted for another degree,
either at University College Cork or elsewhere.
Signed: ………………………………………………
(Christina Tlustos)

8
Acknowledgements
Many people have assisted, helped and encouraged me during the last 5 years and I would
like to thank you all. In particular, my thanks extend to my supervisors Prof. Albert Flynn
(UCC) and Wayne Anderson (FSAI) for their input and support.
I wish to thank the Department of Agriculture, Food and the Marine for its assistance in
compiling the data required. In particular I would like to extend my gratitude to Michael
Sheridan, who provided me with a lot of his time, patience and knowledge and the data
required to facilitate this thesis. I would also like to thank Andrew O'Connor, Dan
O'Sullivan, Peter Maher, Michael Gunn, Mary Kavanagh, Pat Brangan, Mary Neenan, Mary
T McMahon, Paul Barry Walsh, Carina Campion, Finbarr O'Connell and Liam Hyde for their
time and effort. I would also like to thank the Environmental Protection Agency, in
particular Ian Marnane, for the provision of data relating to the contamination in oil. I
further wish to thank An Bord Bia for the provision of meat balance data, which was kindly
provided by Peter Duggan.
I would like to thank the FSAI for funding this work, in particular Alan Reilly for his
encouragement, Wayne Anderson for his much valued assistance and supervision, Iona
Pratt for her input and support, Carol Heavey and Donal McCoy for helping me track the
last few missing slaughter statistics, and Karl McDonald, Elaine Connolly, Vanessa Cooling,
Anne Marie Boland and Helen Crowley for their help and moral support during my long
journey of recipe disaggregation, my manager Rhodri Evans for his support and Oonagh
Eustace for her help with all my administrative needs.

9
To Iona Pratt,
Sorely missed friend and mentor

10
Personal contribution
I have personally been involved in the implementation, management, analysis and
reporting of the FSAI monitoring programs on POPs, and I have published and presented
this work nationally and on an international basis, which provided me with an in-depth
knowledge of the data used for the background exposure assessment on dioxins.
I collated all the above information in this thesis together with all other existing data on
dioxin contamination in Ireland to provide one single overview of data collected in Ireland. I
was also actively involved in the 2008 Irish dioxin food contamination incident, in particular
I personally carried out the initial risk assessment and personally submitted all relevant
information to the European Commission and the European Food Safety Authority.
For the in-depth re-assessment of additional exposure to dioxins as a result of the 2008
Irish dioxin food contamination incident discussed in this thesis, I extensively liaised with
officials from the Department of Agriculture, Food and the Marine (DAFM) and associated
laboratories, with the Environmental Protection Agency (EPA) and foreign contract
laboratories (i.e FERA, RIKILT and SAL) to collect, collate, scrutinise and quality control all
available analytical data and to create one single database capturing all incident related
data. This information has also been published since.
I also spent a considerable amount of time with colleagues from DAFM to trace and track
all available information on the implicated herds, their movement, slaughter statistics,
information on recall numbers, final cull numbers and other related information required
to derive the contamination presence probabilities required for the exposure assessment
to dioxins.
I have personally carried out all required modifications on the two adult food consumption
surveys to facilitate the probabilistic exposure assessments on dioxins carried out as part of
this study and I have personally selected, coded and matched all food consumption and
contaminant occurrence data, designed the exposure models and performed all data runs
using CremeTM probabilistic software and subsequent analysis on the so generated data.

11
I have published, presented and contributed to work, which has been incorporated into this
thesis. These are as follows:
Tlustos C. (2009a) The dioxin contamination incident in Ireland 2008. Organohalogen
Compounds Vol.71 p. 1155-1159.
Tlustos C. (2009b) The dioxin crisis in Ireland 2008. Challenges in risk management and risk
communication. Organohalogen Compounds Vol.71 p. 1152-1154.
Tlustos C, Sheridan M, O'Sullivan D, Anderson W, and Flynn A. (2012) The dioxin
contamination incident in Ireland, 2008: analytical results and congener patterns. Food
Addit Contam Vol.29/1 p. 128-138.
Pratt IS, Anderson WA, Crowley D, Daly SF, Evans RI, Fernandes AR, Fitzgerald M, Geary MP,
Keane DP, Malisch R, McBride J, Morrison JJ, Reilly A, and Tlustos C. (2012)
Polychlorinated dibenzo-p-dioxins (PCDDs), polychlorinated dibenzofurans (PCDFs) and
polychlorinated biphenyls (PCBs) in breast milk of first-time Irish mothers: Impact of the
2008 dioxin incident in Ireland. Chemosphere Vol.88/7 p. 865-872.
Tlustos C, Anderson W, and Flynn A. (2014) Exposure of the Irish Adult population to
dioxins and PCBs from the diet Food Addit Contam Part A Chem Anal Control Expo Risk Assess.
2014 Mar 19
Tlustos C, Anderson W, and Flynn A. (2014) Additional exposure of the Irish Adult
population to dioxins and PCBs from the diet as a consequence of the 2008 Irish dioxin
food contamination incident. Food Addit Contam Part A Chem Anal Control Expo Risk
Assess. 2014 Mar 28

12
Abstract
Irish monitoring data on PCDD/Fs, DL-PCBs and Marker PCBs were collated and combined
with Irish Adult Food Consumption Data, to estimate dietary background exposure of Irish
adults to dioxins and PCBs. Furthermore, all available information on the 2008 Irish pork
dioxin food contamination incident was collated and analysed with a view to evaluate any
potential impact the incident may have had on general dioxin and PCB background
exposure levels estimated for the adult population in Ireland.
The average upperbound daily intake of Irish adults to dioxins Total WHO TEQ (2005)
(PCDD/Fs & DL-PCBs) from environmental background contamination, was estimated at 0.3
pg/kg bw/d and at the 95th percentile at 1 pg/kg bw/d. The average upperbound daily
intake of Irish adults to the sum of 6 Marker PCBs from environmental background
contamination ubiquitous in the environment was estimated at 1.6 ng/kg bw/d and at the
95th percentile at 6.8 ng/kg bw/d.
Dietary background exposure estimates for both dioxins and PCBs indicate that the Irish
adult population has exposures below the European average, a finding which is also
supported by the levels detected in breast milk of Irish mothers. Exposure levels are below
health based guidance values and/or Body Burdens associated with the TWI (for dioxins) or
associated with a NOAEL (for PCBs). Given the current toxicological knowledge, based on
biomarker data and estimated dietary exposure, general background exposure of the Irish
adult population to dioxins and PCBs is of no human health concern.
In 2008, a porcine fat sample taken as part of the national residues monitoring programme
led to the detection of a major feed contamination incidence in the Republic of Ireland. The
source of the contamination was traced back to the use of contaminated oil in a direct-
drying feed operation system. Congener profiles in animal fat and feed samples showed a
high level of consistency and pinpointed the likely source of fuel contamination to be a
highly chlorinated commercial PCB mixture.
To estimate additional exposure to dioxins and PCBs due to the contamination of pig and
cattle herds, collection and a systematic review of all data associated with the
contamination incident was conducted. A model was devised that took into account the
proportion of contaminated product reaching the final consumer during the 90 day
contamination incident window.
13
For a 90 day period, the total additional exposure to Total TEQ (PCDD/F &DL-PCB) WHO
(2005) amounted to 407 pg/kg bw/90d at the 95th percentile and 1911 pg/kg bw/90d at
the 99th percentile.
Exposure estimates derived for both dioxins and PCBs showed that the Body Burden of the
general population remained largely unaffected by the contamination incident and
approximately 10 % of the adult population in Ireland was exposed to elevated levels of
dioxins and PCBs.
Whilst people in this 10 % cohort experienced quite a significant additional load to the
existing body burden, the estimated exposure values do not indicate approximation of
body burdens associated with adverse health effects, based on current knowledge.
The exposure period was also limited in time to approximately 3 months, following the FSAI
recall of contaminated meat immediately on detection of the contamination.
A follow up breast milk study on Irish first time mothers conducted in 2009/2010 did not
show any increase in concentrations compared to the study conducted in 2002. The latter
supports the conclusion that the majority of the Irish adult population was not affected by
the contamination incident.
14
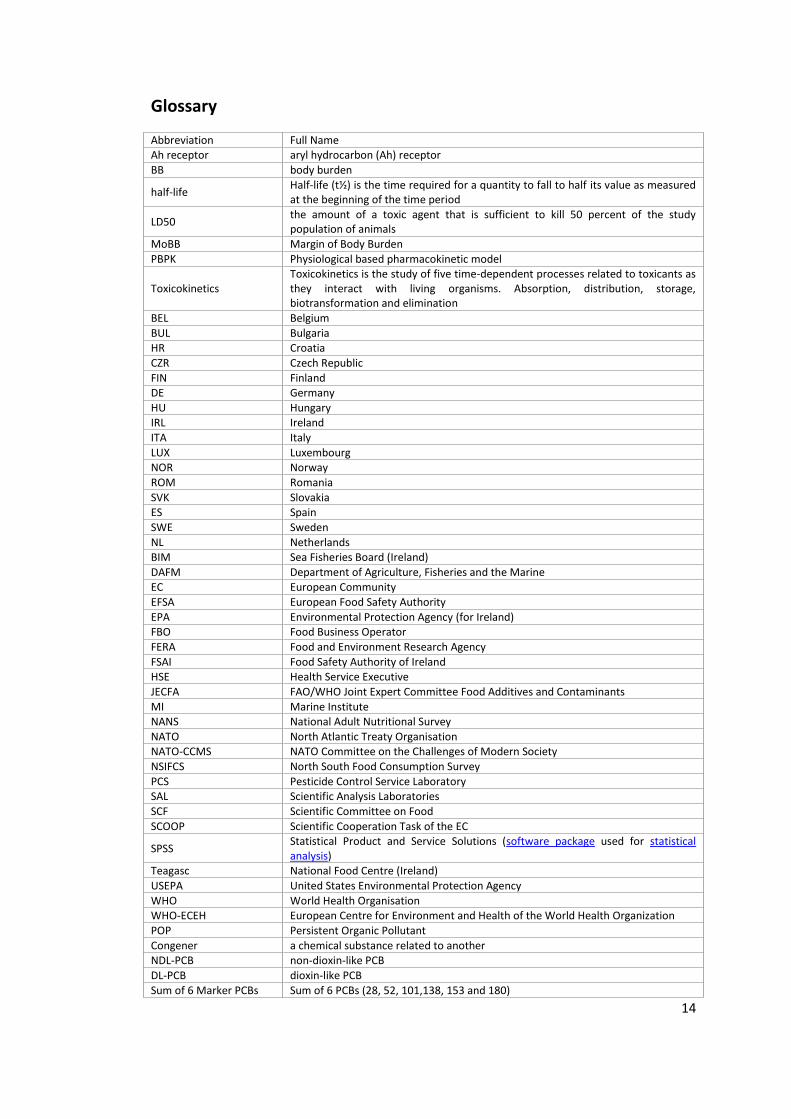
Glossary
Abbreviation Full Name Ah receptor aryl hydrocarbon (Ah) receptor
BB body burden
half-life Half-life (t½) is the time required for a quantity to fall to half its value as measured at the beginning of the time period
LD50 the amount of a toxic agent that is sufficient to kill 50 percent of the study population of animals
MoBB Margin of Body Burden
PBPK Physiological based pharmacokinetic model
Toxicokinetics Toxicokinetics is the study of five time-dependent processes related to toxicants as they interact with living organisms. Absorption, distribution, storage, biotransformation and elimination
BEL Belgium
BUL Bulgaria HR Croatia
CZR Czech Republic
FIN Finland DE Germany
HU Hungary IRL Ireland
ITA Italy
LUX Luxembourg NOR Norway
ROM Romania
SVK Slovakia ES Spain
SWE Sweden
NL Netherlands BIM Sea Fisheries Board (Ireland)
DAFM Department of Agriculture, Fisheries and the Marine EC European Community
EFSA European Food Safety Authority
EPA Environmental Protection Agency (for Ireland) FBO Food Business Operator
FERA Food and Environment Research Agency
FSAI Food Safety Authority of Ireland HSE Health Service Executive
JECFA FAO/WHO Joint Expert Committee Food Additives and Contaminants
MI Marine Institute NANS National Adult Nutritional Survey
NATO North Atlantic Treaty Organisation NATO-CCMS NATO Committee on the Challenges of Modern Society
NSIFCS North South Food Consumption Survey
PCS Pesticide Control Service Laboratory SAL Scientific Analysis Laboratories
SCF Scientific Committee on Food
SCOOP Scientific Cooperation Task of the EC
SPSS Statistical Product and Service Solutions (software package used for statistical analysis)
Teagasc National Food Centre (Ireland)
USEPA United States Environmental Protection Agency
WHO World Health Organisation WHO-ECEH European Centre for Environment and Health of the World Health Organization
POP Persistent Organic Pollutant
Congener a chemical substance related to another NDL-PCB non-dioxin-like PCB
DL-PCB dioxin-like PCB
Sum of 6 Marker PCBs Sum of 6 PCBs (28, 52, 101,138, 153 and 180)

15
Glossary continued
ICES-6 International Council for the Exploration of the Seas-6 Indicator PCBs
ICES-7 International Council for the Exploration of the Seas-7 Indicator PCBs DDT dichlorodiphenyltrichloroethane
HpCB heptachlorobiphenyl HpCDD heptachlorodibenzo-p-dioxin
HpCDF heptachlorodibenzofuran
HxCB hexachlorobiphenyl HxCDD hexachlorodibenzo-p-dioxin
HxCDF hexachlorodibenzofuran
OCDD octachlorodibenzo-p-dioxin OCDF octachlorodibenzofuran
PCB polychlorinated biphenyl
PCBs polychlorinated biphenyls PCDD/F Abbreviation for PCDDs and PCDFs
PCDDs polychlorinated dibenzo-p-dioxins PCDFs polychlorinated dibenzofurans
PnCB pentachlorobiphenyl
PnCDD pentachlorodibenzo-p-dioxin PnCDF pentachlorodibenzofuran
TCB tetrachlorobiphenyl
TCDD tetrachlorodibenzo-p-dioxin TCDF tetrachlorodibenzofuran
LOD Limit of Detection
LOQ Limit of Quantification/Quantitation Lower-bound (LB) Analytical results below the LOQ set at zero for calculation purposes
Upper-bound (UB) Analytical results below the LOQ set at the LOQ value for calculation purposes bw body weight
atm Unit to measure atmospheric pressure. 1 atmosphere = 101325 Pascal (Pa)
K0W The octanol-water partition coefficient is the ratio of the concentration of a chemical in octanol and in water at equilibrium and at a specified temperature.
d day
m month 90d 90 days
ng nanogram (0.000000001 g, 10-9
g or one billionth of a gram) ng/g nanogram per gram
ng/kg nanogram per kilogram
ng/kg bw nanogram per kilogram bodyweight pg picogram (0.000000000001 g, 10
-12 g or one trillionth of a gram)
pg/g picogram per gram
pg/kg picogram per kilogram pg/kg bw picogram per kilogram bodyweight
ww wet weight or whole weight
μg microgram (0.000001 g, 10-6
g or one millionth of a gram) μg/g microgram per gram
μg/kg microgram per kilogram μg/kg bw microgram per kilogram bodyweight
cwe carcass weight equivalent
PTMI Provisional Tolerable Monthly Intake TDI Tolerable Daily Intake
TEF toxic equivalency factor
TEQ toxicity equivalent or toxic equivalency TWI Tolerable Weekly Intake
RfD Oral Reference Dose
Boxplot
Boxplot showing the median, quartiles, and outlier and extreme values for a scale variable. The interquartile range (IQR) is the difference between the 75th and 25th percentiles and corresponds to the length of the box. ○: Outliers are values between 1.5 IQR’s and 3 IQR’s from the end of a box *: Values more than 3 IQR’s from the end of a box are defined as extreme.

16
1 Introduction
Persistent organic pollutants (POPs) are chemical substances that persist in the
environment, bio-accumulate through the food web, and pose a risk of causing adverse
effects to human health and the environment. This group of priority pollutants consists of
pesticides (e.g. dichlorodiphenyltrichloroethane (DDT)), industrial chemicals (e.g.
polychlorinated biphenyls (PCBs)) and unintentional by-products of industrial processes
(e.g. dioxins and furans).
POPs are distributed across international boundaries far from their sources, even to regions
where they have never been used or produced. Because of the long-range environmental
transportation and bio-magnification1 of these substances, persistent organic pollutants
pose a threat to the environment and to human health all over the globe.
Amongst the group of POPs, dioxins and dioxin-like chemicals form a large group of
compounds which are structurally related, are environmentally and biologically persistent,
induce a common spectrum of responses, and have a common mechanism of action (Van
den Berg et al, 1998).
1.1 Structure of chlorinated dioxins, furans and biphenyls
Chlorinated dibenzo-p-dioxins (CDDs) and chlorinated dibenzofurans (CDFs) are two series
of tricyclic aromatic compounds with similar chemical and physical properties (WHO,
1989b) and chlorinated biphenyls (CBs) are a class of chemical compounds in which 2–10
chlorine atoms are attached to the biphenyl molecule (ATSDR, 2000) (see Figure 1).
For dioxins the basic structure is a dibenzo-p-dioxin (DD) molecule, which is comprised of 2
benzene rings joined at their para carbons by 2 oxygen atoms whereas furans contains two
benzene rings fused to a central furan ring (ATSDR, 1994; ATSDR, 1998). For chlorinated
biphenyls the basic structure is a biphenyl molecule (Erickson, 2001).
Based on the number of chlorine substituents on the benzene rings, there are eight
homologues of chlorinated dioxins and furans (monochlorinated through octachlorinated),
1 "A process where chemicals are retained in fatty body tissue and increase in concentration over time.
Biomagnification is the increase of tissue accumulation in species higher in the natural food chain as
contaminated food species are eaten" (US EPA, 2013).

17
(ATSDR, 1994; ATSDR, 1998) and ten homologues of chlorinated biphenyls
(monochlorinated through decachlorinated), each homologue group containing one or
more congeners (ATSDR, 2000).
The class of CDDs contains 75 congeners, consisting of 2 monoCDDs, 10 diCDDs, 14 triCDDs,
22 tetraCDDs, 14 pentaCDDs, 10 hexaCDDs, 2 heptaCDDs, and a single octaCDD. Because of
molecular asymmetry, PCDFs have 135 congeners, compared to 75 for PCDDs (Ryan et al,
1991). These are 4 monoCDFs, 16 diCDFs, 28 triCDFs, 38 tetraCDFs, 28 pentaCDFs, 16
hexaCDFs, 4 heptaCDFs, and one octaCDF (ATSDR, 2000).
PCDDs and PCDFs are commonly referred to as dioxins or PCDD/Fs.
Chlorinated biphenyls comprise 3 monoCBs, 12 diCBs, 24 triCBs, 42 tetraCBs, 46 pentaCBs,
42 hexachlorobiphenysl, 24 heptaCBs, 12 octaCBs, 3 nonaCBs and one decaCB (ATSDR,
2000).
Figure 1 Structure of PCDD/Fs and PCBs
1.2 Sources and Environmental Fate
Polychlorinated biphenyls (PCBs) are industrial chemicals, which were produced as
technical mixtures and marketed under various brand names, characterised by their
chlorine content, such as ‘Aroclor’ (produced in the USA), ‘Clophen’ (produced in
Germany), ‘Phenoclor’ (produced in France), ‘Fenclor’ (produced in Italy), and ‘Kanechlor’
(produced in Japan). They were mainly used in electronic appliances, heat-transfer systems,
and hydraulic fluids, but also in building materials, lubricants, coatings, plasticizers and inks,
although their use has now largely been phased out (ATSDR, 2001; Srogi, 2008).
Dioxins are unwanted contaminants almost exclusively produced by industrial and
combustion processes (Bumb et al, 1980; Cleverly et al, 2007; Fiedler, 2007; Hites, 2011;
Olie et al, 1977), chlorine bleaching of paper and pulp (Engwall et al, 1997), the
manufacture of some agro-chemicals (Stone, 2007; Young et al, 2004) and as by-products
of the chlor-alkali process (Rappe et al, 1991) or chlorophenol production (Oeberg and
1
2
3
46
8
7
9
PCDDClCl
1
2 2
2'
3
3
3'4
4 4'
5
5'
6
6'
6
7
8
9
Cl
ClCl
Cl
PCDF PCB

18
Rappe, 1992). Natural processes such as forest fires and volcanoes (EFSA, 2010b) can also
lead to formation of dioxins.
Deposition of airborne dioxins onto farmland and water, and subsequent ingestion of this
contaminated vegetation and soil by food animals, followed by bioaccumulation up
terrestrial and aquatic food chains, is considered the primary pathway by which dioxins
enter the food chain. Other sources may include contaminated feed, improper application
of sewage sludge, flooding of pastures, contaminated soil or industrial waste effluents
washed into rivers and lakes and certain types of food processing (Fries, 1995; Van
Leeuwen et al, 2000).
According to the Environment Protection Agency (EPA) in Ireland, the main sources of
dioxin emissions to air in Ireland in 2010 include open burning processes (e.g.: accidental
burning of vehicles and buildings, and backyard burning), and emissions from fuel being
burned for heat and power generation (residential and commercial). Emissions from
controlled waste incineration are comparatively low as a result of environmental
protection controls through high temperature combustion, high standards of pollution
abatement and strict dioxin emission limits (EPA, 2012).
Many hydrophobic and lipophilic compounds are highly resistant to breakdown processes
in the environment and to metabolism in vertebrate species, including humans. Three
physical chemical characteristics are important in determining the fate and transport of
PCDDs and PCDFs in the environment, namely water-solubility, volatility and the octanol-
water partition coefficient (log Kows). Water-solubility is low, ranging from 317 ng/L for
TCCD to 0.074 for OCDD and the log Kows range from 6.8 for TCDD to 8.2 for OCDD and
OCDF (Shiu et al, 1988). The PCDDs and PCDFs are characterized as semi-volatile to non-
volatile with vapour pressures ranging from 10-8 atm2 for TCDD to 10-12 atm for OCDD
(Eitzer and Hites, 1991). Nearly all PCDD and PCDF congeners with the 2,3,7,8-chlorine
substitution pattern are chemically and metabolically stable under normal environmental
conditions. As a result, PCDDs and PCDFs persist and concentrate in the lipids of biological
systems and bio-magnification occurs through the food chain. Therefore high tissue
concentrations can often occur in top predator species (Van den Berg et al, 1998; Weber et
al, 2008).
2 1 atmosphere (atm) = 101,325 Pascal (Pa)

19
Humans, as a result, retain a large number of PCDD and PCDF congeners with a 2,3,7,8-
chlorine substitution pattern in their tissues, blood, and milk (Van den Berg et al, 1994). A
wide range of PCB congeners are also strongly retained (Liem et al, 2000; Schecter et al,
1994) and higher levels of PCDD/Fs and PCBs are commonly found in people living in more
industrialised countries (Schecter et al, 2006).
1.3 Toxicity
Long term exposure to PCDDs, PCDFs and PCBs can cause serious health effects like cancer,
hormone disruption, impaired reproduction, skin toxicity and immune system disorders
(IARC, 1997; JECFA, 2002; Kogevinas, 2001; US EPA, 2003). Based on both animal studies
and epidemiological evidence, 2,3,7,8-TCDD was classified as a "known human carcinogen"
(class 1) by the WHO International Agency for Research on Cancer (IARC) in 1997 (IARC,
1997). PCBs, without distinction into dioxin-like (DL-PCBs) or non dioxin-like congeners
(NDL-PCBs), on the other hand, were classified as "probably carcinogenic to humans"
(Group 2A) (IARC, 1999). A wide range of toxicity endpoints including reproductive toxicity
have been identified and used as critical effects in the risk assessment of PCDDs, PCDFs and
PCBs, as discussed further in section 1.3.1.4.
1.3.1 Dioxins and dioxin-like substances (PCDD/Fs and DL-PCBs)
Of a total of 75 possible PCDDs and 135 possible PCDFS and 209 possible PCBs, there are
seven PCDDs, ten PCDFs and twelve PCBs which are considered dioxins or dioxin-like
compounds by the WHO (Van den Berg et al, 2006). The toxic PCDDs and PCDFs have
chlorines on the 2, 3, 7, and 8 positions. The 12 specific PCB congeners elicit similar
toxicological properties to PCDD/Fs. These include four non-ortho (PCBs 77, 81, 126, 169)
and eight mono-ortho congeners (PCBs 105, 114, 118, 123, 156, 157, 167, 189) and are
referred to as "dioxin-like", with the remainder being referred to as "non dioxin like" PCBs
(NDL-PCBs). Of the latter, the most commonly reported are the sum of six PCB congeners
(PCBs 28, 52, 101, 138, 153, 180) often referred to as indicator or marker PCBs or the sum
of seven (sum of six indicator PCBs plus PCB 118), because these congeners are appropriate
indicators for different PCB patterns in various sample matrices (La Rocca and Mantovani,
2006).
Most, if not all, toxic and biological effects of PCDD/Fs and DL-PCBs are mediated through
the aryl hydrocarbon receptor (AhR), a cytosolic receptor protein present in most
vertebrate tissues with high affinity for 2,3,7,8–substituted PCDD/Fs and some PCBs (Van

20
den Berg et al, 2006). It is believed, that the AhR is a key regulatory protein in normal
development and homeostasis (Andersson et al, 2002; Andersson et al, 2003) aging,
hypoxia and circadian rhythms (Carlson and Perdew, 2002) and that dioxins induce toxicity
through persistent activation of the receptor (White and Birnbaum, 2009).
Adverse health effects of dioxin exposure in humans may include cardiovascular disease,
diabetes, cancer, porphyria, endometriosis, early menopause, reduced testosterone and
thyroid hormones, altered immunologic response, skin, tooth, and nail abnormalities,
altered growth factor signalling, and altered metabolism (US EPA, 2003).
The effects of dioxin exposure during development are also many, and include altered
thyroid and immune status, altered neurobehaviour at the level of hearing, psychomotor
function, and gender-related behaviours, altered cognition, dentition, and development of
reproductive organs, and delays in breast development, in addition to altered sex ratios
among the exposed offspring (White and Birnbaum, 2009).
Recent studies have revealed that thyroid-stimulating hormone was elevated in neonates
born from mothers with presently elevated plasma dioxin levels, nearly 30 years after their
exposures during the 1976 Seveso dioxin disaster (Baccarelli et al, 2008). Another study on
men who were exposed to dioxin in their youth in Seveso, found that those who were
exposed prior to puberty exhibited reduced sperm count and motility as adults, 22 years
later, while those who were exposed during adolescence exhibited increased sperm counts
and motility (Mocarelli et al, 2008).
1.3.1.1 The toxic equivalency system (TEQ system)
Due to their common mechanism of action (AhR receptor activation) and because they
occur as mixtures in the environment, in food, and in human tissues, the dioxins and dioxin-
like compounds are commonly assessed and regulated as a class (Srogi, 2008; Van den Berg
et al, 2006).
However, PCDDs, PCDFs and DL-PCB congeners exhibit variable toxic potency, and
therefore a relative potency ranking scheme has been devised that assigns a Toxic
Equivalency Factor (TEF) (see Table 1) to each compound, representing the relative toxicity of
the compound being measured to the most toxic dioxin congener, TCDD. This in turn reflects
the relative strength of binding to the Ah receptor (White and Birnbaum, 2009).

21
TEFs for dioxin-like compounds apply only to AhR mediated responses and cannot be
applied to effects that are not AhR-mediated and this concept assumes a model of dose
additivity (Van den Berg et al, 2000). The criteria for including a compound in the TEF
scheme for dioxin like compounds are (Ahlborg et al, 1994):
A compound must show a structural relationship to the PCDDs and PCDFs
A compound must bind to the Ah receptor
A compound must elicit Ah receptor-mediated biochemical and toxic responses
A compound must be persistent and accumulate in the food chain
The concept of toxic equivalency was first developed in New York by the State Health
Department in a series of experiments in response to the need for re-entry criteria of an
office building contaminated by a mixture of dioxins and PCBs following an electrical
transformer fire (Eadon and Kaminsky, 1986).
An arbitrary TEF of 1 is assigned to TCDD, and by multiplying the analytically determined
concentrations of each congener in a sample by its corresponding TEF, individual toxicity
equivalents (TEQs) are determined.
Summing the contribution from each congener, the Total TEQ value of the sample can be
obtained using the following equation:
Equation 1 Calculation of Total Toxic Equivalency
TEQ = (PCDDi × TEFi) + (PCDFi × TEFi) + (DL-PCBi × TEFi)
Where i is the specific PCDD/F or PCB congener and congener associated TEF (see Table 1)
Several different TEF schemes have been proposed. For many years the most widely used
schemes were that of the NATO Committee on the Challenges of Modern Society
(NATO/CCMS) (NATO/CMS, 1988), giving the so-called International TEFs (I-TEFs) for PCDDs
and PCDFs and the European Centre for Environment and Health of the WHO (WHO-ECEH)
scheme for PCBs. In 1998, WHO-ECEH proposed a new scheme of WHO-TEFs for PCDDs,
PCDFs and DL-PCBs, which to date has been the most commonly used scheme (Van den
Berg et al, 1998). Dioxin TEQ values for food and human samples based on WHO-TEFs are
approximately 10-20 % higher than those obtained by using the I-TEFs of NATO/CCMS.
WHO has recently re-evaluated the WHO-TEFs proposed in 1998 (Van den Berg et al, 2006)
and has adjusted the TEFs for a number of compounds (see Table 1 ). For this re-evaluation
22
process, a refined TEF database (Haws et al, 2006) was used as a starting point. Decisions
about a TEF value were made based on a combination of un-weighted relative effect
potency (REP) distributions from this database, expert judgment, and point estimates.
Previous TEFs were assigned in increments of 0.01, 0.05, 0.1, etc., but for this re-evaluation,
it was decided to use half order of magnitude increments on a logarithmic scale of 0.03,
0.1, 0.3, etc. Changes were decided by the expert panel for 2,3,4,7,8-
pentachlorodibenzofuran (PeCDF) (TEF 0.3), 1,2,3,7,8-pentachlorodibenzofuran (PeCDF)
(TEF 0.03), octachlorodibenzo-p-dioxin and octachlorodibenzofuran (TEFs 0.0003), 3,4,4',5-
tetrachlorbiphenyl (PCB 81) (TEF 0.0003), 3,3',4,4',5,5'-hexachlorobiphenyl (PCB 169) (TEF
0.03), and a single TEF value (0.00003) for all relevant mono-ortho–substituted PCBs.
The biochemical and toxicological effects of PCDDs, PCDFs and DL-PCBs are directly related
to their concentrations in tissues, and not to the daily dose (WHO, 2002). Metabolism and
excretion rates for dioxins are highly variable among species, which contributes to the
difficulty of developing relevant animal models for toxicological studies (Yakitine et al,
2006).

23
Table 1 Toxic Equivalency Factors for dioxins and DL-PCBs
Toxic Equivalency Factor (TEF)
PCDDs and PCDFs I-TEF (NATO/CMS,
1988)
1998 WHO-TEF (Van den Berg et al, 1998)
2005 WHO-TEF (Van den Berg et al, 2006)
2,3,7,8-TCDD 1 1 1
1,2,3,7,8-PnCDD 0.5 1 1
1,2,3,4,7,8-HxCDD 0.1 0.1 0.1
1,2,3,6,7,8-HxCDD 0.1 0.1 0.1
1,2,3,7,8,9-HxCDD 0.1 0.1 0.1
1,2,3,4,6,7,8-HpCDD 0.01 0.01 0.01
OCDD 0.001 0.0001 0.0003
2,3,7,8-TCDF 0.1 0.1 0.1
1,2,3,7,8-PnCDF 0.05 0.05 0.03
2,3,4,7,8-PnCDF 0.5 0.5 0.3
1,2,3,4,7,8-HxCDF 0.1 0.1 0.1
1,2,3,6,7,8-HxCDF 0.1 0.1 0.1
1,2,3,7,8,9-HxCDF 0.1 0.1 0.1
2,3,4,6,7,8-HxCDF 0.1 0.1 0.1
1,2,3,4,6,7,8-HpCDF 0.01 0.01 0.01
1,2,3,4,7,8,9-HpCDF 0.01 0.01 0.01
OCDF 0.001 0.0001 0.0003
PCBs (IUPAC No. in parenthesis)
Non-ortho PCBs
3,3',4,4'-TCB (77) 0.0005 0.0001 0.0001
3,4,4',5-TCB (81) - 0.0001 0.0003
3,3',4,4',5-PnCB (126) 0.1 0.1 0.1
3,3',4,4',5,5'-HxCB (169) 0.01 0.01 0.03
Mono-ortho PCBs
2,3,3',4,4'-PnCB (105) 0.0001 0.0001 0.00003
2,3,4,4',5-PnCB (114) 0.0005 0.0005 0.00003
2,3',4,4',5-PnCB (118) 0.0001 0.0001 0.00003
2,3,4,4'5-PnCB (123) 0.0001 0.0001 0.00003
2,3,3',4,4',5-HxCB (156) 0.0005 0.0005 0.00003
2,3,3',4,4',5'-HxCB (157) 0.0005 0.0005 0.00003
2,3',4,4',5,5'-HxCB (167) 0.00001 0.00001 0.00003
2,3,3',4,4',5,5'-HpCB (189) 0.0001 0.0001 0.00003
Abbreviations: PnCDD, pentachlorodibenzo-p-dioxin; HxCDD, hexachlorodibenzo-p-dioxin; HpCDD, heptachlorodibenzo-p-dioxin; OCDD, octachlorodibenzo-p-dioxin; PnCDF, pentachlorodibenzofuran; HxCDF, hexachlorodibenzofuran; HpCDF, heptachlorodibenzofuran; OCDF, octachlorodibenzofuran. TCB, tetrachlorobiphenyl; PnCB, pentachlorobiphenyl; HxCB, hexachlorobiphenyl; HpCB, heptachlorobiphenyl.

24
1.3.1.2 Species Sensitivity
The differences in species sensitivity can vary by a factor of nearly 10000 when looking at
the short-term toxicity (LD50) observed in different species (Geyer et al, 2002). It has been
suggested though, that on average, humans are among the more dioxin-resistant species.
However, the human data set is too limited to be conclusive (Harper et al, 2002; Okey et al,
2005) and further research into REP values in human systems to establish if the present
TEFs based on rodent studies are indeed also valid for humans may therefore be warranted
(Van den Berg et al, 2006).
In his review of half lives, Geyer et al (Geyer et al, 2002) stated:
“The adult ‘‘Reference Western Man’’ of 70 kg body weight and 21 % body fat with an
estimated LD50 of 6230 µg TCDD/kg body weight would be relatively resistant to acute
toxicity of TCDD, whereas newborns with ca. 13.6 % body fat would be about 10 times
more sensitive, LD50: 614 µg/kg, and the human foetus with 2.9 kg body weight and 6.7 %
body fat is predicted to be much more sensitive to acute toxicity of TCDD, LD50: ca. 15
µg/kg (Geyer et al., 1990, Geyer et al., 1999, unpublished results).”
In accordance with short term toxicity, half life estimates also vary considerably between
species, and have been reported to vary for TCDD from an average of 18.7 days in rats
(Geyer et al, 2002) to 93 days in cattle (Thorpe et al, 2001) to an average of 7.8 years in
humans (Geyer et al, 2002). Other dioxins may be eliminated more or less rapidly with as
little as a 6-month half-life of elimination estimated for some PCDFs, but 20 years for
others (Schecter et al, 2006).
However, the half-life of a persistent chemical is not constant and depends on many biotic
and abiotic factors, such as body weight, total body fat of the organism, age, sex, dose and
existing body burden (Geyer et al, 2002). Recent pharmacokinetic studies indicate faster
elimination at higher concentrations, also varying with body composition, so that higher
amounts of body fat lead to increased persistence (Aylward et al, 2005; Emond et al, 2005).
Also, lactating women and infants have much faster clearance rates, due to increased
excretion (parturition) and in the case of infants, dilution due to increasing body mass.
Kreutzer et al (Kreuzer et al, 1997) reported an apparent half-life of 5 months in infants,
with a steady increase to approximately 10 years in adults.

25
In their review of relevant literature, Geyer et al (Geyer et al, 2002) also found that it takes
between six and seven half-lives to approach steady state (equilibrium) levels of chemicals
in an organism, which would be reached between 47 and 55 years in the case of TCDD
based on a mean half-life of 7.8 years.
1.3.1.3 Body Burden concept
As mentioned previously, biochemical and toxicological effects of dioxins are directly
related to their concentrations in tissues, however, in the absence of information on the
latter, body burden data (see section 1.3.1.4) can be used, which were found to show a
clear association for a number of effects at similar levels in humans and animals (DeVito et
al, 1995). Therefore, the body burden is generally considered to be a suitable dose metric
to scale dioxin dose-response across species (Van Leeuwen et al, 2000) and this approach
was used to derive tolerable intake values by the WHO (JECFA, 2002; Van Leeuwen et al,
2000) and the Scientific Committee on Food of the European Commission (SCF) (SCF, 2000;
SCF, 2001) in their risk assessments of dioxins (see Table 2).
1.3.1.4 Risk assessment of dioxins, furans and DL-PCBs in food
The SCF carried out a risk assessment of dioxins and dioxin-like PCBs (DL-PCBs ) in food
(SCF, 2000; SCF, 2001), as a consequence of which they concluded that the Tolerable
Weekly Intake (TWI) for PCDDs, PCDFs and DL-PCBs should be no more than 14 pg WHO-
TEQ/kg body weight (bw). This is very similar to the Provisional Tolerable Monthly Intake
(PTMI) of 70 pg/kg bw per month derived by the FAO/WHO Joint Expert Committee on
Food Additives and Contaminants (JECFA) (JECFA, 2002) and the Tolerable Daily Intake (TDI)
expressed as range of 1-4 TEQ pg/kg bw established by the WHO European Centre for
Environment and Health (ECEH) in collaboration with the International Programme on
Chemical Safety (IPCS) (Van Leeuwen et al, 2000).
In all cases, tolerable intake values were derived using the body burden approach. This is
based on the consideration that elimination of low doses of PCDDs follows first-order
kinetics, and may be calculated using the following toxicokinetic equation:
26
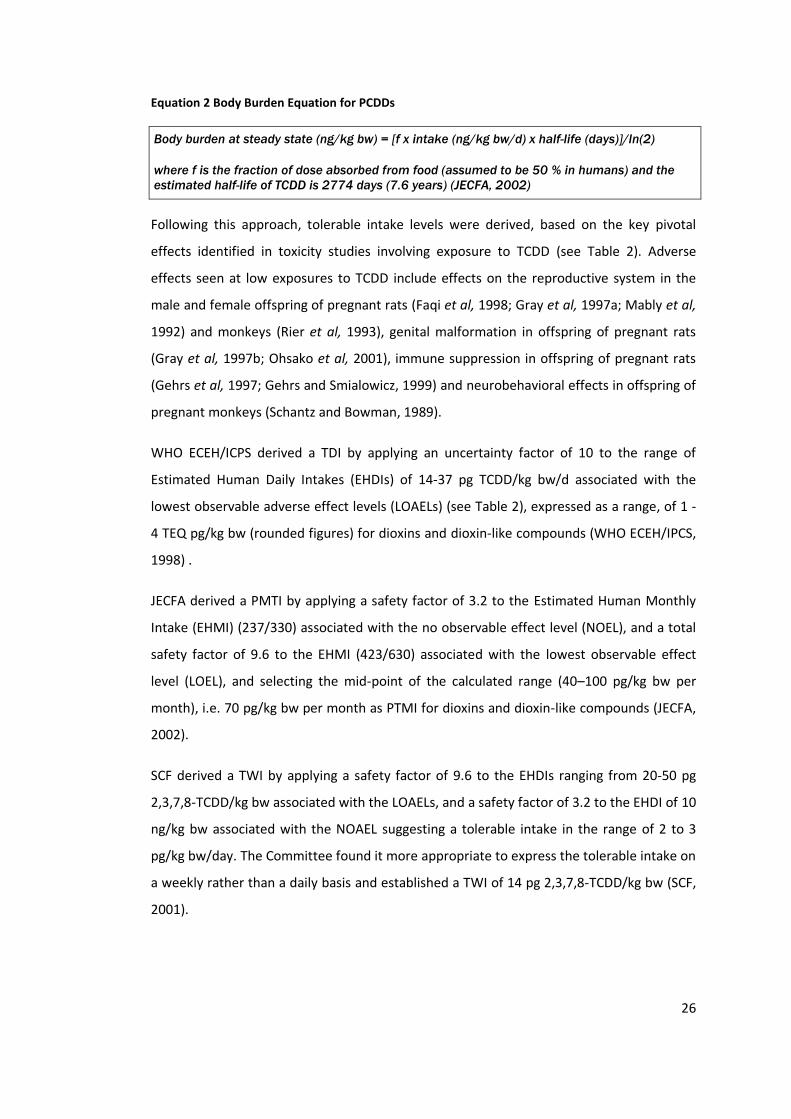
Equation 2 Body Burden Equation for PCDDs
Body burden at steady state (ng/kg bw) = [f x intake (ng/kg bw/d) x half-life (days)]/ln(2)
where f is the fraction of dose absorbed from food (assumed to be 50 % in humans) and the
estimated half-life of TCDD is 2774 days (7.6 years) (JECFA, 2002)
Following this approach, tolerable intake levels were derived, based on the key pivotal
effects identified in toxicity studies involving exposure to TCDD (see Table 2). Adverse
effects seen at low exposures to TCDD include effects on the reproductive system in the
male and female offspring of pregnant rats (Faqi et al, 1998; Gray et al, 1997a; Mably et al,
1992) and monkeys (Rier et al, 1993), genital malformation in offspring of pregnant rats
(Gray et al, 1997b; Ohsako et al, 2001), immune suppression in offspring of pregnant rats
(Gehrs et al, 1997; Gehrs and Smialowicz, 1999) and neurobehavioral effects in offspring of
pregnant monkeys (Schantz and Bowman, 1989).
WHO ECEH/ICPS derived a TDI by applying an uncertainty factor of 10 to the range of
Estimated Human Daily Intakes (EHDIs) of 14-37 pg TCDD/kg bw/d associated with the
lowest observable adverse effect levels (LOAELs) (see Table 2), expressed as a range, of 1 -
4 TEQ pg/kg bw (rounded figures) for dioxins and dioxin-like compounds (WHO ECEH/IPCS,
1998) .
JECFA derived a PMTI by applying a safety factor of 3.2 to the Estimated Human Monthly
Intake (EHMI) (237/330) associated with the no observable effect level (NOEL), and a total
safety factor of 9.6 to the EHMI (423/630) associated with the lowest observable effect
level (LOEL), and selecting the mid-point of the calculated range (40–100 pg/kg bw per
month), i.e. 70 pg/kg bw per month as PTMI for dioxins and dioxin-like compounds (JECFA,
2002).
SCF derived a TWI by applying a safety factor of 9.6 to the EHDIs ranging from 20-50 pg
2,3,7,8-TCDD/kg bw associated with the LOAELs, and a safety factor of 3.2 to the EHDI of 10
ng/kg bw associated with the NOAEL suggesting a tolerable intake in the range of 2 to 3
pg/kg bw/day. The Committee found it more appropriate to express the tolerable intake on
a weekly rather than a daily basis and established a TWI of 14 pg 2,3,7,8-TCDD/kg bw (SCF,
2001).

27
Table 2 Overview of pivotal studies used in the derivation of tolerable intake levels by WHO ECEH/IPCS, JECFA and SCF
Pivotal study Evaluating body Species Effect Point of Departure
WHO/ECEH (Van
Leeuwen et al, 2000) JECFA (JECFA, 2002) SCF (SCF, 2001) NOAEL LOAEL
BB ng/kg
bw (1) EHDI pg/kg
bw/d BB ng/kg bw
(2) EHMI pg/kg bw/m(d) (3)
BB ng/kg bw (1)
EHDI pg/kg bw/d
(Mably et al, 1992)
28 14
28 100 50 Holtzman Rats Decreased sperm count in offspring 64 ng/kg bw single bolus dose by gavage
(Gray et al, 1997a) 28 80 40 Long Evan rats Decreased sperm count in offspring, accelerated eye opening
50 ng/kg bw single bolus dose by gavage
(Faqi et al, 1998) 25 423/630 (7.9/11)
40 20 Wistar rats Decreased sperm production and altered sexual behaviour in male offspring
Maintenance of 25 ng/kg bw by subcutaneous injections
(Ohsako et al, 2001)
13 237/330 (14.1/21)
20 10
Holtzman Rats
Decreased anogenital distance in male offspring; ventral prostate weight
12.5 ng/kg bw single bolus dose by gavage
51 80 40 50 ng/kg bw single bolus dose by gavage
(Gray et al, 1997b) 73 37 Long Evan rats Increased genital malformations in offspring
(Gehrs et al, 1997)
50 25 50
F344 rats Immune suppression in offspring Single oral bolus dose by gavage on day 14 of gestation
(Gehrs and Smialowicz, 1999)
F344 rats Immune suppression in offspring
(Rier et al, 1993) 69 35 Rhesus Monkeys
Endometriosis
(Schantz and Bowman, 1989)
42 21 Monkeys Neurobehavioral effects in offspring
BB = Body Burden, EHDI = Estimated human daily intake EHMI = Estimated human monthly intake
(1) Increment over background body burden (estimated at 4 ng/kg bw) (2) Excluding background body burden (3) Liner Model/Power Model derived values; values divided by 30 to approximate daily values
28
In February 2012 the US EPA released a reanalysis of key issues related to dioxin toxicity in
response to comments submitted by the National Academy of Science (NAS) (NAS, 2006)
and provided for an oral reference dose (RfD) for TCDD of 7 × 10⁻¹⁰ mg/kg/d (i.e. 0.7 pg/kg
bw/d) (US EPA, 2012). Whilst the JECFA, the SCF and WHO/ECEH all based their evaluations
of a tolerable intake using the body burden as dose metric, which is based on the
consideration that elimination of low doses of PCDDs follows first-order kinetics, the US
EPA adopted a different approach. They derived an oral reference dose (RfD) based on a
dose metric of concentration in whole blood, modelled as a function of administered dose.
The blood concentrations were modelled using a TCDD physiologically based
pharmacokinetic (PBPK) model based on the Seveso cohort, whose members were exposed
environmentally to high peak concentrations of TCDD as a consequence of an industrial
accident. Two epidemiologic studies were used: a study that associated TCDD exposures
with decreased sperm concentration and sperm motility in men who were exposed during
childhood (Mocarelli et al, 2008) and a study that associated increased thyroid-stimulating
hormone levels in newborn infants born to mothers who were exposed to TCDD (Baccarelli
et al, 2008). Because these two studies defined the most sensitive endpoints evaluated in
the epidemiologic literature, they were designated as co-principal studies for the RfD. The
two points of departure (PODs) based on these studies, were adjusted LOAELs with the
same value of 0.020 ng/kg bw/d and designated as co-critical effects. EPA used a composite
uncertainty factor (UF) of 30 for the RfD. A factor of 10 for UFL3 was applied to account for
lack of a NOAEL. A factor of 3 for UFH4 was applied to account for human inter-individual
variability because the effects were elicited in sensitive life stages. A UF of 1 was not
applied because the sample sizes in these two epidemiologic studies were relatively small,
which, combined with uncertainty in exposure estimation, may not fully capture the range
of inter-individual variability. In addition, potential chronic effects are not well defined for
humans and could possibly be more sensitive (US EPA, 2012).
This so derived safe dose for non-cancer effects of 0.7 pg/kg bw/d is slightly lower than the
health based guidance values derived by the other previously mentioned expert bodies.
This is due to the agency taking a more conservative view of the margin of exposure
needed to ensure safety (Hays and Aylward, 2003). Whilst the US EPA used recent
3 UFL = LOAEL-to-NOAEL UF
4 UFH = human variability UF

29
epidemiological studies versus rodent studies used by JECFA, SCF and WHO, and different
pharmacokinetic models, the derived estimated human intake values, used as PODs were
of similar size to those used by JECFA, SCF and WHO. The major difference in deriving the
RfD versus the other health based guidance values (i.e. TDI, TWI, PTMI) was the use of a UF
of 30 versus factors ranging from 3.2 - 10 used by the other expert bodies.
1.3.2 NDL-PCBs
Although many toxicity studies on PCBs (mainly technical mixtures) exist, evaluation of
toxicity of NDL-PCBs is hampered mainly due to presence of DL-PCB constituents in these
mixtures, and hence are not suitable for the separate assessment of NDL-PCBs (EFSA,
2005).
Studies on individual NDL-PCBs are available, however, the effects observed, including
thyroid, liver, immune and reproductive toxicity, are not specific for NDL-PCBs, but can also
be observed after exposure to PCDD/F and DL-PCBs. Thus, any estimate of a NOAEL for
NDL-PCBs is hampered by the uncertainty as to what extent the individual congeners were
contaminated with PCDD/F and/or DL-PCB, as even minute concentrations of potent
dioxin-like contaminants (in the range of 0.1 % ) in the NDL-PCB test preparations might be
sufficient to explain the effects observed (EFSA, 2005).
The most sensitive effects seen in studies with NDL-PCBs in experimental animals are liver
and thyroid toxicity. The NOAELs in 90-day rat studies were in the range of 30-40 μg/kg
bw/d. The effects seen in these studies occurred at considerably lower dose levels than
many other effects observed in studies of shorter duration with different NDL-PCBs.
However, when a comparison is made on the basis of estimated body burdens it appears
that the NOAELs for all these effects are found at rather similar body burdens, ranging from
about 400-1200 μg/kg bw or higher (EFSA, 2005).
1.3.2.1 Risk assessment of NDL-PCBs in food
A risk assessment for the NDL-PCBs in food has been carried out at European level by the
European Food Safety Authority (EFSA) CONTAM Panel in 2005, to include identification of
the most relevant/sensitive toxicological endpoints for the PCB-congener patterns usually
found in food (EFSA, 2005). The panel concluded that the current toxicological database on
health effects is not suitable for the separate assessment of NDL-PCBs. Also the human
data on exposure did not enable a distinction between the effects of NDL-PCBs and
30
PCDD/Fs to be made, due to co-occurrence of PCDDs and PCDFs, and therefore the
assessment was based on individual NDL-PCB congeners. Due to the absence of
genotoxicity the establishment of a health-based guidance value for levels of NDL-PCBs in
food was considered possible, however, the Panel considered the toxicological database
too limited and hence a "Margin of Exposure” (MoE)5 approach was used. This approach,
which can be used to assess the risks to human health of exposure to a substance in
absence of a tolerable daily intake or similar guidance value, was endorsed by the Scientific
Committee of EFSA (EFSA, 2005) and JECFA (WHO, 2005).
Considering that the LOAEL Body Burden (BB) for the most sensitive effects (liver, thyroid)
were 10 times higher than the NOAEL BB (400, 800, and 1200 μg /kg bw for PCBs 28, 128,
and 153, respectively), the Panel chose an overall body burden of 500 μg /kg bw as a
representative conservative body burden at the NOAEL (NOAEL BB) for all individual NDL-
PCBs and for the sum of NDL-PCBs occurring in human tissues.
The Panel noted that the NDL-PCBs found in human milk are the congeners that
accumulate in the human body: PCBs 18, 28, 33, 37, 52, 60, 66, 74, 99, 101, 110, 128, 138,
141, 153, 170, 180, 183, 187, 194, 206, and 209. The median total concentration of all the
NDL-PCBs measured in human milk was about 240 ng/g fat, which would correspond to an
estimated median human body burden of about 48 μg/kg bw, assuming 20 % fat content in
the human body. A rather small margin of body burden (MoBB) of 10 was calculated,
however, the panel stressed that the endpoints considered in the evaluation of individual
NDL-PCB congeners can also be observed with PCDD/Fs and DL-PCBs (EFSA, 2005).
To convert the median human body burden of about 48 μg/kg NDL-PCB/kg bw at steady
state into a daily intake, the Panel considered the limited data on bioavailability and the
reported half-lives for the most persistent congeners (PCBs 28, 52, 101, 105, 118, 138, 153,
170, 180) and assumed a bioavailability from food of 90 % and an overall biological half-life
of 10 years. Using these assumptions, an estimated intake of about 10 ng/kg bw per day of
total NDL-PCBs would be needed to achieve steady state at 48 μg/kg bw following the
equation below:
5 The margin of exposure is defined as the reference point on the dose-response curve (usually based on animal experiments in the absence of human data) divided by the estimated intake by humans. (EFSA 2005b)

31
Equation 3 Body Burden Equation for PCBs
Body burden at steady state (ng/kg bw) = [f x intake (ng/kg bw/d) x half-life (days)]/ln(2)
where f is the fraction of dose absorbed from food (assumed to be 90 % in humans) and the
estimated half-life of PCBs is 3650 days (10 years) (EFSA, 2005)
This median estimate is in the same order of magnitude as the current estimated average
intakes of 10 - 45 ng/kg bw per day and of the median intakes reported for adults by
several European countries (EFSA, 2005).
1.4 Reduction Strategies and Legislative Measures
Given the concerns regarding the health effects of these ubiquitous environmental
contaminants and their persistence in the environment, international strategies have been
adopted to minimise their release into the environment, such as the United Nations
Economic Commission for Europe (UNECE) Convention on Long-Range Transboundary Air
Pollution on Persistent Organic Pollutants (UNECE, 1979) and the United Nations
Environment Program (UNEP) Stockholm POPs Convention (UNEP, 2001). The Stockholm
Convention was adopted in 2004 and aims to protect human health and the environment
by reducing or eliminating releases of POPs as a result of intentional production and use
(UNEP, 2001). Strategies for the reduction of exposure to POPs introduced under the
Stockholm Convention and other international measures include the establishment of
emission limits for dioxins to air, prohibition of the use of PCBs, and safe collection, storage
and environmentally compatible disposal or destruction of dioxin and PCB-contaminated
devices and products (UNEP, 2007).
The Stockholm Convention entered into force for Ireland in 2010 and in accordance with
Article 7 of the Convention, Ireland has developed a National Implementation Plan on POPs
for the implementation of its obligations under the Convention. The Environmental
Protection Agency, as competent authority, has prepared the National Implementation
Plan in consultation with a number of public authorities, national stakeholders and the
public. The National Implementation Plan on POPs includes an assessment of POPs in
Ireland and details the measures put in place to protect human health and the
environment from the POPs that are listed under the Convention. The Plan also outlines
further activities which will be carried out to support the control of POPs (EPA, 2012).

32
In 2001, the European Commission (EC, 2001a) introduced their reduction strategy aimed
at directly or indirectly reducing the release of these compounds into the environment,
with the objective of reducing human exposure and protecting human health and the
environment .
In accordance with this strategy, a number of legislative measures related to food and feed
have been introduced since then, including:
the introduction of measures to reduce the contamination of feeding stuffs for animal
nutrition originally via Council Directive 2001/102/EC amending Directive 1999/29/EC
on the undesirable substances and products in animal nutrition (EC, 2001b). The latter
has since been replaced by Directive 2002/32/EC, as amended (EC, 2002c).
The introduction of maximum levels for PCDDs and PCDFs in foodstuffs, originally via
Council Regulation (EC) No. 2375/2001 amending Commission Regulation 466/2001
(EC, 2001c) which set maximum levels for certain contaminants in foodstuffs.
Maximum levels for dioxin-like PCBs were originally introduced via Commission
Regulation 199/2006 (EC, 2006f). All the cited legal instruments above have since been
replaced by Regulation 1881/2006/EC (EC, 2006c), as amended. Concerning PCDD/Fs
and DL-PCBs maximum levels have been updated in accordance with the 2005 TEF
scheme (Van den Berg et al, 2006). Maximum limits for the sum of 6 Marker PCBs
(PCBs 28, 52, 101, 138, 153, 180) were established in 2012. Currently existing MLs for
PCDD/Fs, DL-PCBs and Marker PCBs are shown in Table 3
The introduction of measures to implement the Community's obligations under the
Protocol and the Convention via Regulation 850/2004/EC on persistent organic
pollutants (EC, 2004d).
In Ireland, The Food Safety Authority of Ireland (FSAI) is the competent authority for the
implementation of Regulation 1881/2006/EC, the Department of Agriculture, Food & the
Marine (DAFM) is the competent authority for the implementation of Directive 2002/32/EC
and the Environmental Protection Agency (EPA) is the competent authority for the
implementation of EC Regulation 850/2004 on persistent organic pollutants.
The above mentioned legislative instruments on food and feed are also accompanied by a
recommendation on the reduction of the presence of dioxins, furans and PCBs in feed and
food, originally introduced in 2002 (EC, 2002b) and since replaced in 2006 (EC, 2006b), in

33
2011 (EC, 2011) and 2013 (EC, 2013). The latter introduces action levels, which are
intended as a tool for competent authorities and operators as an early warning of higher
than expected levels of dioxins in food and feed. They are set at a lower level than the
maximum levels to highlight those cases where it is appropriate to identify a source of
contamination and to take measures for its reduction or elimination.
Furthermore, recommendations on the monitoring of background levels of dioxins and DL-
PCBs, both in foodstuffs (EC, 2004a; EC, 2006a) and feedingstuffs (EC, 2004a) were
introduced .
Under this obligation, Ireland has carried out substantial monitoring for a range of POPs in
a variety of foodstuffs. Results for monitoring surveys have been published and reports are
available on the FSAI website (FSAI, 2001; FSAI, 2002a; FSAI, 2002b; FSAI, 2004; FSAI,
2005a; FSAI, 2005b; FSAI, 2010a; FSAI, 2010b; FSAI, 2010c; Tlustos et al, 2007). All these
data were submitted to EFSA as part of the review of maximum limits and to gauge the
effectiveness of the reduction strategy (EFSA, 2010b).
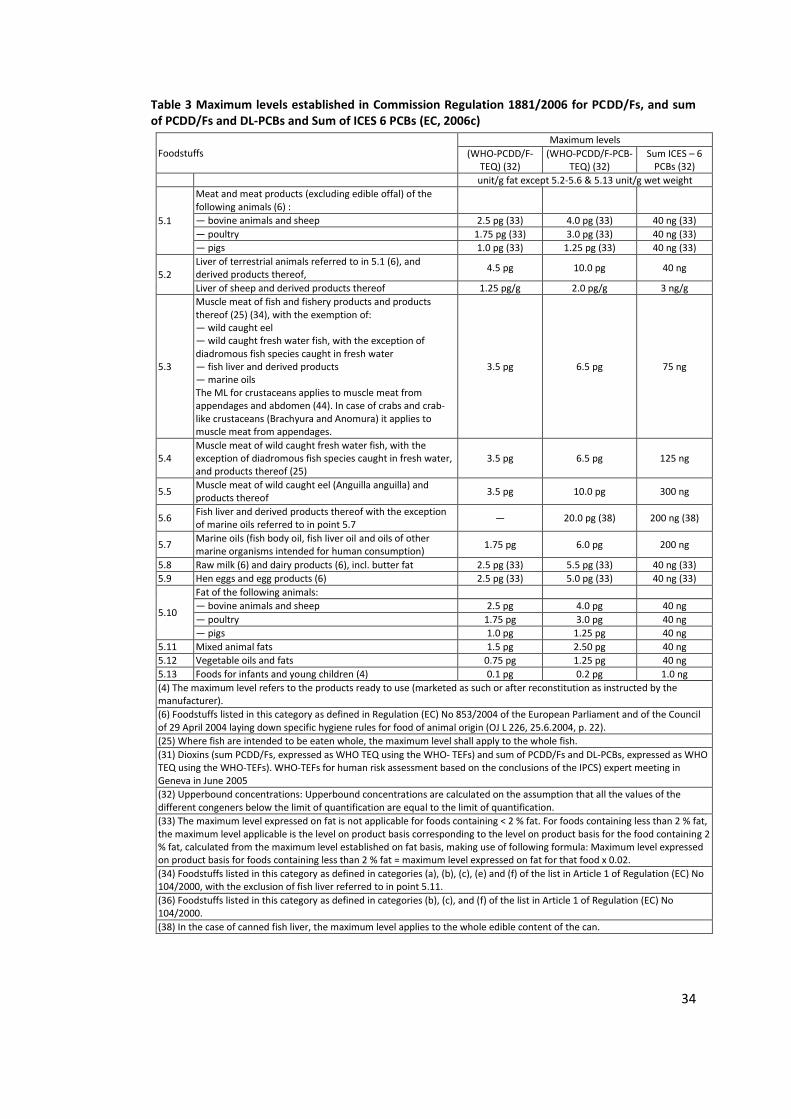
34
Table 3 Maximum levels established in Commission Regulation 1881/2006 for PCDD/Fs, and sum of PCDD/Fs and DL-PCBs and Sum of ICES 6 PCBs (EC, 2006c)
Foodstuffs
Maximum levels
(WHO-PCDD/F-TEQ) (32)
(WHO-PCDD/F-PCB- TEQ) (32)
Sum ICES – 6 PCBs (32)
unit/g fat except 5.2-5.6 & 5.13 unit/g wet weight
5.1
Meat and meat products (excluding edible offal) of the following animals (6) :
— bovine animals and sheep 2.5 pg (33) 4.0 pg (33) 40 ng (33)
— poultry 1.75 pg (33) 3.0 pg (33) 40 ng (33)
— pigs 1.0 pg (33) 1.25 pg (33) 40 ng (33)
5.2 Liver of terrestrial animals referred to in 5.1 (6), and derived products thereof,
4.5 pg 10.0 pg 40 ng
Liver of sheep and derived products thereof 1.25 pg/g 2.0 pg/g 3 ng/g
5.3
Muscle meat of fish and fishery products and products thereof (25) (34), with the exemption of: — wild caught eel — wild caught fresh water fish, with the exception of diadromous fish species caught in fresh water — fish liver and derived products — marine oils The ML for crustaceans applies to muscle meat from appendages and abdomen (44). In case of crabs and crab-like crustaceans (Brachyura and Anomura) it applies to muscle meat from appendages.
3.5 pg 6.5 pg 75 ng
5.4 Muscle meat of wild caught fresh water fish, with the exception of diadromous fish species caught in fresh water, and products thereof (25)
3.5 pg 6.5 pg 125 ng
5.5 Muscle meat of wild caught eel (Anguilla anguilla) and products thereof
3.5 pg 10.0 pg 300 ng
5.6 Fish liver and derived products thereof with the exception of marine oils referred to in point 5.7
— 20.0 pg (38) 200 ng (38)
5.7 Marine oils (fish body oil, fish liver oil and oils of other marine organisms intended for human consumption)
1.75 pg 6.0 pg 200 ng
5.8 Raw milk (6) and dairy products (6), incl. butter fat 2.5 pg (33) 5.5 pg (33) 40 ng (33)
5.9 Hen eggs and egg products (6) 2.5 pg (33) 5.0 pg (33) 40 ng (33)
5.10
Fat of the following animals:
— bovine animals and sheep 2.5 pg 4.0 pg 40 ng
— poultry 1.75 pg 3.0 pg 40 ng
— pigs 1.0 pg 1.25 pg 40 ng
5.11 Mixed animal fats 1.5 pg 2.50 pg 40 ng
5.12 Vegetable oils and fats 0.75 pg 1.25 pg 40 ng
5.13 Foods for infants and young children (4) 0.1 pg 0.2 pg 1.0 ng
(4) The maximum level refers to the products ready to use (marketed as such or after reconstitution as instructed by the manufacturer).
(6) Foodstuffs listed in this category as defined in Regulation (EC) No 853/2004 of the European Parliament and of the Council of 29 April 2004 laying down specific hygiene rules for food of animal origin (OJ L 226, 25.6.2004, p. 22).
(25) Where fish are intended to be eaten whole, the maximum level shall apply to the whole fish.
(31) Dioxins (sum PCDD/Fs, expressed as WHO TEQ using the WHO- TEFs) and sum of PCDD/Fs and DL-PCBs, expressed as WHO TEQ using the WHO-TEFs). WHO-TEFs for human risk assessment based on the conclusions of the IPCS) expert meeting in Geneva in June 2005
(32) Upperbound concentrations: Upperbound concentrations are calculated on the assumption that all the values of the different congeners below the limit of quantification are equal to the limit of quantification.
(33) The maximum level expressed on fat is not applicable for foods containing < 2 % fat. For foods containing less than 2 % fat, the maximum level applicable is the level on product basis corresponding to the level on product basis for the food containing 2 % fat, calculated from the maximum level established on fat basis, making use of following formula: Maximum level expressed on product basis for foods containing less than 2 % fat = maximum level expressed on fat for that food x 0.02.
(34) Foodstuffs listed in this category as defined in categories (a), (b), (c), (e) and (f) of the list in Article 1 of Regulation (EC) No 104/2000, with the exclusion of fish liver referred to in point 5.11.
(36) Foodstuffs listed in this category as defined in categories (b), (c), and (f) of the list in Article 1 of Regulation (EC) No 104/2000.
(38) In the case of canned fish liver, the maximum level applies to the whole edible content of the can.
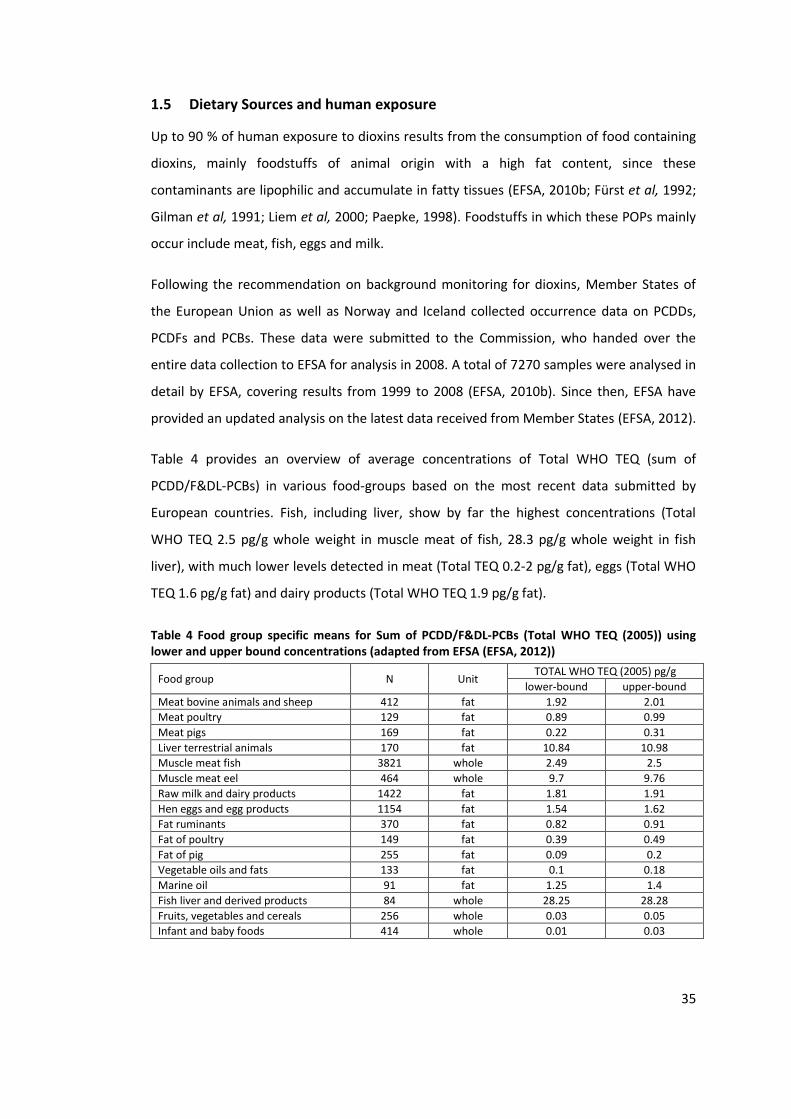
35
1.5 Dietary Sources and human exposure
Up to 90 % of human exposure to dioxins results from the consumption of food containing
dioxins, mainly foodstuffs of animal origin with a high fat content, since these
contaminants are lipophilic and accumulate in fatty tissues (EFSA, 2010b; Fürst et al, 1992;
Gilman et al, 1991; Liem et al, 2000; Paepke, 1998). Foodstuffs in which these POPs mainly
occur include meat, fish, eggs and milk.
Following the recommendation on background monitoring for dioxins, Member States of
the European Union as well as Norway and Iceland collected occurrence data on PCDDs,
PCDFs and PCBs. These data were submitted to the Commission, who handed over the
entire data collection to EFSA for analysis in 2008. A total of 7270 samples were analysed in
detail by EFSA, covering results from 1999 to 2008 (EFSA, 2010b). Since then, EFSA have
provided an updated analysis on the latest data received from Member States (EFSA, 2012).
Table 4 provides an overview of average concentrations of Total WHO TEQ (sum of
PCDD/F&DL-PCBs) in various food-groups based on the most recent data submitted by
European countries. Fish, including liver, show by far the highest concentrations (Total
WHO TEQ 2.5 pg/g whole weight in muscle meat of fish, 28.3 pg/g whole weight in fish
liver), with much lower levels detected in meat (Total TEQ 0.2-2 pg/g fat), eggs (Total WHO
TEQ 1.6 pg/g fat) and dairy products (Total WHO TEQ 1.9 pg/g fat).
Table 4 Food group specific means for Sum of PCDD/F&DL-PCBs (Total WHO TEQ (2005)) using lower and upper bound concentrations (adapted from EFSA (EFSA, 2012))
Food group N Unit TOTAL WHO TEQ (2005) pg/g
lower-bound upper-bound
Meat bovine animals and sheep 412 fat 1.92 2.01
Meat poultry 129 fat 0.89 0.99
Meat pigs 169 fat 0.22 0.31
Liver terrestrial animals 170 fat 10.84 10.98
Muscle meat fish 3821 whole 2.49 2.5
Muscle meat eel 464 whole 9.7 9.76
Raw milk and dairy products 1422 fat 1.81 1.91
Hen eggs and egg products 1154 fat 1.54 1.62
Fat ruminants 370 fat 0.82 0.91
Fat of poultry 149 fat 0.39 0.49
Fat of pig 255 fat 0.09 0.2
Vegetable oils and fats 133 fat 0.1 0.18
Marine oil 91 fat 1.25 1.4
Fish liver and derived products 84 whole 28.25 28.28
Fruits, vegetables and cereals 256 whole 0.03 0.05
Infant and baby foods 414 whole 0.01 0.03

36
EFSA estimated the exposure of dioxins and DL-PCBs to European adults ≥ 18 years of age
at an average exposure of between 0.57 and 1.64 pg/kg bw/d TOTAL WHO TEQ (2005) and
a 95th percentile of exposure between 1.2 and 4.6 pg pg/kg bw/d TOTAL WHO TEQ (2005)
(EFSA, 2012).
Besides the estimates provided for the general European population by EFSA, many
countries have performed national intake evaluations on dioxins and DL-PCBs. Table 5
provides an overview of dietary intake estimates performed in Europe, available in the
literature between 2003 and 2011. These estimates are consistent with estimates provided
by EFSA.
Comparisons between countries are difficult and are hampered by the use of different
survey methodologies, treatment of left censored data (i.e. analytical data below the Limit
of Quantification) timeframe of occurrence data used, selection of food-groups and
modelling used to derive estimates. However, as a general indication, this overview
indicates that average exposure estimates in Europe range from 0.4 – 2.8 pg/kg bw/d
TOTAL WHO TEQ.
The estimates derived by EFSA and individual Member States show a lower range than
reported in the SCOOP task in 2000 (EC, 2000a) which was based on data collected up to
1999. This is consistent with several reports from Member States indicating a general
downward trend in exposure. A reduction of between 60 - 70 % was observed in Belgium
between 2000/2001 – 2008 (Windal et al, 2010), a 60 % decrease between 2000 and 2005
in France (Tard et al, 2007), a decrease of 36 % between 1999 and 2004 in the Netherlands
(De Mul et al, 2008), a 46 % decrease from 1999 - 2005 in Sweden (Tornkvist et al, 2011)
and an 88 % decrease from 1982 to 2001 in the UK (Fernandes et al, 2004). Consistent with
the observed decrease of levels in food and dietary intake, a decline in levels has also been
observed in human breast milk (see 1.5.1).

37
Table 5 Overview of dietary intake of dioxins (pg Total TEQ (1998)/kg bw/d) reported for European countries between 2003 and 2011
Country Year of occurrence data
Reporting Level
Age of population
Survey method
Total TEQ % Contribution
mean (median)
Dairy Meat Fish Eggs Reference
Denmark 2000 - 2002
Adults
1.9 30 9 58 3 (Cederberg, 2004)
Denmark 2000 - 2004
Adults
0.8 - 1.1 30-40 13-18 (Cederberg et al, 2010)
Denmark 2005 - 2009
Adults
0.7-1
Finland 1997 - 1999 UB 25 - 64 24HR 1.5 14 5 (6) 72
(Kiviranta et al, 2004)
Sweden 1999/2003/2004 MB 17 - 79 7d Dietary Record 1.3
(1.07) 20 14 43
(Ankarberg et al, 2007)
Sweden (1) 2005 MB ? Food Balance (5) 0.7 23 14 40 2 (Tornkvist et al, 2011)
Sweden 1999 MB Adults Food Balance (5) 1.3 20 15 32 6 (Darnerud et al, 2006)
Sweden 1998 - 2004 MB 1 - 24 7d Dietary Record 1.5 10 5 75
(Bergkvist et al, 2008)
Netherlands (2) 2001 - 2004 MB 1 - 97 2d Dietary Record (0.82) 38 17 12
(De Mul et al, 2008)
Netherlands 1998/1999 LB 1 - 97 2d Dietary Record (1.2) 27 23 16 4 (Baars et al, 2004)
Belgium (3) 2008 MB >15 24hR/FFQ 0.72 51 22 18 4.8 (Windal et al, 2010)
Italy (4) 1997 - 2003 UB 0 - 94 3 - 7d Dietary Record 2.3 27 7 44 1 (Fattore et al, 2006)
Norway 2003 ? Adults FFQ (0.78)
(Kvalem et al, 2009)
France 2001 - 2004 UB >15 7d Dietary Record 1.8 31 8 48
(Volatier et al, 2006)
Spain 2006 - 2008 UB >17 3dDietary Record 2.9 12 5 59
(Marin et al, 2011)
Spain (Catalonia) 2006 MB Adults
1.12
6.2 58
(Llobet et al, 2008b; Llobet et al, 2008a)
UK (7) 1999/2000 UB Adult males duplicate diet 1.09
(Harrad et al, 2003)
UK 2001 UB Adults TDS 0.9
(Fernandes et al, 2004)
Ireland 2002 - 2006 UB 18 - 64 7d Dietary Record 0.4
(FSAI, 2010a)
Total TEQ = Sum WHO TEQ PCDD/F+DL-PCB; UB = upperbound (<LOQ=LOQ) ; MB = mediumbound (<LOQ=1/2LOQ) ; LB = lowerbound (<LOQ=0)
1 per capita intake from food balance information 2 Usual intake, 2005 WHO TEQs 3 Usual intake 4 Concentration data from EU Commission Database collection data from all Member States 5 per capita consumption data, derived from Swedish producers and trade statistics 6 includes eggs 7 Not representative for the whole UK population

38
Data on the sum of 6 marker PCBs collected by European Member States, following the
recommendation on background monitoring for dioxins, was first evaluated by EFSA in
2005 (EFSA, 2005), and was reported to range between 4.8 and 18 ng/kg bw/d. In 2012,
EFSA provided an update of the monitoring data, which showed consistency with the lower
range of the earlier estimates, providing an average exposure between 4.3 and 12.5 ng/kg
bw/d and a 95th percentile of exposure between 7.8 and 36.5 ng/kg bw/d for the adult ≥18
year old population (EFSA, 2012). EFSA further undertook a review of national exposure
estimates (see Table 6) and observed consistency with estimates derived in their 2012
update.
Table 6 National Exposure estimates available for adults in the European Union
Country Population group Survey Type Mean P95
Source Sum of 6 Marker PCBs
ITA Adolescents and adults Monitoring 10.9 23.8 Fattore et al. 2008
F Adults Monitoring/TDS 7.7 16 Arnich et al., 2009
DE Adults (Bavaria) Duplicate diet *5.6
Fromme et al. 2009
F Adults TDS 2.7 7.9 Sirot et al., 2012
SVK General population Monitoring **17.0 45 Salgovicova et al., 2007
Europe General population Monitoring 15 meat consumer: 20, fish consumer: 35
EFSA, 2005
*Median for the sum of the 6 NDL-PCB indicators multiplied by a factor 2; **Median
Source: adapted from EFSA (EFSA, 2012)
1.5.1 Breast milk as an indicator of human exposure
Given the lipophilicity of the POPs, they also accumulate in fatty tissues in the human body
following consumption of foodstuffs of animal origin and can be detected in human blood,
adipose tissue and, in particular, human breast milk (Furst, 2006; Phillips et al, 1989).
Measurement of POPs in breast milk is accepted as providing a robust and relatively non-
invasive measurement of body burden of these ubiquitous contaminants. Breast milk
contains many lipid soluble compounds that are also present in mothers' adipose tissue
and can be assumed to be representative for those in plasma, serum lipid and adipose
tissue (Malisch et al, 2008), which is confirmed by the levels of POPs in breast milk fat
generally reflecting the levels found in blood lipids (Aylward et al, 2003; Wehler et al,
1997). Therefore levels of these contaminants in human milk reflect the body burden and
can thus be used as an indicator for the overall exposure of the general population to POPs
(Malisch et al, 2008).
A substantial source of comparable data on dioxins in breast milk relating to the majority of
Member States is the WHO co-ordinated study, which since the mid-eighties, in

39
collaboration with other international organisations and national institutions, has
coordinated a comprehensive programme on possible health risks of PCBs, dioxins and
furans (Van Leeuwen and Malisch, 2002). The first WHO-coordinated exposure study took
place in 1987 - 1988 (WHO, 1989a), the second round in 1992 - 1993 (WHO, 1996). Over
the period from 1987 to 1993 the average dioxin concentration in breast milk in EU
Member States decreased by around 35 % (8.3 % per year), with a slightly higher decrease
in rural areas and slightly lower in industrial areas (Buckley-Golder, 1999). This trend
continued through to the next round, showing a 40 % decline between the levels found in
the second round in 1993 and the third round in 2003 (Van Leeuwen and Malisch, 2002)
(see section 1.5.1.1, Figure 2 and Figure 3). During the years 2005 - 2007 and 2008 - 2010,
UNEP and the WHO implemented the fourth and fifth round surveys on human milk.
Results of these two rounds for WHO-PCDD/F-TEQs show that the median was 6 and 5.9 pg
WHO-PCDD/F-TEQ/g fat, and 6.8 and 6.9 pg WHO-PCB-TEQ/g fat, for participating western
and eastern European countries, respectively (UNEP, 2011).
1.5.1.1 Human breast milk studies in Ireland
Human breast milk samples from Ireland were analysed in 2002, as part of round 3 of the
coordinated WHO study and again in 2009/2010 following the same protocol but with the
aim to examine any potential influence of the 2008 dioxin contamination of Irish pork on
the overall population exposure. In 2002, pooled breast milk samples from two urban areas
(Cork and Dublin) had concentrations of Total WHO TEQs (1998) of 13.3 and 13.7 pg/g fat,
respectively, with lower concentrations being observed in two sub-urban and rural samples
(Wicklow and Donegal) of 11.6 pg/g fat and 8.9 pg/g fat respectively, giving an overall mean
of 11.9 pg/g fat over the 4 samples. In 2009/2010 eleven pools were analysed with results
ranging from Total WHO-TEQs (1998) from 7.5–13.7 pg/g fat, the overall pooled sample of
milk from 109 mothers in 2010 showing 9.7 pg/g fat. Comparison of results of the two
studies revealed generally lower concentrations of PCDD/Fs and dioxin-like PCBs in the
2010 samples, confirming the declining trend (Pratt et al, 2012).
As mentioned previously, Ireland participated in the 3rd round of the WHO-coordinated
exposure study, comprising a total of 26 countries from all over the world. Lowest levels of
PCDDs/PCDFs and DL-PCBs were found in countries on the southern hemisphere (Fiji,
Brazil, Philippines, Australia, New Zealand) and for a number of European countries
(Bulgaria, Croatia, Hungary, Ireland) and for the USA, whereas comparatively high levels
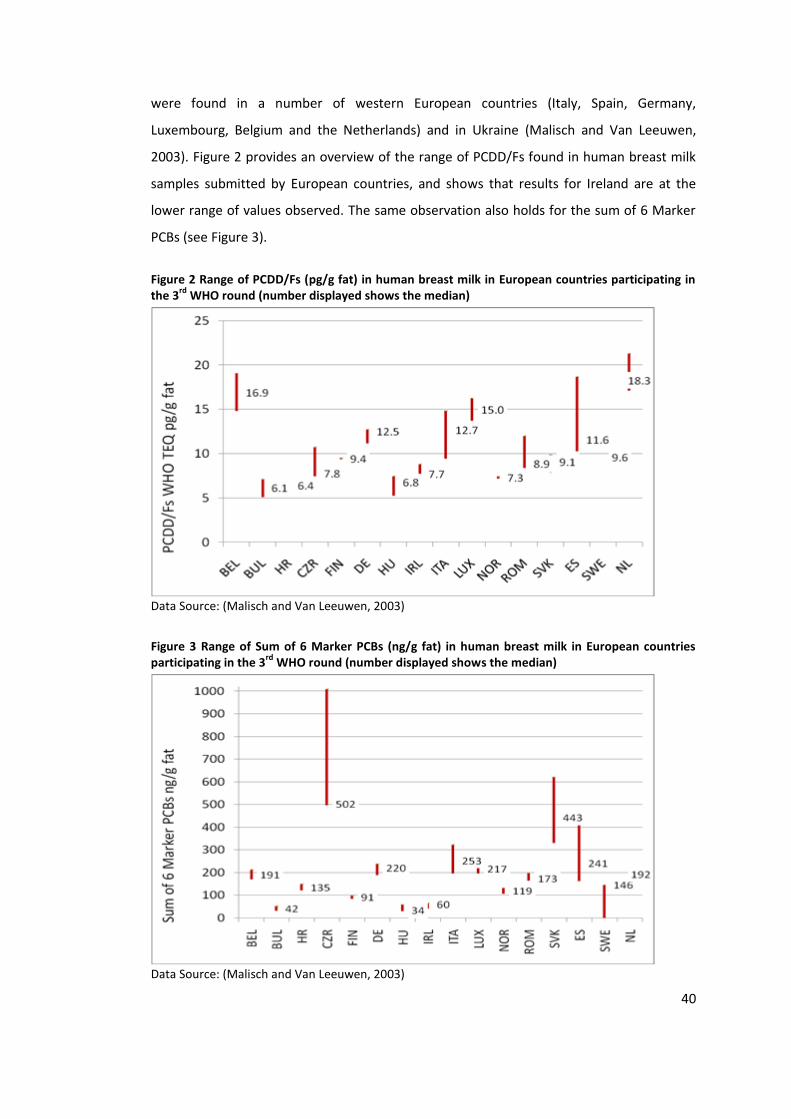
40
were found in a number of western European countries (Italy, Spain, Germany,
Luxembourg, Belgium and the Netherlands) and in Ukraine (Malisch and Van Leeuwen,
2003). Figure 2 provides an overview of the range of PCDD/Fs found in human breast milk
samples submitted by European countries, and shows that results for Ireland are at the
lower range of values observed. The same observation also holds for the sum of 6 Marker
PCBs (see Figure 3).
Figure 2 Range of PCDD/Fs (pg/g fat) in human breast milk in European countries participating in the 3
rd WHO round (number displayed shows the median)
Data Source: (Malisch and Van Leeuwen, 2003)
Figure 3 Range of Sum of 6 Marker PCBs (ng/g fat) in human breast milk in European countries participating in the 3
rd WHO round (number displayed shows the median)
Data Source: (Malisch and Van Leeuwen, 2003)

41
1.6 POPs contamination incidents
While levels of POPs in the human population, as assessed in human breast milk studies,
are primarily influenced by environmental levels of these contaminants, including levels in
food, which in turn are influenced by the degree of local urbanisation and industrialisation,
levels in the human population may also be influenced by specific incidents or accidents
leading to high exposure of the environment or the food supply with POPs. One example of
industrial accidents is the so-called Seveso incident in 1976, in which an explosion in a
chemical manufacturing facility located in the Seveso area in northern Italy led to
contamination of humans, animals, food crops and land in the vicinity of the plant with
2,3,7,8-tetrachloro-dibenzo-para-dioxin (TCDD) (Weiss et al, 2003). Non-industrial accident
related contamination of the food/feed chain occurs more frequently and over the last 15
years a number of food contamination incidents occurred in Europe (see Table 7).
Table 7 Overview of recent dioxin and PCB food/feed contamination incidents
Year Contamination Source
1998 Contamination of dairy products and meat by the use of contaminated citrus pulp in feedstuffs in Germany
(Carvalhaes et al, 1999; Malisch, 2000)
1999 Contamination of feed fat with PCB containing oil in Belgium (Bernard et al, 1999)
1999 Contamination of feed due to the use of contaminated kaolin as anticoagulant in Switzerland
(Schmid and Uthrich, 2000)
2000 Contamination of animal feed due to contaminated sawdust used as carrier in pre-mixed choline chloride in Germany.
(Llerena et al, 2001)
2003 Contamination of bakery waste due to use of waste wood in the drying process in Germany
(Hoogenboom and Traag, 2003)
2004 Contamination of poultry meat and eggs due to PCP contaminated wood shavings as litter in Italy
(Diletti et al, 2005)
2004 Contamination of pig feed due to inclusion of waste fat contaminated by a malfunction in gelatine processing in the Netherlands
(Hoogenboom et al, 2006)
2004 Contamination of milk by use of potato by-products contaminated by kaolinic clay during sorting in animal feed in the Netherlands
(Hoogenboom et al, 2005)
2008 Contamination of pork due to contaminated zinc oxide used as feed ingredient in Chile
(Kim et al, 2009)
2008 Contamination of buffalo milk due to illegal waste burning in Italy (Borrello et al, 2008; CRL, 2009; Esposito et al, 2010)
2008 Contamination of pork and beef due to contamination of bakery waste via burning of contaminated oil in Ireland
(Tlustos, 2009a; Tlustos et al, 2012), see 1.6.1
2010 Contamination of pigs and poultry via dioxin-contaminated oil in animal feed in Germany
(BMELV, 2011)
1.6.1 The 2008 Dioxin Contamination of Irish Pork
In September 2008 a feed contamination incident occurred in Ireland, which subsequently
led to contamination of pig herds and cattle herds supplied with this feed.

42
A porcine fat sample taken as part of the national residues monitoring programme in 2008
led to the detection of a major feed contamination incidence in the Republic of Ireland. The
source of the contamination was traced back to the use of contaminated oil in a direct-
drying feed operation system. Congener profiles in animal fat and feed samples showed a
high level of consistency and pinpointed the likely source of fuel contamination to be a
highly chlorinated commercial PCB mixture. Chapter 4 provides in-depth results of the
research into source identification and provides the analytical data gathered during the
incidence (Tlustos, 2009a; Tlustos et al, 2012), which was collated and analysed for the
purposes of the exposure assessment for dioxins and PCBs performed in Chapter 5. The
following sections provide an overview of additional information related to the incident
published in the literature:
1.6.1.1 Critical reviews of the contamination incident
Subsequent to the contamination incident, several government bodies and research
institutes performed critical reviews and case studies on the incident. In 2009, an inter-
agency review group reviewed what factors contributed to the contamination incident and
what policies, and practices, might be put in place to prevent similar incidents from
occurring in the future (Wall et al, 2009). Similarly, the Joint Oireachtas committee
undertook an investigation into the impact and consequences of the dioxin contamination
incident, with a view to identifying the causes of the problem and suggesting some lessons
for the future. This report particularly focused on the circumstances surrounding the pork
recall in terms of the effectiveness of the existing traceability system, the monitoring of
licensed feed premises, the proportionality of the response and the way forward for the
industry domestically and globally (House of the Oireachtas, 2009).
Two case studies comparing the crisis in Belgium in 1999 with the 2008 crisis in Ireland
were published in 2010. Jacob et al (Jacob et al, 2010) published an analysis of the
management of the two crises by their respective federal governments and highlighted the
good crisis management performed by the Irish authorities. The Irish government, due to
prompt and detailed communication managed to maintain the trust of the public and other
nations throughout their crisis situation, in stark contrast to the Belgian authorities, whose
practices resulted in widespread distrust in the government by both consumers and
importing nations. Similar to the paper by Jacobs et al, Casey et al (Casey et al, 2010)
reviewed the strengths and weaknesses in the management of the Belgian and Irish dioxin
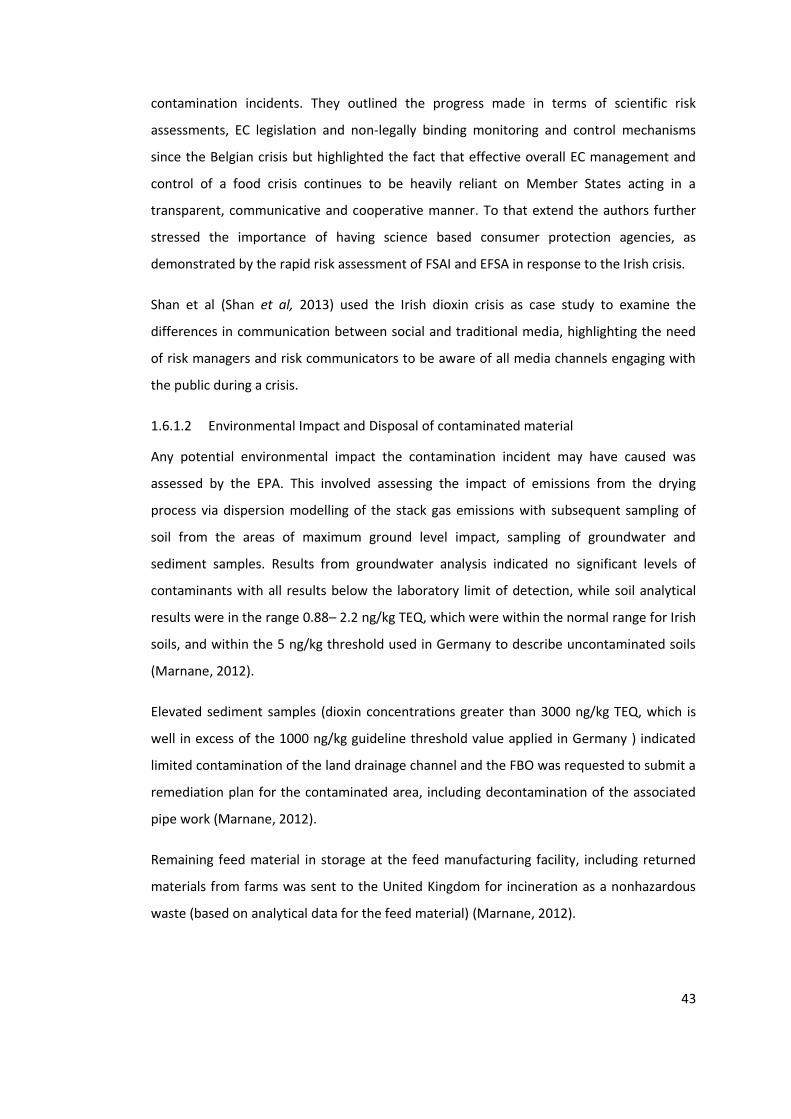
43
contamination incidents. They outlined the progress made in terms of scientific risk
assessments, EC legislation and non-legally binding monitoring and control mechanisms
since the Belgian crisis but highlighted the fact that effective overall EC management and
control of a food crisis continues to be heavily reliant on Member States acting in a
transparent, communicative and cooperative manner. To that extend the authors further
stressed the importance of having science based consumer protection agencies, as
demonstrated by the rapid risk assessment of FSAI and EFSA in response to the Irish crisis.
Shan et al (Shan et al, 2013) used the Irish dioxin crisis as case study to examine the
differences in communication between social and traditional media, highlighting the need
of risk managers and risk communicators to be aware of all media channels engaging with
the public during a crisis.
1.6.1.2 Environmental Impact and Disposal of contaminated material
Any potential environmental impact the contamination incident may have caused was
assessed by the EPA. This involved assessing the impact of emissions from the drying
process via dispersion modelling of the stack gas emissions with subsequent sampling of
soil from the areas of maximum ground level impact, sampling of groundwater and
sediment samples. Results from groundwater analysis indicated no significant levels of
contaminants with all results below the laboratory limit of detection, while soil analytical
results were in the range 0.88– 2.2 ng/kg TEQ, which were within the normal range for Irish
soils, and within the 5 ng/kg threshold used in Germany to describe uncontaminated soils
(Marnane, 2012).
Elevated sediment samples (dioxin concentrations greater than 3000 ng/kg TEQ, which is
well in excess of the 1000 ng/kg guideline threshold value applied in Germany ) indicated
limited contamination of the land drainage channel and the FBO was requested to submit a
remediation plan for the contaminated area, including decontamination of the associated
pipe work (Marnane, 2012).
Remaining feed material in storage at the feed manufacturing facility, including returned
materials from farms was sent to the United Kingdom for incineration as a nonhazardous
waste (based on analytical data for the feed material) (Marnane, 2012).

44
The residual contaminated oil from the feed manufacturing site was retained at a secure
facility as evidence in the event of legal proceedings, but will eventually be disposed of via
an appropriate waste management facility (Marnane, 2012).
The actual processing building and the feed drying equipment itself are also required to be
decontaminated, and this work is ongoing. The incineration of the recalled pork, culled
animals and contaminated feed was carried out at permitted facilities operating in line with
the requirements of the Waste Incineration Directive (2000/76/ EC) (Marnane, 2012).
1.6.1.3 The economic impact
The Irish Government provided €182,000,000 as an industry support measure, however,
the total economic burden of the crisis is as yet unknown. As direct economic
consequences, pig farmers were facing financial ruin, 1800 pig processors were laid off as a
result of the pork recall and another 10000 indirect jobs were at threat. Many companies in
Ireland lost their status as sole suppliers of pork to overseas markets and Ireland's
reputation as "clean" food supplier came under threat (Tlustos, 2009b).
1.6.1.4 Media Coverage
The crisis was heavily reported by the media, with the FSAI receiving over 700 queries from
journalists as follows:
385 Articles in National Press
200 Articles in Regional Press
70 Radio Programs and phone-interviews
17 Television Programs
200 Internet News Items
Daily press conferences
For those specifically seeking information on the internet, Google provided 36700 hits
when queried about toxins in Irish pork (Tlustos, 2009b).
1.6.1.5 Consumer interest
The FSAI's helpline received a total of 3725 calls between 6th and 12th December 2008 with
the majority of queries relating to health issues (see Figure 4). 2660 of these calls were
received on Sun 7th 2008, the day after the recall had been issued (Tlustos, 2009b).

45
Figure 4 Type of queries received by the Food Safety Authority
In the same period, the FSAI Website registered 42400 visitors, half of which visited the
website between Sat 6th and Sun 7th December 2008, an increase of 4310 % compared to
the previous weekend (Tlustos, 2009b).
Not Recorded
16%
Other 14%
Disposal 8%
Refund 13%
Health Issue
41%
Complaint
4%
Products
Affected 2% Science &
Risk 2%

46
2 Collation of occurrence data of dioxins and PCBs in food in Ireland
There are different food monitoring programs for dioxins and PCBs in operation in Ireland.
Some of them are rolling programs implemented to test for compliance with legislation
whereas others have been implemented to provide time-trends or provide information on
environmental contamination, etc. Overall, over the last 20 years, 1038 food samples6 were
analysed for dioxins in Ireland (see Table 8). The majority of samples were taken by the
FSAI in collaboration with its agencies, followed by independent studies performed by
DAFM, EPA, Teagasc Food Research Centre and Bord Iascaigh Mhara (Irish Sea Fisheries
Board, BIM). These data are reported in different formats and in different places by the
various organisations. This chapter provides an overview of the various programs in
operation in Ireland and a collation of all data on dioxins and PCBs available in Ireland with
a view to facilitate exposure assessment to dioxins and PCBs in this study and any further
assessments in the future.
6 Excluding targeted samples taken as part of the 2008 contamination incident

47
Table 8 Breakdown of routine monitoring samples taken in Ireland between 1991 - 2010 for dioxin analysis
Category 1991 1992 1993 1995 1997 1998 1999 2000 2001 2003 2004 2005 2006 2007 2008 2009 2010 Grand Total
Carcass fat
34
38
72
Carcass fat (Teagasc)
60
60
Liver
7
12 12
31
Dairy
6
9 30
51
Dairy (Teagasc)
90*
90
Milk (Cork County Council) 1 1 1 2 2 2 2 2 2 2 2 10 5 6 7 6 1 54
Milk (EPA)
33*
37
37
37 37 37 37 37 259
Eggs
47
20
67
Fats and Oils
3
3
Fish
45 13 55
52 165
Fish, canned
15
15
Soup
1
1
Vegetables
8
8
Fruit
3
3
Cereals
3
3
Supplements
15
43
58
Infant Formula (DAFM)
6* 6 7 19
Fish (BIM)
52
52
Grand Total 1 1 1 2 2 92 2 99 62 127 161 74 142 43 50 49 97 1038
* PCDD/Fs only Not included are figures for programs covering Marker PCBs only Not included are targeted samples taken as a consequence of the 2008 contamination incident

48
2.1 Methodologies
2.1.1 FSAI Monitoring Programme
2.1.1.1 Monitoring Rationale
The FSAI co-ordinates the collation of food safety surveillance information in Ireland and
also conducts targeted food safety surveillance in areas where potential safety issues have
been identified and/or on food contaminants for which there are limited facilities in
Ireland, such as dioxins. In response to the recommendations on the monitoring of
background levels of dioxins and DL-PCBs in foodstuffs (EC, 2004b; EC, 2006a) the FSAI has
carried out substantial monitoring for a range of POPs in a variety of foodstuffs.
2.1.1.2 Sampling & Analysis
The FSAI has published numerous surveys on dioxins over the last 10 years (see Table 8),
covering a wide range of foodstuffs, in particular foods of lipophilic nature known to
accumulate dioxins, such as fish, eggs, meat, offal, fish oils and other oily supplements , fats
and oils and dairy products (FSAI, 2001; FSAI, 2002a; FSAI, 2002b; FSAI, 2004; FSAI, 2005a;
FSAI, 2005b; FSAI, 2010a; Tlustos et al, 2004; Tlustos et al, 2005; Tlustos et al, 2007).
All surveys conducted by FSAI were designed to follow EC legislation "on the sampling and
analysis of sampling methods and the methods of analysis for the official control of dioxins
and the determination of dioxin-like PCBs in foodstuffs" in 2002 (EC, 2002a), which has
since been replaced by Regulation 252/2012 (EC, 2012).
The latter requires a sample to be representative of the lot from which it was taken and is
based on a principle of aggregating incremental samples. Depending on the lot size, the
type of sample and homogeneity of contaminant distribution, between 3 - 10 incremental
samples are to be taken, the minimum weight of an incremental sample being at least 100
g, however, depending on the particle size in the lot, this number may change requiring the
recording of the departure of the standard procedure. The overall aggregate sample should
be 1 kg. An exception was made for eggs, for which the aggregate sample should consist of
12 eggs. More specific provisions were also introduced in 2004 for fish, providing for the
sampling of fish of different sizes. General exceptions to the above rule also exist for
samples taken at retail, or lots were following the above procedure would result in
considerable damage to the lot and subsequent economic loss. The latter problem was not
49
encountered in any sampling regime employed for any program described in the following
chapters.
Analysis of all samples was carried out by laboratories accredited according to the DIN EN
ISO/IEC 17025:2000 standard. The analytical methodology for dioxin and PCB analysis
followed international standards, such as EPA 1613 (EPA, 1994), Directive 2002/69/EC
laying down the methods of analysis for the determination of dioxin-like PCBs in foodstuffs
(EC, 2002a), as amended by Commission Directive 2004/44/EC (EC, 2004c), which was
eventually replaced by EU Regulation 1883/2006/EC (EC, 2006d). All analyses were carried
out using 13Carbon labelled internal standards and measurement was made using both,
high-resolution GC-MS and low-resolution GC-MS as appropriate. The method
implemented quality assurance and quality control followed the requirements of
international standards for the analysis of Dioxins and PCBs at low concentration levels (e.
g. EC Directive 2002/69, EN 1948, EPA 1613). All laboratories provided proof of successful
participation in inter-laboratory comparison schemes and proficiency tests, such as FAPAs7,
Quasimeme8, Folkehelsea9, etc.
2.1.2 Animal Health Surveillance Scheme (AHSS) in County Cork
2.1.2.1 Monitoring Rationale
Since 1991, the Veterinary Department of Cork County Council has operated an Animal
Health Monitoring Scheme (Buckley and Larkin, 1998). The scheme monitors the health of
dairy cattle herds in the vicinity of the harbour area (Target herds) and herds in non-
industrialised areas (Control herds). As part of this monitoring programme, Cork County
Council, in collaboration with FSAI have carried out dioxin analysis on cow’s milk samples
for the years 1991 – 2010.
2.1.2.2 Sampling & Analysis
The AHSS sampling regime was designed to follow any trends in target versus control dairy
herds and employed a sampling regime of 10 pooled milk samples from impact herds
versus 2 pooled milk samples of control herds. The latter does not present a huge variation
7 www.fapas.com 8 www.quasimeme.org 9 www.fhi.no

50
from the EC sampling requirements, which due to the heterogeneity of contaminant
distribution generally only requires the taking of a minimum of 3 incremental samples.
Analysis of all samples was carried out by laboratories accredited according to the DIN EN
ISO/IEC 17025:2000 standard, as described in 2.1.1.2 .
2.1.3 EPA National milk surveys
2.1.3.1 Monitoring Rationale
The EPA, since 1995 have carried out a dioxin monitoring program in cow's milk samples
taken during the grazing season, levels of dioxins in which are used to serve as indicators
for the actual average local dioxin exposure by atmospheric deposition (EPA, 2000; EPA,
2004; EPA, 2006; EPA, 2007; EPA, 2008; EPA, 2009).
2.1.3.2 Sampling & Analysis
Milk samples taken by the EPA are pooled regional samples, taken from bulk tankers, which
are representative of herds within certain regions. Whilst not in exact agreement with the
EC sampling requirements, the sampling methodology complies with the general concept
of representativeness of the sample with the lot from which it was taken.
Analysis of all samples was carried out by laboratories accredited according to the DIN EN
ISO/IEC 17025:2000 standard, as described in 2.1.1.2.
2.1.4 Teagasc Food Research Centre Monitoring
2.1.4.1 Monitoring Rationale
Teagasc undertook studies in 1998 and 2000 on dioxins and DL-PCBs in dairy products
(cheese) and in carcass fat samples (beef, pork, poultry and sheep) which were
representative of food in the export market and were supplied by food companies. The aim
was to produce a Food Residue Database10 providing information to be used by the Irish
food industry to assist production, processing and marketing of food.
2.1.4.2 Sampling & Analysis
Monitoring undertaken by Teagasc was conducted prior to introduction of EC legislation on
sampling and consisted of taking of individual samples. Sampling was in accordance with
10 See here http://nfrd.teagasc.ie/

51
schedules provided by Teagasc (formerly The National Food Centre) to ensure random
geographical and seasonal distribution of samples. Samples were stored frozen or
refrigerated at the laboratory prior to analysis (O'Keeffe et al, 2001). The study on cheese
examined 90 samples from seven dairy companies during the period September 1998 to
August 1999. The study on carcass fat was undertaken between January and July 2000 and
comprised of 15 samples each of beef, pork, poultry and sheep fat from 13 meat processing
companies. Analysis of all samples was carried out by laboratories accredited according to
the DIN EN ISO/IEC 17025:2000 standard, as described in 2.1.1.2.
2.1.5 96/23 DAFM Residue Monitoring Program
Directive 96/23/EC (EC, 1996) requires all member states to monitor certain „substances
and residues thereof in live animals and animal products‟. Under this program, DAFM, has
coordinated routine analysis on Marker PCBs on samples of animal origin via its agencies.
Sampling under this program is matrix specific and deviates from the requirements of
sampling associated with Regulation 1881/2006/EC. Monitoring under this program led to
the detection of the 2008 dioxin in pork contamination incident.
2.1.6 MI Bivalve Molluscs and Fish Landings Monitoring
The Marine Institute has carried out various monitoring programmes that provide
information on PCBs in fish and shellfish, including studies in collaboration with FSAI (see
2.1.1), the 96/23 finfish aquaculture monitoring (see 2.1.5), a bivalve mollusc monitoring
program and a monitoring program on fish landed at Irish ports. The latter two programs
serve the requirements under EU food safety monitoring obligations and the requirements
of the shellfish waters Directive (EC, 2006g) and also provide information on the range of
naturally occurring and anthropogenic substances in fish/shellfish (McGovern et al, 2011).
Sampling and analysis under these programs generally agree with the requirements on
sampling associated with Regulation 1881/2006/EC (EC, 2006c).
2.1.7 DAFM Infant Formula and Follow on Formula Monitoring
The dairy section of DAFM has been monitoring infant formula and ingredients of infant
formula since 2008. A limited number of samples are taken from the manufacturers in
Ireland every year and are tested by an accredited laboratory according to the DIN EN
ISO/IEC 17025:2000 standard, as described in 2.1.1.2 for compliance with Regulation
1881/2006 (EC, 2006c).

52
2.1.8 BIM Ad hoc salmon survey
In 2004, BIM conducted an ad-hoc survey of 52 samples of farmed salmon (homogenates)
taken from the West and North coast of Ireland. Analysis was undertaken by an accredited
laboratory according to the DIN EN ISO/IEC 17025:2000 standard, as described in 2.1.1.2,
with the aim to collect comparative data on fish analysed with and without skin and cooked
versus raw fish.
Not included here are data which did not meet the required quality criteria. These were an
FSAI survey on cream samples in 2005 and a DAFM survey on milk from 2004. A substantial
amount of targeted sampling of bovine and porcine tissue also took place in 2008/2009
related to the feed contamination incidence (Tlustos et al, 2012). This data is further
described in Chapter 3.3.4.
2.2 Results and Discussion
2.2.1 FSAI Monitoring Programme
Table 8 provides information on the number and sampling location of samples analysed for
PCDD/Fs & DL-PCBs. The same number of samples was also analysed for the sum of 6
Marker PCBs. Table 9 and 10 provide average LB and UB results for dioxins and sum of 6
Marker PCBs and Table 44 - 45 in Annex provide the min - max ranges for dioxins and sum
of 6 Marker PCBs.
2.2.1.1 Carcass Fat and Liver Samples
Average mean concentrations of Total TEQ (LB - UB) calculated over all years were 0.08 -
0.38, 0.69 - 0.73, 0.53 - 0.56, and 0.12 - 0.22 ng/kg fat for avian, bovine, ovine and porcine
carcass fat, respectively. Levels in liver were 0.40 - 0.97, 1.77 - 1.83, 5.05 - 5.17 and 0.63 -
1.67 ng/kg fat for avian, bovine, ovine and porcine liver, respectively (see Table 9 for more
detail).
Average mean concentrations for the sum of 6 Marker PCBs (LB - UB) calculated over all
years were 1.3 - 1.4, 0.2 - 0.2, 1.1 - 1.2, 1.2 - 1.3 and 0.7 - 0.9 µg/kg fat for avian, bovine,
ovine and porcine carcass fat, respectively. Levels in liver were 1.0 - 2.8, 2.8 - 2.9, 4.3 - 4.3,
1.8 - 3.2 and 0.5 - 0.7 µg/kg fat for avian, bovine, ovine and porcine liver, respectively (see
Table 10 for more details).

53
2.2.1.2 Eggs
Average mean concentrations of Total TEQ (LB - UB) calculated over all years were 0.27 -
0.41, 0.35 - 0.57, 0.51 - 0.69 and 2.44 - 2.5 ng/kg fat in barn, battery, free range and organic
eggs, respectively. The relatively higher result in organic eggs can be attributed to high
results obtained in a sample in 2003, and results excluding this sample are 0.76 - 0.86 ng/kg
fat) (see Table 9 for more detail).
Average mean concentrations for the sum of 6 Marker PCBs (LB - UB) calculated over all
years were 5.4 - 5.5, 2.2 - 2.4, 1.7 - 1.9 and 51 µg/kg fat in barn, battery, free range and
organic eggs, respectively. The relatively higher result in organic eggs can be attributed to
high results obtained in a sample in 2003, and results excluding this sample are 4.9 - 5.0
µg/kg fat (see Table 10 for more details).
2.2.1.3 Fish and fish products
Average mean concentrations of Total TEQ (LB - UB) calculated over all years ranged from
0.32 - 25.16 ng/kg fat. Levels in shellfish were 1.20 - 15.55 ng/kg fat in mussels, oysters and
prawns, respectively (see Table 9 for more detail).
Average mean concentrations for the sum of 6 Marker PCBs (LB - UB) calculated over all
years ranged from 1 - 150 µg/kg fat. Levels in shellfish were 1 - 43 µg/kg fat in mussels,
oysters and prawns, respectively (see Table 10 for more details).
2.2.1.4 Milk and Milk products
Average mean concentrations of Total TEQ (LB - UB) calculated over all years were 0.48 -
0.5, 0.16 - 0.23, 0.07 - 0.13 and 0.33 - 0.63 Total TEQ ng/kg fat for butter/cheese, yoghurt,
dairy spreads and milk, respectively (see Table 9 for more detail).
Average mean concentrations for the sum of 6 Marker PCBs (LB - UB) calculated over all
years were 0.5 - 1.1, 0.2 - 0.7, 0 - 0.8 and 0.4 - 1 µg/kg fat for butter/cheese, yoghurt, dairy
spreads and milk, respectively (see Table 10 for more details).
2.2.1.5 Other (Fats/Oils, Cereals, Fruit, Vegetables, Packet Soup)
Average mean concentrations of Total TEQ (LB - UB) calculated over all years were 0.43 -
0.45 and 0.03 - 0.10 ng/kg whole weight for animal/vegetable fat and vegetable oils,
respectively. Levels in all other food groups were below the limit of detection and ranged

54
from 0 - 0.06, 0 - 0.05 and 0 - 0.47 ng/kg whole weight in cereals, fruit & vegetables and
packet soup, respectively (see Table 9 for more detail).
Average mean concentrations for the sum of 6 Marker PCBs (LB - UB) calculated over all
years are 0.6 - 1 and 0.1 - 0.4 µg/kg whole weight for animal/vegetable fat and vegetable
oils, respectively. Levels in all other food groups were below the limit of detection and
ranged from 0 - 0.1, 0 - 0.06 and 0 - 0.07 µg/kg whole weight in cereals, fruit & vegetables
and packet soup, respectively (see Table 10 for more details).
2.2.1.6 Food Supplements
Food Supplements were tested in 2001 and 2005. Monitoring in 2001 was conducted prior
to legislative limits being established and relatively high concentrations were found in fish
oils (mean Total TEQ of 17 ng/kg whole weight). These levels decreased considerably after
regulations were introduced, and levels in 2005 were 2.96 - 3.28 ng/kg whole weight. Other
food supplements (plant oils, vitamins, omega 3 formulations) contained on average 0.01 -
1.12 Total TEQ ng/kg whole weight (see Table 9 for more detail).
The average mean concentrations for the sum of 6 Marker PCBs (LB - UB) was 120 µg/kg fat
in 2001 and considerable lower in 2005 at 35 µg/kg fat (see Table 10 for more details).

55
Table 9 Number of samples and results expressed as LB and UB Mean Total TEQ (1998) fat weight covered by FSAI monitoring programs 2001 - 2010
Category Species Sampling Stage
2001 2003 2004 2005 2006 2010 2001 - 2010
N Mean
N Mean
N Mean
N Mean
N Mean
N Mean
N Mean
LB UB LB UB LB UB LB UB LB UB LB UB LB UB
Carcass Fat Avian Slaughterhouse
7 0.27 0.36
11 0.37 0.39
18 0.34 0.38
Avian (Duck) Slaughterhouse
1 0.06 0.17
2 0.10 0.13
3 0.08 0.14
Bovine Slaughterhouse
10 0.82 0.88
9 0.54 0.56
19 0.69 0.73
Ovine Slaughterhouse
8 0.60 0.64
10 0.48 0.50
18 0.53 0.56
Porcine Slaughterhouse
8 0.05 0.17
6 0.23 0.28
14 0.12 0.22
Dairy Butter Retail
1 0.48 0.50
1 0.48 0.50
Cheese Retail
3 0.41 0.45
3 0.41 0.45
Milk Farm
5 0.43 0.58 30 0.31 0.36
35 0.33 0.39
Retail
4 0.54 0.63
4 0.54 0.63
Spread Retail
1 0.07 0.13
1 0.07 0.13
Yogurt Retail
1 0.16 0.23
1 0.16 0.23
Eggs Eggs (Barn) Packing Station
4 0.33 0.58
5 0.23 0.27
9 0.27 0.41
Eggs (Battery) Packing Station
16 0.42 0.65
5 0.14 0.30
21 0.35 0.57
Eggs (Free Range) Packing Station
16 0.57 0.79
5 0.30 0.36
21 0.51 0.69
Eggs (Organic) Packing Station
11 3.34 3.39
5 0.46 0.55
16 2.44 2.50
Eggs (Organic) * Packing Station
3 1.25 1.39
5 0.46 0.55
8 0.76 0.86
Offal Avian Slaughterhouse
3 0.40 0.51
3 0.39 0.41
6 0.40 0.46
Avian (Turkey) Slaughterhouse
1 0.82 0.97
1 0.82 0.97
Bovine Slaughterhouse
1 2.06 2.12
2 1.62 1.68
3 1.77 1.83
Equine Slaughterhouse
2 14.23 14.26
2 14.23 14.26
Ovine Retail
11 4.10 4.23 2 10.30 10.32
13 5.05 5.17
Retail**
11 4.10 4.23 1 4.22 4.25
12 4.11 4.24
Slaughterhouse
1 5.41 5.46
1 5.19 5.20
2 5.30 5.33
Porcine Retail
1 0.63 1.67
1 0.63 1.67
Slaughterhouse
1 1.01 1.23
2 0.91 0.97
3 0.94 1.06
* excluding one extreme value and seven targeted follow up samples ** excluding one extreme value
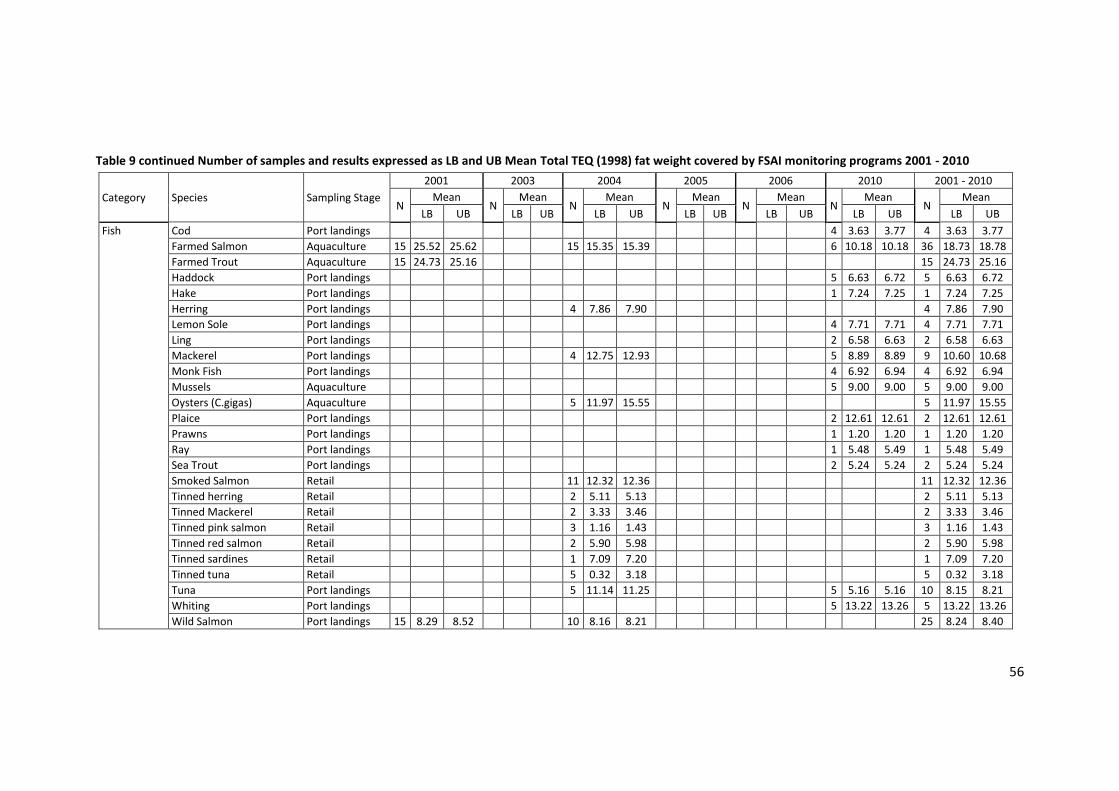
56
Table 9 continued Number of samples and results expressed as LB and UB Mean Total TEQ (1998) fat weight covered by FSAI monitoring programs 2001 - 2010
Category Species Sampling Stage
2001 2003 2004 2005 2006 2010 2001 - 2010
N Mean
N Mean
N Mean
N Mean
N Mean
N Mean
N Mean
LB UB LB UB LB UB LB UB LB UB LB UB LB UB
Fish Cod Port landings
4 3.63 3.77 4 3.63 3.77
Farmed Salmon Aquaculture 15 25.52 25.62
15 15.35 15.39
6 10.18 10.18 36 18.73 18.78
Farmed Trout Aquaculture 15 24.73 25.16
15 24.73 25.16
Haddock Port landings
5 6.63 6.72 5 6.63 6.72
Hake Port landings
1 7.24 7.25 1 7.24 7.25
Herring Port landings
4 7.86 7.90
4 7.86 7.90
Lemon Sole Port landings
4 7.71 7.71 4 7.71 7.71
Ling Port landings
2 6.58 6.63 2 6.58 6.63
Mackerel Port landings
4 12.75 12.93
5 8.89 8.89 9 10.60 10.68
Monk Fish Port landings
4 6.92 6.94 4 6.92 6.94
Mussels Aquaculture
5 9.00 9.00 5 9.00 9.00
Oysters (C.gigas) Aquaculture
5 11.97 15.55
5 11.97 15.55
Plaice Port landings
2 12.61 12.61 2 12.61 12.61
Prawns Port landings
1 1.20 1.20 1 1.20 1.20
Ray Port landings
1 5.48 5.49 1 5.48 5.49
Sea Trout Port landings
2 5.24 5.24 2 5.24 5.24
Smoked Salmon Retail
11 12.32 12.36
11 12.32 12.36
Tinned herring Retail
2 5.11 5.13
2 5.11 5.13
Tinned Mackerel Retail
2 3.33 3.46
2 3.33 3.46
Tinned pink salmon Retail
3 1.16 1.43
3 1.16 1.43
Tinned red salmon Retail
2 5.90 5.98
2 5.90 5.98
Tinned sardines Retail
1 7.09 7.20
1 7.09 7.20
Tinned tuna Retail
5 0.32 3.18
5 0.32 3.18
Tuna Port landings
5 11.14 11.25
5 5.16 5.16 10 8.15 8.21
Whiting Port landings
5 13.22 13.26 5 13.22 13.26
Wild Salmon Port landings 15 8.29 8.52
10 8.16 8.21
25 8.24 8.40
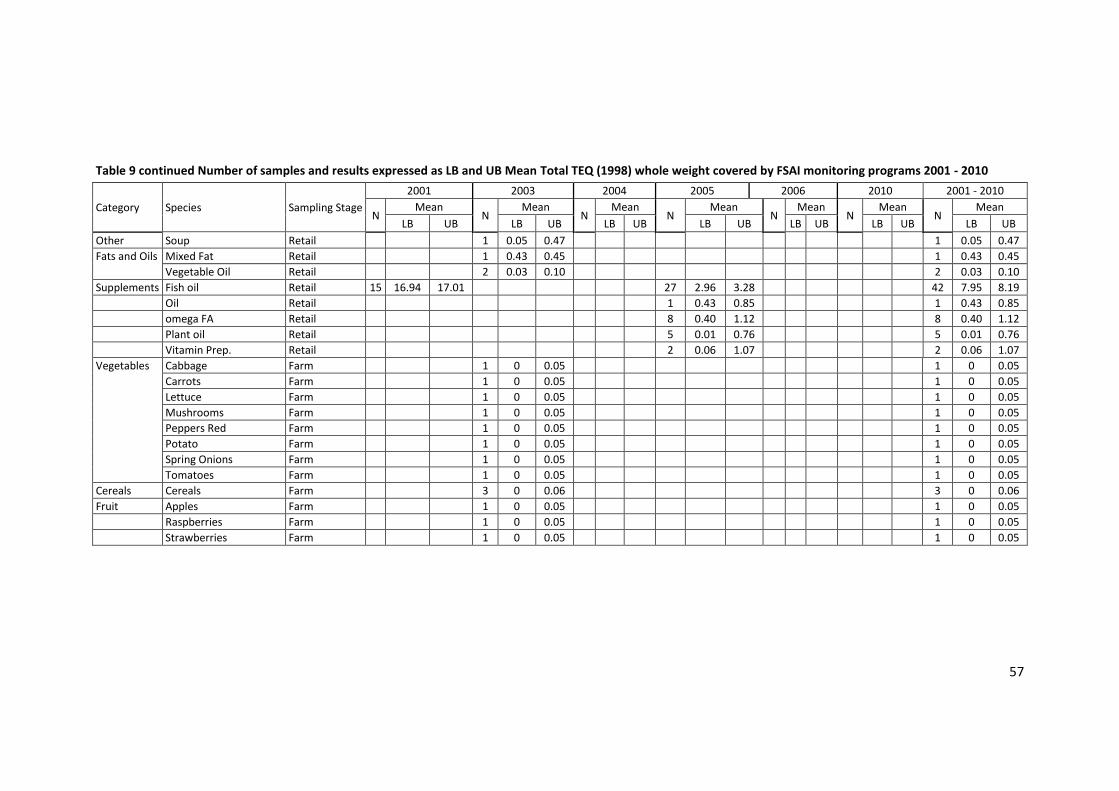
57
Table 9 continued Number of samples and results expressed as LB and UB Mean Total TEQ (1998) whole weight covered by FSAI monitoring programs 2001 - 2010
Category Species Sampling Stage
2001 2003 2004 2005 2006 2010 2001 - 2010
N Mean
N Mean
N Mean
N Mean
N Mean
N Mean
N Mean
LB UB LB UB LB UB LB UB LB UB LB UB LB UB
Other Soup Retail
1 0.05 0.47
1 0.05 0.47
Fats and Oils Mixed Fat Retail
1 0.43 0.45
1 0.43 0.45
Vegetable Oil Retail
2 0.03 0.10
2 0.03 0.10
Supplements Fish oil Retail 15 16.94 17.01
27 2.96 3.28
42 7.95 8.19
Oil Retail
1 0.43 0.85
1 0.43 0.85
omega FA Retail
8 0.40 1.12
8 0.40 1.12
Plant oil Retail
5 0.01 0.76
5 0.01 0.76
Vitamin Prep. Retail
2 0.06 1.07
2 0.06 1.07
Vegetables Cabbage Farm
1 0 0.05
1 0 0.05
Carrots Farm
1 0 0.05
1 0 0.05
Lettuce Farm
1 0 0.05
1 0 0.05
Mushrooms Farm
1 0 0.05
1 0 0.05
Peppers Red Farm
1 0 0.05
1 0 0.05
Potato Farm
1 0 0.05
1 0 0.05
Spring Onions Farm
1 0 0.05
1 0 0.05
Tomatoes Farm
1 0 0.05
1 0 0.05
Cereals Cereals Farm
3 0 0.06
3 0 0.06
Fruit Apples Farm
1 0 0.05
1 0 0.05
Raspberries Farm
1 0 0.05
1 0 0.05
Strawberries Farm
1 0 0.05
1 0 0.05
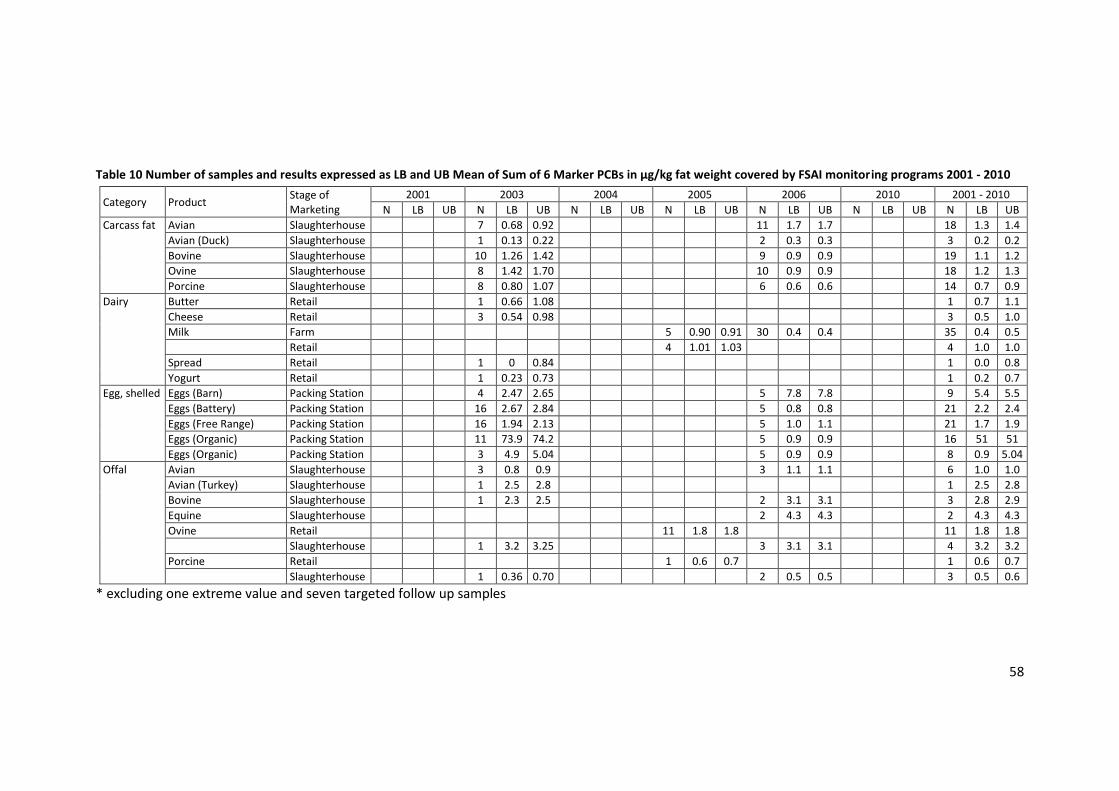
58
Table 10 Number of samples and results expressed as LB and UB Mean of Sum of 6 Marker PCBs in µg/kg fat weight covered by FSAI monitoring programs 2001 - 2010
Category Product Stage of Marketing
2001 2003 2004 2005 2006 2010 2001 - 2010
N LB UB N LB UB N LB UB N LB UB N LB UB N LB UB N LB UB
Carcass fat Avian Slaughterhouse
7 0.68 0.92
11 1.7 1.7
18 1.3 1.4
Avian (Duck) Slaughterhouse
1 0.13 0.22
2 0.3 0.3
3 0.2 0.2
Bovine Slaughterhouse
10 1.26 1.42
9 0.9 0.9
19 1.1 1.2
Ovine Slaughterhouse
8 1.42 1.70
10 0.9 0.9
18 1.2 1.3
Porcine Slaughterhouse
8 0.80 1.07
6 0.6 0.6
14 0.7 0.9
Dairy Butter Retail
1 0.66 1.08
1 0.7 1.1
Cheese Retail
3 0.54 0.98
3 0.5 1.0
Milk Farm
5 0.90 0.91 30 0.4 0.4
35 0.4 0.5
Retail
4 1.01 1.03
4 1.0 1.0
Spread Retail
1 0 0.84
1 0.0 0.8
Yogurt Retail
1 0.23 0.73
1 0.2 0.7
Egg, shelled Eggs (Barn) Packing Station
4 2.47 2.65
5 7.8 7.8
9 5.4 5.5
Eggs (Battery) Packing Station
16 2.67 2.84
5 0.8 0.8
21 2.2 2.4
Eggs (Free Range) Packing Station
16 1.94 2.13
5 1.0 1.1
21 1.7 1.9
Eggs (Organic) Packing Station
11 73.9 74.2
5 0.9 0.9
16 51 51
Eggs (Organic) Packing Station
3 4.9 5.04
5 0.9 0.9
8 0.9 5.04
Offal Avian Slaughterhouse
3 0.8 0.9
3 1.1 1.1
6 1.0 1.0
Avian (Turkey) Slaughterhouse
1 2.5 2.8
1 2.5 2.8
Bovine Slaughterhouse
1 2.3 2.5
2 3.1 3.1
3 2.8 2.9
Equine Slaughterhouse
2 4.3 4.3
2 4.3 4.3
Ovine Retail
11 1.8 1.8
11 1.8 1.8
Slaughterhouse
1 3.2 3.25
3 3.1 3.1
4 3.2 3.2
Porcine Retail
1 0.6 0.7
1 0.6 0.7
Slaughterhouse
1 0.36 0.70
2 0.5 0.5
3 0.5 0.6
* excluding one extreme value and seven targeted follow up samples
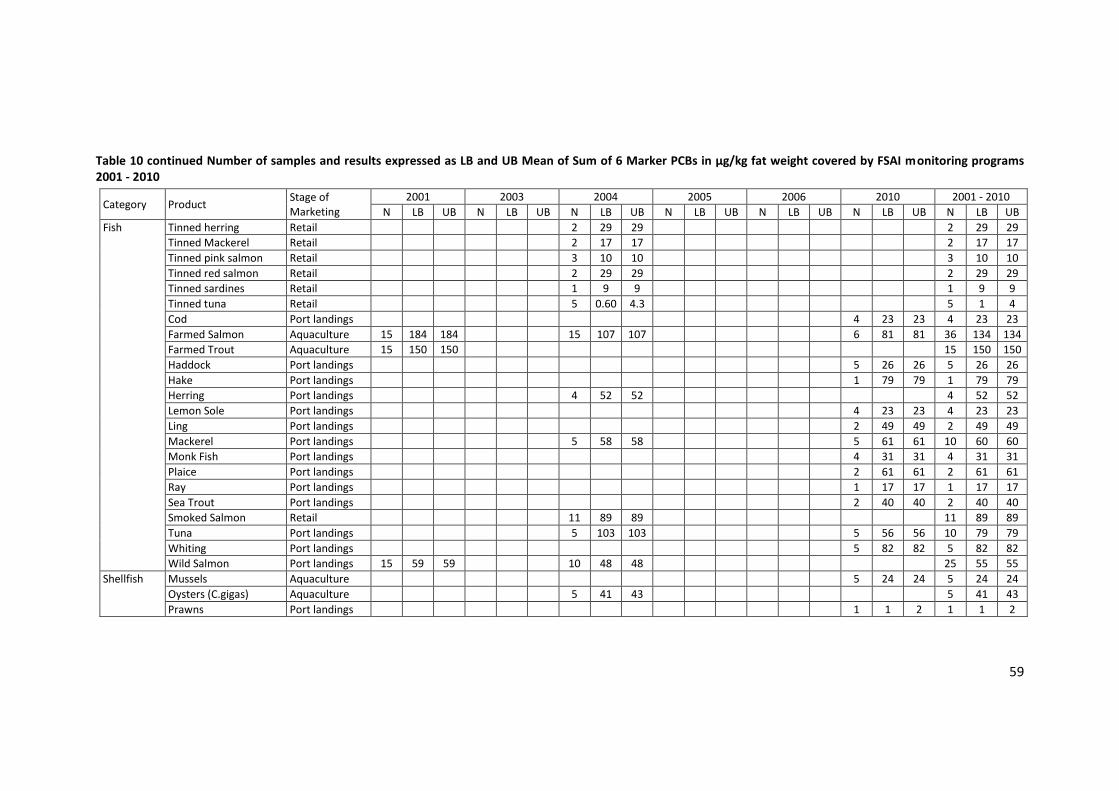
59
Table 10 continued Number of samples and results expressed as LB and UB Mean of Sum of 6 Marker PCBs in µg/kg fat weight covered by FSAI monitoring programs 2001 - 2010
Category Product Stage of Marketing
2001 2003 2004 2005 2006 2010 2001 - 2010
N LB UB N LB UB N LB UB N LB UB N LB UB N LB UB N LB UB
Fish
Tinned herring Retail
2 29 29
2 29 29
Tinned Mackerel Retail
2 17 17
2 17 17
Tinned pink salmon Retail
3 10 10
3 10 10
Tinned red salmon Retail
2 29 29
2 29 29
Tinned sardines Retail
1 9 9
1 9 9
Tinned tuna Retail
5 0.60 4.3
5 1 4
Cod Port landings
4 23 23 4 23 23
Farmed Salmon Aquaculture 15 184 184
15 107 107
6 81 81 36 134 134
Farmed Trout Aquaculture 15 150 150
15 150 150
Haddock Port landings
5 26 26 5 26 26
Hake Port landings
1 79 79 1 79 79
Herring Port landings
4 52 52
4 52 52
Lemon Sole Port landings
4 23 23 4 23 23
Ling Port landings
2 49 49 2 49 49
Mackerel Port landings
5 58 58
5 61 61 10 60 60
Monk Fish Port landings
4 31 31 4 31 31
Plaice Port landings
2 61 61 2 61 61
Ray Port landings
1 17 17 1 17 17
Sea Trout Port landings
2 40 40 2 40 40
Smoked Salmon Retail
11 89 89
11 89 89
Tuna Port landings
5 103 103
5 56 56 10 79 79
Whiting Port landings
5 82 82 5 82 82
Wild Salmon Port landings 15 59 59
10 48 48
25 55 55
Shellfish Mussels Aquaculture
5 24 24 5 24 24
Oysters (C.gigas) Aquaculture
5 41 43
5 41 43
Prawns Port landings
1 1 2 1 1 2

60
Table 10 continued Number of samples and results expressed as LB and UB Mean of Sum of 6 Marker PCBs in µg/kg whole weight covered by FSAI monitoring programs 2001 - 2010
Category Product Stage of Marketing
2001 2003 2004 2005 2006 2010 2001 - 2010
N LB UB N LB UB N LB UB N LB UB N LB UB N LB UB N LB UB
Cereals Cereals Farm
3 0 0.10
3 0 0.1
Fruit Apples Farm
1 0 0.06
1 0 0.1
Raspberries Farm
1 0 0.06
1 0 0.1
Strawberries Farm
1 0 0.06
1 0 0.1
Soup Soup Retail
1 0 0.07
1 0 0.1
Supplements
Supplements, oil Retail
1 18 18
1 18 18
Supplements, Fish oil Retail 15 120 120
26 35 35
41 66 66
Supplements, omega fatty acids
Retail
8 2 3
8 2.1 2.7
Supplements, Plant oil Retail
5 0 0.94
5 0 0.9
Supplements, Vitamin preparation
Retail
2 0 0.98
2 0 1.0
Vegetables Cabbage Farm
1 0 0.06
1 0 0.1
Carrots Farm
1 0 0.06
1 0 0.1
Lettuce Farm
1 0 0.06
1 0 0.1
Mushrooms Farm
1 0 0.06
1 0 0.1
Peppers Red Farm
1 0 0.06
1 0 0.1
Potato Farm
1 0 0.06
1 0 0.1
Spring Onions Farm
1 0 0.06
1 0 0.1
Tomatoes Farm
1 0 0.06
1 0 0.1
Fats and Oils
Animal and Vegetable Retail
1 0.59 1.03
1 0.6 1.0
Vegetable Oil Retail
2 0.07 0.39
2 0.1 0.4

2.2.2 Animal Health Surveillance Scheme (AHSS) in County Cork
Table 8 provides information on the number and sampling location of samples analysed for
PCDD/Fs & DL-PCBs under this program. The same number of samples was also analysed
for the sum of 6 Marker PCBs.
All samples collected between 1991 and 2001 were sent for analysis in 2001 and are
therefore particularly suitable for assessing any trends in concentration, as analysis on all
samples was carried out at the same time and by the same laboratory (FSAI, 2001). Levels
monitored thereafter have to be interpreted with caution, as these were analysed by
different laboratories, and advances in analytical sensitivity has also had an influence on
detection limits. However, these data suggest that concentrations of dioxins started to
level off from 2001 onwards and the fluctuation that can be observed is most likely due to
seasonal variation.
1991 – 2001: Mean levels of PCDD/Fs in milk from herds in the harbour area declined from
0.81 pg WHO-TEQ/g fat in 1991 to 0.31 in 2001. This equated to a decrease of just over 60
%. The reduction was particularly marked in the period 1991 – 1994, coinciding with the
introduction of the Environmental Protection Agency’s Integrated Pollution Control
licensing system. DL-PCB levels in harbour milk were essentially similar to those for the
dioxins with a 65 % drop in levels over the ten year period from 1.7 pg WHO-TEQ/g fat to
0.57 pg WHO-TEQ/g fat. In total, levels decreased by 70 % from an average of 1.79 pg
WHO-TEQ/g fat for 1991/1992 to an average of 0.55 pg WHO-TEQ/g fat measured between
2001 - 2009. Levels of dioxins in milk from the control herds ranged from 0.75 to 0.47 pg
WHO-TEQ/g fat over the period 1995 to 2001. Figure 5 shows the Total TEQ (Sum PCDD/F
& DL-PCBs) for all samples analysed between 1991 and 2009. A more in-depth review of
these data, covering the years 1991 - 2005 was recently published by Donovan et al
(O'Donovan et al, 2011). The mean Irish dioxin levels of 0.2 to 0.4 pg WHO-TEQ/g fat
reported for 1995 - 2000 from milk in the control herds can be compared with those for
Belgium (2.06 pg/g), United Kingdom (1.01 pg/g), Netherlands (0.94 pg/g), France (0.67
pg/g) and Germany (0.57 pg/g) generated between 1995 and 1999 and reported as part of
an EU led scientific cooperation task (SCOOP, 2000).

62
Figure 5 Total TEQ ng/kg fat weight (upperbound) measured in cow’s milk samples taken from target and control herds between 1991 – 2009 under the AHSS scheme
Data Source: FSAI
A similar decline could be observed for the sum of 6 Marker PCBs, which decreased from
2.9 µg/kg fat in 1991 to 0.6 µg/kg fat in 2009 in the harbour herds. Concentrations of the
sum of 6 Marker PCBs in control herds declined from 1.3 µg/kg fat in 1995 to 0.5 µg/kg fat
in 2009.
2.2.3 EPA National milk surveys
Table 8 provides information on the number and sampling location of samples analysed for
PCDD/Fs & DL-PCBs. Marker PCBs are not analysed as part of this monitoring program.
In 1995, data was only collected for PCDD/Fs (mean I-TEQ 0.24 pg/g fat medium-bound)
and DL-PCBs were only included from 2000 onwards. The mean value for PCDD/F in milk fat
in the 2000 survey was 0.20 pg I-TEQ/g compared to a mean value of 0.24 pg I-TEQ/g for
the 1995 survey, corresponding to a reduction of around 16 per cent over the 5 year
period. Table 11 provides a summary of mean upper-bound concentrations for Total WHO
TEQ (1998) ng/kg fat determined by the EPA since 2000, which are in line with the reported
findings under the AHSS scheme (see Figure 5).
Table 11 Mean Total WHO TEQ (1998) ng/kg fat weight (upperbound) measured in cow’s milk samples taken from sentinel herds between 2000 – 2009
2000 2004 2006 2007 2008 2009
Mean Total WHO TEQ ng/kg fat upperbound
0.496 0.379 0.468 0.425 0.440 0.385
Source : (EPA, 2000; EPA, 2004; EPA, 2006; EPA, 2007; EPA, 2008; EPA, 2009)
0.00
0.20
0.40
0.60
0.80
1.00
1.20
1.40
1.60
1.80
2.00
1991 1992 1993 1995 1997 1998 1999 2000 2001 2003 2004 2005 2006 2007 2008 2009
Total WHO TEQ ng/kg fat weightTarget
Control

63
2.2.4 Teagasc Monitoring 1998 and 2000
Table 8 provides information on the number and sampling location of samples analysed for
PCDD/Fs & DL-PCBs as part of these surveys. Marker PCBs were not analysed.
The values in cheese sampled in 1998/1999 for dioxins and DL-PCBs combined ranged from
0.15 - 1.2 pg Total TEQ/g fat, with a mean of 0.44 pg Total TEQ/g fat, which is slightly lower
than the reported findings by both the EPA and AHSS in milk fat. The study on carcass fat
was undertaken between January and July 2000 and comprised of 15 samples each of beef,
pork, poultry and sheep fat from 13 meat processing companies. All of the meat samples
taken in 2000 contained less than 5 pg TEQ/g fat for dioxins and DL-PCBs combined, using a
bio-assay screen. A smaller number of samples analysed using HRGC/MS showed a range of
0.3 – 1.1 pg Total TEQ/g fat in bovine fat, 0.1 - 0.9 pg Total TEQ/g fat in porcine fat, 0.2 - 1.6
pg Total TEQ/g fat in poultry fat and 1.4 - 3.3 pg Total TEQ/g fat in ovine fat.
2.2.5 96/23 DAFM Residue Monitoring Program
Between 1999 and 2010 in excess of 4000 analyses on samples of animal origin (excluding
aquaculture) have been carried out by the Pesticides Control Service Laboratory for the
presence of marker PCBs. Within this timeframe, 6 samples were found to contain levels
above the reporting limit of 0.005 mg/kg fat (see Table 12). Monitoring under this program
led to the detection of the 2008 pork dioxin contamination incident in Ireland.
Residue Analysis under the 96/23 monitoring program in finfish aquaculture has been
carried out by the Marine Institute. Since 2001, 421 samples of salmon, freshwater and sea
trout have been analysed for the presence of PCBs. Source: National Residue Database
(O'Keeffe et al, 2001), PCS
Table 13 provides an overview of results for samples, for which complete congener
information was available (for 60 samples sum of 7 Marker PCBs/6 Marker PCBs could not
be calculated and result have been excluded).
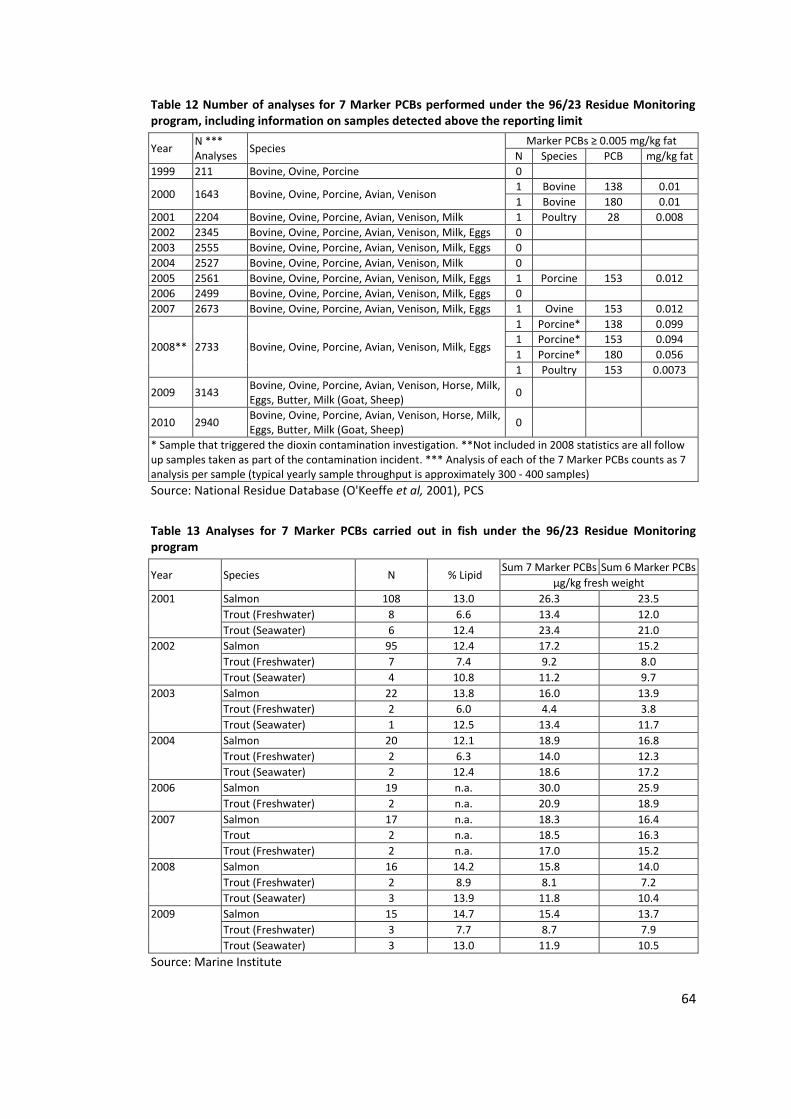
64
Table 12 Number of analyses for 7 Marker PCBs performed under the 96/23 Residue Monitoring program, including information on samples detected above the reporting limit
Year N *** Analyses
Species Marker PCBs ≥ 0.005 mg/kg fat
N Species PCB mg/kg fat
1999 211 Bovine, Ovine, Porcine 0
2000 1643 Bovine, Ovine, Porcine, Avian, Venison 1 Bovine 138 0.01
1 Bovine 180 0.01
2001 2204 Bovine, Ovine, Porcine, Avian, Venison, Milk 1 Poultry 28 0.008
2002 2345 Bovine, Ovine, Porcine, Avian, Venison, Milk, Eggs 0
2003 2555 Bovine, Ovine, Porcine, Avian, Venison, Milk, Eggs 0
2004 2527 Bovine, Ovine, Porcine, Avian, Venison, Milk 0
2005 2561 Bovine, Ovine, Porcine, Avian, Venison, Milk, Eggs 1 Porcine 153 0.012
2006 2499 Bovine, Ovine, Porcine, Avian, Venison, Milk, Eggs 0
2007 2673 Bovine, Ovine, Porcine, Avian, Venison, Milk, Eggs 1 Ovine 153 0.012
2008** 2733 Bovine, Ovine, Porcine, Avian, Venison, Milk, Eggs
1 Porcine* 138 0.099
1 Porcine* 153 0.094
1 Porcine* 180 0.056
1 Poultry 153 0.0073
2009 3143 Bovine, Ovine, Porcine, Avian, Venison, Horse, Milk, Eggs, Butter, Milk (Goat, Sheep)
0
2010 2940 Bovine, Ovine, Porcine, Avian, Venison, Horse, Milk, Eggs, Butter, Milk (Goat, Sheep)
0
* Sample that triggered the dioxin contamination investigation. **Not included in 2008 statistics are all follow up samples taken as part of the contamination incident. *** Analysis of each of the 7 Marker PCBs counts as 7 analysis per sample (typical yearly sample throughput is approximately 300 - 400 samples)
Source: National Residue Database (O'Keeffe et al, 2001), PCS
Table 13 Analyses for 7 Marker PCBs carried out in fish under the 96/23 Residue Monitoring program
Year Species N % Lipid Sum 7 Marker PCBs Sum 6 Marker PCBs
µg/kg fresh weight
2001 Salmon 108 13.0 26.3 23.5
Trout (Freshwater) 8 6.6 13.4 12.0
Trout (Seawater) 6 12.4 23.4 21.0
2002 Salmon 95 12.4 17.2 15.2
Trout (Freshwater) 7 7.4 9.2 8.0
Trout (Seawater) 4 10.8 11.2 9.7
2003 Salmon 22 13.8 16.0 13.9
Trout (Freshwater) 2 6.0 4.4 3.8
Trout (Seawater) 1 12.5 13.4 11.7
2004 Salmon 20 12.1 18.9 16.8
Trout (Freshwater) 2 6.3 14.0 12.3
Trout (Seawater) 2 12.4 18.6 17.2
2006 Salmon 19 n.a. 30.0 25.9
Trout (Freshwater) 2 n.a. 20.9 18.9
2007 Salmon 17 n.a. 18.3 16.4
Trout 2 n.a. 18.5 16.3
Trout (Freshwater) 2 n.a. 17.0 15.2
2008 Salmon 16 14.2 15.8 14.0
Trout (Freshwater) 2 8.9 8.1 7.2
Trout (Seawater) 3 13.9 11.8 10.4
2009 Salmon 15 14.7 15.4 13.7
Trout (Freshwater) 3 7.7 8.7 7.9
Trout (Seawater) 3 13.0 11.9 10.5
Source: Marine Institute

65
2.2.6 MI Bivalve Molluscs and Fish Landings Monitoring Program
Since 1993, MI has carried out PCB analysis in excess of 700 (pooled) samples. Table 14
provides mean concentrations for the sum of 7 and sum of 6 Marker PCBs determined
under the various monitoring programs.
Table 14 Analyses for Marker PCBs carried out in port landings and shellfish
Programme Year N
Mean of Sum 7 Marker PCBs
Mean of Sum 6 Marker PCBs
µg/kg whole weight
Fish Port Landings 1995 15 2.6 2.3
1996 9 4.4 3.9
2000 15 2.5 2.3
2001 11 8.8 7.8
2004 14 1.5 1.4
2005 13 3.8 3.5
2006 10 0.4 0.4
2007 10 0.9 0.8
2008 10 1.8 1.5
2009 10 2.1 1.9
2010 11 3.0 2.6
2011 11 1.9 1.6
Fish Port Landings Total
139 2.8 2.5
Spatial Shellfish Monitoring* 1993 50 9.8 8.3
1994 31 26.0 22.7
1995 9 1.9 1.7
1996 12 1.7 1.5
1997 7 4.5 4.0
1998 5 3.7 3.3
1999 10 4.1 3.6
2000 11 2.3 2.1
2001 27 2.6 2.4
2002 23 1.1 0.9
2004 10 1.2 1.0
2005 17 1.7 1.4
2006 15 1.3 1.1
2007 12 1.0 0.9
2009 9 1.2 1.0
2010 8 1.2 1.0
2011 6 1.5 1.2
Spatial Shellfish Monitoring Total
262 6.3 5.5
Shellfish Waters Directive Monitoring 2008 60 0.9 0.7
2009 113 0.8 0.7
2010 123 0.8 0.7
2011 18 1.1 0.9
Shellfish Waters Directive Monitoring Total
314 0.8 0.7
Grand Total
715 3.2 2.8
* spatial shellfish – predominantly taken for the purpose of environmental monitoring and not food safety Source: Marine Institute
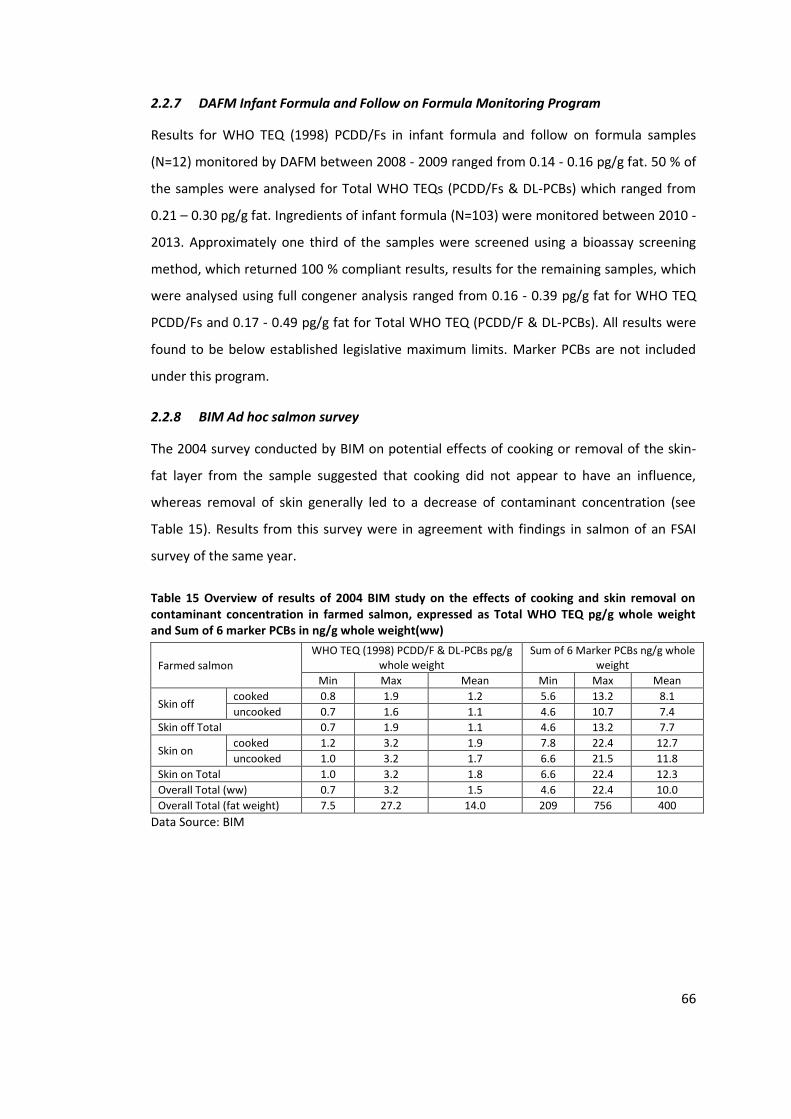
66
2.2.7 DAFM Infant Formula and Follow on Formula Monitoring Program
Results for WHO TEQ (1998) PCDD/Fs in infant formula and follow on formula samples
(N=12) monitored by DAFM between 2008 - 2009 ranged from 0.14 - 0.16 pg/g fat. 50 % of
the samples were analysed for Total WHO TEQs (PCDD/Fs & DL-PCBs) which ranged from
0.21 – 0.30 pg/g fat. Ingredients of infant formula (N=103) were monitored between 2010 -
2013. Approximately one third of the samples were screened using a bioassay screening
method, which returned 100 % compliant results, results for the remaining samples, which
were analysed using full congener analysis ranged from 0.16 - 0.39 pg/g fat for WHO TEQ
PCDD/Fs and 0.17 - 0.49 pg/g fat for Total WHO TEQ (PCDD/F & DL-PCBs). All results were
found to be below established legislative maximum limits. Marker PCBs are not included
under this program.
2.2.8 BIM Ad hoc salmon survey
The 2004 survey conducted by BIM on potential effects of cooking or removal of the skin-
fat layer from the sample suggested that cooking did not appear to have an influence,
whereas removal of skin generally led to a decrease of contaminant concentration (see
Table 15). Results from this survey were in agreement with findings in salmon of an FSAI
survey of the same year.
Table 15 Overview of results of 2004 BIM study on the effects of cooking and skin removal on contaminant concentration in farmed salmon, expressed as Total WHO TEQ pg/g whole weight and Sum of 6 marker PCBs in ng/g whole weight(ww)
Farmed salmon
WHO TEQ (1998) PCDD/F & DL-PCBs pg/g whole weight
Sum of 6 Marker PCBs ng/g whole weight
Min Max Mean Min Max Mean
Skin off cooked 0.8 1.9 1.2 5.6 13.2 8.1
uncooked 0.7 1.6 1.1 4.6 10.7 7.4
Skin off Total 0.7 1.9 1.1 4.6 13.2 7.7
Skin on cooked 1.2 3.2 1.9 7.8 22.4 12.7
uncooked 1.0 3.2 1.7 6.6 21.5 11.8
Skin on Total 1.0 3.2 1.8 6.6 22.4 12.3
Overall Total (ww) 0.7 3.2 1.5 4.6 22.4 10.0
Overall Total (fat weight) 7.5 27.2 14.0 209 756 400
Data Source: BIM
67
3 Dietary Background Exposure of the Irish Population to Dioxins
and PCBs
In general, exposure to contaminants present in food cannot be measured directly and
therefore indirect approaches, such as combining consumption data with contaminant
concentration data are used to estimate exposure. The following chapter provides the
results of an exposure assessment based on historic food consumption data and in the
following describes in detail the updated exposure assessment, based on more recent food
consumption and occurrence data.
3.1 Overview of exposure estimate based on North/South Ireland Food
Consumption Survey (NSIFCS) 1997 - 1999
A first estimate of dietary intake to dioxins was conducted in 2006, which utilised available
food consumption data and occurrence data at the time.
3.1.1 Food Consumption Database
The North/South Ireland Food Consumption Survey (NSIFCS) was carried out by the Irish
Universities Nutrition Alliance (IUNA) and investigated habitual food and beverage
consumption, lifestyle, health indicators and attitudes to food and health in a
representative sample (n=1379) of the 18 - 64 year old adult population in the Republic of
Ireland and Northern Ireland during 1997 - 1999. Food intake was determined using a 7-day
estimated food record (IUNA, 2001). All data collected was stored in relational Statistical
Package for the Social Sciences (SPSS) databases.
The modifications applied to the food consumption database for the exposure assessment
included disaggregation of recipes into their constituent ingredients, application of weight
loss factors and application of fat fraction factors. These mirror the methodologies
described in detail in section 3.2.1.
3.1.2 Concentration Data
Background exposure was estimated using occurrence data available for each food group
collected between 2002 and 2006, and was estimated for intake from foods of animal
origin and vegetable oils/fats. For the purpose of probabilistic modelling, all data points for
each food group were used as inputs in the model when available (i.e. for some food
groups only single values were available).
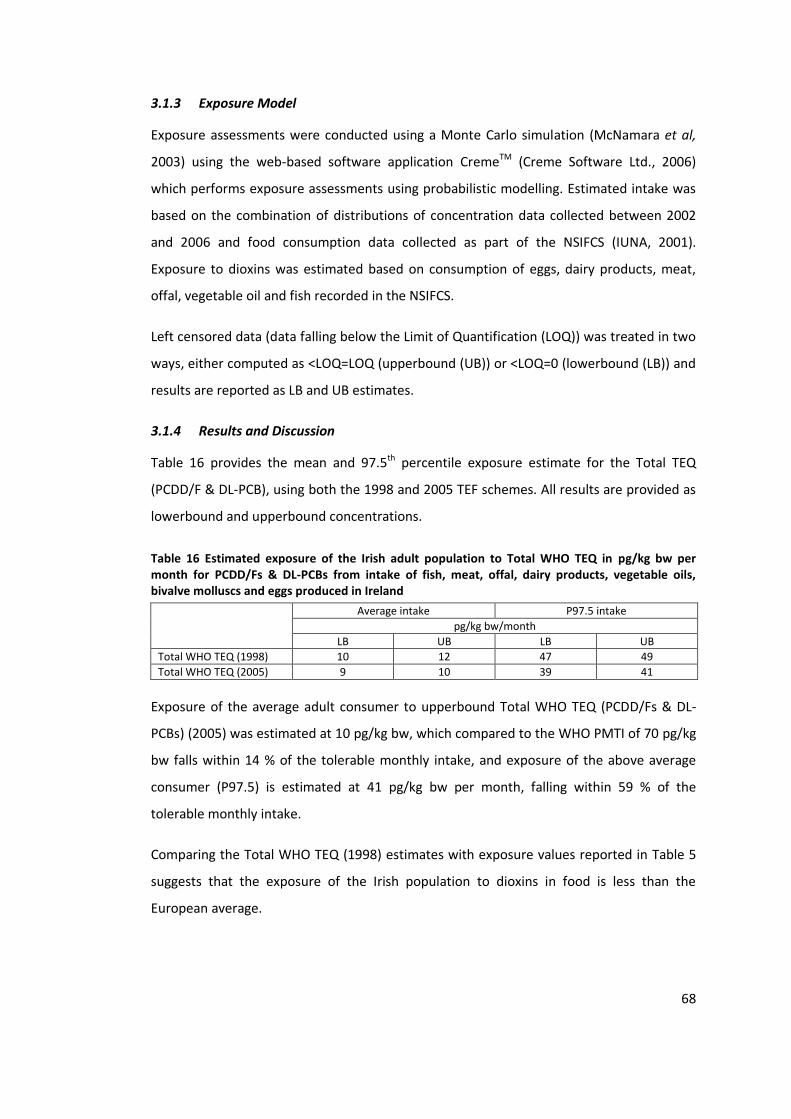
68
3.1.3 Exposure Model
Exposure assessments were conducted using a Monte Carlo simulation (McNamara et al,
2003) using the web-based software application CremeTM (Creme Software Ltd., 2006)
which performs exposure assessments using probabilistic modelling. Estimated intake was
based on the combination of distributions of concentration data collected between 2002
and 2006 and food consumption data collected as part of the NSIFCS (IUNA, 2001).
Exposure to dioxins was estimated based on consumption of eggs, dairy products, meat,
offal, vegetable oil and fish recorded in the NSIFCS.
Left censored data (data falling below the Limit of Quantification (LOQ)) was treated in two
ways, either computed as <LOQ=LOQ (upperbound (UB)) or <LOQ=0 (lowerbound (LB)) and
results are reported as LB and UB estimates.
3.1.4 Results and Discussion
Table 16 provides the mean and 97.5th percentile exposure estimate for the Total TEQ
(PCDD/F & DL-PCB), using both the 1998 and 2005 TEF schemes. All results are provided as
lowerbound and upperbound concentrations.
Table 16 Estimated exposure of the Irish adult population to Total WHO TEQ in pg/kg bw per month for PCDD/Fs & DL-PCBs from intake of fish, meat, offal, dairy products, vegetable oils, bivalve molluscs and eggs produced in Ireland
Average intake P97.5 intake
pg/kg bw/month
LB UB LB UB
Total WHO TEQ (1998) 10 12 47 49
Total WHO TEQ (2005) 9 10 39 41
Exposure of the average adult consumer to upperbound Total WHO TEQ (PCDD/Fs & DL-
PCBs) (2005) was estimated at 10 pg/kg bw, which compared to the WHO PMTI of 70 pg/kg
bw falls within 14 % of the tolerable monthly intake, and exposure of the above average
consumer (P97.5) is estimated at 41 pg/kg bw per month, falling within 59 % of the
tolerable monthly intake.
Comparing the Total WHO TEQ (1998) estimates with exposure values reported in Table 5
suggests that the exposure of the Irish population to dioxins in food is less than the
European average.

69
Since then, more recent occurrence data has become available for some of the food
groups, and also more recent food consumption data has been published (IUNA, 2011). The
exposure calculated in the following chapters is based on this newly available data.
3.2 Exposure estimate based on National Adult Nutrition Survey (NANS) 2008 -
2010
3.2.1 Food Consumption Database
The NANS was conducted between 2008 and 2010 by IUNA (IUNA, 2011). The survey
collected provides data for 1500 adults (including elderly) on food, beverage and nutritional
supplement intake along with habitual physical activity levels, attitudes to food and health
and factors influencing food choice. Physical measurements including weight, height, body
fat and blood pressure were also taken. Four day, semi-weighed food diaries were used to
record the food and drink intake of the participants. Each time food/drink was consumed, it
was recorded as well as the location, amount, cooking method and quantity of each food
item/drink consumed.
All data collected was stored in relational SPSS databases. The primary food consumption
file (food file) provides food intake on an individual level, with each individual line in the file
representing one single eating occasion recorded by the participant. In total, the database
comprises 133068 rows of data. Food items are coded following the food classification
system as described in Mc Cance and Widdowson's (MCW) Composition of Food and
supplementary editions (Chan et al, 1994; Chan, 1995; Chan, 1996; Holland et al, 1989;
Holland et al, 1991; Holland et al, 1992a; Holland et al, 1992b; McCance et al, 1988;
McCance and Widdowson, 2002) and supplemented with additional national codes
developed by IUNA for foods for which no suitable MCW code was available. In total, 2552
different foodcodes were used to classify food recorded in this survey. In tandem with this
survey, also information on recipes and food ingredients were collected when available and
entered into two databases as follows:
3.2.1.1 Recipe Database
The recipe database contains information on constituent ingredients of composite foods
recorded in the consumption surveys. Contribution to the total weight of the composite
food is recorded for each Ingredient based either on recipes as recorded by the survey
participants or standard recipe information available from MCW Composition of Food and
70
supplementary editions (Chan et al, 1994; Chan, 1995; Chan, 1996; Holland et al, 1989;
Holland et al, 1991; Holland et al, 1992a; Holland et al, 1992b; McCance et al, 1988;
McCance and Widdowson, 2002). Of the 2552 foodcodes used in the database, recipe
information was available for 26 % (15 % IUNA recipes, 11 % McCance and Widdowson
recipes).
3.2.1.2 National Food Ingredients Database (INFID)
The Irish National Food Ingredients Database (INFID) was first established by researchers at
UCD and UCC and includes data on food additives, packaging type and ingredient data for
brand foods consumed by food consumption survey participants. Since then, updated
versions accompanying each new food consumption survey have become available and are
to be used in tandem with the survey for which they were collected (IUNA, 1999; IUNA,
2006; IUNA, 2010; IUNA, 2012).
3.2.2 Modification of the Food Consumption Database
For the purposes of estimating exposure to dioxins, the NANS foodfile was manipulated to
convert the food consumption data as described in sections 3.2.2.1 to 3.2.2.4. The final
foodfile used in the exposure assessment model comprised fat intake from food
disaggregated into ingredients and converted back to raw as appropriate. The final
database therefore presents a convenient tool to estimate exposure to lipophilic
substances, such as dioxins and other POPs.
3.2.2.1 Disaggregation of recipes/composite foods into ingredients
Recipes or composite dishes were disaggregated into single ingredients using the recipe
database (see 3.2.1.1). This allowed for the conversion of 26 % of foodcodes into
ingredients. Where no recipe was available for a particular composite food, recipe fractions
were either derived based on comparable composite foods for which information was
available, extrapolated from the list of ingredients using INFID (see 3.2.1.2) or derived from
ingredient information available on the labels of pre-packaged food sold in Ireland. These
approaches were used for another 20 % of foodcodes contained in the database. The
remainder, i.e. 54 % of foodcodes did not require further disaggregation.
In order to retain subject specific information and to create a new SPSS database
containing information on the final ingredient, the original database was re-coded into a
multitude of sub-files, each containing different ingredient information. These were

71
subsequently merged back into one file. For a number of foodcodes, an additional step had
to be applied as some of the ingredients required further disaggregation into sub-
ingredients. Table 17 provides an example for the composite food "Apple Slices/Lattice",
which contains 7 ingredients, of which ingredient 1 contains a further 6 sub-ingredients.
Table 17 Example of disaggregated composite food
Foodcode Ingredient
number
Sub-ingredient
number
Ingredient Sub-Ingredient
Apple Slices/Lattice 1 1 Flaky pastry, raw Wheat flour, white, plain
Apple Slices/Lattice 1 2 Flaky pastry, raw Margarine
Apple Slices/Lattice 1 3 Flaky pastry, raw Butter
Apple Slices/Lattice 1 4 Flaky pastry, raw Salt
Apple Slices/Lattice 1 5 Flaky pastry, raw Water, distilled
Apple Slices/Lattice 1 6 Flaky pastry, raw Lemon juice, fresh
Apple Slices/Lattice 2 0 Wheat flour, white, plain Wheat flour, white, plain
Apple Slices/Lattice 3 0 Cooking apples, raw peeled Cooking apples, raw peeled
Apple Slices/Lattice 4 0 Sugar, white Sugar, white
Apple Slices/Lattice 5 0 Cinnamon, ground Cinnamon, ground
Apple Slices/Lattice 6 0 Lemon juice, fresh Lemon juice, fresh
Apple Slices/Lattice 7 0 Eggs, chicken, whole, raw Eggs, chicken, whole, raw
This procedure was applied to 46 % of all foodcodes contained in the database, which
varied in the number of final ingredients from between 2 to 37 ingredients. Overall, this
procedure resulted in the addition of 105609 rows to the original database (133068 rows),
creating a new database of 238677 rows of information. The number of foodcodes used for
classifying the disaggregated final ingredients was 1759, compared to the original number
of 2552 required to classify the original foodfile. The observed reduction is due to less
foodcodes being required to describe single ingredients than foodcodes required to
describe all composite foods and recipes.
On finalisation of this procedure, rigorous quality checks were performed on all data to test
against coding and weight conversion errors. This included re-aggregation of the entire
database to compare aggregated weight for each foodcode (addition of recipe ingredient
weights) against the weight recorded in the original database and checking of aggregated
recipe information (foodcodes and ingredient fractions) against information held in the
recipe databases.

72
3.2.2.2 Conversion of cooked weight into raw weight
Heat treatment of food, such as frying, baking, boiling, etc may result in the change of
composition, in particular gain or loss of water and gain or loss of fat. The change in water
status is usually covered by weight loss or weight gain factors to be applied in tandem with
recipe fractions and recipe ingredients are typically recorded in their raw state (see Table
18).
For foods, which were prepared and were not part of a recipe, weight loss factors were
applied separately, based on information contained in MCW Composition of Food and
supplementary editions (Chan et al, 1994; Chan, 1995; Chan, 1996; Holland et al, 1989;
Holland et al, 1991; Holland et al, 1992a; Holland et al, 1992b; McCance et al, 1988;
McCance and Widdowson, 2002) and weight loss and yield factors published by the
Bundesforschungsanstalt für Ernährung (Bognár, 2002). Application of these factors
typically results in an increase of the originally recorded weight (due to the correction for
loss of water and/or fat) but in some cases can also result in a decrease of the original
weight (due to the correction for gain of water, i.e. rice, spaghetti, etc).
Table 18 Example of recipe with recorded weight loss factor
Composite food Raw ingredients Ingredient
portion (g)
Raw ingredient weight (g)
Ingredient fraction
Weight loss after
cooking (% )
Homemade Lentil, Onion & Carrot Soup
Lentils, red, split, dried, raw 250 1720 0.145 0.28
Onions, raw 250 1720 0.145 0.28
Carrots, old, raw 420 1720 0.244 0.28
Stock cubes, chicken 5 1720 0.003 0.28
Water, distilled 795 1720 0.462 0.28
3.2.2.3 Conversion of weight of food consumed into fat from food consumed
Since POPs are associated with the fat compartment of foods, the weight of food
consumed was converted into fat intake from foods consumed via the application of fat
fractions. The latter were derived from compositional information contained in MCW
Composition of Food and supplementary editions (Chan et al, 1994; Chan, 1995; Chan,
1996; Holland et al, 1989; Holland et al, 1991; Holland et al, 1992a; Holland et al, 1992b;
McCance et al, 1988; McCance and Widdowson, 2002), compositional information
recorded by IUNA for foodcodes derived by IUNA, or in absence of the former two options,
derived from nutritional information available from pre-packaged foods sold at retail.

73
3.2.2.4 Assignment of a purpose built food classification system
In order to facilitate the exposure assessment, MCW and IUNA foodcodes were converted
into a purpose built 3 tiered food classification system (Category I, II and III), which groups
fat intake from related foods into food groups and food categories (see Annex 7.1). The
introduction of this system considerably reduced the amount of coding required to
combine dioxin concentration data with food consumption data.
3.2.3 Exposure assessment methodology
When separate data sets are available for food consumption, as measured in food
consumption surveys, and for chemical concentration, one of three approaches is usually
applied to combine or integrate the data to provide an estimate of exposure: (i) point
estimates; (ii) simple distributions; and (iii) probabilistic analyses. The method chosen will
usually depend on a number of factors, including the purpose of the assessment (target
chemical, population group, degree of accuracy required) and the availability of data.
(Kroes et al, 2002).
For the purposes of this assessment, a probabilistic model was chosen to facilitate an as
accurate as possible exposure of the adult population to general background
concentration. This type model allows for usage of all data points collected. Furthermore,
using full data distributions better takes into account variability of both the survey
population and the presence of dioxins in the environment. Exposure assessments were
conducted using a Monte Carlo simulation (McNamara et al, 2003) using the web-based
software application CremeTM (Creme Software Ltd., 2013a), which performs exposure
assessments using probabilistic modelling.
For all exposure scenarios calculated here, distributions of data have been used for both
occurrence data (see section 3.3.2) and food consumption data (see section 3.2.1), and for
each scenario, intake for a population of 30000 people was simulated (i.e. 20 iterations of
1500 people, i.e. the number of NANS survey participants, see 3.3.1).
Typically, chronic exposure estimates are calculated for mean and high percentile
consumers of the total population, the latter typically expressed as the 95th percentile
(EFSA, 2011b). In addition, to facilitate comparison with modelling of the 2008 incident
concentration data (see chapter 4.4.4), also the median and additional percentiles (P97.5,
P98 and P99) were included in this model

74
Since PCDD/Fs and DL-PCBs persist and concentrate in the lipids of biological systems,
foods of animal origin (see section 1.2), which naturally contain a considerable portion of
fat, and vegetable oils and fats are considered the major foods of interest with regard to
dioxin exposure. Therefore, of the eleven Category I food categories contained in the
converted foodfile (see Annex 7.1), the following six were included in the model: Dairy,
Eggs, Fats & Oils, Fish & Fish Products, Meat & Meat Products and Oil based supplements.
As consumption of food in the foodfile has been converted into intake of fat from these
food groups a direct match with concentration data, which is expressed on a fat weight
basis, was possible. The matching of concentration data and food data was done at
Category level I, II or level III, depending on the amount of detail available (see Annex 7.3).
Left censored data was treated in two ways, computed as UB and LB and results are
reported as ranges. This approach was chosen as very few data points were below the LOQ
and the range between LB and UB was hence expected to be very small. This approach is in
line with recent recommendations issued by EFSA (EFSA, 2010a).
For this exposure scenario six output models were developed:
Total WHO TEQ (1998) PCDD/F&DL-PCBs – LB
Total WHO TEQ (1998) PCDD/F&DL-PCBs – UB
Total WHO TEQ (2005) PCDD/F&DL-PCBs - LB
Total WHO TEQ (2005) PCDD/F&DL-PCBs - UB
Sum of 6 Marker PCBs - LB
Sum of 6 Marker PCBs - UB
For each model, intake for the total population was calculated, expressed as intake per
kilogram bodyweight per day (kg/bw/d) to facilitate comparison with health based
guidance values which are expressed on a kg bw basis. Exposure estimates were calculated
based on average daily intakes, however, since averages over a small number of days may
not adequately represent individual usual long term intake due to the large amount of
random error, calculation of "usual" or "lifetime" was also added to the model, based on
the methodologies developed by Nusser (Nusser et al, 1996). However, the technique of
estimating usual intakes relies on the ability to transform the input data to normality and
this requirement is tested using the Anderson-Darling test statistic (Creme Software Ltd.,
2013b). Several food groups included in the models failed this requirement and therefore
75
usual intake estimates could not be calculated for these food groups. Also, overall total
intake figures could not be expressed on a lifetime basis, as the aggregated data failed the
Anderson-Darling test. Therefore, overall assessment of total intake from all food groups
could only be based on statistics derived from average daily intakes. However, the
availability of lifetime estimates for some food groups provides some indication of the
potential over-estimation of higher percentiles based on average daily intakes due to
presence of inter-individual variation.
3.2.4 Concentration Data
Background exposure was estimated using the most recent occurrence data available for
each food group and was derived from occurrence data available for Ireland (see Chapter
2). For the purpose of probabilistic modelling, all data points for each food group were
used as inputs for data distributions in the model, where available (i.e. for some food
groups only single values were available).
3.2.5 Presence Probability
Occurrence of POPs in the modelled food groups is generally ubiquitous and therefore a
presence probability of 100 % was assigned in order to estimate general background
exposure to the Irish population from dietary intake. This means that it was assumed that
all food in the food groups was contaminated.
3.3 Results and Discussion
3.3.1 Number of Iterations required
To determine the number of iterations required to produce robust statistical outcomes, the
99th percentile and change in % of Error were chosen as performance indicators. The model
was run repeatedly with an increasing number of iterations until the error of the 99th
percentile stabilised.

76
Figure 6 Change of P99+/- Error and 95 % confidence interval over increasing iterations
Figure 7 Change of Error of Mean, Median, P95 and P99 over increasing iterations
Figure 6 shows that stabilisation of the 99th percentile value occurs from 20 iteration
onwards, whereas Figure 7 shows that the % Error of the 99th percentile fluctuates
between 7 - 8 % with no significant improvement over increasing iterations. Therefore, the
model was run over 20 iterations.
3.3.2 Concentration Data
Table 19 provides an overview of data used in the exposure assessment providing the
minimum, average and maximum for the Total TEQ (PCDD/F & DL-PCB), using both the
1998 and 2005 TEF schemes and for the sum of 6 Marker PCBs. All results are provided as
LB and UB concentrations. The distributions of data used for each food group is shown as
tables in the Annex (see Annex 7.3)
1.4
1.5
1.6
1.7
1.8
1.9
2.0
2.1
2.2
1 5 10 20 30 40 60 80 100 120
Tota
l WH
O T
EQ p
g/k
g b
w/d
Number of Iterations
P99 CI 95L
P99 +/- Error
P99 CI 95U
1
2
3
4
5
6
7
8
9
1 5 10 20 30 40 60 80 100 120
% E
rro
r o
f Po
pu
lati
on
Sta
tist
ic
Number of Iterations
% Mean Err
% Median Err
% P95 Err
% P99 Err
77
3.3.2.1 Bovine, porcine, avian and ovine fat, bovine and porcine liver and eggs
General background concentration of dioxins and PCBs in animal fat and liver were derived
from routine monitoring programmes conducted by FSAI, the latest available data having
been collected in 2006 (see Table 19). Meat and liver results are based on composite
samples (N=10 - 40) collected from slaughterhouses all over Ireland and egg results are
based on composite samples (N=24) collected from packing stations all over Ireland, in
accordance with Directive 1883/2006/EC (EC, 2006e).
3.3.2.2 Dairy Fat
General background concentration of dioxins and PCBs in milk were derived from routine
monitoring programmes conducted by FSAI, the latest available data for milk having been
collected in 2006 - 2009 (see Table 19). Results comprise individual and composite samples
(N=2) collected from bulk tankers all over Ireland, in accordance with Directive
1883/2006/EC (EC, 2006e). Information on dairy spreads is available from 2003 based on a
composite sample of ten subsamples.
3.3.2.3 Fish
General background concentrations of dioxins and PCBs in fish were derived from routine
monitoring programmes conducted by FSAI, the latest available data for fresh fish and
shellfish having been collected in 2010 and for canned fish in 2004 (see Table 19). Results
are based on individual fish and composite samples (N=1 - 200) collected from aquaculture,
ports and/or retail, in accordance with Directive 1883/2006/EC (EC, 2006e).
3.3.2.4 Fats and Oils, excl butter
General background concentration of dioxins and PCBs in fats, oils and dairy spreads were
derived from routine monitoring programmes conducted by FSAI, the latest available data
having been collected in 2003 (see Table 19). Results are based on individual samples
collected at retail, in accordance with Directive 1883/2006/EC (EC, 2006e).
3.3.2.5 Food Supplements
General background concentration of dioxins and PCBs in food supplements were derived
from routine monitoring programmes conducted by FSAI, the latest available data having
been collected in 2005 (see Table 19). Results are based on individual samples collected at
retail, in accordance with Directive 1883/2006/EC (EC, 2006e).

78
Table 19 Overview of concentration data used to estimate background exposure expressed in ng/kg fat for Total WHO TEQ and µg/kg for the sum of 6 Marker PCBs
Year Food Category
Species N Sub N TOTTEQ1998 (LB) TOTTEQ1998 (UB) TOTTEQ2005 (LB) TOTTEQ2005 (UB) 6 Marker PCBs (LB) 6 Marker PCBs (UB)
Range min mean max min mean max min mean max min mean max min mean max min mean max
2006
Carcass Fat
Avian 11 10-40 0.16 0.37 0.83 0.18 0.39 0.83 0.14 0.32 0.69 0.15 0.33 0.69 0.48 1.69 4.25 0.48 1.69 4.25
2006 Avian (Duck) 2 20 0.08 0.1 0.11 0.12 0.13 0.14 0.07 0.09 0.1 0.09 0.1 0.11 0.25 0.26 0.26 0.25 0.26 0.26
2006 Bovine 9 10 0.17 0.54 0.77 0.2 0.56 0.78 0.14 0.49 0.71 0.16 0.5 0.71 0.68 0.92 1.34 0.68 0.92 1.34
2006 Ovine 10 10 0.35 0.48 0.71 0.37 0.5 0.73 0.33 0.45 0.66 0.34 0.45 0.66 0.71 0.94 1.13 0.71 0.94 1.13
2006 Porcine 6 20 0.06 0.23 0.86 0.13 0.28 0.88 0.07 0.22 0.81 0.11 0.26 0.81 0.34 0.62 0.95 0.34 0.62 0.95
2006-2009
Dairy Milk 39 1-2 0.16 0.32 0.62 0.22 0.37 0.66 0.15 0.3 0.6 0.19 0.32 0.6 0.21 0.41 0.95 0.26 0.47 1.04
2006 Eggs Barn, Battery, F. Range 15 24 0.06 0.22 0.37 0.2 0.31 0.42 0.06 0.21 0.33 0.17 0.27 0.36 0.23 3.21 30.62 0.37 3.25 30.62
2003 Fats and Oils
Mixed Fat 1 7 0.43 0.43 0.43 0.45 0.45 0.45 0.39 0.39 0.39 0.4 0.4 0.4 0.59 0.59 0.59 1.03 1.03 1.03
2003 Vegetable Oil 2 3 0.01 0.03 0.05 0.09 0.1 0.1 0.01 0.03 0.04 0.06 0.07 0.07 0.02 0.07 0.11 0.35 0.39 0.42
2003 Dairy Spread 1 10 0.07 0.07 0.07 0.13 0.13 0.13 0.06 0.06 0.06 0.11 0.11 0.11 0 0 0 0.84 0.84 0.84
2010
Fish
Cod 4 4-44 2.14 3.63 6.72 2.35 3.77 6.73 2.21 3.71 6.86 2.4 3.84 6.87 13.12 23.27 48.47 13.12 23.38 48.47
2010 Farmed Salmon 6 5-6 7.32 10.18 12.51 7.32 10.18 12.51 7.25 10.07 12.4 7.25 10.07 12.4 59.05 80.74 102.15 59.05 80.74 102.15
2010 Haddock 5 4-10 1.08 6.63 15.9 1.46 6.72 15.92 1.12 6.62 16.03 1.4 6.7 16.04 7 26.49 74 7 26.49 74
2010 Hake 1 5 7.24 7.24 7.24 7.25 7.25 7.25 7.35 7.35 7.35 7.36 7.36 7.36 78.98 78.98 78.98 78.98 78.98 78.98
2010 Lemon Sole 4 7-34 3.14 7.7 11.37 3.15 7.71 11.37 2.94 7.2 10.64 2.95 7.2 10.64 12.59 22.63 35.21 12.59 22.63 35.21
2010 Ling 2 3-5 4.3 6.58 8.86 4.36 6.63 8.89 4.32 6.64 8.96 4.39 6.69 8.99 35.27 49.43 63.58 35.27 49.43 63.58
2010 Mackerel 5 11-30 3.96 8.89 15.53 3.96 8.89 15.53 3.9 8.71 15.29 3.9 8.71 15.29 25.08 61.38 127.54 25.08 61.38 127.54
2010 Monk Fish 4 3-15 2.44 6.92 18.96 2.46 6.94 18.98 2.33 6.62 18.14 2.35 6.64 18.15 11.06 31.35 84.58 11.06 31.35 84.58
2010 Mussels 5 122-200 2.15 9 17.13 2.15 9 17.14 2.1 8.73 16.46 2.1 8.74 16.47 7.17 24.22 47.83 7.41 24.48 47.83
2010 Plaice 2 10-29 7.94 12.61 17.27 7.95 12.61 17.27 7.5 12 16.49 7.5 12 16.49 33.98 61.29 88.6 33.98 61.29 88.6
2010 Prawns 1 141 1.2 1.2 1.2 1.2 1.2 1.2 1.1 1.1 1.1 1.11 1.11 1.11 1.49 1.49 1.49 1.58 1.58 1.58
2010 Ray 1 10 5.48 5.48 5.48 5.49 5.49 5.49 5.23 5.23 5.23 5.24 5.24 5.24 17.47 17.47 17.47 17.47 17.47 17.47
2010 Sea Trout 2 5 5.04 5.23 5.43 5.04 5.23 5.43 4.94 5.14 5.34 4.94 5.14 5.34 39.14 40.19 41.23 39.14 40.19 41.23
2004 Tinned herring 2 5 4.79 5.11 5.42 4.81 5.13 5.44 3.93 4.15 4.36 3.94 4.16 4.38 26.71 28.63 30.54 26.71 28.63 30.54
2004 Tinned Mackerel 2 5 3.23 3.33 3.43 3.34 3.46 3.57 2.78 2.87 2.96 3 3.12 3.23 16.93 17.47 18.01 16.93 17.47 18.01
N= number of composite samples; Sub-N = Number of subsamples in the composite; UB = upperbound; LB = lowerbound, TOTEQ1998 = Total WHO TEQ (1998) Sum of PCDD/F & DL-PCBs based on 1998 TEF system; TOTEQ2005 = Total WHO TEQ (2005) Sum of PCDD/F & DL-PCBs based on 2005 TEF system

79
Table 19 continued Summary statistics concentration data used to estimate background exposure expressed in ng/kg fat for Total WHO TEQ (TOTEQ) and µg/kg for the sum of 6 Marker PCBs
Year Food Category
Species N Sub N TOTTEQ1998 (LB) TOTTEQ1998 (UB) TOTTEQ2005 (LB) TOTTEQ2005 (UB) 6 Marker PCBs (LB) 6 Marker PCBs (UB)
Range min mean max min mean max min mean max min mean max min mean max min mean max
2004
Fish
Tinned pink salmon
3 5 0.99 1.16 1.29 1.25 1.43 1.62 0.76 0.91 1.03 1.15 1.36 1.56 8.88 10.48 12.13 8.88 10.48 12.13
2004 Tinned red salmon 2 5 4.14 5.9 7.66 4.27 5.98 7.69 3.37 4.84 6.31 3.67 5.01 6.34 21.4 28.66 35.92 21.4 28.66 35.92
2004 Tinned sardines 1 5 7.09 7.09 7.09 7.2 7.2 7.2 6.74 6.74 6.74 6.95 6.95 6.95 8.89 8.89 8.89 8.89 8.89 8.89
2004 Tinned tuna 5 5 0 0.32 1.56 0.49 3.18 7.1 0 0.31 1.56 0.56 3.58 7.93 0 0.6 2.14 0.63 4.34 9.83
2010 Tuna 5 1 4.48 5.16 6.71 4.49 5.16 6.71 4.54 5.24 6.73 4.54 5.24 6.73 43.86 55.76 78 43.86 55.76 78
2010 Whiting 5 7-35 1.25 13.22 27.16 1.29 13.26 27.16 1.21 13.02 27.21 1.25 13.07 27.22 9.77 82.25 173.73 9.77 82.25 173.73
2006
Offal
Avian 3 10-40 0.24 0.39 0.62 0.25 0.41 0.65 0.21 0.37 0.6 0.22 0.37 0.6 0.38 1.13 1.95 0.38 1.13 1.95
2006 Bovine 2 10 1.56 1.62 1.68 1.64 1.68 1.72 1.39 1.46 1.54 1.44 1.5 1.55 2.94 3.06 3.18 2.94 3.06 3.18
2006 Equine 2 10 6.04 14.23 22.42 6.08 14.25 22.43 5.11 11.99 18.86 5.12 11.99 18.86 2.9 4.33 5.75 2.9 4.33 5.75
2006 Ovine 2 10 4.22 4.71 5.19 4.25 4.73 5.2 3.34 3.72 4.1 3.35 3.72 4.1 2.13 3.49 4.85 2.13 3.49 4.85
2006 Porcine 2 10 0.68 0.91 1.14 0.74 0.97 1.2 0.58 0.77 0.97 0.61 0.8 1 0.46 0.52 0.57 0.46 0.52 0.57
2005
Supplements
Fish oil 27 1-6 0 2.96 10.11 0.45 3.28 10.15 0 2.11 8.2 0.46 2.54 8.24 0.11 37.87 131.79 0.24 37.97 131.79
2005 Oil 1 2 0.43 0.43 0.43 0.85 0.85 0.85 0.12 0.12 0.12 0.63 0.63 0.63 17.95 17.95 17.95 17.95 17.95 17.95
2005 omega FA 8 1-4 0 0.4 1.4 0.69 1.12 1.55 0 0.38 1.69 0.78 1.22 1.8 0 2.11 8.32 0.86 2.9 8.32
2005 Plant oil 5 1 0 0.01 0.05 0.68 0.76 0.86 0 0.01 0.05 0.77 0.86 0.98 0 0 0 0.85 0.94 1.09
2005 Vitamin prep. 2 1 0.03 0.06 0.08 0.81 1.07 1.32 0.03 0.06 0.08 0.91 1.21 1.5 0 0 0 0.96 1.32 1.68
N= number of composite samples; Sub-N = Number of subsamples in the composite; UB = upperbound; LB = lowerbound; TOTEQ1998 = Total WHO TEQ (1998) Sum of PCDD/F & DL-PCBs based on 1998 TEF system; TOTEQ2005 = Total WHO TEQ (2005) Sum of PCDD/F & DL-PCBs based on 2005 TEF system

80
3.3.3 Exposure Estimates
3.3.3.1 Food consumption
Survey Population Count
Table 20 provides the number of consumers within the overall NANS survey population of
N= 1500 that consumed food within the food categories of interest.
Table 20 Amount of consumers of total population (N=1500) in each food group selected
Category Name Group Name Total Population Food Consumers
N N %
DAIRY
DAIRY, MILKS 1500 1463 97.5
DAIRY, CREAMS 1500 779 51.9
DAIRY, CHEESE 1500 1151 76.7
DAIRY, BUTTER 1500 1083 72.2
DAIRY, YOGHURTS 1500 708 47.2
TOTAL 1500 1498 99.9
EGGS
EGGS, CHICKEN 1500 1254 83.6
EGGS, DUCK 1500 4 0.27
TOTAL 1500 1254 83.6
MEAT AND MEAT PRODUCTS
MEAT AND MEAT PRODUCTS, BEEF 1500 1062 70.8
MEAT AND MEAT PRODUCTS, PORK 1500 1295 86.3
MEAT AND MEAT PRODUCTS, POULTRY 1500 1218 81.2
MEAT AND MEAT PRODUCTS, LAMB 1500 260 17.3
MEAT AND MEAT PRODUCTS, MIXED MEAT 1500 7 0.47
MEAT AND MEAT PRODUCTS, OTHER 1500 4 0.27
OFFAL, PORK 1500 23 1.5
OFFAL, POULTRY 1500 6 0.40
OFFAL, LAMB 1500 19 1.3
OFFAL, BEEF 1500 12 0.80
TOTAL 1500 1476 98.4
FISH AND FISH PRODUCTS
FISH AND FISH PRODUCTS, OILY FISH 1500 481 32.1
FISH AND FISH PRODUCTS, WHITE FISH 1500 409 27.3
FISH AND FISH PRODUCTS, SHELLFISH 1500 116 7.7
FISH AND FISH PRODUCTS, OTHER 1500 6 0.40
FISH AND FISH PRODUCTS, MIXED FISH 1500 2 0.13
TOTAL 1500 798 53.2
FATS AND OILS EXCL BUTTER
FAT/DAIRY SPREADS EXCL BUTTER 1500 1385 92.3
OILS 1500 1464 97.6
TOTAL 1500 1493 99.5
SUPPLEMENTS SUPPLEMENTS, OILS/FATTY ACIDS 1500 200 13.3
TOTAL 1500 200 13.3
For several food groups, namely, "Eggs, Duck", "Offal, Pork", "Offal, Poultry", "Meat and
Meat Products, Mixed Meat", "Offal, Lamb", "Offal, Beef", "Meat and Meat Products,
Other", "Fish and Fish Products, Other" and "Fish and Fish Products, Mixed", the number of
consumers was very low, ranging from 2 - 23 consumers, which indicates that these foods
are rarely consumed by Irish adults in comparison to other foods. The latter is important
when calculating high percentiles, as these are used to identify consumers with above
average consumption. The issue of reliability of high percentiles has recently been

81
addressed by EFSA (EFSA, 2011a) who proposed guidelines for the minimum number of
samples for which (extreme) percentiles can be computed, namely at n ≥ 59 and n ≥ 298 for
the 95th or 99th percentiles, respectively. All of the above-mentioned food groups have
considerably less than 59 consumers, therefore, the higher percentiles calculated for the
estimate of dioxin exposure for these food groups are not statistically robust and
consequently have a very wide uncertainty associated with them. However, estimates
derived on category basis, with the exception of food supplements, which only shows 200
consumers, have sufficient consumer numbers to calculate robust extreme percentiles.
Also, for these rarely consumed foods, calculation of lifetime values was not possible, due
to the low consumer count. To enable calculation of the latter, information on frequency of
consumption is needed, which was not collected as part of the NANS.
Intake of fat from food groups
Table 21 provides an overview of fat intake from the six food categories of interest. The
overall fat intake of the total population was on average 0.8 g fat/kg bw/d with a 95th
percentile intake of 1.4 g fat/kg bw/d. The 99th percentile intake of fat was estimated at 1.9
g fat/kg bw/d. The food categories "Dairy", "Meat and meat products" and "Fats and Oils"
contributed to 93 % of average daily fat intake. The major individual food group
contributors were "Fats/dairy spreads excluding butter" and "oils" contributing on average
16.7 % and 15.5 %, respectively, followed by "Meat and meat products, pork" and "Dairy,
milks", contributing on average 13 % and 11 %, respectively. The categories, "Fish and fish
products", "Eggs" and "Supplements" were found to be minor contributors to total average
fat intake, contributing 2.1 %, 3.9 % and 0.6 %, respectively.
Figure 8 provides a comparison of total population intake versus consumers only intake per
food category. With the exception of "Fish and fish products" and "Supplements", the
distributions are in good agreement, which can be attributed to the high number of
consumers in the food groups displayed. The boxplots further indicate that the
distributions are skewed to the right.
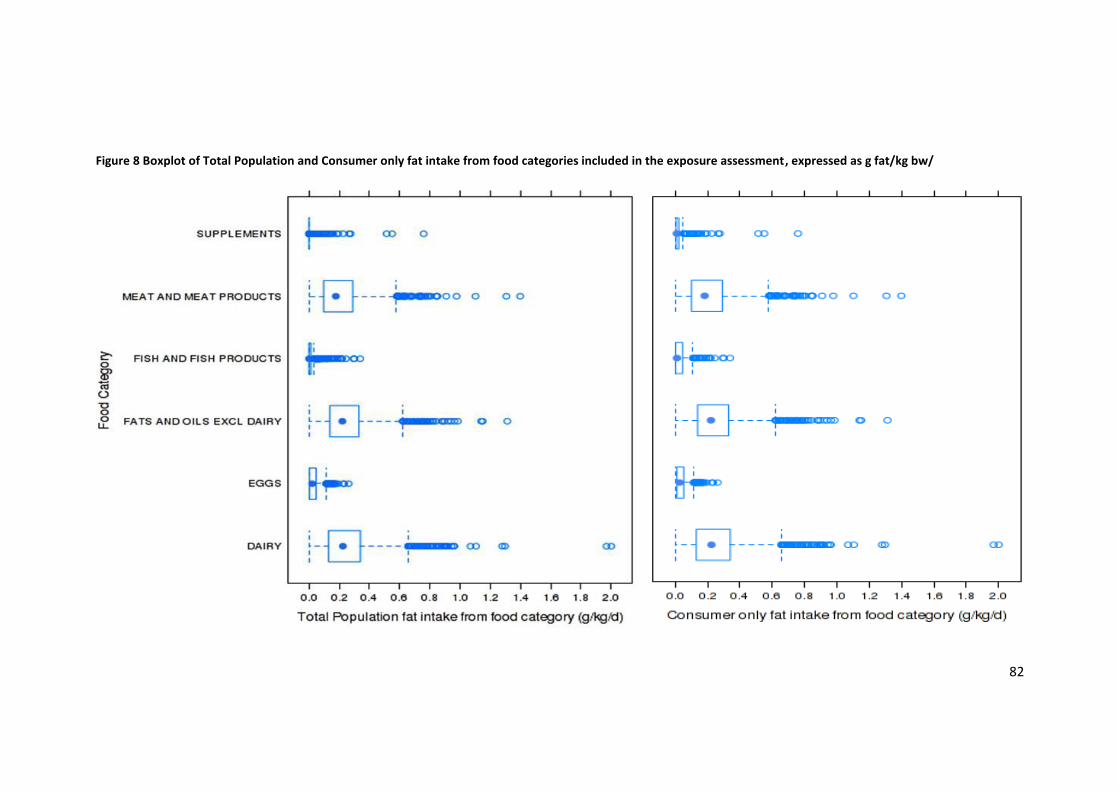
82
Figure 8 Boxplot of Total Population and Consumer only fat intake from food categories included in the exposure assessment, expressed as g fat/kg bw/

83
To account for inter-individual variation in food consumption, a lifetime model was also run
on the same data. For a number of food groups, this was not possible due to insufficient
data or violation of the lifetime model requirement of normality of the transformed
distribution. For the following groups no lifetime intake could be calculated: "Eggs, Duck",
"Meat and meat products, Other", Meat and Meat Products, Mixed Meat", "Offal, Beef",
"Offal, Lamb", "Offal, Pork", "Offal, Poultry", "Fish and Fish products, Mixed Fish" and "Fish
and Fish Products, Other". For the remaining food groups, for which lifetime estimates
could be calculated, a number of warnings were received however (see Table 22) and
results are to be interpreted with caution.
Mean average daily and mean lifetime values, where available, are generally in good
agreement, whereas for higher percentiles, lifetime values are generally lower than
average daily values (see Figure 9), which is expected due to the reduction of variance
within the distribution by the model applied (Creme Software Ltd., 2013b). The latter
("tightening of the distribution") also leads to an increase in the median values for lifetime
estimates for some food groups.
However, since lifetime values could not be calculated for all food groups of interest,
average daily intakes have been used for the assessment of total intake and note has been
taken that higher percentile intakes are likely to present an overestimate of lifelong high
percentile exposure. At the 95th percentile, lifetime estimates for the categories "Dairy",
"Eggs", "Meat", "Fish" and "Fats & Oils" were 15, 28, 28, 43 and 13 % lower than estimates
derived based on average daily intakes, respectively.

84
Figure 9 Comparison of summary statistics for consumption of g fat/kg bw/d derived using average daily intake (DA) versus lifetime estimates (LIFE)
0.0
0.5
1.0
1.5
2.0
2.5 DAIRY, TOTAL
DA
LIFE
0.00
0.05
0.10
0.15
0.20
0.25
0.30 EGGS, TOTAL
DA
LIFE
0.0
0.2
0.4
0.6
0.8
1.0
1.2
1.4
1.6
1.8
2.0 MEAT AND MEAT PRODUCTS, TOTAL
DA
LIFE
0.00
0.05
0.10
0.15
0.20
0.25
0.30
0.35
0.40 FISH AND FISH PRODUCTS, TOTAL
DA
LIFE
0.0
0.2
0.4
0.6
0.8
1.0
1.2
1.4 FATS AND OILS, EXCL. BUTTER TOTAL
DA
LIFE
0.0
0.1
0.2
0.3
0.4
0.5
0.6
0.7
0.8
0.9
1.0 SUPPLEMENTS, OILS/FATTY ACIDS
DA
LIFE

85
Table 21 Mean and high percentile Intakes of fat from six food groups, expressed as g/kg bw/d
Group Name % Contribution to mean of Total population fat intake from food groups (g fat/kg bw/d)
Category Total Min Mean Med P75 P90 P95 P97.5 P98 P99 Max
DAIRY, MILKS 33.3 11.2 0 0.09 0.06 0.1 0.2 0.2 0.3 0.3 0.4 0.8
DAIRY, CREAMS 10.4 3.5 0 0.03 0.004 0.04 0.08 0.1 0.2 0.2 0.2 0.4
DAIRY, YOGHURTS 3.7 1.3 0 0.010 0 0.01 0.03 0.05 0.06 0.06 0.08 0.2
DAIRY, CHEESE 27.8 9.4 0 0.07 0.05 0.1 0.2 0.2 0.3 0.3 0.4 0.7
DAIRY, BUTTER 24.8 8.4 0 0.07 0.03 0.08 0.2 0.2 0.3 0.4 0.5 1.8
DAIRY TOTAL 100 33.7 0 0.3 0.2 0.3 0.5 0.6 0.7 0.8 0.9 2.0
EGGS, CHICKEN 99.6 3.9 0 0.03 0.02 0.05 0.07 0.10 0.1 0.1 0.1 0.3
EGGS, DUCK 0.4 0.02 0 0.0001 0 0 0 0 0 0 0 0.06
EGGS TOTAL 100 3.9 0 0.03 0.02 0.05 0.07 0.10 0.1 0.1 0.1 0.3
MEAT AND MEAT PRODUCTS, BEEF 32.7 9.0 0 0.07 0.05 0.1 0.2 0.2 0.3 0.3 0.4 0.6
MEAT AND MEAT PRODUCTS, LAMB 9.5 2.6 0 0.02 0 0 0.08 0.1 0.2 0.2 0.3 0.9
MEAT AND MEAT PRODUCTS, PORK 47.0 12.9 0 0.1 0.07 0.1 0.2 0.3 0.4 0.4 0.5 0.9
MEAT AND MEAT PRODUCTS, POULTRY 10.4 2.9 0 0.02 0.010 0.02 0.05 0.10 0.2 0.2 0.3 0.7
MEAT AND MEAT PRODUCTS, OTHER 0.04 0.01 0 0.00008 0 0 0 0 0 0 0 0.06
MEAT AND MEAT PRODUCTS, MIXED MEAT 0.10 0.03 0 0.0002 0 0 0 0 0 0 0 0.2
OFFAL, BEEF 0.02 0.00 0 0.00004 0 0 0 0 0 0 0 0.02
OFFAL, LAMB 0.13 0.03 0 0.0003 0 0 0 0 0 0 0.003 0.06
OFFAL, PORK 0.07 0.02 0 0.0001 0 0 0 0 0 0 0.002 0.07
OFFAL, POULTRY 0.01 0.002 0 0.00001 0 0 0 0 0 0 0 0.01
MEAT AND OFFAL TOTAL 100 27.5 0 0.2 0.2 0.3 0.4 0.5 0.6 0.6 0.7 1.8

86
Table 21 continued, Mean and high percentile Intakes of fat from six food groups, expressed as g/kg bw/d
Group Name % Contribution to mean of Total population fat intake from food groups (g fat/kg bw/d)
Category Total Min Mean Med P75 P90 P95 P97.5 P98 P99 Max
FISH AND FISH PRODUCTS, WHITE FISH 8.3 0.17 0 0.001 0 0.001 0.004 0.007 0.01 0.01 0.02 0.06
FISH AND FISH PRODUCTS, OILY FISH 89.9 1.9 0 0.01 0 0.009 0.05 0.08 0.1 0.1 0.1 0.3
FISH AND FISH PRODUCTS, MIXED FISH 0.01 0.0002 0 0.000001 0 0 0 0 0 0 0 0.001
FISH AND FISH PRODUCTS, SHELLFISH 1.8 0.04 0 0.0003 0 0 0 0.001 0.003 0.004 0.007 0.04
FISH AND FISH PRODUCTS, OTHER 0.07 0.002 0 0.00001 0 0 0 0 0 0 0 0.005
FISH AND FISH PRODUCTS, TOTAL 100 2.1 0 0.02 0.001 0.01 0.06 0.08 0.1 0.1 0.2 0.3
FAT/DAIRY SPREADS EXCL BUTTER 51.8 16.7 0 0.1 0.10 0.2 0.3 0.4 0.5 0.5 0.6 1.3
OILS 48.2 15.5 0 0.1 0.1 0.2 0.2 0.3 0.4 0.4 0.4 1.1
FATS&OILS EXCL BUTTER TOTAL 100 32.2 0 0.3 0.2 0.3 0.5 0.5 0.7 0.7 0.8 1.3
SUPPLEMENTS, OILS/FATTY ACIDS 100 0.6 0 0.005 0 0 0.006 0.01 0.03 0.05 0.1 0.8
SUPPLEMENTS TOTAL 100 0.6 0 0.005 0 0 0.006 0.01 0.03 0.05 0.1 0.8
ALL FOODGROUPS TOTAL 100 100 0.05 0.8 0.7 1.0 1.2 1.4 1.6 1.6 1.9 3.2
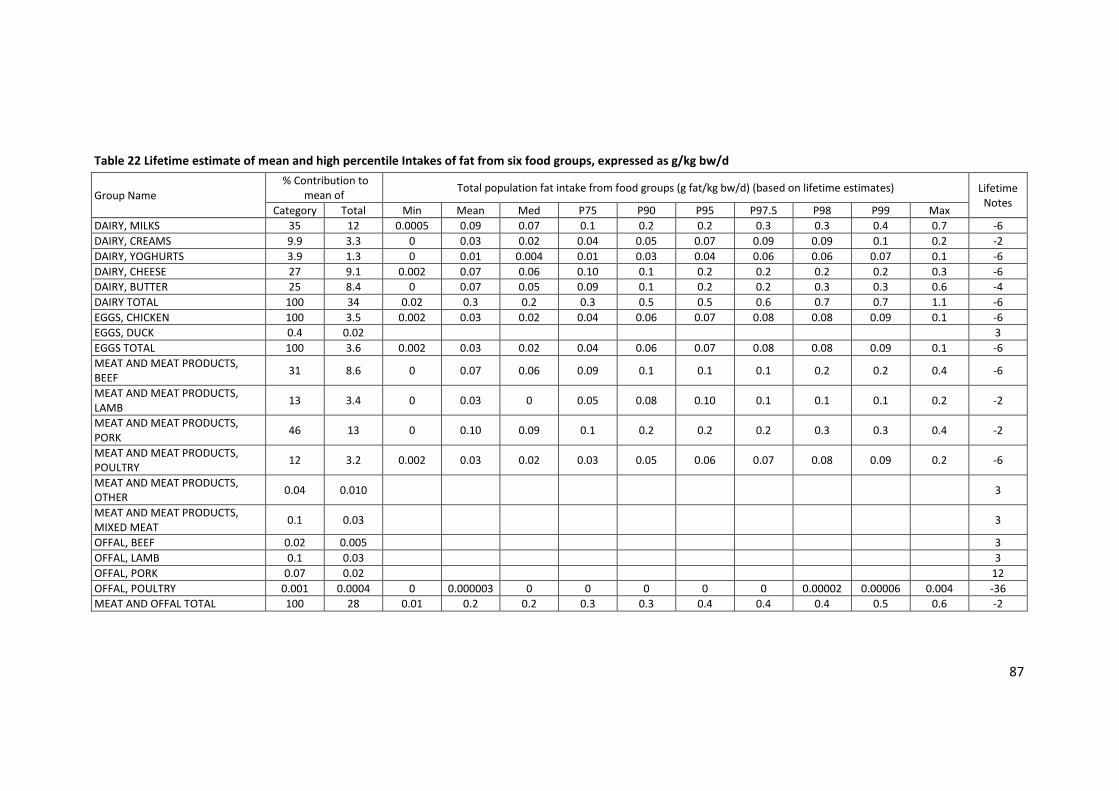
87
Table 22 Lifetime estimate of mean and high percentile Intakes of fat from six food groups, expressed as g/kg bw/d
Group Name
% Contribution to mean of
Total population fat intake from food groups (g fat/kg bw/d) (based on lifetime estimates) Lifetime Notes
Category Total Min Mean Med P75 P90 P95 P97.5 P98 P99 Max
DAIRY, MILKS 35 12 0.0005 0.09 0.07 0.1 0.2 0.2 0.3 0.3 0.4 0.7 -6
DAIRY, CREAMS 9.9 3.3 0 0.03 0.02 0.04 0.05 0.07 0.09 0.09 0.1 0.2 -2
DAIRY, YOGHURTS 3.9 1.3 0 0.01 0.004 0.01 0.03 0.04 0.06 0.06 0.07 0.1 -6
DAIRY, CHEESE 27 9.1 0.002 0.07 0.06 0.10 0.1 0.2 0.2 0.2 0.2 0.3 -6
DAIRY, BUTTER 25 8.4 0 0.07 0.05 0.09 0.1 0.2 0.2 0.3 0.3 0.6 -4
DAIRY TOTAL 100 34 0.02 0.3 0.2 0.3 0.5 0.5 0.6 0.7 0.7 1.1 -6
EGGS, CHICKEN 100 3.5 0.002 0.03 0.02 0.04 0.06 0.07 0.08 0.08 0.09 0.1 -6
EGGS, DUCK 0.4 0.02
3
EGGS TOTAL 100 3.6 0.002 0.03 0.02 0.04 0.06 0.07 0.08 0.08 0.09 0.1 -6
MEAT AND MEAT PRODUCTS, BEEF
31 8.6 0 0.07 0.06 0.09 0.1 0.1 0.1 0.2 0.2 0.4 -6
MEAT AND MEAT PRODUCTS, LAMB
13 3.4 0 0.03 0 0.05 0.08 0.10 0.1 0.1 0.1 0.2 -2
MEAT AND MEAT PRODUCTS, PORK
46 13 0 0.10 0.09 0.1 0.2 0.2 0.2 0.3 0.3 0.4 -2
MEAT AND MEAT PRODUCTS, POULTRY
12 3.2 0.002 0.03 0.02 0.03 0.05 0.06 0.07 0.08 0.09 0.2 -6
MEAT AND MEAT PRODUCTS, OTHER
0.04 0.010
3
MEAT AND MEAT PRODUCTS, MIXED MEAT
0.1 0.03
3
OFFAL, BEEF 0.02 0.005
3
OFFAL, LAMB 0.1 0.03
3
OFFAL, PORK 0.07 0.02
12
OFFAL, POULTRY 0.001 0.0004 0 0.000003 0 0 0 0 0 0.00002 0.00006 0.004 -36
MEAT AND OFFAL TOTAL 100 28 0.01 0.2 0.2 0.3 0.3 0.4 0.4 0.4 0.5 0.6 -2

88
Table 22 continued Lifetime estimate of mean and high percentile Intakes of fat from six food groups, expressed as g/kg bw/d
Group Name
% Contribution to mean of
Total population fat intake from food groups (g fat/kg bw/d) based on lifetime estimates Lifetime Notes
Category Total Min Mean Med P75 P90 P95 P97.5 P98 P99 Max
FISH AND FISH PRODUCTS, WHITE FISH 8.2 0.2 0 0.001 0.001 0.002 0.002 0.003 0.003 0.003 0.00
4 0.00
5 -6
FISH AND FISH PRODUCTS, OILY FISH 94 1.9 0 0.02 0.007 0.02 0.04 0.06 0.08 0.09 0.1 0.2 -6
FISH AND FISH PRODUCTS, MIXED FISH 0.008 0.0002
3
FISH AND FISH PRODUCTS, SHELLFISH 1.0 0.02 0 0.0002 0 0.0001 0.000
6 0.0009 0.001 0.001
0.002
0.004
-38
FISH AND FISH PRODUCTS, OTHER 0.07 0.002
3
FISH TOTAL 100 2.1 0.0005 0.02 0.01 0.02 0.03 0.05 0.06 0.07 0.08 0.1 -6
FAT/DAIRY SPREADS EXCL BUTTER 51 17 0.002 0.1 0.1 0.2 0.3 0.3 0.4 0.4 0.4 0.7 -6
OILS 48 15 0.008 0.1 0.1 0.2 0.2 0.2 0.3 0.3 0.3 0.4 -2
FATS&OILS EXCL BUTTER TOTAL 100 32 0.03 0.3 0.2 0.3 0.4 0.5 0.5 0.6 0.6 0.8 -2
SUPPLEMENTS, OILS/FATTY ACIDS 100 0.6 0 0.005 0 0 0.006 0.01 0.03 0.05 0.1 0.9 -20
SUPPLEMENTS TOTAL 100 0.6 0 0.005 0 0 0.006 0.01 0.03 0.05 0.1 0.9 -20
ALL FOODGROUPS TOTAL
100
3
Lifetime return values:-2: Added extra lower endpoints to curve fit; 3: Usual Intake could not be calculated due to insufficient or unsuitable data; -4: Added extra upper endpoints to curve fit; -6: Added extra lower endpoints to curve fit & Added extra upper endpoints to curve fit; 12: Negative variance of Usual Intakes [too few people with multiple observations]; -36: Added extra upper endpoints to curve fit & Fourth moment of Usual intakes less than 3.0; -38: Added extra lower endpoints to curve fit & Added extra upper endpoints to curve fit & Fourth moment of Usual intakes less than 3.0

89
3.3.3.2 Background exposure to TOTAL WHO TEQ (PCDD/F&DL-PCBs)
Table 23 shows summary statistics for total exposure to Total WHO TEQ (2005), reported as
LB - UB range for mean, median and higher percentile intake, expressed as pg/kg bw/d and
Table 24 provides summary statistics for all food groups. Figure 10 displays the exposure
distribution for total intake from the six food groups considered. Results expressed using
the 1998 TEF scheme are provided in the Annex (see Annex 7.4) to facilitate comparison
with previous results.
Table 23 Overall total exposure to Total TEQ (PCDD/F&DL-PCB) WHO (2005) pg/kg bw/d
LB - UB Total TEQ (PCDD/F&DL-PCB) WHO (2005) pg/kg bw/d
Mean Med P95 P97.5 P99
TOTAL 0.3 - 0.3 0.2 - 0.2 0.9 - 1 1.2 - 1.3 1.7 - 1.8
Figure 10 Total Population Distribution of exposure to Total WHO TEQ from six food groups
Total mean average daily intake to Total WHO TEQ (2005) was estimated at 0.3 pg/kg bw/d
and 95th percentile intake at 0.9 - 1 pg/kg bw/d, which translates into a monthly (30 day)
intake of 9 pg/kg bw/m at the mean and 27 - 30 pg/kg bw/m at the 95th percentile. At the
99th percentile intake was estimated at 1.7 - 1.8 pg/kg bw/d, which translates into a
monthly intake of 51 - 54 pg/kg bw/m.

90
The most important contributor to the mean average daily exposure comes from the
category "Fish and fish products", contributing up to 41 % to the total exposure, followed
by "Meat and meat products" and "Dairy", each contributing up to 25 % to the total
exposure.
These exposure figures can be compared to the WHO PMTI of 70 pg/kg bw indicating a
mean exposure of 13 % of the tolerable monthly intake, and exposure of the 95th percentile
consumer falling within 39 - 43 % of the tolerable monthly intake. Estimated intake at the
99th percentile falls within 73 - 77 % of the PMTI.
As observed for fat intake from the food groups of interest, lifetime exposure values, where
available (see Table 25), are lower for high percentile consumers, which suggests that high
percentile long-term exposure may be lower than estimated based on average daily intake
values. Consequently, the median values increase with also the mean values for food
categories "Fish and fish products" and "Supplements", which are not consumed as
frequently as the other food groups, increasing due to the removal of variance in the
distribution.

91
Table 24 Range of LB - UB summary statistics of exposure to Total WHO TEQ (2005) expressed as pg/kg bw/d and % contribution to the total mean average daily intake
Group Names LB - UB Total TEQ (PCDD/F&DL-PCB) WHO (2005) pg/kg bw/d (Statistics derived based on average daily intake)
% Contribution Mean Med P75 P90 P95 P97.5 P98 P99
DAIRY, MILKS 8.7-8.5 0.03-0.03 0.02-0.02 0.04-0.04 0.06-0.06 0.08-0.08 0.1-0.1 0.1-0.1 0.1-0.1
DAIRY, CREAMS 2.7-2.6 0.008-0.009 0.0009-0.001 0.01-0.01 0.02-0.03 0.03-0.04 0.05-0.05 0.06-0.06 0.08-0.08
DAIRY, YOGHURTS 1-1 0.003-0.003 - 0.004-0.004 0.01-0.01 0.01-0.02 0.02-0.02 0.02-0.02 0.02-0.03
DAIRY, CHEESE 7.3-7.1 0.02-0.02 0.01-0.02 0.03-0.03 0.05-0.06 0.07-0.08 0.09-0.1 0.1-0.1 0.1-0.1
DAIRY, BUTTER 6.5-6.3 0.02-0.02 0.009-0.01 0.02-0.03 0.05-0.06 0.08-0.08 0.1-0.1 0.1-0.1 0.1-0.2
DAIRY 26-25 0.08-0.09 0.07-0.07 0.1-0.1 0.1-0.2 0.2-0.2 0.2-0.2 0.2-0.3 0.3-0.3
EGGS, CHICKEN 2.1-2.4 0.006-0.008 0.004-0.006 0.01-0.01 0.02-0.02 0.02-0.03 0.03-0.03 0.03-0.03 0.03-0.04
EGGS, DUCK 0.008-0.009 0.00002-0.00003 - - - - - - -
EGGS 2.1-2.4 0.006-0.008 0.004-0.006 0.01-0.01 0.02-0.02 0.02-0.03 0.03-0.03 0.03-0.03 0.03-0.04
MEAT AND MEAT PRODUCTS, BEEF 11-11 0.03-0.04 0.02-0.02 0.05-0.05 0.09-0.09 0.1-0.1 0.2-0.2 0.2-0.2 0.2-0.2
MEAT AND MEAT PRODUCTS, LAMB 3-2.8 0.009-0.009 - - 0.04-0.04 0.06-0.06 0.09-0.09 0.1-0.1 0.1-0.1
MEAT AND MEAT PRODUCTS, PORK 7.2-7.7 0.02-0.03 0.009-0.01 0.03-0.03 0.06-0.07 0.09-0.09 0.1-0.1 0.1-0.1 0.2-0.2
MEAT AND MEAT PRODUCTS, POULTRY 2.4-2.2 0.007-0.007 0.003-0.003 0.007-0.007 0.02-0.02 0.03-0.03 0.05-0.05 0.06-0.06 0.08-0.08
MEAT AND MEAT PRODUCTS, OTHER 0.009-0.008 0.00003-0.00003 - - - - - - -
MEAT AND MEAT PRODUCTS, MIXED MEAT 0.03-0.03 0.0001-0.0001 - - - - - - -
OFFAL, BEEF 0.01-0.01 0.00003-0.00003 - - - - - - -
OFFAL, LAMB 0.3-0.3 0.0009-0.0009 - - - - - - 0.002-0.002
OFFAL, PORK 0.03-0.03 0.00009-0.0001 - - - - - - 0.001-0.002
OFFAL, POULTRY 0.002-0.002 0.000005- - - - - - - -
MEAT AND MEAT PRODUCTS 24-24 0.07-0.08 0.06-0.06 0.1-0.1 0.2-0.2 0.2-0.2 0.2-0.3 0.3-0.3 0.3-0.3

92
Table 24 continued Range of LB - UB summary statistics of exposure to Total WHO TEQ (2005) expressed as pg/kg bw/d and % contribution to the total mean average daily intake
Group Names LB - UB Total TEQ (PCDD/F&DL-PCB) WHO (2005) pg/kg bw/d (Statistics derived based on average daily intake)
% Contribution Mean Med P75 P90 P95 P97.5 P98 P99
FISH AND FISH PRODUCTS, WHITE FISH 2.6-2.4 0.008-0.008 - 0.003-0.004 0.02-0.02 0.05-0.05 0.09-0.09 0.09-0.09 0.1-0.1
FISH AND FISH PRODUCTS, OILY FISH 38-36 0.1-0.1 - 0.001-0.03 0.5-0.5 0.7-0.7 1-1.1 1.1-1.2 1.5-1.5
FISH AND FISH PRODUCTS, MIXED FISH 0.002-0.002 0.000006- - - - - - - -
FISH AND FISH PRODUCTS, SHELLFISH 0.4-0.3 0.001-0.001 - - - 0.001-0.001 0.004-0.004 0.006-0.006 0.04-0.04
FISH AND FISH PRODUCTS, OTHER 0.02-0.02 0.00006-0.00006 - - - - - - -
FISH AND FISH PRODUCTS 41-39 0.1-0.1 0-0.002 0.05-0.08 0.5-0.5 0.7-0.8 1.1-1.1 1.2-1.2 1.5-1.5
FAT/DAIRY SPREADS EXCL BUTTER 2.6-4.3 0.008-0.01 0.006-0.01 0.01-0.02 0.02-0.03 0.02-0.04 0.03-0.05 0.03-0.06 0.04-0.07
OILS 1-2.4 0.003-0.008 0.002-0.007 0.004-0.01 0.006-0.02 0.008-0.02 0.01-0.02 0.01-0.03 0.01-0.03
FATS AND OILS EXCL BUTTER 3.6-6.6 0.01-0.02 0.009-0.02 0.01-0.03 0.02-0.04 0.03-0.05 0.03-0.06 0.03-0.07 0.04-0.08
SUPPLEMENTS, OILS/FATTY ACIDS 2.2-2.8 0.007-0.009 - - 0.005-0.01 0.02-0.03 0.04-0.06 0.05-0.08 0.1-0.2
SUPPLEMENTS 2.2-2.8 0.007-0.009 0-0 0-0 0.005-0.01 0.02-0.03 0.04-0.06 0.05-0.08 0.1-0.2
TOTAL 100-100 0.3-0.3 0.2-0.2 0.3-0.4 0.7-0.7 0.9-1 1.2-1.3 1.4-1.4 1.7-1.8

93
Table 25 Lifetime estimate of UB summary statistics of exposure to Total WHO TEQ (2005) expressed as pg/kg bw/d
Group Name Lifetime statistic UB Total TEQ (PCDD/F&DL-PCB) WHO (2005) pg/kg bw/d Lifetime
return value Mean Med P75 P90 P95 P97.5 P98 P99
DAIRY, MILKS 0.03 0.02 0.04 0.06 0.08 0.10 0.1 0.1 0.00*
DAIRY, CREAMS 0.008 0.007 0.01 0.02 0.02 0.03 0.03 0.04 -6.00
DAIRY, YOGHURTS 0.003 0.001 0.004 0.010 0.01 0.02 0.02 0.02 0.00*
DAIRY, CHEESE 0.02 0.02 0.03 0.05 0.06 0.07 0.07 0.08 -2.00
DAIRY, BUTTER 0.02 0.01 0.03 0.05 0.06 0.08 0.09 0.1 0.00
DAIRY 0.08 0.08 0.1 0.1 0.2 0.2 0.2 0.2 0.00*
EGGS, CHICKEN 0.007 0.006 0.009 0.01 0.02 0.02 0.02 0.03 -2.00
EGGS, DUCK
3.00
EGGS 0.007 0.006 0.010 0.01 0.02 0.02 0.02 0.03 -2.00
MEAT AND MEAT PRODUCTS, BEEF 0.03 0.03 0.04 0.06 0.06 0.07 0.08 0.09 -4.00
MEAT AND MEAT PRODUCTS, LAMB 0.01 0 0.02 0.04 0.05 0.05 0.05 0.06 0.00
MEAT AND MEAT PRODUCTS, PORK 0.02 0.02 0.03 0.04 0.05 0.06 0.07 0.07 -2.00
MEAT AND MEAT PRODUCTS, POULTRY 0.008 0.006 0.01 0.02 0.02 0.02 0.02 0.03 -6.00
MEAT AND MEAT PRODUCTS, OTHER
3.00
MEAT AND MEAT PRODUCTS, MIXED MEAT
3.00
OFFAL, BEEF
3.00
OFFAL, LAMB
3.00
OFFAL, PORK
12.00
OFFAL, POULTRY 0.000001 0 0 0 0 0 0.000008 0.00003 -36.00
MEAT AND MEAT PRODUCTS 0.08 0.08 0.10 0.1 0.1 0.2 0.2 0.2 -6.00

94
Table 25 continued Lifetime estimate of UB summary statistics of exposure to Total WHO TEQ (2005) expressed as pg/kg bw/d
Group Name Lifetime statistic UB Total TEQ (PCDD/F&DL-PCB) WHO (2005) pg/kg bw/d Lifetime return value
Mean Med P75 P90 P95 P97.5 P98 P99
FISH AND FISH PRODUCTS, WHITE FISH 0.008 0.008 0.01 0.01 0.02 0.02 0.02 0.02 -6.00
FISH AND FISH PRODUCTS, OILY FISH 0.1 0.05 0.2 0.4 0.5 0.7 0.8 1.0 -6.00
FISH AND FISH PRODUCTS, MIXED FISH
3.00
FISH AND FISH PRODUCTS, SHELLFISH 0.001 0 0.0004 0.003 0.006 0.010 0.01 0.02 -38.00
FISH AND FISH PRODUCTS, OTHER
3.00
FISH AND FISH PRODUCTS 0.2 0.10 0.2 0.4 0.6 0.8 0.9 1.2 -6.00
FAT/DAIRY SPREADS EXCL BUTTER 0.01 0.01 0.02 0.03 0.03 0.04 0.04 0.05 -6.00
OILS 0.008 0.007 0.010 0.01 0.01 0.02 0.02 0.02 -2.00
FATS AND OILS EXCL BUTTER 0.02 0.02 0.03 0.04 0.04 0.05 0.05 0.06 -2.00
SUPPLEMENTS, OILS/FATTY ACIDS 0.01 0 0 0.01 0.05 0.1 0.1 0.2 0.00*
SUPPLEMENTS 0.01 0 0 0.01 0.05 0.1 0.1 0.2 0.00*
TOTAL
3.00
Lifetime return values:-2: Added extra lower endpoints to curve fit; 3: Usual Intake could not be calculated due to insufficient or unsuitable data; -4: Added extra upper endpoints to curve fit; -6: Added extra lower endpoints to curve fit & Added extra upper endpoints to curve fit; 12: Negative variance of Usual Intakes [too few people with multiple observations]; -36: Added extra upper endpoints to curve fit & Fourth moment of Usual intakes less than 3.0; -38: Added extra lower endpoints to curve fit & Added extra upper endpoints to curve fit & Fourth moment of Usual intakes less than 3.0 *Requirement of normality not met
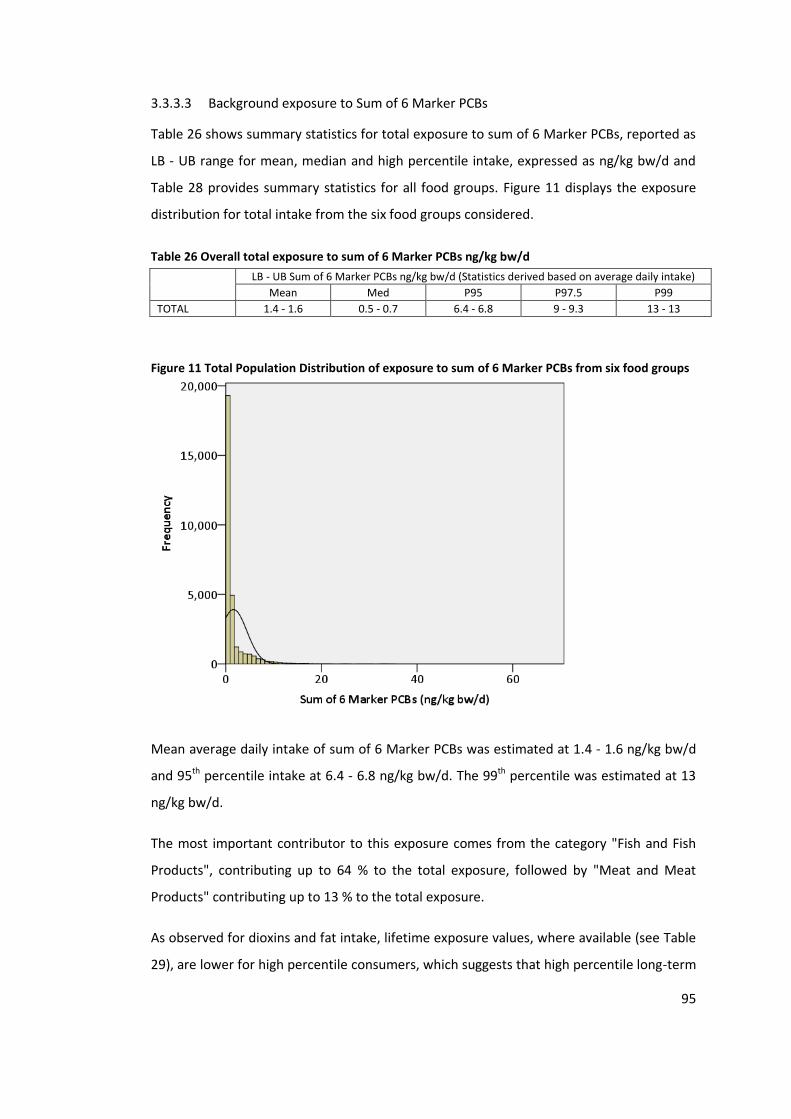
95
3.3.3.3 Background exposure to Sum of 6 Marker PCBs
Table 26 shows summary statistics for total exposure to sum of 6 Marker PCBs, reported as
LB - UB range for mean, median and high percentile intake, expressed as ng/kg bw/d and
Table 28 provides summary statistics for all food groups. Figure 11 displays the exposure
distribution for total intake from the six food groups considered.
Table 26 Overall total exposure to sum of 6 Marker PCBs ng/kg bw/d
LB - UB Sum of 6 Marker PCBs ng/kg bw/d (Statistics derived based on average daily intake)
Mean Med P95 P97.5 P99
TOTAL 1.4 - 1.6 0.5 - 0.7 6.4 - 6.8 9 - 9.3 13 - 13
Figure 11 Total Population Distribution of exposure to sum of 6 Marker PCBs from six food groups
Mean average daily intake of sum of 6 Marker PCBs was estimated at 1.4 - 1.6 ng/kg bw/d
and 95th percentile intake at 6.4 - 6.8 ng/kg bw/d. The 99th percentile was estimated at 13
ng/kg bw/d.
The most important contributor to this exposure comes from the category "Fish and Fish
Products", contributing up to 64 % to the total exposure, followed by "Meat and Meat
Products" contributing up to 13 % to the total exposure.
As observed for dioxins and fat intake, lifetime exposure values, where available (see Table
29), are lower for high percentile consumers, which suggests that high percentile long-term

96
exposure may be lower than estimated based on average daily intake values. Consequently,
the median values increase with also the mean values for food categories "Fish and Fish
Products" and "Supplements", which are not consumed as frequently as the other food
groups, increasing due to the removal of variance in the distribution.
No health based guidance value has been adopted for NDL-PCBs by any scientific body. In
absence of the latter, a Margin of Exposure (MoE), or in this case a Margin of Body Burden
(MoBB) can be used. In 2005 the EFSA CONTAM Panel (EFSA, 2005), chose an overall body
burden of 500 μg/kg bw as a representative conservative body burden at the NOAEL
(NOAEL BB) for all individual NDL-PCBs and for the sum of NDL-PCBs occurring in human
tissues (see 1.3.2.1)11.
The UB mean average daily intake of sum of 6 Marker PCBs of 1.6 ng/kg bw/d derived in
this study may be converted into an estimate of the body burden (see 1.3.2.1, Equation 3).
To account for total NDL-PCB intake, a correction factor of 212, as proposed by EFSA (EFSA,
2005), has been applied. The calculated body burden was estimated at 15 μg/kg bw, giving
a MoBB at the NOAEL of 33 which is 3 times larger than the MoBB at the NOAEL of 10
estimated by EFSA for the average European population (see 1.3.2.1). However, data from
the latest Irish breast milk survey suggest that the ratio between sum of 6 Marker PCBs and
total PCBs (as identified by EFSA) is 1.5, which results in a lower estimated body burden of
11.4 μg/kg bw/ with an associated MoBB at the NOAEL of 44.
However, a better indicator of the PCB body burden can be derived from breast milk data.
NDL-PCBs were analysed in human breast milk in Ireland in 2002 and in 2009/2010.
Average sum of 6 Marker PCBs and sum of all PCBs measured in 2002 were 54 μg/g fat and
74 μg/g fat and in 2010, 41 μg/g fat and 68 μg/g fat, respectively. In the 2010 survey, more
PCB congeners were included than in the 2002 study, and the sum of the PCBs for 2010,
which were included in the 2002 survey was 61 μg/g fat (see Table 27).
11 The EFSA Panel noted that the NDL-PCB found in human milk are the congeners that accumulate
in the human body: PCBs 18, 28, 33, 37, 52, 60, 66, 74, 99, 101, 110, 128, 138, 141, 153, 170, 180, 183, 187, 194, 206, and 209 (EFSA, 2005) 12
Sum of Marker PCBs can be converted into total NDL-PCB by multiplying the "sum of the three" by 3, the "sum of the six" by 2 and the "sum of the seven" by 2 x 0.85 (the latter factor is a correction for the contribution of PCB 118) (EFSA, 2005)

97
The average bodyweight recorded in the 2010 breast milk study was 65 kg, which is in line
with the average body weight of 67.4 kg reported in the NANS for women 18 - 35 years old.
The NANS further reported a mean body fat percent of 31 % for this population group and
the latter has been used in the estimation of the body burden (see 1.3.2.1, Equation 3).
Based on a body weight of 65 kg and 30 % body fat the average 2002 levels of 54 and 74
μg/g fat NDL-PCBs in human breast milk correspond to body burdens of 16 μg/kg bw and
22 ng/kg bw for sum of 6 Marker PCBs and sum Total NDL-PCBs, respectively. The average
2010 levels of 41 and 68 μg/g fat NDL-PCBs in human breast milk correspond to body
burdens of 12 μg/kg bw and 20 μg/kg bw for sum 6 Marker PCBs and sum Total NDL-PCBs,
respectively (see Table 27). Adding up the concentrations of the PCBs identified by EFSA to
be present in human milk (see footnote 11) provides a slightly smaller estimate of 19 μg/kg
bw.
Table 27 Estimated Body Burden based on NDL-PCBs in breast milk
Irish Breast milk content Associated Body Burden
2002 2010 2002 2010
μg/g breast milk fat μg/kg bw
Sum 6 Marker PCBs 54 41 16 12
Sum Total PCBs included in both surveys* 73 61 22 18
Sum Total PCBs included in survey 74 68 22 20
Sum Total EFSA-PCBs ** - 62 - 19
* 2004: PCBs 28, 33, 37, 52, 55, 56/60 , 61/74, 66, 101, 122, 124, 128, 138, 141, 153, 170, 180, 183, 187, 194, 206, 209
* 2010: PCBs 18, 28, 31, 33, 37, 41, 44, 47, 49, 51, 52, 56/60 , 61/74, 66, 87, 99, 101, 110, 128, 129, 138, 141, 149, 151, 153, 170, 180, 183, 185, 187, 191, 193, 194, 201 , 202, 203, 206, 208, 209
** PCBs identified by EFSA to be present in human milk: PCBs 18, 28, 33, 37, 52, 60, 66, 74, 99, 101, 110, 128, 138, 141, 153, 170, 180, 183, 187, 194, 206, 209
The BB associated with the total NDL-PCB content of the 2010 breast milk survey of 20
μg/kg bw (19 μg/kg bw when based on PCBs selected by EFSA) is less than the BB of 50
μg/kg bw based on reports from European Member States used by EFSA in their risk
assessment. Therefore the MoBB, compared with a NOAEL BB of 500 μg/kg bw calculates
at 25 (26 based on EFSA PCBs) for the Irish adult population, compared to a MoBB at the
NOAEL of 10 calculated for the European adult population by EFSA.
The MoBBs at the NOAEL of 44 and 25, derived via the two different methods above
indicate that the current body burden status of the population is below the NOAEL BB of
500 μg/kg bw and that current intakes are also not of concern. Whereas the average
dietary exposure estimate reflects recent eating behaviour and recent occurrence data in

98
food, the breast milk concentration reflects lifetime exposure, which for most of the
mothers participating in the breast milk surveys would be in excess of 30 years.

99
Table 28 Range of LB - UB summary statistics of exposure to sum of 6 Marker PCBs expressed as ng/kg bw/d and % contribution to the total mean average daily intake
Group Names LB - UB Sum of 6 Marker PCBs ng/kg bw/d (Statistics derived based on average daily intake)
% Contribution Mean Med P75 P90 P95 P97.5 P98 P99
DAIRY, MILKS 2.5-2.5 0.04-0.04 0.03-0.03 0.05-0.05 0.08-0.09 0.1-0.1 0.1-0.2 0.1-0.2 0.2-0.2
DAIRY, CREAMS 0.8-0.8 0.01-0.01 0.001-0.001 0.01-0.02 0.03-0.04 0.05-0.05 0.07-0.08 0.08-0.09 0.1-0.1
DAIRY, YOGHURTS 0.3-0.3 0.004-0.005
0.005-0.006 0.01-0.02 0.02-0.02 0.03-0.03 0.03-0.03 0.03-0.04
DAIRY, CHEESE 2.1-2.1 0.03-0.03 0.02-0.02 0.04-0.05 0.07-0.08 0.1-0.1 0.1-0.1 0.1-0.2 0.2-0.2
DAIRY, BUTTER 1.9-1.9 0.03-0.03 0.01-0.01 0.03-0.04 0.07-0.08 0.1-0.1 0.1-0.2 0.2-0.2 0.2-0.2
DAIRY 7.5-7.6 0.1-0.1 0.09-0.1 0.1-0.2 0.2-0.2 0.3-0.3 0.3-0.4 0.3-0.4 0.4-0.4
EGGS, CHICKEN 6.6-6 0.1-0.1 0.02-0.03 0.08-0.08 0.2-0.2 0.5-0.5 0.8-0.8 0.9-0.9 1.2-1.2
EGGS, DUCK 0.03-0.02 0.0005-0.0004
EGGS 6.7-6.1 0.1-0.1 0.02-0.03 0.08-0.08 0.2-0.2 0.5-0.5 0.8-0.8 0.9-0.9 1.2-1.2
MEAT AND MEAT PRODUCTS, BEEF 4.5-4 0.06-0.06 0.04-0.04 0.09-0.09 0.2-0.2 0.2-0.2 0.3-0.3 0.3-0.3 0.4-0.4
MEAT AND MEAT PRODUCTS, LAMB 1.3-1.2 0.02-0.02
0.08-0.08 0.1-0.1 0.2-0.2 0.2-0.2 0.3-0.3
MEAT AND MEAT PRODUCTS, PORK 4.4-3.9 0.06-0.06 0.04-0.04 0.09-0.09 0.2-0.2 0.2-0.2 0.3-0.3 0.3-0.3 0.3-0.3
MEAT AND MEAT PRODUCTS, POULTRY 2.7-2.3 0.04-0.04 0.01-0.01 0.03-0.03 0.08-0.08 0.1-0.1 0.3-0.3 0.3-0.3 0.5-0.5
MEAT AND MEAT PRODUCTS, OTHER 0.004-0.003 0.00005-0.00005
MEAT AND MEAT PRODUCTS, MIXED MEAT 0.01-0.01 0.0002-0.0002
OFFAL, BEEF 0.005-0.004 0.00007-0.00007
OFFAL, LAMB 0.06-0.05 0.0008-0.0008
0.004-0.004
OFFAL, PORK 0.005-0.005 0.00008-0.00008
0.0009-0.0009
OFFAL, POULTRY 0.001-0.001 0.00002-0.00002
MEAT AND MEAT PRODUCTS 13-11 0.2-0.2 0.2-0.2 0.2-0.2 0.4-0.4 0.5-0.5 0.6-0.6 0.6-0.6 0.7-0.7
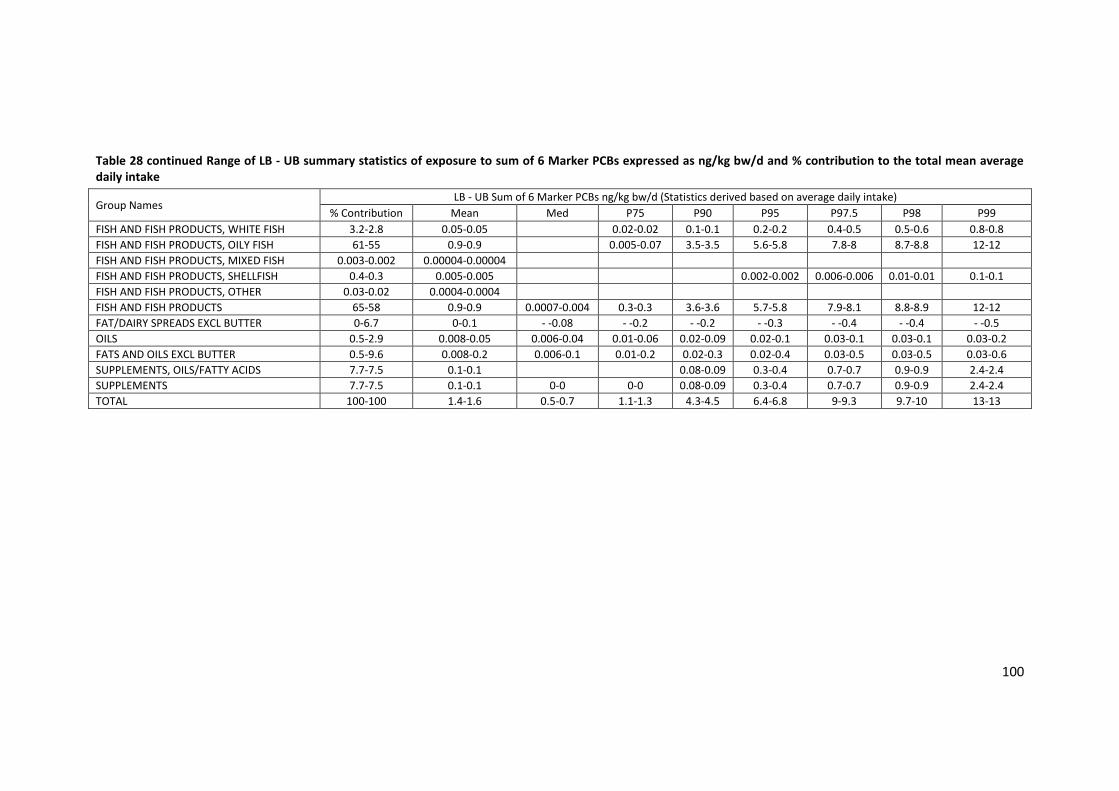
100
Table 28 continued Range of LB - UB summary statistics of exposure to sum of 6 Marker PCBs expressed as ng/kg bw/d and % contribution to the total mean average daily intake
Group Names LB - UB Sum of 6 Marker PCBs ng/kg bw/d (Statistics derived based on average daily intake)
% Contribution Mean Med P75 P90 P95 P97.5 P98 P99
FISH AND FISH PRODUCTS, WHITE FISH 3.2-2.8 0.05-0.05
0.02-0.02 0.1-0.1 0.2-0.2 0.4-0.5 0.5-0.6 0.8-0.8
FISH AND FISH PRODUCTS, OILY FISH 61-55 0.9-0.9
0.005-0.07 3.5-3.5 5.6-5.8 7.8-8 8.7-8.8 12-12
FISH AND FISH PRODUCTS, MIXED FISH 0.003-0.002 0.00004-0.00004
FISH AND FISH PRODUCTS, SHELLFISH 0.4-0.3 0.005-0.005
0.002-0.002 0.006-0.006 0.01-0.01 0.1-0.1
FISH AND FISH PRODUCTS, OTHER 0.03-0.02 0.0004-0.0004
FISH AND FISH PRODUCTS 65-58 0.9-0.9 0.0007-0.004 0.3-0.3 3.6-3.6 5.7-5.8 7.9-8.1 8.8-8.9 12-12
FAT/DAIRY SPREADS EXCL BUTTER 0-6.7 0-0.1 - -0.08 - -0.2 - -0.2 - -0.3 - -0.4 - -0.4 - -0.5
OILS 0.5-2.9 0.008-0.05 0.006-0.04 0.01-0.06 0.02-0.09 0.02-0.1 0.03-0.1 0.03-0.1 0.03-0.2
FATS AND OILS EXCL BUTTER 0.5-9.6 0.008-0.2 0.006-0.1 0.01-0.2 0.02-0.3 0.02-0.4 0.03-0.5 0.03-0.5 0.03-0.6
SUPPLEMENTS, OILS/FATTY ACIDS 7.7-7.5 0.1-0.1
0.08-0.09 0.3-0.4 0.7-0.7 0.9-0.9 2.4-2.4
SUPPLEMENTS 7.7-7.5 0.1-0.1 0-0 0-0 0.08-0.09 0.3-0.4 0.7-0.7 0.9-0.9 2.4-2.4
TOTAL 100-100 1.4-1.6 0.5-0.7 1.1-1.3 4.3-4.5 6.4-6.8 9-9.3 9.7-10 13-13

101
Table 29 Lifetime estimate of UB summary statistics of exposure to sum of 6 Marker PCBs expressed as ng/kg bw/d
Group Name
Lifetime statistic UB Sum of 6 Marker PCBs ng/kg bw/d Lifetime return value Mean Med P75 P90 P95 P97.5 P98 P99
DAIRY, MILKS 0.04 0.03 0.06 0.09 0.1 0.1 0.2 0.2 0.00*
DAIRY, CREAMS 0.01 0.010 0.02 0.03 0.03 0.04 0.04 0.05 -4.00
DAIRY, YOGHURTS 0.005 0.002 0.006 0.01 0.02 0.03 0.03 0.03 -2.00
DAIRY, CHEESE 0.03 0.03 0.05 0.07 0.08 0.10 0.1 0.1 0.00
DAIRY, BUTTER 0.03 0.02 0.04 0.07 0.09 0.1 0.1 0.2 -2.00
DAIRY 0.1 0.1 0.2 0.2 0.3 0.3 0.3 0.3 -2.00
EGGS, CHICKEN 0.1 0.08 0.2 0.3 0.4 0.5 0.5 0.6 -6.00
EGGS, DUCK
3.00
EGGS 0.1 0.08 0.2 0.3 0.4 0.5 0.5 0.6 -6.00
MEAT AND MEAT PRODUCTS, BEEF 0.06 0.06 0.08 0.1 0.1 0.1 0.1 0.2 -4.00
MEAT AND MEAT PRODUCTS, LAMB 0.03 0 0.05 0.08 0.09 0.1 0.1 0.1 0.00
MEAT AND MEAT PRODUCTS, PORK 0.06 0.06 0.08 0.1 0.1 0.1 0.2 0.2 -2.00
MEAT AND MEAT PRODUCTS, POULTRY 0.05 0.03 0.06 0.10 0.1 0.1 0.2 0.2 -6.00
MEAT AND MEAT PRODUCTS, OTHER
3.00
MEAT AND MEAT PRODUCTS, MIXED MEAT
3.00
OFFAL, BEEF
3.00
OFFAL, LAMB
3.00
OFFAL, PORK
12.00
OFFAL, POULTRY 0.000004 0 0 0 0 0 0.00003 0.0001 -38.00
MEAT AND MEAT PRODUCTS 0.2 0.2 0.2 0.3 0.3 0.4 0.4 0.4 -6.00

102
Table 29 continued Lifetime estimate of UB summary statistics of exposure to sum of 6 Marker PCBs expressed as ng/kg bw/d
Group Name Lifetime statistic UB Sum of 6 Marker PCBs ng/kg bw/d Lifetime
return value Mean Med P75 P90 P95 P97.5 P98 P99
FISH AND FISH PRODUCTS, WHITE FISH 0.05 0.04 0.06 0.1 0.1 0.2 0.2 0.2 -6.00
FISH AND FISH PRODUCTS, OILY FISH 1.0 0.4 1.2 2.7 4.1 5.6 6.1 7.9 -6.00
FISH AND FISH PRODUCTS, MIXED FISH
3.00
FISH AND FISH PRODUCTS, SHELLFISH 0.005 0 0.0006 0.02 0.03 0.05 0.06 0.08 -38.00
FISH AND FISH PRODUCTS, OTHER
3.00
FISH AND FISH PRODUCTS 1.2 0.9 1.5 2.5 3.4 4.3 4.6 5.6 -6.00
FAT/DAIRY SPREADS EXCL BUTTER 0.1 0.09 0.1 0.2 0.3 0.3 0.3 0.4 -6.00
OILS 0.05 0.04 0.06 0.07 0.09 0.10 0.1 0.1 -2.00
FATS AND OILS EXCL BUTTER 0.2 0.1 0.2 0.3 0.3 0.4 0.4 0.4 -6.00
SUPPLEMENTS, OILS/FATTY ACIDS 0.1 0 0 0.2 0.7 1.5 1.9 3.2 -4.00
SUPPLEMENTS 0.1 0 0 0.2 0.7 1.5 1.9 3.2 -4.00
TOTAL
3.00
Lifetime return value: -2: Added extra lower endpoints to curve fit; 3: Usual Intake could not be calculated due to insufficient or unsuitable data; -4: Added extra upper endpoints to curve fit; -6: Added extra lower endpoints to curve fit & Added extra upper endpoints to curve fit; 12: Negative variance of Usual Intakes [too few people with multiple observations]; -36: Added extra upper endpoints to curve fit & Fourth moment of Usual intakes less than 3.0; -38: Added extra lower endpoints to curve fit & Added extra upper endpoints to curve fit & Fourth moment of Usual intakes less than 3.0 *Requirement of normality not met

3.3.4 Uncertainty Analysis
A review of each step was performed and uncertainties are considered qualitatively, using
a tabular format (see Table 30), as recommended by EFSA for refined assessments (EFSA,
2006).
Table 30 Qualitative evaluation of influence of uncertainties on the exposure estimate of dioxin from background contamination of the Irish Adult Population
Source of uncertainty Direction & magnitude*
Consumption data:
Representativeness/under-reporting/misreporting/portion size estimation ++/--
Extrapolation from food consumption survey of few days to estimate chronic exposure, especially at high percentiles
++
Modification of (NANS) food consumption database:
Application of standard recipes, application of extrapolated recipes, application of recipes derived from ingredient information
+/-
Application of conversion factors from cooked to raw food : +/-
Consumption data applies to the general population and does not consider regions with potential higher consumption due to particular consumption patterns (e.g. fishermen)
--
Food intake has been converted from cooked to raw and does not take into account loss of contaminants due to processing/cooking of the food
+
Occurrence data used in models:
Exclusion of foods with potentially very low contamination (fruit, vegetable) -
For some food categories older concentration data was used (data used was collected between 2003-2010)
+
Occurrence data is predominantly based on national food production only and does not take into consideration imported food (with the exception of canned fish)
-
Linkage of food consumption data and occurrence data:
For some food groups concentration data was extrapolated from other related food groups +/-
Body Burden Calculations:
Extrapolations from breast milk concentration data to body burden +/-
* Key to direction and magnitude: +, ++, +++ = uncertainty likely to cause small, medium or large over-estimation of exposure; -, - -, - - - = uncertainty likely to cause small, medium or large under-estimation of exposure.
Several sources of potential under- and/or overestimation of exposure were identified.
Whilst certain sources of error are difficult to minimise, such as those associated with
collecting food consumption information from individuals, for other errors generating
additional data would lead to a decrease in uncertainty. In this particular study, additional
information on frequency of food consumption via for example a food frequency
questionnaire could have assisted in the estimate of long term intake of foods. Surveys
targeting specific areas, such as coastal areas would improve knowledge on of specific
consumption patterns and collection of up up-to to-date contaminant concentration data
for a wider group of foods (thereby decreasing the need for extrapolation from one food
type to another), and inclusion of imported foods for all food categories would provide a
more precise estimate of exposure. For example, the exclusion of fruit, vegetables and
cereals from the exposure assessment was a likely source of under-estimation, but due to

104
generally low occurrence levels in these foodstuffs, exposure estimates are typically driven
by the analytical method sensitivity, i.e. where methods have a high LOQ and POPs are not
detected, the requirement to estimate upperbound concentrations can greatly
overestimate the contribution of these foodstuffs to the overall intake. For this reason,
data generated in Ireland in 2003 for fruit, vegetables and cereals (FSAI, 2005b) were not
included in the exposure assessment due to the relatively high LOQs reported for these
foodstuffs (LOQ of 0.04 pg/g fresh weight).
A study specifically targeted at estimating dioxin exposure from vegetables was conducted
in the Netherlands in 2004 (Hoogerbrugge et al, 2004), which arrived at a most likely
estimated average intake of 0.014 pg TEQ (1998)/kg bw /day (Sum PCDD/F & non-ortho
PCBs), contributing to less than 2 % of the mean total daily dioxin intake in the
Netherlands, which was deemed negligible by the authors. A recent study undertaken in
Spain in 2010 (Perello et al, 2012) reported mean medium-bound (MB: <LOD=½LOD)
concentrations of TEQ (2005) PCDD/F 0.002 and 0.003 ng/kg fresh weight (fw) in
vegetables & tubers and pulses, TEQ (2005) DL-PCBs of 0.003 ng/kg fw in all vegetables
including tubers and pulses. Levels reported for fruit and cereals were similar at 0.003 and
0.006 ng/kg fw TEQ (2005) PCDD/F and 0.004 and 0.006 ng/kg fw for TEQ (2005) DL-PCBs,
respectively. Summed exposure values reported by Perello et al (2012) indicate an intake of
Total WHO TEQ (2005) 2.6 pg/d (0.04 pg/kg bw/d for a 70 kg adult) from fruit and
vegetables, presenting approximately 6.8% of total exposure to dioxins. For cereals, the
reported figure of 2.7 pg/d represent 7% of total exposure to dioxins.
In an attempt to estimate potential additional exposure of adults resident in Ireland to
dioxins from fruit and vegetables, the concentration data reported for Spain (Perello et al,
2012) have been combined with consumption data available for Ireland. The so derived
exposure estimates indicate a potential 10% contribution from fruit and vegetables, and a
6% contribution from cereals to the total dioxin intake. The latter derived estimates would
increase the mean exposure estimate derived in this study to Total WHO TEQ (2005) 0.35
pg/kg bw/d, however, due to all concentration data for fruit, vegetables and cereals being
reported as <LOD, and data being derived from a study conducted in Spain, there is
considerable uncertainty associated with these estimates.
105
4 The 2008 Dioxin Contamination of Irish Pork
4.1 Introduction
In September 2008 a feed contamination incident occurred in Ireland, which subsequently
led to contamination of pig herds and cattle herds supplied with this feed.
4.1.1 Discovery of the contamination
The incident was discovered in November 2008, when a pork fat sample, taken as part of a
routine monitoring programme under Commission Directive 96/23/EC (EC, 1996) was
found by the PCS to contain elevated levels of three Marker PCBs (NDL- PCBs 153, 138,
180). Under this program, an average of 300 animal kidney fat samples are analysed for the
7 Marker PCBS (PCBs 28, 52, 101, 118, 138, 153, 180) per year. Following on from this
discovery, further porcine fat tissue samples and also animal feed ingredients were
analysed from the identified pig farm and tested for the presence of Marker PCBs.
Simultaneously, the same samples were also sent to the Food and Environment Research
Agency (FERA) in the United Kingdom for High Resolution Gas Chromatography/Mass
Spectrometry (GC/MS) analysis of dioxins.
4.1.2 Source of contamination
Feed ingredients taken from the implicated farm comprised of Pot Ale Syrup, Soya Oil, Soya
Meal, Soya Hulls, Feed Minerals, Barley, Dried Breadcrumbs and Wheat.
Analysis of these samples by PCS, using Gas Chromatography/Electron Capture Detector
(GC/ECD) and Gas Chromatography/Mass Selective Detector (GC/MSD), confirmed the
presence of elevated levels of Marker PCBs in the porcine fat samples and found elevated
levels of Marker PCBs in the dried breadcrumb feed components. All other feed
components did not contain detectable levels of PCBs.
The source of the breadcrumb ingredient was traced back to a feed recycling plant, and a
full investigation into the manufacture and distribution of this feed was undertaken. The
plant produced feed via recycling of waste bread and waste dough delivered to the site
from various bread factories.
The process was based on a convection drying system, in which combustion gas was used
as a drying gas, thereby coming in direct contact with the material to be dried. The
106
reported gas temperature in the fire tube was on average 425°C, whereas the temperature
of the exhaust gas at the end of the dryer was on average 80°C. In this system, feed
material was conveyed through the dryer entrained in the flue gas/air stream assisted by
the rotary motion of the dryer, reducing the moisture content of the ingoing material from
on average 40 % down to on average 8 %. This system was capable of processing
approximately 7 tonnes of raw material per hour.
Examination of the production process revealed that the fuel oil used to produce the drying
gas was the cause of the contamination. Analysis of individual samples of raw material
sampled prior to the drying process confirmed this conclusion, as none of these samples
were found to be contaminated. It was therefore concluded, that contamination must have
taken place during the drying process and was due to airborne deposition and consequent
adsorption of contaminants contained in the exhaust gas onto the surface of the feed
material. Subsequent analysis of the fuel oil confirmed a very high contamination with
PCBs.
4.1.3 Tracing of contaminated produce and onset of contamination
A list of farms which had received feed material from the premises was compiled and feed
samples, both current and archive samples from late July 2008, were submitted to the PCS
for analysis for presence of Marker PCBs. All animal herds which had received feed from
the implicated feed mill were identified and immediately put under restriction by DAFM
pending further investigation. In total, 12 pig farms and 49 cattle farms were restricted.
Two animals from each affected herd and known to have been fed contaminated feed from
the implicated feed mill were slaughtered and renal fat was analysed for the presence of
marker PCBs and dioxins. As a consequence, nine of the restricted pig herds and 27 of the
restricted cattle herds were fully depopulated and 8 cattle herds were partially
depopulated (due to farm to farm animal movement). In total, 5707 cattle and 170605 pigs
were culled as a result, representing 0.09 % of the entire live cattle herd population and 10
% of the entire live pig herd population in 2008
Analysis of archive feed samples from the implicated feed mill indicated that the
contamination incident began 25th August and ended on 26th September, which correlates
with an on-farm contamination window from 1st September through to approximately the
10th of October (see Figure 12).

107
Figure 12 Results of Analysis of Archive Feed Samples (13Aug – 3 Dec)
Data Source: PCS
This window was further supported by the presence of certain congeners in the pork fat
which are usually metabolised quickly and information received from the feed mill operator
regarding the use of the oil.
A simultaneous investigation by the Dutch authorities into elevated levels of dioxins found
in a deboned pork loin sample detected in a French processing plant identified the origin of
pork to be from Ireland.
This was based on tracking and tracing of origin of the meat supply and subsequent testing
of batches received. Full confirmatory results for samples taken from meat of Irish origin
became available shortly after the issue had already been identified in Ireland, and the
congener patterns in samples analysed in the Netherlands matched results for samples
taken in Ireland. The contamination had also been picked up by a gelatine processing plant
in Belgium, which observed a steady increase in dioxin concentrations from mid September
onwards, further supporting the estimated onset of contamination identified from analysis
of archive feed samples. The congener profile showed a comparable distribution of
congeners with the meat sample taken from the French processing plant, which was a
strong argument for one source of contamination (Heres L et al, 2010). A full review of the
tracing and identification of the contamination source in the Netherlands was published by
Heres et al (Heres L et al, 2010).
13-A
ug
20-A
ug
27-A
ug
03-S
ep
10-S
ep
17-S
ep
24-S
ep
01-O
ct
08-O
ct
15-O
ct
22-O
ct
29-O
ct
05-N
ov
12-N
ov
19-N
ov
26-N
ov
03-D
ec
Negative
Positive ++
Traces
Positive --
Positive
108
4.1.4 The Recall
Final confirmation and full extent of the scale of contamination became apparent when full
congener profile analysis for the first lot of pork fat samples became available on Dec 6th
2008. These indicated a Total TEQ ranging from 80 - 200 pg/g fat in the pork fat samples.
An Inter Departmental/Agency group chaired by the Minister for Agriculture, Food and the
Marine, and attended by the Irish Prime Minister, the Minister for Health and Children, the
Minister of State for Food Safety, the Minister of State for Food Promotion, the Chief
Medical Officer, the FSAI, and officials from the Department of Agriculture, Food and the
Marine and Department of Health and Children met on 6th December 2008 to discuss the
emerging situation. At least 10 pig farms were implicated in the feed incident, representing
8 % of total pig production in Ireland. However products from a wider range of farms were
supplied to major processing plants and it was impossible to trace back final consumer
products to the individual farms. As a consequence all pork products manufactured from
pigs slaughtered in Ireland between 1st Sep and 6th December were withdrawn and a
consumer recall was initiated. Cattle farms were less implicated, with only 0.02 % of the
total beef production affected and implicated products were traced and withdrawn from
trade.
A recall is generally viewed as a public process in which unsafe food must be removed from
the market whilst informing consumers. Withdrawal, on the other hand, is viewed as a
business to business communication process to remove unsafe food from the distribution
chain before it has reached the consumer (FSAI, 2007).
4.1.5 Initial Risk Assessment
From all the information available at the time, it was possible to determine that consumers
were exposed to contaminated pork and beef products for a period of approximately 3
months, starting September 1st and ending December 6th 2008 when the recall of pork
produce was issued.
The initial calculated additional body burden to Irish consumers from the incident was
estimated at 10 % from pork products. EFSA (EFSA, 2008) considered this increase in body
burden of no concern for this single event. An additional increase to the body burden of
0.035 % from beef products was also derived at the time. However, the actual span of
contamination was found to be wider after the initial risk assessments were performed.
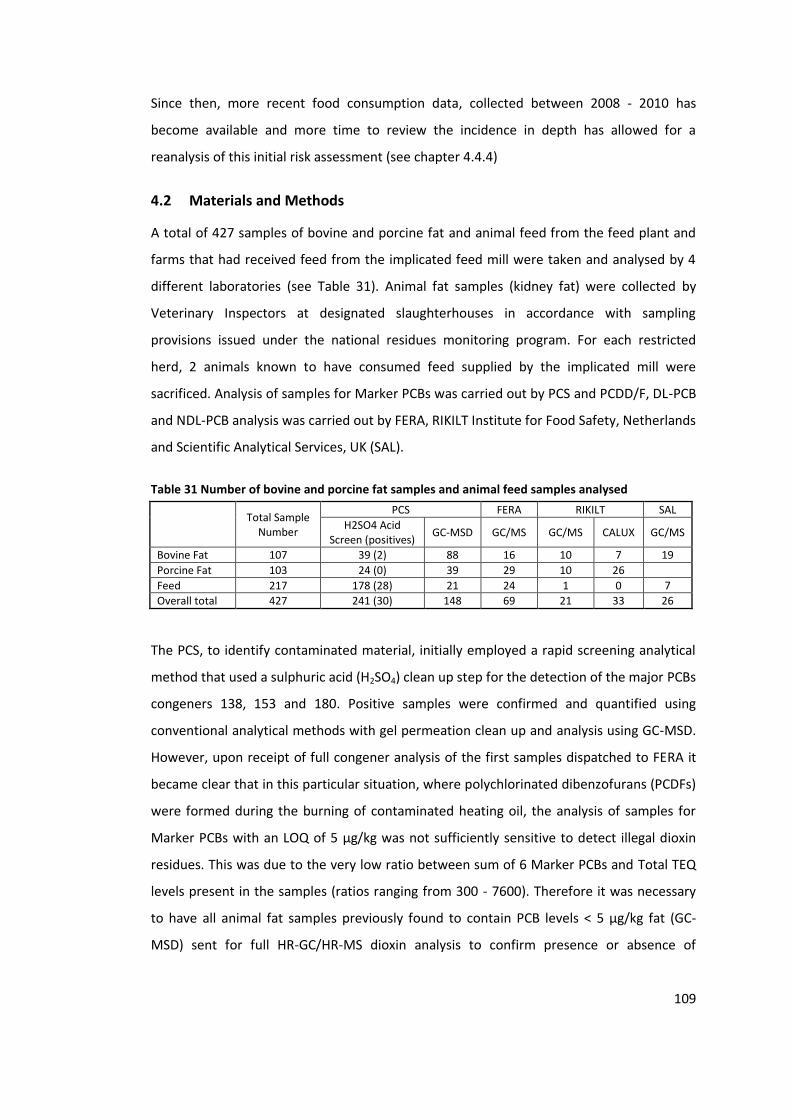
109
Since then, more recent food consumption data, collected between 2008 - 2010 has
become available and more time to review the incidence in depth has allowed for a
reanalysis of this initial risk assessment (see chapter 4.4.4)
4.2 Materials and Methods
A total of 427 samples of bovine and porcine fat and animal feed from the feed plant and
farms that had received feed from the implicated feed mill were taken and analysed by 4
different laboratories (see Table 31). Animal fat samples (kidney fat) were collected by
Veterinary Inspectors at designated slaughterhouses in accordance with sampling
provisions issued under the national residues monitoring program. For each restricted
herd, 2 animals known to have consumed feed supplied by the implicated mill were
sacrificed. Analysis of samples for Marker PCBs was carried out by PCS and PCDD/F, DL-PCB
and NDL-PCB analysis was carried out by FERA, RIKILT Institute for Food Safety, Netherlands
and Scientific Analytical Services, UK (SAL).
Table 31 Number of bovine and porcine fat samples and animal feed samples analysed
Total Sample Number
PCS FERA RIKILT SAL
H2SO4 Acid Screen (positives)
GC-MSD GC/MS GC/MS CALUX GC/MS
Bovine Fat 107 39 (2) 88 16 10 7 19
Porcine Fat 103 24 (0) 39 29 10 26
Feed 217 178 (28) 21 24 1 0 7
Overall total 427 241 (30) 148 69 21 33 26
The PCS, to identify contaminated material, initially employed a rapid screening analytical
method that used a sulphuric acid (H2SO4) clean up step for the detection of the major PCBs
congeners 138, 153 and 180. Positive samples were confirmed and quantified using
conventional analytical methods with gel permeation clean up and analysis using GC-MSD.
However, upon receipt of full congener analysis of the first samples dispatched to FERA it
became clear that in this particular situation, where polychlorinated dibenzofurans (PCDFs)
were formed during the burning of contaminated heating oil, the analysis of samples for
Marker PCBs with an LOQ of 5 µg/kg was not sufficiently sensitive to detect illegal dioxin
residues. This was due to the very low ratio between sum of 6 Marker PCBs and Total TEQ
levels present in the samples (ratios ranging from 300 - 7600). Therefore it was necessary
to have all animal fat samples previously found to contain PCB levels < 5 µg/kg fat (GC-
MSD) sent for full HR-GC/HR-MS dioxin analysis to confirm presence or absence of
110
contamination. A number of samples were also pre-screened by RIKILT using the Dr CALUX
Bioassay.
Animal samples found to contain levels of individual Marker PCBs > LOQ (5 µg/kg fat) were
treated as confirmative of contamination and the relevant herds were subsequently
depopulated without further testing.
4.3 Results
4.3.1 Feed
HRGC/HRMS results in raw feed ingredient material (20 samples), pre-drying, were found
to contain up to 0.95 pg/g whole weight Total TEQ (1998) (upperbound). Six of these 20
samples were dough and bakery waste samples used in the production of the breadcrumb
and biscuit feed material. This indicated that the dough and bakery waste was not
contaminated prior to its arrival at the feed processing plant.
HRGC/HRMS results in the final, dried product, i.e. contaminated breadcrumb/biscuit feed
(12 samples) ranged from 25 to 18870 Total TEQ (1998) pg/g whole weight, of which
between 92 - 99 % was attributable to PCDFs. 2,3,4,7,8 Penta-Chloro-Dibenzo-Furan
(2,3,4,7,8 PeCDF) was found to be the major congener, contributing between 73 - 75 % to
the Total TEQ (1998), followed by Tetra-Chloro-Dibenzo-Furan (TCDF) which on average
contributed 16 % to the Total TEQ (1998). DL-PCBs contributed between 0.6 - 3 % to the
Total TEQ (1998), PCB 126 contributing between 42 and 50 % to the DL-PCB-TEQ (1998).
In terms of total mass, TCDF and 2,3,4,7,8 PeCDF were the dominant congeners,
contributing on average 35 % each to the total mass of PCDD/Fs in the products. For DL-
PCBs, PCBs 118 and 156 were the top contributors, each contributing on average 41 and 22
% respectively (see Figure 13).
The concentration of sum of 6 Marker PCBs (Marker PCBs 28, 52, 101, 138, 153, 180)
ranged from 0.47 – 3615 µg/kg whole weight with contributions of PCB 138 > PCB 153 >
PCB 180 > PCB 101 > PCB 52 ≥ PCB 28 (see Figure 14).
4.3.2 Porcine Fat
Results in pork fat taken from 12 implicated herds (Herds A - L) ranged from 0.21 – 1430
Total TEQ (1998) pg/g fat weight. Of the 12 herds tested, 9 herds (Herds A – I) showed the
111
characteristic contamination pattern (see Figure 13), whereas the remaining 3 herds
indicated only traces (Herd J) or absence (Herds K and L) of contamination (see Table 32).
Concentration in Herds A – I ranged from 12 – 1430 Total TEQ (1998) pg/g fat weight, of
which between 91 – 97 % was attributable to PCDFs. 2,3,4,7,8 PeCDF contributed between
76 – 87 % to the Total TEQ (1998). DL-PCBs contributed between 4 – 8 % to the Total TEQ
(1998), PCB 156 being the major contributor to DL-PCB-TEQ (1998).
In terms of total mass, 2,3,4,7,8 PeCDF was the dominant congener in 8 herds (Herds A, C -
I), contributing on average 51 % to the total mass of PCDD/Fs in the samples. In one herd
(Herd B) OCDD was the dominant congener, contributing on average 51 % to total PCDD/F
mass. For DL-PCBs, PCB 156 was the top contributor, contributing on average 54 % to total
DL-PCB mass (see Figure 13).
The sum of 6 Marker PCBs ranged from 10 to 5364 µg kg/fat, with congeners 180, 153 and
138 being the major contributors in contaminated samples (Herds A - I), contributing a total
of between 98 - 99 % to the total in the contaminated herds (see Figure 14).
4.3.3 Bovine Fat
Of a total of 49 restricted herds, 12 showed levels of Sum 3 Marker PCBs (138, 153, 180) >
LOQ (5 µg/kg fat), ranging from 46 to 1650 µg kg/fat, and no further confirmatory testing
was performed. Of the remainder, HRGC/HRMS results in bovine fat taken from 30
restricted herds (Herds 1 - 30, see Table 33) ranged from 0.5 – 1403 Total TEQ (1998) pg/g
fat weight. Of these 30 herds tested, 17 herds contained levels below the legal limit (3 pg/g
fat PCDD/F and 4.5 pg/g fat Total WHO TEQ (1998)). The remaining 13 herds showed Total
TEQ (1998) levels ranging from 11.6 – 1403 pg/g fat. 2,3,4,7,8 PeCDF was found to
positively correlate to Total TEQ (1998) (0.99), contributing between 77 – 91 % to the Total
TEQ (1998) in non-compliant samples (see Figure 13), and between 7.6 - 64 % in compliant
samples.
DL-PCBs contributed between 1.4 – 7.1 % to the Total TEQ (1998) in non-compliant
samples, PCB 126 being the major contributor to DL-PCB-TEQ (1998) (see Figure 13).
The concentration of sum of 6 Marker PCBs ranged from 7.8 - 913 µg kg/fat weight with
contributions of PCB 138/PCB 153 > PCB 180 > PCB 101 > PCB 52/PCB 28 (see Figure 14).

112
4.3.4 Fuel Oil
Fuel oil samples were initially analysed by the PCS for Marker PCBs and further samples
were taken from the feed plant by the Environmental Protection Agency (EPA) and sent for
full dioxin analysis as part of their investigation into potentially illegal disposal of PCBs. The
latter samples were found to contain high levels of PCBs (on average 364 mg/kg 7 Marker
PCBs and 29 mg/kg DL-PCBs) and also some PCDD/Fs (on average 10 µg/kg, 75 % PCDFs).
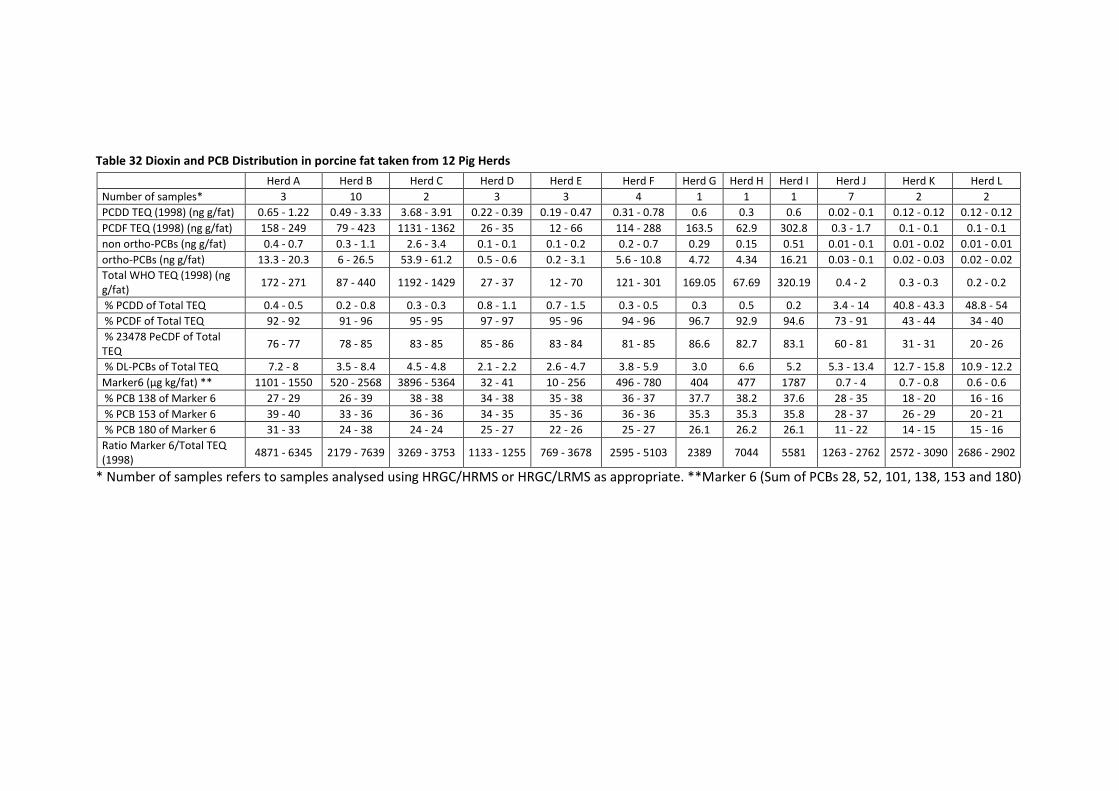
Table 32 Dioxin and PCB Distribution in porcine fat taken from 12 Pig Herds
Herd A Herd B Herd C Herd D Herd E Herd F Herd G Herd H Herd I Herd J Herd K Herd L
Number of samples* 3 10 2 3 3 4 1 1 1 7 2 2
PCDD TEQ (1998) (ng g/fat) 0.65 - 1.22 0.49 - 3.33 3.68 - 3.91 0.22 - 0.39 0.19 - 0.47 0.31 - 0.78 0.6 0.3 0.6 0.02 - 0.1 0.12 - 0.12 0.12 - 0.12
PCDF TEQ (1998) (ng g/fat) 158 - 249 79 - 423 1131 - 1362 26 - 35 12 - 66 114 - 288 163.5 62.9 302.8 0.3 - 1.7 0.1 - 0.1 0.1 - 0.1
non ortho-PCBs (ng g/fat) 0.4 - 0.7 0.3 - 1.1 2.6 - 3.4 0.1 - 0.1 0.1 - 0.2 0.2 - 0.7 0.29 0.15 0.51 0.01 - 0.1 0.01 - 0.02 0.01 - 0.01
ortho-PCBs (ng g/fat) 13.3 - 20.3 6 - 26.5 53.9 - 61.2 0.5 - 0.6 0.2 - 3.1 5.6 - 10.8 4.72 4.34 16.21 0.03 - 0.1 0.02 - 0.03 0.02 - 0.02
Total WHO TEQ (1998) (ng g/fat)
172 - 271 87 - 440 1192 - 1429 27 - 37 12 - 70 121 - 301 169.05 67.69 320.19 0.4 - 2 0.3 - 0.3 0.2 - 0.2
% PCDD of Total TEQ 0.4 - 0.5 0.2 - 0.8 0.3 - 0.3 0.8 - 1.1 0.7 - 1.5 0.3 - 0.5 0.3 0.5 0.2 3.4 - 14 40.8 - 43.3 48.8 - 54
% PCDF of Total TEQ 92 - 92 91 - 96 95 - 95 97 - 97 95 - 96 94 - 96 96.7 92.9 94.6 73 - 91 43 - 44 34 - 40
% 23478 PeCDF of Total TEQ
76 - 77 78 - 85 83 - 85 85 - 86 83 - 84 81 - 85 86.6 82.7 83.1 60 - 81 31 - 31 20 - 26
% DL-PCBs of Total TEQ 7.2 - 8 3.5 - 8.4 4.5 - 4.8 2.1 - 2.2 2.6 - 4.7 3.8 - 5.9 3.0 6.6 5.2 5.3 - 13.4 12.7 - 15.8 10.9 - 12.2
Marker6 (µg kg/fat) ** 1101 - 1550 520 - 2568 3896 - 5364 32 - 41 10 - 256 496 - 780 404 477 1787 0.7 - 4 0.7 - 0.8 0.6 - 0.6
% PCB 138 of Marker 6 27 - 29 26 - 39 38 - 38 34 - 38 35 - 38 36 - 37 37.7 38.2 37.6 28 - 35 18 - 20 16 - 16
% PCB 153 of Marker 6 39 - 40 33 - 36 36 - 36 34 - 35 35 - 36 36 - 36 35.3 35.3 35.8 28 - 37 26 - 29 20 - 21
% PCB 180 of Marker 6 31 - 33 24 - 38 24 - 24 25 - 27 22 - 26 25 - 27 26.1 26.2 26.1 11 - 22 14 - 15 15 - 16
Ratio Marker 6/Total TEQ (1998)
4871 - 6345 2179 - 7639 3269 - 3753 1133 - 1255 769 - 3678 2595 - 5103 2389 7044 5581 1263 - 2762 2572 - 3090 2686 - 2902
* Number of samples refers to samples analysed using HRGC/HRMS or HRGC/LRMS as appropriate. **Marker 6 (Sum of PCBs 28, 52, 101, 138, 153 and 180)

114
Table 33 Dioxin and PCB Distribution in bovine fat taken from 30 Cattle Herds
Herd 1 Herd 2 Herd 3 Herd 4 Herd 5 Herd 6 Herd 7 Herd 8 Herd 9 Herd 10
Number of samples* 1 1 1 3 1 1 1 1 1 5
PCDD TEQ (1998) (ng g/fat) 11 7 10 0.5-3 3 0.71 0.88 0.43 0.47 0.21 - 0.42
PCDF TEQ (1998) (ng g/fat) 1372 700 943 1-332 228 79 81 36 23 11 - 30
non ortho-PCBs (ng g/fat) 6 3 4 0.44-2 2 0.43 0.74 0.38 0.55 0.31 - 0.42
ortho-PCBs (ng g/fat) 14 17 14 0.07-2.8 2.2 0.52 0.69 0.28 0.27 0.24 - 0.34
Total WHO TEQ (1998) (ng g/fat) 1403 727 971 2-340 235 80 84 37 25 12 - 31
% PCDD of Total TEQ 0.8 1.0 1.0 0.9-21 1.1 0.9 1.0 1.2 1.9 1.3 - 1.9
% PCDF of Total TEQ 98 96 97 57-98 97 98 97 97 95 93 - 96
% 23478 PeCDF of Total TEQ 90 83 86 51-91 91 91 90 91 91 87 - 88
% DL-PCBs of Total TEQ 1.4 2.7 1.9 1.4-24 1.8 1.2 1.7 1.8 3.3 2.2 - 5.3
Marker6 (µg kg/fat) ** 710.6 912.6 737.6 2-147.2 107.5 23.7 31.5 12.3 12.0 5.7 - 13.24
% PCB 138 of Marker 6 39 38 36 25-38 35 37 37 37 37 27 - 42
% PCB 153 of Marker 6 36 38 37 37-46 35 36 37 37 37 39 - 40
% PCB 180 of Marker 6 25 24 26 16-24 29 25 25 24 25 19 - 30
Ratio Marker 6/Total TEQ (1998) 506 1255 760 432-821 457 294 376 335 485 373 - 493
Herd 11 Herd 12 Herd 13 Herd 14 Herd 15 Herd 16 Herd 17 Herd 18 Herd 19 Herd 20
Number of samples 1 1 3 2 2 2 1 1 2 1
PCDD TEQ (1998) (ng g/fat) 0 0.14 0.12 - 0.21 0.25 - 1.2 0.12 - 0.53 0.36 - 0.43 0.51 0.35 0.36 - 0.42 0.70
PCDF TEQ (1998) (ng g/fat) 16 11 0 - 1 2 - 12 0 - 1 0.3 - 0.3 0.3 0.65 0 - 1 0.42
non ortho-PCBs (ng g/fat) 0.35 0.58 0.18 - 0.33 0.23 - 0.29 0.12 - 0.57 0.4 - 0.5 0.17 0.28 0.2 - 0.35 0.25
ortho-PCBs (ng g/fat) 0.19 0.25 0.04 - 0.1 0.2 - 0.24 0.05 - 0.05 0.05 - 0.07 0.08 0.06 0.04 - 0.13 0.05
Total WHO TEQ (1998) (ng g/fat) 17 12 1 - 2 3 - 14 1 - 2 1 - 1 1.06 1.35 1 - 2 1.4
% PCDD of Total TEQ 2.0 1.2 13 - 23 8.5 - 9 11 - 35 33 - 34 48 26 24 - 35 49
% PCDF of Total TEQ 95 92 31 - 69 77 - 87 25 - 74 24 - 24 28 49 42 - 48 30
% 23478 PeCDF of Total TEQ 88 86 25 - 59 74 - 77 17 - 64 19 - 20 13 41 24 - 32 18
% DL-PCBs of Total TEQ 3.2 7.1 18 - 47 3.9 - 14.7 15.4 - 40 42 - 43 24 25 23 - 28 21
Marker6 (µg kg/fat) ** 7.8
Not analysed
1 - 2 4 - 6 1 - 1 1 - 2 1.3 0.90 1 - 2 0.50
% PCB 138 of Marker 6 37 21 - 37 36 - 39 25 - 33 30 - 33 38 44 32 - 38 40
% PCB 153 of Marker 6 38 32 - 44 37 - 37 37 - 50 44 - 46 46 44 38 - 41 40
% PCB 180 of Marker 6 23 12 - 21 24 - 27 14 - 17 15 - 16 15 11 25 - 27 20
Ratio Marker 6/Total TEQ (1998) 467 1323 - 1550 432 - 1304 389 - 1088 1286 - 1612 5205 669 766 - 1284 352
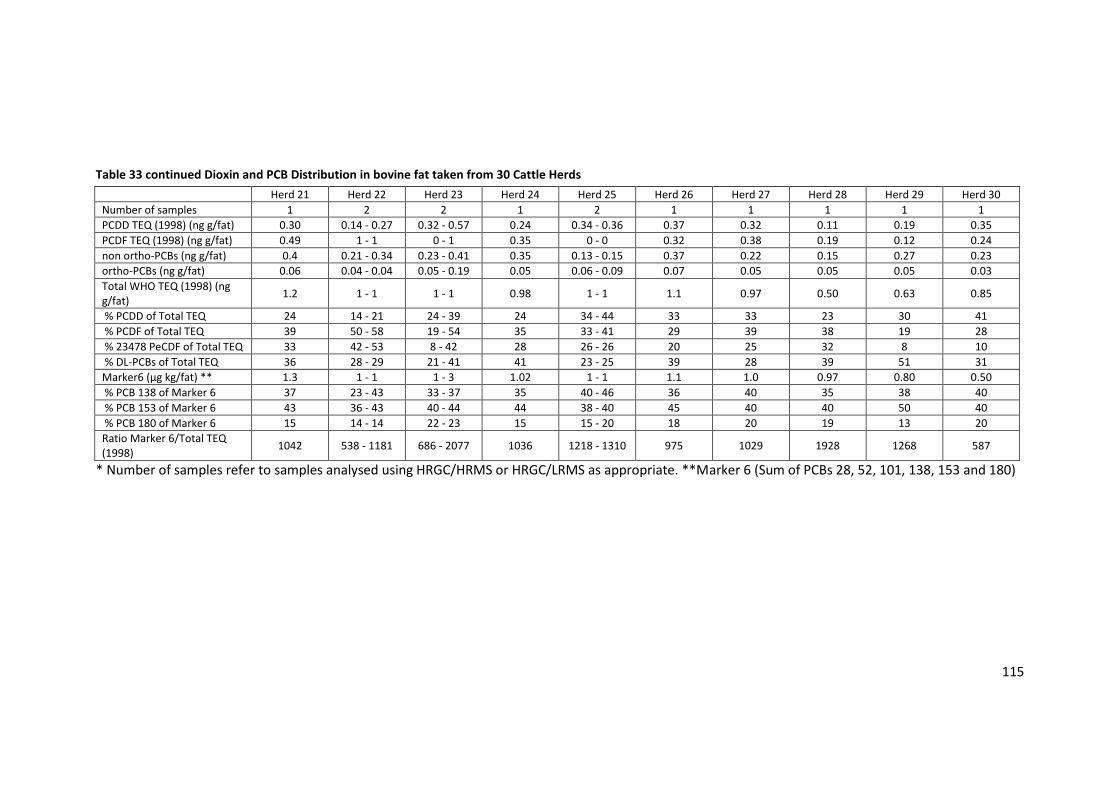
115
Table 33 continued Dioxin and PCB Distribution in bovine fat taken from 30 Cattle Herds
Herd 21 Herd 22 Herd 23 Herd 24 Herd 25 Herd 26 Herd 27 Herd 28 Herd 29 Herd 30
Number of samples 1 2 2 1 2 1 1 1 1 1
PCDD TEQ (1998) (ng g/fat) 0.30 0.14 - 0.27 0.32 - 0.57 0.24 0.34 - 0.36 0.37 0.32 0.11 0.19 0.35
PCDF TEQ (1998) (ng g/fat) 0.49 1 - 1 0 - 1 0.35 0 - 0 0.32 0.38 0.19 0.12 0.24
non ortho-PCBs (ng g/fat) 0.4 0.21 - 0.34 0.23 - 0.41 0.35 0.13 - 0.15 0.37 0.22 0.15 0.27 0.23
ortho-PCBs (ng g/fat) 0.06 0.04 - 0.04 0.05 - 0.19 0.05 0.06 - 0.09 0.07 0.05 0.05 0.05 0.03
Total WHO TEQ (1998) (ng g/fat)
1.2 1 - 1 1 - 1 0.98 1 - 1 1.1 0.97 0.50 0.63 0.85
% PCDD of Total TEQ 24 14 - 21 24 - 39 24 34 - 44 33 33 23 30 41
% PCDF of Total TEQ 39 50 - 58 19 - 54 35 33 - 41 29 39 38 19 28
% 23478 PeCDF of Total TEQ 33 42 - 53 8 - 42 28 26 - 26 20 25 32 8 10
% DL-PCBs of Total TEQ 36 28 - 29 21 - 41 41 23 - 25 39 28 39 51 31
Marker6 (µg kg/fat) ** 1.3 1 - 1 1 - 3 1.02 1 - 1 1.1 1.0 0.97 0.80 0.50
% PCB 138 of Marker 6 37 23 - 43 33 - 37 35 40 - 46 36 40 35 38 40
% PCB 153 of Marker 6 43 36 - 43 40 - 44 44 38 - 40 45 40 40 50 40
% PCB 180 of Marker 6 15 14 - 14 22 - 23 15 15 - 20 18 20 19 13 20
Ratio Marker 6/Total TEQ (1998)
1042 538 - 1181 686 - 2077 1036 1218 - 1310 975 1029 1928 1268 587
* Number of samples refer to samples analysed using HRGC/HRMS or HRGC/LRMS as appropriate. **Marker 6 (Sum of PCBs 28, 52, 101, 138, 153 and 180)
4.4 Discussion
4.4.1 Feed
Following the discovery of the contamination in pigs, all individual feed components in herd
F were analysed for dioxins and PCBs. Full congener analysis of cereals, minerals, oils and
raw feed ingredients (waste bread and waste dough prior to drying) showed levels of total
upper bound TEQ (1998) of 51 pg/g whole weight and were found consistent with normal
background concentrations in these substrates (EFSA, 2010b). A very wide range of
elevated concentrations of dioxins and PCBs was observed in the final product (dried
breadcrumb/biscuit), with concentrations differing in up to three orders of magnitude. The
sum of six marker PCBs were found to be present in very high concentrations ranging from
0.4 to 3615 mg/kg whole weight. PCDD/F and DL-PCB TEQ (1998)s ranged from 2 to 18756
pg/g and from 0.04 to 112 pg/g, respectively, with TCDF and 2,3,4,7,8-PeCDF on average
contributing 16 % and 72 % to the Total TEQ (1998), respectively. The average ratio
between the sum of six marker PCBs and Total TEQ (1998) was 200. The wide span of
contamination levels can be attributed to a number of factors. The samples were sourced
from the feed manufacturer and farms/feed mills that had obtained material from the feed
manufacturer, suggesting that samples taken came from different production batches.
Contaminant uptake in the feed is also dependent on the amount of fat in the raw feed
material, the surface area exposed to the exhaust gases, the absorptive/adsorptive capacity
of the feed material, the level of contamination in the fuel oil used in the production line,
the burning temperature in the firing unit and the time of exposure to the exhaust gases
during drying. A high level of consistency between the relative concentrations of specific
congeners to the overall total (mass and TEQ (1998), as shown in Figure 13 and Figure 14)
can be seen for all samples, confirming that all samples were most likely to have been
exposed to the same source of contamination.
4.4.2 Porcine fat
Of the 12 pig herds tested, nine primary pig herd producers were found to hold
contaminated livestock, and these nine herds and all associated secondary or tertiary herds
were depopulated (12 full depopulations and six partial depopulations). The congener
profiles found in the fat samples taken from the affected pig herds (Figure 13 and Figure
14) were all in agreement and confirmed that contamination was likely to have originated
from the same source. 2,3,4,7,8-PCDF was the major congener, contributing between 76 %
and 86 % to the Total TEQ (1998). The overall congener profile found was in agreement

117
with the pattern found in feed, taking into account the selective metabolism of 2,3,7,8-
TCDF and 1,2,3,7,8-PCDF in pigs (Hoogenboom et al, 2004). As in feed samples, a wide
range of contamination across samples from the pig herds was observed, which can be
explained by the variation found in the feed in combination with differing feed inclusion
rates, age and size of the pigs at slaughter.
4.4.3 Bovine fat
Of the initially 49 restricted cattle herds, 27 were fully depopulated, eight were partially
depopulated and the remaining 14 were found to be free of contamination. Depopulation
took place in accordance with a Veterinary Procedures Notice, requiring the disposal of
animals at a category I animal by-products rendering plant. The congener profile again
compared well with the profile found in feed and in porcine fat samples (Figure 13 and
Figure 14). As with samples taken from pig herds, the low levels of TCDF and 1,2,3,7,8-PCDF
may be attributed to their selective metabolism, which was also observed in other studies
on dairy cows (Fries et al, 1999; McLachlan et al, 1990; Slobs et al, 1995). The wide range of
contamination across samples from bovine herds can be explained by the variation in feed
contamination combined with differing feed inclusion rates, age and size of the cattle at
slaughter.

Figure 13 Congener Pattern for PCDD/Fs and DL-PCBS, expressed on a % of mass and % of TEQ (1998) basis
0%
10%
20%
30%
40%
50%
60%
70%
Percent Contribution to Sum of PCDD/F (mass)
Feed Beef Pork
0%
10%
20%
30%
40%
50%
60%
70%
80%
90%
Percent Contribution to Sum of PCDD/F (TEQ)
Feed Beef Pork
0%
10%
20%
30%
40%
50%
60%
Percent Contribution to Sum of 12 dl-PCB (mass)
Feed Beef Pork
0%
10%
20%
30%
40%
50%
60%
70%
80%
Percent Contribution to Sum of 12 dl-PCB (TEQ)
Feed Beef Pork

119
Figure 14 Congener Pattern for Sum of 6 and Sum of 7 Marker PCBs, expressed on a % of mass basis
0%
5%
10%
15%
20%
25%
30%
35%
40%
Percent Contribution to Sum of 6 Marker PCBs (mass)
Feed Beef Pork
0%
5%
10%
15%
20%
25%
30%
35%
40%
Percent Contribution to Sum of 7 Marker PCBs
Feed Beef Pork

120
4.4.4 Fuel oil
In order to identify the potential source of the contamination, the average congener
pattern of the measured PCBs (7 Marker PCBs and 12 DL-PCBs) in the fuel oil sampled by
the EPA was compared to congener patterns available for several commercial PCB mixtures
(WHO, 1993) and was found to be highly correlated (R = 0.975) with an Aroclor 1260
mixture (see Figure 15 and Figure 16).
Figure 15 shows the average relative levels of analysed PCB congeners in the oil and their
equivalent % in several Aroclor mixtures and Figure 16 displays the correlation between the
PCB concentration found in the fuel oil and the % mol of the same congeners in the Aroclor
1260 mixture. This association strongly suggested that the source of the PCBs in the fuel oil
was a highly chlorinated technical mixture such as Aroclor 1260. Highly chlorinated
mixtures such as Aroclor 1260 and Aroclor 1254 were most commonly used in transformers
(WHO, 1993), pinpointing the possible origin of the PCB mixture. Also the presence of
PCDFs in the fuel oil is consistent with reports of their presence in PCB mixtures in the
literature (WHO, 1993), however, the presence of PCDDs was unexpected, and might be
due to a different source.
Figure 15 Percent contribution of DL-PCBs and 7 Marker PCBs to total mass in commercial Aroclor mixtures and in fuel oil
Source of Aroclor composition: EHC 141 (WHO, 1993)
0% 20% 40% 60% 80% 100%
Aroclor 1242
Aroclor 1016
Aroclor 1248
Aroclor 1254
Aroclor 1260
Fuel Oil
Feed
28 52 77 81 101 105 114 118 123 126 138 153 156 157 167 169 180 189

121
Figure 16 Correlation of PCB composition (mg/kg) in fuel oil and PCB composition (% mol) in Aroclor 1260 commercial PCB mixture
Source of Aroclor composition: EHC 141 (WHO, 1993); R = Pearson Correlation coefficient
The very high concentration of PCDFs found in the feed, could be explained by the
incomplete combustion of the PCBs during burning and subsequent formation of PCDFs
during pyrolysis, as demonstrated by several researchers (Hutzinger et al, 1985).
Production of up to 10 % of PCDFs calculated on the amount of PCBs decomposed under
optimal conditions (temperature range of 550 - 700°C) has been reported by Bentley
(Bentley, 1983). The additional formation of PCDFs during combustion therefore could
explain the very poor correlation of the two PCDD/F datasets for the fuel oil and feed
(R=0.12), whilst for the PCBs, correlation was found to be excellent (R=0.96), further
providing evidence of a contaminant carry-over from the oil onto the feed material. The
fuel oil originated in the UK (Northern Ireland) but it is still unclear how the oil became
contaminated.
4.5 Conclusion
Elevated levels of PCDD/Fs and PCBs were found in bovine and porcine fat samples, which
were in agreement with levels found in feed samples traced back to the contamination site
and resulting from the use of contaminated oil used in a direct-heat feed-drying system.
Strong consistencies in the congener profiles confirmed that contamination most likely
stemmed from the same source, which is strongly indicated to be a commercial highly
chlorinated PCB mixture, such as Aroclor 1260 or similar. Although the manufacture,
processing and distribution of PCBs has been prohibited in almost all industrial countries
R = 0.975
0
20
40
60
80
100
120
0 1 2 3 4 5 6 7 8 9
Fue
l Oil
PC
B c
on
cen
trat
ion
(mg/
kg)
Aroclor 1260 PCB % mol
122
since the 1980s, their entry into the environment still occurs, especially due to leaks in
electrical equipment and hydraulic systems still in use or improper disposal practices (EFSA,
2005). Whilst general background levels of dioxins and PCBs in food are low in Ireland
(FSAI, 2010a), this contamination incident underlines the importance of continued
monitoring of the food and feed supply and it gave rise to new guidelines being issued by
the European Commission Directorate General for Health and Consumers on the use of
convection drying by business operators in the animal feed sector.
123
5 Impact of the 2008 dioxin contamination of Irish pork on exposure
of the Irish Population to Dioxins and PCBs
In 2008 a feed contamination incident (see Chapter 3.3.4) led to contamination of beef and
pork products, which by the time the incident was detected had been available on the Irish
market for approximately 3 months. The following exposure assessment provides an
estimate of the impact of this additional exposure to dioxins and PCBs on top of the general
background exposure estimates to dioxins and PCBs derived in chapter 3.
5.1 Food Consumption Database
The NANS was used to estimate the impact of the 2008 dioxin contamination incident on
dioxin body burden and was modified to facilitate the exposure model as detailed in
section 3.2.1.
5.2 Exposure assessment methodology
Similarly to the estimate of background exposure (see 3.1.3), exposure assessments were
conducted using a Monte Carlo simulation (McNamara et al, 2003) using the web-based
software application CremeTM (Creme Software Ltd., 2013a), which performs exposure
assessments using probabilistic modelling.
For all exposure scenarios calculated here, data has been used for both occurrence data
(see section 5.3.2) and food consumption data (see section 3.2.1), and for each scenario,
intake for a population of 210000 people was simulated (140 iterations of the 1500 NANS
survey population, see 5.3.1).
Of the eleven Category I food categories contained in the converted foodfile (see Annex
7.1), the following six were included in the model: Dairy, Eggs, Fats & Oils, Fish & Fish
Products, Meat & Meat Products, Oil based supplements. With the exception of beef and
pork products for which contamination incident concentration data was used, general
background concentration data was matched to the food groups as described in chapter 3.
As consumption in the foodfile is expressed as intake of fat from these food groups a direct
match with concentration data was possible. The matching of concentration data and food
data was done at Category level I, II or level III, depending on the amount of detail available
(see Annex 7.3).

124
Left censored data was treated as UB. This approach was chosen as the range of results for
the background concentration between LB and UB was very small (see section 3.3.3.2), and
the model was designed to take a conservative approach.
For this exposure scenario three outputs were modelled:
Post-incident Total WHO TEQ (1998) PCDD/F&DL-PCBs – UB
Post-incident Total WHO TEQ (2005) PCDD/F&DL-PCBs - UB
Post incident Sum of 6 Marker PCBs - UB
For each model, intake for the total population was calculated, expressed as intake per
kilogram bodyweight per day (kg/bw/d). Exposure estimates were calculated based on
average daily intakes only, since the additional short term exposure to elevated levels due
to the contamination incident introduced a huge bias in the dataset violating the
requirement for normality for the calculation of usual exposure estimates.
It was assumed that all animals from farms that had received contaminated feed from the
feed mill during the timeframe identified were contaminated, which is a conservative
assumption, since not all farms received feed at the beginning of the contamination time-
frame, and feed inclusion rates and exposure time-frame would have varied widely from
farm to farm. Therefore, this assumption is likely to result in an over-estimate of exposure.
5.2.1 Concentration Data
For the purpose of estimating additional exposure from consumption of contaminated beef
and/or pork, concentration data generated during the crisis in 2008 had to be collated from
several different laboratories and/or state departments, scrutinised in collaboration with
officials from DAFM and was subsequently presented to the public in a recent publication
(Tlustos et al, 2012) (see Chapter 4). Suitable incidence concentration data for beef and
pork were selected from this pool of data and incorporated into the model. As the
presence of the contaminated food needed to be taken into account in addition to the
existing background contamination, a discrete function (background
contamination/incident contamination probability) was used based on the derived
presence probabilities (see 5.2.2) to apportion occurrence.

125
5.2.2 Presence Probability
Only a small amount of beef and pork products were placed on the market during the
contamination incidence and presence probabilities of 5 % for pork and 1.1 % for beef were
incorporated into the discrete function (see 5.3.3).
5.3 Results and Discussion
5.3.1 Number of Iterations
As the presence probabilities derived for both pork and beef were quite small (5 % and 1.1
%, respectively, see section 5.3.3), the model needed to be run a sufficient number of times
to produce robust outcomes, especially in the higher percentiles, which are of the greatest
interest in this model, due to the low presence of contaminated produce.
To determine the number of iterations required, the model was run repeatedly with an
increasing number of iterations and outcome was judged using the higher percentiles of
the food group with the lowest presence probability (i.e. beef at 1.1 % ) and their
associated errors as performance measure for each simulation.
Figure 17 Change of P99 +/- Error and 95 % confidence interval over increasing iterations
0.15
0.25
0.35
0.45
0.55
0.65
0.75
0.85
0.95
1.05
1 5 10 20 40 60 80 100 120 160 200 250 300
Tota
l WH
O T
EQ n
g/k
g b
w/d
Number of Iterations
P99 CI 2.5
P99
P99 CI 97.5

126
Figure 18 Change % Error of P98.9, P99 and P99.9 over increasing iterations
Figure 17 shows that stabilisation of the 99th percentile occurs from 120 iterations
onwards. Figure 18 displays the change in % Error of the higher percentiles with increasing
iterations, showing a decreasing change at the higher end of the scale. A cut-off point of 10
% Error for the 99th percentile was chosen to determine the number of iterations required,
which occurred somewhere between 120 - 160 iterations, therefore 140 iterations were
chosen for the model.
5.3.2 Incident Concentration data used in the exposure model
5.3.2.1 Beef
In total, 45 full congener analyses were carried out on bovine fat samples taken during the
crisis. For the purposes of this exposure assessment, results which confirmed absence of
contamination were not included (N=25). Similar to pork (see following section 5.3.3.2), the
results had a very wide span, ranging from Total WHO TEQ (1998) 3 – 1403 pg/g fat (see
Figure 19) with a mean of 204 and a median of 27 pg/g fat, and 75 % of results below 84
pg/g fat. Whilst theoretically, due to better traceability in beef production, it may have
been possible to attribute specific weighting factors to results from specific herds and
derive a distribution for the input model, the latter was hampered by the absence of
specific congener data for all herds implicated. The latter is due to some herds not
requiring confirmatory analysis as the Marker PCB screen already indicated contamination
and the herd was subsequently culled. Therefore, for some herds no congener data is
available. Furthermore, similar to pork, wide inter herd variation could be observed,
therefore individual results cannot be assumed to be valid for an entire herd. The latter
0
5
10
15
20
25
30
35
40
45
50
55
60
1 5 10 20 40 60 80 100 120 160 200 250 300
% E
rro
r o
f P
op
ula
tio
n S
tati
stic
Number of Iterations
% P98.9 Err
% P99 Err
% P99.9 Err

127
variation is assumed to be due to the heterogeneity of the contamination of the feed, feed
inclusion rate, duration of exposure and inter animal variation.
Therefore, for the purpose of estimating additional exposure to the Irish adult population
from consumption of contaminated beef products, a distribution of all selected
concentration data were included for random selection in the model (see Table 34).
5.3.2.2 Pork
In total, 39 full congener analyses were carried out on pork fat samples taken during the
crisis. For the purposes of the exposure assessment, samples taken from sows (N=12) were
excluded, as these were not representative of the product that typically reached the
market. The latter is due to the different physiological condition of the animal, potential
differences in body burden due to repeated pregnancies and lactation and also differences
in feeding regime. Results for these excluded animals were typically found to be at the
lower end of results obtained for animals deemed representative of the final market
product, i.e. weaners/fattening pigs. Also excluded were results which indicated absence of
contamination in the samples tested (N=4) (these farms were subsequently de-restricted
by DAFM). After the exclusions, 23 samples were deemed suitable and results for Total
WHO TEQ (1998) ranged from 37 – 1429 pg/g fat, with a mean of 300 pg/g fat and a
median of 213 pg/g fat. Figure 19 displays a box plot of the available results, which
indicates that the two highest results are statistical extremes13. These samples were taken
from the herds belonging to the feed mill operator, which, possibly due to direct and longer
access to the contaminated feed, may have contributed to the higher concentrations found
in those samples, compared to samples obtained from herds which obtained feed from the
mill.
Any attempt to assign a specific distribution or weighting factors in accordance with
slaughter figures to results associated with specific herds was hampered by the fact that
samples were not taken for the purposes of an exposure assessment, but rather as a
contamination presence/absence indicator to facilitate the recall. Therefore, results
obtained can only be regarded as spot samples and cannot be used to derive any
13 A boxplot shows the five statistics (minimum, first quartile, median, third quartile, and maximum). The points
are outliers. These are defined as values that do not fall in the inner fences. The asterisks or stars are extreme outliers. These represent cases/rows that have values more than three times the height of the boxes.

128
conclusions on potential contamination of other samples, even from the same herd. The
latter is due to the very heterogeneous nature of the contaminated feed (adsorption of
contaminant onto feed material in a tumble drier), which would have resulted in
considerable inter- as well as intra-batch variation of feed. In addition, different feed
inclusion rates, different life stages of the animals exposed, natural variation within the
animal population of interest and absence of information on the age and weight of the
animals slaughtered further adds to the uncertainties already outlined. However, given the
short life span of pigs (e.g. 6 months), it was assumed that the available results provided a
reasonable estimate of the contamination span that may have occurred over the 3 months
exposure period.
Therefore, for the purpose of estimating additional exposure to the Irish adult population
from consumption of contaminated pork products, a distribution of all concentration data,
which were deemed representative of a pig ready for slaughter for human consumption
were included for random selection in the model (see Table 34)
Figure 19 Boxplot of 23 porcine fat and 20 bovine fat results for Total WHO TEQ (1998) used in the exposure assessment

129
Table 34 Summary statistics of incident concentration data used for exposure assessment
Bovine Fat Porcine Fat
N 20 23
TOTAL WHO TEQ (2005) (UB) ng/kg fat
min 1.89 23.4
med 17.2 136
mean 130 188
P75 76.8 180
P90 488 279
max 884 890
TOTAL WHO TEQ (1998) (UB) ng/kg fat
min 2.40 36.6
med 26.9 213
mean 204 300
P75 122 285
P90 752 439
max 1403 1429
Sum of 6 Marker PCBs (UB) µg/kg fat
min 2 41
med 12 958
mean 146 1236
P75 70 1287
P90 716 2364
max 913 5364
5.3.2.3 Additional considerations
No data was collected for offal during the incident and exposure from liver consumption
has been modelled using concentration data collected from fat tissue. Monitoring data
collected in Ireland shows that levels in liver are generally higher than in carcass fat and
there is evidence of sequestration in the liver during high exposure (Hoogenboom et al,
2004; Marchand et al, 2010; Schulz et al, 2005; Spitaler et al, 2005; Thorpe et al, 2001). This
higher accumulation of contamination in the liver has been observed in experimental
studies in pig, cattle and sheep, with levels between 2 - 10 times higher being reported.
However, the accumulation depends on the contamination profile and varies much with
exposure followed by non-exposure (Marchand et al, 2010; Thorpe et al, 2001). Whilst the
chosen approach is likely to present an underestimation of exposure, it is likely to be of low
impact, as consumption of pork and beef liver is extremely rare in Ireland. Of a survey
population of 1500 only 23 (1.5 % ) and 12 (0.8 % ) consumers recorded intake of pork liver
or beef liver, respectively. Due to these very low consumption figures, calculation of
reliable higher percentiles is also not possible or appropriate. However, to test any
potential impact consumption of highly contaminated liver may have had, a ten-fold
concentration of occurrence data observed in carcass fat was incorporated into a separate
model for liver to test for this hypothetical exposure. The outcomes of this hypothetical
sensitivity model are discussed in the Chapter "Summary and Conclusion".
130
5.3.3 Presence Probability
To estimate additional burden from the contamination incident in 2008, specific presence
probabilities were derived to account for the percentage of contaminated beef and pork of
total beef and pork reaching the Irish consumer during the incident window (September –
December 2008).
5.3.3.1 Beef
To determine the amount of contaminated beef that reached the Irish consumer, cattle
balance statistics (see Figure 20) and cattle movement data (see Figure 22) available for
2008 were used.
In 2008 the total output of beef from Irish slaughterhouses was 536554 tonnes carcass
weight equivalents (cwe)14 (DAFM, 2008) and 33939 cwe were imported (CSO, 2013), giving
a total domestic production including imports of 570493 cwe. Of these 87842 went onto
the domestic Irish market (‘domestic consumption’) (CSO, 2013). The latter comprises 27 %
of production from local abattoirs and 73 % from factories and imports. The exact
contribution from each factories and imports to domestic consumption is unknown but can
be approximated (see Table 35). Two scenarios have been created to calculate the range of
contribution, namely A) all imported meat remains on the market and B) all imported meat
is re-exported. The true value will fall in-between these two scenarios. For scenario A, the
contribution from imports and factories was calculated at 34 % and 39 %, respectively and
for scenario B at zero and 73 %, respectively. In terms of overall total factory output
(512463 tonnes cwe), potential supply to the domestic market from factories translates
into between 6 - 12 % (see Figure 20).
This range was used to estimate the amount of contaminated cattle slaughtered in
factories that reached the domestic market during the incident timeframe (Sept - Mid
December). Within this timeframe, a total of 2742 cattle from the affected herds were
moved (see Figure 22) (DAFM, 2011). Of those, 2564 went for slaughter for human
consumption. 652 animals were slaughtered in local abattoirs destined for the domestic
market and 1912 were slaughtered in larger factories, mainly for export purposes (DAFM,
2011). As calculated above, of the latter, between 6 - 12 % was assumed to have reached
14 536,554 tonnes cwe ≈ 1,7 Mio animals (cattle carcase weight = 322 kg)

131
the domestic market, equating to 115 - 230 animals. Therefore, a total of 767 - 882 (652
contaminated animals from local abattoirs and between 115 - 230 contaminated animals
from export factories) reached the domestic market between September and mid
December, which represents 0.96 - 1.11 % of the total amount of cattle (contaminated +
uncontaminated) being placed onto the domestic market in that timeframe (approx. 80000
(DAFM, 2008)).
Whilst a considerable amount of beef would have been consumed already by the time the
contamination incident was discovered, beef from the contaminated herds was traced and
withdrawn from the market on discovery of the contamination. In total 208.5 tonnes of
meat were withdrawn, however, the actual amount of carcasses coming from
contaminated herds is unknown, as the total amount of withdrawn meat also contained
meat from uncontaminated herds (DAFM, 2011). Based on individual daily slaughter
records, it has been estimated that approximately 10 % (DAFM, 2011) of withdrawn meat
originated from contaminated herds. For the purposes of estimating exposure of the
population from consumption of contaminated beef, the amount of withdrawn beef was
not taken into account, which may have resulted in a slight overestimate of exposure.
The presence probability used in the model therefore was 0.011 (1.1 % ), which reflects the
upper estimate of percent contaminated beef of total beef being placed onto the market
during the contamination time period.
5.3.3.2 Pork
In 2008 200500 tonnes cwe15 of pig meat were slaughtered in Ireland and 75500 tonnes
were imported, giving a total domestic production including imports of 276000 tonnes cwe.
Of these, 138000 tonnes cwe went onto the domestic Irish market (‘domestic
consumption’) and 138000 tonnes cwe went for export (see
Figure 21) (Bord Bia, 2008).
Total Domestic Consumption comprises 4000 tonnes cwe from abattoirs slaughtering
exclusively for the domestic market and 134000 tonnes from both imports and factories,
slaughtering predominantly for export but also for the domestic market. The exact
15 201,000 tonnes cwe ≈ 2.5 Mio animals (pig carcase weight = 81 kg)

132
contribution from each factories and imports to domestic consumption is unknown but can
be approximated (see Table 35). Three scenarios were created to calculate the potential
percent contribution from both imports and factory output to domestic consumption,
namely A) all imported meat remained on the market and B) all imported meat was re-
exported. The true value falls in-between these two scenarios. For scenario A, the
contribution from imports and factories was calculated at 55 % and 42 %, respectively and
for scenario B at zero and 97 %, respectively. However, neither of these two scenarios
occur in reality, rather, only a certain amount of imported pig meat is likely to be re-
exported, therefore, a third, scenario, based on expert opinion, was added, namely C) only
imported carcasses and primal cuts were re-exported (after further processing), whereas
imported value added processed product largely remained on the market. The latter
assumption results in a contribution of 31 % from imports and 66 % from factories to the
total of 134000 tonnes cwe from factories and imports. Compared to the total factory
output (196500 tonnes cwe for export and domestic supply), the potential supply to the
domestic market from factories calculates at 47 % .
This percentage can be used to estimate the amount of contaminated pigs slaughtered in
factories that reached the domestic market during the incident timeframe (Sept - Mid
December) (see Figure 22). Within this timeframe, a total of 51734 pigs (DAFM, 2013) from
the affected herds went for slaughter for human consumption. 12 animals were
slaughtered in local authority abattoirs destined for the domestic market (FSAI, 2013) and
51722 pigs were slaughtered in larger export factories, also supplying the domestic market
(DAFM, 2013). As calculated above, of the latter, 47 % was assumed to have reached the
domestic market, equating to 24309 animals. Therefore, a total of 24321 (12 contaminated
animals from local abattoirs and 24309 contaminated animals from export factories)
reached the domestic market between September and mid December, which represents
4.86 % of the total amount of pigs (contaminated + uncontaminated) being placed on the
market in that timeframe (approximately 500000).
Whilst a considerable amount of pork would have been consumed already by the time the
contamination incident was discovered, pork from the contaminated herds was traced and
withdrawn from the market on discovery of the contamination. In total 30000 tonnes of
meat were destroyed (DAFM, 2013), however, the actual amount of carcasses from
contaminated herds is unknown, as the total amount of withdrawn meat also contained

133
meat from uncontaminated herds. For the purposes of estimating exposure of the
population from consumption of contaminated pork, the amount of withdrawn pork was
not taken into account, which may have resulted in a slight overestimate of exposure.
The presence probability used in the model was 0.05 (5 % ), rounded up from 4.86 %, which
reflects the medium bound estimate of percent contaminated pork of total pork being
placed onto the market during the contamination time period, based on expert opinion
incorporated in scenario C.
Table 35 Estimation of contribution of factory slaughter and imports to total domestic consumption
Estimation of Contribution of Factory Slaughter and Import to Total Domestic Consumption (TDC)
Pig (tonnes
cwe)
% of TDC (138000)
% of total factory
slaughter (196500)
Beef (tonnes
cwe)
% of TDC (87842)
% of total factory
slaughter (512463)
Scenario A) All imports remain on market
Abattoirs (domestic) 4000 3 24091 27
Imports 75500 55 33939 39
Contribution from Factories 58500 42 30 29812 34 6
Total Domestic Consumption 138000 100 87842 100
Scenario B) All imports are re-exported
Abattoirs (domestic) 4000 3 24091 27
Imports 0 0 0 0
Contribution from Factories 134000 97 68 63751 73 12
Total Domestic Consumption 138000 100 87842 100
Scenario C) A proportion of imports is re-exported
Abattoirs (domestic) 4000 3
Imports* 42591 31
Contribution from Factories 91409 66 47
Total Domestic Consumption 138000 100 Data Sources: (Bord Bia, 2008; CSO, 2012; DAFM, 2008; DAFM, 2012) Cwe = carcass weight equivalent * In 2008, 75500 cwe of pork were imported, comprising 43.6 % of pork carcasses, cuts and offal and 56.4 % of added value products (bacon, ham, sausages, etc)

134
Figure 20 Beef production statistics 2008 (tonnes carcase weight equivalents (cwe))
Data Sources: (Bord Bia, 2008; CSO, 2012; DAFM, 2008; DAFM, 2012)
Factories (Export &
Domestic)
Abattoirs (Domestic)
Factories 29,812 47%
Import 33,939 53%
Factories 63,751 100%
Import 0 0%
Scenario B % of total Factory output going for
Domestic Consumption12%
Scenario A % of total Factory output going for
Domestic Consumption6%
Total Domestic
Production
512,463536,554 Exports 482,652
24,091
Total Domestic
Production and
Imports
570,493 Abattoirs 24,091
Total Imports 33,939Total Domestic
Consumption87,842 Scenario A
Factories and
Imports63,751
Scenario B
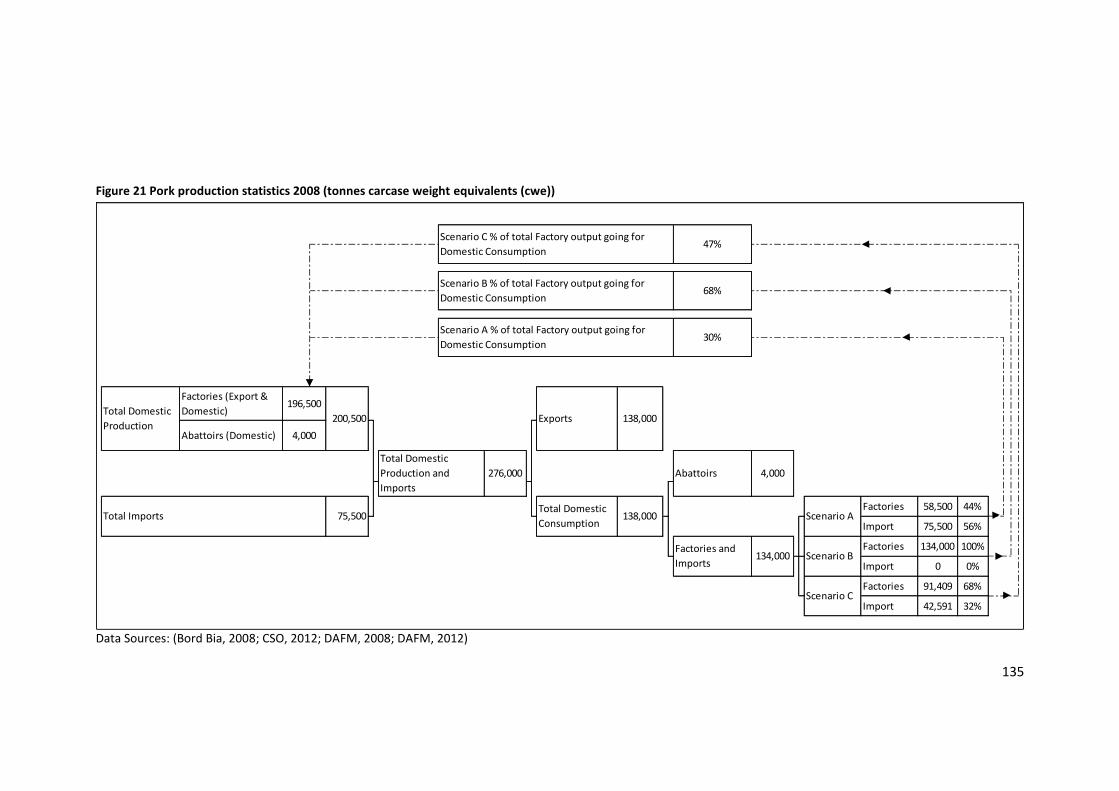
135
Figure 21 Pork production statistics 2008 (tonnes carcase weight equivalents (cwe))
Data Sources: (Bord Bia, 2008; CSO, 2012; DAFM, 2008; DAFM, 2012)
Factories (Export &
Domestic)
Abattoirs (Domestic)
Factories 58,500 44%
Import 75,500 56%
Factories 134,000 100%
Import 0 0%
Factories 91,409 68%
Import 42,591 32%
4,000
Scenario C
276,000
200,500Total Domestic
Production
196,500
4,000
134,000
Total Domestic
Consumption
Exports
Abattoirs
Factories and
Imports
Scenario A
Scenario B
Total Domestic
Production and
Imports
Total Imports 75,500
47%
68%
30%
Scenario C % of total Factory output going for
Domestic Consumption
Scenario B % of total Factory output going for
Domestic Consumption
Scenario A % of total Factory output going for
Domestic Consumption
138,000
138,000

136
Figure 22 Movement of contaminated cattle and pigs during the incident time-frame (Sept – mid Dec), expressed in Number of animals
Data Sources: (Bord Bia, 2008; CSO, 2012; DAFM, 2012; FSAI, 2013)
Knackery 70
Mart 19
Feedlot 73
On Farm Burial 2
Rendering 4
private sale 4
other 6
Affected Cattle Movement 1st Sep 2008 - 13 December 2008 (3.5 months)
Total
2742
0.96 - 1.10 % of
domestic
consumption
Sep-Dec 2008Export Factories 51722 27 Herds 1912Domestic Market
6 - 12%
Local Abattoirs 12 4 Herds 652Domestic Market
100% 767 - 882 animals
on domestic market
Sep-Dec
Affected Pig Movement 1st Sep 2008 - 13 December 2008 (3.5 months)
Total 51,734
4.86 % of domestic
consumption
Sep-Dec 2008Factories (Export/
Domestic)51,722 24,309
Domestic Market
47%
Abattoirs
(Domestic)12 12
Domestic Market
100%24,321 animals on
domestic market
Sep-Dec

137
5.3.4 Exposure Estimates
5.3.4.1 Food consumption
Survey Population Count and Intake of fat from food groups are as described in section
3.3.3.1
5.3.4.2 Post Incidence exposure to Total WHO TEQ (2005) (Sum PCDD/F & DL-PCBS)
Table 36 shows summary statistics of the total population exposure to Total WHO TEQ
(2005) for the total exposure from all food groups following the 2008 contamination
incident, the same data is also displayed graphically in Figure 23. Table 38 provides an
overview of estimated UB exposure to Total WHO TEQ per food group. Results expressed
using the 1998 TEF scheme are provided in the Annex (see Annex 7.4) to facilitate
comparison with previous results.
Table 36 UB Summary statistics of post incident exposure to Total WHO TEQ (2005) from all food groups (pg/kg bw/d)
Group Names Total WHO TEQ (2005) pg/kg bw/d post incident
Mean Med P75 P90 P95 P97.5 P98 P99
TOTAL 1.4 0.27 0.6 2.0 5.5 11 13 23
Figure 23 Total Population Distribution of exposure to Total WHO TEQ from six food groups (Chart truncated at P99)

138
Figure 24 Plotting of background versus post incident distribution for Total WHO TEQ (2005)
As can be seen from Figure 24, the vast majority of the population were not particularly
impacted by the contamination incident, and only higher percentile consumers of the
population had elevated intakes. Table 36 shows that the mean exposure is higher than the
75th percentile, being situated at the 87.4th percentile. This is due to the mean being
"dragged" to the right by the extreme skewness of the distribution, as can be seen in Figure
23. The latter is due to the very low presence of contaminated product (1.1 % and 5 % for
beef and pork, respectively), the effects of which can only be observed in the higher
percentiles of the exposure distribution. The mean therefore does not serve as a good
indicator of the population exposure in this case, and the median, which describes the 50th
percentile is a better statistic.
The median daily intake to Total WHO TEQ (2005) was estimated at 0.3 pg/kg bw/d and
95th percentile intake at 5.5 pg/kg bw/d, which translates into a monthly (30 day) intake of
8 pg/kg bw/m at the median and 165 pg/kg bw/m at the 95th percentile.
The most important contributor to the mean exposure, as expected, came from the
category "Meat and Meat Products, Pork", contributing to 70 % to the total exposure,
followed by "Meat and Meat Products, Beef" and "Fish and Fish Products, Oily Fish",
0
5
10
15
20
25
10 15 20 25 30 35 40 45 50 55 60 65 70 75 80 85 90 95 99
Tota
l WH
O T
EQ (
20
05
) pg
/kg
bw
/d
Percentiles of Population Distribution
Background
Post Incidence

139
contributing up to 10 and 9 % to the total exposure, respectively. Again the latter
percentages were based on the population mean, which as discussed above, sits at the
87.4th percentile, therefore the contribution of food groups to total intake reflects
consumption patterns observed at the higher percentiles.
These exposure figures may be compared to the WHO PMTI of 70 pg/kg bw indicating a
median exposure of 11 % of the tolerable monthly intake. 90.9 % of consumers had intakes
at or below the PTMI, the remaining 9.1 % of the population exceeding the PMTI with an
exposure of the 95th percentile consumer at 244 % of the tolerable monthly intake. The 99th
percentile consumer would have been exposed to almost ten times the PTMI, practically
eroding the safety factor built into the PTMI derived by JECFA (see 1.3.1.4).
However, considering the long biological half-life of dioxins, the impact of an additional
exposure on the body burden is a more relevant indicator of the potential health risk rather
than the daily dose (EFSA, 2008; JECFA, 2002), and therefore comparisons were made using
human milk dioxin data as biomarker of body burden in Ireland.
Human breast milk samples from Ireland were analysed in 2002 and 2009/2010. In 2002,
pooled breast milk samples from the industrialised/urban areas of Cork and Dublin had
concentrations of Total WHO TEQs (1998) of 13.3 and 13.7 pg/g fat, respectively, with
lower concentrations being observed in the sub-urban and rural samples from Wicklow and
Donegal of 11.6 pg/g fat and 8.9 pg/g fat respectively, giving an overall mean of 11.9 pg/g
fat over the 4 samples. In 2009/2010 eleven pools were analysed with results ranging from
Total WHO-TEQs (1998) from 7.5 - 13.7 pg/g fat, the overall pooled sample of milk from
109 mothers in 2010 showing 9.7 pg/g fat (Pratt et al, 2012). These figures were converted
into 2005 WHO TEQs, giving a mean Total WHO TEQ (2005) for the 2002 study of 9.5 pg/g
fat and 8.1 pg/g fat for the overall pooled milk in 2010, respectively.
An average concentration of 9.5 pg/g fat Total WHO TEQ (2005) was used to derive an
estimate of the body burden prior to the contamination incident. No information on body
weight was recorded in the 2002 study, however available information on the body mass
index (BMI) is consistent with BMIs recorded in the 2010 study, which reported an average
bodyweight of 65 kg, which is in line with the average body weight of 67.4 kg reported in
the NANS for women 18-35 years old. The NANS further reported a mean body fat percent
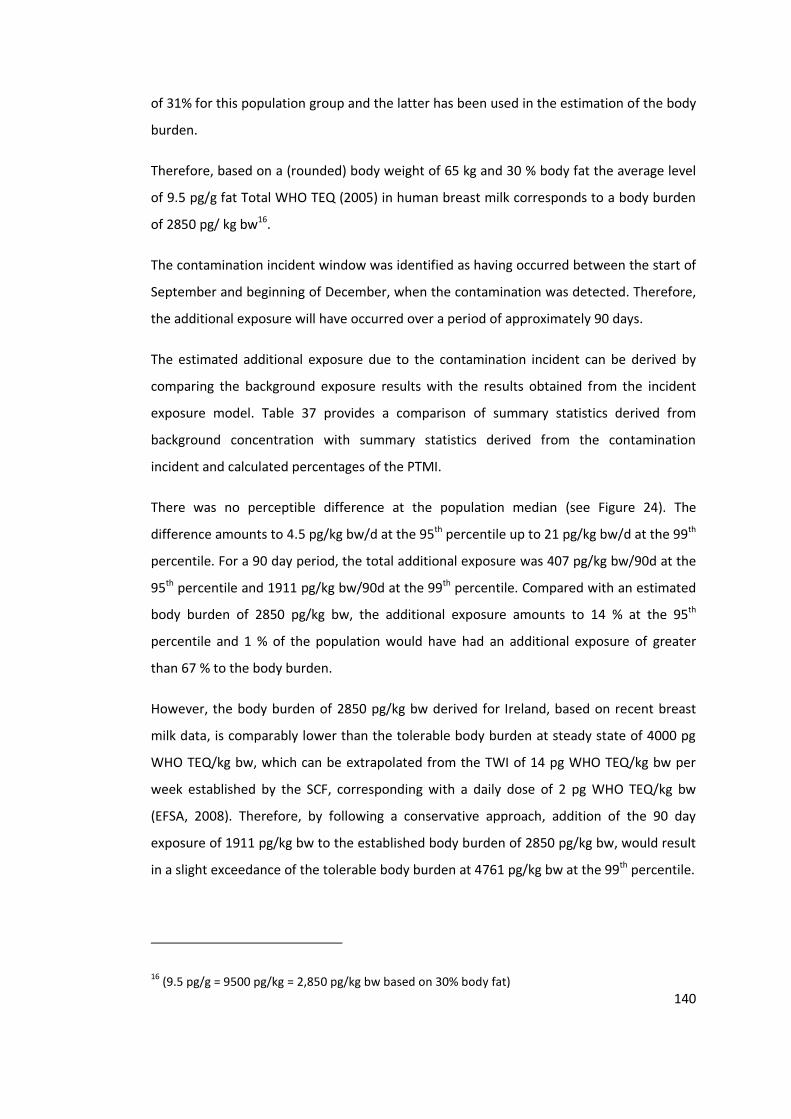
140
of 31% for this population group and the latter has been used in the estimation of the body
burden.
Therefore, based on a (rounded) body weight of 65 kg and 30 % body fat the average level
of 9.5 pg/g fat Total WHO TEQ (2005) in human breast milk corresponds to a body burden
of 2850 pg/ kg bw16.
The contamination incident window was identified as having occurred between the start of
September and beginning of December, when the contamination was detected. Therefore,
the additional exposure will have occurred over a period of approximately 90 days.
The estimated additional exposure due to the contamination incident can be derived by
comparing the background exposure results with the results obtained from the incident
exposure model. Table 37 provides a comparison of summary statistics derived from
background concentration with summary statistics derived from the contamination
incident and calculated percentages of the PTMI.
There was no perceptible difference at the population median (see Figure 24). The
difference amounts to 4.5 pg/kg bw/d at the 95th percentile up to 21 pg/kg bw/d at the 99th
percentile. For a 90 day period, the total additional exposure was 407 pg/kg bw/90d at the
95th percentile and 1911 pg/kg bw/90d at the 99th percentile. Compared with an estimated
body burden of 2850 pg/kg bw, the additional exposure amounts to 14 % at the 95th
percentile and 1 % of the population would have had an additional exposure of greater
than 67 % to the body burden.
However, the body burden of 2850 pg/kg bw derived for Ireland, based on recent breast
milk data, is comparably lower than the tolerable body burden at steady state of 4000 pg
WHO TEQ/kg bw, which can be extrapolated from the TWI of 14 pg WHO TEQ/kg bw per
week established by the SCF, corresponding with a daily dose of 2 pg WHO TEQ/kg bw
(EFSA, 2008). Therefore, by following a conservative approach, addition of the 90 day
exposure of 1911 pg/kg bw to the established body burden of 2850 pg/kg bw, would result
in a slight exceedance of the tolerable body burden at 4761 pg/kg bw at the 99th percentile.
16 (9.5 pg/g = 9500 pg/kg = 2,850 pg/kg bw based on 30% body fat)

141
Table 37 Difference in summary statistics between background concentration and post incident concentration in Total WHO TEQ (2005) pg/kg bw
BACKGROUND Total WHO TEQ (2005) pg/kg bw
Population statistics Median Mean P95 P98 P99
TOTAL Exposure 0.23 0.34 0.99 1.40 1.76
TOTAL Exposure (30 days) 7 10 30 42 53
% of PTMI (70 pg/kg bw/m) 10 14 42 60 75
INCIDENT Total WHO TEQ (2005) pg/kg bw
Population statistics Median Mean P95 P98 P99
TOTAL Exposure (per day) 0.27 1.39 5.5 13 23
TOTAL Exposure (30 days) 8.0 42 166 401 690
% of PTMI (70 pg/kg bw/m) 11 60 236 573 985
ADDITIONAL EXPOSURE (INCIDENCE DATA - BACKGROUND DATA) Total WHO TEQ (2005) pg/kg bw
Population statistics Median Mean P95 P98 P99
TOTAL Exposure (per day) excl background 0.03 - 4.5 12 21
TOTAL Exposure (90 days) excl background 3.1 - 407 1077 1911
% of Body Burden = 2850 pg/kg bw 0.1 - 14 38 67
The derived estimates are likely to present an overestimation, as it is assumed that all of
the contaminants present in the food were absorbed at 100 %, which is unlikely.
Absorption rates for the top two contributing congeners to the Total WHO TEQ in the
contaminated food, namely 2,3,4,7,8 Penta CDF and 1,2,3,4,7,8 Hexa CDF (≈90 %
contribution, see Figure 13), are reported to be around 70 % (US EPA, 2003).
Additional sources of overestimates include the conservative approach taken by
incorporating the higher end of the presence probability range in the model and the
calculation of exposure based on average daily intakes, rather than usual intakes, which is
likely to overestimate exposure in the higher percentiles (see Figure 9).

142
Table 38 Contamination impact - UB Mean, Median and higher percentile exposure to Total WHO TEQ (2005) expressed as pg/kg bw/d and % contribution to the total mean average daily intake
Group Names Total WHO TEQ (2005) pg/kg bw/d post incident
% Contribution Mean Med P75 P90 P95 P97.5 P98 P99
DAIRY, MILKS 2.0 0.03 0.02 0.04 0.06 0.08 0.1 0.1 0.1
DAIRY, CREAMS 0.6 0.009 0.001 0.01 0.03 0.04 0.05 0.06 0.08
DAIRY, YOGHURTS 0.2 0.003 0 0.004 0.01 0.02 0.02 0.02 0.03
DAIRY, CHEESE 1.7 0.02 0.02 0.03 0.06 0.08 0.10 0.1 0.1
DAIRY, BUTTER 1.5 0.02 0.010 0.03 0.06 0.08 0.1 0.1 0.2
DAIRY 6.1 0.09 0.07 0.1 0.2 0.2 0.2 0.3 0.3
EGGS, CHICKEN 0.6 0.008 0.006 0.01 0.02 0.03 0.03 0.03 0.04
EGGS, DUCK 0.002 0.00003 0 - - - - - -
EGGS 0.6 0.008 0.006 0.01 0.02 0.03 0.03 0.03 0.04
MEAT AND MEAT PRODUCTS, BEEF 9.6 0.1 0.02 0.05 0.10 0.1 0.2 0.2 0.4
MEAT AND MEAT PRODUCTS, LAMB 0.7 0.009 0 - 0.04 0.06 0.09 0.1 0.1
MEAT AND MEAT PRODUCTS, PORK 70 1.0 0.02 0.06 1.2 4.8 9.9 12 20
MEAT AND MEAT PRODUCTS, POULTRY 0.5 0.007 0.003 0.007 0.02 0.03 0.05 0.06 0.08
MEAT AND MEAT PRODUCTS, OTHER 0.002 0.00003 0 - - - - - -
MEAT AND MEAT PRODUCTS, MIXED MEAT 0.2 0.003 0 - - - - - -
OFFAL, BEEF 0.006 0.00008 0 - - - - - -
OFFAL, LAMB 0.06 0.0009 0 - - - - - 0.002
OFFAL, PORK 0.1 0.002 0 - - - - - 0.002
OFFAL, POULTRY 0.0004 0.000005 0 - - - - - -
MEAT AND MEAT PRODUCTS 82 1.1 0.07 0.2 1.5 5.3 11 13 23
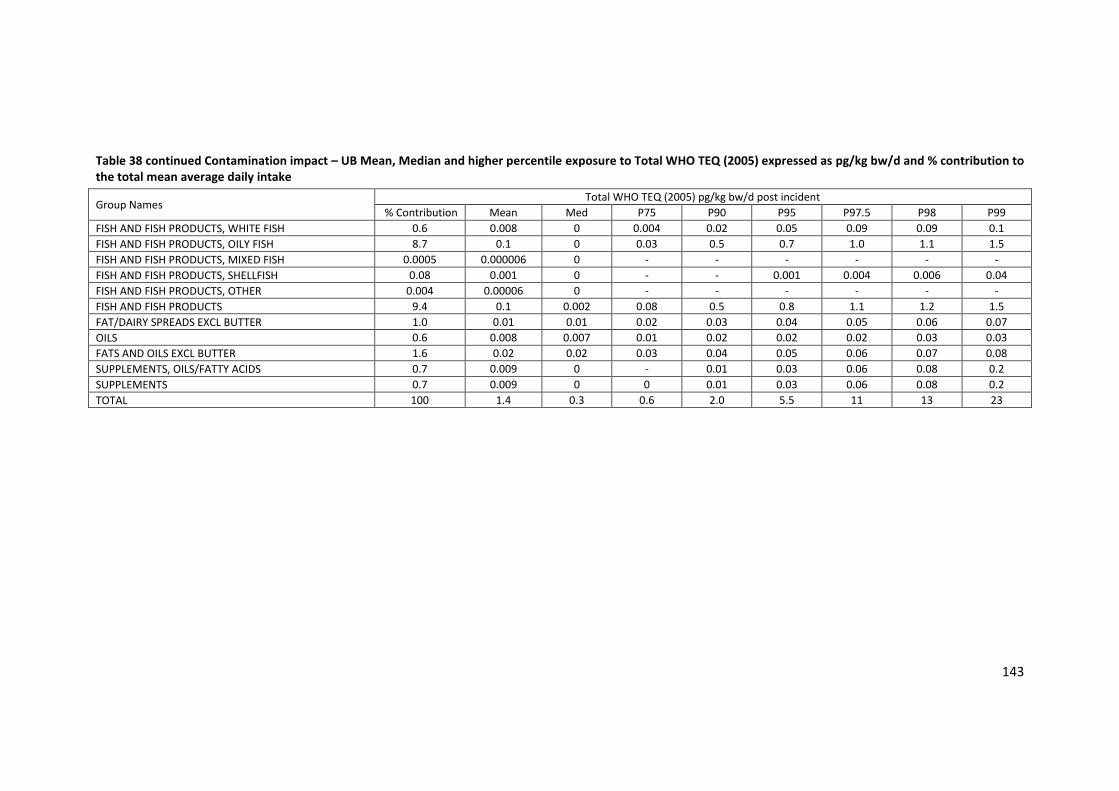
143
Table 38 continued Contamination impact – UB Mean, Median and higher percentile exposure to Total WHO TEQ (2005) expressed as pg/kg bw/d and % contribution to the total mean average daily intake
Group Names Total WHO TEQ (2005) pg/kg bw/d post incident
% Contribution Mean Med P75 P90 P95 P97.5 P98 P99
FISH AND FISH PRODUCTS, WHITE FISH 0.6 0.008 0 0.004 0.02 0.05 0.09 0.09 0.1
FISH AND FISH PRODUCTS, OILY FISH 8.7 0.1 0 0.03 0.5 0.7 1.0 1.1 1.5
FISH AND FISH PRODUCTS, MIXED FISH 0.0005 0.000006 0 - - - - - -
FISH AND FISH PRODUCTS, SHELLFISH 0.08 0.001 0 - - 0.001 0.004 0.006 0.04
FISH AND FISH PRODUCTS, OTHER 0.004 0.00006 0 - - - - - -
FISH AND FISH PRODUCTS 9.4 0.1 0.002 0.08 0.5 0.8 1.1 1.2 1.5
FAT/DAIRY SPREADS EXCL BUTTER 1.0 0.01 0.01 0.02 0.03 0.04 0.05 0.06 0.07
OILS 0.6 0.008 0.007 0.01 0.02 0.02 0.02 0.03 0.03
FATS AND OILS EXCL BUTTER 1.6 0.02 0.02 0.03 0.04 0.05 0.06 0.07 0.08
SUPPLEMENTS, OILS/FATTY ACIDS 0.7 0.009 0 - 0.01 0.03 0.06 0.08 0.2
SUPPLEMENTS 0.7 0.009 0 0 0.01 0.03 0.06 0.08 0.2
TOTAL 100 1.4 0.3 0.6 2.0 5.5 11 13 23

144
5.3.4.3 Post Incidence exposure to Sum of 6 Marker PCBs
Table 39 shows summary statistics of the total population exposure to the sum of 6 Marker
PCBs for the total exposure from all food groups following the 2008 contamination
incident, the same data is also displayed graphically in Figure 25. Table 41 provides an
overview of estimated UB exposure to Total WHO TEQ per food group.
Table 39 UB Summary statistics of post incident exposure to sum of 6 Marker PCBs from all food groups (ng/kg bw/d)
Group Sum of 6 Marker PCBs (ng/kg bw/d) post incident
Mean Med P75 P90 P95 P97.5 P98 P99
TOTAL 8.0 0.8 3.3 13 36 70 84 136
Figure 25 Total Population Distribution of exposure to sum of 6 Marker PCBs from six food groups (Chart truncated at P99)

145
Figure 26 Plotting of background versus post incident distribution for sum of 6 Marker PCBs
Similar to the Total WHO TEQ (2005) (see 5.3.4.2) and as can be seen from Figure 26 the
vast majority of the population were not particularly impacted by the contamination
incident, only higher percentile consumers of the population had elevated intakes. Table 39
shows that the mean exposure is higher than the 75th percentile, being situated at the
86.1th percentile. This is due to the mean being "dragged" to the right by the extreme
skewness of the distribution (see Figure 25). The latter is due to the very low presence of
contaminated product (1.1 and 5 % for beef and pork, respectively), the effects of which
can only be observed in the higher percentiles of the exposure distribution. The mean
therefore does not serve as a good indicator of the population average in this case, and the
median, which describes the 50th percentile may provide a better measure.
The median daily intake of sum of 6 Marker PCBs was estimated at 0.8 pg/kg bw/d and 95th
percentile intake at 36 pg/kg bw/d, which translates into a monthly (30 day) intake of 240
pg/kg bw/m at the median and 1080 pg/kg bw/m at the 95th percentile. The most
important contributor to this exposure comes from the category "Meat and Meat Products,
Pork", contributing up to 79 % to the total exposure, followed by "Fish and Fish Products"
contributing up to 12 % to the total exposure. Again the latter percentages are based on
the population mean, which as discussed above, sits at the 86.1th percentile, therefore the
0
20
40
60
80
100
120
140
10 15 20 25 30 35 40 45 50 55 60 65 70 75 80 85 90 95 99
Sum
of
6 M
arke
r P
CB
s n
g/k
g b
w/d
Percentiles of Population Distribution
Background
Post Incidence

146
contribution of food groups to total intake reflects consumption patterns observed at the
higher percentiles.
The estimated additional exposure due to the contamination incident can be derived by
comparing the background exposure results with the results obtained from the incident
exposure model.
Again, as for the Total WHO TEQ, there was no perceptible difference at the population
median (see Figure 26). Comparing the means is not practical in this case, as the shapes of
the two distributions are very different and the means subsequently describe different
positions of the exposure distribution. Therefore it is more meaningful to compare results
for the different higher percentiles.
Table 40 provides a comparison of summary statistics derived from background
concentration with summary statistics derived from the contamination incident.
Table 40 Estimated additional exposure to sum of 6 Marker PCBs (ng/kg bw/d) due to the contamination incident
Sum of 6 Marker PCBs (ng/kg bw/d)
Percentile P50 P75 P90 P95 P97.5 P98 P99
Background 0.67 1.30 4.50 6.80 9.30 10.10 13.50
Post Incidence 0.81 3.30 13.30 36.10 70.30 83.50 136.10
Difference Incident - Background 0.14 2.10 8.80 29.30 61.00 73.40 122.60
TOTAL Exposure excl background ng/kg bw/90 days
12.6 189 792 2637 5490 6606 11034
90 day exposure expressed as % of Body Burden (22 µg/kg bw)
0.06 0.86 3.6 12 25 30 50
The contamination incident window was identified as having occurred between the start of
September and beginning of December, when the contamination was detected. Therefore,
the additional exposure would have occurred over a period of approximately 90 days. The
difference amounts to 29.3 ng/kg bw/d at the 95th percentile up to 122.6 ng/kg bw/d at the
99th percentile. Therefore, for a 90 day period, the total additional exposure amounts to
2637 ng/kg bw/90d at the 95th percentile and 11034 ng/kg bw/90d at the 99th percentile.
This data may be put into context against an estimate of the existing body burden for NDL-
PCBs, which is available from recent breast milk studies (see 3.3.3.2). As the contamination
profile showed that 95 % of the PCBs present consisted of 3 of the 6 Marker PCBs (PCBs
138, 153 and 180) (see section 4.1.2), this additional exposure can be compared against the
estimated body burden for all NDL-PCBs of 22 μg/kg bw (see Table 27). The additional

147
exposure amounts to 12 % at the 95th percentile and 1 % of the population would have had
an additional exposure of in excess of 50 % to the body burden.
Again, the derived intake estimates are likely to present an overestimation, as it is assumed
that all of the contaminants present in the food were absorbed at 100 %, which is unlikely.
Bioavailability for PCBs has been reported to vary from 66 - 96 % with increasing absorption
efficiency with increasing level of chlorination (Tanabe et al, 1981).
However, assuming a worst case scenario of 100 % absorption and tissue distribution, an
increase of the existing body burden of 22 μg/kg bw by 50 % would result in a body burden
of 33 μg/kg bw, which compared against the NOAEL BB of 500 μg/kg bw identified by EFSA
(EFSA, 2005) would result in a MoBB at the NOAEL of 15, which is still larger than the MoBB
at the NOAEL of 10 calculated for the European adult population by EFSA.

148
Table 41 Contamination Impact: Range of LB - UB Mean, Median and higher percentile exposure to sum of 6 Marker PCBs expressed as ng/kg bw/d and % contribution to the total mean average daily intake
Food Group
Sum of 6 marker PCBs (ng/kg bw/d) post incident
% Contribution Mean Median P75 P90 P95 P97.5 P98 P99
DAIRY, MILKS 0.5 0.04 0.03 0.05 0.09 0.1 0.2 0.2 0.2
DAIRY, CREAMS 0.2 0.01 0.001 0.02 0.04 0.06 0.08 0.09 0.1
DAIRY, YOGHURTS 0.06 0.005 0 0.006 0.02 0.02 0.03 0.03 0.04
DAIRY, CHEESE 0.4 0.03 0.02 0.05 0.08 0.1 0.1 0.2 0.2
DAIRY, BUTTER 0.4 0.03 0.01 0.04 0.08 0.1 0.2 0.2 0.2
DAIRY 1.5 0.1 0.1 0.2 0.2 0.3 0.4 0.4 0.4
EGGS, CHICKEN 1.2 0.1 0.03 0.08 0.2 0.5 0.9 1.0 1.3
EGGS, DUCK 0.005 0.0004 0 0 0 0 0 0 0
EGGS 1.3 0.1 0.03 0.08 0.2 0.5 0.9 1.0 1.3
MEAT AND MEAT PRODUCTS, BEEF 2.2 0.2 0.04 0.10 0.2 0.2 0.3 0.4 0.5
MEAT AND MEAT PRODUCTS, LAMB 0.2 0.02 0 0 0.08 0.1 0.2 0.2 0.3
MEAT AND MEAT PRODUCTS, PORK 79 6.3 0.05 0.1 8.2 33 67 81 133
MEAT AND MEAT PRODUCTS, POULTRY 0.5 0.04 0.01 0.03 0.08 0.1 0.3 0.3 0.5
MEAT AND MEAT PRODUCTS, OTHER 0.0006 0.00005 0 0 0 0 0 0 0
MEAT AND MEAT PRODUCTS, MIXED MEAT 0.2 0.02 0 0 0 0 0 0 0
OFFAL, BEEF 0.001 0.0001 0 0 0 0 0 0 0
OFFAL, LAMB 0.01 0.0009 0 0 0 0 0 0 0.004
OFFAL, PORK 0.1 0.01 0 0 0 0 0 0 0.0009
OFFAL, POULTRY 0.0002 0.00002 0 0 0 0 0 0 0
MEAT AND MEAT PRODUCTS 82 6.6 0.2 0.3 9.0 35 69 82 135
149
Table 41 continued Contamination Impact: Range of LB - UB Mean, Median and higher percentile exposure to sum of 6 Marker PCBs expressed as ng/kg bw/d and % contribution to the total mean average daily intake
Food Group Sum of 6 marker PCBs (ng/kg bw/d) post incident
% Contribution Mean Median P75 P90 P95 P97.5 P98 P99
FISH AND FISH PRODUCTS, WHITE FISH 1 0.05 0 0.02 0.1 0.2 0.5 0.5 0.8
FISH AND FISH PRODUCTS, OILY FISH 11 0.9 0 0.07 3.5 5.7 7.9 8.8 12
FISH AND FISH PRODUCTS, MIXED FISH 0 0.00004 0 0 0 0 0 0 0
FISH AND FISH PRODUCTS, SHELLFISH 0 0.005 0 0 0 0.002 0.006 0.01 0.1
FISH AND FISH PRODUCTS, OTHER 0 0.0004 0 0 0 0 0 0 0
FISH AND FISH PRODUCTS 12 0.9 0.004 0.3 3.6 5.8 8.0 8.9 12
FAT/DAIRY SPREADS EXCL BUTTER 1 0.1 0.08 0.2 0.2 0.3 0.4 0.4 0.5
OILS 1 0.05 0.04 0.06 0.09 0.1 0.1 0.1 0.2
FATS AND OILS EXCL BUTTER 2 0.2 0.1 0.2 0.3 0.4 0.5 0.5 0.6
SUPPLEMENTS, OILS/FATTY ACIDS 1 0.1 0 0 0.09 0.4 0.7 0.9 2.3
SUPPLEMENTS 1 0.1 0 0 0.09 0.4 0.7 0.9 2.3
TOTAL 100 8.0 0.8 3.3 13 36 70 84 136

150
5.3.5 Uncertainty Analysis
The method applied in any dietary exposure assessment should be clearly stated and
reproducible and the need to discuss the uncertainties affecting exposure assessment has
repeatedly been highlighted by various scientific and regulatory bodies over recent times
(EC, 2000b; EC, 2003; EFSA, 2006; EFSA, 2009; WHO, 2009)
A systematic review of each step has been performed and uncertainties are considered
qualitatively, using a tabular format (see Table 42), as recommended by EFSA for refined
assessments (EFSA, 2006).
Table 42 Qualitative evaluation of influence of uncertainties on the exposure estimate of dioxin contamination of the Irish Adult Population
Source of uncertainty Direction & magnitude*
Consumption data:
Representativeness/under-reporting/misreporting/portion size estimation ++/--
Extrapolation from food consumption survey of few days to estimate chronic exposure, especially at high percentiles
++
Modification of (NANS) food consumption database
Application of standard recipes, application of extrapolated recipes, application of recipes derived from ingredient information
+/-
Application of conversion factors from cooked to raw food +/-
Application of fat fractions to amount of food consumed +/-
Consumption data applies to the general population and does not consider regions with potential higher consumption due to particular consumption patterns (e.g. fishermen)
--
Food intake has been converted from cooked to raw and does not take into account loss of contaminants due to processing/cooking of the food
+
Occurrence data used in models
Exclusion of foods with potentially very low contamination (fruit, vegetable) -
For some food categories older concentration data was used, +
Occurrence data is based on national food production only and does not take into consideration imported food
-
Incident data was not collected for the purposes of exposure assessment and may not fully be representative of the contaminant occurrence
+/-
It was assumed that all animals from affected herds were contaminated at the same time and to the same extent
+
Linkage of food consumption data and occurrence data
For some food groups concentration data was extrapolated from other food groups +/-
Presence Probability
The presence probabilities derived are based on conservative assumptions and do not take into account any potential meat recalled from the market
++
Body Burden Calculations
Extrapolations from human biomarkers to body burden +/-
Extrapolations from estimated intake data to body burden ++/--
* Key to direction and magnitude: +, ++, +++ = uncertainty likely to cause small, medium or large over-estimation of exposure; -, - -, - - - = uncertainty likely to cause small, medium or large under-estimation of exposure.
151
6 Summary and Conclusion
PCDD/Fs and DL-PCBs have long half-lives in the body and therefore accumulate during
continuous exposure and reach a pseudo-steady state only after decades (JECFA, 2002).
The biochemical and toxicological effects of PCDDs, PCDFs and DL-PCBs are directly related
to their concentrations in tissues, and not to the daily dose (WHO, 2002). In the absence of
information on tissue concentration data, body burden data (see section 1.3.1.3) has been
used to derive tolerable intake values by the various expert bodies (JECFA, 2002; SCF, 2000;
SCF, 2001; Van Leeuwen et al, 2000) in their risk assessments of dioxins (see Table 2). To
that extent, measurement of POPs in breast milk is accepted as providing a robust and
relatively non-invasive measurement of body burden of these ubiquitous contaminants ,
and can thus be used as an indicator for the overall exposure of the general population
(Malisch et al, 2008).
However, the breast milk concentration data does not reveal much about the contributing
sources, and for regulatory and risk assessment purposes different means of assessing
dietary exposure are needed. Furthermore, due to ethical considerations, only pooled
samples containing milk from several mothers are typically analysed, which are not likely to
pick up any extreme consumer behaviour due to dilution in the pool.
One aim of this particular study was to provide an estimate of background exposure to the
Irish adult population with a view to characterise major contributors and compare intake
estimates with established health based guidance values. Another aim was to estimate the
impact of the 2008 dioxin contamination incident in Ireland on this background exposure,
and lastly, the latter intake estimates provided a means to assess the validity of the
exposure assessment performed during the crisis, which had been performed subject to
extreme time limitations and which had lacked a lot of the information which became
available later and which was subsequently utilised in the refined assessment performed
here.
In order to fulfil the above aims, a rather resource intensive model was chosen, which
provided a full distribution of dietary exposure and utilised individual food consumption
data and the full range of chemical concentration data available for Ireland.

152
6.1 Estimated background exposure
6.1.1 Background exposure to Total WHO TEQ PCDD/Fs & DL-PCBs
The average daily intake of Irish adults to dioxins Total WHO TEQ (2005) (PCDD/Fs & DL-
PCBs) from background contamination ubiquitous in the environment, was estimated at 0.3
pg/kg bw/d and at the 95th percentile at 0.9 - 1 pg/kg bw/d. Upperbound and lowerbound
results at the mean were equal with a difference of 10 % at the 95th percentile. Comparing
the upperbound values to the health based guidance value of WHO PMTI of 70 pg/kg bw
indicating a mean exposure of 13 % of the tolerable monthly intake, and exposure of the
95th percentile consumer falling within 39 - 43 % of the tolerable monthly intake. The most
important contributor to this exposure comes from the category "Fish and Fish Products",
contributing up to 41 % to the total exposure, followed by "Meat and Meat Products" and
"Dairy", each contributing up to 25 % to the total exposure.
As described earlier, lifetime estimates could not be computed for all food groups due to
violation of the requirement for normality in the data distribution and hence, total
estimates could only be calculated based on average daily intakes. However, with the
exception of food supplements, lifetime estimates could be derived on a food category
basis and comparisons could be made with estimates derived based on average daily
intakes. At the 95th percentile, lifetime estimates were lower than average daily estimates
as follows: 12 % for dairy, 39 % for eggs, 29 % for meat and meat products, 24 % for fish
and fish products and 13 % for fats and oils, giving an overall average of 24 %. For the 99th
percentile this overall average increases to 29 %, indicating that long term high percentile
chronic intake is likely to be lower.
Concerning the mean exposure to Total WHO TEQ PCDD/F &DL-PCBs, the majority of food
groups gave similar results for daily average and lifetime estimates, however, for the food
group "Fish and Fish Products", the highest contributor to the total mean intake, lifetime
values returned higher mean results, with a difference of 5 - 33 % in comparison to the
daily average derived mean. This suggests that the calculated mean might slightly
underestimate long term mean chronic intake.
Compared to reported findings in other EU Member States (see Table 5) the results of this
study suggest that exposure of Irish adults to dioxins is lower than the reported European
average. The UB mean of 0.4 pg/kg bw/d Total WHO TEQ (1998) derived in this study is

153
below the range of means of 0.9 – 2.9 pg/kg bw/d reported for other Member States.
However, direct comparisons cannot be made, due to the different methodologies
employed by the various countries and also due to the different points of time of the
studies undertaken.
6.1.2 Background exposure to Sum of 6 Marker PCBs
The average daily intake of Irish adults to sum of 6 Marker PCBs from background
contamination ubiquitous in the environment was estimated at 1.4 - 1.6 ng/kg bw/d and at
the 95th percentile at 6.4 - 6.8 ng/kg bw/d.
The most important contributor to this exposure comes from the category "Fish and Fish
Products", contributing up to 64 % to the total exposure, followed by "Meat and Meat
Products" contributing up to 13 % to the total exposure.
As observed for dioxins, lifetime exposure values, where available, are lower for high
percentile consumers, which suggests that high percentile long-term exposure may be
lower than estimated based on average daily intake values. Consequently, the median
values increase with also the mean values for food categories "Fish and Fish Products" and
"Supplements", which are not consumed as frequently as the other food groups, increasing
due to the removal of variance in the distribution.
No health based guidance value has been adopted for NDL-PCBs by any scientific body. In
the absence of the latter, a MoBB at the NOAEL of 44 was calculated based on the UB mean
dietary intake of 1.6 ng/kg bw/d, which is larger than the European average MoBB at the
NOAEL of 10 as estimated by EFSA (EFSA, 2005). Dietary exposure estimates derived for
Ireland were also lower than recently reported national estimates for other Member
States, which ranged from 2.7 - 11 ng/kg bw/d at the mean and 7.9 - 24 and the 95th
percentile (see Table 6).
6.1.3 Use of breast milk data as biomarker for exposure to dioxins and PCBs
A better indicator of the average dioxin and PCB body burden can be derived from breast
milk data. Human breast milk samples from Ireland were analysed in 2002, as part of round
3 of the coordinated WHO study and again in 2009/2010 following the same protocol, to
examine any potential influence of the 2008 dioxin contamination of Irish pork on the
overall population exposure (Pratt et al, 2012).

154
The mean Total WHO TEQ (2005) for the 2002 study was 9.5 pg/g fat and 8.1 pg/g fat for
the overall pooled milk in 2010, respectively. Based on these data and anthropometric data
available in the NANS a body burden of 2850 pg/ kg bw was calculated for the Irish adult
population. This body burden is generally lower than the average body burden of 4000
reported for Europe, which corresponds to the TWI of 14 pg WHO-TEQ/kg bw per week
established by the SCF (SCF, 2001). These findings are in line with generally lower
concentrations of dioxins found in breast milk in Ireland compared with other more
industrialised European Member States (see Figure 2).
Average sum of 6 Marker PCBs and sum of all NDL-PCBs measured in 2002 were 54 μg/g fat
and 74 μg/g fat and in 2010, 41 μg/g fat and 68 μg/g fat, respectively. The average 2010
levels of 41 and 68 μg/g fat NDL-PCBs in human breast milk correspond to body burdens of
12 μg/kg bw and 20 μg/kg bw for sum 6 Marker PCBs and sum Total NDL-PCBs,
respectively. The BB associated with total NDL-PCB content of the 2010 breast milk survey
of 20 μg/kg bw is less than the BB of 50 μg/kg bw based on reports from European Member
States used by EFSA in their risk assessment. Therefore the MoBB, compared with a NOAEL
BB of 500 μg/kg bw amounts to 25 for the Irish adult population, compared to a MoBB at
the NOAEL of 10 calculated for the European adult population by EFSA. These findings are
in line with generally lower concentrations of PCBs found in breast milk in Ireland
compared with other more industrialised European Member States (see Figure 3).
6.1.4 Overall conclusions on background exposure of the Irish adult population to dioxins and PCBs
Dietary exposure estimates for both dioxins and PCBs indicate that the Irish adult
population has exposures below the European average, a finding which is also supported
by the levels detected in breast milk of Irish mothers. Exposure levels are below health
based guidance values and/or Body Burdens associated with the TWI (for dioxins) or
associated with a NOAEL (for PCBs). Given the current toxicological knowledge, based on
biomarker data and estimated dietary exposure, general background exposure of the Irish
adult population to dioxins and PCBs is unlikely to be of human health concern.
155
6.2 Estimated additional post incident exposure
6.2.1 The exposure model
To estimate additional exposure to dioxins and PCBs due to the contamination incident, a
model was devised that took into account the proportion of contaminated product
reaching the final consumer during the contamination incident window, which was
determined to have occurred between September and December 2008. After collating all
available data on animal movement, slaughter, import and export and home consumption
statistics, and all available traceability data on the implicated herds the dioxins and PCBs
presence probabilities for both pork and beef were derived. These estimates were reported
as ranges, and were 4.86 % for pork and 0.96 - 1.1 % for beef, respectively. As a
conservative approach, the upper end estimated presence probabilities were incorporated
into the model, which will have led to an overestimation of exposure. Due to the very low
presence probability, the impact on population exposure could only be observed in the
higher percentiles, given the very low probability of consuming a contaminated product.
The resulting exposure distributions were extremely skewed, which made using the mean
level of contamination as population exposure indicator meaningless. Therefore, the model
was run over sufficient amount of iterations to fully capture and produce robust statistics
for the upper percentiles, which were deemed the critical indicators of additional exposure.
A conservative approach was also taken in assigning contamination concentrations, by
assuming that all animals from all implicated herds were contaminated and that no meat
from the affected animals was removed from the market. Whilst a considerable amount of
product was recalled from the market, the exact proportion of contaminated meat
withdrawn could not be reliably determined, as recalled product was a mixture of
uncontaminated and contaminated food. Therefore, not excluding the fraction of removed
product would have led to an overestimation of exposure. All concentration data gathered
from contaminated herds was included in the model. The latter assumes that all animals
from implicated herds that went for slaughter for human consumption were exposed to the
contaminated feed. Whether this was indeed the case or not was difficult to establish, as
feed supply from the implicated mill was not always directly delivered to the implicated
farms, but often via indirect sources. Therefore, not all implicated herds would have been
exposed to the contaminated feed for the entire contamination window identified, and
depending on feeding rates and feed inclusion ratios large intra as well as inter herd

156
variations were likely. However, the wide span of contamination data gathered during the
incident suggests that this variation was captured to a certain extent.
No data, however, was collected for offal during the incident and exposure from liver
consumption has been modelled using concentration data collected from fat tissue.
However, to test any impact consumption of contaminated liver may have had, a
hypothetical model using a ten-fold concentration observed in carcass fat was used to
model potentially higher exposure from liver (see 3.2.4. additional considerations).
Exposure statistics were derived based on average daily intakes, which is likely to provide
an overestimate in the upper percentiles and an underestimate of the population mean.
The latter is due to inter-individual variation in food consumption. The latter can be
reduced via mathematical modelling following the principles developed by Nusser et al
(Nusser et al, 1996), however, due to the extremely skewed data, the requirement for
normality in the dataset was violated and the required transformation of the dataset was
not possible. However, lifetime estimates were derived for food intake and background
exposure estimates and the so derived estimates indicate that lifetime estimates in the
higher percentiles are on average 24 % and 29 % lower at the 95th and 99th percentile,
respectively.
Comparisons with body burden data also assumed a 100 % absorption rate of the
contaminants, which has been reported to be lower in the literature (Schlummer et al,
1998; Tanabe et al, 1981; US EPA, 2003).
In conclusion, the model employed to estimate additional exposure as a consequence of
the 2008 dioxin contamination of Irish pork errs on the conservative side and is likely to
over-estimate exposure.
6.2.2 Additional post incident exposure to Total WHO TEQ PCDD/F & DL-PCBs
The median daily intake of Total WHO TEQ (PCDD/F & DL-PCBs) (2005) was estimated at 0.3
pg/kg bw/d and 95th percentile intake at 5.5 pg/kg bw/d, which translates into a monthly
(30 day) intake of 8 pg/kg bw/m at the median and 165 pg/kg bw/m at the 95th percentile.
The most important contributor to the mean exposure, as expected, comes from the
category "Meat and Meat Products, Pork", contributing to 70 % to the total exposure,

157
followed by "Meat and Meat Products, Beef" and "Fish and Fish Products, Oily Fish",
contributing up to 10 % and 9 % to the total exposure, respectively.
These exposure figures may be compared to the WHO PMTI of 70 pg/kg bw indicating a
median exposure of 11 % of the tolerable monthly intake. 90.9 % of consumers were
exposed to levels equal or less than the PTMI, the remaining 9.1 % of the population
exceeded the PMTI with an exposure at the 95th percentile of 244 % of the PTMI. The 99th
percentile consumer would have been exposed to almost ten times the PTMI, practically
eroding the safety factor built into the PTMI derived by JECFA (see 1.3.1.4).
However, considering the long biological half-life of dioxins, the impact of an additional
exposure on the body burden is a more relevant indicator of the potential health risk rather
than the daily dose (EFSA, 2008; JECFA, 2002), and therefore comparisons have been made
using human milk dioxin data as biomarker of body burden in Ireland.
The estimated additional exposure due to the contamination incident can be derived by
comparing the background exposure results with the results obtained from the incident
exposure model. For a 90 day period, the total additional exposure amounts to 407 pg/kg
bw/90d at the 95th percentile and 1911 pg/kg bw/90d at the 99th percentile. Compared
with an estimated body burden of 2850 pg/kg bw, the additional exposure amounts to 15
% at the 95th percentile and 1 % of the population would have had an additional exposure
of greater than 71 % to the body burden.
However, the body burden of 2850 pg/kg bw derived for Ireland, based on recent breast
milk data, is comparably lower than the tolerable body burden at steady state of 4000 pg
WHO TEQ/kg bw, which can be extrapolated from the TWI of 14 pg WHO TEQ/kg bw per
week established by the SCF, corresponding with a daily dose of 2 pg WHO TEQ/kg bw
(EFSA, 2008). Therefore, by following a conservative approach, straight addition of the 90
day exposure of 1911 pg/kg bw to the established body burden of 2850 pg/kg bw, would
result in a slight exceedance of the tolerable body burden at 4761 pg/kg bw at the 99th
percentile intake.
6.2.3 Additional post incident exposure to Sum of 6 Marker PCBs
The median daily intake of sum of 6 Marker PCBs was estimated at 0.8 pg/kg bw/d and 95th
percentile intake at 36 pg/kg bw/d. The most important contributor to this exposure comes
158
from the category "Meat and Meat Products, Pork", contributing up to 79 % to the total
exposure, followed by "Fish and Fish Products" contributing up to 12 % to the total
exposure.
The additional exposure to Marker PCBs due to the contamination incident was estimated
at 2637 ng/kg bw/90d at the 95th percentile and 11034 ng/kg bw/90d at the 99th percentile.
This additional exposure was compared against the estimated body burden for all NDL-
PCBs of 22 μg/kg bw. The additional exposure to the existing BB of marker PCBs amounts to
12 % at the 95th percentile and 1 % of the population would have had an additional
exposure to the existing BB of marker PCBs in excess of 50 % .
Again, the latter is also likely to present an overestimation, as it is assumed that all of the
contaminants present in the food were absorbed at 100 %, which is unlikely. Bioavailability
for PCBs has been reported to vary from 66 - 96 % with increasing absorption efficiency
with increasing level of chlorination (Tanabe et al, 1981).
However, assuming a worst case scenario of 100 % absorption and tissue distribution, an
increase of the existing body burden of 22 μg/kg bw by 50 % would result in a body burden
of 33 μg/kg bw, which compared against the NOAEL BB of 500 μg/kg bw identified by EFSA
(EFSA, 2005) would result in a MoBB at the NOAEL of 15, which is larger than the MoBB at
the NOAEL of 10 calculated for the European adult population by EFSA.
6.2.4 Additional considerations
In the absence of real occurrence data for liver from contaminated animals, potential
impact of consumption of contaminated liver was estimated based on a hypothetical model
using a ten-fold concentration of carcass fat concentrations for liver (see 3.2.4. additional
considerations). Due to the very rare consumption of pork and beef liver in Ireland
compared to other foodstuffs (1.5 % and 0.8 % consumers of pork liver or beef liver,
respectively) and the very low contamination presence in the food supply, no difference
could be observed for exposure on a total population basis for dioxins or PCBs. Due to the
very low number of consumers, however, this can be expected. Therefore, statistics have
been derived for the very low number of consumers of offal. For consumers of offal
product, for the Total WHO TEQ (2005) an increase of 0.3 pg/kg bw/d at the 95th percentile
and an increase of 1 pg/kg bw/d at the 99th percentile was estimated. The latter would lead

159
to an additional increase of 2 % to the body burden assuming a regular eating pattern of
offal. For the sum of 6 Marker PCBs, an increase of 3 ng/kg bw/d and 7 ng/kg bw/d for the
95th and 99th percentile consumer, respectively, was estimated. This would lead to
additional increase of 1.5 % and 3 % to the body burden at the 95th and 99th percentile,
respectively, again assuming a regular consumption pattern of offal.
6.2.5 Overall conclusions on additional post incident exposure of the Irish adult population to dioxins and PCBs
Exposure estimates derived for both dioxins and PCBs showed that the BB of the general
population remained largely unaffected by the contamination incident and only a small
percentage of approximately 10 % were exposed to elevated levels of dioxins and PCBs.
Whilst this small percent of the population experienced quite a significant additional load
to the existing body burden, the estimated exposure values do not indicate approximation
of body burdens associated with adverse health effects.
The exposure period was also limited in time to approximately 3 months, following the FSAI
recall of contaminated meat immediately on detection of the contamination.
The follow up breast milk study conducted in 2009/2010 did also not show any increase in
concentrations compared to the study conducted in 2002. The latter supports the
conclusion that the majority of the Irish adult population was not affected by the
contamination incident.
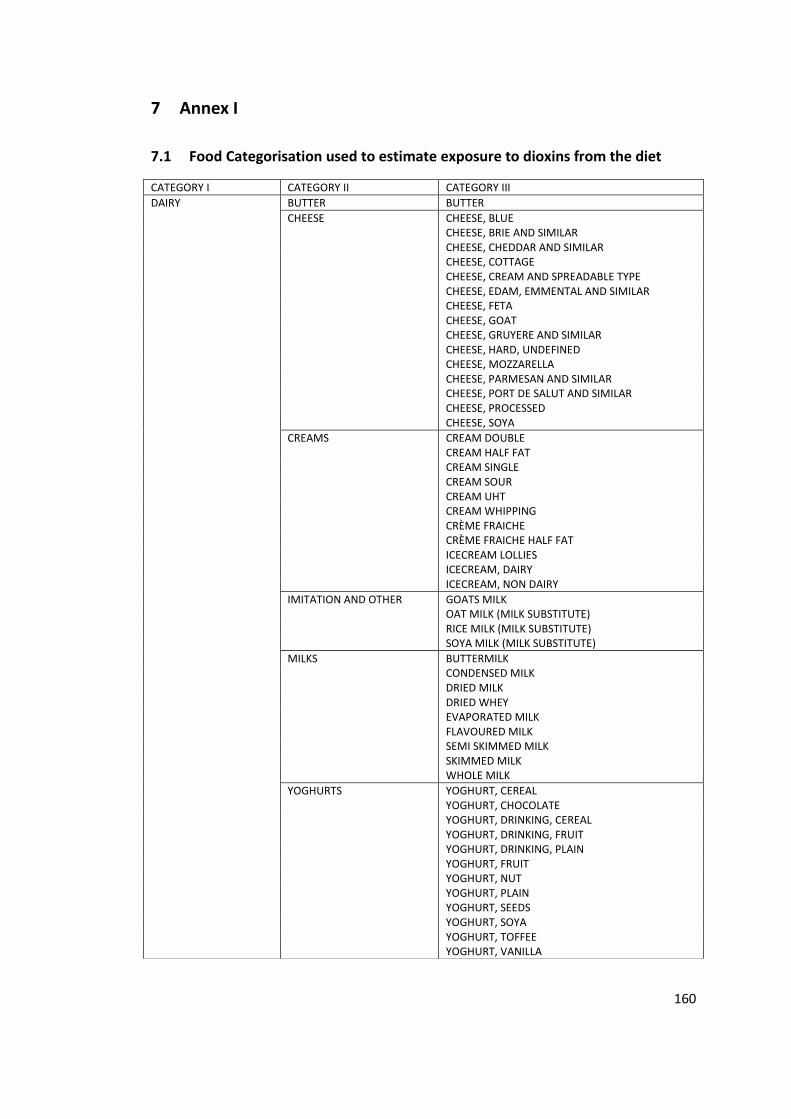
160
7 Annex I
7.1 Food Categorisation used to estimate exposure to dioxins from the diet
CATEGORY I CATEGORY II CATEGORY III
DAIRY BUTTER BUTTER
CHEESE CHEESE, BLUE
CHEESE, BRIE AND SIMILAR
CHEESE, CHEDDAR AND SIMILAR
CHEESE, COTTAGE
CHEESE, CREAM AND SPREADABLE TYPE
CHEESE, EDAM, EMMENTAL AND SIMILAR
CHEESE, FETA
CHEESE, GOAT
CHEESE, GRUYERE AND SIMILAR
CHEESE, HARD, UNDEFINED
CHEESE, MOZZARELLA
CHEESE, PARMESAN AND SIMILAR
CHEESE, PORT DE SALUT AND SIMILAR
CHEESE, PROCESSED
CHEESE, SOYA
CREAMS CREAM DOUBLE
CREAM HALF FAT
CREAM SINGLE
CREAM SOUR
CREAM UHT
CREAM WHIPPING
CRÈME FRAICHE
CRÈME FRAICHE HALF FAT
ICECREAM LOLLIES
ICECREAM, DAIRY
ICECREAM, NON DAIRY
IMITATION AND OTHER GOATS MILK
OAT MILK (MILK SUBSTITUTE)
RICE MILK (MILK SUBSTITUTE)
SOYA MILK (MILK SUBSTITUTE)
MILKS BUTTERMILK
CONDENSED MILK
DRIED MILK
DRIED WHEY
EVAPORATED MILK
FLAVOURED MILK
SEMI SKIMMED MILK
SKIMMED MILK
WHOLE MILK
YOGHURTS YOGHURT, CEREAL
YOGHURT, CHOCOLATE
YOGHURT, DRINKING, CEREAL
YOGHURT, DRINKING, FRUIT
YOGHURT, DRINKING, PLAIN
YOGHURT, FRUIT
YOGHURT, NUT
YOGHURT, PLAIN
YOGHURT, SEEDS
YOGHURT, SOYA
YOGHURT, TOFFEE
YOGHURT, VANILLA

161
CATEGORY I CATEGORY II CATEGORY III
EGGS EGGS, CHICKEN EGG WHITE
EGG WHOLE
EGG YOLK
EGGS, DUCK DUCK EGG
FATS AND OILS EXCL BUTTER FAT/DAIRY SPREADS EXCL BUTTER SPREADS, DAIRY <2 %
SPREADS, DAIRY 10 %
SPREADS, DAIRY 30 %
SPREADS, DAIRY 50 %
SPREADS, DAIRY FREE
OILS OILS, NUT
OILS, SEED
OILS, VEGETABLE
FISH AND FISH PRODUCTS MIXED FISH PROCESSED FISH, MIXED FISH
OILY FISH ANCHOVIES
BRISLING
Fish ROE
HERRING
HERRING, CANNED
MACKEREL
MACKEREL, CANNED
MACKEREL, PATE
SALMON
SALMON, CANNED
SARDINES
SARDINES, CANNED
SWORDFISH
TROUT
TUNA
TUNA, CANNED
OTHER SQUID
SHELLFISH COCKLES
CRAB
LOBSTER
MUSSELS
OYSTERS
PRAWNS
SCALLOPS
SHRIMPS
WHITE FISH COD
COLEY
HADDOCK
HAKE
HALIBUT
HOKI
JOHN DORY
MONKFISH
PLAICE
POLLACK
SEA BASS
SEA BREAM
SOLE
WHITE FISH, DRIED
WHITE FISH, PROCESSED
WHITE FISH, UNSPECIFIED
WHITING

162
CATEGORY I CATEGORY II CATEGORY III
MEAT AND MEAT PRODUCTS BEEF BEEF
BEEF MINCE
BEEF, FAT
BEEF, PROCESSED
LAMB LAMB
LAMB MINCE
MIXED MEAT PORK/BEEF, PROCESSED
PORK/BEEF, SAUSAGES
OTHER PHEASANT
RABBIT
VENISON
PORK PORK
PORK, BACON
PORK, FAT
PORK, HAM
PORK, PROCESSED
PORK, PUDDINGS
PORK, SAUSAGES, BREAKFAST
PORK, SAUSAGES, OTHER
POULTRY CHICKEN
CHICKEN, PROCESSED
DUCK
TURKEY
TURKEY, PROCESSED
OFFAL, BEEF OFFAL, BOVINE KIDNEY
OFFAL, CALF LIVER
OFFAL, LAMB OFFAL, LAMB KIDNEY
OFFAL, LAMB LIVER
OFFAL, PORK OFFAL, PORK KIDNEY
OFFAL, PORK LIVER
OFFAL, PORK LIVER, PROCESSED
OFFAL, PORK TROTTERS AND TAILS
OFFAL, POULTRY OFFAL, CHICKEN LIVER
OFFAL, DUCK LIVER
SUPPLEMENTS OILS/FATTY ACIDS SUPPLEMENTS, CONTAINING SPECIAL FATTY ACIDS
SUPPLEMENTS, EVENING PRIMROSE AND/OR STARFLOWER
SUPPLEMENTS, FISH OILS
SUPPLEMENTS, FLAXSEED OIL

163
7.2 FSAI Monitoring Data (2000 - 2010) for sum of 6 Marker PCBs and Total TEQ (PCDD/F & DL-PCBs) (1998 & 2005) expressed as N
(number of samples) and range (min - max)
Table 43 Number of samples for the analysis of 6 Marker PCBs, Total TEQ (1998) and Total TEQ (2005) covered by FSAI monitoring programs 2001 - 2010
2000 2001 2003 2004 2005 2006 2007 2008 2009 2010 ALL
Number of Samples
Carcass Fat
34
38.0
72
Cereals
3
3
Dairy 1 1 7 1 20 33.0 2 2 2
69
Eggs
40
60
Fats and Oils
3
3
Fish
45 13 70
52 180
Fruit
3
3
Offal
7
12 20.0
31
Other
1
1
Supplements
15
43
58
Vegetables
8
8
Dairy 1 1 1 1 5 12.0 4 4 4
23
Eggs
7
7
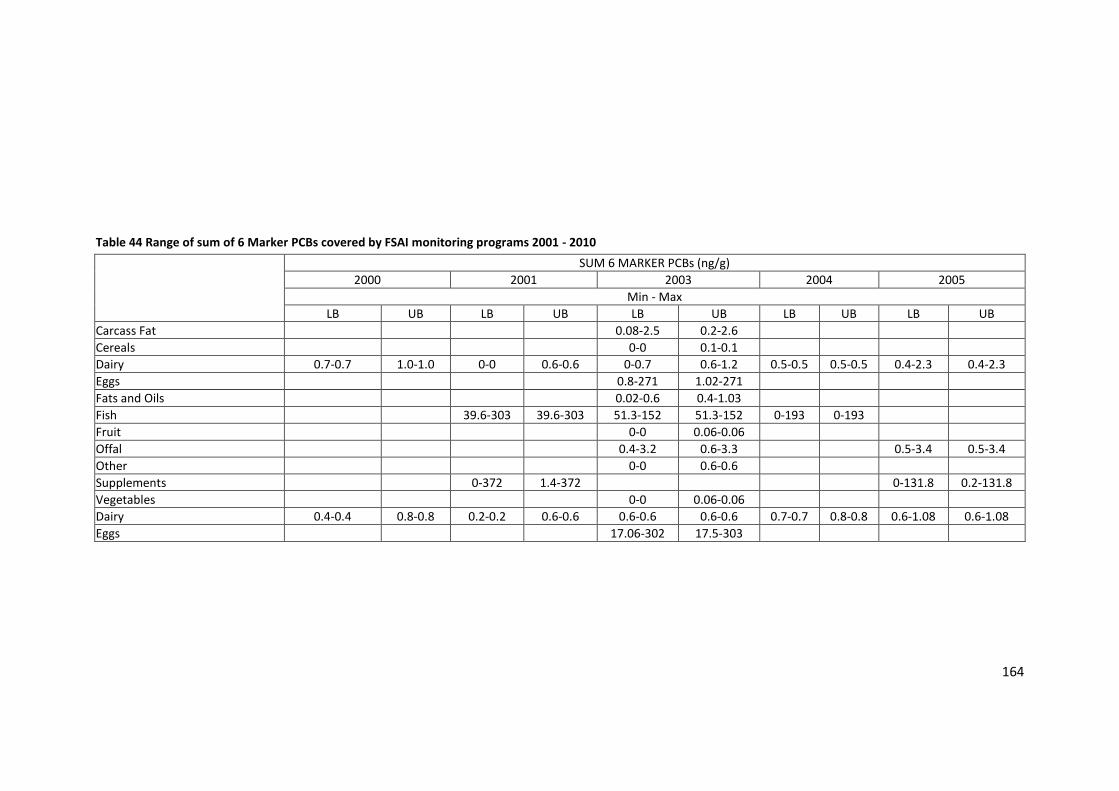
164
Table 44 Range of sum of 6 Marker PCBs covered by FSAI monitoring programs 2001 - 2010
SUM 6 MARKER PCBs (ng/g)
2000 2001 2003 2004 2005
Min - Max
LB UB LB UB LB UB LB UB LB UB
Carcass Fat
0.08-2.5 0.2-2.6
Cereals
0-0 0.1-0.1
Dairy 0.7-0.7 1.0-1.0 0-0 0.6-0.6 0-0.7 0.6-1.2 0.5-0.5 0.5-0.5 0.4-2.3 0.4-2.3
Eggs
0.8-271 1.02-271
Fats and Oils
0.02-0.6 0.4-1.03
Fish
39.6-303 39.6-303 51.3-152 51.3-152 0-193 0-193
Fruit
0-0 0.06-0.06
Offal
0.4-3.2 0.6-3.3
0.5-3.4 0.5-3.4
Other
0-0 0.6-0.6
Supplements
0-372 1.4-372
0-131.8 0.2-131.8
Vegetables
0-0 0.06-0.06
Dairy 0.4-0.4 0.8-0.8 0.2-0.2 0.6-0.6 0.6-0.6 0.6-0.6 0.7-0.7 0.8-0.8 0.6-1.08 0.6-1.08
Eggs
17.06-302 17.5-303

165
Table 44 continued Range of sum of 6 Marker PCBs covered by FSAI monitoring programs 2001 - 2010
SUM 6 MARKER PCBs (ng/g)
2006 2007 2008 2009 2010 2001 - 2010
Min - Max
LB UB LB UB LB UB LB UB LB UB LB UB
Carcass Fat 0.3-4.3 0.3-4.3
0.08-4.3 0.2-4.3
Cereals
0-0 0.1-0.1
Dairy 0.2-1 0.3-1.04 0.7-0.7 0.7-0.7 0.2-0.4 0.4-0.5 0.3-0.6 0.3-0.6
0-2.3 0.3-2.3
Eggs 0.2-31 0.4-32
0.2-271 0.4-271
Fats and Oils
0.02-0.6 0.4-1.03
Fish
1.5-174 1.6-174 0-303 0-303
Fruit
0-0 0.06-0.06
Offal 0.4-5.8 0.4-5.8
0.4-5.8 0.4-5.8
Other
0-0 0.6-0.6
Supplements
0-372 0.2-371
Vegetables
0-0 0.06-0.06
Dairy 0.6-2.6 0.7-2.6 0.5-1.3 0.5-1.3 0.3-0.6 0.4-0.7 0.3-0.6 0.4-0.7 0.4-0.4 0.4-0.4 0.2-2.6 0.4-2.6
Eggs
17.1-302 17.5-303

166
Table 45 LB and UB Range of Total TEQ (1998) covered by FSAI monitoring programs 2001 - 2010
WHO TEQ (1998) (pg/g)
2000 2001 2003 2004 2005
Min - Max
LB UB LB UB LB UB LB UB LB UB
Carcass Fat
0.02-1.2 0.1-1.2
Cereals
0-0 0.05-0.06
Dairy 0.8-0.8 0.8-0.8 0.3-0.3 0.5-0.5 0.07-0.5 0.1-0.5 0.3-0.3 0.4-0.4 0.2-0.7 0.3-0.9
Eggs
0.1-6.6 0.4-6.6
Fats and Oils
0.01-0.4 0.09-0.5
Fish
41-43 5.2-43 7.7-22.3 7.8-22.3 0-28 0-31
Fruit
0-0 0.05-0.05
Offal
0.3-5.4 0.4-5.5
0.4-8.3 0.8-8.3
Other
0.05-0.05 0.5-0.5
Supplements
0.2-37.5 0.6-38
0-10 0.5-10
Vegetables
0-0 0.05-0.05
Dairy 0.6-0.6 0.7-0.7 0.4-0.4 0.6-0.6 0.3-0.3 0.3-0.3 0.7-0.7 0.7-0.7 0.3-0.7 0.3-0.7
Eggs
2.1-7.8 2.1-7.8
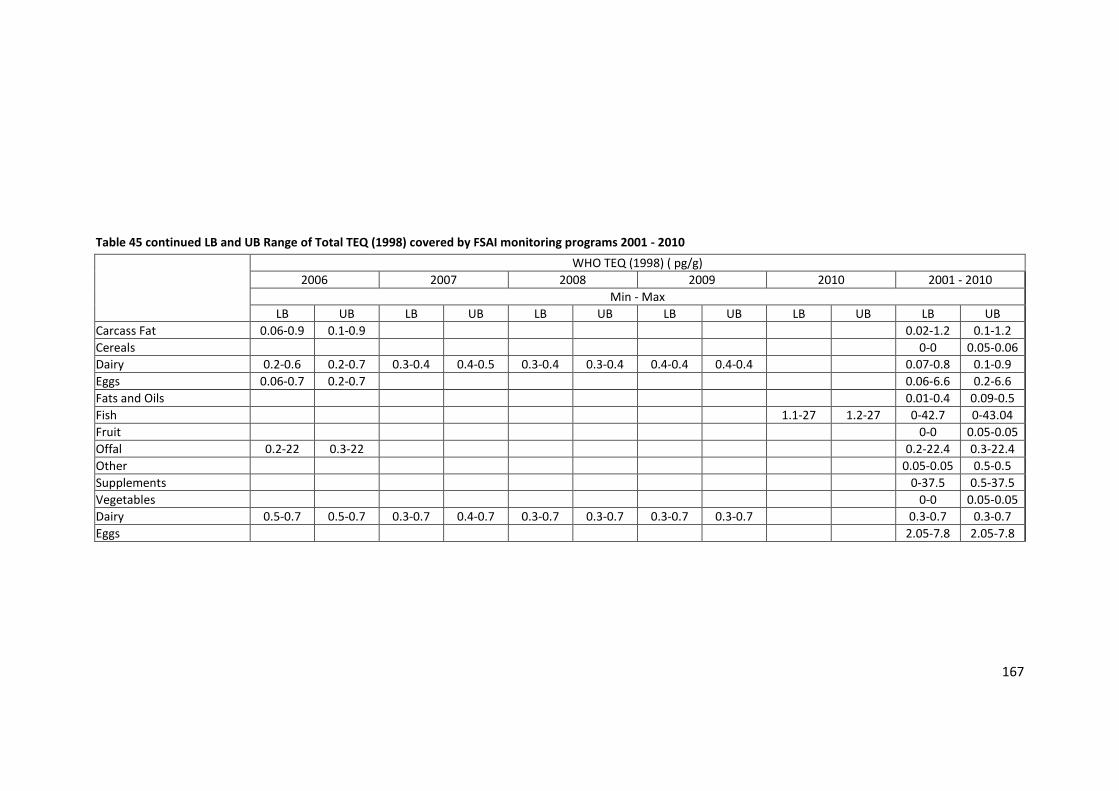
167
Table 45 continued LB and UB Range of Total TEQ (1998) covered by FSAI monitoring programs 2001 - 2010
WHO TEQ (1998) ( pg/g)
2006 2007 2008 2009 2010 2001 - 2010
Min - Max
LB UB LB UB LB UB LB UB LB UB LB UB
Carcass Fat 0.06-0.9 0.1-0.9
0.02-1.2 0.1-1.2
Cereals
0-0 0.05-0.06
Dairy 0.2-0.6 0.2-0.7 0.3-0.4 0.4-0.5 0.3-0.4 0.3-0.4 0.4-0.4 0.4-0.4
0.07-0.8 0.1-0.9
Eggs 0.06-0.7 0.2-0.7
0.06-6.6 0.2-6.6
Fats and Oils
0.01-0.4 0.09-0.5
Fish
1.1-27 1.2-27 0-42.7 0-43.04
Fruit
0-0 0.05-0.05
Offal 0.2-22 0.3-22
0.2-22.4 0.3-22.4
Other
0.05-0.05 0.5-0.5
Supplements
0-37.5 0.5-37.5
Vegetables
0-0 0.05-0.05
Dairy 0.5-0.7 0.5-0.7 0.3-0.7 0.4-0.7 0.3-0.7 0.3-0.7 0.3-0.7 0.3-0.7
0.3-0.7 0.3-0.7
Eggs
2.05-7.8 2.05-7.8

168
Table 46 LB and UB Range of Total TEQ (2005) covered by FSAI monitoring programs 2001 - 2010
WHO TEQ (2005) ( pg/g)
2000 2001 2003 2004 2005
Min - Max
LB UB LB UB LB UB LB UB LB UB
Carcass Fat
0.02-1.07 0.09-1.08
Cereals
0-0 0.04-0.04
Dairy 0.7-0.7 0.7-0.7 0.2-0.2 0.4-0.4 0.06-0.4 0.1-0.5 0.3-0.3 0.4-0.4 0.1-0.6 0.3-0.8
Eggs
0.1-31 0.2-31
Fats and Oils
0.01-0.4 0.06-0.4
Fish
4.06-37 4.2-38 6.2-18.5 6.5-19 0-26 0-31
Fruit
0-0 0.04-0.04
Offal
0.2-4.4 0.4-4.4
0.3-6.5 0.7-6.6
Other
0.05-0.05 0.3-0.3
Supplements
0.2-32 0.6-32
0-8.2 0.5-8.2
Vegetables
0-0 0.04-0.04
Dairy 0.6-0.6 0.6-0.6 0.3-0.3 0.5-0.5 0.2-0.2 0.3-0.3 0.5-0.5 0.6-0.6 0.2-0.6 0.3-0.7
Eggs
1.7-5.1 1.7-5.1

169
Table 46 continued LB and UB Range of Total TEQ (2005) covered by FSAI monitoring programs 2001 - 2010
WHO TEQ (2005) ( pg/g)
2006 2007 2008 2009 2010 2001 - 2010
Min - Max
LB UB LB UB LB UB LB UB LB UB LB UB
Carcass Fat 0.07-0.8 0.09-0.8
0.02-1.07 0.09-1.08
Cereals
0-0 0.04-0.04
Dairy 0.2-0.6 0.2-0.6 0.3-0.4 0.3-0.4 0.2-0.3 0.2-0.4 0.3-0.4 0.3-0.4
0.06-0.7 0.1-0.8
Eggs 0.06-0.7 0.2-0.7
0.06-31 0.2-31
Fats and Oils
0.01-0.4 0.06-0.4
Fish
1.1-27.2 1.1-27.2 0-37.2 0-37.6
Fruit
0-0 0.04-0.04
Offal 0.2-18.9 0.2-18.9
0.2-18.9 0.2-18.9
Other
0.05-0.05 0.3-0.3
Supplements
0-31.9 0.5-31.9
Vegetables
0-0 0.04-0.04
Dairy 0.4-0.6 0.4-0.6 0.3-0.6 0.3-0.6 0.3-0.6 0.3-0.6 0.3-0.6 0.3-0.6
0.2-0.6 0.3-0.7
Eggs
1.7-5.1 1.7-5.1

170
7.3 Chemical Concentration Data used in probabilistic modelling
TTOLB = Total WHO TEQ (1998) PCDD/F&DL-PCBs – LB
TTOUB =Total WHO TEQ (1998) PCDD/F&DL-PCBs – UB
TTNLB = Total WHO TEQ (2005) PCDD/F&DL-PCBs - LB
TTNUB = Total WHO TEQ (2005) PCDD/F&DL-PCBs - UB
M6LB = Sum of 6 Marker PCBs - LB
M6UB = Sum of 6 Marker PCBs - UB
Table 47 Creme Data Entry Background Concentration
Chemical Code
Food Code Name Presence Probability
Concentration ng/kg (Marker PCBs in µg/kg)
M6LB DAIRY 1
Data(0.54, 0.21, 0.29, 0.25, 0.41, 0.3, 0.35, 0.43, 0.8, 0.38, 0.42, 0.29, 0.35, 0.22, 0.34, 0.22, 0.35, 0.28, 0.32, 0.31, 0.22, 0.25, 0.35, 0.51, 0.27, 0.54, 0.46, 0.32, 0.28, 0.47, 0.8, 0.52, 0.95, 0.65, 0.66, 0.44, 0.23, 0.57, 0.34)
M6LB CHICKEN EGG 1 Data(0.62, 1.08, 2.99, 3.74, 30.62, 0.23, 0.51, 2.37, 0.41, 0.36, 1.72, 0.82, 0.88, 0.67, 1.08)
M6LB DUCK EGG 1 Data(0.62, 1.08, 2.99, 3.74, 30.62, 0.23, 0.51, 2.37, 0.41, 0.36, 1.72, 0.82, 0.88, 0.67, 1.08)
M6LB BEEF 1 Data(0.93, 0.78, 0.84, 1.34, 0.85, 1.13, 0.97, 0.76, 0.68)
M6LB LAMB 1 Data(0.97, 1.1, 1.05, 0.95, 0.71, 1.13, 0.86, 0.99, 0.76, 0.85)
M6LB PORK 1 Data(0.66, 0.95, 0.34, 0.62, 0.38, 0.79)
M6LB POULTRY 1 Data(2.19, 3.58, 0.87, 0.69, 0.85, 0.54, 0.67, 0.65, 0.48, 3.83, 4.25)
M6LB PHEASANT 1 Data(0.25, 0.26)
M6LB RABBIT 1 0.79
M6LB VENISON 1 Data(0.97, 1.1, 1.05, 0.95, 0.71, 1.13, 0.86, 0.99, 0.76, 0.85)
M6LB PORK/BEEF 1 0.79
M6LB OFFAL, CALF LIVER 1 Data(3.18, 2.94)
M6LB OFFAL, LAMB KIDNEY 1 Data(0.97, 1.1, 1.05, 0.95, 0.71, 1.13, 0.86, 0.99, 0.76, 0.85)
M6LB OFFAL, LAMB LIVER 1 Data(4.85, 2.13)
M6LB OFFAL, PORK KIDNEY 1 Data(0.66, 0.95, 0.34, 0.62, 0.38, 0.79)
M6LB OFFAL, PORK LIVER 1 Data(0.46, 0.57)
M6LB OFFAL, CHICKEN LIVER 1 Data(1.95, 0.38, 1.07)
M6LB OFFAL, DUCK LIVER 1 Data(1.95, 0.38, 1.07)
M6LB COD 1 Data(17.92, 13.56, 13.12, 48.47)
M6LB COLEY 1 31.68
M6LB HADDOCK 1 Data(74, 7, 34.96, 8.85, 7.62)
M6LB HAKE 1 78.98
M6LB HALIBUT 1 31.68
M6LB HOKI 1 31.68
M6LB JOHN DORY 1 31.68
M6LB MONKFISH 1 Data(15.23, 11.06, 84.58, 14.54)
M6LB PLAICE 1 Data(88.6, 33.98)
M6LB POLLACK 1 31.68
M6LB SEA BASS 1 31.68

171
Table 47 continued Creme Data Entry Background Concentration
Chemical Code
Food Code Name Presence Probability
Concentration ng/kg (Marker PCBs in µg/kg)
M6LB SEA BREAM 1 31.68
M6LB SOLE 1 Data(35.21, 29.38, 13.34, 12.59)
M6LB WHITE FISH, DRIED 1 31.68
M6LB WHITE FISH, PROCESSED 1 31.68
M6LB WHITE FISH, UNSPECIFIED
1 31.68
M6LB WHITING 1 Data(78.69, 34.98, 114.07, 173.73, 9.77)
M6LB SALMON 1 Data(75.38, 93.4, 102.15, 59.05, 94.49, 59.94)
M6LB TUNA 1 Data(50.58, 52.69, 53.66, 78, 43.86)
M6LB TROUT 1 Data(39.14, 41.23)
M6LB HERRING 1 Data(44.96, 51.54, 53.5, 59.73)
M6LB MACKEREL 1 Data(25.08, 47.23, 127.54, 67.37, 39.67)
M6LB MACKEREL, PATE 1 Data(25.08, 47.23, 127.54, 67.37, 39.67)
M6LB SARDINES 1 8.89
M6LB BRISLING 1 Data(25.08, 47.23, 127.54, 67.37, 39.67)
M6LB ANCHOVIES 1 8.89
M6LB SWORDFISH 1 31.68
M6LB Fish ROE 1 31.68
M6LB SALMON, CANNED 1 Data(10.43, 12.13, 8.88, 21.4, 35.92)
M6LB TUNA, CANNED 1 Data(0, 0.12, 0.73, 0, 2.14)
M6LB HERRING, CANNED 1 Data(30.54, 26.71)
M6LB MACKEREL, CANNED 1 Data(18.01, 16.93)
M6LB SARDINES, CANNED 1 8.89
M6LB PROCESSED FISH, MIXED FISH
1 31.68
M6LB MUSSELS 1 Data(47.83, 7.17, 38.87, 13.94, 13.29)
M6LB OYSTERS 1 Data(51.21, 39.43, 75.84, 16.3, 21.13)
M6LB PRAWNS 1 1.49
M6LB SHRIMPS 1 1.49
M6LB SCALLOPS 1 Data(47.83, 7.17, 38.87, 13.94, 13.29)
M6LB CRAB 1 31.68
M6LB LOBSTER 1 1.49
M6LB COCKLES 1 Data(47.83, 7.17, 38.87, 13.94, 13.29)
M6LB SQUID 1 31.68
M6LB SPREADS, EXCL. BUTTER 1 0
M6LB OILS 1 Data(0.11, 0.02)
M6LB CONTAINING SPECIAL FATTY ACIDS
1 Data(8.32, 1.33, 4.54, 0, 0, 0.17, 0.32, 2.2, 17.95)
M6LB EVENING PRIMROSE AND/OR STARFLOWER
1 0
M6LB FISH OILS 1
Data(19.38, 62.06, 53.14, 23.82, 46.47, 69.89, 131.79, 4.38, 91.02, 25.03, 106.89, 94.23, 50.92, 50.95, 16.66, 11.27, 11.32, 40.62, 0.66, 18.91, 2.03, 3.22, 32.02, 7.36, 0.11, 46.19, 2.05)
M6LB FLAXSEED OIL 1 Data(8.32, 1.33, 4.54, 0, 0, 0.17, 0.32, 2.2, 17.95)
M6UB DAIRY 1
Data(0.6, 0.41, 0.36, 0.34, 0.47, 0.35, 0.4, 0.46, 0.8, 0.42, 0.46, 0.33, 0.41, 0.29, 0.43, 0.28, 0.39, 0.32, 0.38, 0.37, 0.26, 0.29, 0.39, 0.56, 0.31, 0.59, 0.51, 0.37, 0.36, 0.54, 0.8, 0.81, 1.04, 0.65, 0.66, 0.54, 0.38, 0.57, 0.34)

172
Table 47 continued Creme Data Entry Background Concentration
Chemical Code
Food Code Name Presence Probability
Concentration ng/kg (Marker PCBs in µg/kg)
M6UB CHICKEN EGG 1 Data(0.62, 1.09, 2.99, 3.74, 30.62, 0.37, 0.53, 2.38, 0.53, 0.43, 1.72, 0.82, 0.9, 0.87, 1.08)
M6UB DUCK EGG 1 Data(0.62, 1.09, 2.99, 3.74, 30.62, 0.37, 0.53, 2.38, 0.53, 0.43, 1.72, 0.82, 0.9, 0.87, 1.08)
M6UB BEEF 1 Data(0.93, 0.78, 0.84, 1.34, 0.85, 1.13, 0.97, 0.76, 0.68)
M6UB LAMB 1 Data(0.97, 1.1, 1.05, 0.95, 0.71, 1.13, 0.86, 0.99, 0.76, 0.85)
M6UB PORK 1 Data(0.66, 0.95, 0.34, 0.62, 0.38, 0.79)
M6UB POULTRY 1 Data(2.19, 3.58, 0.87, 0.69, 0.85, 0.54, 0.67, 0.65, 0.48, 3.83, 4.25)
M6UB PHEASANT 1 Data(0.25, 0.26)
M6UB RABBIT 1 0.79
M6UB VENISON 1 Data(0.97, 1.1, 1.05, 0.95, 0.71, 1.13, 0.86, 0.99, 0.76, 0.85)
M6UB PORK/BEEF 1 0.79
M6UB OFFAL, CALF LIVER 1 Data(3.18, 2.94)
M6UB OFFAL, LAMB KIDNEY 1 Data(0.97, 1.1, 1.05, 0.95, 0.71, 1.13, 0.86, 0.99, 0.76, 0.85)
M6UB OFFAL, LAMB LIVER 1 Data(4.85, 2.13)
M6UB OFFAL, PORK KIDNEY 1 Data(0.66, 0.95, 0.34, 0.62, 0.38, 0.79)
M6UB OFFAL, PORK LIVER 1 Data(0.46, 0.57)
M6UB OFFAL, CHICKEN LIVER 1 Data(1.95, 0.38, 1.07)
M6UB OFFAL, DUCK LIVER 1 Data(1.95, 0.38, 1.07)
M6UB COD 1 Data(18.39, 13.56, 13.12, 48.47)
M6UB COLEY 1 31.68
M6UB HADDOCK 1 Data(74, 7, 34.96, 8.85, 7.62)
M6UB HAKE 1 78.98
M6UB HALIBUT 1 31.68
M6UB HOKI 1 31.68
M6UB JOHN DORY 1 31.68
M6UB MONKFISH 1 Data(15.23, 11.06, 84.58, 14.54)
M6UB PLAICE 1 Data(88.6, 33.98)
M6UB POLLACK 1 31.68
M6UB SEA BASS 1 31.68
M6UB SEA BREAM 1 31.68
M6UB SOLE 1 Data(35.21, 29.38, 13.34, 12.59)
M6UB WHITE FISH, DRIED 1 31.68
M6UB WHITE FISH, PROCESSED 1 31.68
M6UB WHITE FISH, UNSPECIFIED
1 31.68
M6UB WHITING 1 Data(78.69, 34.98, 114.07, 173.73, 9.77)
M6UB SALMON 1 Data(75.38, 93.4, 102.15, 59.05, 94.49, 59.94)
M6UB TUNA 1 Data(50.58, 52.69, 53.66, 78, 43.86)
M6UB TROUT 1 Data(39.14, 41.23)
M6UB HERRING 1 Data(44.96, 51.54, 53.5, 59.73)
M6UB MACKEREL 1 Data(25.08, 47.23, 127.54, 67.37, 39.67)
M6UB MACKEREL, PATE 1 Data(25.08, 47.23, 127.54, 67.37, 39.67)
M6UB SARDINES 1 8.89
M6UB BRISLING 1 Data(25.08, 47.23, 127.54, 67.37, 39.67)
M6UB ANCHOVIES 1 8.89
M6UB SWORDFISH 1 31.68
M6UB Fish ROE 1 31.68

173
Table 47 continued Creme Data Entry Background Concentration
c Food Code Name Presence Probability
Concentration ng/kg (Marker PCBs in µg/kg)
M6UB SALMON, CANNED 1 Data(10.43, 12.13, 8.88, 21.4, 35.92)
M6UB TUNA, CANNED 1 Data(9.83, 0.63, 0.95, 6.49, 3.79)
M6UB HERRING, CANNED 1 Data(30.54, 26.71)
M6UB MACKEREL, CANNED 1 Data(18.01, 16.93)
M6UB SARDINES, CANNED 1 8.89
M6UB PROCESSED FISH, MIXED FISH
1 31.68
M6UB MUSSELS 1 Data(47.83, 7.41, 38.87, 15.01, 13.29)
M6UB OYSTERS 1 Data(56.46, 39.43, 77.32, 18.01, 24.02)
M6UB PRAWNS 1 1.58
M6UB SHRIMPS 1 1.58
M6UB SCALLOPS 1 Data(47.83, 7.41, 38.87, 15.01, 13.29)
M6UB CRAB 1 31.68
M6UB LOBSTER 1 1.58
M6UB COCKLES 1 Data(47.83, 7.41, 38.87, 15.01, 13.29)
M6UB SQUID 1 31.68
M6UB SPREADS, EXCL. BUTTER 1 0.84
M6UB OILS 1 Data(0.35, 0.42)
M6UB CONTAINING SPECIAL FATTY ACIDS
1 Data(8.32, 1.94, 4.82, 1.78, 0.86, 0.87, 1.8, 2.8, 17.95)
M6UB EVENING PRIMROSE AND/OR STARFLOWER
1 Data(0.85, 1.09, 0.86, 0.91, 1.01)
M6UB FISH OILS 1
Data(19.67, 62.06, 53.28, 23.96, 46.61, 69.89, 131.79, 4.61, 91.02, 25.03, 106.89, 94.23, 51.06, 51.09, 16.66, 11.41, 11.32, 40.77, 1.16, 18.91, 2.33, 3.36, 32.02, 7.52, 0.24, 46.19, 2.08)
M6UB FLAXSEED OIL 1 Data(8.32, 1.94, 4.82, 1.78, 0.86, 0.87, 1.8, 2.8, 17.95)
TTNLB DAIRY 1
Data(0.37, 0.4, 0.26, 0.16, 0.4, 0.32, 0.23, 0.31, 0.6, 0.42, 0.41, 0.17, 0.23, 0.16, 0.15, 0.17, 0.22, 0.24, 0.22, 0.32, 0.23, 0.17, 0.26, 0.41, 0.22, 0.35, 0.47, 0.32, 0.27, 0.35, 0.33, 0.38, 0.24, 0.29, 0.38, 0.34, 0.23, 0.35, 0.31)
TTNLB CHICKEN EGG 1 Data(0.25, 0.17, 0.19, 0.2, 0.25, 0.11, 0.23, 0.25, 0.06, 0.07, 0.33, 0.23, 0.18, 0.3, 0.28)
TTNLB DUCK EGG 1 Data(0.25, 0.17, 0.19, 0.2, 0.25, 0.11, 0.23, 0.25, 0.06, 0.07, 0.33, 0.23, 0.18, 0.3, 0.28)
TTNLB BEEF 1 Data(0.5, 0.44, 0.14, 0.66, 0.58, 0.53, 0.71, 0.45, 0.39)
TTNLB LAMB 1 Data(0.66, 0.46, 0.41, 0.44, 0.42, 0.56, 0.33, 0.44, 0.38, 0.39)
TTNLB PORK 1 Data(0.81, 0.1, 0.07, 0.11, 0.13, 0.07)
TTNLB POULTRY 1 Data(0.38, 0.54, 0.24, 0.24, 0.2, 0.15, 0.15, 0.18, 0.14, 0.63, 0.69)
TTNLB PHEASANT 1 Data(0.1, 0.07)
TTNLB RABBIT 1 0.44
TTNLB VENISON 1 Data(0.66, 0.46, 0.41, 0.44, 0.42, 0.56, 0.33, 0.44, 0.38, 0.39)
TTNLB PORK/BEEF 1 0.44
TTNLB OFFAL, CALF LIVER 1 Data(1.39, 1.54)
TTNLB OFFAL, LAMB KIDNEY 1 Data(0.66, 0.46, 0.41, 0.44, 0.42, 0.56, 0.33, 0.44, 0.38, 0.39)
TTNLB OFFAL, LAMB LIVER 1 Data(4.1, 3.34)
TTNLB OFFAL, PORK KIDNEY 1 Data(0.81, 0.1, 0.07, 0.11, 0.13, 0.07)
TTNLB OFFAL, PORK LIVER 1 Data(0.58, 0.97)
TTNLB OFFAL, CHICKEN LIVER 1 Data(0.6, 0.3, 0.21)
TTNLB OFFAL, DUCK LIVER 1 Data(0.6, 0.3, 0.21)
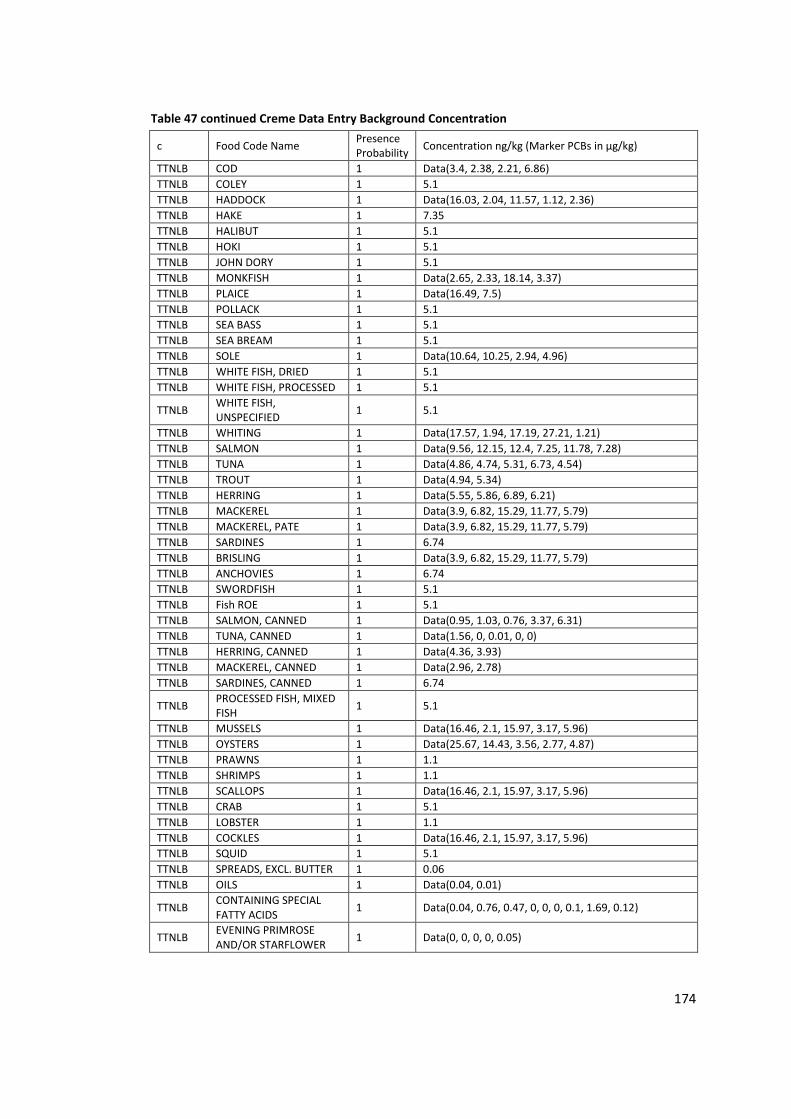
174
Table 47 continued Creme Data Entry Background Concentration
c Food Code Name Presence Probability
Concentration ng/kg (Marker PCBs in µg/kg)
TTNLB COD 1 Data(3.4, 2.38, 2.21, 6.86)
TTNLB COLEY 1 5.1
TTNLB HADDOCK 1 Data(16.03, 2.04, 11.57, 1.12, 2.36)
TTNLB HAKE 1 7.35
TTNLB HALIBUT 1 5.1
TTNLB HOKI 1 5.1
TTNLB JOHN DORY 1 5.1
TTNLB MONKFISH 1 Data(2.65, 2.33, 18.14, 3.37)
TTNLB PLAICE 1 Data(16.49, 7.5)
TTNLB POLLACK 1 5.1
TTNLB SEA BASS 1 5.1
TTNLB SEA BREAM 1 5.1
TTNLB SOLE 1 Data(10.64, 10.25, 2.94, 4.96)
TTNLB WHITE FISH, DRIED 1 5.1
TTNLB WHITE FISH, PROCESSED 1 5.1
TTNLB WHITE FISH, UNSPECIFIED
1 5.1
TTNLB WHITING 1 Data(17.57, 1.94, 17.19, 27.21, 1.21)
TTNLB SALMON 1 Data(9.56, 12.15, 12.4, 7.25, 11.78, 7.28)
TTNLB TUNA 1 Data(4.86, 4.74, 5.31, 6.73, 4.54)
TTNLB TROUT 1 Data(4.94, 5.34)
TTNLB HERRING 1 Data(5.55, 5.86, 6.89, 6.21)
TTNLB MACKEREL 1 Data(3.9, 6.82, 15.29, 11.77, 5.79)
TTNLB MACKEREL, PATE 1 Data(3.9, 6.82, 15.29, 11.77, 5.79)
TTNLB SARDINES 1 6.74
TTNLB BRISLING 1 Data(3.9, 6.82, 15.29, 11.77, 5.79)
TTNLB ANCHOVIES 1 6.74
TTNLB SWORDFISH 1 5.1
TTNLB Fish ROE 1 5.1
TTNLB SALMON, CANNED 1 Data(0.95, 1.03, 0.76, 3.37, 6.31)
TTNLB TUNA, CANNED 1 Data(1.56, 0, 0.01, 0, 0)
TTNLB HERRING, CANNED 1 Data(4.36, 3.93)
TTNLB MACKEREL, CANNED 1 Data(2.96, 2.78)
TTNLB SARDINES, CANNED 1 6.74
TTNLB PROCESSED FISH, MIXED FISH
1 5.1
TTNLB MUSSELS 1 Data(16.46, 2.1, 15.97, 3.17, 5.96)
TTNLB OYSTERS 1 Data(25.67, 14.43, 3.56, 2.77, 4.87)
TTNLB PRAWNS 1 1.1
TTNLB SHRIMPS 1 1.1
TTNLB SCALLOPS 1 Data(16.46, 2.1, 15.97, 3.17, 5.96)
TTNLB CRAB 1 5.1
TTNLB LOBSTER 1 1.1
TTNLB COCKLES 1 Data(16.46, 2.1, 15.97, 3.17, 5.96)
TTNLB SQUID 1 5.1
TTNLB SPREADS, EXCL. BUTTER 1 0.06
TTNLB OILS 1 Data(0.04, 0.01)
TTNLB CONTAINING SPECIAL FATTY ACIDS
1 Data(0.04, 0.76, 0.47, 0, 0, 0, 0.1, 1.69, 0.12)
TTNLB EVENING PRIMROSE AND/OR STARFLOWER
1 Data(0, 0, 0, 0, 0.05)

175
Table 47 continued Creme Data Entry Background Concentration
Chemical Code
Food Code Name Presence Probability
Concentration ng/kg (Marker PCBs in µg/kg)
TTNLB FISH OILS 1 Data(0.09, 3.81, 1.1, 0.89, 0.95, 8.2, 2.74, 0.53, 5.05, 0.44, 6.53, 2.91, 1.05, 1.19, 1.08, 1.94, 3.23, 4.14, 0.04, 2.14, 0.01, 0.02, 1.34, 1.83, 0, 3.58, 2.15)
TTNLB FLAXSEED OIL 1 Data(0.04, 0.76, 0.47, 0, 0, 0, 0.1, 1.69, 0.12)
TTNUB DAIRY 1
Data(0.38, 0.41, 0.3, 0.19, 0.41, 0.32, 0.27, 0.34, 0.6, 0.42, 0.43, 0.21, 0.28, 0.2, 0.26, 0.21, 0.26, 0.28, 0.3, 0.35, 0.24, 0.2, 0.27, 0.42, 0.22, 0.36, 0.48, 0.33, 0.28, 0.36, 0.34, 0.43, 0.28, 0.31, 0.39, 0.35, 0.24, 0.35, 0.32)
TTNUB CHICKEN EGG 1 Data(0.25, 0.17, 0.24, 0.24, 0.26, 0.24, 0.3, 0.34, 0.21, 0.21, 0.36, 0.28, 0.25, 0.36, 0.29)
TTNUB DUCK EGG 1 Data(0.25, 0.17, 0.24, 0.24, 0.26, 0.24, 0.3, 0.34, 0.21, 0.21, 0.36, 0.28, 0.25, 0.36, 0.29)
TTNUB BEEF 1 Data(0.51, 0.46, 0.16, 0.67, 0.59, 0.55, 0.71, 0.45, 0.4)
TTNUB LAMB 1 Data(0.66, 0.47, 0.41, 0.44, 0.43, 0.57, 0.34, 0.44, 0.38, 0.4)
TTNUB PORK 1 Data(0.81, 0.13, 0.13, 0.2, 0.15, 0.11)
TTNUB POULTRY 1 Data(0.39, 0.56, 0.25, 0.24, 0.2, 0.21, 0.15, 0.19, 0.15, 0.63, 0.69)
TTNUB PHEASANT 1 Data(0.11, 0.09)
TTNUB RABBIT 1 0.45
TTNUB VENISON 1 Data(0.66, 0.47, 0.41, 0.44, 0.43, 0.57, 0.34, 0.44, 0.38, 0.4)
TTNUB PORK/BEEF 1 0.45
TTNUB OFFAL, CALF LIVER 1 Data(1.44, 1.55)
TTNUB OFFAL, LAMB KIDNEY 1 Data(0.66, 0.47, 0.41, 0.44, 0.43, 0.57, 0.34, 0.44, 0.38, 0.4)
TTNUB OFFAL, LAMB LIVER 1 Data(4.1, 3.35)
TTNUB OFFAL, PORK KIDNEY 1 Data(0.81, 0.13, 0.13, 0.2, 0.15, 0.11)
TTNUB OFFAL, PORK LIVER 1 Data(0.61, 1)
TTNUB OFFAL, CHICKEN LIVER 1 Data(0.6, 0.3, 0.22)
TTNUB OFFAL, DUCK LIVER 1 Data(0.6, 0.3, 0.22)
TTNUB COD 1 Data(3.43, 2.4, 2.65, 6.87)
TTNUB COLEY 1 5.1
TTNUB HADDOCK 1 Data(16.04, 2.09, 11.58, 1.4, 2.37)
TTNUB HAKE 1 7.36
TTNUB HALIBUT 1 5.1
TTNUB HOKI 1 5.1
TTNUB JOHN DORY 1 5.1
TTNUB MONKFISH 1 Data(2.66, 2.35, 18.15, 3.4)
TTNUB PLAICE 1 Data(16.49, 7.5)
TTNUB POLLACK 1 5.1
TTNUB SEA BASS 1 5.1
TTNUB SEA BREAM 1 5.1
TTNUB SOLE 1 Data(10.64, 10.25, 2.95, 4.96)
TTNUB WHITE FISH, DRIED 1 5.1
TTNUB WHITE FISH, PROCESSED 1 5.1
TTNUB WHITE FISH, UNSPECIFIED
1 5.1
TTNUB WHITING 1 Data(17.59, 2.08, 17.2, 27.22, 1.25)
TTNUB SALMON 1 Data(9.57, 12.15, 12.4, 7.25, 11.78, 7.28)
TTNUB TUNA 1 Data(4.86, 4.74, 5.31, 6.73, 4.54)
TTNUB TROUT 1 Data(4.94, 5.34)
TTNUB HERRING 1 Data(5.8, 5.89, 6.93, 6.24)
TTNUB MACKEREL 1 Data(3.9, 6.82, 15.29, 11.77, 5.79)
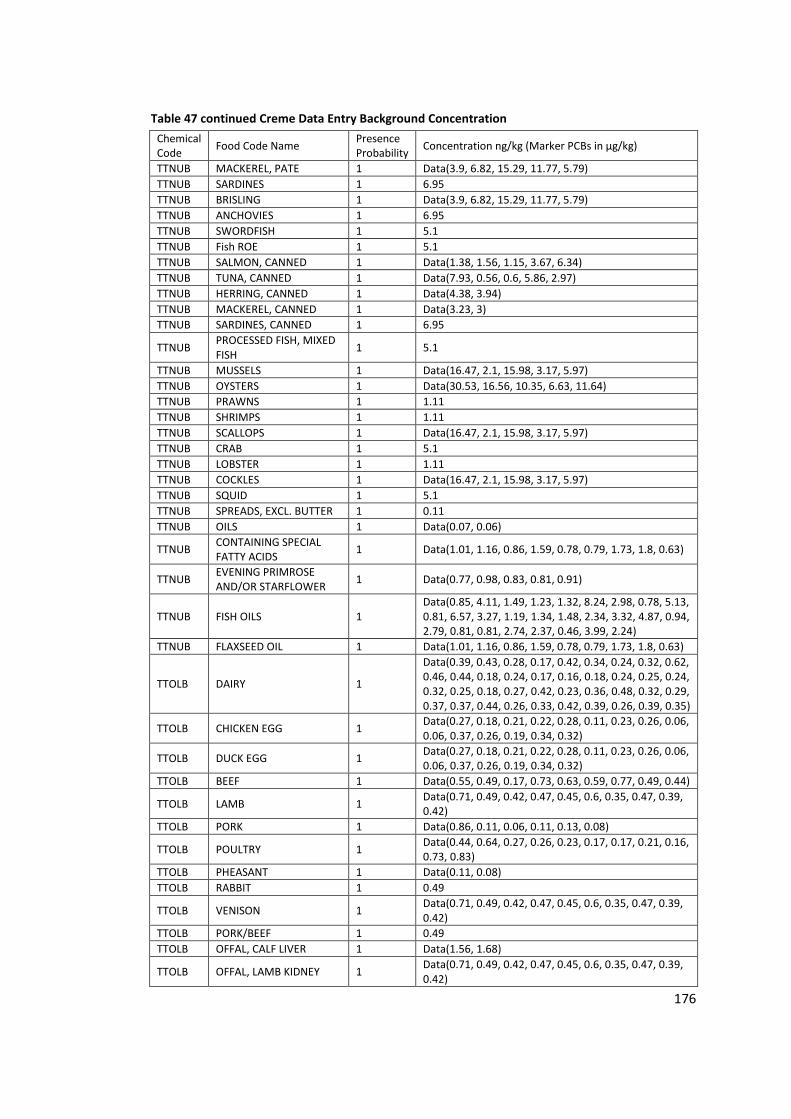
176
Table 47 continued Creme Data Entry Background Concentration
Chemical Code
Food Code Name Presence Probability
Concentration ng/kg (Marker PCBs in µg/kg)
TTNUB MACKEREL, PATE 1 Data(3.9, 6.82, 15.29, 11.77, 5.79)
TTNUB SARDINES 1 6.95
TTNUB BRISLING 1 Data(3.9, 6.82, 15.29, 11.77, 5.79)
TTNUB ANCHOVIES 1 6.95
TTNUB SWORDFISH 1 5.1
TTNUB Fish ROE 1 5.1
TTNUB SALMON, CANNED 1 Data(1.38, 1.56, 1.15, 3.67, 6.34)
TTNUB TUNA, CANNED 1 Data(7.93, 0.56, 0.6, 5.86, 2.97)
TTNUB HERRING, CANNED 1 Data(4.38, 3.94)
TTNUB MACKEREL, CANNED 1 Data(3.23, 3)
TTNUB SARDINES, CANNED 1 6.95
TTNUB PROCESSED FISH, MIXED FISH
1 5.1
TTNUB MUSSELS 1 Data(16.47, 2.1, 15.98, 3.17, 5.97)
TTNUB OYSTERS 1 Data(30.53, 16.56, 10.35, 6.63, 11.64)
TTNUB PRAWNS 1 1.11
TTNUB SHRIMPS 1 1.11
TTNUB SCALLOPS 1 Data(16.47, 2.1, 15.98, 3.17, 5.97)
TTNUB CRAB 1 5.1
TTNUB LOBSTER 1 1.11
TTNUB COCKLES 1 Data(16.47, 2.1, 15.98, 3.17, 5.97)
TTNUB SQUID 1 5.1
TTNUB SPREADS, EXCL. BUTTER 1 0.11
TTNUB OILS 1 Data(0.07, 0.06)
TTNUB CONTAINING SPECIAL FATTY ACIDS
1 Data(1.01, 1.16, 0.86, 1.59, 0.78, 0.79, 1.73, 1.8, 0.63)
TTNUB EVENING PRIMROSE AND/OR STARFLOWER
1 Data(0.77, 0.98, 0.83, 0.81, 0.91)
TTNUB FISH OILS 1 Data(0.85, 4.11, 1.49, 1.23, 1.32, 8.24, 2.98, 0.78, 5.13, 0.81, 6.57, 3.27, 1.19, 1.34, 1.48, 2.34, 3.32, 4.87, 0.94, 2.79, 0.81, 0.81, 2.74, 2.37, 0.46, 3.99, 2.24)
TTNUB FLAXSEED OIL 1 Data(1.01, 1.16, 0.86, 1.59, 0.78, 0.79, 1.73, 1.8, 0.63)
TTOLB DAIRY 1
Data(0.39, 0.43, 0.28, 0.17, 0.42, 0.34, 0.24, 0.32, 0.62, 0.46, 0.44, 0.18, 0.24, 0.17, 0.16, 0.18, 0.24, 0.25, 0.24, 0.32, 0.25, 0.18, 0.27, 0.42, 0.23, 0.36, 0.48, 0.32, 0.29, 0.37, 0.37, 0.44, 0.26, 0.33, 0.42, 0.39, 0.26, 0.39, 0.35)
TTOLB CHICKEN EGG 1 Data(0.27, 0.18, 0.21, 0.22, 0.28, 0.11, 0.23, 0.26, 0.06, 0.06, 0.37, 0.26, 0.19, 0.34, 0.32)
TTOLB DUCK EGG 1 Data(0.27, 0.18, 0.21, 0.22, 0.28, 0.11, 0.23, 0.26, 0.06, 0.06, 0.37, 0.26, 0.19, 0.34, 0.32)
TTOLB BEEF 1 Data(0.55, 0.49, 0.17, 0.73, 0.63, 0.59, 0.77, 0.49, 0.44)
TTOLB LAMB 1 Data(0.71, 0.49, 0.42, 0.47, 0.45, 0.6, 0.35, 0.47, 0.39, 0.42)
TTOLB PORK 1 Data(0.86, 0.11, 0.06, 0.11, 0.13, 0.08)
TTOLB POULTRY 1 Data(0.44, 0.64, 0.27, 0.26, 0.23, 0.17, 0.17, 0.21, 0.16, 0.73, 0.83)
TTOLB PHEASANT 1 Data(0.11, 0.08)
TTOLB RABBIT 1 0.49
TTOLB VENISON 1 Data(0.71, 0.49, 0.42, 0.47, 0.45, 0.6, 0.35, 0.47, 0.39, 0.42)
TTOLB PORK/BEEF 1 0.49
TTOLB OFFAL, CALF LIVER 1 Data(1.56, 1.68)
TTOLB OFFAL, LAMB KIDNEY 1 Data(0.71, 0.49, 0.42, 0.47, 0.45, 0.6, 0.35, 0.47, 0.39, 0.42)
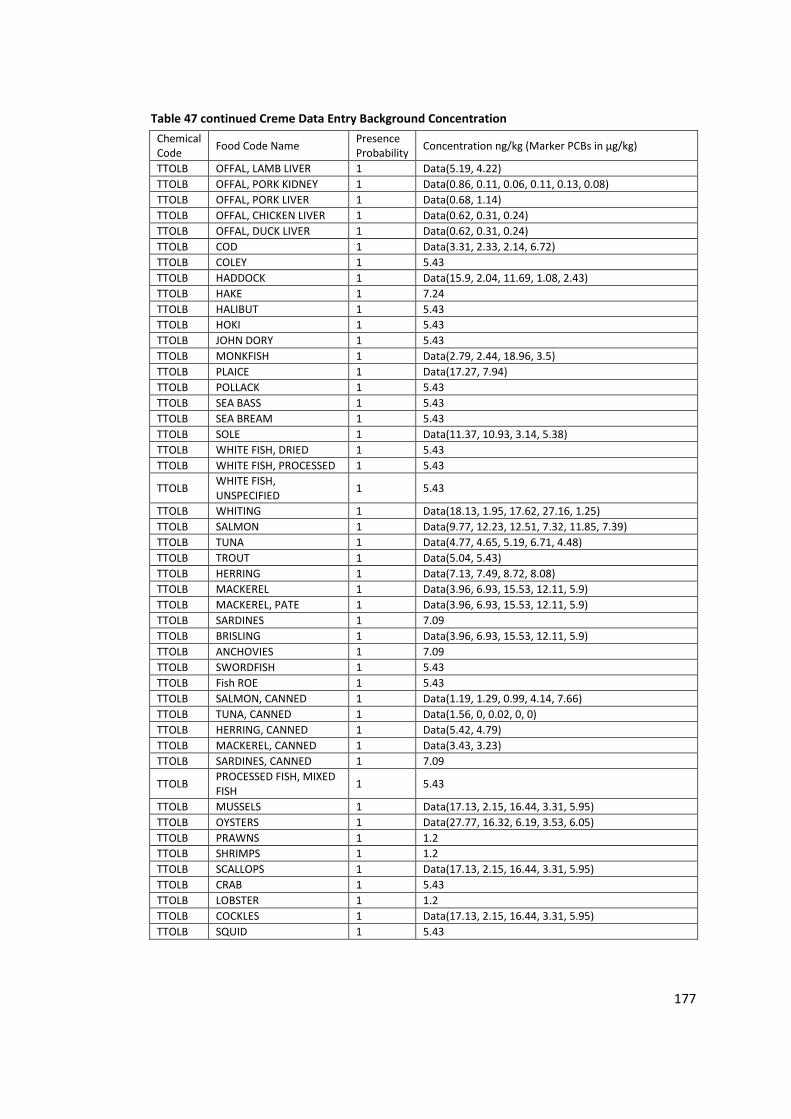
177
Table 47 continued Creme Data Entry Background Concentration
Chemical Code
Food Code Name Presence Probability
Concentration ng/kg (Marker PCBs in µg/kg)
TTOLB OFFAL, LAMB LIVER 1 Data(5.19, 4.22)
TTOLB OFFAL, PORK KIDNEY 1 Data(0.86, 0.11, 0.06, 0.11, 0.13, 0.08)
TTOLB OFFAL, PORK LIVER 1 Data(0.68, 1.14)
TTOLB OFFAL, CHICKEN LIVER 1 Data(0.62, 0.31, 0.24)
TTOLB OFFAL, DUCK LIVER 1 Data(0.62, 0.31, 0.24)
TTOLB COD 1 Data(3.31, 2.33, 2.14, 6.72)
TTOLB COLEY 1 5.43
TTOLB HADDOCK 1 Data(15.9, 2.04, 11.69, 1.08, 2.43)
TTOLB HAKE 1 7.24
TTOLB HALIBUT 1 5.43
TTOLB HOKI 1 5.43
TTOLB JOHN DORY 1 5.43
TTOLB MONKFISH 1 Data(2.79, 2.44, 18.96, 3.5)
TTOLB PLAICE 1 Data(17.27, 7.94)
TTOLB POLLACK 1 5.43
TTOLB SEA BASS 1 5.43
TTOLB SEA BREAM 1 5.43
TTOLB SOLE 1 Data(11.37, 10.93, 3.14, 5.38)
TTOLB WHITE FISH, DRIED 1 5.43
TTOLB WHITE FISH, PROCESSED 1 5.43
TTOLB WHITE FISH, UNSPECIFIED
1 5.43
TTOLB WHITING 1 Data(18.13, 1.95, 17.62, 27.16, 1.25)
TTOLB SALMON 1 Data(9.77, 12.23, 12.51, 7.32, 11.85, 7.39)
TTOLB TUNA 1 Data(4.77, 4.65, 5.19, 6.71, 4.48)
TTOLB TROUT 1 Data(5.04, 5.43)
TTOLB HERRING 1 Data(7.13, 7.49, 8.72, 8.08)
TTOLB MACKEREL 1 Data(3.96, 6.93, 15.53, 12.11, 5.9)
TTOLB MACKEREL, PATE 1 Data(3.96, 6.93, 15.53, 12.11, 5.9)
TTOLB SARDINES 1 7.09
TTOLB BRISLING 1 Data(3.96, 6.93, 15.53, 12.11, 5.9)
TTOLB ANCHOVIES 1 7.09
TTOLB SWORDFISH 1 5.43
TTOLB Fish ROE 1 5.43
TTOLB SALMON, CANNED 1 Data(1.19, 1.29, 0.99, 4.14, 7.66)
TTOLB TUNA, CANNED 1 Data(1.56, 0, 0.02, 0, 0)
TTOLB HERRING, CANNED 1 Data(5.42, 4.79)
TTOLB MACKEREL, CANNED 1 Data(3.43, 3.23)
TTOLB SARDINES, CANNED 1 7.09
TTOLB PROCESSED FISH, MIXED FISH
1 5.43
TTOLB MUSSELS 1 Data(17.13, 2.15, 16.44, 3.31, 5.95)
TTOLB OYSTERS 1 Data(27.77, 16.32, 6.19, 3.53, 6.05)
TTOLB PRAWNS 1 1.2
TTOLB SHRIMPS 1 1.2
TTOLB SCALLOPS 1 Data(17.13, 2.15, 16.44, 3.31, 5.95)
TTOLB CRAB 1 5.43
TTOLB LOBSTER 1 1.2
TTOLB COCKLES 1 Data(17.13, 2.15, 16.44, 3.31, 5.95)
TTOLB SQUID 1 5.43
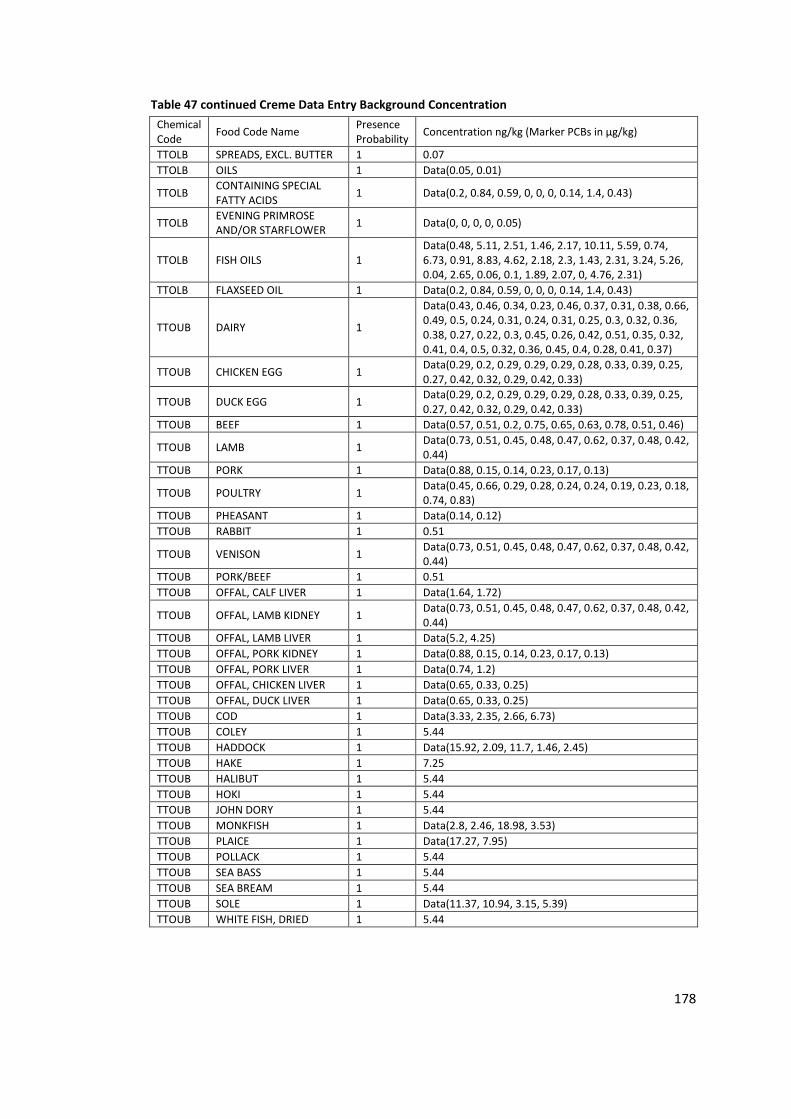
178
Table 47 continued Creme Data Entry Background Concentration
Chemical Code
Food Code Name Presence Probability
Concentration ng/kg (Marker PCBs in µg/kg)
TTOLB SPREADS, EXCL. BUTTER 1 0.07
TTOLB OILS 1 Data(0.05, 0.01)
TTOLB CONTAINING SPECIAL FATTY ACIDS
1 Data(0.2, 0.84, 0.59, 0, 0, 0, 0.14, 1.4, 0.43)
TTOLB EVENING PRIMROSE AND/OR STARFLOWER
1 Data(0, 0, 0, 0, 0.05)
TTOLB FISH OILS 1 Data(0.48, 5.11, 2.51, 1.46, 2.17, 10.11, 5.59, 0.74, 6.73, 0.91, 8.83, 4.62, 2.18, 2.3, 1.43, 2.31, 3.24, 5.26, 0.04, 2.65, 0.06, 0.1, 1.89, 2.07, 0, 4.76, 2.31)
TTOLB FLAXSEED OIL 1 Data(0.2, 0.84, 0.59, 0, 0, 0, 0.14, 1.4, 0.43)
TTOUB DAIRY 1
Data(0.43, 0.46, 0.34, 0.23, 0.46, 0.37, 0.31, 0.38, 0.66, 0.49, 0.5, 0.24, 0.31, 0.24, 0.31, 0.25, 0.3, 0.32, 0.36, 0.38, 0.27, 0.22, 0.3, 0.45, 0.26, 0.42, 0.51, 0.35, 0.32, 0.41, 0.4, 0.5, 0.32, 0.36, 0.45, 0.4, 0.28, 0.41, 0.37)
TTOUB CHICKEN EGG 1 Data(0.29, 0.2, 0.29, 0.29, 0.29, 0.28, 0.33, 0.39, 0.25, 0.27, 0.42, 0.32, 0.29, 0.42, 0.33)
TTOUB DUCK EGG 1 Data(0.29, 0.2, 0.29, 0.29, 0.29, 0.28, 0.33, 0.39, 0.25, 0.27, 0.42, 0.32, 0.29, 0.42, 0.33)
TTOUB BEEF 1 Data(0.57, 0.51, 0.2, 0.75, 0.65, 0.63, 0.78, 0.51, 0.46)
TTOUB LAMB 1 Data(0.73, 0.51, 0.45, 0.48, 0.47, 0.62, 0.37, 0.48, 0.42, 0.44)
TTOUB PORK 1 Data(0.88, 0.15, 0.14, 0.23, 0.17, 0.13)
TTOUB POULTRY 1 Data(0.45, 0.66, 0.29, 0.28, 0.24, 0.24, 0.19, 0.23, 0.18, 0.74, 0.83)
TTOUB PHEASANT 1 Data(0.14, 0.12)
TTOUB RABBIT 1 0.51
TTOUB VENISON 1 Data(0.73, 0.51, 0.45, 0.48, 0.47, 0.62, 0.37, 0.48, 0.42, 0.44)
TTOUB PORK/BEEF 1 0.51
TTOUB OFFAL, CALF LIVER 1 Data(1.64, 1.72)
TTOUB OFFAL, LAMB KIDNEY 1 Data(0.73, 0.51, 0.45, 0.48, 0.47, 0.62, 0.37, 0.48, 0.42, 0.44)
TTOUB OFFAL, LAMB LIVER 1 Data(5.2, 4.25)
TTOUB OFFAL, PORK KIDNEY 1 Data(0.88, 0.15, 0.14, 0.23, 0.17, 0.13)
TTOUB OFFAL, PORK LIVER 1 Data(0.74, 1.2)
TTOUB OFFAL, CHICKEN LIVER 1 Data(0.65, 0.33, 0.25)
TTOUB OFFAL, DUCK LIVER 1 Data(0.65, 0.33, 0.25)
TTOUB COD 1 Data(3.33, 2.35, 2.66, 6.73)
TTOUB COLEY 1 5.44
TTOUB HADDOCK 1 Data(15.92, 2.09, 11.7, 1.46, 2.45)
TTOUB HAKE 1 7.25
TTOUB HALIBUT 1 5.44
TTOUB HOKI 1 5.44
TTOUB JOHN DORY 1 5.44
TTOUB MONKFISH 1 Data(2.8, 2.46, 18.98, 3.53)
TTOUB PLAICE 1 Data(17.27, 7.95)
TTOUB POLLACK 1 5.44
TTOUB SEA BASS 1 5.44
TTOUB SEA BREAM 1 5.44
TTOUB SOLE 1 Data(11.37, 10.94, 3.15, 5.39)
TTOUB WHITE FISH, DRIED 1 5.44
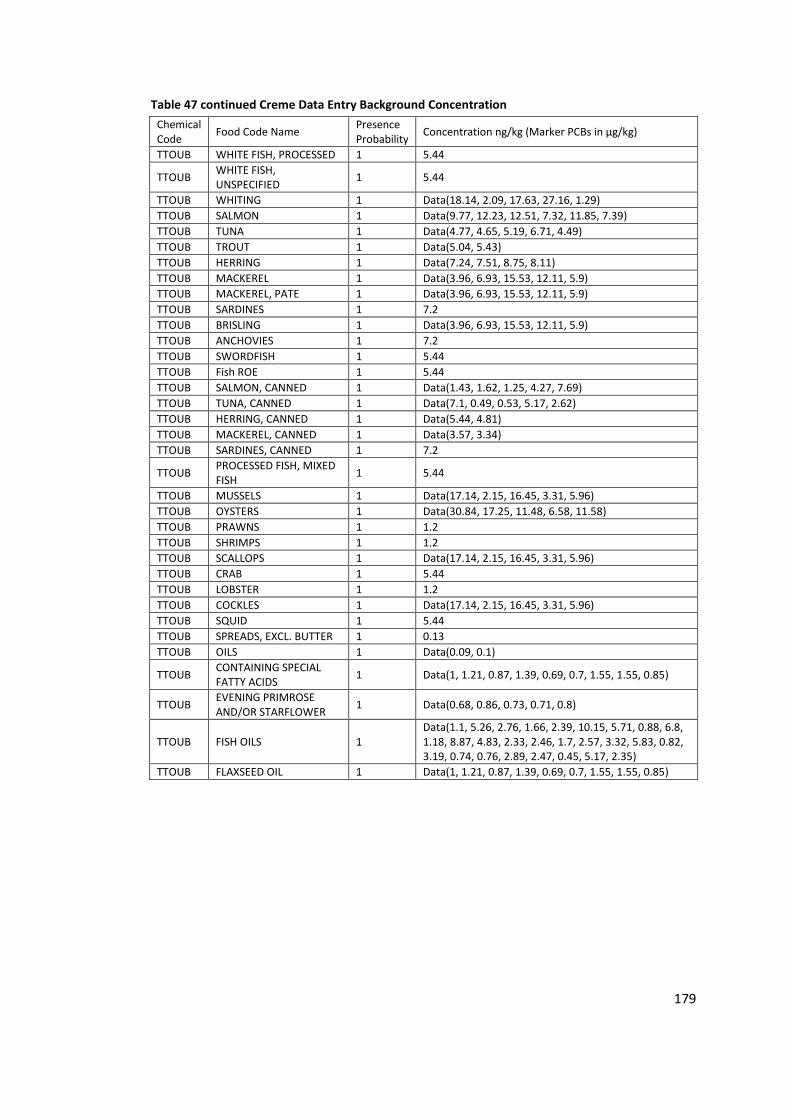
179
Table 47 continued Creme Data Entry Background Concentration
Chemical Code
Food Code Name Presence Probability
Concentration ng/kg (Marker PCBs in µg/kg)
TTOUB WHITE FISH, PROCESSED 1 5.44
TTOUB WHITE FISH, UNSPECIFIED
1 5.44
TTOUB WHITING 1 Data(18.14, 2.09, 17.63, 27.16, 1.29)
TTOUB SALMON 1 Data(9.77, 12.23, 12.51, 7.32, 11.85, 7.39)
TTOUB TUNA 1 Data(4.77, 4.65, 5.19, 6.71, 4.49)
TTOUB TROUT 1 Data(5.04, 5.43)
TTOUB HERRING 1 Data(7.24, 7.51, 8.75, 8.11)
TTOUB MACKEREL 1 Data(3.96, 6.93, 15.53, 12.11, 5.9)
TTOUB MACKEREL, PATE 1 Data(3.96, 6.93, 15.53, 12.11, 5.9)
TTOUB SARDINES 1 7.2
TTOUB BRISLING 1 Data(3.96, 6.93, 15.53, 12.11, 5.9)
TTOUB ANCHOVIES 1 7.2
TTOUB SWORDFISH 1 5.44
TTOUB Fish ROE 1 5.44
TTOUB SALMON, CANNED 1 Data(1.43, 1.62, 1.25, 4.27, 7.69)
TTOUB TUNA, CANNED 1 Data(7.1, 0.49, 0.53, 5.17, 2.62)
TTOUB HERRING, CANNED 1 Data(5.44, 4.81)
TTOUB MACKEREL, CANNED 1 Data(3.57, 3.34)
TTOUB SARDINES, CANNED 1 7.2
TTOUB PROCESSED FISH, MIXED FISH
1 5.44
TTOUB MUSSELS 1 Data(17.14, 2.15, 16.45, 3.31, 5.96)
TTOUB OYSTERS 1 Data(30.84, 17.25, 11.48, 6.58, 11.58)
TTOUB PRAWNS 1 1.2
TTOUB SHRIMPS 1 1.2
TTOUB SCALLOPS 1 Data(17.14, 2.15, 16.45, 3.31, 5.96)
TTOUB CRAB 1 5.44
TTOUB LOBSTER 1 1.2
TTOUB COCKLES 1 Data(17.14, 2.15, 16.45, 3.31, 5.96)
TTOUB SQUID 1 5.44
TTOUB SPREADS, EXCL. BUTTER 1 0.13
TTOUB OILS 1 Data(0.09, 0.1)
TTOUB CONTAINING SPECIAL FATTY ACIDS
1 Data(1, 1.21, 0.87, 1.39, 0.69, 0.7, 1.55, 1.55, 0.85)
TTOUB EVENING PRIMROSE AND/OR STARFLOWER
1 Data(0.68, 0.86, 0.73, 0.71, 0.8)
TTOUB FISH OILS 1 Data(1.1, 5.26, 2.76, 1.66, 2.39, 10.15, 5.71, 0.88, 6.8, 1.18, 8.87, 4.83, 2.33, 2.46, 1.7, 2.57, 3.32, 5.83, 0.82, 3.19, 0.74, 0.76, 2.89, 2.47, 0.45, 5.17, 2.35)
TTOUB FLAXSEED OIL 1 Data(1, 1.21, 0.87, 1.39, 0.69, 0.7, 1.55, 1.55, 0.85)

180
Table 48 Crème Data Entry for contaminated beef and pork
Chemical Code
Food Code Name Presence Probability
Concentration ng/kg (Marker PCBs in µg/kg)
M6UB BEEF 1
Discrete(Data(0.93, 0.78, 0.84, 1.34, 0.85, 1.13, 0.97, 0.76, 0.68), 0.989, Data(710.62, 912.56, 737.59, 147.22, 1.97, 3.22, 107.54, 23.65, 31.50, 12.34, 11.95, 0.00, 10.28, 13.24, 11.80, 10.40, 7.79), 0.011)
M6UB BEEF MINCE 1
Discrete(Data(0.93, 0.78, 0.84, 1.34, 0.85, 1.13, 0.97, 0.76, 0.68), 0.989, Data(710.62, 912.56, 737.59, 147.22, 1.97, 3.22, 107.54, 23.65, 31.50, 12.34, 11.95, 0.00, 10.28, 13.24, 11.80, 10.40, 7.79), 0.011)
M6UB BEEF, FAT 1
Discrete(Data(0.93, 0.78, 0.84, 1.34, 0.85, 1.13, 0.97, 0.76, 0.68), 0.989, Data(710.62, 912.56, 737.59, 147.22, 1.97, 3.22, 107.54, 23.65, 31.50, 12.34, 11.95, 0.00, 10.28, 13.24, 11.80, 10.40, 7.79), 0.011)
M6UB BEEF, PROCESSED 1
Discrete(Data(0.93, 0.78, 0.84, 1.34, 0.85, 1.13, 0.97, 0.76, 0.68), 0.989, Data(710.62, 912.56, 737.59, 147.22, 1.97, 3.22, 107.54, 23.65, 31.50, 12.34, 11.95, 0.00, 10.28, 13.24, 11.80, 10.40, 7.79), 0.011)
M6UB PORK 1
Discrete(Data(0.66, 0.95, 0.34, 0.62, 0.38, 0.79), 0.95, Data(1549.70, 1157.20, 1100.50, 958.10, 2567.64, 971.65, 1101.36, 1034.06, 647.50, 519.62, 916.16, 1516.30, 1417.07, 5363.78, 3896.16, 41.45, 255.98, 496.48, 629.27, 630.26, 780.26, 403.81, 476.80), 0.05)
M6UB PORK, BACON 1
Discrete(Data(0.66, 0.95, 0.34, 0.62, 0.38, 0.79), 0.95, Data(1549.70, 1157.20, 1100.50, 958.10, 2567.64, 971.65, 1101.36, 1034.06, 647.50, 519.62, 916.16, 1516.30, 1417.07, 5363.78, 3896.16, 41.45, 255.98, 496.48, 629.27, 630.26, 780.26, 403.81, 476.80), 0.05)
M6UB PORK, HAM 1
Discrete(Data(0.66, 0.95, 0.34, 0.62, 0.38, 0.79), 0.95, Data(1549.70, 1157.20, 1100.50, 958.10, 2567.64, 971.65, 1101.36, 1034.06, 647.50, 519.62, 916.16, 1516.30, 1417.07, 5363.78, 3896.16, 41.45, 255.98, 496.48, 629.27, 630.26, 780.26, 403.81, 476.80), 0.05)
M6UB PORK, SAUSAGES, BREAKFAST
1
Discrete(Data(0.66, 0.95, 0.34, 0.62, 0.38, 0.79), 0.95, Data(1549.70, 1157.20, 1100.50, 958.10, 2567.64, 971.65, 1101.36, 1034.06, 647.50, 519.62, 916.16, 1516.30, 1417.07, 5363.78, 3896.16, 41.45, 255.98, 496.48, 629.27, 630.26, 780.26, 403.81, 476.80), 0.05)
M6UB PORK, SAUSAGES, OTHER
1
Discrete(Data(0.66, 0.95, 0.34, 0.62, 0.38, 0.79), 0.95, Data(1549.70, 1157.20, 1100.50, 958.10, 2567.64, 971.65, 1101.36, 1034.06, 647.50, 519.62, 916.16, 1516.30, 1417.07, 5363.78, 3896.16, 41.45, 255.98, 496.48, 629.27, 630.26, 780.26, 403.81, 476.80), 0.05)
M6UB PORK, PUDDINGS 1
Discrete(Data(0.66, 0.95, 0.34, 0.62, 0.38, 0.79), 0.95, Data(1549.70, 1157.20, 1100.50, 958.10, 2567.64, 971.65, 1101.36, 1034.06, 647.50, 519.62, 916.16, 1516.30, 1417.07, 5363.78, 3896.16, 41.45, 255.98, 496.48, 629.27, 630.26, 780.26, 403.81, 476.80), 0.05)
M6UB PORK, FAT 1
Discrete(Data(0.66, 0.95, 0.34, 0.62, 0.38, 0.79), 0.95, Data(1549.70, 1157.20, 1100.50, 958.10, 2567.64, 971.65, 1101.36, 1034.06, 647.50, 519.62, 916.16, 1516.30, 1417.07, 5363.78, 3896.16, 41.45, 255.98, 496.48, 629.27, 630.26, 780.26, 403.81, 476.80), 0.05)
M6UB PORK, PROCESSED 1
Discrete(Data(0.66, 0.95, 0.34, 0.62, 0.38, 0.79), 0.95, Data(1549.70, 1157.20, 1100.50, 958.10, 2567.64, 971.65, 1101.36, 1034.06, 647.50, 519.62, 916.16, 1516.30, 1417.07, 5363.78, 3896.16, 41.45, 255.98, 496.48, 629.27, 630.26, 780.26, 403.81, 476.80), 0.05)

181
Table 48 continued Creme Data Entry for contaminated beef and pork
Chemical Code
Food Code Name Presence Probability
Concentration ng/kg (Marker PCBs in µg/kg)
M6UB PORK/BEEF, PROCESSED
1
Discrete(Data(0.79), 0.95, Data(1549.70, 1157.20, 1100.50, 958.10, 2567.64, 971.65, 1101.36, 1034.06, 647.50, 519.62, 916.16, 1516.30, 1417.07, 5363.78, 3896.16, 41.45, 255.98, 496.48, 629.27, 630.26, 780.26, 403.81, 476.80), 0.05)
M6UB PORK/BEEF, SAUSAGES
1
Discrete(Data(0.79), 0.95, Data(1549.70, 1157.20, 1100.50, 958.10, 2567.64, 971.65, 1101.36, 1034.06, 647.50, 519.62, 916.16, 1516.30, 1417.07, 5363.78, 3896.16, 41.45, 255.98, 496.48, 629.27, 630.26, 780.26, 403.81, 476.80), 0.05)
M6UB OFFAL, CALF LIVER 1 Discrete(Data(3.18, 2.94), 0.989, Data(710.62, 912.56, 737.59, 147.22, 1.97, 3.22, 107.54, 23.65, 31.50, 12.34, 11.95, 0.00, 10.28, 13.24, 11.80, 10.40, 7.79), 0.011)
M6UB OFFAL, BOVINE KIDNEY
1
Discrete(Data(0.93, 0.78, 0.84, 1.34, 0.85, 1.13, 0.97, 0.76, 0.68), 0.989, Data(710.62, 912.56, 737.59, 147.22, 1.97, 3.22, 107.54, 23.65, 31.50, 12.34, 11.95, 0.00, 10.28, 13.24, 11.80, 10.40, 7.79), 0.011)
M6UB OFFAL, PORK KIDNEY
1
Discrete(Data(0.66, 0.95, 0.34, 0.62, 0.38, 0.79), 0.95, Data(1549.70, 1157.20, 1100.50, 958.10, 2567.64, 971.65, 1101.36, 1034.06, 647.50, 519.62, 916.16, 1516.30, 1417.07, 5363.78, 3896.16, 41.45, 255.98, 496.48, 629.27, 630.26, 780.26, 403.81, 476.80), 0.05)
M6UB OFFAL, PORK LIVER 1
Discrete(Data(0.46, 0.57), 0.95, Data(1549.70, 1157.20, 1100.50, 958.10, 2567.64, 971.65, 1101.36, 1034.06, 647.50, 519.62, 916.16, 1516.30, 1417.07, 5363.78, 3896.16, 41.45, 255.98, 496.48, 629.27, 630.26, 780.26, 403.81, 476.80), 0.05)
M6UB OFFAL, PORK LIVER, PROCESSED
1
Discrete(Data(0.46, 0.57), 0.95, Data(1549.70, 1157.20, 1100.50, 958.10, 2567.64, 971.65, 1101.36, 1034.06, 647.50, 519.62, 916.16, 1516.30, 1417.07, 5363.78, 3896.16, 41.45, 255.98, 496.48, 629.27, 630.26, 780.26, 403.81, 476.80), 0.05)
M6UB OFFAL, PORK TROTTERS AND TAILS
1
Discrete(Data(0.66, 0.95, 0.34, 0.62, 0.38, 0.79), 0.95, Data(1549.70, 1157.20, 1100.50, 958.10, 2567.64, 971.65, 1101.36, 1034.06, 647.50, 519.62, 916.16, 1516.30, 1417.07, 5363.78, 3896.16, 41.45, 255.98, 496.48, 629.27, 630.26, 780.26, 403.81, 476.80), 0.05)
TTNUB BEEF 1
Discrete(Data(0.51, 0.46, 0.16, 0.67, 0.59, 0.55, 0.71, 0.45, 0.4), 0.989, Data(884.34, 472.55, 625.79, 214.24, 1.89, 3.47, 147.65, 50.62, 53.16, 23.25, 15.45, 7.36, 16.52, 19.87, 15.63, 17.87, 10.66, 7.47, 9.25, 1.91), 0.011)
TTNUB BEEF MINCE 1
Discrete(Data(0.51, 0.46, 0.16, 0.67, 0.59, 0.55, 0.71, 0.45, 0.4), 0.989, Data(884.34, 472.55, 625.79, 214.24, 1.89, 3.47, 147.65, 50.62, 53.16, 23.25, 15.45, 7.36, 16.52, 19.87, 15.63, 17.87, 10.66, 7.47, 9.25, 1.91), 0.011)
TTNUB BEEF, FAT 1
Discrete(Data(0.51, 0.46, 0.16, 0.67, 0.59, 0.55, 0.71, 0.45, 0.4), 0.989, Data(884.34, 472.55, 625.79, 214.24, 1.89, 3.47, 147.65, 50.62, 53.16, 23.25, 15.45, 7.36, 16.52, 19.87, 15.63, 17.87, 10.66, 7.47, 9.25, 1.91), 0.011)
TTNUB BEEF, PROCESSED 1
Discrete(Data(0.51, 0.46, 0.16, 0.67, 0.59, 0.55, 0.71, 0.45, 0.4), 0.989, Data(884.34, 472.55, 625.79, 214.24, 1.89, 3.47, 147.65, 50.62, 53.16, 23.25, 15.45, 7.36, 16.52, 19.87, 15.63, 17.87, 10.66, 7.47, 9.25, 1.91), 0.011)

182
Table 48 continued Creme Data Entry for contaminated beef and pork
Chemical Code
Food Code Name Presence Probability
Concentration ng/kg (Marker PCBs in µg/kg)
TTNUB PORK 1
Discrete(Data(0.81, 0.13, 0.13, 0.2, 0.15, 0.11), 0.95, Data(171.09, 151.61, 108.16, 278.41, 206.68, 137.08, 132.85, 124.24, 53.53, 57.72, 139.01, 279.39, 164.06, 890.21, 748.59, 23.42, 43.78, 76.16, 136.17, 75.84, 189.28, 106.36, 41.44), 0.05)
TTNUB PORK, BACON 1
Discrete(Data(0.81, 0.13, 0.13, 0.2, 0.15, 0.11), 0.95, Data(171.09, 151.61, 108.16, 278.41, 206.68, 137.08, 132.85, 124.24, 53.53, 57.72, 139.01, 279.39, 164.06, 890.21, 748.59, 23.42, 43.78, 76.16, 136.17, 75.84, 189.28, 106.36, 41.44), 0.05)
TTNUB PORK, HAM 1
Discrete(Data(0.81, 0.13, 0.13, 0.2, 0.15, 0.11), 0.95, Data(171.09, 151.61, 108.16, 278.41, 206.68, 137.08, 132.85, 124.24, 53.53, 57.72, 139.01, 279.39, 164.06, 890.21, 748.59, 23.42, 43.78, 76.16, 136.17, 75.84, 189.28, 106.36, 41.44), 0.05)
TTNUB PORK, SAUSAGES, BREAKFAST
1
Discrete(Data(0.81, 0.13, 0.13, 0.2, 0.15, 0.11), 0.95, Data(171.09, 151.61, 108.16, 278.41, 206.68, 137.08, 132.85, 124.24, 53.53, 57.72, 139.01, 279.39, 164.06, 890.21, 748.59, 23.42, 43.78, 76.16, 136.17, 75.84, 189.28, 106.36, 41.44), 0.05)
TTNUB PORK, SAUSAGES, OTHER
1
Discrete(Data(0.81, 0.13, 0.13, 0.2, 0.15, 0.11), 0.95, Data(171.09, 151.61, 108.16, 278.41, 206.68, 137.08, 132.85, 124.24, 53.53, 57.72, 139.01, 279.39, 164.06, 890.21, 748.59, 23.42, 43.78, 76.16, 136.17, 75.84, 189.28, 106.36, 41.44), 0.05)
TTNUB PORK, PUDDINGS 1
Discrete(Data(0.81, 0.13, 0.13, 0.2, 0.15, 0.11), 0.95, Data(171.09, 151.61, 108.16, 278.41, 206.68, 137.08, 132.85, 124.24, 53.53, 57.72, 139.01, 279.39, 164.06, 890.21, 748.59, 23.42, 43.78, 76.16, 136.17, 75.84, 189.28, 106.36, 41.44), 0.05)
TTNUB PORK, FAT 1
Discrete(Data(0.81, 0.13, 0.13, 0.2, 0.15, 0.11), 0.95, Data(171.09, 151.61, 108.16, 278.41, 206.68, 137.08, 132.85, 124.24, 53.53, 57.72, 139.01, 279.39, 164.06, 890.21, 748.59, 23.42, 43.78, 76.16, 136.17, 75.84, 189.28, 106.36, 41.44), 0.05)
TTNUB PORK, PROCESSED 1
Discrete(Data(0.81, 0.13, 0.13, 0.2, 0.15, 0.11), 0.95, Data(171.09, 151.61, 108.16, 278.41, 206.68, 137.08, 132.85, 124.24, 53.53, 57.72, 139.01, 279.39, 164.06, 890.21, 748.59, 23.42, 43.78, 76.16, 136.17, 75.84, 189.28, 106.36, 41.44), 0.05)
TTNUB PORK/BEEF, PROCESSED
1
Discrete(Data(0.45), 0.95, Data(171.09, 151.61, 108.16, 278.41, 206.68, 137.08, 132.85, 124.24, 53.53, 57.72, 139.01, 279.39, 164.06, 890.21, 748.59, 23.42, 43.78, 76.16, 136.17, 75.84, 189.28, 106.36, 41.44), 0.05)
TTNUB PORK/BEEF, SAUSAGES
1
Discrete(Data(0.45), 0.95, Data(171.09, 151.61, 108.16, 278.41, 206.68, 137.08, 132.85, 124.24, 53.53, 57.72, 139.01, 279.39, 164.06, 890.21, 748.59, 23.42, 43.78, 76.16, 136.17, 75.84, 189.28, 106.36, 41.44), 0.05)
TTNUB OFFAL, CALF LIVER 1
Discrete(Data(1.44, 1.55), 0.989, Data(884.34, 472.55, 625.79, 214.24, 1.89, 3.47, 147.65, 50.62, 53.16, 23.25, 15.45, 7.36, 16.52, 19.87, 15.63, 17.87, 10.66, 7.47, 9.25, 1.91), 0.011)
TTNUB OFFAL, BOVINE KIDNEY
1
Discrete(Data(0.51, 0.46, 0.16, 0.67, 0.59, 0.55, 0.71, 0.45, 0.4), 0.989, Data(884.34, 472.55, 625.79, 214.24, 1.89, 3.47, 147.65, 50.62, 53.16, 23.25, 15.45, 7.36, 16.52, 19.87, 15.63, 17.87, 10.66, 7.47, 9.25, 1.91), 0.011)

183
Table 48 continued Creme Data Entry for contaminated beef and pork
Chemical Code
Food Code Name
Presence Probability
Concentration ng/kg (Marker PCBs in µg/kg)
TTNUB OFFAL, PORK KIDNEY
1
Discrete(Data(0.81, 0.13, 0.13, 0.2, 0.15, 0.11), 0.95, Data(171.09, 151.61, 108.16, 278.41, 206.68, 137.08, 132.85, 124.24, 53.53, 57.72, 139.01, 279.39, 164.06, 890.21, 748.59, 23.42, 43.78, 76.16, 136.17, 75.84, 189.28, 106.36, 41.44), 0.05)
TTNUB OFFAL, PORK LIVER
1
Discrete(Data(0.61, 1), 0.95, Data(171.09, 151.61, 108.16, 278.41, 206.68, 137.08, 132.85, 124.24, 53.53, 57.72, 139.01, 279.39, 164.06, 890.21, 748.59, 23.42, 43.78, 76.16, 136.17, 75.84, 189.28, 106.36, 41.44), 0.05)
TTNUB OFFAL, PORK LIVER, PROCESSED
1
Discrete(Data(0.61, 1), 0.95, Data(171.09, 151.61, 108.16, 278.41, 206.68, 137.08, 132.85, 124.24, 53.53, 57.72, 139.01, 279.39, 164.06, 890.21, 748.59, 23.42, 43.78, 76.16, 136.17, 75.84, 189.28, 106.36, 41.44), 0.05)
TTNUB
OFFAL, PORK TROTTERS AND TAILS
1
Discrete(Data(0.81, 0.13, 0.13, 0.2, 0.15, 0.11), 0.95, Data(171.09, 151.61, 108.16, 278.41, 206.68, 137.08, 132.85, 124.24, 53.53, 57.72, 139.01, 279.39, 164.06, 890.21, 748.59, 23.42, 43.78, 76.16, 136.17, 75.84, 189.28, 106.36, 41.44), 0.05)
TTOUB BEEF 1
Discrete(Data(0.57, 0.51, 0.2, 0.75, 0.65, 0.63, 0.78, 0.51, 0.46), 0.989, Data(1403.25, 727.29, 970.63, 340.43, 2.40, 4.45, 235.30, 80.32, 83.78, 36.84, 24.65, 12.00, 25.81, 31.14, 24.35, 27.91, 16.68, 12.00, 14.00, 2.90), 0.011)
TTOUB BEEF MINCE 1
Discrete(Data(0.57, 0.51, 0.2, 0.75, 0.65, 0.63, 0.78, 0.51, 0.46), 0.989, Data(1403.25, 727.29, 970.63, 340.43, 2.40, 4.45, 235.30, 80.32, 83.78, 36.84, 24.65, 12.00, 25.81, 31.14, 24.35, 27.91, 16.68, 12.00, 14.00, 2.90), 0.011)
TTOUB BEEF, FAT 1
Discrete(Data(0.57, 0.51, 0.2, 0.75, 0.65, 0.63, 0.78, 0.51, 0.46), 0.989, Data(1403.25, 727.29, 970.63, 340.43, 2.40, 4.45, 235.30, 80.32, 83.78, 36.84, 24.65, 12.00, 25.81, 31.14, 24.35, 27.91, 16.68, 12.00, 14.00, 2.90), 0.011)
TTOUB BEEF, PROCESSED
1
Discrete(Data(0.57, 0.51, 0.2, 0.75, 0.65, 0.63, 0.78, 0.51, 0.46), 0.989, Data(1403.25, 727.29, 970.63, 340.43, 2.40, 4.45, 235.30, 80.32, 83.78, 36.84, 24.65, 12.00, 25.81, 31.14, 24.35, 27.91, 16.68, 12.00, 14.00, 2.90), 0.011)
TTOUB PORK 1
Discrete(Data(0.88, 0.15, 0.14, 0.23, 0.17, 0.13), 0.95, Data(270.00, 240.00, 170.00, 439.74, 336.13, 219.73, 213.20, 200.81, 86.61, 92.28, 218.45, 434.05, 257.46, 1429.27, 1191.88, 36.57, 69.60, 120.94, 213.24, 123.50, 300.70, 169.06, 67.69), 0.05)
TTOUB PORK, BACON
1
Discrete(Data(0.88, 0.15, 0.14, 0.23, 0.17, 0.13), 0.95, Data(270.00, 240.00, 170.00, 439.74, 336.13, 219.73, 213.20, 200.81, 86.61, 92.28, 218.45, 434.05, 257.46, 1429.27, 1191.88, 36.57, 69.60, 120.94, 213.24, 123.50, 300.70, 169.06, 67.69), 0.05)
TTOUB PORK, HAM 1
Discrete(Data(0.88, 0.15, 0.14, 0.23, 0.17, 0.13), 0.95, Data(270.00, 240.00, 170.00, 439.74, 336.13, 219.73, 213.20, 200.81, 86.61, 92.28, 218.45, 434.05, 257.46, 1429.27, 1191.88, 36.57, 69.60, 120.94, 213.24, 123.50, 300.70, 169.06, 67.69), 0.05)
TTOUB PORK, SAUSAGES, BREAKFAST
1
Discrete(Data(0.88, 0.15, 0.14, 0.23, 0.17, 0.13), 0.95, Data(270.00, 240.00, 170.00, 439.74, 336.13, 219.73, 213.20, 200.81, 86.61, 92.28, 218.45, 434.05, 257.46, 1429.27, 1191.88, 36.57, 69.60, 120.94, 213.24, 123.50, 300.70, 169.06, 67.69), 0.05)
TTOUB PORK, SAUSAGES, OTHER
1
Discrete(Data(0.88, 0.15, 0.14, 0.23, 0.17, 0.13), 0.95, Data(270.00, 240.00, 170.00, 439.74, 336.13, 219.73, 213.20, 200.81, 86.61, 92.28, 218.45, 434.05, 257.46, 1429.27, 1191.88, 36.57, 69.60, 120.94, 213.24, 123.50, 300.70, 169.06, 67.69), 0.05)

184
Table 48 continued Creme Data Entry for contaminated beef and pork
Chemical Code
Food Code Name
Presence Probability
Concentration ng/kg (Marker PCBs in µg/kg)
TTOUB PORK, PUDDINGS
1
Discrete(Data(0.88, 0.15, 0.14, 0.23, 0.17, 0.13), 0.95, Data(270.00, 240.00, 170.00, 439.74, 336.13, 219.73, 213.20, 200.81, 86.61, 92.28, 218.45, 434.05, 257.46, 1429.27, 1191.88, 36.57, 69.60, 120.94, 213.24, 123.50, 300.70, 169.06, 67.69), 0.05)
TTOUB PORK, FAT 1
Discrete(Data(0.88, 0.15, 0.14, 0.23, 0.17, 0.13), 0.95, Data(270.00, 240.00, 170.00, 439.74, 336.13, 219.73, 213.20, 200.81, 86.61, 92.28, 218.45, 434.05, 257.46, 1429.27, 1191.88, 36.57, 69.60, 120.94, 213.24, 123.50, 300.70, 169.06, 67.69), 0.05)
TTOUB PORK, PROCESSED
1
Discrete(Data(0.88, 0.15, 0.14, 0.23, 0.17, 0.13), 0.95, Data(270.00, 240.00, 170.00, 439.74, 336.13, 219.73, 213.20, 200.81, 86.61, 92.28, 218.45, 434.05, 257.46, 1429.27, 1191.88, 36.57, 69.60, 120.94, 213.24, 123.50, 300.70, 169.06, 67.69), 0.05)
TTOUB PORK/BEEF, PROCESSED
1
Discrete(Data(0.51), 0.95, Data(270.00, 240.00, 170.00, 439.74, 336.13, 219.73, 213.20, 200.81, 86.61, 92.28, 218.45, 434.05, 257.46, 1429.27, 1191.88, 36.57, 69.60, 120.94, 213.24, 123.50, 300.70, 169.06, 67.69), 0.05)
TTOUB PORK/BEEF, SAUSAGES
1
Discrete(Data(0.51), 0.95, Data(270.00, 240.00, 170.00, 439.74, 336.13, 219.73, 213.20, 200.81, 86.61, 92.28, 218.45, 434.05, 257.46, 1429.27, 1191.88, 36.57, 69.60, 120.94, 213.24, 123.50, 300.70, 169.06, 67.69), 0.05)
TTOUB OFFAL, CALF LIVER
1 Discrete(Data(1.64, 1.72), 0.989, Data(1403.25, 727.29, 970.63, 340.43, 2.40, 4.45, 235.30, 80.32, 83.78, 36.84, 24.65, 12.00, 25.81, 31.14, 24.35, 27.91, 16.68, 12.00, 14.00, 2.90), 0.011)
TTOUB OFFAL, BOVINE KIDNEY
1
Discrete(Data(0.57, 0.51, 0.2, 0.75, 0.65, 0.63, 0.78, 0.51, 0.46), 0.989, Data(1403.25, 727.29, 970.63, 340.43, 2.40, 4.45, 235.30, 80.32, 83.78, 36.84, 24.65, 12.00, 25.81, 31.14, 24.35, 27.91, 16.68, 12.00, 14.00, 2.90), 0.011)
TTOUB OFFAL, PORK KIDNEY
1
Discrete(Data(0.88, 0.15, 0.14, 0.23, 0.17, 0.13), 0.95, Data(270.00, 240.00, 170.00, 439.74, 336.13, 219.73, 213.20, 200.81, 86.61, 92.28, 218.45, 434.05, 257.46, 1429.27, 1191.88, 36.57, 69.60, 120.94, 213.24, 123.50, 300.70, 169.06, 67.69), 0.05)
TTOUB OFFAL, PORK LIVER
1
Discrete(Data(0.74, 1.2), 0.95, Data(270.00, 240.00, 170.00, 439.74, 336.13, 219.73, 213.20, 200.81, 86.61, 92.28, 218.45, 434.05, 257.46, 1429.27, 1191.88, 36.57, 69.60, 120.94, 213.24, 123.50, 300.70, 169.06, 67.69), 0.05)
TTOUB OFFAL, PORK LIVER, PROCESSED
1
Discrete(Data(0.74, 1.2), 0.95, Data(270.00, 240.00, 170.00, 439.74, 336.13, 219.73, 213.20, 200.81, 86.61, 92.28, 218.45, 434.05, 257.46, 1429.27, 1191.88, 36.57, 69.60, 120.94, 213.24, 123.50, 300.70, 169.06, 67.69), 0.05)
TTOUB
OFFAL, PORK TROTTERS AND TAILS
1
Discrete(Data(0.88, 0.15, 0.14, 0.23, 0.17, 0.13), 0.95, Data(270.00, 240.00, 170.00, 439.74, 336.13, 219.73, 213.20, 200.81, 86.61, 92.28, 218.45, 434.05, 257.46, 1429.27, 1191.88, 36.57, 69.60, 120.94, 213.24, 123.50, 300.70, 169.06, 67.69), 0.05)

185
7.4 Results expressed on WHO-TEQ (1998) basis
7.4.1 Background exposure
Table 49 Range of LB - UB summary statistics of exposure to Total WHO TEQ (1998) expressed as pg/kg bw/d and % contribution to the total mean average daily intake
Group Names Range of LB - UB TOTAL WHO TEQ (1998) pg/kg bw/d
% Contribution Mean Med P75 P90 P95 P97.5 P98 P99
DAIRY, MILKS 8.7-8.8 0.03-0.03 0.02-0.02 0.04-0.04 0.06-0.07 0.08-0.09 0.1-0.1 0.1-0.1 0.1-0.2
DAIRY, CREAMS 2.7-2.7 0.009-0.01 0.001-0.001 0.01-0.01 0.02-0.03 0.04-0.04 0.05-0.06 0.06-0.07 0.08-0.09
DAIRY, YOGHURTS 1-1 0.003-0.004 0 0.004-0.005 0.01-0.01 0.02-0.02 0.02-0.02 0.02-0.02 0.03-0.03
DAIRY, CHEESE 7.3-7.3 0.02-0.03 0.02-0.02 0.03-0.04 0.06-0.06 0.08-0.09 0.1-0.1 0.1-0.1 0.1-0.1
DAIRY, BUTTER 6.5-6.5 0.02-0.02 0.009-0.01 0.03-0.03 0.06-0.06 0.08-0.09 0.1-0.1 0.1-0.1 0.2-0.2
DAIRY 26-26 0.08-0.1 0.07-0.08 0.1-0.1 0.2-0.2 0.2-0.2 0.2-0.3 0.3-0.3 0.3-0.3
EGGS, CHICKEN 2.1-2.6 0.007-0.009 0.004-0.006 0.01-0.01 0.02-0.02 0.02-0.03 0.03-0.04 0.03-0.04 0.03-0.05
EGGS, DUCK 0.008-0.01 0.00003-0.00004 0 0 0 0 0 0 0
EGGS 2.1-2.6 0.007-0.01 0.004-0.007 0.01-0.01 0.02-0.02 0.02-0.03 0.03-0.04 0.03-0.04 0.03-0.05
MEAT AND MEAT PRODUCTS, BEEF 12-11 0.04-0.04 0.02-0.02 0.06-0.06 0.1-0.1 0.1-0.1 0.2-0.2 0.2-0.2 0.2-0.2
MEAT AND MEAT PRODUCTS, LAMB 3-2.8 0.01-0.01 0 0 0.04-0.04 0.07-0.07 0.1-0.1 0.1-0.1 0.1-0.1
MEAT AND MEAT PRODUCTS, PORK 7-7.7 0.02-0.03 0.009-0.01 0.03-0.04 0.06-0.08 0.09-0.1 0.1-0.1 0.1-0.1 0.2-0.2
MEAT AND MEAT PRODUCTS, POULTRY 2.6-2.4 0.008-0.009 0.003-0.003 0.008-0.008 0.02-0.02 0.03-0.04 0.06-0.06 0.07-0.07 0.1-0.1
MEAT AND MEAT PRODUCTS, OTHER 0.009-0.009 0.00003-0.00003 0 0 0 0 0 0 0
MEAT AND MEAT PRODUCTS, MIXED MEAT 0.03-0.03 0.0001-0.0001 0 0 0 0 0 0 0
OFFAL, BEEF 0.01-0.01 0.00004-0.00004 0 0 0 0 0 0 0
OFFAL, LAMB 0.3-0.3 0.001-0.001 0 0 0 0 0 0 0.002-0.002
OFFAL, PORK 0.03-0.03 0.0001-0.0001 0 0 0 0 0 0 0.001-0.002
OFFAL, POULTRY 0.002-0.002 0.000006-0.000006 0 0 0 0 0 0 0
MEAT AND MEAT PRODUCTS 25-24 0.08-0.09 0.06-0.07 0.1-0.1 0.2-0.2 0.2-0.2 0.3-0.3 0.3-0.3 0.3-0.3
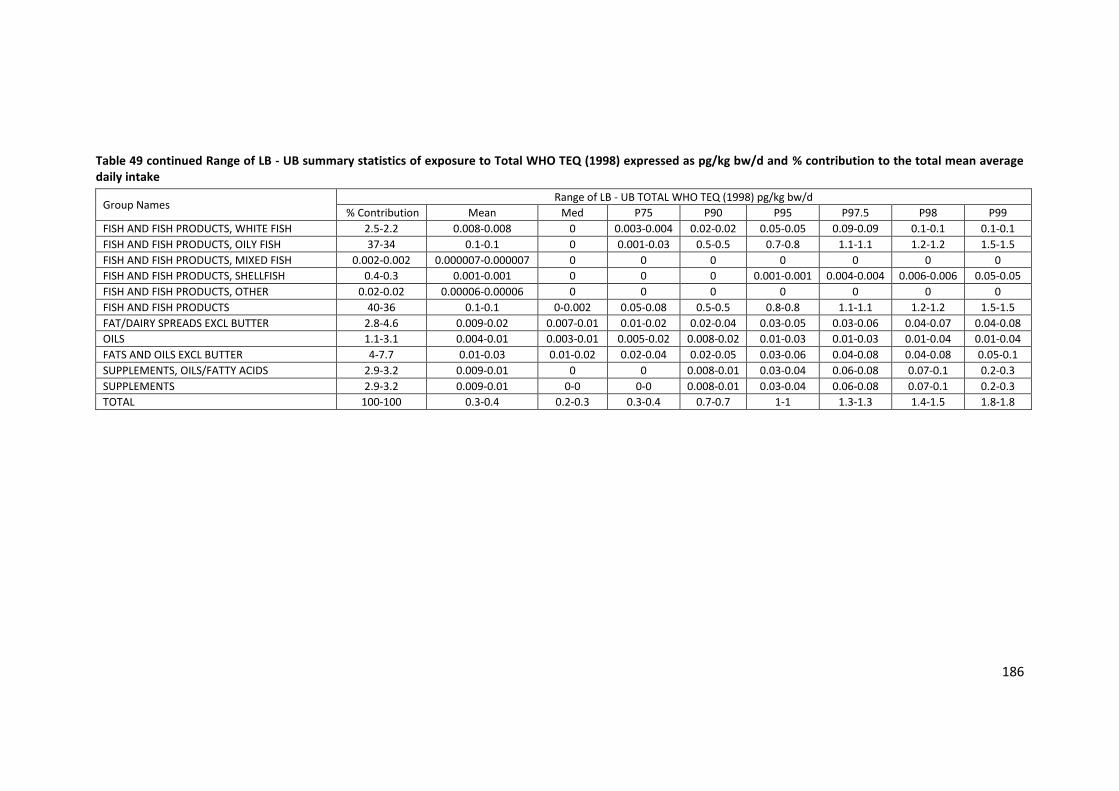
186
Table 49 continued Range of LB - UB summary statistics of exposure to Total WHO TEQ (1998) expressed as pg/kg bw/d and % contribution to the total mean average daily intake
Group Names Range of LB - UB TOTAL WHO TEQ (1998) pg/kg bw/d
% Contribution Mean Med P75 P90 P95 P97.5 P98 P99
FISH AND FISH PRODUCTS, WHITE FISH 2.5-2.2 0.008-0.008 0 0.003-0.004 0.02-0.02 0.05-0.05 0.09-0.09 0.1-0.1 0.1-0.1
FISH AND FISH PRODUCTS, OILY FISH 37-34 0.1-0.1 0 0.001-0.03 0.5-0.5 0.7-0.8 1.1-1.1 1.2-1.2 1.5-1.5
FISH AND FISH PRODUCTS, MIXED FISH 0.002-0.002 0.000007-0.000007 0 0 0 0 0 0 0
FISH AND FISH PRODUCTS, SHELLFISH 0.4-0.3 0.001-0.001 0 0 0 0.001-0.001 0.004-0.004 0.006-0.006 0.05-0.05
FISH AND FISH PRODUCTS, OTHER 0.02-0.02 0.00006-0.00006 0 0 0 0 0 0 0
FISH AND FISH PRODUCTS 40-36 0.1-0.1 0-0.002 0.05-0.08 0.5-0.5 0.8-0.8 1.1-1.1 1.2-1.2 1.5-1.5
FAT/DAIRY SPREADS EXCL BUTTER 2.8-4.6 0.009-0.02 0.007-0.01 0.01-0.02 0.02-0.04 0.03-0.05 0.03-0.06 0.04-0.07 0.04-0.08
OILS 1.1-3.1 0.004-0.01 0.003-0.01 0.005-0.02 0.008-0.02 0.01-0.03 0.01-0.03 0.01-0.04 0.01-0.04
FATS AND OILS EXCL BUTTER 4-7.7 0.01-0.03 0.01-0.02 0.02-0.04 0.02-0.05 0.03-0.06 0.04-0.08 0.04-0.08 0.05-0.1
SUPPLEMENTS, OILS/FATTY ACIDS 2.9-3.2 0.009-0.01 0 0 0.008-0.01 0.03-0.04 0.06-0.08 0.07-0.1 0.2-0.3
SUPPLEMENTS 2.9-3.2 0.009-0.01 0-0 0-0 0.008-0.01 0.03-0.04 0.06-0.08 0.07-0.1 0.2-0.3
TOTAL 100-100 0.3-0.4 0.2-0.3 0.3-0.4 0.7-0.7 1-1 1.3-1.3 1.4-1.5 1.8-1.8

187
7.4.2 Incident exposure (1998 TOTTEQ)
Table 50 Contamination impact – UB Mean, Median and higher percentile exposure to Total WHO TEQ (1998) expressed as pg/kg bw/d and % contribution to the total mean average daily intake
Group Names Post incident UB TOTAL WHO TEQ (1998) pg/kg bw/d
% Contribution Mean Med P75 P90 P95 P97.5 P98 P99
DAIRY, MILKS 1.6 0.03 0.02 0.04 0.07 0.09 0.1 0.1 0.2
DAIRY, CREAMS 0.5 0.01 0.001 0.01 0.03 0.04 0.06 0.07 0.09
DAIRY, YOGHURTS 0.2 0.004 0 0.005 0.01 0.02 0.02 0.02 0.03
DAIRY, CHEESE 1.3 0.03 0.02 0.04 0.06 0.09 0.1 0.1 0.1
DAIRY, BUTTER 1.2 0.02 0.01 0.03 0.06 0.09 0.1 0.1 0.2
DAIRY 4.7 0.10 0.08 0.1 0.2 0.2 0.3 0.3 0.3
EGGS, CHICKEN 0.5 0.009 0.006 0.01 0.02 0.03 0.04 0.04 0.05
EGGS, DUCK 0.002 0.00004 0
EGGS 0.5 0.010 0.006 0.01 0.02 0.03 0.04 0.04 0.05
MEAT AND MEAT PRODUCTS, BEEF 9.4 0.2 0.02 0.06 0.1 0.2 0.2 0.2 0.6
MEAT AND MEAT PRODUCTS, LAMB 0.5 0.01 0
0.04 0.07 0.10 0.1 0.1
MEAT AND MEAT PRODUCTS, PORK 76 1.6 0.02 0.06 1.9 7.7 16 19 32
MEAT AND MEAT PRODUCTS, POULTRY 0.4 0.009 0.003 0.008 0.02 0.04 0.06 0.07 0.10
MEAT AND MEAT PRODUCTS, OTHER 0.002 0.00003 0
MEAT AND MEAT PRODUCTS, MIXED MEAT 0.2 0.005 0
OFFAL, BEEF 0.006 0.0001 0
OFFAL, LAMB 0.06 0.001 0
0.002
OFFAL, PORK 0.1 0.003 0
0.002
OFFAL, POULTRY 0.0003 0.000006 0
MEAT AND MEAT PRODUCTS 86 1.8 0.08 0.2 2.3 8.4 17 21 36
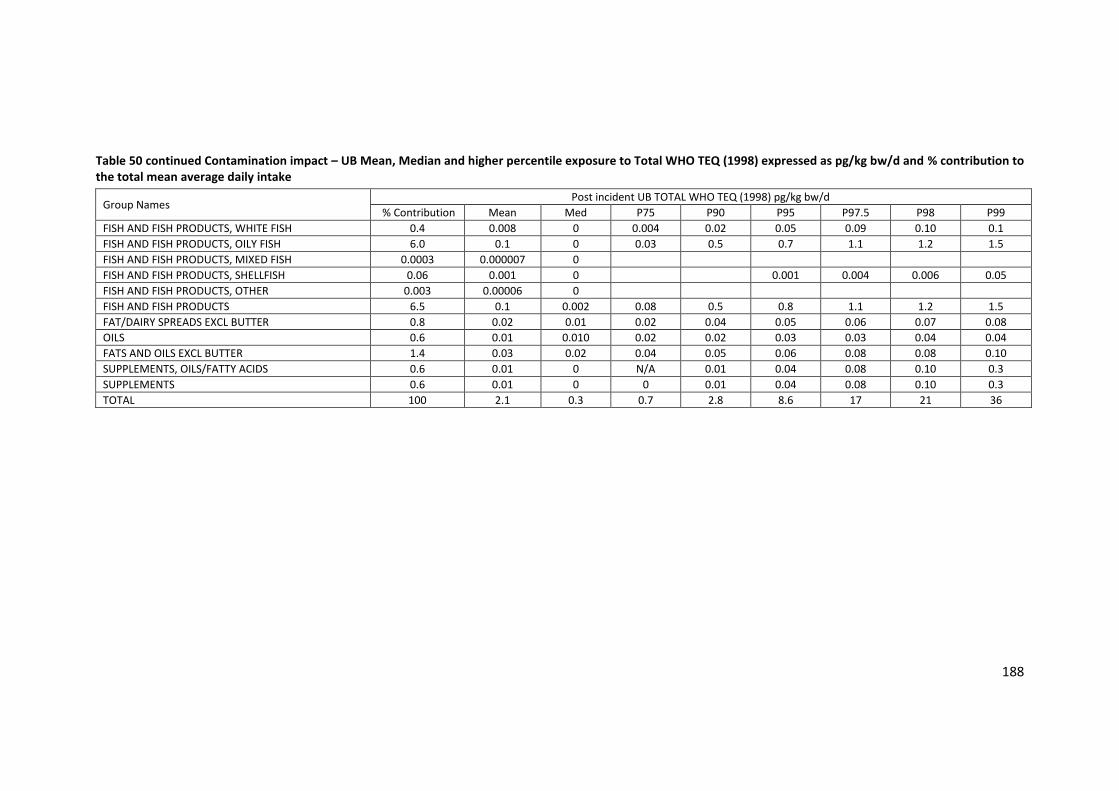
188
Table 50 continued Contamination impact – UB Mean, Median and higher percentile exposure to Total WHO TEQ (1998) expressed as pg/kg bw/d and % contribution to the total mean average daily intake
Group Names Post incident UB TOTAL WHO TEQ (1998) pg/kg bw/d
% Contribution Mean Med P75 P90 P95 P97.5 P98 P99
FISH AND FISH PRODUCTS, WHITE FISH 0.4 0.008 0 0.004 0.02 0.05 0.09 0.10 0.1
FISH AND FISH PRODUCTS, OILY FISH 6.0 0.1 0 0.03 0.5 0.7 1.1 1.2 1.5
FISH AND FISH PRODUCTS, MIXED FISH 0.0003 0.000007 0
FISH AND FISH PRODUCTS, SHELLFISH 0.06 0.001 0
0.001 0.004 0.006 0.05
FISH AND FISH PRODUCTS, OTHER 0.003 0.00006 0
FISH AND FISH PRODUCTS 6.5 0.1 0.002 0.08 0.5 0.8 1.1 1.2 1.5
FAT/DAIRY SPREADS EXCL BUTTER 0.8 0.02 0.01 0.02 0.04 0.05 0.06 0.07 0.08
OILS 0.6 0.01 0.010 0.02 0.02 0.03 0.03 0.04 0.04
FATS AND OILS EXCL BUTTER 1.4 0.03 0.02 0.04 0.05 0.06 0.08 0.08 0.10
SUPPLEMENTS, OILS/FATTY ACIDS 0.6 0.01 0 N/A 0.01 0.04 0.08 0.10 0.3
SUPPLEMENTS 0.6 0.01 0 0 0.01 0.04 0.08 0.10 0.3
TOTAL 100 2.1 0.3 0.7 2.8 8.6 17 21 36

189
8 References
Ahlborg UG, Becking GC, Birnbaum LS, Brouwer A, Derks HJGM, Feeley M, Golor G, Hanberg A, Larsen JC, Liem AKD, Safe SH, Schlatter C, Waern F, Younes M, and Yrj+ñnheikki E. (1994) Toxic equivalency factors for dioxin-like PCBs: Report on WHO-ECEH and IPCS consultation, December 1993. Chemosphere Vol.28 /6 p. 1049-1067. Available at: http://www.sciencedirect.com/science/article/pii/0045653594903247
Andersson P, McGuire J, Rubio C, Gradin K, Whitelaw ML, Pettersson S, Hanberg A, and Poellinger L. (2002) A constitutively active dioxin/aryl hydrocarbon receptor induces stomach tumors. Proc Natl. Acad. Sci U. S. A. Vol.99 /15 p. 9990-9995.
Andersson P, Ridderstad A, McGuire J, Pettersson S, Poellinger L, and Hanberg A. (2003) A constitutively active aryl hydrocarbon receptor causes loss of peritoneal B1 cells. Biochem. Biophys. Res Commun. Vol.302 /2 p. 336-341.
Ankarberg EH, Concha G, Darnerud PO, Aune M, Tornkvist A, and Glynn A. (2007) Dietary intake of polychlorinated dibenzo-p-dioxins, dibenzofurans and polychlorinated biphenyls in Swedish consumers. Organohalogen Compounds Vol.69 p. 1965-1968.
Arnich N, Sirot V, Rivière G, Jean J, Noël L, Guérin T, Leblanc JC (2012) Dietary exposure to trace elements and health risk assessment in the 2nd French Total Diet Study. Food Chem Toxicol. 2012 Jul;50(7):2432-49. doi: 10.1016/j.fct.2012.04.016
ATSDR. (1994) Toxicological profile for chlorodibenzofurans (CDFs). Department of Health and Human Services, Public Health Service.
ATSDR. (1998) Toxicological profile for Chlorinated Dibenzo-p-dioxins (CDDs). Department of Health and Human Services, Public Health Service.
ATSDR. (2000) Toxicological profile for polychlorinated biphenyls (PCBs). Department of Health and Human Services, Public Health Service.
ATSDR. (2001) Polychlorinated Biphenyls. Department of Health and Human Services, Public Health Service. Available at: www.atsdr.cdc.gov/tfacts17.pdf
Aylward LL, Brunet RC, Carrier G, Hays SM, Cushing CA, Needham LL, Patterson DG, Gerthoux PM, Brambilla P, and Mocarelli P. (2005) Concentration-dependent TCDD elimination kinetics in humans: toxicokinetic modeling for moderately to highly exposed adults from Seveso, Italy, and Vienna, Austria, and impact on dose estimates for the NIOSH cohort. J Expo Anal Environ Epidemiol Vol.15 /1 p. 51-65. Available at: http://europepmc.org/abstract/MED/15083163
Aylward LL, Hays SM, LaKind JS, and Ryan JJ. (2003) Rapid communication: partitioning of persistent lipophilic compounds, including dioxins, between human milk lipid and blood lipid: an initial assessment. J Toxicol. Environ Health A. Vol.66 /1 p. 1-5.
Baars AJ, Bakker MI, Baumann RA, Boon PE, Freijer JI, Hoogenboom LA, Hoogerbrugge R, van Klaveren JD, Liem AK, Traag WA, and de VJ. (2004) Dioxins, dioxin-like PCBs and non-dioxin-like PCBs in foodstuffs: occurrence and dietary intake in The Netherlands. Toxicol. Lett. Vol.151 /1 p. 51-61.
Baccarelli A, Giacomini SM, Corbetta C, Landi MT, Bonzini M, Consonni D, Grillo P, Patterson DG, Pesatori AC, and Bertazzi PA. (2008) Neonatal thyroid function in Seveso 25 years after maternal exposure to dioxin. PLoS Med Vol.5 /7 p. e161-e161. Available at: http://pubget.com/paper/18666825
Bentley J. (1983) Incineration of PCBs. In: Barros, M.C., Könemann, H., & Visser, R., ed. Proceedings of the PCB Seminar. The Hague, Ministry of the Environment, pp. 281-288.
Bergkvist C, Oberg M, Appelgren M, Becker W, Aune M, Ankarberg EH, Berglund M, and Hakansson H. (2008) Exposure to dioxin-like pollutants via different food commodities in Swedish children and young adults. Food. Chem. Toxicol. Vol.46 /11 p. 3360-3367.
Bernard A, Hermans C, and Broeckaert F. (1999) Food contamination by PCBs and dioxins. Nature Vol.401 p. 231-232.
BMELV. (2011) Background information: Dioxins in feed fats. Bundesministerium für Ernährung,Landwirtschaft und Verbraucherschutz Available at: http://www.bmelv.de/SharedDocs/Standardartikel/EN/Food/DioxinSummaryReport.html
Bognár A. (2002) Tables on weight yield of food and retention factors of food constituents for the calculation of nutrient composition of cooked foods (dishes). Bundesforschungsanstalt für Ernährung.
Bord Bia. (2008) Meat and Livestock Review & Outlook 2008/09. Available at: http://www.bordbia.ie/industryservices/information/publications/MeatLivestockReview/Meat%20and%20Livestock%20-%20Review%202008-09.pdf

190
Borrello S, Brambilla G, Candela L, Diletti G, Gallo P, Iacovella G, Iovane G, Limone A, Migliorati G, Pinto O, Sarnelli P, Serpe L, Scortichini G, and Di Domenico A. (2008) Management of the 2008 "Buffalo Milk Crisis" in the Campania Region under the Perspective of Consumer Protection. Organohalogen Compounds Vol.70 p. 891-893.
Buckley J and Larkin H. (1998) Health surveillance of cattle in the vicinity of a chemical industrial complex. Veterinary Record Vol.143 p. 323-326.
Buckley-Golder D. (1999) Compilation of EU Dioxin Exposure and Health Data. Summary Report. Report produced for European Commission DG Environment UK Department of the Environment Transport and the Regions (DETR).
Bumb RR, Crummet WB, Cutie SS, Gledhil JR, Hummel RH, Kagel RO, Lamparski LL, Luoma EV, Miller DL, Nestrick TJ, Shadoff LA, Stehl RH, and Woods JS. (1980) Trace chemistries of fire: A source of chlorinated dioxins. Science Vol.210 p. 385-389.
Carlson DB and Perdew GH. (2002) A dynamic role for the Ah receptor in cell signaling? Insights from a diverse group of Ah receptor interacting proteins. J Biochem. Mol Toxicol. Vol.16 /6 p. 317-325.
Carvalhaes G, Brooks P, and Krauss T. (1999) Lime as the source of PCDD/F contamination in citrus pulp pellets from Brazil. Organohalogen Compounds Vol.41
Casey DK, Lawless JS, and Wall PG. (2010) A tale of two crises: the Belgian and Irish dioxin contamination incidents. British Food Journal Vol.112 p. 1077-1091.
Cederberg T. (2004) Levels of dioxins and PCB in Danish food and human milk – assessment of dietary intake. Poster Presentation. Presented at the Dioxin2004 symposium, September 6-10, 2004 Available at: http://www.food.dtu.dk/Admin/Public/DWSDownload.aspx?File=Files%2FFiler%2FProjektbeskrivelser%2FPOPs+in+human+milk%2FPOPs_in_human_milk_Dioxin2004poster.pdf
Cederberg T, Sorensen S, Lund KH, and Friis-Wandall S. (2010) Danish monitoring of dioxins and PCB in food and feed during the years 2000 to 2009 - Levels, time trend and human exposure. Organohalogen Compounds Vol.72 p. 952-955.
Chan W. (1995) Meat Poultry and Game: Fifth Supplement to the Fifth Edition of McCance and Widdowson's The Composition of Foods. Royal Society of Chemistry and Ministry of Agriculture, Fisheries and Food. Available at: http://books.google.ie/books?id=MrAzN1YdGtkC
Chan W. (1996) Meat Products and Dishes: Sixth Supplement to the Fifth Edition of McCance and Widdowson's The Composition of Foods. Royal Society of Chemistry and Ministry of Agriculture, Fisheries and Food. Available at: http://books.google.ie/books?id=KKTr6tW-MUkC
Chan W, Brown J, and Buss DH. (1994) Miscellaneous Foods: Fourth Supplement to the Fifth Edition of McCance and Widdowson's The Composition of Foods. /v. 4 Royal Society of Chemistry and Ministry of Agriculture, Fisheries and Food. Available at: http://books.google.ie/books?id=xh98QgAACAAJ
Cleverly D, Ferrario J, Byrne C, Riggs K, Joseph D, and Hartford P. (2007) A general indication of the Contemporary background levels of PCDDs, PCDFs, and coplanar PCBs in the ambient air over rural and remote areas of the United States. Environ Sci Technol. Vol.41 /5 p. 1537-1544.
Creme Software Ltd. (2006) Creme 2 Software. Creme Software Ltd. (2013a) Creme Food Version 3.6.9. Available at:
http://www.cremefood.com/food/home/ Creme Software Ltd. (2013b) Creme User Manual for Creme Food® 3.6.12. CRL. (2009) Analytical capacities of National Reference Laboratories (NRLs) and Official Laboratories
(OFLs) in case of dioxin incidents in the feed and food chain and conclusions for management in crisis situations. CRL for Dioxins and PCBs in Feed and Food. http://ec. europa. eu/food/food/chemicalsafety/contaminants/emergency_analyses_en. pdf State Institute for Chemical and Veterinary Analysis of Food, Freiburg, Germany.
CSO. (2012) Meat Supply Balance by Type of Meat, Year and Statistic. Available at: http://www.cso.ie/px/pxeirestat/Database/eirestat/Supply%20Balances/Supply%20Balances_statbank.asp?SP=Supply%20Balances&Planguage=0 (Accessed 2012)
CSO. (2013) Meat Supply Balance by Type of Meat, Year and Statistic. Available at: http://www.cso.ie/px/pxeirestat/Database/eirestat/Supply%20Balances/Supply%20Balances_statbank.asp?SP=Supply%20Balances&Planguage=0 (Accessed 2012)
DAFM. (2008) AIM 2008 Bovine Statistics Report. Issued by NBAS Division, Backweston Campus. Available at: http://www.agriculture.gov.ie/media/migration/animalhealthwelfare/animalidentificationandmovement/cattlemovementmonitoringsystem/AIM%20Bovine%20Statistics%20Report%202008%20Ver1.pdf
DAFM. (2011) Personal Communication.

191
DAFM. (2012) Cattle Movement Data 2008. Unpublished Data. DAFM. (2013) Personal Communication. Darnerud PO, Atuma S, Aune M, Bjerselius R, Glynn A, Grawe KP, and Becker W. (2006) Dietary intake
estimations of organohalogen contaminants (dioxins, PCB, PBDE and chlorinated pesticides, e.g. DDT) based on Swedish market basket data. Food. Chem. Toxicol. Vol.44 /9 p. 1597-1606.
De Mul A, Bakker MI, Zeilmaker MJ, Traag WA, Leeuwen SP, Hoogenboom RL, Boon PE, and Klaveren JD. (2008) Dietary exposure to dioxins and dioxin-like PCBs in The Netherlands anno 2004. Regul. Toxicol. Pharmacol. Vol.51 /3 p. 278-287.
DeVito MJ, Birnbaum LS, Farland WH, and Gasiewicz TA. (1995) Comparisons of estimated human body burdens of dioxinlike chemicals and TCDD body burdens in experimentally exposed animals. Environ Health Perspect. Vol.103 /9 p. 820-831.
Diletti G, Ceci R, De Massis MR, Scortichini G, and Migliorati G. (2005) A case of eggs contamination by PCDD/Fs in Italy: analytical levels and contamination source identification. Organohalogen Compounds Vol.67
Eadon G and Kaminsky L. (1986) Calculation of 2,3,7,8-TCDD equivalent concentrations of complex environmental contaminant mixtures. Environ Health Perspect. Vol.70 p. 221-227.
EC. (1996) Council Directive 96/23/EC of 29 April 1996 on measures to monitor certain substances and residues thereof in live animals and animal products. Official Journal of the European Communities Vol.L125 p. 10-32. Available at: http://eur-lex.europa.eu/LexUriServ/LexUriServ.do?uri=OJ:L:1996:125:0010:0032:EN:PDF
EC. (2000a) Assessment of dietary intake of dioxins and related PCBs by the population of EU Member States. Vol.Task 3.2.5 European Commission. Available at: http://ec.europa.eu/dgs/health_consumer/library/pub/pub08_en.pdf
EC. (2000b) Communication from the Commission on the precautionary principle. COM(2000) 1 final. http://eur-lex. europa. eu/LexUriServ/LexUriServ. do?uri=COM:2000:0001:FIN:EN:PDF European Commission. Available at: http://eur-lex.europa.eu/LexUriServ/LexUriServ.do?uri=COM:2000:0001:FIN:EN:PDF
EC. (2001a) Community Strategy for Dioxins, Furans and Polychlorinated Biphenyls. Vol.COM(2001) 593 final Available at: http://eur-lex.europa.eu/LexUriServ/LexUriServ.do?uri=COM:2001:0593:FIN:EN:PDF
EC. (2001b) Council Directive 2001/102/EC of 27 November 2001 amending Directive 1999/29/EC on the undesirable substances and products in animal nutrition. Official Journal of the European Communities Vol.L6 Available at: http://eur-lex.europa.eu/LexUriServ/LexUriServ.do?uri=OJ:L:2002:006:0045:0049:EN:PDF
EC. (2001c) Council Regulation (EC) No 2375/2001 of 29 November 2001 amending Commission Regulation (EC) No 466/2001 setting maximum levels for certain contaminants in foodstuffs. Official Journal of the European Communities Vol.L321 Available at: http://eur-lex.europa.eu/LexUriServ/LexUriServ.do?uri=OJ:L:2001:321:0001:0005:EN:PDF
EC. (2002a) Commission Directive 2002/69/EC of 26 July 2002 laying down the sampling methods and the methods of analysis for the official control of dioxins and the determination of dioxin-like PCBs in foodstuffs. Official Journal of the European Communities Vol.209 /L5 Available at: http://eur-lex.europa.eu/LexUriServ/LexUriServ.do?uri=OJ:L:2002:209:0005:0014:EN:PDF
EC. (2002b) Commission Recommendation of 4 March 2002 on the reduction of the presence of dioxins, furans and PCBs in feedingstuffs and foodstuffs. Official Journal of the European Communities Vol.L67 Available at: http://eur-lex.europa.eu/LexUriServ/LexUriServ.do?uri=OJ:L:2002:067:0069:0073:EN:PDF
EC. (2002c) Directive 2002/32/EC of the European Parliament and of the Council of 7 May 2002 on undesirable substances in animal feed. Official Journal of the European Communities Vol.L140 Available at: http://eur-lex.europa.eu/LexUriServ/LexUriServ.do?uri=OJ:L:2002:140:0010:0021:EN:PDF
EC. (2003) The future of risk assessment in the European Union. Scientific Steering Committee. The second report on the harmonisation of risk assessment procedures. Available at: http://ec.europa.eu/food/fs/sc/ssc/out361_en.pdf
EC. (2004a) 2004/704/EC:Commission Recommendation of 11 October 2004 on the monitoring of background levels of dioxins and dioxin-like PCBs in feedingstuffs. Official Journal of the European Communities Vol.L321 /38 Available at: http://eur-lex.europa.eu/LexUriServ/LexUriServ.do?uri=OJ:L:2004:321:0038:0044:EN:PDF
192
EC. (2004b) 2004/705/EC: Commission Recommendation of 11 October 2004 on the monitoring of background levels of dioxins and dioxin-like PCBs in foodstuffs. Official Journal of the European Communities Vol.321 /L45 Available at: http://eur-lex.europa.eu/LexUriServ/LexUriServ.do?uri=OJ:L:2004:321:0045:0052:EN:PDF
EC. (2004c) Commission Directive 2004/44/EC of 13 April 2004 amending Directive 2002/69/EC laying down the sampling methods and the methods of analysis for the official control of dioxins and the determination of dioxin-like PCBs in foodstuffs. Official Journal of the European Communities Vol.L113 /17 Available at: http://eur-lex.europa.eu/LexUriServ/LexUriServ.do?uri=OJ:L:2004:113:0017:0018:EN:PDF
EC. (2004d) Regulation (EC) No 850/2004 of the European Parliament and of the Council of 29 April 2004 on persistent organic pollutants and amending Directive 79/117/EEC. Official Journal of the European Communities Vol.158 /L7 Available at: http://eur-lex.europa.eu/LexUriServ/LexUriServ.do?uri=OJ:L:2004:158:0007:0049:EN:PDF
EC. (2006a) Commission Recommendation of 16 November 2006 on the monitoring of background levels of dioxins, dioxin-like PCBs and non-dioxin-like PCBs in foodstuffs. Official Journal of the European Communities Vol.L322 Available at: http://eur-lex.europa.eu/LexUriServ/site/en/oj/2006/l_322/l_32220061122en00240031.pdf
EC. (2006b) Commission Recommendation of 6 February 2006 on the reduction of the presence of dioxins, furans and PCBs in feedingstuffs and foodstuffs. Official Journal of the European Communities Vol.L42 Available at: http://eur-lex.europa.eu/LexUriServ/LexUriServ.do?uri=OJ:L:2006:042:0026:0028:EN:PDF
EC. (2006c) Commission Regulation (EC) No 1881/2006 of 19 December 2006 setting maximum levels for certain contaminants in foodstuffs. Official Journal of the European Communities Vol.L364 Available at: http://eur-lex.europa.eu/LexUriServ/LexUriServ.do?uri=OJ:L:2006:364:0005:0024:EN:PDF
EC. (2006e) Commission Regulation (EC) No 1883/2006 of 19 December 2006 laying down methods of sampling and analysis for the official control of levels of dioxins and dioxin-like PCBs in certain foodstuffs. Official Journal of the European Communities Vol.L364 /20.12.2006 p. 32-43. Available at: http://eur-lex.europa.eu/LexUriServ/site/en/oj/2006/l_364/l_36420061220en00320043.pdf
EC. (2006d) Commission Regulation (EC) No 1883/2006 of 19 December 2006 laying down methods of sampling and analysis for the official control of levels of dioxins and dioxin-like PCBs in certain foodstuffs. Official Journal of the European Communities Vol.L364 /20.12.2006 p. 32-43. Available at: http://eur-lex.europa.eu/LexUriServ/site/en/oj/2006/l_364/l_36420061220en00320043.pdf
EC. (2006f) Commission Regulation (EC) No 199/2006 of 3 February 2006 amending Regulation (EC) No 466/2001 setting maximum levels for certain contaminants in foodstuffs as regards dioxins and dioxin-like PCBs. Official Journal of the European Communities Vol.L32 Available at: http://eur-lex.europa.eu/LexUriServ/LexUriServ.do?uri=OJ:L:2006:032:0034:0038:EN:PDF
EC. (2006g) Directive 2006/113/EC of the European Parliament and of the Council of 12 December 2006 on the quality required of shellfish waters. Official Journal of the European Communities Vol.L 376 /L14 Available at: http://eur-lex.europa.eu/LexUriServ/LexUriServ.do?uri=OJ:L:2006:376:0014:0020:EN:PDF
EC. (2011) Commission Recommendation of 23 August 2011 on the reduction of the presence of dioxins, furans and PCBs in feed and food. Official Journal of the European Communities Vol.L218 Available at: http://eur-lex.europa.eu/LexUriServ/LexUriServ.do?uri=OJ:L:2011:218:0023:0025:EN:PDF
EC. (2012) Commission Regulation 252/2012 of 21 March 2012 laying down methods of sampling and analysis for the official control of levels of dioxins, dioxin- like PCBs and non-dioxin-like PCBs in certain foodstuffs and repealing Regulation (EC) No 1883/2006. Official Journal of the European Communities Vol.L84 /23.3.2012 p. 1-22.
EC. (2013) 2013/711/EU: Commission Recommendation of 3 December 2013 on the reduction of the presence of dioxins, furans and PCBs in feed and food. Official Journal of the European Communities Vol.323 /04/12/2013 p. 37-39. Available at: http://eur-lex.europa.eu/legal-content/EN/TXT/PDF/?uri=CELEX:32013H0711&qid=1396016870089&from=EN
EFSA. (2005) Opinion of the Scientific Panel on Contaminants in the food chain on a request from the Commission related to the presence of non dioxin-like polychlorinated biphenyls (PCB) in feed and food. The EFSA Journal Vol.284 p. 1-137. European Food Safety Authority. Available at: http://www.efsa.europa.eu/en/efsajournal/doc/284.pdf
EFSA. (2006) Guidance of the Scientific Committee on a request from EFSA related to Uncertainties in Dietary Exposure Assessment. EFSA Journal Vol.438 p. 1-54.

193
EFSA. (2008) Statement of EFSA on the risks for public health due to the presence of dioxins in pork from Ireland. European Food Safety Authority. Available at: http://www.efsa.europa.eu/en/efsajournal/pub/911.htm
EFSA. (2009) Transparency in Risk Assessment - Scientific Aspects Guidance of the Scientific Committee on Transparency in the Scientific Aspects of Risk Assessments carried out by EFSA. Part 2: General Principles1. EFSA Journal Vol.1051 p. 1-22.
EFSA. (2010a) Management of left-censored data in dietary exposure assessment of chemical substances. EFSA Journal 2010; 8(3):1557 Available at: http://www.efsa.europa.eu/en/efsajournal/pub/1557.htm
EFSA. (2010b) Results of the monitoring of dioxin levels in food and feed. EFSA Journal Vol.8 /3 p. 1385-European Food Safety Authority. Available at: http://www.efsa.europa.eu/en/efsajournal/doc/1385.pdf
EFSA. (2011a) Guidance of EFSA: Use of the EFSA Comprehensive European Food Consumption Database in Exposure Assessment. EFSA Journal 2011;9(3):2097
EFSA. (2011b) Overview of the procedures currently used at EFSA for the assessment of dietary exposure to different chemical substances. EFSA Journal 2011;9(12):2490
EFSA. (2012) Update of the monitoring of dioxins and PCBs levels in food and feed. EFSA Journal Vol.10 /7 p. 2832-European Food Safety Authority.
Eitzer BD and Hites RA. (1991) Vapor pressures of chlorinated dioxins and dibenzofurans. The Science of The Total Environment Vol.104 /1-2 p. 9-15. Available at: http://www.sciencedirect.com/science/article/pii/004896979190004X
Emond C, Michalek JE, Birnbaum LS, and DeVito MJ. (2005) Comparison of the use of a physiologically based pharmacokinetic model and a classical pharmacokinetic model for dioxin exposure assessments. Environmental health perspectives Vol.113 /12 p. 1666-1668. Available at: http://europepmc.org/abstract/MED/16330344
Engwall M, Broman D, Dencker L, N+ñf C, Zeb++hr Y, and Brunstr+Âm B. (1997) Toxic potencies of extracts of sediment and settling particulate matter collected in the recipient of a bleached pulp mill effluent before and after abandoning chlorine bleaching. Environmental Toxicology and Chemistry Vol.16 /6 p. 1187-1194. Wiley Periodicals, Inc. Available at: http://dx.doi.org/10.1002/etc.5620160613
EPA. (1994) Method 1613 Tetra- through Octa-Chlorinated Dioxins and Furans by Isotope Dilution HRGC/HRMS. U.S. Environmental Protection Agency Office of Water Engineering and Analysis Division (4303).
EPA. (2000) Dioxin Levels in the Irish Environment 2000. Environmental Protection Agency Ireland. EPA. (2004) Dioxin Levels in the Irish Environment 2004. Environmental Protection Agency Ireland.
Available at: http://www.epa.ie/downloads/pubs/other/dioxinresults/ EPA. (2006) Dioxin Levels in the Irish Environment 2006. Environmental Protection Agency Ireland.
Available at: http://www.epa.ie/downloads/pubs/other/dioxinresults/ EPA. (2007) Dioxin Levels in the Irish Environment 2007. Environmental Protection Agency Ireland.
Available at: http://www.epa.ie/downloads/pubs/other/dioxinresults/ EPA. (2008) Dioxin Levels in the Irish Environment 2008. Environmental Protection Agency Ireland.
Available at: http://www.epa.ie/downloads/pubs/other/dioxinresults/ EPA. (2009) Dioxin Levels in the Irish Environment 2009. Environmental Protection Agency Ireland.
Available at: http://www.epa.ie/downloads/pubs/other/dioxinresults/ EPA. (2012) National Implementation Plan on Persistent Organic Pollutants. Environmental Protection
Agency, Ireland. Erickson MD. (2001) Introduction: PCB Properties, Uses, occurrence, and Regulatory History. p. xi-xxx.
University Press of Kentucky. Esposito M, Serpe FP, Neugebauer F, Cavallo S, Gallo P, Colarusso G, Baldi L, Iovane G, and Serpe L. (2010)
Contamination levels and congener distribution of PCDDs, PCDFs and dioxin-like PCBs in buffalo's milk from Caserta province (Italy). Chemosphere Vol.79 /3 p. 341-348. Available at: http://www.sciencedirect.com/science/article/pii/S0045653510000512
Faqi AS, Dalsenter PR, Merker HJ, and Chahoud I. (1998) Reproductive toxicity and tissue concentrations of low doses of 2,3,7,8-tetrachlorodibenzo-p-dioxin in male offspring rats exposed throughout pregnancy and lactation. Toxicol. Appl Pharmacol. Vol.150 /2 p. 383-392.
Fattore E, Fanelli R, Turrini A, and di DA. (2006) Current dietary exposure to polychlorodibenzo-p-dioxins, polychlorodibenzofurans, and dioxin-like polychlorobiphenyls in Italy. Mol Nutr Food. Res. Vol.50 /10 p. 915-921.
Fernandes A, Gallani B, Gem M, White S, and Rose M. (2004) Trends in the dioxin and PCB content of the UK diet. Organohalogen Compounds Vol.66 p. 2027-2034.

194
Fiedler H. (2007) National PCDD/PCDF release inventories under the Stockholm Convention on Persistent Organic Pollutants. Chemosphere. Vol.67 /9 p. S96-108.
Fries GF. (1995) Transport of organic environmental contaminants to animal products. Rev Environ Contam. Toxicol. Vol.141:71-109. p. 71-109.
Fries GF, Paustenbach DJ, Mather DB, and Luksemburg WJ. (1999) A Congener Specific Evaluation of Transfer of Chlorinated Dibenzo-p-dioxins and Dibenzofurans to Milk of Cows following Ingestion of Pentachlorophenol-Treated Wood. Environmental Science & Technology Vol.33 /8 p. 1165-1170. American Chemical Society. Available at: http://dx.doi.org/10.1021/es981153d
Fromme H, Shahin N, Boehmer S, Albrecht M, Parlar H, Liebl B, Mayer R, Bolte G. (2009) Dietary intake of non-dioxin-like polychlorinated biphenyls (PCB) in Bavaria, Germany. Results from the Integrated Exposure Assessment Survey (INES). Gesundheitswesen. 2009 May;71(5):275-80. doi: 10.1055/s-0028-1104600
FSAI. (2001) Investigation on PCDDs/PCDFs and several PCBs in milk samples. Food Safety Authority of Ireland. Available at: http://www.fsai.ie/uploadedFiles/Monitoring_and_Enforcement/Monitoring/Surveillance/Dioxins_milk_survey.pdf
FSAI. (2002a) Investigation on PCDDs/PCDFs and several PCBs in Fish liver oil capsules. Food Safety Authority of Ireland. Available at: http://www.fsai.ie/WorkArea/DownloadAsset.aspx?id=8234
FSAI. (2002b) Investigation on PCDDs/PCDFs and several PCBs in Fish Samples (Salmon and Trout). Food Safety Authority of Ireland. Available at: http://www.fsai.ie/WorkArea/DownloadAsset.aspx?id=8236
FSAI. (2004) Investigation into the Levels of Dioxins, Furans, PCBs and some Elements in Battery, Free-Range, Barn and Organic Eggs. Food Safety Authority of Ireland. Available at: http://www.fsai.ie/WorkArea/DownloadAsset.aspx?id=8260
FSAI. (2005a) Investigation into Levels of Dioxins, Furans, PCBs and PBDEs in Food Supplements, Offal and Milk. Food Safety Authority of Ireland. Available at: http://www.fsai.ie/WorkArea/DownloadAsset.aspx?id=8280
FSAI. (2005b) Investigation into levels of dioxins, furans, PCBs and PBDEs in Irish food. Food Safety Authority of Ireland. Available at: http://www.fsai.ie/WorkArea/DownloadAsset.aspx?id=1228
FSAI. (2007) Guidance Note 10: Product Recall and Traceability. Food Safety Authority of Ireland. Available at: www.fsai.ie/gn10productrecallandtraceabilityrevision2.html
FSAI. (2010a) Investigation into levels of chlorinated and brominated organic pollutants in carcass fat, offal, eggs and milk produced in Ireland. Monitoring & Surveillance Series Food Safety Authority of Ireland. Available at: http://www.fsai.ie/WorkArea/DownloadAsset.aspx?id=9456
FSAI. (2010b) Investigation into Levels of Perfluoroalkylated Substances (PFAs) in Meat, Offal, Eggs,Fish and Milk Producted in Ireland. Food Safety Authority of Ireland. Available at: http://www.fsai.ie/WorkArea/DownloadAsset.aspx?id=10134
FSAI. (2010c) Investigation into Levels of Polychlorinated Naphthalenes (PCNs) in Carcass Fat, Offal, Fish, Eggs, Milk and Processed Products. Food Safety Authority of Ireland. Available at: http://www.fsai.ie/WorkArea/DownloadAsset.aspx?id=10133
FSAI. (2013) Local Authority Abattoir 2008 Slaughter Statistics. Unpublished Data. Fürst P, Beck H, and Theelen R. (1992) Assessment of human intake of PCDDs and PCDFs from different
environmental sources. Toxic Substances Journal Vol.12 p. 133-150. Furst P. (2006) Dioxins, polychlorinated biphenyls and other organohalogen compounds in human milk.
Levels, correlations, trends and exposure through breastfeeding. Mol Nutr Food Res. Vol.50 /10 p. 922-933.
Gehrs BC, Riddle MM, Williams WC, and Smialowicz RJ. (1997) Alterations in the developing immune system of the F344 rat after perinatal exposure to 2,3,7,8-tetrachlorodibenzo-p-dioxin: II. Effects on the pup and the adult. Toxicology. Vol.%19;122 /3 p. 229-240.
Gehrs BC and Smialowicz RJ. (1999) Persistent suppression of delayed-type hypersensitivity in adult F344 rats after perinatal exposure to 2,3,7,8-tetrachlorodibenzo-p-dioxin. Toxicology. Vol.134 /1 p. 79-88.
Geyer HJ, Schramm KW, Feicht EA, Behechti A, Steinberg C, Bruggemann R, Poiger H, Henkelmann B, and Kettrup A. (2002) Half-lives of tetra-, penta-, hexa-, hepta-, and octachlorodibenzo-p-dioxin in rats, monkeys, and humans--a critical review. Chemosphere. Vol.48 /6 p. 631-644.
Gilman A, Newhook R, and Birmingham B. (1991) An updated assessment of the exposure of Canadians to dioxins and furans. Chemosphere Vol.23 /11-12 p. 1661-1667. Available at: http://www.sciencedirect.com/science/article/pii/0045653591900145
195
Gray LE, Ostby JS, and Kelce WR. (1997a) A dose-response analysis of the reproductive effects of a single gestational dose of 2,3,7,8-tetrachlorodibenzo-p-dioxin in male Long Evans Hooded rat offspring. Toxicol. Appl Pharmacol. Vol.146 /1 p. 11-20.
Gray LE, Wolf C, Mann P, and Ostby JS. (1997b) In utero exposure to low doses of 2,3,7,8-tetrachlorodibenzo-p-dioxin alters reproductive development of female Long Evans hooded rat offspring. Toxicol. Appl Pharmacol. Vol.146 /2 p. 237-244.
Harper PA, Wong JY, Lam MS, and Okey AB. (2002) Polymorphisms in the human AH receptor. Chem. Biol. Interact. Vol.141 p. 161-187.
Harrad S, Wang Y., Sandaradura S., and Leeds A. (2003) Human dietary intake and excretion of dioxin-like conpounds. J Environ Monit. Vol.5 p. 224-228.
Haws LC, Su SH, Harris M, DeVito MJ, Walker NJ, Farland WH, Finley B, and Birnbaum LS. (2006) Development of a Refined Database of Mammalian Relative Potency Estimates for Dioxin-like Compounds. Toxicological Sciences Vol.89 /1 p. 4-30. Available at: http://toxsci.oxfordjournals.org/content/89/1/4.abstract
Hays SM and Aylward LL. (2003) Dioxin risks in perspective: past, present, and future. Regulatory Toxicology and Pharmacology Vol.37 /2 p. 202-217. Available at: http://www.sciencedirect.com/science/article/pii/S0273230002000442
Heres L, Hoogenboom LAP, Herbes R, Traag WA, and Urlings B. (2010) Tracing and analytical results of the dioxin contamination incident in 2008 originating from the Republic of Ireland. Food Additives & Contaminants: Part A: Chemistry, Analysis, Control, Exposure & Risk Assessment Vol.27 /12 p. 1733-1744.
Hites RA. (2011) Dioxins: an overview and history. Environ Sci Technol. Vol.45 /1 p. 16-20. Holland B, Unwin ID, and Buss DH. (1992a) Fruits and Nuts: First Supplement to the Fifth Edition of
McCance and Widdowson's the Composition of Foods. Royal Society of Chemistry and Ministry of Agriculture, Fisheries and Food. Available at: http://books.google.ie/books?id=dMlV8Fr4NRgC
Holland B, Unwin ID, McCance RA, and Buss DH. (1989) Milk products and eggs: fourth supplement to McCance and Widdowson's The composition of foods. Royal Society of Chemistry. Available at: http://books.google.ie/books?id=6ewfAQAAIAAJ
Holland B, Welch AA, and Buss DH. (1992b) Vegetable Dishes: Second Supplement to the Fifth Edition of McCance and Widdowson's The Composition of Foods. /v. 2 Royal Society of Chemistry. Available at: http://books.google.ie/books?id=P3hRMgEACAAJ
Holland B, Widdowson EM, Unwin ID, and Buss DH. (1991) Vegetables, Herbs Ans Spices: Fifth Supplement [to the Fourth Edition Of] to McCance and Widdowson's The Composition of Foods. Royal Society of Chemistry and Ministry of Agriculture, Fisheries and Food. Available at: http://books.google.ie/books?id=-M1khtZ31BwC
Hoogenboom LAP, Kan CA, Bovee TFH, van der Weg G, Onstenk C, and Traag WA. (2004) Residues of dioxins and PCBs in fat of growing pigs and broilers fed contaminated feed. Chemosphere Vol.57 /1 p. 35-42. Available at: http://www.sciencedirect.com/science/article/B6V74-4CTCSX9-5/2/3093d44f5f73d7795afcaac736623b57
Hoogenboom LAP and Traag WA. (2003) The German bakery waste incident. Organohalogen Compounds Vol.64 p. 13-16.
Hoogenboom LAP, Van Eijkeren J, Zeilmaker MJ, Mengelers MB, Herbes R, and Traag WA. (2006) A novel source for dioxins present in waste fat from gelatine production. Organohalogen Compounds Vol.68
Hoogenboom LAP, Zeilmaker MJ, Kan KA, Mengelers MB, Van Eijkeren J, and Traag WA. (2005) Kaolinic clay derived dioxins in potato by-products. Organohalogen Compounds Vol.67
Hoogerbrugge R, Bakker MI, Hijman WC, Den Boer AC, Den Hartog RS, and Baumann RA. (2004) Dioxins in Dutch Vegetables. Vol.RIVM report 310305003 RIVM. Available at: http://rivm.openrepository.com/rivm/bitstream/10029/8878/1/310305003.pdf?origin=publication_detail
House of the Oireachtas. (2009) Joint Committee on Agriculture, Fisheries and Food First Report Report on the contamination of Irish pork products. Vol.PRN No. A9/0686
Hutzinger O, Choudhry G.G., Chittim B.G., and Johnston LE. (1985) Formation of Polychiorinated Dibenzofurans and Dioxins during Combustion, Electrical Equipment Fires and PCB Incineration. Environ Health Perspect. Vol.60 p. 3-9.
IARC. (1997) Polychlorinated dibenzo-p-dioxins and polychlorinated dibenzofurans. Vol.69 p. 1-343. International Agency for Research into Cancer, Lyon.
196
IARC. (1999) IARC Monographs on the Evaluation of Carcinogenic Risks to Humans Overall Evaluations of Carcinogenicity: An Updating of IARC Monographs Volumes 1 to 42. IARC Monographs Vol.Supplement 7 Available at: http://monographs.iarc.fr/ENG/Monographs/suppl7/suppl7.pdf
IUNA. (1999) INFID Version 1 (1995-1999). IUNA. (2001) North/South Ireland Food Consumption Survey. Irish Universities Nutrition Alliance
Available at: http://www.iuna.net/?p=25 IUNA. (2006) INFID Version 2 (2003-2006) (National Children's Food Survey and National Teen's Food
Survey). IUNA. (2010) INFID Version 3 (2008-2010) (National Adults Nutrition Survey). IUNA. (2011) The National Adult Nutrition Survey. Irish Universities Nutrition Alliance Available at:
http://www.iuna.net/?p=106 IUNA. (2012) INFID Version 4 (2011-2012) (National Pre-school Nutrition Survey). Jacob CJ, Lok C, Morley K, and Powell DA. (2010) Government management of two media-facilitated crises
involving dioxin contamination of food. Public Understanding of Science Available at: http://pus.sagepub.com/content/early/2010/02/05/0963662509355737.abstract
JECFA. (2002) Safety evaluation of certain food additives and contaminants polychlorinated dibenzodioxins, polychlorinated dibenzofurans, and coplanar polychlorinated biphenyls. Vol.48 Available at: http://www.inchem.org/documents/jecfa/jecmono/v48je20.htm
Kim MK, Choi SW, Park JY, Kim DG, Bong YH, Jang JH, Song SO, Chung GS, and Guerrero P. (2009) Dioxin contamination of Chilean pork from zinc oxide in feed. Organohalogen Compounds Vol.71
Kiviranta H, Ovaskainen ML, and Vartiainen T. (2004) Market basket study on dietary intake of PCDD/Fs, PCBs, and PBDEs in Finland. Environ Int. Vol.30 /7 p. 923-932.
Kogevinas M. (2001) Human health effects of dioxins: cancer, reproductive and endocrine system effects. Hum. Reprod. Update. Vol.7 /3 p. 331-339.
Kreuzer PE, Csanídy GA, Baur C, Kessler W, Papke O, Greim H, and Filser JG. (1997) 2,3,7,8-Tetrachlorodibenzo-para-dioxin (TCDD) and congeners in infants. A toxicokinetic model of human lifetime body burden by TCDD with special emphasis on its uptake by nutrition. Archives of Toxicology Vol.71 /6 p. 383-400. Springer Berlin / Heidelberg. Available at: http://dx.doi.org/10.1007/s002040050402
Kroes R, Mueller D, Lambe J, Loewik MRH, van Klaveren J, Kleiner J, Massey R, Mayer S, Urieta I, Verger P, and Visconti A. (2002) Assessment of intake from the diet. Food and Chemical Toxicology Vol.40 /2GÇô3 p. 327-385. Available at: http://www.sciencedirect.com/science/article/pii/S0278691501001132
Kvalem HE, Knutsen HK, Thomsen C, Haugen M, Stigum H, Brantsaeter AL, Froshaug M, Lohmann N, Papke O, Becher G, Alexander J, and Meltzer HM. (2009) Role of dietary patterns for dioxin and PCB exposure. Mol Nutr Food. Res. Vol.53 /11 p. 1438-1451.
La Rocca C and Mantovani A. (2006) From environment to food: the case of PCB. Ann Ist Super Sanita Vol.42 /4 p. 410-416.
Liem AK, Furst P, and Rappe C. (2000) Exposure of populations to dioxins and related compounds. Food Addit. Contam. Vol.17 /4 p. 241-259.
Llerena JJ, Abad E, Caixach J, and Rivera J. (2001) A new episode of PCDDs/PCDFs feed contamination in Europe: The choline chloride. Organohalogen Compounds Vol.51
Llobet JM, Marti-Cid R, Castell V, and Domingo JL. (2008a) Significant decreasing trend in human dietary exposure to PCDD/PCDFs and PCBs in Catalonia, Spain. Toxicol. Lett. Vol.178 /2 p. 117-126.
Llobet JM, Marti-Cid R, Perello G, and Domingo JL. (2008b) Human dietary exposure to PCDD/PCDFs and PCBs in Catalonia, Spain. Organohalogen Compounds Vol.70 p. 1534-1537.
Mably TA, Bjerke DL, Moore RW, Gendron-Fitzpatrick A, and Peterson RE. (1992) In utero and lactational exposure of male rats to 2,3,7,8-tetrachlorodibenzo-p-dioxin. 3. Effects on spermatogenesis and reproductive capability. Toxicol. Appl Pharmacol. Vol.114 /1 p. 118-126.
Malisch R, Kypke K, van Leeuwen FX, Moy G, and Park S. (2008) Evaluation of WHO-coordinated exposure studies on levels of persistent organic pollutants (POPs) in human milk wiht regard to the global monitoring plan. Organohalogen Compounds Vol.70 p. 228-232.
Malisch R and Van Leeuwen FXR. (2003) Results of the WHO-coordinated exposure study on the levels of PCBs, PCDDs and PCDFs in human milk. Organohalogen Compounds Vol.64 p. 140-143.
Malisch R. (2000) Increase of the PCDD/F-contamination of milk, butter and meat samples by use of contaminated citrus pulp. Chemosphere Vol.40 /9-11 p. 1041-1053. Available at: http://www.sciencedirect.com/science/article/B6V74-3YGDCT1-P/2/449f2ce58b3f4e517612fe9d8fdfbe63
197
Marchand P, Cariou R, Venisseau A, Brosseaud A, Antignac JP, and Le Bizec B. (2010) Predicting PCDD/F and dioxin-like PCB contamination levels in bovine edible tissues from in vivo sampling. Chemosphere Vol.80 /6 p. 634-640. Available at: http://www.sciencedirect.com/science/article/pii/S0045653510005059
Marin S, Villalba P, Diaz-Ferrero J, Font G, and Yusa V. (2011) Congener profile, occurrence and estimated dietary intake of dioxins and dioxin-like PCBs in foods marketed in the Region of Valencia (Spain). Chemosphere. Vol.82 /9 p. 1253-1261.
Marnane I. (2012) Comprehensive environmental review following the pork PCB/dioxin contamination incident in Ireland. J. Environ. Monit. Vol.14 /10 p. 2551-2556. The Royal Society of Chemistry. Available at: http://dx.doi.org/10.1039/C2EM30374D
McCance RA, Holland B, Widdowson EM, Unwin ID, and Buss DH. (1988) Cereals and Cereal Products: Third Supplement to McCance and Widdowson's The Composition of Foods. Royal Society of Chemistry. Available at: http://books.google.ie/books?id=GzO7cQAACAAJ
McCance RA and Widdowson EM. (2002) McCance and Widdowson's The Composition of Foods. Royal Society of Chemistry and the Food Standards Agency. Available at: http://books.google.ie/books?id=ALDkOIwZod8C
McGovern E, McHugh B, O'Hea L, Joyce E, Tlustos C, and Glynn D. (2011) Assuring Seafood Safety. Contaminants and Residues in Irish Seafood 2004-2008. Marine Institute, Rinville, Oranmore.
McLachlan MS, Thoma H, Reissinger M, and Hutzinger O. (1990) PCDD/F in an agricultural food chain Part 1: PCDD/F mass balance of a lactating cow. Chemosphere Vol.20 /7-9 p. 1013-1020. Available at: http://www.sciencedirect.com/science/article/B6V74-487FD5V-ND/2/550df648a786f578f44fdbd3fa7248c0
McNamara C, Naddy B, Rohan D, and Sexton J. (2003) Design, development and validation of software for modelling dietary exposure to food chemicals and nutrients. Food Addit Contam Part A Chem Anal Control Expo Risk Assess Vol.20 /sup001 p. S8-S26. Taylor & Francis. Available at: http://dx.doi.org/10.1080/0265203031000152460
Mocarelli P, Gerthoux PM, Patterson DG, Milani S, Limonta G, Bertona M, Signorini S, Tramacere P, Colombo L, Crespi C, Brambilla P, Sarto C, Carreri V, Sampson EJ, Turner WE, and Needham LL. (2008) Dioxin exposure, from infancy through puberty, produces endocrine disruption and affects human semen quality. Environ Health Perspect Vol.116 /1 p. 70-77. Available at: http://pubget.com/paper/18197302
NAS. (2006) Health risks from dioxin and related compounds: Evaluation of the EPA reassessment. National Academy Press. Available at: http://www.nap.edu/catalog.php?record_id=11688.
NATO/CMS. (1988) International Toxicity Equivalency Factor (I-TEF) Method of Risk Assessment for Complex Mixtures of Dioxins and Related Compounds. Pilot Study on International Information Exchange on Dioxins and Related Compounds. Vol.176 North Atlantic Treaty Organization, Committee on Challenges of Modern Society.
Nusser SM, Carriquiry A.L., Dodd KW, and Fuller WA. (1996) A Semiparametric Transformation Approach to Estimating Usual Daily Intake Distributions. Journal of the American Statistical Association Vol.91 /436 1440. American Statistical Association. Available at: http://www.jstor.org/stable/2291570
O'Donovan JV, O'Farrell KJ, O'Mahony P, and Buckley JF. (2011) Temporal trends in dioxin, furan and polychlorinated biphenyl concentrations in bovine milk from farms adjacent to industrial and chemical installations over a 15year period. Vet. J.
O'Keeffe M, Kennedy O, Farrell F, Nolan ML, Dooley M, Byrne P, Nugent A, Cantwell H, Horne E, and Nelson V. (2001) Food Residue Database. Teagasc.
Oeberg LG and Rappe C. (1992) Biochemical formation of PCDD/Fs from chlorophenols. Chemosphere Vol.25 /1-2 p. 49-52. Available at: http://www.sciencedirect.com/science/article/pii/0045653592904779
Ohsako S, Miyabara Y, Nishimura N, Kurosawa S, Sakaue M, Ishimura R, Sato M, Takeda K, Aoki Y, Sone H, Tohyama C, and Yonemoto J. (2001) Maternal exposure to a low dose of 2,3,7,8-tetrachlorodibenzo-p-dioxin (TCDD) suppressed the development of reproductive organs of male rats: dose-dependent increase of mRNA levels of 5alpha-reductase type 2 in contrast to decrease of androgen receptor in the pubertal ventral prostate. Toxicol. Sci. Vol.60 /1 p. 132-143.
Okey AB, Franc MA, Moffat ID, Tijet N, Boutros PC, Korkalainen M, Tuomisto J, and Pohjanvirta R. (2005) Toxicological implications of polymorphisms in receptors for xenobiotic chemicals: The case of the aryl hydrocarbon receptor. Toxicol. Appl. Pharmacol. Vol.207 p. 43-51.

198
Olie K, Vermeulen PL, and Hutzinger O. (1977) Chlorodibenzo-p-dioxins and chlorodibenzofurans are trace components of fly ash and flue gas of some municipal incinerators in the Netherlands. Chemosphere Vol.6 p. 455-459.
Paepke O. (1998) PCDD/F: human background data for Germany, a 10-year experience. Environ. Health Perspect Vol.106 /Suppl. 2 p. 723-731.
Perello G, Gomez-Catalan J, Castell V, Llobet JM, and Domingo JL. (2012) Assessment of the temporal trend of the dietary exposure to PCDD/Fs and PCBs in Catalonia, over Spain: health risks. Food Chem Toxicol Vol.50 /2 p. 399-408. Available at: http://europepmc.org/abstract/MED/21763388
Phillips DL, Pirkle JL, Burse VW, Bernert JT, Jr., Henderson LO, and Needham LL. (1989) Chlorinated hydrocarbon levels in human serum: effects of fasting and feeding. Arch Environ Contam. Toxicol. Vol.18 /4 p. 495-500.
Pratt IS, Anderson WA, Crowley D, Daly SF, Evans RI, Fernandes AR, Fitzgerald M, Geary MP, Keane DP, Malisch R, McBride J, Morrison JJ, Reilly A, and Tlustos C. (2012) Polychlorinated dibenzo-p-dioxins (PCDDs), polychlorinated dibenzofurans (PCDFs) and polychlorinated biphenyls (PCBs) in breast milk of first-time Irish mothers: Impact of the 2008 dioxin incident in Ireland. Chemosphere Vol.88 /7 p. 865-872. Available at: http://www.sciencedirect.com/science/article/pii/S0045653512004778
Rappe C, Kjeller LO, Kulp SE, de Wit C, Hasselsten I, and Palm O. (1991) Levels, profile and pattern of PCDDs and PCDFs in samples related to the production and use of chlorine. Chemosphere Vol.23 /11-12 p. 1629-1636. Available at: http://www.sciencedirect.com/science/article/pii/004565359190010B
Rier SE, Martin DC, Bowman RE, Dmowski WP, and Becker JL. (1993) Endometriosis in rhesus monkeys (Macaca mulatta) following chronic exposure to 2,3,7,8-tetrachlorodibenzo-p-dioxin. Fundam. Appl Toxicol. Vol.21 /4 p. 433-441.
Ryan JJ, Conacher HBS, Panopio LG, Lau BPY, Hardy JA, and Masuda Y. (1991) Gas chromatographic separations of all 136 tetra- to octapolychlorinated dibenzo-p-dioxins and polychlorinated dibenzofurans on nine different stationary phases. Journal of Chromatography A Vol.541 p. 131-183. Available at: http://www.sciencedirect.com/science/article/B6TG8-44TP5BC-4C/2/44e2d4be1607d9a920698ad194336261
Salgovicová D, Pavlovicová D (2007) Exposure of the population of the Slovak Republic to dietary polychlorinated biphenyls. Food Chem Toxicol. 2007 Sep;45(9):1641-9. Epub 2007 Feb 28
Sirot V, Tard A, Venisseau A, Brosseaud A, Marchand P, Le Bizec B, Leblanc JC (2012) Dietary exposure to polychlorinated dibenzo-p-dioxins, polychlorinated dibenzofurans and polychlorinated biphenyls of the French population: Results of the second French Total Diet Study.Chemosphere. 2012 Jul;88(4):492-500. doi: 10.1016/j.chemosphere.2012.03.004
SCF. (2000) Opinion of the SCF on the Risk Assessment of Dioxins and Dioxin-like PCBs in Food. European Commission. Available at: http://ec.europa.eu/food/fs/sc/scf/out78_en.pdf
SCF. (2001) Opinion on the risk assessment of dioxins and dioxins-like PCBs in food (update based on the new scientific information available since the adoption of the SCF opinion of 22 November 2000. European Commission. Available at: http://ec.europa.eu/food/fs/sc/scf/out90_en.pdf
Schantz SL and Bowman RE. (1989) Learning in monkeys exposed perinatally to 2,3,7,8-tetrachlorodibenzo-p-dioxin (TCDD). Neurotoxicol. Teratol. Vol.11 /1 p. 13-19.
Schecter A, Birnbaum LS, Ryan JJ, and Constable JD. (2006) Dioxins: An overview. Environmental Research Vol.101 /3 p. 419-428. Available at: http://www.sciencedirect.com/science/article/pii/S0013935105001921
Schecter A, Stanley J, Boggess K, Masuda Y, Mes J, Wolff M, Fürst P, Fürst C, Wilson-Yang K, and Chisholm B. (1994) Polychlorinated biphenyl levels in the tissues of exposed and nonexposed humans. Environ Health Perspect. Vol.102 /Suppl. 1 p. 149-158.
Schlummer M, Moser GA, and McLachlan MS. (1998) Digestive tract absorption of PCDD/Fs, PCBs, and HCB in humans: mass balances and mechanistic considerations. Toxicology and Applied Pharmacology Vol.152 /1 p. 128-137. Available at: http://europepmc.org/abstract/MED/9772208
Schmid P and Uthrich W. (2000) Dioxin contamination of kaolins (bolus alba): Monitoring of PCDDS and PCDFS in kaolin, feed and foodstuffs of animal origin. Organohalogen Compounds Vol.47
Schulz AJ, Wiesmueller T, Appuhn H, Stehr D, Severin K, Landmann D, and Kamphues J. (2005) Dioxin concentration in milk and tissues of cows and sheep related to feed and soil contamination. J Anim Physiol Anim Nutr (Berl) Vol.89 /3-6 p. 72-78. Available at: http://europepmc.org/abstract/MED/15787974
Shan L, Regan A, De Brun A, Barnett J, van der Sanden MCA, Wall P, and McConnon +. (2013) Food crisis coverage by social and traditional media: A case study of the 2008 Irish dioxin crisis. Public
199
Understanding of Science Available at: http://pus.sagepub.com/content/early/2013/01/30/0963662512472315.abstract
Shiu WY, Doucette W, Gobas FAPC, Andren A, and Mackay D. (1988) Physical-chemical properties of chlorinated dibenzo-p-dioxins. Environmental Science & Technology Vol.22 /6 p. 651-658. American Chemical Society. Available at: http://dx.doi.org/10.1021/es00171a006
Slobs W, Olling M, Derks HJGM, and de Jong APJM. (1995) Congener-specific bioavailability of PCDD/Fs and coplanar PCBs in cows: Laboratory and field measurements. Chemosphere Vol.31 /8 p. 3827-3838. Available at: http://www.sciencedirect.com/science/article/B6V74-404RMRG-2F/2/3483abc725216255f330385d42a601ff
Spitaler M, Iben C, and Tausch H. (2005) Dioxin residues in the edible tissue of finishing pigs after dioxin feeding. J Anim Physiol Anim Nutr (Berl) Vol.89 /3-6 p. 65-71. Available at: http://europepmc.org/abstract/MED/15787973
Srogi K. (2008) Levels and congener distributions of PCDDs, PCDFs and dioxin-like PCBs in environmental and human samples: a review. Environmental Chemistry Letters Vol.6 /1 p. 1-28. Springer Berlin / Heidelberg. Available at: http://dx.doi.org/10.1007/s10311-007-0105-2
Stone R. (2007) Epidemiology. Agent Orange's bitter harvest. Science. Vol.315 /5809 p. 176-179. Tanabe S, Nakagawa Y, and Tatsukawa R. (1981) Absorption efficiency and biological half-life of individual
chlorobiphenyls in rats treated with kanechlor products. Agric Biol Chem Vol.45 /3 p. 717-726. Available at: http://europepmc.org/abstract/AGR/IND81045315
Tard A, Gallotti S, Leblanc JC, and Volatier JL. (2007) Dioxins, furans and dioxin-like PCBs: occurrence in food and dietary intake in France. Food. Addit. Contam. Vol.24 /9 p. 1007-1017.
Thorpe S, Kelly M, Startin J, Harrison N, and Rose M. (2001) Concentration changes for 5 PCDD/F congeners after administration in beef cattle. Chemosphere. Vol.43 /4-7 p. 869-879.
Tlustos C. (2009a) The dioxin contamination incident in Ireland 2008. Organohalogen Compounds Vol.71 p. 1155-1159.
Tlustos C. (2009b) The dioxin crisis in Ireland 2008. Challenges in risk management and risk communication. Organohalogen Compounds Vol.71 p. 1152-1154.
Tlustos C, McHugh B, Pratt I, Tyrrell L, and McGovern E. (2007) Investigation into Levels of Dioxins, Furans, Polychlorinated Biphenyls and Brominated Flame Retardants in Fishery Products in Ireland. Vol.26
Tlustos C, Pratt I, Moylan R, Neilan R, White S, Fernandes AR, and Rose M. (2004) Investigation into levels of dioxins, furans and PCBs in battery, free range, barn and organic eggs. Organohalogen Compounds Vol.66 p. 1901-1907.
Tlustos C, Pratt I, White S, Fernandes AR, and Rose M. (2005) Investigation into levels of PCDD/Fs, PCBs and PBDEs in Irish produce. Organohalogen Compounds Vol.67 p. 1474-1477.
Tlustos C, Sheridan M, O'Sullivan D, Anderson W, and Flynn A. (2012) The dioxin contamination incident in Ireland, 2008: analytical results and congener patterns. Food Addit Contam Part A Chem Anal Control Expo Risk Assess Vol.29 /1 p. 128-138. Available at: http://pubget.com/paper/22035259
Tornkvist A, Glynn A, Aune M, Darnerud PO, and Ankarberg EH. (2011) PCDD/F, PCB, PBDE, HBCD and chlorinated pesticides in a Swedish market basket from 2005--levels and dietary intake estimations. Chemosphere. Vol.83 /2 p. 193-199.
UNECE. (1979) Convention on Long-range Transboundary Air Pollution. Available at: http://www.unece.org/env/lrtap/welcome.html
UNEP. (2001) Stockholm Convention on Persistent Organic Pollutants. Available at: http://www.pops.int UNEP. (2011) Results of the joint Stockholm Convention Secretariat/World Health Organization human
milk survey (fourth and fifth rounds). Conference of the Parties to the Stockholm Convention on Persistent Organic Pollutants Fifth meeting.
US EPA. (2003) Part II: Health Assessment of 2.3.7.8-Tetrachlorodibenzo-p-dioxin (TCDD) and related compounds. US Environmental Protection Agency.
US EPA. (2012) EPA's Reanalysis of Key Issues Related to Dioxin Toxicity and Response to NAS Comments, Volume 1. EPA/600/R-10/038F www. epa. gov/iris U.S. Environmental Protection Agency Washington, DC. Available at: http://www.epa.gov/iris/supdocs/dioxinv1sup.pdf
US EPA. (2013) Guide to Environmental Issues: Glossary of Terms & Acronyms. Available at: http://iaspub.epa.gov/sor_internet/registry/termreg/searchandretrieve/glossariesandkeywordlists/search.do?details= (accessed 10/9/2013)
Van den Berg M, Birnbaum L, Bosveld AT, Brunstrom B, Cook P, Feeley M, Giesy JP, Hanberg A, Hasegawa R, Kennedy SW, Kubiak T, Larsen JC, van Leeuwen FX, Liem AK, Nolt C, Peterson RE, Poellinger L, Safe S, Schrenk D, Tillitt D, Tysklind M, Younes M, Waern F, and Zacharewski T. (1998) Toxic equivalency
200
factors (TEFs) for PCBs, PCDDs, PCDFs for humans and wildlife. Environ Health Perspect. Vol.106 /12 p. 775-792.
Van den Berg M, Birnbaum LS, Denison M, De Vito M, Farland W, Feeley M, Fiedler H, Hakansson H, Hanberg A, Haws L, Rose M, Safe S, Schrenk D, Tohyama C, Tritscher A, Tuomisto J, Tysklind M, Walker N, and Peterson RE. (2006) The 2005 World Health Organization Reevaluation of Human and Mammalian Toxic Equivalency Factors for Dioxins and Dioxin-Like Compounds. Toxicological Sciences Vol.93 /2 p. 223-241. Available at: http://toxsci.oxfordjournals.org/content/93/2/223.abstract
Van den Berg M, de Jong J, Poiger H, and Olson JR. (1994) The toxicokinetics and metabolism of polychlorinated dibenzo-p-dioxins (PCDDs) and dibenzofurans (PCDFs) and their relevance for toxicity. Crit. Rev. Toxicol. Vol.24 p. 1-74.
Van den Berg M, Peterson RE, and Schrenk D. (2000) Human risk assessment and TEFs. Food. Addit. Contam. Vol.17 /4 p. 347-358.
Van Leeuwen FXR and Malisch R. (2002) Results of the third round of the WHO-coordinated exposure study on the levels of PCBs, PCDDs and PCDFs in human milk. Organohalogen Compounds Vol.56 p. 311-316.
Van Leeuwen FXR, Younes M, and eds. (2000) Assessment of the health risk of dioxins: re-evaluation of the tolerable daily intake (TDI). Geneva, Switzerland, 25-29 May 1998. Food. Addit. Contam. Vol.17 /4 p. 223-369.
Volatier JL, Tard A, and Gallotti S. (2006) Assessment of dietary intake of dioxins, furans and dioxin-like PCBs for the French Population. Organohalogen Compounds Vol.68 p. 391-394.
Wall PG, Reilly A, Heraghty M, Dalton T, Keegan J, O'Brien K, and Maloney M. (2009) Report of The Inter-Agency Review Group on the Dioxin Contamination Incident in Ireland in December 2008.
Weber R, Gaus C, Tysklind M, Johnston P, Forter M, Hollert H, Heinisch E, Holoubek I, Lloyd-Smith M, Masunaga S, Moccarelli P, Santillo D, Seike N, Symons R, Torres J, Verta M, Varbelow G, Vijgen J, Watson A, Costner P, Woelz J, Wycisk P, and Zennegg M. (2008) Dioxin- and POP-contaminated sites - contemporary and future relevance and challenges. Environmental Science and Pollution Research Vol.15 /5 p. 363-393. Springer Berlin / Heidelberg. Available at: http://dx.doi.org/10.1007/s11356-008-0024-1
Wehler EK, Hovander L, and Bergman A. (1997) New organohalogens in human plasma. Identification and quantification. Organohalogen Compounds Vol.33 p. 420-425.
Weiss J, Paepke O, Bignert A, Jensen S, Greyerz E, Agostoni C, Besana R, Riva E, Giovannini M, and Zetterstroem R. (2003) Concentrations of dioxins and other organochlorines (PCBs, DDTs, HCHs) in human milk from Seveso, Milan and a Lombardian rural area in Italy: a study performed 25 years after the heavy dioxin exposure in Seveso. Acta P+ªdiatrica Vol.92 /4 p. 467-472. Blackwell Publishing Ltd. Available at: http://dx.doi.org/10.1111/j.1651-2227.2003.tb00580.x
White SS and Birnbaum L. (2009) An Overview of the Effects of Dioxins and Dioxin-like Compounds on Vertebrates, as Documented in Human and Ecological Epidemiology. J Environ Sci Health C Environ Carcinog Ecotoxicol Rev Vol.27 /4 p. 197-211.
WHO. (1989a) Levels of PCBs, PCDDs, and PCDFs in breast milk. WHO Regional Office for Europe. WHO. (1989b) Polychlorinated dibenzo-para-dioxins and dibenzofurans. /88 WHO. WHO. (1993) Polychlorinated Biphenyl's and Terphenyls (Second Edition). Vol.140 WHO. Available at:
http://www.inchem.org/documents/ehc/ehc/ehc140.htm#2.1.4 WHO. (1996) Levels of PCBs, PCDDs and PCDFs in human milk: Second round of WHO-coordinated
exposure study. Vol.3 WHO Regional Office for Europe, Copenhagen, Denmark. WHO. (2002) Polychlorinated dibenzodioxins, polychlorinated dibenzofurans and coplanar
polychlorinated biphenyls. Vol.WHO FOOD ADDITIVES SERIES: 48 Available at: http://www.inchem.org/documents/jecfa/jecmono/v48je20.htm
WHO. (2005) Joint FAO/WHO Expert Committee on Food Additives and Contaminants, Sixty-fourth meeting. Summary and Conclusions. WHO/FAO. Rome, 8-17 February 2005.
WHO. (2009) Chapter 6: Dietary Exposure Assessment of Chemicals in Food. Principles and methods for the risk assessment of chemicals in food. Vol.EHC 240 WHO. Available at: http://www.who.int/foodsafety/chem/principles/en/index1.html
WHO ECEH/IPCS. (1998) Assessment of the health risk of dioxins: re-evaluation of the Tolerable Daily Intake (TDI). Executive Summary.
Windal I, Vandevijvere S, Maleki M, Goscinny S, Vinkx C, Focant JF, Eppe G, Hanot V, and Van LJ. (2010) Dietary intake of PCDD/Fs and dioxin-like PCBs of the Belgian population. Chemosphere. Vol.79 /3 p. 334-340.

201
Yakitine AL, Harrison G, and Lawrence RS. (2006) Reducing Exposure to Dioxins and Related Compounds through Foods in the Next Generation. Nutrition Reviews Vol.64 /9 p. 403-409.
Young AL, Giesy JP, Jones PD, and Newton M. (2004) Environmental fate and bioavailability of Agent Orange and its associated dioxin during the Vietnam War. Environ Sci Pollut. Res Int. Vol.11 /6 p. 359-370.