search.jsp?r=19680015172 2018-06-12t11:03:43+00:00z · of the degree of background enhancement or...
TRANSCRIPT
https://ntrs.nasa.gov/search.jsp?R=19680015172 2018-07-17T03:25:02+00:00Z

I R I S PHOTOMETRY ON SMALL S C A U PLATES
by
W. G. T i f f t
SPACE ASTRONOMY
of the
STEWARD OBSERVATORY
UNIVERSITY OF ARIZONA
TUCSON, ARIZONA
T 67-10

IRIS PHOT@mTRY ON SMALL SCALE PLATES
To determine t h e prec is ion obtainable i n normal ir is photometry of
stars on very small s c a l e d i r e c t sky photographs, a s e r i e s of measurements
were made on four p l a t e s wi th the following objec t ives :
1. Determine t h e i n t r i n s i c accuracy poss ib le i n normal i s o l a t e d
ind iv idua l stars.
2 . Determine how general unresolved background and c lose companion
stars e f f e c t t h e photometry
The four low s c a l e p l a t e s u t i l i z e d were se l ec t ed from a s e t of p l a t e s
of t he region of t h e Small Magellanic Cloud obtained a t Mount Stromlo
i n 1959. This region w a s s e l ec t ed because da ta from seve ra l telescopes
was ava i l ab le for comparison. The camera u t i l i z e d f o r t he low sca l e
p l a t e s i s an 8-inch F/1 Meinel-Pearson Schmidt with a 12O f i e l d .
s ca l e i s 18 a r c minutes/rrm.
P la t e
Standard B or V p l a t e s were not ava i l ab le ,
but t he combinations of p l a t e s and f i l t e r s c l o s e s t t o these wavelength
bands a r e s u f f i c i e n t f o r t he purpose of t h i s study. Table L7 contains the
basic, data on the four low sca l e p l a t e s and seve ra l comparison p l a t e s
used. "Range" 5s discussed la te r i n t h i s r epor t . The f i l t e r s are i n t h e
English Chance s e r i e s , except the U2557 p l a t e which u t i l i z e d a Schott
GG-14 f i l t e r .
S t a r s from s tud ie s i n t h e SMC and nearby 47 Tucanae were used a s
magnitude standards f o r measurement on each p l a t e . All stars which could
be d is t inguished from the background were u t i l i z e d .
l i s t i n g of stars, t h e i r adopted V and B magnitudes, t he i r i s readings f o r
each F/1 camera p l a t e , and references t o the sources of the V and B photo-
metry. The t a b l e a l s o contains a "class" for each s ta r which i s a measure
Table I1 contains t h e
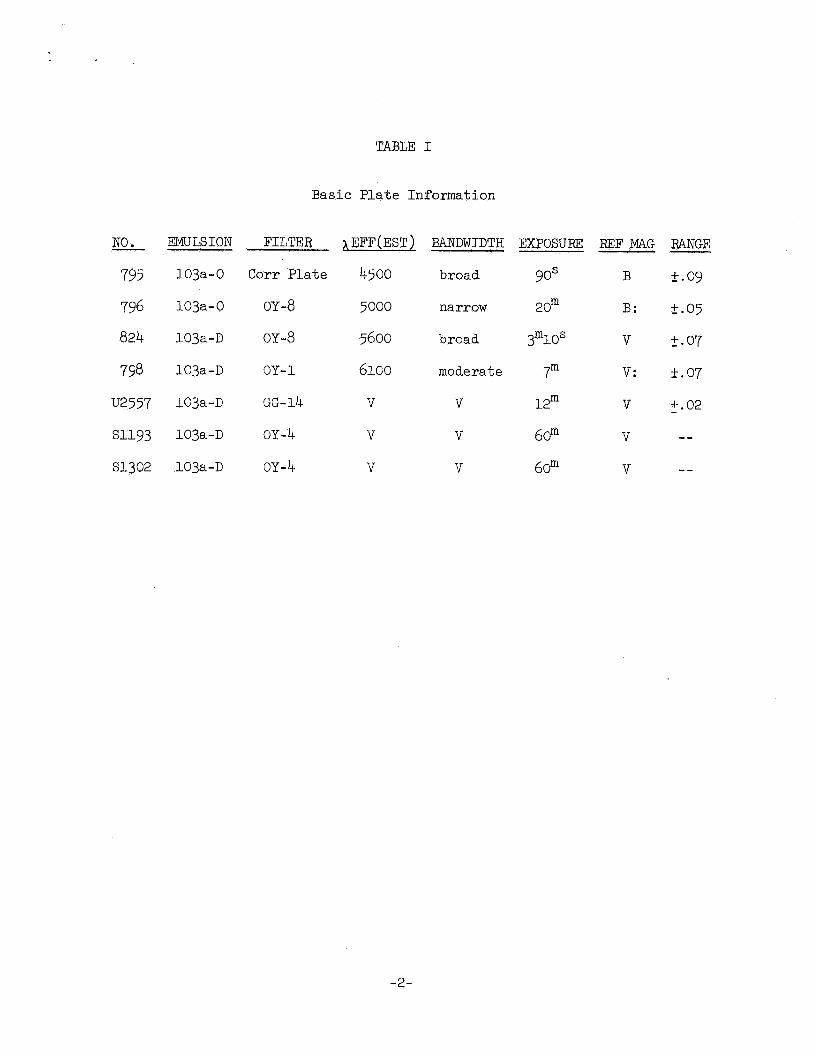
TABLE I
Basic Plate Information
NO. EMULSION FILTER AEFF(EST) BANDWIDTH EXPOSURE REF MAG RANGE
795 103a-0 Corr Plate 4500 broad 9 9 B k.09
2om B: 2.05 796 103a-0 OY-8 5000 narrow
824 103a-D OY-8 5600 broad 3"1OS v t.07
758 1 0 3 a - ~ OY-1 61co moderate 7m v: k.07
U2557 lO3a-D GG-14 v V 12m v +.02
S1193 103a-D OY-4 v v 6@ V
si302 103a-~ OY-4 v v 6om v -- --
-2-

. TABLE I1 Stellar Measurements
STAR SMC-A SMC-B SMC-D SMC-E SMC - F SMC-G SMC-H 47%
47-a
SMC-I 121-A
SMC- J SMC -K SMC-L SMC-M SMC-N SMC-0 m7583 121-B SMC-P SMC-Q SMC-R 121-D ~~6884 SMC-T m5291
m7099 SMC-V
SMC-c SMC - d SMC-e SMC-f SMC -g 47-d 47- 121-E 121-F 121-G 47-
47-x 121-H
121-1 121-K 47-b 121-L
47-1 121-M 121-N 121-0 121-P
47-p
V 6.84 7.11 7.64 7.73 7.80 8.05 8.40 8.46 9.04 9.06 9.52 9.53 9.73 9.74 9.76 9.79 9.89 10.13 10.21 10.25 10.56 10.58 10.66 10.73 10.74 10.75 10.87 11.00 11.28 11.30 11.38
11.58
11.78 11.81 11.82
12.36
12.70
13.06 13. c8 13.12 13.32 13.42 13.44 14.38 14.76
11.53
11.73
11.84
12.46 12.48
13.04
B 6.95 7.18 8.97 8.83 8.68 8.57 9.38 8.93 9-90 9.96 10.59 10.04 10.05 10.16 10.13
10.28 10.69
11.32 11.72 10.77 11.17 10.77 11.33 10.93 11.80 11.42 11.36 12.06
12.25 13.38 12.70
12.36 13.68 13-17 13.27 13.26 13.57 14.13 13.95 13.99 14.40 14.06 14-19 15.11 15.44
10 79 10.40
10.43 11 * 73
11.74
12.46
Background SMC Arp, A.J. 63, 118 121 Tifft, M . N r m , 199
CLASS 5 5 8 6 4 10 10 2 6 1 2 1 6 3 4 3 5 2 1 4 4 8 1 8 4 15 3 6 6 5 10 3 6 4 6 3 1 1 7 3 2 3 1 2 1 6 3 1 2 1 1
HD 47 -3-
~ ~~
795 1492 1486 1515, 1611 1606
1618 1625 1679
1672
1692 1696
1666 1706 16 58
1635 1766
1537 1544
1704
1646
1727 1679
1731
1674 1498 1742 17c6 1739 172 5 1609 1789
1786 1782 1788
1750
1770
1791- 1792 1772 1795
1804
1784 1813
1822 1821 1850
IRIS RFADIKG 796 824 793 1432 1500 1555 1432 1426
1509 1428 1419 1552 1521 1611 1594 1593
1590 1588 1610 1578 1580 164 5 1601 1633 1509 1690
1620 1.338 1624 1562 1599 1614 1531 1690
1686
1719 1737 1732 1681
1752
1786
1652
1780 1773
1-794 18 50
1750 1778
1519 1502 1554 1553 1524 1516 1-590 1608 1631 1632 1656
1658 1639
1620 1678 1689 16 58 1666
1601 1673
1697 1653
1670 162 9 1716
1711 1688 1728
1646
1592 1705
1463
1664
1748 1740
1748
1773 1759 1769
1777
1801 1809 1850
1555
1578 1520
1588 1562
1632 1617 1662 1661 1663
1542
1659 1684 1654 1668 1666
1680 1676 1601
1660 1676
1721 1712 1711 1732 1676 1759 1748
1739 1737 1762 1767 17c6
178 1 1762 178 5
1715 1713
1715
1551
1759
1789 1792 1741 1760 1795 1796 1820 1820 18 50
Buscombe, Kennedy, RASC 56, 113 Wildey, Ap. J. 133, 430 - -

of the degree of background enhancement or crowding of each star. Class
1 stars are well away from the SMC and nearby companions.
the stars lie well within the obvious halo of the SMC. One star in the
center of the SMC was classified 15.
The iris photometry was carried out on the Cuffey iris photometer
By classes 8-10
at the Steward Observatory. For each plate, the clear background reading
was placed at a standard level. Five settings on each star were made to
form the averages contained in Table 11. Table I contains the approximate
iris range between least and greatest reading on each star averaged over
all stars measured on a given plate. This is an indication of the internal
measuring consistency and has been converted to magnitudes at the middle
of the magnitude range measured. Single measurement errors from setting
are seen not to exceed about 0.07 magnitude, and with five measures the
setting errors are well below the intrinsic plate errors discussed below.
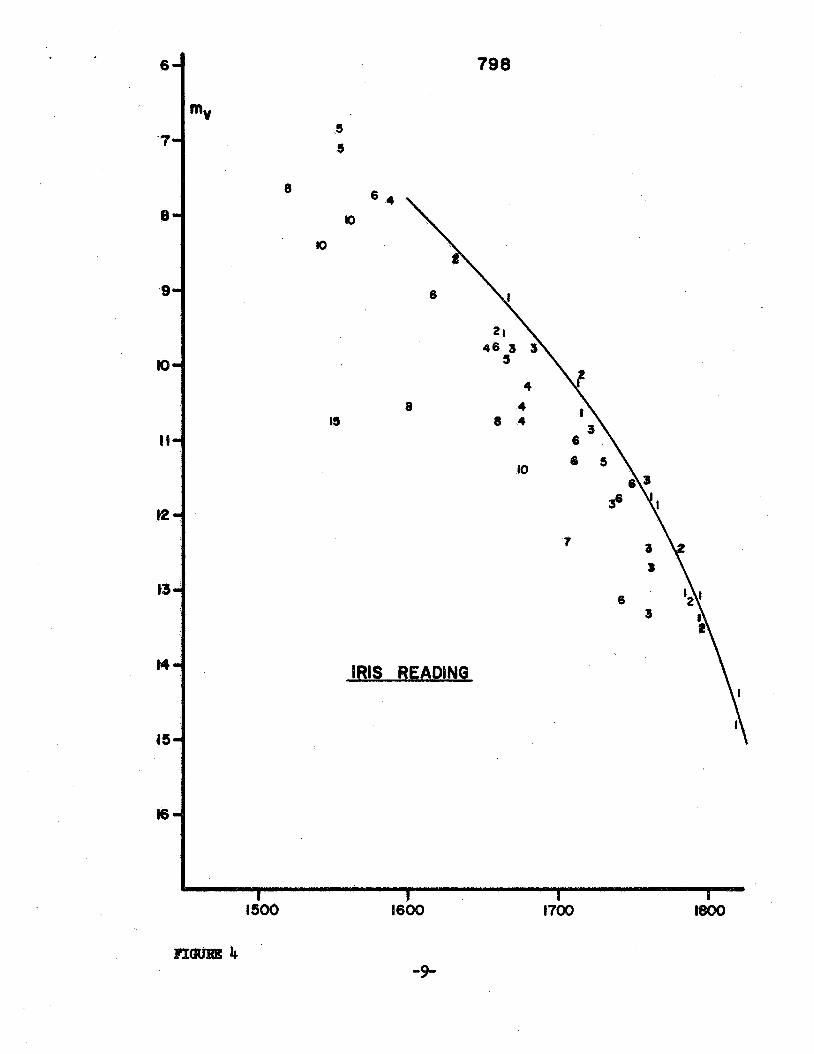
For each plate a calibration curve between magnitude and iris reading
was drawn for class 1 stars to determine the performance of photometry on
isolated stars. The deviation of stars of other classes from the basic
class 1 curve then measures background enhancement effects. Figures 1-4
show the complete set of measurements. Table I11 swnarizes the quanti-
tative results for magnitude residuals as a function of class in the iris
range indicated.
The toe region of the curves has been omitted since such measures are
intrinsically much less accurate. The table also contains the mean absolute
residual of class 1 stars, denoted 1". There is a correlation of residuals
with exposure time in that locger exposures tend to minimize both setting
range and final mean residuals.
The number of stars in each mean is given in paranthesis.
This is logically expected since the longer
exposures tend to produce more smoothly blurred image spots.
-4-

TABLE I11
PLATE 1 -
795 0.0 (9)
796 0.0 (8)
824 0.0 (9)
798 0.0 (9)
Mean Magnitude Residuals
- 2-3
0.4 (14)
l* - IRIS RANGE
1600-1815 0.26 (9)
1500-1780 0.12 (8)
1580- 1800 0.07 (9)
1600- 1800 0.14 (9)
- 5-

6
7
0
9
IO
I I
12
13
14
15
I6
795
5 5
K)
8
10
I5
IRIS READING
4
6 .
3 4
6 \ 5
6
1 0 8
46
I 1500
I 1600
FIGURE 1 -6-

IRIS RE AD1 NG
796
I 1 1 1 c 1400 1500 1600 1700 1
FIGURE 2 -7-

6
7
0
9
IO
II
12
13
14
15
mV
824
IRIS READING
1500
FImRE 3
1600
-8-
5 5
6
8 I5
790
7
IRIS READING
I I500
I 1600
I 1700
From Table I11 it i s apparent t h a t photometry t o about IC% accuracy
can be expected from photographic i r i s photometry of i s o l a t e d stars.
Background enhancement and crowding w i l l produce ser ious systematic
e r r o r s .
t o the stars should improve measurement accuracy although f u r t h e r quanti-
t a t i v e examination on t h i s po in t i s required.
c lasses based upon background c l e a r l y produces a smooth ordering of
res idua ls .
exposure than on t h e normal yellow exposure. This i s l o g i c a l on the
bas i s t h a t the SMC halo i s dominated by yellow (o lde r ) stars which a r e
l e s s e f f ec t ive i n enhancement a t shor t wavelengths. Enhancement i s
g rea t e s t on the narrow band long exposure where the SMC has been brought
out s t rongly by improving i t s cont ras t aga ins t the sky. The reduction
of galaxy halo region enhancement a t broadband shor t e r wavelengths should
be p a r t i c u l a r l y e f f ec t ive i n the u l t r a v i o l e t and should permit f a i r l y
accurate photometry close t o the Magellanic Clouds.
Systematic correct ions as a funct ion of background l e v e l adjacent
Qua l i t a t ive assignment t o
There appears t o be l e s s enhancement on t h e normal shor t blue
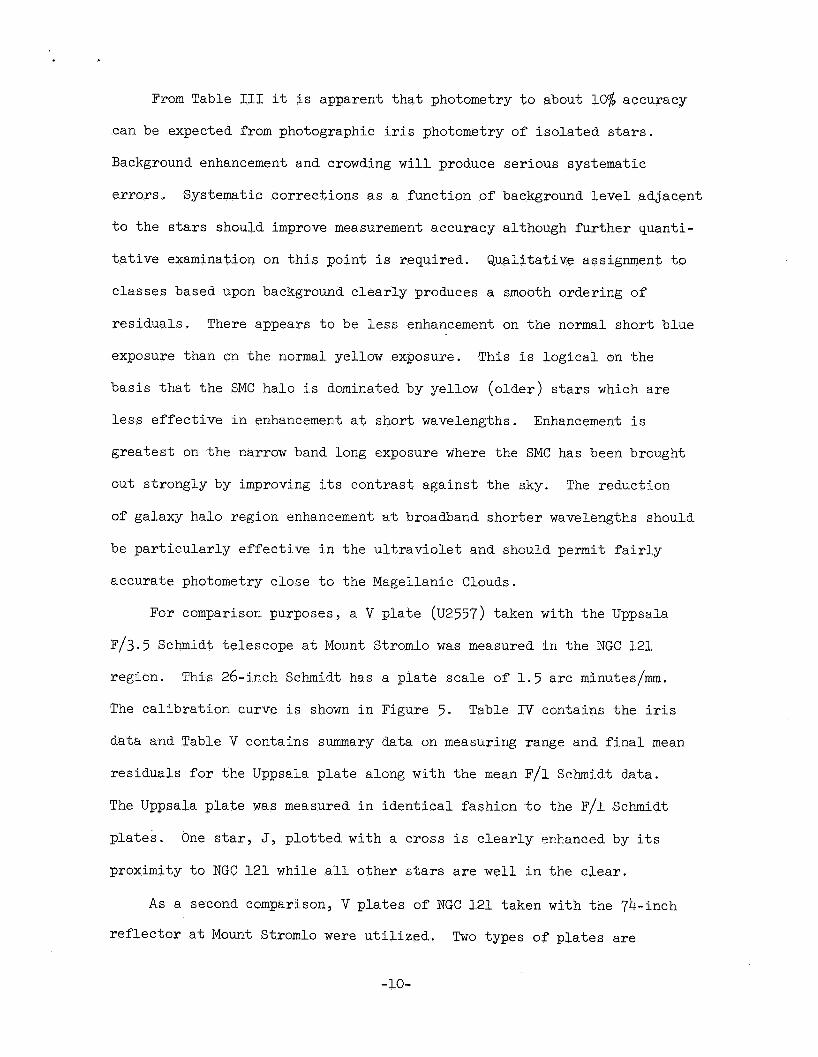
For comparison purposes, a V p l a t e (U2557) taken with the Uppsala
F/3.5 Schmidt te lescope a t Mount Stromlo was measured i n the NGC 121
region.
The ca l ib ra t ion curve i s shown i n Figure 5. Table I V contains the ir is
data and Table V contains summary data on measuring range and f i n a l mean
res idua ls f o r t h e Uppsala p l a t e along with the mean F/1 Schmidt data .
The Uppsala p l a t e was measured i n i d e n t i c a l fashion t o the F/1 Schmidt
p l a t e s . One s tar , J, p l o t t e d w i t h a cross i s c l e a r l y enhanced by i t s
proximity t o NGC 121 while a l l o the r stars a r e w e l l i n the c l e a r .
This 26-inch Schmidt has a p l a t e sca le of 1 .5 a r c minutes/rm.
A s a second comparison, V p l a t e s of NGC 121 taken with the 74-inch
r e f l e c t o r a t Mount Stromlo were u t i l i z e d . Two types of p l a t e s are
-10-

9
10
I I
12
rn " 13
14
I6
16
17
18
U 2557
I R I S READING
I300 1400 1500 1600 1700
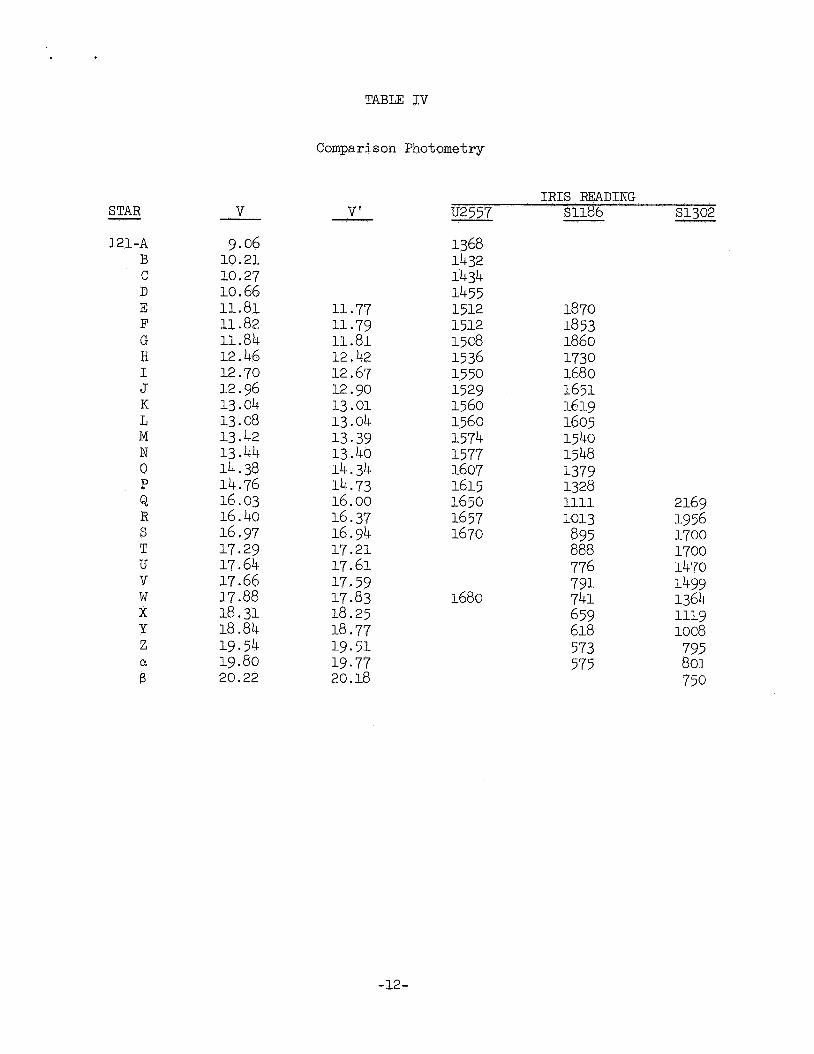
TABLE IV
Comparison Photometry
STAR - 121-A
B C D E F G H I J K L M N 0 P Q R S T U v W x Y Z
B a
v 9.06
10.21 10.27 10.66 11.81 11.82
12.70 12.96
13. c8
11.84 12.46
13.04
13.42 13.44 14.38 14.76 16-03 16.40 16.97
17.64 17.66 17.88 18.31 18.84 19.54 19.80 20.22
17.29
IRIS REllDING u2557 S1186 si302
11 * 79 11.81
12.67 12.90 13.01 13.04 13.39 13.40 14.34 14.73 16.00
16.94 17.21 17.61
17.83 18.25
12.42
16.37
17 * 59
18.77 19 51 19.77 20.18
1512 15c8 1536 1550 1529 1560 1560 1-574 1577 1607 1615 1650
1670 1657
1680
1368
1455 11 * 77 1512 1870
1853 1860
1680 1651 1619 1605
1432 1434
1730
1540 1548 1379 1328 1111 1013 895 888 776 791. 741. 659 618 573 575
2169 1956 1700 1700
1499 1364 1119 10c8 795 801 750
1470
-12-
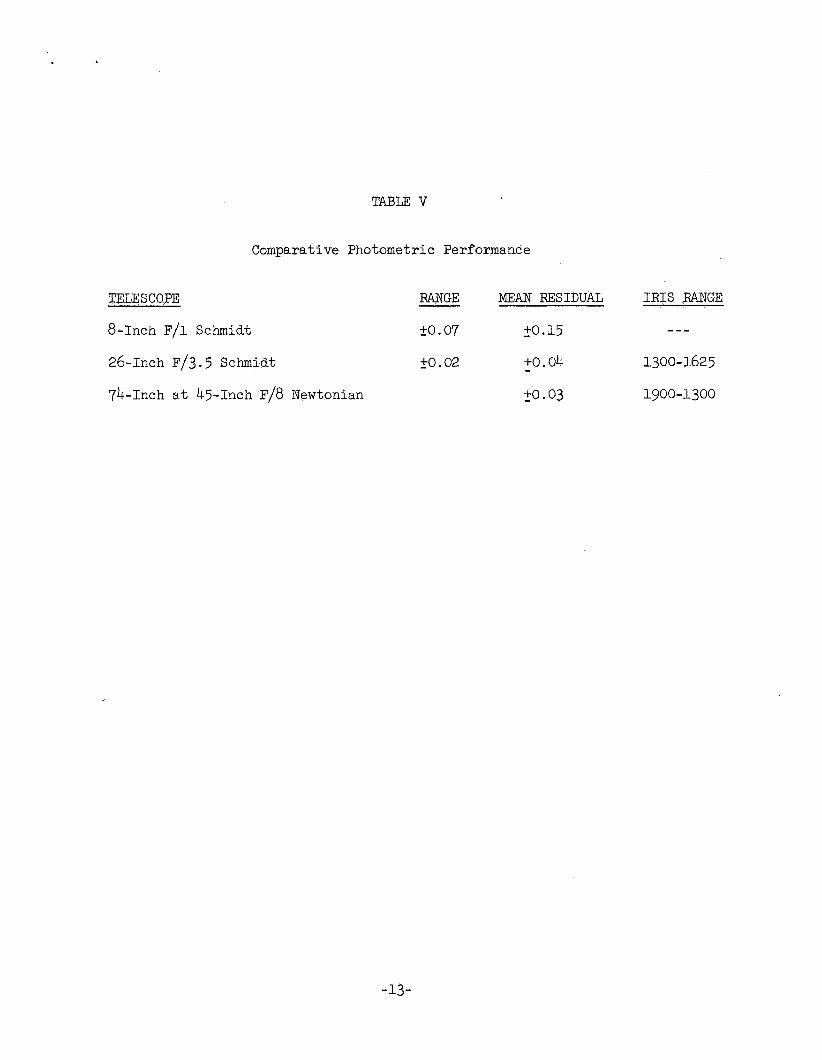
TABLE V
Comparative Photometric Performance
TELESCOPE RANGE MEAN RESIDUAL IRIS RANGE
8-Inch F/1 Schmidt to . 07 50.15 ---
26-Inch F/3.5 Schmidt io. 02 +o - .04 1300-1625
74-Inch at 45-Inch F/8 Newtonian 20.03 1900-1300
-13-
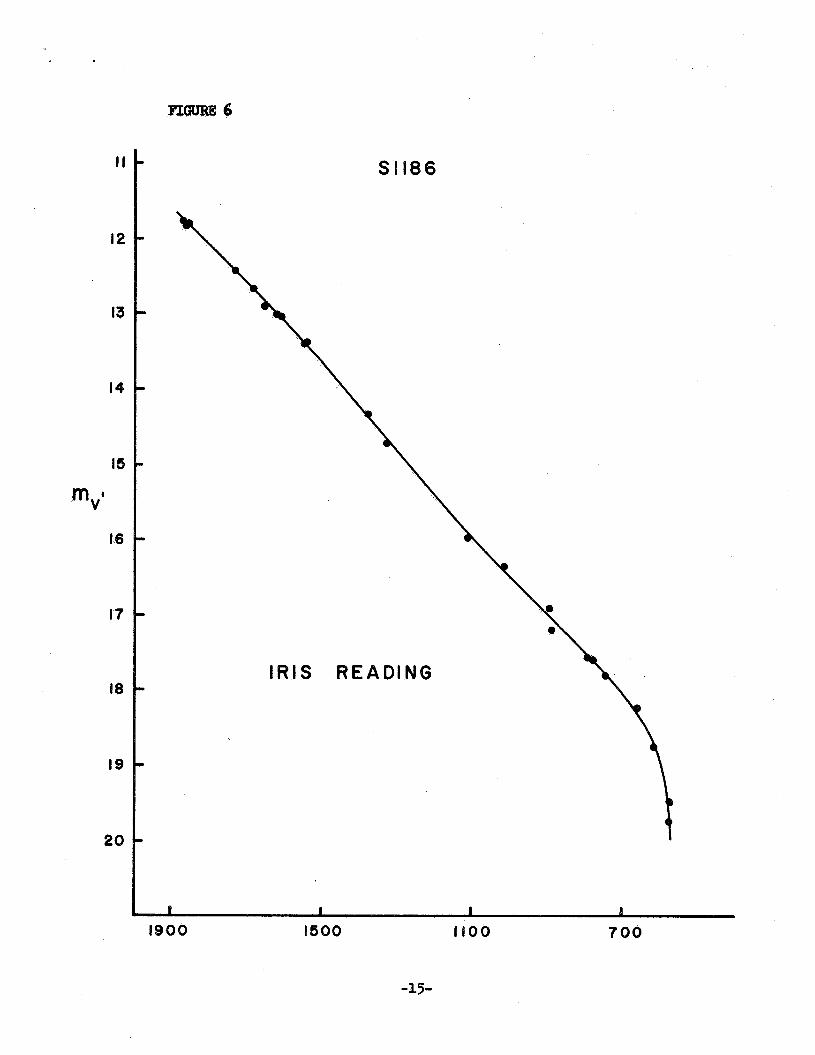
available, F/8 plates taken with a 45-inch stop (~1186) and F/5 plates
at full aperture (51302). These
plates were not available f o r measurement for this program; original
measurements from the NGC 121 analysis (Tifft, M.N. 125, 199, 1963)
were utilized.
was not recorded.
Palomar Observatory Sartorius instrument.
curves while Table V contains the mean residuals, and Table IV the raw
iris data.
due to the OY-4 filter match to V.
Plate scale is 22 arc seconds/mm.
- The procedure of measurement was very similar but range
The iris photometer used was the Mount Wilson and
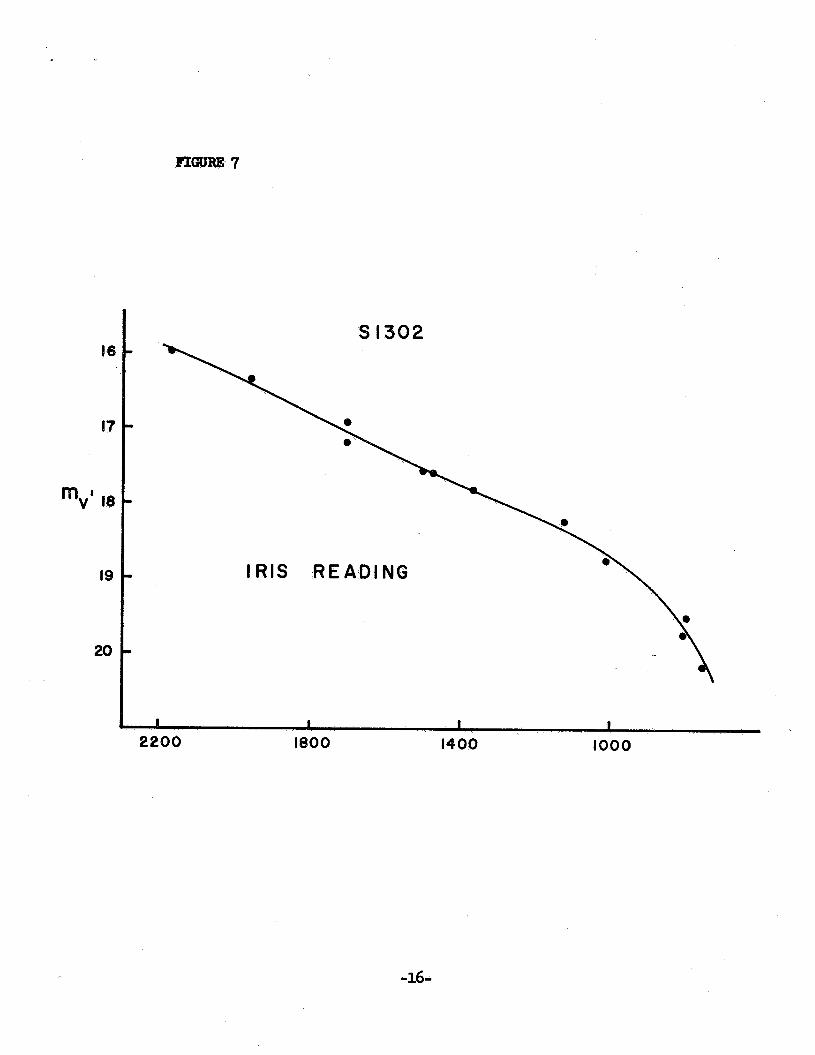
Figures 6-7 give calibration
A very slight color equation applies to the 74-inch V measures
Thus, V' = V + 0.05(B-V) is used in
the 74-inch tabulations. The mean residual is not calculated for the
full aperture 74-inch data since only stars below magnitude 15-16 are
suitably exposed for measurement. At these faint limits, the calibration
photoelectric photometry is less accurate than the photographic photometry.
A comparison of figures 6 and 7 show that the stars deviate from the mean
curves in the same manner for both plates. There is no reason to expect
the intrinsic accuracy of the iris photometry to differ for the two 74-inch
plates.
be the result of photoelectric magnitude uncertainties, perhaps 2%.
A significant portion of the residuals of the brighter stars may
The general conclusions to be drawn from this study may be briefly
summarized as follows :
1. Iris photometry is a valid means of photographic phctometry on
plates of all scales from the wide field fast Schmidt to the
large scale reflector in a small detailed field.
2. Except near the plate limit, iris photometry intrinsic accuracy
(single plate magnitude for a single star) is about 1-3% for
large scale telescope plates. Accuracy decreases only slightly,
I I
12
13
14
15
16
17
18
20
FZGURE 6
5i186
I R I S READING
1 1 1 1
1900 1500 1100 7 0 0
-15-
51302 16
17
m,' 18
19
20
I R I S READING
I 1 1 1
2200 1800 1400 1000
3.
4.
t o 2-4% f o r conventional Schmidt imagery, and drops t o 10-15% f o r
t he very wide f i e l d fas t Schmidt systems. There i s a s l i g h t
tendency f o r sho r t exposures t o have lower i n t r i n s i c accuracy
than longer exposures.
Errors from s l i g h t va r i a t ions i n centering on images i s less than
i n t r i n s i c p l a t e e r r o r s (running about 1/2) such t h a t taking the
mean of s eve ra l s e t t i n g s can render t h i s e r r o r i n s i g n i f i c a n t .
Unresolved background and c lose companions w i l l e f f e c t t h e
photometry appreciably; however, t h e e f f e c t s a r e v i s u a l l y apparent,
and i s o l a t e d stars can be r e a d i l y d is t inguished f o r photometry.
For s l i g h t l y enhanced stars, systematic cor rec t ions based upon
adjacent background readings a r e l i k e l y t o be qu i t e e f f e c t i v e .
Background enhancement e f f e c t s show a wavelength dependence
with sho r t e r wavelengths providing less enhancement i n the
v i c i n i t y of t he SMC. Residual crowding of stars i s probably
a l a r g e p a r t of t he reason f o r t he general growth of e r r o r
with p l a t e s ca l e .
Figure 8 contains photomicrographs of t h e images of s eve ra l stars on
some of t he various types of p l a t e s used i n t h i s study. All p l a t e s were
of the lO3a va r i e ty , hence, have s imi l a r g ra in s t ruc tu re . The sca l e of
a l l t h e photographs i s ind ica ted by a sca l e i n 0 .1 llim un i t s .
The iris photometry and data tabula t ion f o r t h i s program was c a r r i e d
out pr imar i ly by Mr. David Webb, graduate a s s i s t a n t i n the Space Astronomy
Group during 1966-67.
-17-

l i l l l l l l l l l l l l
FIGURE 8. Photographs of P la tes Used i n t h e Study
Top Row, F/1 Schmidt; Middle Row, Uppsala Schmidt; Bottom Row,
74-inch Reflector.
Below each column a sca l e i n 0.1m u n i t s i s shown. A mark on
each p i c t u r e i d e n t i f i e s a s t a r i n common.
Two magnifications of each p l a t e are included.
-18-