wind turbine modelling for lightning simulations. - upcommons
TRANSCRIPT
Master’s Tesis
Master in energy engineering
Wind turbine modelling for lightning simulations.
REPORT
Author: Alejandro Cao Faci Director: Joan Montanyà Puig Co-director: Jesús Alberto López Trujillo Convocation: September 2018
Escola Tècnica Superior d’Enginyeria Industrial de Barcelona
Wind turbine modelling for lightning simulations. Pag. 1
ABSTRACT
The present project proposes a wind turbine model for studies about its effects with
reference to lightning strikes. For this, a meticulous compilation of high frequency models of
each element of a conventional wind turbine has been carried out in order to select the most
suitable ones. Subsequently, these models have been introduced in the ATPDraw software
to perform the relevant simulations.
In parallel, due to the absence of models about the power converter in the available
literature, we have tried to model it and obtain an equivalent circuit that could reflect its
behaviour in lightning tests. To do this, a series of experiments were carried out using a
pulse generator and real equipment to obtain tangible information about its behaviour and,
then, some tests were carried out with different models until finding one that offered the
adequate operation.
Finally, all previously evaluated models are introduced into the ATPDraw forming a wind
turbine, and an impulse similar to that of a standard lightning is applied. In this way, it is
possible to study which is the overall behaviour of the whole system and specifically, about
each element presented to obtain the final conclusions. As a whole, it can be said that a
relatively simple system is obtained that offers a performance very similar to the reality one.
Wind turbine modelling for lightning simulations. Pag. 2
INDEX
ABSTRACT ........................................................................................................................ 1
INDEX ................................................................................................................................ 2
1. GLOSSARY ................................................................................................................ 4
2. INTRODUCTION ......................................................................................................... 5
2.1 OBJECTIVES ................................................................................................ 6
3. OVERVOLTAGES IN WIND TURBINES .................................................................... 8
3.1 Overvoltages analysis in wind farms ........................................................... 10
3.2 Behaviour of the main wind turbine’s elements under overvoltages. ........... 12
3.2.1 Transformer behaviour under overvoltages ................................... 14
3.2.2 Generator behaviour under overvoltages ...................................... 17
3.2.3 Power converter behaviour under overvoltages ............................ 19
3.3 TOV protection ............................................................................................. 20
4. MODELLING OF THE WIND TURBINES ................................................................. 24
4.1 Transformer modelling ................................................................................. 24
4.2 Generator modelling .................................................................................... 27
4.3 Power converter modelling .......................................................................... 28
4.3.1 Real data getting ........................................................................... 29
4.3.2 Models Review .............................................................................. 31
4.3.3 Main improvements of model 2 to obtain 3 .................................... 38
4.4 Other elements of the wind turbine. ............................................................. 38
5. FINAL RESULTS ...................................................................................................... 45
5.1 Wind farm characteristics ............................................................................ 45
5.2 Simulation tools ........................................................................................... 46
5.2.1 Lightning current source simulation ............................................... 47
5.2.2 Blades and tower simulation .......................................................... 48
5.2.3 Power cable system ...................................................................... 49
5.3 Wind turbine Simulation ............................................................................... 51
5.3.1 Evaluation of the overvoltages including a surge arrester ............. 56
5.4 Limitations and possible improvements of the project ................................. 57
Wind turbine modelling for lightning simulations. Pag. 3
6. CONCLUSIONS ........................................................................................................ 59
7. BIBLIOGRAPHY ....................................................................................................... 60
8. ANNEX I: TOOLS USED IN THE TESTS ................................................................. 63
9. ANNEX II: GRAPHICS OBTAINED IN THE TESTS................................................. 66
9.1 Test 1: .......................................................................................................... 66
9.2 Test 2 ........................................................................................................... 69
9.3 Test 3 ........................................................................................................... 71
10. ANNEX III: COMPARISON BETWEEN THE TEST AND THE FINAL CONVERTER
MODEL ................................................................................................................................. 74
10.1 Open circuit test: ...................................................................................... 74
10.2 Short-Circuit Test. .................................................................................... 76
11. ANNEX IV: FINAL SIMULATION ............................................................................. 78
Wind turbine modelling for lightning simulations. Pag. 4
1. GLOSSARY
In this section the meaning of the different abbreviations and symbols used along the
project is specified:
Abbreviations
AC Alternating Current.
CP Constant Parameter.
DC Direct Current.
DFIG Doubly Fed Induction Generator.
EHV Extra high voltage.
FEM Finite Element Program.
HV High Voltage.
LPS Lightning Protection System.
LV Low Voltage.
MV Medium Voltage.
OC Open Circuit.
PWM Pulse-Width Modulation.
SC Short-Circuit.
THD Total Harmonic Distortion.
TOV Transitory overvoltages.
Symbols
ε Permittivity.
μ Permeability
Ω Ohm.
ρ Resistivity.
Wind turbine modelling for lightning simulations. Pag. 5
2. INTRODUCTION
During the last years, the production of wind energy has been expanded all over the
world, reaching an installed power worldwide of more than 486 MW in 2016, with such a
growth that has doubled the power of 2011 [1]. In this way, wind energy is the most mature
and developed renewable energy currently, being the one that generates more electricity
behind hydroelectric power, using only the force of the wind as an energy source. In
addition, its future is no less promising, since with the constant increase of the nominal
power of the installed wind turbines and the increasing viability of offshore wind farms, it is
believed that between solar and wind energy they could generate the 80% of the electricity
demanded in some countries before 2030 [2].
Even so, this growing presence of the wind energy presents several challenges to bear in
mind, apart from those already existing for being an energy source dependent on weather
conditions. As will be discussed below, the project will study in depth the problem of
overvoltages in wind turbines, and more specifically those produced by lightning.
The concept of overvoltage is referred to those voltage surges that can appear in
electrical distribution lines, data, communications or telephony, causing premature
deterioration of the components and damage the equipment connected to the network. In
particular, the present project will study the incidence of transient overvoltages produced by
direct, indirect atmospheric discharges, disconnection of inductive loads and network
switching.
Specifically, the transients to study will be those caused by direct or indirect atmospheric
discharges. The main reason for this, is the large amplitude and high frequency that a
lightning can achieve, becoming dangerous even in an indirect impact. In some cases, they
can reach around 100 kA with a frequency higher than 105 Hz.
Regarding the wind energy scenario, it must cover large areas of land to produce big
amounts of energy. In this way, wind turbines are usually located in high places where the
wind can be used, so the incident lightning strike is increased, causing adverse effects on
the individual and common operation of wind turbines. The main reason for this is that they
are structures that are very exposed to lightning and statistically, can initiate lightning very
easily [3]. If they are not properly dissipated, it can lead to consequences on the physical
condition of the wind turbine.
Then, the problem may seem very simple, only by placing the correspondent protections
in the system, the consequences could be mitigated to a great extent. But, if the economic
factor is taken into account, it is essential to know that a large investment is required.
Consequently, it would be necessary to carry out the pertinent studies on each case and
wind farm location, in order to evaluate the risks of the system and its vulnerability to those
disturbances provoked by lightning strokes.
Wind turbine modelling for lightning simulations. Pag. 6
In this way, an important part of the present project will focus on analysing the most
problematic overvoltages, with the aim of optimally modelling the main elements of wind
turbines, both individually and in a wind farm. Therefore, the second part of the project will
consist in compiling and studying the high frequency models of the most representative
elements of a wind turbine.
At present, it is very difficult to find studies on high frequency models of the elements of a
wind turbine. The reason for this, is that nowadays exist a set of standard models for each of
them, and they are good approximations for almost any application in the industry. The main
problem then, is that the classic models do not work for the high frequencies of the
disturbances that appear during a temporary overvoltage, because important impedances
can appear that for common applications are totally negligible.
In summary, it can be said that the motivation for the present study of the overvoltages
produced by lightning in wind turbines, is based on different reasons. Firstly, we are facing a
problem that affects many countries nowadays, and due to the increasing use of wind
energy, it could be more frequent in the following years. In addition, the expansion of wind
energy is a relative recent phenomenon, so the number of deep studies about the problem is
limited. Apart from this, there does not exist a set of models in high frequency accepted for
the community for all the elements of a wind turbine, even in the case of the converter there
is a very limited bibliography about it.
2.1 OBJECTIVES
The main objective of the project is to obtain a complete model for lightning tests of a
wind farm, and specifically of an individual wind turbine in the ATPDraw software. To do this,
each and every one of the elements that composes a wind farm must be considered
individually, bearing in mind the high frequencies that can appear owing to the overvoltages
produced by lightning.
In addition, it is necessary to focus on the power converter model, because due to the
absence of available literature, it is intended to obtain an own model that could be used in
high voltage tests. At the end, the project will finish with a lightning simulation to evaluate the
final results obtained, and its precision bearing in mind the time constraints, and the
available software and bibliography. For this, the following previously established steps will
be carried out:
1. Compilation of information on various related topics such as the characteristics of
lightning, parts of wind turbines and their behaviour against overvoltages, and
electrical protection against major disturbances.
Wind turbine modelling for lightning simulations. Pag. 7
2. Obtain different models of wind turbines and its main components to make a
selection of the most precise bearing in mind the predefined objectives and the
pertinent limitations.
3. To obtain the model of the converter, a series of tests will be carried out in a
laboratory and later compared with the available models, modifying them if
necessary to achieve a model that can reflect the corresponding overvoltages as
much as possible.
4. Finally, once the previous steps have been completed, the aim is to unite all the
models of the components in a single program in order to simulate a lightning and
evaluate the final behaviour of the system.
Wind turbine modelling for lightning simulations. Pag. 8
3. OVERVOLTAGES IN WIND TURBINES
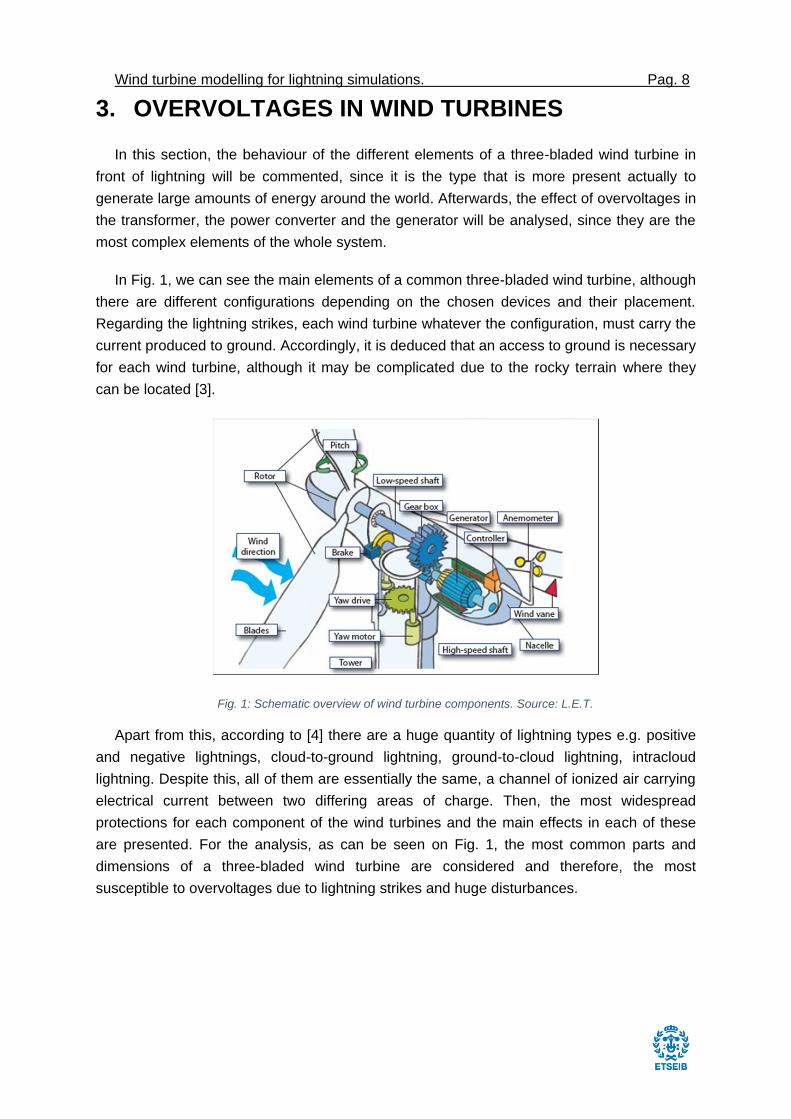
In this section, the behaviour of the different elements of a three-bladed wind turbine in
front of lightning will be commented, since it is the type that is more present actually to
generate large amounts of energy around the world. Afterwards, the effect of overvoltages in
the transformer, the power converter and the generator will be analysed, since they are the
most complex elements of the whole system.
In Fig. 1, we can see the main elements of a common three-bladed wind turbine, although
there are different configurations depending on the chosen devices and their placement.
Regarding the lightning strikes, each wind turbine whatever the configuration, must carry the
current produced to ground. Accordingly, it is deduced that an access to ground is necessary
for each wind turbine, although it may be complicated due to the rocky terrain where they
can be located [3].
Fig. 1: Schematic overview of wind turbine components. Source: L.E.T.
Apart from this, according to [4] there are a huge quantity of lightning types e.g. positive
and negative lightnings, cloud-to-ground lightning, ground-to-cloud lightning, intracloud
lightning. Despite this, all of them are essentially the same, a channel of ionized air carrying
electrical current between two differing areas of charge. Then, the most widespread
protections for each component of the wind turbines and the main effects in each of these
are presented. For the analysis, as can be seen on Fig. 1, the most common parts and
dimensions of a three-bladed wind turbine are considered and therefore, the most
susceptible to overvoltages due to lightning strikes and huge disturbances.
Wind turbine modelling for lightning simulations. Pag. 9
Blades
To start, it is necessary to highlight the blades of the wind turbines, since they are their
most distinctive part and can reach heights of 200 m, making it the most susceptible part to
receive lightning strikes. The main function of the blades is to extract the energy from the
wind, transforming it into kinetic energy of rotation, which thanks to its connection to the hub
by means of a ball bearing, allows it to rotate around its axis. The bearing is attached to the
blade by its inner ring and the hub by the outside one.
At the moment, the materials of construction of the blades are very varied, although the
most common are usually made of a matrix of fiberglass meshes impregnated with a
material such as hardened polyester or epoxy. In this way the base matrix can be made,
totally or partially, of carbon fibber, being a material with high strength and lightness, but
more expensive. In large rotor blades, wood-epoxy sheet materials are also being used [5].
Even though depending on the material the consequences of a direct impact by a
lightning can be mitigated, there can usually be found considerable erosions in the air
terminals, shell punctures and tearing, and stripping of the materials of the blade [6]. In more
extreme cases, blade breakdown or blade burnout and wire melting can occur. For this
reason, it is important that the blades have a good lightning protection system (LPS) to
safely drive those dangerous currents to the hub or nacelle. This is achieved through an air
termination system, based on different configurations and is described in detail in [6].
Hub
The vast majority of the direct impacts of lightning on wind turbines occur in the blades,
meaning that the current must be properly conducted to the ground, so there are some
models that are responsible for transferring this current to the nacelle through the hub. This
is mainly because the hub itself is not very susceptible to be damaged, since it is made of
metal, but some inner systems could be deteriorated.
As a result, a set of methods has been developed to protect the hub from high currents,
which are again listed in [6]. Among them, the most common are to implement the model of
wind turbine that avoid the passage of current through the hub by spark gaps or brushed
contacts between the root of the blade and the nacelle, by bonding all conductive
components, bypassing pitch bearings and hydraulic actuators, shielding and installing
overvoltage protection of wiring.
Wind turbine modelling for lightning simulations. Pag. 10
Nacelles
As for the nacelle, we are in a scenario very
similar to the previous one, with the difference that it
is an element manufactured with fiberglass as
previously mentioned, so there is the obligation of
installing an LPS. In addition, although statistically
does not happen commonly, there exist the
possibility that a direct impact against the nacelle
happens, therefore we must protect the system by
installing a mesh or fixing some air termination
systems.
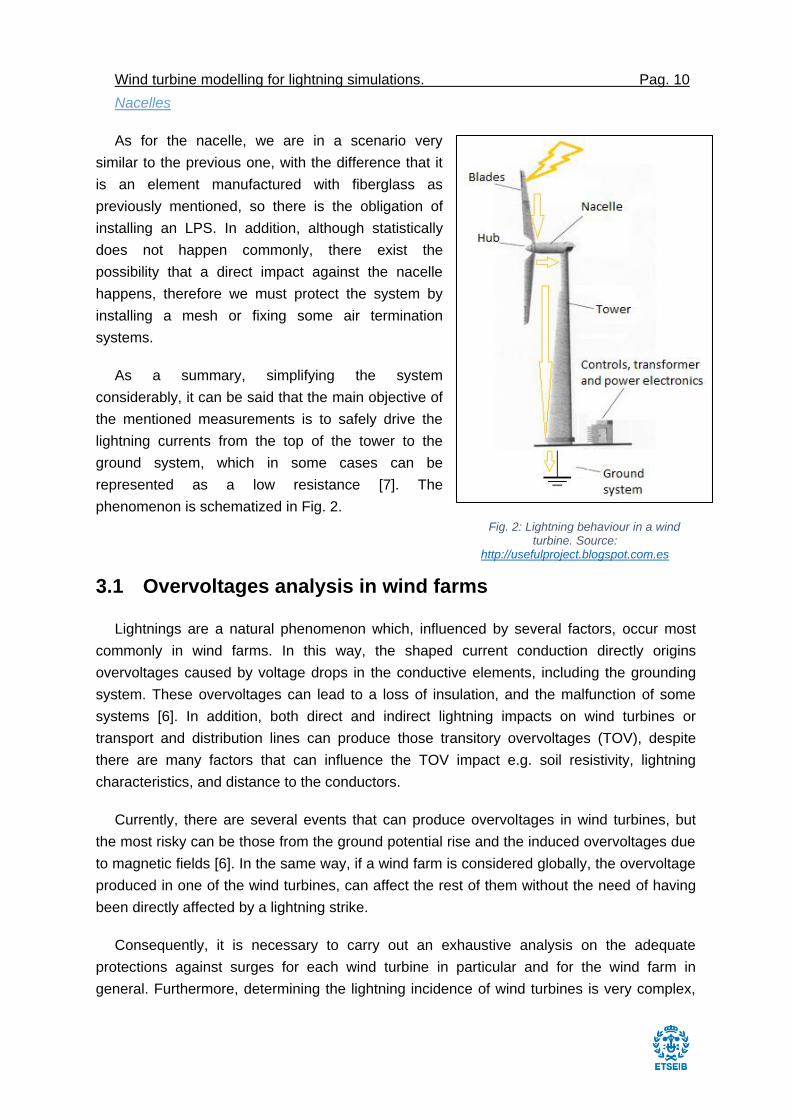
As a summary, simplifying the system
considerably, it can be said that the main objective of
the mentioned measurements is to safely drive the
lightning currents from the top of the tower to the
ground system, which in some cases can be
represented as a low resistance [7]. The
phenomenon is schematized in Fig. 2.
Fig. 2: Lightning behaviour in a wind turbine. Source:
http://usefulproject.blogspot.com.es
3.1 Overvoltages analysis in wind farms
Lightnings are a natural phenomenon which, influenced by several factors, occur most
commonly in wind farms. In this way, the shaped current conduction directly origins
overvoltages caused by voltage drops in the conductive elements, including the grounding
system. These overvoltages can lead to a loss of insulation, and the malfunction of some
systems [6]. In addition, both direct and indirect lightning impacts on wind turbines or
transport and distribution lines can produce those transitory overvoltages (TOV), despite
there are many factors that can influence the TOV impact e.g. soil resistivity, lightning
characteristics, and distance to the conductors.
Currently, there are several events that can produce overvoltages in wind turbines, but
the most risky can be those from the ground potential rise and the induced overvoltages due
to magnetic fields [6]. In the same way, if a wind farm is considered globally, the overvoltage
produced in one of the wind turbines, can affect the rest of them without the need of having
been directly affected by a lightning strike.
Consequently, it is necessary to carry out an exhaustive analysis on the adequate
protections against surges for each wind turbine in particular and for the wind farm in
general. Furthermore, determining the lightning incidence of wind turbines is very complex,
Wind turbine modelling for lightning simulations. Pag. 11
for the peculiarities of being a tall structure in general, and specifically a wind turbine. Below
are the most imperative factors to consider for a lightning surge analysis of a wind farm,
presented in [8]:
Soil resistivity. The fact that wind turbines are usually located in rocky and
mountainous places means that installing the necessary ground system is very
expensive and a technological challenge for the designers. On the one hand, in case
of a direct impact, the currents that circulate towards the ground can cause the
overvoltages mentioned by the voltage drop of the ground resistance, and cause
losses of insulation and damages in the systems. On the other hand, in case of an
impact on the surface of the ground, the overvoltage can end up in the cables and
again produce losses of insulation and damage to the systems, although it also
depends on the distance of the lightning from the point of study.
Lightning characteristics. Choosing the appropriate protections for wind turbines
is greatly complicated when this factor is taken into account, mainly because it is
linked to the economic factor. The best solution from the technological point of view,
would be simply to install some protections that could absorb the maximum possible
energy, but for practical purposes, choosing that type of protection in a place where
practically any lightning strike during the year would be illogical.
Therefore, the most usual procedure is to carry out a statistical study on the
characteristics of the lightnings in the wind farm, and more specifically the lightning
strike density. Then, the next step is to choose the optimal protection regarding its
price, and the risk of system failure. It is explained deeply in [8].
Individual characteristics of the wind turbines. It is important to bear in mind
that the characteristics of the individual equipment of each wind turbine and its
disposition may have a huge impact when finding the suitable surge protections. With
the reason that the electrical system of a wind turbine is very complex, the great
impact that this factor could mean will be explained later in the project.
Wind farm topology. The topology of the electrical system of the wind farm
affects to a large extent the magnitude of the TOV in some of the parts of the wind
farm, in the same way as the disposition and calibration of the different protections to
be implemented. As an example, it can be highlighted that the cascade connection
between wind turbines means higher overvoltages than in the parallel configuration.
The main reason for the great importance of this factor, is that although it does not
look like it, when the transient overvoltage appears a back-surge can occur. Then,
from the ground system of the wind turbine that has suffered the TOV, the
disturbance can be transferred to the phase conductors. Consequently, the
Wind turbine modelling for lightning simulations. Pag. 12
disturbance can spread through the ground system throughout the wind farm until it
is finally dissipated by the available protections.
So, if all these factors are kept in mind, even driving the current safely to the ground, this
circulation can cause an increase in the soil potential. Thus, this potential increase can
produce large potential differences in many elements that are referenced to ground, such as
the transformer, which under certain conditions can transfer the disturbance from the point of
MV to the point of LV. In addition, the converter and the generator can transfer the TOV in a
similar way, so they must also be taken into consideration.
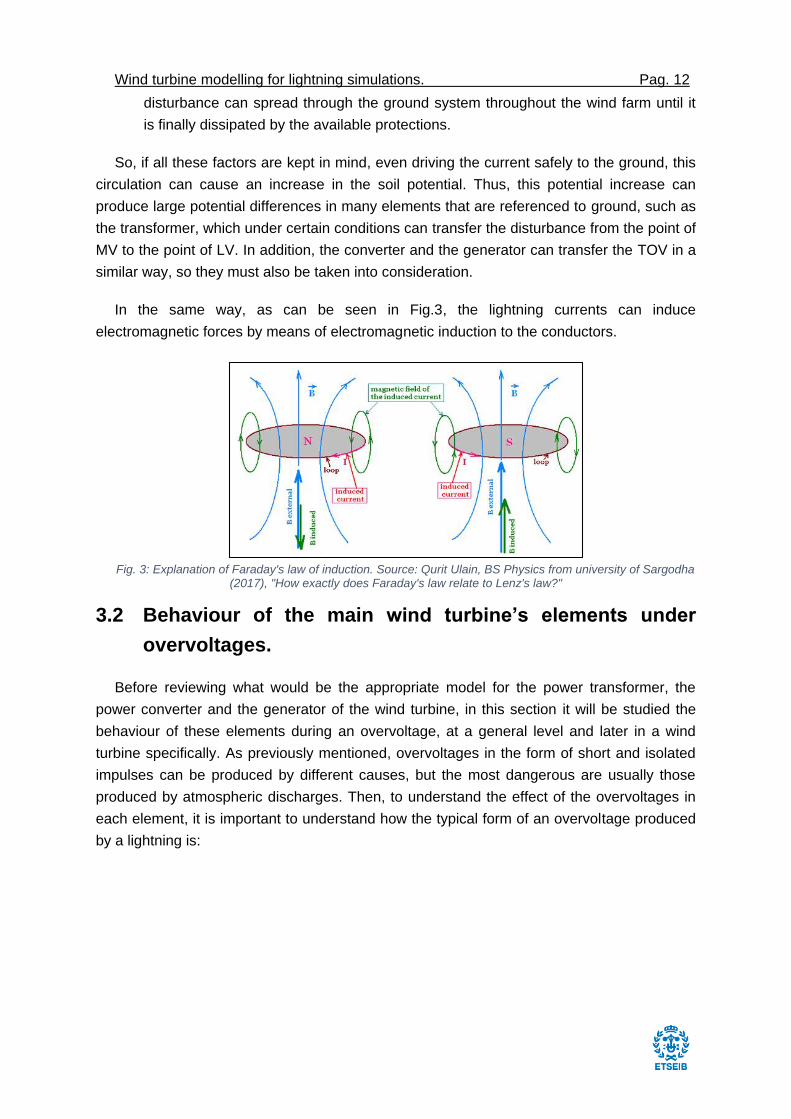
In the same way, as can be seen in Fig.3, the lightning currents can induce
electromagnetic forces by means of electromagnetic induction to the conductors.
Fig. 3: Explanation of Faraday's law of induction. Source: Qurit Ulain, BS Physics from university of Sargodha
(2017), "How exactly does Faraday's law relate to Lenz's law?"
3.2 Behaviour of the main wind turbine’s elements under
overvoltages.
Before reviewing what would be the appropriate model for the power transformer, the
power converter and the generator of the wind turbine, in this section it will be studied the
behaviour of these elements during an overvoltage, at a general level and later in a wind
turbine specifically. As previously mentioned, overvoltages in the form of short and isolated
impulses can be produced by different causes, but the most dangerous are usually those
produced by atmospheric discharges. Then, to understand the effect of the overvoltages in
each element, it is important to understand how the typical form of an overvoltage produced
by a lightning is:
Wind turbine modelling for lightning simulations. Pag. 13
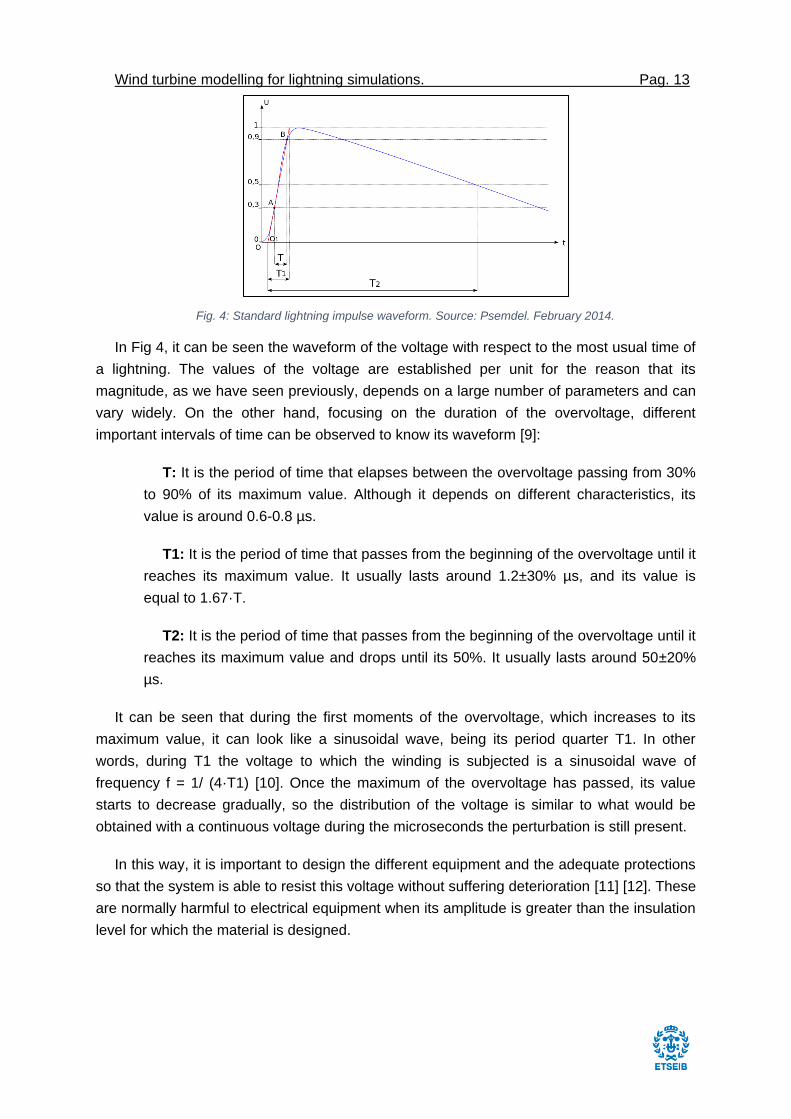
Fig. 4: Standard lightning impulse waveform. Source: Psemdel. February 2014.
In Fig 4, it can be seen the waveform of the voltage with respect to the most usual time of
a lightning. The values of the voltage are established per unit for the reason that its
magnitude, as we have seen previously, depends on a large number of parameters and can
vary widely. On the other hand, focusing on the duration of the overvoltage, different
important intervals of time can be observed to know its waveform [9]:
T: It is the period of time that elapses between the overvoltage passing from 30%
to 90% of its maximum value. Although it depends on different characteristics, its
value is around 0.6-0.8 µs.
T1: It is the period of time that passes from the beginning of the overvoltage until it
reaches its maximum value. It usually lasts around 1.2±30% µs, and its value is
equal to 1.67·T.
T2: It is the period of time that passes from the beginning of the overvoltage until it
reaches its maximum value and drops until its 50%. It usually lasts around 50±20%
µs.
It can be seen that during the first moments of the overvoltage, which increases to its
maximum value, it can look like a sinusoidal wave, being its period quarter T1. In other
words, during T1 the voltage to which the winding is subjected is a sinusoidal wave of
frequency f = 1/ (4·T1) [10]. Once the maximum of the overvoltage has passed, its value
starts to decrease gradually, so the distribution of the voltage is similar to what would be
obtained with a continuous voltage during the microseconds the perturbation is still present.
In this way, it is important to design the different equipment and the adequate protections
so that the system is able to resist this voltage without suffering deterioration [11] [12]. These
are normally harmful to electrical equipment when its amplitude is greater than the insulation
level for which the material is designed.
Wind turbine modelling for lightning simulations. Pag. 14
3.2.1 Transformer behaviour under overvoltages
A transformer generally has the same level of insulation as the rest of the installation's
materials, but it is much more sensitive to overvoltages [13]. A transformer has a high input
impedance and is a very sensitive component for wave reflection, so to limit the acceptable
overvoltages, it is necessary to install the pertinent protections. The most widespread
solution is to implement surge arresters as closer as possible to the connection points of the
transformer [6].
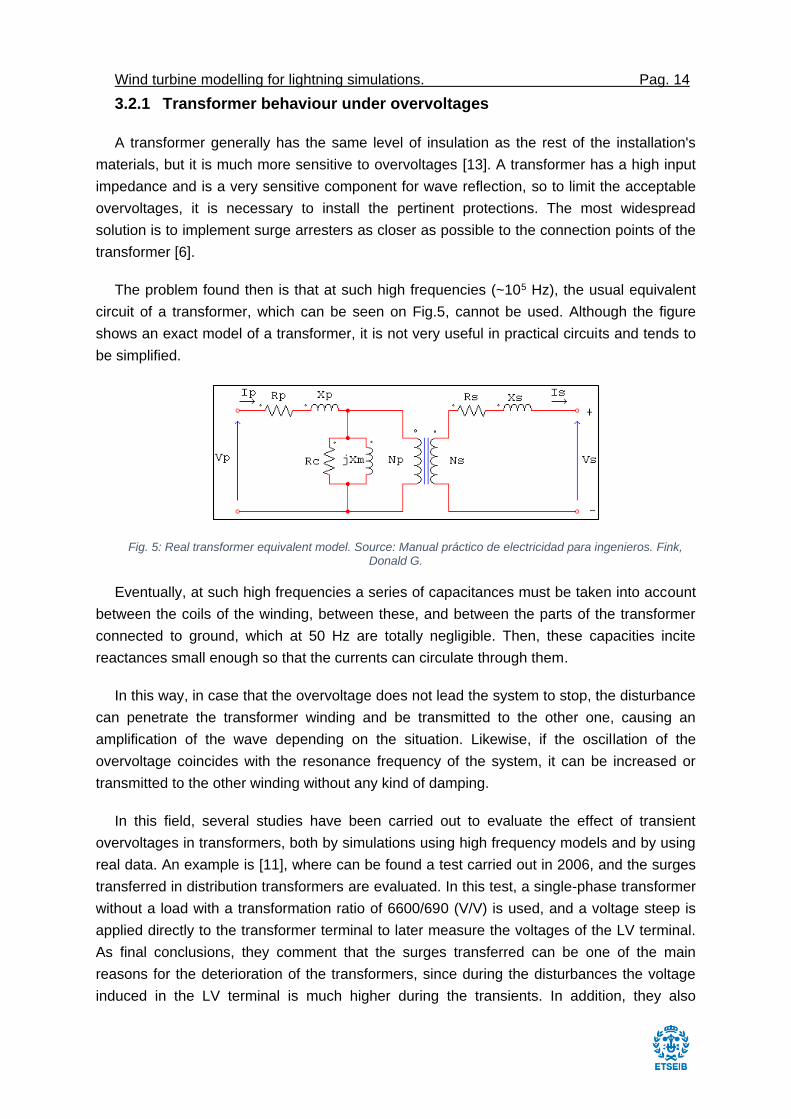
The problem found then is that at such high frequencies (~105 Hz), the usual equivalent
circuit of a transformer, which can be seen on Fig.5, cannot be used. Although the figure
shows an exact model of a transformer, it is not very useful in practical circuits and tends to
be simplified.
Fig. 5: Real transformer equivalent model. Source: Manual práctico de electricidad para ingenieros. Fink, Donald G.
Eventually, at such high frequencies a series of capacitances must be taken into account
between the coils of the winding, between these, and between the parts of the transformer
connected to ground, which at 50 Hz are totally negligible. Then, these capacities incite
reactances small enough so that the currents can circulate through them.
In this way, in case that the overvoltage does not lead the system to stop, the disturbance
can penetrate the transformer winding and be transmitted to the other one, causing an
amplification of the wave depending on the situation. Likewise, if the oscillation of the
overvoltage coincides with the resonance frequency of the system, it can be increased or
transmitted to the other winding without any kind of damping.
In this field, several studies have been carried out to evaluate the effect of transient
overvoltages in transformers, both by simulations using high frequency models and by using
real data. An example is [11], where can be found a test carried out in 2006, and the surges
transferred in distribution transformers are evaluated. In this test, a single-phase transformer
without a load with a transformation ratio of 6600/690 (V/V) is used, and a voltage steep is
applied directly to the transformer terminal to later measure the voltages of the LV terminal.
As final conclusions, they comment that the surges transferred can be one of the main
reasons for the deterioration of the transformers, since during the disturbances the voltage
induced in the LV terminal is much higher during the transients. In addition, they also
Wind turbine modelling for lightning simulations. Pag. 15
demonstrate that when the nominal ratio of the transformer is low, these overvoltages can be
accentuated, so it is important to consider the relationship between the inductive transferred
voltage coefficient and the capacitive transferred voltage. The results obtained are reinforced
by other subsequent studies, e.g. [12] [14] [15].
In [12], it can be seen a report similar to the previous one, in which some tests are again
carried out using different simulations and obtaining different conclusions in this regard.
Firstly, they present the most common mechanisms that can incite an overvoltage present in
one of the windings of one transformer is transferred to the other:
Capacitive voltage transfer due to electrostatic induction. When the
overvoltage appears in one of the windings of the transformer, as previously
mentioned, the high frequencies of the perturbation cause that certain capacitances
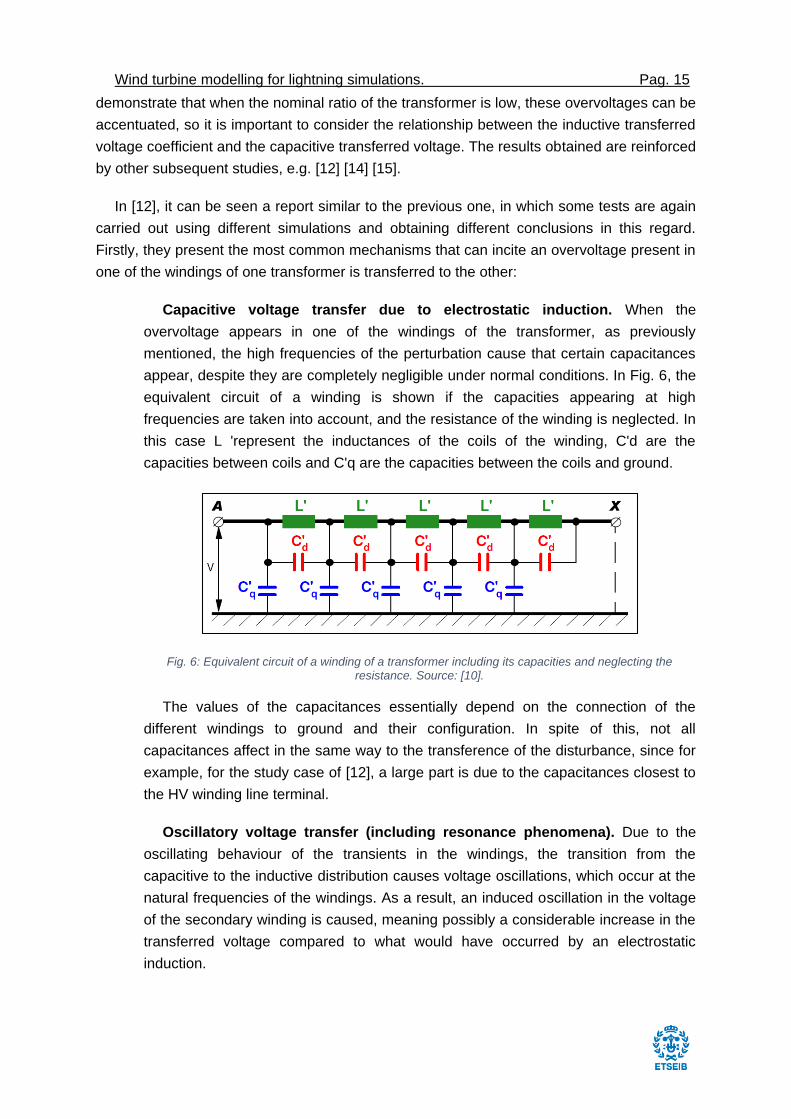
appear, despite they are completely negligible under normal conditions. In Fig. 6, the
equivalent circuit of a winding is shown if the capacities appearing at high
frequencies are taken into account, and the resistance of the winding is neglected. In
this case L 'represent the inductances of the coils of the winding, C'd are the
capacities between coils and C'q are the capacities between the coils and ground.
Fig. 6: Equivalent circuit of a winding of a transformer including its capacities and neglecting the resistance. Source: [10].
The values of the capacitances essentially depend on the connection of the
different windings to ground and their configuration. In spite of this, not all
capacitances affect in the same way to the transference of the disturbance, since for
example, for the study case of [12], a large part is due to the capacitances closest to
the HV winding line terminal.
Oscillatory voltage transfer (including resonance phenomena). Due to the
oscillating behaviour of the transients in the windings, the transition from the
capacitive to the inductive distribution causes voltage oscillations, which occur at the
natural frequencies of the windings. As a result, an induced oscillation in the voltage
of the secondary winding is caused, meaning possibly a considerable increase in the
transferred voltage compared to what would have occurred by an electrostatic
induction.
Wind turbine modelling for lightning simulations. Pag. 16
Effect of design of windings on transferred voltages. In [12], we are told about
the design parameters of the transformers that can influence the impact of the
transmission of surges:
The type of windings. Apart from the capacity to ground of the windings,
the longitudinal capacity of the transformer can influence the transfer of
surges. In this way, the windings with a higher longitudinal capacity, e.g.
interlaced or with nonloaded turns, are in better conditions due to their
superior input capacity.
Performance of windings according to the number of concerters. Currently,
there is a tendency to install for the larger transformers, a LV winding
placed between two concentrators of HV windings. Then, a lower capacity
of the LV winding to the ground and a greater capacity between windings
is obtained, which results in higher voltages transmitted to the LV winding.
Therefore, to dampen the transmission of surges it is preferable to single-
concentric performance of HV winding.
Mutual position of the winding and order of their location on the rod. The
position of the windings can also influence a bit in the transmission of
surges. For example, placing the low voltage winding first in the magnetic
core increases the capacity of the winding in the ground, meaning
advantageous in front of other configurations.
The transformation ratio. As has been commented previously, transferred
overvoltages are most dangerous for transformers with high transformation
ratios.
The connection scheme of windings and presence of grounding. When the
low and medium voltage windings are connected in a triangle and one of
the terminals of the line is connected to ground, or the neutral cable is
connected to ground in the case of a star connection, the ground capacity
of these windings increases. Therefore, through these configurations a
considerable reduction in the voltage transferred to these windings can be
achieved.
For the specific case of transformers in wind turbines, it is complicated to present specific
data about their performance under transient overvoltages, mainly due to the lack of
available bibliography. This fact is aggravated because the faults in distribution transformers
are much more common worldwide, and there is also a variety of different wind turbine
topologies that can vary the results. Some examples are the wind turbines that place the
step-up transformer in the nacelle, that place it at the base of the tower, that place it in an
adjacent housing, or inclusively there are wind turbines that generate electricity directly at
Wind turbine modelling for lightning simulations. Pag. 17
mid voltage to avoid having a step-up transformer [8]. Even so, it can be estimated that its
behaviour will be similar to another one habitually used in other type of industries.
3.2.2 Generator behaviour under overvoltages
The generator to be examined in this project will be that relating to the particular
asynchronous machine. This type of machine consists of a winding stator that, when injected
with a three-phase alternating current, generates a rotating magnetic field; and a rotor that
consists of a certain number of copper or aluminium bars, electrically connected. In this way,
by means of the rotary field of the stator, a current is induced in the rotor which causes a
rotatory movement until it reaches a speed close to that of the rotating magnetic field
(operation as a motor). On the other hand, if an external force is applied to achieve a rotor
speed higher than the relative of the magnetic field, it will begin to transfer power to the
stator in the form of an electromotive force, and later converted into electricity (operation as
generator).
Nowadays, the majority of the wind turbines in the world use this type of generator, also
called induction generator, to produce the alternating current. In this case, this induction
generator converts the mechanical energy coming from wind into electrical energy, being
unusual compared to other generators connected to the grid. The main reason of this is
because the generator must work with a power source that provides a very variable
mechanical power. Thus, the induction motor is the one that is more adapted to these
conditions to extract the maximum energy in total.
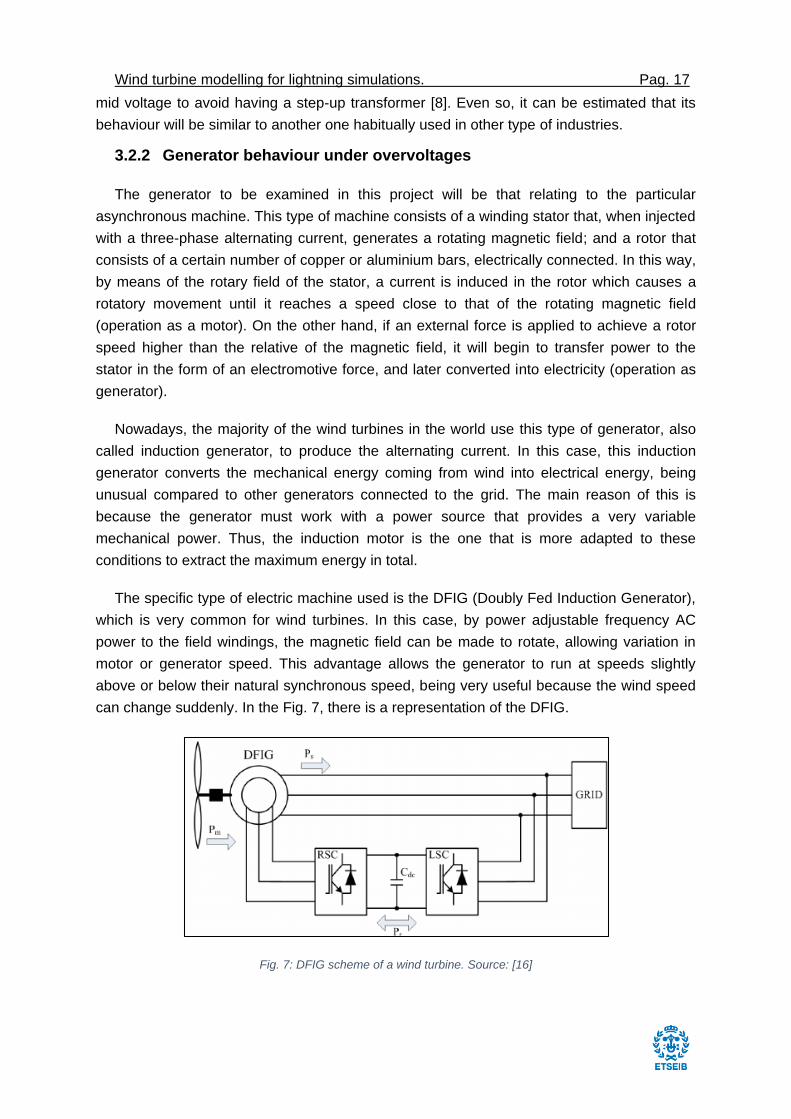
The specific type of electric machine used is the DFIG (Doubly Fed Induction Generator),
which is very common for wind turbines. In this case, by power adjustable frequency AC
power to the field windings, the magnetic field can be made to rotate, allowing variation in
motor or generator speed. This advantage allows the generator to run at speeds slightly
above or below their natural synchronous speed, being very useful because the wind speed
can change suddenly. In the Fig. 7, there is a representation of the DFIG.
Fig. 7: DFIG scheme of a wind turbine. Source: [16]
Wind turbine modelling for lightning simulations. Pag. 18
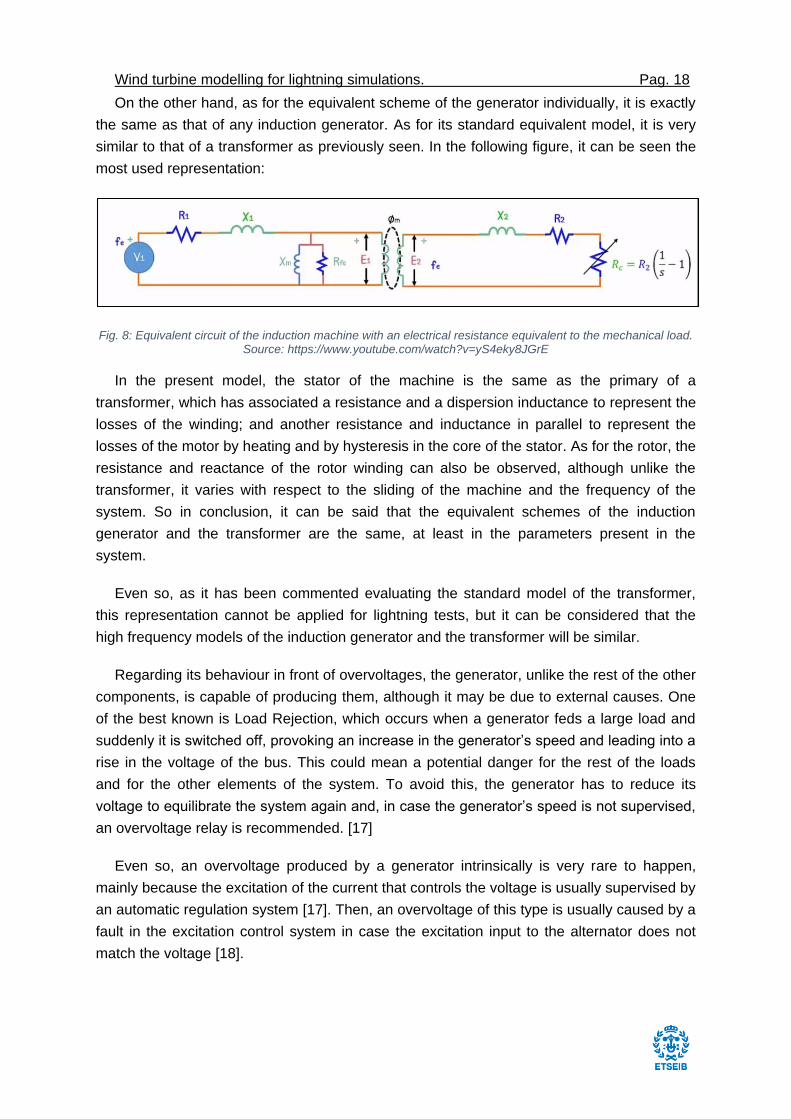
On the other hand, as for the equivalent scheme of the generator individually, it is exactly
the same as that of any induction generator. As for its standard equivalent model, it is very
similar to that of a transformer as previously seen. In the following figure, it can be seen the
most used representation:
Fig. 8: Equivalent circuit of the induction machine with an electrical resistance equivalent to the mechanical load. Source: https://www.youtube.com/watch?v=yS4eky8JGrE
In the present model, the stator of the machine is the same as the primary of a
transformer, which has associated a resistance and a dispersion inductance to represent the
losses of the winding; and another resistance and inductance in parallel to represent the
losses of the motor by heating and by hysteresis in the core of the stator. As for the rotor, the
resistance and reactance of the rotor winding can also be observed, although unlike the
transformer, it varies with respect to the sliding of the machine and the frequency of the
system. So in conclusion, it can be said that the equivalent schemes of the induction
generator and the transformer are the same, at least in the parameters present in the
system.
Even so, as it has been commented evaluating the standard model of the transformer,
this representation cannot be applied for lightning tests, but it can be considered that the
high frequency models of the induction generator and the transformer will be similar.
Regarding its behaviour in front of overvoltages, the generator, unlike the rest of the other
components, is capable of producing them, although it may be due to external causes. One
of the best known is Load Rejection, which occurs when a generator feds a large load and
suddenly it is switched off, provoking an increase in the generator’s speed and leading into a
rise in the voltage of the bus. This could mean a potential danger for the rest of the loads
and for the other elements of the system. To avoid this, the generator has to reduce its
voltage to equilibrate the system again and, in case the generator’s speed is not supervised,
an overvoltage relay is recommended. [17]
Even so, an overvoltage produced by a generator intrinsically is very rare to happen,
mainly because the excitation of the current that controls the voltage is usually supervised by
an automatic regulation system [17]. Then, an overvoltage of this type is usually caused by a
fault in the excitation control system in case the excitation input to the alternator does not
match the voltage [18].
Wind turbine modelling for lightning simulations. Pag. 19
To finish, facing the transient surges such as those produced by lightning, it can be
estimated that their behaviour would be similar to that of the transformer, although with some
differences. Firstly, an induction generator is more solid than a transformer due to its
physical design, in addition to being oversized to withstand the variations of tension that the
force of the wind can produce. In the same way, it does not have a transformation
relationship that could aggravate the disturbance created, as in the case of the transformer.
Even so, due to the fact that it has a rotatory element, overvoltages in an induction
generator can lead to overheating and deterioration of the whole equipment if it is constantly
repeated, and, in case the overvoltage exceeds its basic insulation level, breakage and
ruptures could occur.
3.2.3 Power converter behaviour under overvoltages
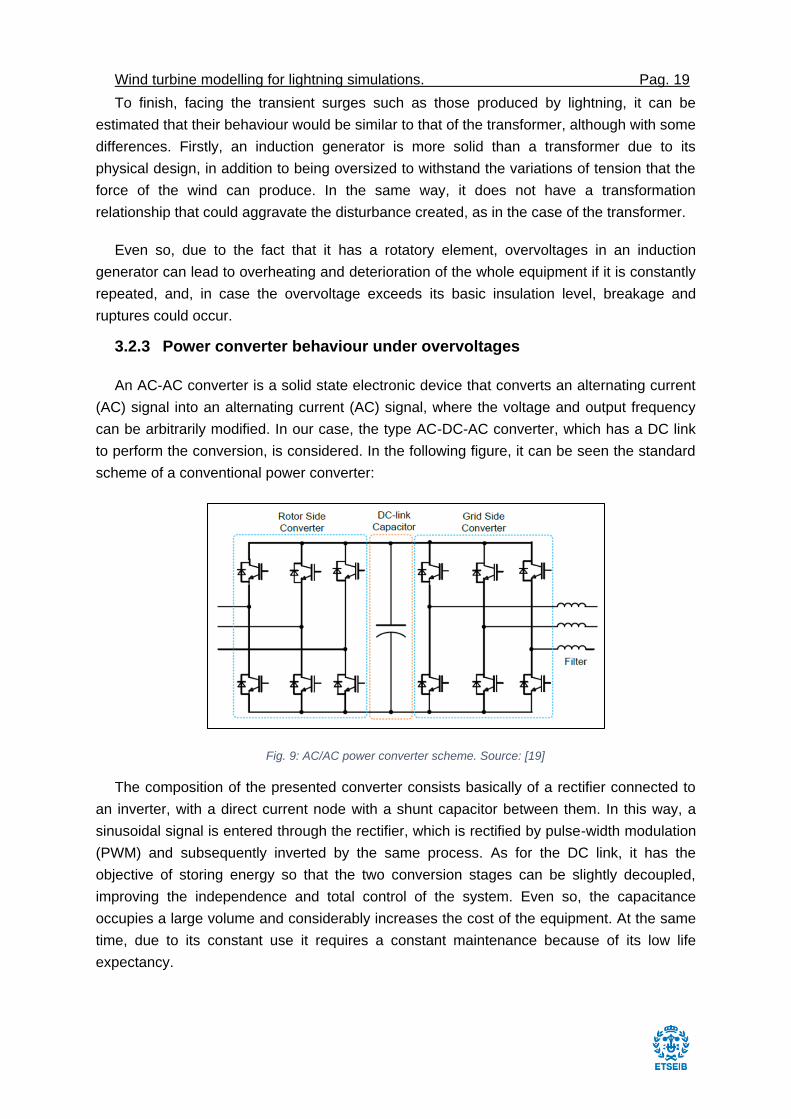
An AC-AC converter is a solid state electronic device that converts an alternating current
(AC) signal into an alternating current (AC) signal, where the voltage and output frequency
can be arbitrarily modified. In our case, the type AC-DC-AC converter, which has a DC link
to perform the conversion, is considered. In the following figure, it can be seen the standard
scheme of a conventional power converter:
Fig. 9: AC/AC power converter scheme. Source: [19]
The composition of the presented converter consists basically of a rectifier connected to
an inverter, with a direct current node with a shunt capacitor between them. In this way, a
sinusoidal signal is entered through the rectifier, which is rectified by pulse-width modulation
(PWM) and subsequently inverted by the same process. As for the DC link, it has the
objective of storing energy so that the two conversion stages can be slightly decoupled,
improving the independence and total control of the system. Even so, the capacitance
occupies a large volume and considerably increases the cost of the equipment. At the same
time, due to its constant use it requires a constant maintenance because of its low life
expectancy.
Wind turbine modelling for lightning simulations. Pag. 20
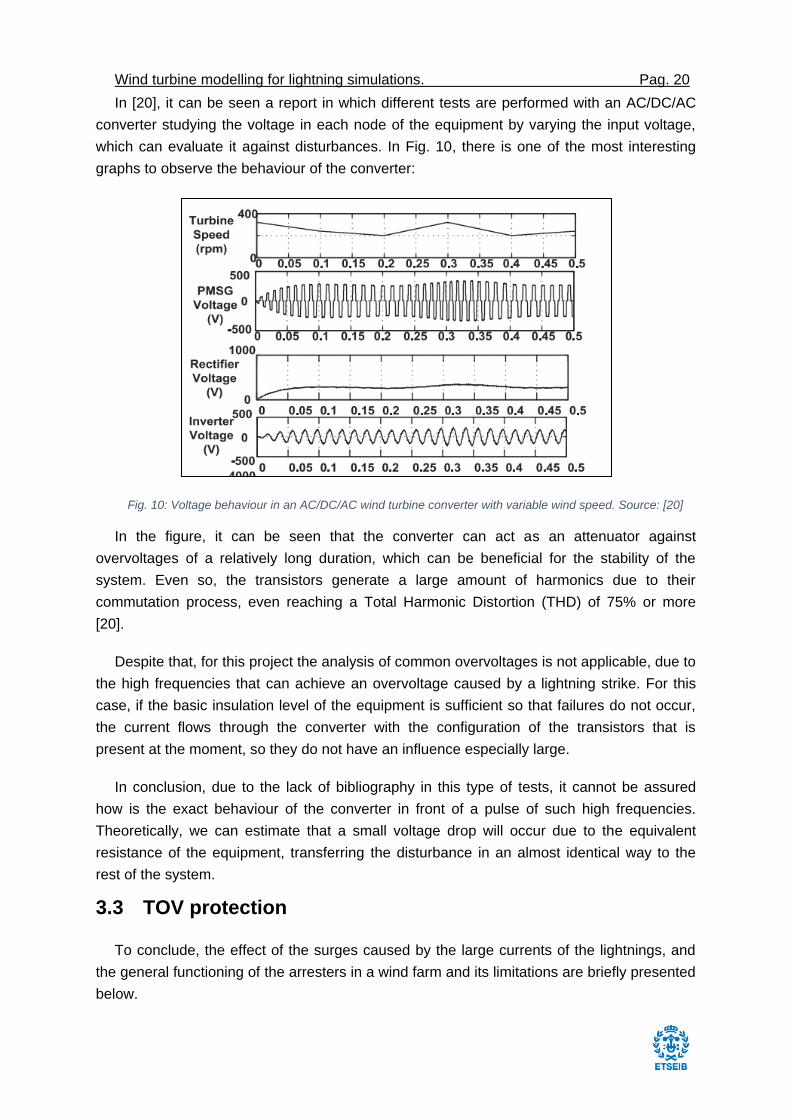
In [20], it can be seen a report in which different tests are performed with an AC/DC/AC
converter studying the voltage in each node of the equipment by varying the input voltage,
which can evaluate it against disturbances. In Fig. 10, there is one of the most interesting
graphs to observe the behaviour of the converter:
Fig. 10: Voltage behaviour in an AC/DC/AC wind turbine converter with variable wind speed. Source: [20]
In the figure, it can be seen that the converter can act as an attenuator against
overvoltages of a relatively long duration, which can be beneficial for the stability of the
system. Even so, the transistors generate a large amount of harmonics due to their
commutation process, even reaching a Total Harmonic Distortion (THD) of 75% or more
[20].
Despite that, for this project the analysis of common overvoltages is not applicable, due to
the high frequencies that can achieve an overvoltage caused by a lightning strike. For this
case, if the basic insulation level of the equipment is sufficient so that failures do not occur,
the current flows through the converter with the configuration of the transistors that is
present at the moment, so they do not have an influence especially large.
In conclusion, due to the lack of bibliography in this type of tests, it cannot be assured
how is the exact behaviour of the converter in front of a pulse of such high frequencies.
Theoretically, we can estimate that a small voltage drop will occur due to the equivalent
resistance of the equipment, transferring the disturbance in an almost identical way to the
rest of the system.
3.3 TOV protection
To conclude, the effect of the surges caused by the large currents of the lightnings, and
the general functioning of the arresters in a wind farm and its limitations are briefly presented
below.
Wind turbine modelling for lightning simulations. Pag. 21
As can be seen in [6], the most expensive corrective maintenance that can be found in a
wind turbine is the blades reparation, so at first glance, it might seem that TOV protection
becomes of secondary importance. Despite this, statistically for countries with a high
lightning strike density the costs for repairs can represent a high percentage of the life cycle
costing of the wind farm e.g. 22.2% in Japan [21]. Accordingly, it is important to study any
method to reduce the great impact that corrective maintenance can mean.
Then, the most basic protection measures to face the TOV generally in MV lines, are
through an increase of the line insulation withstand capability, the use of grounded shield
wires in the lines, and the installation of surge arresters [3]. Even so, the installation of a
single protection element does not guarantee the total elimination of the disturbances, but
the ideal would be to install all of them for optimum protection of the system.
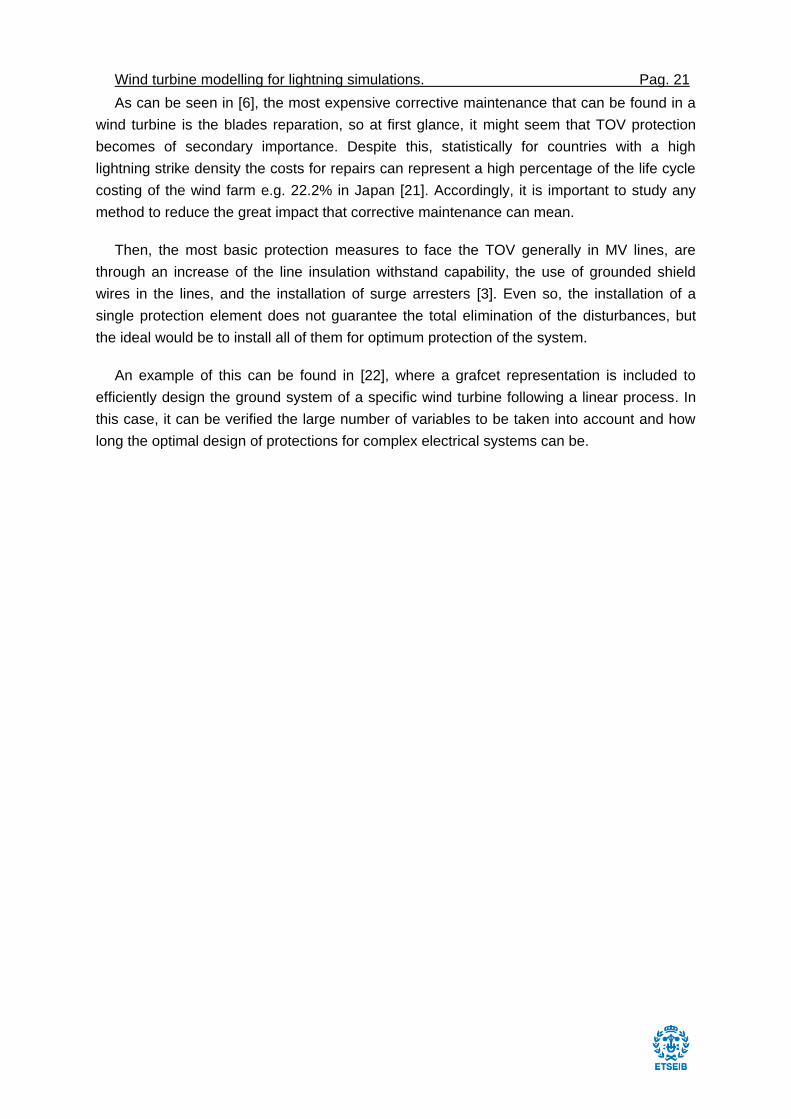
An example of this can be found in [22], where a grafcet representation is included to
efficiently design the ground system of a specific wind turbine following a linear process. In
this case, it can be verified the large number of variables to be taken into account and how
long the optimal design of protections for complex electrical systems can be.
Wind turbine modelling for lightning simulations. Pag. 22
Fig. 11: Grafcet representation of a proper ground design in a wind turbine. Source: [22]
On the other hand, for the specific case of wind farms the installation of surge arresters is
usually taken into account [6]. For example, according to [23], on a line of 83 km long if they
are installed arises arresters every 300m, you could reduce the name of lightning outages by
approximately 50%, with a reduction of about 75% for indirect impacts.
Wind turbine modelling for lightning simulations. Pag. 23
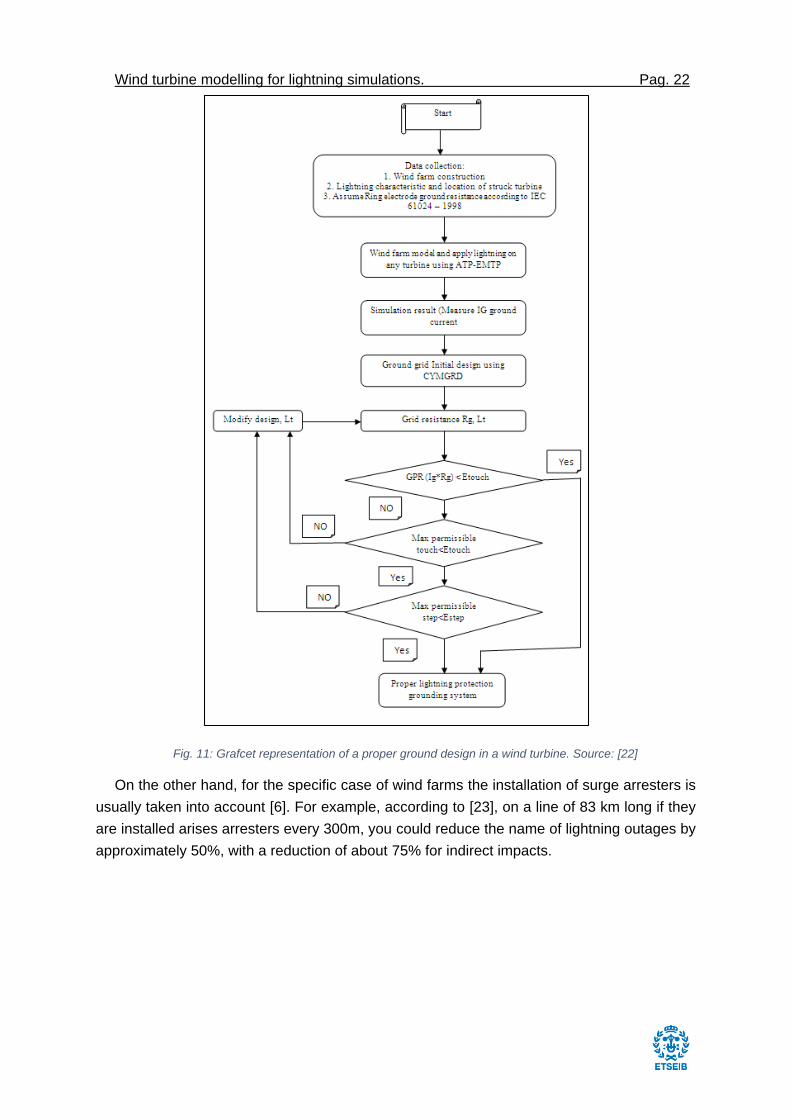
Fig. 12: Left: DEHNguard surge arrester for low voltage lines. Right: Metal oxide surge arrester for HV lines.
A surge arrester is used to protect the equipment from transients, so that it deviates the
power from the overvoltage directly to ground. The main drawback of this device is its low
energy density, so in case of exceeding its limit the surge arrester must be bypassed to the
ground in order to avoid a breakdown [6]. In addition, as previously mentioned, there are
many different configurations of wind turbines and wind farms, so it is difficult to find the
optimum type, number and location of the arresters.
Wind turbine modelling for lightning simulations. Pag. 24
4. MODELLING OF THE WIND TURBINES
In this section, we will proceed to present the steps followed to obtain the models in high
frequency of each of the elements of the wind turbine. To do this, an extensive bibliography
of each of the elements has been reviewed to find the most functional model in simulations
with lightning surges. In this way, its simplicity of implementation in the available software
and its behaviour in high frequencies has been valued.
In general, it is necessary to comment that the software that will be used to implement the
different models is the ATPDraw, which can limit the implementation of the most complex
models. In this way, the transformer, the generator and especially the converter will be
studied deeper, since the high frequency models of each can be the most complex of the
entire system.
4.1 Transformer modelling
In the case of transformer modelling for high frequency surges, there is an extensive
bibliography on this, mainly due to the large presence of these devices in practically all areas
of industry today. Therefore, the models that could be adapted better to the project are
presented in this section.
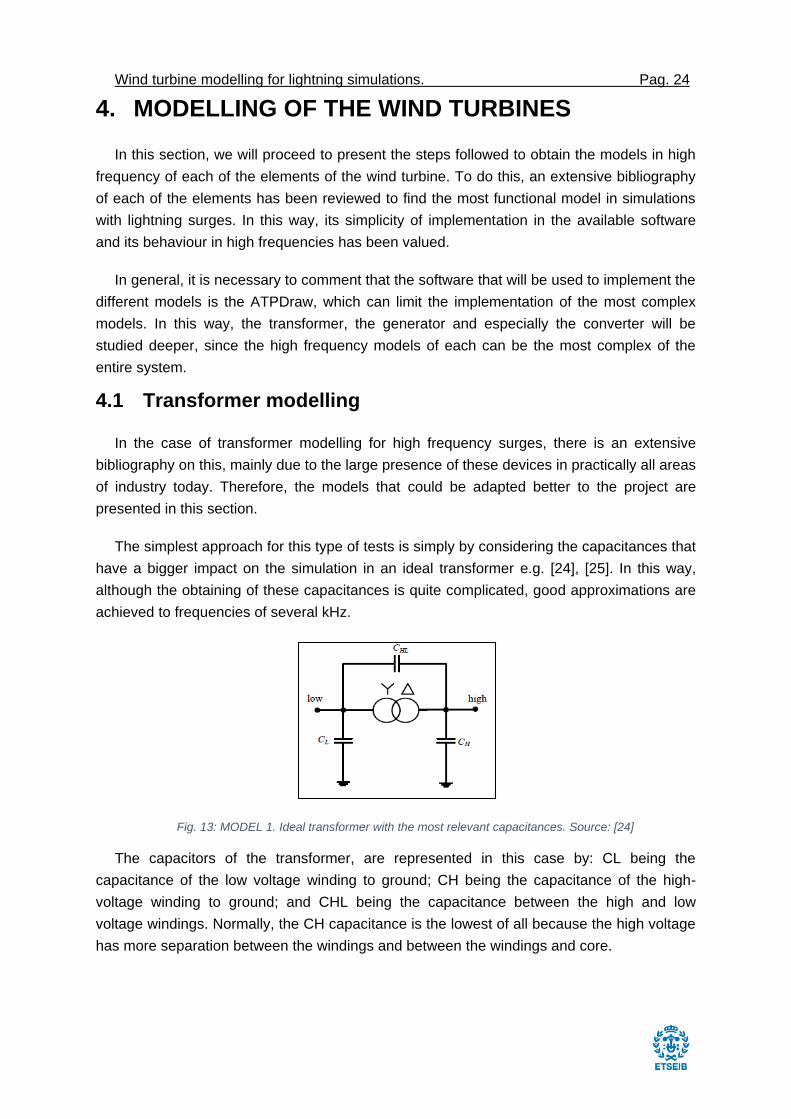
The simplest approach for this type of tests is simply by considering the capacitances that
have a bigger impact on the simulation in an ideal transformer e.g. [24], [25]. In this way,
although the obtaining of these capacitances is quite complicated, good approximations are
achieved to frequencies of several kHz.
Fig. 13: MODEL 1. Ideal transformer with the most relevant capacitances. Source: [24]
The capacitors of the transformer, are represented in this case by: CL being the
capacitance of the low voltage winding to ground; CH being the capacitance of the high-
voltage winding to ground; and CHL being the capacitance between the high and low
voltage windings. Normally, the CH capacitance is the lowest of all because the high voltage
has more separation between the windings and between the windings and core.
Wind turbine modelling for lightning simulations. Pag. 25
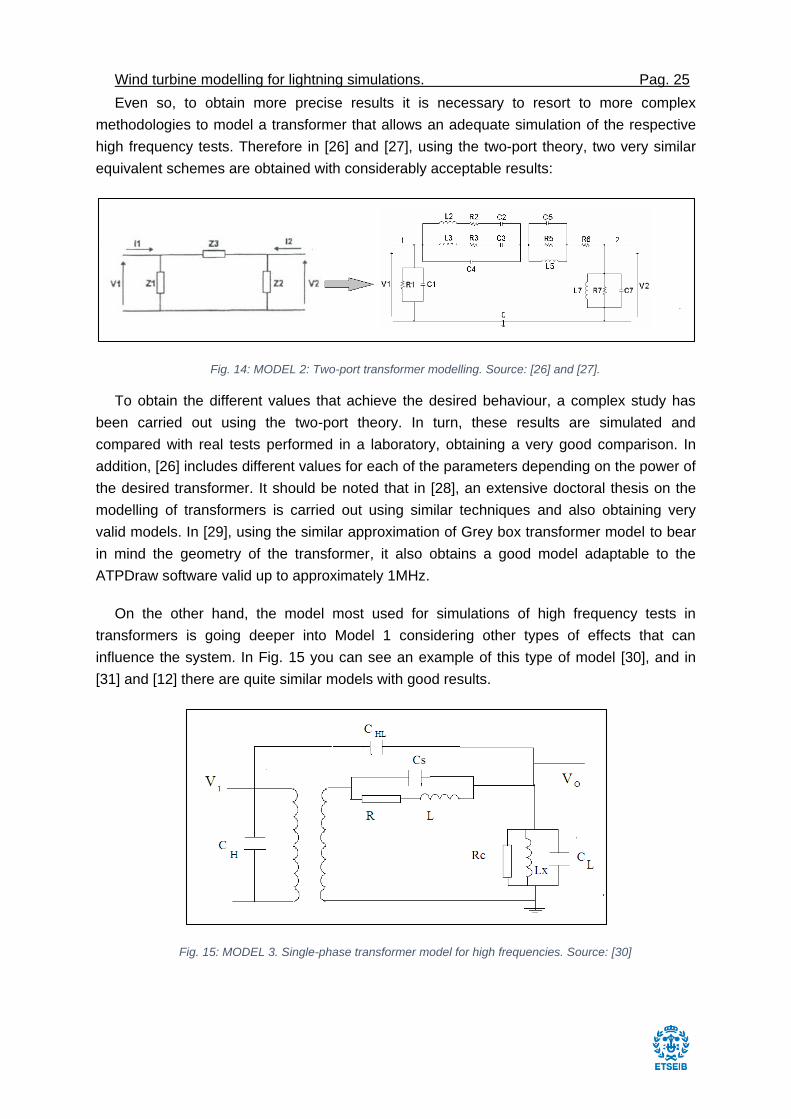
Even so, to obtain more precise results it is necessary to resort to more complex
methodologies to model a transformer that allows an adequate simulation of the respective
high frequency tests. Therefore in [26] and [27], using the two-port theory, two very similar
equivalent schemes are obtained with considerably acceptable results:
Fig. 14: MODEL 2: Two-port transformer modelling. Source: [26] and [27].
To obtain the different values that achieve the desired behaviour, a complex study has
been carried out using the two-port theory. In turn, these results are simulated and
compared with real tests performed in a laboratory, obtaining a very good comparison. In
addition, [26] includes different values for each of the parameters depending on the power of
the desired transformer. It should be noted that in [28], an extensive doctoral thesis on the
modelling of transformers is carried out using similar techniques and also obtaining very
valid models. In [29], using the similar approximation of Grey box transformer model to bear
in mind the geometry of the transformer, it also obtains a good model adaptable to the
ATPDraw software valid up to approximately 1MHz.
On the other hand, the model most used for simulations of high frequency tests in
transformers is going deeper into Model 1 considering other types of effects that can
influence the system. In Fig. 15 you can see an example of this type of model [30], and in
[31] and [12] there are quite similar models with good results.
Fig. 15: MODEL 3. Single-phase transformer model for high frequencies. Source: [30]
Wind turbine modelling for lightning simulations. Pag. 26
In this case, the three-phase transformer is once again simplified into a single-phase
transformer, since the perturbations propagate in a very similar way in both cases.
Therefore, the model includes the impedances of the windings (Rp, Rs, Lp, Ls), the shunt
elements (Rc and Lx), the same capacitances that have been discussed in Model 1, (CHL, CL
and CH), and finally the capacitance among the windings (CS). This model has different
parameters depending on the power of the transformer and has been compared with real
data offering very good results.
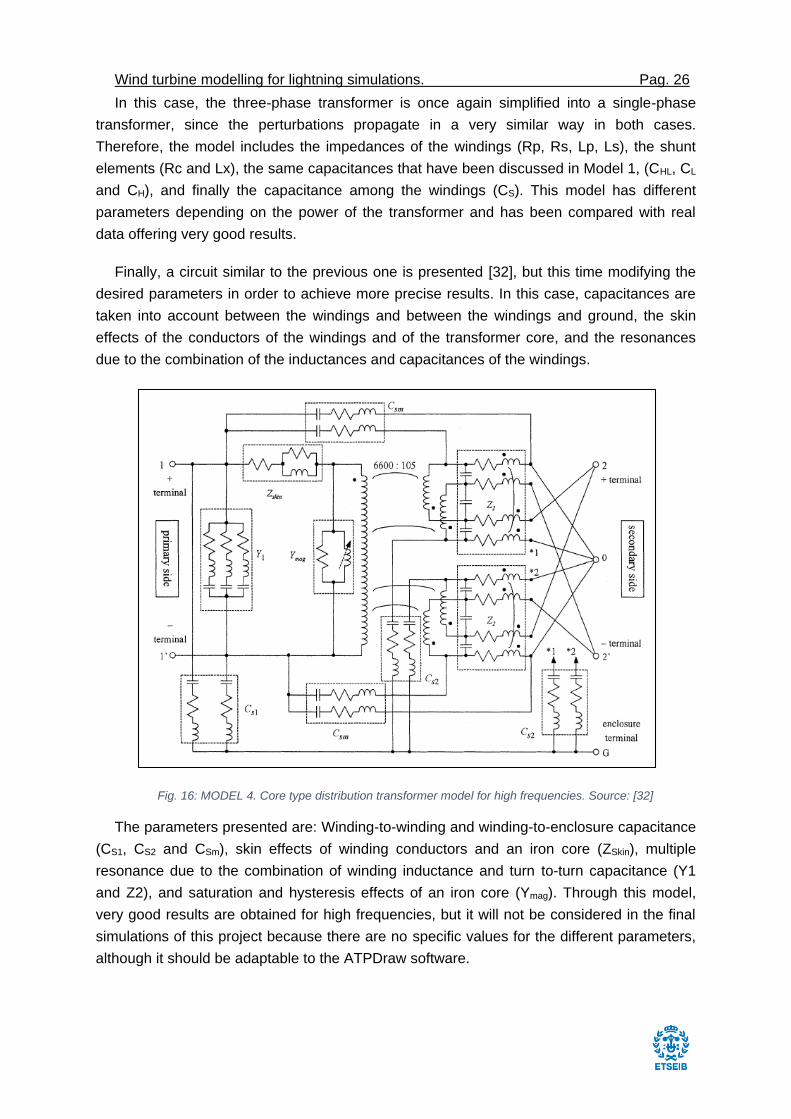
Finally, a circuit similar to the previous one is presented [32], but this time modifying the
desired parameters in order to achieve more precise results. In this case, capacitances are
taken into account between the windings and between the windings and ground, the skin
effects of the conductors of the windings and of the transformer core, and the resonances
due to the combination of the inductances and capacitances of the windings.
Fig. 16: MODEL 4. Core type distribution transformer model for high frequencies. Source: [32]
The parameters presented are: Winding-to-winding and winding-to-enclosure capacitance
(CS1, CS2 and CSm), skin effects of winding conductors and an iron core (ZSkin), multiple
resonance due to the combination of winding inductance and turn to-turn capacitance (Y1
and Z2), and saturation and hysteresis effects of an iron core (Ymag). Through this model,
very good results are obtained for high frequencies, but it will not be considered in the final
simulations of this project because there are no specific values for the different parameters,
although it should be adaptable to the ATPDraw software.
Wind turbine modelling for lightning simulations. Pag. 27
4.2 Generator modelling
For the case of the induction generator, the process to find a model for high frequencies
valid for simulations with lightning is much simpler, mainly due its behaviour is very related to
the transformer one. In this way as has been commented previously, the standard model of
an induction generator is very similar to that of a transformer, so in short, the models for high
frequencies will not be quite different.
The main difference between the equivalent models of the transformer and the induction
generator is the value of its parameters, although physically they are completely differently.
Therefore, in front of a lightning surge, a similar behaviour must be considered to transmit
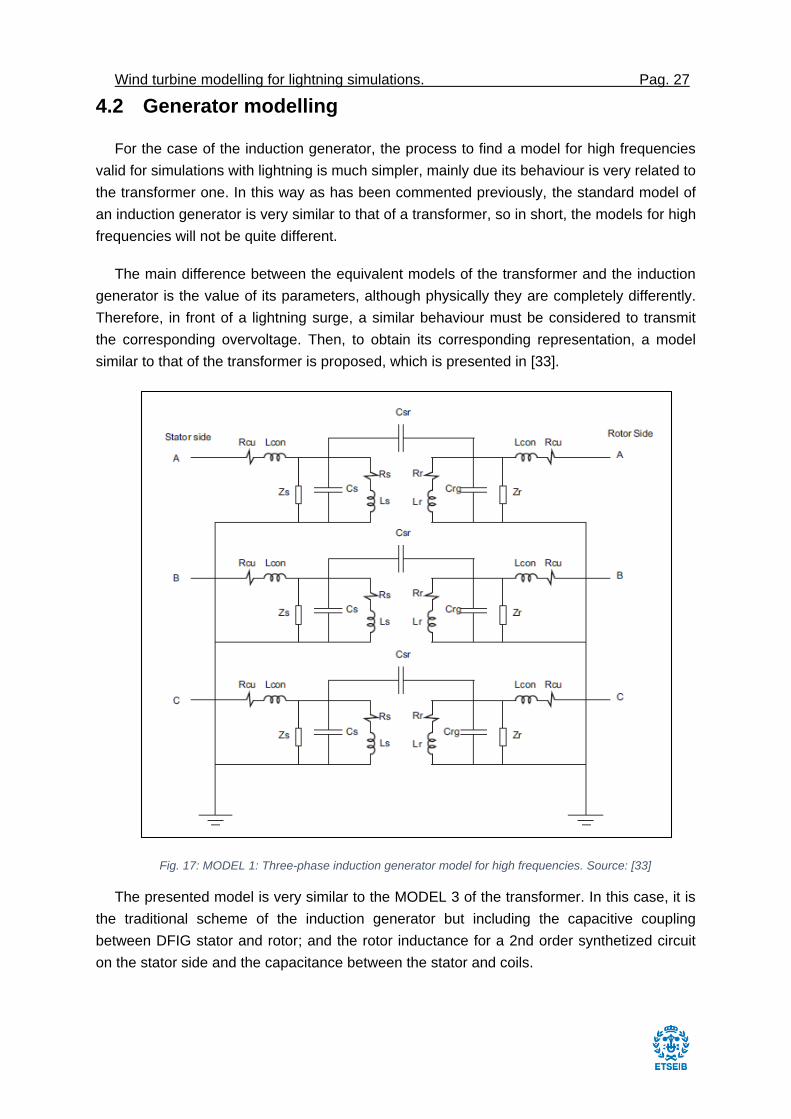
the corresponding overvoltage. Then, to obtain its corresponding representation, a model
similar to that of the transformer is proposed, which is presented in [33].
Fig. 17: MODEL 1: Three-phase induction generator model for high frequencies. Source: [33]
The presented model is very similar to the MODEL 3 of the transformer. In this case, it is
the traditional scheme of the induction generator but including the capacitive coupling
between DFIG stator and rotor; and the rotor inductance for a 2nd order synthetized circuit
on the stator side and the capacitance between the stator and coils.
Wind turbine modelling for lightning simulations. Pag. 28
Next, the origin of the parameters presented in [33], is briefly explained.
Rcon and Lcon: These parameters represent the resistance and inductance that
can appear due to the contacts and wiring of the motor.
Zs and Zr: According to [33], Zs and Zr are the impedances to reflect the
attenuation in the oscillations and for integration stability of the model.
Cs and Cr: The capacitors in parallel to ground represent in this case the ground
capacitance produced by the stator and rotor. Although the respective capacitances
are very small, the value of the capacitance of the rotor is much lower than that of the
stator.
Rs and Rr: These parameters represent the total resistance of the windings at
normal temperature.
Ls and Lr: They represent an estimation of the present stator (Ls) and rotor (Lr)
inductances. According to [33], the value of Lr ranges between 1/5 and 1/10 of Ls.
Csr: By last, Csr represents the capacitance that can appear in the air gap of the
machine between the rotor and the stator, which is still smaller than the capacitances
of the stator and rotor to ground.
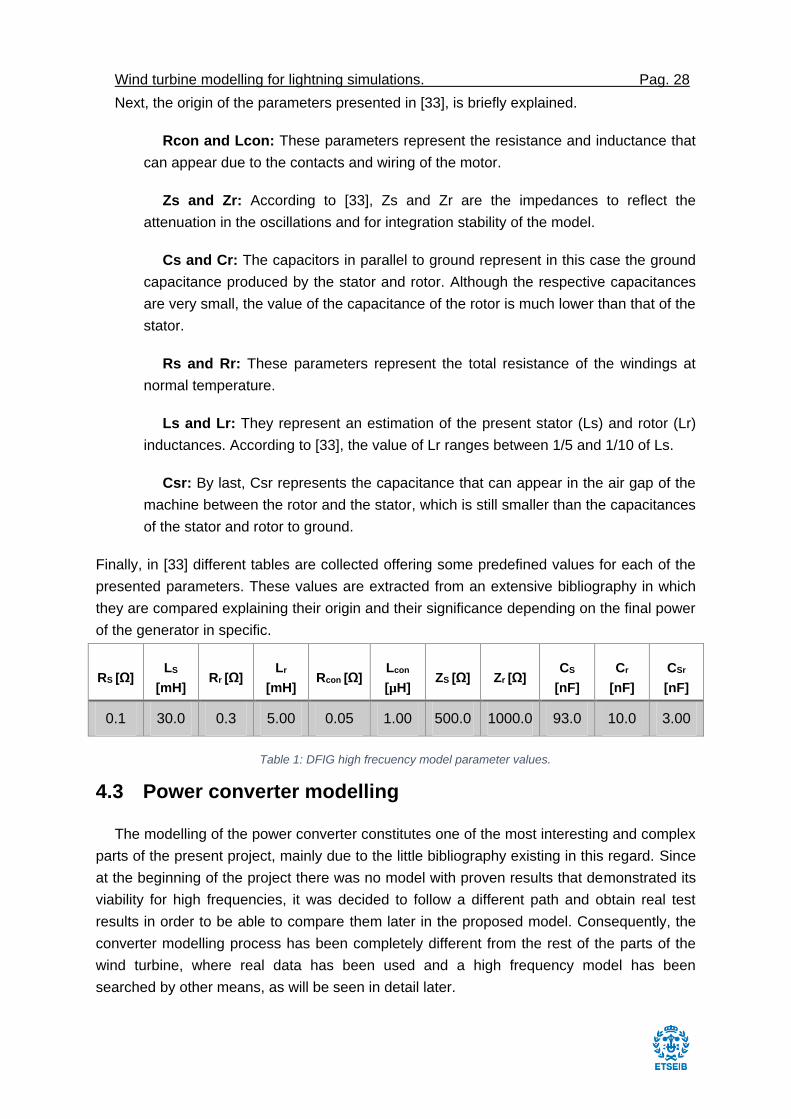
Finally, in [33] different tables are collected offering some predefined values for each of the
presented parameters. These values are extracted from an extensive bibliography in which
they are compared explaining their origin and their significance depending on the final power
of the generator in specific.
RS [Ω] LS
[mH] Rr [Ω]
Lr
[mH] Rcon [Ω]
Lcon
[µH] ZS [Ω] Zr [Ω]
CS
[nF]
Cr
[nF]
CSr
[nF]
0.1 30.0 0.3 5.00 0.05 1.00 500.0 1000.0 93.0 10.0 3.00
Table 1: DFIG high frecuency model parameter values.
4.3 Power converter modelling
The modelling of the power converter constitutes one of the most interesting and complex
parts of the present project, mainly due to the little bibliography existing in this regard. Since
at the beginning of the project there was no model with proven results that demonstrated its
viability for high frequencies, it was decided to follow a different path and obtain real test
results in order to be able to compare them later in the proposed model. Consequently, the
converter modelling process has been completely different from the rest of the parts of the
wind turbine, where real data has been used and a high frequency model has been
searched by other means, as will be seen in detail later.
Wind turbine modelling for lightning simulations. Pag. 29
4.3.1 Real data getting
The first step, then, was to obtain real data to compare the models that will later be
considered. For this, a set of tests were carried out in a controlled laboratory to analyse the
behaviour of the converter in front of high frequency impulses. In our case, as it is done in
the transformers to obtain the different parameters of the equivalent circuit, we performed
the open circuit and short-circuit tests. The purpose of doing these tests was to verify the
comportment of the converter in both situations.
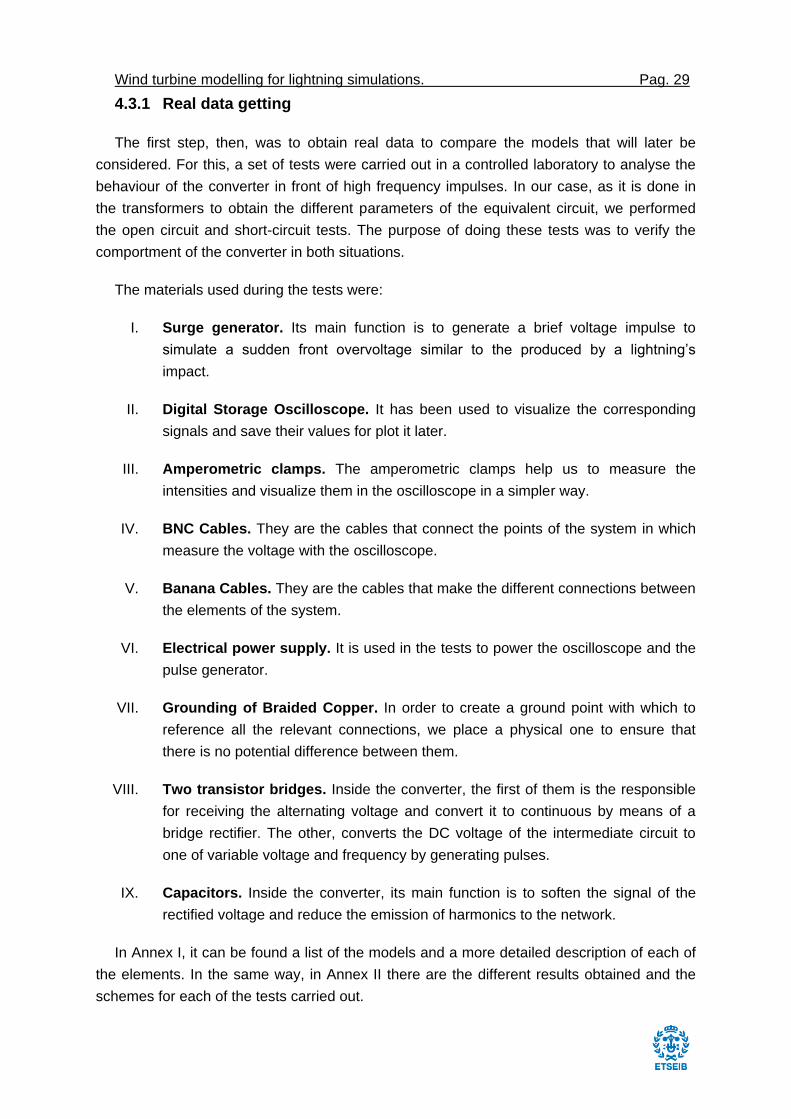
The materials used during the tests were:
I. Surge generator. Its main function is to generate a brief voltage impulse to
simulate a sudden front overvoltage similar to the produced by a lightning’s
impact.
II. Digital Storage Oscilloscope. It has been used to visualize the corresponding
signals and save their values for plot it later.
III. Amperometric clamps. The amperometric clamps help us to measure the
intensities and visualize them in the oscilloscope in a simpler way.
IV. BNC Cables. They are the cables that connect the points of the system in which
measure the voltage with the oscilloscope.
V. Banana Cables. They are the cables that make the different connections between
the elements of the system.
VI. Electrical power supply. It is used in the tests to power the oscilloscope and the
pulse generator.
VII. Grounding of Braided Copper. In order to create a ground point with which to
reference all the relevant connections, we place a physical one to ensure that
there is no potential difference between them.
VIII. Two transistor bridges. Inside the converter, the first of them is the responsible
for receiving the alternating voltage and convert it to continuous by means of a
bridge rectifier. The other, converts the DC voltage of the intermediate circuit to
one of variable voltage and frequency by generating pulses.
IX. Capacitors. Inside the converter, its main function is to soften the signal of the
rectified voltage and reduce the emission of harmonics to the network.
In Annex I, it can be found a list of the models and a more detailed description of each of
the elements. In the same way, in Annex II there are the different results obtained and the
schemes for each of the tests carried out.
Wind turbine modelling for lightning simulations. Pag. 30
In the following figure, there is the set of elements presented and the corresponding
connections:
Fig. 18: Real photograph of the test carried out.
In short, it is considered that the results obtained can roughly reflect the behaviour of a
simple converter against an overvoltage with a frequency and waveform similar to that
produced by lightning. Then, to continue with the modelling of the converter, we will take the
results obtained as good, although before, different factors should be taken into account that
may result in possible variations with respect to reality:
Different amplitude. In the tests, impulses of around 400V as much were made,
mainly due to the limitation of the elements of the system that we had. Even so, we
must bear in mind that the overvoltage produced by a lightning could be more than
100kV, and may lead to a different behaviour of the converter depending on the
possible damage, among other factors.
Variety in the waveform. Another difference that we can find in the obtained
results is that the tests have been carried out with a specific impulse. In the reality,
the waveforms of the overvoltage produced by a lightning strike could vary slightly,
so the currents and the resulting surges could vary again.
Simplicity of the converter used. In order to study the behaviour of a standard
converter, it was preferred to assemble the most basic parts that comprise it, omitting
other elements that could influence in the results obtained. The main reasons for this
are, on the one hand, that the configuration could present great differences from one
model of wind turbine to another, and on the other, the great complexity that we
Wind turbine modelling for lightning simulations. Pag. 31
could find when studying the specific performance of the converter against
overvoltages and the influence produced by the different variations. An example in
this regard would be the presence of filters.
Possible imperfections in the connection during the tests. As previously
mentioned, at the time of doing the tests we were limited by the material available in
the laboratory. Consequently, although the tests were performed as accurately as
possible, some errors can appear due to the certain imperfections in the connection
of the elements or the deterioration of the measuring devices. Then, the results
obtained may not be as accurate as they could be if the tests have been carried out
in a more controlled environment and with more precise devices.
Test place. The geometry of the place where the converter is located may
influence its behaviour in front of high frequency overvoltages. Then, the results
obtained were performed in a laboratory in a controlled environment, while
depending on the typology of the wind turbine, the converter can be in a completely
hermetic place or at other temperatures, for example.
4.3.2 Models Review
Once obtained the practical values, the next step was to test the different models by
simulations to compare the results obtained in the tests with them. But before, it was
necessary to recreate through the ATPDraw software the impulse generated in them to
reconstruct the laboratory conditions as best as possible.
Then, to generate an impulse similar enough to the correspondent of the physical impulse
generator, it was preferred to access to its datasheet, and study its model and see how to
adapt it to the software.
Wind turbine modelling for lightning simulations. Pag. 32
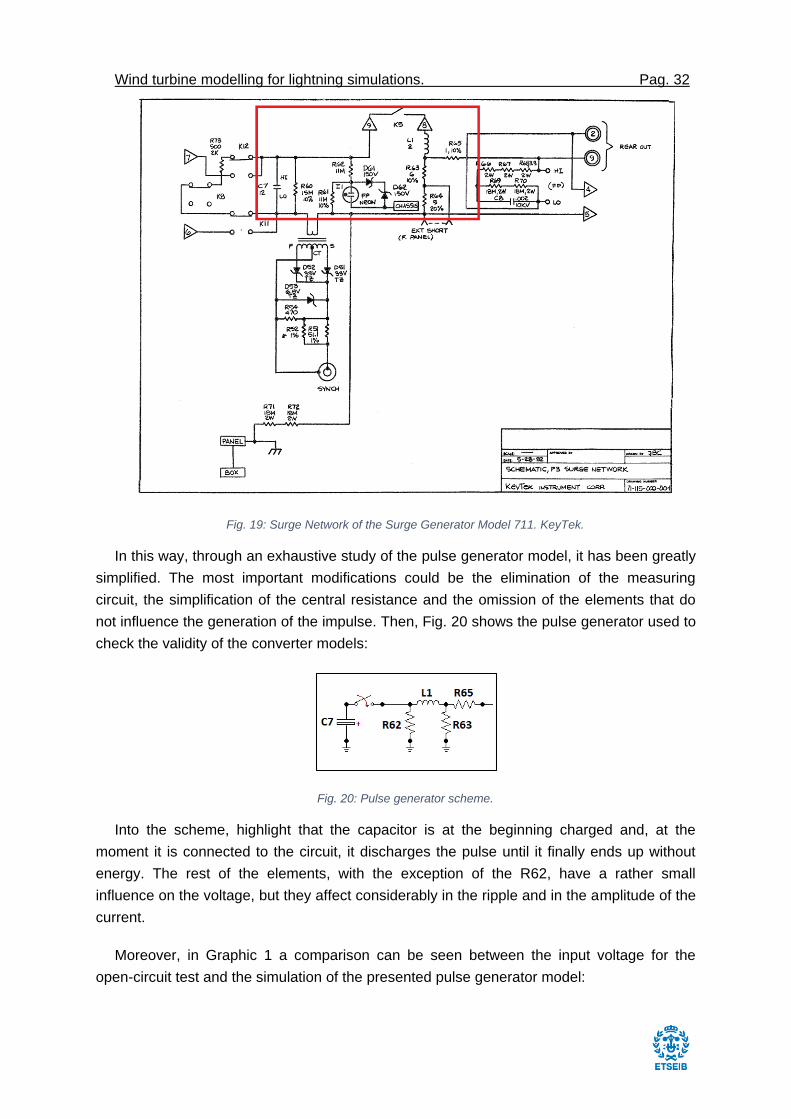
Fig. 19: Surge Network of the Surge Generator Model 711. KeyTek.
In this way, through an exhaustive study of the pulse generator model, it has been greatly
simplified. The most important modifications could be the elimination of the measuring
circuit, the simplification of the central resistance and the omission of the elements that do
not influence the generation of the impulse. Then, Fig. 20 shows the pulse generator used to
check the validity of the converter models:
Fig. 20: Pulse generator scheme.
Into the scheme, highlight that the capacitor is at the beginning charged and, at the
moment it is connected to the circuit, it discharges the pulse until it finally ends up without
energy. The rest of the elements, with the exception of the R62, have a rather small
influence on the voltage, but they affect considerably in the ripple and in the amplitude of the
current.
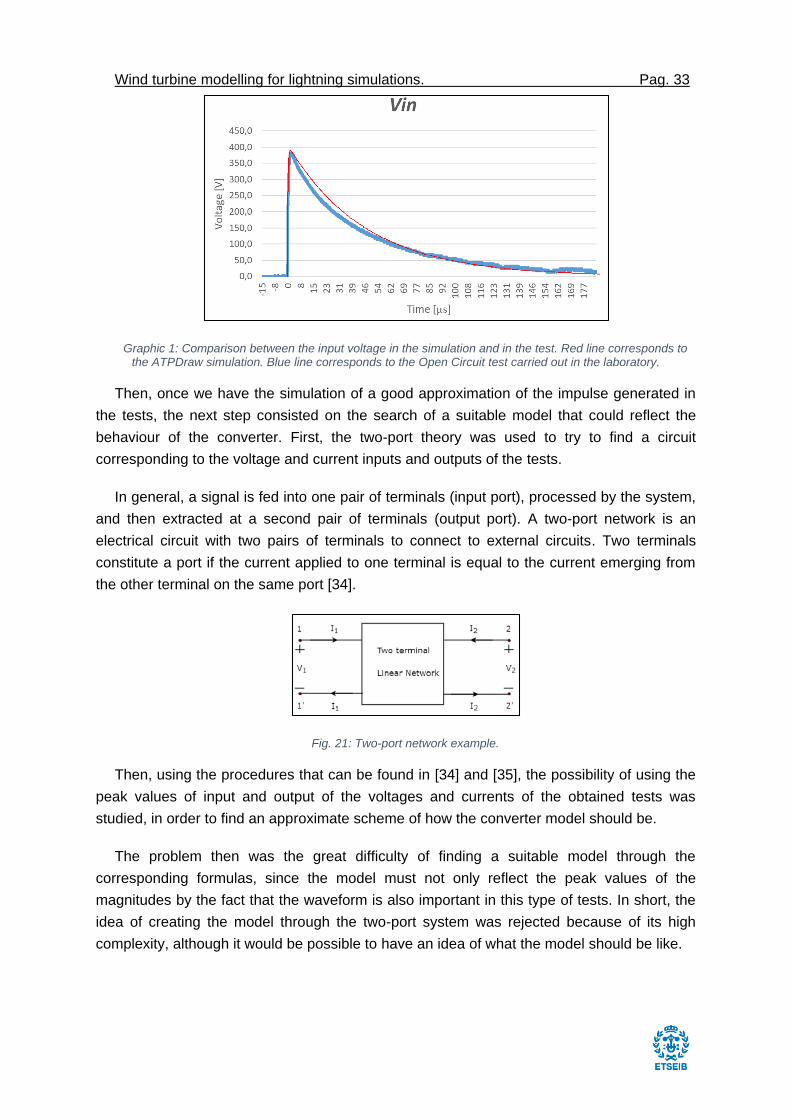
Moreover, in Graphic 1 a comparison can be seen between the input voltage for the
open-circuit test and the simulation of the presented pulse generator model:
Wind turbine modelling for lightning simulations. Pag. 33
Graphic 1: Comparison between the input voltage in the simulation and in the test. Red line corresponds to the ATPDraw simulation. Blue line corresponds to the Open Circuit test carried out in the laboratory.
Then, once we have the simulation of a good approximation of the impulse generated in
the tests, the next step consisted on the search of a suitable model that could reflect the
behaviour of the converter. First, the two-port theory was used to try to find a circuit
corresponding to the voltage and current inputs and outputs of the tests.
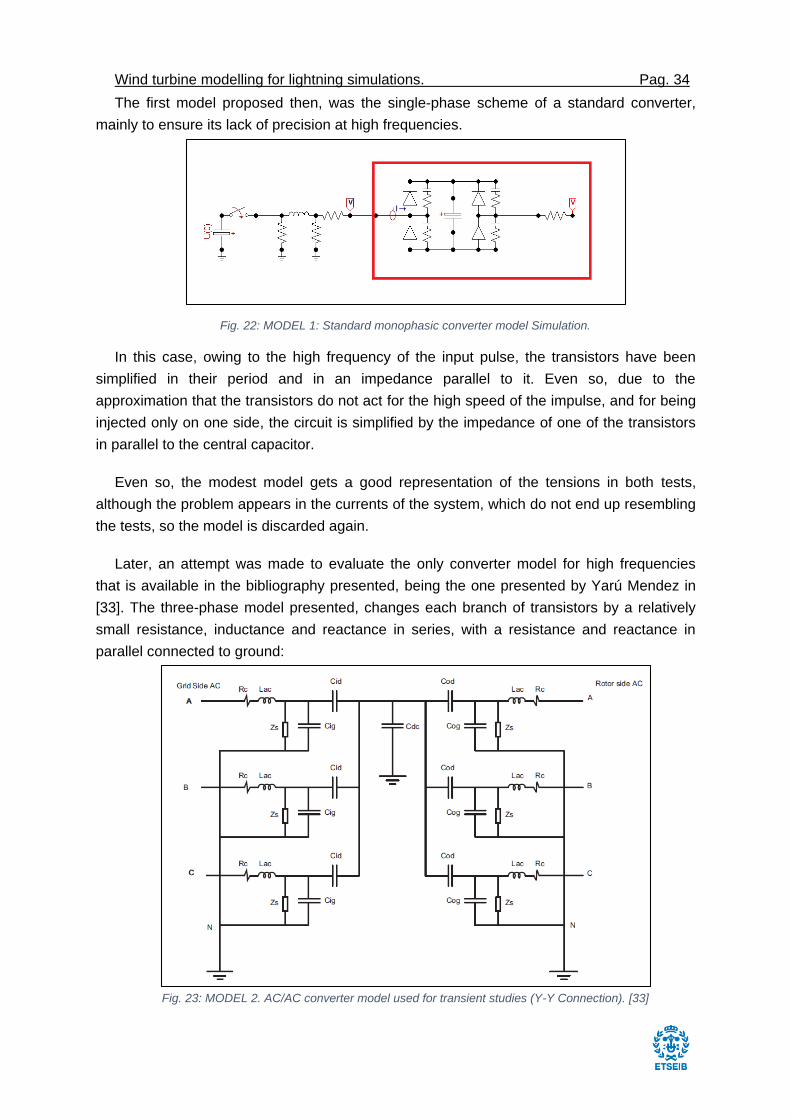
In general, a signal is fed into one pair of terminals (input port), processed by the system,
and then extracted at a second pair of terminals (output port). A two-port network is an
electrical circuit with two pairs of terminals to connect to external circuits. Two terminals
constitute a port if the current applied to one terminal is equal to the current emerging from
the other terminal on the same port [34].
Fig. 21: Two-port network example.
Then, using the procedures that can be found in [34] and [35], the possibility of using the
peak values of input and output of the voltages and currents of the obtained tests was
studied, in order to find an approximate scheme of how the converter model should be.
The problem then was the great difficulty of finding a suitable model through the
corresponding formulas, since the model must not only reflect the peak values of the
magnitudes by the fact that the waveform is also important in this type of tests. In short, the
idea of creating the model through the two-port system was rejected because of its high
complexity, although it would be possible to have an idea of what the model should be like.
Wind turbine modelling for lightning simulations. Pag. 34
The first model proposed then, was the single-phase scheme of a standard converter,
mainly to ensure its lack of precision at high frequencies.
Fig. 22: MODEL 1: Standard monophasic converter model Simulation.
In this case, owing to the high frequency of the input pulse, the transistors have been
simplified in their period and in an impedance parallel to it. Even so, due to the
approximation that the transistors do not act for the high speed of the impulse, and for being
injected only on one side, the circuit is simplified by the impedance of one of the transistors
in parallel to the central capacitor.
Even so, the modest model gets a good representation of the tensions in both tests,
although the problem appears in the currents of the system, which do not end up resembling
the tests, so the model is discarded again.
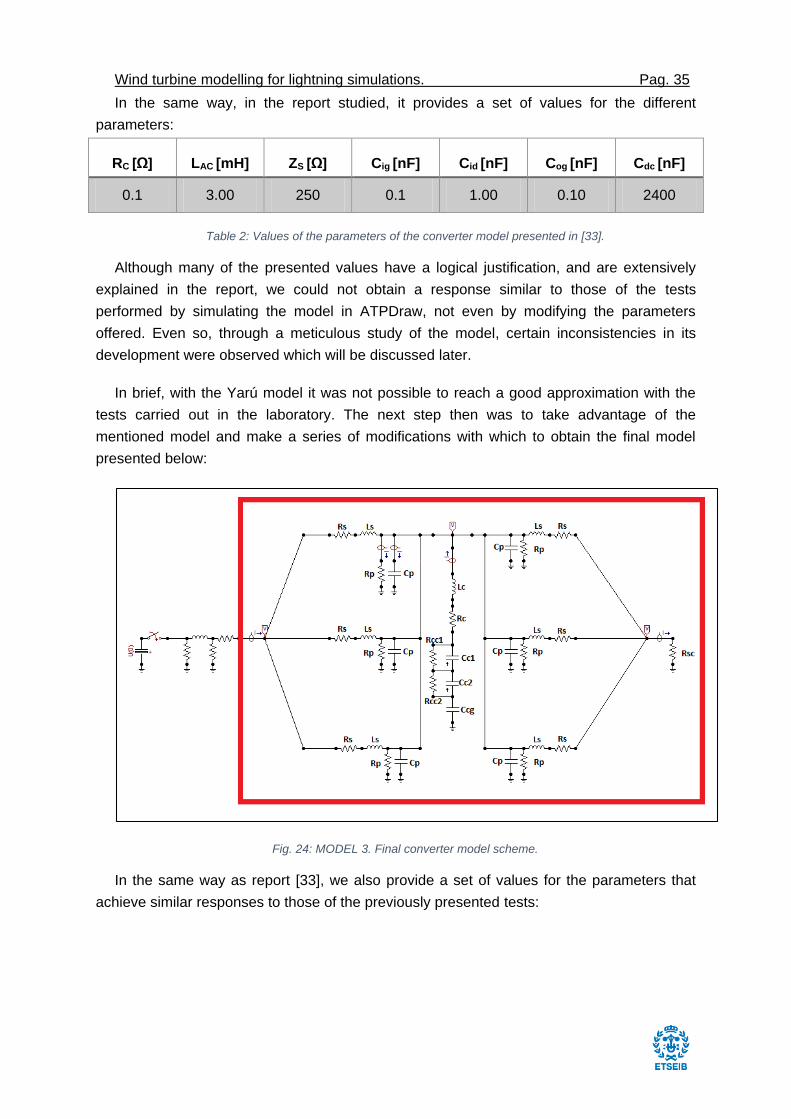
Later, an attempt was made to evaluate the only converter model for high frequencies
that is available in the bibliography presented, being the one presented by Yarú Mendez in
[33]. The three-phase model presented, changes each branch of transistors by a relatively
small resistance, inductance and reactance in series, with a resistance and reactance in
parallel connected to ground:
Fig. 23: MODEL 2. AC/AC converter model used for transient studies (Y-Y Connection). [33]
Wind turbine modelling for lightning simulations. Pag. 35
In the same way, in the report studied, it provides a set of values for the different
parameters:
RC [Ω] LAC [mH] ZS [Ω] Cig [nF] Cid [nF] Cog [nF] Cdc [nF]
0.1 3.00 250 0.1 1.00 0.10 2400
Table 2: Values of the parameters of the converter model presented in [33].
Although many of the presented values have a logical justification, and are extensively
explained in the report, we could not obtain a response similar to those of the tests
performed by simulating the model in ATPDraw, not even by modifying the parameters
offered. Even so, through a meticulous study of the model, certain inconsistencies in its
development were observed which will be discussed later.
In brief, with the Yarú model it was not possible to reach a good approximation with the
tests carried out in the laboratory. The next step then was to take advantage of the
mentioned model and make a series of modifications with which to obtain the final model
presented below:
Fig. 24: MODEL 3. Final converter model scheme.
In the same way as report [33], we also provide a set of values for the parameters that
achieve similar responses to those of the previously presented tests:
Wind turbine modelling for lightning simulations. Pag. 36
RS [Ω] LS
[µH]
RP
[kΩ]
CP
[nF]
LC
[µH] RC [Ω]
CC1
[µF]
CC2
[µF]
RCC1
[kΩ]
RCC2
[kΩ]
CCG
[nF]
RSC*
[Ω]
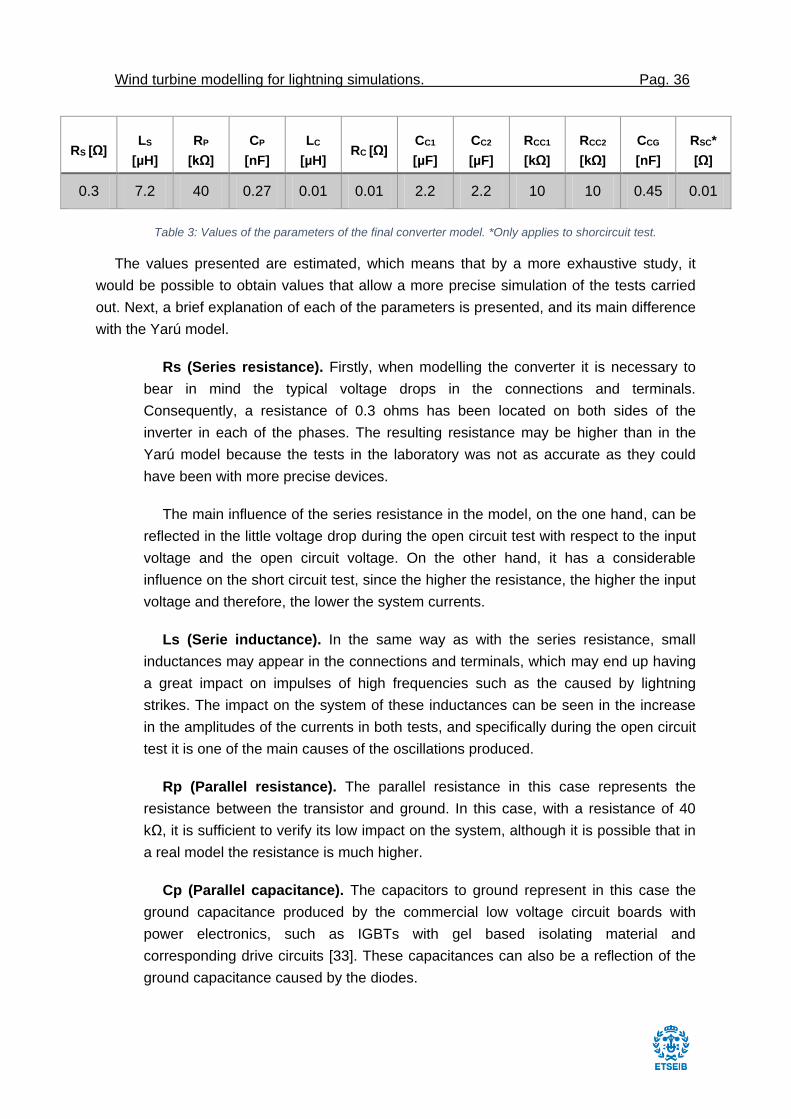
0.3 7.2 40 0.27 0.01 0.01 2.2 2.2 10 10 0.45 0.01
Table 3: Values of the parameters of the final converter model. *Only applies to shorcircuit test.
The values presented are estimated, which means that by a more exhaustive study, it
would be possible to obtain values that allow a more precise simulation of the tests carried
out. Next, a brief explanation of each of the parameters is presented, and its main difference
with the Yarú model.
Rs (Series resistance). Firstly, when modelling the converter it is necessary to
bear in mind the typical voltage drops in the connections and terminals.
Consequently, a resistance of 0.3 ohms has been located on both sides of the
inverter in each of the phases. The resulting resistance may be higher than in the
Yarú model because the tests in the laboratory was not as accurate as they could
have been with more precise devices.
The main influence of the series resistance in the model, on the one hand, can be
reflected in the little voltage drop during the open circuit test with respect to the input
voltage and the open circuit voltage. On the other hand, it has a considerable
influence on the short circuit test, since the higher the resistance, the higher the input
voltage and therefore, the lower the system currents.
Ls (Serie inductance). In the same way as with the series resistance, small
inductances may appear in the connections and terminals, which may end up having
a great impact on impulses of high frequencies such as the caused by lightning
strikes. The impact on the system of these inductances can be seen in the increase
in the amplitudes of the currents in both tests, and specifically during the open circuit
test it is one of the main causes of the oscillations produced.
Rp (Parallel resistance). The parallel resistance in this case represents the
resistance between the transistor and ground. In this case, with a resistance of 40
kΩ, it is sufficient to verify its low impact on the system, although it is possible that in
a real model the resistance is much higher.
Cp (Parallel capacitance). The capacitors to ground represent in this case the
ground capacitance produced by the commercial low voltage circuit boards with
power electronics, such as IGBTs with gel based isolating material and
corresponding drive circuits [33]. These capacitances can also be a reflection of the
ground capacitance caused by the diodes.
Wind turbine modelling for lightning simulations. Pag. 37
The effect of this capacitance at high frequencies can be seen actively in the open
circuit test, since it has a great influence on the amplitude and on the wavefront of
the current of the whole system. As for its value, an approximation can be made by
looking at model 2.
Lc and Rc (Central resistance and inductance). In the same way that Rs and
Ls, at the time of realizing the model it has been thought that it could be interesting to
take into account the voltage drop and the small inductance of the connections and
terminals of the DC bus. The impact it has on the system is very low, and it can be
appreciated on how small the values of both magnitudes are.
Cc1 and Cc2 (Central Capacitors). The modelling of these capacitors is really
intuitive, since they are physically located in the DC bus of the converter. Then, by
simply checking the data of the capacitors in their datasheet an exact value of the
actual system has been achieved. The value of the capacitor mainly affects the
amplitude and wavefront of the currents.
Rcc1 and Rcc2 (Resistances of the central capacitors). Although the present
resistors do not have a direct impact on the magnitudes of the presented model, the
DC bus capacitor's datasheet physically locates them in parallel of each capacitor, so
it has been decided to place them in the same place to offer more realism to the final
model.
Ccg (Capacitance to ground of the central capacitor). The most important
change made with respect to model 2, is the situation of this capacitor between the
central capacitor and the ground. The reason for the appearance of this capacitance,
it is believed to be the same as in the case of the Cp, but instead of being due to the
transistors and diodes that are switched on, is for those that do not act at the moment
of the surge.
The greatest impact of this capacitance is very similar to that of the capacitance in
parallel, since they have a very similar origin. In short, the amplitude and waveform of
currents vary considerably depending on the value of the capacitance, which can be
similar to the Yarú model again [33].
Rsc (Short-circuit resistance). Finally, the ground resistance in the short circuit
test is presented. The origin is similar to that of the series resistance, since it is again
due to voltage drops in the connection. Therefore, it is thought that both its value and
its magnitude are quite similar to those of the series resistors.
Wind turbine modelling for lightning simulations. Pag. 38
4.3.3 Main improvements of model 2 to obtain 3
In this section, it can be seen which have been the most important modifications made to
the Yarú model [33] to obtain a behaviour of the system in front of a surge similar to those of
the tests presented.
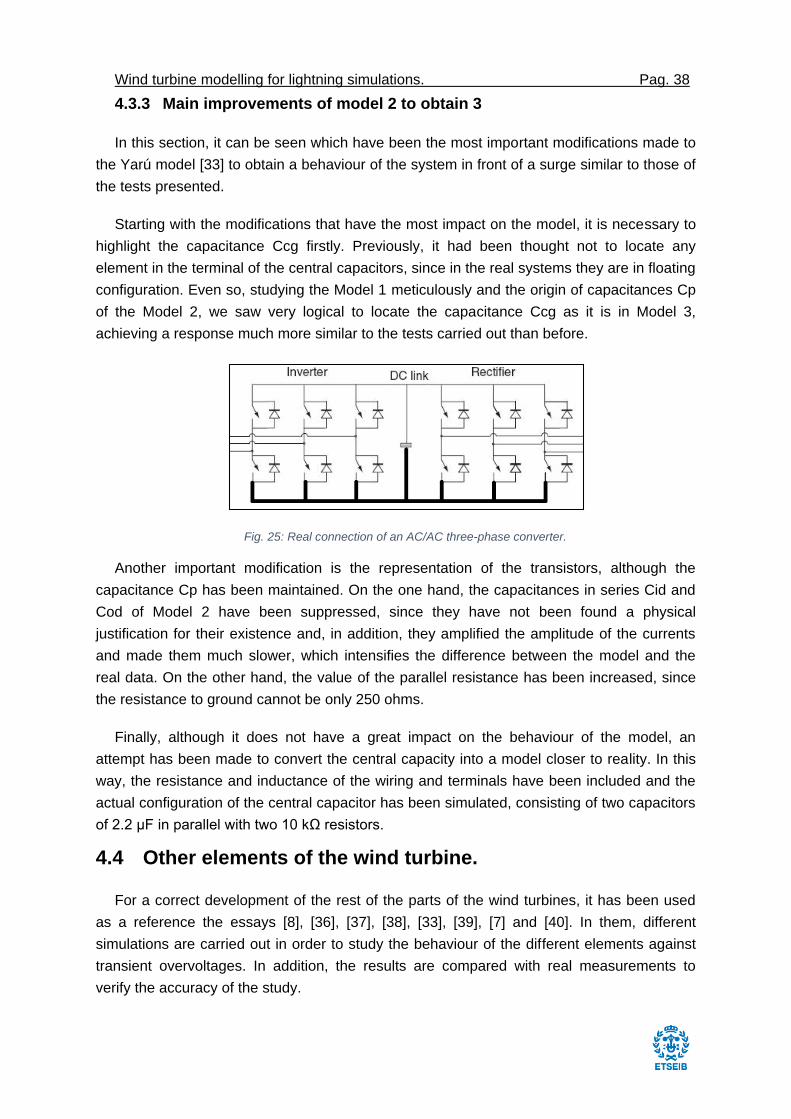
Starting with the modifications that have the most impact on the model, it is necessary to
highlight the capacitance Ccg firstly. Previously, it had been thought not to locate any
element in the terminal of the central capacitors, since in the real systems they are in floating
configuration. Even so, studying the Model 1 meticulously and the origin of capacitances Cp
of the Model 2, we saw very logical to locate the capacitance Ccg as it is in Model 3,
achieving a response much more similar to the tests carried out than before.
Fig. 25: Real connection of an AC/AC three-phase converter.
Another important modification is the representation of the transistors, although the
capacitance Cp has been maintained. On the one hand, the capacitances in series Cid and
Cod of Model 2 have been suppressed, since they have not been found a physical
justification for their existence and, in addition, they amplified the amplitude of the currents
and made them much slower, which intensifies the difference between the model and the
real data. On the other hand, the value of the parallel resistance has been increased, since
the resistance to ground cannot be only 250 ohms.
Finally, although it does not have a great impact on the behaviour of the model, an
attempt has been made to convert the central capacity into a model closer to reality. In this
way, the resistance and inductance of the wiring and terminals have been included and the
actual configuration of the central capacitor has been simulated, consisting of two capacitors
of 2.2 µF in parallel with two 10 kΩ resistors.
4.4 Other elements of the wind turbine.
For a correct development of the rest of the parts of the wind turbines, it has been used
as a reference the essays [8], [36], [37], [38], [33], [39], [7] and [40]. In them, different
simulations are carried out in order to study the behaviour of the different elements against
transient overvoltages. In addition, the results are compared with real measurements to
verify the accuracy of the study.
Wind turbine modelling for lightning simulations. Pag. 39
In order to perform the pertinent simulations valid, they must include specific models of
each element that composes the wind farm, and that can have a direct impact on the study
of surges. Despite this, as we have seen previously, there is no specific model for each
component and may vary depending on the study [33]. Therefore, for each element, the
most realistic and suitable model for the study of high-frequency overvoltages caused by
both direct and indirect lightning impacts will be selected.
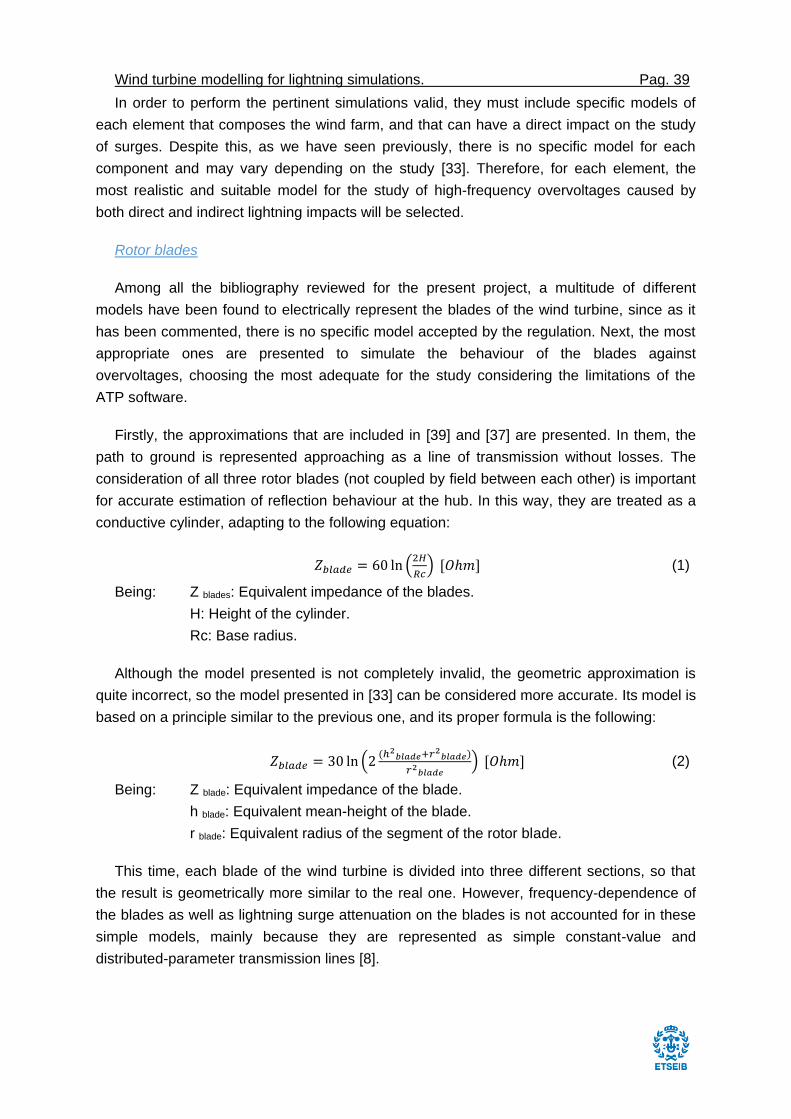
Rotor blades
Among all the bibliography reviewed for the present project, a multitude of different
models have been found to electrically represent the blades of the wind turbine, since as it
has been commented, there is no specific model accepted by the regulation. Next, the most
appropriate ones are presented to simulate the behaviour of the blades against
overvoltages, choosing the most adequate for the study considering the limitations of the
ATP software.
Firstly, the approximations that are included in [39] and [37] are presented. In them, the
path to ground is represented approaching as a line of transmission without losses. The
consideration of all three rotor blades (not coupled by field between each other) is important
for accurate estimation of reflection behaviour at the hub. In this way, they are treated as a
conductive cylinder, adapting to the following equation:
𝑍𝑏𝑙𝑎𝑑𝑒 = 60 ln (2𝐻
𝑅𝑐) [𝑂ℎ𝑚] (1)
Being: Z blades: Equivalent impedance of the blades.
H: Height of the cylinder.
Rc: Base radius.
Although the model presented is not completely invalid, the geometric approximation is
quite incorrect, so the model presented in [33] can be considered more accurate. Its model is
based on a principle similar to the previous one, and its proper formula is the following:
𝑍𝑏𝑙𝑎𝑑𝑒 = 30 ln (2(ℎ2
𝑏𝑙𝑎𝑑𝑒+𝑟2𝑏𝑙𝑎𝑑𝑒)
𝑟2𝑏𝑙𝑎𝑑𝑒
) [𝑂ℎ𝑚] (2)
Being: Z blade: Equivalent impedance of the blade.
h blade: Equivalent mean-height of the blade.
r blade: Equivalent radius of the segment of the rotor blade.
This time, each blade of the wind turbine is divided into three different sections, so that
the result is geometrically more similar to the real one. However, frequency-dependence of
the blades as well as lightning surge attenuation on the blades is not accounted for in these
simple models, mainly because they are represented as simple constant-value and
distributed-parameter transmission lines [8].
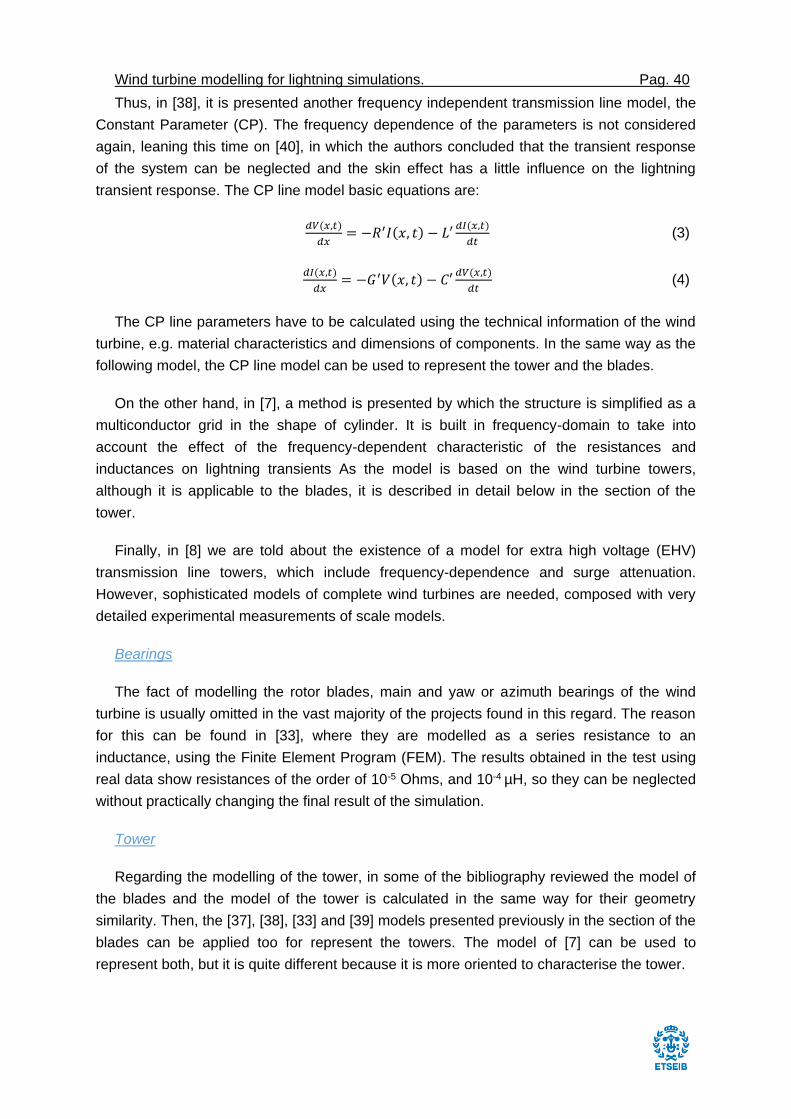
Wind turbine modelling for lightning simulations. Pag. 40
Thus, in [38], it is presented another frequency independent transmission line model, the
Constant Parameter (CP). The frequency dependence of the parameters is not considered
again, leaning this time on [40], in which the authors concluded that the transient response
of the system can be neglected and the skin effect has a little influence on the lightning
transient response. The CP line model basic equations are:
𝑑𝑉(𝑥,𝑡)
𝑑𝑥= −𝑅′𝐼(𝑥, 𝑡) − 𝐿′
𝑑𝐼(𝑥,𝑡)
𝑑𝑡 (3)
𝑑𝐼(𝑥,𝑡)
𝑑𝑥= −𝐺′𝑉(𝑥, 𝑡) − 𝐶′
𝑑𝑉(𝑥,𝑡)
𝑑𝑡 (4)
The CP line parameters have to be calculated using the technical information of the wind
turbine, e.g. material characteristics and dimensions of components. In the same way as the
following model, the CP line model can be used to represent the tower and the blades.
On the other hand, in [7], a method is presented by which the structure is simplified as a
multiconductor grid in the shape of cylinder. It is built in frequency-domain to take into
account the effect of the frequency-dependent characteristic of the resistances and
inductances on lightning transients As the model is based on the wind turbine towers,
although it is applicable to the blades, it is described in detail below in the section of the
tower.
Finally, in [8] we are told about the existence of a model for extra high voltage (EHV)
transmission line towers, which include frequency-dependence and surge attenuation.
However, sophisticated models of complete wind turbines are needed, composed with very
detailed experimental measurements of scale models.
Bearings
The fact of modelling the rotor blades, main and yaw or azimuth bearings of the wind
turbine is usually omitted in the vast majority of the projects found in this regard. The reason
for this can be found in [33], where they are modelled as a series resistance to an
inductance, using the Finite Element Program (FEM). The results obtained in the test using
real data show resistances of the order of 10-5 Ohms, and 10-4 µH, so they can be neglected
without practically changing the final result of the simulation.
Tower
Regarding the modelling of the tower, in some of the bibliography reviewed the model of
the blades and the model of the tower is calculated in the same way for their geometry
similarity. Then, the [37], [38], [33] and [39] models presented previously in the section of the
blades can be applied too for represent the towers. The model of [7] can be used to
represent both, but it is quite different because it is more oriented to characterise the tower.
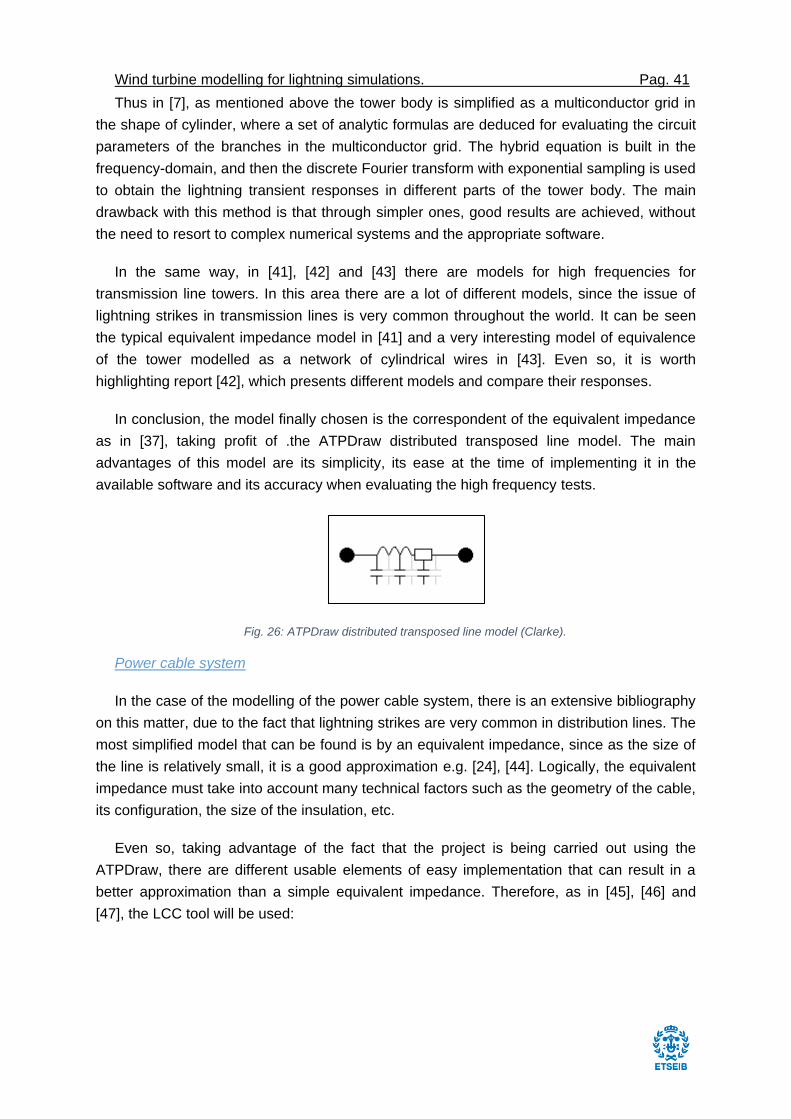
Wind turbine modelling for lightning simulations. Pag. 41
Thus in [7], as mentioned above the tower body is simplified as a multiconductor grid in
the shape of cylinder, where a set of analytic formulas are deduced for evaluating the circuit
parameters of the branches in the multiconductor grid. The hybrid equation is built in the
frequency-domain, and then the discrete Fourier transform with exponential sampling is used
to obtain the lightning transient responses in different parts of the tower body. The main
drawback with this method is that through simpler ones, good results are achieved, without
the need to resort to complex numerical systems and the appropriate software.
In the same way, in [41], [42] and [43] there are models for high frequencies for
transmission line towers. In this area there are a lot of different models, since the issue of
lightning strikes in transmission lines is very common throughout the world. It can be seen
the typical equivalent impedance model in [41] and a very interesting model of equivalence
of the tower modelled as a network of cylindrical wires in [43]. Even so, it is worth
highlighting report [42], which presents different models and compare their responses.
In conclusion, the model finally chosen is the correspondent of the equivalent impedance
as in [37], taking profit of .the ATPDraw distributed transposed line model. The main
advantages of this model are its simplicity, its ease at the time of implementing it in the
available software and its accuracy when evaluating the high frequency tests.
Fig. 26: ATPDraw distributed transposed line model (Clarke).
Power cable system
In the case of the modelling of the power cable system, there is an extensive bibliography
on this matter, due to the fact that lightning strikes are very common in distribution lines. The
most simplified model that can be found is by an equivalent impedance, since as the size of
the line is relatively small, it is a good approximation e.g. [24], [44]. Logically, the equivalent
impedance must take into account many technical factors such as the geometry of the cable,
its configuration, the size of the insulation, etc.
Even so, taking advantage of the fact that the project is being carried out using the
ATPDraw, there are different usable elements of easy implementation that can result in a
better approximation than a simple equivalent impedance. Therefore, as in [45], [46] and
[47], the LCC tool will be used:
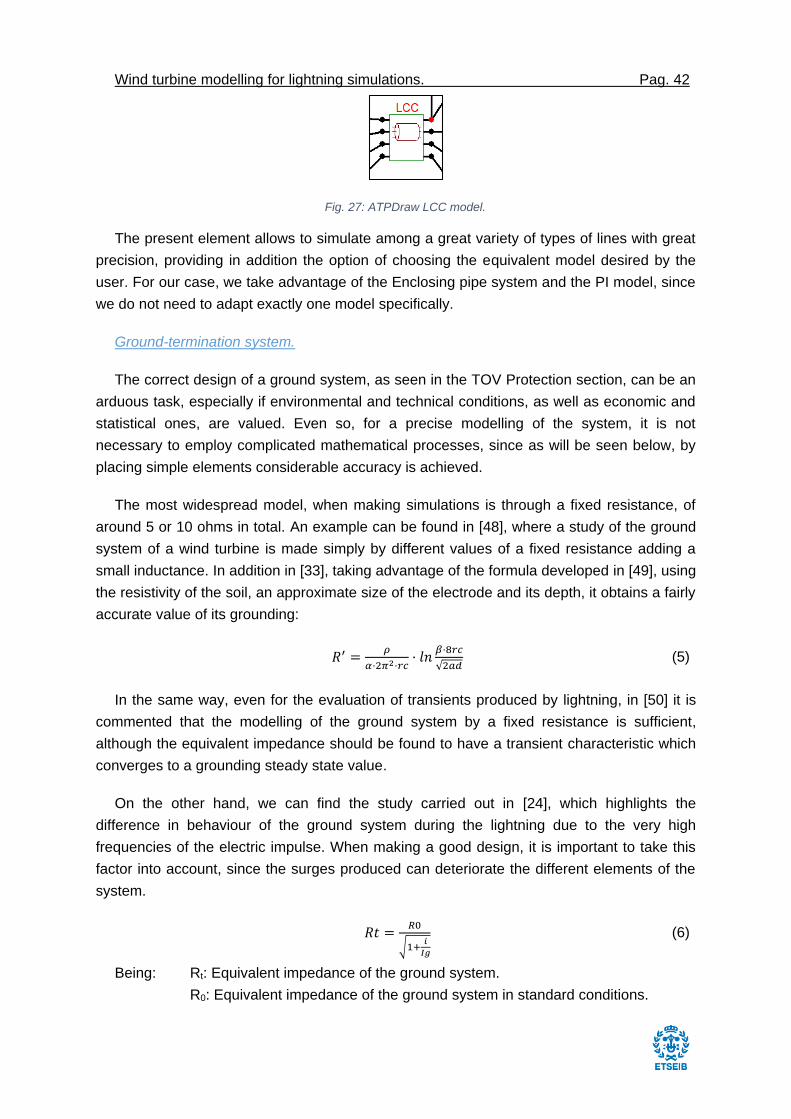
Wind turbine modelling for lightning simulations. Pag. 42
Fig. 27: ATPDraw LCC model.
The present element allows to simulate among a great variety of types of lines with great
precision, providing in addition the option of choosing the equivalent model desired by the
user. For our case, we take advantage of the Enclosing pipe system and the PI model, since
we do not need to adapt exactly one model specifically.
Ground-termination system.
The correct design of a ground system, as seen in the TOV Protection section, can be an
arduous task, especially if environmental and technical conditions, as well as economic and
statistical ones, are valued. Even so, for a precise modelling of the system, it is not
necessary to employ complicated mathematical processes, since as will be seen below, by
placing simple elements considerable accuracy is achieved.
The most widespread model, when making simulations is through a fixed resistance, of
around 5 or 10 ohms in total. An example can be found in [48], where a study of the ground
system of a wind turbine is made simply by different values of a fixed resistance adding a
small inductance. In addition in [33], taking advantage of the formula developed in [49], using
the resistivity of the soil, an approximate size of the electrode and its depth, it obtains a fairly
accurate value of its grounding:
𝑅′ =𝜌
𝛼·2𝜋2·𝑟𝑐· 𝑙𝑛
𝛽·8𝑟𝑐
√2𝑎𝑑 (5)
In the same way, even for the evaluation of transients produced by lightning, in [50] it is
commented that the modelling of the ground system by a fixed resistance is sufficient,
although the equivalent impedance should be found to have a transient characteristic which
converges to a grounding steady state value.
On the other hand, we can find the study carried out in [24], which highlights the
difference in behaviour of the ground system during the lightning due to the very high
frequencies of the electric impulse. When making a good design, it is important to take this
factor into account, since the surges produced can deteriorate the different elements of the
system.
𝑅𝑡 =𝑅0
√1+𝑖
𝐼𝑔
(6)
Being: Rt: Equivalent impedance of the ground system.
R0: Equivalent impedance of the ground system in standard conditions.
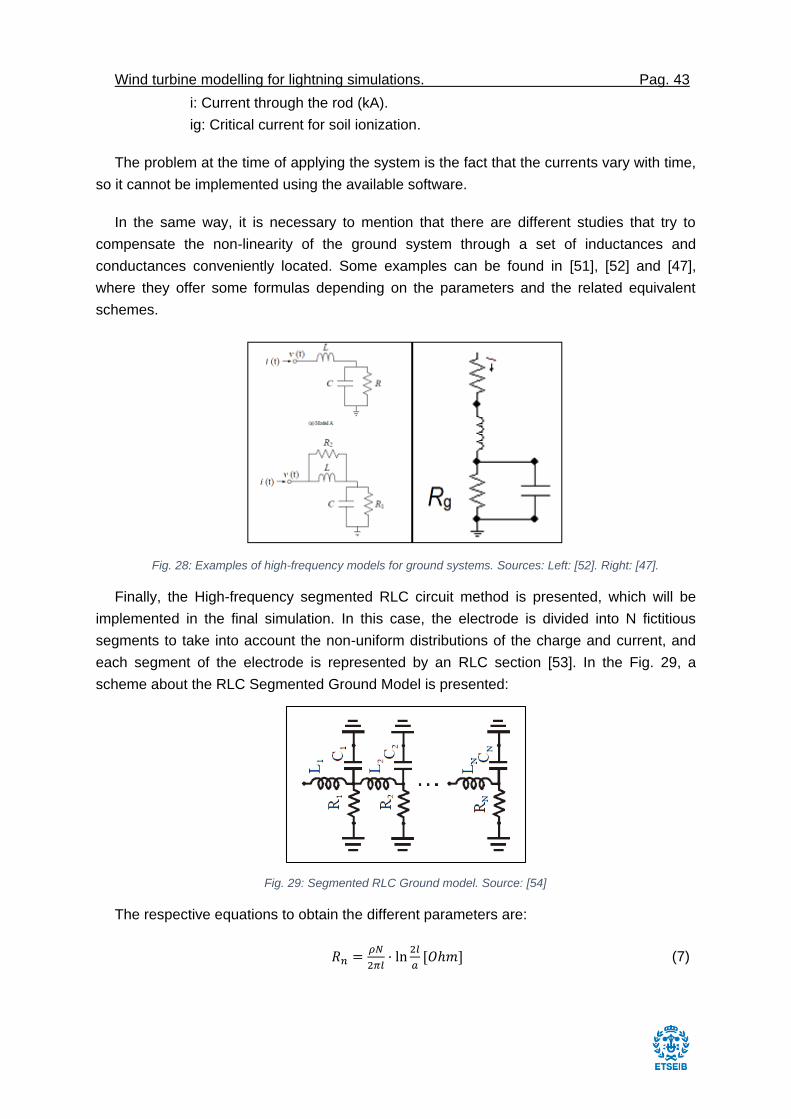
Wind turbine modelling for lightning simulations. Pag. 43
i: Current through the rod (kA).
ig: Critical current for soil ionization.
The problem at the time of applying the system is the fact that the currents vary with time,
so it cannot be implemented using the available software.
In the same way, it is necessary to mention that there are different studies that try to
compensate the non-linearity of the ground system through a set of inductances and
conductances conveniently located. Some examples can be found in [51], [52] and [47],
where they offer some formulas depending on the parameters and the related equivalent
schemes.
Fig. 28: Examples of high-frequency models for ground systems. Sources: Left: [52]. Right: [47].
Finally, the High-frequency segmented RLC circuit method is presented, which will be
implemented in the final simulation. In this case, the electrode is divided into N fictitious
segments to take into account the non-uniform distributions of the charge and current, and
each segment of the electrode is represented by an RLC section [53]. In the Fig. 29, a
scheme about the RLC Segmented Ground Model is presented:
Fig. 29: Segmented RLC Ground model. Source: [54]
The respective equations to obtain the different parameters are:
𝑅𝑛 =𝜌𝑁
2𝜋𝑙· ln
2𝑙
𝑎[𝑂ℎ𝑚] (7)
Wind turbine modelling for lightning simulations. Pag. 44
𝐶𝑛 =2𝜋𝜀𝑙
𝑁· [𝑙𝑛
2𝑙
𝑎]
−1[𝐹𝑎𝑟𝑎𝑑] (8)
𝐿𝑛 =𝜇0𝑙
2𝜋𝑁· ln
2𝑙
𝑎[𝐻𝑒𝑛𝑟𝑦] (9)
Being: ρ: Resistivity of the ground.
ε: Permittivity.
l: Total length of the ground system.
N: Number of segments.
a: Radius of the ground cable.
Comparing the results from all the models, the segmented circuit achieves the best
performance during lightning strokes simulations, being hardly exact until 1MHz. The
exception can be found in extremely conductive soil with a resistivity of 10 Ω·m or less.
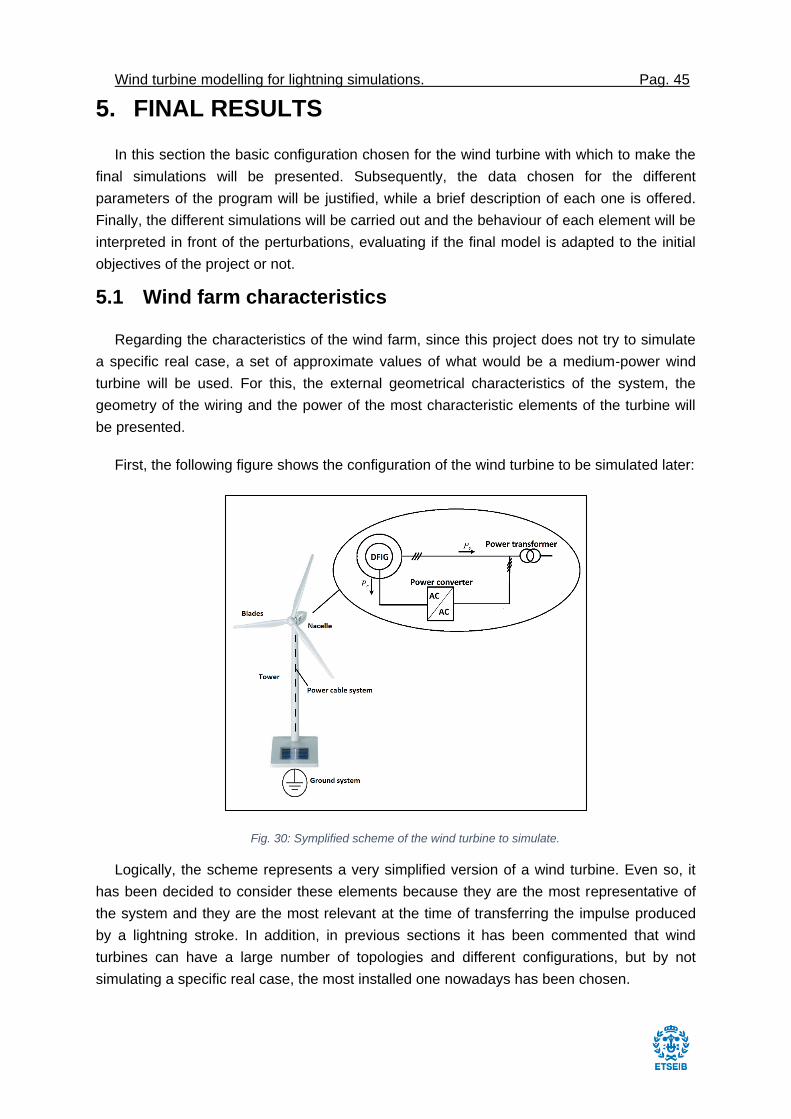
Wind turbine modelling for lightning simulations. Pag. 45
5. FINAL RESULTS
In this section the basic configuration chosen for the wind turbine with which to make the
final simulations will be presented. Subsequently, the data chosen for the different
parameters of the program will be justified, while a brief description of each one is offered.
Finally, the different simulations will be carried out and the behaviour of each element will be
interpreted in front of the perturbations, evaluating if the final model is adapted to the initial
objectives of the project or not.
5.1 Wind farm characteristics
Regarding the characteristics of the wind farm, since this project does not try to simulate
a specific real case, a set of approximate values of what would be a medium-power wind
turbine will be used. For this, the external geometrical characteristics of the system, the
geometry of the wiring and the power of the most characteristic elements of the turbine will
be presented.
First, the following figure shows the configuration of the wind turbine to be simulated later:
Fig. 30: Symplified scheme of the wind turbine to simulate.
Logically, the scheme represents a very simplified version of a wind turbine. Even so, it
has been decided to consider these elements because they are the most representative of
the system and they are the most relevant at the time of transferring the impulse produced
by a lightning stroke. In addition, in previous sections it has been commented that wind
turbines can have a large number of topologies and different configurations, but by not
simulating a specific real case, the most installed one nowadays has been chosen.
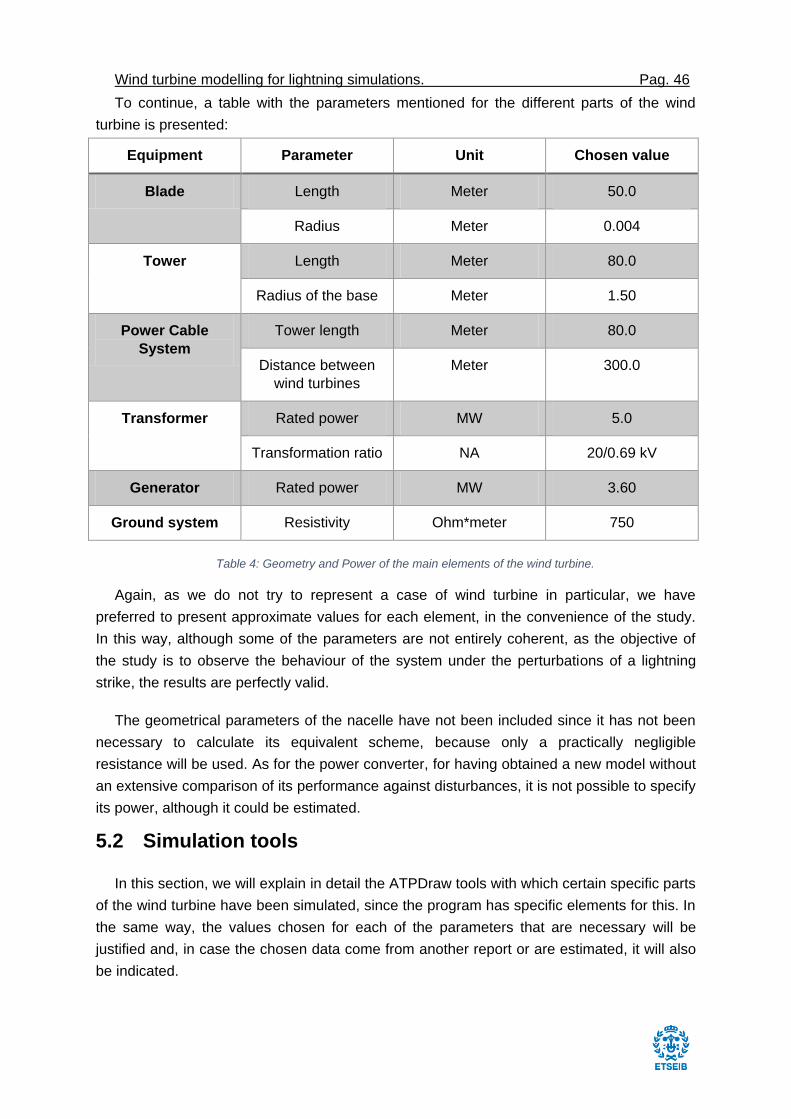
Wind turbine modelling for lightning simulations. Pag. 46
To continue, a table with the parameters mentioned for the different parts of the wind
turbine is presented:
Equipment Parameter Unit Chosen value
Blade Length Meter 50.0
Radius Meter 0.004
Tower Length Meter 80.0
Radius of the base Meter 1.50
Power Cable
System
Tower length Meter 80.0
Distance between
wind turbines
Meter 300.0
Transformer Rated power MW 5.0
Transformation ratio NA 20/0.69 kV
Generator Rated power MW 3.60
Ground system Resistivity Ohm*meter 750
Table 4: Geometry and Power of the main elements of the wind turbine.
Again, as we do not try to represent a case of wind turbine in particular, we have
preferred to present approximate values for each element, in the convenience of the study.
In this way, although some of the parameters are not entirely coherent, as the objective of
the study is to observe the behaviour of the system under the perturbations of a lightning
strike, the results are perfectly valid.
The geometrical parameters of the nacelle have not been included since it has not been
necessary to calculate its equivalent scheme, because only a practically negligible
resistance will be used. As for the power converter, for having obtained a new model without
an extensive comparison of its performance against disturbances, it is not possible to specify
its power, although it could be estimated.
5.2 Simulation tools
In this section, we will explain in detail the ATPDraw tools with which certain specific parts
of the wind turbine have been simulated, since the program has specific elements for this. In
the same way, the values chosen for each of the parameters that are necessary will be
justified and, in case the chosen data come from another report or are estimated, it will also
be indicated.
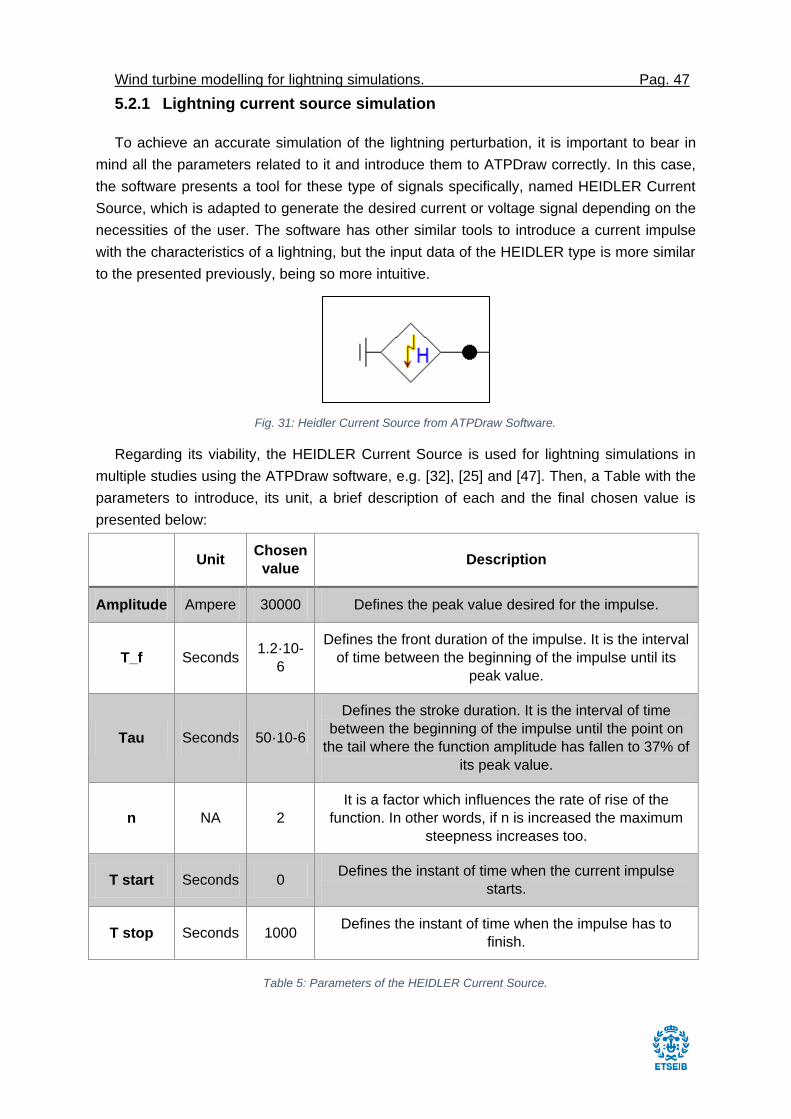
Wind turbine modelling for lightning simulations. Pag. 47
5.2.1 Lightning current source simulation
To achieve an accurate simulation of the lightning perturbation, it is important to bear in
mind all the parameters related to it and introduce them to ATPDraw correctly. In this case,
the software presents a tool for these type of signals specifically, named HEIDLER Current
Source, which is adapted to generate the desired current or voltage signal depending on the
necessities of the user. The software has other similar tools to introduce a current impulse
with the characteristics of a lightning, but the input data of the HEIDLER type is more similar
to the presented previously, being so more intuitive.
Fig. 31: Heidler Current Source from ATPDraw Software.
Regarding its viability, the HEIDLER Current Source is used for lightning simulations in
multiple studies using the ATPDraw software, e.g. [32], [25] and [47]. Then, a Table with the
parameters to introduce, its unit, a brief description of each and the final chosen value is
presented below:
Unit Chosen
value Description
Amplitude Ampere 30000 Defines the peak value desired for the impulse.
T_f Seconds 1.2·10-
6
Defines the front duration of the impulse. It is the interval
of time between the beginning of the impulse until its
peak value.
Tau Seconds 50·10-6
Defines the stroke duration. It is the interval of time
between the beginning of the impulse until the point on
the tail where the function amplitude has fallen to 37% of
its peak value.
n NA 2
It is a factor which influences the rate of rise of the
function. In other words, if n is increased the maximum
steepness increases too.
T start Seconds 0 Defines the instant of time when the current impulse
starts.
T stop Seconds 1000 Defines the instant of time when the impulse has to
finish.
Table 5: Parameters of the HEIDLER Current Source.
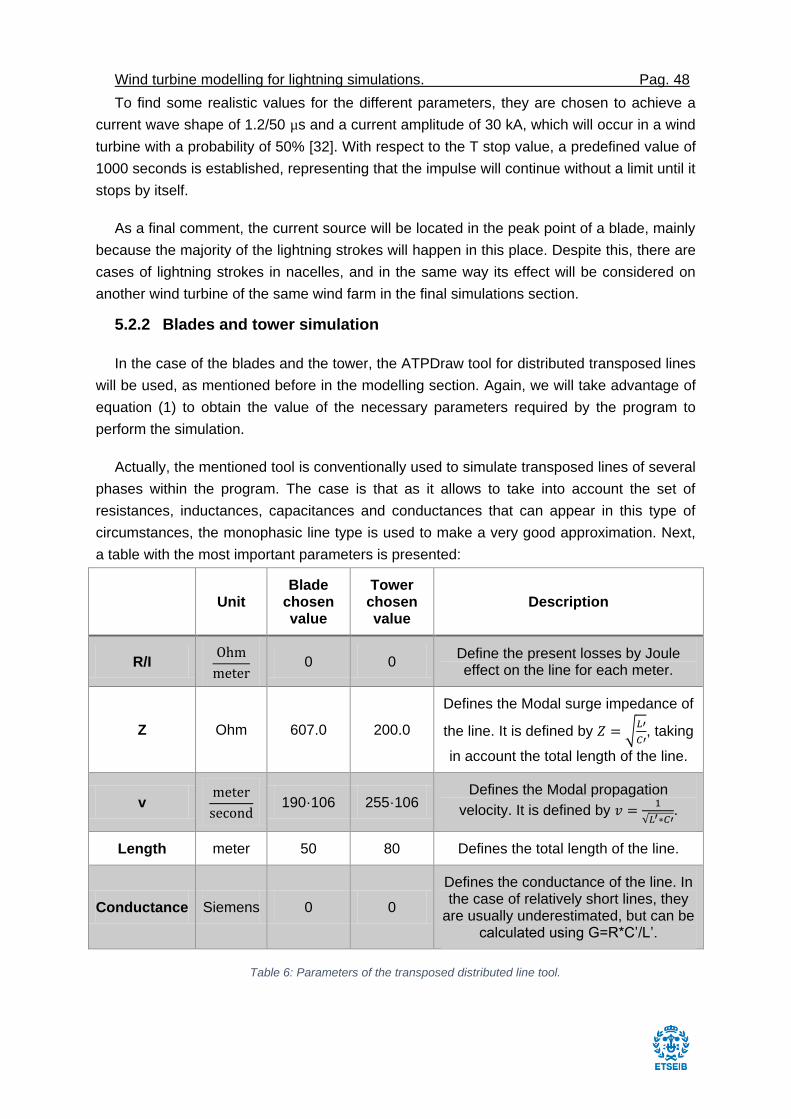
Wind turbine modelling for lightning simulations. Pag. 48
To find some realistic values for the different parameters, they are chosen to achieve a
current wave shape of 1.2/50 µs and a current amplitude of 30 kA, which will occur in a wind
turbine with a probability of 50% [32]. With respect to the T stop value, a predefined value of
1000 seconds is established, representing that the impulse will continue without a limit until it
stops by itself.
As a final comment, the current source will be located in the peak point of a blade, mainly
because the majority of the lightning strokes will happen in this place. Despite this, there are
cases of lightning strokes in nacelles, and in the same way its effect will be considered on
another wind turbine of the same wind farm in the final simulations section.
5.2.2 Blades and tower simulation
In the case of the blades and the tower, the ATPDraw tool for distributed transposed lines
will be used, as mentioned before in the modelling section. Again, we will take advantage of
equation (1) to obtain the value of the necessary parameters required by the program to
perform the simulation.
Actually, the mentioned tool is conventionally used to simulate transposed lines of several
phases within the program. The case is that as it allows to take into account the set of
resistances, inductances, capacitances and conductances that can appear in this type of
circumstances, the monophasic line type is used to make a very good approximation. Next,
a table with the most important parameters is presented:
Unit Blade
chosen value
Tower chosen value
Description
R/I Ohm
meter 0 0
Define the present losses by Joule effect on the line for each meter.
Z Ohm 607.0 200.0
Defines the Modal surge impedance of
the line. It is defined by 𝑍 = √𝐿′
𝐶′, taking
in account the total length of the line.
v meter
second 190·106 255·106
Defines the Modal propagation
velocity. It is defined by 𝑣 =1
√𝐿′∗𝐶′.
Length meter 50 80 Defines the total length of the line.
Conductance Siemens 0 0
Defines the conductance of the line. In the case of relatively short lines, they
are usually underestimated, but can be calculated using G=R*C’/L’.
Table 6: Parameters of the transposed distributed line tool.
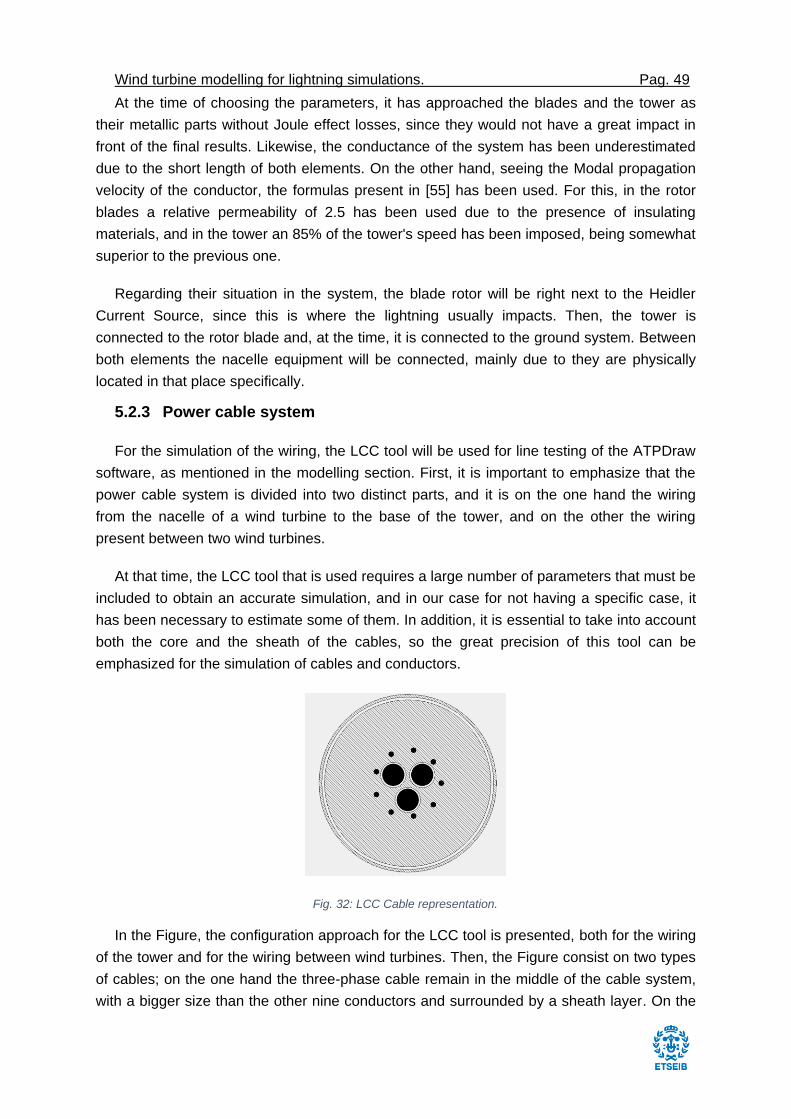
Wind turbine modelling for lightning simulations. Pag. 49
At the time of choosing the parameters, it has approached the blades and the tower as
their metallic parts without Joule effect losses, since they would not have a great impact in
front of the final results. Likewise, the conductance of the system has been underestimated
due to the short length of both elements. On the other hand, seeing the Modal propagation
velocity of the conductor, the formulas present in [55] has been used. For this, in the rotor
blades a relative permeability of 2.5 has been used due to the presence of insulating
materials, and in the tower an 85% of the tower's speed has been imposed, being somewhat
superior to the previous one.
Regarding their situation in the system, the blade rotor will be right next to the Heidler
Current Source, since this is where the lightning usually impacts. Then, the tower is
connected to the rotor blade and, at the time, it is connected to the ground system. Between
both elements the nacelle equipment will be connected, mainly due to they are physically
located in that place specifically.
5.2.3 Power cable system
For the simulation of the wiring, the LCC tool will be used for line testing of the ATPDraw
software, as mentioned in the modelling section. First, it is important to emphasize that the
power cable system is divided into two distinct parts, and it is on the one hand the wiring
from the nacelle of a wind turbine to the base of the tower, and on the other the wiring
present between two wind turbines.
At that time, the LCC tool that is used requires a large number of parameters that must be
included to obtain an accurate simulation, and in our case for not having a specific case, it
has been necessary to estimate some of them. In addition, it is essential to take into account
both the core and the sheath of the cables, so the great precision of this tool can be
emphasized for the simulation of cables and conductors.
Fig. 32: LCC Cable representation.
In the Figure, the configuration approach for the LCC tool is presented, both for the wiring
of the tower and for the wiring between wind turbines. Then, the Figure consist on two types
of cables; on the one hand the three-phase cable remain in the middle of the cable system,
with a bigger size than the other nine conductors and surrounded by a sheath layer. On the
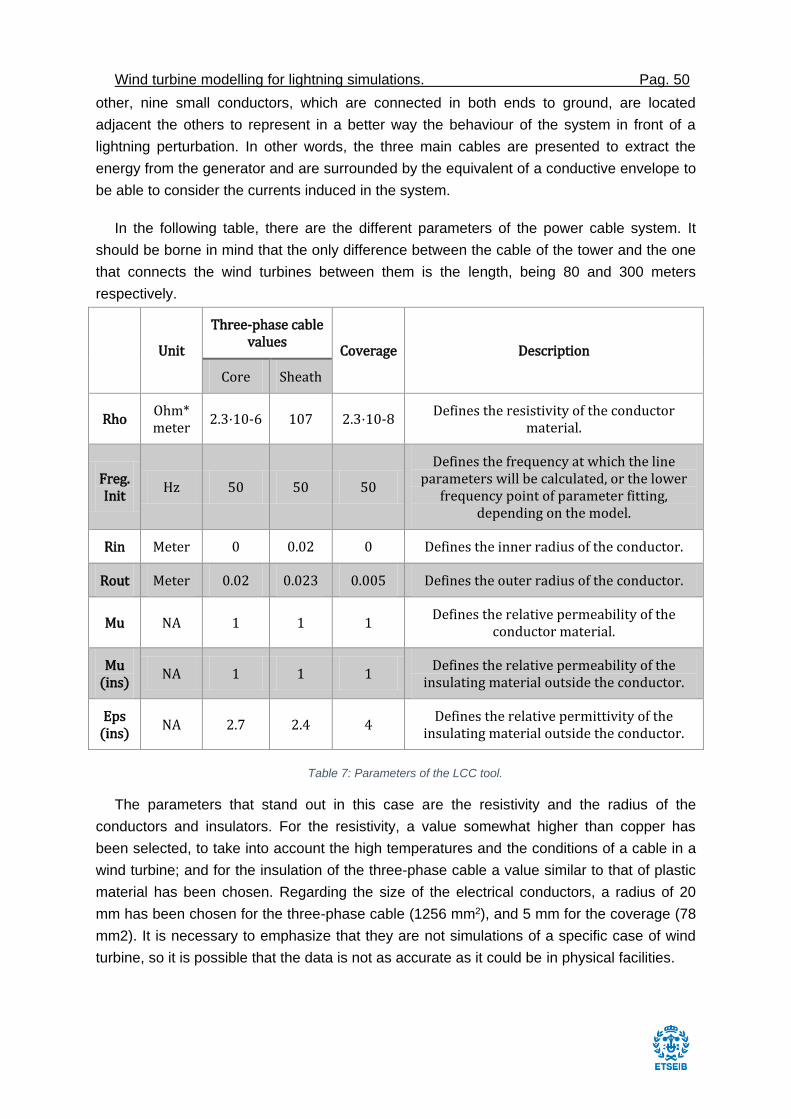
Wind turbine modelling for lightning simulations. Pag. 50
other, nine small conductors, which are connected in both ends to ground, are located
adjacent the others to represent in a better way the behaviour of the system in front of a
lightning perturbation. In other words, the three main cables are presented to extract the
energy from the generator and are surrounded by the equivalent of a conductive envelope to
be able to consider the currents induced in the system.
In the following table, there are the different parameters of the power cable system. It
should be borne in mind that the only difference between the cable of the tower and the one
that connects the wind turbines between them is the length, being 80 and 300 meters
respectively.
Unit
Three-phase cable values
Coverage Description
Core Sheath
Rho Ohm* meter
2.3·10-6 107 2.3·10-8 Defines the resistivity of the conductor
material.
Freg. Init
Hz 50 50 50
Defines the frequency at which the line parameters will be calculated, or the lower
frequency point of parameter fitting, depending on the model.
Rin Meter 0 0.02 0 Defines the inner radius of the conductor.
Rout Meter 0.02 0.023 0.005 Defines the outer radius of the conductor.
Mu NA 1 1 1 Defines the relative permeability of the
conductor material.
Mu (ins)
NA 1 1 1 Defines the relative permeability of the
insulating material outside the conductor.
Eps (ins)
NA 2.7 2.4 4 Defines the relative permittivity of the
insulating material outside the conductor.
Table 7: Parameters of the LCC tool.
The parameters that stand out in this case are the resistivity and the radius of the
conductors and insulators. For the resistivity, a value somewhat higher than copper has
been selected, to take into account the high temperatures and the conditions of a cable in a
wind turbine; and for the insulation of the three-phase cable a value similar to that of plastic
material has been chosen. Regarding the size of the electrical conductors, a radius of 20
mm has been chosen for the three-phase cable (1256 mm2), and 5 mm for the coverage (78
mm2). It is necessary to emphasize that they are not simulations of a specific case of wind
turbine, so it is possible that the data is not as accurate as it could be in physical facilities.
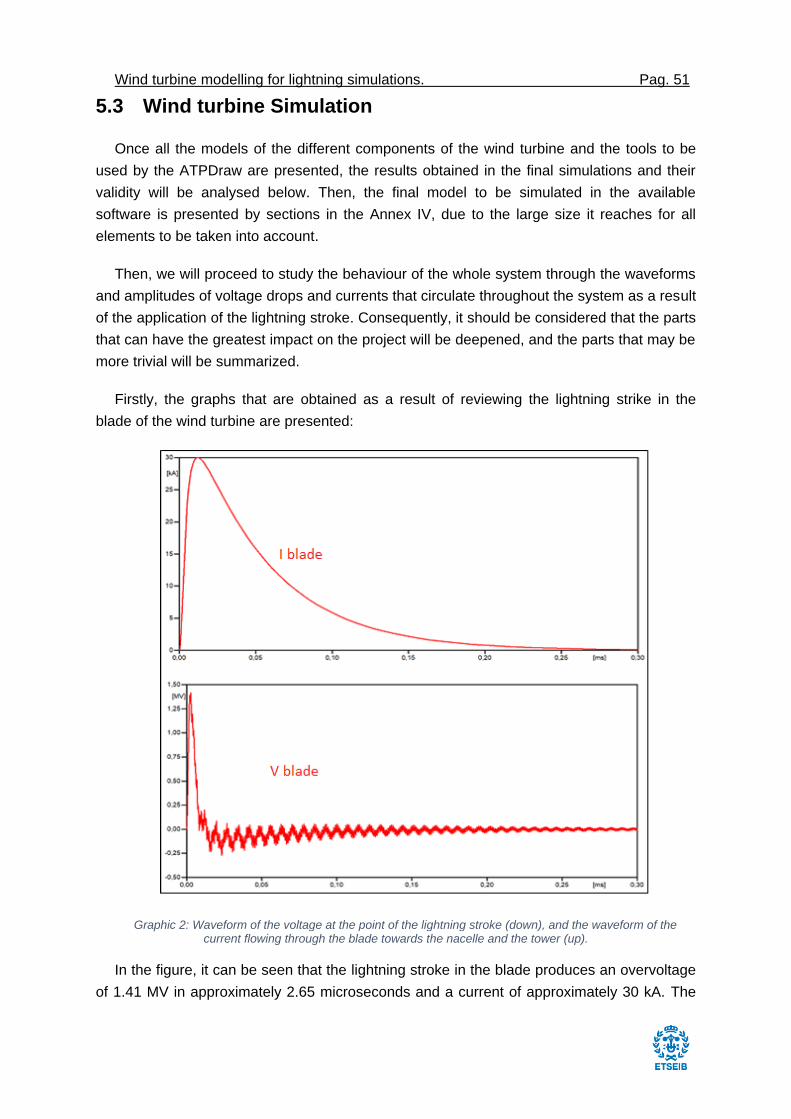
Wind turbine modelling for lightning simulations. Pag. 51
5.3 Wind turbine Simulation
Once all the models of the different components of the wind turbine and the tools to be
used by the ATPDraw are presented, the results obtained in the final simulations and their
validity will be analysed below. Then, the final model to be simulated in the available
software is presented by sections in the Annex IV, due to the large size it reaches for all
elements to be taken into account.
Then, we will proceed to study the behaviour of the whole system through the waveforms
and amplitudes of voltage drops and currents that circulate throughout the system as a result
of the application of the lightning stroke. Consequently, it should be considered that the parts
that can have the greatest impact on the project will be deepened, and the parts that may be
more trivial will be summarized.
Firstly, the graphs that are obtained as a result of reviewing the lightning strike in the
blade of the wind turbine are presented:
Graphic 2: Waveform of the voltage at the point of the lightning stroke (down), and the waveform of the current flowing through the blade towards the nacelle and the tower (up).
In the figure, it can be seen that the lightning stroke in the blade produces an overvoltage
of 1.41 MV in approximately 2.65 microseconds and a current of approximately 30 kA. The
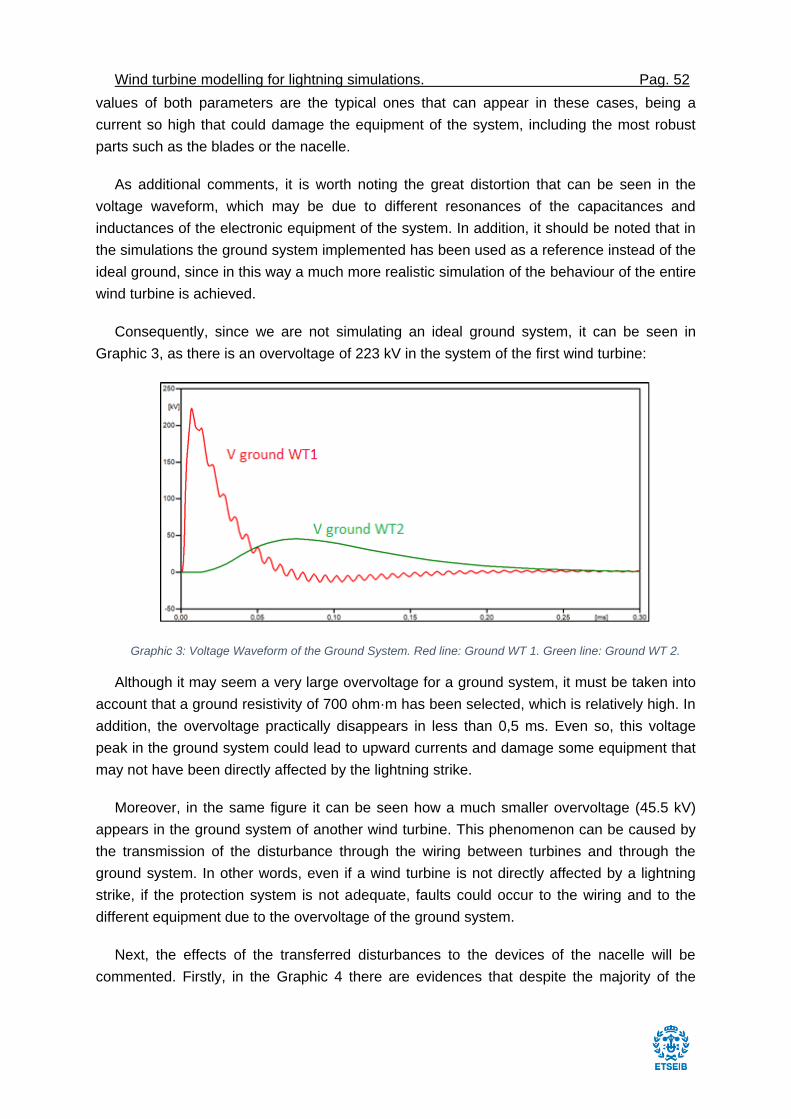
Wind turbine modelling for lightning simulations. Pag. 52
values of both parameters are the typical ones that can appear in these cases, being a
current so high that could damage the equipment of the system, including the most robust
parts such as the blades or the nacelle.
As additional comments, it is worth noting the great distortion that can be seen in the
voltage waveform, which may be due to different resonances of the capacitances and
inductances of the electronic equipment of the system. In addition, it should be noted that in
the simulations the ground system implemented has been used as a reference instead of the
ideal ground, since in this way a much more realistic simulation of the behaviour of the entire
wind turbine is achieved.
Consequently, since we are not simulating an ideal ground system, it can be seen in
Graphic 3, as there is an overvoltage of 223 kV in the system of the first wind turbine:
Graphic 3: Voltage Waveform of the Ground System. Red line: Ground WT 1. Green line: Ground WT 2.
Although it may seem a very large overvoltage for a ground system, it must be taken into
account that a ground resistivity of 700 ohm·m has been selected, which is relatively high. In
addition, the overvoltage practically disappears in less than 0,5 ms. Even so, this voltage
peak in the ground system could lead to upward currents and damage some equipment that
may not have been directly affected by the lightning strike.
Moreover, in the same figure it can be seen how a much smaller overvoltage (45.5 kV)
appears in the ground system of another wind turbine. This phenomenon can be caused by
the transmission of the disturbance through the wiring between turbines and through the
ground system. In other words, even if a wind turbine is not directly affected by a lightning
strike, if the protection system is not adequate, faults could occur to the wiring and to the
different equipment due to the overvoltage of the ground system.
Next, the effects of the transferred disturbances to the devices of the nacelle will be
commented. Firstly, in the Graphic 4 there are evidences that despite the majority of the
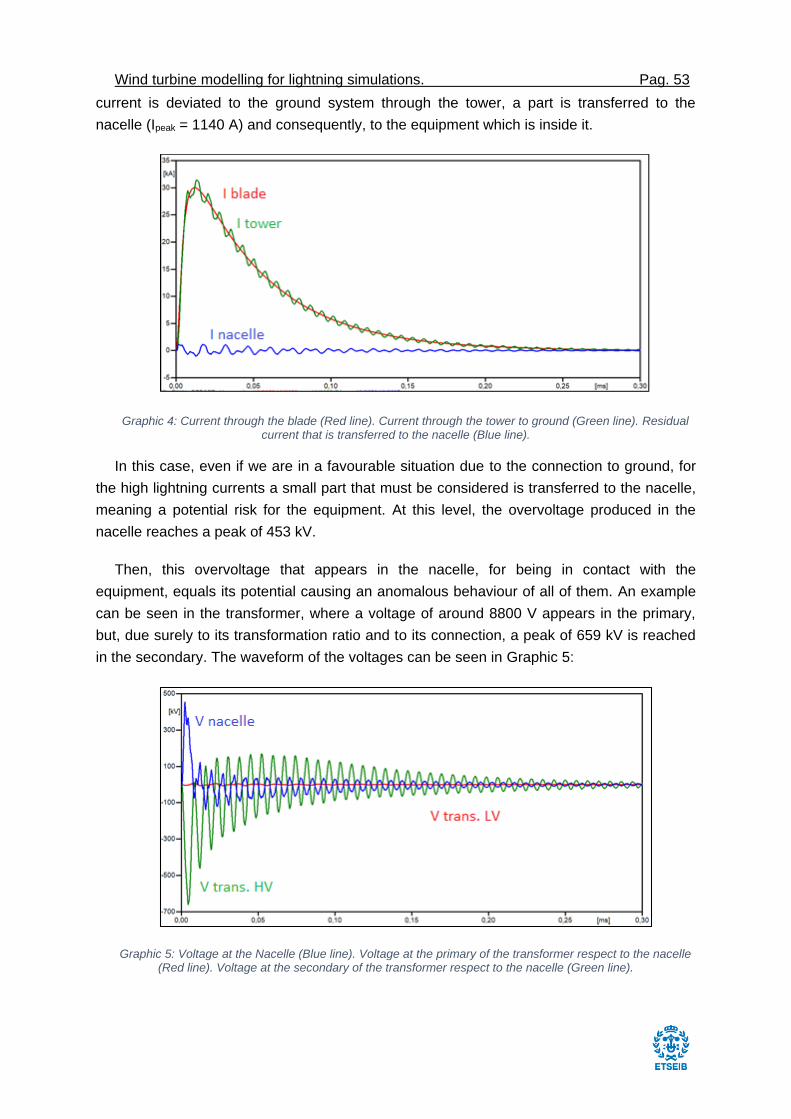
Wind turbine modelling for lightning simulations. Pag. 53
current is deviated to the ground system through the tower, a part is transferred to the
nacelle (Ipeak = 1140 A) and consequently, to the equipment which is inside it.
Graphic 4: Current through the blade (Red line). Current through the tower to ground (Green line). Residual current that is transferred to the nacelle (Blue line).
In this case, even if we are in a favourable situation due to the connection to ground, for
the high lightning currents a small part that must be considered is transferred to the nacelle,
meaning a potential risk for the equipment. At this level, the overvoltage produced in the
nacelle reaches a peak of 453 kV.
Then, this overvoltage that appears in the nacelle, for being in contact with the
equipment, equals its potential causing an anomalous behaviour of all of them. An example
can be seen in the transformer, where a voltage of around 8800 V appears in the primary,
but, due surely to its transformation ratio and to its connection, a peak of 659 kV is reached
in the secondary. The waveform of the voltages can be seen in Graphic 5:
Graphic 5: Voltage at the Nacelle (Blue line). Voltage at the primary of the transformer respect to the nacelle (Red line). Voltage at the secondary of the transformer respect to the nacelle (Green line).
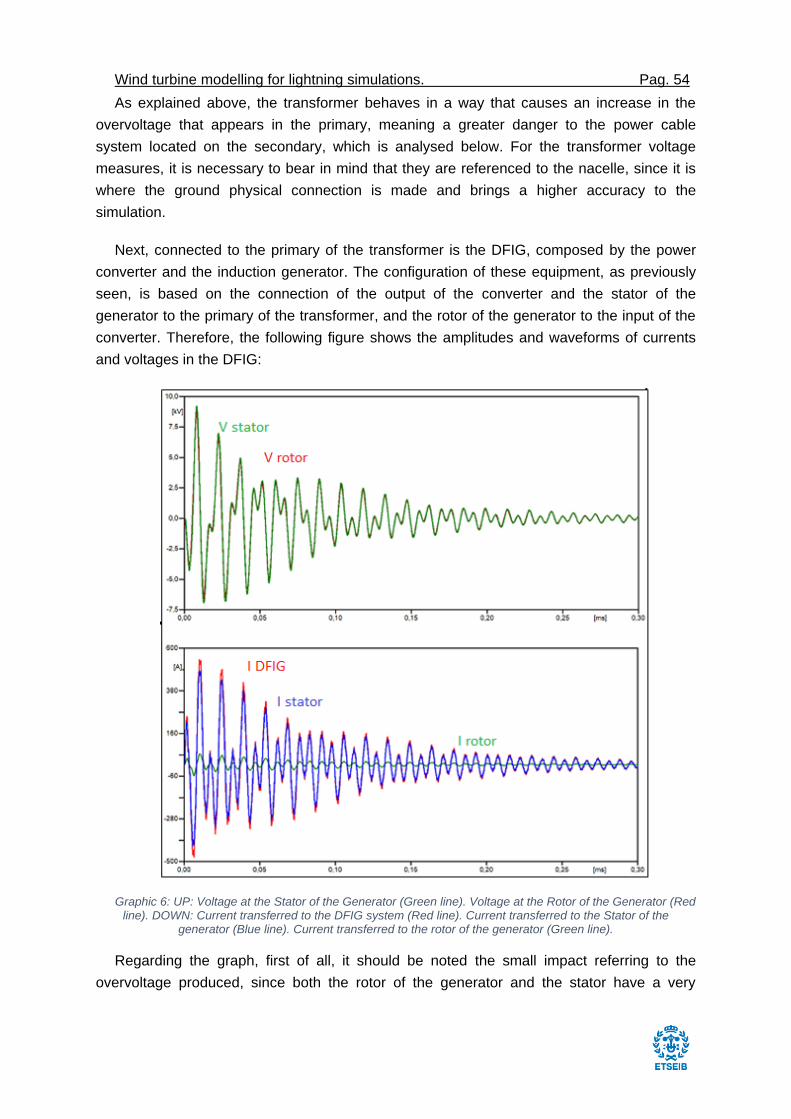
Wind turbine modelling for lightning simulations. Pag. 54
As explained above, the transformer behaves in a way that causes an increase in the
overvoltage that appears in the primary, meaning a greater danger to the power cable
system located on the secondary, which is analysed below. For the transformer voltage
measures, it is necessary to bear in mind that they are referenced to the nacelle, since it is
where the ground physical connection is made and brings a higher accuracy to the
simulation.
Next, connected to the primary of the transformer is the DFIG, composed by the power
converter and the induction generator. The configuration of these equipment, as previously
seen, is based on the connection of the output of the converter and the stator of the
generator to the primary of the transformer, and the rotor of the generator to the input of the
converter. Therefore, the following figure shows the amplitudes and waveforms of currents
and voltages in the DFIG:
Graphic 6: UP: Voltage at the Stator of the Generator (Green line). Voltage at the Rotor of the Generator (Red line). DOWN: Current transferred to the DFIG system (Red line). Current transferred to the Stator of the
generator (Blue line). Current transferred to the rotor of the generator (Green line).
Regarding the graph, first of all, it should be noted the small impact referring to the
overvoltage produced, since both the rotor of the generator and the stator have a very
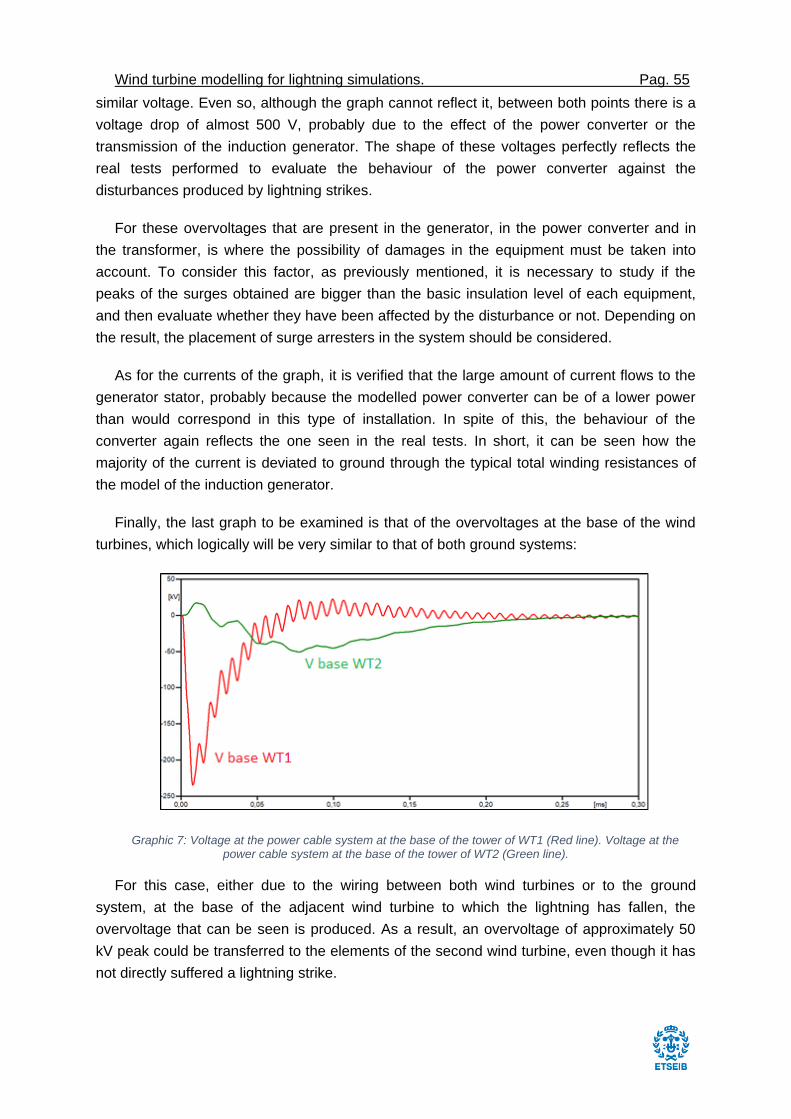
Wind turbine modelling for lightning simulations. Pag. 55
similar voltage. Even so, although the graph cannot reflect it, between both points there is a
voltage drop of almost 500 V, probably due to the effect of the power converter or the
transmission of the induction generator. The shape of these voltages perfectly reflects the
real tests performed to evaluate the behaviour of the power converter against the
disturbances produced by lightning strikes.
For these overvoltages that are present in the generator, in the power converter and in
the transformer, is where the possibility of damages in the equipment must be taken into
account. To consider this factor, as previously mentioned, it is necessary to study if the
peaks of the surges obtained are bigger than the basic insulation level of each equipment,
and then evaluate whether they have been affected by the disturbance or not. Depending on
the result, the placement of surge arresters in the system should be considered.
As for the currents of the graph, it is verified that the large amount of current flows to the
generator stator, probably because the modelled power converter can be of a lower power
than would correspond in this type of installation. In spite of this, the behaviour of the
converter again reflects the one seen in the real tests. In short, it can be seen how the
majority of the current is deviated to ground through the typical total winding resistances of
the model of the induction generator.
Finally, the last graph to be examined is that of the overvoltages at the base of the wind
turbines, which logically will be very similar to that of both ground systems:
Graphic 7: Voltage at the power cable system at the base of the tower of WT1 (Red line). Voltage at the power cable system at the base of the tower of WT2 (Green line).
For this case, either due to the wiring between both wind turbines or to the ground
system, at the base of the adjacent wind turbine to which the lightning has fallen, the
overvoltage that can be seen is produced. As a result, an overvoltage of approximately 50
kV peak could be transferred to the elements of the second wind turbine, even though it has
not directly suffered a lightning strike.
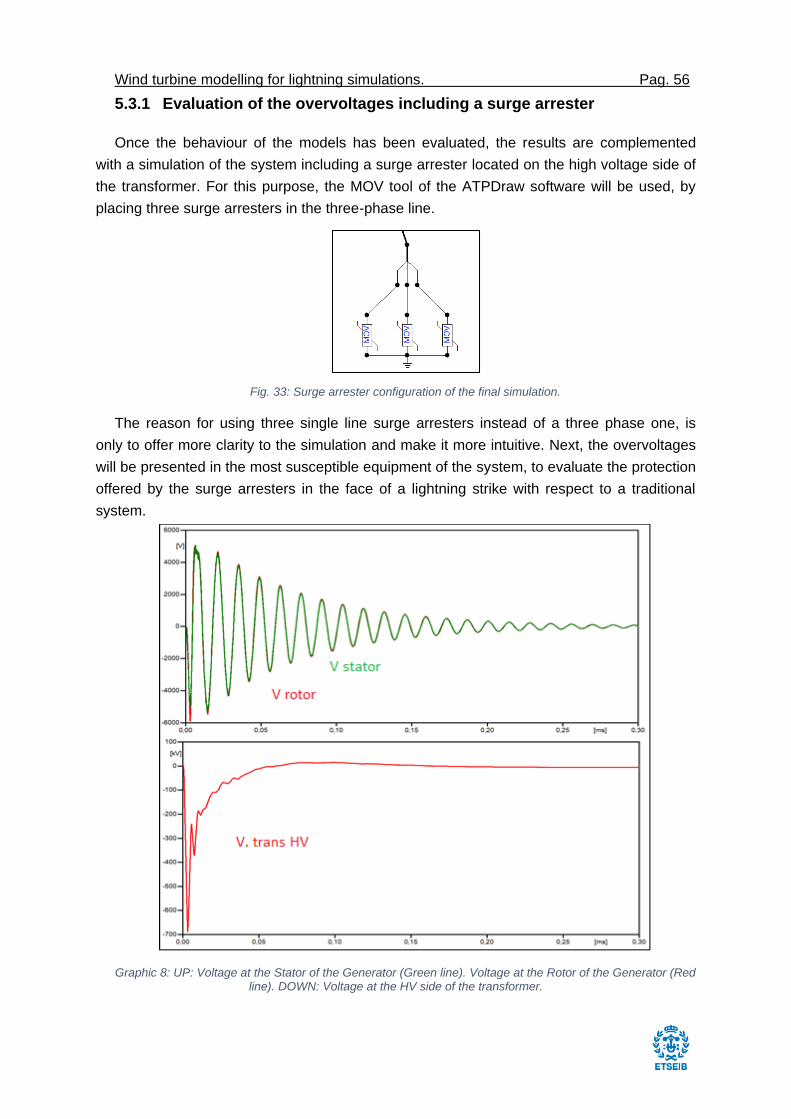
Wind turbine modelling for lightning simulations. Pag. 56
5.3.1 Evaluation of the overvoltages including a surge arrester
Once the behaviour of the models has been evaluated, the results are complemented
with a simulation of the system including a surge arrester located on the high voltage side of
the transformer. For this purpose, the MOV tool of the ATPDraw software will be used, by
placing three surge arresters in the three-phase line.
Fig. 33: Surge arrester configuration of the final simulation.
The reason for using three single line surge arresters instead of a three phase one, is
only to offer more clarity to the simulation and make it more intuitive. Next, the overvoltages
will be presented in the most susceptible equipment of the system, to evaluate the protection
offered by the surge arresters in the face of a lightning strike with respect to a traditional
system.
Graphic 8: UP: Voltage at the Stator of the Generator (Green line). Voltage at the Rotor of the Generator (Red line). DOWN: Voltage at the HV side of the transformer.
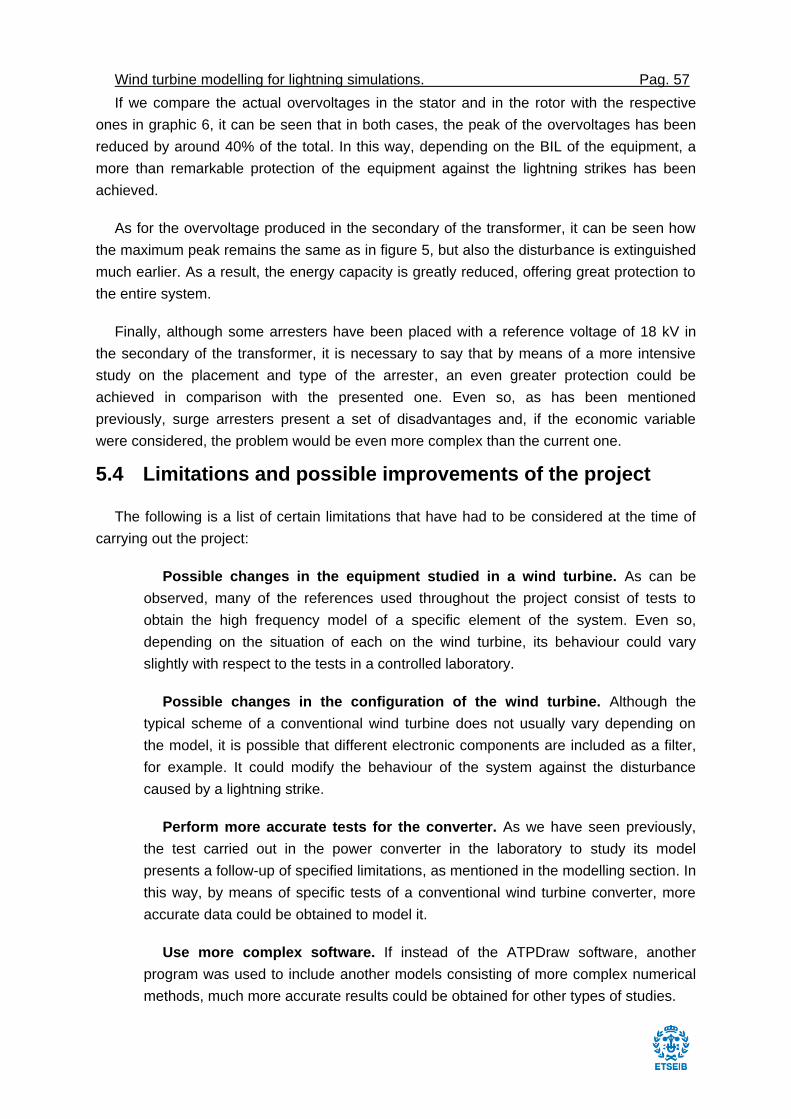
Wind turbine modelling for lightning simulations. Pag. 57
If we compare the actual overvoltages in the stator and in the rotor with the respective
ones in graphic 6, it can be seen that in both cases, the peak of the overvoltages has been
reduced by around 40% of the total. In this way, depending on the BIL of the equipment, a
more than remarkable protection of the equipment against the lightning strikes has been
achieved.
As for the overvoltage produced in the secondary of the transformer, it can be seen how
the maximum peak remains the same as in figure 5, but also the disturbance is extinguished
much earlier. As a result, the energy capacity is greatly reduced, offering great protection to
the entire system.
Finally, although some arresters have been placed with a reference voltage of 18 kV in
the secondary of the transformer, it is necessary to say that by means of a more intensive
study on the placement and type of the arrester, an even greater protection could be
achieved in comparison with the presented one. Even so, as has been mentioned
previously, surge arresters present a set of disadvantages and, if the economic variable
were considered, the problem would be even more complex than the current one.
5.4 Limitations and possible improvements of the project
The following is a list of certain limitations that have had to be considered at the time of
carrying out the project:
Possible changes in the equipment studied in a wind turbine. As can be
observed, many of the references used throughout the project consist of tests to
obtain the high frequency model of a specific element of the system. Even so,
depending on the situation of each on the wind turbine, its behaviour could vary
slightly with respect to the tests in a controlled laboratory.
Possible changes in the configuration of the wind turbine. Although the
typical scheme of a conventional wind turbine does not usually vary depending on
the model, it is possible that different electronic components are included as a filter,
for example. It could modify the behaviour of the system against the disturbance
caused by a lightning strike.
Perform more accurate tests for the converter. As we have seen previously,
the test carried out in the power converter in the laboratory to study its model
presents a follow-up of specified limitations, as mentioned in the modelling section. In
this way, by means of specific tests of a conventional wind turbine converter, more
accurate data could be obtained to model it.
Use more complex software. If instead of the ATPDraw software, another
program was used to include another models consisting of more complex numerical
methods, much more accurate results could be obtained for other types of studies.
Wind turbine modelling for lightning simulations. Pag. 58
With the purpose of improving the current project, we propose a follow-up of possible
improvements to deepen the subject and obtain other conclusions in this regard:
Improvement of the models applied. First, as a main improvement, it is
proposed to use a better software in which include more complex models of each
element than previously presented. In this way it could be possible get more
accuracy at the time of evaluating the behaviour of the wind turbine.
Add more wind turbines to the system. By introducing other wind turbines, it
would be possible to evaluate the effect of lightning strikes on a wind farm seen from
a more global point of view.
Evaluate a specific wind turbine. One possibility to obtain more solid results
would be through the introduction of specific parameters in the different elements of a
real model. In this case, so many estimations would not be necessary and it would be
possible to evaluate the system in a much more realistic way.
Include protection measures. Another way to expand the project would be by
placing different protective equipment and studying its effectiveness depending on
the type chosen and the place of its location.
Perform an economic study. To complement the previous improvement, it would
be possible to carry out a study depending on the geographical situation of the wind
farm to assess its risk of suffering some type of damage due to a lightning strike.
Therefore, the costs of the protection equipment must be evaluated depending on the
area to estimate the economic viability of the project as opposed to the corrective
maintenance of the systems.
Evaluate the future IEC CDV 61400-27-1. By the end of this year 2018, The
International Electrotechnical Commission (IEC), which is a worldwide organization
for standardization comprising all national electrotechnical committees, will propose a
new law to specify the standard dynamic electrical simulation models for wind
turbines and wind power plants.
The main object of IEC is to promote international co-operation on all questions
concerning standardization in the electrical and electronic fields, so the new law
intends to specify some wind turbine models to be used in wind power plants models
or to simulate wind turbines without wind power plant relationships.
Wind turbine modelling for lightning simulations. Pag. 59
6. CONCLUSIONS
In the present project the transient energy characteristics of a wind turbine under natural
lightning has been investigated through proper modelling and simulation. To do this, the
most suitable high frequency models for each element have been studied, without using a
specific wind turbine model. At the end, the results of the final simulations obtained are
included, with which the proposed models are validated and checked.
As a result, it could be considered that it has been possible obtain a model of wind turbine
suitable for tests in which evaluate its behaviour against the disturbances produced by a
lightning strike. So, although there are certain limitations in the accuracy of the final results,
the models have been compiled and analysed as appropriate as possible for each element,
bearing in mind the predetermined objectives at the beginning of the project and the
complexity of the system.
In this way, observing the final simulations, it is possible to interpret that the different
elements behave in a way that could be expected, since they correspond to what logically
should be obtained. Even so, to achieve more solid conclusions, a more exhaustive study of
the load flows of the system would be necessary, comparing them at all times with data
obtained from cases of real lightning strikes in wind turbines, monitoring it with the
appropriate measurement equipment.
Regarding the specific power converter, it has been possible to obtain a model to
represent high frequencies, motivated mainly by the absence of this type of studies. To do
this, different models have been considered and, specifically, the one presented in [33],
which has been modified to achieve the expected behaviour.
In fact, it could be assured that the power converter model has a very similar operation to
the one that the equipment would have in the reality during a disturbance with a waveform
similar to the one produced by a lightning strike, as can be seen in the annexes and in the
final simulations. For this, many factors that are normally neglected have had to be taken
into account by estimating their parameters and evaluating them. Consequently, to find a
response more similar to a real case, it would be necessary obtain data from a converter
with the adequate power to be installed in a wind turbine, and study it against the
disturbance corresponding to a lightning strike.
In short, as a final conclusion it can be highlighted that the initial objectives have been
satisfactorily achieved, obtaining a wind turbine model considerably suitable for lightning
simulations; developing a new model of a power converter for high frequencies that can offer
very good results; and a set of possible improvements to the present project that could
become very interesting for the world of wind energy.
Wind turbine modelling for lightning simulations. Pag. 60
7. BIBLIOGRAPHY
[1] “Asociación Empresarial Eólica (AEE),” February 2018. [Online]. Available: https://www.aeeolica.org/.
[2] J. M. Ponce, “Global Energy,” 07 November 2017. [Online]. Available: www.globalenergy.com. [Accessed 01 March 2018].
[3] A. Piantini, “Lightning Transients in MV Power Distribution Lines,” V Russian Conference on Lightning Protection, São Paulo, 2016.
[4] D. Robinson, “Storm Highway,” [Online]. Available: http://stormhighway.com. [Accessed 02 03 2018].
[5] E. (. E. d. Galicia), “Ega (Asociación Eólica de Galicia),” 12 01 2009. [Online]. Available: http://www.interempresas.net.
[6] M. Ishii and J. Montanyá, “Renewable Energy Systems - Wind Power Systems”.
[7] X. Zhang and Y. Zhang, Calculation of Lightning Transient Responses on Wind Turbine Towers, Beijing: Hindawi Publishing Corporation, 2013.
[8] P. Sarajcev and R. Goic, “A Review of Current Issues in State-of-Art of Wind Farm Overvoltage Protection,” energies, 2011.
[9] H. Odoglu, BEST Transformer Tests, Balikesir: Balikesir Elektromekanik Sanayi Tesisleri A.S, 2009.
[10] M. Á. R. Pozueta, Sobretensiones en los transformadores, Cantabria: Universidad de Cantabria, 2010.
[11] M. Popov, L. v. d. Sluis and R. Smeets, Evaluation of surge-transferred overvoltages in distribution transformers, Holland: ELSEVIER, 2006.
[12] Federal State Unitary Enterprise All-Russian Electrotechnical Institute, “Transferred Overvoltage on Nonloaded Transformer Windings: Evaluation of Voltage and Protective Measures,” Elektrotekhnika, Moscow, 2015.
[13] Merlín Gerín, El transformador y su entorno, para una protección máxima.
[14] M. Florkowski, M. Kuniewski, J. Furgal and P. Pajak, “Investigation of Overvoltages in Distribution Transformers,” IEEE, Kraków, 2017.
[15] J. Das, S. MIEE and PE, “Surges transferred through transformers,” IEEE, Atlanta, 2002.
[16] Ş. Demirbaş and S. Bayhan, “Grid synchronization of doubly fed induction generator in wind power systems,” in International Conference on Power Engineering, Energy and Electrical Drives, Torremolinos, 2011.
[17] “All kinds of faults in an alternator and their protection.,” Electrical Engineering Blog, 10 October 2012. [Online]. Available: http://eblogbd.com/faults-in-an-alternator/.
[18] Electrotechnik, “Types of faults in an alternator,” March 2014. [Online]. Available: https://www.electrotechnik.net/2014/03/types-of-faults-in-alternator.html. [Accessed 02 August 2018].
[19] M. Ebeed, “Enhancement Protection and Operation of The Doubly Fed Induction Generator During Grid Fault,” 2013.
[20] N. Singh and V. Agarwal, “Single-stage AC–AC power conversion for WECS,” Allahabad, 2013.
[21] E. Mizuno, “Overview of wind energy policy and development in Japan.,” in Renewable and Sustainable Energy Reviews, 2014, pp. 999-1018.
[22] M. N. A. A. S. M. A. Abd-Allah, “A Proper Design of Wind Turbine Grounding Systems under Lightning,” in World Academy of Science, Engineering and Technology

Wind turbine modelling for lightning simulations. Pag. 61
International Journal of Electrical and Computer Engineering., 2014.
[23] S. P. d. Silva, A. Piantini, J. L. D. Franco and J. Gonçalves, “Lightning performance studies for a 13.8kV distribution network,” in 7th International Symposium on Lightning Protection (SIPDA, Sao Paulo, 2003.
[24] M. A. Abd-Allah, M. N and A. S. Ali, “Towards an Accurate Modeling of Frequency-dependent Wind Farm,” in WSEAS TRANSACTIONS on POWER SYSTEMS, 2014.
[25] M. A. Abd-Allah, A. Said and M. N. Ali, “Mitigation of Lightning Hazards at the More Sensitive Points in Wind Farms Using Ant-Colony Optimization Technique.,” in Journal of Electrical Engineering, Shoubra.
[26] A. Piantini and A. G. Kanashiro, “A distribution transformer model for calculating transferred voltages.,” Sao Paulo.
[27] A. G. Kanashiro, A. Piantini and G. F. Burani, “A methodology for transformer modelling concerning high frequency surges,” VI International Symposium on Lighting Protection, Santos - Brazil, 2001.
[28] K. Imdad, “High Frequency Modeling of Power Transformers under Transients,” 2017.
[29] B. Jurisic, I. Uglesic, A. Xemard and F. Paladian, “High frequency transformer model derived from limited information,” in Electrical Power and Energy Systems, 2017.
[30] M. Fernando and V. Cooray, “Lightning Surges at Distribution Transformer Secondary,” in International Conference on Industrial and Information Systems, 2010.
[31] W. Wijayapala, J. Lucas and L. Hasthanayake, “A Methodology to Develop a Distribution Transformer Model for Transient Studies,” in ENGINEER - Vol. XLIX, No. 02, Sri Lanka, 2016, pp. 51-59.
[32] R. Rodrigues, V. Mendes and J. Catalão, “Lightning Surges on Wind Power Systems: Study of Electromagnetic Transients.”.
[33] Y. Hernández, T. Tsovilis, F. Asimakopoulou, Z.Politis, W. Barton and M. M. Lozano, “A simulation approach on rotor blade electrostatic charging and its effect on the lightning overvoltages in wind parks.,” Venezuela, 2016.
[34] J. O. Attia, “Two-Port Networks,” in Electronics and Circuit Analysis using MATLAB, CRC Press LLC, 1999.
[35] S. P. S. N. Rishabh Verma, “Brief study of two port network and its parameters.,” in INTERNATONAL JOURNAL OF INNOVATIVE RESEARCH IN TECHNOLOGY, 2014.
[36] B. Badrzadeh, M. H. Zamastil and E. Isabegovic, “Transients in Wind Power Plants—Part I: Modeling Methodology and Validation,” in IEEE Transactions on industry applications, IEEE, 2012, pp. 794-806.
[37] J. Birkl, E. Schulzhenko, J. Kolb and M. Rock, “Approach for Evaluation of Lightning Current Distribution on Wind Turbine with Numerical Model,” International Conference on Lightning Protection, Estoril, Portugal, 2016.
[38] R. B. Rodrigues, V. Mendes and J. Catalão, Protection of interconnected wind turbines against lightning effects: Overvoltages and electromagnetic transients study, Lisbon: Elsevier, 2012.
[39] D. Romero, J. Montanyà and A. Candela, Behaviour of the windturbines under lightning strikes including nonlinear grounding system, Terrasa, 2004.
[40] W. Xiaohui, Z. Xiaoqing and Y. Dasheng, An efficient algorithm of transient responses on wind turbine towers struck by lightning., Beijing: Compel, 2008.
[41] W. Chisholm and K. Srivastava, “Surge response of transmission towers”.
[42] T. Hara and O. Yamamoto, “Modelling of a transmission tower for lightning surge analysis,” 1996.
[43] P. M. J. L. N. A. Gutiérrez R., J. L. Bermúdez, M. Paolone, C. A. Nucci and F. Rachidi, “Nonuniform Transmission Tower Model for,” in IEEE TRANSACTIONS ON POWER
Wind turbine modelling for lightning simulations. Pag. 62
DELIVERY,, 2004.
[44] R. B. Rodrigues, V. M. F. Mendes and J. P. S. Catalão, “Analysis of Transient Phenomena Due to a Direct Lightning,” 2012.
[45] Y. M. Hernéndez, G. Drobnjak and M. Kizilcay, “An Engineering Approach in Modeling Lightning E®ects on,” Marrakesh, 2010.
[46] T. Q. Nguye, T. Pham and T. V. Tran, “Electromagnetic transient simulation of lightning overvoltage in a wind farm,” in 2013 Electrical Insulation Conference, Ottawa, 2013.
[47] B. J, S. E and R. M, “Study of Lightning Current Distribution inside of a Wind Turbine,” in Asia-Pacific International Conference on Lightning, Nagoya, 2015.
[48] Y. Yasuda and T. Funabashi, “Transient analysis on wind farm suffered from lightning.”.
[49] T. F. Yoh Yasuda, “Equivalent equation of earth resistance for ring electrode of wind turbine.,” in 30th International Conference on Lightninf Protection., Cagliari, Italy, 2010.
[50] H.-C. C. C.-C. K. Jheng-Lun Jiang, “Analysis of transient energy affection for wind farm under lightning,” in Elsevier, Taipei, Taiwan, 2011.
[51] N. Malcolm and R. K. Aggarwal, “Transient Overvoltage Study of an Island Wind Farm,” 2012.
[52] K. Yamamoto and S. Sumi, “EMTP models of a Wind Turbine Grounding System,” in International Conference on Lightning Protection, Shanghai, 2014.
[53] L. Grcev, “Modeling of Grounding Electrodes Under Lightning Currents,” IEEE TRANSACTIONS ON ELECTROMAGNETIC COMPATIBILITY, vol. 51, no. 3, pp. 559-570, 2009.
[54] L. Grcev, “Cource on Lightning Protection: High Frequency Grounding.,” in 29th International Conference on Lightning Protection, Uppsala, 2008.
[55] K. Hirabayashi, “Phase velocity of electromagnetic waves and medium constants,” 2001. [Online]. Available: http://www.mogami.com/e/puzzle/pzl-18.html. [Accessed 27 August 2018].
[56] P.Sarajcev, J. Vasilj and D. Jakus, “Monte-Carlo analysis of wind farm lightning-surge transients aided by LINET lightning-detection network data,” Renewable Energy, 2016.
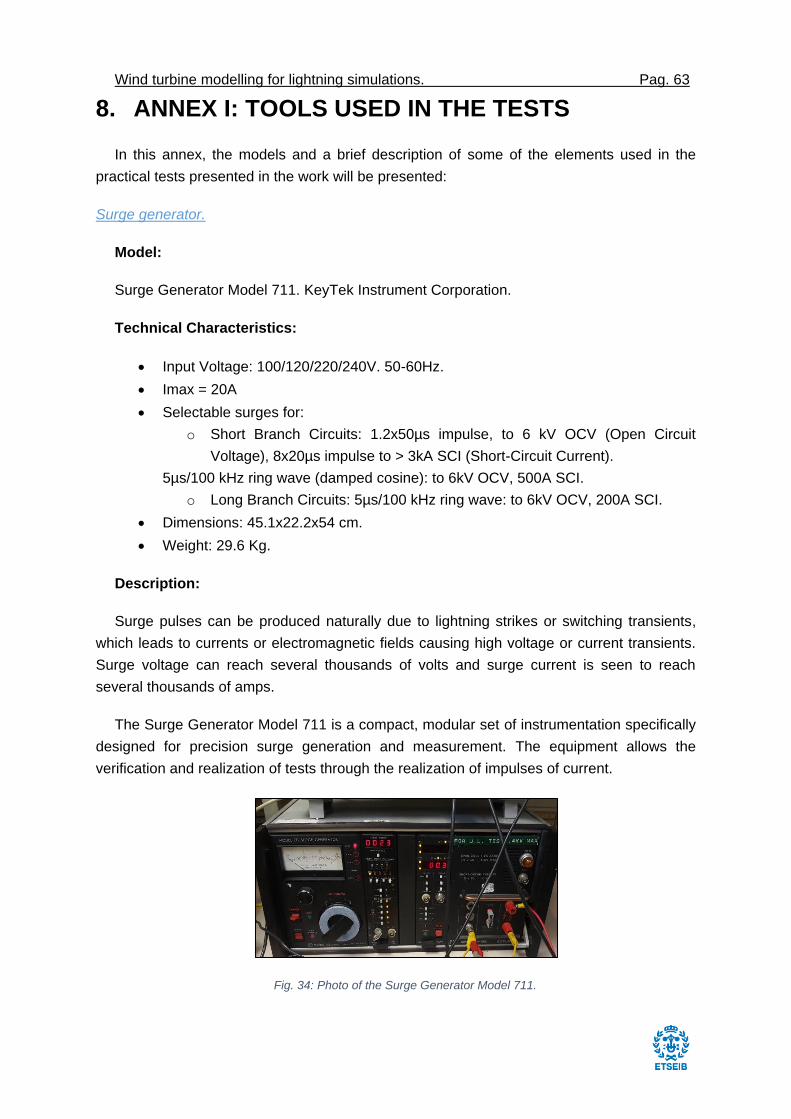
Wind turbine modelling for lightning simulations. Pag. 63
8. ANNEX I: TOOLS USED IN THE TESTS
In this annex, the models and a brief description of some of the elements used in the
practical tests presented in the work will be presented:
Surge generator.
Model:
Surge Generator Model 711. KeyTek Instrument Corporation.
Technical Characteristics:
Input Voltage: 100/120/220/240V. 50-60Hz.
Imax = 20A
Selectable surges for:
o Short Branch Circuits: 1.2x50µs impulse, to 6 kV OCV (Open Circuit
Voltage), 8x20µs impulse to > 3kA SCI (Short-Circuit Current).
5µs/100 kHz ring wave (damped cosine): to 6kV OCV, 500A SCI.
o Long Branch Circuits: 5µs/100 kHz ring wave: to 6kV OCV, 200A SCI.
Dimensions: 45.1x22.2x54 cm.
Weight: 29.6 Kg.
Description:
Surge pulses can be produced naturally due to lightning strikes or switching transients,
which leads to currents or electromagnetic fields causing high voltage or current transients.
Surge voltage can reach several thousands of volts and surge current is seen to reach
several thousands of amps.
The Surge Generator Model 711 is a compact, modular set of instrumentation specifically
designed for precision surge generation and measurement. The equipment allows the
verification and realization of tests through the realization of impulses of current.
Fig. 34: Photo of the Surge Generator Model 711.
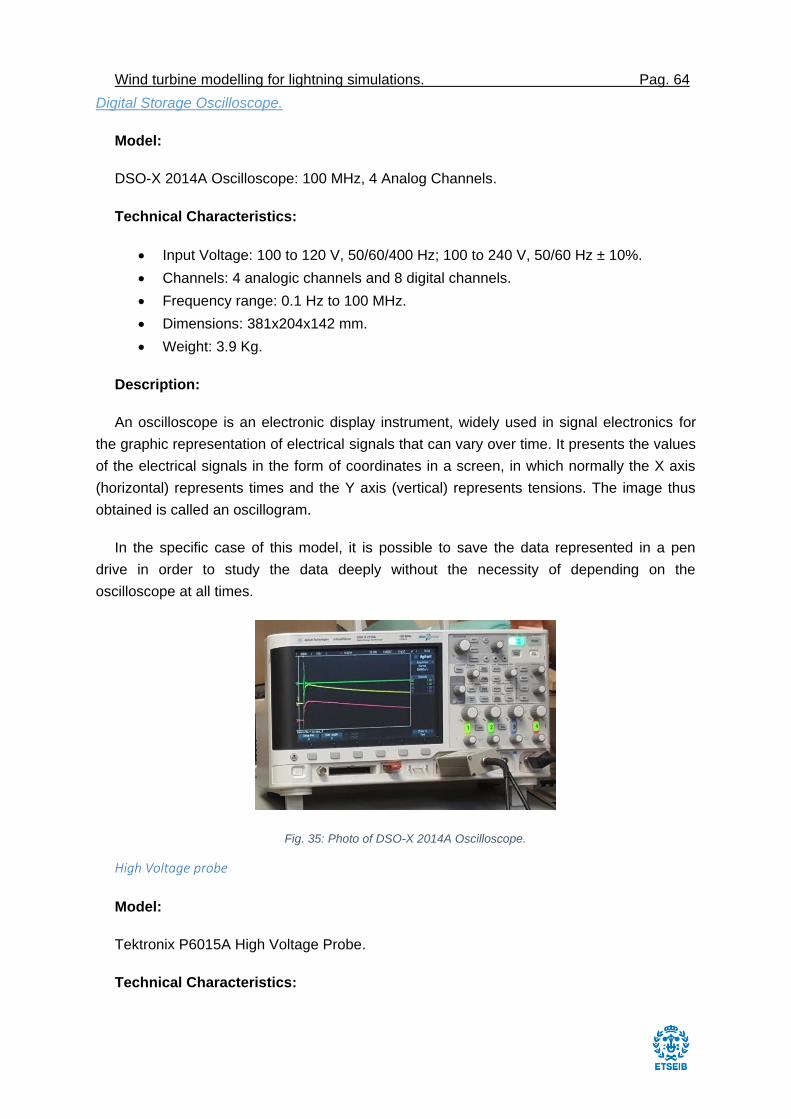
Wind turbine modelling for lightning simulations. Pag. 64
Digital Storage Oscilloscope.
Model:
DSO-X 2014A Oscilloscope: 100 MHz, 4 Analog Channels.
Technical Characteristics:
Input Voltage: 100 to 120 V, 50/60/400 Hz; 100 to 240 V, 50/60 Hz ± 10%.
Channels: 4 analogic channels and 8 digital channels.
Frequency range: 0.1 Hz to 100 MHz.
Dimensions: 381x204x142 mm.
Weight: 3.9 Kg.
Description:
An oscilloscope is an electronic display instrument, widely used in signal electronics for
the graphic representation of electrical signals that can vary over time. It presents the values
of the electrical signals in the form of coordinates in a screen, in which normally the X axis
(horizontal) represents times and the Y axis (vertical) represents tensions. The image thus
obtained is called an oscillogram.
In the specific case of this model, it is possible to save the data represented in a pen
drive in order to study the data deeply without the necessity of depending on the
oscilloscope at all times.
Fig. 35: Photo of DSO-X 2014A Oscilloscope.
High Voltage probe
Model:
Tektronix P6015A High Voltage Probe.
Technical Characteristics:
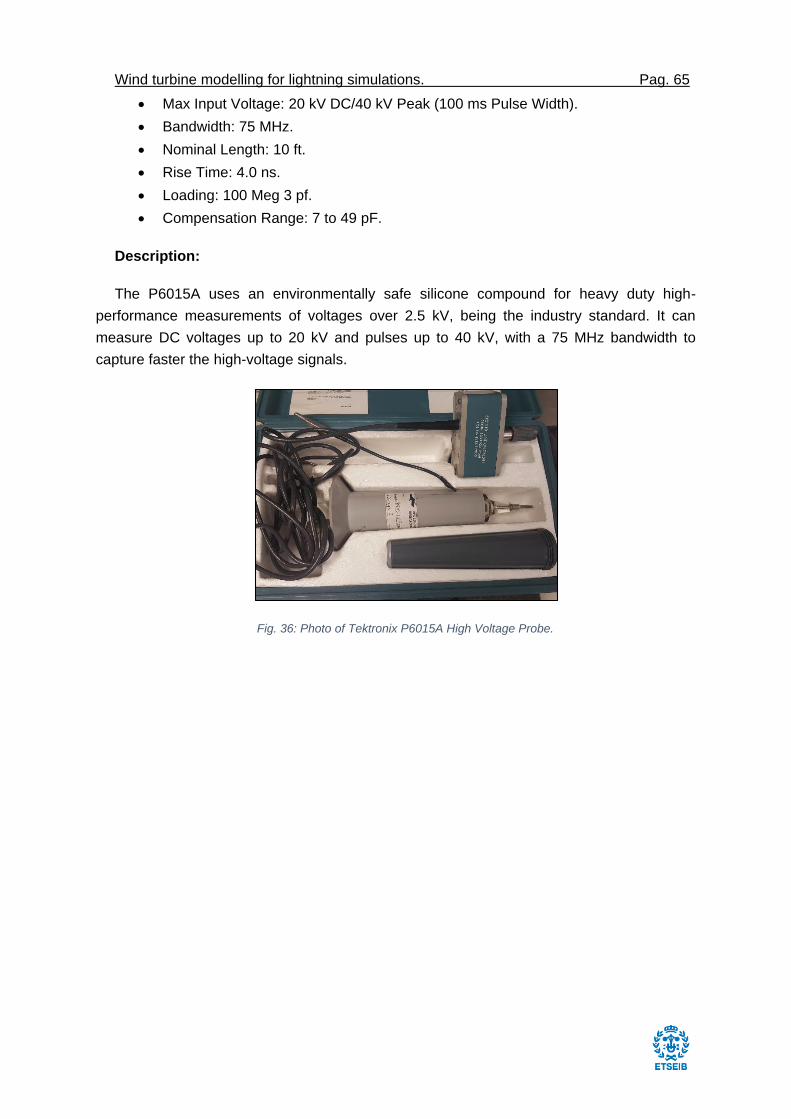
Wind turbine modelling for lightning simulations. Pag. 65
Max Input Voltage: 20 kV DC/40 kV Peak (100 ms Pulse Width).
Bandwidth: 75 MHz.
Nominal Length: 10 ft.
Rise Time: 4.0 ns.
Loading: 100 Meg 3 pf.
Compensation Range: 7 to 49 pF.
Description:
The P6015A uses an environmentally safe silicone compound for heavy duty high-
performance measurements of voltages over 2.5 kV, being the industry standard. It can
measure DC voltages up to 20 kV and pulses up to 40 kV, with a 75 MHz bandwidth to
capture faster the high-voltage signals.
Fig. 36: Photo of Tektronix P6015A High Voltage Probe.
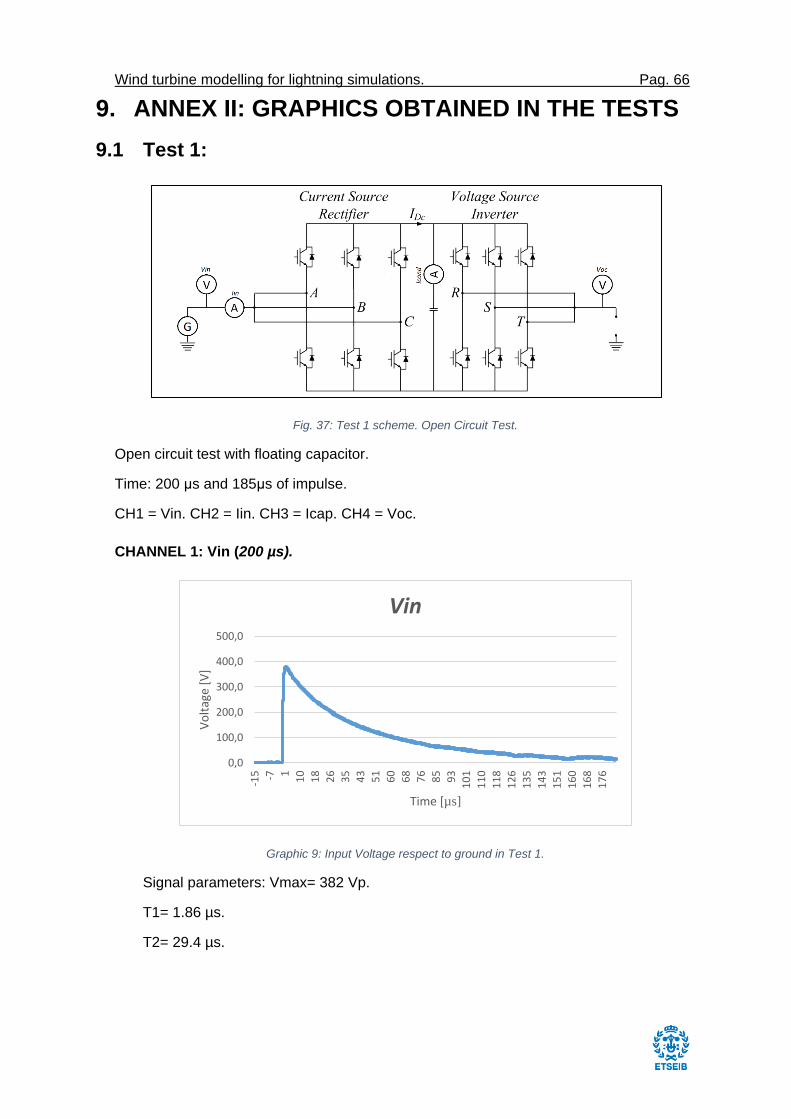
Wind turbine modelling for lightning simulations. Pag. 66
9. ANNEX II: GRAPHICS OBTAINED IN THE TESTS
9.1 Test 1:
Fig. 37: Test 1 scheme. Open Circuit Test.
Open circuit test with floating capacitor.
Time: 200 μs and 185μs of impulse.
CH1 = Vin. CH2 = Iin. CH3 = Icap. CH4 = Voc.
CHANNEL 1: Vin (200 µs).
Graphic 9: Input Voltage respect to ground in Test 1.
Signal parameters: Vmax= 382 Vp.
T1= 1.86 µs.
T2= 29.4 µs.
0,0
100,0
200,0
300,0
400,0
500,0
-15 -7 1
10
18
26
35
43
51
60
68
76
85
93
10
1
11
0
11
8
12
6
13
5
14
3
15
1
16
0
16
8
17
6
Vo
ltag
e [V
]
Time [µs]
Vin
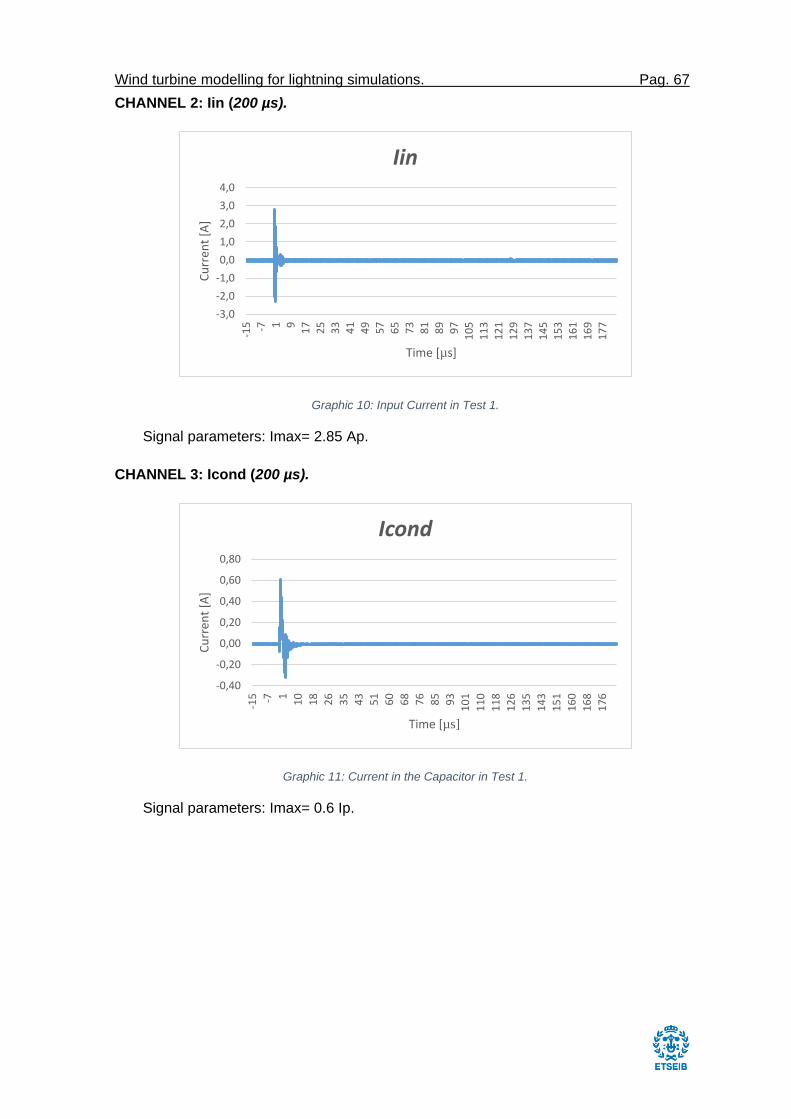
Wind turbine modelling for lightning simulations. Pag. 67
CHANNEL 2: Iin (200 µs).
Graphic 10: Input Current in Test 1.
Signal parameters: Imax= 2.85 Ap.
CHANNEL 3: Icond (200 µs).
Graphic 11: Current in the Capacitor in Test 1.
Signal parameters: Imax= 0.6 Ip.
-3,0
-2,0
-1,0
0,0
1,0
2,0
3,0
4,0
-15 -7 1 9
17
25
33
41
49
57
65
73
81
89
97
10
51
13
12
11
29
13
71
45
15
31
61
16
91
77
Cu
rren
t [A
]
Time [µs]
Iin
-0,40
-0,20
0,00
0,20
0,40
0,60
0,80
-15 -7 1
10
18
26
35
43
51
60
68
76
85
93
10
1
11
0
11
8
12
6
13
5
14
3
15
1
16
0
16
8
17
6
Cu
rren
t [A
]
Time [µs]
Icond
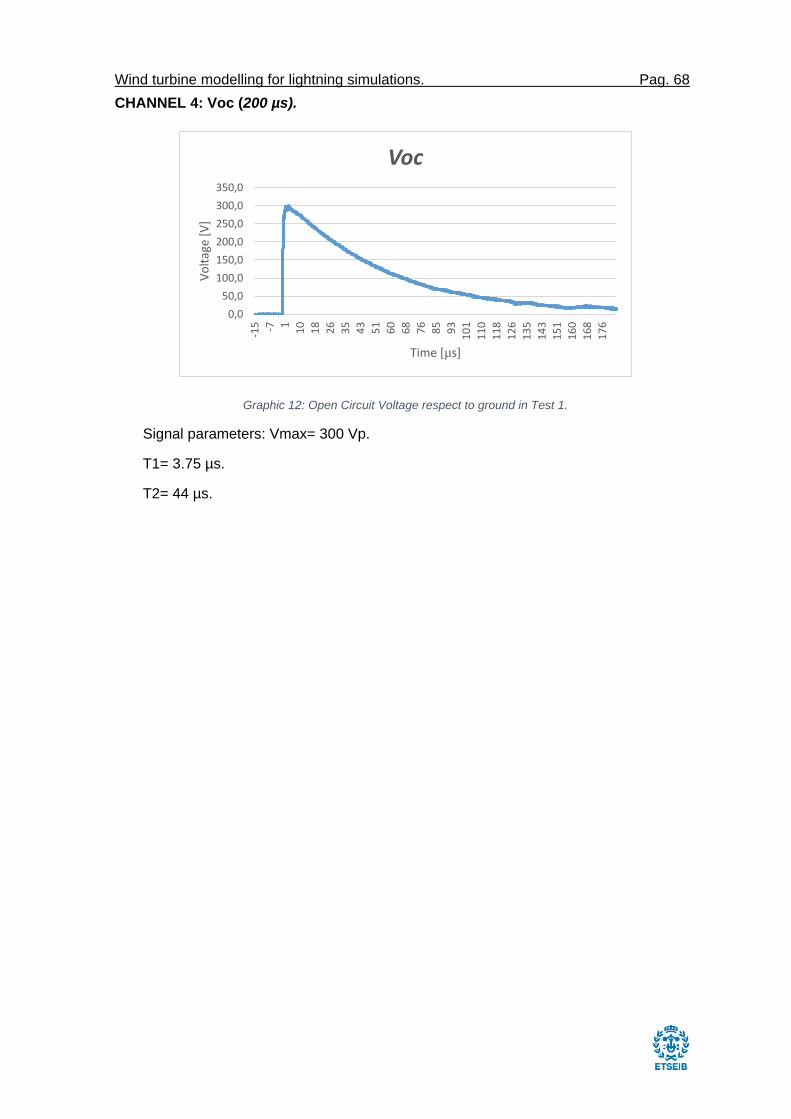
Wind turbine modelling for lightning simulations. Pag. 68
CHANNEL 4: Voc (200 µs).
Graphic 12: Open Circuit Voltage respect to ground in Test 1.
Signal parameters: Vmax= 300 Vp.
T1= 3.75 µs.
T2= 44 µs.
0,0
50,0
100,0
150,0
200,0
250,0
300,0
350,0
-15 -7 1
10
18
26
35
43
51
60
68
76
85
93
10
1
11
0
11
8
12
6
13
5
14
3
15
1
16
0
16
8
17
6
Vo
ltag
e [V
]
Time [µs]
Voc
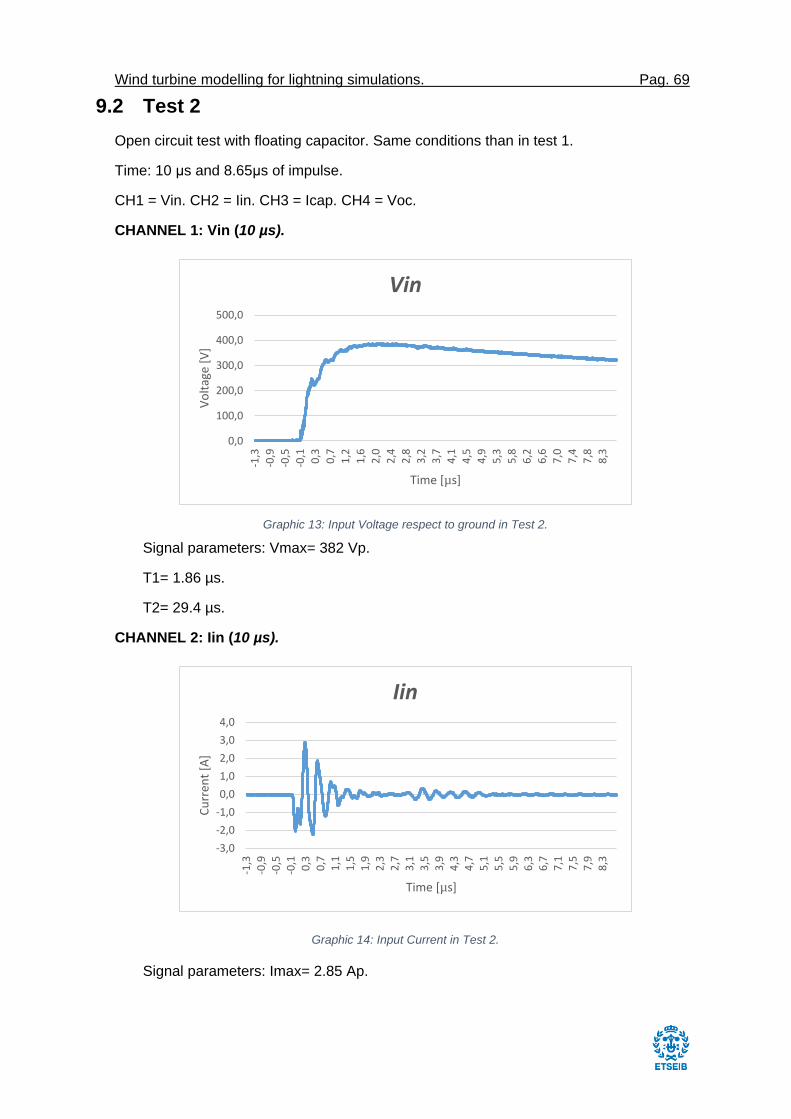
Wind turbine modelling for lightning simulations. Pag. 69
9.2 Test 2
Open circuit test with floating capacitor. Same conditions than in test 1.
Time: 10 μs and 8.65μs of impulse.
CH1 = Vin. CH2 = Iin. CH3 = Icap. CH4 = Voc.
CHANNEL 1: Vin (10 µs).
Graphic 13: Input Voltage respect to ground in Test 2.
Signal parameters: Vmax= 382 Vp.
T1= 1.86 µs.
T2= 29.4 µs.
CHANNEL 2: Iin (10 µs).
Graphic 14: Input Current in Test 2.
Signal parameters: Imax= 2.85 Ap.
0,0
100,0
200,0
300,0
400,0
500,0
-1,3
-0,9
-0,5
-0,1
0,3
0,7
1,2
1,6
2,0
2,4
2,8
3,2
3,7
4,1
4,5
4,9
5,3
5,8
6,2
6,6
7,0
7,4
7,8
8,3
Vo
ltag
e [V
]
Time [µs]
Vin
-3,0
-2,0
-1,0
0,0
1,0
2,0
3,0
4,0
-1,3
-0,9
-0,5
-0,1
0,3
0,7
1,1
1,5
1,9
2,3
2,7
3,1
3,5
3,9
4,3
4,7
5,1
5,5
5,9
6,3
6,7
7,1
7,5
7,9
8,3
Cu
rren
t [A
]
Time [µs]
Iin
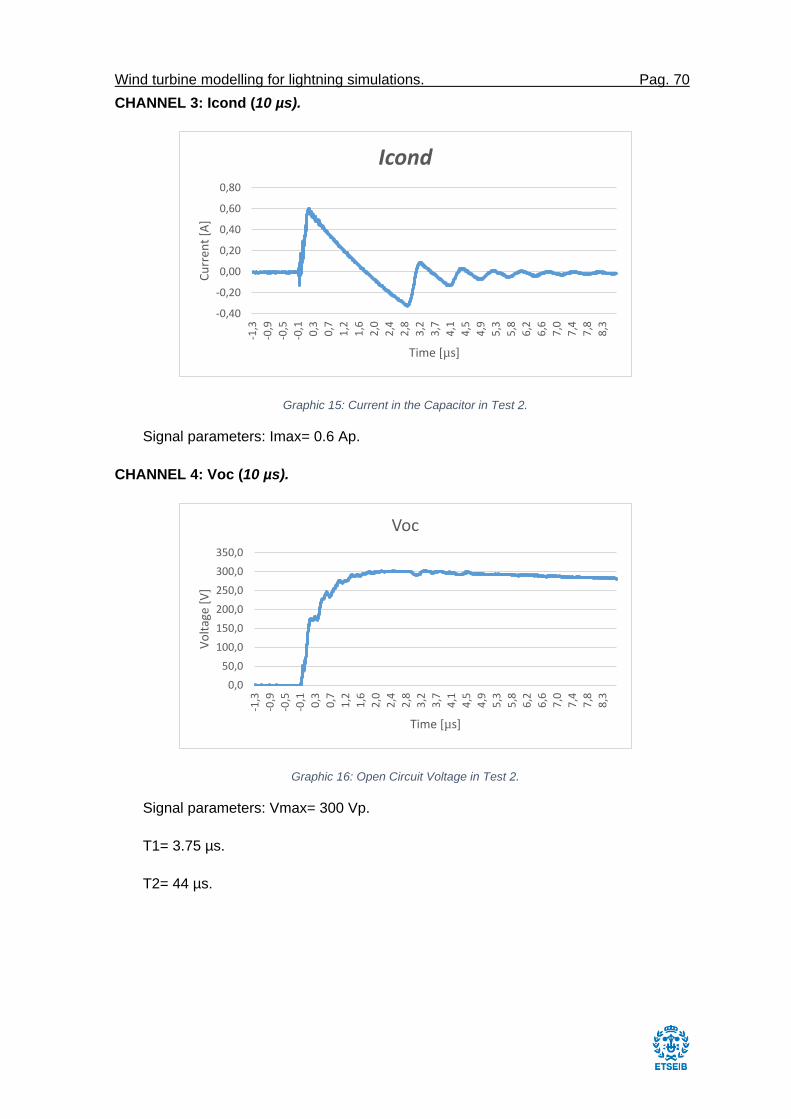
Wind turbine modelling for lightning simulations. Pag. 70
CHANNEL 3: Icond (10 µs).
Graphic 15: Current in the Capacitor in Test 2.
Signal parameters: Imax= 0.6 Ap.
CHANNEL 4: Voc (10 µs).
Graphic 16: Open Circuit Voltage in Test 2.
Signal parameters: Vmax= 300 Vp.
T1= 3.75 µs.
T2= 44 µs.
-0,40
-0,20
0,00
0,20
0,40
0,60
0,80
-1,3
-0,9
-0,5
-0,1
0,3
0,7
1,2
1,6
2,0
2,4
2,8
3,2
3,7
4,1
4,5
4,9
5,3
5,8
6,2
6,6
7,0
7,4
7,8
8,3
Cu
rren
t [A
]
Time [µs]
Icond
0,0
50,0
100,0
150,0
200,0
250,0
300,0
350,0
-1,3
-0,9
-0,5
-0,1
0,3
0,7
1,2
1,6
2,0
2,4
2,8
3,2
3,7
4,1
4,5
4,9
5,3
5,8
6,2
6,6
7,0
7,4
7,8
8,3
Vo
ltag
e [V
]
Time [µs]
Voc
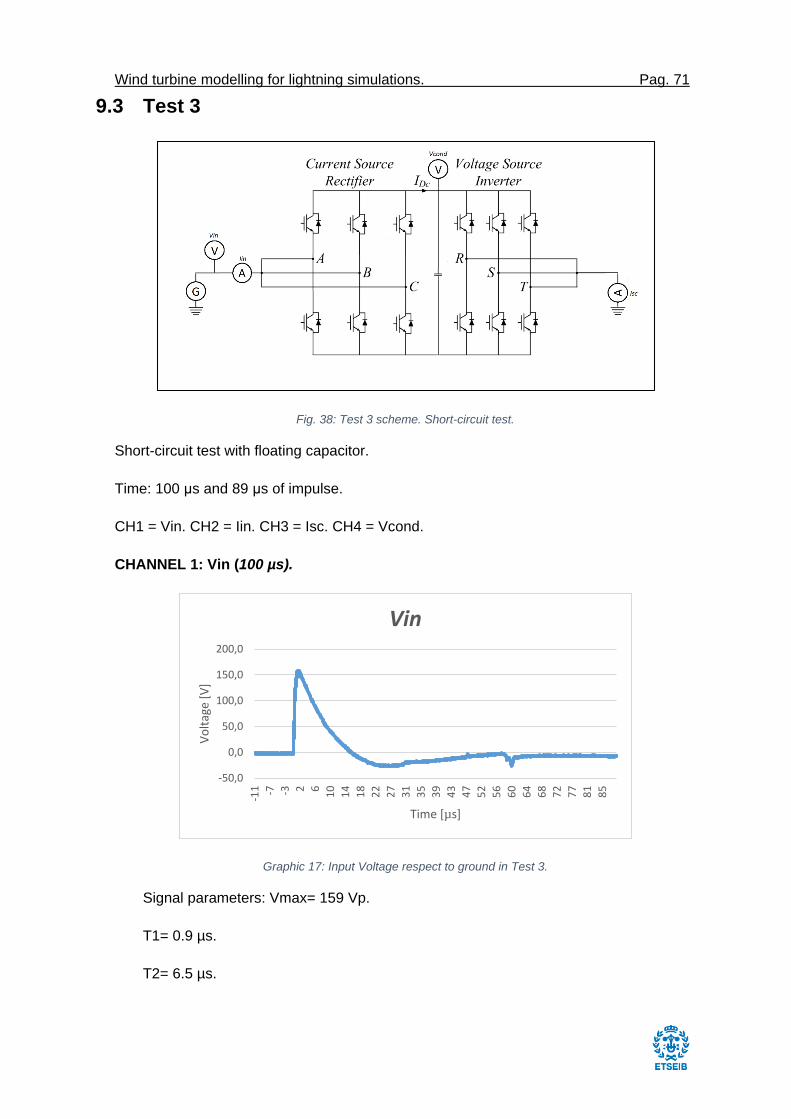
Wind turbine modelling for lightning simulations. Pag. 71
9.3 Test 3
Fig. 38: Test 3 scheme. Short-circuit test.
Short-circuit test with floating capacitor.
Time: 100 μs and 89 μs of impulse.
CH1 = Vin. CH2 = Iin. CH3 = Isc. CH4 = Vcond.
CHANNEL 1: Vin (100 µs).
Graphic 17: Input Voltage respect to ground in Test 3.
Signal parameters: Vmax= 159 Vp.
T1= 0.9 µs.
T2= 6.5 µs.
-50,0
0,0
50,0
100,0
150,0
200,0
-11 -7 -3 2 6
10
14
18
22
27
31
35
39
43
47
52
56
60
64
68
72
77
81
85
Vo
ltag
e [V
]
Time [µs]
Vin
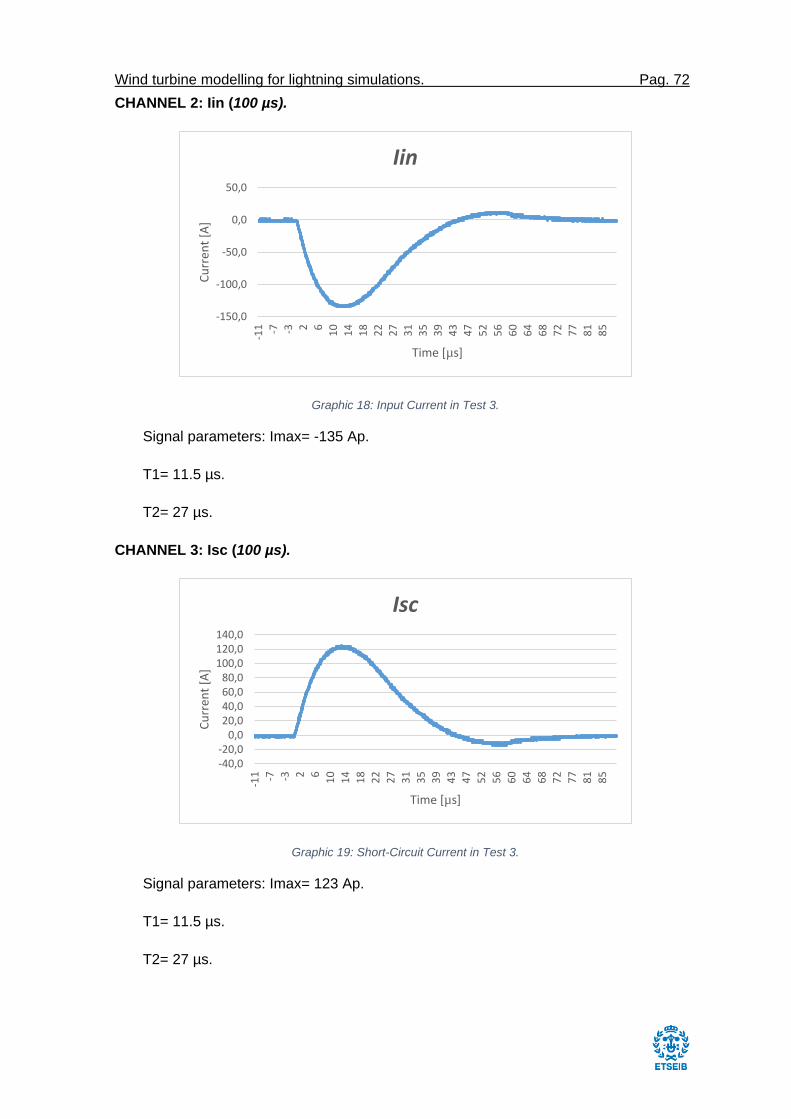
Wind turbine modelling for lightning simulations. Pag. 72
CHANNEL 2: Iin (100 µs).
Graphic 18: Input Current in Test 3.
Signal parameters: Imax= -135 Ap.
T1= 11.5 µs.
T2= 27 µs.
CHANNEL 3: Isc (100 µs).
Graphic 19: Short-Circuit Current in Test 3.
Signal parameters: Imax= 123 Ap.
T1= 11.5 µs.
T2= 27 µs.
-150,0
-100,0
-50,0
0,0
50,0
-11 -7 -3 2 6
10
14
18
22
27
31
35
39
43
47
52
56
60
64
68
72
77
81
85
Cu
rren
t [A
]
Time [µs]
Iin
-40,0-20,0
0,020,040,060,080,0
100,0120,0140,0
-11 -7 -3 2 6
10
14
18
22
27
31
35
39
43
47
52
56
60
64
68
72
77
81
85
Cu
rren
t [A
]
Time [µs]
Isc
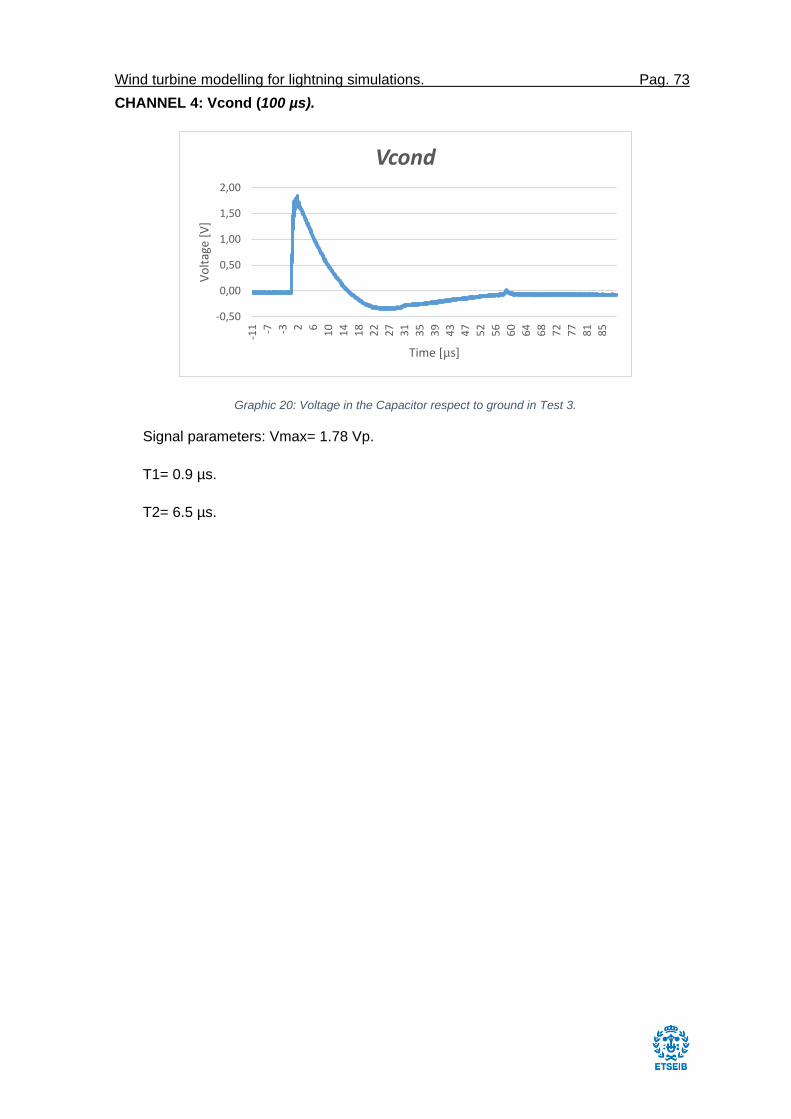
Wind turbine modelling for lightning simulations. Pag. 73
CHANNEL 4: Vcond (100 µs).
Graphic 20: Voltage in the Capacitor respect to ground in Test 3.
Signal parameters: Vmax= 1.78 Vp.
T1= 0.9 µs.
T2= 6.5 µs.
-0,50
0,00
0,50
1,00
1,50
2,00
-11 -7 -3 2 6
10
14
18
22
27
31
35
39
43
47
52
56
60
64
68
72
77
81
85
Vo
ltag
e [V
]
Time [µs]
Vcond
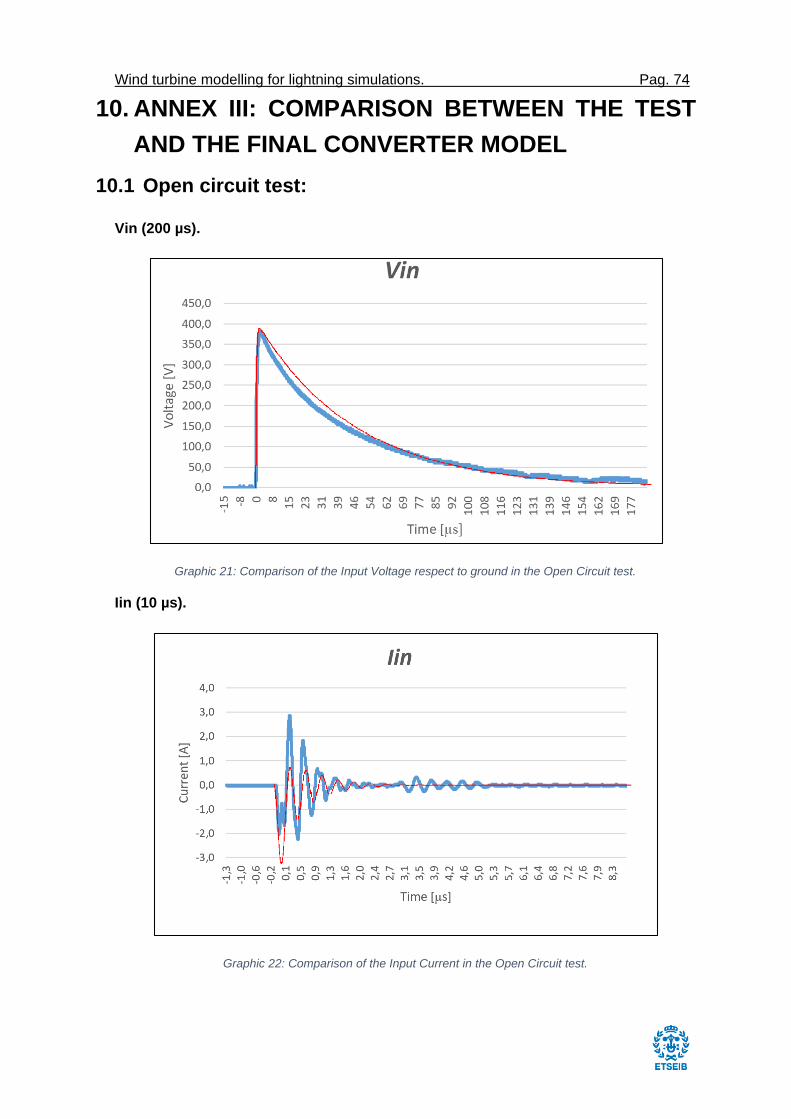
Wind turbine modelling for lightning simulations. Pag. 74
10. ANNEX III: COMPARISON BETWEEN THE TEST
AND THE FINAL CONVERTER MODEL
10.1 Open circuit test:
Vin (200 µs).
Graphic 21: Comparison of the Input Voltage respect to ground in the Open Circuit test.
Iin (10 µs).
Graphic 22: Comparison of the Input Current in the Open Circuit test.
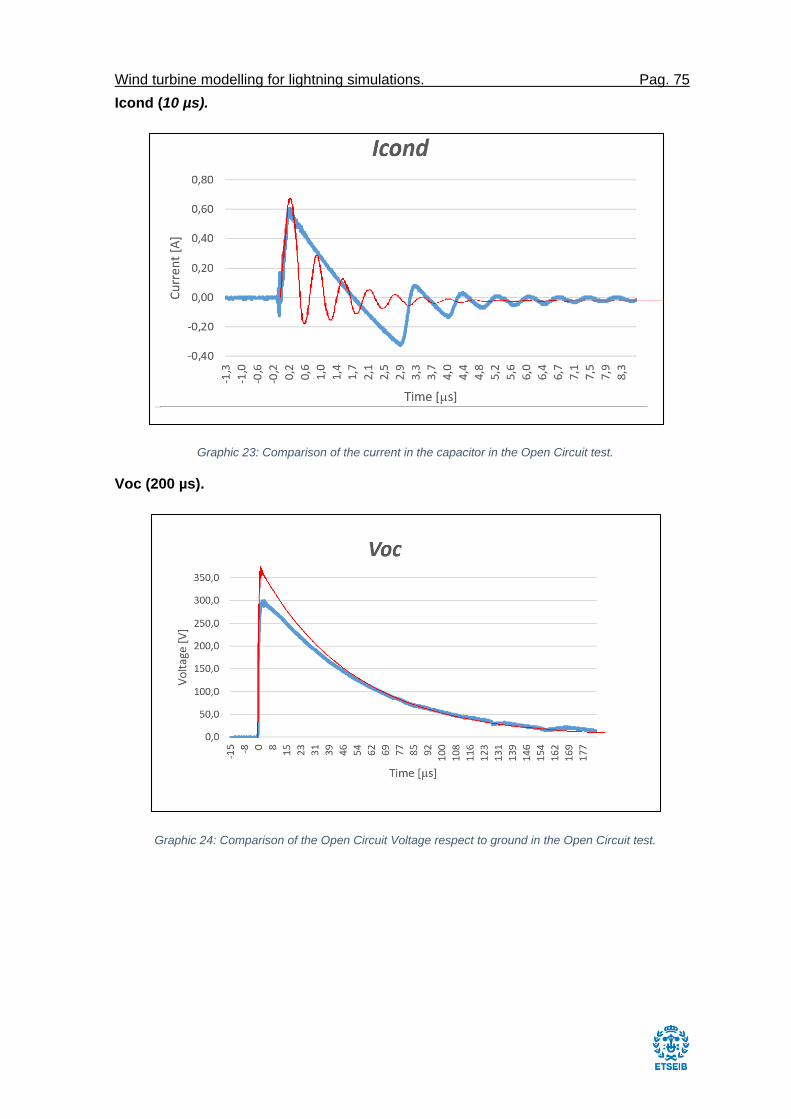
Wind turbine modelling for lightning simulations. Pag. 75
Icond (10 µs).
Graphic 23: Comparison of the current in the capacitor in the Open Circuit test.
Voc (200 µs).
Graphic 24: Comparison of the Open Circuit Voltage respect to ground in the Open Circuit test.
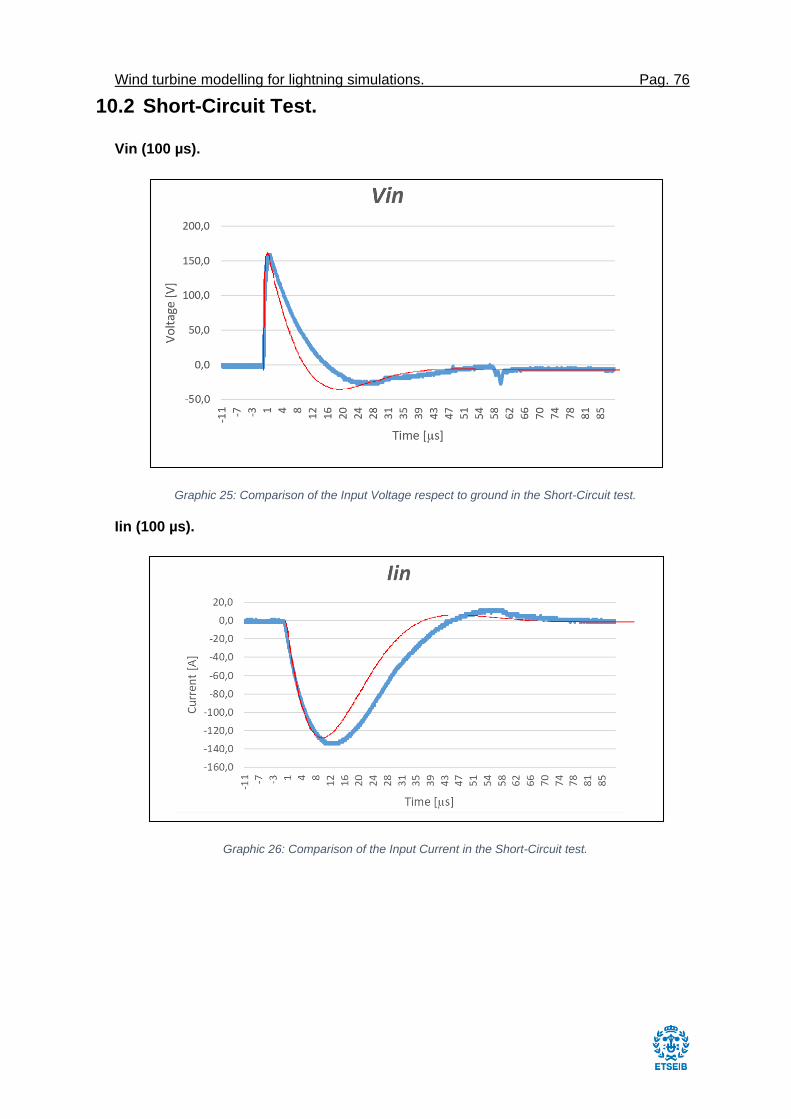
Wind turbine modelling for lightning simulations. Pag. 76
10.2 Short-Circuit Test.
Vin (100 µs).
Graphic 25: Comparison of the Input Voltage respect to ground in the Short-Circuit test.
Iin (100 µs).
Graphic 26: Comparison of the Input Current in the Short-Circuit test.
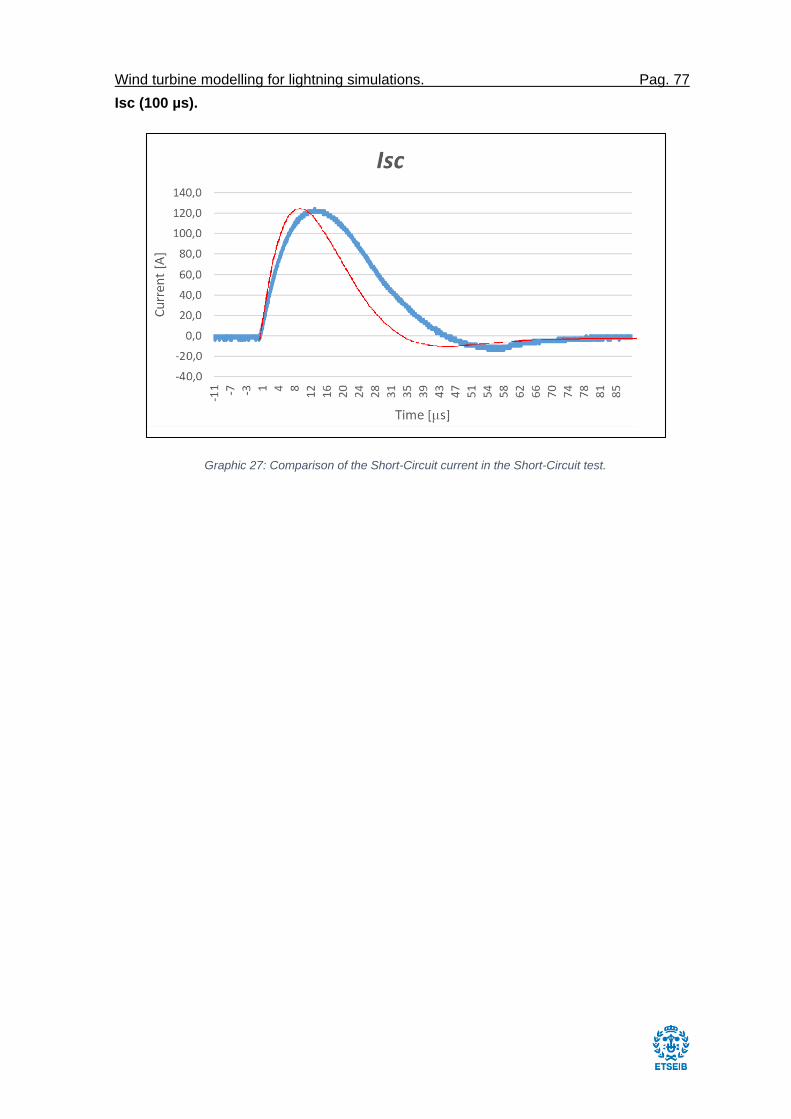
Wind turbine modelling for lightning simulations. Pag. 77
Isc (100 µs).
Graphic 27: Comparison of the Short-Circuit current in the Short-Circuit test.
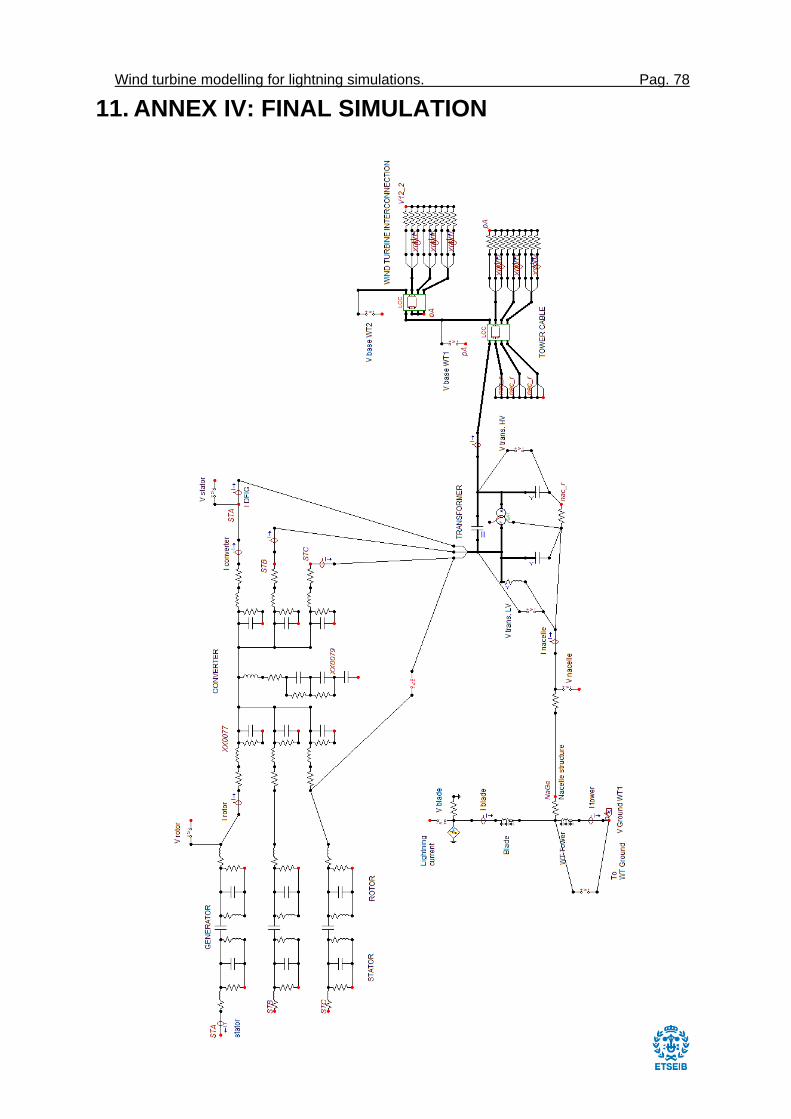
Wind turbine modelling for lightning simulations. Pag. 78
11. ANNEX IV: FINAL SIMULATION
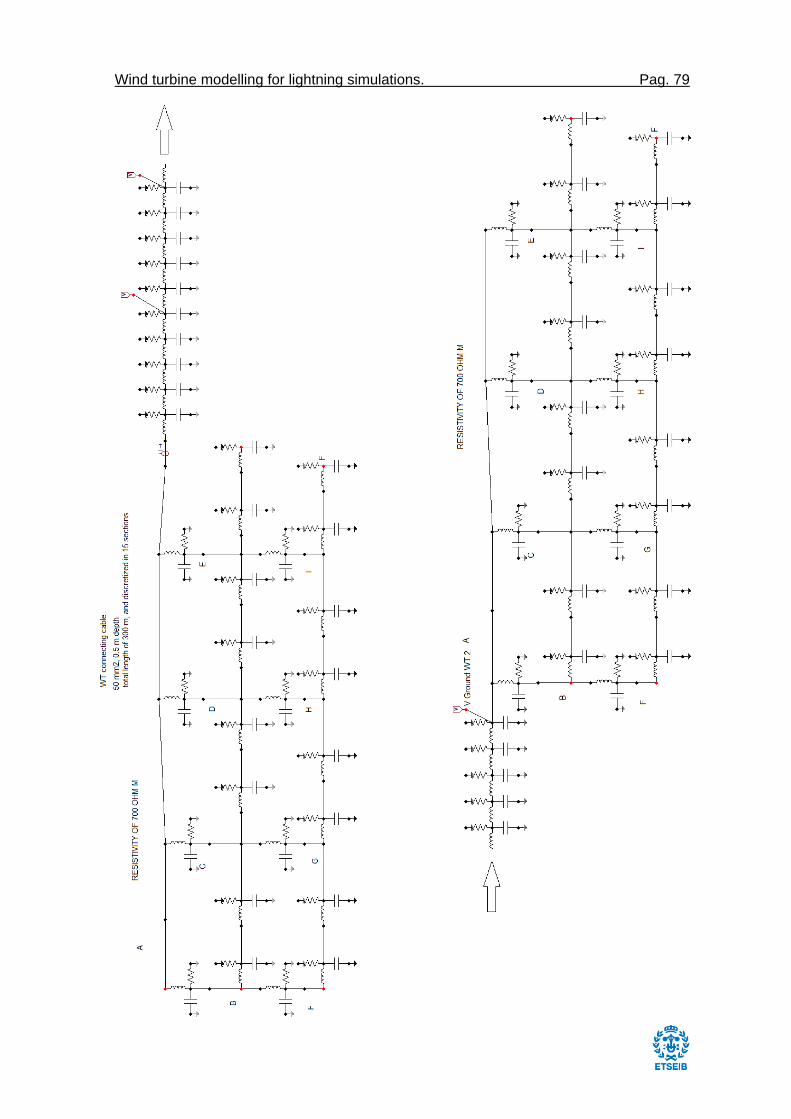
Wind turbine modelling for lightning simulations. Pag. 79