welcome to powerpoint - eva air
TRANSCRIPT
1
Welcome to PowerPoint\
5 tips for a simpler way to work
EVA AIR
2019 Investor Conference
2019.03.29
2
Legal Disclaimer
• The information contained in this presentation, including all forward-
looking information, is subject to change without notice, whether as a
result of new information, further events or otherwise, and EVA Airways
(the “Company”) undertakes no obligation to publicly update or revise
the information contained in this presentation.
• Investors should not regard the above forward-looking information as
legally binding but as information subject to change. No guarantees
regarding the completeness, accuracy, and reliability of information
contained are made explicitly or implicitly. They are not intended to
represent complete statement of the Company, industry or future
development.
3
Outline
• 2018 Business Results
• State of the Airline Industry
• Operating Performance
• Challenges and Prospects
• Operational Planning
• Major Affiliated Enterprises
4
2018 Business Results
5
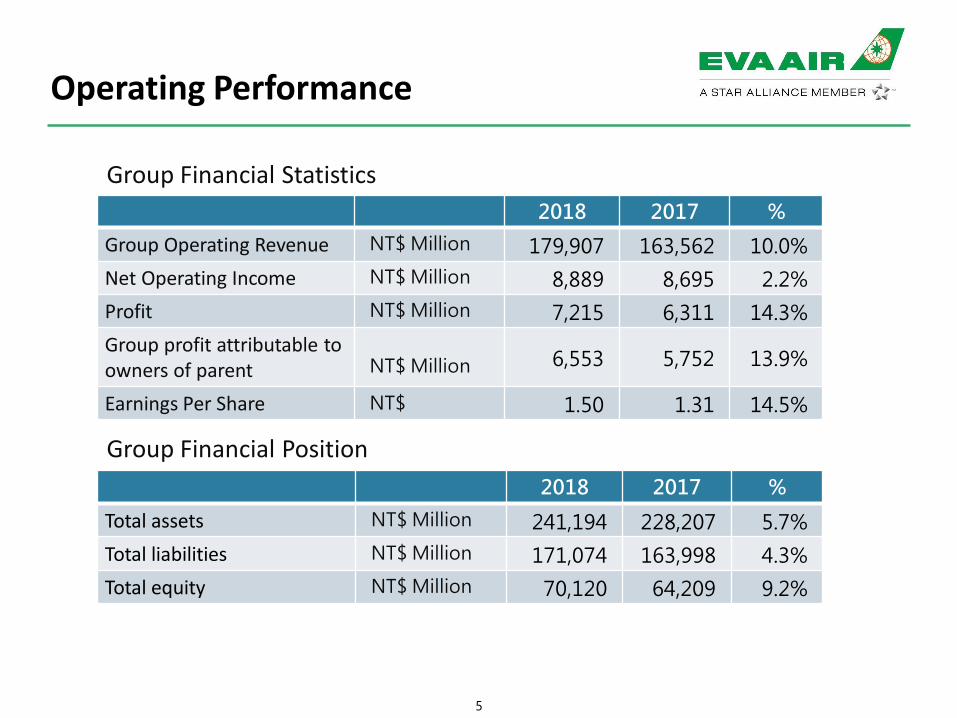
Operating Performance
Group Financial Statistics
2018 2017 %
Group Operating Revenue NT$ Million 179,907 163,562 10.0%
Net Operating Income NT$ Million 8,889 8,695 2.2%
Profit NT$ Million 7,215 6,311 14.3%
Group profit attributable to owners of parent NT$ Million 6,553 5,752 13.9%
Earnings Per Share NT$ 1.50 1.31 14.5%
Group Financial Position
2018 2017 %
Total assets NT$ Million 241,194 228,207 5.7%
Total liabilities NT$ Million 171,074 163,998 4.3%
Total equity NT$ Million 70,120 64,209 9.2%
6
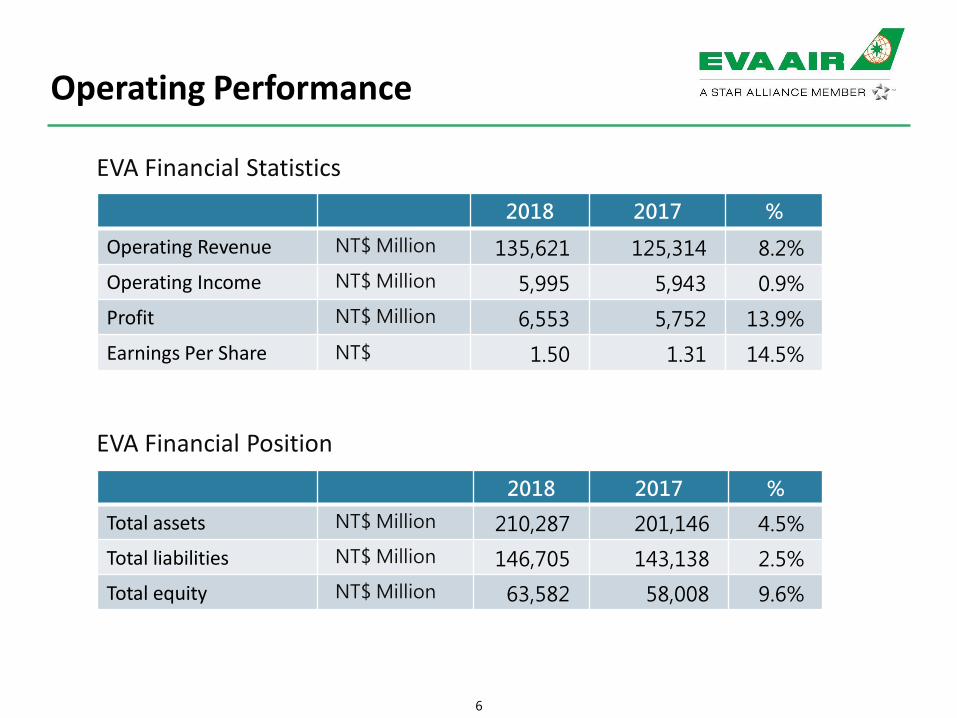
Operating Performance
EVA Financial Statistics
EVA Financial Position
2018 2017 %
Operating Revenue NT$ Million 135,621 125,314 8.2%
Operating Income NT$ Million 5,995 5,943 0.9%
Profit NT$ Million 6,553 5,752 13.9%
Earnings Per Share NT$ 1.50 1.31 14.5%
2018 2017 %
Total assets NT$ Million 210,287 201,146 4.5%
Total liabilities NT$ Million 146,705 143,138 2.5%
Total equity NT$ Million 63,582 58,008 9.6%
7
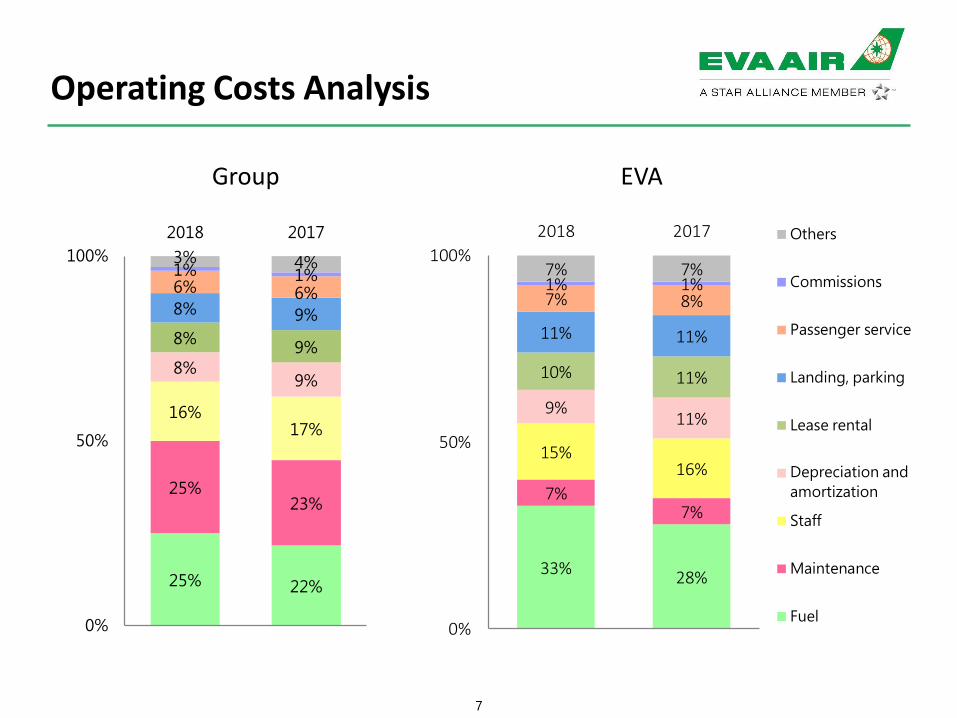
Operating Costs Analysis
Group EVA
33%28%
7%7%
15%16%
9%11%
10% 11%
11% 11%
7% 8%1% 1%7% 7%
0%
50%
100%
2018 2017 Others
Commissions
Passenger service
Landing, parking
Lease rental
Depreciation and
amortization
Staff
Maintenance
Fuel
25% 22%
25%23%
16%17%
8%9%
8%9%
8% 9%
6% 6%
1% 1%3% 4%
0%
50%
100%
2018 2017
8
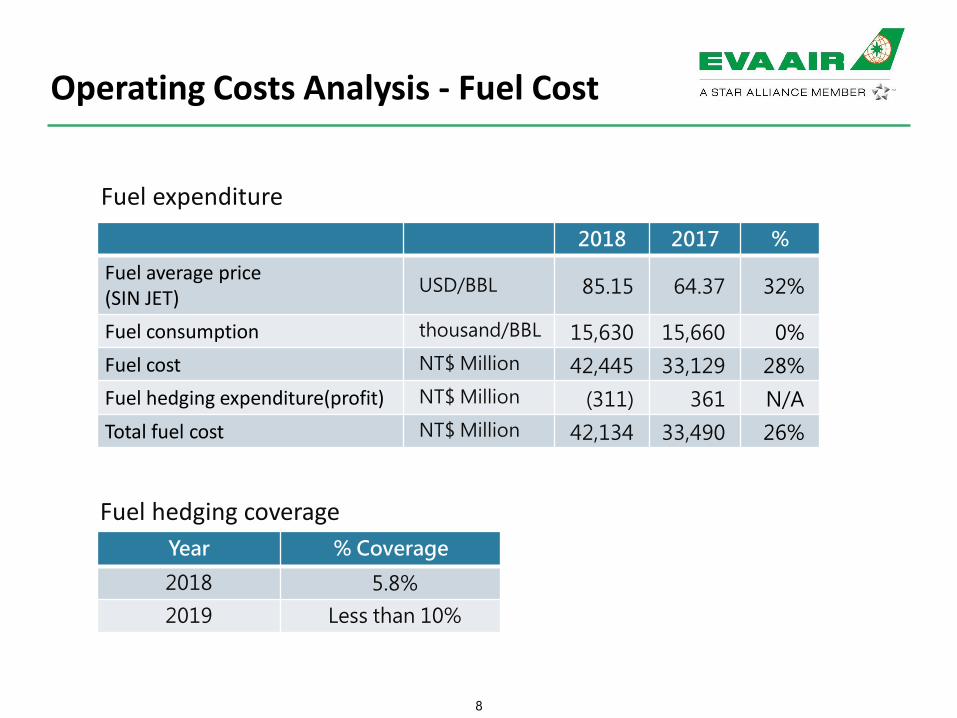
Operating Costs Analysis - Fuel Cost
Fuel expenditure
Fuel hedging coverage
2018 2017 %
Fuel average price(SIN JET)
USD/BBL 85.15 64.37 32%
Fuel consumption thousand/BBL 15,630 15,660 0%
Fuel cost NT$ Million 42,445 33,129 28%
Fuel hedging expenditure(profit) NT$ Million (311) 361 N/A
Total fuel cost NT$ Million 42,134 33,490 26%
Year % Coverage
2018 5.8%
2019 Less than 10%
9
Financial Risk Management-Currency
• The operating revenue of the Company is mainly frominternational passenger, cargo and postal revenue. Foreigncurrency income is sufficient to cover the demand for foreigncurrency expenditure, which is equivalent to the effect of NaturalHedge.
• As for extra expense and demand in foreign currency due to timedifferences, the Company would carry out forward exchangeagreement according to the trend of foreign exchange markets toreduce risk.
10
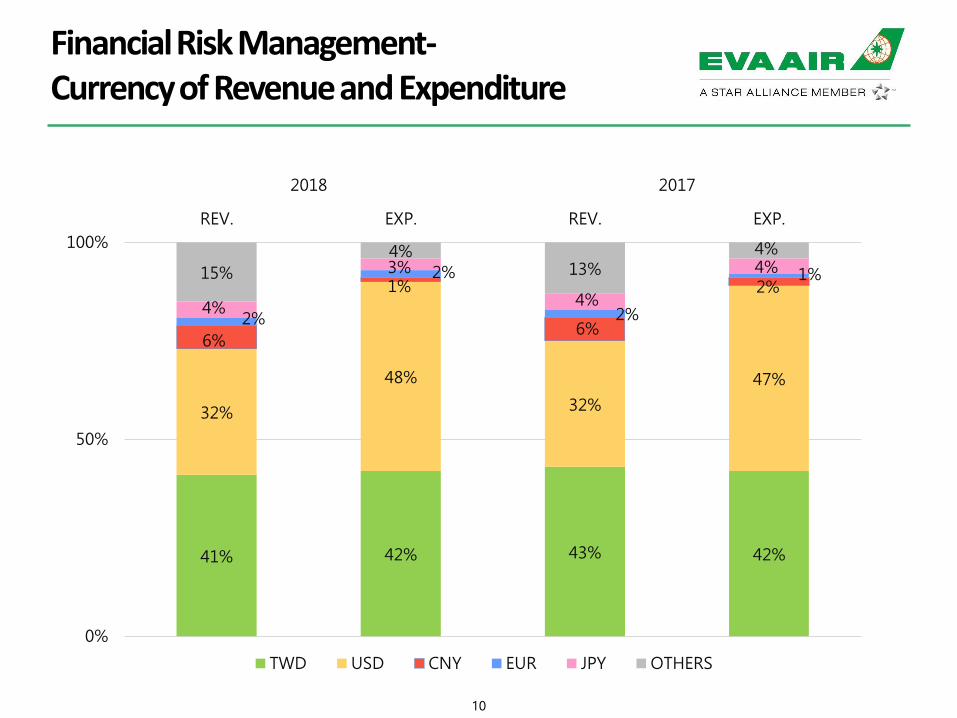
Financial Risk Management-Currency of Revenue and Expenditure
41% 42% 43% 42%
32%
48%
32%
47%
6%
1%
6%
2%
2%
2%
2%
1%
4%
3%
4%
4%15%
4%13%
4%
0%
50%
100%
REV. EXP. REV. EXP.
2018 2017
TWD USD CNY EUR JPY OTHERS
11
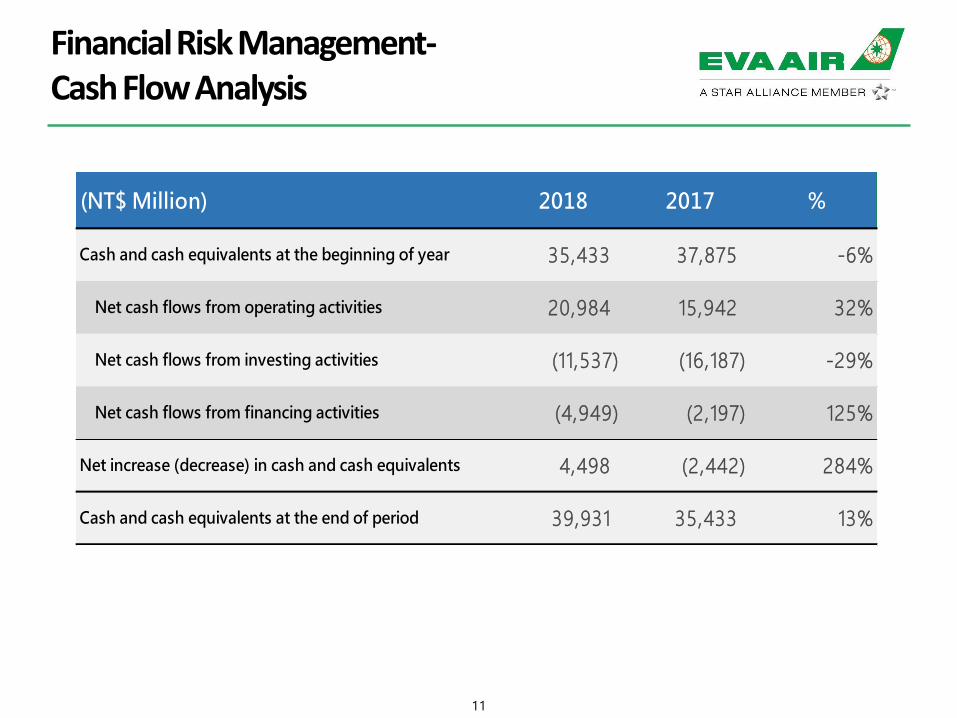
Financial Risk Management-Cash Flow Analysis
(NT$ Million) 2018 2017 %
Cash and cash equivalents at the beginning of year 35,433 37,875 -6%
Net cash flows from operating activities 20,984 15,942 32%
Net cash flows from investing activities (11,537) (16,187) -29%
Net cash flows from financing activities (4,949) (2,197) 125%
Net increase (decrease) in cash and cash equivalents 4,498 (2,442) 284%
Cash and cash equivalents at the end of period 39,931 35,433 13%
12
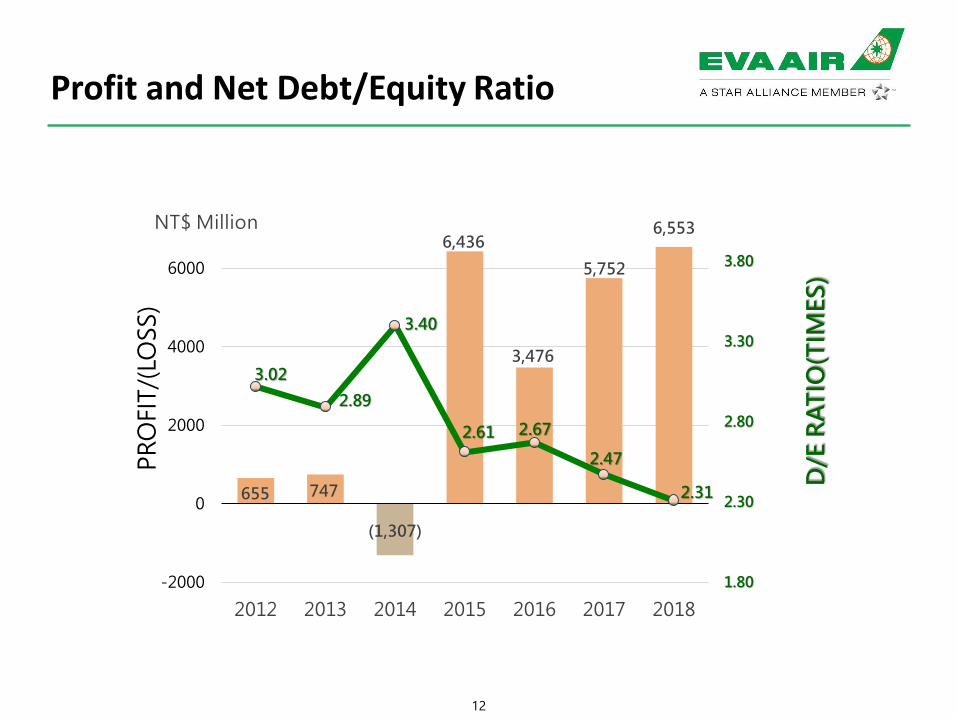
Profit and Net Debt/Equity Ratio
655 747
(1,307)
6,436
3,476
5,752
6,553
3.02
2.89
3.40
2.61 2.67
2.47
2.31
1.80
2.30
2.80
3.30
3.80
-2000
0
2000
4000
6000
2012 2013 2014 2015 2016 2017 2018
D/E
RA
TIO
(TIM
ES
)
PR
OF
IT/(
LOS
S)
NT$ Million
13
State of the Airline Industry
14
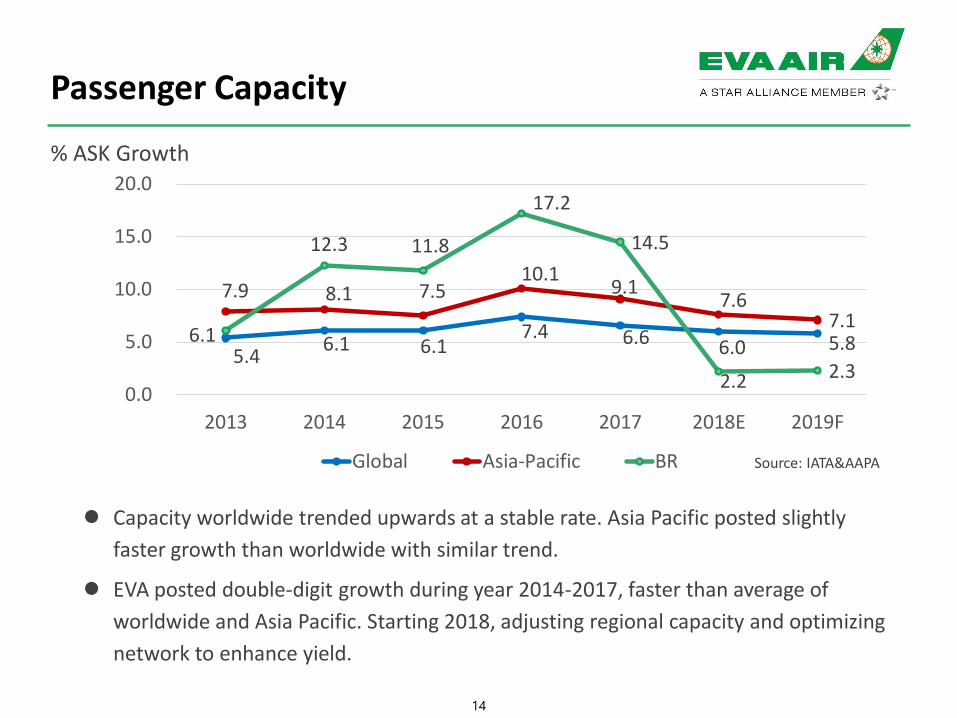
Passenger Capacity
Source: IATA&AAPA
% ASK Growth
Capacity worldwide trended upwards at a stable rate. Asia Pacific posted slightly
faster growth than worldwide with similar trend.
EVA posted double-digit growth during year 2014-2017, faster than average of
worldwide and Asia Pacific. Starting 2018, adjusting regional capacity and optimizing
network to enhance yield.
5.4 6.1 6.1
7.4 6.6 6.0 5.8
7.9 8.1 7.5 10.1
9.1 7.6
7.1 6.1
12.3 11.8
17.2
14.5
2.2 2.3 0.0
5.0
10.0
15.0
20.0
2013 2014 2015 2016 2017 2018E 2019F
Global Asia-Pacific BR
15
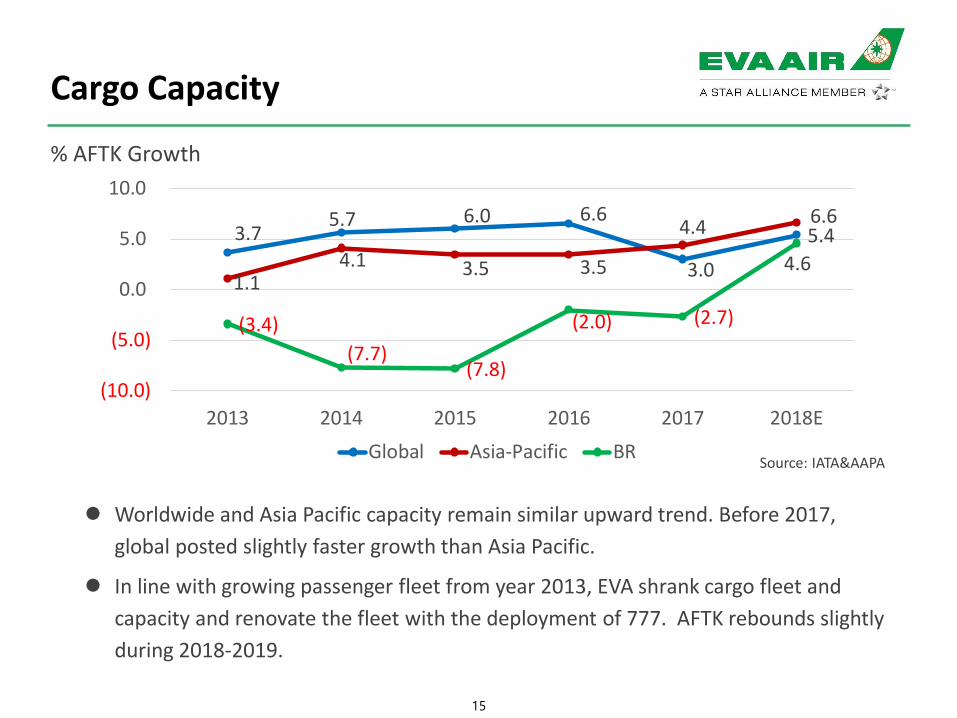
Cargo Capacity
Source: IATA&AAPA
% AFTK Growth
Worldwide and Asia Pacific capacity remain similar upward trend. Before 2017,
global posted slightly faster growth than Asia Pacific.
In line with growing passenger fleet from year 2013, EVA shrank cargo fleet and
capacity and renovate the fleet with the deployment of 777. AFTK rebounds slightly
during 2018-2019.
3.7 5.7 6.0 6.6
3.0
5.4
1.1 4.1 3.5 3.5
4.4 6.6
(3.4)
(7.7)(7.8)
(2.0) (2.7)
4.6
(10.0)
(5.0)
0.0
5.0
10.0
2013 2014 2015 2016 2017 2018E
Global Asia-Pacific BR
16
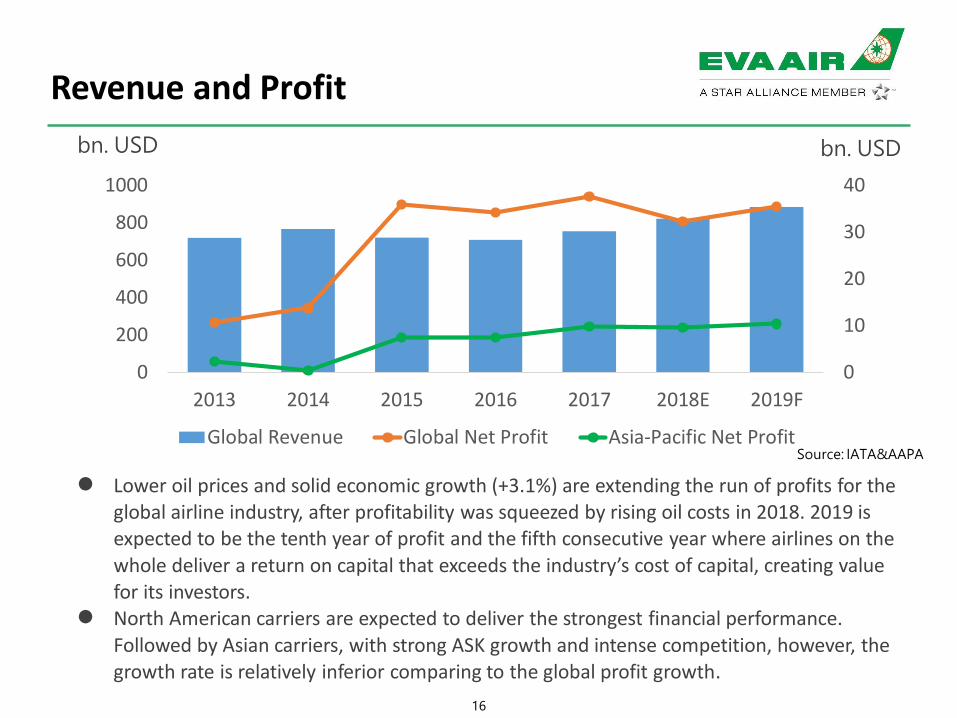
Revenue and Profit
Source: IATA&AAPA
Lower oil prices and solid economic growth (+3.1%) are extending the run of profits for the global airline industry, after profitability was squeezed by rising oil costs in 2018. 2019 is expected to be the tenth year of profit and the fifth consecutive year where airlines on the
whole deliver a return on capital that exceeds the industry’s cost of capital, creating value for its investors.
North American carriers are expected to deliver the strongest financial performance.
Followed by Asian carriers, with strong ASK growth and intense competition, however, the growth rate is relatively inferior comparing to the global profit growth.
bn. USD bn. USD
0
10
20
30
40
0
200
400
600
800
1000
2013 2014 2015 2016 2017 2018E 2019F
Global Revenue Global Net Profit Asia-Pacific Net Profit
17
Industry Development
Capacity Growing
1. Global airlines continue to grow in fleet number, capacity and volume.
2. Several airports expand the scale to strive for more transit passengers.
3. Low cost carriers start constructing network, entering medium to long-haul service.
Product Improving
1. New generation aircraft model with highly efficient performance, accelerates the
development of long-haul direct flights.
2. Full-service airlines continue to enhance facilities and services to secure premium market.
3. Premium economy class, firstly introduced by EVA, becomes the mainstream product in
the industry
Business Model
1. Full-service airlines start to provide custom-made fare product.
2. Full-service airlines are introducing diversified ancillary service options to increase
revenue.
3. Deepening airline partnerships to improve competitiveness.
18
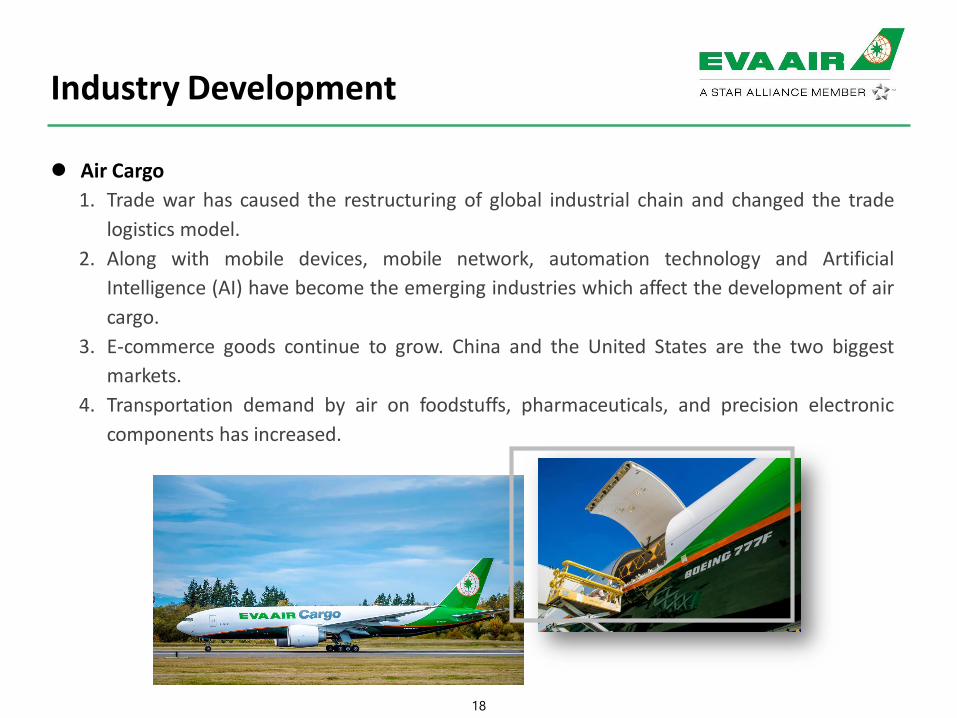
Industry Development
Air Cargo
1. Trade war has caused the restructuring of global industrial chain and changed the trade
logistics model.
2. Along with mobile devices, mobile network, automation technology and Artificial
Intelligence (AI) have become the emerging industries which affect the development of air
cargo.
3. E-commerce goods continue to grow. China and the United States are the two biggest
markets.
4. Transportation demand by air on foodstuffs, pharmaceuticals, and precision electronic
components has increased.
19
Operating Performance
20
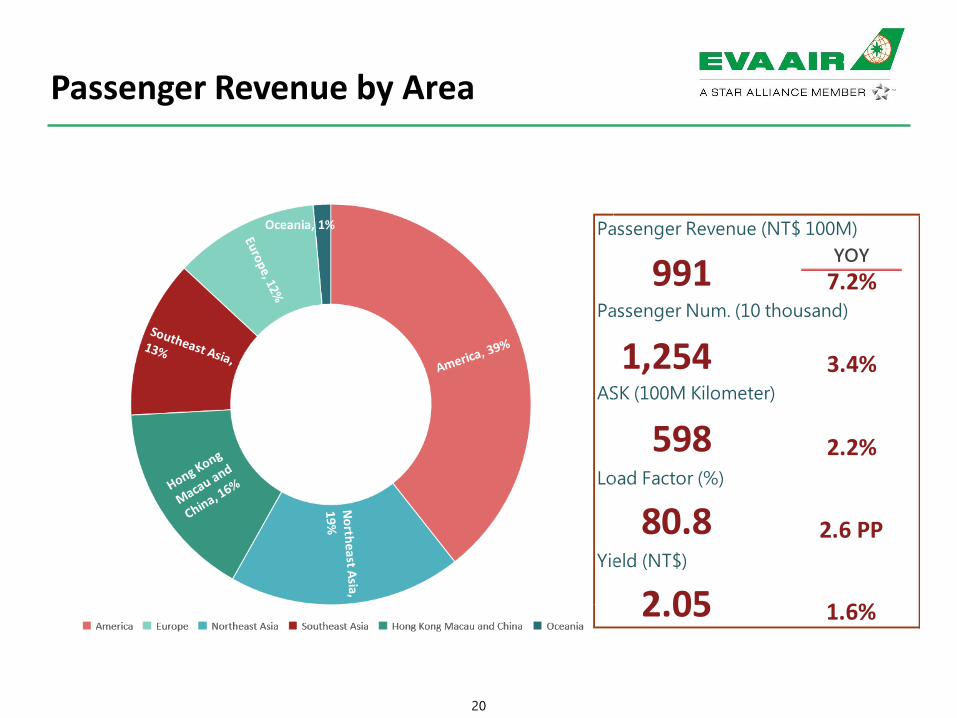
Passenger Revenue by Area
Passenger Revenue (NT$ 100M)
YOY
7.2%Passenger Num. (10 thousand)
3.4%ASK (100M Kilometer)
2.2%Load Factor (%)
2.6 PPYield (NT$)
1.6%
991
1,254
598
80.8
2.05
Oceania, 1%
21
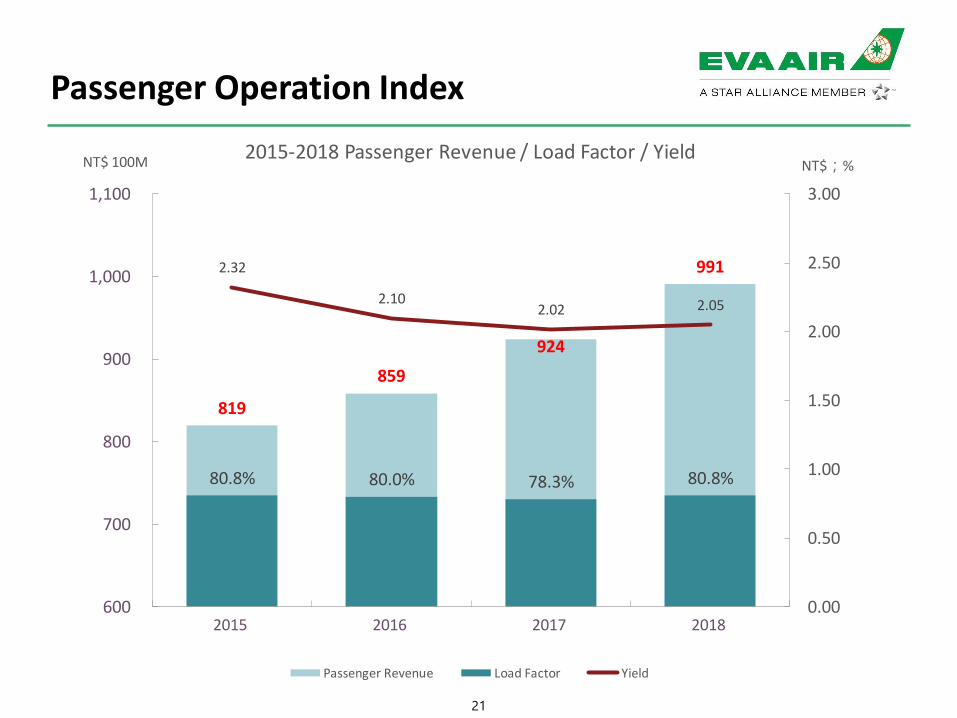
Passenger Operation Index
819
859
924
991
80.8% 80.0% 78.3% 80.8%
2.32
2.10 2.02 2.05
0.00
0.50
1.00
1.50
2.00
2.50
3.00
600
700
800
900
1,000
1,100
2015 2016 2017 2018
NT$;%NT$ 100M2015-2018 Passenger Revenue / Load Factor / Yield
Passenger Revenue Load Factor Yield
22
IATA statistics shows passenger numbers increased to 4.3 billion in 2018 indicating that RPKs
rose by 6.5% while Asia-Pacific airlines’ 2018 traffic rose 8.5%, compared to 2017, driven by
robust regional economic expansion.
North America
1. Asian airlines launched non-stop trans-pacific routes, and ASKs of trans-pacific
increased by 2% YOY in 2018.
2. EVA’s load factor edged up 3.3 pp with passenger yield climbed 4%.
Europe
1. Strong passenger demand leaded to 13% growth but the average fare decreased
rapidly due to intensifying competition.
2. Passengers carried by EVA increased 13% by additional non-stop flights
Northeast Asia
1. Despite the impact by typhoon in Kansai and earthquake in Sapporo, the total
passenger traffic still increased by 5%.
2. Profitability of FSC is under pressure of the accelerating expansion of LCC.
Passenger Operation Overview
23
Passenger Operation Overview
Southeast Asia
1. Facilitated by strong passenger demand, capacity continued to grow.
2. Although Asian carriers continued to launch ultra long non-stop flight to N. America,
EVA still grew 7% in transfer passengers between N. America and S.E. Asia.
3. EVA passenger volume increased by 6% with passenger yield rising by 4%.
Oceanian
1. Demand between high and low season is significant, indicating oversupply in low
season.
2. EVA adapted its frequency to the demand to maximize its load factor.
China
1. China visitors have been constrained by cross-straits relation.
2. Average load factor maintained high above 80% at China first-tier cities given the
stable market demand.
24
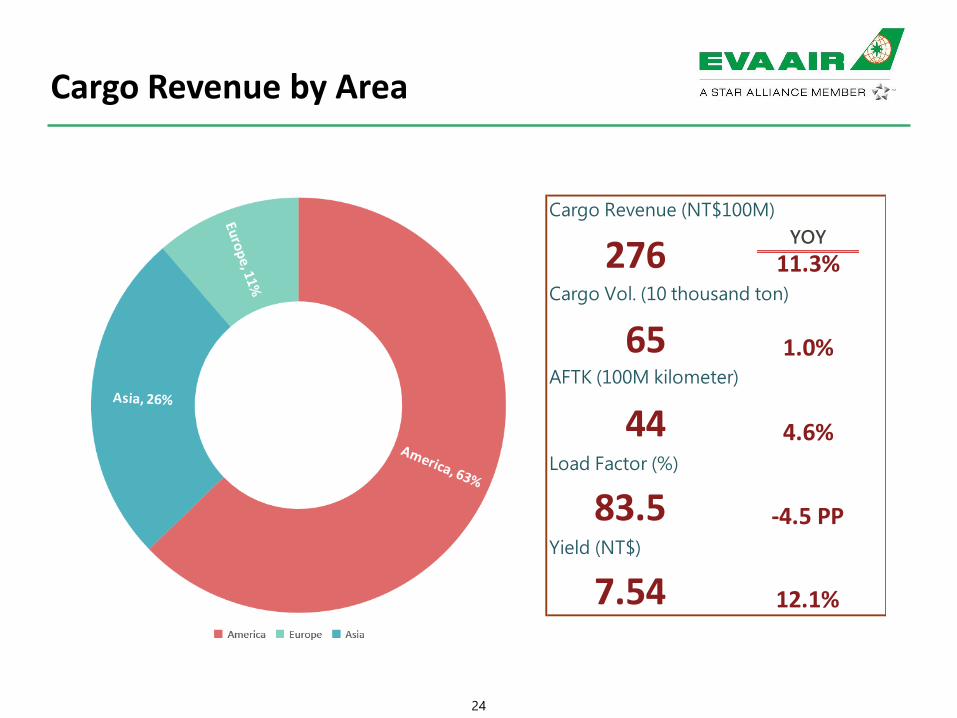
Cargo Revenue by Area
Cargo Revenue (NT$100M)
YOY
11.3%Cargo Vol. (10 thousand ton)
1.0%AFTK (100M kilometer)
4.6%Load Factor (%)
-4.5 PPYield (NT$)
12.1%
276
65
44
83.5
7.54
25
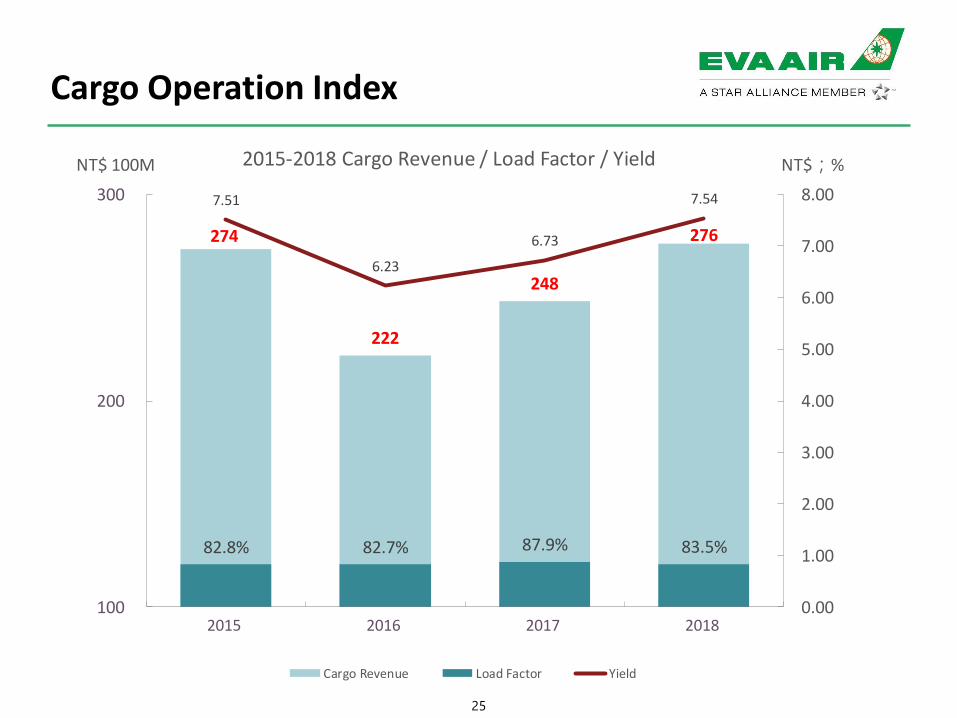
Cargo Operation Index
274
222
248
276
82.8% 82.7% 87.9% 83.5%
7.51
6.23
6.73
7.54
0.00
1.00
2.00
3.00
4.00
5.00
6.00
7.00
8.00
100
200
300
2015 2016 2017 2018
NT$;%NT$ 100M 2015-2018 Cargo Revenue / Load Factor / Yield
Cargo Revenue Load Factor Yield
26
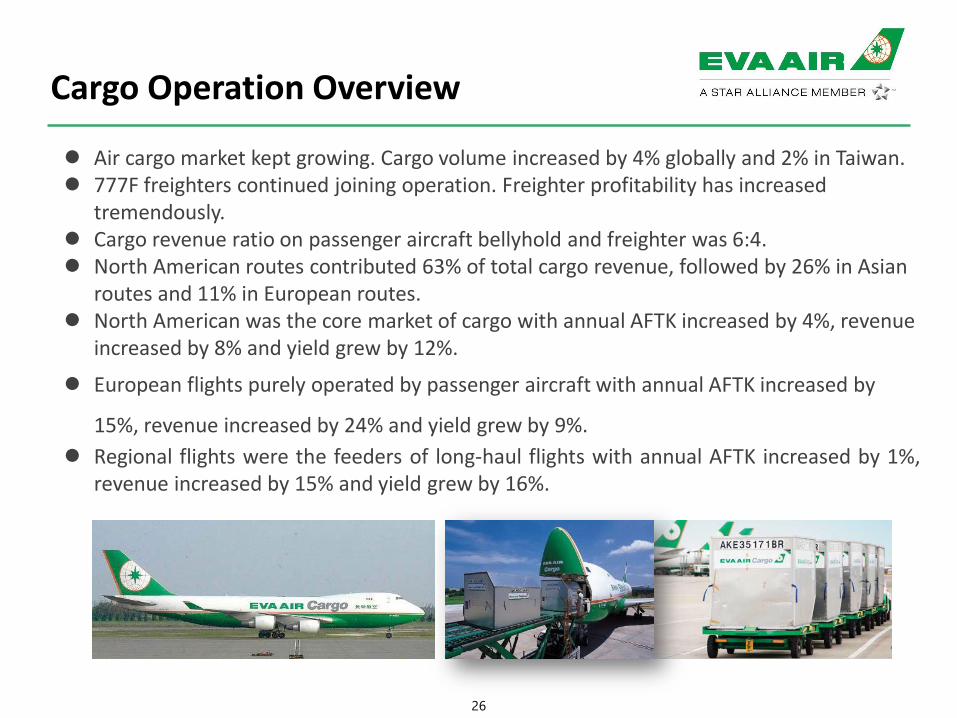
Cargo Operation Overview
Air cargo market kept growing. Cargo volume increased by 4% globally and 2% in Taiwan. 777F freighters continued joining operation. Freighter profitability has increased
tremendously. Cargo revenue ratio on passenger aircraft bellyhold and freighter was 6:4. North American routes contributed 63% of total cargo revenue, followed by 26% in Asian
routes and 11% in European routes. North American was the core market of cargo with annual AFTK increased by 4%, revenue
increased by 8% and yield grew by 12%.
European flights purely operated by passenger aircraft with annual AFTK increased by
15%, revenue increased by 24% and yield grew by 9%.
Regional flights were the feeders of long-haul flights with annual AFTK increased by 1%,revenue increased by 15% and yield grew by 16%.
27
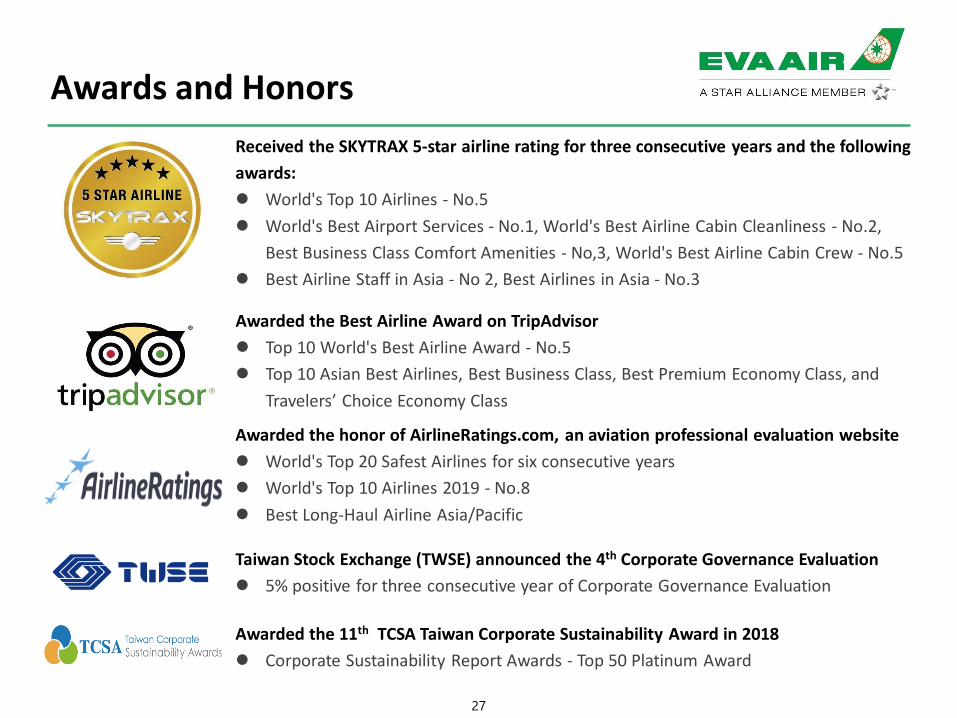
Awards and Honors
Received the SKYTRAX 5-star airline rating for three consecutive years and the following
awards:
World's Top 10 Airlines - No.5
World's Best Airport Services - No.1, World's Best Airline Cabin Cleanliness - No.2,
Best Business Class Comfort Amenities - No,3, World's Best Airline Cabin Crew - No.5
Best Airline Staff in Asia - No 2, Best Airlines in Asia - No.3
Awarded the Best Airline Award on TripAdvisor
Top 10 World's Best Airline Award - No.5
Top 10 Asian Best Airlines, Best Business Class, Best Premium Economy Class, and
Travelers’ Choice Economy Class
Awarded the honor of AirlineRatings.com, an aviation professional evaluation website
World's Top 20 Safest Airlines for six consecutive years
World's Top 10 Airlines 2019 - No.8
Best Long-Haul Airline Asia/Pacific
Awarded the 11th TCSA Taiwan Corporate Sustainability Award in 2018
Corporate Sustainability Report Awards - Top 50 Platinum Award
Taiwan Stock Exchange (TWSE) announced the 4th Corporate Governance Evaluation
5% positive for three consecutive year of Corporate Governance Evaluation
28
Challenges and Prospects
29
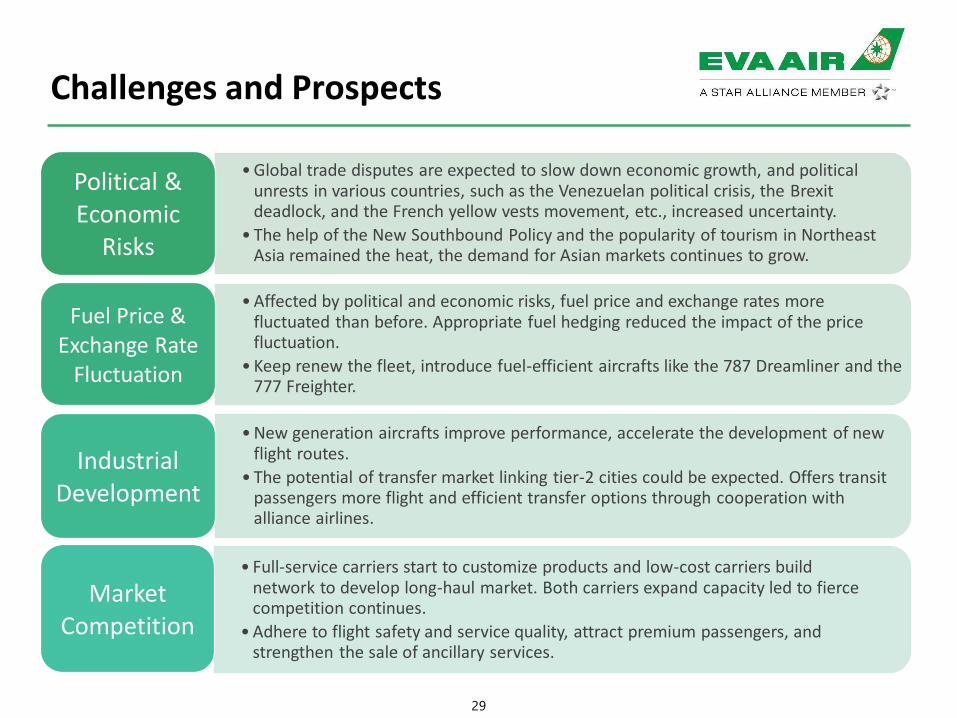
Challenges and Prospects
• Global trade disputes are expected to slow down economic growth, and political unrests in various countries, such as the Venezuelan political crisis, the Brexitdeadlock, and the French yellow vests movement, etc., increased uncertainty.
• The help of the New Southbound Policy and the popularity of tourism in Northeast Asia remained the heat, the demand for Asian markets continues to grow.
Political & Economic
Risks
• Affected by political and economic risks, fuel price and exchange rates more fluctuated than before. Appropriate fuel hedging reduced the impact of the price fluctuation.
• Keep renew the fleet, introduce fuel-efficient aircrafts like the 787 Dreamliner and the 777 Freighter.
Fuel Price & Exchange Rate
Fluctuation
• New generation aircrafts improve performance, accelerate the development of new flight routes.
• The potential of transfer market linking tier-2 cities could be expected. Offers transit passengers more flight and efficient transfer options through cooperation with alliance airlines.
Industrial Development
• Full-service carriers start to customize products and low-cost carriers build network to develop long-haul market. Both carriers expand capacity led to fierce competition continues.
• Adhere to flight safety and service quality, attract premium passengers, and strengthen the sale of ancillary services.
Market Competition
30
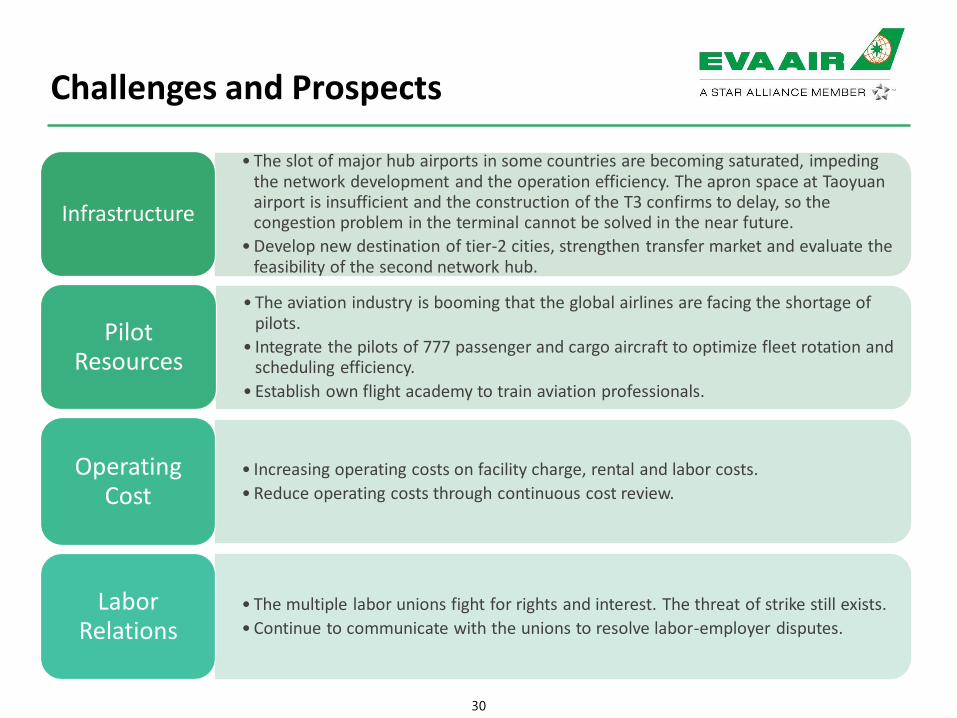
Challenges and Prospects
• The slot of major hub airports in some countries are becoming saturated, impeding the network development and the operation efficiency. The apron space at Taoyuanairport is insufficient and the construction of the T3 confirms to delay, so the congestion problem in the terminal cannot be solved in the near future.
• Develop new destination of tier-2 cities, strengthen transfer market and evaluate the feasibility of the second network hub.
Infrastructure
• The aviation industry is booming that the global airlines are facing the shortage of pilots.
• Integrate the pilots of 777 passenger and cargo aircraft to optimize fleet rotation and scheduling efficiency.
• Establish own flight academy to train aviation professionals.
Pilot Resources
• Increasing operating costs on facility charge, rental and labor costs.
• Reduce operating costs through continuous cost review.
Operating Cost
• The multiple labor unions fight for rights and interest. The threat of strike still exists.
• Continue to communicate with the unions to resolve labor-employer disputes.
Labor Relations
31
Operational Planning
32
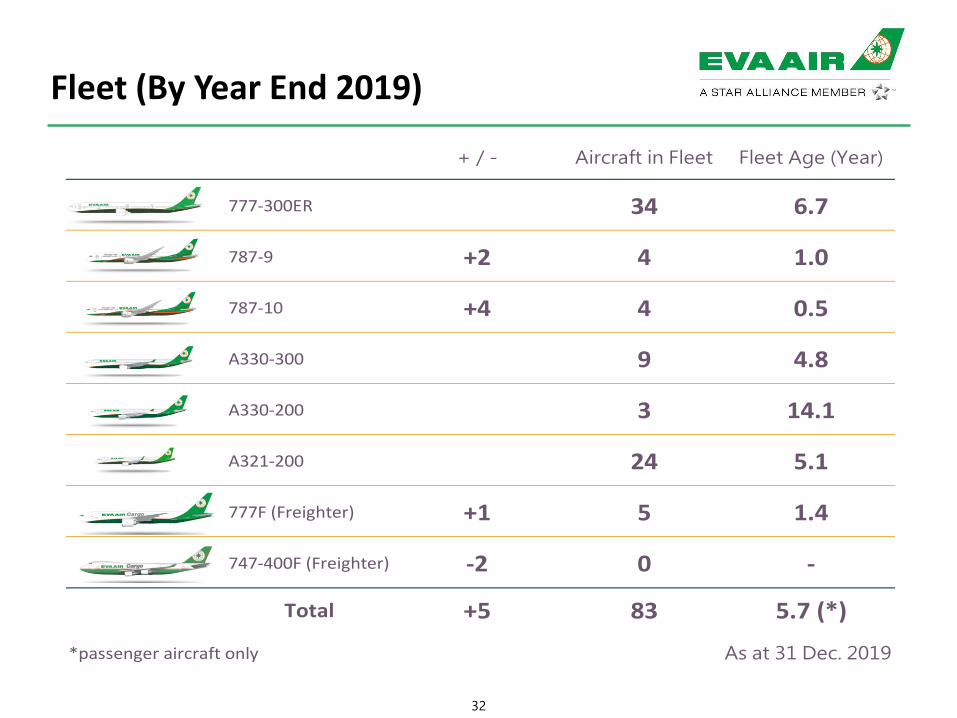
Fleet (By Year End 2019)
+ / - Aircraft in Fleet Fleet Age (Year)
777-300ER 34 6.7
787-9 +2 4 1.0
787-10 +4 4 0.5
A330-300 9 4.8
A330-200 3 14.1
A321-200 24 5.1
777F (Freighter) +1 5 1.4
747-400F (Freighter) -2 0 -
Total +5 83 5.7 (*)
*passenger aircraft only As at 31 Dec. 2019
33
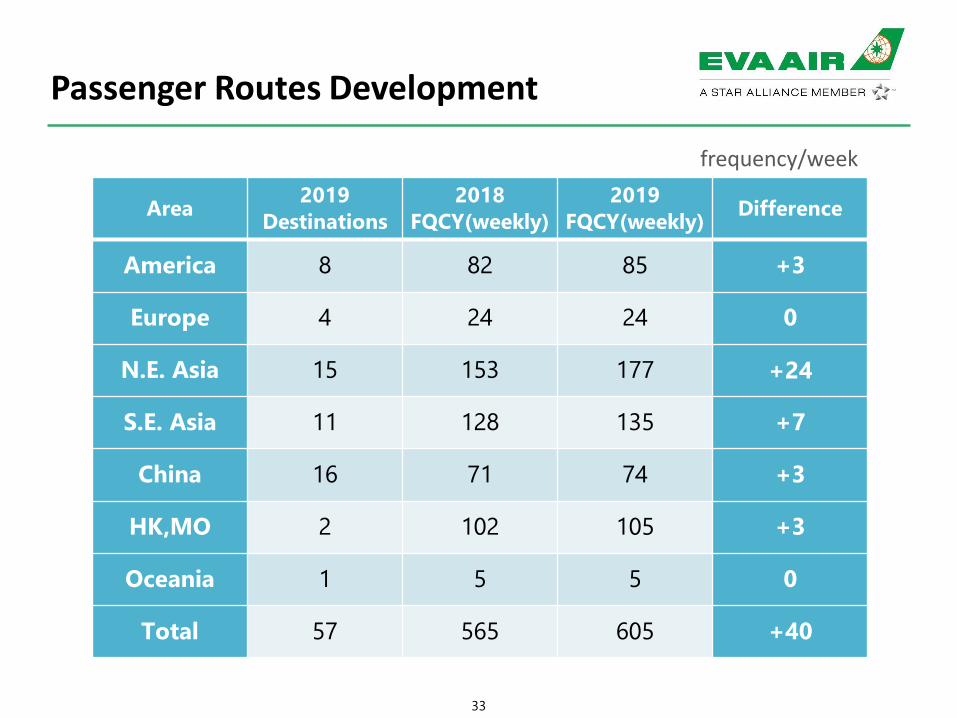
Passenger Routes Development
frequency/week
Area2019
Destinations
2018
FQCY(weekly)
2019
FQCY(weekly)Difference
America 8 82 85 +3
Europe 4 24 24 0
N.E. Asia 15 153 177 +24
S.E. Asia 11 128 135 +7
China 16 71 74 +3
HK,MO 2 102 105 +3
Oceania 1 5 5 0
Total 57 565 605 +40
34
frequency/week
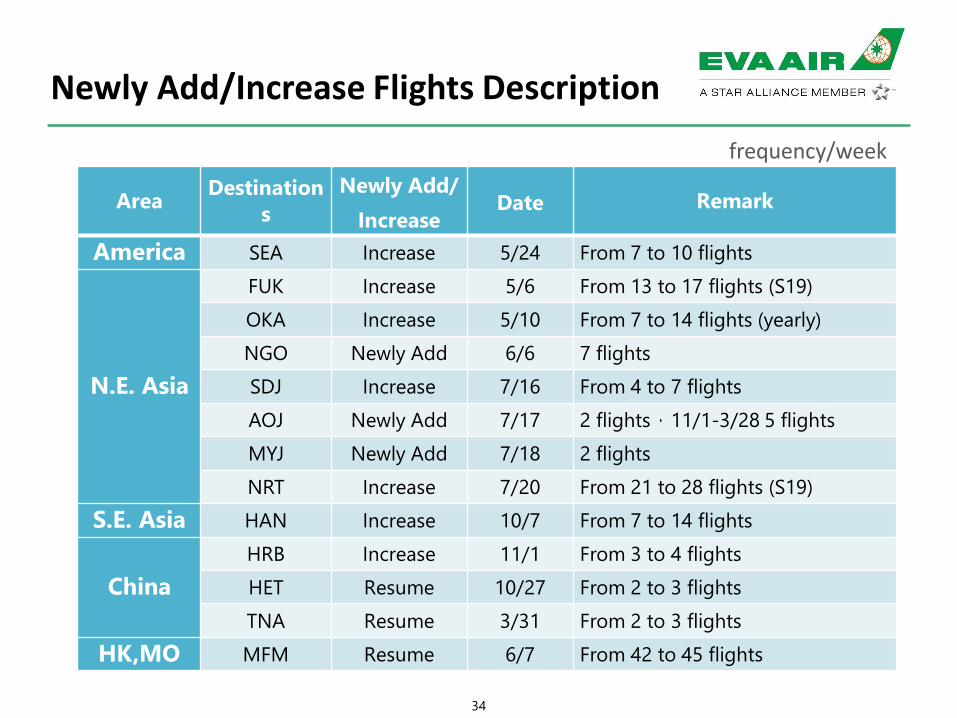
Newly Add/Increase Flights Description
AreaDestination
s
Newly Add/
IncreaseDate Remark
America SEA Increase 5/24 From 7 to 10 flights
N.E. Asia
FUK Increase 5/6 From 13 to 17 flights (S19)
OKA Increase 5/10 From 7 to 14 flights (yearly)
NGO Newly Add 6/6 7 flights
SDJ Increase 7/16 From 4 to 7 flights
AOJ Newly Add 7/17 2 flights,11/1-3/28 5 flights
MYJ Newly Add 7/18 2 flights
NRT Increase 7/20 From 21 to 28 flights (S19)
S.E. Asia HAN Increase 10/7 From 7 to 14 flights
China
HRB Increase 11/1 From 3 to 4 flights
HET Resume 10/27 From 2 to 3 flights
TNA Resume 3/31 From 2 to 3 flights
HK,MO MFM Resume 6/7 From 42 to 45 flights
35
Passenger Business Strategy
Regional capacity expansion, Strength hub and spoke
1. Increase flight frequency in North-East Asia cities (TYO, OSA, FUK, SDJ, OKA).
2. Expand new schedule destinations: NGO, MYJ, AOJ
3. Increase flight frequency in South-East Asia cities (HAN, PNH, CNX, CEB, MNL).
Scheduling optimization, Profit maximization
1. Utilize 787 new generation aircraft in heavy traffic and mid-long-haul flights to enhance
competitive advantage.
2. Reduce long-haul flights in low season and switch to profitable regional routes and
seasonal charter to match market demand.
Proactive market strategies , Maximize target revenue.
1. Launching new fare management module offers diversified fare types tailored to different
customer demand.
2. Introducing ancillary services and new revenue management system to generate more
revenue resources.
3. Elevate brand and product awareness through sports and events.
36
Passenger Business Strategy
Catch up with the trend of digitalization and enhance the use of E-commerce
1. The mobile platform continues to support more languages to expand the coverage of
services.
2. The new website project focuses on cross-platform compatibility, enhancing user
experience, functions, and visual layouts.
3. Continuous cultivating the social media to promote brand and products.
4. Analyzing customer data to target specific audiences and explore potential customers.
Elevate member benefits by Frequent Flyer program adjustment
1. Distinct two types of miles which make the program more flexible and attractive.
2. More opportunities of card tier upgrade and encourage more revenue contribution
from members.
3. Premium members are able to earn extra miles to differentiate themselves from regular
members.
4. Differentiate upgrade criteria according to fare products to motivate members purchase
premium fares.
37
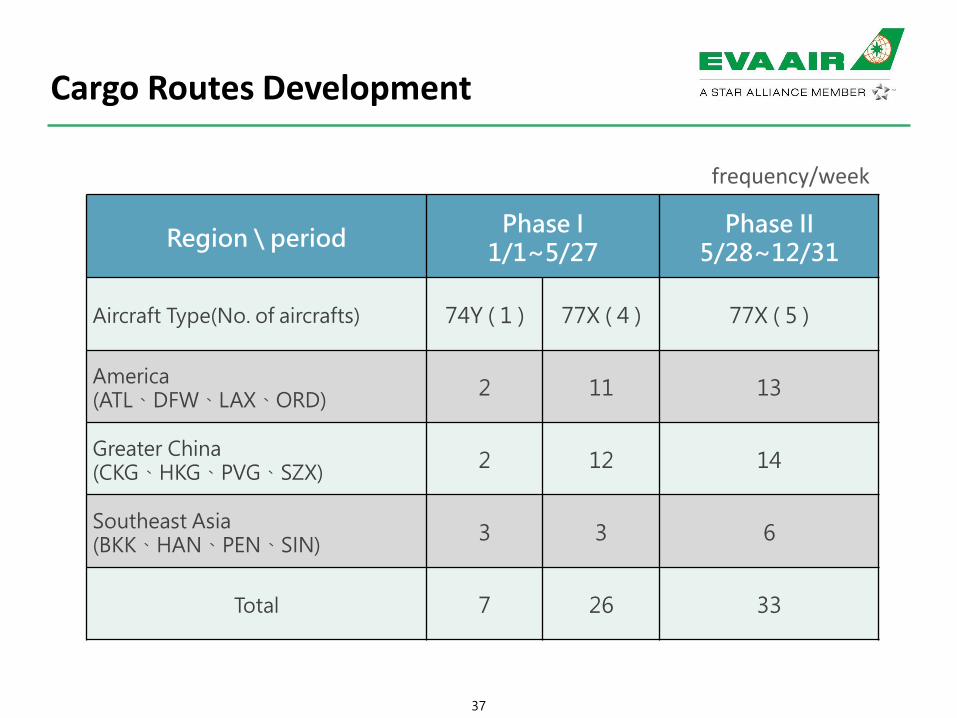
Cargo Routes Development
frequency/week
Region \ periodPhase I
1/1~5/27Phase II
5/28~12/31
Aircraft Type(No. of aircrafts) 74Y ( 1 ) 77X ( 4 ) 77X ( 5 )
America(ATL、DFW、LAX、ORD)
2 11 13
Greater China(CKG、HKG、PVG、SZX)
2 12 14
Southeast Asia(BKK、HAN、PEN、SIN)
3 3 6
Total 7 26 33
38
Cargo Business Strategy
To flexibly adjust freighter routes in response to the shifting of manufacturerproduction due to trade conflicts.
To enhance the bellyhold sales of passenger aircraft on the new route and additionalfrequency on current route.
To receive the fifth high efficient 777F freighter and intensify North America freighternetwork as well as secure revenue on core routes.
To continuously enhance the service quality of high yield freights such as cold chain,express and e-commerce goods.
39
EVA’s 787 Dreamliner~The Smile in the Sky
40
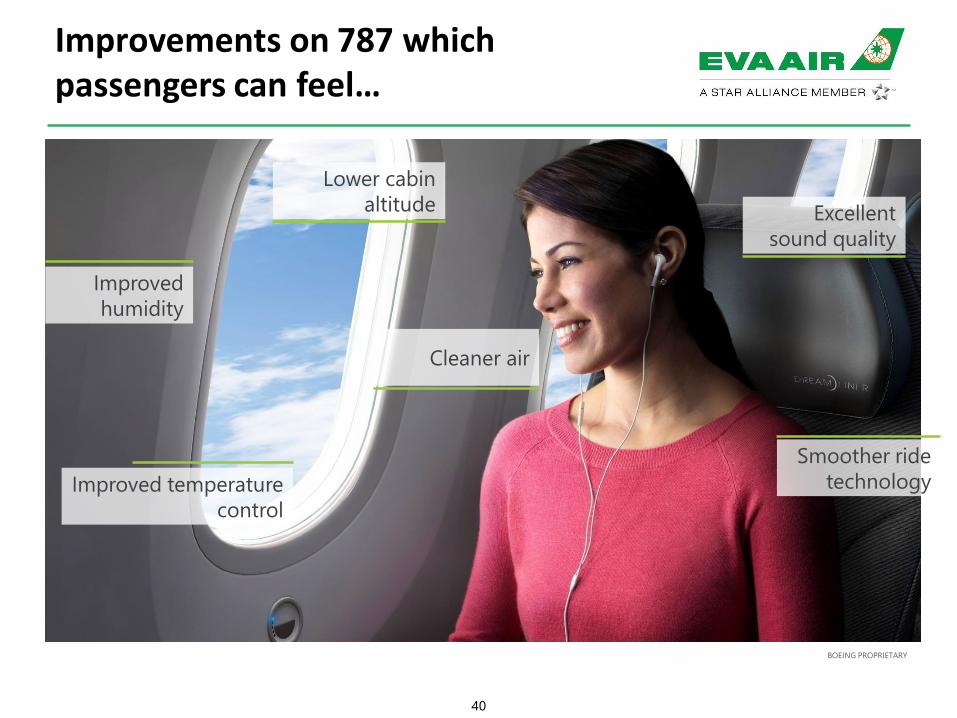
Improvements on 787 which passengers can feel…
Lower cabin
altitude Excellent
sound quality
Cleaner air
Smoother ride
technology
Improved
humidity
Improved temperature
control
BOEING PROPRIETARY
41
Boutique Service Items and Meals
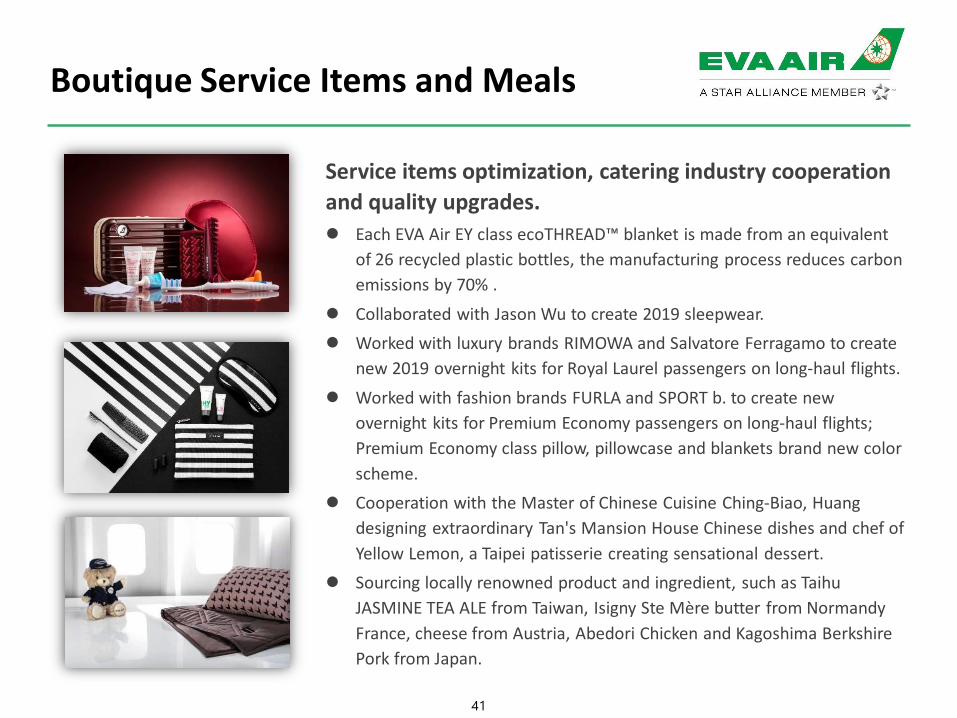
Service items optimization, catering industry cooperation
and quality upgrades.
Each EVA Air EY class ecoTHREAD™ blanket is made from an equivalent
of 26 recycled plastic bottles, the manufacturing process reduces carbon
emissions by 70% .
Collaborated with Jason Wu to create 2019 sleepwear.
Worked with luxury brands RIMOWA and Salvatore Ferragamo to create
new 2019 overnight kits for Royal Laurel passengers on long-haul flights.
Worked with fashion brands FURLA and SPORT b. to create new
overnight kits for Premium Economy passengers on long-haul flights;
Premium Economy class pillow, pillowcase and blankets brand new color
scheme.
Cooperation with the Master of Chinese Cuisine Ching-Biao, Huang
designing extraordinary Tan's Mansion House Chinese dishes and chef of
Yellow Lemon, a Taipei patisserie creating sensational dessert.
Sourcing locally renowned product and ingredient, such as Taihu
JASMINE TEA ALE from Taiwan, Isigny Ste Mère butter from Normandy
France, cheese from Austria, Abedori Chicken and Kagoshima Berkshire
Pork from Japan.
42
Major Affiliated Enterprises
43
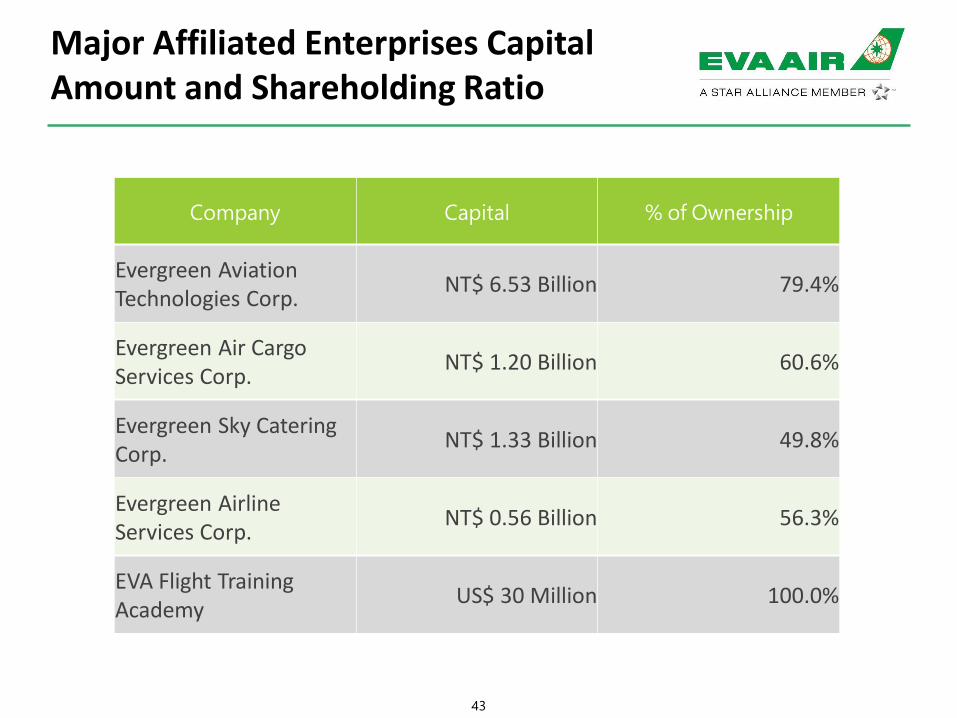
Major Affiliated Enterprises Capital Amount and Shareholding Ratio
Company Capital % of Ownership
Evergreen Aviation Technologies Corp.
NT$ 6.53 Billion 79.4%
Evergreen Air Cargo Services Corp.
NT$ 1.20 Billion 60.6%
Evergreen Sky Catering Corp.
NT$ 1.33 Billion 49.8%
Evergreen Airline Services Corp.
NT$ 0.56 Billion 56.3%
EVA Flight Training Academy
US$ 30 Million 100.0%
44
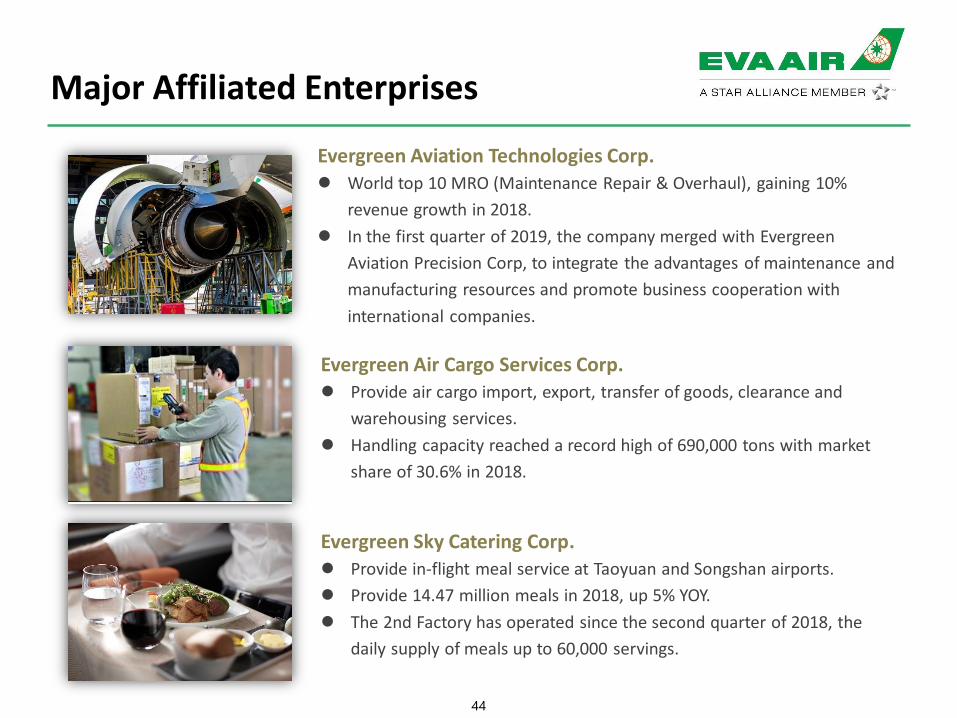
Major Affiliated Enterprises
Evergreen Aviation Technologies Corp. World top 10 MRO (Maintenance Repair & Overhaul), gaining 10%
revenue growth in 2018.
In the first quarter of 2019, the company merged with Evergreen
Aviation Precision Corp, to integrate the advantages of maintenance and
manufacturing resources and promote business cooperation with
international companies.
Evergreen Air Cargo Services Corp. Provide air cargo import, export, transfer of goods, clearance and
warehousing services.
Handling capacity reached a record high of 690,000 tons with market
share of 30.6% in 2018.
Evergreen Sky Catering Corp. Provide in-flight meal service at Taoyuan and Songshan airports.
Provide 14.47 million meals in 2018, up 5% YOY.
The 2nd Factory has operated since the second quarter of 2018, the
daily supply of meals up to 60,000 servings.
45
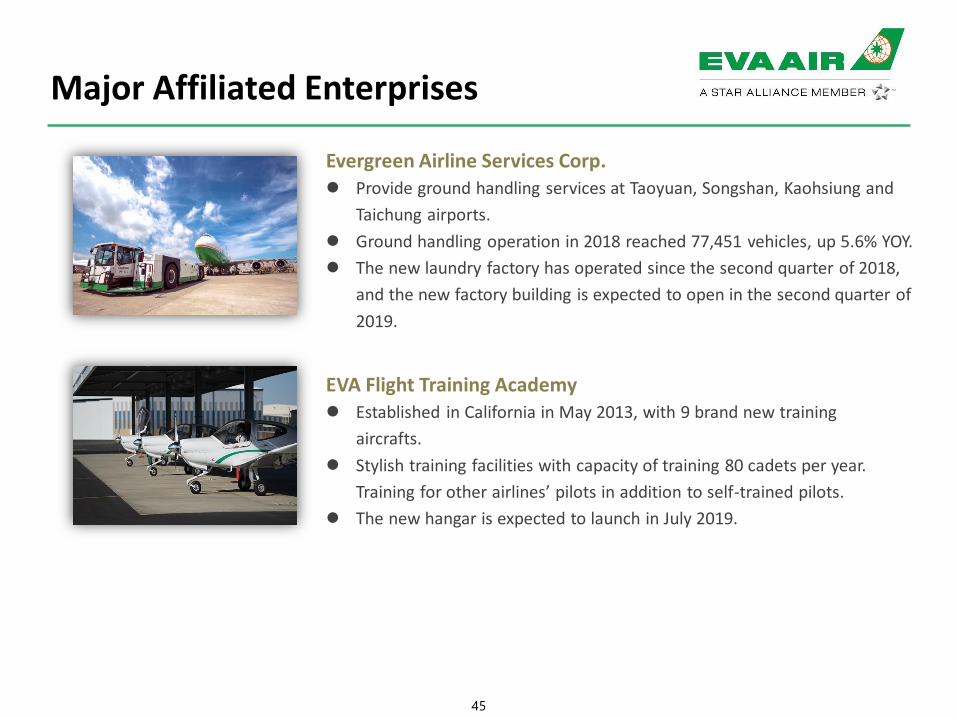
Major Affiliated Enterprises
Evergreen Airline Services Corp. Provide ground handling services at Taoyuan, Songshan, Kaohsiung and
Taichung airports.
Ground handling operation in 2018 reached 77,451 vehicles, up 5.6% YOY.
The new laundry factory has operated since the second quarter of 2018,
and the new factory building is expected to open in the second quarter of
2019.
EVA Flight Training Academy Established in California in May 2013, with 9 brand new training
aircrafts.
Stylish training facilities with capacity of training 80 cadets per year.
Training for other airlines’ pilots in addition to self-trained pilots.
The new hangar is expected to launch in July 2019.
46
THANK YOU