waves, light and optics - sasbadi
TRANSCRIPT

Concepts and phenomena of waves, light and optics have many applications inour lives.
Th e topics in this theme discuss propagation of waves, properties of light and electromagnetic waves. Th is knowledge is applied in wireless communication, home appliances, medicine, industry and others.
Waves, Light and Optics
4
169169169169
Let’s StudyLet’s Study
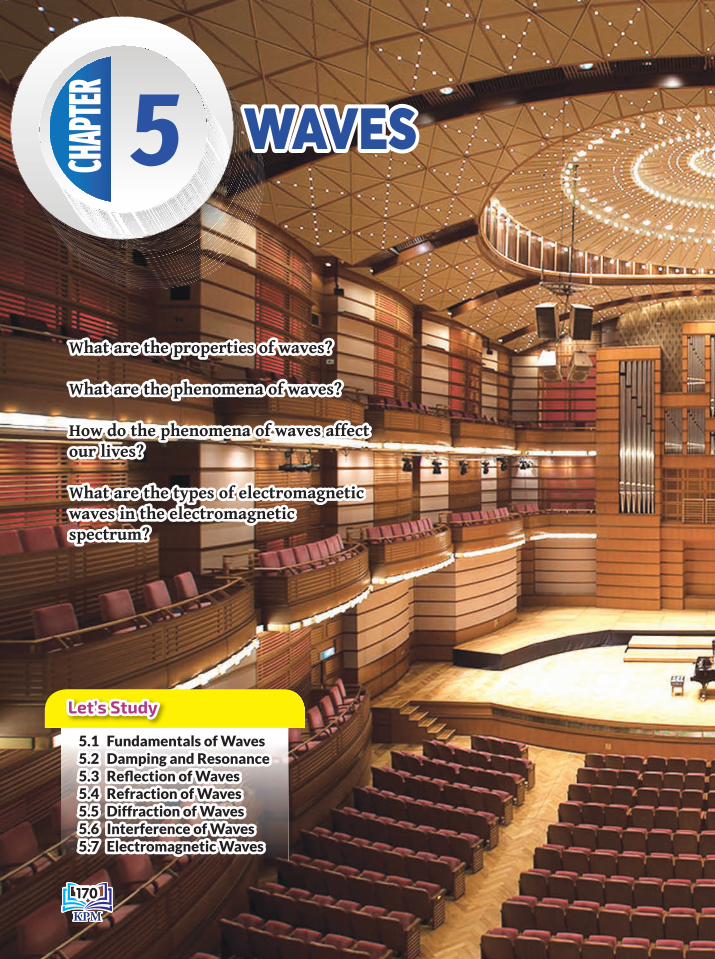
5.1 Fundamentals of Waves5.1 Fundamentals of Waves5.2 Damping and Resonance5.2 Damping and Resonance5.3 Refl ection of Waves5.3 Refl ection of Waves5.4 Refraction of Waves5.4 Refraction of Waves5.5 Diffraction of Waves5.5 Diffraction of Waves5.6 Interference of Waves5.6 Interference of Waves5.7 Electromagnetic Waves5.7 Electromagnetic Waves
What are the properties of waves?What are the properties of waves?
What are the phenomena of waves?What are the phenomena of waves?
How do the phenomena of waves affect How do the phenomena of waves affect our lives?our lives?
What are the types of electromagnetic What are the types of electromagnetic waves in the electromagnetic waves in the electromagnetic spectrum?spectrum?
CHAPTE
RWAVESWAVES5
170170170170
PageInformation
Learning Standards and Learning Standards and List of FormulaeList of Formulae
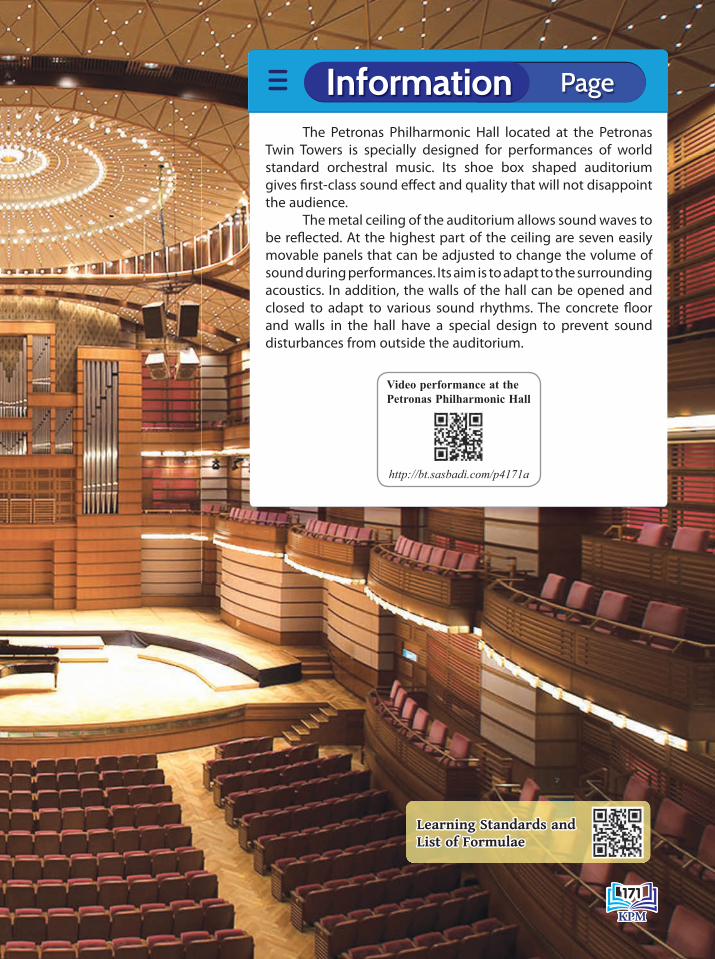
The Petronas Philharmonic Hall located at the Petronas Twin Towers is specially designed for performances of world standard orchestral music. Its shoe box shaped auditoriumgives fi rst-class sound eff ect and quality that will not disappoint the audience.
The metal ceiling of the auditorium allows sound waves to be refl ected. At the highest part of the ceiling are seven easily movable panels that can be adjusted to change the volume of sound during performances. Its aim is to adapt to the surrounding acoustics. In addition, the walls of the hall can be opened and closed to adapt to various sound rhythms. The concrete fl oor and walls in the hall have a special design to prevent sound disturbances from outside the auditorium.
Video performance at the Petronas Philharmonic Hall
http://bt.sasbadi.com/p4171a
171171171171
Activity 5.1
Fundamentals of WavesFundamentals of Waves5.1
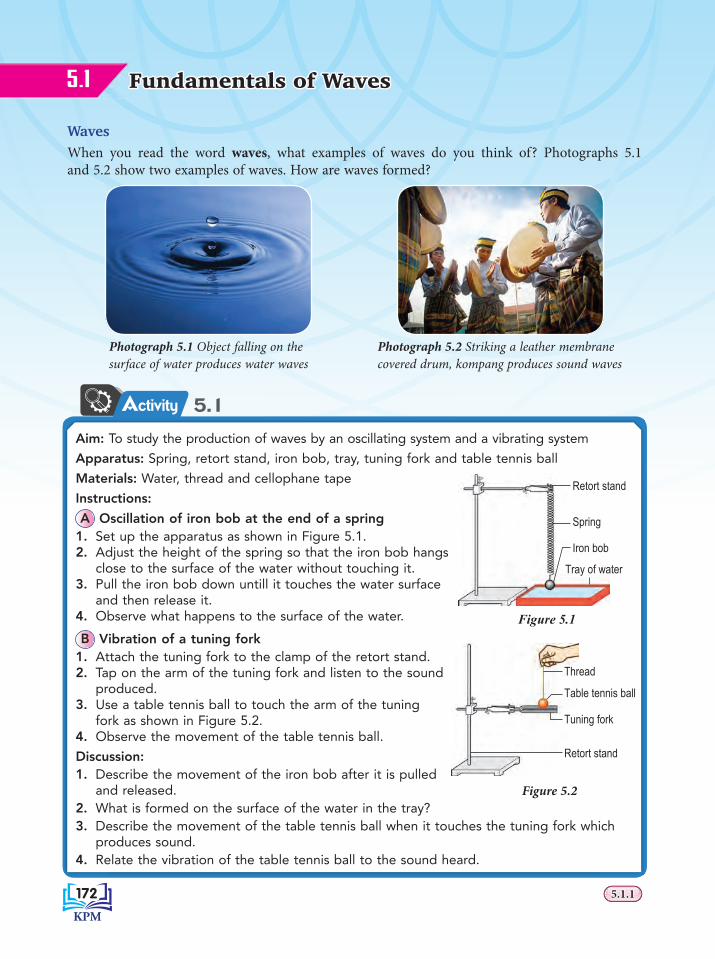
WavesWhen you read the word waves, what examples of waves do you think of? Photographs 5.1 and 5.2 show two examples of waves. How are waves formed?
Aim: To study the production of waves by an oscillating system and a vibrating system
Apparatus: Spring, retort stand, iron bob, tray, tuning fork and table tennis ball
Materials: Water, thread and cellophane tape
Instructions:
A Oscillation of iron bob at the end of a spring 1. Set up the apparatus as shown in Figure 5.1.2. Adjust the height of the spring so that the iron bob hangs
close to the surface of the water without touching it.3. Pull the iron bob down untill it touches the water surface
and then release it.4. Observe what happens to the surface of the water.
B Vibration of a tuning fork 1. Attach the tuning fork to the clamp of the retort stand.2. Tap on the arm of the tuning fork and listen to the sound
produced. 3. Use a table tennis ball to touch the arm of the tuning
fork as shown in Figure 5.2.4. Observe the movement of the table tennis ball.
Discussion:1. Describe the movement of the iron bob after it is pulled
and released.2. What is formed on the surface of the water in the tray?3. Describe the movement of the table tennis ball when it touches the tuning fork which
produces sound.4. Relate the vibration of the table tennis ball to the sound heard.
Figure 5.1
Retort stand
Spring
Iron bob
Tray of water
Thread
Table tennis ball
Tuning fork
Retort stand
Figure 5.2
Photograph 5.1 Object falling on the surface of water produces water waves
Photograph 5.2 Striking a leather membrane covered drum, kompang produces sound waves
172172172172 5.1.15.1.1
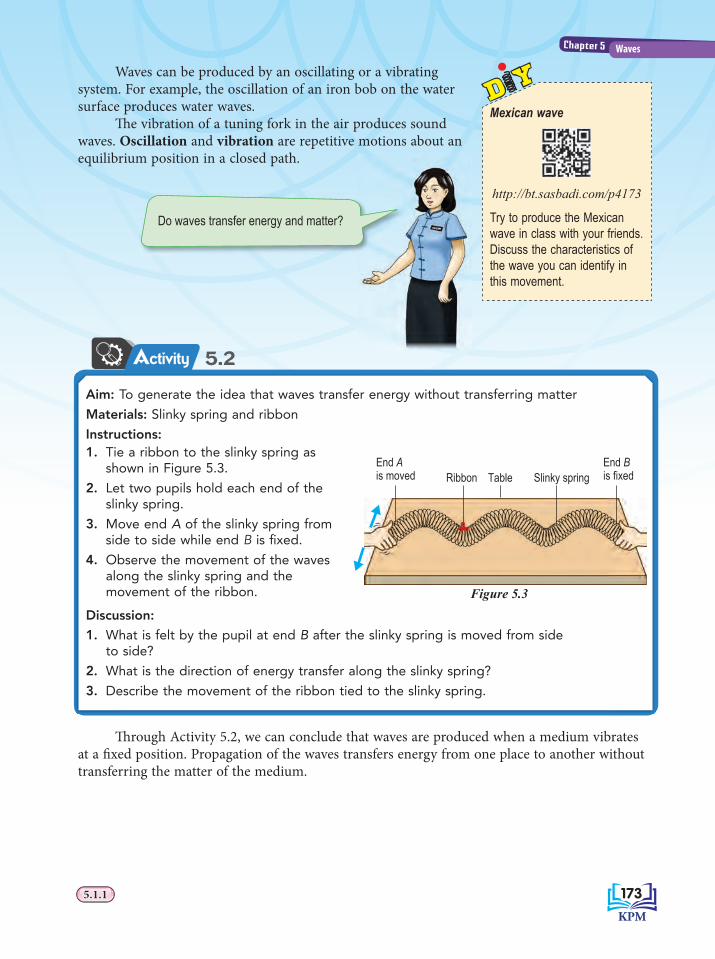
Waves can be produced by an oscillating or a vibrating system. For example, the oscillation of an iron bob on the water surface produces water waves. Th e vibration of a tuning fork in the air produces sound waves. Oscillation and vibration are repetitive motions about an equilibrium position in a closed path.
Do waves transfer energy and matter?
Activity 5.2
Aim: To generate the idea that waves transfer energy without transferring matter
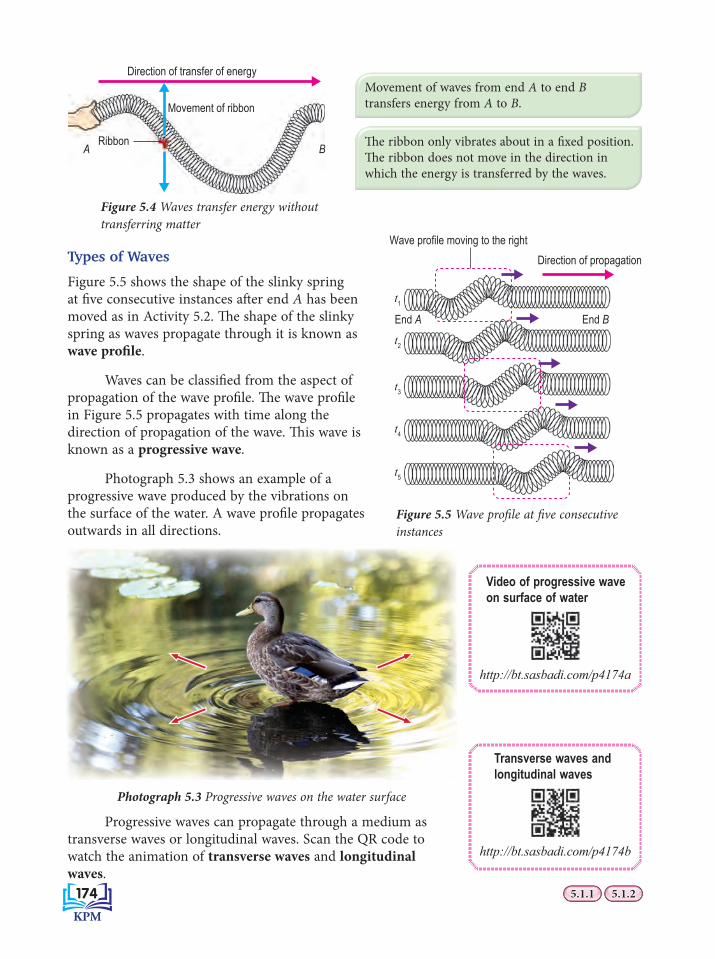
Materials: Slinky spring and ribbon
Instructions:1. Tie a ribbon to the slinky spring as
shown in Figure 5.3.
2. Let two pupils hold each end of the slinky spring.
3. Move end A of the slinky spring from side to side while end B is fi xed.
4. Observe the movement of the waves along the slinky spring and the movement of the ribbon.
Discussion:
1. What is felt by the pupil at end B after the slinky spring is moved from sideto side?
2. What is the direction of energy transfer along the slinky spring?
3. Describe the movement of the ribbon tied to the slinky spring.
End A is moved Ribbon Table Slinky spring
End B is fixed
Figure 5.3
Th rough Activity 5.2, we can conclude that waves are produced when a medium vibrates at a fi xed position. Propagation of the waves transfers energy from one place to another without transferring the matter of the medium.
Mexican wave
http://bt.sasbadi.com/p4173
Try to produce the Mexican wave in class with your friends. Discuss the characteristics of the wave you can identify in this movement.
173173173173
Chapter 5 Waves
5.1.15.1.1
Types of Waves
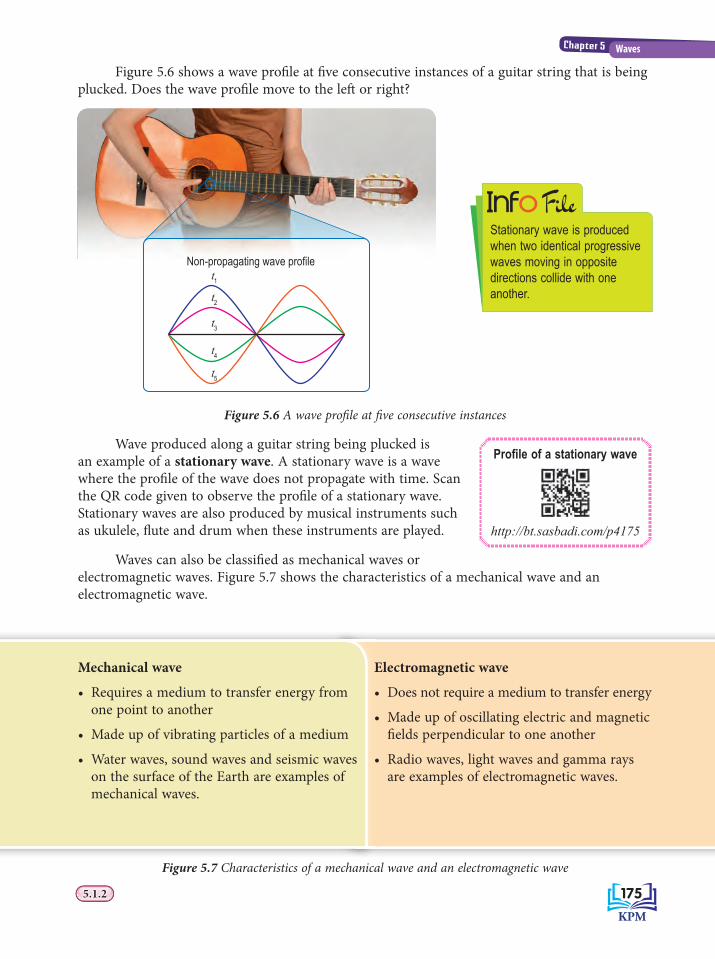
Figure 5.5 shows the shape of the slinky spring at fi ve consecutive instances aft er end A has been moved as in Activity 5.2. Th e shape of the slinky spring as waves propagate through it is known as wave profi le.
Waves can be classifi ed from the aspect of propagation of the wave profi le. Th e wave profi le in Figure 5.5 propagates with time along the direction of propagation of the wave. Th is wave is known as a progressive wave.
Photograph 5.3 shows an example of a progressive wave produced by the vibrations on the surface of the water. A wave profi le propagates outwards in all directions.
Photograph 5.3 Progressive waves on the water surface
Progressive waves can propagate through a medium as transverse waves or longitudinal waves. Scan the QR code to watch the animation of transverse waves and longitudinal waves.
Video of progressive wave on surface of water
http://bt.sasbadi.com/p4174a
Transverse waves and longitudinal waves
http://bt.sasbadi.com/p4174b
Movement of waves from end A to end B transfers energy from A to B.
Th e ribbon only vibrates about in a fi xed position. Th e ribbon does not move in the direction in which the energy is transferred by the waves.
Figure 5.4 Waves transfer energy without transferring matter
Ribbon
Direction of transfer of energy
Movement of ribbon
A B
Figure 5.5 Wave profi le at fi ve consecutive instances
t1
t2
t3
t4
t5
Direction of propagationWave profile moving to the right
End A End B
174174174174 5.1.25.1.25.1.15.1.1
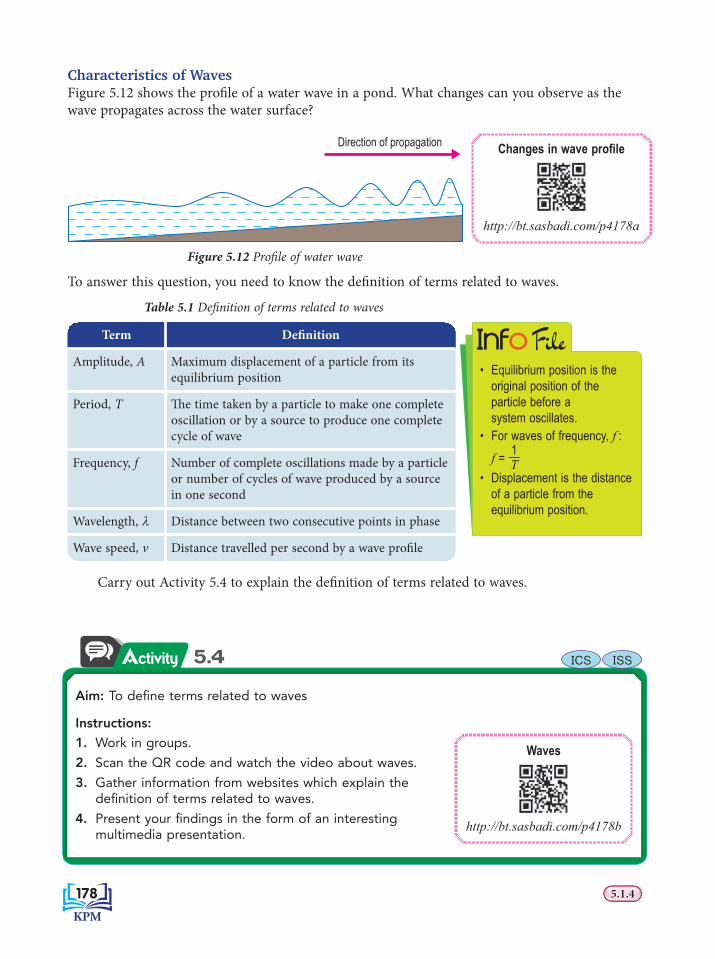
Electromagnetic wave
• Does not require a medium to transfer energy
• Made up of oscillating electric and magnetic fi elds perpendicular to one another
• Radio waves, light waves and gamma rays are examples of electromagnetic waves.
Figure 5.6 shows a wave profi le at fi ve consecutive instances of a guitar string that is being plucked. Does the wave profi le move to the left or right?
t1t2
t3
t4t5
Non-propagating wave profile
Figure 5.6 A wave profi le at fi ve consecutive instances
Wave produced along a guitar string being plucked is an example of a stationary wave. A stationary wave is a wave where the profi le of the wave does not propagate with time. Scan the QR code given to observe the profi le of a stationary wave. Stationary waves are also produced by musical instruments such as ukulele, fl ute and drum when these instruments are played.
Waves can also be classifi ed as mechanical waves or electromagnetic waves. Figure 5.7 shows the characteristics of a mechanical wave and an electromagnetic wave.
Figure 5.7 Characteristics of a mechanical wave and an electromagnetic wave
EE
••
••
••
Mechanical wave
• Requires a medium to transfer energy from one point to another
• Made up of vibrating particles of a medium
• Water waves, sound waves and seismic waves on the surface of the Earth are examples of mechanical waves.
Stationary wave is produced when two identical progressive waves moving in opposite directions collide with one another.
F ile
Profi le of a stationary wave
http://bt.sasbadi.com/p4175
175175175175
Chapter 5 Waves
5.1.25.1.2

Comparison between Transverse Wave and Longitudinal Wave
Th ere are two types of progressive waves, transverse wave and longitudinal wave. What are the similarities and diff erences between these two waves?
Activity 5.3
Aim: To compare transverse wave and longitudinal wave
Materials: Ribbon and slinky spring
A Transverse wave
Instructions:1. Tie two short ribbons to a slinky spring.2. Let two pupils hold each end of the
slinky spring.3. Move end P left and right repeatedly
until a pattern of a wave is formed as shown in Figure 5.8.
4. Observe the propagation of the wave along the slinky spring and the movement of the ribbons.
5. Draw the wave profi le formed and mark the direction of propagation of the wave.
6. Mark the direction of the ribbons.
Discussion:Compare the direction of propagation of the wave and the direction of movement of the ribbons.
B Longitudinal wave
Instructions:
1. Repeat activity A by moving the end P of the slinky spring forward and backward repeatedly until waves are formed as shown in Figure 5.9.
2. Observe the propagation of the waves along the slinky spring and the movement of the ribbons.
3. Sketch the shape of the entire length of the slinky spring and mark the direction of propagation of the waves.
4. Mark the direction of movement of the ribbons.
Discussion:Compare the direction of propagation of the wave and the direction of movement of the ribbons.
Figure 5.8
End P Ribbons Table Slinky springEnd Qis fixed
Figure 5.9
End PEnd Qis fixedRibbons Table Slinky spring
176176176176 5.1.35.1.3

Transverse wave
• Particles of the medium vibrate in the direction perpendicular to the direction of propagation of the wave.
• Made up of consecutive crests and troughs.Crest Trough
Trough
Crest
Direction ofvibration ofparticles
Direction of propagationof the waves
Figure 5.10 Transverse wave
• Radio waves, light waves and water waves are examples of transverse waves.
Earthquakes produce P-waves and S-waves. S-wave is a transverse wave and P-wave is a longitudinal wave. Both waves have different speeds. Analysis of the time difference between the two waves helps to determine the epicentre of earthquakes.
A seismologist investigates, predicts and reports earthquakes.
Longitudinal wave
• Particles of the medium vibrate in the direction parallel to the direction of propagation of the wave.
• Made up of consecutive compressions (compressed regions) and rarefactions (stretched regions).
Direction of propagationof the wavesCompressionRarefactionCompression
Direction of vibrationof particles
Rarefaction Compression Rarefaction Compression Rarefaction
Figure 5.11 Longitudinal wave
• Sound wave is an example of longitudinal wave.
F ile
CAREERiNFO
177177177177
Chapter 5 Waves
5.1.35.1.3
Activity 5.4
Characteristics of Waves Figure 5.12 shows the profi le of a water wave in a pond. What changes can you observe as the wave propagates across the water surface?
Direction of propagation
Figure 5.12 Profi le of water wave
To answer this question, you need to know the defi nition of terms related to waves.
Table 5.1 Defi nition of terms related to waves
Term Defi nition
Amplitude, A Maximum displacement of a particle from its equilibrium position
Period, T Th e time taken by a particle to make one complete oscillation or by a source to produce one complete cycle of wave
Frequency, f Number of complete oscillations made by a particle or number of cycles of wave produced by a source in one second
Wavelength, λ Distance between two consecutive points in phase
Wave speed, v Distance travelled per second by a wave profi le
Carry out Activity 5.4 to explain the defi nition of terms related to waves.
Aim: To defi ne terms related to waves
Instructions:
1. Work in groups.
2. Scan the QR code and watch the video about waves.
3. Gather information from websites which explain the defi nition of terms related to waves.
4. Present your fi ndings in the form of an interesting multimedia presentation.
Waves
http://bt.sasbadi.com/p4178b
Changes in wave profi le
http://bt.sasbadi.com/p4178a
ICS ISS
• Equilibrium position is the original position of the particle before a system oscillates.
• For waves of frequency, f : f = 1—T • Displacement is the distance
of a particle from the equilibrium position.
F ile
178178178178 5.1.45.1.4
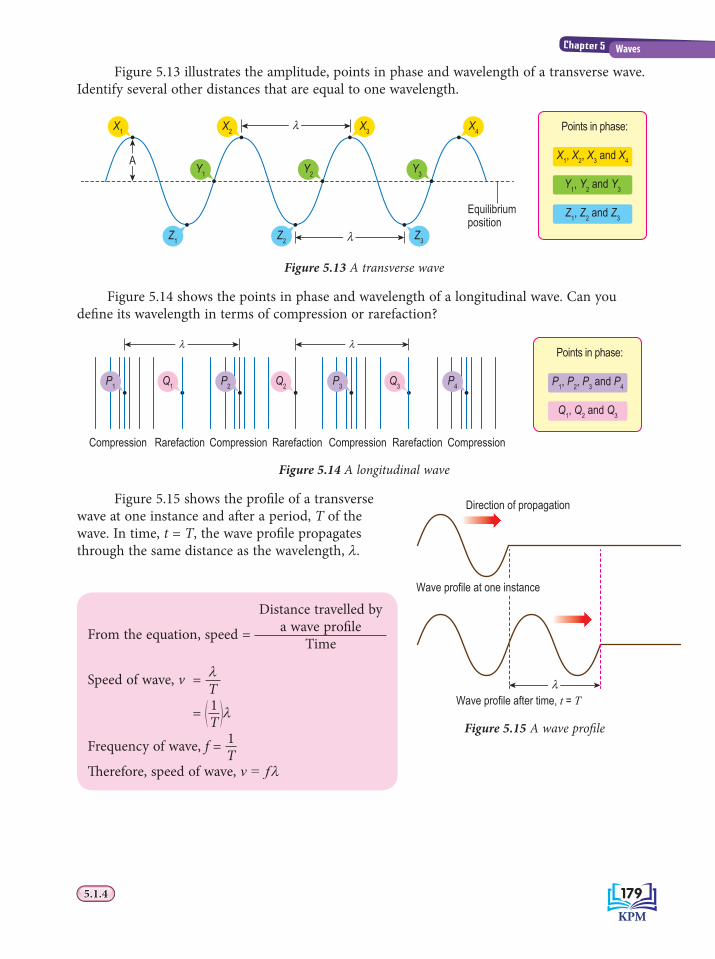
Figure 5.13 illustrates the amplitude, points in phase and wavelength of a transverse wave. Identify several other distances that are equal to one wavelength.
Equilibriumposition
Points in phase:
X1, X
2, X
3 and X
4
Y1, Y
2 and Y
3
Z1, Z
2 and Z
3
X2
Y1
Z2
Z1
Z3
Y2
Y3
X1
X3
X4
λ
λ
A
Figure 5.13 A transverse wave
Figure 5.14 shows the points in phase and wavelength of a longitudinal wave. Can you defi ne its wavelength in terms of compression or rarefaction?
Compression
Points in phase:
P1, P2, P3 and P4
Q1, Q2 and Q3
λλ
Rarefaction Rarefaction RarefactionCompression Compression Compression
P1 P2Q1 Q2 Q3P3 P4
Figure 5.14 A longitudinal wave
Figure 5.15 shows the profi le of a transverse wave at one instance and aft er a period, T of the wave. In time, t = T, the wave profi le propagates through the same distance as the wavelength, λ.
Figure 5.15 A wave profi le
Wave profile after time, t = T λ
Direction of propagation
Wave profile at one instance
From the equation, speed =
Distance travelled by a wave profi le
Time
Speed of wave, v = λT
= � 1T �λ
Frequency of wave, f = 1T
Th erefore, speed of wave, v = fλ
179179179179
Chapter 5 Waves
5.1.45.1.4
Activity 5.5
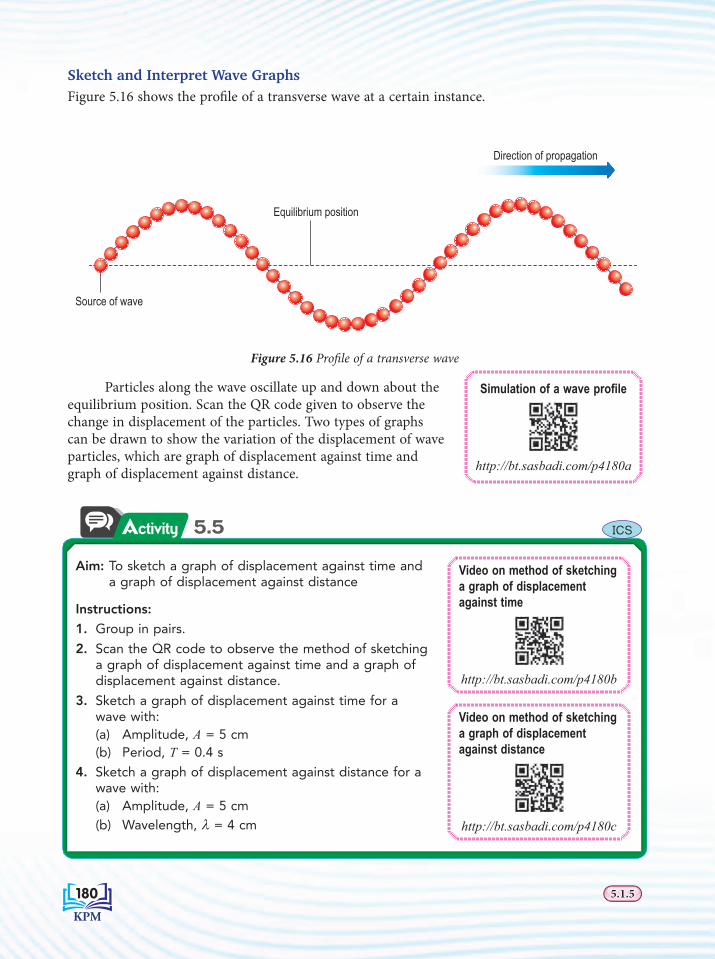
Sketch and Interpret Wave GraphsFigure 5.16 shows the profi le of a transverse wave at a certain instance.
Direction of propagation
Equilibrium position
Source of wave
Figure 5.16 Profi le of a transverse wave
Particles along the wave oscillate up and down about the equilibrium position. Scan the QR code given to observe the change in displacement of the particles. Two types of graphs can be drawn to show the variation of the displacement of wave particles, which are graph of displacement against time and graph of displacement against distance.
Aim: To sketch a graph of displacement against time and a graph of displacement against distance
Instructions:
1. Group in pairs.
2. Scan the QR code to observe the method of sketching a graph of displacement against time and a graph of displacement against distance.
3. Sketch a graph of displacement against time for a wave with:
(a) Amplitude, A = 5 cm (b) Period, T = 0.4 s
4. Sketch a graph of displacement against distance for a wave with:
(a) Amplitude, A = 5 cm (b) Wavelength, λ = 4 cm
Video on method of sketching a graph of displacement against time
http://bt.sasbadi.com/p4180b
Video on method of sketching a graph of displacement against distance
http://bt.sasbadi.com/p4180c
Simulation of a wave profi le
http://bt.sasbadi.com/p4180a
ICS
180180180180 5.1.55.1.5
Activity 5.6
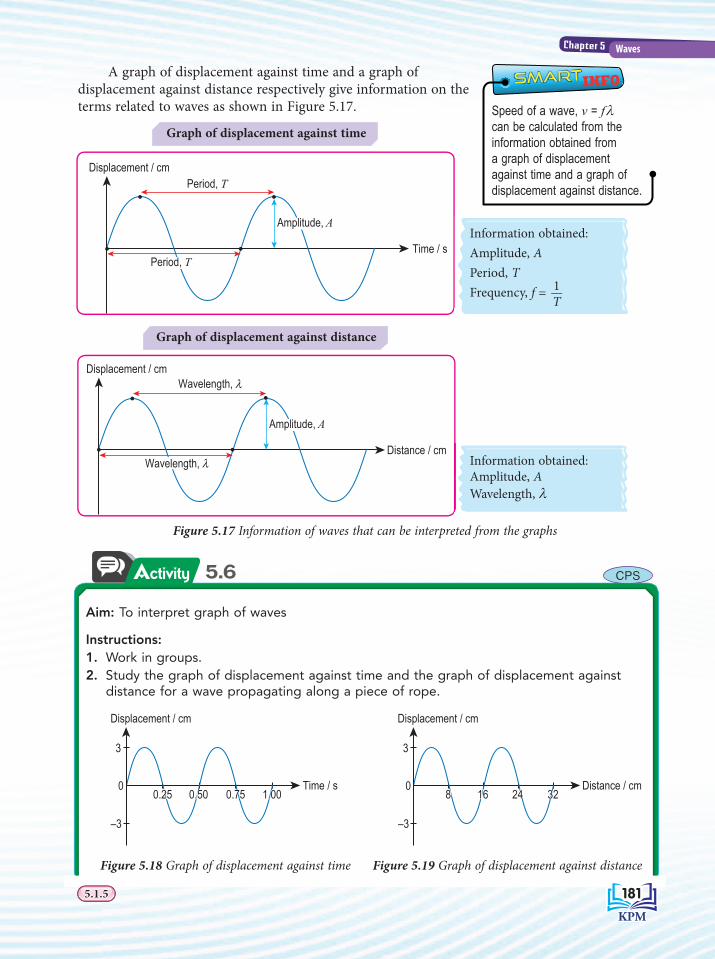
Displacement / cmPeriod, T
Time / sPeriod, T
Amplitude, AInformation obtained: Amplitude, APeriod, TFrequency, f = 1—
T
Graph of displacement against time
Graph of displacement against distance
A graph of displacement against time and a graph of displacement against distance respectively give information on the terms related to waves as shown in Figure 5.17. 5.1.5
Figure 5.17 Information of waves that can be interpreted from the graphs
Aim: To interpret graph of waves
Instructions:1. Work in groups.2. Study the graph of displacement against time and the graph of displacement against
distance for a wave propagating along a piece of rope.
Displacement / cm
3
0
–3
Time / s0.500.25 0.75 1.000.500.25 0.75 1.00
Displacement / cm
3
0
–3
Distance / cm8 16 24 328 16 24 32
Figure 5.18 Graph of displacement against time Figure 5.19 Graph of displacement against distance
Displacement / cmWavelength, λ
Distance / cmWavelength, λ
Amplitude, A
Information obtained: Amplitude, AWavelength, λ
CPS
5 1 55.1.5INFOSMARTSMART
Speed of a wave, v = fλcan be calculated from the information obtained from a graph of displacement against time and a graph of displacement against distance.
181181181181
Chapter 5 Waves
5.1.55.1.5
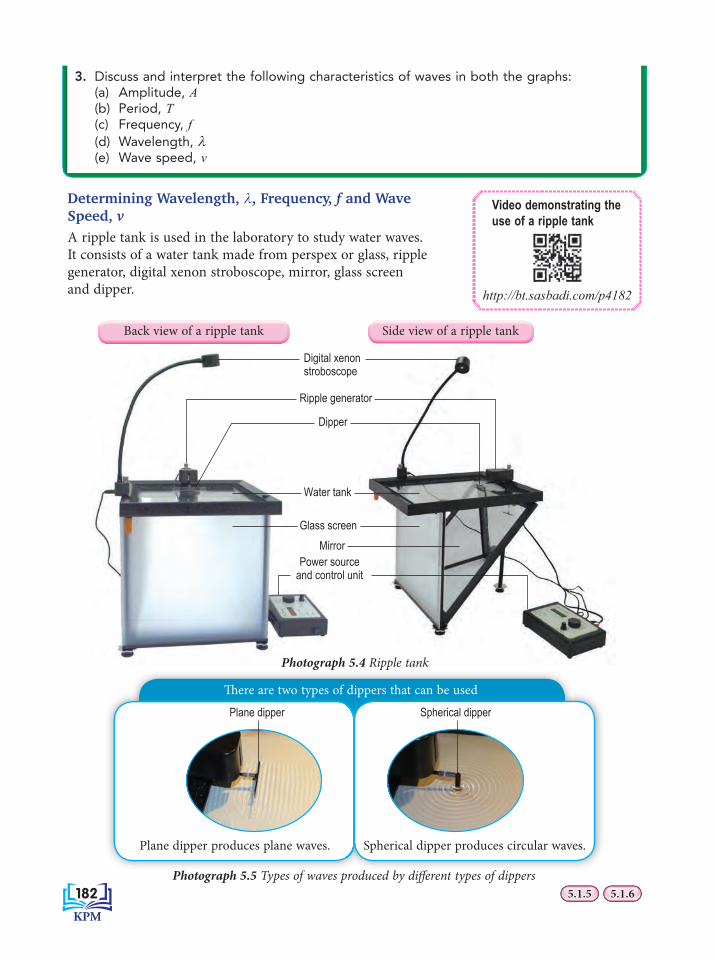
Determining Wavelength, λ, Frequency, f and Wave Speed, vA ripple tank is used in the laboratory to study water waves. It consists of a water tank made from perspex or glass, ripple generator, digital xenon stroboscope, mirror, glass screen and dipper.
Digital xenonstroboscopeDigital xstrobos
n
Water tank
Glass screen
Power sourceand control unit
Mirror
Ripple generator
Dipper
Photograph 5.4 Ripple tank
3. Discuss and interpret the following characteristics of waves in both the graphs:(a) Amplitude, A(b) Period, T(c) Frequency, f(d) Wavelength, λ(e) Wave speed, v
Video demonstrating the use of a ripple tank
http://bt.sasbadi.com/p4182
Photograph 5.5 Types of waves produced by diff erent types of dippers
Th ere are two types of dippers that can be usedPlane dipper Spherical dipper
Plane dipper produces plane waves. Spherical dipper produces circular waves.
Back view of a ripple tank Side view of a ripple tank
182182182182 5.1.65.1.65.1.55.1.5
Formative Practice 5.15.1
1. Figure 5.20 shows a graph of displacement against time for a wave.
Displacement / cm
3
00.2 0.4 0.6 0.8
–3
Time / s
Figure 5.20(a) What is meant by amplitude?(b) Determine the period of oscillation, T. Th en, calculate the frequency of oscillation.
2. Compare and contrast progressive wave and stationary wave.
3. Figure 5.21 shows a slinky spring being moved forward and backward at one of its ends.(a) What type of wave is produced by a
slinky spring?(b) Mark “X” at the rarefaction part of the wave
in Figure 5.21.(c) What is the wavelength, λ of the wave?
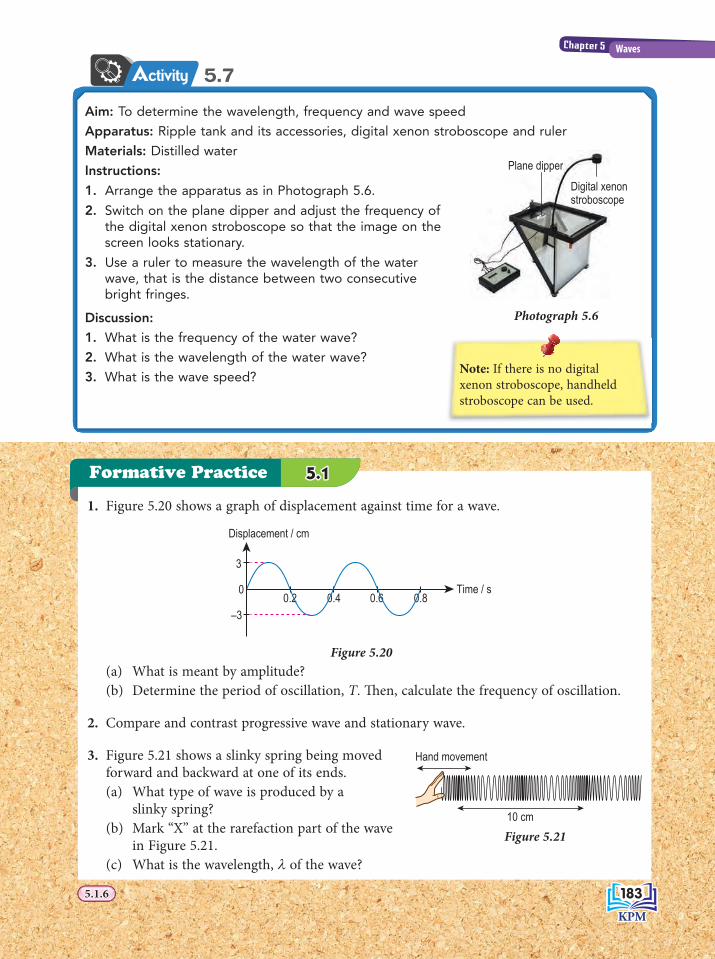
Activity 5.7
Aim: To determine the wavelength, frequency and wave speed
Apparatus: Ripple tank and its accessories, digital xenon stroboscope and ruler
Materials: Distilled water
Instructions:
1. Arrange the apparatus as in Photograph 5.6.
2. Switch on the plane dipper and adjust the frequency of the digital xenon stroboscope so that the image on the screen looks stationary.
3. Use a ruler to measure the wavelength of the water wave, that is the distance between two consecutive bright fringes.
Discussion:
1. What is the frequency of the water wave?
2. What is the wavelength of the water wave?
3. What is the wave speed?
Hand movement
10 cm
Figure 5.21
Photograph 5.6
Digital xenonstroboscope
Plane dipper
Digital xestrobosco
Plane dipper
Note: If there is no digital xenon stroboscope, handheld stroboscope can be used.
183183183183
Chapter 5 Waves
5.1.65.1.6
Activity 5.8
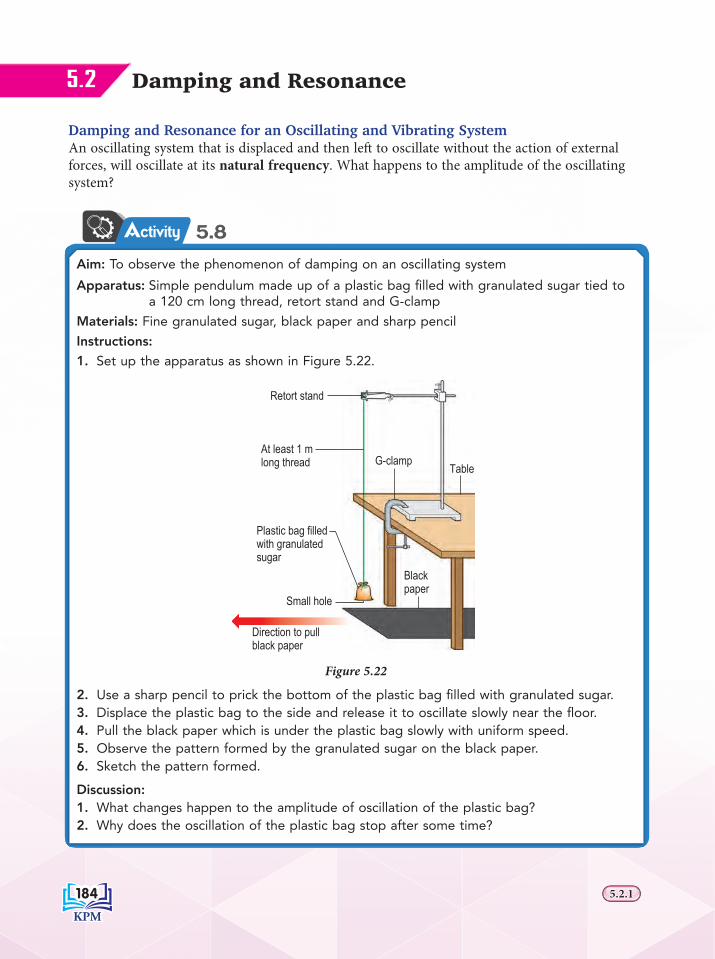
Damping and ResonanceDamping and Resonance5.2
Aim: To observe the phenomenon of damping on an oscillating system
Apparatus: Simple pendulum made up of a plastic bag fi lled with granulated sugar tied to a 120 cm long thread, retort stand and G-clamp
Materials: Fine granulated sugar, black paper and sharp pencil
Instructions:
1. Set up the apparatus as shown in Figure 5.22.
TableAt least 1 m long thread
Small hole
Retort stand
G-clamp
Plastic bag filledwith granulatedsugar
Blackpaper
Direction to pullblack paper
Figure 5.22
2. Use a sharp pencil to prick the bottom of the plastic bag fi lled with granulated sugar.3. Displace the plastic bag to the side and release it to oscillate slowly near the fl oor.4. Pull the black paper which is under the plastic bag slowly with uniform speed.5. Observe the pattern formed by the granulated sugar on the black paper.6. Sketch the pattern formed.
Discussion:1. What changes happen to the amplitude of oscillation of the plastic bag?2. Why does the oscillation of the plastic bag stop after some time?
Damping and Resonance for an Oscillating and Vibrating SystemAn oscillating system that is displaced and then left to oscillate without the action of external forces, will oscillate at its natural frequency. What happens to the amplitude of the oscillating system?
184184184184 5.2.15.2.1

Figure 5.23 shows the graph of displacement against time for the oscillation in Activity 5.8.
Displacement
0T
A1 A
2 A3
Time
Amplitude A1 > A
2 > A
3 > A
4
2T 3T
A4
Figure 5.23 Graph of displacement against time for the oscillation of the simple pendulum
Observe that the amplitude for the oscillation decreases with time. Figure 5.24 shows the graph of amplitude against time for the oscillation of the simple pendulum.
Amplitude
0T
A1
A2
A4
Time2T 3T
A3
Figure 5.24 Graph of amplitude against time for the oscillation of the simple pendulum
An oscillation with its amplitude decreasing with time shows that the system experiences a gradual loss of energy. Finally the oscillation stops. Th is phenomenon is known as damping. Oscillating systems experience loss of energy due to:
External damping Oscillating system loses energy to overcome friction or air resistance.
Internal damping Oscillating system loses energy because of the stretching and compression of the vibrating particles in the system.
Damping is the reduction in amplitude in an oscillating system due to loss of energy. During damping, the oscillating frequency remains constant while the oscillating amplitude decreases. Th e eff ect of damping can be overcome by applying periodic external force on the oscillating system. Th e periodic external force transfers energy into the oscillating system to replace the energy lost. Th e system is said to be in a forced oscillation.
The oscillation of a simple pendulum experiences signifi cant external damping but insignifi cant internal damping. For the vibration of a spring, both external and internal damping happen signifi cantly.
F ile
Periodic force is a force which acts at specifi c time intervals. Periodic force does not act continuously.
F ile
185185185185
Chapter 5 Waves
5.2.15.2.1
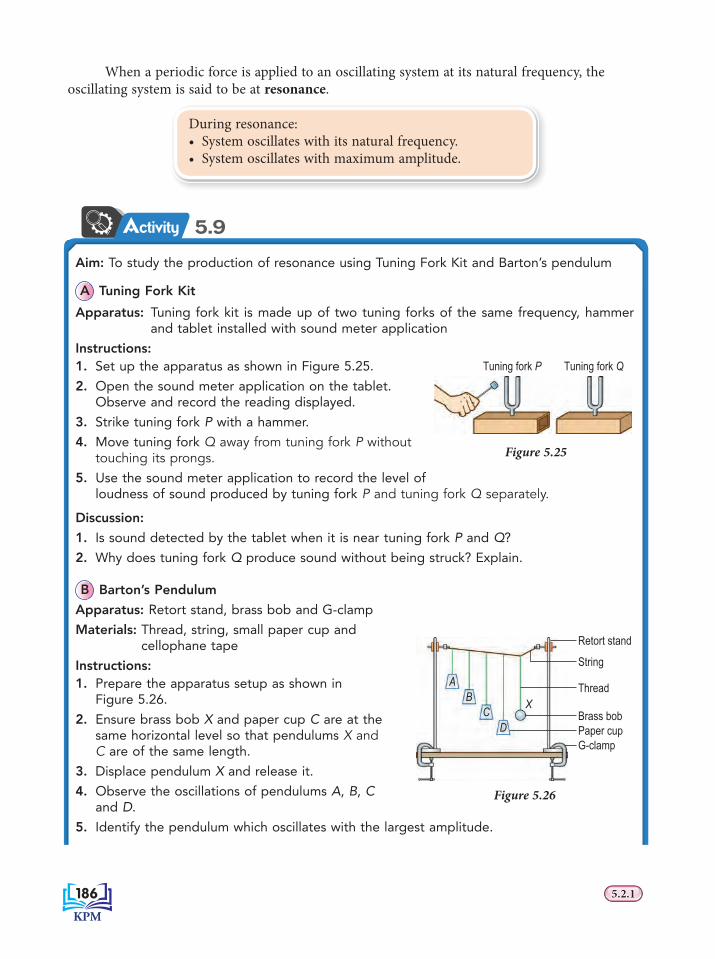
When a periodic force is applied to an oscillating system at its natural frequency, the oscillating system is said to be at resonance.
During resonance:• System oscillates with its natural frequency.• System oscillates with maximum amplitude.
Activity 5.9
Aim: To study the production of resonance using Tuning Fork Kit and Barton’s pendulum
A Tuning Fork Kit
Apparatus: Tuning fork kit is made up of two tuning forks of the same frequency, hammer and tablet installed with sound meter application
Instructions:1. Set up the apparatus as shown in Figure 5.25.
2. Open the sound meter application on the tablet. Observe and record the reading displayed.
3. Strike tuning fork P with a hammer.
4. Move tuning fork Q away from tuning fork P without touching its prongs.
5. Use the sound meter application to record the level of loudness of sound produced by tuning fork P and tuning fork Q separately.
Discussion:
1. Is sound detected by the tablet when it is near tuning fork P and Q?
2. Why does tuning fork Q produce sound without being struck? Explain.
B Barton’s Pendulum
Apparatus: Retort stand, brass bob and G-clamp
Materials: Thread, string, small paper cup and cellophane tape
Instructions:1. Prepare the apparatus setup as shown in
Figure 5.26.
2. Ensure brass bob X and paper cup C are at the same horizontal level so that pendulums X and C are of the same length.
3. Displace pendulum X and release it.
4. Observe the oscillations of pendulums A, B, C and D.
5. Identify the pendulum which oscillates with the largest amplitude.
Figure 5.25
Tuning fork P Tuning fork Q
Figure 5.26
Retort stand
StringA
BC
D
XThread
Brass bobPaper cupG-clamp
186186186186 5.2.15.2.1

Activity 5.10 ISS ICS
Formative Practice 5.25.2
Th e vibrations of tuning fork P have forced tuning fork Q to vibrate in resonance with P.Energy is transferred from tuning fork P to tuning fork Q. Tuning fork Q vibrates with maximum amplitude and produces sound that can be detected. Th e oscillation of brass pendulum X transfers energy to pendulums A, B, C and D causing all pendulums to oscillate. Resonance happens to pendulum C because pendulum C has the same natural frequency as pendulum X. Pendulum C oscillates with the largest amplitude.
Effects of Resonance in Daily Life
1. What is the meaning of damping?
2. Sketch a graph of displacement against time for a system experiencing damping.
3. State three examples of the eff ects of resonance in our daily lives.
4. How can resonance overcome damping of an oscillating system?
Aim: To show a video on effects of resonance in daily life
Instructions:1. Work in groups.2. Examples of the effects of resonance in daily life are as
follows:
In 1940, the hanging bridge Tacoma Narrows in Washington, USA collapsed due to strong winds which caused the bridge to oscillate with large resonance and amplitude.
Th e London Millennium Footbridge was opened in June 2000. Th is bridge experienced unexpected oscillations when 2 000 pedestrians walked on it.
Resonance is used in the tuning of musical instruments.
3. Search for videos on the effects of resonance given and present your videos.
4. Search for more examples of resonance.
Video on examples of resonance
http://bt.sasbadi.com/p4187
Discussion: 1. Which pendulum oscillates with the largest amplitude?2. Why does that pendulum oscillate with the largest amplitude?
187187187187
Chapter 5 Waves
5.2.15.2.1 5.2.25.2.2
Reflection of WavesReflection of Waves5.3
You have studied that light and sound waves can be refl ected. In reality, all waves can be refl ected. Photograph 5.7 shows sea waves refl ected by an embankment. Scan the QR code to watch the video on the refl ection of waves.
Photograph 5.7 Sea waves refl ected by an embankment
Video on refl ection of waves
http://bt.sasbadi.com/p4188
WavefrontTh e phenomenon of refl ected waves can be studied with the help of a ripple tank and its accessories. Figure 5.27 shows plane waves produced by a ripple tank.
Figure 5.27 Wavefront Figure 5.28 Formation of bright and dark fringes
All points along line AB are in phase as the points are of the same distance from the source of vibration and have the same displacement. Line AB which joins the points in phase in a wave is known as wavefront. Line CD is also a wavefront. When light rays move through water in a ripple tank, alternate bright and dark fringes can be seen on the screen as shown in Figure 5.27.Figure 5.28 shows the formation of bright and dark fringes by light rays.
Crest
A
B
C
D
Bright fringes
Dark fringes
Direction ofpropagation
Light rays
Water
Screen
Dark fringe Dark fringe Dark fringe Bright fringeBright fringe
188188188188 5.3.15.3.1
Activity 5.11
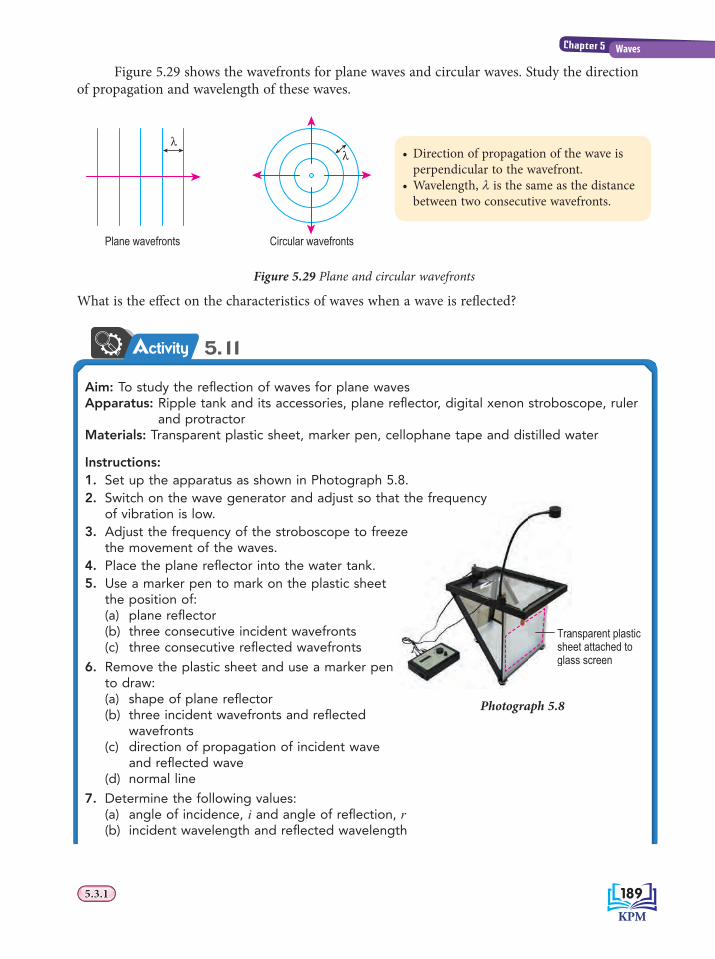
Figure 5.29 shows the wavefronts for plane waves and circular waves. Study the direction of propagation and wavelength of these waves.
Figure 5.29 Plane and circular wavefronts
What is the eff ect on the characteristics of waves when a wave is refl ected?
Aim: To study the refl ection of waves for plane wavesApparatus: Ripple tank and its accessories, plane refl ector, digital xenon stroboscope, ruler
and protractorMaterials: Transparent plastic sheet, marker pen, cellophane tape and distilled water
Instructions: 1. Set up the apparatus as shown in Photograph 5.8.2. Switch on the wave generator and adjust so that the frequency
of vibration is low.3. Adjust the frequency of the stroboscope to freeze
the movement of the waves. 4. Place the plane refl ector into the water tank.5. Use a marker pen to mark on the plastic sheet
the position of:(a) plane refl ector(b) three consecutive incident wavefronts(c) three consecutive refl ected wavefronts
6. Remove the plastic sheet and use a marker pen to draw:(a) shape of plane refl ector(b) three incident wavefronts and refl ected
wavefronts(c) direction of propagation of incident wave
and refl ected wave(d) normal line
7. Determine the following values:(a) angle of incidence, i and angle of refl ection, r(b) incident wavelength and refl ected wavelength
Transparent plasticsheet attached toglass screen
t the frequency
ze
Trasheglas
Plane wavefronts
λλ
Circular wavefronts
• Direction of propagation of the wave is perpendicular to the wavefront.
• Wavelength, λ is the same as the distance between two consecutive wavefronts.
Photograph 5.8
189189189189
Chapter 5 Waves
5.3.15.3.1

Discussion:
1. Compare angle of incidence and angle of refl ection.
2. Compare incident wavelength and refl ected wavelength.
3. Can the stroboscope freeze the movement of incident waves and refl ected waves at the same time?
4. Based on your answer in question 3, compare the frequency of incident wave and frequency of refl ected wave.
5. From your answers in questions 2 and 4, compare the speed of incident wave with refl ected wave.
Photograph 5.9 shows refl ected plane water waves in a ripple tank. Th e phenomenon of refl ected waves only cause the wave direction to change while other characteristics of the wave do not change.
λ1
λ2
λ1
λ2
ir
ir
Incident wavefronts
Reflected wavefronts
Normal
Plane reflector
Photograph 5.9 Refl ection of plane water waves by a plane refl ector
Table 5.2 summarizes the eff ects of refl ection on the characteristics of waves.
Table 5.2 Eff ects of refl ection on characteristics of waves
Characteristic of wave Eff ect aft er refl ection of wave
Angle of incidence and angle of refl ection Angle of incidence = angle of refl ection
Wavelength No change
Frequency No change
Wave speed No change
Direction of propagation Changes with the condition that the angle of incidence is the same as angle of refl ection
190190190190 5.3.15.3.1
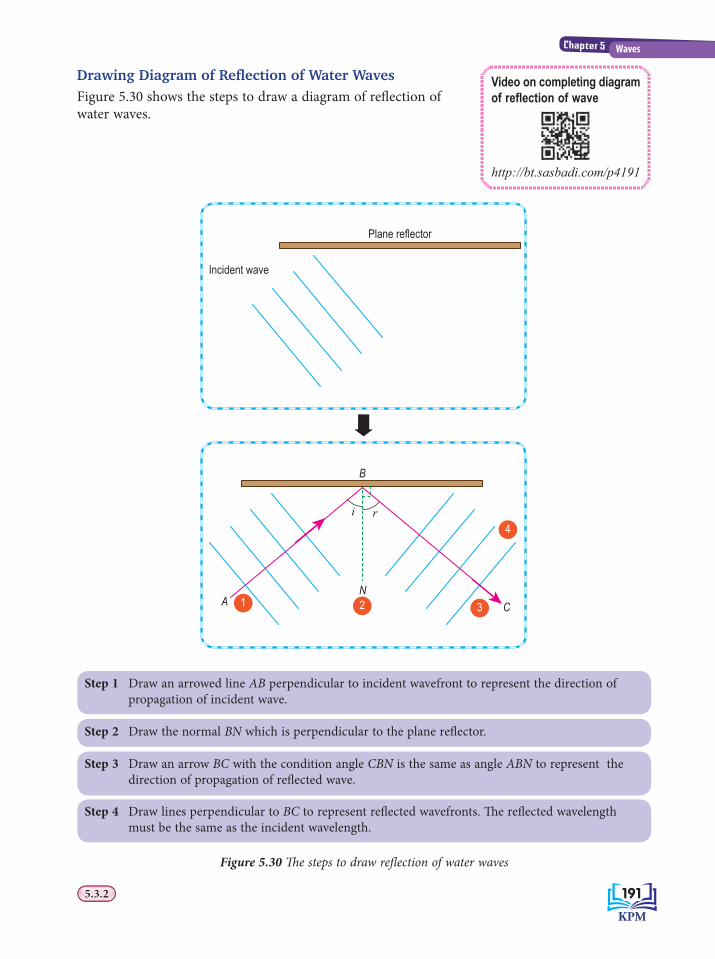
Step 1 Draw an arrowed line AB perpendicular to incident wavefront to represent the direction of propagation of incident wave.
Step 3 Draw an arrow BC with the condition angle CBN is the same as angle ABN to represent the direction of propagation of refl ected wave.
Step 4 Draw lines perpendicular to BC to represent refl ected wavefronts. Th e refl ected wavelength must be the same as the incident wavelength.
Step 2 Draw the normal BN which is perpendicular to the plane refl ector.
Drawing Diagram of Refl ection of Water WavesFigure 5.30 shows the steps to draw a diagram of refl ection of water waves.
Figure 5.30 Th e steps to draw refl ection of water waves
Video on completing diagram of refl ection of wave
http://bt.sasbadi.com/p4191
B
N
i r
A C1 2 3
4
Incident wave
Plane reflector
191191191191
Chapter 5 Waves
5.3.25.3.2

Figure 5.31 Applications of refl ected waves in daily life
Radio waves from communication satellites are refl ected by the parabolic dish and focussed onto the antenna on the feed horn.
Technology of ultrasonic refl ection which is known as SONAR helps to detect areas which have a lot of fi sh. Transducer transmits waves into the water and these waves are refl ected by the fi sh to the transducer.
Patterns of refl ected sound waves caused by diff erent rocks enable the location, depth and structure of the seabed which contain sources of natural gas to be identifi ed.
Applications of Refl ection of Waves in Daily Life
Th e phenomenon of refl ection of waves can be applied in our daily lives. Figure 5.31 shows some examples of the application of refl ection of waves.
Ultrasonic waves are used in the medical fi eld to examine a foetusor other internal organs.
Transducer
Receiver ofreflectedwaves
Transmitter ofincident waves
Offi cers of Science (Physics) in the diagnostic imaging and radiotherapy division in hospitals maintain and callibrate all apparatus that produce electromagnetic and sound waves so that they are safe to use.
CAREERiNFO
192192192192 5.3.35.3.3

Example 1
Solving Problems Involving Refl ected Waves
Ultrasonic waves of frequency 25 kHz are transmitted from a ship to the seabed to determine the depth of the sea. Th ese waves travel at a speed of 1 500 m s–1 in the water. Time between sending the ultrasonic wave and receiving the refl ected wave is 120 ms.Determine (a) depth of sea, and (b) ultrasonic wave length.
Solution:
Th e ultrasonic wave takes 120 ms to travel from the ship to the seabed and back to the ship. Distance travelled by the wave is two times the depth of the sea.(a)
Step �List the given information in symbols.
Speed of the wave, v = 1 500 m s–1
Time interval, t = 120 ms
Step �Identify and write down the formula used.
Distance travelled = Speed × time 2d = vt
Step �Substitute numerical values into the formula and perform the calculations
Depth, d = vt2
= 1 500(120 × 10–3)2
= 90 m(b) v = fλ 1 500 = (25 × 103)λ λ = 1 500
25 × 103
= 0.06 m
Formative Practice 5.35.3
1. Copy Figure 5.32 and draw the wavefront and the direction of the refl ected water waves.
2. Figure 5.33 shows the use of ultrasonic waves by a ship to determine the depth of the sea. Th e interval time between transmission and receiving of echo of the ultrasonic sound is 0.06 seconds. Speed of the ultrasonic wave in the water is 1 500 m s–1. Determine the depth of the sea.
Normal
70°
Figure 5.32
Figure 5.33
14
24
31
42
43
14
24
3
193193193193
Chapter 5 Waves
5.3.45.3.4
INFOSMARTSMART
Activity 5.12
Refraction of WavesRefraction of Waves5.4
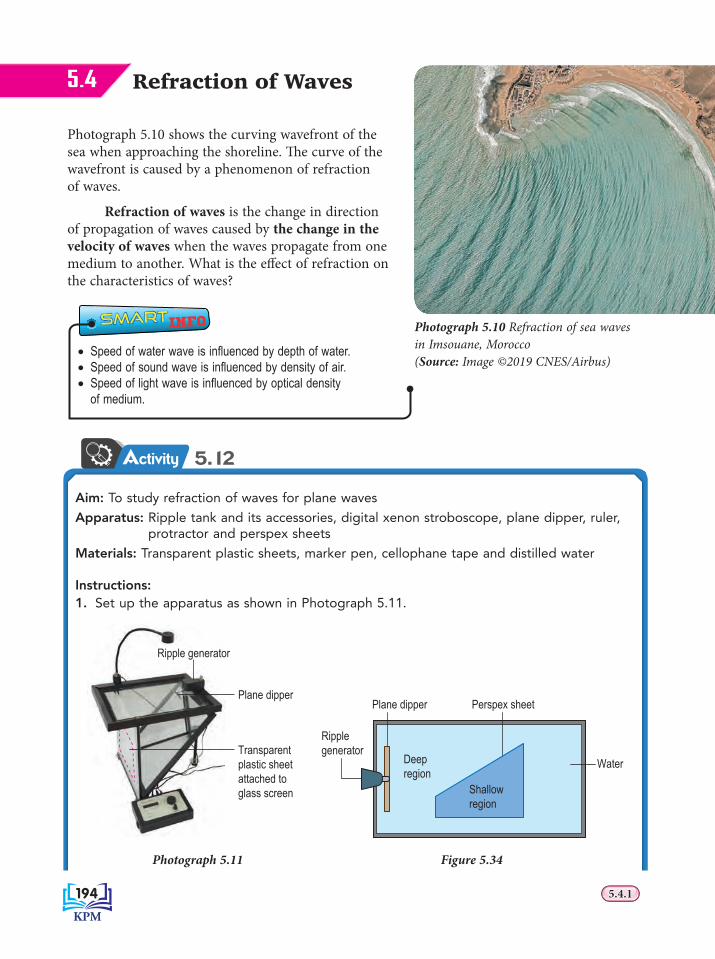
Photograph 5.10 shows the curving wavefront of the sea when approaching the shoreline. Th e curve of the wavefront is caused by a phenomenon of refraction of waves.
Refraction of waves is the change in direction of propagation of waves caused by the change in the velocity of waves when the waves propagate from one medium to another. What is the eff ect of refraction on the characteristics of waves?
Aim: To study refraction of waves for plane waves
Apparatus: Ripple tank and its accessories, digital xenon stroboscope, plane dipper, ruler, protractor and perspex sheets
Materials: Transparent plastic sheets, marker pen, cellophane tape and distilled water
Instructions:1. Set up the apparatus as shown in Photograph 5.11.
Plane dipper
Ripple generatorRipple generato
Transparentplastic sheetattached toglass screen
Plane dipper
Ripplegenerator
Water
Perspex sheet
Deep region
Shallow region
Photograph 5.11 Figure 5.34
5.4.15.4.1
Photograph 5.10 Refraction of sea waves in Imsouane, Morocco (Source: Image ©2019 CNES/Airbus)
• Speed of water wave is infl uenced by depth of water.• Speed of sound wave is infl uenced by density of air.• Speed of light wave is infl uenced by optical density
of medium.
194194
3.2.25.4.15.4.1
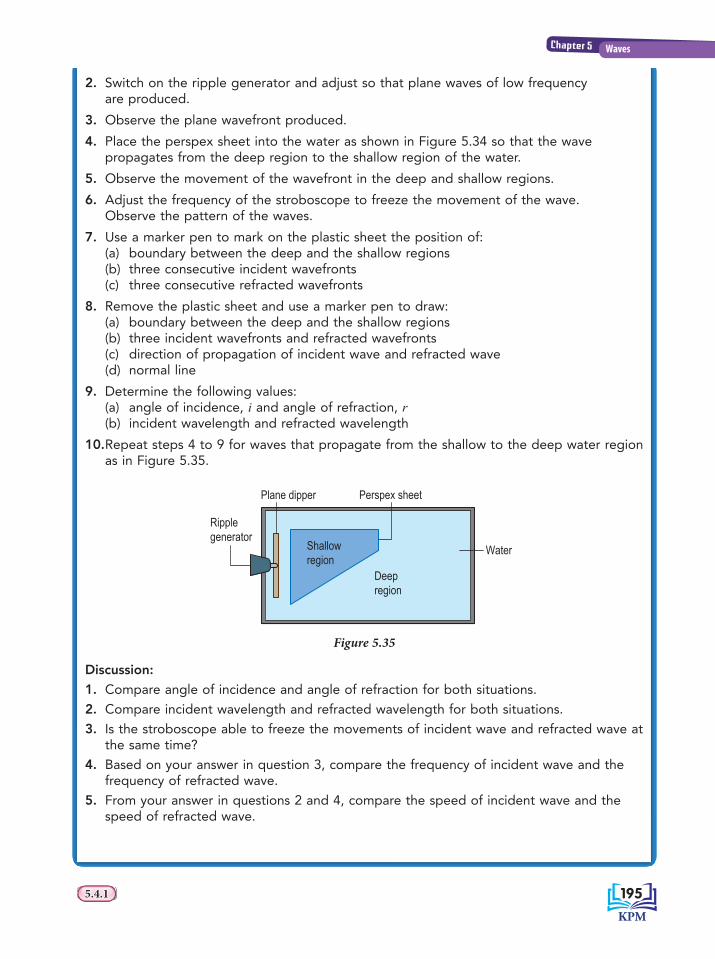
2. Switch on the ripple generator and adjust so that plane waves of low frequency are produced.
3. Observe the plane wavefront produced.
4. Place the perspex sheet into the water as shown in Figure 5.34 so that the wave propagates from the deep region to the shallow region of the water.
5. Observe the movement of the wavefront in the deep and shallow regions.
6. Adjust the frequency of the stroboscope to freeze the movement of the wave. Observe the pattern of the waves.
7. Use a marker pen to mark on the plastic sheet the position of:(a) boundary between the deep and the shallow regions(b) three consecutive incident wavefronts(c) three consecutive refracted wavefronts
8. Remove the plastic sheet and use a marker pen to draw:(a) boundary between the deep and the shallow regions(b) three incident wavefronts and refracted wavefronts(c) direction of propagation of incident wave and refracted wave(d) normal line
9. Determine the following values:(a) angle of incidence, i and angle of refraction, r(b) incident wavelength and refracted wavelength
10. Repeat steps 4 to 9 for waves that propagate from the shallow to the deep water region as in Figure 5.35.
Plane dipper
Ripplegenerator
Water
Perspex sheet
Shallow region
Deep region
Figure 5.35
Discussion:
1. Compare angle of incidence and angle of refraction for both situations.
2. Compare incident wavelength and refracted wavelength for both situations.
3. Is the stroboscope able to freeze the movements of incident wave and refracted wave at the same time?
4. Based on your answer in question 3, compare the frequency of incident wave and the frequency of refracted wave.
5. From your answer in questions 2 and 4, compare the speed of incident wave and the speed of refracted wave.
195195
Chapter 5 Waves

Figure 5.36 Refraction of plane water waves
Table 5.3 summarizes the eff ects of refraction on the characteristics of waves.
Table 5.3 Eff ects of refraction on the characteristics of waves
Characteristic of wave From deep water region to shallow water region
From shallow water region to deep water region
Angle of incidence and angle of refraction
Angle of incidence > angle of refraction
Angle of incidence < angle of refraction
Wavelength Decreasing Increasing
Frequency No change No change
Wave speed Decreasing Increasing
Direction of propagation Refracted towards the normal Refracted away from the normal
5.4.15.4.1
Deep water region
NormalNormal
i
r
i
r
Direction of propagation of refracted wave
Shallow water region
λ1λ1
λ2λ2
Direction of propagation of incident wave
Direction of propagation of incident wave Direction of
propagation of refracted wave
From deep water region to shallow water region
Deep water region
Shallow water region
NormalNormal
i ri r
λ1λ1
λ2λ2
Direction of propagation of refracted wave
Direction of propagation of refracted waveDirection of
propagation of incident wave
Direction of propagation of incident wave
From shallow water region to deep water region
From Activity 5.12, you will obtain the refraction of plane water wave. Figure 5.36 shows the refraction of plane water wave.
196196

Drawing Diagram of Refraction of Plane Water WavesFigure 5.37(a) shows plane wavefronts in deep water region approaching shallow water region. Figure 5.37(b) which shows wavefronts of refracted waves can be drawn using four steps.
Incident wave
Deep region
Shallow region
A
B
C
Normal1 2
4
3
Figure 5.37(a) Figure 5.37(b)
Th e steps to draw refraction of plane water waves are as follows:
Draw an arrowed line AB perpendicular to the incident wavefront to represent direction of propagation of the incident wave.
Draw the normal which is perpendicular to the boundary of the deep region and shallow region at B.
Draw an arrowed line BC, which is nearer the normal than AB to represent the direction of propagation of the refracted wave.
Draw three lines perpendicular to BC to represent the refracted wavefronts. Th e lines have to be closer to one another compared to the incident wavefronts.
Step 1:
Step 2:
Step 3:
Step 4:
3.2.25.4.25.4.2
If water wave propagates from shallow region to deep region, direction of propagation of the refracted wave is bent away from the normal.
197197
Chapter 5 Waves
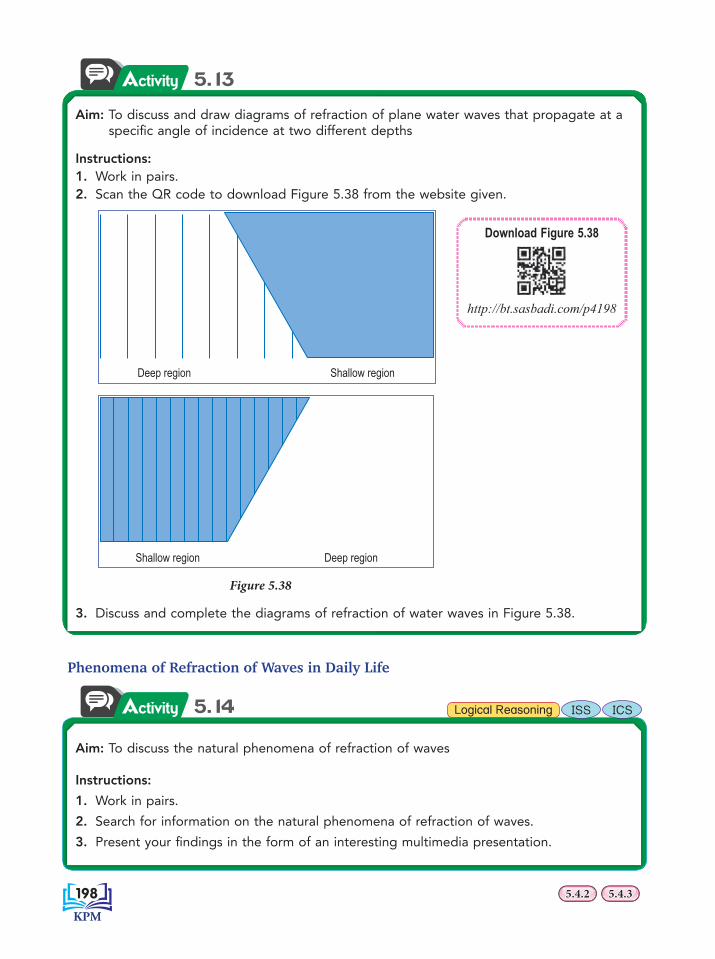
5.13Activity
Phenomena of Refraction of Waves in Daily Life
5.4.35.4.35.4.25.4.2
Aim: To discuss and draw diagrams of refraction of plane water waves that propagate at a specifi c angle of incidence at two different depths
Instructions:1. Work in pairs.2. Scan the QR code to download Figure 5.38 from the website given.
Deep region Shallow region
Deep regionShallow region
Figure 5.38
3. Discuss and complete the diagrams of refraction of water waves in Figure 5.38.
Aim: To discuss the natural phenomena of refraction of waves
Instructions:
1. Work in pairs.
2. Search for information on the natural phenomena of refraction of waves.
3. Present your fi ndings in the form of an interesting multimedia presentation.
Download Figure 5.38
http://bt.sasbadi.com/p4198
Logical Reasoning ISS ICS5.14Activity
198198
5.4.35.4.3
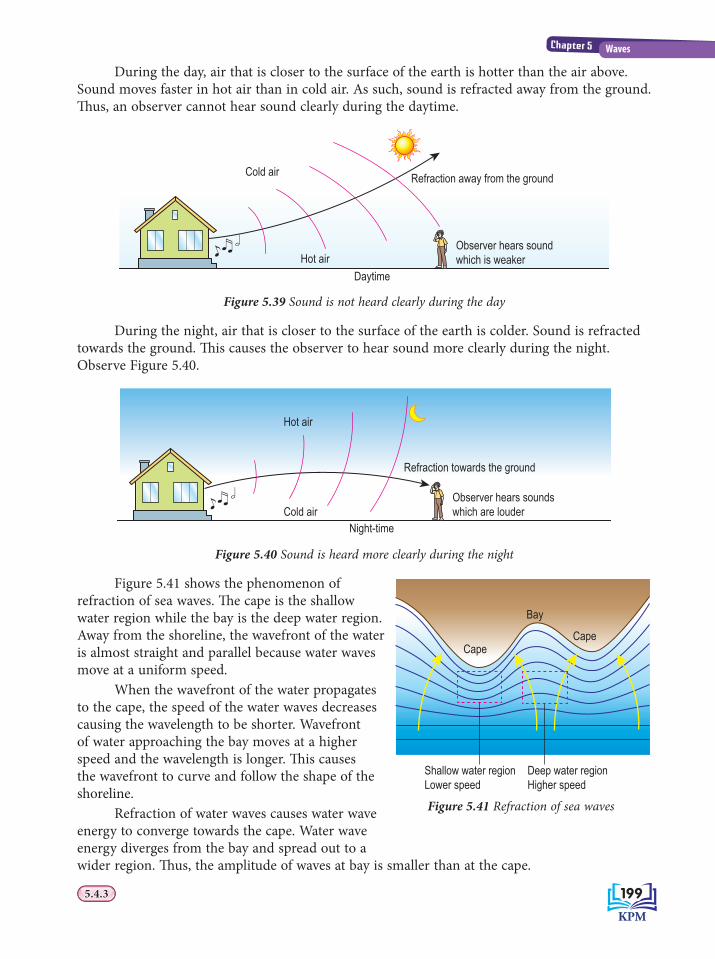
During the day, air that is closer to the surface of the earth is hotter than the air above. Sound moves faster in hot air than in cold air. As such, sound is refracted away from the ground. Th us, an observer cannot hear sound clearly during the daytime.
Observer hears sound which is weaker
Refraction away from the ground
Hot airDaytime
Cold air
Figure 5.39 Sound is not heard clearly during the day
During the night, air that is closer to the surface of the earth is colder. Sound is refracted towards the ground. Th is causes the observer to hear sound more clearly during the night. Observe Figure 5.40.
Observer hears sounds which are louder
Refraction towards the ground
Hot air
Night-timeCold air
Figure 5.40 Sound is heard more clearly during the night
Figure 5.41 shows the phenomenon of refraction of sea waves. Th e cape is the shallow water region while the bay is the deep water region. Away from the shoreline, the wavefront of the water is almost straight and parallel because water waves move at a uniform speed. When the wavefront of the water propagates to the cape, the speed of the water waves decreases causing the wavelength to be shorter. Wavefront of water approaching the bay moves at a higher speed and the wavelength is longer. Th is causes the wavefront to curve and follow the shape of the shoreline. Refraction of water waves causes water wave energy to converge towards the cape. Water wave energy diverges from the bay and spread out to a wider region. Th us, the amplitude of waves at bay is smaller than at the cape.
Shallow water regionLower speed
Deep water regionHigher speed
CapeCape
Bay
Figure 5.41 Refraction of sea waves
199199
Chapter 5 Waves
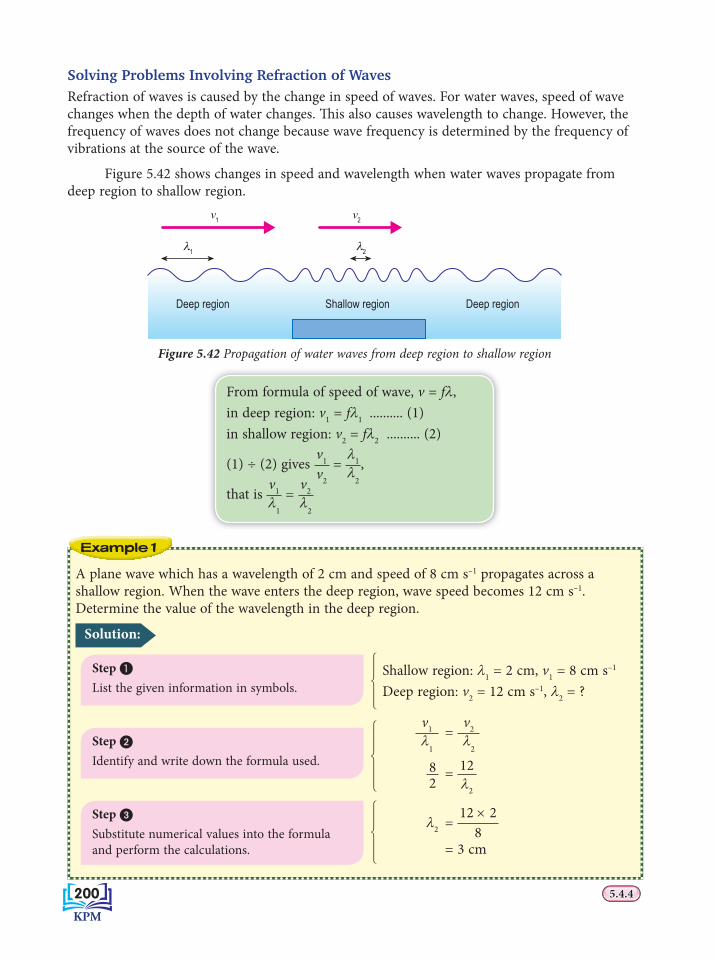
A plane wave which has a wavelength of 2 cm and speed of 8 cm s–1 propagates across a shallow region. When the wave enters the deep region, wave speed becomes 12 cm s–1. Determine the value of the wavelength in the deep region.
Solution:
Step �List the given information in symbols.
Shallow region: λ1 = 2 cm, v1 = 8 cm s–1
Deep region: v2 = 12 cm s–1, λ2 = ?
Step �Identify and write down the formula used.
v1λ
1
= v2λ
2
82 = 12
λ2
Step �Substitute numerical values into the formula and perform the calculations.
λ2 = 12 × 2
8
= 3 cm
5.4.45.4.4
Solving Problems Involving Refraction of WavesRefraction of waves is caused by the change in speed of waves. For water waves, speed of wave changes when the depth of water changes. Th is also causes wavelength to change. However, the frequency of waves does not change because wave frequency is determined by the frequency of vibrations at the source of the wave.
Figure 5.42 shows changes in speed and wavelength when water waves propagate from deep region to shallow region.
Deep region Shallow region
v2
21
v1
Deep region
Figure 5.42 Propagation of water waves from deep region to shallow region1
42
43
14
24
31
42
43
From formula of speed of wave, v = fλ,in deep region: v1 = fλ1 .......... (1)in shallow region: v2 = fλ2 .......... (2)
(1) ÷ (2) gives v1
v2
= λ1λ
2
,
that is v1λ
1
= v2λ
2
Example 1
200200
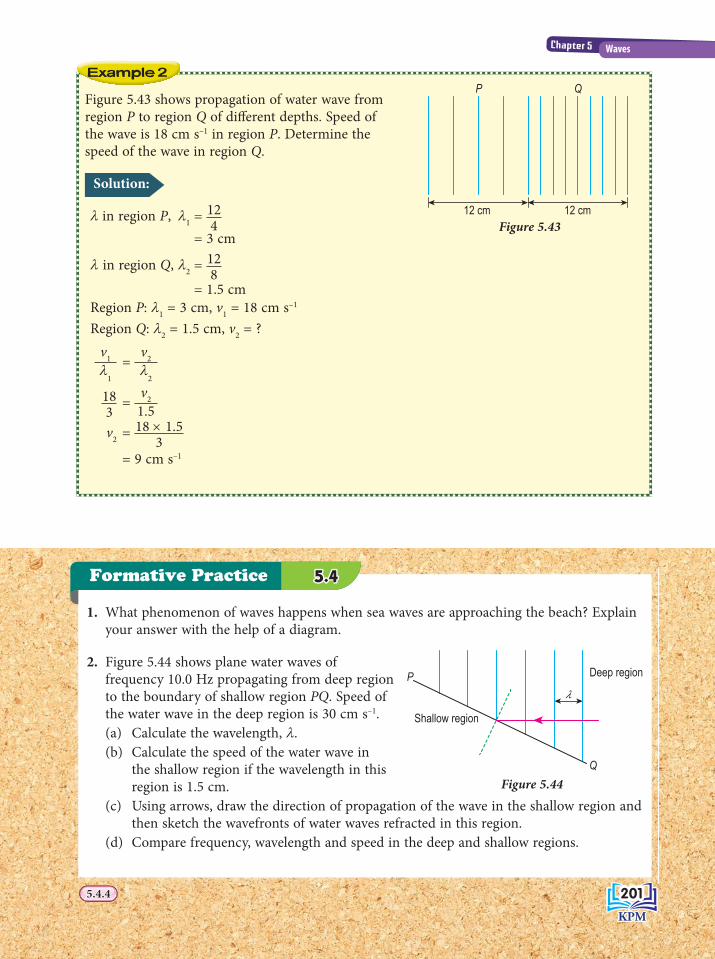
Figure 5.43 shows propagation of water wave from region P to region Q of diff erent depths. Speed of the wave is 18 cm s–1 in region P. Determine the speed of the wave in region Q.
Solution:
λ in region P, λ1 = 124
= 3 cm
λ in region Q, λ2 = 128
= 1.5 cmRegion P: λ1 = 3 cm, v1 = 18 cm s–1
Region Q: λ2 = 1.5 cm, v2 = ?
v1λ
1
= v2λ
2
183 =
v21.5
v2 = 18 × 1.53
= 9 cm s–1
1. What phenomenon of waves happens when sea waves are approaching the beach? Explain your answer with the help of a diagram.
2. Figure 5.44 shows plane water waves of frequency 10.0 Hz propagating from deep region to the boundary of shallow region PQ. Speed of the water wave in the deep region is 30 cm s–1.(a) Calculate the wavelength, λ. (b) Calculate the speed of the water wave in
the shallow region if the wavelength in this region is 1.5 cm.
(c) Using arrows, draw the direction of propagation of the wave in the shallow region and then sketch the wavefronts of water waves refracted in this region.
(d) Compare frequency, wavelength and speed in the deep and shallow regions.
5.4.45.4.4
12 cm 12 cm
P Q
Deep region
Shallow region
λP
Q
Figure 5.43
Figure 5.44
Example 2
Formative Practice 5.45.4
201201
Chapter 5 Waves

Activity 5.15
Diffraction of WavesDiffraction of Waves5.5
Photograph 5.12 shows the embankment built in Marang, Terengganu. What causes the wavefront of the seawater in region A and region B to have diff erent shapes? Th e wavefront of the seawater changes from plane wavefront in region A to circular wavefront in region B. Th is shows that sea waves spread out while propagating through the gap in the embankment. Photograph 5.12 shows the phenomenon of diff raction of waves. Diff raction of waves can happen to water, light and sound waves.
Aim: To show diffraction of water, light and sound waves
A Diffraction of water waves
Apparatus: Ripple tank and its accessories, digital xenon stroboscope and barriers
Materials: Distilled water
Instructions:1. Set up the apparatus as shown in Figure 5.45. 2. Adjust the speed of the ripple generator so
that waves can be seen clearly on the screen using the stroboscope.
3. Place the barriers to form a gap with size almost similar to the wavelength of the wave produced.
4. Switch off the ripple generator and wait until the water in the ripple tank becomes calm.
5. Switch on the ripple generator again.6. Observe the shape of the wavefront before and
after passing through the gap.7. Draw the shape of the wavefront after passing
through the gap and record the characteristics of the wavefront before and after passing through the gap in Table 5.4.
5.5.15.5.1
Ripple generator
Plane wave dipper
Barriers
AA BB
Photograph 5.12 Embankment at Marang, Terengganu(Source: Image ©2019 TerraMetrics Image ©2019 Maxar Technologies)
Figure 5.45
202202

Results:
Table 5.4
Characteristic of wave Comparison before and aft er the gap
Wavelength
Frequency
Wave speed
Amplitude
Direction of propagationFigure 5.46
Discussion:
Compare the shape of the incident wavefront with the wavefront that has passed through the gap.
B Diffraction of light waves
Apparatus: Laser pen, retort stand, single narrow slit, single wide slit, small sized pin hole, large sized pin hole and white screen
Instructions:
1. Set up the apparatus as shown in Figure 5.47. Use a single wide slit.
Retort stand
Laser penSingle slit
Screen
Figure 5.47
2. Direct the laser light ray through the single slit. Observe the pattern formed on the screen and draw the pattern in Table 5.5.
3. Repeat steps 1 and 2 using:(a) a single narrow slit(b) a large pin hole(c) a small pin hole
Demonstration using self-made adjustable single slit
http://bt.sasbadi.com/p4203
You can also carry out this activity using a self-made adjustable single slit as shown below.
Credit card
Wide slit
Pencil
Narrow slit
Rubber band
Credit card
Wide slit
Pencil
Narrow slit
Rubber band
5.5.15.5.1 203203
Chapter 5 Waves

Results:Table 5.5
Wide slit Narrow slit
Large pin hole Small pin hole
Discussion:1. What is the difference in the image formed by the single
wide slit and single narrow slit?2. Compare the image formed by the small pin hole with
the large pin hole.
C Diffraction of sound waves
Apparatus: Tablet, small loudspeaker that can be connected to tablet
Instructions:1. Set up the apparatus as shown in Figure 5.48 at a
corner of a building.2. Scan the QR code to download the sound
generator application from the website given.3. Generate a sound of frequency of 500 Hz from
the application.4. Stand at position X as shown in Figure 5.48 and
listen to the sound from the loudspeaker.5. Repeat step 4 by standing at position Y. 6. Record your observations in Table 5.6.
Results:Table 5.6
Position Sound heard
X
Y
Discussion:1. Can the sound from the loudspeaker be heard at positions X and Y?2. Explain why sound can be heard at position Y even though the loudspeaker cannot
be seen.
Sound generator application
http://bt.sasbadi.com/p4204
5.5.15.5.1
Position X
Position Y
Tablet
Loudspeaker
Figure 5.48
204204
5.5.15.5.1
Incident wave
Wave diffracted
Diff raction pattern through single slit Diff raction pattern through pin hole
Figure 5.51 Diff raction patterns of light waves
Figure 5.49 Diff raction pattern of water wave Figure 5.50 Diff raction pattern of sound wave
Waves spread around corners of building
Source of sound
BuildingBuilding
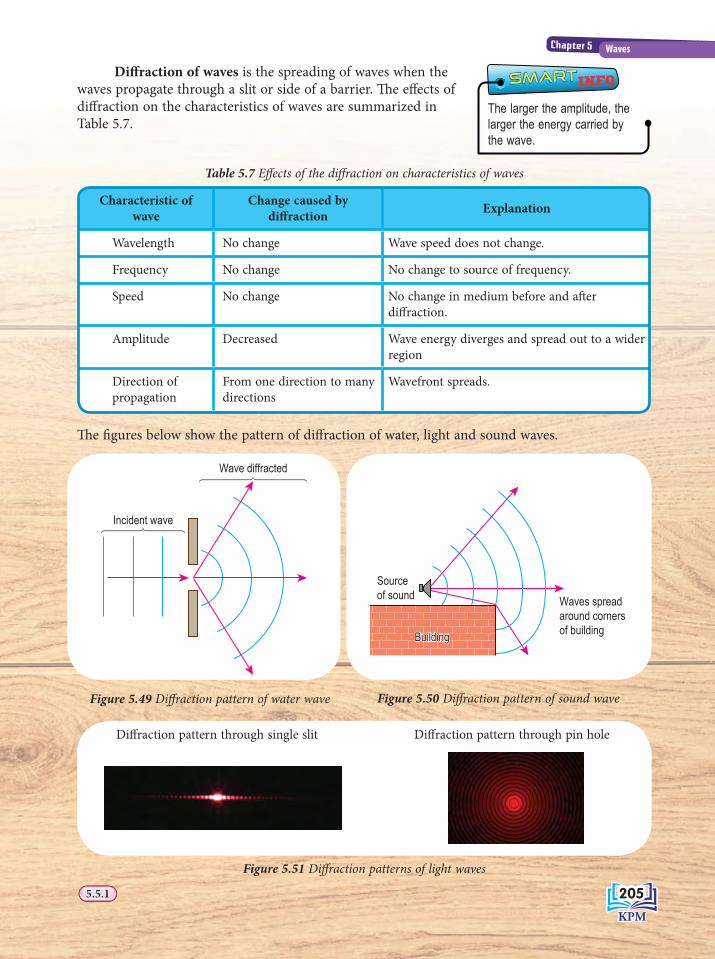
Diff raction of waves is the spreading of waves when the waves propagate through a slit or side of a barrier. Th e eff ects of diff raction on the characteristics of waves are summarized in Table 5.7.
Table 5.7 Eff ects of the diff raction on characteristics of waves
Characteristic of wave
Change caused by diff raction Explanation
Wavelength No change Wave speed does not change.
Frequency No change No change to source of frequency.
Speed No change No change in medium before and aft er diff raction.
Amplitude Decreased Wave energy diverges and spread out to a wider region
Direction of propagation
From one direction to many directions
Wavefront spreads.
Th e fi gures below show the pattern of diff raction of water, light and sound waves.
INFOSMARTSMART
The larger the amplitude, the larger the energy carried by the wave.
205205
Chapter 5 Waves
Activity 5.16
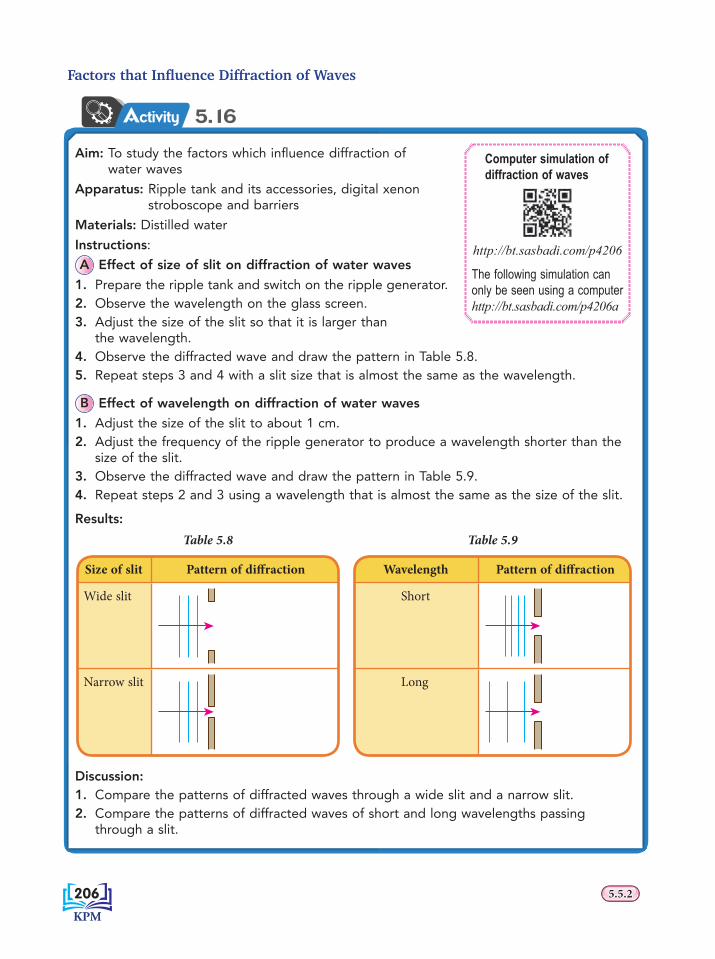
Factors that Infl uence Diffraction of Waves
Aim: To study the factors which infl uence diffraction of water waves
Apparatus: Ripple tank and its accessories, digital xenon stroboscope and barriers
Materials: Distilled water
Instructions:
A Effect of size of slit on diffraction of water waves
1. Prepare the ripple tank and switch on the ripple generator.2. Observe the wavelength on the glass screen.3. Adjust the size of the slit so that it is larger than
the wavelength.4. Observe the diffracted wave and draw the pattern in Table 5.8.5. Repeat steps 3 and 4 with a slit size that is almost the same as the wavelength.
B Effect of wavelength on diffraction of water waves
1. Adjust the size of the slit to about 1 cm.2. Adjust the frequency of the ripple generator to produce a wavelength shorter than the
size of the slit.3. Observe the diffracted wave and draw the pattern in Table 5.9.4. Repeat steps 2 and 3 using a wavelength that is almost the same as the size of the slit.
Results:
Table 5.8 Table 5.9
Size of slit Pattern of diff raction
Wide slit
Narrow slit
Wavelength Pattern of diff raction
Short
Long
Discussion:1. Compare the patterns of diffracted waves through a wide slit and a narrow slit.2. Compare the patterns of diffracted waves of short and long wavelengths passing
through a slit.
5.5.25.5.2
Computer simulation of diffraction of waves
http://bt.sasbadi.com/p4206
The following simulation can only be seen using a computerhttp://bt.sasbadi.com/p4206a
206206
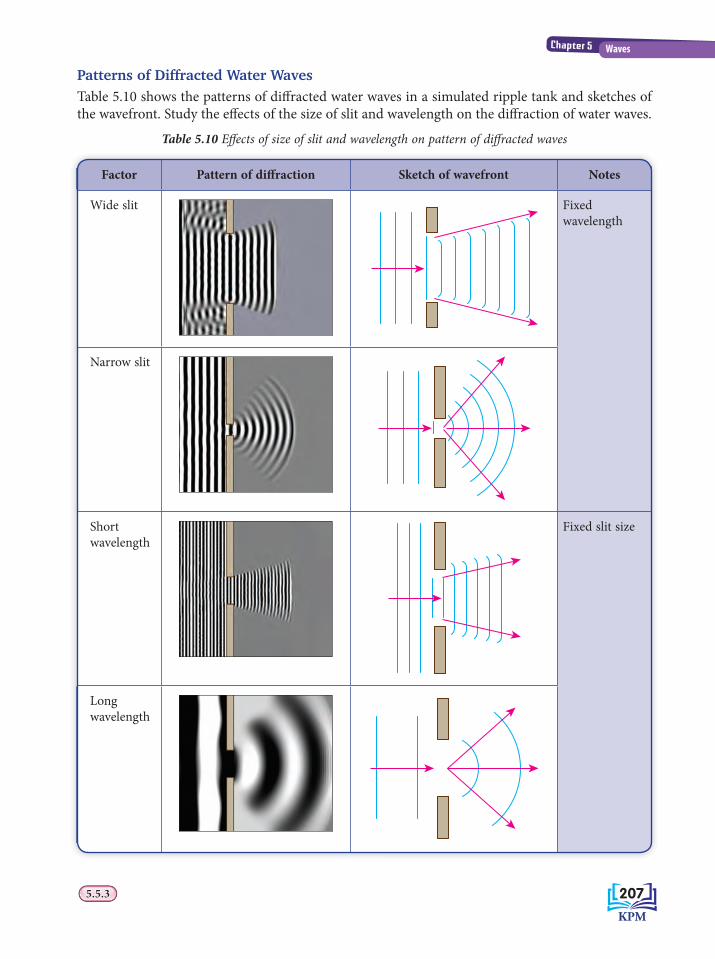
Patterns of Diffracted Water WavesTable 5.10 shows the patterns of diff racted water waves in a simulated ripple tank and sketches of the wavefront. Study the eff ects of the size of slit and wavelength on the diff raction of water waves.
Table 5.10 Eff ects of size of slit and wavelength on pattern of diff racted waves
Factor Pattern of diff raction Sketch of wavefront Notes
Wide slit Fixed wavelength
Narrow slit
Short wavelength
Fixed slit size
Long wavelength
5.5.35.5.3 207207
Chapter 5 Waves
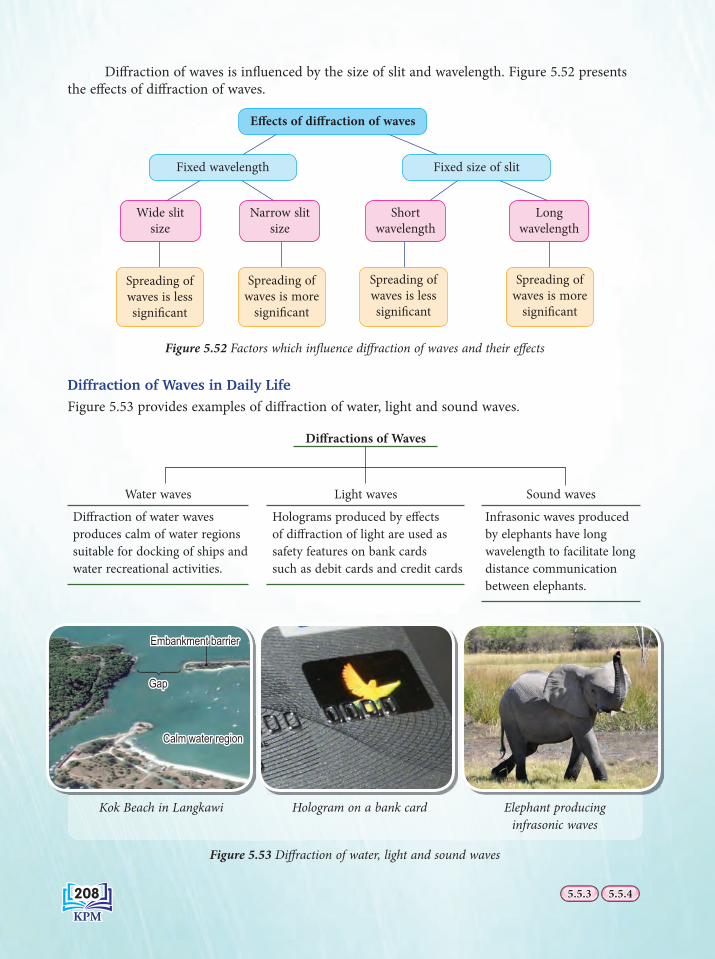
Diff raction of waves is infl uenced by the size of slit and wavelength. Figure 5.52 presents the eff ects of diff raction of waves.
Eff ects of diff raction of waves
Fixed wavelength
Wide slit size
Short wavelength
Spreading of waves is less signifi cant
Spreading of waves is more
signifi cant
Spreading of waves is less signifi cant
Spreading of waves is more
signifi cant
Narrow slit size
Long wavelength
Fixed size of slit
Figure 5.52 Factors which infl uence diff raction of waves and their eff ects
Diffraction of Waves in Daily LifeFigure 5.53 provides examples of diff raction of water, light and sound waves.
Figure 5.53 Diff raction of water, light and sound waves
5.5.45.5.45.5.35.5.3
Kok Beach in Langkawi Hologram on a bank card Elephant producing infrasonic waves
Calm water regionCalm water region
GapGap123
Water waves
Diff raction of water waves produces calm of water regions suitable for docking of ships and water recreational activities.
Light waves
Holograms produced by eff ects of diff raction of light are used as safety features on bank cards such as debit cards and credit cards
Sound waves
Infrasonic waves produced by elephants have long wavelength to facilitate long distance communication between elephants.
Diff ractions of Waves
Embankment barrierEmbankment barrier
208208
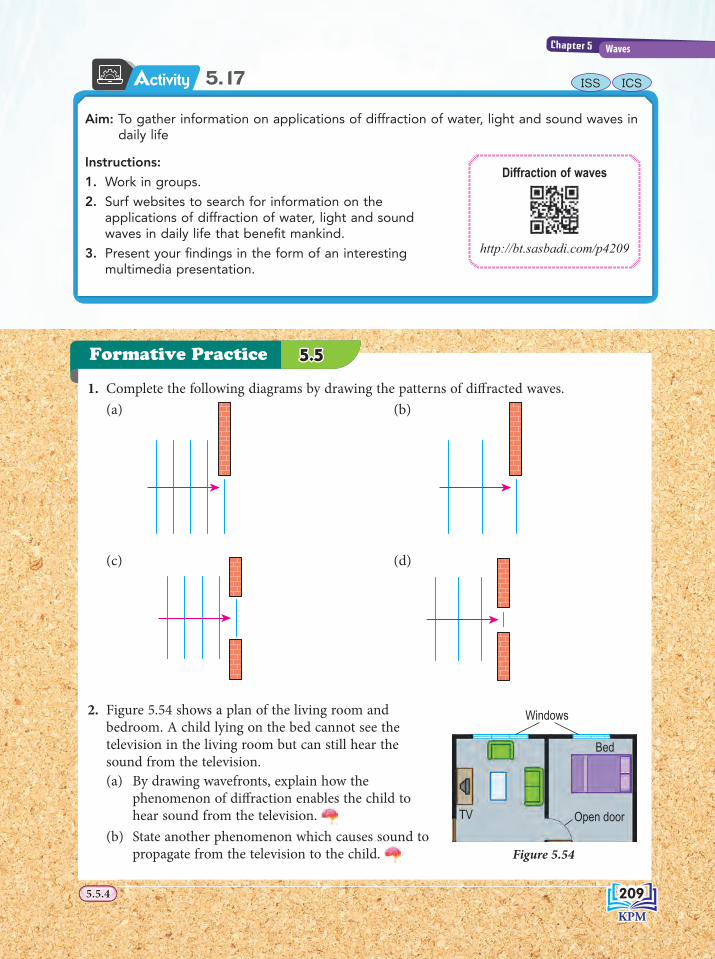
Activity 5.17
1. Complete the following diagrams by drawing the patterns of diff racted waves. (a) (b)
(c) (d)
2. Figure 5.54 shows a plan of the living room and bedroom. A child lying on the bed cannot see the television in the living room but can still hear the sound from the television.(a) By drawing wavefronts, explain how the
phenomenon of diff raction enables the child to hear sound from the television.
(b) State another phenomenon which causes sound to propagate from the television to the child.
TV Open door
Bed
Windows
Figure 5.54
5.5.45.5.4
Aim: To gather information on applications of diffraction of water, light and sound waves in daily life
Instructions:
1. Work in groups.
2. Surf websites to search for information on the applications of diffraction of water, light and sound waves in daily life that benefi t mankind.
3. Present your fi ndings in the form of an interesting multimedia presentation.
ISS ICS
Formative Practice 5.55.5
Diffraction of waves
http://bt.sasbadi.com/p4209
209209
Chapter 5 Waves
5.18Activity 5 18AA
Interference of WavesInterference of Waves5.6
Principle of Superposition of Waves
Photograph 5.13 Superposition of two circular waves
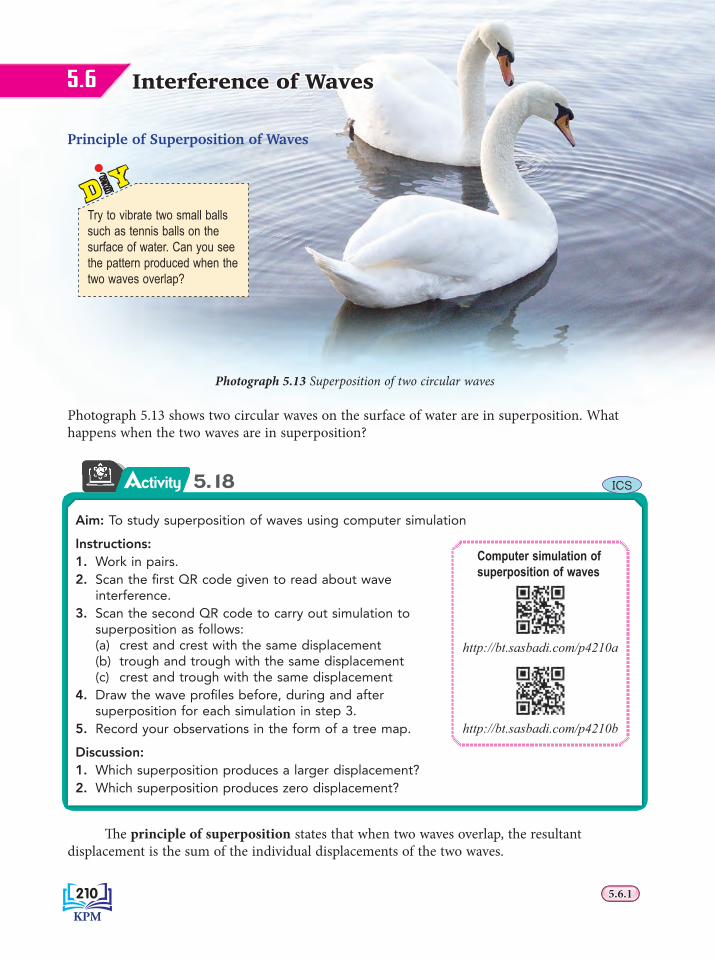
Photograph 5.13 shows two circular waves on the surface of water are in superposition. What happens when the two waves are in superposition?
Aim: To study superposition of waves using computer simulation
Instructions:1. Work in pairs. 2. Scan the fi rst QR code given to read about wave
interference.3. Scan the second QR code to carry out simulation to
superposition as follows:(a) crest and crest with the same displacement(b) trough and trough with the same displacement(c) crest and trough with the same displacement
4. Draw the wave profi les before, during and after superposition for each simulation in step 3.
5. Record your observations in the form of a tree map.
Discussion:1. Which superposition produces a larger displacement?2. Which superposition produces zero displacement?
Computer simulation of superposition of waves
http://bt.sasbadi.com/p4210a
http://bt.sasbadi.com/p4210b
Th e principle of superposition states that when two waves overlap, the resultant displacement is the sum of the individual displacements of the two waves.
5.6.15.6.1
ICS
Try to vibrate two small balls such as tennis balls on the surface of water. Can you see the pattern produced when the two waves overlap?
210210
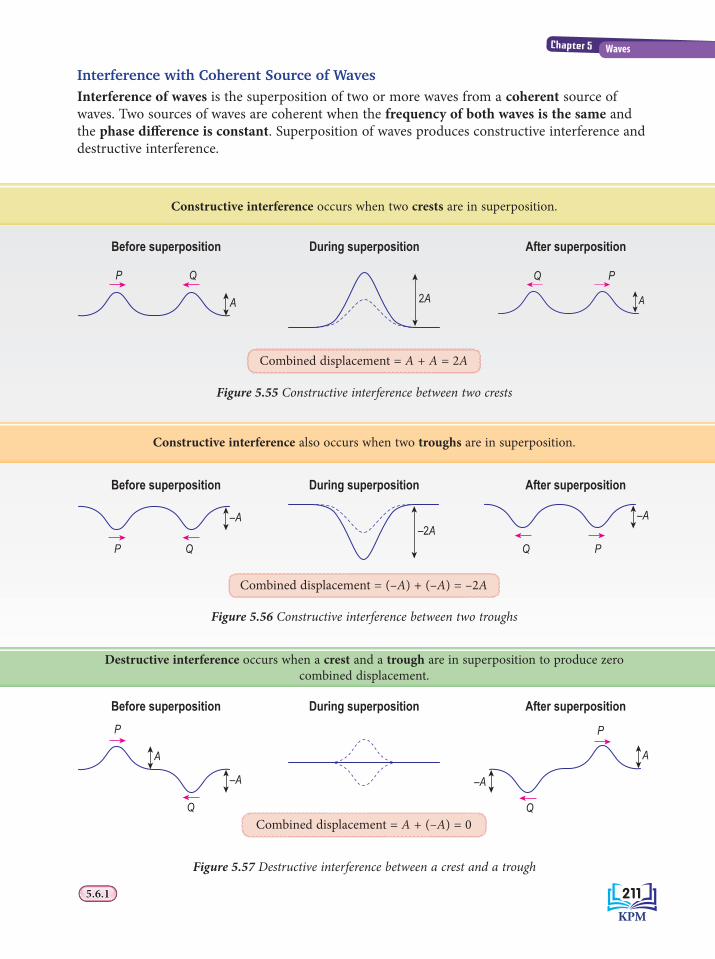
Figure 5.55 Constructive interference between two crests
Figure 5.56 Constructive interference between two troughs
Figure 5.57 Destructive interference between a crest and a trough
Before superposition During superposition After superposition
Before superposition During superposition After superposition
Before superposition During superposition After superposition
Constructive interference occurs when two crests are in superposition.
Constructive interference also occurs when two troughs are in superposition.
Destructive interference occurs when a crest and a trough are in superposition to produce zero combined displacement.
Combined displacement = (–A) + (–A) = –2A
Combined displacement = A + (–A) = 0
Interference with Coherent Source of WavesInterference of waves is the superposition of two or more waves from a coherent source of waves. Two sources of waves are coherent when the frequency of both waves is the same and the phase diff erence is constant. Superposition of waves produces constructive interference and destructive interference.
2A
–2A
5.6.15.6.1
A
P Q
A
Q P
–A
A
P
Q
A
–A
Q
P
–A
P Q
–A
Q P
Combined displacement = A + A = 2A
211211
Chapter 5 Waves

5.19
Aim: To show interference with two coherent sources of waves
A Pattern of interference for water waves
Apparatus: Ripple tank and its accessories and digital xenon stroboscope
Materials: Distilled water
Instructions:1. Prepare the ripple tank and attach a pair of spherical
dippers as in Photograph 5.14.
2. Adjust the frequency of the ripple generator so that a clear pattern can be seen on the glass screen.
3. Observe the pattern of interference formed on the screen.
4. Repeat steps 1 and 2 using two spherical dippers which have a smaller gap between the two dippers. Observe the change in the interference pattern.
5. Adjust the ripple generator to obtain a lower wave frequency. Observe the change in the interference pattern.
Discussion:1. Why must the base of the ripple tank be on a horizontal plane?
2. What causes the formation of bright and dark regions in the interference pattern?
3. Suggest an alternative way to produce two coherent circular water waves.
B Pattern of interference for light waves
Apparatus: Laser pen, retort stand, two pieces of double-slit with different distance of separation and white screen
Instructions:1. Set up the apparatus as shown in Figure 5.58.
2. Direct the laser light ray through the double-slit. Observe the pattern formed on the screen.
3. Repeat step 2 with a double-slit with a larger distance of separation between the slits.
Discussion:
1. What phenomenon occurs when light passes through each slit?
2. What pattern is formed on the screen when two light rays superpose after passing through the double-slit?
3. Explain the formation of dark fringes in the interference pattern.
5.6.15.6.1
Retort stand
Laser pen
Double-slit with differentdistances of separation
Screen
Double-slit D
a
Figure 5.58
Photograph 5.14
Spherical dippers which produce two circular waves
DipperDipper
Activity
212212
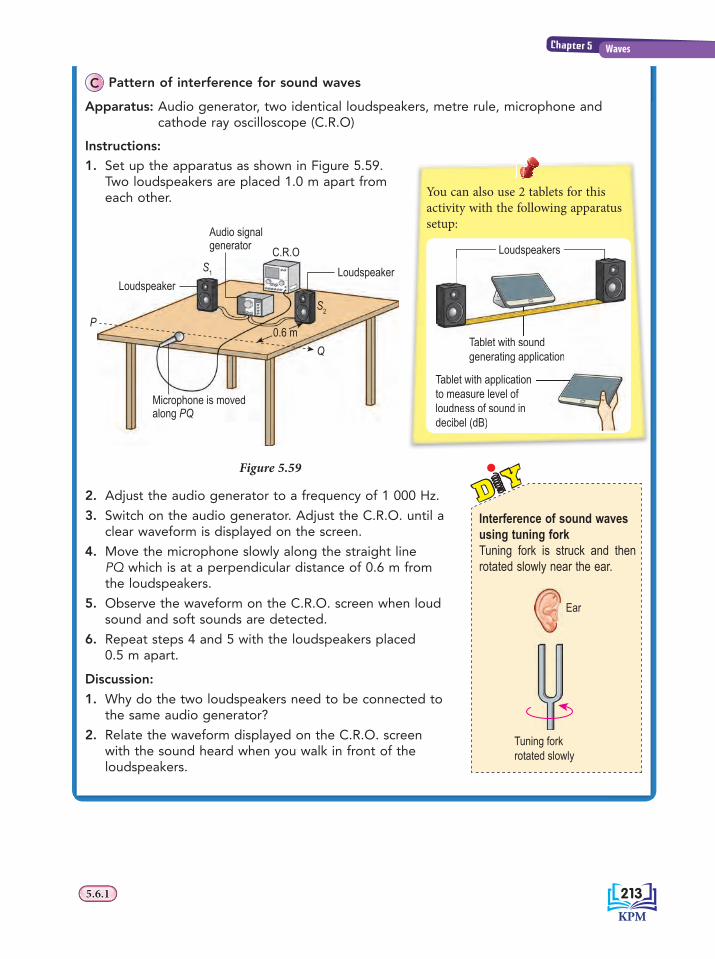
C Pattern of interference for sound waves
Apparatus: Audio generator, two identical loudspeakers, metre rule, microphone and cathode ray oscilloscope (C.R.O)
Instructions:
1. Set up the apparatus as shown in Figure 5.59. Two loudspeakers are placed 1.0 m apart from each other.
Microphone is movedalong PQ
Loudspeaker
Audio signal generator
LoudspeakerC.R.O
0.6 mQ
P
S1
S2
Figure 5.59
2. Adjust the audio generator to a frequency of 1 000 Hz.
3. Switch on the audio generator. Adjust the C.R.O. until a clear waveform is displayed on the screen.
4. Move the microphone slowly along the straight line PQ which is at a perpendicular distance of 0.6 m from the loudspeakers.
5. Observe the waveform on the C.R.O. screen when loud sound and soft sounds are detected.
6. Repeat steps 4 and 5 with the loudspeakers placed 0.5 m apart.
Discussion:
1. Why do the two loudspeakers need to be connected to the same audio generator?
2. Relate the waveform displayed on the C.R.O. screen with the sound heard when you walk in front of the loudspeakers.
5.6.15.6.1
You can also use 2 tablets for this activity with the following apparatus setup:
Loudspeakers
Tablet with sound generating application
Tablet with applicationto measure level ofloudness of sound indecibel (dB)
Tablet with sound generating application
Tablet with applicationto measure level ofloudness of sound indecibel (dB)
Interference of sound waves using tuning forkTuning fork is struck and then rotated slowly near the ear.
Ear
Tuning forkrotated slowly
213213
Chapter 5 Waves

In Activity 5.19, can you identify the constructive and destructive interferences for water, light and sound waves?
Figure 5.60 shows the pattern of interference of water waves produced by two coherent sources S1 and S2 in a ripple tank.
S1
S2 Constructive interference
Destructive interference
Line with interfaced bright and dark areas
Uniform grey coloured line
Grey area + =
Dark area + =
Bright area + =
Figure 5.60 Interference pattern for water waves
Figure 5.61 shows the interference pattern formed on the screen with light from a laser pen. Diff racted light waves that appear from the double-slit are coherent. Superposition of waves from the double-slit produces a pattern made up of bright fringes and dark fringes. Constructive interference produces bright fringes while destructive interference produces dark fringes.
Dark fringe
Smaller distance of separation of slits Larger distance of separation of slits
Bright fringe
Figure 5.61 Interference pattern for light waves
Sound waves cannot be seen. Observer can only hear loud sounds in constructive interference regions and soft sound in destructive interference regions. Figure 5.62 shows a waveform displayed on a C.R.O. screen.
HISTORYINTEGRATION OF
5.6.15.6.1
Audio signal generator
C.R.O. screen
Key:Loud soundSoft sound
S1
S2
Figure 5.62 Pattern of interference for sound waves
Activity on interference of light waves is also known as Young’s double-slit experiment after the name of a physicist, Thomas Young. He successfully showed that light has wave characteristics through experiments which produce bright and dark fringes.
214214
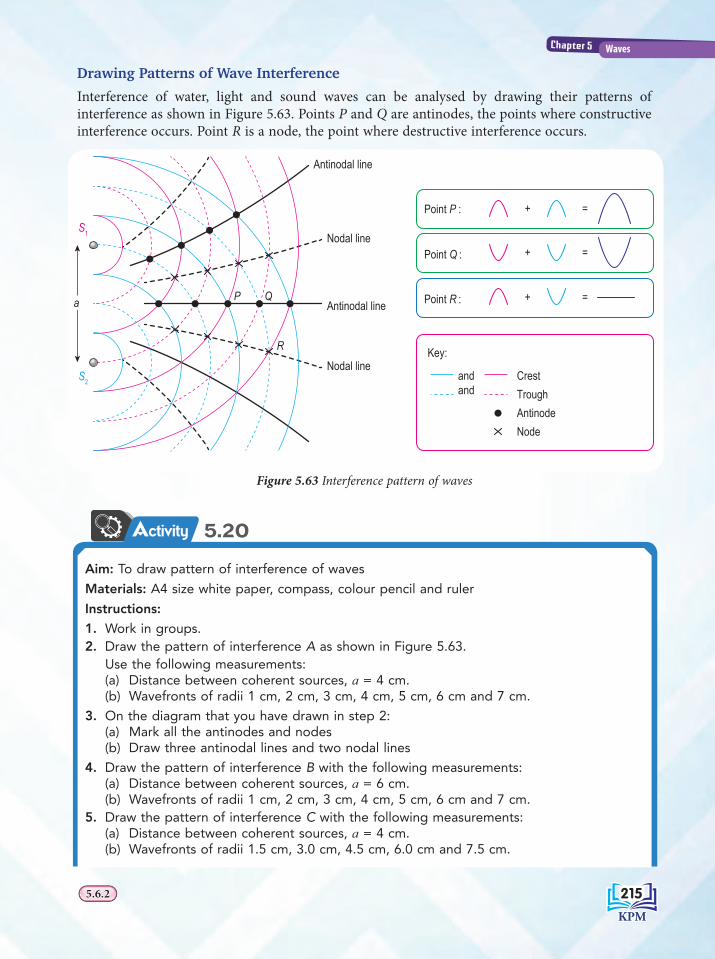
Drawing Patterns of Wave InterferenceInterference of water, light and sound waves can be analysed by drawing their patterns of interference as shown in Figure 5.63. Points P and Q are antinodes, the points where constructive interference occurs. Point R is a node, the point where destructive interference occurs.
Antinodal line
Antinodal line
Nodal line
Nodal lineS1
S2
P Q
R Key:
andand
CrestTroughAntinodeNode
a Point R : + =
Point Q : + =
Point P : + =
Figure 5.63 Interference pattern of waves
5.20
Aim: To draw pattern of interference of waves
Materials: A4 size white paper, compass, colour pencil and ruler
Instructions:
1. Work in groups.2. Draw the pattern of interference A as shown in Figure 5.63. Use the following measurements:
(a) Distance between coherent sources, a = 4 cm.(b) Wavefronts of radii 1 cm, 2 cm, 3 cm, 4 cm, 5 cm, 6 cm and 7 cm.
3. On the diagram that you have drawn in step 2:(a) Mark all the antinodes and nodes(b) Draw three antinodal lines and two nodal lines
4. Draw the pattern of interference B with the following measurements:(a) Distance between coherent sources, a = 6 cm.(b) Wavefronts of radii 1 cm, 2 cm, 3 cm, 4 cm, 5 cm, 6 cm and 7 cm.
5. Draw the pattern of interference C with the following measurements:(a) Distance between coherent sources, a = 4 cm.(b) Wavefronts of radii 1.5 cm, 3.0 cm, 4.5 cm, 6.0 cm and 7.5 cm.
5.6.25.6.2
Activity
215215
Chapter 5 Waves
5.21Activity
6. On the diagrams that you have drawn in steps 4 and 5, draw three antinodal lines and two nodal lines.
Discussion:1. Based on the patterns of interference A and B, describe the difference in the pattern of
interference when the distance of separation between sources increases.2. Based on the patterns of interference A and C, describe the difference in the pattern of
interference when wavelength increases.3. How does the distance between antinodal lines change at positions further from the
coherent sources?
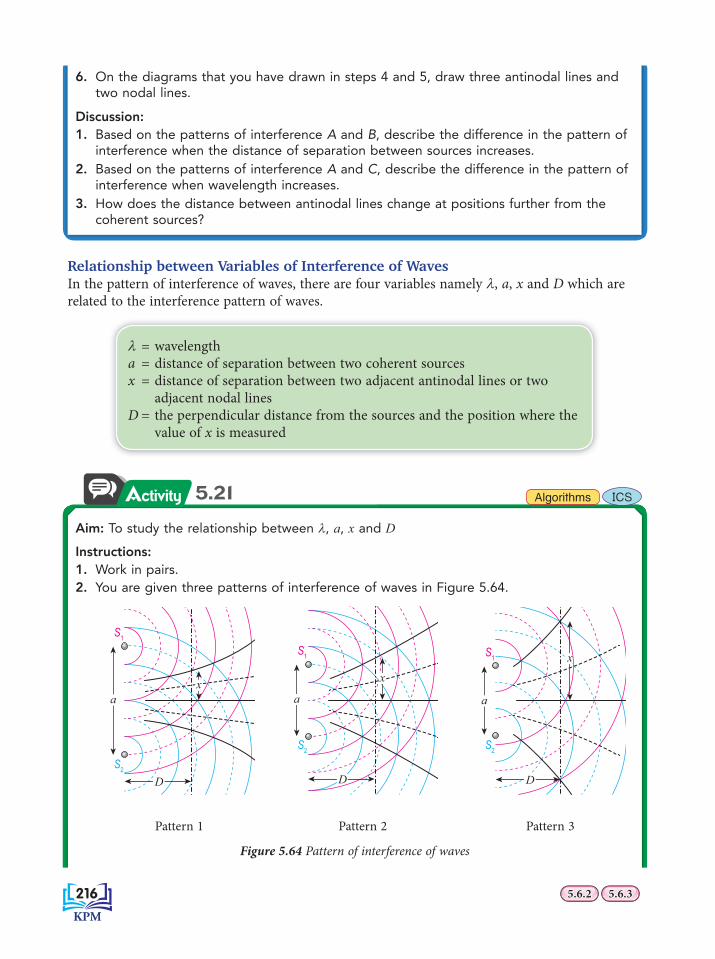
Relationship between Variables of Interference of WavesIn the pattern of interference of waves, there are four variables namely λ, a, x and D which are related to the interference pattern of waves.
λ = wavelengtha = distance of separation between two coherent sourcesx = distance of separation between two adjacent antinodal lines or two
adjacent nodal linesD = the perpendicular distance from the sources and the position where the
value of x is measured
Aim: To study the relationship between λ, a, x and D
Instructions:1. Work in pairs.2. You are given three patterns of interference of waves in Figure 5.64.
S1
S2
a
D
x
S1
S2
a
D
x
S1
S2
a
D
x
Pattern 1 Pattern 2 Pattern 3
Figure 5.64 Pattern of interference of waves
5.6.35.6.35.6.25.6.2
Algorithms ICS
216216

3. From Pattern 1 and Pattern 2:(a) Determine the constant variable.(b) What is the relationship between x and a?
4. From Pattern 2 and Pattern 3:(a) Determine the constant variable.(b) Compare the wavelength, λ.(c) What is the relationship between x and λ?
5. From Pattern 3, determine the relationship between x and D.
5.6.3
In the pattern of interference of water, sound and light waves, variables λ, a, x and D are mutually dependent on one another. Th rough Activity 5.21, we can interrelate the four variables as x = λD
a. From the formula, we can determine the wavelength, λ as follows:
λ = axD
Solving Problems Involving Interference of Waves
Figure 5.65 shows Young’s double-slit experiment which produces interference pattern on the screen. Th e distance between adjacent bright fringes is 4.5 mm. What is the wavelength of the light used?
Solution:
Separation of slit, a = 0.4 mm = 0.4 × 10⁻³ m
Distance between adjacent bright fringes, x = 4.5 mm = 4.5 × 10⁻³ m
Distance between screen and double slit, D = 3.0 m
Wavelength, λ = axD
= (0.4 × 10⁻³)(4.5 × 10⁻³)3.0
= 6.0 × 10⁻⁷ m5.6.45.6.3
5.6.35.6.3 5.6.45.6.4
D = 3.0 m
Transparent screenYoung’s double-slita = 0.4 mm
Light sourcex = 4.5 mm
Bright fringeDark fringe
Figure 5.65 Young’s double-slit experiment
Example 1
217217
Chapter 5 Waves

Figure 5.66 Applications of interference of waves in daily life
Applications of Interference of Waves in Daily LifeKnowledge on interference of waves is widely used in our daily life. Figure 5.66 shows examples of applications of interference of water, light and sound waves.
5.6.55.6.5
Bulbous bow generates water waves which interfere destructively with the water waves around the hull. Th is causes the water around the ship to become calmer and thus, reduces water drag.
Coating on the surface of anti-refl ection lens causes refl ected light to interfere destructively. Th is helps to improve vision.
Microphone and transmitter system in head phones used on aeroplanes produces sound waves which interfere destructively with the surrounding noise.
1
2LensAnti-reflection coating
Bulbous bowBulbous bow
218218
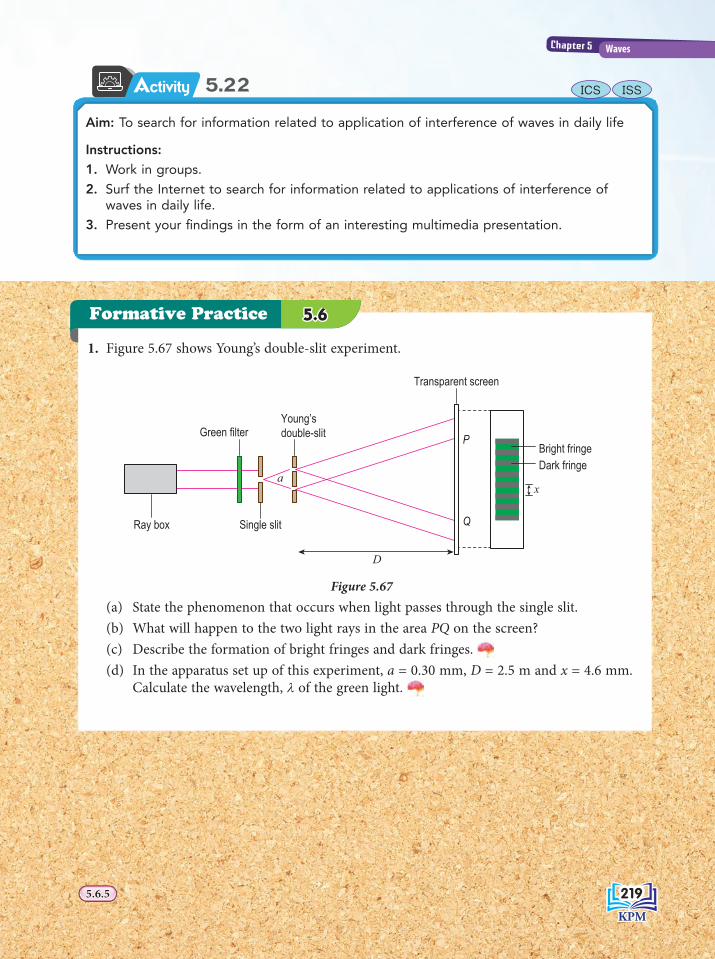
1. Figure 5.67 shows Young’s double-slit experiment.
D
P
Q
a
Transparent screen
Green filterYoung’sdouble-slit
Ray box Single slit
Bright fringeDark fringe
x
Figure 5.67(a) State the phenomenon that occurs when light passes through the single slit.(b) What will happen to the two light rays in the area PQ on the screen?(c) Describe the formation of bright fringes and dark fringes. (d) In the apparatus set up of this experiment, a = 0.30 mm, D = 2.5 m and x = 4.6 mm. Calculate the wavelength, λ of the green light.
5.22
Aim: To search for information related to application of interference of waves in daily life
Instructions:
1. Work in groups.
2. Surf the Internet to search for information related to applications of interference of waves in daily life.
3. Present your fi ndings in the form of an interesting multimedia presentation.
5.6.55.6.5
ICS ISSActivity
Formative Practice 5.65.6
219219
Chapter 5 Waves
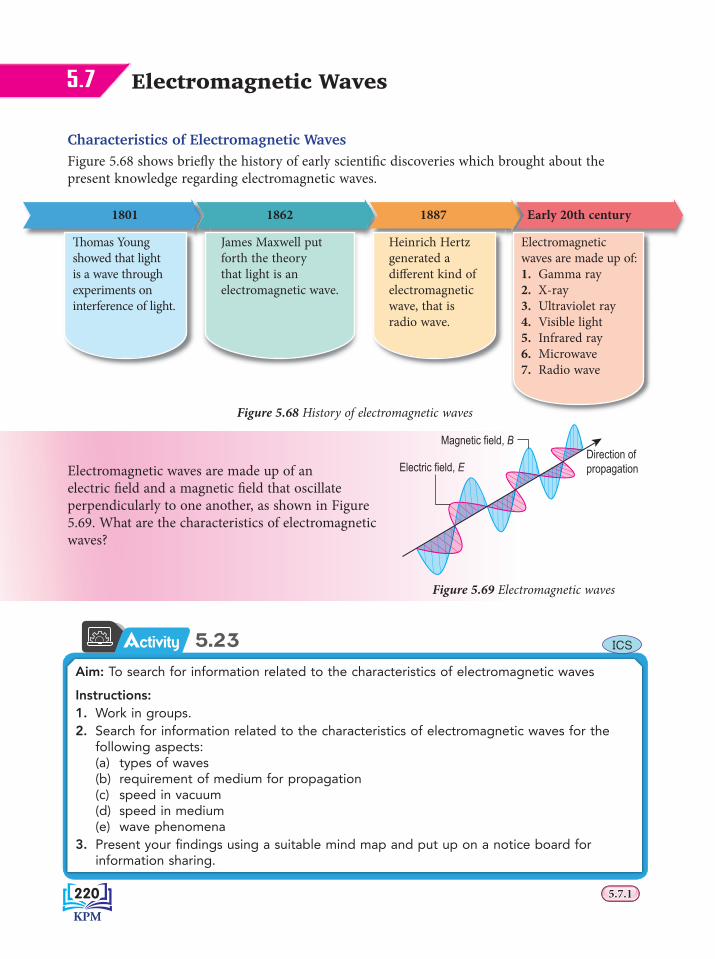
Electromagnetic WavesElectromagnetic Waves5.7
Figure 5.68 History of electromagnetic waves
Characteristics of Electromagnetic WavesFigure 5.68 shows briefl y the history of early scientifi c discoveries which brought about the present knowledge regarding electromagnetic waves.
Figure 5.69 Electromagnetic waves
1801
Th omas Young showed that light is a wave through experiments on interference of light.
1862
James Maxwell put forth the theory that light is an electromagnetic wave.
1887
Heinrich Hertz generated a diff erent kind of electromagnetic wave, that is radio wave.
Early 20th century
Electromagnetic waves are made up of:1. Gamma ray2. X-ray3. Ultraviolet ray4. Visible light5. Infrared ray6. Microwave7. Radio wave
Electromagnetic waves are made up of an electric fi eld and a magnetic fi eld that oscillate perpendicularly to one another, as shown in Figure 5.69. What are the characteristics of electromagnetic waves?
5.23
Aim: To search for information related to the characteristics of electromagnetic waves
Instructions:1. Work in groups.2. Search for information related to the characteristics of electromagnetic waves for the
following aspects:(a) types of waves(b) requirement of medium for propagation (c) speed in vacuum(d) speed in medium(e) wave phenomena
3. Present your fi ndings using a suitable mind map and put up on a notice board for information sharing.
Direction of propagationElectric field, E
Magnetic field, B
5.7.15.7.1
ICSActivity
220220
Electromagnetic waves:• are transverse waves• do not need medium for propagation• can propagate through vacuum• have speed in vacuum, c = 3.00 × 10⁸ m s–1, and move with
lower speed in any medium.• show phenomena of refl ection, refraction, diff raction and
interference under suitable conditions
Electromagnetic Spectrum
Seven types of electromagnetic waves form a continuous spectrum known as electromagnetic spectrum. Figure 5.70 shows the electromagnetic spectrum.
400 500 600 700 750 nmWavelength
Visible light
104
104
Wavelength (m)
Radio waveX-ray MicrowaveInfrared ray
Ultraviolet ray
Gamma ray
Increasing wavelength
Frequency (Hz)
Increasing frequency
10510610710810910101011101210131014101510161017101810191020
103102101110–110–210–310–410–510–610–710–810–910–1010–11
Figure 5.70 Electromagnetic spectrum
Th e energy carried by electromagnetic waves is directly proportional to its frequency. Th is means gamma ray and X-ray carry large amount of energy. Th ese waves need to be handled properly as not to endanger the users.
Applications of Electromagnetic WavesElectromagnetic spectrum is made up of seven types of electromagnetic waves and covers a very wide range of wavelengths. As such, applications of electromagnetic waves encompass various fi elds. With the rapid advancements in science and technology, new applications are discovered from time to time. What applications of electromagnetic waves do you know?
5.7.15.7.1 5.7.25.7.2 5.7.35.7.3
F ile• For electromagnetic waves,
the formula v = f λ is rewritten as c = f λ.• Continuous spectrum means
no specifi c boundary which separates two adjacent types of waves.
Smartphone as a remote control deviceSurf the Internet to get guidelines on how to confi gure smartphones to function as television or air conditioner remote control.
221221
Chapter 5 Waves
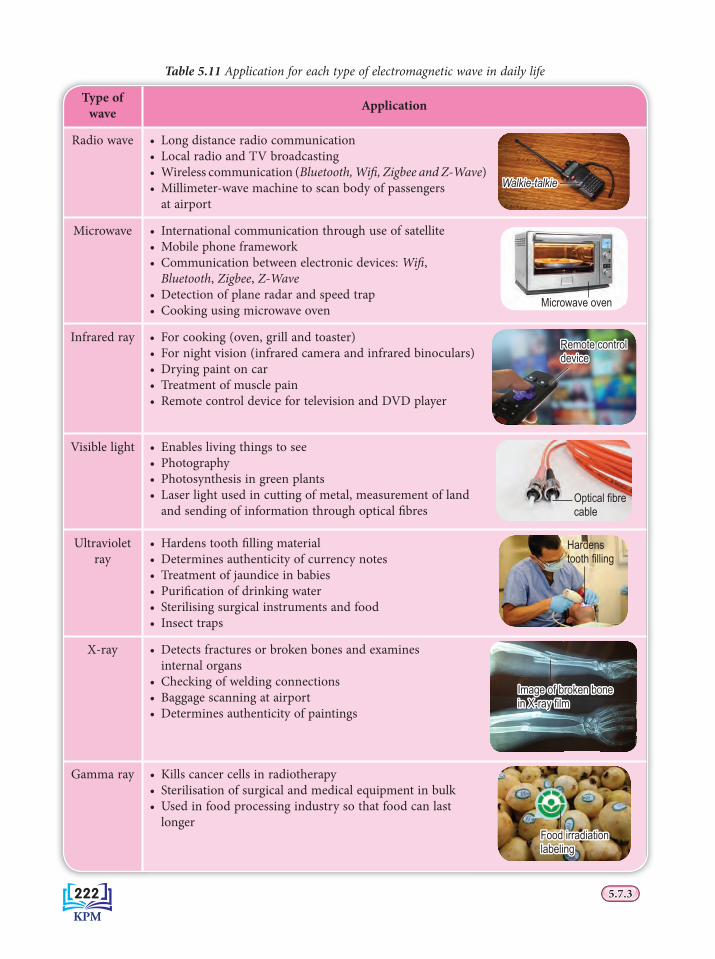
Type of wave Application
Radio wave • Long distance radio communication• Local radio and TV broadcasting• Wireless communication (Bluetooth, Wifi , Zigbee and Z-Wave)• Millimeter-wave machine to scan body of passengers
at airportWalkie-talkieWalkie-talkie
Microwave • International communication through use of satellite• Mobile phone framework• Communication between electronic devices: Wifi ,
Bluetooth, Zigbee, Z-Wave• Detection of plane radar and speed trap• Cooking using microwave oven Microwave oven
Infrared ray • For cooking (oven, grill and toaster)• For night vision (infrared camera and infrared binoculars) • Drying paint on car • Treatment of muscle pain• Remote control device for television and DVD player
Remote control Remote control devicedevice
Visible light • Enables living things to see• Photography• Photosynthesis in green plants• Laser light used in cutting of metal, measurement of land
and sending of information through optical fi bresOptical fi bre cable
Ultraviolet ray
• Hardens tooth fi lling material• Determines authenticity of currency notes• Treatment of jaundice in babies• Purifi cation of drinking water • Sterilising surgical instruments and food• Insect traps
Hardens tooth fi lling
X-ray • Detects fractures or broken bones and examines internal organs
• Checking of welding connections• Baggage scanning at airport• Determines authenticity of paintings
Image of broken bone Image of broken bone in X-ray fi lmin X-ray fi lm
Gamma ray • Kills cancer cells in radiotherapy• Sterilisation of surgical and medical equipment in bulk• Used in food processing industry so that food can last
longerFood irradiation Food irradiation labelinglabeling
Table 5.11 Application for each type of electromagnetic wave in daily life
5.7.35.7.3222222
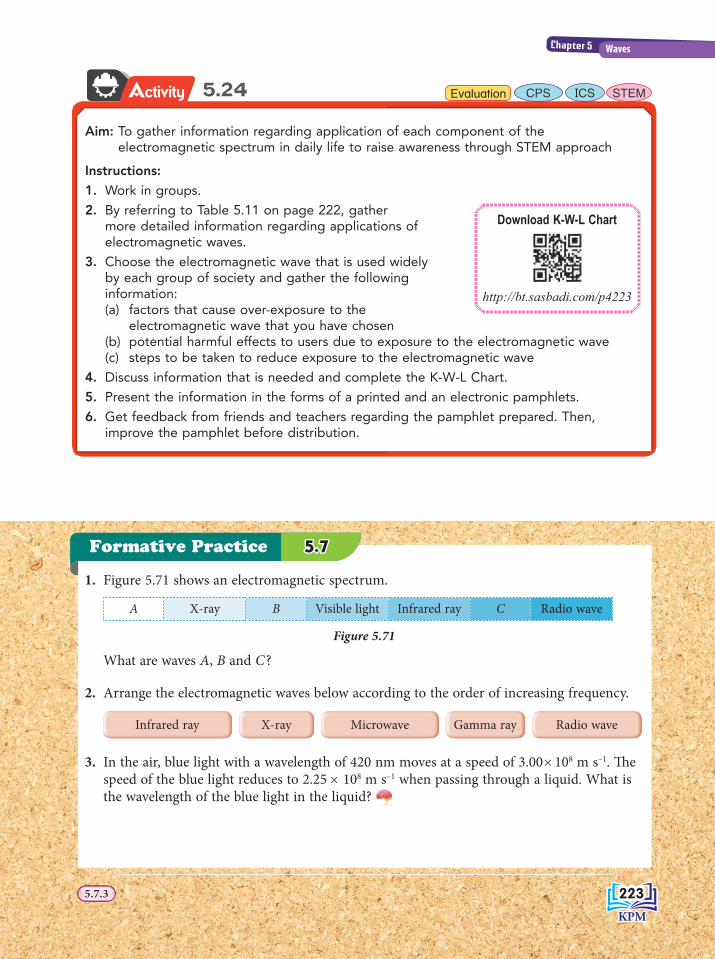
5.24
1. Figure 5.71 shows an electromagnetic spectrum.
A X-ray B Visible light Infrared ray C Radio wave
Figure 5.71
What are waves A, B and C?
2. Arrange the electromagnetic waves below according to the order of increasing frequency.
Infrared ray
X-ray Microwave Gamma ray Radio wave
3. In the air, blue light with a wavelength of 420 nm moves at a speed of 3.00 × 10⁸ m s–1. Th e speed of the blue light reduces to 2.25 × 10⁸ m s–1 when passing through a liquid. What is the wavelength of the blue light in the liquid?
Aim: To gather information regarding application of each component of the electromagnetic spectrum in daily life to raise awareness through STEM approach
Instructions:
1. Work in groups.
2. By referring to Table 5.11 on page 222, gather more detailed information regarding applications of electromagnetic waves.
3. Choose the electromagnetic wave that is used widely by each group of society and gather the following information: (a) factors that cause over-exposure to the
electromagnetic wave that you have chosen(b) potential harmful effects to users due to exposure to the electromagnetic wave(c) steps to be taken to reduce exposure to the electromagnetic wave
4. Discuss information that is needed and complete the K-W-L Chart.
5. Present the information in the forms of a printed and an electronic pamphlets.
6. Get feedback from friends and teachers regarding the pamphlet prepared. Then, improve the pamphlet before distribution.
Download K-W-L Chart
http://bt.sasbadi.com/p4223
5.7.35.7.3
Evaluation CPS STEMICS
Formative Practice 5.75.7
Activity
223223
Chapter 5 Waves
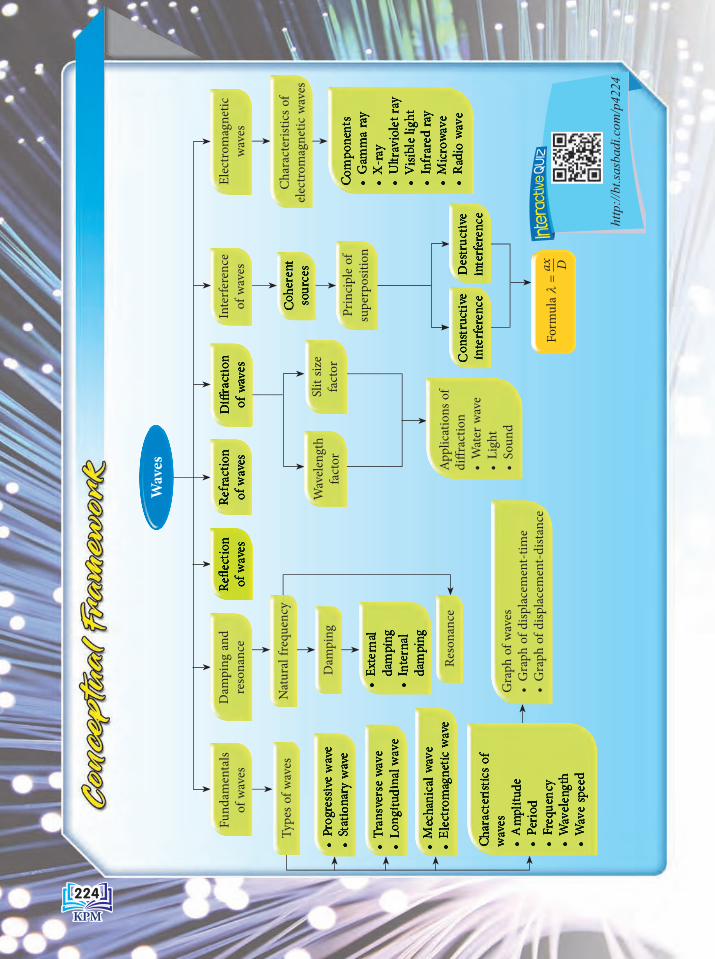
Wav
es
Elec
trom
agne
tic
wav
es
Char
acte
ristic
s of
elec
trom
agne
tic w
aves
Form
ula λ
= ax D
Prin
cipl
e of
su
perp
ositi
on
Inte
rfere
nce
of w
aves
Appl
icat
ions
of
diff r
actio
n•
Wat
er w
ave
• Li
ght
• So
und
Slit
size
fact
orW
avele
ngth
fa
ctor
Fund
amen
tals
of w
aves
Type
s of w
aves
Gra
ph o
f wav
es•
Gra
ph o
f disp
lace
men
t-tim
e•
Gra
ph o
f disp
lace
men
t-dist
ance
Dam
ping
and
re
sona
nce
Dam
ping
Reso
nanc
e
Nat
ural
freq
uenc
y
http
://bt
.sasb
adi.c
om/p
4224
224224

SELF REFLECTIONSELF-REFLECTION
1. New things I learnt in the chapter on waves are ✎ .
2. Th e most interesting thing I learnt in the chapter on waves is ✎ .
3. Th ings I still do not fully understand or comprehend are ✎ .
4. My performance in this chapter ,
Poor 1 2 3 4 5 Excellent
5. I need to ✎ to improve my performance in this chapter.
Download and printSelf-refl ection Chapter 5
http://bt.sasbadi.com/p4225
1. Figure 1 shows a port and the area around it.(a) State the wave phenomena that occur when
sea waves(i) collide with the embankment of the port
at A,(ii) move towards the beach at B, and(iii) pass through the entrance of the port at C.
(b) Draw the wavefronts aft er the waves pass C. (c) What is the eff ect on the waves if the entrance
of the port is widened?
2. Figure 2 shows the wavefront of water waves approaching a barrier. Complete Figure 2 by sketching the wavefront aft er passing around the barrier.
Figure 1
Figure 2
BeachPort
Embankment Sea
A
C
B
Barrier
Performance EvaluationPerformance Evaluation
225225
Chapter 5 Waves

3. Figure 3 shows superposition of two coherent plane waves.(a) What is a coherent wave?(b) State the points where the following occur
(i) constructive interference,(ii) destructive interference.
(c) Explain with suitable diagrams, interference at point (i) Q,(ii) R, and(iii) S.
4. Figure 4 shows the apparatus set up of Young’s double-slit experiment.
D
Ka
Transparent screen
Blue filterYoung’sdouble-slit
Ray box Single slit
Bright fringeDark fringe
x
Figure 4
(a) What happens to the light rays at area K? (b) Explain the formation of bright fringes and dark fringes on the screen. (c) You are given the following information:
• Distance between double slits, a = 0.30 mm• Distance between double-slits and screen, D = 2.70 m• Separation distance between two adjacent bright fringes, x = 4.0 mm
Calculate the wavelength, λ of blue light in this experiment.
5. A student moves a slinky spring repeatedly at a frequency of 5 Hz so that a transverse wave is produced as shown in Figure 5.(a) Determine the amplitude, period and
wavelength of the wave. (b) Calculate the wave speed along the slinky
spring.
6. A judge blew a whistle which produced a sound of frequency 500 Hz and a wavelength of 0.67 m in the air. What is the wave speed of the sound?
PQ
RS
Key:CrestTrough
Figure 5
1.2 m
15 cm
Figure 3
226226

7. Figure 6 shows a tuning fork vibrating and producing sound waves.
0.5 cm
225 cmTuning fork
Figure 6
Based on Figure 6, determine the(a) amplitude of the sound waves,(b) wavelength of the sound waves,(c) speed of the sound waves produced when the tuning fork vibrates with a frequency
of 440 Hz.
8. Figure 7 shows an image of water waves moving from a deep water region to a shallow water region.
(a) In Figure 7, draw the pattern of wavefront in region A and region B.
(b) Given that the speed of water waves in the shallow water region and deep water region are 4.0 m s–1 and 9.0 m s–1 respectively. Wavelength of water waves in the shallow water region is 2 m. Calculate the wavelength of water waves in the deep water region.
9. Figure 8 shows the graph of displacement against time which represents the oscillation of a pendulum.
0
Displacement, s / cm
Time, t / s
Figure 8 Based on the graph, answer the following questions:
(a) What happens to the amplitude of the oscillating pendulum?(b) What phenomenon is experienced by the oscillating pendulum?(c) What is the main reason for the phenomenon?(d) How is the pendulum able to keep oscillating?
Figure 7
Shallow water Deep water
ABIncident
waveDeep waterDeep water
227227
Chapter 5 Waves
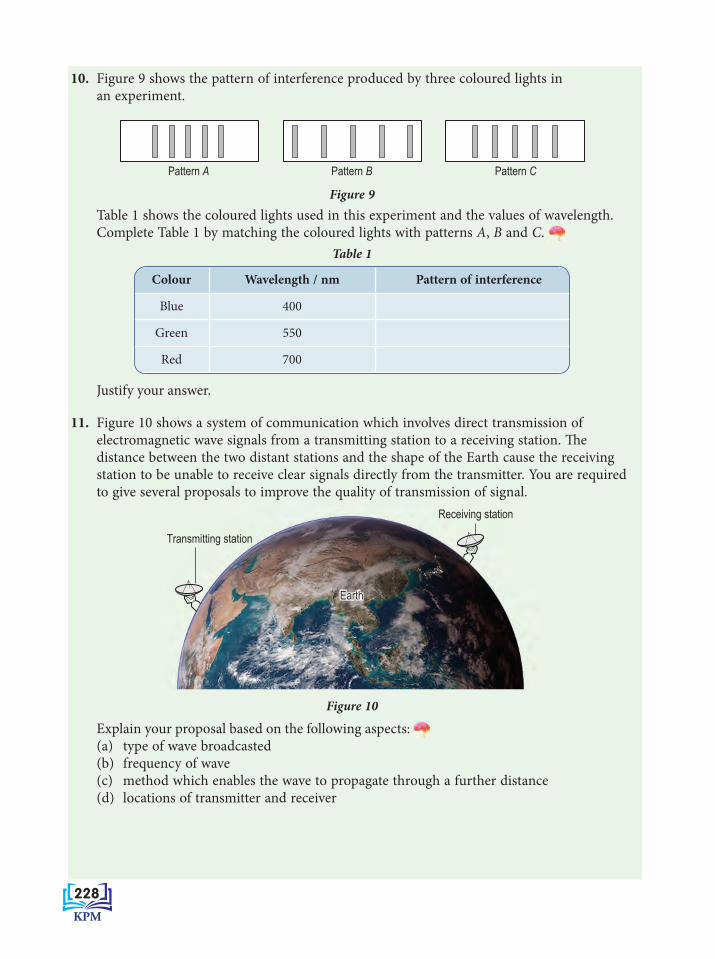
10. Figure 9 shows the pattern of interference produced by three coloured lights in an experiment.
Pattern A Pattern B Pattern C
Figure 9 Table 1 shows the coloured lights used in this experiment and the values of wavelength.
Complete Table 1 by matching the coloured lights with patterns A, B and C. Table 1
Colour Wavelength / nm Pattern of interference
Blue 400
Green 550
Red 700
Justify your answer.
11. Figure 10 shows a system of communication which involves direct transmission of electromagnetic wave signals from a transmitting station to a receiving station. Th e distance between the two distant stations and the shape of the Earth cause the receiving station to be unable to receive clear signals directly from the transmitter. You are required to give several proposals to improve the quality of transmission of signal.
Transmitting station
Receiving station
EarthEarth
Figure 10
Explain your proposal based on the following aspects: (a) type of wave broadcasted(b) frequency of wave(c) method which enables the wave to propagate through a further distance(d) locations of transmitter and receiver
228228
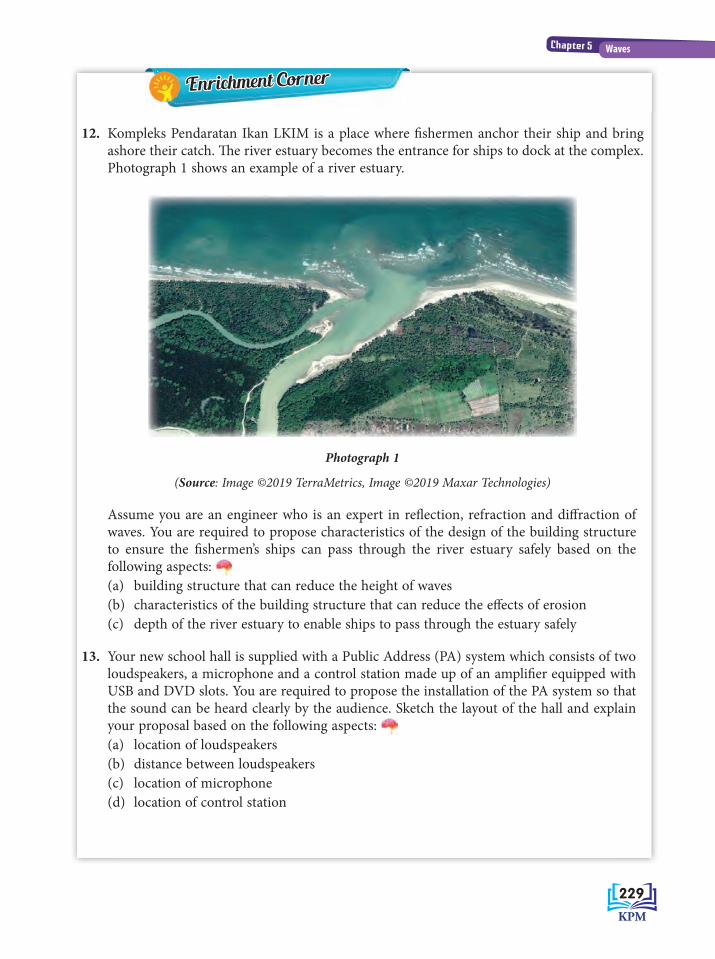
12. Kompleks Pendaratan Ikan LKIM is a place where fi shermen anchor their ship and bring ashore their catch. Th e river estuary becomes the entrance for ships to dock at the complex. Photograph 1 shows an example of a river estuary.
Photograph 1
(Source: Image ©2019 TerraMetrics, Image ©2019 Maxar Technologies)
Assume you are an engineer who is an expert in refl ection, refraction and diff raction of waves. You are required to propose characteristics of the design of the building structure to ensure the fi shermen’s ships can pass through the river estuary safely based on the following aspects: (a) building structure that can reduce the height of waves(b) characteristics of the building structure that can reduce the eff ects of erosion(c) depth of the river estuary to enable ships to pass through the estuary safely
13. Your new school hall is supplied with a Public Address (PA) system which consists of two loudspeakers, a microphone and a control station made up of an amplifi er equipped with USB and DVD slots. You are required to propose the installation of the PA system so that the sound can be heard clearly by the audience. Sketch the layout of the hall and explain your proposal based on the following aspects: (a) location of loudspeakers(b) distance between loudspeakers(c) location of microphone(d) location of control station
Enrichment CornerEnrichment Corner
229229
Chapter 5 Waves