volume 9, issue 1(ix) : january – march 2022
TRANSCRIPT

Indian Academicians and Researchers Association
www.iaraedu.com
International Journal of
Advance and Innovative Research (Conference Special)
Volume 9, Issue 1 (IX)
January - March 2022
ISSN: 2394 – 7780

Bunts Sangha’s
S. M. Shetty College of Science, Commerce and Management Studies Powai, Mumbai
PERMANENTLY AFFILIATED TO UNIVERSITY OF MUMBAI NAAC Accredited ‘A’ Grade
IMC RBNQ Certificate of Merit 2019 ISO 21001:2018 Certified
National level MULTI-DISCIPLINARY
E-CONFERENCE- 2022
“Changing Trends in Information Technology, Media and Management: Post Pandemic Challenges and Prospects”
Saturday, 12th February, 2022
Organised by
Department of Information Technology Department of Mass Media
and Department of Management Studies
Publication Partner
Indian Academicians and Researcher’s Association

A BRIEF ABOUT ORGANIZING COMMITTEES
Patrons
Shri B R Shetty
Chairman, PEC
Shri Rathnakar Shetty Mundkur
Vice-Chairman, PEC
Shri Vasanth N. Shetty
Vice-Chairman, PEC
CS Uttam Shetty
Secretary, PEC
CA Jagdish Shetty,
Treasurer, PEC
CA Harish Shetty,
Cordinator, PEC
CONFERENCE COMMITTEE
Dr. Sridhara Shetty (Principal)
Dr. Liji Santosh (Vice-Principal & IQAC Coordinator)
Asst. Prof. Sandesha Shetty (Vice-Principal & B.COM Coordinator)
ORGANISING COMMITTEE
Asst. Prof. Nidhi Chandorkar (Convenor)
Asst. Prof. Dr. Tushar Sambare (Co-Convenor)
Asst. Prof. Kalpana Rai Menon (Co-Convenor)
Mrs. Smitha Ravindranath (Co-Convenor)

Guest Editor of Special Issue
Dr. Sridhara Shetty
Principal
Member Editors
Asst. Prof. Nidhi Chandorkar
Asst. Prof. Neena Sharma
Mrs. Smitha Ravindranath

ABOUT THE COLLEGE
Bunts Sangha, Mumbai was established in 1927 as a Charitable Trust and devoted itself to the cause of
education, health care, and social reforms of downtrodden and underprivileged sections of people. The Sangha
has been in the service of people for almost ten decades. During the last decade, more emphasis was given to
the education of the masses. Bunts Sangha’s S.M. Shetty College of Science, Commerce and Management
Studies was established in 2008 by Bunts Sangha, Mumbai. The college is permanently affiliated to University
of Mumbai. Bunts Sangha’s S.M. Shetty College of Science, Commerce and Management Studies is committed
to the promotion and propagation of quality education with excellence Currently the college offers B.Com,
B.B.I., B.A.F., B.M.S., BAMMC., B.Sc.IT., M.Com(Advanced Accountancy), M.Com (Business Management)
& M.Sc.IT Programmes with more than 2500 students on roll. College has approved Ph.D. Centre in Commerce
leading to Ph.D. degree. College looks forward eagerly to a continuing and creative engagement in the field of
education with the challenges of time. It has been accredited by NAAC with ‘A’ grade, received IMC RBNQ
Certificate of Merit 2019 and is also ISO 21001:2018 certified.
ABOUT THE DEPARTMENTS
The Department of Information Technology
The Department of Information Technology was established in 2008 with the objective of channelizing
mathematical, logical and technical skills of students in a way that can lead them to develop problem solving
abilities through information technology and to enable students to become globally and holistically competent
individuals. There is an ample job opportunity after the completion of the programme. On completion of the
programme the student can join the master's programme, M.Sc IT.
The Department of Mass Media & Communication Skills
The Department of Mass Media & Communication Skills was established in 2009 with the objective of
providing the much sought after media program within the undergraduate student community. It hones the
media related skills of the students and introduces them to the various opportunities available in the field of
Advertising and Journalism.
The Department of Management Studies
The Department of Management Studies offers a BMS programme which was established in 2008. With over
400 students actively participating in activities and self-development initiatives, the department leaves no stone
unturned to offer them opportunities for growth and development. Every year students take up internship and
research activities to develop understanding of the corporate world and prepare themselves for future
challenges. The department currently offers specializations in Marketing and Finance.
ABOUT THE CONFERENCE
The once in a lifetime pandemic that we have faced has brought about a paradigm shift in the way the world
works. There has been a short term and long term impact of this global pandemic on the way in which the
economy, country and people work. This conference aims to understand the way in which the world has adapted
to the given crisis and what it foretells about the future. The world has come together to fight the pandemic and
information technology has become the key to information and commerce. Management practices have
undergone a 180 degree change with respect to the way business is incorporated, conducted and promoted and
Media has seen a turn around with instant information and social media platforms transforming the way
businesses communicate with their audience and the way news is reported. Post pandemic environment will
bring its own opportunities and challenges. As Winston Churchill rightly put it “Never let a good crisis go to
waste”, we must explore the prospective areas and be proactive in our approach to take on the new challenges.
This National Conference aims to provide the platform to researchers and academicians to put forth their ideas
and lead the way.

KEYNOTE ADDRESS
The Covid-19 Pandemic and the other general factors have
repercussions for every one of us around the world. We have witnessed
rigorous changes in every field. There were a quick succession of
events leading to suspension of all travel in and out of the country
followed by most of the economic activities having a major fall. The
pandemic has significantly changed the way the Economies of the
world work irrespective of the level of their development. It has
affected how we live, work and behave as individuals, Institutions and Nations. Business has
witnessed unprecedented changes such as New Products to New markets, Service extension to
service precision, Competitive to customer advantage, Competition to Co-optition, Product to
customer life cycle, felt needs to latent needs, selling product to selling concept, Monologue to
dialogue, Product innovation to product redefinition.
Companies have also gone about rapidly deploying digital and automation technologies,
dramatically accelerating different trends such as remote work place, shopping, entertainment, and
even medicine going online. Computing power will continue to explode in 2022 with trends such
as Smarter Devices, Quantum Computing, Datafication Artificial Intelligence and Machine
Learning, Extended Reality, Digital Trust, 3D Printing, Edge Computing, Block chain, Quantum
computing to name a few developments. Businesses everywhere is scrambled to deploy digital
systems to accommodate the shift.
The media also has experienced few changes such as Mobile Video Marketing, use of data
Analytics, Investment in Virtual reality and augmented reality, media scrutiny, Forensic
Journalism, creative content and media activism.
Thus these changes have great impact positively also on Economy through prospects of Economic
growth, employment, and productivity paving way for development which calls for innovative
measures such as relooking at Infrastructure development, Startup India, Make in India, Be Indian
Buy Indian, Banks and FI’s reaching out, Encouraging Insurance, Improving quality of products
and services, Improving brand India, Promoting innovative products, Traditional products,
Promoting heath tourism, Subsidies, Administered pricing, buybacks, Low and no interest Loans,
Working capital liquidity, Ease of doing Business, Attracting FDI, Personal tax cuts, tax holidays
for 6 – 12 months reviving consumption, which will help spur Economic growth. I am sure that
the deliberations of this conference will be of great use to policy makers, researchers, teacher’s
students and the industry
Dr. S Ramesh
Dean, International Programs & Partnerships
Mount Carmel College, Autonomous

International Journal of Advance and Innovative Research
Volume 9, Issue 1 (IX) January - March 2022
Editor- In-Chief Dr. Tazyn Rahman
Members of Editorial Advisory Board
Mr. Nakibur Rahman
Ex. General Manager ( Project )
Bongaigoan Refinery, IOC Ltd, Assam
Dr. Mukesh Saxena
Pro Vice Chancellor,
University of Technology and Management, Shillong
Dr. Alka Agarwal
Director,
Mewar Institute of Management, Ghaziabad
Dr. Archana A. Ghatule Director,
SKN Sinhgad Business School, Pandharpur
Prof. (Dr.) Sudhansu Ranjan Mohapatra
Dean, Faculty of Law,
Sambalpur University, Sambalpur
Prof. (Dr.) Monoj Kumar Chowdhury
Professor, Department of Business Administration,
Guahati University, Guwahati
Dr. P. Malyadri
Principal,
Government Degree College, Hyderabad
Prof. (Dr.) Baljeet Singh Hothi
Professor,
Gitarattan International Business School, Delhi
Prof.(Dr.) Shareef Hoque
Professor,
North South University, Bangladesh
Prof. (Dr.) Badiuddin Ahmed
Professor & Head, Department of Commerce,
Maulana Azad Nationl Urdu University, Hyderabad
Prof.(Dr.) Michael J. Riordan
Professor,
Sanda University, Jiashan, China
Dr. Anindita Sharma
Dean & Associate Professor,
Jaipuria School of Business, Indirapuram, Ghaziabad
Prof.(Dr.) James Steve
Professor,
Fresno Pacific University, California, USA
Prof. (Dr.) Jose Vargas Hernandez
Research Professor,
University of Guadalajara,Jalisco, México
Prof.(Dr.) Chris Wilson Professor,
Curtin University, Singapore
Prof. (Dr.) P. Madhu Sudana Rao Professor,
Mekelle University, Mekelle, Ethiopia
Prof. (Dr.) Amer A. Taqa
Professor, DBS Department,
University of Mosul, Iraq
Prof. (Dr.) Himanshu Pandey
Professor, Department of Mathematics and Statistics
Gorakhpur University, Gorakhpur
Dr. Nurul Fadly Habidin
Faculty of Management and Economics,
Universiti Pendidikan Sultan Idris, Malaysia
Prof. (Dr.) Agbo Johnson Madaki
Faculty, Faculty of Law,
Catholic University of Eastern Africa, Nairobi, Kenya
Dr. Neetu Singh
HOD, Department of Biotechnology,
Mewar Institute, Vasundhara, Ghaziabad
Prof. (Dr.) D. Durga Bhavani
Professor,
CVR College of Engineering, Hyderabad, Telangana

Prof. (Dr.) Shashi Singhal
Professor,
Amity University, Jaipur
Prof. (Dr.) Aradhna Yadav
Professor,
Krupanidhi School of Management, Bengaluru
Prof. (Dr.) Alireza Heidari
Professor, Faculty of Chemistry,
California South University, California, USA
Prof.(Dr.) Robert Allen
Professor
Carnegie Mellon University, Australia
Prof. (Dr.) A. Mahadevan
Professor
S. G. School of Business Management, Salem
Prof. (Dr.) S. Nallusamy
Professor & Dean,
Dr. M.G.R. Educational & Research Institute,Chennai
Prof. (Dr.) Hemant Sharma
Professor,
Amity University, Haryana
Prof. (Dr.) Ravi Kumar Bommisetti
Professor,
Amrita Sai Institute of Science & Technology, Paritala
Dr. C. Shalini Kumar
Principal,
Vidhya Sagar Women’s College, Chengalpet
Dr. Syed Mehartaj Begum
Professor,
Hamdard University, New Delhi
Prof. (Dr.) Badar Alam Iqbal Adjunct Professor,
Monarch University, Switzerland
Dr. Darshana Narayanan Head of Research,
Pymetrics, New York, USA
Prof.(Dr.) D. Madan Mohan
Professor,
Indur PG College of MBA, Bodhan, Nizamabad
Dr. Rosemary Ekechukwu
Associate Dean,
University of Port Harcourt, Nigeria
Dr. Sandeep Kumar Sahratia
Professor
Sreyas Institute of Engineering & Technology
Dr. P.V. Praveen Sundar
Director,
Shanmuga Industries Arts and Science College
Dr. S. Balamurugan Director - Research & Development,
Mindnotix Technologies, Coimbatore
Dr. Manoj P. K.
Associate Professor,
Cochin University of Science and Technology
Dr. Dhananjay Prabhakar Awasarikar
Associate Professor,
Suryadutta Institute, Pune
Dr. Indu Santosh
Associate Professor,
Dr. C. V.Raman University, Chhattisgath
Dr. Mohammad Younis
Associate Professor,
King Abdullah University, Saudi Arabia
Dr. Pranjal Sharma
Associate Professor, Department of Management Mile Stone Institute of Higher Management, Ghaziabad
Dr. Kavita Gidwani
Associate Professor,
Chanakya Technical Campus, Jaipur
Dr. Lalata K Pani
Reader,
Bhadrak Autonomous College, Bhadrak, Odisha
Dr. Vijit Chaturvedi
Associate Professor,
Amity University, Noida
Dr. Pradeepta Kishore Sahoo Associate Professor,
B.S.A, Institute of Law, Faridabad
Dr. Marwan Mustafa Shammot
Associate Professor,
King Saud University, Saudi Arabia
Dr. R. Navaneeth Krishnan
Associate Professor,
Bharathiyan College of Engg & Tech, Puducherry

Dr. Mahendra Daiya
Associate Professor,
JIET Group of Institutions, Jodhpur
Dr. G. Valarmathi
Associate Professor,
Vidhya Sagar Women's College, Chengalpet
Dr. Parbin Sultana
Associate Professor,
University of Science & Technology Meghalaya
Dr. M. I. Qadir
Assistant Professor,
Bahauddin Zakariya University, Pakistan
Dr. Kalpesh T. Patel
Principal (In-charge)
Shree G. N. Patel Commerce College, Nanikadi
Dr. Brijesh H. Joshi
Principal (In-charge)
B. L. Parikh College of BBA, Palanpur
Dr. Juhab Hussain
Assistant Professor,
King Abdulaziz University, Saudi Arabia
Dr. Namita Dixit
Associate Professor,
Shri Ramswaroop Memorial University, Lucknow
Dr. V. Tulasi Das
Assistant Professor,
Acharya Nagarjuna University, Guntur, A.P.
Dr. Nidhi Agrawal
Assistant Professor,
Institute of Technology & Science, Ghaziabad
Dr. Urmila Yadav
Assistant Professor,
Sharda University, Greater Noida
Dr. Ashutosh Pandey
Assistant Professor,
Lovely Professional University, Punjab
Dr. M. Kanagarathinam
Head, Department of Commerce
Nehru Arts and Science College, Coimbatore
Dr. Subha Ganguly
Scientist (Food Microbiology)
West Bengal University of A. & F Sciences, Kolkata
Dr. V. Ananthaswamy
Assistant Professor
The Madura College (Autonomous), Madurai
Dr. R. Suresh
Assistant Professor, Department of Management
Mahatma Gandhi University
Dr. S. R. Boselin Prabhu
Assistant Professor,
SVS College of Engineering, Coimbatore
Dr. V. Subba Reddy Assistant Professor,
RGM Group of Institutions, Kadapa
Dr. A. Anbu
Assistant Professor,
Achariya College of Education, Puducherry
Dr. R. Jayanthi
Assistant Professor,
Vidhya Sagar Women's College, Chengalpattu
Dr. C. Sankar
Assistant Professor,
VLB Janakiammal College of Arts and Science
Dr. Manisha Gupta Assistant Professor,
Jagannath International Management School
Copyright @ 2022 Indian Academicians and Researchers Association, Guwahati
All rights reserved.
No part of this publication may be reproduced or transmitted in any form or by any means, or stored in any retrieval system of any nature
without prior written permission. Application for permission for other use of copyright material including permission to reproduce
extracts in other published works shall be made to the publishers. Full acknowledgment of author, publishers and source must be given.
The views expressed in the articles are those of the contributors and not necessarily of the Editorial Board or the IARA. Although every
care has been taken to avoid errors or omissions, this publication is being published on the condition and understanding that information
given in this journal is merely for reference and must not be taken as having authority of or binding in any way on the authors, editors
and publishers, who do not owe any responsibility for any damage or loss to any person, for the result of any action taken on the basis of
this work. All disputes are subject to Guwahati jurisdiction only.


International Journal of Advance and Innovative Research Volume 9, Issue 1 (IX) January - March 2022
CONTENTS
Research Papers
A COMPARATIVE STUDY OF DEEP LEARNING ALGORITHMS FOR COMMODITY
MARKET PREDICTION
Deepa K. Bogle, Parag U. Bhalchandra and Aniket A. Muley
1 – 6
NEP 2020 AND TECHNOLOGY: AI AS A FUTURE COMPONENT OF
TECHNOLOGICAL EDUCATIONAL PROCESSES WITH NEW EDUCATION POLICY.
Prof. Yaseera Tausif Nevrekar and Ms. Umama Shahid Anware
7 – 11
TO STUDY AND EVALUATE THE IMPACT OF EDUCATIONAL DATA MINING FOR
21ST CENTURY COMPETENCIES
Mrs. Swetha M. S
12 – 15
THE ROLE OF INFORMATION TECHNOLOGY IN AGRICULTURE
Dr. Kadam Dadasaheb Devidasrao
16 – 18
A STUDY OF CURRENT TECHNOLOGIES IN HRM USING ML
Angela Biswas and Bhawna Puraswani
19 – 23
A STUDY ON MENSTRUAL HYGIENE MANAGEMENT AWARENESS
Radhika Poyyara, Sana Mohammed Shamun, Arifa Malik and Nidhi Chandorkar
24 – 26
IMPLEMENTING FLIPPED CLASSROOM IN EDUCATION
Durga Laxman Ursal
27 – 30
A MODEL FOR EARLY PREDICTION OF HEART ATTACK USING MACHINE
LEARNING
Ms. Sweety Garg and Ms. Gunveen Kaur
31 – 35
COMPARATIVE STUDY ON PRECISION FARMING FOR APPLES IN REGIONS OF
INDIA - USING ARTIFICIAL INTELLIGENCE AND ANALYTICS
Grishma Shringarpure and Disha Roshan Bhakta
36 – 38
CORPORATE JOB VS ENTREPRENEURSHIP: A STUDY OF CAREER PREFERENCES
AMONG MILLENNIALS
Prerana Gurav, Aaryan Poojary, Amrit Kaur Rashi, Sweekrati Shetty, Aaryan Ajit and Nidhi
Chandorkar
39 – 43
TRENDS IN MEDIA CONSUMPTION
Siddharth S. Apte
44 – 47

PREFERENCE OF USE OF PUBLIC TRANSPORT BY INDIVIDUALS IN MUMBAI
Pravita Kulal, Khush Satra, Aashna Shetty, Ahsan Syed, Anish Mudhguri and Ashish Navik
48 – 50
A STUDY ON INFLUENCE OF SOCIAL MEDIA ADVERTISING ON YOUTH WITH
RESPECT TO FASHION PRODUCTS
Nitish Jha, Konika Bhandari, Anand Sharma and Ashish Navik
51 – 54
PARADIGM SHIFT IN SPORTS REPORTING WITH INTERNET BOOM AND NEW
NORMAL SCARE
Arindam Basu
55 – 61
WIRELESS AND MOBILE COMPUTING: TO SECURE A WIRELESS AND BAND
SOLUTIONS
Patel Mahima Rambali and Nadigottu Lavanya Lingaiah
62 – 67
DATA VAULT IN BUSINESS HUB 2027
Ansari Kaniz Amina Murtuza Ansari Mariya Asghar Ali and Pannati Shruti Venkatesh
68 – 73
A STUDY ON SOCIAL MEDIA AND IT’S IMPACT ON TEENAGERS
Aditya Tiwari, Sudeep Poojary, Shyam Prajapat, Prathamesh Dhawan, Siddharth Chawan and
Ashish Navik
74 – 76
A STUDY ON CONSUMERS PREFERANCE TOWARDS GREEN PRODUCTS
Khushi Bangera, Roshani Jaiswal, Riddhi Patel, Sameeksha Shetty, Vinisha Uchil and Ashwini
Devadiga
77 – 80
CYBER SECURITY: CRYPTOGRAPHY AND STEGANOGRAPHY TECHNOLOGY -
TWO SIDES OF MIRROR FOR SECURING ANY TYPE OF INFORMATION IN
DIGITAL WORLD
Mr. Rupesh Sudhakar Patil and Dr. Tushar Vinayak Sambare
81 – 86
WASTE MANAGEMENT AND ITS AWARENESS AMONG PEOPLE IN MUMBAI
Ruben Dsouza, Tanisha Shetty, Pragati Sahu, Leslie Chettiar and Nidhi Chandorkar
87 – 89
HIGHER EDUCATION AND CHALLENGES OF ICT TOOLS: POST PANDEMIC ERA
Dr. P. R. Karulkar
90 – 93
IMPACT OF CHANGES IN GOVERNMENT POLICIES IN BUSINESS
Subhash Baban Nakhate and Dr. Geeta Kohade
94 – 99
CUSTOMER CHURN PREDICTION IN BANK
Mr. Ashish Modi and Ms. Sachi Shah
100 - 104
VISION WALK- A STUDY ON CHALLENGES & SOLUTIONS OF VISION
IMPAIRMENT
Adarsh Gupta, Yohan D’souza and Nabila M. Kazi
105 - 108

A STUDY OF THE SCOPE OF ARTIFICIAL INTELLIGENCE IN CUSTOMER
EXPERIENCE IN BANKING SECTOR IN INDIA
Ankur Aggarwal and Dr. (Smt.) Shubhra Garg
109 – 116
IMPACT OF ADVERTISEMENT ON CONSUMER BEHAVIOR
Vrushali Kolte, Sampat Shetty, Ritesh Shirsat, Vineesh Shetty, Rudraksh Solanki and Ashwini
Devadiga
117 – 121
STUDY ON IMPACT OF PANDEMIC ON SLEEP QUALITY OF INDIVIDUALS
Preeti Matharu
122 – 126
A STUDY ON IMPLEMENTATION OF DATA SCIENCE IN HEALTHCARE SECTOR
Omkar R. Nikam and Nabila M Kazi
127 – 130
IMPACT OF SMARTPHONE ON YOUNG GENERATION
Pavitra Mudaliyar and Mithilesh Chauhan
131 – 134
READERS OF NEWS TO PARTICIPANTS IN NEWS MAKING - A STUDY OF
BEHAVIOUR CHANGE AMONG YOUNG READERS OF NEWS IN MUMBAI
Mr. Ameya Sunildatta Bal
135 – 139
A STUDY ON CONSUMER PREFERENCES TOWARDS MOBILE WALLETS
Sachin Gupta Nitin Moolya, Rohit Poojary and CA Zainab Rangwala
140 – 144
IMPACT OF TIME MANAGEMENT ON WORK LIFE BALANCE: A STUDY OF
EMPLOYEES WORKING FROM HOME
Nidhi Chandorkar and Dr. Sridhara Shetty
145 – 148
PRIVACY AND SAFETY VIS A VIA SOCIAL MEDIA
Dr. Yatindra Hruday Ingle
149 – 152
IMAGE PROCESSING IN RETAIL INDUSTRY
Hemant V Karekar and Mr. Mithilesh Chouhan
153 – 156
COVID-19 DETECTION THROUGH BREATH SOUND ANALYSIS VIA A
SMARTPHONE APP
Sania F. Sayed and Bhumika Nakum
157 – 164
AWARENESS OF PESTER POWER ADVERTISING IN YOUTH
Mrs. Kshamata Sachin Lad
165 – 170
FUTURE OUTLOOK FOR NEXT GENERATION INTERNET OF THINGS (IOT)
Aniket Ramakant Verma, Animesh Kulkarni and Himani Shukla
171 – 175
A REVIEW ON THE ARTIFICIAL INTELLIGENCE OF THINGS (AIOT) :WHEN AI
MEETS IOT
Sheetal Khanore
176 – 178

CORPORATE JOB VS ENTREPRENEURSHIP: A STUDY OF MILLENNIALS
Adnan Shaikh, Ziad Shaikh, Rugved Chavan, Jivin Chacko, Sushanth Shetty and Preeti Matharu
179 – 183
A STUDY OF CHANGING DIGITAL BANKING HABITS OF INDIVIDUALS DURING
PANDEMIC COVID'19 IN MUMBAI CITY
Prof. CA Zainab Shabbir Rangwala
184 – 190
A RESEARCH PAPER ON CONSUMERS BUYING PATTERNS BEFORE, DURING AND
POST COVID- 19 PANDEMIC
Ms. Charmy S. Shah and Dr. Rinkesh Chheda
191 – 193
SEE WHAT INDIA'S COVID 19 DATA LOOKS LIKE BY USING PYTHON.
Mrs. Sujitha Mohan and Dr. Tushar Sambare
194 – 198
STUDY ON IMPACT OF SOCIAL MEDIA ADVERTISING ON CONSUMER BEHAVIOR.
Vishwajeet Yadav, Roger Dsouza, Avani Waghela, Krishna Khatri, Rekha Chaudhary and C. A.
Zainab Rangwala
199 – 202
A STUDY ON ATTRIBUTES INFLUENCING CONSUMERS BUYING BEHAVIOUR
TOWARDS CONSUMER DURABLES IN MUMBAI-THANE REGION
Ashish C. Navik
203 – 208
RISE OF INSTANT DELIVERY APPS DURING PANDEMIC AND ITS IMPACT ON
CONSUMER BUYING BEHAVIOUR
Kalpana Rai Menon
209 – 217
A STUDY ON “SUBMARINE / UNDERWATER NETWORKING TECHNOLOGY FOR
COMMUNICATIONS: BOON OR A CURSE”
Anita Charles and Vinay Shahapurkar
218 – 224
IMPACT OF SLEEPING PATTERN ON LIFESTYLE: A STUDY OF COLLEGE
STUDENTS IN MUMBAI
Dipesh Patel, Pooja Devadiga, Aryaan Shaikh, Ekta Kale and Preeti Matharu
225 – 229
STUDY ON USE OF CRYPTOCURRENCY IN INDIA
Abhishek Mohanty and Preeti Matharu
230 – 233
A STUDY ON INVESTMENT PATTERN AMONGST SALARIED PEOPLE LIVING IN
MUMBAI
Kartik Bhamane, Kanchan Choudhary, Diya Thakkar and Ashwini Devadiga
234 – 236
A LITERATURE REVIEW ON THE CONCEPT OF CRYPTOGRAPHY AND RSA
ALGORITHM
Prof. Suman Upadhyay and Prof. Vipinkumar Gupta
237 – 240

IMPACT OF WEBSERIES BINGE WATCHING AMONG COLLEGE STUDENTS
DURING COVID ERA WITH REFERENCE TO ULHASNAGAR AREA
Ridhi Aswani
241 – 243
A RESEARCH ON SOCIAL MEDIA USAGE AND ITS IMPACT ON THE HEALTH
STATUS IN UNDERGRADUATE STUDENTS IN MUMBAI
Ashwini Devadiga
244 – 247
THE PREDATOR DRONE: UNMANNED HEALTHCARE WELFARE
Raveena Shetty, Sujit Tilak, Asmita Kate and Pratik Chalke
248 – 253
HELIACAL POTENTIAL: RACING TOWARDS GREEN
Sairaj Shetty, Pavitra Shetty and Raveena Shetty
254 – 259
THE EFFECTS OF COVID 19 ON GROCERY SHOPPING
Dr. Yashesh Ranpura
260 – 266
PODCASTING IN INDIA -THE COVID 19 IMPACT (A STUDY OF GROWTH AND
CONSUMPTION PATTERNS OF PODCASTING IN INDIA)
Neena Sharma
267 – 270
A STUDY OF UTILIZATION OF SOCIAL MEDIA IN DAY TO DAY LIFE.
Mr. Vikas Nishad and Sheetal Khanore
271 - 273

International Journal of Advance and Innovative Research Volume 9, Issue 1 (IX) January - March 2022
1
ISSN 2394 - 7780
A COMPARATIVE STUDY OF DEEP LEARNING ALGORITHMS FOR COMMODITY MARKET
PREDICTION
Deepa K. Bogle1*
, Parag U. Bhalchandra2 and Aniket A. Muley
3
1,2School of Computational Sciences, Swami Ramanand Teerth Marathwada University, Nanded, Maharashtra,
India 3School of Mathematical Sciences, Swami Ramanand Teerth Marathwada University, Nanded,
Maharashtra, India
ABSTRACT
The paper compares the efficiency of the Long Short-Term Memory (LSTM) neural network model with the
Auto-Regressive Integrated Moving Average (ARIMA) regression model and the Artificial Neural Network (ANN) model. ARIMA, ANN, and LSTM network models are used for simulation in this work. The process is
based on historical commodity prices from year 1985 to 2021. The practical results obtained shows that the
LSTM neural networks model is superior over ARIMA model and ANN model. LSTM models outperform both ARIMA and ANN models with the values of MSE ~ 0.00. Considering the various lead-time simulations, the
LSTM model was discovered to be more stable with better simulation performance than the ANN model.
Besides, the special forgetting gate block makes the LSTM model a better simulator and smarter than the ANN
model. This research suggests a new data-driven forecasting method for commodities.
Keywords: Deep learning, LSTM, ANN, ARIMA, commodity market prices, prediction.
INTRODUCTION The commodity market is ambiance where things change rapidly and community likes to be prepared for unexpected dealings (Moews, & Ibikunle, (2020). Prediction is basically a calculated guess based on some
previous records or facts which includes social, trade and industry conditions, political affairs, rumors and
media plug, etc. Professional traders have tried to make price forecasts and developed a variety of analysis
methods such as technical, fundamental, quantitative, etc. (Zheng, & Jin, 2017).
LSTM is a model derived from RNN architecture that addresses the loss gradient problem, which allows long
term dependencies. It was designed in order to be more accurate than CNN(Chen, 2020). This method not only
has the ability of analyzing the time series with a long range of prediction, but also to solve difficulties in missing gradients in data. The LSTM model has been proven to be best(Moritz & Zimmermann, 2016). The
data used in price forecasting may be large and, more than likely, nonlinear.Therefore, a good forecasting
requires models like LSTM which can investigate hidden patterns and dynamics within large datasets (Namini,
Tavakoli & Namin, 2018, Chen, 2020).
2 RELATED WORKS
Traditional econometric approaches mostly utilized previously, such as Auto regressive integrated moving average (ARIMA) which has been popular in researches observing the behavior of foreign exchange and stock
market (Khashei, Bijari, Ali, & Ardali, 2009,Chen, 2020).
According to the lowest error percentage, many have selected ANN and regression prediction algorithms (Peng,
Y., Hsu, C & Huang,P. 2015). Kumar, et.al as proposed a system to apply prediction by analyzing past soil dataset and rainfall dataset(Venugopal,Aparna & Mani, 2018), while Aakunuri proposed crop prediction using
weather forecasting, implementing pesticides, fertilizers, and (Aakunuri, & Narsimha, 2016). The neural
network forecasting problems are based on analyzing the explored parts, which primarily focus on interval forecasting of agricultural commodity futures prices(Cao, & Tay, 2003). Firstly, the emphasis is on interval
prediction, and the point forecasting of agricultural commodity futures prediction in neural network fields has
been overlooked (Cao, & Tay, 2003). Secondly, because of gradient vanishing, these existing methods fail to capture very long-term information (Cao, & Tay, 2003). Further on, the dynamic dependencies among multiple
variables are not being taken into consideration (Connor, Atlas, Douglas, & Martin, 1991). Deep neural
networks, an approach derived from neural networks, can mainly be separated into three categories (Tang,
Almeida, & Fishwick, 1991). First category is to identify statistically significant events, second is to find and predict inherent structure and third is to do accurate prediction on numerical value (Namaki, Lin, & Wu, 2017).
Studies have shown that LSTMs are on average 85% more accurate than ARIMA predictions (Namini,
Tavakoli, & Namin, 2018).

International Journal of Advance and Innovative Research Volume 9, Issue 1 (IX) January - March 2022
2
ISSN 2394 - 7780
2.1 ARIMA MODEL
2.1.1 Theheoretical Introduction of Arima Model
The ARIMA (p, d, q) model is uses as time series analysis model proposed by the American statistician Box GE P and the British statistician Jenkins GM in the 1970s(Khashei, & Bijari, 2010). It is also called the Box-Jenkins
methodology. The ARIMA model for stationary time series is also called the ARMA (p, q) model (Ma, 2020).
In the ARMA model, variable's future value is a linear combination of its past value and past error, as expressed
below(Ma, 2020):
𝑢𝑡 = 𝜑0 + 𝜑1𝑢𝑡−1 + ⋯+ 𝜑𝑛𝑢𝑡−𝑛 + 𝜀0 − 𝜃1𝜀𝑡−1 − ⋯− 𝜃𝑛𝜀𝑡−𝑛 (1)
where, 𝑢𝑡 is the actual value at t., {𝜀𝑡 } is the white noise sequence, p and q are integers which are called
autoregressive and moving average, respectively(Khashei, & Bijari, 2010, Ma, 2020). When dealing with a non-stationary time series, certain processing is required to generate a new stationary series. The simplest equation
of this type of model is ARIMA (1, 1, 1), which can be expressed as(Ma, 2020):
(1-B) (1-𝜑1B) 𝑢𝑡= (1-𝜑𝜃1B) 𝜀𝑡 (2)
where, B is the lag factor, like .
2.1.2 TOOLS AND METHODS
The order determination method of ARMA model (Ma, 2020). The methods for determining the values of p and
q in equation (1) mainly include the autocorrelation and partial correlation function order determination method and the AIC criterion, and the AIC criterion is the most widely used(Ma, 2020). Firstly, the model should be
chose by examining the properties of the autocorrelation and partial correlation coefficients of stationary time
series(Ma, 2020). Secondly, when it is difficult to determine the order based on the correlation coefficient, AIC can be used to determine the order of the model. When p and q reach a certain logarithmic value, AIC (p, q) has
a minimum value. At this time, p and q are the best model orders (Khashei, & Bijari, 2010).
2.1.3 STATIONARY TEST OF ARMA MODEL —— ADF TEST
Δ𝑢𝑡=c-δ𝑢𝑡−1 + ∑𝑝−1𝑖=1 𝑖𝑢𝑡−1+𝜀𝑡 (3)
First, perform regression on equation (3) and divide the estimated ̂ by its standard deviation to obtain a
statistic τ( Khashei, & Bijari, 2010). Then check the ADF critical table to see if the hypothesis(δ) can be
rejected.
2 ANN MODEL
Figure 1: Neural network structure (Khashei, & Bijari, 2010).
2.2.1 THEORETICAL INTRODUCTION OF ANN MODEL: The ANN model is widely used in function approximation and predictions; advantages of net-work of three layers of simple processing units connected by a cyclic links as shown in Figure 1(Khashei, & Bijari, 2010).
The relationship between the 𝑦𝑡 (is the output variable) and 𝑦𝑡−1,𝑦𝑡−2, … , 𝑦𝑡−𝑝 (are the input variables) has the
following mathematical representation:
𝑦𝑡 = 𝑤0 + ∑𝑞𝑗=1 𝑤𝑗𝑔(𝑤0,𝑗 + ∑𝑝
𝑖=1 𝑤𝑖𝑗𝑦𝑡−𝑖) + 𝜀𝑡 (4)
Where, 𝑤𝑗(𝑗 = 0,1,2, …𝑞)and 𝑤𝑖𝑗(𝑖 = 0,1,2, …𝑝; 𝑗 = 0,1,2, … 𝑞) are model parameters called the connection
weight, p and q are the number of input and hidden nodes, respectively(Ma, 2020).Under normal circumstances,
the activation function has several forms that can be used, and its type is indicated by the condition of neurons in the network(Ma, 2020). In general, neurons in the input layer do not have an activation function, because
their role is mainly to transmit the input variables to the hidden layer(Ma, 2020). In the output layer, the linear
function is widely used because they are unlikely to introduce distortion into the output of the predicted

International Journal of Advance and Innovative Research Volume 9, Issue 1 (IX) January - March 2022
3
ISSN 2394 - 7780
value(Ma, 2020). Logistic function(Ma, 2020) given in equation 5 and hyperbolic function in equation 6 are
used as the transfer function of the hidden layer.
L(x) = 1
1+𝑒−𝑥 (5)
f(x) = 1−𝑒−2𝑥
1+𝑒−2𝑥 (6)
2.3 LSTM MODEL
2.3.1 Theoretical Introduction of LSTM Model: The LSTM model is a type of RNN that primarily addresses the problem of gradient disappearance, which is
common in traditional RNNs, so that it can analyze longer time series data(Ma, 2020). The working principle of
LSTM is to process the input information at time t, select useful information with a certain probability, and
finally extract useful information through the output gate as the state of the final retention layer, and then
participate in the calculation of the next time (Ma, 2020).
After inputting a new set of variable values 𝑥𝑡at time t and the output state ℎ𝑡−1 of the hidden layer at the
previous time through the operation of the output gate state 𝑜𝑡, the output result ℎ𝑡 of the hidden layer is
obtained(Ma, 2020). The new cell state 𝐶𝑡 and hidden layer output will be passed to the next moment to
participate in the calculation (Ma, 2020). The mathematical relationship of the entire process can be stated as
(Ma, 2020).
𝑖𝑡 = 𝜎(𝑊𝑖ℎ𝑡−1 + 𝑈𝑖𝑥𝑡 + 𝑏𝑖)
𝑓𝑡 = 𝜎(𝑊𝑓ℎ𝑡−1 + 𝑈𝑓𝑥𝑡 + 𝑏𝑓)
𝑜𝑡 = 𝜎(𝑊𝑜ℎ𝑡−1 + 𝑈𝑜𝑥𝑡 + 𝑏𝑜)
𝐶𝑡 = 𝑡𝑎𝑛 𝑡𝑎𝑛 ℎ (𝑊𝐶ℎ𝑡−1 + 𝑈𝐶𝑥𝑡 + 𝑏𝐶)
𝐶𝑡 = 𝐶𝑡−1 ʘ 𝑓𝑡 + 𝑖𝑡ʘ 𝐶𝑡⃗⃗ ⃗
ℎ𝑡 = 𝑜𝑡ʘ 𝑡𝑎𝑛 𝑡𝑎𝑛 ℎ (𝐶𝑡)
Where 𝑊𝑖, 𝑊𝑓 , 𝑊𝑜 , 𝑊𝐶 , are the weights of ℎ𝑡−1. 𝑈𝑖 , 𝑈𝑓, 𝑈𝑜 , 𝑈𝐶 are the weights of 𝑥𝑡. 𝑏𝑖 , 𝑏𝑓, 𝑏𝑜, 𝑏𝐶 are
bias factors. 𝜎 is the sigmoid function making sure that the values of(Ma, 2020) 𝑖𝑡, 𝑓𝑡 , 𝑜𝑡 are between 0 and 1.
𝑡𝑎𝑛 𝑡𝑎𝑛 ℎ is the hyperbolic tangent function. It can be seen from the above equation that the size of is jointly
affected by the present condition of the cell and the(Ma, 2020) information ℎ𝑡−1 contained in the hidden state at
the previous moment and 𝑊𝐶, the main cause of the disappearance of the gradient, has no influence on the
calculation of the current cell state. Therefore, by adding a gating
structure,the issue of the gradient disappearing in the training process is effectively reduced, and the accuracy of
model prediction is also improved (Ma, 2020).
2.4 COMPARISON OF ANN AND LSTM MODEL: There are relatively few studies on stock price prediction using LSTM models. In a few studies comparing the
prediction results of LSTM and ANN models, we can conclude that the LSTM model performs better (Sethia & Raut, 2018) and this difference may be due to the LSTM model's improvement on the vanishing gradient
problem(Sethia & Raut, 2018). It could also result from the addition of indicators to help differentiate between
market fluctuations and unintentional fluctuations in the input variables(Sethia & Raut, 2018).
Although the LSTM model have certain advantages, it has not been extensively studied. This could be because the current data processing is better suited to the ANN model(Ma, 2020). Unprocessed data is introduced into
the LSTM model, which has a significant impact on its performance, resulting in unsatisfactory prediction
results (Ma, 2020, Chen, 2020).
3 DATASET DESCRIPTIONS Data used in this work is international prices for two commodities: two precious metals (gold and silver). All
the data are taken from the Yahoo fiancé commodity prices dataset. All prices are observed week days of daily data. The gold datasets have 9024 data points each, acquired from 13/02/1985 to 19/08/2021. The silver datasets
have 3864 data points each, acquired from 28/04/2006 to 01/09/2021.
4 PREDICTION MODEL
This research, preparation, and data manipulation is done entirely in Python 3.5 using the numpy and pandas packages. ARIMA, ANN and LSTM networks were developed using keras based on Google TensorFlow, a

International Journal of Advance and Innovative Research Volume 9, Issue 1 (IX) January - March 2022
4
ISSN 2394 - 7780
powerful library used for large-scale machine learning on heterogeneous systems (Wu, Li, Jian, Li, & Lou,
2018). Now separate the training data and test data. The test data will be the last 500 data points and the rest
will be the train data.
The model chooses ARIMA (0, 1, 2) as best fit model for gold and ARIMA(0,1,0) as best fit model for Silver.
We define the LSTM for discharge prediction as 50 neurons in the first hidden layer and 1 neuron in the out
layer. There will be one time step and sixteen features in the input shape. The MAE loss function and the efficient Adam version of stochastic gradient descent will be used (Kingma & Adam, 2014). The type of ANN
used in this study is a multi-layer-feed-forward perception (ML) trained with the use of back propagation
learning algorithm. The MLP network consists of input layer, hidden layer, and output layer (Kingma & Adam,
2014).
5 RESULTS AND DISCUSSION
The values for MSE were obtained when evaluating the LSTM model’s train score and test score, where the
score is the evaluation of our chosen loss function which in our case is MSE (War & Bahador, 2018, Wu, Li, H Jian, Li & Lou, 2018).It is because of LSTM is very effective in modeling time-series data. In figure 2 and 3,
we can see the LSTM model’s prediction for the adjusted closing price (orange line) compared to the actual
adjusted closing price (blue line) ( War & Bahador, 2018) of Gold and Silver respectively. In figure 4, we can see the ARIMA model’s prediction for the adjusted closing price comparing with actual price of gold and silver
price respectively.
Table 1: Obtained MSE and R2 values from ANN and LSTM
Commodity MSE Value
ARIMA ANN LSTM
Gold 0.0047 0.005002 0.001147
Silver 0.0807 0.006764 0.002730
Figure 2: Comparison of actual and predicted gold price with ANN and LSTM model.
Figure 3: Comparison of actual and predicted Silver price with ANN and LSTM model.

International Journal of Advance and Innovative Research Volume 9, Issue 1 (IX) January - March 2022
5
ISSN 2394 - 7780
Figure 4: ARIMA model for Gold price and Silver price prediction respectively.
6 CONCLUSIONS
During this analysis of the establishment process and results of these three models, conclusions can be made.
The ANN model is better than that of the ARIMA model, and the performance of the LSTM model may be more due to the ANN. The downside is that, as we all know, fluctuations in commodity prices are not only
related to changes over time, but also to economic factors, socio-political factors and other commodities.
7. FUTURE WORK AND LIMITATIONS Deep learning techniques are highly computation intensive. The current work was completed on Google Colab,
which is equipped with eight Tensor processing units (TPUs). If dedicated computational resources are vailable,
more experiments with more data and higher epochs can be run. This can help with hyperparameter tuning. The
current focus is on developing a basic LSTM architecture. Other types of LSTM models can be built in a similar
manner.
REFERENCES
1. Moews, B. & Ibikunle, G, Physica A 547 (2020) 124392(DOI: 10.1016/j.physa.2020.124392)
2. Zheng, A, & Jin, J., (2017). Using AI to make predictions on stock market, Stanford University,
Tech.(extension://nhppiemcomgngbgdeffdgkhnkjlgpcdi/data/pdf.js/web/viewer.html?file=http%3A%2
F%2Fcs229.stanford.edu%2Fproj2017%2Ffinal-reports%2F5212256.pdf)
3. Khashei, M., Bijari, Ali, G., & Ardali, R. (2009). 72 (4–6) 956
https://dl.acm.org/doi/10.1016/j.neucom.2008.04.017
4. Peng, Y., Hsu, C & Huang,P. (2015). https://www.semanticscholar.org/paper/Developing-crop-price-
forecasting-service-using-Peng-Hsu/e441c3ef2a7b1c6fd5a8296d18619a23629451b7
5. Venugopal. A., Aparna. S, Mani, J.(2018). Mathew R., & Williams, V., (IRJET) 9(13) 87
https://www.ijert.org/crop-yield-prediction-using-machine-learning-algorithms
6. Aakunuri, M.& Narsimha, G. (2016). 6(1)25 https://www.ripublication.com/irph/ijict16/ijictv6n1_04.pdf
7. Cao, L. J. &Tay, F. E. (2003). 14(6) 1506 (DOI: 10.1109/TNN.2003.820556)
https://www.researchgate.net/publication/3303316_Support_vector_machine_with_adaptive_parameters_in
_financial_time_series_forecasting
8. Connor, J., Atlas, L. E., Douglas, R., & Martin, (1991).Recurrent networks and NARMA modeling, NIPS'91: Proceedings of the 4th International Conference on Neural Information Processing Systems 301
https://www.semanticscholar.org/paper/Recurrent-Networks-and-NARMA-Modeling-Connor-
Atlas/06778bd87125a28f0d045e0221ca1b8ad1d469b6
9. Tang, Z., Almeida, C. A. & Fishwick, P. A.(1991). Time series forecasting using neural networks vs. Box-
Jenkins Methodology, Simulation, 57(5) 303 (DOI: 10.1177/003754979105700508)
10. Namaki, M. H., Lin, P. &Wu, Y.(2017) :IEEE International Conference on Big Data (Big Data), 982
https://www.tandfonline.com/doi/pdf/10.1080/15140326.2019.1668664.
11. Namini, S. S., Tavakoli, N. & Namin, A. S.(2018). 1394 (DOI: 10.1109/ICMLA.2018.00227)
https://par.nsf.gov/servlets/purl/10186768

International Journal of Advance and Innovative Research Volume 9, Issue 1 (IX) January - March 2022
6
ISSN 2394 - 7780
12. Moritz, B. & Zimmermann, T.(2016): SSRN Electronic Journal (DOI: 10.2139/ssrn.2740751)
https://www.researchgate.net/publication/315024907_Tree-
Based_Conditional_Portfolio_Sorts_The_Relation_between_Past_and_Future_Stock_Returns
13. Khashei, M. & Bijari, M. (2010). 37(1) 479
https://citeseerx.ist.psu.edu/viewdoc/download?doi=10.1.1.475.3147&rep=rep1&type=pdf
14. Sethia, A. & Raut, P.(2018). Application of LSTM, GRU and ICA for Stock Price Prediction, Proceedings of classification ICTIS 479 (DOI: 10.1007/978-981-13-1747-7_46)
https://www.researchgate.net/publication/329685590_Application_of_LSTM_GRU_and_ICA_for_Stock_P
rice_Prediction_Proceedings_of_ICTIS_2018_Volume_2
15. Kingma. D, & Adam, J. Ba. (2014): A method for stochastic optimization, Comput. Sci.
https://arxiv.org/pdf/1412.6980.pdf/
16. War, A. & Bahador, M. (2018):http://www.diva-portal.org/smash/get/diva2:1213449/FULLTEXT01.pdf
17. Hu, C., Wu, Q., Li, H., Jian, S., Li, N. & Lou, Z. 10, (2018) 1543 ; https://doi.org/10.3390/w10111543
18. Ma,Q.(2020). https://www.e3s-
conferences.org/articles/e3sconf/pdf/2020/78/e3sconf_iseese2020_01026.pdf
19. Chen, Z. (2020). https://dl.acm.org/doi/10.1145/3417473.3417481
20. https://www.japsonline.com/admin/php/uploads/908_pdf.pdf

International Journal of Advance and Innovative Research Volume 9, Issue 1 (IX) January - March 2022
7
ISSN 2394 - 7780
NEP 2020 AND TECHNOLOGY: AI AS A FUTURE COMPONENT OF TECHNOLOGICAL
EDUCATIONAL PROCESSES WITH NEW EDUCATION POLICY.
Prof. Yaseera Tausif Nevrekar1 and Ms. Umama Shahid Anware
2
1Assistant Professor, Department of Computer Science, M.A Economics, S.P.P.U 2Maharashtra College of Arts, Science and Commerce
ABSTRACT Artificial intelligence (AI) now is applicable in real life situation and application which was previously only an
imagination or may be a dream, it has now become a daily life activity and has pervaded every facet of our
lives, and it may now be the next big thing in education. It’s still a field in its commencement stage, but as time
progressing, we’re now witnessing AI evolving and is exploring its untapped eventuality. My paper with this background, examines current insights and future scope and applicability of AI in various contexts, such as
natural language processing (NLP), machine learning, and deep learning and how its use will be immense
benefit to education field. As i am very hopeful that Artificial Intelligence and Machine Learning can not only increase the level of education but it can also be a boon to the learning centric education. The goal of my
research paper is to provide an insight for educators of AI applications in the field of education and with the
new education policy(NEP 2020) it is just going to be a blessing in disguise. Given the magnetic development in recent years, and the growing interest of educators in this field, a review of the literature on AI in education is
vindicate.
Keyword: Artificial Intelligence, Machine Learning, NLP, Deep learning, NEP.
INTRODUCTION Artificial Intelligence and machine learning in Education is one of the currently booming fields in educational
technology. Whilst it is a part since for about more than 25-35 years, it is still unclear for educators how to take
advantage of it on a broader scale, and environment with AI is relevant to tackling educational difficulties stemming from both the inadequacies of traditional methods of teaching today's generation and the complexity
of the educational system itself. In particular, e-learning is generating enormous data and this will in turn
enable AI to address complex challenges in education and adopt smarter educational technology solutions. Over
the past decade, the role of AI in learning has been on the radar of education institutions, government agencies, funding agencies, and industry. Given all the diverse amount of research endeavors in the application of AI in
education, it has become therefore more conceivable to address grand challenges facing the education of our
society.
The questions are
1. How will technology support learning in fundamentally new ways across lifespan?
2. How far can scientific advances take us towards highly adaptive learning?
3. How will new data sets, algorithm and methods of analysis help us explore and unravel new horizon in
teaching and learning?
4. What innovations join re-search, methods, approaches to enable improvement in teaching and learning?
5. How technology can be utilized to develop a cost effective personalized learning experience in remote
corner easily?
These questions point to the challenge brought by the interplay of adopting a cost-effective traditional mass
education system that has a one system fits all and the current trend of developing a personalized education system that is expensive to adopt. Besides, different constituents see the problems from different perspectives
and they have objectives that are sometimes competing. These decade-old research challenges are now
exemplified with multiple projects being investigated using machine learning, and there is a big hope that
solutions are forthcoming.
LITERATURE REVIEW
1. AI TOOLS: - AI tools mostly follows basic principles generally categorize in 3 parts.
● Learning: With the help of data sets creating new behavior models.
● Refining: Self correcting and training data set with the help of algorithms to ensure the most accurate
results.

International Journal of Advance and Innovative Research Volume 9, Issue 1 (IX) January - March 2022
8
ISSN 2394 - 7780
● Reasoning: Selection of algorithm as per specific functionality and task.
In terms of large opportunities, AI tools are applicable to all industries, including education. One of the most
promising approaches to restructure businesses appears to be through the use of technology in a way where we
can make maximum benefit out of it.
2. Roles Of AI In Education with the new policy:- The use of technology in education is changing the way we
teach and learn all across the world. Artificial Intelligence (AI) is one of the disruptive tools (Romero,
2017) for customizing the learning experience of various learning groups, teachers, and tutors.
The following is an example of how Artificial Intelligence tools could be used to improve study processes:
● Personalize Learning (Hart, 2016):- Artificial Intelligence assists in determining what a student knows and
does not know, allowing for the creation of a customised study timetable for each learner that takes into account knowledge gaps. AI tailors lessons to the unique and specific needs and level of learners specially
slow learners in this way, enhancing their efficiency.
● Produce Smart Content and Digital lessons:- AI can create digital learning platform with customization choices, digital e-book, study notes, virtual reality lectures, and much more. E-Content can be developed in
regional languages also and AI tool can assist it for better recognition and wider reach. Divyang friendly
education software can be developed too.
● Information visualization:- AI can enable new ways of seeing information, such as visualization, simulation,
virtual reality, web-based learning and assessment environments.
● Learning content updates:- Furthermore, AI assists in the creation and updating of lesson content, ensuring
that the knowledge is current and tailored to different learners and groups.
● Contribute To Task Automation:- Simplicity of administrative tasks like grading, assessing, and
responding to students is a time-consuming activity and sometimes difficult to achieve this is what a teacher
could enhance using AI very effectively(Romero,2012).
● Do Tutoring:- Personal study programmes that are always growing take into account the gaps that students
need to fill during individual courses. Personal tutoring and support for pupils outside of the classroom
helps students stay on track with their studies and relieves their parents of the burden of explaining algebra
to their children. Teachers save time using AI tutors since they don't have to spend extra time explaining difficult concepts to students. Scholars can avoid being embarrassed by asking for help in front of their
peers by using AI-powered chatbots or AI virtual particular sidekicks.
● 24/7 Access To Learning:- Students can always learn thanks to AI assistants who are based online. They can arrange their days without being tied to a specific location. They can study on the go, at any location
and at any time. They can plan their days around their most productive times. Also students who are from
economically weaker can simultaneously do job and complete their degree is 24/7 access is available to
them.
● Personalized Learning Made Possible With AI (Webb & Fluck, 2020):- If you keep up with worldwide
trends, you'll notice that personalization is becoming increasingly popular. The fundamental benefit of AI is
that it can be trained to perform a wide range of jobs, allowing for a more individualized approach to education. It's a universal solution for learners and educators to acquire a set of tools adapted to their unique
needs to improve their routine, increase productivity, improve accessibility, and scale processes.
● Sentiment Analysis in Education:- Sentiment Analysis aims to improve the learning process in an e-learning environment by assessing students' feedback in order to better understand their perspectives and make
appropriate changes to the content or delivery of learning materials.
● Students’ Performance Prediction:- To be able to predict a student’s likely future performance in a course
can provide very powerful platforms that facilitate educational interventions and remedial actions promptly.
3. HOW TO START IMPLEMENTING AI
AI tools as enhancement option for learner centric environment, these steps will help us accordingly to plan our
project:-
● Identify your needs and AI technologies (Bienkowski & Feng, 2012). The identification of the pain areas
that this technology can target and resolve is the first step in implementing any technology. Find the
bottlenecks in your system and look into how AI might help you improve them.

International Journal of Advance and Innovative Research Volume 9, Issue 1 (IX) January - March 2022
9
ISSN 2394 - 7780
● Establish the strategic goals for AI transformation in your company. Determine how empty you're Do you
want to be a trailblazer or a lingerer? Which technologies are most applicable for your business? Are you
apprehensive of the limitations of AI and how you plan to break them? Which of the following commercial objects should AI technology help to achieve? You should conduct a cost- benefit analysis for AI
robotization and addition grounded on the answers to these questions.
● Ensure that the necessary culture, talent, and technology are in place.To get the most out of AI technologies, you should not only choose the proper team to implement the technology, but also build the ideal
atmosphere on all organizational levels, one that is driven by analytical insights and focused on decisive
decisions.
● Ingenious methods for influencing the result of AI transformations. It's critical to ensure process openness and stay up with the major concerns and KPIs of AI adoption when creating an environment where humans
and AI can coexist. Determine the performance indicators to track, security risks to address, and
technological ecosystems to support based on the unique characteristics of your enterprise and the type of AI employed. There are numerous AI-based solutions available which is quite promising due to incredible
opportunities for development.
HOW TO DEVELOP AI-ENABLED PLATFORM FOR EDUCATION There are six main steps that we need to follow.
● Step 1. Study the competitors’ solution.
● Step 2. Consider interactive and interesting content.
● Step 3. Gather, set and analyze your project need and discuss them with the developers.
● Step 4. Test your app properly for fullfiment of requirement and to eliminate errors.
● Step 5. Deploy the app and get users’ feedback.
● Step 6. Update your solution regularly.
Step 1. Study the Competitors:- We must thoroughly research our competition before developing answer. Users
are spoiled these days, therefore we will need to provide them with some new features. Furthermore, by
understanding the existing platforms, we may come up with more fascinating project designs. We can research
the technology stack or brainstorm design concepts.
Step 2. Consider the following examples of interactive and useful content:- When developing an educational
solution, provide users with useful content. We can choose from a variety of fields or themes, such as math,
literature, and others. Following that, we can work with university or college tutors. we can also get learning
materials from a variety of places, such as training programmes, courses, and more.
Step 3. Set Your Project Requirements:- Before we begin development, we must first define our project's
requirements and commercial objectives. You should think about the quantity of features that are required.For example, construct a minimal version of platform as an MVP. It allows to gather some user feedback. After that,
keep the system up to date by adding sophisticated features on a regular basis. By the way, it's a good idea to
research what kinds of features users want. To get started, work with professional software engineers. They
must have prior Artificial Intelligence experience. Working with software builders can take two forms: forming
an in-house team or collaborating with an outsourcing firm. Each choice has advantages and disadvantages.
Step 4. Test the Platform to Avoid Bugs:- We must create an exceptional user experience in order to get more
committed users. Users, of course, do not want to interact with a platform that is riddled with flaws. Better to
work with qualified Quality Assurance engineers to detect and solve faults before launching the project.
Step 5. Release Solution and Get Users’ Feedback:- Users’ opinions can help us understand what parts of the
system you need to improve. Additionally, students and teachers can tell about their expectations and
requirements for application.
Step 6. Update the System Regularly:- It’s vital to improve our platform regularly, offering users new
opportunities and exciting features. To be competitive in the market, we should stay up-to-date. It’s better to
cooperate with various tutors and offer new training programs. As you can see, the education field offers a lot of openings to integrate and use Artificial Intelligence. The request formerly has several great results for grown-
ups, children, teachers, and indeed seminaries. AI- grounded operations can dissect an enormous quantum of
information, offering education druggies more individualized literacy accoutrements.

International Journal of Advance and Innovative Research Volume 9, Issue 1 (IX) January - March 2022
10
ISSN 2394 - 7780
AI ISSUES AND CONCERNS
1. Identifying Ethical and Privacy Issues: While AI can provide potential solutions in a variety of fields,
including education, various ethical issues can develop, limiting its application. Because of the various definitions of what is and isn't ethical in education, developing AI algorithms for education with ethical
considerations in mind is difficult. Also, when it comes to evaluating data and discovering trends, it's vital
to avoid utilizing AI that leads to major biases. In terms of privacy, entrusting our data to machines to analyze and find patterns might have major privacy concerns on its own. Having access to students' online
search patterns, for example, can lead to the detection of personal concerns, which can have long-term
consequences. As a result, AI researchers must seek for new approaches. (Knox, 2020).
2. Security Implications:- AI is heavily reliant on data. In the field of education, there is a wide range of data. It's vital to design AI algorithms with security as a top priority. Before applying AI approaches to
educational data, it is necessary to distinguish between sensitive and insensitive data. As a result,
researchers must build sophisticated AI algorithms.
OBSERVATIONS
1. Under the current pandemic crisis, the practical utility of distant learning has proven to be an extremely
innovative and significant means of delivering education. Unfortunately, due to a lack of merit levelling between the conventional and ODL systems prior to the pandemic, the enormous potential of ODL went
largely untapped.
2. The new education policy has proven to be timely, appropriate, pragmatic, and solution focused by
integrating open and choice based learning through Econtent delivery, online classes in the traditional mode
of education.
3. The development of digital infrastructure will be critical for the policy to achieve the desired results,
especially given the need for a multi-disciplinary approach.
4. Due to the COVID pandemic, the NEP has been launched at a key moment, with classes being done digitally
or physically, or a combination of the two, and teaching styles and tactics needing to be re-imagined. The
significant use of technology in teaching and learning, the removal of language barriers, educational
planning and management will all be important principles guiding the education system.
5. The use of Artificial Intelligence (AI) tools should be increased. The strategy also aims to raise knowledge
about the different aspects of disruptive technologies that solve critical challenges such as data security.
CONCLUSION If we talk about education, the Indians have been working on creating intelligent education. The New education
policy 2020 has also emphasized on technology enabled education. Integration of technology in education is a
major thrust of NEP 2020. The government’s ambitious plan would require huge amounts of research in AI, supported by professionals trained in the technology. In this regard, huge strides are already being made when it
comes to educating the populace using AI. This way, India is not only working to make its young population
familiar with the technology, but it is also revolutionizing how education is being imparted. According to an
estimate, India led the way, with over $1 billion invested globally last year in AI education and with new education policy it is expected to grow. There should be a focused effort on discovering and nurturing the talent
of a country’s next generation. Currently, the world is battling a pandemic and such a technology can be
optimally utilized in such situations. Classrooms can be shut, but classes cannot.
When it comes to education, Indians have been attempting to develop intelligent education. Technology-enabled
education is also stressed in the New Education Policy 2020. NEP 2020 places a strong emphasis on integrating
technology into education. The government's ambitious ambition will necessitate massive quantities of AI research, backed up by experts in the field. Huge strides have formerly been made in this area when it comes to
employing AI to educate the general public. India is reinventing education in this way, not only to familiarize its
youthful population with technology, but also to revise how it's delivered. According to estimates, India led the
way with over$ 1 billion invested encyclopedically in AI education last time, and with new education programs, it'll continue to do so. A concentrated trouble should be made to identify and nurture the gift of a country's
coming generation. The globe is now fighting a epidemic, and similar technology can be relatively useful in
similar cases. Classes can not be closed, although classrooms can be closed
REFRENCES
1. C. Romero, S. Ventura,2012, IEEE Transactions on Systems, Man, and Cybernetics, PartC (Applications
and Reviews) .

International Journal of Advance and Innovative Research Volume 9, Issue 1 (IX) January - March 2022
11
ISSN 2394 - 7780
2. C. Romero, S. Ventura, 2017 , Wiley Interdisciplinary Reviews: Data Mining and Knowledge Discovery
7(1).
3. Hart, 2016 S.A. Hart : Precision education initiative: Moving toward personalized education.(Mind, Brain,
and Education.
4. J. Knox, 2020, “Artificial intelligence and education in China”, Learning, Media and Technology.
5. M. Bienkowski, M. Feng, B. Means,2012 ., US Department of Education, Office of Educational
Technology.
6. M. E. Webb, A. Fluck, J. Magenheim et al.,2020, “Machine learning for human learners: opportunities,
issues, tensions and threats”,Educational Technology Research and Development.
7. T.E.D. Mining 2012, in Proceedings of conference on advanced technology for education.
8. https://www.education.gov.in/shikshakparv/docs/NEP_2020_CIET_Behera.pdf
9. https://shikshan.org/nep-2020/technology-integration/

International Journal of Advance and Innovative Research Volume 9, Issue 1 (IX) January - March 2022
12
ISSN 2394 - 7780
TO STUDY AND EVALUATE THE IMPACT OF EDUCATIONAL DATA MINING FOR 21ST
CENTURY COMPETENCIES
Mrs. Swetha M. S HoD -Department of Management Studies, East Point College of Higher Education, Bangalore, Karnataka
ABSTRACT The tremendous impact of information technology has shaken the old leisurely outlook on life and has created
intricate problems of social adjustments. It has engendered an intellectual revolt against tradition and against
established institutions, beliefs and social practices. It has marked a progressive rise in standard of living. It
has created demand for greater diversity of new skills for manning the developing network of industry and
commerce.
Education institution has considered as the support of Indian economy as it generates new human resources
which cater the needs and wants of industrial sector. The supply of human resources is not adequate to cater the demands and quality needs of industry, due to this the gap between Supply and Demand is increasing and
resulting in increase in unemployment ratio.
Keeping in view above background, this paper shed a light an intermediate approach called Educational data mining which bridge the gap between institution and industry. The paper emphases on applications and
approaches of EDM and its benefits to society in general and teachers and students community in particular.
The primary goal of this paper is shed a light on EDM and its usages in education sector especially in
analyzing and uncovering the hidden competencies of students to increase their quality, skills and decision
making capability.
Keywords: Information Technology, Institutions, Human Resources, Industry, Educational Data Mining
Competencies, Decision making.
EDM is a foremost global forum for high-quality research that mines data sets to answer educational research
questions that shack light on the knowledge process. The data groups may create from a diversity of learning
contexts, counting Learning Management Systems, Interactive Learning Environments, Intelligent Tutoring
Systems, Educational Games, and data-rich knowledge activities. Educational data mining considers a extensive varied of types of data, including but not limited to raw record documents , student-produced objects ,
discourse, multimodal streams such as eye-tracking, and other sensor data. The overarching goal of the
Educational Data Mining research community is to better support learners by developing data-driven
understandings of the learning process in a extensive varied of settings and for assorted initiates.
TOP OF FORM
Educational data mining is developing as a research zone with a suite of computational and psychological methods and research approaches for understanding to students learn. New computer-supported communicating
learning methods and tackles bright tutoring systems, simulations, games have unlocked up chances to gather
and examine student data, to discover patterns and trends in those data, and to make novel detections and test
hypotheses about in what way students learn. Data collected from online knowledge systems can be shared over large numbers of students and can contain many variables that data mining algorithms can portable for model
building.
OBJECTIVES OF EDM: 1. Predicting students upcoming knowledge behavior by creating student models that join such detailed
information as students knowledge, motivation, metacognition, and attitudes.
2. Discovering domain models that describe the satisfied to be learned and best instructional sequences.
3. Stuying the special effects of different classes of pedagogical wherewithal that can be provided be
knowledgesoftware.
4. Advancing practical knowledge about learning and learners through building computational replicas that
chain models of the student, the area, and the software training.

International Journal of Advance and Innovative Research Volume 9, Issue 1 (IX) January - March 2022
13
ISSN 2394 - 7780
The main objective of EDM viewed by different Researchers as
1. Student modeling: it is related with the creation of student models that comprises student behaviour,
learning style, presentation and environment in which they can develop their assistance and solve their
glitches.
2. Domain Modeling: it is related with the designing of methods, tools and techniques for the development of
particular branch.
3. Learning System: developing the system for studying the properties of educational support. e.g.
Pedagogical support.
4. Structure the computational models for knowledge and learners that consist of students, domain.
5. Study the results of resources related to infrastructure, HR, and Industry-academic relationship in the
organization.
To meet all the above mentioned objectives, a study of EDM is obligatory for delivering the value education. This objective of this paper is to provide short term knowledge of EDM to the researchers or non skilled user in
this field.The unlike chapter of EDM and the opportunities for future research. The paper is precarranged into
Sections. Process of EDM is defined in Section 2. Different phases of EDM are described in Section 3.
upcoming Research Directions are given in Section 4.Section 5 conclude the Introduction.
II. EDM PROCESS
The process of Educational data mining is an iterative, information discovery process which consists of
Hypothesis formulation, Testing and refinement (see Fig-1). Hypothesis is developed from various educational environments. It creates large volume of data. The main process of EDM starts with authenticating data (i.e.
finding relationship between variables items). This is also known as pre processing of data. After pre processing
various DM techniques, gears will be employed on processed data and final grades will be given to different
user of education. Further reference will be suggested for the alteration of problems.
Fig-1 Process of EDM
III. EDM MODULES The modules of EDM are operator and Stake holders of Education, Tools, Techniques and Models of DM,
Educational Data, job and results that will altogether charity to achieve the goal of EDM.

International Journal of Advance and Innovative Research Volume 9, Issue 1 (IX) January - March 2022
14
ISSN 2394 - 7780
1. Users and Stakeholders: According to researchers there are four main groups of users and stakeholders
intricate in achieving the specific objectives.
i) Learners (Students): The main objective of Learners is to reply to student requisites, recover learning
performance, and bring response to learners.
ii) ii) Educators (Teachers/Faculties/Tutors): The researchers to develop new tools and techniques for the
growth of educational system Administrators: The main objective is to use and improve obtainable
resources and their educational offer and so on.
2. EDM Methods: One of the essential chapter of EDM is the methods of DM, used for unlike purpose.
Romer Ventura and Ryan Baker branded the methods as-
Prediction Clustering Relationship mining The methods are valuable in mining web information and in mining other forms of educational data. globally
believed category of DM. Some of the methods which are acknowledged when validated relationships are
applied to make predictions are-
● Distillation of data for human judgment
● Discovery with models
● Knowledge Tracing(KT)
i) Prediction: This technique is used to derive predicted variable from predictor variables (combination of
variables). Prediction is used examine student performance and drop out. and for detecting student behaviour. It
is classified into three
Density Estimation: probability density function is used to predicted variable. compactness estimator can be
based on variety of seed functions
ii) Clustering: Clustering is an unsupervised classification process .it is used for grouping objects into classes of
similar object. Data items are partitioned into groups or subsets (clusters) based on their locality and
connectivity within N-dimensional space.
3. EDM Environment - the areas in which different users study. they are secret into following three categories.
i) Traditional Class room Environment: It is a prescribed environment in which users of education inform
directly with each other(i.e. face-to face).for e.g. schools, colleges where lectures are delivered by teacher to
students in classrooms.
ii) Online/Web Based Environment: It is an non official environment in which informers of education make use
of internet. For e.g. e-knowledge, Web Based performance prediction.
iii)Computer Based Learning: It is hybrid environment of both.In computer based Environment user can work
Offline: Intelligent Tutoring System (ITS). Knowledge Management, Online for e.g., e-knowledge.
5. EDM DATA: The large volume of data gathered from distributed and different fields are used for choice making and learning process in educational context. Data collected depends on the EDM environment discussed
in section D.
i) Private data: Direct environment creates disconnected or remote data (connected to data collected from
academic institution)
6. EDM Tools: There are various tools for mining the repositories of data based on their usage, functionality,
and working environment.
Tool Goal
WEKA Tool Used for developing Machine Learning Task
Moodle Tool Help Users in Course Management System
Rapid Miner Identify Student Behavior model in virtual courses
KEEL Use to assess the behavior of evolutionary learning and soft computing based
techniques.
TADA-ED To Identify patterns in student’s online exercise
DataShop To store and analyze Public data
Decision Tool To analyze factors related to success and failure of student

International Journal of Advance and Innovative Research Volume 9, Issue 1 (IX) January - March 2022
15
ISSN 2394 - 7780
7. EDM Application:
Application Objective DM techniques
Course Management To focus on the construction/development/selection of
course curriculum which helps
students to increase learning outcomes
and success
Clustering algorithms, naïve algo, Rough set theory
Predicting
Performance of
Students
To focus on knowledge, grade of
student various researchers predict the
performance of students based on academic and other psychometric
factor
Regression(Continuous Variables),
Classification(Discrete Variables,
Bayesian networks, Neural Network, Decision tree etc.
Personal Learning
Environments / Recommender
System
It provides various tools and services
so that the system can adapt to student learning needs and recommend
students directly to their personalized
activities, next task and links to visit.
Association-rule mining,
Clustering(PRS)/Neural Networks, Decision tree
CONCLUSION Educational data Mining (EDM) has been evolved as multidisciplinary scientific knowledge part ,rich in data,
methods, tools and techniques used to provide better learning environment for educational users in educational
context. These paper cartels all the modules of EDM required to facilitate the objectives of educational study.
REFERENCES
Scheuer, O. & McLaren, B.M., ― Educational Data Mining‖. In the Encyclopedia of the Sciences of
Learning, 2011,Springer
[Corbett A, Anderson J. Knowledge tracing: modeling the acquisition of procedural knowledge. User
Model User-Adapted Interact 1995, 4:253–278.
[Zocco D.‖ Risk Theory and Student Course Selection‖, Research in Higher Education Journal ,Vol. 3.
Anthony G. Greenwald and Gerald M. Gillrnore,‖ No Pain, No Gain? The Importance of Measuring Course Workload in Student Ratings of Instruction‖, Journal of Educational Psychology,1997, Vol. 89, No.
4.743-751.
F. Lu, X. Li, Q. Liu, Z. Yang, G. Tan, and T. He, ―Research on personalized e-learning system using
fuzzy set based clustering algorithm,‖ in Proc. Int. Conf. Comput. Sci., Beijing, China, 2007, pp. 587–590.
Jing Luan, ―Data Mining and Its Applications in Higher Education‖, NEW DIRECTIONS FOR
INSTITUTIONAL RESEARCH, no. 113, Spring 2002 © Wiley Periodicals, Inc.
J. Herlocker, J. Konstan, L. G. Tervin, and J. Riedl, ―Evaluating collaborative filtering recommender
systems,‖ ACM Trans. Inf. Syst. J., vol. 22,no. 1, pp. 5–53, 2004.
Selmoune N, Alimazighi Z. A decisional tool for quality improvement in higher education. In:
InternationalConference on Information and Communication Technologies.Damascus, Syria; 2008, 1–6.
Merceron A.,Yacef K.,‖TADA-ED for educational Data Mining‖,Interactive Multimedia Electronic Journal
of Computer-Enhanced Learning,2005.
Rapid Miner: Available at http:// rapid-i.com,2009.
,S. Ventura,and Gracia E.‖Data Mining in Course Managemnt System :Moodle Case Study
P.V.Praveen Sundar.‖ A Comparative Study For Predicting Student’s Academic Performance Using Bayesian Network Classifiers‖, IOSR Journal of Engineering (IOSRJEN) e-ISSN: 2250-3021, p-ISSN:
2278-8719 Vol. 3, Issue 2 (Feb. 2013), ||V1|| PP 37
Dekker, G., Pechenizkiy, M., and Vleeshouwers J.‖Predicting Students Drop Out:A Case Study‖In
Proceeding of the 2nd International Conference on Educational Data Mining,2009,pp.41-50

International Journal of Advance and Innovative Research Volume 9, Issue 1 (IX) January - March 2022
16
ISSN 2394 - 7780
THE ROLE OF INFORMATION TECHNOLOGY IN AGRICULTURE
Dr. Kadam Dadasaheb Devidasrao
Assistant Professor in Chemistry, Narayanrao Waghmare College, Akhada Balapur, Dist. Hingoli (M.S.), India
ABSTRACT For communication of knowledge the information technology is very helpful. Particularly for the small as well as poor farmers, does not have knowledge of their progress and diversity their farm enterprises. Near about
17% GDP of Indian economy contributes agricultural sector.
Near about 65% population of India depends on agriculture. In developing countries the agricultural sector is
facing with challenges, e.g. requirement for increases of food production and yield and creation of opportunity for employment of rural and poor population. The main aim of present study to know the uses of IT in
agriculture sector.
The information technology is used to know how agriculture development is possible by using effective communication skill. The communication tools include celluar phones, computer, internet as well as various
application and services e.g. distance learning, videoconferencing etc.
Keywords: Information technology, farmers, agriculture sector, communication tools etc.
1) INTRODUCTION For the survival of man agriculture play a major role. We know that are very important and without which we
can not think about the possibility of life. For the progress of agriculture field their should be support of other
disciplines such as Management, Economics etc.
In this research paper-I focus on technology particularly IT which in essential for provision of information
across the agricultural value chain i.e. right from production to marking. For the good yield of crop farmers
required information on latest varieties, changing weather patterns, crop production techniques and improved
agronomic practices etc. For that information technology is usefull in order to access information about crop.
Information technology is nothing but various application of computers, manipulation of data, retrieval and
transmission among the other tasks. Now a day agricultural sector facing lot of challenges like increased food
demand, reduction in malnutrition etc. we know that for the rural people in most of the countries cultivation of
crop is their main income.
But information technology is useful to meet the challenges faced by farmers and can enhance the living
standard of rural community. formers faces many problems like there is low profit margin to agricultural products because increase in the prices of fertilizers, pesticides and fuel. There is also decrease in agricultural
development very slow because of urbanization and industrialization.
In order to overcome from facing of various difficulties, the information technology gives relevant information facilitating an environment for more remunerative agriculture. For successful farming and cultivation a plant is
very important factors. Farmers should be aware about the benefits of internet and the other application of
services which are useful for significant management of agricultural production.
For the management of their crops and live stock farmers could get useful knowledge and information about potential technology. According to Anderson and Feder (2007), agriculture extension services have been started
by government and international institutions to overcome the information failures regarding technology
implementation.
The role determines the increased efficiency, enhanced productivity and reduced costs. According to Samah et
al (2009), development of information systems based on farmers requirement should be given highest priority
and focus of systems should be on new challenges addressed from deregulation and globalization of agriculture
sector.
2) DEVELOPMENT IN RURAL The information technology play an important role in the development of peoples. It gives chance to know
services, new activities and applications in the rural areas. The role of government of India is the development
in the rural areas. We know that the uses of technology in the rural development is very slow.
This is due to poor knowledge and awareness among agency officials which are working in rural areas and local

International Journal of Advance and Innovative Research Volume 9, Issue 1 (IX) January - March 2022
17
ISSN 2394 - 7780
language problems etc. As we know that near about 70% of the Indian population living in rural areas and their
economical conditions depends on agriculture.
The problems which are inhibiting the effective implementation technology in rural and agricultural sector is to be resolved. There are three main challenges in rural areas i.e. to access, quality and cost. In rural areas there is
insufficient infrastructure e.g. water, electricity, communication, transportation etc.
As compared to urban areas, there is very poor mobile connectivity in rural area. The biggest problem in the ICT services in rural areas is the lack of electricity. In rural areas of developing countries there are less
availability of resources to response the effects natural hazards, floods, landslides, drought on local social
systems.
Information technology shows fundamental change in all types of our lives such as knowledge dissemination, education, economic, social interaction, media, political engagement, health and entertainment. ICT play an
important significant role in increasing the efficiency, productivity and sustainability of small-scale farms.
Information technology gives information about agriculture such as, pest control, seed sourcing and market
prices, etc.
3) Information Technology In Agriculture Development
Our planet is mostly affected by population growth and urbanization. Due to increase in population there will less availability of food material on the planet. For performing basic functions information technology in
transportation, communication, national security and health system normaly.
Now a days modern man depends on agriculture for their survival on the planet We know that plants are the
producers and without which there is no possibility of life cycle. With the help of information technology there
will be increase in the progress of agricultural field.
In this way everyone can be benefited from IT and agriculture plants. Plants are used for the production of by-
products e.g. bread, powder, organic additives etc.
Because of benefits of IT to society, it must meet the needs of modern people. Precision farming particularly in
development countries, extensive use of IT to agriculture productivity. An effective use of technology in
agriculture should be increase in food production and productivity.
In order to plough lands the developed countries are uses laser technology Laser technology helps in optimizing e.g. fertilizers, seeds, water etc. with the help of information technology it is possible to have information on
weather forecasts timely. Information technology also helps in order to increase in incomes.
IIT Kanpur and BSNL developed a mobile application i.e. Digital Mandi, in order to give information of current rates and market to sell their crops for maximum profit. The new information technology consisting of
motherboard computer systems helps to humidity, temperature, and also wireless connectivity etc. Geographic
information system (GIS) is used in agriculture particularly in precision farming.
It also helps in making decision such as which where to plant by GPS in agriculture helps in Geo-fencing, Map-
making and surveying Drone technology in agriculture provides information about mass data collection, uses of
fertilizers, water irrigation, land survey, uses of pesticides, seed planting etc.
4) Limitations of Information Technology in Agriculture Following are some of the limitations of information technology in agriculture:
1) In the rural areas there is not a trained technician.
2) There is not a reliable internet connectivity and internet access.
3) Peoples haven’t known about different services provided by the information technology and their uses in
agriculture field.
4) By setting up information kiosks, a sufficient knowledge of services.
5) Rural peoples do not understand English and because of that it is not suitable to understand instruction of ICT
in English.
6) There is high expenditure on advocacy.
7) There is very slow bandwidth network in rural areas but information concerned to agriculture require
intensive use of graphics.
8) There should be coordination between the agency, stakeholders and government to develop a system for

International Journal of Advance and Innovative Research Volume 9, Issue 1 (IX) January - March 2022
18
ISSN 2394 - 7780
agriculture improvement.
9) Rural peoples are not motivated about the uses of ICT. 10) Income of rural people depends upon seasonal
cultivation of plants.
5) CONCLUSION It provides useful information about exchange, to buy, to produce and to sell the products. It is possible to give
awareness and intensive training of it and their benefits to rural peoples and farmers. By making better decision, quality of rural peoples and farmers can be improved by quality information. No institution which can alone
successfully implemented ICT in agriculture and rural areas in India. With the help of information technology
there is possible to improve the economical conditions of rural peoples and farmers.
6) REFERENCES
1. 1Anderson, J.R. and Gershon F. (2007). Handbook of Agricultural Economics Agri. Ext, 3:2343-2778.
2. Battman, C; Jensen, R., Roman, R. (2003) : Assessing the Need and potential of community Networking
for Development in Rural India, information society, Vol.19, Issue 5, PP 349-364.
3. Banu, S. (2015).Precision Agriculture. : tomorrow’s Technology for Today’s Farmer. J.Food process
Techmol, 6:1-6
4. Duncombe, R. 2011. Researching impact of mobile phones for development ; Concepts, methods and
lessons for practice, Info technol Develop, 17(4) : 268-288.
5. Gorla, N. 2009 : A survey of Rural e-Government projects in India: Status and Benefits, Information
Technology for Development, Vol.15 Issue1, PP52-58.
6. Gerard Sylvestor Food and Agriculture Organization of united Nations regional office for Asia and the
pacific Bankok, 2015.
7. Mitta, S.C. (2012) : Role of Information Technology in Agriculture and it scope in India, Available at : http
: //125.19.20.220/ applications /Brihaspat. Nsf/edca49b7264f71ce65 256a81003 adlcb
/82f2cl5ccd4dd9a065256b37001af3fe/FILE/itfai.pdf.
8. Slavoljab Milovanoviel : The Role and potential of information Technology In agricultural Improvement
Economics of Agriculture 2 UDC : 004-738.5:631 Review article 2014.
9. Susmita Mukherjee : Application of ICT in Rural Development : opportunities and challenges, Global
Media Journal-India Edition ISSN2249-5835 winter Issue Vol2/No.2 December-2011
10. Samah, B.A. Saffril , H.A.M.Hassan, M.D.S. Hassan, M.A. Ismail, N. (2009) : Contribution of Information
and communication Technology in increasing Agrobased Entrepreneurs productivity in Malaysia, Journal
of Agriculture and social sciences, Vol.5, No.3 PP.93-97.
11. Khanal, S.R, 2011, Role of radio on agricultural development: A Review. Bodhi : An Interdisciplinary
Journal, 5:201-206
12. Murthy, C.S.H.N.2009 Use of Convergent mobile technologies for sustainable economic transformation in
the lives of small farmers in rural India. The Turk.online J.Dist Educ.10 (10):32-40
13. Chauhan, R.M. 2015 Advantages and challenging in E Agriculure. Orental J comp Sci. Technol, 8 (3):228-
233.
14. Monica, N ; application of ICT in Agricultural Sector : Women’s perspective Agu International Journal of
Soft computing and Engineering (IJSCE) ISSN : 2231-2307, Vol.2 Issue-6, Jan2013.
15. Vinayak, N.M. and Pooja, K.A.2016. Role of ICT in Agriculture. IOSRJ Comp Engineering, 56-57.
16. Xiaohui, W. and Nannan, L.2014. The application of internet in agricultural means of production supply
chain management. J Chem pharm Res, 6(7) : 2304-2310.

International Journal of Advance and Innovative Research Volume 9, Issue 1 (IX) January - March 2022
19
ISSN 2394 - 7780
A STUDY OF CURRENT TECHNOLOGIES IN HRM USING ML
1Angela Biswas and
2Bhawna Puraswani
1Student, Department of BVoc SD & BSc IT, Student, Department of BVoc SD & BSc IT, 2Jai Hind College, Mumbai, Maharashtra, India Jai Hind College, Mumbai, Maharashtra, India
[email protected] and [email protected]
1. ABSTRACT Having the right workforce in an organization is important. The problem with selection of candidates from a
large pool of candidates can be a daunting job for the HR team. It can impede team progress for getting the
right person at the right time [1]. Making sure that the candidate is the right fit for the organization can be a
difficult process.
In this paper, we present a set of techniques that can make candidate selection and resume recommendation
more practical and economical. We have mentioned KNN, cosine similarity, content-based recommendation
system, ESCO ontology, skill Recommendation Deep Q-Network, CV recommender system, parse tree.
Keywords: HRM, CV recommender system, KNN, Cosine Similarity, Stop Word Removal, Stemming,
Lemmatization, Classification models, skill clustering, ESCO ontology, SRDQN.
2. INTRODUCTION Ability securing is a vital, complex, and time-devouring work inside Human Assets. The sheer size of India's
market is overpowering. In addition to the fact that there is an amazing 1,000,000 individuals coming into the
gig market consistently, yet there is likewise tremendous turnover. According to LinkedIn, India has the most
noteworthy level of the labor force that is "effectively looking for a new position". Obviously, this is an amazingly fluid, huge market however one that additionally has many disappointing inadequacies. The foremost
challenging portion is the need for a standard structure and organization for which shortlisting for wanted
profiles for required parts is exceptionally dull and time-devouring. Effective screening of resumes requires space information, to be able to get the significance and applicability of a profile for the work part. With a
gigantic number of distinctive work parts existing nowadays alongside the ordinarily large number of
applications gotten, short-listing postures is a challenge for the human asset division.
The industry faces major problems such as: Isolating right candidates from the pack- India being a huge work publicize and with millions trying to find
occupations. it is humanly inconceivable to screen the CV’s and discover the correct coordinate. This makes
the entire contracting prepare moderate and inadequately costing assets to the companies.
Making sense of Candidate CV’s- Minute challenges are posed by the reality that the CV’s inside the
exhibit are not standard for all intents and purposes each proceed inside the showcase has assorted structure
and orchestrate. HR must physically go through the CVs to find the right coordinate to the work depiction. Usually frequently resource truly and slanted to goof whereby a right candidate do the work might get
missed inside the handle.
Knowing that candidates can do the work a few times as of late you contract them- The third and major
challenge is mapping the CV to the hon depiction to urge it in case the candidate would be able to do the
work for which is being contracted
To conquer the said issues inside the proceed short-listing handle, in this paper, we show a motorized Machine
Learning based outline. The illustrate takes the highlights removed from the candidate’s proceed as input and finds their categories, advance based on the specified work delineation the categorized continue mapped and
prescribe the foremost suitable candidate’s profile to HR.
3. LITERATURE SURVEY
a. METHODOLOGY
A. Dataset and Attributes.
PRE-PROCESSING:
Data pre-processing may be a data mining method that is utilized to convert the raw information into a valuable and productive manner. In this, the CV’s being given as input would be cleansed to clear exceptionally or any
waste characters that are there inside the CV. In cleaning, all exceptional characters, numbers, and single letter
words get removed. Using pre-processing steps associated on tokenized dataset like end word removal,

International Journal of Advance and Innovative Research Volume 9, Issue 1 (IX) January - March 2022
20
ISSN 2394 - 7780
stemming, lemmatization we got clean dataset after those steps having no exceptional characters. The data of
the unrefined CV record was imported and was cleansed to remove numbers and extra spaces inside the date.
Stop word removal: Stop words are the words in any language which does not include much meaning to a sentence. They can securely be disregarded without relinquishing the meaning of the sentence. Stop words such
as and, the, was, etc. are as often as possible showed up within the content and not supportive for prediction
process, thus it is removed. [1]
Stemming: Stemming could be a preparation where words are diminished to a root by expelling emphasis
through dropping superfluous characters, as a rule, a suffix
LEMMATIZATION
Lemmatization is the method involved with gathering the distinctive arched types of a word so they can be dissected as a solitary thing. Lemmatization is similar to stemming but it brings context to the words. Thus, it
joins words with similar meanings to one word. Unlike Stemming, lemmatization diminishes the curved
expressions to guarantee that the root word has a place with the language accurately.
B. COSINE SIMILARITY
In this drawn nearer, the employer's Work Portrayal is coordinated against the substance of resumes in the
space, and the beat n coordinating resumes are suggested to the manager. The model combines the cleansed proceed data and JD into a single data set a few times as of late computing the cosine likeness between the JD
and resumes. Cosine likeness is calculated between each set of resume vectors and work depictions which are
spoken to in vector space containing. Concurring to closeness score gotten resumes are positioned with the job
description. Based on relegated positions, the beat n positioned resumes are prescribed to the recruiters.
C. KNN
KNN is utilized to discover the CVs that are closest to the work portrayal given. To start, we utilized an open-
source apparatus called "gensim" to scale the Work depictions and resumes. This library produces a rundown of the given content inside the word restrained. To bring the Job descriptions and resumes to a comparable word
scale, this library was utilized to produce a summary of the Job descriptions and resumes, and after that KNN
was utilized to find CVs that closely matched the given work portrayals.
D. RESUME PARSER: Parsing framework incorporates the parsing of taking after candidate continue and their social profiles utilizing
NLP. Continue parser could be a compiler or translator that changes over the unstructured frame of information
into a organized frame. NLP (Natural Language Processing) requires following constraint for parsing making
use of Lexical analysis, Semantic Analysis, Syntactic Analysis.
E. Recommendation System
The Resume Screening system is built using recommendation system mechanisms, specifically content-based filtering recommendation systems. A recommendation engine, often known as a recommender framework,
could be a sort of data sifting framework that tries to predict a user's "rating" or "inclination" for a thing.[1]
F. CV Recommender System [2]
Content-Based Recommendation System A content-based recommender takes use of data provided by the user, either directly (ratings) or indirectly
(search results) Based on this data, a client profile is made, which is at that point utilized to provide suggestions
to the user. The engine grows more accurate as the user offers more inputs or acts on the recommendations [2].
Collaborative Filtering Recommendation System Collaborative filtering (CF) may be a technique utilized by recommender frameworks. Within the more up-to-
date, smaller sense, collaborative filtering could be a strategy of making programmed expectations (sifting)
around the interface of a client by collecting inclinations or taste data from numerous users.
Fig. 1: : Collaborative Filtering vs Content Based Filtering [2]

International Journal of Advance and Innovative Research Volume 9, Issue 1 (IX) January - March 2022
21
ISSN 2394 - 7780
G. CV recommender system[4]
For each uploaded document, skill extraction is first performed. Then, the extracted skills are converted into
numerical vector representations. This is then used to query an index of representations of existing documents to
find similar entities.
Skill Extraction: A rundown of abilities for every language was put away as a standard set information
structure, with the capacity to rapidly answer questions of the structure "does string x have a place in the set?".
Skill Clustering: A notion of skill similarity was introduced for clustering purposes with the meaning of “how
related are skills s1 and s2?”[4]. For each cv where two abilities show up together, their similarity is increased,
yet how much augmentation relies upon their overall individual frequency. Utilizing the characterized expertise
similarity, spectral clustering was performed.
Candidate Classification: All obtained clusters were manually inspected, a name was given to each cluster,
some skills that appeared bogus were cleaned. Finally, candidate classification is finished by removing a
rundown of hard skills from the CV, and afterwards rank the clusters as for the number of skills from a cluster
are available in the extracted candidate’s skills.
Skill Recommendation: Subsequent stage is to suggest missing abilities for a given CV. For this separate
rundown of skills is used. For every ability that is absent in the candidate's CV, average similarity to the extracted CV skills is calculated using predefined skill similarity. Then, main 15 skills with the highest obtained
average similarity are recommended.
Fig. 2: Overview of the CV Recommender [4]
H. Skill Recommendation Deep Q-Network (SRDQN)[5]
Structure of SRDQN is introduced in following manner: (a) multi-task structure (b)tower layer for modeling the
Q-value (c) training process.
Multi-Task Q-value Estimation: SRDQN estimates Qs and Qd with an extraordinarily designed multiple task
structure, which can furnish the clients with logical long-term utility data. This brings the framework with
higher interpretability. Then, at that point, it consolidates the two Q-values to obtain a unified recommendation
policy.
Tower Layers for Deterministic State Dynamic: The enormous state-activity space of the skill suggestion
issue brings challenges for fitting the Q-value function. To raise the model exhibition, they designed an
extraordinary double construction that connects X (O) and x(s) and uses multi-facet perceptron (MLP) to
display д(O ∪ {s}; Φд).
Training Process: SRDQN suggests skills for the given range of skills and acquires rewards for model training.
During the training process, the ϵ- greedy system is used to test activities from the candidate skills.
Fig. 3: Overall Structure of multi-task Deep Q-Network.[5]

International Journal of Advance and Innovative Research Volume 9, Issue 1 (IX) January - March 2022
22
ISSN 2394 - 7780
I. ESCO Ontology[6] [9]
European Skills, Competences, Qualifications, and Occupations or ESCO is a multilingual arrangement. ESCO
is organized on the premise of: a) Occupations, b) Skills and abilities, and c) Qualifications. Data collection is the primary step in this technique it incorporates data set for both the work searchers and recruiters. The data
after pre-processing (cleaning, integration, selection, and transformation) contains the individual expertise sets,
involvement, instruction, and anticipated compensation data. This pre-processed information of CVs and Employments can be semantically connected by utilizing space metaphysics of expertise set. Subsequent stage
is looking for best fit between the CV and work portrayal by considering various standards that describe the
work description. The CVs are positioned based on the wellness score and comes about are provided.
Fig. 4: Overview of the ESCO ontology[6]
J. Classifications Models Used Were: Random Forest (RF): Random decision forests are a gathering learning strategy for classification, regression,
and other errands that work by building a large number of decision trees at preparing time.
Multinomial Naïve Bayes: Bayes The multinomial Naïve Bayes algorithm is a Bayesian learning method
generally in Natural Language Processing (NLP). The program surmises the tag of a content, such as a mail or a
daily paper story, utilizing the Bayes hypothesis. It calculates each tag's probability for a given test and yields
the tag with the most noteworthy chance.
Logistic Regression: Logistic Regression makes use of a calculated note to demonstrate a binary dependent
variable.
Linear Support Vector Classifier: A SVM could be a supervised machine learning classifier which
characterized by a separating hyperplane. In two-dimensional space, a hyperplane may be a line which isolates a
plane into two isolated planes, where each plane has a place to a Course. For illustration, in the event that the preparing test contained two-course information such as male (Class 0) and female (Lesson 1), at that point the
yield of the SVM may be a line that isolates the total information into two classes employing a line. Each plane
speaks to a lesson of the information either male (Course 0) or female (Course 1).
Classifier Accuracy
Random Forest 0.3899
Multinomial Naïve
Bayes
0.4439
Logistic Regression 0.6240
Linear Support Vector
Machine Classifier
0.7853
Table 1. Results using different classifiers [1]
4. CONCLUSION In this paper, we described a few resume recommendation and candidate selection techniques that can replace
traditional way of hiring workforce and make recruitment process faster helping the HRM of the organization. The techniques can accept or reject candidates based on skills, occupation, qualification. In our paper, we have
described CV recommender system, Skill Recommendation Deep Q-Network, ESCO ontology, KNN, cosine
similarity, lemmatization, stemming, random forest. Based on our observation these techniques can be explored

International Journal of Advance and Innovative Research Volume 9, Issue 1 (IX) January - March 2022
23
ISSN 2394 - 7780
further and used accurately for effective recruitment. And can be a devouring solution to the challenges faced
by the modern Human Resource Department.
5. REFERENCES 1. Roy, P. K., Chowdhary, S. S., & Bhatia, R. (2020). A Machine Learning approach for automation of
Resume Recommendation system. Procedia Computer Science, 167, 2318-2327.
2. Tejaswini, K., Umadevi, V., Kadiwal, S. M., & Revanna, S. (2021). Design and Development of Machine
Learning based Resume Ranking System. Global Transitions Proceedings.
3. Kurdija, A. S., Afric, P., Sikic, L., Plejic, B., Silic, M., Delac, G., ... & Srbljic, S. (2020, September).
Candidate Classification and Skill Recommendation in a CV Recommender System. In International
Conference on AI and Mobile Services (pp. 30-44). Springer, Cham.
4. Sun, Y., Zhuang, F., Zhu, H., He, Q., & Xiong, H. (2021, April). Cost-Effective and Interpretable Job Skill Recommendation with Deep Reinforcement Learning. In Proceedings of the Web Conference 2021 (pp.
3827-3838).
5. Shakya, A., & Paudel, S. (2019). Job-candidate matching using ESCO ontology. Journal of the Institute of
Engineering, 15(1), 1-13.
6. Zaroor, A., Maree, M., & Sabha, M. (2017, November). JRC: a job post and resume classification system
for online recruitment. In 2017 IEEE 29th International Conference on Tools with Artificial Intelligence
(ICTAI) (pp. 780-787). IEEE
7. Harsh Oza, Darrel Noronha, Shelton Jade Pinto, Janhavi Parab, Prof. Dakshata Panchal: Company to
Candidate Mapper. In 2021 International Journal of Emerging Technologies and Innovative Research.
JETIRFD06027
8. V. Yadav, U. Gewali, S. Khatri, S. R. Rauniyar and A. Shakya, "Smart Job Recruitment Automation:
Bridging Industry and University," 2019 Artificial Intelligence for Transforming Business and Society
(AITB), 2019, pp. 1-6, doi: 10.1109/AITB48515.2019.8947445.
9. Paudel, S., & Shakya, A. Ontology based Job-Candidate Matching using Skill Sets.

International Journal of Advance and Innovative Research Volume 9, Issue 1 (IX) January - March 2022
24
ISSN 2394 - 7780
A STUDY ON MENSTRUAL HYGIENE MANAGEMENT AWARENESS
1Radhika Poyyara,
2Sana Mohammed Shamun and
3Arifa Malik
Mentor 4Asst. Prof. Nidhi Chandorkar
[email protected] [email protected] [email protected] and [email protected]
ABSTRACT
Menstruation, whenever we talk about females this word will somehow always show up as this has been the
most beautiful and important phase for a female. During this phase females tend to suffer and struggle and there should be resources available for easing it out. The most important part of the menstruation is the
hygiene and availability of essential resources.
In this research paper you will get to know the problems and the solutions for the same. Problems such as availability of resources, the condition of available facilities, usage of such amenities provided by the colleges
or universities, awareness about the menstrual hygiene among females and more.
After the pandemic of corona virus sanitizers are provided free of costs by the management like sanitizers, sanitary napkins or pads should be provided free of costs by the management of college or university as
menstrual cycle is natural and is not intended by anyone.
Keywords: Menstruation, Sanitary Napkins, sanitary pads, females, awareness, menstrual hygiene,
management, sanitizers.
INTRODUCTION
Everyone is talking about menstrual health and menstrual hygiene but nobody is talking about the solution for
it. People now a days are aware of menstrual health and hygiene but does not know the implementation in
detail. This research paper is all about the solution for this problem and awareness.
Almost every girl while travelling once thinks about a synchronizing their menstrual cycle dates. The main
reason behind this is menstrual hygiene management. Most of the female have to travel from long distances and
they prefer to attend offline lectures. If the College/University does not have basic amenities it would make very
much difficult for females to attend College/University while menstruating.
According to the survey, female students are aware about the hygiene management. Most of the colleges in
which the female respondents are has basic amenities for menstrual hygiene management. After Corona virus outbreak, sanitizers are made freely available by the management for everyone. As far as menstrual hygiene is
concerned sanitary napkins, pads and tampons should be made freely available by the management for the
females.
STATEMENT OF OBJECTIVE
This research is conducted to accomplish the following objective are as follows:
1. To identity various problem suffered by females while menstruating.
2. To identify the awareness about the facilities available for menstrual hygiene management.
3. To know whether the basic amenities are available or not.
4. To know if females use the amenities that are made available for them.
RESEARCH METHOD USED This is the qualitative research using the empirical technique to identify the menstrual hygiene management
awareness among the female students. The sources of data are both primary and secondary. Analyzing is done
using the primary data. The primary data is collected by using the survey method whereas secondary data is derived from various websites and research articles. The sample units are the females studying in Junior
colleges, Degree colleges or Universities. The sample size is 60.
REVIEW OF LITERATURE
▪ As per the article scholarly (website) uploaded in 2016 menstruation hygiene is very important to every women to all over the world and research shows that many people give review. Awareness levels were
significantly better among females (72.3%) than males (29.6%). Among the female students, 384 (99.5%)

International Journal of Advance and Innovative Research Volume 9, Issue 1 (IX) January - March 2022
25
ISSN 2394 - 7780
were aware of sanitary napkins, 165 (42.7%) of menstrual cup, 12 (3.1%) of tampon and 254 (65.8%) of
reusable cloth, however majority (96.9%) preferred use of sanitary napkins
Indian Journal of Community Medicine Official Publication of Indian Association of as per the sanitary pads
disposable pads ventage Preventive & Social Medicine
While reviewing literature, we found that little, inaccurate, or incomplete knowledge about menstruation is a
great hindrance in the path of personal and menstrual hygiene management. Girls and women have very less or no knowledge about reproductive tract infections caused due to ignorance of personal hygiene during
menstruation time
▪ According to the India Menstrual Health Literature and Landscape review Girls need access to toilets that
enable them to attend to their menstrual hygiene needs, such as washing themselves and changing menstrual products. Merely providing access to a sanitation facility is not enough, since toilets should also be girl-
friendly with adequate water supply, doors with locks, electricity, ventilation, and light. In the past six
years, investments for building gender-segregated toilets in schools improved when the Indian Prime Minister pledged to provide separate toilet facilities for girls and boys in every school in his first
Independence Day address. NGOs and CSR funds have been mobilized to build separate toilets for girls in
schools, including girl friendly facilities with private space for changing and disposing of menstrual waste
▪ As per National Health Mission the scheme was initially implemented in 2011 in 107 selected districts in 17
States wherein a pack of six sanitary napkins called “Freedays” was provided to rural adolescent girls for
Rs. 6. From 2014 onwards, funds are now being provided to States/UTs under National Health Mission for
decentralized procurement of sanitary napkins packs for provision to rural adolescent girls at a subsidized
rate of Rs 6 for a pack of 6 napkins.
PRIMARY DATA AND INTERPRETATION
The primary data was collected using sample survey technique. The questionnaire comprised of 12 qualitative questions. The data was obtained from twenty six different colleges. Most of the respondents belonged to the
age group of 18 to 20 years of age. Respondents education qualification were mainly HSC, Undergraduate,
Graduate, Post graduate.
Our very first question was about females prefer attending offline lecture while menstruating and most of the
females that is out of sixty respondents, thirty three respondents do prefer attending offline lectures.
Out of sixty respondents fifty were aware of the hygiene management facilities which proves 83.3%
respondents were aware whereas 16.7% were not sure about their awareness regarding hygiene management.
When asked about what hygiene management facilities, most of the respondents knew about the dustbin and
following it there were sanitary napkin vending machine or dispenser, sanitary napkin disposal bag and the least
known by everyone was sanitary napkin shredder. By this we can understand that sanitary napkin shredder will
be used the least or not at all.
The next question was whether the respondents respective college had basic amenities, there were some really
shocking response for this as most of the college that is college of thirty three respondents had basic
amenities, twenty three respondents were not sure if their college had basic facilities and college of 4
respondents did not have even basic respondents.
Our next question was about the utilization of the facilities provided by the colleges. Out of sixty respondents,
thirty seven respondents utilize the amenities provided by the college whereas twenty three respondents do not
use the provided facilities.
When asked about the amenities provided by their respective college, most of them answered dustbin which was
followed by sanitary napkin vending machine or dispenser then followed by sanitary napkin disposal bags after
that comes sanitary napkin disposal machine and then with the least votes comes the sanitary napkin shredder.
Colleges of most of the respondents had amenities installed in working conditions but rest twenty respondents
colleges provide amenities but are not in working condition. College of fifty respondents have to pay to buy
sanitary pads or napkins which is the most essential thing for a female student whereas college of only 10 respondents provide it for free of cost. Each and every respondent feels that the sanitary napkins should be
provided free as sanitizers are provided at these times of pandemic.

International Journal of Advance and Innovative Research Volume 9, Issue 1 (IX) January - March 2022
26
ISSN 2394 - 7780
Thirty eight respondents feel that there is lack of some resources that should be made available by the college
for the menstrual hygiene management whereas twenty two respondents are satisfied with the facilities provided
by their colleges.
Most of the respondents think that there should be a sanitary napkin disposal machine which means there is
lack of such disposal facilities. After disposal machine comes sanitary napkin vending machine or dispenser
followed by sanitary napkin shredder and dustbin. Five respondents doesn’t feel the need of such thing in their
colleges.
According to this survey we got to know that most of the females are likely to use such facilities if provided by
the college.
RECOMMENDATIONS
There are few recommendations made also by our respondents are as follows:
▪ Every college should have sanitary napkin vending machine and disposal machine
▪ The taxes on menstrual products should be waived as these products are the basic necessities for every
woman.
▪ To maintain the cleanliness in restrooms more often and maintain proper dustbins. Disposal machine should
be kept in every institution
▪ Sanitary napkin vending machine must be placed at every girl's washroom and it must be free of cost as it is
a matter of hygiene.
▪ Make people as aware as possible about the hygiene through various means of social media. Spread the
education about tampons and menstrual cups among girls. Need to create more awareness amongst women regarding hygiene management during menstruation. Women in remote should be made aware of these
amenities and provide the same
LIMITATIONS
▪ The samples were of college going females.
▪ Most of the female students did not visit college because of the on going pandemic and so are unaware of
the resources available.
CONCLUSION In light of all these information collected, we can conclude that there should be sanitary napkins and pads
disposal machine or shredder as there is a very serious need of it. We can find sanitary napkin and pads vending
machine or dispenser but in very rare condition disposal machine or shredders are installed. Female students should be made aware of menstrual hygiene management including disposal of sanitary pads, napkins, tampons
or menstrual cups. Essentials such as sanitary pads should be made freely available by the college or university
management. Installed machines should be in working condition and it should be made compulsory for all the
colleges to have at least basic facilities for menstrual hygiene management.
REFERENCE
▪ https://www.hindawi.com/journals/jeph/2018/1730964/
▪ https://scholar.google.co.in/scholar?q=menstrual+hygiene+articles&hl=en&as_sdt=0&as_vis=1&oi=schola
rt
▪ https://www.hindawi.com/journals/jeph/2018/1730964/
▪ https://saraldesigns.in/sanitary-napkins-and-its-environmental-impact-part-1/
▪ https://nhm.gov.in/index1.php?lang=1&level=3&sublinkid=1021&lid=391
▪ https://nhm.gov.in/index4.php?lang=1&level=0&linkid=449&lid=53

International Journal of Advance and Innovative Research Volume 9, Issue 1 (IX) January - March 2022
27
ISSN 2394 - 7780
IMPLEMENTING FLIPPED CLASSROOM IN EDUCATION
Durga Laxman Ursal
Vikas College of Science, Arts and Commerce, Vikhroli
ABSTRACT
There is an increasing no of educational institutions adopting the method of flipped learning. Flipped classroom model that primarily focuses on learner-centered instructions. The students are expected to learn the
concept before attending the lecture, which is the reverse of the traditional teaching method where the concept
was introduced in class and later it was on students to re-in force their learnings after the lecture.
The aim is to enhance student participation by investing lecture time in collaborative activities which are based
on the concept learned by the students before the lecture.
For a smooth run of flipped method teaching, teachers should have the required technical skills, pedagogical
expertise, and conceptual knowledge. Also, the students should have access to resources to avail themselves of
the online lectures and tests.
This paper provides a comprehensive survey of prior and ongoing research of the flipped classroom. The
challenges in identifying flipped classrooms were identified, they were further categorized as operational challenges, faculty challenges, and student-related challenges and also tried to recommend solutions to
overcome those problems.
Keywords: Flipped classroom, Learning styles, constructivist model, transmittal model, ARCS model,
Motivational design
INTRODUCTION
In traditional systems, a teacher used to be a ‘sage on the stage’ meaning, they will try to impart their
knowledge to students in the allotted time, and the HomeWorks were given to students to revise the concept taught. This method is also known as the ‘transmittal’ model. In this method students are passive and they lack
the motivation to keep themselves updated with relevant knowledge.
The flipped classroom tries to increase students’ involvement in learning which helps to shift the instruction
model to a learner-centered model.
By the word “Flipped classroom”, the concept suggests carrying out lower levels of cognitive work outside the
classroom and leaving the classroom discussion for a higher level of cognitive work.
In Flipped teaching method, the students are expected to prepare before attending the lecture. Hence, the classroom discussion could focus more on the collaborative form of learning enhancing the critical thinking
skills among students.
The study material should be provided to the user in advance. The material can include pre-recorded video /
asking to read certain pages from textbook etc.
By doing this, the students are already aware of the concept that is going to be taught in the lecture. In
classroom discussions, the student can present their doubts. Due to this, the students feel more confident and
improvement is reflected in their grades.
During the lecture, the teachers can conduct different types of activities to increase collaboration:
1. Roleplay: Students can create a simulation of real-world problem scenarios that is relevant to the topic of
discussion and apply the knowledge gained as the solution to the proposed problem.
2. Group discussion: Given a topic, openly discuss learned topic, their ideas, problems, solutions, anticipating
the pros and cons of the suggested solution.
3. Demonstrations: Ask students to prepare for a topic and demonstrate in front of the class. This will enable
students to engage with the topic and improve other areas such as communication skills.
4. Case studies: Present a case in front of students and they will try to come up with a solution
By carrying out different activities as mentioned above, the teacher will be able to provide individual attention
to the student. It benefits students as they are actively participating in the learning process. This form of
learning will make students understand the concept on their own hence self-study is encouraged.

International Journal of Advance and Innovative Research Volume 9, Issue 1 (IX) January - March 2022
28
ISSN 2394 - 7780
This is a ‘constructivist’ model that enables ‘active’ participation from the students enabling them to construct
their knowledge meaningfully.
METHODOLOGY The interest in the implementation of the flipped classroom is increasing significantly. However, the instruction
on the methods to start the implementation is scarce.
The article ‘Implementing a Flipped Classroom: An Instructional Module’ describes the implementation of
flipped teaching method through a web-based platform.
The instructional strategy was based on the ARCS model. ARCS model is a motivational design process that is
clustered in four categories:
A – Attention: To develop the content that will grasp the student’s attention and will remain focused.
R – Relevance: To explain why the topic is relevant and important for future upcoming topics
C – Confidence: To develop activities that will increase confidence in users will pre-lecture tests to enable
students to be well equipped with the concept.
S – Satisfaction: Provide scenarios where the users can practically apply the knowledge gained.
The research included in-class as well as out-of-class activities.
For Out-of-class activities, some students were asked to view video lectures. Types of online instructions included online videos, narrated screencasts, and videotaped lectures. Regardless of the type of instruction
selected, the basic technical requirement was a computer and broadband internet connection. The teacher should
have the domain expertise and relevant technical skills for recording and editing videos for narrated screencasts
and videotaped lectures.
Some were asked to read textbooks. Students had regular access to computers and the internet outside
the classroom.
It was observed that students who were given video lectures came better prepared than students who were given
textbook reading assignments. Many institutions also conducted required before-class tests.
For In-class activities, there were activities conducted to enhance student collaboration. The initial lecture time
was invested in the short briefing of the concept by the teacher to the student. Later, the teacher could conduct
the collaborative activities. Many activities like presentations, debates, etc were taken in the classroom.
Due to these active learning exercises, there was an increase in students’ performance. The results tended to be
positive, students and teachers were keen to implement this method of teaching.
CHALLENGES There are various challenges observed in this method of teaching as not all students have access to devices and
stable internet connections.
To study student’s attitudes towards this method, there were surveys conducted under paper – “A critical review
of flipped classroom challenges in K-12 education: possible solutions and recommendations for future research”
Many students were satisfied by this new method, but there were few challenges analyzed. Those identified
challenges were: student-related, faculty related and operational challenges.

International Journal of Advance and Innovative Research Volume 9, Issue 1 (IX) January - March 2022
29
ISSN 2394 - 7780
STUDENT CHALLENGES
Category Description
1. Familiarity with flipped teaching Some students liked conventional learning and could not get comfortable with flipped teaching
approach
2. Online content Watching long video lectures at home was
boring.
3. Pre-class activities Pre-class activities included reviewing the
online content and attempting the pre-lecture
tests which often overwhelmed the students.
FACULTY CHALLENGES
Category Description
1. Familiarity with the flipped teaching
method
Teachers might not be comfortable with the
technology and the new change in the way of
teaching
2. Online content creation Preparing flipped learning materials required
start-up effort
OPERATIONAL CHALLENGES
Category Description
Monitoring students outside class It was difficult to ensure that the students truly
watched the video
Teachers IT skills The teacher should be able to record, edit and
upload the video
Institutional support This approach relies on the extent of investment
by the educational institutions in computer
resources
Student’s IT resources Not all students can have a device and a stable internet connection
Lack of teaching resources was also a challenge since it costs time and effort for the teacher to generate the
online material. There were still a few students, who disagreed with this method as they were not accustomed to
this online way of learning.
RECOMMENDATIONS
Below could be possible recommendations to overcome some of the challenges,
1. Teacher-Student communication: In Flipped teaching, the students can study at any time, anywhere as per their convenience, unlike traditional
classrooms. However, the objective behind this flipping of learning and teaching activities is often not made
clear to students. Therefore, before implementing this new technique, there should be a session conducted for teacher-student communication, in which the teacher should brief the change teaching method and goal of the
change being implemented. The students should express their concerns and difficulties faced while adopting this
change in the learning process so that the teacher can help to find a solution provide guidance if necessary.
2. Demonstration of the flipped classroom A demonstration should be given to the students as a practice before full implementation of the flipped
classroom. In this demonstration, it is required for the students to watch online videos, they will also be
introduced to some cognitive skills such as making their notes while performing this activity.
Instructions regarding the activities that are to be conducted by teachers should be provided by teachers.
3. Retaining Workload
The estimated time taken by students to do their homework traditionally should be calculated. This estimated
time calculated could be the reference to anticipate the required time while designing the out-of-class activities
so that students don’t get overburdened with homework.
4. Providing a communication platform
In the online teaching method, the student cannot interrupt in between in case of doubt. To overcome this, the teachers should create an online discussion forum students can post their questions and have discussions with
their peers.

International Journal of Advance and Innovative Research Volume 9, Issue 1 (IX) January - March 2022
30
ISSN 2394 - 7780
5. Educational institutions should invest more in hardware and software requirements for implementing this
new method of teaching.
CONCLUSION From this research, it was observed that switching to flipped classrooms had several advantages in the student’s
learning process. This method had shifted from passive learning to active learning. It also encouraged self-paced
instruction, the students could pause/rewind, watch the same video multiple times until they feel the concept is well understood. They could also refer to the older content to find explanations. The lectures were available to
them 24/7. With added class time for collaborative activities, this method promoted social interaction among the
students. Using technology develops basic technical skills and provides students with the working knowledge to
make use of available tools and resources.
The findings regarding students’ attitudes towards implementing this new method of teaching were mixed. Most
students welcomed this change, however, few students had concerns. This research contains the probable
challenges which will be faced by students, teaching staff, and educational institutions and tried to recommend a
solution to overcome those challenges.
REFERENCES
Research paper on ‘the-flipped-classroom-a-survey-of-the-research’ by Jacob Bishop Utah State University
and Matthew A Verleger Embry-Riddle Aeronautical Univ., Daytona Beach
‘Implementing a Flipped Classroom: An Instructional Module’ by Shimamoto, Dean
https://scholarspace.manoa.hawaii.edu/handle/10125/22527
http://www.kokuamai.com/test/flipped/#echo
‘7 Stories From Educators About Teaching In The Flipped Classroom’ By Kelly Walsh
https://www.emergingedtech.com/2011/09/7-stories-from-educators-about-teaching-in-the-flipped-
classroom/
https://resourced.prometheanworld.com/obstacles-flipped-learning-overcome/

International Journal of Advance and Innovative Research Volume 9, Issue 1 (IX) January - March 2022
31
ISSN 2394 - 7780
A MODEL FOR EARLY PREDICTION OF HEART ATTACK USING MACHINE LEARNING
1Ms. Sweety Garg and
2Ms. Gunveen Kaur
1Assistant Professor, Department of B.Sc IT/CS, Nagindas Khandwala College, Malad (W), 2Student, Nagindas Khandwala College, Malad (W)
[email protected] and [email protected]
ABSTRACT Medical care is an estimative undertaking to be done in human existence. Cardiovascular infection is general
term that encompasses a number of illnesses that affect the heart and veins. Early strategies for estimating the
heart prediction infections helped in settling on the progressions that would have occurred in high-risk patients.
The medical care industry contains bunches of clinical information, consequently AI calculations are needed to settle on choices adequately in the expectation of heart sicknesses. Late exploration has done into joining these
methods to give mixture AI calculations. In the proposed research, information pre-handling utilizes methods
like the expulsion of boisterous information, evacuation of missing information, filling default esteems if relevant and order of properties for expectation and decision making at various levels. The presentation of the
conclusion model is acquired by utilizing techniques like arrangement, exactness, awareness and particularity
examination. The goal of this venture is to offer a prediction model for predicting whether a person will suffer from a coronary illness and to provide a result or understanding of it. In order to achieve this, we contrast the
exactness's of applying rules with the singular outcomes of Support Vector Machine, Gradient Boosting,
Random Woods, Naive Bayes classifier and strategic relapse, and introduce a precise forecasting model.
Keywords – AI, Naïve Bayes Classifier, heart prediction, cardiovascular, Machine Learning
INTRODUCTION
Nowadays doctors are adopting many scientific technologies and methodology for both identification and
diagnosing not only common diseases, but also many fatal diseases. The successful treatment is always attributed to the right and accurate diagnosis. The diagnosis of a patient's disease is sometimes difficult, so
disease prediction systems that use machine learning algorithms can help in these cases.
A Heart Disease Prediction system is one which utilizes information provided by the user to predict the disease.
The proposed system predicts the disease of the patient or the user based on the information or the symptoms the user enters into the system and provides the accurate results based on that information. The proposed system
aims to design a model for predicting a heart disease at an early-stage. A system such as this can benefit
individuals by providing self-awareness and empowering them to lead a healthy lifestyle, while helping medical
users to diagnose the outcome of a patient's condition and prevent future heart diseases.
LITERATURE REVIEW
The various machine and deep learning models in classifying and predicting heart disease have been used in a few existing systems. Artificial neural networks (ANN) have also been utilized in the medical services industry
for quite a while.
Rishabh Magar et al (2020) paper titled “Heart Disease Prediction using Machine Learning”. In this
study, data mining techniques are used to extract hidden patterns and predict heart disease in patients whose presence is valued on a scale. Data mining techniques such as Support Vector Machine (SVM), Decision Tree,
and Naive Bayes Algorithm, Logistic Regression are tested using Cleveland heart diseases data from the
University of California Irvine (UCI) machine learning repository. Their goal is to identify a machine learning technique that is computationally efficient as well as accurate for predicting heart disease. In their work, they
show that Logistic Regression has the best accuracy of the four, with 82.89%, followed by Decision Tree and
Nave Bayes with 80.43% and 80.43%, respectively, and SVM with 81.57%.
Muhammad Zeeshan Younas (Apr 2021) paper titled “Effective Heart Disease Prediction using Machine
Learning and Data Mining Techniques”. By summarizing current research findings, the work investigates the
results of modern techniques and uses them to predict the outcomes of heart disease. The Cleveland Heart
Disease dataset reveals that the percentage of patients who have heart disease is 54.46%, and the percentage of patients who don't have heart disease is 45.54%, where 0 represents the absence of heart disease and
1 represents the presence of heart disease. In this study, several data mining algorithms are used, including
Decision Tree, SVM, KNN, Naive Bayes, Logistic Regression, and Random Forest. The proposed method best achieves 86.89 % accuracy by utilizing the logistic regression algorithm. Conducting the same experiment on a
large-scale real-life dataset would extend this research work.

International Journal of Advance and Innovative Research Volume 9, Issue 1 (IX) January - March 2022
32
ISSN 2394 - 7780
Anupama Yadav et al (Sep 2021) paper titled “Heart Disease Prediction using Machine Learning”. In
their research, they applied machine learning algorithms to predict heart disease using Python programming.
One of the major purposes of this paper is to improve the accuracy of the detection of heart disease using algorithms that calculate whether a person has heart disease. Their research used Svetlana Ulianova's
Cardiovascular Disease Dataset, 2019. The dataset has 70,000 patient records composed of 11 featuresThis
study used several algorithms: K-Nearest Neighbour algorithm, Random Forest Classifier, Decision Tree Classifier, and Support Vector Machine (SVM). They conclude that machine learning can reduce the
psychological and physical harm to a person by predicting heart disease with 86.2% accuracy using Gaussian
SVM Kernels.
Muhammad Jawwad Ali Junaid and Dr. Rajeev Kumar (2020) wrote the paper titled “Data Science and its Application in Heart Disease” , the paper makes the heart disease prediction at very early stage and
creates a hybrid model to predict and suggest the heart patient with world class heart solutions made with the
help of data science algorithms namely Naïve Bayes, ANN, SVM and Hybrid Naïve Bayes. According to their study, the hybrid model could better predict heart disease by 2%. The results of the study show that the hybrid
model is superior in terms of accuracy, specificity and sensitivity by 88.54%, 82.11% and 91.47 % respectively.
Dinesh Kumar G et al (2018) wrote the paper titled “Prediction of Cardiovascular Disease Using Machine Learning Algorithm”. In their project, they propose a prediction model for predicting whether someone has a
heart condition and to provide an awareness or diagnosis of that. In order to present an accurate prediction
model of cardiovascular disease in a region, we compare the accuracies of various classification techniques
including Support Vector Machines, Gradient Boosting, Random Forests, Naive Bayes classifiers, and logistic regressions to the individual results of these methods. In terms of accuracy, the Logistic regression algorithm
gives the highest accuracy of 91.61% while the overall accuracy of 86.51% is achieved using the Cleveland,
Hungarian, Swiss, and Long Beach VA heart disease databases (UCI machine learning repository).
PROBLEM DEFINITION
In the world, heart disease is among the most serious health problems that affects human life in the worst way.
Heart disease occurs when the heart cannot push enough blood to other parts of the body. It is important to
diagnose heart disease accurately and on time in order to prevent and treat heart failure. Many aspects of
traditional medical history have been considered unreliable in diagnosing heart disease.
We find that noninvasive methods using machine learning are effective and reliable for classifying healthy
people and those with heart disease. In the proposed system, a machine-learning-based diagnosis system is employed to predict heart failure using a heart failure dataset. Numerous machine learning models are used in
the proposed system. With the proposed system, people with heart disease can easily be identified and classified
from healthy people. Using the proposed machine-learning system, doctors can diagnose heart patients much
more accurately.
OBJECTIVES
● The idea is to build a model that predicts the risk of heart disease as accurately as possible
● The dataset used in the proposed system is a modified healthcare dataset consisting of a range of health
factors such as age, sex, cp, trestbps, chol, fbs, restecg, thalach, exang, oldpeak, slope, ca, thal and target.
● The goal of this project is to develop a prediction model and categorize the risk for heart disease.
● The proposed system aims at calculating heart disease prediction probability and classifying each
individual's risk level based on their personal heart risk.
METHODOLOGY
In order to classify people with heart disease, the proposed system was developed. A number of machine learning predictive models for heart disease diagnosis were evaluated according to their performance on full and
selected features. The methodology of the proposed system incorporates five stages, including (1) Data
Acquisition (2) Data Preprocessing (3) Data Exploration (4) Suitable Model Selection (5) Training and testing.
1. DATA ACQUISITION The Cleveland heart disease dataset can be accessed from the University of California, Irvine's online repository
of data mining. This dataset was utilized in this study to develop a machine-learning-based method for
diagnosing cardiac disease. There are 304 patients in the Cleveland heart disease dataset, 14 attributes, and some missing information. The target output label was extracted during the study and used to diagnose the heart

International Journal of Advance and Innovative Research Volume 9, Issue 1 (IX) January - March 2022
33
ISSN 2394 - 7780
ailment. To represent a cardiac patient or a healthy individual, the goal output label contains two classes: 0 and
1.
The dataset has 14 attributes:
● Age: age in years.
● Sex: sex (1 = male; 0 = female).
● cp: chest pain (Value 0: Typical angina: chest pain related decrease blood supply to the heart, Value 1: Atypical angina: chest pain not related to heart, Value 2: Non-anginal pain: typically esophageal spasms
(non heart related), Value 3: Asymptomatic: chest pain not showing signs of disease)
● trestbps: resting blood pressure (in mm Hg on admission to the hospital) anything above 130-140 is
typically cause for concern
● Chol: serum cholesterol in mg/dl. serum = LDL + HDL + .2 * triglycerides above 200 is cause for concern
fbs - (fasting blood sugar > 120 mg/dl) (1 = true; 0 = false) '>126' mg/dL signals diabetes.
● Fbs: fasting blood sugar > 120 mg/dl (1 = true; 0 = false).
● restecg: resting electrocardiographic results (Value 0: Nothing to note, Value 1: ST-T Wave abnormality:
can range from mild symptoms to severe problems signals non-normal heart beat, Value 2: Probable or
definite left ventricular hypertrophy Enlarged heart's main pumping chamber)
● Thalach: maximum heart rate achieved.
● exang: exercise induced angina (1 = yes; 0 = no)
● Oldpeak: ST depression induced by exercise relative to rest looks at stress of heart during exercise. An
unhealthy heart will stress more.
● slope: the slope of the peak exercise ST segment (Value 0: Upsloping: better heart rate with exercise
(uncommon), Value 1: Flat Sloping: minimal change (typical healthy heart), Value 2: Down sloping: signs
of unhealthy heart)
● ca: number of major vessels (0-3) colored by fluoroscopy colored vessel means the doctor can see the blood
passing through the more blood movement the better (no clots)
● thal: thalassemia or thallium stress result (Value 1: normal, Value 2: fixed defect: used to be defect but ok
now, Value 3: reversible defect: no proper blood movement when exercising)
● target: heart disease (0 = no, 1 = yes)
Figure 1.1: Dataset
2. Data Preprocessing Data preparation is required for efficient data representation and machine learning classifiers that must be
effectively trained and validated. For successful use in the classifiers, preprocessing approaches such as
eliminating duplicate values, missing values, and MinMax Scalar were applied to the dataset. The standard
scalar assures that each feature has the same mean and variance, resulting in the same coefficient for all features. MinMax Scalar, on the other hand, adjusts the data so that all features are between 0 and 1. The
dataset's missing values feature row is simply removed. In this research, all of these data pretreatment
approaches were applied.

International Journal of Advance and Innovative Research Volume 9, Issue 1 (IX) January - March 2022
34
ISSN 2394 - 7780
3. DATA EXPLORATION
The examination of each attribute of the dataset begins after the data has been pre-processed. Age, gender,
hypertension, and cholesterol are only a few of the characteristics evaluated in the heart disease dataset.
4. Suitable Model Selection
Random Forest
The random forest is a classification algorithm that uses numerous decision trees to classify data. When creating each individual tree, it employs bagging and feature randomization in order to generate an uncorrelated forest of
trees whose committee prediction is more accurate than that of any one tree.
Ada Boost Classifier/Adaptive Boosting Classifier
Yoav Freund and Robert Schapire proposed Ada-boost, or Adaptive Boosting, as an ensemble boosting classifier in 1996. It combines many classifiers to improve classifier accuracy. Ada Boost is a way for creating
iterative ensembles. The AdaBoost classifier creates a powerful classifier by combining several low-performing
classifiers, resulting in a high-accuracy classifier. Ada boost's core principle is to establish the weights of classifiers and train the data sample in each iteration so that accurate predictions of uncommon observations
may be made. Any machine learning method that accepts weights on the training set can be used as a basic
classifier. Two requirements must be met for Ada boost to be effective:
1. The classifier should be trained interactively on various weighed training examples.
2. In each iteration, it tries to provide an excellent fit for these examples by minimizing training error.
5. Training and Testing
Finally, this resulting data split into 80% train and 20% test data, which was further passed to the Random
Forest and Ada Boost Classifier model to fit, predict and obtain accuracy score of the model.
RESULTS
The results obtained by applying Random Forest and Ada Boost Classifier are shown in this section. Accuracy score, Precision (P), Recall (R), and F-measure are the metrics used to assess the algorithm's performance. The
pre-processed dataset is employed in the suggested system to carry out the experiments of the above-mentioned
algorithms, which are studied and applied. The accuracy score obtained for Random Forest and Ada Boost
Classifier is shown below in Table 1.
Table 1: Accuracy
Algorithm Used Accuracy
Ada Boost Classifier 92%
Random Forest 86.88%
CONCLUSION
In this paper, the system presented discusses machine learning algorithms of several types which were applied
on the dataset. The proposed model used 14 features to predict one of the classes with 92% accuracy. A web application is used to deploy this model. Additionally based on the feature importance the three most important
features which had a high score are used to classify the heart disease as low, medium, and high risk. The
combination values of the data such as age, sex, chest pain, cholesterol blood pressure, fasting blood sugar,
electrocardiographic measurement, maximum heart rate, exercise induced angina, Exercise-induced ST depression, slope peak exercise The ST segment, the number of major vessels, and the blood disorder
thalassemia are used to categorise the risk since these values have a big role in predicting heart disease.
Family history of heart disease can also be a reason for developing a heart disease as mentioned earlier. So, this
data of the patient can also be included for further increasing the accuracy of the model.
FUTURE WORK
As an extension of this research work, further enhancement can be done by classifying the different types of
heart disease. And more diverse traits that can help you predict heart illness can be considered. Also, this system can be made into a fully enhanced disease classification system wherein report of a patient can be generated and
also the previous consultants of the patient is recorded when user inputs and predict the disease. Also,
preventive measures can be suggested based on the classified disease.
REFERENCES
1. Anupama Yadav, Levish Gediya, Adnanuddin Kazi, (2021), "Heart Disease Prediction Using Machine
Learning", p-ISSN: 2395-0072, IRJET.

International Journal of Advance and Innovative Research Volume 9, Issue 1 (IX) January - March 2022
35
ISSN 2394 - 7780
2. C. T. and A. Choudhary, "Heart Disease Diagnosis using a Machine Learning Algorithm," 2019
Innovations in Power and Advanced Computing Technologies (i-PACT), Vellore, India, 2019, pp. 1-4.
3. Dinesh Kumar G, Santhosh Kumar D, Arumugaraj K, Mareeswari V. (2018), "Prediction of Cardiovascular
Disease Using Machine Learning Algorithms", IEEE.
4. Kaur, B., & Singh, W. (2014). Review on heart disease prediction system using data mining techniques.
International journal on recent and innovation trends in computing and communication, 2(10), 3003-3008.
5. Mohammed Jawwad Ali Junaid, Dr. Rajeev Kumar, (2020)," Data Science And Its Application In Heart
Disease Prediction", ICIEM.
6. M.A.Jabbar, B.L. Deekshatulu and Priti Chandra, 2015. Prediction of heart disease using Random forest
and Feature subset selection, AISC SPRINGER, vol 424, pp187-196.
7. Mr.Santhana Krishnan.J and Dr.Geetha.S, 2019. Prediction of Heart Disease Using Machine Learning
Algorithms, (ICIICT) IEEE, 2019. DOI: 10.1109/ICIICT1.2019.8741465.
8. Muhammad Zeeshan Younas,(2021), "Effective Heart Disease Prediction using Machine Learning and Data
Mining Techniques ", P-ISSN: 2395-0072 IRJET.
9. P. S. Kohli and S. Arora, "Application of Machine Learning in Disease Prediction," 2018 4th International
Conference on Computing Communication and Automation (ICCCA), Greater Noida, India, 2018, pp. 1-4.
10. Patel, J., Tejal Upadhyay, D., and Patel, S. (2015). Predicting heart condition using machine learning and
data mining techniques. Heart disease, 7 (1), 129-137.
11. Rishabh Magar, Rohan Memane, Sura Raut, Prof. V. S. Rupnar, (2020), "Heart Disease Prediction Using
Machine Learning"ISSN-2349-5162.
12. Senthilkumar Mohan, Chandrasegar Thirumalai and Gautam Srivastava, 2019. Effective Heart Disease
Prediction Using Hybrid Machine Learning Techniques, Computer Science (IEEE Access) Vol 7, pp
81542-81554(2019).DOI 10.1109/ACCESS.2019.2923707.
13. Soni, J., Ansari, U., Sharma, D., & Soni, S. (2011). Intelligent and effective heart disease prediction system
using weighted associative classifiers. International Journal on Computer Science and Engineering, 3(6),
2385-2392.
14. S. Mohan, C. Thirumalai and G. Srivastava, "Effective Heart Disease Prediction Using Hybrid Machine
Learning Techniques," in IEEE Access, vol. 7, pp. 81542-81554, 2019.
15. S. K. J. and G. S., "Prediction of Heart Disease Using Machine Learning Algorithms.," 2019 1st
International Conference on Innovations in Information and Communication Technology (ICIICT),
CHENNAI, India, 2019, pp. 1-5.

International Journal of Advance and Innovative Research Volume 9, Issue 1 (IX) January - March 2022
36
ISSN 2394 - 7780
COMPARATIVE STUDY ON PRECISION FARMING FOR APPLES IN REGIONS OF INDIA -
USING ARTIFICIAL INTELLIGENCE AND ANALYTICS
1Grishma Shringarpure
Mentor
2Asst. Prof. Disha Roshan Bhakta
1-2S M Shetty College of Science, Commerce and Management Studies Powai,
[email protected], [email protected]
ABSTRACT
India is versatile and high in population. Large variety of agriculture is produced in India ranging from pulses,
millets to vegetables and fruits.
Certain produce matches the demand ratio in tune with population whereas, on the contrary, certain have to be
imported. Considering fruits, India is a high consumer for apples. Though the production of apples is more it
fails to equate the supply demand cycle. In this research paper we will try to work on proof of concept which helps in increasing apple production using precision farming. This kind of farming is driven by technologies
like Artificial Intelligence, data analytics and forecasting. It takes an approach where the crop production
amplifies to its best performance.
Keywords: precision farming, agriculture analytics, apple farming, fruit imports, tech farms, smart farming
INTRODUCTION
India stands at second position in terms of the population parameter. As per the records of world population has
given in 2019 Indian population prospects around 132 crores. India is largely known for the agriculture and variety of food production. The agriculture has spanned across various grains, pulses, species, vegetables, fruits
and so on. Every agricultural product grows in a different region best suited for their climatic needs as well as
soil needs. This leads to either excessive production or reduced production according to the supply demand
chain. As an agricultural country it exports and imports several agricultural commodities.
Discussing one of the agricultural commodities as fruits, there are huge imports and exports of fruits found in
India very similar to other nations as a part of demand and weather scenarios.
Narrowing down to one of the important fruits consumed on a daily basis apples, as per the latest statistics India
imports apples but also there is a huge export. Many countries like Iran, Turkey, Chile, New Zealand and China
are one of the biggest exporters for apples in India. So the questions arises what leads to these huge exports, one
of the reason is quality, texture, taste and also less production of quality apples. The paper will discuss how different parts of India majorly responsible for apple production culminates technology as a part of day to day
agriculture and how they have certain advantages over that. The paper also discusses how Artificial Intelligence,
Machine learning, Mining and Internet of Things can be a stepping stone to the production of quality apples ahead. The paper mostly focuses on the study done for the particular area and gives a proof of concept on how
enhancement can be done with respect to the same.
SCOPE The current research paper evaluates the idea of precision farming on the growth of food production. It also
discusses on a technical platform which will help the farmers and stimulate the production of apples. However
the paper does not focus on a particular region where it has to be implemented. It discusses more on a generic
basis how the study can be worked as proof of concept.
Discussion and Study
1. The reason to consider and study on the apple production: About 76 million tons of apples were grown
worldwide in 2018, with China producing more than half of this total (58 per cent) followed by United States (6 percent), Turkey (3.61 per cent), India (3.02 per cent), and Iran (2.06 per cent).The largest exporters of
apples were China, the U.S, Turkey, Poland, Italy [1].Average productivity of apple in India is nearly 6-8 tons
per hectare, which is much lower than that of countries like Belgium (46.22t/ha), Denmark (41.87t/ha), and
Netherlands (40.40 t/ha) (FAO, 2018).[1]Apple is considered to be one of the most significant and commercial crop for India. However the production and quality are significantly less because of the traditional old age
practices for cultivation, ineffective control on pests and diseases. Also the cold storage facilities are in deficit
and weak production supply chain management and the poor marketing strategies. This discussion comes from

International Journal of Advance and Innovative Research Volume 9, Issue 1 (IX) January - March 2022
37
ISSN 2394 - 7780
the paper Potential of Apple Cultivation in Doubling Farmers Income through Technological and Market
Interventions: An Empirical Study in Jammu & Kashmir [1].
2. The significance of precision framing is increasing. Considering the advantages of technology integrated with farming on how it stimuli the production. Precision Agriculture (PA) or satellite farming or site specific crop
management (SSCM) is a farming management concept based on observing, measuring and responding to inter
and intra-field variability in crops. Crop variability typically has both a spatial and temporal component which makes statistical/computational treatments quite involved. The holy grail of precision agriculture research will
be the ability to define a Decision Support System (DSS) for whole farm management with the goal of
optimizing returns on inputs while preserving resources. [6] Many western countries have implemented
Precision Agriculture which now is treated as modern agricultural management using advanced and digitized techniques. Innovative Artificial Intelligence technologies can significantly contribute to organize, connect, and
further develop this knowledge in order to better supply the collective demand for food.
3. Data Analytics and Machine Learning techniques are playing an important role in the agrarian sector in order to handle the increasing challenges due to the weather and climatic changes like temperature, rain, humidity etc.
which are causing serious damage in crop production. It is necessary to increase the accuracy of data analysis
for vigorous and proliferating production. [2]Neural networks and Machine Learning are useful decision-making tools. In Hamad et al. (2018) authors have emphasized the importance of smart mobile phones for
obtaining agronomy facts and information of different parameters like soil moisture, humidity, temperature etc.
In the same article they have highlighted benefits of smart-phones in the agricultural field. The authors
conducted the survey of around 230 farmers through questionnaires and interviews to know what they want. After completing the process they come to the conclusion that farmers are interested in making use of smart-
phones to acquire information about current farm data. [2]
Technological Implementation Artificial Intelligence is the ability of computers/machines to perform tasks while being controlled by an
external machine that has been programmed by humans .It has been observed that use of AI has grown in
almost all aspects. There are already a lot of modern equipment and machines which are being used on a large
scale in farming .However, if observed data from these equipment is managed systematically it could be of great advantage in saving resources, cost cutting and increasing efficiency in crop yield using technologies like
machine learning and data mining.
Machine Learning and Artificial Intelligence - Artificial Intelligence helps drone sensors and ground sensors to provide and capture ample amounts of data. This includes data like soil nutrients, fertilizers, moisture in various
regions .Here machine learning can help in finding the empty patches in farms(from drone sensor data)as well
as anomalies in a specific region observed. It can highly be used to identify specific areas in farms which could be worked on and improved on as well as fruit quality data could be further analyzed. Several fruit decays could
be easily detected from images clicked by these drones having sensors.
Data mining - The data of this technology could enable data from nearby farms to be easily found along with
their problems and how they solved it. Previous data of the seasonal shifts, weather changes could help in understanding correlation of various factors and analysis of the same. For this the ML data of empty patches and
specific anomalies in a region as well soil data from equipment and regional weather data combined can be
used. It would give an overall insight of the farm and future possibilities and predictions could be found.
Proof of Concept Flow

International Journal of Advance and Innovative Research Volume 9, Issue 1 (IX) January - March 2022
38
ISSN 2394 - 7780
SUMMARIZATION AND CONCLUSION
India stands second in world population and the cultivation system works in the form of demand supply chain.
Narrowing down to one such crop that has a high import and export in the country is apple. Iran, Turkey, Chile, New Zealand and China are one of the biggest exporters for apples in India. Some reasons for exports from
India could be quality, texture, taste and also less production of quality apples. The current research paper
evaluates the idea of precision farming on the growth of food production. However the paper does not focus on a particular region where it has to be implemented. It discusses more on a generic basis how the study can be
worked as proof of concept. Technical implementations towards precision farming like Artificial Intelligence,
Machine learning and Data Mining and their flow of work is discussed further in the paper. Modern
technologies could help in predictive analysis which could give useful insights. Several factors like best time to sow seeds, harvest, pesticides required, nutrient deficient soil in specific areas and also crop diseases could be
early detected. This could help in increasing number of quality apples, thus leading to a higher yield.
FUTURE SCOPE Apples with moderate to high levels can’t be stored for a long time. These fruits with subtle flaws might lead to
a bad taste and might affect the other fruits too. Thus, a computational system that scans X-ray images of apples
might be used often in near future. Thus, forthcoming technologies could be used to analyze images and
measure probability of fruit containing water core defect.
This research paper remains open to further study these technological implementations mentioned, their
feasibility levels in given geographical regions, costs and upcoming inventions in precise farming which could
further enhance and elaborate the generic techniques described.
Before going to the market, apples are inspected and those that show certain defects are removed. However,
there are also subtle flaws, which can ruin the apple's taste and appearance for example, water core. This is an
internal disease of apples that can affect the long life of the fruit. Apples with small or soft water cores are delicious, but apples with moderate to high water core cannot be stored for much time. In addition, a few fruits
with heavy water core can damage a lot of apples. For this reason, a computational system that studies X-ray
images of apples is still being studied, which will be able to analyze images taken and measure the probability
that the fruit contains water core defects by means of data mining.
REFERENCE
1. S.A.Wani,Shiv Kumar, Farheen Naqash,F.A.Shaheen, Felim.J.Wani and Hasseb Ur
Rehman(2021),Potential of Apple Cultivation In Doubling Farmer's Income through Technological and Market Interventions : An empirical study in Jammu & Kashmir, Indian Journal of Agriculture Economics
Volume 76, April-June 2021,pp. 278-291
2. Ravesa Akhter,Sahbir Ahmad Sofi(2021),Precision Agriculture using IoT data analytics and machine
learning,Journal of King Saud University- Computer and Information Sciences,May 2021
3. Rayda Ben Ayed, Mohsen Hanan(2021),Artificial Intelligence to Improve the Food and Agriculture
Sector,Hindawi Journal of Food Quality Volume 2021, Article ID 5584754, 7 pages
https://doi.org/10.1155/2021/5584754,April 2021
4. R. K. Naresh, M. Sharath Chandra1, Vivek, Shivangi, G. R. Charankumar, Jakkannagari Chaitanya, Mohd
Shah Alam, Pradeep Kumar Singh and Prasant Ahlawat(2020),The Prospect of Artificial Intelligence (AI)
in Precision Agriculture for Farming Systems Productivity in Sub-Tropical India: A Review,Current
Journal of Applied Science and Technology ISSN: 2457-1024 ,December 2020, pp. 96-110
5. A.Gailums(2016),The Methods And Applications Of Artificial Intelligence Used In The Technologies Of
Precision Agriculture,13th International Conference on Precision Agriculture, July 31 – August 4,2016,St.
Louis , Missouri USA
6. Aushmin Lodh, Ankit Galgat(2014), Implementing Artificial Intelligence in Precision Farming ,
International Journal of Engineering Research & Technology (IJERT) IJERT,www.ijert.org,NCETECE`14
Conference Proceedings,ISSN: 2278-0181 Volume & Issue : NCETECE – 2014 (Volume 2 – Issue
10),pp.65-69
7. Theofanis Gemtos,S. Fountas, A. Tagarakis,V. Liakos(2013),Precision Agriculture Application in Fruit
Crops: Experience in Handpicked Fruits,13th International Conference on Information and Communication Technologies in Agriculture, Food and Environment (HAICTA 2013) ,Food and Environment
(HAICTA),doi: 10.1016/j.protcy.2013.11.043

International Journal of Advance and Innovative Research Volume 9, Issue 1 (IX) January - March 2022
39
ISSN 2394 - 7780
CORPORATE JOB VS ENTREPRENEURSHIP: A STUDY OF CAREER PREFERENCES AMONG
MILLENNIALS
1Prerana Gurav,
2Aaryan Poojary,
3Amrit Kaur Rashi,
4Sweekrati Shetty and
5Aaryan Ajit
Bunts Sangha’s S.M Shetty College of Science, Commerce and Management Studies [email protected] [email protected] [email protected]
[email protected] and [email protected]
Mentor
Asst. Prof. Nidhi Chandorkar
ABSTRACT The purpose of this paper was to study millennials perspective on corporate jobs and entrepreneurship and to
understand the hurdles they think they might face when dabbling into entrepreneurship. Career aspirations
related to entrepreneurship or organizational employment were studied during a sample of 136 students, the majority being business students. employment are any piece of labor that's performed in exchange for an agreed
price and similar benefits whereas entrepreneurship is creating new ventures keeping in mind the risks and
difficulties and thinking out of the confine order to make a profit. for school students the prospect of starting and operating their own business could also be a viable alternative to being employed by a longtime company.
As companies are being downsized, fewer management positions are available. Job or entrepreneurship both
have its own comforts and discomforts one must face the bad and good situations within the race to excel within
the duty or business and learn from them. Many government schemes are introducing in India to encourage
young graduates and everybody should make use of them.
Keywords: Entrepreneurship, Risk, employment, millennials, career aspirations, government schemes.
INTRODUCTION Corporate jobs are the positions within a company organization. This typically means an employee’s position
within a bigger company, organisation or corporation, which might be sometimes be composed of several
branches in several regions or global locations. Corporate jobs are often founded in a very hierarchy or defined
structure, meaning there’s usually opportunity for career advancement within the corporate. the company hierarchy includes different seniority levels of employees, each working together to attain the company’s
business goals. When people visit a “corporate jobs”, they sometimes mean employment where the employer
could be a commercial enterprise with a multi-tier management structure as contrasted with a government job. Corporate jobs provide us to figure with a spread of individuals, which develops team working skills, develop
leadership qualities and also increase mutual affection among the staff. Corporate jobs don't require any kind of
payment or investment and involves lesser risk in terms of job stability whether or not you lose the work you'll get another job easily if you've got the credentials. There are some cons also of getting a company job like time
barrier, getting break day and recognition within the company. Example of corporate jobs are often being Chief
military officer (CEO), chief accounting officer of the corporate (CAO).
The willingness to start out a brand new venture keeping in mind the danger and difficulties so as to form a profit is entrepreneurship, or when someone identifies a chance and converts them into a viable process. As an
entrepreneur one gets to make things, makes one stronger and lots more courageous and assured to figure per
their own schedule furthermore as can bring out more job opportunities for everybody. One gets to follow his/her passion which brings more satisfaction and provides more happiness in contrast to employment or
working for somebody else’s dream. The degree of satisfaction is usually proportional to the success. The
entrepreneur knows the way to use the resources within the absolute best ways and know the way to survive within the worst conditions possible. they're more flexible and have more leadership qualities and you finish up
being the jack of all trades. consistent with A. H. Cole,” Entrepreneurship may be the purposeful activity of a
private or a gaggle of associated individuals, undertaken to initiate, maintain or aggrandize profit by production
or distribution of economic goods and services.” Example of entrepreneurs will be computer scientist, founding
father of Microsoft; Mark Zuckerberg, founding father of Facebook.
Corporate jobs are totally different from entrepreneurship. Once Warren Buffet said,” the difference between
successful people and really successful is that successful people say no to almost everything.” Entrepreneurs flex their “no” muscle often to keep up their concentrate on what matters. Employees, on the opposite hand, say
“yes” to everything because they fear that, if they assert no to a chance, they’ll miss out on their big break.

International Journal of Advance and Innovative Research Volume 9, Issue 1 (IX) January - March 2022
40
ISSN 2394 - 7780
Major difference between corporate jobs and entrepreneurship is that employees with corporate jobs always
avoid risk while entrepreneurs always thrive on risk because without risk there’s no reward. As Peter Drucker
said,” Whenever you see a successful business, someone once made a courageous decision.” Entrepreneur’s
purpose is to earn profits and gains while employees earn income within the style of salary
STATEMENT OF OBJECTIVES
This research is conducted to accomplish the following objectives:
1. To study the difference between corporate jobs and entrepreneurship
2. To scrutinise the measures taken by the government to help entrepreneurs and employees
3. To study the types of personalities that prefer corporate jobs or entrepreneurship.
4. To find out the hurdles faced by the entrepreneurs to start their own business.
RESEARCH METHODOLOGY
The research undertaken is to study corporate job versus entrepreneurs a study of millennial. It’s a qualitative
research for understanding the career preferences. Empirical evidences have been generated to draw conclusion.
The data for research has been collected through secondary and primary sources. Secondary sources are articles,
research paper, internet and newspaper. The Primary data is collected from sample survey technique.
The primary data is collected using questionnaire method. The questionnaire comprises 15 questions out of which 2 questions are about personal information and 13 questions are framed to collect information about
perceptions of Students about corporate Job VS entrepreneurs. The sample size is 136.
LITERATURE REVIEW
According to Andrei Cretu (2020), In entrepreneurship, we usually get a way of freedom, more flexibility but fairly often a scarcity of structure. On the company end, there's different know-how, resources, but the
environment is often perceived as somehow rigid and not agile enough. at the moment worlds are colliding,
behaviours are blending and new breeds are overlapping. it's the more entrepreneurial corporate employee, the professional that's given more freedom, whose value is recognized and is empowered to carve out its own
operating rules, as long because the outcome of his or her work is clearly of import. There are medium and
enormous companies that open themselves to the current new quite mentality, that have both the courage and
maturity to completely trust their employees and provides them that special set of liberties and privileges
accessible up to now only to entrepreneurs and startups.
According to the times of India (2021): Man needs money to execute social family obligations. And money will
be earned only by doing a little business or job. what's going to be suitable for someone depends on various factors like education, interest, goals of life, experience, skills, family status, personal circumstances, etc. In
business, the entrepreneur is his own boss, whereas during the duty the person must work under some boss. The
time to travel to office consistent with his business and private needs. Can choose its own. If the person doing
business could be a partner of the full profit then do the duty.
According to Mathews D (2018) -Being an entrepreneur will be risky, but if executed correctly, can have big
payoffs. Entrepreneurs enjoy being 100% autonomous (e.g., no boss). there's no cap to their potential, but being
an entrepreneur is risky as 50% of all startups fail within the first 5 years. Employees enjoy a gentle income (while employed, at least) and fewer stress. The employer is accountable for keeping the business profitable and
handling business problems. Employees generally have a benefits package with perks like PTO (paid time off)
and insurance and retirement options.
According to Vora R (2018) it's not right to think that pursuing entrepreneurship is best or worse than pursuing
a job of a successful entrepreneur. Not everyone can become an entrepreneur and not every entrepreneur can
have the abilities to figure in an exceedingly corporate environment. There are many hurdles within the early stages of business. These elements of risk and uncertainty aren't there after you sign for a company job. There
are various reasons why people choose entrepreneurship like pursuit of passion, refund to society, thriving
beyond boundaries, constant growth and expansion, solving a problem/addressing a desire.
According to Makin T (2019), Job is any activity that's performed in exchange for money and similar benefits. Whereas entrepreneurship is that the willingness to begin a brand new venture keeping in mind the chance and
difficulties so as to create a profit, or when someone identifies a chance and converts them into a viable process.
The increasing number of career choices before of scholars always creates confusion amongst the scholars to wether choose an honest job or select entrepreneurship. After the launch of the “Startup India Scheme”, by the

International Journal of Advance and Innovative Research Volume 9, Issue 1 (IX) January - March 2022
41
ISSN 2394 - 7780
Indian government, people are becoming more inclined towards entrepreneurship. Both careers involves a
particular quite risk and benefit. Taking into consideration, both sections are essential for the event of a nation,
it resides upon the individual thoughts and interests to settle on they require to follow.
PRIMARY DATA AND ITS INTERPRETATION
The primary data was collected using sample survey technique. The questionnaire comprised of 15 qualitative
questions.
1. 52.2% of our respondents are males and 45.6% of our respondents are females and the other 2.2%
respondents prefer not to say.
From this we can interpret that the majority of males are higher than that of females.
2. Most of our respondents are pursuing educational program such as BMS while there are many uncommon
ones also.
From this we can interpret that the most common educational program our respondents are pursuing is BMS
while the uncommon ones are startup , engineering, diploma, bsc, film, mba.
3. 74.3% of our respondents responded that Indian education system is designed to generate employees and the
rest 25.7% respondents responded that Indian education system is designed to generate entrepreneurs.
From the majority responses received we can interpret that the Indian education is designed to generate
employees.
4. 54.4% respondents have thought about starting their own business venture while 28.7% respondents are not
sure about it and the remaining 16.9% have not thought about it.
From the responses received we can interpret that majority of our respondents have thought about starting their
own business venture while some have never thought about it and some are not sure.
5. 27.2% respondents are not aware about any initiative, 25% respondents are aware about the Skill India
initiative, 16.9% respondents are aware about the Procurement and Marketing Support initiative, 11.8% respondents are aware about the Ambedkar Social Innovation and Incubation mission,10.3% respondents are
aware about the Multiplier Grants Scheme and the remaining 8.8% respondents are aware about the Modified
Special Incentive Package Scheme.
From this we can interpret that most of our respondents are not aware about any initiative while some of them
are aware about different intiatives taken by the Indian government for entrepreneurs.
6. 77.9% respondents agree that venturing into entrepreneurship is risky and 22.1% respondents disagree with it.
From this we can interpret that majority of the people agreeing with the fact that venturing into entrepreneurship
is risky are more while some percent of people disagree.
7. In lack of family support no. of respondents facing biggest hurdle is 73% and least hurdle is 71%. In technical
expertise no. of respondents facing biggest hurdle is 69% and least hurdle is 70%. In lack of financial resources no. of respondents facing biggest hurdle is 121% and least hurdle is 22%. In understanding market no. of
respondents facing biggest hurdle is 81% and least hurdle is 64%
8. From the responses received 35.3% respondents think that making a difference in the world is the motivation
for entrepreneurship, 32.4% respondents respondents think that personal growth and accomplishment is the motivation while 24.3% respondents think that satisfaction of doing something great and the remaining 8.1%
respondents think helping others achieve their goals is the motivation for entrepreneurship.
From this we can interpret that majority of our respondents think that making a difference in the world is the
motivation for entrepreneurship.
9. According to the responses 56.6% respondents think that type A (the risktaker) is the most important
personality trait in entrepreneurs. 22.8% think that type X (combines two personalities) is the most important trait in entrepreneurs. 11% respondents think that type C (the thinker) is the most important trait while 6.6%
respondents think that type B ( the socializer) and the remaining 2.9% respondents think that type D (the
supporter) is the most important personality trait in entrepreneurs.
From this we can interpret that majority of our respondents think that type A is the most important personality
trait in entrepreneurs.

International Journal of Advance and Innovative Research Volume 9, Issue 1 (IX) January - March 2022
42
ISSN 2394 - 7780
10. According to the responses 30.1% respondents think that type D (the supporter) is the most important
personality trait in corporate employees, 22.1% respondents think that type B (the socializer), 20.6%
respondents think that type C (the thinker) while 18.4% think that type X (combines two personalities) and the
remaining 8.8% think that Type A (the risktaker) is the most important personality trait in corporate employees.
From this we can interpret that majority of our respondents think that type D is the most important personality
trait in coporate employees.
11. 51.5% respondents are not sure about the policies made by the government to help start a business. 35.3%
respondents are not aware about the policies and the remaining 13.2% are aware about the policies made by the
government to help start a business.
From this we can interpret that majority of our respondents are not aware about the policies made by the
government to help start a business.
12. 38.3% respondents responded that the government should start connecting to students, 30.8% respondents
responded that it should be a compulsory part of academics, 15.8% respondents responded that there should be a user friendly website and the remaining 15% respondents responded that the government should start
entrepreneurship cells to popularize on entrepreneurship awareness.
From this we can interpret that majority of our respondents think that government should start connecting to
students.
13. 53.7% respondents prefer having a corporate job because of the stable income, 48.5% respondents prefer
having it because of the stable job, 38.2% respondents prefer having it because of the interaction with diverse
community, 36% respondents prefer having a corporate job because they get to learn from the best people and
22.1% respondents prefer having a corporate job because of the office perks.
From this we can interpret that majority of our respondents prefer having a corporate job because of the stable
income.
14. 64.7% of our respondents prefer being an entrepreneur because they can follow their own passion, 55.1%
respondents prefer being an entrepreneur because of the greater self confidence, 44.1% respondents prefer
being a entrepreneur because they can have a flexible schedule and the remaining 30.9% respondents prefer
being an entrepreneur as they can choose who to work with.
From this we can interpret that majority of our respondents prefer being an entrepreneur because they can
follow their own passion
15. 70.7% of our respondents entrepreneurship is better and the remaining 29.3% respondents think that
corporate job is better.
From this we can interpret that majority of our respondents think that entrepreneurship is better .
CONCLUSION The Study indicated that -
Majority of students thinks that Indian education system is designed to generate employees and they prefer a
corporate job because of the stable income. They have the type D (the supporter) personality trait.
Entrepreneurs have type A (Risk takers) personality trait , as majority of respondents agree with the fact that
venturing into business is risky and the biggest hurdle is family support.
Their are some respondents who have thought about starting their own venture as entrepreneurship is better than
having a corporate job because they can follow their passion and make a difference in the world.
Government should start connecting to students more because majority of students are not aware about the
policies made by the government to help start a business.
Problems faced by Millennial for starting their ventures:
Lack of family support – It is one of the biggest hurdles for entrepreneurs in India because of the traditional
mindset and inclination towards jobs and it is considered to be less risky than entrepreneurship.
Technical expertise – The Indian education system is inclined towards generating employers than
employees. Therefore lacking the knowledge (technical) of entrepreneurship. Thus resulting in poor
technical expertise.

International Journal of Advance and Innovative Research Volume 9, Issue 1 (IX) January - March 2022
43
ISSN 2394 - 7780
Lack of financial support – Money or Capital is the fuel to run any business efficiently. Hence playing an
important role in the smooth working cycle in any business. Lack of funds can even lead to shutting down
of business. Therefore a strong financial background can be a blessing to a budding entrepreneur.
REFERENCES 1. Dean Mathews, Entrepreneurship vs Employment : Which is the best?, Oct 2018 https://www.red-
gate.com/simple-talk/opinion/editorials/entrepreneurship-vs-employment-which-is-the-best/on 13/1/2022
2. Rushabh Vora, Entrepreneurship vs a Corporate Job: What should you select? September 2018
https://www.entrepreneur.com/article/319786 on 13/1/2022
3. Andrei Cretu, Corporate world vs Entrepreneurship – can we please end the debate? November 2020
https://pluria.co/corporate-world-vs-entrepreneurship-debate/ on 13/1/2022
4. Tanuj Makin, Job vs Entrepreneurship debate : Pros and Cons of Entrepreneurship and Job, July 2019
https://godofsmallthing.com/job-vs-entrepreneurship/ on 14/1/2022
5 Lucky Gupta, Business vs Job, Feb 2021
https://timesofindia.indiatimes.com/readersblog/theluckygupta/business-vs-job-29904/ on 13/1/2022

International Journal of Advance and Innovative Research Volume 9, Issue 1 (IX) January - March 2022
44
ISSN 2394 - 7780
TRENDS IN MEDIA CONSUMPTION
Asst. Prof. Siddharth S. Apte
Ladhidevi Ramdhar Maheshwari Night College of Commerce
ABSTRACT
This research paper is an endeavor to encapsulate the growth of each media right from its point of inception till
the current date.
It is also an attempt to trace various points in time when these traditional Medias like newspaper, radio,
magazines and such others were made digitally to the general public, as it will not give one a complete picture
of a growth a particular medium if one fails to take into account the digital growth and consumption of a
particular medium. Today, each media has its digital as well as physical footprints.
A consolidated data of all media needs to be made available so that it can help the media organisations to
frame policies which will help them to reach out to the commonest of common and thus do the noble job of
information dissemination. By consolidated data the researcher means the digital consumption as well as the
physical consumption or both; of a particular media or all the media.
Keywords: Mass Media, Media Convergence
MASS MEDIA The term mass media refers to any form of communication that simultaneously reaches a large number of
people, including but not limited to radio, TV, newspapers, magazines, billboards, films, recordings, books and
the Internet. (Dominick)
HISTORY OF NEWSPAPER IN INDIA Print is the oldest medium in India and has its origins before Independence when the newspaper played a
significant role in starting and facilitating conversations and awareness about the freedom struggle. (Media
Ownership Monitor India , n.d.)
The first printed Indian newspaper was in English, edited and published by James Augustus Hicky, an ex-
employee of the East India Company. It was called Hicky’s Bengal Gazette or the Calcutta General Advertiser.
Its first issue came out on January 1780. By 1947, other major English newspapers had emerged in India such as
the Times of India from Bombay, Statesman from Calcutta, Hindu from Madras, Hindustan Times from New
Delhi, Pioneer from Lucknow, Indian Express from Bombay and Madras.
Generally speaking, not only is journalism flourishing in India today, Indian language newspapers have
overtaken the English newspapers in numbers and circulation. The total number of Registered Publications in newspaper and periodicals category is 1,43,423 as on 31st March, 2020. (Registrar of Newspaper of India ,
n.d.)
HISTORY OF RADIO IN INDIA
Radio in India, too, has its origins in pre-independence, British India.
It was a club called the Madras Presidency Club Radio that is said to have pioneered radio broadcasting in India
in 1924. (Media Ownership Monitor India , n.d.) The phenomenal growth achieved by All India Radio over the
past eight decades has made it one of the largest media organisations in the world. Currently, it has 479 stations
and 681 transmitters. (Prasar Bharati Annual Report , 2018)
The phenomenal growth achieved by All India Radio over the past eight decades has made it one of the largest
media organisations in the world. Currently, it has 479 stations and 681 transmitters. (Prasar Bharati Annual
Report , 2018)
HISTORY OF TELEVISION IN INDIA
Television came to India in September 15, 1959 with an experimental transmission based in Delhi. By 1972, TV stations had opened in Bombay and Madras; in 1973, a 150 kms from Bombay, a relay station started operation
in Poona. And on 1st April 1976, the television unit was separated from AIR and given the name Doordarshan
(DD). Today, the country has nearly 900 television channels of which, more than 400 are news channels.(India
Ownership Monitor India , n.d.)
THE HISTORY OF INTERNET
Although Indian universities joined the Internet in 1988, the internet was very different then than it is today.

International Journal of Advance and Innovative Research Volume 9, Issue 1 (IX) January - March 2022
45
ISSN 2394 - 7780
Early university networks were run by and for a handful of technicians.
It wasn’t until the mid-1990s when policy makers, politicians, the IT industry and the middle-class public
became aware of the internet that the race truly began.. (Mchenry, 2003 )The internet was first introduced by the government-owned agency, Videsh Sanchar Nigam Limited (VSNL), in August 1995. Coincidentally, the first
mobile phone call in India was made in the same month. (Chandra Gnanasambandam, 2012) Before 1995, the
internet was only used by military and other top ranking and highly specialized sectors for research purposes and the public had no access to it. That changed on the Independence Day of 1995, when internet was offered to
public in six cities through telephone connection. In 1996 some news publishers developed websites for their
own publications and in 1997 the Telecom Regulatory Authority of India (TRAI) was formed to provide a
transparent environment in telecommunication.(Webnots , 2021) The government established the prestigious National Taskforce on IT and Software Development in May 1998 to formulate IT policy. The task force
released a 108-step IT Action Plan in July 1998, an IT Action Plan on the Development, Manufacture and
Export of IT Hardware in October 1998 and a long-term National IT Policy in April 1999. By October 2000, the
Department of IT had even issued a progress report on the initial 108 steps. (Mchenry, 2003 )
In 2004, the government formulated its broadband policy, which defined broadband as “an always- on Internet
connection with download speed of 256 kbit/s (Kilobits per second) or above.” In 2010, the government auctioned 3G spectrum followed by the auction of 4G spectrum which changed the pace and scope of the
broadband market.. (Mint , 2022)
DIGITAL MEDIA AND TRADITIONAL MEDIA
Digital media refers to the media that exist in machine-readable formats. It can be created, consumed, edited and preserved on digital electronics devices such as softwares, digital images, videos, websites, social media,
digital audio and E books. It is digital data that can be transmitted and consumed over the internet or computer
networks.
Such data can include text, audio, video, and graphics. This means that content from a non-digital medium,
content that is typically found on traditional media, when presented on a web site or blog, can fall into this
category (Abraham, 2020) “Traditional media” refers to mass communication via mediums or vehicles that are
an alternative to digital platforms. These include: print (newspapers and magazines) and broadcast (radio and
television).
“Non-traditional” or “new” media refer to all digital and online mediums accessed by individual or mass
audiences (e.g digital newspapers, online news etc.)(Nhezdi, 2018)
MEDIA CONVERGENCE
The convergence in media industry refers to the assimilation and the merger of old and new forms of media.
Media organizations that earlier identified with one form like print, television and radio are engaging with a variety of news formats, disseminating the same news content across different mediums.(Negi) It is yet another
example of technological revolution profoundly influencing the media scenario: convergence is coming about in
various branches of entertainment like film, TV and music industry. All of these use computers, CDS,
audio/video tapes and more.
The digital advancement that led to the transformation in the media industry has revolutionized it in the last two
decades. This convergence can be observed all around the world.(communication)
Specifically speaking, Media Convergence is a phenomenon that involves the interaction of “new” media with “traditional media”. The interaction of computing and information technology and telecommunication networks,
including the internet, with “traditional media” like magazines, newspapers, radio, television, films and the likes
is what media convergence looks like. It’s the meeting, converging and union of two schools and forms of
media communication.
(Negi)
MEDIA CONVERGENCE AND NEWSPAPERS IN INDIA
Digital transition of newspapers generally happens on two counts: publishing with digital and publishing for digital. The first involves a shift towards using the digital in the process of sowing and publishing news.
Second, publishing for the highly competitive which has its own challenges.
Distribution and consumption of news has been happening on digital platforms now more than ever. This has led to a climate of collaboration but also a culture of interdependence, impacting news providers in previously

International Journal of Advance and Innovative Research Volume 9, Issue 1 (IX) January - March 2022
46
ISSN 2394 - 7780
unforeseen ways. The major newspaper houses in India have significant online presence. They continue to
attract most of the online traffic in India. Mint, for instance, is a business newspaper that not only does normal
interviews, but also does weekly shows on issues and even presents a wrap up of the top business news of the
day, just like a TV station.
(The centre for Internet and society , 2022)
MEDIA CONVERGENCE AND TELEVISION IN INDIA In 2008 the Ministry of Information and Broadcasting issued guidelines for self-regulation for the broadcasting
sector. The downlinking guidelines to enable IPTV (Internet Protocol TV) services were ammended and policy
guidelines for the provision of IPTV services in India were issued. Towards the end of 2014, cable digitization
was made mandatory by the legislation. (Mathai) IPTV (Internet Protocol Television) is a technology wherein digital television programs and services are delivered to television sets or smart phones through a broadband
connection, rather than being delivered through the conventional cable or broadcasts set-up. This way, a user
can watch ‘TV programs’ on a computer screen, a television screen (with a set-top box installed) or a mobile device like a cell phone or an iPad. These changes were the result of Media Convergence playing out.
(Chidambaram, 2014 )
THE GROWTH IN DIGITAL MEDIA CONSUMPTION In 2019, digital media grew 31% to reach Rs 221 billion and is expected to grow at 23% CAGR to reach Rs 414
billion by 2022.
Digital advertising grew to INR 192 billion to 24% driven by increased consumption of content on digital
platforms and marketers’ preference to measure performance. SME and long tail advertisers increased their spends on digital media as well. Pay digital subscribers crossed 10 million for the first time as sports and other
premium content were put behind a paywall..
Consequently, subscription revenue grew to Rs 29 billion in percentage it is 106%. Digital consumption grew across platforms where video viewers increased by 16%, audio streamers by 33% and news consumers by
22%(FICCI India's Vocie for policy change , 2021)
With over 560 million internet users, India is the second largest online market in the world, ranked only behind
China. It was estimated that by 2023, there would be over 650 million internet users in the country. Despite the large base of internet users, the internet penetration rate in the country stood at around 50 percent in 2020. This
meant that around half of the 1.37 billion Indians had access to Internet that year.
There has been a substantial and consistent growth in internet accessibility compared to just five years ago,
when the Internet accessibility rate was around 27 percent(Keelay, 2021)
CONCLUSION
There has been a phenomenal growth in the consumption of the traditional media like the newspapers, magazines, radio as well as the digital media. However, one can get a bird’s eye view of the overall media
consumption scenario, if one separates the physical consumption pattern of the traditional mediums like any
newspaper, radio channel etc than their digital counterpart as the availability of traditional media on the internet
and its digital consumption calls for the separate measurement methods, which will help one to achieve a
holistic perspective of the media consumption across platforms.
REFERENCES AND BIBLIOGRAPHY
Abraham, P. (2020). Impact of Digital Media on society . International journal of creative research
thoughts.
Chandra Gnanasambandam, A. M. (2012, December ). Online and Upcoming : The Internet's Impact on
India . Mckinsey and Company .
Chidambaram, V. V. (2014 ). Internet protocol television and its security threats . International journal of
computer science trends and technology .
communication, r. r. (n.d.). Mass media in India 2004 .
Dominick, R. D. (n.d.). Mass Media Research : An Introduction .
FICCI India's Vocie for policy change . (2021, December Friday ). Retrieved from FICCI India's Vocie for
policy change: https://ficci.in/ficci-in-news-page.asp?nid=20985
India Ownership Monitor India . (n.d.). Retrieved from https://india.mom-rsf.org/en/media/tv/

International Journal of Advance and Innovative Research Volume 9, Issue 1 (IX) January - March 2022
47
ISSN 2394 - 7780
Keelay, S. (2021, August ). Statista . Retrieved from Statista :
https://www.statista.com/topics/2157/internet-usage-in-india/#dossierkeyfigures
Mathai, S. (n.d.). Indian television in the eras of pre liberalisation and liberalisation .
Mchenry, L. P. (2003 , October ). The Internet in India and China . Research Gate .
Media Ownership Monitor India . (n.d.).
Mint . (2022, January Sunday ). Retrieved from Mint :
https://www.livemint.com/Opinion/gzWbpGZVD83W3iq3uOLD70/Evolving-Internet-in-India.html
Negi, D. S. (n.d.). Convergence in Indian media: A new paradigm of ICT .
Nhezdi, D. A. (2018). The relationship between Traditional and digital media as an influnece on
generational consumer preference . Communitas , 18-38.
Prasar Bharati Annual Report . (2018).
Registrar of Newspaper of India . (n.d.).
The centre for Internet and society . (2022, January Thursday ). Retrieved from The centre for Internet and
society : https://cis-india.org/raw/digital-transition-in-newspapers-in-india-pilot-study
Webnots . (2021, May). Retrieved from Webnots: https://www.webnots.com/history-of-internet-growth-in-
india/

International Journal of Advance and Innovative Research Volume 9, Issue 1 (IX) January - March 2022
48
ISSN 2394 - 7780
PREFERENCE OF USE OF PUBLIC TRANSPORT BY INDIVIDUALS IN MUMBAI
1Pravita Kulal,
2Khush Satra,
3Aashna Shetty,
4Ahsan Syed,
5Anish Mudhguri
Mentor
6Asst. Prof. Ashish Navik
Bunts Sangha’s S M Shetty College of Science, Commerce and Management Studies, Powai, Mumbai [email protected], [email protected], [email protected] and
ABSTRACT
This study is considering the transportation problems faced among the people of Mumbai. Mumbai’s public transport system is of railways namely Central, Western, and Harbour, bus system as well as black-and-yellow
taxis and auto rickshaws.
Unfortunately, the infrastructure of transport in Mumbai is on a steady decline, which have an effect on time and energy Mumbaikars spend on travel. Nowadays, traffic management works as a support for public
transportation.
Reliability and Timeliness of public transport is been considered very very important by users of Public
transport. Lack of management in public transport results in delays discomfort for the passengers to travel.
INTRODUCTION
Transportation is the lifeblood of all the major cities as far as business affairs are concerned. May it be
transportation of goods or commuting of people for business or service is concerned. Mumbai city is not an exception to this. Mumbai being the finance capital caters to large business and service industries.
Transportation of people in Mumbai involves by train, road, and water. Most of the people use public transport
.Mumbai is having the largest systematic bus transport network among other Indian cities.
The ‘BEST’ ‘TMT’ ‘NMMT’ are the public bus services provided by all the three municipalities for all the
people of Navi Mumbai, Thane, and Greater Mumbai. Public transport in Mumbai consists primarily of fast
transit on exclusive localized railway lines. The Central, Western, Harbour are the main rail lines serving the
citizens of Mumbai. People also prefer taxis and auto rickshaws, as the fares are relatively low. A metro and a monorail system were inaugurated in 2014. The Metro was a very successful project for the convenience of the
people.
STATEMENT OF PROBLEMS When we travel by public transport the biggest problem we go through is hygiene and cleanliness. Secondly, the
Safety and Security the question arises while women and children are travelling alone at night.
We also think the frequency of public transport is also a problem. This gives rise to crowds in the peak hours.
There are no Social Distancing measures followed during this Covid times.
RESEARCH QUESTIONS
What can be done to increase the frequency of Public Transport?
What steps can be taken to improve the cleanliness and Hygiene in Public Transport?
What percentage of Income does an Individual spend while travelling in Public Transport?
How can the Safety and Security of Women and Children be improved?
STATEMENT OF OBJECTIVE
To check whether there are enough facilities for Disabled people.
To bring out solutions for people facing difficulties while travelling in public transport.
To study why people prefer Public transport.
To study the advantages of the Public transport System.

International Journal of Advance and Innovative Research Volume 9, Issue 1 (IX) January - March 2022
49
ISSN 2394 - 7780
RESEARCH METHODOLOGY
For the purpose of this study the researchers have used Qualitative Research to identify the preference of use of
public transport by individuals in Mumbai. The researcher has made use of primary data. The researcher has
also used secondary data.
The primary data was collected by sample survey technique, using google forms as a tool for data collection.
The sample units include people of all age groups living in different regions of Mumbai, Thane and Navi Mumbai. The sample size is One Hundred. Secondary data was referred for preliminary analysis and setting a
theoretical base for the study from previous articles, research papers, newspaper articles and the internet.
REVIEW OF LITERATURE
According to Prasad. V Public surveys show that safety and security attracts locals towards public transport. Unfortunately, only few understand and take this topic seriously. Adding to this, close distances to station is one
factor which government should take care of.
According to Kristian. P, after analysing, a railway trail should be introduced close to the current train track to divert the crowd and panic. Major drawback of public transport as mentioned by everyone is overcrowding.
This additional train track will not only solve this problem but also the situation of road traffic and global
warming. Although this needs a lot if research and calculation as to not affect the current timetable.
According to Helena S. Emphasis on pre-trip information is very important for avoiding waiting times and
frustration of citizens. Pre trips should include the timetable, current schedule and real time delay. In the times
of modern technology, passengers must have access to information in real time especially for long distance
trips. Amidst growing passenger availability, real time applications on smartphones will help avoid congestion.
According to Sharma S. Appropriate spacing between bus stops reduces the chance of delay and travel time. One
of the common answers of the unfavorably of transport seemed to be less frequency. Every individual has to
spend time everyday contributing to their cost. Eliminating unwanted stops will improve availability without affecting the quality of service. Bus stops should be decided as per passengers and distance between stops so that
proper passenger distribution takes place.
According to Sharma H, Overcrowding is the reason for lack of interest of people in public transport. The
government should hire decision makers to calculative the number of buses actually needed to run the system which will satisfy the existing and future passenger demand. Excess number of buses leads to road congestion
and few buses accelerate over gathering. To eliminate both, bus planning is required.
According to Rita P. Public transport majorly buses are still undesirable by many because of lack of responsibility in drivers. A policy should be introduced safeguarding the security of passengers by developing a
'Drivers program' wherein they are made aware of their duties and roles. Also strict action should be taken in
case they don't abide by the rules.
According to Times of India (TOI). The transportation of Mumbaikars is by train, road, and water. Inclusive of
Trains, Metro, buses, taxis, monorails. This altogether makes the city more working 24/7.This city never sleeps.
For travelling in Mumbai may that person be rich or poor everyone one uses public transport in their daily life
because that costs them less compared to their private vehicle. Mumbai's BEST bus services were suspended when Maharashtra started implementing measures to curb the spread of the of covid cases. Which thereby
affected the local public. Because of this pandemic many lives have been affected. Travelling in the public
transport has become less because of the safety which also results in the loss for the government.
Mumbai people including senior citizens and students everyone is comfortable using public transport over their
private vehicle in terms of less expense. Rising price of petrol is also affecting the private vehicle users. Train is
the lifeline of Mumbai. The tracks get flooded during heavy rains. Sometimes trains travels for short distances. The result of this is that the trains are over filled by double of its seating capacity. On Sunday there is a major
block in Mumbai. Strike of motor men's use of more public transport than private transport. There should be
better signboards at each and every crossings which will help to reduce traffic.
Mumbai has a very well-developed railways and bus services under BEST- management. Despite such a successful operational history of its transport system, Mumbai has done very poorly in framing a coherent urban
transport policy for its future transport development.
PRIMARY DATA PRESENTATION The primary data was collected using sample survey technique making use of Google forms as a tool for data
collection. Data is collected by using simple random sampling techniques, Google forms were floated amongst

International Journal of Advance and Innovative Research Volume 9, Issue 1 (IX) January - March 2022
50
ISSN 2394 - 7780
various groups and the responses were collected. Total 100 responses were collected. The questionnaire
consisted of 15 qualitative questions. The responses were from varied categories like students, self-employed,
homemaker and employed.
1. Majority of the respondents belonged to the age group of 18-25 years.
2. The people of Mumbai use public transport several times in a month.
3. Over 74% of them from the data we have collected use's Auto rickshaw.
4. Local public found the public transport more convenient, safe and comfortable over the private
vehicles.
5. Because of the launch of apps like Ola, IRCTC etc. have helped boost up public transport.
6. Majority of the people face difficulties like crowd, lack of cleanliness etc. while travelling in a public
transport.
7. The Analysis shows that only 20% of income is spent by people on public transport every month.
8. Half of the responses that we have collected say travelling in a public transport increases social
interaction, saves money and reduces congestion on the road.
CONCLUSION
At last we can conclude that people of Mumbai prefer public transport in subjects like low travelling cost, and
social interaction.
Whereas their preference changes when it comes to cleanliness, safety and security, as safety of women and
children is a very sensitive issue. We have read that the Railways of India is making a constant effort to improve
all the passenger trains in India. A new train is launched at a top speed of 160 km/h. This is to decrease the
travelling time and for the convenience of the people.
So after going through our research we can take steps that can make public transport more efficient by
improving infrastructure, spreading awareness, keeping fares low, and increasing safety.
REFERENCE
● https://m.timesofindia.com/topic/public-transport%20in%20Mumbai/news
● https://link.springer.com/search?query=&search-within=Journal&facet-journal-id=12469
● https://kids.britannica.com/students/article/transportation/277414
● https://en.wikipedia.org/wiki/Public_transport_in_Mumbai#:~:text=Mumbai's%20public%20transport%20c
onsists%20primarily,as%20well%20as%20ferry%20services.

International Journal of Advance and Innovative Research Volume 9, Issue 1 (IX) January - March 2022
51
ISSN 2394 - 7780
A STUDY ON INFLUENCE OF SOCIAL MEDIA ADVERTISING ON YOUTH WITH RESPECT TO
FASHION PRODUCTS
1Nitish Jha,
2Konika Bhandari and
3Anand Sharma
Mentor 4Asst. Prof. Ashish Navik
1-4S. M. Shetty College of Science, Commerce and Management Studies, Powai [email protected]
[email protected] [email protected]
ABSTRACT Social media advertising is a recent development in the field of advertising. Many industries have been doing
online business. Advertising is a boom to social media platforms, which creates eye-appealing & attractive
advertisements with their creative ideas. Social media advertising refers to online marketing by using social media platforms like facebook, twitter, instagram, etc. Social media advertisement is the art of using the
internet as a medium to deliver marketing messages to an identified and intended audience. It helps to attract
website traffic and brand exposure, but first and foremost, online advertising is designed to persuade the targeted customer to engage in a specific action and tend them to purchase the products. Social media is open
to all and gives businesses a chance to follow their consumers' activities or potential buyers. This helps fashion
brands to be more informed about their target audience, likes, dislikes, and interests so that they can create a
better marketing strategy to attract such customers.
This paper aims to examine the influence of social media advertisements on youth in the case of fashion
products.
Keywords: Social Media Advertising, Youth, fashion, Online shopping,Consumers, Advertisements, Purchase,
Social media.
INTRODUCTION
There has been a drastic shift in the buying pattern in recent times and also due to changing scenario and on-
going situation of pandemic, social distancing, people have switched from retail shopping to online shopping in the past few years and this has created a boom in the field of online advertising. It can be seen that all the big
brands have their own pages on social media and are investing a huge amount in it.In addition, they are
investing a lot of money in their social media marketing and, youth always wants to look good in front of everyone, so we can say social media advertisements have profoundly affected the youth with regards to fashion
products. As we scroll our social media handles, there are ads everywhere. Our eyes are always focused on
Fashion. So when we see any attractive product, we click on the ad and spend hours on the site. Influencers nowadays have a significant impact on consumer purchasing decisions. In the fashion sphere, influencers often
post pictures of their clothes on Instagram to promote their sponsors, videos of clothing hauls, and humorous
sketches related to fashion. In response to this Consumers try to copy the trend by going to an ecommerce
website and searching for the product they have seen.
STATEMENT OF OBJECTIVE
1) To know whether influencers have an impact on youngsters' buying behavior.
2) To know whether advertisements of fashion products on social media have an impact on youth's buying
behavior.
3) To know whether youth give preference to review and recommendation on social media about fashion
products.
RESEARCH METHODOLOGY
The researchers have made an attempt to undertake this qualitative research using empirical techniques to study
the influence of social media advertising on buying behavior of youths in Mumbai with respect to fashion
products. The researcher has collected data from Primary as well as secondary sources for the purpose of the study. The secondary data has been collected from already published information on the internet, related
published research papers, articles etc. The Primary data has been collected using sample survey technique.
Simple random sampling technique has been used by the researchers to collect data from the respondents using

International Journal of Advance and Innovative Research Volume 9, Issue 1 (IX) January - March 2022
52
ISSN 2394 - 7780
google forms as a tool for data collection. Sample units are Youths in Mumbai using social media. The Sample
size for the purpose of this study is 103.
REVIEW OF LITERATURE ● As per one article on Clootrack (website) uploaded in 2022 Social media have become communication tools
for people all over the world and research shows that many people give importance to review and
information which are shared as a guide for making future purchases.
54% of social media browsers use social media to research about products .Social proof has emerged due to the
tendency of people to imitate the behavior of people around them or people imitate people who have influence
over them. 64%Online consumers wait to buy products until they go on sale. Social media influencers too have
impact because before making any purchase people see that products are being recommended by their trusted
influencer.
● As per EDKENT MEDIA (website article) uploaded in 2020 Social media has a huge impact on the fashion
industry and what is trending. Posts can blow up extremely fast, constantly changing fashion trends, anyone can start a new trend overnight. Advertisements on social media create an open service platform where
customers can express their views and feelings about services and products offered. By giving attention to
consumer opinions, customer satisfaction levels rise exponentially, and loyalty to your brand is increased. Social media gives customers the choice to grab between trends and of course the joy of shopping with the
help of clicks.
● As per Fayq Al Akayleh, Social media have emerged as a effective medium for businesses to place their
products in front of customers and to do that firms are pumping a good amount of capital.Now a days it important to have a presence on only platform not only for common people but for firms as well to target
their audience who can become their customers.
● As per an article published on 2018 in ICI world of Journals .The impact of social media on current fashion trends as social media is getting very much in . The fashion industry is one of the businesses where frequent
changes occur and social media is the most convenient and economical means to communicate while trying
to create buzz about their product.
● As per e-journal on journal.lucp.net .Social media advertisement is a type of digital advertisement which has become one of the most effective means of advertising through the internet in an online platform. This
type of advertisement is spread all over the globe. It is the fastest and newest way of advertising. Nowadays,
the internet provides a direct link on various sites for advertising products or services. The provision for pay-per-click advertising is also available. Social media advertisements are displayed uniquely so that the
customers visit the advertisements and show some interest. As compared to the traditional modes of
advertisement such as radio, TV, magazines, etc. the social media advertisement is mostly preferred by the customers. Social media advertisement includes text ads, image ads, pop-up ads, banner ads, and HTML
ads.
● According to Shreya & Prachi Trivedi(2020).Today in this 21st century people do not find time to come &
interact with each other. Social media bridges the gap and helps in connecting themselves with social networking sites through which now people can stay far and yet remain connected. Not only does social
media connect people but also has large advertising opportunities and here it is where social media
marketing comes into play. The fashion industry is one of the businesses were frequent changes occur and
social media is the most convenient and cheapest means to communicate with the target consumers.
● According to Jincy T. C & Dr.A.Enoch (2019).New Technology transformed communication innovatively
and creatively. Media has an inevitable role in the evolution of communication. The emergence of social media networking sites such as Facebook, Twitter, LinkedIn, etc. created a direct and instant relationship
with the people. Social media marketing twisted a new era in the marketing world. It is a new trend and
fast-growing way in the field of marketing to create a quick communication with the customers and
branders. Advertisement through social media is a powerful and effective way to advertise products to the customers as a whole. Social media advertisement is a modern technique to attract people and make
purchasing most easy.
● As per journal The Power of Social Media in Fashion Advertising published in Journal of Interactive advertisement(2020) in today’s digital era, as people increasingly spend their time online, social media has
become a trendsetter for society. Social media platforms are now the primary source of information for
consumers and one of the most powerful marketing tools for fashion businesses. The fashion industry has

International Journal of Advance and Innovative Research Volume 9, Issue 1 (IX) January - March 2022
53
ISSN 2394 - 7780
benefited from using social media, posting pictures and videos and writing about their fashion products and
business practices to attract consumers and increase brand awareness. In particular, social media provides
an interactive channel of mass communication to amplify marketing strategy for fashion brands.
● As per information on digital republic website (2020)social media is a powerful platform which provides
businesses access to all demographic customers who can be target customer or can be made target customer
by advertisement,discount and many more other than this customer too nowadays prefer social media to get
review and recommendation for product which there are planning to buy.
● As per a blog on Connextdigital website(2019) 71% customers are more likely to make purchase way a
social media referrals.Current generation are the one who spends most of their time online, 47% of their
purchases are influenced by social media and are likely 1.6 times to use digital channel to learn more about product They are also 1.6 times more likely to use digital channels to learn more about product.Businesses
study psychology, motivations, and behaviors, such as how people make choice and how to make recognise
there need.
DATA ANALYSIS
The researcher has collected primary data using simple random sampling method through google forms. Total
103 responses were collected from youths in Mumbai who are using social media platforms on a rampant basis. The respondents were from different backgrounds like HSC, Undergraduate, Graduate, Employees major
respondents belonged to the age group of 15 - 20 years. Out of the total respondents 56.3% of the respondents
were female and 427% of the respondents were male.
1) In response to the question related to the social media platform, respondents have seen most ads for fashion products, towards which 83.5% responded by Instagram, 9.7% by Facebook and remaining are divided between
Whatsapp, Pinterest, Youtube and last was Instagram and Pinterest both. Hence it was observed that majority of
the respondents used Instagram for viewing social media advertisements.
2) Towards the second question, which was how often respondents have seen ads of fashion products on social
media towards which 59.7% responded by everyday ,19.4% by often,19.4% by very often and remaining
responded hardly once. Here it can be seen that the majority of the respondents view social media
advertisements related to fashion products.
3) In the third question related to the preference of the respondents about their preference on social media to
know the current trend in fashion products, 86.4% said yes, and 13.6% said no. In this case it can be seen that
the majority of respondents are interested in viewing advertisements related to fashion products on social media.
4) For the fourth question, which was how many times buyers have made purchases by seeing ads 64.1%
responded 1-3 times ,19.4% by 4-6 times,6. 8% by 7-9 times and remaining responded by never. Thus majority
of the respondents have made purchases through social media advertising, here it can be said that social media
advertisements are influencing the youth to buy fashion products online.
5)Towards a question regarding do responded likes to buy products after watching ads of it repeatedly to which
26.1% responded by Yes, 28.4% responded by No, and 44.7% responded by may be. Here the majority of
respondents are not sure about their buying of products after watching social media advertisements repeatedly.
6) For the sixth question,do respondents buy products which their influencer uses or recommends. 44.7%
responded may be, 31.1% responded no and the remaining 24.3% responded by sometimes. In this response it is
seen that majority of respondents buy products recommended by influencers.
7) For question: Have responded changed their purchase decisions after looking at reviews and
recommendations about fashion products, responses were 85.4% for yes, while 13.6% were no and remaining
responded by sometimes.
8) For the sixth question, which type of advertisement respondents have seen regularly on social media. 71.6%
of respondents said seasonal sales, while 52.9% said ads for products starting at the minimum price, 15.7% of
respondents said quiz offers. 43.7% said coupons for discounts and the rest replied with others.
9) Towards the last question, respondents have felt attracted to fashion products because of discounts and decided to make a purchase to which 56.3% responded by yes, 30.1% by maybe and remaining responded by
no. Here it can be seen that majority of respondents have been attracted towards fashion products because of the
discounts and offers available on social media.

International Journal of Advance and Innovative Research Volume 9, Issue 1 (IX) January - March 2022
54
ISSN 2394 - 7780
Source: Primary Data
CONCLUSION
After looking all the expect of this study along with objectives and data together this research have arrived to a
conclusion that social media is one of those effective communication tool to know current trend in fashion product and advertisements of fashion products is proven successful special by way of discount or sales
advertisement, frequently placing an ads can or cannot have influences on youth depending upon various
situation and need to be looked for better communication of products while in case of influencer they have impact but they too don't not a 100% influence on youth which follows them and on their buying behaviour.On
the other hand review and recommendation of products funded more effective because Gen Z give importance
to it.
RECOMMENDATIONS
Fashion firms should give a look towards what review and recommendation is given on social media platforms
to understand where they can make changes in their products and get it communicated in better ways to target
the audience.
RESEARCH LIMITATIONS: ● The study was confined to the social media users in Mumbai only.
● The study only covers the advertising in social media with respect to fashion products only.
● The sample selected were youths only and no other attributes of population were considered.
● The responses received may be influenced by the individual respondents ideology about social media
advertising.
REFERENCES
● https://clootrack.com/knowledge_base/how-does-social-media-influence-consumer-behavior/?amp
● https://edkentmedia.com/5-benefits-advertising-social-media/
● https://www.researchgate.net/publication/351225157_The_influence_of_social_media_advertising_on_cons
umer_behaviour
● https://journals.indexcopernicus.com/search/article?articleId=1786625
● https://ejournal.lucp.net/index.php/ijrtbt/article/view/1183/1281
● https://www.researchgate.net/publication/343236688_THE_IMPACT_OF_SOCIAL_MEDIA_MARKETIN
G_ON_ONLINE_FASHION_INDUSTRY
● https://www.google.com/url?sa=t&source=web&rct=j&url=https://www.infokara.com/gallery/73-nov-
c149.pdf&ved=2ahUKEwjpkfSfjKD1AhUtUGwGHajXAP4QFnoECC8QAQ&usg=AOvVaw0BJNDqcbx-
FQcDpgMt9J1g
● https://www.tandfonline.com/doi/full/10.1080/15252019.2020.1802955
● https://www.digitalrepublic.ng/post/impact-of-social-media-on-consumer-buying-behavior
● https://connextdigital.com/how-social-media-impact-consumer-buying-behavior/

International Journal of Advance and Innovative Research Volume 9, Issue 1 (IX) January - March 2022
55
ISSN 2394 - 7780
PARADIGM SHIFT IN SPORTS REPORTING WITH INTERNET BOOM AND NEW NORMAL
SCARE
Arindam Basu
Sister Nivedita University
ABSTRACT
Sports Journalism has been an essential part of information boom in the modern era. What began as mere chronicling of sporting events as part of entertainment has slowly become an important part of daily news
consumed by people of all ages. With its rise in prominence the demand for more of the same, yet different in
perspective and approach, spiked through the roof. It was first fanned with the advent of social media that
completely changed the technology and way news was consumed. As consumers became active contributors and participants in the news making process, sports journalists needed to evolve to stay ahead of the social
juggernaut that was on a roll. Hardly had they come to terms with the change in their very primal nomenclature
that they have been tossed into the hitherto uncharted orbit of the new normal thrust upon us by an endemic that mankind was not prepared for. This led to a challenge of a very different kind when the basic fibre of sports
journalism and the news making process was put to question. However, as a tribe sports journalists have
successfully navigated the challenges of media convergence and advent of social media and then went on to use
the skills obtained to harness the apparent unsurmountable odds thrown by this endemic.
Keywords: #SportsJournalism #Covid19 #NewMedia #SocialMedia #InformationBoom #NewNormal
INTRODUCTION
Sports have been an integral part of human civilization. Be it the archers’ competition or Mallya Yudha (wrestling) as outdoor sports in Mahabharata or the game of Pasha (a game of dice) that decided the fate of a
nation in that great epic, sports have been a part of the Indian mainstream since time immemorial.
Similarly ever since Athenians and Spartans sought to prove their manhood by running and jumping their way to applause at the ancient Olympic Games Western civilisation’s fascination for sporting prowess grew
inexorably.
Add to these the chariot races in Egypt, the tug-of-war practiced by the Assyrians and boxing and board games
of ancient Mesopotamia and the growth of human civilization remain closely stitched with its sports and games. Never has anything been written about and caught through art so widely and relentlessly throughout our
existence, like sports.
This paper closely looks at the growth of Sports Journalism into one of the fulcrums of modern news content. It looks at the ways in which sports journalism manoeuvred its way as the world took two leaps, one that opened
up the information horizon and the way it is sourced, put out and consumed and the next that went on to close
down this planet and throw a curve ball at the sports journalists asking them to keep quenching the bottomless
thirst of the consumers in a world on a lockdown.
Birth of Modernity
Cut back to the last millennium. The 19th century witnessed two notable developments — the establishment of
English-language newspapers across the world, including India, and codification of the rules that led to the
spread of international sport. It was the birth of modernity.
When Charles Bannerman became the first batsman to score a Test century in 1877 against England, he did not
have to do television interviews, keep track of his Instagram handle or block trolls on Twitter from the Balmy Army. On the other hand, the newest invention then in the telephone might have irritated him from call to call.
However, the only action replay that was provided of his monstrous retired hurt at 165 in those times came
through written sports journalism.
The same year, Spencer Gore became the first Wimbledon champion. The following year, the Parsis planned to
set out on the first-ever cricket tour by an Indian team to England. But the Russo-Turkish War interfered.
Britain in war mode readied to defend its colonies in the eastern Mediterranean, and 7,000 Indian troops set sail
for Malta. The contingent had two key Parsi players, including their best bowler. It was another eight years
before a Parsi team set foot on the English soil.
It wasn’t just cricket and tennis that entered modern era. The Marquess of Queensberry rules, by which boxing
was governed, were published in 1867. Likewise England’s Football Association was formed in 1863, the

International Journal of Advance and Innovative Research Volume 9, Issue 1 (IX) January - March 2022
56
ISSN 2394 - 7780
Amateur Athletics Association in 1881, the Rugby Union in 1871 and the Hockey Association in 1886.
England’s first division football league commenced in 1888. The Durand Cup football tournament, the second
oldest in the world, was played in 1888 too on the other side of the globe in Britain’s colonial capital Calcutta and the Rovers Cup followed in 1891. It was around this time only that basketball was conceived by an
American gymnasium teacher, James Naismith, in 1891 and around the same time, volleyball too made its debut
in America. The modern Olympics was inaugurated in Athens in 1896. Sport had become structured, codified
and a serious affair.
Road to Immortality
Most of these sports like the Olympics existed before. But rules varied for the same sport or game and so did the
equipment in certain cases. Setting of rules and systematization was a crucial step on the road to immortality. But this process would remain incomplete if it did not form a part of the social history of human civilization.
Competitive sport needed a platform to spread its message and make heroes out of champions and legends out
of heroes. They needed a catalyst that would spread the game and be sporting enough to do it correctly.
Newspapers provided that platform.
While The Guardian, The Scotsman and Sydney Morning Herald already existed in the first half of the 19th
century, the likes of Daily Telegraph, Daily Mail and Daily Express joined them in the second half. And they gave sports the place it deserved in face of stiff opposition, cruel banter and some good old sledging. But they
carried on and soon were able to enamour the readers with the liberating effect of sports.
The London Olympics of 1908 was a benchmark in the coverage of sporting events and played witness to
several newspapers sending their top writers to cover the event. The Daily Mail, history has it, had sent Sir
Arthur Conan Doyle for covering the marathon.
And what of India in the meantime? English newspapers that came into being in the 19th century were The
Statesman, The Hindu, The Tribune, The Times of India, Amrita Bazaar Patrika and The Pioneer. It was around the 1930s or a little after that a leading English daily from Bombay dedicated a full page to sport to unequivocal
criticism. But slowly like opium the addiction grew. It was during this time that India had also won gold in field
hockey in 1928 Olympics beating an English team. What Sovabazar Club winning the Trades Cup defeating an
East Surrey Regiment in Calcutta in 1892 and then Mohun Bagan winning the IFA Shield beating the East Yorkshire Regiment in 1911 did to regional journalism in Bengal was ignite it with a spirit of nationalism. But
the Olympics gold was a different beast.
Let’s Time Machine By the early 20th century sports had come a long way from being referred by certain editors as a ‘Toy
Department’. The kind of attraction the page generated over a period of time forced the naysayers to grudgingly
accept it despite all the drug-taking, match-fixing, financial corruption and incompetence, racism, sexism,
gratuitous violence and ugly nationalism as more worthy of a carnival than an anathema.
Having firmly seated itself at the heart of human attention, sports evolved beyond its purview. Jeremy Engle of
the New York Times says: “What do you think? Should sports journalists stick exclusively to sports — box
scores, highlights, stories of heroic achievement? Or should they also cover “outside the lines” issues like
concussions, domestic violence, racism and politics? Is it possible to separate the rest of the world from sports?
Why do you read and watch sports news and commentary — whether it’s in Sports Illustrated or Bleacher
Report, or in TV shows like “SportsCenter” or “Fox NFL Sunday”? Do you care only about the entertainment value of the games? Do you see sports news as an escape from other kinds of news? Or are you also interested
in the broader societal issues that affect athletes, leagues and fans?”
True. If we take India for example: Can we leave out Anushka Sharma’s reaction to Virat Kohli’s resignation as Indian Test Team’s captain? Or do we not do the story of the Sen family from a small town of Almora in
Uttarakhand who dedicated three generations to badminton before getting Lakshya Sen to win big? Or do we
ignore the Indo-Pak polity every time we talk about Sania Mirza and Shoaib Malik? Or do we not do a story of
the rise of minor sports in India post commercialization of sports into franchise leagues following the IPL model
with the upsurge of the likes of Pro Kabaddi League, Pro Volleyball League or Ultimate Karate League?
“Reporting sports with integrity requires knowing that there’s no way to wall off the games from the world
outside. To anyone who knows anything about sports or cares about the world outside the arena, the notion that
sports should or even can be covered merely by box scores and transaction wires is absurd,” Engle said.

International Journal of Advance and Innovative Research Volume 9, Issue 1 (IX) January - March 2022
57
ISSN 2394 - 7780
With sports ever expanding its horizons, exclusives, interviews, analysis, supplements and often predictions
become the sought after sections of sports journalism along with match reports. Then the internet boom
happened and along with it a liberation of the readers from the shackles of limiting themselves to letters to the editors or occasional phone-ins on televisions. With the advent of convergent journalism, the media was now
open to and for news that would be henceforth received, processed, created and consumed on an open platform
open to accountability, criticism and discussion. The world of journalism was poised for a change and with it sports journalism. Suddenly sports journalists were like gold fishes in a glass bowl that both entertained and
were open to scrutiny.
Paradigm Shift Part One
With the advent of social media, journalists in general were like the metaphoric sharks swarming in a hot current of news. Now news had several forms and formats—it came from official sources, unofficial sources,
eyewitness accounts, personal blogs, social media posts, micro-blogging and through counter perspectives
garbed often as memes and trolls.
The changes in access, content, technology, and media consumers’ tendencies all led to the inevitable
inference: If you’re a sports reporter, you ultimately have to engage with your reader, audience, twitterati, and
listen to the feedback. This is a shift that the traditional sports reporter was not ready for because it entailed confronting uncomfortable realities — about the meaning of their own work; about the origins of their medium
and platform and most importantly about themselves.
Let’s not live in any illusion. The sports reporters have been receiving feedback all their lives from classmates
in school now in some other profession, editors at work, peers in the field from other beats and of course their readers. But in today’s date and time it is easier than ever to be among the peers of a sports journalist. You
could be one of his Facebook friends or a follower on twitter. Thus it becomes even easier to engage with the
written word. In fact, sports journalists are more exposed to feedback than they’ve ever been, particularly that emanating from people who aren’t in the same demographic. Your typical fellow professional tends to be a
cultured, harmless, cisgendered man, but fans aren’t always any of these things. In fact they are frequently none.
As such, the feedback pool becomes more diverse than ever and makes life even more challenging for them.
Giving here excerpts of an article in The Indian Express published on January 17, 2022. And it reads thus:
Nadia Nadim, Footballer Who Fled Afghanistan As 11-Year Old, Becomes Doctor
Nadia was born in Herat and raised in Afghanistan until her father, an Afghan National Army (ANA) general,
was executed by the Taliban in 2000. Her family then fled to Denmark.
Nadia Nadim, a prolific Danish international with 98 caps under her belt, qualified as a doctor after 5 years of
studying whilst playing football. Last season, she played a crucial role in Paris Saint-Germain lifting the
Division 1 title for the first time in their history, scoring 18 goals in 27 games.
“Thanks to everyone who has been supporting me from day 1, and all new friends I made along the road. I
could not have done it without you, and I will forever be grateful for your support,” she tweeted on January 14.
The story itself was put out on Twitter and was based on a twitter post made by the footballer. It had nothing to do with football per se, but had everything to do with a race called life. And in both the cases, whether it was

International Journal of Advance and Innovative Research Volume 9, Issue 1 (IX) January - March 2022
58
ISSN 2394 - 7780
Nadia’s tweet or the report, the feedbacks are of paramount importance. And it happens every day every minute
after every story is put out into the world wide web.
Technology and its accessibility play an outsized role in this. For many, and especially certain human-rights activists, the Internet has long been considered a rudimentary and collective necessity for modern civil society
as evident through Arab Spring. Western capitalism has moved quickly to try to sell and grow technology — to
make it a fundamental aspect of every industry on Earth, including journalism. Selling smartphones, computers, and network connectivity to everyone wasn’t nearly as difficult as dictating what content they would consume
and at what pace. Everyone who uses social media, then, has become an automatic participant in the business of
content creation and commodification. And as a sports journalist you have to deal with this counter creation
everyday now.
With this at stake, life of a sports journalist has taken a tour of the galaxy and back. And they have returned
with alien skills. Long lost are those days of having a single newspaper delivering your daily news.
Accountability has become a much more complicated term because your opinion columns or front-page takes aren’t the only things people are reading. They are seeing whom you rub shoulder with in the afterhours and
what your political, social and sporting preferences are. They create an opinion about you that is kept hanging
before every word you write.
It’s harder for journalists to get jobs, keep jobs, and stand out within those jobs. It’s no secret that the “game
story” isn’t what it used to be. It will be a shame to just define it by what it’s not, which is an interlocking series
of boilerplate stats and boring quotes while describing the chronology. Rather every story has to be a
commentary; expert observation; an experience in and of itself. In other words a modern version of the old
fashioned action replay that we talked of right at the beginning of this piece.
It can be a multimedia fluffy piece teeming with quotes, gifs, posts, reel and tweets. It can be grave solid
blogpost. It can be an article engraved on newsprint. It can be all these, plus it can also be news. It’s allowed to be intimate and exhilarating, rigorous and investigative, or anything and everything in between. And that is not
a bad thing. Because it makes sports journalism so much more.
And then there is your tyrant—Time. We’ve filtered the process of sports reporting down to a matter of
seconds, rather than a matter of hours, forget days. If your Twitter account for some unforeseeable circumstances run even a few couple seconds behind the action, you’re old news. You have been left behind;
the world has moved on. The discussion that you just analysed has changed its course and topic.
The challenge of sports journalism is to hold, maintain, and build on the high standards of reporting on these shifty sands of time. Instead of working in a hermetic vacuum of facts backed by stats and that old craft of just
reporting, we are all being challenged to think on our feet on how to write that game story, that hit piece, that
think piece that would be sought by the print paper tomorrow and the spunky website tonight. All of this might sound a bit intimidating particularly if one is not ready to swim with the tide. Just don’t be surprised if the
spaces where your bylines glowed suddenly started reflecting names that looked younger energetic and were
ready to do work that was far more nuanced, interesting, and challenging.
At this juncture when the sports journalists were coming to terms with their new found world of nano-second
deadlines and diversely opinionated life that Covid 19 hit.
Paradigm Shift Final Part
Nelson Mandela while referring to sports had said, “It has the power to inspire. It has the power to unite people in a way that little else does. It speaks to youth in a language they understand. Sport can create hope where once
there was only despair.”
Come 2020 when suddenly the world was put on a pause button, these lines seemed more relevant than ever. Everything around us stopped. The skies were blue yet again with no planes cutting across every second. The
grass grew greener under the feet and actually ran wild in most places. The animal world for the first time in
modern era saw their superiors, the ones at the top of the food chain, go into hibernation and took to the streets.
People scurried in and out of their homes to complete the bare essentials dodging through humanity falling ill on roadside curbs and wailing sirens of ambulances. We were scared as a race in face of an unacceptable yet
undeniable obliteration.
Like everything else sports came to a halt. The Maidan, famously called the lungs of Kolkata, the city from where I hail, also turned into a valley of silence, broken occasionally by birds and squirrels, livestock and
horses. You could hear the winnowing wind breeze past the foliage that grew freely after centuries. The trees

International Journal of Advance and Innovative Research Volume 9, Issue 1 (IX) January - March 2022
59
ISSN 2394 - 7780
did not have to toil with smoke and pollution to breathe easy. Suddenly as humanity receded behind closed
doors, nature flourished.
But even in the midst of this rebooting, the cricket and football grounds wore a forlorn look; the boundary lines drawn with slaked lime slowly faded away, the manual scoreboards and club railings gathered dust and rust.
The dressing rooms themselves looked like haunted mausoleums whispering of the fun and gay not so distant in
time.
At least as far back as ancient Rome, spectators have clapped, cheered and booed to encourage the home team
and intimidate the opponents. And the Amphitheatre of the City, Eden Gardens is no stranger to the partisan din
that makes opposition knock their knees in doubt. But with games stopped, players bottled up in their houses,
Eden too gave an eerie, vacuous look that was hard to digest.
Sports Journalists were introduced to the words like bio-bubble, lockdowns, work from home, social distancing,
stay away from locker rooms, no in-person interviews. Journalists lost their games, their track and field, their
grounds and the back room access as the pandemic raged.
The endemic struct at the very root of the news making process for the sports journalists. That was bad for
reporters, yes, but also for teams, athletes and fans in the long run too. People, read fans here, like their heroes
because of their near perfect existence, flaws on and off the ground is received as gratefully as the success. And
with no game time at all how would the pages be filled?
In-person interviews had mostly disappeared. One-on-one sit-downs had become virtually non-existent. Locker
room scrums were replaced by video calls that meant almost nothing. And in-depth interviews? It sounded like
a fairy tale. Unfortunately, these changes also severely hampered the way sports journalists did their jobs and, even more unfortunately, the changes could become permanent. The sports scribes needed to wrap their head
around the problem and find a way. For at stake was their circulation, TRPs and clicks. Barcelona Football club
understood the predicament of the modern sports journalists and in their Barca Innovation Hub talked about
how media and journalists now needed the support of the game and players more than ever.
Innovation is the name of the game and sports journalists innovated with the crumbs they collated throughout
the day. Social reels, tweets, Instagram posts, private fitness videos, small talks about their disciplines,
ruminations and stories on nostalgia, glories forgotten, pride disregarded, stories forgotten filled the pages and portals as the sports journalists took the readers on a fam trip to the backstage of their favourite sporting theatre.
The spotlight was firm on the content and it did not disappoint during the 200 odd days of no sports at all.
But Charles Darwin’s best bet never disappoints. And we found a way to battle back, albeit with some changes that looked more permanent for the recent future. As slowly the world came to terms with the virus and life
began coming back to normality, the world of sport also resumed albeit in bio-bubbles. And with it the second
issue which was more operational reared its head. Sports journalists were used to being on the spot of the event. To cover it from home through a television set or over their smart phones felt cruel. How could one understand
the formation change of a football team from 4-3-3 to 4-1-3-2 without seeing the team operate on the ground.
Now they depended on news that was almost second hand.
Moreover, it was only while interacting with the sports personalities that journalists could churn out interesting stories like the great Michael Jordan wore his Tar Heel powder blue North Carolina practice shorts underneath
for good luck. This gets even better. Quirky facts and stories about world’s one of the most sought after
footballer Cristiano Ronaldo could be possible when a sports journalist purposefully crossed over. Or we would never know that Ronaldo was always the first person to disembark when he travelled to a game by plane and
last one off if transportation to the match required a bus; and that he always stepped on the pitch right foot first
and always did his hair differently at halftime. The fans who worship Ronaldo found peace in these pieces.
Tim Abraham, Senior Lecturer in Journalism, Liverpool John Moores University, in a recent article in The
Conversation on March 31, 2021, states: “Beaten in India, in Test and One Day International cricket, the usual
tour post-mortem for England’s cricketers has got under way, though with a slightly different feel to usual years
given it was the first time in living memory that the cricket media were not part of the winter tours. COVID-19
restrictions prevented UK journalists from travelling, which meant covering the tours back home “off the telly”.
It’s not a situation I faced in my 23 years at Sky Sports. My work relied so much on being with the England
cricket team day-in-day-out, providing daily updates from the camp – at home and abroad. For me, that regular contact was crucial to keep on top of stories and it helped build up trust and familiarity. Reporting is often about

International Journal of Advance and Innovative Research Volume 9, Issue 1 (IX) January - March 2022
60
ISSN 2394 - 7780
being on the front line, where a physical presence counts for so much. It was an approach and work ethic that
served me well in years as a broadcaster.”
With access gone these stories were at stake. But the journalists did find a way out. The tribe realised virtual interviews largely dissolved fear of embarrassment, toxicity, or even harassment for reporters on the job. Locker
room culture could be laden with backstage dialogue that in many cases could be unpleasant and uncomfortable
especially for female reporters. Now that was off the plate. You do your job and disappear with a click.
Come to think of it the video-based interviews, especially of the post-match nature, could now offer new
opportunities for reporters to truly ask the right questions, without having to think of person-to-person relations.
More often than not, traditional post-game interviews were composed of the same batch of generic questions
that air of predictability; questions like “how do you feel your team did out there?” or “how big is this win for
your team?”.
With an intimidating and sometimes angry sportsperson standing at arm’s length, it could be difficult to truly
ask sensitive and thoughtful questions without fear of embarrassment or a hostile response. Over a video call, however, reporters could without fear or favour ask a truly difficult question that they otherwise would feel
uncomfortable posing as a result of the mediated relationship that had been developed over time.
Technologically and logistically it was a nightmare, though. For the television show producers and the ones doing broadcast and live streaming it was a walk through Elm Street in the dead of the night. Explaining this
aspect, Abraham further states: ”For the India series, Talksport gathered its team in London, socially distanced
of course. Cricket editor John Norman says it’s all doable, but ‘you are at the mercy of the TV producer, so the
story they are telling, isn’t necessarily the one you want to tell’.”
Abraham further writing about the handicap the restrictions provided, made his point that it also brought about
the best of the trade: “In many instances this has meant reporters and producers having to go to extraordinary
logistical lengths to provide listeners and viewers with the same level of coverage they have come to expect. The amount of work, for example, that went into getting the BBC’s Test match special on the air for the Sri
Lanka series – with commentators and pundits dotted all over the UK – prompted producer Adam Mountford to
Tweet about how the team work brought out the best of live radio.”
Now let us again fall back on something that we talked about that shaped the paradigm shift the idea of not just sticking to sports. Cross Pollination of news have always happened even if we have failed to recognise it given
the time and age. For example when football star O.J. Simpson stood trial for murder, sports journalism
contributed to the shaping of the story of the trial. But now as the colossal issues of racism, gender equality, and politicization of sports moved on the collision path with the pandemic, readers appeared to be easing up on their
favourite scribes, allowing them to use their platforms for more than just reporting the last game they were
assigned to. Even more positively, the intersection of professional sports and the above issues have now created
a market for intersectional sports journalism that is gift wrapped with humanism.
Diggings into a player psychology keeping in mind Monika Batra refusing to take help of her coach or Simone
Biles withdrawing from her floor final in the Tokyo Olympics or looking into criminalisation of sports with the
arrest and incarceration of two time Olympic medal winning wrestler Sushil gave stories a separate degree of importance. Quinton de Kock refusing to take the knee during the last ICC T20 World Cup or whispers of
racism in Yorkshire cricket are fruits of some good sports journalism that broke boundaries by not sticking to
sports only and gave it a new perspective. These pieces were liked and accepted by the new audience with an
insatiable thirst for the new intermittently bottled up because of the various waves of the endemic.
The jury is still out on this shift in audience perception of non-sports-related discourse from hardcore sports
scribes. Is this content being more accepted and embraced given the holistic global turmoil? Regardless of whether or not that’s actually the case, the diversity that is organically seeping into the sports media landscape
makes for a richer, more unbiased pipeline of information. If not reduced to being mere souvenirs, writers who
are approaching these intricate issues from a sporting lens could radically improve the current straightjacketing
of professional sports.
CONCLUSION
Thus in this paper I have tried to put forward the challenges faced by sports journalists since the turn of the
millennium first through convergence and social media explosion that called for a change in approach and understanding of news and then with covid how the world of sports journalism had changed forever. Cross
pollination has become the name of the game, as sporting schedules were replaced by cancellation notices and

International Journal of Advance and Innovative Research Volume 9, Issue 1 (IX) January - March 2022
61
ISSN 2394 - 7780
when it resumed it had no place for the journalists. Both the legacy news scribes and their digital counterpart
had to innovate first and now reinvigorate that innovation to sustain in these uncertain times.
While the COVID-19 pandemic has definitely undermined the work of an endless number of professionals, but with the secret weapon of information boom through convergence the need of the hour for the sports journalists
is not only to navigate through this transitional new normal, but also making sure they remain factual, ethical,
relevant and most importantly in sync with what’s trending.

International Journal of Advance and Innovative Research Volume 9, Issue 1 (IX) January - March 2022
62
ISSN 2394 - 7780
WIRELESS AND MOBILE COMPUTING: TO SECURE A WIRELESS AND BAND SOLUTIONS
Patel Mahima Rambali and Nadigottu Lavanya Lingaiah
G.M. Momin Women’s Collage, Bhiwandi-421302, MaharashtraBhiwandi-421302, Maharashtra
India
ABSTRACT
Today’s quick growing world desires briskly communication. Technology is creating rapid-fire progress and is creating various effects easier. The innovative ideas that are surfaced from the tender minds of immature
scientists light-emitting diode to the elaboration of diverse ways in which wherever our gift content ‘MOBILE
COMPUTING ‘fits by.
“MOBILE COMPUTING” and Dispatches may be a major a part of wireless communication technology. Mobile shrewd in suggests that shrewd done by intermittently connected druggies UN agency pierce network
coffers. It needs a wireless medium similar as cellular radio, radio nets and low- route satellites. It incorporates
wireless appendages victimization cell technology to attach movable computers with the cabled network. Mobile oral communication is extensively established throughout the globe and had a veritably rapid-fire
increase within the range of subscribers to the colorful cellular networks over the last over and over. Associate
degree extension of this technology is that the capability to shoot and admit information across these cellular
networks. This can be the principle of mobile computing.
Mobile electronic communication has come back a veritably necessary and swiftly evolving technology because
it permits druggies to transmit information from remote locales to alternative remote or fastened locales. This
proves to be the result to the largest downside of business individuals on the move-mobility. We have a tendency to during this paper describes concerning the quality Services design that supports operations by a middleware
finish. Mobile Computing evolved throughout the last over and over as results of shrinking portables and
growing wireless networks. It enlarges the usability of computers, however rises hard to please challenges.
The paper describes concerning the methodology, issues in wireless diligence, and the way J2SE is employed
during this technology. The paper concludes with the execs and cons of this mobile computing and its future.
INTRODUCTION
The most acquainted facet of mobile computing technology is that the hand phone. Regarding twenty years past, a hand phone was massive and was solely used for spoken communication. It had been merely associate
extension of the mounted line telecommunication that allowed druggies to stay to bear with associates.
Currently the hand phone is not solely used for spoken communication; it is also wont to shoot textbook and multimedia system dispatches. Unborn mobile bias will not solely change net access; however also will support
high- speed information services.
In addition to the hand phone, numerous varieties of mobile devices square measure currently obtainable, as an
example, personal digital assistants (PDAs) and pocket personal computers (PCs). Road warrior’s use
Mobile devices to access up-to-date info from the company info. A peace officer at against the law scene could
send a fingerprint picked up there for matching with information during a central info through a wireless
network, thence resulting in quicker identification and arrest of potential suspects. The world positioning system (GPS) is employed in search and rescue missions, for observation and preservation of life, and for vehicle
thieving interference. Although several folks square measure unaware of once mobile computing technology is
being employed, it’s penetrating all aspects of our lives.
What is mobile computing? Merely outlined, it's the employment of a wireless network infrastructure to
produce anytime, anyplace communications and access to info. There square measure several aspects of mobile
computing and, sometimes, completely different terms square measure wont to sit down with them. This chapter offers an outline of what mobile computing needs to provide and the way it improves the standard of our lives.
Later chapters discuss the underlying wireless networks and technologies that create mobile computing
applications doable.
Band Solutions
A band is termed a band is split among ranges from terribly low frequencies (vlf) to very high frequencies (ehf).
Because 2 radio transmitters sharing a similar band cause mutual interference, band usage is regulated.
International use of the spectrum is regulated by the International Telecommunication Union (ITU). Domestic use of the spectrum is regulated by national agencies like the Federal Communications Commission (FCC)

International Journal of Advance and Innovative Research Volume 9, Issue 1 (IX) January - March 2022
63
ISSN 2394 - 7780
within the U.S. restrictive organizations assign every transmission supply a band of operation, a transmitter
pattern, and a most transmitter power.
Bands, Frequency Ranges and Allocations: Very low frequencies (vlf) vary from 3 to 30 kc (kHz). Time signals and normal frequencies are among the
users of this band.
Low frequencies (lf) vary from 30 to 300 kHz. Fixed, maritime mobile and steering systems and radio
broadcasting are among the users of this band.
Medium frequencies (mf) vary from 300 to 3000 kHz. Land, maritime mobile and radio broadcasting are among
the users of this band.
High frequencies (hf) - additionally referred to as shortwaves - vary from three to thirty megacycle per second (MHz). Fixed, mobile, aeronautic and marine mobile, amateur radio and radio broadcasting are among the users
of this band.
Very high frequencies (vhf) vary from thirty to three hundred megacycles. Fixed, mobile, aeronautic and marine
mobile, amateur radio, TV and radio broadcasting, and radio navigation are among the users of this band.
Evolution of Wireless Networks And Services
The first generation (1G) wireless network was analog. the primary in North America was advanced transportable system (AMPS), that was supported frequency division multiple access. a complete of 1664
channels were obtainable within the 824 to 849 rate and 869 to 894 rate band, providing 832 downlink (DL) and
832 transmission (UL) channels. AMPS, wide utilized in North America, supports frequency employ. The
underlying network could be a cellular network wherever a nation-state is split into cells. A base station (BS) at
the middle of the cell transmits signals to and from users among the cell.
The second generation (2G) systems onward area unit digital. Digital systems modify Associate in Nursing
array of recent services like caller ID. The worldwide System for Mobile Communications (GSM) could be a fashionable 2G system. GSM offers an information rate of nine.6 to 14.4 kbps. It supports international
roaming, which suggests users could have access to wireless services even once traveling abroad. The foremost
fashionable service offered by GSM is that the Short Message Service (SMS), that permits users to send text
messages up to one hundred sixty characters long.
2.5G systems support over simply voice communications. Additionally to text electronic communication, 2.5G
systems provide knowledge a knowledge an information} rate on the order of a hundred kbps to support
numerous data technologies, like web access. Most 2.5G systems implement packet switch. The 2.5G systems facilitate give seamless transition technology between 2G and third generation (3G) systems. The subsequent
are 2.5G systems:
High-Speed Circuit-Switched Data (HSCSD): Even though most a 2.5G systems implement packet shift, HSCSD continues support for circuit- switched knowledge. It offers an information rate of a hundred and fifteen
kbps and is intended to boost GSM networks. The access technology used is time division multiple access
(TDMA). It provides support for internet browsing and file transfers.
General Packet Radio Service (GPRS): GPRS offers a speed of 168 kbps. It enhances the performance and transmission speeds of GSM. GPRS provides always-on property, which suggests users don't have to be
compelled to reconnect to the network for every transmission. As a result of there's a most of eight slots to
transmit calls on one device, it permits quite one transmission at one time; as an example, a voice decision
associated an incoming text message are often handled at the same time.
Enhanced Data Rates for GSM Evolution (EDGE): EDGE works in conjunction with GPRS and TDMA over
GSM networks. Its offered rate is 384 kbps. EDGE supports information communications while voice
communications area unit supported victimization the technology on existing networks.
Third-generation (3G) wireless systems square measure designed to support high bit rate telecommunications.
3G systems square measure designed to fulfill the wants of transmission applications and web services. The bit
rate offered ranges from one hundred forty four kbps for full quality applications, 384 kbps for restricted quality applications in macro- and microcellular environments, and a pair of Mbps for low- quality applications in
micro- and Pico cellular environments. An awfully helpful service provided by 3G systems is AN emergency
service with the flexibility to spot a user's location at intervals one hundred twenty five m sixty seven of time.
Figure 1.1 shows the evolution of wireless standards.

International Journal of Advance and Innovative Research Volume 9, Issue 1 (IX) January - March 2022
64
ISSN 2394 - 7780
Initially, the International Telecommunication Union (ITU) meant to style one 3G standard; but, thanks to
variety of difficulties, it's sanctioned two 3G standards. The two standards area unit CDMA2000, that provides
a touch rate of up to a pair of.4 Mbps, and broadband CDMA (WCDMA), that provides a touch rate of up to
eight Mbps. The high bit rate permits new wireless services which will be classified into 3 classes:
1. Information retrieval: It permits location applications to remotely download information from a corporate
database.
2. Mobile commerce: It allows users to pay bills and book tickets.
3. General communication: It permits users to send or receive messages, make or receive phone calls.
Compound wireless service permits users to mix differing kinds of services to hold out specialised functions.
For instance, you'll be able to take a photograph employing a camera phone and send it to follower exploitation the multimedia system message service (MMS). A lot of helpful application would be to mix a home device
with a wireless service so once AN interloper is detected, a photograph of the interloper is captured by the
police work camera and sent to the authorities, whereas the owner is alerted via portable.
A compound service contains a basic wireless service (one that can't be partitioned off into smaller recognizable services), a utility service (one that carries out a operate inside a specific compound service sequence), and
presumably another compound service. For instance, think about a traveler service driver UN agency has got to
deliver a document before an explicit point and he has got to realize the quickest and least engorged route to his destination. He makes use of a route coming up with application on the wireless terminal in his van that consists
of 3 basic wireless services:
1. A location service to determine the location of the driver.
2. A travel route computation to determine the fastest route.
3. Traffic information retrieval to obtain traffic information from many sources.
The compound service consists of continuous iterations of those services: verify this location and supply it to
the wireless terminal, reckon the smallest amount full route from this location to the destination, and retrieve the foremost updated traffic data. It involves death penalty step one and deciding whether or not to repeat step two.
Going back to step one is that the utility service.
TYPES OF MOBILE COMPUTING Mobile computing may be a generic term describing one's ability to use technology whereas moving, as against
moveable computers that are solely sensible to be used whereas deployed during a stationary configuration.
Many types of mobile computers are:
Wearable computer
Personal digital assistant
Smartphone
Carputer
Ultra-Mobile PC
Technical and other limitations of mobile computing:

International Journal of Advance and Innovative Research Volume 9, Issue 1 (IX) January - March 2022
65
ISSN 2394 - 7780
[1] Insufficient bandwidth
Mobile web access is mostly slower than direct cable connections, exploitation technologies like GPRS and
EDGE, and a lot of recently 3G networks. These networks are sometimes on the market inside vary of business
mobile phone towers. Higher speed wireless LANs are cheap, however have terribly restricted vary.
[2] Security standards
When working mobile one is dependent on public networks, requiring careful use of VPNs.
[3] Power consumption
When an influence outlet or transportable generator isn't obtainable, mobile computers should trust entirely on
battery power. Combined with the compact size of the many mobile devices, this usually means that
outstandingly dearly-won batteries should be wont to get the mandatory battery life.
[4] Transmission interferences
Weather, terrain, and therefore the vary from the closest signal purpose will all interfere with signal reception.
Reception in tunnels, some buildings, and rural areas is usually poor.
[5] Potential health hazards
More automobile accidents area unit associated with drivers UN agency were talking through a mobile device.
Cell phones could interfere with sensitive medical devices. There area unit allegations that cellular phone
signals could cause health issues.
[6] Human interface with device
Screens and keyboards tend to be small, which may make them harder to use. Alternate input methods such as
speech or handwriting recognition require training.
1. GH Forman, J Zahorjan - Computer, 1994 - doi.ieeecomputersociety.org
2. David P. Helmbold, "A dynamic disk spin-down technique for mobile computing",
citeseer.ist.psu.edu, 1996
3. MH Repacholi, "health risks from the use of mobile phones", Toxicology Letters, 2001 – Elsevier
Portable computing devices There are many classes of moveable computing devices that may run on batteries however don't seem to be
sometimes classified as laptops: moveable computers, keyboard less pill PCs, net tablets, PDAs, extremist
Mobile PCs (UMPCs) and good phones.
Portable computers
The Compaq Portable; the first portable IBM PC compatible.
A Portable pc may be a general- purpose pc which will be simply enraptured from place to position, however
can't be used whereas in transit, actually because it needs some "setting-up" and an AC power supply. The
foremost known example is that the John James Osborne one. Transportable computers also are referred to as a
"transportable" or a "luggable" computer.
Tablet PC
HP Compaq tablet PC with rotating/removable keyboard
A tablet laptop that lacks a keyboard (also referred to as a non- convertible tablet PC) is formed like slate or a paper notebook, options a touchscreen with a stylus and handwriting recognition software package. Tablets
might not be best suited to applications requiring a physical keyboard for writing, however square measure
otherwise capable of ending most tasks that a normal portable computer would be ready to perform.
Internet Tablet A Nokia N800 Internet tablet
An Internet tablet is an online appliance in tablet kind. Not like a tablet laptop, an online tablet doesn't have a lot of computing power and its applications suite is restricted, and it can't replace a general purpose pc. Web
tablets usually feature AN MP3 and video player, an internet browser, a talk application and an image viewer.
PDA
The Palm TX

International Journal of Advance and Innovative Research Volume 9, Issue 1 (IX) January - March 2022
66
ISSN 2394 - 7780
A Personal digital assistant (PDA) could be a tiny, typically pocket-sized, laptop with restricted practicality. It’s
meant to supplement and to synchronize with a PC, giving access to contacts, address book, notes, e-mail and
different options.
Ultra Mobile PC
An Ultra Mobile PC is a full- featured, PDA-sized computer running a general-purpose operating system
SMARTPHONE A Smart phone is a PDA with integrated radiotelephone practicality. Current smartphones have a good vary of
options and installable applications.
CARPUTER A Carputer could be a machine put in in associate automobile. It operates as a wireless laptop, system, GPS, and
DVD player. Conjointly contains data processing software package and its Bluetooth compatible.
Mobile Computing Application Issues:- The programs utilized in mobile devices like mobile phones, laptops, palm computers, etc. for web property and alternative pc connected activities area unit referred to as mobile computing applications. Numerous the varied
the assorted problems and styles of mobile computing application area unit mentioned underneath various
headings below.
Technical Design
First comes the Technical Design Issues, which consist of network design, capacity planning, response time
calculations, data compression considerations, system availability design and security issues. The technical
design plays a key role in a mobile computing project and offers unique challenges to the system professionals.
Network Design
Issues regarding Wireless Local Area Network design and Wide Area Radio Network Design which network
design comprises are discussed below.
1. Wireless LAN design issues
[7] The number of mobile users who will use wireless Local Area Network and the number of them active
during the peak period.
[8] The varieties of LAN application accessed by them. (Keeping in mind that wireless networks will not be
acceptable for the intended users as they operate at much slower speeds than wired LANs).
[9] Use of notebook with a wireless NIC as a primary and user device.
Wide Area Radio Network Design Issues:-
It is the most appropriate radio network technology for the suite of applications.
Matching of user application- usage profiles to a given network capacity.
Integration of RNA technology with a radio network infrastructure.
Ensuring good coverage & minimum number of dead spots.
System availability Design
Rather than sticking out on with the final base station hardware & network controllers, redundancy & message
switches are usually engineered on fault- tolerant platforms. Public shared network suppliers should be approached for details of their redundancies. MCSS is another important part that badly desires intrinsically
redundancy.

International Journal of Advance and Innovative Research Volume 9, Issue 1 (IX) January - March 2022
67
ISSN 2394 - 7780
Security issues
It is tough to track down securing information by unauthorized access.
Common security breaches of mobile computing applications include,
Network by criminal elements.
Physical breach security at communication centers mainly unmanned base stations.
Interception of credit card authorization over wireless network.
Careful security considerations including on-the-air encryption & firewalls must be used.
Other than technical design the next major issue under Mobile computing application is Ergonomics &
Logistics Design where the designers evaluate the following.
TABLE I. Form factor of end user devices
TABLE II. Battery life
TABLE III. Input method-keyboard, pen, touch or voice
TABLE IV. Ruggedness
TABLE V. Whether Portable or fixed
Mobile computing application deals with the future of computer usage and is therefore of great relevance.
CONCLUSION The world of non-public computing is turning into additional connected. The arrival of the globe Wide internet
has caused AN explosive growth within the population of net users. Everyday new members are part of the
network community. It’s dynamical the manner we have a tendency to work, the manner we predict. Everyday
one reads another story concerning the ``global network'' and also the manner it's dynamical the globe. Major laptop firms have designed entire advertising campaigns around this terribly plan, and also the future promise of
transfer it concerning. Providing on-line services to the house user has become a multi-million dollar business.
The world of computing is turning into additional interactive. The times of batch computing area unit near gone. We got become wont to, and have returned to expect, fast response times. Whilst we have a tendency to move to
an additional suburbanized, remote model of computing our expectations keep an equivalent. In fact, the unfold
of graphical interfaces and multimedia system has solely served to extend our expectations. The result on the
computing world of the graphical, multimedia system based mostly nature of the net stands as testimony to the
present.
The world of computing is turning into additional mobile. Mobile computers have become smaller and
additional powerful each day. However, folks don't need to allow up property for quality.
With the additional connected, additional interactive, additional mobile paradigm comes the requirement for the
fast transmission of programs from an overseas server. The recent and continued advances in network
technology can facilitate alleviate this drawback by providing bigger information measure; however network usage appears to invariably increase to fill the quantity of information measure out there. Additionally, whereas
network technology is up quickly, advances in wireless computing still lag way behind that of wire-based
media.
We additionally showed that the performance of the continual compiler is powerfully smitten by the planning of assorted aspects of the compiler. Specifically, the strategy wont to replace ASCII text file with native code and
also the order within which the interpretation from ASCII text file to native code is applied each have a
powerful have an effect on performance.
REFERENCES
http://www.google.com/
https://www.xplenty.com/blog/multi-clouddata-analytics
https://www.cisco.com/c/en/us/products/collateral/security/stealthwatch/datasheet-c78-739619.html
http://sersc.org/journals/index.php/IJAS

International Journal of Advance and Innovative Research Volume 9, Issue 1 (IX) January - March 2022
68
ISSN 2394 - 7780
DATA VAULT IN BUSINESS HUB 2027
1Ansari Kaniz Amina Murtuza
2Ansari Mariya Asghar Ali and
3Pannati Shruti Venkatesh
Department of M. Sc (It) Part1, University Of Mumbai, Institute for G. M. Momin Women’s College [email protected] [email protected] and [email protected]
ABSTRACT
The population of India day each day growing with the ratio approximate 0.95% Over the next period of time a huge quantity of information will generated through the Business, Education, Share Market, Ecosystem, Health
Department, Crime, Development and Politics etc… and coming period of time most of business comes over the
internet or virtual platform due to Covid-19, pandemic And also there is well modern technology comes in
market. Business is always creating and capturing the value based on business model that representing a method of Creating value for clients and collecting that value in the form of a profit an acquirement in
competitive market. Business will improve process such as to improve; we must change and re-measure again.
Revenue the effectiveness and prestige of the firm. Because in future there are problems facing such as data growth, data integration from various sources, data securing is one of the biggest issue because world is grown
up day by there is a smart city plan, artificial intelligence, robotics, automation, digitalization, internet of
things arrives even all these technology will grown up highly. To managing data, handling in a proper manner and to secure data are big issues in a coming era. To overcome these problem. Data has various source
systems and connections that change regularly. When data comes from several sources or has continually
changing relationships, a data vault gives the biggest benefits. Data vault works effectively for the systems with
these qualities since it makes adding attributes straightforward simple. If a modification is made to only one source system, the change does not have to be reflected in all source systems. Similarly,
because of characterist ics are saved independently from structural data in satell ites, you
may restrict the number of areas where updates are performed. You must be able to easily track back and audit your data. Data vault inherently enables auditing, as load times and
record sources are required for every row. As satelli tes incorporat e the load t ime as part of
the main key, i t keeps a history of all updates. A new record is produced when an attribute is
modified. All of this auditing allows you to quickly provide audit ing capabili ty for regulatory and data governance needs. You can ret rieve data at any point in t ime since you store all of
your history.
Keywords: Business, Data, Accuracy, Time, Models, Technology, Money.
INTRODUCTION
Coming Generation Grown up well with respective virtual platform such as online shopping online payment,
education and extremely data will through the business field to managing and overcome all these problem. Data-driven organizations with a clear picture of their data may utilize it to drive change, remove inefficiencies, and
swiftly adjust to market or supply changes throughout the world. And, as business environments become more
turbulent, these businesses require enterprise data infrastructures to be resilient. flexible and adaptable to the
dynamically changing world around us. One common challenge with dimensional and normalized data modeling techniques is that they were not designed to respond to fast changes. Data Vault modeling helps to
address this challenge and equips organizations with superior flexibility for their analytics. Data vault is a
detail-oriented data modeling strategy that keeps track of data across time and in relation to its history. When data volumes expand dramatically and data environments become more sophisticated and dispersed, it provides
companies with greater agility and flexibility. They will be able to use their data to make better educated
business decisions if they can overcome these difficulties in their data model. A data vault model, sometimes known as a data vault, is a method of organizing data that isolates structural information from its properties,
such as a table's unique identifier or foreign key associations. It was designed to provide for the storing and
auditing of historical data, parallel loading, and scalability for businesses with many source systems without
requiring a complete redesign of the solution. It offers flexibil ity and readily expands, making it ideal for expanding enterpr ises that would ordinar ily face frequent redesigns of their data
solution.
DATA VAULT METHODOLOGY Data vault have served the purpose of providing a source of value-added information for quite some decades. In
supporting business users in their day-to-day operations, data warehouses integrate multiple sources used
throughout the organisation, track history for Knowledge improvements, Auditing and Compliancy, and provide

International Journal of Advance and Innovative Research Volume 9, Issue 1 (IX) January - March 2022
69
ISSN 2394 - 7780
the business with an easy-to-access and easy-to-explore insight layer. While kimball or inmon approaches are
commonly used to model data warehouses, data vault is also a viable option.
The archetypal modelling technique used by Data Vault, which involves Hubs, Links, and Satellites, is well-
known. A project methodology, architectures, and implementation recommendations are also included.
DATA VAULT METHODOLOGY
The following layers would be included in a minimalist approach to Data Vault.
A STAGING area is used as a pre-processing step to reduce the load of retrieving data from source systems
and to aid in feeding the data vault layer (already implementing some constraints). Staging is simply used as
a means of transit; no history is recorded here.
Hubs, Links, and Satellites were used to model the Data Vault Layer. Its main goal is to keep track of
changes and provide a consistent access layer. Business logic (such as business interpretations and additional calculations) are not located in this layer, contrary to what you may assume given the layer that
holds your'single source of truth.'
Business users are presented with an Information Layer. (Kimball) star is one example.
DATA VAULT MODELING The data vault layer' is the throbbing heart of your information in a Data Vault oriented data warehouse. It
stores all of the data that your company has ever collected and organises it into three categories: Hubs,
Satellites, and Links.
The goal of this layer is to log every change of attribute in your source systems and offer a consistent 'basis' on
which succeeding objects (e.g., kimball-oriented layer, data/information marts, olap cubes) are formed. The
three different types of tables that support the data vault layer have the following functions.
UBS Identify records (customers, products) in a unique way across the organization's systems (and even outside of
it). This object contains only the (hash of this) unique key, as well as certain technical logging columns.

International Journal of Advance and Innovative Research Volume 9, Issue 1 (IX) January - March 2022
70
ISSN 2394 - 7780
LINKS Relationships between hubs' objects are modelled. Every relationship is portrayed as a many-to-many to
promote flexibility and enable changing business processes. These could be alliances, hierarchies, or
redefinitions of business terms.
SATELLITES
The validity of each historical observation is registered in this object, which tracks all history connected to the unique record in the hub or the attributes of by utilising a start and end date. These objects are frequently very
broad (= many columns) since they contain all properties connected to the hub or link.
DATA VAULT DATA ORGANIZATION AND FLOW
The Data Vault is based on the tried-and-true Input, Store/Process, and Output method.
These Steps and Structures / Zones are where the data flows:-
SOURCES OF DATA
Data originators, such as application databases, cloud providers, the internet of things (IOT), and data brokers.
STAGING When entering the data vault, the data is first saved in this section. The data is saved in the same format as when
it was first entered into the data source.
THE RAW VAULT
The heart of the data vault, where raw data (like the data source) is saved and formatted so that history may be
preserved. For further information about the raw vault, see the section below.
BUSINESS VAULT
Business rules were applied to data supplied from the raw vault in order to fit it to business demands. Reference
data can be added to data.
INFORMATION MARTS
Information marts are used to transmit information to end-users in the Data Vault architecture. Information
marts are databases that give data to business users in the form of dashboards and reports.
BUSINESS INTELIGENCE
Reports, Dashboards, and Data Visualizations are used to provide business insights.
DATA SCIENCE:-
Artificial intelligence (AI) and machine learning (ML) techniques are used to process data in a flattened or
graph style.
SERVICES:-
APIS is used to gain access to data. For instance, a web service could be utilised to acquire current account
information for a consumer.
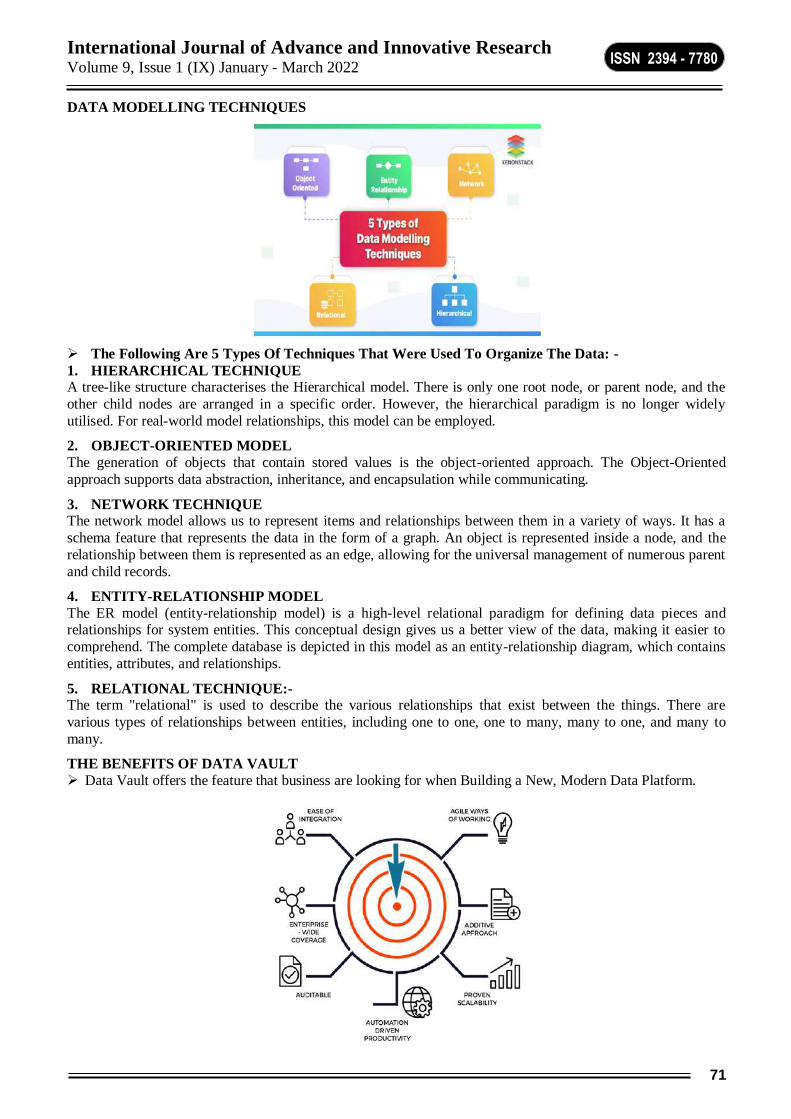
International Journal of Advance and Innovative Research Volume 9, Issue 1 (IX) January - March 2022
71
ISSN 2394 - 7780
DATA MODELLING TECHNIQUES
The Following Are 5 Types Of Techniques That Were Used To Organize The Data: -
1. HIERARCHICAL TECHNIQUE A tree-like structure characterises the Hierarchical model. There is only one root node, or parent node, and the
other child nodes are arranged in a specific order. However, the hierarchical paradigm is no longer widely
utilised. For real-world model relationships, this model can be employed.
2. OBJECT-ORIENTED MODEL
The generation of objects that contain stored values is the object-oriented approach. The Object-Oriented
approach supports data abstraction, inheritance, and encapsulation while communicating.
3. NETWORK TECHNIQUE The network model allows us to represent items and relationships between them in a variety of ways. It has a
schema feature that represents the data in the form of a graph. An object is represented inside a node, and the
relationship between them is represented as an edge, allowing for the universal management of numerous parent
and child records.
4. ENTITY-RELATIONSHIP MODEL
The ER model (entity-relationship model) is a high-level relational paradigm for defining data pieces and relationships for system entities. This conceptual design gives us a better view of the data, making it easier to
comprehend. The complete database is depicted in this model as an entity-relationship diagram, which contains
entities, attributes, and relationships.
5. RELATIONAL TECHNIQUE:- The term "relational" is used to describe the various relationships that exist between the things. There are
various types of relationships between entities, including one to one, one to many, many to one, and many to
many.
THE BENEFITS OF DATA VAULT
Data Vault offers the feature that business are looking for when Building a New, Modern Data Platform.

International Journal of Advance and Innovative Research Volume 9, Issue 1 (IX) January - March 2022
72
ISSN 2394 - 7780
A. AGILE WAYS OF WORKING
The greatest difference between using Data Vault 2.0 to develop a new Data Platform and using Data Vault 2.0
to construct a new Data Platform is that it supports an agile project strategy by default.
Whereas in the past, executives tasked with modernising their data platform would have been trapped into a
lengthy and costly process, data vault 2.0 allows initiatives to be broken down into manageable chunks rather
than large, 12- to 18-month-long undertakings. Engineers can now configure one specific aspect of a system at a
time, adding new data sources in a stepwise manner, thanks to the new agile working methods.
B. ADDITIVE APPROACH
Indeed, by utilising data vault in this fashion, firms can begin with a small-scale data warehouse that can be
built upon – and expanded upon – in an evolutionary manner, resulting in less overall disturbance. Many of the
dangers associated with "big bang" migrations can be avoided by migrating in stages.
C. PROVEN SCALABILITY
When you choose data vault 2.0, you can be assured that you're using a tried-and-true solution that can handle
anything from gigabytes to petabytes of data.
As a result, no matter how big your organisation – and the data it generates – gets, your data platform can keep
up without requiring any architecture changes.
D. AUTOMATION DRIVEN PRODUCTIVITY
Another significant benefit is the increased productivity that data vault 2.0 will enable you to attain while also
saving money. Working methods in the Data Vault are "Templatable," with standardised processes driven by
metadata and well-defined and validated models. Between 80 and 95 percent of the ETI required for loading
data into the data vault can be generated automatically.
E. AUDITABLE
To fulfil rising privacy and security concerns, as well as industry standards, most firms must ensure that their
data is maintained in such a way that its source can be fully traced..
LIMITATIONTS
To create data Marts in Data Vault, you'll need a number of JOINS.
Bridge tables can be useful.
Data vault, like 3nf, is unsuitable for direct querying.
Use a derived data mart to make a query.
De-normalization necessitates the use of additional Storeg.
It is preferable to use Low-Cost Storage.
Architects can automate aspects of the model to minimise time-consuming manual chores during the
modelling process, making it more efficient to design, update, and maintain over time.
CONCLUSION
For reasons such as agility, flexibility, and scalability, the data vault proves to be an outstanding option for
the data warehouse.
The model's data vault design makes it ideal for storing massive amounts of data.
The data vault for scientific repositories has been modelled, and the usage of the data vault has provided
benefits in terms of security, storage, and other factors.
The data vault should be effectively overcome by understanding the business and user needs and developing
more cost-effective solutions in accordance with the requirements.
Data Vault has a lot of the functionality that companies want in their data platform modernization efforts.
Data vault is a developing community of professionals, trainers, and users who are prepared to discuss their
concerns and challenges.
It's possible to make "rookie" mistakes when learning a new method, therefore some professional training
and guidance is recommended.

International Journal of Advance and Innovative Research Volume 9, Issue 1 (IX) January - March 2022
73
ISSN 2394 - 7780
Data Vault has a lot of the functionality that companies want in their data platform modernization efforts.
In addition to Data vault, there is a growing community of specialists, trainers, and users, such as the Data
Vault Alliance, who are willing to share their experiences and knowledge, so you will not feel your
difficulties and challenges are unique
It's possible to make "rookie" mistakes when learning a new method, therefore some professional training
and guidance is recommended.
Many companies receive assistance in developing their business case and running a prototype to
demonstrate what's possible, allowing them to make the case for enhancing, creating, or replacing existing
data platforms, as well as fast improving their BI and analytics capabilities
As more on-premise data warehouse projects migrate to the cloud, more businesses are rethinking their data
warehouse architecture. The transition from numerous independent on-premise data silos to a modern cloud-based solution is a once-in-a-lifetime chance to bring data from across the company together in a
single, uniform repository.
RESULTS Data Vault distinguishes between raw and business-derived data, and it accommodates changes brought on by
both the source system and business regulations. Data Vault makes data lineage easier by including metadata
that identifies the originating systems. The Business Vault stores the results of business rules, including
reduplication, conforming results, and even calculations. When results are calculated for two or more data
marts, this helps avoid duplicate computation and associated inconsistencies.
Architects can automate aspects of the model to save time-consuming manual chores during the modelling
process, making it more effective to design, update, and maintain in the long run. When compared to other ways – such as tables and columns – Data Vault's approach to data modelling results in a substantially larger number
of data objects. This is due to the fact that Data Vault distinguishes between different sorts of data. As a result,
the upfront modelling effort may be greater than with other approaches, but the benefits of data handling will be realised. It also means that there may be a greater number of manual or mechanical chores involved in creating
the flexible and complete data model with all of its components during the modelling process.
One of the purposes of the Data Vault architecture's flexibility is to be able to easily establish and re-build
Information Marts, as well as to ensure that the data in numerous marts is calculated consistently. The frequency with which you rerun the aggregate is up to you and your company needs. It's possible that the re-aggregation
should be triggered whenever a record for a specific employee is updated, or maybe simply once a quarter?
REFFRENCES
Https://www.macrotrends.net/countries/IND/india/population-growth-rate
Https://simplicable.com/new/business
Https://www.datacenterdynamics.com/en/opinions/data-vault-modeling-can-improve-business-performance/#:~:text=Organizations%20that%20are%20data%2Ddriven,to%20market%20or%20supply%2
0changes.

International Journal of Advance and Innovative Research Volume 9, Issue 1 (IX) January - March 2022
74
ISSN 2394 - 7780
A STUDY ON SOCIAL MEDIA AND IT’S IMPACT ON TEENAGERS
1Aditya Tiwari,
2Sudeep Poojary,
3Shyam Prajapat,
4Prathamesh Dhawan and
5Siddharth Chawan
Bunts Sangha’s S.M. Shetty College Of Science, Commerce & Management Studies [email protected], [email protected], [email protected],
[email protected], [email protected]
Mentor
Asst. Prof. Ashish Navik
Bunts Sangha’s S. M Shetty College of Science, Commerce and Management Studies
ABSTRACT One of the best innovations of Mankind is Technology. Technology improvements were a blessing to human
beings, and today, computer systems and cell gadgets have grown to be part of our lives. Social media makes a
extensive contribution online training that connects a set of human beings specially young adults to engage and alternate their knowledge. Sadly, our young adults and children have taken on the usage of social media to the
volume that it could have a very intense consequences on their common wellbeing if now no longer supervised
or restricted. But right here is the massive question- is social networking really a boon or bane? The fast adoption of social community sites via way of means of young adults in India and in lots of different
international locations round the arena increases a few vital questions. This paper throws a light on pattern of
social media usage and its impact on teenagers.
Keywords: Social media, Teenagers, Impact, Communication and Health.
INTRODUCTION
Social networking is an online interaction sites that manages to build and connect people with a shared interest.
The word “Social media” means collection of applications (Facebook, Twitter, WhatsApp, LinkedIn, or YouTube etc.) and websites that connect people to share information and aware people about any event through
social media. Some sites cater to diverse audiences while others attract people based on their common language
or national –based identity by making their own blog in the web. According to the latest Facebook figures,
WhatsApp has more than 2 billion users. WhatsApp has added 1 billion new users over the last 4 years (2016-
2020). This makes India the second largest country to be active on social media.
Moreover, these sites are becoming so popular in the status because it continuously attracts many people
especially teenagers since their interests are being catered by these websites. Besides, virtual communication it also enhances people’s friendship and love relationship. Teenagers also use social media for learning purpose,
for entertainment, and for innovation. Social media is like virtual world without limitation of boundaries and
where no matter whether you are rich or poor or old or young everyone is a frenzy when it comes to socializing.
STATEMENT OF OBJECTIVES
To understand why teenagers, use social media.
To what extent social networking sites are affecting on teenager’s studies.
To identify the effects of social networking Sites on personal life of teenagers.
To explore the impact of SNS on teenagers.
RESEARCH METHODOLOGY
For the purpose of the study the researcher(s) made use of primary and secondary data. Primary data has been
collected using a simple random sampling method. Questionnaires was framed and data collected using google forms as a tool of collection. Google forms were floated randomly on various groups and responses were
received from the targeted group of respondents. Secondary data was collected through various websites,
journals, previous articles and research papers. The sample size is 76.
LITERATURE REVIEW
Literature review provided the results of previous studies relating to the topic and it helped to select appropriate
objectives and methodology for further enhancement on the topic.
According to Child Mind Institute, A survey performed through the Royal Society for Public Health requested
14–24-year-olds in the UK how social media structures impacted their fitness and wellbeing. The survey

International Journal of Advance and Innovative Research Volume 9, Issue 1 (IX) January - March 2022
75
ISSN 2394 - 7780
consequences located that Snapchat, Facebook, Twitter and Instagram all brought about extended emotions of
depression, anxiety, bad body image and loneliness. Some expertise worry about teens than they have anxiety
and have lower self-esteem because of Social Media and Texting. Some threats which are on social media is Cyber bullying, imposter syndrome Stalking and being Ignored. Now what should parents do? The best thing
that parents can do to minimize the risks associated with technology is to impose a restriction on their own
consumption first. It’s up to parents to set an awesome instance of what healthy pc utilization looks like.
According to The Lancet Child & Adolescent Health: Teenagers is a period of life characterized by increased
sensitivity to social stimuli and an increased need for interaction with same age group. Globally mandated
physical distancing measures to prevent the spread of COVID-19 have radically reduced opportunities for
young people to have face-to-face social interaction outside their homes. In light of this interdisciplinary perspective, we use literature from a variety of disciplines to emphasize how widespread teenager’s social
deprivation can be. Human studies show the significance of peer reputation have an impact on in adolescence
However, given the widespread availability of digital social interactions through technologies such as social
networks, reducing face-to-face contact with adolescents may not be as harmful.
According to mayo clinic, social media has a lot of benefits. It allows a person to create an online identity,
communicate with other people and make social networks. Social media is also used for entertainment and self-
expression.
Teenagers’ impulsive behaviour also risks their privacy on social media. Social media affects teens negatively
as well by distracting them, disrupting their sleep, and exposing them to bullying, rumour spreading, unrealistic
views of other people's lives and peer pressure.
According to Newport Academy, Depression among teenagers has increased over the past decade. According to
a survey of adolescents in the US, rates of suicide and depressive symptoms among teenagers (especially
females) increased between 2010 and 2015.Studies show that people who are more active on social media tend to have mental health problems. In a 2018 study, people between the ages of 14 and 17 who spent 7 hours a day
on social media reported depression, were treated or prescribed by a psychologist for other mental disorders,
mental or behavioural medications. This is compared to people who spend only one hour a day in front of the
screen. However, several studies on social media and depression in adolescents suggest that the causal relationship is reversed. This means that when teens are depressed, they will look at social media more often.
Whatever the reason, many young people with depression consciously and actively use social media and other
digital tools to protect and promote their happiness.
According to Duncan J. 2003, social media are computer-mediated technology that permit the growing and
sharing of information, ideas, profession pursuits and different types of expression through digital groups and
networks. The variety of stand-alone and integrated social media offerings presently to be had introduces the
demanding situations of defining
PRIMARY DATA AND ITS INTERPRETATION
The Primary Data Was Collected Using Sample Survey Technique. The Questionnaire Comprised Of 13
Qualitative Questions.
1. Majority of the respondents belonged to the age group of 18-19 years.
2. From all our 76 respondents 60% are Male whereas 40% are Female.
3. According to our research, Instagram, WhatsApp and You Tube were the most used social networking sites
by teenagers.
4. We analysed that 46.1% of teenagers have 1-3 hours of average screen time on these social media and
around 34.2% teenagers have an 3-5 hours of average screen time, there is a minority of teenagers who have
screen time of 5+ hours.
5. We realised that most of the people use these sites to keep up with new trends, to contact with
family/friends, to interact with new people and to feel a sense of belonging.
6. Around 47% of the teenagers feel that social media has affected their relationship with friends and family, around 30% of the teenagers feel that their relationship isn’t affected by social media and 22% of the
teenagers aren’t sure about the effect of social media on their relationship.

International Journal of Advance and Innovative Research Volume 9, Issue 1 (IX) January - March 2022
76
ISSN 2394 - 7780
7. Around 48.7% of teenagers feel like their sleeping pattern is affected by social media, 34.2% of teenagers
feel like their sleeping pattern isn’t affected by social media and 17.1% of the teenagers feel like their
“maybe” affected.
8. 46% that is the majority of people do not feel threatened to post because of other people’s reaction whereas,
38% feel threatened to post on social media.
9. 46% of teenagers change their opinion because of the peer pressure on social media, 31% of teenagers do not care of others opinion and remaining teenagers are not sure that they are getting influence or not by the
social media.
10. 56% feel that they are getting distracted by social media while doing some important work, 28% of
teenagers do not get distracted and 14% of teens aren’t sure about getting distracted by social media.
11. The emotions experienced by the teenagers are Happiness, jealousy, sadness, rejection and some teenagers
also feel inspired by these sites.
12. Around 42% of teenagers consider themselves they are not addicted to social media and 40% of the
teenagers which is very high numbers consider themselves addicted to social media.
13. 67.1% which is the majority of our respondents experienced both positive and negative impact from social
media,17.1% think they have been positively impacted and 11.8% are not at all impacted from social media,
3% which is the minority feel that there is a negative impact of social media on their life.
CONCLUSION
As per the survey conducted by us, we conclude that, there was a large number of teenagers who admitted that
they were addicted to social media which isn't a very good sign. As teens the element of feeling a sense of social belonging is very common and necessary. Social media does a very good job in providing that element
but the problem starts when there is no moderation. This problem then translates into disturbing the sleeping
pattern, change in opinions because of peer pressure, creating a glittering online identity, distraction from important work, opening oneself to online bullying and disrupting the line between the real and online life.
Prominent apps like Instagram, WhatsApp and YouTube does a very good job of providing happiness,
motivation and sense of belonging but the emotions like jealousy, sadness and rejection are also available to the
consumers. A teenager should be aware that social media is a product of a company and these free apps / social media sites may appear free to majority but only a few realize that they are paying for it in "attention". This
realization is important to protect oneself from addictive nature of social media.
REFERENCE 1. Child mind institute article refers, https://childmind.org/article/how-using-social-media-affects-teenagers/
on 10/01/2022.
2. Newport article refers, https://www.newportacademy.com/resources/well-being/effect-of-social-media-on-
teenagers/ on10/01/2022.
3. Mayo clinic article refered, https://www.mayoclinic.org/healthy-lifestyle/tween-and-teen-health/in-
depth/teens-and-social-media-use/art-
20474437#:~:text=Social%20media%20harms&text=Another%202019%20study%20of%20more,and%20d
epression%20or%20anxiety%20symptoms on11/02/2022.
4. The lancet and adolescent child for impact
https://www.sciencedirect.com/science/article/pii/S2352464220301863 on 11/02/2022.
5. Researchrefences
https://www.researchgate.net/publication/311104510_EFFECTS_OF_SOCIAL_MEDIA_ON_YOUTH_A_
CASE_STUDY_IN_UNIVERSITY_OF_SARGODHA on 5/01/2022.

International Journal of Advance and Innovative Research Volume 9, Issue 1 (IX) January - March 2022
77
ISSN 2394 - 7780
A STUDY ON CONSUMERS PREFERANCE TOWARDS GREEN PRODUCTS
1Khushi Bangera,
2Roshani Jaiswal,
3Riddhi Patel,
4Sameeksha Shetty and
5Vinisha Uchil
[email protected], [email protected], [email protected], [email protected] and [email protected]
Mentor
Asst. Prof. Ashwini Devadiga Bunts Sangha’s S. M Shetty College of Science, Commerce and Management Studies
ABSTRACT
This research attempts to understand the consumer’s behavior towards purchasing green products. In this research we will find the different aspects about how people think when it comes to purchasing green products.
Making our world a better place to live for our upcoming generation is the motive of our young generation and
this can only be possible if we start using more of products which are best suitable for our environment. Most of the people that participated in the survey were the people of young mindsets. Green products are usually
identified by having two basic goals – reducing waste and maximizing resource efficiency. They are
manufactured using toxic-free ingredients and environmental-friendly procedures and are certified by recognized organizations like Energy star, Forest Stewardship Council; etc.They can be used in the sectors of
the conser goods, industrial goods and services.
Keywords: Green products, environment friendly, resource
INTRODUCTION Green product is a product which has minimum impacts on the environment and is sustainable in nature. Rachel
Carson's mention in the book silent spring in 1962 about her prediction that pesticides like DDT are not only
hurting people but also animals and environment and ten years later when Carson's book released, DDT was no
longer allowed to be used in the United States.
April 22nd became Earth Day to focus this energy and draw more attention to environmental issues. Consumers
today are more concerned about environment
STATEMENT OF OBJECTIVES
This research is conducted to accomplish the following objectives:
1. To analyze the factors influencing consumers to buy green products.
2. To understand the issue and challenges of green marketing practices
3. To explore the level of awareness of Indian consumers about green products.
4. To measure the green values of customers.
RESEARCH METHOD USED Qualitative research method is used to know the consumer preferences towards green products. Primary data
was collected through survey method. Information collected through consumer survey is utilized for further
analysis.
Data was collected from 100 respondents. Secondary data were collected from published sources like textbooks,
journals, articles, research report, internet, etc
REVIEW OF LITERATURE
Green marketing came into prominence in the late 1980s and early 1990s. The first book titled Ecological Marketing was the outcome of first workshop on “Ecological Marketing”, held by American Marketing
Association (AMA) in 1975.
There has been occurring about green consumers and green consumerism in 1970s and 1980s. According to prof. (Akehurst M, 2012) in the workshop held by American Marketing Association in 1974, green marketing
was defined as the study of positive and negative aspects of pollution and depletion of energy sources.
As per prof (Polonsky M, 1994) green marketing consists of all planned activities to generate and facilitate
exchanges in order to satisfy human needs and desires with the least possible impact on the environment. According to prof Peattie and Charter (2003) defined green marketing as the holistic management process
responsible for identifying, anticipating and satisfying customer needs in a profitable and sustainable manner.

International Journal of Advance and Innovative Research Volume 9, Issue 1 (IX) January - March 2022
78
ISSN 2394 - 7780
According to (Weiner and Doescher, 1991 Green consumerism was described as a form of “pro-social”
consumer behavior. There are several issues and challenges identified by various researchers with respect to
Green Marketing (Welling and Chavan, 2010). According to prof (Renfro L A, 2010) practicing green marketing initially may prove to be a costly affair as it encourages green products/services, green technology
(procuring new technology or modification of existing technology), green power/energy which requires a lot of
money to be spent on R&D programs.
High amount of money is required in marketing promotions to create awareness regarding green products and
their uses. Many customers do not care or are not willing to pay a premium for green products which may affect
the sales of the company. It requires the companies to extensively communicate the presence and benefits of
green marketing to the customers by means of various tools available for integrated marketing communication. Eco-labeling is a good way to convince the customers regarding green products.Consumers might be willing to
pay premium price if they see additional benefit (such as quality, environmentally safe product, fuel-efficient
vehicles, and non-hazardous products) attached with the product. According to prof Mendleson N, Polonsky M J,(1995) A strong willingness is shown by consumers to favor environmentally conscious products and
companies as per various opinion polls taken in US and elsewhere, however action to do so in reality are
debatable.
The green products are not as high as expected even after a huge interest in marketing by researchers and
organization.
PRIMARY DATA AND ITS INTERPRETATION The primary data was collected using sample survey technique. The questionnaire comprised of 15 qualitative
questions. The total number of respondents was 100
1. The first question which was asked in the survey was gender and the responses received from the
respondents who participated comprised of 71% belonging to the female category and 29% belonging to
male category
From this we can conclude that majority of the respondents belonged to the female category as compared
to male.
2. The Second question which was asked in the survey was age and the responses received from the respondents who participated comprised 80% belonging to the age group of 18-25, 7% belonging to the age
group below 18, 6% belonging to the age group of 25-35 and 3% belonging to the category of 35-45 and
45-55.
From this we can conclude that majority of the respondents belonged to the age group of 18-25.
3. The third question was related to educational status and the responses received from the respondents who
participated in the survey out of which 61% belongs to the undergraduate category, 18% to the graduate
category, 11% were higher secondary and 5% belonged to the secondary and post graduate category.
From this we can conclude that the majority of the responses were from the undergraduate category.
4. The responses that were received from the 4th question had 98% of the respondents agreeing to the fact that
green products exist in the market on the other hand, only 2% denied to the fact that green products existed.
From this it can be concluded that majority of the people know that green products exist.
5. The fifth question had 10 options out of which the responses that were received from the respondents had
majority of 23.36% stating that they get to know about green products through social media, 16.42% from websites, 12.04% from blogs, 10.95% from friends, 8.39% from family, 8.03% from
subscriptions/magazines/newspaper, 7.66% from school, 5.47% from groups, 5.11% from the retail i.e. at
the point of purchase while the remaining 2.55% do not find it necessary to search information about green
products.
From this we can interpret that many people know what are green products and find it important to seek
more information about them.
6. In this sixth question out of the total respondents who participated in the survey 99% agreed that green
products helps save resources and manage waste while 1% disagreed that it does not.
From this we can conclude that almost all respondents think that using green products can help us save
the environment and conserve resources

International Journal of Advance and Innovative Research Volume 9, Issue 1 (IX) January - March 2022
79
ISSN 2394 - 7780
7. The seventh question had responses where 57% respondents choose yes as an answer that green products
are not easily available in the market. On the other hand, the remaining 43% believed that green products
are easily available.
8. Out of the total respondents who answered the 8th question 88% disagreed that green products has less
benefits while 12% agreed that green products has less benefits.
From this we can see that people are aware about the benefits that they can get by using products that
are environment friendly.
9. The responses that were received from this question was surprisingly equal i.e. 50% respondents think that
green products are costly while 50% do not think that they are costly.
10. The 10th question had altogether 5 options out of all the respondents who participated in the survey 68.50% think that green products are used to protect environment, 11.02% think they use green products because it
is available easily, 9.45% think they use green products as they are more affordable whereas 10.24% of the
respondents have never used environmental friendly products.
11. Out of all the respondents who participated in the survey 26.6% think that it is extremely important that
their home cleaning products should be environment friendly, 41.41% think it is important while 32.32 %
do not care whether its green product or not while purchasing home cleaning products
From this it can be concluded that the responses varies from individual to individual when it comes to
make use of environment friendly products
12. The next question that was asked in the survey received 49.9% respondents stating that they haven’t heard
about the concept of green building, 33.33% stated that they heard it from television, 5.05% from the builders, 6.06% from home shows, 3.03% from some real estate agent, 1.01% from the suppliers while the
remaining 2.02% heard from the social media and sustainable architects.
From this it can be concluded that most of the people know about green building and its concept to
protect environment.
13. The next 13th question had multiple choice option to select from and out of the total respondents that
participated in the survey 35.85% think the marketing element which influenced them to buy green products
was promotion, 25.16% think that it was price, 24.53% think that it was package while the remaining
14.47% think the element that influenced them to purchase green product was price.
From this we can conclude that the preferred marketing element that made the consumers to buy green
products was promotion. 14. The majority of the responses that was received from the 14th question had 98% agreeing to the fact that we
should start using green products while 2% denied to the fact that we should avoid using more of green
products.
From this it can concluded that most of the respondents were in the favor that we should all start to use
products which can protect the environment and make it a better place to live.
15. The last question consisted of 2 options and out of the total respondents who participated 56.90% have used
recycled and recyclable cutlery whereas 38.79% have used biodegradable garden pots and the remaining
4.31% have not used any green products so far.
CONCLUSION AND RECOMMENDATIONS
This study statistically proved that level of age, education has influence the perception on green products. The study has concluded that consumers have positive impact on green products. The people are having higher
levels of income and education has more knowledge of environmental issues and green products. This has
conversely reveals that the level of education has impact on the choice of the green house hold products in the
consumers.
From the above analysis, it can be concluded that though majority respondents claim to be aware of green
products, but the awareness seems superficial and over-claimed. The deeper analysis reveals clearly that
majority respondents, who claimed to be aware of green products, actually did not know as to what green products constitutes, exactly. Furthermore, the respondents did not understand that buying green products also
contributes towards environment protection. The study also shows that people in general have lot of concern
and strong desire to do something towards environment but they did not know how they can contribute. Hence marketers and Government cannot be individually held responsible but environmental protection agencies,
media, must create awareness about green products as a mean to save the environment. Marketer should take

International Journal of Advance and Innovative Research Volume 9, Issue 1 (IX) January - March 2022
80
ISSN 2394 - 7780
initiative keeping in the mind that consumer are concerned and willing to do their bit towards environment
protection. Marketers by satisfying this urge and desire of consumer towards environment through effective
promotional strategies to educate them about green products, their usage and resultant impact on the environment protection will in long run help enhance their goodwill and building strong brand image in the
eyes of consumers. Similarly the study points towards the need for an active role on the part of government and
various stakeholders in educating the consumers towards being a green consumer.
LIMITATIONS
The Study has certain limitations. The area of study was conducted was limited only to few areas of Mumbai.
Therefore, the results of the study are specific to only that particular area and cannot be applied or utilized at a
general or broader level. The future research in this direction may be undertaken covering a larger area. The
study is conducted within the tenure of 3 weeks it may not be applicable afterwards
REFERENCES
Akehurst, G., Afonso, C., & Gonçalves, H. M. (2012). Reexamining green purchase behavior and the
green consumer profile: new evidences. Management Decision, 50(5), 972-988 on 9/01/2022
Polonsky, M. J. (1994). An Introduction to Green Marketing. Electronic Green Journal,Issue # 2 UCLA
Library, UC Los Angeles. http://escholarship.org/uc/item/49n325b7 on 10/01/2022
Renfro, L. A. (2010) Green Business Operations and Green Marketing. Gatton Student Research
Publication. Vol. 2, No.
2.https://www.researchgate.net/publication/235356505_Environmentally_responsible_purchase_behaviour
_A_test_of_a_consumer_model#:~:text=Green%20Marketing%20and%20Consumer%20Scepticism%20in
%20Emerging%20Economies on 11/01/2022
Mendleson, N. and Polonsky, M. J. (1995). Using Strategic Alliances to DevelopCredible Green
Marketing. Journal of Consumer Marketing. Vol. 12, No.2, pp. 4 – 18 on 12/01/2022
Juwaheer, T. D. (2005). Emerging Shades of Green Marketing Conscience among the Population of a
Small Island Economy-A Case Study on Mauritius.
Source:http://irfd.org/events/wfsids/virtual/papers/sids_tdjuwaheer.pdf on 13/01/2022

International Journal of Advance and Innovative Research Volume 9, Issue 1 (IX) January - March 2022
81
ISSN 2394 - 7780
CYBER SECURITY: CRYPTOGRAPHY AND STEGANOGRAPHY TECHNOLOGY - TWO SIDES
OF MIRROR FOR SECURING ANY TYPE OF INFORMATION IN DIGITAL WORLD
1Mr. Rupesh Sudhakar Patil and
2Dr. Tushar Vinayak Sambare
1(Research Scholar, Shri Jagdishprasad Jhabarmal Tibrewala, University), Department of Computer Science,
Bunts Sangha's S. M. Shetty College of Science, Commerce and Management Studies, Powai, Mumbai,
Maharashtra
2(Research Supervisor, Shri Jagdishprasad Jhabarmal Tibrewala University), (B.Sc. (It) & M.Sc. (It)
Coordinator), Bunts Sangha's S. M. Shetty College of Science, Commerce and Management Studies, Powai,
Mumbai, Maharashtra
[email protected], [email protected]
ABSTRACT
From last two years COVID-19 pandemic situation was there and today’s scenario also is quite dangerous due
to corona variant virus spreads all over the world. Due to this problem of virus, all over the world is under
some rules and restrictions to stop spreading of this virus. As per this rules and restrictions, we can’t come together for any type of events, work etc. Because of this pandemic situation, today peoples are more & more
depends on digital data or information access through various IT technologies or applications in digital world
to fulfill their regular life needs. Also, peoples slowly know the different developed internet tools & technologies. Now, Internet plays a vital role to connect the peoples from all over the world under this COVID-
19 pandemic situation. Digital data or information is a data that can be in the electronic form & also represents
other forms of data using specific machine language system. It is information stored on a computer system for
future use & that can be access from anywhere through internet. Digital data or information can be beneficial in various forms as it helps to improve online execution, save cost & time, also provides quality output as per
your needs. Apart from these benefits, security (Attacks) is the major challenge for Digital data in Digital
World. Attacks is the use of a computer as an instrument or tool to further illegal ends, such as data frauds, stealing identities of others, violating privacy etc. To overcome from these Attacks, Cyber Security is the
emerging Actions to prevent attacks in Digital World for securing digital data or information. This paper
discusses the different type’s security attacks on digital data & their prevention cyber security techniques as cryptography and steganography with security principles and mechanisms for securing digital data or
information in digital world.
Keywords: Digital Data, Security Services, Security Mechanisms, Security Attacks, Cyber Security.
INTRODUCTION The development of computers and the expansion of the Internet tools & technologies made likely the
accomplishment of large developments in all areas. Nowadays, each and every one uses the internet as it
provides essential communication between tens of millions of peoples and is popularly used as a tool for E-commerce. Unfortunately, computers and the Internet have furthermore gives a new natural environment for
computer crimes. Attacks (Computer Crime) is basically characterized as committing a breaching of digital data
or information through the use of a computer or the Internet in digital world. Internet is a string of connections of computers that are attached together for the purpose of digital data communication in all over the digital
world.
SECURITY SERVICES: Security Services are planned by a protocol layer of communicating open systems. It
safeguards essential and satisfactory security of systems and transmission of data.
SECURITY MECHANISMS: Security mechanisms are used to implement the security services. It is a
mechanism that protects the digital data or information in digital world.
CYBER SECURITY: Cyber security is the techniques of protecting network systems and digital data or
information from intruders or attacks or threats that are aimed for breaching of data.
REVIEW OF LITERATURE
(RAGHAVAN & PARTHIBAN, 2014), the research paper mainly explains the concept of security attacks
with their different types and also examines the growing case of security attacks.

International Journal of Advance and Innovative Research Volume 9, Issue 1 (IX) January - March 2022
82
ISSN 2394 - 7780
(Alghamdi, I, 2020), the research paper mainly discusses the various forms of security attacks worldwide and
why there is a rapid growth in such types of activities and also recommends various measures and
recommendations to reduce the program harmness.
(Singh, 2018), this research paper mainly explains the different types of Cryptography techniques for securing
the digital data or information in digital world.
(Kaur & Rani, 2016), this research paper mainly discusses the different types of Steganography techniques for
securing the digital data or information in digital world.
OBJECTIVES
1. To understand the different levels of Security Services and Security Mechanisms in Digital World.
2. To find and categorized out different types of Security Attacks in Digital World.
3. To ascertain the effectiveness use of Cyber Security techniques as emerging actions for preventing the
Security Attacks in Digital World.
RESEARCH METHODOLOGY This research paper has been elaborate on the basis of secondary data. The secondary data is simply the analysis
of pre-existing data in a different ways or to answers the different questions than originally intended. Secondary
data are collected through the existing research in the related fields, electronic journals, research papers, research databases, research books and from various sources. Secondary data is a data/information that is
collected by someone other user than the primary user.
SCOPE AND LIMITATION:
This research paper gives the clear ideas of different levels of Security Services and Security Mechanisms available in digital world for securing digital data or information. This paper explains the different types of
Security Attacks present in Digital World. It also explains the cyber security techniques are Cryptography and
Steganography as the emerging Actions to Prevent Security Attacks in Digital World for securing digital data or information. This paper explains only the Cryptography and Steganography cyber security techniques but not
focus on other security techniques.
DISCUSSIONS
Digital World is a global world which includes all types of digital data or information. This information is of comprises various forms like images, audios, videos, Numbers and Texts in a digital form. This information can
be utilized or process in a variety of ways as per the user requirements and needs. Digital world faces one of the
biggest problem is the Attacks. Attacks are a crimes or threats that directly attack on digital data or information in digital world. The types of Security Attacks that affecting businesses and individuals are shown in below
figure 1: (RAGHAVAN & PARTHIBAN, 2014)
Figure 1: Types of Security Attacks
1. PASSIVE ATTACKS: This type of attacks makes use of information from the system but does not affect
system resources. The attacker is tries to obtain information that is being transmitted. These attacks do not
involve any modifications to the content of the original message. There are two types of passive attacks as
follows:
a. RELEASE OF MESSAGE CONTENT (SNOOPING): The attacker read the contents of message
between two authorized parties as sender and receiver.
b. TRAFFIC ANALYSIS: The attacker observes the pattern of messages between two authorized parties as
sender and receiver.
2. ACTIVE ATTACKS: This type of attacks attempts to alter system resources or affect their operation. The
attacker involves some modifications to the content of the original message. These attacks can harm the
system. There are four types of active attacks as follows:

International Journal of Advance and Innovative Research Volume 9, Issue 1 (IX) January - March 2022
83
ISSN 2394 - 7780
a. MASQUERADE (SPOOFING): The message from attacker that appears to be come from client to the
receiver.
b. REPLAY: The attacker captures a sequence of events or some data units and re-sends them to the receiver.
c. MODIFICATION OF MESSAGES: The attacker modifies the messages from client to receiver.
d. DOS (DENIAL OF SERVICE): The attacker disrupts the services provided by the service provider
between two authorized parties as sender and receiver.
So, security is the major concern in today’s digital world for securing any types of digital data or information.
The Security Services for digital data or information are mainly divided into six principles are as follows:
1. AUTHENTICATION: The authentication service assures authorizations of communication. The message
receiver should be sure that the arrived message is from the original source which it entitles to be. This principle ensures that the before carrying out any transaction the identities of both the entities is
authenticated.
2. ACCESS CONTROL: This principle controls which type of users or resources should be able to access
data or resources up to what extent.
3. DATA CONFIDENTIALITY: This principle specifies that only the sender and the intended receiver
should be able to access the content of the message.
4. DATA INTEGRITY: This principle assures that the digital data received is exactly as sent by an
authorized entity with also no changes.
5. NON-REPUDIATION: This principle ensures that either of the parties involved in communication do not
deny sending or receiving data.
6. AVAILABILITY: This principle states that information/resources should be available to the authorized
parties at all the times.
The Security Mechanisms for digital data or information are mainly divided into eight principles are as
follows:
1. ENCIPHERMENT: Encipherment basically includes algorithms based on mathematics that are used to
convert data into a form that is not easily comprehensible. The conversion and recovery of data depends on
these algorithms and also on encryption keys.
2. DIGITAL SIGNATURE: Digital Signature is cryptographic alteration of data which allows recovery of
messages to prove the source and integrity of the message and guard against counterfeit attacks.
3. ACCESS CONTROL: Access Control is the basic type of mechanism which determines who should be
able to access what resources.
4. DATA INTEGRITY: The exchange of original data or the maintaining of data integrity during its route.
5. AUTHENTICATION EXCHANGE: This consists of exchanging information between parties to assure
authenticity.
6. TRAFFIC PADDING: Appending data bits into gaps of data flow to prevent traffic analysis attempts.
7. ROUTING CONTROL: Allows selecting secure route from confident data and also enables outing
modification when violation to security suspects.
8. NOTARIZATION: To guarantee particular features of data exchange, a trusted third party is used.
Still we required some strong security techniques to protect the vital information or digital data in digital world.
The Cyber security techniques are emerging actions for preventing the Security Attacks in Digital World. There
are two mainly techniques as follows:
1. CRYPTOGRAPHY TECHNIQUE: It is a technique of encryption (readable data format transmit into
unreadable data format) and decryption (unreadable data format transmit into readable data format). The
two main types of cryptography technique are as follows: (Singh, 2018)
a. SECRET KEY CRYPTOGRAPHY: The same key is used for encryption and decryption. For Examples:
DES, AES and etc. The process of secret key cryptography is shown below in figure 2:

International Journal of Advance and Innovative Research Volume 9, Issue 1 (IX) January - March 2022
84
ISSN 2394 - 7780
Figure 2: Secret Key Cryptography
b. PUBLIC KEY CRYPTOGRAPHY: The different key is used for encryption and decryption. For
Examples: RSA, ELLIPTIC CURVE and etc. The process of public key cryptography is shown in below
figure 3:
Figure 3: Public Key Cryptography
2. STEGANOGRAPHY TECHNIQUE: It is a technique of hide the messages into other sources of information like text/documents, audios, videos, and images. So that it is not visible to unauthorized users.
The five main types of steganography technique are as follows: (Kaur & Rani, 2016)
a. TEXT STEGANOGRAPHY: It is a technique of hide the messages into other sources of information like
text.
b. IMAGE STEGANOGRAPHY: It is a technique of hide the messages into other sources of information
like image.
c. NETWORK STEGANOGRAPHY: It is a technique of hide the messages into other sources of
information like network protocols.
d. AUDIO STEGANOGRAPHY: It is a technique of hide the messages into other sources of information
like audio.
e. VIDEO STEGANOGRAPHY: It is a technique of hide the messages into other sources of information
like video.
The process of steganography is shown in below figure 4:
Figure 4: Steganography Process

International Journal of Advance and Innovative Research Volume 9, Issue 1 (IX) January - March 2022
85
ISSN 2394 - 7780
The following table 1 shows some security attacks with their countermeasures as follows: (Alghamdi, I, 2020)
Table 1: Security Attacks with their Countermeasures
SR. NO. SECURITY ATTACKS COUNTERMEASURES
1. Finding a way into the network Firewalls
2. Exploiting software bugs, buffer overflows Intrusion Detection Systems
3. Denial of service Intrusion Detection Systems
4. TCP hijacking IP Security Protocol
5. Packet Sniffing Encryption
6. Social Problems Education
FINDINGS This research study is found that today so many things we are doing through digitally to complete our daily
tasks and needs. This digital world includes various types of digital data or information and we can use that digital data as per our needs. The biggest problem for this digital world is security attacks from all over the
world. So, from this research study it is found that always used Hypertext Transfer Protocol (HTTP) with
security that comes from Secure Socket Layer (SSL) Protocol for prevention of security attacks. Also, it is found that always use that digital data which includes security services, security mechanisms, cryptography and
steganography cyber security techniques and follow above suggested countermeasures for prevention of
security attacks. For security & safety of any digital data in digital world always use that URL’s starting with
HTTPS is shown in below figure 5:
Figure 5: HTTP Protocol with SSL Security Certificate
RECOMMENDATION Some recommended cyber-safety actions for securing our credentials data are install operating system and
software’s updates, turn on personal firewalls, Avoid spyware and adware spam messages, protect your
passwords, Backup your all important documents and change credential data on a regular basis. Run your
system checks often and keep your system & antivirus software up-to-date. Use proper cyber security guidelines
while working with the various digital applications from the digital world.
CONCLUSION
Security attacks and Cyber security awareness is more important now in our all over the global level. Cyber threats & Attacks to personal credential information are increasing and identities are getting stolen every-day in
Digital World. Making individuals aware of this is the first step. The second step is giving individuals the tools
and technologies knowledge that they need to protect their personal credential information themselves from security attacks. Also, implement above cyber security techniques and countermeasures for preventing of
security attacks to give security for our digital data or information in digital world. It is conclude that follow
above principles and mechanisms of security to give more security to our digital data or information. Finally,
Focusing more on the cyber security area in higher education curriculum is a key factor for the safety of our world in future. We are now aware that this is an issue; it is our moral responsibility to make our world aware as
well.
REFERENCES
Alghamdi, I, M. (2020). A Descriptive Study on the Impact of Cybercrime and Possible Measures to Curtail its Spread Worldwide. International Journal of Engineering Research Technology, 09(06), 1321–
1330. https://www.ijert.org/research/a-descriptive-study-on-the-impact-of-cybercrime-and-possible-
measures-to-curtail-its-spread-worldwide-IJERTV9IS060565.pdf.
Kaur, H., & Rani, J. (2016). A Survey on different techniques of steganography. MATEC Web of
Conferences, 57. https://doi.org/10.1051/matecconf/20165702003.

International Journal of Advance and Innovative Research Volume 9, Issue 1 (IX) January - March 2022
86
ISSN 2394 - 7780
RAGHAVAN, A. R., & PARTHIBAN, L. (2014). the Growing Case of Cybercrime and Types of
Cybercrime on a Global Scale. Journal of Computer Science Engineering and Information Technology
Research, 4(2), 1–6.
Singh, K. K. (2018). a Survey Paper on Multicarrier. 2018 5th IEEE Uttar Pradesh Section International
Conference on Electrical, Electronics and Computer Engineering (UPCON), 1–6.

International Journal of Advance and Innovative Research Volume 9, Issue 1 (IX) January - March 2022
87
ISSN 2394 - 7780
WASTE MANAGEMENT AND ITS AWARENESS AMONG PEOPLE IN MUMBAI
1Ruben Dsouza,
2Tanisha Shetty,
3Pragati Sahu and
4Leslie Chettiar
[email protected], [email protected], [email protected] and [email protected]
Mentor
Asst. Prof. Nidhi Chandorkar
Bunts Sangha’s SM Shetty College of Science, Commerce and Management Studies (Powai) [email protected]
ABSTRACT Waste management is still the most difficult problems to solve because no proper initiative has been taken by
the people or the government to solve the problem and assist in waste reduction and spreading awareness, as well as to try to eliminate the use of plastic because it is a threat to various species of animals and is non-
degradable.
There is a scarcity of waste management information. The key issue is the separation of dry trash, moist waste,
and bio-hazard waste, which leads to a variety of diseases. in comparison to urban and rural locations
People do not understand the concept of segregation because they lack sufficient education about it.
There should be more awareness in rural areas because segregation does not occur there, and medical waste
should be properly disposed of as it is dangerous and can cause various diseases as it is sometimes dumped
along river banks, contaminating the water and harming aquatic life, and drinking water is also contaminated.
Keywords: Awareness, Government, Bio & Hazardous waste, Reusing and recycling, Waste separation
INTRODUCTION Waste management is a concern in our society because as the population grows, so does the amount of waste
produce, which leads to a variety of social and health issues. The key issue is waste segregation, which includes
wet trash, dry waste, and bio-hazardous waste.
Waste dumped into the sea is harmful to aquatic life and poses a threat to endangered species. the government has taken steps to ban plastic and replace it with recycled paper, which allows people to reuse items such as
straws and food packing materials.
Plastic bag bans and the usage of cloth bags can help reduce trash, and excessive packaging also contributes to
waste.
REVIEW OF LITERATURE According to AV Shekdar. (2004), E-waste contains a wide range of electronics devices like televisions,
computers, refrigerators, air conditioners etc, which contains various types of toxic materials that poses both
occupational and environmental health hazard after from polluting the environment severely.
According to Amasuomo, E & Baird, J (2016), It is agreed that waste is a direct result of human interactions
and activities. It is agreed that are materials who have no further use of. This is evident from the fact that, it is the knowledge of what specifically constitute a waste and the categories of waste that determines how waste are
dealt with or managed. Waste management is a process where waste is collected, transported and disposed in
the best way by limiting or eliminating the harmful effects of waste. factors such as population increase the
waste management. Effectively planning ahead will prevent disposal which poses health risks.
Waste management is still the most difficult problems to solve because no proper initiative has been taken by
the people or the government to solve the problem and assist in waste reduction and spreading awareness, as
well as to try to eliminate the use of plastic because it is a threat to various species of animals and is non-
degradable.
Waste management is an important issue that needs governmental action quickly. But at present there is very
little awareness that exists regarding this issue in our society.
There are also people who are aware about it and try to manage their waste in a systematic way.

International Journal of Advance and Innovative Research Volume 9, Issue 1 (IX) January - March 2022
88
ISSN 2394 - 7780
STATEMENT OF OBJECTIVE
This research is conducted to accomplish the following objectives
1. To find if people are aware about the concept of waste management
2. To find out whether people are aware of measures to minimize the use of landfills for disposing solid waste.
3. To study how the protection of the environment can take place through an effective waste management
system
4. To examine whether people actually practice waste recycle and reuse.
RESEARCH METHODOLOGY This is qualitative research using empirical techniques to understand the awareness about waste management
among the people in Mumbai.
The sources of data collection are both primary and secondary. Secondary data collection sources are mostly
information found online in form of articles published by different people and organizations on waste
management awareness.
Primary data is collected through convenient sample survey technique. The sample units are employees,
students, etc from different industries
The sample size is 50
PRIMARY DATA AND ITS INTERPRETATION 1. There are more of 19-20 age group active in the survey and below 18-above 50 people also responded in the
survey. Almost most of the people know about waste management.
2. As per the responses about knowledge of waste disposal problem in their area sometimes this is a problem
and some of them think
3. The common barriers respondents face is cost and time, support of people, collection of waste is mixed,
sometimes people are not active to manage their own waste.
4. It is found that there is lack of awareness among respondents regarding waste management.
5. Most of the respondents responded “YES" they do follow waste separation.
6. Most of the respondents agree that they follow recycling, reusing and separation of dry and wet waste.
7. Most respondent feel that the process of recycling is not always cost-effective: This process needs a lot of
money, time and land to set up a plant and run.
CONCLUSION & RECOMMENDATION From the survey that we have conducted and the research articles that we read we can conclude that -
The information provided about the factors influencing solid waste management system is very useful for any individual or organization interested in planning, changing or implementing a waste management in a
city.
Waste management is an important issue that needs governmental action quickly. But at present there is
very little awareness that exists regarding this issue in our society.
There are also people who are aware about it and try to manage their waste in a systematic way.
In the survey we conducted it is seen that people separate their waste into wet waste and dry waste, wet waste is then stored into barrels and recycled into fodder, people also try to recycle their waste or try to re-
use it
Some people face many barriers while implementing waste separation method like cost, time and the lack of
information are the problem they face.
LIMITATION
The study was conducted in a limited period of one month, hence practices and perception might be
different in different span of time
The study has used convenient sampling, so the responses may be tilted towards certain type of opinion

International Journal of Advance and Innovative Research Volume 9, Issue 1 (IX) January - March 2022
89
ISSN 2394 - 7780
The scope of study was limited to Mumbai and hence the outcome may not accurately fit for other
locations.
REFERENCE
Collected information from the survey we conducted.
MN Mundada, S Kumar, AV Shekhar,, Sep 2004 ,
Amasuomo, E & Baird, J, 2016, The concept of waste and waste management
PWC (ASSOCHAM)

International Journal of Advance and Innovative Research Volume 9, Issue 1 (IX) January - March 2022
90
ISSN 2394 - 7780
HIGHER EDUCATION AND CHALLENGES OF ICT TOOLS: POST PANDEMIC ERA
Dr. P. R. Karulkar
Assistant Professor, Department of Commerce, K. G. Uran College of Commerce & Arts, Uran Raigad
ABSTRACT
In today's world e-business has made great strides. As an information technology manager, you can find information on e-business. E-business operations primarily help companies to make their data processing
systems more efficient and flexible, communicate with partners and suppliers, and meet customer needs and
expectations. E-commerce is a subset of e-business. E-commerce aims to increase the company's revenue, while
e-business includes electronic purchases, supply chain management, customer service handling and interaction with business partners. Now-a-days, in this pandemic situation, the use of Information Technology is
increasing. The pandemic arose due to covid-19, globally; use of information technology is increasing. Jaggars,
S. S.; Edgecombe, N.; Stacey, G. W. (2013) rightly pointed that, “Online college course enrollment has seen a 29% increase in enrollment with nearly one third of all college students, or an estimated 6.7 million students
are currently enrolled in online classes.1” Coin has both sides, same is applicable to use of information
technology- it is important as well as there are many challenges in using ICT tools. The current paper focuses
on the use of ICT Tools and challenges in using challenges in the post covid-19 era.
Keywords: Global era, ICT, Pandemic situation, online meeting, online education, etc.
INTRODUCTION
Education is the fundamental right of every individual. If even a single child is deprived of online education, then this medium of education will be unjust. The central and state governments on India should show this
commitment that they will provide broadband service and proper equipment for online education to all
educational institutions going forward to prevent covid-19 on 24 March, when the nationwide lockdown was implemented. So, soon after that the state governments started the provision of making school education online.
NGOs, foundations and private sector technical education companies were also made partners. All these
together started using all available means of communication to impart education. In this, TV, DTH channels,
radio broadcasting, WhatsApp and SMS groups and print media were also used. Many organizations even distributed books for the new academic year. Compared to school education, the higher education sector was far
less prepared to meet this new challenge.
Youngberg, David stated as, “Although massive open online courses (MOOCs) may have limitations that
preclude them from fully replacing college education,[161] such programs have significantly expanded.2”
Now, universities and colleges started online classes from the coming semester, and then they are preparing
themselves with keeping in mind the difference between this remote online education and regular online education because, as the number of patients of covid-19 continues to increase in the country, then higher
educational institutions also have to started regular online education like schools.
India's Higher Educational Institutions and Online Education: India's Higher Educational Institutions
(HEIs) have been sluggish in adopting online education
India's higher education sector has been very slow in adopting online education curriculum. That is why
suddenly the need for online education arose in front, so this sector does not seem completely ready for it. As of
30 January 2020, there were only seven higher educational institutions in the country that had taken permission to offer online courses as per the UGC 2018 guidelines. Before the outbreak of the Covid-19 pandemic, most of
the country's nearly 40,000 higher education institutions did not have permission to start online courses. That is
why, when the central and state governments invited these institutes to educate their students through online classes, these institutes were not ready for it. It was in the middle of May that the Finance Minister had
announced that under the National Institutional Ranking Framework (NIRF) of the country, the top 100
educational institutions would automatically be allowed to conduct online education programs. But, this step of
the government will benefit only a small section of the students.
The Situation of Higher Education before Outbreak of Covid-19: Before the outbreak of the Covid-19
pandemic, most of the country's nearly 40,000 higher education institutions did not have permission to start
online courses. That is why, when the central and state governments invited these institutions to educate their
students through online classes, these institutes were not ready for it.

International Journal of Advance and Innovative Research Volume 9, Issue 1 (IX) January - March 2022
91
ISSN 2394 - 7780
There is a big difference between education and emergency online remote education. Online education is being
put into practice after well research. This medium of education is being used for many decades in many
countries.
Many experts in this matter, such as Professor Sahana Murthy of IIT Bombay, believe that the sudden shift from
face-to-face learning to online medium has changed the nature of imparting education. This online education is
being called Emergency Remote Teaching. There is a lot of difference between online education and emergency online remote education. Online education is being put into practice after well research. This medium of
education has been used in many countries for many decades, so that courses can be made available online. In
comparison, the availability of this online education is very less in the higher educational institutions of India.
UGC Initiatives in Covid and Post Covid Era: Just two days after the imposition of the lockdown, the UGC had released a list of initiatives in the field of education through the government's resources based on ICT i.e.
information and technology. The UGC said that through this, students can continue their studies for free during
the lockdown. In this, alternatives like SWAYAM and National Digital Library were mentioned. Recently, students have also been allowed to start second degree which they can get along with their regular degree course
through online or open and distance education. However, these are great efforts, which will benefit the students
immensely even after the pandemic of Covid-19. But when it comes to online higher education, it is still too late
and steps taken for the benefit of few students.
Challenges of Online Education during Covid-19
Incomplete Preparation to Move towards Online Education:
Major challenges in the way of providing more online courses are: a. The most of the faculty members who teach are not trained for it and that's why they are not ready to run
online classes.
b. It may take six to nine months to plan and prepare for a completely online course.
c. These cannot be prepared in just a few weeks during the Covid-19 pandemic. Institutions and faculty
members taking initiatives to adopt online education will need a lot of help from their colleagues to adopt it.
d. The institutions or other members of the teaching community need mental preparation to adopt the online
techniques. In one webinar organized by ORF, Dr. Shakeela Shamsu, OSD of the New Education Policy in
the Ministry of Human Resource Development, emphasized this point a lot.
e. Faculty members usually get comfortable with online education by going to the second or third semester of
their course. In such a situation, they should be encouraged to start it.
f. They should be helped through teaching assistants who specialize in technology. Till now India has not
adopted this option whereas Teaching Assistants (TAs) are being used extensively in foreign universities.
These teaching aids, chat rooms for students and learning from colleagues
g. These teaching aides also organize chat rooms for students and peer learning sessions. Which are very
beneficial in getting education.
h. Online education is considered by many faculty members to be inferior compared to face-to-face training.
i. There is no doubt that it is not possible to completely transfer campus education from online specially if someone is given the option to choose one of the two. But, online education can be made very useful if
online courses are designed on the basis of higher mediums of instruction such as audio-video clips. This
will help a lot for regular university education. This has been proved by Coursera, Edex and other online courses. The delay in the start of the new session has given an opportunity to the higher educational
institutions and faculty to prepare high quality online courses.
Efforts to Overcome the Challenges of Online Education All higher educational institutions are trying their level best to adopt the online teaching-learning process to
overcome the challenges of it. Such as, IIT Bombay has launched self-promoting courses for online education,
which college teachers can take advantage of. It is necessary to create more such resources. And they should be
used more and more for the expansion of online education.
There is also an economic rationale behind the expansion of online courses, as Professor V Sridhar of IIT
Bangalore said in the ORF webinar. The success of all online education platforms is an example of this. Online
courses are very less expensive. And more students than many colleges and universities study on these

International Journal of Advance and Innovative Research Volume 9, Issue 1 (IX) January - March 2022
92
ISSN 2394 - 7780
platforms. It would be good for India to take advantage of the opportunity given by this epidemic to spread
awareness about online education. So that the educational institutions of the country recognize the long term
opportunity given by this disaster and take advantage of it. Recently IIT Bombay has launched self-promoting courses for online education, which college teachers can take advantage of. It is necessary to create more such
resources. And they should be used more and more for the expansion of online education, especially in Indian
languages.
Availability of ICT Tools as the Challenge in Online Education: During the emergency of the pandemic, all
discussions regarding distance education i.e. online education are based on the premise that all students have
internet service. And everyone has equipment i.e. laptop or computer for online studies with the help of which
they can study online. But the unfortunate thing is that this thing is wrong at the school level as well as at the level of higher education in schools where students from local communities usually study. Either, they don’t
have sufficient ICT tools or they can’t offer it, due to their weak economical background.
Diversity of Students At the same time, students studying in higher educational institutions also come from far and wide. They can
also be students from different states and can also be residents of rural areas. In such a situation, if the
assessment regarding online education is that all students will have its resources, then it will have a bad effect on almost all higher education institutions because most of the students, who returned to their homes after the
lockdown, did not have adequate internet access. The data of the 75th phase of education of the National Sample
Survey shows that only 24 % of the households in the country have internet access. Of these, 42 percent are in
urban areas, while only 15% of households in rural areas have internet access. At the same time, only 11% of the households in the country have their own computers. (23 percent of urban households have computers. Only
4.4 percent of rural households have computers. Smartphones are not included in this.)
Current Scenario of ICT Users in India- the Challenges of Connectivity and Insufficient Data Plan: According to the latest IAMAI report, India currently has about 500 million Internet users. Of these, 433
million users are over the age of 12 and 65 percent are male. Other large university surveys also justify this
digital gap between rural and urban, men and women. For example, according to a survey by the University of
Hyderabad, only 37 % of the students said that they can take online classes. At the same time, 90% of the students said that they prefer to take lectures in the class. Even ten percent or more students of the country's big
technical institutes i.e. IITs said that they cannot download the study material. Or they cannot take online
classes.
The reason for this was sometimes given by the students due to connectivity and sometimes insufficient data
plan. Bharat Net, a scheme to provide internet service to 2.5 lakh gram panchayats of the country, is going on
since 2011. But, this plan also hangs in the balance due to no access to internet service till the last mile. Whenever this scheme is fully implemented, and it should be done on priority basis, then it will be able to
connect rural communities and students with good broadband service.
Survey Base Report A recent survey by ranking agency Quacquarelli Symonds (QS) was presented by their regional director Dr. Ashwin Fernandes in an ORF webinar. The survey showed that 72.6% of the more than 7500 students involved
in using mobile phone data or hot spots mobile phone for internet access. UNESCO calls this medium of
internet facility bad technology. Only 15.87% students had broadband access. However, these students told that their broadband also had connectivity problems. There was never electricity and there was never a signal.
And about 97% of the students who were using mobile hot spots for internet were facing challenges of poor
connectivity or no signal. Now, if combination of these figures with the fact that only 30% of the Indian population has smartphones, then one will know that a very small part of the total population of the country uses
smartphones. Using the best accessible technology i.e. TV channel for education is also not a solution because
only 67% of the houses in the country have TV.
Today, the options of sharing smartphones, laptops, TVs, etc. among themselves are also being tried. But, if even a student remains out of the purview of online education, then it will be unfair to him. For the long-term
solution of online education, the states and central governments should provide good broadband service to all
educational institutions and laptops and computers for online education. Bharat Net, a scheme to provide internet service to 2.5 lakh gram panchayats of the country, is going on since 2011. But, this plan also hangs in
the balance due to no access to internet service till the last mile. Whenever this scheme is fully implemented,
and it should be done on priority basis, then it will be able to connect rural communities and students with good

International Journal of Advance and Innovative Research Volume 9, Issue 1 (IX) January - March 2022
93
ISSN 2394 - 7780
broadband service. Then it can be used not only for education. Rather, it will also be able to help people in
health services, agriculture and other means of employment.
Till then all the faculty members of higher education will have to work with the available resources. So that he should be in constant touch with all his students and with his cleverness, keep motivating these students to study
in this corona period.
CONCLUSION Thus, such disaster can become an opportunity, if individual can work on new concepts for providing higher
education. Move away from traditional thinking about education and adopt new methods of study, teaching and
review. If not forever, then at least in this period it can happen. The data uploaded is very apt by digital
LEARNING Networkon the use of ICT tool in the current era, “ICT is important in schools and educational institutions as it assists in carrying out their activities and functions such as record keeping, research work,
instructional uses, presentations, financial analysis, examination results management, communication,
supervision, MIS, teaching learning activities, and general school management functions.3”
Whenever, there is matter of accepting new things new skills, there are lots f challenges at initial stage, as all are
facing in using online mode today, but using it on continuity base-the adoption is acquired easily. The scenario
of March 2020 and current scenario of higher education is different now. Students-teachers and parents are now
accepted the method of teaching-learning on online mode from higher education primary to higher education.
CITATION
1. Jaggars, S. S.; Edgecombe, N.; Stacey, G. W. (2013). "What we know about online course outcomes
(research overview)". Community College Research Center. Archived from the original on 4 April 2016.
Retrieved 2 April 2016
2. Youngberg, David (13 August 2012). "Why Online Education Won't Replace College--Yet". The Chronicle
of Higher Education. Archived from the original on 29 November 2014. Retrieved 20 November 2014.
3. https://digitallearning.eletsonline.com/2020/10/teaching-and-learning-with-ict-tools-issues-and-challenges/
REFERENCES
1. Auer, Sören. "First Public Beta of SlideWiki.org". Archived from the original on 20 February 2013.
Retrieved 22 February 2013.
2. Begley, Sharon. "The Science of Making Decisions" Archived 1 July 2014 at the Wayback Machine.
Newsweek 27 February 2011. Web. 14 March 2011.
3. Cuban, Larry (2001). Oversold and Underused: Computers in the Classroom (PDF). Harvard University
Press. Archived from the original (PDF) on 9 August 2017. Retrieved 2 April 2016.
4. Clark, R. C., Mayer, R. E. (2007). eLearning and the Science of Instruction. San Francisco: Pfeiffer. ISBN
978-0787986834
5. Chi, Michelene T.H.; Siler, Stephanie A.; Jeong, Heisawn; Yamauchi, Takashi; Hausmann, Robert G. (July
2001). "Learning from human tutoring". Cognitive Science. 25 (4): 471–533.
doi:10.1207/s15516709cog2504_1. ISSN 0364-0213.
6. Harasim, L., Hiltz, S., Teles, L. and Turoff, M. (1995). Learning Networks: A Field Guide to Teaching and
Learning Online. Cambridge, MA: MIT Press
7. Graziadei, W. D., et al., 1997. Building Asynchronous and Synchronous Teaching-Learning Environments:
Exploring a Course/Classroom Management System Solution Archived 13 June 2010 at the Wayback
Machine.
8. https://digitallearning.eletsonline.com/2020/10/teaching-and-learning-with-ict-tools-issues-and-challenges/

International Journal of Advance and Innovative Research Volume 9, Issue 1 (IX) January - March 2022
94
ISSN 2394 - 7780
IMPACT OF CHANGES IN GOVERNMENT POLICIES IN BUSINESS
1Subhash Baban Nakhate and
2Dr. Geeta Kohade
1Research Scholar and 2Supervisor, Chhatrapati Shivaji Maharaj University, Panvel, New Mumbai [email protected]
ABSTRACT The Government policy is one of the guidelines for businesses. The government framed the policy for businesses to bring uniformity to businesses all over the country. Through the government policy in the business, the
government gets revenue for the welfare of the public. A body of people that work for the government to guide
communities.The government policy content the customs laws and institution to exercise political executive and
so virgin power. The government frame policy means the principal or course of action to be controlled on business. The government policy in business is a rule or principle to guide the decision resulting in positive
outcomes that enhance the community. The government policy contains the directions for the betterment of
customers as well as the nation.
The following are the factors that impact the changes in government business policy.
1. Liberalization
2. Globalization
3. Privatization
1. Liberalization means whenever the businessman strictly followed the laws and regulations of government
policy. He is not able to improve his business by he became demotivated and his mind turns to be the employee.
Hence, the government has changed the business policy by that businessmen perform their business activities
smoothly.
2. Privatization most of the services sector is handled by the government and for that government charges are
low. Due to low charges of the government burden comes on the budgets of the government. To provide better and more efficient services to customers Government has made changes in business policy. The government
made changes to be privatized recently because of prompt services. we have seen the example of Air India
travel services, Banking services, Insurance services, telecommunication, etc.
3. Globalization means any manufacturer or any product producer can sell their product all over the world.
There is no limit to selling their product.
The research study aims to study the view of the impact of changes in government policy in the business. While
considering the changes' insurance sector, banking sector passenger travel transportation, telecommunication are considered and the secondary data have been taken into consideration as GDP, Unemployment. The data
were analyzed using descriptive statistics. The reason for the study is to analyze the growth of the
manufacturing sector and service sector at the National and State level in pre and post-reform periods using growth rate in percentage. The statistics information denoted at the end of the research study is servicing and
manufacturing in states are facing various problems of wages, disposal child labor, which require need in full
attention. There are small problems also like related to infrastructure and taxation policy, availability of raw
material. This study will contribute to new outcomes in the area of services and manufacturing sector of
banking, insurance, electricity supply, and government services and manufacturing sector too helpful to people.
Keywords- policies, businesses, government, growth.
INTRODUCTION The Government frames from time to time the rules acts, and laws to make streamline the various businesses.
The intention behind making these regulations are to be safe for the manufacturers and customers. While
forming the structure of the policy, Government takes care of the availability of various opportunities to the manufacturers, customers, etc. The customer should get quality products at a reasonable cost. There should not
be any hindrance to starting a new business as we see the Make in India, Stand up India Startup India, etc. The
new policy has been launched by the government for manufacturers by that customers will get the standard
products within unlimited efforts. Due to development in technology the process of manufacturing changed and hence the cost of the manufacturing product has come down. Another aspect of change in business policies is
that there is no remaining boundary for the market. The manufacturers can supply their products throughout the
world. The government has made changes in a business policy by that impact went on the business as follows.

International Journal of Advance and Innovative Research Volume 9, Issue 1 (IX) January - March 2022
95
ISSN 2394 - 7780
COMPETITIVE SCENARIO ARISE - Due to relaxation brought in some procedure of the working, the most
of the people started their own business in 1991. The government has made changes in business policy as
liberalization, privatization, and globalization according to that situation change in business the competition increase business. The quality product is made available to the customer. Every business went behind to make
some advanced strategy. Adopted, updated resources by every business have got an opportunity to sell their
products throughout the world. Another reason is that most of the Indian companies started their business in foreign countries. Simultaneously foreign companies have started their own business in our country, so every
company started to update the businesses
MORE DEMANDING CUSTOMERS Due to changes in the business policy every manufacturer has got an opportunity to produce products as per the customer’s choice. The customers started to consume the products as per their choices. The product quality
available to customers in good and attractive shape and packaging so the people brought in to use a new
features' product. To survive in a business the industrialist or manufacturers are to update their techniques, attitude, knowledge. The manufacturers started to accept the opinion of customers. We see the example of soaps
etc. Before 1991 some products were famous and for that product, no substitute was there, but now due to
changes in government policy in the business, we get the variety of products. This is only possible by the
demand of customers.
RAPIDLY CHANGED TECHNOLOGY Before this policy, most of the work process was completed by hand, but now most of the work is completed
through machinery. We may see the example of woodcutting, the earlier woodcutter was using the hacksaw, but now in days due to the use of the machine the work of woodcutting is possible within a short period and with
fewer efforts. This happened due to changes in technology. We may give an example of flat TV, small notepad,
laptop, etc. Before acceptance of these technology changes, the MNC was spending a huge amount on research and development work. Due to changes in the technology, the manufacturers have possible to produce the
product of customers choices and therefore the customer will get the maximum benefit. The manufacturers have
now become easy to reduce the operational expenses.
CHANGE IS UNAVOIDABLE The policy of businesses has to be changed due to environmental changes like demographic factors, economic
factors, political factors, ecological factors, social culture, and technological factors.
Demographic force — The manufacturer has to keep their production in force as per the different communities peoples, different age wise peoples, different density wise peoples are using different products which are
suitable to them. Hence, the changes are unavoidable.
Economic forces - This force is related to the consumer's purchasing power and spending capacity. Another aspect of this force is related to unemployment, inflation, duties, and taxes, which are essential for consideration
as the impact of changes in government policies in the business.
Social-cultural force - The social-cultural force is linked to the factors that affect the society's basic value,
preference, and behavior of the customers.
Technology forces – The advanced technology made possible new products within limited efforts and therefore
the manufacturer has got the opportunity, for example, wireless communication, smartphone, tablet, etc.
Ecological force - It is also known as a natural source of foods like water pollution air pollution etc.
Political force- Every business is limited by the political environment, like a loss of government agencies.
TO EXPERTISE HUMAN RESOURCES AND MARKET ORIENTATION-The human resources should
make experts because of improvement in production activities and other essential business growth. Through human resources utilizing the opportunity is possible. The knowledge, training, and skill make it easy to
develop human resources development. It helps to make a strong relationship between the superior and
subordinate staff within the organization. The customer is a king in the market hence the manufacturer has to
produce the product as per the choice of customers. Example of edible oil and the choice of various flavors of
Colgate etc.
INADEQUATE FINANCIAL SUPPORT TO THE PUBLIC SECTOR -The public sector services were
working on a loss basis hence, Government earlier used to give them budgetary support. When the government realized the situation and compare their performance with the private companies. The Government concluded as

International Journal of Advance and Innovative Research Volume 9, Issue 1 (IX) January - March 2022
96
ISSN 2394 - 7780
the public sector should work in a way by that revenue will get to met their expenses. The customer should get
better services within a limited period.
After considering all the above impacts of changes in government policies in business, the following is the
statistical information that makes justification.
India gross domestic products (GDP) in current prices from 1986 to 2026
The research work on the impact of changes of government policy on business is important because of the
betterment of the customers. The customer can enjoy various types of products at a reasonable price. The
manufacturers are also getting the benefit due to changes in business policies after having the expert technological knowledge, skill and creating a good relationship with superiors and subordinates. The research
work on the impact of changes of government policy in business is important to verify the situation of industries
after having the uniformity in business practices.
LITERATURE REVIEW Padmashree K (1999) Banking operation impact of liberalization policy on the performance of banking sector
in respect of network deposit etc. To analyze banking services. The priority sector
data was compiled from the report of the progress of banking. A statistical technique was used. The
liberalization policy was introduced in 1991. By the recommendation of M. Narasimahan.The aim was to
promote the efficiency of management.
Godavale Mangesh Manohar (2009) The impact of economic liberalization on industrial structure and performance. India experienced liberalization. It resulted in a more competitive industry structure and improved
competitive performance to identify the major changes in industrial policy. The response to the changes' policy
in business is good. The data collected from books and journals review and articles as secondary data.
Vijay Lakshmi K N ( 2014) A study of the interrelationship between business ethics and consumer protection.
Society as a whole stand as a consumer against the economist entities as producer or distributors. protection.
The consumer has been the victim of exploitation in marketplaces by an unethical business. To study the ethical practices of the selected business unit in India. To evaluate the level of awareness among consumers about their
rights etc. The study is based on primary and secondary data. The collected data was analyzed with the help of
mean, median, mode, percentage, and tasted chi-square test, etc. Most of the consumers are aware of the
exploitation of business and ways to fight against cheating. To create awareness among the customers need
systematic study of a variety of products and services.
Tripathi Rahul (2017) Foreign direct investment in India. Foreign direct investment is a component of
investment and is a need for India to achieve economic reforms and maintain growth. To review the changing scenario of FDI in India. To measure the impact of FDI on the top 5 sectors in India. The descriptive research
method was used. For analysis data, descriptive statistics are used through statistical tools, mean, standard
deviation, correlation, t-test, etc. The FDI is appropriate for improvement in a business for the benefit of
customers.
Petra Moresova, Ivan Soukal (2018) Consequences of industry 4 .0 in business and economics, license MDPI
base Switzerland. The article showing the consequences of technology in the industrial revolution provides the
gap of studies.

International Journal of Advance and Innovative Research Volume 9, Issue 1 (IX) January - March 2022
97
ISSN 2394 - 7780
Alabi F (2019) The impact of government policies on business growth of SMEs in SouthWestern, Nigeria. This
is with ex post facto type. Used primary and secondary data. The stratified sampling method was brought into
use, and the SPSS package was used to analyze the data. It has resulted as government policy and SM industries have a significant relationship. International journal of management studies and social science search IJMR
2019 volume I, issue 2, March- April.
Ramesh Dangol (2020) how do country regulations and business environment impact foreign direct investment inflow. This paper denoted how the multinational country chooses for investment. The data was collected
through a questionnaire. International Business Review volume 29, issue 2, April 2020, science direct.
Emad Harash , Sofri Bin Yahya, etc.(2013) The impact of government policy in the influences of market
practices on the financial performance of small and medium enterprises in Iraq. The study denotes the review of moderating effect of government policy on the relationship between market practices related to the provision of
high-quality products and market activity. Journal of Accounting and Business, volume 13, issue 2, 2013
Mamuni, V Shah (2018) The study on problems and prospects of manufacturing unit in Gujarat. Manufacturing activities are not possible with advanced technology. To study the growth of the manufacturing
sector of India during the pre and post-reform period. To study the financial performance and for strengthening
the manufacturing sector of Gujarat. The secondary data were collected at the National level and State level. The primary data was collected by sending a questionnaire. To analyze the data. The SPSS software was used to
find out the mean and standard deviation for descriptive analysis. In a conclusion, significant growth could not
be observed in the growth of the manufacturing sector between the pre and post-reform period.
Dixit Kirit (2011) An appraisal social impact of LIC of India and private sector insurance companies. The insurance business is known as social security and helps economic development. To find out the effect of the
population. To see the effect on employment. The early entrant has already captured the business is concluded.
RESEARCH METHODOLOGY AND INTERPRETATION The study adopted the descriptive method. This study used secondary data from a government report, published
in various research papers books, articles, news, government report, etc.
The following are the statistical pieces of information related to the research work.
Table -1
Data
Data Inflows, US $ % of GDP
2019 50.16B 1.76%
2018 42.12B 1.56%
2017 39.97B 1.51%
2016 44.46B 1.94%
2015 44.01B 2.09%
2014 34.58B 1.70%
2013 28.15B 1.52%
2012 24.00B 1.31%
2011 36.50B 2.00%
2010 27.40B 1.64%
2009 35.58B 2.65%
2008 43.41B 3.62%
2007 25.23B 2.07%
2006 20.03B 2.13%
2005 7.27B 0.89%
2004 5.43B 0.77%
2003 3.68B 0.61%
2002 5.21B 1.01%
2001 5.13B 1.06%
2000 3.58B 0.77%
1999 2.17B 0.61%
1998 2.63B 1.01%
1997 3.58B 1.06%
1996 2.43B 0.77%

International Journal of Advance and Innovative Research Volume 9, Issue 1 (IX) January - March 2022
98
ISSN 2394 - 7780
TABLE - 2
As per table 1, we come to know that the GDP rate was 0.03 % in 1991 at the inception stage of the policy changes period and thereafter it move to 0.10% in 1992. Thereafter increased as 0.20% in 1993, In 1994 GDP
rate reached up to 0.30% ,in 1994 it became 0.60%, in 1995 increased up to 0.62%, in 1996 it was 0.86% . In
short, we observed that the impact of changes in the government policy of business was positive. As per
available data, the rate of GDP is constantly increasing. till 2019 thereafter due to the pandemic situation of the
Covid -19 in 2020 the rate of GDP was slightly affected.
As per table -2, It comes to our notice that annual change of unemployment remained unaffected due to not
having a perfect idea or knowledge or information to almost manufacturers, till 1993. In 1995 the annual change s in unemployment remained the same up to 1996. Thereafter towards 1996, the rate of annual changes in
unemployment remained as flexible.
RESULT The changes in government policy in businesses are essential because the customer can avail the benefit of a
variety of products at a reasonable price. the government is also benefited by collecting the taxes and duties
from MNC of various countries, these changes made help to increase the GDP of our country. Due to advanced
technology, employment opportunities arose. The manufacturers have got the opportunity to sell their products
throughout the world.
1995 2.14B 0.60%
1994 0.97B 0.30%
1993 0.68B 0.20%
1992 0.43B 0.10%
1991 0.29B 0.03%
India Unemployment Rate - Historical Data
Year Unemployment Rate (%) Annual Change
2019 5.27% -0.06%
2018 5.33% -0.08%
2017 5.41% -0.10%
2016 5.51% -0.05%
2015 5.56% -0.04%
2014 5.60% -0.07%
2013 5.67% 0.01%
2012 5.66% 0.01%
2011 5.65% 0.00%
2010 5.65% 0.04%
2009 5.61% 0.25%
2008 5.36% -0.05%
2007 5.41% -0.11%
2006 5.52% -0.13%
2005 5.65% -0.07%
2004 5.72% -0.05%
2003 5.77% 0.00%
2002 5.77% 0.04%
2001 5.73% -0.02%
2000 5.75% -0.03%
1999 5.78% 0.04%
1998 5.74% 0.00%
1997 5.74% -0.01%
1996 5.75% 0.00%
1995 5.75% 0.00%
1994 5.75% 0.03%
1993 5.72% 0.11%
1992 5.61% 0.06%
1991 5.55% 0.06%

International Journal of Advance and Innovative Research Volume 9, Issue 1 (IX) January - March 2022
99
ISSN 2394 - 7780
CONCLUSION It is safe to say that changes in a government policy in a business, justify the manufacturers, customers, and
government to increase their efficiency and stability.
REFERENCES
Alabi, F. (2019), The impact of government policies on business growth of in south-western Nigeria. www.
shodhganga
Dangal, R.( 2019), How do country regulation and business environment impact foreign direct investment
inflow. www. shodhganga
Dixit, K.( 2018), Appraisal social impact of LIC of India and private sector insurance company. www.
shodhganga
Emal, H.&, Sofri, B.( 2013), Impact of government policies in the influences of market practice on the
financial performance of small and medium enterprises in Iraq. Journal of accounting and business volume
13, issue 2.
Manohar, M.( 2009), Impact of economic liberalization on industrial structure and performance. www.
shodhganga
Padmashri, K.( 1999), Banking operation impact of liberalization policy. www. shodhganga
Petra, M. Sova, I.( 2018), Consequences of industry 4.0 in business and economics license based
Switzerland. www. shodhganga
Shah, & Mamuni, V.( 2018), Study on problems and prospects of manufacturing units in Gujarat. www.
shodhganga
Tripathi, R.(2017), Foreign direct investment in India.www.shodhganga
Vijayalakshmi, K.( 2014), Study of interrelation between business ethics and consumer protection. www.
shodhganga

International Journal of Advance and Innovative Research Volume 9, Issue 1 (IX) January - March 2022
100
ISSN 2394 - 7780
CUSTOMER CHURN PREDICTION IN BANK
1Mr. Ashish Modi and
2Ms. Sachi Shah
1Assistant Professor and 2Student Department of IT and CS, Nagindas Khandwala College, Malad (West),
Mumbai
ABSTRACT
Customers becomes a very important stakeholder for any industry, as customers are considered to be the drive revenues of the industry. Without customer, none of the industry can run successfully. Losing a customer, or any
customer discontinuing their services provided by that respective industry is a topic to think on as it might
impact on the company’s or industry’s sales projections, cash flow, and their hold in market. Identifying
customers thinking pattern and the factors a customer considers while taking a decision on whether to continue a particular service or not is very important. The proposed paper tries to identify the factors or reasons a
customer considers before exiting a particular bank using machine learning algorithms so that customer
churning can be reduced.
Keywords: Customer churning, banks, machine learning, algorithms, customers.
INTRODUCTION
Customers are individuals or businesses who purchase goods or services from another company. In sales, churning is the loss of customers. The tendency of customers to leave a company is called customer churn or
customer attrition.
Customers are the foundation of any company. In today's competitive market, customers have a variety of
options to choose from and select the company that best suits their needs. The customer churn rate describes the rate at which a company's customers quit doing business with the company. Churn rates rise as more customers
stop buying your products or services. Customers are a major source of income for any company or business.
Companies are experiencing a rapid increase in customer churn rates due to increased competition. Customer churn results in a decline in revenue for the company. It has emerged as one of the major issues because it is an
expensive problem for all industries. Research indicates that having a new customer is more expensive then to
retain an old one and it belongs to the ratio of 5:25. It has a direct impact on the ability to expand the company.
Hence, retaining a customer is an important topic in recent years for research.
To resolve customer churn, it has become necessary to identify the reasons behind it and find solutions.
Customer churn is caused by a variety of factors, including high costs, bad support, slow response times,
inexperienced staff, and unattractive plans, among others. Therefore, we need to identify some technical and non-technical solutions that can help the company identify its churners. The company can then act accordingly
to avoid losing its customers. By predicting potential churners and their reasons for leaving in advance, a
company can take the necessary actions to retain its customers.
LITERATURE REVIEW
Various machine and deep learning models have been used in a few existing systems for classifying and
predicting customer churn.
Hemlata Dalmia et al (2020), the paper titled Churning of Bank Customers Using Supervised Learning. The dataset contains 10000 customers with 14 features for each customer of a bank extracted from an online
source. For training the data, it is split at 80% training rate and 20% testing rate. A combination of KNN with
the algorithm of XGBoost is used to improve the model accuracy. KNN is used to address the classification and regression problems and XGBoost is used to improve the performance of the classifier. The boosting gave an
increased accuracy of 86.85%.
Kamorudeen A. Amuda & Adesesan B. Adeyemo (2019), carried out research on Customers Churn Prediction in Financial Institution Using Artificial Neural networks. Author used the dataset of the financial
institution in Nigeria containing 50000 records of customers’ data. There were 42 attributes associated with the
data. After dealing with the missing values, the numerical data was replaced with the average of the variables
and the categorical data with the ‘mode’. Label Encoder was used to transform the categorical data into numerical data. MLP of Artificial Neural Network was applied and Neuro Solution Infinity software was
launched. The implementation gave 97.53 % accuracy and the Neuro Solution Infinity software gave 97.36%
accuracy.

International Journal of Advance and Innovative Research Volume 9, Issue 1 (IX) January - March 2022
101
ISSN 2394 - 7780
Sina E. Charandabi (2020) studied Customer churn prediction using supervised classification techniques. The dataset contains data from 10000 European banks. Six different supervised classification models were
developed and their performance was compared. Random forest and ANN were observed to have a greater performance. The study also suggested that decision trees are good for prediction as it helped to rank the
variables by their classification. Both random forest and ANN gave an initial accuracy of 0.81 and 0.82
respectively. ANN showed to have a better accuracy due to its robustness to outliers.
Praveen Lalwani et al (2021), the paper titled Customer churn prediction system: a machine learning
approach. The telecommunication dataset used has 21 features, 16 categorical and 5 numerical. After pre-
processing of data, multiple algorithms were tested for better accuracy. After evaluating the performance,
XGBoost Classifier outperformed compared to other algorithms by having an accuracy score of 84%.
Isabelle Tandan & Erika Goteman (2020), the paper titled ‘Bank Customer Churn Prediction’. Authors
tried to make a comparison between methods of classification and evaluation. Study witnessed identifying the
best model for predicting bank’s customer churn. The accuracy for logistic models was approximately 81%, the random forest was approximately 86% and K-nearest was approximately 83%. After comparison, logistic
regression had the overall worst performance.
PROBLEM DEFINITION Retaining a customer is an important topic in recent years for research. To resolve customer churn, it has
become necessary to identify the reasons behind it. The company can then act accordingly to avoid losing its
customers. By predicting potential churners and their reasons for leaving in advance, a company can take the
necessary actions to retain its customers.
In the proposed research work, the bank gathers its churners' information for a while, in order to identify
patterns in the behavior of its future potential churners. It is a very cost-effective method as you’ve already
earned the trust and loyalty of existing customers. To reduce the churning of customers, many machine learning techniques are available which are useful for prediction. The proposed research work used the decision tree
regressor model to train the bank’s churner’s data. The model then predicts the potential churners by using pre-
trained algorithms by analyzing the patterns and behaviors.
OBJECTIVES The research objective of the customer churn prediction model is to retain customers that can be the most
potential churners by taking appropriate measures.
● The goal of this system is to build a model and find the best accuracy for predicting customer churn.
● The purpose of this project is to develop a prediction model that predicts whether the customer will leave or
not.
● The proposed system is intended to build a prediction model and predict the reason why a customer would
leave.
METHODOLOGY
The proposed research work has been carried out with the aim to reduce customer churn. The performances of
different machine learning predictive models for customer churn prediction on full and selected features were tested. The methodology of the proposed system is structured into five stages including (1) Data Acquisition (2)
Data Preprocessing (3) Data Exploration (4) Suitable Model Selection (5) Training and testing
1. Data Acquisition The data was acquired from an online source and contains 10000 customers’ data that have exited the bank. The
data contains 14 features of customers which are CustomerId, Surname, CreditScore, Geography, Gender, Age,
Tenure, Balance, NumOfProducts, HasCrCard, IsActiveMember, EstimatedSalary, Exited, and Reason for exiting company. The dataset collected contains a randomly sampled population of banking customers detailing
demographics and whether a customer left the bank within the last 6 months. The dataset has 14 attributes:
● RowNumber – It corresponds to the record (row) number and has no effect on the output.
● CustomerId - It contains the customer ID for each customer.
● Surname - The surname of the customer is stored in this column.
● CreditScore - Credit score is an indicator of a person's ability to repay debt. It can impact the customer
churn as a customer with a higher credit score is less likely to leave the bank.

International Journal of Advance and Innovative Research Volume 9, Issue 1 (IX) January - March 2022
102
ISSN 2394 - 7780
● Geography - It contains the customer’s location.
● Gender - It tells us the gender of the customer.
● Age - The age of the customer is stored in this column. This is a relevant column since older customers are
less likely to leave their bank than younger ones.
● Tenure - It refers to the number of years that the customer has been a client of the bank.
● Balance - It stores the current balance amount of the customer that is in his/her account.
● NumOfProducts - It refers to the number of products that a customer has purchased through the bank.
● HasCrCard - It denotes whether or not a customer has a credit card.
● IsActiveMember - It tells us whether the customer is active or not. Active customers are normally less likely
to leave the bank.
● EstimatedSalary – This column stores the approximate salary that the customer earns. This column stores
the balance amount of the customers. People with lower salaries are likely to leave the bank compared to
those with higher salaries.
● Exited - It tells us whether or not the customer left the bank.
● Reason for exiting company - – This column tells us the most probable reason for the customers’ exit.
Figure 1.1: Sample Dataset
2. Data Preprocessing
The preprocessing of data is necessary for the efficient representation of data and machine learning classifiers which should be trained and tested in an effective manner. Preprocessing techniques such as removing duplicate
values, missing values, and Label encoding has been applied to the dataset for effective use in the classifiers.
Label encoding is used to convert each label of the categorical column into an integer value to make them
machine-understandable. All these data preprocessing techniques were used in this project.
3. Data Exploration
After the pre-processing of the data is done the exploration of each attribute of the dataset is done. Multiple
variables from the heart disease dataset are examined, including Geography, Gender, Age, Tenure to name a
few.
4. Suitable model Selection: Decision Tree Regression
Decision tree learning is one of the approached used for predictive modeling that uses a decision tree to go from observations about an item i.e. attribute (branches) to conclusions about the item's target value i.e. churn or not
(leaves). This algorithm splits a sample dataset into homogeneous sets on the basis of most significant
differentiator in input variables to make a prediction. A part of a tree is being generated, with each split. Hence,
a tree with decision nodes and leaf nodes is generated. A tree starts from a root node which is the best predictor.
5. Training and Testing
Finally, this resulting data was split into 67% train and 33% test data, which was further passed to the Decision
Tree Regression model to fit, predict, and obtain the accuracy score of the model.
Working Model
The proposed system uses the decision tree regressor model to train the bank’s churner’s data.
Model 1: To predict whether the customer will leave or not, the Decision Tree Regression model is
implemented.

International Journal of Advance and Innovative Research Volume 9, Issue 1 (IX) January - March 2022
103
ISSN 2394 - 7780
Figure 1.2: Implementation of Model 1
Model 2: To predict the reason for the customer’s exit, the Decision Tree Regression model is implemented.
Figure 1.3: Implementation of Model 2
RESULTS The results obtained by applying the Decision Tree Regression model are shown in this section. In order to
assess which model is most reliable, we evaluate the model based on its accuracy. Accuracy tells us how much
percent of the total classifications done by the model is correct. There are two models implemented; one to predict whether the customer will leave and another to predict the reason that they will leave. The accuracy
score obtained for the Decision Tree Regression model is shown below in Table 1.
Algorithm Used Purpose of the model Accuracy
Model 1: Decision Tree Regression model
To predict whether the customer will leave or not.
0.92 (R2 score) 98% (Accuracy Score)
Model 2: Decision Tree
Regression model
To predict the reason for the
customer’s exit.
0.98 (R2 score)
Table 1: Accuracy
CONCLUSION
In this paper, we propose an effective model to prevent the churn of customers in the banking industry. It uses a decision tree regression model to enhance the accuracy of the model. The decision tree gives the best result of
98% in terms of accuracy, sensitivity, and specificity. Organizations periodically calculate customer churn in
multiple aspects. Customer Churning can be predicted easily using this model and then the company can put in
appropriate efforts required to stop this churning. The churn rate can be calculated quarterly or annually. An
accurate forecast will assist the company in formulating strategies for reducing churning rates in the future.
FUTURE WORK
As an extension of this research work, further enhancement can be done by applying the customer churn to industries other than the banking industry like the telecom sector. Also, once strategies have been formulated
for reducing the customer churn, Business Intelligence and reporting tools can be used to visualize and
understand the impact of these strategies and modify them as per the requirements.

International Journal of Advance and Innovative Research Volume 9, Issue 1 (IX) January - March 2022
104
ISSN 2394 - 7780
REFERENCES
1. Hemlata Dalmia, Ch V S S Nikil and Sandeep Kumar (2020), “Churning of Bank Customers Using
Supervised Learning”. A combination of KNN with the XGBoost algorithm is used to enhance the accuracy
of the model.
2. Amuda Kamorudeen Akindele & Adesesan B. Adeyemo (2019), “Customers Churn Prediction in Financial
Institution Using Artificial Neural Network”.
3. Sina E. Charandabi (2020) “Customer churn prediction using supervised classification techniques”.
4. Praveen Lalwani, Manas Kumar Mishra, Jasroop Singh Chadha and Pratyush Sethi (2021), “Customer
churn prediction system: a machine learning approach”.
5. Isabelle Tandan & Erika Goteman (2020), “Bank Customer Churn Prediction” is a comparison between
classification and evaluation methods.
6. Ahmad AK, Jafar A, Aljoumaa K(2019) “Customer churn prediction in telecom using machine learning in
big data platform”. Journal of Big Data.
7. Asthana P (2018) “A comparison of machine learning techniques for customer churn prediction”.
International Journal of Pure and Applied Mathematics 119(10):1149–1169
8. Adwan O, Faris H, Jaradat K, Harfoushi O, Ghatasheh N (2014) “Predicting customer churn in telecom industry using multilayer perceptron neural networks: Modeling and analysis”. Life Science Journal
11(3):75–81
9. Sharma H, Kumar S (2016) “A survey on decision tree algorithms of classification in data mining”.
International Journal of Science and Research (IJSR) 5(4):2094–2097

International Journal of Advance and Innovative Research Volume 9, Issue 1 (IX) January - March 2022
105
ISSN 2394 - 7780
VISION WALK- A STUDY ON CHALLENGES & SOLUTIONS OF VISION IMPAIRMENT
1Adarsh Gupta
2Yohan D’souza
Mentor 3Asst. Prof. Nabila M. Kazi
Bunts Sangha’s S.M. Shetty College of Science, Commerce & Management Studies, Powai
ABSTRACT
Humans can visualize the world through their senses. However, when a person has a physical disability or
lacks a sense organ, they don't have any control. To cope with sight loss or low imaginative and prescient is
simply one of the challenging situations that the visually impaired are always dealing with. Due to advancement in technology, there are many computers assistive systems that are helping vision impaired individuals to live
independently. The limitations faced by this assistive technology are usability and accessibility since age is a
barrier when it comes to adapting any advanced technology. In this paper we are going to overcome the shortcomings faced by this assistive technology and implement a system using embedded technology, voice
recognition systems, GPS systems that can aid sight impaired individuals to overcome static & dynamic
obstacles.
Keywords: visually impaired, assistive technology, embedded technology, voice recognition systems, GPS
systems static & dynamic obstacles.
INTRODUCTION According to WHO, there are 250 billion blind people worldwide, of which 37 million out of them are visually impaired. Vision impaired people face difficulty in moving or to do anything without assistance. In this modern
era, technology plays an important role in everyone's life. Each new advancement in technology makes our
lives more comfortable and easier. The innovation in technology makes life easier even for the visually impaired. So, we came up with the concept of Sensor Stick using different technologies such as artificial
intelligence, embedded systems, GPS systems etc.
OBJECTIVE It has been claimed that computers and the Internet are two of the most significant developments since the invention of braille, as for the first time ever many blind and partially sighted people have access to the same
wealth of information as sighted people and on the same terms (Abner & Lahm, 2002).
The main objective of this paper is to aid vision impaired people to walk independently and reduce the difficulty faced while using computer assistive technology. The purpose of the Stick is to make the life of the visually
impaired more efficient and comfortable. The stick helps to reach the location safely for people with disabilities,
and in case of an emergency, there is a voice recognition system that takes voice commands and directs the vision impaired to reach safely. The camera sensor enabled in the stick will automatically read braille language
and convert it into audio so that it's easier for them to identify obstacles as well as any unhygienic surfaces they
are in contact will be intimated through voice commands. To be connected with their near and dear ones all the
time the stick will be connected to a web app (with the help of QR code) which can trace their location and
timely update their dear and near ones about their whereabouts.
PROBLEM STATEMENT
Nearly 37 million humans are affected by vision-associated problems. Among them, a number of them absolutely lack vision. A national survey done in 1986-89 reported that 1.5% of the Indian population (12
million people) was blind with a presenting visual acuity of < 6/60 in the better eye. The original goal of the
National Programme for Control of Blindness was to reduce this prevalence to 0.3% by 2000. We have recently reported the prevalence of blindness in the population of Andhra Pradesh to be 1.66% with a presenting visual
acuity of < 6/60 in the better eye as the sole criterion and 1.84% with a presenting visual acuity of < 6/60
orcentral visual field < 20 degrees in the better eye. "The prevalence of blindness in India has come down by
around 47 per cent since the last survey conducted in 2006-2007 and the findings of the current survey are for
blindness as defined to be vision of less than 3/60 in the better eye,"
LITERATURE SURVEY In this paper, we have studied papers from different research paper like

International Journal of Advance and Innovative Research Volume 9, Issue 1 (IX) January - March 2022
106
ISSN 2394 - 7780
1. Blind Aid Stick: Hurdle Recognition, Along with Voice-Based Cooperation & Via GPS & GSM & Panic
Alert System by Ayesha Rafat Arkeri, Sumaiya Sadaf.
2. An IoT based Voice Controlled Blind Stick to Guide Blind People by Md. Adil, Taiyabashadaka Rafa,
Jannatul Ferdoush, Mohammad Abir Mahmud
3. Sensor Stick walking aid for the Blinds by Lucian Zaratang, Daniel Kimbin.
4. Smart Walking Stick for Visually Impaired People Using Ultrasonic Sensors and Arduino by Dada
Emmanuel Gbenga, Arhyel Ibrahim Shani, Adebimpe Lateef Adekunle.
Here we have studied innovative ideas like GPS, Voice Control, Sensors, and other ideas from the above
authors. In our paper, we have something which is very unique from the above-mentioned papers. We have a
unique QR code as well as A chip that can convert any normal metal stick into a smart sensor stick with all the
below mentioned features.
There are various methods and devices used to guide the visually impaired. Top institutions and universities
perform several research programs to provide the best navigational technology to visually impaired people.
Here is a brief review of several navigational aids for blind individuals.
Blind people are at a disadvantage while travelling as they cannot inherit information about their surrounding
areas and their threats and cannot sense threats concerning traffic and various other obstacles which can be
easily detected by an individual without any visual impairment anomalies.
Traditional ways of navigation like a guide dog or a stick, only help in a certain way to avoid the obstacle but do
not let the user have a brief idea of what it is.
There are many technologies available today like GPS, GRS available e for the navigational purpose of the
blind. Many pieces of research for future development have been done as well.
Before more advanced technologies are discussed let us put forth the traditional ways of navigation for the blind
and their main properties and limitations.
STICK
One of the most popular handheld aids. It is foldable and can be adjusted according to the user’s limitations and
comfortability. A blind person uses sweeping motion to scan the path (approx. 1m). As per studies, to use a
stick efficiently, it requires up to 100 hours of training to know about the whereabouts like stairs difference in
heights.
Advantages: 1. Cost-efficient
2. Lightweight and easy to use
Disadvantages: 1. Does not make users aware of the dangers which are more
Prevalent in nature.
2.1 Guide Animal A professionally trained dog assists in the avoidance of obstacles, the dog may take the user on a familiar path
(e.g. the dog is trained to stop in front of obstacles). It is one of the most rarely used visual aids.
Advantages: 1. Good in sensing danger and overall obstacle avoidance.
Disadvantages: 1. Expensive to maintain.
2.2 Human Guide
A human walking hand in hand guiding the blind individual along the path.
Advantages/disadvantages: In practice but not the most feasible solution as it also infringes the privacy of the
blind individual.
PROPOSED SYSTEM

International Journal of Advance and Innovative Research Volume 9, Issue 1 (IX) January - March 2022
107
ISSN 2394 - 7780
2.3- System Description The above figure shows the components of the proposed walking stick model. The user will have all inbuilt
functions like LED screen, mic, braille keyboard, etc. The stick will be made up of any metal .
2.4. Led Screen The LED screen is used to visualize the output. The device has a 15x10 screen which can be used to portray the
details of the individuals using the stick as well as to show basic details like the battery percentage, etc.
2.5- Voice Input or Mic The Mic will be used to input commands by the user and other things like destination, weather, traffic, and so
on. The mic will have a range of -50dBV and -25dBV (decibels) so that even if the person is not near the mic,
they will still be in range.
2.6- Power Supply/Battery The stick will be powered by a 4000 mAh Lithium-Ion battery which will last for up to 2days once fully
charged and can be fully charged within 1 hour using Quick Charge Technology.
2.7- Processor Chip This is where all the action takes place and it will be a 4 GHz processor for faster computation of programs and
certain codes. The Chip will be easy to replace in case of problems occur. This processor chip can convert any regular stick into a smart stick which will be cost-efficient and environmentally friendly as it will use old metal
sticks. Below is a diagrammatical representation of the chip
2.8- Voice Output/ Speaker or Headphone
The speaker/headphones will make the user aware of the functions being executed, e.g., tell directions to the
destination, make the user aware of the dangers and obstacles around. The speakers will have an output range of
500 Hz to 5000Hz.
2.9. Braille Keyboard
Braille keyboards are specialty keyboards that contain single keys that represent each of the dots in a braille
cell. Thus, making it easier for the user to input data.
2.10. EEPROM
EEPROM (electrically erasable programmable read-only memory) is user-modifiable read-only memory
(ROM) that allow users to erase and reprogram stored data repeatedly in an application
2.11. Bluetooth Connectivity/App
The stick will be connected to an app with Bluetooth 5.0. connectivity, the app will track the user’s movement
and all the data will be displayed in the app, the app will also be connected to the people closest to them making
them aware of their location and well-being.

International Journal of Advance and Innovative Research Volume 9, Issue 1 (IX) January - March 2022
108
ISSN 2394 - 7780
2.12. SD CARD
Secure Digital, officially abbreviated as SD, is a proprietary non-volatile memory card format developed by the
SD Association for use in portable devices. A 32GB SD will be provided as a backup memory for the data.
2.13. QR CODE
A unique QR code will be given to each user and will be connected directly to the app. In case the user gets lost
somewhere, the QR code can be scanned wherein all the details of the user will be saved and the user can reach
their required destination safely.
LIMITATIONS Everything has its pros and cons. As the coin has two sides, limitations are less as compared to other models on
the market. The software is updated annually and has up to 12 updated versions. (6 updates per year). is therefore much more convenient to use. Battery level is another limitation that can be circumvented by
providing solar panels to recharge the battery on the go. Molten anodized metal can be cheaper, so using it
could be another problem you can solve.
CONCLUSION
This is the era of digitization and this proposed model will be a revolutionary change to the current Visual Aid
Stick line as it will help make life easier for many visions impaired people. However, there are many models, but none of them resemble the model presented in this study. The future of digitization is not just growing, but
is taking a different leap as expected. Across industries, including high-tech, the COVID-19 crisis is
accelerating businesses' digital transformation initiatives. So, this one step towards innovation and technology
will be beneficial to society.
REFERENCES
Dandona, L & Dandona, Rakhi & John, R. (2000). Estimation of blindness in India from 2000 through
2020: Implications for the blindness control policy. The National medical journal of India. 14. 327-34.
Kori, Dayanandappa & K.R, Mulla. (2021). Assistive Technologies for Visual Impaired Students: A Study
at Visually Impaired Schools in Karnataka.
Kugler, Logan. (2020). Technologies for the visually impaired. Communications of the ACM. 63. 15-17.
10.1145/3427936.
Sriram, N. & Hosur, Anirudh & Reshan, Akash & Vetrivelan, P.. (2022). Assistive Device for Visually
Impaired People. 10.1007/978-981-16-4625-6_90.
Dharan, Dharani & Aakash, & Kumar, Sai & Getsy, D.. (2021). Visually Impaired Smart Assistance. 1-3.
10.1109/ICSCAN53069.2021.9526495.
https://www.dailypioneer.com/2019/india/blindness-in-india-drops-by-47---report.html.

International Journal of Advance and Innovative Research Volume 9, Issue 1 (IX) January - March 2022
109
ISSN 2394 - 7780
A STUDY OF THE SCOPE OF ARTIFICIAL INTELLIGENCE IN CUSTOMER EXPERIENCE IN
BANKING SECTOR IN INDIA
1Ankur Aggarwal and
2Dr. (Smt.) Shubhra Garg
1(Research Scholar, Chaudhry Charan Singh University, Meerut) 2(Reader, Faculty of commerce & business administration, M.M.H. College, Ghaziabad)
ABSTRACT Banking sector is the most revolutionary sector among all other sectors in India. Last five to ten years were full
of changes. Banking services have touched the common mans’ life. Once all the banking services were
revolving around the salaried or earners, it become an integral part of our life. Scholarship, subsidy transfer,
salary, day to day remittances all is due to banking services. Banking functions have been increased, so as increased the demand to regulate the banking services safely and securely. Present study is based upon the
scope of artificial intelligence in customer experience and robotic process automation in banking sector in
India. Researchers have asked question to customers whether they feel it suitable with AI based service or need human interaction for solving their problems. Most of the customer experience related aspects showed good
correlation with AI based services by banks.
Keywords: AI (artificial intelligence), RPA (robotic process automation) Customer experience, Secure banking
practices
I. INTRODUCTION
Artificial intelligence in the banking sector makes the bank efficient, trustworthy, and more comprehensive.
Artificial intelligence can be defined in many ways. But most common explanation comes from ‘Allen Turing Test’ i.e., if a work done (action, speech, conversation etc.) cannot be distinguished that it has been done by a
machine or human, then the machine can be called as intelligent. Origin of AI has its deep roots in history since
1943. It can be classified in several stages.
(a) Maturation of Artificial Intelligence (1943-1952)
o Year 1943: The main work which is currently perceived as AI was finished by Warren McCulloch and
Walter pits in 1943. They proposed a model of fake neurons.
o Year 1949: Donald Hebb exhibited a refreshing principle for adjusting the association strength between
neurons. His standard is presently called Hebbian learning.
o Year 1950: The Alan Turing who was an English mathematician and spearheaded Machine learning in
1950. Alan Turing distributes "Registering Machinery and Intelligence" in which he proposed a test. The test can really look at the machine's capacity to show astute conduct identical to human insight, called a
Turing test.
(b) The introduction of Artificial Intelligence (1952-1956) o Year 1955: An Allen Newell and Herbert A. Simon made the "main man-made consciousness program"
Which was named as "Rationale Theorist". This program had demonstrated 38 of 52 Mathematics
hypotheses and track down new and more rich confirmations for certain hypotheses.
o Year 1956: "Man-made brainpower" first embraced by American Computer researcher John McCarthy at
the Dartmouth Conference. Interestingly, AI begat as a scholastic field.
o Around then undeniable level codes like FORTRAN, LISP, or COBOL were created. Also the energy for
AI was extremely high around then.
o The brilliant years-Early excitement (1956-1974)
o Year 1966: The analysts underscored creating calculations which can take care of numerical issues. Joseph
Weizenbaum made the first chatbot in 1966, which was named as ELIZA.
o Year 1972: The main keen humanoid robot was underlying Japan which was named as WABOT-1.
(c) The primary AI (1974-1980)
o The span between years 1974 to 1980 was the main AI winter term. Simulated intelligence winter alludes to
the time span where PC researcher managed a serious lack of financing from government for AI research.
o During AI winters, an interest of exposure on computerized reasoning was diminished.

International Journal of Advance and Innovative Research Volume 9, Issue 1 (IX) January - March 2022
110
ISSN 2394 - 7780
o A blast of AI (1980-1987)
o Year 1980: After AI winter duration, AI came back with "Expert System". Expert systems were
programmed that emulate the decision-making ability of a human expert.
o In the Year 1980, the first national conference of the American Association of Artificial Intelligence was
held at Stanford University.
(d) The second AI (1987-1993)
o The span between the years 1987 to 1993 was the subsequent AI Winter term.
o Again, Investors and government halted in financing for AI research as because of significant expense yet
not productive outcome. The master framework, for example, XCON was extremely financially savvy.
The development of clever specialists (1993-2011) o Year 1997: In the year 1997, IBM Deep Blue beats world chess champion, Gary Kasparov, and turned into
the principal PC to beat a world chess champion.
o Year 2002: interestingly, AI entered the home as Roomba, a vacuum more clean.
o Year 2006: AI came in the Business world till the year 2006. Organizations like Facebook, Twitter, and
Netflix likewise began utilizing AI.
Profound learning, enormous information and counterfeit general insight (2011-present) o Year 2011: In the year 2011, IBM's Watson won peril, a test show, where it needed to tackle the mind
boggling questions just as conundrums. Watson had demonstrated that it could comprehend regular
language and can address interesting inquiries rapidly.
o Year 2012: Google has sent off an Android application include "Google now", which had the option to give
data to the client as an expectation.
o Year 2014: In the year 2014, Chatbot "Eugene Goostman" won a contest in the notorious "Turing test."
o Year 2018: The "Venture Debater" from IBM bantered on complex subjects with two expert debaters and
furthermore performed amazingly well.
Banking and Artificial Intelligence Advanced interruption is rethinking enterprises and changing how organizations work. Each industry is
surveying choices and taking on ways of making esteem in the innovation-driven world. The financial area is
seeing historic changes: chief being the ascent in client centricity. Technically knowledgeable clients, presented with cutting-edge innovations in their everyday lives, anticipate that banks should convey consistent encounters.
To measure up to these assumptions, banks have extended their industry scene to retail, IT, and telecom to
empower administrations like versatile banking, e-banking, and continuous cash moves. While these
progressions have empowered clients to benefit a large portion of the financial administrations readily available whenever, anyplace, it has likewise accompanied an expense for the financial area. Meeting up of banking and
areas like IT, telecom and retail have expanded the exchange of basic data over virtual organizations that are
helpless against digital assaults and deceitfulness. These occurrences influence the benefit of banks, yet in addition, hamper banks' trust and relationship with clients. The ascent of online security dangers in financial
exchanges has fixed unofficial laws. However, these guidelines are helpful to screen online monetary
exchanges, it has checked banks' ability to stay aware of the advanced change. Banks can't put resources into
innovation, as they need to keep up with capital ampleness proportion according to global administrative system rules. Hence, banks succumb to the opposition presented by deft Financial Technology (FinTech) players, who
don't need to keep up with capital ampleness proportion. As per the World Retail Banking Report of 2016,
about a portion of the clients all over the planet have announced an improved probability to switch them manages an account with these players. Saddling mental innovation with Artificial Intelligence (AI) carries the
upside of digitization to banks and assists them with meeting the opposition presented by FinTech players.
Truth be told, around 32% of monetary specialist organizations are now utilizing AI advances like Predictive Analytics, Voice Recognition, among others, as per a joint exploration led by the National Business Research
Institute and Narrative Science.
AI is the eventual fate of banking as it brings the force of cutting-edge information examination to battle fake
exchanges and further develop consistency. Simulated intelligence calculation achieves hostile to tax evasion exercises in a couple of moments, which in any case require hours and days. Computer-based intelligence

International Journal of Advance and Innovative Research Volume 9, Issue 1 (IX) January - March 2022
111
ISSN 2394 - 7780
likewise empowers banks to oversee immense volumes of information at record speed to get significant
experiences from it.
Elements like AI bots, advanced instalment consultants, and biometric misrepresentation discovery components lead to a better calibre of administrations to a more extensive client base. This means expanded income,
diminished expenses, and a lift in benefits. Artificial intelligence at the bank is boon for customers as well as
service providers. A customer can know loan amount that he can avail at different interest rates without talking to any bank employee. AI enables banks to update the process automatically. AI helps banks to be man less on
three fronts i.e., conversational banking, anti-fraud and Backoffice underwriting. AI helps banks in prediction of
business in a segment and in a specific year. Banks can restructure their regulations accordingly. AI has three
major thrust area of application in banking sector:
1. AI integrated with Machine Learning: In these, banks provide solutions that a human does like front office
support, robo-advice and customer recommendations etc.
2. AL and natural language processing: Chat-bot (Gautam Jaiswal 2020), anti-fraud detection, e-KYC etc are
provided to banks in this.
3. Cognitive Computing: AI provided facility of algorithm-based trading and investment options. In this,
trends of several years are fed in the computers. With the help of neural network and prescribed algorithm, best investment options are predicted. Further the variation between predicted and actual outcomes are fed
to computer and with the help of this the model keeps improving and self-learning.
AI have helped the banks to make complex work easy. KYC, loan processing and many other activities are
human interaction free now. Credit approval, fraud detection and anti-money laundering activity can be dealt with the help of AI. State bank of India Intelligent Assistant (SIA) is a chat bot of SBI that handles almost
10000 queries per second. HDFC bank’s chat bot ‘EVA’ works with 85% accuracy to answer most of the
queries.
Axis bank have applied robotic process automation for their processes. In July 2020 they have launched
conversational interactive voice response (IVR) known as AXAA. We have seen that AI is affecting the
banking positively. But to know the response we need to understand the issue in detail.
II. Literature Review Literature review is very important part of the research. An extensive study of the research will ensure the
avoidance of the duplication of the work. Payne, E. M., Peltier, J. W., & Barger, V. A. (2018) identifies
determining factors for mobile banking and AI-enabled mobile banking services. Results indicate a divide in how digital natives perceive relative advantage between our two dependent variables. Consistent with previous
studies, the relative advantage construct has the most impact on mobile banking usage. However, relative
advantage was not significant for AI-enabled mobile banking, suggesting an extra layer of complexity that goes beyond convenient fast banking. Alzaidi, A. A. (2018) suggests Artificial intelligence is a cutting-edge
technology that have been forefront in technological revolution worldwide. Owing to greater acceptance of new
technological innovations, artificial intelligence sector had been developing at an unprecedented pace and is
being applied in many walks of life. Artificial intelligence systems have potential in transforming all operations of banking industry is seen as (AI) and is received with enthusiasm due to its capability of taking human-like
decisions and avoiding humanlike errors. Artificial intelligence has been adopted in some sectors more widely
than others, banking sector is amongst the few sectors that had shown moderate level of acceptance and adoption of this technology. His study explores the adaption of artificial intelligence in banking sector of
Middle East. This region is known for its mixed pace acceptance of various technological tools in the local
banking industry. The primary data required to analyse issue at hand was collected using survey as a research strategy, the data was collected from 200 bank employees across a few selected banks in the region. The main
behind this survey is to gather information related to understanding implementation of Artificial intelligence in
banking sector and understand its impact. Caron, M. S. (2019) aims to bolster further awareness and provide
additional guidance for banks’ corporate governance and national policymaking, to better assess development, deployment and scaling of sophisticated algorithms — Artificial Intelligence (AI). It assesses key
considerations and relevant challenges AI brings to the banking industry. It identifies publicly disclosed
algorithms and categorizes them in three functional layers — internal, external, and regulatory — applicable to financial services’ providers, and compares potential benefits and costs. Soni, V. D. (2019) suggests that with
the advances in information technology, various cyberspaces are used by criminals to enhance cybercrime. To
mitigate this cybercrime and cyber threats, the bank and financial industry try to implement artificial
intelligence. Various opportunities are provided by AI techniques, which help the banking sector to increase

International Journal of Advance and Innovative Research Volume 9, Issue 1 (IX) January - March 2022
112
ISSN 2394 - 7780
prosperity and growth. To maintain trust in artificial intelligence, it is important to maintain transparency and
explain ability. Information about customer's behavior and interest is provided by artificial intelligence
techniques. Robo-advice is an automated platform that is maintained by AI. Artificial Intelligence is also involved in protecting personal data. Proper design provided by AI towards the banking sector, by which they
are able to identify fraud in transactions. AI directly linked with the domain of cyber security. Various kinds of
cybercrimes are prevented and identified by AI-based fraud detection systems. However, implementation and maintenance of artificial intelligence consist of the high cost. Along with this unemployment rate is increased
by AI techniques. Aitken, M. et al (2020) illustrate that participants’ concerns did not typically relate to private
or individual interests but more often to wider ethical and social concerns. The focus groups demonstrated the
value of qualitative, deliberative methods to explore the nuances of public responses and highlighted the importance of taking account of conditions for public acceptability - rather than just customer uptake - in order
to develop ethical practice and establish a social licence for uses of AI in banking. Burgt, J. V. D. (2020)
concludes that trust is crucial when it comes to AI in banking. Complex AI technologies are new, and it will take time for banks supervisors, as well as wider society, to grow comfortable with their application. Banks
must ensure this technology is deployed conscientiously across the banking system, which may require certain
changes to the regulatory framework. Rahman, M., Ming, T. H., Baigh, T. A., & Sarker, M. (2021) suggested that hat AI is an essential tool for fraud detection and risk prevention. The absence of regulatory requirements,
data privacy and security, and lack of relevant skills and IT infrastructure are significant challenges of AI
adoption. The quantitative results indicate that attitude towards AI, perceived usefulness, perceived risk,
perceived trust, and subjective norms significantly influence intention to adopt AI in banking services while perceived ease of use and awareness do not. The results also show that attitude towards AI significantly
mediates the relationship between perceived usefulness and intention to adopt AI in banking services. After
studying lots of research the researchers have found that there is need of study of AI based banking service
effect upon consumer experience. So the researchers have framed the present study.
III. Research Methodology
Research Methodology is very important part of any research. Researcher has detailed about the sampling and
research tool in detail.
Population: All the customers of banking services
Sample Size: 200 customers of banking services
Geographical Location: Hapur, Meerut, Ghaziabad, NOIDA, Moradnagar
Objective: To study the effect of different aspects of consumer experience based upon AI based banking
services
HYPOTHESIS
1H0: There is no significant relationship of artificial intelligence-based banking services and customer
experience
1Ha: There is no significant relationship of artificial intelligence-based banking services and customer
experience
Research Tool: Questionnaire, 20 questions, Cronbach’s’ alpha 0.752, extracting factors 05
Table 3.1. KMO and Bartlett's Test
KMO and Bartlett's Test
Kaiser-Meyer-Olkin Measure of Sampling Adequacy. .737
Bartlett's Test of Sphericity Approx. Chi-Square 2907.029
df 190
Sig. .000
Kaiser-Meyer-Olkin (KMO) Test is a measure of how well-suited data is for factor analysis. Different scholars of statistics have different views for accepting KMO value. In practice value between 0.80 to 1.00 is excellent.
A value between 0.60 to 0.80 is middling (Gautam Jaiswal (2018)). Value of research data is 0.737 which can
be considered acceptable for sampling adequacy. The sig. value for Bartlett's Test of Sphericity is 0.000. For factor analysis to be recommended suitable, the Bartlett’s Test of Sphericity must be less than 0.05. So, the
current data is adequate for factor analysis.
Further to test the reliability of the tool the Reliability Statistics have been measured by Cronbach's Alpha for
20 Items, which has been found 0.752. There are several tools to measure reliability for example Test-Retest

International Journal of Advance and Innovative Research Volume 9, Issue 1 (IX) January - March 2022
113
ISSN 2394 - 7780
Reliability, Alternate/Parallel Forms Reliability, Split-Half Reliability, Spearman-Brown, Cronbach’s
Coefficient Alpha and Maximized Lambda. Researcher is using SPSS as statistical package; the most common
measurement of reliability is Cronbach’s Alpha. Value above 0.600 is considered to predict a reliable tool. The tool shows Cronbach’s Alpha 0.752 that is predicting that our tool is reliable and repeats the research results.
Item- Total Statistics shows that if we delete any of 20 items how much it will increase the reliability of tool.
The study of ‘Cronbach's Alpha if Item deleted’ column shows that deleting any item is not making any
significant change in reliability. So, all 20 items are considered for tool.
Fig: 3.1 Measurement Model
Factors are shown by oval, items are shown by square and small circle related to square shows error terms of
items. The covariance among the factors is shown by double-headed arrow. The values of standardized estimates are all less for every factor to accept the tool. Factors are related with items with single headed arrow.
Loadings are mentioned above arrow. These loadings must be high to accept the tool. Few loadings are less than
0.700 which may be not good. Removing these items may increase model fit. Due to research need, these items
are retained. Present measurement model has CMIN/DF 5.908, GFI 0.654, CFI .726, and RMSEA value 0.176. Using modification indices with five modification {e19-e2 (-.25), e19-e4 (.24), e13-e2 (.57), e16-e8 (-.39), e14-
e12 (0.10)} the model fit has improved CMIN/DF 4.912, GFI 0.705, CFI .788, and RMSEA value 0.152. The
relation between the error term can be explained as the questionnaire is based upon the contemporary factors rather than any established postulate. These Five factors were named as customer experience, safety, fraud
prevention, quick processing, convenience.
IV. FINDINGS AND SUGGESTIONS
1-The researchers have collected data and with the help of SPSS analyze it to test the hypothesis. The findings
are documented below:
1H0: There is no significant relationship of artificial intelligence-based banking services and customer
experience
1Ha: There is significant relationship of artificial intelligence-based banking services and customer experience
These four factors were named as safety (0.436), fraud prevention (0.511), quick processing (.398), convenience
(0.611) have significant correlation with the customer experience. Further, the regression model summary shows that the model with 4 predictor variables explains 72.9 % (Adjusted R Square= .729) variance of
customer experience (Y). Any model with Adjusted R Square value .400 and above is acceptable. Multiple
correlation coefficient (R) value is 0.856, which shows that all the factors explained in the model are highly
correlated. In coefficient table all the sig value are below 0.05 (p=0.05 level), this shows that the entire variables have good regression weight on dependent variable. This supports the hypotheses testing results. So, it can be
said as, ‘There is significant relationship of artificial intelligence-based banking services and customer
experience’.
2- Front office support: Researchers have found that the AI have affected the banking sector at large. At this
stage of banking operations biometric system, chatbots and voice assistance etc. comes. Earlier this work was
done by human beings. An individual has to be assigned for these tasks but after the implementation of AI things have changed. Chat bots are very important as they can engage people like humans. Those tech support
lines which were hut down after banking hour are now answering queries of customers 24X7. They are capable
of handling multiple queries. They are diligent and can not make errors even after working for longer period.
Not only customer experience has been improved but the cost also has been reduced.

International Journal of Advance and Innovative Research Volume 9, Issue 1 (IX) January - March 2022
114
ISSN 2394 - 7780
3- Middle level operations: These are very crucial part of banking services. AI has improved the middle level
operations of banks. All the banking frauds are majorly affected by the middle level operations. The loan
approval, credit evaluation etc. are done at this stage. KYC, Antifraud ML, and other monitoring activities are done at this level. Past transactions-based alerts, CIBIL monitoring are done with the help of AI. Further robotic
process automation can help the banks in anti-money laundering, KYC, automated report generation, account
opening, loan approval etc.
4- Fascial recognition to initial transaction, Micro-expression analysis with virtual loan officers, biometric to
authenticate and authorize, ML to detect fraud and cybercrimes, Real time transaction analysis to prevent fraud
are some scope areas of AI in banking services.
5- Robotic Process Automation (RPA) is used to improve the efficiency of the banks in India. RPA uses bots to that interact with website applications, e-mails etc. to automate the task. It is most effective automation solution.
It is auditable and secure.
6- Significant banks set up AI innovation as a regular occurrence that approaches fraud location from a ground-breaking viewpoint rather than delaying until after fraud happens to act. Ongoing information saw that as 63%
of financial institutions accept that AI can forestall fraud, while 80% concur that AI assumes a basic part in
diminishing fraudulent instalments and endeavours to submit fraud.
7- Artificial intelligence is reclassifying extortion avoidance from depending just on previous encounters to
considering arising exercises, practices, and patterns in exchange oddities. Before AI, misrepresentation
anticipation frameworks would depend on rules alone, which dominate at examining past extortion designs
without giving experiences into what's to come. By consolidating managed learning calculations prepared on authentic information with unaided learning, computerized organizations gain a more prominent degree of
keenness and clearness about the overall danger of clients' practices. Choices to acknowledge or dismiss the
instalment, stop false movement to restrict chargebacks and decrease hazard are for the most part conceivable
now, on account of AI.
8- Artificial intelligence makes it conceivable to distinguish misrepresentation assaults progressively as opposed
to holding up six or two months until chargebacks begin coming in. Man-made intelligence's capacity to
distinguish misrepresentation assaults in under a subsequent utilizing progressed AI-based rating innovations like Omniscore is the fate of extortion the board. At the point when an advanced business depends on organized
learning and rules alone, new assaults are extremely challenging to get. Chargebacks appear 6 to about two
months after the misrepresentation has occurred, and computerized organizations race to refresh their principles motors. By adjusting regulated and unaided learning, AI eases the need generally to play get up to speed to
online misrepresentation.
9- It's presently conceivable to foil more refined, nuanced misuse assaults including alluding to a companion misuse, advancement misuse, or merchant agreement in a commercial center. Rules motors and prescient
investigation can scale just such a long way in ruining extortion endeavors. Advanced organizations will
frequently return to stricter, controlling principles for exchange endorsements in the event that they have been
signed by extortion previously. The outcome is an awful client experience. By having an AI-based extortion avoidance framework accomplishes crafted by assessing recorded information and inconsistencies, client
encounters can remain more certain, and the more complex nuanced misuse assaults can be halted.
10- Furnishes extortion investigators with ongoing danger scores and more noteworthy knowledge into where best to set edge scores to expand deals and limit misrepresentation misfortunes. The best extortion experts have
an instinctive feeling of when exchange designs are authentic or not. With AI, a misrepresentation examiner
gets a 360-degree perspective on exchanges interestingly, having the advantage of seeing authentic information in a setting. Including oddity discovery and bits of knowledge into continuous action utilizing solo AI, extortion
investigators can immediately approve or rethink their choice with respect to limit levels, overseeing hazard
well.
Man-made intelligence empowers computerized organizations to oversee chargeback rates, decay rates, and functional expenses with the goal that business destinations can be accomplished. One of the most significant
parts of an AI-based extortion avoidance stage is its capacity to immediately redo and change business results
explicit to the whole business, separate items lines, offices, and selling seasons. Computerized organizations are depending on the mix of administered and unaided AI to achieve more prominent degrees of readiness, speed,
and time-to-showcase, with AI-based misrepresentation avoidance frameworks being essential to that work.
Empowers computerized organizations selling virtual products, including gaming, to give a more steady, top-

International Journal of Advance and Innovative Research Volume 9, Issue 1 (IX) January - March 2022
115
ISSN 2394 - 7780
notch client experience on an all-day, everyday premise. Web-based games have dramatically filled in
prominence in the course of the most recent five years with web-based gaming stages frequently having north of
250 million clients around the world. Game stage suppliers need however many individuals as could reasonably be expected on the stages to drive publicizing, membership, upsell, and strategically pitch income. For game
stage suppliers to succeed, they need to give a prompt, exceptionally responsive buy insight. Rather than
constraining their clients or fans to go through a check, they can allot a danger score to the exchange and satisfy the buy demand right away. Computer-based intelligence makes it feasible for gamers to purchase the coins or
tokens they need when they need them to continue to play. Man-made intelligence-based misrepresentation
anticipation frameworks make it conceivable to promptly acknowledge the exchanges while as yet remaining
inside the chargeback edges from American Express, MasterCard, VISA, and others. Empowers low-edge organizations and product offerings to remain beneficial by controlling chargebacks levels that
straightforwardly affect edges. Web-based business organizations blossom with offering value, accessibility,
and a positive and consistent client experience. Many penances gross edges for more noteworthy scale and more exchanges. The test is remaining productive while drawing in new clients whose buy history isn't essential for
the regulated learning history of their misrepresentation frameworks. That is the place where an AI-based
methodology that consolidates both unaided and directed gaining pays off from a net edge outlook.
V. CONCLUSION
Cybercrime stays one of the costliest dangers to purchasers and the banking industry, costing an expected $600
billion consistently in the United States alone. Online transaction fraud represents the greatest cut, with a
normal expense adding up to more than $200 billion over the course of the following five years. Or then again, to put it another way, every $15 out of $1,000 spent web-based will be the result of fraudulent activity. Banks
and financial institutions are innately defenceless against fraud and tricks, which is the reason having the option
to distinguish unlawful activity isn't a choice. As computerized banking applications and web-based spending
keep on developing, so should the endeavours to distinguish and forestall fraud.
One of the issues financial institutions face is the way that fraud can take many shapes and structures. For
instance, somebody who has taken an individual's Visa data and character and is taking part in fraudulent
spending might fly under the radar since they're utilizing real card numbers and individual subtleties. Many banks have various bogus up-sides each day that regularly go under a manual survey process, yet in doing as
such, banks hazard burdening a client who is attempting to manage valid transactions. Machine learning is
being utilized as an answer for distinguish transaction fraud before it happens. This not just serves to shield clients from fraudulent impacts yet in addition lessens or kills erosion for clients whose transactions are
mistakenly hailed.
Straightforward applications, for example, payday advance advances, charge cards, and opening an immediate store account, just require a couple of bits of individual data. This by itself makes it simple to submit application
misrepresentation. Assuming a cheat was to acquire delicate information like a federal retirement aide number,
they could without much of a stretch total an application and make obliterating results for the person in
question. Research shows that credit misrepresentation is the most exorbitant type of wholesale fraud, averaging about $4,687 per occurrence. Alarmingly, it's not simply vocation cybercriminals that are directing home loan
misrepresentation, yet in addition industry insiders like bank officials, dealers, appraisers, and other related
experts. These exercises are commonly to submit extortion for benefit, in which a singular abuse the home loan
loaning cycle to take assets from mortgage holders or moneylenders.
Truth be told, research shows that the financial business is the hardest hit with regards to word-related
misrepresentation, with around 17% of all revealed extortion cases. These appear as kiting look at altering, and charging plans, yet wholesale fraud and Mastercard extortion are turning out to be more normal as web-based
banking develops. Man-made intelligence can help battle and rout application misrepresentation by
distinguishing illegal movement from the get-go simultaneously. Calculations can search for associations
between applications for charge cards and credit applications, just as a screen recently opened records to stop monetary harm before it happens. While money laundering isn't simple 100% of the time to recognize, AI's
capacity to screen investing and store designs over energy can make staff aware of inconsistencies and square
instalments before they can be finished. Calculations can pull from an assortment of elements, from transaction beginning to the end objective and that's only the tip of the iceberg, to distinguish deviations from ordinary
examples. The objective is twofold: first, AI can assist with guaranteeing that instalments are being made
readily by the person. Furthermore second, AI can assist with lessening bogus up-sides that could happen with
conventional fraud recognition techniques. Customary machine learning models are reliant upon marked
preparing information that requires a couple of months to show up.

International Journal of Advance and Innovative Research Volume 9, Issue 1 (IX) January - March 2022
116
ISSN 2394 - 7780
According to a 2019 RBI report, losses due to banking frauds have grown by 73.8%. Banks are investing
heavily in artificial intelligence for risk reduction, namely fraud detection, compliance and cybersecurity. In
machine learning terms, these are applications of anomaly detection techniques. The present study has tried to put an effort to enlighten the use of AI in improving the banking industry experience in terms of promptness and
security.
REFERENCE
Alzaidi, A. A. (2018). Impact of artificial intelligence on performance of banking industry in Middle
East. International Journal of Computer Science and Network Security, 18(10), 140-148.
Aitken, M., Ng, M., Toreini, E., van Moorsel, A., Coopamootoo, K. P., & Elliott, K. (2020, September).
Keeping it Human: A Focus Group Study of Public Attitudes Towards AI in Banking. In European
Symposium on Research in Computer Security (pp. 21-38). Springer, Cham.
Burgt, J. V. D. (2020). Explainable AI in banking. Journal of Digital Banking, 4(4), 344-350.
Caron, M. S. (2019). The transformative effect of AI on the banking industry. Banking & Finance Law
Review, 34(2), 169-214.
Mehrotra, M. S., Sharma, S. D., & Jaiswal, G., (2018). A Systematic Review of Transformational leadership upon vital organizational aspects: An Imitation of Meta Analysis methodologies of PRISMA and
Meta Essentials., COMMERCE TODAY, Volume 14, Issue 01, 2018, Pages 45-49
Jaiswal, G. (2018). BUSINESS VIABILITY OF STREET VENDING: A STUDY OF VARIOUS
FACTORS OF PEST MODEL OF STREET VENDING IN THE GEOGRAPHICAL AREA OF UTTAR PRADESH. Journal of Management Research and Analysis (JMRA), ISSN: 2394-2770, Impact Factor:
4.878, Volume 05 Issue 02, June 2018, Pages: 25-28
Jaiswal, G. (2019). Emerging Trends in Informal Economy in The Context of Street Vending. 2019, IFTM
University Moradabad Http://Hdl.Handle.Net/10603/256773
Jaiswal Gautam, (2019). Identifying Informal Markets for Sustainable Urbanization: Developing Sustainability Index for Informal Economy, Commerce Today, Volume 14, No 01 (2019), 45-49, MRI
Publications Private Limited (OPC), India
https://www.javatpoint.com/history-of-artificial-intelligence, Last accessed 25 Dec 2021.
Garg, A., Garg, V., & Dutta, P. (2016). Impact of Office Ergonomics on Business Performance– (In Special
Reference to Noida Region).
Singhal, R., & Garg, A. (2015). Study of Online Shopping In Ghaziabad and Noida Region–A Customer
Perspective.
Jaiswal Gautam. (2020), A study of emotional marketing in changing context of Indian product advertisements: the nationalism perspective in India 2020, International Journal of Advanced
Science and Technology;29(3s):1665 -70. 7. Retrieved form
http://sersc.org/journals/index.php/IJAST/article/view/6 224
Jaiswal Gautam. Emerging trends in street vending businesses and its relation with street vending: A business acceptance and viability study of street vending business in Uttar Pradesh, International Research
Journal of Management and Commerce, ISSN: (2348-9766), 2018, 5(2). Available on
http://aarf.asia/management2.php?p=Volume5,Issue2,F ebruary%202018, last accessed on 12 Jan 2020
Payne, E. M., Peltier, J. W., & Barger, V. A. (2018). Mobile banking and AI-enabled mobile banking: The differential effects of technological and non-technological factors on digital natives’ perceptions and
behavior. Journal of Research in Interactive Marketing.
Soni, V. D. (2019). Role of Artificial Intelligence in Combating Cyber Threats in Banking. International
Engineering Journal For Research & Development, 4(1), 7-7.
Rahman, M., Ming, T. H., Baigh, T. A., & Sarker, M. (2021). Adoption of artificial intelligence in banking
services: an empirical analysis. International Journal of Emerging Markets.

International Journal of Advance and Innovative Research Volume 9, Issue 1 (IX) January - March 2022
117
ISSN 2394 - 7780
IMPACT OF ADVERTISEMENT ON CONSUMER BEHAVIOR
1Vrushali Kolte,
2Sampat Shetty,
3Ritesh Shirsat,
4Vineesh Shetty and
5Rudraksh Solanki
Bunts Sangha’s S. M. Shetty College of Science, Commerce and Management Studies, Powai,
Mumbai [email protected], [email protected], [email protected],
[email protected] and [email protected]
Mentor
Asst. Prof. Ashwini Devadiga
Bunts Sangha’s S.M Shetty College of Science, Commerce and Management Studies
ABSTRACT The current study has been created with the read to check the impact of promotion on shopper behavior. This
study appearance at the link between promotion and behavior of the customers. The objectives of this study
were to grasp the ability of persuasion in promotion to shop for a product and determine the foremost most
popular promotion media.
The study clearly tells the importance of promotion to the companies moreover as its influence on the patron.
Most organizations in Asian country pay lukewarm perspective in advertising their merchandise and services
through effective advertising medium, and this have adverse impact on their output in terms of sales.
They do not see the requirement of paying a part of their budget in promotion to push their merchandise and
services and influence shopper shopping for behavior. With nice increase in technological advancement,
effective advertising has become very vital to be ready to have competitive advantage, therefore the requirement for this study. This study adopted a survey analysis style. It involves assortment of knowledge from respondents
through form to check hypotheses.
The analysis findings show that a big and positive relationship lie between the experimental variable emotional response, environmental response towards whole, whole awareness and sensory excited advertising and
variable shopper shopping for behavior
Keywords: Advertising, Consumer behavior, Target audience, emotional response, environmental response,
consumer.
INTRODUCTION
The impact of advertisement is felt all over the globe through advertising, newspaper, the internet, music, films,
videos, magazine, movies and billboards. Among these media, advertising is the one that has a lasting impact on
viewers’ minds.
Advertising is the main source of a communication tool between the producer and the consumer. Advertising is
a subset of the promotion mix and is one of the 4ps in the marketing mix which comprises product, price, place and promotion. Advertising is a promotion strategy that serves as many tool in creating product awareness in
the mind of the consumer to make a purchasing decision.
Advertising, sales promotion and public relations are mass communications tools used by marketers.
Advertising through mass media influences the audience, but television has the mass reach and is the strongest medium of advertising. Advertising can influence the attitude of individual behavior, lifestyle in the long run as
well as the culture of the country.
A company can enhance the brand of their product by investing in promotional activities in order to compete in a consumer market that is dominated through advertising. The primary aim of advertisers is to reach consumers
and influence their awareness, attitude and buying behavior. Their major preoccupation is to keep individuals
interested in their product through spending on advertising.
They additionally got to perceive what influence customers behavior. Advertising has the potential to contribute to the complete alternative of shoppers. It impacts shopper behavior. Advertising impact on brands amendment
oftentimes in people’s memory. complete reminiscences comprise those associations that are associated with
complete names within the consumer’s mind.
These complete noises influence thought, analysis and final purchase. shopper behavior ought to be study for

International Journal of Advance and Innovative Research Volume 9, Issue 1 (IX) January - March 2022
118
ISSN 2394 - 7780
effective advertising, to {understand to grasp} why shoppers behave specifically ways in which under sure
circumstances. And also, to understand the factors that influence shopper behavior, particularly the economic,
social and psychological aspects.
Advertising additionally creates advertisements that carry AN emotional bond with shoppers. Positive
emotional appeals additionally offer a powerful complete cue and stimulate category-based process. With
productive categorization, the impact and beliefs related to this class in memory are translated to the target
itself.
Consumers attempt to reason the complete association with the prevailing memory once thousands of
merchandises are moon-faced by them and would possibly reposition reminiscences to a complete image and
perception towards new merchandise. during this method, they will reason the most recent info during a explicit complete and shore consequently in their memory. Some organizations don't attach importance to advertising
their merchandise and this has an adverse impact on their output in terms of sales of merchandise.
Others use totally different advertising media like tv, the web (Facebook; email) newspaper, billboard, magazine etc. to convey their product message to their audience. firms pay a serious a part of their budget on
advertising ways to push their products/services. These advert ways influence shopper shopping for behavior.
STATEMENT OF OBJECTIVES: This study makes an attempt to work out the impact of advertising on shopper behavior. In specific terms, the
target of the study is to:
1. Determine the result of emotional response on shoppers’ behavior.
2. Ascertain the result of environmental response towards complete on shopper behavior.
3. Determine the result of name awareness on shopper behavior.
4. Identify the result of sensory stirred up advertising on shopper behavior
RESEARCH METHOD
Sampling
The sampling method which was uses was random sampling for distributing questionnaire. The total samples
collected where 102 covering is around Mumbai. Tools used for study: For the present study researchers used
primary data. Primary data has been collected through structured questionnaire. Secondary data was collected
from internet, journals, articles and books.
For analysis and interpretations, researcher used simple statistical tools and some of the simple and relevant data
are presented in the tabular form.
LITERATURE REVIEW
Roy and Sonar started with all that marketing started with their consumer. So, consumer is very important to a
marketer. Consumer decides what to purchase, for whom to purchase, why to purchase, from where to purchase,
and how much to purchase.
In order to become a successful marketer, he must know the liking or disliking of the customers. The study of
the consumer preference not only focuses on how and why consumers make buying decision, but also focuses
on how and why consumers make choice of the goods they buy and their evaluation of these goods after use.
Barban (1987) defined advertising as a paid, non-personal communication through various media by business
firms, non-profit organizations and individuals who are in some way identified in the advertising message and
who hope to inform persuade member of a particular audience B.A Chukwu, E.C. Kanu and A.N. Ezeabogu (2019), in their research “The impact of advertising on consumer behavior”, concluded that the predicator
variables, emotional response, environmental response towards brands, brand awareness and sensory stimulated
advertising have positive relationship with consumer buying behavior. R.
Sunderaraj, in his study (2018), “Impact of advertisement on buying behavior of consumers in Sivakasi”
concluded that the role of advertisement is important in influencing buying behavior of consumers. The
advertising should be genuine, correct and serve the informational needs of the consumers. The companies
should use attractive and informative content to create awareness in the consumers and they should not rely on the advertisement for changing the perception of consumers instead they should use new ways of sales
promotion or other mediums for changing the perception of the people. P. Sathya and Dr. R.
Indrajith (2018), in their study “A study on purchase behavior of consumer durables with special reference to

International Journal of Advance and Innovative Research Volume 9, Issue 1 (IX) January - March 2022
119
ISSN 2394 - 7780
Tiruvarur District”, conveys that the consumers buying preferences are rapidly changing and moving towards
high end technology products with acculturation. Products which were once considered luxury items have
become a necessity because of the changing lifestyle and rising income levels. Amandeep, Dr. Seema Varshney, Syed Aulia (2017), in their research “The Impact of Advertising on Consumer Purchase Decision with reference
to Consumer Durable Goods in Oman”, conveys that, there are four factors that influences the consumer
purchase decision. They are ad recall, ad persuasiveness, attitude towards ads, ad attractiveness and purchase
intention.
Dr. Krishna Banana, Balakrishna Swarna, Dr. Meera Vali Shaik (2017), in their research “An Analysis on
impact of Advertising on Buying Behavior of consumers on two wheelers industry in Prakarsa District, Andhra
Pradesh” summarized that product recognition and brand recall are achieved significantly through the specific advertisements. It is found that some customers are not happy by the advertisements and some of them
mechanically purchase products without any ambition towards the product.
Amrita Dhaliwal (2016), in their thesis, “Effect of advertisement on consumer behavior”, shows that advertising on the behavior of consumers plays an important role in selling the products. Consumer behavior and
advertising are dynamic Felds, in terms of practice and scientific training.
The television commercials that appear in the year 2012 have little in common with those from 1970s. Advertisements from this earlier period used modern techniques and were primarily informative. Advertising
research styles have involved and advanced partly through the influence of improved technology and access to
advanced theories and methods.
Naveen Rai (2013), in his study “Impact of Advertising on Consumer Behavior and Attitude with Reference to Consumer Durables”, concluded that, advertisement influences the behavior and attitude of the consumers
worldwide. The advertisement motivates them to materialize the purchase of durables. The consumers are
induced significantly by advertisements when the target is on quality and price.
[Dinu Gabriel] and [Dinu Loredana] (2012) in their thesis 'The impact of advertising on consumer behavior in
the Resita city Population', says that advertising plays an important role in selling products and it also influences
the consumer buying behavior. It is found that temporary price discounts occupy an important place in buying
decision and sponsorship has a negative effect on buyers.
DATA INTERPRETATION: • Age Group: The Age group of the respondent are as follows 17.6% are Below
18 years of age, 48% are in the age group of 18 to 30 years, 12.7% are in the age group of 31 to 40 years, 11.8%
are in the age group of 41 to 50 years, 9.8% are in the age group Above 50 years old. • Gender: The Gender of
the respondent are as follows 57.8% are Female and 42.2% are Male.
• Education Qualification: The Education Qualification of the respondent are as follows 10.8% of respondent
has done there SSC, 31.4% of the respondent are done there HSC, 38% of respondent has done there Graduate and Undergraduate, 16.7% of respondent has done their Postgraduation and 1% of respondent has done GNM
Nurse.
• Occupation: The Occupation of the respondent are as follows 19.6% of the respondent are working in office,
27.5% of the respondent are Self Employed, 20.6% of the respondent are in Service Sector, 8.8% of respondent are Teacher, 7.8% of the respondent are Student and some reaming respondents are Unemployed and
Housewife.
• Salary: The Salary of the respondent are as follows 67.6% of respondent Earning Below 6 Lakh, 21.6% of respondent Earning 6 to 10 Lakh, 10% of respondent are Earning 10 to 15 Lakh, 4.9% of respondent are
Earning 15 Lakh and Above. • Which advertising media do you prefer more? The Advertising media prefer by
the respondent are 80.4% for Mobile Advertisement and 19.6% for Outdoor Advertisement.
• What type of advertisement attracts you to buy that product?
The type of advertisement attracts to buy are as follows 31.4% is for New Paper, 53.9% is for Television, 23.5%
is for Radio, 26.5% is for Hoarding, 19.6% is for Bus Shelters, 75.5% is for social media.
• Can a better advertisement change your mind towards the brand you are loyal?
The responses collected by the respondent are 37.3% says Yes, 16.7% says No, 46.1% says Maybe.
• Does a bad advertisement affect even if you are using the brand and its good?
The responses collected by the respondent are 32.4% says Yes, 35.3% says No, 32.4% says Maybe.

International Journal of Advance and Innovative Research Volume 9, Issue 1 (IX) January - March 2022
120
ISSN 2394 - 7780
• Does advertisement make the brand appear good than it is?
The responses collected by the respondent are 52% says Yes, 11.8% says No, 36.3% says Maybe.
• Do Advertisement force you to buy the product?
The responses collected by the respondent are 16.7% says Yes, 52% says No, 31.4% says Maybe.
• Rate your overall experience for online advertisement The experience rated by the respondent are 1% is lowest
and highest is 34.3% • Rate the experience online/ offline The experience rated by the respondent are Mobile Advertisement is good, Social Media Advertisement is very good, Television is satisfied, Newspaper is poor,
Hoarding is very poor.
LIMITATION
The following square measure the most limitations of advertising:
1. Less Forceful:
Absence of non-public bit makes advertising less forceful. Listening to the message isn't mandatory for the
purchasers.
2. Lack of Feedback:
It’s terribly troublesome to gauges the effectiveness of AN advertising message as there's no correct feedback
relating to its impact.
3. Inflexibility:
Advertising message is standardized and thence can't be modified in line with the wants of various customers.
4. Low Influence
A rise within the volume of advertising has created it troublesome to form any advertising message normally to be received properly by the target customers. several messages don’ts extremely get even detected, to not speak
of being effective etc.
CONCLUSION Advertisement acts as a motivator in purchasing of products or services of the particular business.
Advertisements are one of the important main tools used by businesses to promote/to deliver the information
about their products or services. Advertisements must not be missuses since it might have negative impact on
the consumers. Effective advertisements also help businesses to increase their sales numbers.
The purpose of this research was to study the impact of advertisements on consumer behavior. This research
paper can be helpful to know the most preferred advertisement media on shopping trends, most remember
aspects of advertisements and much more
REFERENCE
https://www.researchgate.net/publication/344692582_IMPACT_OF_ADVERTISEMENT_ON_CONSUMER_
BUYING_BEHAVIOUR https://www.businessmanagementideas.com/advertisement/advantages-and-
limitations-of-advertising/2263
INTERNET SOURCES:
7% -
https://www.researchgate.net/publication/344692582_IMPACT_OF_ADVERTISEMENT_ON_CONSUMER_
BUYING_BEHAVIOUR
1% - https://dallas3.onyxservers.com/a-study-on-consumers-attitude-towards-online-shopping-on-pdf
13% - https://ijac.org.uk/the-impact-of-advertising-on-consumers-buying-behaviour/
<1% - https://repository.up.ac.za/bitstream/handle/2263/28684/03chapter3.pdf?sequence=4&isAllowed=y
7% - https://ijac.org.uk/articles/8.1-1.1-15.pdf
<1% - https://journals.sagepub.com/doi/full/10.1177/02633957211015231
4% - https://www.coursehero.com/file/70566962/RRLdocx/
1% - https://acadpubl.eu/hub/2018-119-12/articles/7/1796.pdf
1% - https://www.researchgate.net/profile/Umesh-
Maiya/publication/344692582_IMPACT_OF_ADVERTISEMENT_ON_CONSUMER_BUYING_BEHAVIO

International Journal of Advance and Innovative Research Volume 9, Issue 1 (IX) January - March 2022
121
ISSN 2394 - 7780
UR/links/5f89bf51a6fdccfd7b6582ba/IMPACT-OF-ADVERTISEMENT-ON-CONSUMER-BUYING-
BEHAVIOUR.pdf
<1% - https://www.coursehero.com/file/ppl59ra/emotional-response-with-consumer-buying-behavior-and-no-
relationship-connecting/
<1% - https://www.coursehero.com/file/51604877/Business-Research-CLA-1docx/
1% - https://www.coursehero.com/file/123260442/Statement-of-the-Problempptx/
1% - https://www.coursehero.com/file/104624755/Dissertation-A3906418312docx/
1% - https://www.inderscience.com/info/inarticle.php?artid=109279
<1% - https://www.arcjournals.org/pdfs/ijmsr/v5-i12/2.pdf
<1% - https://www.slideshare.net/ShashankSrivastav2/effect-of-branding-on-consumer-buying-behaviour
<1% - http://ijlera.com/vol2-iss11.html
<1% - https://www.academia.edu/38632794/Effect_of_Advertisement_on_Consumer_Behavior
1% - https://www.academia.edu/31582126/THE_IMPACT_OF_ADVERTISING_ON_CONSUMER_BEHAVIOR_I
N_THE_RESITA_CITY_POPULATION
<1% - http://www.waynesthisandthat.com/commerciallength.htm
2% - https://www.slideshare.net/keziaflorence/impact-on-advertising-on-consumer-behaviour
1% -
https://www.academia.edu/7809876/The_Impact_of_Advertising_on_Consumer_Purchase_Decision_A_Study_
of_GIJ_Students_
<1% - https://iosrjournals.org/iosr-jbm/papers/Vol19-issue11/Version-3/H1911035459.pdf
<1% - https://www.slideshare.net/siddannabalapgol1/sample-mba-final-year-project
<1% - https://www.ncbi.nlm.nih.gov/pmc/articles/PMC5958567/
1% - https://www.quora.com/What-are-the-limitations-of-advertising-from-social-ethical-etc-point-of-view
2% - https://www.businessmanagementideas.com/advertisement/advantages-and-limitations-of-
advertising/2263
1% - https://theintactone.com/2019/10/27/pom-u4-topic-7-advertising-media-their-relative-merits-and-
limitation/
<1% - https://www.yourarticlelibrary.com/marketing/public-relation-top-6-tools-of-public-relation-with-
diagram/48696
<1% - http://www.journalglobal.in/uploads/paper/39.pdf

International Journal of Advance and Innovative Research Volume 9, Issue 1 (IX) January - March 2022
122
ISSN 2394 - 7780
STUDY ON IMPACT OF PANDEMIC ON SLEEP QUALITY OF INDIVIDUALS
Preeti Matharu
Assistant Professor, S.M.shetty College of Science, Commerce and Management Studies
ABSTRACT
Sleep is an essential part of everyone’s life. It is like salt in food. Its presence may not realise its value but its absence will certainly affect. The way food and breathing is important for an individual, sleep is also very
important. If an individual does not get the required amount of sleep then it makes him/her irritated, affects
efficiency, productivity and also affect the health of an individual. Pandemic and Work from home has affected
the sleep quality of individuals and it is important to study the sleep quality of individuals to ultimately find its effect on their life and this paper tries to achieve that. Primary data from around 200 respondents is collected
to study their sleep quality. Secondary data is also collected from various online resources to give a
background to the study. The results show difference between the sleep quality and sleep pattern of individuals before and after pandemic and the reasons and effects for the same. The sleep quality of the majority of
respondents has deteriorated and it has affected their everyday working, chores, functions, etc. It is important
for individuals to set a schedule for everyday so that over a period of time their sleep quality improves and its
effects subside.
Keywords: Sleep quality, pandemic, lockdown
INTRODUCTION
In the last two years, the word pandemic has been a part and parcel of everyone’s life. The Corona Virus pandemic hit all over the world with many people losing their lives, livelihood and facing various health
problems. Globally, as of 5:31pm CET, 10 January 2022, there have been 305,914,601 confirmed cases of
COVID-19, including 5,486,304 deaths, reported to WHO. There is a 360 degree change in everyone’s life. People are stressed out because of the effects that Covid - 19 had on their lives. People suffered physically,
some losing their lives, some losing their loved ones, many lost their livelihood, many were working through
Work from home, being stuck in their homes/closed walls - not being able to go out due to lockdown. All these
resulted in a lot of stress in people and stress affects sleep of an individual. So, this study is undertaken to study the impact of Pandemic on the sleep quality of individuals. Sleep quality measures as to how well a person
sleeps i.e. whether your sleep is restful and restorative. Sleep quality is determined by a variety of factors like
time taken to fall asleep, number of times a person wakes up in between sleep, sleep schedule, feeling of rest,
restoration and being energetic on waking up, etc.
Sleep is an essential part of everyone’s life. It is like salt in food. Its presence may not realise its value but its
absence will certainly affect. The way food and breathing is important for an individual, sleep is also very important. If an individual does not get the required amount of sleep then it makes him/her irritated, affects
efficiency, productivity and also affect the health of an individual. Sleep deprivation and poor sleep quality may
result in heart disease, increased risk of stroke, depression, high blood pressure, anxiety, etc. Hence, it is very
important to pay attention to one’s sleep and get quality sleep.
REVIEW OF LITERATURE
Voitsidis P, Gliatas I, Bairachtari V, Papadopoulou K, Papageorgiou G, Parlapani E, Syngelakis M, Holeva V,
Diakogiannis (2020) in their research paper “Insomnia during the COVID-19 pandemic in a Greek population” found that 37.6% of the participants were having sleep problems. Women and people in urban areas were more
vulnerable to sleep problems, while younger age showed a non-significant trend. Sukriti Banthiya, Sucheta
Sharma, Divya Jahagirdar, Vinay Jahagirdar, Manisha Garg, and H.K Sahadev (2021) in their paper “Sleep Quality in the Indian Adult Population During the COVID-19 Pandemic” show that poor sleep quality is widely
prevalent among the the general population in India during the COVID-19 pandemic. Samhita Panda, Arun B
Taly, Sanjib Sinha, G Gururaj, N Girish, D Nagaraja(2012) in their paper “Sleep-related disorders among a
healthy population in South India” found that Sleep Related Disorders are widely prevalent in India. Considering the health implications and poor awareness, there is a need to sensitize physicians and increase
awareness among the public.
OBJECTIVES
1. To understand the sleeping patterns of individuals before and during pandemic.
2. To study the impact of sleep quality on individuals

International Journal of Advance and Innovative Research Volume 9, Issue 1 (IX) January - March 2022
123
ISSN 2394 - 7780
HYPOTHESIS
H01 – There is no change in sleeping pattern of individuals before and during pandemic
H1 - There is change in sleeping pattern of individuals before and during pandemic
H02 - There is no effect of pandemic on sleep quality of individuals.
H2 - There is a negative effect of pandemic on sleep quality of individuals.
RESEARCH METHODOLOGY In this study, data has been collected from both secondary as well as primary sources. Google form was created
for collecting the data and through convenient and random sampling method, the data was collected from 234
respondents through social media sites (whatsapp, instagram). Secondary data was collected through different
websites.
Data interpretation and analysis
· Profile of the respondents
AGE
AGE NO. OF RESPONDENTS % OF RESPONDENTS
15-20 80 34.19%
21-30 90 38.46 %
31-45 32 13.68 %
46-60 27 11.54 %
Above 60 5 2.14 %
GENDER
GENDER NO. OF RESPONDENTS % OF RESPONDENTS
MALE 137 58.55 %
FEMALE 97 41.45 %
Occupation
OCCUPATION NO. OF RESPONDENTS % OF RESPONDENTS
STUDENT 117 50.00%
SERVICE 79 33.76%
BUSINESS 26 11.11%
HOUSEWIFE 6 2.56%
RETIRED/OTHERS 6 2.56%
INTERPRETATION
Out of the total respondents, majority are male. In terms of age group of the respondents, majority belong to the
age group 15-30. Majority of the respondent are students or occupied in service.
Timings at Which Individuals Sleep At:
SLEEP AT Before pandemic After pandemic
8:00 pm - 9:30 pm 2 3
9:30 pm -10:30 pm 28 12
10:30 pm-12:00 am 133 64

International Journal of Advance and Innovative Research Volume 9, Issue 1 (IX) January - March 2022
124
ISSN 2394 - 7780
12:00 am -1:30 am 60 86
later than 1:30 am 11 69
Timings At Which Individuals Wake Up At:
WAKE UP AT Before pandemic After pandemic
before 5 am 8 5
5:00 am -6:30 am 96 22
6:30 am -8:00 am 71 73
8:00 am -9:30 am 37 68
9:30 am -11:00 am 19 40
later than 11 am 3 26
INTERPRETATION As it can be observed from the table, majority of the respondents used to sleep between 10:30 pm to 1:30 am
before pandemic but now after pandemic majority of them sleep between 10:30 pm to beyond 1:30 am. There is
a drastic increase of close to 527% in the number of respondents sleeping later than 1:30 am. A similar pattern can be seen in the wake up timings of the respondents. These 2 tables show that there has been a major change
in the sleeping pattern/timings of majority of the respondents. A pattern of sleeping late at night and waking up
late in the morning can be observed which is against the body clock of humans. This also causes stress,
depressions, diseases, etc. in individuals.
Time Taken To Sleep
Time taken to sleep Before pandemic After pandemic
less than 10 min 82 41
10-30 min 113 93
30-60 min 34 62
more than 1 hour 5 38
INTERPRETATION Before pandemic data indicates that majority of the respondents taken around half an hour to fall asleep, but the
After pandemic data shows that there is an increase in the time taken to fall asleep with majority of the
respondents taking around 10 min to an hour for falling asleep. The increase in the time taken to fall asleep may
be because of stress or some underlying problem in the body.
Sleep Quality and Pattern Affected By Pandemic
yes 130
no 47
maybe 57
INTERPRETATION
As per the data collected, majority of the respondents agree that their sleep quality and sleep pattern have been
affected by the pandemic.
Reaction To The Statements
never rarely sometimes often almost always
I wake up while sleeping 38 71 84 31 10
I have difficulty falling asleep 62 57 69 30 16
I take medicines for sleep 226 2 4 2 nil
I fall into deep sleep 12 38 75 61 48
I feel refreshed after sleep 6 31 73 62 62
I lose interest in work due to poor 42 44 88 46 14

International Journal of Advance and Innovative Research Volume 9, Issue 1 (IX) January - March 2022
125
ISSN 2394 - 7780
sleep
Poor sleep quality is affecting my
health 32 55 63 59 25
INTERPRETATIONS
The above table indicates that there is a mixed reaction to different topics from the respondents, with majority stating that they enjoy deep sleep, feel refreshed after sleep and do not take any medicines for falling asleep but
at the same time they also face difficulty for falling asleep and wake up while sleeping. Majority of the
respondents also stated that they lose interest in their work due to poor sleep and the same is affecting their
health as well. So, all in all, even if it experienced sometimes and not always, it can be seen that majority of the
respondents have poor sleep and the same is affecting their work and health.
Factors Causing Delay In Sleep
CORONA (LOCKDOWN)
STRESS 54
STRESS 111
USING OTT PLATFORMS 111
PLAYING GAMES 49
NOT APPLICABLE 40
OTHER 3
INTERPRETATIONS
From the above table, it can be observed that Corona (Lockdown) Stress and Stress in general are the major
causes for delay in sleep and using OTT platforms (like Netflix, Amazon Prime, Hotstar, etc.) stand in the
second position.
Major Change In Sleep Quality And Pattern During Pandemic
YES 126
NO 60
MAYBE 48
INTERPRETATIONS Majority of the respondents are of the view that they experienced major change in sleep quality and pattern
during Pandemic. This may be attributed to stress and excessive use of OTT platforms.
Poor Sleep Due To Pandemic Interfering In Your Daily Functioning (Work, Daily Chores, Mood, Etc.)
YES 133
NO 53
NOT APPLICABLE 48
INTERPRETATIONS
Majority of the respondents experienced poor sleep which affected their daily functioning (work, daily chores,
mood) etc. This indicates that poor sleep has adverse effect on the everyday functioning of the individuals.
Satisfaction Level of Overall Sleep Quality And Pattern (1-Very Satisfied, 5 - Very Dissatisfied)
Satisfaction level No. of respondents
1 25
2 82
3 85
4 60
5 23

International Journal of Advance and Innovative Research Volume 9, Issue 1 (IX) January - March 2022
126
ISSN 2394 - 7780
INTERPRETATIONS
There are mixed views on the satisfaction level of the individuals for overall sleep quality and sleep pattern with
majority giving medium level of satisfaction related to their sleep.
CONCLUSION
The Covid - 19 Pandemic specially the lockdown which resulted because of it had a major effect on the lifestyle
of individuals. One of the important element of the lifestyle is sleep and the impact of pandemic on sleep quality of individuals has been studies in this paper. From the data collected it can be clearly observed that sleeping
pattern of a majority of the respondents has changed with most of them sleeping late and waking up late during
the lockdown (pandemic). So with this observation the first null hypothesis is rejected which is that there is no
change in the sleeping pattern of individuals before and during pandemic. Thus, the first alternative hypothesis is accepted that there is change in sleeping pattern of individuals before and during pandemic. With majority of
the respondents stating that they experienced change in the sleep quality and sleep pattern, poor sleep affecting
their everyday working, they lost interest in work due to poor sleep and their health getting affected due to poor sleep, it can be concluded that the pandemic had a negative effect on the sleep quality of individuals. Thus, the
second null hypothesis is rejected that there is no effect of pandemic on sleep quality of individuals and the
second alternative hypothesis is accepted that is there is a negative effect of pandemic on sleep quality of individuals. So, overall it can be concluded that the sleep pattern and sleep quality of individuals has changed
during the pandemic and the same has negatively affected the individuals with majority of the respondents
stating that change in sleep has affected their everyday working and health.
REFERENCES
1. https://pubmed.ncbi.nlm.nih.gov/22406784/
2. https://www.ncbi.nlm.nih.gov/pmc/articles/PMC8477644/
3. https://covid19.who.int/
4. https://www.med.upenn.edu/cbti/assets/user-content/documents/Sleep%20Quality%20Scale%20(SQS).pdf
5. https://www.ncbi.nlm.nih.gov/pmc/articles/PMC7353829/

International Journal of Advance and Innovative Research Volume 9, Issue 1 (IX) January - March 2022
127
ISSN 2394 - 7780
A STUDY ON IMPLEMENTATION OF DATA SCIENCE IN HEALTHCARE SECTOR
Omkar R. Nikam
Mentor
Asst. Prof. Nabila M Kazi
Bunts Sangha’s S. M. Shetty College of Science, Commerce & Management Studies, Powai
ABSTRACT
Data Science and Big Data analytics can enhance patient outcomes, advance and personalize care, improve
provider relationships with patients, and reduce medical spending. This paper inaugurate healthcare data, Big
data analytics in healthcare systems, and applications and advantages of Big Data analytics in healthcare. We also shown the technological advancement of data science in healthcare, such as cloud computing and stream
processing. Problem faced by data science and Big Data analytics in healthcare Sector are also discussed.
Keywords: Data Science, Big data, Big Data analytics, Healthcare, Personalized medicine, Precision medicine,
Cloud computing, Stream processing.
INTRODUCTION:
According to a research, the data generated by every human body is 2 terabytes per day. This data embrace activities of the brain, stress level, heart rate, diabetes, and many more. To handle such a huge amount of data,
now, we have more modern technologies and one of them Data science. It takes help of recorded data to detect
patients health .It has now become possible to discover the trait of a disease at a very early stage. Also, with the
arrival of various innovative tools and technologies, doctors are able to detect patients’ conditions from distant locations. In premature days, medical practitioner and hospital management were not able to handle many
numbers of victims at the same time. And due to the absence of proper Therapy, the victims’ conditions used to
get poor. However, now, the storyline has interchange. With the assist of Data Science, Big data analytics and Machine Learning (ML) applications, medical practitioner can be advice about the health situation of the
victims through wearable devices. Then, hospital management can convey their junior assistant or caregiver to
these patients’ homes where they can inform about their health issue with patients. Hospitals can further set
numerous equipment and devices for the treatment of these patients. For efficiently gathering data like patients heart rate, body temperature, sugar and blood pressure these devices are assembled on top of Data Science.
Doctors get this immediate data of the patients’ health through updates and notifications through the mobile
applications. They can then treat the conditions and guide or help the assistant doctors or caregiver to give particular treatments to the patients at home. This is how Data Science helps in caring for victims using
technology.
Benefits of Data Science In Healthcare: Data Science helps in enhancing healthcare facilities and processes. It helps uplift productiveness in detecting
and treatment and improves the workflow of healthcare systems. The main goals of the healthcare system are as
follows:
To soothe the workflow of the healthcare system
To lessen the risk of treatment failure
To provide appropriate treatment on time
To prevent unnecessary emergencies due to the non-availability of doctors
To lessen the waiting time of victim
PROPOSED SYSTEM Stream Processing it is Big Data Technology. is used to query continuous data transmission and detect
conditions, quickly, within a short period of time from data acquisition. The detection time-period varies from
few milliseconds to minutes. There are major 3 different options in which data healthcare centre store their data,
they are public cloud data storage, Onsite data storage and Hybrid cloud data storage.
QUESTIONNAIRE
Do you know what Big data analytics?
How useful can it be for healthcare?

International Journal of Advance and Innovative Research Volume 9, Issue 1 (IX) January - March 2022
128
ISSN 2394 - 7780
How data science affects the healthcare?
What are challenges that are faced while using data science?
Source of Data Collection:
Questionnaire was provided to 100 people
How useful can it be for healthcare?
A represents number of people knowing Data Science.
B represents number of people heard about it.
C represents number of people having no idea about Data Science.
A represents number of people find Data Science Very Useful.
B represents number of people find it somewhat Useful.
C represents number of people says it is not Useful.
D represents number of people says they have no idea about it.
Analysis of Data Collected
When asked if they know about Big Data Analytics, 19% knew what big data is where as 51% said they
have heard about it but don’t have exact knowledge about it and 30% said they don’t know.
Out of all, 19% finds Big Data Analytics as very useful for healthcare 25% finds it somewhat useful where
as 38% says it is not useful and 18% have no idea about it.
On asking some open-ended questions like how big data and data science affects the healthcare industry and
what are it’s challenges variety of opinions were found, out of which most of people said it has affected the
industry as it detected the diseases in the earlier stages so because of which they can treated as soon as
possible.

International Journal of Advance and Innovative Research Volume 9, Issue 1 (IX) January - March 2022
129
ISSN 2394 - 7780
These are some of the images how model is trained by feeding them appropriate information
Above image shows tumour detected in patient through MRI
RESEARCH MYTHOLOGY
It was a primary survey.
We prepared the questionnaire for the interview.
We visited the nearest healthcare centre where we interviewed junior doctor and assistants and tried to get
desirable answers for the same.
RESEARCH LIMITATIONS:
Data collected is very minimal and so conclusion cannot be accurate.
Time Constraint, time for this research was very less resulting into not-in-depth research.
TESTING HYPOTHESIS:
If organization is using data science, then it may help them to grow in faster rate than others.
Benefits to The Society
Improves patient healthcare
Predicts patients at higher risk quickly & efficiently
Eases patient diagnostics with EHRs
Ensures to reduce overall healthcare costs
Delivers greater insights into patient cohorts
Enables improved healthcare with fitness devices
LIMITATIONS Estimated Estimates of Actuarial Models Insurance companies, hospitals and other health care organizations all rely on sensible actuarial models for risk management. Data science can help them develop their actuary models
into a point. However, there are limitations. Tod Meyrick and David Toomey of Insurance Thought Leadership
leadership point out that informal health care data is rarely distributed. Data Availability and Reliability Large healthcare data models require very reliable and detailed data sets. This means that health care providers need
access to more information about their patients. They also need to be carefully monitored, as accuracy can affect

International Journal of Advance and Innovative Research Volume 9, Issue 1 (IX) January - March 2022
130
ISSN 2394 - 7780
all of their health care models. Social media in particular is often unreliable, as patients are less likely to double
check what they post on their profiles.
FUTURE SCOPE
Data science and big data analytics may help us to predict many more diseases if appropriate data is being
feeded to the model
It may also help us in performing very highly precise surgeries.
It can also help to track down which elements are useful in treating a specific disease.
CONCLUSION
Big Data Discovery, new information management and analytics software have produced a unique moment in the history of data analysis. The combination of these trends means that we have the capacity to analyze
amazing data sets quickly and inexpensively for the first time in history. These capabilities have completely
changed the healthcare industry. Healthcare industry find it useful only if they know it’s proper implementation.
I would conclude by saying “The Age of Data science and Big Data is here, and these are truly revolutionary
times if both business and technology professionals continue to work together and deliver on the promise”.
REFERENCES
https://www.researchgate.net/publication/303821594_Analysis_of_Research_in_Healthcare_Data_Analytic
s
https://pubmed.ncbi.nlm.nih.gov/34398394/
https://www.jmir.org/2019/4/e13043/
https://www.mdpi.com/journal/applsci/special_issues/data_analytics_smart_healthcare
https://www.sciencedirect.com/science/article/pii/B9780128202036000060
https://www-simplilearn-com.cdn.ampproject.org/v/s/www.simplilearn.com/how-ai-and-data-science-is-changing-the-role-of-radiologists-
article/amp?amp_js_v=a6&_gsa=1&usqp=mq331AQKKAFQArABIIACAw%3D%3D#aoh=16428494
909378&referrer=https%3A%2F%2Fwww.google.com&_tf=From%20%251%24s&share=https%
3A%2F%2Fwww.simplilearn.com%2Fhow-ai-and-data-science-is-changing-the-role-of-radiologists-article
https://data--flair-training.cdn.ampproject.org/v/s/data-flair.training/blogs/data-science-in-
healthcare/amp/?amp_js_v=a6&_gsa=1&usqp=mq331AQKKAFQArABIIACAw%3D%3D#aoh=1642
8494909378&referrer=https%3A%2F%2Fwww.google.com&_tf=From%20%251%24s&share=htt
ps%3A%2F%2Fdata-flair.training%2Fblogs%2Fdata-science-in-healthcare%2F
https://data--flair-training.cdn.ampproject.org/v/s/data-flair.training/blogs/data-science-in-healthcare/amp/?amp_js_v=a6&_gsa=1&usqp=mq331AQKKAFQArABIIACAw%3D%3D#aoh=1642
8497236881&referrer=https%3A%2F%2Fwww.google.com&_tf=From%20%251%24s&share=htt
ps%3A%2F%2Fdata-flair.training%2Fblogs%2Fdata-science-in-healthcare%2F

International Journal of Advance and Innovative Research Volume 9, Issue 1 (IX) January - March 2022
131
ISSN 2394 - 7780
IMPACT OF SMARTPHONE ON YOUNG GENERATION
Pavitra Mudaliyar1
Mentor
Asst. Prof. Mithilesh Chauhan2
1Vikas College of Arts, Science and Commerce 2SM Shetty College, Powai
[email protected] and [email protected]
ABSTRACT
A Smartphone is a mobile phone which is used for calls, messages, emails, playing videos, surfing, and web,
etc. By 1979, Nippon telegraph and telephone (NTT) introduced the first-ever (analog) IG phone service in
Tokyo. In the 1980s the NTT gave Japanese consumers the first access to mobile phone services. Then the technology is moved worldwide on October 13, 1983, Ameritech mobile communication became the first
company to launch a 1G phone network in the US, started in Chicago. In the 1990s Germany and the official
formation of the European Union, the first GSM was made in 1991. the first GSM phone has introduced the Nokia 1011, and also introduced text messaging. The first smartphone was created by International business
machines(IBM). By 1979,It was invented on the year of 1992 and released for purchase in 1994. Smartphone
are very important in the day to day life In the 21st century the Smartphone are used by all age groups people the adult and children. We can use Smartphone for education, business, entertainment, marketing, social life,
etc. In this paper, we will be discussing the advantages and disadvantages of Smartphone.
Keywords: Smartphone, young generation, mobile phones, teenagers, social media, screen timer
INTRODUCTION
Smartphone are representing an important role based in modern life, They enable us to communicate from
anywhere, anytime and everywhere (as long as the phone signal is available), the use of the Smartphone we can surf the internet things of software like emails, drop box, Google maps, etc. the Smartphone is helping us many
ways for example, We want to go for the school or college we don’t the routes or vehicles, then we can use the
help of the Google map we can find the way. The young generation is mostly using the Smartphone for education, entertainment, etc. everyone can say that a mobile phone is a handy tool. It is easy to access or
communicate with friends, family members, relatives, etc. but we can’t say that every technology that provides
such benefits comes with a set of negative impacts.
Use of the mobile phones of positivity and negativity:
When the teenagers or young generation are using the smart for a long time they are getting some side effects like stress, anxiety, and depression, sleep loss, risk of cancer, obesity, vision problems, etc.
When a teenager is using mobile phones daily for more than 3-4 hours they get side effects based on vision problems.
Research reveals the most of the people like the young generation are mostly using the mobile phones anywhere they will be going like public, family function, workplaces every one remains in touch with it.
Smartphone are very useful in many things in the current situation we want to start an online business so we can use Smartphone.

International Journal of Advance and Innovative Research Volume 9, Issue 1 (IX) January - March 2022
132
ISSN 2394 - 7780
According to the teenagers they are using Smartphone for entertainment purposes only, but they can use the smart for educational purposes also.
The features based on Smartphone are many things we want to store any of the files or document we having
the option of Google drive application.
Use of The Mobile Positivity Smartphone’s are very useful for teenagers to do their home works like they are stuck in a maths problem they
can use you tube to solve their maths problems.
The students can share the notes and information can share by the application of WhatsUp or by the mails.
The benefit of Smartphone use we can learn anything from the use of surfing and internet access.
The Smartphone is very important for every person because of the Covid situation.
In the Covid time the education system changed, all educations have become as online, so without a Smartphone, we can't study.
The Smartphone is useful for teenagers because any emergency will come where they can easily contact through the Smartphone.
In the covid situation, all the education systems are converted into online, so we want to attend any lecture so
we are using with the Teams application in the Teams application all the students are interconnected with the teacher, we are learning the lecture by visually it is helpful based of the Smartphone.
With the help of the Smartphone, we are learning new things and surfing the internet, for example, we want to do any project or learn to code so we can use you tube or we can surf the webpage of w3school.
Some of the Smartphone have the security apps like GPS(global positioning system), with the help of GPS we want to go anywhere any place so we can easily navigate the Google map.
In the Smartphone, we can use many things like we want to purchase anything or order anything we can use the applications.
for example, any people want to do online shopping so they use the applications.
With the help of Smartphone, we can easily access bank services.
For example, any of the people who want to open an account can easily surf the internet and they can open the
account by online mode, or they want to transfer the money from one account to another account, and we can pay the electric bill by the mode of online.
On the Smartphone, students can easily store the information of assignments, notes, books, etc.
In the Smartphone different language dictionaries, translators are available in the play store they can learn from the application.
With the help of the camera, we can capture the images of study material.
Before mobile phones, people use telephones to which they have to sit in front and communicate.
On the Smartphone, we can set the alarm and we can set the schedule for the whole day.
In Smartphone, we are having a flashlight; in case of any dark place we can use the torch.
In the Smartphone the calculator applications also there it is helpful for calculating bills, taxes, etc,
Before mobile phones, people are using diaries to note down the contact numbers of people, now day's we can
easily save the contact numbers, and we can easily search the contact number by their name.
Anderson, (2019) reveals that the phone in your pocket is like a slot machine, the Smartphone is a very useful
device we can use the device anywhere and anytime. With the help of Smartphone, we can do online shopping,
read the newspaper, learn new things, etc.
Smith, (2012), reveals that Smartphone are very beneficial, the mobile phone were equally balanced between
positive and negative. Most people say that using the mobile phone their daily routine has become very easy;
they can plan anything from anywhere.
Use of the Mobile Negativity
The Smartphone is a waste of time; peoples are very addicted to the Smartphone.
Mostly the students and the young generations are affected by Smartphone.

International Journal of Advance and Innovative Research Volume 9, Issue 1 (IX) January - March 2022
133
ISSN 2394 - 7780
The young generations are mostly using Smartphone for entertainment purposes only.
Smartphone’s are very distracting things nowadays.
Most people are using Smartphone on the roadside while driving.
The mobile phones distract the students while they are studying.
Studies found that teenagers who use mobile phones after the light out experienced increased tiredness.
Teenagers are mostly using their phones when they are driving or walking, which is proven to be dangerous.
As per a study conducted on 30 medical students, 83% of them have vision syndrome problems.
Smartphone’s can be expensive, especially those high-end phones with great features.
When we are using the Smartphone for using to listen to music, songs, watch a movie, or call for a long time it
causes the issue of ear and eye problems.
There are common issues are happening with mobile users of the security of a phone.
Mobile phones include mental disorders like anger, depression, anxiety, tension, etc.
The weakness of the mobile phone is we have to check regularly the battery power.
Mobile phones are very easier for bosses whenever any work will be done their then-boss will be calling their
employees to do the work.
Using the mobile phone we are getting, more spam calls and spam messages regularly.
Mobile phones are a major distraction for children; this can affect education making a harder to do their home
works and projects.
Most teenagers are keeping their mobile phones nearby while sleeping to check the calls and SMS.
They are also using mobile phones on the bus and the local trains also.
When teenagers are using mobile phones for more than an hour they get the health issue of the neck problem,
sleep loss, risk of cancer, anxiety.
Bhalla, (2019) reveals that Smartphone is a disadvantage for teenagers, and the children teenagers are mostly using mobile phones for entertainment purposes, their health also causes affected, more uses of the phones they
are getting the health issue of tumours, affects brain activity, sleep loss, medical issues, mental health issues,
etc.
According to Munoz, (2012), people using Smartphone significantly, are getting the health issue of
radiofrequency energy, HEV (high energy visible) light which can damage our eye retina.
Leonard, (2015), says that the Smartphone is an addition to a real phenomenon. Using the base of the
Smartphone we are getting the issue of the back problem, nerve damage, anxiety &depression, stress, etc.
Mobile Phone Safety Tips to Decrease The Risk
Avoid mobile phones given to your children, and tell them they want to use the mobile phone for only the purpose of the work.
Try to use the phone for daily 2 hrs only, turn off the unwanted notification screen so you can ignore the mobile phone screen.
Try to avoid the phone to see the screen; you can do any other work instead of seeing the mobile phone.
Whenever you are doing any other work you can avoid the mobile phone.
Turn off your mobile phone or you can keep the mobile phone in the pocket or the bag while travelling or walking.
Try to avoid the mobile phone when you're studying, and avoid the phone at the night.
Avoid scrolling social media like Facebook, Instagram, etc. for entertainment purposes.
Try to avoid digital applications like notes, calculators, etc, try replacing as many digital tools as the physical ones.
For example, you can carry a notebook and pen to write a note, read newspapers and books avoid digital versions.

International Journal of Advance and Innovative Research Volume 9, Issue 1 (IX) January - March 2022
134
ISSN 2394 - 7780
Delete the application which we are not using continuously and the other application is there which we are getting distracted.
For example, we are mostly using the Facebook application for entertainment purposes and social interaction so we can avoid or delete the app so it will not distract us or we will not get to addict it.
We can use the screen time application so it will show that how much time we are spending on our mobile
and phones and it will show us which application distracts us and which application we are spending more time on.
we can set time limitations on the distracting application, for example, put a limitation for the Facebook application or any other application for 15 minutes so we can use the application for only 15 minutes per day.
Avoid social media applications or games instead of this you can read the books.
CONCLUSION
Smartphone’s are a very useful device. it gives access to surfing the internet and we new things. Smartphone
give the entire information one fingertip. In the Smartphone there are many applications are there which we can
use to access. we can store the data files and documentation in the Smartphone and easily can be carried in the pocket. With the help of the Smartphone we can easily communicate to calls, voice calls, send messages, emails
directly by their phone. Smartphone cause health issues like brain tumors, skin cancer, accidents, distraction in
studies.
A Smartphone has positivity and negativity also we have to know that how to use the mobile in a way. when
teenagers are using the mobile phone for more than 2 hours so they are getting health issues problems like
vision syndrome, neck and back pain, sleep loss, anxiety, anger, etc.
REFERENCES
Afaliq, A. (2013). Smartphone improvements: Positive and negative impact on society. Retrieved from https://sites.psu.edu/alwaleedafaliq/2013/09/19/smartphones-improvements-positive-and negative-I
https://sciencenode.org/feature/How%20did%20smartphones%20evolve.php
https://www.start.io/audience/smartphone-users-in-india
Smriti Tiwari (2020),https://honestproscons.com/advantages-and-disadvantages-of-smartphones/
Addiction tips, https://www.addictiontips.net/phone-addiction/positive-effects-of-mobile-phones-on-youth/
Scholastic,https://www.scholastic.com/parents/family-life/social-emotional-learning/technology-and-kids/10-tips-cell-phone-safety.html
Moms Junction,https://www.momjunction.com/articles/side-effects-of-mobile-phones-on-teenagers_00352682/
Anderson, https://www.eukhost.com/forums/forum/general/technology-forum/17752-10-advantages-and-disadvantages-of-having-smartphone
Smith, https://www.pewresearch.org/internet/2012/11/30/part-iii-the-impact-of-mobile-phones-on-peoples-lives/
Yazin akkawi,https://www.inc.com/yazin-akkawi/7-ways-to-curb-your-smartphone-addiction-right-now.html
Smriti Tiwari, (2020)https://honestproscons.com/advantages-and-disadvantages-of-smartphones/
Jari roomer, (2020)https://medium.com/personal-growth-lab/15-tips-to-spend-less-time-on-your-phone-cdbdc63a5a72
Shruti bhalla, (2017)http://www.myeducorner.com/advantages-disadvantages-of-mobile-essay-speech-article/
Richard Munoz, https://www.mobilecon2012.com/8-advantages-and-disadvantages-of-smartphone-
technology/

International Journal of Advance and Innovative Research Volume 9, Issue 1 (IX) January - March 2022
135
ISSN 2394 - 7780
READERS OF NEWS TO PARTICIPANTS IN NEWS MAKING - A STUDY OF BEHAVIOUR
CHANGE AMONG YOUNG READERS OF NEWS IN MUMBAI
Mr. Ameya Sunildatta Bal Assistant Professor, Mass Communication, S K Somaiya College, Somaiya Vidyavihar University, Vidyavihar
ABSTRACT After second industrial revolution mass media or mass communication was established as form of
communication in the society. The transmission of information to large audience was started. News is a form of
information that began as the "first" popular transmission in the realm of mass communication. This is where
the journalism profession arose and established itself. This industry's core functions included gathering, evaluating, presenting, generating, and disseminating news and information. Journalism evolved as a process
of "Transforming information" in the shadow of mass communication.
The recent revolution in mass communication that is digital media changed the meaning of traditional communication media and set up the new communication order. Traditional media also faced sudden
challenges in collecting, assessing and distributing the information. Especially print media had to go with lots
of shifts and turns. Readers being the other end of journalistic process and always at the bottom; started
uplifting their status. Digital media brought them to the level of users and participants.
This paper focuses on the study of, how does this change in position of audience occur? Where and how this
change will have its impact in journalistic process? The shift in the role of readers to users and now
participants of the news. Does digital media have a role to play in this shift? The young readers or users are the key in finding out the change in the role. They are from a generation which brought up with new technologies
and digital media. The changing behaviour of them will help in achieving the aims and objectives of the study.
Thus this paper aims to find out the transformation in young newspapers readers from reads to participants in
news making process.
Keywords: “Participants, news making process, readers, digital media, shift in role”
1. OBJECTIVES The objective of the research is to understand changing nature of role of readers to participants in the news
domain. The research paper primarily focuses at the young readers who are apparently users of digital media
and have impact of it while disseminating the news. It further aims to identify the change in behaviour of these
young readers in how they consume the news and what they do after that. The research is only deals with
understanding the parameters which can identify this behavioural change in young readers
2. INTRODUCTION
Communication is essential for sharing information with others and ensuring that everyone understands what is being said so that action can be taken. The first scream a child makes to get its parents' attention is the
beginning of communication. As he grows older, he discovers new ways to communicate in other realms.
Communication is a broad term that incorporates a wide range of experiences, acts, and events. Any conference, event, procession, or meeting is a "Communication Event"; newspapers, radio, cinema, and television are
"Communication media," mobile phones, computers, the internet, and satellite are "Communication
technologies," and journalists, advertisers, public relations personnel, camera crews, and newsreaders are
"Communication professionals." "Information age," "Communication age," or "Network age" are all terms used to describe the contemporary era. Communication began with "means of transportation" and then
"transmission"; at its most basic level, communication is a human connection involving individuals who come
together to share knowledge. As a result, communication is more than just a process, event, or act; it is also a
social or cultural phenomenon.
In the journey of communication development, Audience are always being the centre point. They are the one
who made communication process interactive. They used all types of media to meet their everyday need of seeking information about the society around them. News undoubtedly stood as a strong source of information
for public in any of these era. The communication technologies has changed the news media and
communication. New players enter the mass communication system as a result of this upheaval. The user is at
the centre of today's mass communication system. Users have the control to select, decide, search, define, subscribe and unsubscribe, remark, and, most importantly, write, chat, and film content. Journalism, as part of

International Journal of Advance and Innovative Research Volume 9, Issue 1 (IX) January - March 2022
136
ISSN 2394 - 7780
the mass communication system, has similar difficulties. From media to content, data to knowledge, linear to
hypertext, and distribution to access, the emphasis has moved.
The changing position of readers to users was very smooth transition. But that’s not the end. It was a beginning of new era in news media in the context of emergence of digital media. Young readers are the major users of
digital media. They have seen the transmission in the traditional media and they are the carriers of the shift in
the role of users to participant in the news process. They break the news in their own contexts based on their interest and then disseminate the news and use digital media for the same. This gives the hint of how users are
becoming the participants of the news making process.
3. BACKGROUND OF THE STUDY
In his landmark work of "A Chapter in the Sociology of Knowledge," Park (1940) examined "news as a type of knowledge." According to Nielsen (2017), digital news is "a new chapter in the sociology of knowledge."
Nielsen raises two key points in reference to Park (1940). First, he demonstrates that Park's study of the
distinctive aspects of news as knowledge is still valid. Second, Nielsen contends, with empirical evidence, that
in the digital and social media era, news has grown more diverse and dynamic.
5.1 DISLOCATION OF NEWS
Prior to the rise of social media, traditional media held sway over the platforms for producing and disseminating news. As a result, the news was inextricably linked to the institution's identity and the setting in which it was
created. News media can take control of their editorial activities by owning and administering widely utilised
proprietary platforms, and the knowledge claim of a particular text is based in part on the institutional voice of
news media. Although legacy news organisations retain a strong grip on their proprietary platforms, non-proprietary platforms have grown in popularity and influence. These firms include, but are not limited to,
Facebook, Twitter, and Google. Social media, particularly Facebook, has grown in importance as a mechanism
for individuals to (accidentally) access news over time. In order to reach a larger audience, many news organisations have become reliant on non-proprietary platforms, which function as a digital intermediary and
compete with them for attention and advertising dollars (Ekström & Westlund, 2019). According to a
longitudinal study of two Singaporean news publishers, some news publishers strategically engage in "platform
counterbalancing" to lessen their dependency on platform corporations (Chua & Westlund, 2019). Overall, recent research reveals that legacy news organisations struggle to strike a compromise between short-term
operational benefits associated to social media and long-term dependency on social media (Nielsen & Ganter,
2018).
5.2 READERS TO WRITERS
According to J. L. Orihuela, there are several new communication paradigms that have emerged in the digital
age. The communication method has shifted to a user-cantered approach. Users are in charge of selecting, deciding, and defining the news. The transition from platforms to contents, as well as an excellent brand image
in relation to a type of content rather than a media format, is resetting media identity. The reflection was lost
along the way from periodicity to real-time. Dynamism and conversational styles are what we gain. The seed of
cyber communities is the capacity to share news and opinions while also being able to communicate in real time. "The growth of online material without clear attribution of source authority and variety of content quality
is one of the strong repercussions of "readers becoming writers."
5.3 UNDERSTANDING THE READERS INTEREST The paper, written by Kim Christian Schroder, Professor of Communication at Roskilde University in Denmark,
aims to offer insight on the decisions that readers make as they confront a growing amount of content on and
offline in a media landscape awash with options. The report further explains the readers derive their own meaning from the story. News today has become a cross – media phenomenon and readers are more interested
in local news irrespective of the topic.
4. RESEARCH METHODOLOGY
The methodology adopted for the research includes sampling, preparation of questionnaire, data collection and tabulation to analyze the data. Researcher prepared a questionnaire (with a Likert Scale and Dichotomous)
comprising of close ended questions. The method of sampling was stratified random sampling for 150
respondents.
5. DATA ANALYSIS
Out of 150 respondents, 111 surveys were valid. Remaining 39 surveys were not properly filled and cannot be
considered for analysis. The analysis is done on the following main categories:

International Journal of Advance and Innovative Research Volume 9, Issue 1 (IX) January - March 2022
137
ISSN 2394 - 7780
1. Reading Interests of the readers, platforms of expressions
2. What readers do after reading or consuming the news?
3. Frequency of disseminating the news
6. INFERENCE
Category No. of
respondents
Inference
Age
Below 18 1 Out of 111 respondents 105 respondents belongs to young
segment. Thus, the research primary speaks about the
demography of the youth. This age group has been most prominent in behavioural change and hence is used in
research to draw conclusions.
18 - 20 69
21 - 23 35
24 above 6
Do you read News?
Yes 102 As evidently present in the earlier age category question, majority of the respondents i.e. 117 read news No 9
Platforms used to read news
Newspaper 35 90 Respondents (81.1%) use Social media platform to read
the news and next highest is E paper when choice is given
to select any two. This is the strong evident that readers are moving towards the digital platform from the traditional
one.
E-paper 38
InShots 28
Daily Hunt 13
Mobile apps 30
Social Media 90
Preferred beats for reading
Crime 42 The highest number of respondents (75) is reading entertainment news and the second highest is Social news
but others are also not neglected by respondents when ask
to choose any three beats. This confirms that the young readers interest in
entertainment news. In other way they want entertainment
in news.
Political 43
Social 68
Sports 37
Entertainment 75
Business & Economics
39
Education 45
Likert Scale Analysis: Behaviour Based
Strongly Agree
Agree Neither Agree nor
Disagree
Disagree Strongly Disagree
I discuss the news with my
Colleagues/friends/family that I have read
37 59 11 3 1
I wish to comment on news that I
have read
19 52 32 6 2
I actually comment or express opinions on social media or public
platforms about the news that I have
read.
13 31 36 24 7
I verify the news that I have read 48 45 14 2 2
I try to figure out the different
dimensions
24 58 22 7 0
I follow up the news frequently that I have read
27 46 28 9 1
I do nothing with news that I have
read
13 18 39 23 18
I never thought of discussing news with anyone, that I have read
9 22 27 25 28

International Journal of Advance and Innovative Research Volume 9, Issue 1 (IX) January - March 2022
138
ISSN 2394 - 7780
I feel news that I have read are not
worth commenting
10 25 29 29 18
I follow or join the virtual groups where detail discussion on news
happens
28 13 24 22 23
The above mentioned Likert scale explains the post news consumption behaviour of young readers. The
percentage of agreeableness on discussing news (86.48%), wish to comment on (63%), verification (83.78%), figuring out different dimensions (73.87%) and following up news is very much high (63.73%). The agreement
on not doing with anything or not discussing the news is very less (28% and 26%). This behaviour of
respondents give suggestive indications towards their role of participation in news making.
Likert Scale: Frequency based
Always Occasionally Sometimes Rarely Never
I post something about the news 05 30 36 20 19
I comment, like or share the post of
others on the news
16 28 38 18 11
I prefer to read news which are
connected to my interest
64 27 16 1 3
I do find the news of my interest on
the platform that I use to read the news
61 26 19 2 3
I choose news reading platforms as
per my choice, interest or convenience.
55 27 22 5 1
In the above mentioned analysis of Frequency based Likert scale confirms that role of readers have been shifted
to participants in mews making. The significant frequency is choosing the platform. 50% of the total
respondents always look for the news reading platforms where their interest news is published. This change in
young readers’ behaviour is enough to say that they are participant in the news.
7. CONCLUSION
Readers though fall in the bottom of the journalistic communication but they are major players in the hierarchy. They significantly influenced mass communication in each of its stages of evolution. Digital media has arrived
as boon to the participatory role of the audience. Earlier in traditional media there was a very little scope for
readers to express their views and opinions of certain news, event or article published in the newspaper or
magazine. Thus feedback from the receiving end of this communication process was limited. But digital media made it easy for them and they are just a click away to participate in the process. The changes and challenges
that has been faced by traditional media under the growth of digital media; participatory role of readers is one of
the most unrevealed challenge. The young minds who brought up with new media; have different behaviour towards news consumption. They break the news in their own context and thus one news can have multiple
meaning in public sphere. Earlier in traditional media also have multiple disseminations of the news but today
the different is those disseminations are publicly available and the primary function of young public to consume
news is to look for these disseminations.
Hence the news industry must look in the behavioural changes of young readers and try to attend these needs of
the young minds because they will ignore the medium which will not meet their needs and will shift to the
presenter of the news in their own context. This will create a major evolution in the communication process and
will shift the journalism process from journalist centric to users centric.
REFERENCES 1. Ekström, M., & Westlund, O. (2019). The dislocation of news journalism: A Conceptual Framework for the
Study of Epistemologies of Digital Journalism. Media and Communication, 7(1).
2. Ekström, M., & Westlund, O. Epistemology and Journalism. Oxford Research Encyclopedia of
Communication. Retrieved 21 Jan 2022, from
https://oxfordre.com/communication/view/10.1093/acrefore/9780190228613.001.0001/acrefore-
9780190228613-e-806.
3. Anshori Mahfud, The Paradigm Shift in News (A theoretical Perspective on Online News Concepts), Jurnal
Komunikasi Massa Vol 3 No. 1 January 2010

International Journal of Advance and Innovative Research Volume 9, Issue 1 (IX) January - March 2022
139
ISSN 2394 - 7780
4. José Luis Orihuela: Digital cultures. Short texts to understand how and why the internet changed our lives
(Ediciones Eunate, Pamplona, 2021).
5. M. Ekström & J. Firmstone (Eds.), the mediated politics of Europe: A comparative study of discourse (pp.
91–122). Cham, Switzerland: Palgrave Macmillan.
6. Park, R. (1940). News as form of knowledge: A chapter in the sociology of knowledge. American Journal
of Sociology, 45(5), 669–686
7. Karlsson, M., Clerwall, C., & Nord, L. (2017). Do not stand corrected: Transparency and users attitudes to
inaccurate news and correction in online journalism. Journalism and Mass Communication Quarterly, 94(1),
148–167.
8. Kaul Vineet, Journalism in the Age of Digital Technology, Online Journal of Communication and Media
Technologies Volume: 3 – Issue: 1 – January - 2013
9. Kaul Vineet., Changing Paradigms of Media Landscape in the Digital Age, Journal of Mass
Communication Journalism 2012, 2:2 DOI: 10.4172/2165-7912.1000110

International Journal of Advance and Innovative Research Volume 9, Issue 1 (IX) January - March 2022
140
ISSN 2394 - 7780
A STUDY ON CONSUMER PREFERENCES TOWARDS MOBILE WALLETS
1Sachin Gupta
2Nitin Moolya and
3Rohit Poojary
Mentor
4CA Zainab Rangwala
Bunts Sangha’s S.M Shetty College of Science, Commerce and Management Studies, Powai, Mumbai [email protected] [email protected] [email protected] and
ABSTRACT
The Government of India is trying to motivate people to use digital technology for financial transactions. Acceptance and use of mobile wallets will require people to adjust their attitudes towards cashless transactions
and their daily behavior. Banking and online trading applications need to be improved as there are consumers
who sometimes experience problems during these online transactions. This research paper gives a glance idea of consumer preference for mobile wallet, by knowing the intention, satisfaction, and the trust with mobile
wallet As per our survey most of the people mostly prefer to use the mobile wallet. We have referred a journal
as a secondary data. There are several authors we mentioned, and they received responses from the regions of
North India, Madras, Karnataka and Chennai. We surveyed 102 people we analyzed in Mumbai.
Keywords: Mobile wallet, Digital wallet, Consumer preference.
INTRODUCTION The mobile wallet is also known as M-wallet, E-wallet or a digital wallet. Mobile wallet generally refers to the payment service operated under a financial regulation and made through a mobile device. Instead of paying with
hard cash, using checks or credit cards, a consumer can make payment using a mobile phone to pay or a wide
range of products and services. mobile wallet is one of the most important contributors in promoting the electronic transactions without cash. The primary goal of this study is to determine the conceptual model of
consumer preference, intention, and satisfaction with regard to mobile wallets. The use of online transactions
with the use of mobile wallet is now commonplace in most places. There's a risk that in the future, no hard
currency will be used for transactions, and only mobile wallet transactions would be possible. Paytm, Amazon pay, Google Pay, and Phone pay are among the companies that are introducing new digital
payment options to the market. Furthermore, Indian banks include. To foster a competitive environment, the
company is also launching digital wallets. The first State Bank Buddy was launched by the State Bank of India (SBI) in August of 2015, a mobile wallet was released. Other digital wallets that have been launched by Pockets
(ICICI Bank) and Lime (Axis Bank) in 2015.
STATEMENT OF THE PROBLEM Despite the Government's efforts to promote cashless transactions, customer attitudes and perceptions play a
critical role in the expansion of the digital economy, particularly with regard to mobile wallets. In order to
embrace and use mobile wallets, people must adjust their attitudes toward cashless transactions and their
everyday behaviors. As a result, this report attempted to investigate user preferences towards M-wallets.
OBJECTIVES OF THE STUDY ● To study the preference of people towards the mobile wallet.
● To study the awareness of youngster towards the mobile wallet in Mumbai city.
REVIEW OF LITERATURE
Dr Florence (2018). They have analyzed in their article entitled on “A STUDY ON CONSUMER
PREFERENCE TOWARDS MOBILE WALLET”. A preference among consumers for mobile wallets Following demonetization, literate to illiterate people are attempting to strategize mobile wallets, with some
favorable aspects including privacy preservation, ease of use, innovation, strong brand loyalty, and less internet
problems. The majority of individuals use mobile wallet, and there is no significant gender difference. People
over the age of 25 are more likely to use mobile wallet.
Ramesh sardar (2016). They have analyzed in their article entitled on “in his study he states that people are
adopting mobile wallets for their day to day work because mobile wallet is a fast mode to pay So they save time
of their day and the research states that most of the use of Mobile wallet is done for mobile recharge, DTH

International Journal of Advance and Innovative Research Volume 9, Issue 1 (IX) January - March 2022
141
ISSN 2394 - 7780
recharge, bill payment and so on. People more likely to start using mobile wallet because there is no paper work
while dealing any transaction they easily pay and there is less chance of fraud to any consumer.
Nidhi Singh, Shalini Srivastava, Neena Sinha (2016). They have analyzed in their article entitled on “CONSUMER PREERENCE AND SATISACTION OF M-WALLET”. Hard cash appeals to the majority of
people. They like the digital wallet, but it is tied to a leather wallet that they own. Consumer perception of
mobile wallet services is constrained. This constraint does not apply to all mobile technologies because newer technology introduces new modifications and features that provide greater user convenience. The mobile wallet
company must always make improvements to meet the needs of its customers. According to the research, the
primary aim of mobile wallet services should be age, because everyone has a distinct impression of mobile
wallets, and young people's needs are much greater, such as more cashback benefits, whereas older people only
require basic services.
Dr. Rajanna (2021). They have analyzed in their article entitled on “PERCEPTION AND AWARENESS OF
CONSUMER TOWARDS MOBILE WALLET”. Customer awareness of new mobile technological innovations is fast growing, and consumer perception is crucial in the use of mobile wallet apps. With the advancement of
technology, the demands of consumers have increased. As a result, mobile wallet service providers are
developing new technology from the consumer's perspective. Y. M-wallet transactions give individuals more flexibility when it comes to paying taxes, licenses, fees, fines, and purchases. The survey found that trust is the
most important factor influencing user’s satisfaction and that it has an impact on many user’s intentions to use
mobile wallets.
Deepti Sharma, Deepshikha Aggarwal, Amisha Gupta (2019). They have analyzed in their article entitled on “A STUDY OF CONSUMER PERCEPTION TOWARDS M-WALLET”. The goal of their study is to find out
how people feel about utilizing m-wallets to pay for things online. The research is based on consumer
perceptions of mobile wallets and assesses the elements that influence consumer’s willingness to use them. Their study focuses on consumer acceptance as a primary indicator of behavioral intention to use m-wallets. M-
wallet providers should aim to raise user understanding of trust and privacy, as well as improve the security of
digital payment transactions.
Dr. S. ARCHANA BAI (2019). They have analyzed in their article entitled on “A STUDY ON CONSUMER PREFERENCE OF MOBILE WALLET IN KANCHIPURAM DISTRICT”. After demonetization many
consumers understood the value of mobile wallet. Just they required good app and phone. There are some
factors which influence the adoption of m-wallet there are internal and external. In internal there are Psychological factor and beneficial factor and in external there are Trend & technology and safety & security
from all this factor the consumer gets influenced towards a safety and security. As per the survey we came to
know that more men use the mobile wallet. There are 21 to 30 age group which use more mobile wallet. Employee in the organization and other institutions mostly prefer not to keep the hard cash and use a mobile
wallet. As compared to 2013 there are more user in 2017Best digital app according to the survey is Paytm and
Mobikwik.
RESEARCH METHODOLOGY The survey looks at how familiar customers are with M-wallets, as well as their awareness and preference for
them. The research is based on primary data. With the use of a well-structured questionnaire, the data was
obtained from Mumbai-based consumers. The poll was conducted using a human contact method. The sample size is 102 consumers from the Mumbai area in the Indian state of Maharashtra. The data was analyzed using
simple statistical methods such as average and percentage.
DATA ANALYSIS AND INTERPRETATION
Table no.1
DEMOGRAPHIC PROFILE OF THE RESPONDENT
SL. NO
DEMOGRAPHIC PROFILE NO. OF RESPONDENT
PERCENTAGE
1 AGE 16-20 65 63.50%
21-24 20 19.60%
25-29 9 8.8.%
30 AND ABOVE 8 7.80%
2 GENDER MALE 74 72.50%
FEMALE 28 27.50%
3 WHERE DO YOU STAY MUMBAI 88 86.30%

International Journal of Advance and Innovative Research Volume 9, Issue 1 (IX) January - March 2022
142
ISSN 2394 - 7780
OUT OF MUMBAI 14 13.70%
4 OCCUPATION STUDENT 69 67.60%
BUSINESS 15 14.70%
EMPLOYEE 18 17.60%
The table no.1 shows the result of demographic profile of the respondent. Out of 102 responses 63.50%
respondent are between 16-20 and 19.60% are between 21-24. And 72.50% of respondent are male, 27.50% are female. 86.30% of respondent belongs to Mumbai and remaining are from out of Mumbai. 67.60% of
respondent are students and 17.60% are employees.
Table no. 2
SL. NO
QUESTIONS OPTIONS RESPONDENTS PERCENTAGE
1 DO YOU USE MOBILE
WALLET
YES 76 74.50%
NO 18 17.60%
NOT YET 8 7.80%
2 If yes; How much percent of
transactions u do using mobile
wallet?
Less than 25% 37 43.30%
26% to 50% 20 23.30%
50% to 75% 15 17.40%
More than 75% 14 16.30%
The table no. 2 shows that 74.50% of respondent use mobile wallet, and 17.60% doesn’t use. When it comes to making transactions, 43.30 percent of respondents use mobile wallet less than 25% of the time, while 14.30
percent use mobile wallet more than 75 percent of the time.
Table no. 3
SL. NO QUESTIONS OPTIONS RESPONDENTS RANK
1 WHICH APP DO YOU PREFER? PAYTM 50 2
GOOGLE PAY 67 1
AMAZON PAY 17 3
PHONE PAY 50 2
OTHERS 9 4
2 Which method of payment do you think is
better? MOBILE WALLET 59 1
HARD CASH 21 3
NET BANKING 22 2
Table 3 illustrates that Google Pay is generally chosen over alternative options. Paytm and Phonepay, on the other hand, received the same amount of responses. Nearly 59 respondents believe that using a mobile wallet is
a preferable option, with little difference between physical cash and net banking.
Table no. 4
SL. NO
QUESTIONS OPTIONS RESPONDENT PERCENTAGE
1 Does every shopkeeper prefer to have a
online transaction with help of mobile wallet? YES 52 51%
NO 10 9.80%
MAYBE 40 39.20%
2
Have you ever done any payment using your
mobile? if yes, please select which all transactions you have done.
TICKET
BOOKING 41 40.20%
FOOD ORDER 55 53.90%
MOBILE
RECHARGE 72 70.60%
FUND 46 45.10%

International Journal of Advance and Innovative Research Volume 9, Issue 1 (IX) January - March 2022
143
ISSN 2394 - 7780
TRANSFER
BILL
PAYMENT 58 56.90%
OTHERS 21 20.60%
Table 4 reveals that 51 percent of respondents answer yes, shopkeepers prefer online transactions, whereas
39.20 percent say maybe they prefer or don't. The majority of respondents chose mobile recharge, followed by
55 who chose food order and 58 who chose bill payment.
Table no. 5
SL.
NO QUESTIONS OPTIONS RESPONDENT PERCENTAGE
1 Did you face any server problem while
doing online transaction? YES 22 21.60%
NO 27 26.50%
SOMETIMES 53 52%
2 Rate the safety versus convenience as a
factor for adopting mobile wallet. 1 0 0%
2 3 2.90%
3 20 19.60%
4 45 44.10%
5 34 33.30%
Table 5 reveals that the majority of respondents claimed they had a server problem during a transaction at some
point, while only 27 respondents said they had never had a server problem. According to the results, 44 percent
of respondents gave a four-star rating to adjusting to mobile wallets, while 0 percent gave a one-star rating.
SUGGESTION According to the statistics collected, the majority of mobile wallet users are under the age of 30, hence plans
and campaigns to persuade people above the age of 30 to switch to mobile wallet should be implemented. Many people have begun to use mobile wallet, yet transactions using mobile wallet account for less than 25% of all
transactions, and over half of the population still does not use mobile wallet. Myths about mobile wallet should
be debunked. Frauds to be stopped to encourage people towards mobile wallet. Server problems to be reduced to control the panic situation among consumer. More features and schemes to be introduced to make people
shifts towards mobile wallet.
CONCLUSION The survey of study on consumer preference towards mobile wallet here concludes that in Mumbai there are people using mobile wallet are more in numbers because now a days there is digitalization increasing in
Mumbai. Our survey of 102 people where 88 of them from Mumbai. However everyone is using mobile wallet
because it often saves time and the physical transaction work gets skipped which also ensure the safety of your money. As everyone knows future is all digitalized and mobile wallet are safer and fast mode of transacting.
Mumbai is a busy city where people struggle daily to earn money and mobile wallet help them to grow faster.
mobile wallet service is also upgrading daily to fulfill everyone’s need and satisfaction so we conclude that
mobile wallet is more useful for people.
REFERENCES
1. Sujith T S, Dr. M Sumathy &Anisha T (2019). “Consumer perception towards mobile wallet among youth
with special reference to Thrissur city”. International journal of scientific & engineering research volume
10, issue 3, ISSN NO. 2229-5518.
2. Nidhi Singh, Shalini Srivastava, Neena Sinha (2017). “Consumer preference and satisfaction of mobile
wallet: A study on north Indian consumer”. International journal of bank marketing, volume. 35, issue 6,
PP.944-965.
3. Dr. S. Archana Rai (2019). “A study on consumer preference of mobile wallet in Kanchipuram district”
Infokara research volume 8, issue 11, ISSN NO. 1021-9058.
4. Dr. Rajanna. K. A (2021). “Perception and awareness of consumer towards mobile wallet”. Science,
technology and development volume 10, issue 6, ISSN NO.0950-0707.

International Journal of Advance and Innovative Research Volume 9, Issue 1 (IX) January - March 2022
144
ISSN 2394 - 7780
5. Deepti Sharma, Deepshikha Aggarwal, Amisha Gupta (2019). “A study of consumer perception towards m-
wallet”. International journal of scientific & technology research volume 8, issue 11, ISSN NO.2277-8616.
6. T. Praiseye, Dr. Florence John (2018). “A study on consumer preference towards mobile wallet”. volume 5,
issue 3, ISSN NO.2349-5138.

International Journal of Advance and Innovative Research Volume 9, Issue 1 (IX) January - March 2022
145
ISSN 2394 - 7780
IMPACT OF TIME MANAGEMENT ON WORK LIFE BALANCE: A STUDY OF EMPLOYEES
WORKING FROM HOME
Asst. Prof. Nidhi Chandorkar [email protected]
Dr. Sridhara Shetty
Bunts Sangha’s S.M. Shetty College of Science, Commerce and Management Studies, Powai
ABSTRACT This research covers three aspects for people who have shifted from working from office to work from home due to restrictions imposed for precaution during COVID 19 pandemic situation. It primarily investigates about the
impact of working from home on professional and personal life and whether people are still able to create a
balance between the two. It also investigates on one of the major reasons of work-life-imbalance, as per earlier
studies, that are time management.
The research examines how working pattern have changed while working from home and impact of this change
on time management.
The research is a qualitative research and has used empirical technique to study the impact of work from home
on time management and eventually its impact on work-life-balance. The populations under study are
employees working in different industries. The research concludes that employees working from home.
Keywords: Time Management, Work Life Balance, Work from Home, Work from Office, Working hours,
Delegation, Urgent, and Important
INTRODUCTION
Since March 2020, most of the organisations had either lowered the scale of business or have opted for Work from Home (WFH). Apart from continuity of business activities, work from home have brought many benefits
like cost saving both for organisation and employees, flexi working hours and employees are also benefitted
because of no dress code in most of the cases. However, due to working from home employees and
organisations are facing few difficulties like lack of communication, availability of resources for working. Though, due to continuous evolvement the situation is becoming better and better. But one area which has been
a cause of concern for not only organisation, employees but also members of employees’ family, that is time
management leading to many problems. One of the major problem due to time mismanagement while working
from home is imbalance of work and life.
Time Management is the process of planning and executing of dividing time of the day for different activities. If
the time is properly managed an employee is able to work smarter and in lesser time. Hence, the employees end up working smarter and better. It also give time for innovation and achieving more in career. It also helps in
reducing stress as one can focus things which are important including one’s personal life.
STATEMENT OF OBJECTIVE
This research is conducted to accomplish the following objectives:
To develop an understanding of the concept and process of time management.
To examine the impact of work from home on work-life balance
To examine the importance of time management while working from home.
To determine the factors affecting time management while working from home.
RESEARCH METHODS USED
This is a qualitative research understand compare the different types of time management techniques before
lockdown, during early days of lock down and current lock down during third cycle. Empirical research is
conducted to provide evidence for difference in time management approach.
The data is collected using both secondary and primary sources. Secondary sources were mainly online, like
articles, research paper and thesis mainly. The details are mentioned in the references section. Primary data was collected using non-probability sampling technique for survey. The questionnaire comprised of 17 questions.
Sample units were employees working in different industry and sample size was 78.

International Journal of Advance and Innovative Research Volume 9, Issue 1 (IX) January - March 2022
146
ISSN 2394 - 7780
Conclusion of research has been drawn merely by observing pattern of responses.
REVIEW OF LITERATURE
The literature related to time management, work from home and work-life balance have been summarized as
following
According to J.Chase J. D et al (2013), time management if effectively applied enhances focus on work and
improves productivity. The time management strategies include setting achievable yet challenging goals, prioritizing and setting an optimized plan. Identifying and managing distractions, working in team and
continuously evaluating and evolving the strategies for time management in light of goals and resources
available.
Jinalee N. and Singh A. (2018) have discussed about various theories and models been proposed for time management. According to the study the pattern of spending free time affects the behaviour of the individual
and also his/her growth in career. The modelsand theories discussed in their study shows that if time is managed
effectively it can reduce stress due to procrastination. There are two ways of considering time, time as on the clock and time as a system (culture). In their article they have described eight different theories and models. The
brief of them is discussed here:
1. ABC Model of Time Management: This model is based on three aspects: Awareness: It talks about awareness of each moment and its potential to achieve. It uses the matrix of four
quadrants based on Urgent and Important. Hence, one can priorize as
I: Urgent and Important
II: Important but not Urgent
III: Urgent but unimportant
IV: Neither urgent nor important
Believe: It is based on the fact that if a person is aware of time and its value and its contribution for success of
career, this person will always do things on time and with confidence.
Continuation: Time management is not a one time activity. Its continued usage will bring long lasting
results. 2. Pareto’s 80-20 Rule: It was proposed by Vilfredo Pareto, an Italian economist. According to it, one should
identify those twenty per cent of tasks which are contribute to eighty per cent of productivity. Remaining
eighty per cent are tasks with secondary importance and they contribute twenty per cent to one’s
achievement. Hence, eighty per cent time and resources should be diverted towards that twenty per cent
tasks which are crucial for success.
3. Eishenhower Matrix and Covey Time Management Grid work similar to ABC Model grid. Only in
Eishenhower Model, it has been explained how to strategize for each of the quadrant.
I: Urgent and Important – Do it as soon as possible. Avoid procrastination
II: Important but not Urgent – Decide on how you can complete with perfection as they are crucial for career.
Do not let it become urgent.
III: Urgent but unimportant – Delegate such work if possible
IV: Neither urgent nor important – They are simply distractions. Avoid them.
4. ALPEN Model: It includes the following steps:
- Activities : List the activities to be done in a week or a day
- Length Estimation : Estimating the duration of each task
- Planning schedule: Time should be so scheduled that sixty per cent of the available time should be used for
completing the listed tasks and forty per cent of time for untold circumstances.
- Establishing Priorities: The tasks which fall at lower level of priority list should be delegated so that more
focus and time can be given for tasks of high priority.
- Next Day: The tasks which could not be completed during the allotted time should be at the top for next
day.

International Journal of Advance and Innovative Research Volume 9, Issue 1 (IX) January - March 2022
147
ISSN 2394 - 7780
Other models for time management are Mind Mapping and Pickle Jar which are also frequently used in
corporate training session.
In the article written by Rehman K., Arif Z. (2020) on working from home and its impact on factors like job satisfaction, productivity and other challenges, they have highlighted that the employees are more satisfied, their
productivity has increased as they have been working beyond working hours to exhibit their commitment. The
employees when realize that they are not supervised, they exhibit more ownership towards their work. Their
nine to five working routine is disrupted and they find it difficult to stick to the schedule.
According to Employers’ Federation of India (ILO) article on work from home, the concerns related to
employees are highlighted. Employee find it difficult to differentiate between work and home time. Female
employees are burdened more due to their role in taking care of family, young kids and ailing members when they are around at home. As the schools of small kids have also closed, these employees have to play role of
teacher as well while working for their employers. Apart from surge in domestic violence, the WFH employees
tend to isolate them from friends and stay working at home most of the time of day.
In their research Shareena P. & Shahid M. (2020), apart from other negative impact of work from home, the
researchers said that WFH is more stressful as its difficult to balance work and personal life. The time
requirement exceeds for the same task at home as compared office due availability of suitable hardware and
software at office and speed of internet connectivity.
PRIMARY DATA
1. Out of 78 responses received during the survey, 39 (50%) were female, 38 (48.7%) were male and 1 others.
2. Most of the respondents were from education rest, next highest were from IT, Banking and Finance,
Insurance and others
3. Out of the people responded 58 (74.3%) were from the age group below or equal to 35 and rest were above
35 years of age.
4. 31 (39.7%) were married and 47 (60.3%) were single.
5. 52 (66.67%) used to leave workplace on time always or mostly while they were working from office. But
while working from home 58 (74.36%) of respondents are not able complete their office work during office
hours while working from home.
6. Only 20 (25.6%) used to do office work after office hours or work on holidays many a times during pre-
COVID times while 37 respondent stated that they have meetings scheduled after working hours during
WFH and a high of 58 respondent said that they generally do office work even after office hours to
complete their work.
7. 40 (51.3%) respondent have to do household work while working hours are on.
8. 57 (73.1%) respondents most of the days prepare a priority list of work and only 15 (26.3%) out of them are able to complete all the items in the list everyday, while 36 (63.2%) are able to complete from 50 to
80% of them.
9. 53 (70.5%) respondents do not like to delegate their non-important work to helpers or family members and
37 ( 69.8%) of them find themselves not able to spend quality time with family members.
10. 55 (70.5% ) respondents have their fitness regime disturbed because of WFH
11. Out of 78 respondents only 15 (19.2%) are very less interested to work back from office and only 3 of them
are married. More than 90% married are interested to work from office
CONCLUSION
Based on the previous researches reviewed and primary data collected and interpreted, the following conclusion
can be drawn:
1. Majority of the respondent used to finish their daily work on time while working from office, but while
working from home they had to stretch it beyond working hours.
2. During office hours, the respondent had to spend some time for house hold work too which could be
considered as one of the reason for stretching working hours more than designated office time.
3. While majority of respondents prepare the work priority list every day, but nearly one-fourth only could
finish all items in it.

International Journal of Advance and Innovative Research Volume 9, Issue 1 (IX) January - March 2022
148
ISSN 2394 - 7780
4. While working from home, delegating less important (which may be urgent) work to others was not seen in majority of respondents.
5. Most of them compromised on their fitness regime so as to complete their office work which took longer time due to engagement in other house hold work.
6. Two benefits which were highly recognized for WFH were spending time with family and completing work at their own pace.
7. However, more than 80% respondents were wanted to work from office.
8. Most of the people who wanted to continue working from home were single with no big responsibility back
at home and they did not want to spend time travelling, follow early morning routine or they do not want to dress up and get ready.
9. While married respondents wanted to go to office as they wanted to spend quality time with their family after coming home.
RECOMMENDATION When WFH is the only option, the following suggestions can be drawn from the primary and secondary data collected:
1. To complete the office work within office hours, it is important to identify important work, urgent work,
both urgent and important work and work which is neither urgent nor important. The “To-Do” list should be prepared based on that.
2. The house hold routine job which has to completed within a time frame can be delegated to other members of domestic helpers.
3. A dedicated space should be identified for doing office work. The more one roams about with work in the house, more diversions will be found.
4. Fitness regime should be decided practically and should be followed strictly.
5. To spend quality time with family, its important you spend quality work time during working hours, hence other members of house-hold should be educated for that.
LIMITATION
1. The research has been conducted using convenient sampling, hence the limitations of this sampling technique is applicable.
2. The numbers of respondents are 78, which may not be true representative of entire theoretical population. Hence, it may not be applicable to entire population.
3. The research was conducted during short duration. Therefore, it may not be applied to other time durations.
REFERENCES
1. Time Doctor, retrived from How To Improve Time Management While Working From Home (Tips + Tools) (timedoctor.com) retrieved on 15/1/2022
2. Jo-Ana D. Chase et al (2013), Time Management Strategies for Research Productivity, Western Journal of
Nursing Research, retrieved from (PDF) Time Management Strategies for Research Productivity (researchgate.net), on 16/1/2022
3. Jinalee N., Singh A (2018), A Descriptive Study of Time Management Models and Theories, International Journal of Advanced Scientific Research and Management, Volume 3 Issue 9, retrieved from (PDF) A descriptive study of time management models and theories (researchgate.net), on 16/1/2022
4. Rehman K (2020)Working from Home during the COVID-19 Pandemic: Satisfaction, Challenges, and
Productivity of Employees,International Journal of Trade and Commerce, retrieved from (PDF) Working
from Home during the COVID-19 Pandemic: Satisfaction, Challenges, and Productivity of Employees | Kazi Turin Rahman - Academia.edu, on 17/1/2022
5. Work From Home- A Policy Prescription, Employers’ Federation of India, retrieved from WORK FROM HOME (ilo.org), on 17/1/2022
6. Shareena P. & Shahid M. (2020), Work from Home During Covid 19: Employees Perception and
experiences, Global Journal for Research Analysis, retrieved from (PDF) Work from home during COVID-
19: Employees perception and experiences | Mahammad Shahid - Academia.edu on 17/1/2022

International Journal of Advance and Innovative Research Volume 9, Issue 1 (IX) January - March 2022
149
ISSN 2394 - 7780
PRIVACY AND SAFETY VIS A VIA SOCIAL MEDIA
Dr. Yatindra Hruday Ingle
Usha Pravin Gandhi College of Arts Science and Commerce
Graffiti: Copy or Copyright?
Being recognized for your artistic talents without copyright protection for original artistic
creations than commercialized Business
Graffiti is an important form of art deserving the same copyright protection as similar to any artistic formats (Schwender, 2007) Many graffiti artists have broken through to galleries and museums with canvas works, but
many more still reside purely on the streets with works on buildings, walls and subways and footpaths.
Although these street artists may not want to be acknowledged, their artwork still must be preserved for freedom of expression. Street artists are unable to assert their legal rights due to current legislation which
prohibits the presence of any government, NGO, or for-profit entity that involves the creation of public art
within public property (Iljadica, 2016). Over the years, this medium of art has found its space and its demand in the modern world. Street art is being duplicated and copied on posters of clothes, company items, and seen and
sold in auctions and shown in galleries. As long as there is a push to commercialize graffiti, there will be
copyright problems. Particular consideration must be paid to see if the statute is capable of meeting the
demands of street and graffiti artists and providing them with the best mechanism to defend their interest, for example, against businesses looking to financially manipulate their artwork (Singh, 2020). This research
focuses on the Indian Graffiti artist's designs being stolen and voiceless as a result of no copyright infringement
on their works of art.
Keywords: Graffiti, Intellectual Property Rights, Digital Media
INTRODUCTION
Graffiti and street art are often used terms to denote many art genres. Graffiti is a technique for stencilling names and text on urban surfaces such as subway and train cars and walls. Graffiti art began in New York in the
early 1970s and swiftly spread to other cities and countries, including the UK. On the other hand, more
elaborate forms of art that focus on visuals rather than letters are regarded as having grown from the early
graffiti movement. Street artists can now paint and draw with traditional tools including brushes, rollers, and palettes, as well as markers, chalks, and charcoal. Other forms of street art include urban knitting, mosaic tiles,
stickers, posters, and cutouts10, as well as abandoned works. Street artworks are routinely created without the
property owner's permission, exposing artists to serious legal consequences, including jail time. Many street artists now make their work legally, acquiring social legitimacy for their profession and creative results.Also,
cities frequently provide sites where street art is tolerated and regularly altered. (Bonadio, Enrico, 2017)
Graffiti was sometimes considered vandalism. Their “street art” has made them a respected art form. Street art
is a more intricate form that involves early graffiti movement but has grown into spray paintings, mosaics, posters, and crocheted installations. As a result, graffiti artists have used their skills to create work that stops
people in their tracks, and some have even gained recognition in more “prestigious” creative fields.
(Enterprises, 2020).
Copyright is never an incentive for artists to place work on the street. While copyright is not a consideration in
the decision to create art in public locations, many street and graffiti artists become interested in legal protection
once their work is created, and especially after it is monetized. Increased legal action and protests by street and
graffitti artists against corporations appropriating their work confirms this fact. (Bonadio, 2018)
The rising public acceptance of graffiti and street art has made some of these artists aware of copyright law. So
when Fiat broadcast a commercial with Jennifer Lopez driving past a Bronx wall with a mural by TATS Cru (a
team of former illegal taggers who now make art for brands like Coca-Cola, Nike, and Beyoncé), the artists sued, claiming copyright infringement. To stop the warehouse's demolition, artists whose work adorns New
York's international graffiti mecca "5 Pointz" filed a copyright lawsuit. Forgers have targeted artists like graffiti
artist John Perello (aka JonOne), who recently sued a Paris gallery for selling forgeries. It allows them to earn from and maintain their works by allowing them restricted, exclusive rights to reproduce distribute and publicly
exhibit their work as well as attribution and integrity rights for certain works. (Schwender D. D., 2016)

International Journal of Advance and Innovative Research Volume 9, Issue 1 (IX) January - March 2022
150
ISSN 2394 - 7780
'Inscriptions, figure drawings, etc. discovered on the walls of ancient sepulchres or ruins such as the Catacombs
or Pompeii.'
The term "graffiti" now refers to a wide range of writings on walls and other surfaces, from the simplest to the most complicated. Attitudes toward graffiti are likewise varied. Vandalism and defacing private property are
two ways that graffiti is perceived. Others consider graffiti to be paintings presented in galleries or etched on
'legal walls.' Others distinguish between public and private writings. Many consider graffiti to be a form of art,
albeit a challenging and uncommon form of art. So the disparities persist.
However, unlike other disciplines, this study will not provide a full definition of graffiti. Rather, it will focus on
the formation of graffiti. Illegality is the first step to understanding graffiti as a medium. That crime is the
graffiti medium is not hyperbole.'
Some writers and pundits argue that graffiti requires illegality, as seen by how far both sides of the graffiti
debate, lawbreakers and legislators, have come. One critic claims the graffiti subculture requires authors to use
stolen spray cans. Thus, authors must be Legality would seem to be the priority in any legal study.
Except for works commissioned or made on 'legal walls,' graffiti must be uninvited and unsolicited.
Unmistakably sanctioned paintings are those painted on standard canvases and presented in galleries.
The alternative perspective is that "it is difficult to accept it on white walls." Then it's a good. Its meaning is
defined by its social context.
General rule: If the technique of production is illegal (trespass, nuisance, or a breach of law), the writing is
likewise illegal.
In other cases, however, graffiti writing is not just not approved, but also not illegal.
Also, graffiti inscriptions should be examined by the public.
The public has the right to use public restrooms, hence this requirement does not apply to all works constructed
within structures. The criterion also does not require a static surface. Several well-known graffiti examples have utilized the exterior and interior of trains, particularly New York's subway trains. The need for access or, at the
very least, an unrestricted view of the literature may also exclude commercial works from consideration in this
study. These artwork may be presented in private spaces. Tags and pieces are also not created to be viewed.
Contrary to popular belief, graffiti artists are aware that their work is temporary. ' As a writer, you accept that your work will not last forever. Everyone knows that society or other writers will not allow it. Graf has always
entailed warfare and competitiveness. Graf is mostly in the execution. Making your thoughts visible to others is
called writing. Like improvisational theatre, graffiti is an ephemeral creative form. (Morgan, 2006)
METHODOLOGY
In the beginning, there was no copyright. Early judgements accepted the assumption that allowing a plaintiff to
profit from his dishonesty was against the public interest, and that the unclean hands doctrine barred copyright remedies. The Copyright Act does not suggest that courts should decide whether the opinions incorporated in a
copyrighted work are true or false, sound or unsound. Concerning the public injury created by a fraudulent
work, the court determined that "the intensity and complexity of the hurdles... are astonishing to consider."
According to the court, if copyright protection was removed, anyone might readily replicate and distribute the false work, increasing the amount of counterfeit materials. "People who have never written false literature can
do so and seek legal protection," the opinion states. In short, the ruling encourages deception. As a result, the
majority and minority assess the incentives that flow both ways, determining whether the judgement will
increase or decrease the amount of fraudulent work.
The "authority, sponsorship, and backing" of deceptive initiatives by the majority is also challenged. In Dream
Games of Arizona, Inc. v. PC Onsite, the court ruled that when utilised in violation of state gambling restrictions, E-Bingo was not protected by copyright. The plaintiff was entitled to injunctive remedy in addition
to statutory damages. This is due to the fact that the Copyright Act does not require, and common sense forbids,
a thorough evaluation of potential public repercussions. It is not necessary to exaggerate the similarity between
copyright in obscene or fraudulent publications with criminal content and copyright in graffiti made by Courts are progressively refusing copyright in works that violate non-copyright public policy. Courts have become
better at identifying copyrightability from other public issues in recent years.
Graffiti would probably be granted copyright protection if given careful consideration. Incentives are the traditional economic concept that explains why innovators produce. According to this viewpoint, copyright

International Journal of Advance and Innovative Research Volume 9, Issue 1 (IX) January - March 2022
151
ISSN 2394 - 7780
rules are intended to maximise creative output. Copyright protection ensures that the market provides an
adequate amount of creative expression by granting the artist certain exclusive rights to a work. Except there's a
problem with intellectual property. Production functions generate and output information. Making a new work
usually entails borrowing or building on previously created content.
The cost of developing new works rises as copyright protection rises. According to recent study, "exclusivity is
merely one aspect of the incentive problem." Because intellectual property is a public good, authors must be compensated for their efforts. Incentives in intellectual property law and economics are being explored to
determine how much copyright protection maximises total profit from the creation of cultural commodities. As
a result, there are two issues: copyright and graffiti. However, standard incentive theory anticipates actual
graffiti output levels (Davies, 2012)
The conventional economic view of why innovators generate is based on the concept of incentives. According
to this theory, copyright rules are intended to promote the highest amount of creative activity possible.
Copyright protection, according to traditional analysis, ensures that the market offers the optimal quantity of creative expression by allowing the artist certain exclusive rights to a work. However, unlike other types of
manufacturing, intellectual property has a shortcoming. Input and output creative works are handled by
production functions. Borrowing or building on material from a previous body of work is frequently used in the creation of a new piece. Thus, more copyright protection can raise the expense of creating new works, lower the
amount of new works created, and raise the price of creative works. According to recent study on intellectual
property's "negative space," "exclusivity is simply one component of the incentive problem."
Because the public benefit nature of intellectual property prevents authors from recouping their costs, they require incentives to create. In intellectual property law and economics, incentives are studied to discover what
level of copyright protection maximises the total benefit derived from the production of cultural assets. As a
result, the economics of copyright protection raises two issues about graffiti and copyright. The question is whether standard incentive theory predicts actual graffiti production levels accurately. The second factor is the
variety of intellectual property rights (and consequently incentive structures)
Overall, it appears that the copyright system is acting against the interests of graffiti artists. Their primary
interests, credit and diffusion, frequently conflict with the current structure of copyright protection. If artists intended to stop unauthorised copying and distribution of their works, they may utilise copyright to do so if they
wished to overcome the natural barriers to starting litigation. Overall, the theory should recognise the
copyrightability of illegal graffiti art, as the current position of copyright doctrine in otherwise forbidden works
renders graffiti an outlier. Works that are obscene, fraudulent, or illegal are equally protected.
CONCLUSION
The copyright system appears to work against graffiti artists. This is often in conflict with the current copyright protection regime. Artists may utilize copyright to restrict illegal copying and distribution of their works if they
sought to overcome the natural barriers to litigation. Overall, the theory should recognize illegal graffiti as
copyrightable. Graffiti is an aberration due to the copyright theory in normally forbidden works. A work can be
obscene, fraudulent, or illegal. the limits of our intellectual property theories and the well of creativity and
creation outside the legal system.
REFERENCES
Bonadio, E. (2018). Graffiti, street art and copyright . Street Art and Urban Creativity, 76 - 81.
Bonadio, Enrico. (2017). Copyright Protection of Street Art and Graffiti under UK Law. Intellectual
Property Quarterly, Issue 2, 39.
Davies, J. (2012). Maine Law Review . Vol. 65 Issue 1, 27-55.
Enterprises, E. A.-s. (2020, September 9). Executive Agency for Small and Medium-sized Enterprises. Retrieved from intellectual-property-helpdesk.ec.europa.eu: https://intellectual-property-
helpdesk.ec.europa.eu/news-events/news/street-art-and-copyright-2020-09-09_en
Iljadica, M. (2016). Copyright Beyond Law: Regulating Creativity in the Graffiti Subculture.
Portland,USA: Bloomsbury.
Morgan, O. J. (2006, September 6). Social Science Research Network. Retrieved from SSRN:
https://papers.ssrn.com/sol3/papers.cfm?abstract_id=929892

International Journal of Advance and Innovative Research Volume 9, Issue 1 (IX) January - March 2022
152
ISSN 2394 - 7780
Schwender, D. (2007). Promotion of the art : an argument for limited copyright protection of illegal
graffiti. Promotion of the Arts, 257.
Schwender, D. D. (2016). Does copyright law protect graffiti and street art? Routledge Handbook of
Graffiti and Street Art, 12.
Singh, R. (2020). Street Art and Copyright. Legal Service India.

International Journal of Advance and Innovative Research Volume 9, Issue 1 (IX) January - March 2022
153
ISSN 2394 - 7780
IMAGE PROCESSING IN RETAIL INDUSTRY
1Hemant V Karekar and
2Mr. Mithilesh Chouhan
1Department of Masters of Science (I.T.), Vikas College of Arts, Science and Commerce, Mumbai, India 2SM Shetty College, Powai, Mumbai, India
[email protected] [email protected]
ABSTRACT As retail industry is increasing day by day number users also increasing rapidly. As we can see numbers of
products are sold via internet, considering Amazon ecommerce platform, an average of 1.3 million products is
added each day. Adding such large number of data manually may lead to inconsistency of data related to
particular products. So, image processing plays an important role in detecting the attributes from image like
neck type, sleeves type, color and pattern type detection.
Keywords- Face Detection, Algorithm, CNN, Feature Detection
INTRODUCTION The purpose of this article is to provide solution for inconsistent data related to garments on ecommerce
platforms. Let’s take an example of casual shirt, it consists information related to color, pattern, sleeves and
neck type. For product the information displayed on website may be incorrect like, sleeves type is ‘full sleeves’ but on website it is mentioned as ‘half sleeves. To avoid such types of incorrect data, we can use image driven
attribute detection system with the help of image processing and machine learning will play an important role to
correctly identify it.
PROCEDURES FOR ATTRIBUTE DETECTION
A. Removal of Gradient Background Color
STEP 1: Edge Detection
When we want to remove the gradient background, first we need to detect the outline of the specific object so that we will know till that pixel we have to replace the color. To detect the edge of the object we will use well
known algorithm Canny Edge Detection algorithm.
Canny edge algorithm can detect all the edges inside the image. Because it follows set of procedure to achieve
the required output that’s why it is the best algorithm for edge detection.
Noise Reduction - Here the Gaussian filter can be used to blur the image so that the edges which are not
sharp can be eliminated and points outside the object area also removed.
Gradient Calculation - It helps you to calculate the intensity and direction of the edges. Once all fine
edges are detected Sobel filter is used to blur the edges.
Non-Maximum Suppression - The guideline is straight forward: the calculation experiences every one of
the focuses on the angle force grid and finds the pixels with the most extreme incentive in the edge
headings.
● Hysteresis Thresholding
The twofold edge step goes for distinguishing 3 sorts of pixels: solid, powerless, and non-significant:
Solid pixels will be pixels that have a force so high that we are certain that they add to the last edge.
Frail pixels will be pixels that have a power esteem that isn't sufficient to be considered as solid ones, yet
not little enough to be considered as non-significant for the edge discovery.
Different pixels are considered as non-pertinent for the edge.
STEP 2: Contour Detection
Detection of contours is a method thatcan simply be explained as a curve that joins all the constant points (along
with the border), having the same color or intensity. The contours are helpful instrument to analyze shape and
to detect, recognize objects.
OpenCV offers a feature called Find Contours to detect contours that attempts to locate contours in the picture.
Of course, to get a decent contour detection, some therapy should be applied to the image. In the instance below, to release contours, we Zirst use the morphology feature with the technique CV MOP OPEN and CV
MOP CLOSE. Then we use the function Find Contours to discover contours and print.

International Journal of Advance and Innovative Research Volume 9, Issue 1 (IX) January - March 2022
154
ISSN 2394 - 7780
STEP 3: Smooth Mask and Blur
● Dilation - This method follows some kernel convolution of a particular form such as a square or a circle.
This kernel has a point of anchor that refers to its middle.
To calculate the highest pixel value, this kernel is overlapped over the image. The image is substituted with
anchor in the middle after calculation. This operation improves the size of the fields for bright regions and thus
reduces the size of the picture.
● Erosion - Erosion is a method very comparable to dilation. But the calculated pixel value in dilation is
minimal rather than maximum. The picture is substituted with the minimum pixel value under the anchor
point. The areas of dark regions are growing in size and bright regions are decreasing with this operation.
● Masking - After erosion and dilation object with fine edges is retained. So now we have to move this object to transparent or white background so that we can achieve the first stage that is removal of gradient. For that
we have to create a new canvas of white background with specific dimension and redraw our object image
into that new canvas.
Example
B. Crop Specific Part from Images (Neck, Sleeves)
As we need to detect attributes from images. First, we need to detect and crop the all-specific parts from image,
such as neck, sleeves etc. Following is the process of cropping the parts from image.
First, we have to detect the face of the model inside image so that we can apply some mathematical calculations
to calculate the accurate distance of all parts from specific distance. Using OpenCV we can detect face detection
algorithm. Once we detect the face of the model, we can draw a rectangle around the face, so that we can get the upper and lower coordinates of the face. Once we have the lower coordinates of the face, we can apply formula
to calculate the neck distance from lower coordinates, same for right and left hand from neck.
Figures
C. Conversion of crop images to black and white
Now passing all crop images directly to convolution layer can increase the processing power of the GPU as well leads to incorrect detection of attributes. So here we have to change the background to black and all outline of
the object to white so it will display the images as follows:

International Journal of Advance and Innovative Research Volume 9, Issue 1 (IX) January - March 2022
155
ISSN 2394 - 7780
D. Classification and Feature Detection
Now the final step is the detection of features, so that we can get the attribute details from images. For that many opensource tools are available like PyTorch, Tensorflow etc. We are going to use Kera’s for attribute
derivation.
Step 1: Collection Dataset
For classification we need to type of dataset one is train and second is test. Number of images on training must
be large as compared to test.
Step 2: Then create a convolution layer
The convolution layer's purpose is to obtain characteristics from the pictures. By studying picture characteristics
using tiny squares of input information, Convolution maintains the spatial connection between pixels.
Step 3: Pooling
Pooling decreases each function map's dimensionality but maintains the most significant data. In the case of
Max Pooling, we define a spatial neighborhood (for example, a 2 premises window) and take the largest element within that window from the corrected feature map. We could also bring the average or sum of all
components in that window instead of taking the biggest component. In practice, it has been shown that Max
Pooling works better.
Step 4: Training
After all step we need to train our model. If you train with a nice RAM video card, this will be performed in less
than an hour. It may take a lot longer if you're training with an ordinary CPU. The precision will improve with a
growing number of epochs.
E. Conversion of crop images to black and white
Now passing all crop images directly to convolution layer can increase the processing power of the GPU as well
leads to incorrect detection of attributes.
CONCLUSION
As this technology will help operational people who uploads the data of particular product on website. It will
classify the images and generate excel file. So, the data which will be inserted into database using excel sheet will be correct. So, the maximum problem of data inconsistency regarding clothes can be solve with this
approach.
REFERENCES 1. Engr. Dr. Amir Manzoor, “E-commerce: an introduction,” Jan. 2010.
https://www.researchgate.net/publication/280443467_E-commerce_an_introduction (accessed Apr. 10,
2021).
2. H. Zhao, Y. Sun, and H. Li, “Retinal vascular junction detection and classification via deep neural networks,” Comput. Methods Programs Biomed., vol. 183, p. 105096, Jan. 2020, doi:
10.1016/j.cmpb.2019.105096.
3. R. Obulakonda Reddy, K.Reddy Madhavi, and V. Nagalakshmi, “Moving Objects Detection & Recognition using Hybrid Canny Edge Detection Algorithm in Digital Image Processing,” Int. J. Innov. Technol. Explor.
Eng., vol. 8, no. 9S3, Jul. 2019, Accessed: Apr. 10, 2021. [Online]. Available:
https://1library.net/document/eqo0jp7q-moving-objects-detection-recognition-detection-algorithm-digital-
processing.html.
4. Amir Ali, “Convolutional Neural Network(CNN) with Practical Implementation | by Amir Ali | Wavy AI

International Journal of Advance and Innovative Research Volume 9, Issue 1 (IX) January - March 2022
156
ISSN 2394 - 7780
Research Foundation | Medium,” medium.com, May 2019. https://medium.com/machine-learning-
researcher/convlutional-neural-network-cnn-2fc4faa7bb63 (accessed Apr. 10, 2021).
5. Sidra Mehtab and Jaydip Sen, “Object Detection and Tracking Using OpenCV in Python Affiliated to,”
March 2020, no. March, 2020, doi: 10.13140/RG.2.2.34682.93128.
6. S. H. Hod, A. A. Nayak, and P. G. Scholar, “An Approach to Improvise Canny Edge Detection using
Morphological Filters,” 2015.
7. Isabel Aracama, “How To Create A Flat Vector Illustration In Affinity Designer — Smashing Magazine,”
Smashing Magazine, Jul. 11, 2018. https://www.smashingmagazine.com/2018/07/flat-vector-illustration-
affinity-designer/ (accessed Apr. 10, 2021).
8. D. Fisica and P. Torino, “Texture analysis for textile fault detection,” vol. 2006, no. January 2006, pp. 862–
867, 2014.
OTHER REFERENCES
1. https://docs.opencv.org/master/d9/df8/tutorial_root.html
2. https://keras.io/
3. https://www.geeksforgeeks.org/image-processing/

International Journal of Advance and Innovative Research Volume 9, Issue 1 (IX) January - March 2022
157
ISSN 2394 - 7780
COVID-19 DETECTION THROUGH BREATH SOUND ANALYSIS VIA A SMARTPHONE APP
1Sania F. Sayed and
2Asst. Prof. Bhumika Nakum
1Vikas College of Arts, Science and Commerce, University of Mumbai, India 2Mulund College of Commerce, University of Mumbai, India
ABSTRACT The ability to test at national level has become a point of concern since the debut of the pandemic. With a
population like India’s, the dire need of the hour is to bring about an approach that is time-efficient, cost
effective and social distance complaint. Cough has been seen as a prominent symptom to predict COVID-19
using various Artificial Intelligence techniques, not much research has been done to detect COVID-19 through breath sounds. CoV.AI is one such approach to diagnose COVID-19 through breath sounds via a Smartphone
App. The dataset used in the project is COSWARA, a respiratory sound database initiated by Indian Institute of
Sciences, Bangalore in August 2020. 240 breathing sounds have been chosen for training the Deep Learning Framework of the App which includes 120 COVID-19 patients and 120 Control Participants, and is then
divided in Deep and Shallow breathing. The App takes in breath sounds into the App via the Smartphone
microphone and it is then fed to the Deep Learning Framework which consists of combination of Hand-Crafted features and Deep-Activated Features, which is then forwarded to a fully connected layer to give an output of
whether COVID-19 is present in the given breath sound or not. The observations inferred in the research show
promising results for deep learning & smartphone applications for COVID-19 detection. This App can be used
as a pre-screening tool to the existing gold-standard RT-PCR tests. This is an early, rapid, feasible, time
efficient and a no-cost diagnosis technique for a densely occupied nation of India.
Keywords: COVID-19, Artificial Intelligence, Deep Learning, Smartphone App, Preliminary Diagnosis, Pre-
Screening, Public Healthcare
INTRODUCTION
Corona Virus 2019 or COVID-19 is novel pathogen which is abbreviated for severe acute respiratory syndrome
coronavirus – SARS-Cov which first appeared in November of 2019 and broke havoc to become an epidemic
and has outspreaded all over the globe. According to World Health Organisation (WHO), the total count of 328 million cases worldwide which accounts of 5.54 million deaths. In India alone, which has been the hotspot and
country with the second-highest number of cases accounted 37.4 million cases by mid-January of 2022 and 4.86
million deaths.
COVID-19 patients range from being asymptomatic to developing acute pneumonia, or worse, death. The
estimated incubation period of the virus inside the body is 1 to 14 days. The symptoms start to be evident after
which, the most common ones are dry cough, fever, fatigue, shortness of breath and acute respiratory distress syndrome (ARDS). The early and mild symptoms can be treated at home by medication but in severe cases with
pneumonia which is caused mostly to patients with existing morbidities of Diabetes, Hypertension, Coronary
Artery Disease, Kidney or Liver Ailments, hospitalization is urgently needed. Early diagnosis facilitates in
preventing the spread and advancing to severe infection. Furthermore, it can also help in suppressing the
symptom and reducing the overall mortality rate.
With the gold-standard RT-PCR test, which is also the most commonly used testing technique that is used
worldwide. But, the cons of this technique are that the testing kits are in scarcity in India and it requires to visit a testing facility or a clinic to undergo testing, also, it requires a considerable duration for diagnosis and is not
considered the most accurate as other diagnostic techniques. X-Ray & CT-Scan are the supplementary
techniques to detect COVID-19. These imaging technologies are effective diagnostic techniques. However, X-Ray is prescribed to patients with early symptoms, and patients with mild and severe symptoms are
recommended CT-Scan. In some developing and under-developed countries, all these techniques and
technologies are not readily available. Therefore, biological signals such as coughing & breathing are promising
indicators of COVID-19. With the advent of Artificial Intelligence, algorithms can be designed to diagnose
infection.

International Journal of Advance and Innovative Research Volume 9, Issue 1 (IX) January - March 2022
158
ISSN 2394 - 7780
A Deep Learning approach is used in our App, that processes breath sound recorded by the patient into the App,
which is further divided into two sets of Hand-Crafted Features and Deep-Activated Features which will be
further supplied to a fully connected layer that which will diagnose whether COVID-19 is present in the sound or not. This App will provide a rapid, cost-effective and pre-screening tool for COVID-19 especially in
developing and under developed countries. Furthermore, the App is trained on patients mostly from India.
Hence, the App will provide better and faster testing approach.
METHODOLOGY
Dataset Collection
The dataset used in training the App is extracted from Coswara, which is open-access respiratory sounds
database initiated by the Indian Institute of Sciences (IISc), Bangalore in August, 7th 2020. The project is a collection of 2,400 participants from all over the globe and especially from India. The database includes breath,
cough & voice sounds which is acquired through an interactive website which was built for smartphone devices
and a average interaction time of 5-7 minutes.
240 subjects have been selected for the project, 120 COVID-19 patients and 120 control participants. Only
breathing sounds of deep and shallow breathing were used for further analysis along with some clinical
information. To include maximum information from the breathing sounds and to cover 2-4 breathing cycles, a
total of 16 seconds were considered.
Deep Learning Framework
The Deep Learning Framework used includes a combination of two set of processing units namely, the Hand-
Crafted Features and the Deep Activated Features. To extract hand-crafted features, various functions and algorithms are used to process signal attributes from the original breathing sound recording. The Deep
Activated Features were extracted from a series of neural networks consisting convolutional & recurrent neural
network.

International Journal of Advance and Innovative Research Volume 9, Issue 1 (IX) January - March 2022
159
ISSN 2394 - 7780
Hand-Crafted Features
They are the features that also refer to signal attributes that are extracted manually through a number of
functions & algorithms in a process called Feature Engineering. The advantage of this approach is it can extract all internal & external features and information in the input data. Additional features about the input data can be
obtained and use it for further analysis & evaluation. Hand-crafted features will initially be obtained from the
input breath recording, then also from MFCC of the signal. The features included are:
Kurtosis & Skewness: With reference to statistics, kurtosis is of quantification for degree of extremity that are
restricted within the tails of a distribution relative to a normal distribution tail. The higher the distribution is
towards the outlier-prone, the more is the kurtosis value. A kurtosis value of 3 is an indicator of them following
a normal distribution. Contrary to this, skewness is a measurement of asymmetry of data that is deviating from the mean of a normal distribution. A negative skewness indicates that the data is spread more towards the left of
the mean, otherwise, a positive skewness indicates data spreading towards the right. Skewness of zero is a
indicator that the data follows normal distribution. Kurtosis & Skewness can be calculated as,
where X included input values, µ and σ are the mean and standard deviation values of the input, respectively,
and E is an expectation operator.
Sample Entropy: In the domain of physiological signals, the sample entropy provides a measure for
complexity contaminated within time sequences. It can be calculated as the negative natural logarithm of a
probability which segments of length m match their consecutive segments under a value of tolerance (r) as
follows,
where segmentA is the first segment in the time sequence and segmentA+1 is the consecutive segment.
Spectral entropy: To measure time series irregularity, spectral entropy (SE) provides a frequency domain entropy measure as a sum of the normalize signal spectral power. Based on Shannon's entropy, the SE can be
calculated as,
where N is the total number of frequency points and P(n) is the probability distribution of the power spectrum.
Fractal Dimension: Higuchi and Katz provided two methods to measure statistically the complexity in a time
series. More specifically, fractal dimension measures provide an index for characterizing how much a time series is self-similar over some region of space. Higuchi (HFD) and Katz (KFD) fractal dimensions can be
calculated as,
where L(k) is the length of the fractal curve, r is the selected time interval, N is the length of the signal, and d is
the maximum distance between an initial point to other points.
Zero-crossing rate: To measure the no. of time a signal has passed through the zero point, a zero-crossingrate
(ZCR) measure is provided. In other word, ZCR

International Journal of Advance and Innovative Research Volume 9, Issue 1 (IX) January - March 2022
160
ISSN 2394 - 7780
refers to frequency of sign substitutes in the signals' data points. It can be calculated as follows,
where xt = 1 if the signal has a positive value at time step t and a value of 0 otherwise.
Mel-frequency cepstral coefficients (MFCC): To better represent speech and voice signals, MFCC provides a
set of coefficients of the discrete cosine transformed (DCT) logarithm of a signal's spectrum (MFC). It is considered as an overall representation of the information contaminated within signals regarding the changes in
its different spectrum bands. Briefly, to obtain the coefficients, the signals goes through several steps, namely
windowing the signal, applying discrete Fourier transform (DFT), calculating the log energy of the magnitude,
transforming the frequencies to the Mel-scale, and applying inverse DCT.
In this work, 13 coefficients (MFCC-1 to MFCC-13) were obtained from each breathing sound signal. For every
coefficient, the aforementioned features were extracted and stored as an additional MFCC hand-crafted features
alongside the original breathing signals features.
Deep-Activated Features
These features refer to attributes extracted from signals through the deep learning process & not by manual
feature engineering techniques. The utilization of deep learning allows for the acquisition of optimized features extracted through deep convolutional layers about the structural information contaminated within signals.
Furthermore, it has the ability to acquire the temporal (time changes) information carried through time
sequences. Such optimized features can be considered as a complete representation of the input data generated
iteratively through an automated learning process. To achieve this, we used an advanced neural network based
on a combination of convolutional neural network and bi-directional long short-term memory (CNN-BiLSTM).
Neural network architecture: The structure of the network starts by 1D convolutional layers. In the domain of
deep learning, convolutions are multiple number of dot products applied to 1D signals on predefined segments. By applying consecutive convolutions, the network extracts deep attributes (activations) to form an overall
feature map for the input data. A single convolution on an input
where l is the layer index, h is the activation function, b is the bias of the jth feature map, M is the kernel size, wj
m is the weight of the jth feature map and mth filter index. In this work, three convolutional layers were used to
form the first stage of the deep neural network. The kernel sizes of each layer are [9, 1], [5, 1], and [3, 1],
respectively.
Furthermore, the number of filters increases as the network becomes deeper, that is 16, 32, and 64, respectively.
Each convolutional layer was followed by a max-pooling layer to reduce the dimensionality as well as the
complexity in the model. The max-pooling kernel size decreases as the network gets deeper with a [8, 1], [4, 1], and [2, 1] kernels for the three max-pooling layers, respectively. It is worth noting that each max-pooling layer
was followed by a batch normalization (BN) layer to normalize all filters as well as by arectified linear unit
(ReLU) layer to set all values less than zero in the feature map to zero.
The network continues with additional extraction of temporal features through bi-directional LSTM units. In recurrent neural networks, LSTM units allows for the detection of long short-term dependencies between time
sequence data points. Thus, it overcomes the issues of exploding and vanishing gradients in chain-like structures
during training. The LSTM block includes a collection of gates, called the input (i), output (o), & forget (f) gates. These gates handle the flow of data as well as the processing of the input and output activations within
the network's memory. The information of the main cell (Ct) at any instance (t) within the block can be
calculated as,

International Journal of Advance and Innovative Research Volume 9, Issue 1 (IX) January - March 2022
161
ISSN 2394 - 7780
where ct is the input to the main cell and Ct-1 includes the information at previous time instance.
In addition, the network performs hidden-units (ht) activations on the output and main cell input using a sigmoid
function as follows,
Furthermore, a bi-directional functionality (BiLSTM) allows the network to process data in both the forward
and backward direction as follows,
hN are the outputs of the hidden layers in the forward & backward directions, respectively, for all N levels of the
stack & by is a bias vector.
Additionally, the network performs hidden-units (ht) activation on the output & in this work, a BiLSTM hidden
units’ functionality was selected with a total number of hidden units of. Thus, the resulting output is a 512
vector (both directions) of 248 the extracted hidden-units of every input.
BiLSTM activations: The capability to use the parameters which the BiLSTM elements have learned, the
activations will correspond to each hidden-unit will be extracted from the network for each and every input
signal. Recurrent neural network activations of a pre-trained network are vectors that carry the final learned attributes about different time steps within the input. In this work, these activations were the final signal
attributes extracted from each of the input signal. Such attributes are referred to as deep-activated features in
this work. Furthermore, they will be concatenated with the hand-crafted features with age & sex information &
used for the final predictions by the network.
Network Configuration And Training Scheme
Prior to deep learning model training, several data preparation and network fine-tuning steps were followed
including data augmentation, best features selection, deciding the training and testing scheme, and network
parameters configuration.
Data augmentation: Due to the small sample size available, it is critical for deep learning applications to
include augmented data. Instead of training the model on the existing dataset only, data augmentation allows for the generation of new modified copies of the original samples. These new copies have similar characteristics of
the original data, however, they are slightly adjusted as if they are coming from a new source (subject). Such
procedure is essential to expose the deep learning model to more variations in the training data. Thus, making it
robust and less biased when attempting to generalize the parameters on new data. Furthermore, it was essential to prevent the model from over-fitting, where the model learns exactly the input data only with a very minimal
generalization capabilities for shrouded data.
In this study, 3,000 samples per class were generated using two 1D data augmentation techniques as follows,
• Volume control: Adjusts the strength of signals in decibels (dB) for the generated data with a probability of
0.8 and gain ranging between -5 and 5 dB.
• Time shift: Modifies st of the sound signals in terms of time, to mutate shifting of time for generated data
within a range [-0.005 to 0.005] seconds.
Best features selection: To ensure the inclusion of the most important hand-crafted features within the trained
model, a statistical univariate chi-square test (chi^2-test) was applied. In this test, a feature is decided to be
important if the observed statistical analysis using this feature matches with the expected one, i.e., label. Furthermore, an important feature indicates that it is considered significant in discriminating between two
categories with a p-value < 0.05. The lower p-value, the more is the feature dependent on the category label.
The importance score can then be calculated as, score = log(p)
In this technique, d-crafted features obtained from original breathing signals & from the MFCC alongside the
age and sex information were selected for this test. The best 20 features were included in the final best features
vector within the final fully-connected layer (along with the deep-activated features) for predictions.
Training configuration: To ensure the inclusion of the whole available data, a leave-one-out training and testing scheme was followed. In this scheme, a total of 240 iterations (number of input samples) were applied, where in

International Journal of Advance and Innovative Research Volume 9, Issue 1 (IX) January - March 2022
162
ISSN 2394 - 7780
each iteration, an ith subject was used as the testing subject, and the remaining subjects were utilized for model
training. And this scheme was crucial to be followed to provision a prediction for each and every subject in the
dataset.
Furthermore, the network was optimized using adaptive moment estimation (ADAM) solver and with a learning
rate of 0.001. The L2-regularization was set to 106 and the mini-batch size to 32.
Performance Evaluation The performance of the proposed DL model in discriminating COVID-19 from healthy participants was
evaluated with traditional evaluation metrics including accuracy, specificity, sensitivity, precision, and F1-
score. These metrics can be calculated as,
where TP is the true positive, TN is the true negative, FP is the false positive, and FN is the false negative
numbers in the confusion matrix.
RESULTS
The overall performance of proposed deep learning model. From the figure, the model correctly predicted 113 and 114 COVID-19 and healthy subjects, respectively, using the shallow breathing dataset out of the 120 total
subjects.
In addition, only 7 COVID-19 subjects were miss-classified as healthy, whereas only 6 subjects were wrongly
classified as carrying COVID-19. The correct predictions number was slightly lower using the deep breathing dataset with a 109 and 112 for COVID-19 and healthy subjects, respectively. Additionally, wrong predictions
were also somewhat higher with 11 COVID-19 & 8 healthy subjects. Thereof, the confusion matrices displays
percentages: 94.20% & 90.80% for COVID-19 patients with the shallow & deep datasets, respectively. Contrary to it, healthy participants resulted percentages around 95.00% & 93.30% for both datasets,
respectively.

International Journal of Advance and Innovative Research Volume 9, Issue 1 (IX) January - March 2022
163
ISSN 2394 - 7780
Evaluation metrics evaluated from such confusion matrices incurred the accuracy measure that of 94.58% &
92.08% for the shallow and deep datasets, respectively. Furthermore, the model had a sensitivity and specificity
measures of 94.21%/94.96% for the shallow dataset and 93.16%/91.06% for the deep dataset. The precision was the highest measure obtained for the shallow dataset (95.00%), where as the deep breathing dataset inferred the
lowest value in the precision score with a 90.83%. Lastly, the F1-score remitted 94.61% & 91.98% for both
datasets, respectively.
To quantify the AUROC, it displays the ROC curves which predicts using both the shallow & deep datasets.
The shallow breathing dataset gives an average AUROC of 0.90 in diagnosing COVID-19 & healthy subjects,
on the contrary, the deep breathing dataset had a 0.86 AUROC, which is slightly lower performance in the
prediction process. Additionally, the model had high accuracy measures in predicting asymptomatic COVID-19 subjects. Using the shallow breathing dataset, the model had a 100.00% accuracy by predicting all subjects
correctly. On the other hand, using the deep breathing dataset, the model achieved an accuracy of 88.89% by
missing
two asymptomatic subjects. It is worth noting that few subjects had close scores (probabilities) to 0.5 using both
datasets, however, the model correctly discriminated them from healthy subjects.
DISCUSSION
This study demonstrated the importance of using deep learning for the detection of COVID-19 subjects, especially those who are asymptomatic. Furthermore, it has been briefed on the significance of biological
signals, like breathing sounds, in the process of acquiring useful information about the viral infection. Unlike
the conventional lung auscultation techniques, i.e., electronic stethoscopes, to record breathing sounds, the study proposed herein utilized breathing sounds recorded via a smartphone microphone. The observations found in
this study (highest accuracy: 94.58%) firmly suggest deep learning as pre-screening tool for COVID-19 also as
an early detection technique prior to the gold standard RT-PCR.
Although current lung auscultation techniques provide high accuracy measures in detecting respiratory disease,
it requires subjects to be present at hospitals for equipment setup and testing preparation prior to data
acquisition. Furthermore, it needs the availability of an expert person, i.e., clinician or nurse, to take data from
patients and store it in a database. Therefore, utilizing a smartphone device to acquire such data allows for a faster data acquisition process from subjects or patients while at the same time, provides highly comparable and
acceptable diagnostic performance. In addition, smartphone-based lung auscultation provides with a better
social distancing compliant behaviour during lockdowns due to pandemics like COVID-19, thus, it opens path
for a rapid and time-efficient detection of diseases despite of strong restrictions.
By visually examining COVID-19 & healthy subjects' breathing recordings, an abnormal pattern was generally
observed by COVID-19 patients, while healthy participants had more consistent patterns during breathing. This could be related to the hidden characteristics of COVID-19 contaminated within lungs and exhibited during
lung inhale and exhale. Additionally, the MFCC transformation of these recordings’ similar observations. By
quantitatively evaluating these coefficients when combined, COVID-19 subjects had a unique distribution
(positively skewed) that can be easily distinguished from the one of healthy participants. This gives an indication about the importance of further extracting the internal attributes carried not only by the recordings
themselves, but rather by the additional MFC transformation of such recordings. Additionally, the
asymptomatic subjects had a distribution of values that was close in shape to the distribution of healthy subjects, however, it was skewed towards right bound of zero mean. This may be considered as a strong attribute when
analyzing COVID-19 patients who do not exhibit any symptoms and thus, discriminating them easily from
healthy participants.

International Journal of Advance and Innovative Research Volume 9, Issue 1 (IX) January - March 2022
164
ISSN 2394 - 7780
CONCLUSION
This study suggests smartphone-based breathing sounds as a promising indicator for COVID-19 cases. It further
suggests the utilization of deep learning as pre-screening tool for cases prior to the gold standard RT-PCR tests. The overall performance found in this study (accuracy 94.58%) in discriminating between COVID-19 and
healthy subjects shows the potential of such approach. This study paves the way towards implementing deep
learning in COVID-19 diagnostics by suggesting it as a rapid, time-efficient, and no-cost technique that does
not violate social distancing restrictions during pandemics such as COVID-19.
REFERENCES
1. Sharma, N., Krishnan, P., Kumar, R., Ramoji, S., Chetupalli, S.R., Ghosh, P.K. and Ganapathy, S., 2020.
Coswara--A Database of Breathing, Cough, and Voice Sounds for COVID-19 Diagnosis. arXiv preprint
arXiv:2005.10548.
2. Alkhodari, M. and Khandoker, A., 2021. Detection of COVID-19 in smartphone-based breathing recordings
using CNN-BiLSTM: a pre-screening deep learning tool. medRxiv.
3. Imran, A., Posokhova, I., Qureshi, H.N., Masood, U., Riaz, M.S., Ali, K., John, C.N., Hussain, M.I. and
Nabeel, M., 2020. AI4COVID-19: AI enabled preliminary diagnosis for COVID-19 from cough samples
via an app. Informatics in Medicine Unlocked, 20, p.100378.
4. Kumar, A., Abhishek, K., Ghalib, M.R., Nerurkar, P., Shah, K., Chandane, M., Bhirud, S., Patel, D. and
Busnel, Y., 2020. Towards cough sound analysis using the Internet of things and deep learning for
pulmonary disease prediction. Transactions on emerging telecommunications technologies, p.e4184.
5. Matos, S., Birring, S.S., Pavord, I.D. and Evans, H., 2006. Detection of cough signals in continuous audio recordings using hidden Markov models. IEEE Transactions on Biomedical Engineering, 53(6), pp.1078-
1083.
6. Russell, S. J., & Norvig, P. (1995). Artificial intelligence: A modern approach. Englewood Cliffs, N.J:
Prentice Hall.
7. Flach, P. (2012). Machine Learning: The Art and Science of Algorithms that Make Sense of Data.
Cambridge: Cambridge University Press. doi:10.1017/CBO9780511973000
8. https://github.com/iiscleap/Coswara-Data

International Journal of Advance and Innovative Research Volume 9, Issue 1 (IX) January - March 2022
165
ISSN 2394 - 7780
AWARENESS OF PESTER POWER ADVERTISING IN YOUTH
Mrs. Kshamata Sachin Lad
Assistant Professor, Business Studies, S. K. Somaiya College, Somaiya Vidyavihar University
1.0 ABSTRACT
Children have always been the center of all activities for the entire family. It is not very surprising to note that the marketers have found this the right way to promote the products to the adults through children. This is in
other words Pester Power advertising. Pester as the word is means nagging. It refers to the effort of kids
constantly nagging to get a certain product from their family. It is been highly seen in food and beverage
industry. Research Methodology adopted for the paper is Stratified Random Sampling which gave 181 samples. The forms were distributed and data collected was analyzed with the help of Data Tabulation. The inference is
then drawn with the help of series of questions falling in various criteria like, Likert scale, dichotomous and
descriptive. This paper addressed the strategy of pester power advertising from the perspective of the youth. Pester power up till now has only been assessed from parents’ perspective and from the children’s tone. The
youth as have passed the age limit have been assumed to not apply pester power on parents. Data findings from
the paper are offered from an analytical perspective involving youth aged between eighteen and twenty years. The research paper suggests that youth is fully aware of the power and position of pester power and
meticulously utilizes for benefit to the family or self. They are of that age where they understand their parents’
rationale towards refusal as well acceptance. Here therefore the pester technique is applied with thought and
planning. It is just not incessant nagging. To add up further, such dialogue between parent and child towards product purchase at this age of child ensures healthy communication fostering decision making skills being
developed at an early age. It undermines the negative conations associated with the theory. The research paper
finally arrives at a conclusion that this interaction between parent and child (even youth) can be closely directed towards the process of understanding customer engagement and delight associated with purchase
decision process and post purchase behavior. This paper highlights the positive side of pester power for
marketers to engage customers on the right note rather than the negative version with pester being associated
with conflict phenomena.
2.0 Keywords: Pester Power Advertising, Youth, Nagging,
3.0 OBJECTIVE OF THE RESEARCH:
The objective of the research is to understand the concept of Pester Power advertising through the perspective of
youth. Objective of the research paper can be listed as follows:
1. To understand the awareness of the term “Pester Power Advertising” in youth
2. To know whether youth use Pester Power to influence parents towards wishful decision
3. To know the decision criteria for product purchase over pester power effect
4.0 INTRODUCTION
Advertising has been evolved over the years and now children, though sought as an indirect audience for many
years have come to the forefront of advertising with a specific message. Kids have always been the center point for all the activities around the house. With both the parents working, it has been very difficult for them to give
as much time to their kids as they should have. Parents find there is need for spending time with kids and not
being able to has created the void for parents and often they fill it with listening to kids demands. The way kids demanded in late 80s is still the same but the frequency of parents agreeing to demands of parents has increased
over the years. With the advent of technology, youth of today has been able to not only learn, understand but
also react to the advertising message. Youth today has more influence than their parents ever had. Not only are they consumers in their own right, they also have a major influence over the family’s purchasing power.
“Kidfluence” is a term used for influence that kids exert over purchase decision of parents. The major driving
force behind this sweeping change is the Advertising. The emergence of niche channels such as Cartoon
Network, Hungama and Toonami has greatly boosted the vocal power of Indian children. According to some estimates, there were more than 120 million tweens (8 – 12 year-old children) in 2005. About 45 million of
them live in urban areas and have the power to determine and influence purchase of Rs. 20,000 crore worth of
groceries, mobile phones, clothing, automobiles, and FMCG. It becomes important to examine the possibility of
youth having an influence over the purchase decision and also become the voice of the purchase in the family.

International Journal of Advance and Innovative Research Volume 9, Issue 1 (IX) January - March 2022
166
ISSN 2394 - 7780
5.0 RESEARCH METHODOLOGY
Methodology adopted for the research includes sampling, preparation of questionnaire, data collection and
tabulation to analyze the data. The sampling technique was stratified random sampling done on the residents of Mumbai Metropolitan region. Researcher prepared a questionnaire comprising of close ended questions (with a
Likert Scale, Semantic Differential, Dichotomous) and one open ended question to understand what efforts the
respondents can take to ensure no effect on them. The method of sampling was stratified random sampling for
200 respondents.
6.0 DATA ANALYSIS
Out of 200 respondents with whom the google form was shared, 181 surveys were valid. Remaining 19 surveys
were not properly filled and cannot be considered for analysis. The analysis is done on the following main
categories:
4. Awareness of the term “Pester Power Effect in Advertising”
5. Factors responsible for the youth to align towards pestering technique
6. Understanding the purchase behaviour of youth towards products related and not related to them
7. Variation of frequency of pester towards various kinds of product
7.0 INFERENCE
1. Demographic Details of Respondents
a. Age of the Respondents
Sr.
No. Age
No. of
Respondents
Percentage of
Respondents Inference
1 Below 18 12 6.63 The Demographic details mentioned
here clearly state that the maximum youth is from the age group of 20-22
(61 respondents - 33.70%). It clearly
indicates that from the total of
181 respondents, the youth accumulate to a total of 151 respondents (83.43%).
2 18-20 41 22.65
3 20-22 61 33.70
4 22-24 49 27.07
5 Above 24 18 9.94
6 Total 181 100
b. Location of Respondents
Sr.
No.
Location of
Respondents
No. of
Respondents
Percentage of
Respondents Inference
1 Alibaug 8 4.42 The demographic details of the
respondents show that out of 9 municipal councils & 9
municipal corporations. It can
be seen that there were few regions where there are no
responses. It is noted that from
the Mumbai Metropolitan
Region, the no of respondents that filled the form, the highest
of 51 respondents (28.18%)
were from Mumbai and the next largest respondents were from
Kalyan Dombivli,
37 respondents (20.44%). Due to time constraint of form filling
the form was circulated for a
stipulated time and it caused
few regions to register zero response.
2 Ambernath 9 4.97
3 Bhiwandi-Nizampur 7 3.87
4 Kalyan- Dombivali 37 20.44
5 Karjat 11 6.08
6 Khopoli 0 0.00
7 Kulgaon-Badalapur 4 2.21
8 Matheran 0 0.00
9 Mumbai 51 28.18
10 Navi Mumbai 23 12.71
11 Palghar 0 0.00
12 Panvel 0 0.00
13 Pen 0 0.00
14 Thane 21 11.60
15 Uran 0 0.00
16 Ulhasnagar 8 4.42

International Journal of Advance and Innovative Research Volume 9, Issue 1 (IX) January - March 2022
167
ISSN 2394 - 7780
17 Vasai Virar City 2 1.10
18 Mira-Bhayander 0 0.00
Total 181 100.00
2. Dichotomous Questions (Yes / No Types)
Sr. No. Dichotomous Questions Yes Percentage of
Respondents No
Percentage of
Respondents Total
1 Have you ever nagged your parent
for purchase of anything? 106 58.56 75 41.44 181
Inference
106 respondents with a percentage of 58.56% of total respondents indicate that the youth do
use the pester effect. It becomes very evident that the youth are aware of the technique and they
use the technique to get things done as per their wish.
2 Do you know the concept of Pester
Power Advertising? 52 28.73 129 71.27 181
Inference
Here as against from the earlier question, the youth is using the technique without knowing the
concept of Pester Power. There are 129 respondents (71.27% of Total Respondents) who are
not aware of the concept but in the above question it is clear that they too use it.
3
Have you ever watched an ad and
nagged your parents to buy the advertised product?
120 66.30 61 33.70 181
Inference
Here again, it resonates that a total of 120 respondents (66.30%) do nag their parents after watching an ad of the product. There is a significant analysis that shows advertising plays an
important role to trigger nag in children. Marketers can definitely take advantage from this and
design promotional material for children.
4
Do you find nagging works with
your parents to purchase the
product? 133 73.48 48 26.52 181
Inference
The question here indicates 133 respondents (73.48%) pester power definitely has an effect on
purchase decision of the product. Pester power is an effective tool and yeilds result in youth. 73.48% percentage of youth have witnessed the effect of pester power on purchase decision.
5 Do you put your parents in guilt-
trip for not spending time with you
because of their working hours? 137 75.69 44 24.31 181
Inference
The total number of respondents 133 indicate youth is aware about the short coming of the
working parents and they use it wisely in their favour. It is a swooping 75.69% which indicates
the youth is utilizing pester power to put their parennts in guilt-trip and make them buy products. It is an indicator for marketers to keep youth and children at the centre of the
advertising messages and can ensure better purchase conversions.
3. Likert Scale Analysis – Behaviour Based
Sr. No. Satements for Likert Scale -
Behaviour based Strongly Agree
Agree
Neither
Agree Nor
Disagree
Disagree Strongly Disagree
Total
1
I like watching the
advertisement and then purchase the product.
106 39 22 12 2 181
Percentage of Respondents 58.56 21.55 12.15 6.63 1.10 100
Inference It shows the behavioiural transition of the Youth, where 106 respondents feel they but the
product after watching the product.
2
Many a times, product is of not
of any use to me but I still nag to parents for buying it.
28 90 10 21 32 181

International Journal of Advance and Innovative Research Volume 9, Issue 1 (IX) January - March 2022
168
ISSN 2394 - 7780
Percentage of Respondents 15.47 49.72 5.52 11.60 17.68 100
Inference
The above statement indicates effect of pester on impulsive buying as well. 90 respondents
(49.72%) have agreed upon that they buy a product that they need but still nag parents to buy it.
3 Usually nagging for 3-4 times
for a product makes my parents
buy it for me. 123 34 11 8 5 181
Percentage of Respondents 67.96 18.78 6.08 4.42 2.76 100
Inference It is very interesting to note that, 123 respondents (67.96%) have strongly agreed upon that usually when they nag their parents 3-4 times for a certain product, it ends up in purchase of
the product.
4 I use my pester power to buy
the product of my choice. 111 25 23 13 9 181
Percentage of Respondents 61.33 13.81 12.71 7.18 4.97 100
Inference It is noted that 111 respondents (61.33%), have strongly agreed to have been used pester
power to buy the product of their choice.
5 My advice is considered for
product purchased in the family. 127 35 12 2 5 181
Percentage of Respondents 70.17 19.34 6.63 1.10 2.76 100
Inference The statement here highlights the positive effects of pester power advertising where youth is
considered that means their opinion now matters in product purchase decision.
6
I put my parents in guilt-trip to
buy on the account of they not
being to able to spend enough time with me.
67 70 21 12 11 181
Percentage of Respondents 37.02 38.67 11.60 6.63 6.08 100
Inference
Here it is seen that 137 respondents (67 + 70) which is a percentage of 75.69% (38.67 +
37.02) who agree to the statement which resonates the strategy that youth apply to use pester power. It is noted here that the youth give their parents the guilt of not being able to spend
enough time due to their working schedules.
7
I have no role in making my
parents purchase product either
for me or family.
11 9 29 13 119 181
Percentage of Respondents 6.08 4.97 16.02 7.18 65.75 100
Inference The above statement highlights the importance of how much nagging has reached the interiors of the house. 119 respondents (65.75%) have stated being strongly disagree to not being a part
in the parents decision to purchase a product.
4. Likert Scale Analysis – Frequency Based
Sr. No. Particulars on Frequency
of Occurrence Always Occasionally Sometimes Rarely Never Total
1 Product purchase on the
basis of advertisement 112 19 27 10 13 181
Percentage of Respondents 61.88 10.50 14.92 5.52 7.18 100.00
Inference
112 Respondents (61.88%) said they always purchase the product on the basis of the advertisement.
It represents the evidence of the effect of advertising on the minds of not only the direct consumers
but the indirect customers. It is evident here that advertising can now be used to trigger pester from
youth to parent and then engage in transactional marketing.
2 Nagging parent to buy you a
product 114 34 13 11 9 181

International Journal of Advance and Innovative Research Volume 9, Issue 1 (IX) January - March 2022
169
ISSN 2394 - 7780
Percentage of Respondents 62.98 18.78 7.18 6.08 4.97 100.00
Inference
62.98% of the total respondents i.e., 114 respondents have agreed to have always nagged parents to
buy product. This statistic has put the youth into the centre of the persuasion matrix. It is evident from here that 114 respondents nag their parents to always buy a product.
3 Regret buying a Product 21 12 91 24 33 181
Percentage of Respondents 11.60 6.63 50.28 13.26 18.23 100.00
Inference
As Nagging is already been proven to be effective, this statement illustrates the negative concern of
pester power. Many a times the product purchased is not the product needed so that is where the
regret is seen. 91 respondents (50.28%) have said that sometimes they do regret the purchase of the product purchased with nagging to parents.
4 Product purchase without
pestering 12 23 11 23 112 181
Percentage of Respondents 6.63 12.71 6.08 12.71 61.88 100.00
Inference
112 respondents above claimed that sometimes they have never purchased the product without
applying pestering technique on parents. It is also notable here that it is conclusive that pester power has reached its peak in changing the minds of the customer.
5 Advice in in purchase
decisions of family 39 87 21 28 6 181
Percentage of Respondents 21.55 48.07 11.60 15.47 3.31 100.00
Inference 87 respondents noted that they have occasionally participated in the purchase decision of the family
and that is a sign where youth has been an active part in decision making of family.
5. Ordinal Rating
Sr.
No.
Ordinal Rating - Product
Purchase decisions based on
Pester Power
1 2 3 4 5 Total
1 Smartphone 144 12 11 12 2 181
2 Apparels & Accessories 124 43 9 3 2 181
3 Stationery 28 12 32 18 91 181
4 Bag 24 21 37 72 27 181
5 Laptop 148 9 11 9 4 181
Inference: The above question was asked to respondents to rate the products on the scale of 1 to 5.
Rate 1 was given to products where they use maximum pester power and 5 to the minimum. It is
clear from the chart above that Smartphone, Apparels and Accessories and Laptop are rated highest in using pester power for purchase whereas Bag and Stationery items are ranked 4 and 5
respectively.
8.0 RECOMMENDATIONS
1. Power in consistence: The above analysis clearly indicates the importance of consistency in applying
the pester technique. Marketers need to identify this and increase frequency in advertising circling
around the youth and hence keep the pester power in memory.
2. Choice of Product: It is also recommended that the choice of product is very essential to understand
where pester power will work and apply the promotion technique accordingly.
3. Youth as Advisor: Another recommendation also pins out the changing role of youth in the family
purchase decisions. Youth has always been at the center point but with working parents increasing role
in the professional world, the personal life is been on compensating zone.
4. Guilt-trip: The Guilt-trip is increasing on the higher note due to the increasing working times of both the parents. Due to which they have very less time to spend with their own kids and this is then
compensated with the purchases
5. Lead to Marketers: The research recommends pester power to be used in advertising products like smart
phone, apparels and accessories and not only in confectionery industry as it is happening right now.

International Journal of Advance and Innovative Research Volume 9, Issue 1 (IX) January - March 2022
170
ISSN 2394 - 7780
9.0 CONCLUSION
Pester power is very promising technique to engage youth in decision making and make an important part in the
decision of purchase of the family. The advertising effect also needs to be tested on various product categories and various region shifts\. Due to time constraint, there was very less to explore in the topic. But the topic can
be further explored to understand the range of pester power in convincing and changing the mind of working
parents towards purchase. Also additionally, it also throws limited light upon the psychological stress and social upheaval through which a working parent goes. As only the part of guilt-trip is studied above, there will be
various other reasons, that are yet to explore.
10.0 REFERENCES
Lawlor, M.-A., & Andrea Prothero. (2011). Pester power – A battle of wills between children and
their parents. Journal of Marketing Management, 27(5–6), 561–581.
https://doi.org/10.1080/0267257X.2010.495281
Soni S. and Upadhyaya M., (2007), “Pester Power Effect of Advertising”, paper presented at
International Marketing Conference on Marketing & Society, Indian Institute of Management,
Kozhikolde, 8-10 April 2007, pp. 313-324
Sutherland A. and Thompson B. (2003), Kidfluence: The Marketer's Guide to Understanding and
Reaching Generation Y – Kids, Tweens, and Teens, New York, McGraw-Hill, 2003, p. 115
Vinnakota S. & Mohan M., (2020) Importance of Pester Power for Marketers:An investigation of
the evolving concept in Marketing. Educational Research (IJMCER) International Journal of
Multidisciplinary and Current, 2 (4), pp. 195 - 204 ISSN: 2581-7027
https://www.brandhome.com/home/bla/pester-power/
https://www.reciproci.com/pester-power-marketing/

International Journal of Advance and Innovative Research Volume 9, Issue 1 (IX) January - March 2022
171
ISSN 2394 - 7780
FUTURE OUTLOOK FOR NEXT GENERATION INTERNET OF THINGS (IOT)
1Aniket Ramakant Verma and
2Animesh Kulkarni
Mentor 3Himani Shukla
3Assistant Professor, S M Shetty College of Science, Commerce and Management Studies, Powai [email protected] [email protected] and [email protected]
ABSTRACT
Internet of Things (IoT) is a new paradigm that has changed the traditional way of living into a high tech life
style. Smart city, smart homes, pollution control, energy saving, smart transportation, smart industries are such transformations due to IoT. A lot of crucial research studies and investigations have been done in order to
enhance the technology through IoT. However, there are still a lot of challenges and issues that need to be
addressed to achieve the full potential of IoT. These challenges and issues must be considered from various aspects of IoT such as applications, challenges, enabling technologies, social and environmental impacts etc.
The main goal of this review article is to provide a detailed discussion from both technological and social
perspective. The article discusses different challenges and key issues of IoT, architecture and important application domains. Also, the article brings into light the existing literature and illustrated their contribution
in different aspects of IoT. Moreover, the importance of big data and its analysis with respect to IoT has been
discussed. This article would help the readers and researcher to understand the IoT and its applicability to the
real world.
Keywords- IoT, Security, Devices, Privacy.
Rationale and Gap Analysis
In the preceding section, we provided the traits of IoT structures which might be the maximum essential to customers and application builders. However, more than one gaps can be diagnosed in the functionality supplied
via these platforms consequently, we found in this segment an opening analysis, we intention to assess the
maturity of the existing-day solutions through assessing their shortcomings alongside numerous dimensions.
The size covered by using the evaluation includes
(i) The extensibility of the platform in terms of assisting heterogeneous sensing and actuating technologies,
(ii) The statistics ownership and its implications for protection and privacy,
(iii) The data processing and sharing for helping new services,
(iv) The support of software developers, and
(v) The completeness of an IoT atmosphere. Then, we increase the gap analysis to dedicated IoT marketplaces
that
(vi) Assist the deployment of IoT programs and offerings.
Data ownership
Current Status
Specifically given to the give up-user however with very simple privateness guidelines
EXPECTATION
• total control given to the user of the information
• Local storage
• Fine-grained data visibility model
GAPS
Manipulation of data in edge devices
Self-storage
PROBLEMS
• Security of the data storage
• tool constrains to shop records and offer comfy access manipulate

International Journal of Advance and Innovative Research Volume 9, Issue 1 (IX) January - March 2022
172
ISSN 2394 - 7780
RECOMMENDATIONS
Algorithms and mechanisms to be had to the records proprietor to restrict the get admission to only to a
Predefined set of the resources
OBJECTIVE
1. To showcase how IOT will turn the life living of the people.
2. Trying to show it’s implemented in Different various sector like Hospital, Army etc.
RESEARCH METHODOLOGY
PRIMARY RESEARCH Firstly, we conducted the Survey by circulating an online form using google form in locality, in different group
(telegram, WhatsApp, Facebook) to understand how many people uses device with IOT in which we got about 123 people response in survey report then we converted that report in stat to use it. We look at that everybody
has at the least one device.
SECONDARY RESEARCH We collected some information from Wikipedia then we have gone through several pdfs, research paper on
IOT. The point which was suiting our topic we included some information from that pdf and papers. We also
analyse some of the Pdf to find the problems/Gap and then provided some recommendation related to tat
problem.
Maximum of them have taken agile wondering as a approach. But they may be monolithic, which aren't smooth
to adopt. Then, a logo-new technique is wanted to address the real nature of IoT, particularity, to deal with
allotted, cell and human out-of-the-loop worries, and that can expand as new product evolve and new problems
emerge. This studies research and analyses a number of the prevailing IOT methodologies.
The comparison supplied on this paper could advantage in choosing the right technique for the IoT tasks.
Further, it identifies their benefits and limits in order to indicate a new accepted IoT methodology method is an
iterative technique inspired by using Lean start-up and design thinking.
SURVEY
We conducted a survey with some of commonly used gadgets in day to day life in which we pick gadgets like
Smartphone, Headphone, Bluetooth speaker/Amazon echo/Google Home, CCTV, Smart TV, Smartwatch, Laptop/Computer, Smart Bulb, VR Glasses, Smart AC, WIFI/Internet, Refrigerator/Washing Machine and
Oven
People with Headphone/Earphone and Smartphone has maximum count around 82.1% for Headphone and
81.3% for Smartphone whereas minimum count was 4.9% for VR Glasses.
There are people with 78.9% using WIFI, 77.2% using Laptop/Computer, 71.5% using Refrigerator/Washing
Machine, 56.9% using Smart TV, 48% using Smart Watch, 40.7% using Google Home/Amazon Echo/Bluetooth Speaker, 30.9% using Oven, 23.6% using Smart AC, 17.1% using Smart Bulb, 11.4% using
CCTV.
Expected Outcome
As we expected that maximum count will be the Smartphone because it is kind of controller of IOT environment with Smartphone having Internet you can operate each and every thing which we mentioned in our

International Journal of Advance and Innovative Research Volume 9, Issue 1 (IX) January - March 2022
173
ISSN 2394 - 7780
survey report. We came to know that somehow each and every people has at least one gadget this show that
IOT has become an essential.
Benefits to the Society
IOT will benefit the society from the ground level as well as on industrial level.
1. Internet of things in our everyday lives such as:
Smart appliances (stoves, fridges, washers and dryers, Washing machines, electric cookers)
Smart security systems, smart locks, and smart doorbells
Smart domestic hubs (that control lighting, Heater, AC etc.)
Smart assistants (like Alexa, Siri, Bixby, Cortana)
Smart Vehicle (like EV cars and Bike)
Fitness trackers, sleep trackers, and smart scales
Emerging consumer trends in IoT that consist of clever lively put on, clever athletic footwear, and connected
cars that inform us the whole lot from how close to we're to the automobiles around us to the first-class route to
take to keep away from rush hour traffic.
regardless of what kind of clever IoT software program you use, most of you'll agree that the records and luxury
you get as an quit end result has stored you time, cash, and a number of worries.
2. Internet of things on Industrial level:
Similarly, to our smart domestic devices, IoT is an important era in business and enterprise, as it offers
organizations an real-time glimpse into the internal workings of their company’s structures. From the
manufacturing facility ground to the consumer’s door, IoT delivers insights into the entirety from device
performance to supply chain and logistics operations.
IoT permits companies to automate techniques and hold cash on labour. It additionally reduces waste and
improves carrier delivery, making it much less costly to fabricate and deliver goods and supplying transparency into client transactions.
It permits organizations to reduce prices, increase safety, and beautify great from cease-to-surrender,
which interprets to a win-win for anybody. As an cease end result, customer items are less pricey to
supply, shipping is more predictable, and companies can develop, stimulating our economic system on
the same time as delivering a experience of delight.
Cost Benefit Analysis
1. Health tracking Devices Nowadays, tracking health as become so easy due to IOT from a Smart watch we can check our Heart Rate
24/7, Oxygen level, sedentary alarms, Sleep Monitoring, Stress counting. In older days when IOT was not in the
existence it was very difficult task to measure all these things as well as it was costly because you have to keep multiple equipment’s which can measures only one. It was also time-consuming process but after IOT it has
become easy task every health checking equipment in compact way on hand.
2. IN INDUSTRY
Smart, related gadgets or statistics factors enable remote monitoring and preservation of key approaches and belongings, which drives each a reduction within the costs of maintenance over the years and a development
inside the degree of carrier to give up-users. Improving performance isn't
always the handiest manner to reduce costs: on the subject of things like structural health monitoring or production web page tracking, wherein incident-associated delays result in sizeable expenses, being capable of
display and are expecting any anomalies is prime to sticking to the price range. Relying at the business, IoT
systems can not only make enterprise operations more efficient but can also save you any accidents or
accidental activities from taking place, saving massive costs over the life of projects.

International Journal of Advance and Innovative Research Volume 9, Issue 1 (IX) January - March 2022
174
ISSN 2394 - 7780
FUTURE SCOPE Net of factors has emerged as a leading technology round the sector. It has received a number of popularities in
lesser time. Also, the advancements in artificial Intelligence and device learning have made the automation of
IoT devices smooth. Basically, AI and ML applications are blended with IoT devices to offer them proper
automation. Because of this, Iot has additionally increased its location of application in numerous sectors. Here,
on this section, the packages and the destiny scope of IoT in healthcare, vehicle, and agriculture industries.
Nowadays, IOT is mainly used in EV vehicle. In EV sector some company use Battery Swapping technique to
monitor Battery health and location IOT is widely used. It is also used to monitor car health, tyre pressure etc.
With the growing population the consumer base of product will boom. With the increasing product use the IOT
will automatically grow.
With the increase in Blockchain technology we can say if Blockchain and IOT somehow combine the security problem in IOT will we solved the user base data will be stored in block therefore, the hacker will now
not be able to breach the consumer records.
In the above graph you can see how IOT Impact in various sectors and this rapid growth will continue at
massive level
As you can see in the above stat the user of IOT device will be about 75.44 billons which is more than double of
current user.

International Journal of Advance and Innovative Research Volume 9, Issue 1 (IX) January - March 2022
175
ISSN 2394 - 7780
SUMMARY
We Conducted a survey with some of commonly used gadgets in day to day life in which we pick gadgets like
Smartphone, Headphone, Bluetooth speaker/Amazon echo Google Home, CCTV, Smart TV, Smartwatch, Laptop/Computer, Smart Bulb, VR Glasses, Smart AC, WIFI Internet, Refrigerator/Washing Machine and Oven
People with Headphone/Earphone and Smartphone has maximum count around 82.1% for Headphone and
81.3% for Smartphone whereas minimum count was 4.9% for VR Glasses. Internet of things in our regular lives together with: clever home equipment (stoves, fridges, washers and dryers, espresso machines, slow cookers)
clever protection structures, smart locks, and clever doorbells smart domestic hubs (that manage lights, home
heating and cooling, etc.) smart assistants (like Amazon Alexa or Apple’s Siri) health trackers, sleep trackers,
and smart scales emerging customer traits in IoT that encompass clever active wear, clever athletic footwear, and linked automobiles that inform us the whole thing from how close to we're to the cars around us to the great
direction to take to keep away from rush hour visitors. With the increase in Blockchain technology we can say if
Blockchain and IOT somehow combine the security problem in IOT will we solved the user base data will be
stored in block therefore, the hacker will not be able to breach the user data.
LIMITATIONS
Though IOT has been a boon in many techniques, it additionally poses sure demanding situations. The primary Challenges are privatising, reliability, statistics confidentiality and protection. A car attached with RFID tag
results in loss of privacy for the passenger inside the car. IOT in healthcare also can Lead to risky effects
inclusive of the records present inside the fitness popularity can be modified By using an outsider, as a result
giving the health practitioner incorrect statistics. Wireless sensors in warfare fields, if discovered through the enemies can be mishandled to generate fake records. An individual’s proper to privatises need to be blanketed.
Robust protection and sound privatise answers will lead to better attractiveness by using public. There ought to
be legal guidelines and regulations to shrink the misuse of IOT technology. Global standards want to be evolved
for the unfold of this new technology.
REFERENCES
1. Sfar AR, Zied C, Challal Y. A systematic and cognitive vision for IoT security: a case study of
military live simulation and security challenges. In: Proc. 2017 international conference on smart,
monitored and controlled cities (SM2C), Sfax, Tunisia, 17–19 Feb.
2017. https://doi.org/10.1109/sm2c.2017.8071828.
2. Sfar AR, Natalizio E, Challal Y, Chtourou Z. A roadmap for security challenges in the internet of
things. Digit Commun Netw. 2018;4(1):118–37.
3. Minoli D, Sohraby K, Kouns J. IoT security (IoTSec) considerations, requirements, and
architectures. In: Proc. 14th IEEE annual consumer communications & networking conference
(CCNC), Las Vegas, NV, USA, 8–11 January 2017.

International Journal of Advance and Innovative Research Volume 9, Issue 1 (IX) January - March 2022
176
ISSN 2394 - 7780
A REVIEW ON THE ARTIFICIAL INTELLIGENCE OF THINGS (AIOT) :WHEN AI MEETS IOT
Sheetal Khanore
Assistant Professor, Department of Information Technology S.M.Shetty College, Powai
ABSTRACT
Artificial Intelligence of Things (AIoT) is dealing with Internet of Things (IoT) infrastructure and Artificial
intelligence (AI) technologies to improve human-machine interaction and handle large scale data and its analytics. Artificial Intelligence is the input to create the integrated computing devices. The vast revolution of
IoT with AI has a great support to develop the smart system. IoT Data main role to improve decision making
process by creating optimistic data with help of AI systems IoT Data as a Service (IoTDaaS)
Keywords: IoT, AIoT
INTRODUCTION AIoT is more valuable for the IoT innovated technologies as machine learning capabilities have improved IoT
with the execution of AI algorithms as well connectivity, signalling and data exchange improved AI operations.
Since the majority of the industries are dealing with the IoT networks there will be huge scale of unorganised
data get generated by human and machine. Data analytics solutions under AIoT can create valuable outcome of this IoT-generated data. The 24/7 vision is defined by IoT as a tag -“from anyplace, anytime connectivity for
anyone; to connect with anything”. IoT has been proposed its vision as AAA (Anytime, Anywhere, Anything).
Artificial intelligence as a service (AIaaS) is not designed as a AI tools but allow the people and business organizations to try with AI services for different operations in the business and implement multiple platforms
before making a commitment. The functioning of Internet of Computers(IoC) have been transformed in the
Internet of Things(IoT). IoT assures the usability of smart and intelligent operations in systems.
Gamut of Smart Systems
Fig: Internet of Things (IoT): Connecting "Anything, Anyone, Anytime, Anyplace" Advanced Vehicular
Communications:
The next generation of information system and computing supports inter-platform of artificial intelligence,
machine learning to build smart systems. It also uses cyber-physical systems (CPS), edge/cloud computing, big data analytics, and Internet of Things (IoT) technologies to provide concurrent networked information and
control. It considerably contributes to the innovation IoT in future. The inter dependency of Artificial
intelligence (AI) and Internet of things (IoT) provides a great support to prevent, diagnose and reduce Covid-19 disease. In day to day life lots of AI systems like Virtual Personal Assistants, Social Networking,
Commuting (Ridesharing Apps Like Uber / Ola / Grab), Online Shopping, Google/ Facebook Ads are useful.
The overall range of smart systems is divided into Narrow level Artificial Intelligence, General level artificial
Intelligence, Artificial Super Intelligence. Searching algorithm in Google, recommendation algorithm in Netflix and social media applications like Facebook, Instagram, Twitter personalizes your interest level. Natural

International Journal of Advance and Innovative Research Volume 9, Issue 1 (IX) January - March 2022
177
ISSN 2394 - 7780
Language Processing (NLP) is more preferable in authenticity in the authorized operations. The advancement
of appliances and devices can make home operations more liveable and automated which controls the devices
from anywhere. The appliances like Smart lighting system, Stick Cam Battery, Spotlight Camrea, Video Door Bell, Wifi Smart Lock, Speakers etc are available for more effective and easy usage of the systems. These
systems are embedded of intelligence and hardware supported by IoT.
Smart technology application is developing rapidly in the agro-industrial sectors. Wearable devices, continuously monitors and track user preferences and habits. Applications include health information trackers,
heart rate monitoring, wireless headphones, and AR/VR devices. Smart home devices such as coffee makers,
lights smart TV and thermostats learn user habit and develop automatic home appliances for everyday tasks;
Applications include efficiency, entertainment, safety, energy, personal comfort and fast access control. All level of public services are more safer and convenient to make places live in smart cities. Applications include
large scale data for urban planning, optimized energy consumption, increased safety through smart traffic
surveillance.
Smart industries devices-the Industrial Internet on Things (IIoT) use real time data analytic and machine to
machine sensors to enhance the operations, logistic and supply chain. The Data generated from these devices
helps industries to prevent financial loss and resources injuries.
Iot Vision – Anytime, Anywhere, Anything
The major contribution of IoT is in wireless connectivity as well varieties of decision making algorithm to mash
up with Artificial Intelligence. Applications based on 5G have become more effective in the current trends by
supporting anytime/anywhere wireless connectivity between all IoT devices and infrastructure. That connectivity must be seamless, reliable, and deliver both high-quality audio and data service. The stack of IoT
technology includes technologies, standards and tools, which lead from the objects communication to the
applications that use these connected things, the data they gather and communicate and the different steps
needed to power them. The following technologies are the key component to achieve IoT- AAA vision:
Cloud Computing: The chargeable on-demand services of IT resources over the Internet is offered by
Cloud Computing. It supports the Remote access of the files and storage backup systems. Public and Private
services are provided online where private services are hosted on a network to specific clients.
Dew Computing: Dew Computing supports a broader level of technologies like mobile data acquisition, wireless networks with sensors, and interactive applications on distributed peer-to-peer ad hoc networking.
It is beyond the concept of storage, network and service to cross operation, cross platform issues associated
with application collaboration and integration in the Internet of Things environment.
Edge Computing: The distribution of storage and its management resources at the location where data
production is Edge computing. Edge computing is more efficient in networking operations. It is low cast solutions and longevity, manages network bandwidth and reduces network traffic, and permits fast
execution of real-time processing.
Fog Computing: Fog computing supports network topology for the creation of data, storages as cloud or
data centre. Fog is another covers a different section of a distributed network and is more associated with cloud computing and the internet of things (IoT). Public infrastructure as a service (PIaaS) is referred as a
large scale universal data created from IoT devices.
IPV6: The latest version of Internet Protocol(IP) is Internet Protocol version 6 (IPv6) provides the more
address space which supports the effective deployment of network resources on the internet.
Machine-to-machine communication (M2M): The wired and wireless systems provide M2M
communication technologies for the effective data sharing.
Radio frequency identification (RFID): RFID belongs to automatic identification and data capture
(AIDC) technology that uses Electromagnetic fields at radio frequencies to transmit information. To
identify each object can be identified by RFID tag attached to it. It is identification with some detail
information about the object. RFID tags are identified by the RFID readers with wirelessly communication and it possibly read or updates additional information stored on the tag in the system. The
line of site communication is preferable in these systems.
Wireless sensor and actuator networks (WSAN): These are large networks with small subnets,
communicating devices and computing with various types of actuators.

International Journal of Advance and Innovative Research Volume 9, Issue 1 (IX) January - March 2022
178
ISSN 2394 - 7780
IoT Analytics: The large scale data analytics based on IoT business models exploit the information
collected by "things" in multiple ways, which will demand new analytic tools and algorithms. For the large
data volumes over the industries, traditional analytics is need of an hour.
Artificial Intelligence: broader level of intelligence The emerging technologies like robotics, big data and IoT have been generated from Artificial Intelligence and
it will continue to advance the innovative systems in future. AI automates tedious learning and discovery
through data. The neural networks with multiple hidden layers support to analyse the deeper data in AI system. AI borders itself in weak, general and strong mechanism using different searching and learning techniques.
Deep Neural network supports improbable accuracy for the AI services
Weak AI or Narrow AI or Artificial Narrow Intelligence (ANI) is AI based tasks. Most of the AI today is driven
by Weak AI. The another descriptor for this type of AI can be narrow AI which some of the applications like Amazon's Alexa, Apple's Siri, IBM Watson and autonomous vehicles. Artificial General Intelligence (AGI) and
Artificial Super Intelligence (ASI) generate strong AI applications. Theoretically AI supports self-conscious
human intelligence with the learning ability of problem solving and plan for the future is Artificial general intelligence (AGI), or general AI. Artificial Super Intelligence (ASI) would be more powerful than this level of
intelligence. The strong AI is not that much useful in current trends, that doesn't mean AI researchers aren't also
exploring its development.
Combo of AI And Iot
It forms AIoT the powerful tools to perform various operations. This is very much useful in traffic monitoring,
Office building network setup, Robots with multifunctional operation, agricultural field, medical diagnosis
systems and so on. As new technology applications emerge where IoT works hand in hand with AI – advancement in IoT can create new business models and change the competitive landscape. The collection of
data and transferring it to cloud through the internet generally achieved by IoT devices and AI which is
considered as the important component of AIoT is what actually helps in decision making and simulating the machines to act or respond. This is the main reason behind combining AI with IoT. The 360 degree view of the
advanced technology acquires the concept of IoT and AI. AIoT general applications are effective to transform
and improve business services and AI operations.
CONCLUSION
AI enabled IoT creates intelligent machines that simulate smart behaviour and supports in decision making with
no human interference. The common persons benefited due to these two streams. Internet based IoT along with
AI makes the devices learn from their data and experience. AIoT is still in its infancy giving a direct impact in our daily lives. The combination of technologies like AI, IoT, 5G, and big data are all relatively young, and
continue in innovation to empower the innovators to build a smarter future for our world.
REFERENCES 1. IEEE Access, vol. 8, pp. 23022-23040, 2020 - "Internet of Things (IoT) for Next-Generation Smart
Systems: A Review of Current Challenges, Future Trends and Prospects for Emerging 5G-IoT Scenarios,"
by K. Shafique, B. A. Khawaja, F. Sabir, S. Qazi and M. Mustaqim
2. 2020 IEEE 17th International Conference on Smart Communities: Improving Quality of Life Using ICT, IoT and AI (HONET), 2020, pp. 214-218, doi: 10.1109/HONET50430.2020.9322829 - "A Survey of
Artificial Intelligence and Internet of Things (IoT) based approaches against Covid-19," by Nadeem, M. S.
Saeed, M. A. Tahir and R. Mumtaz
3. Fadi Al-Turjman (Editor), Anand Nayyar (Editor), Ajantha Devi (Editor), Intelligence of Things: Ai-Iot
Based Critical-Applications and Innovations (Hardcover)
4. Prof. Dr. Chih-Yu Wen special issue by processes MDPI Journal (ISSN 2227-9717), Special Issue "Smart
Systems and Internet of Things (IoT)"
5. https://www.techtarget.com/searchenterpriseai/definition/AI-Artificial-Intelligence
6. https://kreatetechnologies.com/ai-iot-better-future/
7. https://www.visualcapitalist.com/aiot-when-ai-meets-iot-technology/

International Journal of Advance and Innovative Research Volume 9, Issue 1 (IX) January - March 2022
179
ISSN 2394 - 7780
CORPORATE JOB VS ENTREPRENEURSHIP: A STUDY OF MILLENNIALS
1Adnan Shaikh,
2Ziad Shaikh,
3Rugved Chavan,
4Jivin Chacko and
5Sushanth Shetty
[email protected], [email protected],
Mentor
Asst. Prof. Preeti Matharu Bunt's Sangha's S.M. Shetty College of Science, Commerce and Management Studies
ABSTRACT
India is among the top five countries globally in terms of recent millennial start-up revolution. According to the survey by Deloitte, millennial entrepreneurs are taking the lead in creating new start-ups in emerging
markets. Six emerging markets economies like Vietnam, Philippines, Thailand, Malaysia, Peru and Indonesia
show higher millennial entrepreneurship rates for women than men. The yearly percentage change is however projected to decrease from 1.07% in 2020 to 0.28% in 2050. The fact that there are such wide variations
between entrepreneurial activity in different countries, distinction between necessity-based and opportunity-
driven entrepreneurs is difficult. Millennial Entrepreneurs are important for sustainable development of emerging economies like IndiaThe potential economic gains could be realised through India’s increasing
"demographic dividend", as county's working age population becomes larger than the dependent population. In
India the median age is forecasted to be between 27 years to 40 years from 2020 to 2050.
Millennials have surpassed Baby Boomers as the largest generation in the workplace, as of April 2016, and organizations are being challenged more than ever to attract and retain job-hopping Millennials. The intent of
this study was to investigate the factors contributing to millennial job satisfaction, dissatisfaction, and their
perspectives on retaining Millenials. They also received satisfaction from competitive remunerations, training and career growth opportunities. On the other hand, others encountered unpleasant work experiences under
bad management with communication problems while working with unpleasant coworkers, and receiving low
remunerations. Millennials retention recommendations were for better management geared towards the needs
of the new generation of employees, higher remuneration, good retention plans, providing mentorship and
coaching opportunities, and establishing a more supportive work environment.
Keywords: Job dissatisfaction, job satisfaction, millenials, Innovation, Motivation, Economic development
INTRODUCTION
Entrepreneurship has received much attention across the world over the last 20 years (Davidsson, 2008).
According to Kobia and Sikalieh (2010), entrepreneurship is relatively a young field of research study.
The millennial entrepreneurs are known for their force of change, persistency and versatility. The entrepreneurship ecosystem is strongest in the innovation-driven economies India has only 10,500 startups.
Technology based startups in India has only 4,400 tech-based startups. Non-tech based startups are only 5,800
in India. Five out of six world’s leading firms are U.S. tech companies with investments in artificial
intelligence, Internet of things, robotics and automation.Millennials have pointed out that organizations have not been very successful in their retention efforts. The low employee retention and high turnover rates have been
a detrimental financial drain on organizations, and strategies need to be developed to retain employees. The
intent of this study was both exploratory and investigative, as it sought to find out what contributed to Millennial job satisfaction and dissatisfaction, as well as implications on Millennial retention from the
Millennials themselves. Invaluable information gathered from the study would shed new light that could be
used as recommendations to organizations in bringing about changes to improve Millennial job satisfaction and
talent retention, as suggested by (Wen et al., 2018).
REVIEW OF LITERATURE
We conducted a sample survey on how secure is a corporate job we collected a total of 115 responses. In which
51% of the people agreed that corporate jobs are secured and 17% of people think that corporate jobs are not secure, and the rest of the people think that corporate jobs are neither secure nor unsafe. People in India Earlier
were more comfortable in doing corporate jobs than being a entrepreneur. As there is less risk involved in
corporate job than entrepreneurship. Most entrepreneurs begin with a business bachelor's degree or a more specific bachelor's in entrepreneurship, and then hone their skills in an MBA program. In entrepreneurship
MBA programs, students are encouraged to draw upon their creative potential as they learn to build ventures.

International Journal of Advance and Innovative Research Volume 9, Issue 1 (IX) January - March 2022
180
ISSN 2394 - 7780
According to our sample survey questionnaire to get into corporate job we require qualification Along with
experience. We can't get a job easily only with qualification we need experience also and. we can't get easily job
with experience we require qualification also. But we Think experience is much important compare to qualification. By the way both are important specially in India qualification is most important but in foreign
countries they firstly gave more priority to experienced person. Because they think experienced people are more
suitable for their work. Nowadays Indian youngsters are more interested in opening their own venture. Many start-ups companies are coming in the Market. Many successful entrepreneurs are now guiding new start-ups
through Tv Shows like 'Shark Tank India' which helps new comers for the upliftment of their company.
STATEMENT OF PROBLEM
Which is better a job or business? If you think about the job vs business debate, both sides have equal supporters but in the present world, we have positively seen the rise of entrepreneurship over employment. But
opening a business is not everyone’s cup of tea and to start your own business, you will need some practical
training that a job can provide you with. If you are looking for financial security, a job is a better reliable option while for those ready to take risks, business seems compelling. Here we bring you all the job vs business
differences, which is better, benefits of job vs business, challenges, quotes, amongst others.
RESEARCH QUESTIONS
Q.1 According to You,Our Indian Education System is designed to Generate?
1.Employees
2.Entrepreneurs
Q.2 We as young generation of 21st century should prepare ourselves to?
1.Become an Employee
2.Become an Entrepreneur
Q.3 Have you ever thought about starting something your own(Business)?
1. Yes
2. No
3. Maybe
Q.4 If you ever had a thought of starting something your own(business) but couldn't start or started but got fail,
What do you think what was the main reason?
1. No cash/No Backup
2. No idea what to start
3. Other Reasons
Q.5 Do you want to start your own business with no risk and want someone who can guide you
1. Yes
2. No
Q.6 Which is more important to get a corporate job easily?
1. Qualification
2. Experience
3. Both
Q.7 If you are getting Hired by MNC(Multi National Company) Or you have a capability to start a business, so
what would you choose?
1. Employee of MNC
2. Start your own Business
Q.8 What is your family major source of income? *
1. Employment

International Journal of Advance and Innovative Research Volume 9, Issue 1 (IX) January - March 2022
181
ISSN 2394 - 7780
2. Business
3. Profession
Q.9 Are you aware of Indian government start up business scheme? If you are aware so which scheme you
know? You can select multiple options Also
1. Aware
2. Not Aware
STATEMENT OF OBJECTIVES
This research is conducted to accomplish the following objectives
1. To study corporate job’s vs entrepreneurship.
2. To understand if the Indian education system was developed for employment or entrepreneurship.
3. To examine which is more suitable for the people
4. To find out if corporate jobs are minimising the true potential of the millennials.
RESEARCH METHOD USED This is a google form survey which is conducted to find out if millennials prefer corporate jobs or
entrepreneurship.
The sources of data collection are both primary and secondary. The secondary sources are websites, newspapers and research articles. Primary data is collected through google form survey. The sample units are students and
working millennials.
The sample size is 115.
Primary data presentation:
The primary data was collected using sample survey technique. The questionnaire comprised of 10 qualitative
questions.
1] The respondents belong to different category like students, employees, entrepreneurs and etc.
2] Most of the people in our survey are belonged to age group of 19 – 2
Percentage Table 1
Our Indian Education System is designed
to generate
Young Generation of 21st century should
prepare ourselves to
Employee 83% 36.5%
Entrepreneur 17% 63.5%
Percentage Table 2
Have you ever thought about starting something your
own(Business)?
Need Guide to start business with no risk
YES 56% 73%
NO 36% 27%
MAYBE 08%
Percentage Table 3
Starting something your
own(business) but couldn't
start or started but got fail
What is more
important to get a
corporate job
No idea what to start
32% Qualification 28%
No cash/No back up 23% Experience 22%
Other reasons 45% Both 50%
Percentage Table 4

International Journal of Advance and Innovative Research Volume 9, Issue 1 (IX) January - March 2022
182
ISSN 2394 - 7780
If you are getting Hired by
MNC(Multi National
Company) Or you have a capability to start a business,
so what would you choose?
Are you aware of
Indian government start
up business scheme ?
Be an
Employee
53% Aware 61%
Start a
Business
47% Not Aware 39%
Percentage Table 5
Families major source of income
Employment 79%
Business 15%
Profession 6%
CONCLUSION
In this conclusion we summarise the part of corporate and entrepreneur role in the world. Where prior work targeted towards understanding the cognition of this project. Our work has several implications for better
understanding.
In corporate life the importance is given to the low absentees the major part is to give satisfaction of job to the employees. The employee should be satisfied with the facilities provided like nature of work, wages and
securities.
In entrepreneur life is its combined list of highly ranked journal in the entrepreneurship domain as basis for quality appraisal. Hence corporate and entrepreneur plays an very important role in business life both should be
balanced equally.
RECOMMENDATION
Nowadays corporate jobs as well as entrepreneurship both are important because without employees the company cannot be successful and without entrepreneur company can't be formed.Schools in India are running
on a basic curriculum that has been there for years. We all have seen the traditional style of exhibiting education
in our schools; there are about five subjects in every class, students appear for exams twice a year and are promoted to the next class on basis of their performance and some are even given trophies and medals. Though
these subjects cover almost all the information from the monarchy in the medieval period to trigonometry, they
lack the basic life skills for which they seem to struggle even after getting into a job or Entrepreneurship. First thing children learn in most of the schools in India is to follow the crowd and get into the job market. No
student has been ever encouraged to study what he truly is passionate about, esspecially when it comes to
creative careers like being an artist. Firstly we should recommend the college to provide more information on
entrepreneurship to students and guide them and motivate students to become an entrepreneur. If the young people from our country focuses on entrepreneurship then our country will grow very well as the youngsters are
the future of our country. So according to our survey the question asked by us is ‘According to you Indian
education system is designed to generate' and we got 83% responses of the people who says employees and 13% for entrepreneurs. So we need generation of people who can create a employment .so we can create a base
for our countries fast growth and shift youth from employee mindset to employer mind set
LIMITATIONS
In Research paper the limitations of our Survey questions is in the controlled only in india n and we did not get any foreign response. And we get a total number of responses are 115. All responded people are mostly from
Maharashtra so it means this primary data analysis is done inside the india only. On Corporate job vs
entrepreneurship.
REFERENCE
https://www.researchgate.net/publication/344270585
https://www.indeed.com/career-advice/career-development/writing-a-business-recommendation-letter
https://scholar.google.co.in/scholar?q=Literature+review+on+entrepreneurship+Pdf&hl=en&as_sdt=0&as
_vis=1&oi=scholart#d=gs_qabs&u=%23p%3DduIR-mnYOb4J

International Journal of Advance and Innovative Research Volume 9, Issue 1 (IX) January - March 2022
183
ISSN 2394 - 7780
https://www.google.com/url?sa=t&source=web&rct=j&url=https://www.red-gate.com/simple-
talk/opinion/editorials/entrepreneurship-vs-employment-which-is-the-
best/&ved=2ahUKEwiijI34kK_1AhWGF6YKHWBNA8EQFnoECDwQAQ&usg=AOvVaw1qvCLYlH4c
vWkWOHWT93U2
https://forms.gle/tGfsF1JvWqzWcJ8g8

International Journal of Advance and Innovative Research Volume 9, Issue 1 (IX) January - March 2022
184
ISSN 2394 - 7780
A STUDY OF CHANGING DIGITAL BANKING HABITS OF INDIVIDUALS DURING PANDEMIC
COVID'19 IN MUMBAI CITY
Prof. CA Zainab Shabbir Rangwala Bunts Sangha’s S.M.Shetty College of Science, Commerce and Management Studies Affiliated to the
University of Mumbai
ABSTRACT
Digital technology is a driving force in being a game changer in the economic development of all nations
globally. Digital technologies in the recent application driven world are playing a pivotal role in achieving the
multi decadal challenge of digital financial transactions. The adoption of artificial intelligence and digital technology in almost all economic and social arena’s is keeping India in pace with international developments.
The focus of Indian Government towards its self-resilience with the echo of “Atmanirbhar Bharat” is a
landmark move towards a digitalized economy. The Pandemic Covid’19 has posed eminent threat to the survival of human civilization in this digital age. Owing to the sudden outbreak and spreading of the virus most
of the nations have been under lockdown thereby having radical changes in the modus operandus of banking
transactions. The masses are undergoing a change in the mannerism of banking habits. The appropriate digital infrastructure, digital literacy and availability of digital banking services have been instrumental in the process
of changing trends towards digital banking habits. This paper is a humble attempt to study the changing trends
in individual banking habits during Pandemic Covid’19 within Mumbai City.
Keywords: - Digital Banking, Digital Financial Transactions, Covid’19 Pandemic
INTRODUCTION
The World Economic Forum enlists how artificial intelligence using digital technology is changing the manner
of financial transactions making customer experience the cortex of banking financial services. The stride of the Government of India through the Digital India campaign, has focused on the facets of digital literacy, digital
infrastructure and e-governance. Currently India is the second largest telecom market in the world. The
nationwide launch of UPI, BHIM, Bharatnet, Smart cities, Artificial Intelligence (AI), Internet of Things (IoT),
Cloud Computing etc. are channelizing the country towards a digitally empowered 5 trillion dollar economy by the year 2025. In January 2021 with 624 million internet users in India, the internet penetration stood at 45%,
which remarkable increased by 8.20% since January 2020. India has secured the 96th position amongst 100
countries at United Nations E-Government Development Index (EGDI) 2018 with an e-governance index of 0.9150. The strong, speedy and advent digitalization process in India with open source software, mobile
technologies, data accessibility etc. has proposed gateways for deploying large scale digital financial inclusions
nationwide. This is entailing a paradigm shift in individual banking habits from the traditionally used mechanism to digital based mechanism. The Pandemic Covid-19 has changed the mannerism our world as we
knew it. It has radically impacted the way we live, work, learn, earn, spend, travel etc. The urge of social
distancing to contain the virus within the economies has boosted the drive of contactless financial channels
thereby boosting the use of digital banking services. The National Lockdown in most countries has also been instrumental in the stride towards digital banking channels. The lockdown being the “New Normal” resulted in
businesses and consumers increased reliance on “Go Digital” by selling and buying goods and services online,
thereby increasing the global e-commerce retail trade from 14% during 2019 to 17% during 2020. The E-Commerce sector in India has witnessed an acute surge with accelerated digital banking transformations. Thus,
this paper is an attempt to study the changing trends in individual banking habits during pandemic Covid-19
within Mumbai the commercial capital of India.
REVIEW OF LITERATURE
The radical lifestyle changes provoked in the era of ‘New Normal’ due to the outbreak Covid’19 pandemic has
affected all entities in a gamut of ways. The enhanced usage of digital payment is becoming an important
characteristic of the ‘New Normal’ and beyond. In Mumbai usage of digital payments had become a necessity
and routine rather than being a perk as conceptualized earlier.
In the research paper “A Compendious Study of Online Payment Systems: Past Developments, Present Impact,
and Future Considerations” of (IJACSA) International Journal of Advanced Computer Science and Applications, 2017 by Burhan Ul Islam Khan, Rashidah F. Olanrewaju, Asifa Mehraj Baba, Adil Ahmad
Langoo and Shahul Assad:- it is concluded that, by establishing a common standard for a variety of service
providers, improving the compatibility with a large number of customers, overcoming privacy and security

International Journal of Advance and Innovative Research Volume 9, Issue 1 (IX) January - March 2022
185
ISSN 2394 - 7780
concerns and employing the latest technology could facilitate expeditious adoption of online payment methods
and expand the market for such a mode of payment.
In the research paper “A Study on Usage of e-Payments for Sustainable Growth of Online Business” of (IOSR) Journal of Business and Management (IOSR-JBM), 2018 by Prof. Sana Khan, and Ms. Shreya Jain deduce that
the organizations are trying their level best to attract the consumers towards using their ecommerce and
payment platforms to increase their business, but there have been always a hitch in consumers mind regarding
the security and privacy.
In the research paper “Adoption of Digital Payment System by Consumer: A review of Literature” of
International Journal of Creative Research Thoughts (1 IJCRT), 2021 by Gourab Ghosh envisaged that digital
payments not only helps individual to payments or receive money it also performs multiple functions such as giving reminder about dues of any kind of payments to be made, it gives various offers to the user and its saves
a lot of time.
Reserve Bank of India Reports on Retail Banking habits in India (2019) – emphasized on the digital literacy of respondents with bank accounts in 6 cities barring the lens of gender, educational qualification and income,
stating that bank account played a significant role in the awareness about digital payments.
Gap in Literature Review
Different surveys and researches done periodically by researchers, scholars and academician have tried to
analyze the several attributes in respect of digital payments in India and the world at large. It is keenly observed
from these studies that the enhanced digital literacy rates in Indian, accompanied by the lifestyle changes due to
pandemic outbreak, has magnified the digitalized payments drive in the nation. This is well supplemented by the magnified e-commerce trends, e-governance and digital infrastructure up gradation efforts of the
government. This paper is an attempt to study within the commercial capital of India, the changing trends of
banking habits during pandemic covid’19.
OBJECTIVES OF THE STUDY 1. To understand the attitude of people towards digital banking in Mumbai
2. To determine factors affecting use of digital banking habits during Covid’19 pandemic.
3. To suggest course of action for secured and enhanced use of digital banking channels.
HYPOTHESIS OF THE STUDY H1:- Individuals have access to digital infrastructure to use digital banking in Mumbai City
H2:- Attitude of individuals towards adopting digital banking habit during Covid’19 is positive
RESEARCH METHODOLOGY FOR THE STUDY 1. Research is conducted in Mumbai city.
2. Primary data is collected through personal interview and questionnaire from over 285 respondents.
3. Secondary data is collected from published reports
4. Statistical tools are applied for data analysis.
LIMITATIONS OF THE STUDY
1. The personal bias and experiences of respondents may affect their responses inappropriately.
2. The study is conducted in the city of Mumbai; alternatively other geographical areas could be used to widen
the scope of the study
3. Only Individuals respondents are considered; alternatively corporates, local authorities, co-op societies and
other entities could also be included.
ANAYLYSIS AND INTERPRETATION
The sample consisted of 285 individuals from the city of Mumbai. The analysis of their responses is as under:-
(a) The age of the respondents is as under:-

International Journal of Advance and Innovative Research Volume 9, Issue 1 (IX) January - March 2022
186
ISSN 2394 - 7780
Source: - Primary data
It is observed from the above data that the maximum number of respondents fall in the age group 21-30 years being 33.68% followed by the age group 31-40 years being 29.47%. As all 100 % of the respondents use some
or the other platform of digital banking, it is deduced that ‘Age is not a constrain in using digital banking.’
Source:- Primary data
It is observed from the above data that the maximum number of respondents hold formal education of being Graduates with 33.68% followed by the Post Graduates being 22.81%. It is also observed that 9.12% of the
respondents have education below Secondary level of Standard 10th whereas 12.63% of the respondents are with
formal education of below Higher secondary level of Standard 12th. As all 100 % of the respondents use some
or the other platform of digital banking, it is deduced that ‘Formal Educational Qualification is not a constrain
for use of digital banking’
Source:- Primary data
It is observed from the above data that the 23.16% of respondents have an average monthly family income of more than Rs. 1,00,000 followed by 22.46% of respondents whose monthly family income is between Rs.
50,000 – Rs. 70,000. As all 100 % of the respondents use some or the other platform of digital banking, it is
deduced that ‘Income is not a constrain for use of digital banking’
Source:- Primary data (Data as percentage is to the total number of respondents; where respondents could select
multiple options.)

International Journal of Advance and Innovative Research Volume 9, Issue 1 (IX) January - March 2022
187
ISSN 2394 - 7780
It is observed that respondents use electronic gadgets for digital banking purposes. They use multiple gadgets at
time. It is observed that 100% use Smart Phones, 47.37% use Laptops, 15.79% use Desktops, 68.42% use
Tablets and 8.77% use other gadgets. It is deduced from this data that all 100% of the respondents have access
to necessary electronic infrastructure to engage in digital banking transactions.
Source:- Primary Data
Source:- Primary data (Data as percentage is to the total number of respondents; where respondents could select
multiple options.)
It is observed that respondents use digital banking for various purposes. It is observed that maximum
respondents use digital banking to avoid cash transactions. This is primarily a fall out of Pandemic Covid-19, as
individuals urge to minimize contact by use of no touch or digital money.
Source:- Primary data (Data as percentage is to the total number of respondents; where respondents could select
multiple options.)
It is observed that respondents use information about digital banking from various sources pertinent to technical issues, digital infrastructure, cyber safety, modus operandus, latest innovations, fees etc. They use multiple
sources at time. It is observed that 85.96% place reliance from information received through friends, family &
peer groups. Furthur,74.04% place reliance on information through advertisements and promotion through social media. Moreover 44.21% use information provided by Banks, whereas 33.68% use information provided
by news channels. Thus it is deduced that all 100% of the respondents use information from various sources in
order to engage digital banking transactions.
(g) Purpose of respondents to engage in digital banking transactions is as under:-
Source:- Primary data (Data as percentage is to the total number of respondents; where respondents could select
multiple options.)

International Journal of Advance and Innovative Research Volume 9, Issue 1 (IX) January - March 2022
188
ISSN 2394 - 7780
It is observed that respondents use digital banking for various purposes. The maximum being 92.98% for
Shopping. Thus it is deduced that all 100% of the respondents use digital banking transactions for multiple
purposes as per their requirements.
Source:- Primary data (Data as percentage is to the total number of respondents; where respondents could select
multiple options.)
It is observed that respondents use multiple channels for digital banking purposes. The maximum being 87.02% through UPI, 82.11% through Debit/Credit Card and 75.09% through E-Wallets. Thus it is deduced that all
100% of the respondents use digital banking transactions through various channels.
(i) Internet penetration in India
Secondary data : -Source Digital India Report 2021
During January 2021 there are 624.0 million internet users in India with an Internet penetration of 45%, which
has increased by 47 million (+8.2%) between 2020 and 2021.
(j) Electronic device ownership in India
Secondary data : -Source Digital India Report 2021
During January 2021, in India percentage of internet users who used smart phones is 96.3% with an average
internet speed of 12.91mbps. Whereas those using laptop / desktop is 56.4% with an average internet speed of
53.90mbps.
(k) Use of mobile applications for different purpose:-

International Journal of Advance and Innovative Research Volume 9, Issue 1 (IX) January - March 2022
189
ISSN 2394 - 7780
Secondary data : -Source Digital India Report 2021
During January 2021, in India percentage of monthly internet users who used mobile applications for the
purpose of shopping is 72.20%. Whereas those using banking and financial services application is 32.30%.
Testing of H1 :- Individuals have access to digital infrastructure to use digital banking in Mumbai City. It is
deduced from the analysis and interpretation of primary and secondary data above that 100% of the respondents have access to electronic devices, with 45% internet availability, reasonable speed of internet connectivity
ranging from 12.91mbps to53.90mbps and information to use digital banking channels with a monthly average
of banking and financial services application is 32.30% . Hence H1 is accepted.
Testing of H2 :- Attitude of individuals towards adopting digital banking habit during Covid’19 is positive.
Attitude of people towards adopting digital banking during Covid’19 for transactions is positive From the above
primary and secondary data it is analyzed that 95.86% of respondents prefer to use digital banking as it avoids
use of currency notes and coins, whereas 90.38% of respondents prefer to use digital banking due to convenience Also 82.69% use e-payments to get associated offers for use. Furthermore age, income level and
formal education are not constrains for use of digital banking. Lastly it is observed that respondents use variety
of devices and numerous proposes frequently. Thus, we accept the hypothesis and conclude that the attitude of
people towards adopting E-Payments during Covid’19 for transactions is positive
MAJOR FINDINGS
Respondents in Mumbai have access to necessary digital infrastructure for digital banking transactions
Individual’s preference in banking habits is based on many different reasons majorly being use of paperless
and no-touch currency pertinent to the safety norms imposed during Pandemic Covid-19
Individuals are digitally literate and have access to necessary information to engage in digital banking
transactions.
Digital banking transactions carry an inherent risk of cybercrime that lead to financial losses. These cyber-
threats should be known and avoided to promote a secure environment for digital banking habits to prevail
amongst individuals.
CONCLUSIONS Based on the survey of 285 respondents from Mumbai city, the paper concludes a positive attitude of
respondents towards digital banking. The availability of necessary digital infrastructure, variety of electronic
gadgets, software technological innovations and appropriate level of e-governance has made a conducive environment for the thriving use of digital banking in Mumbai and whole of India. The new era influencing
technologies like Robotic Process automation (RPA), Artificial intelligence (AI), Internet of Things (IOT),
Block chains etc are profound drivers of the changing digital banking landscape in India. Furthermore the social
distancing norms endured by the masses to counter and combat the spread of pandemic Covid’19 have surged the use of no touch money, thereby boosting digital banking. Although there are some issues associated with the
smooth use of digital banking with the threat of deepening cybercrime in recent times, yet the use of digital
banking is not curtailed. Collective caution and efforts are required from the government, corporates, financial institutions, regulatory authorities, banks, and individuals to maintain a safe and secure environment for digital
banking.
REFERENCES
1. United Nations Digital Economy report 2019
2. Digital India Report 2021

International Journal of Advance and Innovative Research Volume 9, Issue 1 (IX) January - March 2022
190
ISSN 2394 - 7780
3. Reserve Bank of India – Digital Financial Inclusions Report 2021
4. Impact of Covid’19 on digital payments in India report by KPMG
5. https://www.financialexpress.com/budget/will-the-union-budget-2021-catalyse-indias-digital-
economy/2183774/
6. https://www.jpmorgan.com/solutions/cib/research/covid-spending-habits
7. https://www.ibef.org/archives/industry/indian-telecommunications-industry-analysis-reports/indian-
telecommunications-industry-analysis-january2021.
8. https://www.india.gov.in/information-national-digital-literacy-mission
9. Global Journal For Research Analysisvolume-9, Issue-1, January-2020 • Print Issn No. 2277 - 8160 • Doi :
10.36106/gjra
10. Journal of Business and Management (IOSR-JBM) e-ISSN: 2278-487X, p-ISSN: 2319-7668 PP 74-811
11. (IJACSA) International Journal of Advanced Computer Science and Applications, Vol. 8, No. 5, 2017
12. (IJCRT) International Journal of Creative Research Thoughts (1) | Volume 9, Issue 2 February 2021 | ISSN:
2320-2882

International Journal of Advance and Innovative Research Volume 9, Issue 1 (IX) January - March 2022
191
ISSN 2394 - 7780
A RESEARCH PAPER ON CONSUMERS BUYING PATTERNS BEFORE, DURING AND POST
COVID- 19 PANDEMIC
1Ms. Charmy S. Shah and
2Dr. Rinkesh Chheda
1Research Scholar, JJT University (Reg no: 29821085) & Assistant Professor at Laxmi Charitable Trust’s Sheth L.U.J College of Arts & Sir M.V. College of Science & Commerce
2Research Guide, JJT University (RegNo: JJT/2K9/CMG) and Assistant Professor at SIES College of
Commerce and Economics [email protected] and [email protected]
ABSTRACT This research is about the study of consumers and their complex purchasing decisions that helps in
understanding the taste and opinions of masses. Nowadays, people have various opinions of brands and
mediums for the purchase of any product which the consumer wants. It is then the level of satisfaction and results persuade them again to buy the goods and services or just switch to some other company. The revolution
of new media has enlighten many ways from where information is shared about the products and services.
Consumers preferences during COVID-19 was different as compared to before and post Covid- 19. The changes, resulted in my shifts or transforming ways to get informed, connected and updated with media
channels. In this research we have used online questionnaire for collecting data. Simple random sampling and
snowball sampling methods were used for collection of the data.
Keywords- Preferences, Consumer buying behaviour and COVID-19
INTRODUCTION
Global economy impacts on the business organisations around the globe in their performances. The Internet,
Globalization and Information transformation through advanced technologies has drastically shifted the scenario of the markets. People have become more informative than ever just in few clicks. It is the consumers now, who
decides the market trends and fashion. The characteristics of consumers is different from country to country.
And thus it results in challenging task for the brands and organisations to understand the wants, needs, buying
patterns of individuals and strategizing them accordingly.
Consumer behavior plays a very important role in studying the consumer’s action towards both offline and
online way of purchasing the products of brands or the services. Consumers have a variety of options to select
the medium for the purchase of the product towards their preferred brands, as brands nowadays have their presence on online and offline channels. Young people seem to be purchasing luxury goods for status purpose,
for self-esteem, affection and so on. The research is been done on the few factors of consumer behaviours
before launching the product or service in markets. The factors could be Culture and Sub-culture, Reference groups, Family, Self-concept etc. While also psychological factors like Motivation, Attitudes, Learning and
Perceptions after being exposed to the advertisements is created. The responses or the experiences towards the
brands makes the consumer to image the brand in the mindset.
In current scenario, the going pandemic has changed the consumers consumption patterns towards the product and services. The lock down in the world had increased the purchases of the products online through e-
commerce platforms. Advertising played an essential role in promoting the products with a lot if ease and
offers, discounts or coupons to attract the consumers. Covid- 19 had made the life of some masses more comfortable in the sense that the delivery of products was also done without stepping out in the dangerous
situation.
Consumer buying patterns was different as people found it hard to believe in online shopping but Covid 19 has taught people to believe in them through online as responses, feedback's, comments also help the masses to
know about the product or service before purchasing it. The consumers have adapted a new change in habits and
preferences that may continue for a long span of time.
METHODS The study aims to understand change in behaviour pattern of consumers before, during and post Covid-19
pandemic.
Data was collected online using a structured questionnaire, between 20th January 2022 to 23rd January 2022. The questionnaire consists of question related to demographic variables like age group, gender, education,
occupation and monthly family income. A 10 pointer liker scale was to understand preferences of consumers

International Journal of Advance and Innovative Research Volume 9, Issue 1 (IX) January - March 2022
192
ISSN 2394 - 7780
related to online shopping, offline shopping, use of restaurant and bars, doing exercise or yoga and use of social
media before during and post pandemic, in this 0 means least preferred and 10 means most preferred.
Simple random sampling and snowball sampling method were used for data collection, and the respondents were contacted by sending questionnaire survey link through social media platform. A total of 100 responses
were collected. However, the response rate was low be only 30% which is a limitation in doing online survey.
Data recording was done in MS excel. Continuous data were expressed as mean + Standard deviation(SD) and
categorical variables as frequency and percentage.
RESULT Out of the 100 respondents, majority of the respondent were in the age group of 18 to 30 years (72%), slightly
higher female (56%) responses and male (44%).
A total of 70% responded combined as Graduates and Post graduates and 44% of the sample population
occupation was service. High percentage (36%) of population in the study had monthly family income above
Rs. 50,000. Complete summary is given in Table (1).
Table 1: Consumers Demographic details
Demographic Frequency Percentage
Age group
18 – 30 72 72%
31 – 40 12 12%
41 – 50 12 12%
More than 50 4 4%
Gender
Female 56 56%
Male 44 44%
Education
HSC and below 30 30%
Graduation 44 44%
Post-Graduation/Other 36 36%
Occupations
Housewife 4 4%
Self Employed 36 36%
Service 44 44%
Student 16 16%
Monthly income
Below 10,000 8 8%
10,001 to 30,000 32 32%
30,001 to 50,000 24 24%
More than 50,000 36 36%
On a 10 pointer liker scale it was observed that there was no major change in preference for online shopping in
consumers before, during and post Covid-19 pandemic; mean score is 6.48,6.48 and 6.84 respectively. We
observed a dip in preference for offline shopping, use of restaurant and bar and preference for exercising and yoga during Covid-19 but consumers had similar preference for them before and post Covid- 19 pandemic.We
also observed a very high preference for use of social media in all the three period. (Table 2)
Table 2: Preference Score before, during and post covid-19 Pandemic
Preference Score on a scale of 0 to 10
Before Covid - 19 During Covid - 19 Post Covid - 19
Mean+SD Mean +SD Mean +SD
Online shopping 6.48 +2.43 6.48 +2.81 6.84 + 2.60
Offline shopping 7.52 +2.34 4.80 +2.83 6.96 +2.71
Restaurant and Bar 6.56+3.11 3.44+2.77 5.36 +3.20
Exercising, Yoga 5.64+3.32 4.4+3.41 5.60+3.69
Social Media Use 8.16+1.54 8.68+1.52 7.88+2.15

International Journal of Advance and Innovative Research Volume 9, Issue 1 (IX) January - March 2022
193
ISSN 2394 - 7780
No significant change was observed between male and female preference for online shopping. Offline
shoppping whereas in gender during COVID- 19 had seen a downfall as compared to before and Post Covid-19.
Restaurant and Bar gender wise before Covid-19 was female dominated and during Covid- 19, it drastically fell down in both the genders whereas Post Covid- 19 it is somehow managing to get back to normal in females and
as well as males. Exercisng- Yoga also got effected during COVID- 19 in both male and female. Social Media
Usage during Covid-19 and Post Covid-19 was seen abit less as compared to be used by both male and female
during the Covid-19, (Table 3)
Table 3: Gender wise Preference Score before, during and post covid-19 Pandemic
Gender
Preference Score on a scale of 0 to 10
Before Covid - 19 During Covid - 19 Post Covid - 19
Mean+SD Mean +SD Mean +SD
Online shopping Female 6.21+2.51 6.28+3.08 6.78+2.38
Male 6.82+2.31 6.72+2.41 6.91+2.87
Offline shopping Female 7.57+2.18 4.50+2.77 6.85+2.63
Male 7.45+2.56 5.18+2.89 7.09+2.84
Restaurant and Bar Female 7.28+2.94 3.21+2.86 4.86+3.23
Male 5.63+3.11 3.73+2.66 6.00+3.08
Exercising, Yoga Female 5.92+2.84 4.07+3.11 5.21+3.70
Male 5.27+3.86 4.82+3.76 6.09+3.67
Social Media Use Female 7.78+1.71 8.78+1.67 7.78+2.02
Male 8.64+1.16 8.55+1.32 8.00+2.32
CONCLUSION
Advertisers now have a wider medium of channels then ever before to reach to the customers. Audiences are
shifting their preferences towards the product via digitally presence of the product or the service offered. Hence, the consumers are explored to more options at a time. Targeting the right audiences will help in expanding the
reach of companies by offline marketing post Covid- 19, it can be taken as an opportunity because the
consumption during Covid-19 was less but before and Post Covid-19 it was stabilized. The social media helps the users in decision-making process as it is a platform where interaction is possible. With just a click on the
link, the vistors gets all the necessary characteristics about the product which influences them towards the
brand. The restaurants and bars have suffered a lot in the Covid-19. They were allowed to resume back after long period of time and that too on 50% capacity. The market for physically going to restaurants and bar by
both male and female has been effected post Covid-19 as many prefer to order food online. The life during
pandemic Covid-19 was more relaxing to consumers as they could spend time on social media platforms where-
as offline shopping faced a lot of difficulties by the vendors because of the COVID-19 pandemic. But once the
pandemic or Covid-19 is over again masses preferred to shop via offline or physically going to the stores.
REFERENCE
1. Mr. Sony Varghese, Ms. Mansi Agrawal (2021). Impact of Social Media on Consumer Buying Behaviour .
Saudi Journal of Business and Management Studies.
2. Jinal Sameer Shah, Vipul’s Consumer Behaviour, June 2016
3. EconomicsDiscussions.net. Economics Discussion.
4. Khor Eng Tatt, (2010) Factors influencing Consumer Buying Behaviour of Luxury Branded Goods.

International Journal of Advance and Innovative Research Volume 9, Issue 1 (IX) January - March 2022
194
ISSN 2394 - 7780
SEE WHAT INDIA'S COVID 19 DATA LOOKS LIKE BY USING PYTHON.
1Mrs. Sujitha Mohan and
2Dr. Tushar Sambare
1Research Scholar, JJT University, Chudela, Rajasthan 2Assistant Professor, S. M. Shetty College, Mumbai, Maharashtra
ABSTRACT With cell culture and molecular tools, the China Center for Disease Control as well as Prevention (CDC) discovered a non-SARS nCoV pneumonia on December 12, 2019. Coronaviridae are a family of single, big, and
plus-stranded RNA viruses that may infect humans and cause colds and diarrheas. In Wuhan, a city in Hubei,
China, the majority of instances of viral pneumonia increased in 2019. Nearly every country on Earth has been
infected by the virus. The virus is thought to have been transmitted to people via touch with local fish or wild animal trades in certain sections of Wuhan. It is possible to see the information that is hidden inside a data
collection by using exploratory data analysis (EDA). It is a frequently used method for drawing conclusions
from a collection of data. Currently, the COVID-19 data set is publicly accessible via a standard dataset repository. These standard datasets may be used to produce conclusions using EDA. The appearance of data of
any kind in a graphic pattern that handles the degree of ambiguity and representation that may be handled
constitutes data visualisation. It's a feature of modern data visualisation techniques to show the connections between the information. There are several cases when a huge amount of information may be produced via the
usage of thousands of lines, specification, and links. In this paper, a deeper look into the latest data of covid-19
is presented in done with the help of the various exploratory methods and visualization tools. Python being the
best for such kind of analysis project it is chosen for its implementation.
Keywords: Exploratory data analysis, Visualization, Python Data analysis, Data Science project
1. INTRODUCTION
The current fuel for today's intelligent decision-making capabilities of smart organisations and services is rich and high-volume data with intrinsic characteristics. Crude oil is an analogy for unprocessed raw data in
comparison to the energy industry. The intelligent knowledge gleaned from raw data fuels internal combustion
engines. Extraction of meaningful insights at multiple levels will enhance the choices of different levels
throughout the business unit, analogous to the extraction of various products utilising fractional distillation for crude oil. EDA is a method that analyses a data collection in order to extrapolate relevant information. It's usual
for the process to provide the data in a visual manner, making it easier for businesses to comprehend and make
educated decisions. Data visualisation helps us highlight testing, trend, and interconnectedness, which is consistent with our approach. It is vital to do preliminary studies on data in order to uncover patterns, to detect
anomalies, and to verify hypotheses and assumptions using summary and graphical representations of the data.
2. EXPLORATORY DATA ANALYSIS The initial stage in your data analysis process is to do an exploratory data analysis (EDA) in Python.
Exploratory data analysis is a statistical strategy that uses visual ways to analyse large data sets in order to distil
their key properties. There's no doubt that this is a process in which the data is analysed, as the name implies.
3. DATA VISUALIZATION In data visualisation, data of any kind may be included in a graphical pattern to solve issues like representational
ambiguity. It's a feature of modern data visualisation techniques to show the connections between the
information. There are several cases when a huge amount of information may be produced via the usage of thousands of lines, requirements, and links. Though heat maps and fever charts lag far behind the classic
histograms and pie charts used in business graphics, these more heterogeneous representations allow decision-
makers to examine data sets for correlation or unintended trimmings. Charts, bars, and graphs are often used to show relationships between data points when a company requests them. Color schemes, words, and figures are
also available to assist. Graphics are used to depict symbols and generate links between pieces of information,
such as personalisation and animation, in the form of data visualisation.
4. DATASET DESCRIPTION On January 13, 2022, this dataset provides the most recent Covid-19 India state-level statistics. Covid in India
may be studied with the use of this dataset. Exploratory Data Analysis is a breeze with this collection. The
dataset had attributes related to-
State/UT – Names of Indian States and Union Territories are used in this attribute.

International Journal of Advance and Innovative Research Volume 9, Issue 1 (IX) January - March 2022
195
ISSN 2394 - 7780
Cases Confirmed - A total of all cases has been identified.
Total number of cases currently in progress
The total number of patients that have been discharged
Deaths For the total death toll, see
Active to Passive Ratio ( percent ) Number of current cases divided by the total number
The ratio of discharge to inflow ( percent ) - Case-to-case ratio of those who were successfully released.
Ratio of Death ( percent ) - The percentage of fatalities to the total number of cases
Inhabitants of the State/UT
5. IMPLEMENTATION
Data from the most recent kaggle covid 19 India statewide update will be used. As a result, we're going to begin
by obtaining the data set, which is highly current and intriguing. Google Colab's environment will deliver a zip file to our machine, which I've already saved as indiacovidata.zip. I'll upload it to the environment. Exclamation
unzip and the name of the data set will remove that zip file. If we refresh over here, we should be able to see
that it has this file right here. Today, we'll really be utilising the pi spark command. There are just three pieces of code that need to be executed one at a time. It takes a little time, but once it's ready, we'll put it into a spark
data frame and use df is equal to spark to achieve this. read.csv It would be nice if we could simply print the df
table if we provided the name of the file and another parameter that said inferschema was false and that header was true since we have a header in the file, so we should get a pretty SQL-like table. we've got 20 rows in our
data frame, which includes the overall number of instances per state or territory. Deaths due to active discharge
What the data set lacks is any kind of memory of the past. The active ratios are 100%, the discharge ratio is
100%, and the death ratio is 100%. Each of these columns has now been pared down to the current cases.
Fig1. Complete Dataframe output
Python does not appreciate characters with slashes or spaces in the centre, so we're simply going to create it as it is now. So that just letters are present, the names of the columns are separated by underscores. Though we'll
import functions from pyspark.sql as f,

International Journal of Advance and Innovative Research Volume 9, Issue 1 (IX) January - March 2022
196
ISSN 2394 - 7780
Fig2. Dataframe after renaming the columns
Now we can query the dataframe using spark.sql and get the required details as we generally do it in the
database. The below queries display the aggregated data of Total cases and Deaths from every state. Also we
can order the data with the sql order by command.
Fig3. Display aggregate and ordered data from the dataframe
We have then loaded the pyspark dataframe into the pandas dataframe and then applied describe function to dee the descriptive statistics. Using corr(), all columns in a dataframe are correlated in a two-way fashion. All
NA values are ruled out immediately. If a column in the dataframe has a data type other than numeric, it is
ignored.
Fig4. Pyspark dataframe to pandas dataframe

International Journal of Advance and Innovative Research Volume 9, Issue 1 (IX) January - March 2022
197
ISSN 2394 - 7780
We can then extract the hidden information from the data in the form of different types of plotting done with the
help of plotly in python. The following visualization graphs help us in easy understanding of the situation
currently of the pandemic and help us to take the actions accordingly. All the below plots like Histogram, Boxplot and Barplot help us in easy understanding of the current Covid-19 status in the Country across various
States or regions. The scatterplot can also be used to predict the death rate for the corresponding Total case
value and thus can be useful in prediction.
Fig5. Histogram displaying the Total cases, Deaths, Active and Discharged.
Fig6. Box plot displaying the Total cases, Deaths, Active and Discharged.
Fig7. Bar chart displaying the Total cases, Deaths, Active and Discharged State wise.
Fig8. Pie chart displaying the Total cases, Deaths, Active and Discharged State wise.

International Journal of Advance and Innovative Research Volume 9, Issue 1 (IX) January - March 2022
198
ISSN 2394 - 7780
Fig9. Scatterplot displaying the Death Vs Total Cases
6. CONCLUSION
From the above visualization it was noted that the Maharashtra was the state with maximum number of cases which is represented using blue colour in the pie chart and currently the maximum active cases is in the state of
Kerala which is in red colour. Thus, the study helped us to easily understand the current status Covid-19 in the
country.
7. FUTURE SCOPE
Though this article failed to implement a complete application for analysing the Covid 19 data, but through its
Analysis and the visualization techniques proved to be of very helpful in understanding the current status of the
country. Thus, the study can be further extended to generate a complete application for analysing the Covid-19
data.
8. REFERENCES
Saini, S. K., Dhull, V., Singh, S., & Sharma, A. (2020, December). Visual exploratory data analysis of
covid-19 pandemic. In 2020 5th IEEE International Conference on Recent Advances and Innovations in
Engineering (ICRAIE) (pp. 1-6). IEEE.
DSouza, J. (2020, July). Using Exploratory Data Analysis for Generating Inferences on the Correlation of
COVID-19 cases. In 2020 11th International Conference on Computing, Communication and Networking
Technologies (ICCCNT) (pp. 1-6). IEEE.
Yu, C. (2016, July). Research of time series air quality data based on exploratory data analysis and representation. In 2016 Fifth International Conference on Agro-Geoinformatics (Agro-
Geoinformatics) (pp. 1-5). IEEE.
Nasser, A., Hamad, D., & Nasr, C. (2006, April). Visualization methods for exploratory data analysis.
In 2006 2nd International Conference on Information & Communication Technologies (Vol. 1, pp. 1379-
1384). IEEE.
Chaloli, A. R., & Kumaraswamy, A. (2019, November). A Paradigmatic Approach to Exploratory Data Analysis Utilising New York’s Road Traffic to Derive Coherent Inferences. In 2019 IEEE International
WIE Conference on Electrical and Computer Engineering (WIECON-ECE) (pp. 1-4). IEEE.
Khan, S. A., & Velan, S. S. (2020, June). Application of Exploratory Data Analysis to Generate Inferences
on the Occurrence of Breast Cancer using a Sample Dataset. In 2020 International Conference on
Intelligent Engineering and Management (ICIEM) (pp. 449-454). IEEE.
Girolami, M., Cichocki, A., & Amari, S. I. (1998). A common neural-network model for unsupervised
exploratory data analysis and independent component analysis. IEEE transactions on neural
networks, 9(6), 1495-1501.
Almendra, V., & Roman, B. (2011, September). Using exploratory data analysis for fraud elicitation through supervised learning. In 2011 13th International Symposium on Symbolic and Numeric Algorithms
for Scientific Computing (pp. 251-254). IEEE.
Maurya, S., & Singh, S. (2020, November). Time Series Analysis of the Covid-19 Datasets. In 2020 IEEE
International Conference for Innovation in Technology (INOCON) (pp. 1-6). IEEE.
Arora, M., Goyal, L. M., Chintalapudi, N., & Mittal, M. (2020, October). Factors affecting digital
education during COVID-19: A statistical modeling approach. In 2020 5th International Conference on
Computing, Communication and Security (ICCCS) (pp. 1-5). IEEE.

International Journal of Advance and Innovative Research Volume 9, Issue 1 (IX) January - March 2022
199
ISSN 2394 - 7780
STUDY ON IMPACT OF SOCIAL MEDIA ADVERTISING ON CONSUMER BEHAVIOR.
1Vishwajeet Yadav,
2Roger Dsouza,
3Avani Waghela,
4Krishna Khatri and
5Rekha Chaudhary
[email protected], [email protected], [email protected], [email protected], [email protected]
Mentor
C. A. Zainab Rangwala
Bunts Sangha’s SM Shetty College of Science, Commerce and Management Studies, Powai
ABSTRACT Social media plays a vital role in marketing and creating relationships with customers. Most of the businesses
are beginning to use social media as a means of marketing. Social media is an emerging phenomenon in
business marketing and public relations (PR). Even though the speed of adaptability of social media as a marketing and PR tool by businesses is relatively low, the trend is constantly growing. Various companies are
incorporating social media in their marketing strategies to connect with their customers and prospects. Social
media can be utilized to perform different tasks of marketing and communication such as marketing intelligence, sentiment research, PR, marketing communications, customer management etc. Most experts and
authors in the area of social media marketing and PR are former online marketers who have been working in
the field since its inception. This research paper tries to evaluate the applicability of social media for corporate
marketing and PR purposes.
In recent years, social media has become ubiquitous and most important for social networking, content sharing
and online accessing. Due to its reliability, consistency and instantaneous features, social media opens a wide
place for businesses such as online marketing. Marketing which occurs via social media is known as social media marketing. Social media marketing has made it possible for companies to reach targeted consumers
easily, effectively and instantly. Besides that, social media marketing also faces several challenges in the field.
This article argues on social media marketing's advantages and disadvantages in the present era.
Keywords- Advertisements, Consumer behavior, Social Media, Target audience.
INTRODUCTION
Social media advertising is an offshoot of digital marketing where paid ad campaigns are run on.
Social media platforms reach target audiences in many different ways. Marketers and advertisers can promote their brands and inspire sales through the social channels that users frequently use. As the emergence of social
media advertising, most of the businesses have introduced their brands on social media platforms. At the initial
stages, fashion retailers use social media to build awareness towards their brands, with the time most of the businessmen have recognized the importance of social media to reach their target customers, throughout the
past decade, social media advertising has become much stronger. Social media advertising, or social media
targeting, are advertisements served to users on social media platforms.
Social media has occupied an important position as a communication tool. People across the globe use social media to connect to other people or organizations. . Social media modifies the communication methods between
sellers and buyers. E commerce influences the consumer in their purchase decision. Communication through
social media is a new platform to exchange information about product and services. The analysis of consumer behavior is the core activity for selling product and service since most consumers are using the internet and on-
line social media tools. Social media become an important media to introduce and market products and also to
do surveys. Nowadays Social media is an important marketing tool for promotional activities. Hence it becomes
necessary to perceive how Social media is affecting consumer behavior
OBJECTIVES
1. To study the impact of social media on the consumer buying decision process.
2. To identify the role of advertisement in building consumer perception.
RESEARCH METHODOLOGY
● Primary data was gathered by administering a questionnaire on 120 respondents living across the Mumbai
region. In this research an electronic survey was used. The respondents are in the age group of 13-45years.

International Journal of Advance and Innovative Research Volume 9, Issue 1 (IX) January - March 2022
200
ISSN 2394 - 7780
● The survey was shared on multiple social media platforms including Facebook groups, Instagram,
WhatsApp and other electronic media was adopted to collect information from the respondents to reach as
comprehensive data as possible and gain data from different consumers with different baselines
● Secondary data has been collected from e-journals, newspapers, books and websites.
● We have adopted a Qualitative Data analysis technique.
REVIEW OF LITERATURE
(1) Nasir S., Vel P. & Mateen H. , Social media and buying behavior of women in Pakistan towards the
purchase of textile garments (Accessed on 11-01-2022) : This article says that Social media doesn’t
continually want some language or the words to unfold the message to the consumer. Once a product and also
the services is marketed then the context is often understood by the potential vendee. On the idea of that, the buyer gives the response. It is often within the method of purchasing a product, repurchasing a product or it can
be within the style of not buying a product. So, this method is predicated on the client's knowledge and feeling
towards the merchandise brand.
(2) Godey B. , Manthiou A. , Pederzoli D. , Rokka J. , Aiello G. , Donvito R. , & Singh R , Social media
marketing efforts of luxury brands (Accessed on 11-01-2022) : According to this article, the utilization of
Social media is increasing rapidly. For the companies and therefore the selling professionals, Social media is wont to increase the attention of a couple of products and therefore the services. During this analysis paper, a
survey has been done to interpret and analyze the affiliation between Social media use, the generated content by
them on those sites. The analysis of the research provides Social media Marketing and therefore the client
shopping for behavior. The key question additionally enclosed the membership standing in different Social media sites and therefore the applied mathematics proof of however Social media makes a better impact on
client buying behavior.
(3) Barhemmati N. & Ahmad A. , Effects of social network marketing (SNM) on consumer purchase behavior through customer engagement ( accessed on 13-01-2022): founds that the best and therefore the
thriving method of advertising is Social Media selling. The study focuses on knowing the factors however the
shopping pattern of those customers amendment UN agency square measure on Social media through Social
Network selling. This study also finds the link between the commercialism activities of the businesses and therefore the client engagement and their purchase behavior. In this, a survey was conducted among the fifty
students in Malaysian National University. The results of the study shows the positive relation in between
consumer shopping behavior and Social media engagement.
(4) Four Ways Social Media Influences Consumer Behavior
(https://clootrack.com/knowledge_base/how-does-social-media-influence-consumer-behavior/ )
1. Builds product awareness: How do individuals get to understand your product? an outsized section of the audience gets to understand your whole through the content that's distributed on social media. Social media
could be a huge influence on shoppers once they are trying to make awareness of a couple of specific products.
2. Social Proof as a greater force of buying decisions: Social media has resulted within the evolution of social
proof as a bigger force for purchasing choices. Happy customers tend to praise the merchandise with likes, shares, reviews and comments on social media. Social marketers ought to have solid social proof in a variety of
case studies, images, video, interviews and influencers as a part of their marketing strategy.
3. Promotions, Discounts and Deals on Social Media: Many social media users have signed up for social media groups/forums that they're fascinated by. once customers see promotions, discounts and deals on social
media, it influences their shopping for behaviour. 64% of online customers wait to shop for things till they are
going available,
4. Social Media Influencers : More than half of shoppers request steering from social media influencers before
creating a shopping call. Consumers are likely to shop for once they get recommendations from an individual
they trust. Celebrities and well-liked individuals inspire their audience and influence their shopping for
behavior.
PRIMARY DATA AND INTERPRETATION
GENDER
Study has received 132 responses in total out of which 56.8% were Male, 43.2% were Female and no one
classified themselves in the category of others. It suggests that responses of the study are influenced by the
views of a particular gender.

International Journal of Advance and Innovative Research Volume 9, Issue 1 (IX) January - March 2022
201
ISSN 2394 - 7780
AGE GROUP
Maximum respondents lie in the age group of 15 to 25 years (75.8) which is the young population of the region.
Other respondents classified themselves into the age group of 25-35 years (9.8%), 35-45 years (6.1%), below 15
(5.3%), above 45 (3%).
OCCUPATION Majority of the respondents classified themselves as Students i.e. 75.8% and 12.1% are full time working.
Other respondents are Professionals (6.1%), Part time working (3.8%) and Homemakers (2.3%).
How Much Time Do You Spend Using Social Media [Per Day]?
According to the survey, Majority of the respondents i.e. 45.5% spend 2 to 3hrs per day on Social Media and on the other hand only 4 respondents did not use social media at all. In addition 18.9% of the respondents spend up
to 3 to 5 hours and 20.5% of the respondents use social media upto 1 hour.
Before Purchase, Where Do You Search For More Information?
Based on the opinions of the respondents, the survey found that the maximum number of respondents [109
respondents out of 132 respondents] prefer searching information on the internet before purchasing any product. Study found that Social Media provides more information with easier access and therefore majority of the
respondents chose Internet over Traditional Media. And the rest of the respondents i.e. 23 respondents still
chose traditional media for collecting information.
Do Social Media Ads Influence Your Product Choices? The study found out that most of the respondents' choices totally rely upon the influencers. In total 50.8% of the
respondents’ change their product choices after watching Social Media Ads. On the other hand 31.8% of the
respondents chose the option ‘Maybe’. and rest of the respondents i.e. 17.4% clearly voted ‘No’ as they don’t
get easily influenced by any Ads or Influencers.
Have You Purchased Any Product On Being Influenced By An Ad On Social Media?
Based on the survey, Majority of the respondents [69.8%] got influenced by an Ad on Social Media and
therefore they tend to buy that product. Social media has gained our respondents' attention easily rather than
conventional media. `And rest of the respondents chose ‘No’ as they don’t get influenced.
How Likely Are You To Buy A Product Recommended On Social Media Sites? By the responses of the respondents, Researchers found out that 57.6% of the respondents are somewhat likely
to buy products online. It seems Social Media Ads or Ads given by influencers boosts up the buying decision of
the consumers. And on the other hand 20 respondents are very likely to buy products from recommendations. 21.2% are quite unlikely to buy and rest of the respondents 6.1% clearly chose very unlikely to buy products
from sites and hence they do not get influence.
To What Extent Does The Brands Social Media Presence Influence Your Purchasing Decision?
This study shows that 37 respondents’ purchasing decision depends upon the brand’s social media presence to a greater extent. Majority of the respondents [58.3%] chose solemnly which means they rarely get influence from
the brands social media presence. Rest of the respondents i.e. 13.6% never get influenced.
Social Media Advertising Is Beneficial To Consumers Because It Provides Important Information
About Goods And Services.
Half of the respondents [50%] agree that Social Media Ads gives exact information about goods and services to the audiences. Social Media Ads are easily accessible, reliable and consumer friendly, hence most of the
consumers rely and trust social media ads. 17.4% strongly agree with the statement. 28% chose neutral 2.3%
disagreed and 2.3% strongly disagreed with the above statement.
If A Product Goes Viral, How Do You Think It Will Affect You? Based on the opinions of the respondents Researchers came to the conclusion that the half of respondents
[50.85] thinks’ to consider it as buying alternative in the future. 25% of the total respondents have an opinion
that their perception towards the buying decision might change. And on the other hand 19.7% of the
respondents chose not to buy it and 6 respondents clearly go and buy the product.
Do Social Media Ads Give The Product In Reality As They Are Demonstrated?
Maximum number of the respondents voted ‘Sometimes’ i.e. 65.2%, which means respondents are still not fully
satisfied with the product which is delivered, whereas 19.7% of the respondents are fully satisfied with the
quality, color, texture and structure etc of the product hence they voted ‘Yes’. On the Contrary 15.2% clearly
chose ‘No’.

International Journal of Advance and Innovative Research Volume 9, Issue 1 (IX) January - March 2022
202
ISSN 2394 - 7780
Which Mode Of Media Do You Rely More For Product Launch Information, Product Promotion
And Its Reviews?
Based on the opinion, Researchers found out that the majority of the respondents i.e.78% prefer Social Media
for product launch information, product promotion and reviews. As rating products and services through the Internet is very easy nowadays and also consumers who wish to buy the particular product can read the reviews
easily. On the contrary 22% still prefer Conventional media over Social Media.
CONCLUSION Our results show that social media advertising has a vital influence on consumers’ buying behavior for
selections. It also showed that social media users found social media advertisements to be easier and enjoyed
the method a lot when compared to those that used different data sources. It was also noticed that residents of
Mumbai have used numerous social media platforms in looking. Social media advertising has been verified to be the more practical methodology of selling than means of advertising like newspapers, TVs, and radio
channels. As a result, social media advertising is cheaper and easier to access and includes larger content and
data that influence client shopping for calls, than the standard media.
LIMITATION
1. The geographical scope of the study can be extended to cover pan India. Present study is focused on the
Mumbai region only.
2. The sample size of the study is not too large. Future research can be undertaken on a larger scale with larger
sample size.
REFERENCES 1. Nasir S., Vel P. & Mateen H. ,(2012) , Social media and buying behaviour of women in Pakistan towards
the purchase of textile garments
2. Godey B. , Manthiou A. , Pederzoli D. , Rokka J. , Aiello G. , Donvito R. , & Singh R , (2016) . Social
media marketing efforts of luxury brands.
3. Barhemmati N. & Ahmad A. (2015) , Effects of social network marketing (SNM) on consumer purchase
behavior through customer engagement.
4. Four ways social media influences consumer (https://clootrack.com/knowledge_base/how-does-social-
media-influence-consumer-behavior/)

International Journal of Advance and Innovative Research Volume 9, Issue 1 (IX) January - March 2022
203
ISSN 2394 - 7780
A STUDY ON ATTRIBUTES INFLUENCING CONSUMERS BUYING BEHAVIOUR TOWARDS
CONSUMER DURABLES IN MUMBAI-THANE REGION
Asst. Prof. Ashish C. Navik Assistant Professor S. M. Shetty College of Science, Commerce and Management Studies, Powai
ABSTRACT Buying is an inevitable activity of consumers. Every individual buys something or other every now and then.
The pattern of buying things depends upon various factors, and these factors differ from consumer to consumer.
Buying behaviour of consumers is influenced by various factors. Attributes like promotional offers, level of
education, Income of the consumers, emotional values, quality, social status, comfort, standard of living etc. plays an important role in buying behaviour of consumers. In this study, the researcher has tried to find out the
influence of such attributes on consumer buying behaviour with reference to consumer durable goods. For the
purpose of this study, the researcher has considered only consumer durable goods. The researcher has tried to find out the level of influence of various attributes on consumer buying behaviour. Attributes like promotional
offers, low price, emotional value, value for money, comfort, after-sales service and warranty, social status,
standard of living, quality of product has been considered for this study. Through this study, the researcher has
made an attempt to find out the level of influence by various attributes on buying behaviour of consumers.
Keywords: Buying behaviour, purchasing patterns, buying attributes, factors influencing buying behaviour,
consumer durables.
INTRODUCTION Buying behaviour of consumers is a marketing concept which evolved in the late 1950s when the need for
marketing services arose. Approaches towards various marketing concepts like production, product, selling
gained more importance. With the advancement of marketing services and upgradation of technology there came a drastic change in the pattern of purchase made by the consumers. Thus, the buying behaviour of
consumers gained more importance in the field of marketing. Marketers studied the buying behaviour of
consumers in framing various marketing strategies. Nowadays in the consumer-oriented market it has become
necessary to offer goods and services as per consumers taste and preferences. Companies ignoring the consumer preferences found it difficult to survive the market competition. Therefore, it has become necessary for the
marketers to have clarity on consumer buying behaviour.
Consumer buying behaviour refers to both commercial consumers as well as individual consumers. For the purpose of this study the researcher has considered individual consumers or households buying consumer
durable goods. Inorder to study the consumer behaviour it requires a lot of efforts, and many factors are
required to be considered. As consumer behaviour is influenced by many factors, a detailed study of such attributes influencing consumer behaviour is required to be considered by the marketers. Various factors like
cultural factors, social factors, personal factors, psychological factors and combination of these variables are
required to be considered for in depth study.
Consumers make purchase decisions based on detailed study of the available products and related services in the market. When the consumer carefully evaluates the available alternatives and makes a choice to buy a
particular product, it can be referred to as a buying decision. The process of selecting buying a particular
product can be said as buying behaviour. The decisions made for purchase of materials depend upon the needs
and wants of the consumer.
In this study the researcher has made an attempt to analyse the factors influencing buying behaviour of
consumers with reference to attributes such as promotional offers, low price, emotional value, value for money,
comfort,after-sales service and warranty, social status, standard of living, quality of product.
REVIEW OF LITERATURE As Chunawalla (2000)25, state "the behaviour of consumers in deciding to buy or use or not to use or dispose or
not to dispose of the products which satisfy their needs", While Solomon and others (2001) describe it as " the study of the processes involved when individuals or groups select, purchase, use or dispose of products,
services, ideas or experiences to satisfy needs and desires, Moreover one of the key analysis under the heading
"consumer behaviour" refers to the interaction between price changes and consumer demand too27, Consumer behaviour can be classified in many ways, but understanding the consumer's needs, wants and buying behaviour
is at the heart of delivering successful products to the marketplace.

International Journal of Advance and Innovative Research Volume 9, Issue 1 (IX) January - March 2022
204
ISSN 2394 - 7780
Schmitte (1997) argued that word- of mouth communication would be an important source of information
among educated consumers.
David L.Landon and Albart.J Della Bitta(2002) stated that, purchase decision of consumers is influenced by various factors. The major factors which influence consumer behavior are culture, subculture, social class and
personal factors.
Dodda S.William B. Monrce.Kent B.Grcewal Dhruv(1991) explained that consumers enter a stage of active information search to get product awareness. He/She tries to collect more information about the product, its key
attributes, and qualities of various brands and about the outlets where they are available.
John William felix (2002) conducted a study to recognize and identify priority of the product values attached to
consumer durables particularly refrigerated. The main finding was that the value of quantity depended on quality, durability, technology, economy, and status. Similarly, the economy was found to depend on durability
economy, status physical characteristics and guarantee Durability depended on the perception of quality,
durability technology, economy status and resale value. The value of physical characteristics significantly depends on the perception of durability, availability, technology, physical characteristics, and status.
Technology was also influenced by quality, technologic states, physical characteristics, and guarantee.
Puns and Stealin (1983) conducted studies to find out the amount of search that consumers undertake when they are in the purchase decision process. They used confirmatory factors analysis to show that high cost of
searching and good brand knowledge was associated with less search activity for new automobiles.
Nakanishi and Bettman (1975) suggest that an evaluation process may be too complex for many consumer
goods; consumers may evaluate brands on two or three key attributes and eliminate brands if they are not
adequate on any one attribute.
RESEARCH PROBLEM In the current market scenario, there is a wide range of products available at display. Along with a wide variety of products they vary in many aspects like features, quality, brand, price, offers etc. All these aspects make the
consumers think before buying. The way consumers respond to the decision for making a purchase decision is
the matter of concern for the companies offering such products. For this study the researcher has considered the
attributes influencing consumers in making buying decisions.
1. One of the factors considered for the purchase decision is age and gender. In this study the researcher has
tried to find out whether there is any relation of age and gender in making expenditure on consumer durable
goods.
2. Attributes like promotional offers, low price, emotional value, value for money, comfort,after-sales service
and warranty, social status, standard of living, quality of product are also considered for the study to
understand the level of influence of such attributes on buying behaviour of consumers.
RESEARCH QUESTIONS
Consumer behaviour depends on various factors, these include attributes like age, gender, income, social status,
promotional offers, low price, emotional value, value for money, comfort,after-sales service and warranty,
social status, standard of living, quality of product. Understanding the behaviour of consumers in making buying decisions is a difficult task. In order to find out the level of influence of such factors on consumer
behaviour, it was found necessary to undertake this study.
The question in consideration for the purpose of this study is to understand the level of influence of the above-mentioned attributes on consumer behaviour. Thus, two major factors under consideration in this study are
relation of age and gender on consumer expenditure on consumer durables and influence of the attributes on
consumer behaviour with respect to consumer durable goods.
STATEMENT OF OBJECTIVE 1. To study the factors influencing consumer buying behaviour.
2. To explore the attributes of consumer behaviour towards consumer durable goods.
3. To find out the level of influence the attributes have on consumers buying behaviour.
4. To understand the relationship of age and gender on the expenditure on consumer durable goods.

International Journal of Advance and Innovative Research Volume 9, Issue 1 (IX) January - March 2022
205
ISSN 2394 - 7780
RESEARCH METHODOLOGY
The researcher has made use of primary and secondary data for the purpose of this study. For the purpose of
conceptual understanding of the topic an extensive literature review has been made using secondary data available on the internet and work done by other scholars in this subject area. For the purpose of this study, the
researcher has collected data from primary sources using google forms as a tool for data collection.
Questionnaire was prepared and circulated to the target group for the purpose of data collection. Questionnaire contained closed ended as well as open ended questions and tools like Likert scale (5-point scale) were used for
data collection. Total of 486 responses were collected for the purpose of this study.
The study was conducted on the Individuals residing in Mumbai-Thane region, hence the population for the
purpose of this study are the residents from Mumbai-Thane region. In all total of 486 respondents were selected
randomly hence, the technique used for data collection is simple random sampling.
HYPOTHESES
1. H0 : There is no significant relationship between age & gender of a consumer and expenditure on consumer
durable goods.
H1 : There is a significant relationship between age & gender of a consumer and expenditure on consumer
durable goods.
PRIMARY DATA AND INTERPRETATION Primary data was collected using survey methods through questionnaires. Questionnaire was converted into
google form and circulated to various people through WhatsApp groups and mails among people residing in
Mumbai-Thane region. Google forms has been used as a tool for data collection. A total of 486 responses were
collected from respondents residing in Mumbai-Thane region.
The Google forms as a tool helped the researcher for ease in data collection and also in preparing summaries
and charts.
Data regarding basic information of the respondents were collected and following observation were made while
carrying out the study.
Considering the age of respondents following observations were made
Age No of Respondents Percentage
below 20 152 31.28
21-30 228 46.91
31-40 56 11.52
41-50 34 7.00
51-60 10 2.06
61 and above 6 1.23
Total 486 100.00
Source : Primary Data
From the above table it is observed that out of the total respondent’s majority (46.91%) of the respondents
belong to the age group of 21-30 years.
Considering gender following observations were made Gender wise distribution of the Respondents
Gender No of Respondents Percentage
Female 294 60.49
Male 192 39.51
Total 486 100
Source: Primary Data
From the above table it can be observed that majority of the respondents (60.49%) are female whereas the
remaining (39.51%) of the respondents are male.
Considering the amount of aggregate expenditure on various consumers durable goods following observations
are drawn
Consumer Durable Total expenditure Percentage
Refrigerator 8813100 18.06
Computer/Laptop 11986698 24.56

International Journal of Advance and Innovative Research Volume 9, Issue 1 (IX) January - March 2022
206
ISSN 2394 - 7780
Washing Machine 6236100 12.78
Television 11520800 23.61
Mixie 1251916 2.57
Air Conditioner 5894400 12.08
Dishwasher 246900 0.51
Microwave Oven 2060400 4.22
Food Processor 536047 1.10
Coffee Maker 255178 0.52
Total 48801539 100
Source: Primary Data
The above table and diagram show the total expenditure made by customers on various consumer durables
indicating the percentage of amount spent on each consumer durable. It is observed that 18.06% of the total consumer expenditure is spent on Refrigerator, 24.56% of the total consumer expenditure is spent on
Computer/Laptop, 12.78% of the total consumer expenditure is spent on washing machine, 23.61% of the total
consumer expenditure is spent on Television, 2.57% of the total consumer expenditure is spent on Mixer,
12.08% of the total consumer expenditure is spent on Air-conditioner, 0.51% of the total consumer expenditure is spent on Dishwasher, 4.22% of the total consumer expenditure is spent on Microwave oven, 1.10% of the
total consumer expenditure is spent on Food Processor, 0.52% of the total consumer expenditure is spent on
Coffee maker.
Responses of the consumers in terms of attributes influencing consumer buying behaviour following
observations were drawn. The attributes were measured using Likert scale (5-point scale) and following
responses were obtained.
The level of influence of each attribute were derived as follows
Influence
level Not at all Slightly Can't Say Moderately Extremely
Attributes 1 2 3 4 5 Total
Promotional Offer
146 (30.04%)
206 (42.39%) 30 (6.17%) 50 (10.29%) 54 (11.11%) 486 (100%)
Low Price
108
(22.22%)
234
(48.15%) 54 (11.11%) 48 (9.88%) 42 (8.64%) 486 (100%)
Emotional Value
172 (35.39%)
168 (34.57%) 88 (18.11%) 34 (7%) 24 (4.94%) 486 (100%)
Value for
Money
102
(20.99%)
194
(39.92%) 56 (11.52%) 68 (13.99%) 66 (13.58%) 486 (100%)
Gives Comfort in
life
120
(24.69%)
162
(33.33%) 60 (12.35%) 78 (16.05%) 66 (13.58%) 486 (100%)
After sale services and
warranty
115
(23.66%)
170
(34.98%) 60 (12.35%) 66 (13.58%) 75 (15.43%) 486 (100%)
Gives the
social status 174 (35.8%)
146
(30.04%) 60 (12.35%) 64 (13.17%) 42 (8.64%) 486 (100%)
Improves
standard of
living
124
(25.51%)
176
(36.21%) 46 (9.47%) 94 (19.34%) 46 (9.47%) 486 (100%)
Quality of product 98 (20.16%)
194 (39.92%) 26 (5.35%) 66 (13.58%)
102 (20.99%) 486 (100%)
From the above table it can be observed that in case of promotional offers 30.04% of the respondents are not at
all influenced, 42.39% of the respondents are slightly influenced, 6.17% of the respondents can't say the
influence level, 10.29% of the respondents are moderately influenced and 11.11% are extremely influenced. Considering the second attribute i.e. low price it is observed that 22.22% of the respondents are not at all
influenced, 48.15% of the respondents are slightly influenced, 11.11% of the respondents can't say the influence
level, 9.88% of the respondents are moderately influenced and 8.64% are extremely influenced. Considering the third attribute i.e. emotional value 35.39% of the respondents are not at all influenced, 34.5% of the respondents

International Journal of Advance and Innovative Research Volume 9, Issue 1 (IX) January - March 2022
207
ISSN 2394 - 7780
are slightly influenced, 18.11% of the respondents can't say the influence level, 7% of the respondents are
moderately influenced and 4.94% are extremely influenced. In case of next attribute i.e. value for money
20.99% of the respondents are not at all influenced, 39.92% of the respondents are slightly influenced, 11.52% of the respondents can't say the influence level, 13.99% of the respondents are moderately influenced and
13.58% are extremely influenced. Considering comfort level 24.69% of the respondents are not at all
influenced, 33.33% of the respondents are slightly influenced, 12.35% of the respondents can't say the influence level, 16.05% of the respondents are moderately influenced and 13.58% are extremely influenced. In case of
next attribute i.e. after sales services and warranty 23.66% of the respondents are not at all influenced, 34.98%
of the respondents are slightly influenced, 12.35% of the respondents can't say the influence level, 13.58% of
the respondents are moderately influenced and 15.43% are extremely influenced. The responses in case of social status it was observed that 35.8% of the respondents are not at all influenced, 30.04% of the respondents are
slightly influenced, 12.35% of the respondents can't say the influence level, 13.17% of the respondents are
moderately influenced and 8.64% are extremely influenced. In case of standard of living 25.51% of the respondents are not at all influenced, 36.21% of the respondents are slightly influenced, 9.47% of the
respondents can't say the influence level, 19.34% of the respondents are moderately influenced and 9.47% are
extremely influenced. Considering the last attribute i.e. quality of the product 20.16% of the respondents are not at all influenced, 39.92% of the respondents are slightly influenced, 5.35% of the respondents can't say the
influence level, 13.58% of the respondents are moderately influenced and 20.99% are extremely influenced.
TESTING OF HYPOTHESES- ANOVA
Model Sum of Squares Df Mean Square F Sig.
1 Regression 70876393288.88
9
8 8859549161.11
1
2.832 .004b
Residual 1492299814770.
092
477 3128511142.07
6
Total 1563176208058.
981
485
The larger the F ratio there will be more variance in the dependent variable that is associated with the independent variable. The F ratio =2.832. The statistical significance is .004-the “Sig”. So we can reject the null
hypothesis that there is no significant relationship between demographics of a consumer and expenditure on
consumer durable goods.
FINDINGS & CONCLUSION It has been observed that 57% respondents prefer to buy household consumer durable goods with a reasonable
quality. Majority of the respondents (412, 84.77%) do not prefer to buy durable goods without warranty about
300 (61.72%) respondents are stratified with the warranty period offered by the seller. The study found that
most of the customers (331) prefer to buy goods with promotional offers, especially discount offers.
It could be observed that there are certain attributes which are identified in the study as influencing purchase
decisions and satisfaction of the consumers. The manufacturers of consumer goods should concentrate on these
features as they may be the choice of a few more prospective buyers.
SCOPE OF FURTHER STUDIES
● Similar study on factors influencing consumer behaviour can be undertaken with respect to other products.
● Study can be conducted on attitudes of consumers towards marketing strategies adopted by sellers.
● Study on consumer behaviour with respect to preferred mode of payment can be carried out considering
specific categories of products.
REFERENCES ● Chunawalla, S. A., Commentary on Consumer Behaviour, M/e, (NewDelhi: Himalaya Publishing House,
2000: 1.
● Solomon, Michael R., Judith L. Zaichkowsky, Rosemary Polegato.Consumer Behaviour. Canadian Edition,
Online study guide for ConsumerBehaviour.

International Journal of Advance and Innovative Research Volume 9, Issue 1 (IX) January - March 2022
208
ISSN 2394 - 7780
● Schmitte, "Who is the consumer? Segment in the people's republic of China," European Management
Journal vol-15 pp-191 to 194.
● David.L London and Albert j. Della Bitta (2002) "Consumer Behaviour Concept and Applications" TAT
McGrace Hill, new Delhi,(4 th ed ) PP- 3-5.
● Dodda S. William B. monrce.Kent B. Grcewal Dhruv "Effect of price, brand, store information an buyers
perception at product quality and value" Journal of Marketing 28, 1991 (pp 307-319)
● John William Felix "Consumer level of perception and experience of product with reference to
refrigeration's. Indian Journal of Marketing Oct 2002 pp.6-8.
● Sundarsana Retty. G and munirajzi.M "Building brands by helping others wins" Indian Journal of
Marketing (2009) pp 21-23
● http:// www. ama. org. Ipublication.
● http://www. ama. org. Ipublication.
● http://www.bized.ac.uk/fme/2-2.
● www.wisecon.org/OnlineGuide/Glossary.htm

International Journal of Advance and Innovative Research Volume 9, Issue 1 (IX) January - March 2022
209
ISSN 2394 - 7780
RISE OF INSTANT DELIVERY APPS DURING PANDEMIC AND ITS IMPACT ON CONSUMER
BUYING BEHAVIOUR
Asst. Prof. Kalpana Rai Menon HOD - Department of Mass Media Bunts Sangha’s S.M. Shetty College of Science, Commerce & Management
Studies, Powai, Mumbai
ABSTRACT The COVID19 pandemic brought the marketplace to a standstill. Travel restrictions, social distancing, covid
protocols gave a boost to e-commerce industry. Delivery of ordered goods became a necessity and led to the
growth of delivery services. E-commerce companies, Courier companies and Food delivery Apps took
advantage of the opportunity and turned their focus on delivery services. With growth in demand for delivery services, the competition increased with many major and local players getting into the field. Cost and time
became the two differentiating factors. Instant Delivery Apps promise to deliver your daily need items in less
than 10 minutes, be it chocolate, diaper, medicine or potatoes. These convenience providing apps are changing the way consumers shop. This study aims to understand the instant delivery market in Mumbai and its impact on
the way people shop now and its scope in the future.
Keyword: Instant Delivery, Next Hour Delivery, Swiggy, Dunzo, Zepto, BlinkIt
INTRODUCTION
The pandemic brought a sudden halt to business activities, the only industry that saw an un-precedented rise
during the COVID-19 is the e-commerce industry. As per the findings of a research done by Business Standard,
(Reporter, 2021), the total e-commerce sales in India, for the year 2021 is estimated to be around $67-84 billion, up from $52.57 billion attained in 2020, and $40.44 billion in 2019. The industry is expected to see a year-on-
year growth till 2026 and beyond as consumers are getting used to the convenience of online shopping.
Reasons for this growth being the need for people to follow the new normal which is to maintain distance, buy online, frequent lockdowns that curtail movement. The environment was conducive for growth of online
business. To add to the scenario, high-speed internet and smart phones at affordable rates and online payments
made online transaction a boon for the house trapped customer, who had to cater to the house and work all
without moving out of the house.
(How COVID-19 Triggered the Digital and e-Commerce Turning Point | UNCTAD, n.d.). The excessive
demand on online commerce gave rise to the need to bring in delivery options, some business had their delivery
systems in place which required anything between 7-8 days to deliver the ordered goods. Pre-2019 consumers were comfortable with a week-long delivery timeline; pandemic brought all kinds of retail outlets to compete
with others. Due to restrictions on movement, people turned to their local stores for their requirements. Daily
essentials became the most demanded items, initially fear of lockdown made people hoard basic essentials, people let go of their brands and favourites stores and bought whatever was available. E-commerce provided the
venue for customers to buy anything and everything at their convenience in the comfort and covid-appropriate
protocol. The staples and cooking essentials led the market with a 33.9% share in 2020 (Grand View Research,
2020). Apart from groceries, dairy products, meat and vegetable are of daily needs and they have a short shell life, they cannot be stocked up. There is a constant need to resource them and hence the repeat online purchase
and delivery requirement. The online grocery market is expected to grow at a CAGR rate of 37.1 % from 2021
to 2028.
Growing e-commerce led to the increase in need for transportation service and delivery partners filled in the
niche created. There was new need created for last-mile transportation services. A big differentiating factor was
created by providing same day and, no-contact, door step delivery. Food delivery Apps got into just delivering anything anywhere as dining-in at restaurants were banned. Big Basket, Grofers and Amazon were the leaders
in e-commerce and delivery systems. Many big and local players got into the delivery business and this led to
the growth of Instant Delivery Apps. Swiggy, the pioneer in restaurant delivery is today India’s biggest food
brand with the addition of their quick delivery Instamart feature and is valued at $11 Billion. (Swiggy: Swiggy
Raises $700 Million at Valuation of $11 Billion - Times of India, n.d.)
LITERATURE REVIEW
Instant delivery Apps are services that facilitate quick delivery of items between Business to Consumer and even Consumer to consumer. Whether a restaurant wants a delivery service, or a customer wants to send a

International Journal of Advance and Innovative Research Volume 9, Issue 1 (IX) January - March 2022
210
ISSN 2394 - 7780
parcel over to a relative residing in the other part of the city the same day or one needs someone to deliver your
groceries to your doorstop because you are in quarantine- Instant Delivery Apps are the solution.
Shopping online and door step deliveries have become a new normal now. The growing demand has led to
growth of hyper local delivery service providers to speed up the delivery and cut short the waiting time.
During the pandemic, these services have picked up pace and also diversified their product offerings. For
example, while before pandemic Swiggy was a food delivery partner for restaurants, it launched Swiggy InstaMart in lockdown in 2020 with a 45 min grocery delivery time and is now offering to deliver anything to
your doorstep that too within 15-30 minutes, from fresh fruits to groceries, to diapers to medicines and even
corona self-testing kits. As mentioned in an article ‘InstaMart will address the unmet grocery needs of the 'time-
pressed' and 'convenience-seeking' consumer. Moreover, InstaMart will offer day and night services (7 am-12 am) across categories such as instant ice-creams, personal care products, medicines, stationary, fruits,
vegetables among others. (Grocery Delivery in 45 Mins?, n.d.). Zepto advertisement shows delivery of items
within 10 minutes. Grofers the second largest online grocery store has rechristened itself to BlinkIt and claims to deliver whatever you want within 10 minutes. The kind of convenience that this set up brings to the customer
at no additional cost is beyond imagination.
The rise of instant delivery business is reflected in the fact that Swiggy is the fifth start-up in India to become a Decacorn (start-up with over $10 billion dollar valuation) after raising $700 million by the Atlanta based
investor Invesco. At the top of the Swiggy business is Swiggy Instamart that has seen unprecedent growth in the
pandemic. In comparison to the gross merchandise value that food delivery business achieved in 40 months, it
has been outperformed by Swiggy InstaMart in just 17 months. (Swiggy Raises $700 Million at Valuation of
$11 Billion - Times of India, n.d.)
HOW DO THESE APPS SERVICE THE DEMAND?
For ‘next-hour delivery’ or ‘next 10 min’ delivery to happen, there is a lot of coordination required, from the moment the customer places the order, to scheduling of the order, to getting the order together and then to
delivering it to the customer by the time the customer has closed the app and started to make a cup of tea, the
delivery happens in the midst of sipping of freshly brewed tea. These apps seem to be working faster than
calling your local Kirana to drop off the grocery. To enable this precision and speed there is a need of a good ‘technology platform at the heart of the business, which allows you to automate key processes, adding speed
and convenience to your delivery model.’ (“Same-Day Delivery Apps Need More than Speed to Survive Post-
Pandemic,” n.d.). These software platforms need to integrate robotic systems, artificial intelligence to speed up the order processing. Apart from these software’s and AI’s the instant delivery network has given birth to ‘dark
stores,’ which are mini warehouses that are stocked with groceries to be delivered within 15 minutes or less.
(Kushner, 2021). These stores are not open to the customer, they are small in size, have minimum staff and are
located in prime retail areas, generally closer to consumers in order to service the 15 minutes and less delivery.
In a study done in UK on the instant delivery grocery app it was found that the sales of grocery have increased
by fifty percent during the pandemic on par with sale of food from restaurants. 35% users of delivery apps are
replacing their visit to the corner shops by these apps and 29% are replacing visit to supermarket by these apps. On a plus for the retailer, the App users would go with an established supermarket brand offering the ‘instant’
service than a new entrant in the market and 65% said they would go with an established online delivery
company rather than a new entrant in the market. (Understanding the Instant Delivery Grocery App Market in
the U.K. [New Report], n.d.)
With respect to age group that is accessing these apps, it was found the 45–54-year-old people were more
aware and also using these apps more than the less than 45 age group. With respect to gender and usage, male
respondents showed more awareness in general and across the brand names than females.
The users of instant delivery apps are predominantly from urban areas, time constrained and younger in
age.(Same-Day Delivery: Ready for a New Omnichannel Strategy | McKinsey, n.d.)
According to a McKinsey report based on a survey done in Europe, the shipping time has gone down drastically. From being comfortable with an 8 days delivery period in 2000, customers today expect their
delivery in less than a day. It was also found that 46% of the online customers abandoned their online cart if the
delivery time was long or if the information was not provided. Also if the delivery time was longer, customers preferred to go to the store.(Same-Day Delivery: Ready for a New Omnichannel Strategy | McKinsey, n.d.) Top
ecommerce companies have made same day delivery their priority, leading players in the market are focusing
on offering variety, price and convenience to the customer which is challenging for a new entrant.

International Journal of Advance and Innovative Research Volume 9, Issue 1 (IX) January - March 2022
211
ISSN 2394 - 7780
Large e-commerce players, as well as various start-ups, have identified last-mile services as a key differentiator.
In fact, the variety of delivery options and the perceived quality of the delivery service are major decision-
making criteria for online customers and hence directly affect e-commerce players’ success in the marketplace. With this in mind, vendors are working hard to offer the best customer experience possible, especially by
improving delivery times
The retail stores need to relook at their network and business model now. They need to incorporate varied channel partners, warehousing, integrated IT based system to process demand, store layout and product
availability to compete in this new instant delivery market.
Last-mile service is becoming a key differentiator in the e-commerce business. Delivery options and quality of
delivery are becoming key factors impacting customer’s online purchase. This has led businesses to better their
delivery timing and enhance customer experience.(Joerss et al., 2022).
TOP PLAYERS IN INDIAN MARKET
Swiggy invested $700Million in the express grocery delivery service Instamart. It caters to 18 cities across India and clocks over a million orders per week and plans to make its delivery within 15 minutes by January
2022.(“Swiggy to Invest $700 Million in Instant Grocery Delivery Service,” n.d.)
Swiggy had started as a food delivery app initially but has transitioned into grocery delivery during the
pandemic with Swiggy Instamart and Swiggy Genie which caters to hyper local courier delivery.
Blinkit the rechristened Grofers food delivery app boasts about 10-minute delivery of your daily essentials.
Mission of the company states “instant commerce indistinguishable from magic.” Grofers and Amazon are
almost on par in the e-grocery market, second only to BigBasket in online grocery sales (Grofers, Zomato and
the Big Online Grocery Battle, n.d.)
Dunzo a domestic delivery start-up saw an investment of $200 Million by Reliance Industries. Dunzo will
provide deliveries from Jio Mart and other local stores that market themselves on JioMart. Dunzo started in 2014 delivering anything from food to stationary for a fee. The requests from customers were accepted on
WhatsApp. The app then extended its service to retail outlets, delivering their orders for a fee. In 2021 it
launched a quick commerce vertical operation, delivering groceries within 20 mins. (India’s Reliance Enters
Instant Grocery Delivery with Dunzo Stake - Nikkei Asia, n.d.) Dunzo is the most popular app-based courier delivery service and works on similar plan like we Fast. Apart from hyper local deliveries, it also caters to food
delivery like Swiggy and Zomato. (Top 5 Apps That Offer Same Day Delivery Of Parcels & Groceries | Cashify
Blog, n.d.)
We Fast is a professional courier service provider which has partnered with restaurants and online businesses to
take care of their delivery requirements. They also buy products on demand by customers from their specified
delivery plans for business and individuals. For hyper local deliveries, i.e., ‘instant delivery.’ they charge
Rupees eight per Kilometre.
Zepto was formerly known as KiranaKart, is a pandemic baby, founded in 2020 by two 19-year-old Stanford
dropouts Aadit Palicha and Kaivalya Vohra; It came into the lime light in August 2021.(“India’s Zepto Raises
$60M for Its 10 Minute Grocery Delivery App,” n.d.)
Starting as a grocery app that provided delivery of groceries from customer selected stores within 45 minutes
and has progressed from there to catering to the delivery for e-commerce segment and now assures a 90%
success rate in delivering groceries under 10 minutes (“Five Months Into Launch, Quick Commerce Startup
Zepto Raises $100 Mn At $570 Mn Valuation,” 2021)
Other major players in the market are Zomato that caters to food delivery, Amazon, BigBasket, Reliance
JioMart, which have delivery verticals of these giant e-commerce establishments and the latest entrant Flipkart Quick.(Flipkart Quick Online Store, n.d.) It goes beyond delivery of groceries to include home appliances,
eatables, sporting equipment, electrical supplies, fresh fruits and vegetable, and the like at the doorstep within
90 minutes. Launched during pandemic in 2020 in Bangalore the service initially catered to covid related
essentials like fresh fruits and vegetables her grocery items. The service has expanded since launch to Mangalore, Hyderabad, Delhi-NCR, Nagpur, Pune and going to be introduced in Kolkata and Mumbai in a
phased manner. (“Flipkart Quick Brings 90-Minute Delivery to 6 More Cities,” 2021). Sandeeep Karwa VP-
Flipkart believes that hyperlocal service has become an imperative if one wants to enhance the “online shopping experience for consumers and boosting supply chain operations for e-commerce companies. It is important to

International Journal of Advance and Innovative Research Volume 9, Issue 1 (IX) January - March 2022
212
ISSN 2394 - 7780
explore ecosystem partnerships to strengthen such capabilities and accelerate faster, reliable deliveries to
customers,”
RESEARCH PROBLEM Before the pandemic hit the civilization, shopping was almost a recreation activity in Mumbai, people would go
to malls on weekends and spend an entire day in their shopping, eating, watching movies, etc. The pandemic
brought a sudden halt to this activity. Social distancing, isolation, health issues and government guidelines necessitated the process of shopping from home. Pandemic saw a rise in e-commerce business and also a spurt
in Instant Delivery Apps, making the process of buying very convenient and quick. With lockdown many
courier services and food delivery apps shifted focus to delivering daily essentials. Growth in players led to a
competition in reduction of delivery time, all this spoiling the customer for choice and convenience. There is a
need to study the impact of Instant Delivery Apps on the changing consumers buying behaviour.
OBJECTIVE OF THE STUDY
The study aims to achieve the following objectives
1. To study the instant delivery app market
2. To study the impact of instant delivery apps on consumer buying behaviour
HYPOTHESIS
H1: There is no relation between gender and use of Instant Delivery apps
H2: There is no relation between age and use of Instant Delivery apps
METHODOLOGY
Research Approach: A combination of descriptive and exploratory research method has been adopted as the phenomenon of instant delivery is as new as the pandemic. The descriptive analysis of secondary data is
presented to understand the working of these Apps and their journey during the pandemic and impact of
pandemic on the acceleration of their business
Data Used: Primary data collected by convenience sampling from residents of Mumbai
And secondary data sourced from research reports, newspaper articles, and online sources.
Data Collection Method: A structured questionnaire was circulated. A total of 106 responses were recorded for
analysis.
DATA ANALYSIS
The secondary data suggested that men in Europe (Same-Day Delivery: Ready for a New Omnichannel
Strategy | McKinsey, n.d.) were more familiar with the Instant Delivery apps than women.
On the basis of this information the first hypotheses was set.
H1: THERE IS NO RELATION BETWEEN GENDER AND USE OF INSTANT DELIVERY APPS
P Value 0.316133671
Degree of Freedom 1
Chi-Squared Calculated 1.004875406 Chi-Square Tabulated 3.84
Let level of significance be 5 Percent
Alpha 0.05 P VALUE >ALPHA
OR
CHI SQUARE CALCULATED < CHI SQUARE TABULATED
Therefore, we do not reject H0 at 5 percent level of significance and conclude that there is no relation between
gender and use of Instant Delivery apps

International Journal of Advance and Innovative Research Volume 9, Issue 1 (IX) January - March 2022
213
ISSN 2394 - 7780
The research proved contrary to the secondary information and it was seen that there is no significant difference
between gender and use of Instant Delivery Apps.
As per a research conducted in Europe (Same-Day Delivery: Ready for a New Omnichannel Strategy | McKinsey, n.d.) age group of 45 to 54 was more familiar with the App and were using it more than the
less than 45 year old customers. On the basis of this information the second hypothesis was set.
H2: THERE IS NO RELATION BETWEEN AGE AND USE OF INSTANT DELIVERY APPS
Age Group Total % Male Not using Female Not using
15 to 19 14 13.2 6 0 7 1
20 to 24 35 33.0 11 0 23 1
25 to 44 46 43.4 13 0 33 0
45 to 79 11 10.4 5 0 6 0
106 100.0 35 0 69 2
Analysis of Variance Results F-statistic value = 0.32623
P-value = 0.80781
H0: There is no significant difference between the use of Instant Delivery Apps among different age groups.
Alpha (LEVEL OF SIGNIFICANCE) = 0.05
Ftab (F3,4 AT 5 PERCENT LEVEL OF SIGNIFICANCE) = 6.591
Fcal < Ftab (or p-value > alpha)
Therefore, we do not reject H0 at 5 % level of significance.
H2 There is no relation between age and use of Instant Delivery apps is accepted.
WHICH OF THE FOLLOWING DELIVERY APPS HAVE YOU HEARD ABOUT?
Name of the
App
No of respondents who
have heard about it
Percentage Used the
app
Percentage
Swiggy 98 92.5% 52 49.1%
Flipkart 96 90.6% 84 79.2%
Big Basket 91 85.8% 61 57.5%
D Mart 81 76.4% 57 53.8%
Grofers 68 64.2% 28 26.4%
Dunzo 53 50% 33 31.1%
Blinkit 30 28.3% 8 7.5%
Amazon 18 16.98% 14 13.20%
Zomato 6 5.6% 7 6.60%
Zepto 5 4.71 2 1.9%
WeFast 3 2.83
Swiggy was the most popular delivery app that respondents with 92.5 % of the respondents acknowledging its
presence, however only 49.1% had used the app. Flipkart stood at second position in terms of awareness with 90.6% responses and at number one in terms of conversion as 79.2 % of respondents had used the app. Big
Basket awareness was at third position with 85.8% response and second position in terms of usage with 57.5%
respondents having used the app. D Mart position with respect to awareness was at fourth position with 76.4%
and it stood at third position in terms of usage with 53.8% response. Grofers at 64.2% in terms of awareness and 26.4 % in terms of usage. Dunzo at 50% for awareness and 31.1% for usage and so on. Other brands that
respondents recalled were Blinkit, Amazon, Zomato. Zepto, WeFast ,1mg, Healthmug, Ajio, Meesho, Myntra,
RaipdBox, Jio Mart, Starquik, Borzo are other names that featured in the response for Delivery Apps.
FOR A QUESTION ON WHETHER RESPONDENTS USED INSTANT DELIVERY APPS FOR
THEIR PURCHASE
Response Total responses Percentage
Yes 37 34.9%
No 26 24.5 %
Sometime 43 40.6%
Total 106 100%

International Journal of Advance and Innovative Research Volume 9, Issue 1 (IX) January - March 2022
214
ISSN 2394 - 7780
Considering regular and occasional purchase, majority of the users, 80 out of 106 respondents use Instant
Delivery Apps for their purchase.
PRODUCTS ORDERED ONLINE
Product purchased No. of responses Percentage
Grocery 91 27%
Food from restaurant 96 29%
Fresh Vegetables 54 16%
Medicines 51 15%
Courier service 36 11%
Others 7 2%
335 100%
Maximum products sourced through instant delivery app was food from restaurants with 29% followed by 43%
who bought grocery and fresh vegetable, 15% bought medicines on instant delivery app.
IMPORTANCE OF DELIVERY TIME TO CONSUMER
Option Responses Percentage
I would like the delivery to be made within 30 minutes 32 30%
I can wait for about 2 to 3 hours 18 17%
I am OK with delivery by end of the day 21 20%
I don't mind waiting till next day 35 33%
Total 106 100%
47 % of respondents wanted the delivery of their order within a few hours, 20 % were comfortable with same
day delivery and 33 % were also open to next day delivery.
IMPORTANCE OF DELIVERY TIME
Option Responses Male Percentage Female Percentage Total
Percentage
I would like the
delivery to be made
within 30 minutes
32 10 31.25 22 68.72 30%
I can wait for about
2 to 3 hours
18 6 33.33 12 66.66 17%
I am OK with
delivery by end of the day
21 9 42.85 12 57.14 20%
I don't mind
waiting till next
day
35 10 28.57 25 71.42 33%
Total 106 35 71 100%
About 47% of customers were comfortable waiting for a few hours for the delivery. About 33% did not mind
waiting for the delivery till the next day. This suggests that immediate delivery has not caught up with all
customers yet.
CONSUMER PERCEPTION TOWARDS INSTANT DELIVERY APPS
Consumer was asked to relate to the following statements with respect to the use of Instant Delivery Apps.
Options No of responses Percentage
Apps help save time 63 59.54%
By using the apps, I don't feel the need to go out personally to
buy daily needs items
61 57.54%
I can order items of any value 48 45.03%
I get huge discounts on my purchase 46 43.4%
I get delivery of urgent supplies within 30 minutes 39 36.8%
I have started buying more items through these apps now 38 35.8%
I get cashbacks on my billing amount 38 35.8%
I can’t imagine going to a crowded shop again and waiting in 30 28.3%

International Journal of Advance and Innovative Research Volume 9, Issue 1 (IX) January - March 2022
215
ISSN 2394 - 7780
line to get my daily essentials
I like the act of personally going out to shop 24 22.6%
I am not comfortable with online transaction 6 5.7%
I have my fears about making online payments 3 2.8%
I do not trust the Apps 3 2.8%
Close to 60% consumers acknowledged the fact that it helps save time and cuts down on the time taken to
procure daily essentials. About 45 % of consumers were aware of the option of no minimum order value. 43
percent of the consumers were delighted with the discounts offered on the apps, leading to lower cost of purchase. 36.8 percent of consumers were happy with the less than 30 minute delivery time and about 35.8
percent said they had started buying more items through the apps. 28.3 % respondents were sceptical about the
being able to go in crowded shops and wait in line to pay bills again. 22.6 percent of customers were keen on resuming their pre pandemic shopping activity and about 5 percent of customers had security concerns with
respect to payment online and data sharing.
WILL YOU USE INSTANT DELIVERY APP AFTER PANDEMIC?
Response No of responses Percentage
Yes 84 79.2%
No 19 17.9%
Maybe 3 2.8%
TOTAL 106 100%
An overwhelming majority of 79.2% respondents will be using instant delivery apps post the pandemic also,
this suggests a change in buying habit of consumers.
CONCLUSION
The pandemic is instrumental in the rapid growth of the e-commerce industry in the past three years which had led to the growth of related services, Instant Delivery Apps being one of them. These apps have bought about a
lifestyle change for customers which last past the pandemic too. These Instant delivery apps are providing
seamless convenience to the customer. In the age of social media and metaverse, the consumer is getting used to
instant gratification and instant delivery apps are adding to the scope of convenience. About 50 percent of
consumers were getting used to expecting their orders delivered within a few hours of placing the order.
Groceries, food, medicines, fresh fruit and vegetables were the most ordered items through the instant delivery
apps.
The extra time that a consumer gets by cutting down on physical travel in sourcing products for use can be spent
on quality time and activities at home.
A majority of consumers have responded that they would continue with online shopping even post the pandemic. The study also suggests that consumers may find it challenging to get back to shopping in
overcrowded shops once again post the pandemic. This would mean that retail outlets would have to offer
incentives to consumers to come to the store.
The study revealed that there is no significant different in the use of app by consumers from different age groups and gender. Consumers valued the time saved on the buying process by using these apps. The study also
identified some of the cause of concern for consumers like online payments, sharing of information and the
need to visit stores personally to shop.
SUGGESTIONS
● Consumers have their inhibitions about using online payment methods and therefore there is a need for these
apps to offer cash on delivery and multiple payment options without having to fill elaborate details.
● More awareness needs to be created about the items that can be bought as not many people were aware the
options.
● Only about 45% of the consumers knew about the ‘no minimum order value’ provision. This is an important
feature of these apps and should be highlighted. Traditionally consumers are used to ordering from the local Kirana, which make home deliveries only on a minimum order value and that too after a couple of hours and
mostly never on time. This comparison can be used as the unique selling proposition for these apps.

International Journal of Advance and Innovative Research Volume 9, Issue 1 (IX) January - March 2022
216
ISSN 2394 - 7780
LIMITATIONS
The primary data collection was done using convenience sampling and may not reflect a more diverse audience.
Instant delivery apps are a recent phenomenon and there is little to demarcate the boundary of operation of e-commerce delivery and Instant app delivery systems. There are other limitations of geographical area and
number of respondents who could be contacted for the survey.
FURTHER SCOPE OF RESEARCH As consumers are getting used to the convenience of shopping from home and getting things delivered almost
instantly, these services will grow. Future research can be done on the feasibility of local players in the market.
Another scope of research can be the impact of these delivery apps on the business and profitability of brick-
and-mortar stores. The study has also identified the lack of research done on impact of these apps on the socialisation process as such, as with offline mode, specially in Mumbai city, families made shopping a
weekend recreation affair. People planned, travelled, met strangers has a social exchange which is totally absent
from the online purchase and delivery system. While convenience is one aspect of the scenario, the undesirable consequence of isolated shopping is also mindless shopping and may have an effect on the socialisation and
health aspect of consumers.
REFERENCES
Five Months Into Launch, Quick Commerce Startup Zepto Raises $100 Mn At $570 Mn Valuation. (2021, December 21). Inc42 Media. https://inc42.com/buzz/five-months-into-launch-quick-commerce-startup-
zepto-raises-100-mn-at-570-mn-valuation/
Flipkart Quick brings 90-minute delivery to 6 more cities. (2021, April 21). The Indian Express.
https://indianexpress.com/article/technology/tech-news-technology/flipkart-quick-will-now-bring-90-
minute-delivery-to-6-more-cities-7283638/
Flipkart Quick Online Store: 90 Mins Delivery. (n.d.). Flipkart.Com. Retrieved January 25, 2022, from
https://www.flipkart.com/flipkartquick-hyperlocal-campaign-store
Grand View Research. (2020, December). India Online Grocery Market Size Report, 2021-2028 [Market
Research & Consulting]. Https://Www.Grandviewresearch.Com/Industry-Analysis/India-Online-Grocery-
Market. https://www.grandviewresearch.com/industry-analysis/india-online-grocery-market
Grocery delivery in 45 mins? Swiggy to launch new service, InstaMart. (n.d.). Business Today. Retrieved January 24, 2022, from https://www.businesstoday.in/technology/news/story/grocery-delivery-in-45-mins-
swiggy-to-launch-new-service-instamart-269689-2020-08-10
Grofers, Zomato and the big online grocery battle. (n.d.). The Economic Times. Retrieved January 26,
2022, from https://economictimes.indiatimes.com/tech/newsletters/morning-dispatch/grofers-zomato-and-
the-big-online-grocery-battle/articleshow/83967806.cms
How COVID-19 triggered the digital and e-commerce turning point | UNCTAD. (n.d.). Retrieved January
24, 2022, from https://unctad.org/news/how-covid-19-triggered-digital-and-e-commerce-turning-point
India’s Reliance enters instant grocery delivery with Dunzo stake—Nikkei Asia. (n.d.). Retrieved January
22, 2022, from https://asia.nikkei.com/Business/Retail/India-s-Reliance-enters-instant-grocery-delivery-
with-Dunzo-stake
India’s Zepto raises $60M for its 10 minute grocery delivery app. (n.d.). TechCrunch. Retrieved January 25, 2022, from https://social.techcrunch.com/2021/10/31/indias-zepto-a-10-minute-grocery-delivery-app-
founded-by-two-19-year-old-stanford-dropouts-raises-60-million/
Joerss, M., Neuhas, F., & Scroder, J. (2022, January 26). How customer demands are reshaping last-mile
delivery | McKinsey. Https://Www.Mckinsey.Com/Industries/Travel-Logistics-and-Infrastructure/Our-Insights/How-Customer-Demands-Are-Reshaping-Last-Mile-Delivery.
https://www.mckinsey.com/industries/travel-logistics-and-infrastructure/our-insights/how-customer-
demands-are-reshaping-last-mile-delivery
Kushner, L. (2021, December 7). The Dark Side of 15-Minute Grocery Delivery. Bloomberg.Com.
https://www.bloomberg.com/news/articles/2021-12-07/what-instant-delivery-services-could-do-to-cities

International Journal of Advance and Innovative Research Volume 9, Issue 1 (IX) January - March 2022
217
ISSN 2394 - 7780
Reporter, B. S. (2021, October 7). Indian e-commerce sales could grow by up to 60%, hit $84 bn in CY21:
Study. Business Standard India. https://www.business-standard.com/article/companies/indian-e-
commerce-sales-could-grow-by-up-to-60-hit-84-bn-in-cy21-study-121100700644_1.html
Same-day delivery apps need more than speed to survive post-pandemic. (n.d.). TechCrunch. Retrieved
January 25, 2022, from https://social.techcrunch.com/2021/07/27/same-day-delivery-apps-need-more-
than-speed-to-survive-post-pandemic/
Same-day delivery: Ready for a new omnichannel strategy | McKinsey. (n.d.). Retrieved January 22, 2022,
from https://www.mckinsey.com/industries/retail/our-insights/same-day-delivery-ready-for-takeoff
Swiggy: Swiggy raises $700 million at valuation of $11 billion—Times of India. (n.d.). Retrieved January
25, 2022, from https://timesofindia.indiatimes.com/business/india-business/swiggy-raises-700-million-at-
valuation-of-11-billion/articleshow/89103923.cms
Swiggy to invest $700 million in instant grocery delivery service. (n.d.). TechCrunch. Retrieved January
22, 2022, from https://social.techcrunch.com/2021/12/02/swiggy-to-invest-700-million-in-express-
delivery-service-instamart/
Top 5 Apps That Offer Same Day Delivery Of Parcels & Groceries | Cashify Blog. (n.d.). Cashify.
Retrieved January 24, 2022, from https://www.cashify.in/top-5-apps-that-offer-same-day-delivery-of-
parcels-groceries
Understanding the Instant Delivery Grocery App Market in the U.K. [New Report]. (n.d.). InMobi.
Retrieved January 22, 2022, from https://www.inmobi.com/blog/2021/11/18/understanding-the-instant-
delivery-grocery-app-market-in-the-u.k-new-report

International Journal of Advance and Innovative Research Volume 9, Issue 1 (IX) January - March 2022
218
ISSN 2394 - 7780
A STUDY ON “SUBMARINE / UNDERWATER NETWORKING TECHNOLOGY FOR
COMMUNICATIONS: BOON OR A CURSE”
Anita Charles
Mentor
Asst. Prof. Vinay Shahapurkar
Bunts Sangha’s S.M. Shetty College of Science, Commerce & Management Studies, Powai
ABSTRACT
In this era of living, technology has set its benchmark to the sky as the development and technology both go
hand in hand in a parallel and simultaneous manner but also it comes with its demerits of affecting nature , in our case it is the water /oceans/seas. Not only the water but the creatures in it are also getting harmed. We
should also be concerned about how difficult it could be when some of the cable gets damaged due to natural
environmental calamity or due to the attack of marine life on the cables as they are unaware of it which
eventually leads them to bite or destroy it.
It is quite obvious that the sea bed is not stable and keeps on moving due to water waves that’s been induced
inside it and so the cable below the oceans are also unstable and sometimes it may lead to floating of cables over the water. The Internet in today’s world is known as widespread information infrastructure as it has been
used by a large population and also been known for its broadcasting capability, information distribution and a
medium for communication between people and their computers devices irrespective of geographic location,
areas and places.
The Internet plays a crucial function in the communication world. An estimated one-third of the world's
population is online now, a proportion that is sure to grow and the count is still ongoing. More users ultimately
results in more devices that are eventually connected to networks and more data-heavy services to ride and pass over the pipes are causing a “bandwidth explosion”. The bandwidth demand is growing faster than the
capacity to deliver it due to the increasing population.
With the latest update with the current data 99% of the data traffic that is crossing oceans is carried by
undersea/submarine cables. These submarine cables are made up of fibre optic technology. Submarine power cables (SPC) have a great impact on marine life as the continuous transmission of the data flow creates noise
and also a magnetic field around the area which leads to an uncertain environment for the aquatic beings.
Keywords: Submarine cables, submarine power cables (SPC), bandwidth explosion, fibre optical technology,
submarine line terminal equipment (SLTE), power feed equipment (PFE)
Rationale and Gap Analysis
This research paper confronts the area of technology where communication is taken forth as a priority with the help of nature that is none other than the oceans. Deep beneath the oceans these cables have been situated. Now
many of the research papers have been published under the concern whether this technology is to be a boon for
people to be connected to each other over and across oceans or is it a curse for the marine life and nature under
the oceans.
According to the research done by the publishers, the part or the gap that is lacking back whether this
technology is favored in its merit or demerits. Though it is having a lot of benefits coming along with it, so
come the drawbacks. Reviewing the relevant research paper things that have been covered is its advantage and
the ease of communication.
Some research papers also emphasized on how it’s affecting life deep down the oceans and seas. Many call it
“Clouds Deep in the Sea: The Infrastructural Inquiry of the Internet” by Shih-che Tang from Taiwan National Chung Cheng University that was published at academia.edu , where the internet is been given an
appreciation that became possible for communication with the help of the submarine cables. There it is referred
as “the Internet fully manifested itself as a socio-technical system”.
“Protecting hidden infrastructure: The security politics of the global submarine data cable network” another research paper published by Christian Bueger University of Copenhagen that addresses the security and
the protection for the data cables in oceans that’s to be protected , also noted three narrow literatures, study the
cables:

International Journal of Advance and Innovative Research Volume 9, Issue 1 (IX) January - March 2022
219
ISSN 2394 - 7780
1) As under threat from terrorism, or treat the cable network
2) Technical
3) Regulatory problem
Many more research papers have their own perspective regarding this field of technology. But the aim here to
publish this research paper is to come to a bottom line whether it is to be favoured on the looks of its benefits or
on its destructions that’s not quite been visible yet.
Questions that are to be answered are:
How reliable is this technology?
Are we not affecting the under-water life just for the sake of our better communication?
If there’s any technical issue with the cable while transmitting then is it easy enough to be resolved? and is it
safe for the people operating the issue under oceans?
All the above queries have a relevant answer to it and these answers have been analysed through reviewing and
studying applicable research views.
OBJECTIVES
This paper evaluates the necessary objective and purpose of the submarine underwater cables in two concerned
and focused areas along with its advantages and disadvantages
1. To know how important this technology has proved itself for the vital purpose of communication over
oceans.
2. To study the effect on the nature and environment living beneath the water.
3. to understand its future scope and also the harms in the environment it’s been placed in.
4. To study the different alternatives other than the water ways for communication and its best use.
5. To study the ease and difficulty to install and repair cables under some technical issues.
INTRODUCTION As per the recent study , there are 15 subsea cables (17 if we count Seacom and MENA as they are considered
separate cables) landing in 15 cable landing stations in 5 cities across India that
are in Mumbai, Chennai, Cochin, Tuticorin and Trivandrum.
The most common use of this technology is to communicate about what’s happening in one part of the world to another part, but we've morphed that to allow technology to exist in multiple countries at the same time, to
enhance the performance and use of it.
According to the research the first commercial cable was laid in 1850, when the English Channel Submarine Telegraph Company laid a telegraph cable between England and France. After a while it was cut weeks later by
fishermen unknowing, thinking that it was seaweed. But now in today’s time there are more than 400 subsea
cables in operation. Some connecting nearby islands can be shorter than 50 miles long in length.
Unfortunately, where the world is getting developed and reaching its height, Antarctica is the only continent not
yet reached by a submarine telecommunications cable, though one is reportedly being considered to improve
connectivity for researchers in the region.
It is said that traditionally, submarine line terminal equipment (SLTE) and power feed equipment (PFE) of a submarine cable system were installed at the cable landing station. And as we know more the population keeps
on increasing so does the capacity on existing cables is always increasing. Google’s Virginia-to-France Dunant
cable is currently the largest capacity cable, capable of 250 terabits per second.
Some of the accidents that took place where cables where damaged are:
● In August, the Vocus Australia Singapore Cable was broken in 'multiple locations at challenging depths' off
the coast of Perth, Australia. Though Vocus never officially declared the cause, the cable was rumoured to
have been broken by a ship’s anchor. The cable was repaired and declared operational 12 days later.
● In January 2020 two subsea cables off West Africa were damaged by undersea mudslides potentially caused
by flooding in the Congo river.
Cables can be broken by natural events too.

International Journal of Advance and Innovative Research Volume 9, Issue 1 (IX) January - March 2022
220
ISSN 2394 - 7780
RESEARCH METHODOLOGY
● For having research on chosen field of area, the research was carried out by mainly two modes they are as
follows:
● The most basic and initial for having started with research was taking surveys from people and the public
that were targeted from the age group above 15+yrs. The crowd people who come under were students and
some were professionals working people
The reason to pick out these people was that they are well known with the world of internet and are more active.
According to a survey that was taken in Distribution of internet users in India 2019 around 54 percent of the
Indian internet user base was between 20 and 39 years old according to a survey conducted in 2019. People over the age of 40 formed the lowest share, while youngsters in the age group of 12 to 15 years made up about 14
percent share of the total internet user base. Among the total internet users in India, it was found out that around
70 % users were male and only about 30 % were female users. While this was expected to change to 60 % male
users and 40 % female users by 2020, as we see though development and technology being equally divided in
human genders but still there is imbalance in the usage of the same.
● The second forth most step of research was analysing, examining, exploring and evaluating the previously
published journals, research papers understanding the exploration areas. The gaps of unreviewed areas that
need to be lightened up are being analysed.
Hypothesis
According to the present study hypothesis are been made they are as follows:
H1: People are not fully aware about submarine networking technology.
H2: Marine underwater life has been affected.
H3: Possibility of technical and its difficulty to resolve it.
H4: Natural calamity can damage the cable.
H5: Unknowing aquatic plants can attack the wires which will turn out in disturbance of transmission of data.
Preliminary work / survey analysis
A survey has been conducted to study the human knowledge on the technology that is being
used by the waterways beneath the oceans. Survey was meant to be conducted to have an overview and a clear
view of the amount of people being aware of it. Information out of it has been collected from the respondents
for the further study of the same. Questionnaire was incorporated according to the basic human understanding
knowledge and no jargons were used that would make them fall in dilemma.
A total count of 72 responses was acquired and the respondents were of the age group of 15+ yrs. As these
groups of individuals have proved to be more active in the case of the new technology and also it is very much
essential to make them aware of how this internet travels and what all have been faced during this process of
traversing.
Are you aware of underwater/submarine cable
under deep oceans?
➔ Here 88.9% of the crowd of people know
about the submarine cables,whereas 11.1%
are not aware of it.
Do you think because of this cabling in deep water are we more connected to people across
nations?
➔ Here 91.7% of individuals think that the technology of submarine cable makes them
more connected to others across oceans and
8.3% are disagreeing the same.

International Journal of Advance and Innovative Research Volume 9, Issue 1 (IX) January - March 2022
221
ISSN 2394 - 7780
Are these cables safe enough beneath oceans?
➔ In this 65.3% are agreeing the safety of the
cables being placed under water and 34.7% are disagreeing.
Are cables more stable in water? ➔ Here 63.9% of people are believing that the
cables are stable enough under the water but
36.1% are objecting the same.
Can satellites be a direct alternative for these
submarine cables?
➔ Satellites being an alternative option for the same communication has been agreed by
16.9% people and 12.7% are disagreeing
,whereas 70.4% people don’t think either of them.
Do you consider the submarine cables as a
highway of communication through oceans?
➔ 84.5% are agreeing on the term the
submarine cable has been named but 15.5% are disagreeing.
Does natural calamity have an affect on these cables?
➔ In this 74.6% individuals are accepting the
fact that natural calamity does affect the cable’s stability but 25.4% are disagreeing.
What are the barriers that the technicians need to
face to repair the cables that have been
damaged?

International Journal of Advance and Innovative Research Volume 9, Issue 1 (IX) January - March 2022
222
ISSN 2394 - 7780
Is it affecting marine /aquatic life in
oceans?How?
Expected Outcome People now have been addicted and got used to the changing world and technology at the
same time, so they have adapted the internet without knowing its effect on the environment and also on humans too. Many companies around the globe have made this up a business of investing as it’s been a backbone of
nations economy. The most usual and the common fact that we all know is that no technology stays constant for
a longer period of time. Technology gets upgraded or gets outdated either of them ,coming to submarine cables it does have pros and cons along with it and though how much it is a successful technology that has been able to
connect people it lacks back for disturbing the environment and also is not fully reliable.
However, this technology is surely growing, which indeed is contributing to the development of the nations ,but
so will the consequences of this technology grow together. According to many researches made by people specially known in their field have believed to have an alternative to it. So that the amount of effect these
cables are having on the environment reduces down.
Satellites are already being used for communication ,but still we are spending the nation's economy on these cables. Obviously it did make people connected overseas ,but then why aren’t satellites being used for the same
purpose?. According to some reports ,there are more than 350 submarine cable systems spanning over 1.2
million kilometers that too are connected very closely to over 100 countries, and most of them remain largely
hidden for most of their span.
Evolution:- It has been noticed that the international communications that have enabled every form of
globalization, and the data travelling superhighways that connect the countries, regions, nations and continents
would not have been possible without rapid development of submarine cables in the last two decades.
Benefits to The Society The effect that the cable is providing to society and the environment is quite obvious ,but using alternative
forms of communication technology can definitely make some difference to society. This research shows a clear idea about the technology that we are all so familiar with is actually a threat to society. As per the survey
analysis ,people are familiar with the fact of cables buried beneath the oceans and are quite friendly with the
technology that is being used.
This research shows the satisfaction of knowing the things around the globe ,also beneath the water. It can motivate and encourage people to know more about the same and make themselves updated ,it also shows all
the timely information.
This can also stimulate and inspire the experts in the field of technology to find more alternatives with less effect on the environment and also be useful and reliable to people around nations. Also it is helpful for people
looking forward to research in the same field of technology, and can refer to this research proposal for their
research studies.
CASE STUDY
According to some recent reports, Reliance Jio company is planning to install around two submarine cable
systems connecting countries like Singapore and Europe, taking high bandwidth connectivity from the US’s
western and eastern coasts ,that is allowing higher data speed to Indian users. And they have established the significance of undersea systems that would offer direct access to innovation centres and hubs to deliver low
latency and high reliability that are necessary for cloud and platform-driven digital applications and all the
required services.
● Also it has been found out that these cables have faced security issues in terms of locating them and does
become troublesome ,as these submarine cables are widely spread over beneath the oceans. This can also

International Journal of Advance and Innovative Research Volume 9, Issue 1 (IX) January - March 2022
223
ISSN 2394 - 7780
turn out difficult for local ship travellers or people who usually voyage overseas ,can eventually damage the
cable accidentally unknowingly .But this problem can be resolved by making relevant and appropriate maps
that can be easily explanative enough for people to locate regions where cables are placed.
● RTI is one of the companies that owns submarine cable that has been spreaded over 38,110 kilometres(to be
precise), that is almost interconnecting 7 cities, landing in 4 countries, connecting to 3 continents and
residing in 2 hemispheres.
● One of the incidents that took place near Taiwan ,a powerful earthquake, had occurred which caused the
shut off international phone and Internet service for the Far East just after Christmas. As per the news ,five
repair ships have been send and working was continued on the damaged undersea cables
● According to new research, the submarine cables that have been installed in Scotland (north sea) may be upsetting the behavior of the commercially valuable brown crabs, otherwise known as the edible crab and
are quite in demand .But these electrified submarine cables could have odd and unexpected effects on
seafloor life.
● With its merits and demerits as per the study,there's a lot of renewable energy off the coasts in strong ocean
winds and waves. Submarine power cables have potential to transport offshore energy back to land, but
researchers are just starting to understand how these cables might influence marine ecosystems. But then they found out that, when the electricity runs through the power cables, they release an electromagnetic field
that several marine creatures can feel and is very much effective.
● Recent updates from the news report that an undersea submarine cable connecting volcano- and tsunami-hit
Tonga with the rest of the world will take at least a month(around 4 weeks) to repair, according to the new zealand foriegn minister . A repair ship directing its way from neighbouring Papua New Guinea has come
for the resolution.
FUTURE SCOPE The research proposal covers the area of research in technology where submarine cables are being used for
connecting people from around the world. It also summarizes how these cables are effective when coming with
its advantages. Researchers can explore more over this field of research, study more about its positive
alternatives that cause less destruction to nature. This can help and make researchers encourage for driving the attention of technical and as well as non technical people for making the necessary changes and innovating new
ways of recreating the communication in an effective manner.
This can help to anticipate the future that is to come up with its benefits and also its drawbacks. The current report addresses all the problems that have been faced with technology and the way it is used. This can be taken
forward and find solutions to unanswered questions.
LIMITATIONS This research is limited upto some extent ,as future events that are to come up are unaware and the research
paper can give an idea for getting precautions before it gets worse. The barriers that are now seen can be
explored and opened up by upcoming researchers who can make this study more in depth.
As the advantages and disadvantages are both being exposed in the research proposal ,it makes things more familiar than what we knew before. The validity of this research can be extended overcoming the barriers and
limitations that are currently present.
Limitations can be investigated and inspected but keeping the main motive and goal at its priority. The study shows how the technology we are using is harmful for other living creatures and also how tough it is to resolve
the issue related to technical problems as it is placed deep beneath the oceans.
CONCLUSION The research study that has been covered makes people convenient enough to understand the technology and
also accepting that the technology also can have flaws along with it. The problem and struggle the life beneath
the oceans bears is not even aware by outside people,hence to make them know what all is being faced and what
all is being ignored is prime and foremost information that must be exposed to all.
No doubt cables have made communication and the power of conveying information very efficient ,but then it is
not totally reliable .Any natural cause can create destruction to the cables. Also the marine life can attack it
unknowingly thinking of their prey or foe and eventually lead to damage and leak/cuts in the cables.

International Journal of Advance and Innovative Research Volume 9, Issue 1 (IX) January - March 2022
224
ISSN 2394 - 7780
Therefore,it becomes a very important and supreme point of discussion and research in the area of technology to
prevent future harms.
REFERENCES / BIBLIOGRAPHY
https://en.wikipedia.org/wiki/Submarine_communications_cable#Security_implications
https://economictimes.indiatimes.com/tech/internet/rcom-to-build-600-mn-submarine-
cable/articleshow/62521690.cms?from=mdr
https://slate.com/news-and-politics/2007/01/how-do-you-fix-an-undersea-cable.html
https://www.submarinenetworks.com/en/insights/an-attempt-to-identify-emerging-trends-in-submarine-
cable-systems
https://www.bbc.com/news/technology-60069066
https://hakaimagazine.com/news/brown-crabs-are-attracted-to-undersea-power-cables/
https://www.datacenterdynamics.com/en/analysis/what-is-a-submarine-cable-subsea-fiber-explained/
https://blog.viavisolutions.com/2020/11/25/overcoming-the-challenges-of-submarine-fiber-optic-cables/
https://www.ndtv.com/world-news/damaged-undersea-cable-that-could-isolate-tonga-will-take-month-to-
repair-2716169

International Journal of Advance and Innovative Research Volume 9, Issue 1 (IX) January - March 2022
225
ISSN 2394 - 7780
IMPACT OF SLEEPING PATTERN ON LIFESTYLE: A STUDY OF COLLEGE STUDENTS IN
MUMBAI
1Dipesh Patel,
2Pooja Devadiga,
3Aryaan Shaikh,
4Ekta Kale
Mentor
Asst. Prof. Preeti Matharu
1-5Bunts Sangha’s S.M Shetty College of Science, Commerce and Management Studies
[email protected], [email protected], [email protected], [email protected]
ABSTRACT The main aim of this paper is to study the sleeping pattern of the college students and determining the
relationship between the academic performance and the sleeping pattern of the students. A questionnaire that
evaluates their sleeping pattern and measures the effects of lack of sleep was designed and was distributed
among the college students. The sample of this study consists of 100 students.
The results of the study indicated that lack of sleep can make one feel demotivated and tired throughout the day
which in turn results to a dip in their productivity. Sleep deficiency results to lack of concentration which in turn affects the academic performance of the students. It also seems that lockdown following by Covid-19
pandemic has changed student’s lifestyle by increasing students screen duration and even sleep duration and
pattern.
Keywords: Academic performance, evaluate, distribute, concentration, lockdown, screen duration, sleep.
INTRODUCTION
Sleep is the time of the day when the body and the mind finally get the rest it well-deserves. According to sleep
researchers, sleep has been divided into 4 stages. The initial three stages come under the Non-Rapid Eye Movement (NREM) sleep and the fourth stage is Rapid Eye Movement (REM) sleep. Stages 1 to 3 (NREM) are
also known as the quiet sleep. Stage 4 (REM) is also known as active sleep or paradoxical sleep. After the body
falls into a deep sleep, it enters REM sleep which is considered the most restorative sleep. Poor sleep hygiene
refers to productive or supported behaviors supported by habits and practices is incompatible with maintaining of good quality sleeping and normal vigilance during the day. Some of the signs of poor sleep hygiene were
frequent sleep disturbances, daytime sleepiness and prolonged sleep duration. College students are continuously
compromising on their sleep, in order to spare time for elevated workload, academic demands, social expectations. Sleep deprivation may be a supply of great fitness dangers to the individual. Sleep deprivation and
sleepiness have a multitude of causes and have many negative consequences. In the literature, sleep deprivation
is often referred to as acute or chronic partial sleep deprivation. For college students, acute sleep deprivation is referred to as a “pulling an all-nighter,” meaning a person is awake for 24 hours or more. More generally, sleep
deprivation is chronic partial sleep deprivation in which a student may get some sleep, but not enough.
Drowsiness can be an obvious consequence of sleep deprivation, but sleepiness can be caused by other
conditions, most commonly a sleep disorder. Going to college can be a stressful time for many students, and mental health issues have been highlighted because the mental health needs of students have increased
dramatically. Research shows that sleep problems are common and linked to poorer mental health, even among
young adults and college students. Increased academic and social pressure and irregular hours make students prone to sleep disorders and sleep deprivation. The social life of students involves many recreational
opportunities and products that reduce sleep quality. College life is characterized by a high degree of freedom
and little control, unhealthy habits such as smoking and drinking, and easily accessible leisure activities (eg
student clubs, concerts, night bars). Young Target Energy drinks and heavy drinking can worsen sleep quality.
Based on current knowledge, caffeine consumption is associated with common symptoms of poor sleep quality,
including insomnia and sleep disturbances. Our research reviews the prevalence of changing sleeping patterns
and how it affects the lifestyle of college students in Mumbai.
STATEMENT OF OBJECTIVES
This research is conducted to accomplish the following objectives
1. To study the sleeping pattern among college students in Mumbai.

International Journal of Advance and Innovative Research Volume 9, Issue 1 (IX) January - March 2022
226
ISSN 2394 - 7780
2. To find the prevalence of changing sleeping pattern in study participants.
3. To study the association of sleep pattern with the lifestyle of study participants.
4. To determine the causes of lack of sleep among college students.
5. To determine the relationship between the academic performance and the sleeping pattern of college students.
RESEARCH METHODOLOGY
SAMPLE
The sample consisted of 100 students studying in different colleges across Mumbai.
PROCEDURE
A Google form consisting of 16 questions that evaluates students sleeping pattern and measures the effects of
lack of sleep was prepared and was distributed among the students.
LITERATURE REVIEW
As an Overall, there is a consistent trend in rate statistics favoring that students report short sleep duration and
poor-quality sleep. Although, the National Sleep Foundation recommends that university students should sleep to nine hours sleep of the current studies indicate that sleep, on average, less than seven hours per night, shows
that college students were regular reported difficulty received recommended sleep time. The results of the
current study indicate that college students consistently struggle to achieve quality sleep, suggesting that there is still room in the field of sleep research as continue to investigate ongoing phenomena. Occurred out of poor
sleep quality and short sleep duration out of college students. Although not all results indicated significant
results, the results provided of lifestyle information to factors of college students. There are multitude of factors
that prevent teenagers from getting the sleep they need. This could be due to technology use, caffeine consumption, heavy workload, extracurricular activities, or early start times. The biggest factor is the stress of a
busy workload and college expectations, which results in students pushing themselves too hard to complete
assignments or study for exams. Students may believe the saying that if you hustle, you can succeed; However, in reality, the only thing that will lead you to success is sleep. Despite popular belief, sacrificing sleep for a
higher score increases the likelihood of a bad grade. According to the American Psychological Association,
research with more than 3,000 students has shown that students who consistently score C, D, and F sleep 25
minutes less and go to bed about 40 minutes later. People report getting grades A and B. Studies have shown that teenagers should sleep about 9 hours a day. As a result, students who didn’t get the full 8-10 hours of sleep
were significantly less likely to succeed. Students will have difficulty learning and processing information,
dealing with stress, and maintaining focus at school. College students most likely experienced first-hand how a lack of sleep significantly affected their mood and behavior the next day. People who don’t get enough sleep are
often irritable, angry, and easily aggravated by common annoyances.
Isolation after the COVID-19 pandemic appears to have significantly changed many aspects of students’ lifestyles, especially by increasing screen time and even the length and nature of sleep. We believe that the
Ministry of Health and Education should implement specific strategies to control not only the visible side
effects of quarantine, but also the side effects on psychological and mental health. Students are one of the most
visible victims of the impact of quarantine strategies that make them vulnerable to a variety of mental health problems. These sweeping changes, such as college closures and constant contact with families, have had a
significant impact on our daily lives, including leisure activities, sleep, and social interactions. Changes in sleep
patterns and reduced physical activity affect children’s physical and mental health, which in turn can lead to weight gain, domestic violence, post-traumatic psychological stress, reduced social contact, and increased
screen time.
PRIMARY DATA AND IT’S INTERPRETATION The primary data was collected using sample survey technique. The questionnaire comprised of 16 qualitative
questions. We received responses from 100 college going students.
1)Most of our student respondents are from the age group 18-20.
From this we can conclude that we have received a high response from the students of age group 18-20 and the
remaining responses are from 15-17 and 21-23 or more.
2)Majority of respondents are females.
From this we can conclude that majority of females is higher than majority of males and other gender.
3)Majority of respondents are not working.

International Journal of Advance and Innovative Research Volume 9, Issue 1 (IX) January - March 2022
227
ISSN 2394 - 7780
From this we can conclude that most of our respondents are not working while some of them are working part
time, full time and are working as interns.
4)44% of our respondents feel refreshed upon waking in the morning, 18% of them do not feel refreshed waking
in the morning while the remaining 38% respondents only feel refreshed sometimes.
From this we can conclude that majority of our respondents feel refreshed upon waking in the morning.
5)77% students feel sleepy during the day, 14 % of them always feel sleepy during the day while the remaining
9% students never feel sleepy during the day.
From this we can conclude that most of the students feel sleepy during the day.
6)42% respondents average screen time for each day is 3-5 hours, 41% of them has an average screen time of 5-
7 hours which the remaining 17% students have an average screen time of less than 3 hours.
From this we can conclude that 3-5 hours is the average screen time of a college going student.
7)50% of the respondents having low screen time experience good sleep, 6% respondents having low screen
time experience bad sleep while the remaining 44% respondents equally have a high screen time and a bad sleep
and a high screen time and a good sleep.
From this we can conclude that a low screen time can give you a good sleep.
8)51% students on an average sleep 6-8 hours on a weekday, 23% students sleep for 8 to 10 hours on a weekday, 22% students on an average sleep for 4 to 6 hours on a weekday while the remaining four percent
students sleep for 10 to 12 hours on a weekday.
From this we can conclude that most of the students sleep for 6 to 8 hours on a weekday.
9)41% students on an average sleep for 6 to 8 hours on a weekend, 40% student sleep for 8 to 10 hours on a weekend, 10% students on an average sleep for 10 to 12 hours on a weekend while the remaining nine percent
of students sleep for 4 to 6 hours on a weekend.
From this we can conclude that the number of average sleeping hours of a student is more on weekend then on a
weekday.
10)52% students sleep for 5 to 8 hours during an exam season, 30% of students sleep for 3 to 5 hours during an
exam season, 12% of them sleep less than 8 hours during an exam season while the remaining 6% students
sleep for more than 3 hours during an exam season.
From this we can conclude that majority of student sleep for 5 to 8 hours during an exam season which is a
smaller number of hours this might be because of the revision that one has to do before the exams.
11)According to 56% student respondents peer pressure effect sleeping duration of a college student while the
remaining 44% students it does not feel that peer pressure effect sleeping duration of a college going student.
From this we can conclude that peer pressure that is the pressure that one feels to behave in a certain way
because your friends or people in your group expect it can affect sleeping duration of a college student.
12)70% of students do not equate their lack of sleep to any sort of pride whereas the remaining 30% students
equate their lack of sleep to pride.
From this we can conclude that college students do not equate their lack of sleep to any sort of pride.
13)50% of respondents usually watch online content when they are supposed to be asleep, 18% respondents are usually studying when they are supposed to be asleep, 9% of student respondents are usually partying when
they are supposed to be asleep while the remaining 30% of students are doing something else when they are
supposed to be asleep.
From this we can conclude that during the sleeping hours most of the students are watching online content.
14)42% of student respondent feel that lack of sleep makes them demotivated/tired throughout the day, 40% of
students do not feel demotivated or tired throughout the day due to lack of sleep while the remaining 18%
students sometimes feel tired due to lack of sleep.
From this we can conclude that lack of sleep can make one feel demotivated for tired throughout the day.

International Journal of Advance and Innovative Research Volume 9, Issue 1 (IX) January - March 2022
228
ISSN 2394 - 7780
15)47% students see a considerable productivity dip after a night of bad sleep, 44% students see a moderate
productivity dip after a night of bad sleep while the remaining 9% students see a tremendous productivity dip
after a night of bad sleep.
From this we can conclude that students face a considerable productivity dip after a night of bad sleep.
16)According to 55% of student respondents a college student should sleep for 6 to 8 hours each night, 35%
respondents feel that a college student should sleep for 8 to 10 hours are each night, 8% respondents feel that a college students should sleep for 10 to 12 hours each night and the remaining 7% student respondents feels that
a college student should sleep for 4 to 6 hours each night.
From this we can conclude that most of the students feel that a college student should sleep for 6 to 8 hour each
night.
CONCLUSION
Daytime sleepiness, lack of sleep, and irregular sleep schedules are common among college students, with 50%
reporting daytime sleepiness and 70% reporting insufficient sleep. Consequences of sleep deprivation and daytime sleepiness are particularly problematic for college students and can lead to lower GPA, increased risk
of academic failure, compromised academics, mood change and increase the risk of occupational accidents on
the road. This article examines the current prevalence of sleepiness and sleep deprivation among college students, the factors that contribute to sleep deprivation, and the role sleep plays in learning and memory. The
impact of sleep and sleep disturbances on academic performance, GPA, behavior and mood will be examined.
Most importantly, effective and viable interventions to reduce sleepiness and sleep deprivation through sleep
education classes, online programs, nap promotion, and adjusted school hours will be reviewed. Gender differences were found in several sleep variables, and they were generally independent of weekday and
weekend differences. Female students go to bed and wake up earlier and sleep later, wake up more often and
sleep quality is poorer than male students. Gender differences are also highlighted in the relationship between sleep quality and other sleep variables. The correlation between sleep quality and waking time, time in bed, and
sleep efficiency was stronger in men than in women. On the other hand, the difference in the estimates mainly
depended on the difference between weekdays and weekends.
RECOMMENDATION
Some Tips on How to Improve Sleep:
1) Proper time management and a healthy lifestyle are essential to get good quality sleep. Even though you`re
working on many things, making rest and sleep, a priority is still vital to keep you on top of your game. To help
you get the sleep you need, you can follow these simple tips:
2) ) Identify the symptoms of sleep deprivation If you always feel tired and have trouble waking up in the
morning, you should be alert from the very beginning. now. When you realize you're sleep-deprived, you can
encourage yourself to rest so you can function properly.
3) Follow a Regular Sleeping Schedule Having a regular sleeping schedule is essential, so your body can
recuperate adequately. It is also important to follow the program to ensure that your body has a consistent sleep
pattern. You can also schedule tasks, classes, and meetings appropriately.
4) Maintain a good sleeping environment. A good sleeping environment is important for a comfortable and
restful sleep. Make sure the room temperature is comfortable enough not to disturb your sleep in the middle of
the night. If it gets too cold or too hot in the middle of the night, it can wake you up.
5) Also, do not use electronic devices before sleeping. Turn off all electronic devices for a good night’s sleep.
However, it is assumed that listening to white noise or sounds of nature while sleeping is much more
comfortable. In this case, you can set the player to a very low volume that doesn’t disturb your sleep.
6) Lead a healthy life Regular exercise and proper nutrition determine a healthy life. If you exercise regularly,
you will feel better and sleep better. Getting at least 30 minutes of moderate exercise 7 hours before bed will
help you get quality rest. Also, avoiding unhealthy foods is essential for a good night’s sleep. Eating too much
sugar or consuming too much caffeine or alcohol can make it harder to fall asleep. Reduce afternoon snacks and
drink warm milk an hour before bed. Before going to bed, prepare everything you need for tomorrow.
LIMITATIONS

International Journal of Advance and Innovative Research Volume 9, Issue 1 (IX) January - March 2022
229
ISSN 2394 - 7780
1) The sample size of 100 participants is small compared to the entire college going population of Mumbai
where the study was conducted. Due to the small sample size, the data and results of this study cannot be
generalized to all university students in Mumbai.
2) Student data is self-reporting and students may not accurately report the nature of their sleeping habits or
difficulties experienced.
3)Few questions were left unanswered by respondents.
4)Some respondents must have interpreted some questions differently rather than what was expected.
5)A major limitation of this study is the lack of random sampling, resulting in a sample with a large proportion
of female, which may not generalize to all of the college students in Mumbai.
6) Another major limitation was that no information was collected on other stimulants (eg nicotine and caffeine) or illicit drugs, and participants were not tested for ADHD, anxiety, or depression. Lack of this information
limits the ability to attribute differences in sleep measures solely to psychostimulant use and precludes analysis
of psychostimulant use in participants with pre-existing disabilities.
REFERENCE
1. https://www.researchgate.net/publication/351057301_Sleep_Pattern_and_Perceived_Stress_among_Underg
raduate_Students_of_a_Medical_College_in_Delhi_IAR_Journal_of_Medical_Sciences
2. https://www.verywellhealth.com/the-four-stages-of-sleep-2795920
3. https://www.ncbi.nlm.nih.gov/pmc/articles/PMC4075951/
4. https://www.sciencedirect.com/science/article/pii/S1550830720303736
5. https://www.alaskasleep.com/blog/4-reasons-college-students-should-improve-their-sleep-habits
6. https://www.webmd.com/sleep-disorders/features/10-results-sleep-loss
7. https://www.medicalnewstoday.com/articles/325353
8. https://www.ncbi.nlm.nih.gov/pmc/articles/PMC4075951/#:~:text=Daytime%20sleepiness%2C%20sleep%
20deprivation%2C%20and,and%2070%25%20attain%20insufficient%20sleep

International Journal of Advance and Innovative Research Volume 9, Issue 1 (IX) January - March 2022
230
ISSN 2394 - 7780
STUDY ON USE OF CRYPTOCURRENCY IN INDIA
1Abhishek Mohanty
Mentor 2Asst. Prof. Preeti Matharu
1-2Bunt Sangha’s SM Shetty College of Science, Commerce and Management Studies, Powai, Mumbai - 400076
[email protected], [email protected]
ABSTRACT The world has been transforming in to cash less transactions through innovation and making transactions by
using digital money. One of huge developments in cash that is Cryptocurrency or cryptographic money is a form of computerized cash, not controlled by any central bank, and simultaneously there are some problems
associated with this new currency hence many countries step back from its implementation among those India is
one of the country prohibited using and mining Cryptocurrencies. But as per the order of supreme court now trading through Cryptocurrencies is no more illegal in India from That’s why it is an important need to
understand about crypto trading in India, how its operates, how it was evolved in India, players who are
involved in this transaction.
Keywords Fiat currencies, crypto currencies, Central Banks, Investment , Block chain, Usage of
cryptocurrency.
INTRODUCTION Quite possibly the most well- known term utilized by the world is "Cryptocurrency". As E-Commerce turning into the most fundamental part, web deals are booming with more Techno-Indian clients. Cryptocurrency
appeared in later 2009 as a mechanism of online exchanges. The gap among purchaser and the seller was
spanned by the monetary organizations. They served as a trusted third- parties to handle online payments. Despite the fact that the hole was crossed over viably, there was generally a reliance factor for both the
purchaser's and vender's exchanging exercises. This reliance goes to be a variable liable for the innovation of
Cryptocurrency. A Cryptocurrency is characterized as "a computerized resource intended to function as a
vehicle of trade utilizing cryptography to get the exchange and to control the formation of extra units of the money". Cryptographic money was very first utilized in the year 2010, 22nd May, by Laszlo Hanycez, Florida.
In 2017, the ubiquity of the utilization of Cryptocurrency expanded quickly, People began to contribute a huge
amount of cash that had no set of experiences of delivering income. Crores of cash was put into in excess of thousand new computerized coins. These coins were in different structure like Bitcoin(BTC), Litecoin (LTC),
Ethereum (ETH), Zcash (ZEC), Dash (Run), Cash (BCH).
The instruments used as exchange instruments to make the trade transactions as easy as possible according to the market needs have experienceda huge development and change. Money is something that serves as a
medium of exchange and has a store of value. From the period of bargain to item cash, metal and coins, to gold
and silver, proceeding by present day financial frameworks and checks and finishing with the most recent
worldwide money advancements. The presentation of cryptographic forms of money has upset the global installment framework in a scale that only couple of years prior were not posssible. A digital currency is an
advanced form of virtual cash that involves cryptography for security.In 1983, the American cryptographer
DavidChaum considered a mysterious cryptographic electronic cash called e-cash. Afterward, in 1995, he executed it through Digicash,an early type of cryptographic electronic installments which required client
programming to pull out notes from a bank and assign explicit scrambled keys before it tends to be shipped off
to a beneficiary. This permitted the advanced cash to be untraceable by the responsible bank, the public authority, or any third party.A digital money is hard to fake in view of its security highlight. A characterizing
component of a digital currency is that it isn't controlled by any institutional power. It is totally decentralized.
STATEMENT OF OBJECTIVE
THE OBJECTIVE OF THIS RESEARCH IS
1) To find out the usage pattern of cryptocurrencies among different individuals.
2) To check if government regulation in the field of cryptocurrency can effect the amount of potential crypto
users.
3)To investigate Challenges that exist related to the integration of cryptocurrencies in India.

International Journal of Advance and Innovative Research Volume 9, Issue 1 (IX) January - March 2022
231
ISSN 2394 - 7780
4) To find whether cryptocurrencies are a worthy investment option.
RESEARCH METHODOLOGY The data for the research has been collected through secondary and primary sources .
Type of data collection method-Non probability sampling (Convenience sampling )
Primary Data :- the primary data is collected from from sample survey method. The unit for sample survey are
from general public across Mumbai region. The data of primary sources are collected using questionnaire are based on personal information of the respondents and fourteen questions are formed to collect information.the
total response we get from the survey is 100.
Secondary Data :- the secondary data was collected from several articles, websites, research paper, e-books,
journals.
DATA INTERPRETATION
From the survey we get to know that from 100 responses eighty-eight percent people are aware about the crypto
currency and sixty-eight are already investing in cryptocurriences as per the survey.
People who are at age group of 18-24 have more knowledgeable about crypto currency are per others.
Percentage table :-
Age group percentage
Below 18 11%
18-24. 40%
25-45. 32%
45 and above 17%
REVIEW OF LITERATURE
The focus on cryptocurrencies in the finance and banking sectors is gaining momentum. In this paper, we investigate that how is crypto currency usefull for India. We apply a narrative literature review method to
synthesize prior researches and draw a conclusion related to the challenges that occur in the integration of
cryptocurrencies in India. The conclusions that have been drawn indicate that cryptocurrencies offer are a
worthy investment option when compared to other alternatives.In his book termed “Cryptocurrency: The Future of Money” ,the author Edward Beckett states the challenges that exist related to the integration of
cryptocurrencies in modern finance. India is one of the world’s fastest-growing markets for cryptocurrency
trading. The government, however, is open to exceptions to promote blockchain technology. It is the easiest
way to understand digital currency.
PRIMARY DATA AND ITS INTERPRETATION
In the first question, the respondents were asked about their gender,out of the 100 responses that were received
,54% of the respondents were males and 46% of the respondents were females.
In the second question the respondents were asked to classify themselves according to their age group, the
maximum number of responses came from respondents belonging to the age group 18-24 i.e (40%),the next
highest number of responses came from the age group 25-45 which was 32%,respondents in the age groups 45
and above had 17% while respondents below the age of 18 had a fairly low response rate which was 11%.
In the third question the respondents were asked to state their occupation, the maximum number of responses
were garnered by students and people with businesses which was 30% and 28% respectively. Respondents who were self- employed and were in service had exactly the same no. of responses which stood at 21% each which
shows to some extent that people invest in cryptocurrencies irrespective of their occupation.
In the fourth question the respondents were asked if they were aware about cryptocurrencies to which maximum no. of respondents said yes(88%) and only 12% of respondents answered they weren’t aware about
cryptocurrencies which shows that the people are aware about cryptocurrencies to a greater extent.
In the fifth question the respondents were asked if they invest in cryptocurrencies to which majority of the
respondents that is 68% said Yes while the remaining respondents 32% said they don’t invest in
cryptocurrencies.

International Journal of Advance and Innovative Research Volume 9, Issue 1 (IX) January - March 2022
232
ISSN 2394 - 7780
In the sixth question the respondents were asked if cryptocurrencies should be legalized in India to which
surprisingly 61% of the respondents said No and 39% of respondents were in favour of legalizing
cryptocurrencies in India which shows that majority of the people want cryptocurrencies to remain in their
present structure without any hindarance.
In the seventh question the respondents were asked if they would invest in cryptocurrencies if they were to be
government regulated , Majority of the respondents that is 54% of the respondents were against government regulations, 38% of the respondents were in favour of government regulations in cryptocurrencies and 5% of the
respondents were not sure enough to make a concrete decision this shows that majority of the respondents are of
the view that there should be no interference from the government in decisions concerning cryptocurrencies.
In the eight question the respondents were told that cryptocurrrencies are still in their introduction stage and are quite volatile in nature so how would these factors affect the respondent’s decisions in investing in
cryptocurrency on a scale of 1 to 5 ranging from least likely to most likely, the highest number of respondents
rated 5(28%),4(23%) which relates that it would likely affect their investment decision, while 13% of respondents rated 3(13%) which pertains that they were not able to make a choice whereas the remaining
respondents rated 1(21%) and 2(15%) which shows these factors of cryptocurrency was least likely to affect
their investment decision.
In the ninth question respondents were asked what were the main reasons for not more people investing in
cryptocurrencies to which 93% of the people stated that Lack of knowledge regarding cryptocurrencies was the
underming reason behind lack of investments ,also 74% of the respondents highlighted that investments in other
alternatives could be a reason. While the remaining respondents were of the view that High fluctuation in
prices(22%) and low security(24%) could the possible reasons of lack of investment.
In the tenth question respondents were asked to rate on a scale of 1 to 5 how do they perceive the worth of
cryptocurrency in the next 5 years, and accordingly majority of the respondents (83%) of the respondents were confident that the worth of cryptocurrency would significantly increase. While only very few respondents who
rated 1(5%) and 2(2%) were skeptical about the worth of cryptocurrencies in the future scenario.
In the eleventh question the respondents were asked which forms of cryptocurrencies were they familiar with to
which all of the respondents pointed out that they were vey much informed about the different forms of cryptocurrencies .The majority of respondents were informed about Bitcoin(97%),Etherium(75%) and Doge
Coin(76%) while the remaining respondents were aware about the other forms which comprised of
Cardano(26%) and Matic(23%)
In the twelfth question the respondents were asked what indian cryptocurrency exchanges were they familiar
with to which the respondents chose these platforms, Coin Switch Kuber(92), Waxir X(57%), CoinDCX(36%)
and Unocoin(28%) which shows that the respondents are very much informed about the indian platforms that
deal in cryptocurrency.
In the thirteenth question the respondents were asked whether cryptocurrencies were beneficial for India to
which majority of the respondents(80%) said Yes and the other respondents (10%) were of the view that
cryptocurrencies weren’t beneficial for India and the rest of the respondents (10%) couldn’t make a decision.
In the fourteenth question, the respondents were asked if cryptocurrencies were worth the investment, to which
majority of the respondents (81%) were in favour of the statement whereas (19%) of the respondents were
against the statement.
CONCLUSION AND RECOMMENDATION
Change is the only thing constant in human life. From barter system to rupees and from physical transactions to
online money transactions there has been an upgrade in the form of money and in the form of interface of their transactions, on which the parties carry on business. And now it is time for cryptocurrency as it is seen as a safe
transaction method and a promising investment. In upcoming years, the government may try to ban
unauthorized cryptocurrencies after launching its own currency, but in the long term it will have to make way
for the upcoming surge of crypto investors.
LIMITATION
It was conducted on study population and may have certain disagreement it may not be able for:-
1)Sample size- The data collected in this research is primarily based on 100 google forms submitted by people
from various works of life, but these results cannot be generalised for 138cr population count of India.

International Journal of Advance and Innovative Research Volume 9, Issue 1 (IX) January - March 2022
233
ISSN 2394 - 7780
2)Method- many respondents might not be comfortable sharing information because of not being
knowledgeable enough, or might just biased on what is expected from him/her. Or to what is socially accepted.
3)Time – deadline for the research might have affected the precision of research.
4)Age of data- other than survey, some part of information was collected from several articles, website, research
papers, e-books, journals etc. the age of these data collected has not been determined. Thus this can be a
limitation for our research.
REFERENCES
https://books.google.co.in/books/about/The_Bitcoin_Standard.html?id=wf9QDwAAQBAJ&source=kp_bo
ok_description&redir_esc=y
https://books.google.co.in/books/about/Blockchain_Revolution.html?id=8qlPEAAAQBAJ&source=kp_bo
ok_description&redir_esc=y
https://zeenews.india.com/economy/cryptocurrency-future-in-india-rbi-to-launch-digital-currency-all-you-
need-to-know-2413592.html
https://www.livemint.com/market/cryptocurrency/india-has-highest-number-of-crypto-owners-in-the-
world-at-10-07-crore-report-11634110396397.html
https://www.ijsdr.org
https://www.classcentral.com
https://www.moneycontrol.com
https://www.sciencedirect.com/science/article/pii/S2666285X21000923
https://www.toptal.com/finance/market-research-analysts/cryptocurrency-market
https://www.worldwidejournals.com/indian-journal-of-applied-research-(IJAR)/article/a-study-on-the-
awareness-and-perception-of-cryptocurrency-in-bangalore/MTc3Mjk=/?is=1

International Journal of Advance and Innovative Research Volume 9, Issue 1 (IX) January - March 2022
234
ISSN 2394 - 7780
A STUDY ON INVESTMENT PATTERN AMONGST SALARIED PEOPLE LIVING IN MUMBAI
1Kartik Bhamane,
2Kanchan Choudhary,
3Diya Thakkar
Mentor 4Asst. Prof. Ashwini Devadiga
1-4S.M Shetty College of Science, Commerce and Management Studies Powai, Mumbai-76
ABSTRACT
Investment may be defined as deployment of funds in various investment avenues made with an anticipation of earning some returns, Investors are always investing their money with the different types of and objectives such
as profit, security, appreciation, Income stability. People in order to save and grown their money invest some
part of their income into various investment options such as fixed deposits, stocks, mutual funds, real estate, crypto, NFT’S, gold and other commodities. There are many factors that influence the investment pattern of an
investor such as lack of awareness about various investment options, education, age, availability of funds,
investment objectives etc. this research was conducted to find out the investment pattern amongst salaried people living in Mumbai. Research was conducted in Mumbai and a total of 101 responses were collected from
salaried people living in Mumbai.
Through this research the main objective was to study the investment patterns amongst salaried people living in
Mumbai, and to study how different factors influence the investment pattern of an investors and whether the
investors were aware about various investment options that are available.
Keywords – investment, salaried people, awareness, investment pattern
INTRODUCTION On 12 March 2020, the Sensex fell by 2919.26 points (-8.18%), the worst continuation of the week in the
history while Nifty-50 broke down by 868.2 points (-8.30%) amid World Health Organisation (WHO) declaring
Coronavirus outbreak as "pandemic". Sensex ended to 33-month low, since than a massive bull run started in
the Indian stock market, a lot of new investors entered the stock market. Because of the covid-19 pandemic peoples whole life savings were wiped out in few days because of extremely expensive medical treatments.
People started to realise the importance of saving and investing and for the first-time people started to explore
different investment avenues instead of the typical investment options like fixed deposits and mutual funds. Also, in the past few years many investment options like cryptocurrency and NFTS started gaining popularity
and a lot of people that were sceptical about this new investment options started believing starting investing in
the new asset class. This research was conducted to find the investing pattern amongst the salaried people in Mumbai. How salaried people look at investing what are their pattern of investing. What are the different aims
and objectives of their investment and to find whether the salaried people living in Mumbai are trusting and
investing in the new investment avenues like stocks, cryptos, NFTS, instead of the classic old investment
options like fixed deposits, real estate and gold.
STATEMENT OF OBJECTIVE
● To find investment pattern amongst salaried people living in Mumbai
● To find different objectives of investing of salaried people living in Mumbai
● To what extent salaried people living in Mumbai are aware about different investment avenues
● To find out people’s approach towards new investment options like cryptocurrency and NFT’S
RESEARCH METHOD USED
The primary data is sourced from sample survey technique. The data is collected using
questionnaire method. The questionnaire comprises of 11questions out of which 3
questions are based on personal information and 8 questions were formed in order to collect data on investment
pattern amongst salaried people living in Mumbai
REVIEW OF LITERATURE
V.R. Palanivelu & K.Chandrakumar (2013)

International Journal of Advance and Innovative Research Volume 9, Issue 1 (IX) January - March 2022
235
ISSN 2394 - 7780
as per research conducted by Mr. V.R Palanivelu the researchers found out that age is one of the major factor
influencing the investment behaviour of a person, this conclusion was made by taking responses of 100 people
Avinash Kumar Singh (2006)
the study conducted by Avinash Kumar Singh (2006) studied the investment pattern of people in Bangalore city
and Bhubaneswar data was collected by collecting responses with the help of survey method. After the study interpretation of data was conducted and the researcher concluded that in Bangalore investors are more aware
about various investment avenues & the risk about investing in those avenues
Zankhana Atodaria a, Ronikadevi Sharma 2019
At the end of the study the researchers concluded that the people living in Somnath were aware about various investment avenues like bank deposits and insurance policies. Researchers also found out that age is also one of
the major influencing factor when it comes to investing regardless of other demographic factors like gender,
educational qualifications. Researchers also found out that people invest with the anticipation of receiving
regular returns, and to save tax
Manish Mittal and Vyas (2008)
According to the research conducted the researchers found out that people are greatly affected by their emotions while investing, a long study states that investors do not take rational decisions while investing, sometime
investors do not act rationally they have behavioural biases this has a negative effect on their investment
patterns
Sonali Patil (2014) As per study made in Pune city the researchers found out that the respondents were very much aware about the
various investment avenues and people were also aware about the risk involved in investment total 60% of the
people were aware and a very few respondents that is around 40% of the respondents were not aware about
various investment avenues
Primary data and its interpretation
Q.1 AGE
According to the responses received, it is found that the maximum responses are received from the people of
age between 18 to 30 years.
Q2. GENDER:
According to the responses received, it is found that there is a slight equilibrium between the male and female
respondents.
Q3. QUALIFICATION
According to the responses received, we can say that the maximum number of respondents are graduated or properly qualified, this shows that awareness with respect to investment is more in qualified people as the have
more knowledge about investment and are aware about different investment avenues
Q4. INCOME GROUP
According to the response received, it is found that the maximum respondents have the income below 10 lakhs annually, and very few that is 8.2% of people have the income above 60 lakhs. As the income of individuals are
low the amount invested by them is also low. This clearly shows that income is a factor that influences
investment made by an investor
Q5. Do You Invest?
According to the response received, we found out that for 101 responses 77.2% people invest and a very few
that is 22.8% don’t invest. As we found out majority of the respondents were graduate and highly qualified this
shows direct relationship between the number of people investing and number of people educated
Q6. Do you consider investment useful?
According to the responses received, it is found that a lot of people among the respondents consider investing
their money, useful Almost 81.2% people believe that investment is useful, and a very small number of people close to 5% of the people believe investment is not very much useful. Hence this shows that the salaried people
living in Mumbai are more aware about the advantages of saving and investing
Q7. How often do you invest?

International Journal of Advance and Innovative Research Volume 9, Issue 1 (IX) January - March 2022
236
ISSN 2394 - 7780
According to the responses received researchers saw that 45.8% people invested their money monthly. 12.5%
invest daily and 9,4% invest annually and about 32.3% people invest sometimes they don’t have a proper
investing time.
Q8. Out of total income how much do you invest?
According to the responses received, it is found that maximum people don't invest much of their income majority of the people invest only 10% of their income. As majority people’s income is low their investing
capital is also low so researchers conclude that income is also one of the major factor when it comes to
investing
Q9. INVESTMENT OBJECTIVE According to the responses received, researchers conclude that there is a slight equilibrium between the
objectives. It shows that people are keener for extra monetary advantages, like passive income, wealth creation,
financial freedom etc.
Q10.Preferable investment
According to the responses received, we can see that the maximum responses are for fixed deposits and mutual
funds. It shows here that people are more interested to invest their money safely. Only 26% of respondents invest in new investment options like cryptocurrency and NFT’S this shows salaried people living in Mumbai
are still sceptical about these new investment options
Q11.Current investment: -
According to the responses received we can see that the maximum respondents have currently invested in fixed deposits, which shows salaried people living in Mumbai invest with low-risk low returns strategy instead of
high-risk high returns by investing in stocks, cryptos and NFT’s
CONCLUSION AND RECOMMENDATION
CONCLUSION
After the analysis & interpretation of data we have concluded that majority of the respondents invest. Most of
the salaried people consider investment useful. They invest on monthly basis. Investors prefer to invest their
money in fixed deposits, mutual funds, gold and stock market Investors are very well aware about investment avenues that are available, but still investors are preferring to invest their money in bank deposit, real estate.
The data analysis of research reveals that the safety is concerned as important factor while doing investment, so
remaining avenues are less found less considerable while doing investment
RECOMMENDATION
● More and more people need to save and invest as it is the need of the hour
● People should invest more and spend less from their income
● People should diversify their portfolio instead of investing in few options
● People should try new investment options instead of sticking to same old investing options
● People should invest in regular intervals continuously for a long period of time
LIMITATION ● First limitation was lack of responses as it is difficult to come on a conclusion with less sample size as
compared to the population on Mumbai city
● Second limitation was scarcity of material as there is not much variation on previously made research on
similar topic
REFERENCES
https://www.researchgate.net/publication/341592811_Investment_Pattern_of_Salaried_Class_of_Somnath
_Daman_-A_Study_of_Various_Investment_Options_Available
https://www.ijcrt.org/papers/IJCRT2010170.pdf
http://aujournals.ipublisher.in/p/58421

International Journal of Advance and Innovative Research Volume 9, Issue 1 (IX) January - March 2022
237
ISSN 2394 - 7780
A LITERATURE REVIEW ON THE CONCEPT OF CRYPTOGRAPHY AND RSA ALGORITHM
1Prof. Suman Upadhyay and
2Prof. Vipinkumar Gupta
1S. M. Shetty College of Science, Commerce & Management Studies, Powai 2Guru Nanak College of Arts, Science and Commerce, Mumbai 400037
ABSTRACT In the digital era, being hacked is a common happening worldwide. With communications over the cloud, the
privacy of data sent and received, is vulnerable. Cryptography is being a protector by safeguarding the data
communicated. In today’s world where everything is possible to get hacked or being tempered while communicating between sender and receiver, in such situation we do want anyone else to access our data or
private messages. With digital currencies a.k.a. cryptocurrencies on the rise, it is of utmost priority to build a
stronger anti-hack mechanism to protect them. The block-chain, that protects the digital currencies, is
fundamentally based on cryptography. This research paper will review cryptography, its types and how RSA
algorithm works.
Keyword: Cryptography, Sender Receiver, Encryption, Decryption, cipher, key, blockchain
OBJECTIVE To understand the concept and techniques of cryptography used in communication, transactions and data
transfer.
LITERATURE REVIEW What is cryptography, where in concept of cryptography are been used, how cryptography works and which all
algorithm are used in securing the private messages and working of RSA algorithm.
INTRODUCTION
Cryptography is a process of developing various techniques and protocols to prevent anyone from accessing and acquiring knowledge of the data from the private message during a communication process. Cryptography is
important because it allows you to protect securely data that one doesn’t want anyone else to have access to, it is
used to protect secrets of the corporate world, secure classified information and to safeguard personal information against things like identity theft. It is derived from Greek word Kryptos which means hidden and
Graphein means to write.
Figure 1: Cryptography
To start with cryptography, we need to know following terminology:
Encryption: A process of plain text (normal text) to a cipher/coded text (random sequence of bits)
Decryption: Inverse process of encryption, conversion of to a cipher/coded text to plain or decoded text
Cipher: The mathematical function, i.e. a cryptographic algorithm which is used to convert plain text to cipher
text
Key: Information that is required to induce the output of the cryptographic algorithm

International Journal of Advance and Innovative Research Volume 9, Issue 1 (IX) January - March 2022
238
ISSN 2394 - 7780
Classification of Cryptography
Symmetric Key Cryptography
An encryption system in which the sender and receiver of a message share a single, common key that is used to
encrypt and decrypt the message. The most popular symmetric key system is the Data Encryption Standards (DES). The symmetry key cryptography is primarily used in banking applications where personally identifiable
information needs to be encrypted. Symmetry cryptography helps in detecting bank fraud and boosts the
security index of these payment gateways in general. They are also helpful in protecting data that is not in
transit and dress on servers and data centres, these centres house a massive amount of data that needs to be encrypted with a fast and efficient algorithm so that when the data needs to recalled by the respective service,
there is assurance of minor to no delay. While browsing the internet we need symmetry encryption to browse
secure https websites so that we get all around protection. It plays a significance role in server authenticity, verifying website, exchange of necessary encryption keys required and generating a session using those keys to
ensure highest level of security. This helps in preventing the rather insecure https website format.
Symmetry key cryptography uses a single key for both encryption and decryption of information. The key needs
to be kept secretly and be available with both sender and receiver. Strength of encryption depends on the key
size being used.
Figure 2: Symmetric Cryptography
Asymmetric Key cryptography: Two different keys are used in Asymmetric Encryption. Private key is used
for encrypting the information and public key is used for decrypting the same.
Asymmetric encryption uses a double layer of protection. There are two different keys in play here, a private
key and a public key. A public key is used to encrypt the information before transmission and the private key is used to decrypt the data post transmission. This pair of keys must belong to the receiver of the message. The
public key can be shared via messaging, blog posts, key servers and there are no restrictions for it as one can see
this image below two keys are working in the system. The sender first encrypts the plain text using the
receiver’s private key after which we received the cipher text, the cipher text is then transmitted to the receiver without any other key. On getting the ciphertext, the receiver uses his/her private key to decrypt the ciphertext
and get the plaintext back. There has been no requirement of any key exchange throughout this process.
Therefore, solving the most glaring flaw faced in symmetric key cryptography. The public key is known to everyone and cannot be used to decrypt messages and the private key which is known to everyone cannot

International Journal of Advance and Innovative Research Volume 9, Issue 1 (IX) January - March 2022
239
ISSN 2394 - 7780
decrypt messages. It doesn’t need to be shared with anyone. The sender and the receiver can exchange personal
data using the same set of keys for as often as possible.
Figure 3: Asymmetric Cryptography
RSA Encryption Algorithm\ Rivest-Shamir-Adleman Algorithm
Digital signatures have become part and parcel of the everyday correspondence in the corporate sector. The
pandemic has further accelerated the need for digital wears to become mainstream in the business world. While DSL (Data Standard) Algorithm which is exclusively used for verification and transmission of signatures, the
RSA algorithm can also be used for general data encryption and decryption as well. Functioning on similar
public key cryptography architecture. It is seen as a more complex solution to bolster security.
The RSA algorithm is a public key signature algorithm developed and named after the developers Ron Rivest, Adi Shamir and Leonard Adleman. Their paper was first published in 1977 and the algorithm uses logarithmic
functions to keep the working complicated enough to withstand brute force and streamlined to be fast post
deployment.
The figure below shows the process of verifying signatures using RSA
Figure 4: Process of Verifying signatures using RSA algorithm
The main case of RSA is encryption and decryption of private information before being transmitted across
communication channel. This is where the data encryption come into play. When using RSA for encryption and
decryption of general data. It reverses the key set usage unlike signature verification, it receives the receiver’s
public key to encrypt the data and uses the receiver’s private key in decrypting the data. Thus, there is no need to exchange any key in this scenario. There are two broad components when it comes to RSA cryptography, one
of them is key generation. Key generation employs a step of generating the private and the public key that are
going to be used for encrypting and decrypting the data. The second part is encryption and decryption functions. These are ciphers and steps that need to be run when scrambling the data or recovering the data from the
ciphertext.
Process for generating keys and encrypting and decrypting the information
1. Two large prime numbers are chosen (p and q)
2. Compute n = p ∗ q and z = (p − 1) ∗ (q − 1)
3. Choose a number e where 1 < 𝑒 < 𝑧
4. A number d is selected so that ed mod z = 1 and calculated as d=𝑑 = 𝑒−1 𝑚𝑜𝑑 𝑧
5. Public key is (𝑛, 𝑒) and the private key is (𝑛, 𝑑)---- Key Generated

International Journal of Advance and Innovative Research Volume 9, Issue 1 (IX) January - March 2022
240
ISSN 2394 - 7780
6. If the plain text is m, encrypted ciphertext c is calculated as 𝑐 = 𝑚𝑒 𝑚𝑜𝑑 𝑛
7. Under similar assumptions, the plaintext can be calculated as 𝑚 = 𝑐𝑑 𝑚𝑜𝑑 𝑛
Example to make it more understandable
1. Choose p and q as 7 and 13 respectively, so that n = p ∗ q = 91
2. We can select value of e to be 5 since it satisfies 1 < 𝑒 < (𝑝 − 1)(𝑞 − 1)
3. Value of d can be calculated as
𝑒𝑑 𝑚𝑜𝑑 (𝑝 − 1)(𝑞 − 1) = 1
5𝑑 𝑚𝑜𝑑 72 = 1
⇒ 𝑑 = 29
4. Public key is (n, e) = (91, 5) and Private key = (n, d) = (91, 29)
5. Let plain text be m be 10 then
Ciphertext c = me mod n = 105 𝑚𝑜𝑑 91 = 82
Plaintext 𝑚 = 𝑐𝑑 𝑚𝑜𝑑 𝑛 = 8229 𝑚𝑜𝑑 91 = 10
Advantages of RSA algorithm
RSA algorithm depends upon receiver’s public key so that one don’t have to share any secret key to receive the messages from others. This was the most glaring flaw faced by symmetric algorithms which were
eventually fixed by asymmetric cryptography structure
Since the key pairs are related to each other, a receiver cannot intercept the message, since they didn’t have
private keys to decrypt the information. If public key can decrypt the information, the sender cannot refuse
signing it with his private key. Without admitting the private key is not in fact private anymore.
The encryption process is faster than the DSA algorithm
Data will be temper proof in transit since meddling with data will alter the usages of the keys, the private key won’t be able to decrypt the information. Hence alerting the receiver of any kind of manipulation in
between the receiver must be aware of any third party who possesses the private key. Since they can alter
the data in mid transit, the cases of which rather are low.
CONCLUSION
The key generation is slower in RSA. Many systems across the world tend to reuse the same keys so that they
can spend less time in key generation and more time on actual ciphertext management.
REFERENCES
Abdalbasit Mohammed Qadir and Nurhayat Varol, A Review Paper on Cryptography,
https://www.researchgate.net/publication/334418542_A_Review_Paper_on_Cryptography, 23 october
2019
Yahia Alemami, Mohamad Afendee Mohamed, Saleh Atiewi, Research on Various Cryptography
Techniques, International Journal of Recent Technology and Engineering (IJRTE) ISSN: 2277-3878,
Volume-8, Issue-2S3, July 2019
https://www.youtube.com/watch?v=vf1z7GlG6Qo
https://www.youtube.com/watch?v=5jpgMXt1Z9Y&t=843s

International Journal of Advance and Innovative Research Volume 9, Issue 1 (IX) January - March 2022
241
ISSN 2394 - 7780
IMPACT OF WEBSERIES BINGE WATCHING AMONG COLLEGE STUDENTS DURING COVID
ERA WITH REFERENCE TO ULHASNAGAR AREA
Ridhi Aswani
Assistant Lecturer, Vedanta College, Ulhasnagar
ABSTRACT
A Significant change has been perceived in the entertainment world during the covid-19 era with the increase of OTT platforms. The emergence of digital revolution has given the people opportunity to easily access these
platforms from anywhere around the world. A pivotal shift has been observed with the popularity of web series
on OTT platforms not just because of content availability but also because of the comfort at one’s place. Due to
quarantine boredom and successive flood of movies and webseries being produced, the number of viewers and viewing time has increased considerably. This has given a momentum to Binge Watching owing to surfeit of
reasons first being the time span of the web series, easy content availability, attractive plotlines, different genre
of web series, etc. And the most who are being affected by it are the students as there is a shift in online classes, less burden of assignments and presentations and more time being idle have inclined them to binge watch
without stopping.
Thus, this research sought to evolve a greater understanding of the behavior of college students in respect of binge watching as it is matter of concern. The excessive inclusion in binge watching has its own merits and
limitations. The positive implications embraces enjoyment, relaxation and fun while binge watching. Students
feel that binge watching strengthen their bond with their friends and family, they feel less stressed and
distracted from loneliness. Whereas the negative implications are more detrimental, it affects their physical and mental health in the form of headache, insomnia, anxiety, stress, guilt, etc. It also affects their academic
engagement due to absenteeism, poor attention during lectures, distracted study time etc.
Through this study, the researcher highlights that the concept of binge-watching is more about the internet and
addictive behavior than the binge-watching itself.
Keywords: pivotal shift, quarantine boredom, binge watching, surfeit, excessive inclusion
INTRODUCTION
The term ‘Binge’ begin with a lincolnshire dialect word which meant “to soak” with an idea that people who are overindulged in alcohol consumption, their brains are soaked in alcohol. In the same manner, this word Binge is
connected with some sort of excessive behavior such as an over-consumption of food as Binge Eating or over-
consumption of alcohol as Binge Drinking. In connection with entertainment media, binge watching make an appearance over the past decennium as a TV viewing practice. In recent times streaming services has
reawakened the bingeing as a regular practice. Binge watching is a habit of viewing multiple episodes of a
single show/ webseries in one go. With the embark of Pandemic- Covid 19, OTT platforms have taken a big place in the comfort of one’s home by providing digital platform on demand. Due to which its very easy for the
students to binge watch anywhere.
Marathon-watching as it was previously named, was used frequently during the late 1970’s to 1980’s when the
Japanese animated shows were viewed on VHS tapes by anime fandom communities. Binge-watching came into existence from 2003 but got popular around 2012 when online streaming started getting attention. In 2013,
with Netflix releasing seasons of its’ multiple original programs simultaneously and not like other shows where
episodes used to stream weekly, binge-watching became more and more evident
Researchers found heavy use of technology by college students to communicate on social media sites to lure
participation from students. Binge-watching is part of that and the idea started spreading more when along with
Netflix other companies like Hulu, Amazon and many others started streaming online content. Individual started taking part in binge-watching in variety of ways. According to the study by researchers (Jacobson and Forste,
2011), the focus was on understanding the behaviors while binge-watching. Questions like how binge-watching
will affect the physical and mental health of students? What effect it will have on their academics? started
prevailing more and study seeks to get more insight on these students.
The main aim of this paper is to study about the behavior of students while they binge watch- do they feel
isolated? Or guilty? Or happy? and also to know till what extent they are being affected by it. As continuous
watching may impact them physically in the form of bodyache, over eating etc and mentally they appear

International Journal of Advance and Innovative Research Volume 9, Issue 1 (IX) January - March 2022
242
ISSN 2394 - 7780
stressful, feel sad due to completion of the season etc. The most important point which is being focused is their
non- attentiveness during lectures, bunking of lectures, poor study schedule etc as a academic impact.
REVIEW OF LITERATURE
1. Swati panda and Satyendra C. Pandey through their article “Binge watching and college students:
Motivations and Outcomes” published in October 2017 concluded that there are many pre-binge and post-
binge motivation which influence the students to do binge watching. Their findings specified that students binge watch due to easy availability of TV shows/ web series, social influence, enjoyment etc. they also
specified that though students enjoy doing it, they might get addicted to it and feel guilty.
2. Harsha Gangadharbatla, Colin Ackerman and Arthur Bamford through their paper, “Antecedents and consequences of binge watching for college students” have used a mixed method approach as a
comprehensive model of antecedents and consequences of Binge watching. Through their findings, they
have concluded that five distinct antecedents such as entertainment, friends and family, procrastination, addictive and social capital are related to Binge watching behavior and three consequences i.e. Negative
impact on self & relationships, school & work, physical and mental. They mentioned that most of the time,
individuals are more inclined to binge watching due to their content, entertainment factors and their
addicted nature.
3. Cassandra Winland through her research paper “An Exploration of Binge-Watching and Its Effects on
College Academics” concluded that there is a co-relation between binge watching and academic
engagement. Her findings emphasized that students are spending a lot of time watching online content while they are studying. She specified that 87% of participants spent more than 3 hours at a stretch in a single
sitting. Another important point she put forth was lack of faculty interaction which further impacts the
academics.
OBJECTIVES OF THE STUDY
1. To understand the concept of “Binge Watching”.
2. To evaluate the positive impact of Binge watching on college students.
3. To analyze the negative impact of Binge watching and its repercussions faced by students.
RESEARCH METHODOLGY
1. The Research is Analytical in nature.
2. The population includes College students of Ulhasnagar area, Thane District.
3. The sample size collected was from 106 respondents.
4. The stratified Sampling technique was used for collecting data.
5. The primary data was collected through a structured questionnaire by way of Google forms.
6. The secondary data was collected through research papers and websites.
7. All the data collected is edited properly followed by classification and tabulation.
ANALYSIS AND INTERPRETATION
1. A qualitative research was undertaken to observe the behavior of students on binge watching. Data was
collected through an online survey by distributing questionnaire in google form.
2. The data collected was from 108 students studying in Ulhasnagar area, out of which, 24% and 34% of the
students agreed and strongly agreed respectively on their viewing practice of web series across different
online platforms.
3. Likert scale was used to measure the positive and negative impact of web series binge watching. Scale items
used for measurement of positive impact were Stress reduction, Distraction from loneliness, strengthening
friendship and completion of show.
4. The students gave a positive outlook on binge watching and data was compared according to different
classes, when it comes to distraction from loneliness- 25% students very strongly agreed comprising of 40%
FY students, 38% SY students and 57% TY students.
5. In relation with completion of Show, 35% students agreed that this is one of the benefit of binge watching
consisting of 53% FY students, 48% SY and 43% TY students.

International Journal of Advance and Innovative Research Volume 9, Issue 1 (IX) January - March 2022
243
ISSN 2394 - 7780
6. And when asked about the strengthening of friendship 35% strongly agreed to it comprising of 51% FY
students agreed, 48% strongly agreed and 44% TY students very strongly agreed.
7. Finally when students were enquired about the stress reduction due to binge watching- 34% agreed consisting of 45% FY students agreed, 34% SY students strongly agreed and 50% TY students very
strongly agreed.
8. When Students Academic performance was observed in terms of their different courses, it was found that
44% BAF students very strongly agreed that absenteeism has been increased due to binge watching.
9. 37.5% BBI and 57% BMS students strongly agreed to it, whereas 50% BCOM students agreed to it.
10. In the context to skipping lectures, 43% BAF students very strongly agreed, 38% BBI and 35% BMS
strongly agreed, 54% Bcom students also agreed to it.
11. With connection to less attention during lectures, 39% of BAF & BMS students strongly agreed whereas
38% of BBI students and 61% of Bcom students agreed on it.
12. In relation to poor study schedule, 48% BAF students very strongly agreed, 50% BBI & BCOM students agree and 48% BMS students strongly agree to it. Thus it can be concluded that Binge Watching impacts
the academic performance of the students.
LIMITATION ⮚ Participation of girls in the survey conducted was more than the boys, due to which the data concluded that
girls / women binge-watch more than boys / men. However, girls were more willing to participate in the
survey, hence it is important to evaluate views of male population further so that we gather more details on
binge-watching behavior.
⮚ Also, majorly students / under graduates participated in the survey as they were more accessible, had more
time to watch online streaming content & binge-watch various web shows. So, the results obtained were
mainly from the population of students. So, it becomes essential to conduct more research on people from different age groups which must include senior citizens, middle-aged people who are doing jobs, are self-
employed or have their own businesses. People with diverse working fields will help achieve better results
CONCLUSION
Today, majority of students are found to binge watching...... number of web series. So all the stakeholders i.e. Parents, Teachers, Organization have to play a participative role than the role of a guardian with hawk eye must
reduce and a hand of friendship must be extended to the young brigade so that they are counselled and brought
to the right track rather than compelling them to accept the fact that binge watch causes a huge negative impact
on the physical and mental aspects of life.
An overall change in the environment needs to be injected and steps must be initiated to counsel students and
make them aware as well as responsible to lead a healthier lifestyle.
REFERENCES
⮚ https://www.researchgate.net/publication/320309167_Binge_watching_and_college_students_motivations_
and_outcomes
⮚ https://journals.uic.edu/ojs/index.php/fm/article/view/9667
⮚ https://en.wikipedia.org/wiki/Binge-watching
⮚ https://static1.squarespace.com/static/54c08e42e4b0f1b78348c9ce/t/5527e9a3e4b0c120ebdc7650/14286790
75633/Winland+-+Final+Paper.pdf
⮚ https://www.tandfonline.com/doi/full/10.1080/15205436.2020.1811346
⮚ https://brandequity.economictimes.indiatimes.com/news/digital/binge-watching-culture-is-on-the-rise-in-
india-dan-report/78051528
⮚ https://www.ncbi.nlm.nih.gov/pmc/articles/PMC7344932/
⮚ https://www.karger.com/Article/FullText/506307

International Journal of Advance and Innovative Research Volume 9, Issue 1 (IX) January - March 2022
244
ISSN 2394 - 7780
A RESEARCH ON SOCIAL MEDIA USAGE AND ITS IMPACT ON THE HEALTH STATUS IN
UNDERGRADUATE STUDENTS IN MUMBAI
Ashwini Devadiga
Assistant Professor, BMS Department, SM Shetty College of Commerce and Science
ABSTRACT A comparative study was conducted on the social media usage and impacts of it on the health status of undergraduate students in Mumbai. The research implemented the evocative survey research design to let
provoke data from the target audience through questionnaire and observations.
The questionnaire was randomly directed to all the undergraduate students of Mumbai District. Social media is
found to be a ubiquitous digital platform for connecting with people and acquiring required information. The pattern of usage of social media has pros and cons attached to the proper use and misuse among the adolescent
students.
The study reveals that with online pattern of education students are compelled to use their phones which then encourages them further to use social media. The number of hours dedicated by students for social media usage
is one of the important factor which determines its health impact. Using social media for more than 2 hours was
found to have more health impacts on age group of 18-21 years.
Delay in completing their tasks, increased anxiety issues among students, social media usage during study
hours were all possible determinants of addiction which over a period of time showed health impacts like eye
strain, neck pain, frequent headaches, depressive symptoms, stress, and loneliness. Social media can contribute
greatly to the lives of students, but only if the appropriate steps are taken to battle the technology’s negative
aspects.
Keywords: social media, addiction, health status, internet, impact
1. INTRODUCTION Advancement in technology had made internet usage cheaper and hence excessive social media usage is become
a prime concern among students studying in the undergraduate level. In the age of networking, Internet has a
tremendous influence on the social life of the students.
Anything in excess is dangerous and so is the social media usage. Although they tend to enhance good relationships and communication among the users, the risk factor involved in excessive usage of social media is
very high. Overuse and misuse of social media has led to social media addiction among the students leading to a
lot of health impacts.
The social media usage has a far reaching effect on the brain and it is considered to be addictive both physically
and mentally. There is no such thing as an official diagnosis of social media addiction, but over use of social
media have serious impacts to individual’s physical and mental health. In this era where technologically driven
communications are obvious among the students, the health impacts and drawbacks are also equally persistent.
Social media is used by students for entertainment and self-expression. The social media platform can help
students explore themselves and stay updated with the current events. It can also facilitate interactions across
geographic barriers and also teach them a variety of subjects.
The risk is associated with the amount of time dedicated to the usage of social media by them. Studies have
revealed that students who spent more than 3 hours using social media are likely to suffer poor mental health
and well-being. How students use the social media platform will also determine its impact over them. The
longer the students use social media, the stronger is their belief that other are happier than them.
2. LITERATURE REVIEW Daria J. Kuss* and Mark D. Griffiths in their research paper ‘Online Social Networking and Addiction—A Review of the Psychological Literature’ says social networks on the Internet are iridescent Web 2.0 phenomena
that offer the potential to become part of, and make use of, collective intelligence. However, the mental health
concerns of over and addictive use are yet to be explored using the most demanding scientific methods.
Berryman in the research titled ‘Social Media Use and Mental Health among Young Adults’ says Social media use was not predicted to create impairment in mental health functioning. Coyne in his 8-year longitudinal
research titled ‘Does Time Spent using Social Media Impact Mental Health?: An Eight Year Longitudinal

International Journal of Advance and Innovative Research Volume 9, Issue 1 (IX) January - March 2022
245
ISSN 2394 - 7780
Study’ mentions the excessive use of social media was not associated with increased mental health issues across
development when examined at the individual level.
Escobar-Viera in his study ‘For Better or for Worse? A Systematic Review of the Evidence on Social Media Use and Depression Among Lesbian, Gay, and Bisexual Minorities’ says Social media provides a space to
disclose minority experiences and share ways to cope and get support; constant surveillance of one's social
media profile can become a stressor, potentially leading to depression.
O’Reilly in his qualitative study ‘Potential of Social Media in Promoting Mental Health in Adolescents’
mentions adolescents frequently utilize social media and the internet to seek information about mental health
and in his focus group study ‘The Social Media and Adolescent Mental Health: The Good, the Bad and the
Ugly’ says much of the negative magniloquence of social media was repeated by mental health practitioners
despite of some acknowledgement of potential benefit.
3. STATEMENT OF OBJECTIVES
The study aims to fulfil the below objectives
• To evaluate and compare the frequency of social media usage among the undergraduate students
• To assess the health problems related to excessive social media usage through factors associated with social
media addiction
• To observe the pattern of social media usage among the students and impacts of it on their studies through
regular interactions held with students during the lectures.
4. RESEARCH METHODOLOGY
4.1 DATA COLLECTION The research was based upon primary data collected from 119 respondents through a structured questionnaire
covering students of different age group between 18-21 years in Mumbai District. The secondary data has been
collected through research papers and web links.
4.2 DATA ANALYSIS
• The three most prominent social media platforms used by students are Instagram (72%), WhatsApp (69%) ad
Youtube (64%).
• According to the study, an average of three hours using social media is spent by students. .
• The study also attempted to understand the pattern of usage and its impacts over daily routine of students and
it stated that 54% of the students check their phone first thing in the morning, 49% of them check social media
during study hours, 34% of the students get anxious when they cannot check social media, 28% of them are deeply engrossed in checking the performance of their posts on social media, 24% of the population spend a lot
of time overthinking and planning for their social media posts, 25% of them have ringxiety. 24% of the students
were found neglecting their hobbies due to prolonged use of social media.
• Only 13% of the population were able to complete their tasks on time, rest faced delays in completing their
tasks due to excessive usage of social media. 5. The study reveals that due to excessive usage of social media
the said percentage of population face health and mental impacts, like eye strain (66%), neck pain (46%),
frequent headaches (54%), sleep disturbance (49%), depressive symptoms (30%), stress (42%), loneliness
(46%)
4.3 DATA INTERPRETATION
A survey was conducted through random sampling by distributing questionnaire to the students studying in the undergraduate level in Mumbai. 119 responses were received. Secondary data was collected through various
web sources like journals, research articles and papers. For analysis and interpretations, simple statistical tools
were used.
The data collected from the respondents through questionnaires were evaluated by the answers provided. Each
student was provided an opportunity to understand the questionnaire in a condition and avoid any kind of
biasness in the response provided. The information provided was considered independently and then compared
with other information provided by the students.
Tables and graphs were used to analyze, and represent the data generated. A detailed analysis of the age of
social media users, gender, and the social media platform most frequently visited and the duration spent on
social media (in hours) was conducted from the responses received on the questionnaire.

International Journal of Advance and Innovative Research Volume 9, Issue 1 (IX) January - March 2022
246
ISSN 2394 - 7780
A comparative study social media usage pattern and the signs of health impacts of undergraduate students was
conducted from the data collated. The analyzed data is interpreted as below:
• Instagram was found to be the most used social media platform for undergraduate students.
• The analysis indicates that 100% of the population are social media operators. With online pattern of
education, WhatsApp was found to be the prime source of communication for the teachers and the students
which has increased the dependency of students on WhatsApp. This has led to an increased usage of social
media.
• Respondents under the age of 18 years who spend less than 2 hours in social media usage never noticed any
eye strain, whereas students who use social media beyond 2 hours have often experienced the physical health
impacts like eye strain, neck pain, frequent headaches, sleep disturbance, depressive symptoms, stress or
loneliness. The no of respondents included both male and female students in equal numbers.
• 10% of the respondents in the age group of 18-19 years who spend less than 2 hours in social media usage
have still noticed some of the health impacts, like eye strain and frequent headaches. • Irrespective of the time consumed in social media usage the said percentage of students face health and mental impacts due to social
media usage eye strain (66%), neck pain (46%), frequent headaches (54%), sleep disturbance (49%), depressive
symptoms (30%), stress (42%), loneliness (46%).
• The study reveals the pattern of social media usage and the impact of it over daily routine of students.
Excessive use of social media has increased the dependency of students on social media. Students were found to
be checking their phones during study hours thus delaying their study and other important co-curricular
activities.
• Anxiety issues were reported with students who were deprived of checking their social media and post’s
performance on social media.
• Students waste a lot of time thinking about their social media posts which could have been utilized for productive purpose. Failure to post important moments on social media or inadequate responses (likes or
comments) has led to overthinking and stressful situations in students.
• Students were found neglecting their co-curricular, extra-curricular and skill development activities due to
prolonged use of social media.
• Only 13% of the students were able to complete their tasks on time which indicates that social media usage
has been the prime reason for procrastination among students.
5. FINDINGS The survey conducted and the interpretation done on the basis of data analysis indicates that usage of social
media beyond 2 hours majorly affects the health of the students between 18 to 21 years.
6. LIMITATIONS Responses were received by 119 students only thus making it difficult to derive a concrete conclusion.
Despite the fact that the connection between social media and mental health is complex, many studies have
revealed that mediating factors may contribute or worsen the relationship. More investigations are required to
clarify the fundamental factors to examine the impact of social media on students mental health, whereas it has
no or positive effect on others’ mental health too.
7. CONCLUSION
The research concludes that students in the age group of 18-21 years use social media for more than 2 hours thus causing a lot of physical health problems. The students nowadays are bound to use the mobile phones
frequently due to online pattern of teaching and learning. This has been among the prime causes of addiction
among the students of this age group.
The age group of 20-21 are comparatively lesser addicted to social media usage. The increased social media
usage among students is also causing anxiety and stressful situations when they are deprived from the usage.
This study has found has revealed that the desire for social media can have an emotional impact on the anxiety
and depression level in students.
To conclude, the students need to be diverted to physical classes and their dependency on communications
through social media like WhatsApp needs to be reduced or eliminated completely to reduce the frequency of
mobile phone usage. This can reduce the number of hours students spend on social media usage, hence

International Journal of Advance and Innovative Research Volume 9, Issue 1 (IX) January - March 2022
247
ISSN 2394 - 7780
lessening the health impacts.
If the outcome of this study were used to explore further connections with another construct, it could probably
enhance the conclusions to lessen the health impacts of social media usage on the students.
8. REFERENCES
Is social media bad for mental health and wellbeing? Exploring the perspectives of adolescents. O’Reilly
M, Dogra N, Whiteman N, Hughes J, Eruyar S, Reilly P. Clin Child Psychol Psychiatry. 2018;23:601–613.
[PubMed] [Google Scholar] 2.
Social media and adolescent mental health: the good, the bad and the ugly. O’Reilly M. J. Ment. Health. 2020;1:7. [PubMed] [Google Scholar] 3. Social media use and mental health among young adults.
Berryman C, Ferguson C, Negy C. Psychiatr Q. 2018;89:307–314. [PubMed] [Google Scholar] 4. Does
time spent using social media impact mental health?: An eight year longitudinal study. Coyne SM, Rogers
AA, Zurcher JD, Stockdale L, Booth M. Comput Hum Behav.
2020;104:106160. [Google Scholar] 5. For better or for worse? A systematic review of the evidence on social media use and depression among lesbian, gay, and bisexual minorities. Escobar-Viera C, Whitfield
D, Wessel C, et al. https://mental.jmir.org/2018/3/e10496/ JMIR Ment Health. 2018;5:10496.
[PMC free article] [PubMed] [Google Scholar] 6. A Comparative Study on Social Media Usage and Health
Status among Students Studying in Pre-University Colleges of Urban Bengaluru by N. R. Ramesh Masthi,
S Pruthvi, and M. S. Phaneendra in 2018 PMCID: PMC6166494 7.
Social Media Use and Its Connection to Mental Health: A Systematic Review by Fazida Karim, Azeezat A
Oyewande,Lamis F Abdalla,Reem Chaudhry Ehsanullah,and Safeera Khan Published online 2020 Jun 15.
doi: 10.7759/cureus.8627

International Journal of Advance and Innovative Research Volume 9, Issue 1 (IX) January - March 2022
248
ISSN 2394 - 7780
THE PREDATOR DRONE: UNMANNED HEALTHCARE WELFARE
Raveena Shetty¹, Sujit Tilak², Asmita Kate³ and Pratik Chalke4
1-3Bunts Sangha S.M. Shetty College of Science, Commerce & Management Studies, Powai 2K. J. Somaiya College of Engineering, Vidyanagar, Vidyavihar (E), Mumbai – 400077
[email protected], [email protected], [email protected]
ABSTRACT
COVID-19 has forced the world to present new implementations. Because of the physical restrictions
throughout the country, all of us turned towards technology. One of the recent developments in the tech world
has been drones which have replaced human menial work. This paper aims to implementation of the research
literature to determine how drones are used for the healthcare and health-related services.
Drones was first used in the 1990s by military institution. although, the decrease in cost due to improvement in
technological field has allowed drones to become feasible options for a various range of services including healthcare services. Currently, health services and medical resources in vulnerable communities are limited to
motor transportation and one-to-one interactions; although, drones may be a feasible option in supplying these
facilities in a more effectual manner. Current research has inspected the use of drones for natural calamities relief, search and surveillance missions, and transfer units. although, there is limited research on how drones
can be used as e-medicine and transmission units.
Drones are also referred as unmanned aerial vehicles. They can play a significant role in the healthcare sector.
It can be use as transportation in healthcare sector. As we know in pandemic human contact has been restricted due to viral transmission therefore science and technology win these situations. Drones in the health care sector
are a new logistical alternative for conventional supply chain model. The medical supplies will be delivered at
home without heading outside.
Keywords: Drones, Healthcare, COVID 19, Medicines, Chain Model, Facilities.
1) OBJECTIVE
1. To make delivery of medicines, vaccines especially to remote areas, more feasible and faster.
2. To “solve the gap, solve the problem of remoteness”
3. To provide contactless delivery of meals during quarantine.
4. To decrease the dependence on human beings that provides care and decrease the cost of assisting people.
5. To cover long distances at faster speeds to deliver blood products and lab samples.
6. To reduce the manpower
7. To improve healthcare outcomes by improving ease of access, and decreasing costs to patients.
2) INTRODUCTION Technological advances in mechanical technology have empowered organizations to make new frameworks for
order preparation, stock administration, delivery, and the management. These days, drones also called
Unmanned Aerial Vehicle (UAV), this is a flying gadget controlled from a distance by an individual or a PC,
have become open working instruments, and their fields of application are turning out to be extremely wide, for
example, such as in the audio-visual sector, security, and surveillance, energy, and health
So far, the delivery of medical supplies and blood to rural, underserved networks has depended on customary
transportation techniques, for example, by foot, airplane, or vehicles. These strategies are restricted, particularly in settings situated a long way from local medical clinics, with poor or non-existent ground transport
frameworks or presenting other challenges to rapid transport, such as mountains. Drones can possibly avoid
such limits. Drones have been utilized to convey medicine to portable in the rural and underserved and mountainous region. Drones are conveying blood from city to local clinics, bringing down conveyance time
from four hours to simply 15 min. In Canada, Drone Delivery Canada has collaborated with Moose Cree First
Nation people group living in far off areas of Northern Ontario to convey products, like medical supplies.
Studies have shown that automatic external defibrillator (AED) delivered by drones can reach individuals in cardiac arrest approximately 19 min faster than the emergency medical services, improving patient survival and
recovery rates. Drones are being utilized to facilitate the most common way of getting biological samples for

International Journal of Advance and Innovative Research Volume 9, Issue 1 (IX) January - March 2022
249
ISSN 2394 - 7780
diagnostic purposes to research centres. Drones can reduce risk of biological samples becoming unusable in the
process of transportation.
The future for drones to support health systems extends beyond rural areas. Drones hold significant promise to support communicable disease control and public health emergency response. Drone use has further
expanded within the course of the COVID-19 pandemic, which is ongoing as we write. Supporting infection
control and response initiatives in several jurisdictions, drones are used during the pandemic to spray disinfecting chemical publicly spaces; issue public health announcements reminding individuals to maintain the
recommended six feet distance from their fellow citizens; to move medical supplies, like PPE, vaccines,
samples and blood to hospitals in need of those supplies; and to deliver medications, masks, and sanitizers to
elders living in remote communities.
A drone can identify the accuracy of the scene, the accident that happened, the quantity of harmed people, and
the scale of the occasion before the emergency services arrived. in this situation, drones provide direct details
about an accident scene, therefore, enabling improved emergency medical services, quick response time, and decrease transportation costs. The current campaign for feasible medical delivery through innovation is born out
of the Covid-19 pandemic. the campaign is aimed at reducing human contact to decrease the spread of the virus.
Drones can enable the medical workforce to perform their job more efficiently, effectively, and in the end, save
more lives.
3) Working of drones
In healthcare sector we use modified autonomous drones. They can carry up to15 kg - 20 kg of weight. The
drone will have its drone port. Each drone port will be at a distance of 50 km from each other.
The weight, model, and energy wellspring of a drone are central point’s impacting its most extreme height,
flight span, flight reach, and greatest payload. A significant classification of payloads is sensors. Most drones
are these days outfitted with cameras. Cameras and mouthpieces are the most frequently involved payloads for drones and regularly come standard when purchasing a drone. Cameras can be ordinary cameras yet in addition
infrared. Such cameras might empower night vision and heat sensing. Different sensors incorporate organic
sensors that can follow microorganisms, synthetic sensors that can quantify compound pieces and hints of
specific substance substances including radioactive particles, and meteorological sensors that can measure wind,
temperature, humidity, etc.
Navigational systems, such as GPS, are typically place in the front of a drone. The GPS on a drone
communicates its precise location to the controller. Drones contain sensors, including ultrasonic, laser or lidar distance sensors, time-of-flight sensors, chemical sensors, and stabilization and orientation sensors. Visual
sensors propose still and video data. Red, green and blue sensors gather excellence visual red wavelengths,
green wavelengths and blue wavelengths, and multispectral sensors gather visible and nonvisible wavelengths, such as infrared and ultraviolet frequency. Accelerometers, magnetometers, gyroscopes, barometers and GPS
are also familiar drone features.
4) RESEARCH METHODOLOGY
● The information for the research is taken through primary and secondary research. For primary data
collection, the survey has been taken from the college students and teachers.
● For secondary data collection, existing research papers, articles, and previous research work has been
referred.
5) REVIEW ANALYSIS
5.1) SAMPLING

International Journal of Advance and Innovative Research Volume 9, Issue 1 (IX) January - March 2022
250
ISSN 2394 - 7780
The Sample size for the research was 115 participants (Male and female) from the college who answered the
defined questions as per their knowledge of drones in healthcare sector. In the given graph, it shows the 47.83%
participants are male and 52.17% participants are female.
5.2) HYPOTHESIS
Hypothesis tested during the present study
H1 Participant considers drones will be utilized as a carrier of essential goods & commodities in remote as well
as in urban area.
H2 Participant thinks that drone will be beneficial in pandemic situation for home quarantine, curfew situation.
H3 Participant thinks that drones are more feasible than other modes of transportation for the supply of
medicines, other commodities etc.
5.3) ANALYSIS
UNPAIRED T TEST RESULTS
An attempt has been made to prove data collected through survey, which is divided among males and females
are statistically significant.
P value and statistical significance
The two-tailed p value equals = 0.492785442
By conventional criteria, this difference is statistically significant with 50% of chance for rejection.
Confidence interval
The mean of group one minus group two = -3 95% confidence interval of this difference from 8.408163265 to -12.32653061
(which is unproved)
Intermediate values used in calculation T=2.145
Df = 14
DATA REVIEW
Group G 1 G 2
Mean 34 37
SD 7.671840904 9.289010404
SEM 2.712405364 3.284161124
5.4) Result Analysis
56.5% participants are face
difficulty while obtaining
medicines and rest 43.5% participants are not facing
any difficulties while
obtaining medicines
48.7% participants are
facing cost problems while obtaining medicines, while
55.7% participants are
facing manual receiving from store problems while
obtaining medicines
And rest of the 66.2%
participants are facing substitute medicines

International Journal of Advance and Innovative Research Volume 9, Issue 1 (IX) January - March 2022
251
ISSN 2394 - 7780
problems while obtaining
medicines
60% participants are aware of drones in the healthcare
sector, rest 40%
participants are unaware of
drones in the healthcare sector
40.9% participants have
considered using drones for transporting medical
supplies, while 27.8%
participants have not
considered using drones for transporting medical
supplies and rest of 31.3%
participants are not sure about the same
64.3% participants are
considering that drones are
more feasible than vehicles, while 4.3%
participants are not
considering that drones are
more feasible than vehicles, rest 31.3% are
not sure about the same.
67% participants are
saying that natural
calamities have effects on
drones, while 33% are disagree with the same.
49.6% participants are
think that drones will be
harmful to aerial animals, rest 50.4% participants are
disagree with it.

International Journal of Advance and Innovative Research Volume 9, Issue 1 (IX) January - March 2022
252
ISSN 2394 - 7780
82.6% participants are
thinks that drones are
useful for quarantine people, while 16.5%
participants are thinks that
drones are not useful for
quarantine people, and rest 0.9% participants are not
sure about the same.
73% participants feel that there is future of drones in
healthcare. Whereas 2.6%
denies for the same and 24.3% participants are not
sure about the same.
6) CONCLUSION
Drone usability is on the growth as it offers a multiple thrilling opportunity. Delivery of medical and laboratory
supplies, and blood samples. Drones used for medical supplies are the aid and future of remote areas that have
become unapproachable by conventional land and air transport as a result of disasters, havoc, poor infrastructure, and other tragedies and also a relief for people faced with extreme weather and pandemics in
desperate need of services but are stuck with strict lockdown policies. In various spots around the world,
wellbeing experts, for example, clinical research centre researchers, doctors, attendants and other clinical faculty are beginning to encounter drone utility in delivering administrations. Drones have the capability to
evolve medical care as well as propel advancement to the health industry.
Drones have the capacity to be an authentic mode of delivery in the clinical business for Laboratory tests, drugs,
antibodies, medical equipment, and rescue vehicle administrations. Government agencies worldwide should place drone use on a global agenda especially considering the present reality. With restriction in movement and
lack of access to health care facilities during pandemics as in COVID-19, drones will be an extremely powerful
method for conveyance just as give locally situated medical services. There should be accelerated research initiatives in the areas of safety and airspace management to ensure a workable traffic management system. For
security concerns, severe standards on enrolment and permitting of drones at a reasonable rate should be urged
to empower close checking, following, and recognizable proof if there should be an occurrence of suspected wrongdoings and interruption. There should also be increased public awareness and manufacturers should look
into manufacturing drones that can accommodate bigger payload and of course drones with better battery life.
REFERENCE
1. https://link.springer.com/chapter/10.1007/978-3-319-61446-5_11
2. EPRS | Author of the European Parliamentary Research Service: Mihalis Kritikos Scientific Foresight Unit
(STOA) PE 641.543 - April 2020
3. Specific Challenges to Content, Opportunities, and Behavior of Drones for the Care of Health Care
Delivery Program Managers and Stadium Staff: Multi-Location Quality
4. The complexity of medical aviation in the delivery of health care: Impact of Africa Albert Apotele Nyaaba,
Matthew Ayamga
5. https://www.weforum.org/agenda/2020/05/medical-drone-delivery-india-africa-modernize-last-mile/
6. Chapter metadata to be displayed on SpringerLink, by T.M.C. Press Asser and authors

International Journal of Advance and Innovative Research Volume 9, Issue 1 (IX) January - March 2022
253
ISSN 2394 - 7780
7. https://www.unmannedsystemstechnology.com/expo/uav-autopilot-systems/
8. https://www.adorama.com/alc/different-drone-types-and-their-differences/
9. THE IMPORTANCE OF DRONES IN THE SUBMISSION OF HEALTH CENTER: THE FOLLOWING
APPLICATION NOW AND GENERATION 1Odigie, E. B., 1Adejumo, B. I. G., & 1 * Oigbochie, A. E.
10. https://www.dovepress.com/impact-of-using-drones-in-emergency-medicine-what-does-the-future-hold-
peer-reviewed-fulltext-article-OAEM
11. https://site.internationalsos.com/airpollution/sitecore/content/corporate-site/corporate/home/client-
magazines/in-this-issue-5/drones-deploying-medical-supplies-and-care.
12. https://www.engineeringforchange.org/solutions/product/ambulance-drone/
13. SAVIOR DRONE: DETERMINED DRONE FOR MEDICAL DEVELOPMENT Rahul Adiga C,
Samiksha U Raikar, and Suma S H, Sumanth S, Dr. Balachandran Achar
14. Development of non-emergency vehicle (UAV) networks that bring pre-hospital cardiac defibrillation
(OHCA)

International Journal of Advance and Innovative Research Volume 9, Issue 1 (IX) January - March 2022
254
ISSN 2394 - 7780
HELIACAL POTENTIAL: RACING TOWARDS GREEN
Sairaj Shetty¹, Pavitra Shetty²
Mentor
Raveena Shetty³ 1-3Bunts Sangha S.M. Shetty College of Science, Commerce & Management Studies, Powai
[email protected], [email protected] and [email protected]
ABSTRACT
The objective of this paper is to construct an efficient solar car that essentially runs on a renewable source of solar energy. This research illustrates the changes generated by a solar panel that flows through the battery
pack which is controlled using a microcontroller based on the charge controller to make sure the efficient
storing of the charge in the battery. Batteries store energy and allow the car to accelerate when it runs out of its own electric power. Solar cars combine technology used in the bicycle, aerospace and other alternative energy
as well as automotive industries. The design of a solar vehicle is limited by some amount of energy input into
the car. There is no car which are primarily power by the sun are available in the automobile market.
The use of electric vehicles is booming and the government is encouraging the use of this technology, as there
are not enough charging stations, so we can use solar energy as a reserve fuel system in the vehicles. The basic
principle of our solar car is to use energy which is stored in the battery after charging it with the help of a solar
panel, this will help us to save non-renewable sources of energy which will ultimately get exhausted. When the sunlight hits the photovoltaic panel, the energy will be stored in batteries in the form of electricity. This
electricity will later travel to the motor, and switch on the motor for the vehicle to move and this stored energy
can be use in future as well. The intensity of the sunlight changes as per the time of the day. changing the
charging time for the solar powered batteries. We measure the energy in Watts per meter square.
Keywords: Solar car, Environment, Solar panel, Sun light, PVC, Power batteries.
1. OBJECTIVE
● To study and analyse the proper use of solar photovoltaic panels.
● To create awareness among the crowd about the conservation and developing of our ecosystem.
● To use solar as a reserve fuel in electric cars
● To reduce the carbon footprints on our environment.
● To increase the moto of going green.
● To preserve natural resources.
2. INTRODUCTION A large part of the world is profoundly subject to petroleum gases and coal to create power. In spite of the fact
that this power source is plentiful, it is displayed to aid an unnatural weather change. There has been an increase
in usage of fossil fuels such as coal, gas and oil results in air pollution and increase in greenhouse effect which
pollutes the environment, also we have huge advantage of using solar panel in vehicle because, in India we have abundant resource and solar power is the India’s fastest development industry as the part of renewable energy
and it is installing in a capacity of 48.556 GW. There are many models of solar-powered cars are currently
working in development of both large and small hybrid solar cars. According to some research, the solar cars
market could reach $689 billion by 2027.
Even they are already working on ways to capitalize on the idea with the technology, such as solar roof panels
for charging batteries. Solar panel allows photons to charge the electrons, generating a flow of electricity. Solar panels are made up of smaller units called photovoltaic cells that are linked together. Each photovoltaic cell is a
stack of two slices of semi-conducting material, such as silicon. The silicon is mixed with other materials such
as phosphorus and boron, to make it conductive of electrical charge between the layers. When a photon pushes
that electron out of the silicon junction, the metal conductive plate.
They are additionally more Solar vehicles that fundamentally work on the batteries or engine assuming the
vehicle is planned that way. We utilize various types of energy here on the planet, however, consider this:

International Journal of Advance and Innovative Research Volume 9, Issue 1 (IX) January - March 2022
255
ISSN 2394 - 7780
practically every one of them starts with the sun. The sun-based battery can store the unreasonable power,
delivered all through a radiant day, and use during the night or an overcast day. Solar car run longer on the same
battery. Solar energy makes definitely no commotion by any means. They don't make a singular peep while isolating valuable energy from the sun. This is maybe the main benefit that makes sunlight-based energy a great
deal more down to earth than oil. Oil consuming deliveries destructive ozone harming substances, cancer-
causing agents, and carbon dioxide into our valuable air. Very little support is needed to keep the sun-powered cells running. There are no moving parts in a sunlight-based cell, which makes it difficult to truly hurt them.
Solar energy will generally keep going a decent significant time frame with just a yearly cleaning to stress over.
Sun-oriented energy doesn't produce air and water pollutants. solar energy doesn't create greenhouse gases,
which are connected to worldwide temperature alteration and environmental change. It has no expense and it
doesn't need energy providers to be imported from different spots.
Component of Solar Car
● Solar Array
● Power Trackers
● Electric Motor
● Navigational device
● Speed Controller
● Chassis
● Wheel
● Battery
working of solar car
Solar cars have solar panels custom-designed to be set up on the surfaces receiving maximum sun rays. The
photovoltaic cells on the solar panels are made up of Silicon and a combination of alloy, Gallium Indium, and Nitrogen gas. These elements have a natural retaining property that allows them to absorb the light energy from
the solar rays. The retained energy then releases in form of free-moving electrons into specially designed
storage sections.
Solar cars depend on a solar array that uses photovoltaic cells (PV cells) to convert sunbeam into electricity. When photons strike PV cells, they stimulate electrons and allow them to flow, generating an electric current.
Each photovoltaic cell is basically a sandwich of two slices of semi-conducting material, such as silicon. The
silicon is diverse with other materials, usually, phosphorus and boron, to give each "slice" a positive or negative electrical charge. This generates an electric field at the junction between the two layers. When a photon of
sunlight collisions an electron free, the electric field will push that electron out of the silicon junction. Metal
conductive plates on the sides of the cell collect the electrons and transfer them to wires. At that point, the
electrons can drift like any other source of electricity.
Solar cars with solar PV panels can produce approximately 8 kWh of energy per day. Energy depends on
various factors such as climate conditions, driving conditions, situating of the boards, and upkeep of boards.
Helpless climate conditions, inappropriate situating of boards, and gathering of soil would make it difficult to accomplish even that 8kWh. Though, sun oriented fueled vehicles are actually manageable, they aren't "100
percent" eco-accommodating. Batteries and solar cells convey a portion of the carbon footprint as the unrefined
components are from the Earth.
SAMPLING

International Journal of Advance and Innovative Research Volume 9, Issue 1 (IX) January - March 2022
256
ISSN 2394 - 7780
The Sample size for the research was 62 participants (Male and female) from the college who answered the
defined questions as per their knowledge of solar car. In the given graph, it shows the 59.7% participants are
male and 40.3% participants are female.
HYPOTHESIS
Hypothesis tested during the present study
H1 Participant considers that solar car will be utilized as a carrier of essential goods & commodities in remote
as well as in urban area.
H2 Participant thinks that solar car will be beneficial to reduce the greenhouse emission and also to protect our
environment.
H3 Participant thinks that solar cars are more valuable than any other vehicle.
3. RESULT ANALYSIS
98.4%participant
are aware of
solar panels and
1.6% are unaware of solar
panels.
There are 88.5% of the
participants
knows the working of solar
panels and rest
of the 11.5%
don’t know the working of solar
panels.
As per the
survey, the
participants use
the following solar gadgets on
their daily basis.

International Journal of Advance and Innovative Research Volume 9, Issue 1 (IX) January - March 2022
257
ISSN 2394 - 7780
80.3% of the
participants have heard about solar
vehicles and rest
of the 19.7%
have not heard about solar
vehicles.
31.1% of the
participants have used an electric
vehicle and
68.9% of the
participants have never used an
electric vehicle.
68.9 % of the participants
prefer electric
vehicles over
other vehicles
95.1% of
participants are
ready to switch to electric car for
the beneficial of
the environment.

International Journal of Advance and Innovative Research Volume 9, Issue 1 (IX) January - March 2022
258
ISSN 2394 - 7780
72.1% of the participants
agree that solar
vehicles would
be able to save our non-
renewable
resources.
95.1% agree that solar vehicles
can be an
alternative for
fossil fuel vehicles.
75.4% participants do
consider solar
vehicles as
future.
METHODOLOGY
• The data for the research taken through primary and secondary research. For primary data collection, the review has been taken from the college students ranging their age from 18-25. Review Analysis has been done
to understand the thought process and cognitive reactions about the use of solar energy in vehicles.
• For secondary data collection, present research papers, articles, and previous research work has been stated.
• Data collection also happened through individual conversation with the individuals to understand the current
situation of growth of electric vehicles in India and also availability of electric station to charge them.
CONCLUSION
In conclusion we can say that, solar cars solve many problems which are related to our environment and we need to make sure that we can reduce the use of fossil fuels. As we know there are some disadvantages in using
solar panels in our car like speed, initial high cost and the conversion of energy is only up to 17%, but we can
easily over come from this disadvantage by researching more in this area. The solar car has a great impact on reducing greenhouse gas emission and also help us to prevent global warming. By making the use of solar car

International Journal of Advance and Innovative Research Volume 9, Issue 1 (IX) January - March 2022
259
ISSN 2394 - 7780
we can ultimately save our future as well as our planet. According to the study, there are 80.6% of the people
who heard about electric vehicles and they do approve that shifting to an electric car would be helpful for the
environment and will be able to save our non-renewable resources, and even deliberate that solar vehicle would be great aspect for the upcoming. The solar vehicle resolves many difficulties related to the environment and is
the best pollution free technique. Solar panels make a tremendous impact on this present reality since it
moderates energy and squanders little power. What's more, saving power is vital in light of the fact that there would be fewer blackouts. Sunlight-based power is an all the more spotless method for monitoring energy and
isn't as contaminating to the earth as petroleum derivatives. On the off chance that everybody on earth takes
care of their business and utilizations sunlight-based power, the world would be a more non-contaminated,
energy-productive world. We need to make use of them so that we can decrease our requirement on fossil fuels. Solar panels make a vast effect on the world today because it conserves energy and wastes minuscule
electricity. In addition, saving electricity is very significant because there would be fewer power outages. Solar
power is a cleaner way to conserve energy and is not as contaminating to the earth as fossil fuels. If everyone
on earth does their job and uses solar power, the world would be a more non-polluted, energy-efficient world.
REFERENCE
1. http://www.123seminarsonly.com/ME/Solar-Cars.html
2. https://en.m.wikipedia.org/wiki/Solar_vehicle
3. Singhal A, Shukla L, Gupta A, Iqbal M, Singh D and Gupta M K, “Solar Electric Powered Hybrid
Vehicle”, Journal of Electronic Design Technology, ISSN: 2229-6980 (online), Vol. 6, Issue 3.
4. https://www.seminarsonly.com/mech%20&%20auto/Solar_Cars.php
5. https://www.cartrade.com/blog/2015/greens/solar-cars-pros-and-cons-1181.html
6. https://en.m.wikipedia.org/wiki/Solar_vehicle
7. http://mosssolar.com/solar_vehicles.html
8. https://www.cartrade.com/blog/2015/greens/solar-cars-pros-and-cons-1181.html
9. https://www.cei.washington.edu/wp-content/uploads/2015/02/Solar-Cars-Activity.pdf
10. https://www.tno.nl/en/focus-areas/energy-transition/roadmaps/renewable-electricity/solar-energy/solar-car/
11. https://www.imarcgroup.com/solar-vehicle-market
12. CAR RUNS BY SOLAR ENERGY V Prathibha Bharathi1, V Pandurangadu2 and V Naga Deepthi.
13. Wamborikar Y S, Sinha A, “Solar Powered Vehicle”, Proceedings of the World Congress on Engineering
and Computer Science, San Francisco, USA, Vol. II, WCECS 2010.

International Journal of Advance and Innovative Research Volume 9, Issue 1 (IX) January - March 2022
260
ISSN 2394 - 7780
THE EFFECTS OF COVID 19 ON GROCERY SHOPPING
Dr. Yashesh Ranpura
Don Bosco College
ABSTRACT
E-retailing is entering into the Indian retail scenario noticeably and online grocery retailing holds a promise of
acceptance by the Indian customers. This paper attempts to discover the market potential of online grocery retailing post-pandemic in India and consumers’ perception towards its different aspects. Confirmatory factor
analysis proposes that there are five underlying dimensions (convenience, value for money, variety, loyalty and
ambient factors) governing the selection of mode for grocery purchase. Thereafter Binary-Logistic Regression
has been employed to analyse the impact of these five broad perceptual dimensions upon the acceptance/rejection of online grocery retailing. Indian Government imposed a nationwide lockdown from
March 25, 2020. The lockdown caused panic buying among the customers. In metro cities, people usually have
a habit of buying their necessities including groceries online. Online retailers like Amazon, Flipkart, Grofers, Big Basket, etc. are the key players in the online grocery market. The lockdown has also largely affected online
retail sectors Due to shortage of stocks, lack of transport and lack of manpower the etailers were able to
provide no service or limited service. The pandemic has disturbed the trust, loyalty and satisfaction level of retail customers. This paper aims to portray an overview of customer experiences related to the services of
online retailers during the pandemic. It is worthwhile to understand that retaining the existing customers
indeed is a huge challenge for the retailers selling groceries online during COVID-19, the retailers should
remain in touch with their customers through their sites, social media and other online platforms and express the concern and support in the dire pandemic situation. This shall help the customer have a sense of
attachment. With COVID-19 becoming a new normal and the start of providing the services, the retailers
should adopt and implement the guidelines issued by the government related to the safety hygiene and protection of their customers particularly related to the packing and delivery of the packages at the customers’
doorsteps.
INTRODUCTION
Online grocery shopping paves a threat to the traditional brick-and-mortar retailers in various sectors and have a lesser impact on food retailers. But this is changing – online grocery is coming of age. Online grocers have
made 6% of the market capture in the UK, largely driven by online offerings from all major bricks-and-mortar
players as well as a maturing offering from online-only player Ocado. Also, online grocers in the U.S. and Germany have a smaller share and has a scope of growing steadily and major players such as Amazon Fresh
and Walmart are ready to invest rapidly to accelerate this growth. As per a recent Nielsen Global E-commerce
and the New Retail Survey, one-quarter of global respondents are already buying groceries online for home
delivery and more than half (55%) are willing to use it in the future.
History of grocery shopping in India Earlier there existed only mom and pop stores, street vendors and street hawkers, from whom the consumers
have been shopping for food and grocery consumption based on their demographic profile which is termed as unorganised sector accounting for around 97% in India Later on, with liberalisation and foreign direct
investment into the retail sector in India paved the way for the evolution of organised retail formats in food and
grocery retail sector crept in, offering plenty of commodity/product offerings along with service orientation and also emphasizing on certain physical determinants of the retail store format such as ambience, better services,
etc. Various retail stores such as hypermarket, supermarkets, malls, discount stores, malls have emerged which
serve the consumers with an enjoyable experience/or a fun-filled family day out rather than just getting into a
particular store, just pick up what you need and then leave.
Online grocery market India The online grocery market in India has gained a lot of traction over the past few months with the emergence of
a host of first-generation start-ups and already established traditional grocery chains expanding to the digital platform. India's online grocery market is estimated to grow at a compounded annual growth rate of 62 per cent
between 2016-2022. Online grocery shopping is still in its nascent stage. Online grocery stores seem to be the
next big opportunity in the e-tailing space. Also, many online grocers are coming up every week. Going by the way the global e-grocers are growing and the growth of e-commerce in the Indian market, and online would
capture a small but significant market share. Therefore, the rapid growth of organized and online players is
going to make their prominence in the next decade.

International Journal of Advance and Innovative Research Volume 9, Issue 1 (IX) January - March 2022
261
ISSN 2394 - 7780
As the E-commerce industry is growing tremendously in the Indian market. The cheap 4G internet packages in
India gives a push to these industries. So, as Covid19 first hit in India, people got scared to go out of their
homes because, in their mind, it’s a fear of coronavirus. They even hesitate to go out to buy essential (FMCG) goods. Panic buying also has seen and to avoid this fear of COVID-19, people are giving preferences to the E-
Commerce sites to buy essential goods and some customers are new which signed up to buy essential goods
during this Pandemic Lockdown period. Many customers are shifting their buying behaviour from offline retail
stores to online stores.
According to data India has more than 483 million internet users in 2018. Due to cheap 4G data, everyone can
easily access it. So, on the contrary, the e-commerce industry is also growing exponentially. Due to the
overnight demonetization of some selected notes, India starts its digital India movement from thereon. The government is also working very hard towards it. When the first coronavirus case came in china and after that
china went on complete lockdown, only essential goods and services were working. In China, there was a huge
boom in the e-commerce of FMCG goods. In India sales of Fast-moving consumer goods (FMCG) online are expected to go further 4 billion dollars by 2022, and 5% contribution is of online packaged consumer goods,
said by market researcher Nielsen. Right now only 2% has been contributed by the online FMCG. And sales
keep on growing as the mobile penetration with increased data consumption and make available every product
online whether it is being done by small or large companies.
Shortage of delivery persons because of the huge online demand for FMCG goods. Online Grocers like
Bigbasket, Grofers, NaturesBasket were going out of delivery guys due to the surge in demand and because of
that, these companies were given 2 weeks or sometimes 3 weeks ahead of dates from the time they put on delivery option. Those people who haven’t used any type of online shopping platforms were also signing up and
putting orders.
People are getting used to E-Grocer’s platform in the time of pandemic lockdown, everyone is trying to buy essential goods online. Even new customers are coming on this platform to buy their goods online. So, those
customers who haven’t tried these platforms before are giving it a call and ordering their essential goods online.
It’s been almost more than 3 months of lockdown and constantly increasing in the covid19 cases after the ease
of the lockdown, still, there is a huge demand for essential goods. JIO has also stepped into this industry during the pandemic lockdown and start its services on 27,4,2020 to take it as the opportunity and get the permanent
base customers. Reliance saw the huge demand in this pandemic lockdown of FMCG goods and after this
consumer Buying behaviour towards e-commerce is going to be different due to this Covid-19 pandemic lockdown. So, every Kirana which is offline they have to go digital by creating their online website or joining
hands with the existing e-commerce industry. This report will give the bigger picture that what consumer
behaviour would be after the pandemic lockdown and how fast steadily shift consumer from offline retail to online e-commerce and what will be the future of the e-commerce industry in India and how the e-commerce
industry starts gaining the trust of new as well as existing customers.
OBJECTIVES
1. To study the preference for online shopping of groceries over the neighbourhood grocery store.
2. To understand the rise of expenses due to online grocery shopping.
3. To study the effects of lockdown on grocery shopping.
4. To study the effects of lockdown and customer fears on the online buying of groceries.
LIMITATIONS OF THE STUDY.
The responses received from the respondents are less due to time constraints.
Due to time constraints this research covered mostly family and friends.
The pandemic covid-19 drops the quality of research.
The research mainly includes participants from Mumbai, and doesn’t include responses from all parts of
India.
LITERATURE REVIEW
Aneesh Reddy (April,14,2020) Covid-19 impact Consumers move towards digital Aneesh Reddy explained that due to the COVID-19 pandemic, the way we
work has changed, the way we used to shop and communicate with people. People are only going out only to
buy essential items from the retail stores and sill they are worried to go out to buy essential gods because they

International Journal of Advance and Innovative Research Volume 9, Issue 1 (IX) January - March 2022
262
ISSN 2394 - 7780
are constantly worried about getting infected. Reddy said that according to trifecta, due to a cheaper 4G network
and constantly increasing consumer wealth, Indian EE-commerce is expected to grow to US$200 billion by
2026. But these projections were based on the pre-covid19. But as COVID-19 hit India, the surging demand of e-commerce for the past few months is so high that the e-commerce industry could hit $200 billion much
earlier.
Bansal S (April 02, 2020) Opinion will consumer behaviour see shift post-covid-19 Shuchi Bansal said that, as a consequence of the COVID-19 lockdown, there would be a major shift in the
supply chain and an increased consumption of e-commerce portals through the internet. It has been estimated
that the online stores engaged in sales of groceries and other FMCG products could see a massive shift in
demand to avoid going out to crowded shops and marketplaces. After analysing the consumer buying behaviour from the time India first encountered COVID-19 till the time it went under lockdown, it could be said that
people have become more conscious about health and hygiene and there would be fewer visits to stores and
more online shopping for customers.
Nath S (April 28, 2020) Did the lockdown accelerate the digitization of India Sanstuti Nath threw light on the term 'digital consumption. Her study on the consumption patterns of consumers
post-pandemic lockdown showed that the e-commerce companies have seen a significant growth of 70-100% for essential commodities. And this sudden adaption of digital platforms can be allocated to mobile advertising.
Top companies and brands were already benefiting themselves from these platforms, and also now post
lockdown this whole scenario is going to change how consumers buy.
News desk (April 29, 2020) Bengaluru-based start-up wagon fly secures $500k in investment from ITI
growth Companies like Wagonfly which is a contact-free shopping and delivery services start-up has just raised
$500,000 funding, where its founder Raghavendra Prasad, has claimed a major shift to take place in the overall operations of the retail stores. As a consequence of this Covid-19 lockdown, consumers are now going to prefer
contact-less shopping through online stores or portals and this is going to completely change their buying and
consumption behaviour and patterns. The company's venture called safely, an online marketplace focuses on
meeting the consumer's changing demands for FMCG products who fear to step out due to the pandemic.
DATA ANALYSIS
This questionnaire is based on knowing the paradigm shift of consumer behaviour towards online grocery
shopping during this COVID-19 pandemic lockdown. The recorded responses of 100+ consumers of E-Commerce buying grocery products online/offline before lockdown and during lockdown from online/offline
platforms. the sample size decided to be 100+
Income level per month
Figure 1
This question shows the Income level of the respondents. Maximum respondents with 38.9% had income of
10000, 25% earned 30000+, 22.2% earned between 10000 – 20000 and the least number of respondents with
13.9% earned between 20000 – 30000.

International Journal of Advance and Innovative Research Volume 9, Issue 1 (IX) January - March 2022
263
ISSN 2394 - 7780
How do you prefer to buy grocery before pandemic lockdown?
Figure 2
In this question 76.6% responded that they preferred to buy their grocery from the neighbourhood grocery store, 18.7% preferred to buy it online and the remaining 4.7% brought their grocery from Government Rationing
Store.
How often do you buy grocery online?
Figure 3
In this question, 64.2% of respondent brought their grocery every month while 31.6% brought grocery on
weekly basis and the least 4.2% brought grocery on daily basis.
Figure 4
In this question we can see a tied between respondents who bought grocery for pandemic reason and
convenience reasons with 38.9%, 18.5% bought grocery for better discounts and 3.7% shopped grocery online
for cashback offer.
Are you satisfied with buying online grocery rather than buying through neighbourhood stores?
Figure 5

International Journal of Advance and Innovative Research Volume 9, Issue 1 (IX) January - March 2022
264
ISSN 2394 - 7780
In this question, we can see that respondent are very neutral with 34.3% about the satisfaction of buying online
grocery rather than buying through neighbourhood stores. The least number of respondents with 7.4% strongly
disagree with this question while 18.5% strongly agree. 14.8% disagree and 25% agree with the question.
Do you think that online grocery shopping is playing a vital role during the lockdown period?
Figure 6
The respondent with 46.3% strongly agree with the question and 3.7% strongly disagree. 32.4% agree and 4.6%
disagree and 13% of respondents are very neutral about it.
What are the reasons to shop grocery online?
Figure 7
In this question maximum respondents with 65.7% shopped their grocery online to avoid interaction with
people, 63% did to avoid travelling and 25% shopped to save money.
How do you purchase grocery online during pandemic?
Figure 8
In this question 45.4% of respondents have purchased grocery online with their debit card, 32.4% preferred cash
on delivery and 22.2%used credit card.

International Journal of Advance and Innovative Research Volume 9, Issue 1 (IX) January - March 2022
265
ISSN 2394 - 7780
While grocery shopping online during pandemic did you spend on unnecessary items?
Figure 9
In this question majority with 26.9% agreed and 23.1% disagreed. While 16.7% strongly, 13% had strongly
disagreed and 20.4% are neutral about it.
ANALYSIS AND INTERPRETATIONS Retailers are constantly experimenting and evolving innovative product and format related strategies, in order to
keep pace with the highly competitive and dynamic Indian retail scenario. Various technological interventions
like Internet and other related technologies have given birth to online shopping. Fast growth of the internet in India has significantly impacted the Indian shopping environment (including retailing) and the trend has made
possible the substantial entry of online grocery retailing. This paper attempts to discover the market potential of
online grocery retailing and the consumer perception towards different aspects of grocery purchase in markets
like India. It attempts to provide useful insights for those retailers who are considering going for a hybrid channel strategy. Results from confirmatory factor analysis have proposed that there are five underlying
dimensions affecting the choice of medium for grocery purchasing. These underlying dimensions are
convenience, value for money, variety, loyalty and ambient factors.
Results from graphs (perception-graphs) suggest that there are some differences in the level of importance
accorded to various factors driving the selection of preferred grocery purchase mode among different
demographic category of respondents. Online retailers may use this information to offer customized online grocery-packages to different demographic groups, which may prove useful in making further inroads into
enlarging their customer base.
CONCLUSION
The research has found that the most important aspects of those customers who have never bought anything (FMCG) goods before have shown interest in buying FMCG goods online. As in the above charts shows, these
number clearly shows that many of the new customers are shifting towards the online platforms to buy grocery
goods online. Not only the number of new customers has been increasing but also the satisfaction level is also increasing dramatically. These are because of several reasons like, the person is fear to buy goods offline due to
the COVID-19 virus. So, they trust more in the E-commerce industry rather than buying goods through offline
Kirana stores. It’s been 2 months since the lockdown period has started and the hike of the new customers is
tremendous. According to some article demand for FMCG goods was so high that it's difficult for the E-Commerce companies to fulfil the demand of the customers. Through this paper, we get the idea that more and
more customers are keeping on adding themselves and becoming a member of the online E-commerce platform.
Many of them believe that the E-commerce industry is going to replace the traditional way of shopping like offline retailers. This indicates that many customers are going to rely on online platforms to buy (FMCG) goods
rather than buying offline. COVID-19 helps E-commerce to generate more customers because everything was
lockdown and people were scared to step out of their house, so they preferred to buy goods online and many of the new customers also joined. As per the survey not only new customers have joined to buy the Essential
(FMCG) goods but the satisfaction level also has increased and most of the customers are going to spend more
on ordering more FMCG goods online rather than going offline Kirana. The respondents say that the e-
commerce industry played a vital role during the lockdown period and most of the customers said that they are kept on buying essential (FMCG) goods online even after the lockdown. Many customers are going to rely on
the E-commerce platform to buy essential (FMCG) goods online. It clearly shows that the E-commerce industry
is going to boom in the future.

International Journal of Advance and Innovative Research Volume 9, Issue 1 (IX) January - March 2022
266
ISSN 2394 - 7780
REFERENCES
Aneesh Reddy (April,14,2020) Covid-19 impact: Consumers move towards digital
https://www.thehindubusinessline.com/opinion/covid-19-impact-consumers-move-more-
towardsdigital/article31337127.ece
Bansal.S (April 02, 2020) Opinion will consumer behaviour see shift post covid-19
https://www.theweek.in/news/biz-tech/2020/04/23/covid-19-impact-permanent-shift-inconsumer-
preferences-to-home-personal-hygiene-products.html
Nath.S (April 28, 2020) Did the lockdown accelerate the digitisation of India Inc?
https://www.livemint.com/opinion/columns/opinion-will-consumer-behaviour-see-shifts-postcovid-19-
11585771616107.html
HrNext News desk (April 29, 2020) Bengaluru-based startup wagonfly secures $500k in investment from
ITI growth https://ndcommerce.in/articles/
PTI (April 19, 2020) Post lockdown, online-to-offline strategy to get prominence in the retail sector: LOTS
Wholesale https://economictimes.indiatimes.com/industry/services/retail/majorityof-indian-consumers-
may-shift-to-online-shopping-in-next-9-monthssurvey/articleshow/75355478.cms?from=mdr
Bailey. R, Mukherjee. W (April 16, 2020) large retailers to focus purely on e-commerce during lockdown 2.0 due to exemption. https://retail.economictimes.indiatimes.com/news/foodentertainment/personal-care-
pet-supplies-liquor/preference-for-hygiene-products-to-rise-onlinesales-to-zoom-amid-covid-19-threat-
gcpl/75007220
Avatar. P (May 05, 2020) lockdown 3.0: Flipkart, Snapdeal see heavy traffic for non - essential items.
https://locus.sh/resources/bulletin/coronavirus-could-be-shot-in-arm-forecommerce-firms-globally/
Tech desk, (May 19, 2020) Lockdown 4.0 relief: Amazon, Flipkart welcome non-Essential deliveries in red
zones. https://www.businesstoday.in/current/corporate/covid-19-fmcg-majorsamul-godrej-itc-hike-output-
up-to-20-as-anxiety-buying-spikes/story/398814.html

International Journal of Advance and Innovative Research Volume 9, Issue 1 (IX) January - March 2022
267
ISSN 2394 - 7780
PODCASTING IN INDIA -THE COVID 19 IMPACT (A STUDY OF GROWTH AND CONSUMPTION
PATTERNS OF PODCASTING IN INDIA)
Neena Sharma Assistant Professor, Bunts Sangha’s S.M.Shetty College of Science Commerce and Management Studies,
Powai, Mumbai
ABSTRACT Podcast are on-demand downloadable audio capsules/episodes which are now available on music streaming
platforms like Spotify or sometimes as standalone platforms. The Covid 19 pandemic brought disruptions to
media consumption habit and also changes. The podcast market in India has been impacted by the pandemic.
The growth and movement were noticeable.
Keywords Podcast, , subscription, streaming service, genre, user generated content, audio on demand
INTRODUCTION Radio is one of the oldest, cheapest and most widespread medium of mass communication. For years audiences
have been lured by the romance of the spoken word over airwaves. As with television, radio is a medium of
appointment listening. The advantage was that one could listen to the radio on the move. Technology disrupts technology. As with most things the Internet created, aided newer forms and variations of the old. Internet
fuelled media changed appointment viewing/listening to on demand viewing/listening. Podcasts is to radio what
OTTs are to television.
The dictionary defines a podcast as a “digital audio file made available on the Internet for downloading to a computer or mobile device, typically available as a series, new installments of which can be received by
subscribers automatically”.
Covid-19 impact on new forms of media has led to new ways of expression - Webinars, LinkedIn, IGTV, Tiktok, and Podcasts. Globally, podcasting revenues have gone up, with the industry expected to generate $1
billion by 2021, according to PwC. Industry estimates suggest that podcasts ae becoming popular for listeners as
they are for content generators.
Popular Podcasts platforms in India include streaming giants Spotify, Podcast Addict, Google Podcasts, JioSaavn and Gaana. However, quite a few standalone podcast platforms are making their mark. Some of these
are:
IVM (Indus Vox Media) Podcasts IVM is a Indian podcasting network hosting a variety of multilingual podcasts, including It was founded in
2015 by Amit Doshi and Kavita Rajwade.. IVM has featured celebrities like Abhishek Bachchan on a football
podcast, Kunal Kapoor and his son Zahan Kapoor on a podcast on theatre.
HEADFONE
Headfone was founded by Pratham Khandelwal and Yogesh Sharma - former Facebook employees- in January
2018. It rates highest (4.7 out of 5) among all podcast platforms with India focused content. Headfone received
$750,000 in seed funding from China’s Fosun RZ Capital in 2019. The platform leads the way in regional language podcasts, talk shows, short stories, and other forms of audio content. In about two years the app saw
more than 500,000 downloads. Podcasts on religion and spirituality, kids and family, news and politics
(including the PM’s Mann Ki Baat) are popular on the platform.
AAWAZ.COM
Aawaz.com is one of India’s first audio-on-demand platforms. Created by Mumbai-based startup Agrahyah
Technologies, it provides its listeners more than 300 hours of original audio programming in Hindi. Content includes devotional music, celebrity interviews, stand-up comedy, health and wellness shows, historical and
mythological stories, among others.
CASTBOX
Castbox is a global podcast platform, with over 10 million downloads. It is becoming increasingly popular in India. ‘India On The Drive’ is a Castbox podcast with an India focus. Content consists of local news bulletins,
talk shows, film reviews, and general interest and entertainment programmes. The Passion People Podcast
(stories of entrepreneurs and inspiring people), The SOS Show (mental health issues), The Musafir Stories

International Journal of Advance and Innovative Research Volume 9, Issue 1 (IX) January - March 2022
268
ISSN 2394 - 7780
(Indian travel tales), and Kahani Suno (stories from Hindi literature) are other prominent podcasts on this
platform.
HUBHOPPER Hubhopper was founded in 2015 by Gautam Raj Anand. Its content include podcasts, news, audiobooks, online
radio, and AI-based personalised suggestions for listeners. Hubhopper has a wide variety of shows in local
languages – English, Hindi, Kannada, and Tamil. Popular podcasts on the platform are Kalki Presents: My Indian Life, Cyrus Says, Sadhguru’s Podcast, Indian Noir, Stories of Premchand, and Mahabharata. The app has
registered over 100,000 downloads.
REVIEW OF LITERATURE The MICA Indian OTT Platforms Report 2020, contains an overview of the global podcasting scenario and studies podcasting as an OTT offering. The report suggests that the podcasting in India lagged till the Covid 19
pandemic happened. With prolonged lockdowns and changes to normal life, podcasting became a disruptor and
a new way to present content. The absence of editorial controls gives credence to the idea of freedom of expression. In the US this has led to a great boom in podcasting. Controversies like the Joe Rogan episodes
continue but Spotify has no trouble accommodating him or his views. The report also suggests that the regional
content is the direction in which Indian podcasts are moving. Traditional news platforms also are seeing
increased used of podcast – HTSmartcast (https://www.htsmartcast.com)being a point in case.
According to a report by Statista.com, in 2019, podcast listeners in India primarily used their mobiles which
amounts to 77 percent of total device used. Although overshadowed by video streaming, the podcast market was
one that was growing in the country.
According to PwC's Global Entertainment & Media Outlook 2021-2025, India is the fastest-growing Internet
Advertising market in the world at a CAGR of 18.8% during 2020-2025. According to its estimate, mobile ad
revenue is likely to be 74.4% of the total internet advertising revenue of INR 30471 Cr by 2025. In 2020 mobile internet advertising revenue in India was 7331 Cr (INR) and will rise to 22350 Cr (INR) in 2025 –a 25.4%
CAGR increase rate.. This makes India the fastest-growing mobile ad market in the world and also shows the
potential for growth.The potential is also driven by the fact that half the population was yet to subscribe to a
mobile Internet connection in 2020.
Considering the growth of mobiles usage and the projected advertisement growth, the growth seems to have
accelerated in the Covid years with room for further consolidation as far as podcasts are concerned.
Mint, quoting market research firm RedSeer said that Indians spent 2,290 billion minutes consuming online
entertainment in 2021. Podcasts made up for 2.5 billion minutes spent online in October 2021.
.OBJECTIVES OF THE STUDY:
The study wants to understand and answer following issues:
1. The growth of podcasts during the pandemic in India
2. The nature of the growth of podcast in India- size and content
3. Scope of growth as revenue generator and as user generated content platforms
SCOPE/LIMITATIONS OF THE STUDY The study limits itself to the scope of podcasting channels/platforms which is freely available and function out
of India. Comparative figures between Indian podcasts and foreign podcasts are not being used in this study.
However publicly available figures in terms of consumption and growth are cited in the research.
RESEARCH METHODOLOGY
The research methodology adopted for this paper uses secondary data available on the internet. The
dataavailable is in the form of news articles, interviews and reports of media and media research organizations.
1. The growth of podcasts during the pandemic in India
According to PricewaterhouseCoopers’ Media and Entertainment Outlook 2020 report, India has over 57.6
million listeners, making it the third-largest podcast listening market after China and the US. In the early part of
2020 podcasting platforms saw significant jump in downloads.
Indian podcasts grew between 8-22% during the peak lockdown period of April and May 2020 according to a
report in the Economic Times. Considering that podcast listenership is associated with driving/commute times,
these figures suggest during the lockdown commuting was much less. Despite this change of behaviour,

International Journal of Advance and Innovative Research Volume 9, Issue 1 (IX) January - March 2022
269
ISSN 2394 - 7780
podcasts have seen growth. Amidst all the restrictions of the pandemic, the pandemic, podcasts became a
screen-free way to consume stories and news, attend discussions and interviews.
2020 saw 42 per cent increase in the time people spent on audio streaming platforms like Spotify, Gaana,
JioSaavn . Many of these platforms also saw a rise in their podcast content, especially locally produced ones.
Spotify, the world’s largest music and podcast streaming service, launched nearly 30 original podcasts with
local creators in a span of one year while JioSaavn, an Indian streaming platform, saw its content grow 200
times in 2020, compared to 2019.
KPMG’s Media and Entertainment Report 2020 found that India recorded a 29.3 % increase in podcast
consumption in the first year of the pandemic.
2. The nature of the growth of podcast in India- size and content The increase in podcasts download could be attributed toa variety of factors. It is not that podcasts suddenly
began to churn out new Covid specific content or better content or special (all of which may have happened to
some degree. Audio content has never gone out of fashion. With the coming of OTT platforms and streaming services audio has acquired a whole new dimension in terms of variety. The OTT in audio is as varied as the
OTT in video.
During the pandemic, it seems to be that the inherent fatigue of the lockdown, increased screentime and a completely unknown unlived experience of being homebound for months made people experiment with
different forms of media and podcasts reaped the benefits of these experiments.
Media reports and interviews with listeners seem to suggests that podcasts provide more immersive experience
in personal spaces. People felt they were listening to a friend. One other factor appears to be the fact that listers
could multitask- listen and continue with chores.
Content growth has been in two specific directions: (a) genre variety and (b)local languages.
GENRE VARIETY Most podcasts stream free of charge. Listeners have a wide range of content to choose from- sport,
entertainment, finance, spirituality and self-improvement, current affairs and general knowledge.
In an article titled “The impact of COVID-19 on the podcast advertising ecosystem” in collectivemeasures.com,
Ben Braman writes about the American podcast listener – “With more people quarantining and working from home, podcast enthusiasts are leaning further into leveraging them either as a form of education (learning new
skills) or entertainment. Consumers can search Spotify for podcasts on how to play the guitar, bake a cake, for
opinions on the best Netflix shows right now, … There’s really no limit to what’s available for consumers.”
India too saw a growth in content of self-help/self-improvement and motivation.
2020 was a year of experimentation. Listeners have access to a variety of content . According to Rathiulung
Elias, host of the podcast The Contemplative Tribal, in an interview to ThePrint said “Not only has this medium amplified the voice of the marginalised people but it also empowers us to ‘undo the misrepresentations’ of the
Northeast people and their culture in India and abroad,” Gita for the Young and Restless, a podcast by Vedanta
expert, corporate guru and life coach Jaya Row, is one of the fastest growing podcasts on Spotify India.
In an interview to TNM(thenewsminute.com) Padma Priya, the editor-in-chief and co-founder of Suno India, a multilingual podcast platform that reports journalistic stories via audio shows, said that that they chose audio
because it provided listeners a more intimate space. The kind of topics they wanted to cover were sensitive, and
would require some amount of anonymity. Suno India specializes in audio journalism which very few
podcasters or platforms dabble in.
Megha Rao, , poet and writer , hosts ‘Poems to Calm Down To’ . She wanted to interview poets and performers
for her show but that became impossible during the pandemic. She, then, decided to make the podcast with a collection of poems she had written during the pandemic, The topics discussed in the poems, centred around
positivity and catharsis, and found resonance with listeners during the pandemic.
Local Languages
In an interview Amarjit Singh Batra, managing director of Spotify India said that there is more local content available and these are also very popular and climb the rating charts quickly. This is in contrst to the
predominance of global content in the previous years.

International Journal of Advance and Innovative Research Volume 9, Issue 1 (IX) January - March 2022
270
ISSN 2394 - 7780
Current podcasting scenario in India comprises more than 40 multilingual podcasts across various languages
and genres .
3. Scope of growth as revenue generator and as user generated content platforms The 2021 edition of the FICCI-EY report on the Indian media and entertainment (M&E) sector states that
Podcast business models will continue to be funded by advertisements. Podcast business models will be largely
creator, community leader and celebrity led, and be used to build ‘stickiness’ and subscriber bases for OTT platforms. Very few stand-alone podcast platforms / creators will be able to generate subscription revenues on
their own.
It is true that the podcast market in India is not growing at a desirable rate where advertising is concerned.
Redseer report (redseer.com) of 2021 states that in order to gain popularity and keep content development costs low, Indian platforms started with both UGC (user generated content) and PGC(professionally generated
content) models. UGC has cause some devaluation of brand value and quality Platforms are now looking to
producing high-quality content and using celebrities to host shows. Platforms, such as Headfone and Khabri, are
creating more filters for user generated content.
The MICA OTT Report for 2020 suggests that podcasts growth in India comes from male audiences and it
could change with reliable audience measurement systems thereby leading to more ‘dynamic advertisement’
and support for podcasters.
CONCLUSION
The Podcasting scenario in India is not in a nascent state, nor is it a self-sufficient industry. Success seems to be
propelled by big streaming services of which podcasts are small part. The potential lies in the fact the there is a co relation between use of mobile phones and access to podcasts. India’s smartphone consumption is on the rise.
Apps that use low data to deliver podcast content, along with focus on local languages and celebrity-driven
content could be the way forward. The pandemic has created new users and opened the gates for new kind of content. The demographic Millennials with smart phone, niche choices, privacy in accessing content could
drive this new form of entertainment and information.
REFERENCES
1. INDIAN OTT PLATFORMS REPORT 2020
2. https://www.pwc.in/press-releases/2021/pwcs-global-entertainment-and-media-outlook-2021-2025.html
3. https://redseer.com/newsletters/indias-podcast-market-worlds-fastest-growing-with-immense-potential/
4. https://www.indiatvnews.com/technology/apps-here-are-the-best-podcast-services-available-in-india-
701404
5. https://www.thenewsminute.com/article/growing-popularity-podcasting-south-india-story-
156662#:~:text=The%20podcast%20industry%20in%20India,after%20China%20and%20the%20US.https://www.hindustantimes.com/lifestyle/art-culture/hear-and-now-inside-india-s-podcast-boom-
101622272494892.html
6. https://theprint.in/features/self-love-storytelling-how-india-saw-a-podcast-boom-in-the-pandemic-year-
2020/593810/
7. https://www.livemint.com/technology/tech-news/audio-content-listeners-in-india-are-expected-to-touch-
100-mn-soon-11639416599286.html
8. https://yourstory.com/2019/09/top-podcast-apps-spotify-google-bookmyshow-local-content-india/amp

International Journal of Advance and Innovative Research Volume 9, Issue 1 (IX) January - March 2022
271
ISSN 2394 - 7780
A STUDY OF UTILIZATION OF SOCIAL MEDIA IN DAY TO DAY LIFE.
1Mr. Vikas Nishad
Mentor 2Sheetal Khanore Mentor
1M.Sc.IT Part-I, S.M.Shetty College, Powai
2Assistant Professor, Department of IT, S.M.Shetty College, Powai
ABSTRACT
This paper identify the uses of social media sites in our daily life. How people can save their time using social
media and how they are utilize social media in there daily life. How people are become a more familiar with social media and what is important of social media in in their daily routine. Today people depend on social
media for entertainment, News, education. With the help of the social media people can interact anyone in the
world. Social media provide a platform for discussion and messaging. Social media is a part of people life and it is a easiest way to communicate, shop, advertisement, to find something do, check the news. Social media is
internet network and give users to quick electronic communication, such as personal chat and group chat,
documents, videos, and photos. Users can use the social media through computer, tablet, or smartphone with
the help of web-based software and applications.
Keywords: Social Media, Social Networking Sites, Facebook, Whatsapp
LITERATURE REVIEW
Social media sites provide a platform for discussion and massaging which is popular among student. The social media is a computer-based technology with the help of that we can share of ideas thoughts, and
information through the internet. Social media is internet network and give users to quick electronic
communication, such as personal chat and group chat, documents, videos, and photos. Users can use the social media through computer, tablet, or smartphone with the help of web-based software and applications. Social
media has become a part of our daily life. People are depending on social media slowly-slowly. They are using
it for news, entertainment, education, business, marketing, etc. Social media is most power tool today because
with the help of that we can do anything. While social media is a ubiquitous in America and Europe, Asian countries like Indonesia lead the list of social media usage. More than 4.5 billion people are using social media,
as of October 2021.
For long time ago we were getting news from local TV and their local news paper. But after 15 to 18 years we are getting news from the internet. There are different type of social media platform that are used for news
purpose like facebook , isntagram, whatsapp, twitter, and youtube. People can consume news from social media
through mobile phone. Social news is sometime beneficial for us because to get an instant news without any professional journalist. Because people can simply feeds news on social media without any experience of
journalist background. After that this news circulates across the whole country without any permission. People
can simply access it by their mobile phone without any charges. Today social news becomes a more popular
because people are educated and it is going toward digitalization. They do not have time for reading a local
newspaper and local TV channel and they want to keep everything in our cell phone to save their time.
Media based daily routines
There are different tools that are used in the communication sector of social media platform like facebook, twitter, whatsapp, telegram, instagram etc. It increase the chances of communication between individuals using
personal details, comment, image, videos, posts, and more. With the help that tools we can communicate with
friends, family member and unknown person in the world. Using that platform we are able to build strong relationship with each other. These tools include Blogs and websites, where can create articles and blogs to
interact, communicate, inform and empower your audiences. The people who read your blog will be able to
comment on it. Facebook, twitter, whatsapp, instagram play a big role on communication because it provide a
lot of features for communication like normal call and video call and it also provide group call. With the help of that we can call any person through the internet. Most of the people use the facebook and whatsapp for their
daily routine. They do share lot of data over the app for communication and more.
Social Ads are advertisements on a social media platforms and networks. They contain a title, a description and some sort of multimedia element like picture, video, clickable product item, etc. With the help of that we can
post our ads on social media and increase productivity and attract the huge people. Social Ad can be published

International Journal of Advance and Innovative Research Volume 9, Issue 1 (IX) January - March 2022
272
ISSN 2394 - 7780
on many different formats. There are many different ways to create an ads, social media advertising isn't too
different from ads found on search engines like Google Ads. Advertisement of social media can be used in
different format like promoting movies, branding some product. Social ads are become a most popular technique for advertisement because the different company are show there ads on social media which will
directly reach to the customer in very less cost and very few moment. Social media show their ads on the basis
of customer requirement.
Utility aspect of Social Media
Social networking sites Facebook, attract millions of users worldwide by offer highly interactive social
communications. Although this has many advantages, with the help of facebook we can share our personal data
to over the social media platform like photo, status, short video etc. Using that we can build strong relationship between each other. Today facebook is used as news many people consumed news through facebook. facebook
is also used for advertisement. There are many company like amazon ,flipkart,swiggy. They show there
advertisement on facebook and attract the customer. Facebook become a most popular app today because across millions of people using facebook for entertainment business, adds, marketing, banding, and promotion.
Facebook is also providing calling system with the help of that user can communicate anyone in the world. It
also provide video calling system using that we see anyone at any time. But some negative effect of facebook like data bleaching and weak data privacy. Because anyone can see our profile without need any permissions. It
has found that a more people share their daily routine on the facebook. Using that if anyone wants to know
about us they will easily follow our page and get information through our daily post like what’s going in our
daily life and what should I like, where we live currently and more information according to their need. It is a
very dangerous for us to share our personal on facebook so we need keep our privacy secure.
WhatsApp is a popular mobile application for instant messaging service in smartphones. Whatapp create user
account using phone as user account. It uses Internet services to communicate different type of text and multimedia messages between users or groups. Whatsapp is used for personal chat and group chat. With the
help of that we can keep our thought across multiple users with the help of whatsapp. It also provide video and
non-video calling system to communicate to each other. It is a very secure app it provide it provide end to end
encryption. Users of whatsapp worldwide have crossed the figure of two billion in February 2021.The big effects whatsApp on our daily lives, culture, and society keeps on increasing. It is also become popular tool for
marketing in businesses and publicity in politics. The growth of whatsapp increase day by day people use
whatsapp in our daily routine .On the basis of that we can assume that whatsapp become a important part of life
social media users.
Twitter is social media app. It is used to share your thought over the internet. With the help of twitter we can
create a post and retweet any post. Twitter is used for blogging and instant messaging. It allows the users to send a short 280-character message (known as a tweet). Such messages are free and can be trivial as in the
examples above, or pertinent, with links to article, web pages, blogs, videos, photos, and other media. This type
is known as micro-blogging. However, Twitter is more interactive it will create a conversation that anyone can
join. One of its fundamental principles is that you elect to follow those whose conversations most interest you these become your “Twitter feed”. Twitter is a very secure app it also keep user personal data securely. It is
official app it most used by politics.
QQ is considered to be the most popular messaging software in China. With the help of QQ we can interact with the people through personal chat and group chat. QQ has a 899 million monthly active users in the second
quarter of 2016. It integrate social networking community, personal website, microblog, email, web browser,
online courses, online homework, live streaming, learning apps and can be used across platforms.
Youtube is social media platform where people can share, watch, like, comment, on video. This video can be
access by mobile, laptop, website, tablet, and wifi smart led. Youtube is the second largest search engine after
google. People can upload 100 hours video per minute on youtube and it is the best ways to communicate with
huge audience. Today youtube used in teaching field where teacher can share there video and students watch there video virtually at anywhere through their mobile phone and laptop. Youtube is also used for
entertainment, advertisement, branding, promotion, etc. Youtube is mostly used for business purpose because
people can upload their video on it and get some money. We can earn a lot of money through youtube by uploading video. Most of the people use youtube for entertainment like to watch some movies, jokes, comedy
video, memes , and some people are used to learn something new.
Telegram is cloud based messanger app for android and ios users. Telegram uses phone internet connection for
message end to end. It is one of the online web based application which was launched by two Russian brothers

International Journal of Advance and Innovative Research Volume 9, Issue 1 (IX) January - March 2022
273
ISSN 2394 - 7780
in 2013 by Pavel and Nikolai Durovis. It create user account using phone number as user account it send one
otp message on the register mobile number for signing to the app. After that user can able to access to telegram
through their cell phone, tablet, and laptop. This app is used for to share photo, audio and video, stickers, any type of file. It is most useful for sharing larger data file in terms of GB. Telegram is providing bot API by using
this bot we can control over the chat. This app is more secure for our data privacy it is secure and very fast app
for messaging. This app provides end to end to encryption using this app we can perform end to end chat. This is used communication between the people but also this app is able to control the devices it is used to read the
status from sensors and are to twitter and gmail.
CONCLUSION
Social media is rapidly growing and gaining popularity. Social media become a routine for each and every person and people are become a more familiar with social media. With the help of that people can save their
time and easily interact with anyone. On the basis of research we find that people are depend on social media
for news, entertainment, communication, education, and more in day to day life. Business man uses the social media for advertisement their product. They are simply put there advertisement on social media after that social
media recommend the ads to the customer. Social media provide a platform for communication with the help of
that we can send message instant. Social media is also used as news consumption. People can consume news from different source like Facebook, what’s app, Instagram, Twitter, etc. There are some negative effects of
social media like data bleaching, time waste, and people are more depends on social media for their daily
routine. If someone spread fake News people can easily trusted them without knowing the reason behind it.
REFERENCE
1. https://www.marketing91.com/what-are-the-uses-of-social-media/
2. https://www.cyberclick.net/advertising/advertising-on-social-me0dia
3. https://www.facebook.com/news/howitworks
4. https://www.researchgate.net/publication/316892755_Survey_Analysis_on_the_usage_and_Impact_of_W
hatsapp_Messenger
5. https://www.emeraldgrouppublishing.com/how-to/research-methods/use-twitter-academic-research
6. https://www.researchgate.net/publication/321669907_THE_USE_OF_QQ_IN_EFL_TEACHING_AND_
LEARNING_A_LITERATURE_REVIEW
7. https://en.wikipedia.org/wiki/Tencent_QQ
8. https://bioresources.cnr.ncsu.edu/resources/the-use-of-social-media-and-its-impact-for-research/
9. https://www.algonquincollege.com/ac-social-media/why-use-youtube/
10. https://www.webology.org/data-cms/articles/20200515033516pma190.pdf
11. http://www.ijcat.com/archives/volume5/issue2/ijcatr05021006.pdf

MANUSCRIPT SUBMISSION
GUIDELINES FOR CONTRIBUTORS 1. Manuscripts should be submitted preferably through email and the research article / paper
should preferably not exceed 8 – 10 pages in all.
2. Book review must contain the name of the author and the book reviewed, the place of publication and publisher, date of publication, number of pages and price.
3. Manuscripts should be typed in 12 font-size, Times New Roman, single spaced with 1” margin on a standard A4 size paper. Manuscripts should be organized in the following order: title, name(s) of author(s) and his/her (their) complete affiliation(s) including zip code(s), Abstract (not exceeding 350 words), Introduction, Main body of paper, Conclusion and References.
4. The title of the paper should be in capital letters, bold, size 16” and centered at the top of the first page. The author(s) and affiliations(s) should be centered, bold, size 14” and single-spaced, beginning from the second line below the title.
First Author Name1, Second Author Name2, Third Author Name3 1Author Designation, Department, Organization, City, email id 2Author Designation, Department, Organization, City, email id 3Author Designation, Department, Organization, City, email id
5. The abstract should summarize the context, content and conclusions of the paper in less than 350 words in 12 points italic Times New Roman. The abstract should have about five key words in alphabetical order separated by comma of 12 points italic Times New Roman.
6. Figures and tables should be centered, separately numbered, self explained. Please note that table titles must be above the table and sources of data should be mentioned below the table. The authors should ensure that tables and figures are referred to from the main text.
EXAMPLES OF REFERENCES All references must be arranged first alphabetically and then it may be further sorted chronologically also.
Single author journal article: Fox, S. (1984). Empowerment as a catalyst for change: an example for the food industry. Supply Chain Management, 2(3), 29–33.
Bateson, C. D.,(2006), ‘Doing Business after the Fall: The Virtue of Moral Hypocrisy’, Journal of Business Ethics, 66: 321 – 335
Multiple author journal article: Khan, M. R., Islam, A. F. M. M., & Das, D. (1886). A Factor Analytic Study on the Validity of a Union Commitment Scale. Journal of Applied Psychology, 12(1), 129-136.
Liu, W.B, Wongcha A, & Peng, K.C. (2012), “Adopting Super-Efficiency And Tobit Model On Analyzing the Efficiency of Teacher’s Colleges In Thailand”, International Journal on New Trends In Education and Their Implications, Vol.3.3, 108 – 114.

Text Book: Simchi-Levi, D., Kaminsky, P., & Simchi-Levi, E. (2007). Designing and Managing the Supply Chain: Concepts, Strategies and Case Studies (3rd ed.). New York: McGraw-Hill.
S. Neelamegham," Marketing in India, Cases and Reading, Vikas Publishing House Pvt. Ltd, III Edition, 2000.
Edited book having one editor: Raine, A. (Ed.). (2006). Crime and schizophrenia: Causes and cures. New York: Nova Science.
Edited book having more than one editor: Greenspan, E. L., & Rosenberg, M. (Eds.). (2009). Martin’s annual criminal code:Student edition 2010. Aurora, ON: Canada Law Book.
Chapter in edited book having one editor: Bessley, M., & Wilson, P. (1984). Public policy and small firms in Britain. In Levicki, C. (Ed.), Small Business Theory and Policy (pp. 111–126). London: Croom Helm.
Chapter in edited book having more than one editor: Young, M. E., & Wasserman, E. A. (2005). Theories of learning. In K. Lamberts, & R. L. Goldstone (Eds.), Handbook of cognition (pp. 161-182). Thousand Oaks, CA: Sage.
Electronic sources should include the URL of the website at which they may be found, as shown:
Sillick, T. J., & Schutte, N. S. (2006). Emotional intelligence and self-esteem mediate between perceived early parental love and adult happiness. E-Journal of Applied Psychology, 2(2), 38-48. Retrieved from http://ojs.lib.swin.edu.au/index.php/ejap
Unpublished dissertation/ paper: Uddin, K. (2000). A Study of Corporate Governance in a Developing Country: A Case of Bangladesh (Unpublished Dissertation). Lingnan University, Hong Kong.
Article in newspaper: Yunus, M. (2005, March 23). Micro Credit and Poverty Alleviation in Bangladesh. The Bangladesh Observer, p. 9.
Article in magazine: Holloway, M. (2005, August 6). When extinct isn't. Scientific American, 293, 22-23.
Website of any institution: Central Bank of India (2005). Income Recognition Norms Definition of NPA. Retrieved August 10, 2005, from http://www.centralbankofindia.co.in/ home/index1.htm, viewed on 7. The submission implies that the work has not been published earlier elsewhere and is not
under consideration to be published anywhere else if selected for publication in the journal of Indian Academicians and Researchers Association.
8. Decision of the Editorial Board regarding selection/rejection of the articles will be final.

www.iaraedu.com
Journal

www.iaraedu.com
Journal

Become a member of IARA to avail attractive benefits upto Rs. 30000/-
http://iaraedu.com/about-membership.php


IARA Organized its 1st International Dissertation & Doctoral Thesis Award in
September’2019

www.editedbook.in
Publish Your Book, Your Thesis into Book or Become an Editor of an Edited Book with ISBN
BOOKS PUBLISHED


Indian Academicians and Researchers Associationwww.iaraedu.com
Indian Academicians and Researchers Association www.iaraedu.com