cluster ix october 2019 to march 2020 - bccl
TRANSCRIPT
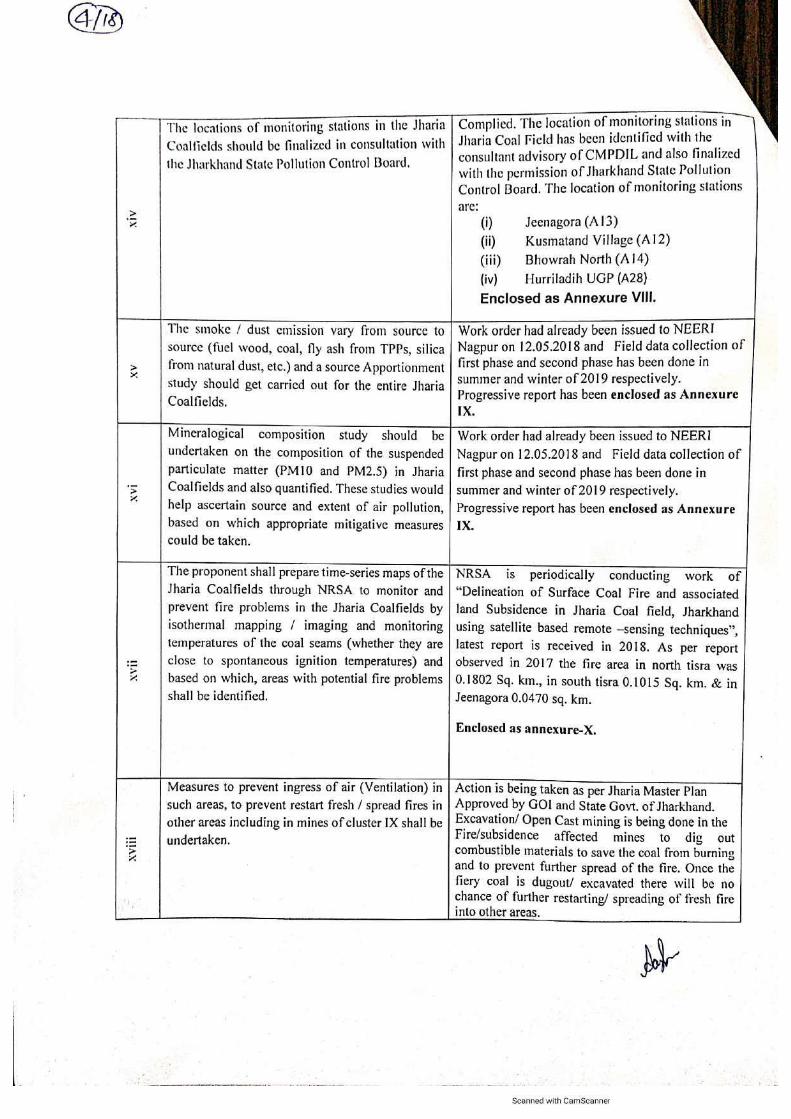
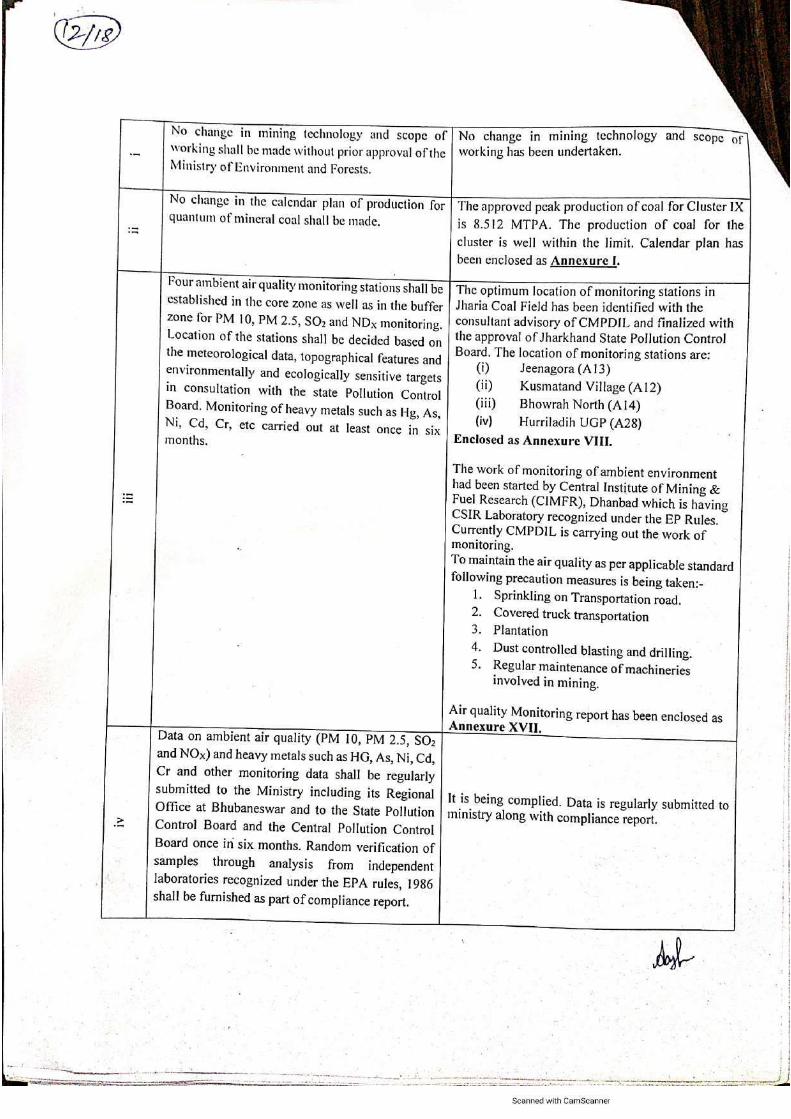

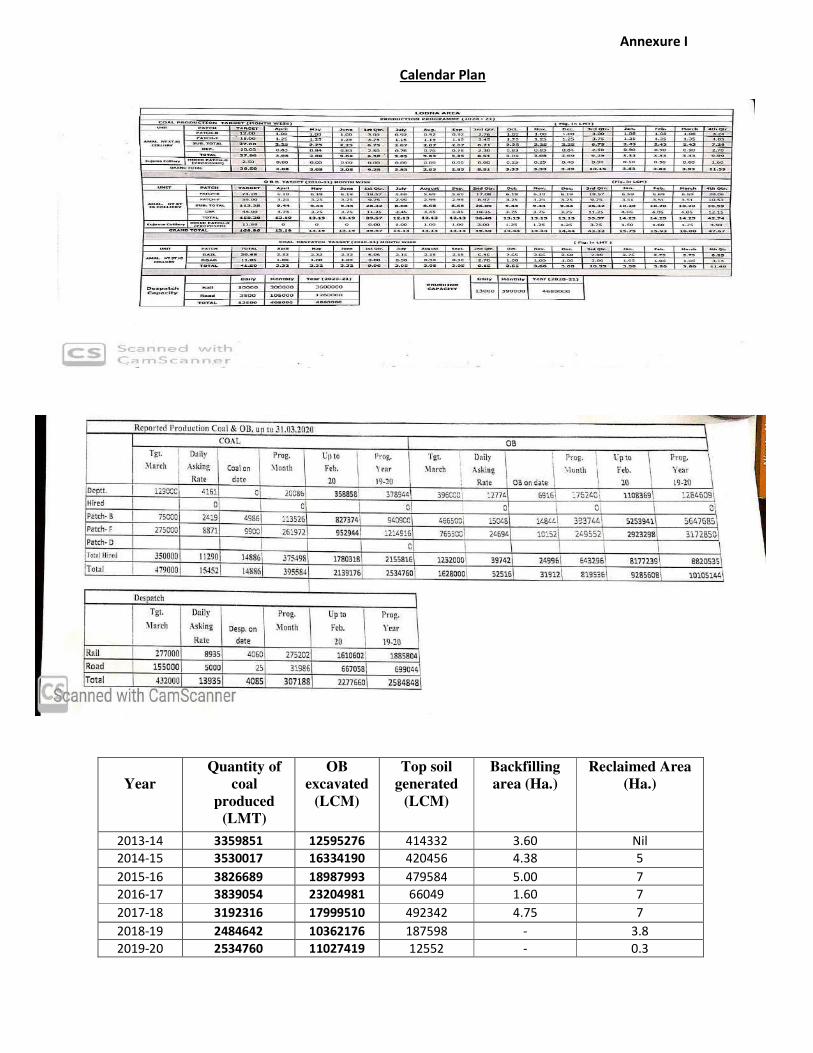
Annexure I
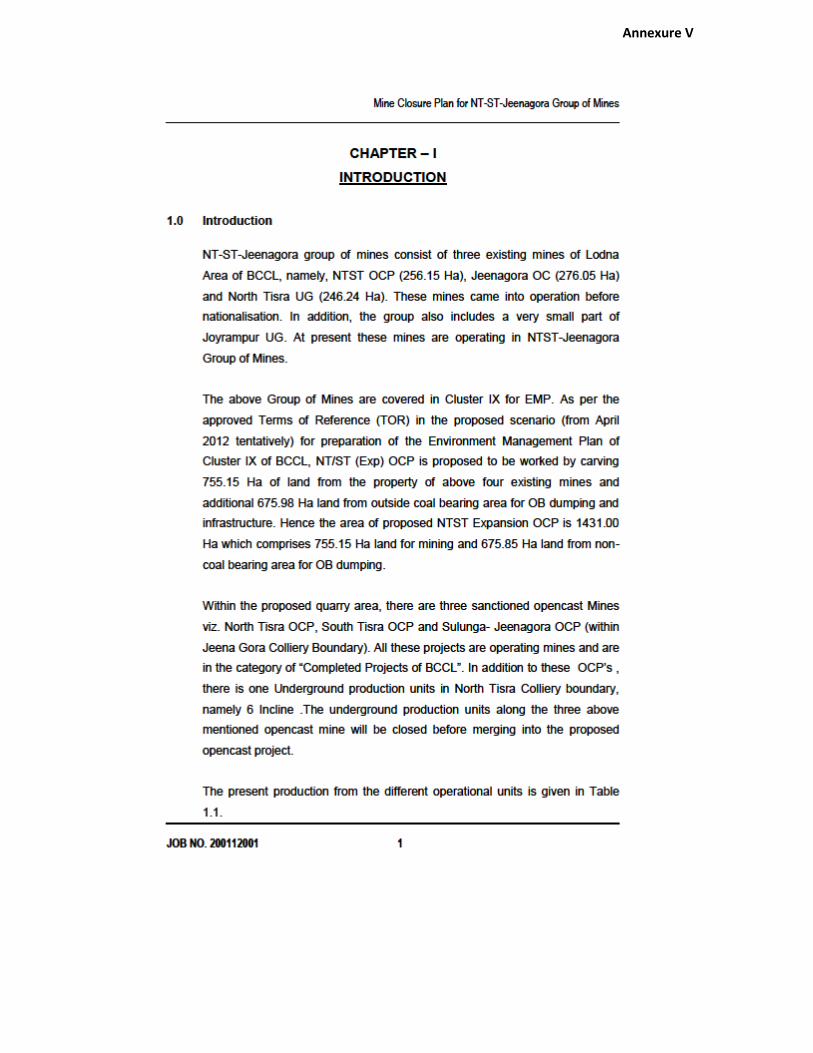
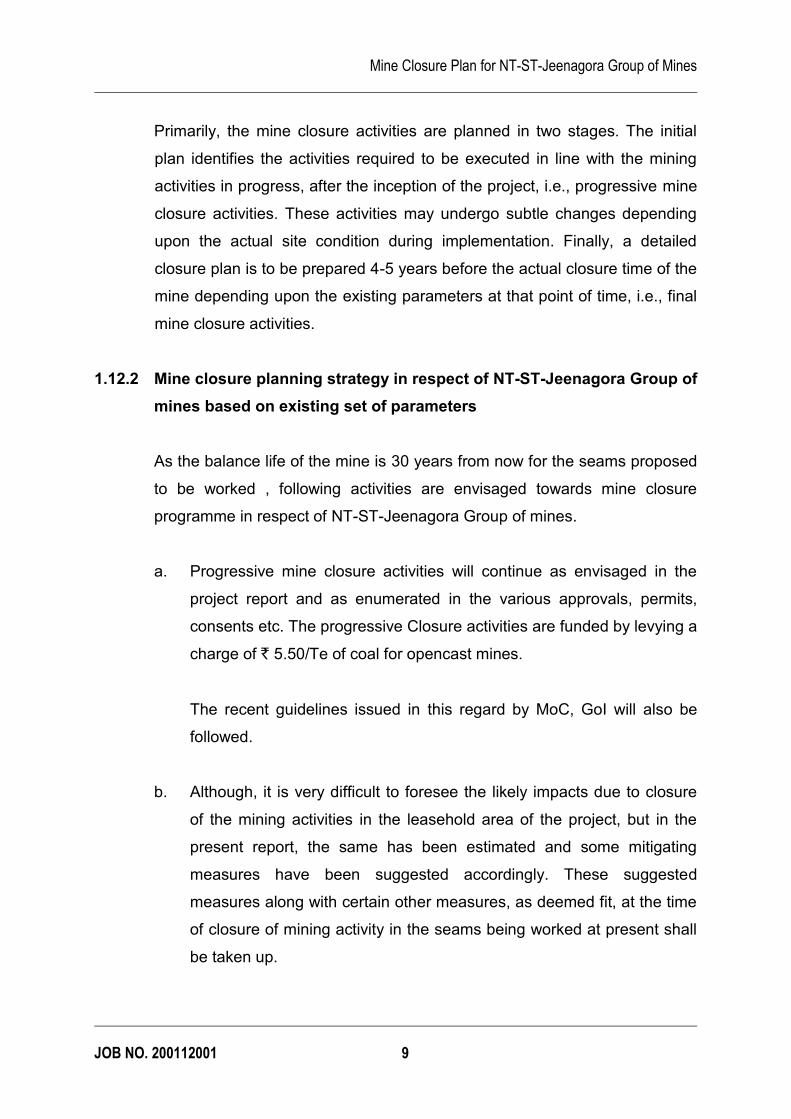
Calendar Plan
Year
Quantity of
coal
produced
(LMT)
OB
excavated
(LCM)
Top soil
generated
(LCM)
Backfilling
area (Ha.)
Reclaimed Area
(Ha.)
2013-14 3359851 12595276 414332 3.60 Nil
2014-15 3530017 16334190 420456 4.38 5
2015-16 3826689 18987993 479584 5.00 7
2016-17 3839054 23204981 66049 1.60 7
2017-18 3192316 17999510 492342 4.75 7
2018-19 2484642 10362176 187598 - 3.8
2019-20 2534760 11027419 12552 - 0.3
Annexure II
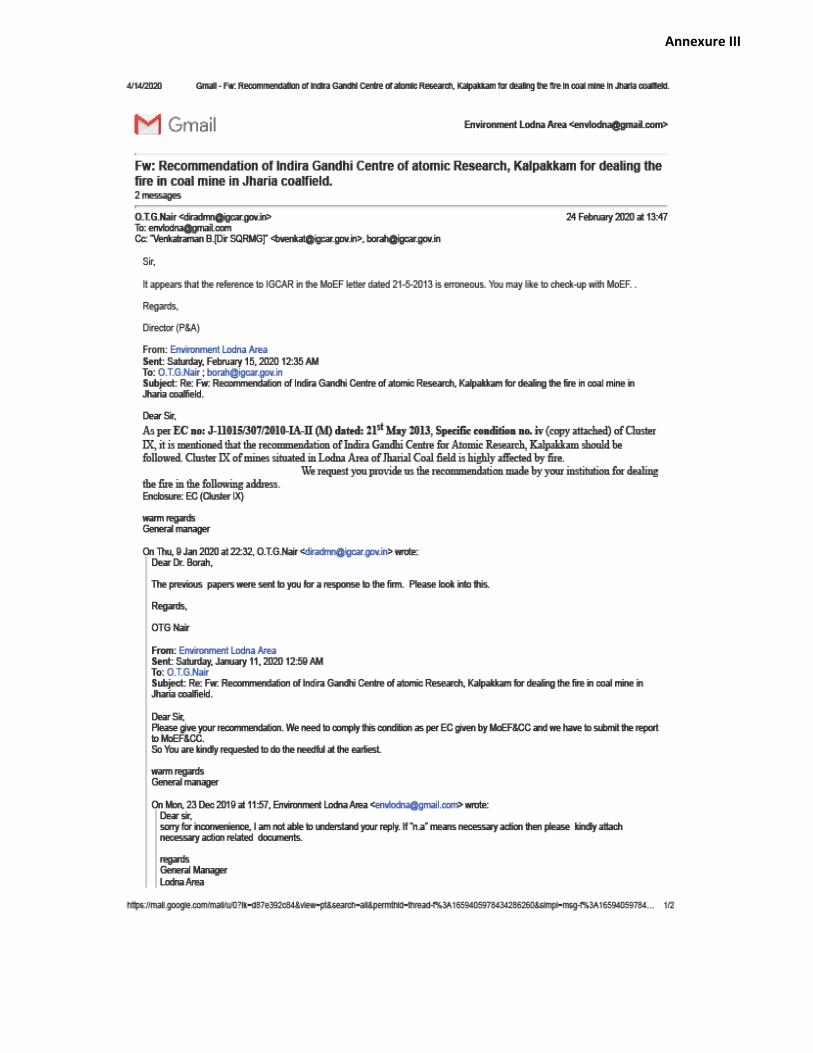
Annexure III
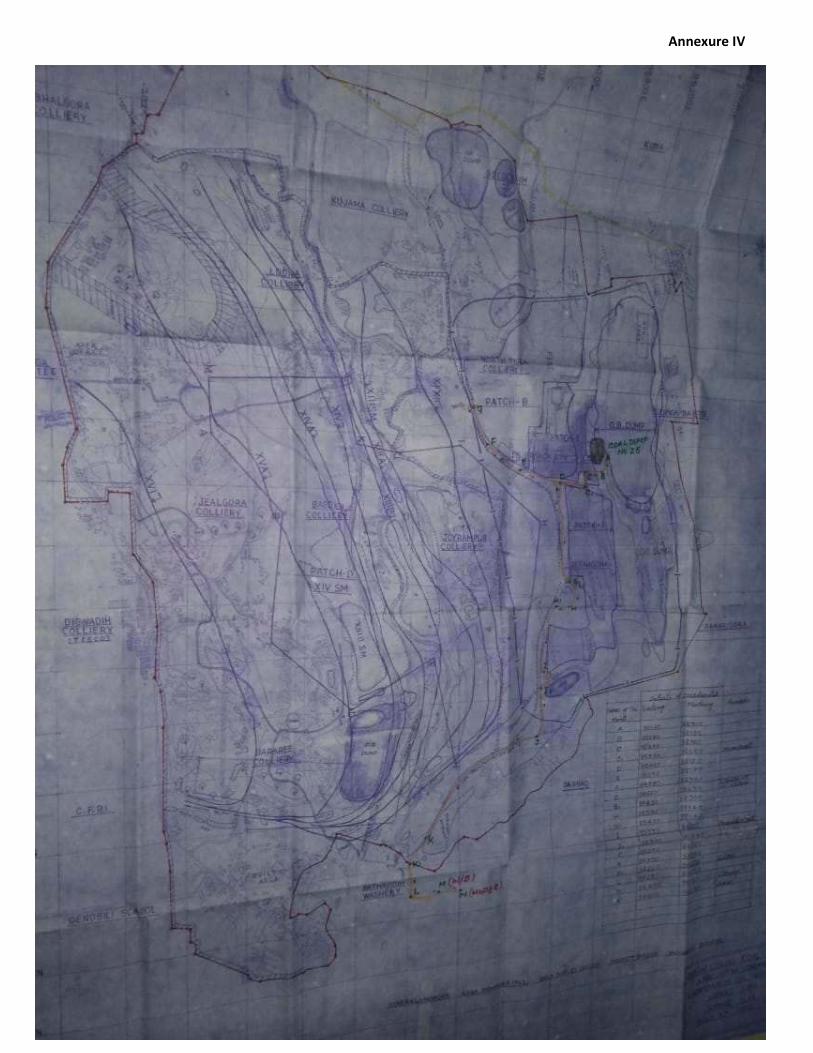
Annexure IV
Annexure V
Mine Closure Plan for NT-ST-Jeenagora Group of Mines
JOB NO. 200112001 2
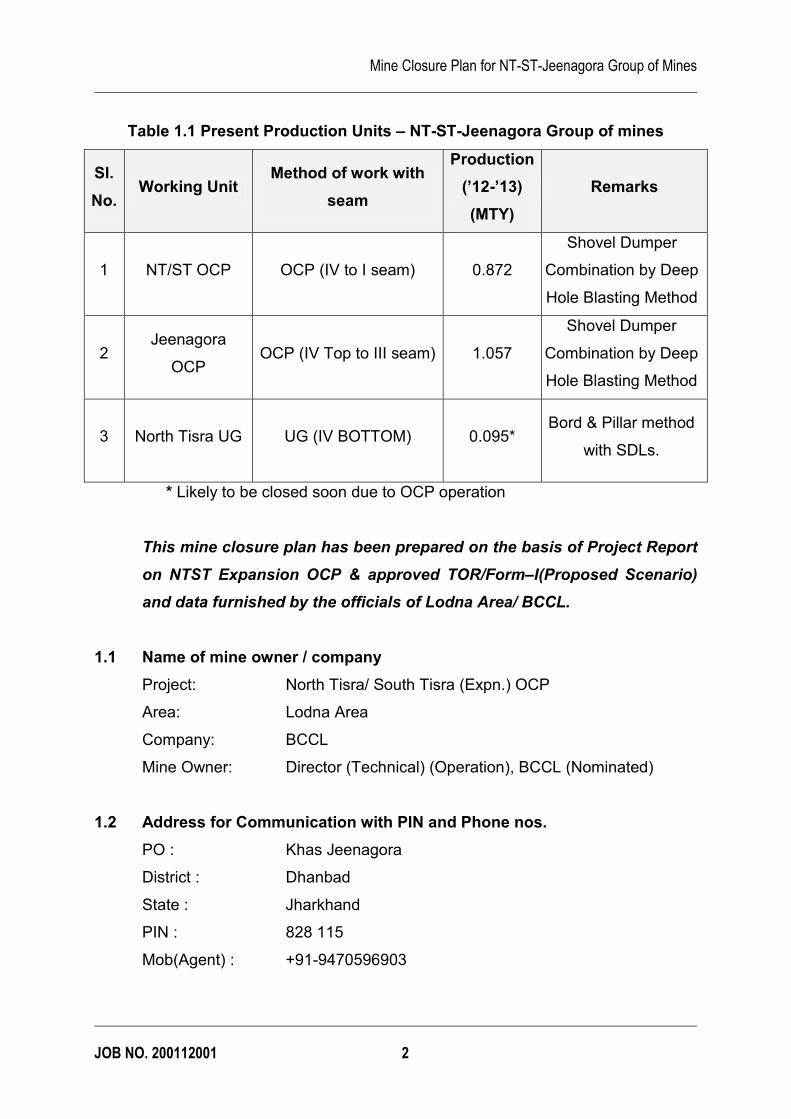
Table 1.1 Present Production Units – NT-ST-Jeenagora Group of mines
Sl.
No. Working Unit
Method of work with
seam
Production
(’12-’13)
(MTY)
Remarks
1 NT/ST OCP OCP (IV to I seam) 0.872
Shovel Dumper
Combination by Deep
Hole Blasting Method
2 Jeenagora
OCP OCP (IV Top to III seam) 1.057
Shovel Dumper
Combination by Deep
Hole Blasting Method
3 North Tisra UG UG (IV BOTTOM)
0.095*
Bord & Pillar method
with SDLs.
* Likely to be closed soon due to OCP operation
This mine closure plan has been prepared on the basis of Project Report
on NTST Expansion OCP & approved TOR/Form–I(Proposed Scenario)
and data furnished by the officials of Lodna Area/ BCCL.
1.1 Name of mine owner / company
Project: North Tisra/ South Tisra (Expn.) OCP
Area: Lodna Area
Company: BCCL
Mine Owner: Director (Technical) (Operation), BCCL (Nominated)
1.2 Address for Communication with PIN and Phone nos.
PO : Khas Jeenagora
District : Dhanbad
State : Jharkhand
PIN : 828 115
Mob(Agent) : +91-9470596903
Mine Closure Plan for NT-ST-Jeenagora Group of Mines
JOB NO. 200112001 3
1.3 Location of mine:
Latitude : 23041’50’’ to 23043’48’’ North
Longitude : 86026’14‘’ to 86027’33‘’ East
Area : Lodna Area
Coalfield : Jharia Coalfield
1.4 Capacity of the mine
Mine started: Proposed
Date of start of production: Proposed
The capacity of the mines 6.0 MTY (PEAK – 7.8MTY)
1.5 Method of Mining including equipments deployment of in the area
There are three active units working in the lease hold area of NT/ST (Expn.)
OCP as depicted in the Table 1.1. The NT/ST OCP is being worked in IVT,
IVB, III, IIT, II B & I by opencast method using shovel & dumper combination,
departmentally. Total O.B. of the running quarry is being dumped in decoaled
area of the existing quarry on the floor of I seam. Deep hole blasting is being
adopted for the quarrying. Blasted coal and overburden is further loaded by
shovels on to the dumpers deployed for it. In Jeengora OCP, mechanised
open cast mine is being worked in geologically IV Top, IV Bottom, & III seams.
On an average IV Top seam & IV Bottom seams are 4.8m & 6.1m thick
respectively while III seam is about 12m thick. IV Bottom has been developed
in one section and SOP.
At North Tisra UG IV Bottom seam is being worked which has been
extensively developed on B&P method of mining through 6 incline. The
gradient of seams is suitable for the deployment of SDLs, wherever thickness
permits. The average gradient of seam is around 1 in 5. It is, therefore will
follow the B&P method of mining with SDL loading onto tubs. Apart from these
three units, there is some part of Joyrampur UG mine considered in the
proposed NTST Expansion OCP where VIII and IV Top seams are being
worked at present. The seam IV (T) is being developed by Bord & Pillar with
Mine Closure Plan for NT-ST-Jeenagora Group of Mines
JOB NO. 200112001 4
SDL while the VIII seam is being depillared with stowing which will be replaced
by V/VI Seam.
Seam IX/X, VIIIA, VIII, V/VI/VII, VII, V/VI, IVT, IVB, III, IIT, IIB & I have been
considered for exploitation within the leasehold of the proposed NT/ST (Exp)
OCP. The base of the quarry will be floor of I seam.
1.6 Coal Processing/ Beneficiation Operation
At present coal production from North Tisra UG is mostly linked by rail to steel
sector and power plant through JGB No. 9 siding which is 2-3 km from the
mine. Coal from pit head stock to siding is transported by road contractually. A
part of its production is linked to various private cokeries through road. Coal
from NT/ST OC is being dispatched through JGB No. 9 and 6 sidings for
different thermal power stations. Road linkage for public sale is being carried
through E-Auction. The production from Jeenagora OC is being sent to power
house by rail. Some coal is being transported through road sale.
In proposed NT/ST (Expn.) OCP, the non-coking coal from the project will be
linked to thermal power station. NLW coal will also be linked to TPS till it is
unacceptable to SAIL/Washery. Coking coal (S-II to W-IV) will be linked to
SAIL/Washeries. Jhama will be linked to cement companies, refractories etc.
No beneficiation is envisaged for the current output of the group of mines.
1.7 Total Lease/Project Area involved:-
Existing : 755.15Ha
Proposed : 1431.00Ha(including existing)
Total : 1431.00Ha
Mine Closure Plan for NT-ST-Jeenagora Group of Mines
JOB NO. 200112001 5
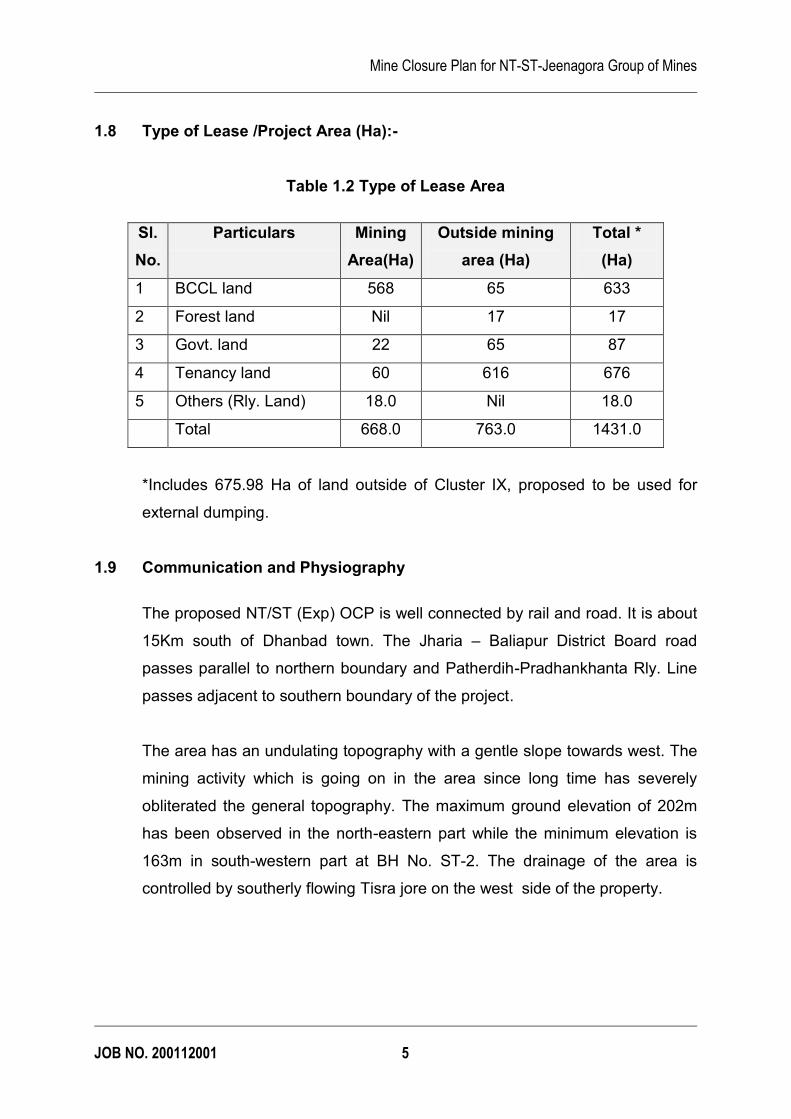
1.8 Type of Lease /Project Area (Ha):-
Table 1.2 Type of Lease Area
Sl.
No.
Particulars Mining
Area(Ha)
Outside mining
area (Ha)
Total *
(Ha)
1 BCCL land 568 65 633
2 Forest land Nil 17 17
3 Govt. land 22 65 87
4 Tenancy land 60 616 676
5 Others (Rly. Land) 18.0 Nil 18.0
Total 668.0 763.0 1431.0
*Includes 675.98 Ha of land outside of Cluster IX, proposed to be used for
external dumping.
1.9 Communication and Physiography
The proposed NT/ST (Exp) OCP is well connected by rail and road. It is about
15Km south of Dhanbad town. The Jharia – Baliapur District Board road
passes parallel to northern boundary and Patherdih-Pradhankhanta Rly. Line
passes adjacent to southern boundary of the project.
The area has an undulating topography with a gentle slope towards west. The
mining activity which is going on in the area since long time has severely
obliterated the general topography. The maximum ground elevation of 202m
has been observed in the north-eastern part while the minimum elevation is
163m in south-western part at BH No. ST-2. The drainage of the area is
controlled by southerly flowing Tisra jore on the west side of the property.
Mine Closure Plan for NT-ST-Jeenagora Group of Mines
JOB NO. 200112001 6
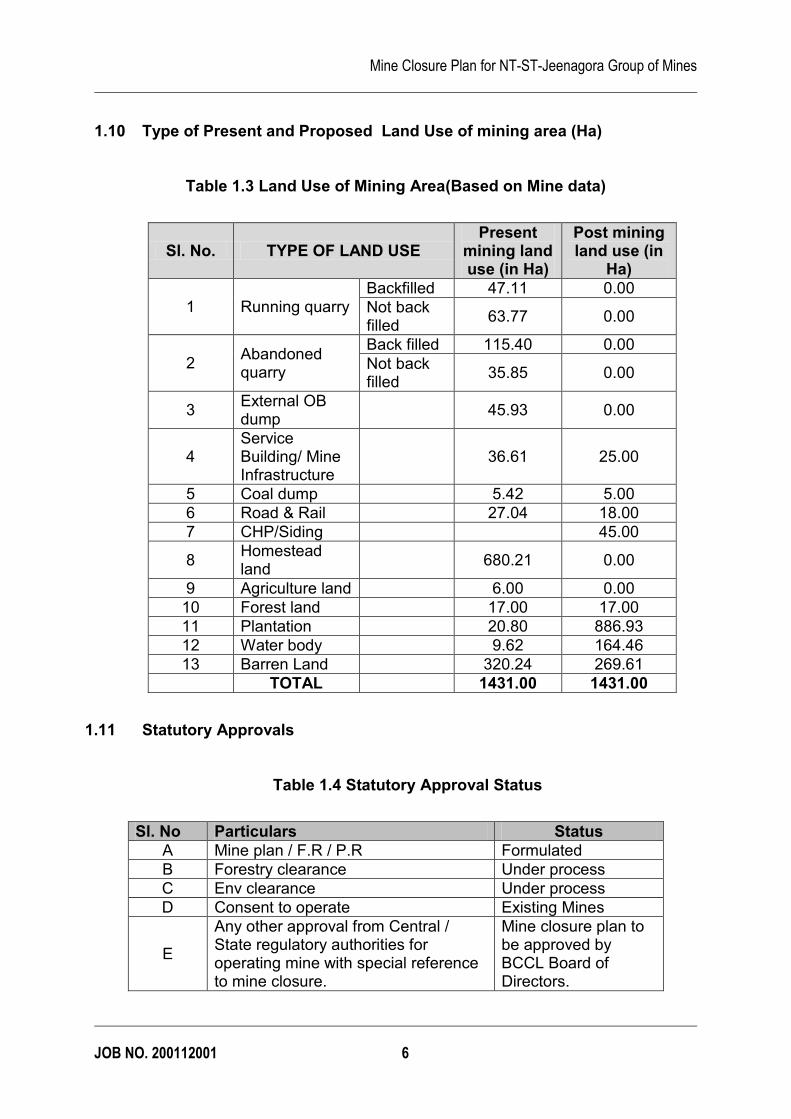
1.10 Type of Present and Proposed Land Use of mining area (Ha)
Table 1.3 Land Use of Mining Area(Based on Mine data)
Sl. No. TYPE OF LAND USE Present
mining land use (in Ha)
Post mining land use (in
Ha)
1 Running quarry Backfilled 47.11 0.00
Not back filled
63.77 0.00
2 Abandoned quarry
Back filled 115.40 0.00
Not back filled
35.85 0.00
3 External OB dump
45.93 0.00
4 Service Building/ Mine Infrastructure
36.61 25.00
5 Coal dump 5.42 5.00
6 Road & Rail 27.04 18.00
7 CHP/Siding 45.00
8 Homestead land
680.21 0.00
9 Agriculture land 6.00 0.00
10 Forest land 17.00 17.00
11 Plantation 20.80 886.93
12 Water body 9.62 164.46
13 Barren Land 320.24 269.61
TOTAL 1431.00 1431.00
1.11 Statutory Approvals
Table 1.4 Statutory Approval Status
Sl. No Particulars Status
A Mine plan / F.R / P.R Formulated
B Forestry clearance Under process
C Env clearance Under process
D Consent to operate Existing Mines
E
Any other approval from Central / State regulatory authorities for operating mine with special reference to mine closure.
Mine closure plan to be approved by BCCL Board of Directors.
Mine Closure Plan for NT-ST-Jeenagora Group of Mines
JOB NO. 200112001 7
1.12 Reasons for Closure
The proposed NTST Expansion OCP has been planned after merging the
properties of existing NTST –Jeenagora group of mines for a nominal
capacity of 6.0MTY having an extractable reserves of 145.08MT. With this
rate of production, the life of the project will be 30 years. This includes 2
years of pre-construction period, 2 years of construction periods and 26
years of production periods. There may be a scope of expansion of the mine
further dip-side after reaching the proposed boundary as per the PR. In such
situation, it is proposed that a new Mine Closure Plan should be prepared in
the changed scenario.
A Report titled “Draft scheme for dealing with fire by excavation method
below Dhanbad-Patherdih Railway Line at Lodna Area (XI/XII Seam
Base)” was prepared and the Report is likely to be implemented in future to
deal with the seams on fire. If the proposal is implemented, it is proposed
that a Revised Mine Closure Plan should be prepared, taking into account
the new emerging scenario.
Any mines in this group may be closed in future on account of exhaustion of
economically recoverable coal reserves in the lease hold area before the
start of the expansion project. It may also be closed on account of other
unforeseen reasons i.e. Force Majeure or directives from statutory
organizations or court etc. for which information and notices shall be served
to concerned Government authorities and departments. Under such
conditions, a revised Mine Closure Plan should be prepared. As per
guidelines of Ministry of Coal, Govt. of India, mine closure plan has to be
submitted along with the mine plan for getting competent approval within one
or two years of date of approval of mine plan.
1.12.1 Need of Mine Closure Planning
Mining is a hazardous operation as it offsets the equilibrium of natural
depositional environment viz. it alters or tries to alter the in-situ field stress,
ground water, surface drainage system as well as the socio-economic
Mine Closure Plan for NT-ST-Jeenagora Group of Mines
JOB NO. 200112001 8
condition. Although mining activities are usually short term phenomena, they
are liable to leave long lasting impacts on landscape, ecology and on the
mind set of local inhabitants. Thus, it is imperative that any mining venture
should have adequate closure plan addressing issues like reclamation,
environmental protection and rehabilitation of disturbed area which should
be acceptable to local community as well as the regulatory authority.
Community acceptable implementation of mine closure plan bound to incur
some extra cost. Neglecting this aspect will lead to future problems of
attending compensation or may creep up expensive socio-economic
problems.
Mine closure encompasses the restoration process designed to restore
physical, chemical and biological quality disturbed by the mining activities.
Mine closure is not just something that happens at the end of a mine’s life,
rather mine closure is an ongoing series of decisions and activities beginning
in the pre-mining stage of mine and ending with a creation of self sustainable
site that can be returned to the community.
Thus, a mine closure plan needs to define the liabilities, responsibilities and
authorities of the different agencies like the mine management, other
regulatory bodies, Central and State Governments after mine closure.
Various objectives of the advance mine closure planning are as given below.
a. To allow productive and sustainable after-use of the site, which is
acceptable to the mine owner and the regulatory authority
b. To protect public health and safety
c. To eliminate environmental damage and thereby encourage
environmental sustainability
d. To minimize adverse socio-economic impacts of mining activities
e. To protect the flora and fauna of the area affected by the mining
f. Effective use of the assets created during the course of mining
Mine Closure Plan for NT-ST-Jeenagora Group of Mines
JOB NO. 200112001 9
Primarily, the mine closure activities are planned in two stages. The initial
plan identifies the activities required to be executed in line with the mining
activities in progress, after the inception of the project, i.e., progressive mine
closure activities. These activities may undergo subtle changes depending
upon the actual site condition during implementation. Finally, a detailed
closure plan is to be prepared 4-5 years before the actual closure time of the
mine depending upon the existing parameters at that point of time, i.e., final
mine closure activities.
1.12.2 Mine closure planning strategy in respect of NT-ST-Jeenagora Group of
mines based on existing set of parameters
As the balance life of the mine is 30 years from now for the seams proposed
to be worked , following activities are envisaged towards mine closure
programme in respect of NT-ST-Jeenagora Group of mines.
a. Progressive mine closure activities will continue as envisaged in the
project report and as enumerated in the various approvals, permits,
consents etc. The progressive Closure activities are funded by levying a
charge of ` 5.50/Te of coal for opencast mines.
The recent guidelines issued in this regard by MoC, GoI will also be
followed.
b. Although, it is very difficult to foresee the likely impacts due to closure
of the mining activities in the leasehold area of the project, but in the
present report, the same has been estimated and some mitigating
measures have been suggested accordingly. These suggested
measures along with certain other measures, as deemed fit, at the time
of closure of mining activity in the seams being worked at present shall
be taken up.

Mine Closure Plan for NT-ST-Jeenagora Group of Mines
JOB NO. 200112001 10
c. The final closure plan carrying the finer details would be prepared at the
time of preparing the mine plan for last mineable patch of coal seam in
the leasehold area of the group.
1.13 Approval of Company Board of Directors or any other competent
authority
The closure plan will be placed to Board of Directors of BCCL for approval.
Mine Closure Plan for NT-ST-Jeenagora Group of Mines
JOB NO. 200112001 11
CHAPTER – II
MINE DESCRIPTION
2.1 Geology of the group
Geology of the block has been established by surface and sub surface data.
The leasehold area of the NT-ST-Jeenagora Group of mines is entirely
covered by Barakar formation. The coal bearing rocks of Barakar formation of
Permian age occur in the NT-ST-Jeenagora Group of mines is located on the
eastern edge of Jharia Coalfield, where rocks of Talchir, Barakar & Barren
Measures are exposed in patches. However NT-ST-Jeenagora Group of
mines is generally covered by soil which is underlain by the coal bearing rocks
of the Barakar Measures.
A total of 44 boreholes have been drilled in time phases in the entire project. In
addition, data of adjoining 10 boreholes have also been considered for the
evaluation of geological features. The borehole density in the area is
approximate 8/Sq. Km.
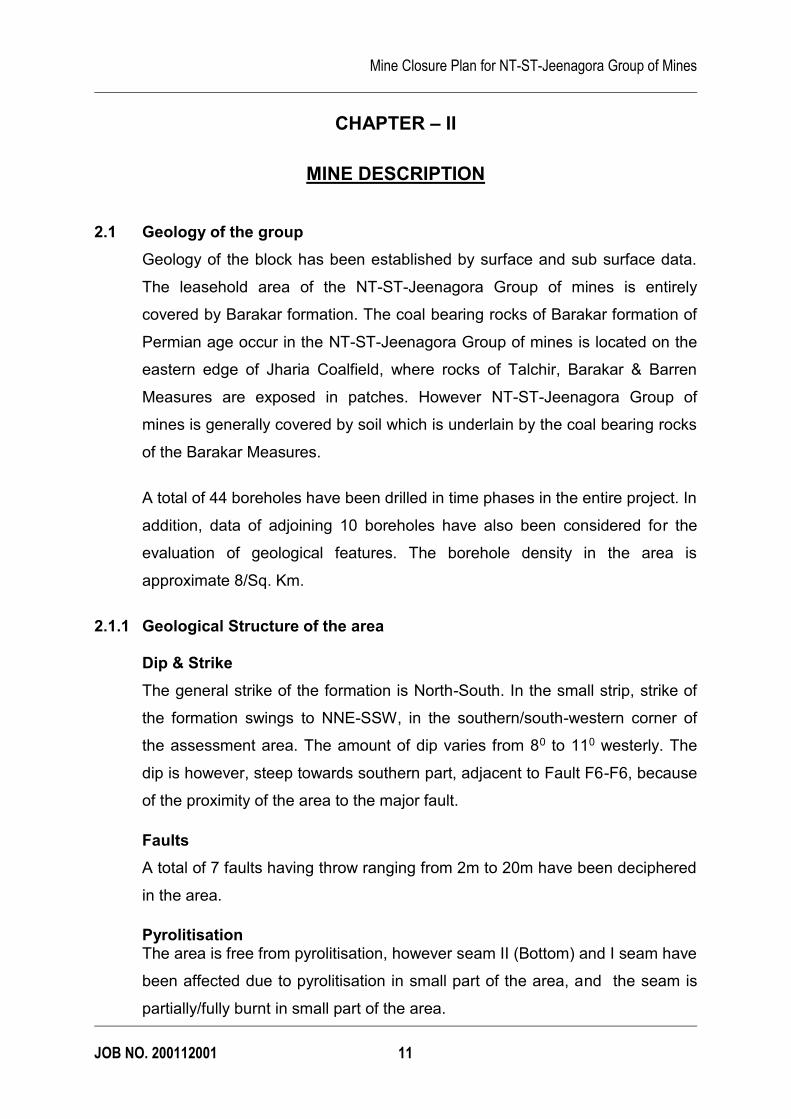
2.1.1 Geological Structure of the area
Dip & Strike
The general strike of the formation is North-South. In the small strip, strike of
the formation swings to NNE-SSW, in the southern/south-western corner of
the assessment area. The amount of dip varies from 80 to 110 westerly. The
dip is however, steep towards southern part, adjacent to Fault F6-F6, because
of the proximity of the area to the major fault.
Faults
A total of 7 faults having throw ranging from 2m to 20m have been deciphered
in the area.
Pyrolitisation The area is free from pyrolitisation, however seam II (Bottom) and I seam have
been affected due to pyrolitisation in small part of the area, and the seam is
partially/fully burnt in small part of the area.
Mine Closure Plan for NT-ST-Jeenagora Group of Mines
JOB NO. 200112001 12
2.1.2 General Description of coal seams
In NT-ST-Jeenagora Group of Mines, detailed drilling has proved existence of
number of workable coal seams of over 0.50m thickness from XI/X to I seam.
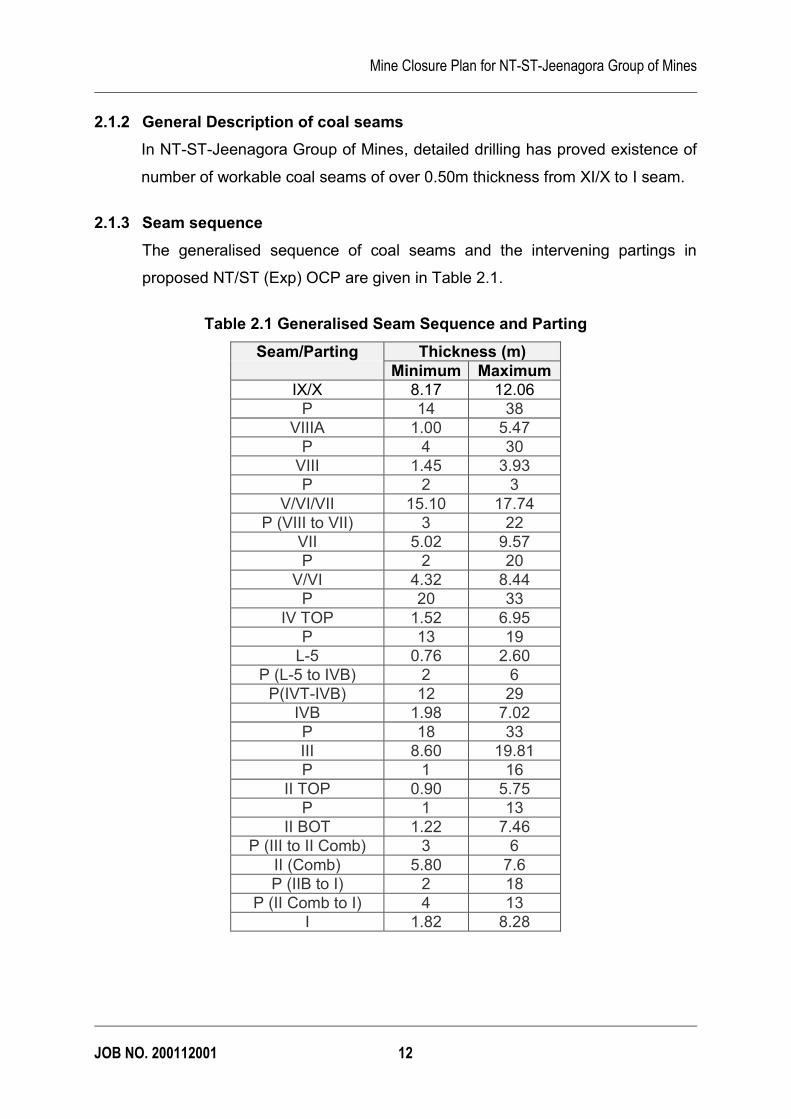
2.1.3 Seam sequence
The generalised sequence of coal seams and the intervening partings in
proposed NT/ST (Exp) OCP are given in Table 2.1.
Table 2.1 Generalised Seam Sequence and Parting
Seam/Parting Thickness (m)
Minimum Maximum
IX/X 8.17 12.06
P 14 38
VIIIA 1.00 5.47
P 4 30
VIII 1.45 3.93
P 2 3
V/VI/VII 15.10 17.74
P (VIII to VII) 3 22
VII 5.02 9.57
P 2 20
V/VI 4.32 8.44
P 20 33
IV TOP 1.52 6.95
P 13 19
L-5 0.76 2.60
P (L-5 to IVB) 2 6
P(IVT-IVB) 12 29
IVB 1.98 7.02
P 18 33
III 8.60 19.81
P 1 16
II TOP 0.90 5.75
P 1 13
II BOT 1.22 7.46
P (III to II Comb) 3 6
II (Comb) 5.80 7.6
P (IIB to I) 2 18
P (II Comb to I) 4 13
I 1.82 8.28
Mine Closure Plan for NT-ST-Jeenagora Group of Mines
JOB NO. 200112001 13
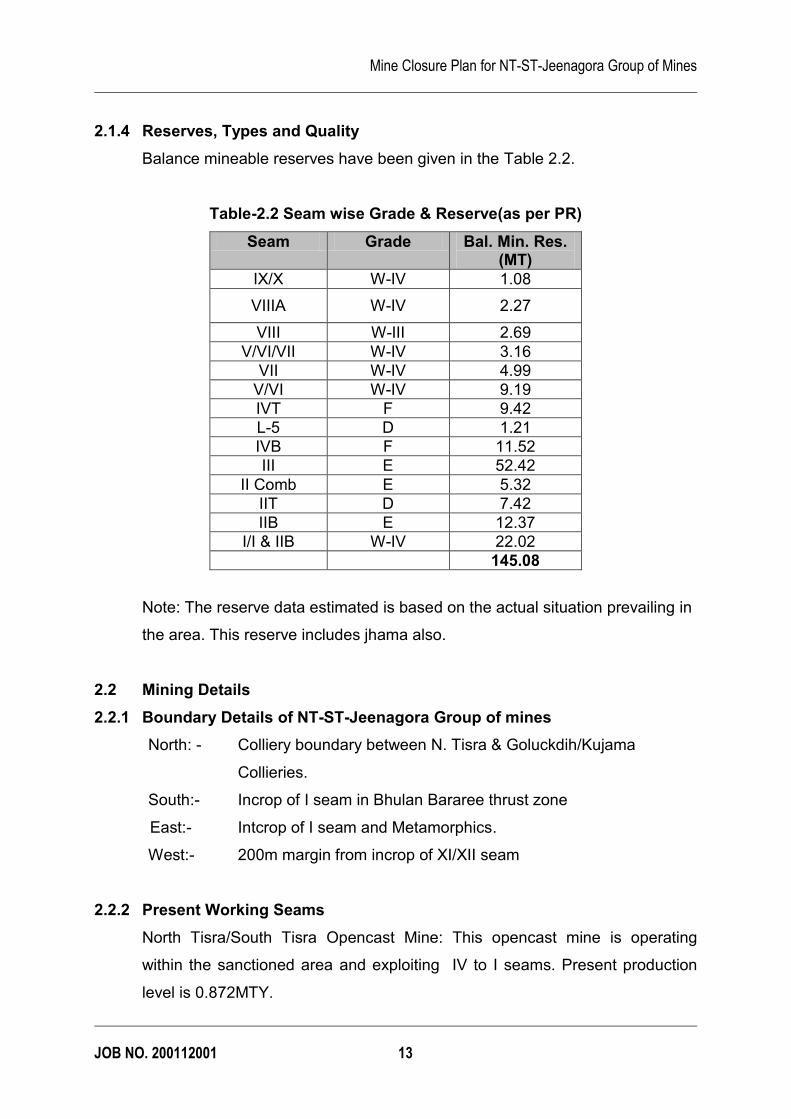
2.1.4 Reserves, Types and Quality
Balance mineable reserves have been given in the Table 2.2.
Table-2.2 Seam wise Grade & Reserve(as per PR)
Seam Grade Bal. Min. Res. (MT)
IX/X W-IV 1.08
VIIIA W-IV 2.27
VIII W-III 2.69
V/VI/VII W-IV 3.16
VII W-IV 4.99
V/VI W-IV 9.19
IVT F 9.42
L-5 D 1.21
IVB F 11.52
III E 52.42
II Comb E 5.32
IIT D 7.42
IIB E 12.37
I/I & IIB W-IV 22.02
145.08
Note: The reserve data estimated is based on the actual situation prevailing in
the area. This reserve includes jhama also.
2.2 Mining Details
2.2.1 Boundary Details of NT-ST-Jeenagora Group of mines
North: - Colliery boundary between N. Tisra & Goluckdih/Kujama
Collieries.
South :- Incrop of I seam in Bhulan Bararee thrust zone
East:- Intcrop of I seam and Metamorphics.
West:- 200m margin from incrop of XI/XII seam
2.2.2 Present Working Seams
North Tisra/South Tisra Opencast Mine: This opencast mine is operating
within the sanctioned area and exploiting IV to I seams. Present production
level is 0.872MTY.
Mine Closure Plan for NT-ST-Jeenagora Group of Mines
JOB NO. 200112001 14
Jeenagora Opencast (Patch): Production from III, IVB & IVT seams are being
done in the name of Jeenagora (Patch) OC. OB Dumping in being done
internally over the coal bearing area. Present production level is 1.057MTY.
Thus, total production from l these two opencast mines is 1.929MTY.
North Tisra UG: Total production from the underground unit from within the
proposed quarry area is 0.095MTY. The winning of coal is being carried out
from IVB seam.
2.3 Mining Methods
The proposed NTST Expansion OCP opencast is an expansion of the existing
opencast mines. In the existing opencast mines, though infrastructure has
been created but they are suitable for small level of production. The proposed
opencast is a large mine with higher level of mechanisation. Therefore, all
necessary infrastrcture need to be created for the larger project.
In the first two years of implementation of the proposed project (1st & 2nd)
land will be acquired and shifting / rehabilitation of houses will be done to
make the site available for working. During 3rd & 4th year of the project
necessary infrastructure will be created like Workshop / Store, Power Supply
arrangement, Feeder Breaker, Railway Siding etc. During these four years of
construction (1st to 4th) of the expansion project, existing opencast mines will
continue to produce coal & excavate OB. In fact the operation of the existing
mines will be tailored to prepare the mine for larger level of mechanisation for
the proposed 6.0 mty Opencast.
OB excavation and coal production from the proposed opencast will start by
5th year of operation and target will be achieved by 6th year. By this year all
major construction activities will be completed for sustaining the production
level for the entire project life.
Mine Closure Plan for NT-ST-Jeenagora Group of Mines
JOB NO. 200112001 15
2.3.1 The status of working and fire in different seams:
The status of exploitation of various coal seams and the area under fire
considered in this report is based on the mine working plan supplied by the
colliery authorities. The status of working and the fire limit of different seams
are given below:
IX/X Seam: This seam has been extensively worked by UG method. The seam
has been goaved in major part of the area and is under fire. This seam has
also been quarried out in outcrop region.
VIIIA Seam: This seam has been quarried out in patches along the incrop
region and extensively worked by underground method in major part of the
area. The seam has been goaved also in major part, particularly in northern
side of the area. The seam is under fire in northern part.
VIII Seam: The seam has been extensively worked by UG method. It has been
quarried out along the incrop region. The seam has been goaved also in major
part. The seam is under fire in northern half of the area.
V/VI/VII Seam: This combined seam is restricted to northern part of the area.
The seam have been developed in two sections and quarried also towards
incrop side. The seam is goaved at places. Seam is on fire in the northern part
of the area.
VII Seam: This seam is quarried out in major part of incrop region. The seam
has been worked through inclines in major part. It is developed in one section
in major part and two sections working in small area in Jeenagora colliery only.
The seam has been goaved also in patches. The part area of the seam is on
fire also.
Mine Closure Plan for NT-ST-Jeenagora Group of Mines
JOB NO. 200112001 16
V/VI Seam: This seam is also extensively developed in the entire area and
quarried out in incrop region. The seam has been goaved also in central part
of the area. The seam has been developed in one section by underground
method. The seam is under fire also in part area.
IV Top Seam: The seam is quarried in incrop region only and the seam is
virgin in major part of the area. It has developed also through underground
working in Jeenagora Colliery only.
IV Bot. Seam: The seam has been worked by underground method and it is
quarried also. In small part, the seam is goaved and depillared.
III Seam: The seam has been quarried out in incrop region and it is extensively
developed also. Two section of workings have been done in major part of the
area.
II Top Seam: This seam has been mainly worked by opencast method.
Underground development is restricted to South Tisra colliery only.
II Bot Seam: This seam is developed by UG method in major part of the area
and quarried also in incrop region. The seam is virgin in dip side.
I Seam: This seam is developed only by underground method. In the northern
side, the seam is goaved in incrop side. The seam is quarried also in small
part.
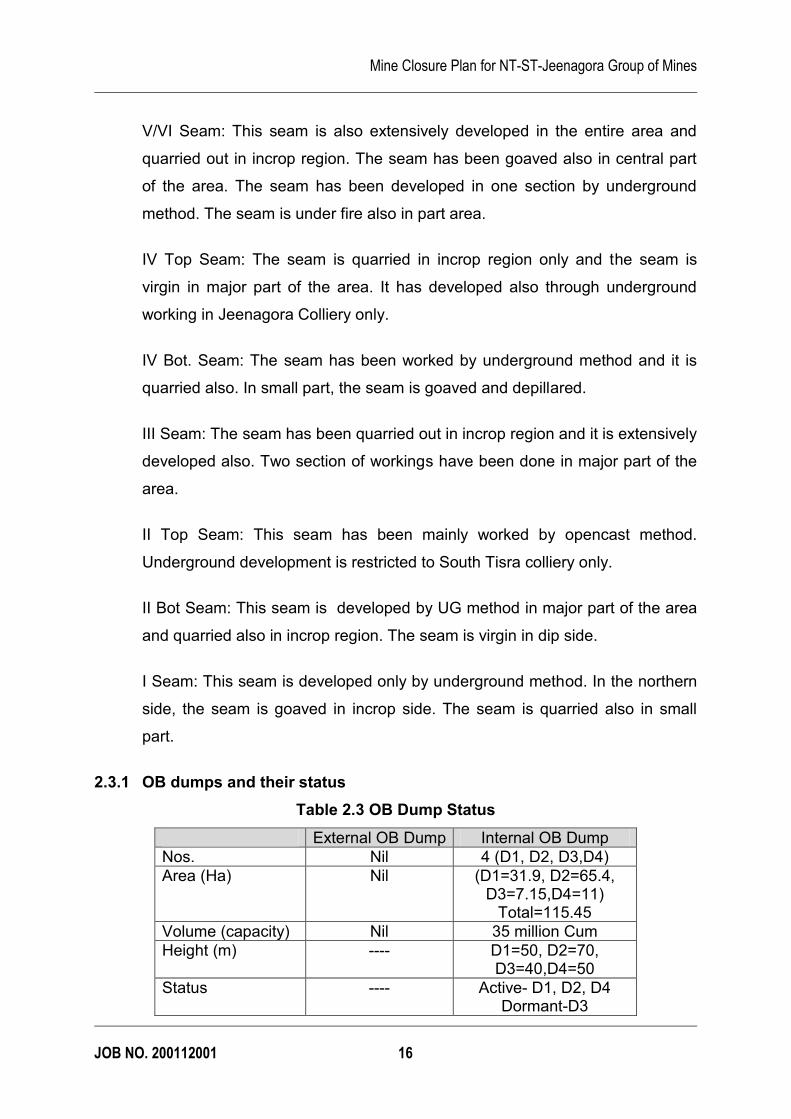
2.3.1 OB dumps and their status
Table 2.3 OB Dump Status
External OB Dump Internal OB Dump
Nos. Nil 4 (D1, D2, D3,D4)
Area (Ha) Nil (D1=31.9, D2=65.4, D3=7.15,D4=11)
Total=115.45
Volume (capacity) Nil 35 million Cum
Height (m) ---- D1=50, D2=70, D3=40,D4=50
Status ---- Active- D1, D2, D4 Dormant-D3
Mine Closure Plan for NT-ST-Jeenagora Group of Mines
JOB NO. 200112001 17
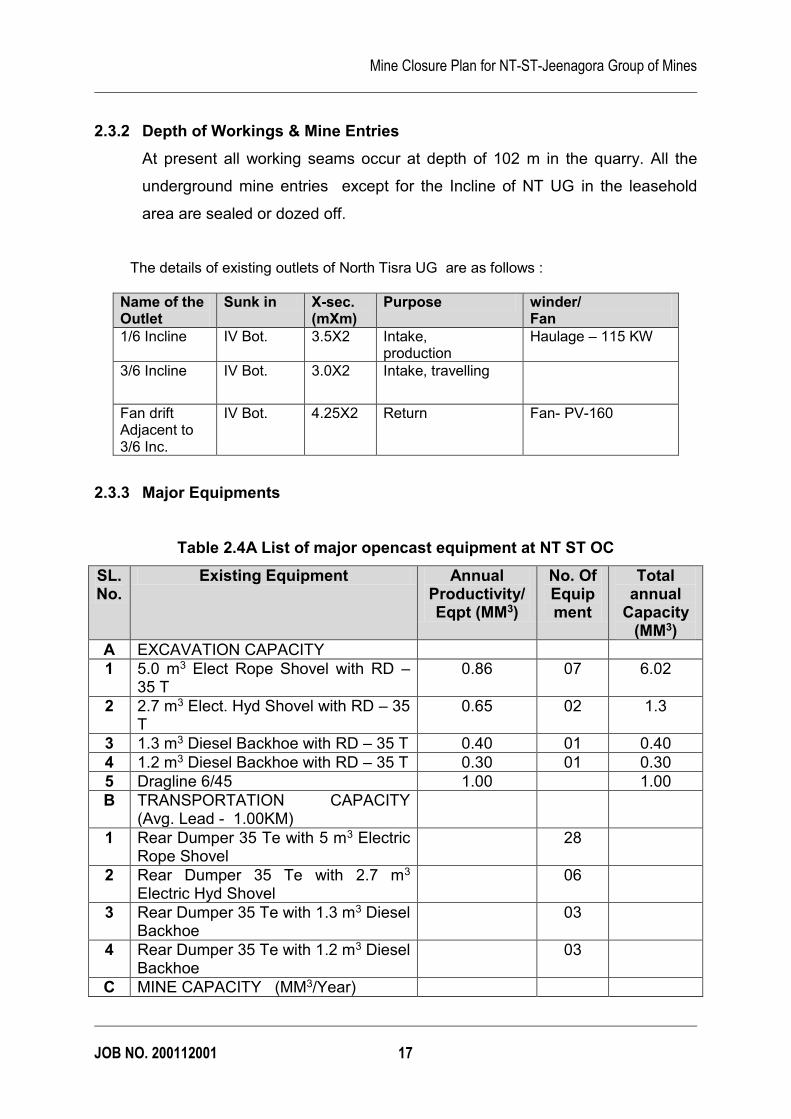
2.3.2 Depth of Workings & Mine Entries
At present all working seams occur at depth of 102 m in the quarry. All the
underground mine entries except for the Incline of NT UG in the leasehold
area are sealed or dozed off.
The details of existing outlets of North Tisra UG are as follows :
Name of the Outlet
Sunk in X-sec. (mXm)
Purpose winder/ Fan
1/6 Incline
IV Bot. 3.5X2 Intake, production
Haulage – 115 KW
3/6 Incline
IV Bot. 3.0X2 Intake, travelling
Fan drift Adjacent to 3/6 Inc.
IV Bot. 4.25X2 Return Fan- PV-160
2.3.3 Major Equipments
Table 2.4A List of major opencast equipment at NT ST OC
SL.No.
Existing Equipment Annual Productivity/Eqpt (MM3)
No. Of Equipment
Total annual
Capacity (MM3)
A EXCAVATION CAPACITY
1 5.0 m3 Elect Rope Shovel with RD – 35 T
0.86 07 6.02
2 2.7 m3 Elect. Hyd Shovel with RD – 35 T
0.65 02 1.3
3 1.3 m3 Diesel Backhoe with RD – 35 T 0.40 01 0.40
4 1.2 m3 Diesel Backhoe with RD – 35 T 0.30 01 0.30
5 Dragline 6/45 1.00 1.00
B TRANSPORTATION CAPACITY (Avg. Lead - 1.00KM)
1 Rear Dumper 35 Te with 5 m3 Electric Rope Shovel
28
2 Rear Dumper 35 Te with 2.7 m3 Electric Hyd Shovel
06
3 Rear Dumper 35 Te with 1.3 m3 Diesel Backhoe
03
4 Rear Dumper 35 Te with 1.2 m3 Diesel Backhoe
03
C MINE CAPACITY (MM3/Year)
Mine Closure Plan for NT-ST-Jeenagora Group of Mines
JOB NO. 200112001 18
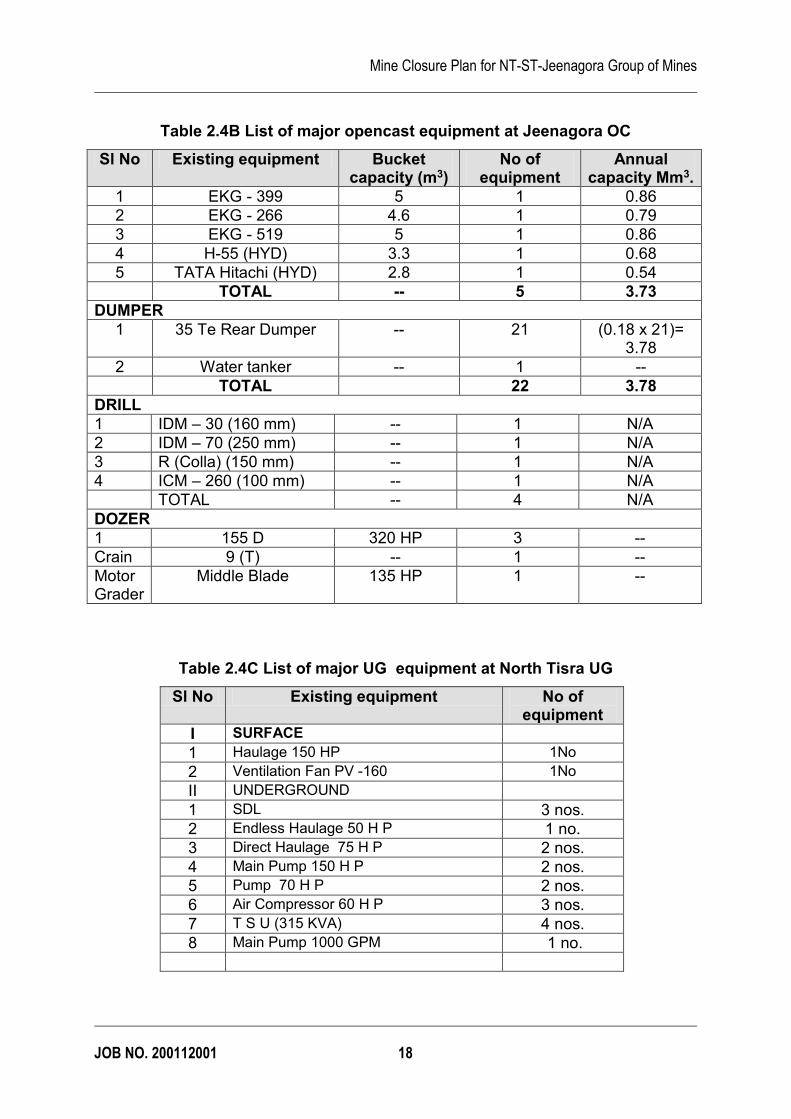
Table 2.4B List of major opencast equipment at Jeenagora OC
Sl No Existing equipment Bucket capacity (m3)
No of equipment
Annual capacity Mm3.
1 EKG - 399 5 1 0.86
2 EKG - 266 4.6 1 0.79
3 EKG - 519 5 1 0.86
4 H-55 (HYD) 3.3 1 0.68
5 TATA Hitachi (HYD) 2.8 1 0.54
TOTAL -- 5 3.73
DUMPER
1 35 Te Rear Dumper -- 21 (0.18 x 21)= 3.78
2 Water tanker -- 1 --
TOTAL 22 3.78
DRILL
1 IDM – 30 (160 mm) -- 1 N/A
2 IDM – 70 (250 mm) -- 1 N/A
3 R (Colla) (150 mm) -- 1 N/A
4 ICM – 260 (100 mm) -- 1 N/A
TOTAL -- 4 N/A
DOZER
1 155 D 320 HP 3 --
Crain 9 (T) -- 1 --
Motor Grader
Middle Blade 135 HP 1 --
Table 2.4C List of major UG equipment at North Tisra UG
Sl No Existing equipment No of equipment
I SURFACE
1 Haulage 150 HP 1No
2 Ventilation Fan PV -160 1No
II UNDERGROUND
1 SDL 3 nos.
2 Endless Haulage 50 H P 1 no.
3 Direct Haulage 75 H P 2 nos.
4 Main Pump 150 H P 2 nos.
5 Pump 70 H P 2 nos.
6 Air Compressor 60 H P 3 nos.
7 T S U (315 KVA) 4 nos.
8 Main Pump 1000 GPM 1 no.
Mine Closure Plan for NT-ST-Jeenagora Group of Mines
JOB NO. 200112001 19
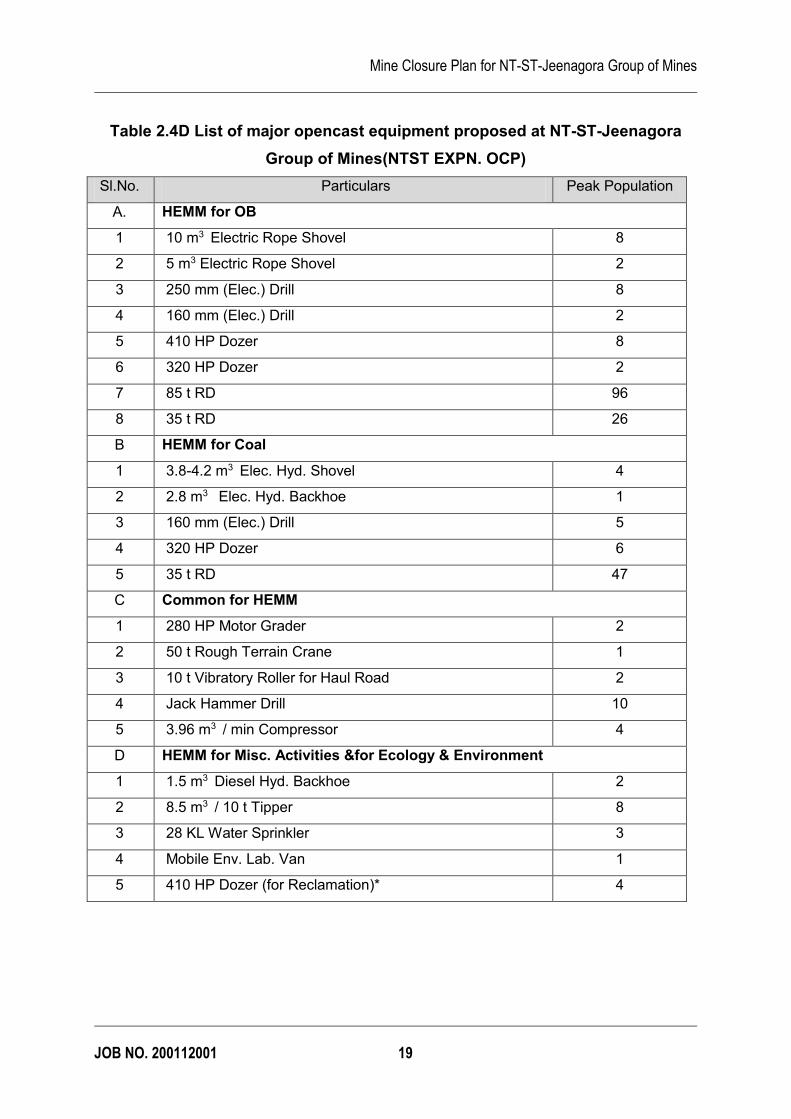
Table 2.4D List of major opencast equipment proposed at NT-ST-Jeenagora
Group of Mines(NTST EXPN. OCP)
Sl.No. Particulars Peak Population
A. HEMM for OB
1 10 m3 Electric Rope Shovel 8
2 5 m3 Electric Rope Shovel 2
3 250 mm (Elec.) Drill 8
4 160 mm (Elec.) Drill 2
5 410 HP Dozer 8
6 320 HP Dozer 2
7 85 t RD 96
8 35 t RD 26
B HEMM for Coal
1 3.8-4.2 m3 Elec. Hyd. Shovel 4
2 2.8 m3 Elec. Hyd. Backhoe 1
3 160 mm (Elec.) Drill 5
4 320 HP Dozer 6
5 35 t RD 47
C Common for HEMM
1 280 HP Motor Grader 2
2 50 t Rough Terrain Crane 1
3 10 t Vibratory Roller for Haul Road 2
4 Jack Hammer Drill 10
5 3.96 m3 / min Compressor 4
D HEMM for Misc. Activities &for Ecology & Environment
1 1.5 m3 Diesel Hyd. Backhoe 2
2 8.5 m3 / 10 t Tipper 8
3 28 KL Water Sprinkler 3
4 Mobile Env. Lab. Van 1
5 410 HP Dozer (for Reclamation)* 4
Mine Closure Plan for NT-ST-Jeenagora Group of Mines
JOB NO. 200112001 20
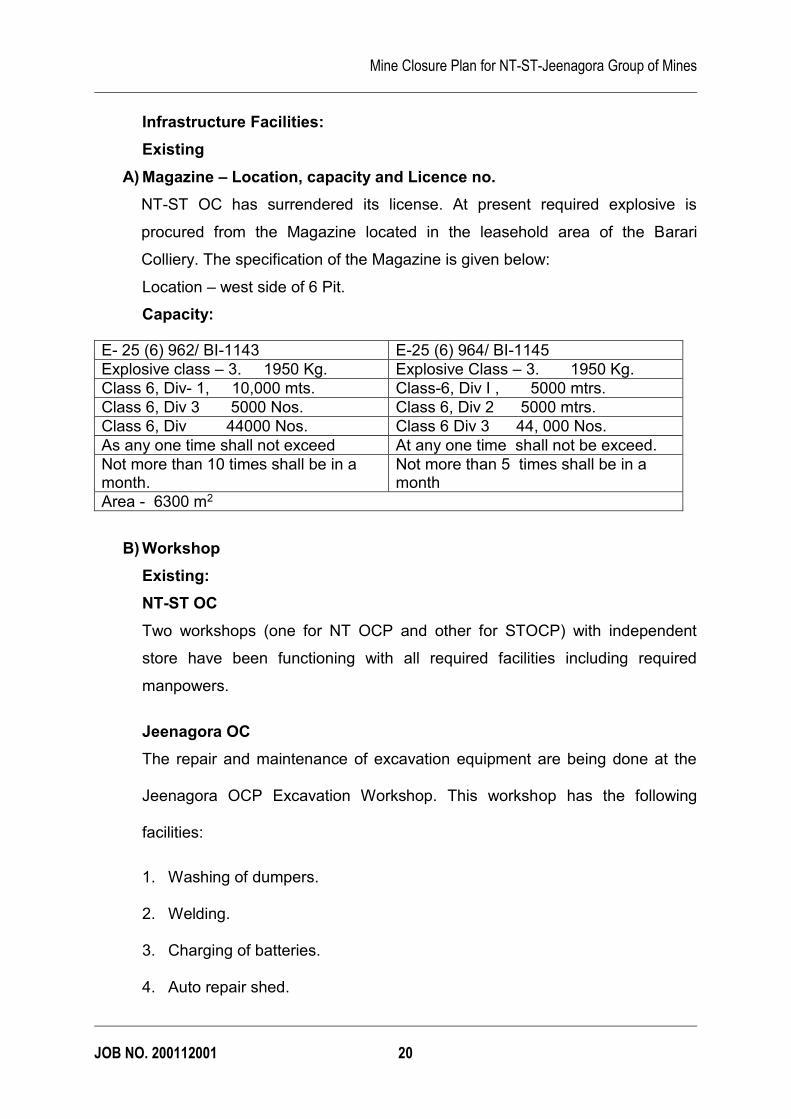
Infrastructure Facilities:
Existing
A) Magazine – Location, capacity and Licence no.
NT-ST OC has surrendered its license. At present required explosive is
procured from the Magazine located in the leasehold area of the Barari
Colliery. The specification of the Magazine is given below:
Location – west side of 6 Pit.
Capacity:
E- 25 (6) 962/ BI-1143 E-25 (6) 964/ BI-1145
Explosive class – 3. 1950 Kg. Explosive Class – 3. 1950 Kg.
Class 6, Div- 1, 10,000 mts. Class-6, Div I , 5000 mtrs.
Class 6, Div 3 5000 Nos. Class 6, Div 2 5000 mtrs.
Class 6, Div 44000 Nos. Class 6 Div 3 44, 000 Nos.
As any one time shall not exceed At any one time shall not be exceed.
Not more than 10 times shall be in a month.
Not more than 5 times shall be in a month
Area - 6300 m2
B) Workshop
Existing:
NT-ST OC
Two workshops (one for NT OCP and other for STOCP) with independent
store have been functioning with all required facilities including required
manpowers.
Jeenagora OC
The repair and maintenance of excavation equipment are being done at the
Jeenagora OCP Excavation Workshop. This workshop has the following
facilities:
1. Washing of dumpers.
2. Welding.
3. Charging of batteries.
4. Auto repair shed.
Mine Closure Plan for NT-ST-Jeenagora Group of Mines
JOB NO. 200112001 21
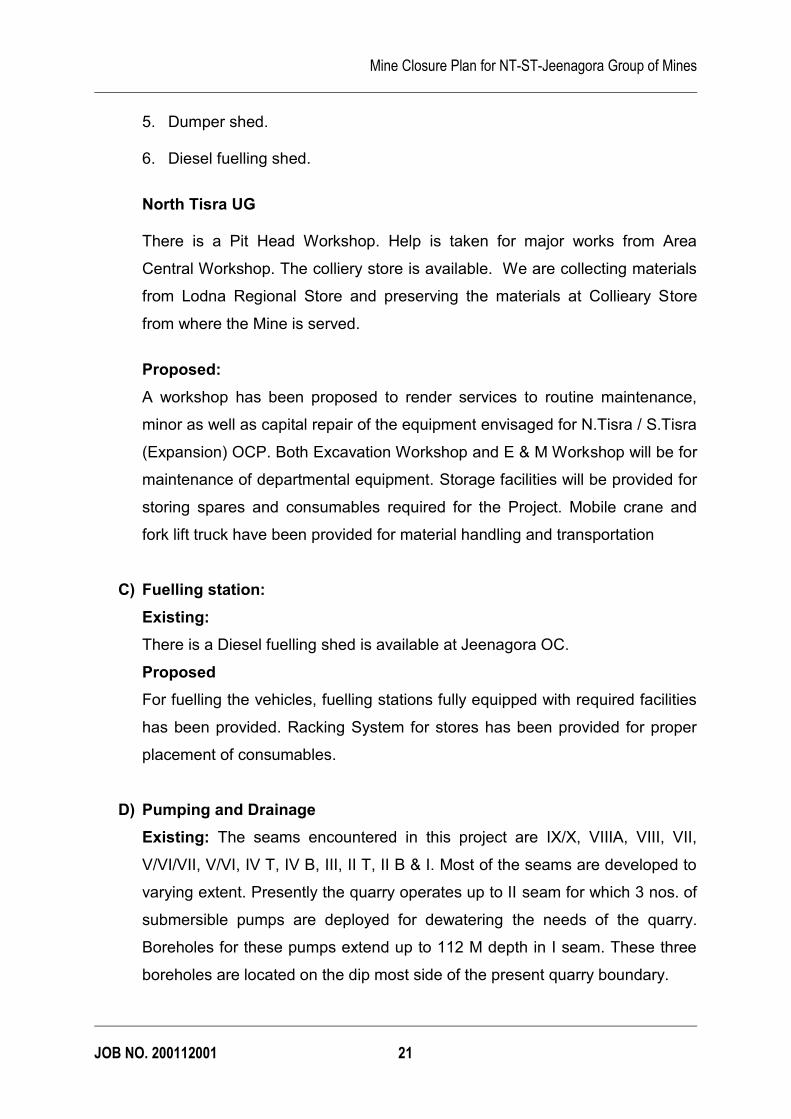
5. Dumper shed.
6. Diesel fuelling shed.
North Tisra UG
There is a Pit Head Workshop. Help is taken for major works from Area
Central Workshop. The colliery store is available. We are collecting materials
from Lodna Regional Store and preserving the materials at Collieary Store
from where the Mine is served.
Proposed:
A workshop has been proposed to render services to routine maintenance,
minor as well as capital repair of the equipment envisaged for N.Tisra / S.Tisra
(Expansion) OCP. Both Excavation Workshop and E & M Workshop will be for
maintenance of departmental equipment. Storage facilities will be provided for
storing spares and consumables required for the Project. Mobile crane and
fork lift truck have been provided for material handling and transportation
C) Fuelling station:
Existing:
There is a Diesel fuelling shed is available at Jeenagora OC.
Proposed
For fuelling the vehicles, fuelling stations fully equipped with required facilities
has been provided. Racking System for stores has been provided for proper
placement of consumables.
D) Pumping and Drainage
Existing: The seams encountered in this project are IX/X, VIIIA, VIII, VII,
V/VI/VII, V/VI, IV T, IV B, III, II T, II B & I. Most of the seams are developed to
varying extent. Presently the quarry operates up to II seam for which 3 nos. of
submersible pumps are deployed for dewatering the needs of the quarry.
Boreholes for these pumps extend up to 112 M depth in I seam. These three
boreholes are located on the dip most side of the present quarry boundary.
Mine Closure Plan for NT-ST-Jeenagora Group of Mines
JOB NO. 200112001 22
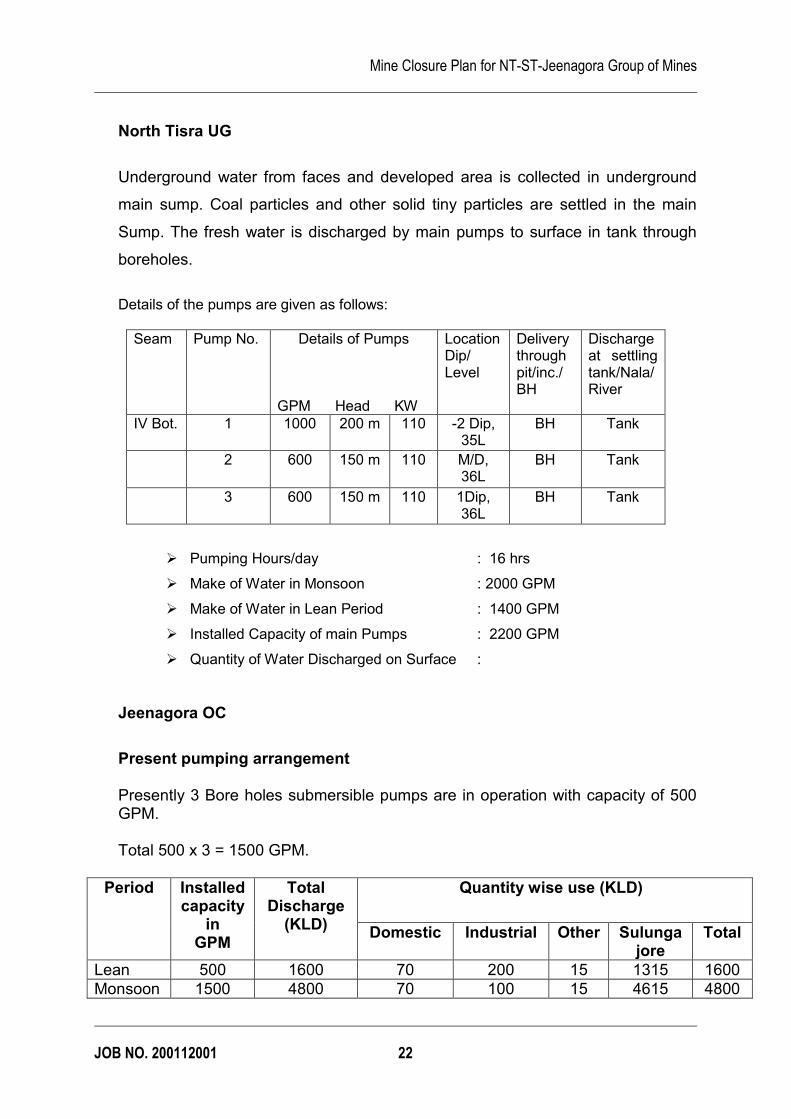
North Tisra UG
Underground water from faces and developed area is collected in underground
main sump. Coal particles and other solid tiny particles are settled in the main
Sump. The fresh water is discharged by main pumps to surface in tank through
boreholes.
Details of the pumps are given as follows:
Seam Pump No. Details of Pumps GPM Head KW
Location Dip/ Level
Delivery through pit/inc./ BH
Discharge at settling tank/Nala/ River
IV Bot. 1 1000 200 m 110 -2 Dip, 35L
BH Tank
2 600 150 m 110 M/D, 36L
BH Tank
3 600 150 m 110 1Dip, 36L
BH Tank
Ø Pumping Hours/day : 16 hrs
Ø Make of Water in Monsoon : 2000 GPM
Ø Make of Water in Lean Period : 1400 GPM
Ø Installed Capacity of main Pumps : 2200 GPM
Ø Quantity of Water Discharged on Surface :
Jeenagora OC
Present pumping arrangement
Presently 3 Bore holes submersible pumps are in operation with capacity of 500
GPM. Total 500 x 3 = 1500 GPM.
Period Installed capacity
in GPM
Total Discharge
(KLD)
Quantity wise use (KLD)
Domestic Industrial Other Sulunga jore
Total
Lean 500 1600 70 200 15 1315 1600
Monsoon 1500 4800 70 100 15 4615 4800
Mine Closure Plan for NT-ST-Jeenagora Group of Mines
JOB NO. 200112001 23
NTST OC
· Installed capacity of main pumps discharging water to surface – 1600 GPM.
· Quantity of water being discharged to surface – 1000 GPM.
· Point of discharged of water – Surface
· Use of discharged water.
Industrial use – 252 KLD. Domestic – 200 KLD.
Proposed: Considering the project area, ultimate depth and life of the mine,
the pumping capacity has been proposed to cover the entire mining activities
under single stage of pumping operation. With the basic considerations as
above, make of water has been estimated as 446512 Cum. (98.26 million
gallon.) and the pumping requirement for the mine works out as to 21.55 Cum
(It includes 30% reserve pumping capacity) up to the end of the project.
Water settling tank / pond (cemented floor) of 0.6 million gallon capacity has
been envisaged for this project. This tank will be suitably located between the
outside edge of quarry and Tisra river. The pumped out quarry water will be
discharged into the proposed settling tank. Dust / contamination will be settled
in the pond. Overflow water will be discharged into theTisra Jore.
In a separate fire dealing report titled “Scheme for Dealing with Fire at Lodna
Area below DP Rly. Line (XI/XII Seam Base)” a surface water reservoir will be
provided near Bararee Colliery site. This water reservoir will act as a reservoir
for this project too.
The proposed reservoir receives water from pumping discharge of various
collieries of Lodna Area (viz. Joyrampur, Bararee, Bagdigi, Lodna &
Jealgora). The water from respective collieries will be guided into the reservoir
from where water will be pumped to fire dealing site / faces of the proposed
opencast.
Mine Closure Plan for NT-ST-Jeenagora Group of Mines
JOB NO. 200112001 24
E) Proposed Surface Coal Handling
Feeder Breaker
Six (6) nos. of feeder breakers having each of 300 to 350 tph capacity have
been proposed for sizing of ROM coal down to (-) 100 mm to handle proposed
production. The proposed feeder breaker will be installed near the Railway
siding which will be located at SW corner of the proposed opencast mine.
Belt Conveyor The crushed coal will be carried out by an elevating belt conveyor for a
distance of about 100 m.
Loading & Transport arrangements Loading of coal at surface stock yard into tippers as well as at Railway siding
into wagon will also be arranged by BCCL with leased out equipment. This is
as per present practices prevailing in BCCL mines. The tippers for
transportation of coal from surface coal dump to the site of feeder breaker and
to transport sized coal from hopper of the feeder breaker to spread all along
the length of the proposed Railway siding will be arranged and organised by
BCCL management with leased out equipment.
Railway Siding There will be two nos. of conventional Railway siding of full length for
accommodating two nos. of full rake capacity (each of 58 box wagons)
proposed for this OCP. The loop take up arrangement for this siding will be
such that there will be single entry at one end and single exist point at other
end drawn from Patherdih Rakhitpur main line.
Mine Closure Plan for NT-ST-Jeenagora Group of Mines
JOB NO. 200112001 25
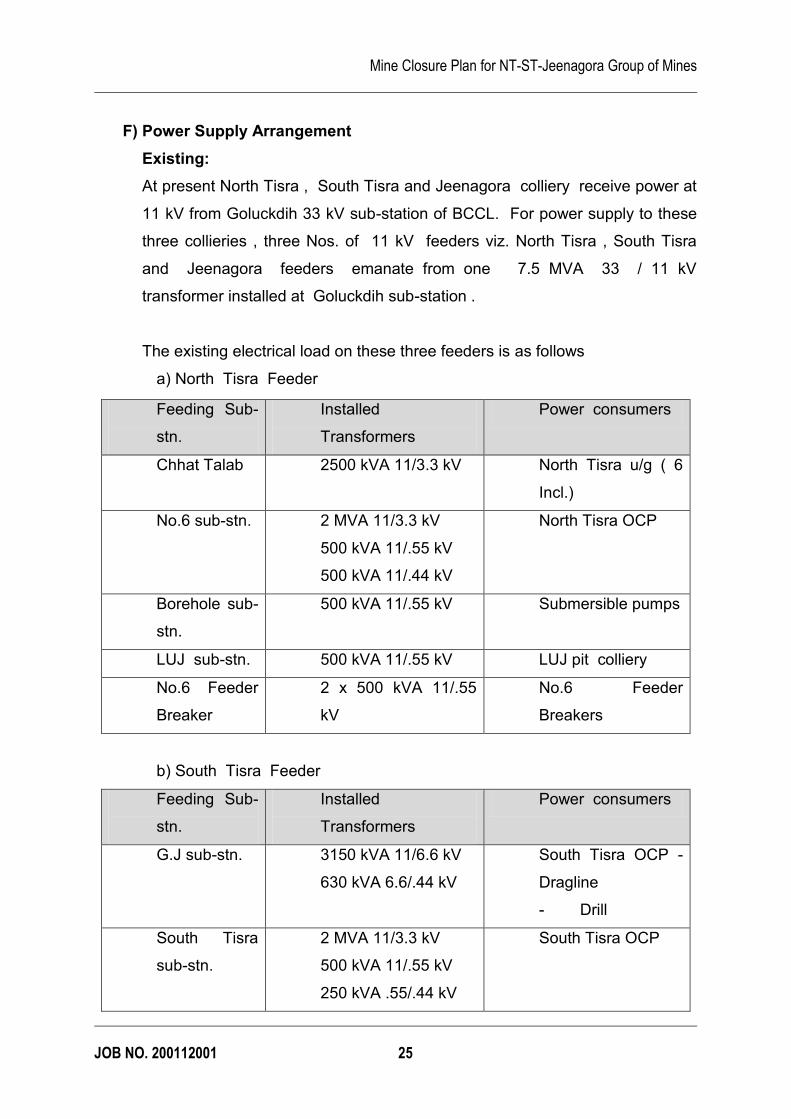
F) Power Supply Arrangement
Existing:
At present North Tisra , South Tisra and Jeenagora colliery receive power at
11 kV from Goluckdih 33 kV sub-station of BCCL. For power supply to these
three collieries , three Nos. of 11 kV feeders viz. North Tisra , South Tisra
and Jeenagora feeders emanate from one 7.5 MVA 33 / 11 kV
transformer installed at Goluckdih sub-station .
The existing electrical load on these three feeders is as follows
a) North Tisra Feeder
Feeding Sub-
stn.
Installed
Transformers
Power consumers
Chhat Talab 2500 kVA 11/3.3 kV North Tisra u/g ( 6
Incl.)
No.6 sub-stn. 2 MVA 11/3.3 kV
500 kVA 11/.55 kV
500 kVA 11/.44 kV
North Tisra OCP
Borehole sub-
stn.
500 kVA 11/.55 kV Submersible pumps
LUJ sub-stn. 500 kVA 11/.55 kV LUJ pit colliery
No.6 Feeder
Breaker
2 x 500 kVA 11/.55
kV
No.6 Feeder
Breakers
b) South Tisra Feeder
Feeding Sub-
stn.
Installed
Transformers
Power consumers
G.J sub-stn. 3150 kVA 11/6.6 kV
630 kVA 6.6/.44 kV
South Tisra OCP -
Dragline
- Drill
South Tisra
sub-stn.
2 MVA 11/3.3 kV
500 kVA 11/.55 kV
250 kVA .55/.44 kV
South Tisra OCP
Mine Closure Plan for NT-ST-Jeenagora Group of Mines
JOB NO. 200112001 26
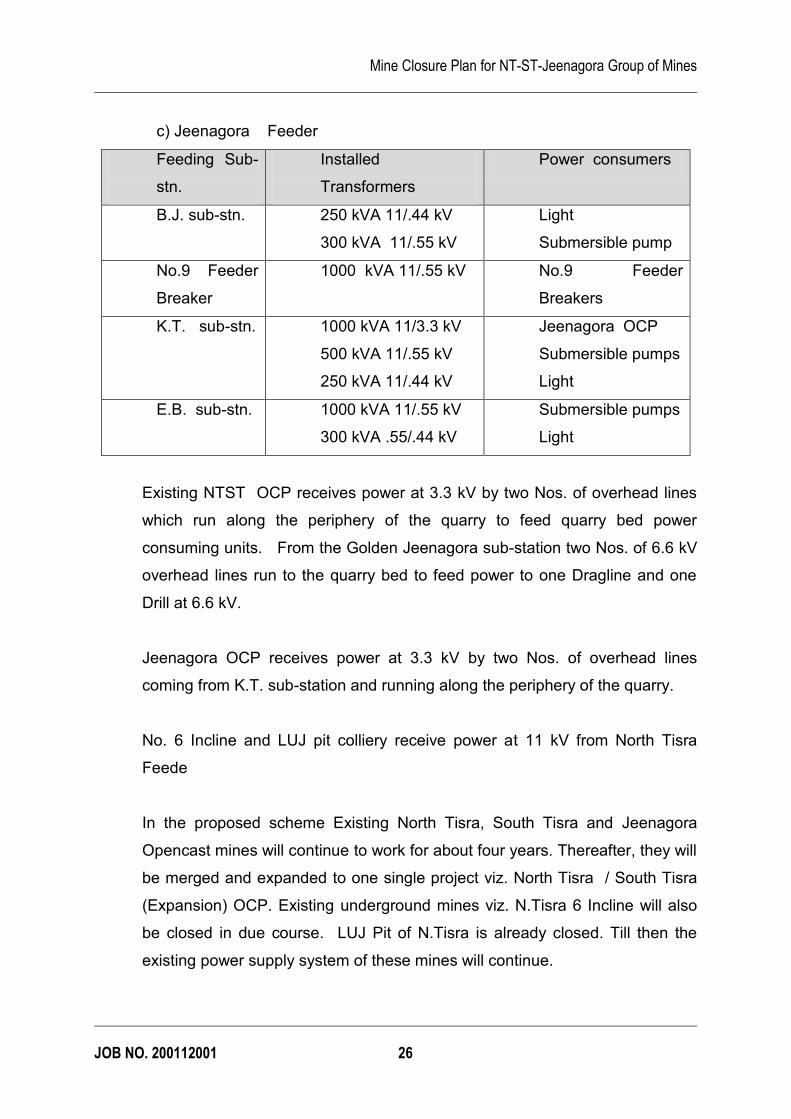
c) Jeenagora Feeder
Feeding Sub-
stn.
Installed
Transformers
Power consumers
B.J. sub-stn. 250 kVA 11/.44 kV
300 kVA 11/.55 kV
Light
Submersible pump
No.9 Feeder
Breaker
1000 kVA 11/.55 kV No.9 Feeder
Breakers
K.T. sub-stn. 1000 kVA 11/3.3 kV
500 kVA 11/.55 kV
250 kVA 11/.44 kV
Jeenagora OCP
Submersible pumps
Light
E.B. sub-stn. 1000 kVA 11/.55 kV
300 kVA .55/.44 kV
Submersible pumps
Light
Existing NTST OCP receives power at 3.3 kV by two Nos. of overhead lines
which run along the periphery of the quarry to feed quarry bed power
consuming units. From the Golden Jeenagora sub-station two Nos. of 6.6 kV
overhead lines run to the quarry bed to feed power to one Dragline and one
Drill at 6.6 kV.
Jeenagora OCP receives power at 3.3 kV by two Nos. of overhead lines
coming from K.T. sub-station and running along the periphery of the quarry.
No. 6 Incline and LUJ pit colliery receive power at 11 kV from North Tisra
Feede
In the proposed scheme Existing North Tisra, South Tisra and Jeenagora
Opencast mines will continue to work for about four years. Thereafter, they will
be merged and expanded to one single project viz. North Tisra / South Tisra
(Expansion) OCP. Existing underground mines viz. N.Tisra 6 Incline will also
be closed in due course. LUJ Pit of N.Tisra is already closed. Till then the
existing power supply system of these mines will continue.
Mine Closure Plan for NT-ST-Jeenagora Group of Mines
JOB NO. 200112001 27
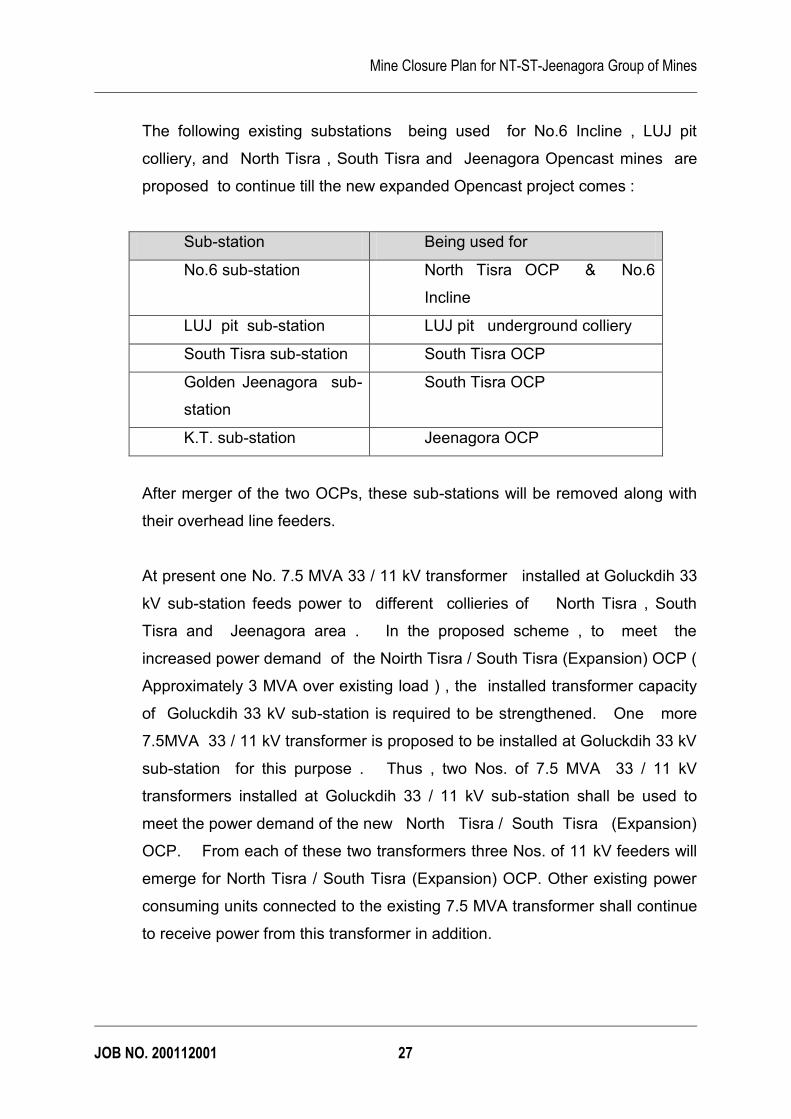
The following existing substations being used for No.6 Incline , LUJ pit
colliery, and North Tisra , South Tisra and Jeenagora Opencast mines are
proposed to continue till the new expanded Opencast project comes :
Sub-station Being used for
No.6 sub-station North Tisra OCP & No.6
Incline
LUJ pit sub-station LUJ pit underground colliery
South Tisra sub-station South Tisra OCP
Golden Jeenagora sub-
station
South Tisra OCP
K.T. sub-station Jeenagora OCP
After merger of the two OCPs, these sub-stations will be removed along with
their overhead line feeders.
At present one No. 7.5 MVA 33 / 11 kV transformer installed at Goluckdih 33
kV sub-station feeds power to different collieries of North Tisra , South
Tisra and Jeenagora area . In the proposed scheme , to meet the
increased power demand of the Noirth Tisra / South Tisra (Expansion) OCP (
Approximately 3 MVA over existing load ) , the installed transformer capacity
of Goluckdih 33 kV sub-station is required to be strengthened. One more
7.5MVA 33 / 11 kV transformer is proposed to be installed at Goluckdih 33 kV
sub-station for this purpose . Thus , two Nos. of 7.5 MVA 33 / 11 kV
transformers installed at Goluckdih 33 / 11 kV sub-station shall be used to
meet the power demand of the new North Tisra / South Tisra (Expansion)
OCP. From each of these two transformers three Nos. of 11 kV feeders will
emerge for North Tisra / South Tisra (Expansion) OCP. Other existing power
consuming units connected to the existing 7.5 MVA transformer shall continue
to receive power from this transformer in addition.
Mine Closure Plan for NT-ST-Jeenagora Group of Mines
JOB NO. 200112001 28
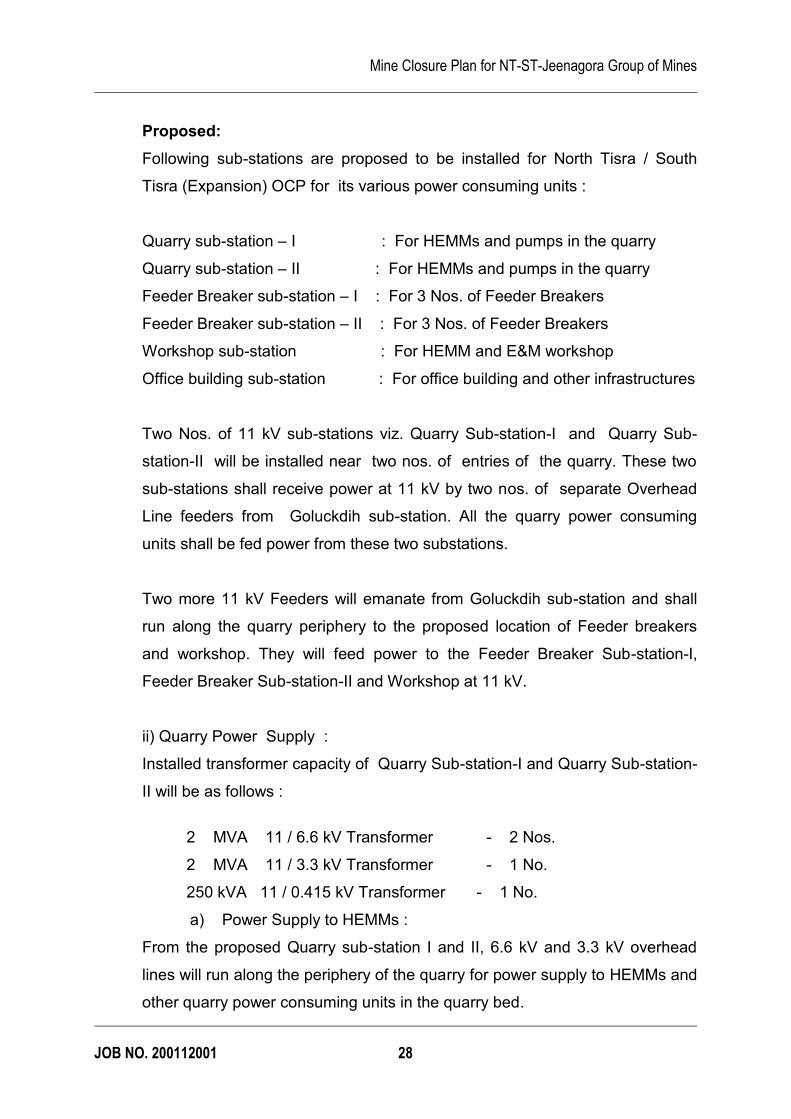
Proposed:
Following sub-stations are proposed to be installed for North Tisra / South
Tisra (Expansion) OCP for its various power consuming units :
Quarry sub-station – I : For HEMMs and pumps in the quarry
Quarry sub-station – II : For HEMMs and pumps in the quarry
Feeder Breaker sub-station – I : For 3 Nos. of Feeder Breakers
Feeder Breaker sub-station – II : For 3 Nos. of Feeder Breakers
Workshop sub-station : For HEMM and E&M workshop
Office building sub-station : For office building and other infrastructures
Two Nos. of 11 kV sub-stations viz. Quarry Sub-station-I and Quarry Sub-
station-II will be installed near two nos. of entries of the quarry. These two
sub-stations shall receive power at 11 kV by two nos. of separate Overhead
Line feeders from Goluckdih sub-station. All the quarry power consuming
units shall be fed power from these two substations.
Two more 11 kV Feeders will emanate from Goluckdih sub-station and shall
run along the quarry periphery to the proposed location of Feeder breakers
and workshop. They will feed power to the Feeder Breaker Sub-station-I,
Feeder Breaker Sub-station-II and Workshop at 11 kV.
ii) Quarry Power Supply :
Installed transformer capacity of Quarry Sub-station-I and Quarry Sub-station-
II will be as follows :
2 MVA 11 / 6.6 kV Transformer - 2 Nos.
2 MVA 11 / 3.3 kV Transformer - 1 No.
250 kVA 11 / 0.415 kV Transformer - 1 No.
a) Power Supply to HEMMs :
From the proposed Quarry sub-station I and II, 6.6 kV and 3.3 kV overhead
lines will run along the periphery of the quarry for power supply to HEMMs and
other quarry power consuming units in the quarry bed.
Mine Closure Plan for NT-ST-Jeenagora Group of Mines
JOB NO. 200112001 29
G) Telecommunication
EPABX system with 200 lines is proposed to be installed for the project with
telephone sets in the office building, other infrastructural building and at all
other strategic points. RAX sets of BCCL network shall also be provided at all
strategic points.
H) Existing Infrastructural facilities available (Road, water supply etc.) :
NT-ST OC
Non metal Road is available from the mine area to nearest DB Road (Lodna
and Jharia) leading to Dhanbad - Sindri. The water supply to residential areas
is only through borehole pumps. Mine water is used for industrial purposes
like sprinkling in the road as well as for washing of HEMM.
Jeenagora OC
Pucca Road has been provided from mine area to the nearest Bhaga –
Jeenagora D.B. Road, which connects office & work shop to area office and
dispensary.
North Tisra UG
D.B.Road - Jharia-Lodna DB road passes through the middle of the
property.
Company’s Road. – Network of kuchcha/pucca colliery roads exist in the
leasehold of the Mine.
Water supply – Drinking water is supplied from MADA ( 200 KLD)
through pipe network. For other miscellaneous domestic
work mine water is supplied (350 KLD).
I) Existing effluent treatment plant & sewage treatment plant (Mine & Colony) with quantity per month:
There is no such plant available in the Mine. However, domestic effluent is
disposed off in soak pit and solid waste is dumped off in abandoned quarry.
Mine Closure Plan for NT-ST-Jeenagora Group of Mines
JOB NO. 200112001 30
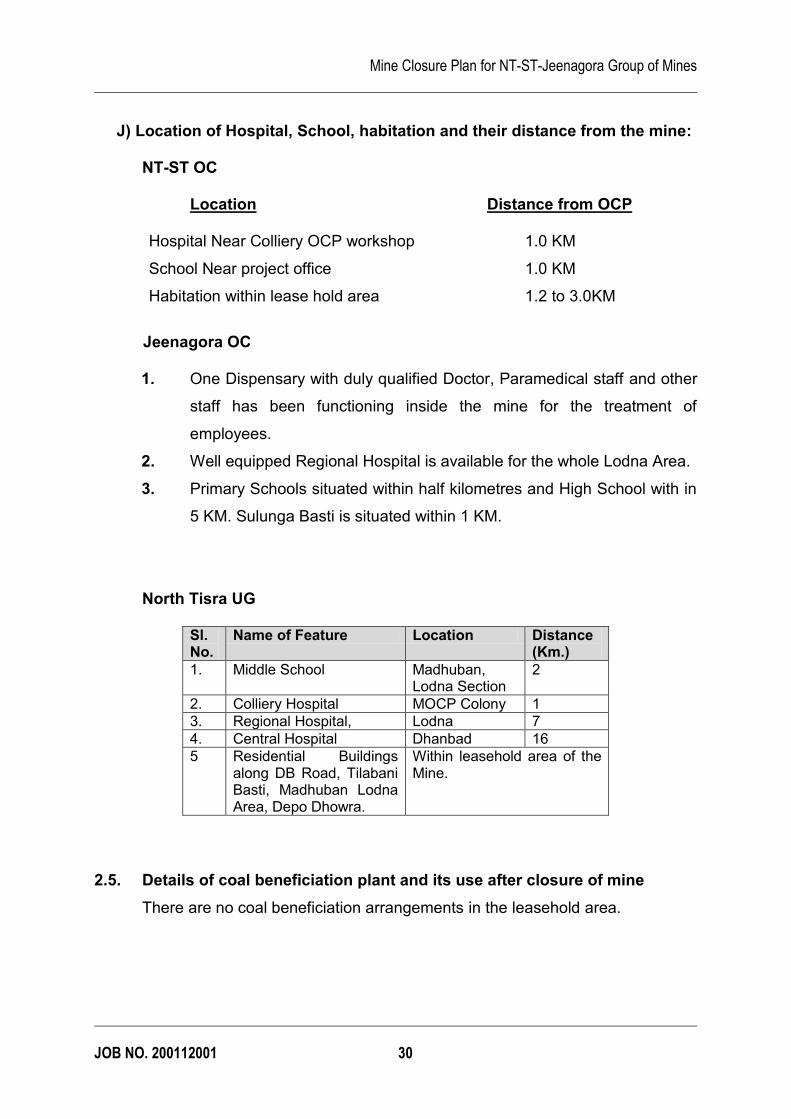
J) Location of Hospital, School, habitation and their distance from the mine: NT-ST OC
Location Distance from OCP Hospital Near Colliery OCP workshop 1.0 KM
School Near project office 1.0 KM
Habitation within lease hold area 1.2 to 3.0KM
Jeenagora OC
1. One Dispensary with duly qualified Doctor, Paramedical staff and other
staff has been functioning inside the mine for the treatment of
employees.
2. Well equipped Regional Hospital is available for the whole Lodna Area.
3. Primary Schools situated within half kilometres and High School with in
5 KM. Sulunga Basti is situated within 1 KM.
North Tisra UG
Sl. No.
Name of Feature Location Distance (Km.)
1. Middle School Madhuban, Lodna Section
2
2. Colliery Hospital MOCP Colony 1
3. Regional Hospital, Lodna 7
4. Central Hospital Dhanbad 16
5 Residential Buildings along DB Road, Tilabani Basti, Madhuban Lodna Area, Depo Dhowra.
Within leasehold area of the Mine.
2.5. Details of coal beneficiation plant and its use after closure of mine
There are no coal beneficiation arrangements in the leasehold area.
Mine Closure Plan for NT-ST-Jeenagora Group of Mines
JOB NO. 200112001 31
CHAPTER – III
CLOSURE PLAN AND RELATED ACTIVITIES
3.1 Closure Planning details of mine
The progressive mine closure activities will continue as envisaged in the
project report and as enumerated in the various approvals, permits, consents
etc. It is very difficult to predict the various parameters which would be
prevalent at the time of final mine closure and also to foresee the likely
impacts due to closure of the mining activities (when the entire reserve in the
block would get exhausted). However, broad mine closure activities need to
be identified under the various heads.
The mines falling in the NTST-Jeenagora Group are covered in Cluster IX for
the purpose of EMP.
3.1.1 Mined out land & proposed final land use
After completion of mining activities, the quarried area shall be reclaimed by
developing ponds, water bodies and plantation, which will not only improve the
aesthetic value of the area but also be used for some productive purpose like
pisciculture and water supply to the local communities. Formation of water
bodies which develops aquatic life and with the plantation around it will lead to
restoration of ecology of the area.
At present opencast mine is being worked in IVT, IVB, III, IIT, IIB and I seams,
which along with other seams(upto X Seam) have balance extractable reserve
of about 145.08 MT.
The proposed conceptual post-mining land use plan vis-à-vis present land use
is provided in Para 1.10.
a. Total Mined out area (Ha) – Present + Proposed----568.38 Ha
b. Backfilled area (Ha)---------- 403.93 Ha.
Mine Closure Plan for NT-ST-Jeenagora Group of Mines
JOB NO. 200112001 32
c. Balance left mined out area (Ha) which will not be backfilled--164.59
Ha.
d. The balanced left mined out area will be developed into ponds which
will be used for Pisciculture & water supply to the local villagers.
As regards, the underground void, if any, which will remain at the time of
closure of the mine, the same will get gradually filled with water. The
necessary precautions for the safety of the neighboring mine would be taken
care of before deciding the voids to get water filled. Further, the water filled in
UG voids will help in maintaining the water level in the nearby area. The
Pit/Shaft will be covered with RCC structure with suitable opening for future
inspection by competent person.
3.2 Water quality management
3.2.1 Drainage pattern of the area (pre and post closure)
3.2.1.1 Existing drainage pattern
The area has an undulating topography with a gentle slope towards west. The
maximum elevation of 202m has been observed in the North-eastern part
while the minimum elevation is 163m in the south-western part. The drainage
of the area is control by the southerly flowing Tisra Jore on the west.
3.2.1.2 Post closure drainage pattern
Major area of the mine will be quarried out. Kuccha garland drain will be
made around the periphery of the quarry. This garland drain will be connected
to Tisra Jore which is not likely to be disturbed by mining operation. Thus,
this garland drain will drain off the rain water away from the mine. Various
measures to prevent water pollution will be taken.
Mine Closure Plan for NT-ST-Jeenagora Group of Mines
JOB NO. 200112001 33
3.2.2 Water Quality Status of Surface and Ground Water
3.2.2.1 Present Practice
The samples were analyzed for relevant physical, chemical and bacteriological
parameters for drawing up the base line data.
All the basic precautions and care were taken during the sampling to avoid
contamination. Analysis of the samples was carried out as per established
standard method and a procedure prescribed by the relevant IS codes and
standard methods (AAPHA).
Standards followed
Standard for mine water - GSR-742(E):2000
Standard for surface water - IS 2296:1982
Standard for drinking water - IS 10500:1991
3.2.2.2 Present status of water quality
The monitoring of water quality under Baseline Environment Data
Generation for Cluster IX has been conducted by CIMFR, Dhanbad by
collecting water samples from ground water, surface water and mine water
discharge / workshop discharge (if any) for the proposed project. The various
purposes of the water environment monitoring are as follows:
· To assess the water quality characteristics for critical parameters;
· To evaluate the impacts on agricultural productivity, habitat conditions,
creational resources and aesthetics in the vicinity ; and
· To facilitate predication of impact on water quality by project activities
The results as per CIMFR, Dhanbad Report are given subsequently.
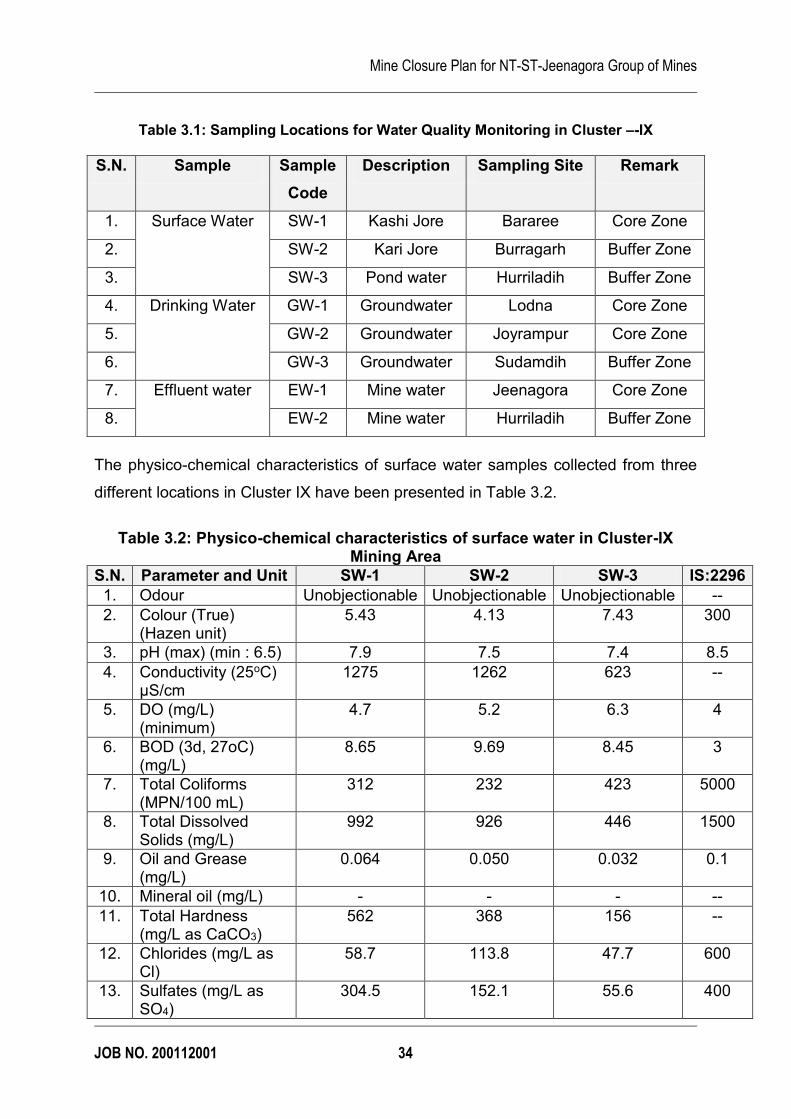
To assess the quality of lotic system (surface water), water samples were
collected from the following locations (Refer to CIMFR, Dhanbad Report):
Mine Closure Plan for NT-ST-Jeenagora Group of Mines
JOB NO. 200112001 34
Table 3.1: Sampling Locations for Water Quality Monitoring in Cluster –-IX
S.N. Sample Sample
Code
Description Sampling Site Remark
1. Surface Water SW-1 Kashi Jore Bararee Core Zone
2. SW-2 Kari Jore Burragarh Buffer Zone
3. SW-3 Pond water Hurriladih Buffer Zone
4. Drinking Water GW-1 Groundwater Lodna Core Zone
5. GW-2 Groundwater Joyrampur Core Zone
6. GW-3 Groundwater Sudamdih Buffer Zone
7. Effluent water EW-1 Mine water Jeenagora Core Zone
8. EW-2 Mine water Hurriladih Buffer Zone
The physico-chemical characteristics of surface water samples collected from three
different locations in Cluster IX have been presented in Table 3.2.
Table 3.2: Physico-chemical characteristics of surface water in Cluster-IX Mining Area
S.N. Parameter and Unit SW-1 SW-2 SW-3 IS:2296
1. Odour Unobjectionable Unobjectionable Unobjectionable --
2. Colour (True) (Hazen unit)
5.43 4.13 7.43 300
3. pH (max) (min : 6.5) 7.9 7.5 7.4 8.5
4. Conductivity (25oC) µS/cm
1275 1262 623 --
5. DO (mg/L) (minimum)
4.7 5.2 6.3 4
6. BOD (3d, 27oC) (mg/L)
8.65 9.69 8.45 3
7. Total Coliforms (MPN/100 mL)
312 232 423 5000
8. Total Dissolved Solids (mg/L)
992 926 446 1500
9. Oil and Grease (mg/L)
0.064 0.050 0.032 0.1
10. Mineral oil (mg/L) - - - --
11. Total Hardness (mg/L as CaCO3)
562 368 156 --
12. Chlorides (mg/L as Cl)
58.7 113.8 47.7 600
13. Sulfates (mg/L as SO4)
304.5 152.1 55.6 400
Mine Closure Plan for NT-ST-Jeenagora Group of Mines
JOB NO. 200112001 35
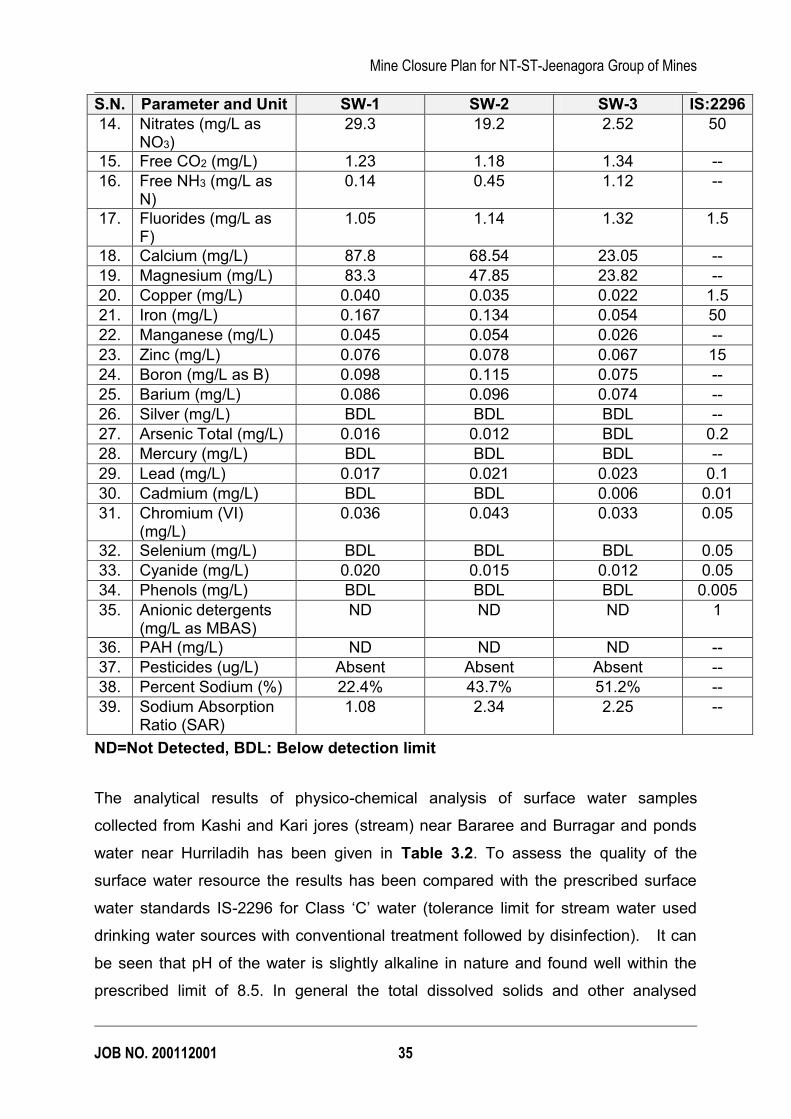
S.N. Parameter and Unit SW-1 SW-2 SW-3 IS:2296
14. Nitrates (mg/L as NO3)
29.3 19.2 2.52 50
15. Free CO2 (mg/L) 1.23 1.18 1.34 --
16. Free NH3 (mg/L as N)
0.14 0.45 1.12 --
17. Fluorides (mg/L as F)
1.05 1.14 1.32 1.5
18. Calcium (mg/L) 87.8 68.54 23.05 --
19. Magnesium (mg/L) 83.3 47.85 23.82 --
20. Copper (mg/L) 0.040 0.035 0.022 1.5
21. Iron (mg/L) 0.167 0.134 0.054 50
22. Manganese (mg/L) 0.045 0.054 0.026 --
23. Zinc (mg/L) 0.076 0.078 0.067 15
24. Boron (mg/L as B) 0.098 0.115 0.075 --
25. Barium (mg/L) 0.086 0.096 0.074 --
26. Silver (mg/L) BDL BDL BDL --
27. Arsenic Total (mg/L) 0.016 0.012 BDL 0.2
28. Mercury (mg/L) BDL BDL BDL --
29. Lead (mg/L) 0.017 0.021 0.023 0.1
30. Cadmium (mg/L) BDL BDL 0.006 0.01
31. Chromium (VI) (mg/L)
0.036 0.043 0.033 0.05
32. Selenium (mg/L) BDL BDL BDL 0.05
33. Cyanide (mg/L) 0.020 0.015 0.012 0.05
34. Phenols (mg/L) BDL BDL BDL 0.005
35. Anionic detergents (mg/L as MBAS)
ND ND ND 1
36. PAH (mg/L) ND ND ND --
37. Pesticides (ug/L) Absent Absent Absent --
38. Percent Sodium (%) 22.4% 43.7% 51.2% --
39. Sodium Absorption Ratio (SAR)
1.08 2.34 2.25 --
ND=Not Detected, BDL: Below detection limit
The analytical results of physico-chemical analysis of surface water samples
collected from Kashi and Kari jores (stream) near Bararee and Burragar and ponds
water near Hurriladih has been given in Table 3.2. To assess the quality of the
surface water resource the results has been compared with the prescribed surface
water standards IS-2296 for Class ‘C’ water (tolerance limit for stream water used
drinking water sources with conventional treatment followed by disinfection). It can
be seen that pH of the water is slightly alkaline in nature and found well within the
prescribed limit of 8.5. In general the total dissolved solids and other analysed
Mine Closure Plan for NT-ST-Jeenagora Group of Mines
JOB NO. 200112001 36
parameters are found well within the threshold values. Concentration of sulphate
varies between 55.6 and 304.5 mg L-1 and is below the prescribed value of 400 mg L-
1 (IS-2296). The concentrations of the analysed heavy metals in the surface water
resource are also found within the prescribed limits. It shows that the surface water of
the area is fit for its designated use as a drinking water source with conventional
treatment followed by disinfection.
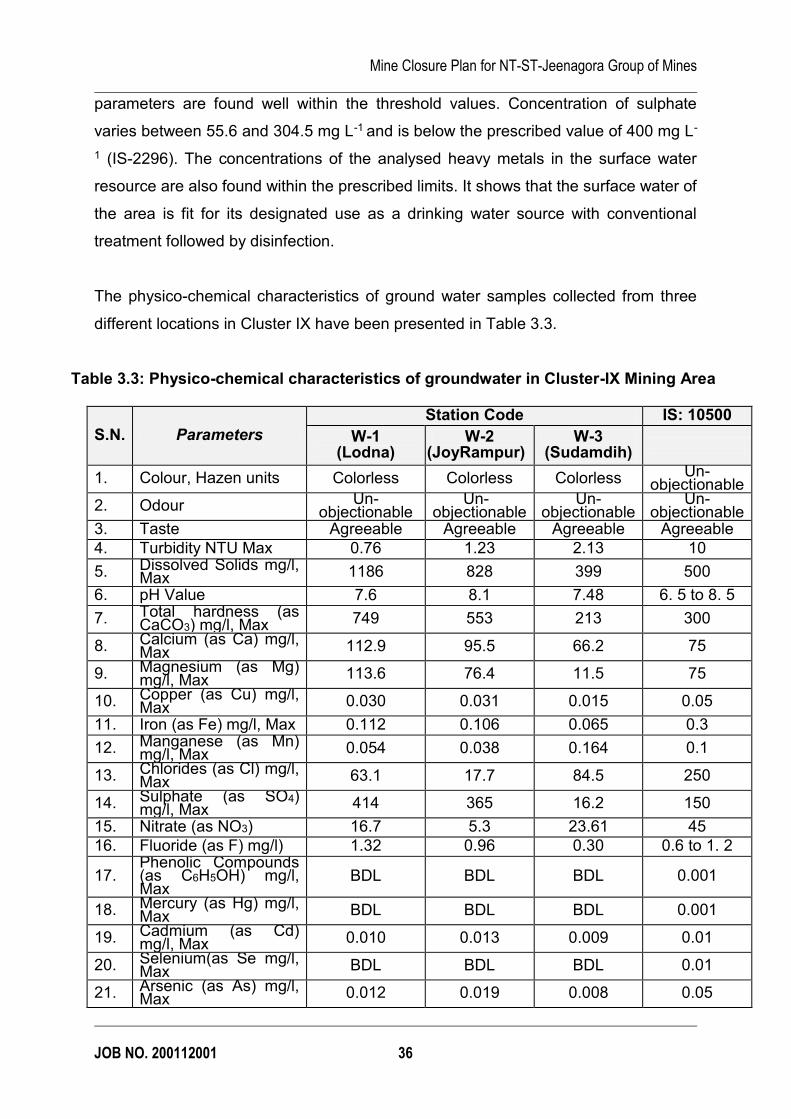
The physico-chemical characteristics of ground water samples collected from three
different locations in Cluster IX have been presented in Table 3.3.
Table 3.3: Physico-chemical characteristics of groundwater in Cluster-IX Mining Area
S.N. Parameters
Station Code IS: 10500
W-1 (Lodna)
W-2 (JoyRampur)
W-3 (Sudamdih)
1. Colour, Hazen units Colorless Colorless Colorless Un- objectionable
2. Odour Un-objectionable
Un-objectionable
Un-objectionable
Un- objectionable
3. Taste Agreeable Agreeable Agreeable Agreeable
4. Turbidity NTU Max 0.76 1.23 2.13 10
5. Dissolved Solids mg/l, Max 1186 828 399 500
6. pH Value 7.6 8.1 7.48 6. 5 to 8. 5
7. Total hardness (as CaCO3) mg/l, Max 749 553 213 300
8. Calcium (as Ca) mg/l, Max 112.9 95.5 66.2 75
9. Magnesium (as Mg) mg/l, Max 113.6 76.4 11.5 75
10. Copper (as Cu) mg/l, Max 0.030 0.031 0.015 0.05
11. Iron (as Fe) mg/l, Max 0.112 0.106 0.065 0.3
12. Manganese (as Mn) mg/l, Max 0.054 0.038 0.164 0.1
13. Chlorides (as Cl) mg/l, Max 63.1 17.7 84.5 250
14. Sulphate (as SO4) mg/l, Max 414 365 16.2 150
15. Nitrate (as NO3) 16.7 5.3 23.61 45
16. Fluoride (as F) mg/l) 1.32 0.96 0.30 0.6 to 1. 2
17. Phenolic Compounds (as C6H5OH) mg/l, Max
BDL BDL BDL 0.001
18. Mercury (as Hg) mg/l, Max BDL BDL BDL 0.001
19. Cadmium (as Cd) mg/l, Max 0.010 0.013 0.009 0.01
20. Selenium(as Se mg/l, Max BDL BDL BDL 0.01
21. Arsenic (as As) mg/l, Max 0.012 0.019 0.008 0.05
Mine Closure Plan for NT-ST-Jeenagora Group of Mines
JOB NO. 200112001 37
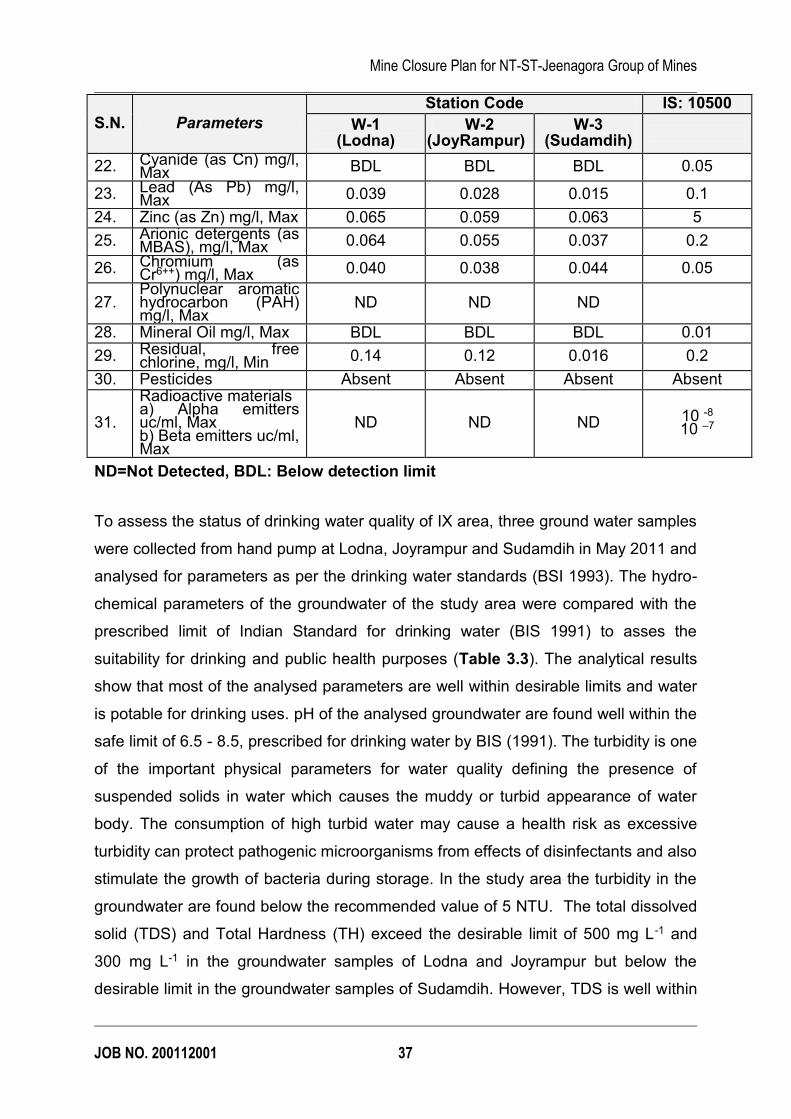
S.N. Parameters
Station Code IS: 10500
W-1 (Lodna)
W-2 (JoyRampur)
W-3 (Sudamdih)
22. Cyanide (as Cn) mg/l, Max BDL BDL BDL 0.05
23. Lead (As Pb) mg/l, Max 0.039 0.028 0.015 0.1
24. Zinc (as Zn) mg/l, Max 0.065 0.059 0.063 5
25. Arionic detergents (as MBAS), mg/l, Max 0.064 0.055 0.037 0.2
26. Chromium (as Cr6++) mg/l, Max 0.040 0.038 0.044 0.05
27. Polynuclear aromatic hydrocarbon (PAH) mg/l, Max
ND ND ND
28. Mineral Oil mg/l, Max BDL BDL BDL 0.01
29. Residual, free chlorine, mg/l, Min 0.14 0.12 0.016 0.2
30. Pesticides Absent Absent Absent Absent
31.
Radioactive materials a) Alpha emitters uc/ml, Max b) Beta emitters uc/ml, Max
ND ND ND 10 -8 10 –7
ND=Not Detected, BDL: Below detection limit
To assess the status of drinking water quality of IX area, three ground water samples
were collected from hand pump at Lodna, Joyrampur and Sudamdih in May 2011 and
analysed for parameters as per the drinking water standards (BSI 1993). The hydro-
chemical parameters of the groundwater of the study area were compared with the
prescribed limit of Indian Standard for drinking water (BIS 1991) to asses the
suitability for drinking and public health purposes (Table 3.3). The analytical results
show that most of the analysed parameters are well within desirable limits and water
is potable for drinking uses. pH of the analysed groundwater are found well within the
safe limit of 6.5 - 8.5, prescribed for drinking water by BIS (1991). The turbidity is one
of the important physical parameters for water quality defining the presence of
suspended solids in water which causes the muddy or turbid appearance of water
body. The consumption of high turbid water may cause a health risk as excessive
turbidity can protect pathogenic microorganisms from effects of disinfectants and also
stimulate the growth of bacteria during storage. In the study area the turbidity in the
groundwater are found below the recommended value of 5 NTU. The total dissolved
solid (TDS) and Total Hardness (TH) exceed the desirable limit of 500 mg L-1 and
300 mg L-1 in the groundwater samples of Lodna and Joyrampur but below the
desirable limit in the groundwater samples of Sudamdih. However, TDS is well within
Mine Closure Plan for NT-ST-Jeenagora Group of Mines
JOB NO. 200112001 38
the maximum permissible limit of 1000 mg L-1 in Joyrampur groundwater.
Concentration of Ca, Mg, SO4 and F are also slightly exceeding the desirable limit in
the groundwater of Lodna area though it is below the maximum permissible limit of
IS-10500. The other analysed parameters like Cl, NO3, Na etc. were found below the
desirable level.
Heavy metal analysis in the groundwater samples indicated that all the analyzed
heavy metals like As, Cd, Cr, Pb, Zn, Mn and Fe are found either below the detection
limit or less than the desirable limit for drinking water.
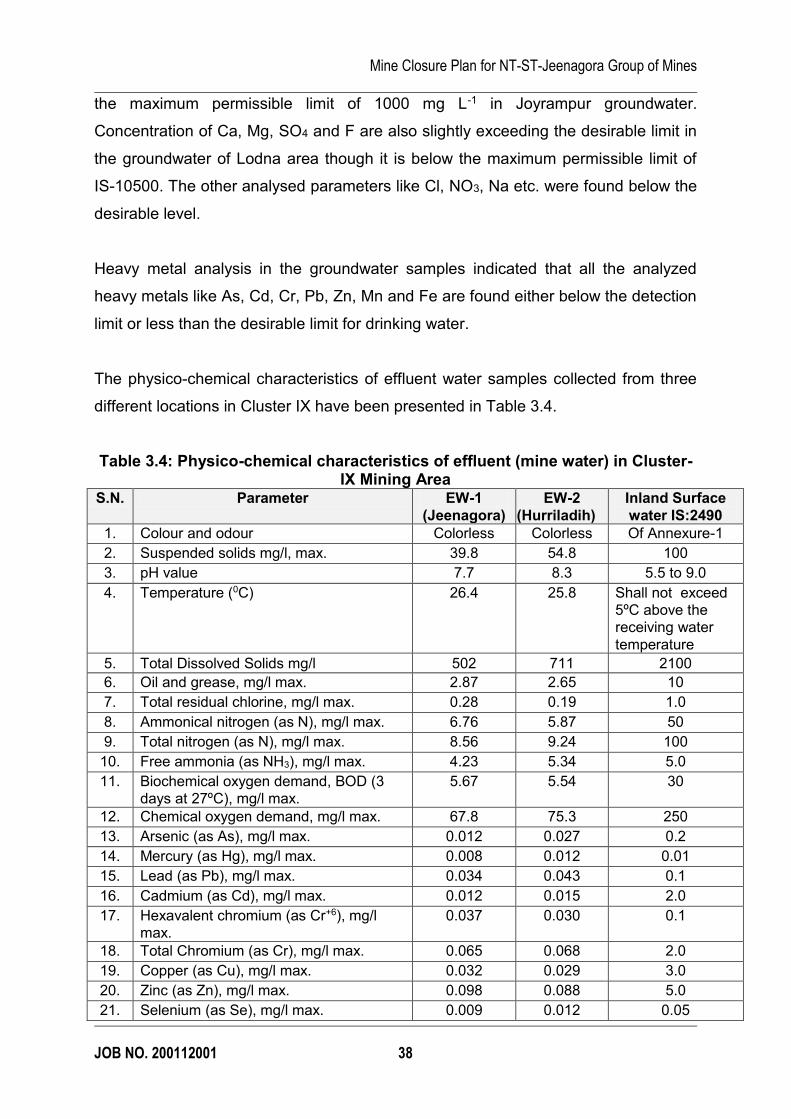
The physico-chemical characteristics of effluent water samples collected from three
different locations in Cluster IX have been presented in Table 3.4.
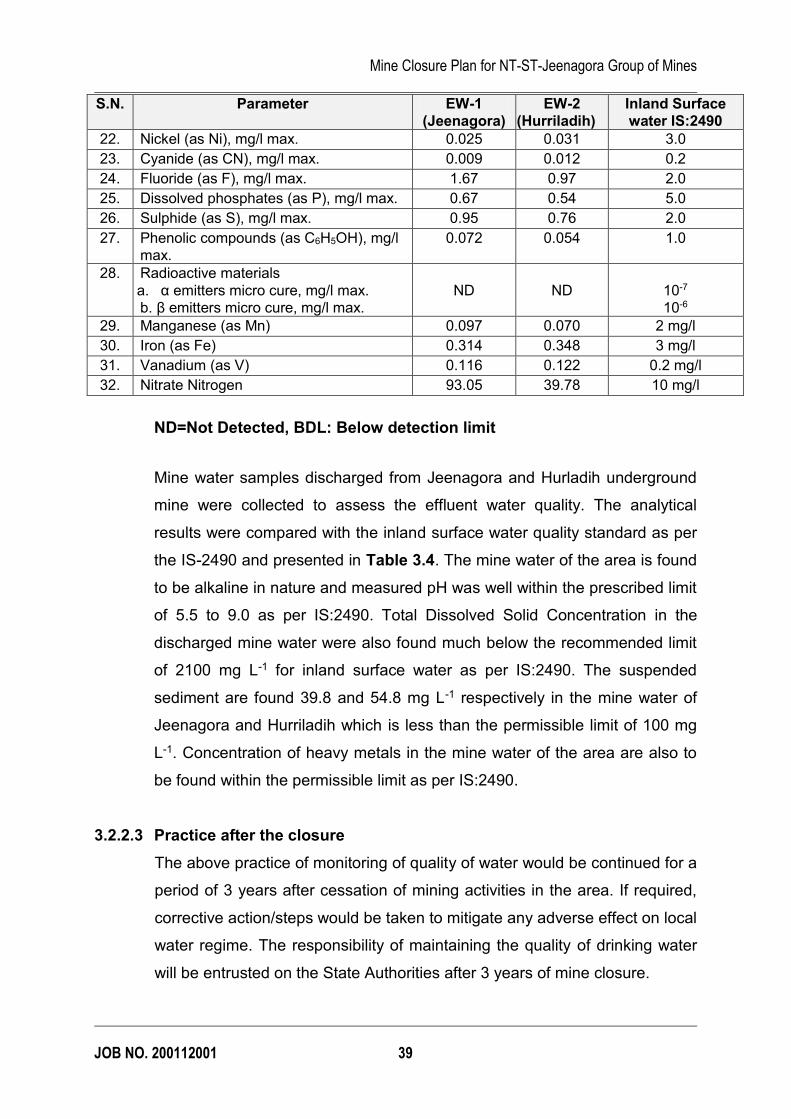
Table 3.4: Physico-chemical characteristics of effluent (mine water) in Cluster-IX Mining Area
S.N. Parameter EW-1
(Jeenagora)
EW-2
(Hurriladih)
Inland Surface
water IS:2490
1. Colour and odour Colorless Colorless Of Annexure-1
2. Suspended solids mg/l, max. 39.8 54.8 100
3. pH value 7.7 8.3 5.5 to 9.0
4. Temperature (0C) 26.4 25.8 Shall not exceed
5ºC above the
receiving water
temperature
5. Total Dissolved Solids mg/l 502 711 2100
6. Oil and grease, mg/l max. 2.87 2.65 10
7. Total residual chlorine, mg/l max. 0.28 0.19 1.0
8. Ammonical nitrogen (as N), mg/l max. 6.76 5.87 50
9. Total nitrogen (as N), mg/l max. 8.56 9.24 100
10. Free ammonia (as NH3), mg/l max. 4.23 5.34 5.0
11. Biochemical oxygen demand, BOD (3
days at 27ºC), mg/l max.
5.67 5.54 30
12. Chemical oxygen demand, mg/l max. 67.8 75.3 250
13. Arsenic (as As), mg/l max. 0.012 0.027 0.2
14. Mercury (as Hg), mg/l max. 0.008 0.012 0.01
15. Lead (as Pb), mg/l max. 0.034 0.043 0.1
16. Cadmium (as Cd), mg/l max. 0.012 0.015 2.0
17. Hexavalent chromium (as Cr+6), mg/l
max.
0.037 0.030 0.1
18. Total Chromium (as Cr), mg/l max. 0.065 0.068 2.0
19. Copper (as Cu), mg/l max. 0.032 0.029 3.0
20. Zinc (as Zn), mg/l max. 0.098 0.088 5.0
21. Selenium (as Se), mg/l max. 0.009 0.012 0.05
Mine Closure Plan for NT-ST-Jeenagora Group of Mines
JOB NO. 200112001 39
S.N. Parameter EW-1 (Jeenagora)
EW-2 (Hurriladih)
Inland Surface water IS:2490
22. Nickel (as Ni), mg/l max. 0.025 0.031 3.0
23. Cyanide (as CN), mg/l max. 0.009 0.012 0.2
24. Fluoride (as F), mg/l max. 1.67 0.97 2.0
25. Dissolved phosphates (as P), mg/l max. 0.67 0.54 5.0
26. Sulphide (as S), mg/l max. 0.95 0.76 2.0
27. Phenolic compounds (as C6H5OH), mg/l
max.
0.072 0.054 1.0
28. Radioactive materials
a. α emitters micro cure, mg/l max.
b. β emitters micro cure, mg/l max.
ND
ND
10-7
10-6
29. Manganese (as Mn) 0.097 0.070 2 mg/l
30. Iron (as Fe) 0.314 0.348 3 mg/l
31. Vanadium (as V) 0.116 0.122 0.2 mg/l
32. Nitrate Nitrogen 93.05 39.78 10 mg/l
ND=Not Detected, BDL: Below detection limit
Mine water samples discharged from Jeenagora and Hurladih underground
mine were collected to assess the effluent water quality. The analytical
results were compared with the inland surface water quality standard as per
the IS-2490 and presented in Table 3.4. The mine water of the area is found
to be alkaline in nature and measured pH was well within the prescribed limit
of 5.5 to 9.0 as per IS:2490. Total Dissolved Solid Concentration in the
discharged mine water were also found much below the recommended limit
of 2100 mg L-1 for inland surface water as per IS:2490. The suspended
sediment are found 39.8 and 54.8 mg L-1 respectively in the mine water of
Jeenagora and Hurriladih which is less than the permissible limit of 100 mg
L-1. Concentration of heavy metals in the mine water of the area are also to
be found within the permissible limit as per IS:2490.
3.2.2.3 Practice after the closure
The above practice of monitoring of quality of water would be continued for a
period of 3 years after cessation of mining activities in the area. If required,
corrective action/steps would be taken to mitigate any adverse effect on local
water regime. The responsibility of maintaining the quality of drinking water
will be entrusted on the State Authorities after 3 years of mine closure.
Mine Closure Plan for NT-ST-Jeenagora Group of Mines
JOB NO. 200112001 40
3.2.3 Measures for Control of Pollution (Details for Pollution Control
Arrangement)
3.2.3.1 Impact due to Water Pollution and its Management
The mine discharge water may contain high-suspended solids and other
pollutants. The treatment scheme thus needs to focus on the removal of
suspended solids from the water. Mine water must be treated to meet the
prescribed standards before being discharged into water bodies. When the
water is used for agricultural or domestic work, it shall undergo further
treatment, as established by Scientific Studies conducted in this regard. The
important factors to be considered in selecting the appropriate method for
treatment are as follows:
(a) Settling tank will be provided to collect the mine discharged water for
settling the suspended solids.
(b) The flow and the quality of mine water vary seasonally. Therefore
settling tank should be so constructed that it will be able to absorb
these fluctuations.
(c) The mine water must be neutral in nature before discharge and
therefore necessary neutraliser may be provided to maintain the pH
of the settling pond water.
(d) In order to reduce the dependence on fresh water sources for
meeting the demands of water in the mining related operations, the
entire mining water will be utilised. The effluent free mine water will
be utilised in water spraying for dust suppression, hydraulic stowing,
equipment washing and other industrial requirements.
(e) Mine water discharge and drainage in the core zone has been
planned to be regulated in a manner so that impact on surface and
other water bodies of the area is not affected. No major diversion of
surface drainage channel is required. Expected increase of solids
particles due to surface handling of coal shall be controlled by:
i. Construction of garland drains around the OB dump & coal
stock area
ii. Construction of settling tanks of adequate size for removal of
particulate matters
Mine Closure Plan for NT-ST-Jeenagora Group of Mines
JOB NO. 200112001 41
iii. De-silting of settling ponds and drains at regular intervals
iv. Effluents from washing areas, garage and workshop will be
collected in garlands and routed through a settling ponds and
oil and grease trap. The solid wastes generated shall be
treated as per the provisions of Hazardous Waste
Management Act. The water shall be recirculated for washing.
3.2.4 Water Balance of the area Hydrogeology and Aquifer characteristics of the area Groundwater occurrence and storage in study area are mainly controlled by
the geological setup of the area. The ability of geological formation to store
and transmit water is dependent on its formation parameters, such as porosity
and hydraulic conductivity. Based on these two parameters, the rock formation
of the area may be classified as hard and soft rocks. Hard rocks (mainly
crystalline and consolidated sedimentary rocks) are characterized by very little
porosity. Ground water in such rocks circulated to a limited extent through the
secondary openings represented by joints, cracks, fissures and such other
planes of discontinuity. Soft rocks represented by sandstone, pebbles and
loose sand, posses higher degree of primary porosity and as such
characterized by higher water storage capacity. As greater part of the study
area is underlain by Precambrian crystalline rocks, the weathered residual of
the hard rocks as well as the fractures, joints, fissures, faults and other zones
of discontinuity are the principle repositories of ground water in the area. The
weathered zone is usually of limited thickness, fractures and joints generally
close up with depth. The thickness of weathered mantle in the hard rock zone
of area is about 10-20 meter in the topographic lows. Ground water in the
weathered and fracture zones of hard rocks occur under unconfined condition.
Ground water circulating through fracture zone is sometimes held under
pressure. Depth of the water table in the hard rock of the area generally
ranges from 3.0m to 15.0m below ground level.
Mine Closure Plan for NT-ST-Jeenagora Group of Mines
JOB NO. 200112001 42
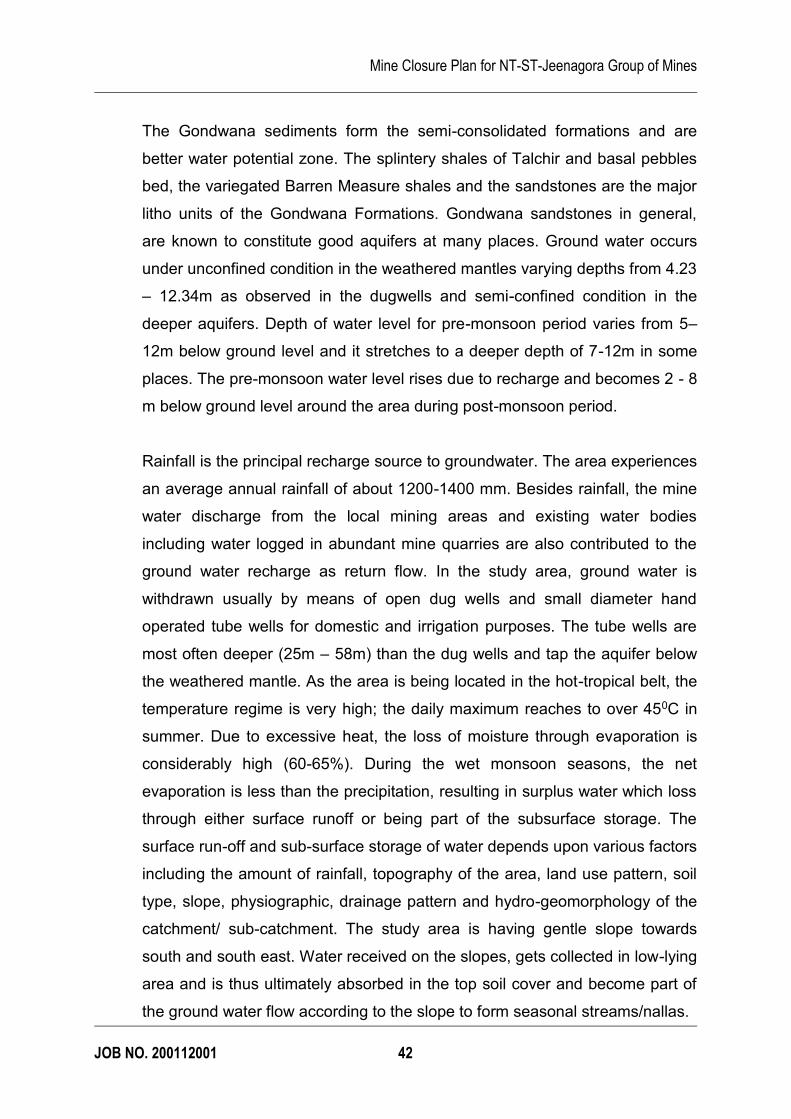
The Gondwana sediments form the semi-consolidated formations and are
better water potential zone. The splintery shales of Talchir and basal pebbles
bed, the variegated Barren Measure shales and the sandstones are the major
litho units of the Gondwana Formations. Gondwana sandstones in general,
are known to constitute good aquifers at many places. Ground water occurs
under unconfined condition in the weathered mantles varying depths from 4.23
– 12.34m as observed in the dugwells and semi-confined condition in the
deeper aquifers. Depth of water level for pre-monsoon period varies from 5–
12m below ground level and it stretches to a deeper depth of 7-12m in some
places. The pre-monsoon water level rises due to recharge and becomes 2 - 8
m below ground level around the area during post-monsoon period.
Rainfall is the principal recharge source to groundwater. The area experiences
an average annual rainfall of about 1200-1400 mm. Besides rainfall, the mine
water discharge from the local mining areas and existing water bodies
including water logged in abundant mine quarries are also contributed to the
ground water recharge as return flow. In the study area, ground water is
withdrawn usually by means of open dug wells and small diameter hand
operated tube wells for domestic and irrigation purposes. The tube wells are
most often deeper (25m – 58m) than the dug wells and tap the aquifer below
the weathered mantle. As the area is being located in the hot-tropical belt, the
temperature regime is very high; the daily maximum reaches to over 450C in
summer. Due to excessive heat, the loss of moisture through evaporation is
considerably high (60-65%). During the wet monsoon seasons, the net
evaporation is less than the precipitation, resulting in surplus water which loss
through either surface runoff or being part of the subsurface storage. The
surface run-off and sub-surface storage of water depends upon various factors
including the amount of rainfall, topography of the area, land use pattern, soil
type, slope, physiographic, drainage pattern and hydro-geomorphology of the
catchment/ sub-catchment. The study area is having gentle slope towards
south and south east. Water received on the slopes, gets collected in low-lying
area and is thus ultimately absorbed in the top soil cover and become part of
the ground water flow according to the slope to form seasonal streams/nallas.
Mine Closure Plan for NT-ST-Jeenagora Group of Mines
JOB NO. 200112001 43
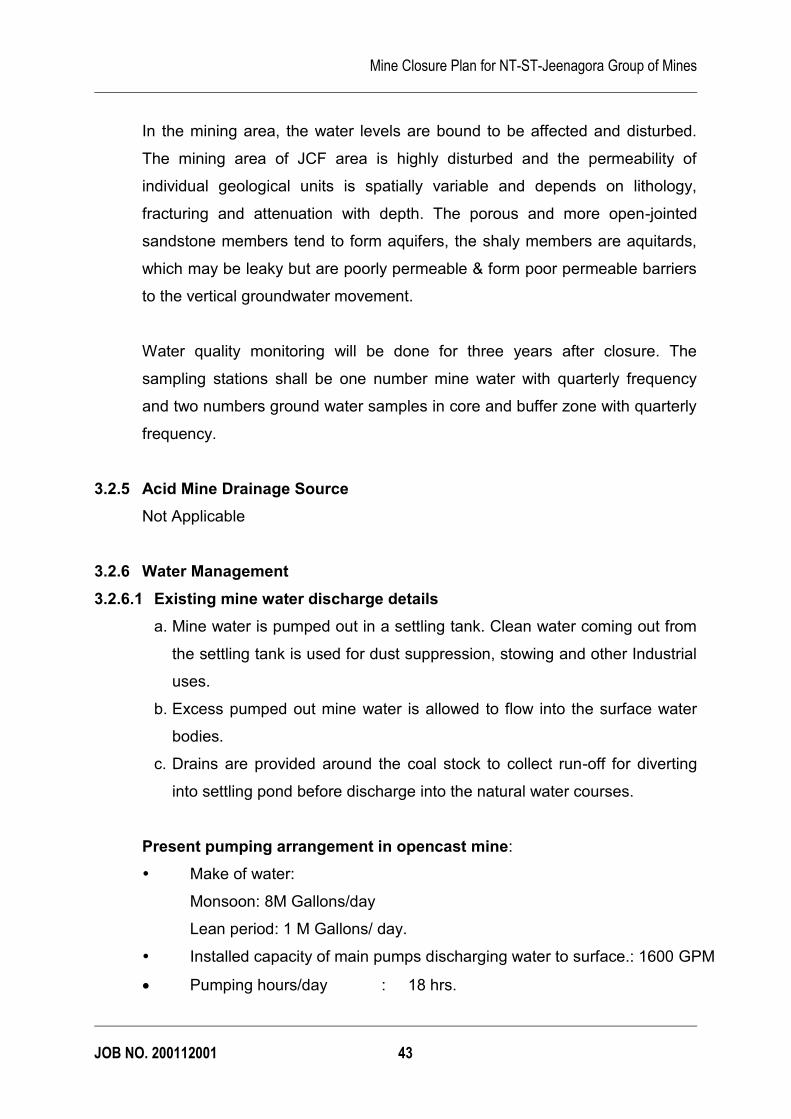
In the mining area, the water levels are bound to be affected and disturbed.
The mining area of JCF area is highly disturbed and the permeability of
individual geological units is spatially variable and depends on lithology,
fracturing and attenuation with depth. The porous and more open-jointed
sandstone members tend to form aquifers, the shaly members are aquitards,
which may be leaky but are poorly permeable & form poor permeable barriers
to the vertical groundwater movement.
Water quality monitoring will be done for three years after closure. The
sampling stations shall be one number mine water with quarterly frequency
and two numbers ground water samples in core and buffer zone with quarterly
frequency.
3.2.5 Acid Mine Drainage Source
Not Applicable
3.2.6 Water Management
3.2.6.1 Existing mine water discharge details
a. Mine water is pumped out in a settling tank. Clean water coming out from
the settling tank is used for dust suppression, stowing and other Industrial
uses.
b. Excess pumped out mine water is allowed to flow into the surface water
bodies.
c. Drains are provided around the coal stock to collect run-off for diverting
into settling pond before discharge into the natural water courses.
Present pumping arrangement in opencast mine:
� Make of water:
Monsoon: 8M Gallons/day
Lean period: 1 M Gallons/ day.
� Installed capacity of main pumps discharging water to surface.: 1600 GPM
· Pumping hours/day : 18 hrs.
Mine Closure Plan for NT-ST-Jeenagora Group of Mines
JOB NO. 200112001 44
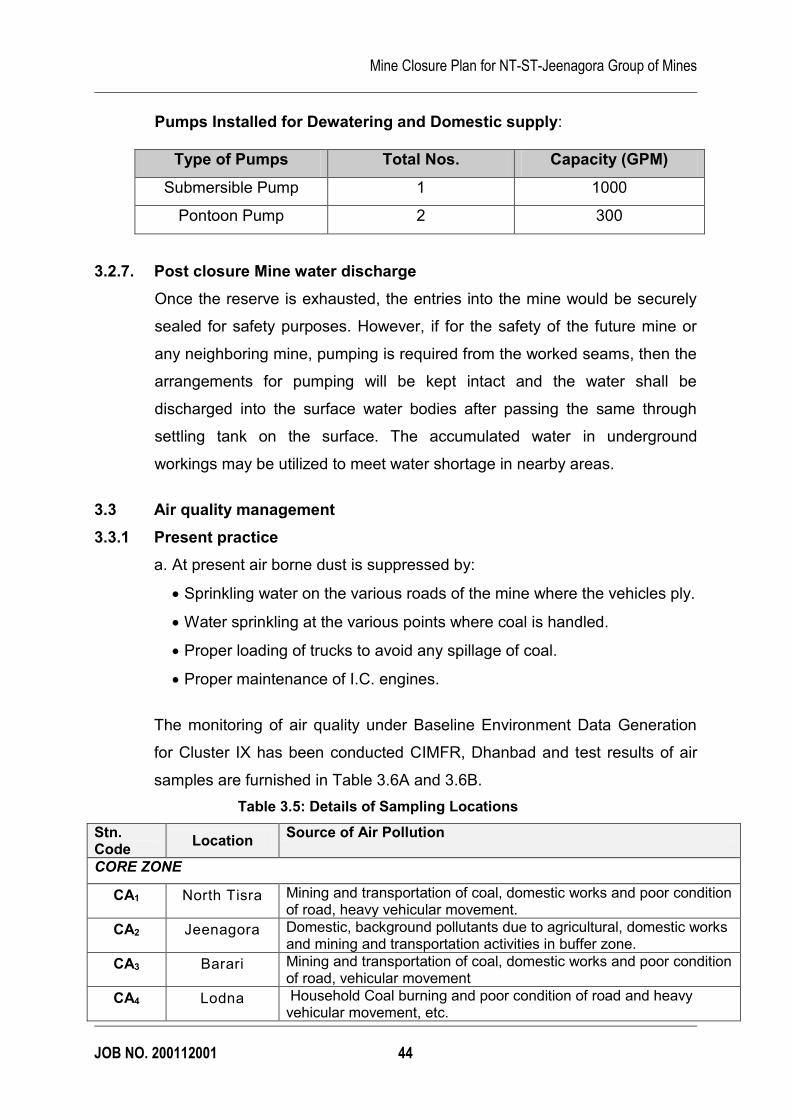
Pumps Installed for Dewatering and Domestic supply:
Type of Pumps Total Nos. Capacity (GPM)
Submersible Pump 1 1000
Pontoon Pump 2 300
3.2.7. Post closure Mine water discharge
Once the reserve is exhausted, the entries into the mine would be securely
sealed for safety purposes. However, if for the safety of the future mine or
any neighboring mine, pumping is required from the worked seams, then the
arrangements for pumping will be kept intact and the water shall be
discharged into the surface water bodies after passing the same through
settling tank on the surface. The accumulated water in underground
workings may be utilized to meet water shortage in nearby areas.
3.3 Air quality management
3.3.1 Present practice
a. At present air borne dust is suppressed by:
· Sprinkling water on the various roads of the mine where the vehicles ply.
· Water sprinkling at the various points where coal is handled.
· Proper loading of trucks to avoid any spillage of coal.
· Proper maintenance of I.C. engines.
The monitoring of air quality under Baseline Environment Data Generation
for Cluster IX has been conducted CIMFR, Dhanbad and test results of air
samples are furnished in Table 3.6A and 3.6B.
Table 3.5: Details of Sampling Locations
Stn. Code
Location Source of Air Pollution
CORE ZONE
CA1 North Tisra Mining and transportation of coal, domestic works and poor condition of road, heavy vehicular movement.
CA2 Jeenagora Domestic, background pollutants due to agricultural, domestic works and mining and transportation activities in buffer zone.
CA3 Barari Mining and transportation of coal, domestic works and poor condition of road, vehicular movement
CA4 Lodna Household Coal burning and poor condition of road and heavy vehicular movement, etc.
Mine Closure Plan for NT-ST-Jeenagora Group of Mines
JOB NO. 200112001 45
Stn. Code
Location Source of Air Pollution
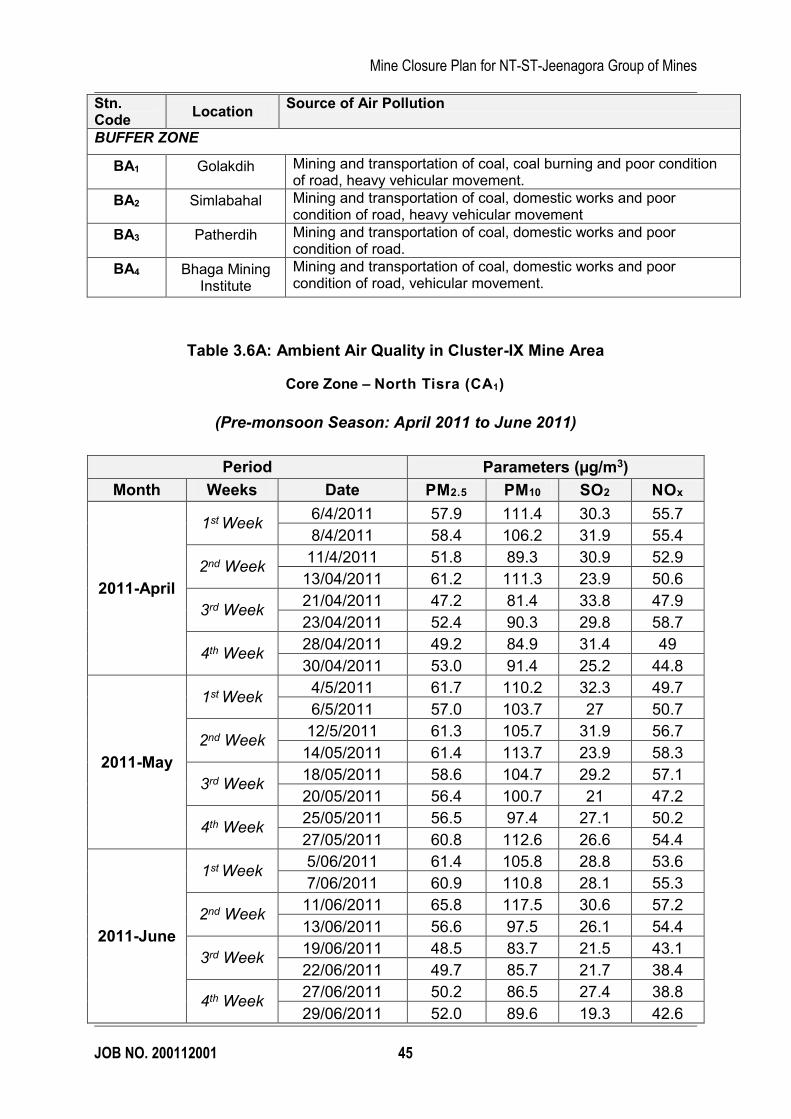
BUFFER ZONE
BA1 Golakdih Mining and transportation of coal, coal burning and poor condition of road, heavy vehicular movement.
BA2 Simlabahal Mining and transportation of coal, domestic works and poor condition of road, heavy vehicular movement
BA3 Patherdih Mining and transportation of coal, domestic works and poor condition of road.
BA4 Bhaga Mining Institute
Mining and transportation of coal, domestic works and poor condition of road, vehicular movement.
Table 3.6A: Ambient Air Quality in Cluster-IX Mine Area
Core Zone – North Tisra (CA1)
(Pre-monsoon Season: April 2011 to June 2011)
Period Parameters (µg/m3)
Month Weeks Date PM2.5 PM10 SO2 NOx
2011-April
1st Week 6/4/2011 57.9 111.4 30.3 55.7
8/4/2011 58.4 106.2 31.9 55.4
2nd Week 11/4/2011 51.8 89.3 30.9 52.9
13/04/2011 61.2 111.3 23.9 50.6
3rd Week 21/04/2011 47.2 81.4 33.8 47.9
23/04/2011 52.4 90.3 29.8 58.7
4th Week 28/04/2011 49.2 84.9 31.4 49
30/04/2011 53.0 91.4 25.2 44.8
2011-May
1st Week 4/5/2011 61.7 110.2 32.3 49.7
6/5/2011 57.0 103.7 27 50.7
2nd Week 12/5/2011 61.3 105.7 31.9 56.7
14/05/2011 61.4 113.7 23.9 58.3
3rd Week 18/05/2011 58.6 104.7 29.2 57.1
20/05/2011 56.4 100.7 21 47.2
4th Week 25/05/2011 56.5 97.4 27.1 50.2
27/05/2011 60.8 112.6 26.6 54.4
2011-June
1st Week 5/06/2011 61.4 105.8 28.8 53.6
7/06/2011 60.9 110.8 28.1 55.3
2nd Week 11/06/2011 65.8 117.5 30.6 57.2
13/06/2011 56.6 97.5 26.1 54.4
3rd Week 19/06/2011 48.5 83.7 21.5 43.1
22/06/2011 49.7 85.7 21.7 38.4
4th Week 27/06/2011 50.2 86.5 27.4 38.8
29/06/2011 52.0 89.6 19.3 42.6
Mine Closure Plan for NT-ST-Jeenagora Group of Mines
JOB NO. 200112001 46
Minimum 47.2 81.4 19.3 38.4
Maximum 65.8 117.5 33.8 58.7
Average 56.3 99.7 27.4 50.8
Std. Deviation 5.5 11.7 4.3 6.3
98th Percentile 63.9 115.8 33.1 58.5
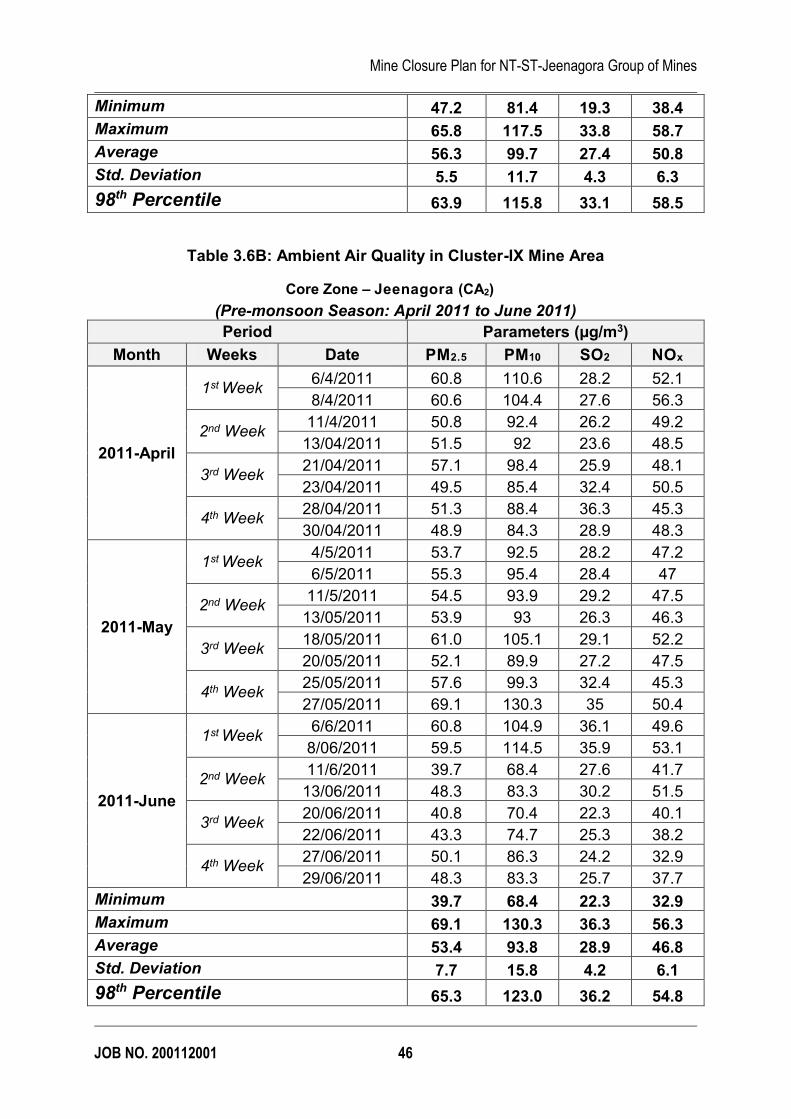
Table 3.6B: Ambient Air Quality in Cluster-IX Mine Area
Core Zone – Jeenagora (CA2)
(Pre-monsoon Season: April 2011 to June 2011)
Period Parameters (µg/m3)
Month Weeks Date PM2.5 PM10 SO2 NOx
2011-April
1st Week 6/4/2011 60.8 110.6 28.2 52.1
8/4/2011 60.6 104.4 27.6 56.3
2nd Week 11/4/2011 50.8 92.4 26.2 49.2
13/04/2011 51.5 92 23.6 48.5
3rd Week 21/04/2011 57.1 98.4 25.9 48.1
23/04/2011 49.5 85.4 32.4 50.5
4th Week 28/04/2011 51.3 88.4 36.3 45.3
30/04/2011 48.9 84.3 28.9 48.3
2011-May
1st Week 4/5/2011 53.7 92.5 28.2 47.2
6/5/2011 55.3 95.4 28.4 47
2nd Week 11/5/2011 54.5 93.9 29.2 47.5
13/05/2011 53.9 93 26.3 46.3
3rd Week 18/05/2011 61.0 105.1 29.1 52.2
20/05/2011 52.1 89.9 27.2 47.5
4th Week 25/05/2011 57.6 99.3 32.4 45.3
27/05/2011 69.1 130.3 35 50.4
2011-June
1st Week 6/6/2011 60.8 104.9 36.1 49.6
8/06/2011 59.5 114.5 35.9 53.1
2nd Week 11/6/2011 39.7 68.4 27.6 41.7
13/06/2011 48.3 83.3 30.2 51.5
3rd Week 20/06/2011 40.8 70.4 22.3 40.1
22/06/2011 43.3 74.7 25.3 38.2
4th Week 27/06/2011 50.1 86.3 24.2 32.9
29/06/2011 48.3 83.3 25.7 37.7
Minimum 39.7 68.4 22.3 32.9
Maximum 69.1 130.3 36.3 56.3
Average 53.4 93.8 28.9 46.8
Std. Deviation 7.7 15.8 4.2 6.1
98th Percentile 65.3 123.0 36.2 54.8
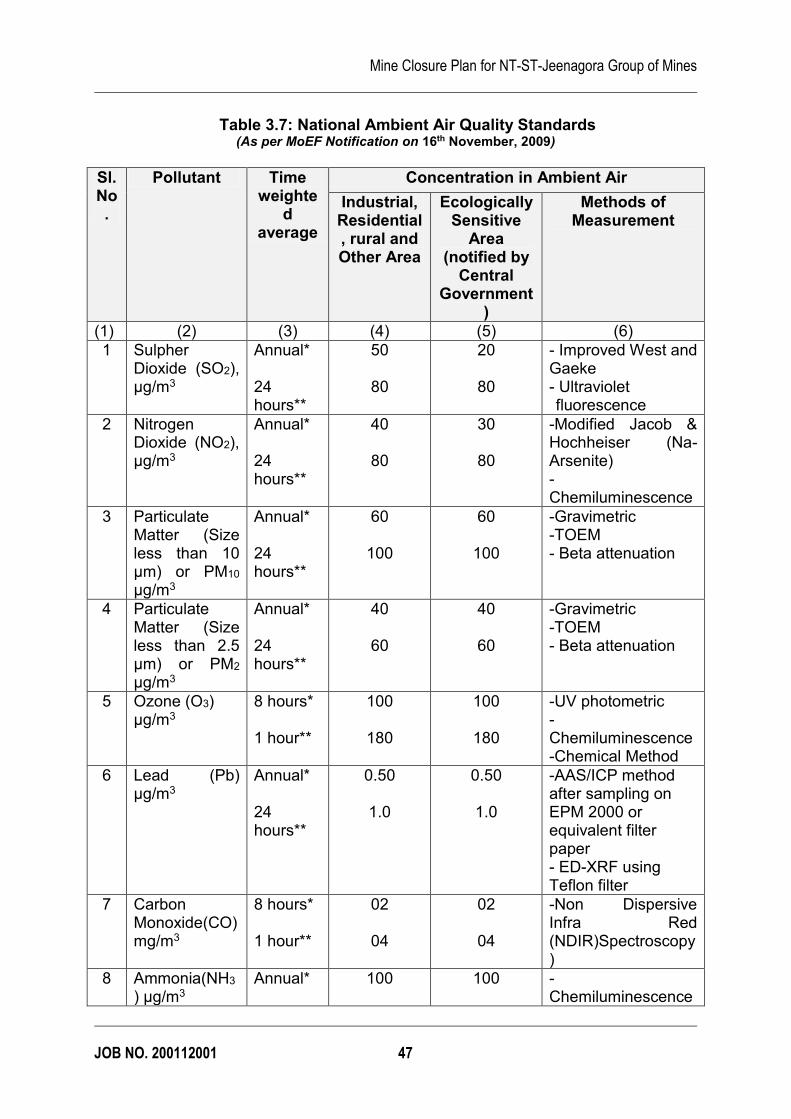
Mine Closure Plan for NT-ST-Jeenagora Group of Mines
JOB NO. 200112001 47
Table 3.7: National Ambient Air Quality Standards
(As per MoEF Notification on 16th November, 2009)
Sl. No.
Pollutant Time weighte
d average
Concentration in Ambient Air
Industrial, Residential, rural and Other Area
Ecologically Sensitive
Area (notified by
Central Government
)
Methods of Measurement
(1) (2) (3) (4) (5) (6)
1 Sulpher Dioxide (SO2), µg/m3
Annual* 24 hours**
50
80
20
80
- Improved West and Gaeke - Ultraviolet fluorescence
2 Nitrogen Dioxide (NO2), µg/m3
Annual* 24 hours**
40
80
30
80
-Modified Jacob & Hochheiser (Na-Arsenite) -Chemiluminescence
3 Particulate Matter (Size less than 10 µm) or PM10 µg/m3
Annual* 24 hours**
60
100
60
100
-Gravimetric -TOEM - Beta attenuation
4 Particulate Matter (Size less than 2.5 µm) or PM2
µg/m3
Annual* 24 hours**
40
60
40
60
-Gravimetric -TOEM - Beta attenuation
5 Ozone (O3) µg/m3
8 hours* 1 hour**
100
180
100
180
-UV photometric -Chemiluminescence -Chemical Method
6 Lead (Pb) µg/m3
Annual* 24 hours**
0.50
1.0
0.50
1.0
-AAS/ICP method after sampling on EPM 2000 or equivalent filter paper - ED-XRF using Teflon filter
7 Carbon Monoxide(CO) mg/m3
8 hours* 1 hour**
02
04
02
04
-Non Dispersive Infra Red (NDIR)Spectroscopy)
8 Ammonia(NH3
) µg/m3 Annual*
100
100
- Chemiluminescence
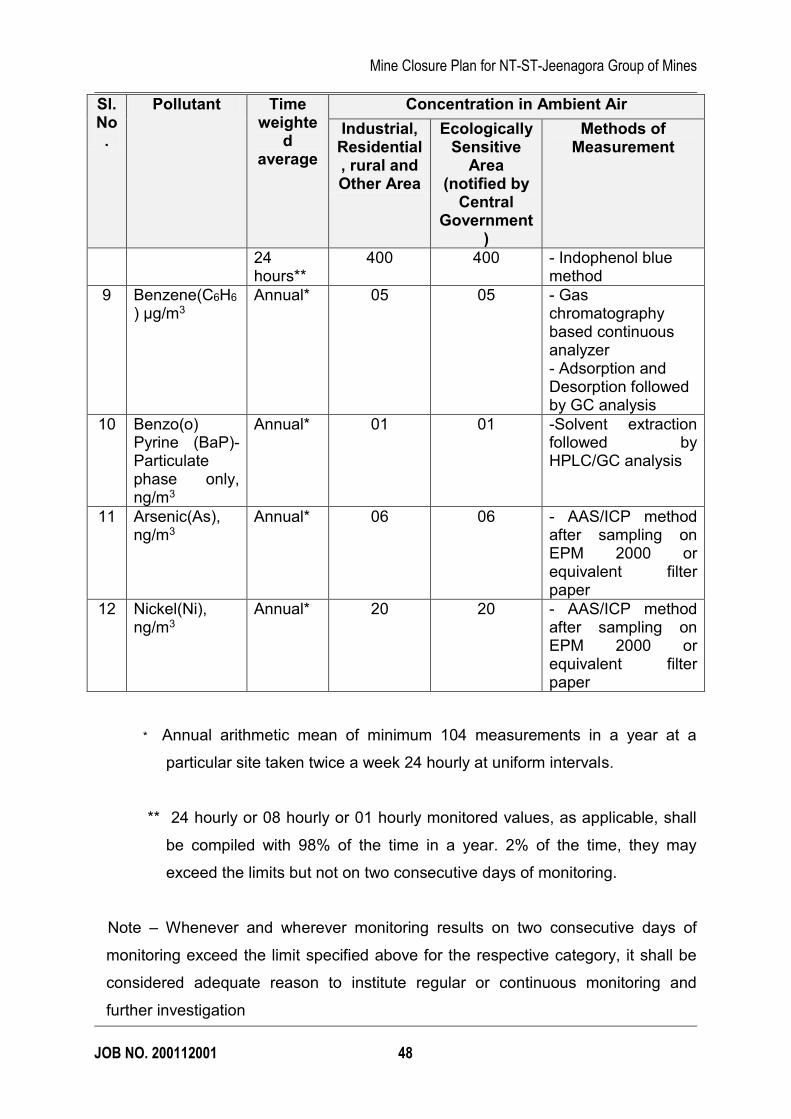
Mine Closure Plan for NT-ST-Jeenagora Group of Mines
JOB NO. 200112001 48
Sl. No.
Pollutant Time weighte
d average
Concentration in Ambient Air
Industrial, Residential, rural and Other Area
Ecologically Sensitive
Area (notified by
Central Government
)
Methods of Measurement
24 hours**
400 400 - Indophenol blue method
9 Benzene(C6H6
) µg/m3 Annual* 05 05 - Gas
chromatography based continuous analyzer - Adsorption and Desorption followed by GC analysis
10 Benzo(o) Pyrine (BaP)-Particulate phase only, ng/m3
Annual* 01 01 -Solvent extraction followed by HPLC/GC analysis
11 Arsenic(As), ng/m3
Annual* 06 06 - AAS/ICP method after sampling on EPM 2000 or equivalent filter paper
12 Nickel(Ni), ng/m3
Annual* 20 20 - AAS/ICP method after sampling on EPM 2000 or equivalent filter paper
* Annual arithmetic mean of minimum 104 measurements in a year at a
particular site taken twice a week 24 hourly at uniform intervals.
** 24 hourly or 08 hourly or 01 hourly monitored values, as applicable, shall
be compiled with 98% of the time in a year. 2% of the time, they may
exceed the limits but not on two consecutive days of monitoring.
Note – Whenever and wherever monitoring results on two consecutive days of
monitoring exceed the limit specified above for the respective category, it shall be
considered adequate reason to institute regular or continuous monitoring and
further investigation
Mine Closure Plan for NT-ST-Jeenagora Group of Mines
JOB NO. 200112001 49
3.3.2 Practice after the closure of the mine
a. As the sources of dust and fume generation would no longer be present,
the present practice of arresting the air pollution, as enumerated above
may be discontinued. However, water sprinkling would be done on the
roads, which remain in use after the mine closure.
b. Quality of air would be monitored for a period of 3 years after cessation of
mining activity. 3 samples at fortnight frequency for 3 years, one sample in
core zone and one sample each in upwind and downwind direction will be
collected and analyzed.
3.4 Dump Reclamation
External dump
The external OB dumps shall be formed in suitable lifts of appropriate height
keeping an overall slope not exceeding 360 from the horizontal. In course of
mining and after the completion of the final lift, the external OB dump shall
be biologically reclaimed. The dumps shall be afforested by selecting proper
plant species in consultation with State Forest Department.
As per new Guidelines for Preparation of Mine Closure Plan GOI (Ministry
for Coal) Dated 7th January, 2013 all efforts should be made and reflected (in
the Project Report/Mining Plan) to keep land requirement bare minimum for
external OB dumping to minimise land degradation. This may necessitate
increase of dump height to the maximum extent keeping in view the safety
requirement with special emphasis on stability analysis. After back filling of
quarry voids, the left out void may be allowed to be filled with water. This will
help to recharge and stabilize the water table in the neighbourhood and the
local populace will benefit from it.
Internal Dumps
Mine Closure Plan for NT-ST-Jeenagora Group of Mines
JOB NO. 200112001 50
The residual voids, if any, will serve as a lagoon and may be utilised as
water reservoir for the locality. The entire area shall be suitably fenced. Most
of the back filled area shall be afforested by selecting proper plant species in
consultation with State Forest Department. A part of the back filled area
would also be developed for agricultural purpose with the help of the
concerned State Authority.
The underground unit is not likely to generate any solid waste during the
mining operation.
3.5 Details of Surface Structures proposed for dismantling
3.5.1 Infrastructure details
As far as possible, industrial structures will be utilized by the adjacent mines.
However, if these structures are not found fit at the end of mine life, the same
will be dismantled and salvaged. The equipments will be removed and used
somewhere else. Every effort will be made to restore the area to economic
utilization value in line with mine closure plan.
A. SERVICE BUILDINGS: The service buildings/ structures, viz. workshop,
stores, office building, cap-lamp room, Pit top office, winding rooms, etc. are
to be demolished after collecting all re-useable items, or be used for some
other projects and the land covered by them restored for productive use.
However, it has to be ensured that as and when a service building is
vacated/ abandoned, the same should be demolished to prevent any
unauthorized occupation.
B.OTHER INFRASTRUCTURES: All other infrastructures like sub-stations,
transformers, community services, pump-houses, water-treatment/ filtration
plants, waterlines, power lines, roads etc. will be utilized for the neighbouring
projects.
However, possibility shall be explored for handing over the buildings and
other infrastructures including the reclaimed land to the State Government
for the benefit of local villagers and strengthening the area infrastructures.
Mine Closure Plan for NT-ST-Jeenagora Group of Mines
JOB NO. 200112001 51
The end use of these facilities shall be decided by the State Government
with the help of District Authorities and Village Panchayat. The peripheral
village community facilities developed by the Mine Authorities will be left to
the Local Body/ State Government for their management and public use.
Prior to surface demolition/ restoration, a surface audit will be undertaken on
all surface structures, spoil heaps etc. to assess whether there is any
hazardous material that could cause problem, i.e. explosive, asbestos,
chemical, oil, etc.
A list of surface and UG assets (Plant & Machinery) will be prepared and
made available to potential purchasers or transferred to other new/ working
mines of the company. This will ensure that the assets perform during their
economic life.
3.5.2 Post closure disposal/Re-use of the Buildings, Plants & Machineries
a. Disposal or reuse of existing HEMM, CHP, workshop and railway siding
for OC
Since the opencast is proposed to be operated through outsourced
HEMM, disposal will not be required.
b. Disposal or reuse of haulage, ventilation, workshop and railway siding
for UG.
At the time of closure of the mine, it is expected that most of the
equipments would complete its rated life and would be surveyed off as
per the Company’s guidelines. The surveyed off equipments would be
auctioned as per prevalent norms.
However, if some of the equipments would not have covered their rated
life, they would be diverted to the neighbouring projects for gainful
utilisation.
There is no railway siding in the leasehold.
c. Disposal or reuse of transmission lines and sub-station
Mine Closure Plan for NT-ST-Jeenagora Group of Mines
JOB NO. 200112001 52
As per the electricity demand of the existing neighbouring projects, an
analysis would be made as to whether the existing sub-station and
transmission lines could be gainfully used or not. If the scope of gainful
utilization is not found, they will be dismantled and the usable
items/spares/conductors etc. would be dispatched to needy
Areas/Projects.
d. Disposal or reuse of residential and non-residential buildings
At the time of final closure, a list of surface buildings would be prepared
in detail. Thereafter following steps would be taken in chorological order
in respect of the available buildings:
· An assessment would be made to find that whether the available
buildings can be used by the existing neighboring projects or any new
project that might have come up in the vicinity.
· In case, the listed assets cannot be utilized by the nearby project,
efforts would be made to sale these assets after making the list
available to potential purchasers and asking the interested purchasers
to submit sealed bids.
· Thereafter, the state agencies/local agencies may be asked to take
possession of the buildings, if they required few of them.
· When there would be no takers, the buildings would be demolished and
usable items would be recovered for future use.
Table 3.8 Proposals for Infrastructure Facilities
Sl. No.
Particulars Action Suggested
A CHP This will be dismantled and land will be covered with plantation
B Workshop -Do-
C Railway Sidings There is a proposal of Rly. Siding in the project.
D Colony These will be handed over to the State Government if fit for use or will be dismantled.
E Details of non-residential buildings
-Do-
Mine Closure Plan for NT-ST-Jeenagora Group of Mines
JOB NO. 200112001 53
F Other facilities ( ETP /STP ) -Do-
3.6 Safety and Security Arrangement
3.6.1 Mine entry
After closure of the mining activities, all the entries to the mine will be
effectively sealed off to avoid any accident and to prevent access to any
unauthorized person. The area that is not reclaimed shall be properly
fenced/ sealed to prevent any unauthorized entry into the area. Flags/Boards
with warning signals shall be posted at vulnerable places to avoid chances of
accidents. However, the guidelines / instructions from DGMS, if any, will be
followed.
Sealing details and dimensions shall also be prepared for the purpose. The
minimum thickness of mine sealing will be 100cm RCC (M20) with nominal
reinforcement. For incline entry, the mine entry path of 5 m will be filled with
debris and clay before sealing the mine.
Details of fencing around abandoned quarry, indicating the length of
the fencing
As explained earlier the proposed OCP patches will not be backfilled and the
void will act as water reservoir. It is proposed to develop a water lagoon in
the area. The water lagoon may be handed over to State Authorities for
conversion into a picnic spot.
The void of the quarry would be properly fenced to avoid any inadvertent
entry of animals or human beings. Sufficient Boards and danger signs shall
be placed all around.
Later on, the responsibility of keeping the fencing secured would be
entrusted on the State Authorities.
Mine Closure Plan for NT-ST-Jeenagora Group of Mines
JOB NO. 200112001 54
The entry into the mine is the haul road. This haul road will remain for entry
into the picnic spot. Both side of this haul road will be afforested.
3.6.2 Slope stability arrangement for high wall and back filled dumps
During operation of the mine, overall slope will be maintained at an angle not
exceeding 220- 280. Vegetation cover will also be provided along the slopes to
arrest any failure.
As regards stability of back-filled dumps, the final level of reclaimed backfill will
be matched with the levels of surrounding areas leaving a final residual void
which will serve as a lagoon which may be utilised as water reservoir for the
locality.
During operation, the external and internal OB dump will be developed with 40
m berm width and maximum height of 60m in case of external OB dump and
the overall dump slope shall not exceed 220- 280. The waste dumps will be
provided with toe wall and garland drains. The dump will be technically
reclaimed and vegetation will be grown after spreading the top soil. The above
measures will prevent slope failure and improve the aesthetic value.
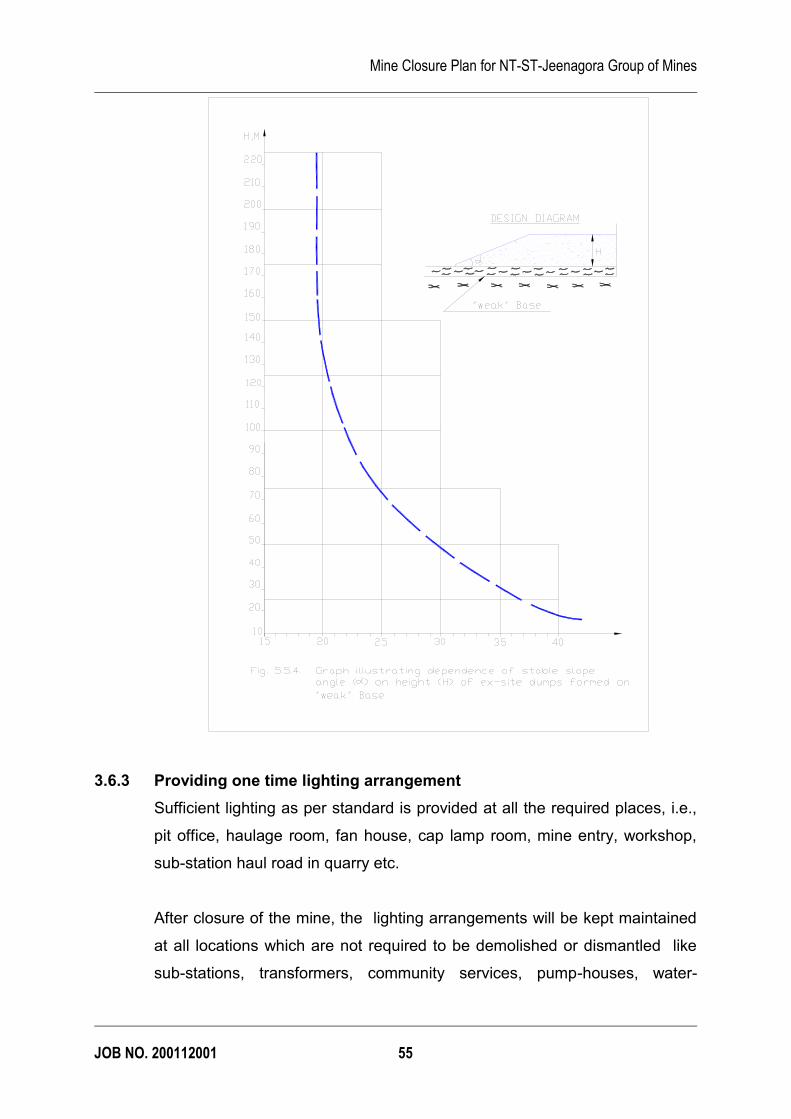
Mine Closure Plan for NT-ST-Jeenagora Group of Mines
JOB NO. 200112001 55
3.6.3 Providing one time lighting arrangement
Sufficient lighting as per standard is provided at all the required places, i.e.,
pit office, haulage room, fan house, cap lamp room, mine entry, workshop,
sub-station haul road in quarry etc.
After closure of the mine, the lighting arrangements will be kept maintained
at all locations which are not required to be demolished or dismantled like
sub-stations, transformers, community services, pump-houses, water-
Mine Closure Plan for NT-ST-Jeenagora Group of Mines
JOB NO. 200112001 56
treatment/ filtration plants, waterlines, power lines, roads etc. to be utilised
for the neighbouring projects and local communities.
3.6.4 Survey records of workings
All the mine workings including subsidence areas, roads, ponds, tanks etc.
shall be resurveyed and records shall be updated. Copy of such records
shall also be submitted to the appropriate competent authorities, such as
DGMS and State Authorities.
Maintenance of records pertaining to Progressive Mine Closure
The Mine management shall maintain following Progressive mine closure
plans for every 5 year period:
A Progressive mine closure plan for surface activities
This plan shall be maintained at a scale of 1: 4000 showing the entire
progressive mine closure activities (surface) carried out on yearly basis. The
plan shall be updated on annual basis and shall be signed by appropriate
authorities from the Project and the Area. After every annual renewal, the
plan shall be placed before HOD (Env.) of the Company for scrutiny and
approval.
The UG unit is likely to be closed soon and entire Group is considered as an
OC Unit for the purpose of Closure. However, if , for any reasons ,
whatsoever, UG Operation is continued, a progressive mine closure plan
showing the UG activities shall be maintained. This plan shall also be
updated on annual basis and signed by all the above mentioned officials.
Besides the above plan, a progressive mine closure register shall also be
maintained by the mine management. This register shall carry details of the
progressive mine closure activities carried out on yearly basis. The details to
be maintained in the said register shall cover inter alia the name of activity,
place, period of execution, executing agency, expenditure incurred, proof of
expenditure incurred, final status of the area where activity was executed,
plan on which such activity has been shown etc.
Mine Closure Plan for NT-ST-Jeenagora Group of Mines
JOB NO. 200112001 57
The entries into the said register shall be signed by the appropriate
authorities from the Project and the Area. At the end of the year the said
register (along with two plans) shall be placed before HOD (Env.) of the
Company for scrutiny and approval.
3.6.5 Disposal management of hazardous material
At the time of closure, assessment would be made as to find whether there
is any hazardous material that could cause problem. Such hazardous
material e.g. explosives, chemicals, oil etc. shall be appropriately disposed
off.
3.7 Entrepreneurship development Program
As the mine progresses, more and more local people gets indirectly
dependent on the mine for their sustainable income. After closure of mine
there would be no source of income for these people. In order to ensure that
these people do not suffer in the post closure period, the Project authorities
in consultation with BCCL (HQ) shall make efforts to develop entrepreneurial
skills in the local people by imparting skill development/vocational training
programs. It is expected that after developing adequate entrepreneurial
skills, the local people would be able to run their own business in the post
closure period and maintain a sustainable income for their livelihood.
3.8 Miscellaneous activities
In future, the prevalent geo-mining/environmental conditions in and around
the project area may require execution of some other progressive mine
closure activities not covered in the preceding paragraphs. Such activities
may be carried out by the mine after observing the needful formalities and
obtaining approval of HOD (Env.) of the Company.
3.9 Execution of progressive mine closure activities and 5 yearly
monitoring
After observing the necessary administrative/financial formalities, the mine
authorities shall execute the identified progressive mine closure activities,
Mine Closure Plan for NT-ST-Jeenagora Group of Mines
JOB NO. 200112001 58
whenever and wherever required. The executed activities shall be shown on
the above said plans and recorded in the said registers.
The executed progressive mine closure activities shall be monitored on 5-
yearly basis by 3rd party (ISM, CMPDI, NEERI etc.).
The 5 yearly return from escrow fund would be equal to expenditure incurred
on progressive mine closure activities during last 5 years or 80 % of total
deposited amount in the escrow account (including interest) whichever is
less. The said return would be subject to above said monitoring of
progressive MCP by a third party (ISM/CMPDI/NEERI etc.).
As the 5 yearly return from escrow fund is linked with the expenditure
incurred on progressive mine closure activities during last 5 years, it is very
important that progressive mine closure records, plans, expenditure details
along with proof are properly maintained.
At this juncture it is important to note that some of the progressive mine
closure activities, enumerated in the preceding paragraphs, are legal
obligations specified in Project reports, EMP, permissions obtained from
statutory bodies such as CPCB, SPCB, DGMS etc. The Project authorities
are bound to comply with these obligations.
3.10 Re-deployment of work force
The current manpower of the project is 1752. And at present, it is very
difficult to assess the manpower of the project, which will remain at the time
of closure of mining activities in the presently worked seams. As some of the
seams of the block is still virgin and is most likely to be mined in future, the
remaining manpower will be gainfully utilized in continuing mining activity.
3.11 Emancipation from the community facilities and the facilities to the
PAPs
3.11.1 The Project affected Persons (PAPs) and also the local communities are
being provided many civic facilities, such as educational facilities, health
Mine Closure Plan for NT-ST-Jeenagora Group of Mines
JOB NO. 200112001 59
facilities, and drinking water. As some of the seams of the block are still
virgin and are most likely to be mined in future, these facilities, in all
probability, will be kept maintained.
3.11.2 However, at the time of final closure after exhaustion of entire mineable
reserve these facilities will be entrusted upon the local bodies/Trust of
PAPs/State bodies after consultation with local people and state authorities
so that same could continue even after the mine closure. If needed, a lump
sum reasonable amount would also be paid to the local bodies/Trust of
PAPs/State bodies after proper approval for proper upkeep and maintenance
of various community facilities.
3.11.3 To ensure that no financial loss due to the closure of mining activity in the
presently worked seam occur to the local community engaged indirectly to
the existing mine, following steps would be taken:
· It has been seen in past that in the event of closure of a mine, the local
people indirectly dependent on the mine switch over their
economic/professional activities in the existing/new or expansion mines
located in the nearby area. Local management, if needed, extends some
basic helps to them in such type of switching over. Hence, it is expected that
in this project also the transition of the local people from one area to the
other area for their sustenance would not be any problem.
· It is proposed that reclaimed and afforested land will be handed over to State
Forest Dept. for the benefit of local ecosystem. The forest wealth can also be
utilised by local people or tribal in the form of fruits and fodders.
· The proposed picnic spot would be handed over to a society of local people for
commercial use of the picnic spot by them.
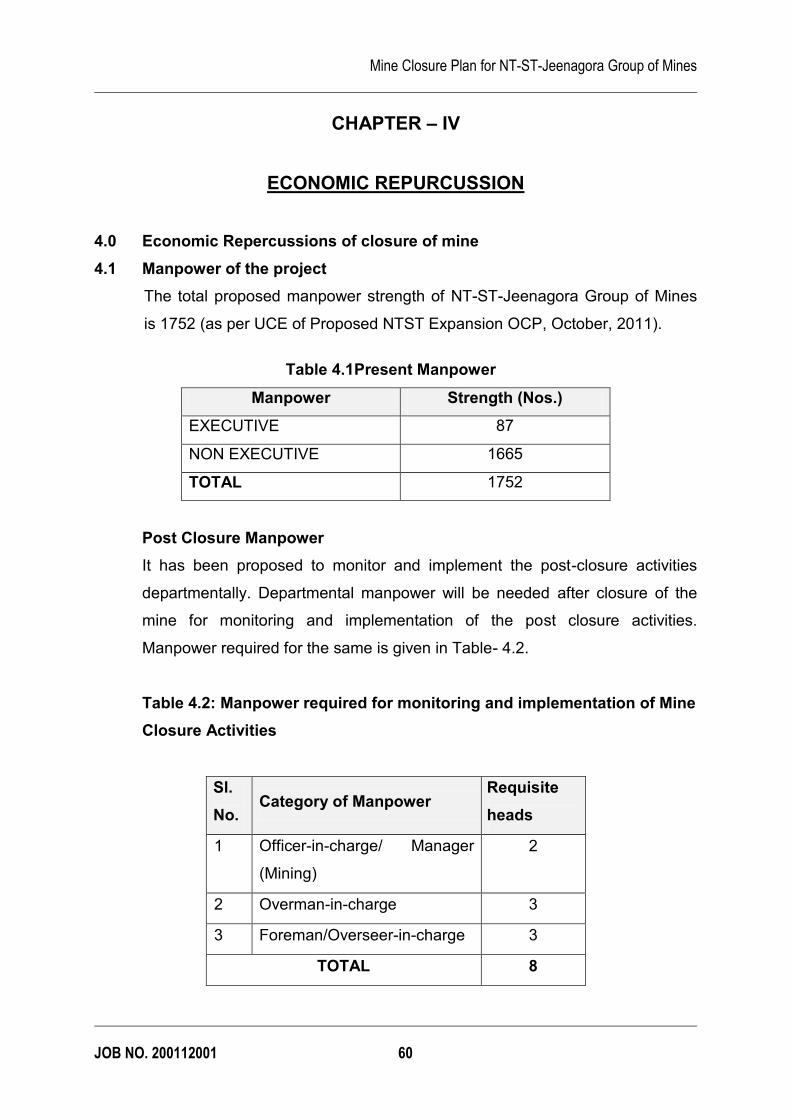
Mine Closure Plan for NT-ST-Jeenagora Group of Mines
JOB NO. 200112001 60
CHAPTER – IV
ECONOMIC REPURCUSSION
4.0 Economic Repercussions of closure of mine
4.1 Manpower of the project
The total proposed manpower strength of NT-ST-Jeenagora Group of Mines
is 1752 (as per UCE of Proposed NTST Expansion OCP, October, 2011).
Table 4.1Present Manpower
Manpower Strength (Nos.)
EXECUTIVE 87
NON EXECUTIVE 1665
TOTAL 1752
Post Closure Manpower
It has been proposed to monitor and implement the post-closure activities
departmentally. Departmental manpower will be needed after closure of the
mine for monitoring and implementation of the post closure activities.
Manpower required for the same is given in Table- 4.2.
Table 4.2: Manpower required for monitoring and implementation of Mine
Closure Activities
Sl.
No. Category of Manpower
Requisite
heads
1 Officer-in-charge/ Manager
(Mining)
2
2 Overman-in-charge 3
3 Foreman/Overseer-in-charge 3
TOTAL 8
Mine Closure Plan for NT-ST-Jeenagora Group of Mines
JOB NO. 200112001 61
4.2 Assessment of income scenario of local people
As NT-ST-Jeenagora Group of Mines is basically an opencast mining project
in the long run, a lot of surface excavation will be undertaken. Moreover, the
basic mining infrastructures have been made on the company acquired land.
So there will be displacement of some local people from this project. Sufficient
fund has been provided in the Jharia Action Plan to rehabilitate and
resettlement of the project affected people of this project.
After the closure of the mine, the manpower deployed in the mine will be
further redeployed in other mines of BCCL to make no loss of sustenance
income of the eligible employee.
4.2.1 At present, it is very difficult to assess the manpower of the project, which will
remain at the time of closure of mining activities in the existing project.
4.2.2 The local communities are being provided many civic facilities, such as
educational facilities, health facilities, and drinking water. At the time of final
closure after exhaustion of entire mineable reserve these facilities will be
entrusted upon the local bodies/Trust of PAPs/State bodies after consultation
with local people and state authorities so that same could continue even after
the mine closure. If needed, a lump sum reasonable amount would also be
paid to the local bodies/Trust of PAPs/State bodies after proper approval for
proper upkeep and maintenance of various community facilities.
4.2.3 To ensure that no financial loss due to the closure of mining activity in the
presently worked seam occur to the local community engaged indirectly to the
existing mine, following steps would be taken:
· It has been seen in past that in the event of closure of a mine, the local
people indirectly dependent on the mine switch over their
economic/professional activities in the existing/new or expansion mines
located in the nearby area. Local management, if needed, extends
some basic helps to them in such type of switching over. Hence, it is
Mine Closure Plan for NT-ST-Jeenagora Group of Mines
JOB NO. 200112001 62
expected that in this project also the transition of the local people from
one area to the other area for their sustenance would not be any
problem.
· It is proposed that reclaimed and afforested land, if any, will be handed
over to State Forest Dept for the benefit of local ecosystem. The forest
wealth can also be utilised by local people in the form of fruits and
fodders.
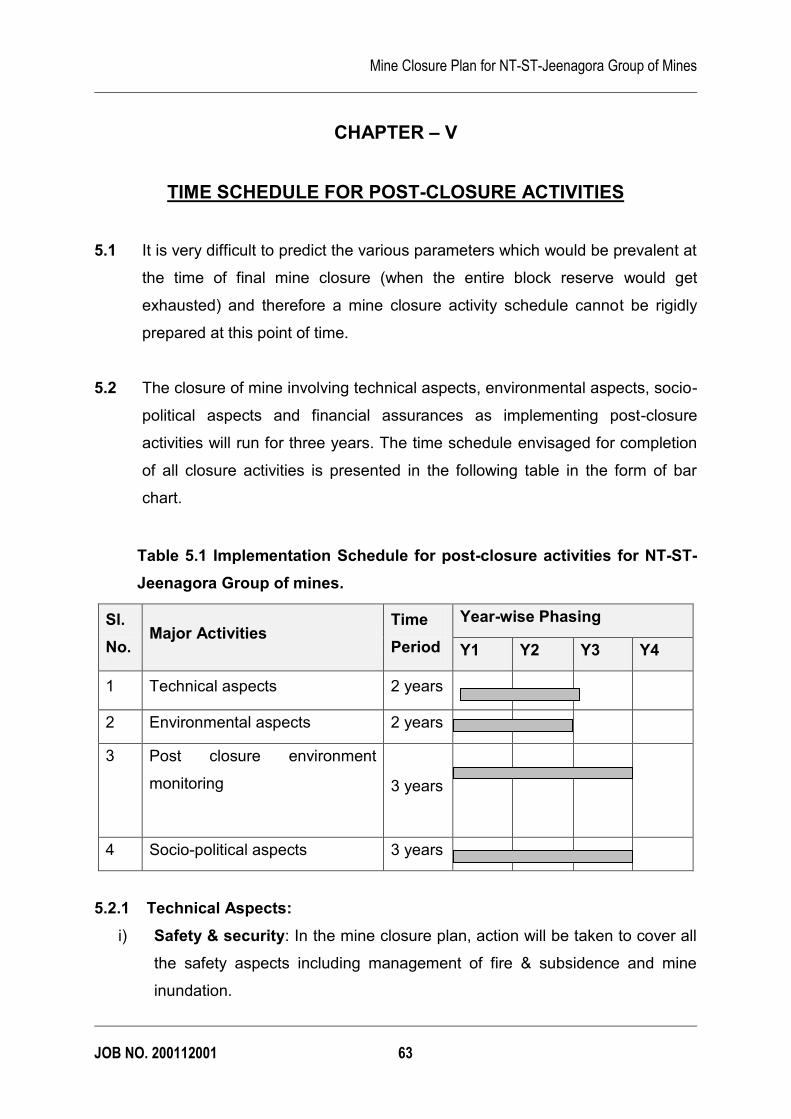
Mine Closure Plan for NT-ST-Jeenagora Group of Mines
JOB NO. 200112001 63
CHAPTER – V
TIME SCHEDULE FOR POST-CLOSURE ACTIVITIES
5.1 It is very difficult to predict the various parameters which would be prevalent at
the time of final mine closure (when the entire block reserve would get
exhausted) and therefore a mine closure activity schedule cannot be rigidly
prepared at this point of time.
5.2 The closure of mine involving technical aspects, environmental aspects, socio-
political aspects and financial assurances as implementing post-closure
activities will run for three years. The time schedule envisaged for completion
of all closure activities is presented in the following table in the form of bar
chart.
Table 5.1 Implementation Schedule for post-closure activities for NT-ST-
Jeenagora Group of mines.
Sl.
No. Major Activities
Time
Period
Year-wise Phasing
Y1 Y2 Y3 Y4
1 Technical aspects 2 years
2 Environmental aspects 2 years
3 Post closure environment
monitoring
3 years
4 Socio-political aspects 3 years
5.2.1 Technical Aspects:
i) Safety & security: In the mine closure plan, action will be taken to cover all
the safety aspects including management of fire & subsidence and mine
inundation.
Mine Closure Plan for NT-ST-Jeenagora Group of Mines
JOB NO. 200112001 64
i) Management of pit slopes and waste dump:
The same has been addressed in detail in the Para No. 3.4 and in Para.
3.6.2.
ii) Management of hydrology and hydro-geology: After closure of mining
activities, the workings will be waterlogged which will help in maintaining the
water table in the surrounding areas and may become a source of water
supply to the neighbouring areas.
iii) Closure of Mine Entries: After closure of the mining activities, all the entries
to the mine will be effectively sealed off to avoid any accident and to prevent
access to any unauthorized person. The area that is not reclaimed shall be
properly fenced/ sealed to prevent any unauthorized entry into the area.
However, the guidelines / instructions from DGMS, if any, will be followed.
iv) Disposal of mining machinery: All the opencast machineries, which will
have residual life, will be shifted to the other collieries of the area/company.
The salvaging and shifting operation of mining machinery and other
equipment will be done considering the ground realities during the period 1
(one) year advance of final mine closure.
v) Details of surface structure proposed to be dismantled:
As far as possible, industrial structures will be utilised by the adjacent mine.
However, if these structures are not found fit at the end of mine life, the same
will be dismantled and salvaged. The equipments will be removed and used
somewhere else. Every effort will be made to restore the area to economic
utilization value in line with mine closure plan.
A. Service Buildings: The service buildings/ structures, viz. workshop,
stores, office building, Site office, rooms, etc. are to be demolished after
collecting all re-useable items, or be used for some other projects and the
land covered by them restored for productive use. However, it has to be
ensured that as and when a service building is vacated/ abandoned, the
same should be demolished to prevent any unauthorized occupation.
B. Other Infrastructures: All other infrastructures like sub-stations,
transformers, community services, pump-houses, water-treatment/
filtration plants, waterlines, power lines, roads etc. will be utilized for the
neighbouring projects.
Mine Closure Plan for NT-ST-Jeenagora Group of Mines
JOB NO. 200112001 65
However, possibility shall be explored for handing over the buildings and
other infrastructures including the reclaimed land to the State Government for
the benefit of local villagers and strengthening the area infrastructures. The
end use of these facilities shall be decided by the State Government with the
help of District Authorities and Village Panchayat. The peripheral village
community facilities developed by the Mine Authorities will be left to the Local
Body/ State Government for their management and public use.
Prior to surface demolition/ restoration, a surface audit will be undertaken on
all surface structures, spoil heaps etc. to assess whether there is any
hazardous material that could cause problem, i.e. explosive, asbestos,
chemical, oil, etc.
A list of surface and OCP assets (Plant & Machinery) will be prepared and
made available to potential purchasers or transferred to other new/ working
mines of the company. This will ensure that the assets perform during their
economic life.
5.2.2 Environment Aspects
i) Mined-out land and proposed final land use: At NT-ST-Jeenagora Group
of mines it is proposed to extract coal by opencast method. The existing
infrastructures, if not usable, will be dismantled and the land will be graded &
will be handed over to the local authorities for community use.
ii) Air & Water quality management: Appropriate air and water pollution
control measures will be taken to contain the air and water pollution for
maintaining the ambient air and water quality within the stipulated standards
besides making the mining operation eco-friendly in the project. These
measures (both preventive and suppressive) are enumerated in Para 3.2.3 of
the present report.
iii) Management of waste: The solid wastes generated by the mine during the
coal production are non-hazardous and non-toxic in nature. The above solid
wastes will be disposed off by backfilling the mined out area and then re-
vegetating without causing any siltation problem on surface water bodies.
Mine Closure Plan for NT-ST-Jeenagora Group of Mines
JOB NO. 200112001 66
However, scientific studies shall be undertaken regarding applicability of solid
wastes for various uses. Toxic solid wastes like used oil, used batteries, oily
sludge, besides filters and filter materials containing oil during maintenance
of vehicles, will be generated by the mining project. Used oil will be stored in
drums safely for disposal through auction to the authorized re-processors.
Similarly, used batteries will be stored safely for auction to the authorized re-
processors. The oily sludge, besides filter and filter materials, will be
disposed off in impervious layer lined pits without causing environmental
hazards.
iv) Management of final voids: It will be dealt as per the directive provided in
the EMP.
v) Land reclamation and rehabilitation: If any cracks or void is created due to
mining activities, it will be restored to original profile by filling up cracks/
voids. It is proposed that the site restoration should be kept progressive so
that the restoration is more or less similar to the rate of mining.
vi) Reclamation of forest/ vegetation and plantation: 17 Ha of forest land is
required for the project. Moreover, regular plantation will be taken up during
the life of the mine to create green barrier. The plant species will be selected
in consultation with the state forest department.
The objective of restoration of post mining area will be determined through
consultation with local community and the Government authority, so that the
potential/ required end use of the mined out land is determined in advance.
Such usage may be agriculture, forestry, amenity development or nature
reserve.
5.2.3 Post Closure Environment Monitoring
After cessation of mining and its related activities, there will be no effect on
ambient air and water quality due to this mine as proper mitigation measures
for air and water pollution control are to be taken by the authorities of the
mine. However, the air and water quality parameters in the mined out area will
be monitored by some external agency for next three years after closure of the
mine.
Mine Closure Plan for NT-ST-Jeenagora Group of Mines
JOB NO. 200112001 67
Air and water samples will be taken from the specified sampling stations at
regular frequency for 3 consecutive years after the closure of the mining
project. 1 sample of mine water will be collected and analyzed with fortnightly
frequency and 2 samples of ground water from core & buffer zones with
monthly frequency. Similarly, 1 air sample will be taken at core zone, and 1 air
sample each in upwind and downwind directions of the project at fortnightly
frequency.
5.2.4 Socio-Political Aspects
i) Re-deployment of work force: Due to closure of mining operations,
the persons directly employed in the mine will be surplus. Suitable
manpower re-deployment plan may be formulated by the mining
company sufficiently before closure of mine for re-deployment of the
work force in other units of the company. Alternatively, they would be
given option of voluntary retirement.
ii) Civic facilities: It is proposed that the civic facilities developed during
the mining phase will be transferred to the local government/
municipality so that the region transforms smoothly into post mining
phase. A one-time payment should be made by the mine for obtaining
its release from providing these facilities, which will there from be taken
care of by the local and state bodies.
iii) Channelisation of available water: If the mine has sufficient water,
this can be used for domestic and agriculture purpose by the local
community. The water from this area shall be discharged after
treatment for domestic and agricultural usages.
iv) Emancipation for project affected population: The village/ basti
which are to be rehabilitated at North Tisra, Jeenagora OCP and South
Tisra as per Master Plan of JCF (March’08) are given in Table No.
5.2A, 5.2B and 5.2C:
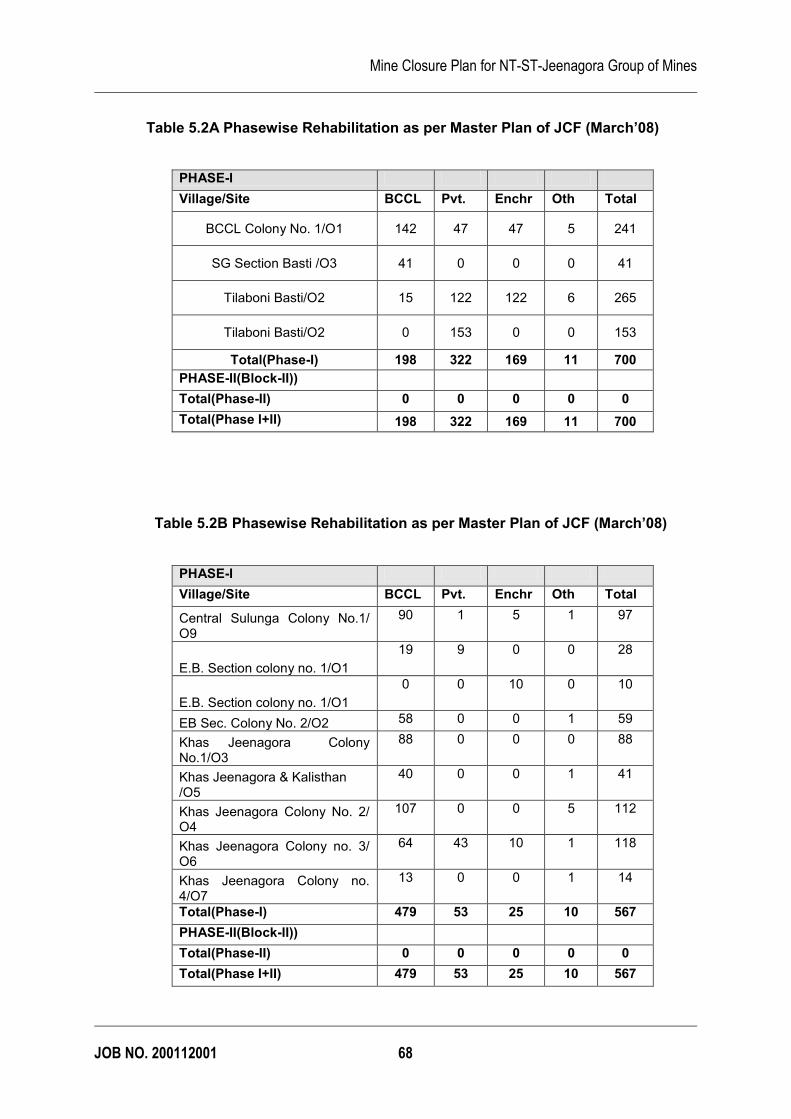
Mine Closure Plan for NT-ST-Jeenagora Group of Mines
JOB NO. 200112001 68
Table 5.2A Phasewise Rehabilitation as per Master Plan of JCF (March’08)
PHASE-I
Village/Site BCCL Pvt. Enchr Oth Total
BCCL Colony No. 1/O1 142 47 47 5 241
SG Section Basti /O3 41 0 0 0 41
Tilaboni Basti/O2 15 122 122 6 265
Tilaboni Basti/O2 0 153 0 0 153
Total(Phase-I) 198 322 169 11 700
PHASE-II(Block-II))
Total(Phase-II) 0 0 0 0 0
Total(Phase I+II) 198 322 169 11 700
Table 5.2B Phasewise Rehabilitation as per Master Plan of JCF (March’08)
PHASE-I
Village/Site BCCL Pvt. Enchr Oth Total
Central Sulunga Colony No.1/ O9
90 1 5 1 97
E.B. Section colony no. 1/O1
19 9 0 0 28
E.B. Section colony no. 1/O1
0 0 10 0 10
EB Sec. Colony No. 2/O2 58 0 0 1 59
Khas Jeenagora Colony No.1/O3
88 0 0 0 88
Khas Jeenagora & Kalisthan /O5
40 0 0 1 41
Khas Jeenagora Colony No. 2/ O4
107 0 0 5 112
Khas Jeenagora Colony no. 3/ O6
64 43 10 1 118
Khas Jeenagora Colony no. 4/O7
13 0 0 1 14
Total(Phase-I) 479 53 25 10 567
PHASE-II(Block-II))
Total(Phase-II) 0 0 0 0 0
Total(Phase I+II) 479 53 25 10 567
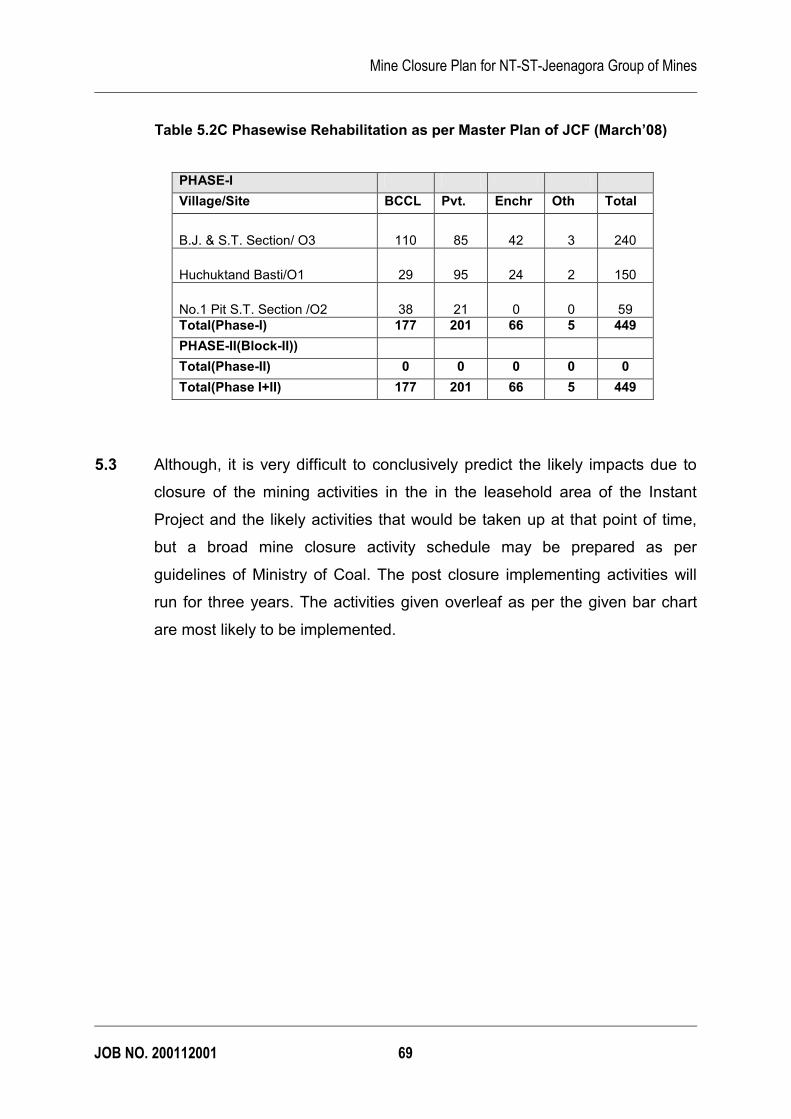
Mine Closure Plan for NT-ST-Jeenagora Group of Mines
JOB NO. 200112001 69
Table 5.2C Phasewise Rehabilitation as per Master Plan of JCF (March’08)
PHASE-I
Village/Site BCCL Pvt. Enchr Oth Total
B.J. & S.T. Section/ O3 110 85 42 3 240
Huchuktand Basti/O1 29 95 24 2 150
No.1 Pit S.T. Section /O2 38 21 0 0 59
Total(Phase-I) 177 201 66 5 449
PHASE-II(Block-II))
Total(Phase-II) 0 0 0 0 0
Total(Phase I+II) 177 201 66 5 449
5.3 Although, it is very difficult to conclusively predict the likely impacts due to
closure of the mining activities in the in the leasehold area of the Instant
Project and the likely activities that would be taken up at that point of time,
but a broad mine closure activity schedule may be prepared as per
guidelines of Ministry of Coal. The post closure implementing activities will
run for three years. The activities given overleaf as per the given bar chart
are most likely to be implemented.
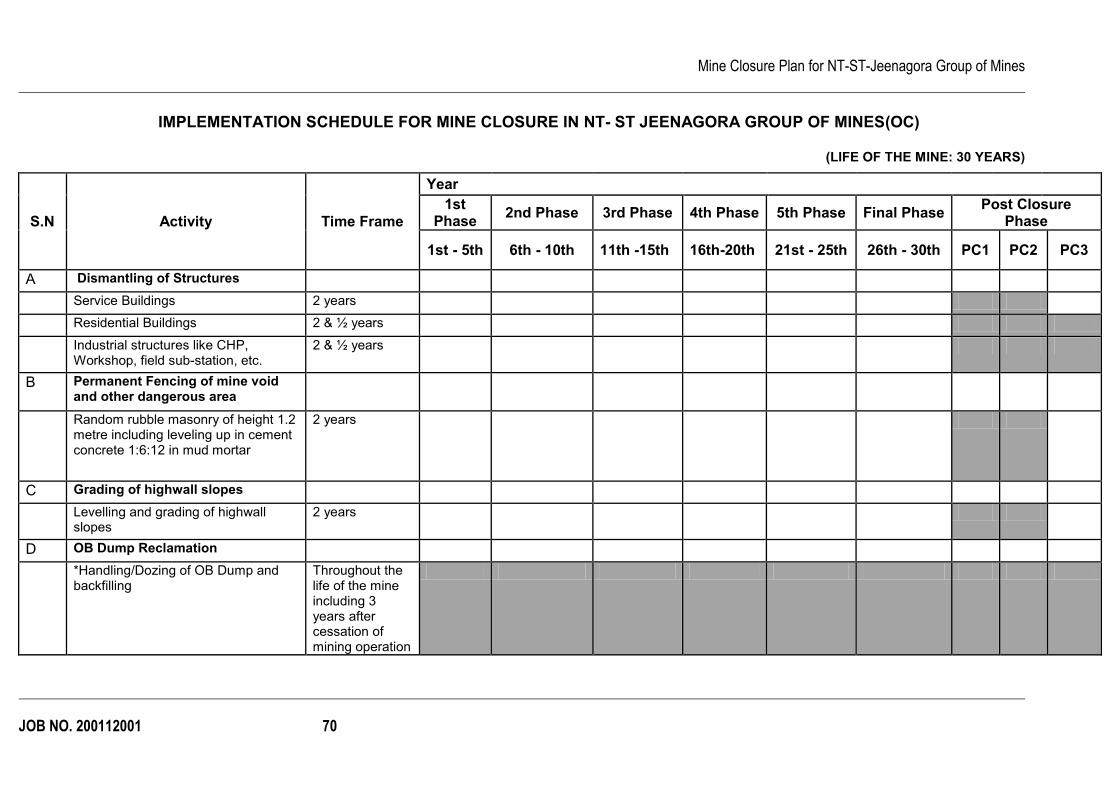
Mine Closure Plan for NT-ST-Jeenagora Group of Mines
JOB NO. 200112001 70
IMPLEMENTATION SCHEDULE FOR MINE CLOSURE IN NT- ST JEENAGORA GROUP OF MINES(OC)
(LIFE OF THE MINE: 30 YEARS)
S.N Activity Time Frame
Year
1st Phase
2nd Phase 3rd Phase 4th Phase 5th Phase Final Phase Post Closure
Phase
1st - 5th 6th - 10th 11th -15th 16th-20th 21st - 25th 26th - 30th PC1 PC2 PC3
A Dismantling of Structures
Service Buildings 2 years
Residential Buildings 2 & ½ years
Industrial structures like CHP, Workshop, field sub-station, etc.
2 & ½ years
B Permanent Fencing of mine void and other dangerous area
Random rubble masonry of height 1.2 metre including leveling up in cement concrete 1:6:12 in mud mortar
2 years
C Grading of highwall slopes
Levelling and grading of highwall slopes
2 years
D OB Dump Reclamation
*Handling/Dozing of OB Dump and backfilling
Throughout the life of the mine including 3 years after cessation of mining operation
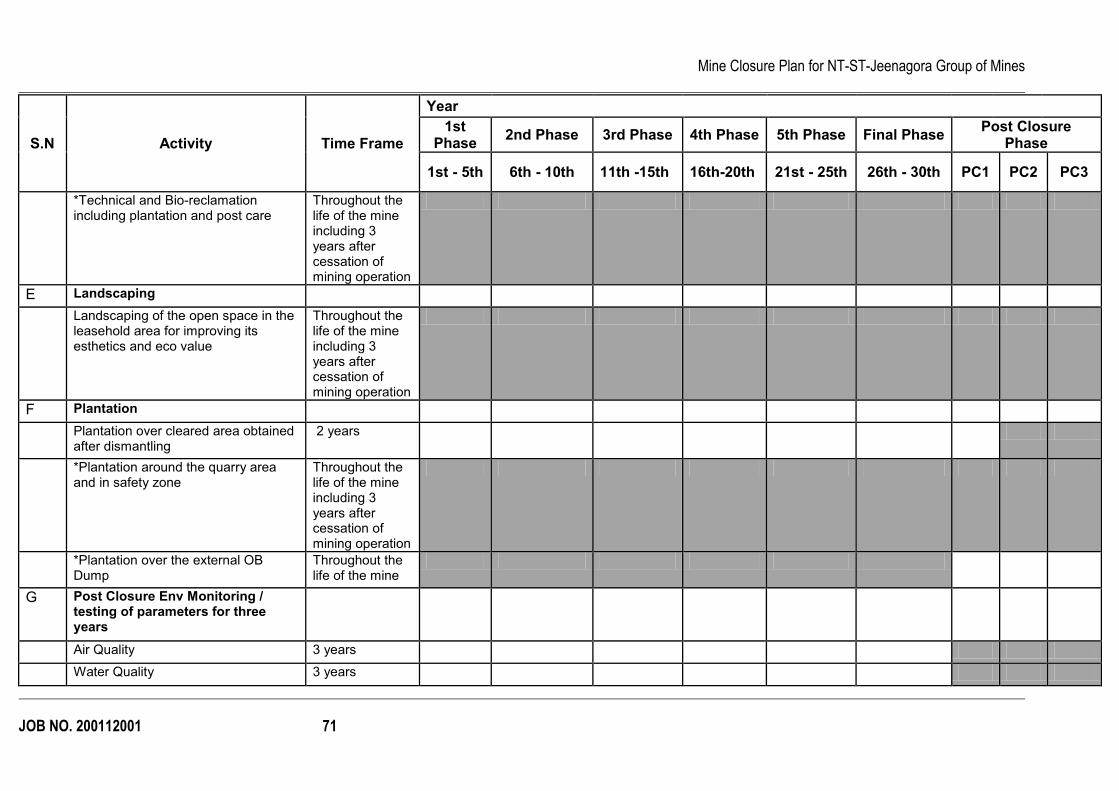
Mine Closure Plan for NT-ST-Jeenagora Group of Mines
JOB NO. 200112001 71
S.N Activity Time Frame
Year
1st Phase
2nd Phase 3rd Phase 4th Phase 5th Phase Final Phase Post Closure
Phase
1st - 5th 6th - 10th 11th -15th 16th-20th 21st - 25th 26th - 30th PC1 PC2 PC3
*Technical and Bio-reclamation including plantation and post care
Throughout the life of the mine including 3 years after cessation of mining operation
E Landscaping
Landscaping of the open space in the leasehold area for improving its esthetics and eco value
Throughout the life of the mine including 3 years after cessation of mining operation
F Plantation
Plantation over cleared area obtained after dismantling
2 years
*Plantation around the quarry area and in safety zone
Throughout the life of the mine including 3 years after cessation of mining operation
*Plantation over the external OB Dump
Throughout the life of the mine
G Post Closure Env Monitoring / testing of parameters for three years
Air Quality 3 years
Water Quality 3 years
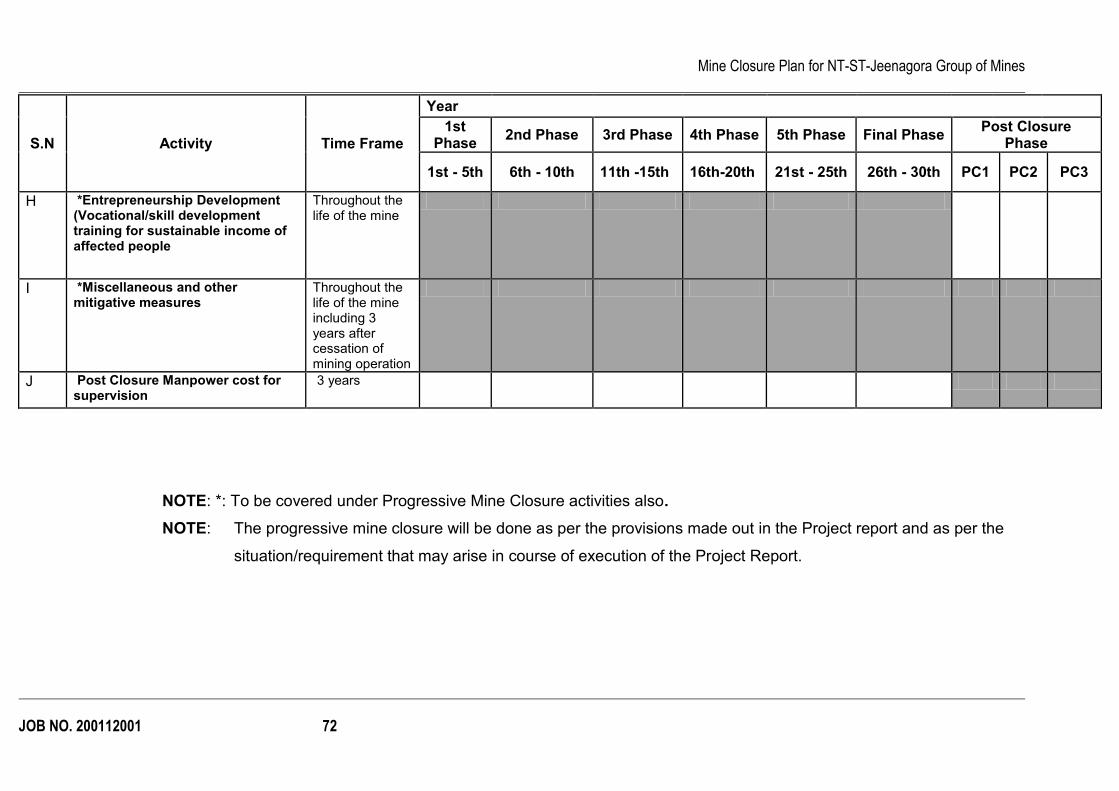
Mine Closure Plan for NT-ST-Jeenagora Group of Mines
JOB NO. 200112001 72
S.N Activity Time Frame
Year
1st Phase
2nd Phase 3rd Phase 4th Phase 5th Phase Final Phase Post Closure
Phase
1st - 5th 6th - 10th 11th -15th 16th-20th 21st - 25th 26th - 30th PC1 PC2 PC3
H *Entrepreneurship Development (Vocational/skill development training for sustainable income of affected people
Throughout the life of the mine
I *Miscellaneous and other mitigative measures
Throughout the life of the mine including 3 years after cessation of mining operation
J Post Closure Manpower cost for supervision
3 years
NOTE: *: To be covered under Progressive Mine Closure activities also.
NOTE: The progressive mine closure will be done as per the provisions made out in the Project report and as per the
situation/requirement that may arise in course of execution of the Project Report.
Mine Closure Plan for NT-ST-Jeenagora Group of Mines
JOB NO. 200112001 73
Mine Closure Plan for NT-ST-Jeenagora Group of Mines
JOB NO. 200112001 74
CHAPTER – VI
MINE CLOSURE COST
6.0 Mine Closure activities would be a constant exercise for the mine which
would begin with the commencement of mining operations and continue till
post closure. The mine closure activities would naturally entail certain
expenditures, which will have to be borne by the mine operator. There would
be two types of expenditures on account of mine closure activities in respect
of NT-ST-Jeenagora Group of mines:
6.1 Revenue expenditures
This would cover the activities which are being executed along with normal
mining operation and would continue to be executed in course of execution
of the project. The cost of progressive mine closure activities is already part
of the project cost.
6.2.1 Expenditures to be incurred just prior to actual mine closure and in the
post closure period
6.2.2 As per MOC guidelines, a corpus escrow account @ ` 1.0 lakhs (August, 2009
Price Level) per Ha (for UG) and @ ` 6.0 lakhs (for OC) of the project area
shall be opened with the coal controller organization to meet the expenses of
final mine closure. The current Guidelines read as:
“It has been estimated that typically closure cost for an opencast mine will
come around Rs. 6.00 lakh per Hectare of the project area and it would be Rs.
1.00 lakh per Hectare for underground mine project area at current price levels
(August, 2009) and these rates will stand modified based on Wholesale Price
Index as notified by Government of India from time to time”.
In NT-ST-Jeenagora Group of Mines, the proposed project area is about
1431.0Ha. Therefore, the entire 1431.0Ha of project area (existing and
Mine Closure Plan for NT-ST-Jeenagora Group of Mines
JOB NO. 200112001 75
proposed) has been considered for the calculation of closure cost of the
area based on OC norms.
The money deposited in the Escrow Account has to deal with the following:
· Cost of closure activities.
· Cost towards organization for executing the closure activities.
· Cost of the post project monitoring.
· Creation of a corpus fund for the final mine closure
6.2.2 As per the above guidelines these rates will stand modified based on Whole
Price Index as notified by Government of India from time to time. Thus the
total expenditure on this front may be calculated in following manner:
Ø The total amount for mine closure activity in respect of the proposed NT-
ST-Jeenagora Group of Mines = 1431.0 Ha X `6.00 lakhs X 1.35416
=`11626.875 lakhs
* The amount has been escalated based on WPI of July, 2013(175.5) vis-
à-vis WPI of August ‘09(129.6).
6.2.3 It is difficult to conclusively predict the mining parameters on a long term basis
owing to rapidly changing mining technology, developments in the field of
clean coal technologies and R&D activities in development of alternative
energy sources.
As per the latest Guidelines issued by the MoC, GoI( dt. 07.01.2013) the
“annual closure cost is to be computed considering the total project area at the
above mentioned rates and dividing the same by the entire life of the mine in
years for new projects and balance life of mine in years for operating/existing
mines.”
Jharia Coalfield is characterized by occurrence of a number of working coal
horizons, giving a leverage of extended working life of the mines. Some more
seams can come in the lap of workable horizons due to improvement in mining
Mine Closure Plan for NT-ST-Jeenagora Group of Mines
JOB NO. 200112001 76
technology in times to come. The underground mines in leasehold of JCF are
generally small capacity mines, giving a false impression of very long lives due
to small level of current production level. There may be a strategy in future to
amalgamate the mines for higher production level to attain the economics of
scale. The existing OC Mines working at shallow depth may be worked at a
greater depth, In such a situation, the life of the mine arrived at with current
level of production for the balance reserve may not be workable in the long
run.
In view of the above, for the purpose of mine closure cost calculations, the life
of the mine has been taken from formulated project report of NT-ST-
Jeenagora Group of Mines as mentioned in the approved TOR/Form-I. Since
the proposed life of the NT-ST-Jeenagora Group of Mines was calculated as
30 years, the life of NT-ST-Jeenagora group will be also 30 years.
To arrive, at the annual cost, to be deposited in each year in an escrow
account, the mine closure cost has been divided by 30, as shown below:
· Amount to deposited in 1st year will be--------` 387.563 lakhs
· Amount to be deposited in 2nd year will be—` 387.563 (1 + 5%)^1 lakhs
· Amount to be deposited in 3rd year will be—` 387.563 (1 + 5%)^2 lakhs 6.2.4 In the above fashion, an amount will be deposited every year up to the last
year of mine life by applying the following formula:
· Amount to be deposited in Nth year will be --- ` 387.563 (1 + 5%) ^(n-1)
lakhs
6.2.5 The amount calculated by the above formula shall be deposited every year by
BCCL in the Escrow Account opened with the Coal Controller organisation in
a scheduled Bank. An agreement, outlining detailed terms and conditions of
operating the said Escrow Account shall be executed amongst BCCL, the
Coal Controller and the commercial Bank.
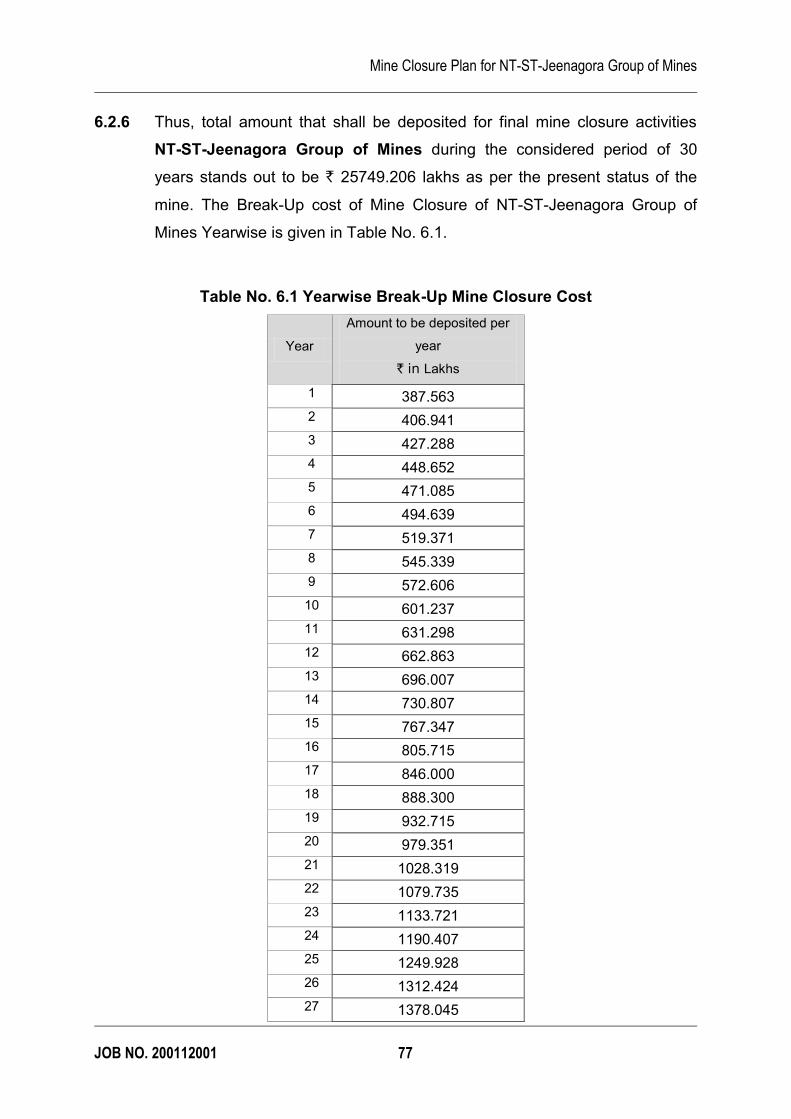
Mine Closure Plan for NT-ST-Jeenagora Group of Mines
JOB NO. 200112001 77
6.2.6 Thus, total amount that shall be deposited for final mine closure activities
NT-ST-Jeenagora Group of Mines during the considered period of 30
years stands out to be ` 25749.206 lakhs as per the present status of the
mine. The Break-Up cost of Mine Closure of NT-ST-Jeenagora Group of
Mines Yearwise is given in Table No. 6.1.
Table No. 6.1 Yearwise Break-Up Mine Closure Cost
Year
Amount to be deposited per
year
` in Lakhs
1 387.563
2 406.941
3 427.288
4 448.652
5 471.085
6 494.639
7 519.371
8 545.339
9 572.606
10 601.237
11 631.298
12 662.863
13 696.007
14 730.807
15 767.347
16 805.715
17 846.000
18 888.300
19 932.715
20 979.351
21 1028.319
22 1079.735
23 1133.721
24 1190.407
25 1249.928
26 1312.424
27 1378.045
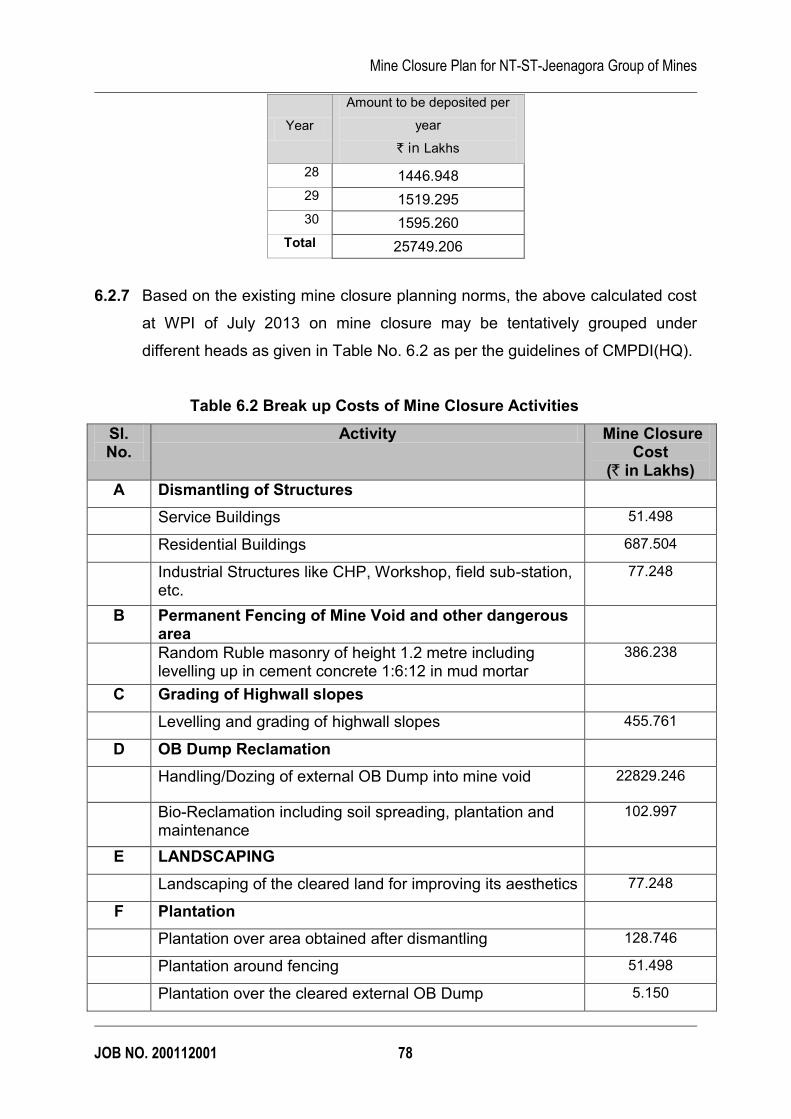
Mine Closure Plan for NT-ST-Jeenagora Group of Mines
JOB NO. 200112001 78
Year
Amount to be deposited per
year
` in Lakhs
28 1446.948
29 1519.295
30 1595.260
Total 25749.206
6.2.7 Based on the existing mine closure planning norms, the above calculated cost
at WPI of July 2013 on mine closure may be tentatively grouped under
different heads as given in Table No. 6.2 as per the guidelines of CMPDI(HQ).
Table 6.2 Break up Costs of Mine Closure Activities
Sl. No.
Activity Mine Closure Cost
(` in Lakhs)
A Dismantling of Structures
Service Buildings 51.498
Residential Buildings 687.504
Industrial Structures like CHP, Workshop, field sub-station, etc.
77.248
B Permanent Fencing of Mine Void and other dangerous area
Random Ruble masonry of height 1.2 metre including levelling up in cement concrete 1:6:12 in mud mortar
386.238
C Grading of Highwall slopes
Levelling and grading of highwall slopes 455.761
D OB Dump Reclamation
Handling/Dozing of external OB Dump into mine void 22829.246
Bio-Reclamation including soil spreading, plantation and maintenance
102.997
E LANDSCAPING
Landscaping of the cleared land for improving its aesthetics 77.248
F Plantation
Plantation over area obtained after dismantling 128.746
Plantation around fencing 51.498
Plantation over the cleared external OB Dump 5.150
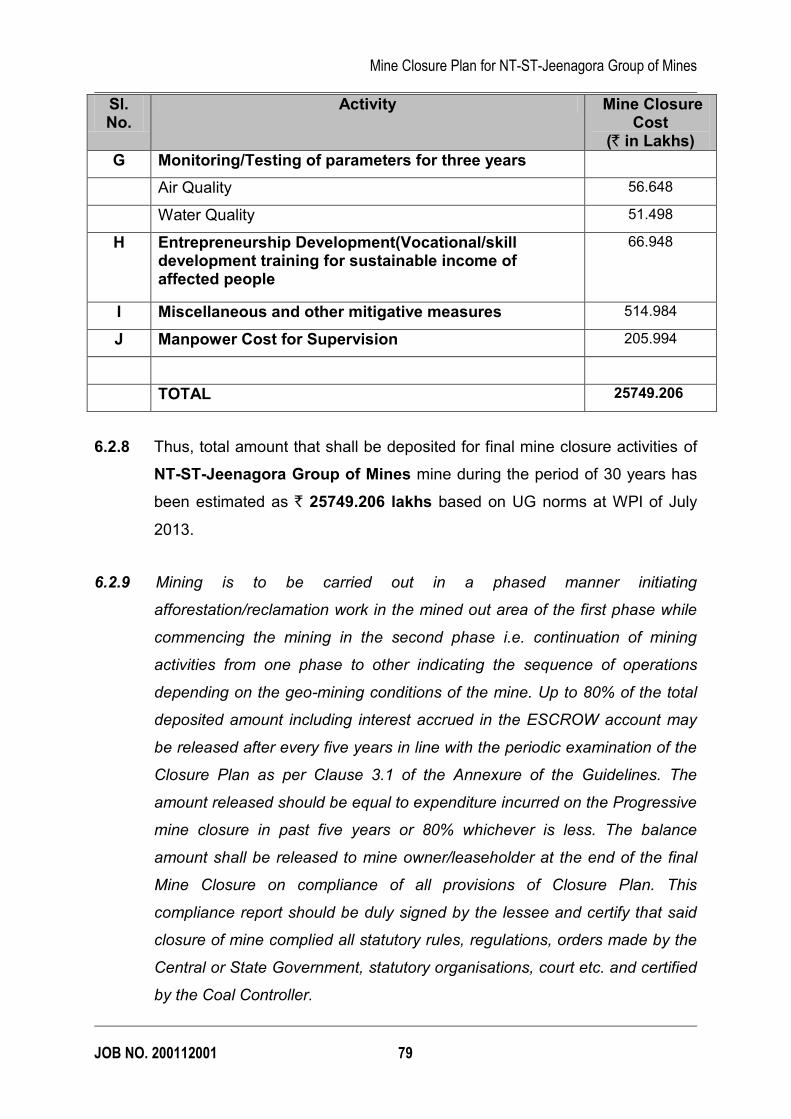
Mine Closure Plan for NT-ST-Jeenagora Group of Mines
JOB NO. 200112001 79
Sl. No.
Activity Mine Closure Cost
(` in Lakhs)
G Monitoring/Testing of parameters for three years
Air Quality 56.648
Water Quality 51.498
H Entrepreneurship Development(Vocational/skill development training for sustainable income of affected people
66.948
I Miscellaneous and other mitigative measures 514.984
J Manpower Cost for Supervision 205.994
TOTAL 25749.206
6.2.8 Thus, total amount that shall be deposited for final mine closure activities of
NT-ST-Jeenagora Group of Mines mine during the period of 30 years has
been estimated as ` 25749.206 lakhs based on UG norms at WPI of July
2013.
6.2.9 Mining is to be carried out in a phased manner initiating
afforestation/reclamation work in the mined out area of the first phase while
commencing the mining in the second phase i.e. continuation of mining
activities from one phase to other indicating the sequence of operations
depending on the geo-mining conditions of the mine. Up to 80% of the total
deposited amount including interest accrued in the ESCROW account may
be released after every five years in line with the periodic examination of the
Closure Plan as per Clause 3.1 of the Annexure of the Guidelines. The
amount released should be equal to expenditure incurred on the Progressive
mine closure in past five years or 80% whichever is less. The balance
amount shall be released to mine owner/leaseholder at the end of the final
Mine Closure on compliance of all provisions of Closure Plan. This
compliance report should be duly signed by the lessee and certify that said
closure of mine complied all statutory rules, regulations, orders made by the
Central or State Government, statutory organisations, court etc. and certified
by the Coal Controller.
Mine Closure Plan for NT-ST-Jeenagora Group of Mines
JOB NO. 200112001 80
6.2.10 However, the additional amount beyond the escrow account, if any
estimated later on, will be provided by the mine operator after estimating the
final mine closure cost five years prior to mine closure (as per the mine
closure guideline).
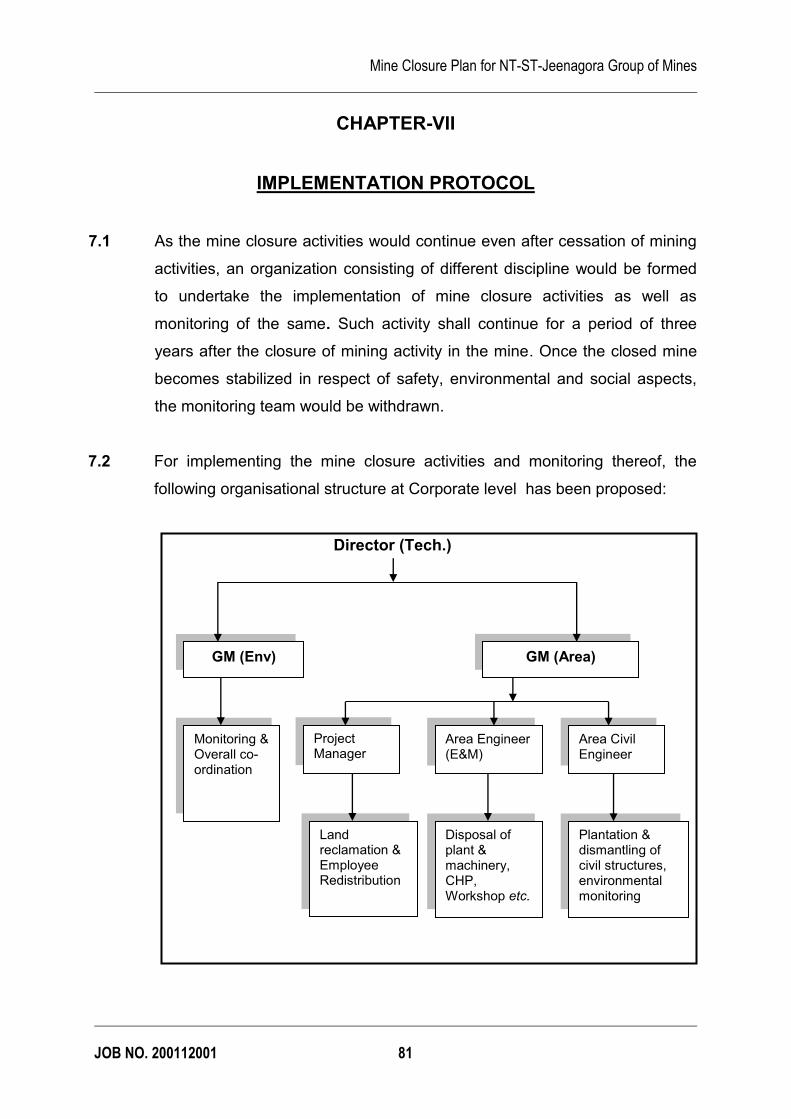
Mine Closure Plan for NT-ST-Jeenagora Group of Mines
JOB NO. 200112001 81
CHAPTER-VII
IMPLEMENTATION PROTOCOL
7.1 As the mine closure activities would continue even after cessation of mining
activities, an organization consisting of different discipline would be formed
to undertake the implementation of mine closure activities as well as
monitoring of the same. Such activity shall continue for a period of three
years after the closure of mining activity in the mine. Once the closed mine
becomes stabilized in respect of safety, environmental and social aspects,
the monitoring team would be withdrawn.
7.2 For implementing the mine closure activities and monitoring thereof, the
following organisational structure at Corporate level has been proposed:
Director (Tech.)
GM (Env) GM (Area)
Land reclamation & Employee Redistribution
Disposal of plant & machinery, CHP, Workshop etc.
Project Manager
Plantation & dismantling of civil structures, environmental monitoring
Area Engineer (E&M)
Area Civil Engineer
Monitoring & Overall co-ordination
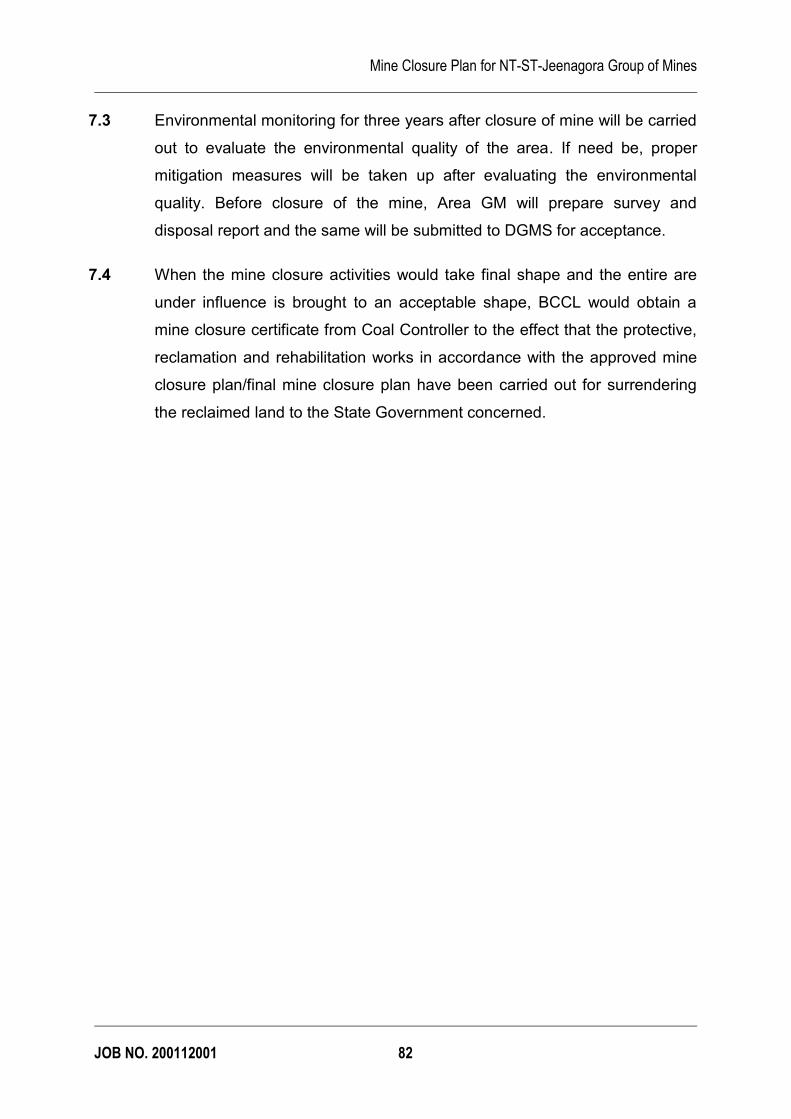
Mine Closure Plan for NT-ST-Jeenagora Group of Mines
JOB NO. 200112001 82
7.3 Environmental monitoring for three years after closure of mine will be carried
out to evaluate the environmental quality of the area. If need be, proper
mitigation measures will be taken up after evaluating the environmental
quality. Before closure of the mine, Area GM will prepare survey and
disposal report and the same will be submitted to DGMS for acceptance.
7.4 When the mine closure activities would take final shape and the entire are
under influence is brought to an acceptable shape, BCCL would obtain a
mine closure certificate from Coal Controller to the effect that the protective,
reclamation and rehabilitation works in accordance with the approved mine
closure plan/final mine closure plan have been carried out for surrendering
the reclaimed land to the State Government concerned.
Mine Closure Plan for NT-ST-Jeenagora Group of Mines
JOB NO. 200112001 83
CHAPTER – VIII
PLANS ENCLOSED
The following underground and surface plans have been enclosed along with
this mine closure report plan:
a. Location Plan of Cluster IX
b. Surface cum Topographical plan of Cluster IX showing surface features,
contours, roads, depot/siding, OB dumps, quarries
(working/old/discontinued), subsidence, plantations, habitations, vacant
land, surface water bodies, natural drainage and mine discharge water
channels
c. Geological Plan of Cluster IX
d. Working plan of IV B Seam- North Tisra UG
e. Surface Plan of existing NTST OC.
f. Final Stage Dump Plan of NTST Expansion OCP
0 | P a g e
Page for Research Team
Impact Assessment of CSR projects undertaken by
Bharat Coking Coal Limited, Dhanbad FY(2015-16)
By
National CSR Hub
Tata Institute of Social Sciences, Mumbai
1 | P a g e
RESEARCH TEAM AT NATIONAL CSR HUB
Project Director
Prof. B. Venkatesh Kumar
Senior Consultant
Ms. Dilnavaz Munshi
Project Co-ordinator
Ms. Dipty Nisha
Data collection, Analysis & Report Writing
Ms. Prachi Kathuria
Mr. Sumit Jagtap
Research Investigators
Mr. Monu Kumar
Mr. Ajay Kumar Singh
Mr. Dinesh Kumar
Mr. Suraj Kumar
Secretariat Support
Ms. Vaishali Gajbiye
Ms. Rajisha Ramankutty
Ms. Sushma Kir
2 | P a g e
ACKNOWLEDGEMENT
This Impact Assessment Study of CSR project of Bharat Coking Coal Limited, Dhanbad for the
FY 2015-16 has been undertaken by National CSR Hub, Tata Institute of Social Sciences (TISS)
as a part of the MoU with CIL and TISS.
At the outset, we would like to thank BCCL for granting this project to National CSR Hub, TISS.
We express heartfelt gratitude to Director (Personnel), BCCL for giving us the opportunity to
carry out the Impact Assessment study of CSR projects for the FY 2015-16. We express our
gratitude to the General Manager, CSR and the entire CSR department of BCCL for their
continuous support and guidance to the research team of NCSR Hub.
We also extend our gratefulness to respective area General Managers, Medical Officers (Health
Department) and concerned project in-charge appointed by BCCL (CSR officials) for making all
the arrangements for the study and making us comfortable with their warm hospitality.
Prof. B. Venkatesh Kumar
Director
National Corporate Social Responsibility Hub
TISS, Mumbai
3 | P a g e
EXECUTIVE SUMMARY
Bharat Coking Coal Limited is a subsidiary of Coal India Limited, a Maharatna Company. The
company is currently operating in 12 administrative areas in Jharia Coalfields encompassing
around 226 peripheral villages mainly in the District of Dhanbad, Jharkhand and in some part of
West Bengal. The Strategic CSR of BCCL states that the company‟s main objective is to
improve the quality of life of people living in and around its command areas. The key areas of
CSR invention are rural development, livelihood generation and skill development. It has a long
history of philanthropic activities which were converged to align with the Corporate Social
Responsibility mandate of the Companies Act 2013. Rural development, livelihood generation
and skill development are thrust areas of the BCCL‟s CSR interventions. As per the CSR
guideline, BCCL has partnered with Tata Institute of Social Sciences to conduct evaluation
studies for the completed CSR projects.
For the purpose of this report, impact assessment studies were carried out for four projects,
namely, Scheme for Multi-Purpose Utilisation of Mine Water, Mobile Medical Van, Village
Adoption and Construction of PCC/Bituminous Road.
The primary data collection for the impact assessment studies was completed in September 2017
by a six member team from TISS. Mixed research methodology was used while In-Depth
Interviews, Household Surveys and focused group discussions were the main methods
implemented to collect data. 1000 samples were collected from 13 operational areas of BCCL for
the impact assessment study.
The objectives of the impact assessment were:
(i) To assess if the objectives of individual projects have been met;
(ii) To understand the continued relevance of the individual projects in their respective
contexts; and
(iii) To identify issues in programmatic implementation and provide recommendation to
fulfill the objectives efficiently.
4 | P a g e
Mobile Medical Van has aimed to provide quality health services to the rural poor residing in the
operational areas of BCCL. The impact of the project on the community has been remarkable as
it provides doorstep medical services to the poor, reduces the medical expenditures, reached the
most remote villages and awareness generation. Limited health services, awareness campaigns
and limited regularity are the major drawbacks of the project.
In the project Scheme for Multi-Purpose Utilisation of Mine Water, 352 samples were collected,
13 FGDs and 4 Key Informant Interviews (KII) were conducted. There is strong demand for the
supply of mine water in the renovated ponds especially during water scarcity periods, which
have been stopped for the last couple of months. The mine water is used for household and cattle
consumption. Livelihood generation activities have not commenced as yet.
BCCL also adopted Lahbera village, situated in Jharia block of Dhanbad district and committed
to the holistic development of the village. Various infrastructural and economic projects were
implemented in the village. Although the project has been a huge success, a lapse in monitoring,
incomplete projects and limited resources for employment generation have inhibited the
successful completion of the project.
BCCL also constructed roads at 7 locations across Dhanbad districts. The roads had led to
improved connectivity and enhanced hygienic living conditions, but lack of monitoring, limited
connectivity and lack of participatory approach have been some of the shortcomings of the
project.
TISS has also provided recommendation such as regular monitoring, creation of employment
generation activities, the formation of SHGs etc. for efficient execution of future projects.
5 | P a g e
LIST OF ABBREVIATIONS
ADC - Adult Education Center
BCCL - Bharat Coking Coal Limited
CHC - Community Healthcare Center
CSR - Social Corporate Responsibility
CTP - Computer Training Program
FGD - Focused Group Discussion
GM - General Manager
HHI - Household Interviews
IDI - In – depth Interviews
IT - Information and Technology
KII - Key Informant Interviews
LVA - Lahbera – Village Adoption
MMV - Mobile Medical Van
MUMW - Scheme for multipurpose utilization of abandoned mine water
PCC - Plain Cement Concrete
PHC - Primary Health Care Center
SHG - Self Help Group
ST - Schedule Tribes
STC - Sewing Training Centre
STP - Sewing Training Program
EJ – Eastern Jharia
WJ – Western Jahria
WWD _ Western Washery Division
CV – Chanch Victora
6 | P a g e
TABLE OF CONTENTS
CHAPTER 1 - INTRODUCTION ................................................................................................................ 9
1.1. About Bharat Coking Coal Limited .................................................................................. 9
1.2 About National Corporate Social Responsibility Hub, TISS ................................................10
1.3 Project Backgrounds ......................................................................................................10
CHAPTER 2 – RESEARCH METHODOLOGY ...................................................................................... 13
2.1 Objective of Study .........................................................................................................13
2.2 Research Design............................................................................................................14
2.3 Tools for Data Collection ...............................................................................................15
2.4 Data collection methods .................................................................................................15
2.5 Participants of Data Collection ........................................................................................16
2.6 Sampling with Location for Data Collection .....................................................................16
2.7 Data Analysis ...............................................................................................................18
2.8 Challenges of the study ..................................................................................................18
CHAPTER 3 –MOBILE MEDICAL VAN (SWASTHA RATH) ............................................................. 19
3.1 Introduction ..................................................................................................................19
3.2 Objectives of the Project ................................................................................................19
3.3 Locations of project .......................................................................................................20
3.4 Impact of the project on community.................................................................................20
3.5 Gap identified in the project ............................................................................................25
3.7 Beneficiaries‟ view point on Swasth Rath .........................................................................28
3.8 Recommendation of the project .......................................................................................29
CHAPTER 4 – MULTIPURPOSE UTILIZATION OF MINE WATER .................................................. 31
4.1 Background of the project ..............................................................................................31
4.2 Objective of the project ..................................................................................................32
4.3 Location of Implementation ............................................................................................32
4.4 Beneficiary details .........................................................................................................33
4.5 Impact on the community ...............................................................................................34
4.6 Gaps Identified .............................................................................................................38
4.7 Recommendations .........................................................................................................43
7 | P a g e
CHAPTER 5 - VILLAGE ADOPTION PROJECT (LAHBERA) ............................................................. 45
5.1 Introduction ..................................................................................................................45
5.2 Objectives of the Study ..................................................................................................45
5.3 Projects and their Impacts ...............................................................................................46
I. Multipurpose Hall .............................................................................................................46
II. Adult Education Centre .....................................................................................................47
III. Health Centre ................................................................................................................48
IV. Masala Chakki ..............................................................................................................49
V. Sewing Training Centre .....................................................................................................50
VI. Solar Lights ..................................................................................................................51
VII. Primary School Building ................................................................................................52
VIII. Computer Training Center ..........................................................................................52
IX. Drainage line and PCC Road ..........................................................................................53
X. Water supply ...................................................................................................................54
5.4 Multi-stakeholder Perspective on village Adoption project .................................................55
5.5 Gaps and Scope for Improvement ....................................................................................57
5.6 Recommendations .........................................................................................................58
CHAPTER 6 - CONSTRUCTION OF PCC ROAD .................................................................................. 59
6.1 Introduction ..................................................................................................................59
6.2 Objective of the project ..................................................................................................59
6.3 Location of implementation ............................................................................................59
6.4 Impact of Road on Community .......................................................................................60
6.5 Gaps identified in the project ..........................................................................................62
6.6 Multi-stakeholder Perspective .........................................................................................63
6.7 Recommendations .........................................................................................................63
ANNEXURE............................................................................................................................................... 64
8 | P a g e
LIST OF TABLES
Table 1 – Showing sampling of Multipurpose Utilization of Mine Water (MUMW) through
Household Survey .....................................................................................................................16
Table 2 – Showing sampling of Mobile Medical Van (MMV) through Household Survey ...........16
Table 3 – Showing list of villages covered under Mobile Medical Van services (Swastha Rath) 20
Table 4 – Beneficiaries awareness about activities done by BCCL for the pond ........................36
Table 5 – Beneficiaries response on last supply of mine water. ................................................43
Table 6 – Multi – stakeholder perspective on village adoption project .......................................55
Table 7 – Location of implementation of road projects in various areas ....................................59
LIST OF FIGURES
Figure 1 – Frequency of Van Visiting in the project locations ....................................................20
Figure 2 – Duration (Timing) of Van in project location ..............................................................21
Figure 3 – Availability of health services....................................................................................22
Figure 4 – Awareness generation through swastha Rath ..........................................................23
Figure 5 – Reduction in economic burden on health .................................................................23
Figure 6 – Major ailments in the families ...................................................................................24
Figure 7 – Decrease in number of sicknesses over the period of MMV service .........................25
Figure 8 – Status of awareness campaign by swastha Rath .....................................................26
Figure 9 – Facilities available in swastha rath ...........................................................................26
Figure 10 – Frequency of Swastha Rath ...................................................................................29
Figure 11 – Caste profile of respondents...................................................................................33
Figure 12 – Source of potable water .........................................................................................34
Figure 13 – Uses of mine water in ponds ..................................................................................35
Figure 14 – Sources of irrigation ...............................................................................................36
Figure 15 – Improvement in storage capacity of the ponds .......................................................37
Figure 16 - Improvement in storage capacity of the ponds ........................................................38
Figure 17 – Reduction in water scarcity ....................................................................................39
Figure 18 - New income generating activities after renovation of ponds ...................................39
Figure 19 – Mine water used in critical irrigation ........................................................................40
Figure 20 - Agricultural production beyond home consumption due to min water supply ...........41
Figure 21 - Increase in Household income due to renovation of ponds .....................................41
Figure 22 – Frequency of mine water supply .............................................................................42
9 | P a g e
CHAPTER 1 - INTRODUCTION
Businesses are the most powerful constituents of the society, and they do not operate in isolation;
there is an increased realization that not only can companies affect society at large, but they are
also in a unique position to influence society and a make positive impact.
“The Organization for Economic Co-operation and Development1 (OECD) established a set
of guidelines for multinational enterprises in 1976 and was thus a pioneer in developing the
concept of CSR. The purpose of these guidelines was to improve the „investment‟ climate
and encourage the positive contribution multinational enterprises can make to economic and
social progress”.
An evaluation is „the systematic and objective assessment of an on-going or completed project,
programme or policy, its design, implementation and results. The aim is to determine the
relevance and fulfilment of objectives, development efficiency, effectiveness, impact and
sustainability. An evaluation should provide information that is credible and useful, enabling the
incorporation of lessons learned into the decision-making process of both recipient and donors.‟
(OECD Publications, 2010)
1.1. About Bharat Coking Coal Limited
Bharat Coking Coal Limited (BCCL) is a subsidiary of Coal India Limited, a Maharatna
Company. The company is operating in 12 administrative areas in Jharia Coalfields
encompassing around 226 peripheral villages mainly in the District of Dhanbad, Jharkhand and
in some part of West Bengal. The Strategic CSR of BCCL states that the company‟s main
objective is to improve the quality of life of people living in and around its command areas.
Towards achieving this objective and understand the interest levels of the local community,
BCCL has undertaken a departmental baseline survey cum Skill Gap Analysis study at some
locations. The recommendations from the study would form the basis for the design and
deployment of the various skill development initiatives to be planned.
1 http://www.oecd.org/about/
10 | P a g e
1.2 About National Corporate Social Responsibility Hub, TISS
National Corporate Social Responsibility Hub, (NCSR Hub) was established in 2011 by the
Department of Public Enterprises to enable the Public Sector Enterprises to design and
implement holistic and rights-based CSR initiatives. Tata Institute of Social Sciences (TISS),
Mumbai and Department of Public Enterprises (DPE), Government of India had come to realize
that there is a need to have a centralized system where core functions of CSR including learning
and knowledge dissemination take place. The core activities of the Hub are:
Vision and strategic direction setting for Policy and Programme
Advisory role for PSEs on Policy and Programme implementation
Research and development and „evidence-based‟ policy advocacy
Capacity building of PSEs, partners and civil society institution
Impact assessment, monitoring and evaluation
Empanelment and partner management
1.3 Project Backgrounds
Bharat Coking Coal Limited (BCCL) sanctioned impact evaluation studies for four projects in
different stages of completion which were carried out by National CSR Hub in August-
September 2017. The following report details the evaluation of projects undertaken by Bharat
Coking Coal Limited in accordance with their CSR policy laid out in 2014. A cogent CSR policy
is a requirement laid out in the Companies (CSR Policy) Rules, 2014 conferred under the
Companies Act, 2013.
As stated above, for this report four projects were evaluated namely: Mobile Medical Van,
Scheme for multipurpose utilisation of abandoned mine water, Village adoption program and
construction of PCC/Bituminous road.
a) Mobile Medical Van (Swastha Ratha) - The service of Mobile Medical Van for
villagers under command areas of BCCL started in 2009 with the help of 2 Mobile
Medical Vans. Now BCCL has fourteen Medical Mobile Vans (MMVs) equipped with
doctors, paramedical staff serving different 203 villages situated in and around the
mining areas on working days. The villagers are examined by the experienced clinicians
11 | P a g e
and medicines are dispensed free of cost to them. This provision has been made by BCCL
exclusively under CSR activities for the benefit of villagers by providing them free
medical assistance.
Objective: To provide health services in peripheral villages in and around BCCL
command area to provide medical facilities with a focused service on identification,
screening, diagnosis and treatment to provide free medical; assistance.
Location of implementation: 203 villages in the peripheral areas of BCCL
b) Scheme for multipurpose utilisation of abandoned mine water - BCCL since
inception has felt the importance of water and endeavoured for effective and gainful
utilisation of mine water from abandoned mines which has to be taken out compulsorily
in the course of the mining process. For harnessing such water, BCCL has taken upon the
task of holding the mine water into the water bodies by restricting them to flow into the
natural drainage course like village reservoirs which gets dried during summers by laying
out a pipeline network of approximately 45 km.
Objective of the project: Harnessing mine water for its gainful multipurpose utilisation
in the peripheral villages of BCCL command area.
Location: Two reservoirs are situated in Khonathi and Behrakudar villages of Baghmara
block of Dhanbad district.
c) Lahbera Village Adoption Program - In order to develop peripheral villages of BCCL
in an integrated manner, including their economic development, infrastructure upliftment,
providing opportunities for social empowerment and other aspects of overall human
development. i.e. education, health, drinking water supply, providing training and tools
for self-employment etc. This would include economic development, infrastructure
development and other aspects of human development, i.e. education, health, drinking
water supply and credit linkage.
12 | P a g e
Objective of the project: The objective of Village Adoption Programme is to develop
the selected village in an integrated manner ensuring the holistic and integrated
development of village through capacity building and participation of local people and
institutions.
Location: Lahbera Village in Jharia block of Dhanbad district
d) Construction of PCC/Bituminous road - Understanding the importance of Road BCCL
had Constructed PCC Roads in and around eight villages of the BCCL command area.
Roads are of vital importance to make a nation grow and develop. In addition, providing
access to employment, social, health and education services makes a road network crucial
in fighting against poverty. They open up areas of economic and social development.
Objective of the project: Enabling and increasing the connectivity from semi-rural to
urban areas by constructing PCC Road.
Location:
SN Name of Village/Area Construction in Km/Meters
1 Kacharra Arah Tola , Hatudih Panchayat 400 meters
2 Lahbera Village 1.5 Km
3 Aamtal Village, Aamtal Panchayat (Kusunda) 1.5 km
4 Satitand Village, Bauakala Panchayat (Kusunda) 500 meters
5 Padugora Village, Padugora Panchayat
(WJ area)
400 meters
6 Kandra Village, Kandrta Panchayat 500 meters
7 Bakaspura Village, Luti Pahari Panchayat 400 meters
13 | P a g e
CHAPTER 2 – RESEARCH
METHODOLOGY
Research methodology is a way to systematically solve the research problem. It may be
understood as a science of studying how research is done scientifically. In it, one studies the
various steps that are adopted by a researcher in studying his research problem along with the
logic behind them (Kothari, 2004). This chapter outlines the research methodology and also
examines the objectives of the study and the research question. The chapter also includes the
research design, methods, and level of engagement for data collection, on and off the field. The
stage of data collection has also been explained in the chapter with a subsequently the steps
utilized to analyze the data that is already collected from the field.
2.1 Objective of Study
The very purpose of the research is to discover answers to the question through the application of
the scientific procedures (Kothari, 2004). The aim of the study was to understand the extent of
the impact of projects on the socio-economic conditions of the targeted beneficiaries.
The Impact Assessment was conducted on four major projects namely:
1. Mobile Medical Van (MMV),
2. Scheme for multipurpose utilization of abandoned mine water (MUMW),
3. Road Construction, and
4. Labhera village adoption project (LVA)
Therefore the objective of each project has some variation from the other even though having
that the main objectives were as follows:
i. To Analyzed the key impact areas of the project
ii. To Analyzed the extent of impact on the beneficiaries
iii. To suggest recommendation for improvement for the project.
14 | P a g e
2.2 Research Design
The research design refers to the overall strategy that one choose to integrate the different
components of the study in a coherent and logical way, thereby, ensuring one will effectively
address the research problem; it constitutes the blueprint for the collection, measurement, and
analysis of data (De Vaus, 2001)
This study is an Evaluation research study as it is designed to assess the outcomes of an
intervention so that the findings will provide insights useful for the organizations that have
funded and implemented the project. The study is an end line evaluation study, which implies
that the findings would be useful if the Company intent to reintroduce the project.
The project undertaken for impact assessment studies were those which are implemented by the
BCCL CSR and which covers a mixed chunk of populate spread across the BCCL Command
area. As there were four projects that required studying, the research team had developed two
research designs based on the project objectives and population covered. This study employs a
mixture of Quantitative and Qualitative research methods to evaluate the key aspects of the two
projects namely; MMV and MUMV. If one has to define mixed method research it can be „In
general, mixed methods research represents research that involves collecting, analyzing, and
interpreting quantitative and qualitative data in a single study or in a series of studies that
investigate the same underlying phenomenon.‟ (Leech N, Onwuegbuzie A, 2008). The study has
attempted not just to generate summary statistics that reveal the overall performance of the
projects but has also attempted to delve into the individual stories, histories, life experiences and
psyche of the beneficiaries through intensive beneficiary-specific case studies (of selected
beneficiaries. While conducting the study of MMV and MUMW the research team used two
major tools for data collection mainly: Focused Group Discussion (FGD) and Household Survey
(HH). These methods were felt appropriate by the research team as it helped in fulfilling the
appropriate size and appropriate response.
Simultaneously a different research design was formed for studying the impact of LVA and Road
Construction. The qualitative research design enabled the research team to understand the impact
of project in their daily life. Along with it, the project had limited beneficiaries that provided the
research team with the opportunity to study and to understand the lived narratives of the
beneficiaries and also the impact of LVA and road in their day to day life.
15 | P a g e
2.3 Tools for Data Collection
The tool is one of the essential components of a research study. It is an instrument that helps the
researcher to meet the objectives of the research. There are various kinds of tools that are utilized
based on the needs and objectives of the research. In the current study the research team
undertook certain sets of tool they are listed below;
Major tools involved in the study were:
i. i. House Hold Interview (Survey) (HHI): As a few projects had greater coverage in
terms of area and population the household survey was used to get details from the
identified villages and areas/panchayats
ii. ii. Focused Group Discussion (FGD): FGDs where conducted in all the four project,
and the interviewers for the FGD was the village members, Ward/Gram Panchayat
Representative, ASHA, Women Representative, SHGs Group Women‟s, Youth group
member etc.
iii. iii. In-depth Interviews (IDI): Similarly IDI was conducted with village members who
were directly affected by the project
iv. iv. Case studies: Case studies were used to get life narratives of the beneficiaries and to
understand the impact of the project on their socio-economic and cultural lives
v.
2.4 Data collection methods
The sampling type used for data collection was stratified random sampling method. The
primary data was collected using the following methods, selected as per the above-explained
research design:
a. Survey of beneficiaries through questionnaire
b. Semi-structured interview (using interview schedule) and In-depth interviews. The in-
depth interviews were open-ended with complete scope for probing and getting detailed
information from the participants.
c. Participatory research methods such as transect walk
d. Document analysis (review of project reports)
e. Direct observation (home visit, village/town visit and institution visit)
16 | P a g e
2.5 Participants of Data Collection
This study emphasizes the obtaining of perspectives from multiple stakeholders. Accordingly,
the following participants and stakeholders were covered through the data collection done in this
study:
i. Beneficiaries, i.e. people impacted by the project
i. ii. Higher authorities of BCCL, Area GM, Medical Officers
ii. iii. Village level stakeholders (Community Leaders):, Sarpanch, ward members and
former Sarpanch
iii. iv. Project In-charge appointed by BCCL (CSR officials) – the monitoring authority
involved in the project
2.6 Sampling with Location for Data Collection
Table 1 – Showing sampling of Multipurpose Utilization of Mine Water (MUMW) through Household Survey
Sr No Village Name Block District Sample
Achieved
1 Darda Baghmara Dhanbad 82
2 Sidhwatand Baghmara Dhanbad 65
3 Behrakhurd Baghmara Dhanbad 34
4 Nisithpur Baghmara Dhanbad 82
5 Konati Baghmara Dhanbad 93
Total 356
Table 2 – Showing sampling of Mobile Medical Van (MMV) through Household Survey
Sr No Village Name Block District Sample
Achieved
1 Karma Tand Chandrapura Bokaro 13
2 Patra Kuli Chandrapura Bokaro 8
3 Uper Devghara Baghmara Dhanbad 15
4 Chhatawad Kailudih Baghmara Dhanbad 10
17 | P a g e
5 Power House Dhanbad Dhanbad 26
6 Madhuban Baghmara Dhanbad 13
7 Rathtand Baghmara Dhanbad 10
8 Chanchpotri Agra Khurd Dhanbad 12
9 Barora Kulti Bangal 25
10 Mohlidih Katras Dhanbad 20
11 Khanodih Baghmara Dhanbad 6
12 Bhim Kanali Baghmara Dhanbad 3
13 Bakaspura Baghmara Dhanbad 10
14 Bhagabandh Dhanbad Dhanbad 19
15 Manjhla Dih Dhanbad Dhanbad 19
16 Bhatdih Jhariya Dhanbad 19
17 Manpur Chandan Kyari Bokaro 19
18 Amlabad Chandan Kyari Bokaro 19
19 Sona Nagar Baghmara Dhanbad 14
20 Mandal Kedwari Baghmara Dhanbad 9
21 Gudri Bera Baghmara Dhanbad 18
22 Southari Dhanbad Dhanbad 19
23 Betenga bandh Dhanbad Dhanbad 12
24 Kari Tand Dhanbad Dhanbad 7
25 Basjoda Dhanbad Dhanbad 24
26 Lavera Manjhi Tola Jhariya Dhanbad 20
27 Ranguni Baghmara Dhanbad 18
28 Bangali Kothi Baliyapur Dhanbad 20
29 Aamtalbauritola Baliyapur Dhanbad 18
30 Nunudih Jhariya Dhanbad 20
18 | P a g e
31 Idgah Pathar tola Jhariya Dhanbad 20
32 Pathaldih(Pandiya
Tola)
Jhariya Dhanbad 18
Total 503
The Data collection for Lebhara and Road construction were through FGD where the research
team intend to capture the live narrative of the beneficiaries impacted by the project, therefore in
FDG the interviews mostly consisted of Sarpanch, Village members, Women Representative,
Senior citizen, Children, youths and BCCL higher authorities
2.7 Data Analysis
As previously mentioned, this study employs a mixture of qualitative and quantitative methods.
Accordingly, SPSS was used for the quantitative data analysis of the study (such as the analysis
of the responses of closed-ended questions in the questionnaires). The responses from the in-
depth interviews and the other qualitative data were subjected to coding for detecting patterns.
The data from interviews and discussions were analyzed thematically, and the data from all the
sources was integrated as per the responses to understand, assess and evaluate the entire process
of implementation. Being a qualitative study, there was an emphasis on understanding and
analyzing the perceptions, views and experiences of the beneficiaries and other key stakeholders
with respect to the scholarship project.
2.8 Challenges of the study
1. Language Barrier: The major hurdle in data collection was the language barriers, few of
the villagers were speaking Bengali, and few were oddia.
2. Limited documentation: The Limited documentation of CSR project was another hurdle
faced by the research team as it had to completely rely on primary data. Most of the employees
working on the projects were mostly retrained and even in a few projects, documentation was not
available.
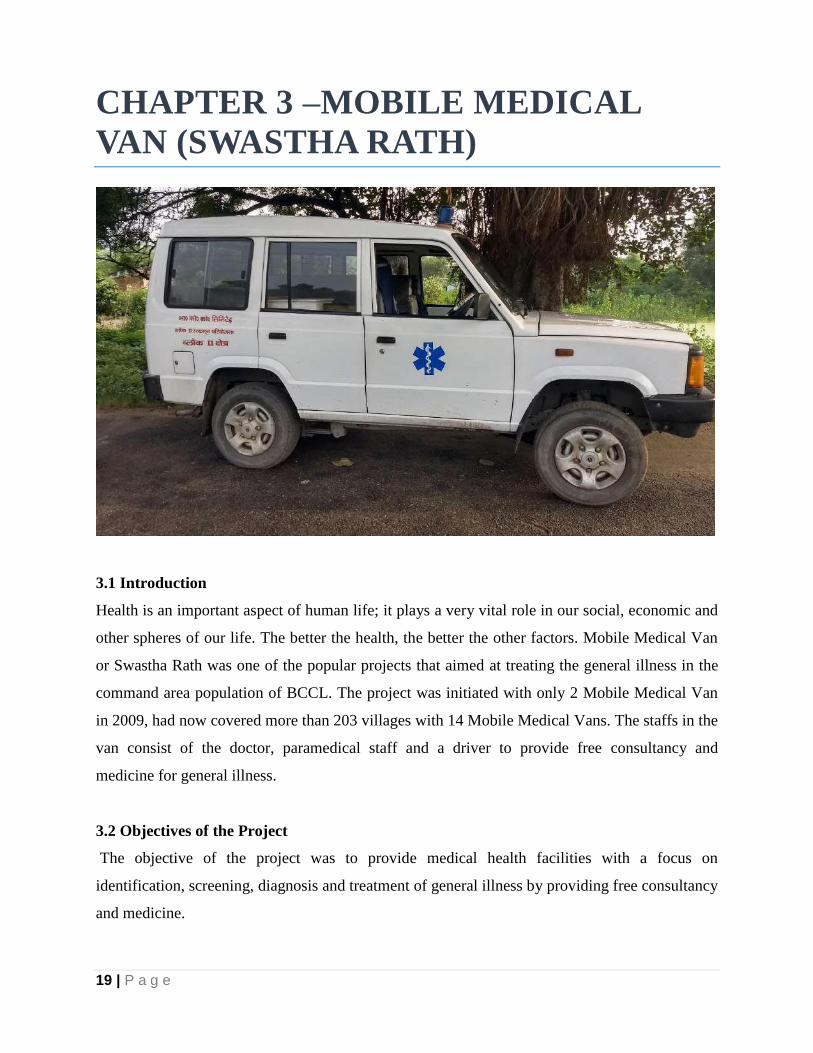
19 | P a g e
CHAPTER 3 –MOBILE MEDICAL
VAN (SWASTHA RATH)
3.1 Introduction
Health is an important aspect of human life; it plays a very vital role in our social, economic and
other spheres of our life. The better the health, the better the other factors. Mobile Medical Van
or Swastha Rath was one of the popular projects that aimed at treating the general illness in the
command area population of BCCL. The project was initiated with only 2 Mobile Medical Van
in 2009, had now covered more than 203 villages with 14 Mobile Medical Vans. The staffs in the
van consist of the doctor, paramedical staff and a driver to provide free consultancy and
medicine for general illness.
3.2 Objectives of the Project
The objective of the project was to provide medical health facilities with a focus on
identification, screening, diagnosis and treatment of general illness by providing free consultancy
and medicine.
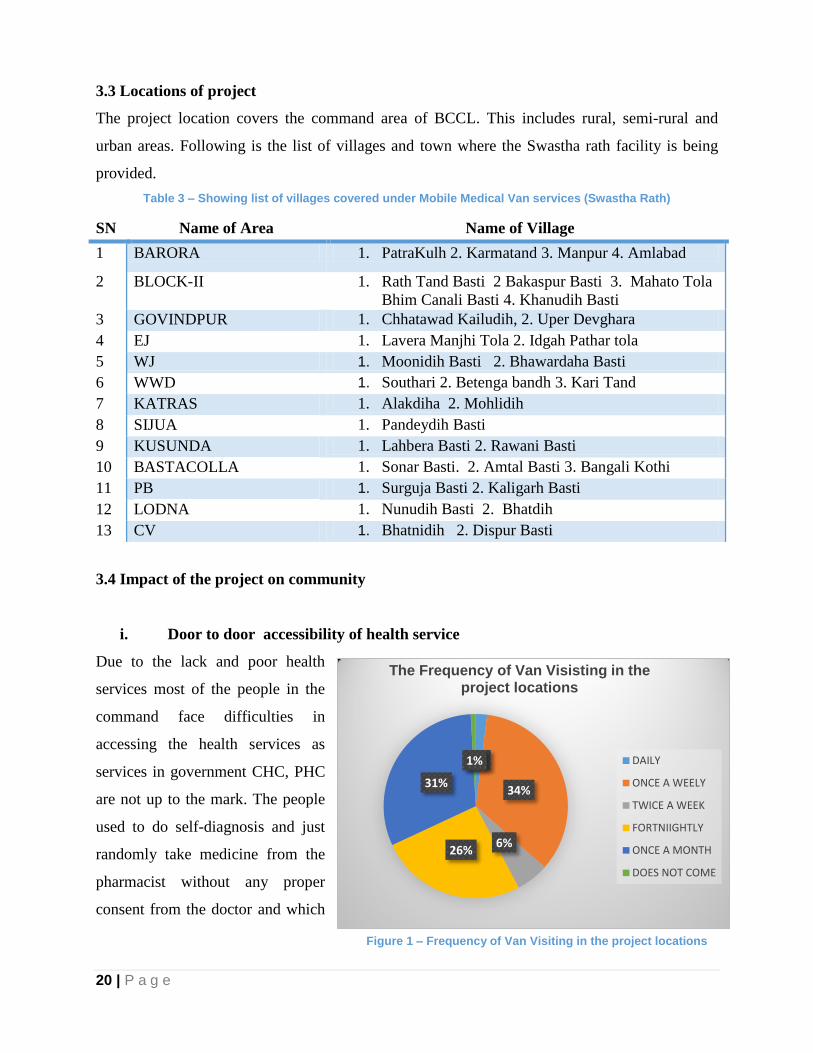
20 | P a g e
3.3 Locations of project
The project location covers the command area of BCCL. This includes rural, semi-rural and
urban areas. Following is the list of villages and town where the Swastha rath facility is being
provided.
Table 3 – Showing list of villages covered under Mobile Medical Van services (Swastha Rath)
SN Name of Area Name of Village
1 BARORA 1. PatraKulh 2. Karmatand 3. Manpur 4. Amlabad
2 BLOCK-II
1. Rath Tand Basti 2 Bakaspur Basti 3. Mahato Tola
Bhim Canali Basti 4. Khanudih Basti
3 GOVINDPUR 1. Chhatawad Kailudih, 2. Uper Devghara
4 EJ 1. Lavera Manjhi Tola 2. Idgah Pathar tola
5 WJ 1. Moonidih Basti 2. Bhawardaha Basti
6 WWD 1. Southari 2. Betenga bandh 3. Kari Tand
7 KATRAS 1. Alakdiha 2. Mohlidih
8 SIJUA 1. Pandeydih Basti
9 KUSUNDA 1. Lahbera Basti 2. Rawani Basti
10 BASTACOLLA 1. Sonar Basti. 2. Amtal Basti 3. Bangali Kothi
11 PB 1. Surguja Basti 2. Kaligarh Basti
12 LODNA 1. Nunudih Basti 2. Bhatdih
13 CV 1. Bhatnidih 2. Dispur Basti
3.4 Impact of the project on community
i. Door to door accessibility of health service
Due to the lack and poor health
services most of the people in the
command face difficulties in
accessing the health services as
services in government CHC, PHC
are not up to the mark. The people
used to do self-diagnosis and just
randomly take medicine from the
pharmacist without any proper
consent from the doctor and which
2%
34%
6% 26%
31%
1%
The Frequency of Van Visisting in the project locations
DAILY
ONCE A WEELY
TWICE A WEEK
FORTNIIGHTLY
ONCE A MONTH
DOES NOT COME
Figure 1 – Frequency of Van Visiting in the project locations

21 | P a g e
eventually seems to be one of the major cause for the adverse impact on their health. To avoid
this and provide basic health care service to the people in the command area of BCCL, Swastha
Rath was introduced. The Swastha Rath used to visit at least twice in each village. The respond
gathered from the respondent through FGD and HH shows positive impacts of the project on the
people in terms of the door to door accessibility of the project.
When interviewed, out of 503 respondents, 93.4 per cent responded that the medical van used to
halt on fixed locations. Around 54.9 per cent people reported that the Medical Van had fixed
timing and date of visits, which was informed by the Mobile Medical Team prior to its arrival.
The locations were selected by keeping in mind the centre point of the villages or near the vital
resource area of the villages such as Samaj Mandir, panchayat office etc. 70 % of respondent
reported that the Swastha Rath used to wait at least 1 to 2 hours in each village making sure that
all the people approaching them are checked and medicines were provided.
When interviewed people regarding the satisfaction of the duration of stay of van in their
villages, 47.9 per cent people reported that they are satisfied by the duration (Time) of the van in
their villages. Whereas, around 44.1 per cent people responded that they are not satisfied by the
timing of the van. Similarly, around 92.8 per cent respondent reported that the location of
Swastha rath was easily accessible by them as well as by their family members.
Figure 2 – Duration (Timing) of Van in project location
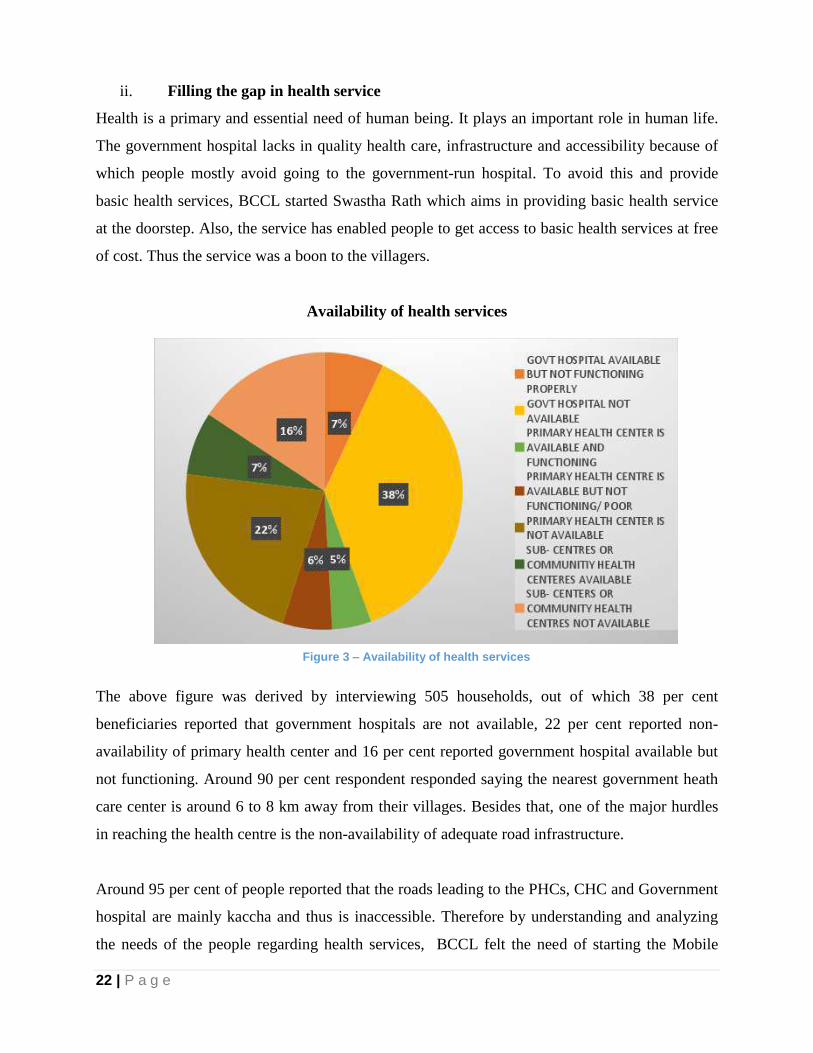
22 | P a g e
ii. Filling the gap in health service
Health is a primary and essential need of human being. It plays an important role in human life.
The government hospital lacks in quality health care, infrastructure and accessibility because of
which people mostly avoid going to the government-run hospital. To avoid this and provide
basic health services, BCCL started Swastha Rath which aims in providing basic health service
at the doorstep. Also, the service has enabled people to get access to basic health services at free
of cost. Thus the service was a boon to the villagers.
Availability of health services
The above figure was derived by interviewing 505 households, out of which 38 per cent
beneficiaries reported that government hospitals are not available, 22 per cent reported non-
availability of primary health center and 16 per cent reported government hospital available but
not functioning. Around 90 per cent respondent responded saying the nearest government heath
care center is around 6 to 8 km away from their villages. Besides that, one of the major hurdles
in reaching the health centre is the non-availability of adequate road infrastructure.
Around 95 per cent of people reported that the roads leading to the PHCs, CHC and Government
hospital are mainly kaccha and thus is inaccessible. Therefore by understanding and analyzing
the needs of the people regarding health services, BCCL felt the need of starting the Mobile
Figure 3 – Availability of health services
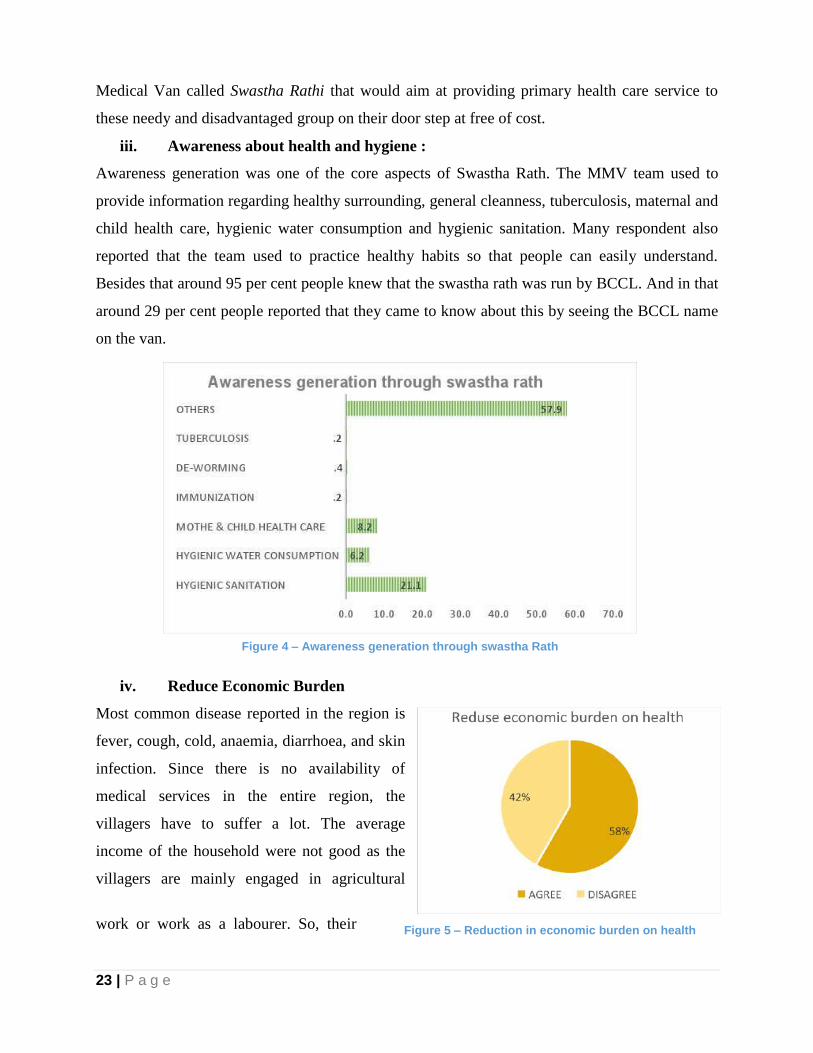
23 | P a g e
Medical Van called Swastha Rathi that would aim at providing primary health care service to
these needy and disadvantaged group on their door step at free of cost.
iii. Awareness about health and hygiene :
Awareness generation was one of the core aspects of Swastha Rath. The MMV team used to
provide information regarding healthy surrounding, general cleanness, tuberculosis, maternal and
child health care, hygienic water consumption and hygienic sanitation. Many respondent also
reported that the team used to practice healthy habits so that people can easily understand.
Besides that around 95 per cent people knew that the swastha rath was run by BCCL. And in that
around 29 per cent people reported that they came to know about this by seeing the BCCL name
on the van.
iv. Reduce Economic Burden
Most common disease reported in the region is
fever, cough, cold, anaemia, diarrhoea, and skin
infection. Since there is no availability of
medical services in the entire region, the
villagers have to suffer a lot. The average
income of the household were not good as the
villagers are mainly engaged in agricultural
work or work as a labourer. So, their
Figure 4 – Awareness generation through swastha Rath
Figure 5 – Reduction in economic burden on health
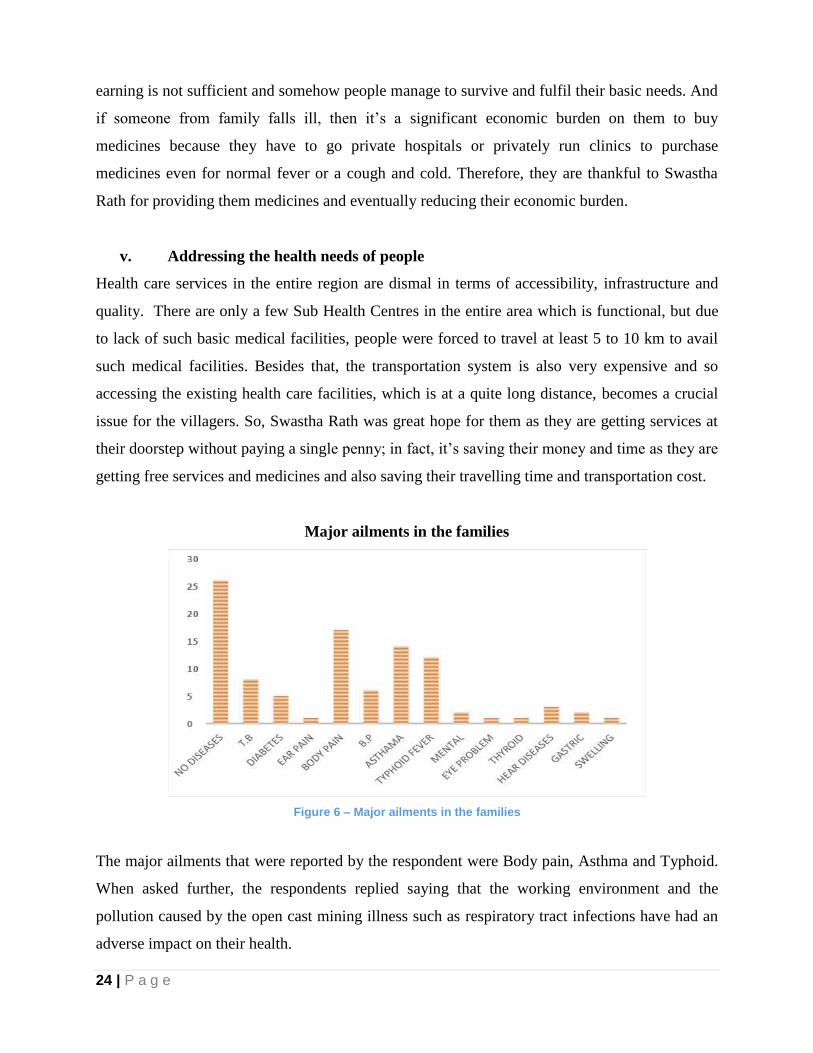
24 | P a g e
earning is not sufficient and somehow people manage to survive and fulfil their basic needs. And
if someone from family falls ill, then it‟s a significant economic burden on them to buy
medicines because they have to go private hospitals or privately run clinics to purchase
medicines even for normal fever or a cough and cold. Therefore, they are thankful to Swastha
Rath for providing them medicines and eventually reducing their economic burden.
v. Addressing the health needs of people
Health care services in the entire region are dismal in terms of accessibility, infrastructure and
quality. There are only a few Sub Health Centres in the entire area which is functional, but due
to lack of such basic medical facilities, people were forced to travel at least 5 to 10 km to avail
such medical facilities. Besides that, the transportation system is also very expensive and so
accessing the existing health care facilities, which is at a quite long distance, becomes a crucial
issue for the villagers. So, Swastha Rath was great hope for them as they are getting services at
their doorstep without paying a single penny; in fact, it‟s saving their money and time as they are
getting free services and medicines and also saving their travelling time and transportation cost.
Major ailments in the families
Figure 6 – Major ailments in the families
The major ailments that were reported by the respondent were Body pain, Asthma and Typhoid.
When asked further, the respondents replied saying that the working environment and the
pollution caused by the open cast mining illness such as respiratory tract infections have had an
adverse impact on their health.
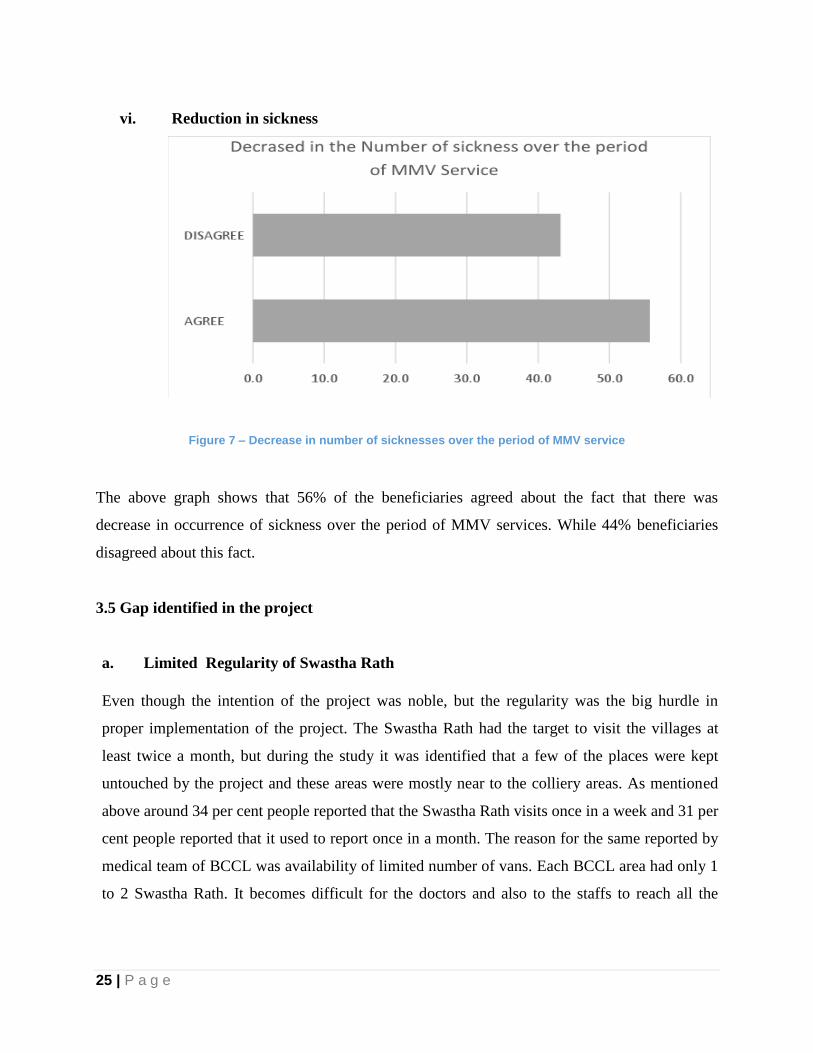
25 | P a g e
vi. Reduction in sickness
Figure 7 – Decrease in number of sicknesses over the period of MMV service
The above graph shows that 56% of the beneficiaries agreed about the fact that there was
decrease in occurrence of sickness over the period of MMV services. While 44% beneficiaries
disagreed about this fact.
3.5 Gap identified in the project
a. Limited Regularity of Swastha Rath
Even though the intention of the project was noble, but the regularity was the big hurdle in
proper implementation of the project. The Swastha Rath had the target to visit the villages at
least twice a month, but during the study it was identified that a few of the places were kept
untouched by the project and these areas were mostly near to the colliery areas. As mentioned
above around 34 per cent people reported that the Swastha Rath visits once in a week and 31 per
cent people reported that it used to report once in a month. The reason for the same reported by
medical team of BCCL was availability of limited number of vans. Each BCCL area had only 1
to 2 Swastha Rath. It becomes difficult for the doctors and also to the staffs to reach all the
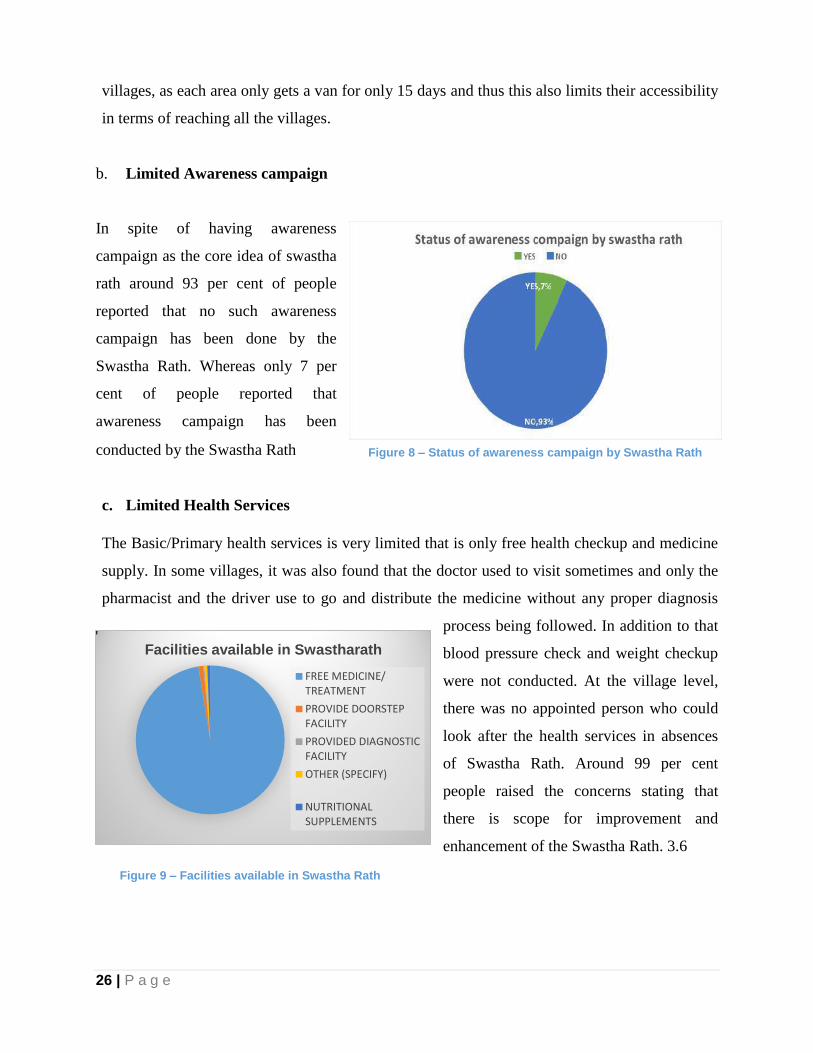
26 | P a g e
villages, as each area only gets a van for only 15 days and thus this also limits their accessibility
in terms of reaching all the villages.
b. Limited Awareness campaign
In spite of having awareness
campaign as the core idea of swastha
rath around 93 per cent of people
reported that no such awareness
campaign has been done by the
Swastha Rath. Whereas only 7 per
cent of people reported that
awareness campaign has been
conducted by the Swastha Rath
c. Limited Health Services
The Basic/Primary health services is very limited that is only free health checkup and medicine
supply. In some villages, it was also found that the doctor used to visit sometimes and only the
pharmacist and the driver use to go and distribute the medicine without any proper diagnosis
process being followed. In addition to that
blood pressure check and weight checkup
were not conducted. At the village level,
there was no appointed person who could
look after the health services in absences
of Swastha Rath. Around 99 per cent
people raised the concerns stating that
there is scope for improvement and
enhancement of the Swastha Rath. 3.6
Facilities available in Swastharath
FREE MEDICINE/TREATMENT
PROVIDE DOORSTEPFACILITY
PROVIDED DIAGNOSTICFACILITY
OTHER (SPECIFY)
NUTRITIONALSUPPLEMENTS
Figure 8 – Status of awareness campaign by Swastha Rath
Figure 9 – Facilities available in Swastha Rath
27 | P a g e
Multi-stakeholder Perspective on Swastha Rath
a. BCCL Officials: BCCL being a responsible corporate in Dhanbad region had always been
active in providing basic health services to the people of the company‟s command area since
a long time. Therefore BCCL started Swastha Rath with the intention of providing basic
health care service in the remote areas for those who are unable to access them or afford
them. Besides that, the company aims at creating general awareness about health and
hygiene. The Project was run in 206 villages and has targeted more than 2 lakhs people.
b. Village People: The Swastha Rath was very useful. It has helped the villagers in many
ways. The accessibility of health care has increased as medicines and treatments are being
provided free of cost at their doorstep. The economic burden has been reduced. Now people
neither travel nor go to the private hospitals and clinics. At the same time, the cost of the
travelling is also being saved. Along with this various awareness campaign are conducted
wherein the people are being provided with the informations regarding health and hygiene.
28 | P a g e
3.6 Beneficiaries’ point of view on Swastha Rath
3.6.1 Vinay Bhal, 49 year old: a resident of fulwar basti is a laborer in coal mine says “Since
the time Swastha Rath had started coming we are very happy because we are staying
here for a very long time and health is the major problem that we are facing. The nearest
Sub-centre is around 8 km away and that too is not in good condition. It was difficult for
us to travel so long, with no other option left, we used to go to local pharmacy and tell
them our sickness, and accordingly they use to give us the medicine, and we use to have
it. Swastha Rath comes in the village twice a month and provides us medicines free of
cost. They treat us all. The doctor behaviour is good. He checks us and also make us
aware of the health and hygienic conditions in we should dwell. Since Swastha Rath
started coming to our village, our money is being saved and also the medicines are
effective”.
3.6.2 Meena Rahman 25 year old, resident of Amlabad village says: “Coming from a poor
background we are unable to afford to go to private clinics or hospitals. The nearest
government Sub-centre is around 7 km away. From where do we bring the money? We
work as a wage earner. There is no guarantee of the job. We would get tomorrow or not,
we don‟t know. Thanks to BCCL Swastha Rath! Since the time it has started coming to
the village, the economic burden of health has been reduced. We get free treatment and
medicines. The van comes twice a month and check all of us. Now we don‟t get worried
so much as the van comes and check us and treat us for free.”
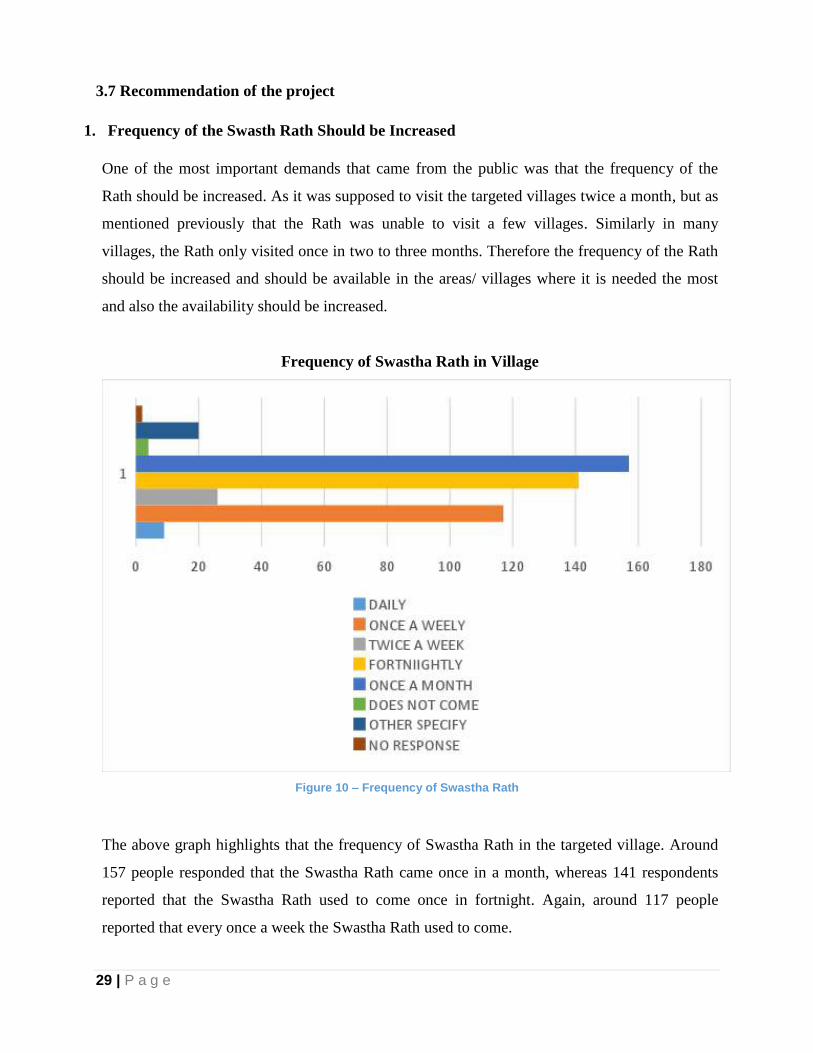
29 | P a g e
3.7 Recommendation of the project
1. Frequency of the Swasth Rath Should be Increased
One of the most important demands that came from the public was that the frequency of the
Rath should be increased. As it was supposed to visit the targeted villages twice a month, but as
mentioned previously that the Rath was unable to visit a few villages. Similarly in many
villages, the Rath only visited once in two to three months. Therefore the frequency of the Rath
should be increased and should be available in the areas/ villages where it is needed the most
and also the availability should be increased.
Frequency of Swastha Rath in Village
Figure 10 – Frequency of Swastha Rath
The above graph highlights that the frequency of Swastha Rath in the targeted village. Around
157 people responded that the Swastha Rath came once in a month, whereas 141 respondents
reported that the Swastha Rath used to come once in fortnight. Again, around 117 people
reported that every once a week the Swastha Rath used to come.

30 | P a g e
2. Need for female doctor and nurse
It was highlighted by the statistical data that out of 500 samples 99.8 per cent reported that there
is a need for female doctors and nurses in the Swastha Rath as the women feel uncomfortable to
open up their sicknesses in front of male doctors.
3. Need of a health worker at the village level
It is recommended that there should be a health worker appointed at the village level that would
look after the health services and status of the village and subsequently could report to the
nearest BCCL regional or area hospital. At the same time, medical stock should be provided to
this appointed health worker, who in times of emergency could provide necessary medicines as
per the need of the villagers.
ii. 4. Necessary Provision for Emergency
Around 98.5 per cent of people responded the need of emergency services in Swastha Rath, and
this could be done by printing the emergency helpline number on the van so that during the
emergency the people can avail the services.
iii. 5. Need of Additional Services
Additional services such as blood pressure check, BMI, Weight test and malnutrition test should
be conducted and if significant issues found in the test results, then further treatment should also
be provided to the beneficiaries by referring them to the nearby BCCL area hospitals.
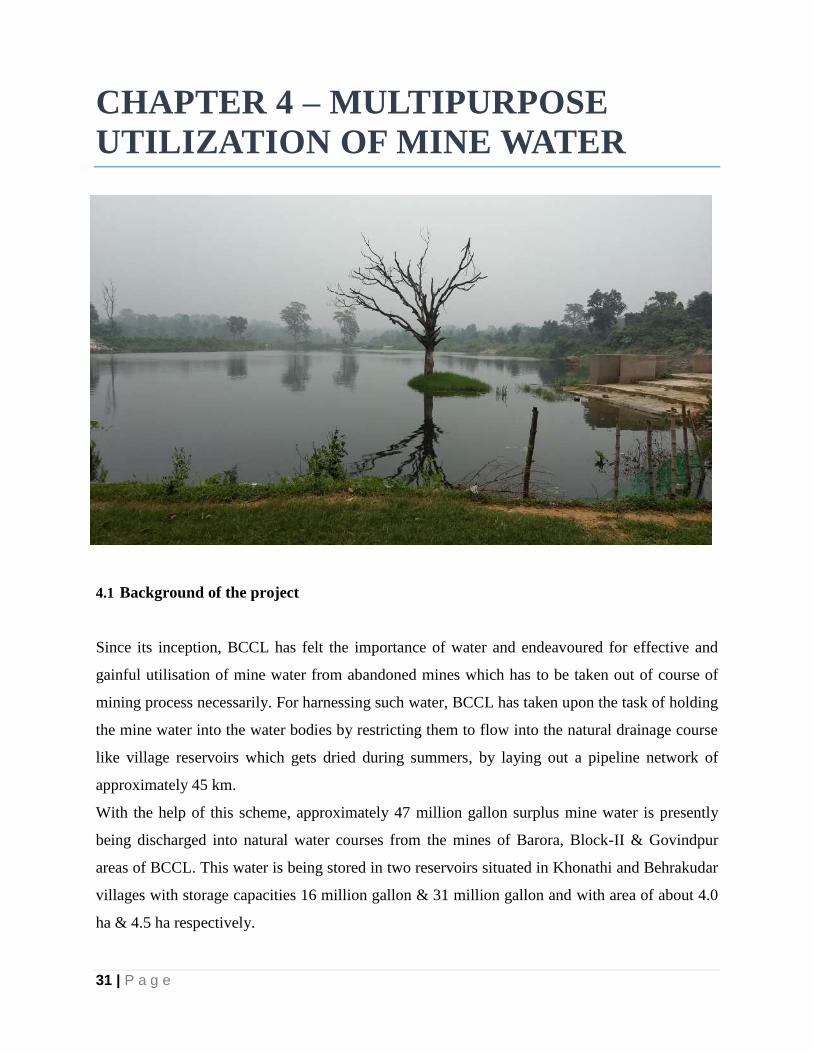
31 | P a g e
CHAPTER 4 – MULTIPURPOSE
UTILIZATION OF MINE WATER
4.1 Background of the project
Since its inception, BCCL has felt the importance of water and endeavoured for effective and
gainful utilisation of mine water from abandoned mines which has to be taken out of course of
mining process necessarily. For harnessing such water, BCCL has taken upon the task of holding
the mine water into the water bodies by restricting them to flow into the natural drainage course
like village reservoirs which gets dried during summers, by laying out a pipeline network of
approximately 45 km.
With the help of this scheme, approximately 47 million gallon surplus mine water is presently
being discharged into natural water courses from the mines of Barora, Block-II & Govindpur
areas of BCCL. This water is being stored in two reservoirs situated in Khonathi and Behrakudar
villages with storage capacities 16 million gallon & 31 million gallon and with area of about 4.0
ha & 4.5 ha respectively.
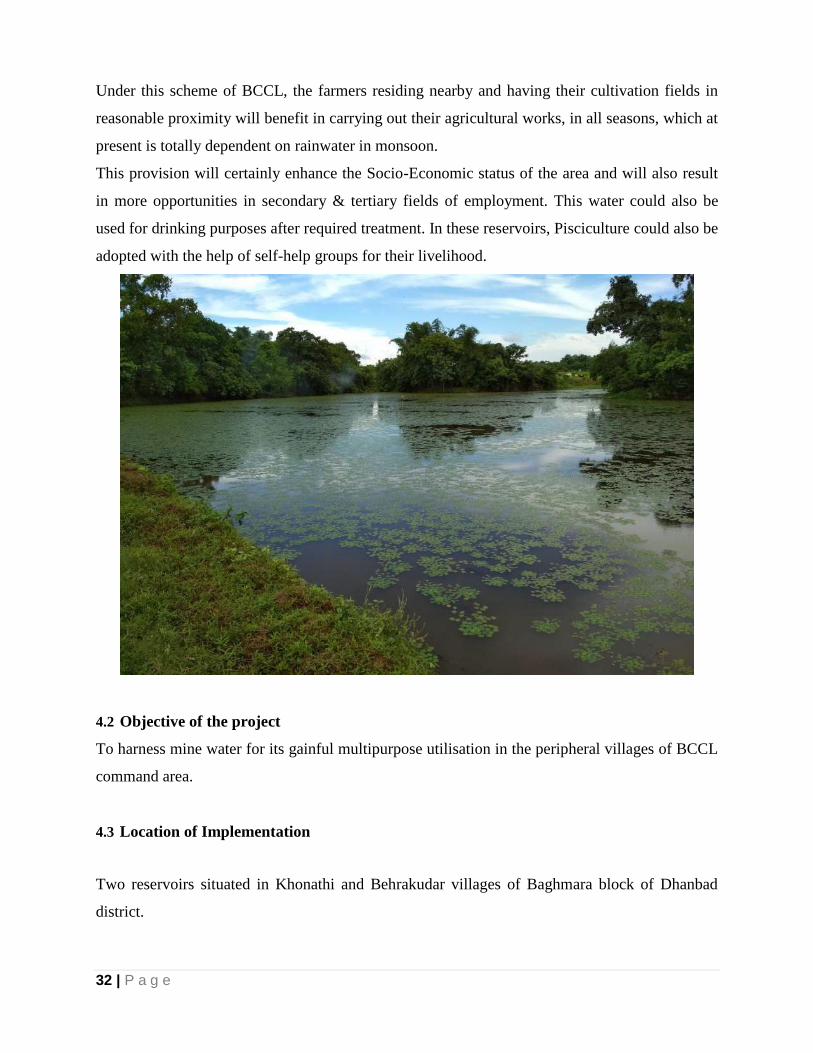
32 | P a g e
Under this scheme of BCCL, the farmers residing nearby and having their cultivation fields in
reasonable proximity will benefit in carrying out their agricultural works, in all seasons, which at
present is totally dependent on rainwater in monsoon.
This provision will certainly enhance the Socio-Economic status of the area and will also result
in more opportunities in secondary & tertiary fields of employment. This water could also be
used for drinking purposes after required treatment. In these reservoirs, Pisciculture could also be
adopted with the help of self-help groups for their livelihood.
4.2 Objective of the project
To harness mine water for its gainful multipurpose utilisation in the peripheral villages of BCCL
command area.
4.3 Location of Implementation
Two reservoirs situated in Khonathi and Behrakudar villages of Baghmara block of Dhanbad
district.
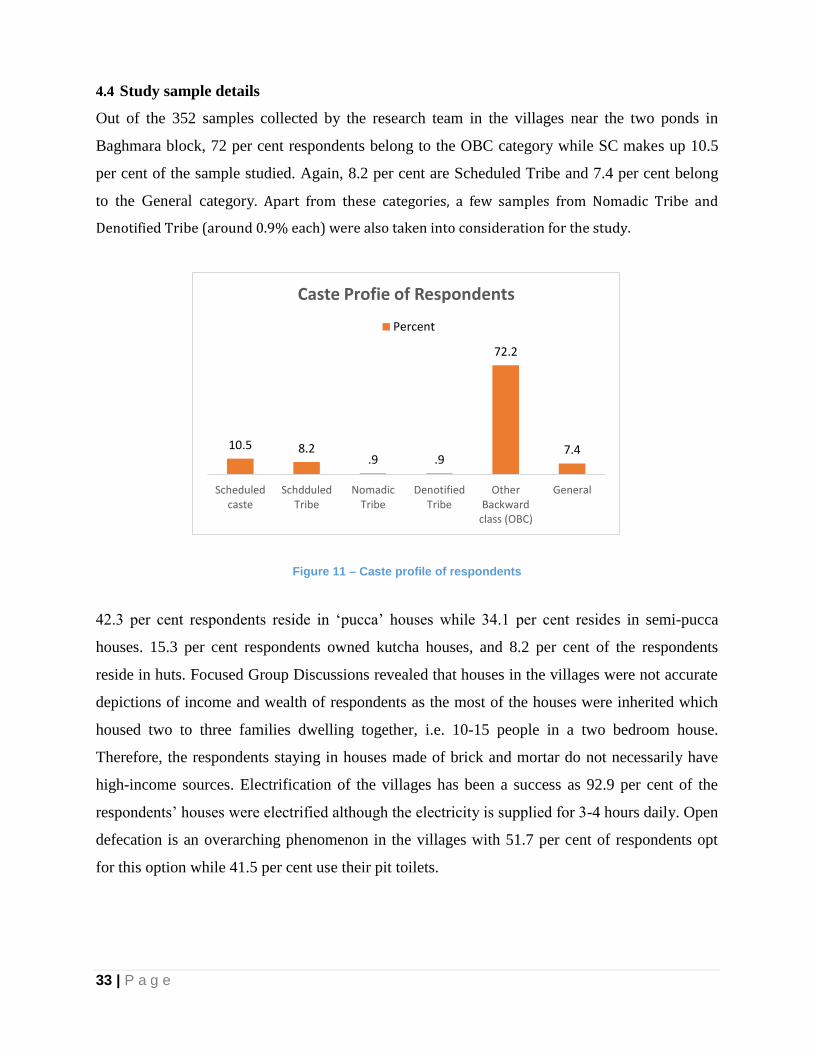
33 | P a g e
4.4 Study sample details
Out of the 352 samples collected by the research team in the villages near the two ponds in
Baghmara block, 72 per cent respondents belong to the OBC category while SC makes up 10.5
per cent of the sample studied. Again, 8.2 per cent are Scheduled Tribe and 7.4 per cent belong
to the General category. Apart from these categories, a few samples from Nomadic Tribe and
Denotified Tribe (around 0.9% each) were also taken into consideration for the study.
Figure 11 – Caste profile of respondents
42.3 per cent respondents reside in „pucca‟ houses while 34.1 per cent resides in semi-pucca
houses. 15.3 per cent respondents owned kutcha houses, and 8.2 per cent of the respondents
reside in huts. Focused Group Discussions revealed that houses in the villages were not accurate
depictions of income and wealth of respondents as the most of the houses were inherited which
housed two to three families dwelling together, i.e. 10-15 people in a two bedroom house.
Therefore, the respondents staying in houses made of brick and mortar do not necessarily have
high-income sources. Electrification of the villages has been a success as 92.9 per cent of the
respondents‟ houses were electrified although the electricity is supplied for 3-4 hours daily. Open
defecation is an overarching phenomenon in the villages with 51.7 per cent of respondents opt
for this option while 41.5 per cent use their pit toilets.
10.5 8.2 .9 .9
72.2
7.4
Scheduledcaste
SchdduledTribe
NomadicTribe
DenotifiedTribe
OtherBackward
class (OBC)
General
Caste Profie of Respondents
Percent
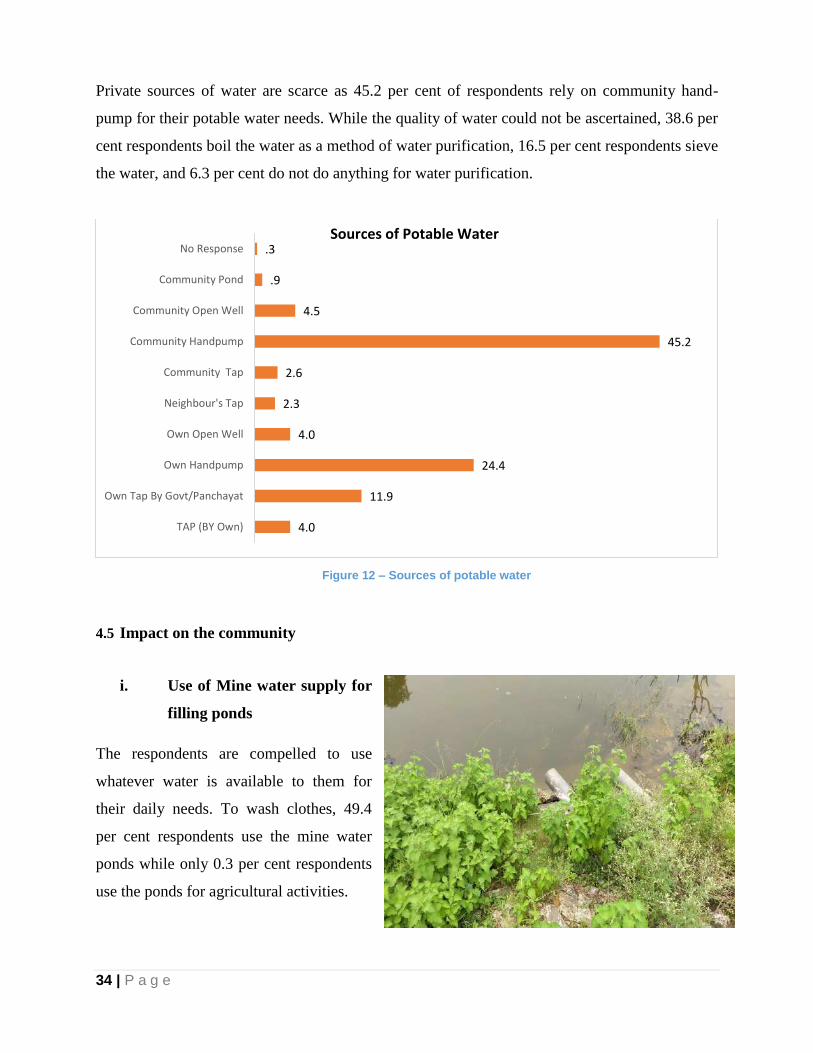
34 | P a g e
Private sources of water are scarce as 45.2 per cent of respondents rely on community hand-
pump for their potable water needs. While the quality of water could not be ascertained, 38.6 per
cent respondents boil the water as a method of water purification, 16.5 per cent respondents sieve
the water, and 6.3 per cent do not do anything for water purification.
Figure 12 – Sources of potable water
4.5 Impact on the community
i. Use of Mine water supply for
filling ponds
The respondents are compelled to use
whatever water is available to them for
their daily needs. To wash clothes, 49.4
per cent respondents use the mine water
ponds while only 0.3 per cent respondents
use the ponds for agricultural activities.
4.0
11.9
24.4
4.0
2.3
2.6
45.2
4.5
.9
.3
TAP (BY Own)
Own Tap By Govt/Panchayat
Own Handpump
Own Open Well
Neighbour's Tap
Community Tap
Community Handpump
Community Open Well
Community Pond
No ResponseSources of Potable Water
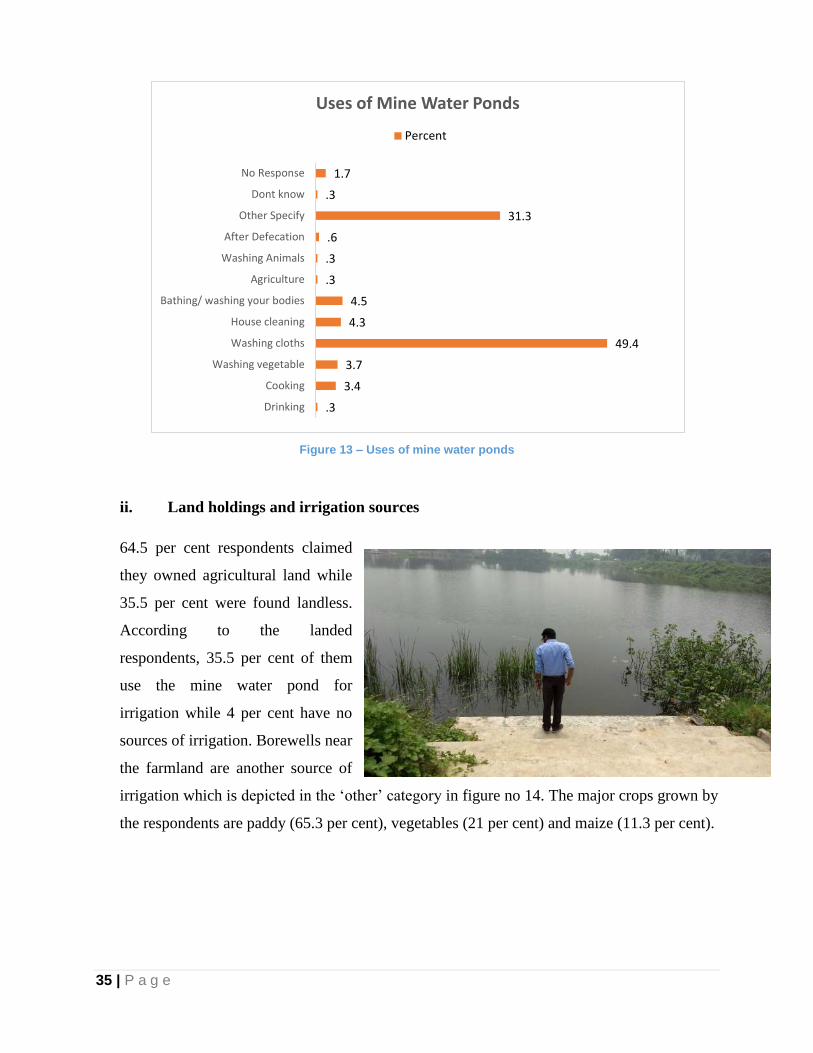
35 | P a g e
Figure 13 – Uses of mine water ponds
ii. Land holdings and irrigation sources
64.5 per cent respondents claimed
they owned agricultural land while
35.5 per cent were found landless.
According to the landed
respondents, 35.5 per cent of them
use the mine water pond for
irrigation while 4 per cent have no
sources of irrigation. Borewells near
the farmland are another source of
irrigation which is depicted in the „other‟ category in figure no 14. The major crops grown by
the respondents are paddy (65.3 per cent), vegetables (21 per cent) and maize (11.3 per cent).
.3
3.4
3.7
49.4
4.3
4.5
.3
.3
.6
31.3
.3
1.7
Drinking
Cooking
Washing vegetable
Washing cloths
House cleaning
Bathing/ washing your bodies
Agriculture
Washing Animals
After Defecation
Other Specify
Dont know
No Response
Uses of Mine Water Ponds
Percent
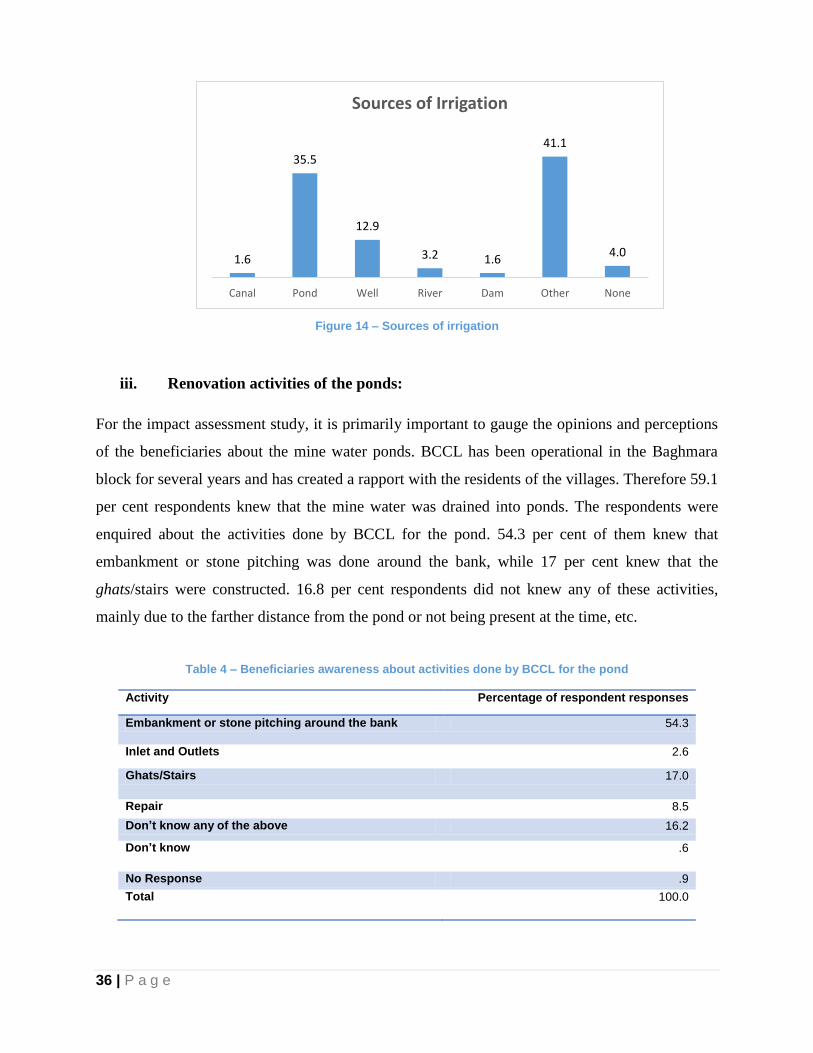
36 | P a g e
Figure 14 – Sources of irrigation
iii. Renovation activities of the ponds:
For the impact assessment study, it is primarily important to gauge the opinions and perceptions
of the beneficiaries about the mine water ponds. BCCL has been operational in the Baghmara
block for several years and has created a rapport with the residents of the villages. Therefore 59.1
per cent respondents knew that the mine water was drained into ponds. The respondents were
enquired about the activities done by BCCL for the pond. 54.3 per cent of them knew that
embankment or stone pitching was done around the bank, while 17 per cent knew that the
ghats/stairs were constructed. 16.8 per cent respondents did not knew any of these activities,
mainly due to the farther distance from the pond or not being present at the time, etc.
Table 4 – Beneficiaries awareness about activities done by BCCL for the pond
Activity Percentage of respondent responses
Embankment or stone pitching around the bank 54.3
Inlet and Outlets 2.6
Ghats/Stairs 17.0
Repair 8.5
Don’t know any of the above 16.2
Don’t know .6
No Response .9
Total 100.0
1.6
35.5
12.9
3.2 1.6
41.1
4.0
Canal Pond Well River Dam Other None
Sources of Irrigation
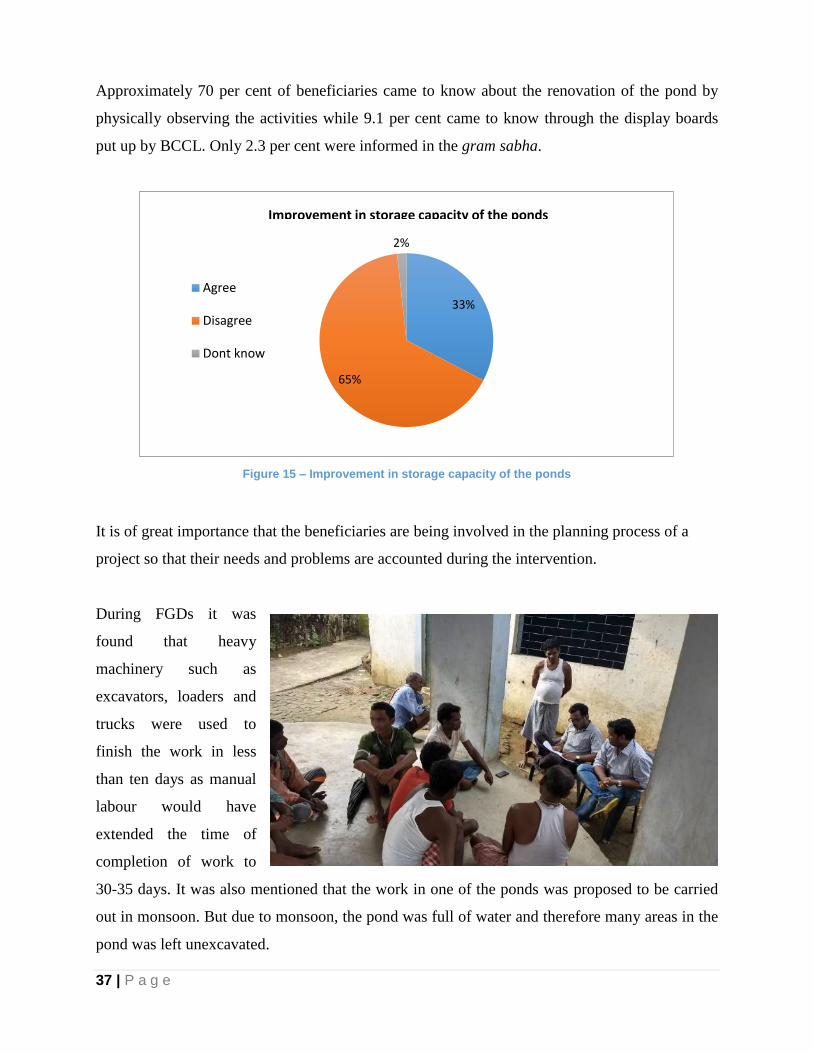
37 | P a g e
Approximately 70 per cent of beneficiaries came to know about the renovation of the pond by
physically observing the activities while 9.1 per cent came to know through the display boards
put up by BCCL. Only 2.3 per cent were informed in the gram sabha.
Figure 15 – Improvement in storage capacity of the ponds
It is of great importance that the beneficiaries are being involved in the planning process of a
project so that their needs and problems are accounted during the intervention.
During FGDs it was
found that heavy
machinery such as
excavators, loaders and
trucks were used to
finish the work in less
than ten days as manual
labour would have
extended the time of
completion of work to
30-35 days. It was also mentioned that the work in one of the ponds was proposed to be carried
out in monsoon. But due to monsoon, the pond was full of water and therefore many areas in the
pond was left unexcavated.
33%
65%
2%
Agree
Disagree
Dont know
Improvement in storage capacity of the ponds
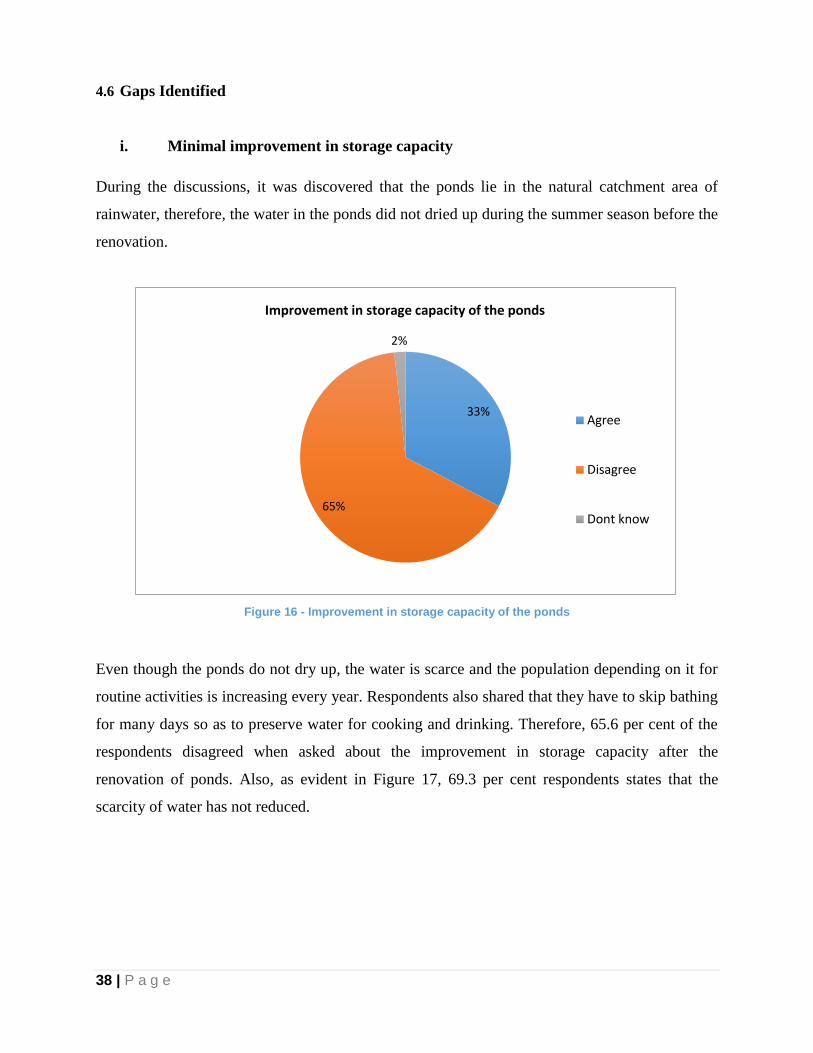
38 | P a g e
4.6 Gaps Identified
i. Minimal improvement in storage capacity
During the discussions, it was discovered that the ponds lie in the natural catchment area of
rainwater, therefore, the water in the ponds did not dried up during the summer season before the
renovation.
Figure 16 - Improvement in storage capacity of the ponds
Even though the ponds do not dry up, the water is scarce and the population depending on it for
routine activities is increasing every year. Respondents also shared that they have to skip bathing
for many days so as to preserve water for cooking and drinking. Therefore, 65.6 per cent of the
respondents disagreed when asked about the improvement in storage capacity after the
renovation of ponds. Also, as evident in Figure 17, 69.3 per cent respondents states that the
scarcity of water has not reduced.
33%
65%
2%
Agree
Disagree
Dont know
Improvement in storage capacity of the ponds
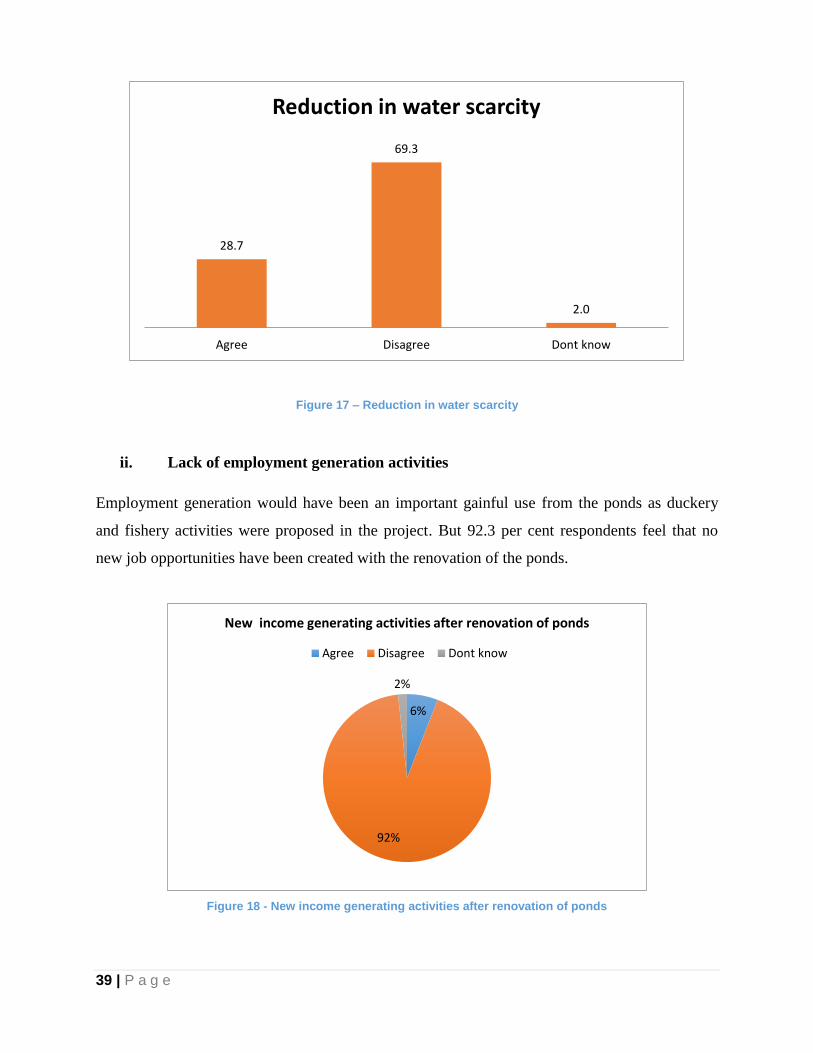
39 | P a g e
Figure 17 – Reduction in water scarcity
ii. Lack of employment generation activities
Employment generation would have been an important gainful use from the ponds as duckery
and fishery activities were proposed in the project. But 92.3 per cent respondents feel that no
new job opportunities have been created with the renovation of the ponds.
Figure 18 - New income generating activities after renovation of ponds
28.7
69.3
2.0
Agree Disagree Dont know
Reduction in water scarcity
6%
92%
2%
New income generating activities after renovation of ponds
Agree Disagree Dont know
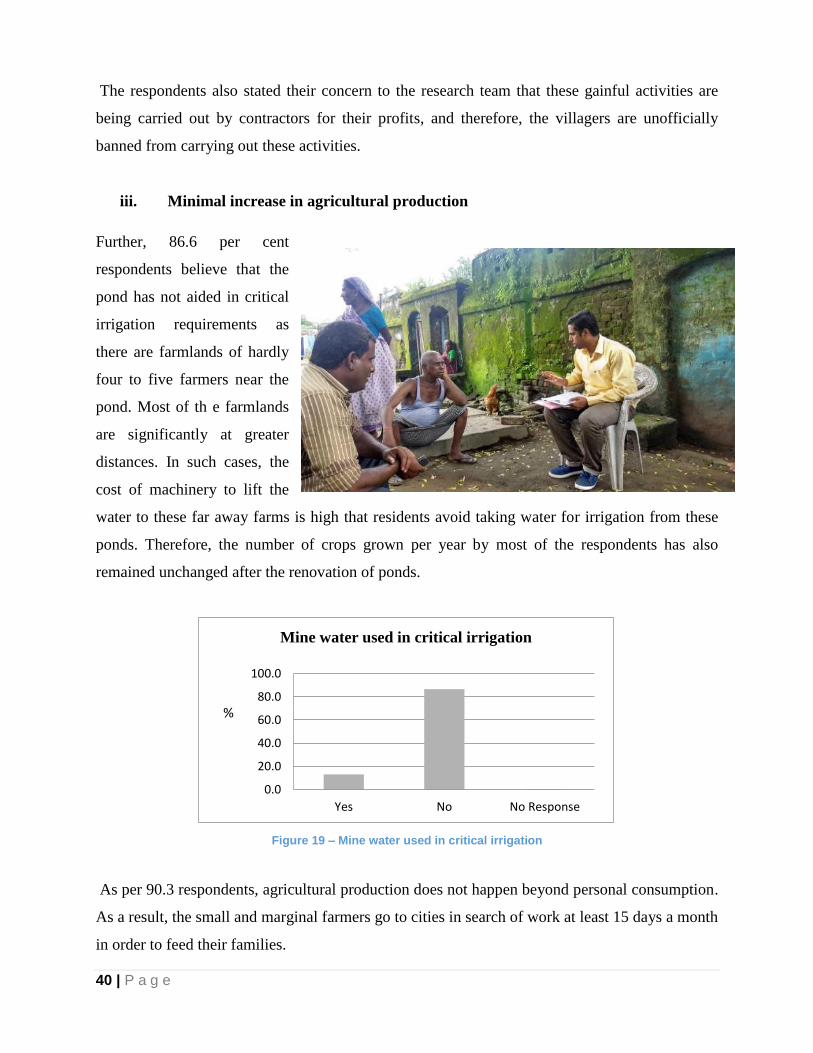
40 | P a g e
The respondents also stated their concern to the research team that these gainful activities are
being carried out by contractors for their profits, and therefore, the villagers are unofficially
banned from carrying out these activities.
iii. Minimal increase in agricultural production
Further, 86.6 per cent
respondents believe that the
pond has not aided in critical
irrigation requirements as
there are farmlands of hardly
four to five farmers near the
pond. Most of th e farmlands
are significantly at greater
distances. In such cases, the
cost of machinery to lift the
water to these far away farms is high that residents avoid taking water for irrigation from these
ponds. Therefore, the number of crops grown per year by most of the respondents has also
remained unchanged after the renovation of ponds.
Figure 19 – Mine water used in critical irrigation
As per 90.3 respondents, agricultural production does not happen beyond personal consumption.
As a result, the small and marginal farmers go to cities in search of work at least 15 days a month
in order to feed their families.
0.0
20.0
40.0
60.0
80.0
100.0
Yes No No Response
Mine water used in critical irrigation
%
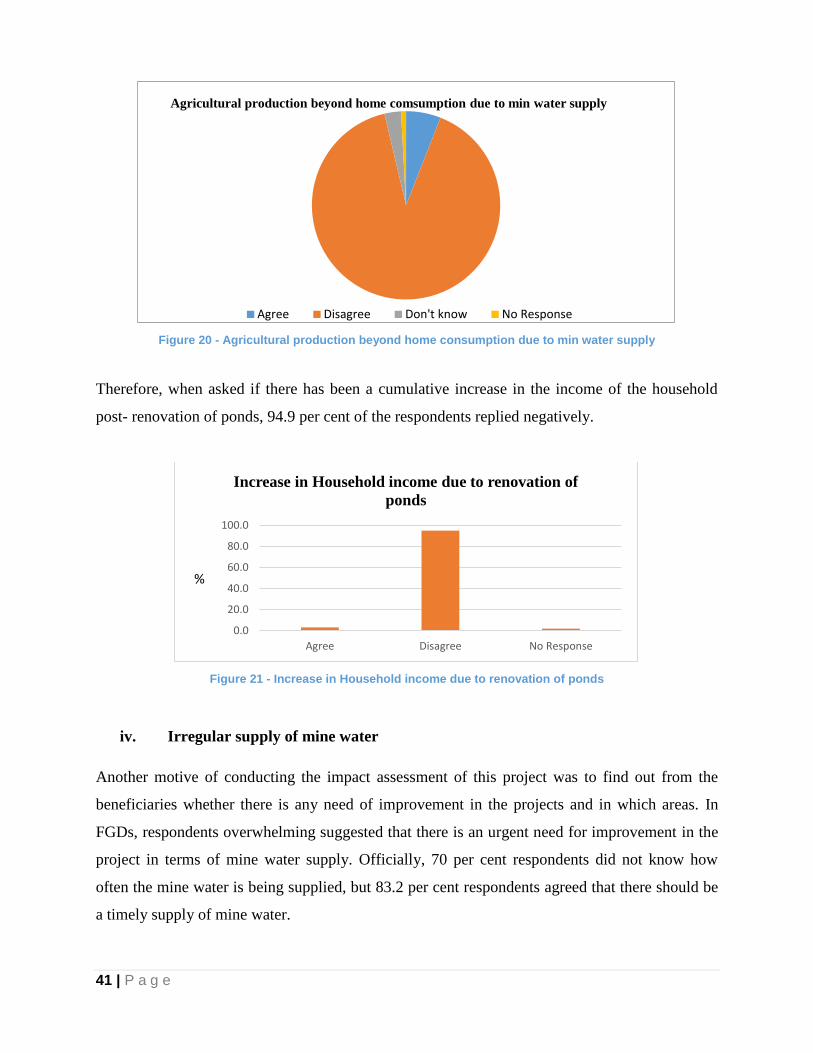
41 | P a g e
Figure 20 - Agricultural production beyond home consumption due to min water supply
Therefore, when asked if there has been a cumulative increase in the income of the household
post- renovation of ponds, 94.9 per cent of the respondents replied negatively.
Figure 21 - Increase in Household income due to renovation of ponds
iv. Irregular supply of mine water
Another motive of conducting the impact assessment of this project was to find out from the
beneficiaries whether there is any need of improvement in the projects and in which areas. In
FGDs, respondents overwhelming suggested that there is an urgent need for improvement in the
project in terms of mine water supply. Officially, 70 per cent respondents did not know how
often the mine water is being supplied, but 83.2 per cent respondents agreed that there should be
a timely supply of mine water.
Agree Disagree Don't know No Response
Agricultural production beyond home comsumption due to min water supply
0.0
20.0
40.0
60.0
80.0
100.0
Agree Disagree No Response
Increase in Household income due to renovation of
ponds
%
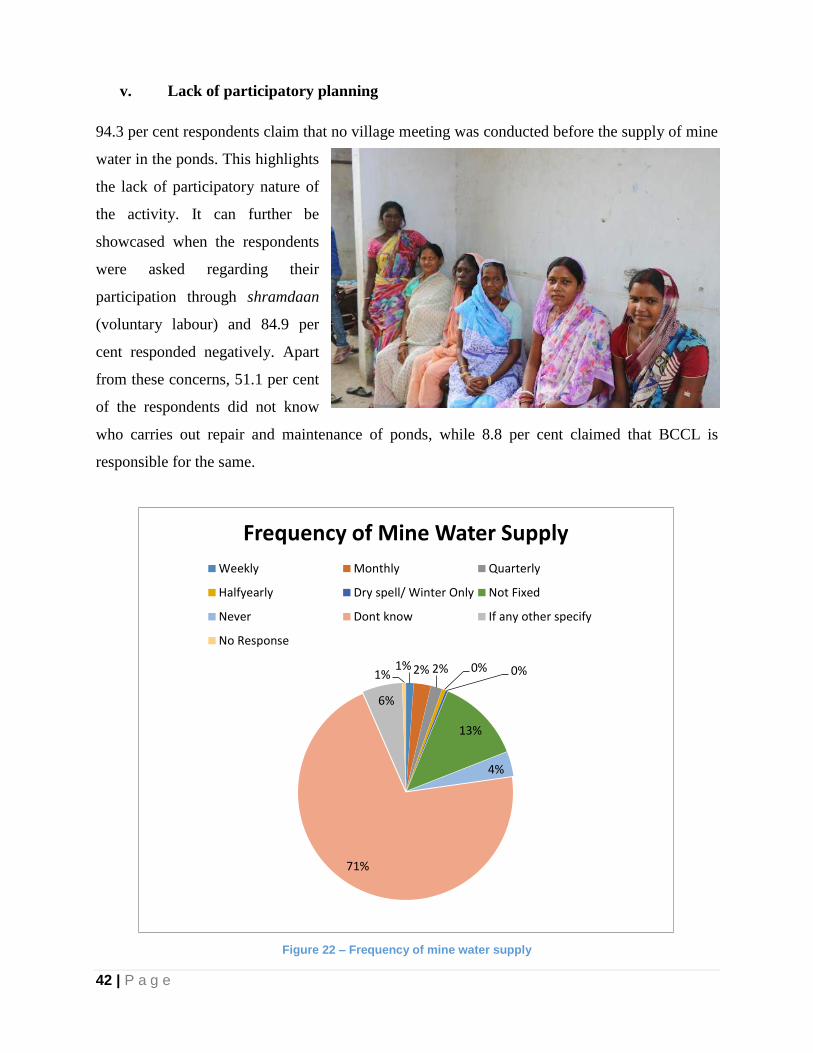
42 | P a g e
v. Lack of participatory planning
94.3 per cent respondents claim that no village meeting was conducted before the supply of mine
water in the ponds. This highlights
the lack of participatory nature of
the activity. It can further be
showcased when the respondents
were asked regarding their
participation through shramdaan
(voluntary labour) and 84.9 per
cent responded negatively. Apart
from these concerns, 51.1 per cent
of the respondents did not know
who carries out repair and maintenance of ponds, while 8.8 per cent claimed that BCCL is
responsible for the same.
Figure 22 – Frequency of mine water supply
1% 2% 2% 0% 0%
13%
4%
71%
6%
1%
Frequency of Mine Water Supply
Weekly Monthly Quarterly
Halfyearly Dry spell/ Winter Only Not Fixed
Never Dont know If any other specify
No Response
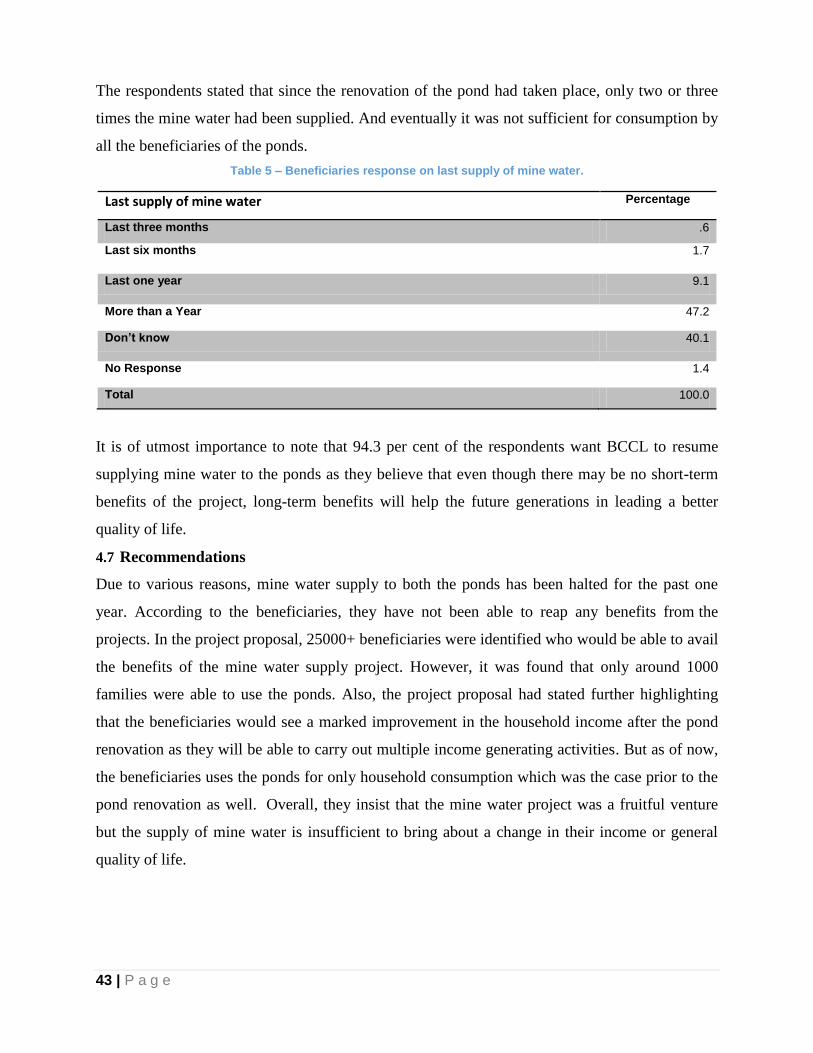
43 | P a g e
The respondents stated that since the renovation of the pond had taken place, only two or three
times the mine water had been supplied. And eventually it was not sufficient for consumption by
all the beneficiaries of the ponds.
Table 5 – Beneficiaries response on last supply of mine water.
Last supply of mine water Percentage
Last three months .6
Last six months 1.7
Last one year 9.1
More than a Year 47.2
Don’t know 40.1
No Response 1.4
Total 100.0
It is of utmost importance to note that 94.3 per cent of the respondents want BCCL to resume
supplying mine water to the ponds as they believe that even though there may be no short-term
benefits of the project, long-term benefits will help the future generations in leading a better
quality of life.
4.7 Recommendations
Due to various reasons, mine water supply to both the ponds has been halted for the past one
year. According to the beneficiaries, they have not been able to reap any benefits from the
projects. In the project proposal, 25000+ beneficiaries were identified who would be able to avail
the benefits of the mine water supply project. However, it was found that only around 1000
families were able to use the ponds. Also, the project proposal had stated further highlighting
that the beneficiaries would see a marked improvement in the household income after the pond
renovation as they will be able to carry out multiple income generating activities. But as of now,
the beneficiaries uses the ponds for only household consumption which was the case prior to the
pond renovation as well. Overall, they insist that the mine water project was a fruitful venture
but the supply of mine water is insufficient to bring about a change in their income or general
quality of life.
44 | P a g e
Following are the main recommendations for the improvement of the Mine Water supply
project:
Participatory approach: Participatory project development is necessary to gauge the
perception and needs of the beneficiarie,s and hence the project needs to be modelled
around that.
Pond upkeep: Repairs and maintenance of the ponds need to be carried out regularly with
an immediate attention to Khonati pond as one of the pipes laid near this pond has been
damaged.
Sharing of information: For proper dissemination of the information regarding project
cost, project details and maps, boards need to be put up at various locations so that
damage to the pipelines could be avoided.
Focus on employment generation: A plan needs to be developed to ensure effective
utilisation of the mine water supplied to the ponds which would subsequently lead to
augmentation of household incomes of the beneficiaries.
BCCL should conduct a cost-benefit analysis as well as Social Return on Investments
(SROI) analysis in such large-scale projects.
45 | P a g e
CHAPTER 5 - VILLAGE ADOPTION
PROJECT (LAHBERA)
5.1 Introduction
Lahbera, a village situated in Jharia block of Dhanbad district, Jharkhand is one of the centers
attraction of BCCL CSR activities. The village mainly consists of the tribal population of 392
people with 63 households. The charm of this project lies in many facts, one of which is the
integrated module of development experimented by the BCCL. The BCCL adopted the village in
the year 2009 with an intention of integrated development of tribal for their economic and social
development through various schemes and program run by them. As the part of the CSR
activities, various infrastructural and economic projects were set up that could help the villagers
in their economic development.
5.2 Objectives of the Study
The main objectives of the project is to develop the selected village in an integrated manner
ensuring its holistic and integrated development through capacity building and participation of
local people and institutions, and this is done through establishing and creating various
infrastructures such as:
a. Construction of Primary School
b. Masala Chakki,
c. Health Centre
d. Sewing Training Centre
e. Multipurpose Hall
f. Adult Education Centre
g. Pipeline for water supplies
h. PCC Road and Drainage lines
i. Solar lights
j. Playground
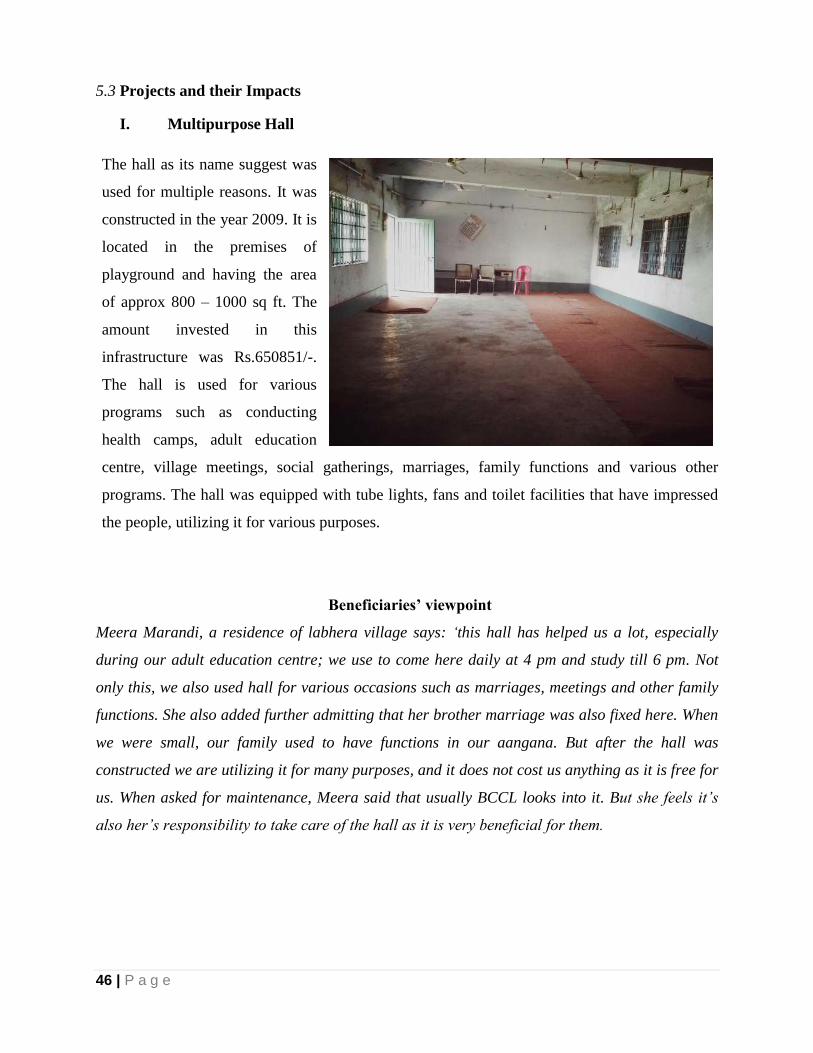
46 | P a g e
5.3 Projects and their Impacts
I. Multipurpose Hall
The hall as its name suggest was
used for multiple reasons. It was
constructed in the year 2009. It is
located in the premises of
playground and having the area
of approx 800 – 1000 sq ft. The
amount invested in this
infrastructure was Rs.650851/-.
The hall is used for various
programs such as conducting
health camps, adult education
centre, village meetings, social gatherings, marriages, family functions and various other
programs. The hall was equipped with tube lights, fans and toilet facilities that have impressed
the people, utilizing it for various purposes.
Beneficiaries’ viewpoint
Meera Marandi, a residence of labhera village says: „this hall has helped us a lot, especially
during our adult education centre; we use to come here daily at 4 pm and study till 6 pm. Not
only this, we also used hall for various occasions such as marriages, meetings and other family
functions. She also added further admitting that her brother marriage was also fixed here. When
we were small, our family used to have functions in our aangana. But after the hall was
constructed we are utilizing it for many purposes, and it does not cost us anything as it is free for
us. When asked for maintenance, Meera said that usually BCCL looks into it. But she feels it‟s
also her‟s responsibility to take care of the hall as it is very beneficial for them.
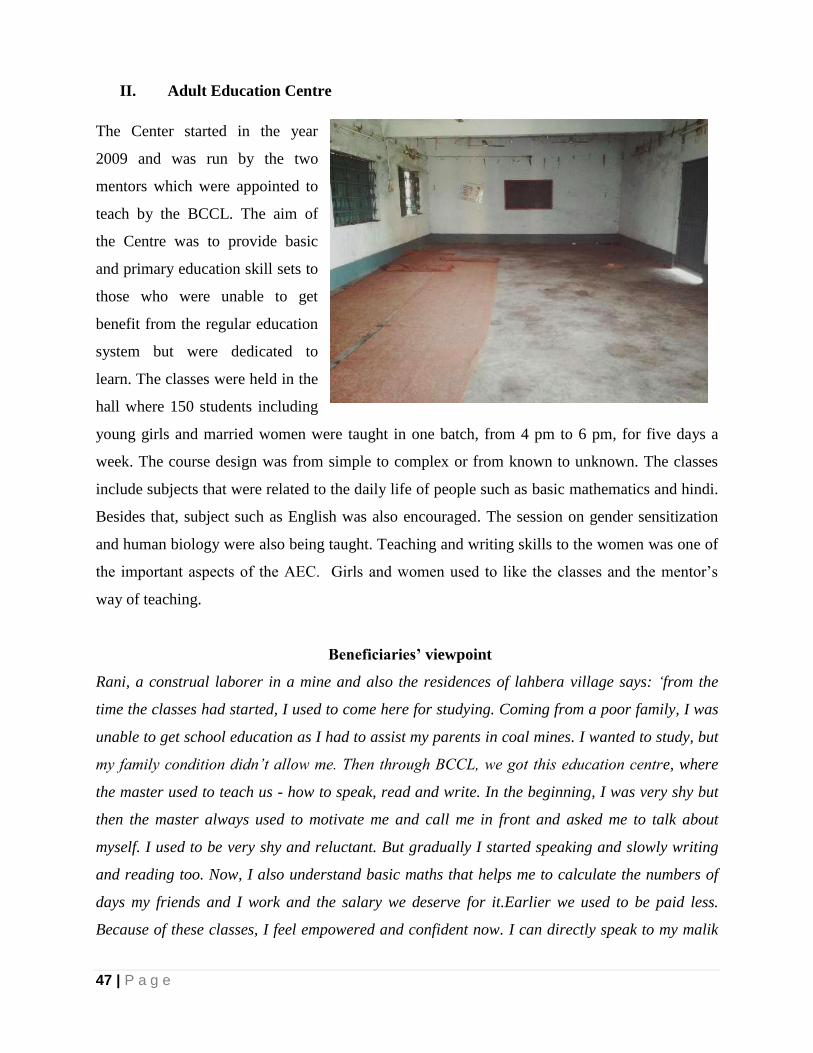
47 | P a g e
II. Adult Education Centre
The Center started in the year
2009 and was run by the two
mentors which were appointed to
teach by the BCCL. The aim of
the Centre was to provide basic
and primary education skill sets to
those who were unable to get
benefit from the regular education
system but were dedicated to
learn. The classes were held in the
hall where 150 students including
young girls and married women were taught in one batch, from 4 pm to 6 pm, for five days a
week. The course design was from simple to complex or from known to unknown. The classes
include subjects that were related to the daily life of people such as basic mathematics and hindi.
Besides that, subject such as English was also encouraged. The session on gender sensitization
and human biology were also being taught. Teaching and writing skills to the women was one of
the important aspects of the AEC. Girls and women used to like the classes and the mentor‟s
way of teaching.
Beneficiaries’ viewpoint
Rani, a construal laborer in a mine and also the residences of lahbera village says: „from the
time the classes had started, I used to come here for studying. Coming from a poor family, I was
unable to get school education as I had to assist my parents in coal mines. I wanted to study, but
my family condition didn‟t allow me. Then through BCCL, we got this education centre, where
the master used to teach us - how to speak, read and write. In the beginning, I was very shy but
then the master always used to motivate me and call me in front and asked me to talk about
myself. I used to be very shy and reluctant. But gradually I started speaking and slowly writing
and reading too. Now, I also understand basic maths that helps me to calculate the numbers of
days my friends and I work and the salary we deserve for it.Earlier we used to be paid less.
Because of these classes, I feel empowered and confident now. I can directly speak to my malik
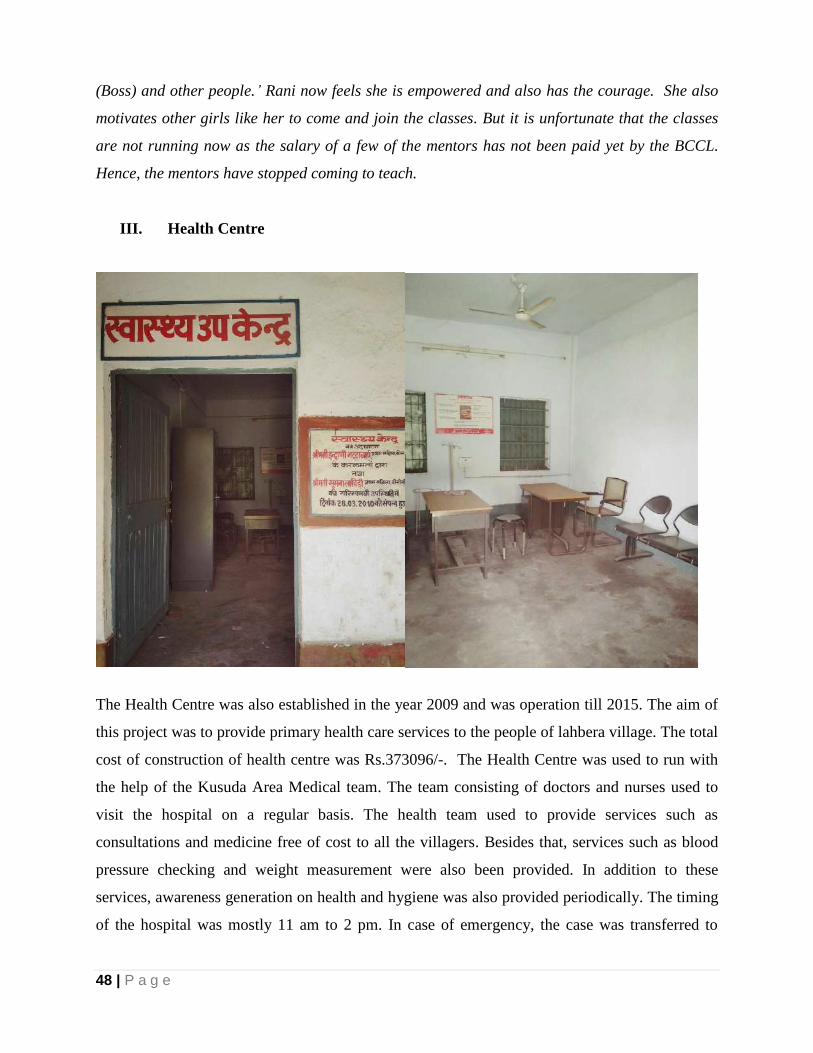
48 | P a g e
(Boss) and other people.‟ Rani now feels she is empowered and also has the courage. She also
motivates other girls like her to come and join the classes. But it is unfortunate that the classes
are not running now as the salary of a few of the mentors has not been paid yet by the BCCL.
Hence, the mentors have stopped coming to teach.
III. Health Centre
The Health Centre was also established in the year 2009 and was operation till 2015. The aim of
this project was to provide primary health care services to the people of lahbera village. The total
cost of construction of health centre was Rs.373096/-. The Health Centre was used to run with
the help of the Kusuda Area Medical team. The team consisting of doctors and nurses used to
visit the hospital on a regular basis. The health team used to provide services such as
consultations and medicine free of cost to all the villagers. Besides that, services such as blood
pressure checking and weight measurement were also been provided. In addition to these
services, awareness generation on health and hygiene was also provided periodically. The timing
of the hospital was mostly 11 am to 2 pm. In case of emergency, the case was transferred to
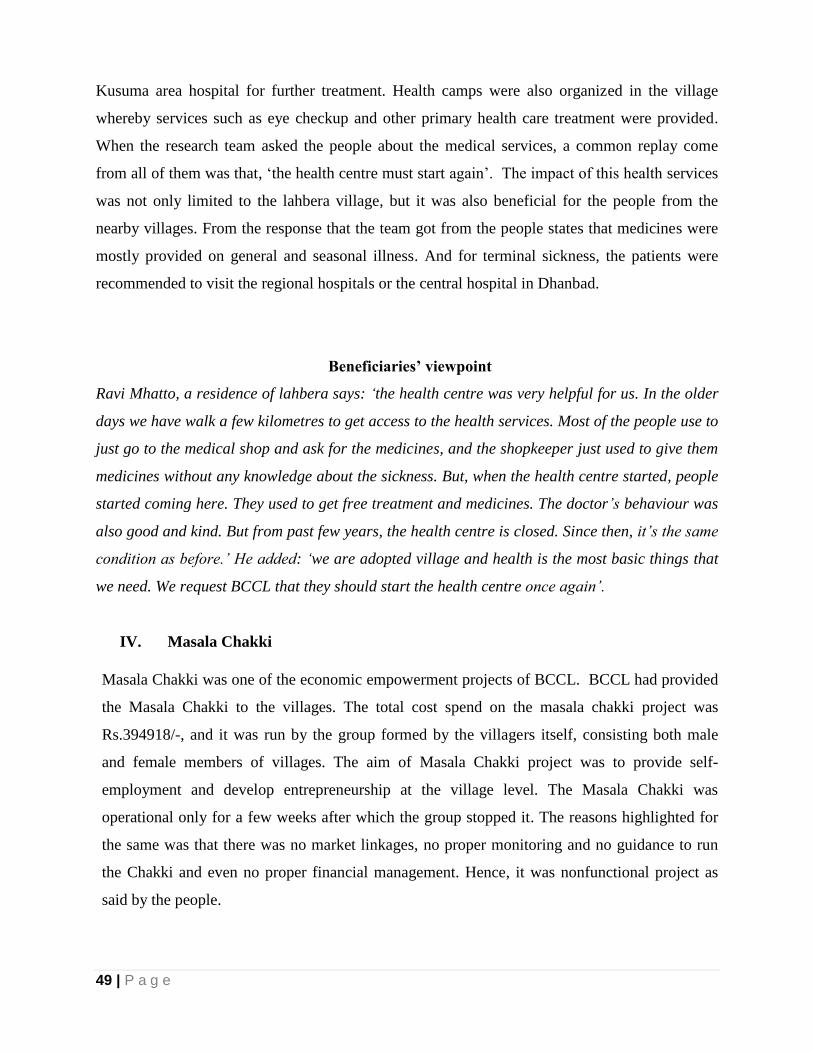
49 | P a g e
Kusuma area hospital for further treatment. Health camps were also organized in the village
whereby services such as eye checkup and other primary health care treatment were provided.
When the research team asked the people about the medical services, a common replay come
from all of them was that, „the health centre must start again‟. The impact of this health services
was not only limited to the lahbera village, but it was also beneficial for the people from the
nearby villages. From the response that the team got from the people states that medicines were
mostly provided on general and seasonal illness. And for terminal sickness, the patients were
recommended to visit the regional hospitals or the central hospital in Dhanbad.
Beneficiaries’ viewpoint
Ravi Mhatto, a residence of lahbera says: „the health centre was very helpful for us. In the older
days we have walk a few kilometres to get access to the health services. Most of the people use to
just go to the medical shop and ask for the medicines, and the shopkeeper just used to give them
medicines without any knowledge about the sickness. But, when the health centre started, people
started coming here. They used to get free treatment and medicines. The doctor‟s behaviour was
also good and kind. But from past few years, the health centre is closed. Since then, it‟s the same
condition as before.‟ He added: „we are adopted village and health is the most basic things that
we need. We request BCCL that they should start the health centre once again‟.
IV. Masala Chakki
Masala Chakki was one of the economic empowerment projects of BCCL. BCCL had provided
the Masala Chakki to the villages. The total cost spend on the masala chakki project was
Rs.394918/-, and it was run by the group formed by the villagers itself, consisting both male
and female members of villages. The aim of Masala Chakki project was to provide self-
employment and develop entrepreneurship at the village level. The Masala Chakki was
operational only for a few weeks after which the group stopped it. The reasons highlighted for
the same was that there was no market linkages, no proper monitoring and no guidance to run
the Chakki and even no proper financial management. Hence, it was nonfunctional project as
said by the people.
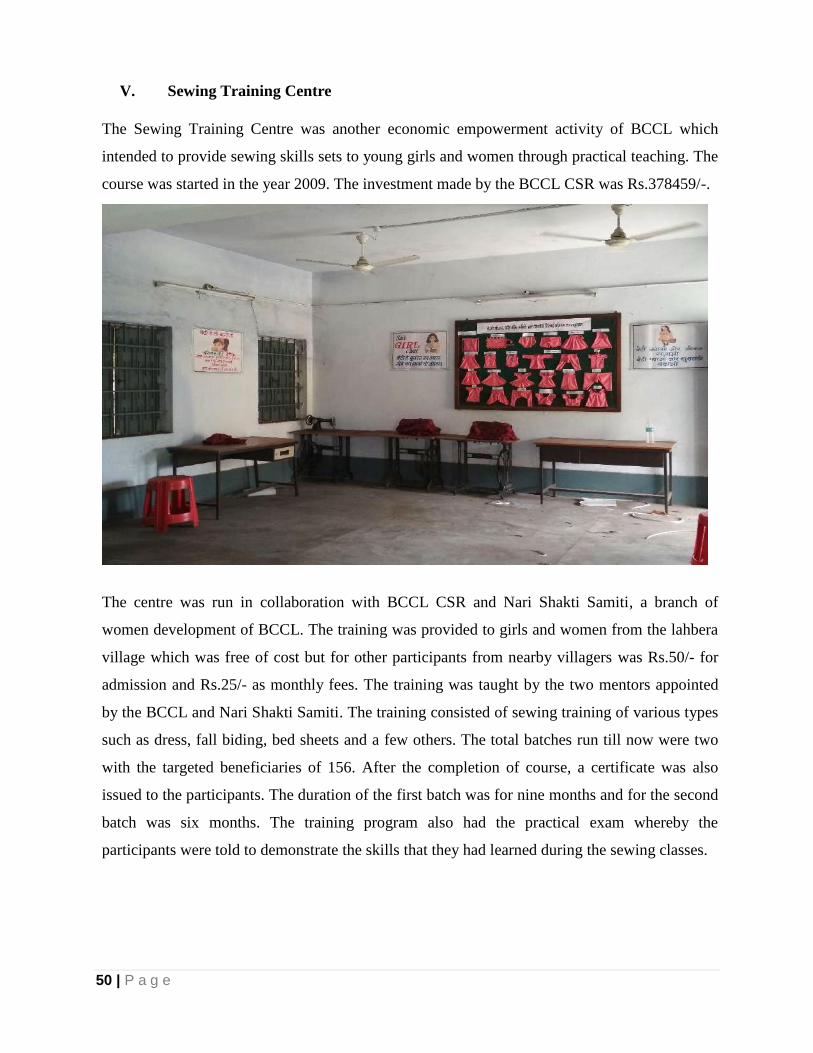
50 | P a g e
V. Sewing Training Centre
The Sewing Training Centre was another economic empowerment activity of BCCL which
intended to provide sewing skills sets to young girls and women through practical teaching. The
course was started in the year 2009. The investment made by the BCCL CSR was Rs.378459/-.
The centre was run in collaboration with BCCL CSR and Nari Shakti Samiti, a branch of
women development of BCCL. The training was provided to girls and women from the lahbera
village which was free of cost but for other participants from nearby villagers was Rs.50/- for
admission and Rs.25/- as monthly fees. The training was taught by the two mentors appointed
by the BCCL and Nari Shakti Samiti. The training consisted of sewing training of various types
such as dress, fall biding, bed sheets and a few others. The total batches run till now were two
with the targeted beneficiaries of 156. After the completion of course, a certificate was also
issued to the participants. The duration of the first batch was for nine months and for the second
batch was six months. The training program also had the practical exam whereby the
participants were told to demonstrate the skills that they had learned during the sewing classes.
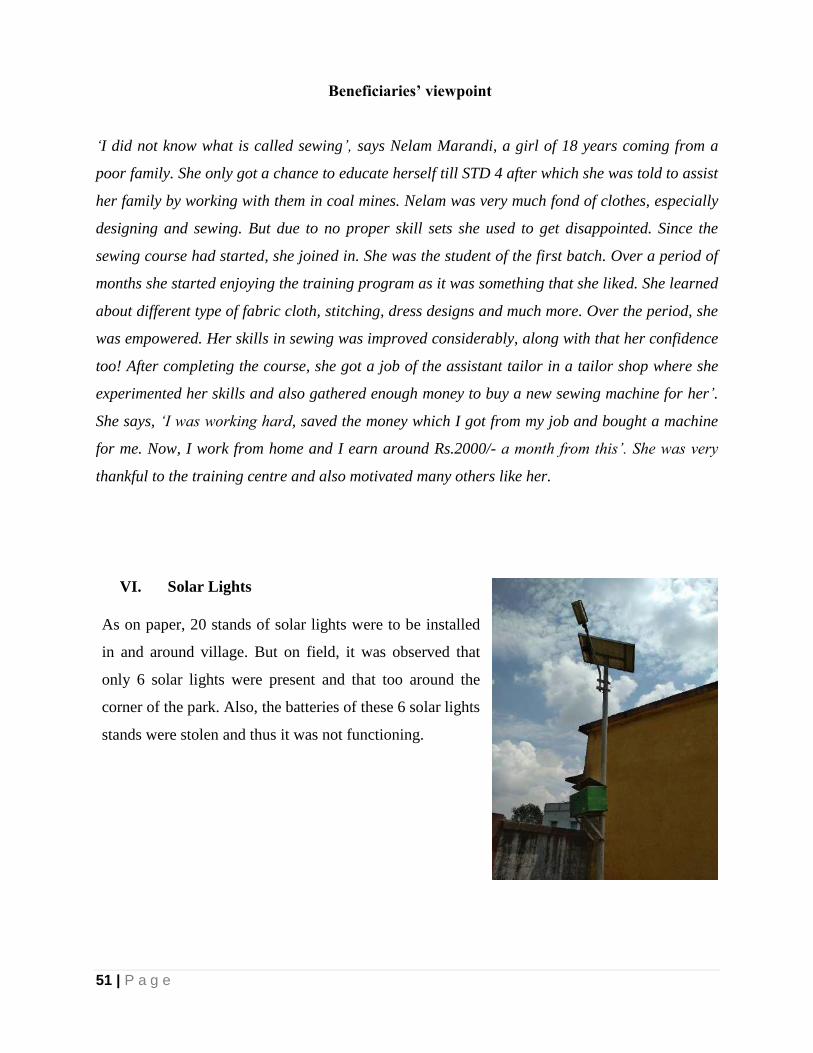
51 | P a g e
Beneficiaries’ viewpoint
„I did not know what is called sewing‟, says Nelam Marandi, a girl of 18 years coming from a
poor family. She only got a chance to educate herself till STD 4 after which she was told to assist
her family by working with them in coal mines. Nelam was very much fond of clothes, especially
designing and sewing. But due to no proper skill sets she used to get disappointed. Since the
sewing course had started, she joined in. She was the student of the first batch. Over a period of
months she started enjoying the training program as it was something that she liked. She learned
about different type of fabric cloth, stitching, dress designs and much more. Over the period, she
was empowered. Her skills in sewing was improved considerably, along with that her confidence
too! After completing the course, she got a job of the assistant tailor in a tailor shop where she
experimented her skills and also gathered enough money to buy a new sewing machine for her‟.
She says, „I was working hard, saved the money which I got from my job and bought a machine
for me. Now, I work from home and I earn around Rs.2000/- a month from this‟. She was very
thankful to the training centre and also motivated many others like her.
VI. Solar Lights
As on paper, 20 stands of solar lights were to be installed
in and around village. But on field, it was observed that
only 6 solar lights were present and that too around the
corner of the park. Also, the batteries of these 6 solar lights
stands were stolen and thus it was not functioning.
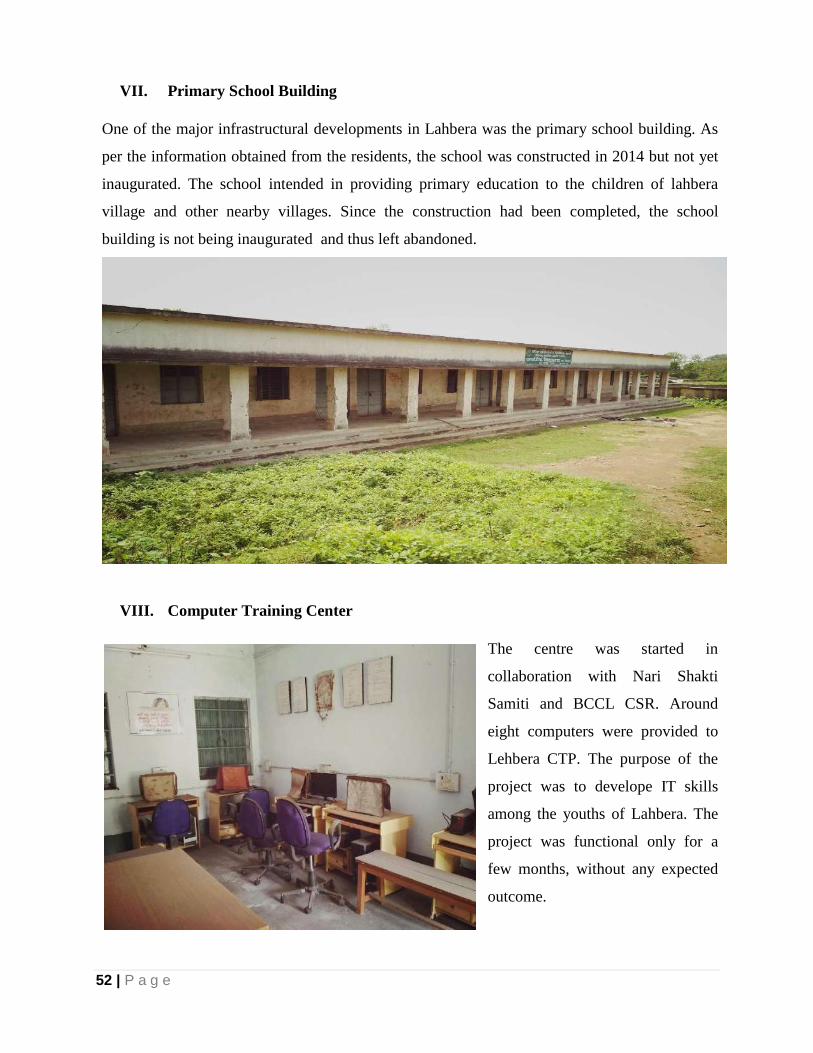
52 | P a g e
VII. Primary School Building
One of the major infrastructural developments in Lahbera was the primary school building. As
per the information obtained from the residents, the school was constructed in 2014 but not yet
inaugurated. The school intended in providing primary education to the children of lahbera
village and other nearby villages. Since the construction had been completed, the school
building is not being inaugurated and thus left abandoned.
VIII. Computer Training Center
The centre was started in
collaboration with Nari Shakti
Samiti and BCCL CSR. Around
eight computers were provided to
Lehbera CTP. The purpose of the
project was to develope IT skills
among the youths of Lahbera. The
project was functional only for a
few months, without any expected
outcome.
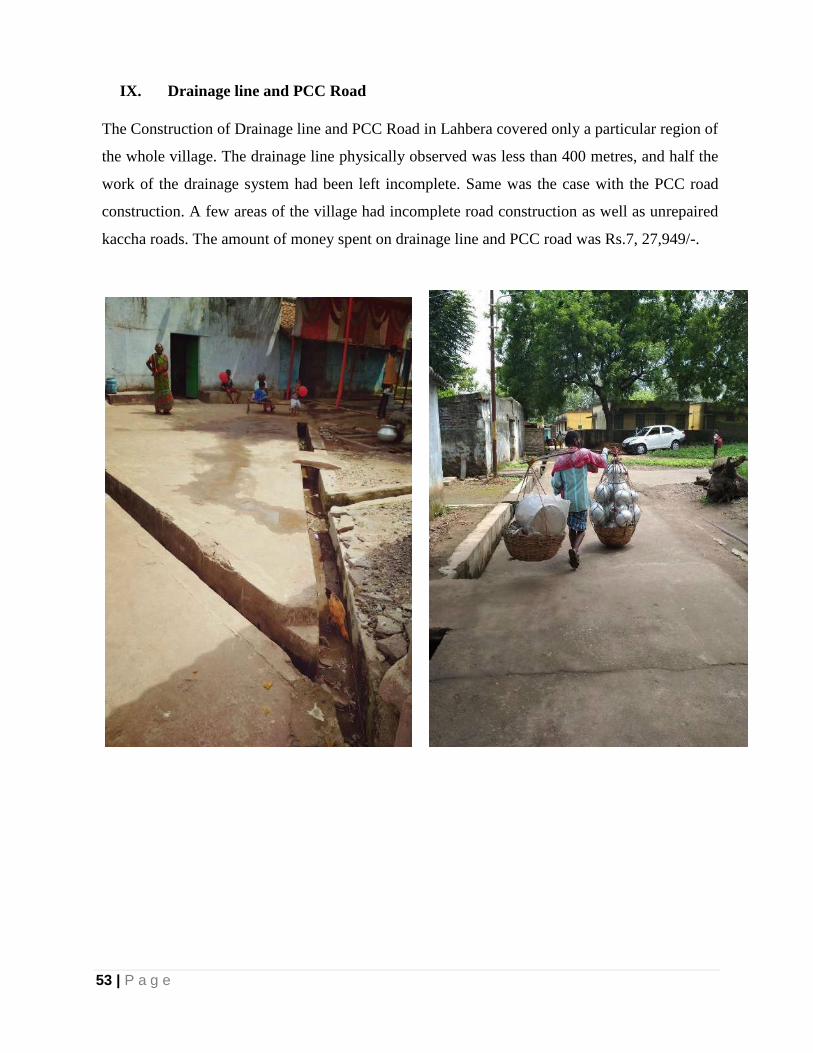
53 | P a g e
IX. Drainage line and PCC Road
The Construction of Drainage line and PCC Road in Lahbera covered only a particular region of
the whole village. The drainage line physically observed was less than 400 metres, and half the
work of the drainage system had been left incomplete. Same was the case with the PCC road
construction. A few areas of the village had incomplete road construction as well as unrepaired
kaccha roads. The amount of money spent on drainage line and PCC road was Rs.7, 27,949/-.
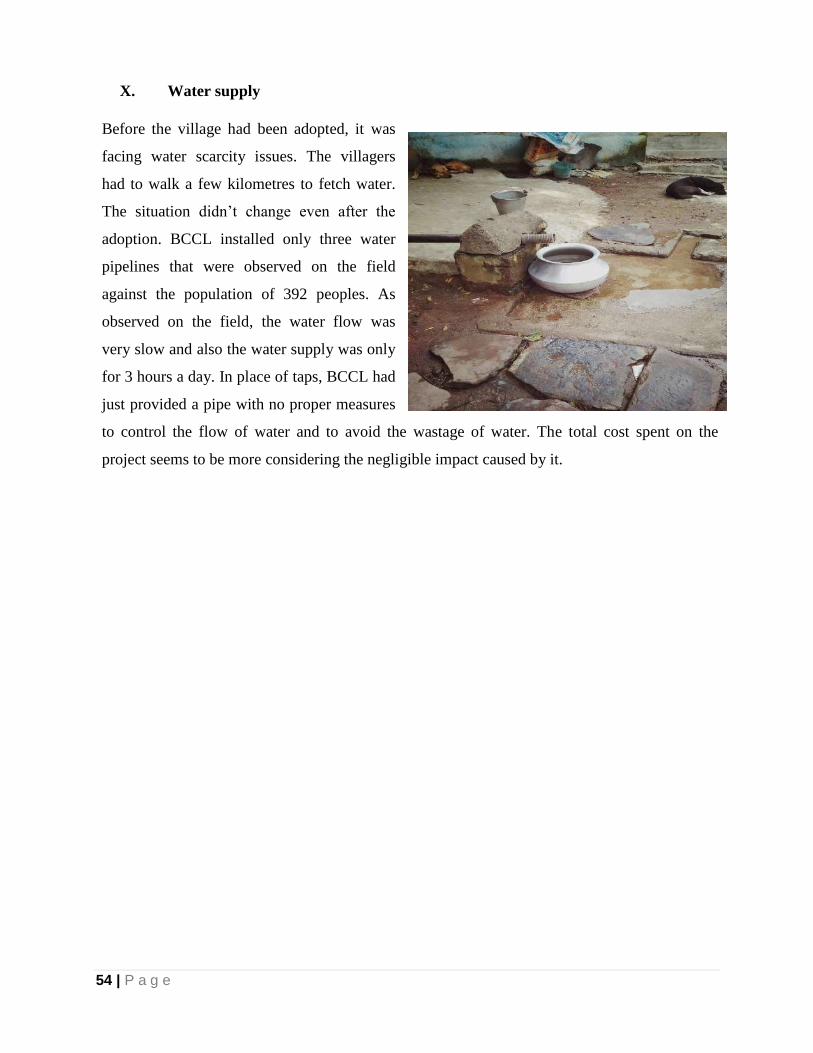
54 | P a g e
X. Water supply
Before the village had been adopted, it was
facing water scarcity issues. The villagers
had to walk a few kilometres to fetch water.
The situation didn‟t change even after the
adoption. BCCL installed only three water
pipelines that were observed on the field
against the population of 392 peoples. As
observed on the field, the water flow was
very slow and also the water supply was only
for 3 hours a day. In place of taps, BCCL had
just provided a pipe with no proper measures
to control the flow of water and to avoid the wastage of water. The total cost spent on the
project seems to be more considering the negligible impact caused by it.
55 | P a g e
5.4 Multi-stakeholder Perspectives on village Adoption project
Table 6 – Multi – stakeholder perspectives on village adoption project
Projects Villagers BCCL
Multipurpose Hall The Hall was very useful for them as
it is easily accessible and can be used
for both, personal and community
functions purposes.
The BCCL was aware of the need
of community hall as it was used
for important purpose, both at
personal and community level.
Health Center The Health centre was useful as it
was providing medical treatment free
of cost. But now disappointed as the
centre is closed from past two years
and even the MMV project has been
stopped. So people now depend upon
the privately run clinics.
As a part of adoption project, health
was seen as an important aspect.
Thus the Health Centre was
constructed.
School Building The school building is constructed.
However, it has not yet started and
thus need to start.
BCCL was aware of the educational
problem of villagers and so they
constructed the school. But the
school has not started yet as the
procurement is under process.
Masala Chakki The people were upset as it had
provided employment only for a few
weeks.
Intention was to generate
employment opportunity by
providing the required
infrastructure.
AEC The centre was very useful as it had
helped many girls and women to
learn basic reading and writing skills
and hence villagers demanded to start
it once again.
Intention was to provide basic skills
of writing and learning.
STC The Training was useful, but at times
there was discrimination among the
girls as the girls from Lahbera were
The intention was to provide
entrepreneur skills to the girls and
women by providing them sewing
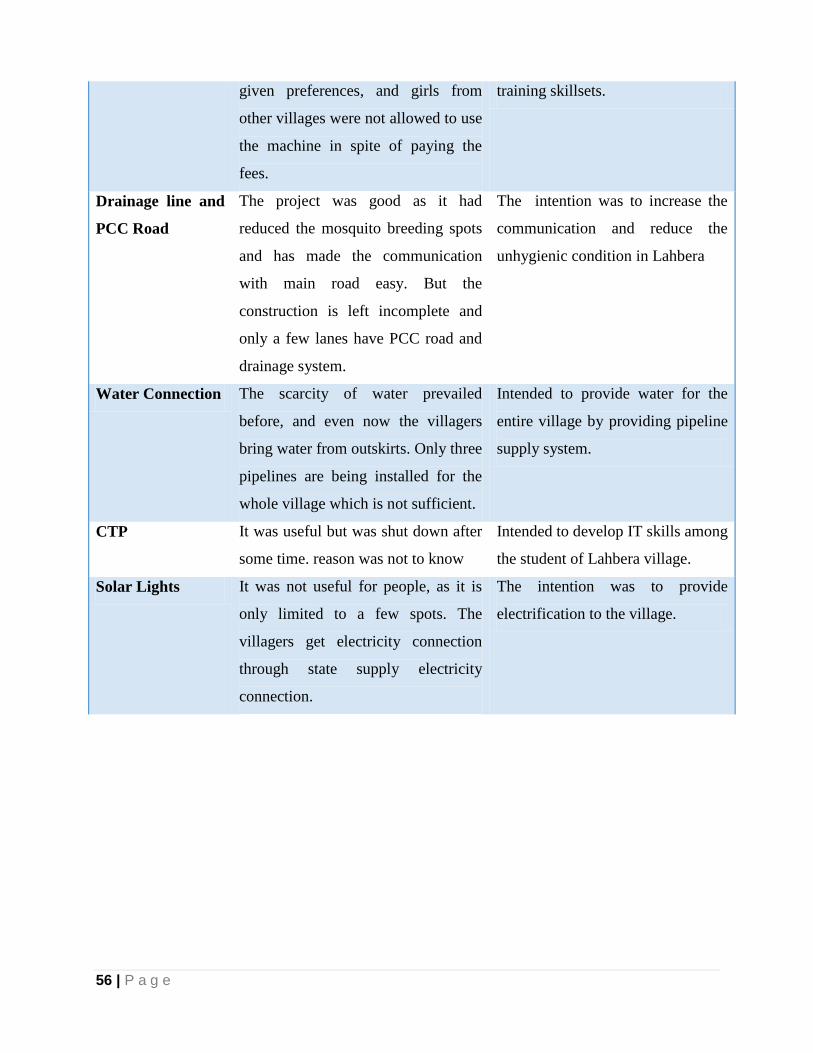
56 | P a g e
given preferences, and girls from
other villages were not allowed to use
the machine in spite of paying the
fees.
training skillsets.
Drainage line and
PCC Road
The project was good as it had
reduced the mosquito breeding spots
and has made the communication
with main road easy. But the
construction is left incomplete and
only a few lanes have PCC road and
drainage system.
The intention was to increase the
communication and reduce the
unhygienic condition in Lahbera
Water Connection The scarcity of water prevailed
before, and even now the villagers
bring water from outskirts. Only three
pipelines are being installed for the
whole village which is not sufficient.
Intended to provide water for the
entire village by providing pipeline
supply system.
CTP It was useful but was shut down after
some time. reason was not to know
Intended to develop IT skills among
the student of Lahbera village.
Solar Lights It was not useful for people, as it is
only limited to a few spots. The
villagers get electricity connection
through state supply electricity
connection.
The intention was to provide
electrification to the village.
57 | P a g e
5.5 Gaps and Scope for Improvement
i. Lack Monitoring: The proposed project intented towards the integrated development of
Lahbera village. But since past few years, no monitoring has been done by the BCCL and
that had led to the ineffectiveness of the projects. Some of the projects have been
unsuccessful, namely Health Center, STP, CTP, and AEC, due to lack of monitoring.
ii. Unfinished projects: A Few of the projects/infrastructures such as school building, road
and drainage lines, solar light stands and water connection is partially done and that had
created a negative image of the company in the eyes of villagers.
iii. Lack of Execution: Among nine projects that were aimed at developing the village four
projects have been unsuccessful, namely Water pipeline connection, Solar Stand Lights,
School and Masala chakki.
iv. Limited Resources in training centre: The resource supply in training centre especially
STP was very limited. The number of students in a batch was more than 50 but the
sewing machines available were only 4. A few batchmates even complaint for not
allowing them to use the machines.
v. No Scope for employment generation: One of the common gaps found among the STP
and the Computer centre was that there was no scope for the students, neither for future
training nor employment generation, as this centre only provided basic training. In case
of masala chakki, no market linkages were made for the production and sale of masala.
vi. Limited growth through training program: The training programs such as STP, AEC,
and CTP had very limited growth outcome as teachers/mentors teaching the courses were
not upgraded, and also the salaries of the mentors were not paid. Thus, it was reflected in
their teaching. In case of STP and CTP, no linkages were created.
58 | P a g e
5.6 Recommendations
i. Creating a local sustainable mechanism to look over the monitoring of the
projects: It is essential that a village development committee consisting of BCCL
officials, village members and the panchayat representative should be formed. This
committee must be autonomous and should monitor and recommend projects that are
essential for the developing Lehbera as an ideal village. At the same time, periodic
training should be provided to the villagers for increasing their skills sets and
capability.
ii. Formation of SHGs: Self Help Groups have played an important role in
development of individual and as well as the community. Therefore, SHGs especially
of women and youth should be formed, and they should be provided training on
capacity building and entrepreneur skills rather than just providing infrastructure.
iii. Need Base Assessment should be done: The demand for a particular project or
infrastructure should come from the voices of people rather than from the BCCL.
Therefore, proper need base assessment should be done.
iv. Creating Jobs and Market linkages: Linkages should be created for jobs so that
after the training the students can get jobs. At the same time, market linkages such as
textile and spice market should be created, might be within BCCL, where the product
produced by the villagers could be sold.
v. Rejuvenating the existing project: The projects such as CTP, ADC, STP, and
Health Centre should be rejuvenated, as these projects had created good impacts on
the villagers. At the same time, it is essential that required resources and periodic
upgradation should be done. Emergency medical vans should be made available. A
female doctor should be available in the health centre.
vi. Linking the villages with existing government schemes: It was evident during the
field visit that most of the villagers belong to the ST community. Hence, they could
be linked with various government schemes and services that are available for them
by creating awareness generation for the same.
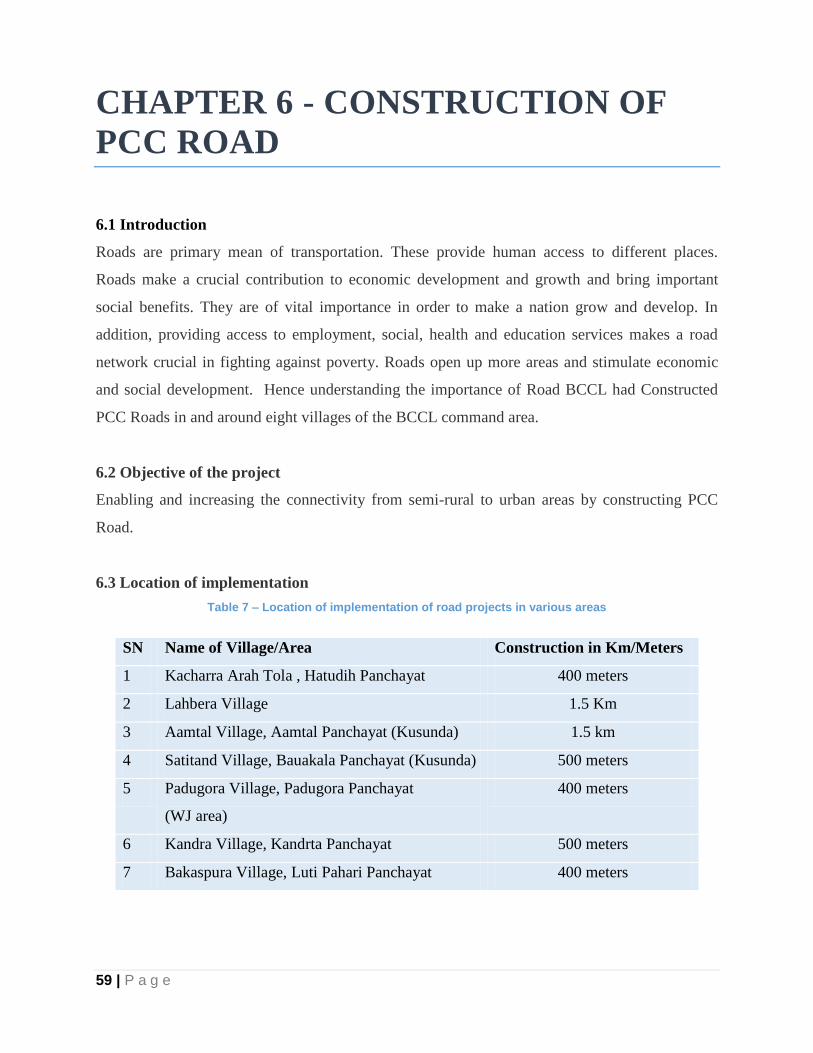
59 | P a g e
CHAPTER 6 - CONSTRUCTION OF
PCC ROAD
6.1 Introduction
Roads are primary mean of transportation. These provide human access to different places.
Roads make a crucial contribution to economic development and growth and bring important
social benefits. They are of vital importance in order to make a nation grow and develop. In
addition, providing access to employment, social, health and education services makes a road
network crucial in fighting against poverty. Roads open up more areas and stimulate economic
and social development. Hence understanding the importance of Road BCCL had Constructed
PCC Roads in and around eight villages of the BCCL command area.
6.2 Objective of the project
Enabling and increasing the connectivity from semi-rural to urban areas by constructing PCC
Road.
6.3 Location of implementation
Table 7 – Location of implementation of road projects in various areas
SN Name of Village/Area Construction in Km/Meters
1 Kacharra Arah Tola , Hatudih Panchayat 400 meters
2 Lahbera Village 1.5 Km
3 Aamtal Village, Aamtal Panchayat (Kusunda) 1.5 km
4 Satitand Village, Bauakala Panchayat (Kusunda) 500 meters
5 Padugora Village, Padugora Panchayat
(WJ area)
400 meters
6 Kandra Village, Kandrta Panchayat 500 meters
7 Bakaspura Village, Luti Pahari Panchayat 400 meters
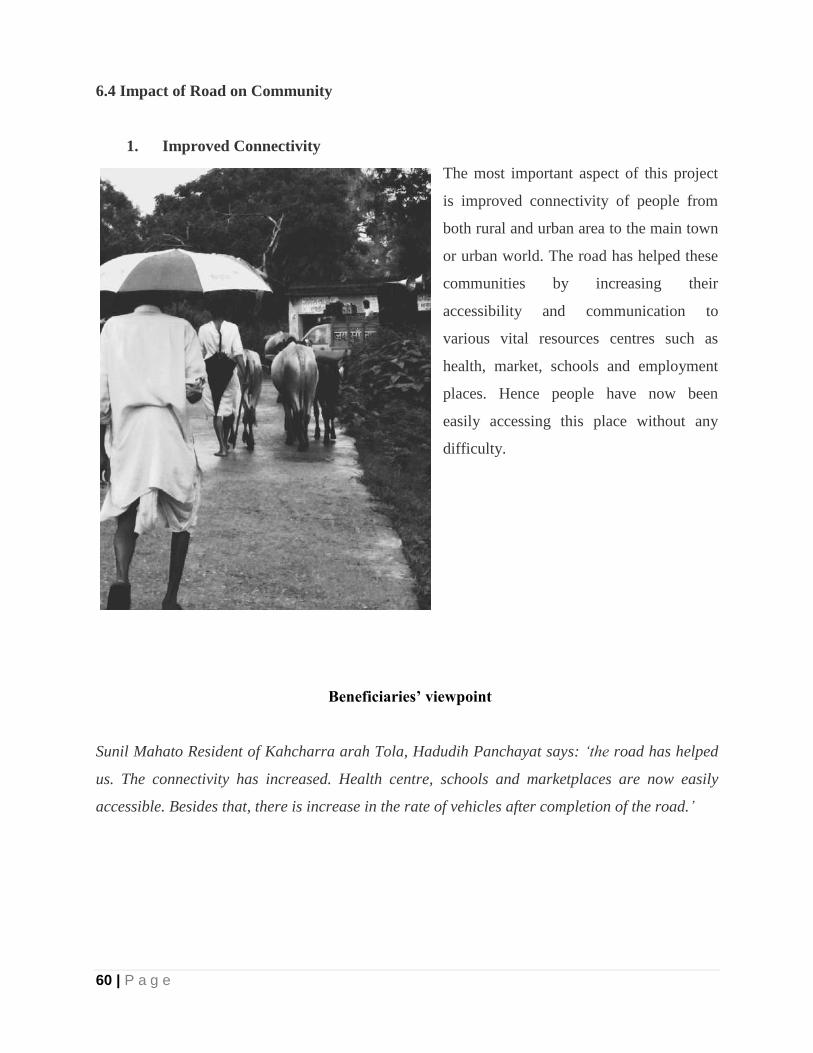
60 | P a g e
6.4 Impact of Road on Community
1. Improved Connectivity
The most important aspect of this project
is improved connectivity of people from
both rural and urban area to the main town
or urban world. The road has helped these
communities by increasing their
accessibility and communication to
various vital resources centres such as
health, market, schools and employment
places. Hence people have now been
easily accessing this place without any
difficulty.
Beneficiaries’ viewpoint
Sunil Mahato Resident of Kahcharra arah Tola, Hadudih Panchayat says: „the road has helped
us. The connectivity has increased. Health centre, schools and marketplaces are now easily
accessible. Besides that, there is increase in the rate of vehicles after completion of the road.‟
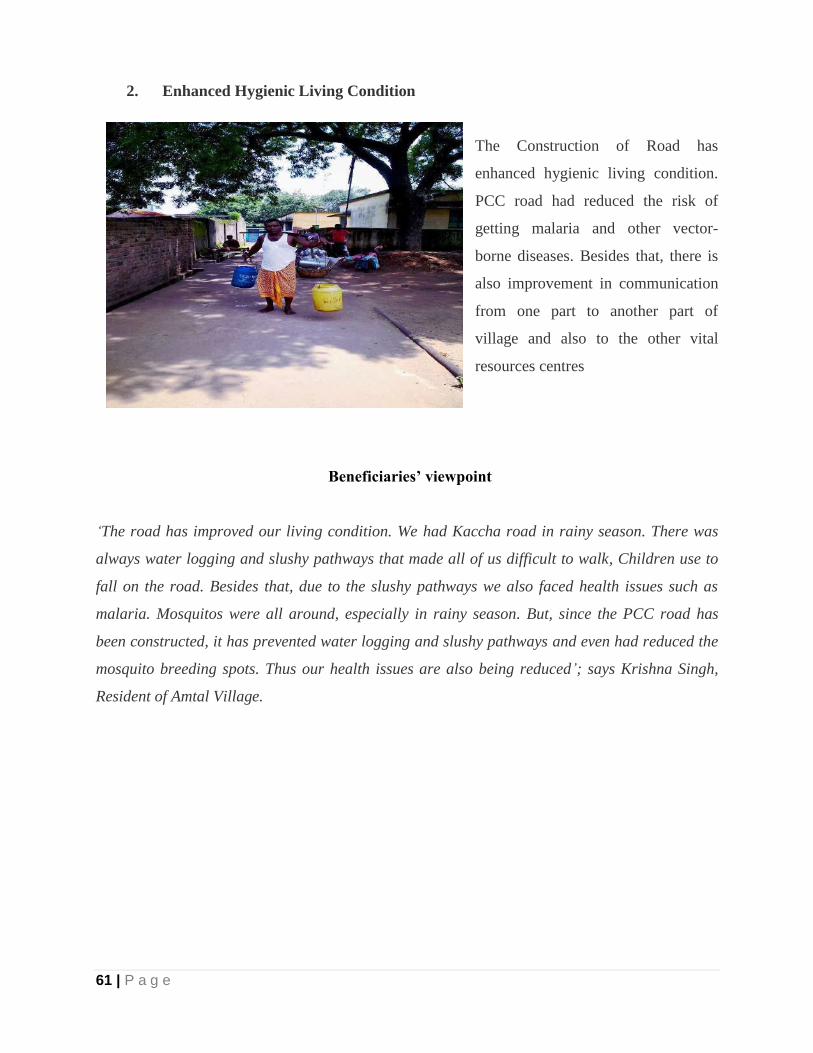
61 | P a g e
2. Enhanced Hygienic Living Condition
The Construction of Road has
enhanced hygienic living condition.
PCC road had reduced the risk of
getting malaria and other vector-
borne diseases. Besides that, there is
also improvement in communication
from one part to another part of
village and also to the other vital
resources centres
Beneficiaries’ viewpoint
„The road has improved our living condition. We had Kaccha road in rainy season. There was
always water logging and slushy pathways that made all of us difficult to walk, Children use to
fall on the road. Besides that, due to the slushy pathways we also faced health issues such as
malaria. Mosquitos were all around, especially in rainy season. But, since the PCC road has
been constructed, it has prevented water logging and slushy pathways and even had reduced the
mosquito breeding spots. Thus our health issues are also being reduced‟; says Krishna Singh,
Resident of Amtal Village.
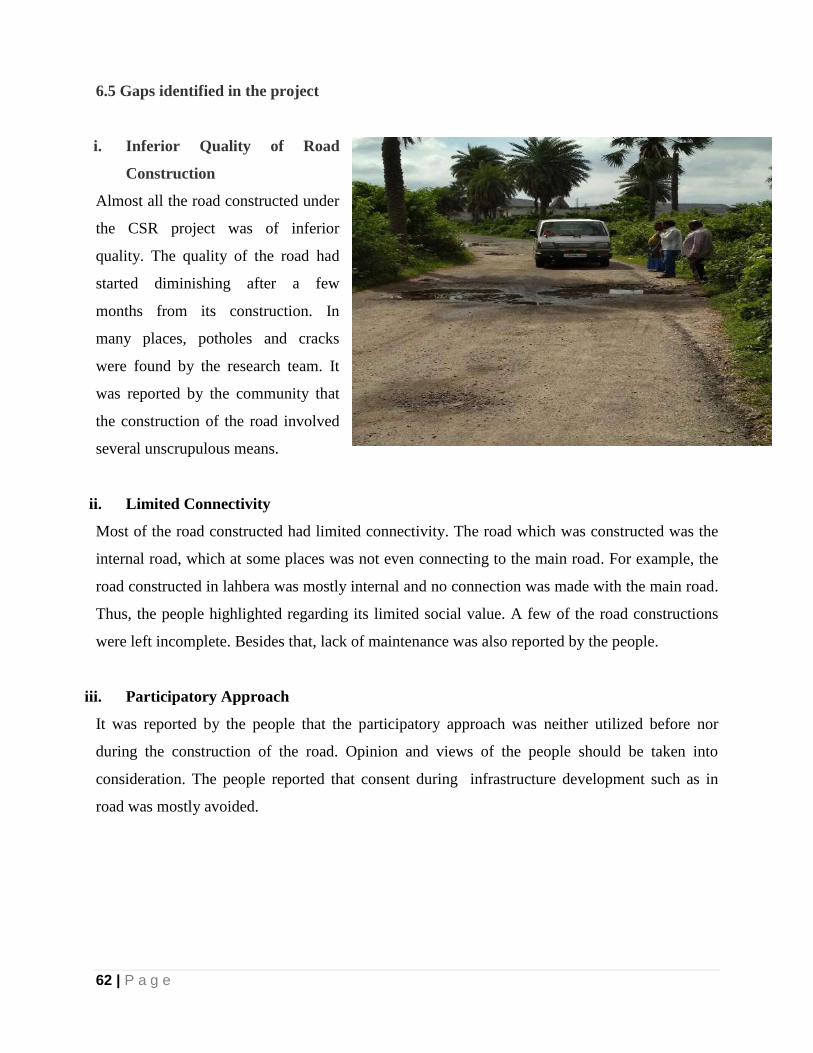
62 | P a g e
6.5 Gaps identified in the project
i. Inferior Quality of Road
Construction
Almost all the road constructed under
the CSR project was of inferior
quality. The quality of the road had
started diminishing after a few
months from its construction. In
many places, potholes and cracks
were found by the research team. It
was reported by the community that
the construction of the road involved
several unscrupulous means.
ii. Limited Connectivity
Most of the road constructed had limited connectivity. The road which was constructed was the
internal road, which at some places was not even connecting to the main road. For example, the
road constructed in lahbera was mostly internal and no connection was made with the main road.
Thus, the people highlighted regarding its limited social value. A few of the road constructions
were left incomplete. Besides that, lack of maintenance was also reported by the people.
iii. Participatory Approach
It was reported by the people that the participatory approach was neither utilized before nor
during the construction of the road. Opinion and views of the people should be taken into
consideration. The people reported that consent during infrastructure development such as in
road was mostly avoided.
63 | P a g e
iv. Lack of monitoring from the BCCL
All the villages and areas where the road had been constructed, people reported that no
monitoring or follow-up was done after the construction of the road. It was also told to the
research team that after the construction of the road that is after two to three years, it is only now
that the BCCL officials have come to inspect the road, along with the research team. People
reported that they were highly unsatisfied for the negligence of BCCL officials in terms of
monitoring and inspection.
6.6 Multi-stakeholder Perspective
i. BCCL officials - The aim of the project was to provide connectivity, connecting the small
villages to the main town or main road that would subsequently enhance the productivity of the
people and also the standard of living.
ii. Villagers - The road is useful to villagers in many ways. For example, it has increased the
accessibility of vital resource centres such as schools, market, hospitals, etc. It has also increased
the communication from one village to another and also from the village to the main town.
6.7 Recommendations
i. Periodic monitoring should be conducted by the BCCL. This would enable the company
to identify the gaps in implementation of project, and at the same time while doing this;
the creditability of the organization will also increase among the people/community.
ii. Considering People's opinion and view will enable the BCCL to implement the project
in more effectively. Besides that good rapport will develope between both the parties.
iii. Regular Maintenances should be done by the BCCL. Similarly expansion should be done
based on the needs and demands of the people/community.
iv. Improvisation of road quality by tendering the project to a contractor with better
credibility and good quality work record in the past.
v. Participation of community should be encouraged before as well as during the
construction of road as it would provide an opportunity to the villagers to monitor and supervise
the construction process in terms of higher transparency, accountability and sustainability.
64 | P a g e
ANNEXURE
Confidential (for research purpose only- property of TISS)
HOUSEHOLD QUESTIONNAIRE
Project - Mobile Medical Van (Swasth Rath)
(As this questionnaire requires input from male and female members of household, it should be administered to head of household in the
presence of other responsible adult male and female members.)
IDENTIFICATION PARTICULARS
Before Starting Interview
Name of District _____________________________________Code:_____________
Name of Taluka _______________________________________Code:_____________
Name of Block ________________________________________Code:_____________
Gram Panchayat _______________________________________Code:_____________
Name of the village__________________________________________Code:_____________
Name of the Mining Area _____________________________________
Date of Interview (DD/MM/YY): _____/_____/______
Time of starting Interview (HH.MM): _____. _____ AM/PM
After Ending Interview
Time of ending interview (HH.MM): _____. _____ AM/PM
Names of Respondents 1: _______________________________ MID: _________
2: _______________________________ MID: _________
3: _______________________________ MID: _________
Name of Interviewer: _________________________________ Code: ____________
After Checking/Editing Questionnaire
Name of Supervisor: __________________________________Code: ____________
Name of Editor: ______________________________________Code:
____________
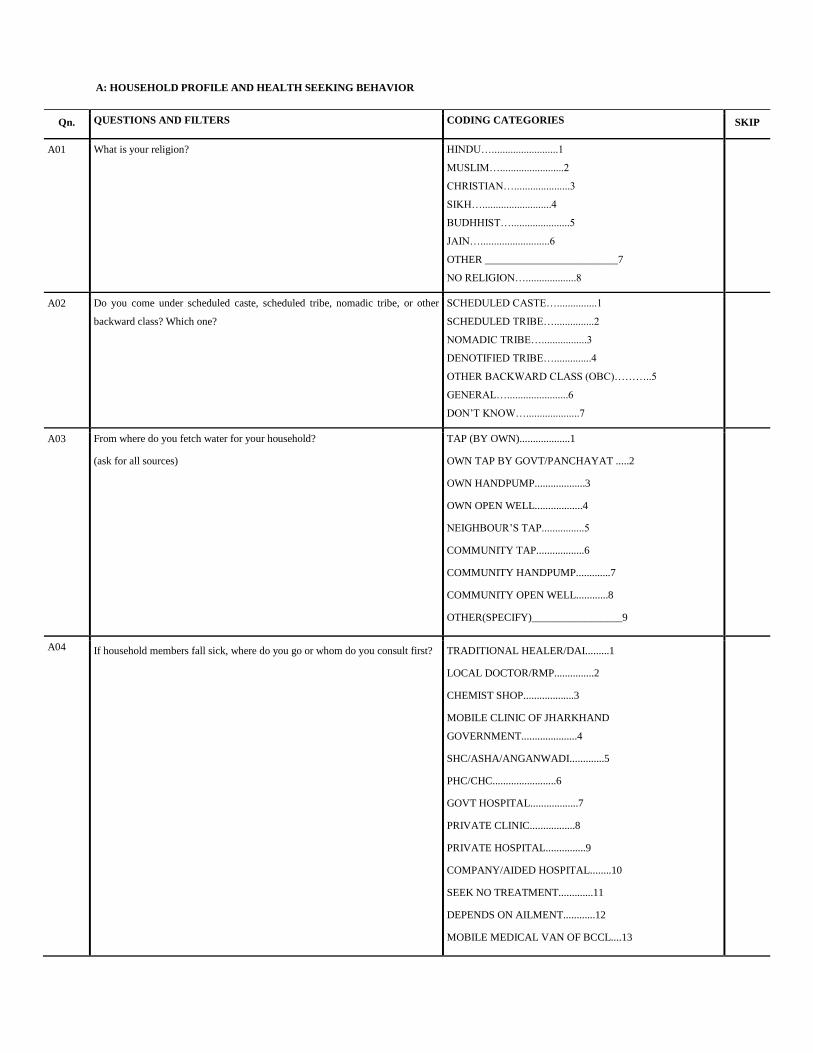
A: HOUSEHOLD PROFILE AND HEALTH SEEKING BEHAVIOR
Qn. QUESTIONS AND FILTERS CODING CATEGORIES SKIP
A01 What is your religion?
HINDU….........................1
MUSLIM…........................2
CHRISTIAN….....................3
SIKH…..........................4
BUDHHIST…......................5
JAIN…..........................6
OTHER _________________________7
NO RELIGION…...................8
A02 Do you come under scheduled caste, scheduled tribe, nomadic tribe, or other
backward class? Which one?
SCHEDULED CASTE…...............1
SCHEDULED TRIBE…...............2
NOMADIC TRIBE….................3
DENOTIFIED TRIBE…..............4
OTHER BACKWARD CLASS (OBC)………..5
GENERAL….......................6
DON‟T KNOW…....................7
A03 From where do you fetch water for your household?
(ask for all sources)
TAP (BY OWN)...................1
OWN TAP BY GOVT/PANCHAYAT .....2
OWN HANDPUMP...................3
OWN OPEN WELL..................4
NEIGHBOUR‟S TAP................5
COMMUNITY TAP..................6
COMMUNITY HANDPUMP.............7
COMMUNITY OPEN WELL............8
OTHER(SPECIFY)_________________9
A04 If household members fall sick, where do you go or whom do you consult first?
TRADITIONAL HEALER/DAI.........1
LOCAL DOCTOR/RMP...............2
CHEMIST SHOP...................3
MOBILE CLINIC OF JHARKHAND
GOVERNMENT.....................4
SHC/ASHA/ANGANWADI.............5
PHC/CHC........................6
GOVT HOSPITAL..................7
PRIVATE CLINIC.................8
PRIVATE HOSPITAL...............9
COMPANY/AIDED HOSPITAL........10
SEEK NO TREATMENT.............11
DEPENDS ON AILMENT............12
MOBILE MEDICAL VAN OF BCCL....13
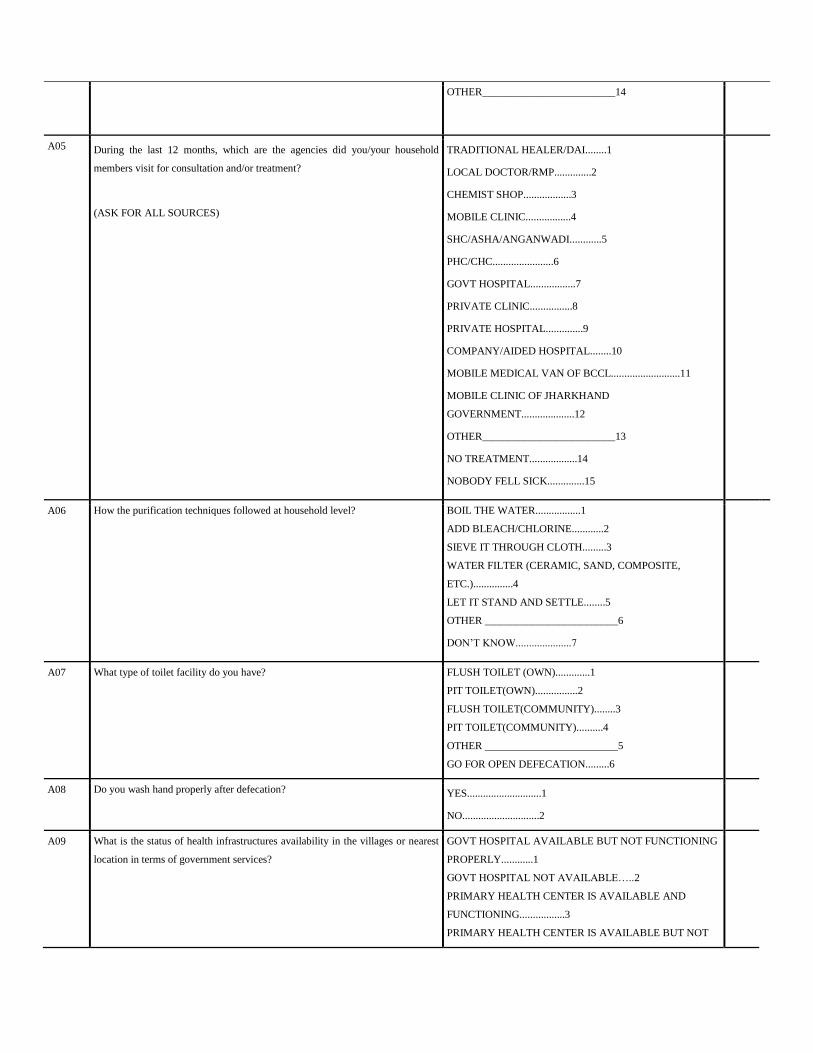
OTHER_________________________14
A05 During the last 12 months, which are the agencies did you/your household
members visit for consultation and/or treatment?
(ASK FOR ALL SOURCES)
TRADITIONAL HEALER/DAI........1
LOCAL DOCTOR/RMP..............2
CHEMIST SHOP..................3
MOBILE CLINIC.................4
SHC/ASHA/ANGANWADI............5
PHC/CHC.......................6
GOVT HOSPITAL.................7
PRIVATE CLINIC................8
PRIVATE HOSPITAL..............9
COMPANY/AIDED HOSPITAL........10
MOBILE MEDICAL VAN OF BCCL..........................11
MOBILE CLINIC OF JHARKHAND
GOVERNMENT....................12
OTHER_________________________13
NO TREATMENT..................14
NOBODY FELL SICK..............15
A06 How the purification techniques followed at household level? BOIL THE WATER.................1
ADD BLEACH/CHLORINE............2
SIEVE IT THROUGH CLOTH.........3
WATER FILTER (CERAMIC, SAND, COMPOSITE,
ETC.)...............4
LET IT STAND AND SETTLE........5
OTHER _________________________6
DON‟T KNOW.....................7
A07 What type of toilet facility do you have? FLUSH TOILET (OWN).............1
PIT TOILET(OWN)................2
FLUSH TOILET(COMMUNITY)........3
PIT TOILET(COMMUNITY)..........4
OTHER _________________________5
GO FOR OPEN DEFECATION.........6
A08 Do you wash hand properly after defecation? YES............................1
NO.............................2
A09 What is the status of health infrastructures availability in the villages or nearest
location in terms of government services?
GOVT HOSPITAL AVAILABLE BUT NOT FUNCTIONING
PROPERLY............1
GOVT HOSPITAL NOT AVAILABLE…..2
PRIMARY HEALTH CENTER IS AVAILABLE AND
FUNCTIONING.................3
PRIMARY HEALTH CENTER IS AVAILABLE BUT NOT
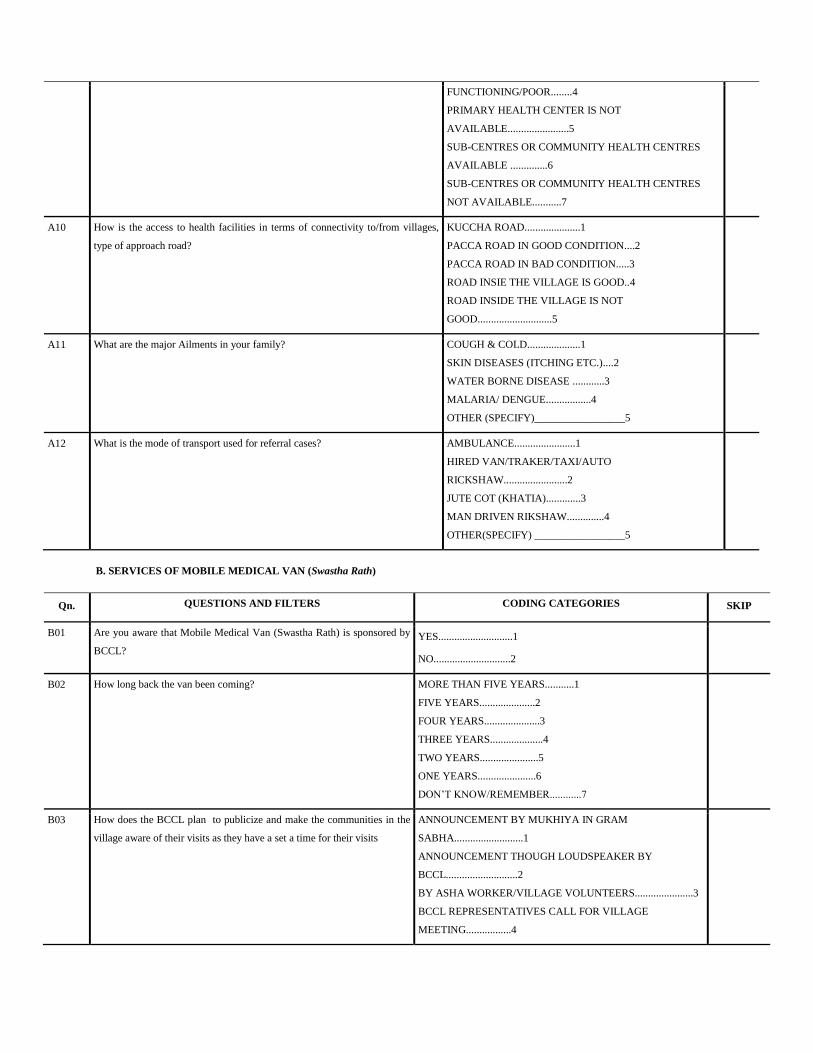
FUNCTIONING/POOR........4
PRIMARY HEALTH CENTER IS NOT
AVAILABLE.......................5
SUB-CENTRES OR COMMUNITY HEALTH CENTRES
AVAILABLE ..............6
SUB-CENTRES OR COMMUNITY HEALTH CENTRES
NOT AVAILABLE...........7
A10 How is the access to health facilities in terms of connectivity to/from villages,
type of approach road?
KUCCHA ROAD.....................1
PACCA ROAD IN GOOD CONDITION....2
PACCA ROAD IN BAD CONDITION.....3
ROAD INSIE THE VILLAGE IS GOOD..4
ROAD INSIDE THE VILLAGE IS NOT
GOOD............................5
A11 What are the major Ailments in your family?
COUGH & COLD....................1
SKIN DISEASES (ITCHING ETC.)....2
WATER BORNE DISEASE ............3
MALARIA/ DENGUE.................4
OTHER (SPECIFY)_________________5
A12 What is the mode of transport used for referral cases? AMBULANCE.......................1
HIRED VAN/TRAKER/TAXI/AUTO
RICKSHAW........................2
JUTE COT (KHATIA).............3
MAN DRIVEN RIKSHAW..............4
OTHER(SPECIFY) _________________5
B. SERVICES OF MOBILE MEDICAL VAN (Swastha Rath)
Qn. QUESTIONS AND FILTERS CODING CATEGORIES SKIP
B01 Are you aware that Mobile Medical Van (Swastha Rath) is sponsored by
BCCL?
YES............................1
NO.............................2
B02 How long back the van been coming?
MORE THAN FIVE YEARS...........1
FIVE YEARS.....................2
FOUR YEARS.....................3
THREE YEARS....................4
TWO YEARS......................5
ONE YEARS......................6
DON‟T KNOW/REMEMBER............7
B03 How does the BCCL plan to publicize and make the communities in the
village aware of their visits as they have a set a time for their visits
ANNOUNCEMENT BY MUKHIYA IN GRAM
SABHA..........................1
ANNOUNCEMENT THOUGH LOUDSPEAKER BY
BCCL...........................2
BY ASHA WORKER/VILLAGE VOLUNTEERS......................3
BCCL REPRESENTATIVES CALL FOR VILLAGE
MEETING.................4
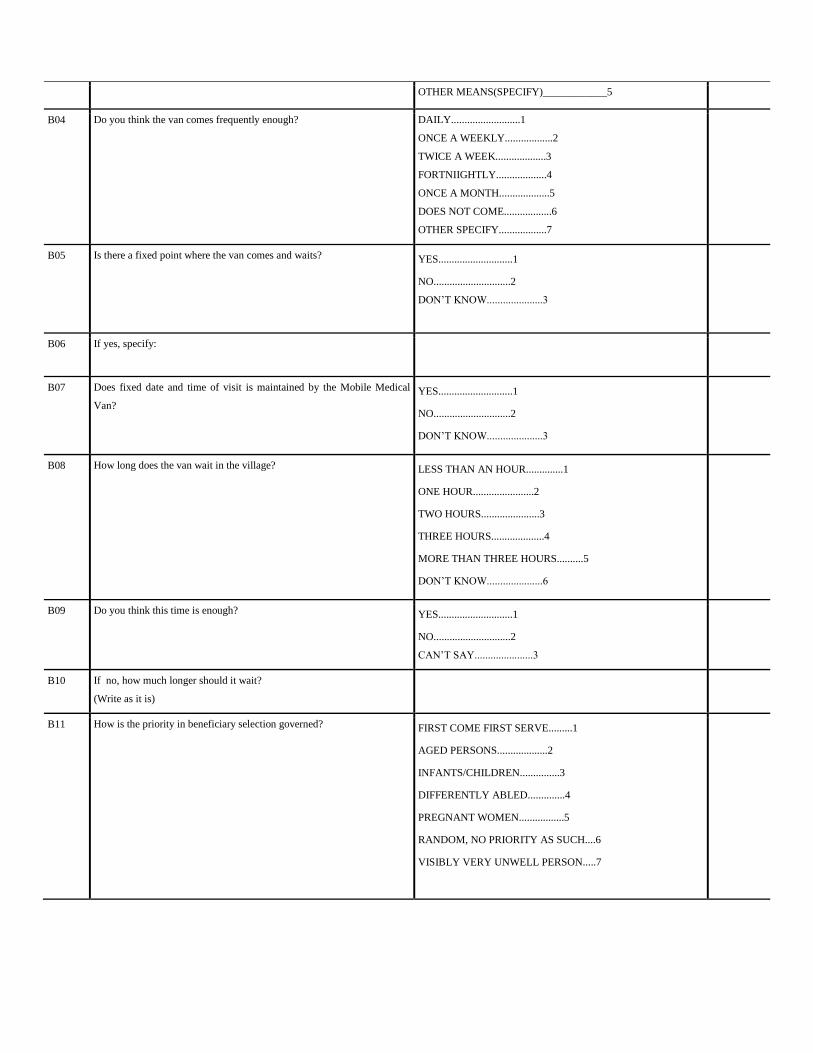
OTHER MEANS(SPECIFY)____________5
B04 Do you think the van comes frequently enough? DAILY..........................1
ONCE A WEEKLY..................2
TWICE A WEEK...................3
FORTNIIGHTLY...................4
ONCE A MONTH...................5
DOES NOT COME..................6
OTHER SPECIFY..................7
B05 Is there a fixed point where the van comes and waits? YES............................1
NO.............................2
DON‟T KNOW.....................3
B06 If yes, specify:
B07 Does fixed date and time of visit is maintained by the Mobile Medical
Van?
YES............................1
NO.............................2
DON‟T KNOW.....................3
B08 How long does the van wait in the village? LESS THAN AN HOUR..............1
ONE HOUR.......................2
TWO HOURS......................3
THREE HOURS....................4
MORE THAN THREE HOURS..........5
DON‟T KNOW.....................6
B09 Do you think this time is enough? YES............................1
NO.............................2
CAN‟T SAY......................3
B10 If no, how much longer should it wait?
(Write as it is)
B11 How is the priority in beneficiary selection governed? FIRST COME FIRST SERVE.........1
AGED PERSONS...................2
INFANTS/CHILDREN...............3
DIFFERENTLY ABLED..............4
PREGNANT WOMEN.................5
RANDOM, NO PRIORITY AS SUCH....6
VISIBLY VERY UNWELL PERSON.....7
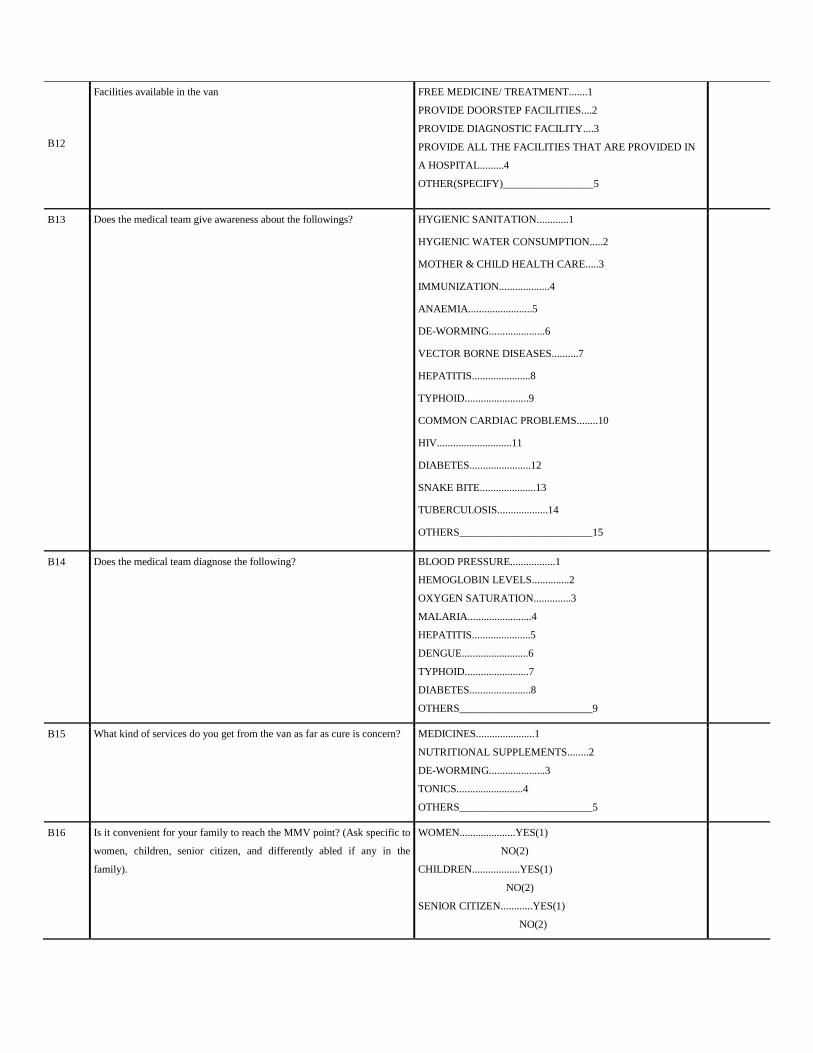
B12
Facilities available in the van
FREE MEDICINE/ TREATMENT.......1
PROVIDE DOORSTEP FACILITIES....2
PROVIDE DIAGNOSTIC FACILITY....3
PROVIDE ALL THE FACILITIES THAT ARE PROVIDED IN
A HOSPITAL.........4
OTHER(SPECIFY)_________________5
B13 Does the medical team give awareness about the followings? HYGIENIC SANITATION............1
HYGIENIC WATER CONSUMPTION.....2
MOTHER & CHILD HEALTH CARE.....3
IMMUNIZATION...................4
ANAEMIA........................5
DE-WORMING.....................6
VECTOR BORNE DISEASES..........7
HEPATITIS......................8
TYPHOID........................9
COMMON CARDIAC PROBLEMS........10
HIV............................11
DIABETES.......................12
SNAKE BITE.....................13
TUBERCULOSIS...................14
OTHERS_________________________15
B14 Does the medical team diagnose the following?
BLOOD PRESSURE.................1
HEMOGLOBIN LEVELS..............2
OXYGEN SATURATION..............3
MALARIA........................4
HEPATITIS......................5
DENGUE.........................6
TYPHOID........................7
DIABETES.......................8
OTHERS_________________________9
B15 What kind of services do you get from the van as far as cure is concern? MEDICINES......................1
NUTRITIONAL SUPPLEMENTS........2
DE-WORMING.....................3
TONICS.........................4
OTHERS_________________________5
B16 Is it convenient for your family to reach the MMV point? (Ask specific to
women, children, senior citizen, and differently abled if any in the
family).
WOMEN.....................YES(1)
NO(2)
CHILDREN..................YES(1)
NO(2)
SENIOR CITIZEN............YES(1)
NO(2)
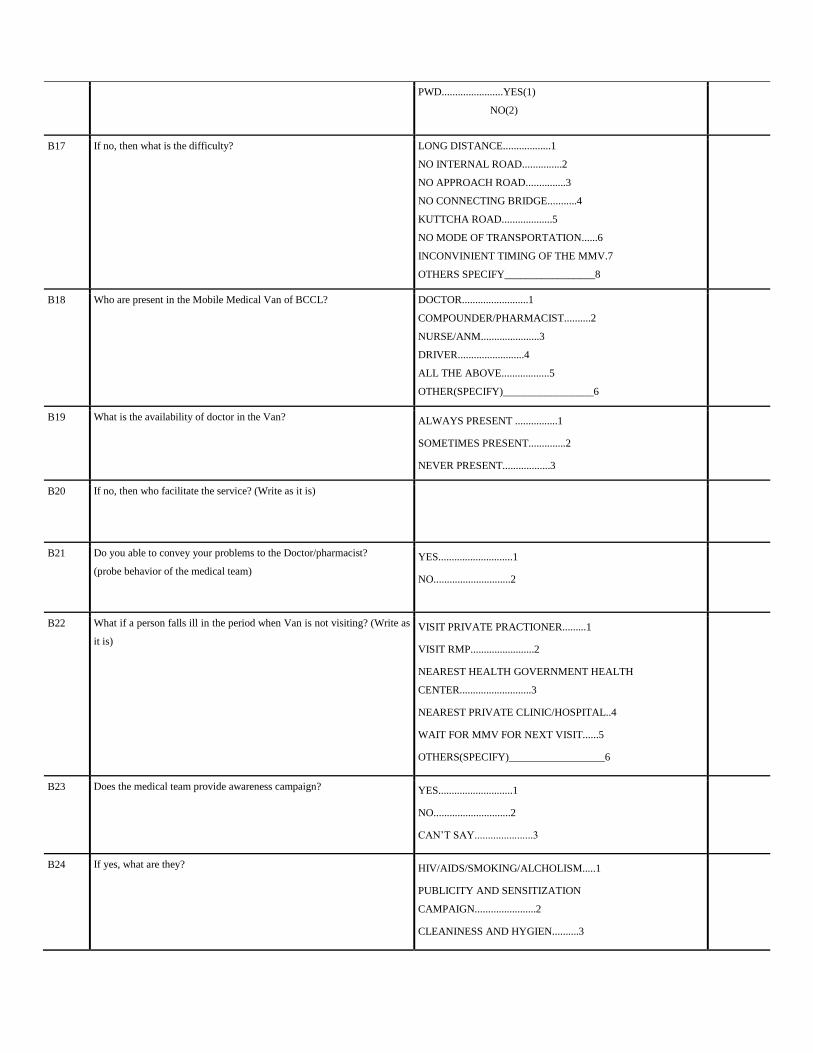
PWD.......................YES(1)
NO(2)
B17 If no, then what is the difficulty? LONG DISTANCE..................1
NO INTERNAL ROAD...............2
NO APPROACH ROAD...............3
NO CONNECTING BRIDGE...........4
KUTTCHA ROAD...................5
NO MODE OF TRANSPORTATION......6
INCONVINIENT TIMING OF THE MMV.7
OTHERS SPECIFY_________________8
B18 Who are present in the Mobile Medical Van of BCCL? DOCTOR.........................1
COMPOUNDER/PHARMACIST..........2
NURSE/ANM......................3
DRIVER.........................4
ALL THE ABOVE..................5
OTHER(SPECIFY)_________________6
B19 What is the availability of doctor in the Van? ALWAYS PRESENT ................1
SOMETIMES PRESENT..............2
NEVER PRESENT..................3
B20 If no, then who facilitate the service? (Write as it is)
B21 Do you able to convey your problems to the Doctor/pharmacist?
(probe behavior of the medical team)
YES............................1
NO.............................2
B22 What if a person falls ill in the period when Van is not visiting? (Write as
it is)
VISIT PRIVATE PRACTIONER.........1
VISIT RMP........................2
NEAREST HEALTH GOVERNMENT HEALTH
CENTER...........................3
NEAREST PRIVATE CLINIC/HOSPITAL..4
WAIT FOR MMV FOR NEXT VISIT......5
OTHERS(SPECIFY)__________________6
B23 Does the medical team provide awareness campaign?
YES............................1
NO.............................2
CAN‟T SAY......................3
B24 If yes, what are they? HIV/AIDS/SMOKING/ALCHOLISM.....1
PUBLICITY AND SENSITIZATION
CAMPAIGN.......................2
CLEANINESS AND HYGIEN..........3
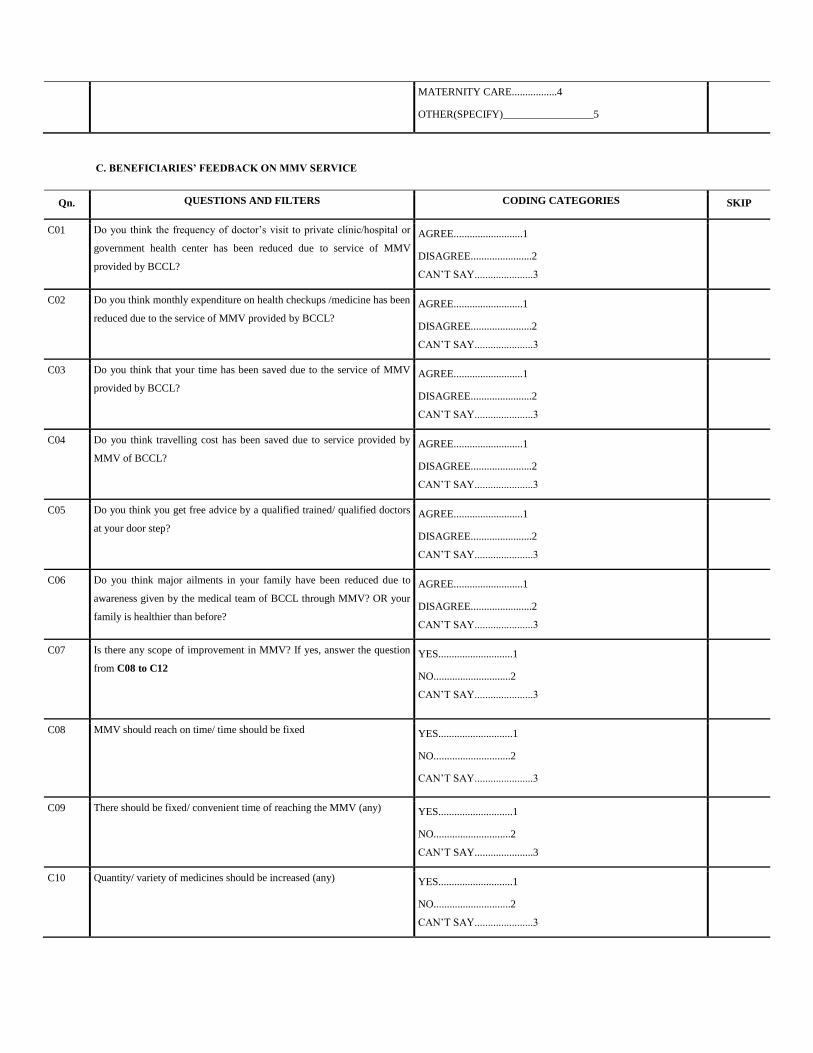
MATERNITY CARE.................4
OTHER(SPECIFY)_________________5
C. BENEFICIARIES’ FEEDBACK ON MMV SERVICE
Qn. QUESTIONS AND FILTERS CODING CATEGORIES SKIP
C01 Do you think the frequency of doctor‟s visit to private clinic/hospital or
government health center has been reduced due to service of MMV
provided by BCCL?
AGREE..........................1
DISAGREE.......................2
CAN‟T SAY......................3
C02 Do you think monthly expenditure on health checkups /medicine has been
reduced due to the service of MMV provided by BCCL?
AGREE..........................1
DISAGREE.......................2
CAN‟T SAY......................3
C03 Do you think that your time has been saved due to the service of MMV
provided by BCCL?
AGREE..........................1
DISAGREE.......................2
CAN‟T SAY......................3
C04 Do you think travelling cost has been saved due to service provided by
MMV of BCCL?
AGREE..........................1
DISAGREE.......................2
CAN‟T SAY......................3
C05 Do you think you get free advice by a qualified trained/ qualified doctors
at your door step?
AGREE..........................1
DISAGREE.......................2
CAN‟T SAY......................3
C06 Do you think major ailments in your family have been reduced due to
awareness given by the medical team of BCCL through MMV? OR your
family is healthier than before?
AGREE..........................1
DISAGREE.......................2
CAN‟T SAY......................3
C07 Is there any scope of improvement in MMV? If yes, answer the question
from C08 to C12
YES............................1
NO.............................2
CAN‟T SAY......................3
C08 MMV should reach on time/ time should be fixed
YES............................1
NO.............................2
CAN‟T SAY......................3
C09 There should be fixed/ convenient time of reaching the MMV (any) YES............................1
NO.............................2
CAN‟T SAY......................3
C10 Quantity/ variety of medicines should be increased (any)
YES............................1
NO.............................2
CAN‟T SAY......................3
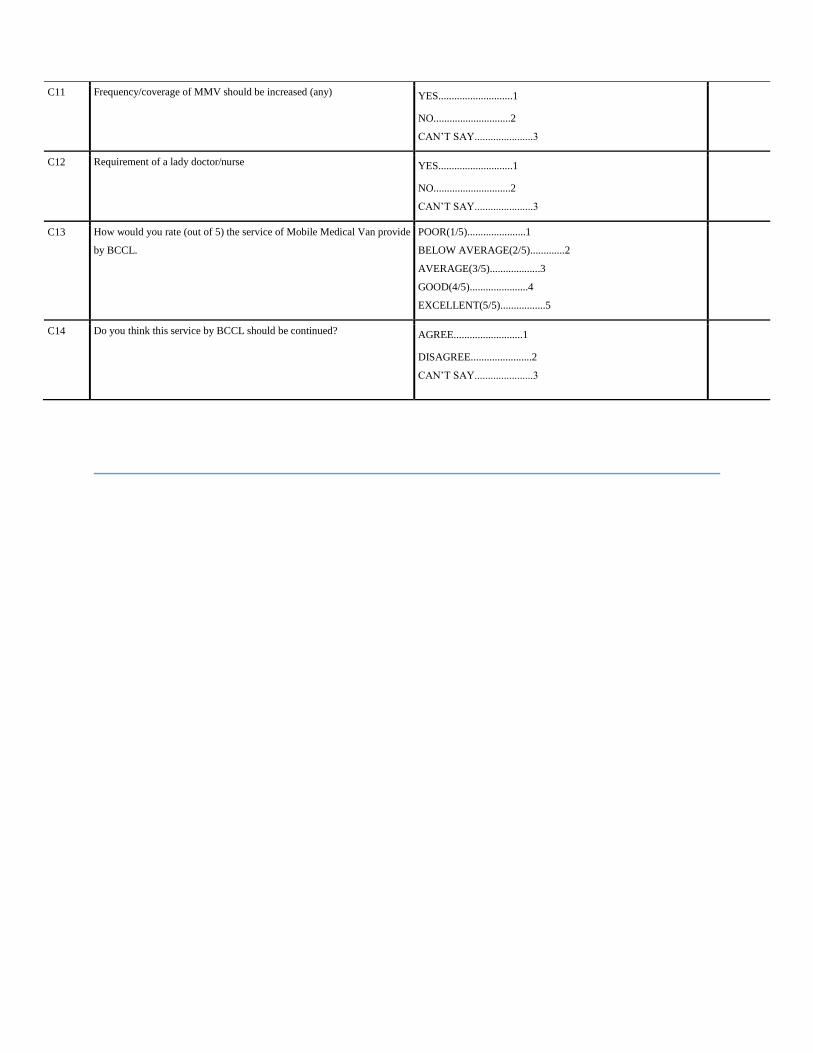
C11 Frequency/coverage of MMV should be increased (any)
YES............................1
NO.............................2
CAN‟T SAY......................3
C12 Requirement of a lady doctor/nurse YES............................1
NO.............................2
CAN‟T SAY......................3
C13 How would you rate (out of 5) the service of Mobile Medical Van provide
by BCCL.
POOR(1/5)......................1
BELOW AVERAGE(2/5).............2
AVERAGE(3/5)...................3
GOOD(4/5)......................4
EXCELLENT(5/5).................5
C14 Do you think this service by BCCL should be continued?
AGREE..........................1
DISAGREE.......................2
CAN‟T SAY......................3

HOUSEHOLD QUESTIONNAIRE
Project - Scheme for multipurpose utilization of abandoned mine water
(As this questionnaire requires input from male and female members of household, it should be administered to head of household in the
presence of other responsible adult male and female members.)
IDENTIFICATION PARTICULARS
Before Starting Interview
Name of District
_____________________________________Code:_____________
Name of Taluka
_______________________________________Code:_____________
Name of Block
________________________________________Code:_____________
Gram Panchayat
_______________________________________Code:_____________
Name of the
village__________________________________________Code:_____________
Pond Name_____________________________________
Date of Interview (DD/MM/YY): _____/_____/______
Time of starting Interview (HH.MM): _____. _____
AM/PM
After Ending Interview
Time of ending interview (HH.MM): _____. _____
AM/PM
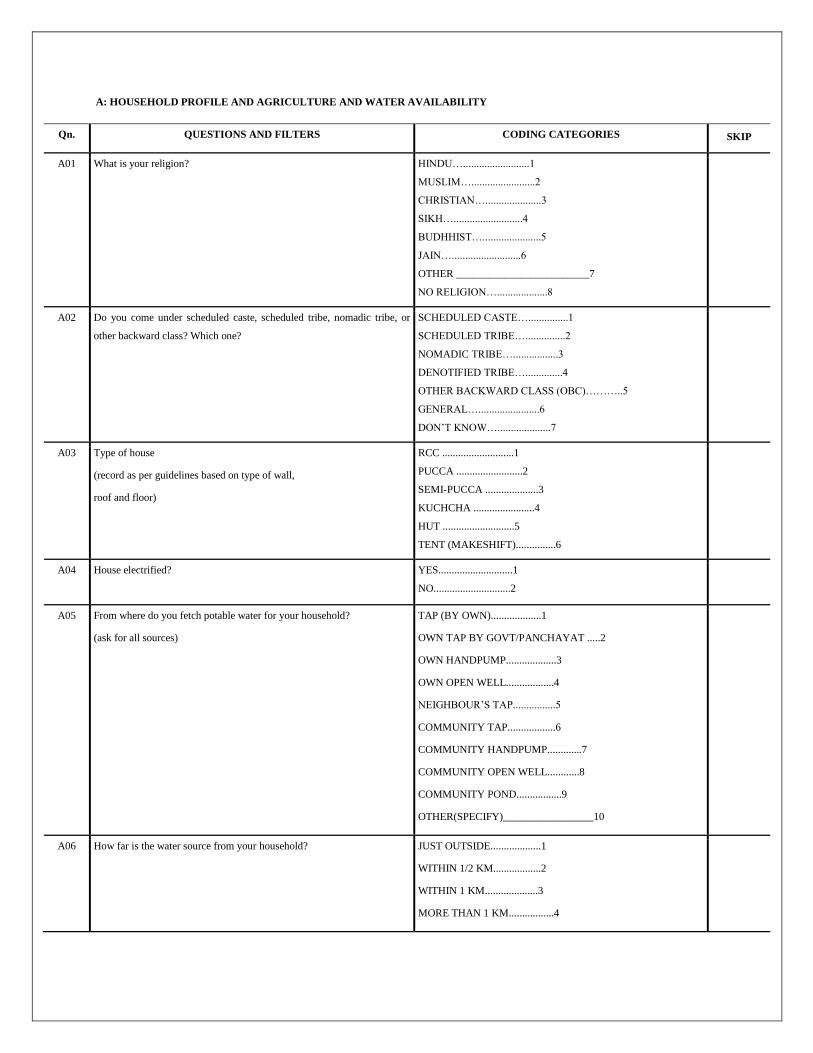
A: HOUSEHOLD PROFILE AND AGRICULTURE AND WATER AVAILABILITY
Qn. QUESTIONS AND FILTERS CODING CATEGORIES SKIP
A01 What is your religion?
HINDU….........................1
MUSLIM…........................2
CHRISTIAN….....................3
SIKH…..........................4
BUDHHIST…......................5
JAIN…..........................6
OTHER _________________________7
NO RELIGION…...................8
A02 Do you come under scheduled caste, scheduled tribe, nomadic tribe, or
other backward class? Which one?
SCHEDULED CASTE…...............1
SCHEDULED TRIBE…...............2
NOMADIC TRIBE….................3
DENOTIFIED TRIBE…..............4
OTHER BACKWARD CLASS (OBC)………..5
GENERAL….......................6
DON‟T KNOW…....................7
A03 Type of house
(record as per guidelines based on type of wall,
roof and floor)
RCC ...........................1
PUCCA .........................2
SEMI-PUCCA ....................3
KUCHCHA .......................4
HUT ...........................5
TENT (MAKESHIFT)...............6
A04 House electrified?
YES............................1
NO.............................2
A05 From where do you fetch potable water for your household?
(ask for all sources)
TAP (BY OWN)...................1
OWN TAP BY GOVT/PANCHAYAT .....2
OWN HANDPUMP...................3
OWN OPEN WELL..................4
NEIGHBOUR‟S TAP................5
COMMUNITY TAP..................6
COMMUNITY HANDPUMP.............7
COMMUNITY OPEN WELL............8
COMMUNITY POND.................9
OTHER(SPECIFY)_________________10
A06 How far is the water source from your household? JUST OUTSIDE...................1
WITHIN 1/2 KM..................2
WITHIN 1 KM....................3
MORE THAN 1 KM.................4
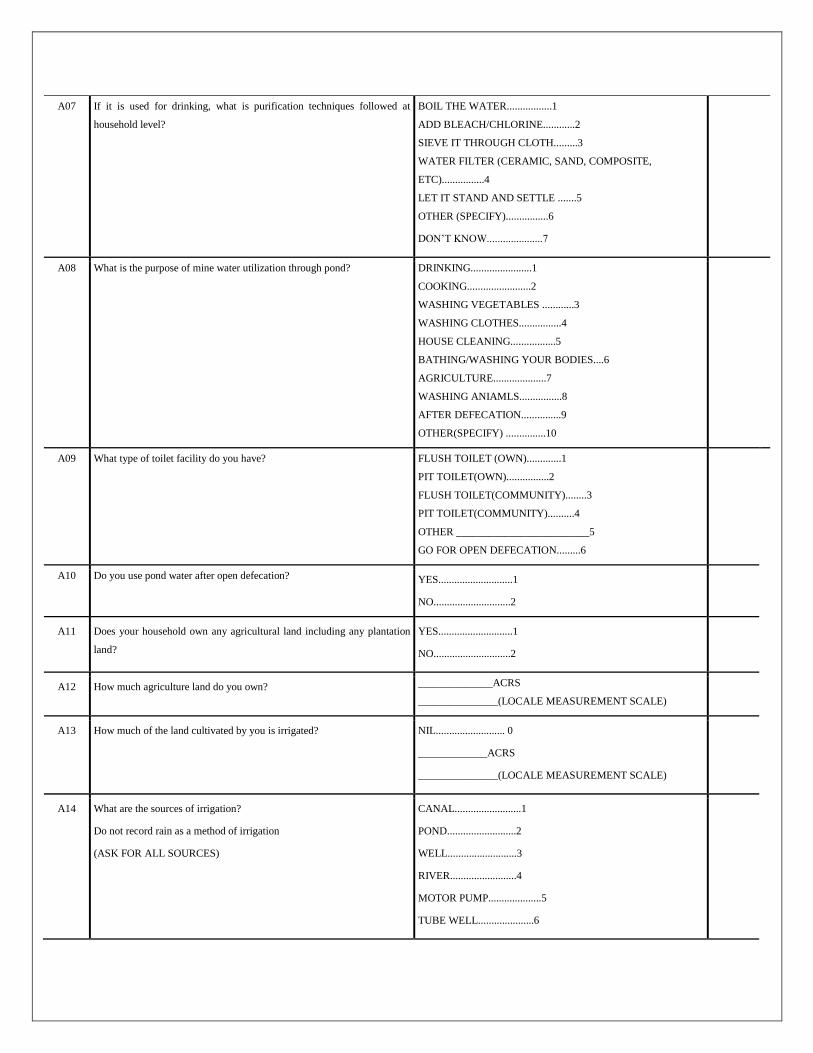
A07 If it is used for drinking, what is purification techniques followed at
household level?
BOIL THE WATER.................1
ADD BLEACH/CHLORINE............2
SIEVE IT THROUGH CLOTH.........3
WATER FILTER (CERAMIC, SAND, COMPOSITE,
ETC)................4
LET IT STAND AND SETTLE .......5
OTHER (SPECIFY)................6
DON‟T KNOW.....................7
A08 What is the purpose of mine water utilization through pond? DRINKING.......................1
COOKING........................2
WASHING VEGETABLES ............3
WASHING CLOTHES................4
HOUSE CLEANING.................5
BATHING/WASHING YOUR BODIES....6
AGRICULTURE....................7
WASHING ANIAMLS................8
AFTER DEFECATION...............9
OTHER(SPECIFY) ...............10
A09 What type of toilet facility do you have?
FLUSH TOILET (OWN).............1
PIT TOILET(OWN)................2
FLUSH TOILET(COMMUNITY)........3
PIT TOILET(COMMUNITY)..........4
OTHER _________________________5
GO FOR OPEN DEFECATION.........6
A10 Do you use pond water after open defecation? YES............................1
NO.............................2
A11 Does your household own any agricultural land including any plantation
land?
YES............................1
NO.............................2
A12 How much agriculture land do you own? ______________ACRS
_______________(LOCALE MEASUREMENT SCALE)
A13 How much of the land cultivated by you is irrigated? NIL.......................... 0
_____________ACRS
_______________(LOCALE MEASUREMENT SCALE)
A14 What are the sources of irrigation?
Do not record rain as a method of irrigation
(ASK FOR ALL SOURCES)
CANAL.........................1
POND..........................2
WELL..........................3
RIVER.........................4
MOTOR PUMP....................5
TUBE WELL.....................6
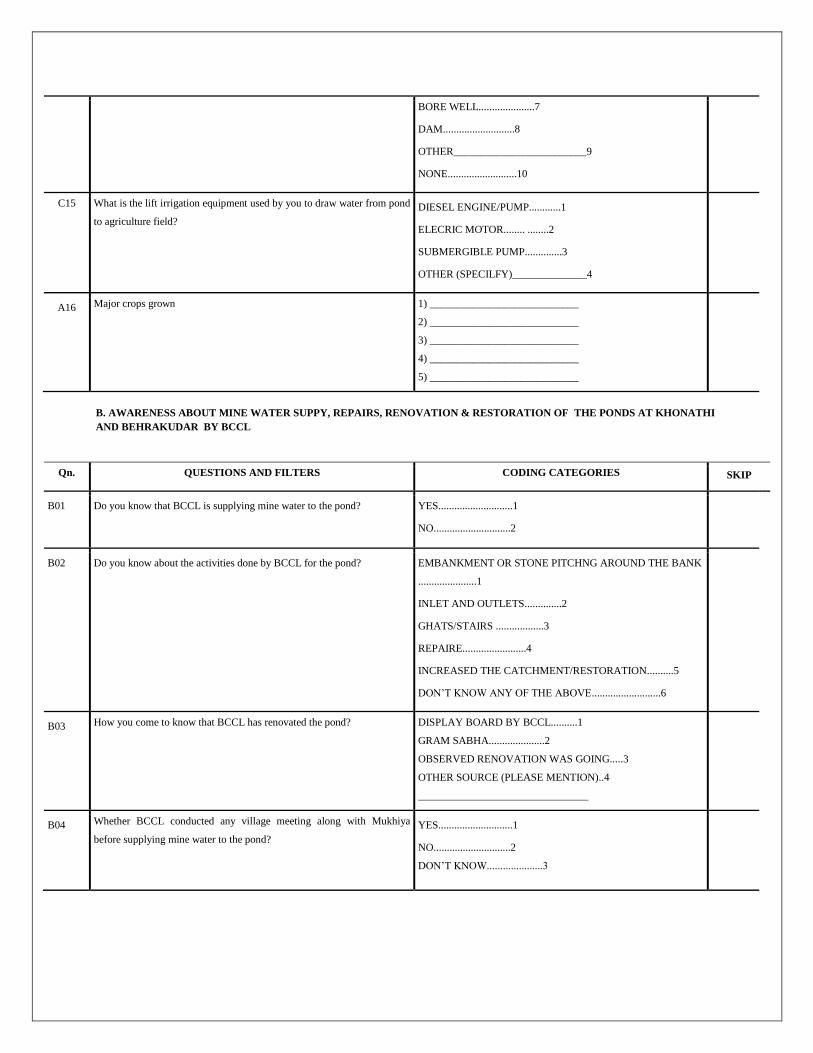
BORE WELL.....................7
DAM...........................8
OTHER_________________________9
NONE..........................10
C15 What is the lift irrigation equipment used by you to draw water from pond
to agriculture field?
DIESEL ENGINE/PUMP............1
ELECRIC MOTOR........ ........2
SUBMERGIBLE PUMP..............3
OTHER (SPECILFY)______________4
A16 Major crops grown 1) ____________________________
2) ____________________________
3) ____________________________
4) ____________________________
5) ____________________________
B. AWARENESS ABOUT MINE WATER SUPPY, REPAIRS, RENOVATION & RESTORATION OF THE PONDS AT KHONATHI
AND BEHRAKUDAR BY BCCL
Qn. QUESTIONS AND FILTERS CODING CATEGORIES SKIP
B01 Do you know that BCCL is supplying mine water to the pond? YES............................1
NO.............................2
B02 Do you know about the activities done by BCCL for the pond? EMBANKMENT OR STONE PITCHNG AROUND THE BANK
......................1
INLET AND OUTLETS..............2
GHATS/STAIRS ..................3
REPAIRE........................4
INCREASED THE CATCHMENT/RESTORATION..........5
DON‟T KNOW ANY OF THE ABOVE..........................6
B03 How you come to know that BCCL has renovated the pond? DISPLAY BOARD BY BCCL..........1
GRAM SABHA.....................2
OBSERVED RENOVATION WAS GOING.....3
OTHER SOURCE (PLEASE MENTION)..4
________________________________
B04 Whether BCCL conducted any village meeting along with Mukhiya
before supplying mine water to the pond?
YES............................1
NO.............................2
DON‟T KNOW.....................3
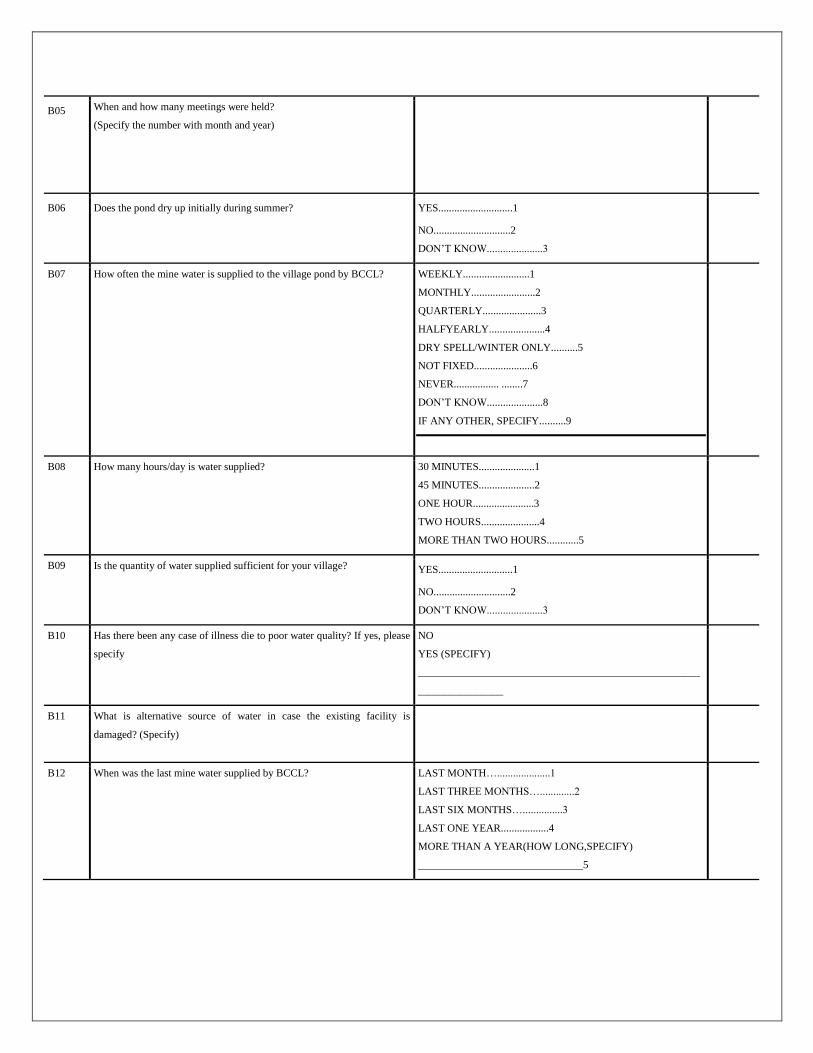
B05 When and how many meetings were held?
(Specify the number with month and year)
B06 Does the pond dry up initially during summer? YES............................1
NO.............................2
DON‟T KNOW.....................3
B07 How often the mine water is supplied to the village pond by BCCL? WEEKLY.........................1
MONTHLY........................2
QUARTERLY......................3
HALFYEARLY.....................4
DRY SPELL/WINTER ONLY..........5
NOT FIXED......................6
NEVER................. ........7
DON‟T KNOW.....................8
IF ANY OTHER, SPECIFY..........9
B08 How many hours/day is water supplied? 30 MINUTES.....................1
45 MINUTES.....................2
ONE HOUR.......................3
TWO HOURS......................4
MORE THAN TWO HOURS............5
B09 Is the quantity of water supplied sufficient for your village? YES............................1
NO.............................2
DON‟T KNOW.....................3
B10 Has there been any case of illness die to poor water quality? If yes, please
specify
NO
YES (SPECIFY)
_____________________________________________________
________________
B11 What is alternative source of water in case the existing facility is
damaged? (Specify)
B12 When was the last mine water supplied by BCCL? LAST MONTH…....................1
LAST THREE MONTHS….............2
LAST SIX MONTHS…...............3
LAST ONE YEAR..................4
MORE THAN A YEAR(HOW LONG,SPECIFY)
_______________________________5
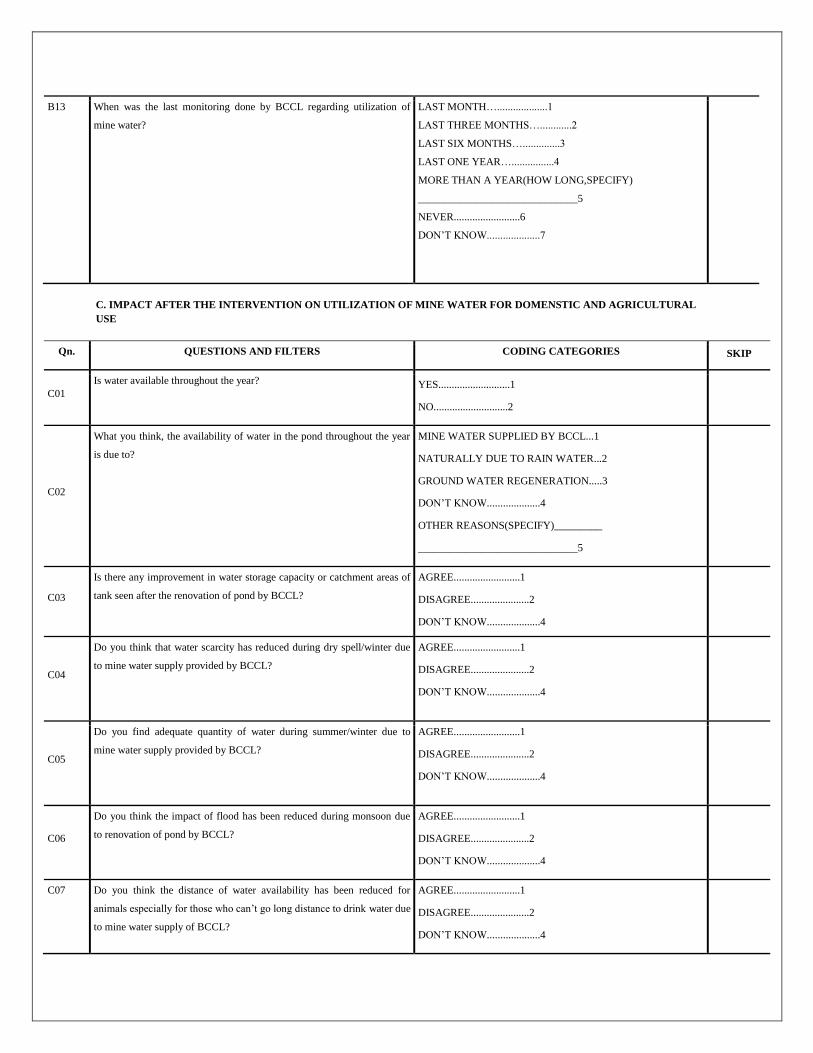
B13 When was the last monitoring done by BCCL regarding utilization of
mine water?
LAST MONTH…...................1
LAST THREE MONTHS…............2
LAST SIX MONTHS…..............3
LAST ONE YEAR…................4
MORE THAN A YEAR(HOW LONG,SPECIFY)
______________________________5
NEVER.........................6
DON‟T KNOW....................7
C. IMPACT AFTER THE INTERVENTION ON UTILIZATION OF MINE WATER FOR DOMENSTIC AND AGRICULTURAL
USE
Qn. QUESTIONS AND FILTERS CODING CATEGORIES SKIP
C01
Is water available throughout the year? YES...........................1
NO............................2
C02
What you think, the availability of water in the pond throughout the year
is due to?
MINE WATER SUPPLIED BY BCCL...1
NATURALLY DUE TO RAIN WATER...2
GROUND WATER REGENERATION.....3
DON‟T KNOW....................4
OTHER REASONS(SPECIFY)_________
______________________________5
C03
Is there any improvement in water storage capacity or catchment areas of
tank seen after the renovation of pond by BCCL?
AGREE.........................1
DISAGREE......................2
DON‟T KNOW....................4
C04
Do you think that water scarcity has reduced during dry spell/winter due
to mine water supply provided by BCCL?
AGREE.........................1
DISAGREE......................2
DON‟T KNOW....................4
C05
Do you find adequate quantity of water during summer/winter due to
mine water supply provided by BCCL?
AGREE.........................1
DISAGREE......................2
DON‟T KNOW....................4
C06
Do you think the impact of flood has been reduced during monsoon due
to renovation of pond by BCCL?
AGREE.........................1
DISAGREE......................2
DON‟T KNOW....................4
C07 Do you think the distance of water availability has been reduced for
animals especially for those who can‟t go long distance to drink water due
to mine water supply of BCCL?
AGREE.........................1
DISAGREE......................2
DON‟T KNOW....................4
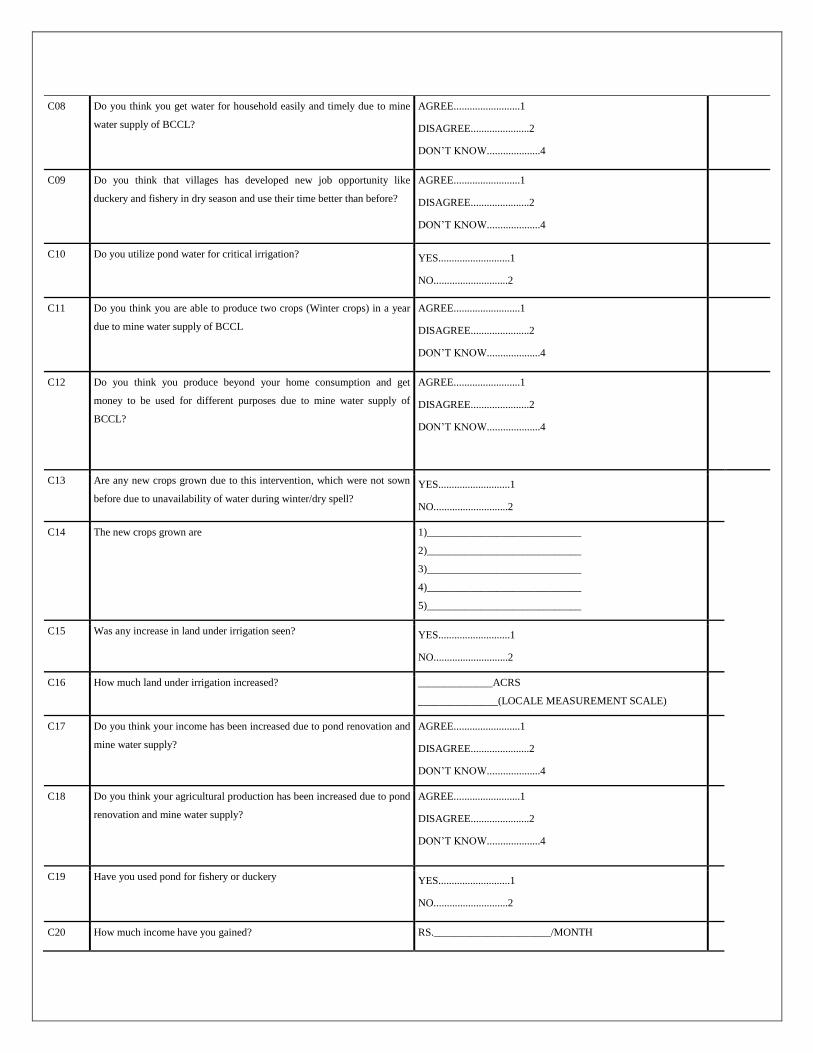
C08 Do you think you get water for household easily and timely due to mine
water supply of BCCL?
AGREE.........................1
DISAGREE......................2
DON‟T KNOW....................4
C09 Do you think that villages has developed new job opportunity like
duckery and fishery in dry season and use their time better than before?
AGREE.........................1
DISAGREE......................2
DON‟T KNOW....................4
C10 Do you utilize pond water for critical irrigation? YES...........................1
NO............................2
C11 Do you think you are able to produce two crops (Winter crops) in a year
due to mine water supply of BCCL
AGREE.........................1
DISAGREE......................2
DON‟T KNOW....................4
C12 Do you think you produce beyond your home consumption and get
money to be used for different purposes due to mine water supply of
BCCL?
AGREE.........................1
DISAGREE......................2
DON‟T KNOW....................4
C13 Are any new crops grown due to this intervention, which were not sown
before due to unavailability of water during winter/dry spell?
YES...........................1
NO............................2
C14 The new crops grown are 1)_____________________________
2)_____________________________
3)_____________________________
4)_____________________________
5)_____________________________
C15 Was any increase in land under irrigation seen? YES...........................1
NO............................2
C16 How much land under irrigation increased? ______________ACRS
_______________(LOCALE MEASUREMENT SCALE)
C17 Do you think your income has been increased due to pond renovation and
mine water supply?
AGREE.........................1
DISAGREE......................2
DON‟T KNOW....................4
C18 Do you think your agricultural production has been increased due to pond
renovation and mine water supply?
AGREE.........................1
DISAGREE......................2
DON‟T KNOW....................4
C19 Have you used pond for fishery or duckery YES...........................1
NO............................2
C20 How much income have you gained? RS.______________________/MONTH
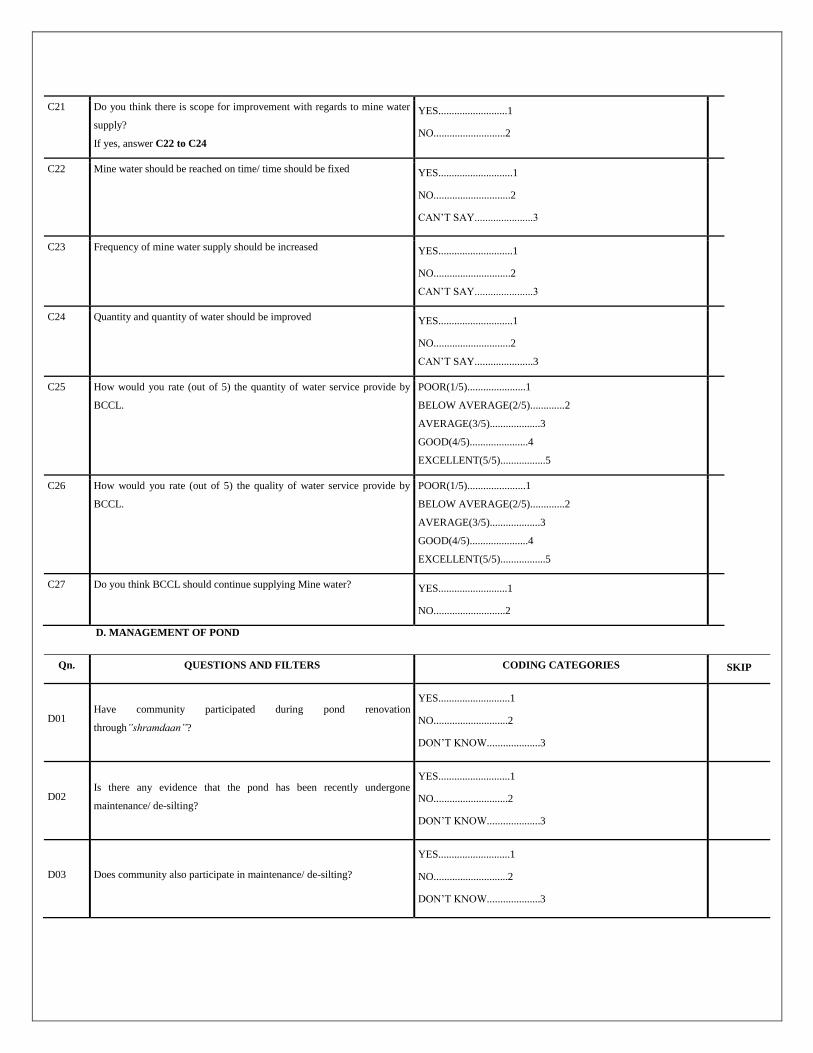
C21 Do you think there is scope for improvement with regards to mine water
supply?
If yes, answer C22 to C24
YES..........................1
NO...........................2
C22 Mine water should be reached on time/ time should be fixed
YES............................1
NO.............................2
CAN‟T SAY......................3
C23 Frequency of mine water supply should be increased YES............................1
NO.............................2
CAN‟T SAY......................3
C24 Quantity and quantity of water should be improved
YES............................1
NO.............................2
CAN‟T SAY......................3
C25 How would you rate (out of 5) the quantity of water service provide by
BCCL.
POOR(1/5)......................1
BELOW AVERAGE(2/5).............2
AVERAGE(3/5)...................3
GOOD(4/5)......................4
EXCELLENT(5/5).................5
C26 How would you rate (out of 5) the quality of water service provide by
BCCL.
POOR(1/5)......................1
BELOW AVERAGE(2/5).............2
AVERAGE(3/5)...................3
GOOD(4/5)......................4
EXCELLENT(5/5).................5
C27 Do you think BCCL should continue supplying Mine water? YES..........................1
NO...........................2
D. MANAGEMENT OF POND
Qn. QUESTIONS AND FILTERS CODING CATEGORIES SKIP
D01 Have community participated during pond renovation
through”shramdaan”?
YES...........................1
NO............................2
DON‟T KNOW....................3
D02 Is there any evidence that the pond has been recently undergone
maintenance/ de-silting?
YES...........................1
NO............................2
DON‟T KNOW....................3
D03 Does community also participate in maintenance/ de-silting?
YES...........................1
NO............................2
DON‟T KNOW....................3
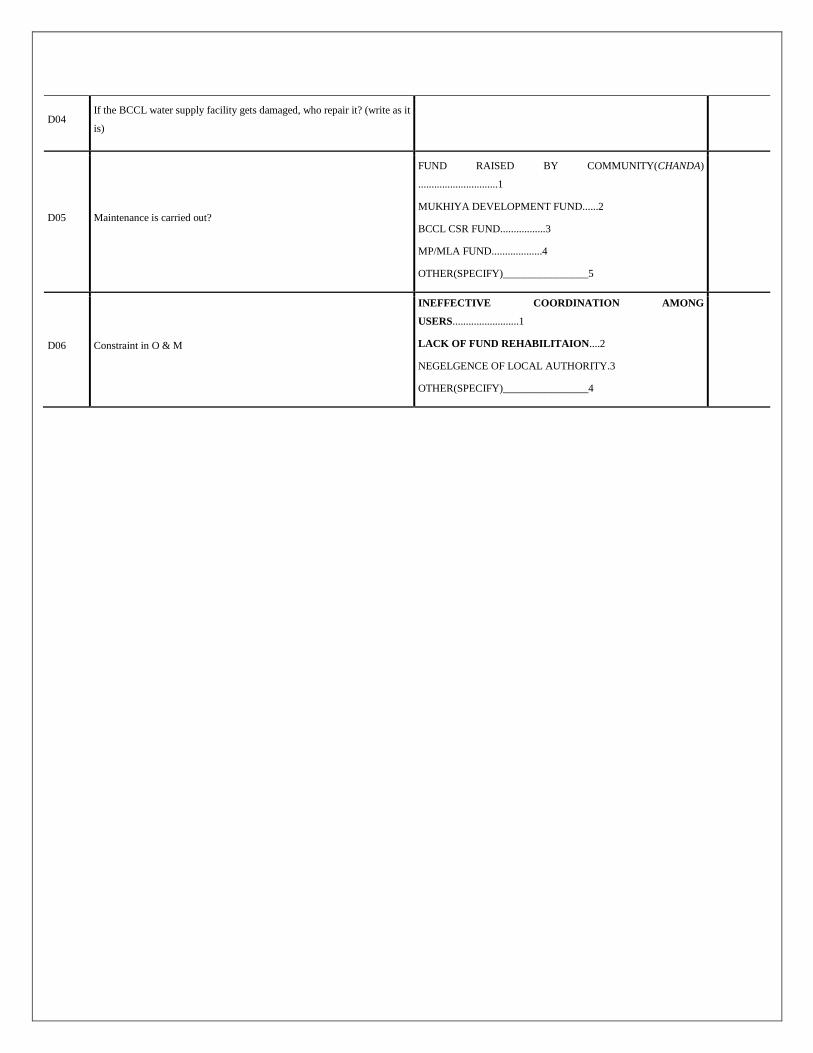
D04 If the BCCL water supply facility gets damaged, who repair it? (write as it
is)
D05 Maintenance is carried out?
FUND RAISED BY COMMUNITY(CHANDA)
..............................1
MUKHIYA DEVELOPMENT FUND......2
BCCL CSR FUND.................3
MP/MLA FUND...................4
OTHER(SPECIFY)________________5
D06 Constraint in O & M
INEFFECTIVE COORDINATION AMONG
USERS.........................1
LACK OF FUND REHABILITAION....2
NEGELGENCE OF LOCAL AUTHORITY.3
OTHER(SPECIFY)________________4
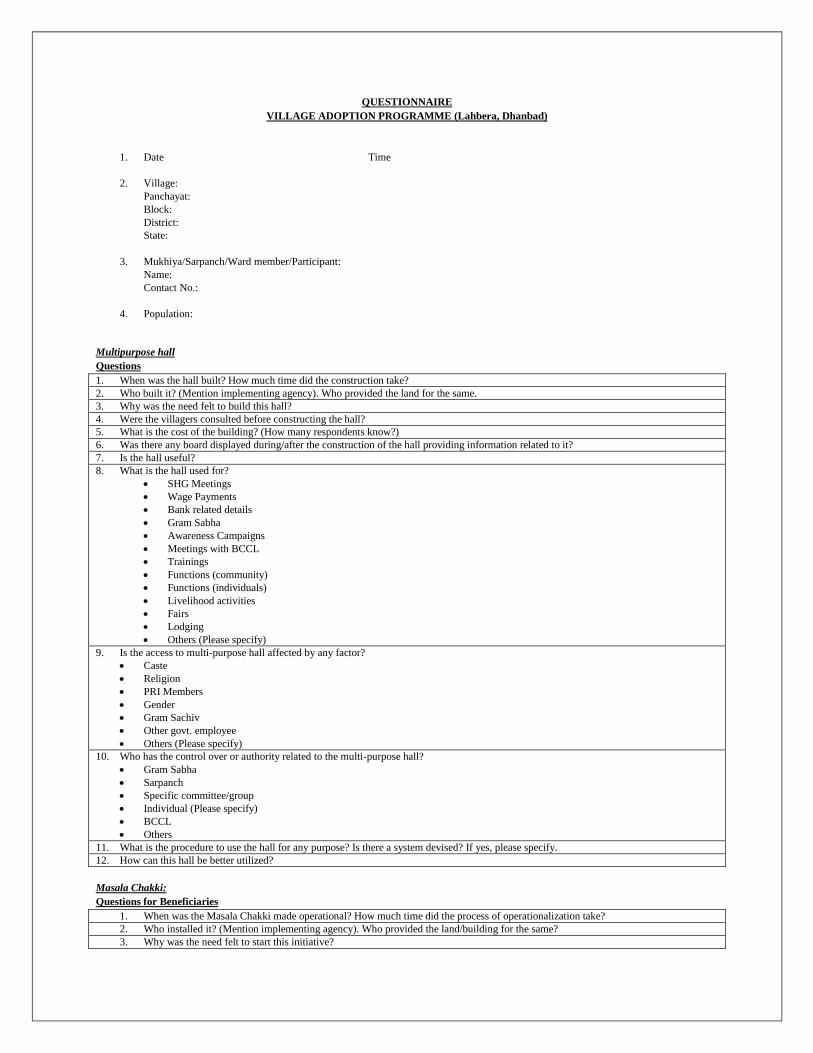
QUESTIONNAIRE
VILLAGE ADOPTION PROGRAMME (Lahbera, Dhanbad)
1. Date Time
2. Village:
Panchayat:
Block:
District:
State:
3. Mukhiya/Sarpanch/Ward member/Participant:
Name:
Contact No.:
4. Population:
Multipurpose hall
Questions
1. When was the hall built? How much time did the construction take?
2. Who built it? (Mention implementing agency). Who provided the land for the same.
3. Why was the need felt to build this hall?
4. Were the villagers consulted before constructing the hall?
5. What is the cost of the building? (How many respondents know?)
6. Was there any board displayed during/after the construction of the hall providing information related to it?
7. Is the hall useful?
8. What is the hall used for?
SHG Meetings
Wage Payments
Bank related details
Gram Sabha
Awareness Campaigns
Meetings with BCCL
Trainings
Functions (community)
Functions (individuals)
Livelihood activities
Fairs
Lodging
Others (Please specify)
9. Is the access to multi-purpose hall affected by any factor?
Caste
Religion
PRI Members
Gender
Gram Sachiv
Other govt. employee
Others (Please specify)
10. Who has the control over or authority related to the multi-purpose hall?
Gram Sabha
Sarpanch
Specific committee/group
Individual (Please specify)
BCCL
Others
11. What is the procedure to use the hall for any purpose? Is there a system devised? If yes, please specify.
12. How can this hall be better utilized?
Masala Chakki:
Questions for Beneficiaries
1. When was the Masala Chakki made operational? How much time did the process of operationalization take?
2. Who installed it? (Mention implementing agency). Who provided the land/building for the same?
3. Why was the need felt to start this initiative?
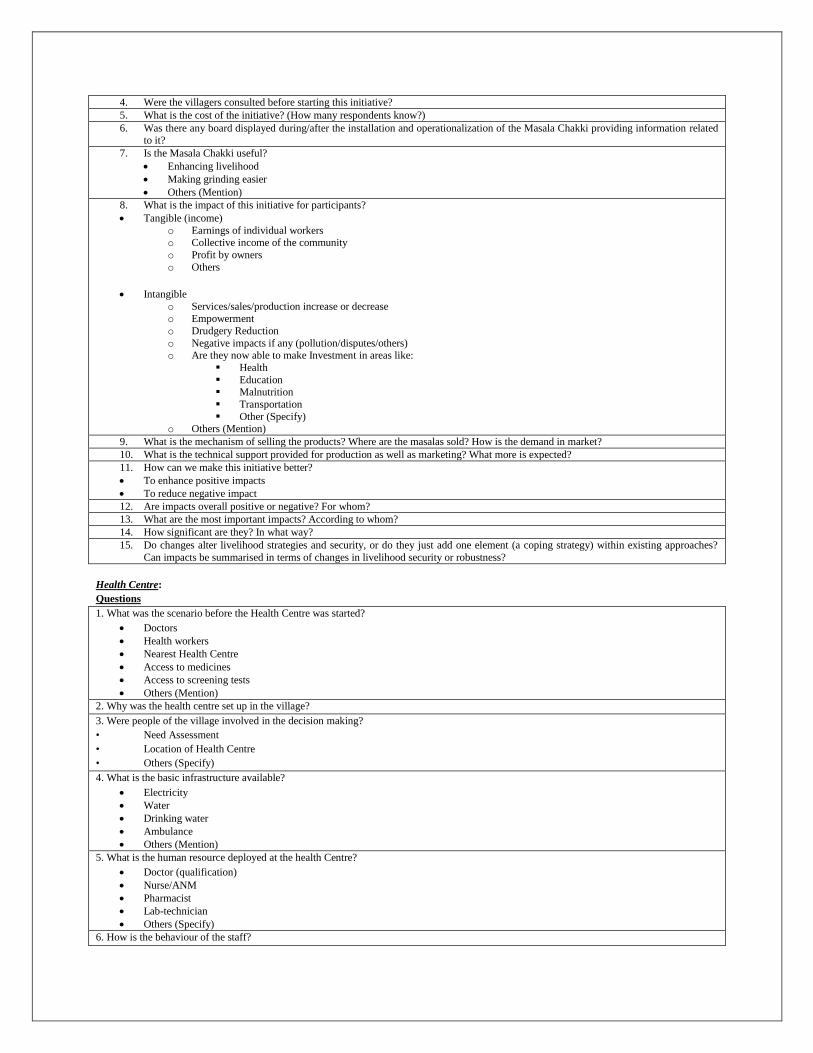
4. Were the villagers consulted before starting this initiative?
5. What is the cost of the initiative? (How many respondents know?)
6. Was there any board displayed during/after the installation and operationalization of the Masala Chakki providing information related to it?
7. Is the Masala Chakki useful?
Enhancing livelihood
Making grinding easier
Others (Mention)
8. What is the impact of this initiative for participants?
Tangible (income)
o Earnings of individual workers o Collective income of the community
o Profit by owners
o Others
Intangible
o Services/sales/production increase or decrease
o Empowerment
o Drudgery Reduction
o Negative impacts if any (pollution/disputes/others) o Are they now able to make Investment in areas like:
Health
Education Malnutrition
Transportation
Other (Specify) o Others (Mention)
9. What is the mechanism of selling the products? Where are the masalas sold? How is the demand in market?
10. What is the technical support provided for production as well as marketing? What more is expected?
11. How can we make this initiative better?
To enhance positive impacts
To reduce negative impact
12. Are impacts overall positive or negative? For whom?
13. What are the most important impacts? According to whom?
14. How significant are they? In what way?
15. Do changes alter livelihood strategies and security, or do they just add one element (a coping strategy) within existing approaches?
Can impacts be summarised in terms of changes in livelihood security or robustness?
Health Centre:
Questions
1. What was the scenario before the Health Centre was started?
Doctors
Health workers
Nearest Health Centre
Access to medicines
Access to screening tests
Others (Mention)
2. Why was the health centre set up in the village?
3. Were people of the village involved in the decision making?
• Need Assessment
• Location of Health Centre
• Others (Specify)
4. What is the basic infrastructure available?
Electricity
Water
Drinking water
Ambulance
Others (Mention)
5. What is the human resource deployed at the health Centre?
Doctor (qualification)
Nurse/ANM
Pharmacist
Lab-technician
Others (Specify)
6. How is the behaviour of the staff?
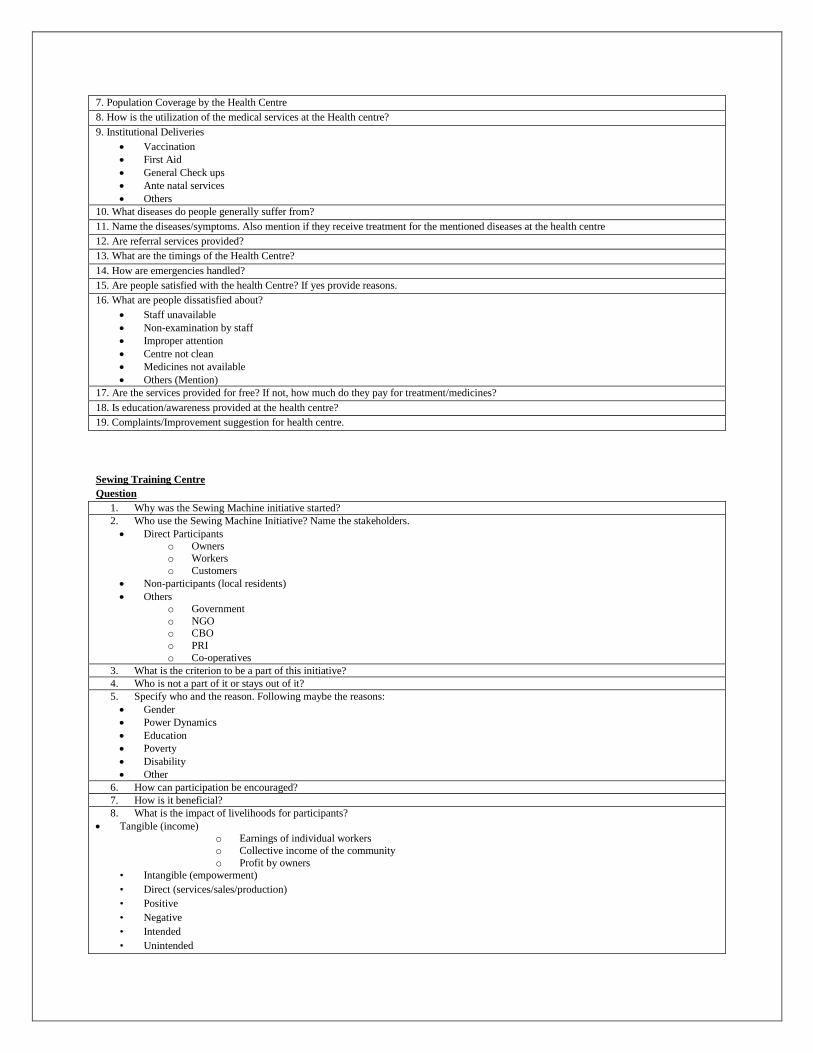
7. Population Coverage by the Health Centre
8. How is the utilization of the medical services at the Health centre?
9. Institutional Deliveries
Vaccination
First Aid
General Check ups
Ante natal services
Others
10. What diseases do people generally suffer from?
11. Name the diseases/symptoms. Also mention if they receive treatment for the mentioned diseases at the health centre
12. Are referral services provided?
13. What are the timings of the Health Centre?
14. How are emergencies handled?
15. Are people satisfied with the health Centre? If yes provide reasons.
16. What are people dissatisfied about?
Staff unavailable
Non-examination by staff
Improper attention
Centre not clean
Medicines not available
Others (Mention)
17. Are the services provided for free? If not, how much do they pay for treatment/medicines?
18. Is education/awareness provided at the health centre?
19. Complaints/Improvement suggestion for health centre.
Sewing Training Centre
Question
1. Why was the Sewing Machine initiative started?
2. Who use the Sewing Machine Initiative? Name the stakeholders.
Direct Participants o Owners
o Workers
o Customers
Non-participants (local residents)
Others o Government
o NGO o CBO
o PRI
o Co-operatives
3. What is the criterion to be a part of this initiative?
4. Who is not a part of it or stays out of it?
5. Specify who and the reason. Following maybe the reasons:
Gender
Power Dynamics
Education
Poverty
Disability
Other
6. How can participation be encouraged?
7. How is it beneficial?
8. What is the impact of livelihoods for participants?
Tangible (income) o Earnings of individual workers
o Collective income of the community
o Profit by owners
• Intangible (empowerment)
• Direct (services/sales/production)
• Positive
• Negative
• Intended
• Unintended
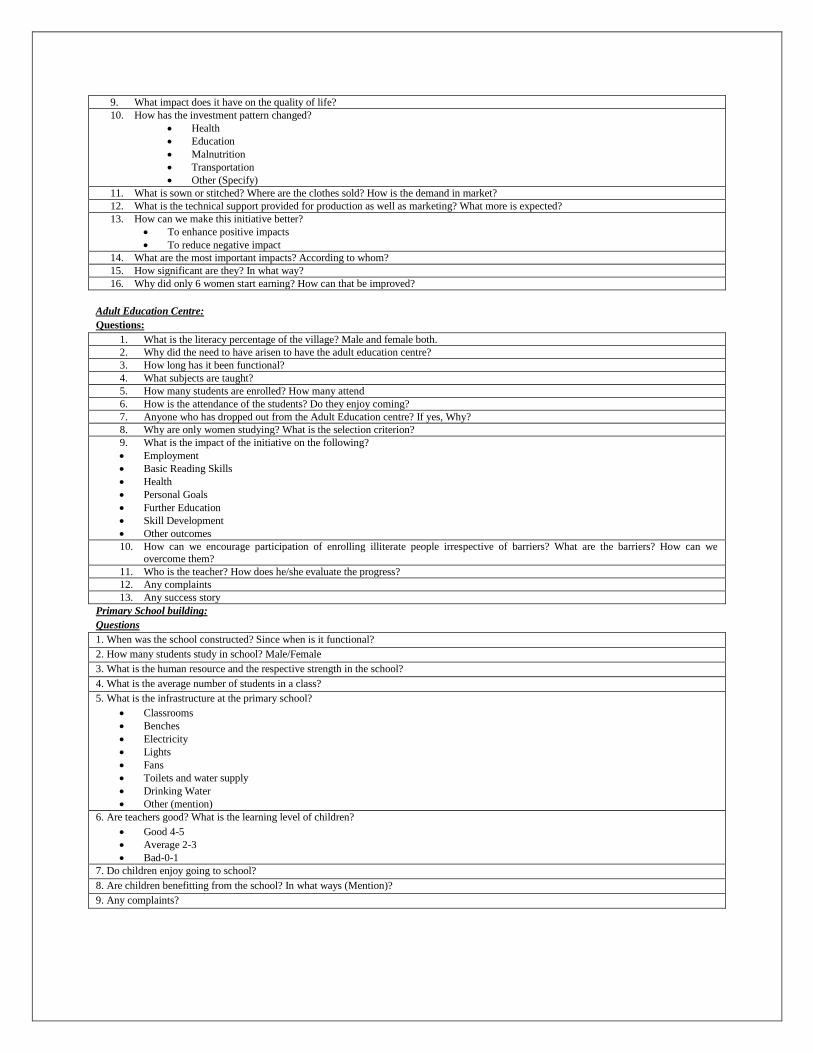
9. What impact does it have on the quality of life?
10. How has the investment pattern changed?
Health
Education
Malnutrition
Transportation
Other (Specify)
11. What is sown or stitched? Where are the clothes sold? How is the demand in market?
12. What is the technical support provided for production as well as marketing? What more is expected?
13. How can we make this initiative better?
To enhance positive impacts
To reduce negative impact
14. What are the most important impacts? According to whom?
15. How significant are they? In what way?
16. Why did only 6 women start earning? How can that be improved?
Adult Education Centre:
Questions:
1. What is the literacy percentage of the village? Male and female both.
2. Why did the need to have arisen to have the adult education centre?
3. How long has it been functional?
4. What subjects are taught?
5. How many students are enrolled? How many attend
6. How is the attendance of the students? Do they enjoy coming?
7. Anyone who has dropped out from the Adult Education centre? If yes, Why?
8. Why are only women studying? What is the selection criterion?
9. What is the impact of the initiative on the following?
Employment
Basic Reading Skills
Health
Personal Goals
Further Education
Skill Development
Other outcomes
10. How can we encourage participation of enrolling illiterate people irrespective of barriers? What are the barriers? How can we
overcome them?
11. Who is the teacher? How does he/she evaluate the progress?
12. Any complaints
13. Any success story
Primary School building:
Questions
1. When was the school constructed? Since when is it functional?
2. How many students study in school? Male/Female
3. What is the human resource and the respective strength in the school?
4. What is the average number of students in a class?
5. What is the infrastructure at the primary school?
Classrooms
Benches
Electricity
Lights
Fans
Toilets and water supply
Drinking Water
Other (mention)
6. Are teachers good? What is the learning level of children?
Good 4-5
Average 2-3
Bad-0-1
7. Do children enjoy going to school?
8. Are children benefitting from the school? In what ways (Mention)?
9. Any complaints?
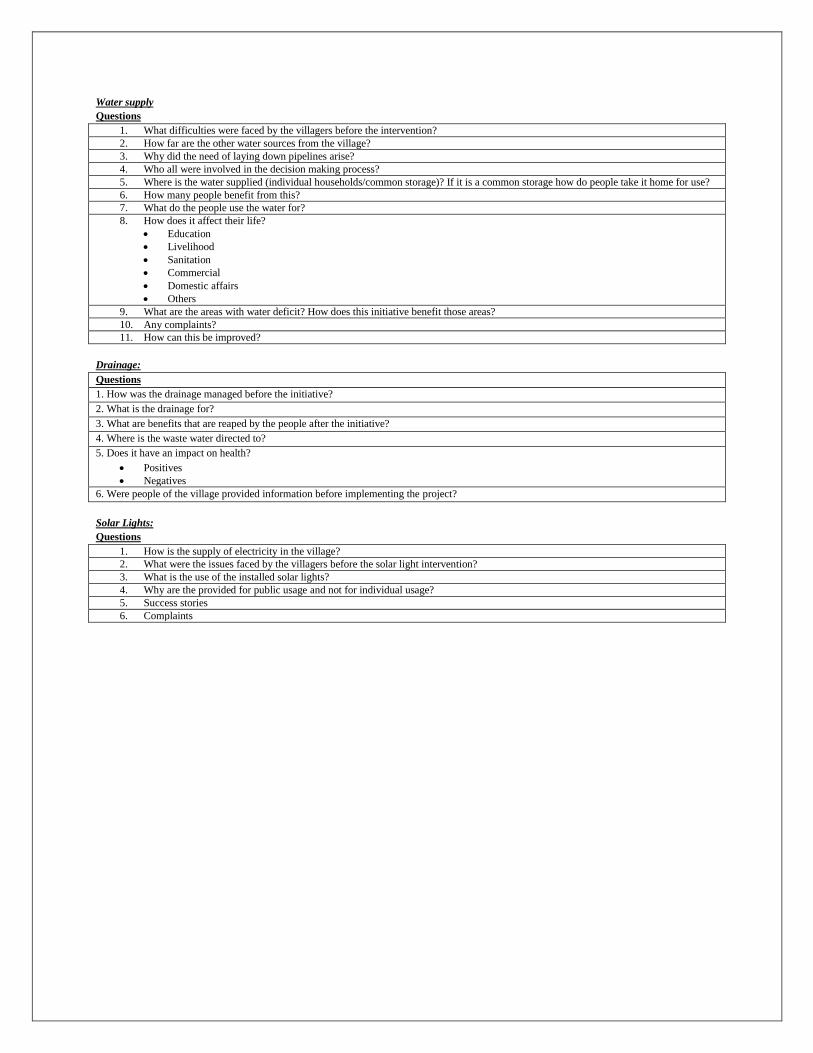
Water supply
Questions
1. What difficulties were faced by the villagers before the intervention?
2. How far are the other water sources from the village?
3. Why did the need of laying down pipelines arise?
4. Who all were involved in the decision making process?
5. Where is the water supplied (individual households/common storage)? If it is a common storage how do people take it home for use?
6. How many people benefit from this?
7. What do the people use the water for?
8. How does it affect their life?
Education
Livelihood
Sanitation
Commercial
Domestic affairs
Others
9. What are the areas with water deficit? How does this initiative benefit those areas?
10. Any complaints?
11. How can this be improved?
Drainage:
Questions
1. How was the drainage managed before the initiative?
2. What is the drainage for?
3. What are benefits that are reaped by the people after the initiative?
4. Where is the waste water directed to?
5. Does it have an impact on health?
Positives
Negatives
6. Were people of the village provided information before implementing the project?
Solar Lights:
Questions
1. How is the supply of electricity in the village?
2. What were the issues faced by the villagers before the solar light intervention?
3. What is the use of the installed solar lights?
4. Why are the provided for public usage and not for individual usage?
5. Success stories
6. Complaints
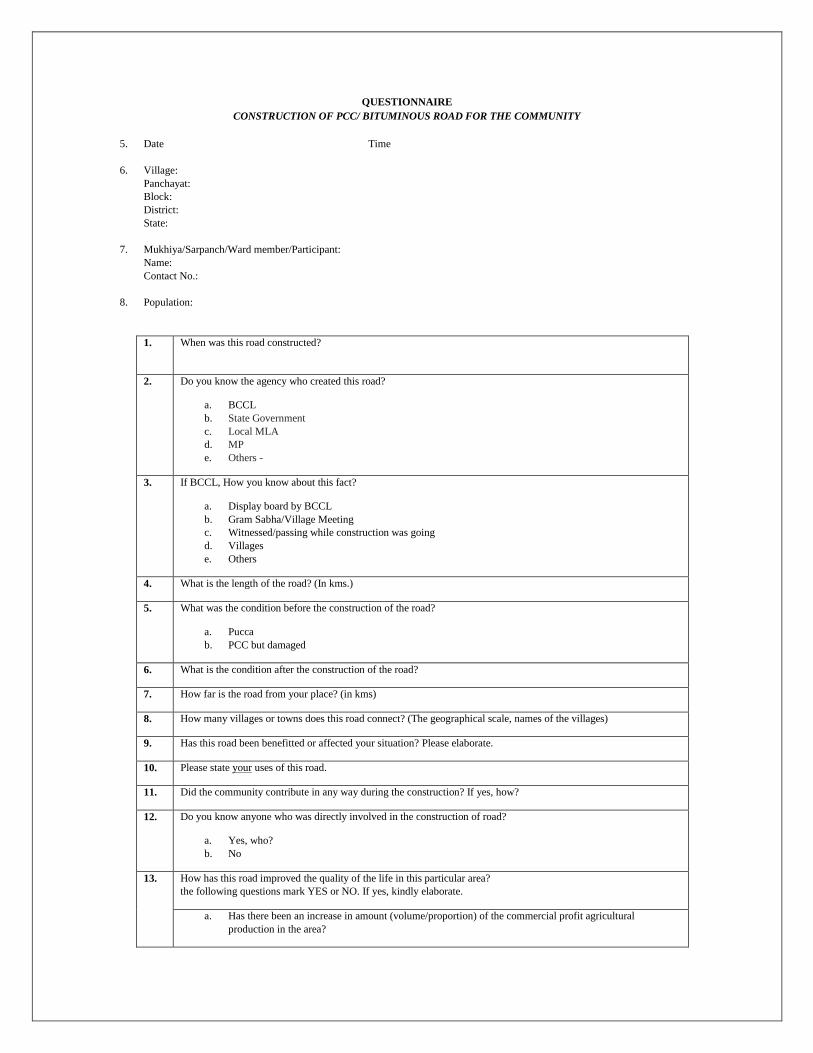
QUESTIONNAIRE
CONSTRUCTION OF PCC/ BITUMINOUS ROAD FOR THE COMMUNITY
5. Date Time
6. Village:
Panchayat:
Block:
District:
State:
7. Mukhiya/Sarpanch/Ward member/Participant:
Name:
Contact No.:
8. Population:
1. When was this road constructed?
2. Do you know the agency who created this road?
a. BCCL
b. State Government
c. Local MLA
d. MP
e. Others -
3. If BCCL, How you know about this fact?
a. Display board by BCCL
b. Gram Sabha/Village Meeting
c. Witnessed/passing while construction was going
d. Villages
e. Others
4. What is the length of the road? (In kms.)
5. What was the condition before the construction of the road?
a. Pucca
b. PCC but damaged
6. What is the condition after the construction of the road?
7. How far is the road from your place? (in kms)
8. How many villages or towns does this road connect? (The geographical scale, names of the villages)
9. Has this road been benefitted or affected your situation? Please elaborate.
10. Please state your uses of this road.
11. Did the community contribute in any way during the construction? If yes, how?
12. Do you know anyone who was directly involved in the construction of road?
a. Yes, who?
b. No
13. How has this road improved the quality of the life in this particular area?
the following questions mark YES or NO. If yes, kindly elaborate.
a. Has there been an increase in amount (volume/proportion) of the commercial profit agricultural
production in the area?
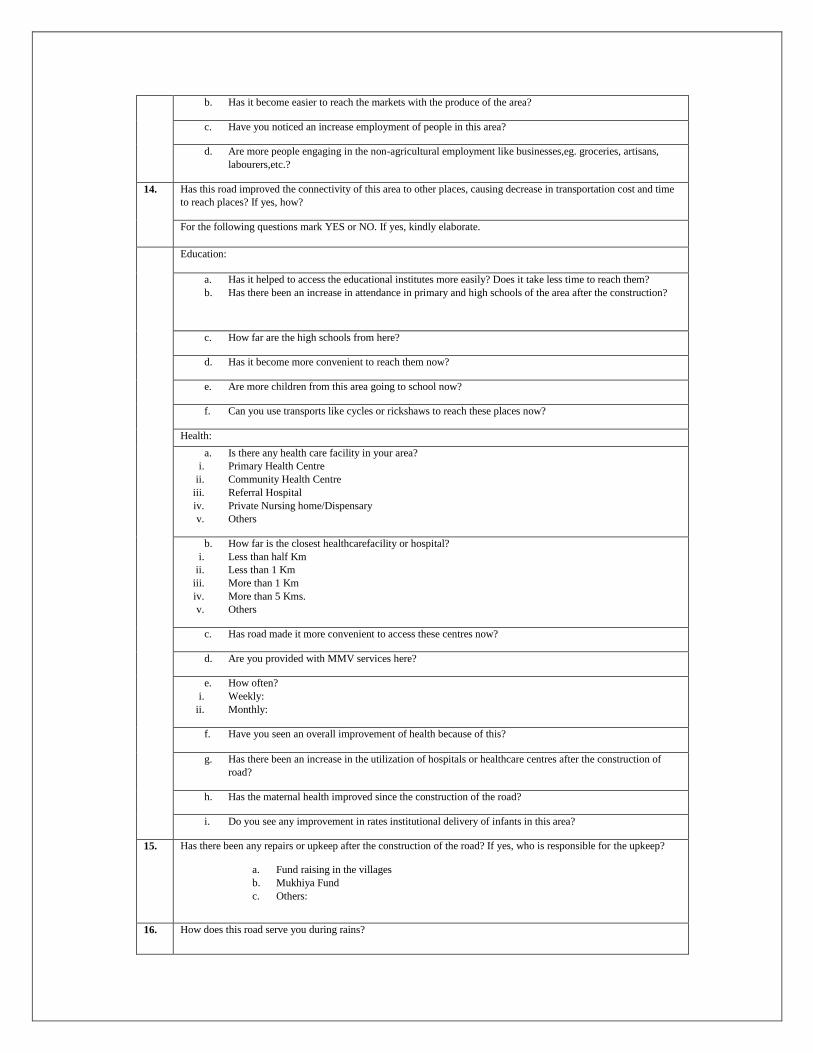
b. Has it become easier to reach the markets with the produce of the area?
c. Have you noticed an increase employment of people in this area?
d. Are more people engaging in the non-agricultural employment like businesses,eg. groceries, artisans,
labourers,etc.?
14. Has this road improved the connectivity of this area to other places, causing decrease in transportation cost and time
to reach places? If yes, how?
For the following questions mark YES or NO. If yes, kindly elaborate.
Education:
a. Has it helped to access the educational institutes more easily? Does it take less time to reach them?
b. Has there been an increase in attendance in primary and high schools of the area after the construction?
c. How far are the high schools from here?
d. Has it become more convenient to reach them now?
e. Are more children from this area going to school now?
f. Can you use transports like cycles or rickshaws to reach these places now?
Health:
a. Is there any health care facility in your area?
i. Primary Health Centre
ii. Community Health Centre
iii. Referral Hospital
iv. Private Nursing home/Dispensary
v. Others
b. How far is the closest healthcarefacility or hospital?
i. Less than half Km
ii. Less than 1 Km
iii. More than 1 Km
iv. More than 5 Kms.
v. Others
c. Has road made it more convenient to access these centres now?
d. Are you provided with MMV services here?
e. How often?
i. Weekly:
ii. Monthly:
f. Have you seen an overall improvement of health because of this?
g. Has there been an increase in the utilization of hospitals or healthcare centres after the construction of
road?
h. Has the maternal health improved since the construction of the road?
i. Do you see any improvement in rates institutional delivery of infants in this area?
15. Has there been any repairs or upkeep after the construction of the road? If yes, who is responsible for the upkeep?
a. Fund raising in the villages
b. Mukhiya Fund
c. Others:
16. How does this road serve you during rains?
17. Have you faced any problems after the construction? If yes, what? Please elaborate.
18. How the village does contributes to the upkeeping of the road?
19. How would rate the quality and viability of this road on a scale
a. Very poor
b. Poor
c. Average
d. Good
e. Excellent
20. Kindly provide any additional comments, concerns and/or observations/suggestions to improve this project?
[Type the abstract of the document here. The abstract is typically a short summary of the contents of the document. Type the abstract of the document here. The abstract is typically a short summary of the contents of the document.]
Mid- term Evaluation of Project Swablamban - Reeling and Spinning Training Projecr under CSR
(Sustainable Development Department), Bharat Coking Coal Limited, Dhanbad
FY(2015-16)
By
National CSR Hub
Tata Institute of Social Sciences, Mumbai
1 | P a g e
RESEARCH TEAM AT NATIONAL CSR HUB
Project Director
Prof. B. Venkatesh Kumar
Senior Consultant
Ms. Dilnavaz Munshi
Project Co-ordinator
Ms. Dipty Nisha
Data collection, Analysis & Report Writing
Ms. Prachi Kathuria
Mr. Sumit Jagtap
Research Investigators
Mr. Monu Kumar
Mr. Ajay Kumar Singh
Mr. Dinesh Kumar
Mr. Suraj Kumar
Secretariat Support
Ms. Vaishali Gajbiye
Ms. Rajisha Ramankutty
Ms. Sushma Kir
2 | P a g e
ACKNOWLEDGEMENT
This Mid –term Evaluation Study of CSR project of Bharat Coking Coal Limited, Dhanbad for
the FY 2015-16 has been undertaken by National CSR Hub, Tata Institute of Social Sciences
(TISS) as a part of the MoU with CIL and TISS.
At the outset, we would like to thank BCCL for granting this project to National CSR Hub, TISS.
We express heartfelt gratitude to Director (Personnel), BCCL for giving us the opportunity to
carry out the Impact Assessment study of CSR projects for the FY 2015-16. We express our
gratitude to the General Manger, CSR and the entire CSR department of BCCL for their
continuous support and guidance to the research team of NCSR Hub.
We also extend our gratefulness to respective area General Managers, Medical Officers (Health
Department) and concerned project in-charge appointed by BCCL (CSR officials) for making all
the arrangements for the study and making us comfortable with their warm hospitality.
Prof. B. Venkatesh Kumar
Director
National Corporate Social Responsibility Hub
TISS, Mumbai
3 | P a g e
EXECUTIVE SUMMARY
The purpose of this report, mid-term evaluation study was conducted for Reeling and Spinning
training as a skill development project. The locations of the study were Alakdiha and Mukunda
training centres, in Dhanbad. The primary data collection for the mid-term evaluation was
completed in September 2017 by a 6 member team from TISS. Qualitative research methodology
was used while in-depth interviews and focused group discussions were the main methods
employed.
The Reeling and Spinning training project was conducted in association with Jharkhand Silk
Textile and Handicraft Development Corporation (JHARCRAFT), a Government of Jharkhand
undertaking under Industry Department, registered under section 26 Companies Act. 1956.
While BCCL provided monetary support and infrastructure, JHARCRAFT provided skilled
trainers, handlooms and raw material for the training. The Primary beneficiaries of the project
were 150 underprivileged women across locations. Five training centres were proposed in the
project proposal out of which two centres were selected as pilot initiatives of the project.
After successful completion of two month long training course at both the centres, beneficiaries
were given access to handloom machinery to hone their skills and earn an income in the process.
Currently, only one centre is functional with 20-25 beneficiaries regularly coming to the training
centre. The project in the mid-implementation phase faces certain challenges such as minimal
increase in household income and lack of orders from JHARCRAFT, these if overcome, can
result in effective and efficient implementation of the reeling and spinning training project.
4 | P a g e
TABLE OF CONTENTS
CHAPTER 1- INTRODUCTION ................................................................................................. 5
1.1. About Bharat Coking Coal Limited .................................................................................. 5
1.2. About National Corporate Social Responsibility Hub, TISS ................................................. 6
1.3. Project Background ........................................................................................................ 6
1.4. Objectives of the project .................................................................................................. 6
1.5. Mid Term Evaluation study for Reeling And Spinning project of BCCL ............................... 7
CHAPTER 2– RESEARCH METHODOLOGY ........................................................................... 8
2.1 Objective of Study .......................................................................................................... 8
2.2 Key issues addressed ...................................................................................................... 8
2.3 Research Design............................................................................................................. 9
2.4 Research Methods .......................................................................................................... 9
2.5 Data collection methods .................................................................................................. 9
2.6 Participants of Data Collection ........................................................................................10
2.7 Data Analysis ...............................................................................................................10
2.8 Challenges of the study ..................................................................................................10
CHAPTER 3–FINDINGS FROM THE FIELD.............................................................................11
3.1 Introduction ..................................................................................................................11
3.2 Background ..................................................................................................................11
3.3 Objectives of the reeling and spinning training project .......................................................12
3.4 Implementation of the Project .........................................................................................13
3.5 Observations of the Mid Term Evaluation ........................................................................14
3.6 Mukunda Training Centre...............................................................................................14
3.7 Alakdiha Training Centre ...............................................................................................17
3.8 Concerns regarding the project ........................................................................................20
CHAPTER 4 - RECOMMENDATIONS ......................................................................................21
ANNEXURE ..............................................................................................................................23
5 | P a g e
CHAPTER 1- INTRODUCTION
Businesses are the most powerful constituents of the society and they do not operate in isolation;
there is an increased realization that not only can companies affect society at large, but they are
also in a unique position to influence society and make positive impact.
“The Organization for Economic Co-operation and Development1 (OECD) established a set
of guidelines for multinational enterprises in 1976, and was thus a pioneer in developing the
concept of CSR. The purpose of these guidelines was to improve the „investment‟ climate
and encourage the positive contribution multinational enterprises can make to economic and
social progress”.
An evaluation is „the systematic and objective assessment of an on-going or completed project,
programme or policy, its design, implementation and results. The aim is to determine the
relevance and fulfillment of objectives, development efficiency, effectiveness, impact and
sustainability. An evaluation should provide information that is credible and useful, enabling the
incorporation of lessons learned into the decision-making process of both recipient and donors.‟
(OECD Publications, 2010)
1.1. About Bharat Coking Coal Limited
Bharat Coking Coal Limited (BCCL) is a subsidiary of Coal India Limited, a Maharatna
Company. The company is operating in 12 administrative areas in Jharia Coalfields
encompassing around 226 peripheral villages mainly in the District of Dhanbad, Jharkhand and
in some part of West Bengal. The CSR strategy of BCCL states that the company‟s main
objective is to improve the quality of life of people living in and around its command areas.
Towards achieving this objective and to understand the interest levels of the local community,
BCCL undertook a departmental baseline survey cum Skill Gap Analysis study at some
locations. The recommendations from the study formed the basis for the design and deployment
of the skill development initiatives.
1 http://www.oecd.org/about/
6 | P a g e
1.2. About National Corporate Social Responsibility Hub, TISS
National Corporate Social Responsibility Hub, (NCSR Hub) was established in 2011 by the
Department of Public Enterprises to enable the Public Sector Enterprises to design and
implement holistic and rights-based CSR initiatives. Tata Institute of Social Sciences (TISS),
Mumbai and Department of Public Enterprises (DPE), Government of India had come to realize
that there is a need to have centralized system where core functions of CSR including learning
and knowledge dissemination take place. The core activities of the Hub are:
Vision and strategic direction setting for Policy and Programme
Advisory role for PSEs on Policy and Programme implementation
Research and development and „evidence-based‟ policy advocacy
Capacity building of PSEs, partners and civil society institution
Impact assessment, monitoring and evaluation
Empanelment and partner management
1.3. Project Background
REELING AND SPINNING TRAINING PROJECT: This is a skill Development cum
employment generation project under “Swaavlambee Project” of BCCL targeting groups of
unemployed and willing to work women from Mukunda, Alakdiha, Gareia , Panchmohali and
Nootangram villages belonging to Dhanbad District. These villages were chosen because they
are located in the command area of BCCL, a project was estimated to generate employment for a
group of thirty women from a village. For this purpose, BCCL and JHARCRAFT entered into an
agreement for implementation of the project.
1.4. Objectives of the project
1. Skill enhancement through Training and shortening the learning curve of skilled and
semi-skilled women.
2. Self-Employment generation and enhancing employability of women groups in the
villages.
7 | P a g e
3. To help improve overall quality of life by providing employment to women especially the
weaker section of the society.
1.5. Mid Term Evaluation study for Reeling And Spinning project of BCCL
Bharat Coking Coal Limited (BCCL) sanctioned mid-term evaluation of the reeling and spinning
skill development project to National CSR Hub in August-September 2017. The following report
details the evaluation of projects undertaken by Bharat Coking Coal Limited in accordance to
their CSR policy laid out in 2014.
As per the agreement with CIL, TISS was entrusted the responsibility to undertake the work of
generating data through a baseline survey in the peripheral villages of BCCL. Accordingly TISS
conducted a sample survey in 42 villages in and around BCCL in the year 2013 to assess
community needs that could be addressed through CSR initiatives. .
Based on the results of the baseline survey, a skilled development and employment generation
project was envisioned for unemployed women of these villages. In order to facilitate the
identified groups of women of these villages with employment opportunities, initiatives have
been taken to take the help of JHARCRAFT, a Government of Jharkhand undertaking. Five
groups of women each group comprising of thirty (30) women were identified at Mukunda,
Alakdiha, Gareria, Panchmohali and Nootangram village.
8 | P a g e
CHAPTER 2– RESEARCH METHODOLOGY
Research methodology is a way to systematically solve the research problem. It may be
understood as a science of studying how research is done scientifically. In it, one studies the
various steps that are generally adopted by a researcher in studying his research problem along
with the logic behind them (Kothari, 2004). This chapter outlines the research methodology and
also examines the objectives of the study and the research question. The chapter also includes the
research design, methods, and level of engagement for data collection, on and off the field as
well as the ethics of research and the limitations that the researcher has kept in consideration.
2.1 Objective of Study
The very purpose of the research is to discover answers to the question through the application of
the scientific procedures (Kothari, 2004). These objectives help in exploring answers and
understanding the behaviour, condition or phenomenon prevalent in the population under study.
The aim of the study was to understand the extent of the impact of the project on the socio-
economic conditions of the targeted beneficiaries. Further, following are the main objectives of
the study:
i. To assess if the objectives of individual projects are being met/have been met;
ii. To understand the continued relevance of the individual projects in their respective
contexts;
iii. To identify issues in programmatic implementation and provide recommendation to fulfil
the objectives efficiently.
2.2 Key issues addressed
Implementation mechanisms used by the Implementation Agencies;
Monitoring mechanisms undertaken by the IAs;
Scope of improvement as articulated by various stakeholders;
Efforts towards ensuring sustainability of the project
Documentation of the project design, outcomes and achievements.
9 | P a g e
2.3 Research Design
The research design refers to the overall strategy that one chooses to integrate the different
components of the study in a coherent and logical way, thereby, ensuring one will effectively
address the research problem; it constitutes the blueprint for the collection, measurement, and
analysis of data (De Vaus, 2001)
This study is an Evaluation research study as it is designed to assess the outcomes of an
intervention, so that the findings will provide insights useful for the organizations that have
funded and implemented the project. For the purpose of the mid-term evaluation of reeling and
spinning training project, qualitative research design was developed.
2.4 Research Methods
Tools for Data Collection
The tool is one of the essential components of a research study. It is an instrument that helps the
researcher to meet the objectives of the research. There are various kinds of tools that are utilized
based on the needs and objectives of the research. In the current study the research team made
use of certain sets of tools which are as follows:
Focused Group Discussion (FGD): FGDs where conducted in all the 4 project, and
those interviewed for the FGD were the village members, Ward/Gram Panchayat
Representative, ASHA workers, Women Representatives, SHGs Youth group members
etc.
In-depth Interviews (IDI): Similarly IDI was conducted with village members who
were directly affected by the project
Case studies: Case studies were used to get life narratives of the beneficiaries and to
understand the impact of the project on their socio-economic and cultural lives
2.5 Data collection methods
The sampling type used for Data collection was Random Stratified sampling. Primary data was
collected using the following methods, selected as per the above-explained research design:
a. Survey of beneficiaries through questionnaire
10 | P a g e
b. Semi-structured interview (using interview schedule) and In-depth interviews. The in-
depth interviews were open-ended with complete scope for probing and getting detailed
information from the participants.
c. Participatory research methods such as transect walk
d. Document analysis (review of project reports)
e. Direct observation (home visit, village/town visit and institution visit)
Secondary data: Secondary data, wherever made available by the implementing agencies,
consisted of Annual reports, Project Proposals, Baseline studies and project blue prints
2.6 Participants of Data Collection
This study aims to capture perspectives from multiple stakeholders. Accordingly the following
participants and stakeholders were covered through the data collection done in this study:
Beneficiaries i.e. people (here SHG/Women‟s group) impacted by the project
Officials of BCCL (Sustainable Development Department)
Village level stakeholders (Community Leaders):, Sarpanch, ward members and former
Sarpanch
2.7 Data Analysis
As previously mentioned, this study employs qualitative methods. The responses from the in-
depth interviews and the other qualitative data were subjected to coding for detecting patterns.
The data from interviews and discussions was analyzed thematically and the data from all the
sources was integrated as per the responses to understand, assess and evaluate the entire process
of implementation. This being a qualitative study, there is an emphasis on understanding and
analyzing the perceptions, views and experiences of the beneficiaries and other key stakeholders
with respect to the skilled development project.
2.8 Challenges of the study
1. Language Barrier: The major hurdle in data collection was the language barriers, few
of the villagers were speaking Bengali and few were Oriya/Odia.
2. Limited documentation: The Limited documentation of the CSR project was another
hurdle faced by the research team. It rendered primary data as the only source of information
11 | P a g e
CHAPTER 3–FINDINGS FROM THE FIELD
3.1 Introduction
“Swaavlambi Project” is a Skill Development initiative of BCCL and JHARCRAFT, an
undertaking of Government of Jharkhand. They have mutually agreed to develop skills in
weaving and reeling to assure sustainable livelihoods to underprivileged and unemployed women
of Dhanbad District of Jharkhand. Mukunda, Alakdiha, Gareia, Panchmohali and Nootangram
are the chosen villages to implement this employment generation program. The purpose of the
intervention is to develop an infrastructure to train women, employ them in the centres and
assure a market linkage for sustainability. The aim is to ensure maximum possible monetary
benefits to these women.
3.2 Background
“Swaavlambi Project” is a Skill Development initiative of BCCL and JHARCRAFT, an
undertaking of Government of Jharkhand. They have mutually agreed to develop skills in
weaving and reeling to assure sustainable livelihoods to underprivileged and unemployed women
of Dhanbad District of Jharkhand. Mukunda, Alakdiha, Gareia, Panchmohali and Nootangram
are the chosen villages to implement this employment generation program. The purpose of the
intervention is to develop an infrastructure to train women, employ them in the centres and
assure a market linkage for sustainability. The aim is to ensure minimum monetary benefits to
these women, BCCL and JHARCRAFT have entered into an agreement to share the
responsibilities of the Weaving and Reeling Training Program. JHARCRAFT imparted skill
development training to a group of thirty women on Reeling and Spinning of cotton and silk
thread in two locations for a period of one month. After having received training, the women
were found to be skilled enough, to produce the cotton and silk handlooms. The training centre
was the production centre and guidance was provided by the trainers and officials of
JHARCRAFT. Apart from training, JHARCRAFT was responsible for generating a market for
the produce. The Emporiums across the country were the platforms to exhibit and sale the
finished products. The money earned from the sale was to be transferred to the bank accounts of
women.
12 | P a g e
Reeling and spinning training project is a CSR initiative which is a skill development and
employment generation project under “Swaavlambee Project” of BCCL. Itis focussed on willing
unemployed groups of women of the villages Mukunda, Alakdiha, Gareia, Panchmohali and
Nootangram belonging to Dhanbad District. To generate employment opportunities for the
women, BCCL and Jharkhand Silk Textile and Handicraft Development Corporation Ltd.
(JHARCRAFT) have entered into an agreement for implementation of the project. JHARCRAFT
is a Government of Jharkhand undertaking under Industry Department and is registered under
section 26 under Companies Act. 1956. It is operating such projects successfully at Khraswan in
Jameshdpur, Nagri in Ranchi and Bhagahiya in Sahebganj. Besides this, their projects are also
being implemented as CSR activities of Gua Ore Mines, Megahatburu, Kirkburn, Durgapur plant
of SAIL and NTPC Hazaribagh, THIESS Minaces, JINDAL Power Patratuas organisations.
In the first phase, for one month, JHARCRAFT imparted skill development training to a group
of thirty women on Reeling and Spinning of cotton and silk thread in two locations, Mukunda
and Alakdiha. Once trained, these women started production of cotton and silk fabrics under the
guidance of JHARCRAFT trainers and officials for the remaining project period. According to
the agreement, JHARCRAFT also managed production of the silk products produced by the
trained women and promoted marketing of the products through their emporiums spread over
various locations of the country. Money earned from the sale of the silk products is being
transferred to bank accounts of the women.
This project, therefore, intended to provide a sustainable employment generation for the women
of the target communities
3.3 Objectives of the reeling and spinning training project
a) Skill enhancement through Training and shortening the learning curve of skilled and semi-
skilled women.
b) Self-Employment generation and enhancing employability of women groups in the villages.
c) To help improve overall quality of life by providing employment to women especially the
weaker section of the society.
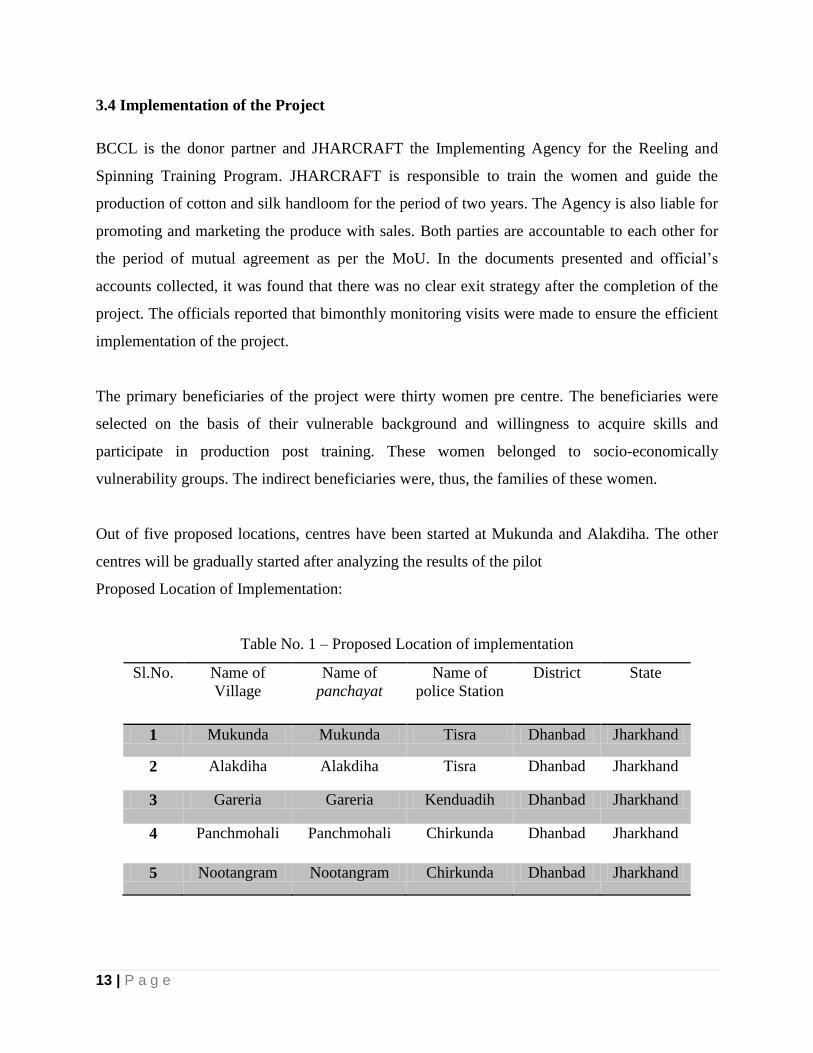
13 | P a g e
3.4 Implementation of the Project
BCCL is the donor partner and JHARCRAFT the Implementing Agency for the Reeling and
Spinning Training Program. JHARCRAFT is responsible to train the women and guide the
production of cotton and silk handloom for the period of two years. The Agency is also liable for
promoting and marketing the produce with sales. Both parties are accountable to each other for
the period of mutual agreement as per the MoU. In the documents presented and official‟s
accounts collected, it was found that there was no clear exit strategy after the completion of the
project. The officials reported that bimonthly monitoring visits were made to ensure the efficient
implementation of the project.
The primary beneficiaries of the project were thirty women pre centre. The beneficiaries were
selected on the basis of their vulnerable background and willingness to acquire skills and
participate in production post training. These women belonged to socio-economically
vulnerability groups. The indirect beneficiaries were, thus, the families of these women.
Out of five proposed locations, centres have been started at Mukunda and Alakdiha. The other
centres will be gradually started after analyzing the results of the pilot
Proposed Location of Implementation:
Table No. 1 – Proposed Location of implementation
Sl.No. Name of
Village
Name of
panchayat
Name of
police Station
District State
1 Mukunda Mukunda Tisra Dhanbad Jharkhand
2 Alakdiha Alakdiha Tisra Dhanbad Jharkhand
3 Gareria Gareria Kenduadih Dhanbad Jharkhand
4 Panchmohali Panchmohali Chirkunda Dhanbad Jharkhand
5 Nootangram Nootangram Chirkunda Dhanbad Jharkhand
14 | P a g e
3.5 Observations of the Mid Term Evaluation
Focused Group Discussions with the beneficiaries and Key Informant Interviews with the
officials of BCCL were conducted to gain insights on the ongoing projects. BCCL provided
financial support to JHARCRAFT so as to develop an infrastructural facility to conduct trainings
and manufacture the handlooms. Whereas, JHARCRAFT provided training and guidance for the
duration of two years. They also arranged for required resources like raw materials, reeling and
spinning equipment, technical support and a network for promotion of sale of the produce from
these centres.
During the study, it was observed that out of two, only one centre at Mukunda is functional with
only twenty to twenty-five women working for five days a week. The other centre at Alakdiha is
non-operational. However, thirty women were provided training at the location. A negotiation is
on-going between BCCL, JHARCRAFT and group of women to re-initiate the centre and start
the production.
3.6 Mukunda Training Centre
The centre was inaugurated in the month of January, 2016 and training started from the month of
March, 2016. The facility was provided in the adjoining centre of Mukunda Hospital operated by
BCCL. The centre is spacious to facilitate trainings and store needful logistics like raw material,
equipment & finished products.
Twenty-five women have been trained and are participating in the process of manufacturing at
the Mukunda Centre. They reside in the radius of five kilometers from the centre and are
between twenty-five to thirty-five years old. Most are either illiterate or barely educated, only
one was reported to be a graduate. The women largely belong to Other Backward Classes,
Scheduled Caste and Scheduled Tribe and monthly average income ranges from Rs. 15000 to Rs.
30000 per month. According to the beneficiaries, they are currently not employed anywhere else
other than the training centre. None of them have started a self-employment venture as a result of
the reeling and spinning training because according to the beneficiaries, the handlooms are
unaffordable for them.
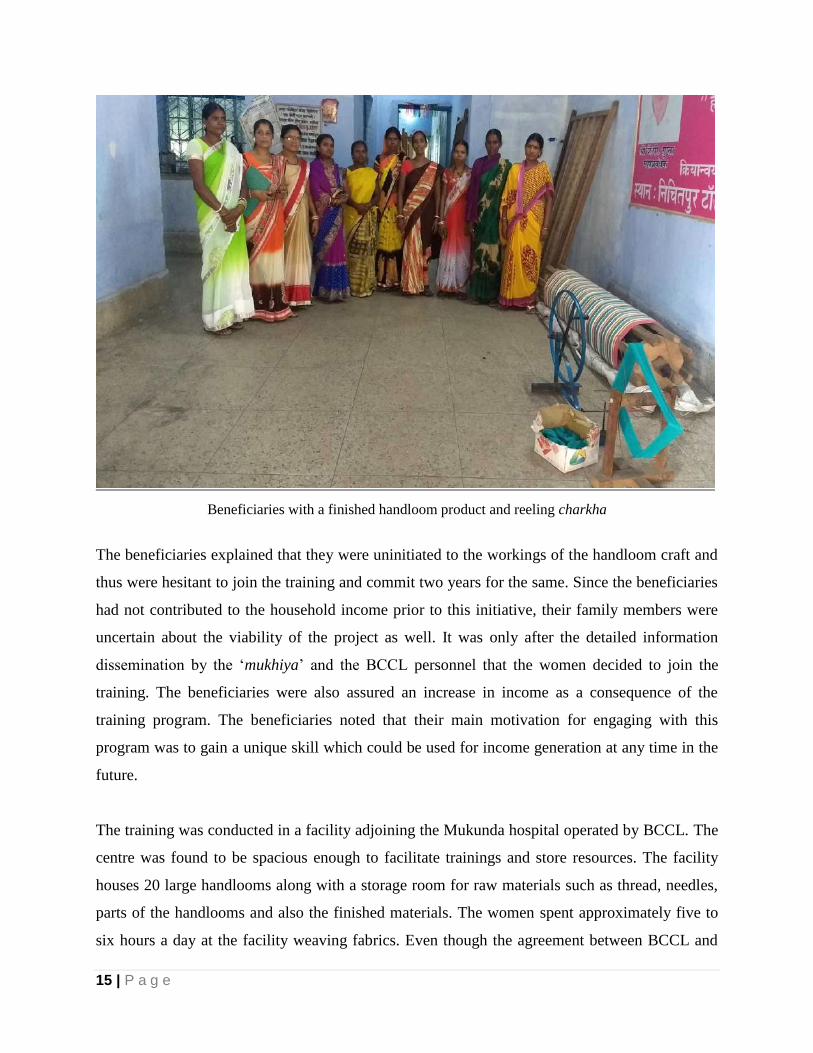
15 | P a g e
Beneficiaries with a finished handloom product and reeling charkha
The beneficiaries explained that they were uninitiated to the workings of the handloom craft and
thus were hesitant to join the training and commit two years for the same. Since the beneficiaries
had not contributed to the household income prior to this initiative, their family members were
uncertain about the viability of the project as well. It was only after the detailed information
dissemination by the „mukhiya‟ and the BCCL personnel that the women decided to join the
training. The beneficiaries were also assured an increase in income as a consequence of the
training program. The beneficiaries noted that their main motivation for engaging with this
program was to gain a unique skill which could be used for income generation at any time in the
future.
The training was conducted in a facility adjoining the Mukunda hospital operated by BCCL. The
centre was found to be spacious enough to facilitate trainings and store resources. The facility
houses 20 large handlooms along with a storage room for raw materials such as thread, needles,
parts of the handlooms and also the finished materials. The women spent approximately five to
six hours a day at the facility weaving fabrics. Even though the agreement between BCCL and
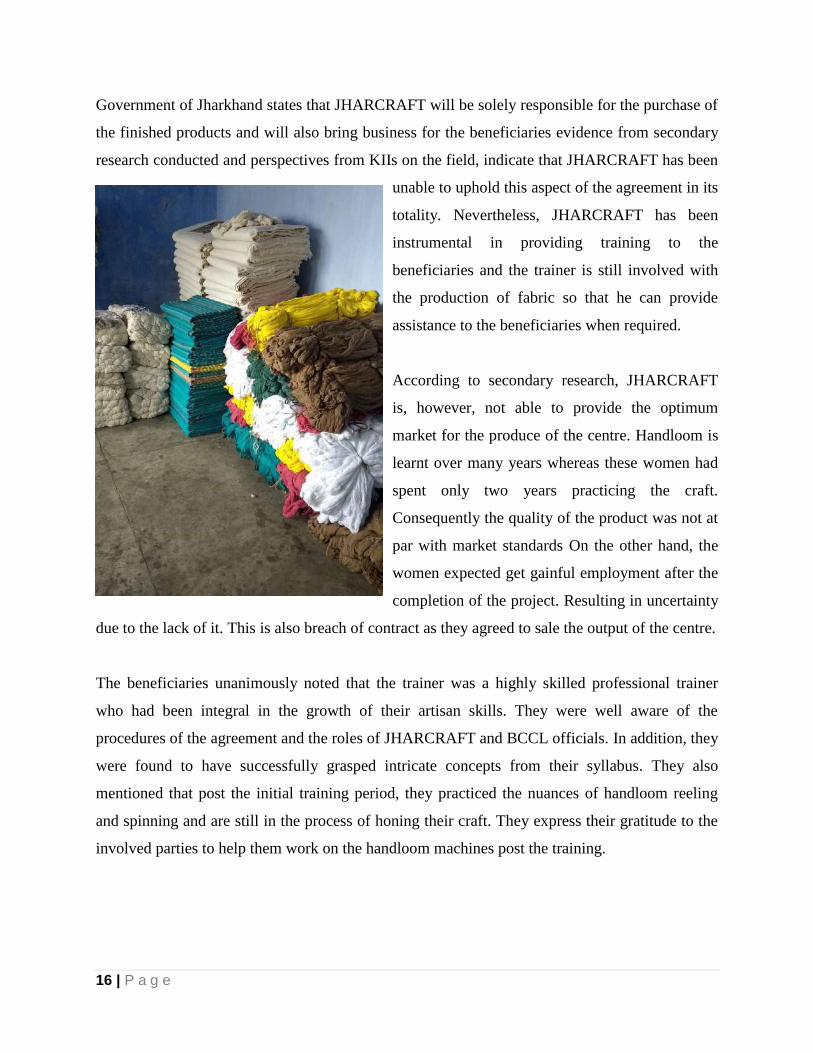
16 | P a g e
Government of Jharkhand states that JHARCRAFT will be solely responsible for the purchase of
the finished products and will also bring business for the beneficiaries evidence from secondary
research conducted and perspectives from KIIs on the field, indicate that JHARCRAFT has been
unable to uphold this aspect of the agreement in its
totality. Nevertheless, JHARCRAFT has been
instrumental in providing training to the
beneficiaries and the trainer is still involved with
the production of fabric so that he can provide
assistance to the beneficiaries when required.
According to secondary research, JHARCRAFT
is, however, not able to provide the optimum
market for the produce of the centre. Handloom is
learnt over many years whereas these women had
spent only two years practicing the craft.
Consequently the quality of the product was not at
par with market standards On the other hand, the
women expected get gainful employment after the
completion of the project. Resulting in uncertainty
due to the lack of it. This is also breach of contract as they agreed to sale the output of the centre.
The beneficiaries unanimously noted that the trainer was a highly skilled professional trainer
who had been integral in the growth of their artisan skills. They were well aware of the
procedures of the agreement and the roles of JHARCRAFT and BCCL officials. In addition, they
were found to have successfully grasped intricate concepts from their syllabus. They also
mentioned that post the initial training period, they practiced the nuances of handloom reeling
and spinning and are still in the process of honing their craft. They express their gratitude to the
involved parties to help them work on the handloom machines post the training.
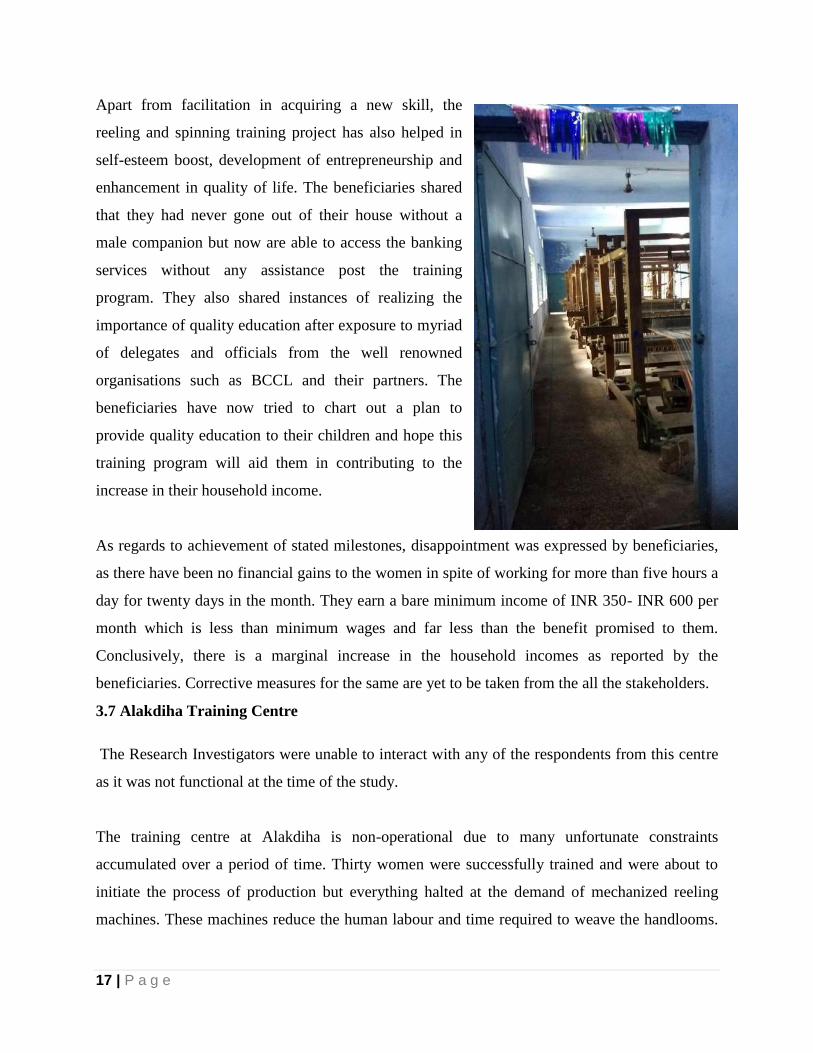
17 | P a g e
Apart from facilitation in acquiring a new skill, the
reeling and spinning training project has also helped in
self-esteem boost, development of entrepreneurship and
enhancement in quality of life. The beneficiaries shared
that they had never gone out of their house without a
male companion but now are able to access the banking
services without any assistance post the training
program. They also shared instances of realizing the
importance of quality education after exposure to myriad
of delegates and officials from the well renowned
organisations such as BCCL and their partners. The
beneficiaries have now tried to chart out a plan to
provide quality education to their children and hope this
training program will aid them in contributing to the
increase in their household income.
As regards to achievement of stated milestones, disappointment was expressed by beneficiaries,
as there have been no financial gains to the women in spite of working for more than five hours a
day for twenty days in the month. They earn a bare minimum income of INR 350- INR 600 per
month which is less than minimum wages and far less than the benefit promised to them.
Conclusively, there is a marginal increase in the household incomes as reported by the
beneficiaries. Corrective measures for the same are yet to be taken from the all the stakeholders.
3.7 Alakdiha Training Centre
The Research Investigators were unable to interact with any of the respondents from this centre
as it was not functional at the time of the study.
The training centre at Alakdiha is non-operational due to many unfortunate constraints
accumulated over a period of time. Thirty women were successfully trained and were about to
initiate the process of production but everything halted at the demand of mechanized reeling
machines. These machines reduce the human labour and time required to weave the handlooms.
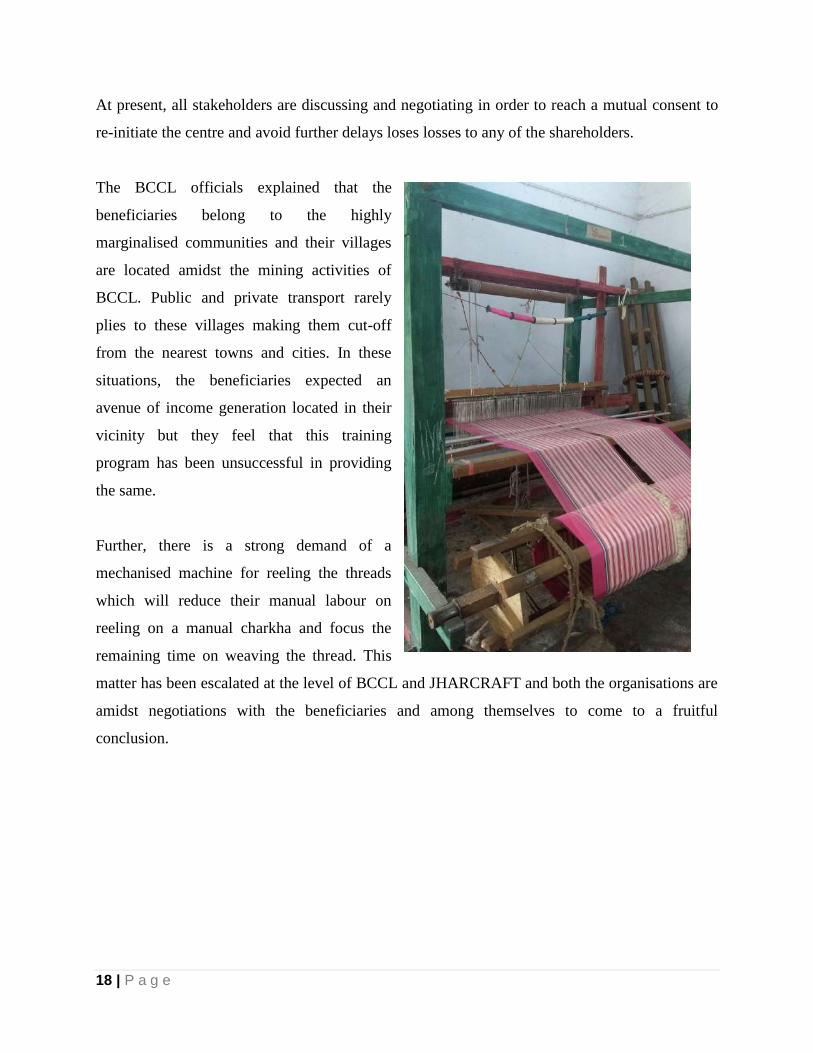
18 | P a g e
At present, all stakeholders are discussing and negotiating in order to reach a mutual consent to
re-initiate the centre and avoid further delays loses losses to any of the shareholders.
The BCCL officials explained that the
beneficiaries belong to the highly
marginalised communities and their villages
are located amidst the mining activities of
BCCL. Public and private transport rarely
plies to these villages making them cut-off
from the nearest towns and cities. In these
situations, the beneficiaries expected an
avenue of income generation located in their
vicinity but they feel that this training
program has been unsuccessful in providing
the same.
Further, there is a strong demand of a
mechanised machine for reeling the threads
which will reduce their manual labour on
reeling on a manual charkha and focus the
remaining time on weaving the thread. This
matter has been escalated at the level of BCCL and JHARCRAFT and both the organisations are
amidst negotiations with the beneficiaries and among themselves to come to a fruitful
conclusion.
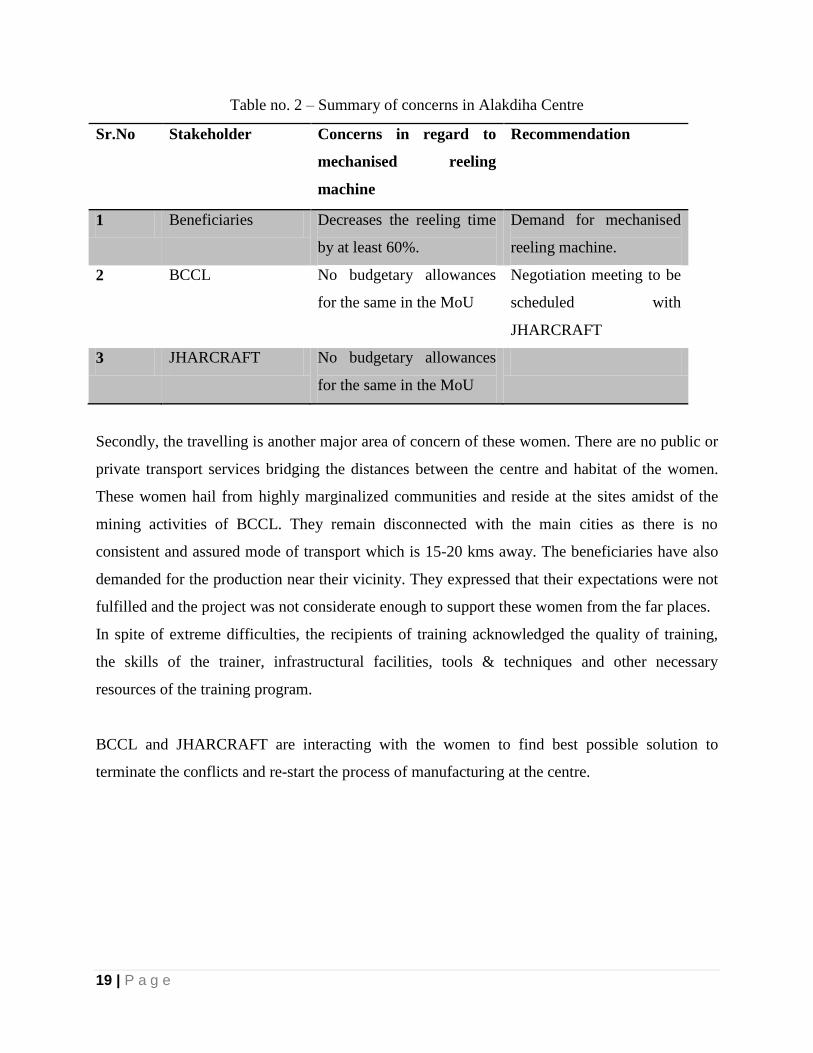
19 | P a g e
Table no. 2 – Summary of concerns in Alakdiha Centre
Sr.No Stakeholder Concerns in regard to
mechanised reeling
machine
Recommendation
1 Beneficiaries Decreases the reeling time
by at least 60%.
Demand for mechanised
reeling machine.
2 BCCL No budgetary allowances
for the same in the MoU
Negotiation meeting to be
scheduled with
JHARCRAFT
3 JHARCRAFT No budgetary allowances
for the same in the MoU
Secondly, the travelling is another major area of concern of these women. There are no public or
private transport services bridging the distances between the centre and habitat of the women.
These women hail from highly marginalized communities and reside at the sites amidst of the
mining activities of BCCL. They remain disconnected with the main cities as there is no
consistent and assured mode of transport which is 15-20 kms away. The beneficiaries have also
demanded for the production near their vicinity. They expressed that their expectations were not
fulfilled and the project was not considerate enough to support these women from the far places.
In spite of extreme difficulties, the recipients of training acknowledged the quality of training,
the skills of the trainer, infrastructural facilities, tools & techniques and other necessary
resources of the training program.
BCCL and JHARCRAFT are interacting with the women to find best possible solution to
terminate the conflicts and re-start the process of manufacturing at the centre.
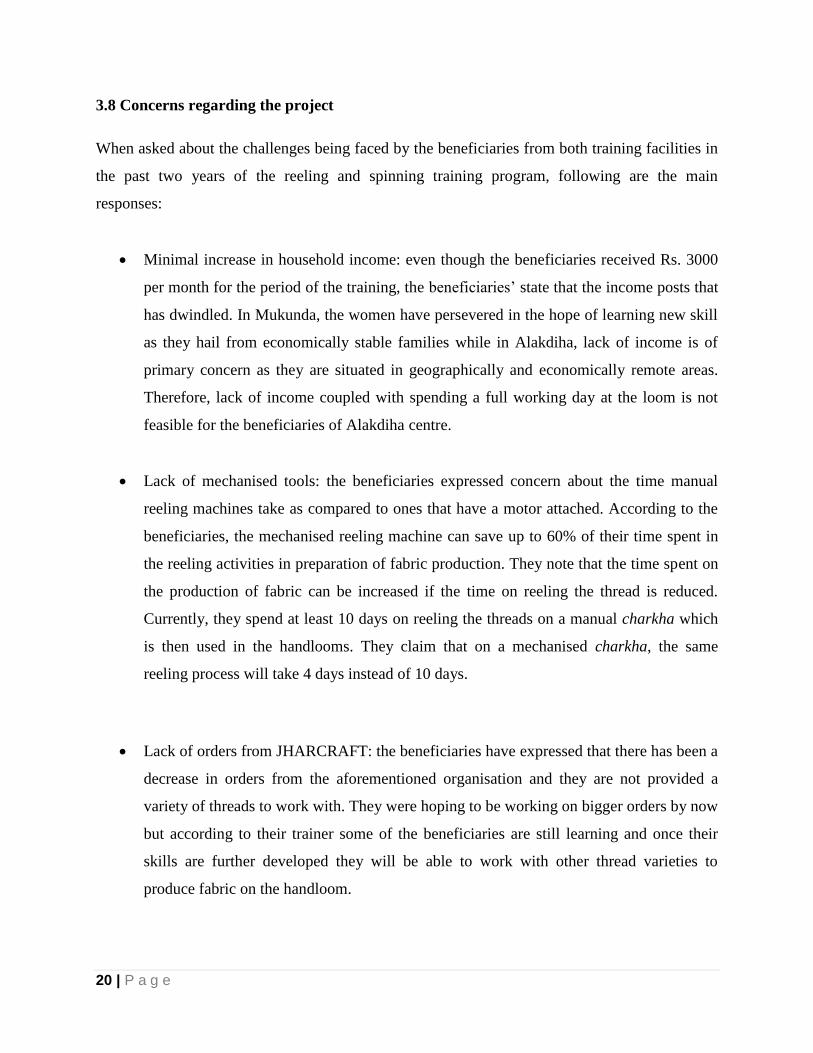
20 | P a g e
3.8 Concerns regarding the project
When asked about the challenges being faced by the beneficiaries from both training facilities in
the past two years of the reeling and spinning training program, following are the main
responses:
Minimal increase in household income: even though the beneficiaries received Rs. 3000
per month for the period of the training, the beneficiaries‟ state that the income posts that
has dwindled. In Mukunda, the women have persevered in the hope of learning new skill
as they hail from economically stable families while in Alakdiha, lack of income is of
primary concern as they are situated in geographically and economically remote areas.
Therefore, lack of income coupled with spending a full working day at the loom is not
feasible for the beneficiaries of Alakdiha centre.
Lack of mechanised tools: the beneficiaries expressed concern about the time manual
reeling machines take as compared to ones that have a motor attached. According to the
beneficiaries, the mechanised reeling machine can save up to 60% of their time spent in
the reeling activities in preparation of fabric production. They note that the time spent on
the production of fabric can be increased if the time on reeling the thread is reduced.
Currently, they spend at least 10 days on reeling the threads on a manual charkha which
is then used in the handlooms. They claim that on a mechanised charkha, the same
reeling process will take 4 days instead of 10 days.
Lack of orders from JHARCRAFT: the beneficiaries have expressed that there has been a
decrease in orders from the aforementioned organisation and they are not provided a
variety of threads to work with. They were hoping to be working on bigger orders by now
but according to their trainer some of the beneficiaries are still learning and once their
skills are further developed they will be able to work with other thread varieties to
produce fabric on the handloom.
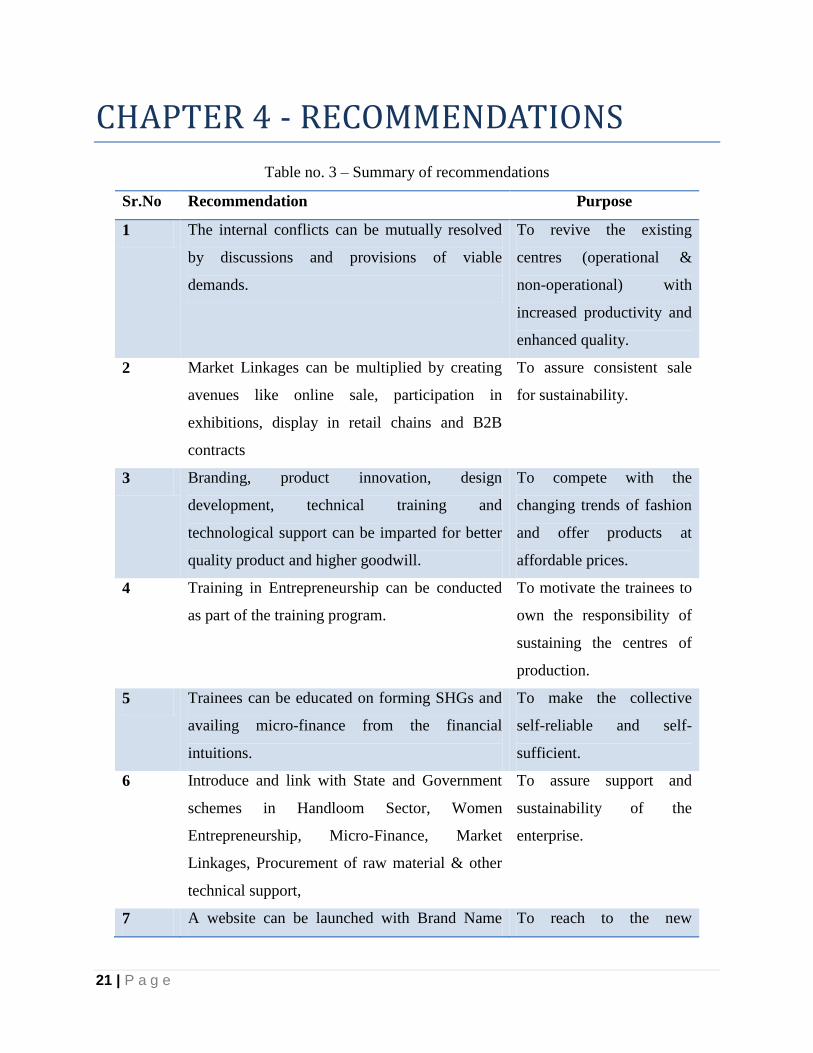
21 | P a g e
CHAPTER 4 - RECOMMENDATIONS
Table no. 3 – Summary of recommendations
Sr.No Recommendation Purpose
1 The internal conflicts can be mutually resolved
by discussions and provisions of viable
demands.
To revive the existing
centres (operational &
non-operational) with
increased productivity and
enhanced quality.
2 Market Linkages can be multiplied by creating
avenues like online sale, participation in
exhibitions, display in retail chains and B2B
contracts
To assure consistent sale
for sustainability.
3 Branding, product innovation, design
development, technical training and
technological support can be imparted for better
quality product and higher goodwill.
To compete with the
changing trends of fashion
and offer products at
affordable prices.
4 Training in Entrepreneurship can be conducted
as part of the training program.
To motivate the trainees to
own the responsibility of
sustaining the centres of
production.
5 Trainees can be educated on forming SHGs and
availing micro-finance from the financial
intuitions.
To make the collective
self-reliable and self-
sufficient.
6 Introduce and link with State and Government
schemes in Handloom Sector, Women
Entrepreneurship, Micro-Finance, Market
Linkages, Procurement of raw material & other
technical support,
To assure support and
sustainability of the
enterprise.
7 A website can be launched with Brand Name To reach to the new
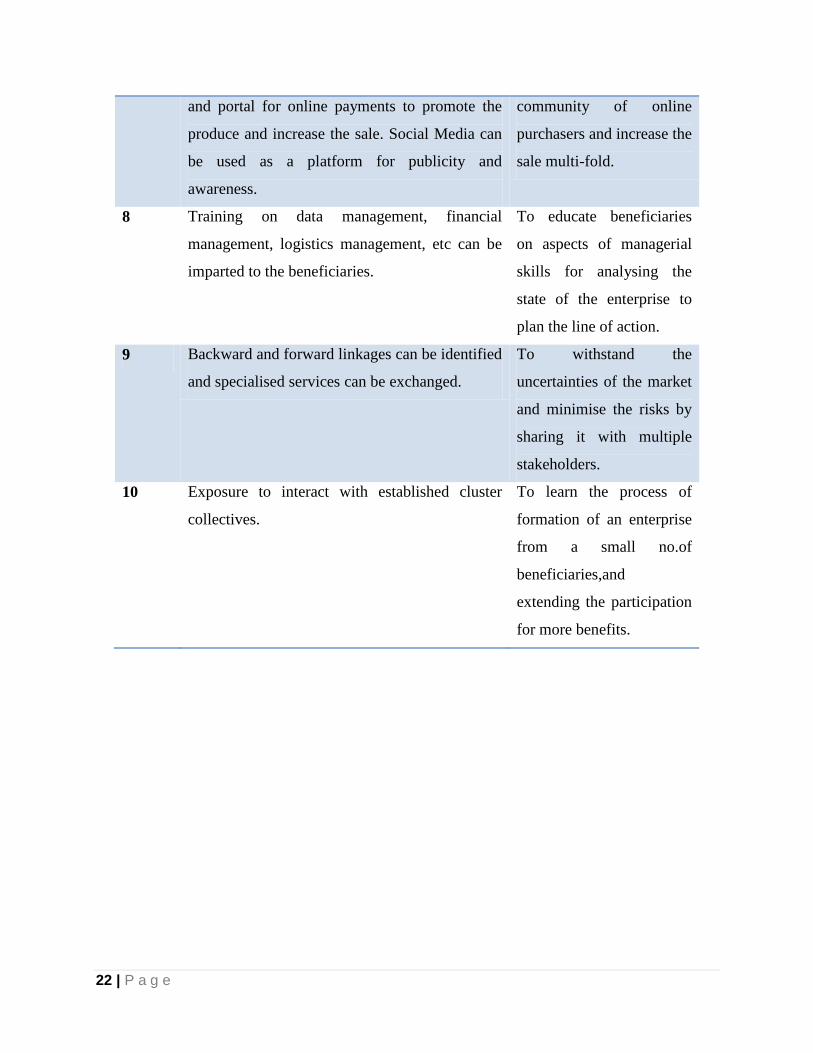
22 | P a g e
and portal for online payments to promote the
produce and increase the sale. Social Media can
be used as a platform for publicity and
awareness.
community of online
purchasers and increase the
sale multi-fold.
8 Training on data management, financial
management, logistics management, etc can be
imparted to the beneficiaries.
To educate beneficiaries
on aspects of managerial
skills for analysing the
state of the enterprise to
plan the line of action.
9 Backward and forward linkages can be identified
and specialised services can be exchanged.
To withstand the
uncertainties of the market
and minimise the risks by
sharing it with multiple
stakeholders.
10 Exposure to interact with established cluster
collectives.
To learn the process of
formation of an enterprise
from a small no.of
beneficiaries,and
extending the participation
for more benefits.
23 | P a g e
ANNEXURE
.
QUESTIONNAIRE FOR BENEFICIARIES
SKILL DEVELOPMENT ON REELING AND SPINNING TRAINING UNDER CSR
OF BCCL
Date:
Time:
Village:
1. Details of the beneficiary:
a) Name:
b) Age:
c) Educational Qualification:
d) Income:
2. Are you currently employed? If yes, with whom?
3. Are you working as a skill artisan?
4. Or are there initiatives taken to make you self-sufficient entrepreneurs?
5. What do you know of this training? (Objectives)
6. When did this training start?
7. How did you know about this training?
8. What made you join this training?
9. What were you trained for?
10. How were you trained?
11. What was the duration of the training?
12. Were you satisfied with the trainer?
13. How has this training benefitted you?
24 | P a g e
14. Has there been an increase in the household income?
15. What personal skills did you develop?
16. Has it brought about any perceptional change in your family?
17. What did you like about the training?
18. What did you not like about the training?
19. What were the immediate effects after training?
Social:
Familial:
Economic:
20. Did you earn from the products made during the training? How much did you
earn?
21. Was it more or less according to your expectations?
22. Were you given any stipend during the training?
23. Can you teach others what you have learnt?
24. Who do you sell your products to?
25. Do they give you a target to achieve in a month?
26. What are the transactions terms by the buyer?
27. Were the beneficiaries given the final assessment at the end of the training? If yes,
what was it?
28. Are the beneficiaries‟ parts of a Self Help Group?
29. What other skills were imparted to them?
30. Was the community involved? If yes, in what ways?
31. How has this project shown improvement in the quality of the life in the
beneficiaries? Please elaborate (medical insurances, bank accounts, etc.)
32. What has been the response/feedback from the beneficiaries to Jharcraft on this
project?
33. Did Jharcraft face any challenges while engaging with the community?
34. To your knowledge, are there any other organizations working with a similar
programme in this geographical area? If yes, could you provide the names of those
organizations?
35. Budget of running the particular project:
25 | P a g e
36. What was the cost decided upon?
37. Was there any deviance?
38. Please provide details about the team who were assigned the project:
What was their role? What was the input and the output?
39. What are the strengths and weaknesses of this project?
40. Has Jharcraft faced any challenges in engaging with BCCL? What were the key
challenges faced during this project?
41. What are the key achievements of this project?
42. According to you should there be additional measures taken to improve this project?
43. Kindly provide any additional comments, concerns and/or observations/suggestions
to improve this project?
INTERVIEW SCHEDULE FOR BHARAT COKING COAL LIMITED
DATE:
TIME:
44. Details of the Company:
e) Name:
f) Designation:
g) Contact No.:
h) Address:
45. Name of project:
46. Date of Implementation:
47. Objectives of the project:
48. List which of these objectives were achieved and which were not achieved?
49. Please explain the process of collaboration with Jharcraft. The rationale is stated in
the proposal, was that idea accomplished?
50. Why and how did BCCL choose Jharcraft to implement this project?
51. As per the MoU, did Jharcraft do any baseline study before commencing the
program?
52. State the geographical areas the project is being implemented in.
53. No. of villages: Names of villages:
54. What is the total number of beneficiaries? (please attach scanned copy of total
number of beneficiaries mentioning their phone numbers)
26 | P a g e
55. Is there a deviance from the numbers decided upon initially? If yes, why?
56. How did you decide upon the beneficiaries?
57. Since when has BCCL been funding this project?
58. What resources did BCCL contribute? E.g.: Infrastructure, monetary contribution,
etc.
59. Was the community involved? If yes, in what ways?
60. Are the beneficiaries aware of the role of BCCL in this project? Has a display board
used to make them aware?
61. How has this project shown improvement in the quality of the life in the
beneficiaries? What has been the response/feedback from the beneficiaries to BCCL
on this project?
62. Did BCCL face any challenges while engaging with the community?
63. Did the community know that BCCL is the funder agency of this project?
64. To your knowledge, are there any other organizations working with a similar
programme in this geographical area? If yes, could you provide the names of those
organizations?
65. Budget of running the particular project:
What was the cost decided upon? Was there any deviance?
66. Please provide details about the team who were assigned the project:
What was their role? What was the input and the output?
67. What are the strengths and weakness of this project?
Strengths:
Weakness:
68. Has BCCL undertaken monitoring of the said project? How many times? Kindly
provide documents if any.
69. Has Jharcraft conducted any evaluation of the project?
70. Has BCCL received any monthly reports from Jharcraft? If yes, how many? Please
provide with the documents.
71. Has BCCL faced any challenges in engaging with Jharcraft? What were the key
challenges faced during this project?
72. What are the key achievements of this project?
73. According to you should there be additional measures taken to improve this project?
74. Would you replicate this model in future as your CSR project in more villages? Has
this model been already replicated?
75. What changes would you include in the replication of the project?
76. Kindly provide any additional comments, concerns and/or observations/
suggestions to improve this project?
Annexure VII
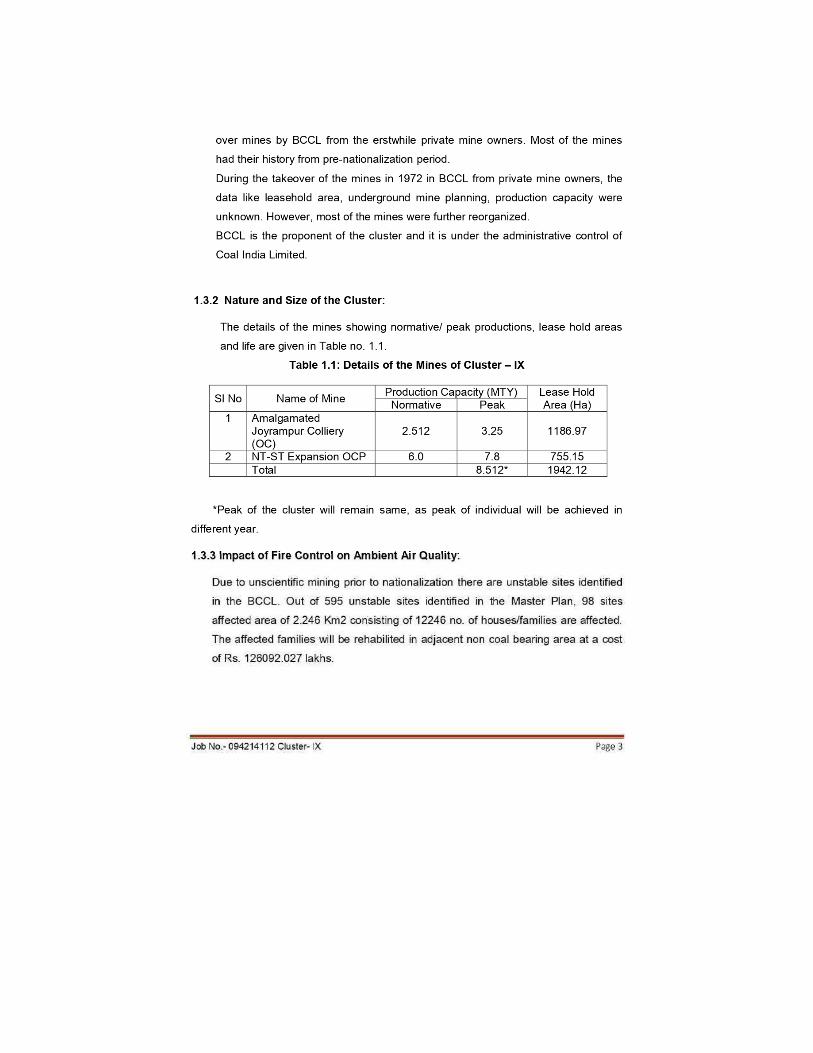
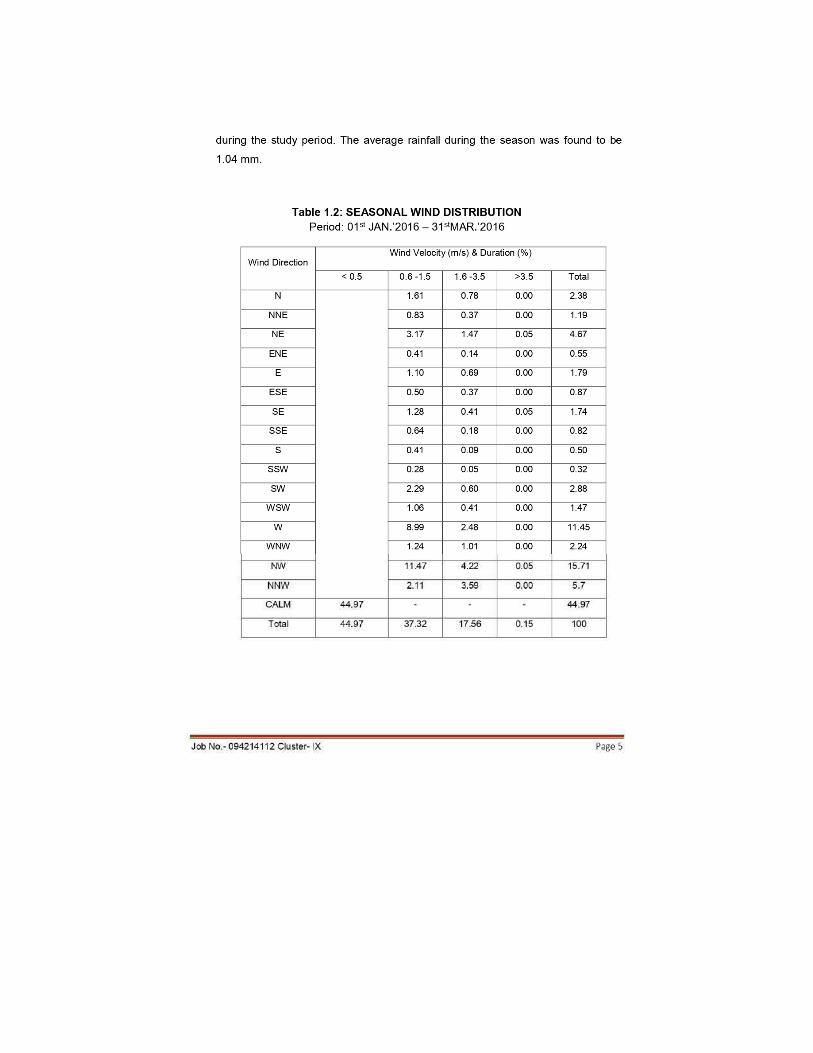
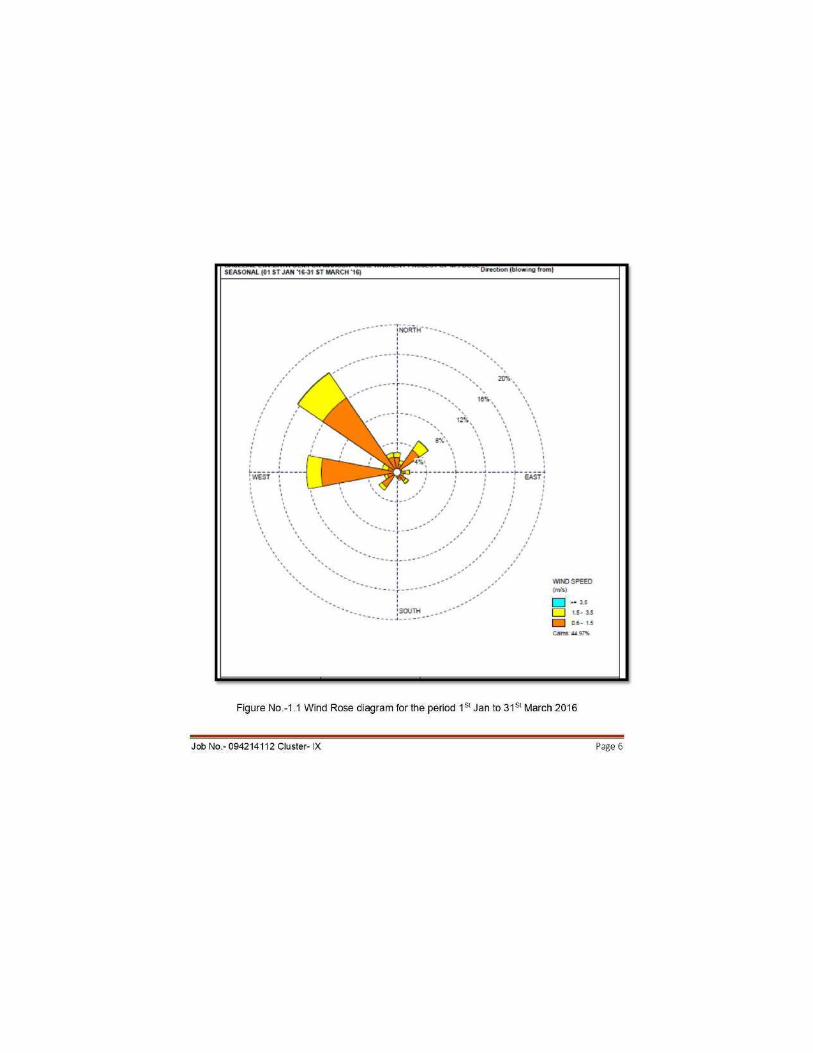

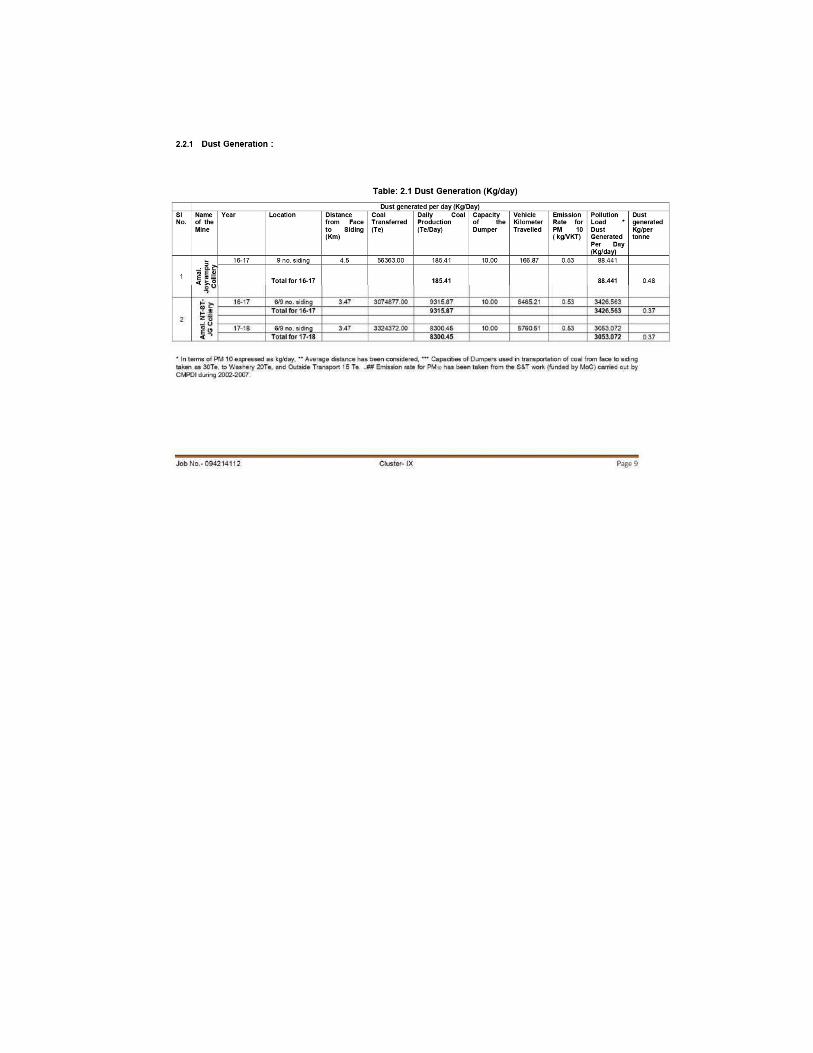
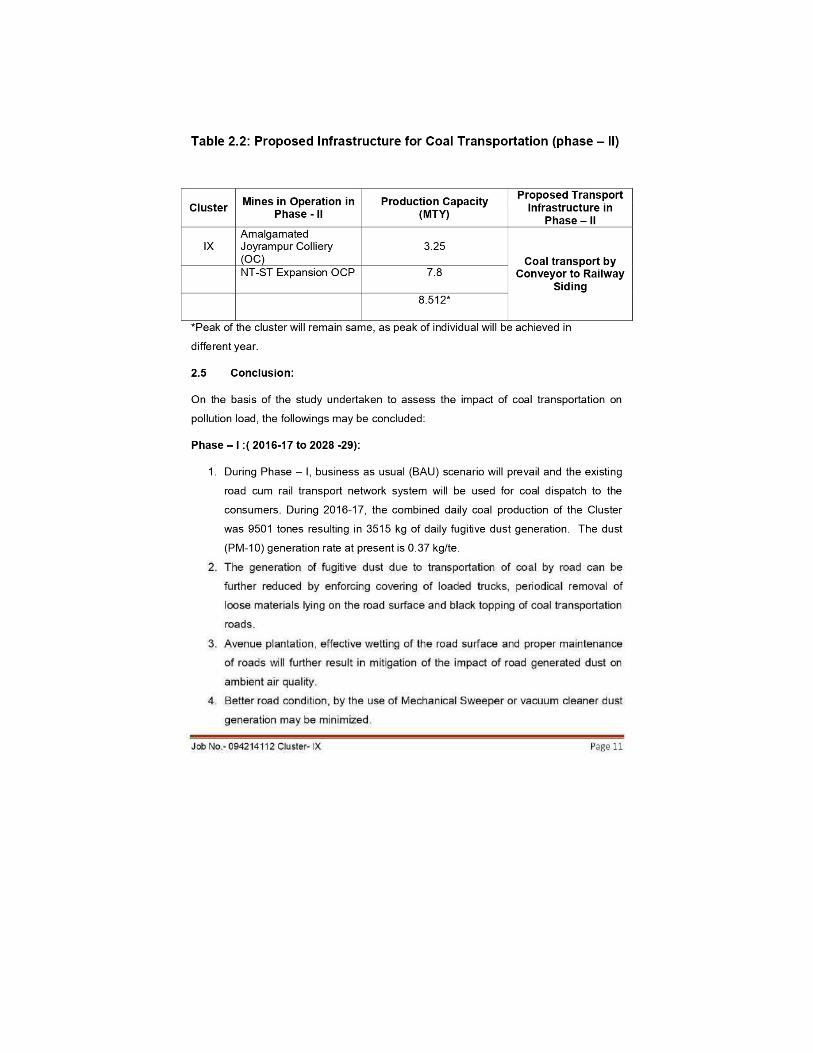
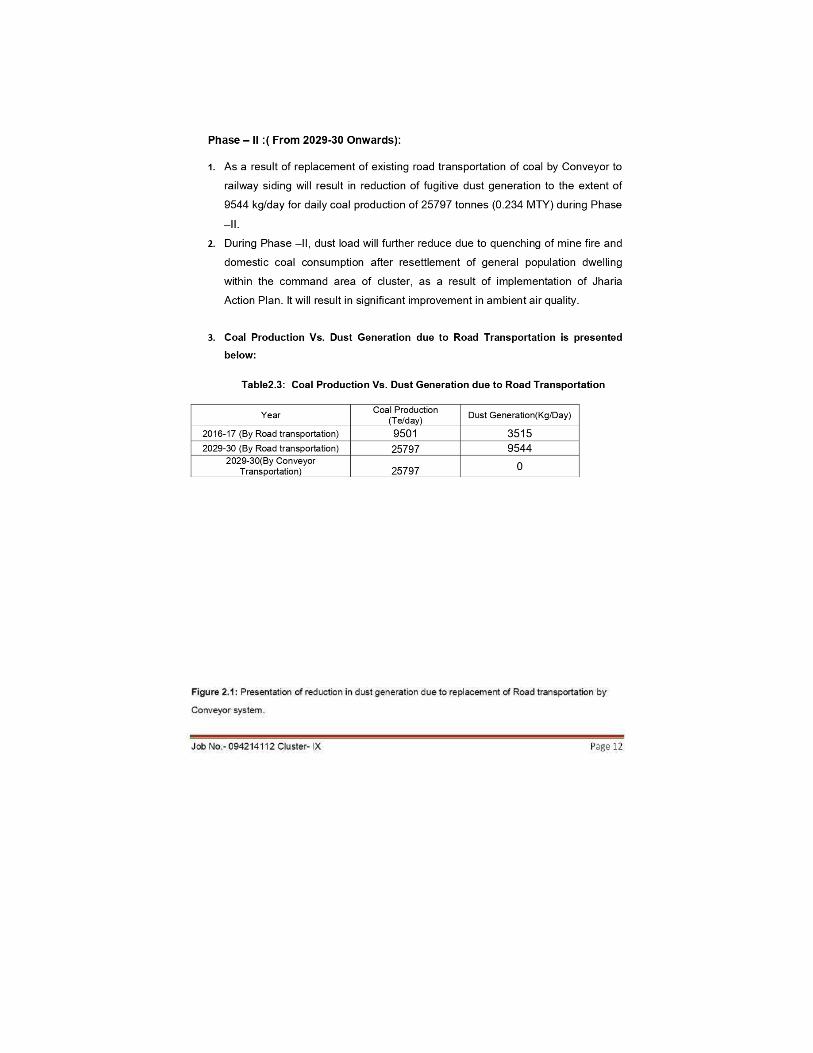
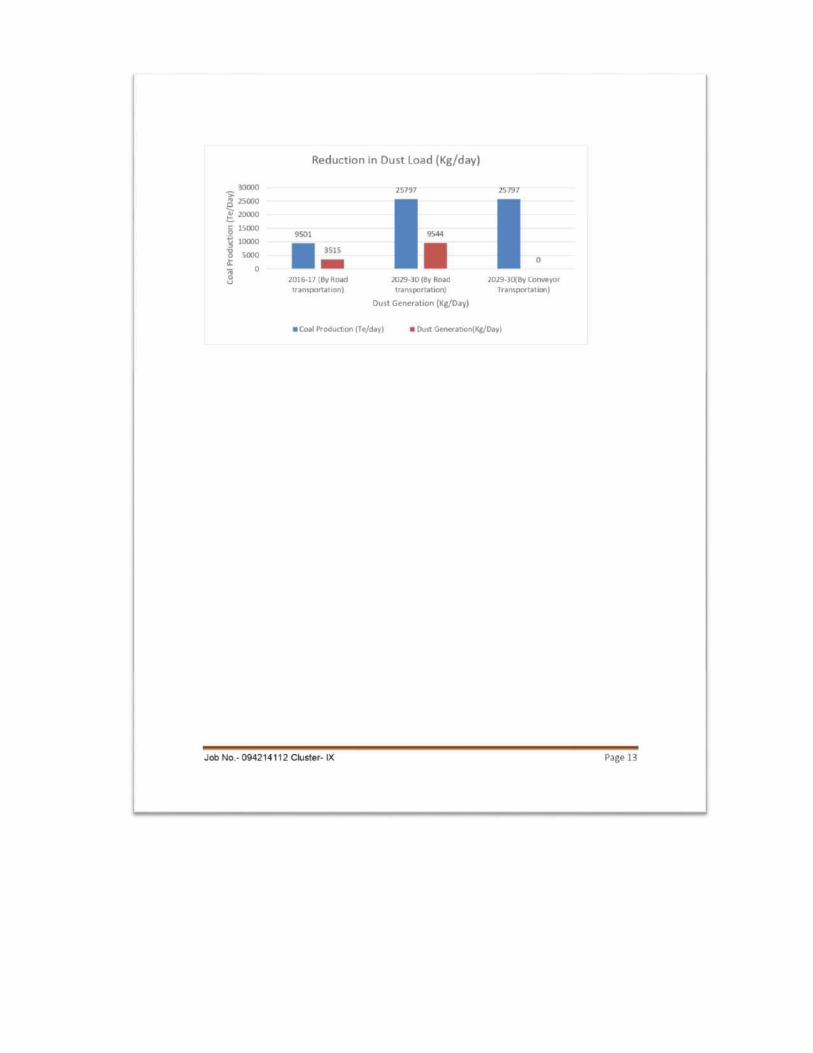
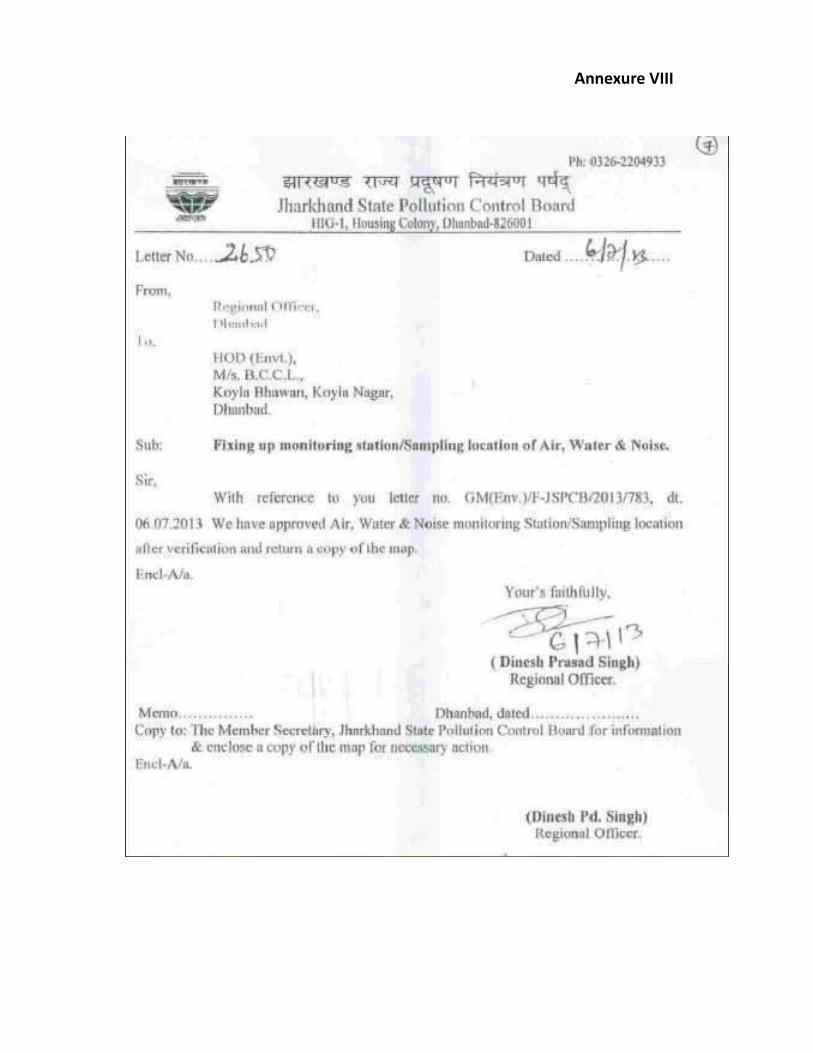
Annexure VIII
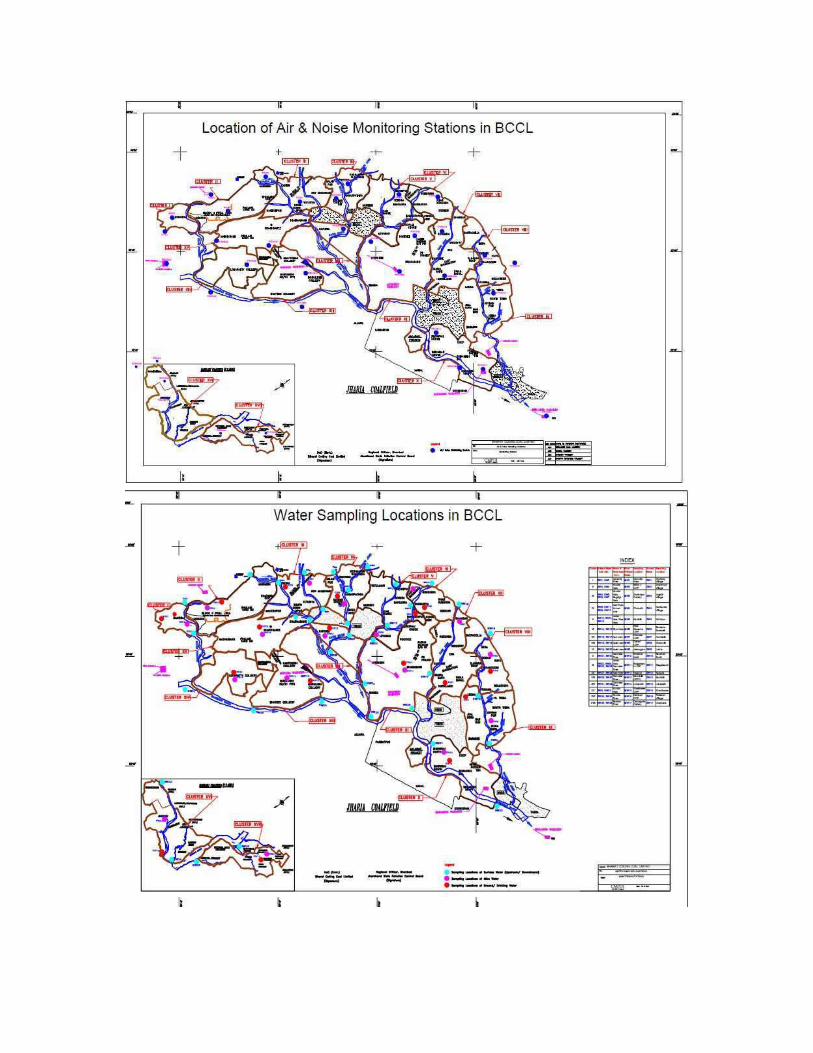
Annexure IX
2
Contents
1. Introduction .......................................................................................................................................... 3
1.1 Project Background ....................................................................................................................... 4
1.2 Project objectives .......................................................................................................................... 4
2. Field visit ............................................................................................................................................. 5
2.1 Jharia coalfield maps: ................................................................................................................... 5
2.2 Site Identification: .......................................................................................................................... 7
3. Sampler Selection and Procurement ................................................................................................... 8
4. Monitoring parameters ........................................................................................................................ 9
4.1 Monitoring Frequency ................................................................................................................ 10
4.2 Filter handling and Weighing: ................................................................................................... 12
5. Ambient Air Quality Monitoring ...................................................................................................... 12
3
List of Figures
Figure 2.1 Identified air monitoring station in Jharia Coalfield .............................................................. 8
Figure 4.1 Glimpses of air monitoring of some locations ..................................................................... 11
List of Tables
Table 2.1 Jharia coalfields Site visit on cluster-base ............................................................................... 6
Table 3.1 Samplers Procured for Monitoring ......................................................................................... 8
Table 4.1 Ambient Air Quality Sampling/Analysis Methodology for Target Pollutants .......................... 9
Table 4.1.1 Frequency of Air pollutants sampling in Jharia Coalfield ................................................... 10
Table 5.1 Physical and Chemical components for characterization of Particulate matter................... 15
4
1. Introduction
1.1 Project Background
Bharat Coking Coal Limited, a subsidiary of Coal India Limited, has been operating the
majority of the coal mines in the Jharia coal field regions since its inception in 1972. Jharia
coal mines are special for its low ash content and high calorific value coals. Therefore, they
are often used directly in iron and steel plants for metal oxide reduction after washing.
Although these coal mines are highly priced for their high quality coal, they are notorious for
their mine fires, which causes lot of fugitive gaseous and PM emissions. Hence, Jharia region
has been under scrutiny by various public authorities and common public with a vision to
improve the ambient air quality.
Various sources contribute to high particular matter concentration in the Jharia region:
vehicles, mining activities, re-suspended dusts, fugitive emissions, fuel oils, household LPGs,
etc. The percentage contribution of these factors in the ambient depends exclusively on the
economic activities of that particular region. In order to improve the existing ambient air
quality, the major sources of PM emissions first need to be identified. Hence, the
environmental clearance committee of MoEF has directed BCCL to conduct a source
apportionment study for particulate matter. In this context, BCCL has approached CSIR-
NEERI to conduct a source apportionment study of ambient air particulate matter in Jharia
coalfields region in order to quantify the various sources PM emissions and suggest an
effective environmental management plan.
1.2 Project objectives
The major objective of the study is to assess the current ambient air quality, sources
of air pollution and propose the priorities for the actions for improvement of air quality. The
study to include the entire Jharia Coalfield along with area up to 10 Km from the periphery /
boundary of BCCL mines.
The detailed objectives are as following:
i. Ambient Air Monitoring
ü Monitoring of ambient air quality at selected receptor locations for pollutants including
PM10, PM 2.5(limited), SO2, NOx, PAHs to establish the status of the air quality in
Jharia Coalfields along with area up to 10 K.M from the periphery/boundary of BCCL
mines. Also, review of the available air quality monitoring data from Central Pollution
Control Board (CPCB) /Jharkhand State Pollution Control Board (JSPCB).
ü To calibrate dispersion modelling predictions using measured air quality parameters.
5
ü To draw supportive data through specific site related monitoring regarding impact
causing sources such as kerbside monitoring.
ü To establish the impact of meteorological conditions on a few select indicator pollutants
in different micro meteorological conditions of the Jharia Coalfields.
ii. Emission Inventory related of Jharia Coalfields along with area up to 10 Km from the
periphery / boundary of BCCL mines.
ü To identify the pollution load grid wise for point, line and area source
ü To establish possibilities of receptor level concentrations of air pollutants by matching
dispersion modelling and air quality-monitoring data.
iii. Source apportionment related
ü To identify and apportion the pollution load at receptor level to various sources in the
Jharia Coalfields along with area up to 10 Km from the periphery / boundary of BCCL
mines.
ü To carry out the source apportionment using molecular markers for a limited number of
samples through a time resolved sample collection at various period of the day and day-
of-the-week.
iv. Any other item in consensus between both BCCL/CIL & NEERI evolved during the
study.
2. Field visit
In connection with the above objectives, the NEERI’s team and BCCL’s team visited
BCCL’s Jharia coal filed for 3 days from 23 September to 27 September 2018. The team
covered the entire Jharia coalfield, which spans roughly 30km in length and 22 km wide in
three days with the following purpose.
To identified the location for air monitoring station in entire Jharia Coal Field region.
2.1 Jharia coalfield maps:
BCCL environmental department provided the map of the Jharia region. The site visit
was carried out with assistance from BCCL’s team. The 15 Jharia mines coal fields were
segregated into three parts and details of the visit along with mine cluster names are given in
Table 2.1.
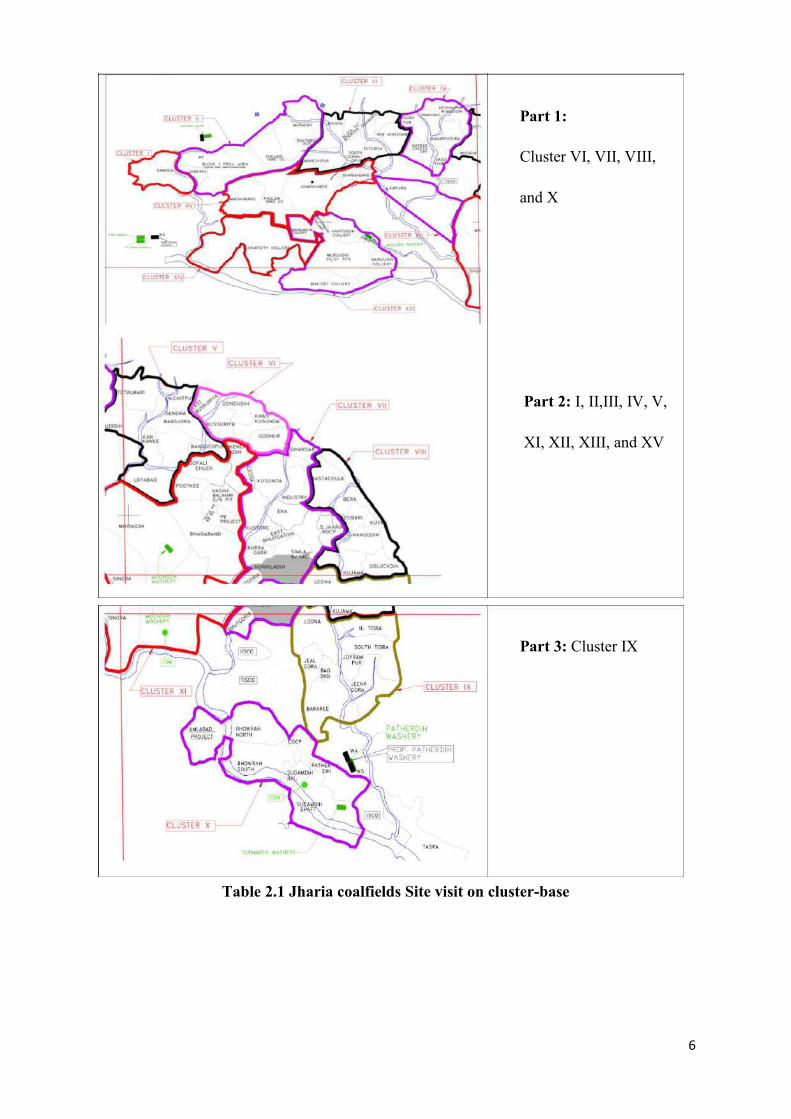
6
Part 1:
Cluster VI, VII, VIII,
and X
Part 2: I, II,III, IV, V,
XI, XII, XIII, and XV
Part 3: Cluster IX
Table 2.1 Jharia coalfields Site visit on cluster-base
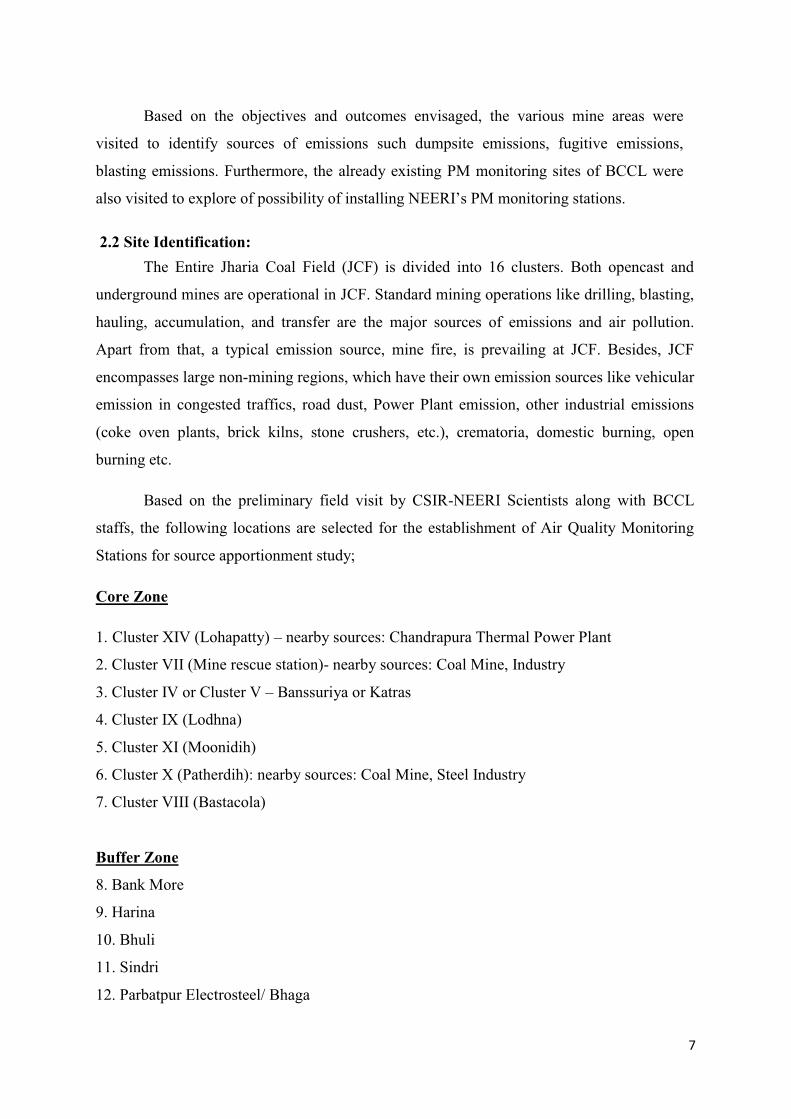
7
Based on the objectives and outcomes envisaged, the various mine areas were
visited to identify sources of emissions such dumpsite emissions, fugitive emissions,
blasting emissions. Furthermore, the already existing PM monitoring sites of BCCL were
also visited to explore of possibility of installing NEERI’s PM monitoring stations.
2.2 Site Identification:
The Entire Jharia Coal Field (JCF) is divided into 16 clusters. Both opencast and
underground mines are operational in JCF. Standard mining operations like drilling, blasting,
hauling, accumulation, and transfer are the major sources of emissions and air pollution.
Apart from that, a typical emission source, mine fire, is prevailing at JCF. Besides, JCF
encompasses large non-mining regions, which have their own emission sources like vehicular
emission in congested traffics, road dust, Power Plant emission, other industrial emissions
(coke oven plants, brick kilns, stone crushers, etc.), crematoria, domestic burning, open
burning etc.
Based on the preliminary field visit by CSIR-NEERI Scientists along with BCCL
staffs, the following locations are selected for the establishment of Air Quality Monitoring
Stations for source apportionment study;
Core Zone
1. Cluster XIV (Lohapatty) – nearby sources: Chandrapura Thermal Power Plant
2. Cluster VII (Mine rescue station)- nearby sources: Coal Mine, Industry
3. Cluster IV or Cluster V – Banssuriya or Katras
4. Cluster IX (Lodhna)
5. Cluster XI (Moonidih)
6. Cluster X (Patherdih): nearby sources: Coal Mine, Steel Industry
7. Cluster VIII (Bastacola)
Buffer Zone
8. Bank More
9. Harina
10. Bhuli
11. Sindri
12. Parbatpur Electrosteel/ Bhaga
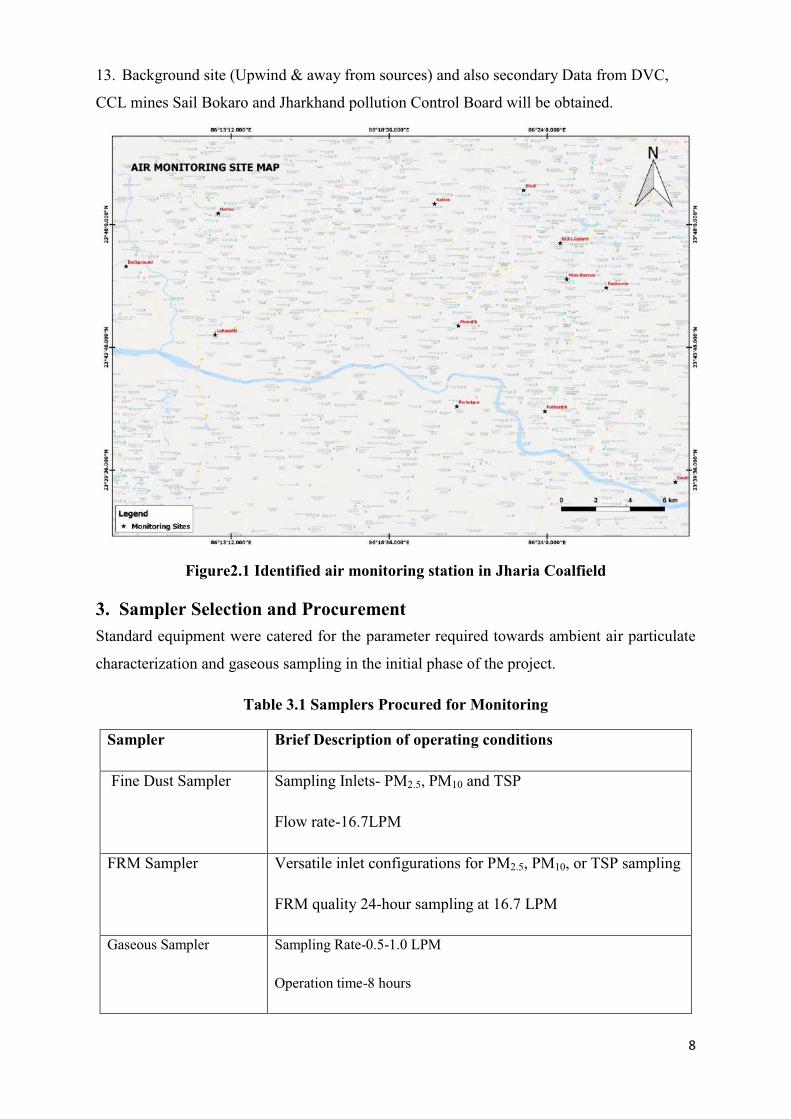
8
13. Background site (Upwind & away from sources) and also secondary Data from DVC,
CCL mines Sail Bokaro and Jharkhand pollution Control Board will be obtained.
Figure2.1 Identified air monitoring station in Jharia Coalfield
3. Sampler Selection and Procurement
Standard equipment were catered for the parameter required towards ambient air particulate
characterization and gaseous sampling in the initial phase of the project.
Table 3.1 Samplers Procured for Monitoring
Sampler Brief Description of operating conditions
Fine Dust Sampler Sampling Inlets- PM2.5, PM10 and TSP
Flow rate-16.7LPM
FRM Sampler Versatile inlet configurations for PM2.5, PM10, or TSP sampling
FRM quality 24-hour sampling at 16.7 LPM
Gaseous Sampler Sampling Rate-0.5-1.0 LPM
Operation time-8 hours
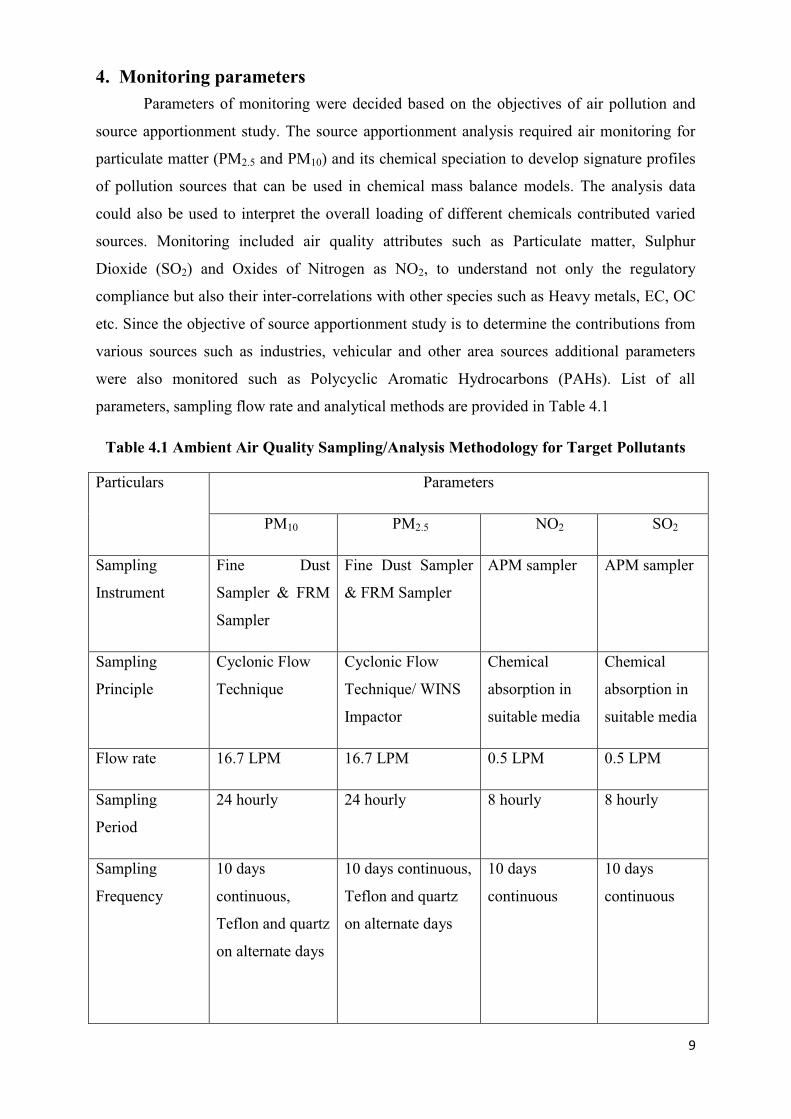
9
4. Monitoring parameters
Parameters of monitoring were decided based on the objectives of air pollution and
source apportionment study. The source apportionment analysis required air monitoring for
particulate matter (PM2.5 and PM10) and its chemical speciation to develop signature profiles
of pollution sources that can be used in chemical mass balance models. The analysis data
could also be used to interpret the overall loading of different chemicals contributed varied
sources. Monitoring included air quality attributes such as Particulate matter, Sulphur
Dioxide (SO2) and Oxides of Nitrogen as NO2, to understand not only the regulatory
compliance but also their inter-correlations with other species such as Heavy metals, EC, OC
etc. Since the objective of source apportionment study is to determine the contributions from
various sources such as industries, vehicular and other area sources additional parameters
were also monitored such as Polycyclic Aromatic Hydrocarbons (PAHs). List of all
parameters, sampling flow rate and analytical methods are provided in Table 4.1
Table 4.1 Ambient Air Quality Sampling/Analysis Methodology for Target Pollutants
Particulars Parameters
PM10 PM2.5 NO2 SO2
Sampling
Instrument
Fine Dust
Sampler & FRM
Sampler
Fine Dust Sampler
& FRM Sampler
APM sampler APM sampler
Sampling
Principle
Cyclonic Flow
Technique
Cyclonic Flow
Technique/ WINS
Impactor
Chemical
absorption in
suitable media
Chemical
absorption in
suitable media
Flow rate 16.7 LPM 16.7 LPM 0.5 LPM 0.5 LPM
Sampling
Period
24 hourly 24 hourly 8 hourly 8 hourly
Sampling
Frequency
10 days
continuous,
Teflon and quartz
on alternate days
10 days continuous,
Teflon and quartz
on alternate days
10 days
continuous
10 days
continuous
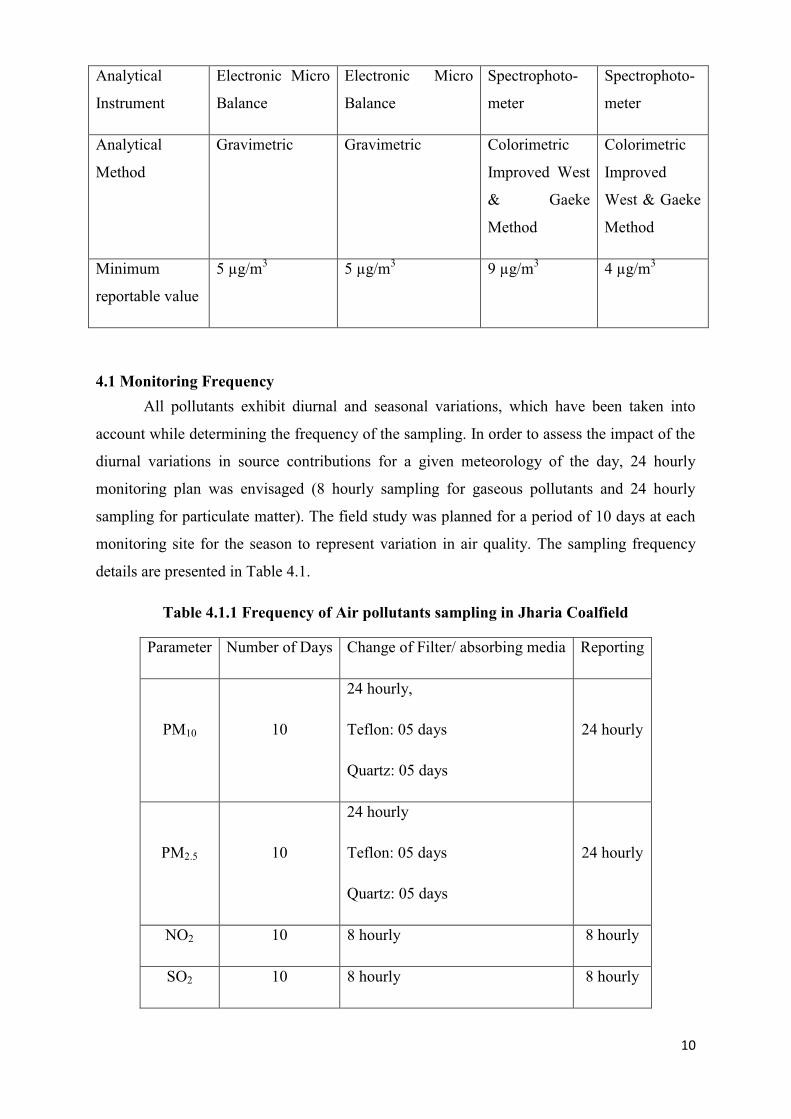
10
Analytical
Instrument
Electronic Micro
Balance
Electronic Micro
Balance
Spectrophoto-
meter
Spectrophoto-
meter
Analytical
Method
Gravimetric Gravimetric Colorimetric
Improved West
& Gaeke
Method
Colorimetric
Improved
West & Gaeke
Method
Minimum
reportable value
5 µg/m3
5 µg/m3 9 µg/m
3 4 µg/m
3
4.1 Monitoring Frequency
All pollutants exhibit diurnal and seasonal variations, which have been taken into
account while determining the frequency of the sampling. In order to assess the impact of the
diurnal variations in source contributions for a given meteorology of the day, 24 hourly
monitoring plan was envisaged (8 hourly sampling for gaseous pollutants and 24 hourly
sampling for particulate matter). The field study was planned for a period of 10 days at each
monitoring site for the season to represent variation in air quality. The sampling frequency
details are presented in Table 4.1.
Table 4.1.1 Frequency of Air pollutants sampling in Jharia Coalfield
Parameter Number of Days Change of Filter/ absorbing media Reporting
PM10 10
24 hourly,
Teflon: 05 days
Quartz: 05 days
24 hourly
PM2.5 10
24 hourly
Teflon: 05 days
Quartz: 05 days
24 hourly
NO2 10 8 hourly 8 hourly
SO2 10 8 hourly 8 hourly
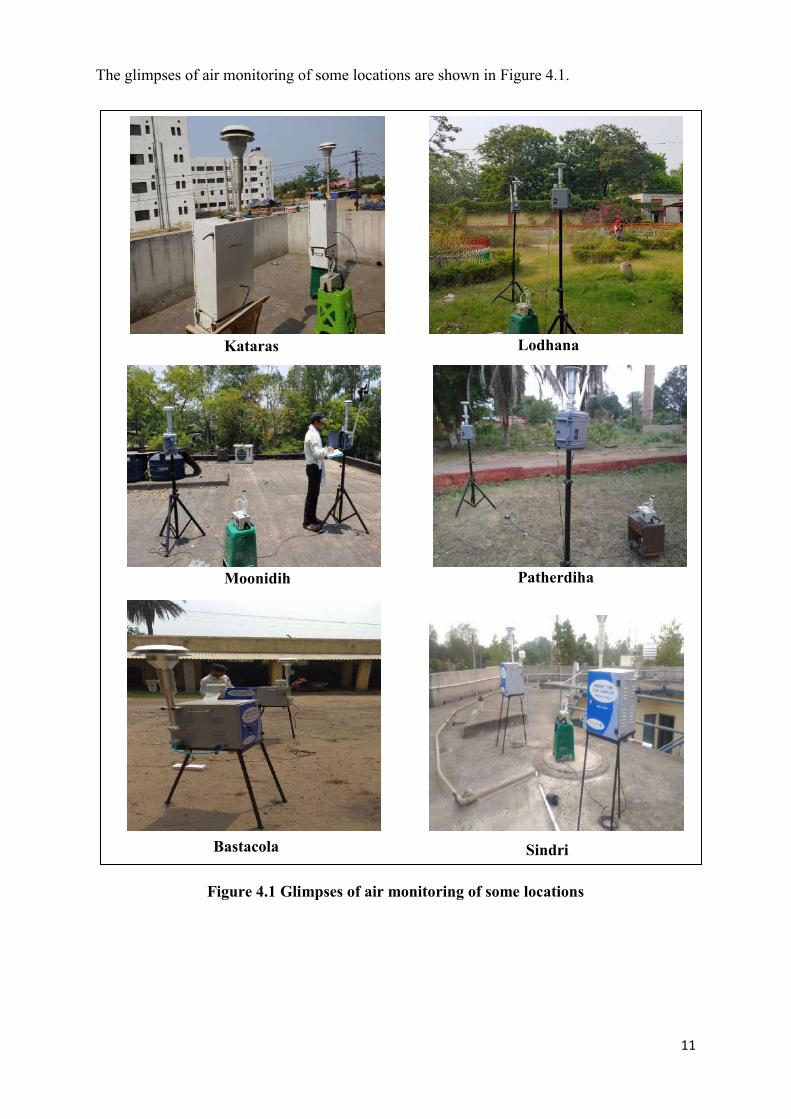
11
The glimpses of air monitoring of some locations are shown in Figure 4.1.
Figure 4.1 Glimpses of air monitoring of some locations
Kataras Lodhana
Moonidih Patherdiha
Bastacola Sindri
12
4.2 Filter handling and Weighing:
Teflon-membrane and quartz-fibre filter are most commonly used for chemical
analysis. Each filter was individually examined prior to labelling for discoloration, pinholes,
creases, separation of ring, chaff or flashing, loose material, or other defects.
Gravimetry measured the net mass on a filter by weighing the filter before and after
sampling with balance in temperature and relative humidity controlled environment. To
minimize particle volatilization and aerosol liquid water bias, PM2.5 Filters were equilibrated
for 24 hours at a constant (within ±5%) relative humidity between 30% and 40% at a constant
(within ±2°C) temperature between 20°C and 23°C. PM10 filters were equilibrated at 20% to
45% relative humidity (±5%) and 15°C to 30°C temperature (±3°C).
Methods of Chemical characterization:
Sulphur dioxide (SO2) : Modified West and Gaeke method
Nitrogen dioxide (NO2) : Sodium Arsenite method
Suspended Particulate Matter (SPM) : High Volume method (Gravimetric method)
Respirable suspended Particulate Matter
(RSPM)
: Gravimetrically with GFA/EPM 2000 filter
paper using respirable dust sampler
(Cyclonic Flow Technique)
5. Ambient Air Quality Monitoring
Core Zone
Site 1: Cluster XIV (Lohapatty)
The samplers were installed on the roof of area office of Lohapatty (Latitude
23.737066 and Longitude 86.210894). It was located near residential colony. Coal mine was
1 km away from the sampling site. Coal has been transported through railway line which is
1.5 km away on a daily basis and also through trucks. NH-32 construction was going on 500
m away from the site. The major fuel used for cooking is coal in the study area.
Site 2: Cluster VII Mine rescue Station
Monitoring station was positioned in Mine rescue station, Dhansar on the roof of
office building (Latitude 23.768746 and Longitude 86.411141). Mine rescue station is next to
13
the state highway 12 where continuous movement of heavy vehicles takes place. Mining
activities were also observed nearby the location.
Site 3: Cluster V Katras
In Katras, samplers were installed at Expert hostel (Latitude 23.811692 and Longitude
86.335910). There was a settlement residential area nearby. Mining activities was in progress
within 500m area. Railway track was nearly at 150m distance from the site. Coal was used
for cooking. Many other activities were observed during sampling in the nearby area which
may contribute. ‘Mela’ and continuous ‘Hawan’ were going on within 100m area. Also road
construction was in progress near 7km.
Site 4: Cluster IX (Lodhana)
Samplers were installed at office in Lodhna (Latitude 23.721713 and Longitude
86.410260). Near Lodhna, colliery was 2 km away from the site. Nearest Railway track was
1.5 km away. Coal was mostly used for cooling.
Site 5: Cluster XI (Moonidih)
Moonidih mine is one of the underground mine of BCCL. Sampler was stationed in
Area office of Moonidih mine (Latitude 23.742228 and Longitude 86.349494). Since
monitoring location was 250-300m from the mine, movement of heavy vehicles was
continuous. There is washery also at distance of 500m where trucks and conveyor were used
for transportation of coal. So the mining activities nearby contributes to particulate matter
emission.
Site 6: Cluster X (Patherdih)
Samplers were stationed in guest house of BCCL in Patherdih area (Latitude
23.693577 and Longitude 86.398728). It is situated beside highway where continuous
movement of heavy vehicles observed. TATA steel coal mine is situated 1km away from the
location where continuous mining activities takes place. Transportation of coal through
railway wagons in same area also contributes to particulate matter emission.
Site 7: Cluster VIII (Bastacola)
The samplers were positioned in area office of Bastacola mine (Latitude 23.763966
and Longitude 86.433635). Here also, coal was used as a cooking media. Railway track was
14
at Jodaphata which was 3-4 km away from the site. Residential area was nearly 0.5-1km.
Mine was situated 3km from the site but no Mining activity was observed during monitoring.
Buffer zone
Site 8: Bank More (BCCL Colony)
Sampling station was installed in BCCL colony, Jawahar Nagar on the roof of a
resident (Latitude 23.789463 and Longitude 86.407448). No mining activities were observed
but the colony was beside the NH 18 highway so it may contribute to particulate matter
emission.
Site 9: Harina
At Harina, the site chosen for air sampling was BCCL colony (Latitude 23.806308
and Longitude 86.212641). Since it was BCCL residential area, fuel used for cooking purpose
was LPG. Settlement residential area was observed nearby where coal was used as a media
for cooking. Colliery and Railway track were 3km and 2 km away from the site respectively.
Highway was 1km away from the site and Coal washery at distance of 4.5km.
Site 10: Bhuli
The samplers were installed on the roof of Saraswati Vidya Mandir, Bhuli (Latitude
23.819554 and Longitude 86.386647). The location was in residential area. Mining activity
was going at a distance of 8-10km. A closed Brick factory was located in the nearby area.
Fuel used for cooking was mostly coal. Railway track used for coal transportation was 4km
from the site. Construction of highway was also going on within 1.5km area during the
monitoring.
Site 11: Sindri
Air samplers were installed at BIT Sindri college campus (Latitude 23.653214 and
Longitude 86.473022). Transportation of coal was done by railway wagons at distance of
2km from monitoring site. LPG was mostly used for cooking rather than coal. A construction
activity was going on nearby. The site was near the highway at a distance of <100m.
Site 12: Parbatpur
The sampling station was installed on roof of a house (Latitude 23.696296 and
Longitude 86.348609). Mining activity was no longer going nearby. Coal was primarily used
for cooking.
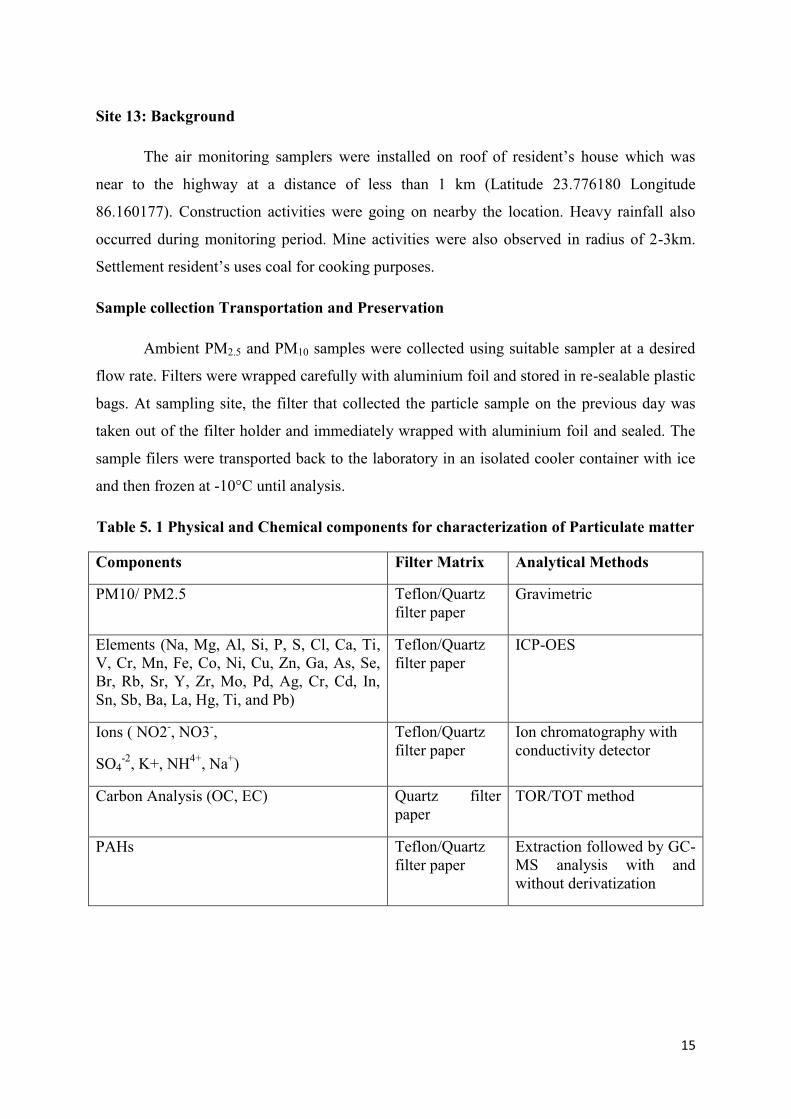
15
Site 13: Background
The air monitoring samplers were installed on roof of resident’s house which was
near to the highway at a distance of less than 1 km (Latitude 23.776180 Longitude
86.160177). Construction activities were going on nearby the location. Heavy rainfall also
occurred during monitoring period. Mine activities were also observed in radius of 2-3km.
Settlement resident’s uses coal for cooking purposes.
Sample collection Transportation and Preservation
Ambient PM2.5 and PM10 samples were collected using suitable sampler at a desired
flow rate. Filters were wrapped carefully with aluminium foil and stored in re-sealable plastic
bags. At sampling site, the filter that collected the particle sample on the previous day was
taken out of the filter holder and immediately wrapped with aluminium foil and sealed. The
sample filers were transported back to the laboratory in an isolated cooler container with ice
and then frozen at -10°C until analysis.
Table 5. 1 Physical and Chemical components for characterization of Particulate matter
Components Filter Matrix Analytical Methods
PM10/ PM2.5 Teflon/Quartz
filter paper
Gravimetric
Elements (Na, Mg, Al, Si, P, S, Cl, Ca, Ti,
V, Cr, Mn, Fe, Co, Ni, Cu, Zn, Ga, As, Se,
Br, Rb, Sr, Y, Zr, Mo, Pd, Ag, Cr, Cd, In,
Sn, Sb, Ba, La, Hg, Ti, and Pb)
Teflon/Quartz
filter paper
ICP-OES
Ions ( NO2-, NO3
-,
SO4-2
, K+, NH4+
, Na+)
Teflon/Quartz
filter paper
Ion chromatography with
conductivity detector
Carbon Analysis (OC, EC) Quartz filter
paper
TOR/TOT method
PAHs Teflon/Quartz
filter paper
Extraction followed by GC-
MS analysis with and
without derivatization
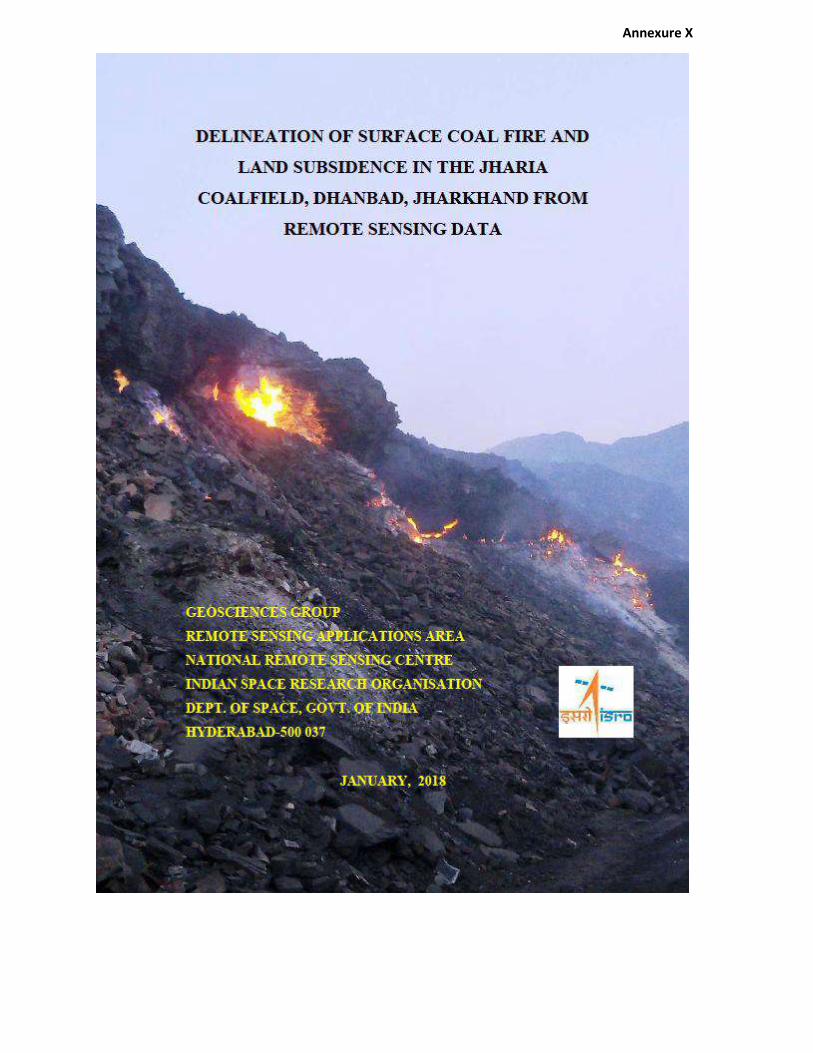
Annexure X
NRSC/RSAA/GSG/BCCL/Project Report/JAN2018
DELINEATION OF SURFACE COAL FIRE AND
LAND SUBSIDENCE IN THE JHARIA COALFIELD,
DHANBAD, JHARKHAND FROM REMOTE
SENSING DATA
Report for
BHARAT COKING COAL LIMITED (BCCL)
(A SUBSIDIARY OF COAL INDIA LTD.)
ENVIRONMENT DEPARTMENT, KOYLA BHAWAN
KOYLA NAGAR, DHANBAD – 826 005, JHARKHAND
GEOSCIENCES GROUP
REMOTE SENSING APPLICATIONS AREA
NATIONAL REMOTE SENSING CENTRE
INDIAN SPACE RESEARCH ORGANISATION
DEPT. OF SPACE, GOVT. OF INDIA
HYDERABAD-500 037
JANUARY, 2018
NRSC/RSAA/GSG/BCCL/Project Report/JAN2018
1. Dr. K VINOD KUMAR, Group Head, Geosciences Group
Project formulation and coordination
2. Dr. Tapas R. Martha, Scientist ‘SF’
Field survey and report preparation
3. Shri Priyom Roy, Scientist ‘SD’
Image processing, interpretation, field survey, maps and report preparation
PROJECT TEAM
NRSC/RSAA/GSG/BCCL/Project Report/JAN2018
ACKNOWLEDGEMENTS i
EXECUTIVE SUMMARY ii
LIST OF FIGURES AND TABLES iii
CHAPTER – I INTRODUCTION 1
1.1 BACKGROUND 2
1.2 OBJECTIVES 2
1.3 STUDY AREA 3
CHAPTER – II GENERAL DESCRIPTION OF THE STUDY AREA 4
2.1 LOCATION AND ACCESSIBILITY 4
2.2 PHYSIOGRAPHY, DRAINAGE AND CLIMATE 4
2.3 GENERAL GEOLOGY 4
CHAPTER – III DATA REQUIREMENTS 7
3.1 REMOTE SENSING DATA 7
3.2 ANCILLARY DATA 7
CHAPTER – IV REMOTE SENSING DATA ANALYSIS 8
4.1 METHODOLOGY 8
4.1.1 PROCESSING OF LANDSAT 8 DATA 8
4.1.2 THRESHOLDING OF RADIANT TEMPERATURE IMAGE 9
4.2 METHODOLOGY FOR SUBSIDENCE DETECTION 12
4.2.1 PROCESSING OF ALOS-PALSAR-2 DATA 12
CHAPTER – V FIELDWORK 17
CHAPTER – VI POST FIELD WORK ANALYSIS 19
CHAPTER – VII DISCUSSIONS AND CONCLUSIONS 20
7.1 DISCUSSION 20
7.2 CONCLUSIONS 22
CHAPTER – VIII LIMITATIONS 24
REFERENCES 26
Annexure – I 27
Annexure - II 29
Annexure - III 31
Annexure - IV 34
CONTENTS
NRSC/RSAA/GSG/BCCL/Project Report/JAN2018
i
ACKNOWLEDGEMENTS
The project team is grateful to Dr. Y.V.N. Krishnamurthy, Director, NRSC, for his
support at various stages during execution of this project. We are extremely grateful
to Dr. P.V.N. Rao, Deputy Director (RSAA), NRSC for his overall guidance and
encouragement. We thank Shri D. Gangopadhyay (Director, P&P). BCCL, for this
project initiative and for providing Geosciences group, NRSC, the opportunity to
carry out the task. We are thankful to Shri A. K. Singh (GM, I/C), BCCL for taking
keen interest in the project work and for the support during our fieldwork. We also
thank Shri Dipankar Maity, Surveyor (Mining) and Shri Mithilesh Kumar, Sr.
Manager (Mining) for their support and fruitful discussion during the fieldwork. The
support of all the BCCL officials in the various collieries visited during the course of
the ground truth verification is duly acknowledged.
NRSC/RSAA/GSG/BCCL/Project Report/JAN2018
ii
EXECUTIVE SUMMARY
Coal fire is a serious problem in Jharia coal field, where high ranking coals are
gradually burnt due to these fires. The combined effect of surface and sub-surface
fires and mining related subsidence has endangered the environmental stability of
Jharia coal field. Coupled with the ecological changes instigated by open cast mining,
the landscape in and around Jharia have changed drastically over the years. In the
present study, delineation of coal fire and mining related land subsidence have been
addressed. Thermal band of Landsat-8 (100m resolution) have been used to demarcate
the coal mine fire areas from non fire areas. For this study, Landsat-8 data of May,
2017 have been used. The band 10 (10.60-11.19 μm) of Landsat-8 data is used to
derive the relative radiant temperature. Further ALOS-PALSAR 2, L band microwave
data has been used to delineate zone of probable land subsidence (using differential
interferometry) due to mining. The study reflects that, compared to 2012, the eastern
flanks (Lodna and Tisra) show a larger fire area. The western flank (Nadkhurkee and
Shatabdi) and the northern flank (Katras and Gaslitand) show isolated fire pockets in
active mines as well as OB dumps. Among all the colliery areas, Kusunda and Lodna
area is most affected by coal mine fire. The current fire area mapped is 3.28 sq.km.
Apart from this, five distinctive areas of land subsidence have been identified using
interferometric method. These are primarily caused by older or active underground
mining. The Moonidih Project is most affected by subsidence. The coal mine fire and
subsidence areas are further verified on the ground. The final coal mine fire and
subsidence map of Jharia coal field is prepared by using remote sensing data analysis
with field validation.
NRSC/RSAA/GSG/BCCL/Project Report/JAN2018
iii
Figure 1 : Study area map of Jharia Coalfield, Jharkhand
Figure 2 : Geological map of Jharia coal field, Dhanbad, Jharkhand (published
by CMPDIL)
Figure 3 : False colour composite image of Jharia Coalfield (VNIR 3N,2,1 ) ,
with subset blocks (in red) to obtain temperature values (from radiant
temperature image) within the Barakar formation across the Jharia
coalfield.
Figure 4 : Maximum temperature plotted against mean temperature for various
locations; cluster separation observed around 39 °C (marked with
arrow)
Figure 5 : Coal mine fire map (May, 2017) of Jharia coal field, Dhanbad. The
fire areas shown in this map have been verified in the field as per
field points in figure 13.
Figure 6 : DInSAR acquisition scheme
Figure 7 : Work flow diagram for generating land subsidence map using
DInSAR technique
Figure 8 : ALOS-PALSAR - 2 Master-Slave pairs for short and long temporal
base line processing
Figure 9 : Fringe patterns generated from short baseline processing (e.g. Master:
Oct, 16, Slave: Feb, 17)
Figure 10 : Fringe patterns generated from long baseline processing (e.g. Master:
Oct, 15, Slave: Feb, 17)
Figure 11 : Subsidence map of Jharia coal field, Dhanbad
Figure 12 : Total fire area statistics
Figure 13 : Field data points for coal fire verification
Figure 14 : Field data points for subsidence verification
Field Photographs
Figure 15 : Fume cracks in Lodna-Tisra Area. (point 39 in figure 13 and table 4)
Figure 16 : Burnt area near OB dump in Lodna area (point 41 in figure 13 and
table 4).
LIST OF FIGURES AND TABLES
NRSC/RSAA/GSG/BCCL/Project Report/JAN2018
iv
Figure 17 : Coalfries in active seams in Kusunda (point 23 in figure 13 and table
4)
Figure 18 : Sagged area due to subsidence, south of Block II OCP. (point 1 in
figure 14 and table 5).
Figure 19 : Fire in OB dumps in Kusunda area. (point 24 in figure 13 and table
4).
Figure 20 : Fume cracks in the Bhulanbarari area.
List of Tables
Table 1 : Generalised stratigraphy of JCF
Table 2 : List of satellite data used in the present study
Table 3 : Threshold temperature for fire area estimation of individual mines.
Table 4 : Coal Fire observations during fieldwork (see figure 13 for reference)
Table 5 : Coal Fire observations during fieldwork (see figure 14 for reference)
Table 6 : Colliery wise break-up of change in fire area from 2012 to
2017
NRSC/RSAA/GSG/BCCL/Project Report/JAN2018
1
INTRODUCTION
Coal fire is a perennial problem in Jharia coal field (JCF) covering 447 sq. km. area in
the Dhanbad district of Jharkhand state. Subsurface and surface coal fires are a serious
problem in many coal-producing countries. The severity and extent of mine fires in
some of the Indian coalfields, particularly Jharia and Raniganj coalfields, are quite
alarming. Combustion can occur either within coal or in coal dumps on the surface.
Considerable economic loss and environmental problem arises due to the coal fire.
Coal fire burns valuable coal and also creates difficulties in mining by increasing the
cost of production or making existing operations difficult. Noxious gases like sulphur
dioxide, nitrogen oxide, carbon monoxide, carbon dioxides, which are the result of
coal burning processes, often affect the immediate surroundings of an active coal fire
area (Gangopadhyay, 2003). These greenhouse gases not only affect local atmosphere
but also play a crucial role in the damages, found associated with coal fire such as
land surface subsidence and surface cracking. Coal fires are caused by oxidation of
coal but the reaction involved in oxidation of coal is not understood till date. Broadly,
the potential for spontaneous combustion lies in its ability to react with oxygen at
ambient temperature. This occurs through the reaction of oxygen at the surface of the
coal resulting in an exothermic reaction. As a consequence, the temperature of coal
rises and if temperature reaches the threshold temperature, ranging between 800 to
1200C, a steady reaction starts, which produces carbon dioxide. Temperature keeps on
increasing once CO2 started to form and at 2300°C, the exothermic reaction becomes
rapid. It is known that high grade coals (high carbon content) are more fire prone,
though the reason behind this is not well understood. Another important parameter,
which controls fire, is the size of the particles. Larger the effective area of coal (fire
particles), more rapidly the reaction proceeds. Cracks, fissures play a role like positive
catalysts to coal oxidation by slowly supplying oxygen / air through their conduits.
Coal mining in Jharia Coal Field (JCF) started way back in 1895. History of
fire in Jharia Coal Field date back to 1916 when the first incidence of fire was
reported from XIV seam of Bhowrah colliery. JCF was nationalised in 1972 and over
the decades, the fire has spread or been contained but never extinguished. The
combination of underground fire and subsidence have affected vast areas of JCF.
CHAPTER I
NRSC/RSAA/GSG/BCCL/Project Report/JAN2018
2
1.1 Background
Remote sensing technique in thermal band offers a cost-effective and time-
saving technology for mapping various geoenvironmental / hazardous features such as
coal fires, forest fires, oil well fires, volcanic eruptions etc. NRSC has carried out coal
fire mapping projects in the past; conducting an airborne campaign in 1989 and using
Landsat-5 TM data in 1995 (Bhattacharya et. al., 1995), over Jharia coalfield,
Jharkhand and using Landsat-5 TM data for 2001 over Raniganj coalfield, West
Bengal. Further, projects were executed in 2006 and 2012 in which coal fires of the
JCF were mapped using Landsat-7 ETM+ and ASTER data, respectively.
Additionally, a R&D study was taken up in 2013 to delineate subsidence areas using
differential interferomteric (DInSAR) technique. In view of the past experiences,
based on the letter (Ref. no. NRSC/16/76) from Director (Tech.), Operations, BCCL
addressed to Director, NRSC on 01 February 2016. a project was formulated to take
up Coal fire and Land Subsidence study of the Jharia Coal Field using space-borne
remote sensing technique. The formal Memorandum of Understanding between
BCCL and NRSC was signed on 23rd of Dec, 2016.
1.2 Objectives
The following objectives are formulated on the basis of the above mentioned
background:
I. To map Coal fire in the study area based on pixel integrated relative radiant
temperature derived from latest available Landsat-8 data of 2016-17 time
period.
II. To compare the change in the coal fire distribution in the Jharia coalfield
within the period of 2012 and 2016-17.
III. To delineate probable subsidence areas in the region using differential
interferometry method.
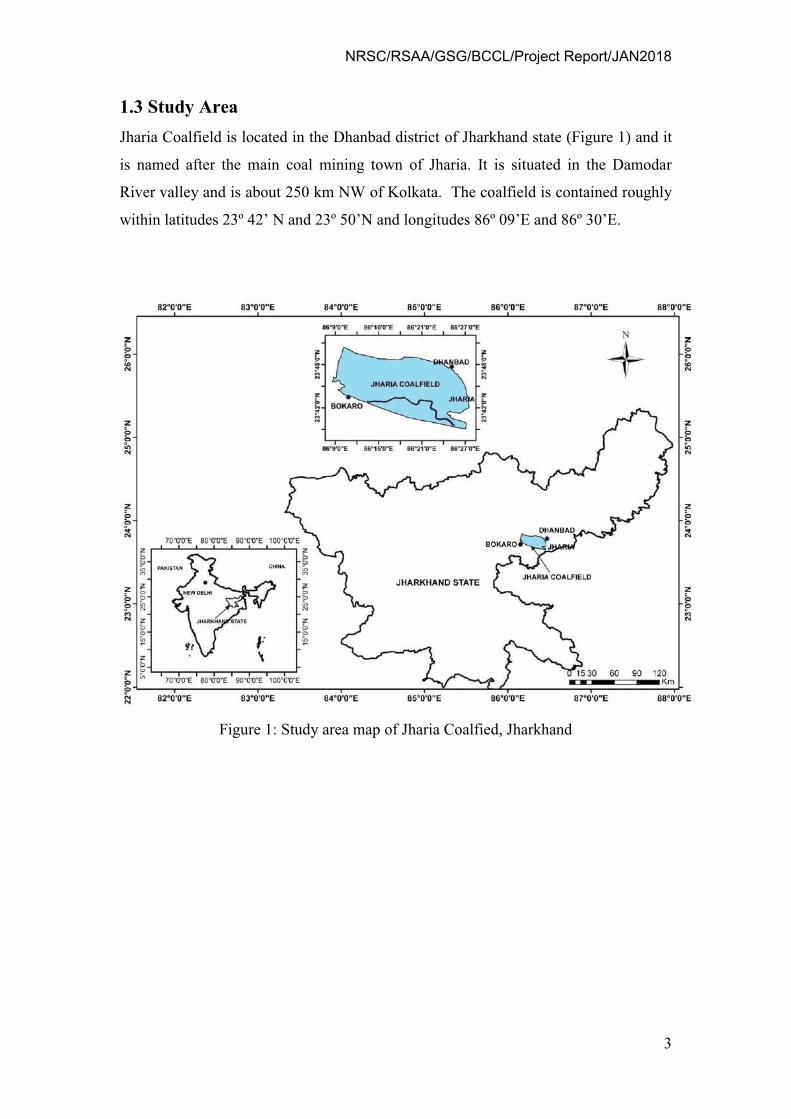
NRSC/RSAA/GSG/BCCL/Project Report/JAN2018
3
1.3 Study Area
Jharia Coalfield is located in the Dhanbad district of Jharkhand state (Figure 1) and it
is named after the main coal mining town of Jharia. It is situated in the Damodar
River valley and is about 250 km NW of Kolkata. The coalfield is contained roughly
within latitudes 23º 42’ N and 23º 50’N and longitudes 86º 09’E and 86º 30’E.
Figure 1: Study area map of Jharia Coalfied, Jharkhand
NRSC/RSAA/GSG/BCCL/Project Report/JAN2018
4
GENERAL DESCRIPTION OF THE STUDY AREA
2.1 Location and Accessibility
Jharia is an old mining town in the Dhanbad district of Jharkhand. This town is
famous for its surrounding mines producing high grade coal and supplying mainly to
the neighbouring industrial areas. Jharia is approximately 6 km in south western
direction from Dhanbad town and connected by metal road. Dhanbad is well
connected to Kolkata by road and rail.
2.2 Physiography, Drainage and Climate
Jharia coalfield is characterised by undulatory topography with very low rolling slope
towards the eastern part of the area. The average height of the area is around 200
meters above the mean sea level. Damodar is the major river in the study area. The
other tributaries to the Damodar River in this area are Jamuniya Nadi, Khudia Nadi,
Khatri Nadi, Jarian Nala, Kari Jora and Domohani Nadi. Damodar River flows from
west to east in this area. The minimum temperature is <10º C in the month of
December – January and maximum temperature is >50º C in the month of May –
June.
2.3 General Geology
Gondwana Super Groups of rocks of Up. Carboniferous to Lr. Cretaceous age (i.e.
from 320 MY to 98 MY) are exposed here. Gondwana Super Group rocks
unconformably overlie Archaean rocks. In Gondwana Rocks, Raniganj and Barakar
Formations of Permian age have more potential as far as the coal production is
concerned. Barakar Formation is exposed in north and north eastern part of the basin
(Figure 2). Most of the coal mines are confined to the Barakar Formation in JCF.
Barakars consists of coarse, medium grey and white sandstones, shales and coal
seams. Raniganj consists of grey and greenish soft feldspathic sandstones, shales and
coal seams. Faults are prevalent in this portion of basins (Figure 2). NW trending
faults are conspicuous north to Jharia. Many lamprophyre and dolerite dykes are also
exposed in this area in a criss-cross manner. The Raniganj Formation though coal
bearing, has suffered much deformation due to faulting, thus causing difficulty for
CHAPTER II
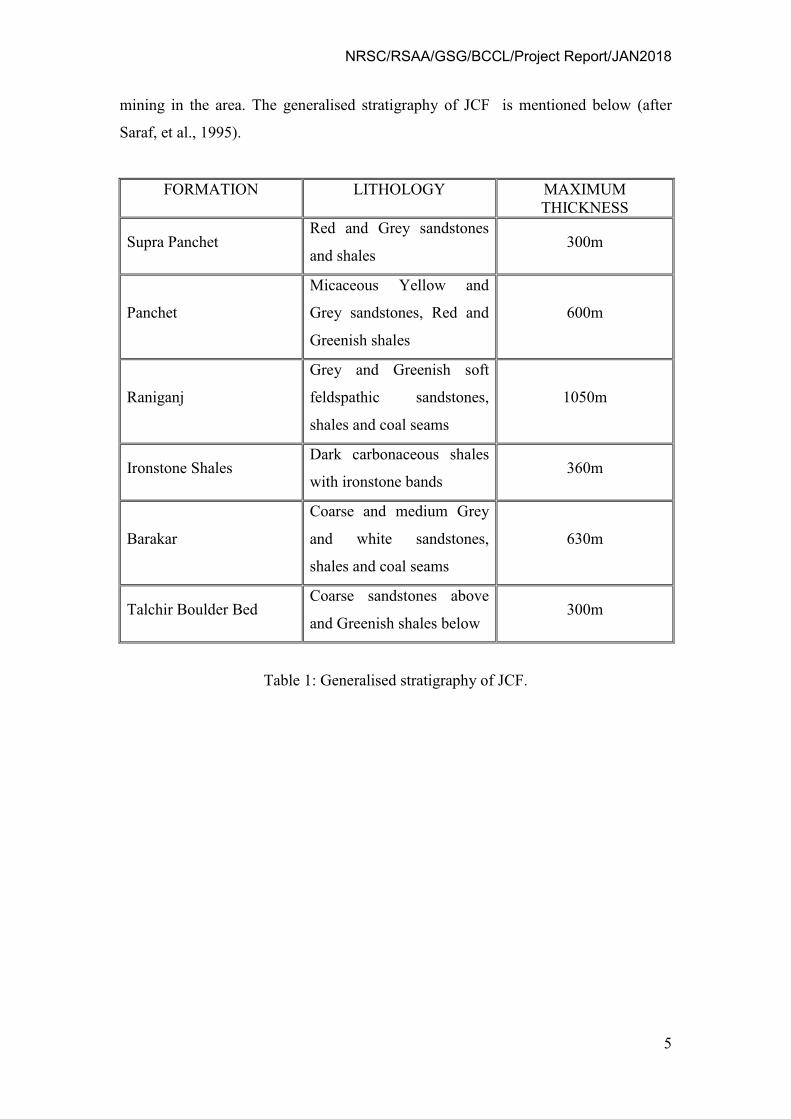
NRSC/RSAA/GSG/BCCL/Project Report/JAN2018
5
mining in the area. The generalised stratigraphy of JCF is mentioned below (after
Saraf, et al., 1995).
FORMATION LITHOLOGY MAXIMUM
THICKNESS
Supra Panchet Red and Grey sandstones
and shales 300m
Panchet
Micaceous Yellow and
Grey sandstones, Red and
Greenish shales
600m
Raniganj
Grey and Greenish soft
feldspathic sandstones,
shales and coal seams
1050m
Ironstone Shales Dark carbonaceous shales
with ironstone bands 360m
Barakar
Coarse and medium Grey
and white sandstones,
shales and coal seams
630m
Talchir Boulder Bed Coarse sandstones above
and Greenish shales below 300m
Table 1: Generalised stratigraphy of JCF.
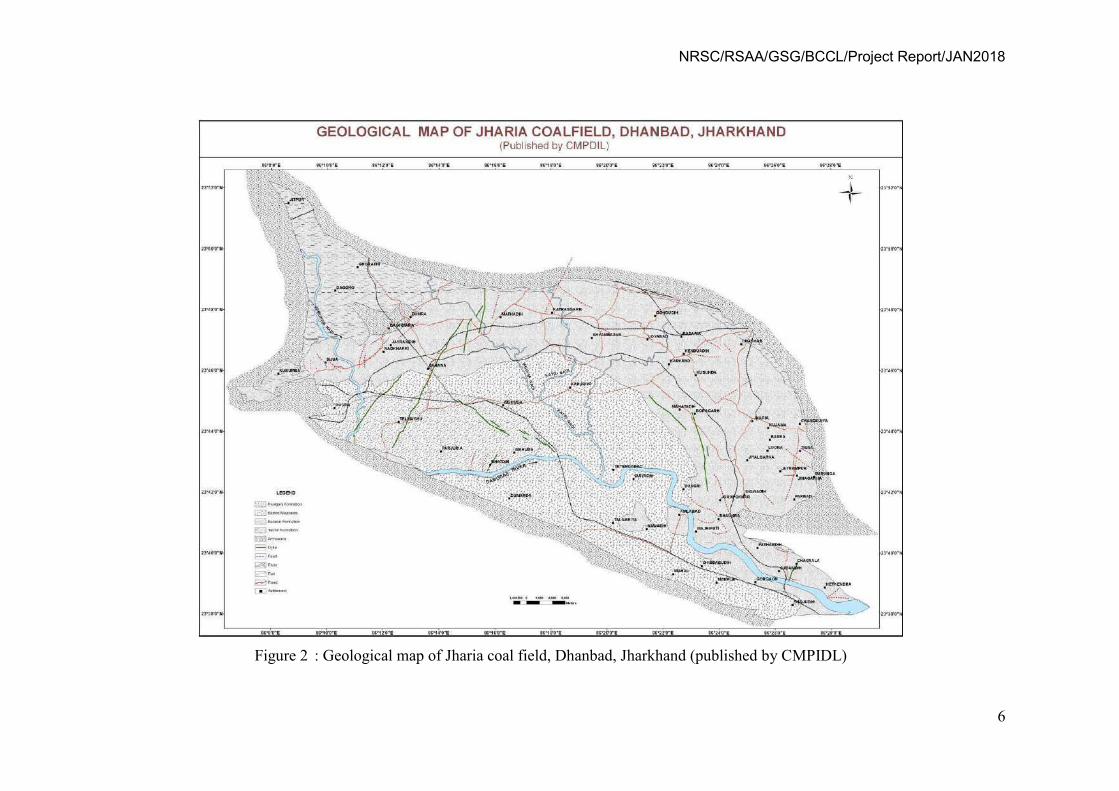
NRSC/RSAA/GSG/BCCL/Project Report/JAN2018
6
Figure 2 : Geological map of Jharia coal field, Dhanbad, Jharkhand (published by CMPIDL)
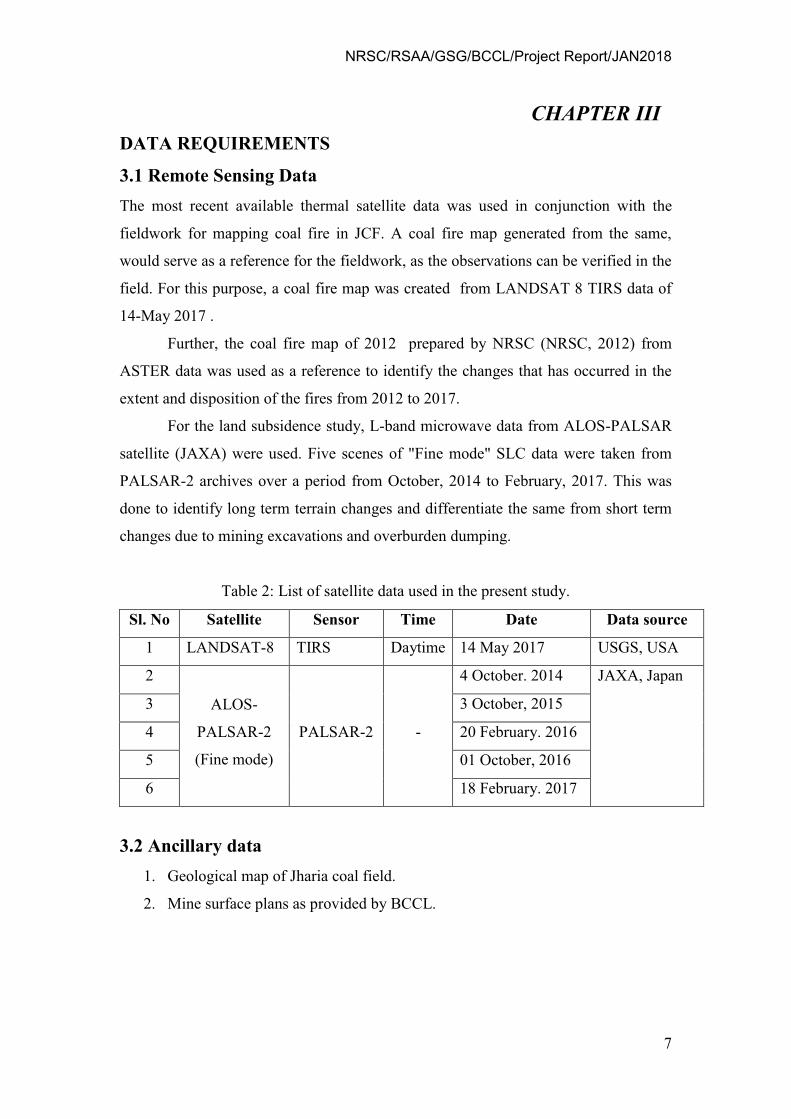
NRSC/RSAA/GSG/BCCL/Project Report/JAN2018
7
DATA REQUIREMENTS
3.1 Remote Sensing Data
The most recent available thermal satellite data was used in conjunction with the
fieldwork for mapping coal fire in JCF. A coal fire map generated from the same,
would serve as a reference for the fieldwork, as the observations can be verified in the
field. For this purpose, a coal fire map was created from LANDSAT 8 TIRS data of
14-May 2017 .
Further, the coal fire map of 2012 prepared by NRSC (NRSC, 2012) from
ASTER data was used as a reference to identify the changes that has occurred in the
extent and disposition of the fires from 2012 to 2017.
For the land subsidence study, L-band microwave data from ALOS-PALSAR
satellite (JAXA) were used. Five scenes of "Fine mode" SLC data were taken from
PALSAR-2 archives over a period from October, 2014 to February, 2017. This was
done to identify long term terrain changes and differentiate the same from short term
changes due to mining excavations and overburden dumping.
Table 2: List of satellite data used in the present study.
Sl. No Satellite Sensor Time Date Data source
1 LANDSAT-8 TIRS Daytime 14 May 2017 USGS, USA
2
ALOS-
PALSAR-2
(Fine mode)
PALSAR-2 -
4 October. 2014 JAXA, Japan
3 3 October, 2015
4 20 February. 2016
5 01 October, 2016
6 18 February. 2017
3.2 Ancillary data
1. Geological map of Jharia coal field.
2. Mine surface plans as provided by BCCL.
CHAPTER III
NRSC/RSAA/GSG/BCCL/Project Report/JAN2018
8
REMOTE SENSING DATA ANALYSIS
4.1 Methodology
4.1.1 Processing of Landsat 8 Data
With the launch of the LANDSAT-8 mission in February, 2013; thermal space borne
data is available from its thermal infrared sensor (TIRS). This has enabled monitoring
of the earth with a spatial resolution of 100 m in the thermal domain with a repeat
cycle of 16 days. The LANDSAT-8 has two channels (Band 10 and Band 11) in the
thermal infrared region (Table 1) which ranges from 10.4 micrometer to 12.5
micrometer. In present study, band 10 of TIRS sensor (acquired on 14 May, 2017) has
been used coal fire mapping (Gangopadhyay et al. 2012). The spectral domain of the
band is known for its maximum transmittance (Chatterjee et al. 2007; Martha et al.
2010). The data are freely accessible through USGS portal (Landsat 8 download
source: http://landsatlook.usgs.gov).
Landsat-8 data are available in GeoTiff format and the data are converted to
top of the atmosphere spectral radiance using the radiance rescaling factors provided
in the metadata file, using equation 1.
Lλ = MLQcal + AL …….. (1)
Where:
Lλ = Spectral radiance (Watts/ (m2 * srad * μm)).
ML = Band-specific multiplicative rescaling factor from the metadata.
AL = Band-specific additive rescaling factor from the metadata.
Qcal = Quantized and calibrated standard product pixel values (DN).
Once the spectral radiance (Lλ) for ASTER Band 13 and Landsat-8 band 10 data is
generated, it is possible to calculate radiant (brightness) temperature directly using
equation 2. Planck's radiation function (Planck, 1914) forms the basis of radiant
temperature derivation from spectral radiances and the theory is discussed in detail in
existing literatures (Gupta, 2003).
TR = K2 /ln ((K1 / Lλ) +1)…….. (2)
TR = Radiant (brightness) temperature,
CHAPTER IV
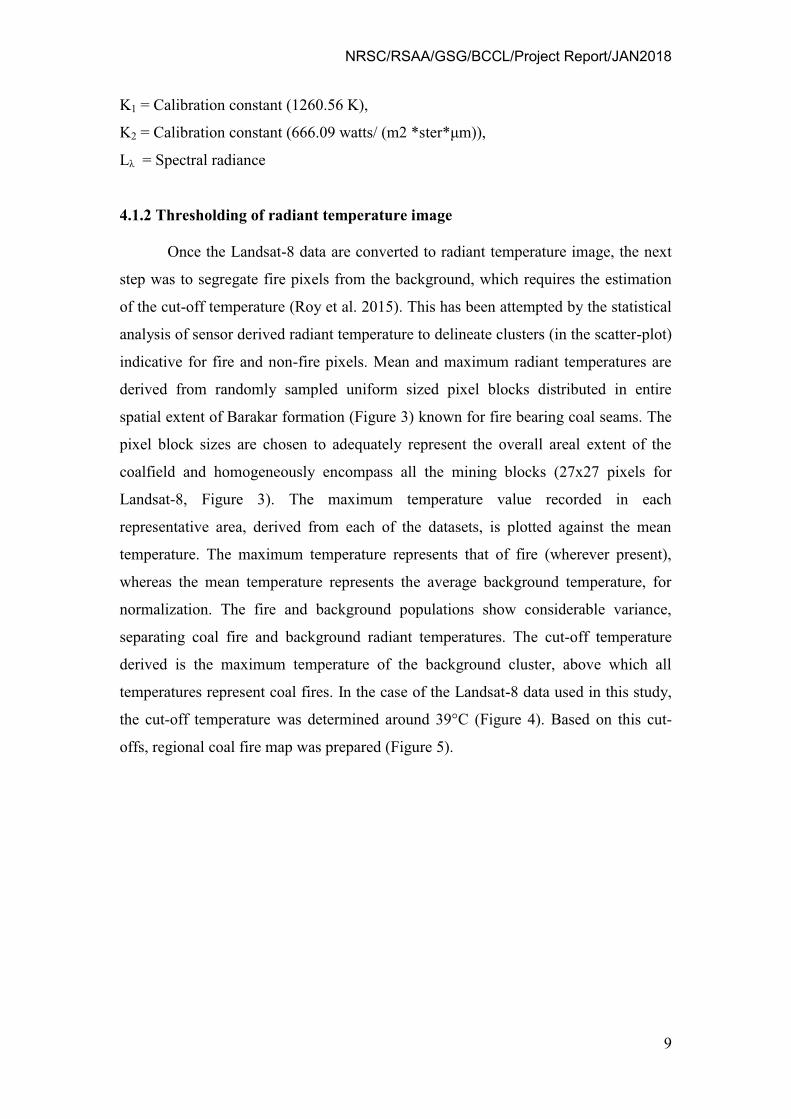
NRSC/RSAA/GSG/BCCL/Project Report/JAN2018
9
K1 = Calibration constant (1260.56 K),
K2 = Calibration constant (666.09 watts/ (m2 *ster*μm)),
Lλ = Spectral radiance
4.1.2 Thresholding of radiant temperature image
Once the Landsat-8 data are converted to radiant temperature image, the next
step was to segregate fire pixels from the background, which requires the estimation
of the cut-off temperature (Roy et al. 2015). This has been attempted by the statistical
analysis of sensor derived radiant temperature to delineate clusters (in the scatter-plot)
indicative for fire and non-fire pixels. Mean and maximum radiant temperatures are
derived from randomly sampled uniform sized pixel blocks distributed in entire
spatial extent of Barakar formation (Figure 3) known for fire bearing coal seams. The
pixel block sizes are chosen to adequately represent the overall areal extent of the
coalfield and homogeneously encompass all the mining blocks (27x27 pixels for
Landsat-8, Figure 3). The maximum temperature value recorded in each
representative area, derived from each of the datasets, is plotted against the mean
temperature. The maximum temperature represents that of fire (wherever present),
whereas the mean temperature represents the average background temperature, for
normalization. The fire and background populations show considerable variance,
separating coal fire and background radiant temperatures. The cut-off temperature
derived is the maximum temperature of the background cluster, above which all
temperatures represent coal fires. In the case of the Landsat-8 data used in this study,
the cut-off temperature was determined around 39°C (Figure 4). Based on this cut-
offs, regional coal fire map was prepared (Figure 5).
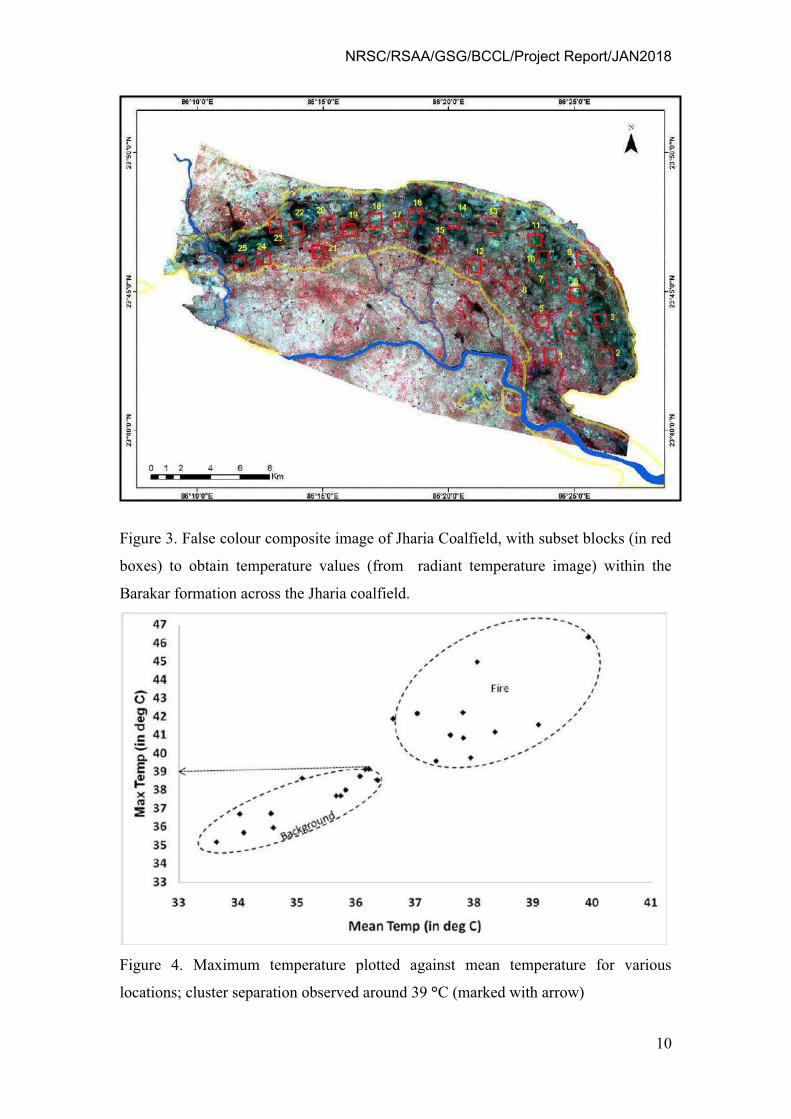
NRSC/RSAA/GSG/BCCL/Project Report/JAN2018
10
Figure 3. False colour composite image of Jharia Coalfield, with subset blocks (in red
boxes) to obtain temperature values (from radiant temperature image) within the
Barakar formation across the Jharia coalfield.
Figure 4. Maximum temperature plotted against mean temperature for various
locations; cluster separation observed around 39 °C (marked with arrow)
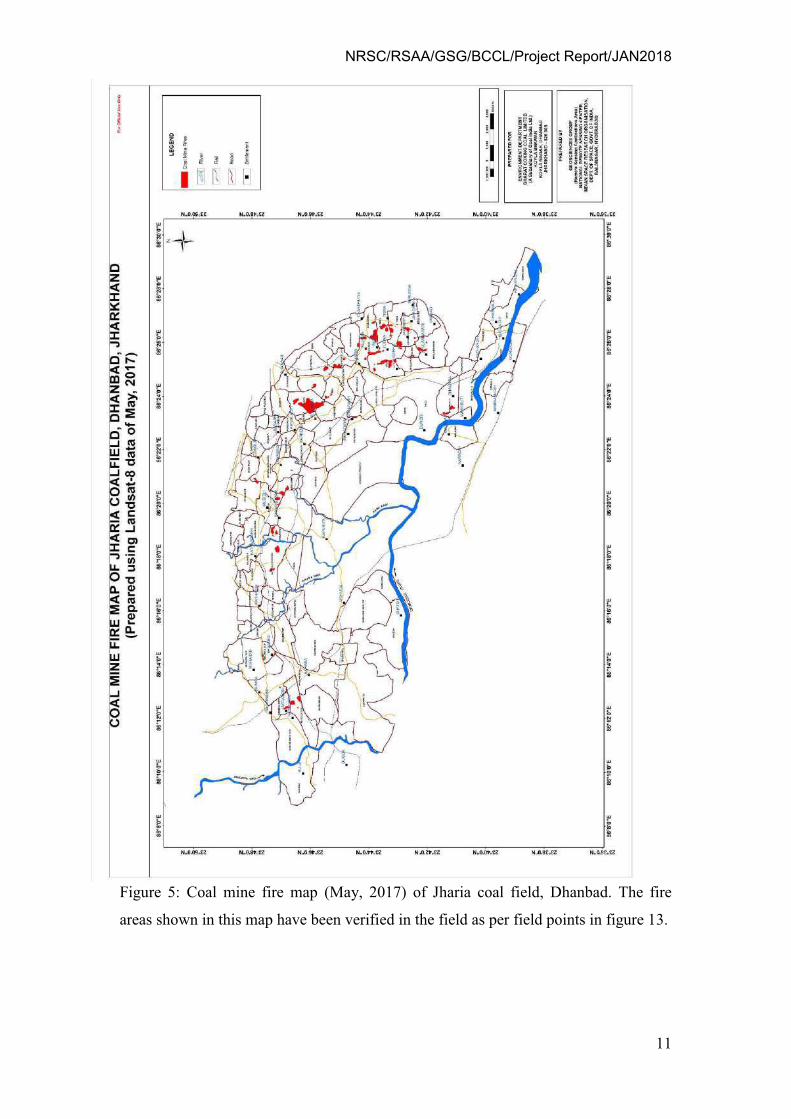
NRSC/RSAA/GSG/BCCL/Project Report/JAN2018
11
Figure 5: Coal mine fire map (May, 2017) of Jharia coal field, Dhanbad. The fire
areas shown in this map have been verified in the field as per field points in figure 13.
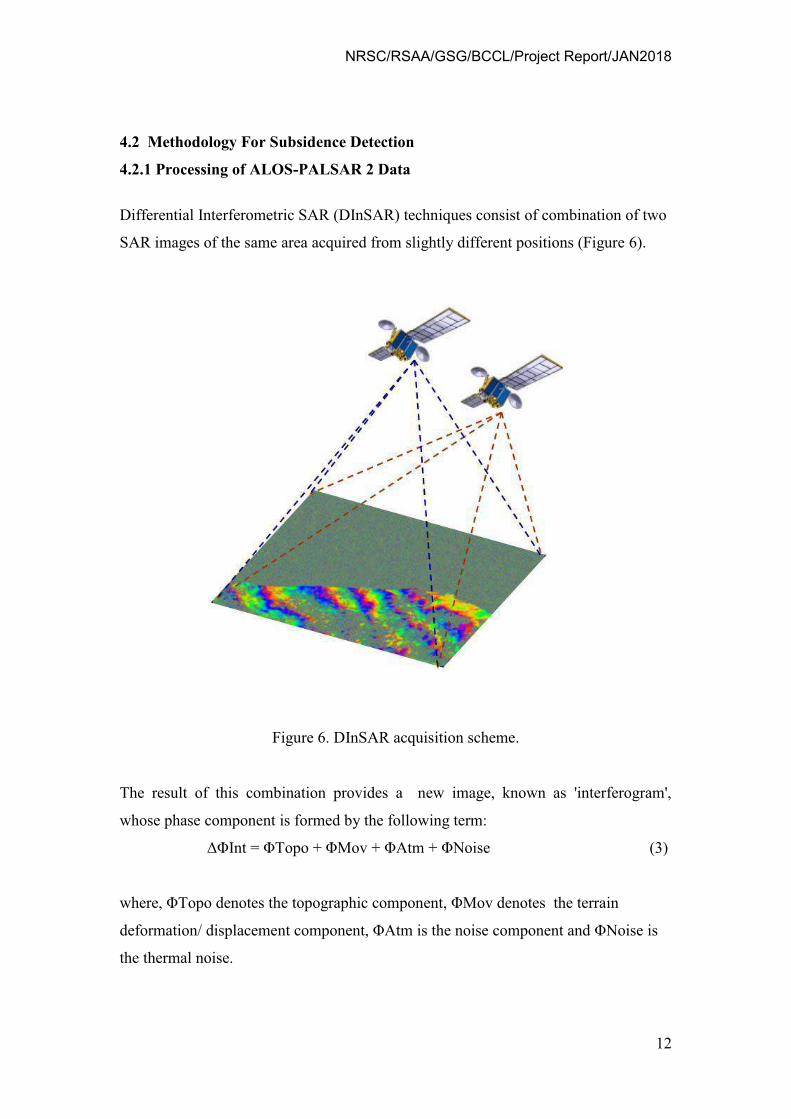
NRSC/RSAA/GSG/BCCL/Project Report/JAN2018
12
4.2 Methodology For Subsidence Detection
4.2.1 Processing of ALOS-PALSAR 2 Data
Differential Interferometric SAR (DInSAR) techniques consist of combination of two
SAR images of the same area acquired from slightly different positions (Figure 6).
Figure 6. DInSAR acquisition scheme.
The result of this combination provides a new image, known as 'interferogram',
whose phase component is formed by the following term:
ΔΦInt = ΦTopo + ΦMov + ΦAtm + ΦNoise (3)
where, ΦTopo denotes the topographic component, ΦMov denotes the terrain
deformation/ displacement component, ΦAtm is the noise component and ΦNoise is
the thermal noise.
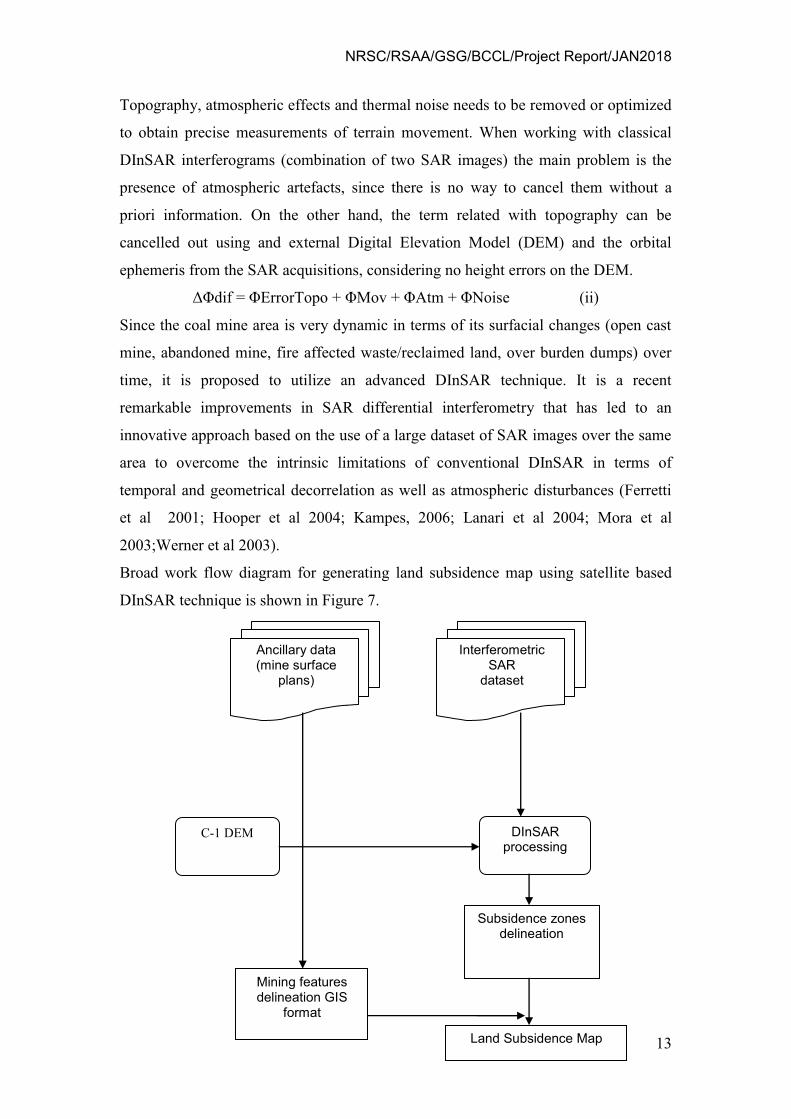
NRSC/RSAA/GSG/BCCL/Project Report/JAN2018
13
Topography, atmospheric effects and thermal noise needs to be removed or optimized
to obtain precise measurements of terrain movement. When working with classical
DInSAR interferograms (combination of two SAR images) the main problem is the
presence of atmospheric artefacts, since there is no way to cancel them without a
priori information. On the other hand, the term related with topography can be
cancelled out using and external Digital Elevation Model (DEM) and the orbital
ephemeris from the SAR acquisitions, considering no height errors on the DEM.
ΔΦdif = ΦErrorTopo + ΦMov + ΦAtm + ΦNoise (ii)
Since the coal mine area is very dynamic in terms of its surfacial changes (open cast
mine, abandoned mine, fire affected waste/reclaimed land, over burden dumps) over
time, it is proposed to utilize an advanced DInSAR technique. It is a recent
remarkable improvements in SAR differential interferometry that has led to an
innovative approach based on the use of a large dataset of SAR images over the same
area to overcome the intrinsic limitations of conventional DInSAR in terms of
temporal and geometrical decorrelation as well as atmospheric disturbances (Ferretti
et al 2001; Hooper et al 2004; Kampes, 2006; Lanari et al 2004; Mora et al
2003;Werner et al 2003).
Broad work flow diagram for generating land subsidence map using satellite based
DInSAR technique is shown in Figure 7.
Subsidence zones delineation
Interferometric SAR
dataset
DInSAR processing
Land Subsidence Map
C-1 DEM
Mining features delineation GIS
format
Ancillary data (mine surface
plans)
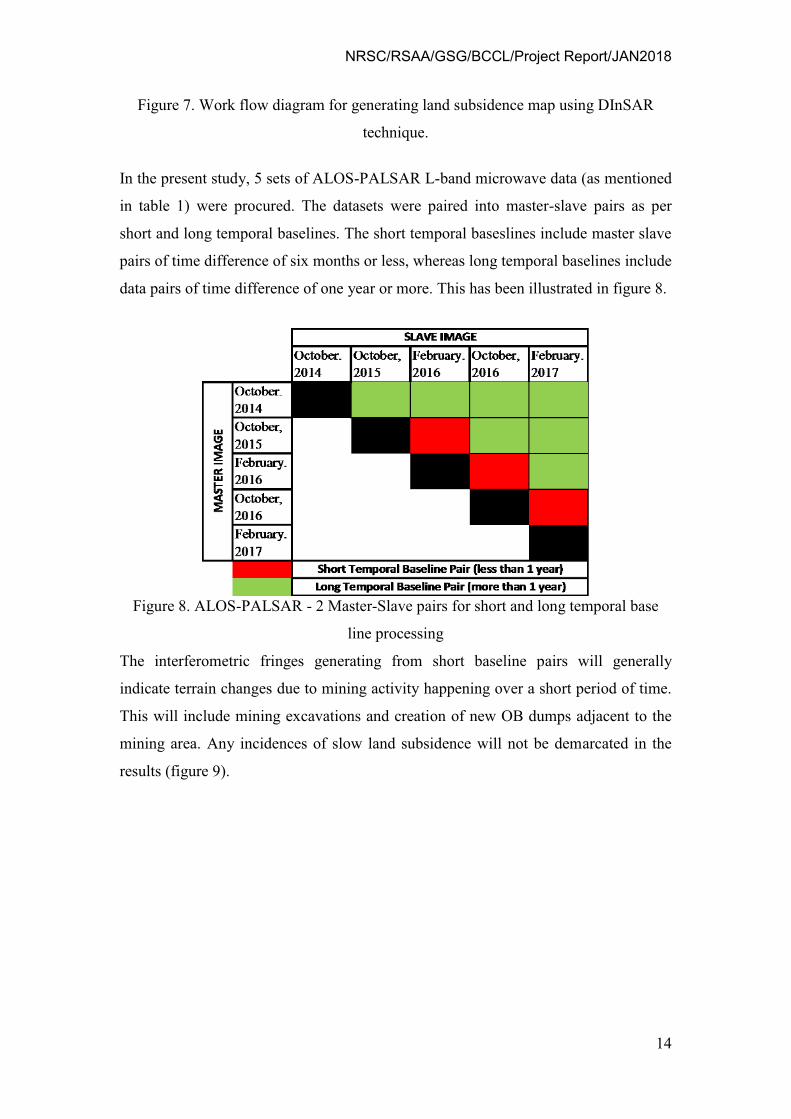
NRSC/RSAA/GSG/BCCL/Project Report/JAN2018
14
Figure 7. Work flow diagram for generating land subsidence map using DInSAR
technique.
In the present study, 5 sets of ALOS-PALSAR L-band microwave data (as mentioned
in table 1) were procured. The datasets were paired into master-slave pairs as per
short and long temporal baselines. The short temporal baseslines include master slave
pairs of time difference of six months or less, whereas long temporal baselines include
data pairs of time difference of one year or more. This has been illustrated in figure 8.
Figure 8. ALOS-PALSAR - 2 Master-Slave pairs for short and long temporal base
line processing
The interferometric fringes generating from short baseline pairs will generally
indicate terrain changes due to mining activity happening over a short period of time.
This will include mining excavations and creation of new OB dumps adjacent to the
mining area. Any incidences of slow land subsidence will not be demarcated in the
results (figure 9).
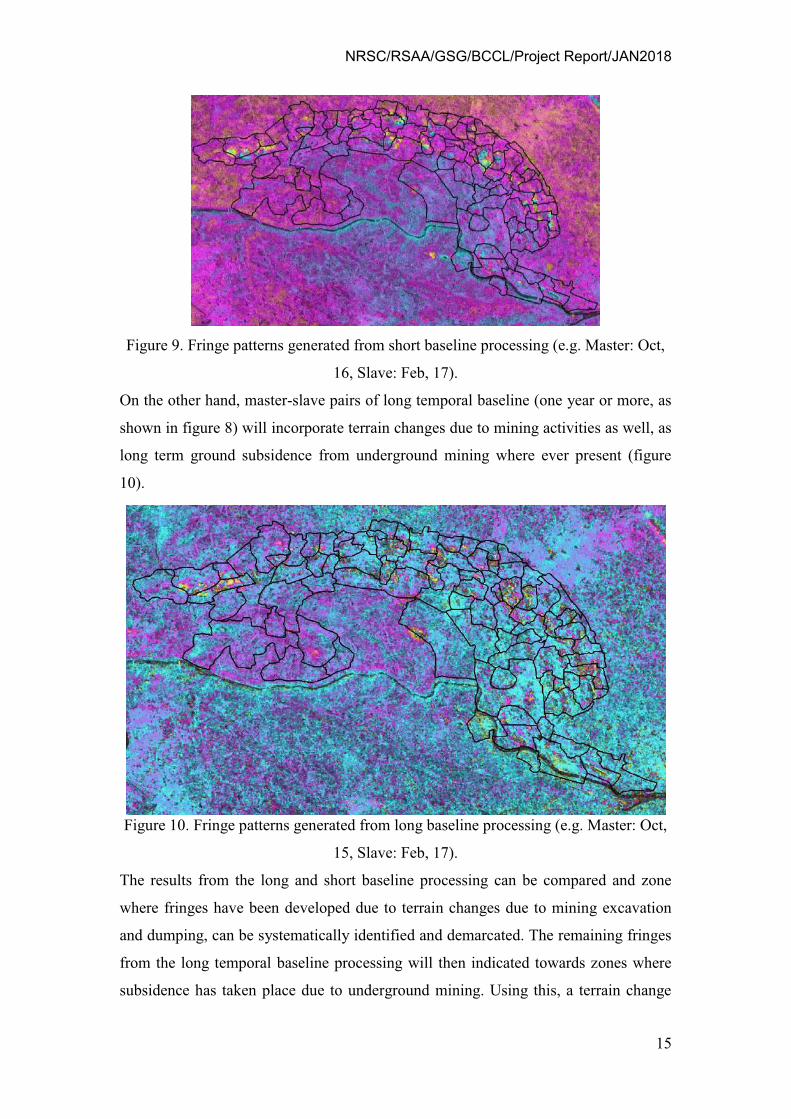
NRSC/RSAA/GSG/BCCL/Project Report/JAN2018
15
Figure 9. Fringe patterns generated from short baseline processing (e.g. Master: Oct,
16, Slave: Feb, 17).
On the other hand, master-slave pairs of long temporal baseline (one year or more, as
shown in figure 8) will incorporate terrain changes due to mining activities as well, as
long term ground subsidence from underground mining where ever present (figure
10).
Figure 10. Fringe patterns generated from long baseline processing (e.g. Master: Oct,
15, Slave: Feb, 17).
The results from the long and short baseline processing can be compared and zone
where fringes have been developed due to terrain changes due to mining excavation
and dumping, can be systematically identified and demarcated. The remaining fringes
from the long temporal baseline processing will then indicated towards zones where
subsidence has taken place due to underground mining. Using this, a terrain change
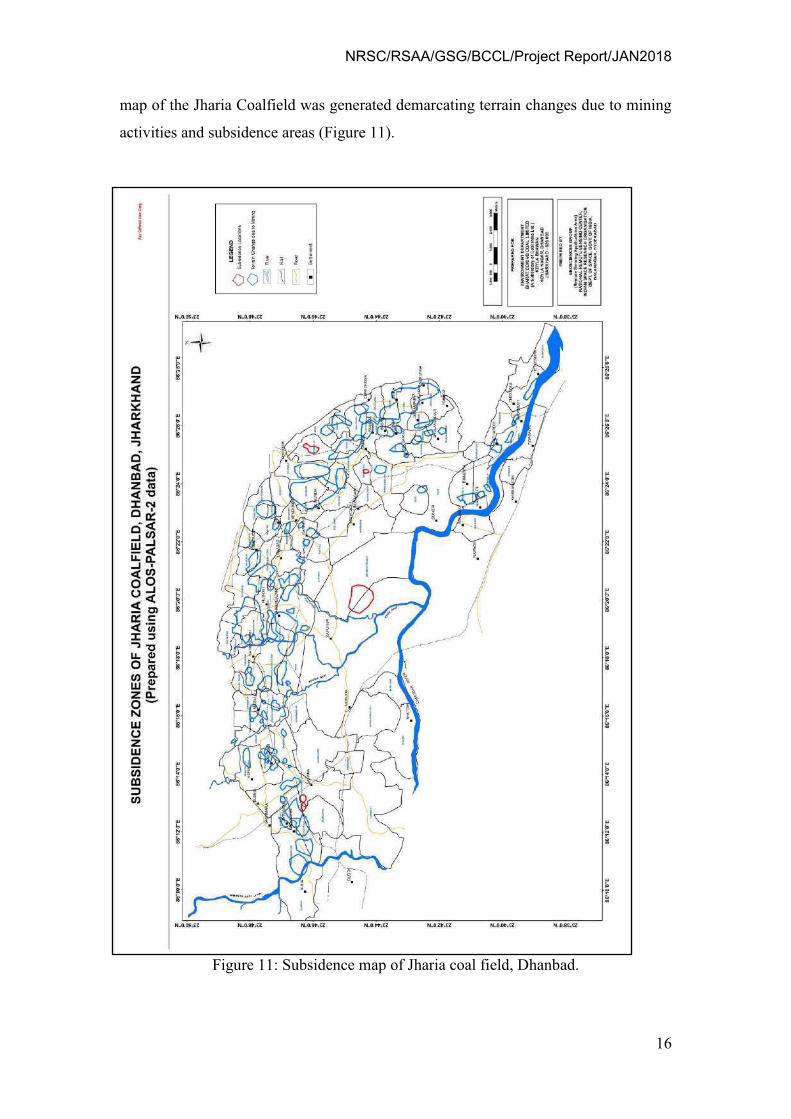
NRSC/RSAA/GSG/BCCL/Project Report/JAN2018
16
map of the Jharia Coalfield was generated demarcating terrain changes due to mining
activities and subsidence areas (Figure 11).
Figure 11: Subsidence map of Jharia coal field, Dhanbad.
NRSC/RSAA/GSG/BCCL/Project Report/JAN2018
17
FIELD WORK
A field work for verification of the coal fire locations and the subsidence zones as
identified by the satellite data were taken up in December, 2017. A total of 53 coal
fire points and 37 land subsidence locations were identified from the satellite data
analysis. The locations of these points along with geographic coordinates were given
to BCCL prior to the December, 2017 field work for their feedback on the status of
these points. Out of the 53 coal fire locations identified, 52 points were confirmed to
be fire bearing as per the present masterplan of the Jharia coalfield created by BCCL
Both the coal fire and the subsidence locations were further independently verified by
NRSC during the fieldwork in December, 2017. The locations and the observations
are coal fire and subsidence are provided in annexure 1 and annexure 2 of this report
respectively.
The salient overview of the field observations are as follows:
Coal-fire observations:
1. The coal fires as observed identified by the Landsat-8 data are mostly
accurately delineated. Fires have been identified in the western, northern and
eastern flank of the coalfield with considerable accuracy in the spatial
locations.
2. In the eastern flank, the main fire affected mines are Kusunda, Lodna and
Tisra. Active fires area present in the mines and fumes can be seen from the
OB dumps. The Bhowra and Bhulanbarari mines also show presence of fire,
however, the extent of the fire area appears to be underestimated in the data.
Similarly, the extent of fires in Lodna and Tisra appears to have been
overestimated in the data. The largest extent of fire in the single mine block is
that in Kusunda.
3. In the northern flank, the main fire bearing mines are Katras, Gaslitand and
Mudidih, However, it is seen that in these areas, the fires appears in pockets
and are not pervasively present. The spatial extent of the fires on the ground
and as estimated in the data can be correlated.
CHAPTER V
NRSC/RSAA/GSG/BCCL/Project Report/JAN2018
18
4. In the western flank, the Block II OCP is the primary fire affected region.
However, it is seen that the Shatabdi OCP also bears fire pockets along semi-
vertical mine walls, This is not identified in the data.
Subsidence location observations:
1. Subsidence locations as identified by the data area difficult to verify in the
field, unless there are tell-tale signatures like large cracks or fissures on the
ground or damage to anthropogenic constructions like vertical cracks on
building cracks etc.
2. Out of the 37 identified subsidence locations from the microwave data, it is
seen that 32 are due to terrain changes resulting from mining activities like
ongoing excavations or formation of new mining dump. These decrease or
increase in elevations has resulted in forming of interferometric fringes in the
data thus creating false positives.
3. Five areas were firmly established as subsidence zones. Out of these, the main
area where subsidence is occurring in a pervasive scale, is that in the
Moonidih Underground Project. The Moonidih Project is an underground long
wall mine where excavations are going on for over decades. This may have
resulted in pervasive subsidence in the region. The signatures of subsidence
such as ground cracks are observed in the area.
4. Two adjacent locations are observed south of the Block II OCP and in
Phularitand mining block. This may be resulted due to older underground
mining in the area. Signatures such as sagging of ground is seen.
5. Another minor subsidence region was identified around the Simlabahal
underground mining project. This is again due to active underground mining
in the area. A similar region was also observed in the northern part of the
Bastacolla mines where active underground mining is ongoing.
In lieu of the observations in field on the fire and subsidence locations, few post field
work correction in the coal fire and subsidence maps was necessitated and has been
discussed in the next chapter.
NRSC/RSAA/GSG/BCCL/Project Report/JAN2018
19
POST FIELDWORK ANALYSIS
As observed in the fieldwork, there were certain mine areas where the presence of fire
was not detected by the satellite data. For example in Shatabdi and Bhulanbarari mine
areas, the fire appears in small pockets on mine faces and was possibly not detected
by the threshold temperature calculated for the entire mine area. On the other hand, in
the Bhowra, Lodna and Tisra mine areas, the spatial extent of fire appears to have
been overestimated by the regional threshold temperature use to separate the fire and
the background areas.
Therefore, mine specific threshold temperature analysis was carried out for
Shatabdi, Bhulanbarari, Bhowra, Lodna and Tisra mine areas to correctly depict the
fire areas on the ground. The threshold temperature selected from each of these mine
areas are given in Table 3.
Table 3: Threshold temperature for fire area estimation of individual mines.
Name of the Mine Block Threshold Temperature (in °C)
Bhowra 38.5
Tisra (north and south) North : 41; South : 40.5
Lodna 41
Bhulanbarari 38.5
Shatabdi 38
Using the threshold temperatures as mentioned in the table 3, the previously
undetected fire areas in the Shatabdi and Bhulanbarari mines were detected. Further
the spatial extent of the fire areas in Bhowra, Lodna and Tisra mines were changed to
adequately represent the actual extent of the fire on the ground. These were
incorporated in the coalfire map shown in figure 5.
CHAPTER VI
NRSC/RSAA/GSG/BCCL/Project Report/JAN2018
20
DISCUSSIONS AND CONCLUSIONS
7.1 Discussions
7.1.1 Coal fire analysis
The present study is aimed to provide the status of coal fire in the Jharia coal field for
the period of 2017. Landsat-8 data of May, 2012 was used to prepare the coal mine
fire map (Figure 5) for the year 2017. The data have 100 m spatial resolution in the
thermal bands and is as on study date, the best thermal satellite data available. The
Coal fire maps of 2017 when compared to map of 2012 (NRSC, 2014) depicts the
dynamics of coal fire. Coal fire is difficult to mitigate because of its dynamic nature.
But the understanding the trend in the shift of coal fire zones and over all distribution
of coal fire will help in environmental and risk management related to coal mining
activities.
The coal mine fire map for the year 2017 (Figure 5 illustrates the overall fire
distribution in the area). The maps reveal that the coal fires are distributed across the
Jharia coal field in pockets associated with major open cast mining activities. All most
all the coal mine fires are restricted to the Barakar Formation where coal seams are
exposed. In the eastern flank of the arcuate shaped mining extent, the collieries in
Lodna and Tisra (North and South) is the highest fire affected mining blocks and
Bhowra, Bhulanbarari, Kujama and Jharia are also affected by multiple smaller fire
pockets. The fire in the areas is mostly manifested by high temperature fume cracks
with occasional presence of active flames especially the the Lodna-Tisra area.
Further, towards the north east, in Ena and Kusunda active fires are more prevalent
and the area is extensively affected. The highest radiant temperatures (in order of
~50°C) are recorded by the satellite sensors in these areas. In the north, a large
number of moderate to small fire pockets are seen in the areas around Shyambazar
(Figure 5 & 6). These are related to the mining areas of Katras, Gaslitand, Mudidih
and Kankanee. Mining activity, over the last few of years has exposed new, isolated
and discontinuous fires in these regions.
In the western flank, three distinguishable fire affected zones are seen. Toward
the western end of the mining area, the Benedih and Block II OCP are affected by
smaller fires from isolated coal seams. These again are surfacialy manifested in the
CHAPTER VII
NRSC/RSAA/GSG/BCCL/Project Report/JAN2018
21
form of fume cracks with smoke emanating from them. The Shatabdi OCP are also
affected but fire is manifested in the along vertical mining wall sections.
Comparison of the 2017 coal fire map with that of 2012 (NRSC, 2014)
indicated the dynamism in the spatial extent and distribution of the coal fires. The
changes are highlighted as follows:
i. In reference to the map generated in 2012, the 2017 map shows that the
emergence/re-emergence of fires in the eastern flank, namely Kujama, Tisra,
Lodna and Jharia etc. The entire zone has been affected by multiple fire
occurrences. The spatial disposition of fires in Bastacolla, Jharia and
Bhulanbarari appear to have a minor increase.
ii. The areal extent of major fire zone around Kusunda/Kenduadih and Ena appears
to remain the same, though here again the spatial location of the anomalies has
changed. This is probably due to the mitigation and active mining in this region.
iii. The fire zones in Benedih/Block II OCP and Shatabdi OCP have also
changed/diminished in areal extent with presence of isolated smaller anomalies.
There has been a considerable reduction in fire areas in and around the Shatabdi
OCP.
iv. The spatial disposition of fire areas around Katras, Gaslitand and Mudidih show
minor change. In 2012, a number of small fire pockets were seen, however
presently those fire pockets have given away to a few fire zones of moderate
disposition.
v. It needs to be noted that the 2012 study was carried out using ASTER data
whereas the present study is carried out using Landsat-8 data. Therefore, the
difference of sensor sensitivities will have a influence on the way the fires are
sensed on the ground. Difference of sensor sensitivities will influence the number
of fires identified as well as the areal extent of the fires in the data.
In summary, there is a change in the areal disposition of the fires from 2012 to 2017.
Observations suggest the emergence/re-emergence of new areas in the eastern flanks
in areas around Lodna and Tisra. Concurrently, there is a decrease in extent of fire
areas Shatabdi, Nadkhurkee area in the western flank from 2012 to 2017. A
quantitative comparison of the 2012 and 2017 data was carried out. As compared
NRSC/RSAA/GSG/BCCL/Project Report/JAN2018
22
2012, when the total fire affected extent of about 2.18 km2; in 2017 total fire affected
extent is about 3.28 km2. The colliery wise break-up of change in fire area from 2012
to 2017 is given in Annexure III.
7.1.2 Subsidence analysis
An attempt to identify subsidence zones in the Jharia Coalfield was also carried out
using ALOS-PALSAR-2 L band microwave data using differential interferometric
technique. 5 scenes of PALSAR-2 data spanning over a period of 2014 to 2017 were
used to delineate the subsidence if any in the region and separately identify them from
the terrain changes due to mining. Verification of the subsidence zones as seen from
data is difficult as it requires visible signatures of subsidence in the form of cracks on
the ground and damage to anthropogenic structures. In this study, data analysis and
consequent field verification resulted in identification is 5 prominent subsidence
areas. Of these, the major area where considerable ground subsidence is occurring is
the Moonidih UG project. Long term underground mining has resulted in continuous
subsidence in the area. Apart from this, the other four areas are south of Block II
OCP, Simlabahal and Bastacolla. No quantitative estimates of the subsidence has
been carried out in the study.
7.2 Conclusions
The following conclusions can be made:
1. As of the date of study in the year 2017 and in comparison with the previous study
done in 2012, there has been a change in areal extent and disposition of the fire
affected areas.
2. Compared to 2012, the eastern flanks (Lodna, Tisra areas) show considerable
increase in fire disposition and the western flank (Shatabdi and Block II area) show
diminished fire presence.
3. The major new fire areas are observed in the northern flank in the areas around
Lodna and Tisra etc. These areas were not mapped as fire in the 2012 study.
4. The mines in Kenduadih and Lodna remain to be the worst affected with maximum
presence of active fires.
5. There is a increase in areal extent of the fire (Figure 12) from 2012 to 2017.
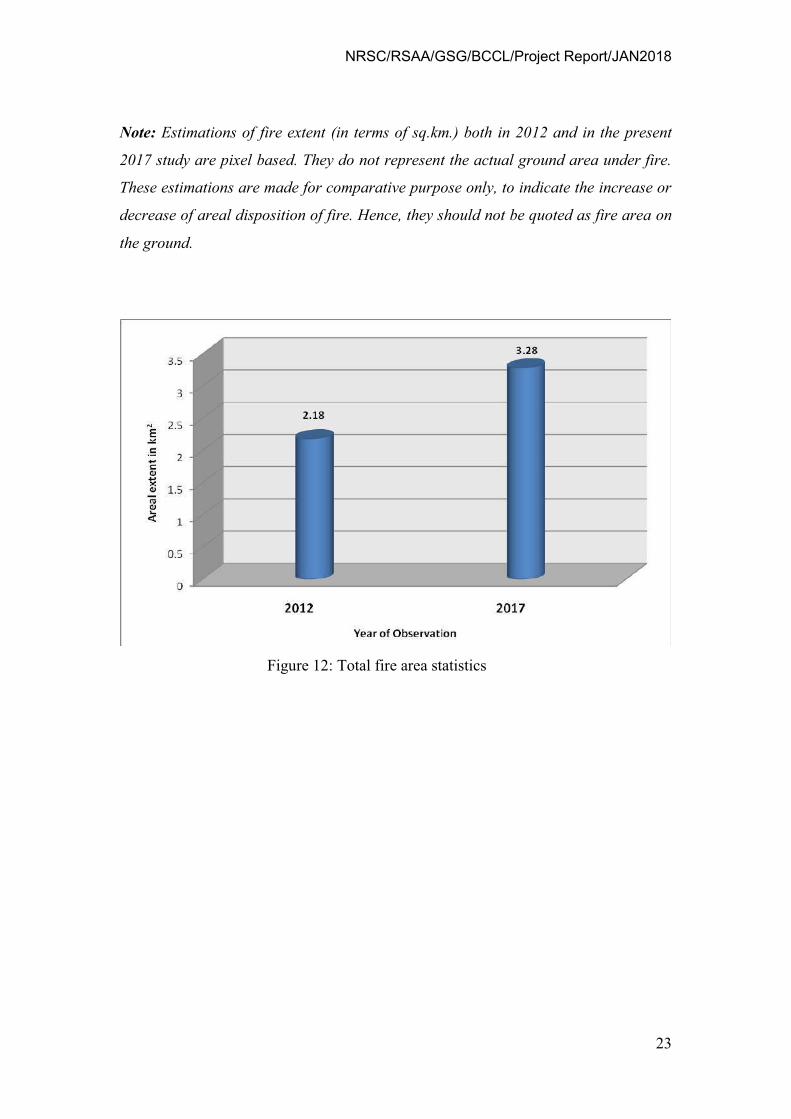
NRSC/RSAA/GSG/BCCL/Project Report/JAN2018
23
Note: Estimations of fire extent (in terms of sq.km.) both in 2012 and in the present
2017 study are pixel based. They do not represent the actual ground area under fire.
These estimations are made for comparative purpose only, to indicate the increase or
decrease of areal disposition of fire. Hence, they should not be quoted as fire area on
the ground.
Figure 12: Total fire area statistics
NRSC/RSAA/GSG/BCCL/Project Report/JAN2018
24
LIMITATIONS
Delineation and mapping of coal fire from thermal data of remote sensing platforms
carries with it some inherent limitations which needs to be understood in order to
decipher the results obtained from it. This will assist is deducing the correct
information and remove any ambiguity associated with the results. The key
limitations of the data and the results obtained are as follows:
1) An anomalous pixel from LANDSAT data represents an area of 30m x 30m
(resampled from spatial resolution of 100m) on the ground whose temperature is
considerably higher than its surroundings. This can be attributed to two
circumstances, namely the area has a very high intensity fire located within a smaller
pocket or there are a number of low intensity fires spread across it. In both the
mentioned cases the actual areal extent of the fire on the surface differs, but appears
as a single anomalous pixel in the data. Hence, representation of fire affected ground
area by means of pixel area is ambiguous and hence should be considered with
caution.
2) There are locations as observed during the fieldwork, where coal seams are
affected by active fires along vertical/semi-vertical sections of open cast mines (see
cover page). In such cases, the actual areal expression of the fire affected area as seen
by the sensor changes considerably and the representation from the same is not
accurate.
3) As discussed in section 4.2.1, thresholding the data to separate the fires from the
non fire areas, is a statistical technique. However, this method is dependent on how
the temperature of non-fire background area is distinctive from the fire temperature.
4) The background temperatures vary with the time of the day when the data is
collected, topography, and season of the year when the data is acquired. Night-time
data has lower background temperature as compared to day-time. Similarly a data
collected in October-November will have a considerably lower background
temperature than that collected in May-June due to seasonal temperature variations.
Hence, identification of the background temperature range becomes essential in
CHAPTER VIII
NRSC/RSAA/GSG/BCCL/Project Report/JAN2018
25
estimation of threshold temperature and the same varies depending upon the discussed
controlling factors.
5) Generally, a constant threshold temperature is estimated over the entire study area,
and the same is applied to delineate the fire areas from those of non-fire. However, it
is seen that the application of such global thresholding may mask fires which are in
turn seen in the field and that the threshold temperature value may vary locally. In the
current scenario, it is seen that the fire locations as verified in the fieldwork at
Bhulanbarari and Shatabdi were not identified in the data on application of a global
threshold of 39°C. However, a subset of the data within the Bulanbarari area only, is
analyzed with a lower threshold of 38.5°C, the fire pixels are manifested in the data.
Hence, the appropriateness of a singular thresholding temperature value may need to
be relooked upon. Future studies can be carried out using colliery wise statistical local
thresholding to create a composite coal fire map.
6) Due to the mitigation measures taking place in various mines, it is seen that in a
number of places the fire affected seam is excavated and dumped as overburden.
However, these overburden dumps retains the excavated burning coals and thus are
seen to have active fires occasionally. There lies a possibility that the same will be
identified as anomalous pixels and hence, although the fire is not a part of any active
coal seam, it will be included as a fire affected area in the final map.
7) Verification of the subsidence zones as detected from the interferometric technique
is sometimes difficult due to lack in observable signatures of subsidence such as
cracks on the ground and damage to anthropogenic structures.
Therefore, in quantitative estimation of fire affected areas and areas denoted as
subsidence, the above mentioned limitations needs to be taken into account diligently,
as it is inevitable that the area estimate will not define the actual fire/subsidence
affected area on the ground. However, the areal extent estimated from the data can be
"like to like" compared to earlier estimates of similar studies to understand the change
and dynamism of the fire in terms of area affected and spatial disposition.
NRSC/RSAA/GSG/BCCL/Project Report/JAN2018
26
References
1. Gangopadhyay, P.K., Lahiri-dutt, K., Saha, K. (2005): “Application of remote
Sensing to identify coal fires in the Raniganj coal belt, India.” Int. Jour of Applied
Earth Observation and Geoinformation.
2. Gangopadhyay, P.K., Malthuis.B, Van Dink (2005): “Aster Derived emissivity and
coal-fire related surface temperature anomaly a case study in Wuda, North China,”
Int. Jour. of Remote Sensing, vol-26, No.-24, pp-5555-5571.
3. Schmugge, T., French, Ritchie, J.C., Rango, A., Pelgrum, H. (2002): “Temperature
and emissivity separation from multispectral thermal infrared observation,” Remote
Sensing of Environment, 79, pp-189-198.
4. Saraf A.K., Prakash A., Sengupta, S., Gupta, R.P (1995): “Landsat-TM data for
estimating ground temperature and depth of sub-surface coal fire in the Jharia
coalfiled, India,” Int. Jour. Remote sensing vol-16, no-12, 2111-2124.
5. Gangopadhyay P.K., (2003): “Coalfire detection and monitoring in Wuda, North
China, A multispectral and multi-sensor approach:-Ph.D. Thesis, ITC Netherland.
6. Gupta, R.P. (2003): “Remote Sensing Geology”, Springer-Verlag.Third ed.pp-183-
216.
7. Kealey, P.S and Hook S.J( 1993): “Separating temperature and emissivity in thermal
infrared Multispectral Scanner Data: Implication for recovering land surface
temperatures”, IEE Transaction on Geoscience and Remote Sensing,vol,31,no-6,pp-
1155-1164
8. Zhang, J., Wagner, W., Prakash, A., Mehl,H. and Voigt,S.(2004): “Detecting coal
fires using remote sensing techniques,” Int. Jour. Remote sensing, vol-25, no-6,
pp3193-3220.
9. Bhattacharya, A. and Reddy, C.S.S. (1995): Inventory and monitoring of underground
and surface coal mine fire in Jharia coalfield, Bihar using thematic mapper thermal IR
data: Geosciences Group, Official report, NRSA.
10. Coal mine fire delineation and surface features mapping using satellite data in Jharia
coal field, Dhanbad, Jharkhand. Geology and Geophysics division. Official report,
NRSA, 2006
11. Coal mine fire delineation and surface features mapping using satellite data in Jharia
coal field, Dhanbad, Jharkhand. Geosciences Group. Official report, NRSC, 2014
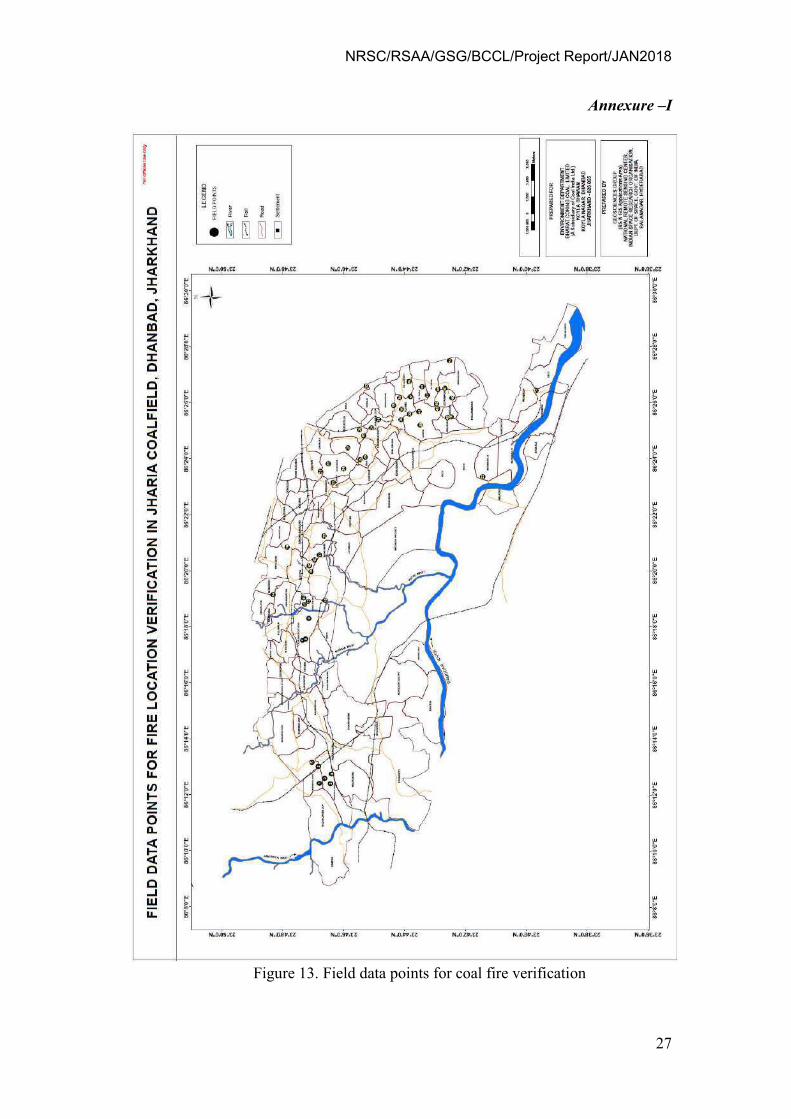
NRSC/RSAA/GSG/BCCL/Project Report/JAN2018
27
Annexure –I
Figure 13. Field data points for coal fire verification
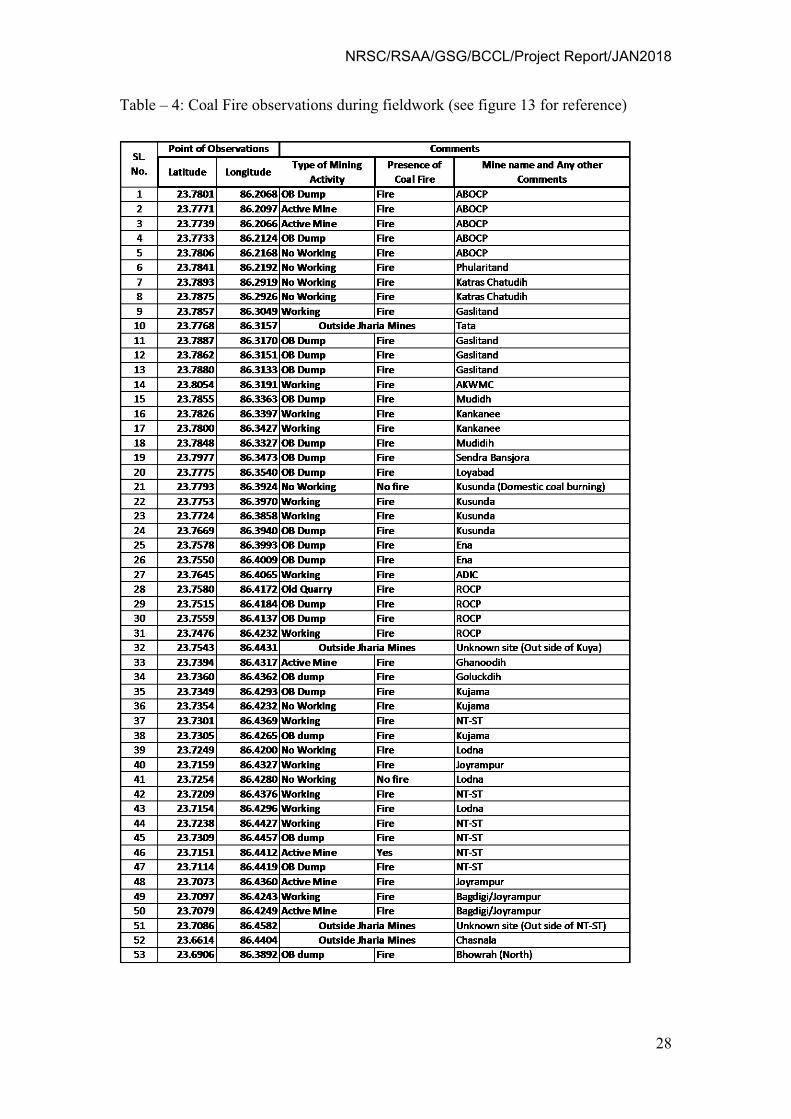
NRSC/RSAA/GSG/BCCL/Project Report/JAN2018
28
Table – 4: Coal Fire observations during fieldwork (see figure 13 for reference)
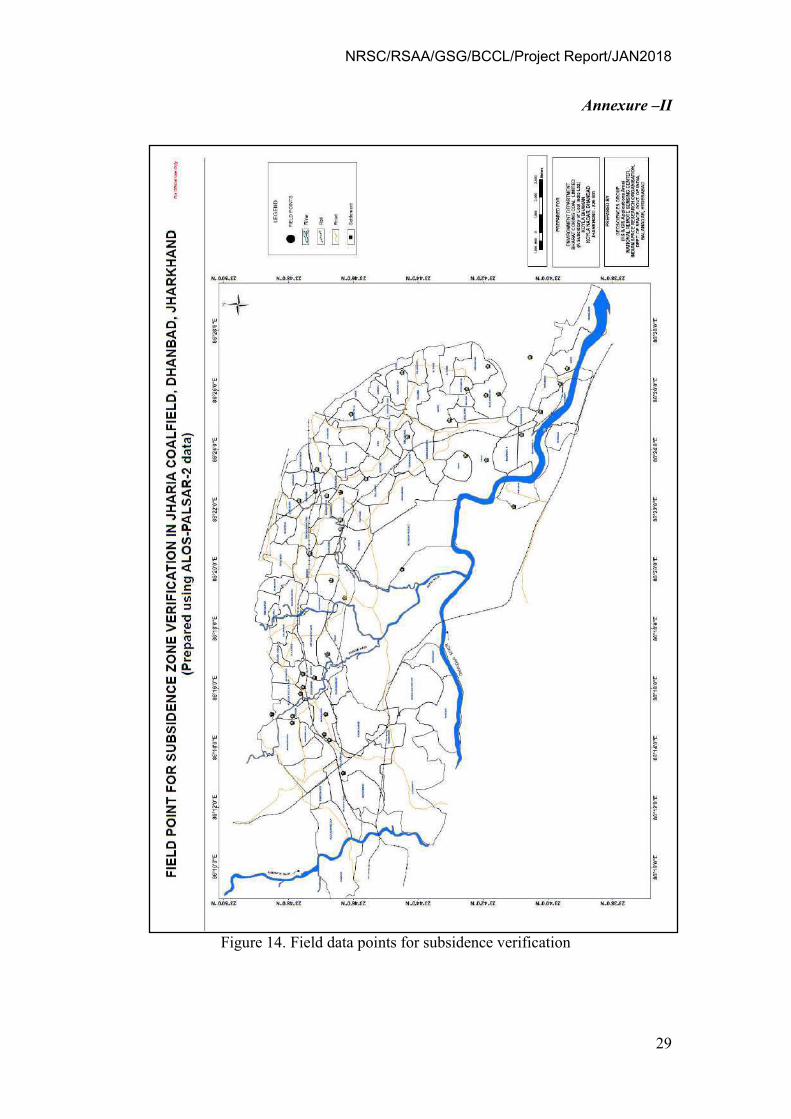
NRSC/RSAA/GSG/BCCL/Project Report/JAN2018
29
Annexure –II
Figure 14. Field data points for subsidence verification
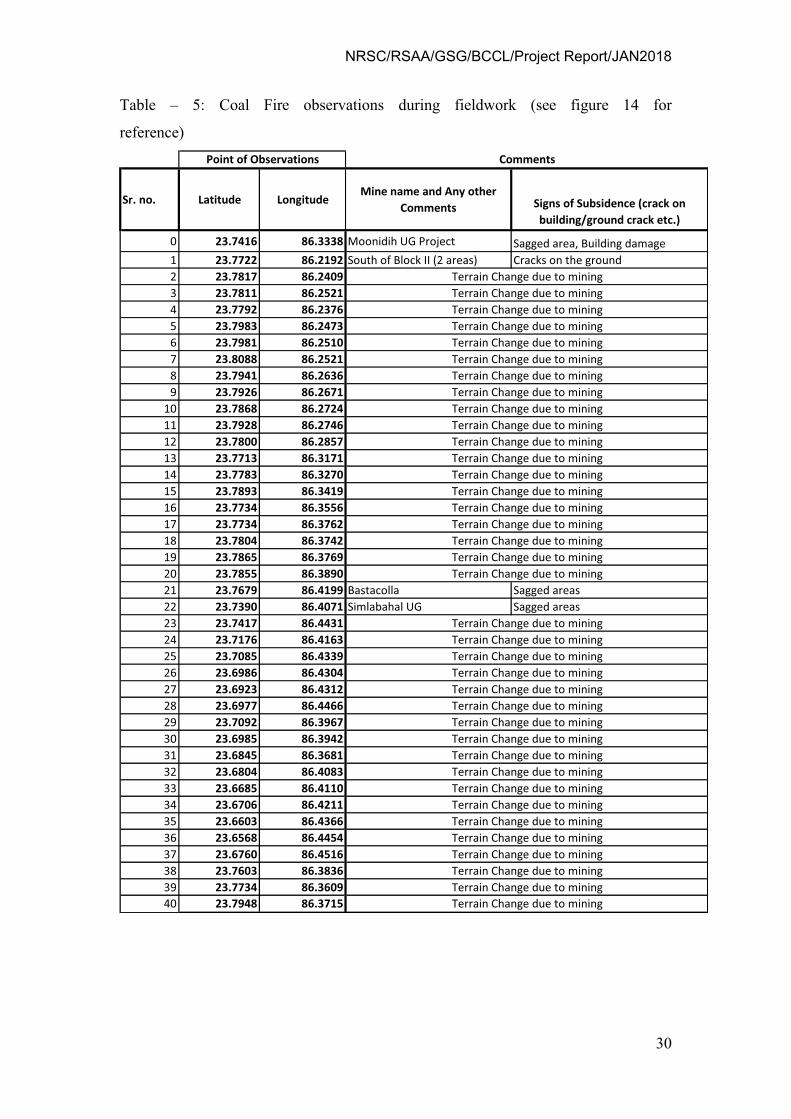
NRSC/RSAA/GSG/BCCL/Project Report/JAN2018
30
Table – 5: Coal Fire observations during fieldwork (see figure 14 for
reference)
Sr. no. Latitude LongitudeMine name and Any other
Comments Signs of Subsidence (crack on
building/ground crack etc.)
0 23.7416 86.3338 Moonidih UG Project Sagged area, Building damage
1 23.7722 86.2192 South of Block II (2 areas) Cracks on the ground
2 23.7817 86.2409
3 23.7811 86.2521
4 23.7792 86.2376
5 23.7983 86.2473
6 23.7981 86.2510
7 23.8088 86.2521
8 23.7941 86.2636
9 23.7926 86.2671
10 23.7868 86.2724
11 23.7928 86.2746
12 23.7800 86.2857
13 23.7713 86.3171
14 23.7783 86.3270
15 23.7893 86.3419
16 23.7734 86.3556
17 23.7734 86.3762
18 23.7804 86.3742
19 23.7865 86.3769
20 23.7855 86.3890
21 23.7679 86.4199 Bastacolla Sagged areas
22 23.7390 86.4071 Simlabahal UG Sagged areas
23 23.7417 86.4431
24 23.7176 86.4163
25 23.7085 86.4339
26 23.6986 86.4304
27 23.6923 86.4312
28 23.6977 86.4466
29 23.7092 86.3967
30 23.6985 86.3942
31 23.6845 86.3681
32 23.6804 86.4083
33 23.6685 86.4110
34 23.6706 86.4211
35 23.6603 86.4366
36 23.6568 86.4454
37 23.6760 86.4516
38 23.7603 86.3836
39 23.7734 86.3609
40 23.7948 86.3715
Terrain Change due to mining
Terrain Change due to mining
Terrain Change due to mining
Comments
Terrain Change due to mining
Terrain Change due to mining
Terrain Change due to mining
Terrain Change due to mining
Terrain Change due to mining
Terrain Change due to mining
Terrain Change due to mining
Terrain Change due to mining
Terrain Change due to mining
Terrain Change due to mining
Terrain Change due to mining
Terrain Change due to mining
Terrain Change due to mining
Terrain Change due to mining
Terrain Change due to mining
Terrain Change due to mining
Terrain Change due to mining
Terrain Change due to mining
Terrain Change due to mining
Terrain Change due to mining
Terrain Change due to mining
Terrain Change due to mining
Terrain Change due to mining
Terrain Change due to mining
Terrain Change due to mining
Terrain Change due to mining
Terrain Change due to mining
Terrain Change due to mining
Terrain Change due to mining
Terrain Change due to mining
Terrain Change due to mining
Point of Observations
Terrain Change due to mining
Terrain Change due to mining
Terrain Change due to mining
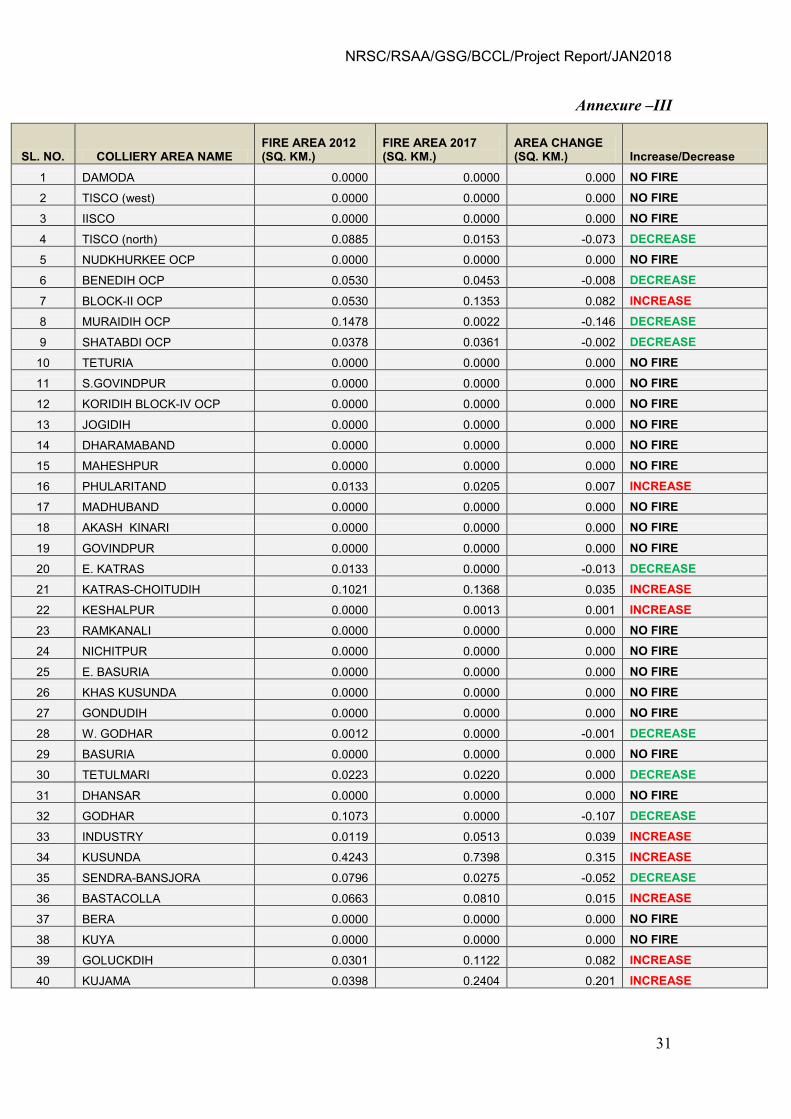
NRSC/RSAA/GSG/BCCL/Project Report/JAN2018
31
Annexure –III
SL. NO. COLLIERY AREA NAME FIRE AREA 2012 (SQ. KM.)
FIRE AREA 2017 (SQ. KM.)
AREA CHANGE (SQ. KM.) Increase/Decrease
1 DAMODA 0.0000 0.0000 0.000 NO FIRE
2 TISCO (west) 0.0000 0.0000 0.000 NO FIRE
3 IISCO 0.0000 0.0000 0.000 NO FIRE
4 TISCO (north) 0.0885 0.0153 -0.073 DECREASE
5 NUDKHURKEE OCP 0.0000 0.0000 0.000 NO FIRE
6 BENEDIH OCP 0.0530 0.0453 -0.008 DECREASE
7 BLOCK-II OCP 0.0530 0.1353 0.082 INCREASE
8 MURAIDIH OCP 0.1478 0.0022 -0.146 DECREASE
9 SHATABDI OCP 0.0378 0.0361 -0.002 DECREASE
10 TETURIA 0.0000 0.0000 0.000 NO FIRE
11 S.GOVINDPUR 0.0000 0.0000 0.000 NO FIRE
12 KORIDIH BLOCK-IV OCP 0.0000 0.0000 0.000 NO FIRE
13 JOGIDIH 0.0000 0.0000 0.000 NO FIRE
14 DHARAMABAND 0.0000 0.0000 0.000 NO FIRE
15 MAHESHPUR 0.0000 0.0000 0.000 NO FIRE
16 PHULARITAND 0.0133 0.0205 0.007 INCREASE
17 MADHUBAND 0.0000 0.0000 0.000 NO FIRE
18 AKASH KINARI 0.0000 0.0000 0.000 NO FIRE
19 GOVINDPUR 0.0000 0.0000 0.000 NO FIRE
20 E. KATRAS 0.0133 0.0000 -0.013 DECREASE
21 KATRAS-CHOITUDIH 0.1021 0.1368 0.035 INCREASE
22 KESHALPUR 0.0000 0.0013 0.001 INCREASE
23 RAMKANALI 0.0000 0.0000 0.000 NO FIRE
24 NICHITPUR 0.0000 0.0000 0.000 NO FIRE
25 E. BASURIA 0.0000 0.0000 0.000 NO FIRE
26 KHAS KUSUNDA 0.0000 0.0000 0.000 NO FIRE
27 GONDUDIH 0.0000 0.0000 0.000 NO FIRE
28 W. GODHAR 0.0012 0.0000 -0.001 DECREASE
29 BASURIA 0.0000 0.0000 0.000 NO FIRE
30 TETULMARI 0.0223 0.0220 0.000 DECREASE
31 DHANSAR 0.0000 0.0000 0.000 NO FIRE
32 GODHAR 0.1073 0.0000 -0.107 DECREASE
33 INDUSTRY 0.0119 0.0513 0.039 INCREASE
34 KUSUNDA 0.4243 0.7398 0.315 INCREASE
35 SENDRA-BANSJORA 0.0796 0.0275 -0.052 DECREASE
36 BASTACOLLA 0.0663 0.0810 0.015 INCREASE
37 BERA 0.0000 0.0000 0.000 NO FIRE
38 KUYA 0.0000 0.0000 0.000 NO FIRE
39 GOLUCKDIH 0.0301 0.1122 0.082 INCREASE
40 KUJAMA 0.0398 0.2404 0.201 INCREASE
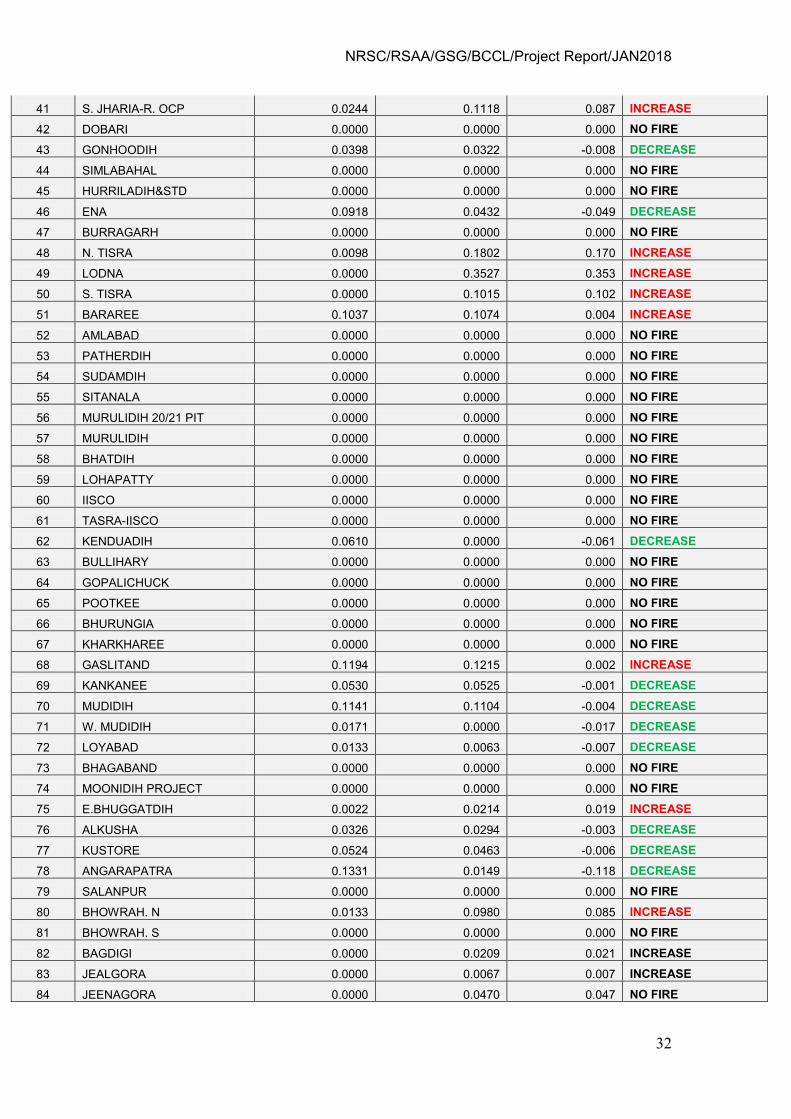
NRSC/RSAA/GSG/BCCL/Project Report/JAN2018
32
41 S. JHARIA-R. OCP 0.0244 0.1118 0.087 INCREASE
42 DOBARI 0.0000 0.0000 0.000 NO FIRE
43 GONHOODIH 0.0398 0.0322 -0.008 DECREASE
44 SIMLABAHAL 0.0000 0.0000 0.000 NO FIRE
45 HURRILADIH&STD 0.0000 0.0000 0.000 NO FIRE
46 ENA 0.0918 0.0432 -0.049 DECREASE
47 BURRAGARH 0.0000 0.0000 0.000 NO FIRE
48 N. TISRA 0.0098 0.1802 0.170 INCREASE
49 LODNA 0.0000 0.3527 0.353 INCREASE
50 S. TISRA 0.0000 0.1015 0.102 INCREASE
51 BARAREE 0.1037 0.1074 0.004 INCREASE
52 AMLABAD 0.0000 0.0000 0.000 NO FIRE
53 PATHERDIH 0.0000 0.0000 0.000 NO FIRE
54 SUDAMDIH 0.0000 0.0000 0.000 NO FIRE
55 SITANALA 0.0000 0.0000 0.000 NO FIRE
56 MURULIDIH 20/21 PIT 0.0000 0.0000 0.000 NO FIRE
57 MURULIDIH 0.0000 0.0000 0.000 NO FIRE
58 BHATDIH 0.0000 0.0000 0.000 NO FIRE
59 LOHAPATTY 0.0000 0.0000 0.000 NO FIRE
60 IISCO 0.0000 0.0000 0.000 NO FIRE
61 TASRA-IISCO 0.0000 0.0000 0.000 NO FIRE
62 KENDUADIH 0.0610 0.0000 -0.061 DECREASE
63 BULLIHARY 0.0000 0.0000 0.000 NO FIRE
64 GOPALICHUCK 0.0000 0.0000 0.000 NO FIRE
65 POOTKEE 0.0000 0.0000 0.000 NO FIRE
66 BHURUNGIA 0.0000 0.0000 0.000 NO FIRE
67 KHARKHAREE 0.0000 0.0000 0.000 NO FIRE
68 GASLITAND 0.1194 0.1215 0.002 INCREASE
69 KANKANEE 0.0530 0.0525 -0.001 DECREASE
70 MUDIDIH 0.1141 0.1104 -0.004 DECREASE
71 W. MUDIDIH 0.0171 0.0000 -0.017 DECREASE
72 LOYABAD 0.0133 0.0063 -0.007 DECREASE
73 BHAGABAND 0.0000 0.0000 0.000 NO FIRE
74 MOONIDIH PROJECT 0.0000 0.0000 0.000 NO FIRE
75 E.BHUGGATDIH 0.0022 0.0214 0.019 INCREASE
76 ALKUSHA 0.0326 0.0294 -0.003 DECREASE
77 KUSTORE 0.0524 0.0463 -0.006 DECREASE
78 ANGARAPATRA 0.1331 0.0149 -0.118 DECREASE
79 SALANPUR 0.0000 0.0000 0.000 NO FIRE
80 BHOWRAH. N 0.0133 0.0980 0.085 INCREASE
81 BHOWRAH. S 0.0000 0.0000 0.000 NO FIRE
82 BAGDIGI 0.0000 0.0209 0.021 INCREASE
83 JEALGORA 0.0000 0.0067 0.007 INCREASE
84 JEENAGORA 0.0000 0.0470 0.047 NO FIRE
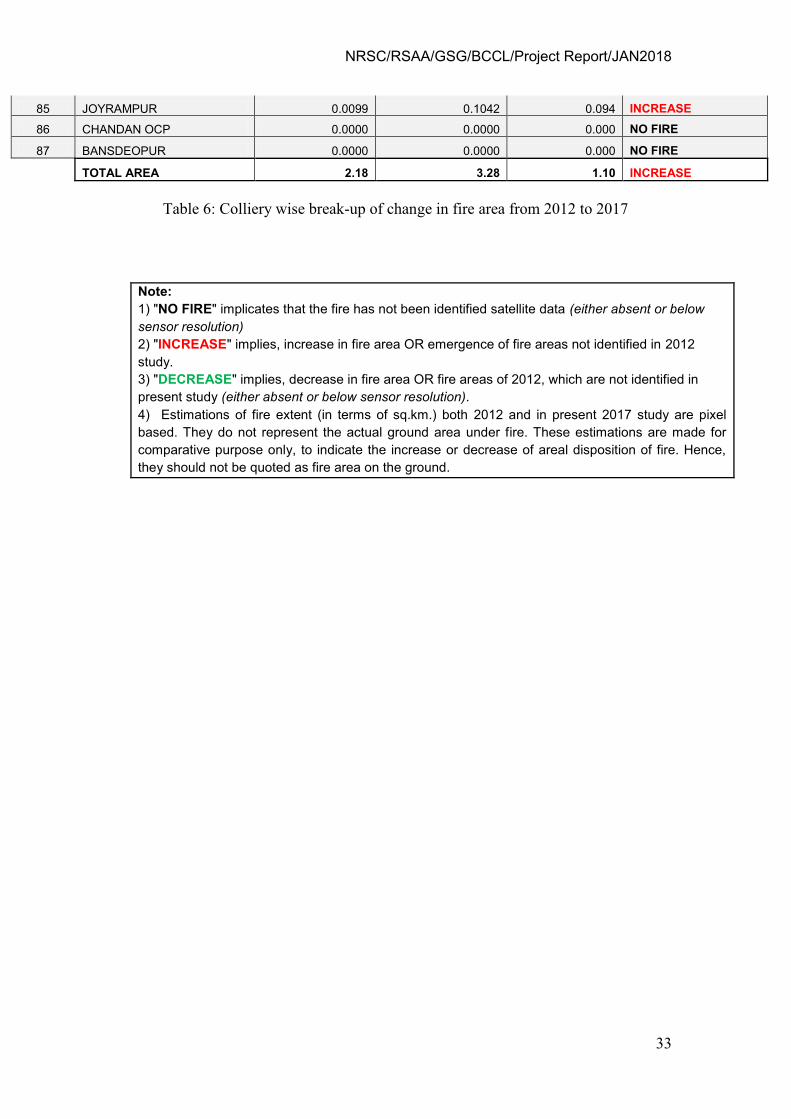
NRSC/RSAA/GSG/BCCL/Project Report/JAN2018
33
85 JOYRAMPUR 0.0099 0.1042 0.094 INCREASE
86 CHANDAN OCP 0.0000 0.0000 0.000 NO FIRE
87 BANSDEOPUR 0.0000 0.0000 0.000 NO FIRE
TOTAL AREA 2.18 3.28 1.10 INCREASE
Table 6: Colliery wise break-up of change in fire area from 2012 to 2017
Note:
1) "NO FIRE" implicates that the fire has not been identified satellite data (either absent or below
sensor resolution)
2) "INCREASE" implies, increase in fire area OR emergence of fire areas not identified in 2012
study.
3) "DECREASE" implies, decrease in fire area OR fire areas of 2012, which are not identified in
present study (either absent or below sensor resolution).
4) Estimations of fire extent (in terms of sq.km.) both 2012 and in present 2017 study are pixel
based. They do not represent the actual ground area under fire. These estimations are made for
comparative purpose only, to indicate the increase or decrease of areal disposition of fire. Hence,
they should not be quoted as fire area on the ground.
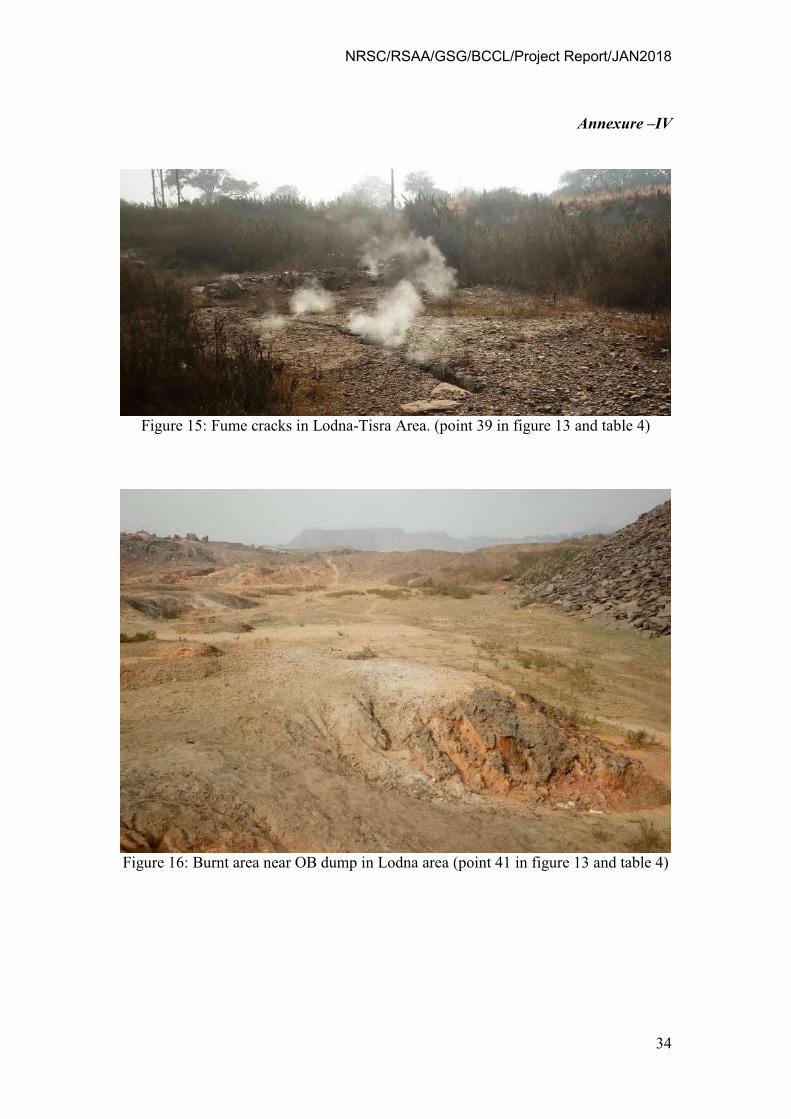
NRSC/RSAA/GSG/BCCL/Project Report/JAN2018
34
Annexure –IV
Figure 15: Fume cracks in Lodna-Tisra Area. (point 39 in figure 13 and table 4)
Figure 16: Burnt area near OB dump in Lodna area (point 41 in figure 13 and table 4)
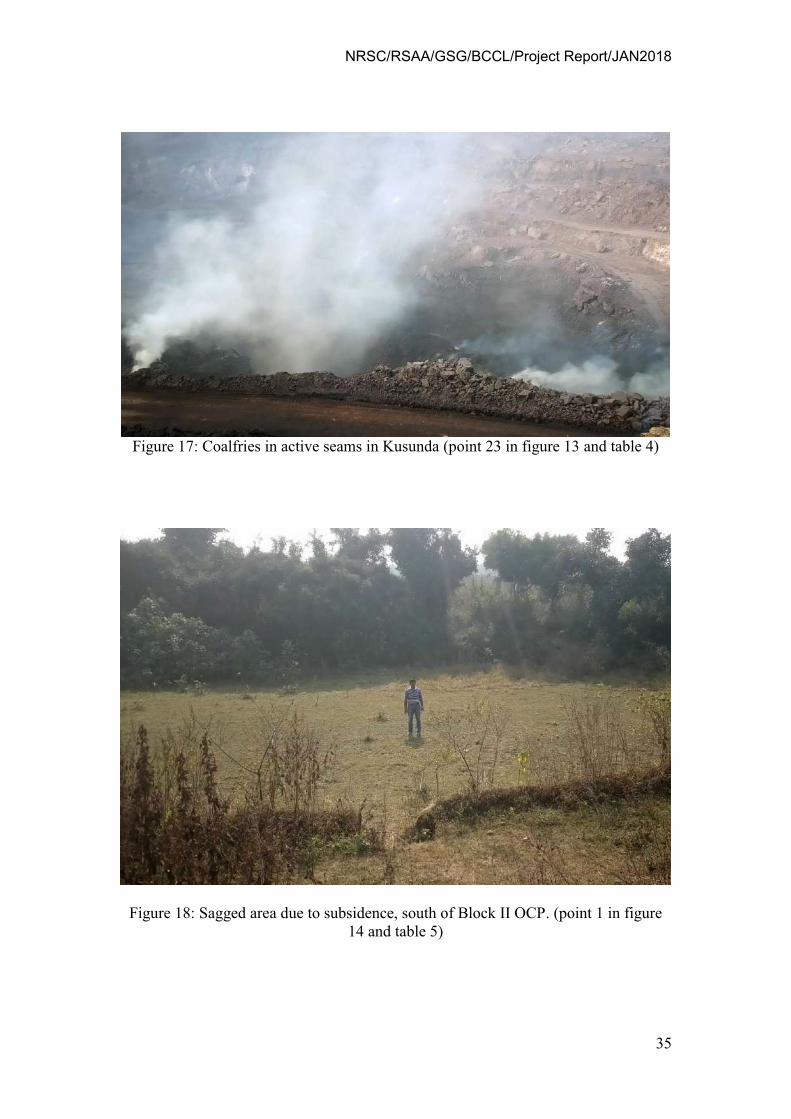
NRSC/RSAA/GSG/BCCL/Project Report/JAN2018
35
Figure 17: Coalfries in active seams in Kusunda (point 23 in figure 13 and table 4)
Figure 18: Sagged area due to subsidence, south of Block II OCP. (point 1 in figure
14 and table 5)
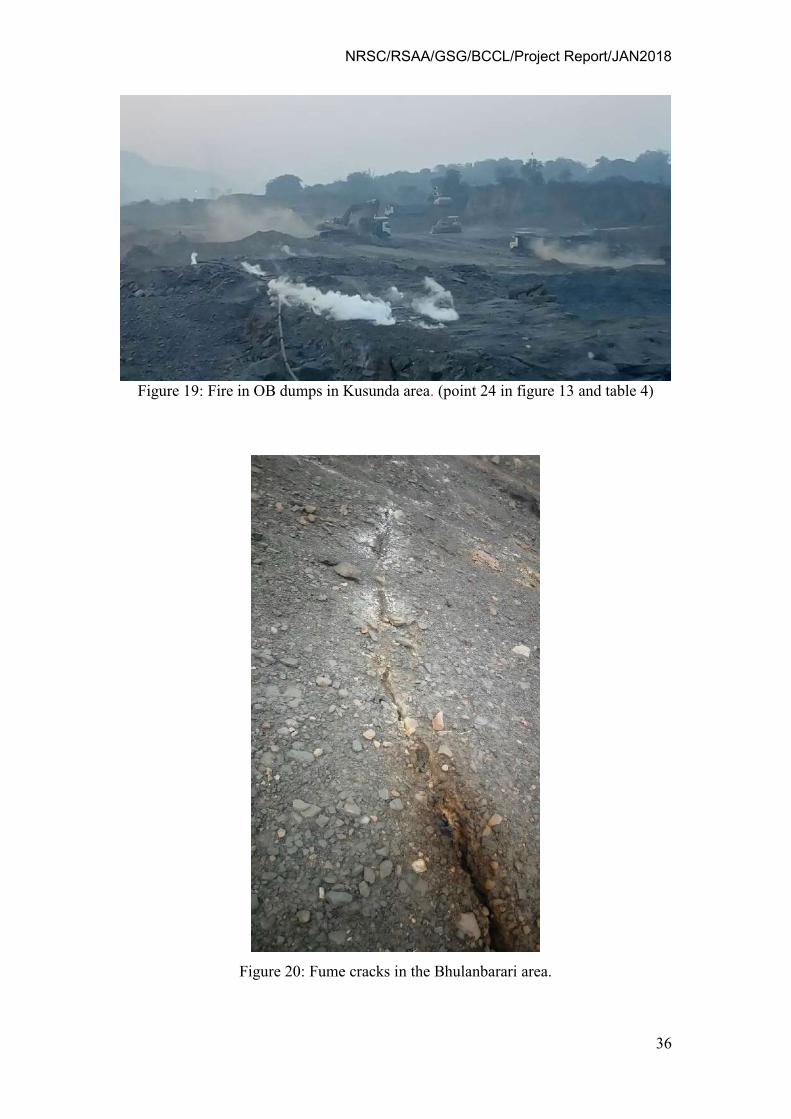
NRSC/RSAA/GSG/BCCL/Project Report/JAN2018
36
Figure 19: Fire in OB dumps in Kusunda area. (point 24 in figure 13 and table 4)
Figure 20: Fume cracks in the Bhulanbarari area.
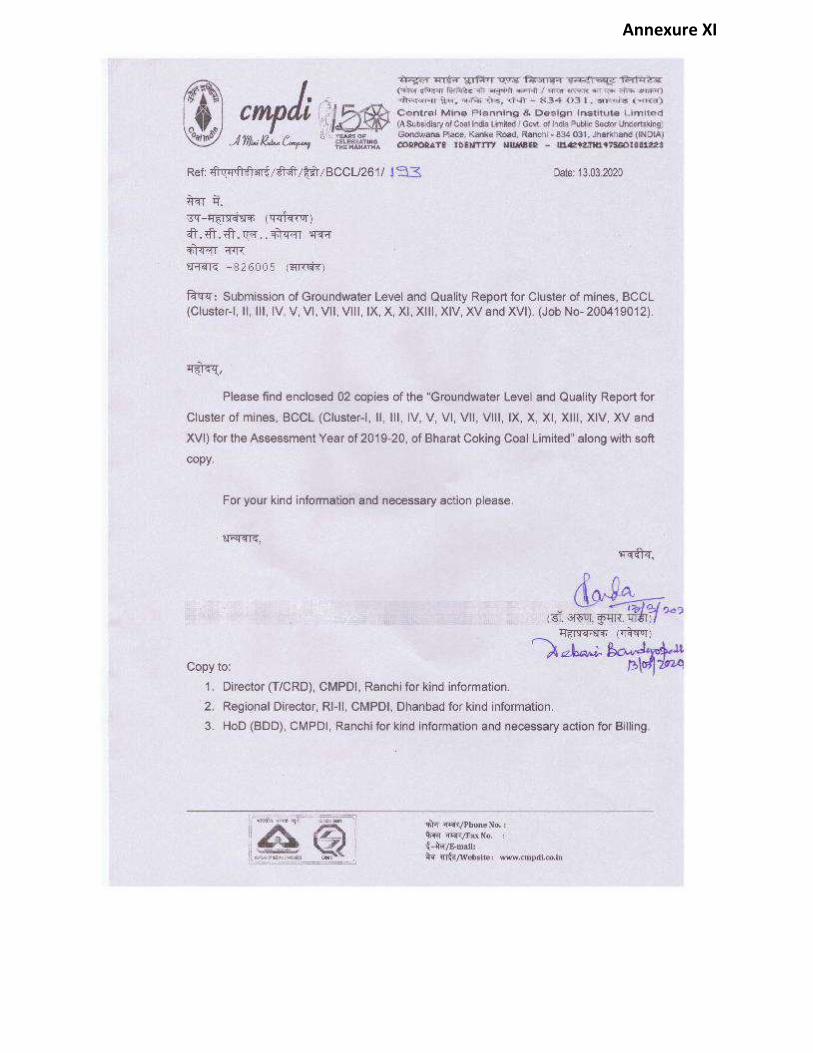
Annexure XI
GROUNDWATER LEVEL & QUALITY REPORT
FOR CLUSTER OF MINES, BCCL
(Assessment year – 2019-20)
[CLUSTER – I, II, III, IV, V, VI, VII, VIII, IX, X, XI, XIII, XIV, XV & XVI of Mines, BCCL]
JHARIA COALFIELD AND RANIGANJ COALFIELD (PART)
For
(BHARAT COKING COAL LIMITED) (A Subsidiary of Coal India Limited)
KOYLA BHAWAN (DHANBAD)
Prepared by
Hydrogeology Department
Exploration Division
CMPDI (HQ), Ranchi
MARCH – 2020
Job no-200419012
STRICTLY RESTRICTED FOR COMPANY USE ONLY
RESTRICTED
The information given in this report is not to be
communicated either directly or indirectly to the press or to any person not holding an official
position in the CIL/
GROUNDWATER LEVEL & QUALITY REPORT
FOR CLUSTER OF MINES, BCCL
(Assessment year – 2019-20)
[CLUSTER – I, II, III, IV, V, VI, VII, VIII, IX, X, XI, XIII, XIV, XV & XVI of Mines, BCCL]
JHARIA COALFIELD AND RANIGANJ COALFIELD (PART)
For
(BHARAT COKING COAL LIMITED) (A Subsidiary of Coal India Limited)
KOYLA BHAWAN (DHANBAD)
Prepared by
Hydrogeology Department
Exploration Division
CMPDI (HQ), Ranchi
MARCH – 2020
PERSONNEL ASSOCIATED
FIELD EXERTION
Debasis Bandyopadhyay Manager (Geology)
HYDROGEOLOGICAL DOCUMENTATION
Debasis Bandyopadhyay Manager (Geology)
OVERALL GUIDANCE
Dr. A.K. Panda General Manager (Exploration)
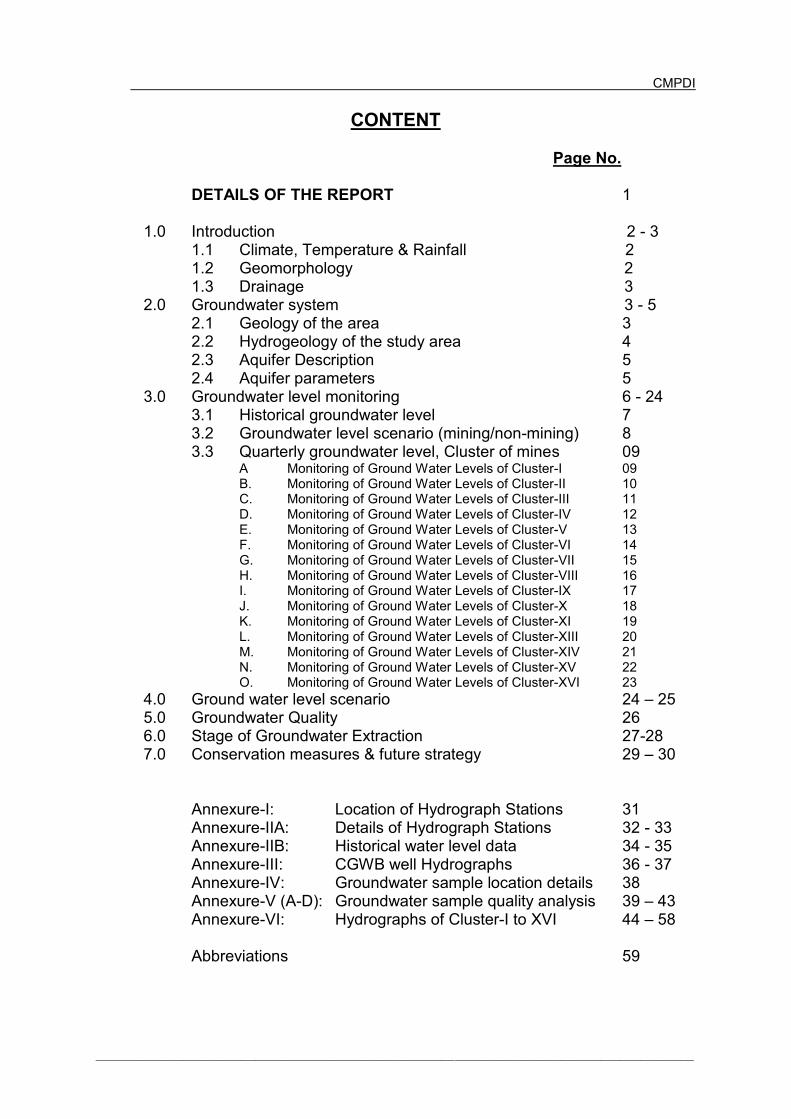
CMPDI
__________________________________________________________________________________________
CONTENT
Page No.
DETAILS OF THE REPORT 1
1.0 Introduction 2 - 3 1.1 Climate, Temperature & Rainfall 2 1.2 Geomorphology 2 1.3 Drainage 3
2.0 Groundwater system 3 - 5 2.1 Geology of the area 3 2.2 Hydrogeology of the study area 4 2.3 Aquifer Description 5 2.4 Aquifer parameters 5 3.0 Groundwater level monitoring 6 - 24 3.1 Historical groundwater level 7 3.2 Groundwater level scenario (mining/non-mining) 8 3.3 Quarterly groundwater level, Cluster of mines 09 A Monitoring of Ground Water Levels of Cluster-I 09 B. Monitoring of Ground Water Levels of Cluster-II 10 C. Monitoring of Ground Water Levels of Cluster-III 11 D. Monitoring of Ground Water Levels of Cluster-IV 12 E. Monitoring of Ground Water Levels of Cluster-V 13 F. Monitoring of Ground Water Levels of Cluster-VI 14 G. Monitoring of Ground Water Levels of Cluster-VII 15 H. Monitoring of Ground Water Levels of Cluster-VIII 16 I. Monitoring of Ground Water Levels of Cluster-IX 17 J. Monitoring of Ground Water Levels of Cluster-X 18 K. Monitoring of Ground Water Levels of Cluster-XI 19 L. Monitoring of Ground Water Levels of Cluster-XIII 20 M. Monitoring of Ground Water Levels of Cluster-XIV 21 N. Monitoring of Ground Water Levels of Cluster-XV 22 O. Monitoring of Ground Water Levels of Cluster-XVI 23
4.0 Ground water level scenario 24 – 25 5.0 Groundwater Quality 26 6.0 Stage of Groundwater Extraction 27-28 7.0 Conservation measures & future strategy 29 – 30
Annexure-I: Location of Hydrograph Stations 31 Annexure-IIA: Details of Hydrograph Stations 32 - 33 Annexure-IIB: Historical water level data 34 - 35 Annexure-III: CGWB well Hydrographs 36 - 37 Annexure-IV: Groundwater sample location details 38 Annexure-V (A-D): Groundwater sample quality analysis 39 – 43 Annexure-VI: Hydrographs of Cluster-I to XVI 44 – 58 Abbreviations 59
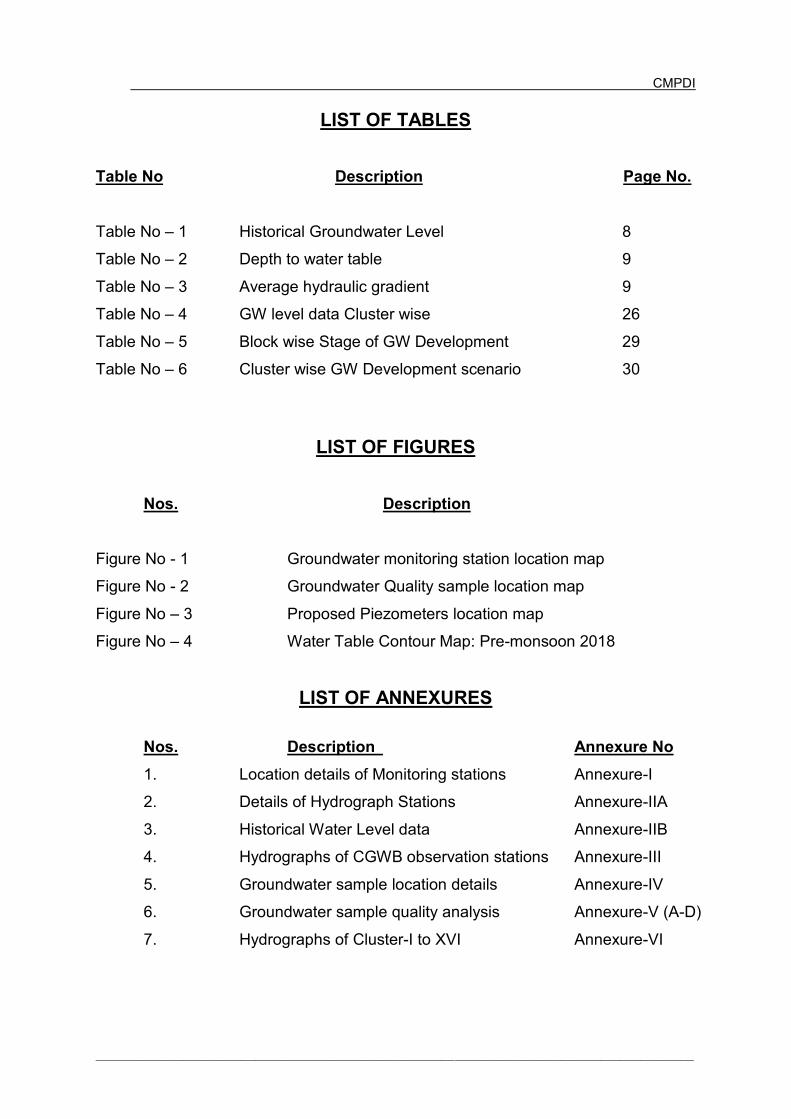
CMPDI
__________________________________________________________________________________________
LIST OF TABLES Table No Description Page No. Table No – 1 Historical Groundwater Level 8
Table No – 2 Depth to water table 9
Table No – 3 Average hydraulic gradient 9
Table No – 4 GW level data Cluster wise 26
Table No – 5 Block wise Stage of GW Development 29
Table No – 6 Cluster wise GW Development scenario 30
LIST OF FIGURES
Nos. Description
Figure No - 1 Groundwater monitoring station location map
Figure No - 2 Groundwater Quality sample location map
Figure No – 3 Proposed Piezometers location map
Figure No – 4 Water Table Contour Map: Pre-monsoon 2018
LIST OF ANNEXURES
Nos. Description Annexure No
1. Location details of Monitoring stations Annexure-I
2. Details of Hydrograph Stations Annexure-IIA
3. Historical Water Level data Annexure-IIB
4. Hydrographs of CGWB observation stations Annexure-III
5. Groundwater sample location details Annexure-IV
6. Groundwater sample quality analysis Annexure-V (A-D)
7. Hydrographs of Cluster-I to XVI Annexure-VI
CMPDI
________________________________________________________________________
________________________________________________________________________ JOB NO – 200419012 1
DETAILS OF THE REPORT
Sl No.
ITEMS INFORMATIONS
1 Geographical Area Jharia Coalfield (JCF): 453 sq. km. Raniganj Coalfield (RCF part): 19.64 sq. km. (Cluster-XVI area only)
2 Major Physiographic Units
Dissected Pediplain with surface Reduced Level (RL) varies from 160 m to 220 m above mean sea level (AMSL) in JCF and 100 m to 140 m AMSL in RCF.
3 Drainage System Damodar River is the master drainage flowing along western boundary of the JCF. Jamunia River, Khudia River, Katri River, Jarian Nala, Ekra Jore, Kari Jore, Kashi Jore, Chatkari Jore and their tributaries are flowing through the JCF area. Damodar River, Barakar River is the master drainage of the part of RCF area (CV Area).
4 Annual Rainfall Jharkhand State – 1264.0 mm Dhanbad District - 1271.60 mm (Source: Rainfall Statistics of India-2018, IMD, Ministry of Earth Sciences) Normal Rainfall – 1296.30 mm Dhansar Mine Rescue Station – 1315 mm (2018)
5 Geological Formations Gondwana Formation (Talchir Formation, Barakar Formation, Barren Measure & Raniganj Formation)
6 Aquifer System Top Unconfined/Phreatic Aquifer – average thickness 25 m Semi-confined to confined Aquifer – average thickness 50–200 m
7 Hydrogeological properties
Unconfined Aquifer (Damoda BJ Section & Block-III): Hydraulic Conductivity – upto 0.50 m/day Transmissivity – 10 - 42 m2/day Semi-confined to confined Aquifer (Sitanala & Kumari Block): Hydraulic Conductivity – 0.0006-1.44 & 0.05-0.0027 m/day Transmissivity – 0.06 – 0.573 m2/day
8 Groundwater Level Monitoring Network
Out of total 254 no of monitoring stations 63 nos located within core mining area and rest comes within Buffers zone. 60 Nos. of Groundwater monitoring well (Dug Wells) network is established by CMPDI to record groundwater level data in and around the Core Zone of JCF and 3 Nos. of Groundwater monitoring well (Dug Wells) in RCF (CV Area).
9 Groundwater Levels Below Ground Level (bgl)
JCF area: Pre-monsoon – 0.95 to 15.88 m (Avg. 5.46 m bgl) in ‘2019 Post-monsoon – 0.45 to 05.95 m (Avg. 2.34 m bgl) in ‘2019 RCF area (part): Pre-monsoon – 1.60 to 9.35 m (Avg. 5.29 m bgl) in ‘2019 Post-monsoon – 0.80 to 3.88 m (Avg. 2.10 m bgl) in ‘2019
10 Groundwater Quality Potable (Annexure- IV)
11 Proposed Piezometers
New piezometers (23 nos.) have been proposed to monitor impact of coal mining on groundwater regime within the coalfield area (JCF & part of RCF) for maximum depth upto 290 m to monitor deeper aquifers.
12 Stage of Groundwater Development (CGWB)
Dhanbad District-76.30% (GWRE-2017)
CMPDI
________________________________________________________________________
________________________________________________________________________ JOB NO – 200419012 2
1.0 INTRODUCTION
1.1 CLIMATE, TEMPERATURE & RAINFALL
The Jharia Coalfield (JCF) and part of Raniganj Coalfield (RCF) area in Dhanbad
District belongs to sub-humid tropical climatic region. The maximum temperature
during summer shoots upto 45o C and falls between 10o C to 5o C in winter. The
maximum rainfall occurs during the period between June and September.
The annual rainfall in the Dhanbad District is 1240.70 mm (Rainfall Statistics of India-
2017, IMD (Ministry of Earth Sciences), has been considered. The non-monsoon
rainfall in the District is 259.50 mm (Winter-9.50 mm, Pre-monsoon-73.80 mm and
Post-monsoon-176.20 mm) and the monsoon rainfall is 981.30 mm of total annual
rainfall. Monsoon Rainfall is around 80% of total annual rainfall in 2017 in Dhanbad
District. Rainfall is the primary source of groundwater recharge. The normal rainfall
of Jharkhand is 1296.30 mm (2015) as documented in MOSPI, Govt. of India.
1.2 GEOMORPHOLOGY
Northern part of the JCF area is covered with hills and thin forest. In general, the
altitude varies from 220 m AMSL in Barora area (Cluster-I) to 160 m above mean
sea level (AMSL) in Sudamdih area (Cluster-X). Pediplains are developed over
sedimentary rocks or Gondwana formation consisting of Sandstone, Shale, coal, etc.
Dissected pediplains are developed over Gondwana formations found in Jharia,
Baghmara, Katras areas etc. However, in RCF (part) areas the altitude varies from
100 m to 140 m AMSL (Cluster-XVI). The general slope of the topography is towards
south, i.e. Damodar River.
CMPDI
________________________________________________________________________
________________________________________________________________________ JOB NO – 200419012 3
1.3 DRAINAGE
The drainage pattern of the area is dendritic in nature. The drainage system of the
area is the part of Damodar sub-basin. All the rivers that originate or flow through the
coalfield area have an easterly or south easterly course and ultimately joins
Damodar River, the master drainage. The drainage of the JCF is mainly controlled
by Jamuniya River (5th order), Khudia nala (3rd order), Katri River (4th) and Chatkari
nala (3rd order) flowing from north to south and joins Damodar River. Whereas,
Barakar River and Khudia River are controlling the drainage pattern of RCF (part)
and joins Damodar River in the south. Damodar River is the main drainage channel
and flows from west to east along the southern boundary of JCF and RCF.
The drainage map of the JCF and part of RCF has been prepared on topographic
map of scale 1:50,000 (Figure No-1). The watershed of all tributary rivers (Jamuniya
River to Barakar River) falls within the north-western part of Damodar sub-basin
which comes under Lower Ganga Basin.
Besides, a large number of ponds/tanks are distributed in and around JCF, out of
which one prominent lake is located at Topchanchi in the north-west part. Two
reservoirs, Maithon dam in Barakar River and Panchet dam in Damodar River near
to Chanch Victoria Area of BCCL (part of RCF) are the main source of water supply
to the nearby area. Jharia Water Board, Damodar Water Supply Scheme and
Mineral Area Development Authority (MADA) are supplying water.
2.0 GROUNDWATER SYSTEM
2.1 GEOLOGY OF THE AREA
The Jharia Coalfield covers an area of 453 sq. km. located in Dhanbad District,
Jharkhand. The non-coal bearing Talchir Formation is exposed in patches along the
northern fringe of the Coalfield. The Barakar Formation which overlies the Talchir is
covering the most part of the Jharia Coalfield and having an area of 218 sq. km. This
is successively overlain by the non-coal bearing Barren Formation which is mainly
exposed in the central part of the Coalfield. This, in turn, is overlain by the Raniganj
formation (Coal Bearing horizon) in the south-western part of the Coalfield and
covers an area of 54 sq. km.
CMPDI
________________________________________________________________________
________________________________________________________________________ JOB NO – 200419012 4
Chanch-Victoria Area which is located in the western part of Raniganj Coalfield. The
Raniganj coalfield represents the eastern most coal basin in the Damodar Valley
Region and located in Burdwan District, West Bengal. The Coalfield is almost
elliptical in shape and covers an area of about 1530 sq. km. out of which only 35 sq.
km. comes under leasehold area of BCCL out of which 19.64 sq. km is the study
area (Cluster-XVI only). The coal bearing formations of the area belongs to Barakar
Formation of the Lower Gondwana.
2.2 HYDROGEOLOGY OF THE STUDY AREA
The permeable formations mainly composed of sandstone behave as aquifer units.
The coal seam and shales developed in the area act as impermeable beds i.e.
aquiclude. The aquifer materials of Gondwana Formation are constituted of fine to
coarse grained sandstone having primary porosity of intergranular void space. The
secondary porosity formed due to presence of faults, fracture, joints, etc. Sandstone
of Gondwana formations in JCF and RCF are very hard, compact and cemented
sandstone and forming less potential aquifer, particularly the deeper aquifer system.
The secondary porosity along with primary porosity forms a conduit system making
these formations good aquifers for movement and storage of ground water.
2.3 AQUIFER DISPOSITION
The aquifer system for shallow and deeper aquifer has been established through
hydrogeological studies, exploration, surface and subsurface geophysical studies in
the JCF and RCF (part) covering all geological formations. The aquifer can be
divided into two zones – Un-confined/Phreatic (shallow) and Semi-confined to
confined (deeper) aquifer.
PHREATIC/UN-CONFINED AQUIFER
The top aquifer occurred above the top most coal seam/shale bed is called un-
confined or water table aquifer and it consists of relatively permeable formation such
as weathered sandstone and loose soil. The thickness of the un-confined aquifer is
varying from few meters to 50 m. This un-confined aquifer is more potential than
deep seated semi-confined to confined aquifer.
CMPDI
________________________________________________________________________
________________________________________________________________________ JOB NO – 200419012 5
SEMI-CONFINED TO CONFINED AQUIFER
The semi-confined to confined aquifer consisting of sandstone bed is sandwiched
with coal seams/shale beds and multiple aquifer system developed due to presence
of multiple numbers of coal seams/shale beds. With the presence of intercalated
shale and carbonaceous shale beds and reduction in permeability with depth, the
lower aquifers are poor in potential.
2.4 AQUIFER PARAMETERS
PHREATIC/UN-CONFINED AQUIFER – The wells are tested by CMPDI for
determination of aquifer parameters in Damuda (BJ Section) and Block-III area of
JCF. The hydraulic conductivity of the un-confined aquifer is 0.50 m/day as
computed from pumping tests on the wells. The transmissivity of the unconfined
aquifer ranges from 10.68 m2 /day to 41.48 m2 /day.
SEMI-CONFINED TO CONFINED AQUIFER – Below the un-confined aquifer, the
sandstone partings in-between impervious layers of shale and coal seams is
designated as semi-confined / confined aquifers. The sandstones in these aquifers
are fine to coarse grained, hard and compact with very low porosity. Mostly
groundwater occurs in the weak zones formed due to weathering, fracture, faults,
which create the secondary porosity. The hydrogeological parameter has been
determined by CMPDI in Sitanala Block by conducting aquifer performance test
(APT). The hydraulic conductivity (K) of semi-confined aquifer in Barakar Formation
ranges from 0.0006 m/day to 1.44 m/day. The hydrogeological parameter has also
been determined at Kumari OCP Block in the central JCF by conducting aquifer
performance test. The hydraulic conductivity (K) of semi-confined aquifer in Barakar
Formation in this area ranges from 0.0027 m/day to 0.05 m/day.
Aquifer Type Hydraulic Conductivity (m/day)
Transmissivity (m2 /day)
Remarks
Unconfined 0.50 10.68 – 41.48 Site: Damuda (BJ Section) and Block-III area
Semi-confined 0.0006 – 1.44 (1)
0.0027 – 0.05 (2)
- Site: (1): Sitanala Block (2): Kumari Block
CMPDI
________________________________________________________________________
________________________________________________________________________ JOB NO – 200419012 6
3.0 GROUNDWATER LEVEL MONITORING
To collect the representative groundwater levels in the study area, CMPDI has
established a monitoring network of total 254 monitoring stations out of which 64
located within core zone and rest comes within Buffer zone. 60 dug wells within JCF
and 04 dug wells within RCF (part) area (Details of the Hydrograph stations & water
level are given in Annexure-I, IIA & IIB) spread over the entire BCCL leasehold
area, Figure No-1. Water level monitoring in 254 hydrograph stations has been done
in pre-monsoon as well as in post monsoon whereas in 64 stations monitoring done
in quarterly (March, May, August and November month of 2018) basis.
Depth to water level of the water table depict the inequalities in the position of water
table with respect to ground surface and is useful in delineating recharge / discharge
areas, planning of artificial recharge structure and shows the overall status of the
groundwater level in the area. Historical groundwater level (GWL) of entire JCF and
part of RCF with fluctuation, GWL of Non-mining / Mining areas and GWL of the
Cluster of Mines of BCCL are shown in this report to assess the effect of Coal mining
activity in the groundwater regime in and around the Coalfield area.
Mining is a dynamic phenomenon. The mining activity creates dis-equilibrium in
environmental scenario of the area and disturbs the groundwater conditions/regime
in particular. The impact on shallow water regime due to mining activity can be
broadly viewed as under:
· Historical GWL with annual fluctuation over the years
· GWL scenario in Non-mining and Mining area (OC/UG mines)
· GWL scenario of Cluster of mines of BCCL
*Construction of piezometers within Jharia Coalfield and part of Raniganj Coalfield to monitor
groundwater level of deeper aquifers is already in progress.
CMPDI
________________________________________________________________________
________________________________________________________________________ JOB NO – 200419012 7
3.1 HISTORICAL GROUNDWATER LEVEL Historical GWL of JCF and part of RCF are given from 2005 to 2019 of CMPDI
monitoring stations (total 63 stations within Coalfield area). Pre-monsoon and Post-
monsoon GWL with Fluctuation has been mentioned below in the table.
Table No – 1: Historical Groundwater Level
Period
(Water level in metre below ground level)
Pre-Monsoon (April/May) Post-Monsoon (Nov/Dec) Fluctuation
From To Average From To Average From To Average
JC
F
2005 0.07 19.08 6.29 0.84 12.13 3.20 0.12 12.45 3.21
2007 0.40 19.27 5.66 0.35 8.21 2.87 0.02 16.15 2.96
2008 0.45 18.35 5.42 0.35 14.20 3.62 0.03 9.22 2.45
2010 0.85 14.47 5.24 0.10 15.88 4.48 0.02 5.55 1.54
2012 1.27 18.68 5.58 0.15 7.80 2.72 0.08 13.45 2.96
2013 0.70 19.20 5.65 0.45 8.35 2.77 0.29 15.88 3.17
2014 0.70 16.28 4.92 0.75 14.98 3.27 0.25 10.15 2.17
2015 1.38 17.20 6.00 0.45 14.58 3.92 0.28 7.62 2.15
2016 0.78 16.73 5.64 0.30 12.43 3.19 0.23 6.35 2.88
2017 0.67 16.28 5.61 0.15 6.97 2.41 0.10 12.10 3.25
2018 1.20 14.58 5.55 0.40 7.17 2.83 0.20 9.45 2.68
2019 0.95 15.88 5.46 0.45 5.95 2.34 0.20 13.40 3.05
RC
F (
part
)
2008 5.02 10.50 7.59 2.85 4.90 3.71 1.82 6.60 3.87
2010 2.20 8.85 4.74 2.78 9.58 4.63 0.68 1.10 0.89
2011 3.57 8.02 4.98 2.50 6.21 3.75 0.55 1.90 1.23
2012 3.10 7.34 4.59 1.55 7.00 3.66 0.05 2.78 0.94
2013 1.70 9.87 6.54 2.90 8.85 4.71 1.02 5.54 2.84
2014 3.27 6.48 4.57 2.13 3.03 2.63 0.54 3.45 1.94
2015 3.38 9.52 5.33 2.68 8.20 5.11 1.06 1.32 1.81
2016 3.61 10.65 6.24 0.90 6.50 3.18 1.63 4.40 3.06
2017 1.93 5.80 3.25 1.63 3.78 2.47 1.63 3.78 0.78
2018 2.34 8.70 4.35 1.75 5.70 2.75 0.41 2.55 1.59
2019 1.60 9.35 5.29 0.80 3.88 2.10 0.80 5.47 3.20
CMPDI
________________________________________________________________________
________________________________________________________________________ JOB NO – 200419012 8
3.2 GROUNDWATER LEVEL SCENARIO IN NON-MINING/MINING AREA Depth to water level (DTW) range in different formations with respect of mining and
non-mining areas is summarized in the Table No-2.
Table No – 2: Depth to water table
Formation Area DTW (bgl, m) [Year-2019]
Average GWL (m)
Pre-monsoon (Apr/May)
Post-monsoon (Nov/Dec) Pre-
monsoon Post- monsoon
Sedimentary (Gondwana)
Non-mining 1.30-11.22 0.65-4.52 5.50 2.50
Mining OC 0.95-12.60 0.45-5.95 5.16 2.21
UG 1.20-15.88 0.55-4.57 5.95 2.74
Metamorphics Peripheral part of the Coalfield
0.45-15.10 0.35-9.20 7.15 3.95
The study revealed that water table is in shallow depth and there is no significant
stress in the water table due to coal mining activity. Mining and Non-mining areas
shows barely any difference in water table condition in the JCF and RCF (part) area.
The average hydraulic gradient of the water table within mining and non-mining
areas is given in Table No-3. There is no significant change in hydraulic gradient has
been observed. Relatively steep gradient near active opencast mining areas w.r.t.,
Non-Mining, Underground mines and Metamorphics areas is observed.
Table No – 3: Average hydraulic gradient
Sl.
No
Formation Area Average hydraulic gradient
1 Sedimentary
(Gondwana)
Non-Mining 1.5 X 10⁻³ to 2.0 X 10⁻³
2 Mining OC 5.0X 10⁻² to 4.0 X 10⁻³
3 UG 2.0 X 10⁻² to 3.0 X 10⁻³
4 Metamorphics Peripheral part of
the Coalfield
1.0 X 10⁻³ to 2.0 X 10⁻³
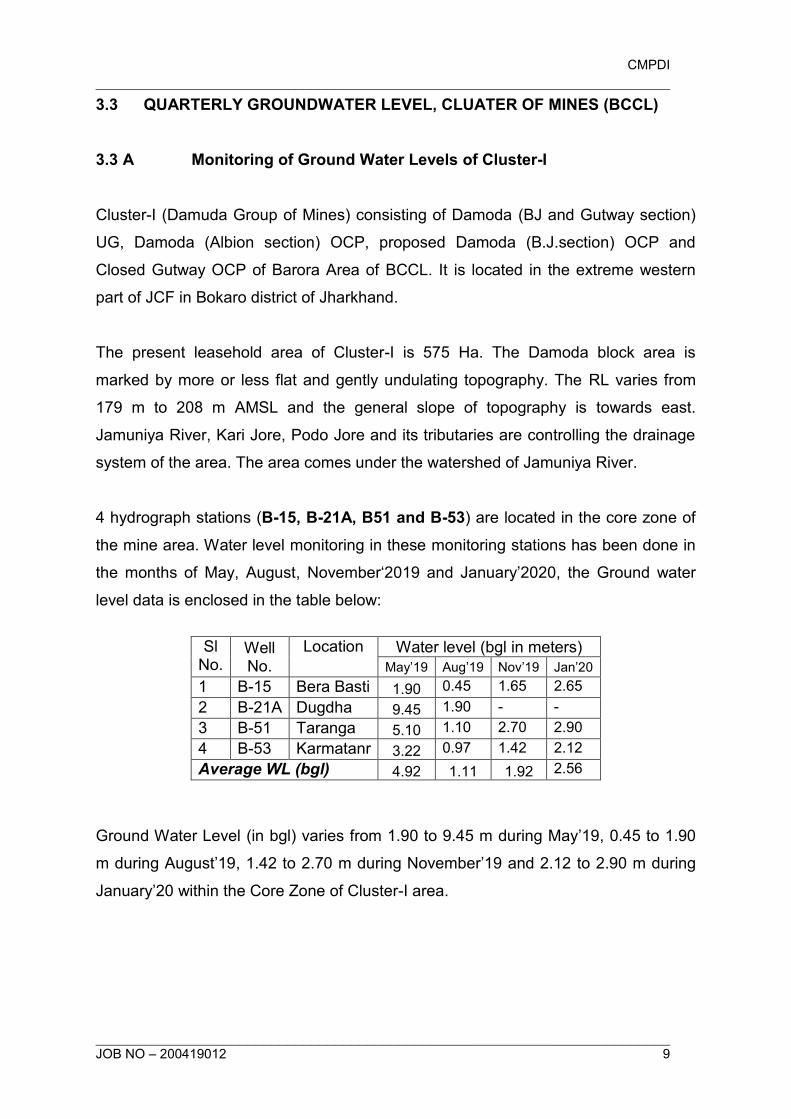
CMPDI
________________________________________________________________________
________________________________________________________________________ JOB NO – 200419012 9
3.3 QUARTERLY GROUNDWATER LEVEL, CLUATER OF MINES (BCCL) 3.3 A Monitoring of Ground Water Levels of Cluster-I Cluster-I (Damuda Group of Mines) consisting of Damoda (BJ and Gutway section)
UG, Damoda (Albion section) OCP, proposed Damoda (B.J.section) OCP and
Closed Gutway OCP of Barora Area of BCCL. It is located in the extreme western
part of JCF in Bokaro district of Jharkhand.
The present leasehold area of Cluster-I is 575 Ha. The Damoda block area is
marked by more or less flat and gently undulating topography. The RL varies from
179 m to 208 m AMSL and the general slope of topography is towards east.
Jamuniya River, Kari Jore, Podo Jore and its tributaries are controlling the drainage
system of the area. The area comes under the watershed of Jamuniya River.
4 hydrograph stations (B-15, B-21A, B51 and B-53) are located in the core zone of
the mine area. Water level monitoring in these monitoring stations has been done in
the months of May, August, November‘2019 and January’2020, the Ground water
level data is enclosed in the table below:
Sl No.
Well No.
Location Water level (bgl in meters)
May’19 Aug’19 Nov’19 Jan’20
1 B-15 Bera Basti 1.90 0.45 1.65 2.65
2 B-21A Dugdha 9.45 1.90 - -
3 B-51 Taranga 5.10 1.10 2.70 2.90
4 B-53 Karmatanr 3.22 0.97 1.42 2.12
Average WL (bgl) 4.92 1.11 1.92 2.56
Ground Water Level (in bgl) varies from 1.90 to 9.45 m during May’19, 0.45 to 1.90
m during August’19, 1.42 to 2.70 m during November’19 and 2.12 to 2.90 m during
January’20 within the Core Zone of Cluster-I area.
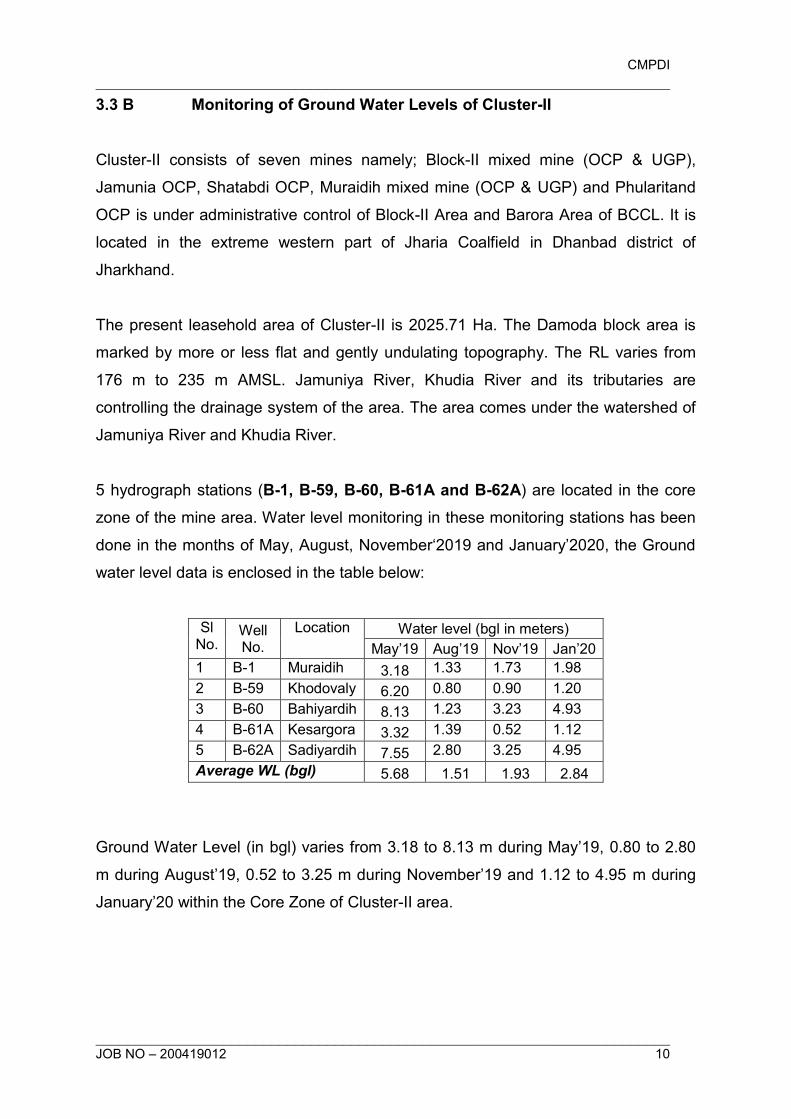
CMPDI
________________________________________________________________________
________________________________________________________________________ JOB NO – 200419012 10
3.3 B Monitoring of Ground Water Levels of Cluster-II Cluster-II consists of seven mines namely; Block-II mixed mine (OCP & UGP),
Jamunia OCP, Shatabdi OCP, Muraidih mixed mine (OCP & UGP) and Phularitand
OCP is under administrative control of Block-II Area and Barora Area of BCCL. It is
located in the extreme western part of Jharia Coalfield in Dhanbad district of
Jharkhand.
The present leasehold area of Cluster-II is 2025.71 Ha. The Damoda block area is
marked by more or less flat and gently undulating topography. The RL varies from
176 m to 235 m AMSL. Jamuniya River, Khudia River and its tributaries are
controlling the drainage system of the area. The area comes under the watershed of
Jamuniya River and Khudia River.
5 hydrograph stations (B-1, B-59, B-60, B-61A and B-62A) are located in the core
zone of the mine area. Water level monitoring in these monitoring stations has been
done in the months of May, August, November‘2019 and January’2020, the Ground
water level data is enclosed in the table below:
Sl No.
Well No.
Location Water level (bgl in meters)
May’19 Aug’19 Nov’19 Jan’20
1 B-1 Muraidih 3.18 1.33 1.73 1.98
2 B-59 Khodovaly 6.20 0.80 0.90 1.20
3 B-60 Bahiyardih 8.13 1.23 3.23 4.93
4 B-61A Kesargora 3.32 1.39 0.52 1.12
5 B-62A Sadiyardih 7.55 2.80 3.25 4.95
Average WL (bgl) 5.68 1.51 1.93 2.84
Ground Water Level (in bgl) varies from 3.18 to 8.13 m during May’19, 0.80 to 2.80
m during August’19, 0.52 to 3.25 m during November’19 and 1.12 to 4.95 m during
January’20 within the Core Zone of Cluster-II area.
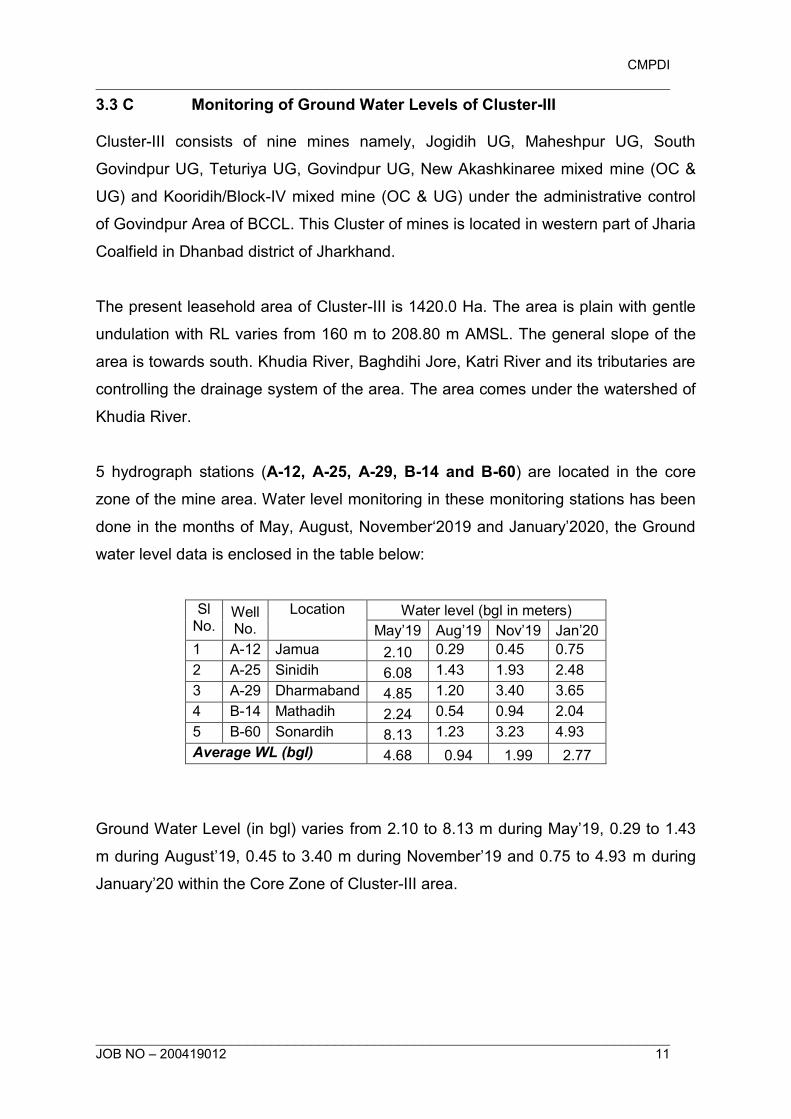
CMPDI
________________________________________________________________________
________________________________________________________________________ JOB NO – 200419012 11
3.3 C Monitoring of Ground Water Levels of Cluster-III Cluster-III consists of nine mines namely, Jogidih UG, Maheshpur UG, South
Govindpur UG, Teturiya UG, Govindpur UG, New Akashkinaree mixed mine (OC &
UG) and Kooridih/Block-IV mixed mine (OC & UG) under the administrative control
of Govindpur Area of BCCL. This Cluster of mines is located in western part of Jharia
Coalfield in Dhanbad district of Jharkhand.
The present leasehold area of Cluster-III is 1420.0 Ha. The area is plain with gentle
undulation with RL varies from 160 m to 208.80 m AMSL. The general slope of the
area is towards south. Khudia River, Baghdihi Jore, Katri River and its tributaries are
controlling the drainage system of the area. The area comes under the watershed of
Khudia River.
5 hydrograph stations (A-12, A-25, A-29, B-14 and B-60) are located in the core
zone of the mine area. Water level monitoring in these monitoring stations has been
done in the months of May, August, November‘2019 and January’2020, the Ground
water level data is enclosed in the table below:
Sl No.
Well No.
Location Water level (bgl in meters)
May’19 Aug’19 Nov’19 Jan’20
1 A-12 Jamua 2.10 0.29 0.45 0.75
2 A-25 Sinidih 6.08 1.43 1.93 2.48
3 A-29 Dharmaband 4.85 1.20 3.40 3.65
4 B-14 Mathadih 2.24 0.54 0.94 2.04
5 B-60 Sonardih 8.13 1.23 3.23 4.93
Average WL (bgl) 4.68 0.94 1.99 2.77
Ground Water Level (in bgl) varies from 2.10 to 8.13 m during May’19, 0.29 to 1.43
m during August’19, 0.45 to 3.40 m during November’19 and 0.75 to 4.93 m during
January’20 within the Core Zone of Cluster-III area.
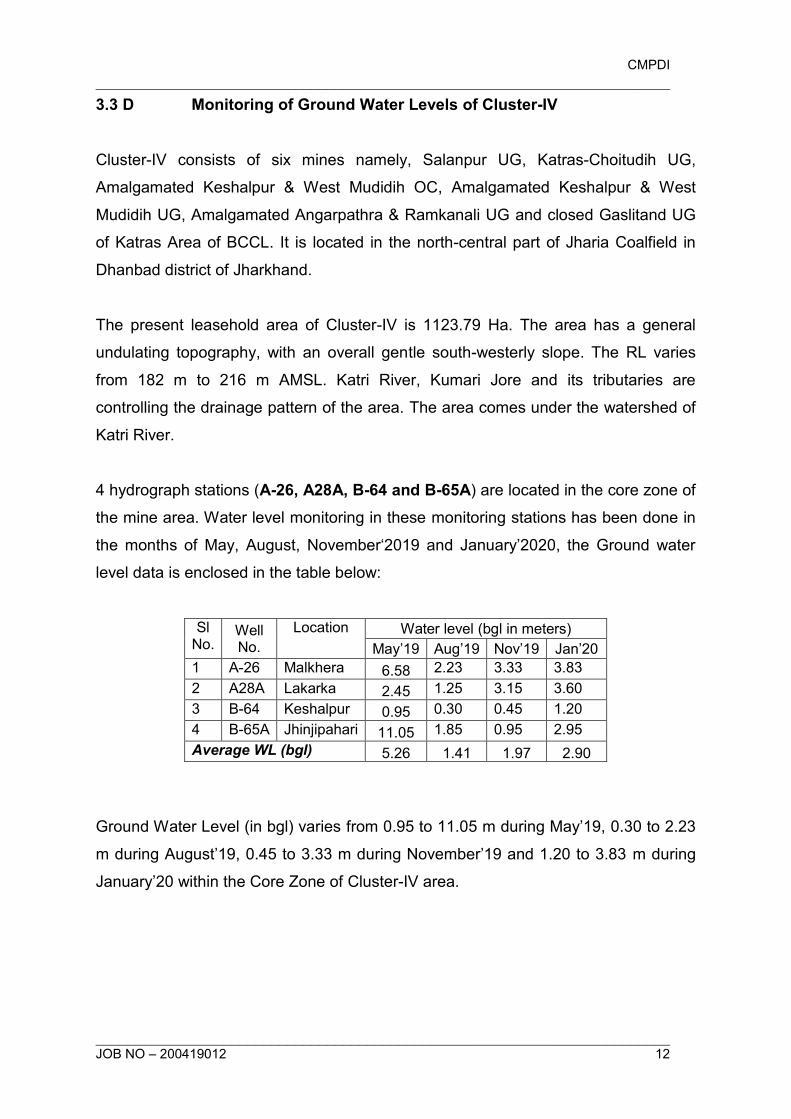
CMPDI
________________________________________________________________________
________________________________________________________________________ JOB NO – 200419012 12
3.3 D Monitoring of Ground Water Levels of Cluster-IV Cluster-IV consists of six mines namely, Salanpur UG, Katras-Choitudih UG,
Amalgamated Keshalpur & West Mudidih OC, Amalgamated Keshalpur & West
Mudidih UG, Amalgamated Angarpathra & Ramkanali UG and closed Gaslitand UG
of Katras Area of BCCL. It is located in the north-central part of Jharia Coalfield in
Dhanbad district of Jharkhand.
The present leasehold area of Cluster-IV is 1123.79 Ha. The area has a general
undulating topography, with an overall gentle south-westerly slope. The RL varies
from 182 m to 216 m AMSL. Katri River, Kumari Jore and its tributaries are
controlling the drainage pattern of the area. The area comes under the watershed of
Katri River.
4 hydrograph stations (A-26, A28A, B-64 and B-65A) are located in the core zone of
the mine area. Water level monitoring in these monitoring stations has been done in
the months of May, August, November‘2019 and January’2020, the Ground water
level data is enclosed in the table below:
Sl No.
Well No.
Location Water level (bgl in meters)
May’19 Aug’19 Nov’19 Jan’20
1 A-26 Malkhera 6.58 2.23 3.33 3.83
2 A28A Lakarka 2.45 1.25 3.15 3.60
3 B-64 Keshalpur 0.95 0.30 0.45 1.20
4 B-65A Jhinjipahari 11.05 1.85 0.95 2.95
Average WL (bgl) 5.26 1.41 1.97 2.90
Ground Water Level (in bgl) varies from 0.95 to 11.05 m during May’19, 0.30 to 2.23
m during August’19, 0.45 to 3.33 m during November’19 and 1.20 to 3.83 m during
January’20 within the Core Zone of Cluster-IV area.
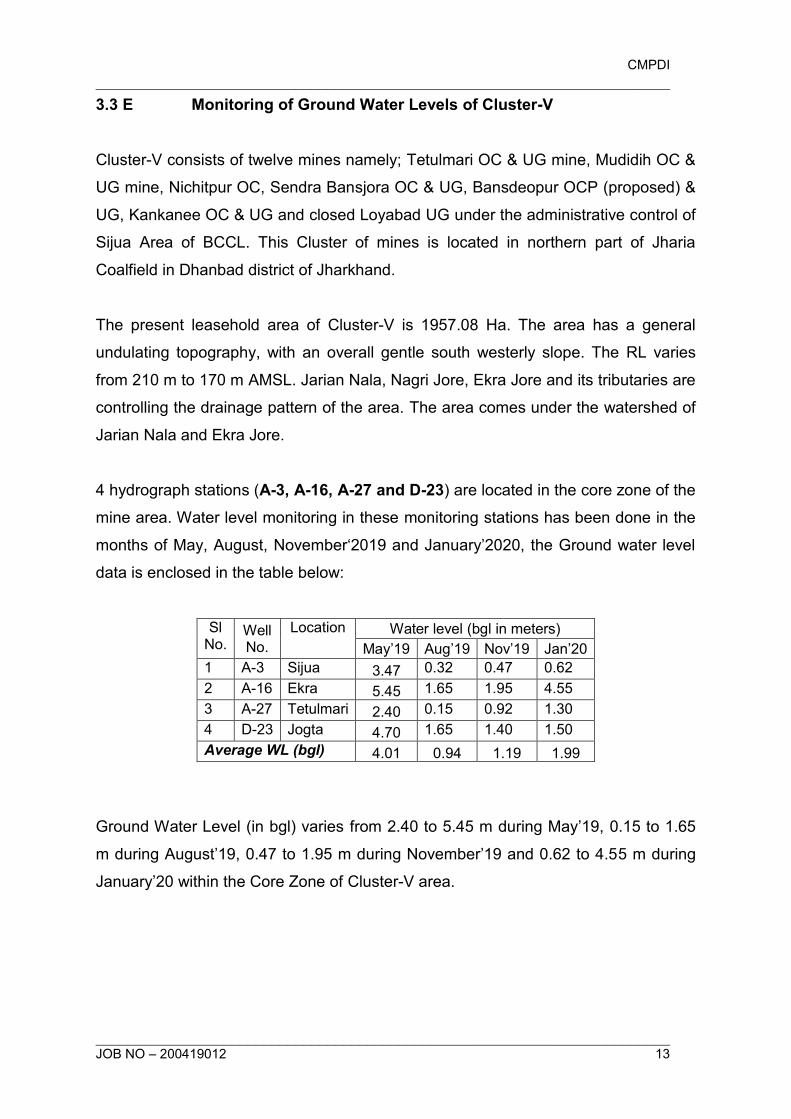
CMPDI
________________________________________________________________________
________________________________________________________________________ JOB NO – 200419012 13
3.3 E Monitoring of Ground Water Levels of Cluster-V Cluster-V consists of twelve mines namely; Tetulmari OC & UG mine, Mudidih OC &
UG mine, Nichitpur OC, Sendra Bansjora OC & UG, Bansdeopur OCP (proposed) &
UG, Kankanee OC & UG and closed Loyabad UG under the administrative control of
Sijua Area of BCCL. This Cluster of mines is located in northern part of Jharia
Coalfield in Dhanbad district of Jharkhand.
The present leasehold area of Cluster-V is 1957.08 Ha. The area has a general
undulating topography, with an overall gentle south westerly slope. The RL varies
from 210 m to 170 m AMSL. Jarian Nala, Nagri Jore, Ekra Jore and its tributaries are
controlling the drainage pattern of the area. The area comes under the watershed of
Jarian Nala and Ekra Jore.
4 hydrograph stations (A-3, A-16, A-27 and D-23) are located in the core zone of the
mine area. Water level monitoring in these monitoring stations has been done in the
months of May, August, November‘2019 and January’2020, the Ground water level
data is enclosed in the table below:
Sl No.
Well No.
Location Water level (bgl in meters)
May’19 Aug’19 Nov’19 Jan’20
1 A-3 Sijua 3.47 0.32 0.47 0.62
2 A-16 Ekra 5.45 1.65 1.95 4.55
3 A-27 Tetulmari 2.40 0.15 0.92 1.30
4 D-23 Jogta 4.70 1.65 1.40 1.50
Average WL (bgl) 4.01 0.94 1.19 1.99
Ground Water Level (in bgl) varies from 2.40 to 5.45 m during May’19, 0.15 to 1.65
m during August’19, 0.47 to 1.95 m during November’19 and 0.62 to 4.55 m during
January’20 within the Core Zone of Cluster-V area.
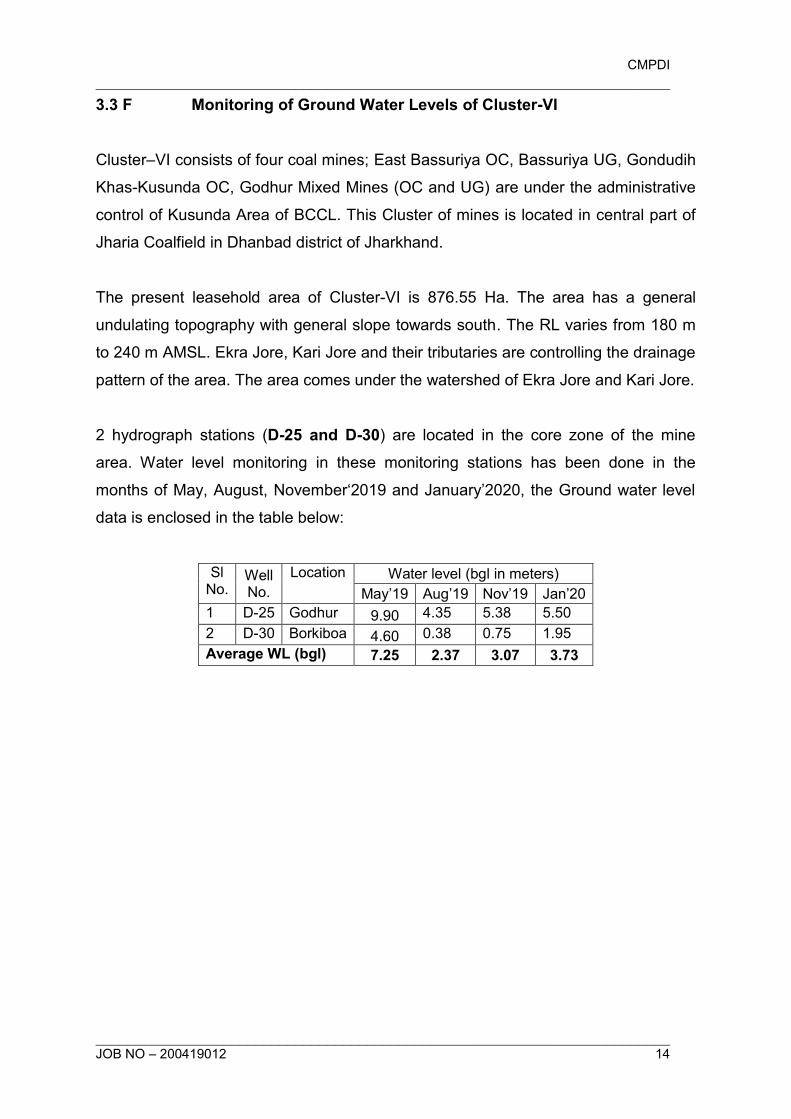
CMPDI
________________________________________________________________________
________________________________________________________________________ JOB NO – 200419012 14
3.3 F Monitoring of Ground Water Levels of Cluster-VI
Cluster–VI consists of four coal mines; East Bassuriya OC, Bassuriya UG, Gondudih
Khas-Kusunda OC, Godhur Mixed Mines (OC and UG) are under the administrative
control of Kusunda Area of BCCL. This Cluster of mines is located in central part of
Jharia Coalfield in Dhanbad district of Jharkhand.
The present leasehold area of Cluster-VI is 876.55 Ha. The area has a general
undulating topography with general slope towards south. The RL varies from 180 m
to 240 m AMSL. Ekra Jore, Kari Jore and their tributaries are controlling the drainage
pattern of the area. The area comes under the watershed of Ekra Jore and Kari Jore.
2 hydrograph stations (D-25 and D-30) are located in the core zone of the mine
area. Water level monitoring in these monitoring stations has been done in the
months of May, August, November‘2019 and January’2020, the Ground water level
data is enclosed in the table below:
Sl No.
Well No.
Location Water level (bgl in meters)
May’19 Aug’19 Nov’19 Jan’20
1 D-25 Godhur 9.90 4.35 5.38 5.50
2 D-30 Borkiboa 4.60 0.38 0.75 1.95
Average WL (bgl) 7.25 2.37 3.07 3.73
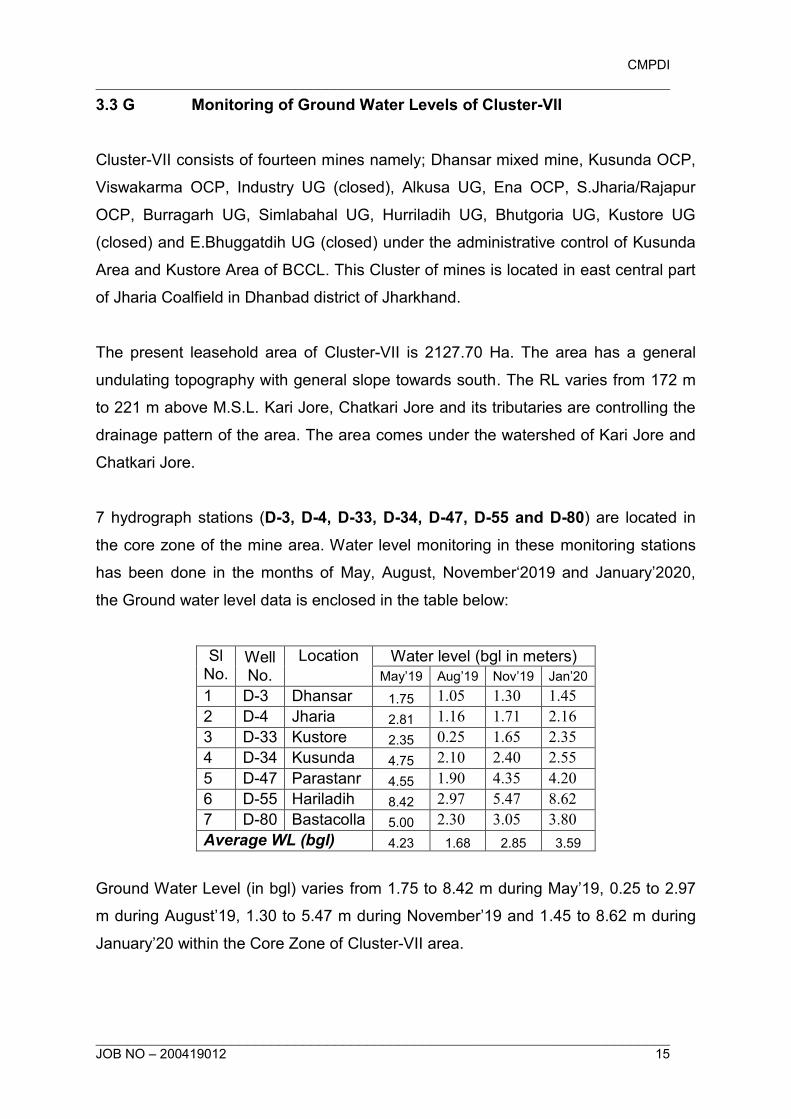
CMPDI
________________________________________________________________________
________________________________________________________________________ JOB NO – 200419012 15
3.3 G Monitoring of Ground Water Levels of Cluster-VII
Cluster-VII consists of fourteen mines namely; Dhansar mixed mine, Kusunda OCP,
Viswakarma OCP, Industry UG (closed), Alkusa UG, Ena OCP, S.Jharia/Rajapur
OCP, Burragarh UG, Simlabahal UG, Hurriladih UG, Bhutgoria UG, Kustore UG
(closed) and E.Bhuggatdih UG (closed) under the administrative control of Kusunda
Area and Kustore Area of BCCL. This Cluster of mines is located in east central part
of Jharia Coalfield in Dhanbad district of Jharkhand.
The present leasehold area of Cluster-VII is 2127.70 Ha. The area has a general
undulating topography with general slope towards south. The RL varies from 172 m
to 221 m above M.S.L. Kari Jore, Chatkari Jore and its tributaries are controlling the
drainage pattern of the area. The area comes under the watershed of Kari Jore and
Chatkari Jore.
7 hydrograph stations (D-3, D-4, D-33, D-34, D-47, D-55 and D-80) are located in
the core zone of the mine area. Water level monitoring in these monitoring stations
has been done in the months of May, August, November‘2019 and January’2020,
the Ground water level data is enclosed in the table below:
Sl No.
Well No.
Location Water level (bgl in meters)
May’19 Aug’19 Nov’19 Jan’20
1 D-3 Dhansar 1.75 1.05 1.30 1.45
2 D-4 Jharia 2.81 1.16 1.71 2.16
3 D-33 Kustore 2.35 0.25 1.65 2.35
4 D-34 Kusunda 4.75 2.10 2.40 2.55
5 D-47 Parastanr 4.55 1.90 4.35 4.20
6 D-55 Hariladih 8.42 2.97 5.47 8.62
7 D-80 Bastacolla 5.00 2.30 3.05 3.80
Average WL (bgl) 4.23 1.68 2.85 3.59
Ground Water Level (in bgl) varies from 1.75 to 8.42 m during May’19, 0.25 to 2.97
m during August’19, 1.30 to 5.47 m during November’19 and 1.45 to 8.62 m during
January’20 within the Core Zone of Cluster-VII area.
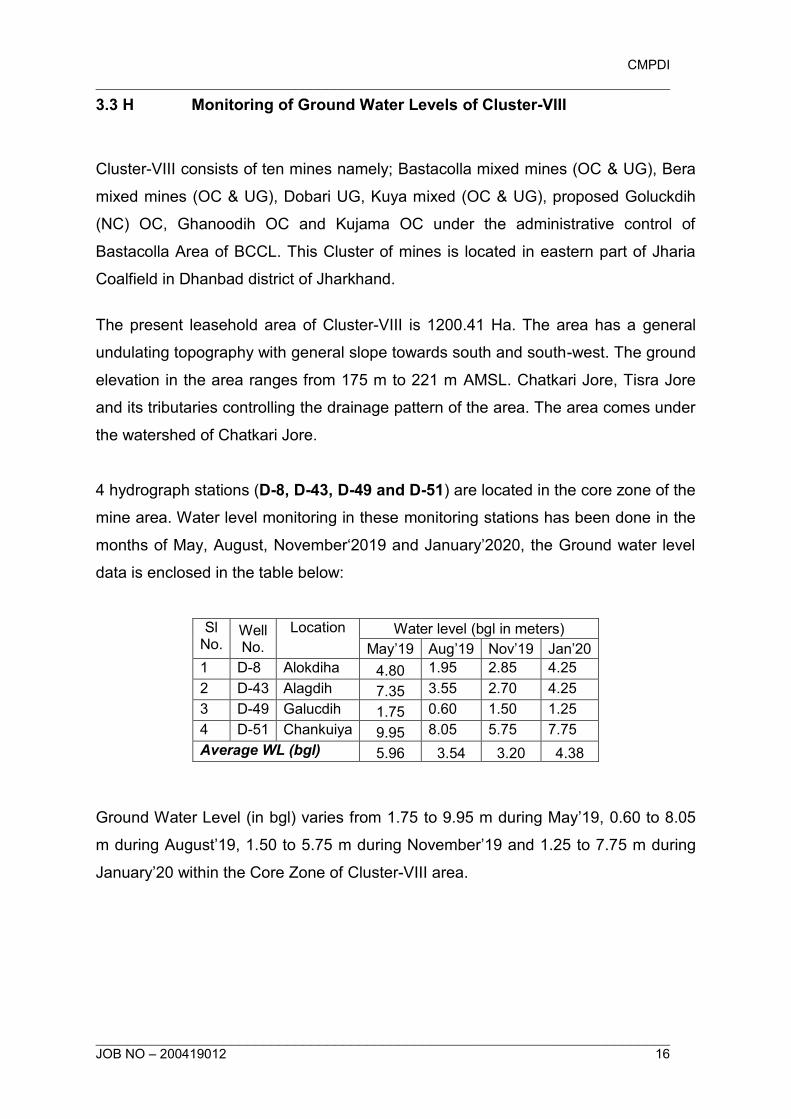
CMPDI
________________________________________________________________________
________________________________________________________________________ JOB NO – 200419012 16
3.3 H Monitoring of Ground Water Levels of Cluster-VIII
Cluster-VIII consists of ten mines namely; Bastacolla mixed mines (OC & UG), Bera
mixed mines (OC & UG), Dobari UG, Kuya mixed (OC & UG), proposed Goluckdih
(NC) OC, Ghanoodih OC and Kujama OC under the administrative control of
Bastacolla Area of BCCL. This Cluster of mines is located in eastern part of Jharia
Coalfield in Dhanbad district of Jharkhand.
The present leasehold area of Cluster-VIII is 1200.41 Ha. The area has a general
undulating topography with general slope towards south and south-west. The ground
elevation in the area ranges from 175 m to 221 m AMSL. Chatkari Jore, Tisra Jore
and its tributaries controlling the drainage pattern of the area. The area comes under
the watershed of Chatkari Jore.
4 hydrograph stations (D-8, D-43, D-49 and D-51) are located in the core zone of the
mine area. Water level monitoring in these monitoring stations has been done in the
months of May, August, November‘2019 and January’2020, the Ground water level
data is enclosed in the table below:
Sl No.
Well No.
Location Water level (bgl in meters)
May’19 Aug’19 Nov’19 Jan’20
1 D-8 Alokdiha 4.80 1.95 2.85 4.25
2 D-43 Alagdih 7.35 3.55 2.70 4.25
3 D-49 Galucdih 1.75 0.60 1.50 1.25
4 D-51 Chankuiya 9.95 8.05 5.75 7.75
Average WL (bgl) 5.96 3.54 3.20 4.38
Ground Water Level (in bgl) varies from 1.75 to 9.95 m during May’19, 0.60 to 8.05
m during August’19, 1.50 to 5.75 m during November’19 and 1.25 to 7.75 m during
January’20 within the Core Zone of Cluster-VIII area.
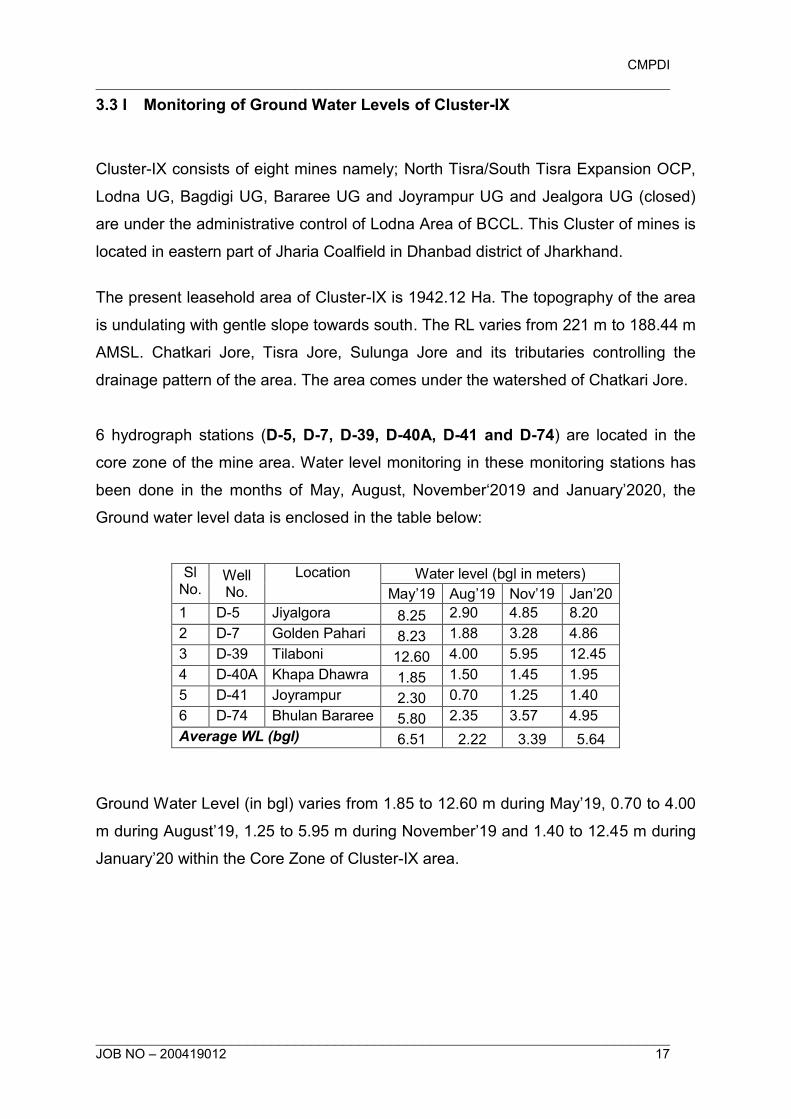
CMPDI
________________________________________________________________________
________________________________________________________________________ JOB NO – 200419012 17
3.3 I Monitoring of Ground Water Levels of Cluster-IX
Cluster-IX consists of eight mines namely; North Tisra/South Tisra Expansion OCP,
Lodna UG, Bagdigi UG, Bararee UG and Joyrampur UG and Jealgora UG (closed)
are under the administrative control of Lodna Area of BCCL. This Cluster of mines is
located in eastern part of Jharia Coalfield in Dhanbad district of Jharkhand.
The present leasehold area of Cluster-IX is 1942.12 Ha. The topography of the area
is undulating with gentle slope towards south. The RL varies from 221 m to 188.44 m
AMSL. Chatkari Jore, Tisra Jore, Sulunga Jore and its tributaries controlling the
drainage pattern of the area. The area comes under the watershed of Chatkari Jore.
6 hydrograph stations (D-5, D-7, D-39, D-40A, D-41 and D-74) are located in the
core zone of the mine area. Water level monitoring in these monitoring stations has
been done in the months of May, August, November‘2019 and January’2020, the
Ground water level data is enclosed in the table below:
Sl No.
Well No.
Location Water level (bgl in meters)
May’19 Aug’19 Nov’19 Jan’20
1 D-5 Jiyalgora 8.25 2.90 4.85 8.20
2 D-7 Golden Pahari 8.23 1.88 3.28 4.86
3 D-39 Tilaboni 12.60 4.00 5.95 12.45
4 D-40A Khapa Dhawra 1.85 1.50 1.45 1.95
5 D-41 Joyrampur 2.30 0.70 1.25 1.40
6 D-74 Bhulan Bararee 5.80 2.35 3.57 4.95
Average WL (bgl) 6.51 2.22 3.39 5.64
Ground Water Level (in bgl) varies from 1.85 to 12.60 m during May’19, 0.70 to 4.00
m during August’19, 1.25 to 5.95 m during November’19 and 1.40 to 12.45 m during
January’20 within the Core Zone of Cluster-IX area.
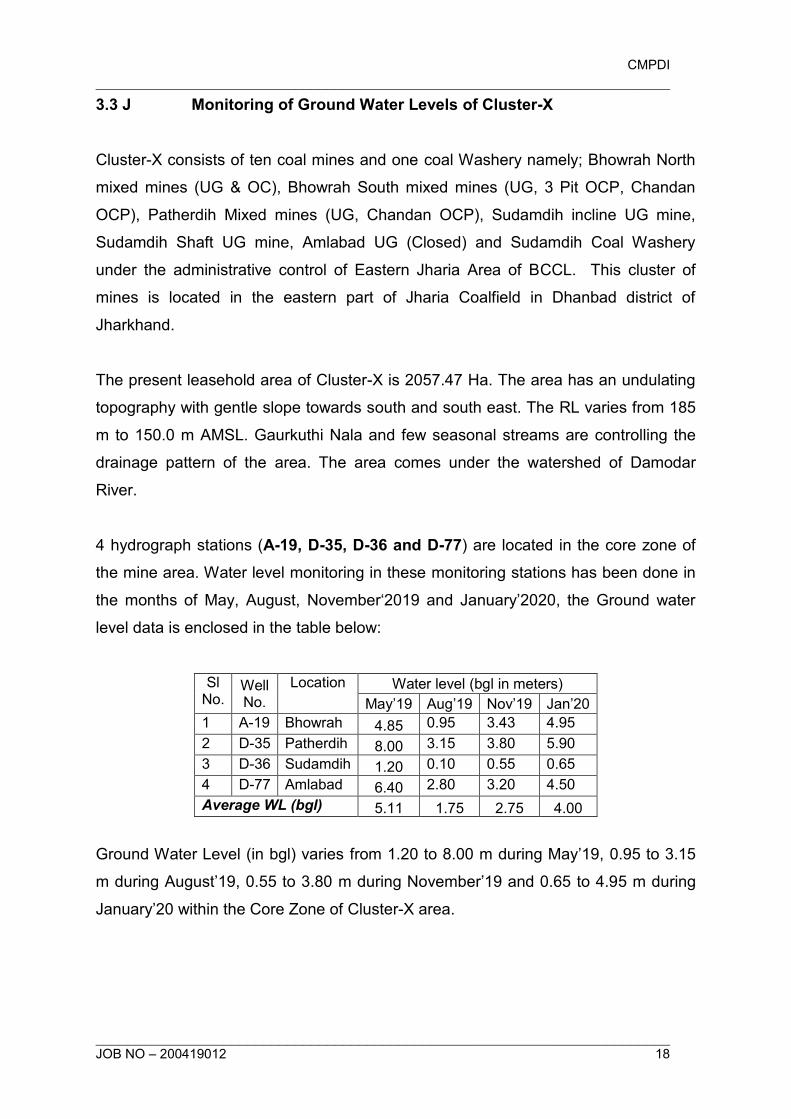
CMPDI
________________________________________________________________________
________________________________________________________________________ JOB NO – 200419012 18
3.3 J Monitoring of Ground Water Levels of Cluster-X Cluster-X consists of ten coal mines and one coal Washery namely; Bhowrah North
mixed mines (UG & OC), Bhowrah South mixed mines (UG, 3 Pit OCP, Chandan
OCP), Patherdih Mixed mines (UG, Chandan OCP), Sudamdih incline UG mine,
Sudamdih Shaft UG mine, Amlabad UG (Closed) and Sudamdih Coal Washery
under the administrative control of Eastern Jharia Area of BCCL. This cluster of
mines is located in the eastern part of Jharia Coalfield in Dhanbad district of
Jharkhand.
The present leasehold area of Cluster-X is 2057.47 Ha. The area has an undulating
topography with gentle slope towards south and south east. The RL varies from 185
m to 150.0 m AMSL. Gaurkuthi Nala and few seasonal streams are controlling the
drainage pattern of the area. The area comes under the watershed of Damodar
River.
4 hydrograph stations (A-19, D-35, D-36 and D-77) are located in the core zone of
the mine area. Water level monitoring in these monitoring stations has been done in
the months of May, August, November‘2019 and January’2020, the Ground water
level data is enclosed in the table below:
Sl No.
Well No.
Location Water level (bgl in meters)
May’19 Aug’19 Nov’19 Jan’20
1 A-19 Bhowrah 4.85 0.95 3.43 4.95
2 D-35 Patherdih 8.00 3.15 3.80 5.90
3 D-36 Sudamdih 1.20 0.10 0.55 0.65
4 D-77 Amlabad 6.40 2.80 3.20 4.50
Average WL (bgl) 5.11 1.75 2.75 4.00
Ground Water Level (in bgl) varies from 1.20 to 8.00 m during May’19, 0.95 to 3.15
m during August’19, 0.55 to 3.80 m during November’19 and 0.65 to 4.95 m during
January’20 within the Core Zone of Cluster-X area.
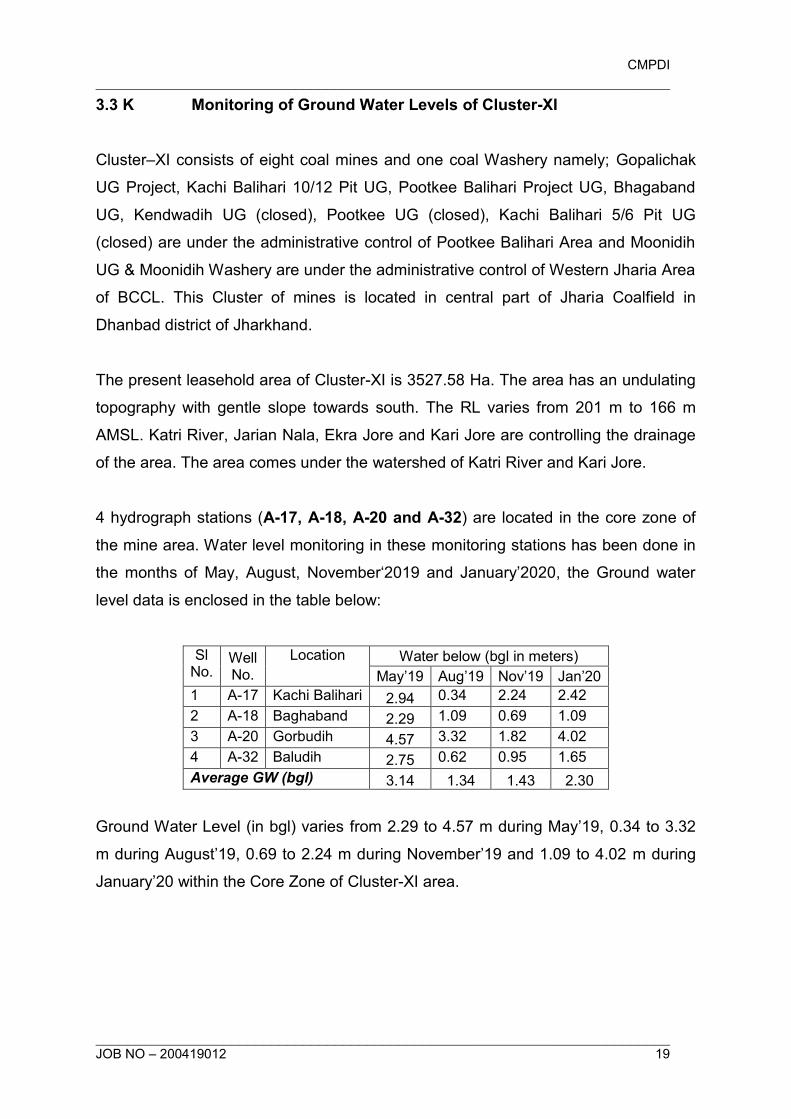
CMPDI
________________________________________________________________________
________________________________________________________________________ JOB NO – 200419012 19
3.3 K Monitoring of Ground Water Levels of Cluster-XI
Cluster–XI consists of eight coal mines and one coal Washery namely; Gopalichak
UG Project, Kachi Balihari 10/12 Pit UG, Pootkee Balihari Project UG, Bhagaband
UG, Kendwadih UG (closed), Pootkee UG (closed), Kachi Balihari 5/6 Pit UG
(closed) are under the administrative control of Pootkee Balihari Area and Moonidih
UG & Moonidih Washery are under the administrative control of Western Jharia Area
of BCCL. This Cluster of mines is located in central part of Jharia Coalfield in
Dhanbad district of Jharkhand.
The present leasehold area of Cluster-XI is 3527.58 Ha. The area has an undulating
topography with gentle slope towards south. The RL varies from 201 m to 166 m
AMSL. Katri River, Jarian Nala, Ekra Jore and Kari Jore are controlling the drainage
of the area. The area comes under the watershed of Katri River and Kari Jore.
4 hydrograph stations (A-17, A-18, A-20 and A-32) are located in the core zone of
the mine area. Water level monitoring in these monitoring stations has been done in
the months of May, August, November‘2019 and January’2020, the Ground water
level data is enclosed in the table below:
Sl No.
Well No.
Location Water below (bgl in meters)
May’19 Aug’19 Nov’19 Jan’20
1 A-17 Kachi Balihari 2.94 0.34 2.24 2.42
2 A-18 Baghaband 2.29 1.09 0.69 1.09
3 A-20 Gorbudih 4.57 3.32 1.82 4.02
4 A-32 Baludih 2.75 0.62 0.95 1.65
Average GW (bgl) 3.14 1.34 1.43 2.30
Ground Water Level (in bgl) varies from 2.29 to 4.57 m during May’19, 0.34 to 3.32
m during August’19, 0.69 to 2.24 m during November’19 and 1.09 to 4.02 m during
January’20 within the Core Zone of Cluster-XI area.
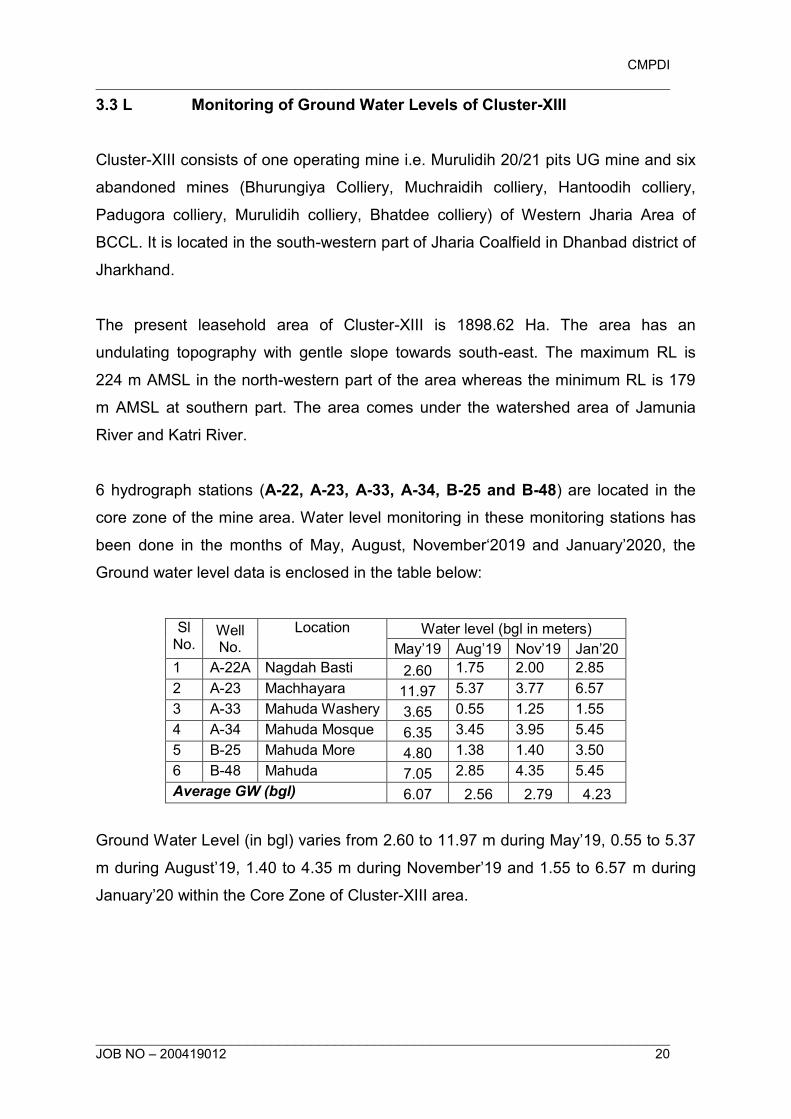
CMPDI
________________________________________________________________________
________________________________________________________________________ JOB NO – 200419012 20
3.3 L Monitoring of Ground Water Levels of Cluster-XIII
Cluster-XIII consists of one operating mine i.e. Murulidih 20/21 pits UG mine and six
abandoned mines (Bhurungiya Colliery, Muchraidih colliery, Hantoodih colliery,
Padugora colliery, Murulidih colliery, Bhatdee colliery) of Western Jharia Area of
BCCL. It is located in the south-western part of Jharia Coalfield in Dhanbad district of
Jharkhand.
The present leasehold area of Cluster-XIII is 1898.62 Ha. The area has an
undulating topography with gentle slope towards south-east. The maximum RL is
224 m AMSL in the north-western part of the area whereas the minimum RL is 179
m AMSL at southern part. The area comes under the watershed area of Jamunia
River and Katri River.
6 hydrograph stations (A-22, A-23, A-33, A-34, B-25 and B-48) are located in the
core zone of the mine area. Water level monitoring in these monitoring stations has
been done in the months of May, August, November‘2019 and January’2020, the
Ground water level data is enclosed in the table below:
Sl No.
Well No.
Location Water level (bgl in meters)
May’19 Aug’19 Nov’19 Jan’20
1 A-22A Nagdah Basti 2.60 1.75 2.00 2.85
2 A-23 Machhayara 11.97 5.37 3.77 6.57
3 A-33 Mahuda Washery 3.65 0.55 1.25 1.55
4 A-34 Mahuda Mosque 6.35 3.45 3.95 5.45
5 B-25 Mahuda More 4.80 1.38 1.40 3.50
6 B-48 Mahuda 7.05 2.85 4.35 5.45
Average GW (bgl) 6.07 2.56 2.79 4.23
Ground Water Level (in bgl) varies from 2.60 to 11.97 m during May’19, 0.55 to 5.37
m during August’19, 1.40 to 4.35 m during November’19 and 1.55 to 6.57 m during
January’20 within the Core Zone of Cluster-XIII area.
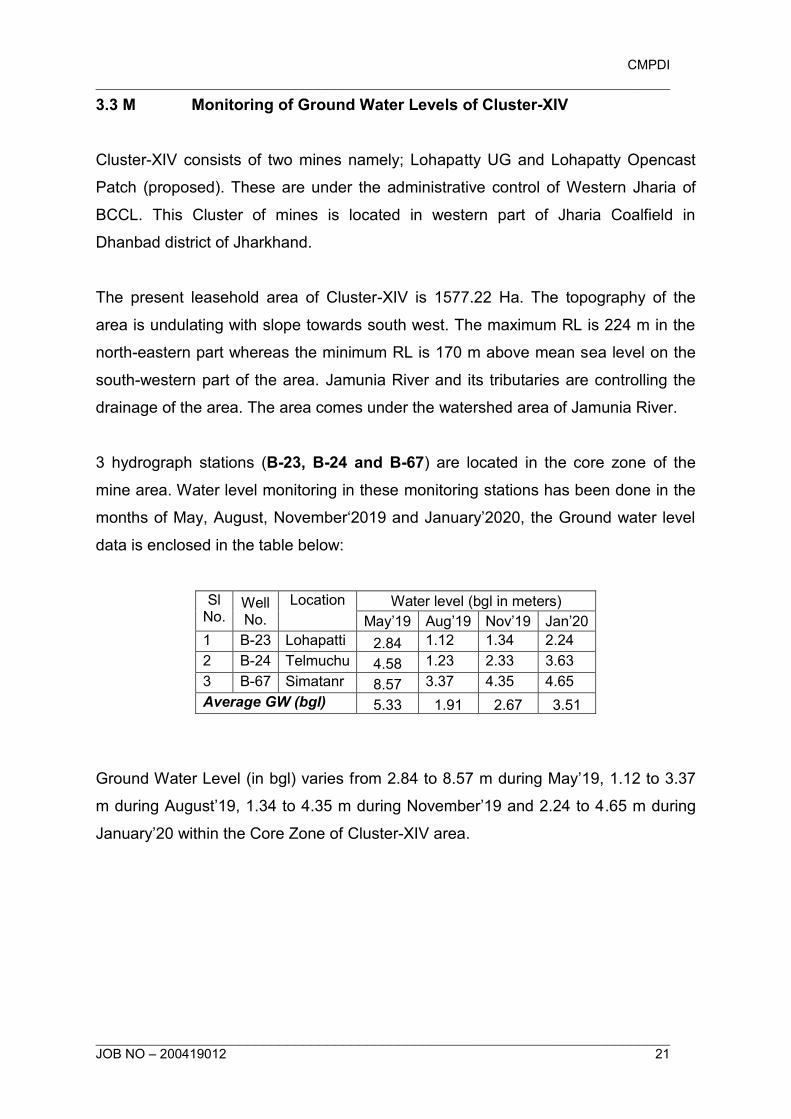
CMPDI
________________________________________________________________________
________________________________________________________________________ JOB NO – 200419012 21
3.3 M Monitoring of Ground Water Levels of Cluster-XIV
Cluster-XIV consists of two mines namely; Lohapatty UG and Lohapatty Opencast
Patch (proposed). These are under the administrative control of Western Jharia of
BCCL. This Cluster of mines is located in western part of Jharia Coalfield in
Dhanbad district of Jharkhand.
The present leasehold area of Cluster-XIV is 1577.22 Ha. The topography of the
area is undulating with slope towards south west. The maximum RL is 224 m in the
north-eastern part whereas the minimum RL is 170 m above mean sea level on the
south-western part of the area. Jamunia River and its tributaries are controlling the
drainage of the area. The area comes under the watershed area of Jamunia River.
3 hydrograph stations (B-23, B-24 and B-67) are located in the core zone of the
mine area. Water level monitoring in these monitoring stations has been done in the
months of May, August, November‘2019 and January’2020, the Ground water level
data is enclosed in the table below:
Sl No.
Well No.
Location Water level (bgl in meters)
May’19 Aug’19 Nov’19 Jan’20
1 B-23 Lohapatti 2.84 1.12 1.34 2.24
2 B-24 Telmuchu 4.58 1.23 2.33 3.63
3 B-67 Simatanr 8.57 3.37 4.35 4.65
Average GW (bgl) 5.33 1.91 2.67 3.51
Ground Water Level (in bgl) varies from 2.84 to 8.57 m during May’19, 1.12 to 3.37
m during August’19, 1.34 to 4.35 m during November’19 and 2.24 to 4.65 m during
January’20 within the Core Zone of Cluster-XIV area.
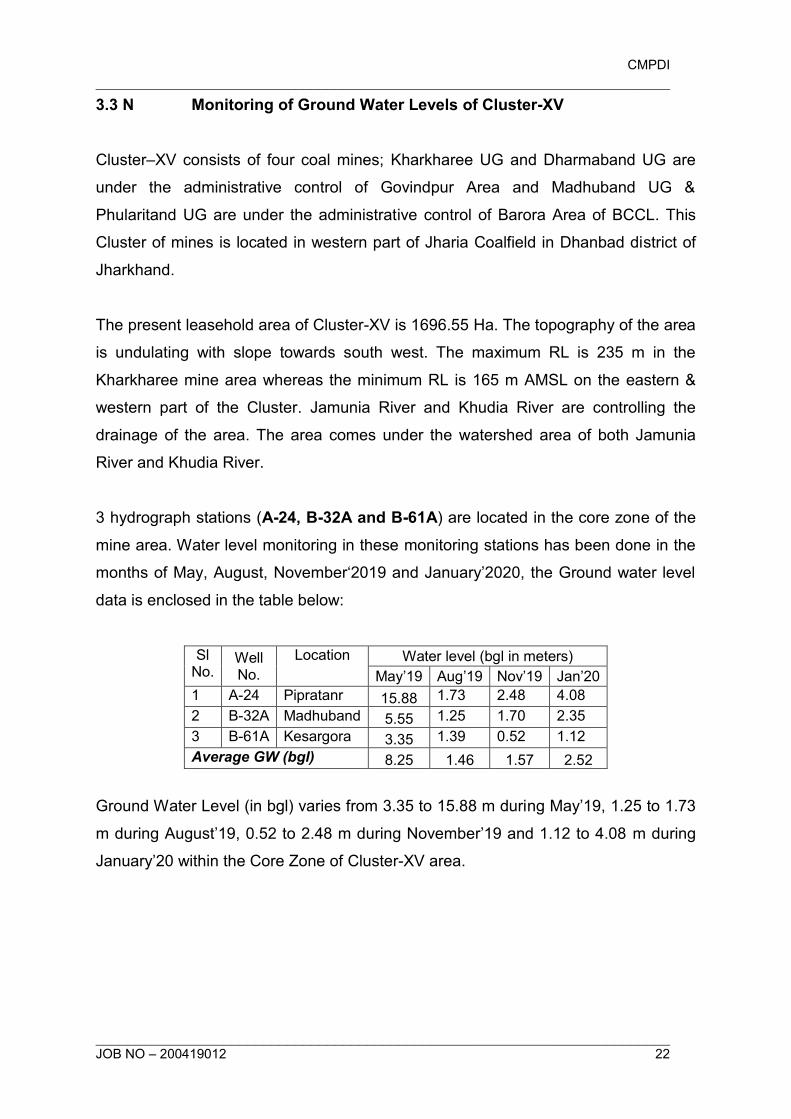
CMPDI
________________________________________________________________________
________________________________________________________________________ JOB NO – 200419012 22
3.3 N Monitoring of Ground Water Levels of Cluster-XV
Cluster–XV consists of four coal mines; Kharkharee UG and Dharmaband UG are
under the administrative control of Govindpur Area and Madhuband UG &
Phularitand UG are under the administrative control of Barora Area of BCCL. This
Cluster of mines is located in western part of Jharia Coalfield in Dhanbad district of
Jharkhand.
The present leasehold area of Cluster-XV is 1696.55 Ha. The topography of the area
is undulating with slope towards south west. The maximum RL is 235 m in the
Kharkharee mine area whereas the minimum RL is 165 m AMSL on the eastern &
western part of the Cluster. Jamunia River and Khudia River are controlling the
drainage of the area. The area comes under the watershed area of both Jamunia
River and Khudia River.
3 hydrograph stations (A-24, B-32A and B-61A) are located in the core zone of the
mine area. Water level monitoring in these monitoring stations has been done in the
months of May, August, November‘2019 and January’2020, the Ground water level
data is enclosed in the table below:
Sl No.
Well No.
Location Water level (bgl in meters)
May’19 Aug’19 Nov’19 Jan’20
1 A-24 Pipratanr 15.88 1.73 2.48 4.08
2 B-32A Madhuband 5.55 1.25 1.70 2.35
3 B-61A Kesargora 3.35 1.39 0.52 1.12
Average GW (bgl) 8.25 1.46 1.57 2.52
Ground Water Level (in bgl) varies from 3.35 to 15.88 m during May’19, 1.25 to 1.73
m during August’19, 0.52 to 2.48 m during November’19 and 1.12 to 4.08 m during
January’20 within the Core Zone of Cluster-XV area.
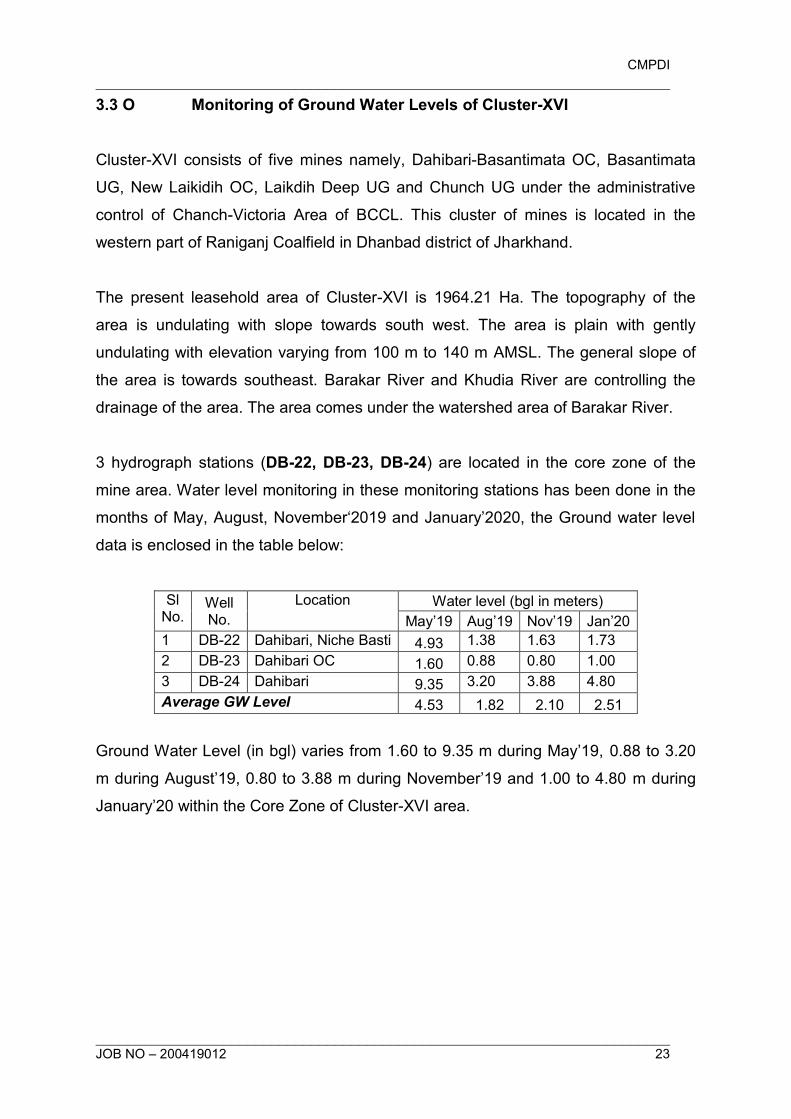
CMPDI
________________________________________________________________________
________________________________________________________________________ JOB NO – 200419012 23
3.3 O Monitoring of Ground Water Levels of Cluster-XVI
Cluster-XVI consists of five mines namely, Dahibari-Basantimata OC, Basantimata
UG, New Laikidih OC, Laikdih Deep UG and Chunch UG under the administrative
control of Chanch-Victoria Area of BCCL. This cluster of mines is located in the
western part of Raniganj Coalfield in Dhanbad district of Jharkhand.
The present leasehold area of Cluster-XVI is 1964.21 Ha. The topography of the
area is undulating with slope towards south west. The area is plain with gently
undulating with elevation varying from 100 m to 140 m AMSL. The general slope of
the area is towards southeast. Barakar River and Khudia River are controlling the
drainage of the area. The area comes under the watershed area of Barakar River.
3 hydrograph stations (DB-22, DB-23, DB-24) are located in the core zone of the
mine area. Water level monitoring in these monitoring stations has been done in the
months of May, August, November‘2019 and January’2020, the Ground water level
data is enclosed in the table below:
Sl No.
Well No.
Location Water level (bgl in meters)
May’19 Aug’19 Nov’19 Jan’20
1 DB-22 Dahibari, Niche Basti 4.93 1.38 1.63 1.73
2 DB-23 Dahibari OC 1.60 0.88 0.80 1.00
3 DB-24 Dahibari 9.35 3.20 3.88 4.80
Average GW Level 4.53 1.82 2.10 2.51
Ground Water Level (in bgl) varies from 1.60 to 9.35 m during May’19, 0.88 to 3.20
m during August’19, 0.80 to 3.88 m during November’19 and 1.00 to 4.80 m during
January’20 within the Core Zone of Cluster-XVI area.
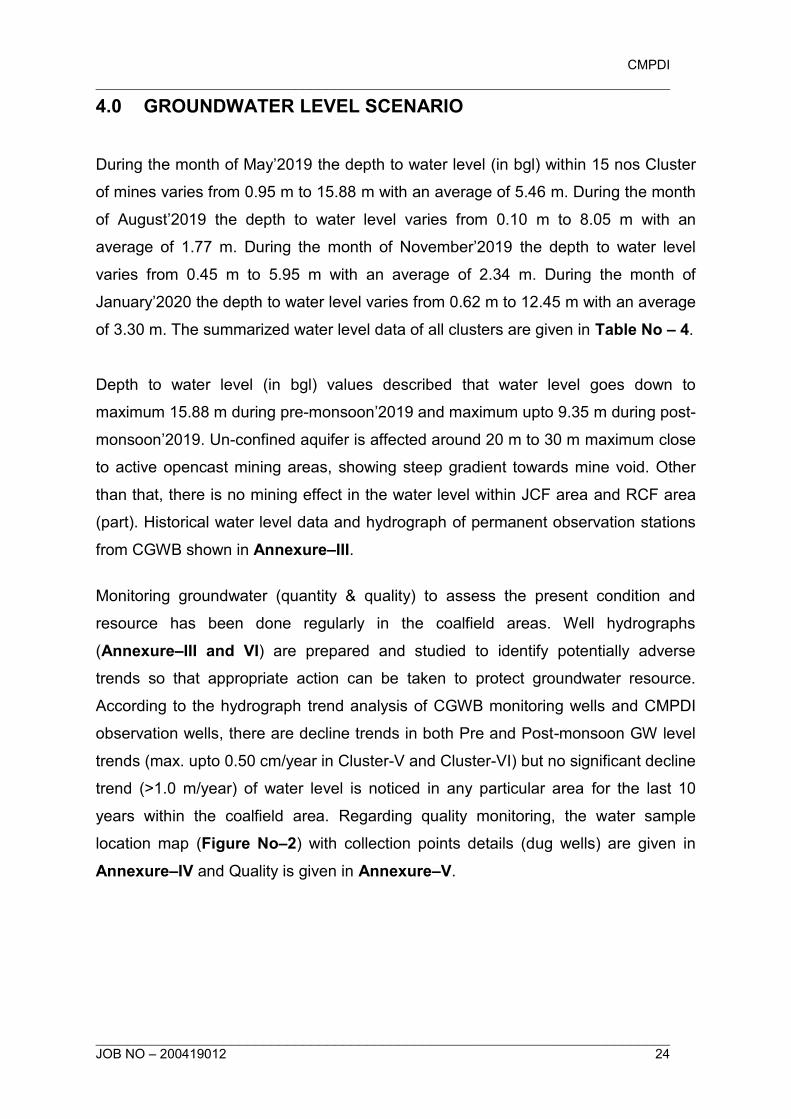
CMPDI
________________________________________________________________________
________________________________________________________________________ JOB NO – 200419012 24
4.0 GROUNDWATER LEVEL SCENARIO
During the month of May’2019 the depth to water level (in bgl) within 15 nos Cluster
of mines varies from 0.95 m to 15.88 m with an average of 5.46 m. During the month
of August’2019 the depth to water level varies from 0.10 m to 8.05 m with an
average of 1.77 m. During the month of November’2019 the depth to water level
varies from 0.45 m to 5.95 m with an average of 2.34 m. During the month of
January’2020 the depth to water level varies from 0.62 m to 12.45 m with an average
of 3.30 m. The summarized water level data of all clusters are given in Table No – 4.
Depth to water level (in bgl) values described that water level goes down to
maximum 15.88 m during pre-monsoon’2019 and maximum upto 9.35 m during post-
monsoon’2019. Un-confined aquifer is affected around 20 m to 30 m maximum close
to active opencast mining areas, showing steep gradient towards mine void. Other
than that, there is no mining effect in the water level within JCF area and RCF area
(part). Historical water level data and hydrograph of permanent observation stations
from CGWB shown in Annexure–III.
Monitoring groundwater (quantity & quality) to assess the present condition and
resource has been done regularly in the coalfield areas. Well hydrographs
(Annexure–III and VI) are prepared and studied to identify potentially adverse
trends so that appropriate action can be taken to protect groundwater resource.
According to the hydrograph trend analysis of CGWB monitoring wells and CMPDI
observation wells, there are decline trends in both Pre and Post-monsoon GW level
trends (max. upto 0.50 cm/year in Cluster-V and Cluster-VI) but no significant decline
trend (>1.0 m/year) of water level is noticed in any particular area for the last 10
years within the coalfield area. Regarding quality monitoring, the water sample
location map (Figure No–2) with collection points details (dug wells) are given in
Annexure–IV and Quality is given in Annexure–V.
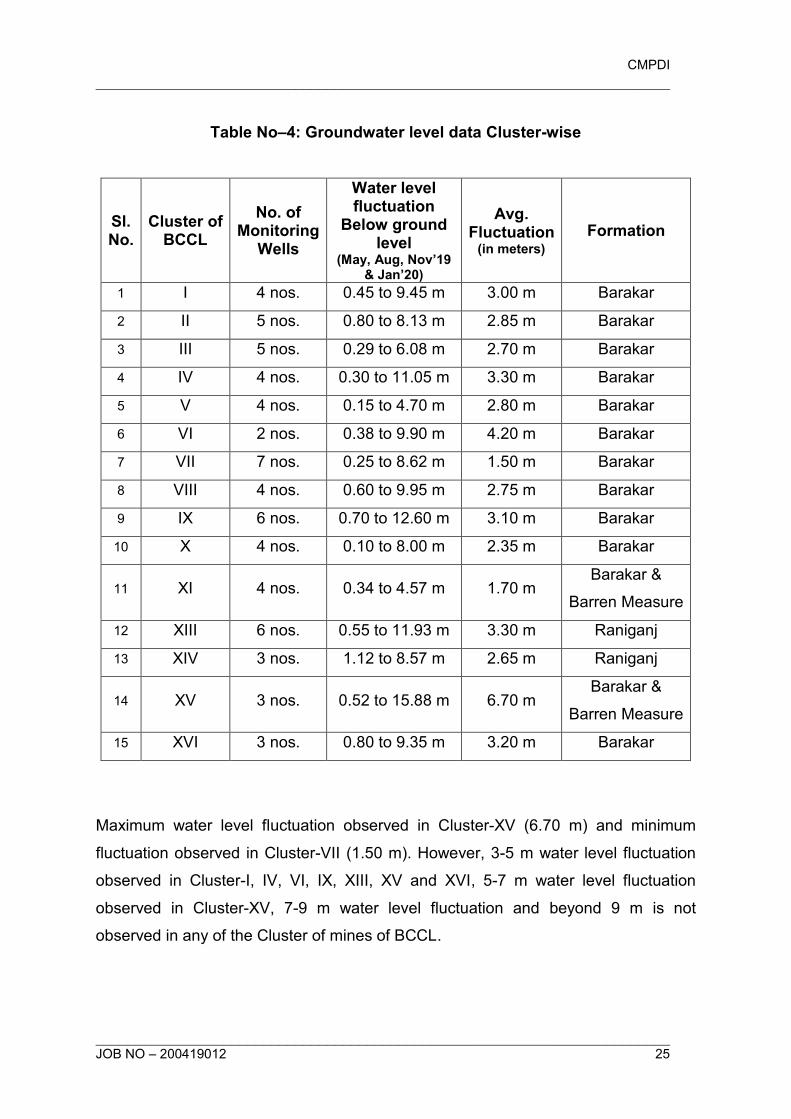
CMPDI
________________________________________________________________________
________________________________________________________________________ JOB NO – 200419012 25
Table No–4: Groundwater level data Cluster-wise
Sl. No.
Cluster of BCCL
No. of Monitoring
Wells
Water level fluctuation
Below ground level
(May, Aug, Nov’19 & Jan’20)
Avg. Fluctuation
(in meters)
Formation
1 I 4 nos. 0.45 to 9.45 m 3.00 m Barakar
2 II 5 nos. 0.80 to 8.13 m 2.85 m Barakar
3 III 5 nos. 0.29 to 6.08 m 2.70 m Barakar
4 IV 4 nos. 0.30 to 11.05 m 3.30 m Barakar
5 V 4 nos. 0.15 to 4.70 m 2.80 m Barakar
6 VI 2 nos. 0.38 to 9.90 m 4.20 m Barakar
7 VII 7 nos. 0.25 to 8.62 m 1.50 m Barakar
8 VIII 4 nos. 0.60 to 9.95 m 2.75 m Barakar
9 IX 6 nos. 0.70 to 12.60 m 3.10 m Barakar
10 X 4 nos. 0.10 to 8.00 m 2.35 m Barakar
11 XI 4 nos. 0.34 to 4.57 m 1.70 m Barakar &
Barren Measure
12 XIII 6 nos. 0.55 to 11.93 m 3.30 m Raniganj
13 XIV 3 nos. 1.12 to 8.57 m 2.65 m Raniganj
14 XV 3 nos. 0.52 to 15.88 m 6.70 m Barakar &
Barren Measure
15 XVI 3 nos. 0.80 to 9.35 m 3.20 m Barakar
Maximum water level fluctuation observed in Cluster-XV (6.70 m) and minimum
fluctuation observed in Cluster-VII (1.50 m). However, 3-5 m water level fluctuation
observed in Cluster-I, IV, VI, IX, XIII, XV and XVI, 5-7 m water level fluctuation
observed in Cluster-XV, 7-9 m water level fluctuation and beyond 9 m is not
observed in any of the Cluster of mines of BCCL.
CMPDI
________________________________________________________________________
________________________________________________________________________ JOB NO – 200419012 26
5.0 GROUNDWATER QUALITY
The ground water sample of the study area (15 nos. of Cluster of mines, BCCL) have
been collected from dug wells and analysed. Fifteen ground water samples (GW-1,
2, 3, 4, 5, 6, 7, 8, 9, 10, 11, 13, 14, 15 & 16) were analysed during the month of
May’2019 at CMPDI, RI-II, Dhanbad. The water sampling details are given in
Annexure–IV and Water sample locations are shown in Figure No-2. The water
quality data are enclosed in Annexure–V.
The study of the variations in water quality parameters are described below:
The pH of the groundwater samples varies between 7.64 (GW-6) to 8.14 (GW-7) in
May 2019, the pH is within the ISI limit of drinking water standard.
The mineral constituents dissolved in water constitute the dissolved solids. The total
dissolve solids vary from 366 (GW-5) to 796 mg/l (GW-6) in May 2019, the TDS
values are above the IS 10500 standards of drinking water.
During the month of May’19 the alkalinity of the water samples varies from 66 (GW-
11) to 124 mg/l (GW-7) and are within the stipulated standard of (200 mg/l) drinking
water. The concentrations of calcium in the water samples vary from 28 (GW-16) to
84 mg/l (GW-6) and are slightly above the permissible limit (75 mg/l) of drinking
water standards. The total hardness ranges between 170 (GW-16) to 420 mg/l (GW-
3) and the value of total hardness in water samples are above the permissible limit
(200 mg/l). The sulphate ranges between 68 (GW-14) to 136 mg/l (GW-3) and the
value of sulphate in water sample are within the permissible limit (200 mg/l). The
Iron, Copper, Manganese, Lead, Zinc and Chromium concentration in the water
samples are found to be below the upper ISI limits for drinking water.
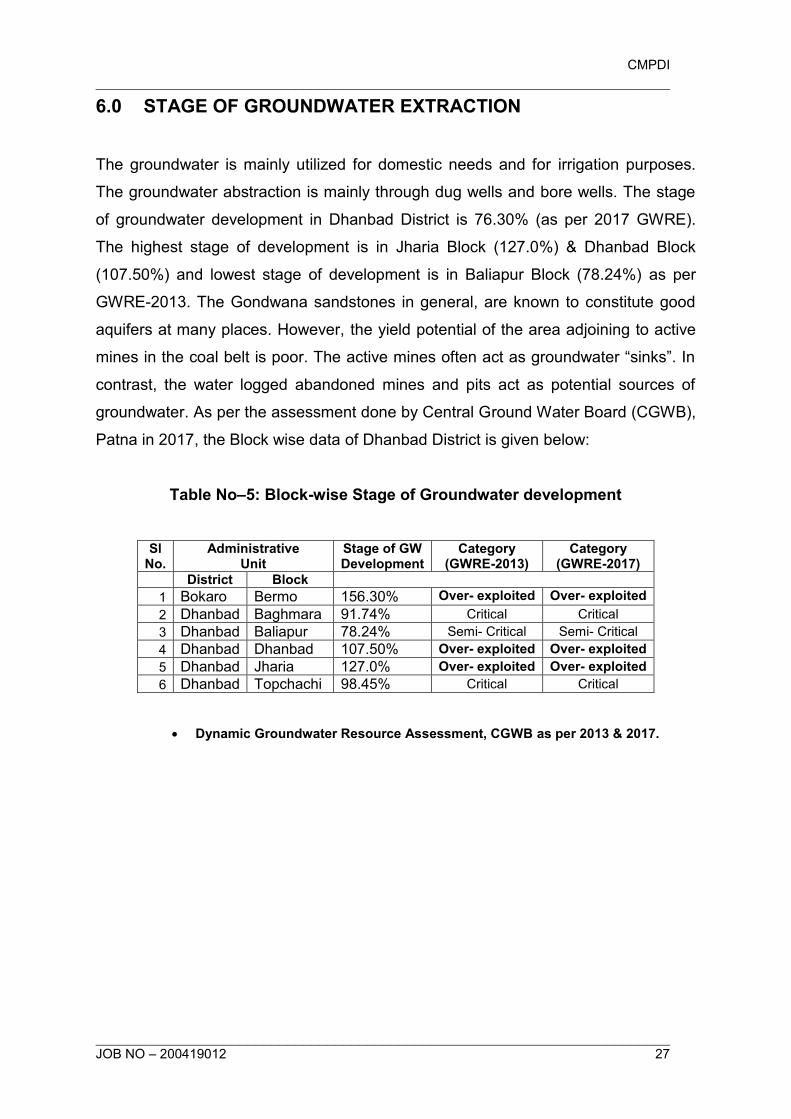
CMPDI
________________________________________________________________________
________________________________________________________________________ JOB NO – 200419012 27
6.0 STAGE OF GROUNDWATER EXTRACTION
The groundwater is mainly utilized for domestic needs and for irrigation purposes.
The groundwater abstraction is mainly through dug wells and bore wells. The stage
of groundwater development in Dhanbad District is 76.30% (as per 2017 GWRE).
The highest stage of development is in Jharia Block (127.0%) & Dhanbad Block
(107.50%) and lowest stage of development is in Baliapur Block (78.24%) as per
GWRE-2013. The Gondwana sandstones in general, are known to constitute good
aquifers at many places. However, the yield potential of the area adjoining to active
mines in the coal belt is poor. The active mines often act as groundwater “sinks”. In
contrast, the water logged abandoned mines and pits act as potential sources of
groundwater. As per the assessment done by Central Ground Water Board (CGWB),
Patna in 2017, the Block wise data of Dhanbad District is given below:
Table No–5: Block-wise Stage of Groundwater development
Sl No.
Administrative Unit
Stage of GW Development
Category (GWRE-2013)
Category (GWRE-2017)
District Block
1 Bokaro Bermo 156.30% Over- exploited Over- exploited
2 Dhanbad Baghmara 91.74% Critical Critical
3 Dhanbad Baliapur 78.24% Semi- Critical Semi- Critical
4 Dhanbad Dhanbad 107.50% Over- exploited Over- exploited
5 Dhanbad Jharia 127.0% Over- exploited Over- exploited
6 Dhanbad Topchachi 98.45% Critical Critical
· Dynamic Groundwater Resource Assessment, CGWB as per 2013 & 2017.
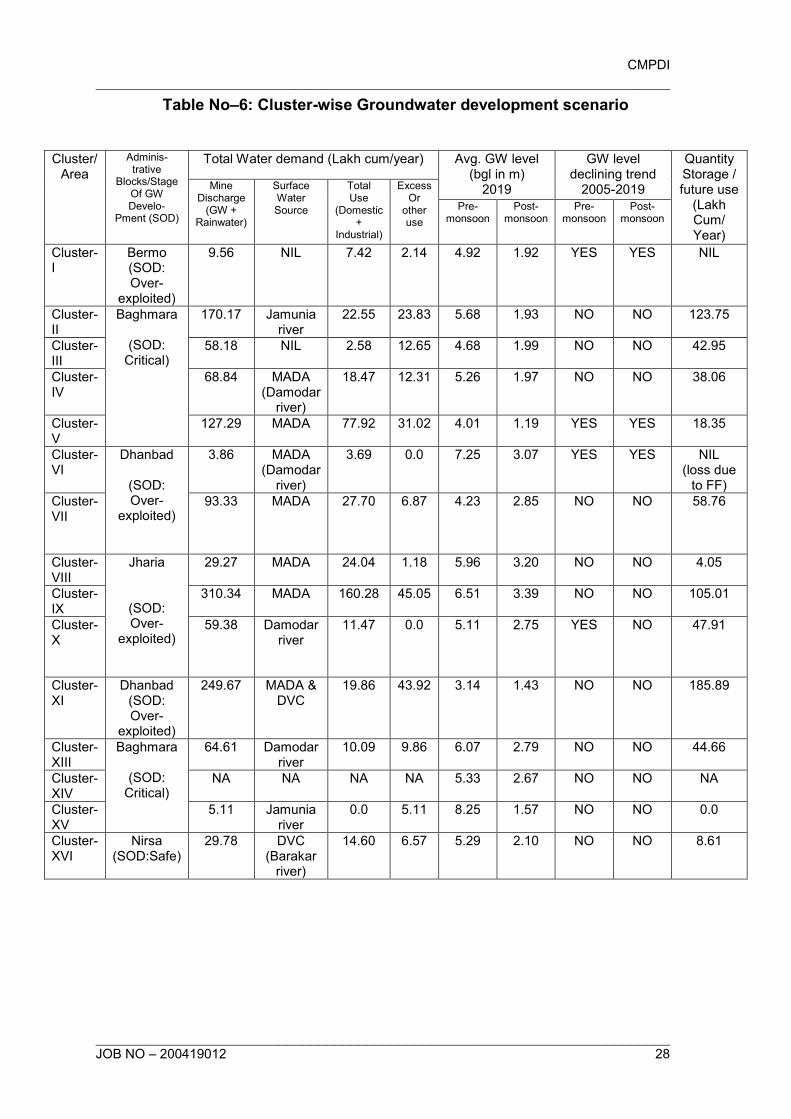
CMPDI
________________________________________________________________________
________________________________________________________________________ JOB NO – 200419012 28
Table No–6: Cluster-wise Groundwater development scenario
Cluster/ Area
Adminis- trative
Blocks/Stage Of GW Develo-
Pment (SOD)
Total Water demand (Lakh cum/year) Avg. GW level (bgl in m)
2019
GW level declining trend
2005-2019
Quantity Storage / future use
(Lakh Cum/ Year)
Mine Discharge
(GW + Rainwater)
Surface Water Source
Total Use
(Domestic +
Industrial)
Excess Or
other use
Pre- monsoon
Post- monsoon
Pre- monsoon
Post- monsoon
Cluster-I
Bermo (SOD: Over-
exploited)
9.56 NIL 7.42 2.14 4.92 1.92 YES YES NIL
Cluster-II
Baghmara
(SOD: Critical)
170.17 Jamunia river
22.55 23.83 5.68 1.93 NO NO 123.75
Cluster-III
58.18 NIL 2.58 12.65 4.68 1.99 NO NO 42.95
Cluster-IV
68.84 MADA (Damodar
river)
18.47 12.31 5.26 1.97 NO NO 38.06
Cluster-V
127.29 MADA 77.92 31.02 4.01 1.19 YES YES 18.35
Cluster-VI
Dhanbad
(SOD: Over-
exploited)
3.86 MADA (Damodar
river)
3.69 0.0 7.25 3.07 YES YES NIL (loss due
to FF)
Cluster-VII
93.33 MADA 27.70 6.87 4.23 2.85 NO NO 58.76
Cluster-VIII
Jharia
(SOD: Over-
exploited)
29.27 MADA 24.04 1.18 5.96 3.20 NO NO 4.05
Cluster-IX
310.34 MADA 160.28 45.05 6.51 3.39 NO NO 105.01
Cluster-X
59.38 Damodar river
11.47 0.0 5.11 2.75 YES NO 47.91
Cluster-XI
Dhanbad (SOD: Over-
exploited)
249.67 MADA & DVC
19.86 43.92 3.14 1.43 NO NO 185.89
Cluster-XIII
Baghmara
(SOD: Critical)
64.61 Damodar river
10.09 9.86 6.07 2.79 NO NO 44.66
Cluster-XIV
NA NA NA NA 5.33 2.67 NO NO NA
Cluster-XV
5.11 Jamunia river
0.0 5.11 8.25 1.57 NO NO 0.0
Cluster-XVI
Nirsa (SOD:Safe)
29.78 DVC (Barakar
river)
14.60 6.57 5.29 2.10 NO NO 8.61
CMPDI
________________________________________________________________________
________________________________________________________________________ JOB NO – 200419012 29
7.0 CONSERVATION MEASURES & FUTURE STRATEGY
Ø BCCL has installed 25 Pressure Filter Plant of total capacity of 4.16 MGD to
meet drinking water requirement nearby the area. At present 63 Water
Treatment Plants are operational having capacity of 16.16 MGD within Jharia
Coalfield area. Further installation of 28 more Pressure Filter Plants with the
capacity of 5.84 MGD are in progress.
Ø BCCL participated in development of low cost technology for drinking water in
a CSIR project along with CIMFR, Dhanbad and a pilot plant of 4000
Liters/hour is functional at PB Project site of BCCL. Similar plant has been
proposed at other sites of BCCL.
Ø A scheme entitled ‘Scheme for multi-purpose utilization of surplus mine water
of Barora Area, Block II and Govindpur Area of BCCL’ was prepared with a
view to harness the excess water discharge to take care of the persistence
problem of water scarcity in the nearby villages. In the scheme, two water
reservoirs of capacity 27 MG and 17 MG have been proposed in the non-coal
bearing area for storage of 3250 GPM and 2000 GPM surplus mine water
which will be fed through pipe line by mine discharge at mines of Barora,
Block-II and Govindpur Area.
Ø Roof-top rainwater harvesting (RWH) will be taken up in the project area using
the administrative buildings. 138 no. of quarters having roof-top area of about
14950 sq. m. is already prepared to harvest rainwater and around 13150
cum/annum of water is going to be recharged the nearby groundwater system
through RWH structures. Proposal already made to facilitate this kind of RWH
structure at suitable locations i.e. Lodna Area, Kusunda Area (Jawahar Nagar,
Matkuria, Coal Board Colony), Sijua Area (Nichitpur and Tetulmari Colony)
within Jharia Coalfield to augment groundwater recharge.
Ø After cessation of mining, with plenty rainfall and abundant ground water
recharge, the water levels will recoup and attain normalcy. Thus, the impact of
mining on groundwater system may be considered as a temporary
CMPDI
________________________________________________________________________
________________________________________________________________________ JOB NO – 200419012 30
phenomenon. The abandoned mine workings (UG) behave as water pool and
improves the resources availability in the coalfield area.
Ø Utilization of treated mine water discharge by both industry and local people in
the mine influence area. The excess mine water can be used to recharge
groundwater system through connecting pipeline to abandoned dug wells.
Utilization of mine water for irrigation use will also enhance the ground water
recharge potential through artificial recharge in the area.
Ø Increase vegetative cover by plantation in the mine area under land
amelioration measures. This will contain the surface run-off and increase the
groundwater recharge.
Ø Creation of awareness among workers and local peoples about Rain water
harvesting and artificial recharge will be given priority. This aspect is usually
covered during the Environmental Week celebrated every year (5 to 12 June).
Ø Monitoring of water quality of mine water discharge, local River/nala and
domestic water source (dug well/hand pump wells) will be continued under
routine monitoring (February, May, August & November).
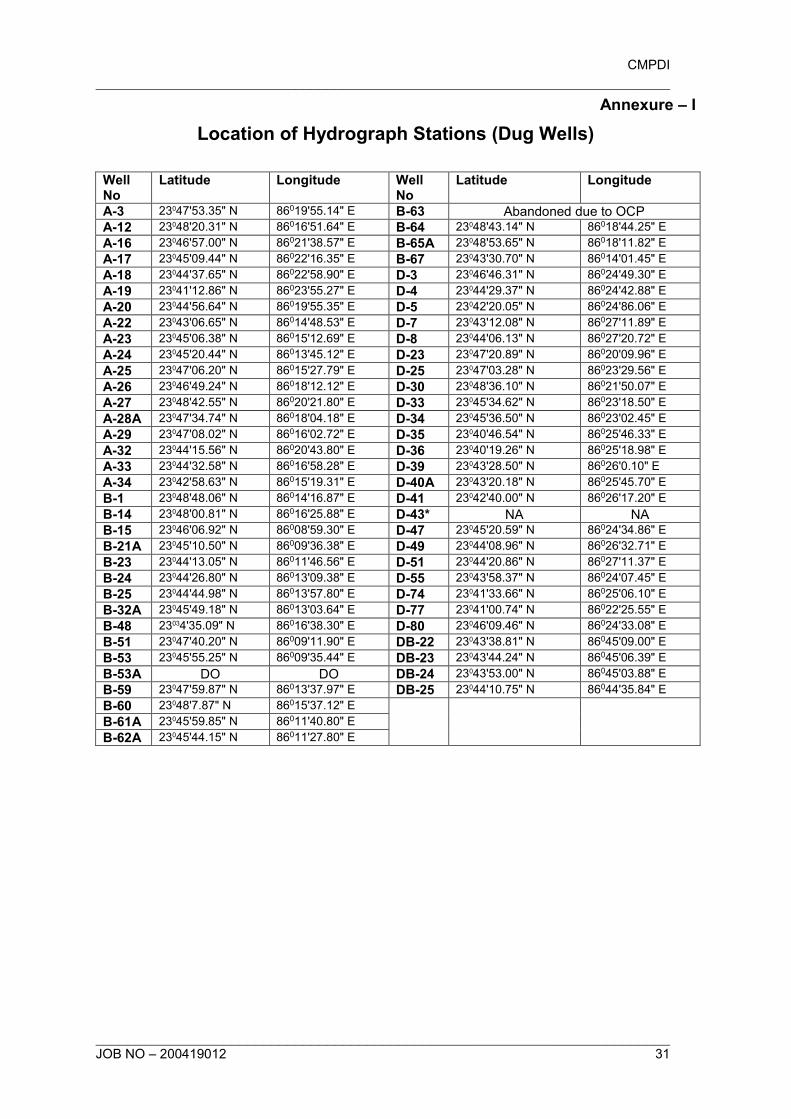
CMPDI
________________________________________________________________________
________________________________________________________________________ JOB NO – 200419012 31
Annexure – I
Location of Hydrograph Stations (Dug Wells)
Well No
Latitude Longitude Well No
Latitude Longitude
A-3 23047'53.35" N 86019'55.14" E B-63 Abandoned due to OCP
A-12 23048'20.31" N 86016'51.64" E B-64 23048'43.14" N 86018'44.25" E
A-16 23046'57.00" N 86021'38.57" E B-65A 23048'53.65" N 86018'11.82" E
A-17 23045'09.44" N 86022'16.35" E B-67 23043'30.70" N 86014'01.45" E
A-18 23044'37.65" N 86022'58.90" E D-3 23046'46.31" N 86024'49.30" E
A-19 23041'12.86" N 86023'55.27" E D-4 23044'29.37" N 86024'42.88" E
A-20 23044'56.64" N 86019'55.35" E D-5 23042'20.05" N 86024'86.06" E
A-22 23043'06.65" N 86014'48.53" E D-7 23043'12.08" N 86027'11.89" E
A-23 23045'06.38" N 86015'12.69" E D-8 23044'06.13" N 86027'20.72" E
A-24 23045'20.44" N 86013'45.12" E D-23 23047'20.89" N 86020'09.96" E
A-25 23047'06.20" N 86015'27.79" E D-25 23047'03.28" N 86023'29.56" E
A-26 23046'49.24" N 86018'12.12" E D-30 23048'36.10" N 86021'50.07" E
A-27 23048'42.55" N 86020'21.80" E D-33 23045'34.62" N 86023'18.50" E
A-28A 23047'34.74" N 86018'04.18" E D-34 23045'36.50" N 86023'02.45" E
A-29 23047'08.02" N 86016'02.72" E D-35 23040'46.54" N 86025'46.33" E
A-32 23044'15.56" N 86020'43.80" E D-36 23040'19.26" N 86025'18.98" E
A-33 23044'32.58" N 86016'58.28" E D-39 23043'28.50" N 86026'0.10" E
A-34 23042'58.63" N 86015'19.31" E D-40A 23043'20.18" N 86025'45.70" E
B-1 23048'48.06" N 86014'16.87" E D-41 23042'40.00" N 86026'17.20" E
B-14 23048'00.81" N 86016'25.88" E D-43* NA NA
B-15 23046'06.92" N 86008'59.30" E D-47 23045'20.59" N 86024'34.86" E
B-21A 23045'10.50" N 86009'36.38" E D-49 23044'08.96" N 86026'32.71" E
B-23 23044'13.05" N 86011'46.56" E D-51 23044'20.86" N 86027'11.37" E
B-24 23044'26.80" N 86013'09.38" E D-55 23043'58.37" N 86024'07.45" E
B-25 23044'44.98" N 86013'57.80" E D-74 23041'33.66" N 86025'06.10" E
B-32A 23045'49.18" N 86013'03.64" E D-77 23041'00.74" N 86022'25.55" E
B-48 23034'35.09" N 86016'38.30" E D-80 23046'09.46" N 86024'33.08" E
B-51 23047'40.20" N 86009'11.90" E DB-22 23043'38.81" N 86045'09.00" E
B-53 23045'55.25" N 86009'35.44" E DB-23 23043'44.24" N 86045'06.39" E
B-53A DO DO DB-24 23043'53.00" N 86045'03.88" E
B-59 23047'59.87" N 86013'37.97" E DB-25 23044'10.75" N 86044'35.84" E
B-60 23048'7.87" N 86015'37.12" E
B-61A 23045'59.85" N 86011'40.80" E
B-62A 23045'44.15" N 86011'27.80" E
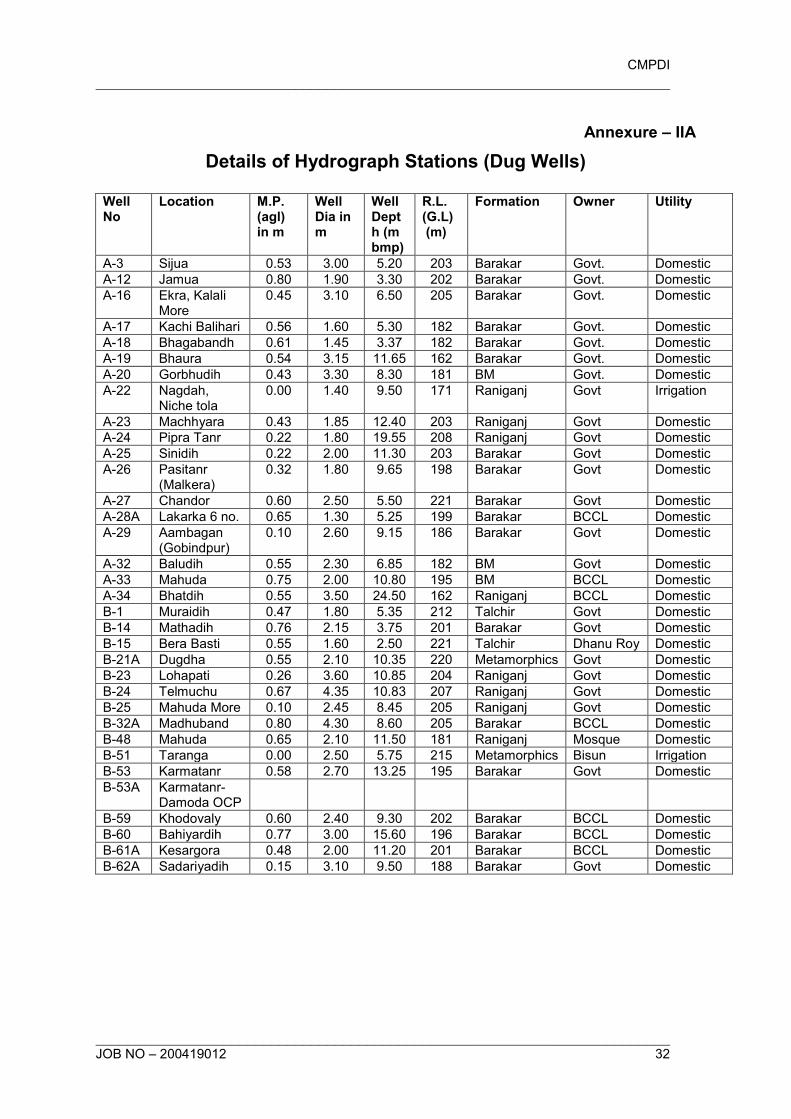
CMPDI
________________________________________________________________________
________________________________________________________________________ JOB NO – 200419012 32
Annexure – IIA
Details of Hydrograph Stations (Dug Wells) Well No
Location M.P. (agl) in m
Well Dia in m
Well Depth (m bmp)
R.L. (G.L) (m)
Formation Owner Utility
A-3 Sijua 0.53 3.00 5.20 203 Barakar Govt. Domestic
A-12 Jamua 0.80 1.90 3.30 202 Barakar Govt. Domestic
A-16 Ekra, Kalali More
0.45 3.10 6.50 205 Barakar Govt. Domestic
A-17 Kachi Balihari 0.56 1.60 5.30 182 Barakar Govt. Domestic
A-18 Bhagabandh 0.61 1.45 3.37 182 Barakar Govt. Domestic
A-19 Bhaura 0.54 3.15 11.65 162 Barakar Govt. Domestic
A-20 Gorbhudih 0.43 3.30 8.30 181 BM Govt. Domestic
A-22 Nagdah, Niche tola
0.00 1.40 9.50 171 Raniganj Govt Irrigation
A-23 Machhyara 0.43 1.85 12.40 203 Raniganj Govt Domestic
A-24 Pipra Tanr 0.22 1.80 19.55 208 Raniganj Govt Domestic
A-25 Sinidih 0.22 2.00 11.30 203 Barakar Govt Domestic
A-26 Pasitanr (Malkera)
0.32 1.80 9.65 198 Barakar Govt Domestic
A-27 Chandor 0.60 2.50 5.50 221 Barakar Govt Domestic
A-28A Lakarka 6 no. 0.65 1.30 5.25 199 Barakar BCCL Domestic
A-29 Aambagan (Gobindpur)
0.10 2.60 9.15 186 Barakar Govt Domestic
A-32 Baludih 0.55 2.30 6.85 182 BM Govt Domestic
A-33 Mahuda 0.75 2.00 10.80 195 BM BCCL Domestic
A-34 Bhatdih 0.55 3.50 24.50 162 Raniganj BCCL Domestic
B-1 Muraidih 0.47 1.80 5.35 212 Talchir Govt Domestic
B-14 Mathadih 0.76 2.15 3.75 201 Barakar Govt Domestic
B-15 Bera Basti 0.55 1.60 2.50 221 Talchir Dhanu Roy Domestic
B-21A Dugdha 0.55 2.10 10.35 220 Metamorphics Govt Domestic
B-23 Lohapati 0.26 3.60 10.85 204 Raniganj Govt Domestic
B-24 Telmuchu 0.67 4.35 10.83 207 Raniganj Govt Domestic
B-25 Mahuda More 0.10 2.45 8.45 205 Raniganj Govt Domestic
B-32A Madhuband 0.80 4.30 8.60 205 Barakar BCCL Domestic
B-48 Mahuda 0.65 2.10 11.50 181 Raniganj Mosque Domestic
B-51 Taranga 0.00 2.50 5.75 215 Metamorphics Bisun Irrigation
B-53 Karmatanr 0.58 2.70 13.25 195 Barakar Govt Domestic
B-53A Karmatanr-Damoda OCP
B-59 Khodovaly 0.60 2.40 9.30 202 Barakar BCCL Domestic
B-60 Bahiyardih 0.77 3.00 15.60 196 Barakar BCCL Domestic
B-61A Kesargora 0.48 2.00 11.20 201 Barakar BCCL Domestic
B-62A Sadariyadih 0.15 3.10 9.50 188 Barakar Govt Domestic
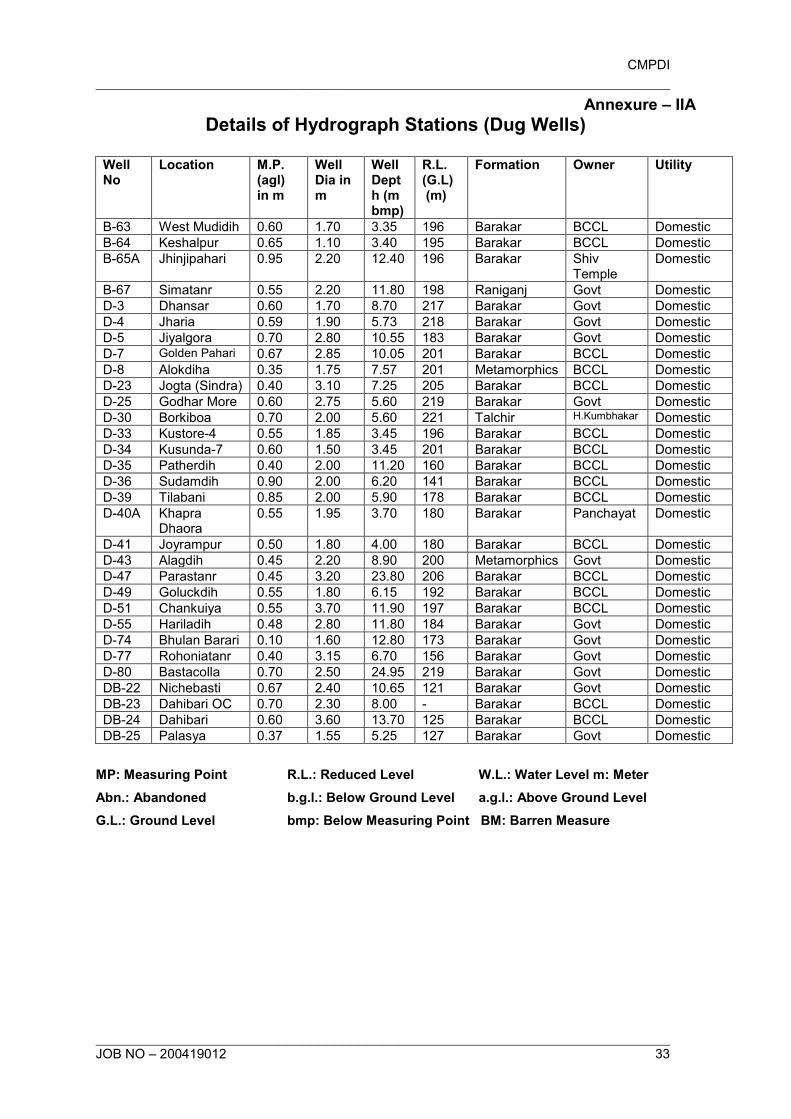
CMPDI
________________________________________________________________________
________________________________________________________________________ JOB NO – 200419012 33
Annexure – IIA
Details of Hydrograph Stations (Dug Wells) Well No
Location M.P. (agl) in m
Well Dia in m
Well Depth (m bmp)
R.L. (G.L) (m)
Formation Owner Utility
B-63 West Mudidih 0.60 1.70 3.35 196 Barakar BCCL Domestic
B-64 Keshalpur 0.65 1.10 3.40 195 Barakar BCCL Domestic
B-65A Jhinjipahari 0.95 2.20 12.40 196 Barakar Shiv Temple
Domestic
B-67 Simatanr 0.55 2.20 11.80 198 Raniganj Govt Domestic
D-3 Dhansar 0.60 1.70 8.70 217 Barakar Govt Domestic
D-4 Jharia 0.59 1.90 5.73 218 Barakar Govt Domestic
D-5 Jiyalgora 0.70 2.80 10.55 183 Barakar Govt Domestic
D-7 Golden Pahari 0.67 2.85 10.05 201 Barakar BCCL Domestic
D-8 Alokdiha 0.35 1.75 7.57 201 Metamorphics BCCL Domestic
D-23 Jogta (Sindra) 0.40 3.10 7.25 205 Barakar BCCL Domestic
D-25 Godhar More 0.60 2.75 5.60 219 Barakar Govt Domestic
D-30 Borkiboa 0.70 2.00 5.60 221 Talchir H.Kumbhakar Domestic
D-33 Kustore-4 0.55 1.85 3.45 196 Barakar BCCL Domestic
D-34 Kusunda-7 0.60 1.50 3.45 201 Barakar BCCL Domestic
D-35 Patherdih 0.40 2.00 11.20 160 Barakar BCCL Domestic
D-36 Sudamdih 0.90 2.00 6.20 141 Barakar BCCL Domestic
D-39 Tilabani 0.85 2.00 5.90 178 Barakar BCCL Domestic
D-40A Khapra Dhaora
0.55 1.95 3.70 180 Barakar Panchayat Domestic
D-41 Joyrampur 0.50 1.80 4.00 180 Barakar BCCL Domestic
D-43 Alagdih 0.45 2.20 8.90 200 Metamorphics Govt Domestic
D-47 Parastanr 0.45 3.20 23.80 206 Barakar BCCL Domestic
D-49 Goluckdih 0.55 1.80 6.15 192 Barakar BCCL Domestic
D-51 Chankuiya 0.55 3.70 11.90 197 Barakar BCCL Domestic
D-55 Hariladih 0.48 2.80 11.80 184 Barakar Govt Domestic
D-74 Bhulan Barari 0.10 1.60 12.80 173 Barakar Govt Domestic
D-77 Rohoniatanr 0.40 3.15 6.70 156 Barakar Govt Domestic
D-80 Bastacolla 0.70 2.50 24.95 219 Barakar Govt Domestic
DB-22 Nichebasti 0.67 2.40 10.65 121 Barakar Govt Domestic
DB-23 Dahibari OC 0.70 2.30 8.00 - Barakar BCCL Domestic
DB-24 Dahibari 0.60 3.60 13.70 125 Barakar BCCL Domestic
DB-25 Palasya 0.37 1.55 5.25 127 Barakar Govt Domestic
MP: Measuring Point R.L.: Reduced Level W.L.: Water Level m: Meter
Abn.: Abandoned b.g.l.: Below Ground Level a.g.l.: Above Ground Level
G.L.: Ground Level bmp: Below Measuring Point BM: Barren Measure
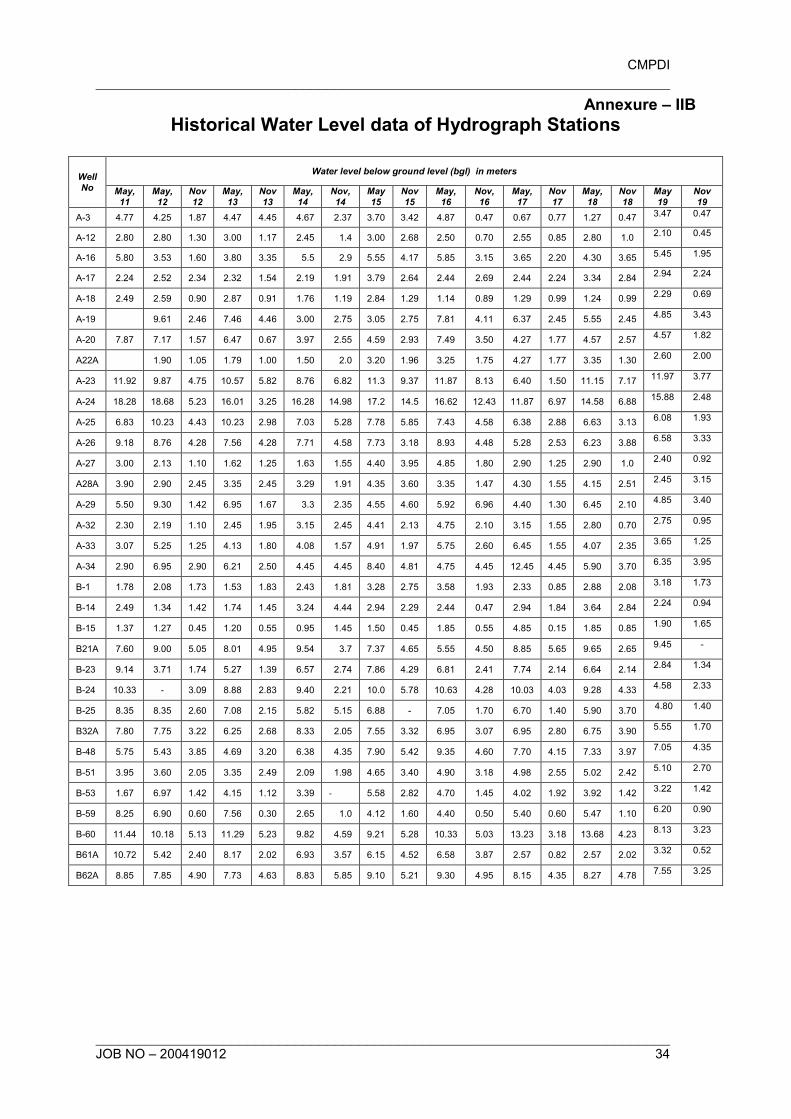
CMPDI
________________________________________________________________________
________________________________________________________________________ JOB NO – 200419012 34
Annexure – IIB
Historical Water Level data of Hydrograph Stations
Well No
Water level below ground level (bgl) in meters
May, 11
May, 12
Nov 12
May, 13
Nov 13
May, 14
Nov, 14
May 15
Nov 15
May, 16
Nov, 16
May, 17
Nov 17
May, 18
Nov 18
May 19
Nov 19
A-3 4.77 4.25 1.87 4.47 4.45 4.67 2.37 3.70 3.42 4.87 0.47 0.67 0.77 1.27 0.47 3.47 0.47
A-12 2.80 2.80 1.30 3.00 1.17 2.45 1.4 3.00 2.68 2.50 0.70 2.55 0.85 2.80 1.0 2.10 0.45
A-16 5.80 3.53 1.60 3.80 3.35 5.5 2.9 5.55 4.17 5.85 3.15 3.65 2.20 4.30 3.65 5.45 1.95
A-17 2.24 2.52 2.34 2.32 1.54 2.19 1.91 3.79 2.64 2.44 2.69 2.44 2.24 3.34 2.84 2.94 2.24
A-18 2.49 2.59 0.90 2.87 0.91 1.76 1.19 2.84 1.29 1.14 0.89 1.29 0.99 1.24 0.99 2.29 0.69
A-19 9.61 2.46 7.46 4.46 3.00 2.75 3.05 2.75 7.81 4.11 6.37 2.45 5.55 2.45 4.85 3.43
A-20 7.87 7.17 1.57 6.47 0.67 3.97 2.55 4.59 2.93 7.49 3.50 4.27 1.77 4.57 2.57 4.57 1.82
A22A 1.90 1.05 1.79 1.00 1.50 2.0 3.20 1.96 3.25 1.75 4.27 1.77 3.35 1.30 2.60 2.00
A-23 11.92 9.87 4.75 10.57 5.82 8.76 6.82 11.3 9.37 11.87 8.13 6.40 1.50 11.15 7.17 11.97 3.77
A-24 18.28 18.68 5.23 16.01 3.25 16.28 14.98 17.2 14.5 16.62 12.43 11.87 6.97 14.58 6.88 15.88 2.48
A-25 6.83 10.23 4.43 10.23 2.98 7.03 5.28 7.78 5.85 7.43 4.58 6.38 2.88 6.63 3.13 6.08 1.93
A-26 9.18 8.76 4.28 7.56 4.28 7.71 4.58 7.73 3.18 8.93 4.48 5.28 2.53 6.23 3.88 6.58 3.33
A-27 3.00 2.13 1.10 1.62 1.25 1.63 1.55 4.40 3.95 4.85 1.80 2.90 1.25 2.90 1.0 2.40 0.92
A28A 3.90 2.90 2.45 3.35 2.45 3.29 1.91 4.35 3.60 3.35 1.47 4.30 1.55 4.15 2.51 2.45 3.15
A-29 5.50 9.30 1.42 6.95 1.67 3.3 2.35 4.55 4.60 5.92 6.96 4.40 1.30 6.45 2.10 4.85 3.40
A-32 2.30 2.19 1.10 2.45 1.95 3.15 2.45 4.41 2.13 4.75 2.10 3.15 1.55 2.80 0.70 2.75 0.95
A-33 3.07 5.25 1.25 4.13 1.80 4.08 1.57 4.91 1.97 5.75 2.60 6.45 1.55 4.07 2.35 3.65 1.25
A-34 2.90 6.95 2.90 6.21 2.50 4.45 4.45 8.40 4.81 4.75 4.45 12.45 4.45 5.90 3.70 6.35 3.95
B-1 1.78 2.08 1.73 1.53 1.83 2.43 1.81 3.28 2.75 3.58 1.93 2.33 0.85 2.88 2.08 3.18 1.73
B-14 2.49 1.34 1.42 1.74 1.45 3.24 4.44 2.94 2.29 2.44 0.47 2.94 1.84 3.64 2.84 2.24 0.94
B-15 1.37 1.27 0.45 1.20 0.55 0.95 1.45 1.50 0.45 1.85 0.55 4.85 0.15 1.85 0.85 1.90 1.65
B21A 7.60 9.00 5.05 8.01 4.95 9.54 3.7 7.37 4.65 5.55 4.50 8.85 5.65 9.65 2.65 9.45 -
B-23 9.14 3.71 1.74 5.27 1.39 6.57 2.74 7.86 4.29 6.81 2.41 7.74 2.14 6.64 2.14 2.84 1.34
B-24 10.33 - 3.09 8.88 2.83 9.40 2.21 10.0 5.78 10.63 4.28 10.03 4.03 9.28 4.33 4.58 2.33
B-25 8.35 8.35 2.60 7.08 2.15 5.82 5.15 6.88 - 7.05 1.70 6.70 1.40 5.90 3.70 4.80 1.40
B32A 7.80 7.75 3.22 6.25 2.68 8.33 2.05 7.55 3.32 6.95 3.07 6.95 2.80 6.75 3.90 5.55 1.70
B-48 5.75 5.43 3.85 4.69 3.20 6.38 4.35 7.90 5.42 9.35 4.60 7.70 4.15 7.33 3.97 7.05 4.35
B-51 3.95 3.60 2.05 3.35 2.49 2.09 1.98 4.65 3.40 4.90 3.18 4.98 2.55 5.02 2.42 5.10 2.70
B-53 1.67 6.97 1.42 4.15 1.12 3.39 - 5.58 2.82 4.70 1.45 4.02 1.92 3.92 1.42 3.22 1.42
B-59 8.25 6.90 0.60 7.56 0.30 2.65 1.0 4.12 1.60 4.40 0.50 5.40 0.60 5.47 1.10 6.20 0.90
B-60 11.44 10.18 5.13 11.29 5.23 9.82 4.59 9.21 5.28 10.33 5.03 13.23 3.18 13.68 4.23 8.13 3.23
B61A 10.72 5.42 2.40 8.17 2.02 6.93 3.57 6.15 4.52 6.58 3.87 2.57 0.82 2.57 2.02 3.32 0.52
B62A 8.85 7.85 4.90 7.73 4.63 8.83 5.85 9.10 5.21 9.30 4.95 8.15 4.35 8.27 4.78 7.55 3.25
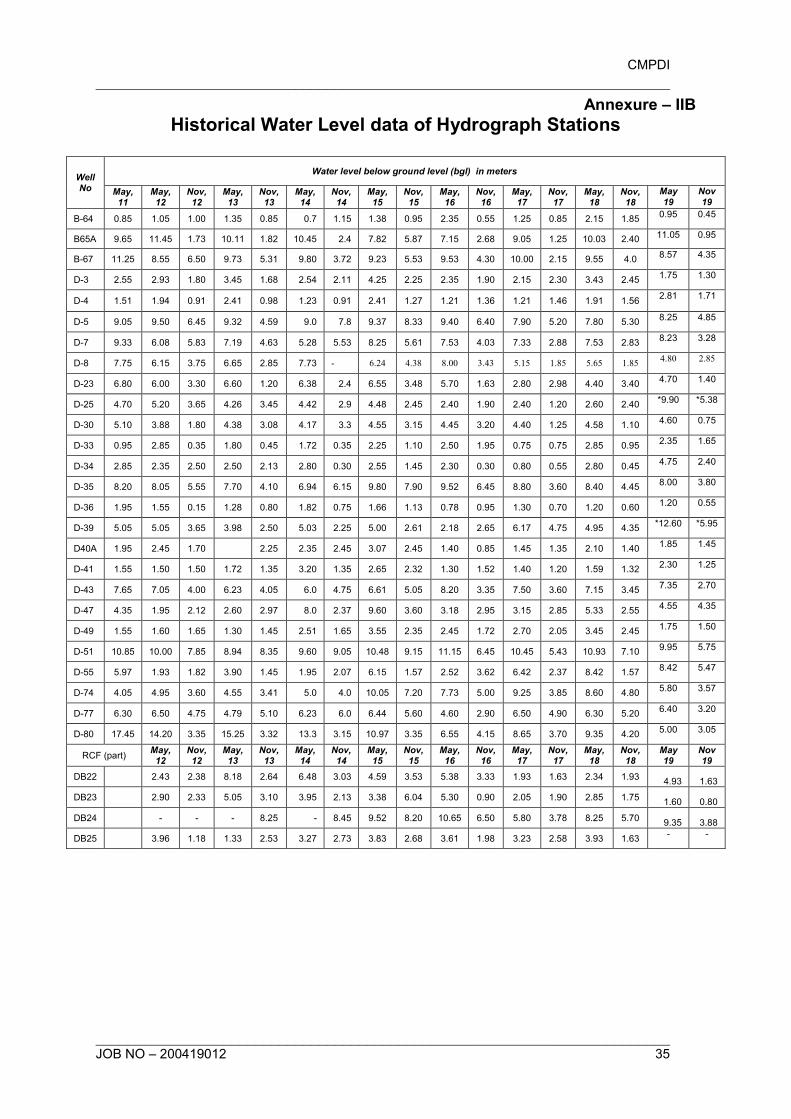
CMPDI
________________________________________________________________________
________________________________________________________________________ JOB NO – 200419012 35
Annexure – IIB
Historical Water Level data of Hydrograph Stations
Well No
Water level below ground level (bgl) in meters
May, 11
May, 12
Nov, 12
May, 13
Nov, 13
May, 14
Nov, 14
May, 15
Nov, 15
May, 16
Nov, 16
May, 17
Nov, 17
May, 18
Nov, 18
May 19
Nov 19
B-64 0.85 1.05 1.00 1.35 0.85 0.7 1.15 1.38 0.95 2.35 0.55 1.25 0.85 2.15 1.85 0.95 0.45
B65A 9.65 11.45 1.73 10.11 1.82 10.45 2.4 7.82 5.87 7.15 2.68 9.05 1.25 10.03 2.40 11.05 0.95
B-67 11.25 8.55 6.50 9.73 5.31 9.80 3.72 9.23 5.53 9.53 4.30 10.00 2.15 9.55 4.0 8.57 4.35
D-3 2.55 2.93 1.80 3.45 1.68 2.54 2.11 4.25 2.25 2.35 1.90 2.15 2.30 3.43 2.45 1.75 1.30
D-4 1.51 1.94 0.91 2.41 0.98 1.23 0.91 2.41 1.27 1.21 1.36 1.21 1.46 1.91 1.56 2.81 1.71
D-5 9.05 9.50 6.45 9.32 4.59 9.0 7.8 9.37 8.33 9.40 6.40 7.90 5.20 7.80 5.30 8.25 4.85
D-7 9.33 6.08 5.83 7.19 4.63 5.28 5.53 8.25 5.61 7.53 4.03 7.33 2.88 7.53 2.83 8.23 3.28
D-8 7.75 6.15 3.75 6.65 2.85 7.73 - 6.24 4.38 8.00 3.43 5.15 1.85 5.65 1.85 4.80 2.85
D-23 6.80 6.00 3.30 6.60 1.20 6.38 2.4 6.55 3.48 5.70 1.63 2.80 2.98 4.40 3.40 4.70 1.40
D-25 4.70 5.20 3.65 4.26 3.45 4.42 2.9 4.48 2.45 2.40 1.90 2.40 1.20 2.60 2.40 *9.90 *5.38
D-30 5.10 3.88 1.80 4.38 3.08 4.17 3.3 4.55 3.15 4.45 3.20 4.40 1.25 4.58 1.10 4.60 0.75
D-33 0.95 2.85 0.35 1.80 0.45 1.72 0.35 2.25 1.10 2.50 1.95 0.75 0.75 2.85 0.95 2.35 1.65
D-34 2.85 2.35 2.50 2.50 2.13 2.80 0.30 2.55 1.45 2.30 0.30 0.80 0.55 2.80 0.45 4.75 2.40
D-35 8.20 8.05 5.55 7.70 4.10 6.94 6.15 9.80 7.90 9.52 6.45 8.80 3.60 8.40 4.45 8.00 3.80
D-36 1.95 1.55 0.15 1.28 0.80 1.82 0.75 1.66 1.13 0.78 0.95 1.30 0.70 1.20 0.60 1.20 0.55
D-39 5.05 5.05 3.65 3.98 2.50 5.03 2.25 5.00 2.61 2.18 2.65 6.17 4.75 4.95 4.35 *12.60 *5.95
D40A 1.95 2.45 1.70 2.25 2.35 2.45 3.07 2.45 1.40 0.85 1.45 1.35 2.10 1.40 1.85 1.45
D-41 1.55 1.50 1.50 1.72 1.35 3.20 1.35 2.65 2.32 1.30 1.52 1.40 1.20 1.59 1.32 2.30 1.25
D-43 7.65 7.05 4.00 6.23 4.05 6.0 4.75 6.61 5.05 8.20 3.35 7.50 3.60 7.15 3.45 7.35 2.70
D-47 4.35 1.95 2.12 2.60 2.97 8.0 2.37 9.60 3.60 3.18 2.95 3.15 2.85 5.33 2.55 4.55 4.35
D-49 1.55 1.60 1.65 1.30 1.45 2.51 1.65 3.55 2.35 2.45 1.72 2.70 2.05 3.45 2.45 1.75 1.50
D-51 10.85 10.00 7.85 8.94 8.35 9.60 9.05 10.48 9.15 11.15 6.45 10.45 5.43 10.93 7.10 9.95 5.75
D-55 5.97 1.93 1.82 3.90 1.45 1.95 2.07 6.15 1.57 2.52 3.62 6.42 2.37 8.42 1.57 8.42 5.47
D-74 4.05 4.95 3.60 4.55 3.41 5.0 4.0 10.05 7.20 7.73 5.00 9.25 3.85 8.60 4.80 5.80 3.57
D-77 6.30 6.50 4.75 4.79 5.10 6.23 6.0 6.44 5.60 4.60 2.90 6.50 4.90 6.30 5.20 6.40 3.20
D-80 17.45 14.20 3.35 15.25 3.32 13.3 3.15 10.97 3.35 6.55 4.15 8.65 3.70 9.35 4.20 5.00 3.05
RCF (part) May, 12
Nov, 12
May, 13
Nov, 13
May, 14
Nov, 14
May, 15
Nov, 15
May, 16
Nov, 16
May, 17
Nov, 17
May, 18
Nov, 18
May 19
Nov 19
DB22 2.43 2.38 8.18 2.64 6.48 3.03 4.59 3.53 5.38 3.33 1.93 1.63 2.34 1.93 4.93 1.63
DB23 2.90 2.33 5.05 3.10 3.95 2.13 3.38 6.04 5.30 0.90 2.05 1.90 2.85 1.75 1.60 0.80
DB24 - - - 8.25 - 8.45 9.52 8.20 10.65 6.50 5.80 3.78 8.25 5.70 9.35 3.88
DB25 3.96 1.18 1.33 2.53 3.27 2.73 3.83 2.68 3.61 1.98 3.23 2.58 3.93 1.63 - -
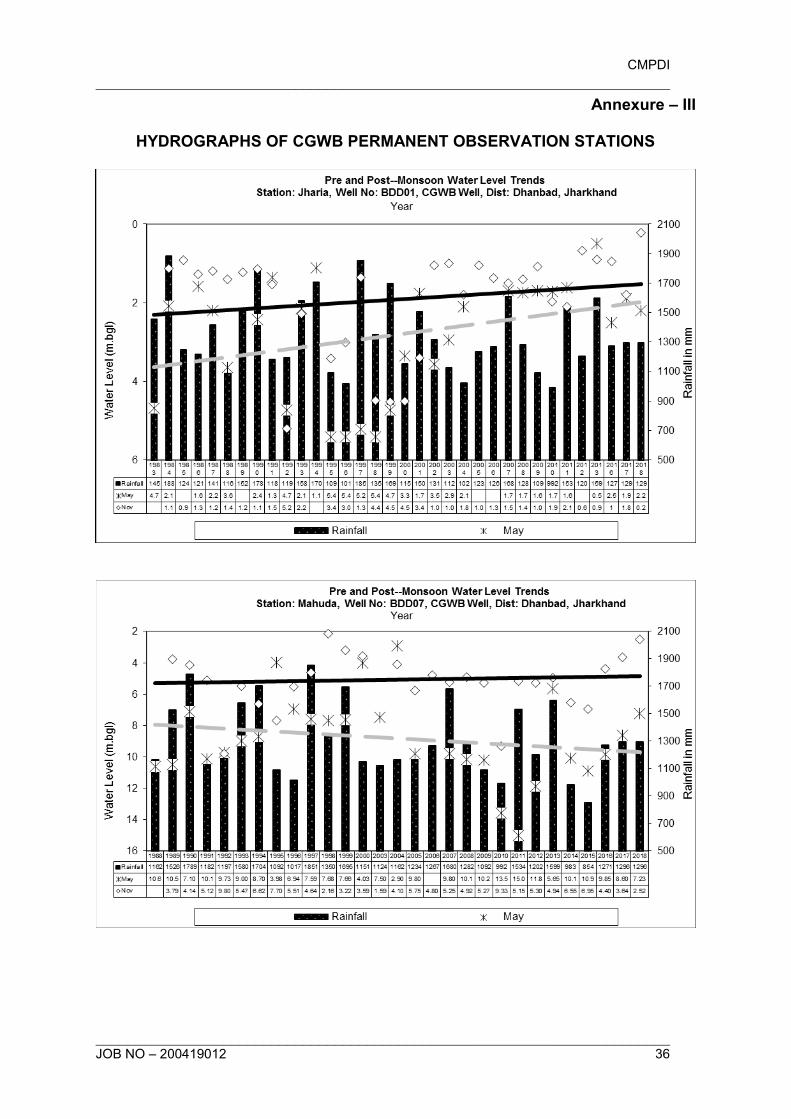
CMPDI
________________________________________________________________________
________________________________________________________________________ JOB NO – 200419012 36
Annexure – III
HYDROGRAPHS OF CGWB PERMANENT OBSERVATION STATIONS
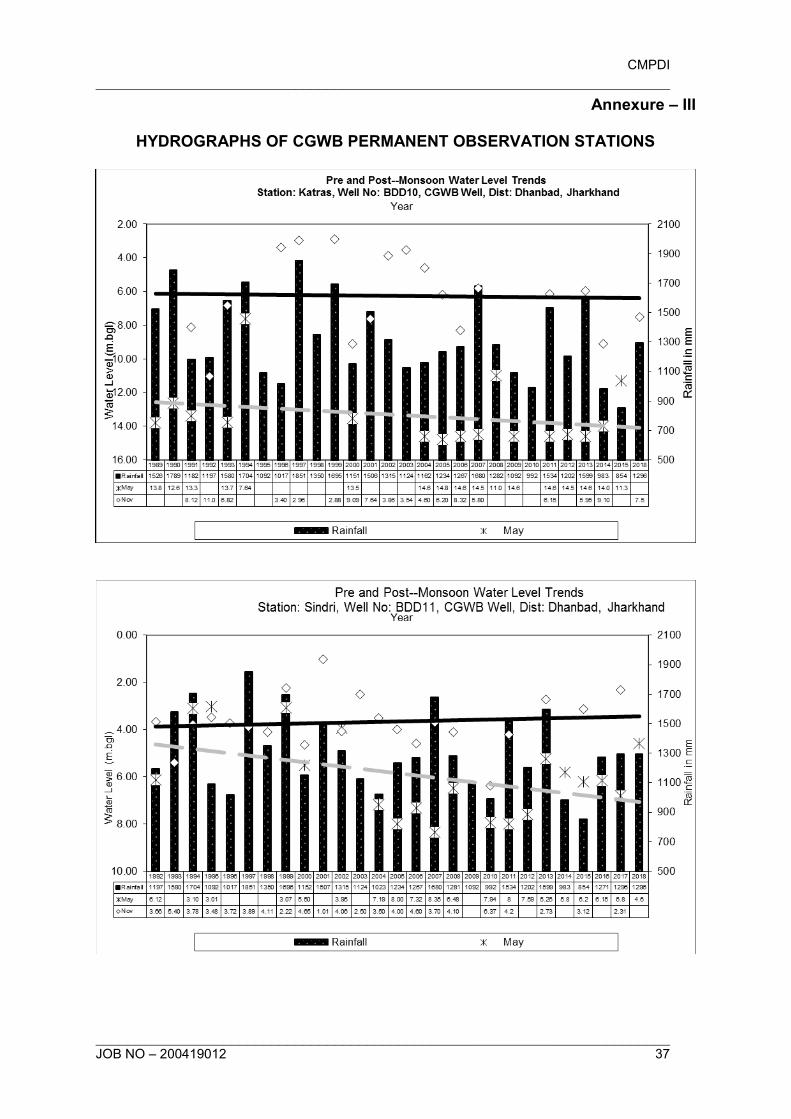
CMPDI
________________________________________________________________________
________________________________________________________________________ JOB NO – 200419012 37
Annexure – III
HYDROGRAPHS OF CGWB PERMANENT OBSERVATION STATIONS
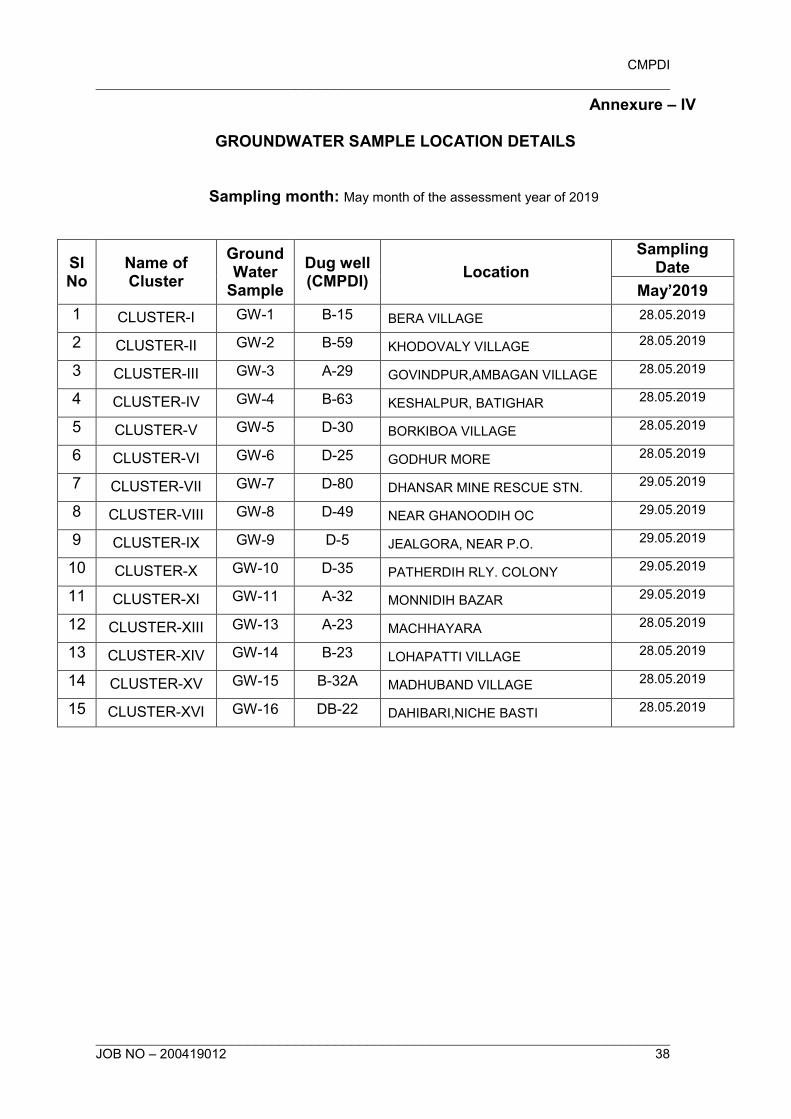
CMPDI
________________________________________________________________________
________________________________________________________________________ JOB NO – 200419012 38
Annexure – IV
GROUNDWATER SAMPLE LOCATION DETAILS
Sampling month: May month of the assessment year of 2019
Sl No
Name of Cluster
Ground Water
Sample
Dug well (CMPDI)
Location
Sampling Date
May’2019
1 CLUSTER-I GW-1 B-15 BERA VILLAGE 28.05.2019
2 CLUSTER-II GW-2 B-59 KHODOVALY VILLAGE 28.05.2019
3 CLUSTER-III GW-3 A-29 GOVINDPUR,AMBAGAN VILLAGE 28.05.2019
4 CLUSTER-IV GW-4 B-63 KESHALPUR, BATIGHAR 28.05.2019
5 CLUSTER-V GW-5 D-30 BORKIBOA VILLAGE 28.05.2019
6 CLUSTER-VI GW-6 D-25 GODHUR MORE 28.05.2019
7 CLUSTER-VII GW-7 D-80 DHANSAR MINE RESCUE STN. 29.05.2019
8 CLUSTER-VIII GW-8 D-49 NEAR GHANOODIH OC 29.05.2019
9 CLUSTER-IX GW-9 D-5 JEALGORA, NEAR P.O. 29.05.2019
10 CLUSTER-X GW-10 D-35 PATHERDIH RLY. COLONY 29.05.2019
11 CLUSTER-XI GW-11 A-32 MONNIDIH BAZAR 29.05.2019
12 CLUSTER-XIII GW-13 A-23 MACHHAYARA 28.05.2019
13 CLUSTER-XIV GW-14 B-23 LOHAPATTI VILLAGE 28.05.2019
14 CLUSTER-XV GW-15 B-32A MADHUBAND VILLAGE 28.05.2019
15 CLUSTER-XVI GW-16 DB-22 DAHIBARI,NICHE BASTI 28.05.2019
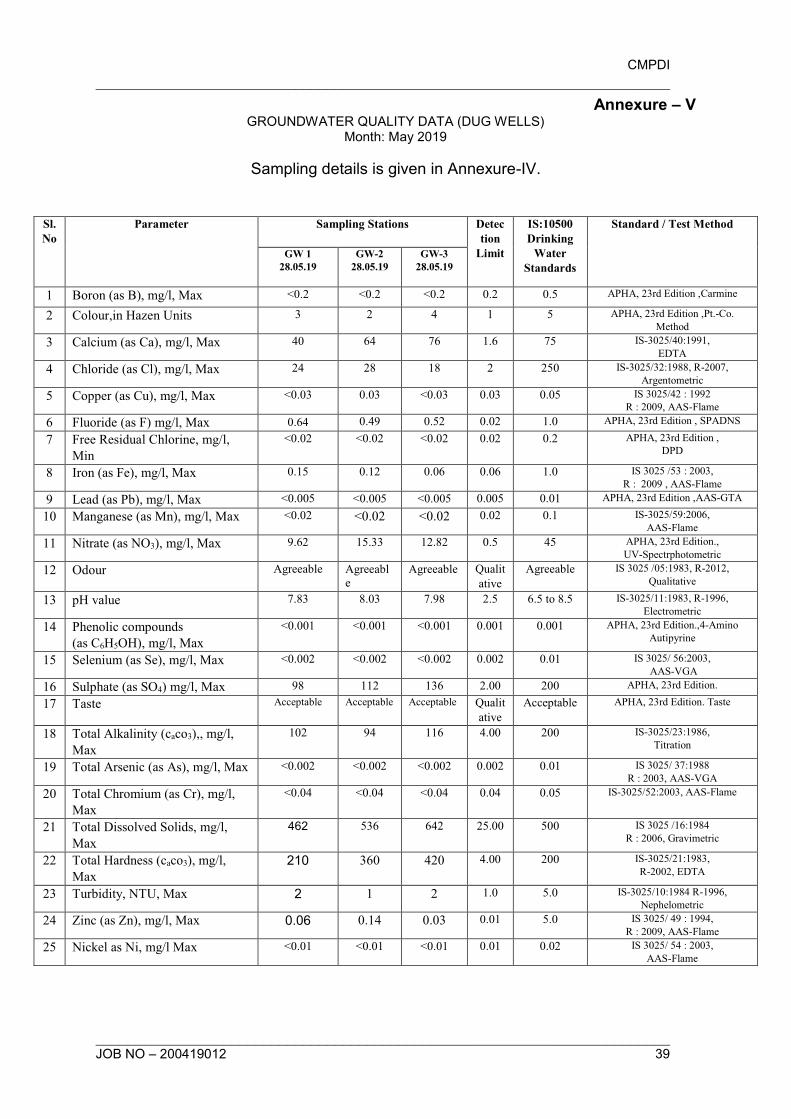
CMPDI
________________________________________________________________________
________________________________________________________________________ JOB NO – 200419012 39
Annexure – V GROUNDWATER QUALITY DATA (DUG WELLS)
Month: May 2019
Sampling details is given in Annexure-IV.
Sl.
No
Parameter Sampling Stations Detec
tion
Limit
IS:10500
Drinking
Water
Standards
Standard / Test Method
GW 1
28.05.19
GW-2
28.05.19
GW-3
28.05.19
1 Boron (as B), mg/l, Max <0.2 <0.2 <0.2 0.2 0.5 APHA, 23rd Edition ,Carmine
2 Colour,in Hazen Units 3 2 4 1 5 APHA, 23rd Edition ,Pt.-Co.
Method
3 Calcium (as Ca), mg/l, Max 40 64 76 1.6 75 IS-3025/40:1991,
EDTA
4 Chloride (as Cl), mg/l, Max 24 28 18 2 250 IS-3025/32:1988, R-2007,
Argentometric
5 Copper (as Cu), mg/l, Max <0.03 0.03 <0.03 0.03 0.05 IS 3025/42 : 1992
R : 2009, AAS-Flame
6 Fluoride (as F) mg/l, Max 0.64 0.49 0.52 0.02 1.0 APHA, 23rd Edition , SPADNS
7 Free Residual Chlorine, mg/l,
Min
<0.02 <0.02 <0.02 0.02 0.2 APHA, 23rd Edition ,
DPD
8 Iron (as Fe), mg/l, Max 0.15 0.12 0.06 0.06 1.0 IS 3025 /53 : 2003,
R : 2009 , AAS-Flame
9 Lead (as Pb), mg/l, Max <0.005 <0.005 <0.005 0.005 0.01 APHA, 23rd Edition ,AAS-GTA
10 Manganese (as Mn), mg/l, Max <0.02 <0.02 <0.02 0.02 0.1 IS-3025/59:2006,
AAS-Flame
11 Nitrate (as NO3), mg/l, Max 9.62 15.33 12.82 0.5 45 APHA, 23rd Edition.,
UV-Spectrphotometric
12 Odour Agreeable Agreeabl
e Agreeable Qualit
ative
Agreeable IS 3025 /05:1983, R-2012,
Qualitative
13 pH value 7.83 8.03 7.98 2.5 6.5 to 8.5 IS-3025/11:1983, R-1996,
Electrometric
14 Phenolic compounds
(as C6H5OH), mg/l, Max
<0.001 <0.001 <0.001 0.001 0.001 APHA, 23rd Edition.,4-Amino
Autipyrine
15 Selenium (as Se), mg/l, Max <0.002 <0.002 <0.002 0.002 0.01 IS 3025/ 56:2003,
AAS-VGA
16 Sulphate (as SO4) mg/l, Max 98 112 136 2.00 200 APHA, 23rd Edition.
17 Taste Acceptable Acceptable Acceptable Qualit
ative
Acceptable APHA, 23rd Edition. Taste
18 Total Alkalinity (caco3),, mg/l,
Max
102 94 116 4.00 200 IS-3025/23:1986,
Titration
19 Total Arsenic (as As), mg/l, Max <0.002 <0.002 <0.002 0.002 0.01 IS 3025/ 37:1988
R : 2003, AAS-VGA
20 Total Chromium (as Cr), mg/l,
Max
<0.04 <0.04 <0.04 0.04 0.05 IS-3025/52:2003, AAS-Flame
21 Total Dissolved Solids, mg/l,
Max
462 536 642 25.00 500 IS 3025 /16:1984
R : 2006, Gravimetric
22 Total Hardness (caco3), mg/l,
Max
210 360 420 4.00 200 IS-3025/21:1983,
R-2002, EDTA
23 Turbidity, NTU, Max 2 1 2 1.0 5.0 IS-3025/10:1984 R-1996,
Nephelometric
24 Zinc (as Zn), mg/l, Max 0.06 0.14 0.03 0.01 5.0 IS 3025/ 49 : 1994,
R : 2009, AAS-Flame
25 Nickel as Ni, mg/l Max <0.01 <0.01 <0.01 0.01 0.02 IS 3025/ 54 : 2003,
AAS-Flame
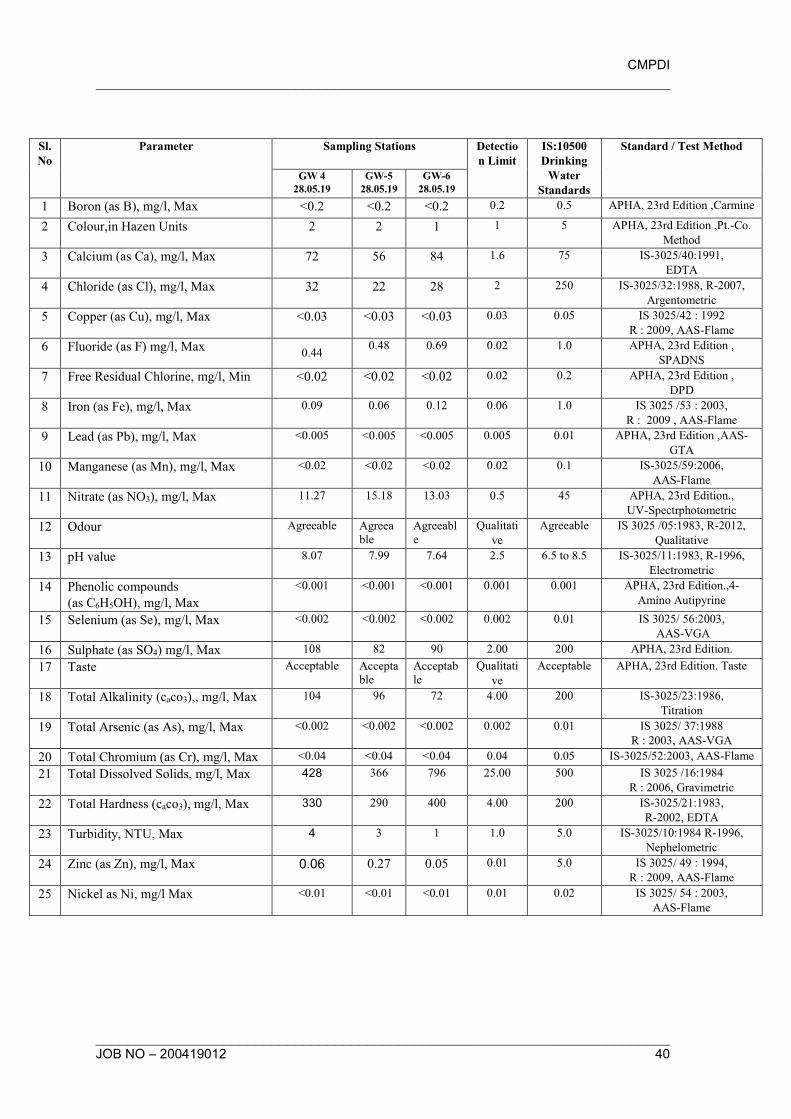
CMPDI
________________________________________________________________________
________________________________________________________________________ JOB NO – 200419012 40
Sl.
No
Parameter Sampling Stations Detectio
n Limit
IS:10500
Drinking
Water
Standards
Standard / Test Method
GW 4
28.05.19
GW-5
28.05.19
GW-6
28.05.19
1 Boron (as B), mg/l, Max <0.2 <0.2 <0.2 0.2 0.5 APHA, 23rd Edition ,Carmine
2 Colour,in Hazen Units 2 2 1 1 5 APHA, 23rd Edition ,Pt.-Co.
Method
3 Calcium (as Ca), mg/l, Max 72 56 84 1.6 75 IS-3025/40:1991,
EDTA
4 Chloride (as Cl), mg/l, Max 32 22 28 2 250 IS-3025/32:1988, R-2007,
Argentometric
5 Copper (as Cu), mg/l, Max <0.03 <0.03 <0.03 0.03 0.05 IS 3025/42 : 1992
R : 2009, AAS-Flame
6 Fluoride (as F) mg/l, Max 0.44
0.48 0.69 0.02 1.0 APHA, 23rd Edition ,
SPADNS
7 Free Residual Chlorine, mg/l, Min <0.02 <0.02 <0.02 0.02 0.2 APHA, 23rd Edition ,
DPD
8 Iron (as Fe), mg/l, Max 0.09 0.06 0.12 0.06 1.0 IS 3025 /53 : 2003,
R : 2009 , AAS-Flame
9 Lead (as Pb), mg/l, Max <0.005 <0.005 <0.005 0.005 0.01 APHA, 23rd Edition ,AAS-
GTA
10 Manganese (as Mn), mg/l, Max <0.02 <0.02 <0.02 0.02 0.1 IS-3025/59:2006,
AAS-Flame
11 Nitrate (as NO3), mg/l, Max 11.27 15.18 13.03 0.5 45 APHA, 23rd Edition.,
UV-Spectrphotometric
12 Odour Agreeable Agreea
ble
Agreeabl
e
Qualitati
ve
Agreeable IS 3025 /05:1983, R-2012,
Qualitative
13 pH value 8.07 7.99 7.64 2.5 6.5 to 8.5 IS-3025/11:1983, R-1996,
Electrometric
14 Phenolic compounds
(as C6H5OH), mg/l, Max
<0.001 <0.001 <0.001 0.001 0.001 APHA, 23rd Edition.,4-
Amino Autipyrine
15 Selenium (as Se), mg/l, Max <0.002 <0.002 <0.002 0.002 0.01 IS 3025/ 56:2003,
AAS-VGA
16 Sulphate (as SO4) mg/l, Max 108 82 90 2.00 200 APHA, 23rd Edition.
17 Taste Acceptable Accepta
ble Acceptab
le Qualitati
ve
Acceptable APHA, 23rd Edition. Taste
18 Total Alkalinity (caco3),, mg/l, Max 104 96 72 4.00 200 IS-3025/23:1986,
Titration
19 Total Arsenic (as As), mg/l, Max <0.002 <0.002 <0.002 0.002 0.01 IS 3025/ 37:1988
R : 2003, AAS-VGA
20 Total Chromium (as Cr), mg/l, Max <0.04 <0.04 <0.04 0.04 0.05 IS-3025/52:2003, AAS-Flame
21 Total Dissolved Solids, mg/l, Max 428 366 796 25.00 500 IS 3025 /16:1984
R : 2006, Gravimetric
22 Total Hardness (caco3), mg/l, Max 330 290 400 4.00 200 IS-3025/21:1983,
R-2002, EDTA
23 Turbidity, NTU, Max 4 3 1 1.0 5.0 IS-3025/10:1984 R-1996,
Nephelometric
24 Zinc (as Zn), mg/l, Max 0.06 0.27 0.05 0.01 5.0 IS 3025/ 49 : 1994,
R : 2009, AAS-Flame
25 Nickel as Ni, mg/l Max <0.01 <0.01 <0.01 0.01 0.02 IS 3025/ 54 : 2003,
AAS-Flame
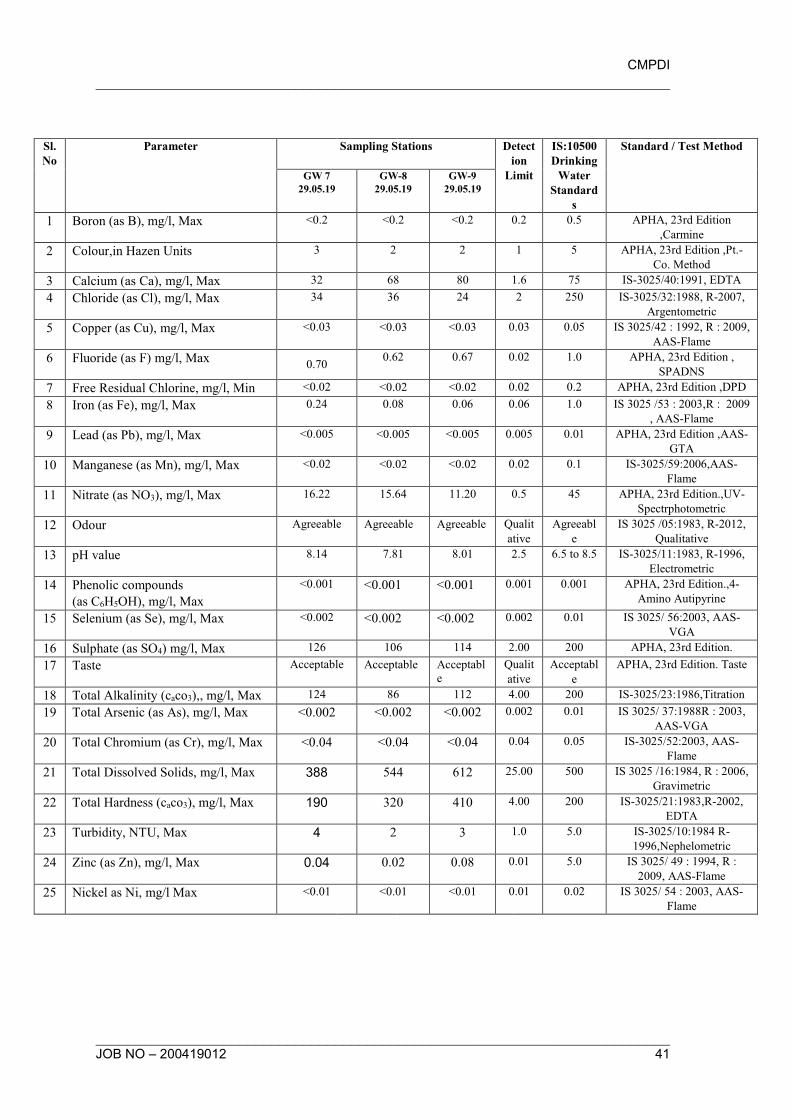
CMPDI
________________________________________________________________________
________________________________________________________________________ JOB NO – 200419012 41
Sl.
No
Parameter Sampling Stations Detect
ion
Limit
IS:10500
Drinking
Water
Standard
s
Standard / Test Method
GW 7
29.05.19
GW-8
29.05.19
GW-9
29.05.19
1 Boron (as B), mg/l, Max <0.2 <0.2 <0.2 0.2 0.5 APHA, 23rd Edition
,Carmine
2 Colour,in Hazen Units 3 2 2 1 5 APHA, 23rd Edition ,Pt.-
Co. Method
3 Calcium (as Ca), mg/l, Max 32 68 80 1.6 75 IS-3025/40:1991, EDTA
4 Chloride (as Cl), mg/l, Max 34 36 24 2 250 IS-3025/32:1988, R-2007,
Argentometric
5 Copper (as Cu), mg/l, Max <0.03 <0.03 <0.03 0.03 0.05 IS 3025/42 : 1992, R : 2009,
AAS-Flame
6 Fluoride (as F) mg/l, Max 0.70
0.62 0.67 0.02 1.0 APHA, 23rd Edition ,
SPADNS
7 Free Residual Chlorine, mg/l, Min <0.02 <0.02 <0.02 0.02 0.2 APHA, 23rd Edition ,DPD
8 Iron (as Fe), mg/l, Max 0.24 0.08 0.06 0.06 1.0 IS 3025 /53 : 2003,R : 2009
, AAS-Flame
9 Lead (as Pb), mg/l, Max <0.005 <0.005 <0.005 0.005 0.01 APHA, 23rd Edition ,AAS-
GTA
10 Manganese (as Mn), mg/l, Max <0.02 <0.02 <0.02 0.02 0.1 IS-3025/59:2006,AAS-
Flame
11 Nitrate (as NO3), mg/l, Max 16.22 15.64 11.20 0.5 45 APHA, 23rd Edition.,UV-
Spectrphotometric
12 Odour Agreeable Agreeable Agreeable Qualit
ative
Agreeabl
e
IS 3025 /05:1983, R-2012,
Qualitative
13 pH value 8.14 7.81 8.01 2.5 6.5 to 8.5 IS-3025/11:1983, R-1996,
Electrometric
14 Phenolic compounds
(as C6H5OH), mg/l, Max
<0.001 <0.001 <0.001 0.001 0.001 APHA, 23rd Edition.,4-
Amino Autipyrine
15 Selenium (as Se), mg/l, Max <0.002 <0.002 <0.002 0.002 0.01 IS 3025/ 56:2003, AAS-
VGA
16 Sulphate (as SO4) mg/l, Max 126 106 114 2.00 200 APHA, 23rd Edition.
17 Taste Acceptable Acceptable Acceptabl
e
Qualit
ative
Acceptabl
e
APHA, 23rd Edition. Taste
18 Total Alkalinity (caco3),, mg/l, Max 124 86 112 4.00 200 IS-3025/23:1986,Titration
19 Total Arsenic (as As), mg/l, Max <0.002 <0.002 <0.002 0.002 0.01 IS 3025/ 37:1988R : 2003,
AAS-VGA
20 Total Chromium (as Cr), mg/l, Max <0.04 <0.04 <0.04 0.04 0.05 IS-3025/52:2003, AAS-
Flame
21 Total Dissolved Solids, mg/l, Max 388 544 612 25.00 500 IS 3025 /16:1984, R : 2006,
Gravimetric
22 Total Hardness (caco3), mg/l, Max 190 320 410 4.00 200 IS-3025/21:1983,R-2002,
EDTA
23 Turbidity, NTU, Max 4 2 3 1.0 5.0 IS-3025/10:1984 R-
1996,Nephelometric
24 Zinc (as Zn), mg/l, Max 0.04 0.02 0.08 0.01 5.0 IS 3025/ 49 : 1994, R :
2009, AAS-Flame
25 Nickel as Ni, mg/l Max <0.01 <0.01 <0.01 0.01 0.02 IS 3025/ 54 : 2003, AAS-
Flame
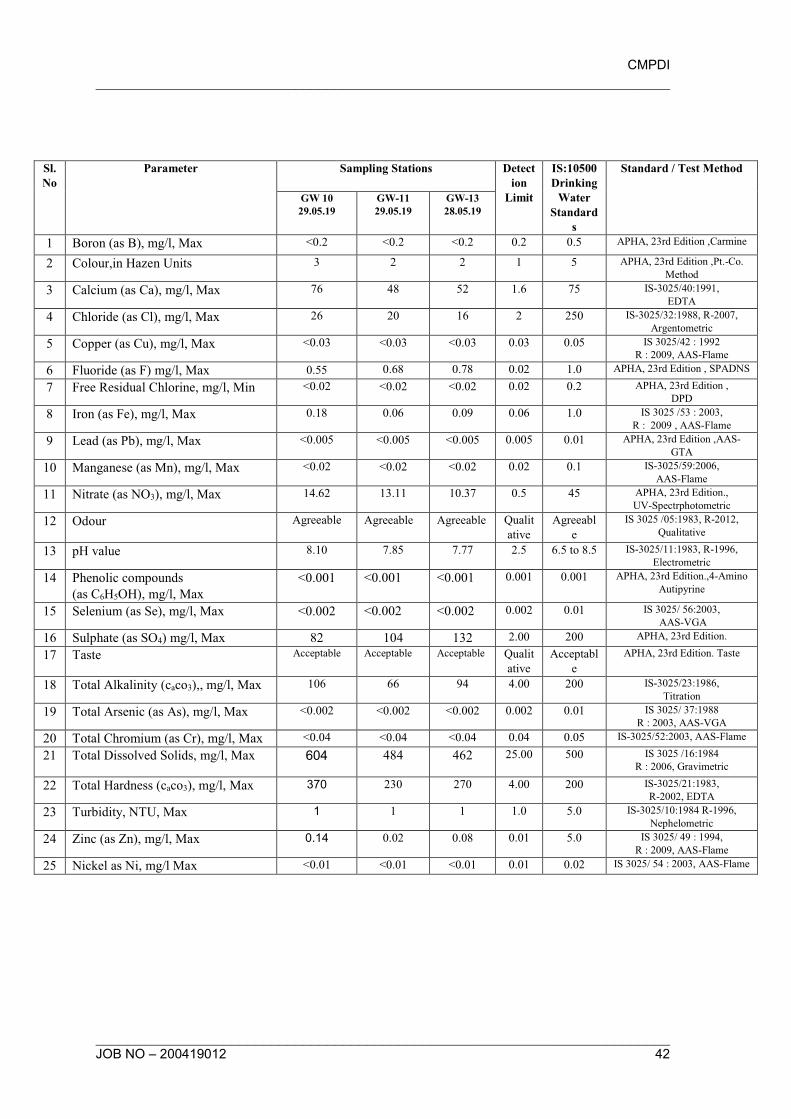
CMPDI
________________________________________________________________________
________________________________________________________________________ JOB NO – 200419012 42
Sl.
No
Parameter Sampling Stations Detect
ion
Limit
IS:10500
Drinking
Water
Standard
s
Standard / Test Method
GW 10
29.05.19
GW-11
29.05.19
GW-13
28.05.19
1 Boron (as B), mg/l, Max <0.2 <0.2 <0.2 0.2 0.5 APHA, 23rd Edition ,Carmine
2 Colour,in Hazen Units 3 2 2 1 5 APHA, 23rd Edition ,Pt.-Co.
Method
3 Calcium (as Ca), mg/l, Max 76 48 52 1.6 75 IS-3025/40:1991,
EDTA
4 Chloride (as Cl), mg/l, Max 26 20 16 2 250 IS-3025/32:1988, R-2007,
Argentometric
5 Copper (as Cu), mg/l, Max <0.03 <0.03 <0.03 0.03 0.05 IS 3025/42 : 1992
R : 2009, AAS-Flame
6 Fluoride (as F) mg/l, Max 0.55 0.68 0.78 0.02 1.0 APHA, 23rd Edition , SPADNS
7 Free Residual Chlorine, mg/l, Min <0.02 <0.02 <0.02 0.02 0.2 APHA, 23rd Edition ,
DPD
8 Iron (as Fe), mg/l, Max 0.18 0.06 0.09 0.06 1.0 IS 3025 /53 : 2003,
R : 2009 , AAS-Flame
9 Lead (as Pb), mg/l, Max <0.005 <0.005 <0.005 0.005 0.01 APHA, 23rd Edition ,AAS-
GTA
10 Manganese (as Mn), mg/l, Max <0.02 <0.02 <0.02 0.02 0.1 IS-3025/59:2006,
AAS-Flame
11 Nitrate (as NO3), mg/l, Max 14.62 13.11 10.37 0.5 45 APHA, 23rd Edition.,
UV-Spectrphotometric
12 Odour Agreeable Agreeable Agreeable Qualit
ative
Agreeabl
e
IS 3025 /05:1983, R-2012,
Qualitative
13 pH value 8.10 7.85 7.77 2.5 6.5 to 8.5 IS-3025/11:1983, R-1996,
Electrometric
14 Phenolic compounds
(as C6H5OH), mg/l, Max
<0.001 <0.001 <0.001 0.001 0.001 APHA, 23rd Edition.,4-Amino
Autipyrine
15 Selenium (as Se), mg/l, Max <0.002 <0.002 <0.002 0.002 0.01 IS 3025/ 56:2003,
AAS-VGA
16 Sulphate (as SO4) mg/l, Max 82 104 132 2.00 200 APHA, 23rd Edition.
17 Taste Acceptable Acceptable Acceptable Qualit
ative
Acceptabl
e
APHA, 23rd Edition. Taste
18 Total Alkalinity (caco3),, mg/l, Max 106 66 94 4.00 200 IS-3025/23:1986,
Titration
19 Total Arsenic (as As), mg/l, Max <0.002 <0.002 <0.002 0.002 0.01 IS 3025/ 37:1988
R : 2003, AAS-VGA
20 Total Chromium (as Cr), mg/l, Max <0.04 <0.04 <0.04 0.04 0.05 IS-3025/52:2003, AAS-Flame
21 Total Dissolved Solids, mg/l, Max 604 484 462 25.00 500 IS 3025 /16:1984
R : 2006, Gravimetric
22 Total Hardness (caco3), mg/l, Max 370 230 270 4.00 200 IS-3025/21:1983,
R-2002, EDTA
23 Turbidity, NTU, Max 1 1 1 1.0 5.0 IS-3025/10:1984 R-1996,
Nephelometric
24 Zinc (as Zn), mg/l, Max 0.14 0.02 0.08 0.01 5.0 IS 3025/ 49 : 1994,
R : 2009, AAS-Flame
25 Nickel as Ni, mg/l Max <0.01 <0.01 <0.01 0.01 0.02 IS 3025/ 54 : 2003, AAS-Flame
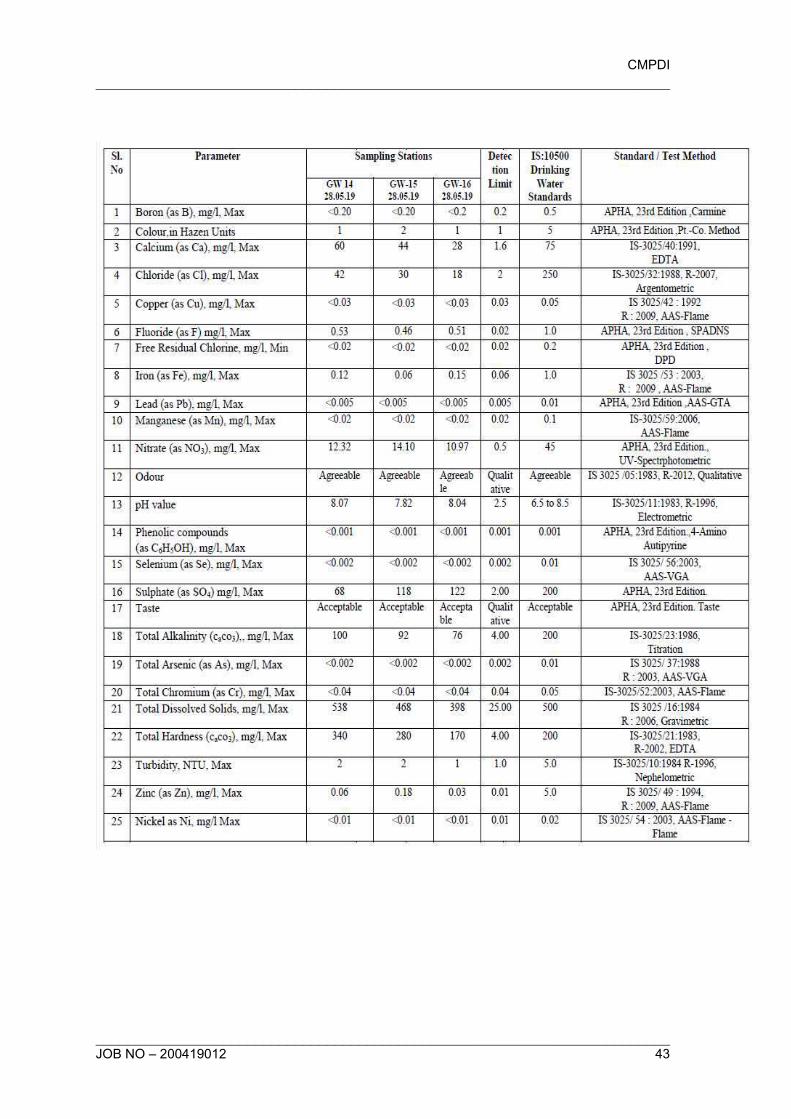
CMPDI
________________________________________________________________________
________________________________________________________________________ JOB NO – 200419012 43
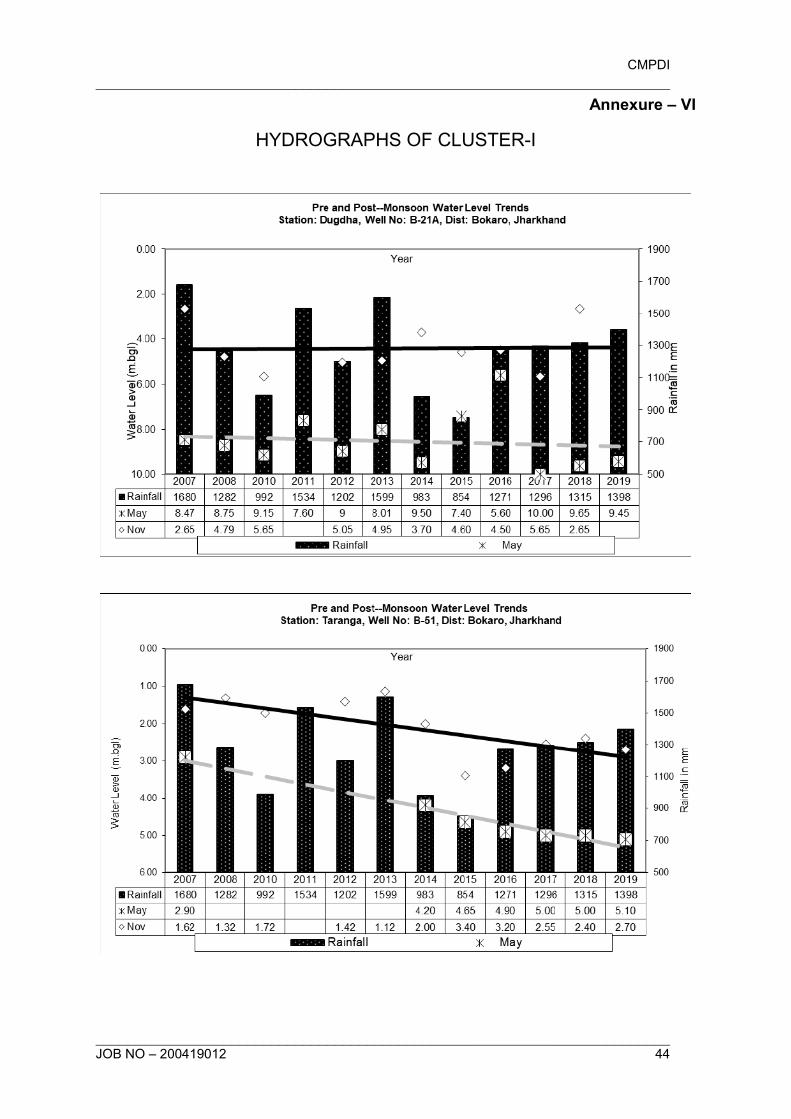
CMPDI
________________________________________________________________________
________________________________________________________________________ JOB NO – 200419012 44
Annexure – VI
HYDROGRAPHS OF CLUSTER-I
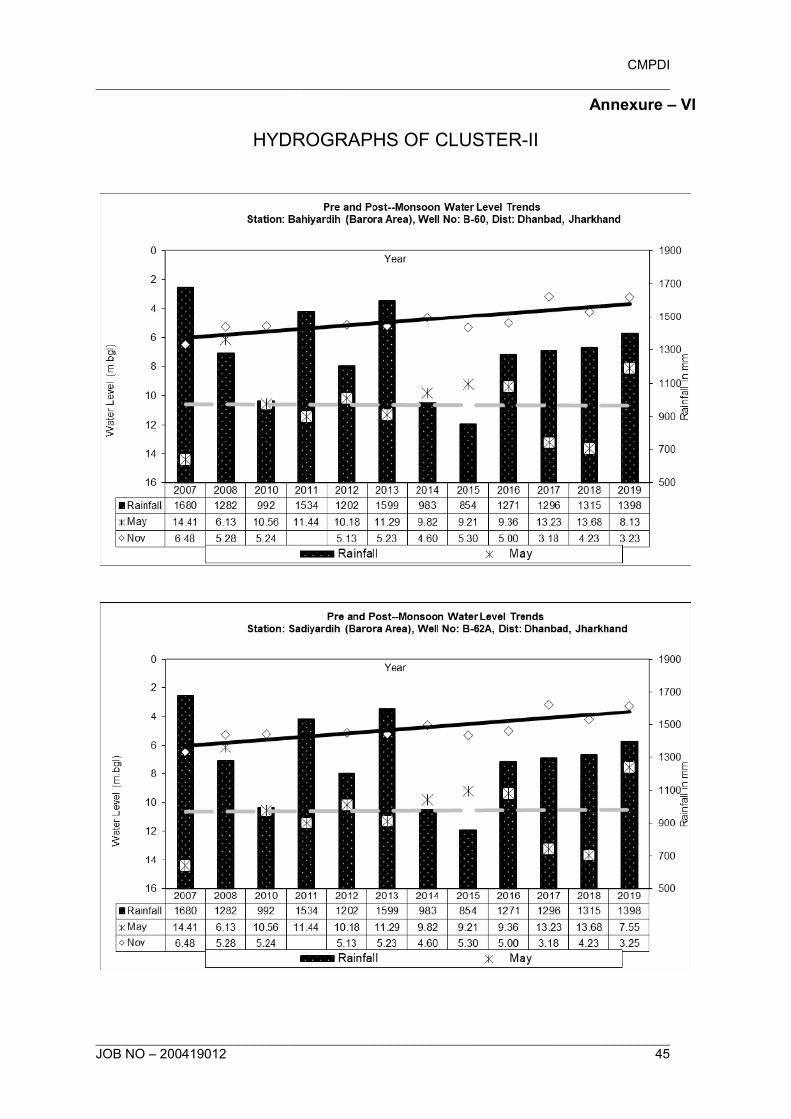
CMPDI
________________________________________________________________________
________________________________________________________________________ JOB NO – 200419012 45
Annexure – VI
HYDROGRAPHS OF CLUSTER-II
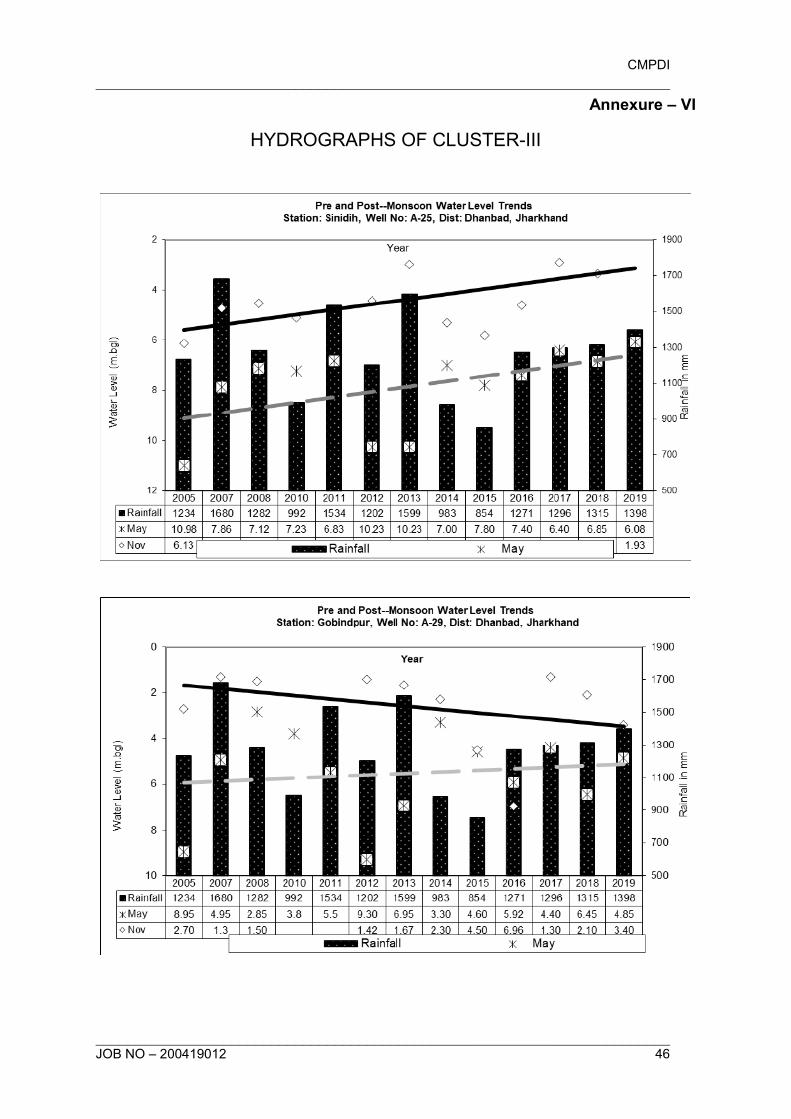
CMPDI
________________________________________________________________________
________________________________________________________________________ JOB NO – 200419012 46
Annexure – VI
HYDROGRAPHS OF CLUSTER-III
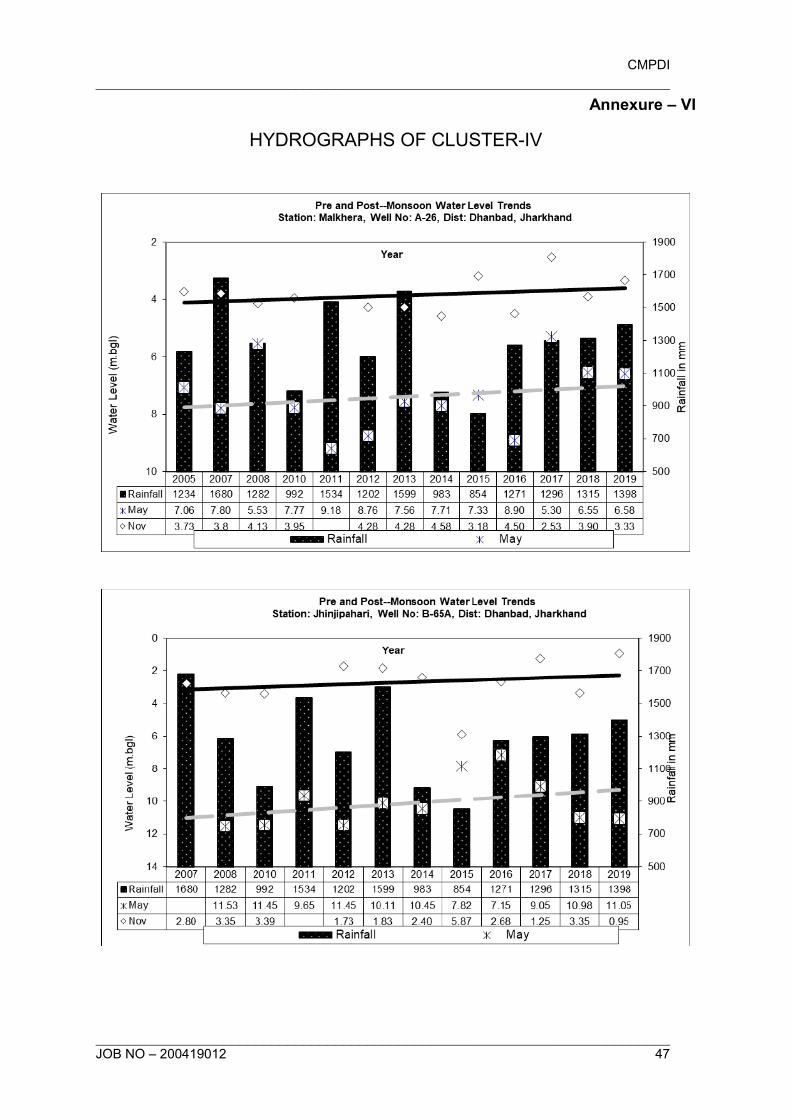
CMPDI
________________________________________________________________________
________________________________________________________________________ JOB NO – 200419012 47
Annexure – VI
HYDROGRAPHS OF CLUSTER-IV
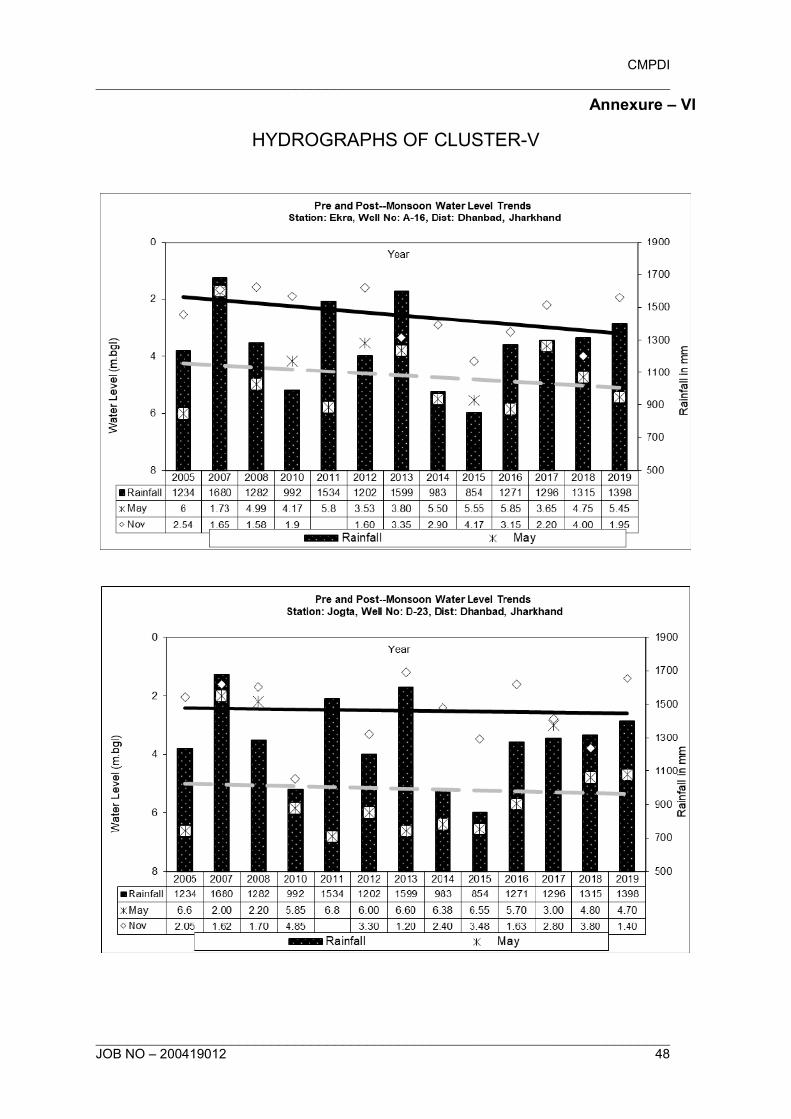
CMPDI
________________________________________________________________________
________________________________________________________________________ JOB NO – 200419012 48
Annexure – VI
HYDROGRAPHS OF CLUSTER-V
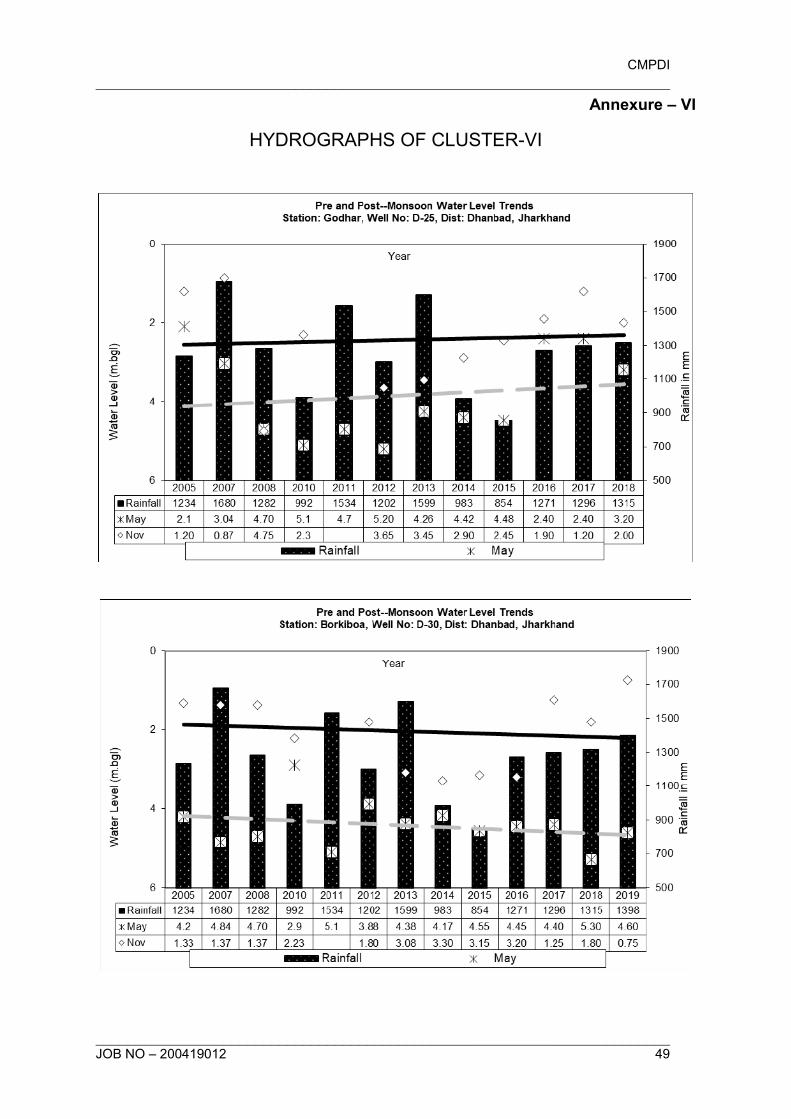
CMPDI
________________________________________________________________________
________________________________________________________________________ JOB NO – 200419012 49
Annexure – VI
HYDROGRAPHS OF CLUSTER-VI
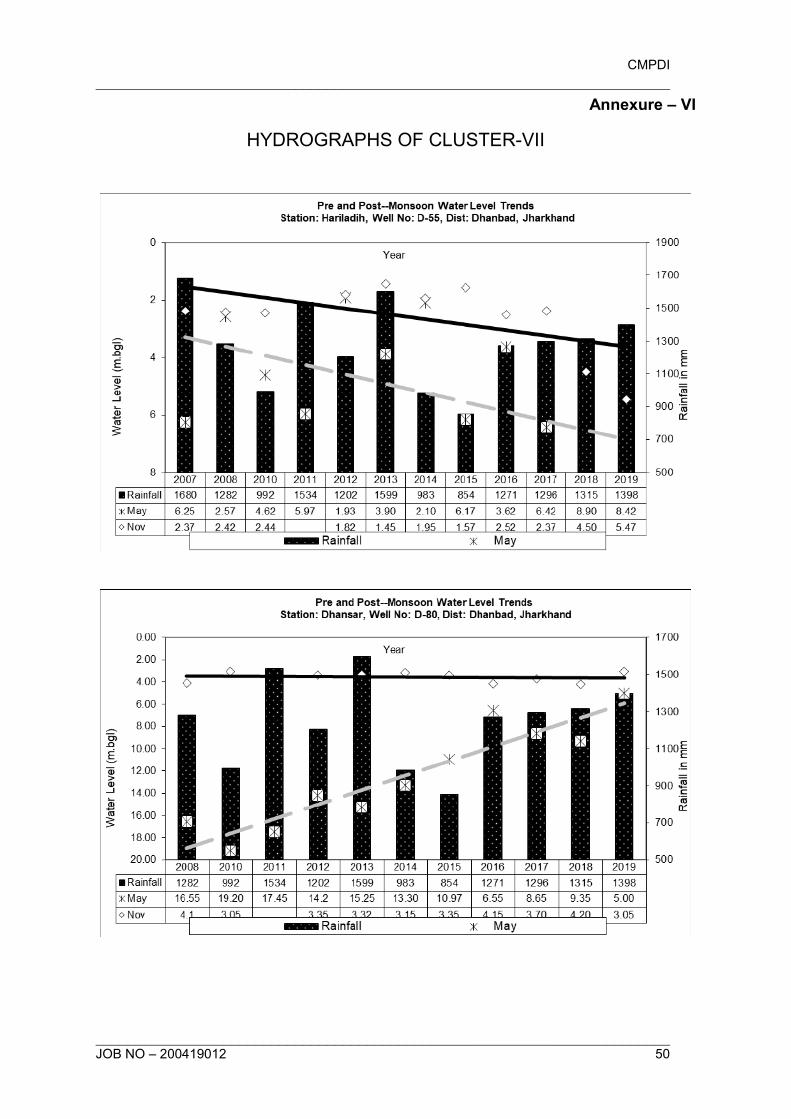
CMPDI
________________________________________________________________________
________________________________________________________________________ JOB NO – 200419012 50
Annexure – VI
HYDROGRAPHS OF CLUSTER-VII
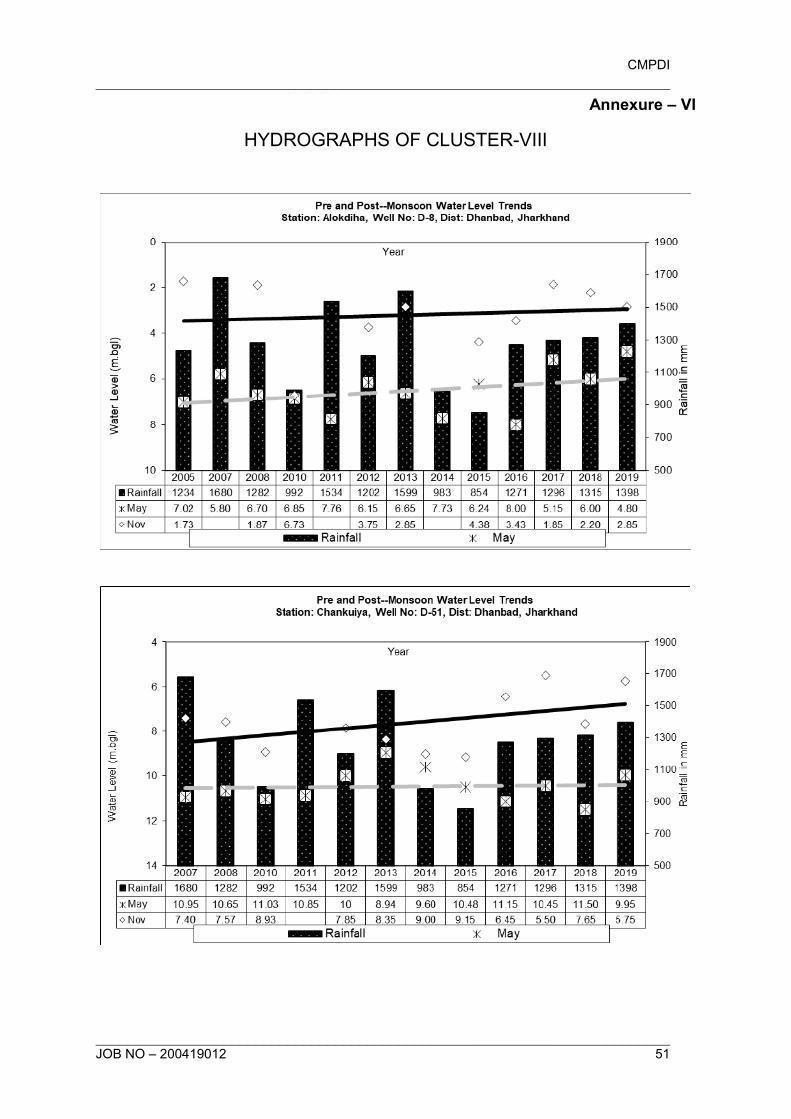
CMPDI
________________________________________________________________________
________________________________________________________________________ JOB NO – 200419012 51
Annexure – VI
HYDROGRAPHS OF CLUSTER-VIII

CMPDI
________________________________________________________________________
________________________________________________________________________ JOB NO – 200419012 52
Annexure – VI
HYDROGRAPHS OF CLUSTER-IX
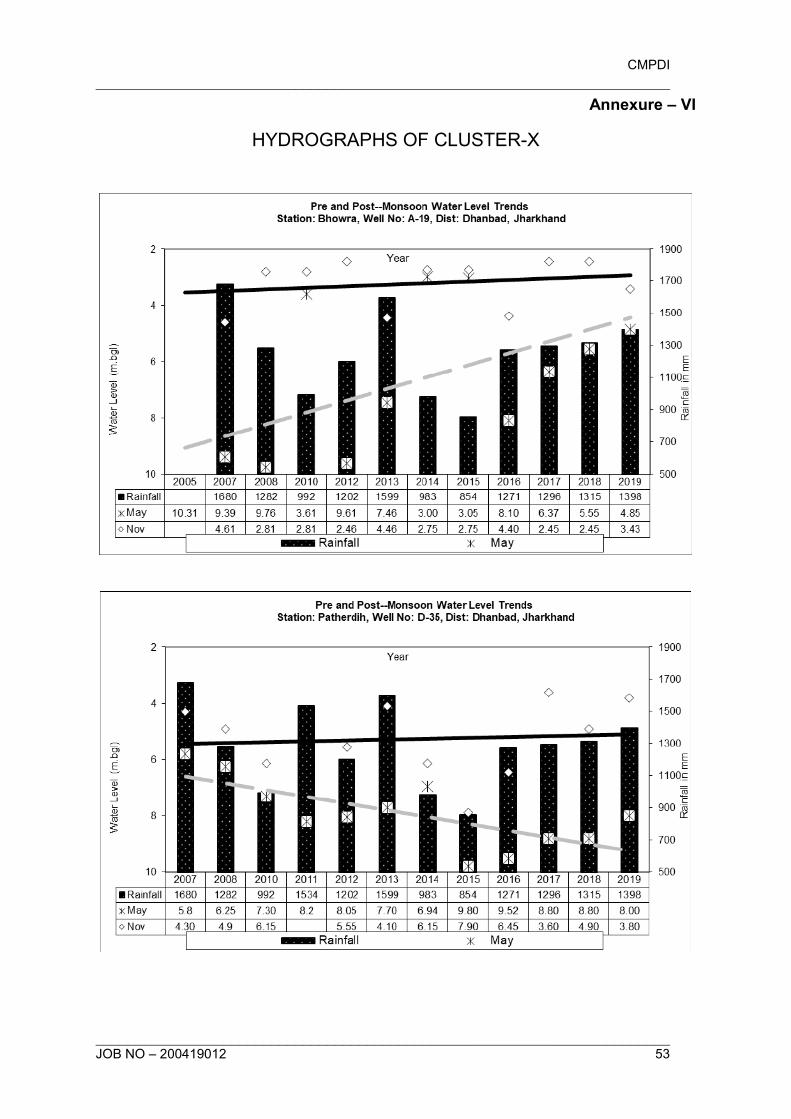
CMPDI
________________________________________________________________________
________________________________________________________________________ JOB NO – 200419012 53
Annexure – VI
HYDROGRAPHS OF CLUSTER-X
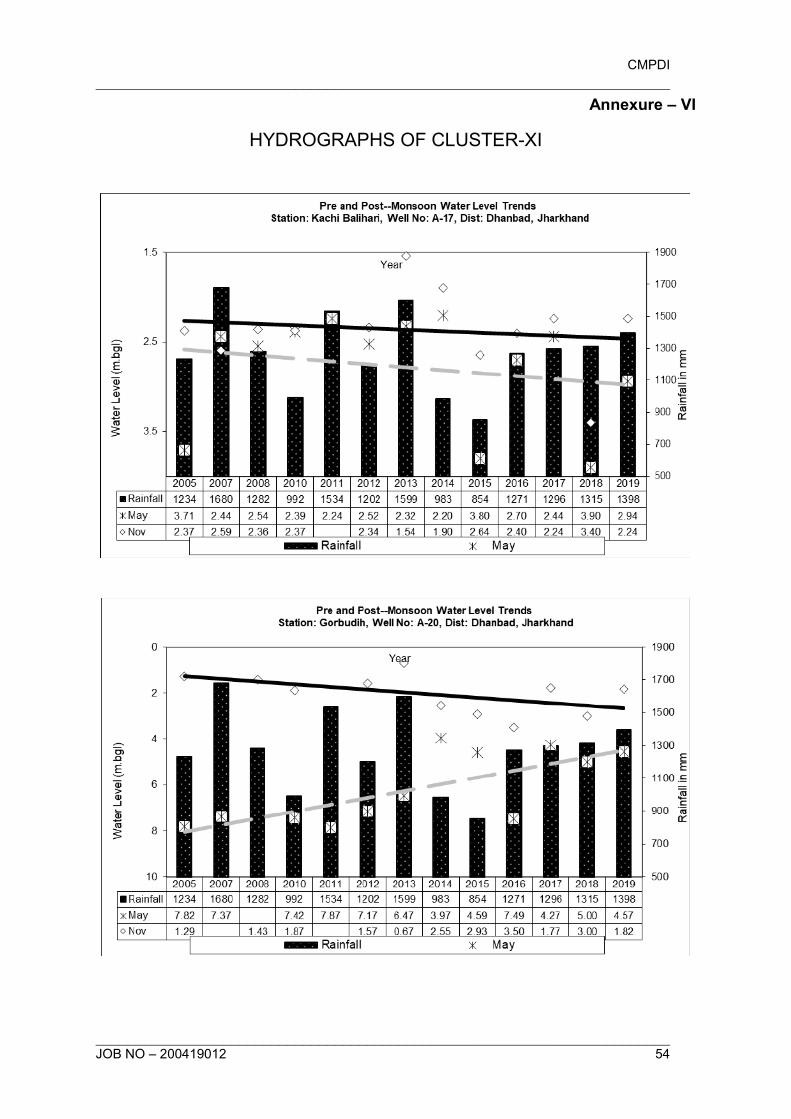
CMPDI
________________________________________________________________________
________________________________________________________________________ JOB NO – 200419012 54
Annexure – VI
HYDROGRAPHS OF CLUSTER-XI
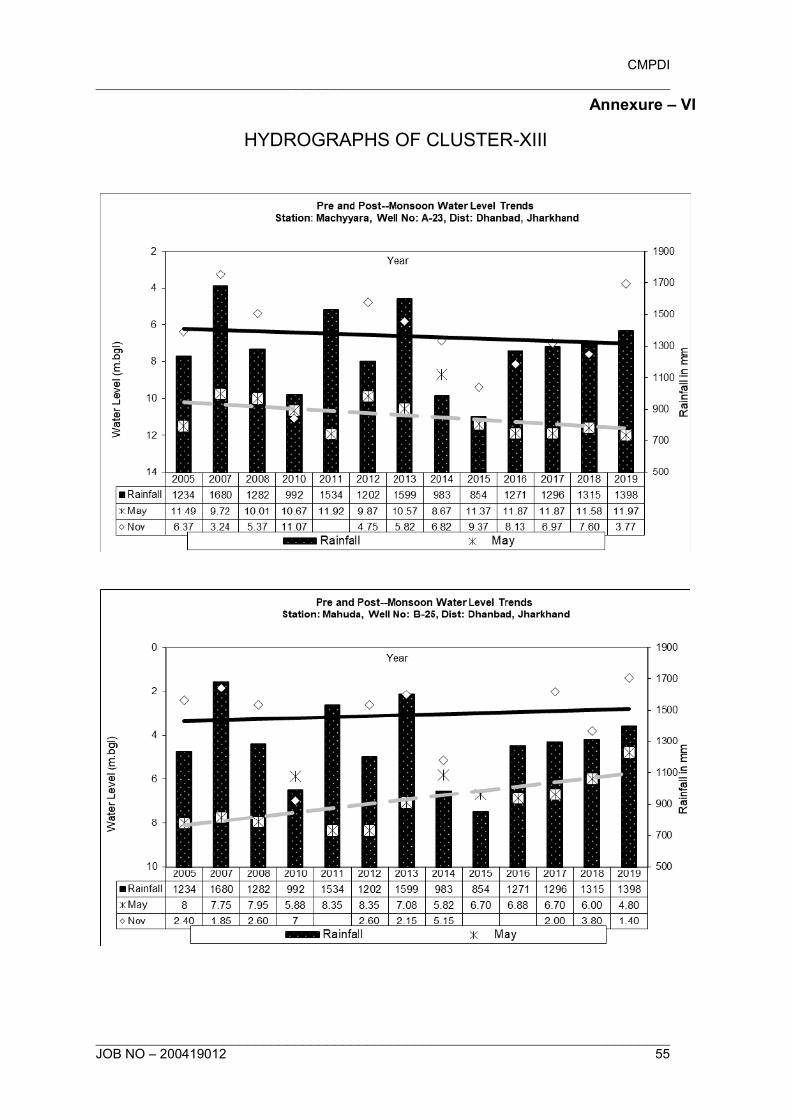
CMPDI
________________________________________________________________________
________________________________________________________________________ JOB NO – 200419012 55
Annexure – VI
HYDROGRAPHS OF CLUSTER-XIII
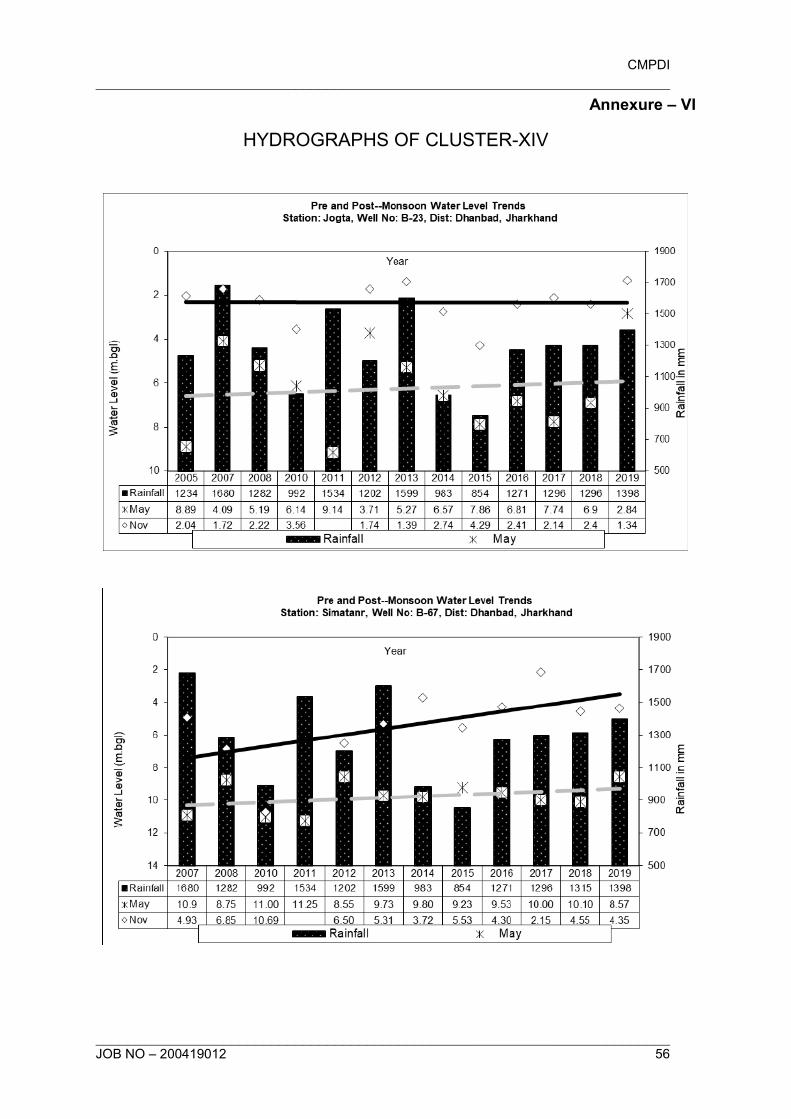
CMPDI
________________________________________________________________________
________________________________________________________________________ JOB NO – 200419012 56
Annexure – VI
HYDROGRAPHS OF CLUSTER-XIV
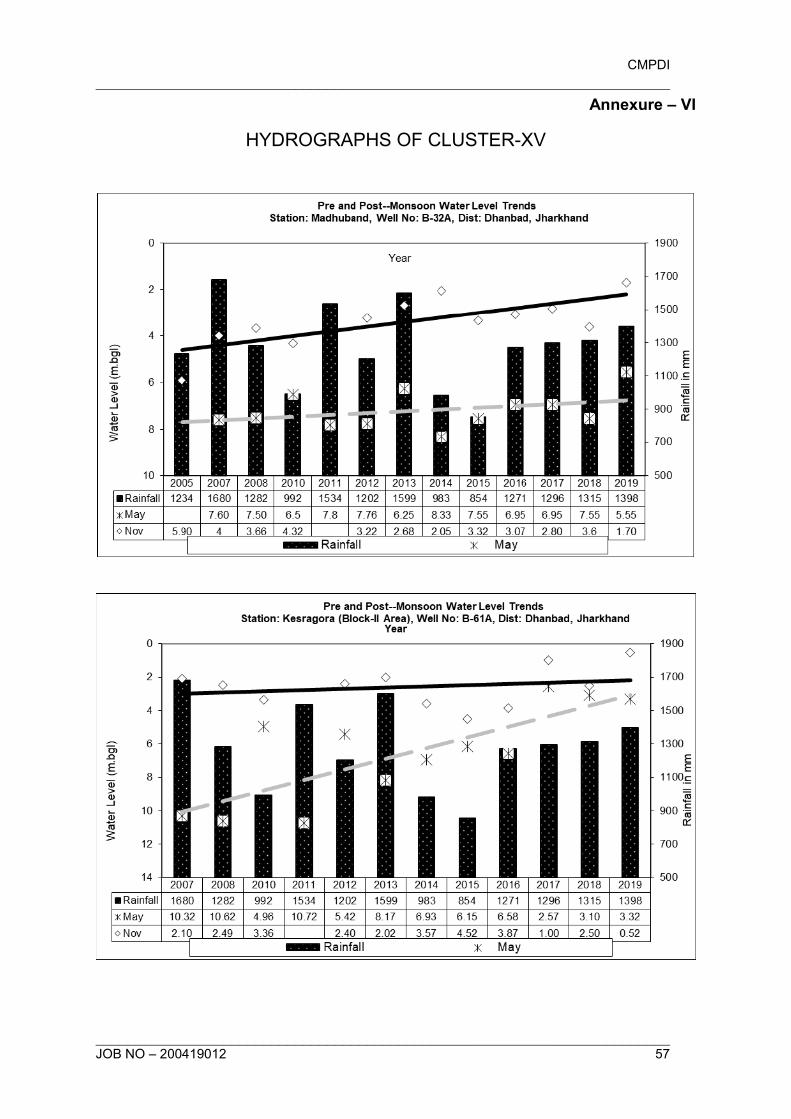
CMPDI
________________________________________________________________________
________________________________________________________________________ JOB NO – 200419012 57
Annexure – VI
HYDROGRAPHS OF CLUSTER-XV
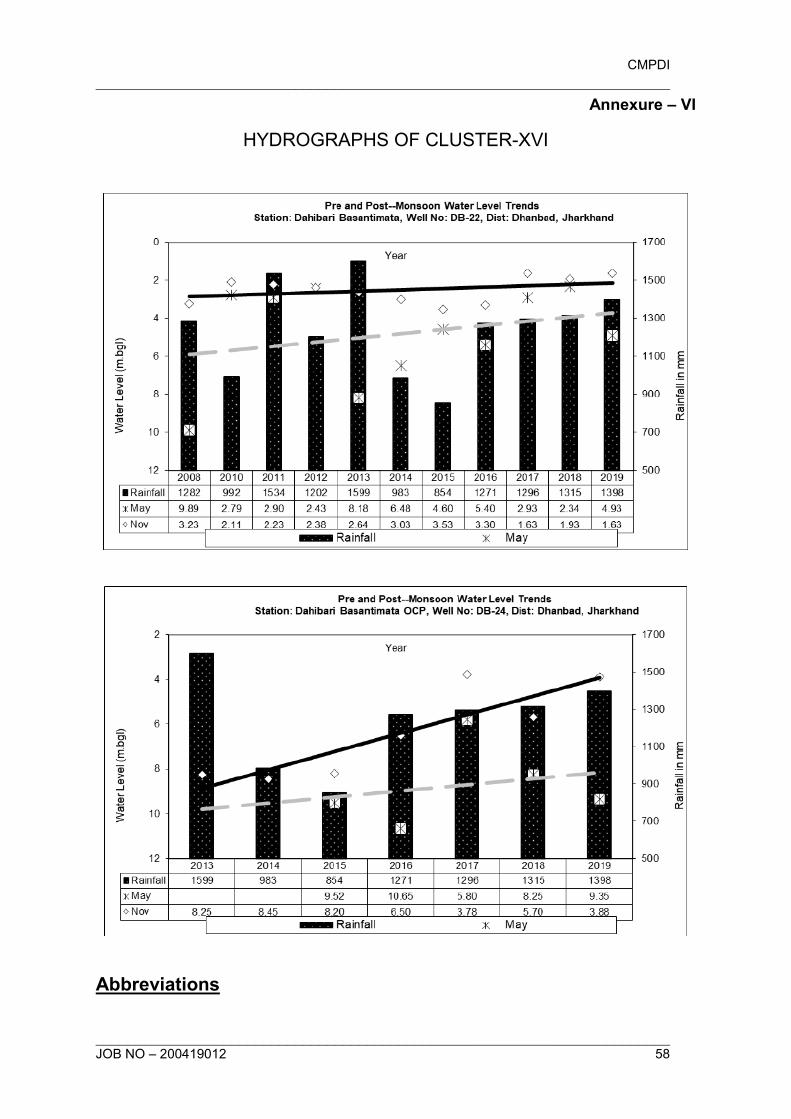
CMPDI
________________________________________________________________________
________________________________________________________________________ JOB NO – 200419012 58
Annexure – VI
HYDROGRAPHS OF CLUSTER-XVI
Abbreviations
CMPDI
________________________________________________________________________
________________________________________________________________________ JOB NO – 200419012 59
AMSL: Above mean sea level
Avg.: Average
APT: Aquifer Pumping Test
BCCL: Bharat Coking Coal Ltd.
bgl: Below Ground Level
Buffer zone: periphery of the 10 km radius from the project boundary
Core zone: Project / mine / colliery boundary (leasehold area)
CMPDI: Central Mine Plan & Design Institute
DVC: Damodar Valley Corporation
DTW: Depth to water level
GW: Groundwater
IMD: Indian Meteorological Division
JCF: Jharia Coalfield
RCF: Raniganj Coalfield
MADA: Mineral Area Development Authority
MCM: Million Cubic Meter
MGD: Million Gallon per day
NTU: Nephlometric Turbidity unit
OC / UG: Opencast / Underground
OCP / UGP: Opencast Project / Underground Project
RL: Reduced Level
RWH: Rainwater Harvesting
FF: Fire Fighting
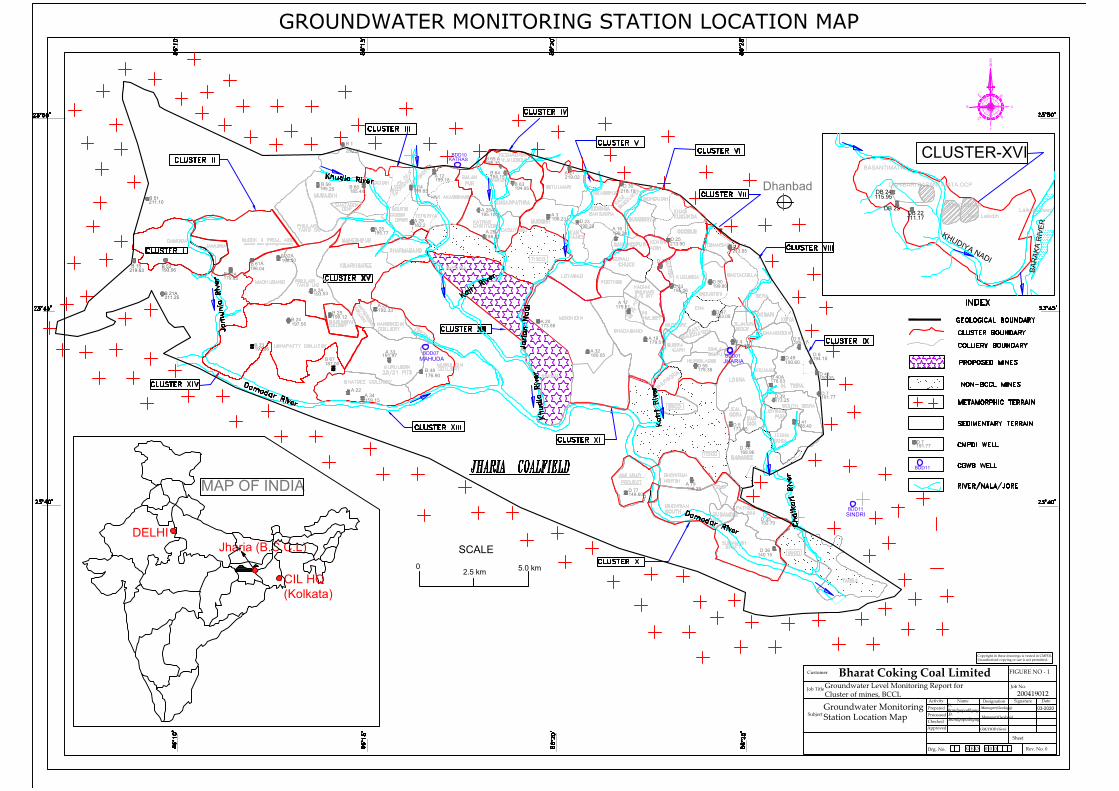
SCALE
02.5 km
5.0 km
GROUNDWATER MONITORING STATION LOCATION MAP
Jharia (B.C.C.L)
MAP OF INDIA
Dhanbad
CIL HQ
(Kolkata)
DELHI
KHUDIYA NADI
BA
RA
KA
RIV
ER
JUNKUNDAR
New LaikdihLaikdih Deep
DAHIBARI BASANTIMATA OCP
BASANTIMATA
CLUSTER-XVI
211.25B 21A
219.63B 15 B 53
193.06
211.10B 51
197.55B 24
197.86B 23
B 67187.00
213.85D 3
215.39D 4
D 33195.06
D 34
203.05D 47
179.38D 55
D 80199.80
BDD01
JHARIA
A 22
A 23192.33
191.97A 33
A 34159.15
B 48176.90
B 25199.12
BDD07
MAHUDA
A 19
D 35
D 36
D 77
140.15
152.70
149.60
158.39
173.95D 5
191.77D 7
173.25D 39
178.03D 40A
178.40D 41
168.96D 74
DB 24115.95
DB 23DB 22111.17
A 17
A 18
A 20
A 32
179.51
180.05
173.58
179.61
B 63
B 64
B 65 A
A 3
A 16A 26
A 28A
D 23
188.82
195.10198.23
198.20
199.20
186.35
194.15
194.95
KATRASBDD10
A 27
D 25
D 30
213.90
219.02
218.10
B 59195.25
B 1
209.57
B 62A
196.04
179.63
B 60 B 14
A 12
A 25
A 29
195.77
182.2
185.44 199.65
199.18
B 32A
B 61A
A 24193.53
198.50
D 8194.15
192.05D 43
D 49190.60
185.97D 51
BDD11
SINDRI
BDD11
191.77D 7
Bharat Coking Coal Limited
Activity Name Designation Signature Date
Prepared
Processed
Checked
Approved
03-2020Manager(Geology)
GM/HOD (Geo)
D.
Bandyopadhyay
Customer
Job Title
FIGURE NO - 1
Subject
Groundwater MonitoringStation Location Map
Job No.
Sheet
Rev. No. 0Drg. No. G E O 0 0 0
Copyright in these drawings is vested in CMPDI.Unauthorised copying or use is not permitted.
Groundwater Level Monitoring Report forCluster of mines, BCCL 200419012
NE
NW
SESW
Manager(Geology)D.
Bandyopadhyay
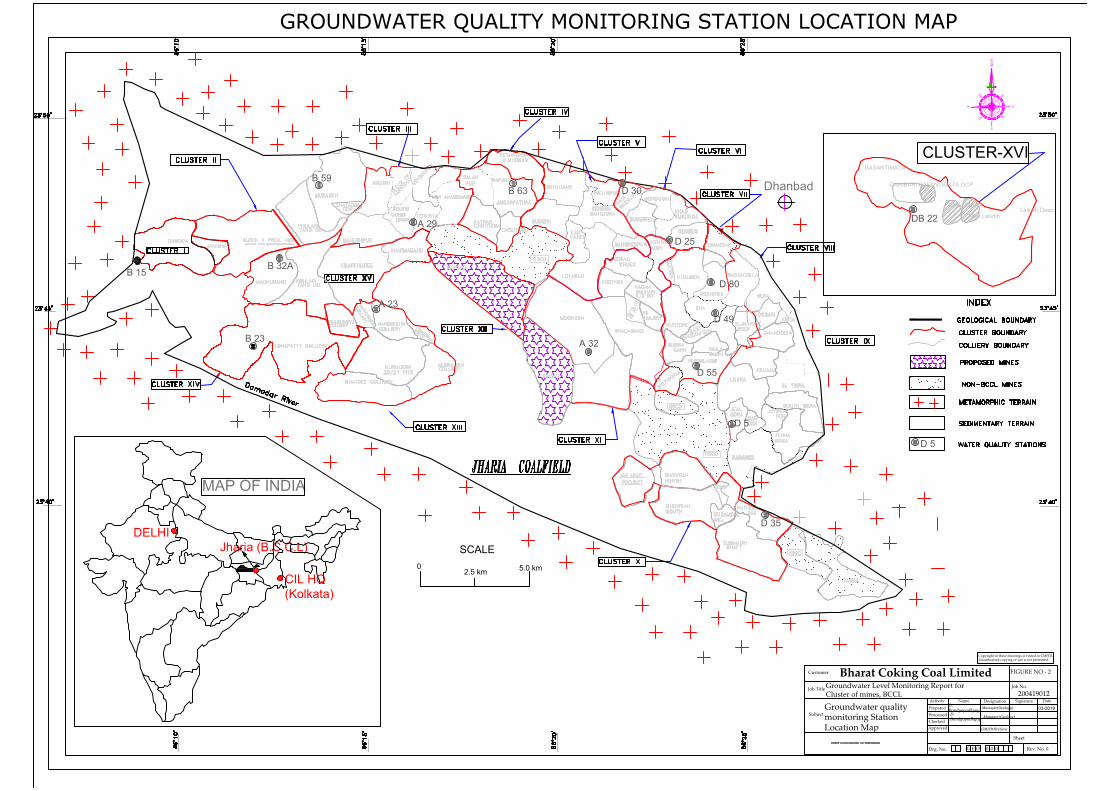
SCALE
02.5 km
5.0 km
GROUNDWATER QUALITY MONITORING STATION LOCATION MAP
Jharia (B.C.C.L)
MAP OF INDIA
Dhanbad
CIL HQ
(Kolkata)
DELHI
JUNKUNDAR
New LaikdihLaikdih Deep
DAHIBARI BASANTIMATA OCP
BASANTIMATA
CLUSTER-XVI
B 15
B 23
D 49
D 55
D 80
A 23
D 35
D 5
DB 22
A 32
B 63
D 25
D 30
B 59
A 29
B 32A
D 5
Bharat Coking Coal Limited
Activity Name Designation Signature Date
Prepared
Processed
Checked
Approved
03-2019Manager(Geology)
GM/HOD (Geo)
D.
Bandyopadhyay
Customer
Job Title
FIGURE NO - 2
Subject
Groundwater qualitymonitoring StationLocation Map
Job No.
Sheet
Rev. No. 0Drg. No. G E O 0 0 0
Copyright in these drawings is vested in CMPDI.Unauthorised copying or use is not permitted.
Groundwater Level Monitoring Report forCluster of mines, BCCL 200419012
NE
NW
SESW
Manager(Geology)D.Bandyopadhyay
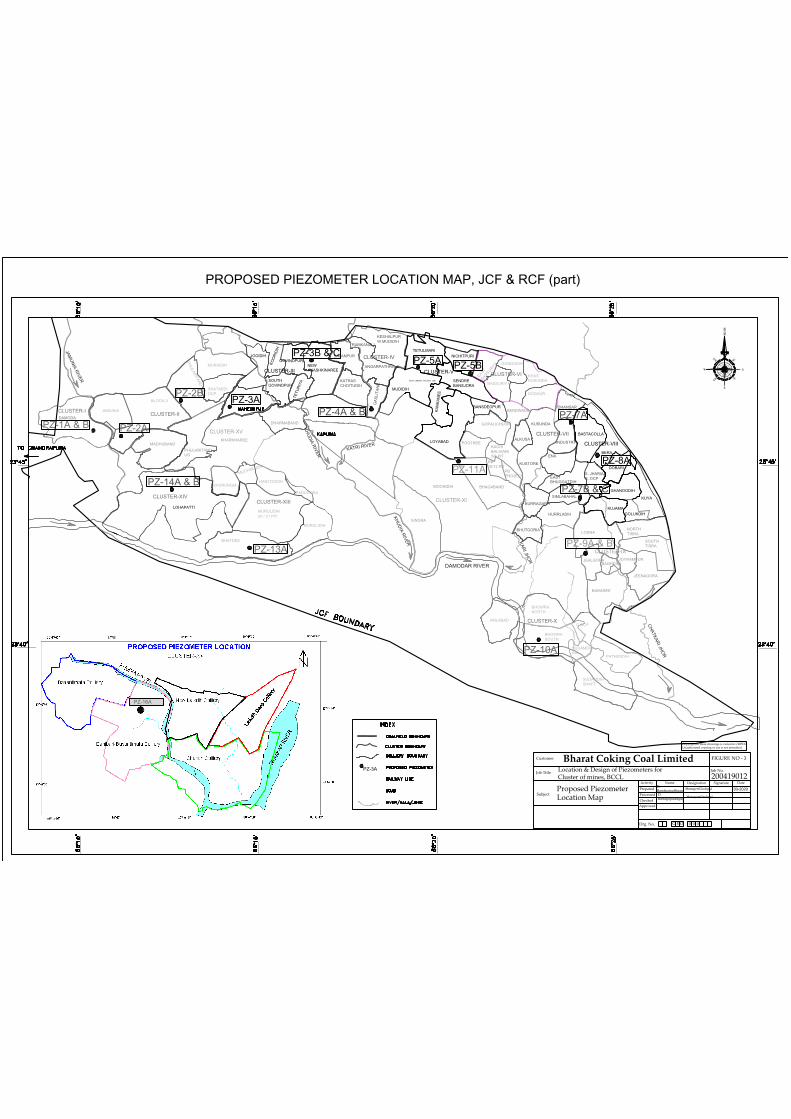
EAST CENTRAL RAILWAY LINE
DAMODA
PZ-1A & B
JAMUNIA
BLOCK-II
PH
ULA
RIT
AN
D O
C
MURAIDIH
SHATABDI
OCP
CLUSTER-ICLUSTER-II
CLUSTER-XIV
LOHAPATTI
MADHUBAND
PHULARITAND
UG
KHARKHAREE
DHARMABAND
CLUSTER-XV
JOGIDIH
KO
OR
IDIH
GOVINDPUR
NEW
AKASHKINAREE
TE
TU
RIY
ASOUTH
GOVINDPUR
SALANPUR
RAMKANALI
KESHALPUR
W.MUDIDIH
KATRAS
CHOITUDIH
GA
SLIT
AN
R
ANGARPATHRA
TETULMARI
MUDIDIH
KA
NK
AN
EE
LOYABAD
SENDRE
BANSJORA
NICHITPURI
BANSDEOPUR
EAST
BASSURIY
A GONDUDIH
KHAS
KUSUNDABASSURIYA
GODHUR
CLUSTER-III
CLUSTER-IV
CLUSTER-V CLUSTER-VI
CLUSTER-XI
SINGRA
MOONIDIH BHAGABAND
POOTKEE
GOPALICHUCK
KENDWADIH
KACHI
BALIHARI
5/6 PIT
PB
PROJECT
KB
10/12 PIT
DHANSAR
KUSUNDA
ENA
INDUSTRY
BASTACOLLA
BERA
HURRLADIH
SIMLABAHAL
EAST
BHUGGATDIH
BURRAGARH
BHUTGORIA
KUSTORE
ALKUSA
DOBARI
GHANOODIH
KUYA
GOLUKDIH
KUJAMA
S. JHARIA/
R. OCP
CLUSTER-VII
CLUSTER-VIII
LODNA
JEALGORABAGHDIGI
BARAREE
JOYRAMPUR
NORTH
TISRA
SOUTH
TISRA
JEENAGORA
CLUSTER-IX
BHURUNGIA
MUCHIRAIDIH
HANTOODIH
MURULIDIH
MURULIDIH
20 / 21 PIT
BHATDEE
PADUGORA
CLUSTER-XIII
AMLABAD
BHOWRA
NORTH
BHOWRA
SOUTH
C OCP
SUDAMDIH
INCPATHERDIH
SUDAMDIH
SHAFT
PROPOSED PIEZOMETER LOCATION MAP, JCF & RCF (part)
PZ-14A & B
PZ-13A
PZ-10A
CLUSTER-X
PZ-9A & B
PZ-8A
PZ-7A
PZ-7B & C
PZ-11A
PZ-4A & B
PZ-5BPZ-5A
PZ-3A
PZ-3B & C
PZ-2A
PZ-2B
Bharat Coking Coal Limited
Activity Name Designation Signature Date
Prepared
Processed
Checked
Approved
03-2020Manager(Geology)D.
Bandyopadhyay
Customer
Job Title
FIGURE NO - 3
SubjectProposed PiezometerLocation Map
Job No.
Drg. No. G E O 0 0 0
Copyright in these drawings is vested in CMPDI.Unauthorised copying or use is not permitted.
NE
NW
SESW
PZ-3A
DAMODAR RIVER
JAM
UN
IA R
IVE
R
KH
UD
IA R
IVE
R
KH
UD
IA R
IVE
R
KATRI RIVER
CH
ATK
AR
I JHO
R
KA
RI JH
OR
200419012Location & Design of Piezometers forCluster of mines, BCCL
PZ-16A
Manager(Geology)D.
Bandyopadhyay
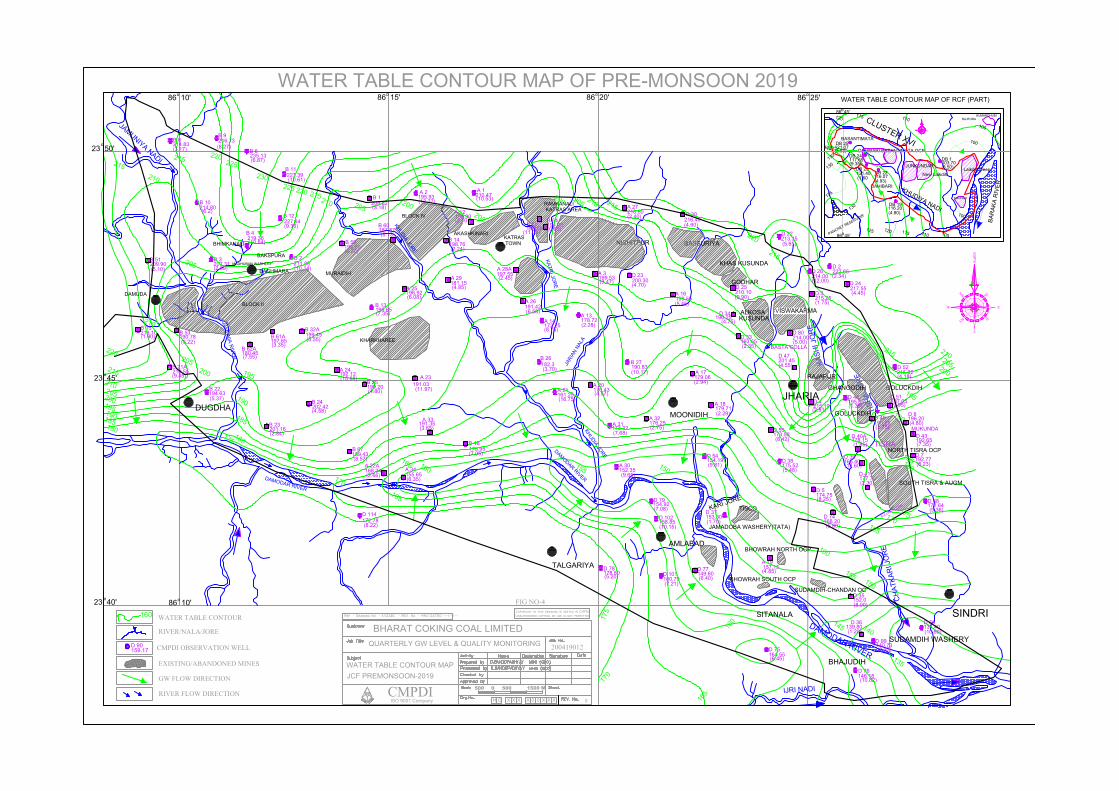
New Laikdih
DAHIBARI BASANTIMATA OCP
CHUNCH
KUMARDHUBIRAJPURA
PANCHET RESERVOIR
BA
RA
KA
RIV
ER
DB 19116.20
DB 22116.07
DB 23
DB 24
121.07DB 25
117.65
(4.80)
(4.93)
121.40
(3.93)
(9.35)
BASANTIMATA
DAHIBARIKHUDIYA NADI
JUNKUNDARLaikdih Deep
(1.60
DB 1103.70(3.50)
CLUSTER XVI
125 120
120
125
130
130
135
135
86 45'o
86 45'o
115 110 105
100
100
105
110115
WATER TABLE CONTOUR MAP OF RCF (PART)
NE
NW
SE
SW
B 60
B 59195.80
B 1208.82
195.93A 2
210.47A 1
B 2B 3
B 4
B 6
B 8B 9
B 10
B 11
B 12
B 13
B 14
B 15
B 21A
B 22
B 23
B 24
B 25
B 26B 27
B 32A
B 48173.95
B 51
B 53B 61A
B 62A
B 64B 65
B 67
A 3
A 12
A 13A 14
A 16
A 17
A 18
A 19
A 20A 21
A 23
A 24
A 25
A 26
A 29
A 27
A 28A
A 30
A 31A 32A 33
A 34
189.43
D 2
D 3
D 4
D 5
D 7
D 8
D 22
D 23
D 25D 24
D 26
D 30
D 34
D 33
D 35
D 36
D 37
D 38D 39
D 40A
D 41
D 43
D 47
D 48
D 49
D 52
D 51
D 54
D 55
D 56
D 68
D 74
D 75
D 76
D 77D 78
D 79
D 80
D 99
D 101
D 102D 114
164.55
173.25
182.3
191.42
178.72
197.55199.53
200.30
199.55
210.10
193.65214.00
214.00
215.25
217.55
192.77
172.64
192.65
196.20
165.40
178.15
190.25
187.05195.65215.19
173.58
175.52
174.75
168.20
177.70
215.82
131.40
140.73
139.80
146.18
152.0
149.60
157.15
160.79
153.30
154.92
158.85
178.80
152.35
154.19
179.71
176.25173.32
176.43161.25
190.83
179.06
218.60
216.40
201.45
202.42
199.20191.03
192.12
199.45
195.65
196.92
181.15
187.87
198.76
199.90
227.39
219.36
207.31 211.86
227.64
235.13
214.83
209.90
219.10190.78
210.55
197.65
180.45
184.95194.05
222.66
213.35
201.16
194.63
155.65
172.78
SINDRI
170
175
BAGHMARA
DAMODAR RIVER
JHARIA
TISRA
TIS
RA
JO
RE
KA
SH
I JO
RE
BHOWRAH NORTH OCP
BHOWRAH SOUTH OCP
SUDAMDIH-CHANDAN OC
SOUTH TISRA & AUGM
NORTH TISRA OCP
BHAJUDIH
AMLABAD
SITANALA
TALGARIYA
IJRI NADI
JAMUNIYA N
ADI
CH
AT
KA
RI JO
RE
MUKUNDA
BASTA COLLA
SULUNGA JOREKARI JORE
TISCO
ALKOSAKUSUNDA
GHANOODIH
GOLUCKDIH
GOLUCKDIH
RAJAPUR
GODHAR
BASSURIYA
KHAS KUSUNDA
NISHITPUR
(5.45)
(2.94)
(2.29)
(4.85)
(7.68)(2.75)
(9.65)
(10.17)
(2.34)
(1.75)
(2.81)
(8.25)
(8.23)
(4.80)
(5.65)
(4.45)(9.90)
(12.00)
(8.00)
(1.20)
(1.70)
(5.48)(12.60)
(1.85)
(2.30)
(7.35)
DUGDHA
SUDAMDIH WASHERY
MOONIDIH
(2.35)
(4.55)
(1.35)
(1.75)
(9.95)
(4.18)
(8.42)
(9.81)
(10.60)
(9.36)
JAMADOBA WASHERY(TATA)
(3.27)
(5.80)
(10.82)
(6.45)
(6.40)(5.20)
(7.08)
(5.00)
(7.21)
(10.15)
(4.70)
(4.60)
(8.22)
(10.53)(12.27)
(3.47)
(2.28)
(2.10)
(8.75)
(4.57)(16.75)
(11.97)
(15.88)
(6.08)
(4.85)
(2.45)
(6.58)
191.35(3.65)
(2.40)
(6.35)
(3.18)
(10.14)(2.69)
(10.64)
(6.87)
(10.61)
(3.17) (8.27)
(6.2)214.80
(9.36)
(7.35)
(2.24)
(1.90)
(9.45)
(5.37)
(2.84)
(4.58)
(4.80)
(8.57)
(3.70)
(5.55)(3.35)
(7.55)
(5.10)
(3.22)
(7.05)
(6.20)
(8.13)(0.95)
(11.05)
BHIMKANALI
BAKSPURA
MADHUBAN WASHERY
DAMUDA
BLOCK II
KHARKHAREE
MURAIDIH
BLOCK IV
RAMKANALIKATRAS AREA
216.73o
23 50'
o23 45'
o23 40'
86 10'o
86 10'o
86 25'o
86 20'o
86 15'o
AKASHKINARIKATRASTOWN
CMPDIISO 9001 Company
BHARAT COKING COAL LIMITED
QUARTERLY GW LEVEL & QUALITY MONITORING
FIG NO-4
X
500 0 500
H Q X
1500 M
0X 0X X XX 0
WATER TABLE CONTOUR MAP OF PRE-MONSOON 2019
JA
MU
NIA
RIV
ER
KH
UD
IA JO
RE
KA
TR
I JO
RE
JAR
IAN
NA
LA
KH
UD
IA JO
RE
DAMODAR RIVER
DAM
ODAR R
IVER
215
210
205
205
205210
215220
225
230
225
220215
210
200
200 195
190
185
180175
170
165
160
165 155150
145 140
135
150
155
160
165
170
175
180
185
190
195
200
205
210215
215
215
220
210205
200
200
220
215
(4.75)196.25
A 22A168.34(2.66)
165
160
210205200195190185180
WATER TABLE CONTOUR160
CMPDI OBSERVATION WELL
RIVER/NALA/JORE
159.17D 90
EXISTING/ABANDONED MINES WATER TABLE CONTOUR MAP
JCF PREMONSOON-2019
NE
NW
SE
SW
GW FLOW DIRECTION
RIVER FLOW DIRECTION
200419012
Annexure XII

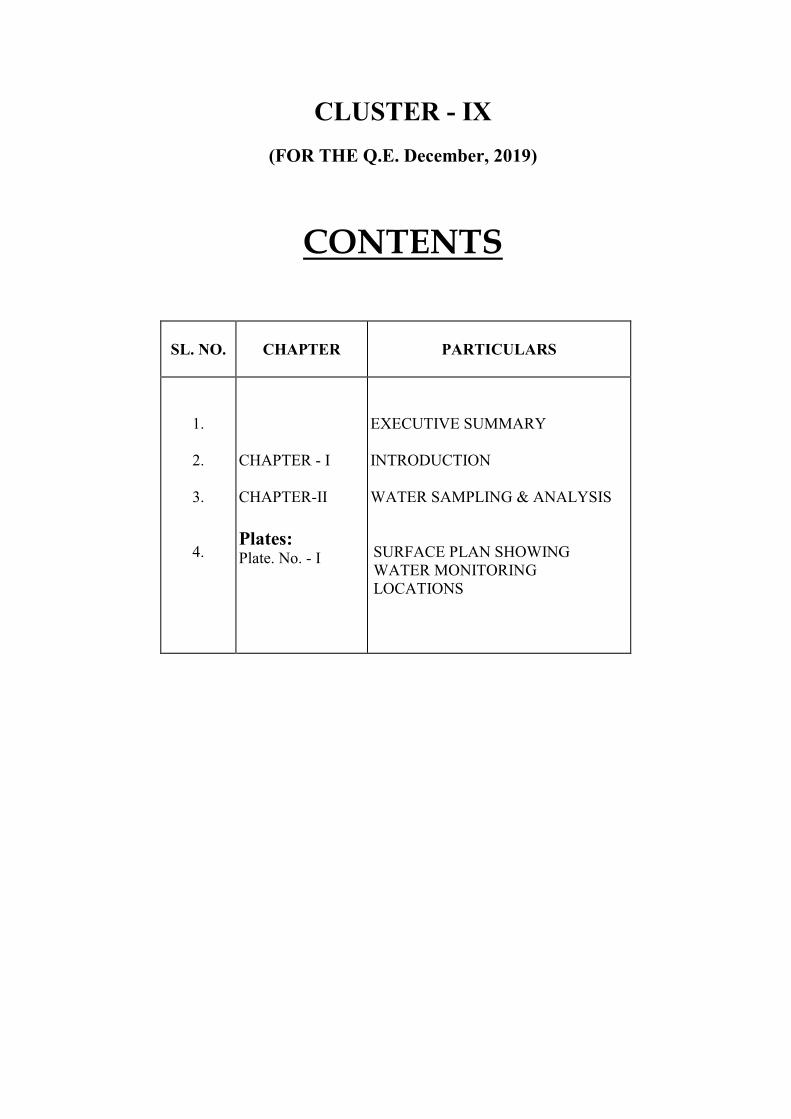
CLUSTER - IX
(FOR THE Q.E. December, 2019)
CONTENTS
SL. NO.
CHAPTER
PARTICULARS
1.
2.
3.
4.
CHAPTER - I
CHAPTER-II
Plates: Plate. No. - I
EXECUTIVE SUMMARY
INTRODUCTION
WATER SAMPLING & ANALYSIS
SURFACE PLAN SHOWING
WATER MONITORING
LOCATIONS

CMPDI
ISO 9001 Company
Regional Institute-II
Dhanbad, Jharkhand
STRICTLY RESTRICTED FOR COMPANY USE ONLY RESTRICTED
The information given in this report is not to be
communicated either directly or indirectly to the
press or to any person not holding an official
position in the CIL / GOVERNMENT.
WATER QUALITY REPORT
OF
BHARAT COKING COAL LIMITED
CLUSTER – IX
(FOR THE Q.E.DECEMBER, 2019)
E. C. no. J-11015/307/2010-IA.II (M) dated 21.05.2013.
EXECUTIVE SUMMARY
1.0 Introduction
The purpose of environmental monitoring is to assess the quality of various
attributes that affects the environment around us. In accordance with the quality of
these attributes appropriate strategy is to be developed to control the pollution level
within the permissible limits. One of these major attributes is water.
Bharat Coking Coal Limited (BCCL), a Subsidiary company of Coal India Limited is
operating Underground and Opencast Mines in Jharia Coalfield (JCF) is a part of
Gondwana Coalfields located in Dhanbad district of Jharkhand, the JCF is bounded
by 23037’ N to 23052’ N latitudes and 86009’ E to 86030’ E longitude occupying an
area of 450 Sq.km. BCCL has awarded Environmental monitoring work of Jharia
Coalfield (JCF) to Central Mine Planning & Design Institute Limited (CMPDIL). The
environmental monitoring has been carried out as per the conditions laid down by
the MoEFCC while granting environmental clearance of project, consent letter
issued by the respective SPCB, and other statutory requirements.
2.0 Sampling location and rationale
2.1 Water sampling stations
The Water sampling stations were selected for mine effluent water, drinking water
supply, well/ Hand pump water & also surface water samples.
2.2 Ambient air sampling locations
The ambient air quality monitoring stations were selected to represent core,
buffer zone area. The rationale has been based on the guidelines stipulated by
MoEF&CC, consent letter of SPCB, as well as other statutory requirements.
3.0 Methodology of sampling and analysis
3.1 Water quality
Water samples were collected as per standard practice. Effluent samples were
analyzed for 25 parameters on quarterly basis & for 27 parameters on half yearly
basis. The drinking and Surface water samples were collected and analyzed for 25
and 17 parameters respectively, on quarterly basis. Thereafter the samples were
preserved and analyzed at the Environmental Laboratory at CMPDI (HQ), Ranchi.
3.2 Heavy Metal in Ambient Air

Parameters chosen for assessment of Heavy metal in Ambient Air Quality were cadmium (Cd), Mercury (Hg), Arsenic (As), Chromium (Cr), Nickel (Ni), and Lead (Pb). Respirable Dust Samplers (RDS) & fine particulates for PM 2.5 sampler were used for sampling PM 10 & PM 2.5 respectively. These heavy metals are analyzed regularly on half yearly basis. The samples were analyzed in Environmental Laboratory of CMPDI, RI-II, Dhanbad
4.0 Results and interpretations
4.1 Water quality
The test results indicate that the major parameters compared with MoEF&CC
Gazette Notification No. GSR 742(E) dt 25.09.2000 Standards for Coal Mines,
IS.10500/2012 (Drinking water) and IS: 2296 (Surface water), are with in
permissible limits.
4.2 Heavy Metal in Ambient Air
The results of Heavy metal in Ambient Air Quality are presented in tabular form
for each monitoring station. The concentration of heavy metals in ambient air is
well within the permissible limit.
CHAPTER - I
INTRODUCTION
1.0 Any industry and development activities including coal mining is bound to affect environmental attributes. There are positive as well as negative impacts of such operations. For controlling the adverse impacts a regular monitoring is essential. The environmental monitoring is being done as per the guide-lines stipulated by Ministry of Environment, Forest and Climate Change (MoEF&CC), Govt. of India.
Bharat Coking Coal Limited (BCCL), a subsidiary company of Coal India Limited
(CIL) is operating UG Mines and Opencast Mines in Jharia Coalfield (JCF). The Jharia Coalfield (JCF) having an area of 450 Sq.KM.
Bharat Coking Coal has awarded Environmental Monitoring work of all Projects,
Cluster wise, to Central Mine Planning & Design Institute Limited (CMPDIL). The environmental monitoring has been carried out as per conditions laid down by MoEF&CC while granting environmental clearance to different projects. CMPDI has trained manpower and well equipped laboratory to carry out monitoring, analysis and R&D work in the field of environment.
1.1 The Cluster-IX is in the Eastern part of the Jharia coalfield. It includes a group
of 7 Mines (viz. Lodna, S. Tisra/NTST OC, Jealgora, Joyrampur, Jeenagora, Bararee, S.Tisra/NTST Expan. OC. The Cluster – IX is situated about 25 - 30 kms from Dhanbad Railway Station. The mines of this Cluster – IX are operating since pre nationalization period (prior to 1972-73). It is connected by both Railway and Road. The drainage pattern of the area is governed by Kashi Jore.
1.2 The Cluster-IX is designed to produce 6.548 MTPA (normative) and 8.512
MTPA (peak) capacity of coal. The Project has Environmental Clearance from Ministry of Environment, Forest and
Climate Change (MoEF&CC) for a rated capacity 6.548 MTPA (normative) and 8.512 MTPA (peak) capacity of coal production vide letter no. J-11015/307/2010-IA.II (M) dated 21st May, 2013.
In compliance of these conditions the Environmental Monitoring has been carried out
& report prepared for submission to MoEF&CC & SPCB and other statutory authorities.

CHAPTER – II
AMBIENT AIR QUALITY MONITORING
2.1 Location of sampling station and their rationale:
(As per G.S.R. 742 (E) dt. 25th December, 2000)
2.2 Ambient Air Quality Sampling Locations
I. CORE ZONE Monitoring Location
i) Jeenagora (A13) : Industrial Area
The location of the sampling station is 230 42’ 31.00’’ N & 860 25’ 48.00’’ E.
II. BUFFER ZONE Monitoring Location
i) Kusmatand Village (A12): Industrial Area
The location of the sampling station is 23045’ 4.65’’ N & 860 26’ 42.10’’ E.
ii) Bhowrah North (A14): Industrial Area
The location of the sampling station is 23o41’ 37.00’’ N & 86o23’ 54.00’’E.
Iii) Hurriladih UGP (A28): Industrial Area
The location of the sampling station is 23044’ 4.18’’ N & 860 24’ 6.21’’ E.
2.3 Results and interpretations
The results of Heavy metal in Ambient Air Quality are presented in tabular form
for each monitoring station. The concentration of heavy metals in ambient air is
well within the permissible limit.
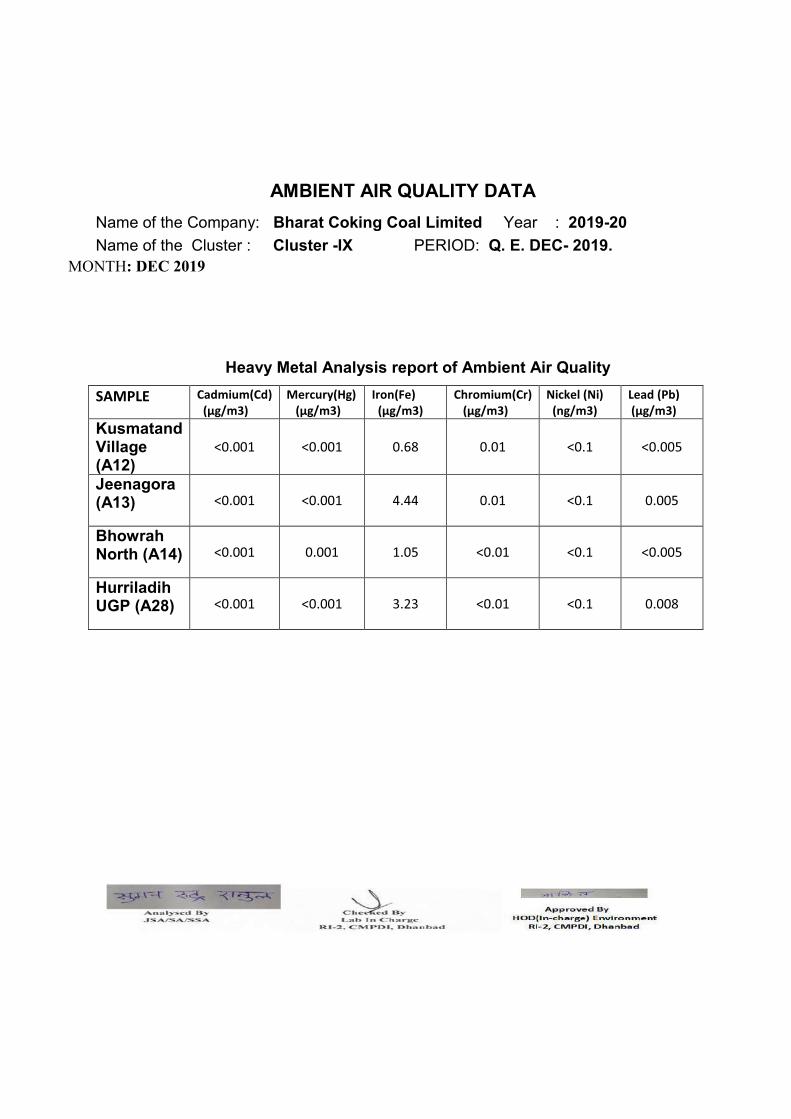
AMBIENT AIR QUALITY DATA
MONTH: DEC 2019
Heavy Metal Analysis report of Ambient Air Quality
SAMPLE Cadmium(Cd)
(µg/m3)
Mercury(Hg)
(µg/m3)
Iron(Fe)
(µg/m3)
Chromium(Cr)
(µg/m3)
Nickel (Ni)
(ng/m3)
Lead (Pb)
(µg/m3)
Kusmatand Village (A12)
<0.001 <0.001 0.68 0.01 <0.1 <0.005
Jeenagora (A13) <0.001 <0.001 4.44 0.01 <0.1 0.005
Bhowrah North (A14) <0.001 0.001 1.05 <0.01 <0.1 <0.005
Hurriladih UGP (A28) <0.001 <0.001 3.23 <0.01 <0.1 0.008
Name of the Company: Bharat Coking Coal Limited Year : 2019-20
Name of the Cluster : Cluster -IX PERIOD: Q. E. DEC- 2019.

CHAPTER – II
WATER QUALITY MONITORING
3.1 Location of sampling sites
(Refer Plate No. - I)
i) Drinking Water quality at Lodna (DW9) ii) Surface Water quality at U/S of Kashi Jore (SW19) iii) Surface quality at D/S of Kashi Jore (SW20) iv) Mine Effluent at Jeenagora (MW9)
3.2 Methodology of sampling and analysis
Water samples were collected as per standard practice. Effluent samples
were analyzed for 25 parameters on quarterly basis & for 27 parameters on
half yearly basis. The drinking and Surface water samples were collected and
analyzed for 25 and 17 parameters respectively, on quarterly basis.
Thereafter the samples were preserved and analyzed at the Environmental
Laboratory at CMPDI (HQ), Ranchi.
3.3 Results & Interpretations
The results are given in tabular form along with the applicable standards.
Results show that most of the parmeters are within the permissible limits.
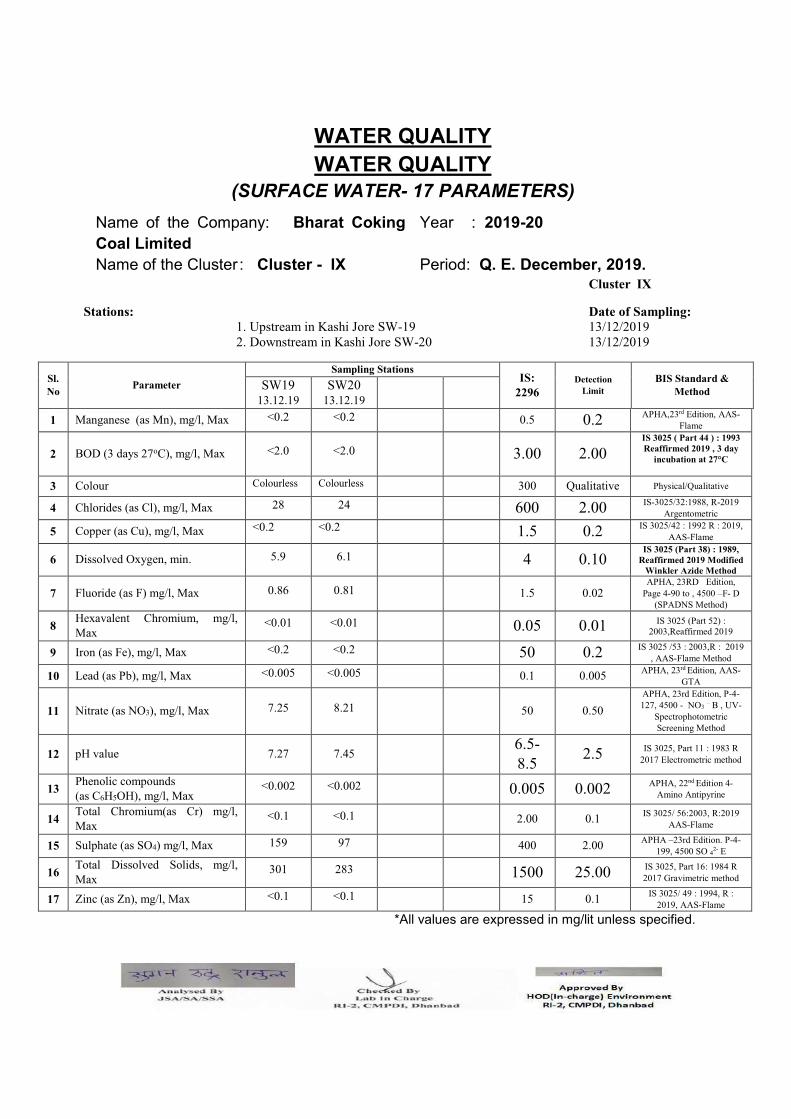
WATER QUALITY
WATER QUALITY
(SURFACE WATER- 17 PARAMETERS)
Cluster IX
Stations: Date of Sampling: 1. Upstream in Kashi Jore SW-19 13/12/2019 2. Downstream in Kashi Jore SW-20 13/12/2019
Sl.
No Parameter
Sampling Stations IS:
2296
Detection
Limit
BIS Standard &
Method SW19
13.12.19
SW20
13.12.19
1 Manganese (as Mn), mg/l, Max <0.2 <0.2 0.5 0.2 APHA,23rd Edition, AAS-
Flame
2 BOD (3 days 27oC), mg/l, Max <2.0 <2.0 3.00 2.00 IS 3025 ( Part 44 ) : 1993
Reaffirmed 2019 , 3 day
incubation at 27°C
3 Colour Colourless Colourless 300 Qualitative Physical/Qualitative
4 Chlorides (as Cl), mg/l, Max 28 24 600 2.00 IS-3025/32:1988, R-2019
Argentometric
5 Copper (as Cu), mg/l, Max <0.2 <0.2 1.5 0.2 IS 3025/42 : 1992 R : 2019,
AAS-Flame
6 Dissolved Oxygen, min. 5.9 6.1 4 0.10 IS 3025 (Part 38) : 1989,
Reaffirmed 2019 Modified
Winkler Azide Method
7 Fluoride (as F) mg/l, Max 0.86 0.81 1.5 0.02 APHA, 23RD Edition,
Page 4-90 to , 4500 –F- D
(SPADNS Method)
8 Hexavalent Chromium, mg/l,
Max <0.01 <0.01 0.05 0.01 IS 3025 (Part 52) :
2003,Reaffirmed 2019
9 Iron (as Fe), mg/l, Max <0.2 <0.2 50 0.2 IS 3025 /53 : 2003,R : 2019
, AAS-Flame Method
10 Lead (as Pb), mg/l, Max <0.005 <0.005 0.1 0.005 APHA, 23rd Edition, AAS-
GTA
11 Nitrate (as NO3), mg/l, Max 7.25 8.21 50 0.50
APHA, 23rd Edition, P-4-
127, 4500 - NO3 – B , UV-
Spectrophotometric
Screening Method
12 pH value 7.27 7.45 6.5-
8.5 2.5
IS 3025, Part 11 : 1983 R
2017 Electrometric method
13 Phenolic compounds
(as C6H5OH), mg/l, Max <0.002 <0.002 0.005 0.002
APHA, 22nd Edition 4-
Amino Antipyrine
14 Total Chromium(as Cr) mg/l,
Max <0.1 <0.1 2.00 0.1
IS 3025/ 56:2003, R:2019
AAS-Flame
15 Sulphate (as SO4) mg/l, Max 159 97 400 2.00 APHA –23rd Edition. P-4-
199, 4500 SO 42- E
16 Total Dissolved Solids, mg/l,
Max 301 283 1500 25.00
IS 3025, Part 16: 1984 R
2017 Gravimetric method
17 Zinc (as Zn), mg/l, Max <0.1 <0.1 15 0.1 IS 3025/ 49 : 1994, R :
2019, AAS-Flame
*All values are expressed in mg/lit unless specified.
Name of the Company: Bharat Coking
Coal Limited
Year : 2019-20
Name of the Cluster : Cluster - IX Period: Q. E. December, 2019.

WATER QUALITY
(DRINKING WATER- 25 PARAMETERS)
Stations: Date of Sampling: 1. Drinking Water from Lodna DW-9 30/12/2019
Sl.
No
Parameter Sampling Stations Detection
Limit
IS:10500
Drinking
Water
Standards
Standard / Test Method
DW09
30.12.19
1 Boron (as B), mg/l, Max <0.2 0.2 0.5 APHA, 23rd Edition ,Carmine
2 Colour,in Hazen Units 2 1 5 APHA, 23rd Edition ,Pt.-Co. Method
3 Calcium (as Ca), mg/l, Max 19 1.6 75 IS 3025, Part 40: 1991 R 2019 EDTA
Method
4 Chloride (as Cl), mg/l, Max 90 2 250 IS-3025/32:1988, R-2019
Argentometric
5 Copper (as Cu), mg/l, Max <0.03 0.03 0.05 IS 3025 Part 42 : 1992 R : 2019, AAS-
Flame
6 Fluoride (as F) mg/l, Max 0.53 0.2 1.0 APHA, 23RD Edition, Page 4-90 to ,
4500 –F- D (SPADNS Method)
7 Free Residual Chlorine, mg/l, Min <0.04 0.04 0.2 APHA, 23rd Edition, , 4500-Cl- B.
(Iodometric Method-I)
8 Iron (as Fe), mg/l, Max 0.17 0.06 1.0 IS 3025 Part 53 : 2003, R : 2019 ,
AAS-Flame Method
9 Lead (as Pb), mg/l, Max 0.005 0.005 0.01 IS:3025(Part 47):1994 (Reaffirmed
2019) APHA, 23rd Edition, AAS-GTA
10 Manganese (as Mn), mg/l, Max 0.02 0.02 0.1 IS-3025(Part 59):2006, R 2017
AAS-Flame /APHA, 23rd Edition,
3111B, Direct Air Acetylene Flame
AAS-Flame/
11 Nitrate (as NO3), mg/l, Max 14.69 0.5 45 APHA, 23rd Edition, P-4-127, 4500 -
NO3 – B , UV-Spectrophotometric
Screening Method
12 Odour Agreeable Qualitative Agreeable APHA, 23rd Edition, , 2150-C
13 pH value 8.26 0.2 6.5-8.5 IS 3025, Part 11 : 1983 R 2017
Electrometric method
14 Phenolic compounds
(as C6H5OH), mg/l, Max <0.001 0.001 0.002 APHA, 22nd Edition,4-Amino
Autipyrine
15 Mercury (as Hg), mg/l, Max <0.0005 0.0005 0.001 APHA,23rd Edition, AAS-VGA
16 Sulphate (as SO4) mg/l, Max 206 2 200 APHA –23rd Edition. P-4-199, 4500
SO 42- E
17 Taste Acceptable Qualitative Acceptable APHA,23rd Edition, 2160-C Flavour
Rating Assesment
18 Total Alkalinity (caco3),, mg/l, Max 206 4 200 IS 3025, Part 23: 1986 R 2019 Titration
Method
19 Cadmium (as Cd), mg/l, Max <0.0005 0.0005 0.003 APHA,23rd Edition, AAS-GTA
Method
20 Total Chromium (as Cr), mg/l, Max <0.04 0.04 0.05 IS-3025 Part 52:2003, R:2019,AAS-
Flame
21 Total Dissolved Solids, mg/l, Max 738 25 500 IS 3025, Part 16: 1984 R 2017
Gravimetric method
22 Total Hardness (caco3), mg/l, Max 476 4 200 IS 3025, Part 21, 2009 R 2019 EDTA
Method
23 Turbidity, NTU, Max 3 1 5 IS 3025, Part 10 : 1984 R 2017
Nephelometric Method
24 Zinc (as Zn), mg/l, Max 0.93 0.01 5 IS 3025 Part 49 : 1994,R : 2019, AAS-
Flame
25 Nickel as Ni, mg/l Max 0.08 0.01 5 IS 3025 Pat 54 : 2003,R : 2019, AAS-
Flame
Name of the Company: Bharat Coking Coal Limited Year : 2019-20.
Name of the Cluster : Cluster - IX Period: Q.E.December,
2019.

WATER QUALITY
(MINE WATER- 27 PARAMETERS)
Effluent water of BCCL Mines Date of Sampling:
Sample Code : Mine Water Discharge Jeenagora MW-9 25.12.2019
Sl.No. Parameter Results
Detection Limit
MOEF -SCH-VI
STANDARDS
Class ‘A’
BIS Standard & Method
1 Ammonical Nitrogen, mg/l, Max 0.02 0.02 50.0 IS 3025/34:1988,
R : 2009, Nessler’s
2 Mercury (as Hg), mg/l, Max <0.0005 0.0005 0.01 APHA 23rd Edition, AAS-VGA
3 B.O.D (3 days 27oC), mg/l, Max <2 2.00 30.0 IS 3025 /44:1993,R:2003
3 day incubation at 27°C
4 Colour Colourless Qualitative Qualitative Physical/Qualitative
5 COD, mg/l, Max 28 4.00 250.0 APHA 23rd Edition 5220 C Titrimetric
Method
6 Copper (as Cu), mg/l, Max <0.2 0.2 3.0 IS 3025(Part42): 1992 R : 2019, AAS-
Flame
7 Dissolved Phosphate (as P), mg/l, Max <0.3 0.30 5.0 IS 3025/ 31, 1988 R 2019
8 Fluoride (as F) mg/l, Max 0.77 0.02 2.0 APHA, 23RD Edition, Page 4-90 to ,
4500 –F- D (SPADNS Method)
9 Free Ammonia, mg/l, Max <0.01 0.01 5.0 IS:3025/34:1988, Nesseler’s
10 Hexavalent Chromium, mg/l, Max 0.024 0.01 0.1 IS 3025 (Part 52) : 2003,Reaffirmed 2019
11 Iron (as Fe), mg/l, Max <0.2 0.2 3.0 IS 3025 (Part 53) : 2003, R : 2019 , AAS-
Flame
12 Lead (as Pb), mg/l, Max <0.005 0.005 0.1 APHA, 23rd Edition, AAS-GTA
13 Manganese(as Mn), mg/l, Max <0.2 0.2 2.0 IS-3025(Part 59):2006, R 2017 AAS-
Flame /APHA, 23rd Edition, 3111B, AAS-
Flame
14 Nickel (as Ni), mg/l, Max <0.1 0.1 3.0 IS-3025(Part 54):2003, R:2019 AAS-
Flame
15 Nitrate Nitrogen, mg/l, Max <0.5 0.50 10.0 APHA, 23 rd Edition,UV-
Spectrphotometric
16 Oil & Grease, mg/l, Max <2.0 2.00 10.0 IS 3025/39:1991, R : 2019, Partition
Gravimetric
17 pH value 8.14 2.5 5.5 to 9.0 IS-3025/11:1983, R-2017, Electrometric
18 Phenolic compounds (as C6H5OH),mg/l, Max
<0.002 0.002 1.0 APHA, 23rd Edition
4-Amino Antipyrine
19 Sodium (as Na), mg/l, Max <0.005 0.005 - IS-3025 (Part 45):1993, R:2019 AAS-
Flame
20 Sulphide (as S2-) mg/l Max. <0.005 0.005 2.0 APHA 23rd Edition Methylene Blue
Method
21 Temperature (o C ) 17.2 Shall not exceed 50 C above the receiving temp.
IS-3025/09:1984, Thermometeric
22 Total Chromium (as Cr), mg/l, Max <0.1 0.1 2.0 IS-3025(Part 52):2003, R:2019 AAS-
Flame
23 Total Kjeldahl Nitrogen, mg/l, Max 1.0 1.00 100.0 IS:3025/34:1988, Nesseler’s
24 Total Residual Chlorine, mg/l, Max <0.04 0.04 1.0 APHA, 23rd Edition, , 4500-Cl B.
(Iodometric Method-I)
25 Total Suspended Solids, mg/l, Max 30 10.00 100.0 IS 3025/17:1984, R :2017, Gravimetric
26 Zinc (as Zn), mg/l, Max <0.1 0.1 5.0 IS 3025 /49 : 1994, R : 2019, AAS-Flame
27 Odour Agreeable Agreeable Qualitative APHA, 23rd Edition, , 2150-C
All values are expressed in mg/lit unless specified.*
Name of the Company: Bharat Coking Coal Limited Year : 2019-20
Name of the Cluster : Cluster - IX Period: Q.E.December,
2019.
Annexure XIII
Land use Map generated from Remote Sensing Data
CMPDI
Job No 561410027 (BCCL) i
Land Restoration / Reclamation Monitoring of 4
Clusters of Opencast Mines of Bharat Coking Coal Limited producing less than 5 m.cu.m (Coal + OB) based on Satellite Data for the Year 2017
March-2018
Remote Sensing Cell Geomatics Division
CMPDI, Ranchi
CMPDI
Job No 561410027 (BCCL) ii
CONTENTS
Executive Summary iii
1.0 Background 01
2.0 Objective 02
3.0 Methodology 02 4.0 Land Reclamation in Bharat Coking Coal Limited 05
List of Tables
Table-1 Cluster wise Land Reclamation Status iv
Table-2 Area Statistics of Land Use Classes in Clusters 06
List of Plates Plate-1 Land Use Map of Cluster-III 07
Plate -2 Land Use Map of Cluster-V 08
Plate -3 Land Use Map of Cluster-VIII 09
Plate-4 Land Use Map of Cluster-IX 10
List of Figures Figure-1 Bar-Chart of Cluster wise Land Reclamation Status v
Figure-2 Methodology of Land Reclamation Monitoring 02
Figure-3 Bar-Chart of Land Reclamation Status of Cluster-III 11
Figure-4 Bar-Chart of Land Reclamation Status of Cluster-V 11
Figure-5 Bar-Chart of Land Reclamation Status of Cluster-VIII 12
Figure-6 Bar-Chart of Land Reclamation Status of Cluster-IX 12
List of Photographs
Photo-1 Ecological Restoration Site ( Tetulmari Colliery) 13
Photo-2 Eco-Restoration Site ( Rajapur OCP) 13
Photo-3 Social Forestry Plantation ( Lodna) 14
CMPDI
Job No 561410027 (BCCL) iii
Executive Summary
1.0 Project Land restoration / reclamation monitoring of 4 clusters of Opencast Mines of Bharat Coking Coal Ltd. (BCCL) producing less than 5 million cu. m. (Coal + OB) per year based on satellite data of the year 2017 on three year interval.
2.0 Objective Objective of the land restoration / reclamation monitoring is to
assess the area of backfilling, plantation, social forestry, active mining area, water bodies and distribution of wasteland, agricultural land and forest land in the leasehold area of the various projects. This will help in assessing the progressive status of mined out land reclamation and to take up remedial measures, if any, required for environmental protection.
3.0 Salient Findings
· Out of the total mine leasehold area of 6576.22 hectares of the 4 Clusters of mines viz. Cluster III, Cluster V, Cluster VIII & Cluster IX considered for monitoring during year 2017-18; total excavated area is 995.60 ha, out of which 31.60 ha (3.17%) has been planted, 457.35 ha (45.94%) area is under backfilling and 506.65 ha (50.89%) area is under active mining. It is evident from the analysis that 49.11% area of the above clusters is under reclamation (biological and technical) and balance 50.89% area is under active mining. Project wise details are given in Table-1 & Fig -1.
· From the analysis of land reclamation for the year 2017 it is evident that the area under technical reclamation is 457.35 Ha. and area under biological reclamation is 31.60 Ha. Out of 4 clusters of BCCL considered for monitoring, Cluster VIII is on top for land reclamation (61.25%) followed by Cluster V (60.13%) and Cluster III (37.06%).
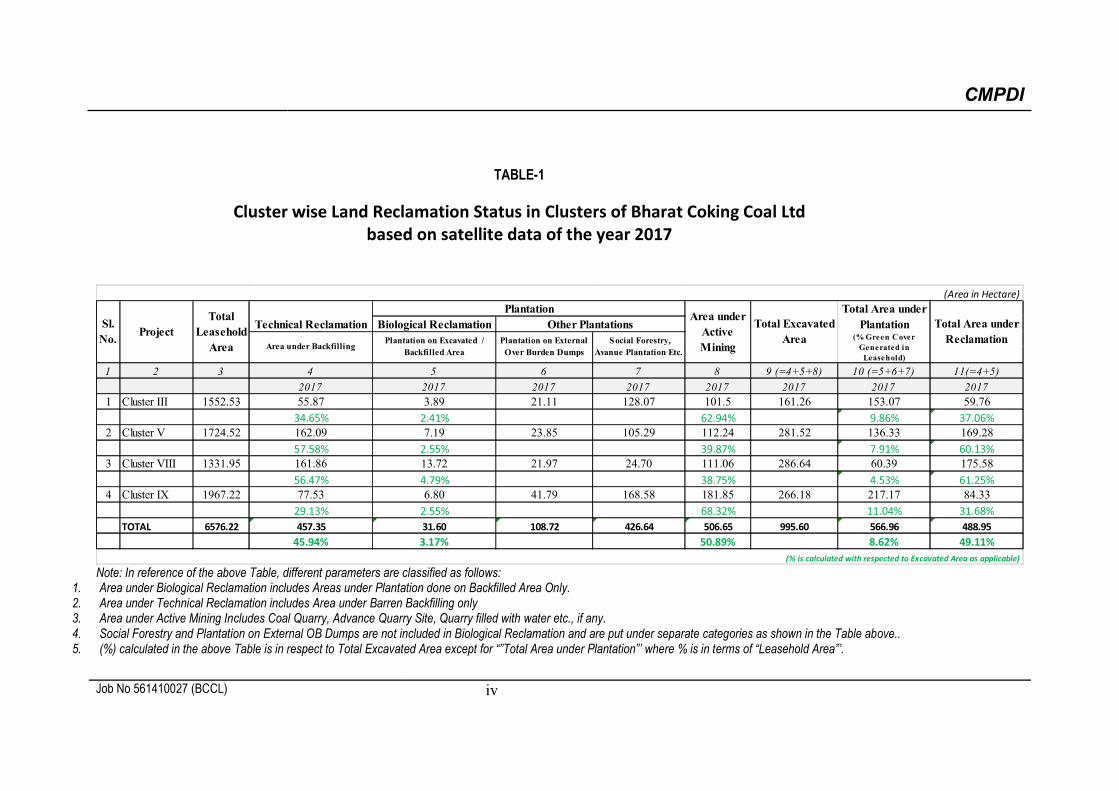
CMPDI
Job No 561410027 (BCCL) iv
TABLE-1
Cluster wise Land Reclamation Status in Clusters of Bharat Coking Coal Ltd
based on satellite data of the year 2017
Note: In reference of the above Table, different parameters are classified as follows:
1. Area under Biological Reclamation includes Areas under Plantation done on Backfilled Area Only. 2. Area under Technical Reclamation includes Area under Barren Backfilling only 3. Area under Active Mining Includes Coal Quarry, Advance Quarry Site, Quarry filled with water etc., if any. 4. Social Forestry and Plantation on External OB Dumps are not included in Biological Reclamation and are put under separate categories as shown in the Table above.. 5. (%) calculated in the above Table is in respect to Total Excavated Area except for “”Total Area under Plantation”’ where % is in terms of “Leasehold Area”’.
Biological Reclamation
1 2 3 4 5 6 7 8 9 (=4+5+8) 10 (=5+6+7) 11(=4+5)
2017 2017 2017 2017 2017 2017 2017 2017
1 Cluster III 1552.53 55.87 3.89 21.11 128.07 101.5 161.26 153.07 59.76
34.65% 2.41% 62.94% 9.86% 37.06%
2 Cluster V 1724.52 162.09 7.19 23.85 105.29 112.24 281.52 136.33 169.28
57.58% 2.55% 39.87% 7.91% 60.13%
3 Cluster VIII 1331.95 161.86 13.72 21.97 24.70 111.06 286.64 60.39 175.58
56.47% 4.79% 38.75% 4.53% 61.25%
4 Cluster IX 1967.22 77.53 6.80 41.79 168.58 181.85 266.18 217.17 84.33
29.13% 2.55% 68.32% 11.04% 31.68%
TOTAL 6576.22 457.35 31.60 108.72 426.64 506.65 995.60 566.96 488.95
45.94% 3.17% 50.89% 8.62% 49.11%
(Area in Hectare)
Sl.
No.Project
Total
Leasehold
Area
Technical Reclamation
PlantationArea under
Active
Mining
Total Excavated
Area
(% is calculated with respected to Excavated Area as applicable)
Total Area under
Plantation (% Green Cover
Generated in
Leasehold)
Total Area under
Reclamation
Other Plantations
Area under BackfillingPlantation on Excavated /
Backfilled Area
Plantation on External
Over Burden Dumps
Social Forestry,
Avanue Plantation Etc.
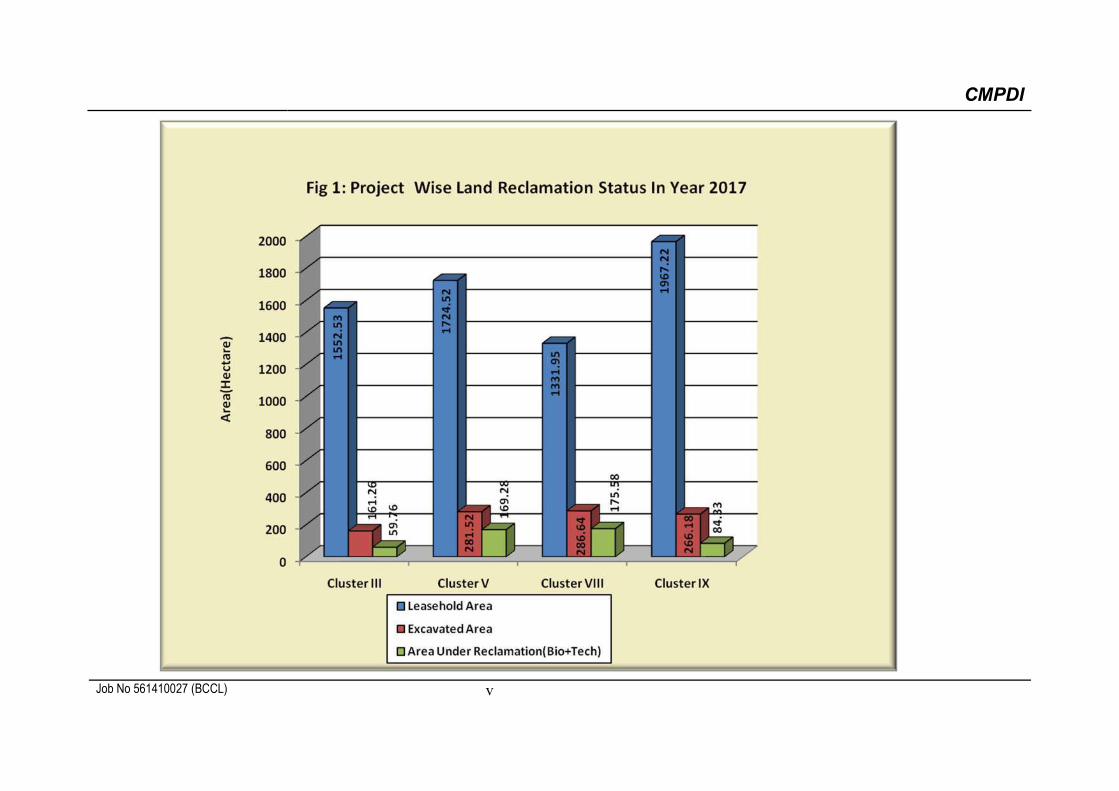
CMPDI
Job No 561410027 (BCCL) v
CMPDI
Job No 561410027 (BCCL) 1
1.0 Background
1.1 Land is the most important natural resource which embodies soil, water, flora, fauna and
total ecosystem. All human activities are based on the land which is the most scarce
natural resource in our country. Mining is a site specific industry and it could not be shifted
anywhere else from the location where mineral occurs. It is a fact that surface mining
activities do effect the land environment due to ground breaking. Therefore, there is an
urgent need to reclaim and restore the mined out land for its productive use for sustainable
development of mining. This will not only mitigate environmental degradation, but would
also help in creating a more congenial environment for land acquisition by coal companies
in future.
1.2 Keeping above in view, M/s. Coal India Ltd. (CIL) issued a work order vide letter no.
CIL/WBP/ENV./2017/DP/8477 dated 21/09/17 for monitoring of opencast mines of less
than 5 million m3 per annum capacity (Coal +OB) for the period 2017-18 to 2021-22 at
intervals of three years. The result of land reclamation status of all such mines is
uploaded on the website of the concerned coal companies in public domain. Detailed
reports are to be submitted to Coal India and respective subsidiaries.
1.3 Land reclamation monitoring of all opencast coal mining projects would also comply the
statutory requirements of Ministry of Environment & Forest (MoEF).Such monitoring would
not only facilitate in taking timely mitigation measures against environmental degradation,
but would also enable coal companies to utilize the reclaimed land for larger socio-
economic benefits in a planned way.
1.4 Present report is embodying the finding of the study based on satellite data of the year
2017 carried out for 4 clusters of Bharat Coking Coal Ltd. producing less than 5 mcm
(Coal+OB) per annum.
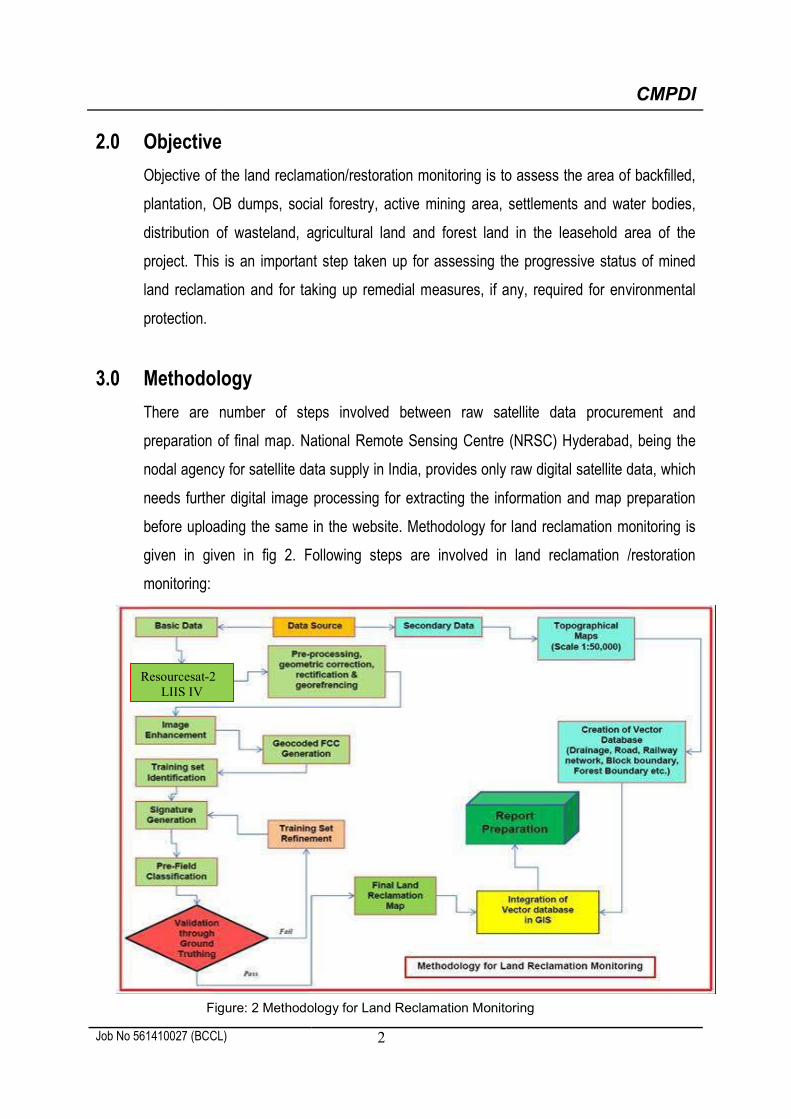
CMPDI
Job No 561410027 (BCCL) 2
2.0 Objective
Objective of the land reclamation/restoration monitoring is to assess the area of backfilled,
plantation, OB dumps, social forestry, active mining area, settlements and water bodies,
distribution of wasteland, agricultural land and forest land in the leasehold area of the
project. This is an important step taken up for assessing the progressive status of mined
land reclamation and for taking up remedial measures, if any, required for environmental
protection.
3.0 Methodology
There are number of steps involved between raw satellite data procurement and
preparation of final map. National Remote Sensing Centre (NRSC) Hyderabad, being the
nodal agency for satellite data supply in India, provides only raw digital satellite data, which
needs further digital image processing for extracting the information and map preparation
before uploading the same in the website. Methodology for land reclamation monitoring is
given in given in fig 2. Following steps are involved in land reclamation /restoration
monitoring:
Figure: 2 Methodology for Land Reclamation Monitoring
Resourcesat-2
LIIS IV
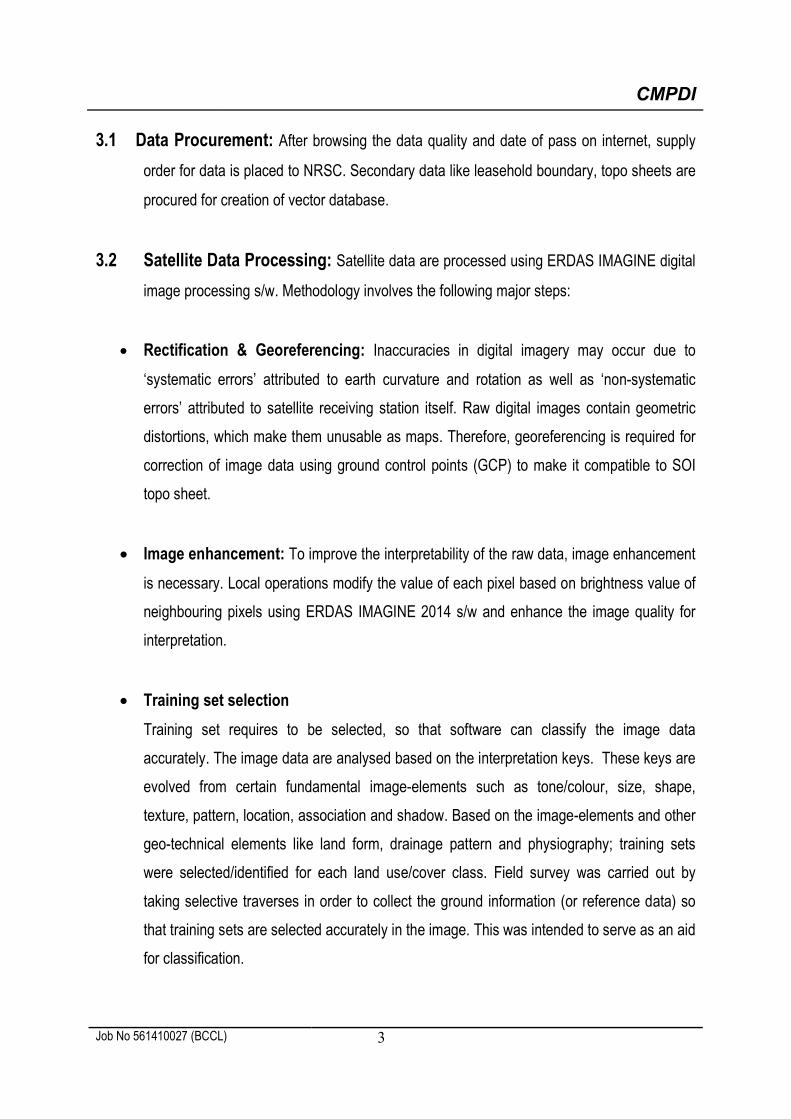
CMPDI
Job No 561410027 (BCCL) 3
3.1 Data Procurement: After browsing the data quality and date of pass on internet, supply
order for data is placed to NRSC. Secondary data like leasehold boundary, topo sheets are
procured for creation of vector database.
3.2 Satellite Data Processing: Satellite data are processed using ERDAS IMAGINE digital
image processing s/w. Methodology involves the following major steps:
· Rectification & Georeferencing: Inaccuracies in digital imagery may occur due to
‘systematic errors’ attributed to earth curvature and rotation as well as ‘non-systematic
errors’ attributed to satellite receiving station itself. Raw digital images contain geometric
distortions, which make them unusable as maps. Therefore, georeferencing is required for
correction of image data using ground control points (GCP) to make it compatible to SOI
topo sheet.
· Image enhancement: To improve the interpretability of the raw data, image enhancement
is necessary. Local operations modify the value of each pixel based on brightness value of
neighbouring pixels using ERDAS IMAGINE 2014 s/w and enhance the image quality for
interpretation.
· Training set selection
Training set requires to be selected, so that software can classify the image data
accurately. The image data are analysed based on the interpretation keys. These keys are
evolved from certain fundamental image-elements such as tone/colour, size, shape,
texture, pattern, location, association and shadow. Based on the image-elements and other
geo-technical elements like land form, drainage pattern and physiography; training sets
were selected/identified for each land use/cover class. Field survey was carried out by
taking selective traverses in order to collect the ground information (or reference data) so
that training sets are selected accurately in the image. This was intended to serve as an aid
for classification.
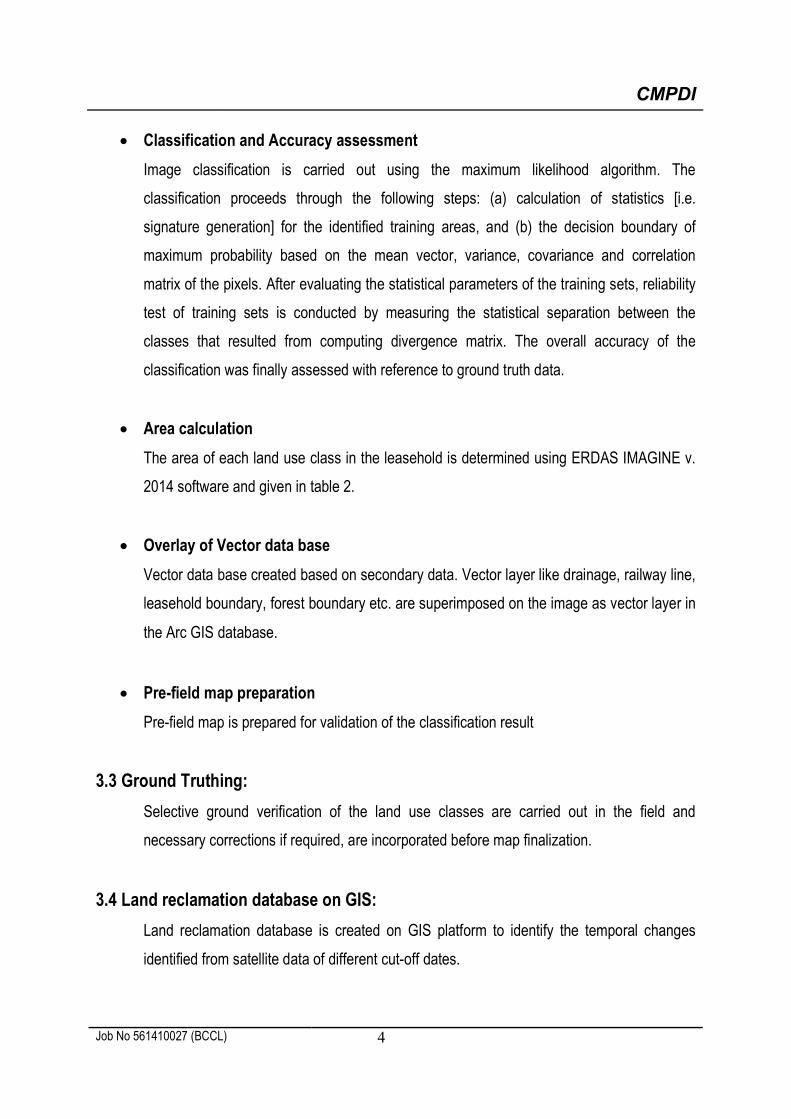
CMPDI
Job No 561410027 (BCCL) 4
· Classification and Accuracy assessment
Image classification is carried out using the maximum likelihood algorithm. The
classification proceeds through the following steps: (a) calculation of statistics [i.e.
signature generation] for the identified training areas, and (b) the decision boundary of
maximum probability based on the mean vector, variance, covariance and correlation
matrix of the pixels. After evaluating the statistical parameters of the training sets, reliability
test of training sets is conducted by measuring the statistical separation between the
classes that resulted from computing divergence matrix. The overall accuracy of the
classification was finally assessed with reference to ground truth data.
· Area calculation
The area of each land use class in the leasehold is determined using ERDAS IMAGINE v.
2014 software and given in table 2.
· Overlay of Vector data base
Vector data base created based on secondary data. Vector layer like drainage, railway line,
leasehold boundary, forest boundary etc. are superimposed on the image as vector layer in
the Arc GIS database.
· Pre-field map preparation
Pre-field map is prepared for validation of the classification result
3.3 Ground Truthing:
Selective ground verification of the land use classes are carried out in the field and
necessary corrections if required, are incorporated before map finalization.
3.4 Land reclamation database on GIS:
Land reclamation database is created on GIS platform to identify the temporal changes
identified from satellite data of different cut-off dates.
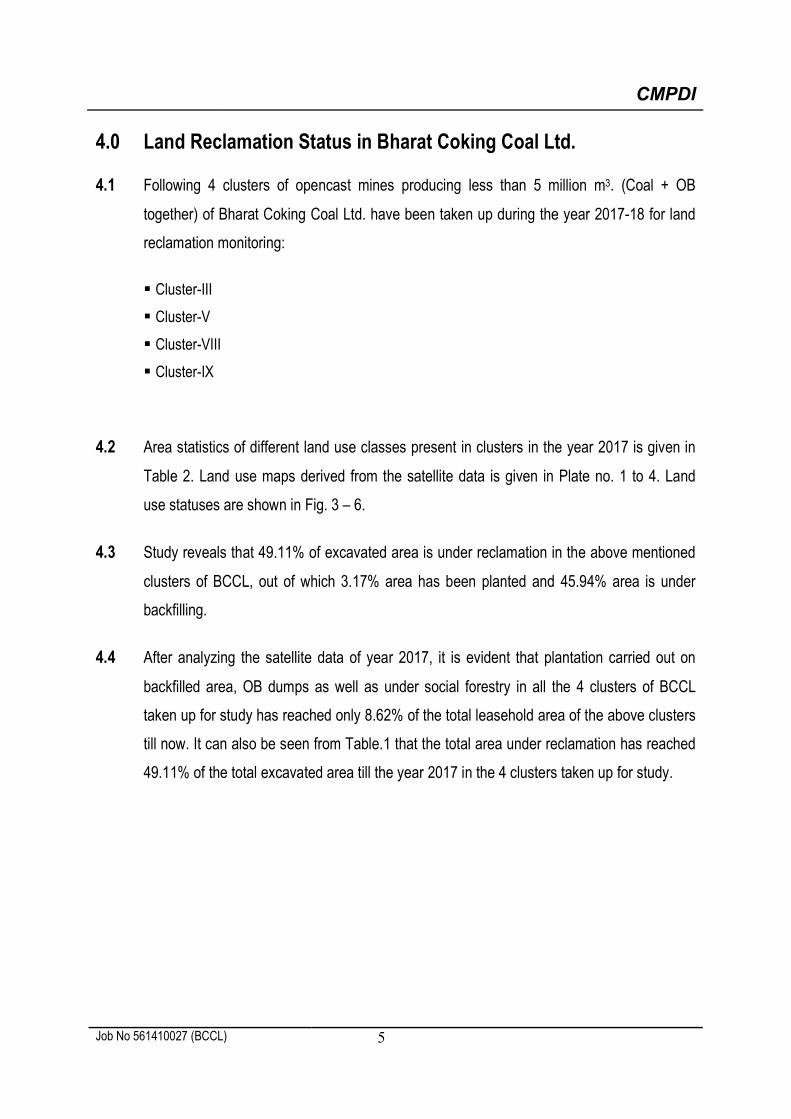
CMPDI
Job No 561410027 (BCCL) 5
4.0 Land Reclamation Status in Bharat Coking Coal Ltd.
4.1 Following 4 clusters of opencast mines producing less than 5 million m3. (Coal + OB
together) of Bharat Coking Coal Ltd. have been taken up during the year 2017-18 for land
reclamation monitoring:
§ Cluster-III
§ Cluster-V
§ Cluster-VIII
§ Cluster-IX
4.2 Area statistics of different land use classes present in clusters in the year 2017 is given in
Table 2. Land use maps derived from the satellite data is given in Plate no. 1 to 4. Land
use statuses are shown in Fig. 3 – 6.
4.3 Study reveals that 49.11% of excavated area is under reclamation in the above mentioned
clusters of BCCL, out of which 3.17% area has been planted and 45.94% area is under
backfilling.
4.4 After analyzing the satellite data of year 2017, it is evident that plantation carried out on
backfilled area, OB dumps as well as under social forestry in all the 4 clusters of BCCL
taken up for study has reached only 8.62% of the total leasehold area of the above clusters
till now. It can also be seen from Table.1 that the total area under reclamation has reached
49.11% of the total excavated area till the year 2017 in the 4 clusters taken up for study.
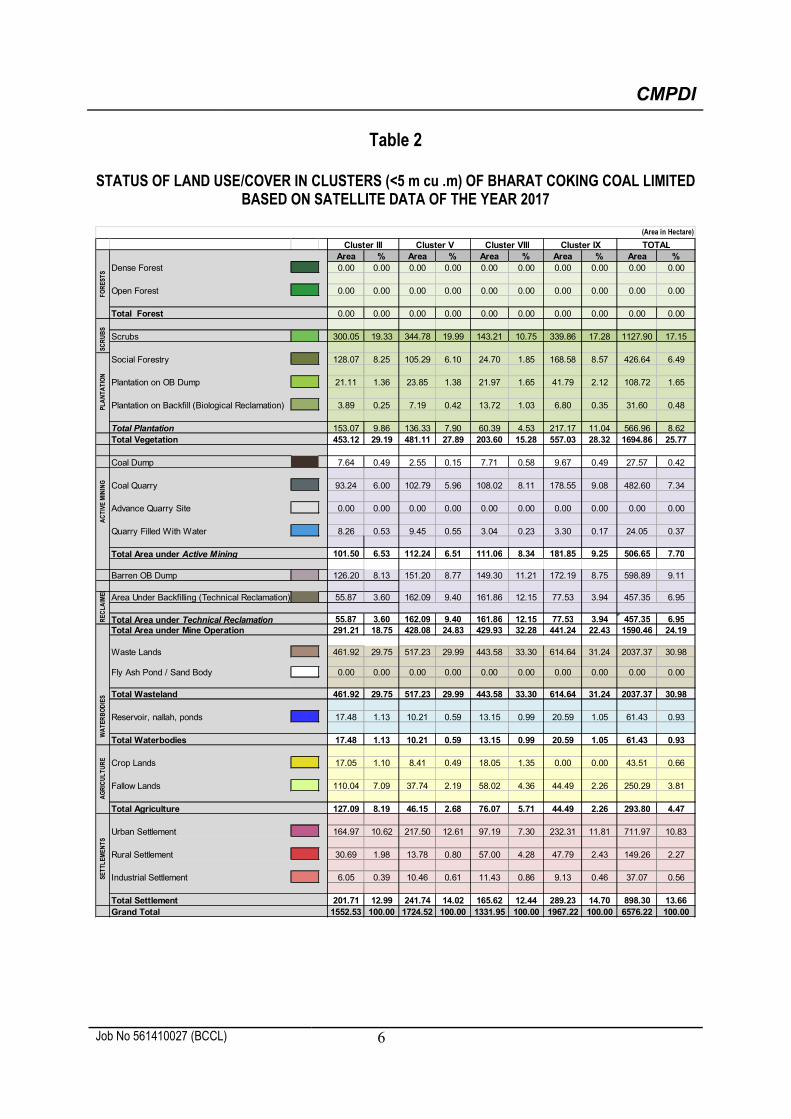
CMPDI
Job No 561410027 (BCCL) 6
Table 2
STATUS OF LAND USE/COVER IN CLUSTERS (<5 m cu .m) OF BHARAT COKING COAL LIMITED BASED ON SATELLITE DATA OF THE YEAR 2017
Area % Area % Area % Area % Area %
Dense Forest 0.00 0.00 0.00 0.00 0.00 0.00 0.00 0.00 0.00 0.00
Open Forest 0.00 0.00 0.00 0.00 0.00 0.00 0.00 0.00 0.00 0.00
Total Forest 0.00 0.00 0.00 0.00 0.00 0.00 0.00 0.00 0.00 0.00
Scrubs 300.05 19.33 344.78 19.99 143.21 10.75 339.86 17.28 1127.90 17.15
Social Forestry 128.07 8.25 105.29 6.10 24.70 1.85 168.58 8.57 426.64 6.49
Plantation on OB Dump 21.11 1.36 23.85 1.38 21.97 1.65 41.79 2.12 108.72 1.65
Plantation on Backfill (Biological Reclamation) 3.89 0.25 7.19 0.42 13.72 1.03 6.80 0.35 31.60 0.48
Total Plantation 153.07 9.86 136.33 7.90 60.39 4.53 217.17 11.04 566.96 8.62
Total Vegetation 453.12 29.19 481.11 27.89 203.60 15.28 557.03 28.32 1694.86 25.77
Coal Dump 7.64 0.49 2.55 0.15 7.71 0.58 9.67 0.49 27.57 0.42
Coal Quarry 93.24 6.00 102.79 5.96 108.02 8.11 178.55 9.08 482.60 7.34
Advance Quarry Site 0.00 0.00 0.00 0.00 0.00 0.00 0.00 0.00 0.00 0.00
Quarry Filled With Water 8.26 0.53 9.45 0.55 3.04 0.23 3.30 0.17 24.05 0.37
Total Area under Active Mining 101.50 6.53 112.24 6.51 111.06 8.34 181.85 9.25 506.65 7.70
Barren OB Dump 126.20 8.13 151.20 8.77 149.30 11.21 172.19 8.75 598.89 9.11
Area Under Backfilling (Technical Reclamation) 55.87 3.60 162.09 9.40 161.86 12.15 77.53 3.94 457.35 6.95
Total Area under Technical Reclamation 55.87 3.60 162.09 9.40 161.86 12.15 77.53 3.94 457.35 6.95
Total Area under Mine Operation 291.21 18.75 428.08 24.83 429.93 32.28 441.24 22.43 1590.46 24.19
Waste Lands 461.92 29.75 517.23 29.99 443.58 33.30 614.64 31.24 2037.37 30.98
Fly Ash Pond / Sand Body 0.00 0.00 0.00 0.00 0.00 0.00 0.00 0.00 0.00 0.00
Total Wasteland 461.92 29.75 517.23 29.99 443.58 33.30 614.64 31.24 2037.37 30.98
Reservoir, nallah, ponds 17.48 1.13 10.21 0.59 13.15 0.99 20.59 1.05 61.43 0.93
Total Waterbodies 17.48 1.13 10.21 0.59 13.15 0.99 20.59 1.05 61.43 0.93
Crop Lands 17.05 1.10 8.41 0.49 18.05 1.35 0.00 0.00 43.51 0.66
Fallow Lands 110.04 7.09 37.74 2.19 58.02 4.36 44.49 2.26 250.29 3.81
Total Agriculture 127.09 8.19 46.15 2.68 76.07 5.71 44.49 2.26 293.80 4.47
Urban Settlement 164.97 10.62 217.50 12.61 97.19 7.30 232.31 11.81 711.97 10.83
Rural Settlement 30.69 1.98 13.78 0.80 57.00 4.28 47.79 2.43 149.26 2.27
Industrial Settlement 6.05 0.39 10.46 0.61 11.43 0.86 9.13 0.46 37.07 0.56
Total Settlement 201.71 12.99 241.74 14.02 165.62 12.44 289.23 14.70 898.30 13.66
Grand Total 1552.53 100.00 1724.52 100.00 1331.95 100.00 1967.22 100.00 6576.22 100.00
WA
TE
RB
OD
IES
AG
RIC
UL
TU
RE
SE
TT
LE
ME
NT
S
Cluster IX
FO
RE
ST
SS
CR
UB
SP
LA
NT
AT
ION
AC
TIV
E M
ININ
GR
EC
LA
IME
D
(Area in Hectare)
Cluster III Cluster V Cluster VIII TOTAL
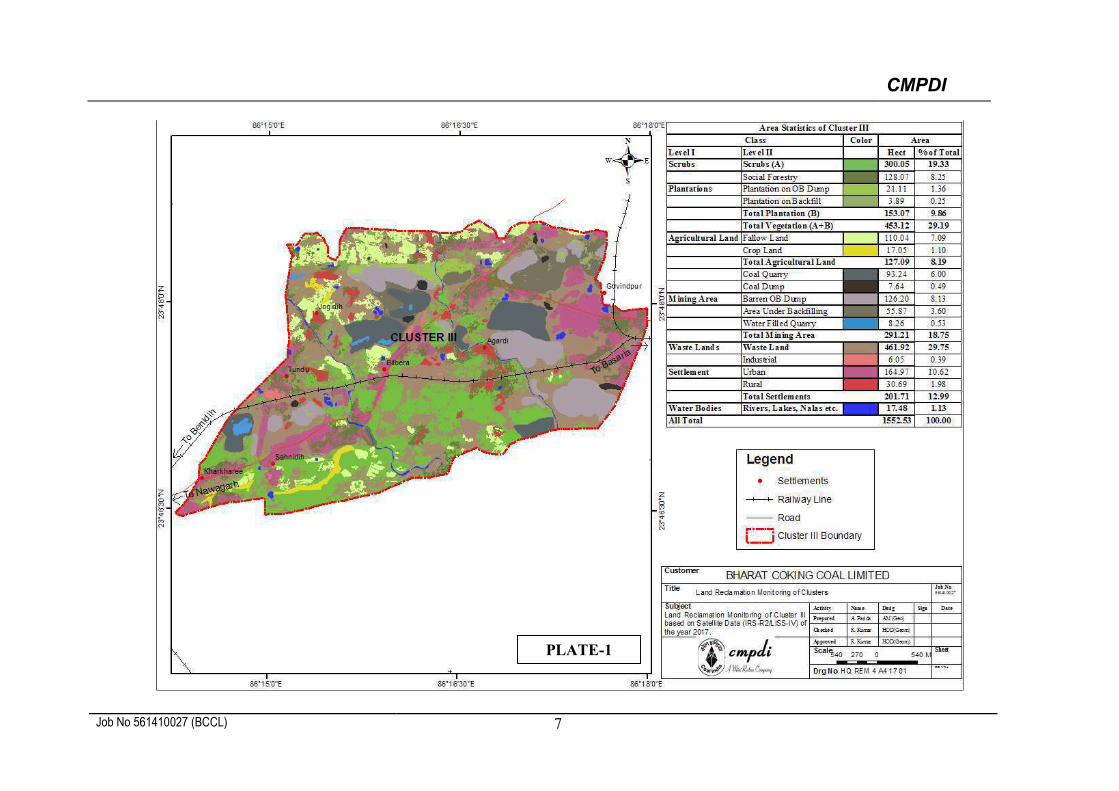
CMPDI
Job No 561410027 (BCCL) 7
PLATE-1
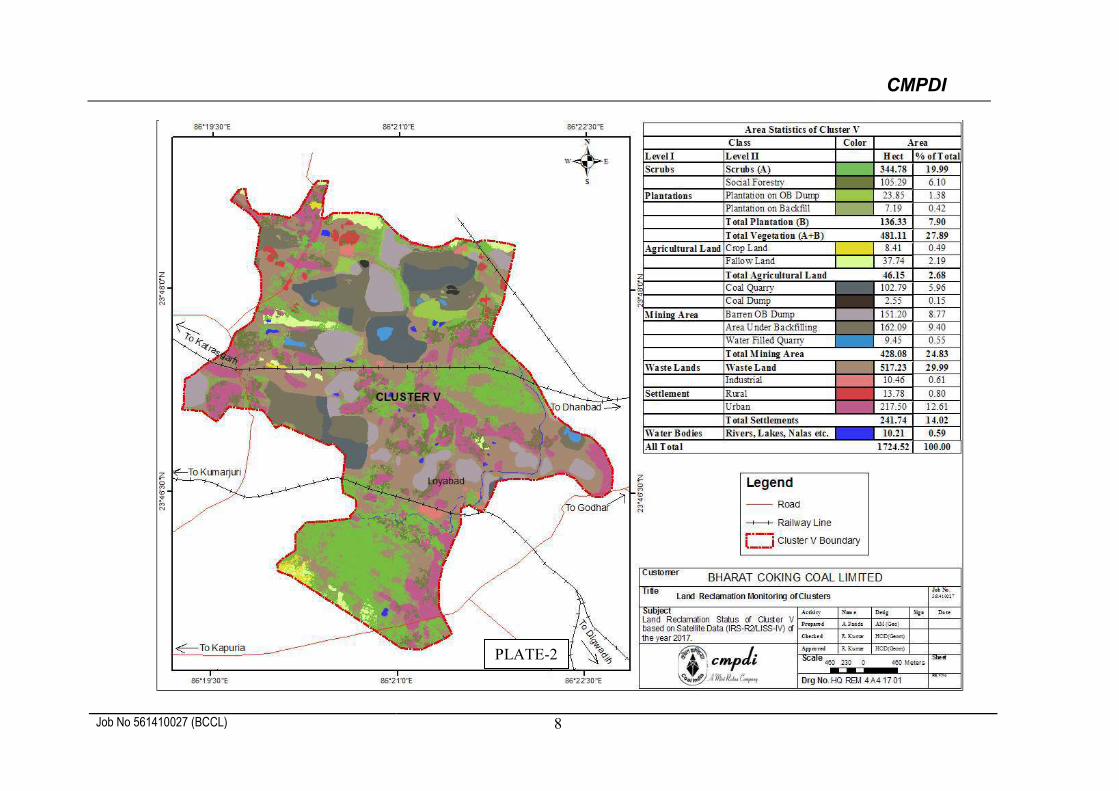
CMPDI
Job No 561410027 (BCCL) 8
PLATE-2
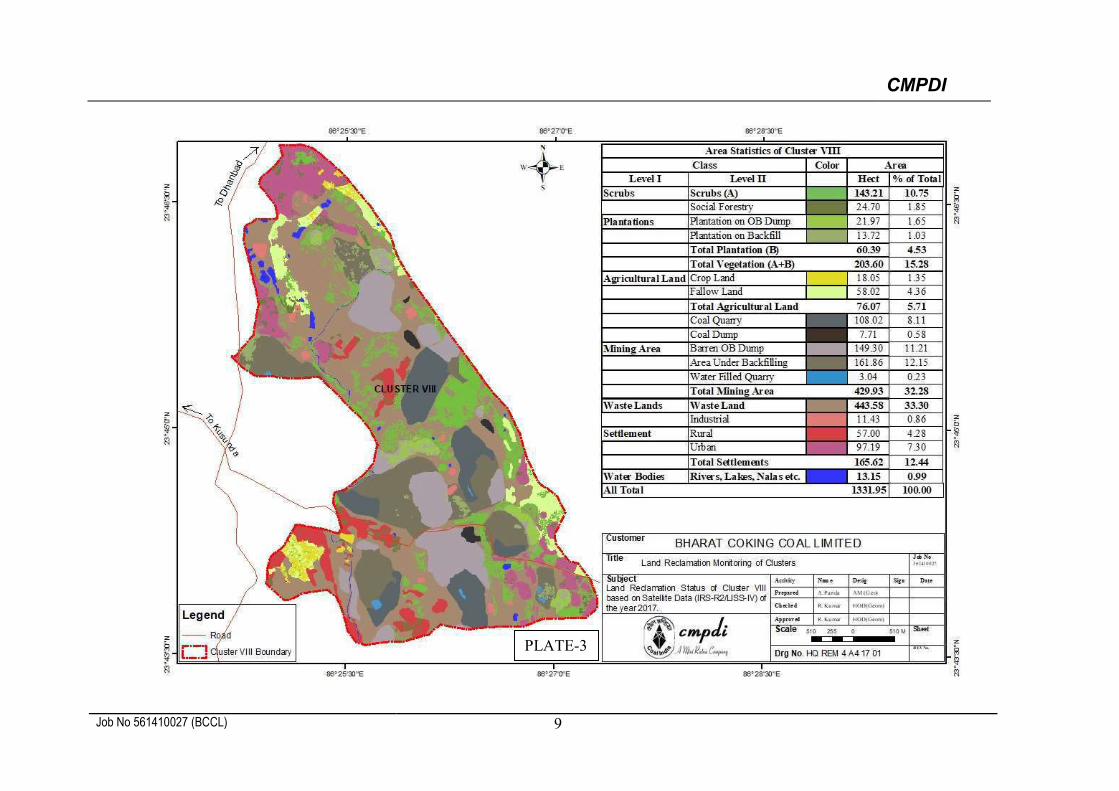
CMPDI
Job No 561410027 (BCCL) 9
PLATE-3
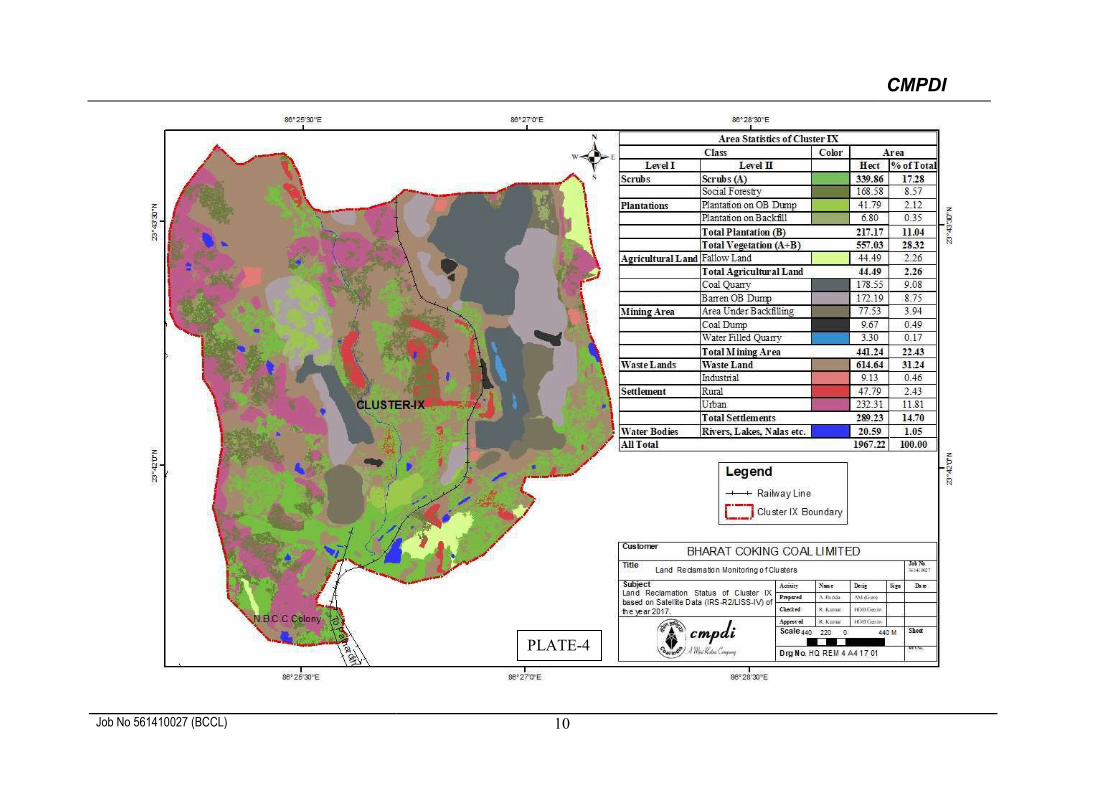
CMPDI
Job No 561410027 (BCCL) 10
PLATE-4
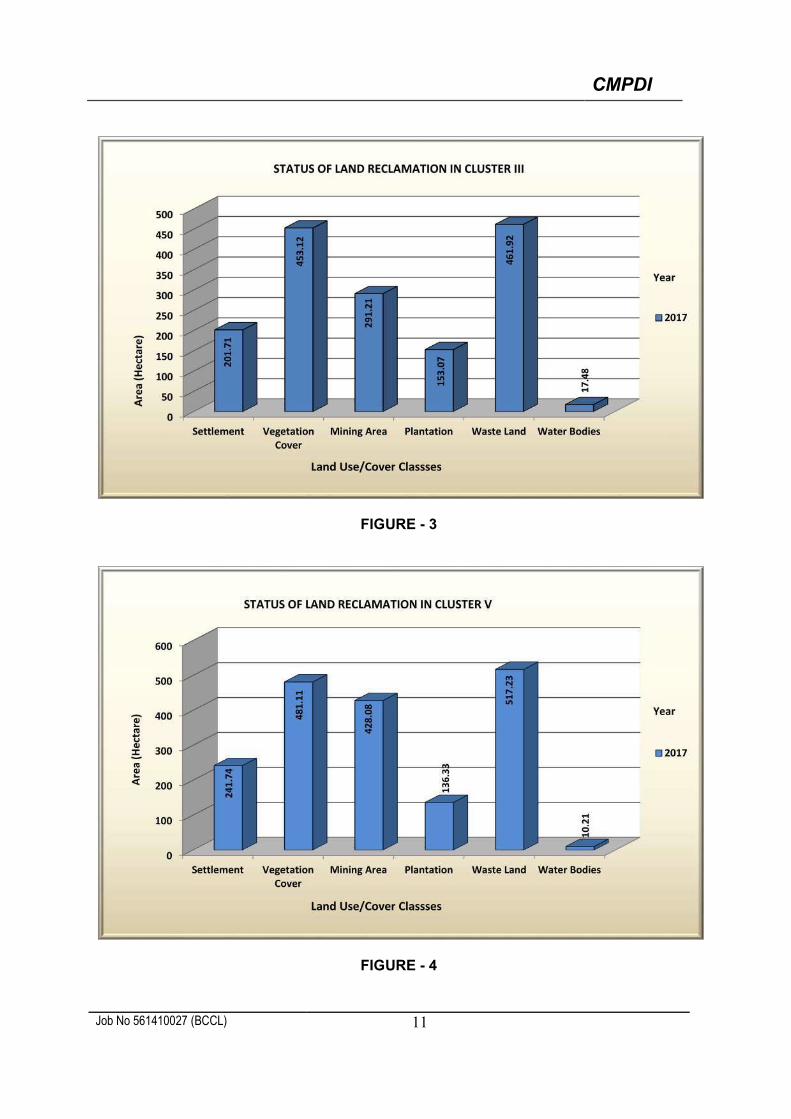
CMPDI
Job No 561410027 (BCCL) 11
FIGURE - 3
FIGURE - 4
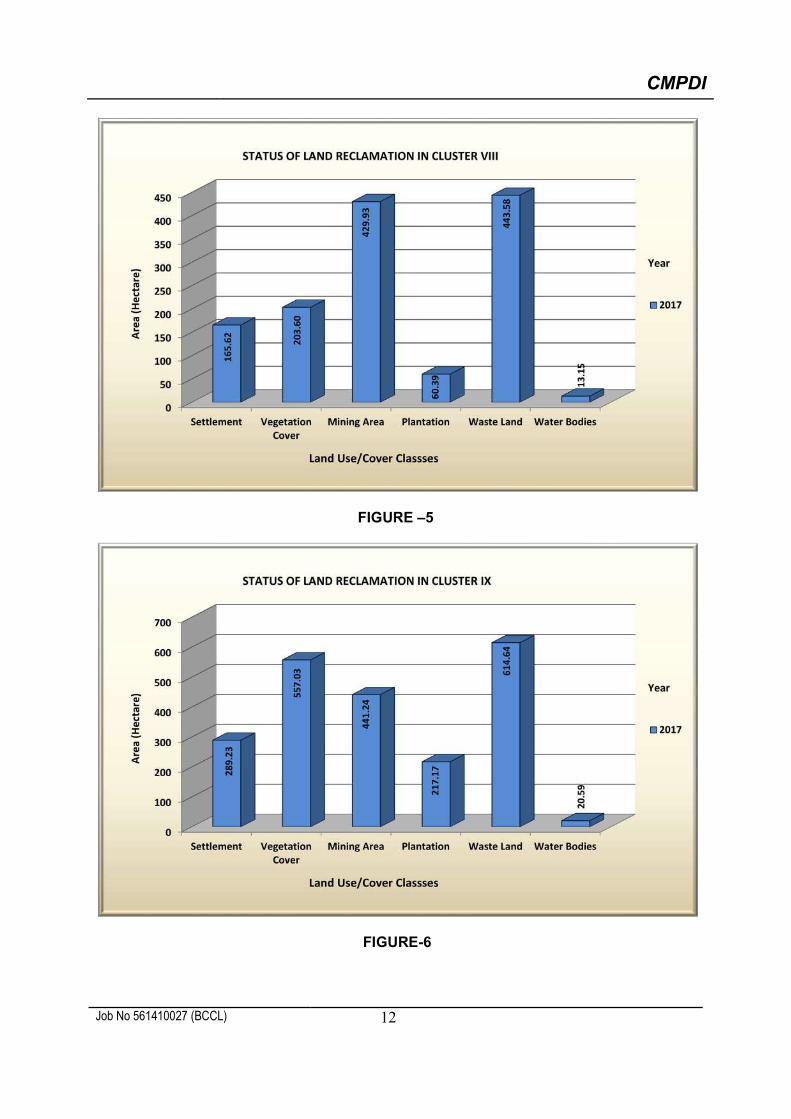
CMPDI
Job No 561410027 (BCCL) 12
FIGURE –5
FIGURE-6
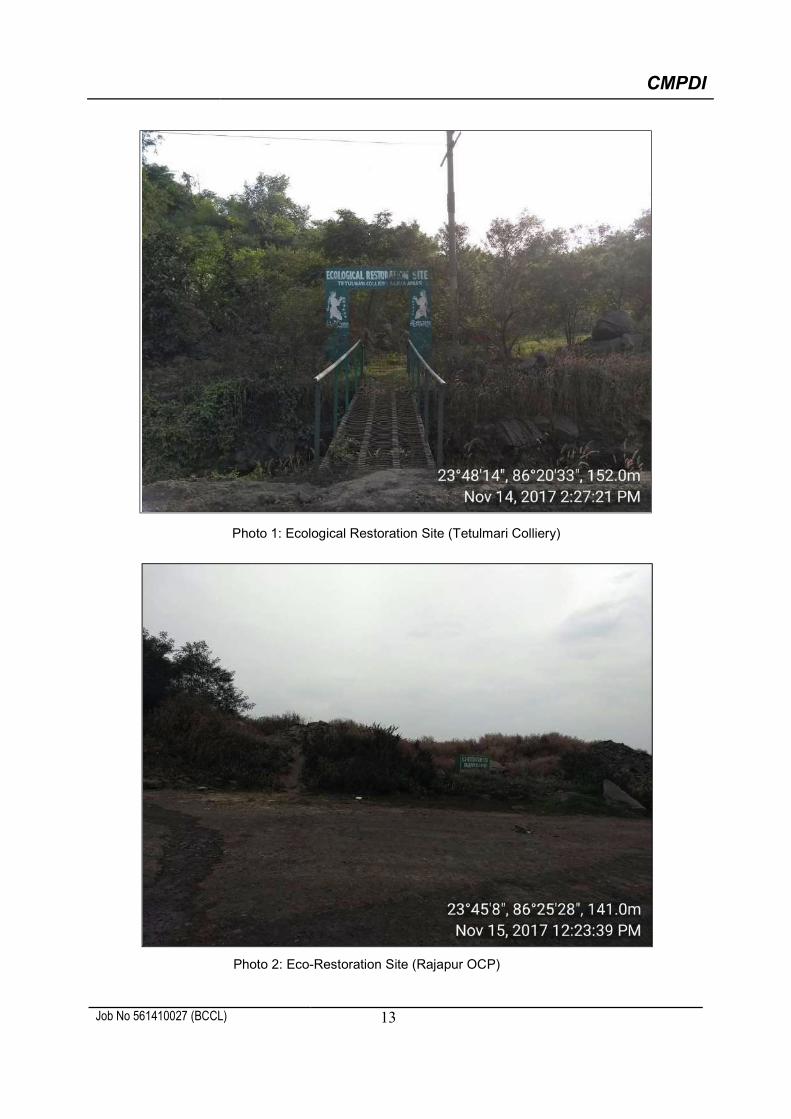
CMPDI
Job No 561410027 (BCCL) 13
Photo 1: Ecological Restoration Site (Tetulmari Colliery)
Photo 2: Eco-Restoration Site (Rajapur OCP)
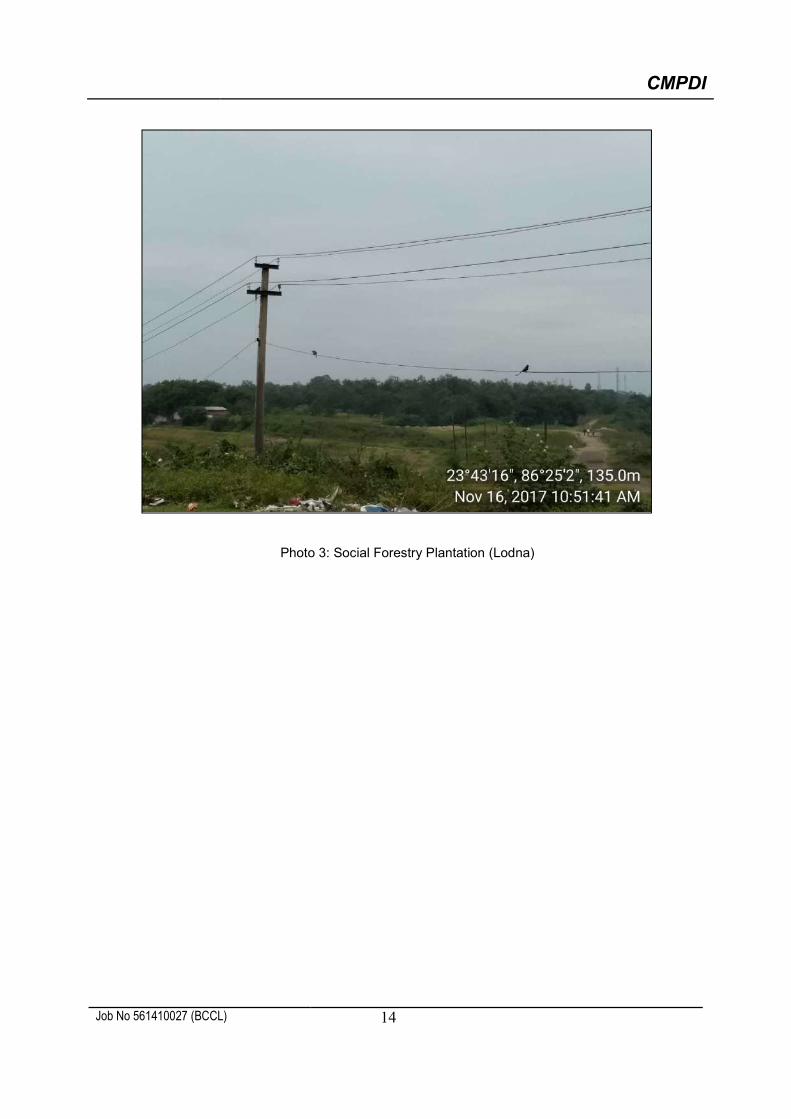
CMPDI
Job No 561410027 (BCCL) 14
Photo 3: Social Forestry Plantation (Lodna)

Annexure XIV
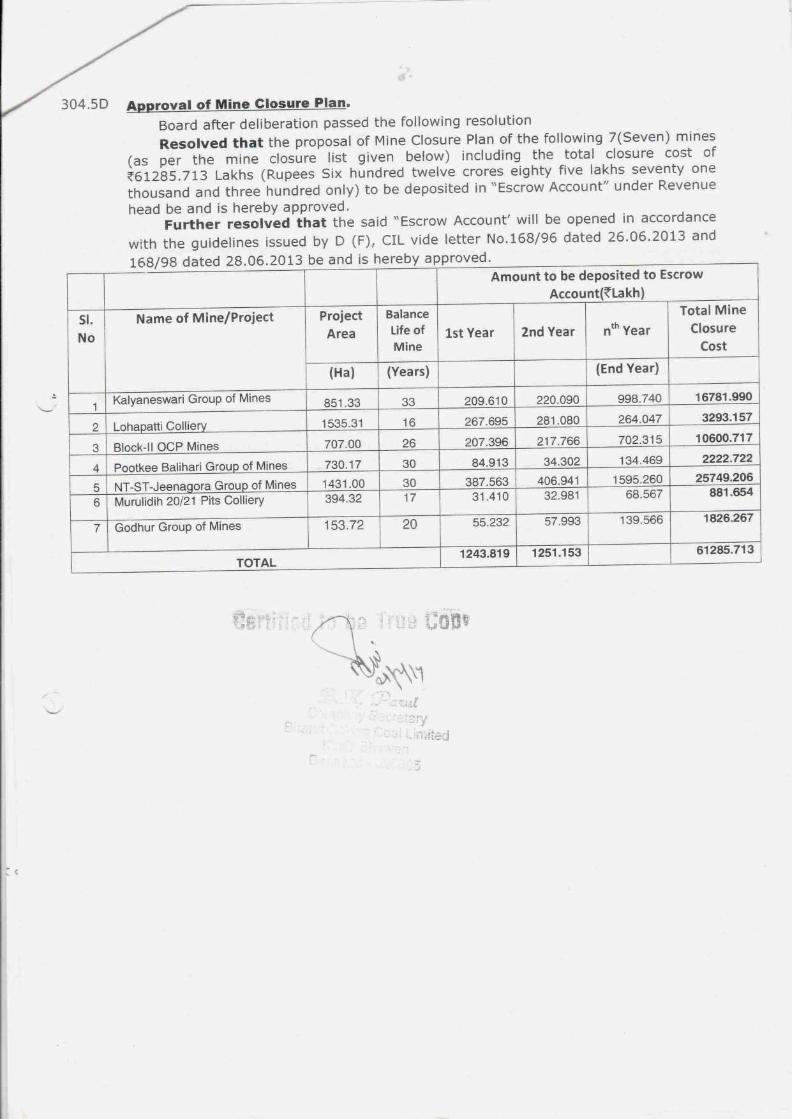
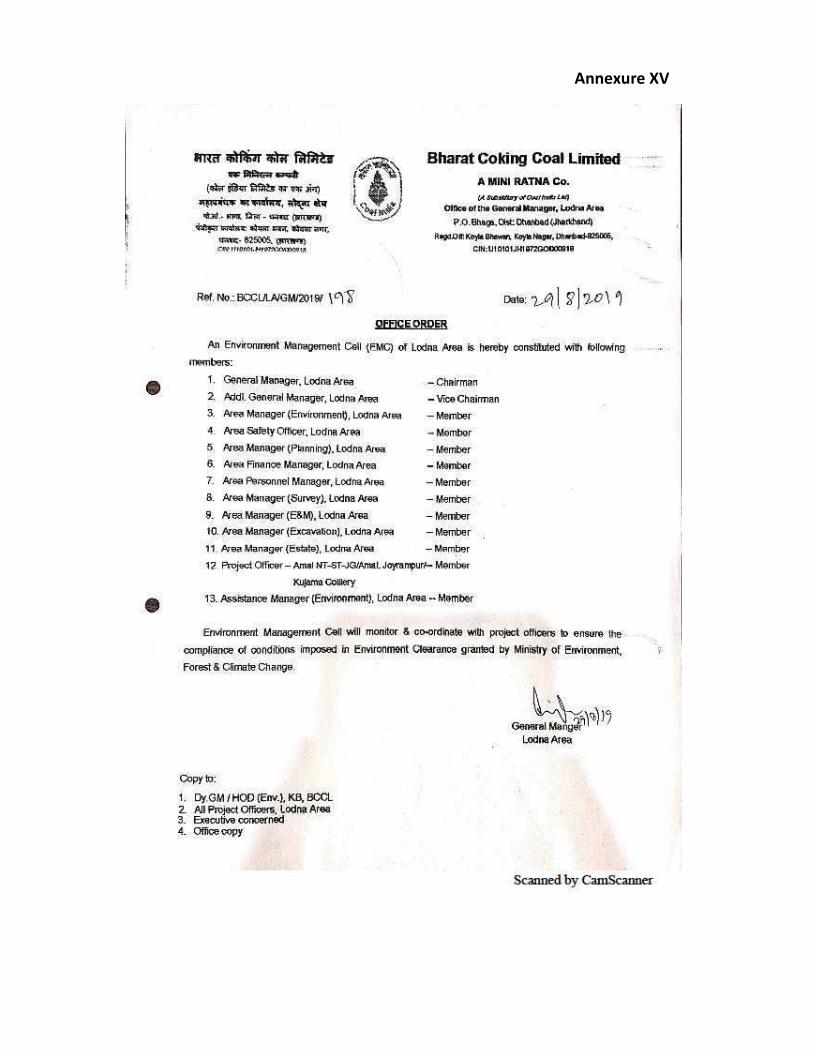
�����������
�
�
�
�
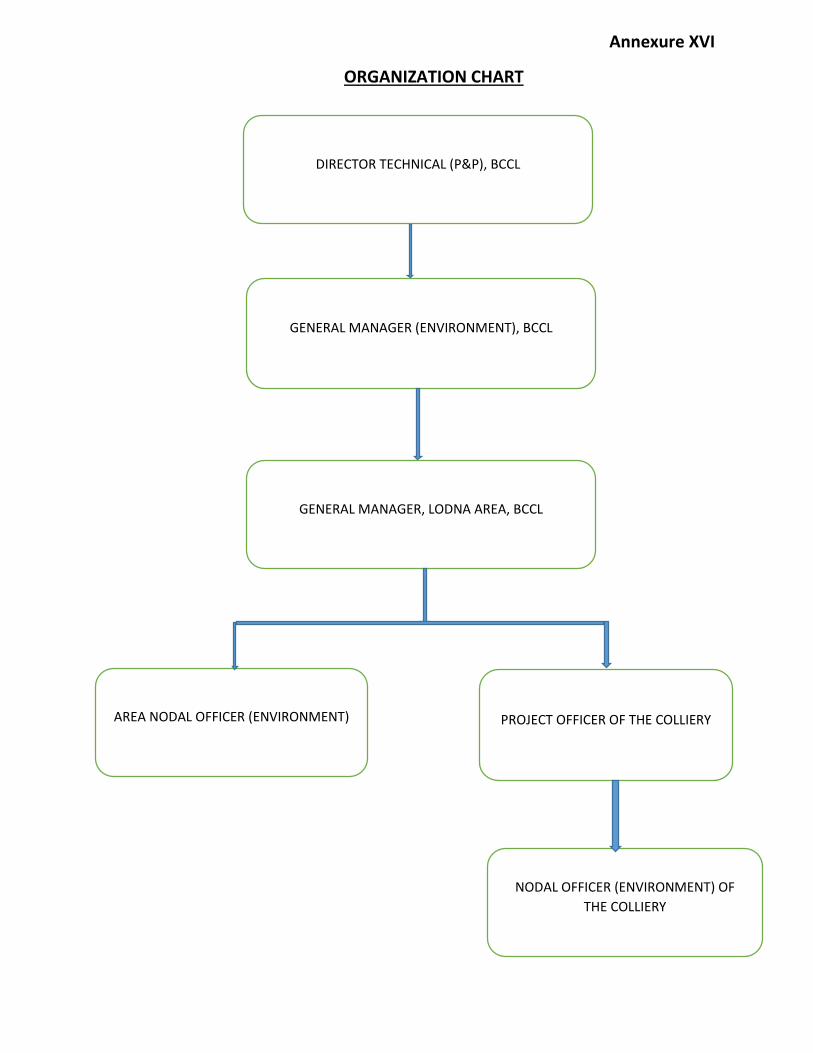
Annexure XVI
ORGANIZATION CHART
DIRECTOR TECHNICAL (P&P), BCCL
GENERAL MANAGER (ENVIRONMENT), BCCL
GENERAL MANAGER, LODNA AREA, BCCL
AREA NODAL OFFICER (ENVIRONMENT) PROJECT OFFICER OF THE COLLIERY
NODAL OFFICER (ENVIRONMENT) OF
THE COLLIERY
Annexure XVII

2
JOB NO. 200316028 Cluster –IX, BCCL Environmental Monitoring Report
CONTENTS
SL. NO.
CHAPTER
PARTICULARS
PAGE NO.
1.
2.
3.
4.
CHAPTER - I
CHAPTER-II
CHAPTER-III
CHAPTER-IV
EXECUTIVE SUMMARY
INTRODUCTION
ANALYSIS & RESULTS
STANDARDS & PLANS
3-5
6
7-11
12-15

3
JOB NO. 200316028 Cluster –IX, BCCL Environmental Monitoring Report
EXECUTIVE SUMMARY
1.0 Introduction
The purpose of environmental monitoring is to assess the quality of various
attributes that affects the fauna and flora. In accordance with the quality of these
attributes appropriate strategy is to be developed to control the pollution level
within the permissible limits. The three major attributes are air, water and noise
level.
Bharat Coking Coal Limited (BCCL), a Subsidiary company of Coal India Limited
is operating Underground and Opencast Mines in Jharia Coalfield (JCF) is a part
of Gondwana Coalfields located in Dhanbad district of Jharkhand, the JCF is
bounded by 23037’ N to 23052’ N latitudes and 86009’ E to 86030’ E longitude
occupying an area of 450 Sq.km. BCCL has awarded Environmental monitoring
work of Jharia Coalfield (JCF) to Central Mine Planning & Design Institute Limited
(CMPDIL). The environmental monitoring has been carried out as per the
conditions laid down by the MoEF&CC while granting environmental clearance of
project, consent letter issued by the respective SPCB, and other statutory
requirements.
2.0 Sampling location and rationale
2.1 Ambient air sampling locations
The ambient air quality monitoring stations were selected to represent core, buffer
zone area. The rationale has been based on the guidelines stipulated by
MoEF&CC, consent letter of SPCB, as well as other statutory requirements.
2.2 Water sampling stations
The Water sampling stations were selected for mine sump water.
2.3 Noise level monitoring locations
Noise levels vary depending on the various activities in mining areas. The
monitoring of noise level in different locations will be helpful to take appropriate
mitigating measures. The rationale has been based on the guidelines stipulated
by MoEF&CC, consent letter of SPCB, as well as other statutory requirements
3.0 Methodology of sampling and analysis
3.1 Ambient air quality
Parameters chosen for assessment of ambient air quality were Particulate Matter
(PM10), Fine Particulate Matter (PM2.5), Sulphur Di-oxide (SO2) and Nitrogen
Oxides (NOx). Respirable Dust Samplers (RDS) and Fine Dust Sampler (PM2.5

4
JOB NO. 200316028 Cluster –IX, BCCL Environmental Monitoring Report
sampler) were used for sampling of PM10, SO2, & NOx and Fine Dust Sampler
(PM2.5 sampler) were used for sampling of PM2.5 at 24 hours interval once in a
fortnight and the same for the gaseous pollutants. The samples were analysed in
Environmental Laboratory of CMPDI, RI-II, Dhanbad.
3.2 Water quality
Water samples were collected as per standard practice. The Mine effluent
samples were collected and analyzed for four parameters on fortnightly basis.
Thereafter the samples were preserved and analyzed at the Environmental
Laboratory of CMPDI, RI- II, Dhanbad.
3.3 Noise level monitoring
Noise level measurements in form of 'LEQ' were taken using Integrated Data
Logging Sound Level Meter. Noise levels were measured in Decibels, 'A' weighted
average, i.e. dB(A).
4.0 Results and interpretations
4.1 Air quality
It has been seen from the analysis results that the 24 hours average concentration
parameters like PM10, PM2.5, SO2 and NOx are mostly within the permissible limits
in all sampling locations as per MoEF&CC Gazette Notification No. GSR 742(E)
dt 25.09.2000 Standards for Coal Mines and National Ambient Air Quality
Standard -2009. Sometimes the concentration of PM10& PM2.5 exceeds the limits
due to heavy public traffic, poor road condition, coke oven plants, burning of coal
by surrounding habitants, brick making, municipal waste dumps and industries like
Steel Plant, thermal Plants including their fly ash etc.
The following preventive and suppressive mitigative measures can be undertaken to contain the pollution level within prescribed level:-
Ø Wet drilling and controlled blasting should be practice. Ø Explosive used should be optimised to restrict the dust generation. Ø Transportation roads should be permanently asphalted free of ruts, potholes
etc. Ø Water should be sprayed on coal transportation road, service road more
frequently and at regular interval. Ø Dust from roads should be removed physically or mechanically. Ø Greenbelts around industrial sites, service building area besides
Avenue plantation along roads should be created. Ø Coal dust should be suppressed by using fixed sprinklers. Ø Regular maintenance of plant and machinery should be undertaken.
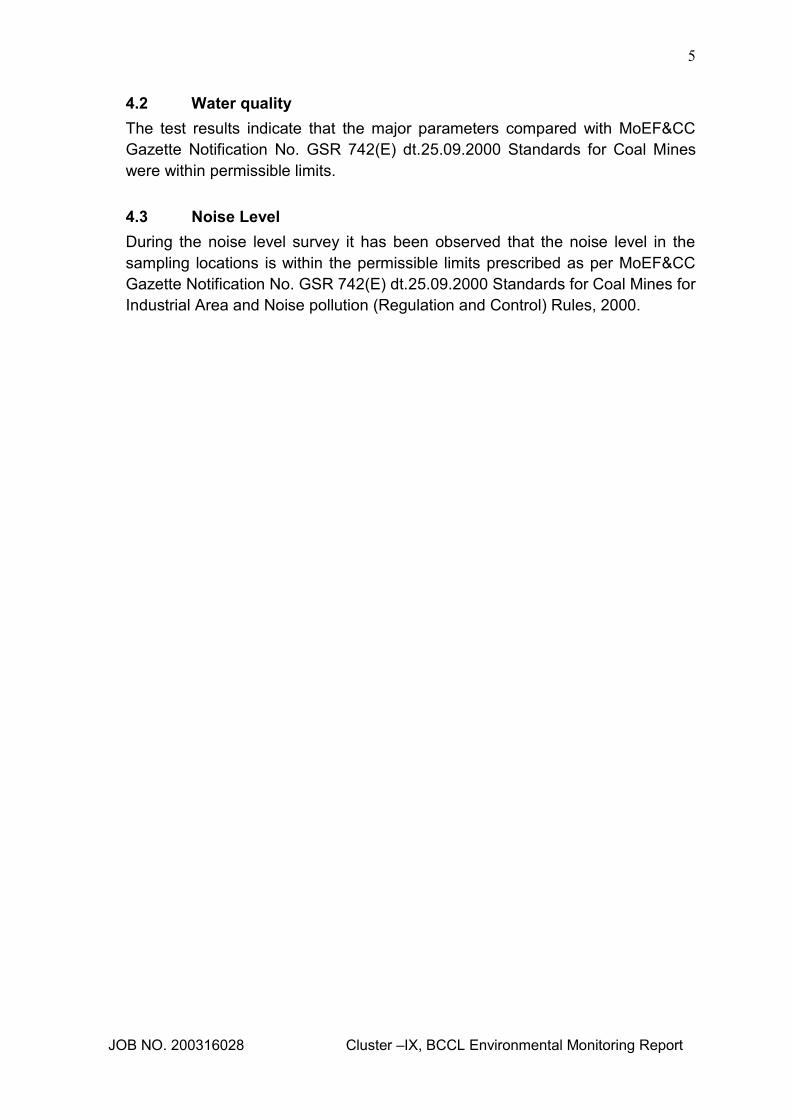
5
JOB NO. 200316028 Cluster –IX, BCCL Environmental Monitoring Report
4.2 Water quality
The test results indicate that the major parameters compared with MoEF&CC
Gazette Notification No. GSR 742(E) dt.25.09.2000 Standards for Coal Mines
were within permissible limits.
4.3 Noise Level
During the noise level survey it has been observed that the noise level in the
sampling locations is within the permissible limits prescribed as per MoEF&CC
Gazette Notification No. GSR 742(E) dt.25.09.2000 Standards for Coal Mines for
Industrial Area and Noise pollution (Regulation and Control) Rules, 2000.
6
JOB NO. 200316028 Cluster –IX, BCCL Environmental Monitoring Report
INTRODUCTION
1.0 Any industry and development activities including coal mining is bound to affect environmental attributes. There are positive as well as negative impacts of such operations. For controlling the adverse impacts a regular monitoring is essential. The environmental monitoring is being done as per the guide-lines stipulated by Ministry of Environment, Forest and Climate Change (MoEF&CC), Govt. of India.
The very purpose of environmental monitoring is to assess the quality of various
attributes which affects the environment. As per quality of these attributes appropriate strategy is to be developed to control the pollution level within the permissible limits. The three major attributes are air, water and noise level.
Bharat Coking Coal has awarded Environmental Monitoring work of all Projects,
Cluster wise, to Central Mine Planning & Design Institute Limited (CMPDIL). The environmental monitoring has been carried out as per conditions laid down by MoEF&CC while granting environmental clearance to different projects. CMPDI has trained manpower and well equipped laboratory to carry out monitoring, analysis and R&D work in the field of environment.
1.1 The Cluster-IX is in the Eastern part of the Jharia coalfield. It includes a group of 7
Mines (viz. Lodna, S. Tisra/NTST OC, Jealgora, Joyrampur, Jeenagora, Bararee, S.Tisra/NTST Expan. OC. The Cluster – IX is situated about 25 - 30 kms from Dhanbad Railway Station. The mines of this Cluster – IX are operating since pre nationalization period (prior to 1972-73). It is connected by both Railway and Road. The drainage pattern of the area is governed by Kashi Jore.
1.2 The Cluster-IX is designed to produce 6.548 MTPA (normative) and 8.512 MTPA
(peak) capacity of coal.
The Project has Environmental Clearance from Ministry of Environment, Forest and Climate Change (MoEF&CC) for a rated capacity 6.548 MTPA (normative) and 8.512 MTPA (peak) capacity of coal production vide letter no. J-11015/307/2010-IA.II (M) dated 21st May, 2013.
Ministry of Environment, Forest and Climate Change while granting environmental clearance has given one of the General conditions that “ Four ambient air quality monitoring stations should be established in the core zone as well as in the buffer zone for PM10, PM2.5, SO2, NOx monitoring. Location of the stations should be decided based on the meteorological data, topographical features and environmentally and ecologically sensitive targets, other conditions regarding water / effluent and noise level monitoring in consultation with the State Pollution Control Board.” In compliance of these conditions the Environmental Monitoring has been carried out & report prepared for submission to MoEF&CC & JSPCB and other statutory authorities.
7
JOB NO. 200316028 Cluster –IX, BCCL Environmental Monitoring Report
AMBIENT AIR QUALITY MONITORING
2.1 Location of sampling station and their rationale:
(As per G.S.R. 742 (E) dt. 25th December, 2000)
2.1.1 Ambient Air Quality Sampling Locations
I. CORE ZONE Monitoring Location
i) Jeenagora (A13) : Industrial Area
The location of the sampling station is 230 42’ 31.00’’ N & 860 25’ 48.00’’ E. The
sampler was placed at a height of 1.5 m from the ground level at the Safety Office.
II. BUFFER ZONE Monitoring Location
i) Kusmatand Village (A12): Industrial Area
The location of the sampling station is 23045’ 4.65’’ N & 860 26’ 42.10’’ E. The sampler
was placed at a height of 1.5 m from the ground level of the village.
ii) Bhowrah North (A14) : Industrial Area
The location of the sampling station is 23o41’ 37.00’’ N & 86o23’ 54.00’’E. The sampler
was placed at 1.5 m above the ground level of Project Office.
Iii) Hurriladih UGP (A28) : Industrial Area
The location of the sampling station is 23044’ 4.18’’ N & 860 24’ 6.21’’ E. The sampler
was placed at a height of 1.5 m from the ground level of the mine office.
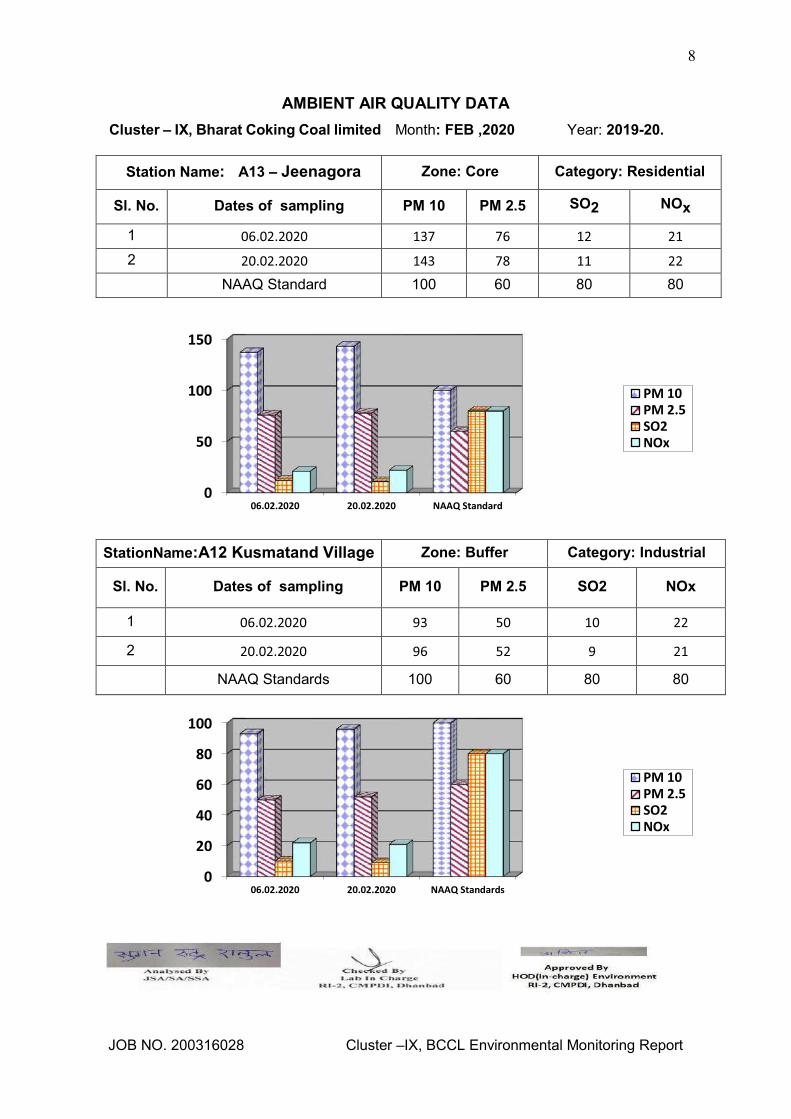
8
JOB NO. 200316028 Cluster –IX, BCCL Environmental Monitoring Report
AMBIENT AIR QUALITY DATA
Cluster – IX, Bharat Coking Coal limited Month: FEB ,2020 Year: 2019-20.
0
50
100
150
06.02.2020 20.02.2020 NAAQ Standard
PM 10
PM 2.5
SO2
NOx
0
20
40
60
80
100
06.02.2020 20.02.2020 NAAQ Standards
PM 10
PM 2.5
SO2
NOx
Station Name: A13 – Jeenagora Zone: Core Category: Residential
Sl. No. Dates of sampling PM 10 PM 2.5 SO2 NOx
1 06.02.2020 137 76 12 21
2 20.02.2020 143 78 11 22
NAAQ Standard 100 60 80 80
StationName:A12 Kusmatand Village Zone: Buffer Category: Industrial
Sl. No. Dates of sampling PM 10 PM 2.5 SO2 NOx
1 06.02.2020 93 50 10 22
2 20.02.2020 96 52 9 21
NAAQ Standards 100 60 80 80

9
JOB NO. 200316028 Cluster –IX, BCCL Environmental Monitoring Report
Ø All values are expressed in microgram per cubic meter.
Ø 24 hours duration
0
20
40
60
80
100
120
11.02.2020 26.02.2020 NAAQ Standards
PM 10
PM 2.5
SO2
NOx
0
20
40
60
80
100
12.02.2020 27.02.2020 NAAQ Standard
PM 10
PM 2.5
SO2
NOx
Station Name:A14- Bhowrah North Zone: Buffer Category: Industrial
Sl. No. Dates of sampling PM 10 PM 2.5 SO2 NOx
1 11.02.2020 96 54 12 23
2 26.02.2020 118 64 10 21
NAAQ Standards 100 60 80 80
Station Name: Hurriladih UGP (A28) Zone: Buffer Category: Industrial
Sl. No. Dates of sampling PM 10 PM 2.5 SO2 NOx
1 12.02.2020 93 51 12 23
2 27.02.2020 90 49 11 22
NAAQ Standard 100 60 80 80

10
JOB NO. 200316028 Cluster –IX, BCCL Environmental Monitoring Report
WATER QUALITY MONITORING
3.1 Location of sampling sites
(Refer Plate No. – II)
i) Mine Discharge of Jeenagora (MW9)
A sampling point is fixed to assess the effluent quality of Mine discharge.
3.2 Methodology of sampling and analysis
Water samples were collected as per standard practice. The effluent samples were
collected and analyzed for four parameters on fortnightly basis at the Environmental
Laboratory of CMPDI RI-II, Dhanbad.
3.3 Results & Interpretations
The results are given in tabular form along with the applicable standards. Results are
compared with Schedule - VI, effluent prescribed by MoEF&CC. Results show that most of
the parameters are within the permissible limits.
WATER QUALITY DATA (EFFLUENT WATER- FOUR PARAMETERS)
Name of the Cluster: Cluster
-IX
Month:
FEB,2020
Name of the Station: Mine Discharge of
Jeenagora
Sl.
No.
Parameters
MW9
First Fortnight
MW9
Second Fortnight
As per MOEF General
Standards for
schedule VI 07.02.2020 21.02.2020
1 Total Suspended Solids 43 33 100 (Max)
2 pH 7.81 7.99 5.5 - 9.0
3 Oil & Grease <2.0 <2.0 10 (Max)
4 COD 44 40 250 (Max)
All values are expressed in mg/lit except pH.
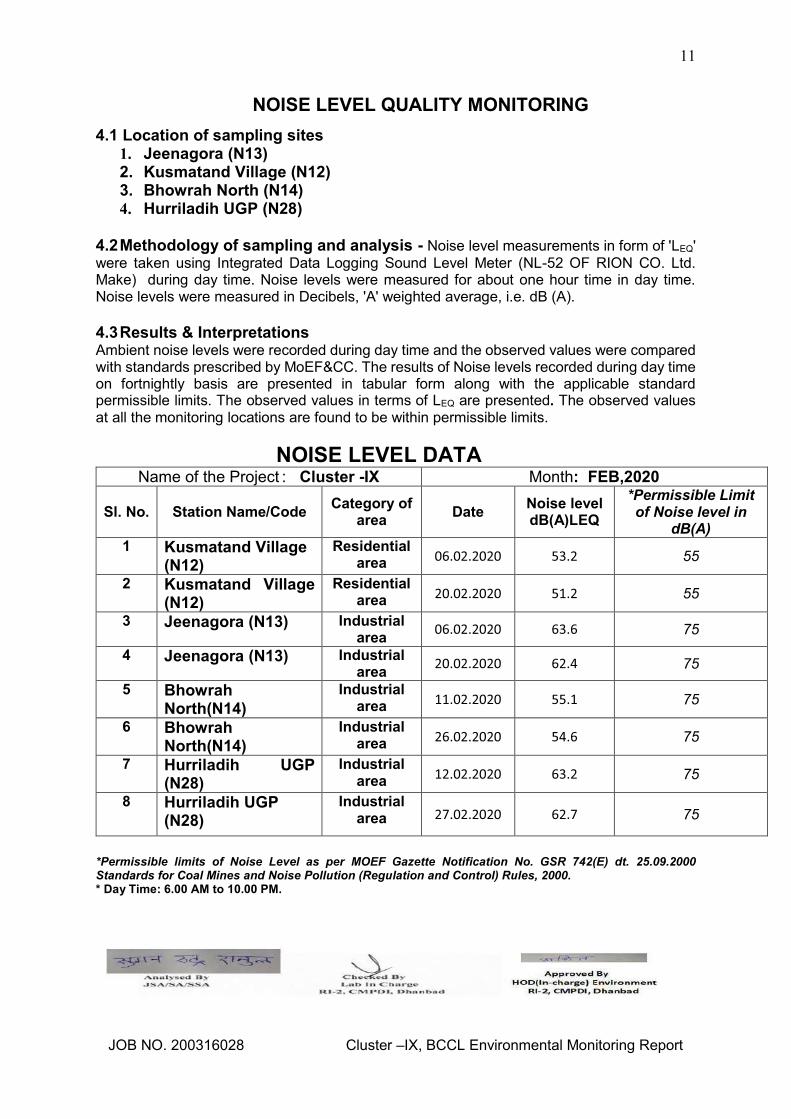
11
JOB NO. 200316028 Cluster –IX, BCCL Environmental Monitoring Report
NOISE LEVEL QUALITY MONITORING
4.1 Location of sampling sites 1. Jeenagora (N13) 2. Kusmatand Village (N12) 3. Bhowrah North (N14) 4. Hurriladih UGP (N28)
4.2 Methodology of sampling and analysis - Noise level measurements in form of 'LEQ'
were taken using Integrated Data Logging Sound Level Meter (NL-52 OF RION CO. Ltd. Make) during day time. Noise levels were measured for about one hour time in day time. Noise levels were measured in Decibels, 'A' weighted average, i.e. dB (A). 4.3 Results & Interpretations Ambient noise levels were recorded during day time and the observed values were compared with standards prescribed by MoEF&CC. The results of Noise levels recorded during day time on fortnightly basis are presented in tabular form along with the applicable standard permissible limits. The observed values in terms of LEQ are presented. The observed values at all the monitoring locations are found to be within permissible limits.
NOISE LEVEL DATA
Name of the Project : Cluster -IX Month: FEB,2020
Sl. No. Station Name/Code Category of
area Date
Noise level dB(A)LEQ
*Permissible Limit of Noise level in
dB(A) 1 Kusmatand Village
(N12)
Residential area 06.02.2020 53.2 55
2 Kusmatand Village (N12)
Residential area 20.02.2020 51.2 55
3 Jeenagora (N13) Industrial area
06.02.2020 63.6 75
4 Jeenagora (N13) Industrial area
20.02.2020 62.4 75
5 Bhowrah North(N14)
Industrial area 11.02.2020 55.1 75
6 Bhowrah North(N14)
Industrial area 26.02.2020 54.6 75
7 Hurriladih UGP (N28)
Industrial area 12.02.2020 63.2 75
8 Hurriladih UGP (N28)
Industrial area 27.02.2020 62.7 75
*Permissible limits of Noise Level as per MOEF Gazette Notification No. GSR 742(E) dt. 25.09.2000 Standards for Coal Mines and Noise Pollution (Regulation and Control) Rules, 2000. * Day Time: 6.00 AM to 10.00 PM.
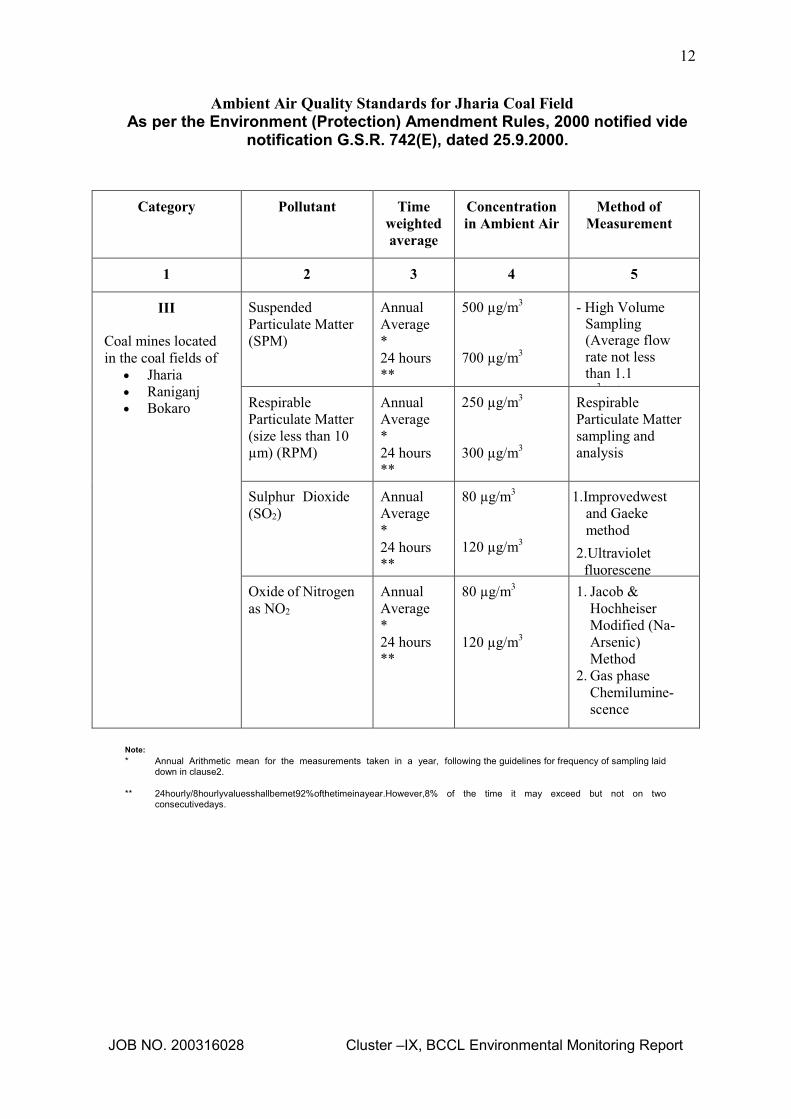
12
JOB NO. 200316028 Cluster –IX, BCCL Environmental Monitoring Report
Ambient Air Quality Standards for Jharia Coal Field
As per the Environment (Protection) Amendment Rules, 2000 notified vide notification G.S.R. 742(E), dated 25.9.2000.
Category Pollutant Time
weighted
average
Concentration
in Ambient Air
Method of
Measurement
1 2 3 4 5
III
Coal mines located
in the coal fields of
· Jharia
· Raniganj · Bokaro
Suspended
Particulate Matter
(SPM)
Annual
Average
*
24 hours
**
500 µg/m3
700 µg/m3
- High Volume Sampling (Average flow rate not less than 1.1
3/minute)
Respirable
Particulate Matter
(size less than 10
µm) (RPM)
Annual
Average
*
24 hours
**
250 µg/m3
300 µg/m3
Respirable
Particulate Matter
sampling and
analysis
Sulphur Dioxide
(SO2)
Annual
Average
*
24 hours
**
80 µg/m3
120 µg/m3
1. Improvedwest
and Gaeke
method
2. Ultraviolet
fluorescene
Oxide of Nitrogen
as NO2
Annual
Average
*
24 hours
**
80 µg/m3
120 µg/m3
1. Jacob &
Hochheiser
Modified (Na-
Arsenic)
Method
2. Gas phase
Chemilumine-
scence
Note:
* Annual Arithmetic mean for the measurements taken in a year, following the guidelines for frequency of sampling laid down in clause2.
** 24hourly/8hourlyvaluesshallbemet92%ofthetimeinayear.However,8% of the time it may exceed but not on two
consecutivedays.

13
JOB NO. 200316028 Cluster –IX, BCCL Environmental Monitoring Report
NATIONAL AMBIENT AIR QUALITY STANDARDS New Delhi the 18th November 2009
In exercise of the powers conferred by Sub-section (2) (h) of section 16 of the Air (Prevention and Control of
Pollution) Act, 1981 (Act No. 14 of 1981), and in supersession of the notification No(s).S.O.384(E), dated 11th April
1994 and S.O.935(E), dated 14th NOVober 1998, the Central Pollution Control Board hereby notify the National
Ambient Air Quality Standards with immediate effect.
* Annual Arithmetic mean of minimum 104 measurements in a year at a particular site taken twice a week 24 hourly at uniform
intervals.
** 24 hourly or 8 hourly or 1 hourly monitored values, as applicable, shall be complied with 98% of the time in a year. 2% of the
time, they may exceed the limits but not on two consecutive days of monitoring.
NOTE: Whenever and wherever monitoring results on two consecutive days of monitoring exceed the limits specified above
for the respective category, it shall be considered adequate reason to institute regular or continuous monitoring and further
investigations.
Pollutant
Time Weighted Average
Concentration in Ambient Air Methods of Measurement
Industrial, Residentia
l, Rural and other
Areas
Ecologically Sensitive Area
(Notified by Central
Government)
Sulphur Dioxide (SO2), µg/m3
Annual * 24 Hours **
50 80
20 80
-Improved West and Gaeke Method -Ultraviolet Fluorescence
Nitrogendioxide (NO2), µg/m3
Annual * 24 Hours **
40 80
30 80
-Jacob &Hochheiser modified (NaOH-NaAsO2) Method -Gas Phase Chemiluminescence
Particulate Matter (Size less than 10µm) or PM10, µg/m3
Annual * 24 Hours **
60 100
60 100
-Gravimetric -TEOM -Beta attenuation
Particulate Matter (Size less than 2.5µm) or PM2.5, µg/m3
Annual * 24 Hours **
40 60
40 60
-Gravimetric -TEOM -Beta attenuation
Ozone (O3) , µg/m3 8 Hours * 1 Hour **
100 180
100 180
-UV Photometric -Chemiluminescence -Chemical Method
Lead (Pb) , µg/m3 Annual * 24 Hours **
0.50 1.0
0.50 1.0
-AAS/ICP Method after sampling on EPM 2000 or equivalent filter paper -ED-XRF using Teflon filter
Carbon Monoxide (CO), mg/m3
8 Hours ** 1 Hour **
02 04
02 04
-Non dispersive Infrared (NDIR) Spectroscopy
Ammonia (NH3), µg/m3 Annual * 24 Hours **
100 400
100 400
-Chemiluminescence -Indophenol blue method
Benzene (C6H6), µg/m3 Annual *
05 05 -Gas Chromatography (GC) based continuous analyzer -Adsorption and desorption followed by GC analysis
Benzo(a)Pyrene (BaP) Particulate phase only, ng/m3
Annual *
01 01 -Solvent extraction followed byHPLC/GC analysis
Arsenic (As), ng/m3 Annual *
06 06 -AAS/ICP Method after sampling on EPM 2000 or equivalent filter paper
Nickel (Ni), ng/m3 Annual *
20 20 -AAS/ICP Method after sampling on EPM 2000 or equivalent filter paper

14
Location of Air & Noise Monitoring Stations in BCCL
CMPDIISO 9001 Company
Monitoring Stations
BHARAT COKING COAL LIMITED
Air & Noise Sampling Locations

15
SW3
SW13
SW4
SW5
SW6
SW7
SW8
SW10
SW9
SW11
SW12
SW14
SW15
SW16
SW17
SW18
SW19
SW20
SW22
SW21
SW26
SW25
SW24
SW23
SW28
SW27
SW30
SW31
SW33
SW34
Water Sampling Locations in BCCL
SW29
SW35
SW36
SW32
Cluster Suface Water Name of
River/ Nala
/ Jore
Mine/
Effluent
Water
Sampling
Location
Ground
Water
Sampling
Location
I SW1, SW2Jamunia
RiverMW1
Damoda
AreaGW1
Ghutway
Village
II SW3, SW4Khudia
NalaMW2
Block II
OCPGW2
Joyrampur
Village
IIISW4, SW5,
SW6, SW7
Khudia
Nala,
Bagdigi
Nala
MW3Govindpur
CollieryGW3
Jogidih
Village
IVSW8, SW11,
SW9, SW10
Katri River,
Kumari
Jore
MW4 Chotudih GW4Kankanee
Village
VSW12, SW13,
SW15
Jarian
Nala, Ekra
Nala
MW5 Mudidih GW5 Nichitpur
VI SW14, SW15 Ekra Nala MW6
East
Bassuria
UGP
GW6Bansjora
Borewell
VII SW16, SW17 Kari Jore MW7Dhansar
UGPGW7 Hurriladih
VIII SW18, SW19 Kashi Jore MW8Dobari
UGPGW8 Ghanudih
IX SW19, SW20 Kashi Jore MW9 Jeenagora GW9 Lodna
X SW21, SW22Damodar
RiverMW10
Bhowrah
NorthGW10
Bhowrah
South
XISW23, SW24,
SW25, SW26
Jarian
Nala,
Damodar
River
MW11Bhagaband
h UGPGW11 Bhagabandh
XII SW27, SW28 Katri River MW12 Kapuria GW12 Kapuria
XIII SW29, SW30Damodar
RiverMW13
Murulidih
(20/21)GW13 Murilidih
XIV SW31, SW29Damodar
RiverMW14 Lohapatti GW14 Lohapatti
XV SW5, SW32Khudia
NalaMW15
Kharkharee
UGPGW15 Kharkharee
XVI SW33, SW34Khudia
RiverMW16
Dahibari
OCPGW16
Patlabari
Village
XVII SW35, SW36Barakar
RiverMW17
Damagoria
CollieryGW17 Chaptoria
INDEX
MW13
(U/S, D/S)
Pit 1
CMPDIISO 9001 Company
MONITORING STATIONS
BHARAT COKING COAL LIMITED
WATER SAMPLING LOCATIONS
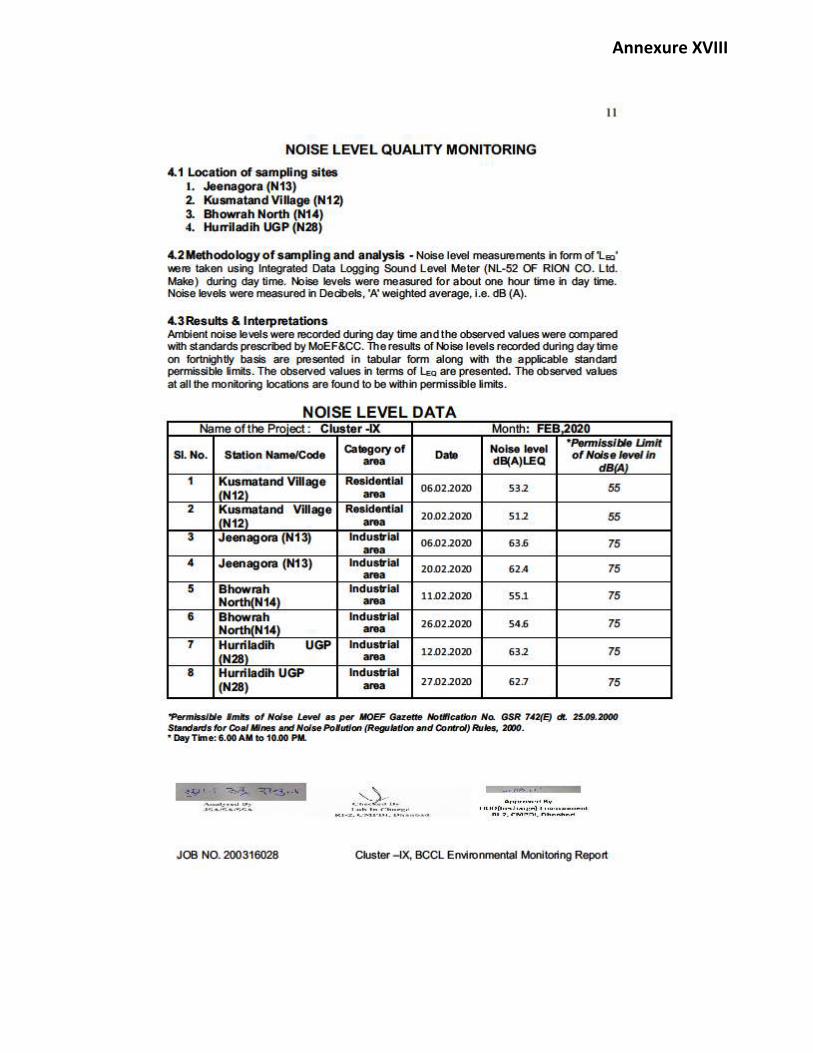
Annexure XVIII
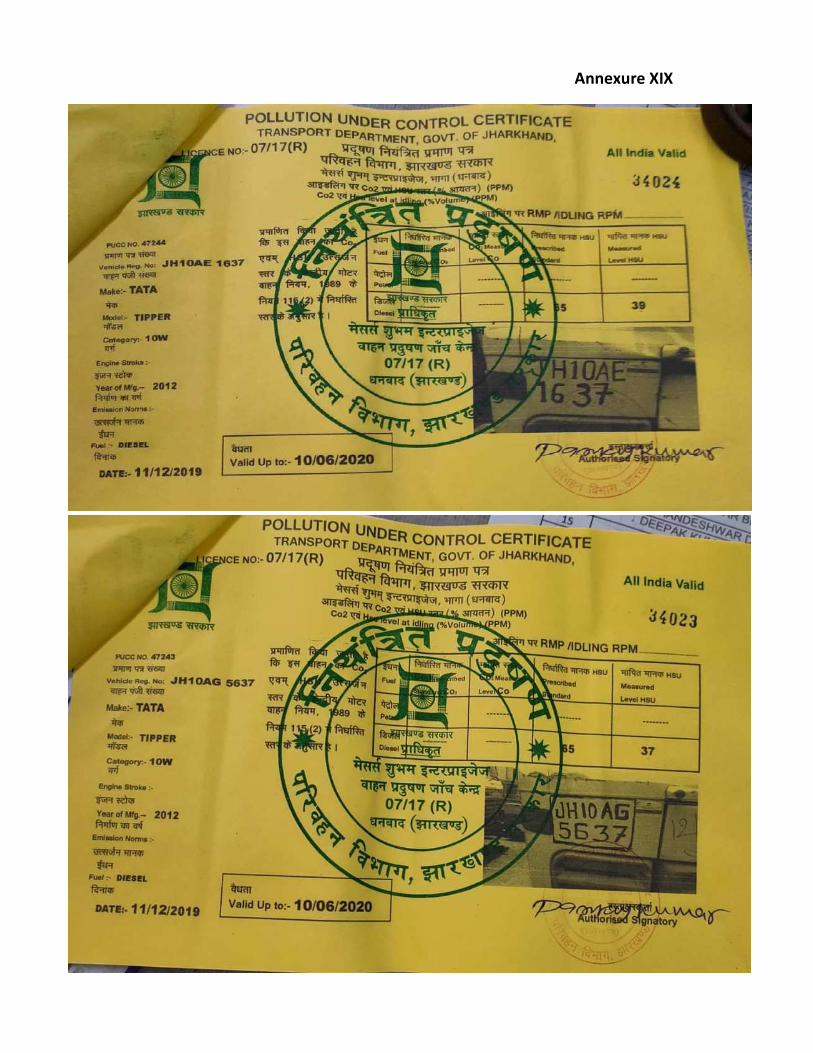
Annexure XIX
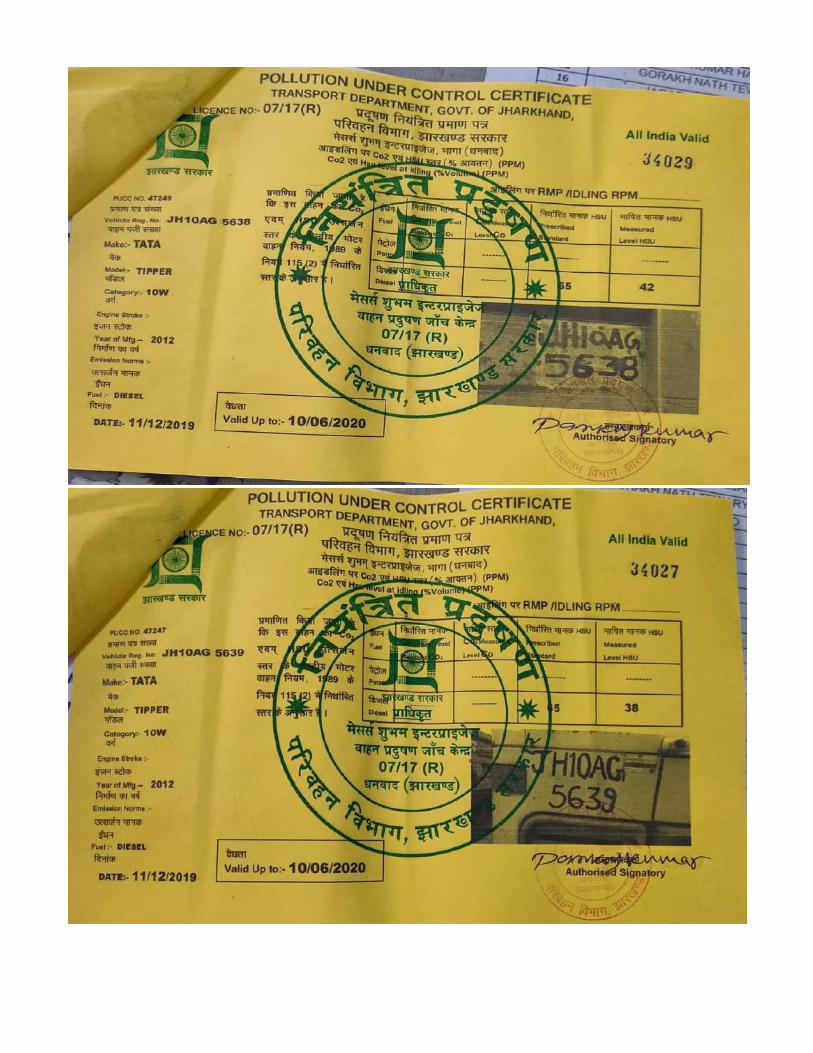
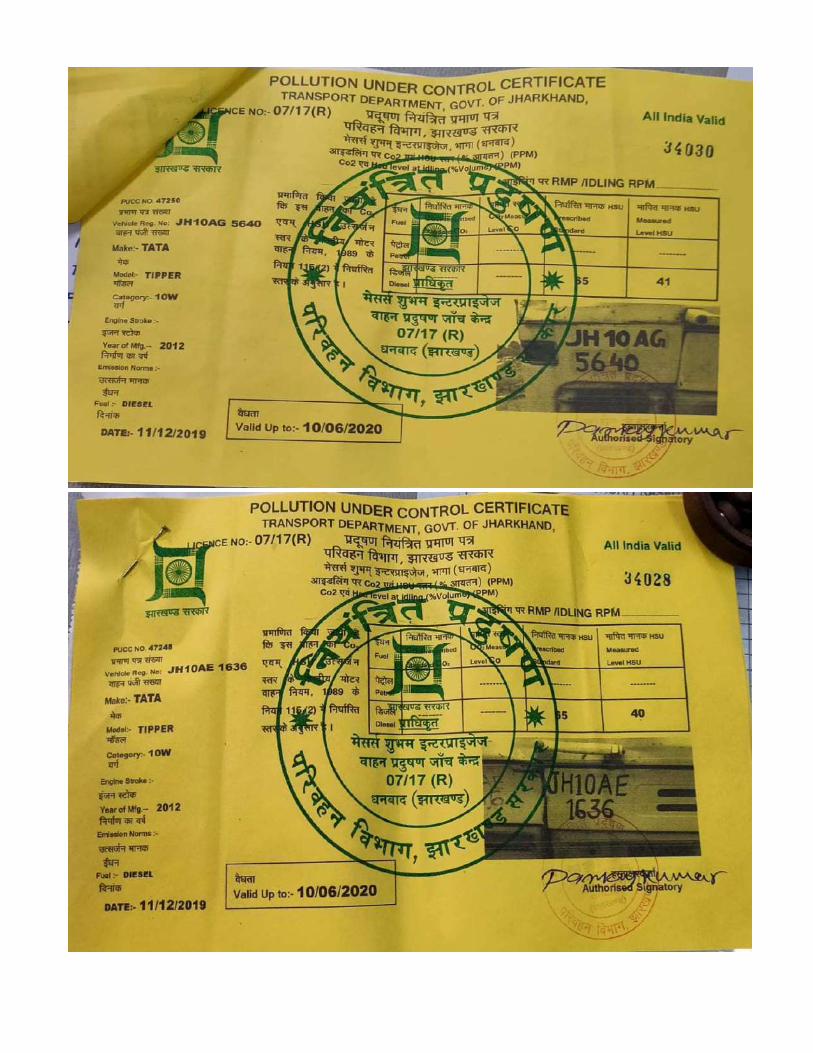
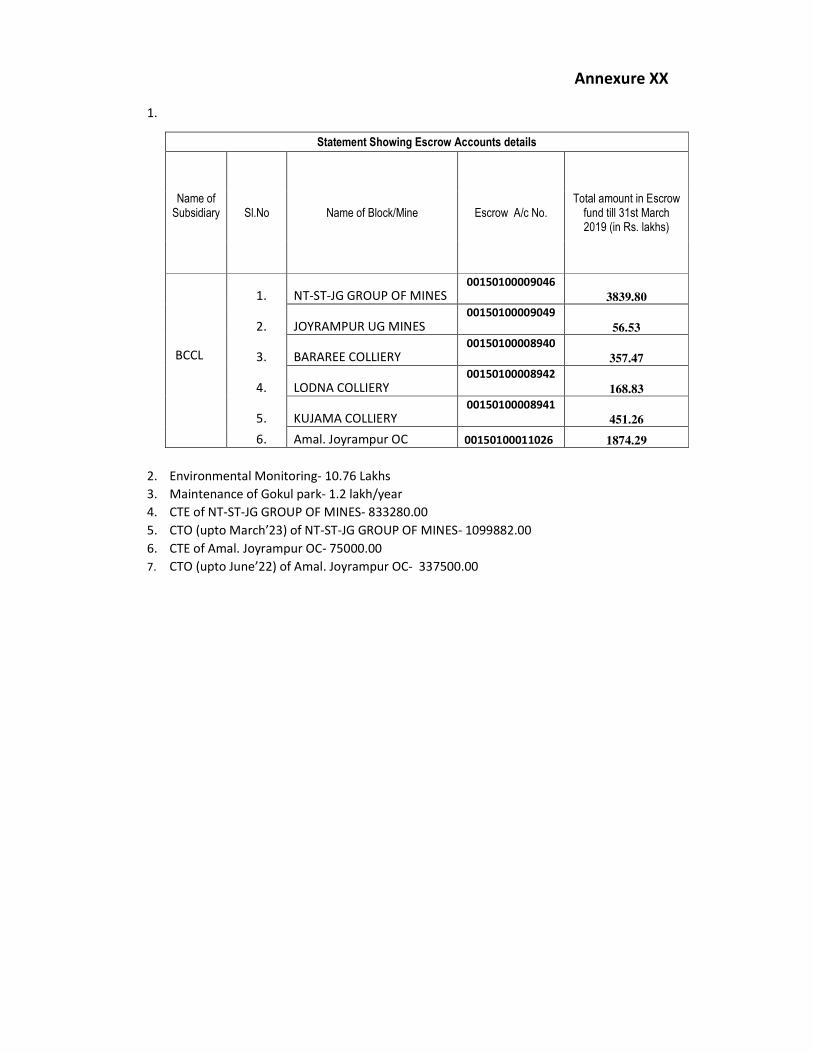
Annexure XX
1.
2. Environmental Monitoring- 10.76 Lakhs
3. Maintenance of Gokul park- 1.2 lakh/year
4. CTE of NT-ST-JG GROUP OF MINES- 833280.00
5. CTO (upto March’23) of NT-ST-JG GROUP OF MINES- 1099882.00
6. CTE of Amal. Joyrampur OC- 75000.00
7. CTO (upto June’22) of Amal. Joyrampur OC- 337500.00
Statement Showing Escrow Accounts details
Name of Subsidiary
Sl.No Name of Block/Mine Escrow A/c No.
Total amount in Escrow fund till 31st March 2019 (in Rs. lakhs)
BCCL
1. NT-ST-JG GROUP OF MINES 00150100009046
3839.80
2. JOYRAMPUR UG MINES 00150100009049
56.53
3. BARAREE COLLIERY 00150100008940
357.47
4. LODNA COLLIERY 00150100008942
168.83
5. KUJAMA COLLIERY 00150100008941
451.26
6. Amal. Joyrampur OC 00150100011026 1874.29
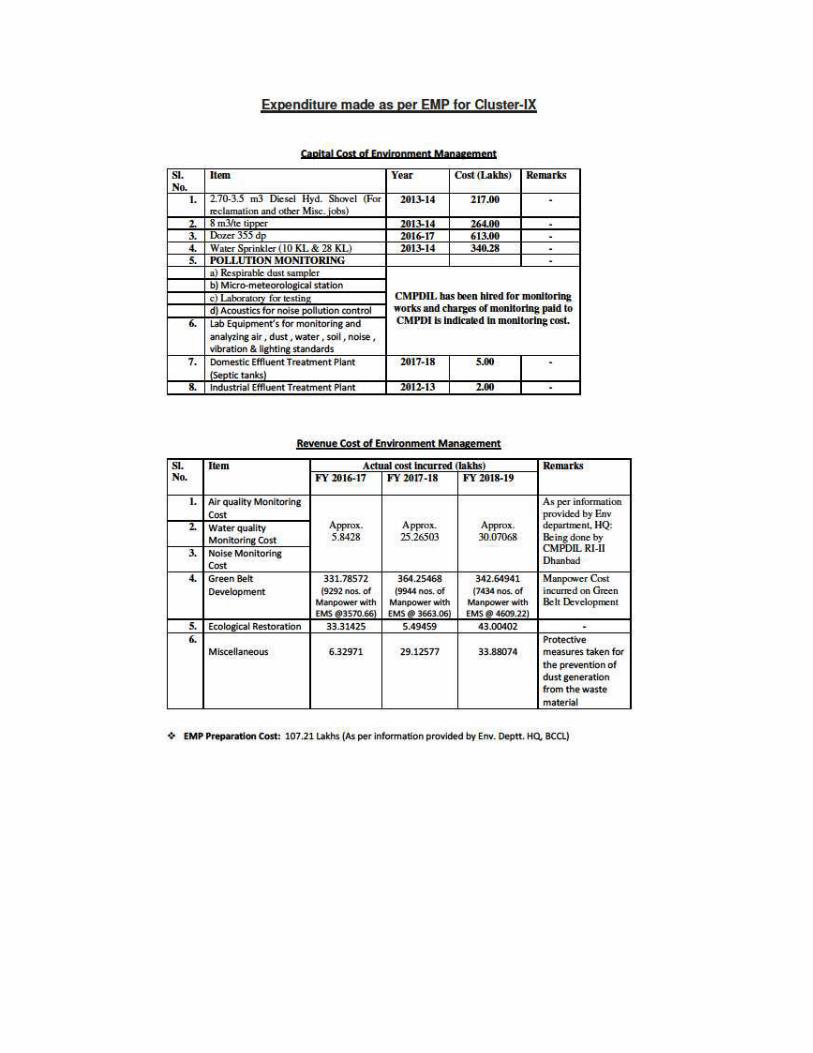
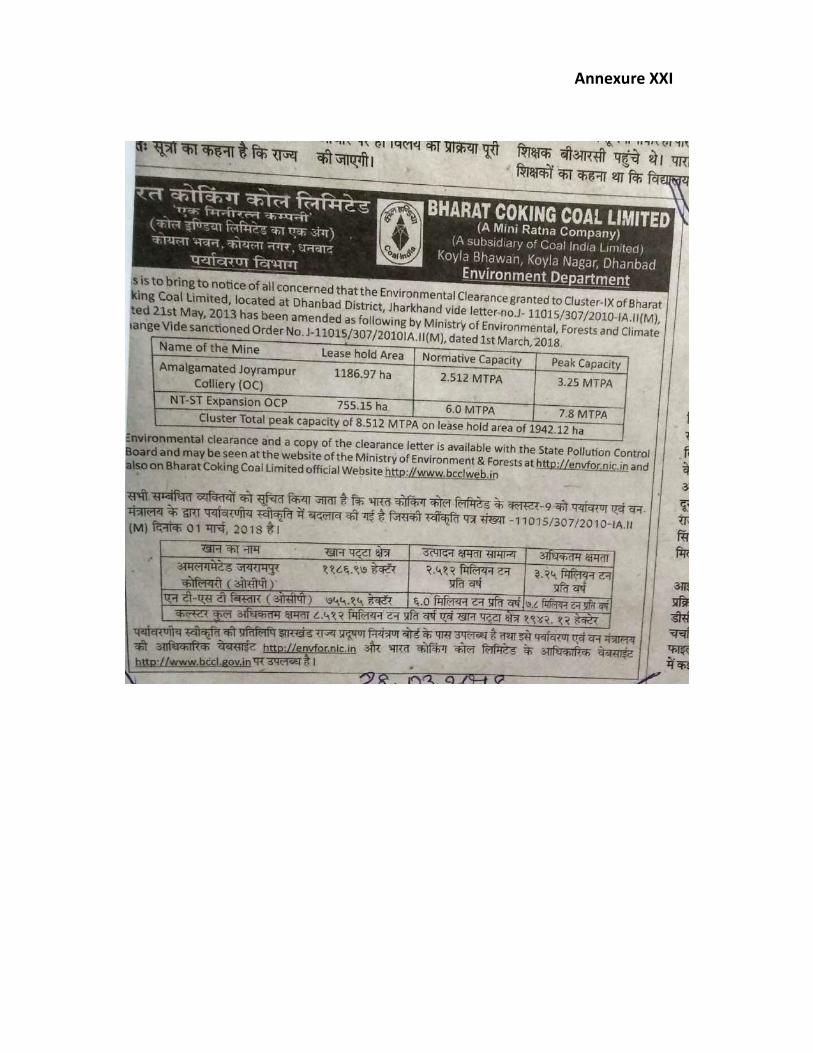
Annexure XXI
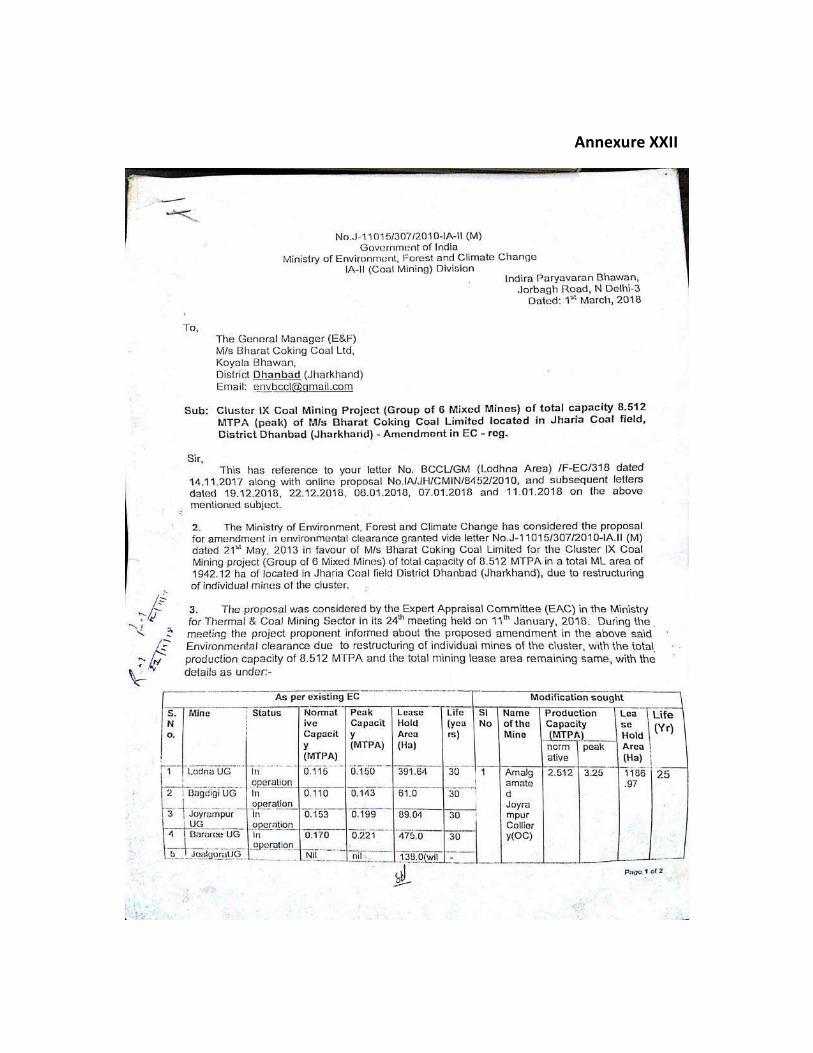
Annexure XXII
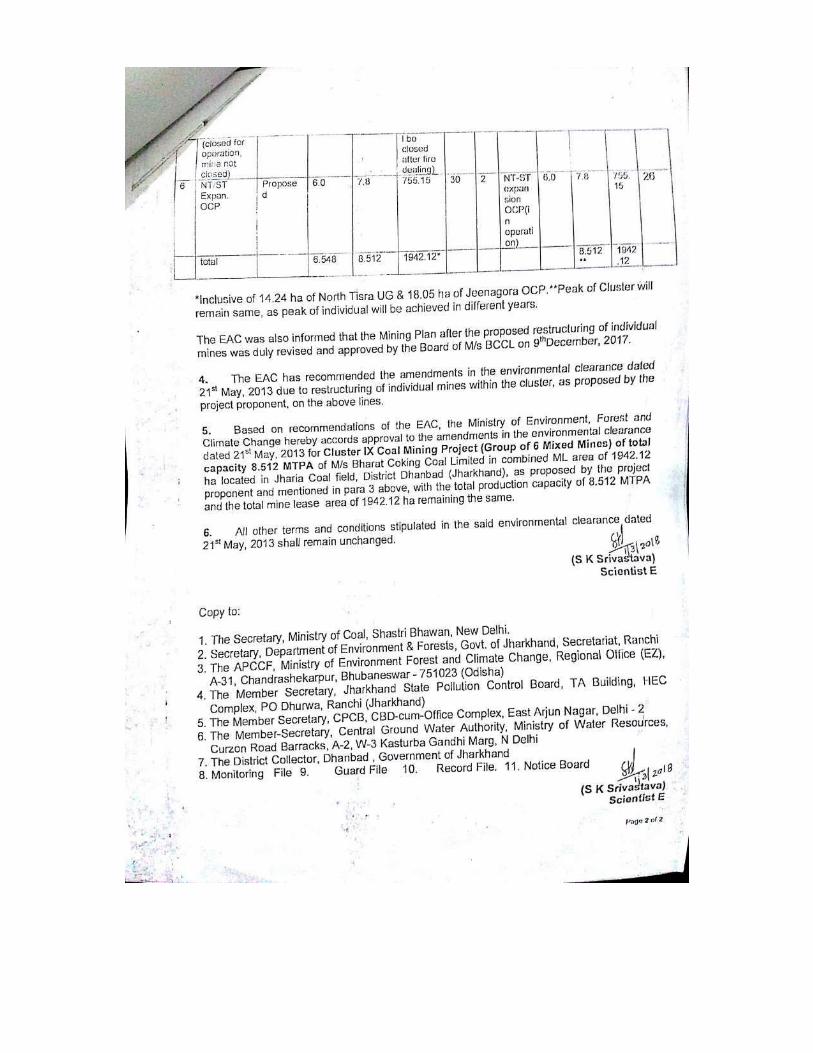
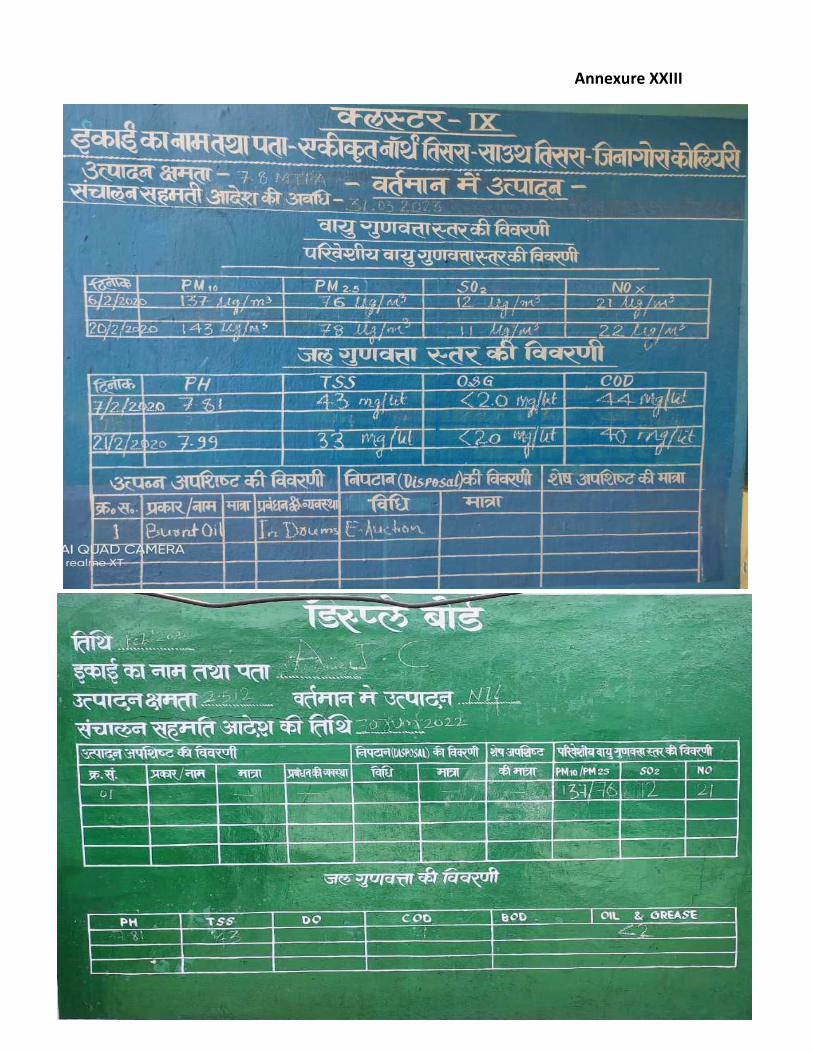
Annexure XXIII
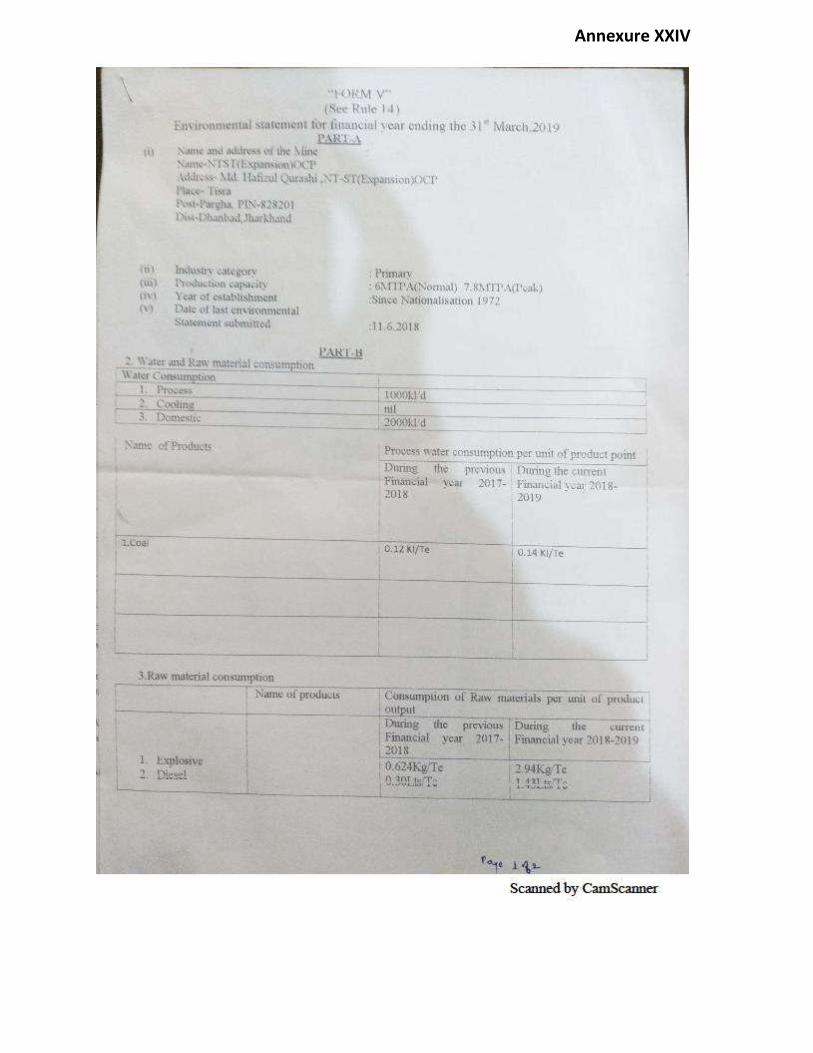
Annexure XXIV
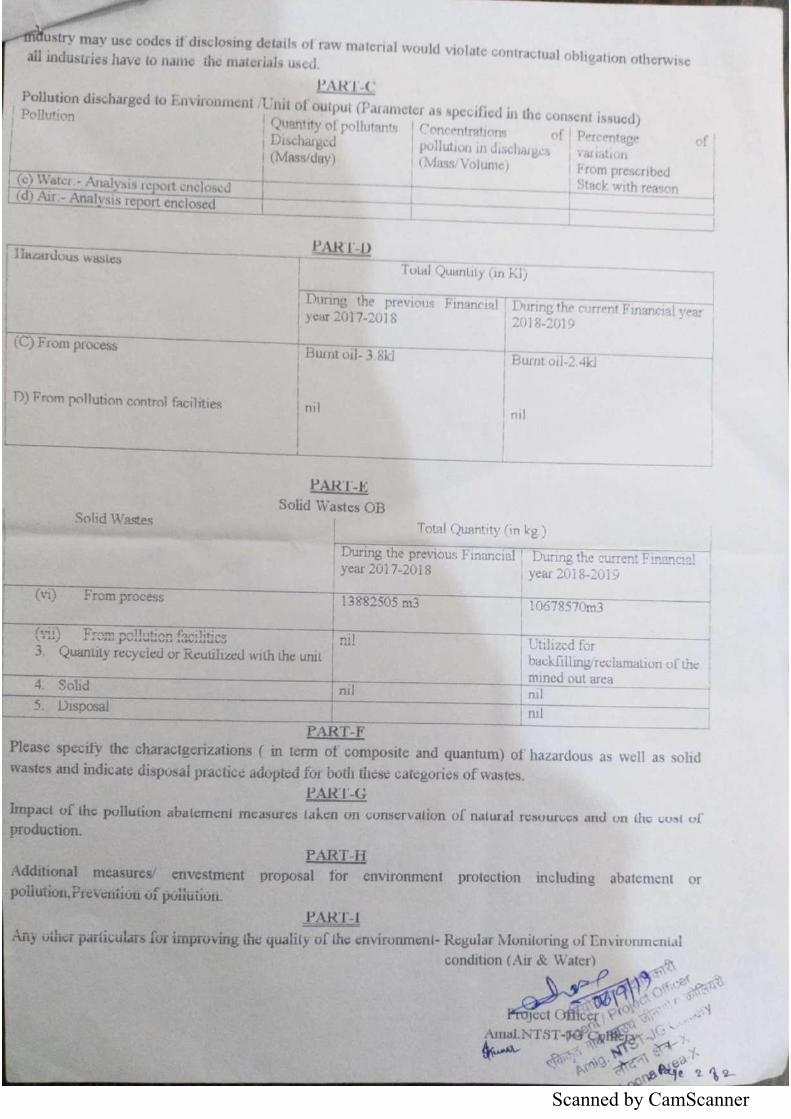
Scanned by CamScanner
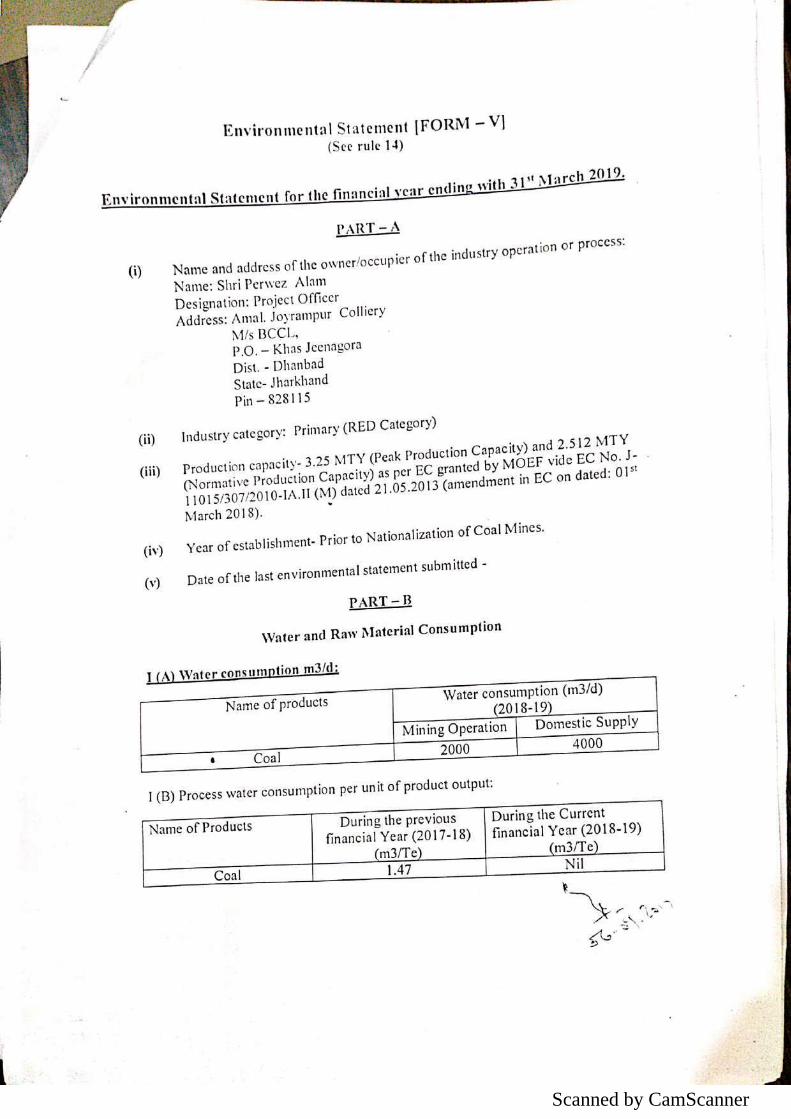
Scanned by CamScanner
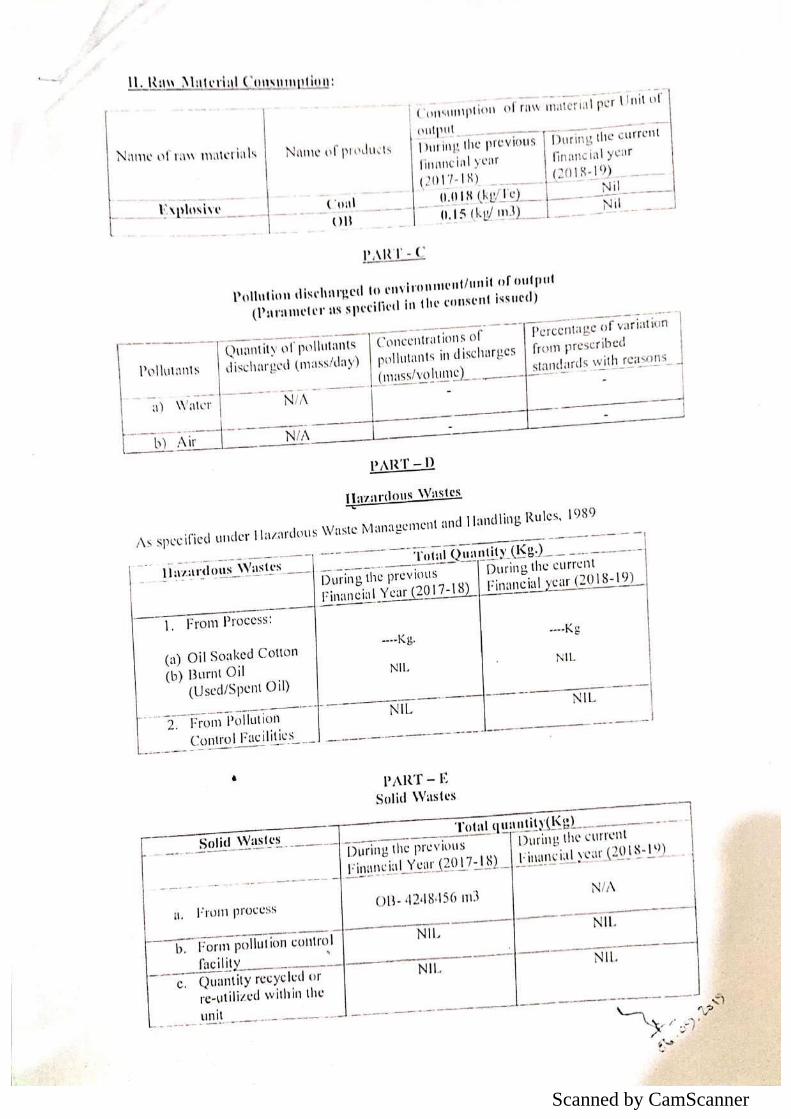
Scanned by CamScanner
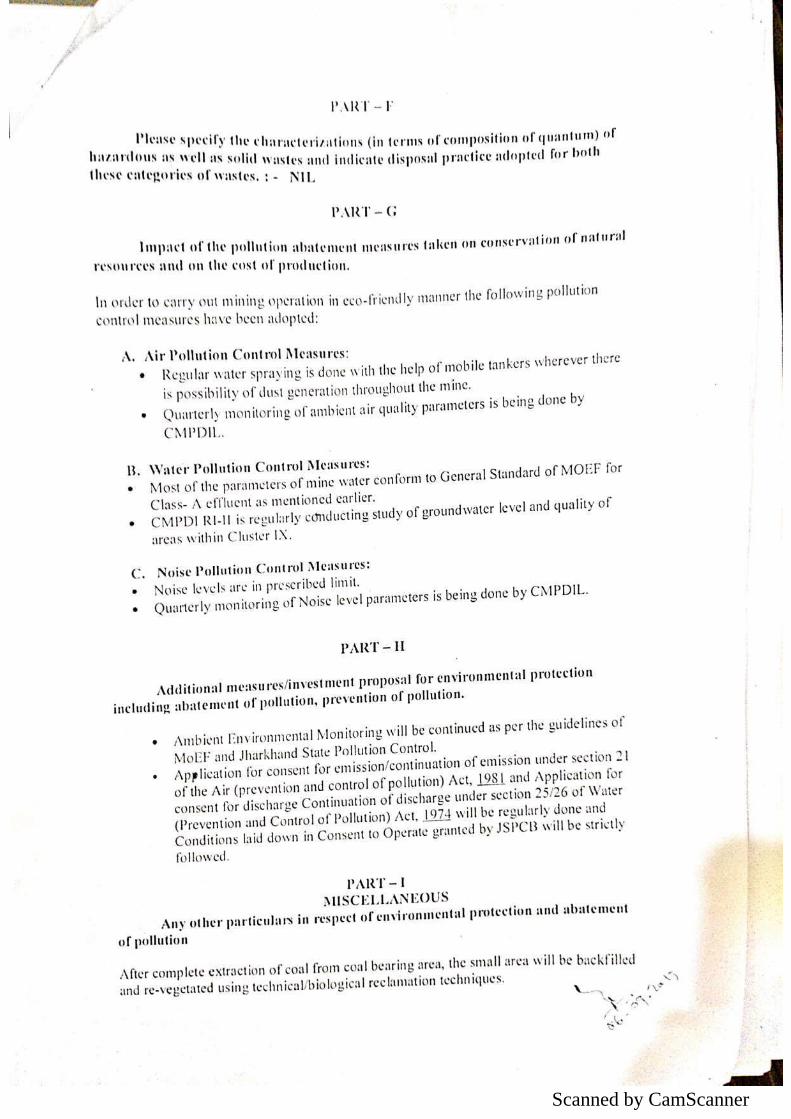
Scanned by CamScanner
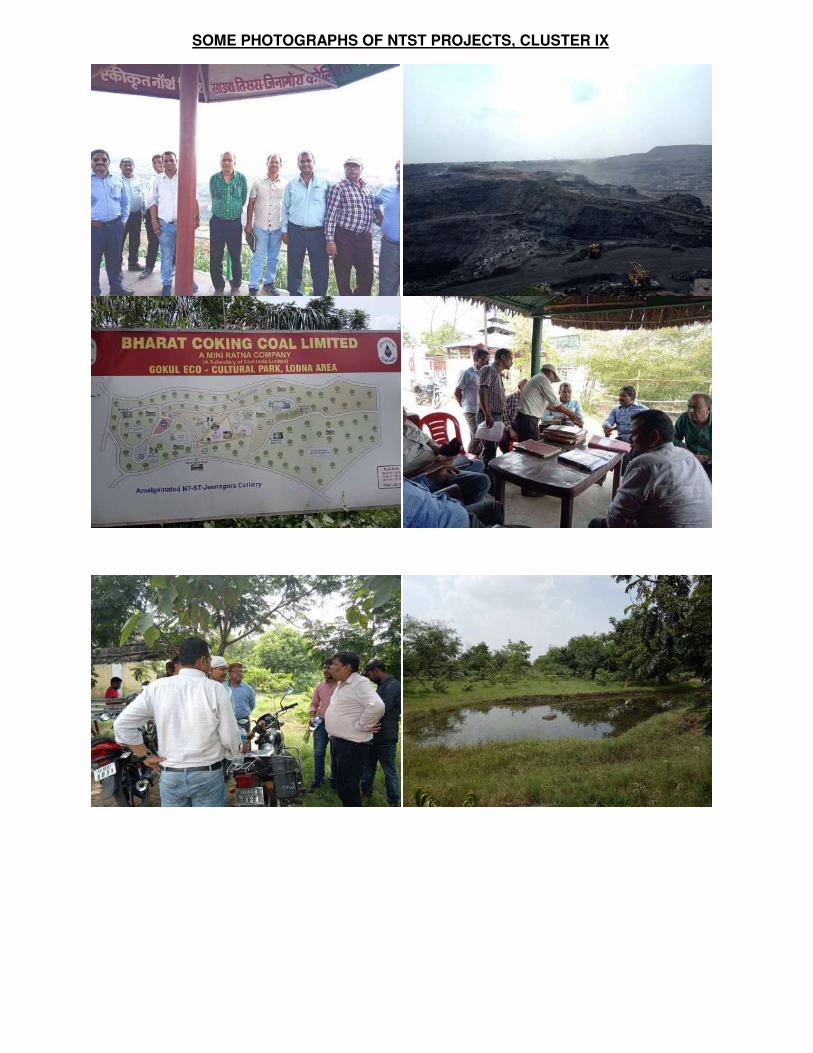
SOME PHOTOGRAPHS OF NTST PROJECTS, CLUSTER IX
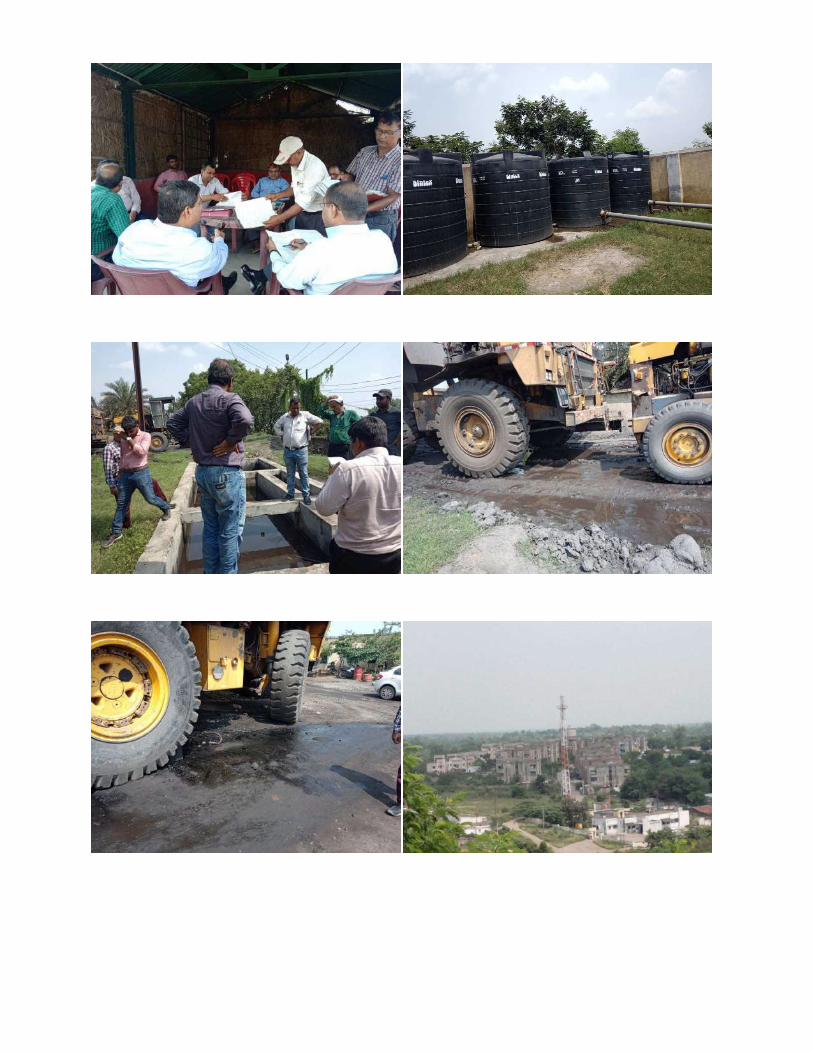
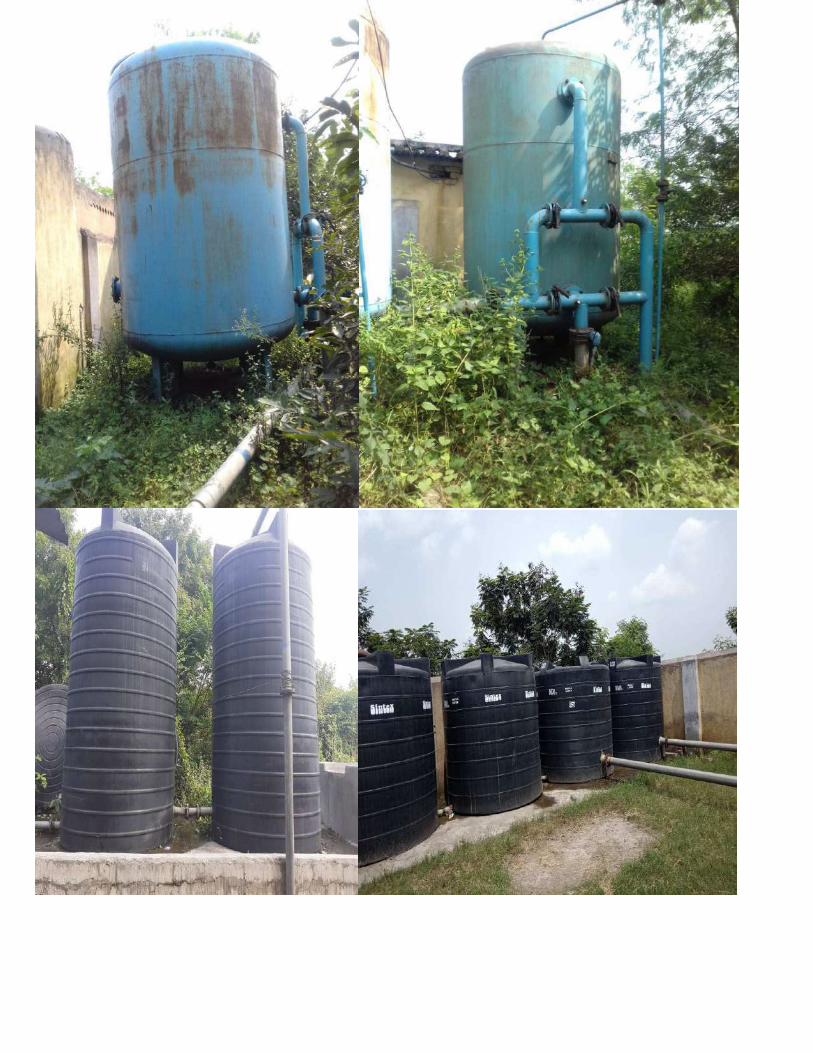
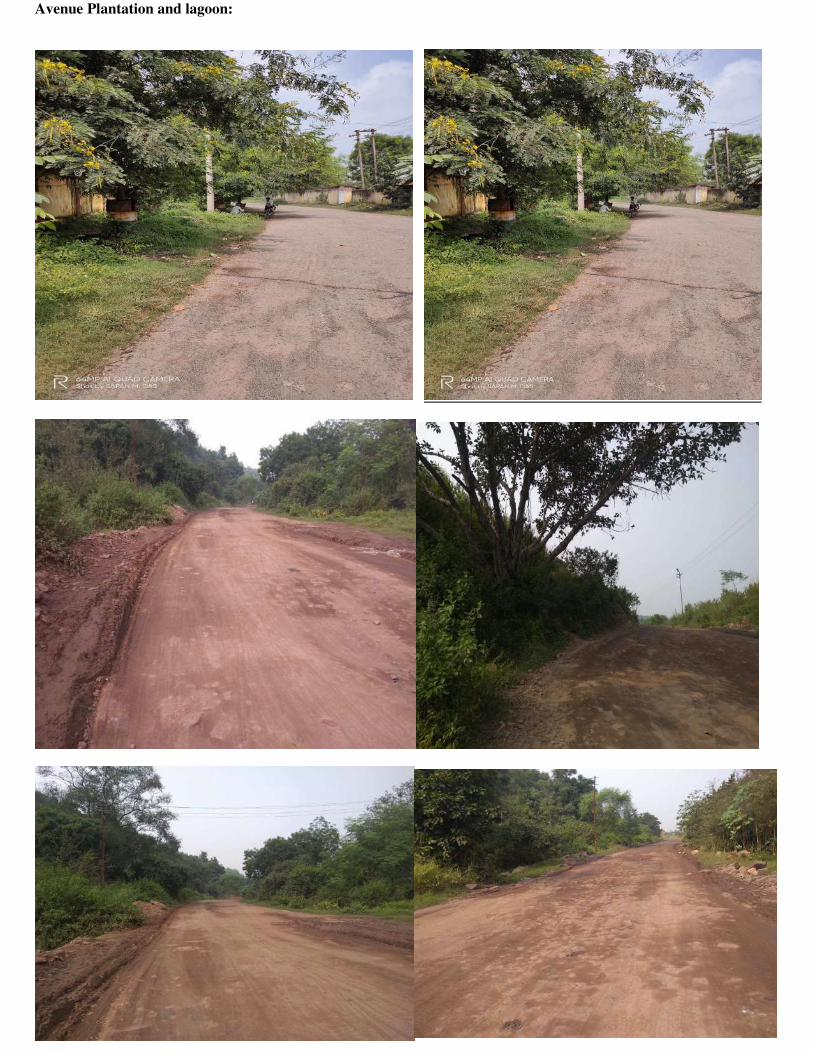
Avenue Plantation and lagoon:
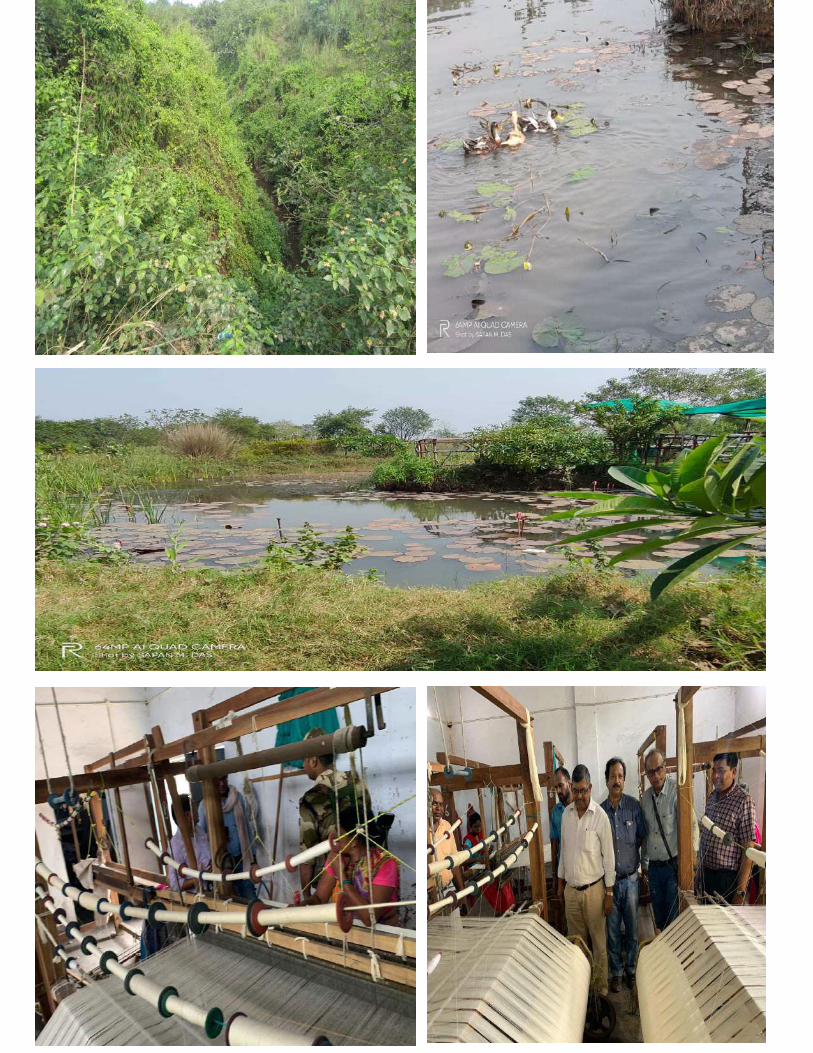
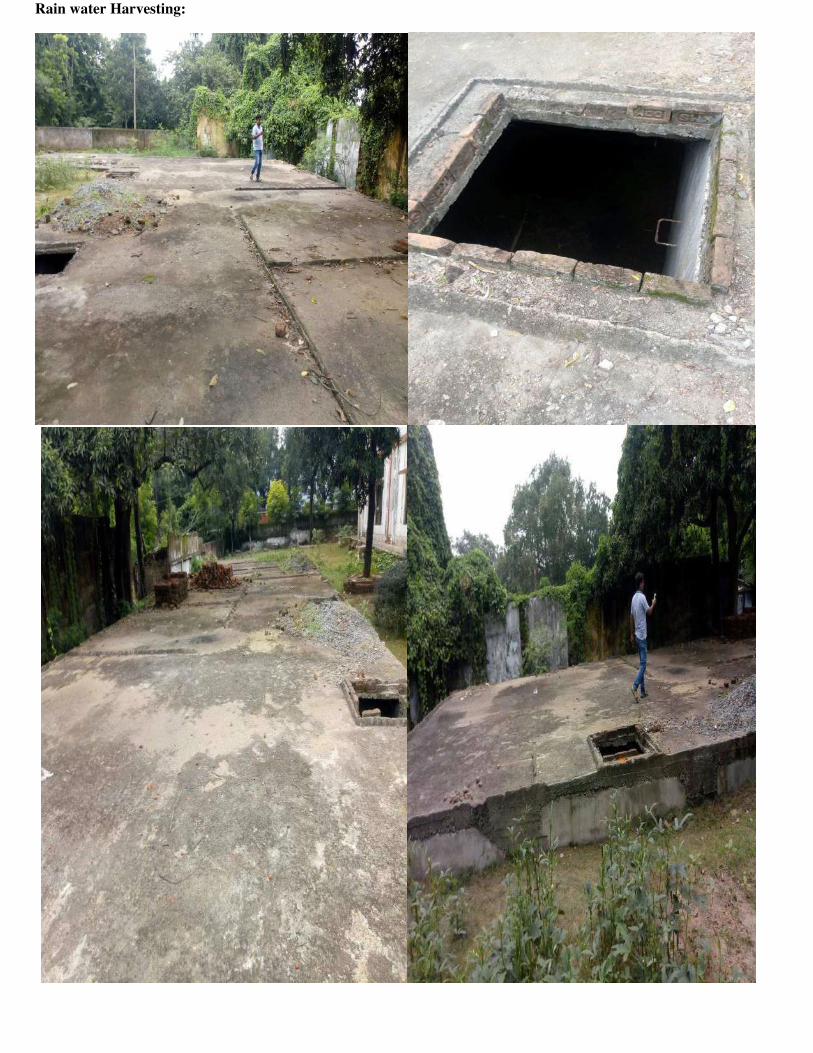
Rain water Harvesting:
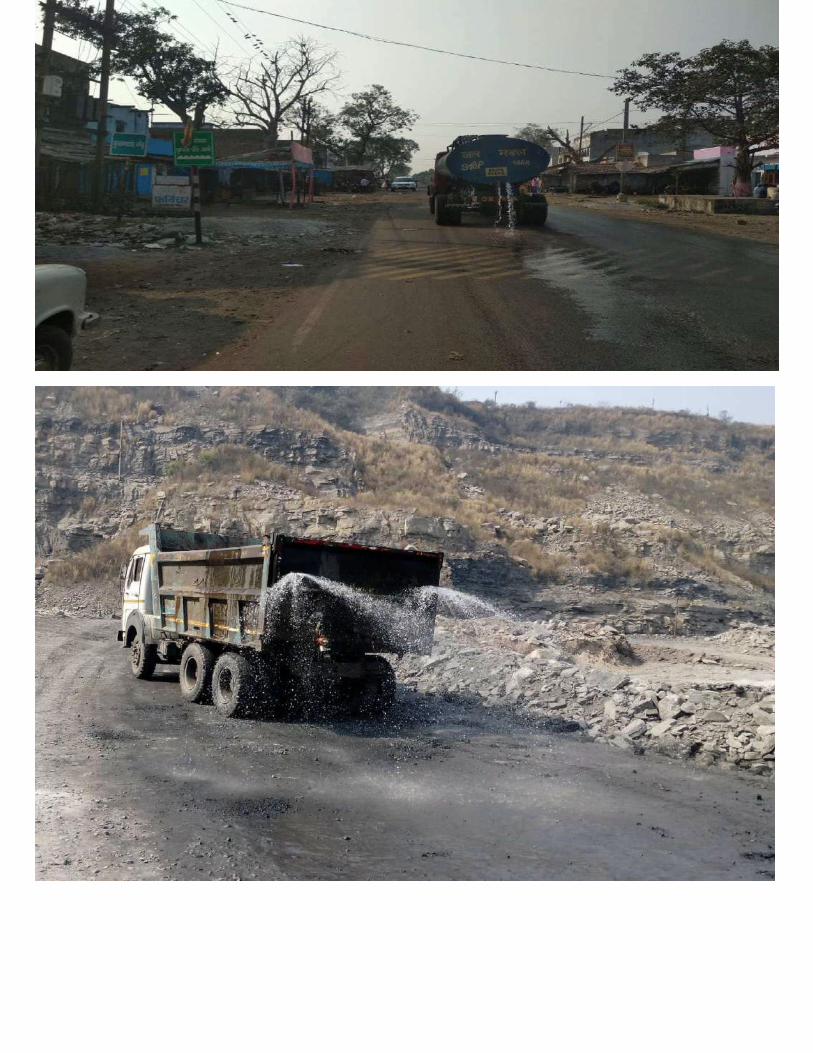
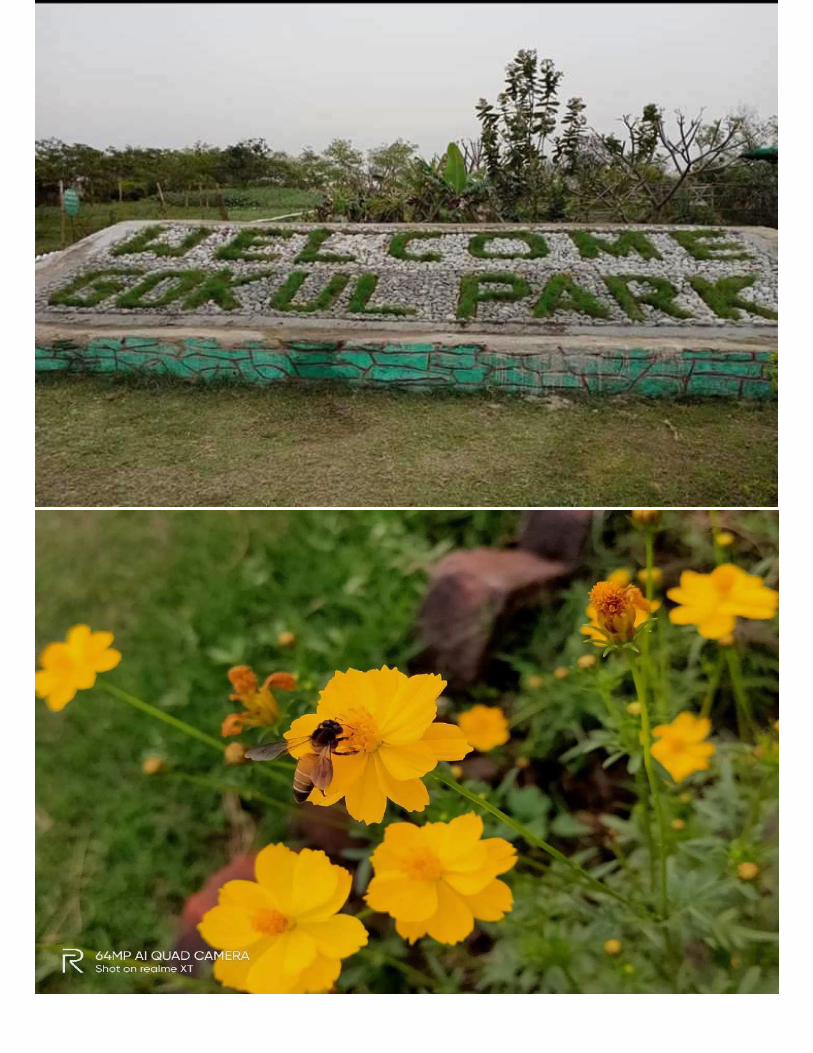
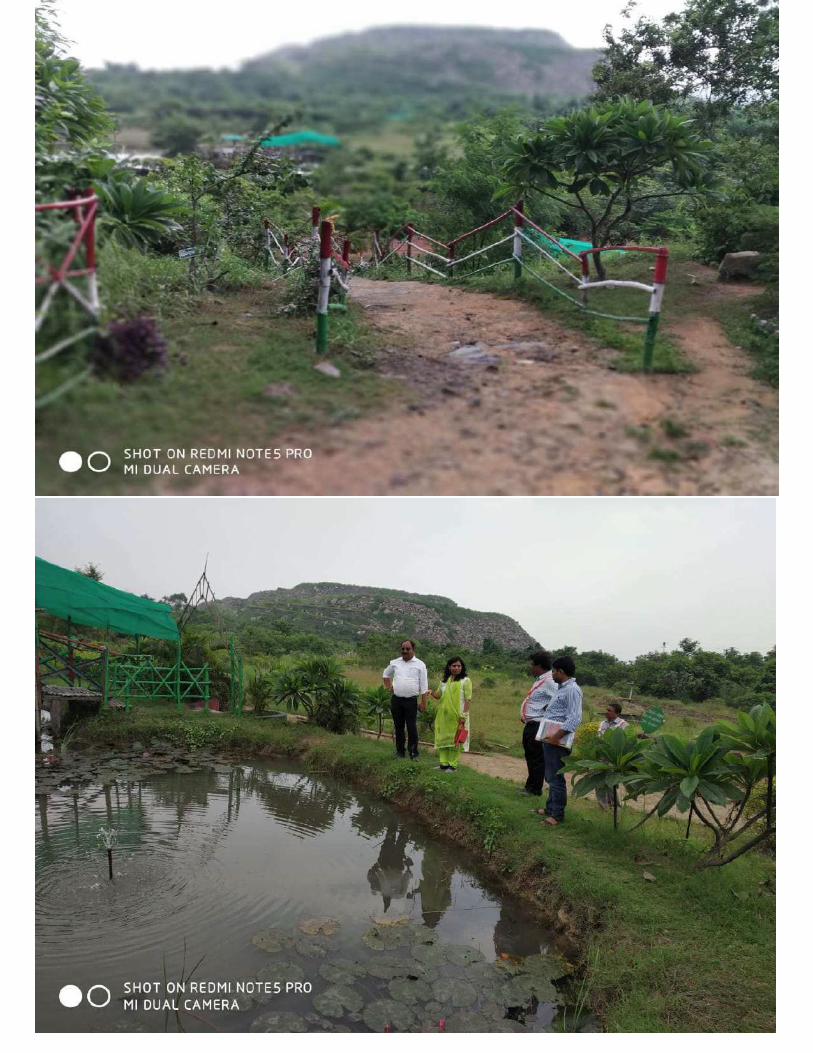
1
CMPDI
ISO 9001 Company
Regional Institute-II
Dhanbad, Jharkhand
STRICTLY RESTRICTED FOR COMPANY USE ONLY RESTRICTED
The information given in this report is not to be
communicated either directly or indirectly to the
press or to any person not holding an official
position in the CIL /GOVERNMENT.
ENVIRONMENTAL MONITORING REPORT
OF
BHARAT COKING COAL LIMITED,
CLUSTER –IX (FOR THE MONTH OCTOBER 2019)
E. C. no. J-11015/307/2010-IA.II (M) dated 21.05.2013
2
JOB NO. 200316028 Cluster –IX, BCCL Environmental Monitoring Report
CONTENTS
SL. NO.
CHAPTER
PARTICULARS
PAGE NO.
1.
2.
3.
4.
CHAPTER - I
CHAPTER-II
CHAPTER-III
CHAPTER-IV
EXECUTIVE SUMMARY
INTRODUCTION
ANALYSIS & RESULTS
STANDARDS & PLANS
3-5
6
7-11
12-15

3
JOB NO. 200316028 Cluster –IX, BCCL Environmental Monitoring Report
EXECUTIVE SUMMARY
1.0 Introduction
The purpose of environmental monitoring is to assess the quality of various
attributes that affects the fauna and flora. In accordance with the quality of these
attributes appropriate strategy is to be developed to control the pollution level
within the permissible limits. The three major attributes are air, water and noise
level.
Bharat Coking Coal Limited (BCCL), a Subsidiary company of Coal India Limited
is operating Underground and Opencast Mines in Jharia Coalfield (JCF) is a part
of Gondwana Coalfields located in Dhanbad district of Jharkhand, the JCF is
bounded by 23037’ N to 23052’ N latitudes and 86009’ E to 86030’ E longitude
occupying an area of 450 Sq.km. BCCL has awarded Environmental monitoring
work of Jharia Coalfield (JCF) to Central Mine Planning & Design Institute Limited
(CMPDIL). The environmental monitoring has been carried out as per the
conditions laid down by the MoEF&CC while granting environmental clearance of
project, consent letter issued by the respective SPCB, and other statutory
requirements.
2.0 Sampling location and rationale
2.1 Ambient air sampling locations
The ambient air quality monitoring stations were selected to represent core, buffer
zone area. The rationale has been based on the guidelines stipulated by
MoEF&CC, consent letter of SPCB, as well as other statutory requirements.
2.2 Water sampling stations
The Water sampling stations were selected for mine sump water.
2.3 Noise level monitoring locations
Noise levels vary depending on the various activities in mining areas. The
monitoring of noise level in different locations will be helpful to take appropriate
mitigating measures. The rationale has been based on the guidelines stipulated
by MoEF&CC, consent letter of SPCB, as well as other statutory requirements
3.0 Methodology of sampling and analysis
3.1 Ambient air quality
Parameters chosen for assessment of ambient air quality were Particulate Matter
(PM10), Fine Particulate Matter (PM2.5), Sulphur Di-oxide (SO2) and Nitrogen
Oxides (NOx). Respirable Dust Samplers (RDS) and Fine Dust Sampler (PM2.5

4
JOB NO. 200316028 Cluster –IX, BCCL Environmental Monitoring Report
sampler) were used for sampling of PM10, SO2, & NOx and Fine Dust Sampler
(PM2.5 sampler) were used for sampling of PM2.5 at 24 hours interval once in a
fortnight and the same for the gaseous pollutants. The samples were analysed in
Environmental Laboratory of CMPDI, RI-II, Dhanbad.
3.2 Water quality
Water samples were collected as per standard practice. The Mine effluent
samples were collected and analyzed for four parameters on fortnightly basis.
Thereafter the samples were preserved and analyzed at the Environmental
Laboratory of CMPDI, RI- II, Dhanbad.
3.3 Noise level monitoring
Noise level measurements in form of 'LEQ' were taken using Integrated Data
Logging Sound Level Meter. Noise levels were measured in Decibels, 'A' weighted
average, i.e. dB(A).
4.0 Results and interpretations
4.1 Air quality
It has been seen from the analysis results that the 24 hours average concentration
parameters like PM10, PM2.5, SO2 and NOx are mostly within the permissible limits
in all sampling locations as per MoEF&CC Gazette Notification No. GSR 742(E)
dt 25.09.2000 Standards for Coal Mines and National Ambient Air Quality
Standard -2009. Sometimes the concentration of PM10& PM2.5 exceeds the limits
due to heavy public traffic, poor road condition, coke oven plants, burning of coal
by surrounding habitants, brick making, municipal waste dumps and industries like
Steel Plant, thermal Plants including their fly ash etc.
The following preventive and suppressive mitigative measures can be undertaken to contain the pollution level within prescribed level:-
Wet drilling and controlled blasting should be practice. Explosive used should be optimised to restrict the dust generation. Transportation roads should be permanently asphalted free of ruts, potholes
etc. Water should be sprayed on coal transportation road, service road more
frequently and at regular interval. Dust from roads should be removed physically or mechanically. Greenbelts around industrial sites, service building area besides
Avenue plantation along roads should be created. Coal dust should be suppressed by using fixed sprinklers. Regular maintenance of plant and machinery should be undertaken.

5
JOB NO. 200316028 Cluster –IX, BCCL Environmental Monitoring Report
4.2 Water quality
The test results indicate that the major parameters compared with MoEF&CC
Gazette Notification No. GSR 742(E) dt.25.09.2000 Standards for Coal Mines
were within permissible limits.
4.3 Noise Level
During the noise level survey it has been observed that the noise level in the
sampling locations is within the permissible limits prescribed as per MoEF&CC
Gazette Notification No. GSR 742(E) dt.25.09.2000 Standards for Coal Mines for
Industrial Area and Noise pollution (Regulation and Control) Rules, 2000.
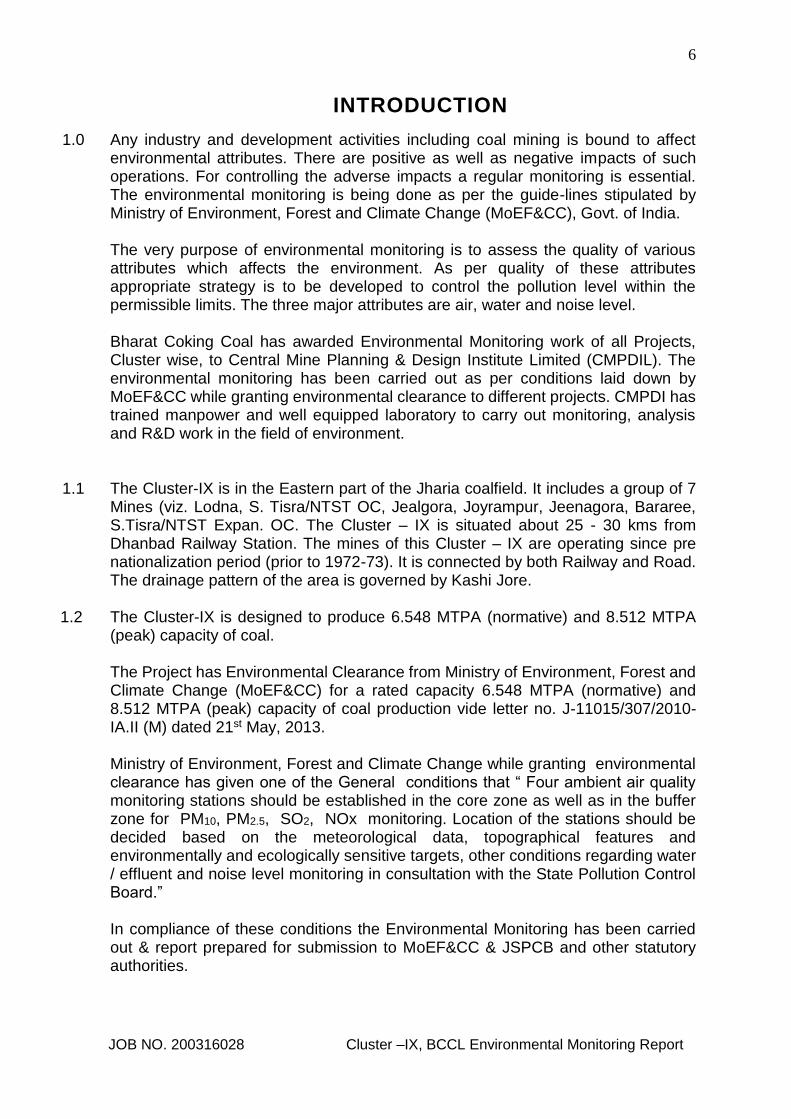
6
JOB NO. 200316028 Cluster –IX, BCCL Environmental Monitoring Report
INTRODUCTION
1.0 Any industry and development activities including coal mining is bound to affect environmental attributes. There are positive as well as negative impacts of such operations. For controlling the adverse impacts a regular monitoring is essential. The environmental monitoring is being done as per the guide-lines stipulated by Ministry of Environment, Forest and Climate Change (MoEF&CC), Govt. of India.
The very purpose of environmental monitoring is to assess the quality of various
attributes which affects the environment. As per quality of these attributes appropriate strategy is to be developed to control the pollution level within the permissible limits. The three major attributes are air, water and noise level.
Bharat Coking Coal has awarded Environmental Monitoring work of all Projects,
Cluster wise, to Central Mine Planning & Design Institute Limited (CMPDIL). The environmental monitoring has been carried out as per conditions laid down by MoEF&CC while granting environmental clearance to different projects. CMPDI has trained manpower and well equipped laboratory to carry out monitoring, analysis and R&D work in the field of environment.
1.1 The Cluster-IX is in the Eastern part of the Jharia coalfield. It includes a group of 7
Mines (viz. Lodna, S. Tisra/NTST OC, Jealgora, Joyrampur, Jeenagora, Bararee, S.Tisra/NTST Expan. OC. The Cluster – IX is situated about 25 - 30 kms from Dhanbad Railway Station. The mines of this Cluster – IX are operating since pre nationalization period (prior to 1972-73). It is connected by both Railway and Road. The drainage pattern of the area is governed by Kashi Jore.
1.2 The Cluster-IX is designed to produce 6.548 MTPA (normative) and 8.512 MTPA
(peak) capacity of coal.
The Project has Environmental Clearance from Ministry of Environment, Forest and Climate Change (MoEF&CC) for a rated capacity 6.548 MTPA (normative) and 8.512 MTPA (peak) capacity of coal production vide letter no. J-11015/307/2010-IA.II (M) dated 21st May, 2013.
Ministry of Environment, Forest and Climate Change while granting environmental clearance has given one of the General conditions that “ Four ambient air quality monitoring stations should be established in the core zone as well as in the buffer zone for PM10, PM2.5, SO2, NOx monitoring. Location of the stations should be decided based on the meteorological data, topographical features and environmentally and ecologically sensitive targets, other conditions regarding water / effluent and noise level monitoring in consultation with the State Pollution Control Board.” In compliance of these conditions the Environmental Monitoring has been carried out & report prepared for submission to MoEF&CC & JSPCB and other statutory authorities.

7
JOB NO. 200316028 Cluster –IX, BCCL Environmental Monitoring Report
AMBIENT AIR QUALITY MONITORING
2.1 Location of sampling station and their rationale:
(As per G.S.R. 742 (E) dt. 25th December, 2000)
2.1.1 Ambient Air Quality Sampling Locations
I. CORE ZONE Monitoring Location
i) Jeenagora (A13) : Industrial Area
The location of the sampling station is 230 42’ 31.00’’ N & 860 25’ 48.00’’ E. The
sampler was placed at a height of 1.5 m from the ground level at the Safety Office.
II. BUFFER ZONE Monitoring Location
i) Kusmatand Village (A12): Industrial Area
The location of the sampling station is 23045’ 4.65’’ N & 860 26’ 42.10’’ E. The sampler
was placed at a height of 1.5 m from the ground level of the village.
ii) Bhowrah North (A14) : Industrial Area
The location of the sampling station is 23o41’ 37.00’’ N & 86o23’ 54.00’’E. The sampler
was placed at 1.5 m above the ground level of Project Office.
Iii) Hurriladih UGP (A28) : Industrial Area
The location of the sampling station is 23044’ 4.18’’ N & 860 24’ 6.21’’ E. The sampler
was placed at a height of 1.5 m from the ground level of the mine office.
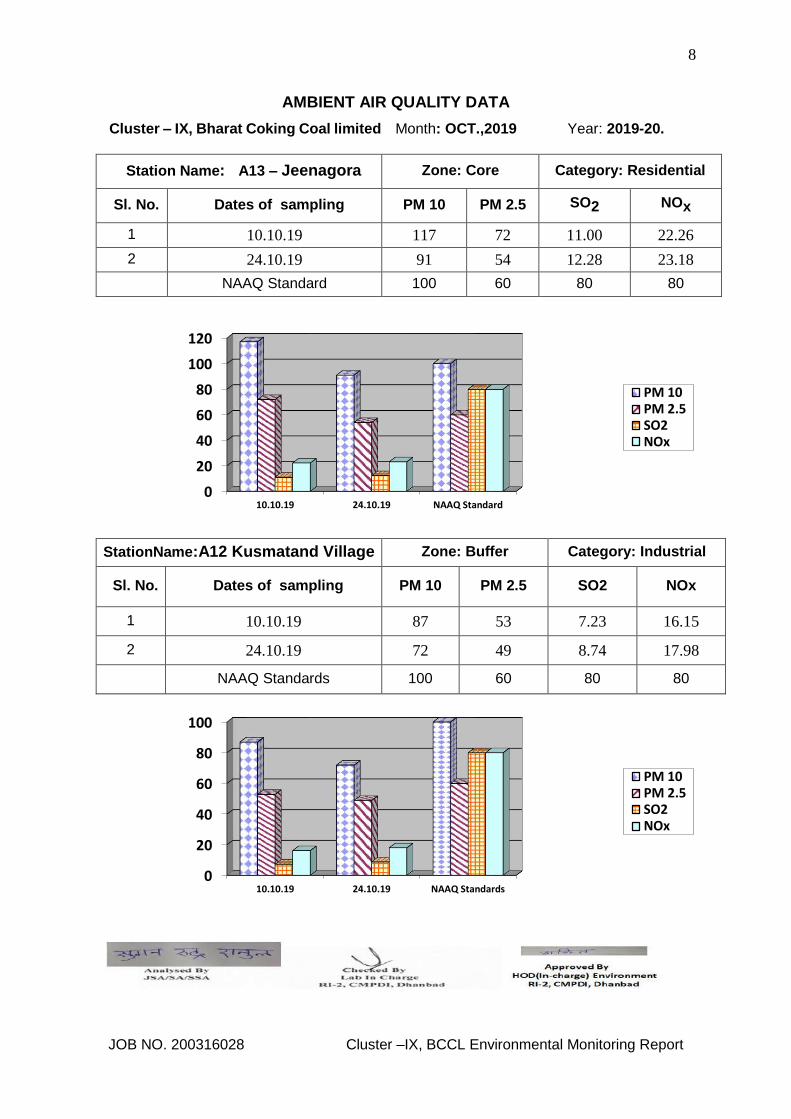
8
JOB NO. 200316028 Cluster –IX, BCCL Environmental Monitoring Report
AMBIENT AIR QUALITY DATA
Cluster – IX, Bharat Coking Coal limited Month: OCT.,2019 Year: 2019-20.
0
20
40
60
80
100
120
10.10.19 24.10.19 NAAQ Standard
PM 10PM 2.5SO2NOx
0
20
40
60
80
100
10.10.19 24.10.19 NAAQ Standards
PM 10PM 2.5SO2NOx
Station Name: A13 – Jeenagora Zone: Core Category: Residential
Sl. No. Dates of sampling PM 10 PM 2.5 SO2 NOx
1 10.10.19 117 72 11.00 22.26
2 24.10.19 91 54 12.28 23.18
NAAQ Standard 100 60 80 80
StationName:A12 Kusmatand Village Zone: Buffer Category: Industrial
Sl. No. Dates of sampling PM 10 PM 2.5 SO2 NOx
1 10.10.19 87 53 7.23 16.15
2 24.10.19 72 49 8.74 17.98
NAAQ Standards 100 60 80 80
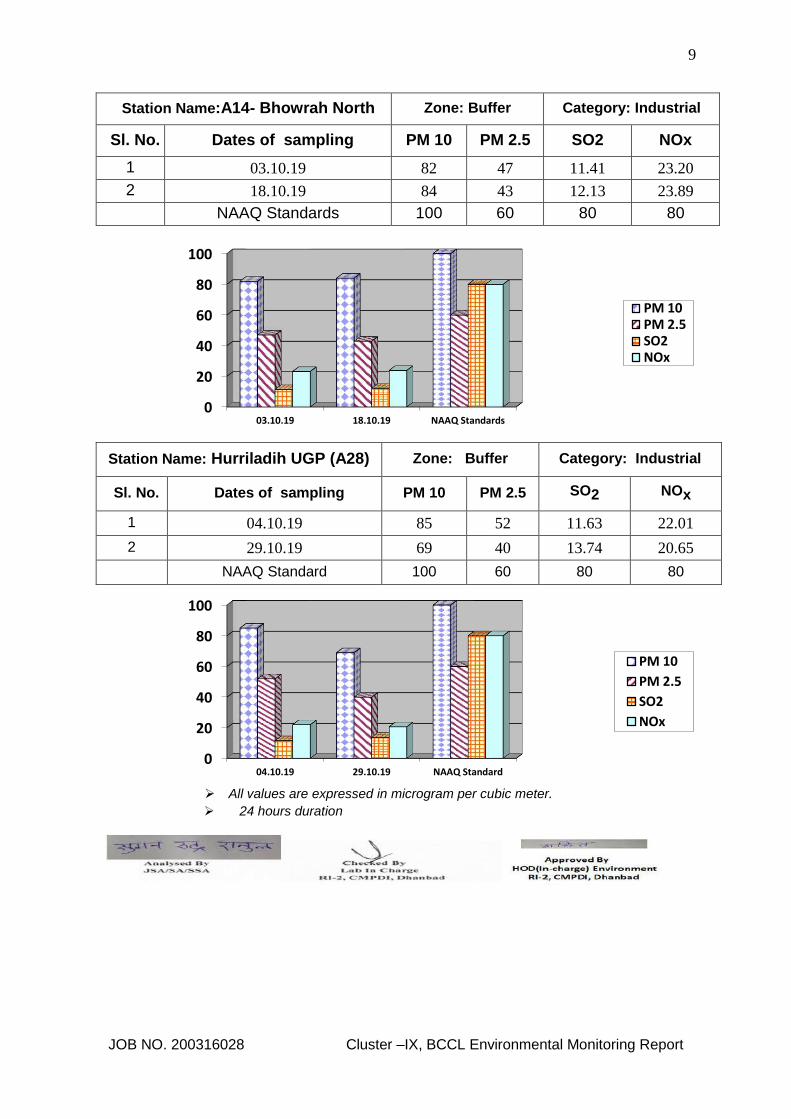
9
JOB NO. 200316028 Cluster –IX, BCCL Environmental Monitoring Report
All values are expressed in microgram per cubic meter.
24 hours duration
0
20
40
60
80
100
03.10.19 18.10.19 NAAQ Standards
PM 10PM 2.5SO2NOx
0
20
40
60
80
100
04.10.19 29.10.19 NAAQ Standard
PM 10
PM 2.5
SO2
NOx
Station Name:A14- Bhowrah North Zone: Buffer Category: Industrial
Sl. No. Dates of sampling PM 10 PM 2.5 SO2 NOx
1 03.10.19 82 47 11.41 23.20
2 18.10.19 84 43 12.13 23.89
NAAQ Standards 100 60 80 80
Station Name: Hurriladih UGP (A28) Zone: Buffer Category: Industrial
Sl. No. Dates of sampling PM 10 PM 2.5 SO2 NOx
1 04.10.19 85 52 11.63 22.01
2 29.10.19 69 40 13.74 20.65
NAAQ Standard 100 60 80 80
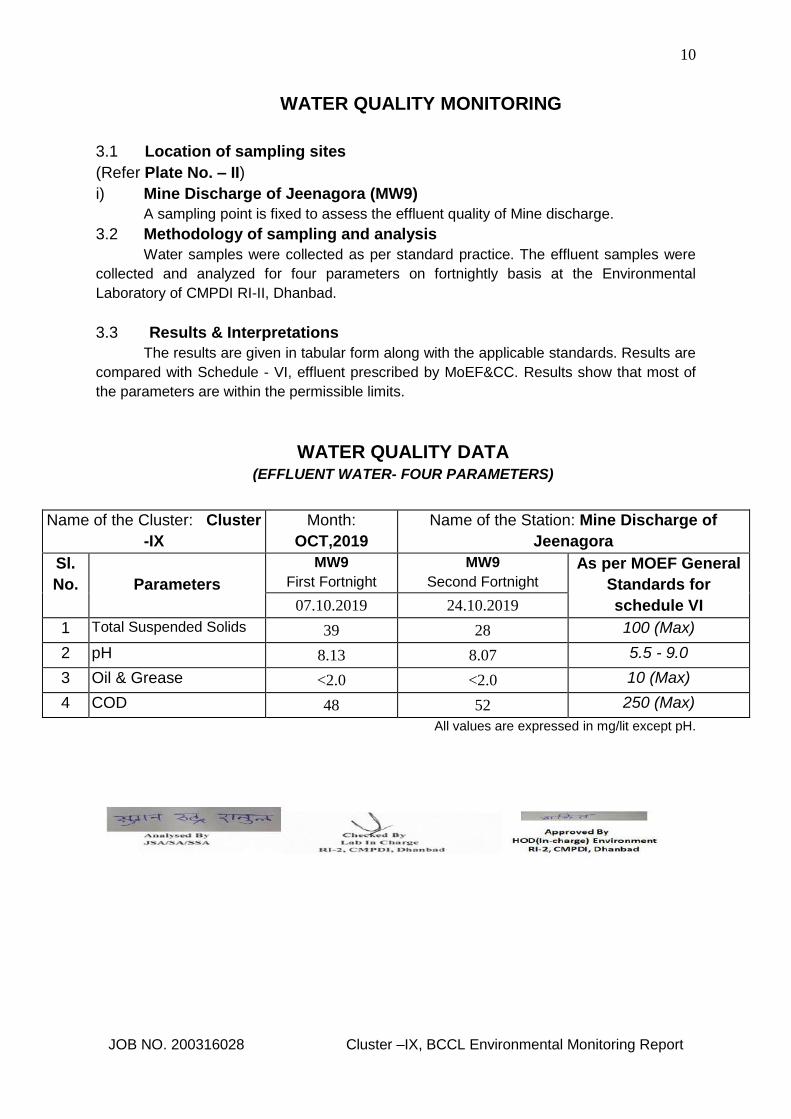
10
JOB NO. 200316028 Cluster –IX, BCCL Environmental Monitoring Report
WATER QUALITY MONITORING
3.1 Location of sampling sites
(Refer Plate No. – II)
i) Mine Discharge of Jeenagora (MW9)
A sampling point is fixed to assess the effluent quality of Mine discharge.
3.2 Methodology of sampling and analysis
Water samples were collected as per standard practice. The effluent samples were
collected and analyzed for four parameters on fortnightly basis at the Environmental
Laboratory of CMPDI RI-II, Dhanbad.
3.3 Results & Interpretations
The results are given in tabular form along with the applicable standards. Results are
compared with Schedule - VI, effluent prescribed by MoEF&CC. Results show that most of
the parameters are within the permissible limits.
WATER QUALITY DATA (EFFLUENT WATER- FOUR PARAMETERS)
Name of the Cluster: Cluster
-IX
Month:
OCT,2019
Name of the Station: Mine Discharge of
Jeenagora
Sl.
No.
Parameters
MW9
First Fortnight
MW9
Second Fortnight
As per MOEF General
Standards for
schedule VI 07.10.2019 24.10.2019
1 Total Suspended Solids 39 28 100 (Max)
2 pH 8.13 8.07 5.5 - 9.0
3 Oil & Grease <2.0 <2.0 10 (Max)
4 COD 48 52 250 (Max)
All values are expressed in mg/lit except pH.

11
JOB NO. 200316028 Cluster –IX, BCCL Environmental Monitoring Report
NOISE LEVEL QUALITY MONITORING
4.1 Location of sampling sites 1. Jeenagora (N13) 2. Kusmatand Village (N12) 3. Bhowrah North (N14) 4. Hurriladih UGP (N28)
4.2 Methodology of sampling and analysis - Noise level measurements in form of 'LEQ'
were taken using Integrated Data Logging Sound Level Meter (NL-52 OF RION CO. Ltd. Make) during day time. Noise levels were measured for about one hour time in day time. Noise levels were measured in Decibels, 'A' weighted average, i.e. dB (A). 4.3 Results & Interpretations Ambient noise levels were recorded during day time and the observed values were compared with standards prescribed by MoEF&CC. The results of Noise levels recorded during day time on fortnightly basis are presented in tabular form along with the applicable standard permissible limits. The observed values in terms of LEQ are presented. The observed values at all the monitoring locations are found to be within permissible limits.
NOISE LEVEL DATA
Name of the Project : Cluster -IX Month: OCT.,2019
Sl. No. Station Name/Code Category of
area Date
Noise level dB(A)LEQ
*Permissible Limit of Noise level in
dB(A) 1 Kusmatand Village
(N12)
Residential area 10.10.19 54.1 55
2 Kusmatand Village (N12)
Residential area 24.10.19 53.5 55
3 Jeenagora (N13) Industrial area
10.10.19 60.8 75
4 Jeenagora (N13) Industrial area
24.10.19 60.2 75
5 Bhowrah North(N14)
Industrial area 03.10.19 62.6 75
6 Bhowrah North(N14)
Industrial area 18.10.19 63.7 75
7 Hurriladih UGP (N28)
Industrial area 04.10.19 59.2 75
8 Hurriladih UGP (N28)
Industrial area 29.10.19 58.4 75
*Permissible limits of Noise Level as per MOEF Gazette Notification No. GSR 742(E) dt. 25.09.2000 Standards for Coal Mines and Noise Pollution (Regulation and Control) Rules, 2000. * Day Time: 6.00 AM to 10.00 PM.

12
JOB NO. 200316028 Cluster –IX, BCCL Environmental Monitoring Report
Ambient Air Quality Standards for Jharia Coal Field
As per the Environment (Protection) Amendment Rules, 2000 notified vide notification G.S.R. 742(E), dated 25.9.2000.
Category Pollutant Time
weighted
average
Concentration
in Ambient Air
Method of
Measurement
1 2 3 4 5
III
Coal mines located
in the coal fields of
Jharia
Raniganj Bokaro
Suspended
Particulate Matter
(SPM)
Annual
Average
*
24 hours
**
500 µg/m3
700 µg/m3
- High Volume Sampling (Average flow rate not less than 1.1
m3/minute)
Respirable
Particulate Matter
(size less than 10
µm) (RPM)
Annual
Average
*
24 hours
**
250 µg/m3
300 µg/m3
Respirable
Particulate Matter
sampling and
analysis
Sulphur Dioxide
(SO2)
Annual
Average
*
24 hours
**
80 µg/m3
120 µg/m3
1. Improvedwest
and Gaeke
method
2. Ultraviolet
fluorescene
Oxide of Nitrogen
as NO2
Annual
Average
*
24 hours
**
80 µg/m3
120 µg/m3
1. Jacob &
Hochheiser
Modified (Na-
Arsenic)
Method
2. Gas phase
Chemilumine-
scence
Note:
* Annual Arithmetic mean for the measurements taken in a year, following the guidelines for frequency of sampling laid down in clause2.
** 24hourly/8hourlyvaluesshallbemet92%ofthetimeinayear.However,8% of the time it may exceed but not on two
consecutivedays.

13
JOB NO. 200316028 Cluster –IX, BCCL Environmental Monitoring Report
NATIONAL AMBIENT AIR QUALITY STANDARDS New Delhi the 18th November 2009
In exercise of the powers conferred by Sub-section (2) (h) of section 16 of the Air (Prevention and Control of
Pollution) Act, 1981 (Act No. 14 of 1981), and in supersession of the notification No(s).S.O.384(E), dated 11th April
1994 and S.O.935(E), dated 14th October 1998, the Central Pollution Control Board hereby notify the National
Ambient Air Quality Standards with immediate effect.
* Annual Arithmetic mean of minimum 104 measurements in a year at a particular site taken twice a week 24 hourly at uniform
intervals.
** 24 hourly or 8 hourly or 1 hourly monitored values, as applicable, shall be complied with 98% of the time in a year. 2% of the
time, they may exceed the limits but not on two consecutive days of monitoring.
NOTE: Whenever and wherever monitoring results on two consecutive days of monitoring exceed the limits specified above
for the respective category, it shall be considered adequate reason to institute regular or continuous monitoring and further
investigations.
Pollutant
Time Weighted Average
Concentration in Ambient Air Methods of Measurement
Industrial, Residentia
l, Rural and other
Areas
Ecologically Sensitive Area
(Notified by Central
Government)
Sulphur Dioxide (SO2), µg/m3
Annual * 24 Hours **
50 80
20 80
-Improved West and Gaeke Method -Ultraviolet Fluorescence
Nitrogendioxide (NO2), µg/m3
Annual * 24 Hours **
40 80
30 80
-Jacob &Hochheiser modified (NaOH-NaAsO2) Method -Gas Phase Chemiluminescence
Particulate Matter (Size less than 10µm) or PM10, µg/m3
Annual * 24 Hours **
60 100
60 100
-Gravimetric -TEOM -Beta attenuation
Particulate Matter (Size less than 2.5µm) or PM2.5, µg/m3
Annual * 24 Hours **
40 60
40 60
-Gravimetric -TEOM -Beta attenuation
Ozone (O3) , µg/m3 8 Hours * 1 Hour **
100 180
100 180
-UV Photometric -Chemiluminescence -Chemical Method
Lead (Pb) , µg/m3 Annual * 24 Hours **
0.50 1.0
0.50 1.0
-AAS/ICP Method after sampling on EPM 2000 or equivalent filter paper -ED-XRF using Teflon filter
Carbon Monoxide (CO), mg/m3
8 Hours ** 1 Hour **
02 04
02 04
-Non dispersive Infrared (NDIR) Spectroscopy
Ammonia (NH3), µg/m3 Annual * 24 Hours **
100 400
100 400
-Chemiluminescence -Indophenol blue method
Benzene (C6H6), µg/m3 Annual *
05 05 -Gas Chromatography (GC) based continuous analyzer -Adsorption and desorption followed by GC analysis
Benzo(a)Pyrene (BaP) Particulate phase only, ng/m3
Annual *
01 01 -Solvent extraction followed byHPLC/GC analysis
Arsenic (As), ng/m3 Annual *
06 06 -AAS/ICP Method after sampling on EPM 2000 or equivalent filter paper
Nickel (Ni), ng/m3 Annual *
20 20 -AAS/ICP Method after sampling on EPM 2000 or equivalent filter paper

14
Location of Air & Noise Monitoring Stations in BCCL
CMPDIISO 9001 Company
Monitoring Stations
BHARAT COKING COAL LIMITED
Air & Noise Sampling Locations
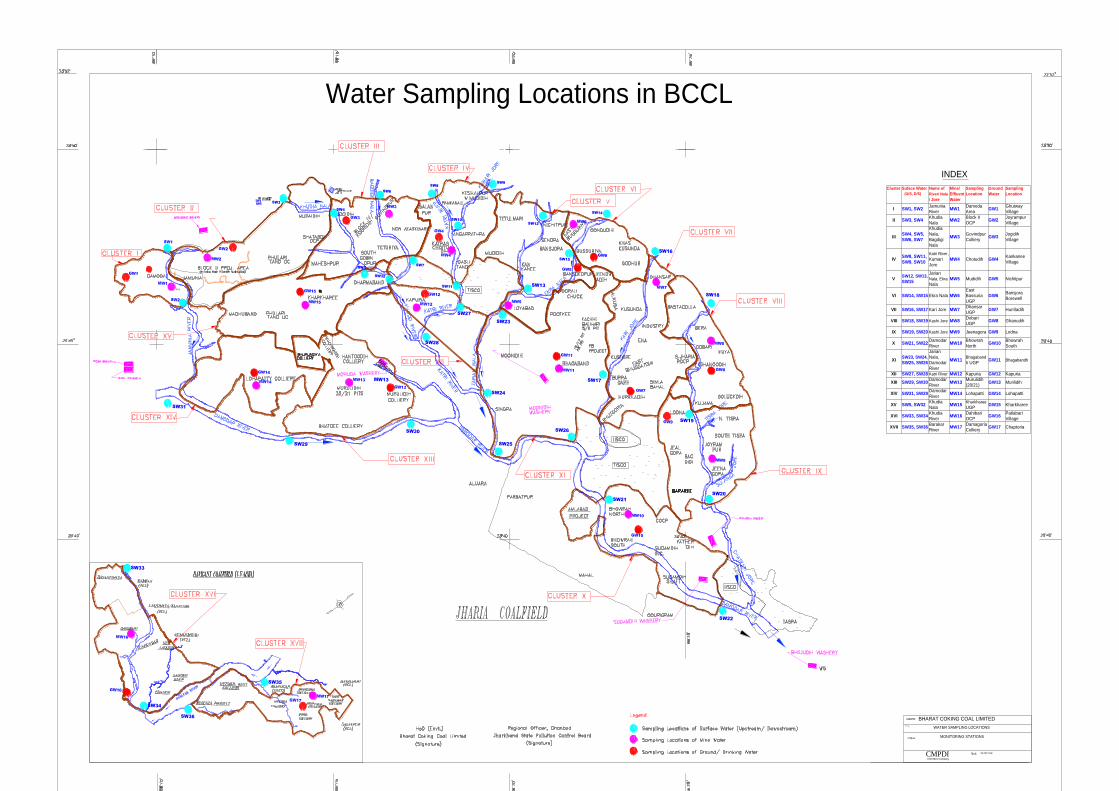
15
SW3
SW13
SW4
SW5
SW6
SW7
SW8
SW10
SW9
SW11
SW12
SW14
SW15
SW16
SW17
SW18
SW19
SW20
SW22
SW21
SW26
SW25
SW24
SW23
SW28
SW27
SW30
SW31
SW33
SW34
Water Sampling Locations in BCCL
SW29
SW35
SW36
SW32
Cluster Suface Water Name of
River/ Nala
/ Jore
Mine/
Effluent
Water
Sampling
Location
Ground
Water
Sampling
Location
I SW1, SW2Jamunia
RiverMW1
Damoda
AreaGW1
Ghutway
Village
II SW3, SW4Khudia
NalaMW2
Block II
OCPGW2
Joyrampur
Village
IIISW4, SW5,
SW6, SW7
Khudia
Nala,
Bagdigi
Nala
MW3Govindpur
CollieryGW3
Jogidih
Village
IVSW8, SW11,
SW9, SW10
Katri River,
Kumari
Jore
MW4 Chotudih GW4Kankanee
Village
VSW12, SW13,
SW15
Jarian
Nala, Ekra
Nala
MW5 Mudidih GW5 Nichitpur
VI SW14, SW15 Ekra Nala MW6
East
Bassuria
UGP
GW6Bansjora
Borewell
VII SW16, SW17 Kari Jore MW7Dhansar
UGPGW7 Hurriladih
VIII SW18, SW19 Kashi Jore MW8Dobari
UGPGW8 Ghanudih
IX SW19, SW20 Kashi Jore MW9 Jeenagora GW9 Lodna
X SW21, SW22Damodar
RiverMW10
Bhowrah
NorthGW10
Bhowrah
South
XISW23, SW24,
SW25, SW26
Jarian
Nala,
Damodar
River
MW11Bhagaband
h UGPGW11 Bhagabandh
XII SW27, SW28 Katri River MW12 Kapuria GW12 Kapuria
XIII SW29, SW30Damodar
RiverMW13
Murulidih
(20/21)GW13 Murilidih
XIV SW31, SW29Damodar
RiverMW14 Lohapatti GW14 Lohapatti
XV SW5, SW32Khudia
NalaMW15
Kharkharee
UGPGW15 Kharkharee
XVI SW33, SW34Khudia
RiverMW16
Dahibari
OCPGW16
Patlabari
Village
XVII SW35, SW36Barakar
RiverMW17
Damagoria
CollieryGW17 Chaptoria
INDEX
MW13
(U/S, D/S)
Pit 1
CMPDIISO 9001 Company
MONITORING STATIONS
BHARAT COKING COAL LIMITED
WATER SAMPLING LOCATIONS

1
CMPDI
ISO 9001 Company
Regional Institute-II
Dhanbad, Jharkhand
STRICTLY RESTRICTED FOR COMPANY USE ONLY RESTRICTED
The information given in this report is not to be
communicated either directly or indirectly to the
press or to any person not holding an official
position in the CIL /GOVERNMENT.
ENVIRONMENTAL MONITORING REPORT
OF
BHARAT COKING COAL LIMITED,
CLUSTER –IX (FOR THE MONTH NOVEMBER 2019)
E. C. no. J-11015/307/2010-IA.II (M) dated 21.05.2013

2
JOB NO. 200316028 Cluster –IX, BCCL Environmental Monitoring Report
CONTENTS
SL. NO.
CHAPTER
PARTICULARS
PAGE NO.
1.
2.
3.
4.
CHAPTER - I
CHAPTER-II
CHAPTER-III
CHAPTER-IV
EXECUTIVE SUMMARY
INTRODUCTION
ANALYSIS & RESULTS
STANDARDS & PLANS
3-5
6
7-11
12-15

3
JOB NO. 200316028 Cluster –IX, BCCL Environmental Monitoring Report
EXECUTIVE SUMMARY
1.0 Introduction
The purpose of environmental monitoring is to assess the quality of various
attributes that affects the fauna and flora. In accordance with the quality of these
attributes appropriate strategy is to be developed to control the pollution level
within the permissible limits. The three major attributes are air, water and noise
level.
Bharat Coking Coal Limited (BCCL), a Subsidiary company of Coal India Limited
is operating Underground and Opencast Mines in Jharia Coalfield (JCF) is a part
of Gondwana Coalfields located in Dhanbad district of Jharkhand, the JCF is
bounded by 23037’ N to 23052’ N latitudes and 86009’ E to 86030’ E longitude
occupying an area of 450 Sq.km. BCCL has awarded Environmental monitoring
work of Jharia Coalfield (JCF) to Central Mine Planning & Design Institute Limited
(CMPDIL). The environmental monitoring has been carried out as per the
conditions laid down by the MoEF&CC while granting environmental clearance of
project, consent letter issued by the respective SPCB, and other statutory
requirements.
2.0 Sampling location and rationale
2.1 Ambient air sampling locations
The ambient air quality monitoring stations were selected to represent core, buffer
zone area. The rationale has been based on the guidelines stipulated by
MoEF&CC, consent letter of SPCB, as well as other statutory requirements.
2.2 Water sampling stations
The Water sampling stations were selected for mine sump water.
2.3 Noise level monitoring locations
Noise levels vary depending on the various activities in mining areas. The
monitoring of noise level in different locations will be helpful to take appropriate
mitigating measures. The rationale has been based on the guidelines stipulated
by MoEF&CC, consent letter of SPCB, as well as other statutory requirements
3.0 Methodology of sampling and analysis
3.1 Ambient air quality
Parameters chosen for assessment of ambient air quality were Particulate Matter
(PM10), Fine Particulate Matter (PM2.5), Sulphur Di-oxide (SO2) and Nitrogen
Oxides (NOx). Respirable Dust Samplers (RDS) and Fine Dust Sampler (PM2.5

4
JOB NO. 200316028 Cluster –IX, BCCL Environmental Monitoring Report
sampler) were used for sampling of PM10, SO2, & NOx and Fine Dust Sampler
(PM2.5 sampler) were used for sampling of PM2.5 at 24 hours interval once in a
fortnight and the same for the gaseous pollutants. The samples were analysed in
Environmental Laboratory of CMPDI, RI-II, Dhanbad.
3.2 Water quality
Water samples were collected as per standard practice. The Mine effluent
samples were collected and analyzed for four parameters on fortnightly basis.
Thereafter the samples were preserved and analyzed at the Environmental
Laboratory of CMPDI, RI- II, Dhanbad.
3.3 Noise level monitoring
Noise level measurements in form of 'LEQ' were taken using Integrated Data
Logging Sound Level Meter. Noise levels were measured in Decibels, 'A' weighted
average, i.e. dB(A).
4.0 Results and interpretations
4.1 Air quality
It has been seen from the analysis results that the 24 hours average concentration
parameters like PM10, PM2.5, SO2 and NOx are mostly within the permissible limits
in all sampling locations as per MoEF&CC Gazette Notification No. GSR 742(E)
dt 25.09.2000 Standards for Coal Mines and National Ambient Air Quality
Standard -2009. Sometimes the concentration of PM10& PM2.5 exceeds the limits
due to heavy public traffic, poor road condition, coke oven plants, burning of coal
by surrounding habitants, brick making, municipal waste dumps and industries like
Steel Plant, thermal Plants including their fly ash etc.
The following preventive and suppressive mitigative measures can be undertaken to contain the pollution level within prescribed level:-
Wet drilling and controlled blasting should be practice. Explosive used should be optimised to restrict the dust generation. Transportation roads should be permanently asphalted free of ruts, potholes
etc. Water should be sprayed on coal transportation road, service road more
frequently and at regular interval. Dust from roads should be removed physically or mechanically. Greenbelts around industrial sites, service building area besides
Avenue plantation along roads should be created. Coal dust should be suppressed by using fixed sprinklers. Regular maintenance of plant and machinery should be undertaken.

5
JOB NO. 200316028 Cluster –IX, BCCL Environmental Monitoring Report
4.2 Water quality
The test results indicate that the major parameters compared with MoEF&CC
Gazette Notification No. GSR 742(E) dt.25.09.2000 Standards for Coal Mines
were within permissible limits.
4.3 Noise Level
During the noise level survey it has been observed that the noise level in the
sampling locations is within the permissible limits prescribed as per MoEF&CC
Gazette Notification No. GSR 742(E) dt.25.09.2000 Standards for Coal Mines for
Industrial Area and Noise pollution (Regulation and Control) Rules, 2000.
6
JOB NO. 200316028 Cluster –IX, BCCL Environmental Monitoring Report
INTRODUCTION
1.0 Any industry and development activities including coal mining is bound to affect environmental attributes. There are positive as well as negative impacts of such operations. For controlling the adverse impacts a regular monitoring is essential. The environmental monitoring is being done as per the guide-lines stipulated by Ministry of Environment, Forest and Climate Change (MoEF&CC), Govt. of India.
The very purpose of environmental monitoring is to assess the quality of various
attributes which affects the environment. As per quality of these attributes appropriate strategy is to be developed to control the pollution level within the permissible limits. The three major attributes are air, water and noise level.
Bharat Coking Coal has awarded Environmental Monitoring work of all Projects,
Cluster wise, to Central Mine Planning & Design Institute Limited (CMPDIL). The environmental monitoring has been carried out as per conditions laid down by MoEF&CC while granting environmental clearance to different projects. CMPDI has trained manpower and well equipped laboratory to carry out monitoring, analysis and R&D work in the field of environment.
1.1 The Cluster-IX is in the Eastern part of the Jharia coalfield. It includes a group of 7
Mines (viz. Lodna, S. Tisra/NTST OC, Jealgora, Joyrampur, Jeenagora, Bararee, S.Tisra/NTST Expan. OC. The Cluster – IX is situated about 25 - 30 kms from Dhanbad Railway Station. The mines of this Cluster – IX are operating since pre nationalization period (prior to 1972-73). It is connected by both Railway and Road. The drainage pattern of the area is governed by Kashi Jore.
1.2 The Cluster-IX is designed to produce 6.548 MTPA (normative) and 8.512 MTPA
(peak) capacity of coal.
The Project has Environmental Clearance from Ministry of Environment, Forest and Climate Change (MoEF&CC) for a rated capacity 6.548 MTPA (normative) and 8.512 MTPA (peak) capacity of coal production vide letter no. J-11015/307/2010-IA.II (M) dated 21st May, 2013.
Ministry of Environment, Forest and Climate Change while granting environmental clearance has given one of the General conditions that “ Four ambient air quality monitoring stations should be established in the core zone as well as in the buffer zone for PM10, PM2.5, SO2, NOx monitoring. Location of the stations should be decided based on the meteorological data, topographical features and environmentally and ecologically sensitive targets, other conditions regarding water / effluent and noise level monitoring in consultation with the State Pollution Control Board.” In compliance of these conditions the Environmental Monitoring has been carried out & report prepared for submission to MoEF&CC & JSPCB and other statutory authorities.

7
JOB NO. 200316028 Cluster –IX, BCCL Environmental Monitoring Report
AMBIENT AIR QUALITY MONITORING
2.1 Location of sampling station and their rationale:
(As per G.S.R. 742 (E) dt. 25th December, 2000)
2.1.1 Ambient Air Quality Sampling Locations
I. CORE ZONE Monitoring Location
i) Jeenagora (A13) : Industrial Area
The location of the sampling station is 230 42’ 31.00’’ N & 860 25’ 48.00’’ E. The
sampler was placed at a height of 1.5 m from the ground level at the Safety Office.
II. BUFFER ZONE Monitoring Location
i) Kusmatand Village (A12): Industrial Area
The location of the sampling station is 23045’ 4.65’’ N & 860 26’ 42.10’’ E. The sampler
was placed at a height of 1.5 m from the ground level of the village.
ii) Bhowrah North (A14) : Industrial Area
The location of the sampling station is 23o41’ 37.00’’ N & 86o23’ 54.00’’E. The sampler
was placed at 1.5 m above the ground level of Project Office.
Iii) Hurriladih UGP (A28) : Industrial Area
The location of the sampling station is 23044’ 4.18’’ N & 860 24’ 6.21’’ E. The sampler
was placed at a height of 1.5 m from the ground level of the mine office.
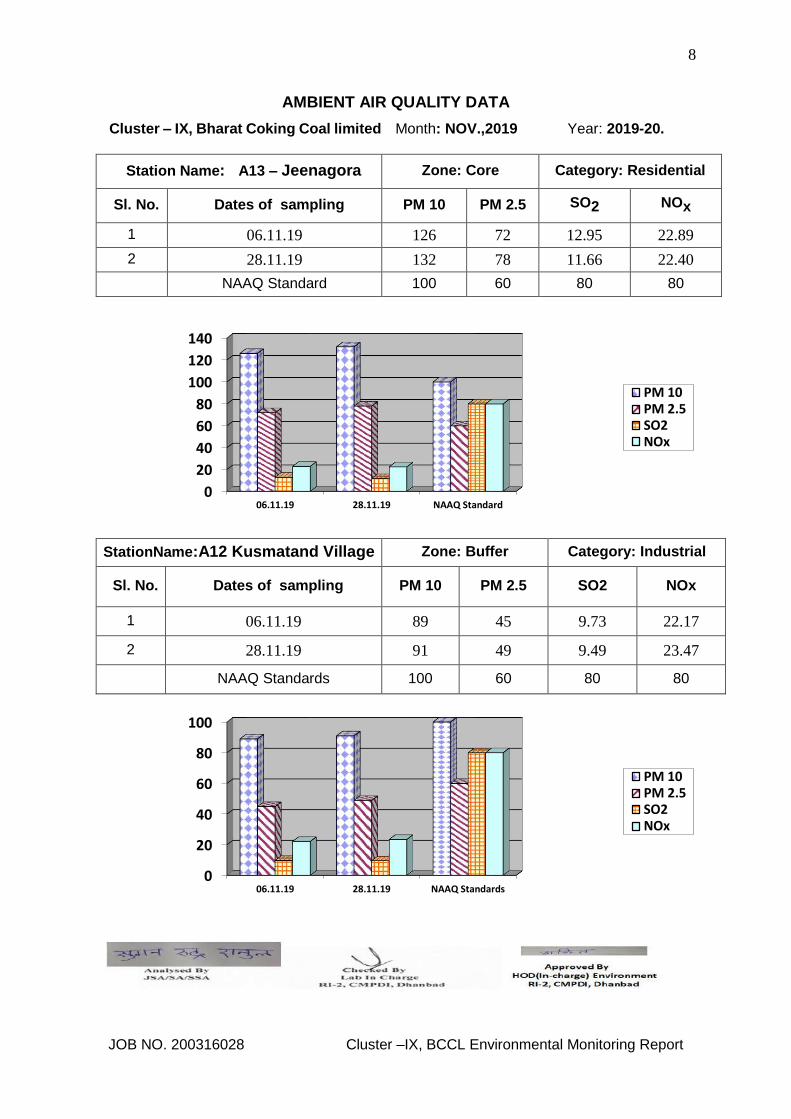
8
JOB NO. 200316028 Cluster –IX, BCCL Environmental Monitoring Report
AMBIENT AIR QUALITY DATA
Cluster – IX, Bharat Coking Coal limited Month: NOV.,2019 Year: 2019-20.
0
20
40
60
80
100
120
140
06.11.19 28.11.19 NAAQ Standard
PM 10PM 2.5SO2NOx
0
20
40
60
80
100
06.11.19 28.11.19 NAAQ Standards
PM 10PM 2.5SO2NOx
Station Name: A13 – Jeenagora Zone: Core Category: Residential
Sl. No. Dates of sampling PM 10 PM 2.5 SO2 NOx
1 06.11.19 126 72 12.95 22.89
2 28.11.19 132 78 11.66 22.40
NAAQ Standard 100 60 80 80
StationName:A12 Kusmatand Village Zone: Buffer Category: Industrial
Sl. No. Dates of sampling PM 10 PM 2.5 SO2 NOx
1 06.11.19 89 45 9.73 22.17
2 28.11.19 91 49 9.49 23.47
NAAQ Standards 100 60 80 80
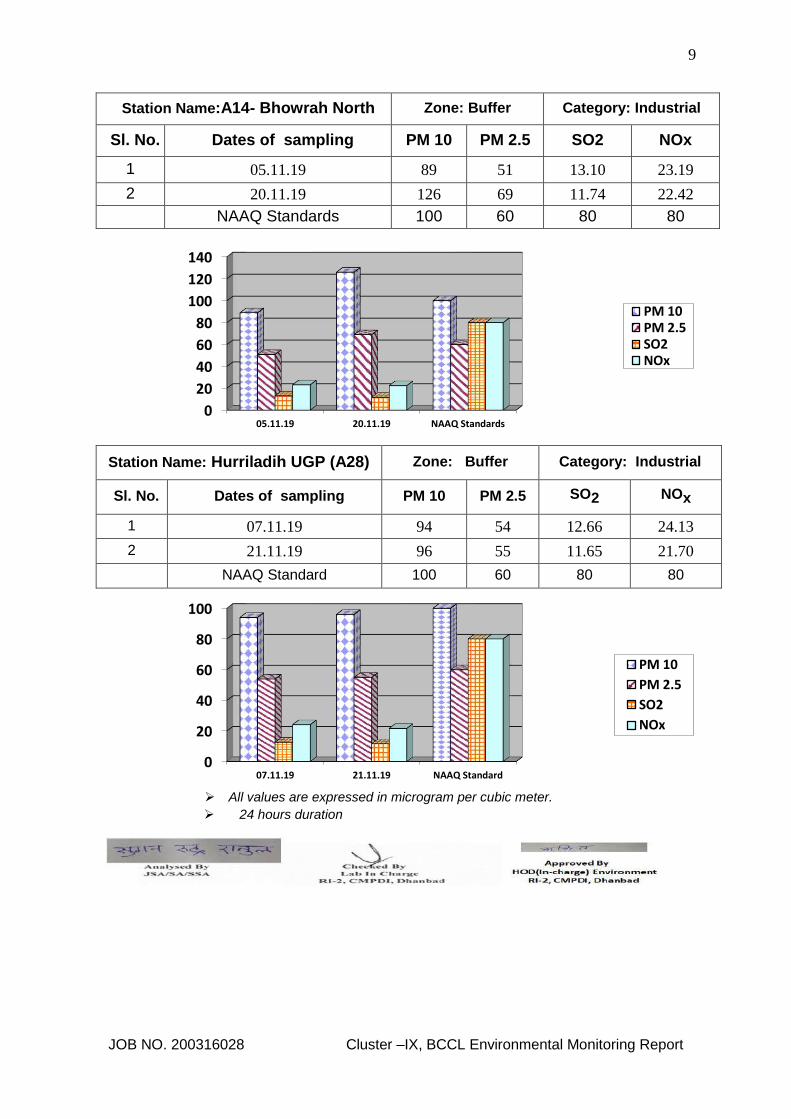
9
JOB NO. 200316028 Cluster –IX, BCCL Environmental Monitoring Report
All values are expressed in microgram per cubic meter.
24 hours duration
0
20
40
60
80
100
120
140
05.11.19 20.11.19 NAAQ Standards
PM 10PM 2.5SO2NOx
0
20
40
60
80
100
07.11.19 21.11.19 NAAQ Standard
PM 10
PM 2.5
SO2
NOx
Station Name:A14- Bhowrah North Zone: Buffer Category: Industrial
Sl. No. Dates of sampling PM 10 PM 2.5 SO2 NOx
1 05.11.19 89 51 13.10 23.19
2 20.11.19 126 69 11.74 22.42
NAAQ Standards 100 60 80 80
Station Name: Hurriladih UGP (A28) Zone: Buffer Category: Industrial
Sl. No. Dates of sampling PM 10 PM 2.5 SO2 NOx
1 07.11.19 94 54 12.66 24.13
2 21.11.19 96 55 11.65 21.70
NAAQ Standard 100 60 80 80

10
JOB NO. 200316028 Cluster –IX, BCCL Environmental Monitoring Report
WATER QUALITY MONITORING
3.1 Location of sampling sites
(Refer Plate No. – II)
i) Mine Discharge of Jeenagora (MW9)
A sampling point is fixed to assess the effluent quality of Mine discharge.
3.2 Methodology of sampling and analysis
Water samples were collected as per standard practice. The effluent samples were
collected and analyzed for four parameters on fortnightly basis at the Environmental
Laboratory of CMPDI RI-II, Dhanbad.
3.3 Results & Interpretations
The results are given in tabular form along with the applicable standards. Results are
compared with Schedule - VI, effluent prescribed by MoEF&CC. Results show that most of
the parameters are within the permissible limits.
WATER QUALITY DATA (EFFLUENT WATER- FOUR PARAMETERS)
Name of the Cluster: Cluster
-IX
Month:
NOV,2019
Name of the Station: Mine Discharge of
Jeenagora
Sl.
No.
Parameters
MW9
First Fortnight
MW9
Second Fortnight
As per MOEF General
Standards for
schedule VI 01.11.2019 28.11.2019
1 Total Suspended Solids 30 38 100 (Max)
2 pH 8.2 8.23 5.5 - 9.0
3 Oil & Grease <2.0 <2.0 10 (Max)
4 COD 40 32 250 (Max)
All values are expressed in mg/lit except pH.

11
JOB NO. 200316028 Cluster –IX, BCCL Environmental Monitoring Report
NOISE LEVEL QUALITY MONITORING
4.1 Location of sampling sites 1. Jeenagora (N13) 2. Kusmatand Village (N12) 3. Bhowrah North (N14) 4. Hurriladih UGP (N28)
4.2 Methodology of sampling and analysis - Noise level measurements in form of 'LEQ'
were taken using Integrated Data Logging Sound Level Meter (NL-52 OF RION CO. Ltd. Make) during day time. Noise levels were measured for about one hour time in day time. Noise levels were measured in Decibels, 'A' weighted average, i.e. dB (A). 4.3 Results & Interpretations Ambient noise levels were recorded during day time and the observed values were compared with standards prescribed by MoEF&CC. The results of Noise levels recorded during day time on fortnightly basis are presented in tabular form along with the applicable standard permissible limits. The observed values in terms of LEQ are presented. The observed values at all the monitoring locations are found to be within permissible limits.
NOISE LEVEL DATA
Name of the Project : Cluster -IX Month: NOV.,2019
Sl. No. Station Name/Code Category of
area Date
Noise level dB(A)LEQ
*Permissible Limit of Noise level in
dB(A) 1 Kusmatand Village
(N12)
Residential area 06.11.19 53.8 55
2 Kusmatand Village (N12)
Residential area 28.11.19 52.7 55
3 Jeenagora (N13) Industrial area
06.11.19 59.2 75
4 Jeenagora (N13) Industrial area
28.11.19 56.9 75
5 Bhowrah North(N14)
Industrial area 05.11.19 56.2 75
6 Bhowrah North(N14)
Industrial area 20.11.19 62.3 75
7 Hurriladih UGP (N28)
Industrial area 07.11.19 57.1 75
8 Hurriladih UGP (N28)
Industrial area 21.11.19 62.5 75
*Permissible limits of Noise Level as per MOEF Gazette Notification No. GSR 742(E) dt. 25.09.2000 Standards for Coal Mines and Noise Pollution (Regulation and Control) Rules, 2000. * Day Time: 6.00 AM to 10.00 PM.

12
JOB NO. 200316028 Cluster –IX, BCCL Environmental Monitoring Report
Ambient Air Quality Standards for Jharia Coal Field
As per the Environment (Protection) Amendment Rules, 2000 notified vide notification G.S.R. 742(E), dated 25.9.2000.
Category Pollutant Time
weighted
average
Concentration
in Ambient Air
Method of
Measurement
1 2 3 4 5
III
Coal mines located
in the coal fields of
Jharia
Raniganj Bokaro
Suspended
Particulate Matter
(SPM)
Annual
Average
*
24 hours
**
500 µg/m3
700 µg/m3
- High Volume Sampling (Average flow rate not less than 1.1
m3/minute)
Respirable
Particulate Matter
(size less than 10
µm) (RPM)
Annual
Average
*
24 hours
**
250 µg/m3
300 µg/m3
Respirable
Particulate Matter
sampling and
analysis
Sulphur Dioxide
(SO2)
Annual
Average
*
24 hours
**
80 µg/m3
120 µg/m3
1. Improvedwest
and Gaeke
method
2. Ultraviolet
fluorescene
Oxide of Nitrogen
as NO2
Annual
Average
*
24 hours
**
80 µg/m3
120 µg/m3
1. Jacob &
Hochheiser
Modified (Na-
Arsenic)
Method
2. Gas phase
Chemilumine-
scence
Note:
* Annual Arithmetic mean for the measurements taken in a year, following the guidelines for frequency of sampling laid down in clause2.
** 24hourly/8hourlyvaluesshallbemet92%ofthetimeinayear.However,8% of the time it may exceed but not on two
consecutivedays.
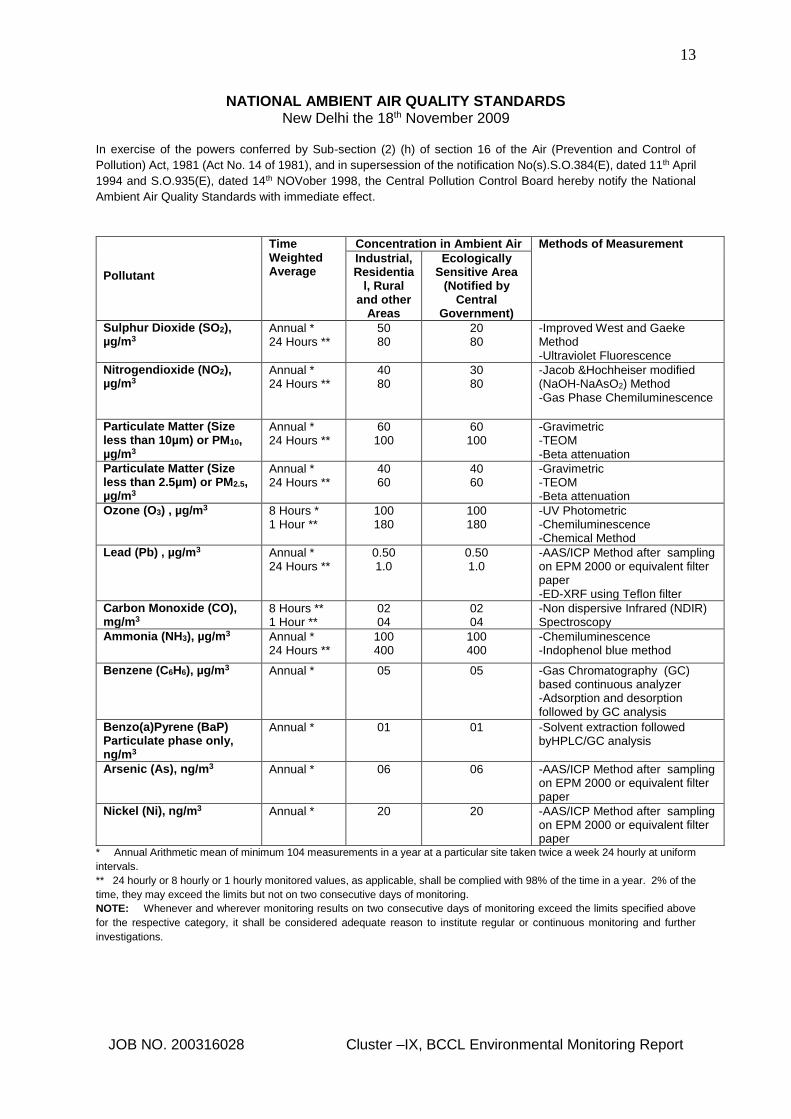
13
JOB NO. 200316028 Cluster –IX, BCCL Environmental Monitoring Report
NATIONAL AMBIENT AIR QUALITY STANDARDS New Delhi the 18th November 2009
In exercise of the powers conferred by Sub-section (2) (h) of section 16 of the Air (Prevention and Control of
Pollution) Act, 1981 (Act No. 14 of 1981), and in supersession of the notification No(s).S.O.384(E), dated 11th April
1994 and S.O.935(E), dated 14th NOVober 1998, the Central Pollution Control Board hereby notify the National
Ambient Air Quality Standards with immediate effect.
* Annual Arithmetic mean of minimum 104 measurements in a year at a particular site taken twice a week 24 hourly at uniform
intervals.
** 24 hourly or 8 hourly or 1 hourly monitored values, as applicable, shall be complied with 98% of the time in a year. 2% of the
time, they may exceed the limits but not on two consecutive days of monitoring.
NOTE: Whenever and wherever monitoring results on two consecutive days of monitoring exceed the limits specified above
for the respective category, it shall be considered adequate reason to institute regular or continuous monitoring and further
investigations.
Pollutant
Time Weighted Average
Concentration in Ambient Air Methods of Measurement
Industrial, Residentia
l, Rural and other
Areas
Ecologically Sensitive Area
(Notified by Central
Government)
Sulphur Dioxide (SO2), µg/m3
Annual * 24 Hours **
50 80
20 80
-Improved West and Gaeke Method -Ultraviolet Fluorescence
Nitrogendioxide (NO2), µg/m3
Annual * 24 Hours **
40 80
30 80
-Jacob &Hochheiser modified (NaOH-NaAsO2) Method -Gas Phase Chemiluminescence
Particulate Matter (Size less than 10µm) or PM10, µg/m3
Annual * 24 Hours **
60 100
60 100
-Gravimetric -TEOM -Beta attenuation
Particulate Matter (Size less than 2.5µm) or PM2.5, µg/m3
Annual * 24 Hours **
40 60
40 60
-Gravimetric -TEOM -Beta attenuation
Ozone (O3) , µg/m3 8 Hours * 1 Hour **
100 180
100 180
-UV Photometric -Chemiluminescence -Chemical Method
Lead (Pb) , µg/m3 Annual * 24 Hours **
0.50 1.0
0.50 1.0
-AAS/ICP Method after sampling on EPM 2000 or equivalent filter paper -ED-XRF using Teflon filter
Carbon Monoxide (CO), mg/m3
8 Hours ** 1 Hour **
02 04
02 04
-Non dispersive Infrared (NDIR) Spectroscopy
Ammonia (NH3), µg/m3 Annual * 24 Hours **
100 400
100 400
-Chemiluminescence -Indophenol blue method
Benzene (C6H6), µg/m3 Annual *
05 05 -Gas Chromatography (GC) based continuous analyzer -Adsorption and desorption followed by GC analysis
Benzo(a)Pyrene (BaP) Particulate phase only, ng/m3
Annual *
01 01 -Solvent extraction followed byHPLC/GC analysis
Arsenic (As), ng/m3 Annual *
06 06 -AAS/ICP Method after sampling on EPM 2000 or equivalent filter paper
Nickel (Ni), ng/m3 Annual *
20 20 -AAS/ICP Method after sampling on EPM 2000 or equivalent filter paper

14
Location of Air & Noise Monitoring Stations in BCCL
CMPDIISO 9001 Company
Monitoring Stations
BHARAT COKING COAL LIMITED
Air & Noise Sampling Locations

15
SW3
SW13
SW4
SW5
SW6
SW7
SW8
SW10
SW9
SW11
SW12
SW14
SW15
SW16
SW17
SW18
SW19
SW20
SW22
SW21
SW26
SW25
SW24
SW23
SW28
SW27
SW30
SW31
SW33
SW34
Water Sampling Locations in BCCL
SW29
SW35
SW36
SW32
Cluster Suface Water Name of
River/ Nala
/ Jore
Mine/
Effluent
Water
Sampling
Location
Ground
Water
Sampling
Location
I SW1, SW2Jamunia
RiverMW1
Damoda
AreaGW1
Ghutway
Village
II SW3, SW4Khudia
NalaMW2
Block II
OCPGW2
Joyrampur
Village
IIISW4, SW5,
SW6, SW7
Khudia
Nala,
Bagdigi
Nala
MW3Govindpur
CollieryGW3
Jogidih
Village
IVSW8, SW11,
SW9, SW10
Katri River,
Kumari
Jore
MW4 Chotudih GW4Kankanee
Village
VSW12, SW13,
SW15
Jarian
Nala, Ekra
Nala
MW5 Mudidih GW5 Nichitpur
VI SW14, SW15 Ekra Nala MW6
East
Bassuria
UGP
GW6Bansjora
Borewell
VII SW16, SW17 Kari Jore MW7Dhansar
UGPGW7 Hurriladih
VIII SW18, SW19 Kashi Jore MW8Dobari
UGPGW8 Ghanudih
IX SW19, SW20 Kashi Jore MW9 Jeenagora GW9 Lodna
X SW21, SW22Damodar
RiverMW10
Bhowrah
NorthGW10
Bhowrah
South
XISW23, SW24,
SW25, SW26
Jarian
Nala,
Damodar
River
MW11Bhagaband
h UGPGW11 Bhagabandh
XII SW27, SW28 Katri River MW12 Kapuria GW12 Kapuria
XIII SW29, SW30Damodar
RiverMW13
Murulidih
(20/21)GW13 Murilidih
XIV SW31, SW29Damodar
RiverMW14 Lohapatti GW14 Lohapatti
XV SW5, SW32Khudia
NalaMW15
Kharkharee
UGPGW15 Kharkharee
XVI SW33, SW34Khudia
RiverMW16
Dahibari
OCPGW16
Patlabari
Village
XVII SW35, SW36Barakar
RiverMW17
Damagoria
CollieryGW17 Chaptoria
INDEX
MW13
(U/S, D/S)
Pit 1
CMPDIISO 9001 Company
MONITORING STATIONS
BHARAT COKING COAL LIMITED
WATER SAMPLING LOCATIONS

1
CMPDI
ISO 9001 Company
Regional Institute-II
Dhanbad, Jharkhand
STRICTLY RESTRICTED FOR COMPANY USE ONLY RESTRICTED
The information given in this report is not to be
communicated either directly or indirectly to the
press or to any person not holding an official
position in the CIL /GOVERNMENT.
ENVIRONMENTAL MONITORING REPORT
OF
BHARAT COKING COAL LIMITED,
CLUSTER –IX (FOR THE MONTH DECEMBER 2019)
E. C. no. J-11015/307/2010-IA.II (M) dated 21.05.2013

2
JOB NO. 200316028 Cluster –IX, BCCL Environmental Monitoring Report
CONTENTS
SL. NO.
CHAPTER
PARTICULARS
PAGE NO.
1.
2.
3.
4.
CHAPTER - I
CHAPTER-II
CHAPTER-III
CHAPTER-IV
EXECUTIVE SUMMARY
INTRODUCTION
ANALYSIS & RESULTS
STANDARDS & PLANS
3-5
6
7-11
12-15

3
JOB NO. 200316028 Cluster –IX, BCCL Environmental Monitoring Report
EXECUTIVE SUMMARY
1.0 Introduction
The purpose of environmental monitoring is to assess the quality of various
attributes that affects the fauna and flora. In accordance with the quality of these
attributes appropriate strategy is to be developed to control the pollution level
within the permissible limits. The three major attributes are air, water and noise
level.
Bharat Coking Coal Limited (BCCL), a Subsidiary company of Coal India Limited
is operating Underground and Opencast Mines in Jharia Coalfield (JCF) is a part
of Gondwana Coalfields located in Dhanbad district of Jharkhand, the JCF is
bounded by 23037’ N to 23052’ N latitudes and 86009’ E to 86030’ E longitude
occupying an area of 450 Sq.km. BCCL has awarded Environmental monitoring
work of Jharia Coalfield (JCF) to Central Mine Planning & Design Institute Limited
(CMPDIL). The environmental monitoring has been carried out as per the
conditions laid down by the MoEF&CC while granting environmental clearance of
project, consent letter issued by the respective SPCB, and other statutory
requirements.
2.0 Sampling location and rationale
2.1 Ambient air sampling locations
The ambient air quality monitoring stations were selected to represent core, buffer
zone area. The rationale has been based on the guidelines stipulated by
MoEF&CC, consent letter of SPCB, as well as other statutory requirements.
2.2 Water sampling stations
The Water sampling stations were selected for mine sump water.
2.3 Noise level monitoring locations
Noise levels vary depending on the various activities in mining areas. The
monitoring of noise level in different locations will be helpful to take appropriate
mitigating measures. The rationale has been based on the guidelines stipulated
by MoEF&CC, consent letter of SPCB, as well as other statutory requirements
3.0 Methodology of sampling and analysis
3.1 Ambient air quality
Parameters chosen for assessment of ambient air quality were Particulate Matter
(PM10), Fine Particulate Matter (PM2.5), Sulphur Di-oxide (SO2) and Nitrogen
Oxides (NOx). Respirable Dust Samplers (RDS) and Fine Dust Sampler (PM2.5

4
JOB NO. 200316028 Cluster –IX, BCCL Environmental Monitoring Report
sampler) were used for sampling of PM10, SO2, & NOx and Fine Dust Sampler
(PM2.5 sampler) were used for sampling of PM2.5 at 24 hours interval once in a
fortnight and the same for the gaseous pollutants. The samples were analysed in
Environmental Laboratory of CMPDI, RI-II, Dhanbad.
3.2 Water quality
Water samples were collected as per standard practice. The Mine effluent
samples were collected and analyzed for four parameters on fortnightly basis.
Thereafter the samples were preserved and analyzed at the Environmental
Laboratory of CMPDI, RI- II, Dhanbad.
3.3 Noise level monitoring
Noise level measurements in form of 'LEQ' were taken using Integrated Data
Logging Sound Level Meter. Noise levels were measured in Decibels, 'A' weighted
average, i.e. dB(A).
4.0 Results and interpretations
4.1 Air quality
It has been seen from the analysis results that the 24 hours average concentration
parameters like PM10, PM2.5, SO2 and NOx are mostly within the permissible limits
in all sampling locations as per MoEF&CC Gazette Notification No. GSR 742(E)
dt 25.09.2000 Standards for Coal Mines and National Ambient Air Quality
Standard -2009. Sometimes the concentration of PM10& PM2.5 exceeds the limits
due to heavy public traffic, poor road condition, coke oven plants, burning of coal
by surrounding habitants, brick making, municipal waste dumps and industries like
Steel Plant, thermal Plants including their fly ash etc.
The following preventive and suppressive mitigative measures can be undertaken to contain the pollution level within prescribed level:-
Wet drilling and controlled blasting should be practice. Explosive used should be optimised to restrict the dust generation. Transportation roads should be permanently asphalted free of ruts, potholes
etc. Water should be sprayed on coal transportation road, service road more
frequently and at regular interval. Dust from roads should be removed physically or mechanically. Greenbelts around industrial sites, service building area besides
Avenue plantation along roads should be created. Coal dust should be suppressed by using fixed sprinklers. Regular maintenance of plant and machinery should be undertaken.

5
JOB NO. 200316028 Cluster –IX, BCCL Environmental Monitoring Report
4.2 Water quality
The test results indicate that the major parameters compared with MoEF&CC
Gazette Notification No. GSR 742(E) dt.25.09.2000 Standards for Coal Mines
were within permissible limits.
4.3 Noise Level
During the noise level survey it has been observed that the noise level in the
sampling locations is within the permissible limits prescribed as per MoEF&CC
Gazette Notification No. GSR 742(E) dt.25.09.2000 Standards for Coal Mines for
Industrial Area and Noise pollution (Regulation and Control) Rules, 2000.

6
JOB NO. 200316028 Cluster –IX, BCCL Environmental Monitoring Report
INTRODUCTION
1.0 Any industry and development activities including coal mining is bound to affect environmental attributes. There are positive as well as negative impacts of such operations. For controlling the adverse impacts a regular monitoring is essential. The environmental monitoring is being done as per the guide-lines stipulated by Ministry of Environment, Forest and Climate Change (MoEF&CC), Govt. of India.
The very purpose of environmental monitoring is to assess the quality of various
attributes which affects the environment. As per quality of these attributes appropriate strategy is to be developed to control the pollution level within the permissible limits. The three major attributes are air, water and noise level.
Bharat Coking Coal has awarded Environmental Monitoring work of all Projects,
Cluster wise, to Central Mine Planning & Design Institute Limited (CMPDIL). The environmental monitoring has been carried out as per conditions laid down by MoEF&CC while granting environmental clearance to different projects. CMPDI has trained manpower and well equipped laboratory to carry out monitoring, analysis and R&D work in the field of environment.
1.1 The Cluster-IX is in the Eastern part of the Jharia coalfield. It includes a group of 7
Mines (viz. Lodna, S. Tisra/NTST OC, Jealgora, Joyrampur, Jeenagora, Bararee, S.Tisra/NTST Expan. OC. The Cluster – IX is situated about 25 - 30 kms from Dhanbad Railway Station. The mines of this Cluster – IX are operating since pre nationalization period (prior to 1972-73). It is connected by both Railway and Road. The drainage pattern of the area is governed by Kashi Jore.
1.2 The Cluster-IX is designed to produce 6.548 MTPA (normative) and 8.512 MTPA
(peak) capacity of coal.
The Project has Environmental Clearance from Ministry of Environment, Forest and Climate Change (MoEF&CC) for a rated capacity 6.548 MTPA (normative) and 8.512 MTPA (peak) capacity of coal production vide letter no. J-11015/307/2010-IA.II (M) dated 21st May, 2013.
Ministry of Environment, Forest and Climate Change while granting environmental clearance has given one of the General conditions that “ Four ambient air quality monitoring stations should be established in the core zone as well as in the buffer zone for PM10, PM2.5, SO2, NOx monitoring. Location of the stations should be decided based on the meteorological data, topographical features and environmentally and ecologically sensitive targets, other conditions regarding water / effluent and noise level monitoring in consultation with the State Pollution Control Board.” In compliance of these conditions the Environmental Monitoring has been carried out & report prepared for submission to MoEF&CC & JSPCB and other statutory authorities.

7
JOB NO. 200316028 Cluster –IX, BCCL Environmental Monitoring Report
AMBIENT AIR QUALITY MONITORING
2.1 Location of sampling station and their rationale:
(As per G.S.R. 742 (E) dt. 25th December, 2000)
2.1.1 Ambient Air Quality Sampling Locations
I. CORE ZONE Monitoring Location
i) Jeenagora (A13) : Industrial Area
The location of the sampling station is 230 42’ 31.00’’ N & 860 25’ 48.00’’ E. The
sampler was placed at a height of 1.5 m from the ground level at the Safety Office.
II. BUFFER ZONE Monitoring Location
i) Kusmatand Village (A12): Industrial Area
The location of the sampling station is 23045’ 4.65’’ N & 860 26’ 42.10’’ E. The sampler
was placed at a height of 1.5 m from the ground level of the village.
ii) Bhowrah North (A14) : Industrial Area
The location of the sampling station is 23o41’ 37.00’’ N & 86o23’ 54.00’’E. The sampler
was placed at 1.5 m above the ground level of Project Office.
Iii) Hurriladih UGP (A28) : Industrial Area
The location of the sampling station is 23044’ 4.18’’ N & 860 24’ 6.21’’ E. The sampler
was placed at a height of 1.5 m from the ground level of the mine office.
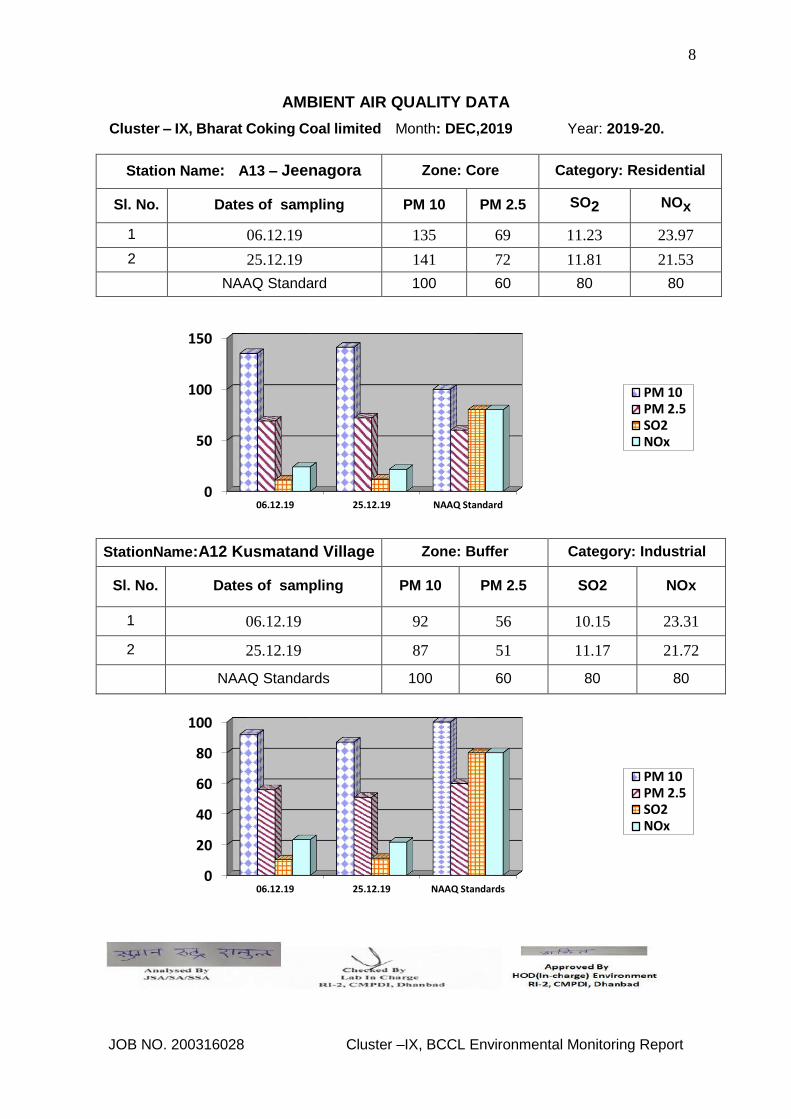
8
JOB NO. 200316028 Cluster –IX, BCCL Environmental Monitoring Report
AMBIENT AIR QUALITY DATA
Cluster – IX, Bharat Coking Coal limited Month: DEC,2019 Year: 2019-20.
0
50
100
150
06.12.19 25.12.19 NAAQ Standard
PM 10PM 2.5SO2NOx
0
20
40
60
80
100
06.12.19 25.12.19 NAAQ Standards
PM 10PM 2.5SO2NOx
Station Name: A13 – Jeenagora Zone: Core Category: Residential
Sl. No. Dates of sampling PM 10 PM 2.5 SO2 NOx
1 06.12.19 135 69 11.23 23.97
2 25.12.19 141 72 11.81 21.53
NAAQ Standard 100 60 80 80
StationName:A12 Kusmatand Village Zone: Buffer Category: Industrial
Sl. No. Dates of sampling PM 10 PM 2.5 SO2 NOx
1 06.12.19 92 56 10.15 23.31
2 25.12.19 87 51 11.17 21.72
NAAQ Standards 100 60 80 80
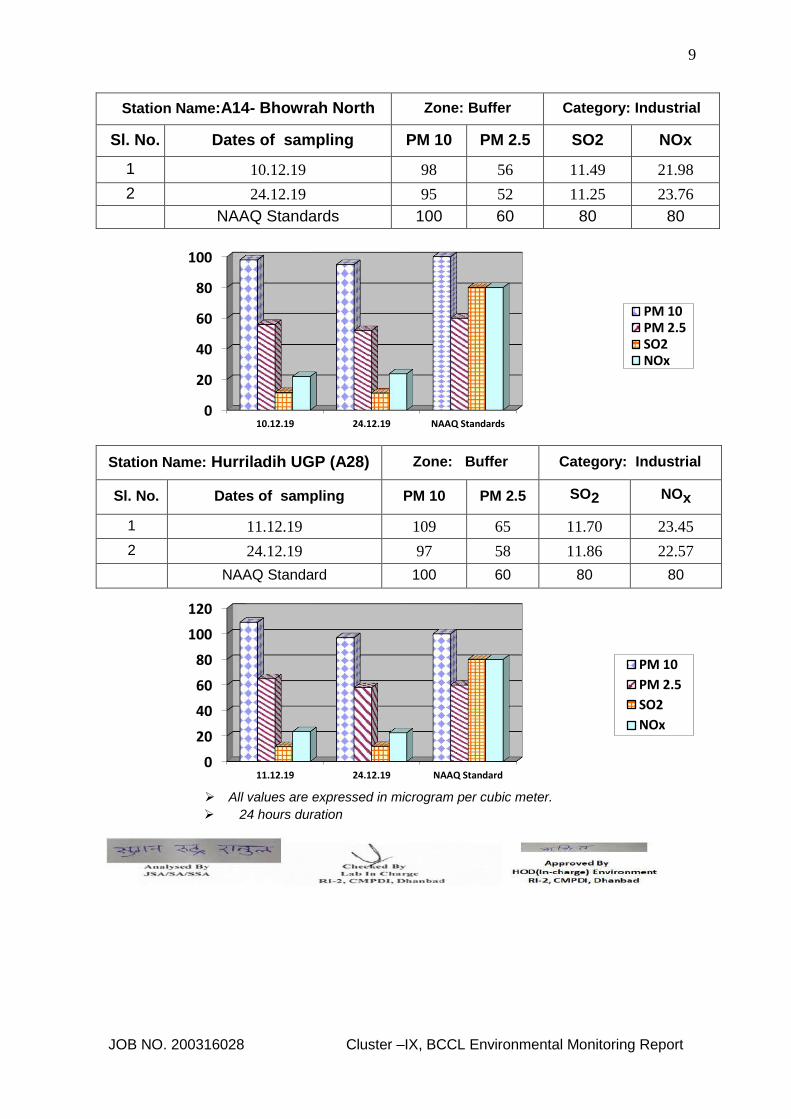
9
JOB NO. 200316028 Cluster –IX, BCCL Environmental Monitoring Report
All values are expressed in microgram per cubic meter.
24 hours duration
0
20
40
60
80
100
10.12.19 24.12.19 NAAQ Standards
PM 10PM 2.5SO2NOx
0
20
40
60
80
100
120
11.12.19 24.12.19 NAAQ Standard
PM 10
PM 2.5
SO2
NOx
Station Name:A14- Bhowrah North Zone: Buffer Category: Industrial
Sl. No. Dates of sampling PM 10 PM 2.5 SO2 NOx
1 10.12.19 98 56 11.49 21.98
2 24.12.19 95 52 11.25 23.76
NAAQ Standards 100 60 80 80
Station Name: Hurriladih UGP (A28) Zone: Buffer Category: Industrial
Sl. No. Dates of sampling PM 10 PM 2.5 SO2 NOx
1 11.12.19 109 65 11.70 23.45
2 24.12.19 97 58 11.86 22.57
NAAQ Standard 100 60 80 80

10
JOB NO. 200316028 Cluster –IX, BCCL Environmental Monitoring Report
WATER QUALITY MONITORING
3.1 Location of sampling sites
(Refer Plate No. – II)
i) Mine Discharge of Jeenagora (MW9)
A sampling point is fixed to assess the effluent quality of Mine discharge.
3.2 Methodology of sampling and analysis
Water samples were collected as per standard practice. The effluent samples were
collected and analyzed for four parameters on fortnightly basis at the Environmental
Laboratory of CMPDI RI-II, Dhanbad.
3.3 Results & Interpretations
The results are given in tabular form along with the applicable standards. Results are
compared with Schedule - VI, effluent prescribed by MoEF&CC. Results show that most of
the parameters are within the permissible limits.
WATER QUALITY DATA (EFFLUENT WATER- FOUR PARAMETERS)
Name of the Cluster: Cluster
-IX
Month:
DEC,2019
Name of the Station: Mine Discharge of
Jeenagora
Sl.
No.
Parameters
MW9
First Fortnight
MW9
Second Fortnight
As per MOEF General
Standards for
schedule VI 06.12.19 25.12.19
1 Total Suspended Solids 23 30 100 (Max)
2 pH 8.15 8.14 5.5 - 9.0
3 Oil & Grease <2.0 <2.0 10 (Max)
4 COD 36 28 250 (Max)
All values are expressed in mg/lit except pH.

11
JOB NO. 200316028 Cluster –IX, BCCL Environmental Monitoring Report
NOISE LEVEL QUALITY MONITORING
4.1 Location of sampling sites 1. Jeenagora (N13) 2. Kusmatand Village (N12) 3. Bhowrah North (N14) 4. Hurriladih UGP (N28)
4.2 Methodology of sampling and analysis - Noise level measurements in form of 'LEQ'
were taken using Integrated Data Logging Sound Level Meter (NL-52 OF RION CO. Ltd. Make) during day time. Noise levels were measured for about one hour time in day time. Noise levels were measured in Decibels, 'A' weighted average, i.e. dB (A). 4.3 Results & Interpretations Ambient noise levels were recorded during day time and the observed values were compared with standards prescribed by MoEF&CC. The results of Noise levels recorded during day time on fortnightly basis are presented in tabular form along with the applicable standard permissible limits. The observed values in terms of LEQ are presented. The observed values at all the monitoring locations are found to be within permissible limits.
NOISE LEVEL DATA
Name of the Project : Cluster -IX Month: DEC.,2019
Sl. No. Station Name/Code Category of
area Date
Noise level dB(A)LEQ
*Permissible Limit of Noise level in
dB(A) 1 Kusmatand Village
(N12)
Residential area 06.12.19 52.1 55
2 Kusmatand Village (N12)
Residential area 25.12.19 54.3 55
3 Jeenagora (N13) Industrial area
06.12.19 58.7 75
4 Jeenagora (N13) Industrial area
25.12.19 62.4 75
5 Bhowrah North(N14)
Industrial area 10.12.19 57.1 75
6 Bhowrah North(N14)
Industrial area 24.12.19 65.3 75
7 Hurriladih UGP (N28)
Industrial area 11.12.19 58.6 75
8 Hurriladih UGP (N28)
Industrial area 24.12.19 57.9 75
*Permissible limits of Noise Level as per MOEF Gazette Notification No. GSR 742(E) dt. 25.09.2000 Standards for Coal Mines and Noise Pollution (Regulation and Control) Rules, 2000. * Day Time: 6.00 AM to 10.00 PM.

12
JOB NO. 200316028 Cluster –IX, BCCL Environmental Monitoring Report
Ambient Air Quality Standards for Jharia Coal Field
As per the Environment (Protection) Amendment Rules, 2000 notified vide notification G.S.R. 742(E), dated 25.9.2000.
Category Pollutant Time
weighted
average
Concentration
in Ambient Air
Method of
Measurement
1 2 3 4 5
III
Coal mines located
in the coal fields of
Jharia
Raniganj Bokaro
Suspended
Particulate Matter
(SPM)
Annual
Average
*
24 hours
**
500 µg/m3
700 µg/m3
- High Volume Sampling (Average flow rate not less than 1.1
m3/minute)
Respirable
Particulate Matter
(size less than 10
µm) (RPM)
Annual
Average
*
24 hours
**
250 µg/m3
300 µg/m3
Respirable
Particulate Matter
sampling and
analysis
Sulphur Dioxide
(SO2)
Annual
Average
*
24 hours
**
80 µg/m3
120 µg/m3
1. Improvedwest
and Gaeke
method
2. Ultraviolet
fluorescene
Oxide of Nitrogen
as NO2
Annual
Average
*
24 hours
**
80 µg/m3
120 µg/m3
1. Jacob &
Hochheiser
Modified (Na-
Arsenic)
Method
2. Gas phase
Chemilumine-
scence
Note:
* Annual Arithmetic mean for the measurements taken in a year, following the guidelines for frequency of sampling laid down in clause2.
** 24hourly/8hourlyvaluesshallbemet92%ofthetimeinayear.However,8% of the time it may exceed but not on two
consecutivedays.

13
JOB NO. 200316028 Cluster –IX, BCCL Environmental Monitoring Report
NATIONAL AMBIENT AIR QUALITY STANDARDS New Delhi the 18th November 2009
In exercise of the powers conferred by Sub-section (2) (h) of section 16 of the Air (Prevention and Control of
Pollution) Act, 1981 (Act No. 14 of 1981), and in supersession of the notification No(s).S.O.384(E), dated 11th April
1994 and S.O.935(E), dated 14th NOVober 1998, the Central Pollution Control Board hereby notify the National
Ambient Air Quality Standards with immediate effect.
* Annual Arithmetic mean of minimum 104 measurements in a year at a particular site taken twice a week 24 hourly at uniform
intervals.
** 24 hourly or 8 hourly or 1 hourly monitored values, as applicable, shall be complied with 98% of the time in a year. 2% of the
time, they may exceed the limits but not on two consecutive days of monitoring.
NOTE: Whenever and wherever monitoring results on two consecutive days of monitoring exceed the limits specified above
for the respective category, it shall be considered adequate reason to institute regular or continuous monitoring and further
investigations.
Pollutant
Time Weighted Average
Concentration in Ambient Air Methods of Measurement
Industrial, Residentia
l, Rural and other
Areas
Ecologically Sensitive Area
(Notified by Central
Government)
Sulphur Dioxide (SO2), µg/m3
Annual * 24 Hours **
50 80
20 80
-Improved West and Gaeke Method -Ultraviolet Fluorescence
Nitrogendioxide (NO2), µg/m3
Annual * 24 Hours **
40 80
30 80
-Jacob &Hochheiser modified (NaOH-NaAsO2) Method -Gas Phase Chemiluminescence
Particulate Matter (Size less than 10µm) or PM10, µg/m3
Annual * 24 Hours **
60 100
60 100
-Gravimetric -TEOM -Beta attenuation
Particulate Matter (Size less than 2.5µm) or PM2.5, µg/m3
Annual * 24 Hours **
40 60
40 60
-Gravimetric -TEOM -Beta attenuation
Ozone (O3) , µg/m3 8 Hours * 1 Hour **
100 180
100 180
-UV Photometric -Chemiluminescence -Chemical Method
Lead (Pb) , µg/m3 Annual * 24 Hours **
0.50 1.0
0.50 1.0
-AAS/ICP Method after sampling on EPM 2000 or equivalent filter paper -ED-XRF using Teflon filter
Carbon Monoxide (CO), mg/m3
8 Hours ** 1 Hour **
02 04
02 04
-Non dispersive Infrared (NDIR) Spectroscopy
Ammonia (NH3), µg/m3 Annual * 24 Hours **
100 400
100 400
-Chemiluminescence -Indophenol blue method
Benzene (C6H6), µg/m3 Annual *
05 05 -Gas Chromatography (GC) based continuous analyzer -Adsorption and desorption followed by GC analysis
Benzo(a)Pyrene (BaP) Particulate phase only, ng/m3
Annual *
01 01 -Solvent extraction followed byHPLC/GC analysis
Arsenic (As), ng/m3 Annual *
06 06 -AAS/ICP Method after sampling on EPM 2000 or equivalent filter paper
Nickel (Ni), ng/m3 Annual *
20 20 -AAS/ICP Method after sampling on EPM 2000 or equivalent filter paper

14
Location of Air & Noise Monitoring Stations in BCCL
CMPDIISO 9001 Company
Monitoring Stations
BHARAT COKING COAL LIMITED
Air & Noise Sampling Locations

15
SW3
SW13
SW4
SW5
SW6
SW7
SW8
SW10
SW9
SW11
SW12
SW14
SW15
SW16
SW17
SW18
SW19
SW20
SW22
SW21
SW26
SW25
SW24
SW23
SW28
SW27
SW30
SW31
SW33
SW34
Water Sampling Locations in BCCL
SW29
SW35
SW36
SW32
Cluster Suface Water Name of
River/ Nala
/ Jore
Mine/
Effluent
Water
Sampling
Location
Ground
Water
Sampling
Location
I SW1, SW2Jamunia
RiverMW1
Damoda
AreaGW1
Ghutway
Village
II SW3, SW4Khudia
NalaMW2
Block II
OCPGW2
Joyrampur
Village
IIISW4, SW5,
SW6, SW7
Khudia
Nala,
Bagdigi
Nala
MW3Govindpur
CollieryGW3
Jogidih
Village
IVSW8, SW11,
SW9, SW10
Katri River,
Kumari
Jore
MW4 Chotudih GW4Kankanee
Village
VSW12, SW13,
SW15
Jarian
Nala, Ekra
Nala
MW5 Mudidih GW5 Nichitpur
VI SW14, SW15 Ekra Nala MW6
East
Bassuria
UGP
GW6Bansjora
Borewell
VII SW16, SW17 Kari Jore MW7Dhansar
UGPGW7 Hurriladih
VIII SW18, SW19 Kashi Jore MW8Dobari
UGPGW8 Ghanudih
IX SW19, SW20 Kashi Jore MW9 Jeenagora GW9 Lodna
X SW21, SW22Damodar
RiverMW10
Bhowrah
NorthGW10
Bhowrah
South
XISW23, SW24,
SW25, SW26
Jarian
Nala,
Damodar
River
MW11Bhagaband
h UGPGW11 Bhagabandh
XII SW27, SW28 Katri River MW12 Kapuria GW12 Kapuria
XIII SW29, SW30Damodar
RiverMW13
Murulidih
(20/21)GW13 Murilidih
XIV SW31, SW29Damodar
RiverMW14 Lohapatti GW14 Lohapatti
XV SW5, SW32Khudia
NalaMW15
Kharkharee
UGPGW15 Kharkharee
XVI SW33, SW34Khudia
RiverMW16
Dahibari
OCPGW16
Patlabari
Village
XVII SW35, SW36Barakar
RiverMW17
Damagoria
CollieryGW17 Chaptoria
INDEX
MW13
(U/S, D/S)
Pit 1
CMPDIISO 9001 Company
MONITORING STATIONS
BHARAT COKING COAL LIMITED
WATER SAMPLING LOCATIONS

1
CMPDI
ISO 9001 Company
Regional Institute-II
Dhanbad, Jharkhand
STRICTLY RESTRICTED FOR COMPANY USE ONLY RESTRICTED
The information given in this report is not to be
communicated either directly or indirectly to the
press or to any person not holding an official
position in the CIL /GOVERNMENT.
ENVIRONMENTAL MONITORING REPORT
OF
BHARAT COKING COAL LIMITED,
CLUSTER –IX (FOR THE MONTH JANUARY 2020)
E. C. no. J-11015/307/2010-IA.II (M) dated 21.05.2013

2
JOB NO. 200316028 Cluster –IX, BCCL Environmental Monitoring Report
CONTENTS
SL. NO.
CHAPTER
PARTICULARS
PAGE NO.
1.
2.
3.
4.
CHAPTER - I
CHAPTER-II
CHAPTER-III
CHAPTER-IV
EXECUTIVE SUMMARY
INTRODUCTION
ANALYSIS & RESULTS
STANDARDS & PLANS
3-5
6
7-11
12-15

3
JOB NO. 200316028 Cluster –IX, BCCL Environmental Monitoring Report
EXECUTIVE SUMMARY
1.0 Introduction
The purpose of environmental monitoring is to assess the quality of various
attributes that affects the fauna and flora. In accordance with the quality of these
attributes appropriate strategy is to be developed to control the pollution level
within the permissible limits. The three major attributes are air, water and noise
level.
Bharat Coking Coal Limited (BCCL), a Subsidiary company of Coal India Limited
is operating Underground and Opencast Mines in Jharia Coalfield (JCF) is a part
of Gondwana Coalfields located in Dhanbad district of Jharkhand, the JCF is
bounded by 23037’ N to 23052’ N latitudes and 86009’ E to 86030’ E longitude
occupying an area of 450 Sq.km. BCCL has awarded Environmental monitoring
work of Jharia Coalfield (JCF) to Central Mine Planning & Design Institute Limited
(CMPDIL). The environmental monitoring has been carried out as per the
conditions laid down by the MoEF&CC while granting environmental clearance of
project, consent letter issued by the respective SPCB, and other statutory
requirements.
2.0 Sampling location and rationale
2.1 Ambient air sampling locations
The ambient air quality monitoring stations were selected to represent core, buffer
zone area. The rationale has been based on the guidelines stipulated by
MoEF&CC, consent letter of SPCB, as well as other statutory requirements.
2.2 Water sampling stations
The Water sampling stations were selected for mine sump water.
2.3 Noise level monitoring locations
Noise levels vary depending on the various activities in mining areas. The
monitoring of noise level in different locations will be helpful to take appropriate
mitigating measures. The rationale has been based on the guidelines stipulated
by MoEF&CC, consent letter of SPCB, as well as other statutory requirements
3.0 Methodology of sampling and analysis
3.1 Ambient air quality
Parameters chosen for assessment of ambient air quality were Particulate Matter
(PM10), Fine Particulate Matter (PM2.5), Sulphur Di-oxide (SO2) and Nitrogen
Oxides (NOx). Respirable Dust Samplers (RDS) and Fine Dust Sampler (PM2.5

4
JOB NO. 200316028 Cluster –IX, BCCL Environmental Monitoring Report
sampler) were used for sampling of PM10, SO2, & NOx and Fine Dust Sampler
(PM2.5 sampler) were used for sampling of PM2.5 at 24 hours interval once in a
fortnight and the same for the gaseous pollutants. The samples were analysed in
Environmental Laboratory of CMPDI, RI-II, Dhanbad.
3.2 Water quality
Water samples were collected as per standard practice. The Mine effluent
samples were collected and analyzed for four parameters on fortnightly basis.
Thereafter the samples were preserved and analyzed at the Environmental
Laboratory of CMPDI, RI- II, Dhanbad.
3.3 Noise level monitoring
Noise level measurements in form of 'LEQ' were taken using Integrated Data
Logging Sound Level Meter. Noise levels were measured in Decibels, 'A' weighted
average, i.e. dB(A).
4.0 Results and interpretations
4.1 Air quality
It has been seen from the analysis results that the 24 hours average concentration
parameters like PM10, PM2.5, SO2 and NOx are mostly within the permissible limits
in all sampling locations as per MoEF&CC Gazette Notification No. GSR 742(E)
dt 25.09.2000 Standards for Coal Mines and National Ambient Air Quality
Standard -2009. Sometimes the concentration of PM10& PM2.5 exceeds the limits
due to heavy public traffic, poor road condition, coke oven plants, burning of coal
by surrounding habitants, brick making, municipal waste dumps and industries like
Steel Plant, thermal Plants including their fly ash etc.
The following preventive and suppressive mitigative measures can be undertaken to contain the pollution level within prescribed level:-
Wet drilling and controlled blasting should be practice. Explosive used should be optimised to restrict the dust generation. Transportation roads should be permanently asphalted free of ruts, potholes
etc. Water should be sprayed on coal transportation road, service road more
frequently and at regular interval. Dust from roads should be removed physically or mechanically. Greenbelts around industrial sites, service building area besides
Avenue plantation along roads should be created. Coal dust should be suppressed by using fixed sprinklers. Regular maintenance of plant and machinery should be undertaken.

5
JOB NO. 200316028 Cluster –IX, BCCL Environmental Monitoring Report
4.2 Water quality
The test results indicate that the major parameters compared with MoEF&CC
Gazette Notification No. GSR 742(E) dt.25.09.2000 Standards for Coal Mines
were within permissible limits.
4.3 Noise Level
During the noise level survey it has been observed that the noise level in the
sampling locations is within the permissible limits prescribed as per MoEF&CC
Gazette Notification No. GSR 742(E) dt.25.09.2000 Standards for Coal Mines for
Industrial Area and Noise pollution (Regulation and Control) Rules, 2000.

6
JOB NO. 200316028 Cluster –IX, BCCL Environmental Monitoring Report
INTRODUCTION
1.0 Any industry and development activities including coal mining is bound to affect environmental attributes. There are positive as well as negative impacts of such operations. For controlling the adverse impacts a regular monitoring is essential. The environmental monitoring is being done as per the guide-lines stipulated by Ministry of Environment, Forest and Climate Change (MoEF&CC), Govt. of India.
The very purpose of environmental monitoring is to assess the quality of various
attributes which affects the environment. As per quality of these attributes appropriate strategy is to be developed to control the pollution level within the permissible limits. The three major attributes are air, water and noise level.
Bharat Coking Coal has awarded Environmental Monitoring work of all Projects,
Cluster wise, to Central Mine Planning & Design Institute Limited (CMPDIL). The environmental monitoring has been carried out as per conditions laid down by MoEF&CC while granting environmental clearance to different projects. CMPDI has trained manpower and well equipped laboratory to carry out monitoring, analysis and R&D work in the field of environment.
1.1 The Cluster-IX is in the Eastern part of the Jharia coalfield. It includes a group of 7
Mines (viz. Lodna, S. Tisra/NTST OC, Jealgora, Joyrampur, Jeenagora, Bararee, S.Tisra/NTST Expan. OC. The Cluster – IX is situated about 25 - 30 kms from Dhanbad Railway Station. The mines of this Cluster – IX are operating since pre nationalization period (prior to 1972-73). It is connected by both Railway and Road. The drainage pattern of the area is governed by Kashi Jore.
1.2 The Cluster-IX is designed to produce 6.548 MTPA (normative) and 8.512 MTPA
(peak) capacity of coal.
The Project has Environmental Clearance from Ministry of Environment, Forest and Climate Change (MoEF&CC) for a rated capacity 6.548 MTPA (normative) and 8.512 MTPA (peak) capacity of coal production vide letter no. J-11015/307/2010-IA.II (M) dated 21st May, 2013.
Ministry of Environment, Forest and Climate Change while granting environmental clearance has given one of the General conditions that “ Four ambient air quality monitoring stations should be established in the core zone as well as in the buffer zone for PM10, PM2.5, SO2, NOx monitoring. Location of the stations should be decided based on the meteorological data, topographical features and environmentally and ecologically sensitive targets, other conditions regarding water / effluent and noise level monitoring in consultation with the State Pollution Control Board.” In compliance of these conditions the Environmental Monitoring has been carried out & report prepared for submission to MoEF&CC & JSPCB and other statutory authorities.

7
JOB NO. 200316028 Cluster –IX, BCCL Environmental Monitoring Report
AMBIENT AIR QUALITY MONITORING
2.1 Location of sampling station and their rationale:
(As per G.S.R. 742 (E) dt. 25th December, 2000)
2.1.1 Ambient Air Quality Sampling Locations
I. CORE ZONE Monitoring Location
i) Jeenagora (A13) : Industrial Area
The location of the sampling station is 230 42’ 31.00’’ N & 860 25’ 48.00’’ E. The
sampler was placed at a height of 1.5 m from the ground level at the Safety Office.
II. BUFFER ZONE Monitoring Location
i) Kusmatand Village (A12): Industrial Area
The location of the sampling station is 23045’ 4.65’’ N & 860 26’ 42.10’’ E. The sampler
was placed at a height of 1.5 m from the ground level of the village.
ii) Bhowrah North (A14) : Industrial Area
The location of the sampling station is 23o41’ 37.00’’ N & 86o23’ 54.00’’E. The sampler
was placed at 1.5 m above the ground level of Project Office.
Iii) Hurriladih UGP (A28) : Industrial Area
The location of the sampling station is 23044’ 4.18’’ N & 860 24’ 6.21’’ E. The sampler
was placed at a height of 1.5 m from the ground level of the mine office.
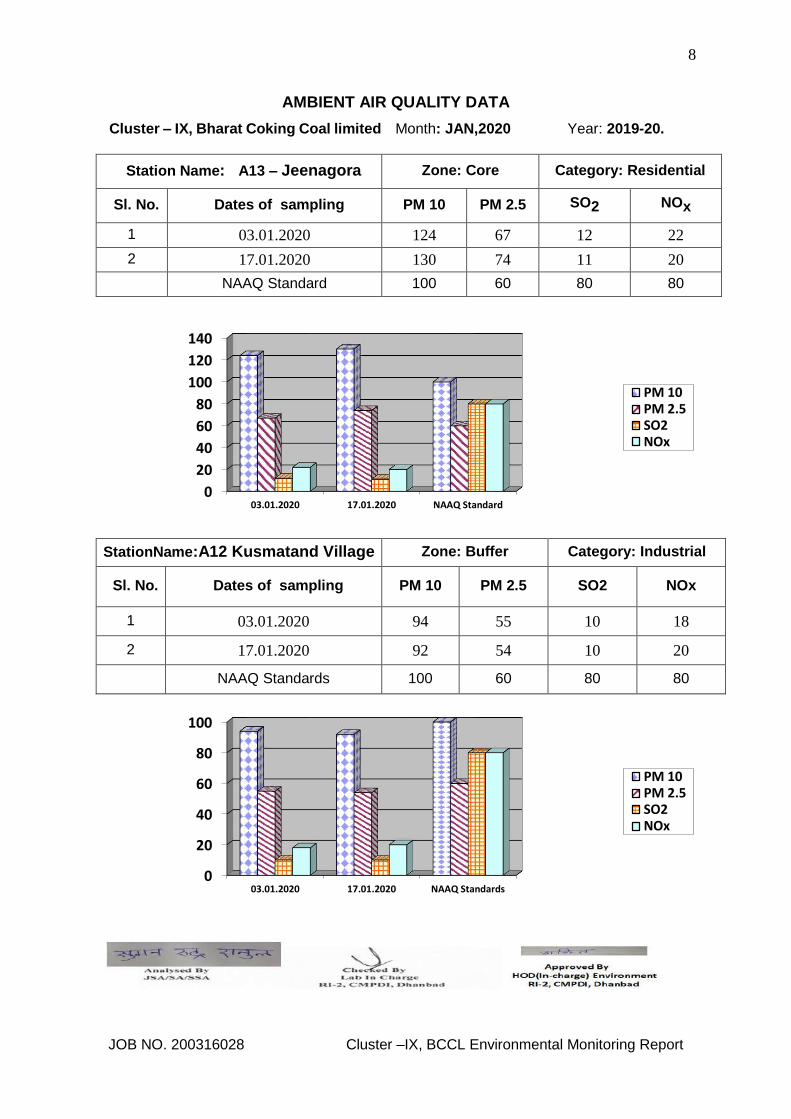
8
JOB NO. 200316028 Cluster –IX, BCCL Environmental Monitoring Report
AMBIENT AIR QUALITY DATA
Cluster – IX, Bharat Coking Coal limited Month: JAN,2020 Year: 2019-20.
0
20
40
60
80
100
120
140
03.01.2020 17.01.2020 NAAQ Standard
PM 10PM 2.5SO2NOx
0
20
40
60
80
100
03.01.2020 17.01.2020 NAAQ Standards
PM 10PM 2.5SO2NOx
Station Name: A13 – Jeenagora Zone: Core Category: Residential
Sl. No. Dates of sampling PM 10 PM 2.5 SO2 NOx
1 03.01.2020 124 67 12 22
2 17.01.2020 130 74 11 20
NAAQ Standard 100 60 80 80
StationName:A12 Kusmatand Village Zone: Buffer Category: Industrial
Sl. No. Dates of sampling PM 10 PM 2.5 SO2 NOx
1 03.01.2020 94 55 10 18
2 17.01.2020 92 54 10 20
NAAQ Standards 100 60 80 80
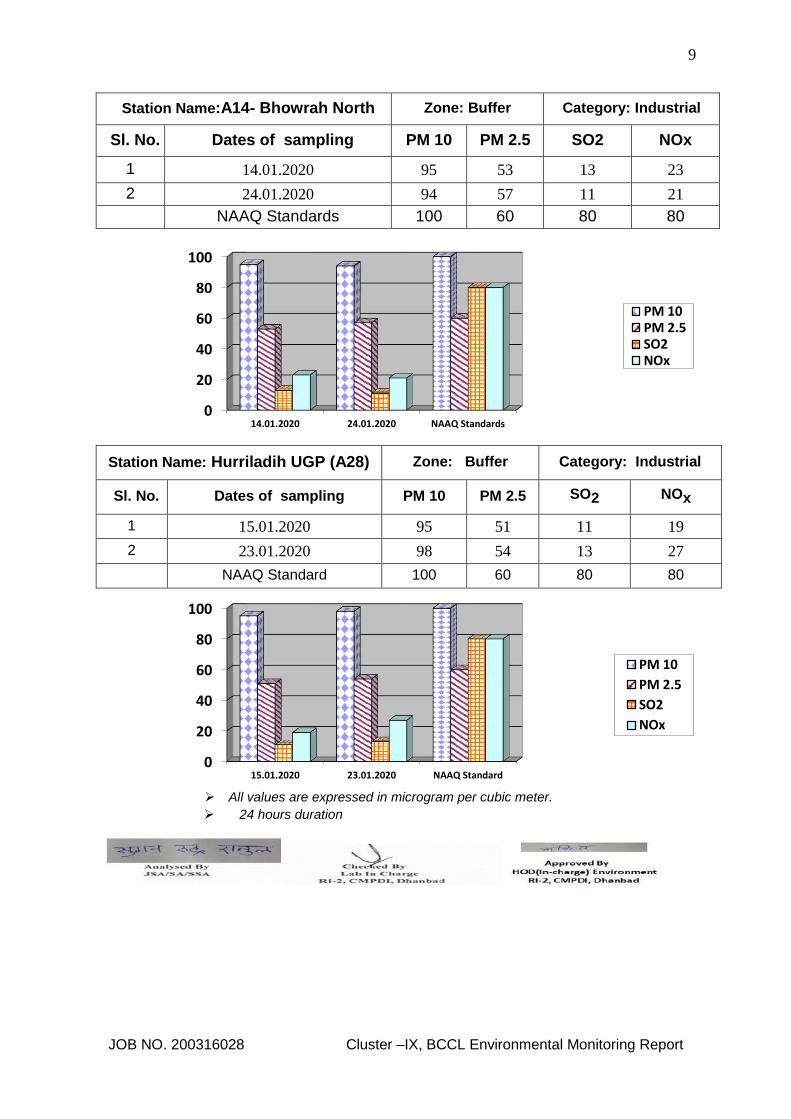
9
JOB NO. 200316028 Cluster –IX, BCCL Environmental Monitoring Report
All values are expressed in microgram per cubic meter.
24 hours duration
0
20
40
60
80
100
14.01.2020 24.01.2020 NAAQ Standards
PM 10PM 2.5SO2NOx
0
20
40
60
80
100
15.01.2020 23.01.2020 NAAQ Standard
PM 10
PM 2.5
SO2
NOx
Station Name:A14- Bhowrah North Zone: Buffer Category: Industrial
Sl. No. Dates of sampling PM 10 PM 2.5 SO2 NOx
1 14.01.2020 95 53 13 23
2 24.01.2020 94 57 11 21
NAAQ Standards 100 60 80 80
Station Name: Hurriladih UGP (A28) Zone: Buffer Category: Industrial
Sl. No. Dates of sampling PM 10 PM 2.5 SO2 NOx
1 15.01.2020 95 51 11 19
2 23.01.2020 98 54 13 27
NAAQ Standard 100 60 80 80

10
JOB NO. 200316028 Cluster –IX, BCCL Environmental Monitoring Report
WATER QUALITY MONITORING
3.1 Location of sampling sites
(Refer Plate No. – II)
i) Mine Discharge of Jeenagora (MW9)
A sampling point is fixed to assess the effluent quality of Mine discharge.
3.2 Methodology of sampling and analysis
Water samples were collected as per standard practice. The effluent samples were
collected and analyzed for four parameters on fortnightly basis at the Environmental
Laboratory of CMPDI RI-II, Dhanbad.
3.3 Results & Interpretations
The results are given in tabular form along with the applicable standards. Results are
compared with Schedule - VI, effluent prescribed by MoEF&CC. Results show that most of
the parameters are within the permissible limits.
WATER QUALITY DATA (EFFLUENT WATER- FOUR PARAMETERS)
Name of the Cluster: Cluster
-IX
Month:
JAN,2020
Name of the Station: Mine Discharge of
Jeenagora
Sl.
No.
Parameters
MW9
First Fortnight
MW9
Second Fortnight
As per MOEF General
Standards for
schedule VI 03.01.2020 17.01.2020
1 Total Suspended Solids 41 35 100 (Max)
2 pH 7.88 7.91 5.5 - 9.0
3 Oil & Grease <2.0 <2.0 10 (Max)
4 COD 52 56 250 (Max)
All values are expressed in mg/lit except pH.
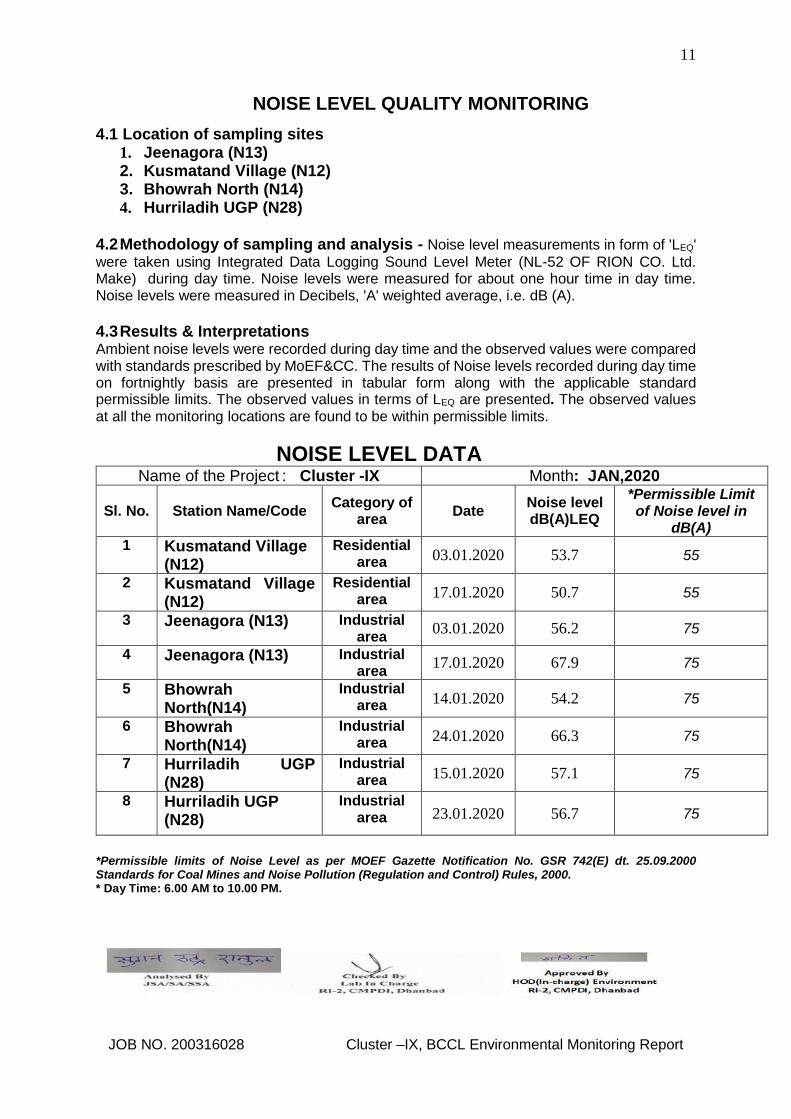
11
JOB NO. 200316028 Cluster –IX, BCCL Environmental Monitoring Report
NOISE LEVEL QUALITY MONITORING
4.1 Location of sampling sites 1. Jeenagora (N13) 2. Kusmatand Village (N12) 3. Bhowrah North (N14) 4. Hurriladih UGP (N28)
4.2 Methodology of sampling and analysis - Noise level measurements in form of 'LEQ'
were taken using Integrated Data Logging Sound Level Meter (NL-52 OF RION CO. Ltd. Make) during day time. Noise levels were measured for about one hour time in day time. Noise levels were measured in Decibels, 'A' weighted average, i.e. dB (A). 4.3 Results & Interpretations Ambient noise levels were recorded during day time and the observed values were compared with standards prescribed by MoEF&CC. The results of Noise levels recorded during day time on fortnightly basis are presented in tabular form along with the applicable standard permissible limits. The observed values in terms of LEQ are presented. The observed values at all the monitoring locations are found to be within permissible limits.
NOISE LEVEL DATA
Name of the Project : Cluster -IX Month: JAN,2020
Sl. No. Station Name/Code Category of
area Date
Noise level dB(A)LEQ
*Permissible Limit of Noise level in
dB(A) 1 Kusmatand Village
(N12)
Residential area 03.01.2020 53.7 55
2 Kusmatand Village (N12)
Residential area 17.01.2020 50.7 55
3 Jeenagora (N13) Industrial area
03.01.2020 56.2 75
4 Jeenagora (N13) Industrial area
17.01.2020 67.9 75
5 Bhowrah North(N14)
Industrial area 14.01.2020 54.2 75
6 Bhowrah North(N14)
Industrial area 24.01.2020 66.3 75
7 Hurriladih UGP (N28)
Industrial area 15.01.2020 57.1 75
8 Hurriladih UGP (N28)
Industrial area 23.01.2020 56.7 75
*Permissible limits of Noise Level as per MOEF Gazette Notification No. GSR 742(E) dt. 25.09.2000 Standards for Coal Mines and Noise Pollution (Regulation and Control) Rules, 2000. * Day Time: 6.00 AM to 10.00 PM.
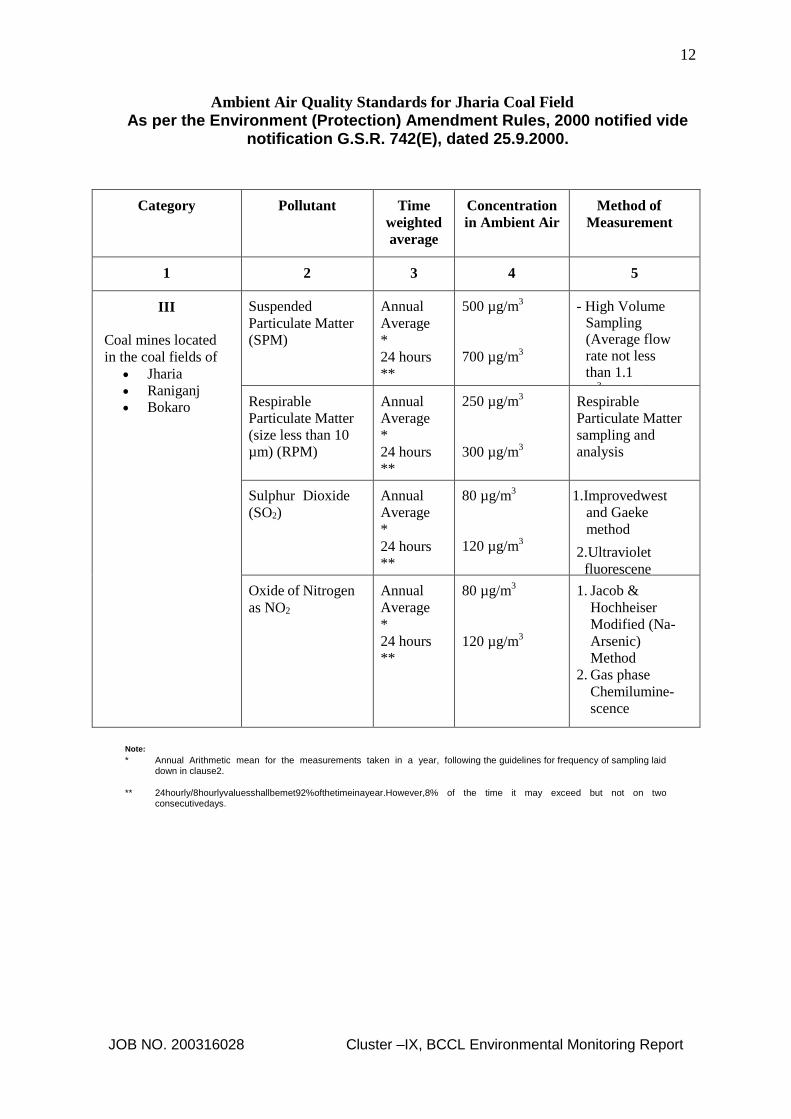
12
JOB NO. 200316028 Cluster –IX, BCCL Environmental Monitoring Report
Ambient Air Quality Standards for Jharia Coal Field
As per the Environment (Protection) Amendment Rules, 2000 notified vide notification G.S.R. 742(E), dated 25.9.2000.
Category Pollutant Time
weighted
average
Concentration
in Ambient Air
Method of
Measurement
1 2 3 4 5
III
Coal mines located
in the coal fields of
Jharia
Raniganj Bokaro
Suspended
Particulate Matter
(SPM)
Annual
Average
*
24 hours
**
500 µg/m3
700 µg/m3
- High Volume Sampling (Average flow rate not less than 1.1
m3/minute)
Respirable
Particulate Matter
(size less than 10
µm) (RPM)
Annual
Average
*
24 hours
**
250 µg/m3
300 µg/m3
Respirable
Particulate Matter
sampling and
analysis
Sulphur Dioxide
(SO2)
Annual
Average
*
24 hours
**
80 µg/m3
120 µg/m3
1. Improvedwest
and Gaeke
method
2. Ultraviolet
fluorescene
Oxide of Nitrogen
as NO2
Annual
Average
*
24 hours
**
80 µg/m3
120 µg/m3
1. Jacob &
Hochheiser
Modified (Na-
Arsenic)
Method
2. Gas phase
Chemilumine-
scence
Note:
* Annual Arithmetic mean for the measurements taken in a year, following the guidelines for frequency of sampling laid down in clause2.
** 24hourly/8hourlyvaluesshallbemet92%ofthetimeinayear.However,8% of the time it may exceed but not on two
consecutivedays.

13
JOB NO. 200316028 Cluster –IX, BCCL Environmental Monitoring Report
NATIONAL AMBIENT AIR QUALITY STANDARDS New Delhi the 18th November 2009
In exercise of the powers conferred by Sub-section (2) (h) of section 16 of the Air (Prevention and Control of
Pollution) Act, 1981 (Act No. 14 of 1981), and in supersession of the notification No(s).S.O.384(E), dated 11th April
1994 and S.O.935(E), dated 14th NOVober 1998, the Central Pollution Control Board hereby notify the National
Ambient Air Quality Standards with immediate effect.
* Annual Arithmetic mean of minimum 104 measurements in a year at a particular site taken twice a week 24 hourly at uniform
intervals.
** 24 hourly or 8 hourly or 1 hourly monitored values, as applicable, shall be complied with 98% of the time in a year. 2% of the
time, they may exceed the limits but not on two consecutive days of monitoring.
NOTE: Whenever and wherever monitoring results on two consecutive days of monitoring exceed the limits specified above
for the respective category, it shall be considered adequate reason to institute regular or continuous monitoring and further
investigations.
Pollutant
Time Weighted Average
Concentration in Ambient Air Methods of Measurement
Industrial, Residentia
l, Rural and other
Areas
Ecologically Sensitive Area
(Notified by Central
Government)
Sulphur Dioxide (SO2), µg/m3
Annual * 24 Hours **
50 80
20 80
-Improved West and Gaeke Method -Ultraviolet Fluorescence
Nitrogendioxide (NO2), µg/m3
Annual * 24 Hours **
40 80
30 80
-Jacob &Hochheiser modified (NaOH-NaAsO2) Method -Gas Phase Chemiluminescence
Particulate Matter (Size less than 10µm) or PM10, µg/m3
Annual * 24 Hours **
60 100
60 100
-Gravimetric -TEOM -Beta attenuation
Particulate Matter (Size less than 2.5µm) or PM2.5, µg/m3
Annual * 24 Hours **
40 60
40 60
-Gravimetric -TEOM -Beta attenuation
Ozone (O3) , µg/m3 8 Hours * 1 Hour **
100 180
100 180
-UV Photometric -Chemiluminescence -Chemical Method
Lead (Pb) , µg/m3 Annual * 24 Hours **
0.50 1.0
0.50 1.0
-AAS/ICP Method after sampling on EPM 2000 or equivalent filter paper -ED-XRF using Teflon filter
Carbon Monoxide (CO), mg/m3
8 Hours ** 1 Hour **
02 04
02 04
-Non dispersive Infrared (NDIR) Spectroscopy
Ammonia (NH3), µg/m3 Annual * 24 Hours **
100 400
100 400
-Chemiluminescence -Indophenol blue method
Benzene (C6H6), µg/m3 Annual *
05 05 -Gas Chromatography (GC) based continuous analyzer -Adsorption and desorption followed by GC analysis
Benzo(a)Pyrene (BaP) Particulate phase only, ng/m3
Annual *
01 01 -Solvent extraction followed byHPLC/GC analysis
Arsenic (As), ng/m3 Annual *
06 06 -AAS/ICP Method after sampling on EPM 2000 or equivalent filter paper
Nickel (Ni), ng/m3 Annual *
20 20 -AAS/ICP Method after sampling on EPM 2000 or equivalent filter paper
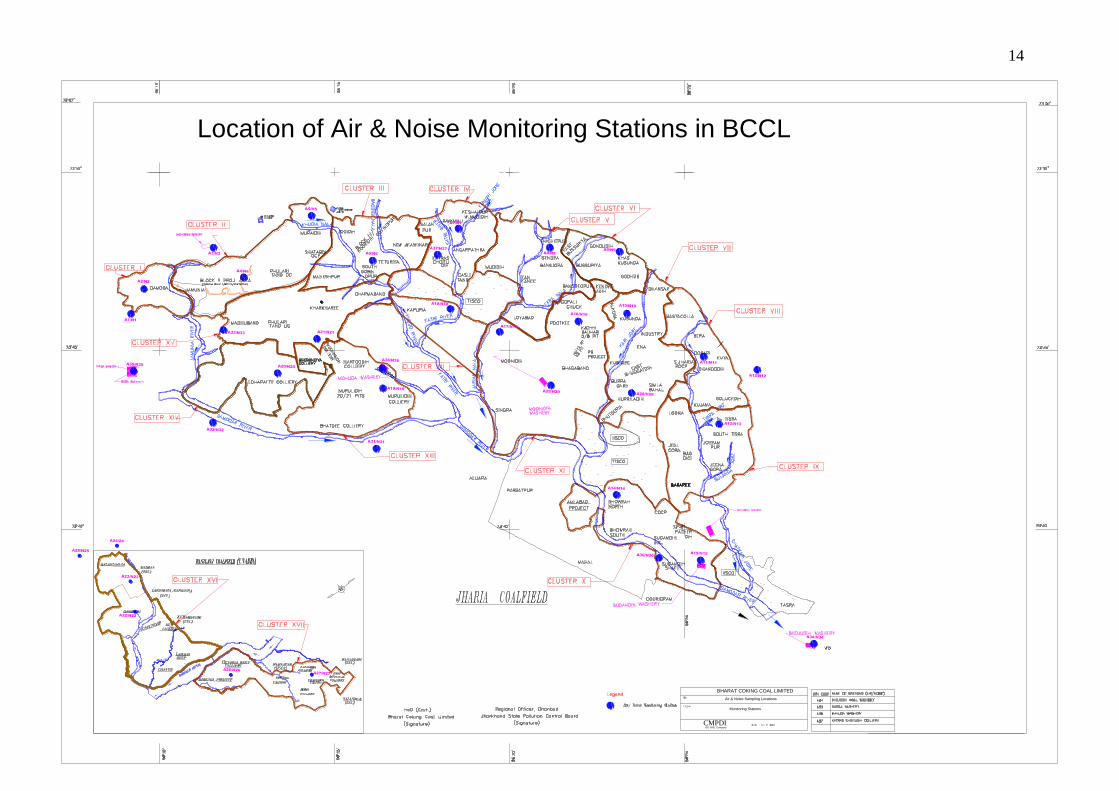
14
Location of Air & Noise Monitoring Stations in BCCL
CMPDIISO 9001 Company
Monitoring Stations
BHARAT COKING COAL LIMITED
Air & Noise Sampling Locations

15
SW3
SW13
SW4
SW5
SW6
SW7
SW8
SW10
SW9
SW11
SW12
SW14
SW15
SW16
SW17
SW18
SW19
SW20
SW22
SW21
SW26
SW25
SW24
SW23
SW28
SW27
SW30
SW31
SW33
SW34
Water Sampling Locations in BCCL
SW29
SW35
SW36
SW32
Cluster Suface Water Name of
River/ Nala
/ Jore
Mine/
Effluent
Water
Sampling
Location
Ground
Water
Sampling
Location
I SW1, SW2Jamunia
RiverMW1
Damoda
AreaGW1
Ghutway
Village
II SW3, SW4Khudia
NalaMW2
Block II
OCPGW2
Joyrampur
Village
IIISW4, SW5,
SW6, SW7
Khudia
Nala,
Bagdigi
Nala
MW3Govindpur
CollieryGW3
Jogidih
Village
IVSW8, SW11,
SW9, SW10
Katri River,
Kumari
Jore
MW4 Chotudih GW4Kankanee
Village
VSW12, SW13,
SW15
Jarian
Nala, Ekra
Nala
MW5 Mudidih GW5 Nichitpur
VI SW14, SW15 Ekra Nala MW6
East
Bassuria
UGP
GW6Bansjora
Borewell
VII SW16, SW17 Kari Jore MW7Dhansar
UGPGW7 Hurriladih
VIII SW18, SW19 Kashi Jore MW8Dobari
UGPGW8 Ghanudih
IX SW19, SW20 Kashi Jore MW9 Jeenagora GW9 Lodna
X SW21, SW22Damodar
RiverMW10
Bhowrah
NorthGW10
Bhowrah
South
XISW23, SW24,
SW25, SW26
Jarian
Nala,
Damodar
River
MW11Bhagaband
h UGPGW11 Bhagabandh
XII SW27, SW28 Katri River MW12 Kapuria GW12 Kapuria
XIII SW29, SW30Damodar
RiverMW13
Murulidih
(20/21)GW13 Murilidih
XIV SW31, SW29Damodar
RiverMW14 Lohapatti GW14 Lohapatti
XV SW5, SW32Khudia
NalaMW15
Kharkharee
UGPGW15 Kharkharee
XVI SW33, SW34Khudia
RiverMW16
Dahibari
OCPGW16
Patlabari
Village
XVII SW35, SW36Barakar
RiverMW17
Damagoria
CollieryGW17 Chaptoria
INDEX
MW13
(U/S, D/S)
Pit 1
CMPDIISO 9001 Company
MONITORING STATIONS
BHARAT COKING COAL LIMITED
WATER SAMPLING LOCATIONS

1
CMPDI
ISO 9001 Company
Regional Institute-II
Dhanbad, Jharkhand
STRICTLY RESTRICTED FOR COMPANY USE ONLY RESTRICTED
The information given in this report is not to be
communicated either directly or indirectly to the
press or to any person not holding an official
position in the CIL /GOVERNMENT.
ENVIRONMENTAL MONITORING REPORT
OF
BHARAT COKING COAL LIMITED,
CLUSTER –IX (FOR THE MONTH FEBRUARY 2020)
E. C. no. J-11015/307/2010-IA.II (M) dated 21.05.2013

2
JOB NO. 200316028 Cluster –IX, BCCL Environmental Monitoring Report
CONTENTS
SL. NO.
CHAPTER
PARTICULARS
PAGE NO.
1.
2.
3.
4.
CHAPTER - I
CHAPTER-II
CHAPTER-III
CHAPTER-IV
EXECUTIVE SUMMARY
INTRODUCTION
ANALYSIS & RESULTS
STANDARDS & PLANS
3-5
6
7-11
12-15

3
JOB NO. 200316028 Cluster –IX, BCCL Environmental Monitoring Report
EXECUTIVE SUMMARY
1.0 Introduction
The purpose of environmental monitoring is to assess the quality of various
attributes that affects the fauna and flora. In accordance with the quality of these
attributes appropriate strategy is to be developed to control the pollution level
within the permissible limits. The three major attributes are air, water and noise
level.
Bharat Coking Coal Limited (BCCL), a Subsidiary company of Coal India Limited
is operating Underground and Opencast Mines in Jharia Coalfield (JCF) is a part
of Gondwana Coalfields located in Dhanbad district of Jharkhand, the JCF is
bounded by 23037’ N to 23052’ N latitudes and 86009’ E to 86030’ E longitude
occupying an area of 450 Sq.km. BCCL has awarded Environmental monitoring
work of Jharia Coalfield (JCF) to Central Mine Planning & Design Institute Limited
(CMPDIL). The environmental monitoring has been carried out as per the
conditions laid down by the MoEF&CC while granting environmental clearance of
project, consent letter issued by the respective SPCB, and other statutory
requirements.
2.0 Sampling location and rationale
2.1 Ambient air sampling locations
The ambient air quality monitoring stations were selected to represent core, buffer
zone area. The rationale has been based on the guidelines stipulated by
MoEF&CC, consent letter of SPCB, as well as other statutory requirements.
2.2 Water sampling stations
The Water sampling stations were selected for mine sump water.
2.3 Noise level monitoring locations
Noise levels vary depending on the various activities in mining areas. The
monitoring of noise level in different locations will be helpful to take appropriate
mitigating measures. The rationale has been based on the guidelines stipulated
by MoEF&CC, consent letter of SPCB, as well as other statutory requirements
3.0 Methodology of sampling and analysis
3.1 Ambient air quality
Parameters chosen for assessment of ambient air quality were Particulate Matter
(PM10), Fine Particulate Matter (PM2.5), Sulphur Di-oxide (SO2) and Nitrogen
Oxides (NOx). Respirable Dust Samplers (RDS) and Fine Dust Sampler (PM2.5

4
JOB NO. 200316028 Cluster –IX, BCCL Environmental Monitoring Report
sampler) were used for sampling of PM10, SO2, & NOx and Fine Dust Sampler
(PM2.5 sampler) were used for sampling of PM2.5 at 24 hours interval once in a
fortnight and the same for the gaseous pollutants. The samples were analysed in
Environmental Laboratory of CMPDI, RI-II, Dhanbad.
3.2 Water quality
Water samples were collected as per standard practice. The Mine effluent
samples were collected and analyzed for four parameters on fortnightly basis.
Thereafter the samples were preserved and analyzed at the Environmental
Laboratory of CMPDI, RI- II, Dhanbad.
3.3 Noise level monitoring
Noise level measurements in form of 'LEQ' were taken using Integrated Data
Logging Sound Level Meter. Noise levels were measured in Decibels, 'A' weighted
average, i.e. dB(A).
4.0 Results and interpretations
4.1 Air quality
It has been seen from the analysis results that the 24 hours average concentration
parameters like PM10, PM2.5, SO2 and NOx are mostly within the permissible limits
in all sampling locations as per MoEF&CC Gazette Notification No. GSR 742(E)
dt 25.09.2000 Standards for Coal Mines and National Ambient Air Quality
Standard -2009. Sometimes the concentration of PM10& PM2.5 exceeds the limits
due to heavy public traffic, poor road condition, coke oven plants, burning of coal
by surrounding habitants, brick making, municipal waste dumps and industries like
Steel Plant, thermal Plants including their fly ash etc.
The following preventive and suppressive mitigative measures can be undertaken to contain the pollution level within prescribed level:-
Wet drilling and controlled blasting should be practice. Explosive used should be optimised to restrict the dust generation. Transportation roads should be permanently asphalted free of ruts, potholes
etc. Water should be sprayed on coal transportation road, service road more
frequently and at regular interval. Dust from roads should be removed physically or mechanically. Greenbelts around industrial sites, service building area besides
Avenue plantation along roads should be created. Coal dust should be suppressed by using fixed sprinklers. Regular maintenance of plant and machinery should be undertaken.

5
JOB NO. 200316028 Cluster –IX, BCCL Environmental Monitoring Report
4.2 Water quality
The test results indicate that the major parameters compared with MoEF&CC
Gazette Notification No. GSR 742(E) dt.25.09.2000 Standards for Coal Mines
were within permissible limits.
4.3 Noise Level
During the noise level survey it has been observed that the noise level in the
sampling locations is within the permissible limits prescribed as per MoEF&CC
Gazette Notification No. GSR 742(E) dt.25.09.2000 Standards for Coal Mines for
Industrial Area and Noise pollution (Regulation and Control) Rules, 2000.

6
JOB NO. 200316028 Cluster –IX, BCCL Environmental Monitoring Report
INTRODUCTION
1.0 Any industry and development activities including coal mining is bound to affect environmental attributes. There are positive as well as negative impacts of such operations. For controlling the adverse impacts a regular monitoring is essential. The environmental monitoring is being done as per the guide-lines stipulated by Ministry of Environment, Forest and Climate Change (MoEF&CC), Govt. of India.
The very purpose of environmental monitoring is to assess the quality of various
attributes which affects the environment. As per quality of these attributes appropriate strategy is to be developed to control the pollution level within the permissible limits. The three major attributes are air, water and noise level.
Bharat Coking Coal has awarded Environmental Monitoring work of all Projects,
Cluster wise, to Central Mine Planning & Design Institute Limited (CMPDIL). The environmental monitoring has been carried out as per conditions laid down by MoEF&CC while granting environmental clearance to different projects. CMPDI has trained manpower and well equipped laboratory to carry out monitoring, analysis and R&D work in the field of environment.
1.1 The Cluster-IX is in the Eastern part of the Jharia coalfield. It includes a group of 7
Mines (viz. Lodna, S. Tisra/NTST OC, Jealgora, Joyrampur, Jeenagora, Bararee, S.Tisra/NTST Expan. OC. The Cluster – IX is situated about 25 - 30 kms from Dhanbad Railway Station. The mines of this Cluster – IX are operating since pre nationalization period (prior to 1972-73). It is connected by both Railway and Road. The drainage pattern of the area is governed by Kashi Jore.
1.2 The Cluster-IX is designed to produce 6.548 MTPA (normative) and 8.512 MTPA
(peak) capacity of coal.
The Project has Environmental Clearance from Ministry of Environment, Forest and Climate Change (MoEF&CC) for a rated capacity 6.548 MTPA (normative) and 8.512 MTPA (peak) capacity of coal production vide letter no. J-11015/307/2010-IA.II (M) dated 21st May, 2013.
Ministry of Environment, Forest and Climate Change while granting environmental clearance has given one of the General conditions that “ Four ambient air quality monitoring stations should be established in the core zone as well as in the buffer zone for PM10, PM2.5, SO2, NOx monitoring. Location of the stations should be decided based on the meteorological data, topographical features and environmentally and ecologically sensitive targets, other conditions regarding water / effluent and noise level monitoring in consultation with the State Pollution Control Board.” In compliance of these conditions the Environmental Monitoring has been carried out & report prepared for submission to MoEF&CC & JSPCB and other statutory authorities.

7
JOB NO. 200316028 Cluster –IX, BCCL Environmental Monitoring Report
AMBIENT AIR QUALITY MONITORING
2.1 Location of sampling station and their rationale:
(As per G.S.R. 742 (E) dt. 25th December, 2000)
2.1.1 Ambient Air Quality Sampling Locations
I. CORE ZONE Monitoring Location
i) Jeenagora (A13) : Industrial Area
The location of the sampling station is 230 42’ 31.00’’ N & 860 25’ 48.00’’ E. The
sampler was placed at a height of 1.5 m from the ground level at the Safety Office.
II. BUFFER ZONE Monitoring Location
i) Kusmatand Village (A12): Industrial Area
The location of the sampling station is 23045’ 4.65’’ N & 860 26’ 42.10’’ E. The sampler
was placed at a height of 1.5 m from the ground level of the village.
ii) Bhowrah North (A14) : Industrial Area
The location of the sampling station is 23o41’ 37.00’’ N & 86o23’ 54.00’’E. The sampler
was placed at 1.5 m above the ground level of Project Office.
Iii) Hurriladih UGP (A28) : Industrial Area
The location of the sampling station is 23044’ 4.18’’ N & 860 24’ 6.21’’ E. The sampler
was placed at a height of 1.5 m from the ground level of the mine office.

8
JOB NO. 200316028 Cluster –IX, BCCL Environmental Monitoring Report
AMBIENT AIR QUALITY DATA
Cluster – IX, Bharat Coking Coal limited Month: FEB ,2020 Year: 2019-20.
0
50
100
150
06.02.2020 20.02.2020 NAAQ Standard
PM 10PM 2.5SO2NOx
0
20
40
60
80
100
06.02.2020 20.02.2020 NAAQ Standards
PM 10PM 2.5SO2NOx
Station Name: A13 – Jeenagora Zone: Core Category: Residential
Sl. No. Dates of sampling PM 10 PM 2.5 SO2 NOx
1 06.02.2020 137 76 12 21
2 20.02.2020 143 78 11 22
NAAQ Standard 100 60 80 80
StationName:A12 Kusmatand Village Zone: Buffer Category: Industrial
Sl. No. Dates of sampling PM 10 PM 2.5 SO2 NOx
1 06.02.2020 93 50 10 22
2 20.02.2020 96 52 9 21
NAAQ Standards 100 60 80 80

9
JOB NO. 200316028 Cluster –IX, BCCL Environmental Monitoring Report
All values are expressed in microgram per cubic meter.
24 hours duration
0
20
40
60
80
100
120
11.02.2020 26.02.2020 NAAQ Standards
PM 10PM 2.5SO2NOx
0
20
40
60
80
100
12.02.2020 27.02.2020 NAAQ Standard
PM 10
PM 2.5
SO2
NOx
Station Name:A14- Bhowrah North Zone: Buffer Category: Industrial
Sl. No. Dates of sampling PM 10 PM 2.5 SO2 NOx
1 11.02.2020 96 54 12 23
2 26.02.2020 118 64 10 21
NAAQ Standards 100 60 80 80
Station Name: Hurriladih UGP (A28) Zone: Buffer Category: Industrial
Sl. No. Dates of sampling PM 10 PM 2.5 SO2 NOx
1 12.02.2020 93 51 12 23
2 27.02.2020 90 49 11 22
NAAQ Standard 100 60 80 80
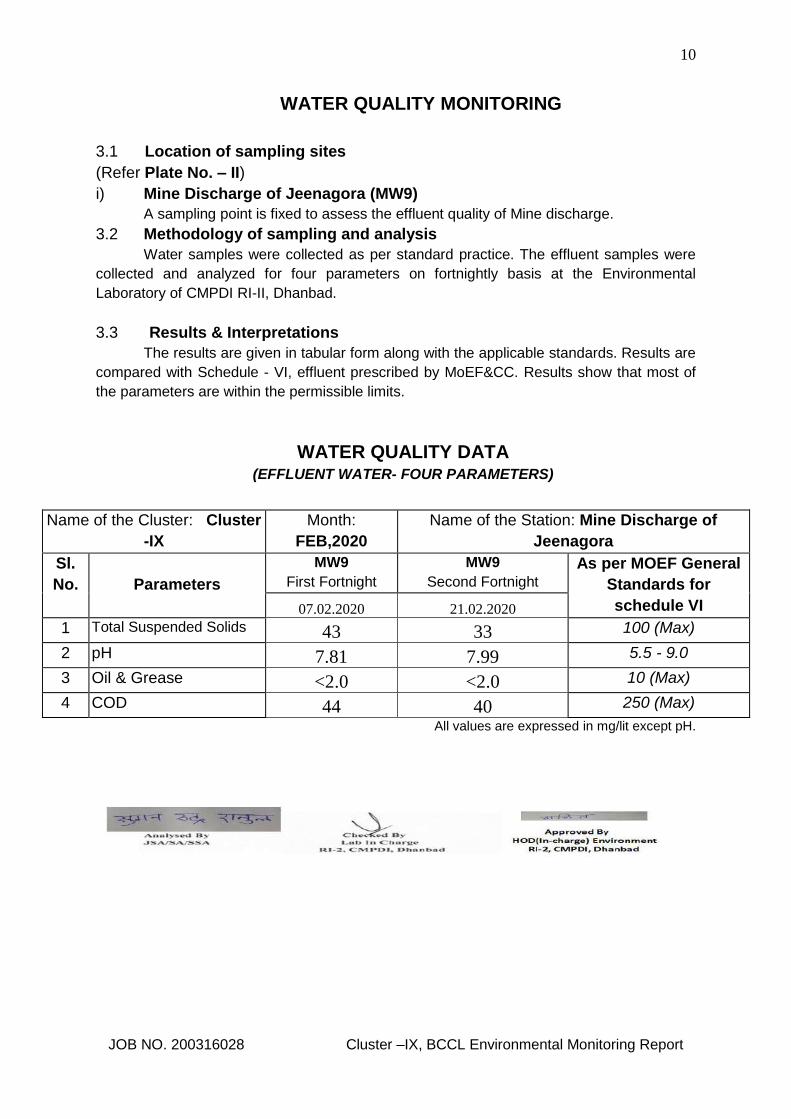
10
JOB NO. 200316028 Cluster –IX, BCCL Environmental Monitoring Report
WATER QUALITY MONITORING
3.1 Location of sampling sites
(Refer Plate No. – II)
i) Mine Discharge of Jeenagora (MW9)
A sampling point is fixed to assess the effluent quality of Mine discharge.
3.2 Methodology of sampling and analysis
Water samples were collected as per standard practice. The effluent samples were
collected and analyzed for four parameters on fortnightly basis at the Environmental
Laboratory of CMPDI RI-II, Dhanbad.
3.3 Results & Interpretations
The results are given in tabular form along with the applicable standards. Results are
compared with Schedule - VI, effluent prescribed by MoEF&CC. Results show that most of
the parameters are within the permissible limits.
WATER QUALITY DATA (EFFLUENT WATER- FOUR PARAMETERS)
Name of the Cluster: Cluster
-IX
Month:
FEB,2020
Name of the Station: Mine Discharge of
Jeenagora
Sl.
No.
Parameters
MW9
First Fortnight
MW9
Second Fortnight
As per MOEF General
Standards for
schedule VI 07.02.2020 21.02.2020
1 Total Suspended Solids 43 33 100 (Max)
2 pH 7.81 7.99 5.5 - 9.0
3 Oil & Grease <2.0 <2.0 10 (Max)
4 COD 44 40 250 (Max)
All values are expressed in mg/lit except pH.

11
JOB NO. 200316028 Cluster –IX, BCCL Environmental Monitoring Report
NOISE LEVEL QUALITY MONITORING
4.1 Location of sampling sites 1. Jeenagora (N13) 2. Kusmatand Village (N12) 3. Bhowrah North (N14) 4. Hurriladih UGP (N28)
4.2 Methodology of sampling and analysis - Noise level measurements in form of 'LEQ'
were taken using Integrated Data Logging Sound Level Meter (NL-52 OF RION CO. Ltd. Make) during day time. Noise levels were measured for about one hour time in day time. Noise levels were measured in Decibels, 'A' weighted average, i.e. dB (A). 4.3 Results & Interpretations Ambient noise levels were recorded during day time and the observed values were compared with standards prescribed by MoEF&CC. The results of Noise levels recorded during day time on fortnightly basis are presented in tabular form along with the applicable standard permissible limits. The observed values in terms of LEQ are presented. The observed values at all the monitoring locations are found to be within permissible limits.
NOISE LEVEL DATA
Name of the Project : Cluster -IX Month: FEB,2020
Sl. No. Station Name/Code Category of
area Date
Noise level dB(A)LEQ
*Permissible Limit of Noise level in
dB(A) 1 Kusmatand Village
(N12)
Residential area 06.02.2020 53.2 55
2 Kusmatand Village (N12)
Residential area 20.02.2020 51.2 55
3 Jeenagora (N13) Industrial area
06.02.2020 63.6 75
4 Jeenagora (N13) Industrial area
20.02.2020 62.4 75
5 Bhowrah North(N14)
Industrial area 11.02.2020 55.1 75
6 Bhowrah North(N14)
Industrial area 26.02.2020 54.6 75
7 Hurriladih UGP (N28)
Industrial area 12.02.2020 63.2 75
8 Hurriladih UGP (N28)
Industrial area 27.02.2020 62.7 75
*Permissible limits of Noise Level as per MOEF Gazette Notification No. GSR 742(E) dt. 25.09.2000 Standards for Coal Mines and Noise Pollution (Regulation and Control) Rules, 2000. * Day Time: 6.00 AM to 10.00 PM.
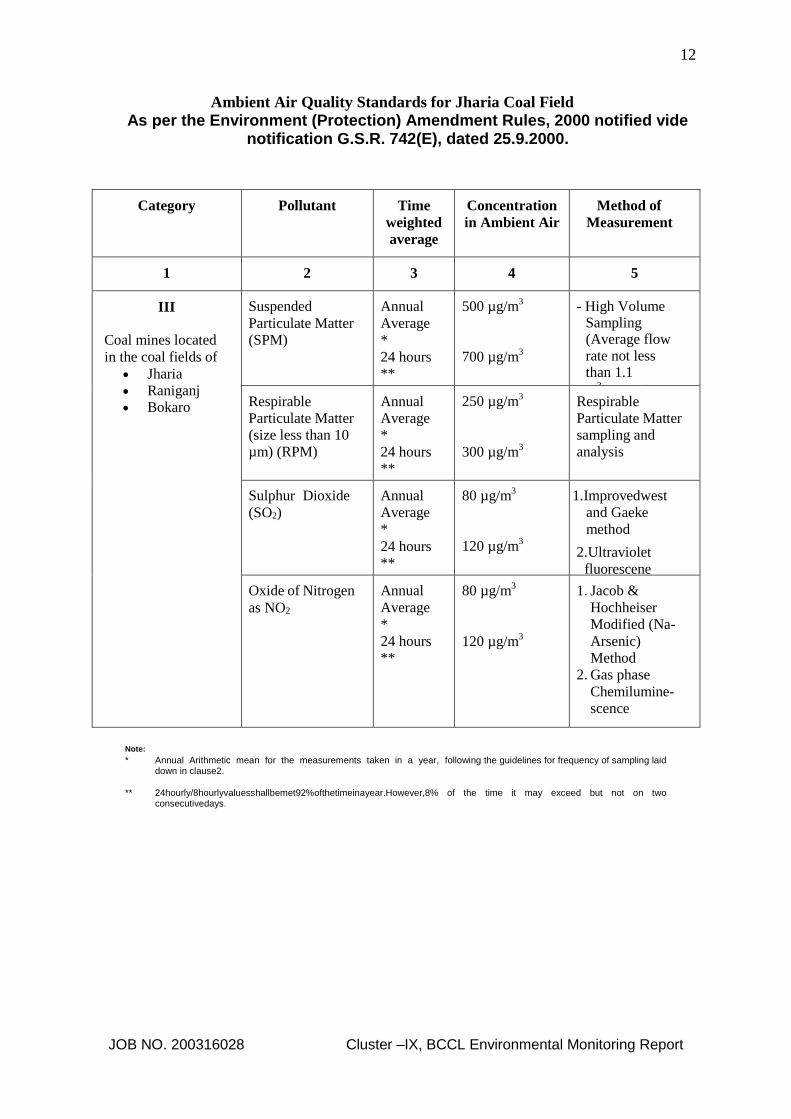
12
JOB NO. 200316028 Cluster –IX, BCCL Environmental Monitoring Report
Ambient Air Quality Standards for Jharia Coal Field
As per the Environment (Protection) Amendment Rules, 2000 notified vide notification G.S.R. 742(E), dated 25.9.2000.
Category Pollutant Time
weighted
average
Concentration
in Ambient Air
Method of
Measurement
1 2 3 4 5
III
Coal mines located
in the coal fields of
Jharia
Raniganj Bokaro
Suspended
Particulate Matter
(SPM)
Annual
Average
*
24 hours
**
500 µg/m3
700 µg/m3
- High Volume Sampling (Average flow rate not less than 1.1
m3/minute)
Respirable
Particulate Matter
(size less than 10
µm) (RPM)
Annual
Average
*
24 hours
**
250 µg/m3
300 µg/m3
Respirable
Particulate Matter
sampling and
analysis
Sulphur Dioxide
(SO2)
Annual
Average
*
24 hours
**
80 µg/m3
120 µg/m3
1. Improvedwest
and Gaeke
method
2. Ultraviolet
fluorescene
Oxide of Nitrogen
as NO2
Annual
Average
*
24 hours
**
80 µg/m3
120 µg/m3
1. Jacob &
Hochheiser
Modified (Na-
Arsenic)
Method
2. Gas phase
Chemilumine-
scence
Note:
* Annual Arithmetic mean for the measurements taken in a year, following the guidelines for frequency of sampling laid down in clause2.
** 24hourly/8hourlyvaluesshallbemet92%ofthetimeinayear.However,8% of the time it may exceed but not on two
consecutivedays.

13
JOB NO. 200316028 Cluster –IX, BCCL Environmental Monitoring Report
NATIONAL AMBIENT AIR QUALITY STANDARDS New Delhi the 18th November 2009
In exercise of the powers conferred by Sub-section (2) (h) of section 16 of the Air (Prevention and Control of
Pollution) Act, 1981 (Act No. 14 of 1981), and in supersession of the notification No(s).S.O.384(E), dated 11th April
1994 and S.O.935(E), dated 14th NOVober 1998, the Central Pollution Control Board hereby notify the National
Ambient Air Quality Standards with immediate effect.
* Annual Arithmetic mean of minimum 104 measurements in a year at a particular site taken twice a week 24 hourly at uniform
intervals.
** 24 hourly or 8 hourly or 1 hourly monitored values, as applicable, shall be complied with 98% of the time in a year. 2% of the
time, they may exceed the limits but not on two consecutive days of monitoring.
NOTE: Whenever and wherever monitoring results on two consecutive days of monitoring exceed the limits specified above
for the respective category, it shall be considered adequate reason to institute regular or continuous monitoring and further
investigations.
Pollutant
Time Weighted Average
Concentration in Ambient Air Methods of Measurement
Industrial, Residentia
l, Rural and other
Areas
Ecologically Sensitive Area
(Notified by Central
Government)
Sulphur Dioxide (SO2), µg/m3
Annual * 24 Hours **
50 80
20 80
-Improved West and Gaeke Method -Ultraviolet Fluorescence
Nitrogendioxide (NO2), µg/m3
Annual * 24 Hours **
40 80
30 80
-Jacob &Hochheiser modified (NaOH-NaAsO2) Method -Gas Phase Chemiluminescence
Particulate Matter (Size less than 10µm) or PM10, µg/m3
Annual * 24 Hours **
60 100
60 100
-Gravimetric -TEOM -Beta attenuation
Particulate Matter (Size less than 2.5µm) or PM2.5, µg/m3
Annual * 24 Hours **
40 60
40 60
-Gravimetric -TEOM -Beta attenuation
Ozone (O3) , µg/m3 8 Hours * 1 Hour **
100 180
100 180
-UV Photometric -Chemiluminescence -Chemical Method
Lead (Pb) , µg/m3 Annual * 24 Hours **
0.50 1.0
0.50 1.0
-AAS/ICP Method after sampling on EPM 2000 or equivalent filter paper -ED-XRF using Teflon filter
Carbon Monoxide (CO), mg/m3
8 Hours ** 1 Hour **
02 04
02 04
-Non dispersive Infrared (NDIR) Spectroscopy
Ammonia (NH3), µg/m3 Annual * 24 Hours **
100 400
100 400
-Chemiluminescence -Indophenol blue method
Benzene (C6H6), µg/m3 Annual *
05 05 -Gas Chromatography (GC) based continuous analyzer -Adsorption and desorption followed by GC analysis
Benzo(a)Pyrene (BaP) Particulate phase only, ng/m3
Annual *
01 01 -Solvent extraction followed byHPLC/GC analysis
Arsenic (As), ng/m3 Annual *
06 06 -AAS/ICP Method after sampling on EPM 2000 or equivalent filter paper
Nickel (Ni), ng/m3 Annual *
20 20 -AAS/ICP Method after sampling on EPM 2000 or equivalent filter paper

14
Location of Air & Noise Monitoring Stations in BCCL
CMPDIISO 9001 Company
Monitoring Stations
BHARAT COKING COAL LIMITED
Air & Noise Sampling Locations

15
SW3
SW13
SW4
SW5
SW6
SW7
SW8
SW10
SW9
SW11
SW12
SW14
SW15
SW16
SW17
SW18
SW19
SW20
SW22
SW21
SW26
SW25
SW24
SW23
SW28
SW27
SW30
SW31
SW33
SW34
Water Sampling Locations in BCCL
SW29
SW35
SW36
SW32
Cluster Suface Water Name of
River/ Nala
/ Jore
Mine/
Effluent
Water
Sampling
Location
Ground
Water
Sampling
Location
I SW1, SW2Jamunia
RiverMW1
Damoda
AreaGW1
Ghutway
Village
II SW3, SW4Khudia
NalaMW2
Block II
OCPGW2
Joyrampur
Village
IIISW4, SW5,
SW6, SW7
Khudia
Nala,
Bagdigi
Nala
MW3Govindpur
CollieryGW3
Jogidih
Village
IVSW8, SW11,
SW9, SW10
Katri River,
Kumari
Jore
MW4 Chotudih GW4Kankanee
Village
VSW12, SW13,
SW15
Jarian
Nala, Ekra
Nala
MW5 Mudidih GW5 Nichitpur
VI SW14, SW15 Ekra Nala MW6
East
Bassuria
UGP
GW6Bansjora
Borewell
VII SW16, SW17 Kari Jore MW7Dhansar
UGPGW7 Hurriladih
VIII SW18, SW19 Kashi Jore MW8Dobari
UGPGW8 Ghanudih
IX SW19, SW20 Kashi Jore MW9 Jeenagora GW9 Lodna
X SW21, SW22Damodar
RiverMW10
Bhowrah
NorthGW10
Bhowrah
South
XISW23, SW24,
SW25, SW26
Jarian
Nala,
Damodar
River
MW11Bhagaband
h UGPGW11 Bhagabandh
XII SW27, SW28 Katri River MW12 Kapuria GW12 Kapuria
XIII SW29, SW30Damodar
RiverMW13
Murulidih
(20/21)GW13 Murilidih
XIV SW31, SW29Damodar
RiverMW14 Lohapatti GW14 Lohapatti
XV SW5, SW32Khudia
NalaMW15
Kharkharee
UGPGW15 Kharkharee
XVI SW33, SW34Khudia
RiverMW16
Dahibari
OCPGW16
Patlabari
Village
XVII SW35, SW36Barakar
RiverMW17
Damagoria
CollieryGW17 Chaptoria
INDEX
MW13
(U/S, D/S)
Pit 1
CMPDIISO 9001 Company
MONITORING STATIONS
BHARAT COKING COAL LIMITED
WATER SAMPLING LOCATIONS

1
CMPDI
ISO 9001 Company
Regional Institute-II
Dhanbad, Jharkhand
STRICTLY RESTRICTED FOR COMPANY USE ONLY RESTRICTED
The information given in this report is not to be
communicated either directly or indirectly to the
press or to any person not holding an official
position in the CIL /GOVERNMENT.
ENVIRONMENTAL MONITORING REPORT
OF
BHARAT COKING COAL LIMITED,
CLUSTER –IX (FOR THE MONTH MARCH 2020)
E. C. no. J-11015/307/2010-IA.II (M) dated 21.05.2013

2
JOB NO. 200316028 Cluster –IX, BCCL Environmental Monitoring Report
CONTENTS
SL. NO.
CHAPTER
PARTICULARS
PAGE NO.
1.
2.
3.
4.
CHAPTER - I
CHAPTER-II
CHAPTER-III
CHAPTER-IV
EXECUTIVE SUMMARY
INTRODUCTION
ANALYSIS & RESULTS
STANDARDS & PLANS
3-5
6
7-11
12-15
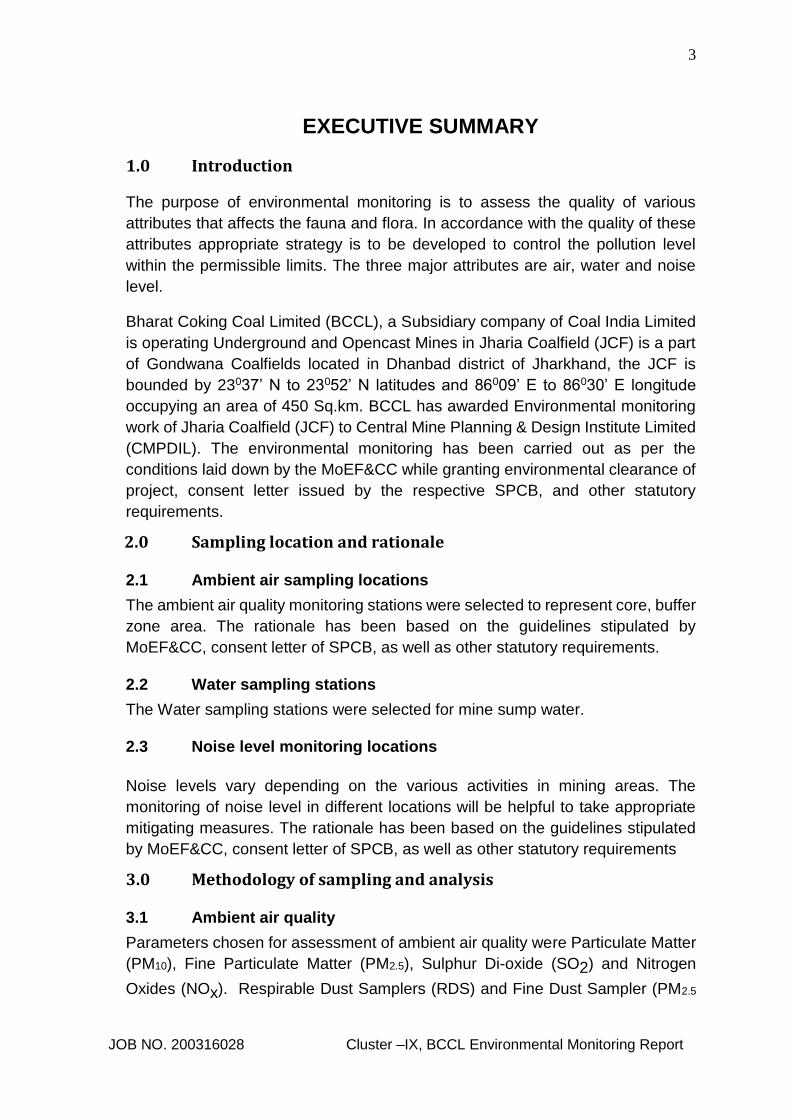
3
JOB NO. 200316028 Cluster –IX, BCCL Environmental Monitoring Report
EXECUTIVE SUMMARY
1.0 Introduction
The purpose of environmental monitoring is to assess the quality of various
attributes that affects the fauna and flora. In accordance with the quality of these
attributes appropriate strategy is to be developed to control the pollution level
within the permissible limits. The three major attributes are air, water and noise
level.
Bharat Coking Coal Limited (BCCL), a Subsidiary company of Coal India Limited
is operating Underground and Opencast Mines in Jharia Coalfield (JCF) is a part
of Gondwana Coalfields located in Dhanbad district of Jharkhand, the JCF is
bounded by 23037’ N to 23052’ N latitudes and 86009’ E to 86030’ E longitude
occupying an area of 450 Sq.km. BCCL has awarded Environmental monitoring
work of Jharia Coalfield (JCF) to Central Mine Planning & Design Institute Limited
(CMPDIL). The environmental monitoring has been carried out as per the
conditions laid down by the MoEF&CC while granting environmental clearance of
project, consent letter issued by the respective SPCB, and other statutory
requirements.
2.0 Sampling location and rationale
2.1 Ambient air sampling locations
The ambient air quality monitoring stations were selected to represent core, buffer
zone area. The rationale has been based on the guidelines stipulated by
MoEF&CC, consent letter of SPCB, as well as other statutory requirements.
2.2 Water sampling stations
The Water sampling stations were selected for mine sump water.
2.3 Noise level monitoring locations
Noise levels vary depending on the various activities in mining areas. The
monitoring of noise level in different locations will be helpful to take appropriate
mitigating measures. The rationale has been based on the guidelines stipulated
by MoEF&CC, consent letter of SPCB, as well as other statutory requirements
3.0 Methodology of sampling and analysis
3.1 Ambient air quality
Parameters chosen for assessment of ambient air quality were Particulate Matter
(PM10), Fine Particulate Matter (PM2.5), Sulphur Di-oxide (SO2) and Nitrogen
Oxides (NOx). Respirable Dust Samplers (RDS) and Fine Dust Sampler (PM2.5
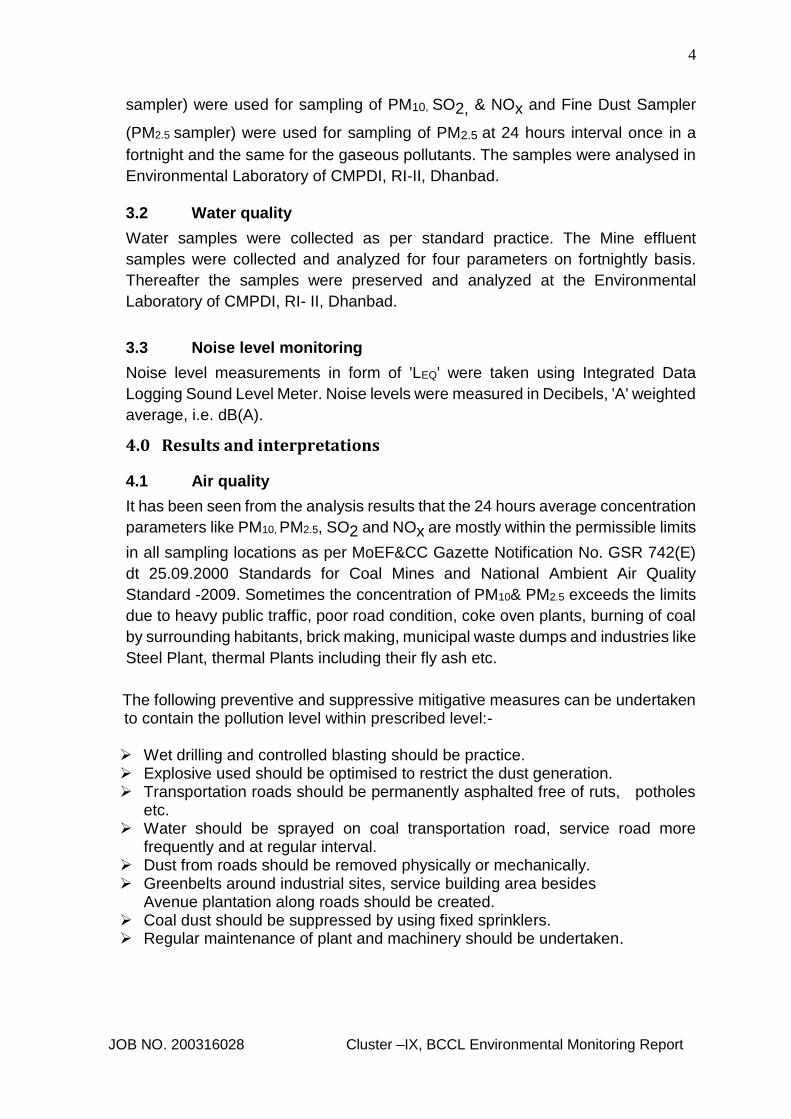
4
JOB NO. 200316028 Cluster –IX, BCCL Environmental Monitoring Report
sampler) were used for sampling of PM10, SO2, & NOx and Fine Dust Sampler
(PM2.5 sampler) were used for sampling of PM2.5 at 24 hours interval once in a
fortnight and the same for the gaseous pollutants. The samples were analysed in
Environmental Laboratory of CMPDI, RI-II, Dhanbad.
3.2 Water quality
Water samples were collected as per standard practice. The Mine effluent
samples were collected and analyzed for four parameters on fortnightly basis.
Thereafter the samples were preserved and analyzed at the Environmental
Laboratory of CMPDI, RI- II, Dhanbad.
3.3 Noise level monitoring
Noise level measurements in form of 'LEQ' were taken using Integrated Data
Logging Sound Level Meter. Noise levels were measured in Decibels, 'A' weighted
average, i.e. dB(A).
4.0 Results and interpretations
4.1 Air quality
It has been seen from the analysis results that the 24 hours average concentration
parameters like PM10, PM2.5, SO2 and NOx are mostly within the permissible limits
in all sampling locations as per MoEF&CC Gazette Notification No. GSR 742(E)
dt 25.09.2000 Standards for Coal Mines and National Ambient Air Quality
Standard -2009. Sometimes the concentration of PM10& PM2.5 exceeds the limits
due to heavy public traffic, poor road condition, coke oven plants, burning of coal
by surrounding habitants, brick making, municipal waste dumps and industries like
Steel Plant, thermal Plants including their fly ash etc.
The following preventive and suppressive mitigative measures can be undertaken to contain the pollution level within prescribed level:-
Wet drilling and controlled blasting should be practice. Explosive used should be optimised to restrict the dust generation. Transportation roads should be permanently asphalted free of ruts, potholes
etc. Water should be sprayed on coal transportation road, service road more
frequently and at regular interval. Dust from roads should be removed physically or mechanically. Greenbelts around industrial sites, service building area besides
Avenue plantation along roads should be created. Coal dust should be suppressed by using fixed sprinklers. Regular maintenance of plant and machinery should be undertaken.
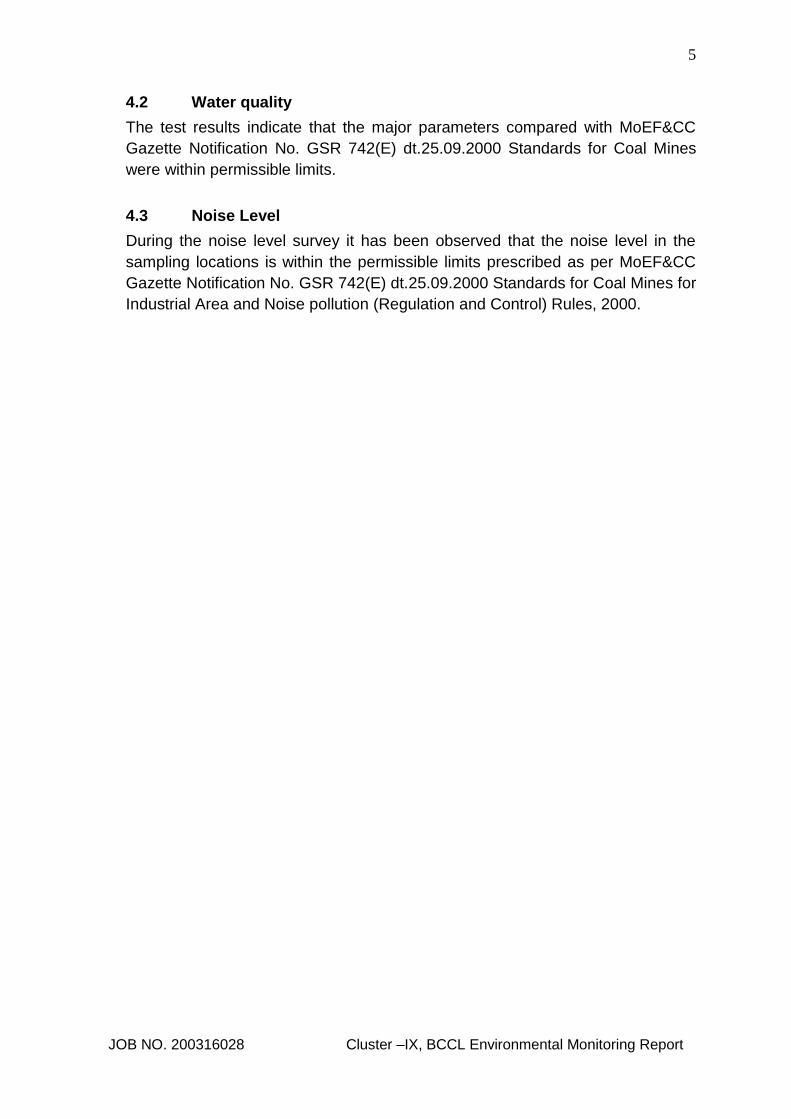
5
JOB NO. 200316028 Cluster –IX, BCCL Environmental Monitoring Report
4.2 Water quality
The test results indicate that the major parameters compared with MoEF&CC
Gazette Notification No. GSR 742(E) dt.25.09.2000 Standards for Coal Mines
were within permissible limits.
4.3 Noise Level
During the noise level survey it has been observed that the noise level in the
sampling locations is within the permissible limits prescribed as per MoEF&CC
Gazette Notification No. GSR 742(E) dt.25.09.2000 Standards for Coal Mines for
Industrial Area and Noise pollution (Regulation and Control) Rules, 2000.

6
JOB NO. 200316028 Cluster –IX, BCCL Environmental Monitoring Report
INTRODUCTION
1.0 Any industry and development activities including coal mining is bound to affect environmental attributes. There are positive as well as negative impacts of such operations. For controlling the adverse impacts a regular monitoring is essential. The environmental monitoring is being done as per the guide-lines stipulated by Ministry of Environment, Forest and Climate Change (MoEF&CC), Govt. of India.
The very purpose of environmental monitoring is to assess the quality of various
attributes which affects the environment. As per quality of these attributes appropriate strategy is to be developed to control the pollution level within the permissible limits. The three major attributes are air, water and noise level.
Bharat Coking Coal has awarded Environmental Monitoring work of all Projects,
Cluster wise, to Central Mine Planning & Design Institute Limited (CMPDIL). The environmental monitoring has been carried out as per conditions laid down by MoEF&CC while granting environmental clearance to different projects. CMPDI has trained manpower and well equipped laboratory to carry out monitoring, analysis and R&D work in the field of environment.
1.1 The Cluster-IX is in the Eastern part of the Jharia coalfield. It includes a group of 7
Mines (viz. Lodna, S. Tisra/NTST OC, Jealgora, Joyrampur, Jeenagora, Bararee, S.Tisra/NTST Expan. OC. The Cluster – IX is situated about 25 - 30 kms from Dhanbad Railway Station. The mines of this Cluster – IX are operating since pre nationalization period (prior to 1972-73). It is connected by both Railway and Road. The drainage pattern of the area is governed by Kashi Jore.
1.2 The Cluster-IX is designed to produce 6.548 MTPA (normative) and 8.512 MTPA
(peak) capacity of coal.
The Project has Environmental Clearance from Ministry of Environment, Forest and Climate Change (MoEF&CC) for a rated capacity 6.548 MTPA (normative) and 8.512 MTPA (peak) capacity of coal production vide letter no. J-11015/307/2010-IA.II (M) dated 21st May, 2013.
Ministry of Environment, Forest and Climate Change while granting environmental clearance has given one of the General conditions that “ Four ambient air quality monitoring stations should be established in the core zone as well as in the buffer zone for PM10, PM2.5, SO2, NOx monitoring. Location of the stations should be decided based on the meteorological data, topographical features and environmentally and ecologically sensitive targets, other conditions regarding water / effluent and noise level monitoring in consultation with the State Pollution Control Board.” In compliance of these conditions the Environmental Monitoring has been carried out & report prepared for submission to MoEF&CC & JSPCB and other statutory authorities.
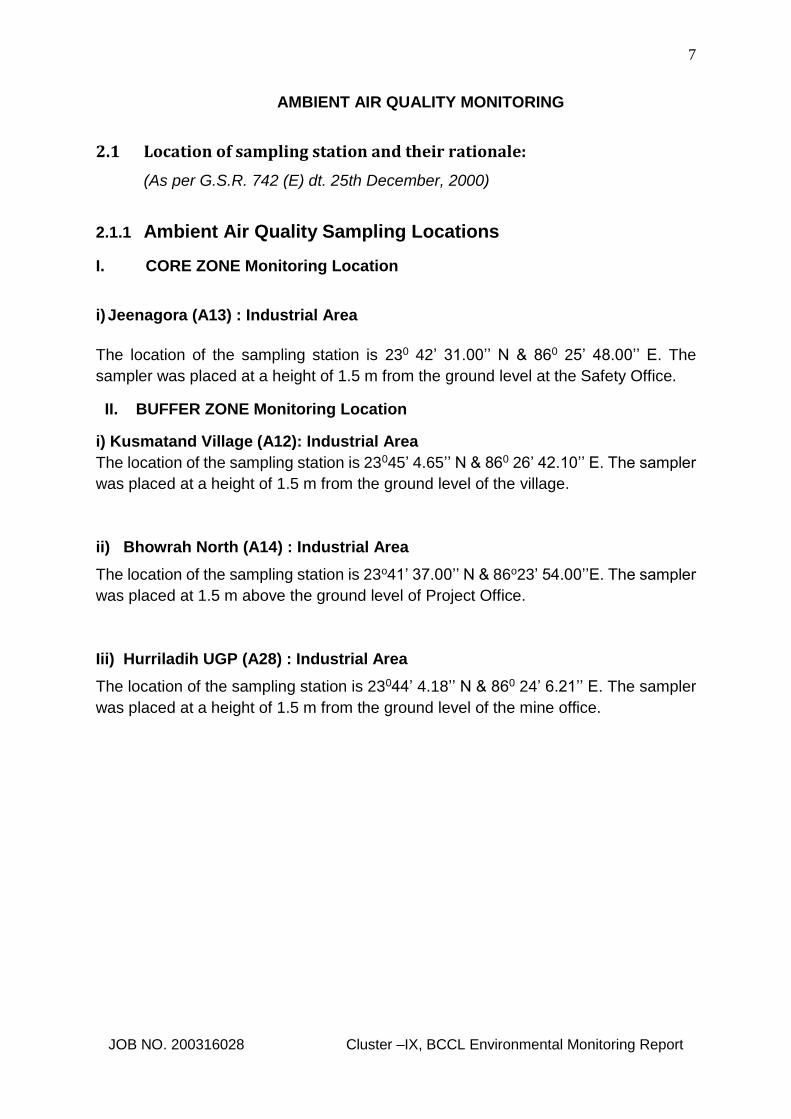
7
JOB NO. 200316028 Cluster –IX, BCCL Environmental Monitoring Report
AMBIENT AIR QUALITY MONITORING
2.1 Location of sampling station and their rationale:
(As per G.S.R. 742 (E) dt. 25th December, 2000)
2.1.1 Ambient Air Quality Sampling Locations
I. CORE ZONE Monitoring Location
i) Jeenagora (A13) : Industrial Area
The location of the sampling station is 230 42’ 31.00’’ N & 860 25’ 48.00’’ E. The
sampler was placed at a height of 1.5 m from the ground level at the Safety Office.
II. BUFFER ZONE Monitoring Location
i) Kusmatand Village (A12): Industrial Area
The location of the sampling station is 23045’ 4.65’’ N & 860 26’ 42.10’’ E. The sampler
was placed at a height of 1.5 m from the ground level of the village.
ii) Bhowrah North (A14) : Industrial Area
The location of the sampling station is 23o41’ 37.00’’ N & 86o23’ 54.00’’E. The sampler
was placed at 1.5 m above the ground level of Project Office.
Iii) Hurriladih UGP (A28) : Industrial Area
The location of the sampling station is 23044’ 4.18’’ N & 860 24’ 6.21’’ E. The sampler
was placed at a height of 1.5 m from the ground level of the mine office.
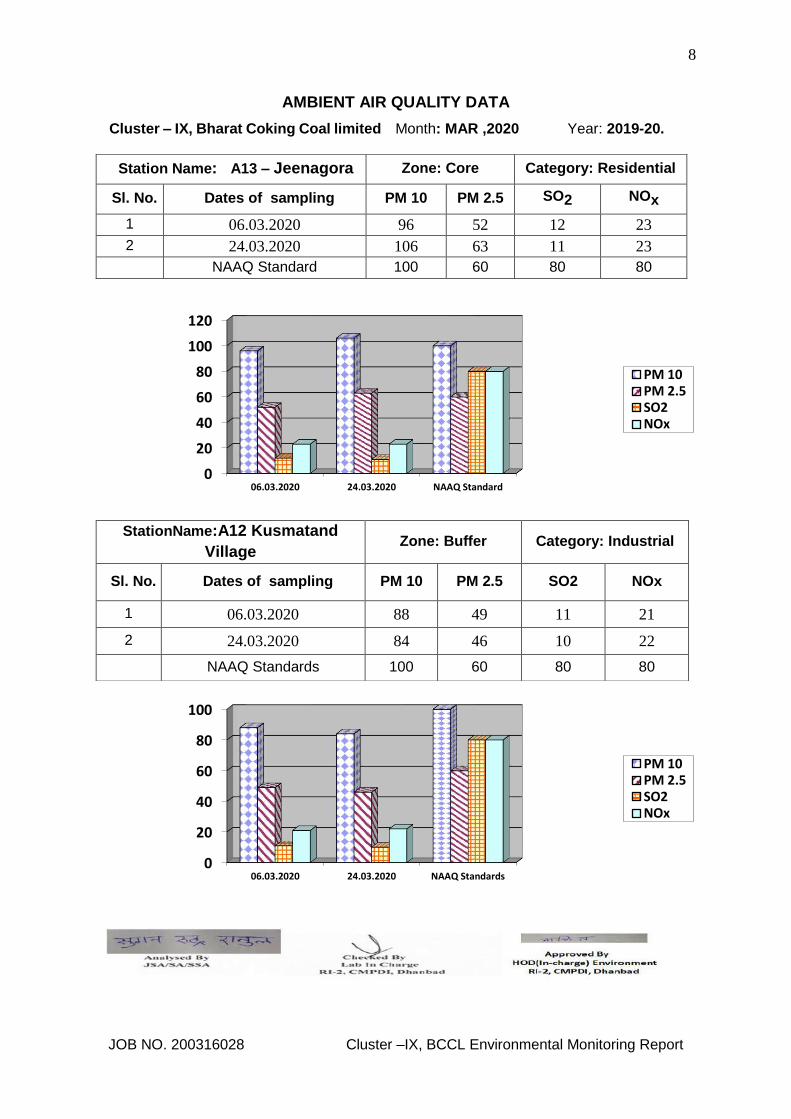
8
JOB NO. 200316028 Cluster –IX, BCCL Environmental Monitoring Report
AMBIENT AIR QUALITY DATA
Cluster – IX, Bharat Coking Coal limited Month: MAR ,2020 Year: 2019-20.
0
20
40
60
80
100
120
06.03.2020 24.03.2020 NAAQ Standard
PM 10PM 2.5SO2NOx
0
20
40
60
80
100
06.03.2020 24.03.2020 NAAQ Standards
PM 10PM 2.5SO2NOx
Station Name: A13 – Jeenagora Zone: Core Category: Residential
Sl. No. Dates of sampling PM 10 PM 2.5 SO2 NOx
1 06.03.2020 96 52 12 23
2 24.03.2020 106 63 11 23
NAAQ Standard 100 60 80 80
StationName:A12 Kusmatand
Village Zone: Buffer Category: Industrial
Sl. No. Dates of sampling PM 10 PM 2.5 SO2 NOx
1 06.03.2020 88 49 11 21
2 24.03.2020 84 46 10 22
NAAQ Standards 100 60 80 80
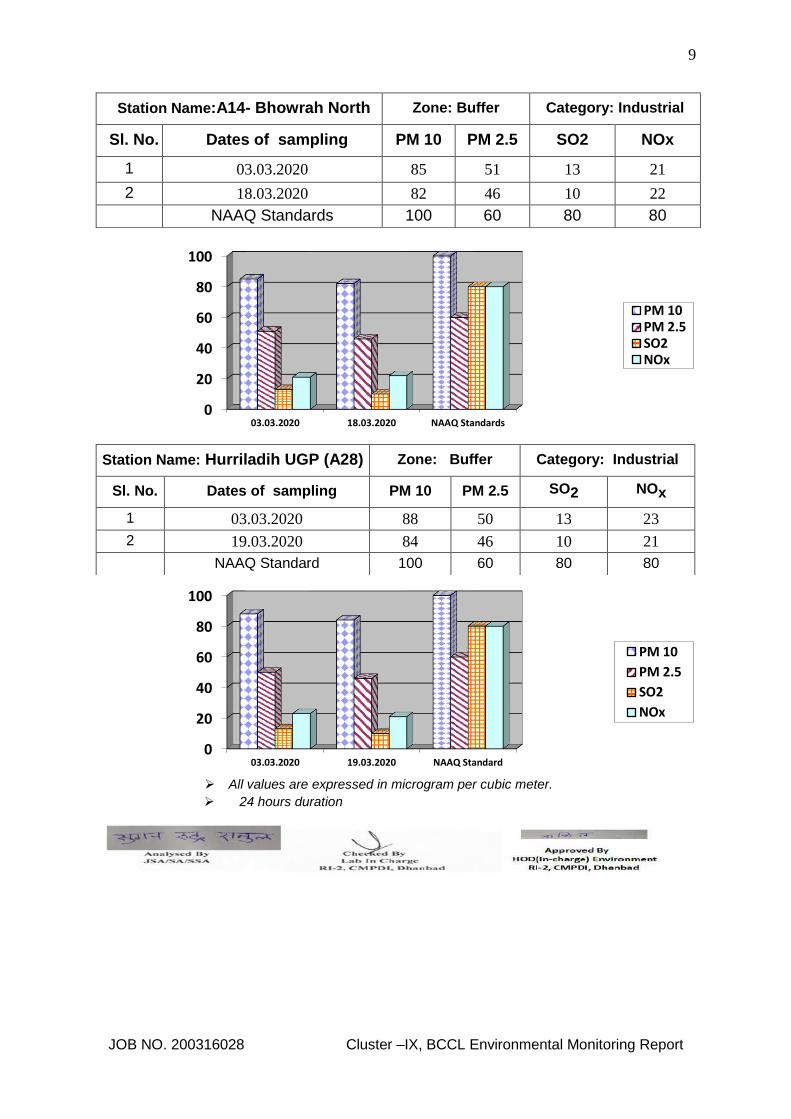
9
JOB NO. 200316028 Cluster –IX, BCCL Environmental Monitoring Report
All values are expressed in microgram per cubic meter.
24 hours duration
0
20
40
60
80
100
03.03.2020 18.03.2020 NAAQ Standards
PM 10PM 2.5SO2NOx
0
20
40
60
80
100
03.03.2020 19.03.2020 NAAQ Standard
PM 10
PM 2.5
SO2
NOx
Station Name:A14- Bhowrah North Zone: Buffer Category: Industrial
Sl. No. Dates of sampling PM 10 PM 2.5 SO2 NOx
1 03.03.2020 85 51 13 21
2 18.03.2020 82 46 10 22
NAAQ Standards 100 60 80 80
Station Name: Hurriladih UGP (A28) Zone: Buffer Category: Industrial
Sl. No. Dates of sampling PM 10 PM 2.5 SO2 NOx
1 03.03.2020 88 50 13 23
2 19.03.2020 84 46 10 21
NAAQ Standard 100 60 80 80
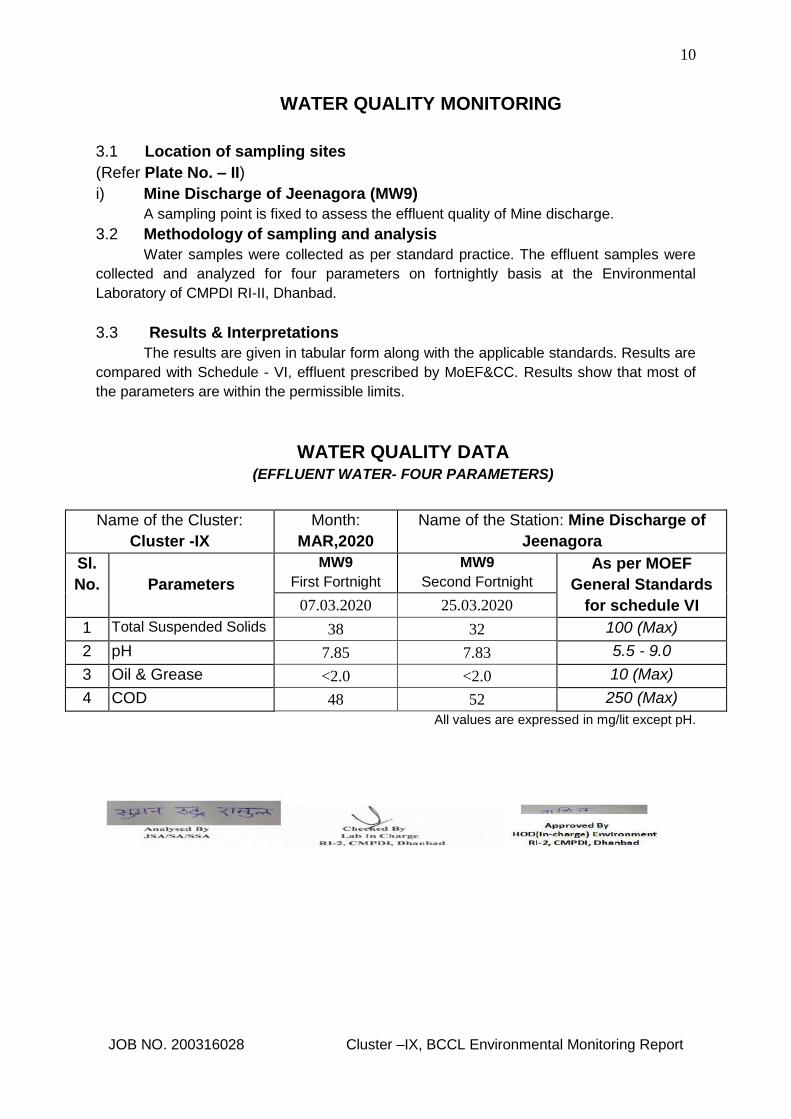
10
JOB NO. 200316028 Cluster –IX, BCCL Environmental Monitoring Report
WATER QUALITY MONITORING
3.1 Location of sampling sites
(Refer Plate No. – II)
i) Mine Discharge of Jeenagora (MW9)
A sampling point is fixed to assess the effluent quality of Mine discharge.
3.2 Methodology of sampling and analysis
Water samples were collected as per standard practice. The effluent samples were
collected and analyzed for four parameters on fortnightly basis at the Environmental
Laboratory of CMPDI RI-II, Dhanbad.
3.3 Results & Interpretations
The results are given in tabular form along with the applicable standards. Results are
compared with Schedule - VI, effluent prescribed by MoEF&CC. Results show that most of
the parameters are within the permissible limits.
WATER QUALITY DATA (EFFLUENT WATER- FOUR PARAMETERS)
Name of the Cluster:
Cluster -IX
Month:
MAR,2020
Name of the Station: Mine Discharge of
Jeenagora
Sl.
No.
Parameters
MW9
First Fortnight
MW9
Second Fortnight
As per MOEF
General Standards
for schedule VI 07.03.2020 25.03.2020
1 Total Suspended Solids 38 32 100 (Max)
2 pH 7.85 7.83 5.5 - 9.0
3 Oil & Grease <2.0 <2.0 10 (Max)
4 COD 48 52 250 (Max)
All values are expressed in mg/lit except pH.
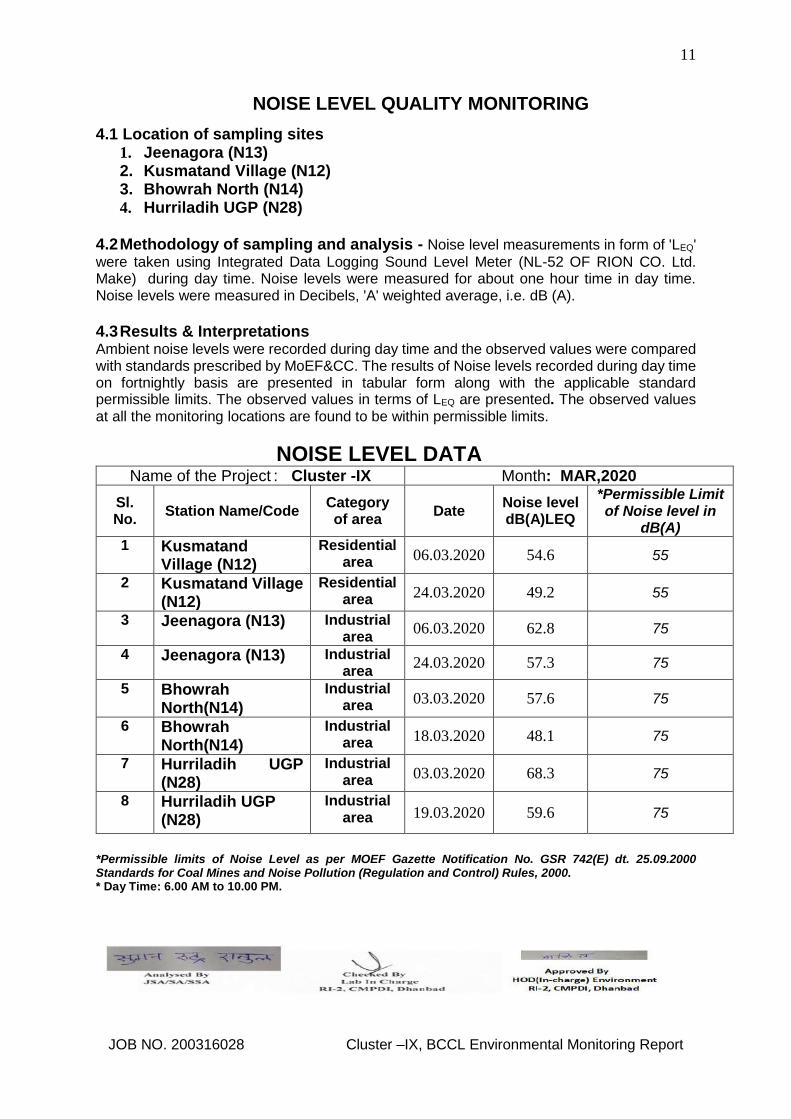
11
JOB NO. 200316028 Cluster –IX, BCCL Environmental Monitoring Report
NOISE LEVEL QUALITY MONITORING
4.1 Location of sampling sites 1. Jeenagora (N13) 2. Kusmatand Village (N12) 3. Bhowrah North (N14) 4. Hurriladih UGP (N28)
4.2 Methodology of sampling and analysis - Noise level measurements in form of 'LEQ'
were taken using Integrated Data Logging Sound Level Meter (NL-52 OF RION CO. Ltd. Make) during day time. Noise levels were measured for about one hour time in day time. Noise levels were measured in Decibels, 'A' weighted average, i.e. dB (A). 4.3 Results & Interpretations Ambient noise levels were recorded during day time and the observed values were compared with standards prescribed by MoEF&CC. The results of Noise levels recorded during day time on fortnightly basis are presented in tabular form along with the applicable standard permissible limits. The observed values in terms of LEQ are presented. The observed values at all the monitoring locations are found to be within permissible limits.
NOISE LEVEL DATA
Name of the Project : Cluster -IX Month: MAR,2020
Sl. No.
Station Name/Code Category of area
Date Noise level dB(A)LEQ
*Permissible Limit of Noise level in
dB(A) 1 Kusmatand
Village (N12)
Residential area 06.03.2020 54.6 55
2 Kusmatand Village (N12)
Residential area 24.03.2020 49.2 55
3 Jeenagora (N13) Industrial area
06.03.2020 62.8 75
4 Jeenagora (N13) Industrial area
24.03.2020 57.3 75
5 Bhowrah North(N14)
Industrial area 03.03.2020 57.6 75
6 Bhowrah North(N14)
Industrial area 18.03.2020 48.1 75
7 Hurriladih UGP (N28)
Industrial area 03.03.2020 68.3 75
8 Hurriladih UGP (N28)
Industrial area 19.03.2020 59.6 75
*Permissible limits of Noise Level as per MOEF Gazette Notification No. GSR 742(E) dt. 25.09.2000 Standards for Coal Mines and Noise Pollution (Regulation and Control) Rules, 2000. * Day Time: 6.00 AM to 10.00 PM.

12
JOB NO. 200316028 Cluster –IX, BCCL Environmental Monitoring Report
Ambient Air Quality Standards for Jharia Coal Field
As per the Environment (Protection) Amendment Rules, 2000 notified vide notification G.S.R. 742(E), dated 25.9.2000.
Category Pollutant Time
weighted
average
Concentration
in Ambient Air
Method of
Measurement
1 2 3 4 5
III
Coal mines located
in the coal fields of
Jharia
Raniganj Bokaro
Suspended
Particulate Matter
(SPM)
Annual
Average
*
24 hours
**
500 µg/m3
700 µg/m3
- High Volume Sampling (Average flow rate not less than 1.1
m3/minute)
Respirable
Particulate Matter
(size less than 10
µm) (RPM)
Annual
Average
*
24 hours
**
250 µg/m3
300 µg/m3
Respirable
Particulate Matter
sampling and
analysis
Sulphur Dioxide
(SO2)
Annual
Average
*
24 hours
**
80 µg/m3
120 µg/m3
1. Improvedwest
and Gaeke
method
2. Ultraviolet
fluorescene
Oxide of Nitrogen
as NO2
Annual
Average
*
24 hours
**
80 µg/m3
120 µg/m3
1. Jacob &
Hochheiser
Modified (Na-
Arsenic)
Method
2. Gas phase
Chemilumine-
scence
Note:
* Annual Arithmetic mean for the measurements taken in a year, following the guidelines for frequency of sampling laid down in clause2.
** 24hourly/8hourlyvaluesshallbemet92%ofthetimeinayear.However,8% of the time it may exceed but not on two
consecutivedays.

13
JOB NO. 200316028 Cluster –IX, BCCL Environmental Monitoring Report
NATIONAL AMBIENT AIR QUALITY STANDARDS New Delhi the 18th November 2009
In exercise of the powers conferred by Sub-section (2) (h) of section 16 of the Air (Prevention and Control of
Pollution) Act, 1981 (Act No. 14 of 1981), and in supersession of the notification No(s).S.O.384(E), dated 11th April
1994 and S.O.935(E), dated 14th NOVober 1998, the Central Pollution Control Board hereby notify the National
Ambient Air Quality Standards with immediate effect.
* Annual Arithmetic mean of minimum 104 measurements in a year at a particular site taken twice a week 24 hourly at uniform
intervals.
** 24 hourly or 8 hourly or 1 hourly monitored values, as applicable, shall be complied with 98% of the time in a year. 2% of the
time, they may exceed the limits but not on two consecutive days of monitoring.
NOTE: Whenever and wherever monitoring results on two consecutive days of monitoring exceed the limits specified above
for the respective category, it shall be considered adequate reason to institute regular or continuous monitoring and further
investigations.
Pollutant
Time Weighted Average
Concentration in Ambient Air Methods of Measurement
Industrial, Residentia
l, Rural and other
Areas
Ecologically Sensitive Area
(Notified by Central
Government)
Sulphur Dioxide (SO2), µg/m3
Annual * 24 Hours **
50 80
20 80
-Improved West and Gaeke Method -Ultraviolet Fluorescence
Nitrogendioxide (NO2), µg/m3
Annual * 24 Hours **
40 80
30 80
-Jacob &Hochheiser modified (NaOH-NaAsO2) Method -Gas Phase Chemiluminescence
Particulate Matter (Size less than 10µm) or PM10, µg/m3
Annual * 24 Hours **
60 100
60 100
-Gravimetric -TEOM -Beta attenuation
Particulate Matter (Size less than 2.5µm) or PM2.5, µg/m3
Annual * 24 Hours **
40 60
40 60
-Gravimetric -TEOM -Beta attenuation
Ozone (O3) , µg/m3 8 Hours * 1 Hour **
100 180
100 180
-UV Photometric -Chemiluminescence -Chemical Method
Lead (Pb) , µg/m3 Annual * 24 Hours **
0.50 1.0
0.50 1.0
-AAS/ICP Method after sampling on EPM 2000 or equivalent filter paper -ED-XRF using Teflon filter
Carbon Monoxide (CO), mg/m3
8 Hours ** 1 Hour **
02 04
02 04
-Non dispersive Infrared (NDIR) Spectroscopy
Ammonia (NH3), µg/m3 Annual * 24 Hours **
100 400
100 400
-Chemiluminescence -Indophenol blue method
Benzene (C6H6), µg/m3 Annual *
05 05 -Gas Chromatography (GC) based continuous analyzer -Adsorption and desorption followed by GC analysis
Benzo(a)Pyrene (BaP) Particulate phase only, ng/m3
Annual *
01 01 -Solvent extraction followed byHPLC/GC analysis
Arsenic (As), ng/m3 Annual *
06 06 -AAS/ICP Method after sampling on EPM 2000 or equivalent filter paper
Nickel (Ni), ng/m3 Annual *
20 20 -AAS/ICP Method after sampling on EPM 2000 or equivalent filter paper

14
Location of Air & Noise Monitoring Stations in BCCL
CMPDIISO 9001 Company
Monitoring Stations
BHARAT COKING COAL LIMITED
Air & Noise Sampling Locations
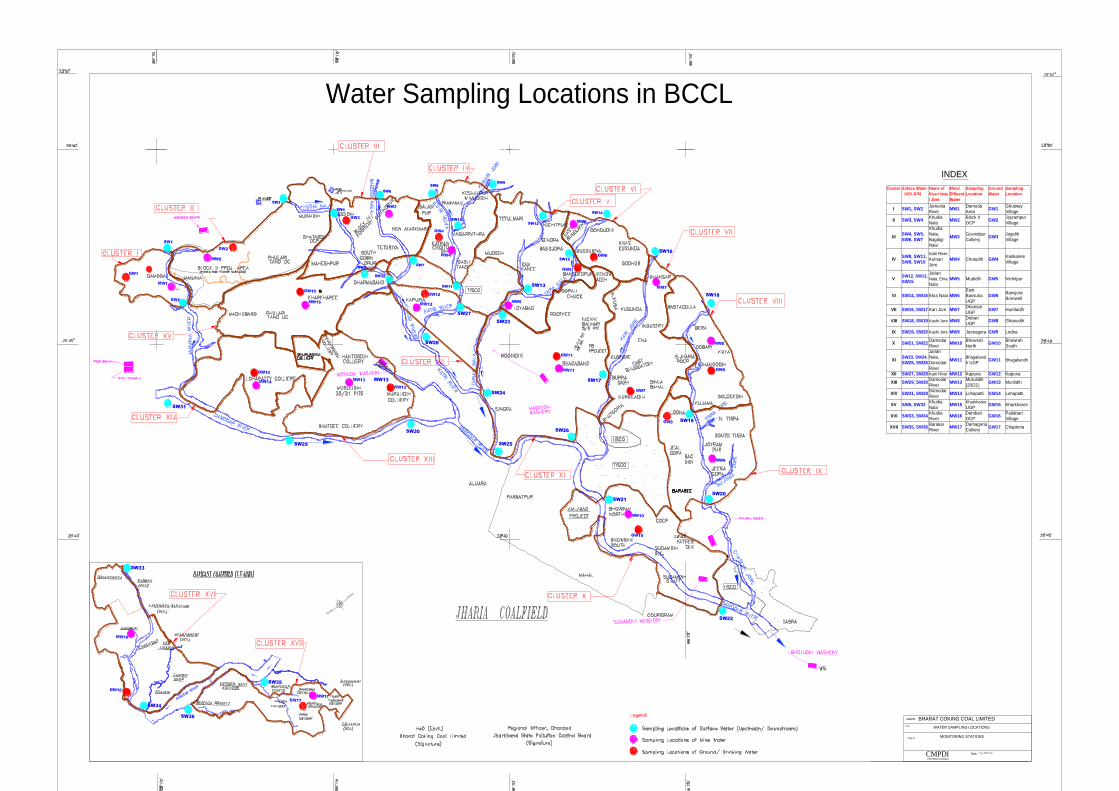
15
SW3
SW13
SW4
SW5
SW6
SW7
SW8
SW10
SW9
SW11
SW12
SW14
SW15
SW16
SW17
SW18
SW19
SW20
SW22
SW21
SW26
SW25
SW24
SW23
SW28
SW27
SW30
SW31
SW33
SW34
Water Sampling Locations in BCCL
SW29
SW35
SW36
SW32
Cluster Suface Water Name of
River/ Nala
/ Jore
Mine/
Effluent
Water
Sampling
Location
Ground
Water
Sampling
Location
I SW1, SW2Jamunia
RiverMW1
Damoda
AreaGW1
Ghutway
Village
II SW3, SW4Khudia
NalaMW2
Block II
OCPGW2
Joyrampur
Village
IIISW4, SW5,
SW6, SW7
Khudia
Nala,
Bagdigi
Nala
MW3Govindpur
CollieryGW3
Jogidih
Village
IVSW8, SW11,
SW9, SW10
Katri River,
Kumari
Jore
MW4 Chotudih GW4Kankanee
Village
VSW12, SW13,
SW15
Jarian
Nala, Ekra
Nala
MW5 Mudidih GW5 Nichitpur
VI SW14, SW15 Ekra Nala MW6
East
Bassuria
UGP
GW6Bansjora
Borewell
VII SW16, SW17 Kari Jore MW7Dhansar
UGPGW7 Hurriladih
VIII SW18, SW19 Kashi Jore MW8Dobari
UGPGW8 Ghanudih
IX SW19, SW20 Kashi Jore MW9 Jeenagora GW9 Lodna
X SW21, SW22Damodar
RiverMW10
Bhowrah
NorthGW10
Bhowrah
South
XISW23, SW24,
SW25, SW26
Jarian
Nala,
Damodar
River
MW11Bhagaband
h UGPGW11 Bhagabandh
XII SW27, SW28 Katri River MW12 Kapuria GW12 Kapuria
XIII SW29, SW30Damodar
RiverMW13
Murulidih
(20/21)GW13 Murilidih
XIV SW31, SW29Damodar
RiverMW14 Lohapatti GW14 Lohapatti
XV SW5, SW32Khudia
NalaMW15
Kharkharee
UGPGW15 Kharkharee
XVI SW33, SW34Khudia
RiverMW16
Dahibari
OCPGW16
Patlabari
Village
XVII SW35, SW36Barakar
RiverMW17
Damagoria
CollieryGW17 Chaptoria
INDEX
MW13
(U/S, D/S)
Pit 1
CMPDIISO 9001 Company
MONITORING STATIONS
BHARAT COKING COAL LIMITED
WATER SAMPLING LOCATIONS
CMPDI
ISO 9001 Company
Regional Institute-II
Dhanbad, Jharkhand
STRICTLY RESTRICTED FOR COMPANY USE ONLY RESTRICTED
The information given in this report is not to be
communicated either directly or indirectly to the
press or to any person not holding an official
position in the CIL / GOVERNMENT.
WATER QUALITY REPORT
OF
BHARAT COKING COAL LIMITED,
CLUSTER – IX
(FOR THE Q.E. DECEMBER, 2019)
E. C. no. J-11015/307/2010-IA.II (M) dated 21.05.2013.


CLUSTER - IX
(FOR THE Q.E. December, 2019)
CONTENTS
SL. NO.
CHAPTER
PARTICULARS
1.
2.
3.
4.
CHAPTER - I
CHAPTER-II
Plates: Plate. No. - I
EXECUTIVE SUMMARY
INTRODUCTION
WATER SAMPLING & ANALYSIS
SURFACE PLAN SHOWING
WATER MONITORING
LOCATIONS
CMPDI
ISO 9001 Company
Regional Institute-II
Dhanbad, Jharkhand
STRICTLY RESTRICTED FOR COMPANY USE ONLY RESTRICTED
The information given in this report is not to be
communicated either directly or indirectly to the
press or to any person not holding an official
position in the CIL / GOVERNMENT.
WATER QUALITY REPORT
OF
BHARAT COKING COAL LIMITED
CLUSTER – IX
(FOR THE Q.E.DECEMBER, 2019)
E. C. no. J-11015/307/2010-IA.II (M) dated 21.05.2013.
EXECUTIVE SUMMARY
1.0 Introduction
The purpose of environmental monitoring is to assess the quality of various
attributes that affects the environment around us. In accordance with the quality of
these attributes appropriate strategy is to be developed to control the pollution level
within the permissible limits. One of these major attributes is water.
Bharat Coking Coal Limited (BCCL), a Subsidiary company of Coal India Limited is
operating Underground and Opencast Mines in Jharia Coalfield (JCF) is a part of
Gondwana Coalfields located in Dhanbad district of Jharkhand, the JCF is bounded
by 23037’ N to 23052’ N latitudes and 86009’ E to 86030’ E longitude occupying an
area of 450 Sq.km. BCCL has awarded Environmental monitoring work of Jharia
Coalfield (JCF) to Central Mine Planning & Design Institute Limited (CMPDIL). The
environmental monitoring has been carried out as per the conditions laid down by
the MoEFCC while granting environmental clearance of project, consent letter
issued by the respective SPCB, and other statutory requirements.
2.0 Sampling location and rationale
2.1 Water sampling stations
The Water sampling stations were selected for mine effluent water, drinking water
supply, well/ Hand pump water & also surface water samples.
2.2 Ambient air sampling locations
The ambient air quality monitoring stations were selected to represent core,
buffer zone area. The rationale has been based on the guidelines stipulated by
MoEF&CC, consent letter of SPCB, as well as other statutory requirements.
3.0 Methodology of sampling and analysis
3.1 Water quality
Water samples were collected as per standard practice. Effluent samples were
analyzed for 25 parameters on quarterly basis & for 27 parameters on half yearly
basis. The drinking and Surface water samples were collected and analyzed for 25
and 17 parameters respectively, on quarterly basis. Thereafter the samples were
preserved and analyzed at the Environmental Laboratory at CMPDI (HQ), Ranchi.
3.2 Heavy Metal in Ambient Air
Parameters chosen for assessment of Heavy metal in Ambient Air Quality were cadmium (Cd), Mercury (Hg), Arsenic (As), Chromium (Cr), Nickel (Ni), and Lead (Pb). Respirable Dust Samplers (RDS) & fine particulates for PM 2.5 sampler were used for sampling PM 10 & PM 2.5 respectively. These heavy metals are analyzed regularly on half yearly basis. The samples were analyzed in Environmental Laboratory of CMPDI, RI-II, Dhanbad
4.0 Results and interpretations
4.1 Water quality
The test results indicate that the major parameters compared with MoEF&CC
Gazette Notification No. GSR 742(E) dt 25.09.2000 Standards for Coal Mines,
IS.10500/2012 (Drinking water) and IS: 2296 (Surface water), are with in
permissible limits.
4.2 Heavy Metal in Ambient Air
The results of Heavy metal in Ambient Air Quality are presented in tabular form
for each monitoring station. The concentration of heavy metals in ambient air is
well within the permissible limit.

CHAPTER - I
INTRODUCTION
1.0 Any industry and development activities including coal mining is bound to affect environmental attributes. There are positive as well as negative impacts of such operations. For controlling the adverse impacts a regular monitoring is essential. The environmental monitoring is being done as per the guide-lines stipulated by Ministry of Environment, Forest and Climate Change (MoEF&CC), Govt. of India.
Bharat Coking Coal Limited (BCCL), a subsidiary company of Coal India Limited
(CIL) is operating UG Mines and Opencast Mines in Jharia Coalfield (JCF). The Jharia Coalfield (JCF) having an area of 450 Sq.KM.
Bharat Coking Coal has awarded Environmental Monitoring work of all Projects,
Cluster wise, to Central Mine Planning & Design Institute Limited (CMPDIL). The environmental monitoring has been carried out as per conditions laid down by MoEF&CC while granting environmental clearance to different projects. CMPDI has trained manpower and well equipped laboratory to carry out monitoring, analysis and R&D work in the field of environment.
1.1 The Cluster-IX is in the Eastern part of the Jharia coalfield. It includes a group
of 7 Mines (viz. Lodna, S. Tisra/NTST OC, Jealgora, Joyrampur, Jeenagora, Bararee, S.Tisra/NTST Expan. OC. The Cluster – IX is situated about 25 - 30 kms from Dhanbad Railway Station. The mines of this Cluster – IX are operating since pre nationalization period (prior to 1972-73). It is connected by both Railway and Road. The drainage pattern of the area is governed by Kashi Jore.
1.2 The Cluster-IX is designed to produce 6.548 MTPA (normative) and 8.512
MTPA (peak) capacity of coal. The Project has Environmental Clearance from Ministry of Environment, Forest and
Climate Change (MoEF&CC) for a rated capacity 6.548 MTPA (normative) and 8.512 MTPA (peak) capacity of coal production vide letter no. J-11015/307/2010-IA.II (M) dated 21st May, 2013.
In compliance of these conditions the Environmental Monitoring has been carried out
& report prepared for submission to MoEF&CC & SPCB and other statutory authorities.
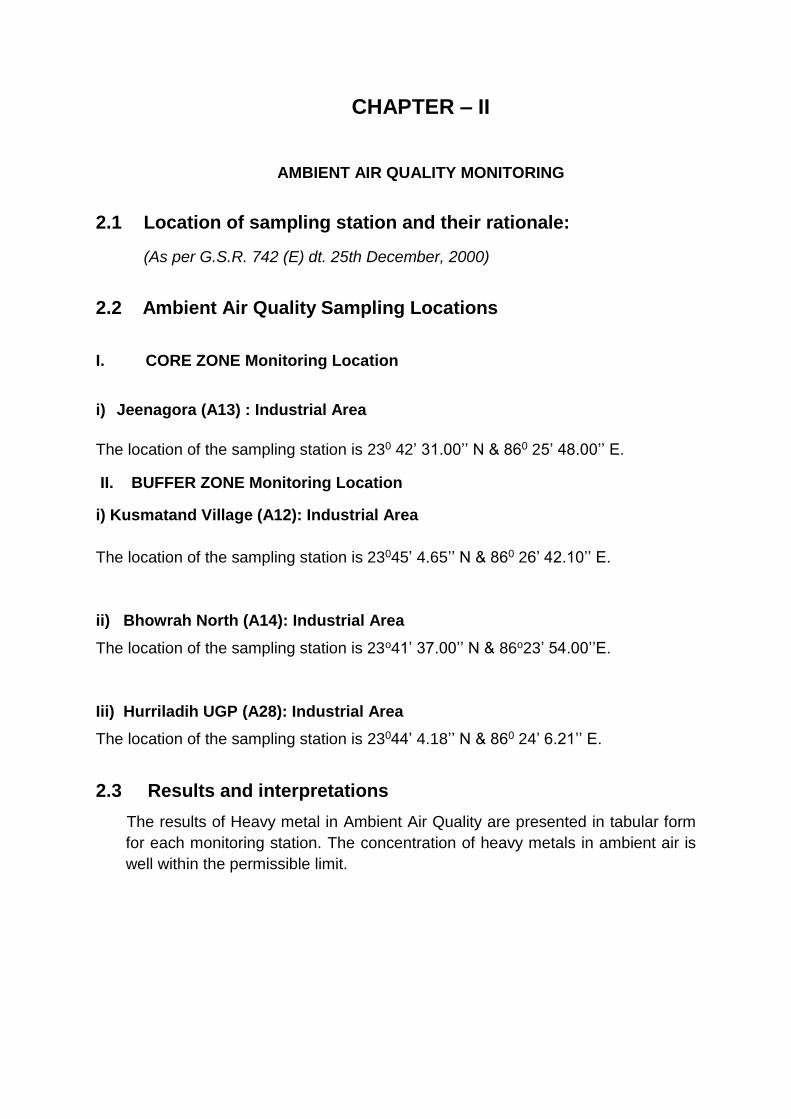
CHAPTER – II
AMBIENT AIR QUALITY MONITORING
2.1 Location of sampling station and their rationale:
(As per G.S.R. 742 (E) dt. 25th December, 2000)
2.2 Ambient Air Quality Sampling Locations
I. CORE ZONE Monitoring Location
i) Jeenagora (A13) : Industrial Area
The location of the sampling station is 230 42’ 31.00’’ N & 860 25’ 48.00’’ E.
II. BUFFER ZONE Monitoring Location
i) Kusmatand Village (A12): Industrial Area
The location of the sampling station is 23045’ 4.65’’ N & 860 26’ 42.10’’ E.
ii) Bhowrah North (A14): Industrial Area
The location of the sampling station is 23o41’ 37.00’’ N & 86o23’ 54.00’’E.
Iii) Hurriladih UGP (A28): Industrial Area
The location of the sampling station is 23044’ 4.18’’ N & 860 24’ 6.21’’ E.
2.3 Results and interpretations
The results of Heavy metal in Ambient Air Quality are presented in tabular form
for each monitoring station. The concentration of heavy metals in ambient air is
well within the permissible limit.
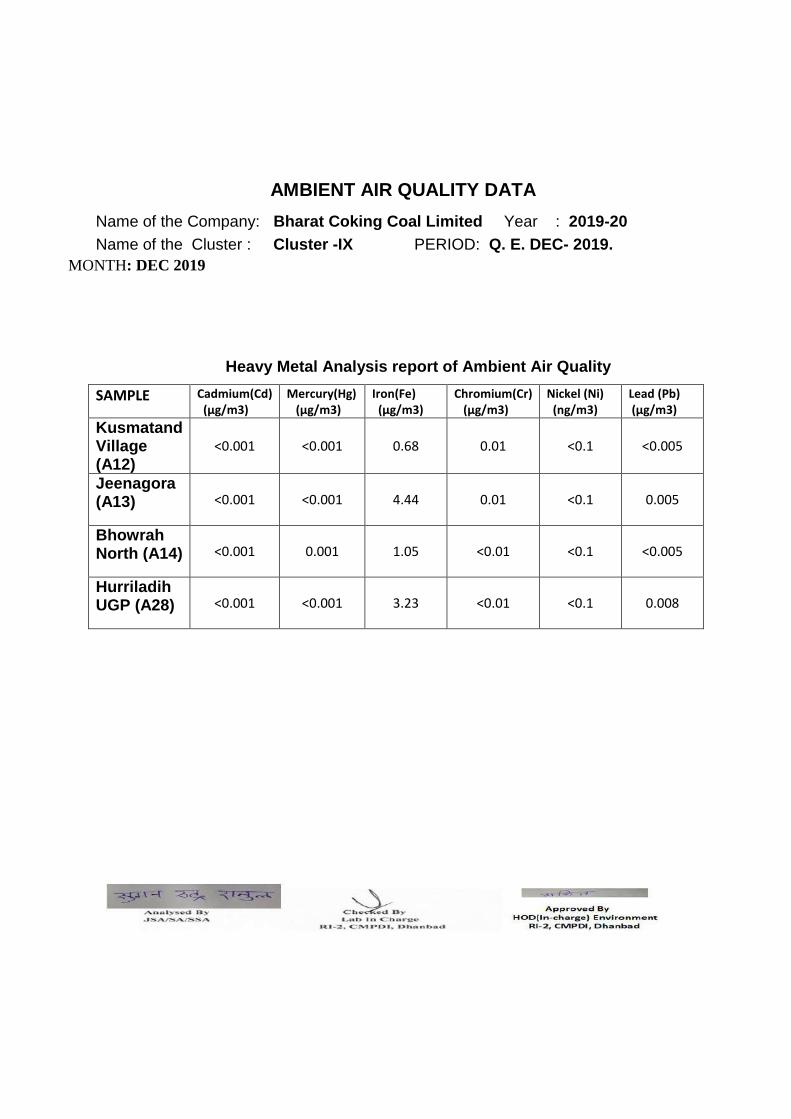
AMBIENT AIR QUALITY DATA
MONTH: DEC 2019
Heavy Metal Analysis report of Ambient Air Quality
SAMPLE Cadmium(Cd) (µg/m3)
Mercury(Hg) (µg/m3)
Iron(Fe) (µg/m3)
Chromium(Cr) (µg/m3)
Nickel (Ni) (ng/m3)
Lead (Pb) (µg/m3)
Kusmatand Village (A12)
<0.001 <0.001 0.68 0.01 <0.1 <0.005
Jeenagora (A13) <0.001 <0.001 4.44 0.01 <0.1 0.005
Bhowrah North (A14) <0.001 0.001 1.05 <0.01 <0.1 <0.005
Hurriladih UGP (A28) <0.001 <0.001 3.23 <0.01 <0.1 0.008
Name of the Company: Bharat Coking Coal Limited Year : 2019-20
Name of the Cluster : Cluster -IX PERIOD: Q. E. DEC- 2019.
CHAPTER – II
WATER QUALITY MONITORING
3.1 Location of sampling sites
(Refer Plate No. - I)
i) Drinking Water quality at Lodna (DW9) ii) Surface Water quality at U/S of Kashi Jore (SW19) iii) Surface quality at D/S of Kashi Jore (SW20) iv) Mine Effluent at Jeenagora (MW9)
3.2 Methodology of sampling and analysis
Water samples were collected as per standard practice. Effluent samples
were analyzed for 25 parameters on quarterly basis & for 27 parameters on
half yearly basis. The drinking and Surface water samples were collected and
analyzed for 25 and 17 parameters respectively, on quarterly basis.
Thereafter the samples were preserved and analyzed at the Environmental
Laboratory at CMPDI (HQ), Ranchi.
3.3 Results & Interpretations
The results are given in tabular form along with the applicable standards.
Results show that most of the parmeters are within the permissible limits.
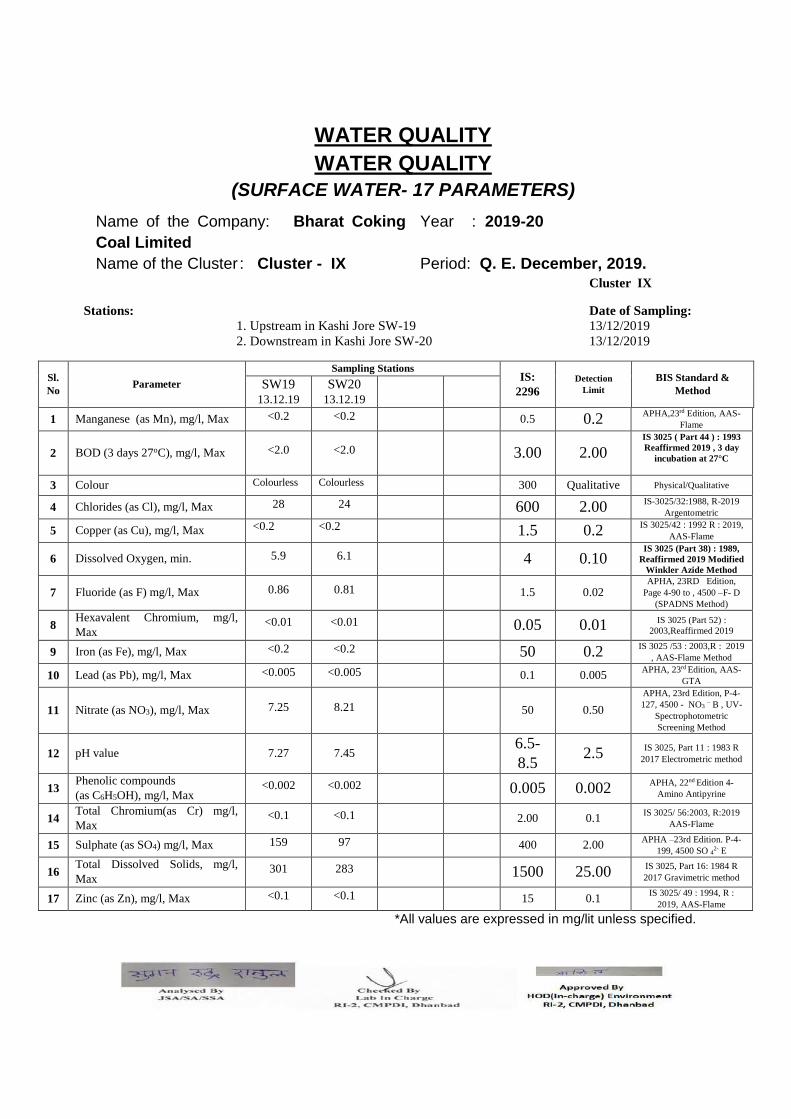
WATER QUALITY
WATER QUALITY
(SURFACE WATER- 17 PARAMETERS)
Cluster IX
Stations: Date of Sampling: 1. Upstream in Kashi Jore SW-19 13/12/2019 2. Downstream in Kashi Jore SW-20 13/12/2019
Sl.
No Parameter
Sampling Stations IS:
2296
Detection
Limit
BIS Standard &
Method SW19
13.12.19
SW20
13.12.19
1 Manganese (as Mn), mg/l, Max <0.2 <0.2 0.5 0.2 APHA,23rd Edition, AAS-
Flame
2 BOD (3 days 27oC), mg/l, Max <2.0 <2.0 3.00 2.00 IS 3025 ( Part 44 ) : 1993
Reaffirmed 2019 , 3 day
incubation at 27°C
3 Colour Colourless Colourless 300 Qualitative Physical/Qualitative
4 Chlorides (as Cl), mg/l, Max 28 24 600 2.00 IS-3025/32:1988, R-2019
Argentometric
5 Copper (as Cu), mg/l, Max <0.2 <0.2 1.5 0.2 IS 3025/42 : 1992 R : 2019,
AAS-Flame
6 Dissolved Oxygen, min. 5.9 6.1 4 0.10 IS 3025 (Part 38) : 1989,
Reaffirmed 2019 Modified
Winkler Azide Method
7 Fluoride (as F) mg/l, Max 0.86 0.81 1.5 0.02 APHA, 23RD Edition,
Page 4-90 to , 4500 –F- D
(SPADNS Method)
8 Hexavalent Chromium, mg/l,
Max <0.01 <0.01 0.05 0.01 IS 3025 (Part 52) :
2003,Reaffirmed 2019
9 Iron (as Fe), mg/l, Max <0.2 <0.2 50 0.2 IS 3025 /53 : 2003,R : 2019
, AAS-Flame Method
10 Lead (as Pb), mg/l, Max <0.005 <0.005 0.1 0.005 APHA, 23rd Edition, AAS-
GTA
11 Nitrate (as NO3), mg/l, Max 7.25 8.21 50 0.50
APHA, 23rd Edition, P-4-
127, 4500 - NO3 – B , UV-
Spectrophotometric
Screening Method
12 pH value 7.27 7.45 6.5-
8.5 2.5
IS 3025, Part 11 : 1983 R
2017 Electrometric method
13 Phenolic compounds
(as C6H5OH), mg/l, Max <0.002 <0.002 0.005 0.002
APHA, 22nd Edition 4-
Amino Antipyrine
14 Total Chromium(as Cr) mg/l,
Max <0.1 <0.1 2.00 0.1
IS 3025/ 56:2003, R:2019
AAS-Flame
15 Sulphate (as SO4) mg/l, Max 159 97 400 2.00 APHA –23rd Edition. P-4-
199, 4500 SO 42- E
16 Total Dissolved Solids, mg/l,
Max 301 283 1500 25.00
IS 3025, Part 16: 1984 R
2017 Gravimetric method
17 Zinc (as Zn), mg/l, Max <0.1 <0.1 15 0.1 IS 3025/ 49 : 1994, R :
2019, AAS-Flame
*All values are expressed in mg/lit unless specified.
Name of the Company: Bharat Coking
Coal Limited
Year : 2019-20
Name of the Cluster : Cluster - IX Period: Q. E. December, 2019.
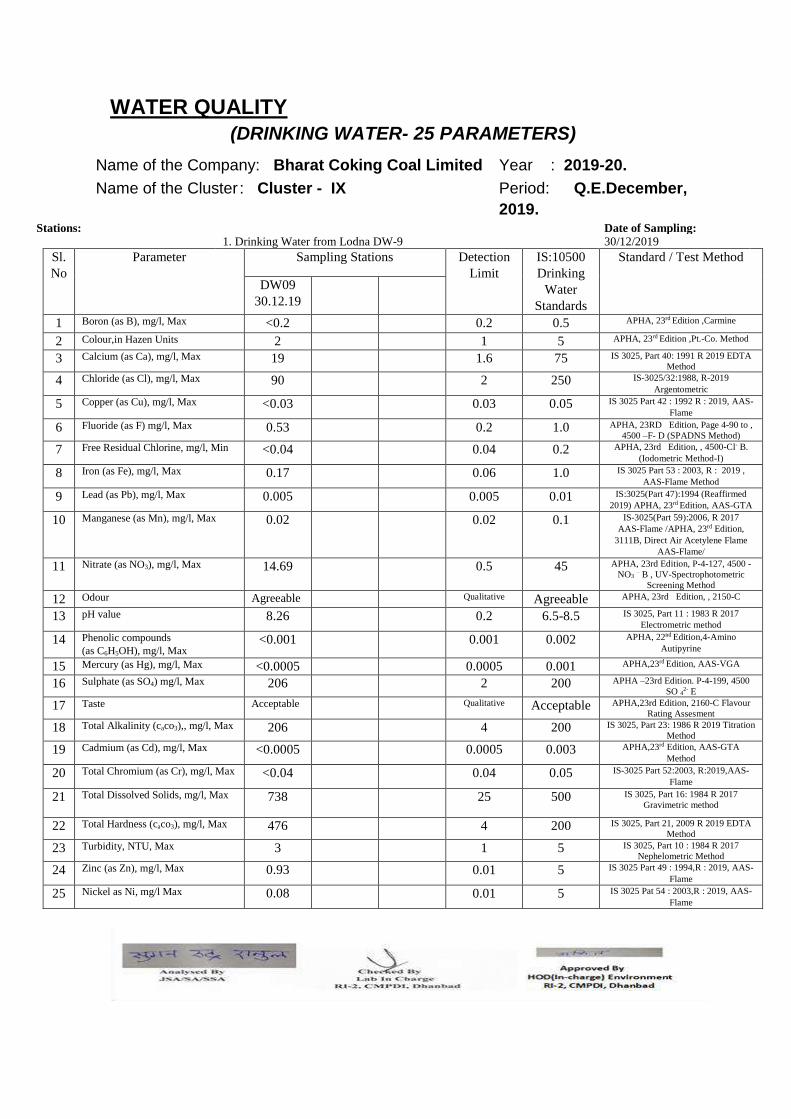
WATER QUALITY
(DRINKING WATER- 25 PARAMETERS)
Stations: Date of Sampling: 1. Drinking Water from Lodna DW-9 30/12/2019
Sl.
No
Parameter Sampling Stations Detection
Limit
IS:10500
Drinking
Water
Standards
Standard / Test Method
DW09
30.12.19
1 Boron (as B), mg/l, Max <0.2 0.2 0.5 APHA, 23rd Edition ,Carmine
2 Colour,in Hazen Units 2 1 5 APHA, 23rd Edition ,Pt.-Co. Method
3 Calcium (as Ca), mg/l, Max 19 1.6 75 IS 3025, Part 40: 1991 R 2019 EDTA
Method
4 Chloride (as Cl), mg/l, Max 90 2 250 IS-3025/32:1988, R-2019
Argentometric
5 Copper (as Cu), mg/l, Max <0.03 0.03 0.05 IS 3025 Part 42 : 1992 R : 2019, AAS-
Flame
6 Fluoride (as F) mg/l, Max 0.53 0.2 1.0 APHA, 23RD Edition, Page 4-90 to ,
4500 –F- D (SPADNS Method)
7 Free Residual Chlorine, mg/l, Min <0.04 0.04 0.2 APHA, 23rd Edition, , 4500-Cl- B.
(Iodometric Method-I)
8 Iron (as Fe), mg/l, Max 0.17 0.06 1.0 IS 3025 Part 53 : 2003, R : 2019 ,
AAS-Flame Method
9 Lead (as Pb), mg/l, Max 0.005 0.005 0.01 IS:3025(Part 47):1994 (Reaffirmed
2019) APHA, 23rd Edition, AAS-GTA
10 Manganese (as Mn), mg/l, Max 0.02 0.02 0.1 IS-3025(Part 59):2006, R 2017
AAS-Flame /APHA, 23rd Edition,
3111B, Direct Air Acetylene Flame
AAS-Flame/
11 Nitrate (as NO3), mg/l, Max 14.69 0.5 45 APHA, 23rd Edition, P-4-127, 4500 -
NO3 – B , UV-Spectrophotometric
Screening Method
12 Odour Agreeable Qualitative Agreeable APHA, 23rd Edition, , 2150-C
13 pH value 8.26 0.2 6.5-8.5 IS 3025, Part 11 : 1983 R 2017
Electrometric method
14 Phenolic compounds
(as C6H5OH), mg/l, Max <0.001 0.001 0.002 APHA, 22nd Edition,4-Amino
Autipyrine
15 Mercury (as Hg), mg/l, Max <0.0005 0.0005 0.001 APHA,23rd Edition, AAS-VGA
16 Sulphate (as SO4) mg/l, Max 206 2 200 APHA –23rd Edition. P-4-199, 4500
SO 42- E
17 Taste Acceptable Qualitative Acceptable APHA,23rd Edition, 2160-C Flavour
Rating Assesment
18 Total Alkalinity (caco3),, mg/l, Max 206 4 200 IS 3025, Part 23: 1986 R 2019 Titration
Method
19 Cadmium (as Cd), mg/l, Max <0.0005 0.0005 0.003 APHA,23rd Edition, AAS-GTA
Method
20 Total Chromium (as Cr), mg/l, Max <0.04 0.04 0.05 IS-3025 Part 52:2003, R:2019,AAS-
Flame
21 Total Dissolved Solids, mg/l, Max 738 25 500 IS 3025, Part 16: 1984 R 2017
Gravimetric method
22 Total Hardness (caco3), mg/l, Max 476 4 200 IS 3025, Part 21, 2009 R 2019 EDTA
Method
23 Turbidity, NTU, Max 3 1 5 IS 3025, Part 10 : 1984 R 2017
Nephelometric Method
24 Zinc (as Zn), mg/l, Max 0.93 0.01 5 IS 3025 Part 49 : 1994,R : 2019, AAS-
Flame
25 Nickel as Ni, mg/l Max 0.08 0.01 5 IS 3025 Pat 54 : 2003,R : 2019, AAS-
Flame
Name of the Company: Bharat Coking Coal Limited Year : 2019-20.
Name of the Cluster : Cluster - IX Period: Q.E.December,
2019.
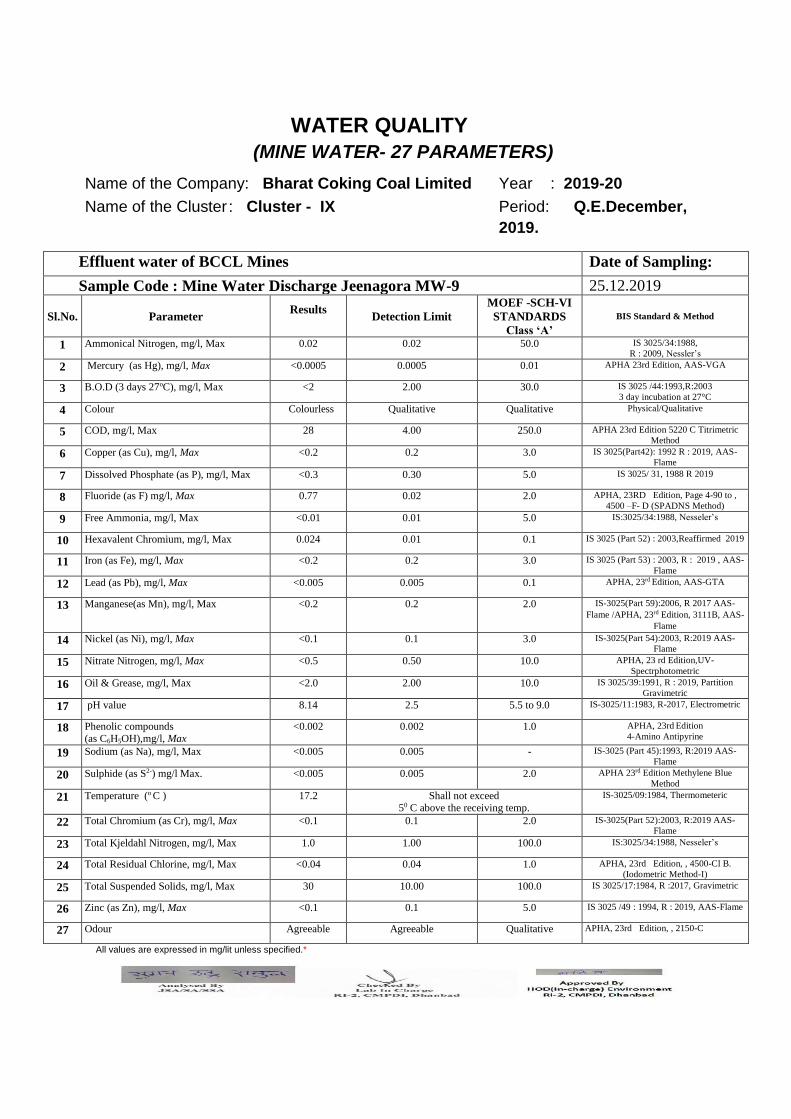
WATER QUALITY
(MINE WATER- 27 PARAMETERS)
Effluent water of BCCL Mines Date of Sampling:
Sample Code : Mine Water Discharge Jeenagora MW-9 25.12.2019
Sl.No. Parameter Results
Detection Limit
MOEF -SCH-VI
STANDARDS
Class ‘A’
BIS Standard & Method
1 Ammonical Nitrogen, mg/l, Max 0.02 0.02 50.0 IS 3025/34:1988,
R : 2009, Nessler’s
2 Mercury (as Hg), mg/l, Max <0.0005 0.0005 0.01 APHA 23rd Edition, AAS-VGA
3 B.O.D (3 days 27oC), mg/l, Max <2 2.00 30.0 IS 3025 /44:1993,R:2003
3 day incubation at 27°C
4 Colour Colourless Qualitative Qualitative Physical/Qualitative
5 COD, mg/l, Max 28 4.00 250.0 APHA 23rd Edition 5220 C Titrimetric
Method
6 Copper (as Cu), mg/l, Max <0.2 0.2 3.0 IS 3025(Part42): 1992 R : 2019, AAS-
Flame
7 Dissolved Phosphate (as P), mg/l, Max <0.3 0.30 5.0 IS 3025/ 31, 1988 R 2019
8 Fluoride (as F) mg/l, Max 0.77 0.02 2.0 APHA, 23RD Edition, Page 4-90 to ,
4500 –F- D (SPADNS Method)
9 Free Ammonia, mg/l, Max <0.01 0.01 5.0 IS:3025/34:1988, Nesseler’s
10 Hexavalent Chromium, mg/l, Max 0.024 0.01 0.1 IS 3025 (Part 52) : 2003,Reaffirmed 2019
11 Iron (as Fe), mg/l, Max <0.2 0.2 3.0 IS 3025 (Part 53) : 2003, R : 2019 , AAS-
Flame
12 Lead (as Pb), mg/l, Max <0.005 0.005 0.1 APHA, 23rd Edition, AAS-GTA
13 Manganese(as Mn), mg/l, Max <0.2 0.2 2.0 IS-3025(Part 59):2006, R 2017 AAS-
Flame /APHA, 23rd Edition, 3111B, AAS-
Flame
14 Nickel (as Ni), mg/l, Max <0.1 0.1 3.0 IS-3025(Part 54):2003, R:2019 AAS-
Flame
15 Nitrate Nitrogen, mg/l, Max <0.5 0.50 10.0 APHA, 23 rd Edition,UV-
Spectrphotometric
16 Oil & Grease, mg/l, Max <2.0 2.00 10.0 IS 3025/39:1991, R : 2019, Partition
Gravimetric
17 pH value 8.14 2.5 5.5 to 9.0 IS-3025/11:1983, R-2017, Electrometric
18 Phenolic compounds (as C6H5OH),mg/l, Max
<0.002 0.002 1.0 APHA, 23rd Edition
4-Amino Antipyrine
19 Sodium (as Na), mg/l, Max <0.005 0.005 - IS-3025 (Part 45):1993, R:2019 AAS-
Flame
20 Sulphide (as S2-) mg/l Max. <0.005 0.005 2.0 APHA 23rd Edition Methylene Blue
Method
21 Temperature (o C ) 17.2 Shall not exceed 50 C above the receiving temp.
IS-3025/09:1984, Thermometeric
22 Total Chromium (as Cr), mg/l, Max <0.1 0.1 2.0 IS-3025(Part 52):2003, R:2019 AAS-
Flame
23 Total Kjeldahl Nitrogen, mg/l, Max 1.0 1.00 100.0 IS:3025/34:1988, Nesseler’s
24 Total Residual Chlorine, mg/l, Max <0.04 0.04 1.0 APHA, 23rd Edition, , 4500-Cl B.
(Iodometric Method-I)
25 Total Suspended Solids, mg/l, Max 30 10.00 100.0 IS 3025/17:1984, R :2017, Gravimetric
26 Zinc (as Zn), mg/l, Max <0.1 0.1 5.0 IS 3025 /49 : 1994, R : 2019, AAS-Flame
27 Odour Agreeable Agreeable Qualitative APHA, 23rd Edition, , 2150-C
All values are expressed in mg/lit unless specified.*
Name of the Company: Bharat Coking Coal Limited Year : 2019-20
Name of the Cluster : Cluster - IX Period: Q.E.December,
2019.
CMPDI
ISO 9001 Company
Regional Institute-II
Dhanbad, Jharkhand
STRICTLY RESTRICTED FOR COMPANY USE ONLY RESTRICTED
The information given in this report is not to be
communicated either directly or indirectly to the
press or to any person not holding an official
position in the CIL / GOVERNMENT.
WATER QUALITY REPORT
OF
BHARAT COKING COAL LIMITED,
CLUSTER – IX
(FOR THE Q.E. MARCH, 2020)
E. C. no. J-11015/307/2010-IA.II (M) dated 21.05.2013.

CLUSTER - IX
(FOR THE Q.E. MARCH, 2020)
CONTENTS
SL. NO.
CHAPTER
PARTICULARS
1.
2.
3.
4.
CHAPTER - I
CHAPTER-II
Plates: Plate. No. - I
EXECUTIVE SUMMARY
INTRODUCTION
WATER SAMPLING & ANALYSIS
SURFACE PLAN SHOWING
WATER MONITORING
LOCATIONS

CMPDI
ISO 9001 Company
Regional Institute-II
Dhanbad, Jharkhand
STRICTLY RESTRICTED FOR COMPANY USE ONLY RESTRICTED
The information given in this report is not to be
communicated either directly or indirectly to the
press or to any person not holding an official
position in the CIL / GOVERNMENT.
WATER QUALITY REPORT
OF
BHARAT COKING COAL LIMITED
CLUSTER – IX
(FOR THE Q.E. MARCH, 2020)
E. C. no. J-11015/307/2010-IA.II (M) dated 21.05.2013.
EXECUTIVE SUMMARY
1.0 Introduction
The purpose of environmental monitoring is to assess the quality of various
attributes that affects the environment around us. In accordance with the quality of
these attributes appropriate strategy is to be developed to control the pollution level
within the permissible limits. One of these major attributes is water.
Bharat Coking Coal Limited (BCCL), a Subsidiary company of Coal India Limited is
operating Underground and Opencast Mines in Jharia Coalfield (JCF) is a part of
Gondwana Coalfields located in Dhanbad district of Jharkhand, the JCF is bounded
by 23037’ N to 23052’ N latitudes and 86009’ E to 86030’ E longitude occupying an
area of 450 Sq.km. BCCL has awarded Environmental monitoring work of Jharia
Coalfield (JCF) to Central Mine Planning & Design Institute Limited (CMPDIL). The
environmental monitoring has been carried out as per the conditions laid down by
the MoEFCC while granting environmental clearance of project, consent letter
issued by the respective SPCB, and other statutory requirements.
2.0 Sampling location and rationale
2.1 Water sampling stations
The Water sampling stations were selected for mine effluent water, drinking water
supply, well/ Hand pump water & also surface water samples.
3.0 Methodology of sampling and analysis
3.1 Water quality
Water samples were collected as per standard practice. Effluent samples were
analyzed for 25 parameters on quarterly basis & for 27 parameters on half yearly
basis. The drinking and Surface water samples were collected and analyzed for 25
and 17 parameters respectively, on quarterly basis. Thereafter the samples were
preserved and analyzed at the Environmental Laboratory at CMPDI (HQ), Ranchi.
4.0 Results and interpretations
4.1 Water quality
The test results indicate that the major parameters compared with MoEF&CC
Gazette Notification No. GSR 742(E) dt 25.09.2000 Standards for Coal Mines,

IS.10500/2012 (Drinking water) and IS: 2296 (Surface water), are with in
permissible limits.
CHAPTER - I
INTRODUCTION
1.0 Any industry and development activities including coal mining is bound to affect environmental attributes. There are positive as well as negative impacts of such operations. For controlling the adverse impacts a regular monitoring is essential. The environmental monitoring is being done as per the guide-lines stipulated by Ministry of Environment, Forest and Climate Change (MoEF&CC), Govt. of India.
Bharat Coking Coal Limited (BCCL), a subsidiary company of Coal India Limited
(CIL) is operating UG Mines and Opencast Mines in Jharia Coalfield (JCF). The Jharia Coalfield (JCF) having an area of 450 Sq.KM.
Bharat Coking Coal has awarded Environmental Monitoring work of all Projects,
Cluster wise, to Central Mine Planning & Design Institute Limited (CMPDIL). The environmental monitoring has been carried out as per conditions laid down by MoEF&CC while granting environmental clearance to different projects. CMPDI has trained manpower and well equipped laboratory to carry out monitoring, analysis and R&D work in the field of environment.
1.1 The Cluster-IX is in the Eastern part of the Jharia coalfield. It includes a group
of 7 Mines (viz. Lodna, S. Tisra/NTST OC, Jealgora, Joyrampur, Jeenagora, Bararee, S.Tisra/NTST Expan. OC. The Cluster – IX is situated about 25 - 30 kms from Dhanbad Railway Station. The mines of this Cluster – IX are operating since pre nationalization period (prior to 1972-73). It is connected by both Railway and Road. The drainage pattern of the area is governed by Kashi Jore.
1.2 The Cluster-IX is designed to produce 6.548 MTPA (normative) and 8.512
MTPA (peak) capacity of coal. The Project has Environmental Clearance from Ministry of Environment, Forest and
Climate Change (MoEF&CC) for a rated capacity 6.548 MTPA (normative) and 8.512 MTPA (peak) capacity of coal production vide letter no. J-11015/307/2010-IA.II (M) dated 21st May, 2013.
In compliance of these conditions the Environmental Monitoring has been carried out
& report prepared for submission to MoEF&CC & SPCB and other statutory authorities.
CHAPTER – II
WATER QUALITY MONITORING
2.1 Location of sampling sites
(Refer Plate No. - I)
i) Drinking Water quality at Lodna (DW9) ii) Surface Water quality at U/S of Kashi Jore (SW19) iii) Surface quality at D/S of Kashi Jore (SW20)
2.2 Methodology of sampling and analysis
Water samples were collected as per standard practice. Effluent samples
were analyzed for 25 parameters on quarterly basis & for 27 parameters on
half yearly basis. The drinking and Surface water samples were collected and
analyzed for 25 and 17 parameters respectively, on quarterly basis.
Thereafter the samples were preserved and analyzed at the Environmental
Laboratory at CMPDI RI-II,Dhanbad.
2.3 Results & Interpretations
The results are given in tabular form along with the applicable standards.
Results show that most of the parmeters are within the permissible limits.
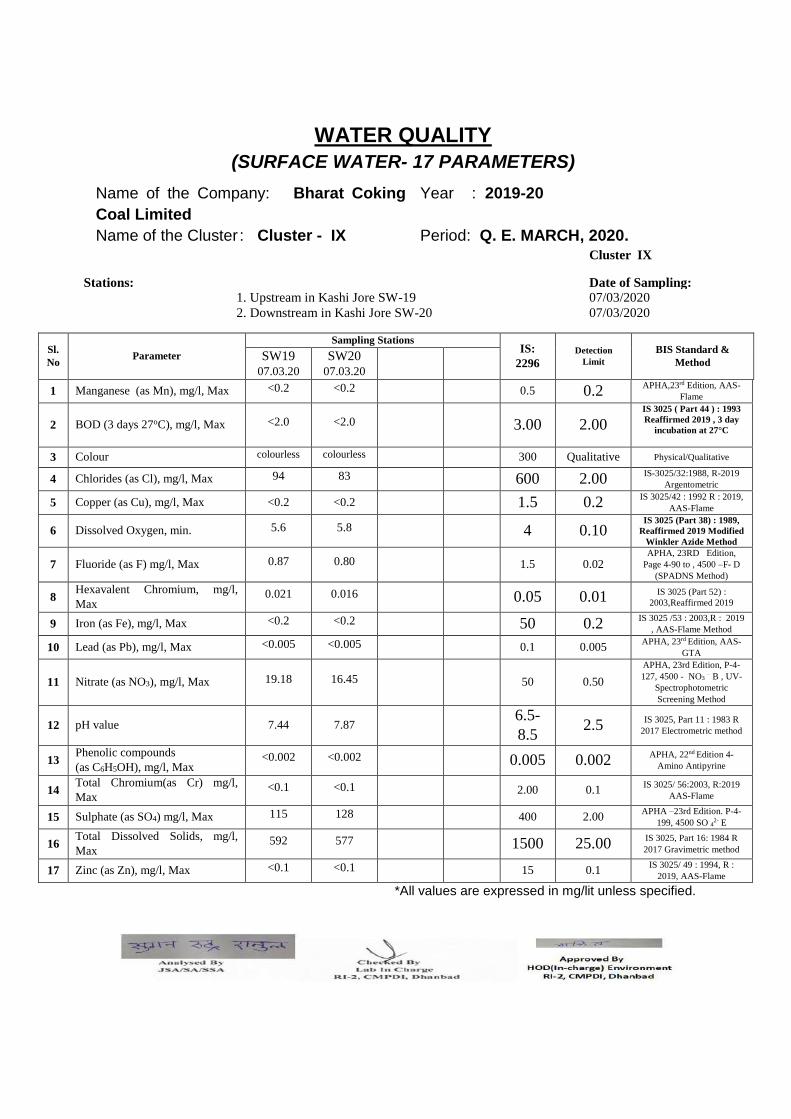
WATER QUALITY
(SURFACE WATER- 17 PARAMETERS)
Cluster IX
Stations: Date of Sampling: 1. Upstream in Kashi Jore SW-19 07/03/2020 2. Downstream in Kashi Jore SW-20 07/03/2020
Sl.
No Parameter
Sampling Stations IS:
2296
Detection
Limit
BIS Standard &
Method SW19
07.03.20
SW20
07.03.20
1 Manganese (as Mn), mg/l, Max <0.2 <0.2 0.5 0.2 APHA,23rd Edition, AAS-
Flame
2 BOD (3 days 27oC), mg/l, Max <2.0 <2.0 3.00 2.00 IS 3025 ( Part 44 ) : 1993
Reaffirmed 2019 , 3 day
incubation at 27°C
3 Colour colourless colourless 300 Qualitative Physical/Qualitative
4 Chlorides (as Cl), mg/l, Max 94 83 600 2.00 IS-3025/32:1988, R-2019
Argentometric
5 Copper (as Cu), mg/l, Max <0.2 <0.2 1.5 0.2 IS 3025/42 : 1992 R : 2019,
AAS-Flame
6 Dissolved Oxygen, min. 5.6 5.8 4 0.10 IS 3025 (Part 38) : 1989,
Reaffirmed 2019 Modified
Winkler Azide Method
7 Fluoride (as F) mg/l, Max 0.87 0.80 1.5 0.02 APHA, 23RD Edition,
Page 4-90 to , 4500 –F- D
(SPADNS Method)
8 Hexavalent Chromium, mg/l,
Max 0.021 0.016 0.05 0.01 IS 3025 (Part 52) :
2003,Reaffirmed 2019
9 Iron (as Fe), mg/l, Max <0.2 <0.2 50 0.2 IS 3025 /53 : 2003,R : 2019
, AAS-Flame Method
10 Lead (as Pb), mg/l, Max <0.005 <0.005 0.1 0.005 APHA, 23rd Edition, AAS-
GTA
11 Nitrate (as NO3), mg/l, Max 19.18 16.45 50 0.50
APHA, 23rd Edition, P-4-
127, 4500 - NO3 – B , UV-
Spectrophotometric
Screening Method
12 pH value 7.44 7.87 6.5-
8.5 2.5
IS 3025, Part 11 : 1983 R
2017 Electrometric method
13 Phenolic compounds
(as C6H5OH), mg/l, Max <0.002 <0.002 0.005 0.002
APHA, 22nd Edition 4-
Amino Antipyrine
14 Total Chromium(as Cr) mg/l,
Max <0.1 <0.1 2.00 0.1
IS 3025/ 56:2003, R:2019
AAS-Flame
15 Sulphate (as SO4) mg/l, Max 115 128 400 2.00 APHA –23rd Edition. P-4-
199, 4500 SO 42- E
16 Total Dissolved Solids, mg/l,
Max 592 577 1500 25.00
IS 3025, Part 16: 1984 R
2017 Gravimetric method
17 Zinc (as Zn), mg/l, Max <0.1 <0.1 15 0.1 IS 3025/ 49 : 1994, R :
2019, AAS-Flame
*All values are expressed in mg/lit unless specified.
Name of the Company: Bharat Coking
Coal Limited
Year : 2019-20
Name of the Cluster : Cluster - IX Period: Q. E. MARCH, 2020.
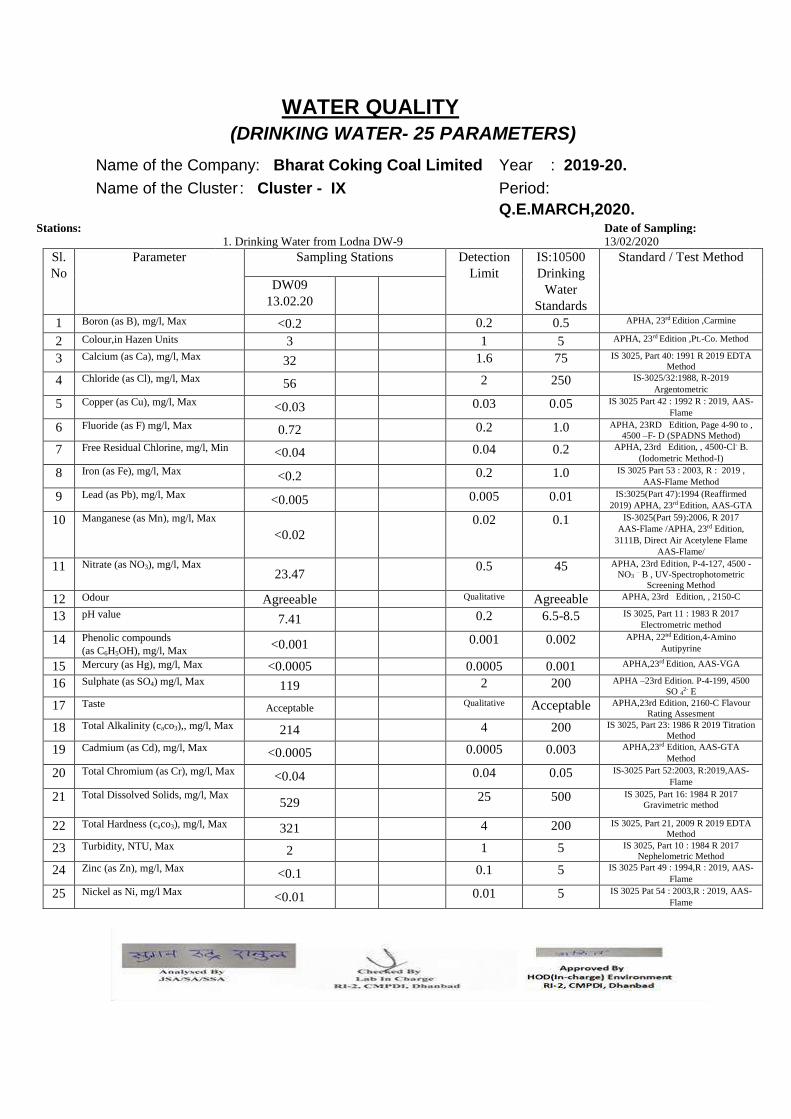
WATER QUALITY
(DRINKING WATER- 25 PARAMETERS)
Stations: Date of Sampling: 1. Drinking Water from Lodna DW-9 13/02/2020
Sl.
No
Parameter Sampling Stations Detection
Limit
IS:10500
Drinking
Water
Standards
Standard / Test Method
DW09
13.02.20
1 Boron (as B), mg/l, Max <0.2 0.2 0.5 APHA, 23rd Edition ,Carmine
2 Colour,in Hazen Units 3 1 5 APHA, 23rd Edition ,Pt.-Co. Method
3 Calcium (as Ca), mg/l, Max 32 1.6 75 IS 3025, Part 40: 1991 R 2019 EDTA
Method
4 Chloride (as Cl), mg/l, Max 56 2 250 IS-3025/32:1988, R-2019
Argentometric
5 Copper (as Cu), mg/l, Max <0.03 0.03 0.05 IS 3025 Part 42 : 1992 R : 2019, AAS-
Flame
6 Fluoride (as F) mg/l, Max 0.72 0.2 1.0 APHA, 23RD Edition, Page 4-90 to ,
4500 –F- D (SPADNS Method)
7 Free Residual Chlorine, mg/l, Min <0.04 0.04 0.2 APHA, 23rd Edition, , 4500-Cl- B.
(Iodometric Method-I)
8 Iron (as Fe), mg/l, Max <0.2 0.2 1.0 IS 3025 Part 53 : 2003, R : 2019 ,
AAS-Flame Method
9 Lead (as Pb), mg/l, Max <0.005 0.005 0.01 IS:3025(Part 47):1994 (Reaffirmed
2019) APHA, 23rd Edition, AAS-GTA
10 Manganese (as Mn), mg/l, Max
<0.02
0.02 0.1 IS-3025(Part 59):2006, R 2017
AAS-Flame /APHA, 23rd Edition,
3111B, Direct Air Acetylene Flame
AAS-Flame/
11 Nitrate (as NO3), mg/l, Max 23.47
0.5 45 APHA, 23rd Edition, P-4-127, 4500 -
NO3 – B , UV-Spectrophotometric
Screening Method
12 Odour Agreeable Qualitative Agreeable APHA, 23rd Edition, , 2150-C
13 pH value 7.41 0.2 6.5-8.5 IS 3025, Part 11 : 1983 R 2017
Electrometric method
14 Phenolic compounds
(as C6H5OH), mg/l, Max <0.001 0.001 0.002 APHA, 22nd Edition,4-Amino
Autipyrine
15 Mercury (as Hg), mg/l, Max <0.0005 0.0005 0.001 APHA,23rd Edition, AAS-VGA
16 Sulphate (as SO4) mg/l, Max 119 2 200 APHA –23rd Edition. P-4-199, 4500
SO 42- E
17 Taste Acceptable Qualitative Acceptable APHA,23rd Edition, 2160-C Flavour
Rating Assesment
18 Total Alkalinity (caco3),, mg/l, Max 214 4 200 IS 3025, Part 23: 1986 R 2019 Titration
Method
19 Cadmium (as Cd), mg/l, Max <0.0005 0.0005 0.003 APHA,23rd Edition, AAS-GTA
Method
20 Total Chromium (as Cr), mg/l, Max <0.04 0.04 0.05 IS-3025 Part 52:2003, R:2019,AAS-
Flame
21 Total Dissolved Solids, mg/l, Max 529
25 500 IS 3025, Part 16: 1984 R 2017
Gravimetric method
22 Total Hardness (caco3), mg/l, Max 321 4 200 IS 3025, Part 21, 2009 R 2019 EDTA
Method
23 Turbidity, NTU, Max 2 1 5 IS 3025, Part 10 : 1984 R 2017
Nephelometric Method
24 Zinc (as Zn), mg/l, Max <0.1 0.1 5 IS 3025 Part 49 : 1994,R : 2019, AAS-
Flame
25 Nickel as Ni, mg/l Max <0.01 0.01 5 IS 3025 Pat 54 : 2003,R : 2019, AAS-
Flame
Name of the Company: Bharat Coking Coal Limited Year : 2019-20.
Name of the Cluster : Cluster - IX Period:
Q.E.MARCH,2020.
