ix: weather forecasting
TRANSCRIPT
Weather Forecasting
Danny M. Vaughn, Ph.D., CMS
Weather forecasting - Predicting how the present state of atmospheric conditions will change over time. W orld weather data- transmitted to the National Center for Environmental Prediction (NCEP) in Camp Springs, M D. Data is analyzed and distributed to private and public agencies. Weather watch - issued to indicate atmospheric conditions that are conducive to hazardous weather. Weather warning - issued to inform the public that hazardous weather conditions are im minent or presently occurring. Advisory - to inform the public of hazardous driving conditions.
Com puters and W eather Forecasting
W eather forecasting by numerical analysis. Atmospheric models are created by: Tem perature, pressure, moisture, winds, and air density are measured at a number of grid points (weather stations). Data are input into 6-8 equations and change among these variables is computed for a sm all increment of time (5 minutes). The variables for 18 levels of the atm osphere are included in these mathematical m odels.
Each 5 m inute increment for each level is computed over a desired range of tim e, e.g. 12, 24, 36, 48 hours. Com puter prints and analyzes the information and draws the projected positions of pressure systems with isobars and contour lines. Termed a prognostic chart or prog (figure 9.1). Limits in the m odel are dependent upon: accuracy of variables, atm ospheric assumptions, density of weather stations, & specific com puter model (figure 9.2).
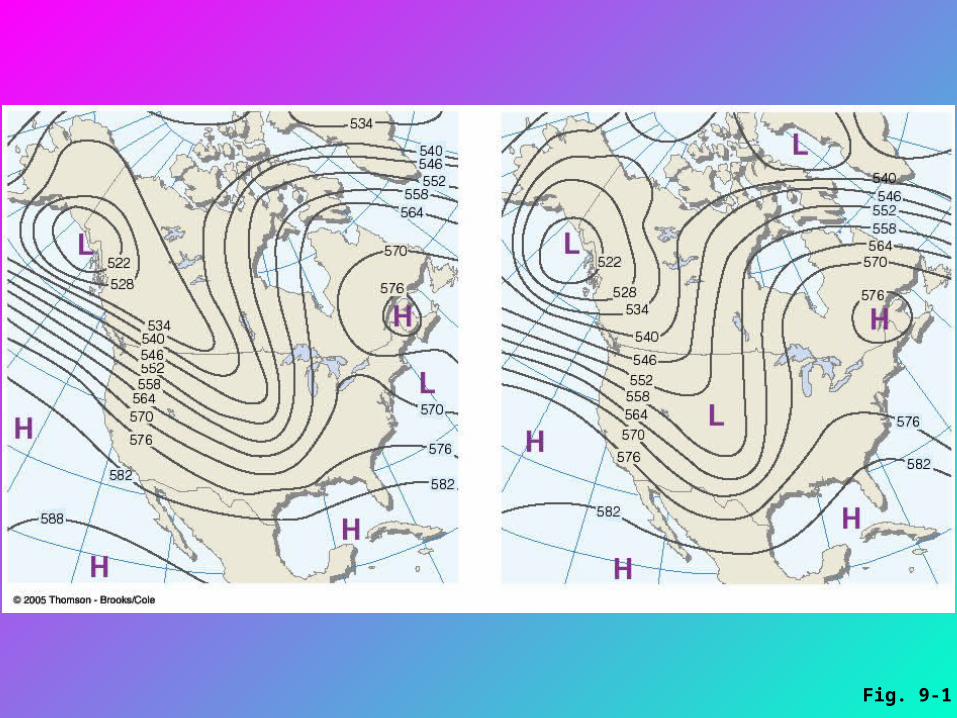
Fig. 9-1
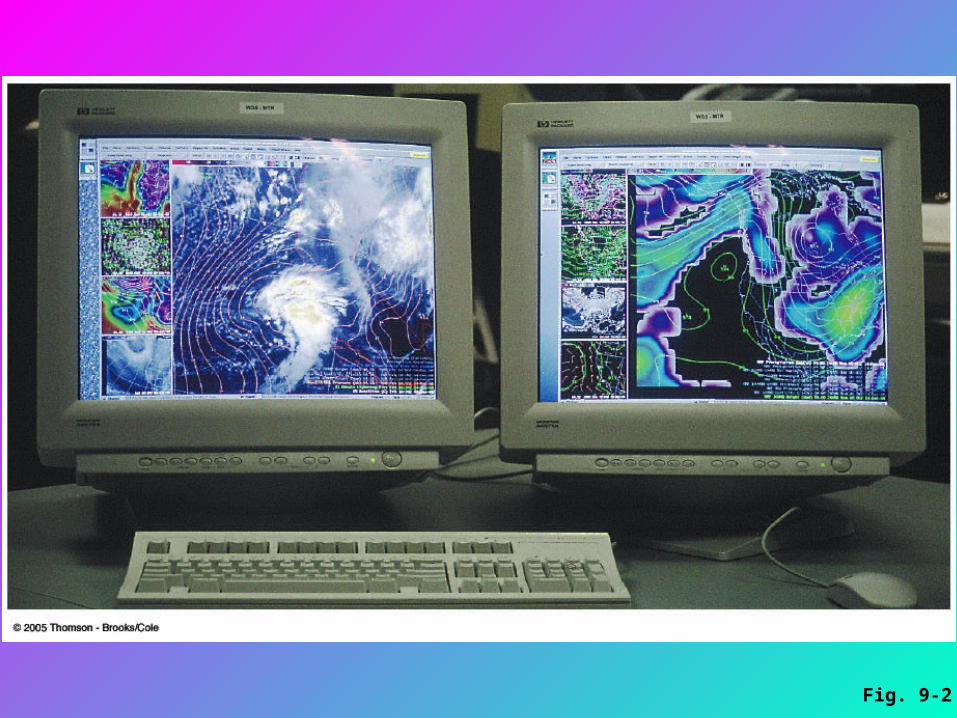
Fig. 9-2
M inicomputers aid in analyzing data. AFOS (Automation of Filed Operations and Services). AW IPS (Advanced W eather Interactive Processing System),also handles Doppler RADAR. Sounding - 2-D forecasting using a measured set oftemperature, dew point, and wind data throughout a verticalslice of the atmosphere. Compared with data upwind to make local, small-scalepredictions (thunderstorms, tornadoes, precipitation types).
Satellites and W eather Forecasting Provide synoptic scale data from space. Good for observing the developm ent of weather conditions over areas without station data (hurricanes and tropical storm s over water).
Geostationary (geosynchronous) orbit (figure 9.6)- revolves about the earth at the same rate as the earth rotates at 22,300 miles above the surface.
Allows specific monitoring over a fixed region (oblique, low viewing angle. Real time images are transmitted to a ground-based station. Tim e lapse m odels are available.
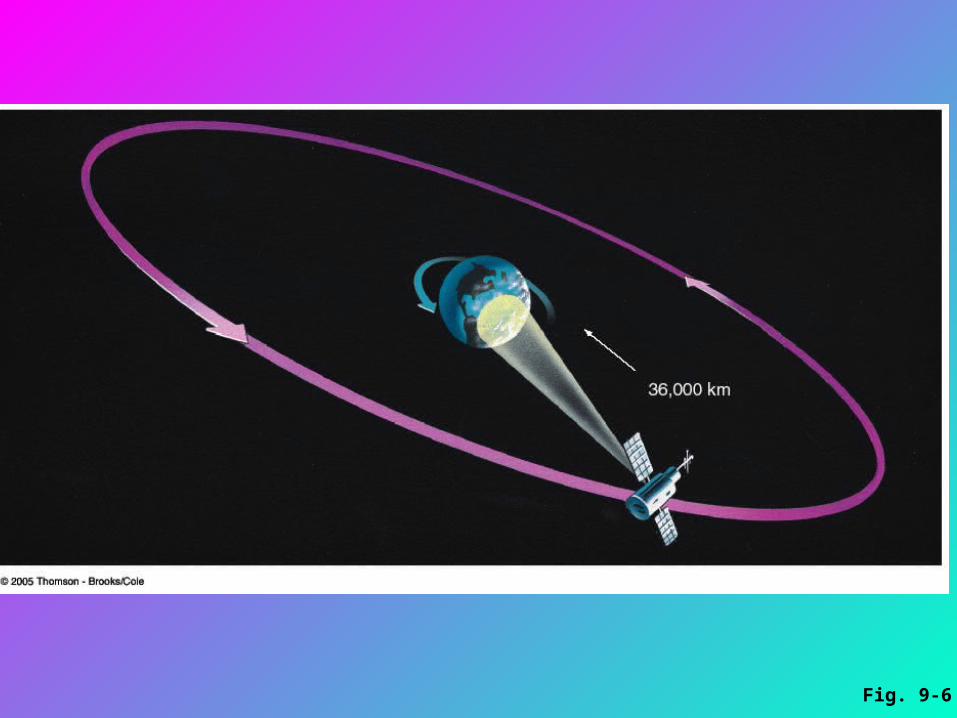
Fig. 9-6
Polar orbiting (sun synchronous, figure 9.7) satellites approx. follow the m eridians.
Provide near vertical im agery that is sharper than the geostationary im agery. Orbit the earth at 530 miles. Provide m ore detailed im agery. TIROS I (1960) used TV cam eras. Newer (mid 1990’s) GOES (Geostationary Operational Environm ental Satellites) use radiometers which m easure IR and m icrowave EM R.
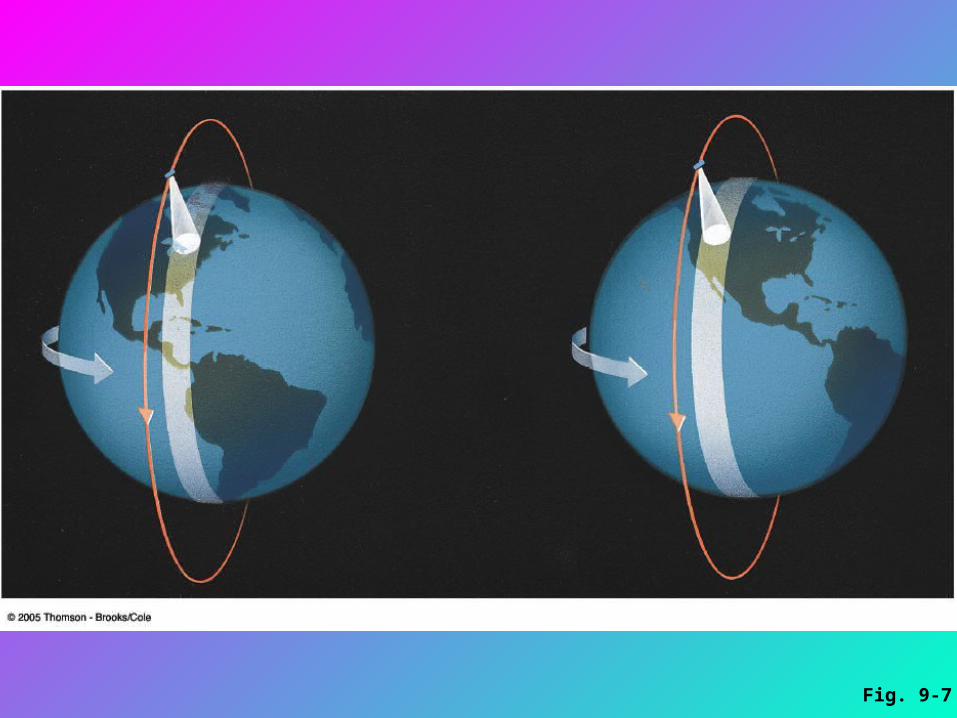
Fig. 9-7
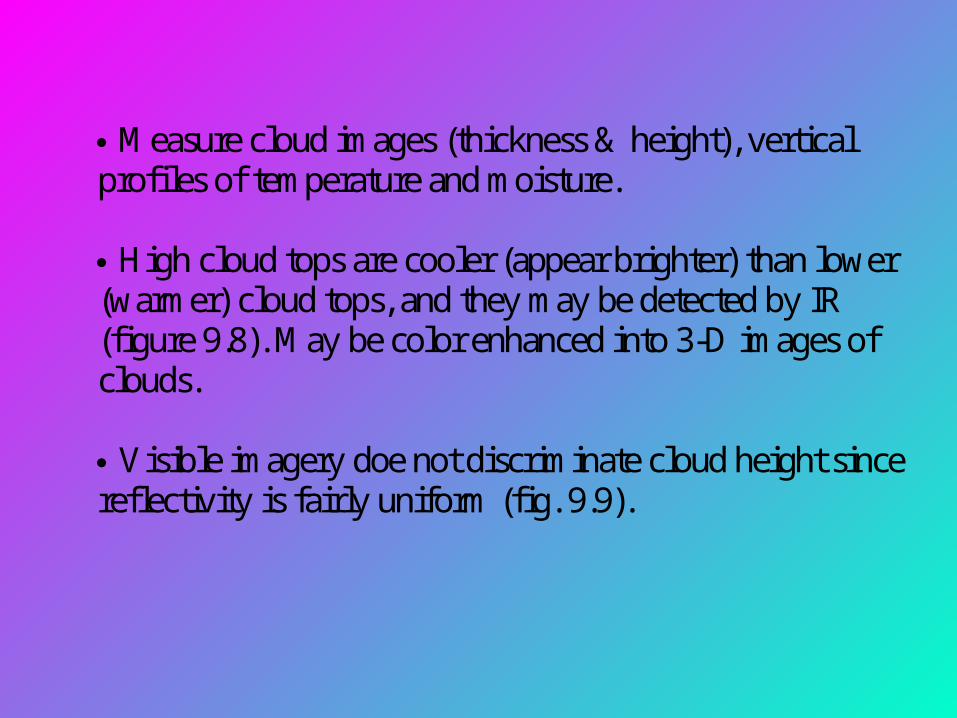
M easure cloud im ages (thickness & height), vertical profiles of temperature and moisture.
High cloud tops are cooler (appear brighter) than lower (warmer) cloud tops, and they may be detected by IR (figure 9.8). M ay be color enhanced into 3-D im ages of clouds.
Visible imagery doe not discrim inate cloud height since reflectivity is fairly uniform (fig. 9.9).
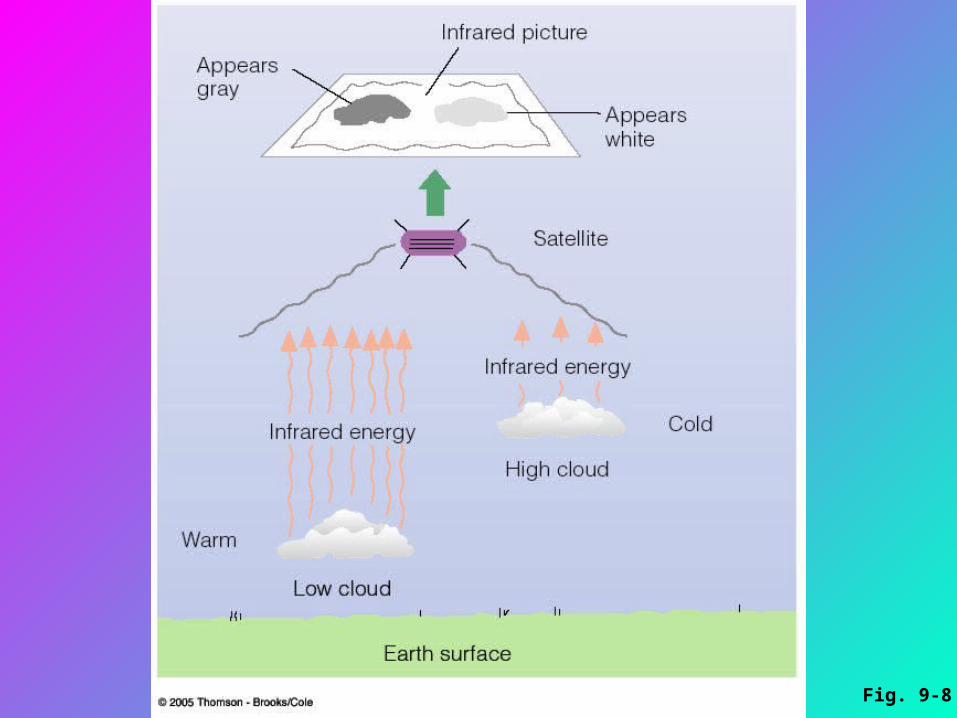
Fig. 9-8
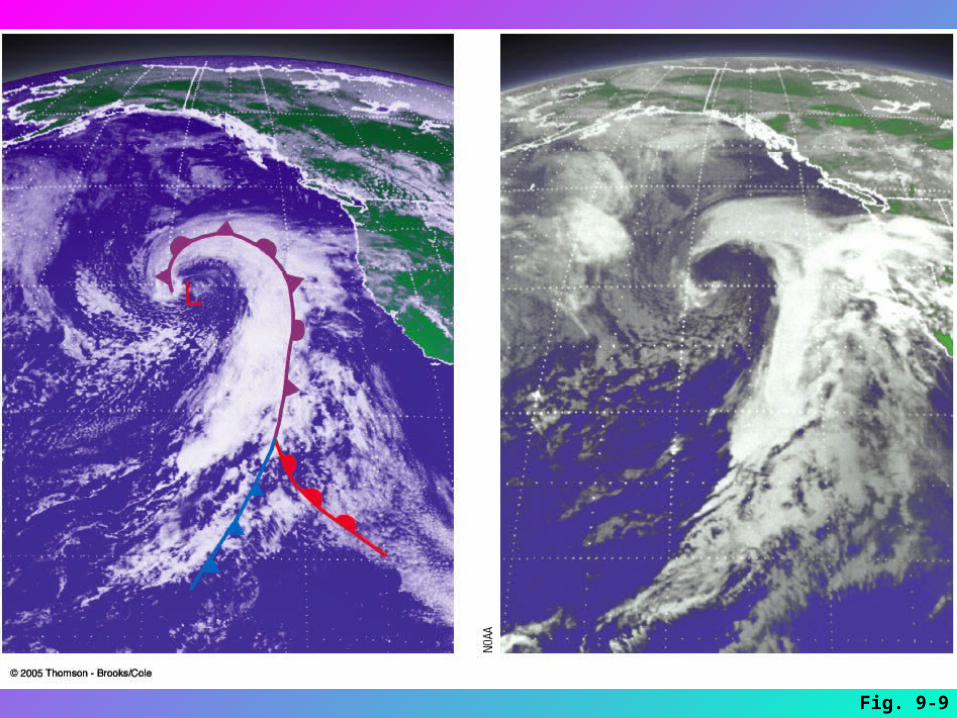
Fig. 9-9
IR image (fig. 9.9b) the darker (warmer) clouds are lower cumulous forms. An enhanced IR im age (fig. 9.10) showing highest, coldest tops, and thickest clouds (with greatest storminess) as dark gray. A color enhanced IR im age (fig. 9.10) shows clouds with the highest (coldest) tops.
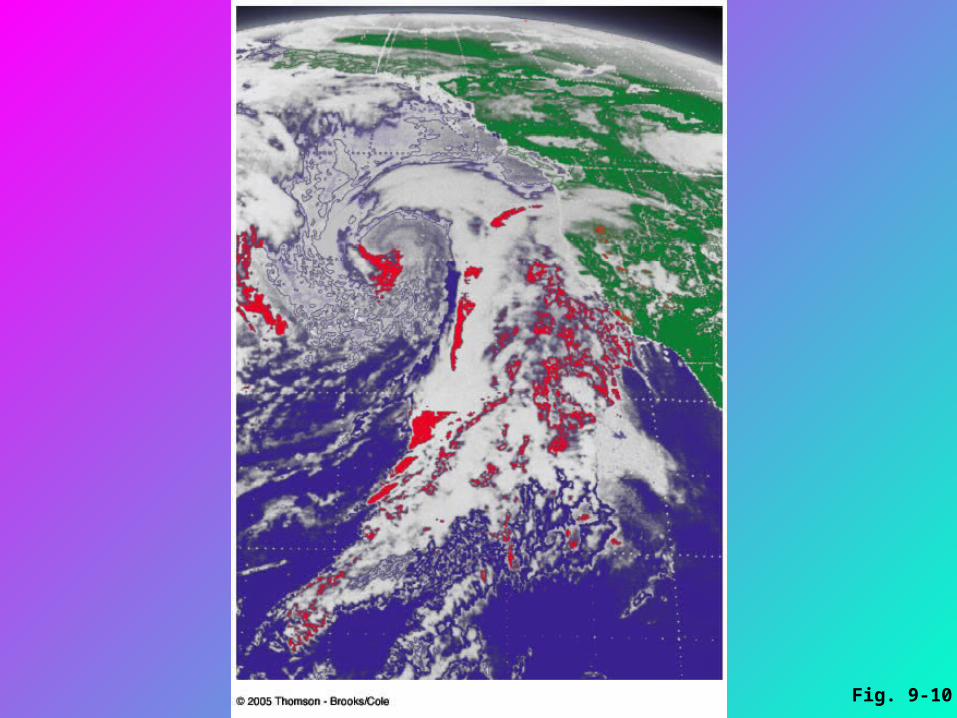
Fig. 9-10
M ethods of W eather Forecasting Persistence forecast - future weather will continue as present (up to half a day, w/ no real skill in predicting. Steady-state or trend forecasting - assum es weather systems m ove in the sam e direction and at the same speed (up to a few hours).
Analogue method - Relies on existing weather. Resembles previously documented conditions. Relies on experience and may be inaccurate since allatmospheric variables are never the same. M ay use regression analysis to predict maximumtemperature or other variables from conditions that arestatistically related. Generally, employs climate statistics.
Weather types are associated with the position of sub-tropical highs and lows, upper level flow, and storm tracks.
Pacific high is weak with zonal (west to east) flow aloft yields surface storms traveling rapidly eastward, w/out developing deep systems.
W hen the air aloft is meridional, (north to south), looping shortwaves develop in the larger long waves w/ surface lows intensifying (figure 9.12). M ay persist for days due to slower m ovement of long waves (Rossby waves). Upper air patterns change from zonal to meridional in 4 to 6 weeks, thus surface conditions may repeat them selves allowing for extended forecasts to be made.
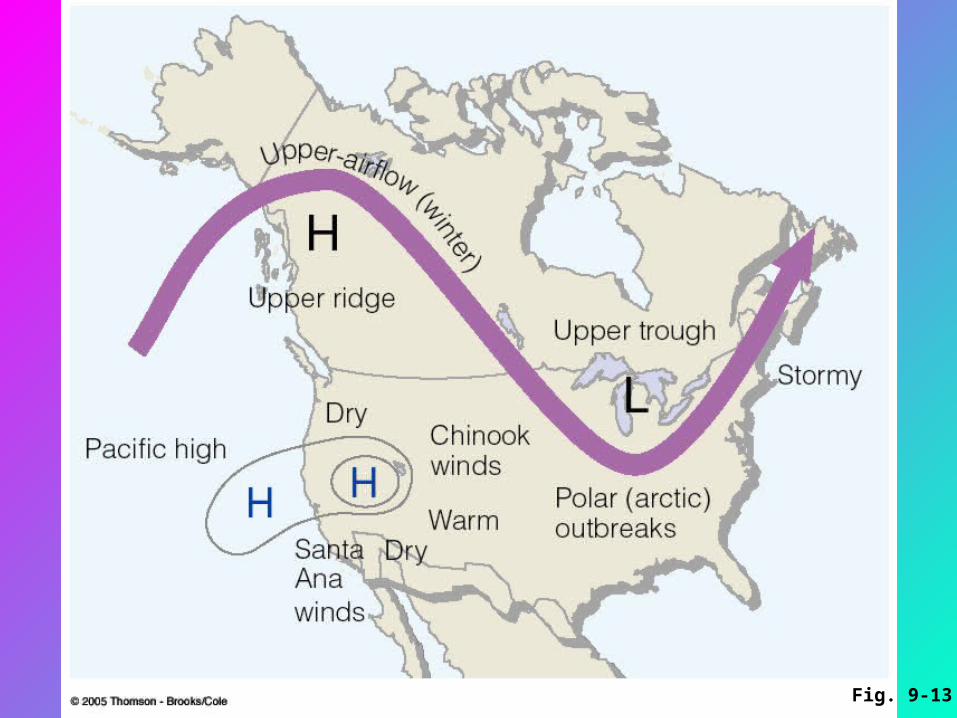
Fig. 9-13
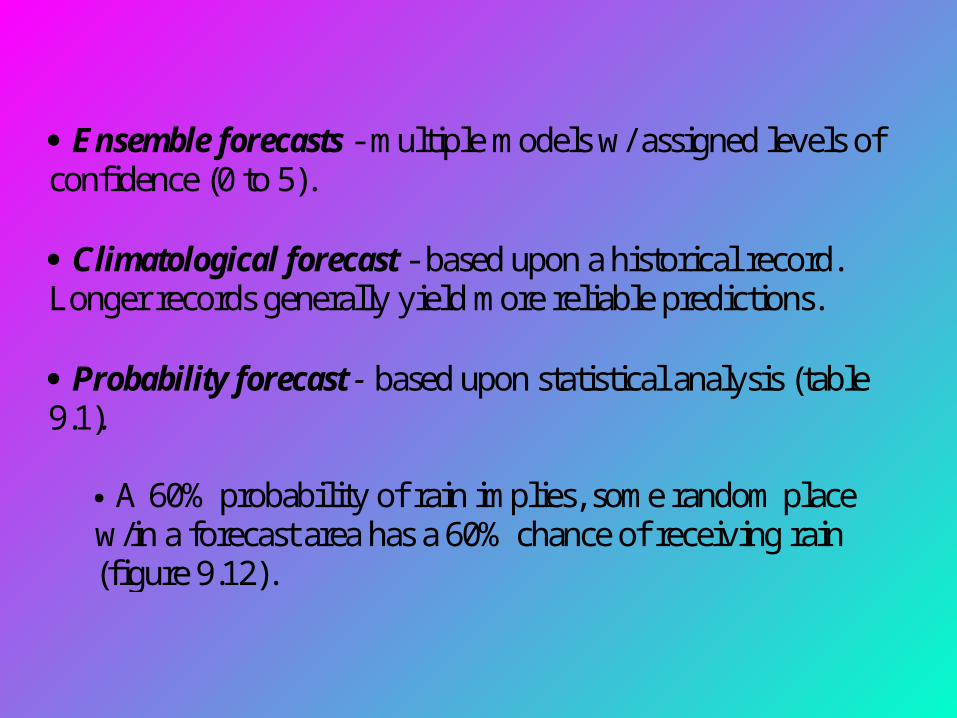
Ensemble forecasts - multiple models w/ assigned levels of confidence (0 to 5).
Climatological forecast - based upon a historical record. Longer records generally yield more reliable predictions. Probability forecast - based upon statistical analysis (table 9.1).
A 60% probability of rain implies, some random place w/in a forecast area has a 60% chance of receiving rain (figure 9.12).
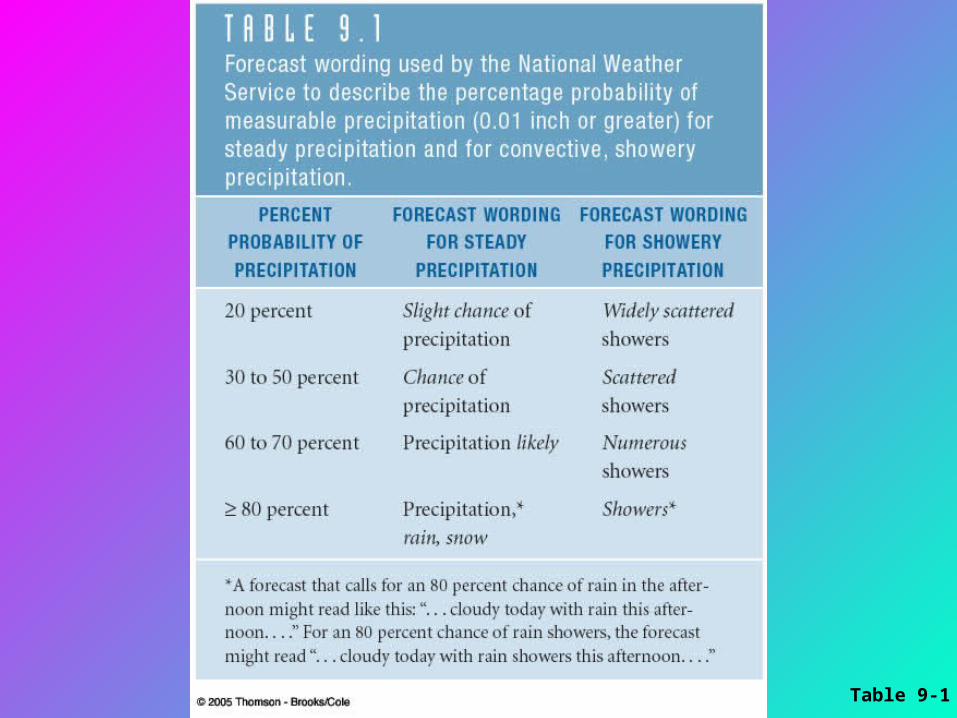
Table 9-1
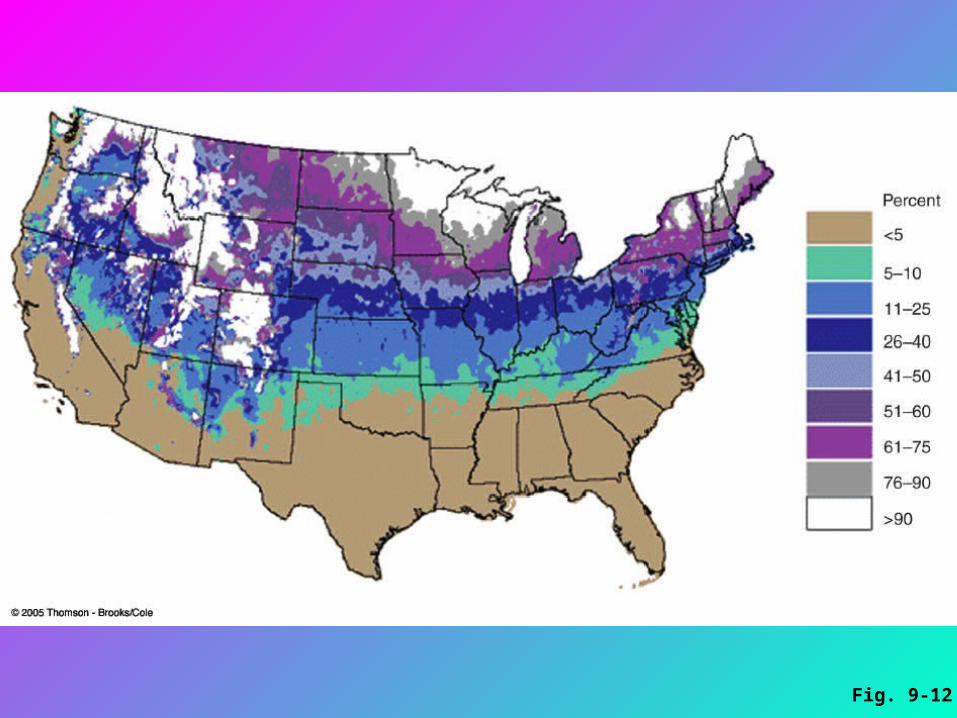
Fig. 9-12

Accuracy skills in Forecasting
Forecast accuracy may be higher for regions where the weather does not change appreciably (persistence or repetitive climatology), yet skill in prediction is minimal. Forecasts can be predicted for 12 hours to 3 days with accuracy & are a measure of predictive skill. A three to five day forecast may show some skill for temperature and precipitation, but beyond 10 days, the predictions are only as good as the historical climate record. Local signs may also be employed to predict general trends (table 9.2).
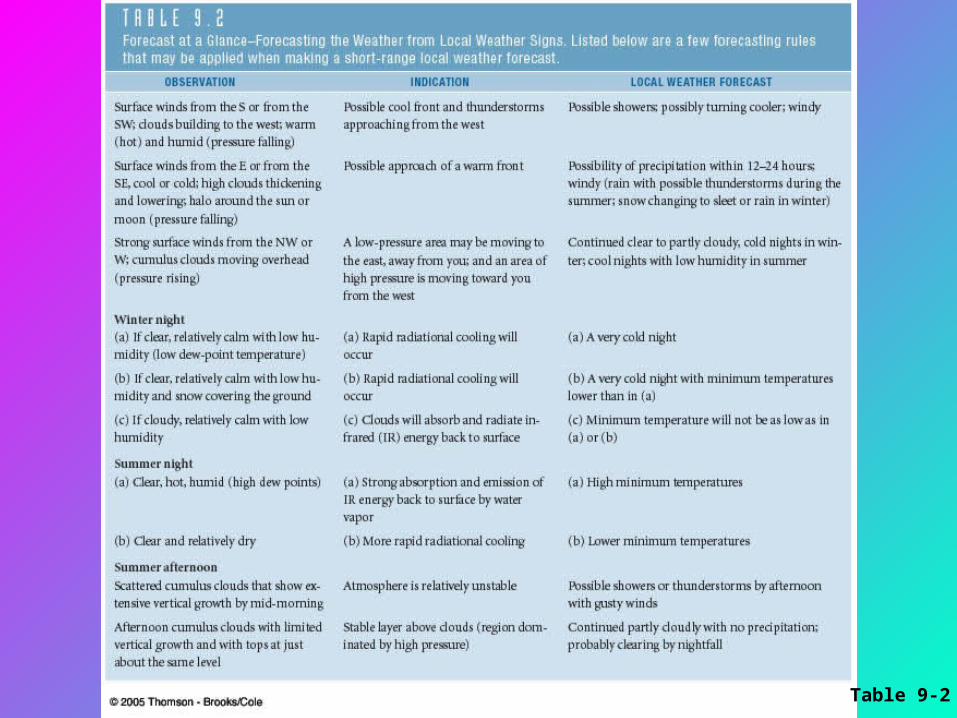
Table 9-2
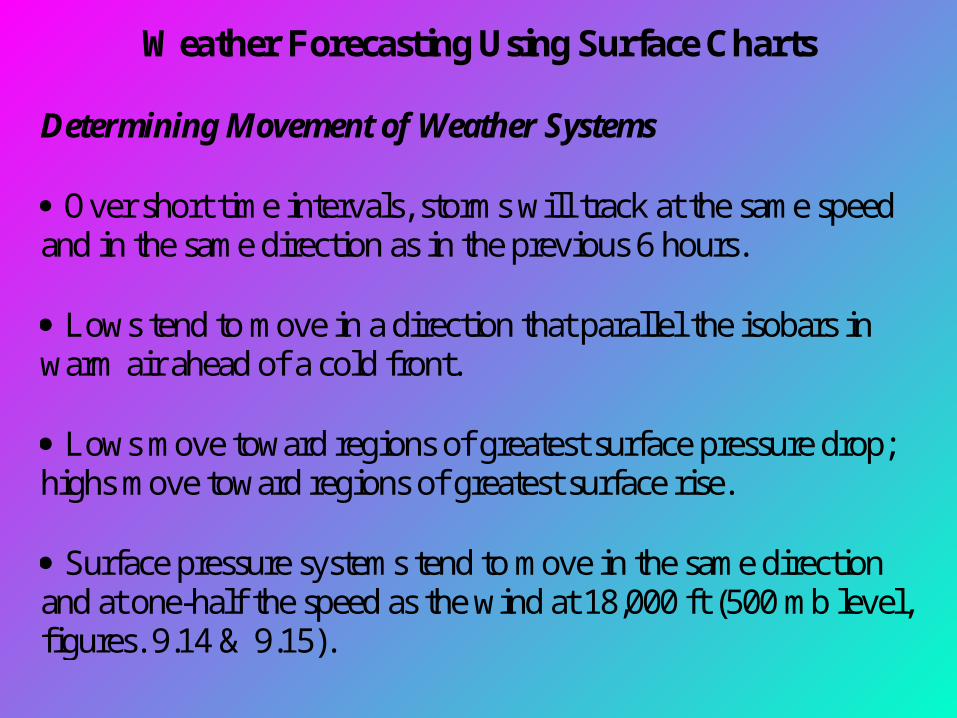
W eather Forecasting Using Surface Charts
Determining Movement of Weather Systems Over short time intervals, storms will track at the same speed and in the same direction as in the previous 6 hours. Lows tend to move in a direction that parallel the isobars in warm air ahead of a cold front. Lows move toward regions of greatest surface pressure drop; highs move toward regions of greatest surface rise. Surface pressure systems tend to m ove in the sam e direction and at one-half the speed as the wind at 18,000 ft (500 mb level, figures. 9.14 & 9.15).
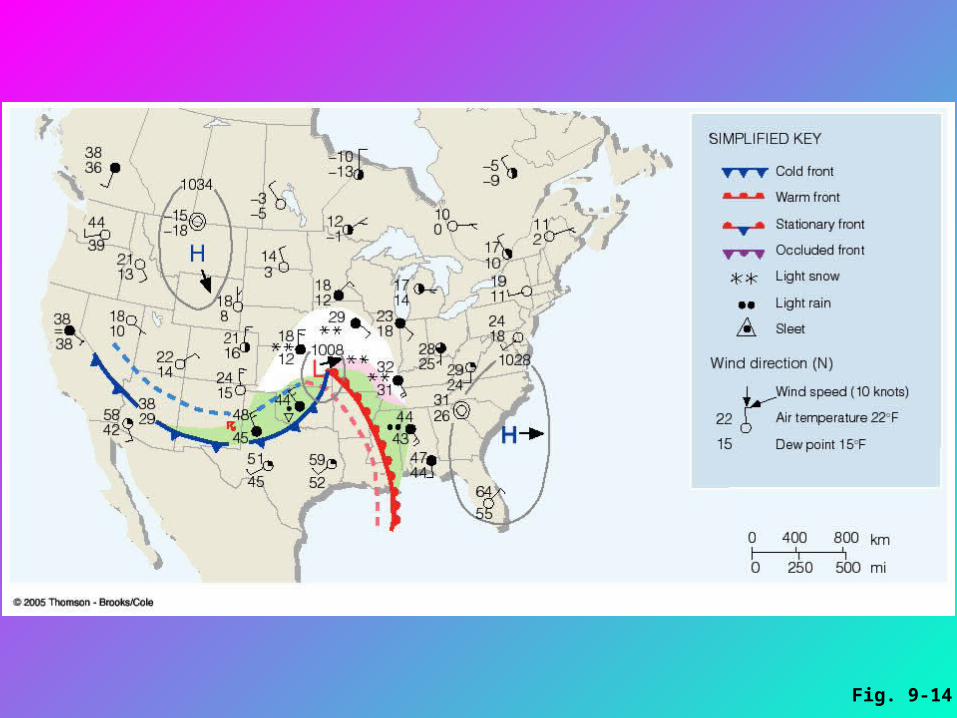
Fig. 9-14
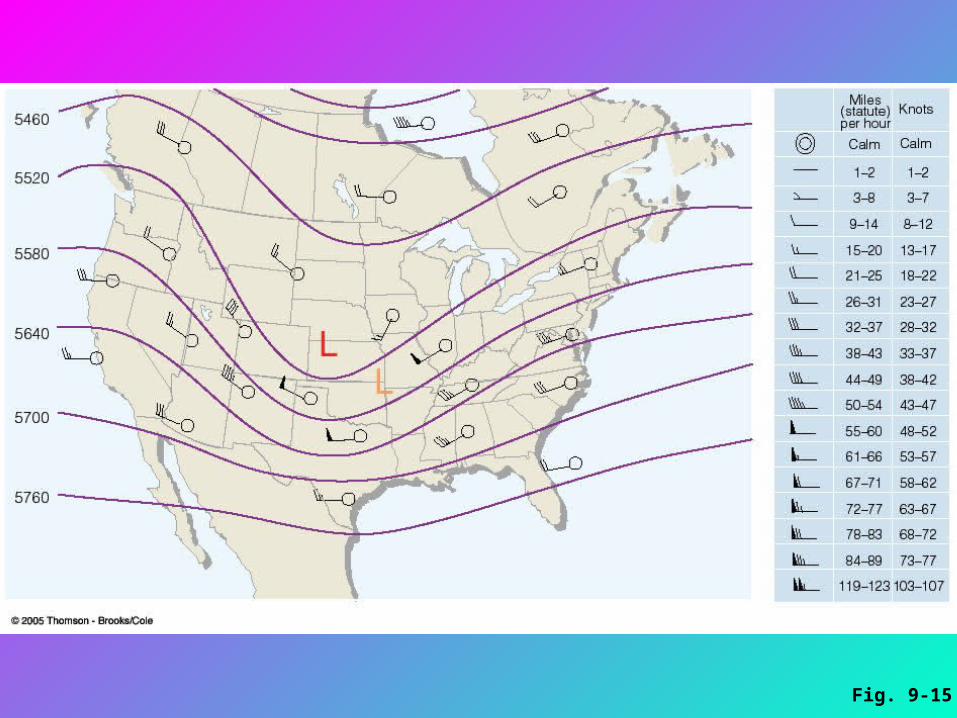
Fig. 9-15
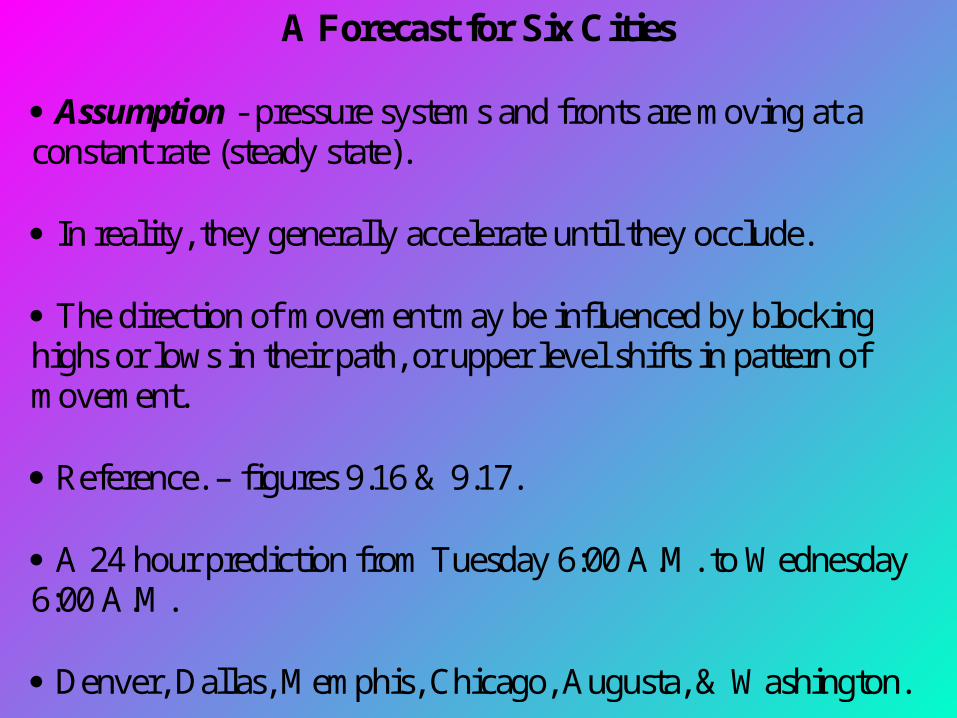
A Forecast for Six Cities Assumption - pressure systems and fronts are moving at a constant rate (steady state). In reality, they generally accelerate until they occlude. The direction of movement may be influenced by blocking highs or lows in their path, or upper level shifts in pattern of movement. Reference. – figures 9.16 & 9.17. A 24 hour prediction from Tuesday 6:00 A.M . to W ednesday 6:00 A.M . Denver, Dallas, M em phis, Chicago, Augusta, & W ashington.
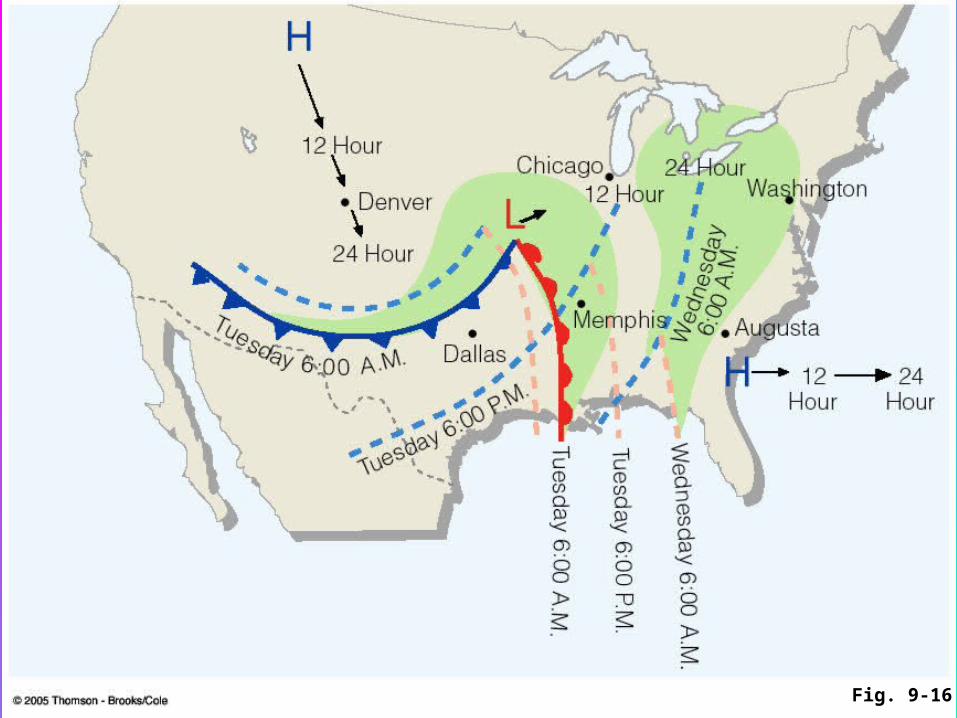
Fig. 9-16
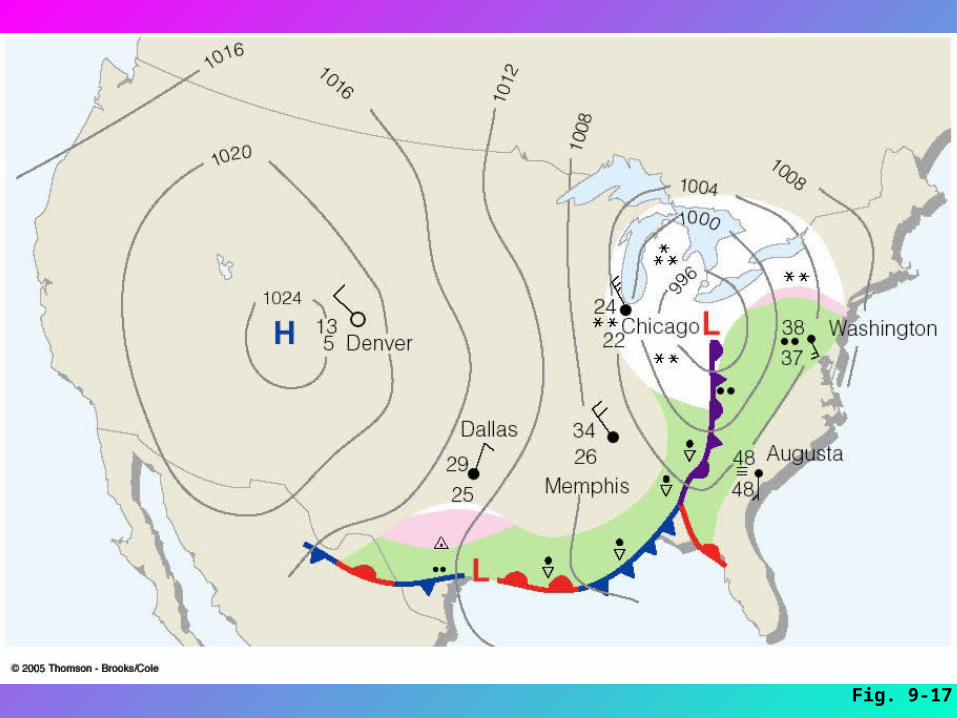
Fig. 9-17