january 2013
TRANSCRIPT
January 2013
Improving Nutrition Through Multisectoral Approaches
© 2013 International Bank for Reconstruction and Development/ International Development Association or The World Bank
1818 H Street NWWashington DC 20433Telephone: 202-473-1000Internet: www.worldbank.org
This work is a product of the staff of The World Bank with external contributions. The findings, interpretations, and conclusions expressed in this work do not necessarily reflect the views of The World Bank, its Board of Executive Directors or the governments they represent.
The World Bank does not guarantee the accuracy of the data included in this work. The boundaries, colors, denominations, and other information shown on any map in this work do not imply any judgment on the part of The World Bank concerning the legal status of any territory or the endorsement or acceptance of such boundaries.
Rights and Permissions
The material in this work is subject to copyright. Because The World Bank encourages dissemination of its knowledge, this work may be reproduced, in whole or in part, for noncommercial purposes as long as full attribution to this work is given.
Queries on rights and licenses, including subsidiary rights, should be addressed to the Office of the Publisher, The World Bank, 1818 H Street NW, Washington, DC 20433, USA; fax: 202-522-2422; e-mail: [email protected].
Improving Nutrition Through Multisectoral Approaches
1
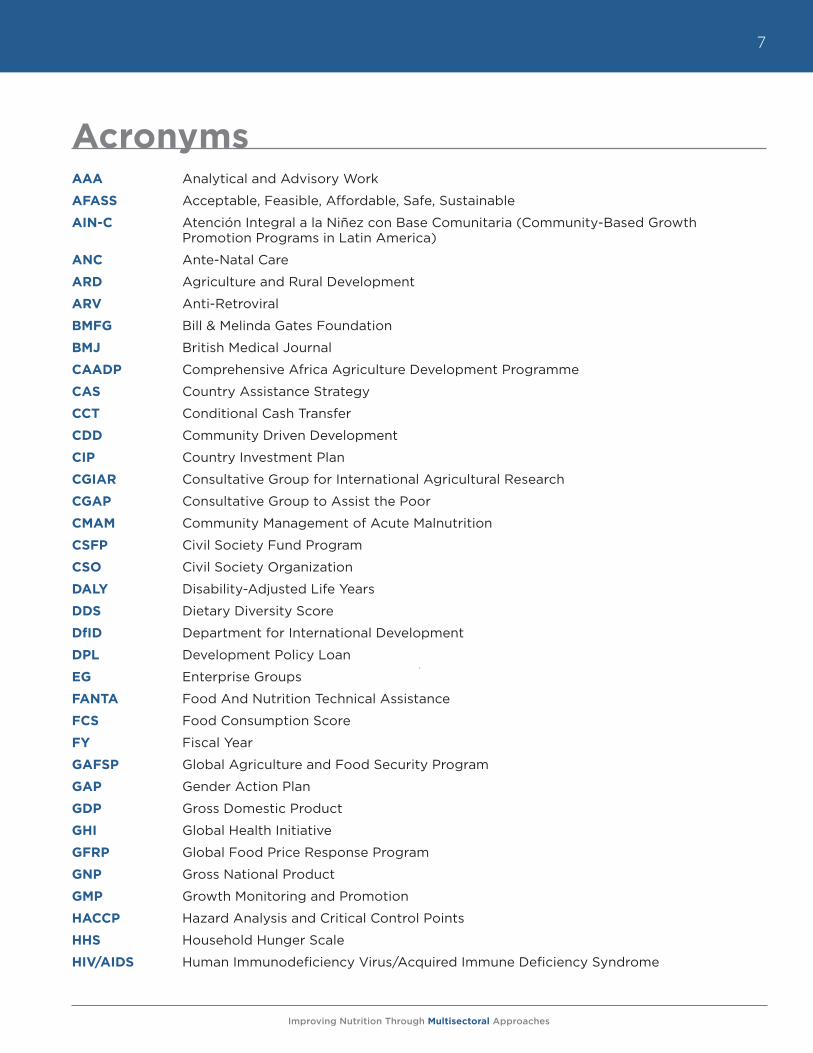
ContentsAcronyms . . . . . . . . . . . . . . . . . . . . . . . . . . . . . . . . . . . . . . . . . . . . . . . . . . . . . . . . . . . . . . . . . . . . . . . . . . . . 7
Glossary of Key Terms . . . . . . . . . . . . . . . . . . . . . . . . . . . . . . . . . . . . . . . . . . . . . . . . . . . . . . . . . . . . . . . . .11
Acknowledgements . . . . . . . . . . . . . . . . . . . . . . . . . . . . . . . . . . . . . . . . . . . . . . . . . . . . . . . . . . . . . . . . . . 19
Executive Summary . . . . . . . . . . . . . . . . . . . . . . . . . . . . . . . . . . . . . . . . . . . . . . . . . . . . . . . . . . . . . . . . . . 21
MODULE A. Introduction. . . . . . . . . . . . . . . . . . . . . . . . . . . . . . . . . . . . . . . . . . . . . . . . . . . . . . . . . . . . . .25
I. Rationale and strategic context . . . . . . . . . . . . . . . . . . . . . . . . . . . . . . . . . . . . . . . . . . . . . . . . . . . . 25
A. Interest in the “forgotten MDG” re-emerges . . . . . . . . . . . . . . . . . . . . . . . . . . . . . . . . . . . . . . . . 25
B. Economic growth, poverty, and malnutrition . . . . . . . . . . . . . . . . . . . . . . . . . . . . . . . . . . . . . . .26
C. Scaling Up Nutrition (SUN): A new global framework and a roadmap for action . . . . . . . . 27
i. SUN principles and partners . . . . . . . . . . . . . . . . . . . . . . . . . . . . . . . . . . . . . . . . . . . . . . . . . . . . .28
ii. The “early riser” countries under the SUN . . . . . . . . . . . . . . . . . . . . . . . . . . . . . . . . . . . . . . . . . .29
iii. Evidence for action . . . . . . . . . . . . . . . . . . . . . . . . . . . . . . . . . . . . . . . . . . . . . . . . . . . . . . . . . . . . .29
II. Nutrition is a multisectoral problem with multisectoral solutions . . . . . . . . . . . . . . . . . . . . . . .29
A. Determinants of malnutrition . . . . . . . . . . . . . . . . . . . . . . . . . . . . . . . . . . . . . . . . . . . . . . . . . . . . .29
B. Key sectors for maximizing nutrition impacts . . . . . . . . . . . . . . . . . . . . . . . . . . . . . . . . . . . . . .32
C. Think multisectorally, act sectorally . . . . . . . . . . . . . . . . . . . . . . . . . . . . . . . . . . . . . . . . . . . . . . .32
D. Rationale for World Bank involvement . . . . . . . . . . . . . . . . . . . . . . . . . . . . . . . . . . . . . . . . . . . .32
i. Five key lessons learned . . . . . . . . . . . . . . . . . . . . . . . . . . . . . . . . . . . . . . . . . . . . . . . . . . . . . . . . .34
ii. The South Asia Regional Assistance Strategy (RAS) on nutrition – a model for change? . . . . . . . . . . . . . . . . . . . . . . . . . . . . . . . . . . . . . . . . . . . . . . . . . . . . . . . . . . . .34
iii. Translating knowledge into practice . . . . . . . . . . . . . . . . . . . . . . . . . . . . . . . . . . . . . . . . . . . . . .34
III. Nutrition basics . . . . . . . . . . . . . . . . . . . . . . . . . . . . . . . . . . . . . . . . . . . . . . . . . . . . . . . . . . . . . . . . . . .36
A. What is malnutrition? . . . . . . . . . . . . . . . . . . . . . . . . . . . . . . . . . . . . . . . . . . . . . . . . . . . . . . . . . . . .36
B. What are the consequences of malnutrition? . . . . . . . . . . . . . . . . . . . . . . . . . . . . . . . . . . . . . . . 37
C. Who is most vulnerable to malnutrition? . . . . . . . . . . . . . . . . . . . . . . . . . . . . . . . . . . . . . . . . . . .38
D. Why is intervening in nutrition important? . . . . . . . . . . . . . . . . . . . . . . . . . . . . . . . . . . . . . . . . .39
E. Where is malnutrition most prevalent? . . . . . . . . . . . . . . . . . . . . . . . . . . . . . . . . . . . . . . . . . . . 40
F. How can countries improve the nutrition status of their population? . . . . . . . . . . . . . . . . . 40
i. The Scaling Up Nutrition Movement . . . . . . . . . . . . . . . . . . . . . . . . . . . . . . . . . . . . . . . . . . . . . . 40
G. How does the Bank cost its investments in nutrition? . . . . . . . . . . . . . . . . . . . . . . . . . . . . . . .42
MODULE B. Economic Growth, Poverty, and Nutrition . . . . . . . . . . . . . . . . . . . . . . . . . . . . . . . . . . .45
I. Objectives . . . . . . . . . . . . . . . . . . . . . . . . . . . . . . . . . . . . . . . . . . . . . . . . . . . . . . . . . . . . . . . . . . . . . . .45
II. Background . . . . . . . . . . . . . . . . . . . . . . . . . . . . . . . . . . . . . . . . . . . . . . . . . . . . . . . . . . . . . . . . . . . . . .45
III. What is the cross-sectional relationship between poverty and malnutrition? . . . . . . . . . . . . .47
Improving Nutrition Through Multisectoral Approaches
2
IV. How far can economic growth take us? . . . . . . . . . . . . . . . . . . . . . . . . . . . . . . . . . . . . . . . . . . . . .49
V. How equitable are nutritional outcomes? . . . . . . . . . . . . . . . . . . . . . . . . . . . . . . . . . . . . . . . . . . . . 51
VI. Why is progress on improving nutritional outcomes lagging in South Asia? . . . . . . . . . . . . . 51
VII. What are the implications for policy? . . . . . . . . . . . . . . . . . . . . . . . . . . . . . . . . . . . . . . . . . . . . . . .53
VIII. Emerging operational research and knowledge gaps . . . . . . . . . . . . . . . . . . . . . . . . . . . . . . . . .54
MODULE C. Improving Nutrition through Agriculture and Rural Development . . . . . . . . . . . . .55
I. Objectives . . . . . . . . . . . . . . . . . . . . . . . . . . . . . . . . . . . . . . . . . . . . . . . . . . . . . . . . . . . . . . . . . . . . . . .55
II. Rationale . . . . . . . . . . . . . . . . . . . . . . . . . . . . . . . . . . . . . . . . . . . . . . . . . . . . . . . . . . . . . . . . . . . . . . . .55
III. Why is agriculture important for nutrition? . . . . . . . . . . . . . . . . . . . . . . . . . . . . . . . . . . . . . . . . . .56
IV. Why is nutrition important for agriculture? . . . . . . . . . . . . . . . . . . . . . . . . . . . . . . . . . . . . . . . . . . 57
V. Pathways from agriculture to nutrition and available evidence . . . . . . . . . . . . . . . . . . . . . . . . .59
A. Pathway 1. National macroeconomic growth . . . . . . . . . . . . . . . . . . . . . . . . . . . . . . . . . . . . . . .59
B. Pathway 2. Higher food production, lower food prices . . . . . . . . . . . . . . . . . . . . . . . . . . . . . 60
C. Pathway 3. Increased income . . . . . . . . . . . . . . . . . . . . . . . . . . . . . . . . . . . . . . . . . . . . . . . . . . . . . 61
D. Pathway 4. Home consumption . . . . . . . . . . . . . . . . . . . . . . . . . . . . . . . . . . . . . . . . . . . . . . . . . . .63
E. Pathway 5. Women’s empowerment . . . . . . . . . . . . . . . . . . . . . . . . . . . . . . . . . . . . . . . . . . . . . .64
VI. Systematic review results and knowledge gaps . . . . . . . . . . . . . . . . . . . . . . . . . . . . . . . . . . . . . .65
Cost effectiveness . . . . . . . . . . . . . . . . . . . . . . . . . . . . . . . . . . . . . . . . . . . . . . . . . . . . . . . . . . . . . . . .65
VII. Principles for nutrition sensitive AES projects . . . . . . . . . . . . . . . . . . . . . . . . . . . . . . . . . . . . . . . .66
VIII. The Bank’s AES program . . . . . . . . . . . . . . . . . . . . . . . . . . . . . . . . . . . . . . . . . . . . . . . . . . . . . . . . . .66
IX. Challenges for nutrition sensitive agriculture . . . . . . . . . . . . . . . . . . . . . . . . . . . . . . . . . . . . . . . . .68
X. Addressing Nutrition through AES Projects . . . . . . . . . . . . . . . . . . . . . . . . . . . . . . . . . . . . . . . . . .70
A. Current status: Mainly through unintentional effects . . . . . . . . . . . . . . . . . . . . . . . . . . . . . . . .70
B. Taking it further: Addressing nutrition explicitly through AES projects . . . . . . . . . . . . . . . . 71
i. Raise agricultural productivity . . . . . . . . . . . . . . . . . . . . . . . . . . . . . . . . . . . . . . . . . . . . . . . . . . . . 73
ii. Link farmers to market and strengthen value chain . . . . . . . . . . . . . . . . . . . . . . . . . . . . . . . . .76
iii. Reduce risk and vulnerability . . . . . . . . . . . . . . . . . . . . . . . . . . . . . . . . . . . . . . . . . . . . . . . . . . . .79
iv. Facilitate agricultural entry, exit, and rural non-farm income . . . . . . . . . . . . . . . . . . . . . . . . .80
v. Enhance environmental services and sustainability . . . . . . . . . . . . . . . . . . . . . . . . . . . . . . . . .80
C. Key Questions for TTLs to consider in designing nutrition sensitive AES projects . . . . . . 81
D. Measuring nutritional outcomes through agricultural projects . . . . . . . . . . . . . . . . . . . . . . . .82
E. “Do no harm” considerations . . . . . . . . . . . . . . . . . . . . . . . . . . . . . . . . . . . . . . . . . . . . . . . . . . . . .84
XI. Summary . . . . . . . . . . . . . . . . . . . . . . . . . . . . . . . . . . . . . . . . . . . . . . . . . . . . . . . . . . . . . . . . . . . . . . . .85
Annex C-1. Guidance matrix of agricultural interventions explicitly targeting nutrition . . . . . .87
Annex C-2. List of all gender disaggregated indicators included in World Bank AES projects approved in FY10 and FY11 . . . . . . . . . . . . . . . . . . . . . . . . .97
Annex C-3. Food consumption indicators . . . . . . . . . . . . . . . . . . . . . . . . . . . . . . . . . . . . . . . . . . . . . .99
Improving Nutrition Through Multisectoral Approaches
3
Annex C-4. Suggested nutrition resources . . . . . . . . . . . . . . . . . . . . . . . . . . . . . . . . . . . . . . . . . . . . . 103
Annex C-5. Recent reviews and strategies to mainstream nutrition into agriculture . . . . . . . . 105
MODULE D. Improving Nutrition through Social Protection . . . . . . . . . . . . . . . . . . . . . . . . . . . . . 107
I. Background . . . . . . . . . . . . . . . . . . . . . . . . . . . . . . . . . . . . . . . . . . . . . . . . . . . . . . . . . . . . . . . . . . . . . 107
II. Objectives . . . . . . . . . . . . . . . . . . . . . . . . . . . . . . . . . . . . . . . . . . . . . . . . . . . . . . . . . . . . . . . . . . . . . . 108
III. How can we maximize the impact of income on nutrition? . . . . . . . . . . . . . . . . . . . . . . . . . . . 109
A. Enhancing the role of income in transfer programs . . . . . . . . . . . . . . . . . . . . . . . . . . . . . . . . 110
i. Size of “payment” or income transfers . . . . . . . . . . . . . . . . . . . . . . . . . . . . . . . . . . . . . . . . . . . 110
ii. Frequency of payment . . . . . . . . . . . . . . . . . . . . . . . . . . . . . . . . . . . . . . . . . . . . . . . . . . . . . . . . . . 111
iii. Control of income . . . . . . . . . . . . . . . . . . . . . . . . . . . . . . . . . . . . . . . . . . . . . . . . . . . . . . . . . . . . . . 111
B. Nature of transfers: Cash versus in-kind transfers . . . . . . . . . . . . . . . . . . . . . . . . . . . . . . . . . . .112
C. Including nutrition counseling or micronutrient supplementation components . . . . . . . . .113
D. Enhancing the role of income in other social protection programs: Public works, insurance, and microfinance . . . . . . . . . . . . . . . . . . . . . . . . . . . . . . . . . . . . . . . . .113
i. Accommodating time demands for women in public works programs . . . . . . . . . . . . . . . .113
ii. Strengthening the role of insurance by promoting utilization of services . . . . . . . . . . . . . .115
iii. Smoothing consumption by promoting insurance . . . . . . . . . . . . . . . . . . . . . . . . . . . . . . . . . .115
IV. How can social protection programs promote the link with other services to increase their nutritional impact? . . . . . . . . . . . . . . . . . . . . . . . . . . . . . . . . . . . . . . . . . . . . . . . .115
A. Conditioning transfers to access to services . . . . . . . . . . . . . . . . . . . . . . . . . . . . . . . . . . . . . . .117
B. Firm versus soft conditions . . . . . . . . . . . . . . . . . . . . . . . . . . . . . . . . . . . . . . . . . . . . . . . . . . . . . .118
C. Conditional versus unconditional transfers . . . . . . . . . . . . . . . . . . . . . . . . . . . . . . . . . . . . . . . . 120
D. Conditional “in-kind” transfers: School feeding and school health and nutrition programs . . . . . . . . . . . . . . . . . . . . . . . . . . . . . . . . . . . . . . . . . . . . . . . . . . . . . . . . . 120
E. Promoting access to services: Community-based growth promotion programs . . . . . . . .121
V. Is there a role for targeting transfers to the nutritionally vulnerable? . . . . . . . . . . . . . . . . . . . 122
A. Targeting by demographic group . . . . . . . . . . . . . . . . . . . . . . . . . . . . . . . . . . . . . . . . . . . . . . . . 123
B. Targeting by nutritional status or risk . . . . . . . . . . . . . . . . . . . . . . . . . . . . . . . . . . . . . . . . . . . . 123
VI. Concluding remarks . . . . . . . . . . . . . . . . . . . . . . . . . . . . . . . . . . . . . . . . . . . . . . . . . . . . . . . . . . . . . . 126
VII. Emerging operational research and knowledge gaps . . . . . . . . . . . . . . . . . . . . . . . . . . . . . . . . 126
VIII. Additional Resources . . . . . . . . . . . . . . . . . . . . . . . . . . . . . . . . . . . . . . . . . . . . . . . . . . . . . . . . . . . . . 127
MODULE E. Improving Nutrition through Health . . . . . . . . . . . . . . . . . . . . . . . . . . . . . . . . . . . . . . . 129
I. Objectives . . . . . . . . . . . . . . . . . . . . . . . . . . . . . . . . . . . . . . . . . . . . . . . . . . . . . . . . . . . . . . . . . . . . . . 129
II. Rationale . . . . . . . . . . . . . . . . . . . . . . . . . . . . . . . . . . . . . . . . . . . . . . . . . . . . . . . . . . . . . . . . . . . . . . . 129
A. Poor nutrition affects health outcomes . . . . . . . . . . . . . . . . . . . . . . . . . . . . . . . . . . . . . . . . . . . 132
B. Poor health affects nutrition outcomes . . . . . . . . . . . . . . . . . . . . . . . . . . . . . . . . . . . . . . . . . . . 132
Improving Nutrition Through Multisectoral Approaches
4
III. What are the key health sector interventions to improve nutrition, and what will they cost? . . . . . . . . . . . . . . . . . . . . . . . . . . . . . . . . . . . . . . . . . . . . . . . . . . . . . . . . . . 133
IV. Which nutrition objectives can be achieved through the health sector, and how? . . . . . . . 135
A. Reduce micronutrient deficiencies among the most vulnerable groups . . . . . . . . . . . . . . . 135
B. Reduce the prevalence of anemia in pregnant and lactating women and children 0-24 months . . . . . . . . . . . . . . . . . . . . . . . . . . . . . . . . . . . . . . . . . . . . . . . . . . . . . . 138
C. Promote good feeding and nutritional care practices for the most vulnerable populations . . . . . . . . . . . . . . . . . . . . . . . . . . . . . . . . . . . . . . . . . . . . . . . . . . . . . . . . . 140
D. Treat and prevent illness . . . . . . . . . . . . . . . . . . . . . . . . . . . . . . . . . . . . . . . . . . . . . . . . . . . . . . . . 142
E. Reduce low birth weight . . . . . . . . . . . . . . . . . . . . . . . . . . . . . . . . . . . . . . . . . . . . . . . . . . . . . . . . 143
F. Improve reproductive health and family planning . . . . . . . . . . . . . . . . . . . . . . . . . . . . . . . . . . 144
G. Treat moderate and severe acute undernutrition in children . . . . . . . . . . . . . . . . . . . . . . . . 145
V. What are the challenges and lessons learned for delivering improved nutrition through the health sector? . . . . . . . . . . . . . . . . . . . . . . . . . . . . . . . . . . . . . . . . . . . . . . . . . . . . . . . . 146
VI. Conclusion . . . . . . . . . . . . . . . . . . . . . . . . . . . . . . . . . . . . . . . . . . . . . . . . . . . . . . . . . . . . . . . . . . . . . . 148
Annex E-1. Guidance matrix: Health sector and nutrition linkages and programming . . . . . . . . 150
Annex E-2. Menu of actions to address undernutrition by delivery mechanism . . . . . . . . . . . . . 157
Annex E-3. WHO’s health systems strengthening framework and nutrition . . . . . . . . . . . . . . . . . .161
Annex E-4. Contribution to mortality of nutrition interventions . . . . . . . . . . . . . . . . . . . . . . . . . . . 163
Annex E-5. Links to other key resources. . . . . . . . . . . . . . . . . . . . . . . . . . . . . . . . . . . . . . . . . . . . . . . . 165
Annex E-6. Suggested nutrition resources . . . . . . . . . . . . . . . . . . . . . . . . . . . . . . . . . . . . . . . . . . . . . . 167
List of Figures
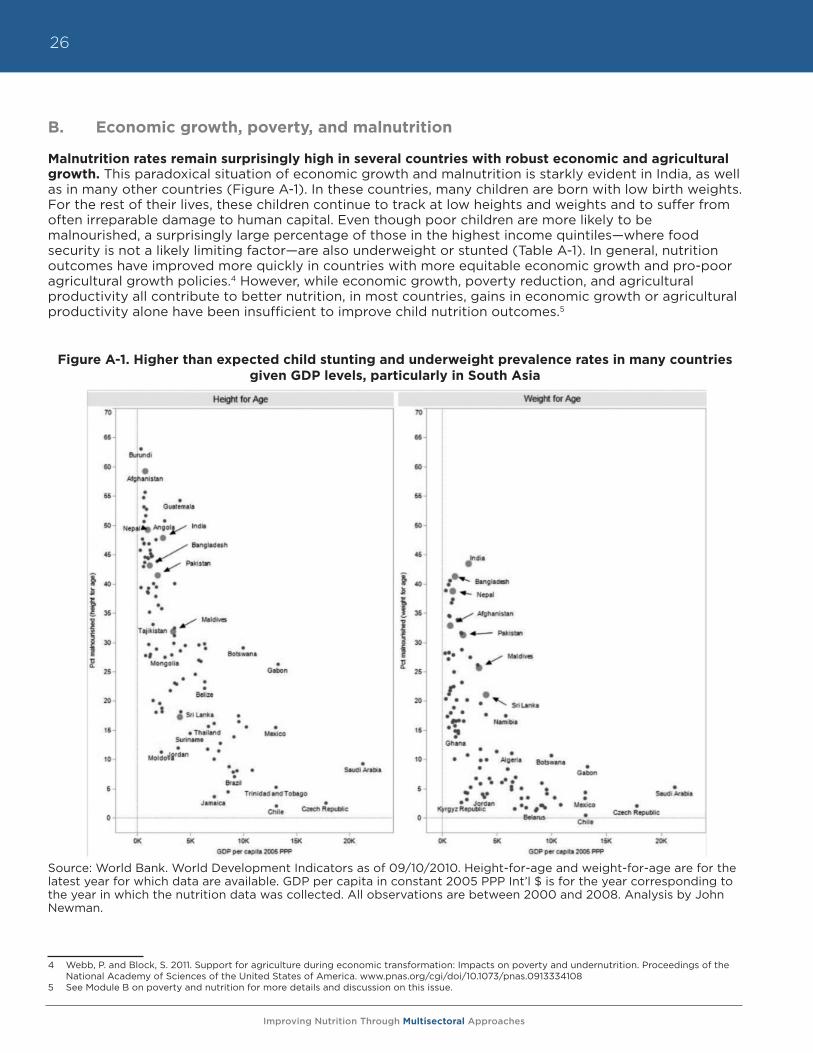
Figure A-1. Higher than expected child stunting and underweight rates in many countries given GDP levels, particularly in South Asia . . . . . . . . . . . . . . . . . . . . . . . . . .26
Figure A-2. The emergence of the Scaling up Nutrition (SUN) movement . . . . . . . . . . . . . . . . . . .28
Figure A-3. Determinants of child nutrition and interventions to address them . . . . . . . . . . . . . .30
Figure A-4. Women’s status and reductions in child undernutrition (contributions in reductions 1970-95) . . . . . . . . . . . . . . . . . . . . . . . . . . . . . . . . . . . . . . . . . . . . . . . . . . . . . . . . 31
Figure A-5. Malnutrition, by type . . . . . . . . . . . . . . . . . . . . . . . . . . . . . . . . . . . . . . . . . . . . . . . . . . . . . . . 37
Figure A-6. Undernutrition and the window of opportunity: A child’s first 1,000 days . . . . . . . .39
Figure A-7. Progression of malnutrition in developing countries from 1990-2010 . . . . . . . . . . . . 40
Figure B-1. Trends in poverty, hunger and malnutrition . . . . . . . . . . . . . . . . . . . . . . . . . . . . . . . . . . . .45
Figure B-2. Malnutrition prevalence over time (stunting=height-for-age) . . . . . . . . . . . . . . . . . . . .47
Figure B-3. Cross-country correlation between poverty rates and measures of malnutrition . . .48
Figure B-4. Episodes of changes in poverty and malnutrition . . . . . . . . . . . . . . . . . . . . . . . . . . . . . .49
Figure B-5. Estimates for the change in stunting incidence in 2015 . . . . . . . . . . . . . . . . . . . . . . . . .50
Figure B-6. Trends in chronic malnutrition (stunting), by wealth quintiles . . . . . . . . . . . . . . . . . . . 51
Improving Nutrition Through Multisectoral Approaches
5
Figure B-7. Dietary diversity is low in South Asia . . . . . . . . . . . . . . . . . . . . . . . . . . . . . . . . . . . . . . . . . 52
Figure B-8. Other proximate factors related to child malnutrition . . . . . . . . . . . . . . . . . . . . . . . . . .53
Figure C-1. Cross-country link between agricultural GDP and child underweight . . . . . . . . . . . . 60
Figure C-2. Ethiopia: Prevalence of stunting among children under 5 (by income quintile) . . . .62
Figure C-3. Five focal areas of AES projects . . . . . . . . . . . . . . . . . . . . . . . . . . . . . . . . . . . . . . . . . . . . .67
Figure C-4. Disbursement focus of agriculture and related sectors . . . . . . . . . . . . . . . . . . . . . . . . .68
Figure C-5. Pipeline of biofortification crops for release in Africa and Asia . . . . . . . . . . . . . . . . . .76
Figure C-6. Measuring nutrition sensitive agricultural projects . . . . . . . . . . . . . . . . . . . . . . . . . . . . .82
Figure D-1. Potential pathways of social protection programs to impact nutrition . . . . . . . . . . . 108
Figure D-2. Elements of social protection programs relevant for nutrition outcomes . . . . . . . . 109
Figure D-3. Income transfers in select countries as a percentage of per capita spending . . . . . 111
Figure E-1. Health sector-specific framework for child nutrition . . . . . . . . . . . . . . . . . . . . . . . . . . . .131
Figure E2. The malnutrition-infection cycle . . . . . . . . . . . . . . . . . . . . . . . . . . . . . . . . . . . . . . . . . . . . . 132
List of Tables
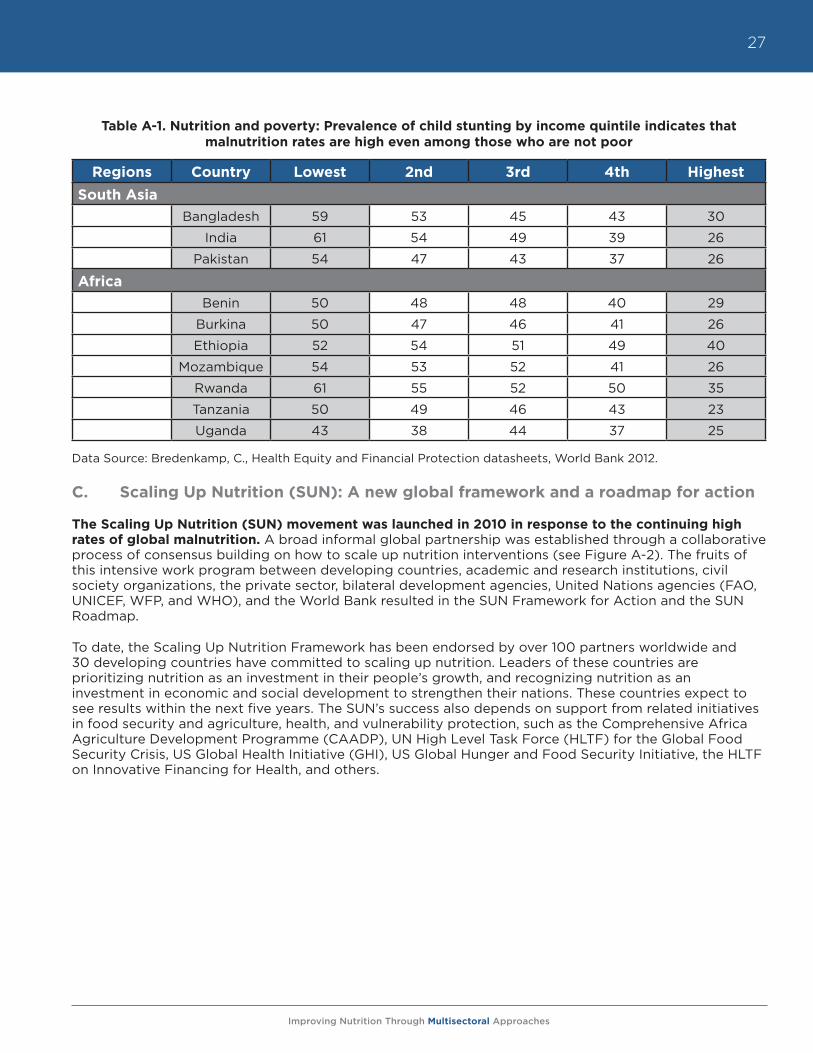
Table A-1. Nutrition and poverty: Prevalence of child stunting by income quintile indicates that malnutrition rates are high even among those who are not poor . . . . . . . . . . . . . . . . . . . . . . . . . . . . . . . . . . . . . . . . . . . . . . . . . . . . . . 27
Table B-1. Statistical relationship between malnutrition and income . . . . . . . . . . . . . . . . . . . . . . . .50
Table C-1. Five pathways linking agriculture to nutrition . . . . . . . . . . . . . . . . . . . . . . . . . . . . . . . . . . .59
Table C-2. Common negative consequences of agricultural interventions . . . . . . . . . . . . . . . . . . .84
Table E-1. Estimated costs, benefits, priority, and feasibility of scaling up selected nutrition interventions . . . . . . . . . . . . . . . . . . . . . . . . . . . . . . . . . . . . . . . . . . . . . . 134
List of Boxes
Box A-1. The SUN framework: Three key elements . . . . . . . . . . . . . . . . . . . . . . . . . . . . . . . . . . . . . . . .28
Box A-2. The South Asia Regional Assistance Strategy for nutrition, 2010-2015 . . . . . . . . . . . . . .35
Box A-3. What activities are included under Code 68? . . . . . . . . . . . . . . . . . . . . . . . . . . . . . . . . . . . .43
Box C-1. Selected gender disaggregated indicators in AES projects (approved in FY10 and FY11) . . . . . . . . . . . . . . . . . . . . . . . . . . . . . . . . . . . . . . . . . . . . . . . . . . . 72
Box C-2. Commonly used food consumption indicators . . . . . . . . . . . . . . . . . . . . . . . . . . . . . . . . . . .83
Box D-1. Assessing the relative impacts of cash and food transfers on nutrition in Nepal . . . . . .113
Box D-2. Djibouti social safety net project that combines workfare with a nutrition intervention . . . . . . . . . . . . . . . . . . . . . . . . . . . . . . . . . . . . . . . . . . . . . . . . . . . . . . . . 114
Box D-3. Variations on the theme: Nutrition co-responsibilities in CCTs in Latin America . . . . . 116
Box D-4. Strengthening the nutrition impact of the Peru CCT program . . . . . . . . . . . . . . . . . . . . 119
Box D-5. Targeting the needs of acutely malnourished children . . . . . . . . . . . . . . . . . . . . . . . . . . . 124
Improving Nutrition Through Multisectoral Approaches
6
Box D-6. What should be monitored in SP programs to keep nutrition as a focus? . . . . . . . . . . 125
Box D-7. Priority objectives of nutrition sensitive social protection . . . . . . . . . . . . . . . . . . . . . . . . 126
Box E-1. Success in reducing maternal anemia in Nepal . . . . . . . . . . . . . . . . . . . . . . . . . . . . . . . . . . 139
Box E-2. Growth monitoring and promotion: A useful delivery platform . . . . . . . . . . . . . . . . . . . 141
Box E-3. Increasing exclusive breastfeeding rates in Sri Lanka . . . . . . . . . . . . . . . . . . . . . . . . . . . . 141
Box E-4. Tools for TTLs that can guide prioritization of nutrition investments . . . . . . . . . . . . . . 149
Improving Nutrition Through Multisectoral Approaches
7
AcronymsAAA Analytical and Advisory Work
AFASS Acceptable, Feasible, Affordable, Safe, Sustainable
AIN-C Atención Integral a la Niñez con Base Comunitaria (Community-Based Growth Promotion Programs in Latin America)
ANC Ante-Natal Care
ARD Agriculture and Rural Development
ARV Anti-Retroviral
BMFG Bill & Melinda Gates Foundation
BMJ British Medical Journal
CAADP Comprehensive Africa Agriculture Development Programme
CAS Country Assistance Strategy
CCT Conditional Cash Transfer
CDD Community Driven Development
CIP Country Investment Plan
CGIAR Consultative Group for International Agricultural Research
CGAP Consultative Group to Assist the Poor
CMAM Community Management of Acute Malnutrition
CSFP Civil Society Fund Program
CSO Civil Society Organization
DALY Disability-Adjusted Life Years
DDS Dietary Diversity Score
DfID Department for International Development
DPL Development Policy Loan
EG Enterprise Groups
FANTA Food And Nutrition Technical Assistance
FCS Food Consumption Score
FY Fiscal Year
GAFSP Global Agriculture and Food Security Program
GAP Gender Action Plan
GDP Gross Domestic Product
GHI Global Health Initiative
GFRP Global Food Price Response Program
GNP Gross National Product
GMP Growth Monitoring and Promotion
HACCP Hazard Analysis and Critical Control Points
HHS Household Hunger Scale
HIV/AIDS Human Immunodeficiency Virus/Acquired Immune Deficiency Syndrome
Improving Nutrition Through Multisectoral Approaches
8
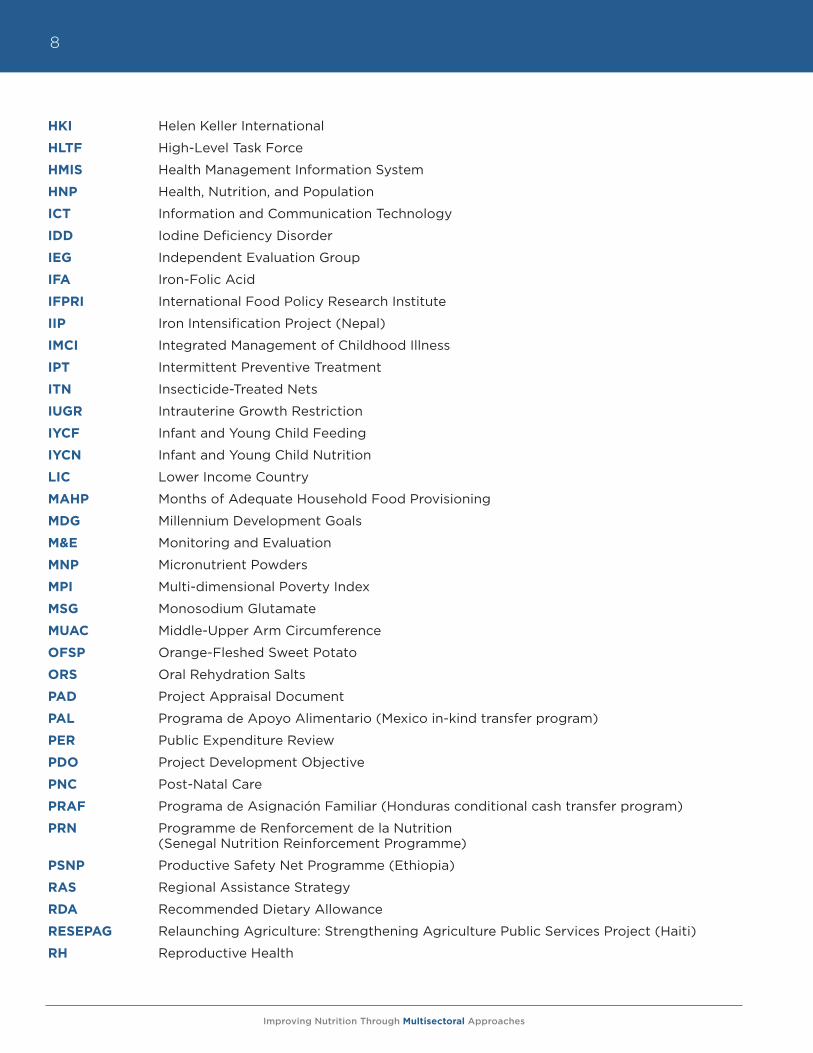
HKI Helen Keller International
HLTF High-Level Task Force
HMIS Health Management Information System
HNP Health, Nutrition, and Population
ICT Information and Communication Technology
IDD Iodine Deficiency Disorder
IEG Independent Evaluation Group
IFA Iron-Folic Acid
IFPRI International Food Policy Research Institute
IIP Iron Intensification Project (Nepal)
IMCI Integrated Management of Childhood Illness
IPT Intermittent Preventive Treatment
ITN Insecticide-Treated Nets
IUGR Intrauterine Growth Restriction
IYCF Infant and Young Child Feeding
IYCN Infant and Young Child Nutrition
LIC Lower Income Country
MAHP Months of Adequate Household Food Provisioning
MDG Millennium Development Goals
M&E Monitoring and Evaluation
MNP Micronutrient Powders
MPI Multi-dimensional Poverty Index
MSG Monosodium Glutamate
MUAC Middle-Upper Arm Circumference
OFSP Orange-Fleshed Sweet Potato
ORS Oral Rehydration Salts
PAD Project Appraisal Document
PAL Programa de Apoyo Alimentario (Mexico in-kind transfer program)
PER Public Expenditure Review
PDO Project Development Objective
PNC Post-Natal Care
PRAF Programa de Asignación Familiar (Honduras conditional cash transfer program)
PRN Programme de Renforcement de la Nutrition (Senegal Nutrition Reinforcement Programme)
PSNP Productive Safety Net Programme (Ethiopia)
RAS Regional Assistance Strategy
RDA Recommended Dietary Allowance
RESEPAG Relaunching Agriculture: Strengthening Agriculture Public Services Project (Haiti)
RH Reproductive Health
Improving Nutrition Through Multisectoral Approaches
9
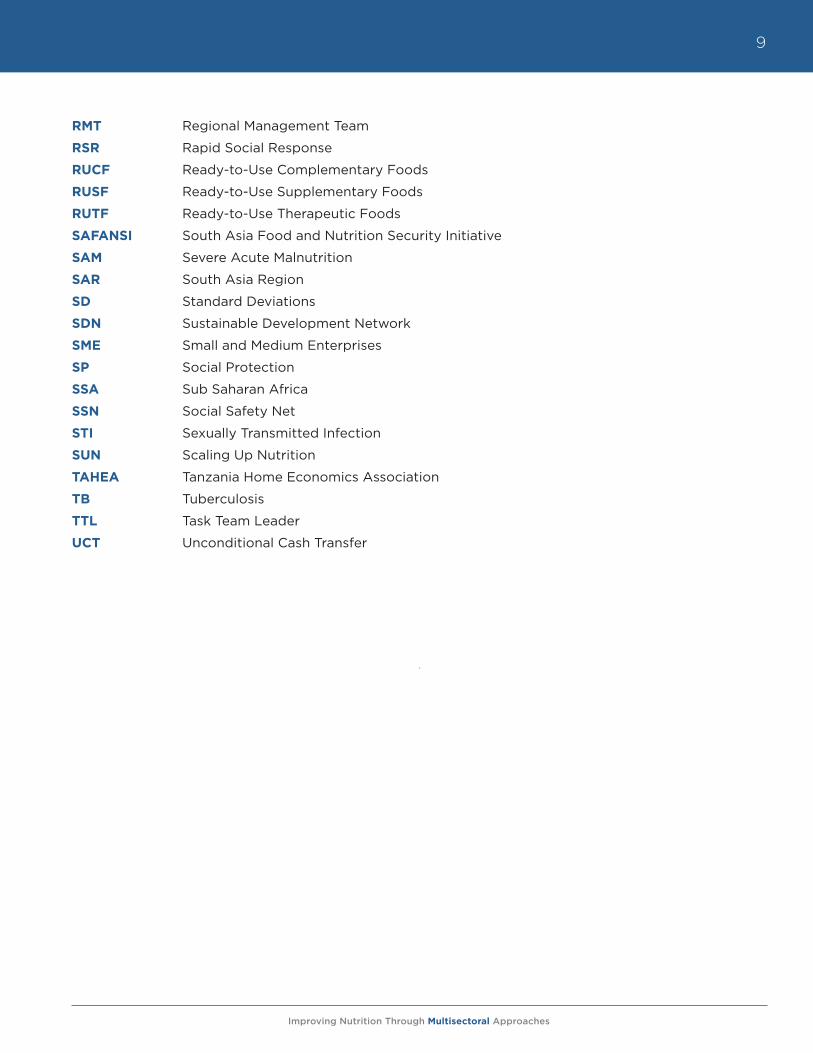
RMT Regional Management Team
RSR Rapid Social Response
RUCF Ready-to-Use Complementary Foods
RUSF Ready-to-Use Supplementary Foods
RUTF Ready-to-Use Therapeutic Foods
SAFANSI South Asia Food and Nutrition Security Initiative
SAM Severe Acute Malnutrition
SAR South Asia Region
SD Standard Deviations
SDN Sustainable Development Network
SME Small and Medium Enterprises
SP Social Protection
SSA Sub Saharan Africa
SSN Social Safety Net
STI Sexually Transmitted Infection
SUN Scaling Up Nutrition
TAHEA Tanzania Home Economics Association
TB Tuberculosis
TTL Task Team Leader
UCT Unconditional Cash Transfer

Improving Nutrition Through Multisectoral Approaches
10
Improving Nutrition Through Multisectoral Approaches
11
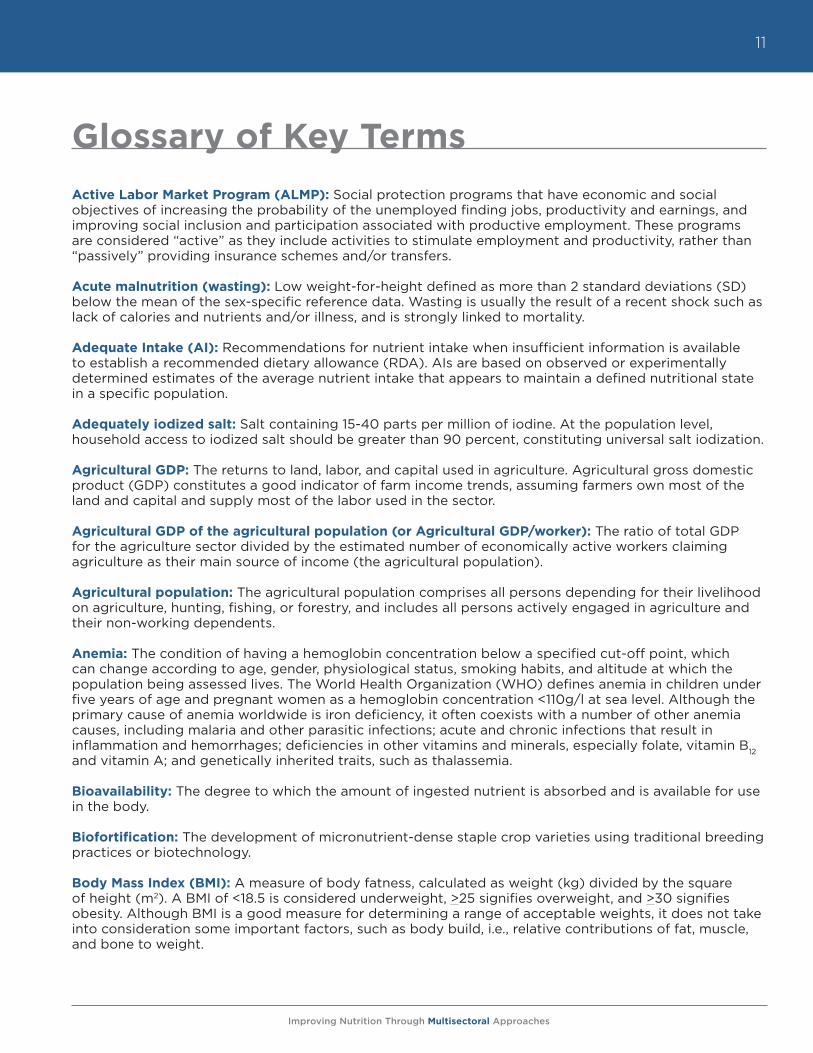
Glossary of Key Terms
Active Labor Market Program (ALMP): Social protection programs that have economic and social objectives of increasing the probability of the unemployed finding jobs, productivity and earnings, and improving social inclusion and participation associated with productive employment. These programs are considered “active” as they include activities to stimulate employment and productivity, rather than “passively” providing insurance schemes and/or transfers.
Acute malnutrition (wasting): Low weight-for-height defined as more than 2 standard deviations (SD) below the mean of the sex-specific reference data. Wasting is usually the result of a recent shock such as lack of calories and nutrients and/or illness, and is strongly linked to mortality.
Adequate Intake (AI): Recommendations for nutrient intake when insufficient information is available to establish a recommended dietary allowance (RDA). AIs are based on observed or experimentally determined estimates of the average nutrient intake that appears to maintain a defined nutritional state in a specific population.
Adequately iodized salt: Salt containing 15-40 parts per million of iodine. At the population level, household access to iodized salt should be greater than 90 percent, constituting universal salt iodization.
Agricultural GDP: The returns to land, labor, and capital used in agriculture. Agricultural gross domestic product (GDP) constitutes a good indicator of farm income trends, assuming farmers own most of the land and capital and supply most of the labor used in the sector.
Agricultural GDP of the agricultural population (or Agricultural GDP/worker): The ratio of total GDP for the agriculture sector divided by the estimated number of economically active workers claiming agriculture as their main source of income (the agricultural population).
Agricultural population: The agricultural population comprises all persons depending for their livelihood on agriculture, hunting, fishing, or forestry, and includes all persons actively engaged in agriculture and their non-working dependents.
Anemia: The condition of having a hemoglobin concentration below a specified cut-off point, which can change according to age, gender, physiological status, smoking habits, and altitude at which the population being assessed lives. The World Health Organization (WHO) defines anemia in children under five years of age and pregnant women as a hemoglobin concentration <110g/l at sea level. Although the primary cause of anemia worldwide is iron deficiency, it often coexists with a number of other anemia causes, including malaria and other parasitic infections; acute and chronic infections that result in inflammation and hemorrhages; deficiencies in other vitamins and minerals, especially folate, vitamin B12 and vitamin A; and genetically inherited traits, such as thalassemia.
Bioavailability: The degree to which the amount of ingested nutrient is absorbed and is available for use in the body.
Biofortification: The development of micronutrient-dense staple crop varieties using traditional breeding practices or biotechnology.
Body Mass Index (BMI): A measure of body fatness, calculated as weight (kg) divided by the square of height (m2). A BMI of <18.5 is considered underweight, >25 signifies overweight, and >30 signifies obesity. Although BMI is a good measure for determining a range of acceptable weights, it does not take into consideration some important factors, such as body build, i.e., relative contributions of fat, muscle, and bone to weight.
Improving Nutrition Through Multisectoral Approaches
12
Breastmilk substitute: Any food marketed or otherwise represented as a partial or total replacement for breastmilk, whether or not suitable for that purpose.
Childhood obesity: Weight-for-height that is >2 SD (see Overnutrition). Childhood obesity is associated with a higher probability of obesity in adulthood, which can lead to a variety of disabilities and diseases, such as diabetes and cardiovascular diseases.
Chronic malnutrition (stunting): Low height-for-age, defined as more than 2 SD below the mean of the sex-specific reference data. Stunting is the cumulative effect of long-term deficits in food intake, poor caring practices, and illness.
Colostrum: The first fluid secreted by the breast during late pregnancy and the first few days after birth. This thick fluid is rich in immune factors and protein.
Community-Based Management of Acute Malnutrition (CMAM): The management of acute malnutrition through (a) inpatient care for children with severe acute malnutrition with medical complications and infants under six-months of age with visible signs of severe acute malnutrition; (b) outpatient care for children with severe acute malnutrition; and (c) community outreach.
Community nutrition program: A community-based program intended to prevent growth faltering, control morbidity, and improve survival of children by promoting breastfeeding, providing education and counseling on optimal feeding practices, preventing diarrheal disease, and monitoring and promoting growth.
Complementary feeding practices: A set of 10 practices recommended for caregivers to implement from 6 to 24 months, at which point breastmilk and/or breastmilk substitutes alone are no longer sufficient to meet the nutritional needs of growing infants. Poor breastfeeding and complementary feeding practices, coupled with high rates of infectious disease, are the principal proximate causes of malnutrition during the first two years of life.
Complementary food: Any food, whether manufactured or locally prepared, suitable as a complement to breastmilk or to infant formula, when either becomes insufficient to satisfy the nutritional requirements of the infant (at about 6 months of age).
Conditional Cash Transfer (CCT): A social safety net program aimed at reducing both present and future poverty by linking a targeted transfer of cash to compliance with a pre-specified investment, usually in child education or health.
Cretinism: The stunting of body growth and poor mental development in the offspring that results from inadequate maternal intake of iodine during pregnancy.
Demographic targeting: A targeting method in which eligibility is based on age.
Diarrhea: The passage of three or more loose or liquid stools per day or more frequently than is normal for the individual. Diarrhea is usually a symptom of gastrointestinal infection, which can be caused by a variety of viral and parasitic organisms. Severe diarrhea leads to fluid loss and plays a particularly important role in nutrition and growth faltering, perhaps because of its association with malabsorption of nutrients and appetite suppression. The adjusted odds of stunting at 24 months of age increases by 5 percent with each episode of diarrhea in the first 24 months of life.
Dietary Diversity: The number of food groups consumed over a given period of time. Household-level dietary diversity can be used as an indicator of household food security, and individual-level dietary diversity is an indicator of diet quality for an individual (typically measured for women or young children).
Improving Nutrition Through Multisectoral Approaches
13
Early initiation of breastfeeding: Initiation of breastfeeding within one hour of birth. As a public health statistic, it is measured as the proportion of children born in the past 24 months who were put to the breast within one hour of birth.
Exclusive Breastfeeding (EBF): The feeding of an infant only with breastmilk from his/her mother or a wet nurse, or expressed breastmilk, and no other liquids or solids except vitamins, mineral supplements, or medicines in drop or syrup form.
Food-based transfer/food-based safety net program: A food-based safety net program intended to support food consumption. It differs from other safety net programs in that it is tied to food either directly or through cash-like instruments (food stamps, coupons) that may be used to purchase food.
Food fortification: The addition of one or more micronutrients (vitamins and minerals) to a food during processing. Ideally, food fortification provides a public health benefit with minimal risks to health in the population.
Food-For-Work Programs (FFW): This type of program provides food rations in exchange for a given amount of work done or a stipulated wage rate. FFW programs have long been used to protect households against the decline in purchasing power that often accompanies seasonal unemployment, climate-induced famine, or other periodic disruptions by providing them with employment.
Food security: According to the UN, food security exists when all people, at all times, have physical and economic access to sufficient, safe and nutritional food to meet their dietary needs and food preferences for an active and healthy life. The concept of food security includes the pillars of food availability, access, utilization, and stability/vulnerability. Food stamp, voucher, or coupon program: A type of safety net program that uses food-related mechanisms to deliver an income transfer to a target population. The specific instruments used to buy food (stamps, voucher, coupon) may restrict beneficiaries to buying only a few specific foods or allow them to purchase any food in the market.
Fortified Blended Foods (FBF): Blends of partially precooked and milled cereals, soya, beans, or pulses, fortified with micronutrients. Special formulations may contain vegetable oil or milk powder. Corn Soya Blend (CSB) and Wheat Soya Blend (WSB) are often used in emergency food distributions.
Global acute malnutrition is weight-for-height of -2 z-scores or more below the median, according to the WHO’s child growth standards (moderate and severe wasting).
Global Hunger Index (GHI): An index that ranks 84 developing and transitional countries using the following three equally weighted indicators to describe the state of countries’ hunger situation: (i) the proportion of people who are undernourished; (ii) the prevalence of underweight children under the age of five; and (iii) the under-five mortality rate. By using these three indicators, the GHI captures various aspects of hunger and undernutrition, and takes into account the special vulnerability of children to nutritional deprivation (IFPRI).
Hidden hunger: Micronutrient malnutrition or vitamin and mineral deficiencies, which can compromise growth, immune function, cognitive development, and reproductive and work capacity.
HIV/AIDS: Human immunodeficiency virus (HIV) is a retrovirus that affects cells of the immune system, destroying or impairing their function. As the disease progresses, the immune system becomes weaker, and the person becomes more susceptible to infection. The most advanced stage of HIV infection is acquired immunodeficiency syndrome (AIDS).
Improving Nutrition Through Multisectoral Approaches
14
Home garden / homestead food production: A small plot or plots around the home, managed by household members, where a variety of crops including vegetables, fruits, legumes, tubers, non-food plants, e.g., medicinal herbs, spices, fuel material are grown throughout the year and often livestock and fish are raised, primarily for household consumption. They typically use low-cost inputs and indigenous varieties, as well as local knowledge and practices and community participation. Home gardens have multiple uses, including improving diets within the household, provide inputs for other farm activities, e.g., fodder for animals, provide shade or natural fencing, raise income from the sale of garden produce, and empower women, who most typically manage home gardens. Nutritional impact of home gardening is increased when combined with nutrition education and linked with other health and development activities in the community.
Human Development Index (HDI): A summary composite measure of a country’s average achievements in three basic aspects of human development: (i) health, as measured by life expectancy at birth; (ii) knowledge, as measured by the adult literacy rate and the combined primary, secondary, and tertiary gross enrollment ratio; and (iii) a decent standard of living, as measured by GDP per capita in purchasing power parity in terms of US$.
Hunger: A feeling of discomfort, illness, weakness, or pain due to prolonged involuntary lack of food that goes beyond the usual uneasy sensation of temporary absence of food in the stomach (Panel to Review the USDA’s Measurement of Food Insecurity and Hunger, 2006). The sensation of hunger that results from a lack of food in the stomach is universal, but there are different manifestations and consequences of hunger, including undernourishment, malnutrition, and wasting.
Infant and Young Child Feeding (IYCF): Refers to specific recommendations and guiding principles for optimal nutrition, health, and development of children. A set of eight population-level IYCF indicators have been developed to: (i) assess IYCF trends over time; (ii) improve targeting of interventions; and (iii) monitor progress in achieving goals and evaluate the impact of interventions (WHO, 2008).
Infant and Young Child Nutrition (IYCN): A term that encompasses all aspects that relate to the nutrition of infants and young children (0 to 24 months).
In-kind transfers: The transfer of ownership of a good or asset other than cash, or the provision of a service without any counterpart.
International Code on Marketing of Breastmilk Substitutes: A set of recommendations to regulate the marketing of breastmilk substitutes, feeding bottles, and teats. This code aims to contribute “to the provision of safe and adequate nutrition for infants, by the protection and promotion of breastfeeding, and by ensuring the proper use of breastmilk substitutes, when these are necessary, on the basis of adequate information and through appropriate marketing and distribution” (Article 1).
Intrauterine Growth Retardation (IUGR): The poor growth of a baby while in the womb, which results in birth weight below a given percentile cut-off (typically the 10th percentile) for gestational age.
Iodine: An essential component of at least two thyroid hormones that are necessary for skeletal growth and neurological development.
Iodine deficiency: The condition resulting when iodine intake falls below recommended levels, tested through median urinary iodine concentration (normal range 100-199 /l).
Iodine Deficiency Disorders (IDD): All of the consequences of iodine deficiency in a population that can be prevented by ensuring that the population has an adequate intake of iodine. IDD can affect children at any stage of rapid growth, with the greatest negative impacts on cognitive development occurring during pregnancy. Symptoms range from mild impairment of brain development and subtle degrees of brain damage, goiter, hypothyroidism, reproductive disorders (spontaneous abortion, stillbirth, congenital abnormalities, perinatal mortality) to its most severe form, cretinism. Iodine deficiency is the primary cause of preventable mental retardation and brain damage in the world.
Improving Nutrition Through Multisectoral Approaches
15
Iron: A key building block of hemoglobin, which plays a central role in oxygen transport throughout the body.
Iron deficiency: The most common nutritional deficiency in the world, resulting from insufficient iron in the body due to inadequate consumption of bioavailable iron, blood loss, or unmet increased iron requirements due to infection, pregnancy, rapid growth, dietary habits, or any combination of these.
Iron Deficiency Anemia (IDA): The condition in which the body does not have enough healthy red blood cells due to a deficiency in iron. Iron deficiency (above) and iron deficiency anemia are associated with fetal and child growth failure, compromised cognitive development in young children, lowered physical activity and labor productivity in adults, and increased maternal morbidity and mortality. Women and young children are the most vulnerable to IDA, which increases the risk of hemorrhage and sepsis during childbirth, and is implicated in 20 percent of maternal deaths. Furthermore, children with IDA suffer from infections, weakened immunity, learning disabilities, impaired physical development, and in severe cases, death.
Large for Gestational Age (LGA): Birth weight above a given high percentile cut-off (typically the 90th percentile) for gestational age.
Lipid-Based Nutrient Supplements (LNS): Refers generically to a range of fortified, lipid-based products (including RUTF, and other highly concentrated supplements used for “point-of-use” fortification) used for the prevention and treatment of acute malnutrition. LNS typically contain milk powder, high-quality vegetable oil, peanut paste, sugar, and micronutrients, and provide 120 to 250 kcal/day.
Low Birth Weight (LBW): A birth weight of less than 2,500g. At the population level, the proportion of infants with a low birth weight often serves as an indicator of a multifaceted public health problem that includes long-term maternal malnutrition, ill health, hard work, and poor health care in pregnancy.
Malaria: A disease caused by the Plasmodium parasite that is transmitted via the bites of infected Anopheles mosquitoes; symptoms include fever, headache, vomiting, and anemia, and the disease can be fatal.
Malnutrition: Poor nutritional status caused by nutritional deficiency or excess (undernutrition or overnutrition).
Measles: A highly contagious viral disease that mostly affects children and can be prevented through routine immunization. Measles infection substantially increases vitamin A utilization and therefore causes vitamin A deficiency in children whose body stores are marginal prior to infection.
Mid-Upper Arm Circumference (MUAC): The circumference of the upper arm measured at the mid-point between the tip of the acromial process (shoulder) and the tip of the olecranon process (elbow).
Micronutrient(s): Vitamins and minerals that are needed in small amounts by the body to produce enzymes, hormones, and other substances essential for proper growth and development. Iodine, vitamin A, iron, and zinc are the most important in terms of prevalence and severity; deficiencies are a major threat to the health and development of populations worldwide, particularly children and pregnant women in low-income countries.
Micronutrient deficiency(ies): Deficiencies in one or more essential vitamin or mineral, often caused by disease and/or lack of access and/or consumption of micronutrient-rich foods such as fruit, vegetables, animal products, and fortified foods. Micronutrient deficiencies increase the severity and risk of dying from infectious disease such as diarrhea, measles, malaria, and pneumonia. More than two billion people in the world are estimated to be deficient in iodine, vitamin A, iron, or zinc.
Improving Nutrition Through Multisectoral Approaches
16
Microfinance: The provision of small-scale financial services to people who lack access to traditional banking services; usually implying very small loans to low-income clients for self-employment or entrepreneurial activity, often with the simultaneous collection of small amounts of savings. Simple application processes, provision of services in underserved communities, targeting poor and female clients, and group lending are traditional features of microfinance (Karlan, D. and N. Goldberg. 2007. Impact Evaluation for Microfinance. Washington, DC: The World Bank.).
Multiple micronutrient powder: A tasteless powder that comes in the form of individual sachets, containing the recommended daily intake of 16 vitamins and minerals for one person. They can be sprinkled into home-prepared food after cooking or just before eating.
Moderate malnutrition: Weight-for-age between -2 and -3 z-scores below the mean of sex-specific reference data (moderate underweight).
Moderate Acute Malnutrition (MAM): Weight-for-height between -2 and -3 standard deviations below the mean of sex-specific reference data (moderate wasting).
Non-Agricultural GDP/worker: The difference between the total national and agricultural GDP divided by the difference between total national and agricultural employment.
Nutrition security: The ongoing access to the basic elements of good nutrition, i.e., a balanced diet, safe environment, clean water, and adequate health care (preventive and curative) for all people, and the knowledge needed to care for and ensure a healthy and active life for all household members.
Obesity: A condition characterized by excess body fat, defined as a BMI of 30 or more.
Oral Rehydration Solution/Salts (ORS): A liquid electrolyte solution that is used for the management of diarrhea among children. ORS is typically distributed in ready-to-use sachets that are added to one liter of clean water.
Overnutrition: A state in which nutritional intake greatly exceeds nutritional need. Overnutrition manifests itself as overweight (BMI>25) and obesity (BMI>30). In children, overnutrition is defined as weight-for-height >2 SD (>2 SD is overweight and >3 SD is obese).
Overweight: A condition characterized by excess body fat, defined as a BMI between 25 and 30 kg/m2.
Pension: Non-contributory cash income given to older persons (usually by the government and/or other social programs).
Pneumonia: A serious bacterial lung infection that is transmitted by direct contact with infected people and is the leading cause of death in children worldwide. Malnutrition is considered a key risk factor for pneumonia; maintaining good nutritional status is thus important to prevent infection.
Protein-Energy Malnutrition (PEM): A condition resulting from insufficient consumption of energy and protein, resulting in wasting.
Public works: Social protection programs where income support for the poor is given in the form of wages (in either cash or food) in exchange for work effort. These programs typically provide short-term employment at low wages for unskilled and semiskilled workers on labor-intensive projects such as road construction and maintenance, irrigation infrastructure, reforestation, and soil conservation. They are generally seen as a means of providing income support to the poor in critical times rather than as a way of getting the unemployed back into the labor market.
Ready-to-use Supplementary Food (RUSF): A high-energy nutrition supplement that is particularly suited as a nutritional support in emergency situations or in the context of nutritional programs for the prevention or treatment of moderate malnutrition and deficiency-related illnesses.
Improving Nutrition Through Multisectoral Approaches
17
Ready-to-use Therapeutic Food (RUTF): A high energy and protein ready-to-eat food with added electrolytes, vitamins and minerals, specifically designed to treat SAM in the rehabilitation phase. RUTF is typically oil- and/or peanut-based; it does not have to be mixed with water so is microbiologically safe and enables outpatient treatment.
Replacement food: Replacement foods are food products given to an infant whose mother is HIV/AIDS positive, to replace breastmilk. Replacement foods are recommended over exclusive breastfeeding only when they are acceptable, feasible, affordable, sustainable, and safe (AFASS).
Respiratory tract infections: Infections that affect the air passages, including the nasal passages, and the bronchi and lungs. Acute Respiratory Tract Infections (ARI), including pneumonia, have been implicated in nutrition through growth faltering, likely due to the contributing factors that define the disease and include anorexia, fever, pain, vomiting, and associated diarrhea.
School feeding programs: A form of supplementary feeding that encourages children’s school enrollment and improves their ability to pay attention in class. These programs vary and may include the provision of breakfast, lunch, a midmorning snack, or a combination of these. Sometimes, school feeding programs are integrated with health and nutrition education, parasite treatment, health screening, and provision of water and sanitation.
Severe Acute Malnutrition (SAM): Weight-for-height more than 3 standard deviations below the mean of sex-specific reference data (severe wasting).
Small for Gestation Age (SGA): Birth weight below a given low percentile cut-off (typically the 10th percentile) for gestational age. SGA and IUGR are not synonymous; some SGA infants (e.g., those born to short mothers) may represent merely the lower extreme of the “normal” fetal growth distribution, while other normal weight infants may actually have been exposed to one or more growth-inhibiting factors. In individual cases, it is usually difficult to ascertain whether the observed birth weight is the result of restricted in utero growth. Therefore, classifying an infant as IUGR is based de facto on the established cut-off for SGA.
Smallholder farmer: Marginal and sub-marginal farm households that own and/or cultivate typically less than two hectares of land. Smallholder farmer households constitute a large proportion of the population in the developing world and of households living in poverty and hunger.
Social protection. The set of public interventions aimed at supporting the poorer and more vulnerable members of society, as well as helping individuals, families, and communities manage risk. Social protection includes safety nets (social assistance), social insurance, labor market policies, social funds, and social services.
Social Safety Net (SSN): Noncontributory transfer programs targeted in some manner to the poor and those vulnerable to poverty and shocks—analogous to the U.S. term “welfare” and the European term “social assistance.”
Stunting (chronic malnutrition): Low height-for-age, defined as more than 2 SD below the mean of the sex-specific reference data. Stunting is the cumulative effect of long-term deficits in food intake, poor caring practices, and/or illness.
Supplementary feeding programs: A direct transfer of food to target households or individuals, most commonly maternal and child feeding and school feeding. The food may be prepared and eaten on-site or given as a dry ration to take home. Supplementary feeding is often provided as an incentive for participation in public services such as primary health care and education.
Unconditional Cash Transfer (UCT): A social safety net program aimed at reducing both present and future poverty through a transfer of cash to vulnerable and specifically targeted populations.
Improving Nutrition Through Multisectoral Approaches
18
Undernourished: A person whose usual food consumption, expressed in terms of dietary energy (kcal), is below the energy requirement norm. The prevalence of undernourishment in a specified population is sometimes used as a measure of food deprivation. This term is not to be confused with undernutrition.
Undernutrition: Poor nutritional status due to nutritional deficiencies. The main three indicators of undernutrition are stunting, wasting, and underweight.
Underweight: Low weight-for-age defined as more than 2 SD below the mean of the sex-specific reference data.
Vitamin A: An essential micronutrient that plays an essential role in vision and immune response.
Vitamin A Deficiency (VAD): The condition resulting when vitamin A intake falls below recommended levels. Vitamin A deficiency may be exacerbated by high rates of infection, and greatly increases the risk that a child may die from diseases such as measles, diarrhea, and acute respiratory infections, and is the leading cause of childhood blindness. Vitamin A deficiency compromises the immune systems of approximately 40 percent of the developing world’s children under five and leads to the deaths of as many as one million young children each year.
Wasting (acute malnutrition): Low weight-for-height defined as more than 2 SD below the mean of the sex-specific reference data. Wasting is the result of a recent shock such as lack of calories and nutrients and/or illness, and is linked strongly to mortality.
Weather-index insurance: A product designed to provide compensation to farmers when specific weather events are insufficient (rainfall) or destructive (cyclones, floods) for farmers to grow and optimize their yields. Weather index insurance does not measure changes in yields; rather it measures changes in weather, assuming that if the weather is poor, the farmers’ yields will be too.
Window of opportunity: The period between conception and age two when irreversible damage caused by malnutrition can and should be prevented.
Zinc: An essential micronutrient that plays a critical role in the structure of cell membranes and in the function of immune cells.
Zinc deficiency: The condition resulting when zinc intake falls below recommended levels. Zinc deficiency is associated with growth retardation, malabsorption syndromes, fetal loss, neonatal death, and congenital abnormalities. Zinc supplementation reduces the duration and intensity of diarrheal illness and reduces clinical disease caused by acute respiratory infections and malaria.
Improving Nutrition Through Multisectoral Approaches
19
Acknowledgements
This document was produced by a team led by Meera Shekar (AFTHW) and Leslie Elder (HDNHE). Authors include Harold Alderman (HDNSP), Leslie Elder (HDNHE), Aparajita Goyal (AES), Anna Herforth (HDNHE), Yurie Tanimichi Hoberg (AES), Alessandra Marini (LCSHS), Julie Ruel-Bergeron (HDNHE), Jaime Saavedra (PRMPR), Meera Shekar (AFTHW), Sailesh Tiwari (PRMPR), and Hassan Zaman (PRMPR).
First round peer reviewers were Liz Drake (DfID), Ariel Fiszbein (HDNCE), Margaret Grosh (LCSHD), and Julie McLaughlin (SASHN). In the second round, peer reviewers were Bénédicte de la Brière (HDNCE), Margaret Grosh, (LCSHD), Steven Jaffee (EASVS), Claudia Rokx (ECSH1), Shelly Sundberg (The Bill & Melinda Gates Foundation), and Anna Taylor (DfID).
This document benefitted greatly from consultations with the following Task Team Leaders (TTLs) and development partner colleagues: Erick Abiassi (AFTAR), Diego Arias Carballo (LCSAR), Katie Bigmore (AFTHE), Luc Laviolette (SASHN), Gayle Martin (AFTHD), Rasit Pertev (AFTAR), Animesh Shrivastava (SASDA), Joana Silva (MNSSP), Eileen Sullivan (EASHH), Shelly Sundberg (The Bill & Melinda Gates Foundation), Ajay Tandon (EASHH), Anna Taylor (DfID), Laketch Imru (AFTAR), Oluwole Odutolu (AFTHE), and Boubou Cisse (AFTED).
The team gratefully acknowledges inputs and support received by both peer reviewers and participants of the TTL and partner consultations, as well as the funding support for this study from DfID, the Japan Trust Fund for Scaling Up Nutrition, and the Rapid Social Response Trust Fund.

Improving Nutrition Through Multisectoral Approaches
20
Improving Nutrition Through Multisectoral Approaches
21
Executive SummaryThis report responds to the global development community’s request for operational guidance to maximize the impact of investments on nutrition outcomes for women and young children. The importance of nutrition guidance has been expressed by the Bank’s regional teams, especially South Asia and Africa, the World Bank Group’s Advisory Council of Foundation Leaders meetings, as well as the wider Scaling up Nutrition (SUN) donor partners group. This report is a first step towards operationalizing a multisectoral approach to improve nutrition worldwide.
The recommendations in this document build on the extensive nutrition research and evidence to-date on issues of malnutrition. The authors’ aim is to mainstream nutrition activities into multisectoral action in Bank operations through a series of guidance notes that are focused initially on the three sectors of agriculture, social protection, and health, including an overview of the link between nutrition and poverty reduction. “Malnutrition” refers only to undernutrition and micronutrient deficiencies in this document, and not in overnutrition. The overweight/obesity aspects of malnutrition are not addressed.
The guidance notes are designed to assist World Bank Task Team Leaders (TTLs), donor partners, and country-level implementers with adjusting the design of existing or future operations in their respective sector to be more nutrition sensitive. When relevant, some of the notes are accompanied by a succinct, operational matrix that highlights the objectives, tracking indicators, opportunities, trade-offs, and issues of policy coherence. Where nutritional evidence is weak, it is noted. Where it is strong, the notes provide programmatic guidance that will help these sectors to adopt a “nutrition lens” as they develop new programs and projects. Each self-contained note can be applied to each sector or used together as one coherent cross-sectoral approach. The document is divided into five modules, some of which include a list of additional resources.
Module A provides the intellectual and theoretical rationale for a multisectoral response to malnutrition. This module is targeted at a wider development policy audience.
Modules B through E are targeted specifically at World Bank and other agencies’ TTLs and country clients that design and support projects and programs in poverty reduction, agriculture, and rural development, social protection, and health. While every effort has been made to make the information as specific as possible, and to give concrete country and contextual examples, the note is meant as generic guidance. Each country and each TTL will need to adapt these recommendations to their country and operational contexts.
Rationale and Strategic Context (Module A). Recent assessments of the Millennium Development Goals (MDGs) show slower progress than expected. The global development community recently has recognized that one reason for slow gains in the MDGs is the lack of investment in nutrition, the virtually “forgotten MDG.” Research confirms that investing in nutrition significantly multiplies positive outcomes in maternal and child health, cognitive function and educability, human capital, and economic growth and poverty reduction. However, despite the proven high returns, 36 countries carry about 90 percent of the global burden of undernutrition, and nutrition investments are inadequate in many of these countries. To finance the scale up of effective nutrition solutions globally, an estimated $10.3 billion per year is required, but current donor investments fall far below this amount.1 In many developing economies, nutrition improvement is further hampered by an emerging problem of overweight and obesity in addition to pre-existing undernutrition, which leads to the “double burden” of undernutrition coexisting with overweight and obesity.
1 BMGF. 2011.
Improving Nutrition Through Multisectoral Approaches
22
Poverty, Economic Growth, and Nutrition (Module B). Global poverty has declined significantly in the last two decades, but this has not been accompanied by commensurate reductions in global hunger and improvements in nutritional outcomes. Since hunger and malnutrition are linked intricately to poverty, the divergence in the trends of these indicators is puzzling. We investigate why nutritional status generally has remained poor despite widespread reduction in income poverty, and discuss policy implications. An emerging clear message is that even though economic development is related significantly to malnutrition, economic growth alone often is insufficient to improve malnutrition rates. Furthermore, there are considerable inequities in nutritional outcomes across socioeconomic groups; the rate of progress in nutritional outcomes varies over time; and in several countries, the gaps between the rich and poor have widened. For example, South Asia and Africa’s comparative malnutrition rates are striking. Relative to the “predicted” levels of malnutrition (stunting and underweight) given poverty rates, South Asian countries are lagging behind, while many African countries are doing better than their poverty levels would predict.
Improving Nutrition through Agriculture and Rural Development (Module C). Global momentum, including that catalyzed by the global Scaling Up Nutrition (SUN) movement framework and roadmap, is bringing the agriculture, food security, and nutrition agendas closer together so that investments in one will have positive impacts on the other. While nutrition investments are designed to improve human capital and to have a positive impact on physical well-being and work capacity, including agricultural productivity, the potential benefits of agriculture investments on nutrition have yet to be maximized. This module explains why agriculture is important for nutrition, and vice versa. The available evidence indicates four strong principles for action in areas where the Bank’s agricultural programs can contribute Priority objectives.
Priority objectives to enhance nutrition in agriculture programs
1. Invest in women: safeguard and strengthen the capacity of women to provide for the food security, health, and nutrition of their families.
2. Increase access to year-round availability of high-nutrient content food.3. Improve nutrition knowledge among rural households to enhance dietary diversity.4. Incorporate explicit nutrition objectives and indicators into agriculture investments.
Although the Bank’s agriculture and rural development (AES) projects have, to date, only addressed nutrition implicitly or unintentionally, there is growing awareness inside and outside of the Bank of the importance of leveraging agriculture to improve nutrition. Of the 21 countries that have met the goal of halving the proportion of the population below the minimum level of dietary energy consumption, only six are on track to meet the underweight goal.2 This is an example of the limits of improving nutrition implicitly through agriculture. Simply increasing household income or raising agricultural productivity is insufficient to improve undernutrition.
This module provides practical guidance for maximizing the nutrition impacts of agriculture investments by action on the following fronts: (i) incorporate nutrition-sensitive analysis and activities into Agriculture (AES) project design and food security policy dialogue; (ii) measure the progress of activities affecting nutrition periodically through relevant output indicators; and through outcome indicators such as food consumption indicators at least at baseline/mid-term/project completion; (iii) ensure that agriculture projects and policies do not cause unintended harm to nutrition.
Improving Nutrition through Social Protection (Module D). While most safety net programs include an income transfer component—and many vulnerable households lack adequate income to purchase key inputs to maintain notable nutrition outcomes—the evidence shows that increased income alone is often 2 Armenia, Georgia, Ghana, Jamaica, Nicaragua, and Vietnam have met the hunger goal and are on track to meet the underweight goal.
Improving Nutrition Through Multisectoral Approaches
23
insufficient to have a major impact on nutrition. Thus, other components, such as directing transfers to women, targeting the most vulnerable and the correct age group (-9 to 24 months), and adding a nutrition education or a micronutrient supplementation component to social protection programs can play an essential role in generating impact. Alternative options to improve nutrition for the most vulnerable populations are reviewed to strengthen the design of existing or future interventions in social protection. We discuss the pathways through which these programs can influence nutritional outcomes and the different policy choices that can derive from each of them by asking three broad questions: (i) How can we maximize the impact of income transfers on nutrition? (ii) With what services might the social protection programs be linked? (iii) Who should be targeted?
Improving Nutrition through Health (Module E). This guidance note aims to assist World Bank and other program staff in maximizing the nutrition impacts of health investments and policies, with a special focus on undernutrition among women and children under two years of age in developing economies. The strong synergies between health and nutrition are highlighted and key evidence-based nutrition interventions that can be delivered through the health sector are presented. Implementing such interventions is cost-effective and can achieve large reductions in morbidity, mortality, and undernutrition, furthering health sector goals. The main nutrition-related objectives that fall within the health sector are outlined in the box below. Evidence-based interventions to address each objective, along with implementation considerations, are presented as options to integrate nutrition interventions in health investments and policies.
Priority objectives of nutrition sensitive social protection
1. Target activities to the most nutritionally vulnerable populations such as pregnant women and children under 24 months.
2. Include nutrition education and counseling activities within social protection interventions toincrease household awareness of care giving and health seeking behaviors.
3. Integrate nutrition services into SP interventions, e.g. growth monitoring and promotion, and/or activities for improved growth and diet quality.
4. Reduce the acute and long-term negative financial impacts of external financial, price, and weather shocks by scaling up programs in times of crises and by targeting shock-affected areas.
Priority objectives to improve nutrition through the health sector
1. Reduce micronutrient deficiencies.2. Reduce anemia in pregnant and lactating women and children 0-24 months.3. Promote good feeding and nutritional care practices.4. Treat and prevent illness.5. Reduce low birth weight.6. Improve reproductive health and family planning.7. Treat moderate and severe undernutrition in children.

Improving Nutrition Through Multisectoral Approaches
24
Improving Nutrition Through Multisectoral Approaches
25
MODULE A. IntroductionMeera Shekar, Julie Ruel-Bergeron, Anna Herforth
I. Rationale and strategic context
A. Interest in the “forgotten MDG” re-emerges
Recent assessments of the MDGs show that progress in nutrition has been slower than expected. The global development community recently recognized that one reason for slow gains in the Millennium Development Goals (MDGs) is the lack of investment in nutrition, the virtually “forgotten MDG.”1 Research shows that investing in nutrition significantly multiplies the positive outcomes for maternal and child health, cognitive function and educability, human capital, and economic growth and poverty reduction. However, despite the proven high returns, 36 countries carry about 90 percent of the global burden of child undernutrition,2 and nutrition investments are inadequate in many of these countries. This is partly due to the inadequacy of total global investments in nutrition, which comprise only a small fraction of the estimated needs (about $10.3 billion), and a very small proportion of the current spending in sectors such as health or agriculture. In many developing economies, nutrition improvement is hampered further by an emerging burden of obesity, leading to the “double burden of malnutrition,” with undernutrition coexisting with overweight and obesity.
The global community now concurs that increasing investment in nutrition will accelerate progress on a range of MDGs, especially MDGs 1 (poverty), 2 (education), and 4 and 5 (maternal and child health). Nutrition investments will support poverty reduction efforts, and have the potential to augment GDP in developing countries by at least 2-3 percent.3 Accelerating progress on the MDGs by 2015 therefore requires urgent investments in nutrition. Translating the high level of national and international political consensus and commitment and the available evidence into nutrition specific actions—delivered primarily through the health sector—and nutrition sensitive actions delivered through several other sectors is now the challenge. This report lays the groundwork for multisectoral action by providing the overall rationale for such action and the programmatic guidance on how to incorporate nutrition actions into the World Bank’s and its partners’ investments in poverty reduction, agriculture, social protection, and health.
1 MDG1 includes a target to halve, between 1990 and 2015, the proportion of children under age 5 who are underweight.2 Child undernutrition is defined as low weight-for-age (underweight); low height-for-age (stunting or chronic malnutrition); low weight-for-height
(wasting or acute malnutrition); and micronutrient deficiencies (minerals and vitamins).3 SUN Framework, http://siteresources.worldbank.org/NUTRITION/Resources/281846-1131636806329/PolicyBriefNutrition.pdf, Repositioning Nutri-
tion, http://siteresources.worldbank.org/NUTRITION/Resources/281846-1131636806329/NutritionStrategy.pdf.
Nutrition Specific
A term that refers to interventions that directly address inadequate dietary intake or disease—the immediate causes of malnutrition. Nutrition specific interventions are those identified in The Lancet series on maternal and child undernutrition (2008), including micronutrient supplementation, deworming, treatment of severe acute malnutrition, and breastfeeding promotion, which directly addresses dietary intake and disease for infants.
Nutrition Sensitive
A term that refers to interventions or development efforts that, within the context of sector-specific objectives, also aim to improve the underlying determinants of nutrition (adequate food access, healthy environments, adequate health services, and care practices), or aim at least to avoid harm to the underlying or immediate causes, especially among the most nutritionally vulnerable populations and individuals. Various actions that would address the determinants of malnutrition are possible in many sectors. In health, for example, reproductive health services can improve birth spacing; in agriculture, the investment and input-delivery portfolio may be diversified to include more nutrient-dense foods; in social protection, cash transfers can have conditionalities for vaccinations and growth monitoring; in education, efforts to keep girls in school can be strengthened; in water and sanitation, improved water provision can prioritize the most nutritionally vulnerable areas or populations; other actions exist in many other sectors.
Improving Nutrition Through Multisectoral Approaches
26
B. Economic growth, poverty, and malnutrition
Malnutrition rates remain surprisingly high in several countries with robust economic and agricultural growth. This paradoxical situation of economic growth and malnutrition is starkly evident in India, as well as in many other countries (Figure A-1). In these countries, many children are born with low birth weights. For the rest of their lives, these children continue to track at low heights and weights and to suffer from often irreparable damage to human capital. Even though poor children are more likely to be malnourished, a surprisingly large percentage of those in the highest income quintiles—where food security is not a likely limiting factor—are also underweight or stunted (Table A-1). In general, nutrition outcomes have improved more quickly in countries with more equitable economic growth and pro-poor agricultural growth policies.4 However, while economic growth, poverty reduction, and agricultural productivity all contribute to better nutrition, in most countries, gains in economic growth or agricultural productivity alone have been insufficient to improve child nutrition outcomes.5
Figure A-1. Higher than expected child stunting and underweight prevalence rates in many countries given GDP levels, particularly in South Asia
Source: World Bank. World Development Indicators as of 09/10/2010. Height-for-age and weight-for-age are for the latest year for which data are available. GDP per capita in constant 2005 PPP Int’l $ is for the year corresponding to the year in which the nutrition data was collected. All observations are between 2000 and 2008. Analysis by John Newman.
4 Webb, P. and Block, S. 2011. Support for agriculture during economic transformation: Impacts on poverty and undernutrition. Proceedings of the National Academy of Sciences of the United States of America. www.pnas.org/cgi/doi/10.1073/pnas.0913334108
5 See Module B on poverty and nutrition for more details and discussion on this issue.
Improving Nutrition Through Multisectoral Approaches
27
Table A-1. Nutrition and poverty: Prevalence of child stunting by income quintile indicates that malnutrition rates are high even among those who are not poor
Data Source: Bredenkamp, C., Health Equity and Financial Protection datasheets, World Bank 2012.
C. Scaling Up Nutrition (SUN): A new global framework and a roadmap for action
The Scaling Up Nutrition (SUN) movement was launched in 2010 in response to the continuing high rates of global malnutrition. A broad informal global partnership was established through a collaborative process of consensus building on how to scale up nutrition interventions (see Figure A-2). The fruits of this intensive work program between developing countries, academic and research institutions, civil society organizations, the private sector, bilateral development agencies, United Nations agencies (FAO, UNICEF, WFP, and WHO), and the World Bank resulted in the SUN Framework for Action and the SUN Roadmap.
To date, the Scaling Up Nutrition Framework has been endorsed by over 100 partners worldwide and 30 developing countries have committed to scaling up nutrition. Leaders of these countries are prioritizing nutrition as an investment in their people’s growth, and recognizing nutrition as an investment in economic and social development to strengthen their nations. These countries expect to see results within the next five years. The SUN’s success also depends on support from related initiatives in food security and agriculture, health, and vulnerability protection, such as the Comprehensive Africa Agriculture Development Programme (CAADP), UN High Level Task Force (HLTF) for the Global Food Security Crisis, US Global Health Initiative (GHI), US Global Hunger and Food Security Initiative, the HLTF on Innovative Financing for Health, and others.
Regions Country Lowest 2nd 3rd 4th Highest
South AsiaBangladesh 59 53 45 43 30
India 61 54 49 39 26
Pakistan 54 47 43 37 26
AfricaBenin 50 48 48 40 29
Burkina 50 47 46 41 26
Ethiopia 52 54 51 49 40
Mozambique 54 53 52 41 26
Rwanda 61 55 52 50 35
Tanzania 50 49 46 43 23
Uganda 43 38 44 37 25
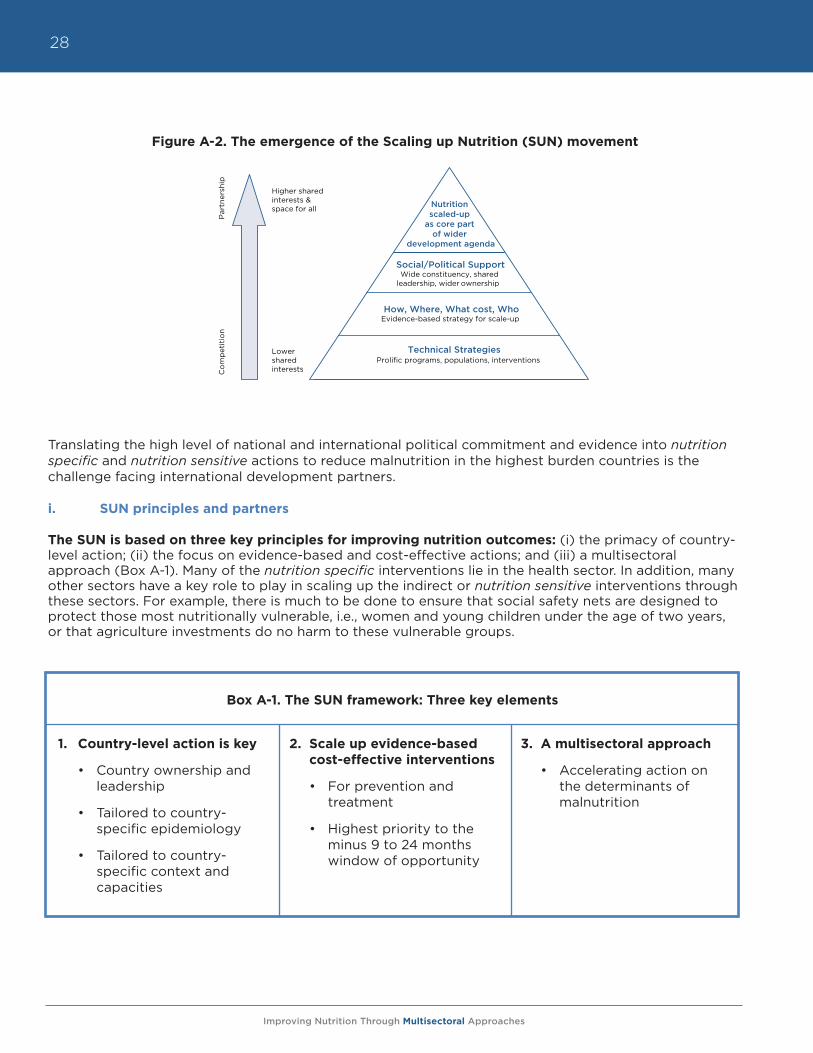
Improving Nutrition Through Multisectoral Approaches
28
Figure A-2. The emergence of the Scaling up Nutrition (SUN) movement
Translating the high level of national and international political commitment and evidence into nutrition specific and nutrition sensitive actions to reduce malnutrition in the highest burden countries is the challenge facing international development partners.
i. SUN principles and partners
The SUN is based on three key principles for improving nutrition outcomes: (i) the primacy of country-level action; (ii) the focus on evidence-based and cost-effective actions; and (iii) a multisectoral approach (Box A-1). Many of the nutrition specific interventions lie in the health sector. In addition, many other sectors have a key role to play in scaling up the indirect or nutrition sensitive interventions through these sectors. For example, there is much to be done to ensure that social safety nets are designed to protect those most nutritionally vulnerable, i.e., women and young children under the age of two years, or that agriculture investments do no harm to these vulnerable groups.
MODULE A
Figure A-2. The emergence of the Scaling Up Nutrition (SUN) movement
Nutrition scaled-up
as core part of wider
development agenda
Co
mp
etit
ion
P
artn
ersh
ip
Technical Strategies Prolific programs, populations, interventions
How, Where, What cost, Who
Social/Political Support Wide constituency, shared
leadership, wider ownership
Evidence-based strategy for scale-up
Higher shared interests & space for all
Lower shared interests
3. A multisectoral approach
• Accelerating action on the determinants of malnutrition
2. Scale up evidence-based cost-effective interventions
• For prevention and treatment
• Highest priority to the minus 9 to 24 months window of opportunity
1. Country-level action is key
• Country ownership and leadership
• Tailored to country-specific epidemiology
• Tailored to country-specific context and capacities
Box A-1. The SUN framework: Three key elements
Improving Nutrition Through Multisectoral Approaches
29
ii. The “early riser” countries under the SUN
Thirty countries have expressed interest in the SUN movement. These “early risers” include Bangladesh, Benin, Burkina Faso, Burundi, Ethiopia, The Gambia, Ghana, Guatemala, Indonesia, Kenya, Kyrgyz Republic, Lao PDR, Madagascar, Malawi, Mali, Mauritania, Mozambique, Namibia, Nepal, Niger, Nigeria, Peru, Rwanda, Senegal, Sierra Leone, Tanzania, Uganda, Zambia, and Zimbabwe. Involvement in the SUN movement as an early riser entails political commitment building within governments, establishing multi-stakeholder platforms, promoting goals and targets for reducing undernutrition, encouraging coherence and support of the movement through a global coalition of partners, and mobilizing support for effective joint action at scale.
iii. Evidence for action
The evidence for action through the health sector (nutrition specific interventions) was presented in The Lancet Series on Maternal and Child Undernutrition (2008), the Copenhagen Consensus (2008), and the World Bank’s 2006 document Repositioning Nutrition as Central to Development. The findings show that there is a very small “window of opportunity” to improve nutrition outcomes and to prevent irreversible losses to human capital in countries. This window starts during pregnancy and closes at about two years of age. These first “1000 days” in a child’s life offer the best opportunity to lock-in future human capital. If implemented at scale, interventions during this period can potentially reduce undernutrition-related mortality and morbidity by 25 percent. Many of the proposed interventions are delivered primarily through the health sector and are summarized in Module E of this document. A similar body of evidence-based recommendations does not exist for multisectoral actions to maximize nutrition improvement across other sectors. This document attempts to fill this gap. It provides guidance on scaling up interventions across several sectors and draws upon the recent reviews of evidence specified in each respective module.
II. Nutrition is a multisectoral problem with multisectoral solutions
A. Determinants of malnutrition
The determinants of malnutrition are multisectoral. The immediate causes are related to food and nutrient intake and to health. The underlying causes are embedded in the household and community level context in which undernutrition occurs. These underlying causes are further impacted by issues such as agricultural practices and climate change, lack of access to and availability of clean water and sanitation, health services, girls’ education and gender issues, social protection, and social safety nets. The basic causes of undernutrition are rooted in institutional, political, and economic issues such as poverty reduction and economic growth, governance and stewardship capacities, environmental safeguards, and trade and patents issues, including the role of the private sector. Addressing the special conditions in fragile states and reducing conflict, are also key in fragile/conflict situations. A framework for the multisectoral causation of malnutrition is shown in Figure A-3.
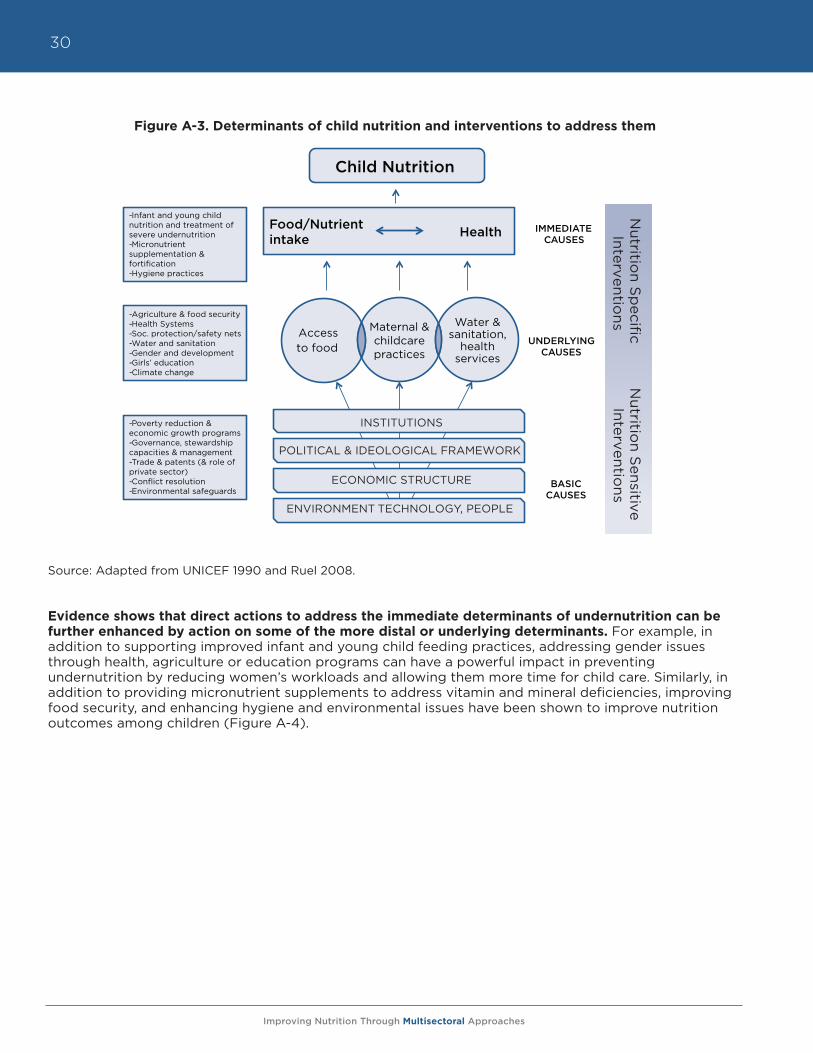
Improving Nutrition Through Multisectoral Approaches
30
Figure A-3. Determinants of child nutrition and interventions to address them
Source: Adapted from UNICEF 1990 and Ruel 2008.
Evidence shows that direct actions to address the immediate determinants of undernutrition can be further enhanced by action on some of the more distal or underlying determinants. For example, in addition to supporting improved infant and young child feeding practices, addressing gender issues through health, agriculture or education programs can have a powerful impact in preventing undernutrition by reducing women’s workloads and allowing them more time for child care. Similarly, in addition to providing micronutrient supplements to address vitamin and mineral deficiencies, improving food security, and enhancing hygiene and environmental issues have been shown to improve nutrition outcomes among children (Figure A-4).
1
Maternal & childcare practices
Water & sanitation,
health services
Access to food
-Infant and young child nutrition and treatment of severe undernutrition -Micronutrient supplementation & fortification -Hygiene practices
-Agriculture & food security -Health Systems -Soc. protection/safety nets -Water and sanitation -Gender and development -Girls’ education -Climate change
-Poverty reduction & economic growth programs -Governance, stewardship capacities & management -Trade & patents (& role of private sector) -Conflict resolution -Environmental safeguards
INSTITUTIONS
POLITICAL & IDEOLOGICAL FRAMEWORK
ECONOMIC STRUCTURE
ENVIRONMENT TECHNOLOGY, PEOPLE
IMMEDIATE CAUSES
UNDERLYING CAUSES
BASIC CAUSES
Food/Nutrient intake Health
Child Nutrition N
utrition S
pecific
Nutritio
n Sensitive
Interventions
Interventions
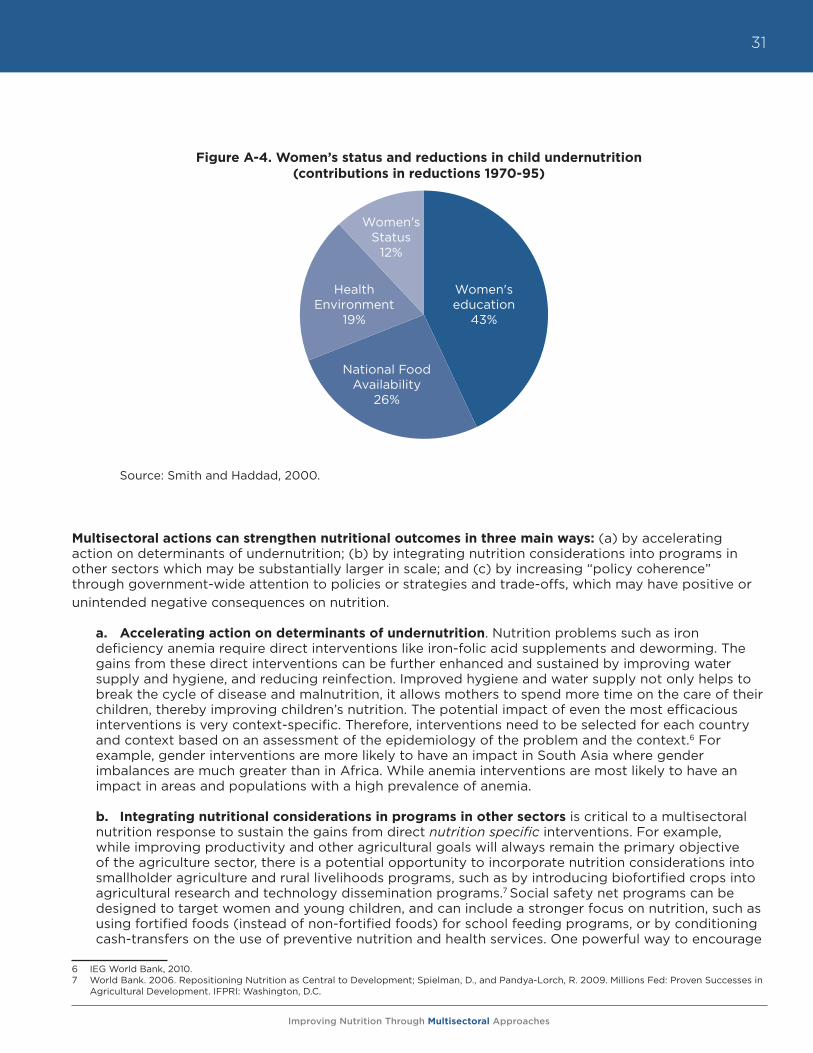
Improving Nutrition Through Multisectoral Approaches
31
Figure A-4. Women’s status and reductions in child undernutrition (contributions in reductions 1970-95)
Source: Smith and Haddad, 2000.
Multisectoral actions can strengthen nutritional outcomes in three main ways: (a) by accelerating action on determinants of undernutrition; (b) by integrating nutrition considerations into programs in other sectors which may be substantially larger in scale; and (c) by increasing “policy coherence” through government-wide attention to policies or strategies and trade-offs, which may have positive or unintended negative consequences on nutrition.
a. Accelerating action on determinants of undernutrition. Nutrition problems such as iron deficiency anemia require direct interventions like iron-folic acid supplements and deworming. The gains from these direct interventions can be further enhanced and sustained by improving water supply and hygiene, and reducing reinfection. Improved hygiene and water supply not only helps to break the cycle of disease and malnutrition, it allows mothers to spend more time on the care of their children, thereby improving children’s nutrition. The potential impact of even the most efficacious interventions is very context-specific. Therefore, interventions need to be selected for each country and context based on an assessment of the epidemiology of the problem and the context.6 For example, gender interventions are more likely to have an impact in South Asia where gender imbalances are much greater than in Africa. While anemia interventions are most likely to have an impact in areas and populations with a high prevalence of anemia.
b. Integrating nutritional considerations in programs in other sectors is critical to a multisectoral nutrition response to sustain the gains from direct nutrition specific interventions. For example, while improving productivity and other agricultural goals will always remain the primary objective of the agriculture sector, there is a potential opportunity to incorporate nutrition considerations into smallholder agriculture and rural livelihoods programs, such as by introducing biofortified crops into agricultural research and technology dissemination programs.7 Social safety net programs can be designed to target women and young children, and can include a stronger focus on nutrition, such as using fortified foods (instead of non-fortified foods) for school feeding programs, or by conditioning cash-transfers on the use of preventive nutrition and health services. One powerful way to encourage
6 IEG World Bank, 2010.7 World Bank. 2006. Repositioning Nutrition as Central to Development; Spielman, D., and Pandya-Lorch, R. 2009. Millions Fed: Proven Successes in
Agricultural Development. IFPRI: Washington, D.C.
Women's education
43%
National Food Availability
26%
Health Environment
19%
Women's Status
12%
Improving Nutrition Through Multisectoral Approaches
32
more emphasis on nutrition—and to hold those sectors accountable for nutrition results—is to include an appropriate nutrition related indicator (or a validated proxy indicator) to measure overall progress on nutrition in these sectoral projects and programs.
c. Increasing “policy coherence” through government-wide attention to policies or strategies, and analyzing trade-offs, which may have positive or unintended negative consequences on nutrition, is another critical means for mainstreaming nutrition into other sectors. National development strategies vary significantly by the extent to which nutritional objectives are incorporated either as a stand-alone issue or mainstreamed within other sectors. While capacity is clearly a binding constraint, ideally what is required is both better and timely reporting of nutritional consequences of different sectoral policies and programs, potentially similar to the Poverty and Social Impact Analyses (PSIA) used in Bank operations.
B. Key sectors for maximizing nutrition impacts
The key sectors for maximizing nutrition impacts are indicated in Figure A-3. These include health, agriculture and food security, social protection (especially social safety nets), poverty reduction (although it is not a traditional “sector”), education (especially girls’ education), water and sanitation, environment and climate change, private sector, and trade and intellectual property rights (especially in view of the growing role of the private sector in food and health systems in developing economies). Gender and governance issues are crosscutting across several of these traditional sectors and need special consideration.
C. Think multisectorally, act sectorally
While there is a strong case for acting across several sectors to improve nutrition outcomes, little evidence exists demonstrating the success of multisectoral projects improving nutrition outcomes. Experience and evidence suggest that while it is perfectly logical to think and plan multisectorally, actions must follow sector by sector, tailored to the specific context, objectives, and operating environment of each sector.8 This approach is further bolstered by the fact that budget allocations in institutions, as well as at country level, are made by sectors or ministries, and governance and accountability structures follow similar sectoral limitations with sectors holding themselves accountable for results within their own domains. Based on this experience and evidence base, the current guidance notes follow this mantra of thinking multisectorally but act sector by sector. The guidance notes are being developed as modular sectoral inputs that can be applied to each sector, but also pulled together into one coherent cross-sectoral approach.
D. Rationale for World Bank involvement
The Bank’s primary mission is poverty reduction and promoting economic growth in the poorest countries of the world, many of which carry the highest burdens of malnutrition. Through its investments in multiple sectors, the Bank is well positioned to support a multisectoral approach to reducing the underlying and immediate causes of undernutrition. Moreover, the Bank is one of the few development organizations that supports client countries acting across sectors and at scale, and strongly emphasizes governance and gender issues. The Bank has recently scaled up its investments in several nutrition relevant sectors. The more direct nutrition specific interventions implemented primarily by the
8 The history of multisectoral projects is littered with non-performance. The 2007 World Bank Health Nutrition & Population (HNP) Strategy stated that actions in other sectors were necessary to reach outcomes in health. Since then, there has been a steady increase in multisectoral projects, with most of the increase being in AIDS projects. However, the performance of multisectoral AIDS projects in Africa has been less than satisfac-tory. A criticism of multisectoral projects has been that the increased number of sectors involved has resulted in reduced clarity and specificity of the role and responsibility of each sector. Also, lending in sectors outside of health, such as water and sanitation and education, has taken place independent of each other and the health sector. In the water and sanitation and transport sectors, projects with health objectives rarely collabo-rate with the Ministry of Health. (Ref: Improving Effectiveness and Outcomes for the Poor in Health, Nutrition and Population, IEG 2009). While PRSPs have helped policymakers link sector strategies with poverty reduction, progress has depended on the capacity of the country’s public sector, partner relationships with the government and relations among donors. There are also no intermediate indicators for measuring progress, which reduces clarity and accountability of what is expected to be achieved by the PRSP. (Ref: The Poverty Reduction Strategy Initiative: An Inde-pendent Evaluation of the World Bank’s Support Through 2003, 2004).
Improving Nutrition Through Multisectoral Approaches
33
health sector will need to be complemented by the indirect nutrition sensitive interventions implemented through sectors such as agriculture and food security, social protection, and water and sanitation. All sectors will need to plan and implement investments to maximize the nutrition benefits for women and young children and minimize harmful, often unintended consequences. An important first step in this effort is to assist regional teams to move rapidly to a multisectoral approach to nutrition by providing programmatic guidance and tools as they develop new programs. Adoption of this guidance would signal a move towards operationalizing nutrition sensitive development. Experience from countries such as Senegal suggests that when this approach is implemented well, with appropriate investments in capacity development and institutional arrangements, results can be achieved.9
In FY12, the Bank’s agricultural projects covered some 40 countries and amounted to approximately $5.4 billion in new IDA/IBRD assistance. The most common focus of these projects is either to raise agricultural productivity and/or to link farmers to markets. Nutrition specific interventions in these projects remain largely absent, and nutrition sensitivity is still weak. However, awareness, commitments, and integration of nutrition activities are growing. In the context of the global food price increases, initiatives such as the Global Food Price Response Program (GFRP), had about 15 percent of the $1.5 billion allocation going towards non-agricultural interventions, such as social protection and school feeding. Housed in the World Bank, the Global Agriculture and Food Security Program (GAFSP) was set up in April 2010, at the request of the G20, to scale up support to country-led and developed agriculture and food security plans and to help promote investments in smallholder agriculture. GAFSP recently allocated US$46.5 million to Nepal to enhance household food security in the poorest and most food insecure regions through increased agricultural productivity, household incomes, and awareness about health and nutrition in the mid-western and far-western development regions.
New strategies in social protection and education hold promise for nutrition. In the social protection sector, nutritional considerations are not yet central to the design of safety nets. But the Rapid Social Response (RSR) trust fund, as well as the new social protection strategy, offer real opportunities to mainstream nutrition issues among the poorest and the most vulnerable populations into future social safety net designs to buffer the impact of future crises. The Bank’s new education strategy is designed to be nutrition sensitive, with a focus on early childhood development, albeit the true test will lie in its implementation at country level. Within the health sector, commitments for nutrition accounted for only 5 percent and 4 percent of overall health commitments in FY11 and FY12, respectively.10 Nutrition is still a marginal focus in the Results-Based Financing trust funds financed by the UK and Norway.
Nutrition must move to the center of the discussion on poverty reduction strategies and on measuring progress on poverty reduction. Despite recent global dialogue on a composite poverty measurement index that includes nutritional considerations, poverty continues to be measured and reported using income and consumption metrics alone. The measurement issue is relevant in that most national development plans set core targets for poverty reduction but do not report on non-income metrics. However, recent progress has been made in this area under the Multi-Dimensional Poverty Index (MPI) developed by Oxford University. The MPI uses 10 indicators that reflect the MDGs and international standards of poverty. The three dimensions in the MPI are education, health, and standard of living. A person is identified as multi-dimensionally poor if they experience deprivation in at least 30 percent of the weighted indicators. The two indicators for health are child mortality and nutrition.
There are major opportunities to incorporate small adjustments to IDA and IBRD investments across the sectors to make them more nutrition sensitive with a potentially impressive impact on nutrition outcomes. Given the Bank’s country-level convening power, its ability to advise on country policies, and current and upcoming investments and strategies in key sectors, the impact of this effort will likely go beyond the Bank to other development partners, and most importantly, it will extend to country clients.
9 More detailed information about the case of Senegal is available from James Garrett and Marcela Natalicchio, eds. “Working Multisectorally in Nutrition: Principles, Practices, and Case Studies,” IFPRI, 2011.
10 Business Warehouse, World Bank April 2012. Includes pipeline investments for 2012.
Improving Nutrition Through Multisectoral Approaches
34
i. Five key lessons learned
Based on experience to-date, five steps are necessary for transforming new operations across several sectors to be more nutrition sensitive:
a. Explicitly incorporate nutritional considerations into initial design of projects/policies.b. Integrate nutritional considerations as elements of investments, not necessarily as the primary
objective.c. Modify the design/consider alternatives to minimize unintended negative consequences and
maximize positive impacts.d. Support nutritional objectives with technical capacity within countries.e. Monitor and evaluate nutrition impacts with appropriate indicators.
Challenges and opportunities for cross-sectoral work. Key challenges to cross-sectoral work include lack of knowledge about the impacts of agriculture and other sectors on nutrition, structural issues (such as institutional and sectoral administrative structures), staff time, budgets, related (dis)incentives, institutionally mandated coding of nutrition investments (which often allows for ownership of products by only one sector/unit), and the political economy of cross-sectoral work.
Potential solutions/incentives for cross-sectoral work. Several potential solutions can be explored. These include results agreements for TTLs and managers with incentives for cross-sectoral work. Earmarked resources for cross-sectoral products/operations could also prove catalytic.
ii. The South Asia Regional Assistance Strategy (RAS) on nutrition – a model for change?
Experience from the implementation of the SAR RAS strategy (Box A-2) over the first year suggests that when management commitment is high, targets for cross-sectoral work are not just achieved, but can be surpassed.
iii. Translating knowledge into practice
Although there is a body of literature demonstrating the importance of linking nutrition and other sectors, the challenge facing partners is translating this knowledge in to practice. The International Food Policy Research Institute (IFPRI) organized a first international conference, “Linking Agriculture with Nutrition and Health” in New Delhi in February 2011. Many development organizations are starting to include multisectoral linkages in their strategies. For example the new DfID strategy on nutrition highlights the need for a multisectoral approach to nutrition; IFAD included nutrition as one of their core objectives in their new Strategic Framework, FAO has prioritized nutrition as a corporate priority and is undergoing a process of mainstreaming nutrition within the institution; and the Bill & Melinda Gates Foundation (BMGF) has just approved a new agriculture strategy that prioritizes a focus on nutrition through the quality of foods produced and consumed. The European Commission has developed a “Reference Document” that provides guidance to their aid administrators working within country teams to complement and extend existing efforts by member states to explore how nutrition components can be incorporated into their projects and programs. Research and programmatic investments in agriculture-nutrition linkages made by BMGF, DfID, USAID, the UN, the Syngenta Foundation, and others are cited in the agriculture module.11
The SUN donor partners group requested the Bank to develop guidance notes to translate current and existing knowledge and research into practice and to increase the nutrition sensitivity of agriculture and social protection projects.12 Principals from the World Bank’s Advisory Council of Foundation Leaders have agreed to work together to incorporate nutrition interventions more seamlessly into future agriculture and food security programs.
11 Information on guidance, statements, and strategies to link agriculture and nutrition, published by over 50 institutions, can be found in: FAO, 2012. Syn-thesis of Guiding Principles on Agriculture Programming for Nutrition. https://www.securenutritionplatform.org/Pages/DisplayResources.aspx?RID=32
12 This group includes the Bill and Melinda Gates Foundation (BMGF), Canada, European Commission, France, Germany, Ireland, Japan, US, UK, and the World Bank.
Improving Nutrition Through Multisectoral Approaches
35
Box A-2. The South Asia Regional Assistance Strategy for Nutrition, 2010-2015
To respond to the alarmingly high rates of child malnutrition in South Asia, the potentially severe consequences of the problem, and the multisectoral nature of its determinants, the South Asia Regional Management Team (RMT) adopted nutrition as a regional priority. The RMT also identified the need for a framework that would ensure that the region maintains and delivers on the results focus, and hence a Results-Based RAS for Nutrition was developed with extensive consultations at the country and regional levels with staff from different sectors.
The strategy outlines the region’s vision and approach to improving nutrition. It draws upon collective knowledge, experience and thinking, and distills concrete actions that the region can take in the immediate to the medium term to translate commitment into results. Recognizing that further development and refinement is possible, it is a “live” document meant to be updated periodically.
The RAS envisions that “Malnutrition will no longer be a public health problem in South Asia by 2016.” To achieve this vision, the strategy outlines some key results and provides a road map to scale up South Asia Region’s work program on nutrition. It proposes some strategic approaches to guide the scale up of this work program, with an emphasis on working intersectorally, focusing on the Bank’s areas of comparative advantages to support client countries implementation of comprehensive programs that integrate critical nutrition sensitive actions in multiple sectors. The overall objective of the RAS is to expand the scale, scope, and impact of the region’s work program, while building SAR Bank staff’s and clients’ commitment to, and capacity for a multisectoral response to the nutrition crisis. The RAS is expected to meet its objective through four key results:
• Improved awareness and commitment by Bank staff and clients to addressing maternal and child nutrition;
• Increased World Bank lending for operations aimed at improving maternal and child nutrition;
• Increased World Bank funding/management of analytical work to address knowledge gaps in maternal and child nutrition;
• Successful implementation of a multisectoral convergence model project aimed at improving child nutrition indicators.
A June 2011 review of the RAS against these objectives suggests that all objectives have been surpassed, and it is time now to raise the targets even further. As of June 2011, awareness and commitment in the region is at record high, several new analytic pieces have been developed, and operations are becoming more and more nutrition sensitive. Three projects in India, three in Nepal, three in Pakistan, one in Afghanistan, and two projects in Bangladesh across the human development, agriculture and environmental services (AES), and social protection are now on their way to becoming nutrition sensitive.
In addition to the RAS, the South Asia Food and Nutrition Security Initiative (SAFANSI) was formed by a World Bank and DfID partnership in 2010. It seeks to increase the commitment of governments and development agencies in South Asia to more effective and integrated food and nutrition security policies and programs through three broad program areas:
• Analysis: improving evidence and analysis on the most cost effective ways to achieve food and nutrition security in South Asia,
• Advocacy: improving awareness of food and nutrition security-related challenges, and advocacy for action amongst relevant stakeholders,
• Capacity Building: strengthening regional and in-country policy and programming capacity to achieve food and nutrition security outcomes.
SAFANSI currently has programs in Afghanistan, Bangladesh, Bhutan, India, Nepal, Pakistan, and Sri Lanka.
Improving Nutrition Through Multisectoral Approaches
36
The Bank’s regional teams, especially South Asia and Africa where the burden of malnutrition is the highest, have also requested this guidance. In the South Asia Region (SAR), the SAR Regional Management Team (as described earlier) is now accountable for supporting a multisectoral response to malnutrition.13 The other regions are also exploring a multisectoral approach to improving nutrition results. Thus, this report is a first step towards operationalizing this multisectoral approach. It has evolved in response to the urgent demands of the development community, and builds on existing research to facilitate translating knowledge in to action. Where evidence is weak, it calls for more evidence; where it is strong, it provides programmatic guidance that will help these sectors to adopt a “nutrition lens” as they develop new programs and projects with client country counterparts. In this first phase, the focus is on poverty reduction, agriculture and food security, social protection, and health. These notes are accompanied by a succinct, operational matrix that highlights the objectives, tracking indicators, opportunities and trade-offs, and issues of policy coherence where relevant.
The Bank has also received funding from the Knowledge and Learning Council to fund a Knowledge Platform, known as “SecureNutrition” to link agriculture, food security, and nutrition. SecureNutrition has both an internal and external audience. It aims to bridge operational knowledge gaps between the three sectors, offering a space to exchange experiences, disseminating information and increasing coordination, collaboration, and cogeneration of knowledge. The platform is working towards building a community of practice by interacting with units within the Bank as well as a comprehensive external partner base that will actively contribute to the knowledge sharing and cogeneration activities.
A similar initiative also has been undertaken in the Latin America and Caribbean region, known as the LAC Nutrition Beam, which has been created to maximize the impact on nutrition outcomes of cross-sector investments and initiatives within the LAC region. The Nutrition Beam has done this through the development of a network of development practitioners that share knowledge and catalyze synergies of interventions across sectors.
III. Nutrition basics
A. What is malnutrition?
The term malnutrition encompasses all categories of poor nutrition caused by insufficiency/deficiency or excess. Malnutrition is internationally categorized as one or more of the following types shown in Figure A-5, and one or more types of malnutrition can coexist not only in one household, but also in one single individual.
13 SAR Regional Assistance Strategy on Nutrition, Box A-2.
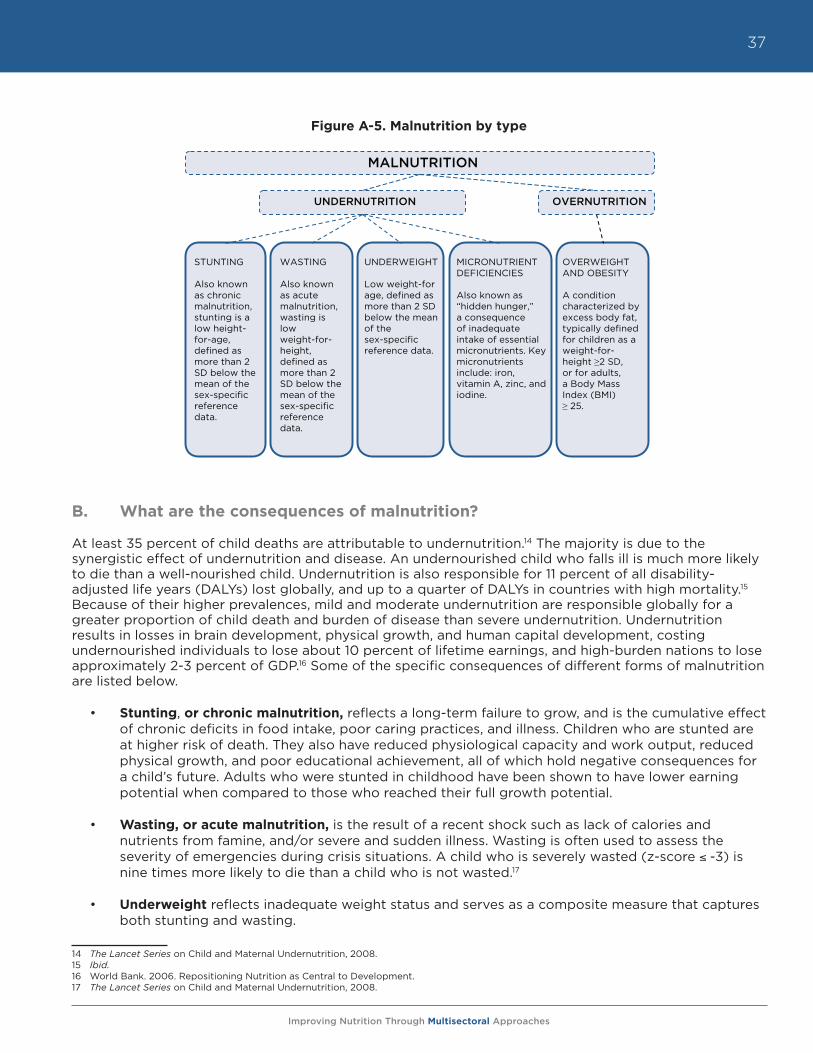
Improving Nutrition Through Multisectoral Approaches
37
Figure A-5. Malnutrition by type
B. What are the consequences of malnutrition?
At least 35 percent of child deaths are attributable to undernutrition.14 The majority is due to the synergistic effect of undernutrition and disease. An undernourished child who falls ill is much more likely to die than a well-nourished child. Undernutrition is also responsible for 11 percent of all disability-adjusted life years (DALYs) lost globally, and up to a quarter of DALYs in countries with high mortality.15 Because of their higher prevalences, mild and moderate undernutrition are responsible globally for a greater proportion of child death and burden of disease than severe undernutrition. Undernutrition results in losses in brain development, physical growth, and human capital development, costing undernourished individuals to lose about 10 percent of lifetime earnings, and high-burden nations to lose approximately 2-3 percent of GDP.16 Some of the specific consequences of different forms of malnutrition are listed below.
• Stunting, or chronic malnutrition, reflects a long-term failure to grow, and is the cumulative effect of chronic deficits in food intake, poor caring practices, and illness. Children who are stunted are at higher risk of death. They also have reduced physiological capacity and work output, reduced physical growth, and poor educational achievement, all of which hold negative consequences for a child’s future. Adults who were stunted in childhood have been shown to have lower earning potential when compared to those who reached their full growth potential.
• Wasting, or acute malnutrition, is the result of a recent shock such as lack of calories and nutrients from famine, and/or severe and sudden illness. Wasting is often used to assess the severity of emergencies during crisis situations. A child who is severely wasted (z-score -3) is nine times more likely to die than a child who is not wasted.17
• Underweight reflects inadequate weight status and serves as a composite measure that captures both stunting and wasting.
14 The Lancet Series on Child and Maternal Undernutrition, 2008.15 Ibid.16 World Bank. 2006. Repositioning Nutrition as Central to Development.17 The Lancet Series on Child and Maternal Undernutrition, 2008.
UNDERNUTRITION OVERNUTRITION
MALNUTRITION
MICRONUTRIENT DEFICIENCIES
Also known as “hidden hunger,” a consequence of inadequate intake of essential micronutrients. Key micronutrients include: iron, vitamin A, zinc, and iodine.
UNDERWEIGHT
Low weight-for age, defined as more than 2 SD below the mean of the sex-specific reference data.
WASTING
Also known as acute malnutrition, wasting is low weight-for-height, defined as more than 2 SD below the mean of the sex-specific reference data.
STUNTING
Also known as chronic malnutrition, stunting is a low height-for-age, defined as more than 2 SD below the mean of the sex-specific reference data.
OVERWEIGHT AND OBESITY
A condition characterized by excess body fat, typically defined for children as a weight-for-height 2 SD, or for adults, a Body Mass Index (BMI) 25.
Figure A-5. Malnutrition by type
Improving Nutrition Through Multisectoral Approaches
38
• Micronutrient deficiencies, also known as “hidden hunger,” are associated with adverse health outcomes, including heightened disease prevalence and severity, poor cognitive function, and increased risk of mortality. Globally, approximately two billion people are deficient in one or more micronutrients.18
o Vitamin A deficiency (VAD) is the result of inadequate dietary intake of vitamin A. Vitamin A deficiency is the largest cause of preventable blindness (irreversible) and night blindness. Healthy functioning of the immune system depends on vitamin A, and VAD is a risk factor for increased severity of infectious disease and mortality.
o Iron deficiency is the most widespread preventable nutritional deficiency in the world and affects both developing and developed nations, across all income groups. The consequences of anemia for children—approximately half of which is due to iron deficiency—include increased morbidity and mortality, stunting, lower performance in school, cognitive delays, and apathy. In adults, anemia is associated with weakness and fatigue, lower productivity, and increased risk of maternal mortality from postpartum hemorrhage.
o Iodine deficiency is caused by lack of iodine in the diet, and can cause irreversible mental retardation (cretinism), goiter, reproductive failure, and increased child mortality. Salt iodization is an extremely effective means of ensuring adequate iodine consumption at the population level.
o Zinc deficiency is estimated to be widespread in countries with inadequate levels of zinc in the food supply. Zinc deficiency is associated with stunting and increased incidence of diarrhea and pneumonia.
• Overweight and obesity are a major risk for non-communicable diseases in adults, including cardiovascular diseases, diabetes, musculoskeletal disorders, and certain types of cancers. Childhood obesity is associated with a higher chance of adult obesity, premature death, and disability. In addition to future risks, obese children experience breathing difficulties, increased risk of fractures, hypertension, early markers of cardiovascular disease, insulin resistance, and psychological effects.
C. Who is most vulnerable to malnutrition?
The damage that occurs from undernutrition in a child’s first 1,000 days, from pregnancy to 24 months of age, is largely irreversible. During this period, nutritional requirements are substantial, in terms of caloric and micronutrient needs for both pregnant women and young children given the rapid growth and development that takes place. As shown in Figure A-6, stunting and underweight can begin in utero, where children who have not received adequate nutrition during gestation are born with a negative z-score for either weight-for-age or height-for-age. Growth faltering occurs mainly before a child’s second birthday, when children are particularly vulnerable to poor caring behaviors, inadequate access to health services, and inappropriate feeding practices, all of which can have detrimental consequences for their health and survival.
Therefore, this critical period or “window of opportunity” between pregnancy and 24 months is when undernutrition can and should be prevented.
18 UNICEF website, Micronutrients- Iodine, iron and vitamin A. Accessed February 21, 2012. < http://www.unicef.org/nutrition/index_iodine.html>
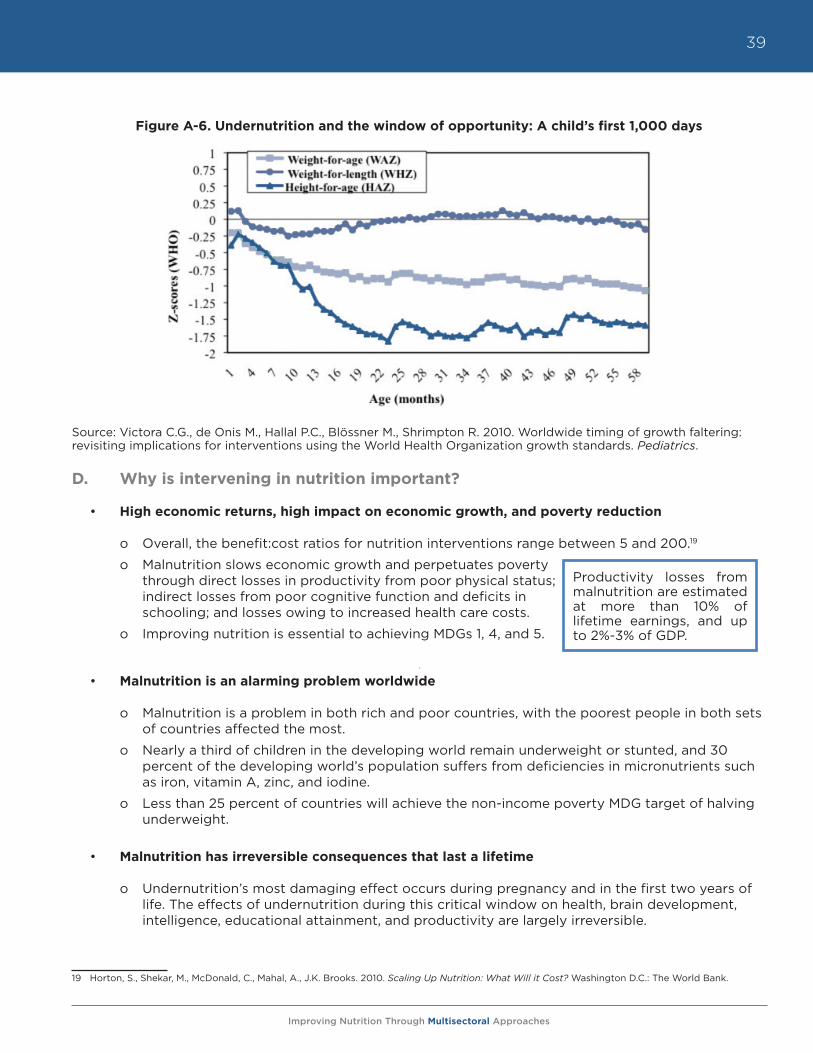
Improving Nutrition Through Multisectoral Approaches
39
Figure A-6. Undernutrition and the window of opportunity: A child’s first 1,000 days
Source: Victora C.G., de Onis M., Hallal P.C., Blössner M., Shrimpton R. 2010. Worldwide timing of growth faltering: revisiting implications for interventions using the World Health Organization growth standards. Pediatrics.
D. Why is intervening in nutrition important?
• High economic returns, high impact on economic growth, and poverty reduction
o Overall, the benefit:cost ratios for nutrition interventions range between 5 and 200.19
o Malnutrition slows economic growth and perpetuates poverty through direct losses in productivity from poor physical status; indirect losses from poor cognitive function and deficits in schooling; and losses owing to increased health care costs.
o Improving nutrition is essential to achieving MDGs 1, 4, and 5.
• Malnutrition is an alarming problem worldwide
o Malnutrition is a problem in both rich and poor countries, with the poorest people in both sets of countries affected the most.
o Nearly a third of children in the developing world remain underweight or stunted, and 30 percent of the developing world’s population suffers from deficiencies in micronutrients such as iron, vitamin A, zinc, and iodine.
o Less than 25 percent of countries will achieve the non-income poverty MDG target of halving underweight.
• Malnutrition has irreversible consequences that last a lifetime
o Undernutrition’s most damaging effect occurs during pregnancy and in the first two years of life. The effects of undernutrition during this critical window on health, brain development, intelligence, educational attainment, and productivity are largely irreversible.
19 Horton, S., Shekar, M., McDonald, C., Mahal, A., J.K. Brooks. 2010. Scaling Up Nutrition: What Will it Cost? Washington D.C.: The World Bank.
Productivity losses from malnutrition are estimated at more than 10% of lifetime earnings, and up to 2%-3% of GDP.
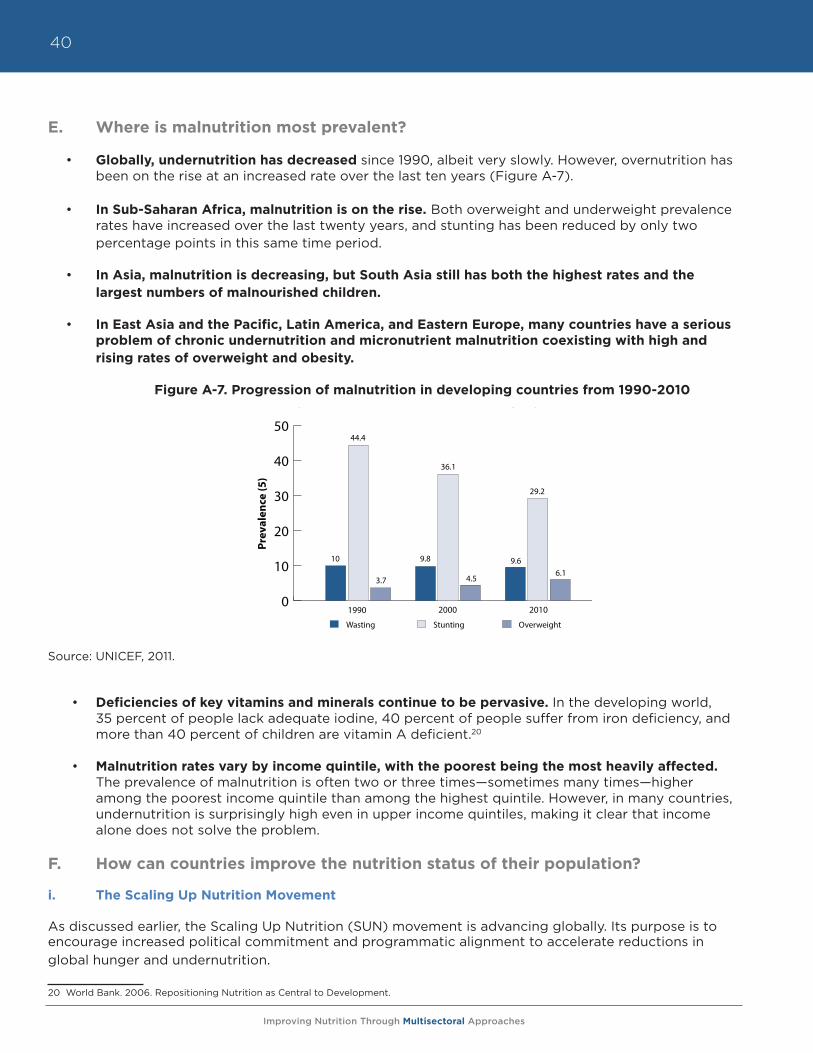
Improving Nutrition Through Multisectoral Approaches
40
E. Where is malnutrition most prevalent?
• Globally, undernutrition has decreased since 1990, albeit very slowly. However, overnutrition has been on the rise at an increased rate over the last ten years (Figure A-7).
• In Sub-Saharan Africa, malnutrition is on the rise. Both overweight and underweight prevalence rates have increased over the last twenty years, and stunting has been reduced by only two percentage points in this same time period.
• In Asia, malnutrition is decreasing, but South Asia still has both the highest rates and the largest numbers of malnourished children.
• In East Asia and the Pacific, Latin America, and Eastern Europe, many countries have a serious problem of chronic undernutrition and micronutrient malnutrition coexisting with high and rising rates of overweight and obesity.
Figure A-7. Progression of malnutrition in developing countries from 1990-2010
Source: UNICEF, 2011.
• Deficiencies of key vitamins and minerals continue to be pervasive. In the developing world, 35 percent of people lack adequate iodine, 40 percent of people suffer from iron deficiency, and more than 40 percent of children are vitamin A deficient.20
• Malnutrition rates vary by income quintile, with the poorest being the most heavily affected.
The prevalence of malnutrition is often two or three times—sometimes many times—higher among the poorest income quintile than among the highest quintile. However, in many countries, undernutrition is surprisingly high even in upper income quintiles, making it clear that income alone does not solve the problem.
F. How can countries improve the nutrition status of their population?
i. The Scaling Up Nutrition Movement
As discussed earlier, the Scaling Up Nutrition (SUN) movement is advancing globally. Its purpose is to encourage increased political commitment and programmatic alignment to accelerate reductions in global hunger and undernutrition.
20 World Bank. 2006. Repositioning Nutrition as Central to Development.
Figure A-7. Progression of malnutrition in developing countries from 1990-2010
Source: UNICEF, 2011.
0
10
20
30
40
50
Wasting Stunting Overweight
10
44.4
3.7
9.8
36.1
4.5
9.6
29.2
6.1
1990 2000 2010
Prev
alen
ce (5
)
Improving Nutrition Through Multisectoral Approaches
41
Main elements of the SUN Framework
• Start from the principle that what ultimately matters is what happens at the country level. Individual country nutrition strategies and programs, while drawing on international evidence of good practice, must be country “owned” and built on the country’s specific needs and capacities.
• Sharply scale up evidence-based cost-effective interventions to prevent and treat undernutrition, giving highest priority to the -9 to 24 month window of opportunity, which has the highest returns on investments. A conservative global estimate of financing needs for these interventions is US$ 10+ billion per year.
• Use a multisectoral approach to target nutrition in related sectors and include indicators of undernutrition as one of the key measures of overall progress in these sectors. The closest actionable links are to food security (including agriculture), social protection (including emergency relief), and health (including maternal and child health care, immunization, and family planning). There are also important links to education, water supply and sanitation, as well as to cross-cutting issues like gender equality, governance (including accountability and corruption), and state fragility.
• Provide substantially scaled up domestic and external assistance for country-owned nutrition programs and capacity. To that end, ensure that nutrition is explicitly supported in global as well as national initiatives for food security, social protection, and health, and that external assistance follows internationally agreed upon principles of aid effectiveness. Support major efforts at national and global levels to strengthen the evidence base, which is important for advocacy.
Priority Interventions for Scaling Up Nutrition
To curb child death and disability in the short term, the immediate priority interventions for Scaling Up Nutrition are the evidence-based direct interventions to prevent and treat undernutrition presented in the 2008 Lancet Series on Maternal and Child Undernutrition. These nutrition specific interventions include:
• Promoting good nutritional practices
o Includes optimal breastfeeding and complementary feeding (after 6 months), and improved hygiene practices (including handwashing)
• Increasing intake of vitamins and minerals through provision of micronutrients for young children and their mothers
o Periodic vitamin A supplements
o Therapeutic zinc supplements for diarrhea management
o Multiple micronutrient powders
o Deworming for children (to reduce loss of nutrients)
o Iron-folic acid supplements for pregnant women to prevent and treat anemia
o Iodized oil capsules when iodized salt is unavailable
• Provision of micronutrients through fortification for all
o Salt iodization
o Iron fortification of staple foods
Improving Nutrition Through Multisectoral Approaches
42
• Therapeutic feeding for malnourished children with special foods
o Prevention or treatment of moderate undernutrition
o Treatment of severe undernutrition (severe acute malnutrition) with ready-to-use therapeutic foods (RUTF)
The Scaling Up Nutrition movement also recognizes the urgent need for multisectoral action, but efficacy evidence is less clear-cut for indirect nutrition sensitive interventions. This document aims to address this gap for technical program staff.
G. How does the Bank cost its investments in nutrition?
In 2002, the Bank released an updated theme and sector coding system that provides the basis for analyzing and reporting on the content of Bank activities, including Bank budget allocations to strategic goals and priority sectors. Theme and sector codes are assigned to all lending operations, economic and sector work, technical assistance (non-lending), research services, client training, and other activities that directly serve the Bank’s external clients. Activities that serve the Bank’s internal needs, such as quality assurance, country assistance strategies, sector strategy papers, knowledge products, and training of Bank staff, are not coded for sectors and themes.
Although nutrition investments in the World Bank only represent a small fraction of total investments, nutrition activities are often not captured properly due to a lack of awareness and/or use of code 68, the Nutrition and Food Security code. Code 68 applies to projects with objectives and specific activities related to improving nutritional status or food security at the household level. It also is used when the actions described in Box A-3 are included in external, client-focused activities.
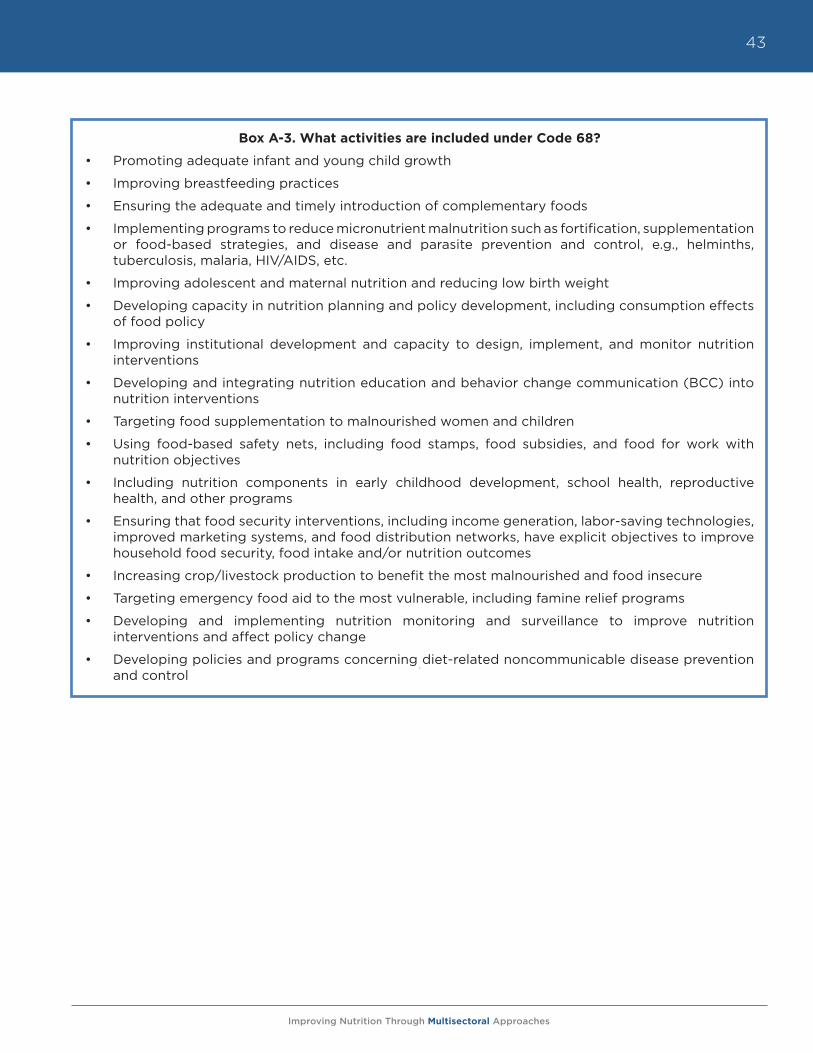
Improving Nutrition Through Multisectoral Approaches
43
Box A-3. What activities are included under Code 68?
• Promoting adequate infant and young child growth
• Improving breastfeeding practices
• Ensuring the adequate and timely introduction of complementary foods
• Implementing programs to reduce micronutrient malnutrition such as fortification, supplementation or food-based strategies, and disease and parasite prevention and control, e.g., helminths, tuberculosis, malaria, HIV/AIDS, etc.
• Improving adolescent and maternal nutrition and reducing low birth weight
• Developing capacity in nutrition planning and policy development, including consumption effects of food policy
• Improving institutional development and capacity to design, implement, and monitor nutrition interventions
• Developing and integrating nutrition education and behavior change communication (BCC) into nutrition interventions
• Targeting food supplementation to malnourished women and children
• Using food-based safety nets, including food stamps, food subsidies, and food for work with nutrition objectives
• Including nutrition components in early childhood development, school health, reproductive health, and other programs
• Ensuring that food security interventions, including income generation, labor-saving technologies, improved marketing systems, and food distribution networks, have explicit objectives to improve household food security, food intake and/or nutrition outcomes
• Increasing crop/livestock production to benefit the most malnourished and food insecure
• Targeting emergency food aid to the most vulnerable, including famine relief programs
• Developing and implementing nutrition monitoring and surveillance to improve nutrition interventions and affect policy change
• Developing policies and programs concerning diet-related noncommunicable disease prevention and control

Improving Nutrition Through Multisectoral Approaches
44
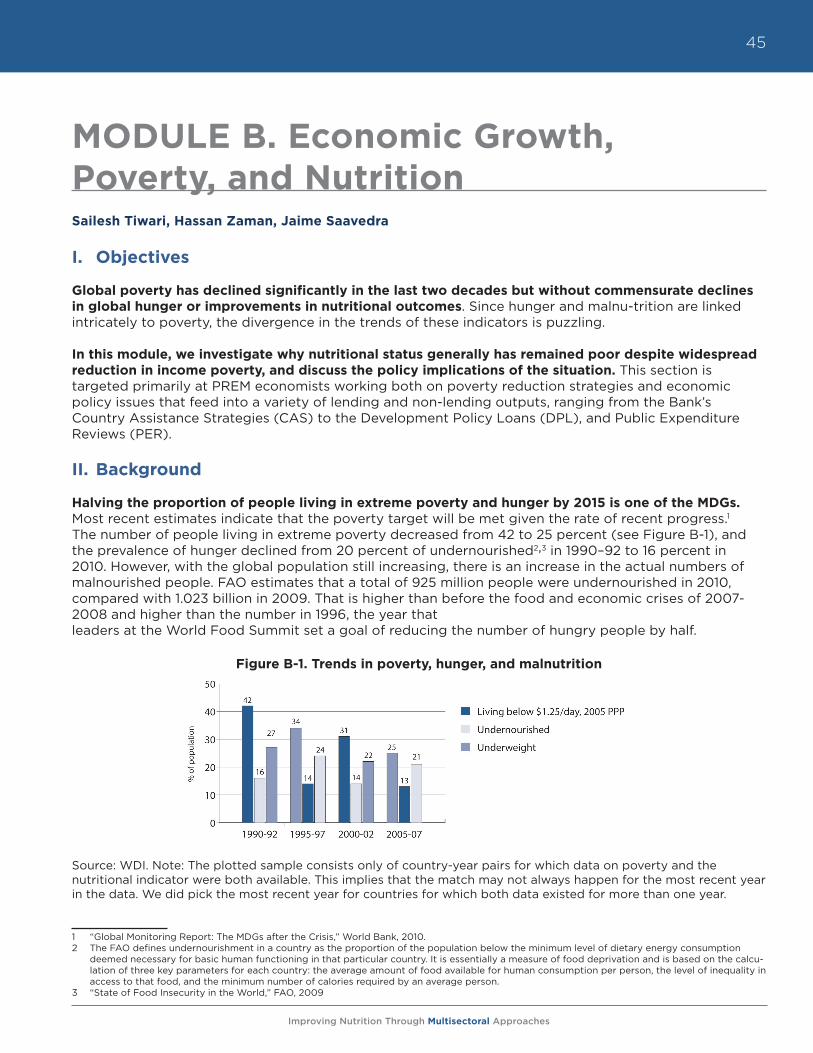
Improving Nutrition Through Multisectoral Approaches
45
MODULE B. Economic Growth, Poverty, and NutritionSailesh Tiwari, Hassan Zaman, Jaime Saavedra
I. Objectives
Global poverty has declined significantly in the last two decades but without commensurate declines in global hunger or improvements in nutritional outcomes. Since hunger and malnu-trition are linked intricately to poverty, the divergence in the trends of these indicators is puzzling.
In this module, we investigate why nutritional status generally has remained poor despite widespread reduction in income poverty, and discuss the policy implications of the situation. This section is targeted primarily at PREM economists working both on poverty reduction strategies and economic policy issues that feed into a variety of lending and non-lending outputs, ranging from the Bank’s Country Assistance Strategies (CAS) to the Development Policy Loans (DPL), and Public Expenditure Reviews (PER).
II. Background
Halving the proportion of people living in extreme poverty and hunger by 2015 is one of the MDGs. Most recent estimates indicate that the poverty target will be met given the rate of recent progress.1 The number of people living in extreme poverty decreased from 42 to 25 percent (see Figure B-1), and the prevalence of hunger declined from 20 percent of undernourished2,3 in 1990–92 to 16 percent in 2010. However, with the global population still increasing, there is an increase in the actual numbers of malnourished people. FAO estimates that a total of 925 million people were undernourished in 2010, compared with 1.023 billion in 2009. That is higher than before the food and economic crises of 2007-2008 and higher than the number in 1996, the year that leaders at the World Food Summit set a goal of reducing the number of hungry people by half.
Figure B-1. Trends in poverty, hunger, and malnutrition
Source: WDI. Note: The plotted sample consists only of country-year pairs for which data on poverty and the nutritional indicator were both available. This implies that the match may not always happen for the most recent year in the data. We did pick the most recent year for countries for which both data existed for more than one year.
1 “Global Monitoring Report: The MDGs after the Crisis,” World Bank, 2010.2 The FAO defines undernourishment in a country as the proportion of the population below the minimum level of dietary energy consumption
deemed necessary for basic human functioning in that particular country. It is essentially a measure of food deprivation and is based on the calcu-lation of three key parameters for each country: the average amount of food available for human consumption per person, the level of inequality in access to that food, and the minimum number of calories required by an average person.
3 “State of Food Insecurity in the World,” FAO, 2009
Improving Nutrition Through Multisectoral Approaches
46
Nutritional status is an important component of human welfare and economic development and slow progress on improving nutritional indicators is worrying in its own right. But undernourishment also directly impinges on adult productivity, particularly in rural, agricultural settings by lowering stature and physical strength, and indirectly by increasing the burden of disease and morbidity. In addition, it retards cognitive development in children, undermining the development of human capital, which is critical for economic growth in the longer term. In addition, there is growing recognition both within and outside the Bank that nutritional deprivation is an important complementary measure to the standard income-related poverty measures. As a result, many multi-dimensional poverty measures being developed take into account nutritional status as one of the components of overall welfare.
There is a growing body of evidence that nutritional deprivation in the early years of life (including in utero) has persistent long-term effects into adulthood. The primary channel is through potential educational attainment, which is lower for undernourished children.4 Children who experience periods of malnutrition in their early childhood years have poorer test scores on cognitive assessments, activity level, and attention span.5 They also tend to start school later and are at a greater risk of dropping out before completing a full primary school cycle. In Guatemala, a recent study found that being stunted at age six is tantamount to losing four grades of schooling in terms of test performance.6 The accumulated evidence on child malnutrition suggests that children’s learning potential in school and their productivity in later life is to a large extent predetermined by their health and nutritional status before the age of two years.
Even in settings in which sufficient calories are consumed, the lack of diversity in the dietary composition of the poor deprives them of the optimal consumption of essential micronutrients such as iron, iodine, phosphorous, vitamin A, and vitamin C. This issue becomes particularly important in the context of rising food prices as households use substitution away from micronutrient-rich food items such as meat, fish, eggs, milk, fruits, and vegetables as a coping strategy to maintain their level of calories.7 Iron deficiency in adults has been estimated to decrease productivity by 5-17 percent, depending on the nature of the work.8 Similarly, the median loss in reduced work capacity associated with anemia in adults has been estimated to be equivalent to 0.6 percent of GDP. The number goes up by an additional 3.4 percent when the secondary effects of retarded cognitive development in children is factored in.9 Overall, these studies reinforce that poor nutritional status is a consequence of low income and also one of its causes over a longer term.
In Figure B-2, we present all observed measurements of chronic malnutrition (stunting) in the World Bank’s World Development Indicators database between 1990 and 2009. Every dot represents a country and the horizontal bar denotes the mean value of the observations for the given year, while the shaded area represents the range of values that are +1 and -1 standard deviation from the mean of that year. A number of interesting patterns emerge from this picture. First, looking at the +1 and -1 standard error bands around the mean, it is evident that the overall decline in stunting rates has been sluggish over the years. The aggregate, however, masks significant heterogeneity within countries. Countries like Bangladesh, Vietnam, and Uzbekistan have made remarkable progress in reducing stunting rates, while progress has been much slower in countries such as Guatemala and Yemen. On the other hand, countries like Benin have actually seen stunting rates increase over the years. This cross-country heterogeneity in malnutrition trends raises important questions about the role played by the prevailing economic context in the evolution of nutritional indicators. Were the fastest growing countries that were able to reduce
4 Glewwe, P., Jacoby, H., and E. King. 2001. “Early childhood nutrition and academic achievement: A longitudinal analysis,” Journal of Public Economics, 81(3): 345-368.
5 Alderman, H. Hoddinott, J. and B. Kinsey. 2006. “Long term consequences of early childhood malnutrition,” Oxford Economic Papers, 58(3): 450-474.
6 Maluccio, J. A., Hoddinott, J., Behrman, J. R., Martorell, R. Quisumbing, A. R. and A. D. Stein. 2009. “The impact of improving nutrition during early childhood on education among Guatemalan adults,” Economic Journal, 119 (537): 734-763.
7 Skoufias, E., Tiwari, S. and H. Zaman. 2011. “Can Cash Transfers Protect Dietary Diversity During Economic Crises? Some Evidence from Indonesia,” World Bank Policy Research Working Paper.
8 Horton, S. 1999. Opportunities for investment in nutrition in low-income Asia, Asian Development Review, 17: 246-273.9 Ibid.
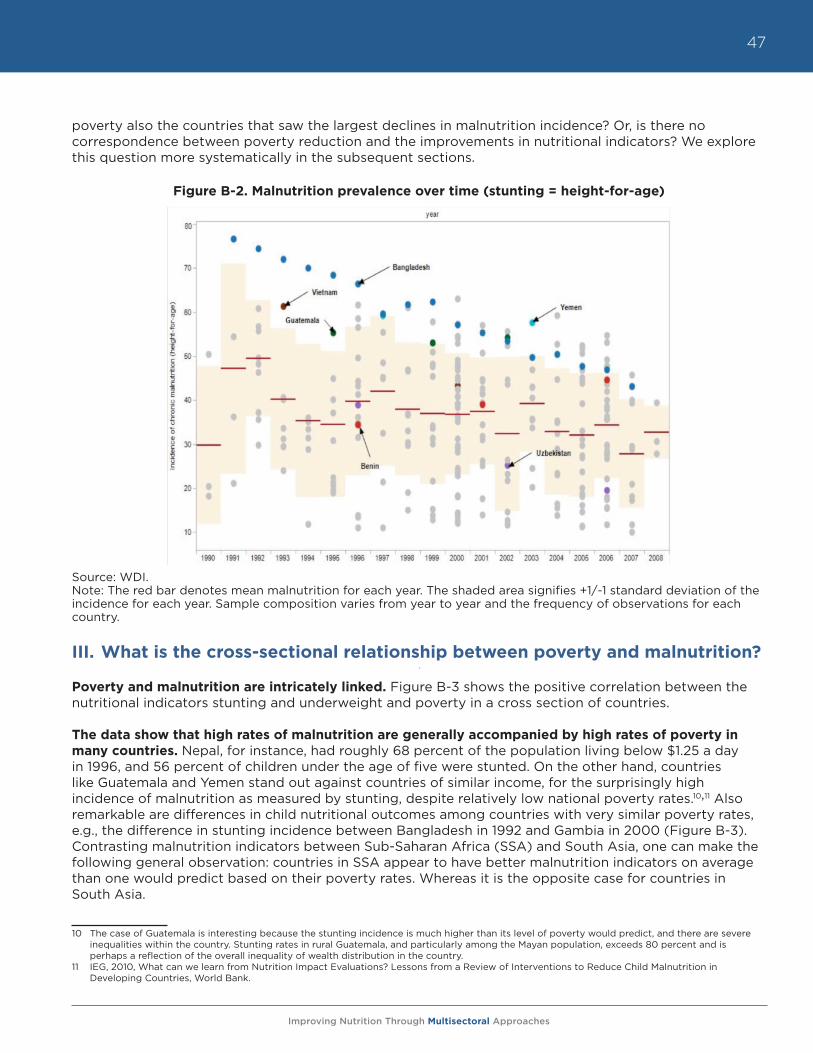
Improving Nutrition Through Multisectoral Approaches
47
poverty also the countries that saw the largest declines in malnutrition incidence? Or, is there no correspondence between poverty reduction and the improvements in nutritional indicators? We explore this question more systematically in the subsequent sections.
Figure B-2. Malnutrition prevalence over time (stunting = height-for-age)
Source: WDI.Note: The red bar denotes mean malnutrition for each year. The shaded area signifies +1/-1 standard deviation of the incidence for each year. Sample composition varies from year to year and the frequency of observations for each country.
III. What is the cross-sectional relationship between poverty and malnutrition?
Poverty and malnutrition are intricately linked. Figure B-3 shows the positive correlation between the nutritional indicators stunting and underweight and poverty in a cross section of countries.
The data show that high rates of malnutrition are generally accompanied by high rates of poverty in many countries. Nepal, for instance, had roughly 68 percent of the population living below $1.25 a day in 1996, and 56 percent of children under the age of five were stunted. On the other hand, countries like Guatemala and Yemen stand out against countries of similar income, for the surprisingly high incidence of malnutrition as measured by stunting, despite relatively low national poverty rates.10,11 Also remarkable are differences in child nutritional outcomes among countries with very similar poverty rates, e.g., the difference in stunting incidence between Bangladesh in 1992 and Gambia in 2000 (Figure B-3). Contrasting malnutrition indicators between Sub-Saharan Africa (SSA) and South Asia, one can make the following general observation: countries in SSA appear to have better malnutrition indicators on average than one would predict based on their poverty rates. Whereas it is the opposite case for countries in South Asia.
10 The case of Guatemala is interesting because the stunting incidence is much higher than its level of poverty would predict, and there are severe inequalities within the country. Stunting rates in rural Guatemala, and particularly among the Mayan population, exceeds 80 percent and is perhaps a reflection of the overall inequality of wealth distribution in the country.
11 IEG, 2010, What can we learn from Nutrition Impact Evaluations? Lessons from a Review of Interventions to Reduce Child Malnutrition in Developing Countries, World Bank.
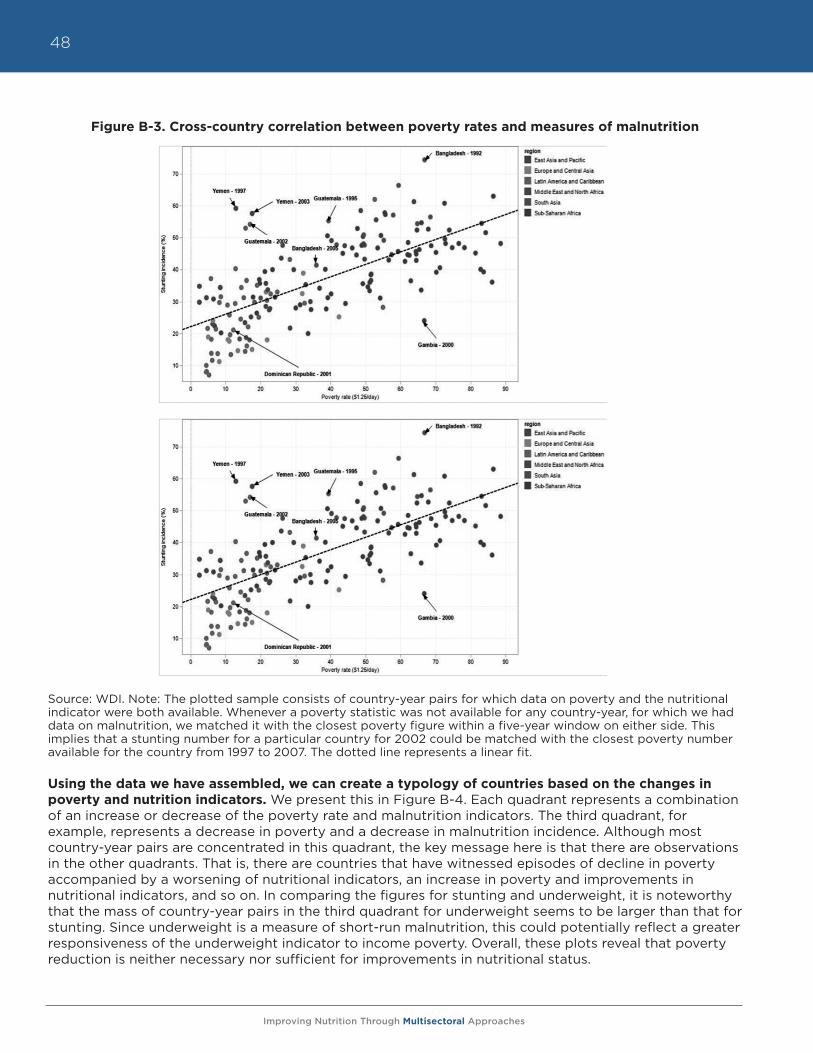
Improving Nutrition Through Multisectoral Approaches
48
Figure B-3. Cross-country correlation between poverty rates and measures of malnutrition
Source: WDI. Note: The plotted sample consists of country-year pairs for which data on poverty and the nutritional indicator were both available. Whenever a poverty statistic was not available for any country-year, for which we had data on malnutrition, we matched it with the closest poverty figure within a five-year window on either side. This implies that a stunting number for a particular country for 2002 could be matched with the closest poverty number available for the country from 1997 to 2007. The dotted line represents a linear fit.
Using the data we have assembled, we can create a typology of countries based on the changes in poverty and nutrition indicators. We present this in Figure B-4. Each quadrant represents a combination of an increase or decrease of the poverty rate and malnutrition indicators. The third quadrant, for example, represents a decrease in poverty and a decrease in malnutrition incidence. Although most country-year pairs are concentrated in this quadrant, the key message here is that there are observations in the other quadrants. That is, there are countries that have witnessed episodes of decline in poverty accompanied by a worsening of nutritional indicators, an increase in poverty and improvements in nutritional indicators, and so on. In comparing the figures for stunting and underweight, it is noteworthy that the mass of country-year pairs in the third quadrant for underweight seems to be larger than that for stunting. Since underweight is a measure of short-run malnutrition, this could potentially reflect a greater responsiveness of the underweight indicator to income poverty. Overall, these plots reveal that poverty reduction is neither necessary nor sufficient for improvements in nutritional status.
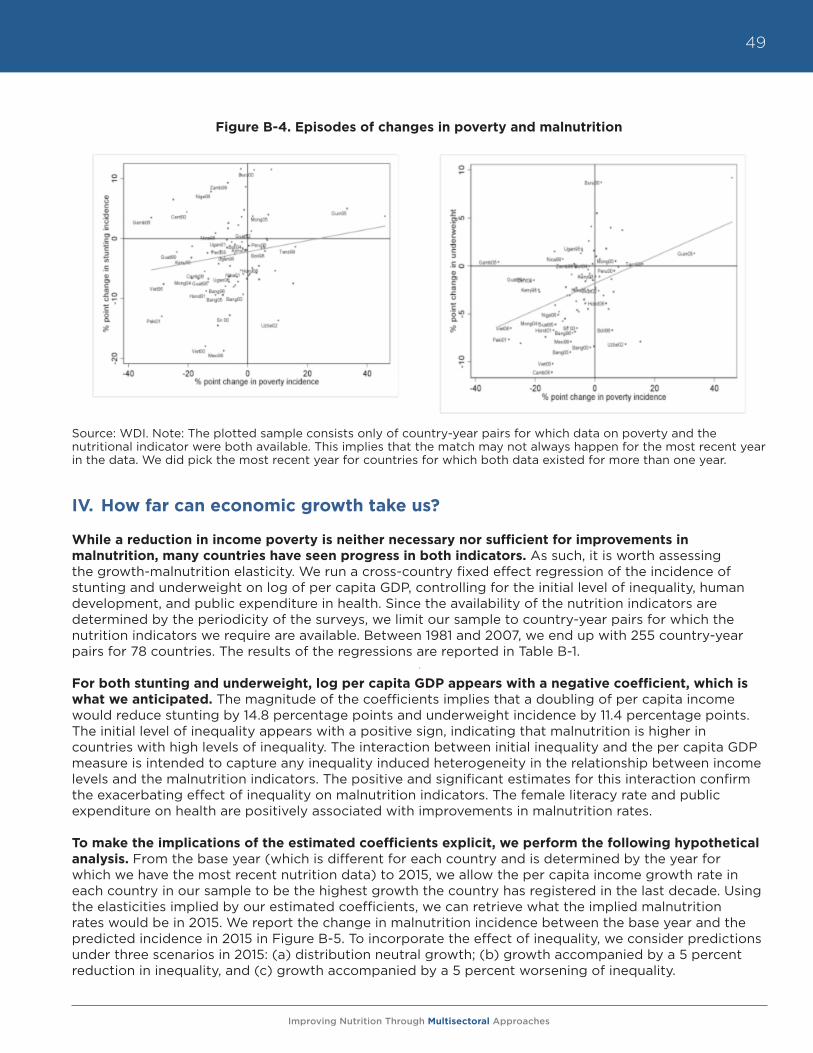
Improving Nutrition Through Multisectoral Approaches
49
Figure B-4. Episodes of changes in poverty and malnutrition
Source: WDI. Note: The plotted sample consists only of country-year pairs for which data on poverty and the nutritional indicator were both available. This implies that the match may not always happen for the most recent year in the data. We did pick the most recent year for countries for which both data existed for more than one year.
IV. How far can economic growth take us?
While a reduction in income poverty is neither necessary nor sufficient for improvements in malnutrition, many countries have seen progress in both indicators. As such, it is worth assessing the growth-malnutrition elasticity. We run a cross-country fixed effect regression of the incidence of stunting and underweight on log of per capita GDP, controlling for the initial level of inequality, human development, and public expenditure in health. Since the availability of the nutrition indicators are determined by the periodicity of the surveys, we limit our sample to country-year pairs for which the nutrition indicators we require are available. Between 1981 and 2007, we end up with 255 country-year pairs for 78 countries. The results of the regressions are reported in Table B-1.
For both stunting and underweight, log per capita GDP appears with a negative coefficient, which is what we anticipated. The magnitude of the coefficients implies that a doubling of per capita income would reduce stunting by 14.8 percentage points and underweight incidence by 11.4 percentage points. The initial level of inequality appears with a positive sign, indicating that malnutrition is higher in countries with high levels of inequality. The interaction between initial inequality and the per capita GDP measure is intended to capture any inequality induced heterogeneity in the relationship between income levels and the malnutrition indicators. The positive and significant estimates for this interaction confirm the exacerbating effect of inequality on malnutrition indicators. The female literacy rate and public expenditure on health are positively associated with improvements in malnutrition rates.
To make the implications of the estimated coefficients explicit, we perform the following hypothetical analysis. From the base year (which is different for each country and is determined by the year for which we have the most recent nutrition data) to 2015, we allow the per capita income growth rate in each country in our sample to be the highest growth the country has registered in the last decade. Using the elasticities implied by our estimated coefficients, we can retrieve what the implied malnutrition rates would be in 2015. We report the change in malnutrition incidence between the base year and the predicted incidence in 2015 in Figure B-5. To incorporate the effect of inequality, we consider predictions under three scenarios in 2015: (a) distribution neutral growth; (b) growth accompanied by a 5 percent reduction in inequality, and (c) growth accompanied by a 5 percent worsening of inequality.
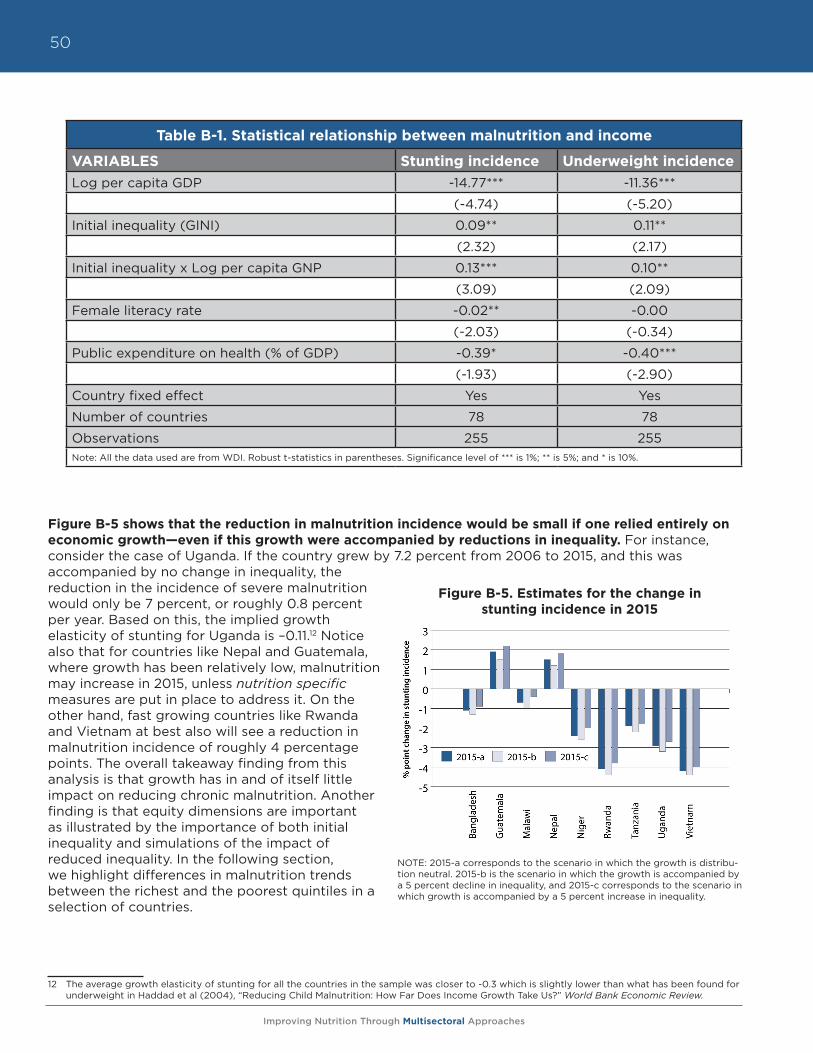
Improving Nutrition Through Multisectoral Approaches
50
Figure B-5 shows that the reduction in malnutrition incidence would be small if one relied entirely on economic growth—even if this growth were accompanied by reductions in inequality. For instance, consider the case of Uganda. If the country grew by 7.2 percent from 2006 to 2015, and this was accompanied by no change in inequality, the reduction in the incidence of severe malnutrition would only be 7 percent, or roughly 0.8 percent per year. Based on this, the implied growth elasticity of stunting for Uganda is –0.11.12 Notice also that for countries like Nepal and Guatemala, where growth has been relatively low, malnutrition may increase in 2015, unless nutrition specific measures are put in place to address it. On the other hand, fast growing countries like Rwanda and Vietnam at best also will see a reduction in malnutrition incidence of roughly 4 percentage points. The overall takeaway finding from this analysis is that growth has in and of itself little impact on reducing chronic malnutrition. Another finding is that equity dimensions are important as illustrated by the importance of both initial inequality and simulations of the impact of reduced inequality. In the following section, we highlight differences in malnutrition trends between the richest and the poorest quintiles in a selection of countries.
12 The average growth elasticity of stunting for all the countries in the sample was closer to -0.3 which is slightly lower than what has been found for underweight in Haddad et al (2004), “Reducing Child Malnutrition: How Far Does Income Growth Take Us?” World Bank Economic Review.
Table B-1. Statistical relationship between malnutrition and income
VARIABLES Stunting incidence Underweight incidenceLog per capita GDP -14.77*** -11.36***
(-4.74) (-5.20)
Initial inequality (GINI) 0.09** 0.11**
(2.32) (2.17)
Initial inequality x Log per capita GNP 0.13*** 0.10**
(3.09) (2.09)
Female literacy rate -0.02** -0.00
(-2.03) (-0.34)
Public expenditure on health (% of GDP) -0.39* -0.40***
(-1.93) (-2.90)
Country fixed effect Yes Yes
Number of countries 78 78
Observations 255 255Note: All the data used are from WDI. Robust t-statistics in parentheses. Significance level of *** is 1%; ** is 5%; and * is 10%.
Figure B-5. Estimates for the change in stunting incidence in 2015
NOTE: 2015-a corresponds to the scenario in which the growth is distribu-tion neutral. 2015-b is the scenario in which the growth is accompanied by a 5 percent decline in inequality, and 2015-c corresponds to the scenario in which growth is accompanied by a 5 percent increase in inequality.
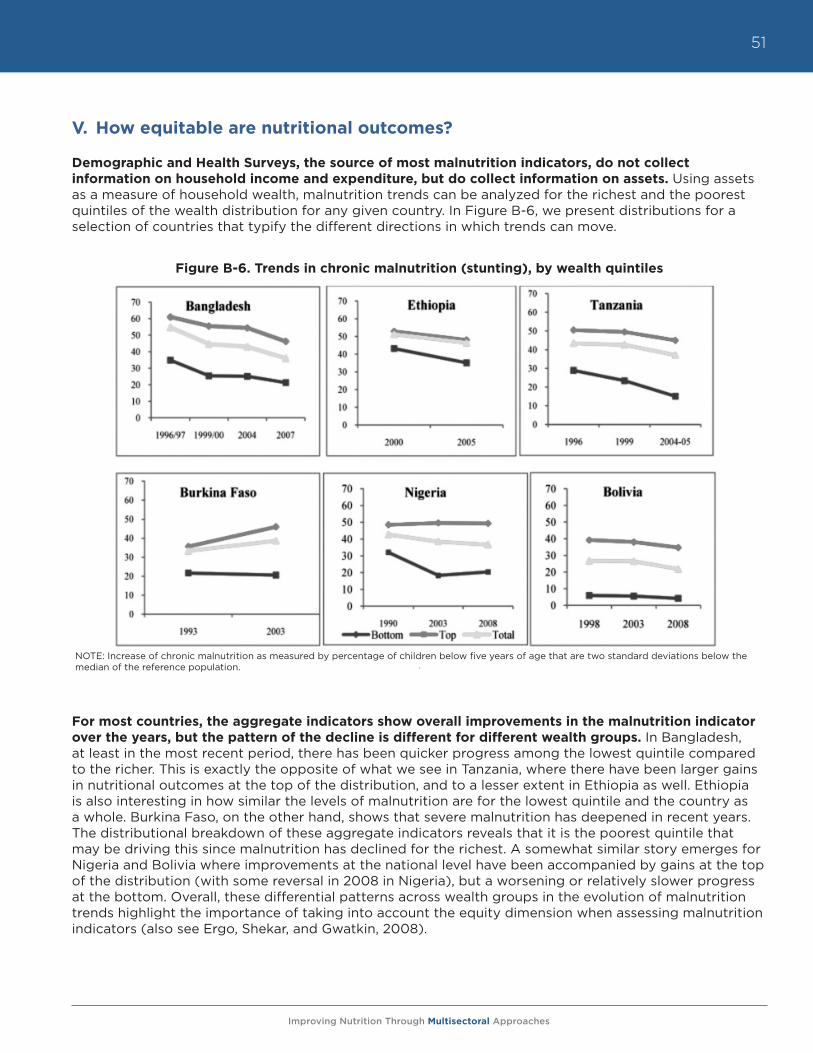
Improving Nutrition Through Multisectoral Approaches
51
V. How equitable are nutritional outcomes?
Demographic and Health Surveys, the source of most malnutrition indicators, do not collect information on household income and expenditure, but do collect information on assets. Using assets as a measure of household wealth, malnutrition trends can be analyzed for the richest and the poorest quintiles of the wealth distribution for any given country. In Figure B-6, we present distributions for a selection of countries that typify the different directions in which trends can move.
For most countries, the aggregate indicators show overall improvements in the malnutrition indicator over the years, but the pattern of the decline is different for different wealth groups. In Bangladesh, at least in the most recent period, there has been quicker progress among the lowest quintile compared to the richer. This is exactly the opposite of what we see in Tanzania, where there have been larger gains in nutritional outcomes at the top of the distribution, and to a lesser extent in Ethiopia as well. Ethiopia is also interesting in how similar the levels of malnutrition are for the lowest quintile and the country as a whole. Burkina Faso, on the other hand, shows that severe malnutrition has deepened in recent years. The distributional breakdown of these aggregate indicators reveals that it is the poorest quintile that may be driving this since malnutrition has declined for the richest. A somewhat similar story emerges for Nigeria and Bolivia where improvements at the national level have been accompanied by gains at the top of the distribution (with some reversal in 2008 in Nigeria), but a worsening or relatively slower progress at the bottom. Overall, these differential patterns across wealth groups in the evolution of malnutrition trends highlight the importance of taking into account the equity dimension when assessing malnutrition indicators (also see Ergo, Shekar, and Gwatkin, 2008).
Figure B-6. Trends in chronic malnutrition (stunting), by wealth quintiles
NOTE: Increase of chronic malnutrition as measured by percentage of children below five years of age that are two standard deviations below the median of the reference population.
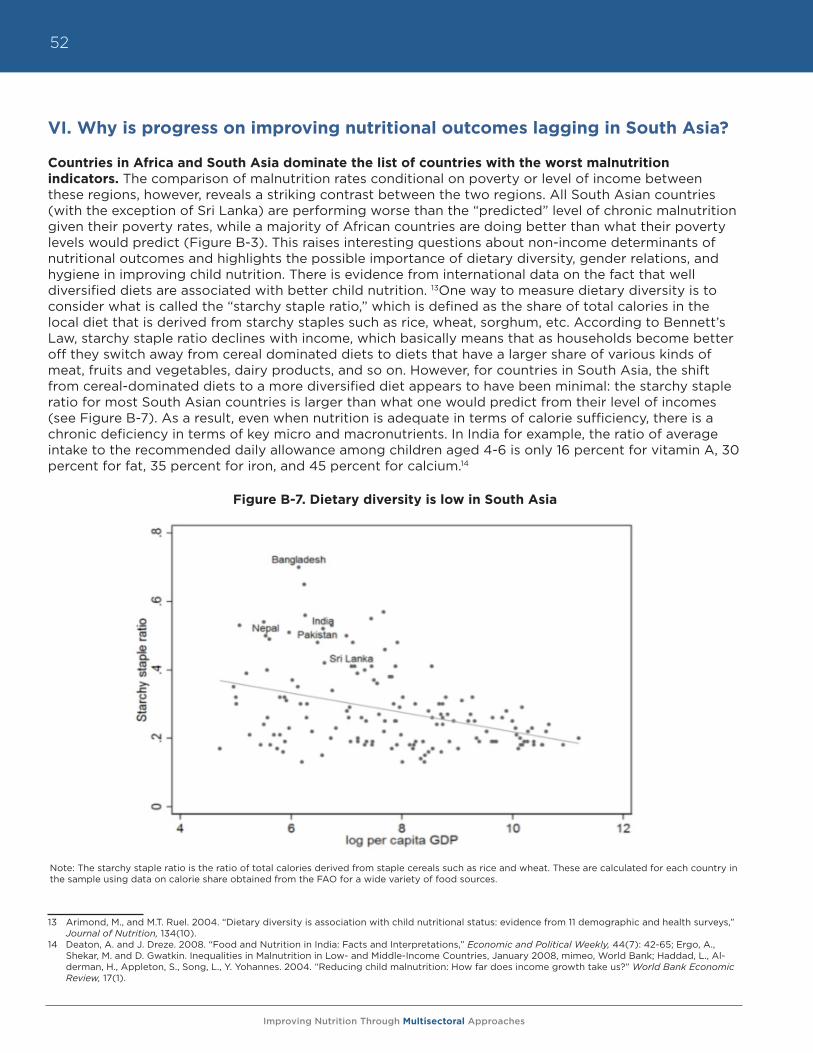
Improving Nutrition Through Multisectoral Approaches
52
VI. Why is progress on improving nutritional outcomes lagging in South Asia?
Countries in Africa and South Asia dominate the list of countries with the worst malnutrition indicators. The comparison of malnutrition rates conditional on poverty or level of income between these regions, however, reveals a striking contrast between the two regions. All South Asian countries (with the exception of Sri Lanka) are performing worse than the “predicted” level of chronic malnutrition given their poverty rates, while a majority of African countries are doing better than what their poverty levels would predict (Figure B-3). This raises interesting questions about non-income determinants of nutritional outcomes and highlights the possible importance of dietary diversity, gender relations, and hygiene in improving child nutrition. There is evidence from international data on the fact that well diversified diets are associated with better child nutrition. 13One way to measure dietary diversity is to consider what is called the “starchy staple ratio,” which is defined as the share of total calories in the local diet that is derived from starchy staples such as rice, wheat, sorghum, etc. According to Bennett’s Law, starchy staple ratio declines with income, which basically means that as households become better off they switch away from cereal dominated diets to diets that have a larger share of various kinds of meat, fruits and vegetables, dairy products, and so on. However, for countries in South Asia, the shift from cereal-dominated diets to a more diversified diet appears to have been minimal: the starchy staple ratio for most South Asian countries is larger than what one would predict from their level of incomes (see Figure B-7). As a result, even when nutrition is adequate in terms of calorie sufficiency, there is a chronic deficiency in terms of key micro and macronutrients. In India for example, the ratio of average intake to the recommended daily allowance among children aged 4-6 is only 16 percent for vitamin A, 30 percent for fat, 35 percent for iron, and 45 percent for calcium.14
Figure B-7. Dietary diversity is low in South Asia
13 Arimond, M., and M.T. Ruel. 2004. “Dietary diversity is association with child nutritional status: evidence from 11 demographic and health surveys,” Journal of Nutrition, 134(10).
14 Deaton, A. and J. Dreze. 2008. “Food and Nutrition in India: Facts and Interpretations,” Economic and Political Weekly, 44(7): 42-65; Ergo, A., Shekar, M. and D. Gwatkin. Inequalities in Malnutrition in Low- and Middle-Income Countries, January 2008, mimeo, World Bank; Haddad, L., Al-derman, H., Appleton, S., Song, L., Y. Yohannes. 2004. “Reducing child malnutrition: How far does income growth take us?” World Bank Economic Review, 17(1).
Note: The starchy staple ratio is the ratio of total calories derived from staple cereals such as rice and wheat. These are calculated for each country in the sample using data on calorie share obtained from the FAO for a wide variety of food sources.
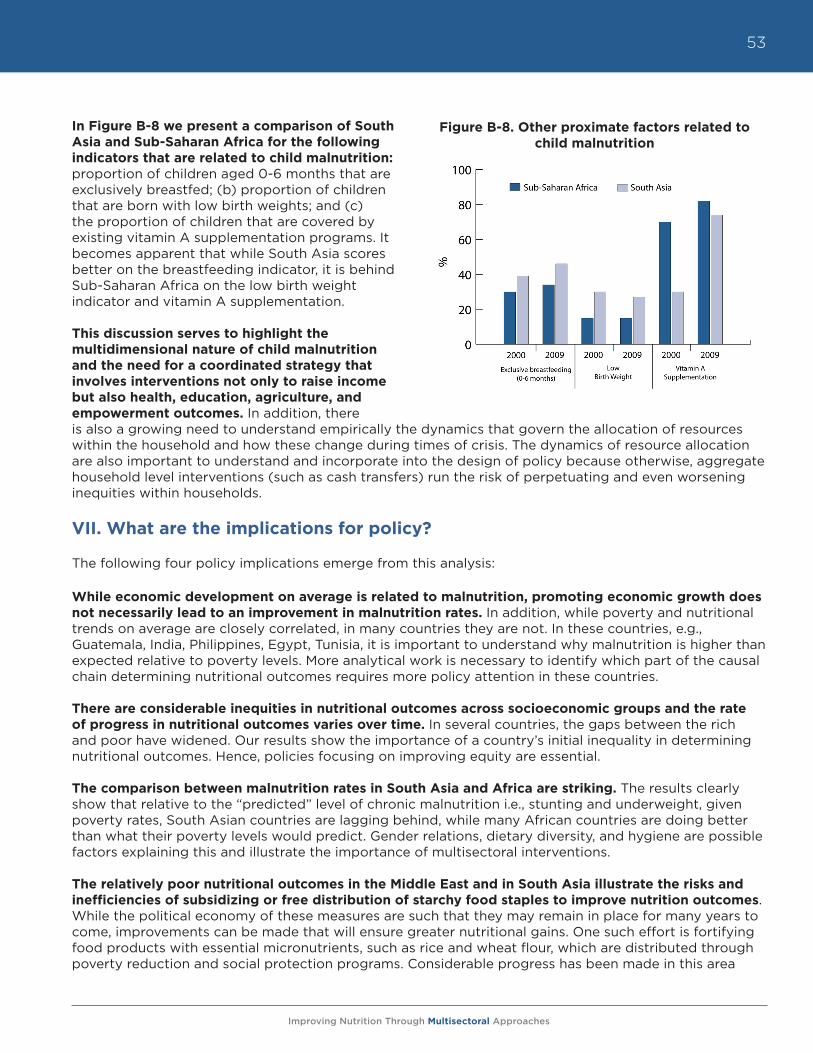
Improving Nutrition Through Multisectoral Approaches
53
In Figure B-8 we present a comparison of South Asia and Sub-Saharan Africa for the following indicators that are related to child malnutrition: proportion of children aged 0-6 months that are exclusively breastfed; (b) proportion of children that are born with low birth weights; and (c) the proportion of children that are covered by existing vitamin A supplementation programs. It becomes apparent that while South Asia scores better on the breastfeeding indicator, it is behind Sub-Saharan Africa on the low birth weight indicator and vitamin A supplementation.
This discussion serves to highlight the multidimensional nature of child malnutrition and the need for a coordinated strategy that involves interventions not only to raise income but also health, education, agriculture, and empowerment outcomes. In addition, there is also a growing need to understand empirically the dynamics that govern the allocation of resources within the household and how these change during times of crisis. The dynamics of resource allocation are also important to understand and incorporate into the design of policy because otherwise, aggregate household level interventions (such as cash transfers) run the risk of perpetuating and even worsening inequities within households.
VII. What are the implications for policy?
The following four policy implications emerge from this analysis:
While economic development on average is related to malnutrition, promoting economic growth does not necessarily lead to an improvement in malnutrition rates. In addition, while poverty and nutritional trends on average are closely correlated, in many countries they are not. In these countries, e.g., Guatemala, India, Philippines, Egypt, Tunisia, it is important to understand why malnutrition is higher than expected relative to poverty levels. More analytical work is necessary to identify which part of the causal chain determining nutritional outcomes requires more policy attention in these countries.
There are considerable inequities in nutritional outcomes across socioeconomic groups and the rate of progress in nutritional outcomes varies over time. In several countries, the gaps between the rich and poor have widened. Our results show the importance of a country’s initial inequality in determining nutritional outcomes. Hence, policies focusing on improving equity are essential.
The comparison between malnutrition rates in South Asia and Africa are striking. The results clearly show that relative to the “predicted” level of chronic malnutrition i.e., stunting and underweight, given poverty rates, South Asian countries are lagging behind, while many African countries are doing better than what their poverty levels would predict. Gender relations, dietary diversity, and hygiene are possible factors explaining this and illustrate the importance of multisectoral interventions.
The relatively poor nutritional outcomes in the Middle East and in South Asia illustrate the risks and inefficiencies of subsidizing or free distribution of starchy food staples to improve nutrition outcomes. While the political economy of these measures are such that they may remain in place for many years to come, improvements can be made that will ensure greater nutritional gains. One such effort is fortifying food products with essential micronutrients, such as rice and wheat flour, which are distributed through poverty reduction and social protection programs. Considerable progress has been made in this area
Figure B-8. Other proximate factors related to child malnutrition
Improving Nutrition Through Multisectoral Approaches
54
and new technology implies that the price premium for fortified products is relatively low, e.g., 3-4% for fortified rice, and could possibly be subsidized to ensure access by the poor. In addition, other direct nutritional interventions such as promotion of breastfeeding, nutrition education, deworming, and improved hygiene practices remain crucial in reducing malnutrition.
VIII. Emerging operational research and knowledge gaps
A better measurement tool that captures the food insecurity at household levels is becoming increasingly necessary. Unlike income poverty and nutritional outcomes such as stunting and underweight, there is lower consensus around an appropriate measure of food security at the household and individual level. FAO publishes aggregate undernourishment or hunger numbers as a proxy for food insecurity. WFP produces a food consumption score and a vulnerability map. IFPRI produces a global hunger index, which is measured as a weighted average of FAO’s hunger measure, underweight incidence, and mortality of children under five within each country. All of these measures are varied in their methodology and often show contradictory results. Moreover, there is very limited distinction between national and household/individual food security measures. A unified approach to measuring and tracking food security at the household level has become increasingly necessary to identify and monitor the effects of various kinds of shocks on vulnerable households and target interventions accordingly.
There is a growing need to understand the dynamics that govern the allocation of resources within the household and how these change during times of crisis. The dynamics are important to understand and incorporate into the design of policy. Otherwise, aggregate household level interventions, such as cash transfers, risk perpetuating and even worsening inequities within households. Existing survey instruments have limited information on food consumption at the individual level. As a result, most analyses of food security that originate from these datasets inevitably are based on food availability as opposed to actual intake. Innovative and cost-effective ways of incorporating modules that can elicit information on actual intakes at the individual level have to be explored because there are important differences in individual food security, particularly between gender groups, and even within the same household.
Finally, country economists working on a variety of Bank outputs such as the CAS, PER and DPLs are uniquely positioned to elevate the importance of nutrition in the national policy agenda and to do so in a manner that recognizes the multisectoral nature of the inputs that go into improving nutritional outcomes. These inputs span trade policies that define tariff rates on agricultural products, fiscal policies that guide subsidies for agricultural inputs such as fertilizers and electricity, regulatory issues that determine the marketplace organization for food, transportation and logistics, and the efficiency of government programs, such as cash transfers, that may aim to improve or protect nutritional status directly.
Improving Nutrition Through Multisectoral Approaches
55
MODULE C. Improving Nutrition through Agriculture and Rural DevelopmentYurie Tanimichi Hoberg, Anna Herforth, Meera Shekar, Aparajita Goyal
Agriculture has a strong influence on food consumption and nutritional status. Agriculture’s influence is maximized when nutrition is explicitly considered and progress is measured.
I. Objectives
The overall objective of this module is to offer practical guidance to support World Bank Task Team Leaders (TTLs), development partners, and country implementers in maximizing the positive nutrition impacts of agricultural investments, and minimizing the unintended negative consequences on nutrition. The World Bank’s support to agriculture aims to contribute to meeting the MDG1 of halving poverty and hunger by 2015, and the indicators for the hunger goal dealing directly with nutrition, i.e., prevalence of underweight among children under five years of age, and the proportion of the population below the minimum level of dietary energy consumption. These indicators do not necessarily decline in tandem. Of the 21 countries that have already met the goal of halving the proportion of the population below the minimum level of dietary energy consumption, only six are on track to meet the underweight goal.1 Among those countries showing insufficient progress toward reducing underweight, Mali has shown no progress on underweight.2
The specific objectives of this guidance note are to support TTLs, partner agencies, and country clients efforts to make agriculture investments more nutrition sensitive in the following ways: (1) enhance the design of Agriculture and Environmental Services (AES) investments and policies to maximize the impact on nutrition outcomes for the poor; (2) measure the progress of activities affecting nutrition periodically through relevant output and outcome indicators, such as food consumption indicators; (3) minimize the unintended negative nutritional consequences of agricultural interventions and policies on the lives of the poor, especially women and young children; and (4) support governments and partners in designing sustainable and coherent policies to improve nutrition outcomes for the poor.
II. Rationale
The message that agriculture plays a major role in nutrition (and vice versa) is gaining traction within and outside of the World Bank. There is considerable global momentum to bring the agriculture, food security, and nutrition agendas closer together so that investments in one will have positive impacts on the others. The new global SUN Framework and Roadmap3 have identified nutrition sensitive development in key sectors as one of the two most urgent priorities for addressing malnutrition, Agriculture is at the top of the list of key sectors.4 Leaders from 27 client countries are ready to scale up nutrition investments through multisectoral approaches and are known as the “SUN early riser countries.” (See Section A for more details on the SUN.)
1 Armenia, Georgia, Ghana, Jamaica, Nicaragua, and Vietnam have met the hunger goal and are on track to meet the underweight goal.2 The 10 countries showing insufficient progress in reducing underweight are Azerbaijan, Congo, Guyana, Mali, Morocco, Myanmar, Nigeria, Sao
Tome and Principe, Solomon Islands, and Uruguay. Morocco and Uruguay have limited data but progress appears insufficient based on average annual rates of reduction of 1.2% and 0.8%, respectively. Five countries have no data on underweight progress: Chile, Cuba, Gabon, Kuwait, and St. Vincent and the Grenadines, http://www.childinfo.org/undernutrition_tables.php.
3 The SUN responds to the continuing high levels of undernutrition and the uneven progress towards the MDGs to halve poverty and hunger by the year 2015. The SUN framework was developed by specialists from governments, academia, research institutions, civil society, private companies, development agencies, and UN organizations, including the World Bank. It is endorsed by more than 100 organizations and was launched in Washington in April 2010, www.scalingupnutrition.org.
4 Malnutrition is defined as a condition resulting from ingesting an unbalanced diet lacking in certain nutrients i.e., undernutrition or excess intake i.e., overnutrition, or a misproportioned diet. As stated in Section A of the report, this document focuses primarily on undernutrition.
Improving Nutrition Through Multisectoral Approaches
56
A series of briefs and papers also resulted from an international conference hosted by IFPRI in February 2011 on “Leveraging Agriculture for Improving Nutrition and Health.” Achieving nutrition results through agriculture has been the subject of several recent reviews and strategy notes prepared by major development partners, such as FAO, IFAD, the European Commission, USAID’s Feed the Future Program, USAID’s Infant and Young Child Nutrition Project (IYCN), DfID, as well as major international CSOs such as World Vision, Save the Children UK, and Action Against Hunger (ACF). (See Annex C-5 for a list of recent reviews and strategies.)
The World Bank has also increased attention to the need for linking agriculture and nutrition. For example, SecureNutrition, a new knowledge platform financed by The Bank, was established in FY12 to link agriculture, food security and nutrition.5 SecureNutrition is led by a team from Health, Nutrition and Population (HNP), AES, and Poverty Reduction and Equity (PRMPR). Its goal is to engage a community of practice to exchange knowledge, awareness, and capacity to support food security interventions to improve nutrition outcomes. One of the key target audience groups of SecureNutrition is the Bank’s TTLs. There has been increasing demand within the Bank for knowledge on how to link agriculture and nutrition, especially from the South Asia region, where the South Asia Food and Nutrition Security Initiative (SAFANSI) provides these resources. The most basic rationale for Bank engagement in this linkage is the critical importance of nutrition to human capital development and ultimately to the reduction of poverty.
The next sections discuss the unique contributions of agriculture and rural development to nutrition and why nutrition action cannot be left to other sectors outside of AES; explain how improved nutrition contributes to core agricultural objectives; review briefly the pathways from agriculture to nutrition; and recommend practical interventions for AES TTLs to consider.
III. Why is agriculture important for nutrition?
In support of the World Bank’s mission to fight poverty, AES works to reduce poverty through sustainable agriculture and rural development. Undernutrition is intimately linked with both poverty and smallholder farmer well-being and is a major constraint to rural development among farmers, who are the primary target population of AES projects. When farmers are undernourished, they are less productive. Furthermore, undernourished children are less likely to attend school. These children in smallholder families are less likely to transition out of small-scale farming, and thereby fail to get out of the poverty trap. Poverty reduction and improvement in well-being among the world’s vulnerable farmers will be more meaningful and sustainable if addressing undernutrition is part of the package for the broad rural population which will ultimately benefit the population in the most vulnerable first 1,000 days from conception to 24 months.6
Why should AES TTLs be concerned with nutrition? Don’t the health and social protection sectors adequately cover nutrition? Agriculture has a unique and critical role in improving nutrition outcomes, and the following five reasons explain why.
a. Agriculture is the sector best placed to affect food production and consumption of nutritious foods needed for healthy and active lives. Physical and economic access to adequate and affordable nutritious food is primarily a function of the agriculture sector through support to increased production and improved post-harvest storage and processing. Agriculture’s unique role in food production and consumption makes it indispensable for enabling people to have consistent access to nutritious diets (food security).
5 The Knowledge Platform is cohosted by HNP, AES, and PRMPR and has received funding for FY12-14 from the Knowledge and Learning Council. For more information, see http://www.securenutritionplatform.org.
6 World Bank. 2006. Repositioning Nutrition as Central to Development, http://siteresources.worldbank.org/NUTRITION/Resources/281846- 1131636806329/NutritionStrategy.pdf.
Improving Nutrition Through Multisectoral Approaches
57
b. Agriculture has the most direct influence and contact with the majority of households in the world where undernourished individuals reside. Beneficiaries of typical AES projects overlap with those most affected by undernutrition: the rural poor. Seventy-five percent of the world’s poor are rural, and most of those are smallholder farmers. Any development activity reaching this population has enormous potential to impact on factors that constrain human capital and well-being, of which nutrition is an essential part. For example, agriculture extension workers have direct and ongoing contact with smallholder farmers, and therefore have a unique opportunity to strengthen messages regarding consumption of nutritious foods.
c. Agricultural-led growth is more pro-poor than non-agricultural-led growth; thereby increasing agriculture’s potential to improve nutrition. Agricultural growth is at least twice as effective in reducing poverty as GDP growth originating outside agriculture and is therefore pro-poor.7 Agriculture-led growth has led to faster (though still insufficient) declines in undernutrition than non-agricultural growth.8
d. A large percentage of rural women are employed in the formal or informal agriculture sector. Women contribute over 50 percent of the agriculture labor force in many developing countries. AES investments will have a large direct impact on nutrition outcomes for the entire household through increased discretionary income and reduced workloads for women.
e. Some agriculture projects could cause unintended nutritional harm. Nutritional status of household members is strongly influenced by clean water, disease occurrence, food quality, and child care practices. Several unintended but related consequences, such as reducing women’s available time for child care, have been documented as arising from some agricultural interventions. Possible harms and mitigation strategies are included at the end of this module (see Table C-2).
IV. Why is nutrition important for agriculture?
The linkage between agriculture and nutrition has reciprocal benefits. Improving nutrition can benefit agricultural sector performance at least in the following four ways.
a. Improved nutrition means improved smallholder well-being. Reducing malnutrition among the world’s most vulnerable people is core to the World Bank’s mission of poverty reduction and core to the AES role of reducing poverty and improving well-being of vulnerable farmers in the “three worlds of agriculture,” presented in the WDR 2008, i.e., agriculture-based, transforming, and urbanized. When agriculture projects improve nutrition, they more fully reach the goal of improving the well-being of farmers and poor people living in rural areas.
b. Nutrition investments improve human capital and have a positive impact on agricultural productivity. Smallholder farmers are often among the populations most likely to be malnourished. Women smallholder farmers, who form a majority of the agricultural labor force in many cases, are disproportionately likely to be malnourished. Undernutrition accounts for 11 percent of all DALYs lost globally, and up to a quarter of DALYs in countries with high mortality.9 This is naturally reflected in lost agricultural productivity. Evidence shows that when farmers are malnourished, they are less productive.10 One analysis determined that every one percent increase in height is associated with a four percent increase in agricultural wages.11 Iron deficiency anemia
7 World Bank. 2008. World Development Report 2008: Agriculture for Development.8 Webb P. and S. Block. 2011. Support for agriculture during economic transformation: Impacts on poverty and undernutrition. PNAS, www.pnas.org/
cgi/doi/10.1073/pnas.0913334108.9 Black, R.E., Allen, L.H., Bhutta, Z.A., Caulfield L.E., de Onis, M., Ezzati, M., Mathers, C. J. Rivera et al. 2008. Maternal and child undernutrition: global
and regional exposures and health consequences. Lancet 371:243-60; World Health Organization. 2002. World Health Report 2002: Reducing Risks, Promoting Healthy Life. Geneva: WHO.
10 D.E. Sahn. “The impact of poor health and nutrition on labor productivity, poverty, and economic growth in Sub-Saharan Africa,” in The African Food System and Its Interaction with Human Health and Nutrition, P. Pinstrup-Andersen, ed. (Ithaca, NY: Cornell University Press/UNU Press); McNamara, P.E., Ulimwengu, J.M., and K.L. Leonard. 2010. Do Health Investments Improve Agricultural Productivity? International Food Policy Research Institute Discussion Paper.
11 Haddad, L.J., H.E. Bouis. 1991. The impact of nutritional status on agricultural productivity: wage evidence from the Philippines. Oxford Bulletin of Economics and Statistics 53(1): 45-68.
Improving Nutrition Through Multisectoral Approaches
58
results in lower work capacity.12 In an agricultural context, anemia has been shown to reduce productivity by 17 percent.13 Overall, malnutrition diminishes lifetime earnings by 10 percent or more, and reduces GDP by 2-3 percent in the worst affected countries.14 Investments in human capital, including nutrition, consistently have been shown to increase productivity.15
c. Nutrition knowledge may be an added incentive to transition to a diversified production model. Transition of households to diversified production is an oft-cited goal for the agricultural sector to raise household income, minimize risk exposure, and promote ecosystem resilience. Nutrition education and information can be leveraged to improve both supply and demand for high-value vegetables, fruits, legumes, fish, and livestock products. Nutrition knowledge among farmers could be anadditional incentive for farmers to diversify their production model to include nutritious, high-value crops, beyond the widely recognized incentives to reduce risk exposure to weather, biotic stress, or price shocks. Additionally, nutrition knowledge among consumers can increase demand for high-value nutritious products substantially, and increase income for farmers who grow them.16
d. Adopting a nutrition lens is likely to improve women’s participation and empowerment, with important effects on income and productivity, in addition to nutrition and gender equity. Approximately half the world’s farmers are women. In some countries, the ratio is much higher. In Southeast Asia, women supply up to 90 percent of the labor required for rice cultivation.17 Women account for 70 percent of farm labor and perform 80 percent of food processing in Africa.18 Gender equity is a corporate priority of the World Bank, including for AES.
Most AES projects measure women’s participation in projects as an indicator of gender equity. Retaining female participation may improve if AES projects adopt a nutrition lens. Apart from their livelihoods, women farmers’ main time demands come from infant and child care and feeding. Agricultural projects that do not account for women’s major role in child care are likely to see female participation in projects flag. Structuring programs so women with small children can meet care needs for their infants/young children can increase female participation and improve project outcomes. If women had the same access to productive resources as men, they could increase yields on their farms by 20-30 percent, raising total agricultural output in developing countries by 2.5-4 percent, and reducing the global number of hungry people by 12-17 percent.19 By implementing programs so women can fulfill their multiple roles, AES projects can achieve a triple win: they can become more nutrition sensitive (to the feeding and care needs of children and mothers), while improving gender equity and concomitantly AES projects’ core productivity objectives.
In summary, evidence shows that when AES investments have explicit nutrition objectives that are tracked and measured over the project’s lifetime, positive impacts can be expected for both nutrition and AES outcomes.
12 Haas J.D, Brownlie, T. 2001. Iron deficiency and reduced work capacity: A critical review of the research to determine a causal relationship. J Nutri-tion 131: 676S-690S.
13 Basta, S.S., Soekirman, Karyadi, D., and N.S. Scrimshaw. 1979. Iron deficiency and productivity of adult males in Indonesia. American Journal of Clinical Nutrition 32, 916-925.
14 Harold Alderman. 2005. “Linkages between Poverty Reduction Strategies and Child Nutrition: An Asian Perspective.” Economic and Political Weekly 40 (46):4837–42; World Bank. 2006. Repositioning Nutrition as Central to Development, http://siteresources.worldbank.org/NUTRITION/Resources/281846-1131636806329/NutritionStrategy.pdf.
15 World Bank, 2008. World Development Report 2008: Agriculture for Development.16 For example, a Kenyan CSO (Farm Concern International) won a World Bank CGAP award for its approach of nutrition-focused marketing of Afri-
can leafy vegetables, driving up the value of these horticultural products 213 percent in five years and substantially increasing incomes and inter-est among farmers interested in growing them. C. Irungu. 2007. “Analysis of markets for African leafy vegetables within Nairobi and its environs,” Global Facilitation Unit for Underutilized Species (GFU); Ewbank, R., Nyang, M., Webo, C., and R. Roothaert. 2007. “Socio-Economic Assessment of Four MATF-Funded Projects,” FARM-Africa Working Paper No. 8, http://www.farmafrica.org.uk/smartweb/news-views/resources/4.
17 International Food Policy Research Institute. 2011. Agriculture, Nutrition, Health: Exploiting the Links. Washington, D.C.: IFPRI.18 Cramer L.K., S.K. Wandira. 2010. Strengthening the Role of Women in the Food Systems of Sub-Saharan Africa to Achieve Nutrition and Health
Goals. In: The African Food System and Its Interaction with Human Health and Nutrition, P. Pinstrup-Andersen, ed. (Ithaca, NY: Cornell University Press/UNU Press).
19 FAO 2011. The State of Food and Agriculture 2010-11, Rome, as quoted in WDR 2012.
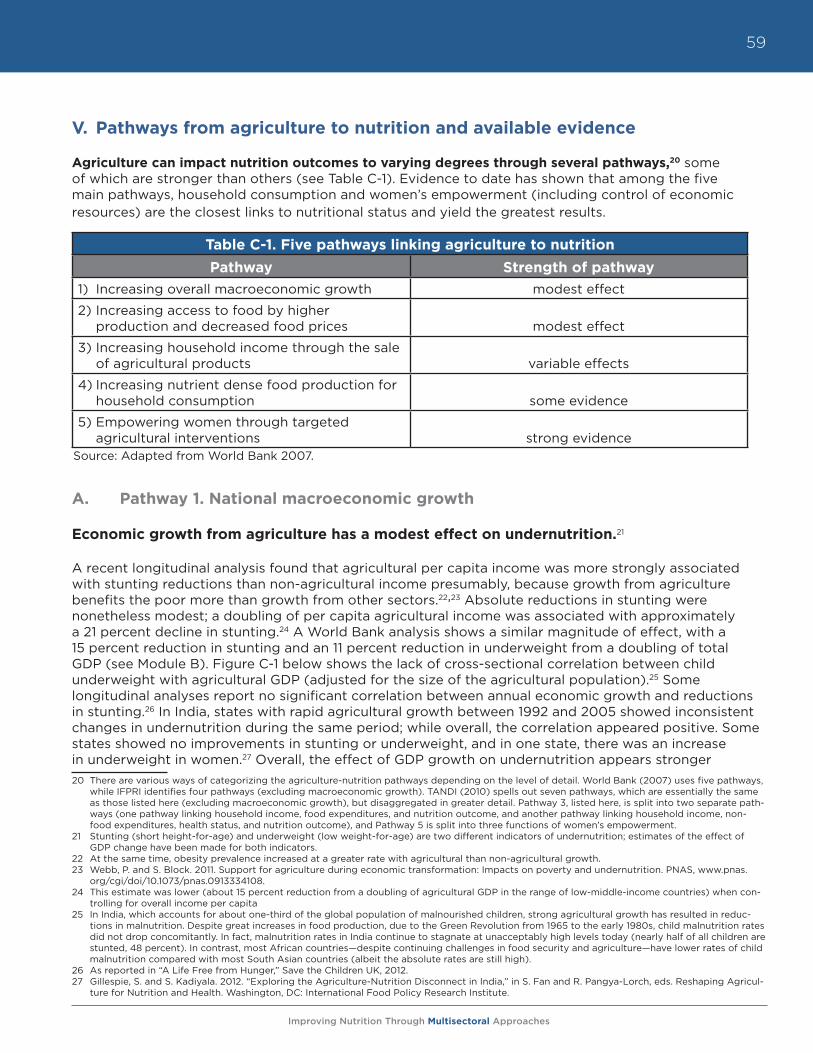
Improving Nutrition Through Multisectoral Approaches
59
V. Pathways from agriculture to nutrition and available evidence
Agriculture can impact nutrition outcomes to varying degrees through several pathways,20 some of which are stronger than others (see Table C-1). Evidence to date has shown that among the five main pathways, household consumption and women’s empowerment (including control of economic resources) are the closest links to nutritional status and yield the greatest results.
A. Pathway 1. National macroeconomic growth
Economic growth from agriculture has a modest effect on undernutrition.21
A recent longitudinal analysis found that agricultural per capita income was more strongly associated with stunting reductions than non-agricultural income presumably, because growth from agriculture benefits the poor more than growth from other sectors.22,23 Absolute reductions in stunting were nonetheless modest; a doubling of per capita agricultural income was associated with approximately a 21 percent decline in stunting.24 A World Bank analysis shows a similar magnitude of effect, with a 15 percent reduction in stunting and an 11 percent reduction in underweight from a doubling of total GDP (see Module B). Figure C-1 below shows the lack of cross-sectional correlation between child underweight with agricultural GDP (adjusted for the size of the agricultural population).25 Some longitudinal analyses report no significant correlation between annual economic growth and reductions in stunting.26 In India, states with rapid agricultural growth between 1992 and 2005 showed inconsistent changes in undernutrition during the same period; while overall, the correlation appeared positive. Some states showed no improvements in stunting or underweight, and in one state, there was an increase in underweight in women.27 Overall, the effect of GDP growth on undernutrition appears stronger 20 There are various ways of categorizing the agriculture-nutrition pathways depending on the level of detail. World Bank (2007) uses five pathways,
while IFPRI identifies four pathways (excluding macroeconomic growth). TANDI (2010) spells out seven pathways, which are essentially the same as those listed here (excluding macroeconomic growth), but disaggregated in greater detail. Pathway 3, listed here, is split into two separate path-ways (one pathway linking household income, food expenditures, and nutrition outcome, and another pathway linking household income, non-food expenditures, health status, and nutrition outcome), and Pathway 5 is split into three functions of women’s empowerment.
21 Stunting (short height-for-age) and underweight (low weight-for-age) are two different indicators of undernutrition; estimates of the effect of GDP change have been made for both indicators.
22 At the same time, obesity prevalence increased at a greater rate with agricultural than non-agricultural growth.23 Webb, P. and S. Block. 2011. Support for agriculture during economic transformation: Impacts on poverty and undernutrition. PNAS, www.pnas.
org/cgi/doi/10.1073/pnas.0913334108.24 This estimate was lower (about 15 percent reduction from a doubling of agricultural GDP in the range of low-middle-income countries) when con-
trolling for overall income per capita25 In India, which accounts for about one-third of the global population of malnourished children, strong agricultural growth has resulted in reduc-
tions in malnutrition. Despite great increases in food production, due to the Green Revolution from 1965 to the early 1980s, child malnutrition rates did not drop concomitantly. In fact, malnutrition rates in India continue to stagnate at unacceptably high levels today (nearly half of all children are stunted, 48 percent). In contrast, most African countries—despite continuing challenges in food security and agriculture—have lower rates of child malnutrition compared with most South Asian countries (albeit the absolute rates are still high).
26 As reported in “A Life Free from Hunger,” Save the Children UK, 2012.27 Gillespie, S. and S. Kadiyala. 2012. “Exploring the Agriculture-Nutrition Disconnect in India,” in S. Fan and R. Pangya-Lorch, eds. Reshaping Agricul-
ture for Nutrition and Health. Washington, DC: International Food Policy Research Institute.
Table C-1. Five pathways linking agriculture to nutrition
Pathway Strength of pathway1) Increasing overall macroeconomic growth modest effect
2) Increasing access to food by higher production and decreased food prices modest effect
3) Increasing household income through the sale of agricultural products variable effects
4) Increasing nutrient dense food production for household consumption some evidence
5) Empowering women through targeted agricultural interventions strong evidence
Source: Adapted from World Bank 2007.
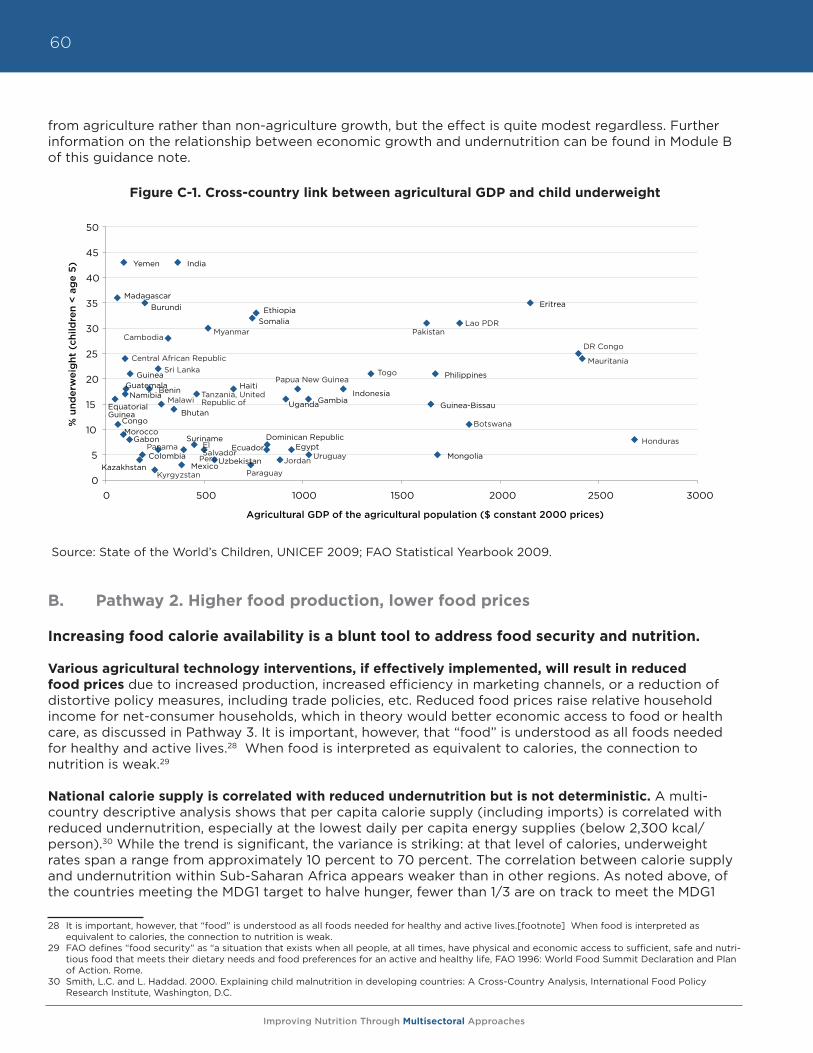
Improving Nutrition Through Multisectoral Approaches
60
from agriculture rather than non-agriculture growth, but the effect is quite modest regardless. Further information on the relationship between economic growth and undernutrition can be found in Module B of this guidance note.
Figure C-1. Cross-country link between agricultural GDP and child underweight
Source: State of the World’s Children, UNICEF 2009; FAO Statistical Yearbook 2009.
B. Pathway 2. Higher food production, lower food prices
Increasing food calorie availability is a blunt tool to address food security and nutrition.
Various agricultural technology interventions, if effectively implemented, will result in reduced food prices due to increased production, increased efficiency in marketing channels, or a reduction of distortive policy measures, including trade policies, etc. Reduced food prices raise relative household income for net-consumer households, which in theory would better economic access to food or health care, as discussed in Pathway 3. It is important, however, that “food” is understood as all foods needed for healthy and active lives.28 When food is interpreted as equivalent to calories, the connection to nutrition is weak.29
National calorie supply is correlated with reduced undernutrition but is not deterministic. A multi-country descriptive analysis shows that per capita calorie supply (including imports) is correlated with reduced undernutrition, especially at the lowest daily per capita energy supplies (below 2,300 kcal/person).30 While the trend is significant, the variance is striking: at that level of calories, underweight rates span a range from approximately 10 percent to 70 percent. The correlation between calorie supply and undernutrition within Sub-Saharan Africa appears weaker than in other regions. As noted above, of the countries meeting the MDG1 target to halve hunger, fewer than 1/3 are on track to meet the MDG1 28 It is important, however, that “food” is understood as all foods needed for healthy and active lives.[footnote] When food is interpreted as
equivalent to calories, the connection to nutrition is weak.29 FAO defines “food security” as “a situation that exists when all people, at all times, have physical and economic access to sufficient, safe and nutri-
tious food that meets their dietary needs and food preferences for an active and healthy life, FAO 1996: World Food Summit Declaration and Plan of Action. Rome.
30 Smith, L.C. and L. Haddad. 2000. Explaining child malnutrition in developing countries: A Cross-Country Analysis, International Food Policy Research Institute, Washington, D.C.
Equatorial Guinea
Madagascar
Congo Morocco
Yemen
Namibia Guatemala
Gabon
Guinea
Kazakhstan Colombia
Burundi
Benin
Bhutan
India
Mexico
Suriname
Uzbekistan
Haiti
Somalia Ethiopia
Ecuador Dominican Republic
Uganda
Egypt
Gambia Indonesia
Guinea-Bissau
Philippines
Mongolia
Eritrea
0
5
10
15
20
25
30
35
40
45
50
0 500 1000 1500 2000 2500 3000
% u
nder
wei
ght
(ch
ildre
n <
ag
e 5)
Agricultural GDP of the agricultural population ($ constant 2000 prices)
Lao PDRPakistan
DR Congo
Mauritania
MyanmarCambodia
Honduras
Central African RepublicSri Lanka
MalawiTanzania, UnitedRepublic of
TogoPapua New Guinea
UruguayPanama
JordanParaguayKyrgyzstan
Peru
ElSalvador
Botswana
Improving Nutrition Through Multisectoral Approaches
61
target to halve undernutrition, showing the limited translation of national-level calorie availability to nutritional improvements.
Limited associations between staple crop production and nutritional status have been observed within countries. For example, in Vietnam, a major rice exporting country, 36 percent of children are stunted, and 19 percent are underweight. A World Bank-funded analysis from the Mekong Delta in Vietnam showed that the provinces with the highest rice production levels were precisely those with the highest child stunting rates.31 Some provinces leading the rice export expansion had a lower reduction in malnutrition than provinces where rice production declined as land was shifted into horticulture and aquaculture.
One factor in the disconnect between food production and nutritional outcomes may be the persistent practice of defining and measuring food as calories, instead of focusing on the diversity of foods needed for a healthy and active life.32 For low-income countries, most research to date on price elasticities of demand has focused on calories, and therefore has not provided information on the effects of relative price changes of nutrient-dense foods or other factors, such as disease patterns. One recent study shows that prices of non-staples increased substantially more than starchy staples in Central Java during the food price crisis in 1999. These price increases were accompanied by strong reductions in the consumption of meat, fish, vegetables, fruit, eggs, and milk.33
C. Pathway 3. Increased income
Increasing household income has variable effects on nutrition.
On average, poverty and undernutrition are correlated, and movement out of poverty is important for improved nutrition. In fact, the ultimate higher-level objective of most agricultural projects—often times beyond the project development objective (PDO)—is to improve the beneficiaries’ overall well-being, especially their household income. Higher household incomes have the potential to improve nutrition outcomes, mainly by increasing the households’ ability to purchase and consume foods that are more nutritious and/or to pay for more and better health care to improve the household members’ health.
The evidence, however, shows that household income does not necessarily lead to improved nutritional status of its most vulnerable members.34 In a particularly striking example, 40 percent of children in Ethiopia are stunted, even in the wealthiest quintile (see Figure C-2).35 In India, similarly high stunting rates among the highest income quintile have declined only marginally and remain at about 25 percent, despite rapid economic growth.36 Module B of this guidance note shows many country examples where poverty reduction is not accompanied by a reduction in malnutrition.
31 World Bank 2011. Unpublished draft report. Vietnam’s Mekong Delta Region: Malnutrition Amongst Plenty. Can Tho University.32 Other factors in this disconnect may be the gap between production, consumption, and utilization of food by the body, e.g., due to non-food
factors such as disease.33 Skoufias, E., Tiwari, S., H. Zaman . 2011. Can we rely on cash transfers to protect dietary diversity during food crises? Policy research working paper
5548. World Bank.34 World Bank. 2006. Repositioning Nutrition as Central to Development, http://siteresources.worldbank.org/NUTRITION/Resourc-
es/281846-1131636806329/NutritionStrategy.pdf.35 Reproduced from the World Bank Nutrition Country Profile for Ethiopia, www.worldbank.org/nutrition/profiles.36 India National Family Health Survey (NFHS-3), India, 2005-06. Mumbai: International Institute for Population Sciences; Calverton, Maryland, USA:
ICF Macro.
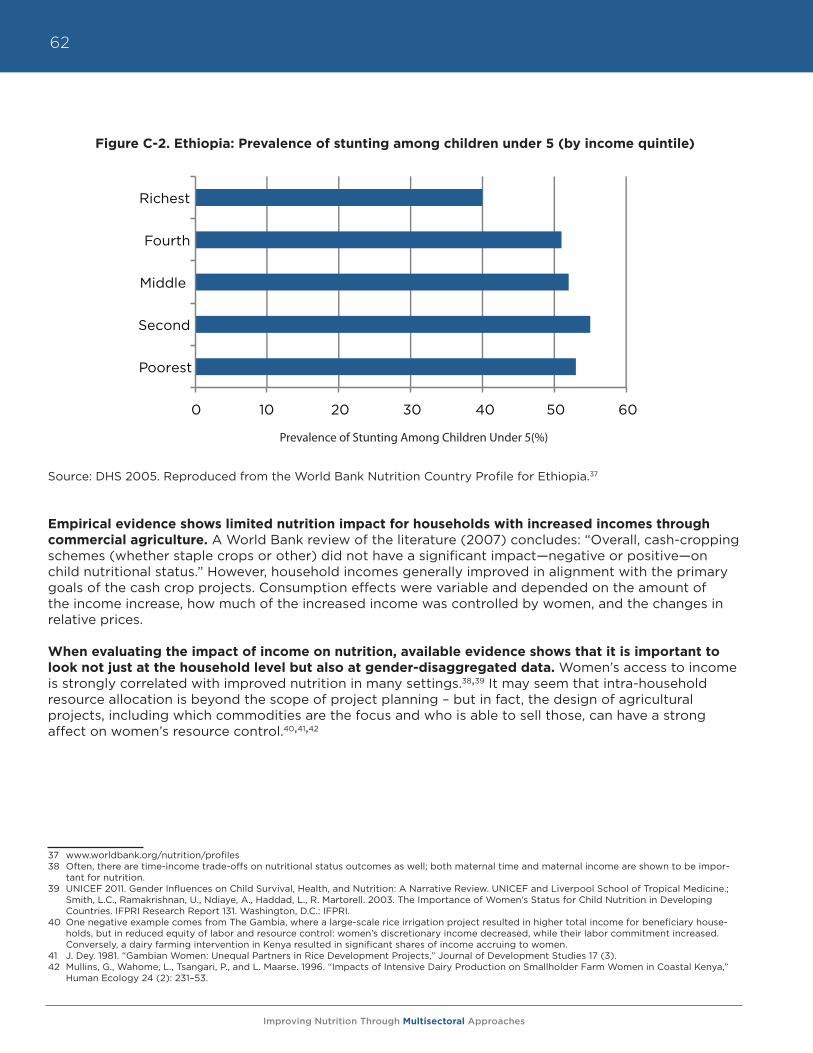
Improving Nutrition Through Multisectoral Approaches
62
Figure C-2. Ethiopia: Prevalence of stunting among children under 5 (by income quintile)
Source: DHS 2005. Reproduced from the World Bank Nutrition Country Profile for Ethiopia.37
Empirical evidence shows limited nutrition impact for households with increased incomes through commercial agriculture. A World Bank review of the literature (2007) concludes: “Overall, cash-cropping schemes (whether staple crops or other) did not have a significant impact—negative or positive—on child nutritional status.” However, household incomes generally improved in alignment with the primary goals of the cash crop projects. Consumption effects were variable and depended on the amount of the income increase, how much of the increased income was controlled by women, and the changes in relative prices.
When evaluating the impact of income on nutrition, available evidence shows that it is important to look not just at the household level but also at gender-disaggregated data. Women’s access to income is strongly correlated with improved nutrition in many settings.38,39 It may seem that intra-household resource allocation is beyond the scope of project planning – but in fact, the design of agricultural projects, including which commodities are the focus and who is able to sell those, can have a strong affect on women’s resource control.40,41,42
37 www.worldbank.org/nutrition/profiles38 Often, there are time-income trade-offs on nutritional status outcomes as well; both maternal time and maternal income are shown to be impor-
tant for nutrition.39 UNICEF 2011. Gender Influences on Child Survival, Health, and Nutrition: A Narrative Review. UNICEF and Liverpool School of Tropical Medicine.;
Smith, L.C., Ramakrishnan, U., Ndiaye, A., Haddad, L., R. Martorell. 2003. The Importance of Women’s Status for Child Nutrition in Developing Countries. IFPRI Research Report 131. Washington, D.C.: IFPRI.
40 One negative example comes from The Gambia, where a large-scale rice irrigation project resulted in higher total income for beneficiary house-holds, but in reduced equity of labor and resource control: women’s discretionary income decreased, while their labor commitment increased. Conversely, a dairy farming intervention in Kenya resulted in significant shares of income accruing to women.
41 J. Dey. 1981. “Gambian Women: Unequal Partners in Rice Development Projects,” Journal of Development Studies 17 (3).42 Mullins, G., Wahome, L., Tsangari, P., and L. Maarse. 1996. “Impacts of Intensive Dairy Production on Smallholder Farm Women in Coastal Kenya,”
Human Ecology 24 (2): 231–53.
0 10 20 30 40 50 60
Poorest
Second
Middle
Fourth
Richest
Prevalence of Stunting Among Children Under 5(%)
Improving Nutrition Through Multisectoral Approaches
63
D. Pathway 4. Home consumption
Increasing nutrient dense food production for home consumption shows some evidence of improving diets and micronutrient status.
In households that consume at least some of what they produce, an increase in production can directly affect the diet and nutritional status of household members. Evidence indicates that dietary impacts differ based on the type of food the household produces. That is, the effect of production on diet cannot be explained by the foods’ monetary value alone. This pathway is particularly important in contexts where market access is limited and households routinely depend on self-production for some components of their diets. The best evidence for nutritional effects of increased production for home consumption is found from increasing small-scale production of nutrient-dense foods.
Increasing nutritious food production can be achieved in three distinct ways:
a. Adding the production of specific nutrient-dense foods, such as fruits and vegetables, fish, and livestock;
b. Increasing nutritional content of the food produced, e.g., through crop biofortification, mineral fertilization, and industrial food fortification;43
c. Improving the preservation of nutritious food for year-round access and to eliminate seasonal food shortages.
Evidence supports the connection between crop diversification, dietary quality, and micronutrient status. A recent DfID-funded review of agricultural interventions to improve nutrition found that with very few exceptions, home garden programs increased the consumption of fruit and vegetables; aquaculture and small fisheries interventions increased the consumption of fish; and dairy development projects increased the consumption of milk.44 In contexts where diets are heavily starch-based, consumption of these nutritious foods is very likely to move dietary patterns closer to those recommended globally and by many countries.45 There is some evidence that consumption of these foods increased micronutrient intakes and status, especially vitamin A.46 Studies that have examined the connection between crop diversity and dietary diversity among smallholders have found positive correlations.47 Biofortified crops have also been demonstrated to improve vitamin A and iron intakes – alleviating two of the deficiencies causing a large amount of death and disability.48 Seasonality of nutrient-dense food production can be important, as they are typically much more perishable than staple grains.49 Low-stock seasons affect child growth and cyclical malnutrition rates through both caloric and micronutrient deprivation.
43 Biofortification is a method of breeding crops to increase their nutritional value. Biofortification differs from ordinary fortification (or industrial food fortification) because it focuses on making plant foods more nutritious as the plants are growing, rather than having nutrients added to the foods when they are being processed. Major organizations involved in biofortification include a CGIAR program called HarvestPlus (www.harvest-plus.org mainly focused on Africa and Asia), and AgroSalud (www.agrosalud.org focused on Latin America). IRRI is also involved in the biofortifi-cation of rice.
44 Masset, E, Haddad, L., Cornelius, A., J. Isaza-Castro. 2012. “Effectiveness of agricultural interventions that aim to improve nutritional status of chil-dren: systematic review.” BMJ, v.344. Open access, available at http://www.bmj.com/content/344/bmj.d8222.
45 FAO repository of Food-based Dietary Guidelines, http://www.fao.org/ag/humannutrition/nutritioneducation/fbdg/en/.46 Masset, E., Haddad, L., Cornelius, A., J. Isaza-Castro. 2012. “Effectiveness of agricultural interventions that aim to improve nutritional status of
children: systematic review. BMJ, v.344. Open access, available at http://www.bmj.com/content/344/bmj.d8222; Leroy, J. and E.A. Frongillo. 2007. “Can interventions to promote animal production ameliorate undernutrition? J Nutr 137: 2311-16.
47 Remans, R., Flynn, D.F.B., DeClerck, F., Diru, W., J. Fanzo et al. 2011. “Assessing Nutritional Diversity of Cropping Systems in African Villages.” PLoS ONE 6(6): e21235. doi:10.1371/journal.pone.0021235; A. Herforth. “Promotion of Traditional African Vegetables in Kenya and Tanzania: A Case Study of an Intervention Representing Emerging Imperatives in Global Nutrition” (Ph.D. diss. Cornell University, 2010); Torheim, L.E., Ouattara, F., Diarra, M.M., Thiam, F., Barikmo, I., Hatloy, A. and A. Oshaug. 2004. “Nutrient adequacy and dietary diversity in rural Mali: Association and determinants,” European Journal of Clinical Nutrition 58, 594–604. doi:10.1038/sj.ejcn.1601853.
48 Low, J., Arimond, M., Osman, N.,Cunguara, B., Zano, F. and D. Tschirley. 2007. “A Food-Based Approach Introducing Orange-Fleshed Sweet Potatoes Increased Vitamin A Intake and Serum Retinol Concentrations among Young Children in Rural Mozambique,” Journal of Nutrition 137; Haas, J.D., J.L. Beard, L.E. Murray-Kolb, A.M. del Mundo, A. Felix, G.B. Gregorio. 2005. “Iron-biofortified rice improves the iron stores of non-anemic Filipino women,” Journal of Nutrition, 135: 2823-2830.
49 World Bank. 2007. Pathways from agriculture to nutrition: Pathways, Synergies and Outcomes, http://siteresources.worldbank.org/EXTARD/Re-sources/Final.pdf; M. Ruel. 2001. “Can Food-Based Strategies Help Reduce Vitamin A and Iron Deficiencies? A Review of Recent Evidence,” Food Policy Review 5. International Food Policy Research Institute.
Improving Nutrition Through Multisectoral Approaches
64
Nutrition education enhances dietary consumption effects, as well as potential for consumer demand. While increased production of nutritious foods may have some independent impact on dietary consumption and micronutrient status, the evidence shows that nutrition education around those foods strongly enhances the effect.50 A review of food-based approaches to reduce iron and vitamin A deficiency found that only those food-based interventions with education, social marketing, or mass media demonstrated impact on nutritional outcomes.51,52
E. Pathway 5. Women’s empowerment Empowering women shows strong evidence for improving nutrition.
Strong evidence indicates that improving women’s status, particularly when combined with nutrition education, results in positive nutrition impact. A multi-country analysis found that improvements in women’s status and education were responsible for over half of the reductions in child underweight from 1970-1995.53 Women’s low status and decision-making power in South Asia is a large part of the explanation for the “Asian enigma” of higher undernutrition rates, despite greater economic growth, than in Sub-Saharan Africa. Since gender, like nutrition, is not a sector, the chance of improving women’s status and gender equity rests in practice with other sectors. Among all aspects of women empowerment, the most relevant for nutrition are (i) increasing women’s access to and control over resources—primarily incomes, and (ii) reducing time constraints.
Increasing women’s discretionary incomes. A large body of evidence across many regions consistently finds that income controlled by women has a significantly greater positive effect on child nutrition and household food security than income controlled by men.54 Projects that increase the likelihood that women are able to control resources accruing from their labor—through inclusion of training and market opportunities for crops and animal products women sell, for example—improve gender equity and are likely to improve nutrition as well.
Reducing time and labor constraints. A careful balance needs to be struck between nutritional gains from improved incomes and potential losses from increased time burden. Agriculture projects that increase the time or labor required from women can have unintended negative consequences. When affordable child care services are unavailable, care of babies may be relegated to child siblings (usually older girls), children may be breastfed less often, time for food preparation may be limited resulting in less nutritious diets, family members may be less likely to access health services, other agricultural production may suffer, and women may avoid off-farm income-earning opportunities.55 Excessive maternal activity during pregnancy may also result in increased risk of poor birth outcomes.56 Time-intensive projects may also come at the expense of other income-generating activities that would result in women’s control of income, the importance of which is addressed above. This points to a need for timesaving and productivity-enhancing technologies for gender-specific tasks carried out by women (e.g., weeding and food processing).
50 World Bank. 2007. Pathways from agriculture to nutrition: Pathways, Synergies and Outcomes, http://siteresources.worldbank.org/EXTARD/Re-sources/Final.pdf; Berti, P.R, Krasevec, J. and S. Fitzgerald. 2004. “A review of the effectiveness of agriculture interventions in improving nutrition,” Public Health Nutrition 7 (5): 599-609.
51 These studies have focused on household-level production and consumption; the effect of price changes on consumption of nutritious foods in the absence of education has not been well studied in low-income contexts. However, nutrition education also has been shown to affect allocation of household food budgets and to reduce price elasticity of demand for foods rich in micronutrients (Block 2003).
52 M. Ruel. 2001. “Can Food-Based Strategies Help Reduce Vitamin A and Iron Deficiencies? A Review of Recent Evidence,” Food Policy Review 5. International Food Policy Research Institute.
53 Smith, L.C. and L. Haddad. 2000. Explaining child malnutrition in developing countries: A Cross-Country Analysis, International Food Policy Re-search Institute, Washington DC.
54 UNICEF 2011. Gender Influences on Child Survival, Health, and Nutrition: A Narrative Review. UNICEF and Liverpool School of Tropical Medicine.55 N. Ilahi. 2000. The Intra-household Allocation of Time and Tasks: What Have We Learnt from the Empirical Literature? Policy Research Report
on Gender and Development, Working Paper Series No. 13. Washington, D.C., World Bank Development Research Group; Blackden, C.M., and Q. Wodon. 2006. “Gender, Time Use, and Poverty in Sub-Saharan Africa: Introduction,” in Gender, Time Use, and Poverty in Sub-Saharan Africa eds. C.M. Blackden and Q. Wodon. World Bank Working Paper No. 73 (Washington, D.C.: World Bank), 1-10.
56 Rao S., Kanade, A., Margetts, B.M., Yajnik, C.S., Lubree, H., Rege, S., Desai, B., Jackson, A., C.H.D. Fall. 2003. “Maternal activity in relation to birth size in rural India.” The Pune Maternal Nutrition Study. European Journal of Clinical Nutrition 57: 531–542; Pitchaya, T., Geater, A., Virasakdi, C., K. Ounjai. 1998. “The Effect of Heavy Maternal Workload on Fetal Growth Retardation and Preterm Delivery: A Study among Southern Thai Women,” Journal of Occupational & Environmental Medicine 40 (11):1013-1021; Barnes, D.L., Adair, U.S., Popkin, B.M., 1991. Women’s Physical Activity and Pregnancy Outcome: A Longitudinal Analysis from the Philippines. International Journal of Epidemiology 20 (1): 162-172.
Improving Nutrition Through Multisectoral Approaches
65
VI. Systematic review results and knowledge gaps
Systematic reviews show few well-designed evaluations to measure the impact of agriculture on nutritional status, but they do show some impact on intermediate outcomes, such as diet and incomes. One of the most thorough reviews of the nutrition impact of agricultural projects, which explicitly target nutrition outputs, is the recent DfID-funded systematic review.57 The review found only a small set of studies from which to summarize the evidence, because too few well-designed studies exist to draw any strong conclusions about agriculture’s impact on nutritional status. The review however did find that agriculture had an impact on intermediate outcomes, such as diet and incomes, which the studies were better powered to detect. A summary of the key results of the DfID review is as follows.
• Of the 300+ studies screened,58 only 23 studies had enough internal validity to be included in the review (studies without baseline measurement or a valid comparison group were excluded). Most of these were evaluations of homestead gardening.
• Of nine studies that measured anthropometry, four showed impact on underweight rates, and only one documented an impact on stunting. The authors note that stunting rates are slower to change and most studies likely were not of sufficient duration to observe a change.
• A meta-analysis of four studies that measured vitamin A status—based on interventions designed to increase vitamin A rich food intake—found an overall significant positive impact.
• Most studies (19 of the 23) found a positive impact on diet composition, based mostly on consumption of the foods produced, although typically, the total diet was not assessed. Several studies also found positive effects on income, but income measurement and comparison suffered from methodological weaknesses.
The lack of a stronger demonstrated impact on nutritional status—despite some impact on diet—is attributable mainly to methodological issues. First, despite ambitious goals, few studies actually measured nutrition impacts, and measurement was inconsistent among those that did. Second, among the studies looked for agricultural impact, many had methodological problems (such as power and sample size) and analytical rigor.
The review underscores important gaps in the evidence and lessons for future studies. There is a strong need for more well-designed analyses of the impact of agricultural interventions on nutrition to inform program decisions. The systematic review suggests that future studies should better measure intermediate outcomes, such as dietary intake, dietary diversity, and incomes, and only attempt to analyze agriculture’s effect on nutritional status when sample sizes and study designs permit adequate power.
Cost effectiveness
Cost-effectiveness data is highly desirable to inform decisions to include nutrition goals in agricultural projects, but such information is currently minimal. Two kinds of cost-effectiveness information could be collected. The most useful approach for AES TTLs would be to compare the cost-effectiveness of a nutrition sensitive intervention with a business-as-usual intervention to reach the primary agriculture sector goals of productivity and income. To date, this evidence is non-existent.
The second approach, somewhat available is data on the cost-effectiveness of an agriculture intervention in reaching nutritional status goals. The cost-effectiveness of biofortification has been the most studied among all agricultural interventions. The 2008 Copenhagen Consensus concluded 57 Masset, E., Haddad, L., Cornelius, A., J. Isaza-Castro. 2012. “Effectiveness of agricultural interventions that aim to improve nutritional status of
children: systematic review,” BMJ; v.344. Open access, available at http://www.bmj.com/content/344/bmj.d8222.58 The 300+ reviewed studies were all peer-reviewed journal articles. Specific inclusion criteria required that the articles were written after 1990, in
English, and that the reviewed intervention (i) took place in a low-income or middle-income country, (ii) aimed to improve child nutritional status through income or diet, and (iii) investigated the impact of an agricultural intervention on at least one of the following: nutritional status, micronu-trient intake, dietary diversity, income, or program participation.
Improving Nutrition Through Multisectoral Approaches
66
that biofortification was the fifth most cost-effective intervention to advance global welfare. Estimates of cost-effectiveness of biofortification are between $10-$120/DALY saved, with benefit:cost ratios of between 50:1 and 4:1, based on the assumption of the adoption of two biofortified crops in low-income countries of Africa and South Asia.59,60 Another analysis estimated the cost-effectiveness of biofortified beans in Nicaragua between $96-379/DALY saved.61
VII. Principles for nutrition sensitive AES projects
To be successful, efforts to maximize nutrition impact first need to incorporate nutrition goals explicitly into the design and implementation of AES projects and policies. The available evidence suggests that maintaining the business-as-usual approach focus on agricultural productivity, economic growth, and household-level income has a limited scope for reducing undernutrition. The current approach misses opportunities that are unique to the agriculture sector to enhance nutrition, such as improving production and consumption of foods to diversify diets, leaving the responsibility of filling the gaps left by poor diets to other sectors. It also misses opportunities to improve farmer well-being and female participation, among other goals.
The agriculture sector can address nutrition more fully, which will likely result in additional gains in productivity, demand for high-value products, and household well-being. The available evidence indicates four strong principles for action in areas in which AES has tremendous growth potential.
1. Invest in women: safeguard and strengthen the capacity of women to provide for the food security, health, and nutrition of their families.
2. Increase access to and year-round availability of high-nutrient content food.
3. Improve nutrition knowledge among rural households to enhance dietary diversity.
4. Incorporate explicit nutrition objectives and indicators into project and policy design.
VIII. The Bank’s AES program
Currently, there are very few agriculture and rural development projects supported by the World Bank that explicitly target nutrition. That is not to say that the current portfolio of projects do not contribute to nutrition. They may well be doing so. However, any nutrition effects are often unintentional and consequently their scale, impact or exact pathway is often undocumented.
The Bank’s agriculture strategy. The official strategic framework for the Bank’s agriculture sector is the 2008 World Development Report Agriculture for Development. The report suggests a four-pronged approach to agricultural development that should be differentiated across the “three worlds of agriculture,” i.e., agriculture-based countries, transforming countries, and urbanized countries.
The four policy objectives of the World Development Report 2008 are as follows:
a. Improve market access; establish efficient value chains,
b. Enhance smallholder competitiveness; facilitate market entry,
c. Improve livelihoods in subsistence agriculture and low-skill rural occupations,
d. Increase employment in agriculture and the rural non-farm economy; enhance skills.
59 The results are described in Horton, Alderman, and Rivera. 2008. Copenhagen Consensus Malnutrition and Hunger Challenge Paper.60 J.V. Meenakshi et al. 2007. How cost-effective is biofortification in combating micronutrient malnutrition? An ex-ante assessment. HarvestPlus
Working Paper No. 2, IFPRI, Washington D.C.61 S. Perez Suarez. 2010. “DALYs: a methodology for conduction economic studies of food-based interventions such as biofortification,” in eds. B.
Thompson and L. Amoroso, Combating Micronutrient Deficiencies: Food-Based Approaches (FAO and CABI International).
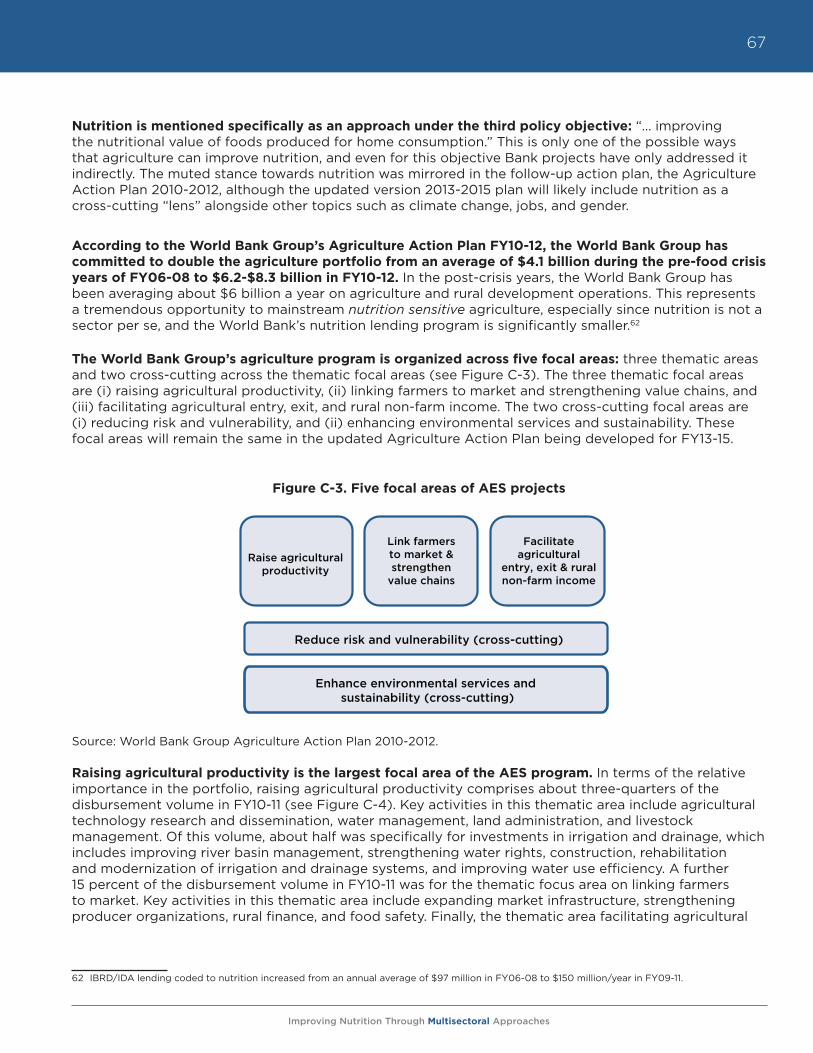
Improving Nutrition Through Multisectoral Approaches
67
Nutrition is mentioned specifically as an approach under the third policy objective: “… improving the nutritional value of foods produced for home consumption.” This is only one of the possible ways that agriculture can improve nutrition, and even for this objective Bank projects have only addressed it indirectly. The muted stance towards nutrition was mirrored in the follow-up action plan, the Agriculture Action Plan 2010-2012, although the updated version 2013-2015 plan will likely include nutrition as a cross-cutting “lens” alongside other topics such as climate change, jobs, and gender.
According to the World Bank Group’s Agriculture Action Plan FY10-12, the World Bank Group has committed to double the agriculture portfolio from an average of $4.1 billion during the pre-food crisis years of FY06-08 to $6.2-$8.3 billion in FY10-12. In the post-crisis years, the World Bank Group has been averaging about $6 billion a year on agriculture and rural development operations. This represents a tremendous opportunity to mainstream nutrition sensitive agriculture, especially since nutrition is not a sector per se, and the World Bank’s nutrition lending program is significantly smaller.62
The World Bank Group’s agriculture program is organized across five focal areas: three thematic areas and two cross-cutting across the thematic focal areas (see Figure C-3). The three thematic focal areas are (i) raising agricultural productivity, (ii) linking farmers to market and strengthening value chains, and (iii) facilitating agricultural entry, exit, and rural non-farm income. The two cross-cutting focal areas are (i) reducing risk and vulnerability, and (ii) enhancing environmental services and sustainability. These focal areas will remain the same in the updated Agriculture Action Plan being developed for FY13-15.
Figure C-3. Five focal areas of AES projects
Source: World Bank Group Agriculture Action Plan 2010-2012.
Raising agricultural productivity is the largest focal area of the AES program. In terms of the relative importance in the portfolio, raising agricultural productivity comprises about three-quarters of the disbursement volume in FY10-11 (see Figure C-4). Key activities in this thematic area include agricultural technology research and dissemination, water management, land administration, and livestock management. Of this volume, about half was specifically for investments in irrigation and drainage, which includes improving river basin management, strengthening water rights, construction, rehabilitation and modernization of irrigation and drainage systems, and improving water use efficiency. A further 15 percent of the disbursement volume in FY10-11 was for the thematic focus area on linking farmers to market. Key activities in this thematic area include expanding market infrastructure, strengthening producer organizations, rural finance, and food safety. Finally, the thematic area facilitating agricultural
62 IBRD/IDA lending coded to nutrition increased from an annual average of $97 million in FY06-08 to $150 million/year in FY09-11.
MODULE C Figure C-3. Five focal areas of ARD projects
Reduce risk and vulnerability (cross-cutting)
Enhance environmental services and sustainability (cross-cutting)
Raise agricultural productivity
Link farmers to market & strengthen
value chains
Facilitate agricultural
entry, exit & rural non-farm income
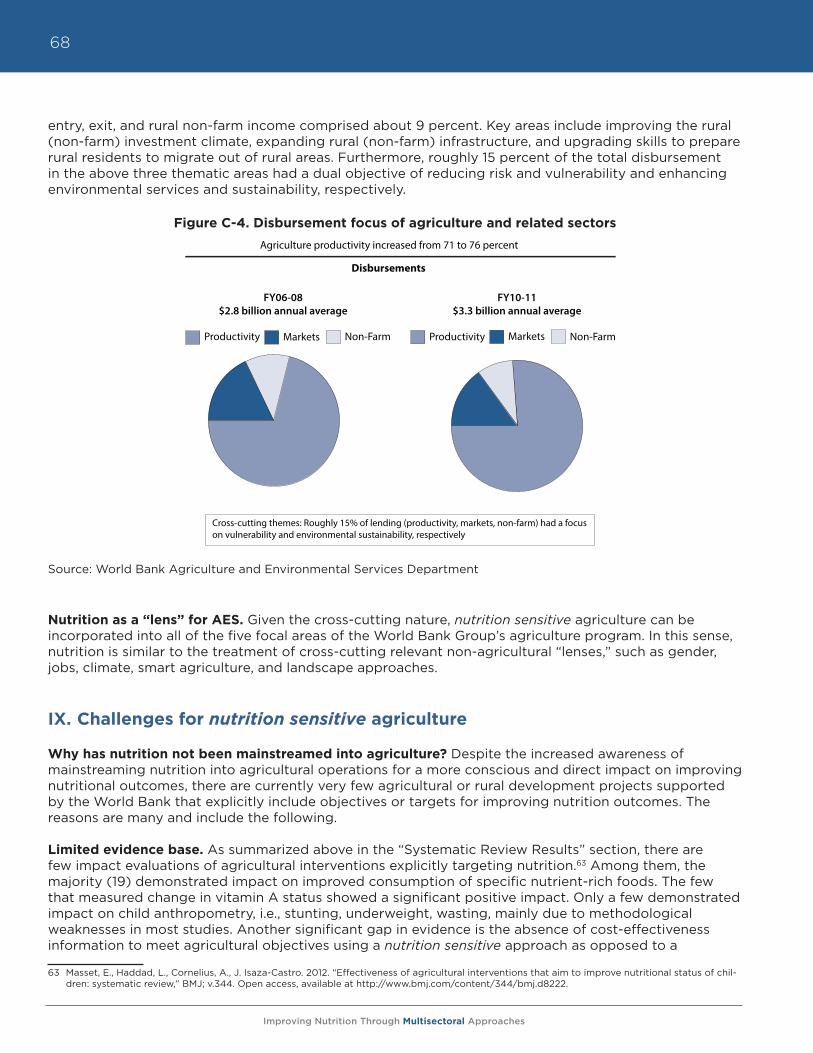
Improving Nutrition Through Multisectoral Approaches
68
entry, exit, and rural non-farm income comprised about 9 percent. Key areas include improving the rural (non-farm) investment climate, expanding rural (non-farm) infrastructure, and upgrading skills to prepare rural residents to migrate out of rural areas. Furthermore, roughly 15 percent of the total disbursement in the above three thematic areas had a dual objective of reducing risk and vulnerability and enhancing environmental services and sustainability, respectively.
Figure C-4. Disbursement focus of agriculture and related sectors
Source: World Bank Agriculture and Environmental Services Department
Nutrition as a “lens” for AES. Given the cross-cutting nature, nutrition sensitive agriculture can be incorporated into all of the five focal areas of the World Bank Group’s agriculture program. In this sense, nutrition is similar to the treatment of cross-cutting relevant non-agricultural “lenses,” such as gender, jobs, climate, smart agriculture, and landscape approaches.
IX. Challenges for nutrition sensitive agriculture
Why has nutrition not been mainstreamed into agriculture? Despite the increased awareness of mainstreaming nutrition into agricultural operations for a more conscious and direct impact on improving nutritional outcomes, there are currently very few agricultural or rural development projects supported by the World Bank that explicitly include objectives or targets for improving nutrition outcomes. The reasons are many and include the following.
Limited evidence base. As summarized above in the “Systematic Review Results” section, there are few impact evaluations of agricultural interventions explicitly targeting nutrition.63 Among them, the majority (19) demonstrated impact on improved consumption of specific nutrient-rich foods. The few that measured change in vitamin A status showed a significant positive impact. Only a few demonstrated impact on child anthropometry, i.e., stunting, underweight, wasting, mainly due to methodological weaknesses in most studies. Another significant gap in evidence is the absence of cost-effectiveness information to meet agricultural objectives using a nutrition sensitive approach as opposed to a
63 Masset, E., Haddad, L., Cornelius, A., J. Isaza-Castro. 2012. “Effectiveness of agricultural interventions that aim to improve nutritional status of chil-dren: systematic review,” BMJ; v.344. Open access, available at http://www.bmj.com/content/344/bmj.d8222.
Figure C-4. Disbursement focus of agriculture and related sectors
Source: World Bank Agriculture and Rural Development Department
Productivity Markets Non-Farm Productivity Markets Non-Farm
Cross-cutting themes: Roughly 15% of lending (productivity, markets, non-farm) had a focuson vulnerability and environmental sustainability, respectively
Disbursements
FY06-08$2.8 billion annual average
FY10-11$3.3 billion annual average
Agriculture productivity increased from 71 to 76 percent
Improving Nutrition Through Multisectoral Approaches
69
business-as-usual approach. With competing demands and a strong focus on results, proposing activities without a strong evidence basis is challenging.
Strong accountability and focus on results. As part of its operational policies, World Bank projects undergo a standard appraisal process that appraises various aspects of project design, such as fiduciary, technical, financial/economical, and safeguards. Project TTLs are expected to demonstrate project linkages with relevant country and Bank strategies. This is done through a clearly articulated singular project development objective together with a results framework that describes the targeted objective of each separate component leading to achieving the project development objective. Activities viewed as overly complex with scant evidence of success have little chance of surviving the layers of review required for a typical project. AES TTLs have expressed concerns that proposing to include nutrition sensitive agriculture activities will result in the project being criticized as a “Christmas tree project,” a derogatory term for a project that is loaded with seemingly novel but untested and unrelated activities that are bound to fail.
Weak client demand. Insufficient nutrition attention or awareness by agriculture TTLs has been mirrored by Ministries of Agriculture. Undernutrition is an invisible problem largely because it is unobservable to the naked eye and not listed on death certificates as the cause of death. The major reasons for the lack of client demand for nutrition interventions—despite wreaking dire consequences on human capital and development—are the invisibility of stunting and micronutrient deficiencies (literally called “hidden hunger”); very low technical nutrition capacity in most countries; and low awareness of how food security interventions can best improve the nutrition of the most vulnerable. The World Bank, as a financial institution providing recipient executed loans and credits to developing country governments, is especially sensitive to client demand. Because the majority of World Bank operations are not grants-based, governments would be reluctant to take out a loan for an agricultural activity that cannot demonstrate a certain level of technical and financial feasibility. Therefore, despite strong evidence to the contrary, nutrition still is considered mainly the domain of the health sector, and very few of the World Bank’s clients have sought to include nutrition activities in non-health sector interventions. Nevertheless, there may be reason to expect some greater demand in coming years. Some South Asian64 and African countries, for example, have begun to treat nutrition as a government-wide priority, especially under the SUN movement.65 Increasing the awareness of food security measured by its quality and not simply by calories may also prompt client requests for food security programs to achieve a greater focus on nutrition, for example through country plans of the Comprehensive African Agriculture Development Programme (CAADP).66
Inherent difficulties of multisectoral activities. Given the World Bank’s sectoral organization, i.e., agriculture and rural development in the Sustainable Development Vice Presidency and nutrition in the Human Development Vice Presidency, and also due to client governments’ structures, it is inherently difficult to work on multisectoral activities across vice presidencies or ministries. Therefore, responsible parties or their managers usually have little incentive to work beyond their “core areas.” They also lack professional contacts to easily solicit technical support in areas beyond their core mandate or mandatory safeguard requirements covering certain environmental and social aspects. However, it is worth noting that the Bank’s nutrition portfolio is much smaller than that of AES. IBRD/IDA lending coded to nutrition increased from an annual average of $97 million in FY06-08 to $150 million/year in FY09-11.67 64 To respond to the prioritization on nutrition by many South Asia countries, the Bank’s South Asia region has developed a region-wide multisec-
toral nutrition strategy. The South Asia AES unit also manages a trust fund specifically to link agriculture and nutrition called the South Asia Food & Nutrition Security Initiative (SAFANSI). SAFANSI is a multi-donor trust fund supported by AusAID and DfID, which seeks to promote coordi-nated efforts within and between countries to improve food and nutrition security in South Asia, www.worldbank.org/safansi.
65 “SUN early riser countries,” which have indicated their interest and commitment to reducing undernutrition, currently include Bangladesh, Benin, Burkina Faso, Burundi, Ethiopia, The Gambia, Ghana, Guatemala, Haiti, Indonesia, Kenya, Kyrgyz Republic, Laos PDR, Madagascar, Malawi, Mali, Mauritania, Mozambique, Namibia, Nepal, Niger, Nigeria, Peru, Rwanda, Senegal, Sierra Leone, Tanzania, Uganda, Zambia, and Zimbabwe.
66 Nutrition is covered in the Comprehensive African Agriculture Development Programme (CAADP) under Pillar 3: Food Supply and Hunger. Nutri-tion is also the subject of recent and upcoming regional workshops to improve the mainstreaming of nutrition into CAADP plans, e.g., West Africa CAADP Regional Nutrition Programme Development Workshop, held November 9-12, 2011, Dakar, Senegal.
67 Typical nutrition activities funded by the Bank include the promotion of optimal infant and young child feeding practices (including breastfeeding and complementary feeding), distribution of micronutrient supplements (particularly vitamin A), community-based growth monitoring and pro-motion activities, and capacity building for the implementation of nutrition-specific and nutrition sensitive interventions (both within and outside of the health sector). Nutrition sensitive interventions within the health sector (through non-nutrition health projects) include prenatal care activi-ties, malaria prevention and treatment, and HIV prevention and treatment, for example.
Improving Nutrition Through Multisectoral Approaches
70
Each of these challenges needs to be addressed to mainstream nutrition sensitive agriculture within World Bank operations. Introducing nutrition sensitive agriculture requires a behavioral change to work across silos. This requires sensitization or awareness building among all parties, including Bank clients, country directors, and the rest of the country management team, Bank agriculture TTLs, and their managers. Nutrition needs to be viewed by all parties as an integral factor necessary to improving human capital and well-being, and the important role played by agriculture in achieving this goal must be unambiguously understood.
X. Addressing Nutrition through AES Projects
A. Current status: Mainly through unintentional effects
Some AES projects already address nutrition, albeit implicitly and without measuring its effect on nutritional outcomes (since any nutritional outcome would be unintentional). The project activities affect the four nutrition-related goals in a significant way, i.e., invest in women, improve nutrition knowledge among rural households for enhanced dietary diversity, and increase access to and year around availability of high nutrient content food.
a. Invest in women. As part of the Bank’s commitment to improving its performance on gender and development, the Bank adopted the Gender Equality as Smart Economics Gender Action Plan (GAP) in 2007. Since then, AES has been tracking gender mainstreaming across all thematic areas according to a common approach established by the SDN, namely including gender analysis and/or gender inclusive consultations, gender-responsive design, and gender-responsive M&E, or inclusion of at least one gender-responsive indicator in the project results framework. In FY11, gender analysis was carried out in 91 percent of AES projects, up from 69 percent in the baseline (FY07-09). Gender-responsive design was carried out in 74 percent of AES projects, up from 59 percent. And finally, gender-responsive M&E was included in 62 percent of AES projects, up from 28 percent. (See Box C-1 for a sample of gender disaggregated indicators that were used in projects approved in FY10 and FY11. A full list of projects is available in Annex C-2).
These gender elements are all assessments at the project design stage. Currently, there are no assessments on gender integration done for the implementation stage.68 Also, with regards to the gender-responsive M&E, the indicators currently collected by AES projects do not fully cover the range of gender empowerment issues that are most critical for nutrition, i.e., (i) women’s access to land and other productive assets, (ii) women’s participation in income generating activities, and (iii) women’s control over cash from agricultural activities.69 Specifically, none of the gender-disaggregated indicators used in projects approved in FY10 and FY11 captured the intra-household allocation of income between men and women, or the dimension of women’s ability to make decisions about purchases.
b. Increase access to and year-round availability of high nutrient content food. AES has projects that support “nutritious foods” beyond basic cereals, e.g., livestock, fisheries, dairy, fruits and vegetables. These projects are typically not justified based on their contribution to dietary diversity, but rather on grounds of income diversification, higher incomes, or safety nets (in the case of livestock). Therefore, analyses of the self-consumption rate of supported producers (which is how production support to such sub-sectors would affect dietary diversity), and other related nutrition indicators are typically absent. In terms of scale, support to high nutrient content foods is not large. For example, only $146 million and $61 million were committed to support
68 The Gender in Agriculture Sourcebook, developed jointly by FAO, IFAD, and the World Bank presents good practice examples and considerations across all AES thematic areas.
69 IFPRI, USAID’s Feed the Future, and Oxford Poverty and Human Development Initiative developed a “Women’s Empowerment in Agriculture In-dex,” which is a composite index of various women empowerment indicators, including women’s control over use of income and access to assets, http://www.ifpri.org/sites/default/files/publications/weai_brochure.pdf.
Improving Nutrition Through Multisectoral Approaches
71
livestock and fishery related projects in FY10 and FY11 respectively, and not all of these projects were targeted to increase access for smallholders; some were narrowly focused on non-livelihood aspects such as animal safety.
However, the Bank has no experience to date supporting crops that have been bred specifically to have higher nutritional content, i.e., biofortified crops, such as the orange fleshed sweet potato (OFSP) that has been developed by HarvestPlus (a CGIAR program) and disseminated in Uganda and Mozambique, or cassava, maize, and other crops70 developed and disseminated by the Brazilian Agricultural Research Corporation (EMBRAPA) in partnership with HarvestPlus and its regional affiliate AgroSalud. As HarvestPlus and other biofortification efforts scale up their dissemination, the Bank could potentially support national agricultural research systems in increasing their role in testing and disseminating these biofortified crops.
c. Improve nutrition knowledge among rural households to enhance dietary diversity. On improving nutrition knowledge, a review of approved Project Appraisal Documents does not reveal how much, if any, is actually being financed. This is because nutrition education is typically offered as part of a menu in a demand driven setting, such as in community driven development projects or women empowering livelihood projects and not as large predefined investment categories.
d. Incorporate explicit nutrition objectives and indicators. Because there are almost no projects that explicitly target nutrition objectives, it is no surprise that almost no projects include explicit nutrition indicators. To date, no projects include direct nutrition indicators such as child anthropometrics or food consumption indicators.
B. Taking it further: Addressing nutrition explicitly through AES projects
The impact of agricultural projects could be greatly scaled up if nutrition considerations are addressed more directly. For example, in an aquaculture project, larger fish may be more profitable to sell at the market and therefore promoted due to financial reasons, but smaller fish are often higher in vitamin A, iron, and zinc, since they are consumed whole, including the head, organs, and bone.71 Therefore, if the project intended to improve nutrition, it could seek to include small fish together with the more commercial large fish, and it should intentionally seek to improve access among the most vulnerable households. It would also be important to promote the preservation of some of the cultivated food for home consumption. This is particularly true for commercialization projects that emphasize sales to improve incomes, where small amounts conserved for home consumption, particularly by the most nutritionally vulnerable family members, can significantly improve nutrient intakes.
Nutrition-sensitive agriculture for World Bank AES projects. Nutrition sensitive agriculture aims to maximize impact on nutrition outcomes for the poor, while minimizing the unintended negative nutritional consequences of agricultural interventions and policies on the lives of the poor, especially women and young children. As stated earlier, there are numerous guidance notes developed by other organizations, which attempt to list ways of addressing nutrition explicitly through agriculture and rural development projects (see Annex E-5). This section attempts to distill interventions that are particularly relevant for World Bank supported AES projects, which are large scale (often national or covering a large part of a country), government executed, and on a credit or loan basis (i.e., not grants). They therefore need to be justified on economic/financial grounds using standard economic and financial rates of return as per Bank appraisal guidelines.
70 EMBRAPA has developed a biofortification program called BioFORT, which is currently working on eight crops: pumpkin, rice, sweet potatoes, beans, cowpeas, cassava, maize, and wheat.
71 Roos, N., Islam, M.M., and S.H. Thilsted. 2003. “Small indigenous fish species in Bangladesh: Contributions to Vitamin A, Calcium, and Iron intakes,” Journal of Nutrition, 133: 11.
Improving Nutrition Through Multisectoral Approaches
72
* WDR 2012 notes that simply comparing female and male-headed households can exaggerate gender differences, because such comparisons fail to account for the number of working-age adults in the household, and the number of dependents. Not surprisingly, female-headed households with a male present often fare better than those with no male households fare, and in some cases, do as well as male-headed households. Therefore, WDR 2012 suggests the use of a more nuanced categorization of rural households for such indicators to be relevant.
Source: World Bank Agriculture and Environmental Services Department.
The list of suggested AES activities, which are expected to improve nutrition outcomes, are presented according to the five focus areas of the World Bank Agriculture Action Plan together with some good practices. Given the fact that the Bank supports very few nutrition sensitive agriculture projects to date, most of the examples are from a non-Bank context, which the Bank may be supporting. The matrix in Annex C-1 summarizes this list of suggested activities, together with suggested output and outcome indicators. To support these activities, nutrition perspectives should be incorporated into the Bank’s AES analytical and advisory (AAA) work, since these often shape or influence project design or the thinking on particular topics.
Box C-1. Selected gender disaggregated indicators in AES projects (approved in FY10 and FY11)
Total number of beneficiaries (for entire project): Direct and indirect project beneficiaries (number), of which female (percentage) in (Benin, CAR, Chad, Kenya, Mali, Nepal, Sierra Leone, West Africa Regional, Zambia).
Overall household income: Percentage increase in agricultural income of participating household (disaggregated by male and female headed households*) (India, Uganda).
Women’s access to land and other productive assets
• Percent of women with use or ownership land rights registered (both joint and individual) (India).• At least 40% of new land titles are provided directly to women and/or jointly with their spouse/
partner (Nicaragua).• At least 70% of the modernized registries’ clients (and 70% of women) rate its services as
satisfactory (third level on a four-level scale) (Honduras).• Number of water users provided with irrigation and drainage services, disaggregated by % female
(Azerbaijan, Malawi).• Number of farmers benefitting from operational community assets, disaggregated by % female.
Women’s participation in income-generating activities
• Percent of women income-generating activities (Djibouti).• Targeted vulnerable groups (women, young people, and landless) develop related markets and
sustainable income-generating activities (AGRs) (Tunisia).• Percent of rural enterprise participants who are youth (<30yrs old) or women (Jamaica).• Women receive minimum 30% of all productive subprojects (Brazil).• At least 30% participating small and medium enterprises (SME) and enterprise groups (EG) will
have increased direct and/or indirect employment by at least 30%. Of these, at least 35% will be women (Afghanistan).
Women’s control over cash
None
Improving Nutrition Through Multisectoral Approaches
73
i. Raise agricultural productivity
Suggested nutrition sensitive AES interventions:
Promotion of time saving technologies72: Promotion of technologies that improve productivity and time savings for productive and domestic tasks performed by women. WDR 2012 shows that for reasons that remain unexplained, even when women contribute a substantial fraction (or in some cases, all) of earned household income, they continue to be largely responsible for housework and care work. Therefore, realizing women’s dominant role in this area, any technology that would save time on tasks performed by women would result in more time for women to dedicate to domestic tasks or income generating activities.
Good practice examples73
• Easier to use and lighter farming tools for tasks typically carried out by women, e.g. planting, weeding, grinding.
• Plastic drum seeders for direct seeding instead of broadcasting or transplanting rice seedlings, allowing for mechanized weeding as seeds are deposited in straight lines.
• Mechanized mills to replace hand pounding or grating (e.g. in Botswana sorghum mills have reduced the time needed to process 20 kg of sorghum from 2-4 hours to 2-4 minutes).
• Water and fuel wood collection is a time consuming task primarily carried out by women and children. As such, rainwater harvesting, protected springs, wheelbarrows, donkey carts, treadle pumps to significantly shorten time that women spend on these activities.
Potential trade-offs• Focusing on women’s income generation could reduce time available for domestic tasks including
child care and health care (see Table C-2 for mitigation considerations during the design phase).
• Labor-saving technologies could result in loss of employment for other workers who were previously performing the time consuming task as a laborer.
Incorporation of a food security and nutrition dimension into the national agricultural innovation system.74 Depending on the country context, this could imply incorporating food security and nutrition modules into extension system curricula, or increasing access to private technical service providers specialized in food security and nutrition.75 Several guidance papers on linking agriculture and nutrition recommend the delivery of simple nutrition messages around specific crops via agricultural extension agents or other technical experts.76 This approach can be effective if messages are targeted to the farmers growing the crops, and packaged together with delivery of seeds or other pertinent information about the crop. In many contexts, it is normal for such a worker to talk to farm households about both food production and consumption decisions. Close coordination between agriculture and health sector staff can also be effective. Challenges include the fact that globally, only 15 percent of extension agentsare women, and in Africa, a mere seven percent.77 Given the reality that food security and nutrition
72 This relates to the nutrition-related goal of “Invest in women,”73 See Module 7 Thematic Note 4 “Labor-Saving Technologies and Practices” in the World Bank/FAO/IFAD, “Gender in Agriculture Sourcebook,” for
a full discussion on labor saving technologies.74 This relates to the nutrition-related goal of “Improve nutrition knowledge among rural households to enhance dietary diversity.”75 In many African countries, home economics extension workers delivered nutrition education and training to rural women in the 1970s. But, many
of these workers have disbanded in recent years during the transformation in the agricultural sector that demanded the integration of agricul-tural extension services and required extension staff to deliver diverse services. These gaps typically are filled by NGOs. Given that most home economics extension workers are women, they are likely to be an effective channel to reach rural women. Even in cases where a home economics extension force exists, food security and nutrition modules need to be specifically incorporated and ideally coordinated with seeds and services available from agricultural extension or projects, since the breadth of home economics extension coverage is broad and encompasses all aspects of domestic livelihood.
76 Herforth, A., Jones, A., and P. Pinstrup-Andersen. 2012. “Prioritizing nutrition in agriculture and rural development projects: Guiding principles for operational investments.” World Bank HNP Discussion Paper.
77 World Bank 2012, World Development Report: Gender Equality and Development.
Improving Nutrition Through Multisectoral Approaches
74
messages are most likely to be delivered effectively by and to women, this poses a challenge, especially in contexts where the social norm prevents women from interacting with non-family males. Including men in nutrition education, however, is also an important practice.
Good practice examples• The success of the biofortified OFSP project in Mozambique was due in part to integrated
extension agent pairs of a male agricultural agent and a female nutrition agent embedded in villages to conduct group education sessions on a variety of agricultural and nutrition topics, including production methods, storage, marketing, infant and young child feeding and hygiene practices.78
• A home gardening program in India showed consumption and nutrition impact when messages were communicated from multiple kinds of extension workers, e.g., agricultural extensionists, health workers from India’s integrated early childhood program, and village-level workers.79
• Kenya’s Ministry of Agriculture maintains a cadre of home economics extension workers that has nationwide coverage.
• The Tanzania Home Economics Association (TAHEA) provides training to farmers on nutrition and preparation and promotion of OFSP through agricultural extension services.
• The Haiti Re-launching Agriculture: Strengthening Agriculture Public Services II Project (RESEPAG II) aims to integrate a nutrition module in the training curriculum of agricultural extension agents and also to facilitate the production of nutrient dense foods through the use of biofortified seeds already present in Haiti, and zinc based fertilizers.
Potential trade-offs• Adding food security and nutrition training could overload already overburdened extension
workers or technical service providers.
Support to increase productivity of small-scale nutritious food production, e.g., livestock, dairy, fish, legumes, fruits and vegetables.80 Most small-scale farmers with market access still consume a portion of the food items they grow. Therefore, by encouraging farmers to grow nutritious foods such as fruits and vegetables, legumes, milk, eggs, fish and meat, the consumption pattern of farmers can be affected positively (particularly if some nutrition education is also included). Animal source foods can provide a variety of micronutrients that are difficult to obtain in adequate quantities from plant source foods alone, and relatively small amounts of these foods can substantially increase nutrient adequacy.81 Increasing vegetable and fruit consumption is important for providing micronutrients and for maintaining or increasing healthful dietary patterns as obesity and chronic disease rates are rising in most developing countries. Food preservation technologies such as solar drying can reduce seasonality of fruits and vegetables.
78 Low, J.W., Arimond, M., Osman, N., Cunguara, B., Zano, F. and D. Tschirley. 2007. “A Food-Based Approach Introducing Orange-Fleshed Sweet Potatoes Increased Vitamin A Intake and Serum Retinol Concentrations among Young Children in Rural Mozambique.” Journal of Nutrition, 137.
79 I. Chakravarty. 2000. “Food-Based Strategies to Control Vitamin A Deficiency.” Food and Nutr Bulletin 21: 135-43.80 This relates to the nutrition-related goal of “Increase year-round access to and availability of high nutrient content food.”81 See Journal of Nutrition Supplement November 2003, “Animal Source Foods to Improve Micronutrient Nutrition and Human Function in
Developing Countries” for a full discussion on nutritional benefits of animal source foods.
Improving Nutrition Through Multisectoral Approaches
75
Good practice examples• The Bangladesh Integrated Agricultural Productivity Project funded by GAFSP Trust Fund aims to
improve the productivity of selected horticultural crops (fruits and vegetables), fish and livestock. The project will support the development of backyard poultry through building the capacity of (women) breeders by imparting appropriate training on routine vaccinations and deworming, well-ventilated night shelters, brood management, and animal nutrition.
• An agriculture project in South Africa provided nutrition education about consuming vitamin A rich foods, such as orange and dark green vegetables, and found that only the households with gardens growing these crops increased consumption of vitamin A and showed significantly improved vitamin A status.82 The impact results suggest that access to a supply of vitamin A-rich vegetables was needed to act on education about nutritious food consumption.
Potential trade-offs• Subsidized, small-scale livestock/fishery projects for household food security are seldom
profitable at the enterprise level.
• Livestock production can have high negative externality on the environment, particularly in larger-scale production.
• There is an increased risk of zoonotic disease, particularly in larger-scale production (see Table C-2 for mitigation considerations during the design phase).
Enhancing capacity of national agricultural research institutions to promote the breeding for and dissemination of developed biofortified crop varieties and fortified inputs.83 Biofortified crops use plant-breeding techniques to improve the nutritional content of food with key micronutrients, such as iron, zinc, and vitamin A. Some of the biofortified crops use traditional plant breeding techniques, such as the crops being developed by HarvestPlus (a CGIAR program), while others use transgenic techniques such as the Golden Rice being developed by the International Rice Research Institute of the CGIAR. Typically, the most profitable, highest yielding varieties are targeted to add micronutrient-dense traits so that there are no trade-offs between yield and nutritional content. Field-testing and dissemination of many of these biofortified varieties could be included under Bank-supported AES projects. So far, the OFSP is the only biofortified crop to have been released in Africa or Asia, although a strong pipeline exists for the next several years (see Figure 5 for the pipeline of biofortification crops in Africa and Asia). In Latin America, EMBRAPA has developed a strong pipeline of biofortified crops, such as cassava, maize, beans, etc., in partnership with HarvestPlus and its regional affiliate Agrosalud.
Zinc and iodine fertilizers can increase nutrient content of food in areas where soils, and therefore the foods produced, are low in these important human micronutrients. Applying zinc as a fertilizer to the soil can double or triple zinc content of cereal grains, depending on the crop species and variety.84The effect on children’s zinc intakes or anthropometry has not been specifically documented. Zinc in fertilizers for AES projects is a potential win-win solution since it can improve agricultural productivity and increase zinc content of crops thus improving nutrition, e.g., improving children’s growth. Fertilization with iodine-containing irrigation water has also met with great success where implemented.85
82 Faber, M., M.A.S. Phungula, S. Venter, M.A. Dhansay, A.J. Spinnler. 2002. “Homestead Gardens Focusing on the Production of Yellow and Dark-Green Leafy Vegetables Increase the Serum Retinol Concentrations of 2–5-Year-Old Children in South Africa.” American Journal of Clinical Nutrition 76: 1048–54.
83 This relates to the nutrition-related goal of “Increase year round access to and availability of high nutrient content food.”84 Rengel, Z., Batten, G.D., and D.E. Crowley. 1999. “Agronomic Approaches for improving the micronutrient density in edible portions of field crops,”
Field Crops Research 60: 27-40.85 X.Y. Cao X et al. 1994. “Iodination of irrigation water as a method of supplying iodine to a severely iodine-deficient population in Xinjiang, China,”
Lancet 344, 107-110.
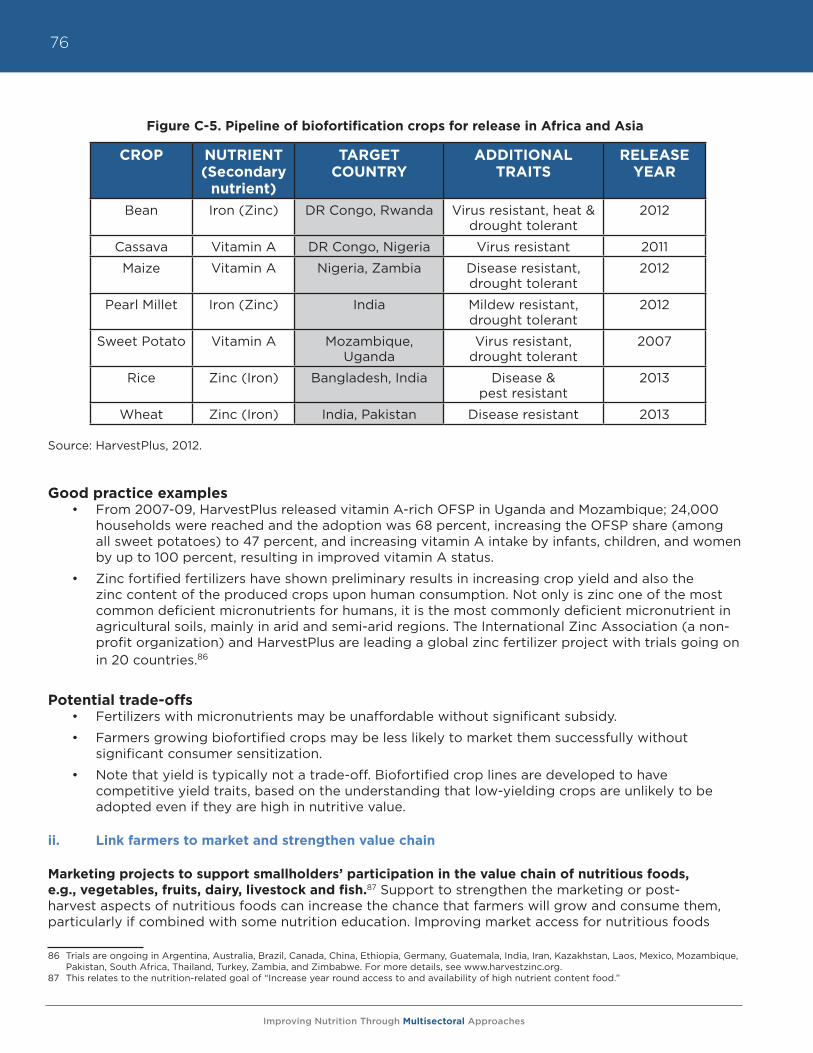
Improving Nutrition Through Multisectoral Approaches
76
Figure C-5. Pipeline of biofortification crops for release in Africa and Asia
Source: HarvestPlus, 2012.
Good practice examples • From 2007-09, HarvestPlus released vitamin A-rich OFSP in Uganda and Mozambique; 24,000
households were reached and the adoption was 68 percent, increasing the OFSP share (among all sweet potatoes) to 47 percent, and increasing vitamin A intake by infants, children, and women by up to 100 percent, resulting in improved vitamin A status.
• Zinc fortified fertilizers have shown preliminary results in increasing crop yield and also the zinc content of the produced crops upon human consumption. Not only is zinc one of the most common deficient micronutrients for humans, it is the most commonly deficient micronutrient in agricultural soils, mainly in arid and semi-arid regions. The International Zinc Association (a non-profit organization) and HarvestPlus are leading a global zinc fertilizer project with trials going on in 20 countries.86
Potential trade-offs• Fertilizers with micronutrients may be unaffordable without significant subsidy.
• Farmers growing biofortified crops may be less likely to market them successfully without significant consumer sensitization.
• Note that yield is typically not a trade-off. Biofortified crop lines are developed to have competitive yield traits, based on the understanding that low-yielding crops are unlikely to be adopted even if they are high in nutritive value.
ii. Link farmers to market and strengthen value chain
Marketing projects to support smallholders’ participation in the value chain of nutritious foods, e.g., vegetables, fruits, dairy, livestock and fish.87 Support to strengthen the marketing or post-harvest aspects of nutritious foods can increase the chance that farmers will grow and consume them, particularly if combined with some nutrition education. Improving market access for nutritious foods
86 Trials are ongoing in Argentina, Australia, Brazil, Canada, China, Ethiopia, Germany, Guatemala, India, Iran, Kazakhstan, Laos, Mexico, Mozambique, Pakistan, South Africa, Thailand, Turkey, Zambia, and Zimbabwe. For more details, see www.harvestzinc.org.
87 This relates to the nutrition-related goal of “Increase year round access to and availability of high nutrient content food.”
CROP NUTRIENT (Secondary
nutrient)
TARGET COUNTRY
ADDITIONAL TRAITS
RELEASE YEAR
Bean Iron (Zinc) DR Congo, Rwanda Virus resistant, heat & drought tolerant
2012
Cassava Vitamin A DR Congo, Nigeria Virus resistant 2011
Maize Vitamin A Nigeria, Zambia Disease resistant, drought tolerant
2012
Pearl Millet Iron (Zinc) India Mildew resistant, drought tolerant
2012
Sweet Potato Vitamin A Mozambique, Uganda
Virus resistant, drought tolerant
2007
Rice Zinc (Iron) Bangladesh, India Disease & pest resistant
2013
Wheat Zinc (Iron) India, Pakistan Disease resistant 2013
Improving Nutrition Through Multisectoral Approaches
77
provides farmers additional incentive to produce the foods, and may involve partnerships with actors along the value chain such as traders and supermarkets. These interventions can include removing bottlenecks along the value chain such as reducing post-harvest loss, improving auxiliary infrastructure such as roads, storage facilities, and wholesale markets, improving the availability of market information or other risk management tools, and strengthening the framework of food safety standards, e.g., reducing aflatoxins.
Good practice examples • The World Bank-supported Haiti RESEPAG II aims to develop capacity building in food harvesting
and storage techniques, e.g., to reduce aflatoxin and improve food processing techniques through capacity building and technical assistance such as fortification and food quality control, including laboratory capacity to analyze micronutrient contents.
Potential trade-offs• Subsidized, small-scale livestock/fishery projects for household food security are seldom
profitable at the enterprise level.
• Livestock production tends to have high negative externality on the environment.
• Food safety standards to reduce aflatoxin could compromise farmer profit margin if farmers have to pay for compliance costs.
• There is an increased risk of zoonotic disease, particularly in larger-scale production (see Table C-2 for mitigation considerations during the design phase).
Promoting the production, marketing, and consumption of nutritious indigenous foods, e.g., development of an indigenous knowledge system.88 Conservation of indigenous food plants are often undertaken for biodiversity reasons and methodologies for collecting and analyzing them are developed. Among these indigenous food plants, some are particularly rich in micronutrients and/or can enhance the bioavailability of micronutrients in other staple crops when consumed together.
Good practice examples • The Ministry of Agriculture in Malawi identified the Moringa tree as a potential solution to the
country’s vitamin A deficiency problem, given its higher nutritious content compared to all other common leafy green vegetables commonly consumed in Malawi. Based on this finding, the government developed an indigenous knowledge system for nutritional plant species, which includes a system of collecting, documenting, and using indigenous knowledge.
• A horticulture project in Kenya, Tanzania, Malawi, and Rwanda, implemented by a Kenyan CSO (Farm Concern International) and supported by BMGF, has supported smallholders’ participation in the commercialization of nutritious traditional African vegetables. Farm Concern International won a World Bank CGAP award for its nutrition-focused marketing approach to African leafy vegetables, driving up the value of these horticultural products 213 percent in five years, and substantially increasing incomes and interest among farmers interested in growing them.89 A “commercial village model” allows smallholder groups to market their vegetables to partnering supermarket chains and other urban markets, includes nutrition education for both farmers and consumers, and has successfully increased farmer incomes as well as consumption.90
88 This relates to the nutrition-related goal of “Increase year round access to and availability of high nutrient content food.”89 C. Irungu. 2007. “Analysis of markets for African leafy vegetables within Nairobi and its environs,” Global Facilitation Unit for Underutilized Spe-
cies (GFU); Ewbank, R., Nyang, M., Webo, C., and R. Roothaert. 2007. “Socio-Economic Assessment of Four MATF-Funded Projects,” FARM-Africa Working Paper No. 8, http://www.farmafrica.org.uk/smartweb/news-views/resources/4.
90 C. Irungu. 2007. “Analysis of markets for African leafy vegetables within Nairobi and its environs,” Global Facilitation Unit for Underutilized Spe-cies (GFU); A. Herforth. 2010. “Promotion of Traditional African Vegetables in Kenya and Tanzania: A Case Study of an Intervention Representing Emerging Imperatives in Global Nutrition. Ph.D. diss. Cornell University.
Improving Nutrition Through Multisectoral Approaches
78
• A small company in Botswana has received international recognition for its approach to harvesting and drying wild fruits rich in vitamin C and dietary fiber. It processes the wild fruits according to HACCP standards for retail, to buyers such as Air Botswana, which provides income to local farmers and pastoralists who harvest the fruit.91
Potential trade-offs
• Markets for indigenous foods may be small, therefore limiting commercial potential.
Promotion of regional/national industrial food fortification.92 Food fortification refers to the addition of micronutrients to processed foods, and is considered a valid technology for reducing malnutrition when people cannot consume a balanced diet adequate in every nutrient.93 In most countries, the Ministry of Health often leads industrial food fortification. However, fortification typically requires the cooperation of the Ministry of Agriculture or Food Safety Agencies, as it relates to the processing of food. Therefore, although no industrial food fortification has been done to date, they could be included in AES projects that support the government’s policy or production of major cereals such as wheat and rice through an activity to fortify them at the national or regional level. Food fortification has a long history of use in industrialized countries for the successful control of deficiencies in vitamins A and D, several B vitamins, iodine, and iron. Fortification can take numerous forms from universal fortification mandated by the law, e.g., folic acid fortification of wheat flour in Canada, the US, and many Latin American countries to lower birth defects, to targeted fortification for vulnerable groups, market-driven fortification, to household-based fortification, e.g., “sprinkles” and micronutrient-rich spreads. However, whatever form it takes, proper government regulation is necessary as part of the national food safety and public health policies to ensure that the benefits of fortification are indeed ensured.
Good practice examples• The recently closed Second Health Sector Development Project in Tanzania included a food
fortification component in its additional financing at the specific request of the Ministry of Health and Social Welfare. The project supported the government’s Nutrition and Food Commission in developing policy guidelines for both private sector and public sector involvement in fortification activities. However, the project Implementation Completion Report shows that the actual fortification process was delayed due to disagreement between the government and the private sector on modalities of implementation including the fortification processes, type of fortificants to be allowed, micronutrients premixes to be used, and development of the nutrition policy.94
• Some examples of food fortification in developing countries beyond iodized salt include vitamin A enriched sugar in Central American countries and Zambia, iron fortified fish sauce in Vietnam and China, iron enriched curry powder in South Africa, vitamin A enriched MSG powder in the Philippines, and folic acid enriched wheat flour in Chile.
Potential trade-offs• None identified.
91 WildFoods (Pty) Ltd of Botswana won the 2008 PhytoTrade Africa Natural Product Award, http://www.phytotradeafrica.com/downloads/press/PhytoTrade_Africa-NP-Awards-Press-Release.pdf.
92 This relates to the nutrition-related goal of “Increase year round access to and availability of high nutrient content food.”93 For more details on food fortification, see “Guidelines on food fortification with micronutrients,” WHO and FAO, 2006.94 World Bank. 2011. Implementation Completion Report of the Tanzania Health Sector Development Phase II, World Bank Report Number
ICR00001511.
Improving Nutrition Through Multisectoral Approaches
79
iii. Reduce risk and vulnerability
Broaden food security policy dialogue to include nutrition perspectives.95 Country demand for projects to improve food security often base discussion on a view equating food security with national-level grain stocks. Abundant evidence has shown that this approach alone is unlikely to address household food insecurity among the most vulnerable. This disconnect is reflected in the MDG1 hunger target (which deals with national-level calories) and the MDG1 undernutrition target, discussed above. The World Bank has a role in engaging in food security dialogues so that plans would better target food insecure households, and would ensure that nutritional quality of food is regarded as part of food security policies. Addressing seasonal food shortages can serve as an entry point to achieving the goal of increasing year-round production of nutritious food.
Good Practice Examples • Nepal has developed a strong development partnership in the areas of food and nutrition
security. In 2010, in consultation with donors, civil society organizations and other stakeholders, the Government of Nepal developed a Country Investment Plan (CIP) to address agriculture and food security issues comprehensively, including nutritious food availability, access, and utilization. Building on this, it submitted an investment proposal to the GAFSP and was competitively awarded a grant of US$46.5 million in June 2011. Nepal has also developed, again in consultation with relevant development partners and stakeholders, a Multisectoral Nutrition Plan of Action. These coordination efforts are likely to attract more planned resource allocation from the government and development partners, e.g., the Asian Development Bank, currently supporting the formulation of a twenty-year Agricultural Development Strategy, is likely to follow up with a project on food security. USAID is in the process of launching its Feed the Future Initiative in the mid- and far-west regions and has an ongoing Suaahara Program.
Potential trade-offs• None identified.
Promotion of nutritional homestead garden plots with appropriate nutrition education.96 Homestead gardens can be in backyards, containers, small patches of available land, vacant lots, on rooftops, and on roadsides. They are generally close to home and managed by family members. Their products include fruits, vegetables, herbs, legumes, and sweet potatoes, and most are grown for household consumption. Studies have found that complementary investments such as nutrition education and targeting women increase the likelihood of household gardens showing positive nutritional outcomes.97 Homestead gardens also could be promoted through rural CDD projects, but in such a case, the selection of the actual investment is typically demand driven and therefore cannot be preselected.
Good Practice Examples • The NGO Helen Keller International (HKI) started the homestead food production program in
Bangladesh in 1990, targeting 1,000 households with a combination of home gardening and nutrition education. It has since expanded to five countries (Bangladesh, Burkina Faso, Cambodia, Nepal, and the Philippines). The original model focused on vitamin A rich vegetables and fruits such as sweet gourd, black arum leaves, and bottle gourd leaves. Because given evidence shows lower than expected bioavailability of pro-vitamin A, HKI has sought to include animal husbandry into the broader homestead food production model.
• The Bank’s Civil Society Fund Program (CSFP) funded a project in Malawi to promote household gardens for balancing nutritional requirements while improving livelihoods.98 A CSO called Lake
95 This relates to the nutrition goal of “Incorporate explicit nutrition objectives and indicators.”96 This relates to the nutrition-related goal of “Increase year round access to and availability of high nutrient content food.”97 Berti, P.R, Krasevec, J., and S. Fitzgerald. 2004. “A review of the effectiveness of agriculture interventions in improving nutrition,” Public Health
Nutrition 7 (5): 599-609; M. Ruel. 2001. “Can Food-Based Strategies Help Reduce Vitamin A and Iron Deficiencies? A Review of Recent Evidence.” Food Policy Review 5. International Food Policy Research Institute.
98 World Bank website. Vegetable gardening improving livelihoods in Malawi, available from http://go.worldbank.org/W4AGQIYY20.
Improving Nutrition Through Multisectoral Approaches
80
Malawi Projects (Malawi) implemented the project, which demonstrated to the islanders how to make and sustain their own gardens year round, including training them on what vegetables and fruits to cultivate, how to conserve soil, and make compost and animal manure. Other than for home consumption, most of the households on the islands grow fruits and vegetables to generate income to meet other daily needs.
Potential trade-offs• Subsidized homestead garden schemes could pose a financial sustainability risk.
iv. Facilitate agricultural entry, exit, and rural non-farm income
Investments to improve opportunities for off-farm laborers (especially women).99 Given the wide range of women’s and men’s needs for rural non-farm services, it is critical to ensure gender equity in the planning, decision-making, and management process or service provision. Rural services to enhance non-farm income encompass a wide range of services, including rural transport, rural energy, ICT, water and sanitation facilities, and employment insurance.
Good practice examples• The second phase of the Peru Rural Roads Project, supported by the World Bank and the Inter-
American Development Bank, was highly recognized by the NGO community for its participatory, inclusive design, and implementation with interconnected, complementary, gender-informed initiatives. One such initiative was the microenterprises for road rehabilitation, in which 24 percent of members were women, despite the initial gender stereotype that women were unfit for construction work. Another initiative was the “local development (financing) window” to assist communities in planning, skill development, and seeking funding to support local development projects once road access was established.
• The Asian Development Bank supported the Community Livestock Development project in Nepal, which recognized that women contribute about 70 percent of the work in livestock rearing. To increase female participation in technology-related training at district and regional centers far from their home and village, the project provided child care facilities at training sites.
Potential trade-offs• Reduction in women’s time could reduce quality of care and feeding for infants and young
children. (See Table C-2 for mitigation considerations during the design phase.)
v. Enhance environmental services and sustainability
Rangeland management or soil carbon sequestration projects that increase legume production for food or fodder.100 Legumes are an important source of nutrition for both humans and livestock by providing protein, minerals, fiber, and vitamins. By biologically fixing nitrogen in the soil, legumes also provide a relatively low-cost method of replacing otherwise expensive inorganic nitrogen in the soil. Moreover, legumes also improve other soil physical properties, provide ground cover and reduce soil erosion, increase soil organic matter, microbial activity, and lowers soil temperature, and suppress weeds and pests. Legumes are crops grown primarily by women in many settings, and women often prefer to grow edible species of legumes to meet their combined goals of food security, fodder, and soil improvement.
Good practice examples • The Soils, Food, and Healthy Communities Project in Malawi supported by the International
Development Research Center of Canada and others aims to improve the health, food security, and soil fertility of resource poor households in northern Malawi through participatory research
99 This relates to the nutrition-related goal of “Invest in women.”100 This relates to the nutrition-related goal of “Increase year round access to and availability of high nutrient content food.”
Improving Nutrition Through Multisectoral Approaches
81
that tests legume systems.101 The project has demonstrated some nutritional outcomes such as nearly tripling the frequency of legume consumption by young children, which has led to improvements in weight and height growth of the children.
Potential trade-offs• Increased land management with legumes may require more labor. Increases in women’s labor
may reduce time spent on other important tasks. (See Table C-2 for mitigation considerations during the design phase.)
C. Key Questions for TTLs to consider in designing nutrition sensitive AES projects
Regardless of the specific interventions that will be incorporated into AES projects, the questions below broadly cover the basic set of questions that the project team may want to consider as they design a nutrition sensitive AES project. These questions may be used as part of a consultant’s TOR specifically to review the agriculture and nutrition linkage of a project’s design.
• What is the nature of the prevailing nutrition problems (energy and protein deficiency, micronutrient deficiency or overweight and obesity) in the country or region where the project or policy will be operating?
• Which population groups suffer most from these problems, e.g., smallholder farm families, landless laborers, indigenous groups, urban poor, women, children? Is it reasonable to expect that the project could reach one or more of these groups?
• How is the project expected to influence gender-specific time demands, e.g., weeding, watering, marketing, etc.? Are time demands for women likely to reduce time for child care? If so, can additional time demands be offset with labor-saving technologies for women?
• Who in the household is most likely to control how the additional income is spent? Can project design be adjusted to increase women’s discretionary income?
• Do farmers reside close enough to markets that they would reasonably be expected to use income to purchase most of their dietary components? If not, is there anything the project could do to improve access to diverse diets, especially for women and young children, e.g., diversified production, improved infrastructure?
• Do farmers have access to markets where they would be able to sell perishable foods? Is it feasible to incorporate farm product preservation into project design?
• Could the project design integrate nutrition education/behavior change strategies into production- and income-related goals, e.g., demand creation for nutrient-dense crops such as biofortified crops?
• Are there opportunities to include relevant nutrition information into the current training and activities of agriculture sector staff, e.g., training on nutritional attributes of biofortified crops and minor crops?
• Is the AES project targeted in the same geographic area as other health, water and sanitation, and social protection programs, which are also important for reducing malnutrition? If yes, is it feasible to encourage agriculture, health, and social protection staff to consider joint supervision and monitoring visits?
• Is the project likely to affect the quantity and quality of water available to the households in the community or risk of water-borne disease?
101 See http://soilandfood.org/ for more information about the project, as well as published research results.
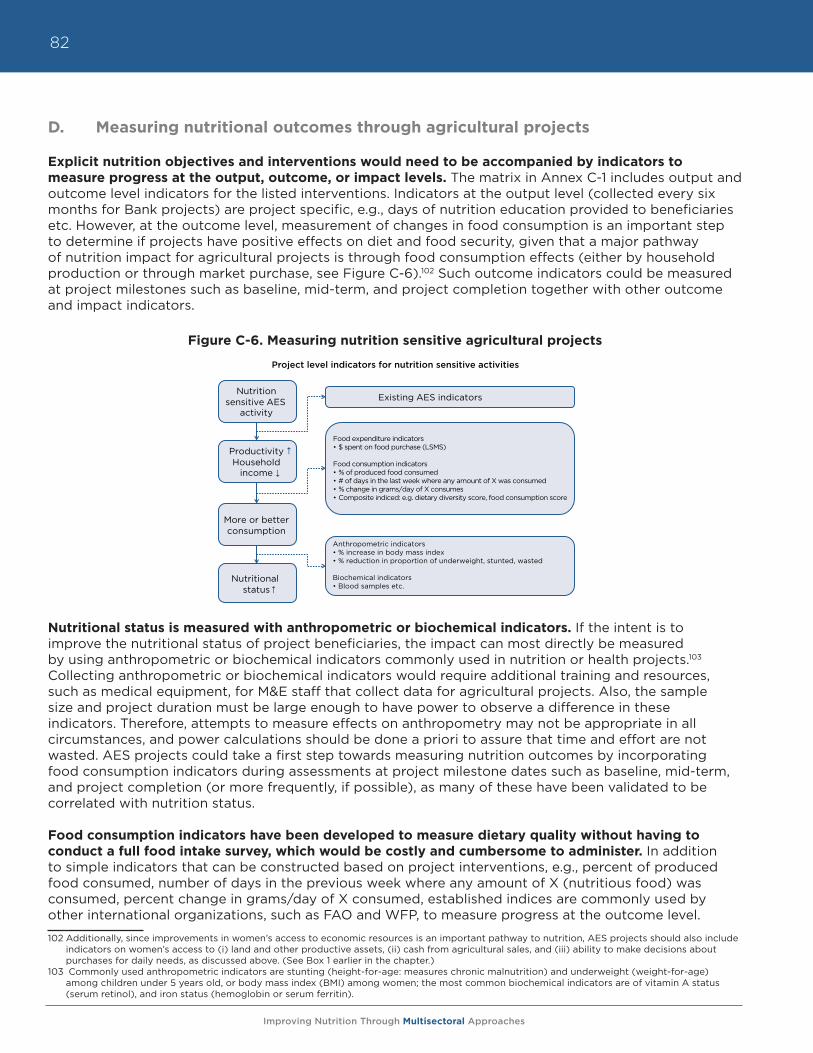
Improving Nutrition Through Multisectoral Approaches
82
D. Measuring nutritional outcomes through agricultural projects
Explicit nutrition objectives and interventions would need to be accompanied by indicators to measure progress at the output, outcome, or impact levels. The matrix in Annex C-1 includes output and outcome level indicators for the listed interventions. Indicators at the output level (collected every six months for Bank projects) are project specific, e.g., days of nutrition education provided to beneficiaries etc. However, at the outcome level, measurement of changes in food consumption is an important step to determine if projects have positive effects on diet and food security, given that a major pathway of nutrition impact for agricultural projects is through food consumption effects (either by household production or through market purchase, see Figure C-6).102 Such outcome indicators could be measured at project milestones such as baseline, mid-term, and project completion together with other outcome and impact indicators.
Figure C-6. Measuring nutrition sensitive agricultural projects
Nutritional status is measured with anthropometric or biochemical indicators. If the intent is to improve the nutritional status of project beneficiaries, the impact can most directly be measured by using anthropometric or biochemical indicators commonly used in nutrition or health projects.103 Collecting anthropometric or biochemical indicators would require additional training and resources, such as medical equipment, for M&E staff that collect data for agricultural projects. Also, the sample size and project duration must be large enough to have power to observe a difference in these indicators. Therefore, attempts to measure effects on anthropometry may not be appropriate in all circumstances, and power calculations should be done a priori to assure that time and effort are not wasted. AES projects could take a first step towards measuring nutrition outcomes by incorporating food consumption indicators during assessments at project milestone dates such as baseline, mid-term, and project completion (or more frequently, if possible), as many of these have been validated to be correlated with nutrition status.
Food consumption indicators have been developed to measure dietary quality without having to conduct a full food intake survey, which would be costly and cumbersome to administer. In addition to simple indicators that can be constructed based on project interventions, e.g., percent of produced food consumed, number of days in the previous week where any amount of X (nutritious food) was consumed, percent change in grams/day of X consumed, established indices are commonly used by other international organizations, such as FAO and WFP, to measure progress at the outcome level.
102 Additionally, since improvements in women’s access to economic resources is an important pathway to nutrition, AES projects should also include indicators on women’s access to (i) land and other productive assets, (ii) cash from agricultural sales, and (iii) ability to make decisions about purchases for daily needs, as discussed above. (See Box 1 earlier in the chapter.)
103 Commonly used anthropometric indicators are stunting (height-for-age: measures chronic malnutrition) and underweight (weight-for-age) among children under 5 years old, or body mass index (BMI) among women; the most common biochemical indicators are of vitamin A status (serum retinol), and iron status (hemoglobin or serum ferritin).
Nutrition sensitive AES
activity
Productivity Household
income
More or better consumption
Nutritional status
Existing AES indicators
Food expenditure indicators$ spent on food purchase (LSMS)
Food consumption indicators% of produced food consumed# of days in the last week where any amount of X was consumed% change in grams/day of X consumesComposite indiced: e.g. dietary diversity score, food consumption score
Anthropometric indicators
Biochemical indicators
Project level indicators for nutrition sensitive activities
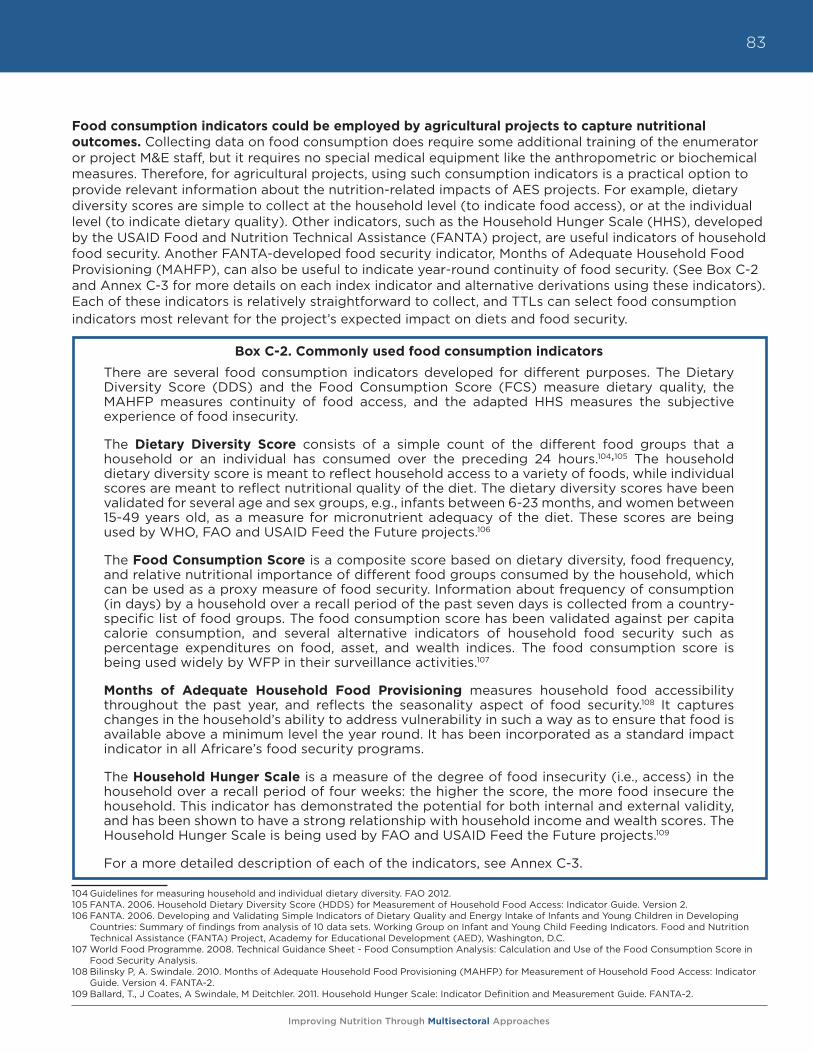
Improving Nutrition Through Multisectoral Approaches
83
Food consumption indicators could be employed by agricultural projects to capture nutritional outcomes. Collecting data on food consumption does require some additional training of the enumerator or project M&E staff, but it requires no special medical equipment like the anthropometric or biochemical measures. Therefore, for agricultural projects, using such consumption indicators is a practical option to provide relevant information about the nutrition-related impacts of AES projects. For example, dietary diversity scores are simple to collect at the household level (to indicate food access), or at the individual level (to indicate dietary quality). Other indicators, such as the Household Hunger Scale (HHS), developed by the USAID Food and Nutrition Technical Assistance (FANTA) project, are useful indicators of household food security. Another FANTA-developed food security indicator, Months of Adequate Household Food Provisioning (MAHFP), can also be useful to indicate year-round continuity of food security. (See Box C-2 and Annex C-3 for more details on each index indicator and alternative derivations using these indicators). Each of these indicators is relatively straightforward to collect, and TTLs can select food consumption indicators most relevant for the project’s expected impact on diets and food security.
Box C-2. Commonly used food consumption indicators
There are several food consumption indicators developed for different purposes. The Dietary Diversity Score (DDS) and the Food Consumption Score (FCS) measure dietary quality, the MAHFP measures continuity of food access, and the adapted HHS measures the subjective experience of food insecurity.
The Dietary Diversity Score consists of a simple count of the different food groups that a household or an individual has consumed over the preceding 24 hours.104,105 The household dietary diversity score is meant to reflect household access to a variety of foods, while individual scores are meant to reflect nutritional quality of the diet. The dietary diversity scores have been validated for several age and sex groups, e.g., infants between 6-23 months, and women between 15-49 years old, as a measure for micronutrient adequacy of the diet. These scores are being used by WHO, FAO and USAID Feed the Future projects.106
The Food Consumption Score is a composite score based on dietary diversity, food frequency, and relative nutritional importance of different food groups consumed by the household, which can be used as a proxy measure of food security. Information about frequency of consumption (in days) by a household over a recall period of the past seven days is collected from a country-specific list of food groups. The food consumption score has been validated against per capita calorie consumption, and several alternative indicators of household food security such as percentage expenditures on food, asset, and wealth indices. The food consumption score is being used widely by WFP in their surveillance activities.107
Months of Adequate Household Food Provisioning measures household food accessibility throughout the past year, and reflects the seasonality aspect of food security.108 It captures changes in the household’s ability to address vulnerability in such a way as to ensure that food is available above a minimum level the year round. It has been incorporated as a standard impact indicator in all Africare’s food security programs.
The Household Hunger Scale is a measure of the degree of food insecurity (i.e., access) in the household over a recall period of four weeks: the higher the score, the more food insecure the household. This indicator has demonstrated the potential for both internal and external validity, and has been shown to have a strong relationship with household income and wealth scores. The Household Hunger Scale is being used by FAO and USAID Feed the Future projects.109
For a more detailed description of each of the indicators, see Annex C-3.
104 Guidelines for measuring household and individual dietary diversity. FAO 2012.105 FANTA. 2006. Household Dietary Diversity Score (HDDS) for Measurement of Household Food Access: Indicator Guide. Version 2.106 FANTA. 2006. Developing and Validating Simple Indicators of Dietary Quality and Energy Intake of Infants and Young Children in Developing
Countries: Summary of findings from analysis of 10 data sets. Working Group on Infant and Young Child Feeding Indicators. Food and Nutrition Technical Assistance (FANTA) Project, Academy for Educational Development (AED), Washington, D.C.
107 World Food Programme. 2008. Technical Guidance Sheet - Food Consumption Analysis: Calculation and Use of the Food Consumption Score in Food Security Analysis.
108 Bilinsky P, A. Swindale. 2010. Months of Adequate Household Food Provisioning (MAHFP) for Measurement of Household Food Access: Indicator Guide. Version 4. FANTA-2.
109 Ballard, T., J Coates, A Swindale, M Deitchler. 2011. Household Hunger Scale: Indicator Definition and Measurement Guide. FANTA-2.
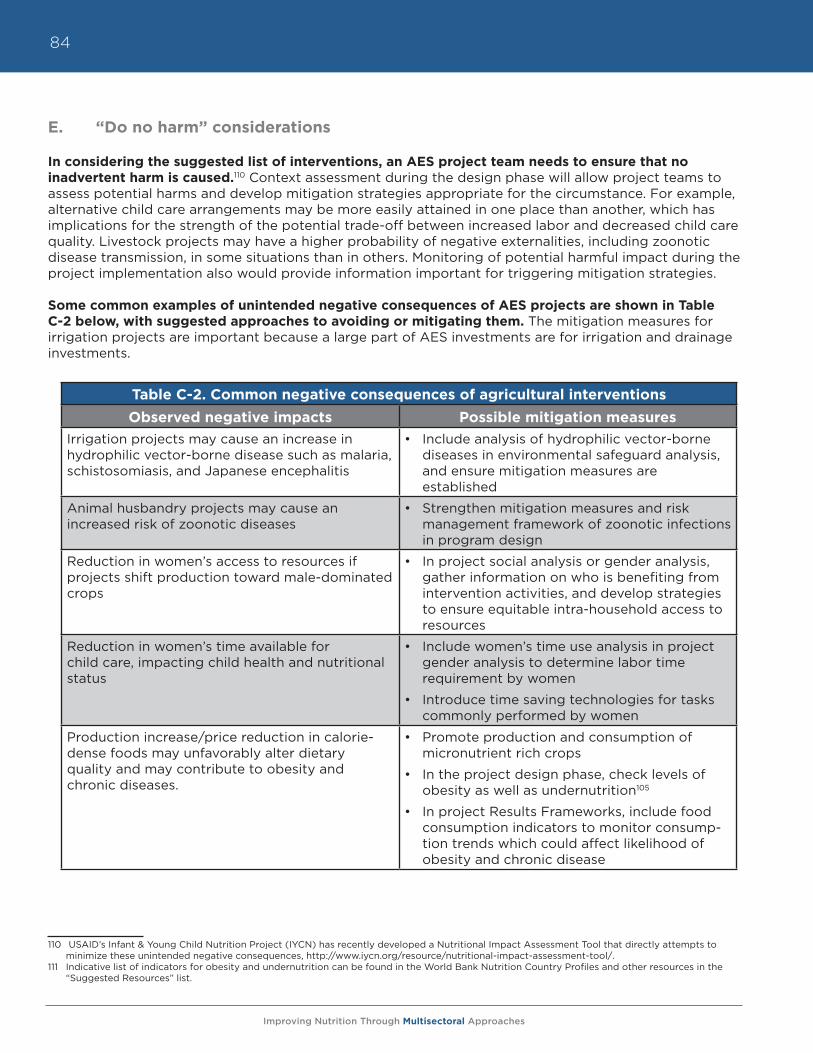
Improving Nutrition Through Multisectoral Approaches
84
E. “Do no harm” considerations
In considering the suggested list of interventions, an AES project team needs to ensure that no inadvertent harm is caused.110 Context assessment during the design phase will allow project teams to assess potential harms and develop mitigation strategies appropriate for the circumstance. For example, alternative child care arrangements may be more easily attained in one place than another, which has implications for the strength of the potential trade-off between increased labor and decreased child care quality. Livestock projects may have a higher probability of negative externalities, including zoonotic disease transmission, in some situations than in others. Monitoring of potential harmful impact during the project implementation also would provide information important for triggering mitigation strategies.
Some common examples of unintended negative consequences of AES projects are shown in Table C-2 below, with suggested approaches to avoiding or mitigating them. The mitigation measures for irrigation projects are important because a large part of AES investments are for irrigation and drainage investments.
110 USAID’s Infant & Young Child Nutrition Project (IYCN) has recently developed a Nutritional Impact Assessment Tool that directly attempts to minimize these unintended negative consequences, http://www.iycn.org/resource/nutritional-impact-assessment-tool/.
111 Indicative list of indicators for obesity and undernutrition can be found in the World Bank Nutrition Country Profiles and other resources in the “Suggested Resources” list.
Table C-2. Common negative consequences of agricultural interventions
Observed negative impacts Possible mitigation measuresIrrigation projects may cause an increase in hydrophilic vector-borne disease such as malaria, schistosomiasis, and Japanese encephalitis
• Include analysis of hydrophilic vector-borne diseases in environmental safeguard analysis, and ensure mitigation measures are established
Animal husbandry projects may cause an increased risk of zoonotic diseases
• Strengthen mitigation measures and risk management framework of zoonotic infections in program design
Reduction in women’s access to resources if projects shift production toward male-dominated crops
• In project social analysis or gender analysis, gather information on who is benefiting from intervention activities, and develop strategies to ensure equitable intra-household access to resources
Reduction in women’s time available for child care, impacting child health and nutritional status
• Include women’s time use analysis in project gender analysis to determine labor time requirement by women
• Introduce time saving technologies for tasks commonly performed by women
Production increase/price reduction in calorie-dense foods may unfavorably alter dietary quality and may contribute to obesity and chronic diseases.
• Promote production and consumption of micronutrient rich crops
• In the project design phase, check levels of obesity as well as undernutrition105
• In project Results Frameworks, include food consumption indicators to monitor consump-tion trends which could affect likelihood of obesity and chronic disease
Improving Nutrition Through Multisectoral Approaches
85
XI. Summary
This module has laid out the rationale for why agriculture is important for nutrition, and vice versa. Agriculture is a key sector in reducing undernutrition, together with health, social protection, education, and other sectors. The available evidence supports four strong principles for action in the agriculture sector, and they are areas for tremendous growth in AES programming.
1. Invest in women: safeguard and strengthen the capacity of women to provide for the food security, health, and nutrition of their families.
2. Increase access to, and year round availability of high nutrient content food.
3. Improve nutrition knowledge among rural households to enhance dietary diversity.
4. Incorporate explicit nutrition objectives and indicators into project and policy design.
Although to date the Bank’s agriculture and rural development projects have only addressed nutrition implicitly or unintentionally through other objectives, there is growing awareness inside and outside of the Bank that leveraging agriculture activities will boost nutrition outcomes. Of the 21 countries that have already met the goal of halving the proportion of the population below the minimum level of dietary energy consumption, only six are on track to meet the underweight goal. While Mali has met the goal of reducing hunger, it has shown no progress on reducing underweight. This case demonstrates the limit of trying to achieve nutrition outcomes implicitly through agriculture. Improving household income or raising agricultural productivity focused on staple grains and income alone is insufficient to reduce undernutrition.
The annexes of this module aims to provide practical guidance to AES TTLs in maximizing the nutrition impacts of World Bank agricultural investments. This module calls on Bank TTLs to take action on the following fronts: (i) incorporate nutrition-sensitive analysis and activities into Agriculture (AES) project design and food security policy dialogue; (ii) measure the progress of activities affecting nutrition periodically through relevant output indicators; and through outcome indicators such as food consumption indicators at least at baseline/mid-term/project completion; (iii) ensure that agriculture projects and policies do not cause unintended harm to nutrition.

Improving Nutrition Through Multisectoral Approaches
86
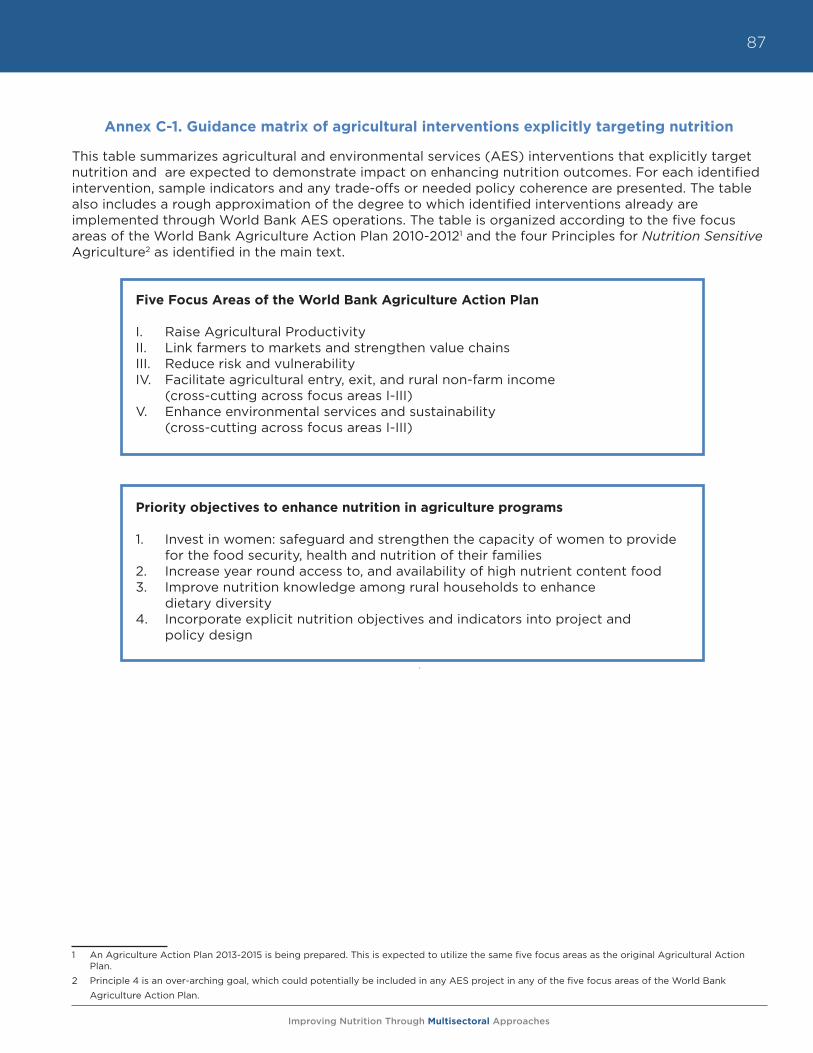
Improving Nutrition Through Multisectoral Approaches
87
Annex C-1. Guidance matrix of agricultural interventions explicitly targeting nutrition
This table summarizes agricultural and environmental services (AES) interventions that explicitly target nutrition and are expected to demonstrate impact on enhancing nutrition outcomes. For each identified intervention, sample indicators and any trade-offs or needed policy coherence are presented. The table also includes a rough approximation of the degree to which identified interventions already are implemented through World Bank AES operations. The table is organized according to the five focus areas of the World Bank Agriculture Action Plan 2010-20121 and the four Principles for Nutrition Sensitive Agriculture2 as identified in the main text.
Five Focus Areas of the World Bank Agriculture Action Plan
I. Raise Agricultural ProductivityII. Link farmers to markets and strengthen value chainsIII. Reduce risk and vulnerabilityIV. Facilitate agricultural entry, exit, and rural non-farm income
(cross-cutting across focus areas I-III)V. Enhance environmental services and sustainability
(cross-cutting across focus areas I-III)
Priority objectives to enhance nutrition in agriculture programs
1. Invest in women: safeguard and strengthen the capacity of women to provide for the food security, health and nutrition of their families
2. Increase year round access to, and availability of high nutrient content food 3. Improve nutrition knowledge among rural households to enhance
dietary diversity4. Incorporate explicit nutrition objectives and indicators into project and
policy design
1 An Agriculture Action Plan 2013-2015 is being prepared. This is expected to utilize the same five focus areas as the original Agricultural Action Plan.
2 Principle 4 is an over-arching goal, which could potentially be included in any AES project in any of the five focus areas of the World Bank Agriculture Action Plan.
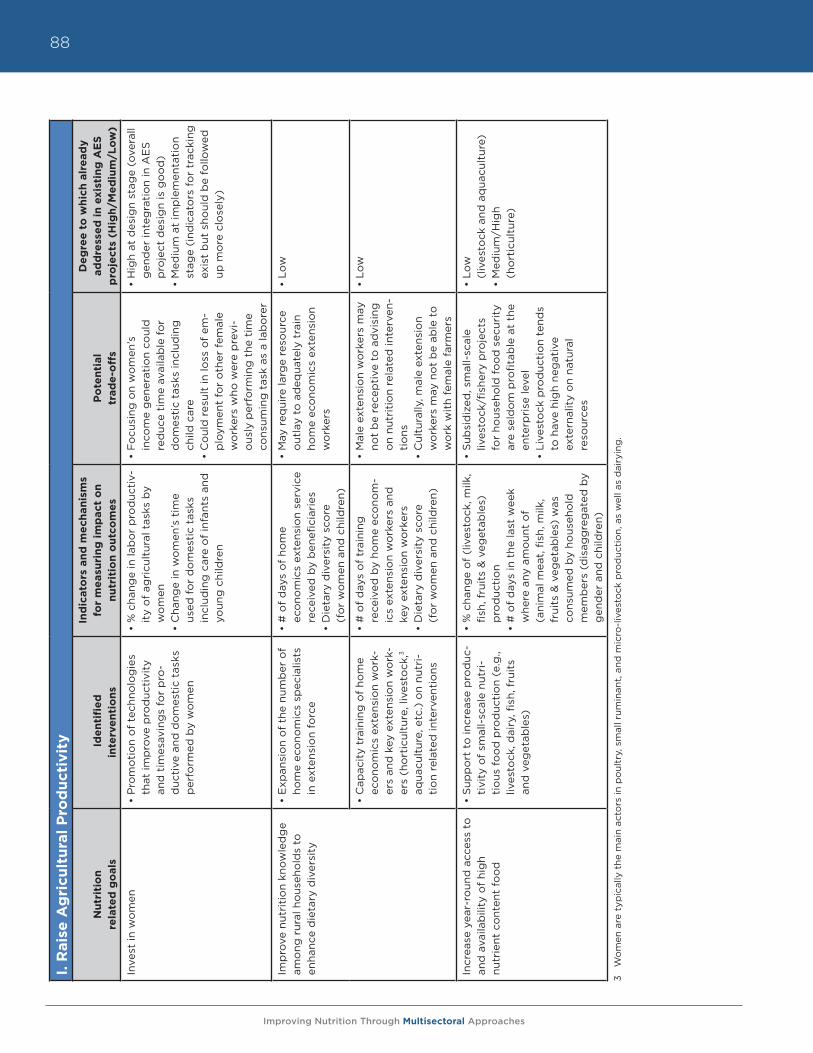
Improving Nutrition Through Multisectoral Approaches
88I.
Rais
e A
gri
cult
ura
l P
rod
uct
ivit
y
Nu
trit
ion
re
late
d g
oals
Id
en
tifi
ed
in
terv
en
tio
ns
Ind
icato
rs a
nd
me
chan
ism
s fo
r m
easu
rin
g i
mp
act
on
n
utr
itio
n o
utc
om
es
Po
ten
tial
tr
ad
e-o
ffs
De
gre
e t
o w
hic
h a
lre
ad
y
ad
dre
sse
d i
n e
xist
ing
AE
S
pro
ject
s (H
igh
/Me
diu
m/L
ow
)
Inve
st in
wo
men
• P
rom
oti
on
of
tech
nolo
gie
s th
at im
pro
ve p
rod
ucti
vity
an
d t
imes
avin
gs
for
pro
-d
ucti
ve a
nd d
om
esti
c ta
sks
per
form
ed b
y w
om
en
• %
cha
nge
in la
bo
r p
rod
ucti
v-it
y o
f ag
ricu
ltur
al t
asks
by
wo
men
• C
hang
e in
wo
men
’s t
ime
used
fo
r d
om
esti
c ta
sks
incl
udin
g c
are
of
infa
nts
and
yo
ung
chi
ldre
n
• F
ocu
sing
on
wo
men
’s
inco
me
gen
erat
ion
coul
d
red
uce
tim
e av
aila
ble
fo
r d
om
esti
c ta
sks
incl
udin
g
child
car
e•
Co
uld
res
ult
in lo
ss o
f em
-p
loym
ent
for
oth
er f
emal
e w
ork
ers
who
wer
e p
revi
-o
usly
per
form
ing
the
tim
e co
nsum
ing
tas
k as
a la
bo
rer
• H
igh
at d
esig
n st
age
(ove
rall
gen
der
inte
gra
tio
n in
AE
S
pro
ject
des
ign
is g
oo
d)
• M
ediu
m a
t im
ple
men
tati
on
stag
e (i
ndic
ato
rs f
or
trac
king
ex
ist
but
sho
uld
be
follo
wed
up
mo
re c
lose
ly)
Imp
rove
nut
riti
on
know
led
ge
amo
ng r
ural
ho
useh
old
s to
en
hanc
e d
ieta
ry d
iver
sity
• E
xpan
sio
n o
f th
e nu
mb
er o
f ho
me
eco
nom
ics
spec
ialis
ts
in e
xten
sio
n fo
rce
• #
of
day
s o
f ho
me
ec
ono
mic
s ex
tens
ion
serv
ice
rece
ived
by
ben
efici
arie
s•
Die
tary
div
ersi
ty s
core
(f
or
wo
men
and
chi
ldre
n)
• M
ay r
equi
re la
rge
reso
urce
o
utla
y to
ad
equa
tely
tra
in
hom
e ec
ono
mic
s ex
tens
ion
wo
rker
s
• Lo
w
• C
apac
ity
trai
ning
of
hom
e ec
ono
mic
s ex
tens
ion
wo
rk-
ers
and
key
ext
ensi
on
wo
rk-
ers
(ho
rtic
ultu
re, l
ives
tock
,3
aqua
cult
ure,
etc
.) o
n nu
tri-
tio
n re
late
d in
terv
enti
ons
• #
of
day
s o
f tr
aini
ng
rece
ived
by
hom
e ec
ono
m-
ics
exte
nsio
n w
ork
ers
and
ke
y ex
tens
ion
wo
rker
s•
Die
tary
div
ersi
ty s
core
(f
or
wo
men
and
chi
ldre
n)
• M
ale
exte
nsio
n w
ork
ers
may
no
t b
e re
cep
tive
to
ad
visi
ng
on
nutr
itio
n re
late
d in
terv
en-
tio
ns•
Cul
tura
lly, m
ale
exte
nsio
n w
ork
ers
may
no
t b
e ab
le t
o
wo
rk w
ith
fem
ale
farm
ers
• Lo
w
Incr
ease
yea
r-ro
und
acc
ess
to
and
ava
ilab
ility
of
hig
h
nutr
ient
co
nten
t fo
od
• S
upp
ort
to
incr
ease
pro
duc
-ti
vity
of
smal
l-sc
ale
nutr
i-ti
ous
fo
od
pro
duc
tio
n (e
.g.,
lives
tock
, dai
ry, fi
sh, f
ruit
s an
d v
eget
able
s)
• %
cha
nge
of
(liv
esto
ck, m
ilk,
fish,
fru
its
& v
eget
able
s)
pro
duc
tio
n•
# o
f d
ays
in t
he la
st w
eek
whe
re a
ny a
mo
unt
of
(a
nim
al m
eat,
fish
, milk
, fr
uits
& v
eget
able
s) w
as
cons
umed
by
hous
eho
ld
mem
ber
s (d
isag
gre
gat
ed b
y g
end
er a
nd c
hild
ren)
• S
ubsi
diz
ed, s
mal
l-sc
ale
lives
tock
/fish
ery
pro
ject
s fo
r ho
useh
old
fo
od
sec
urit
y ar
e se
ldo
m p
rofit
able
at
the
ente
rpri
se le
vel
• Li
vest
ock
pro
duc
tio
n te
nds
to h
ave
hig
h ne
gat
ive
ex
tern
alit
y o
n na
tura
l re
sour
ces
• Lo
w
(liv
esto
ck a
nd a
qua
cult
ure)
• M
ediu
m/H
igh
(h
ort
icul
ture
)
3 W
om
en a
re t
ypic
ally
the
mai
n ac
tors
in p
oul
try,
sm
all r
umin
ant,
and
mic
ro-l
ives
tock
pro
duc
tio
n, a
s w
ell a
s d
airy
ing
.
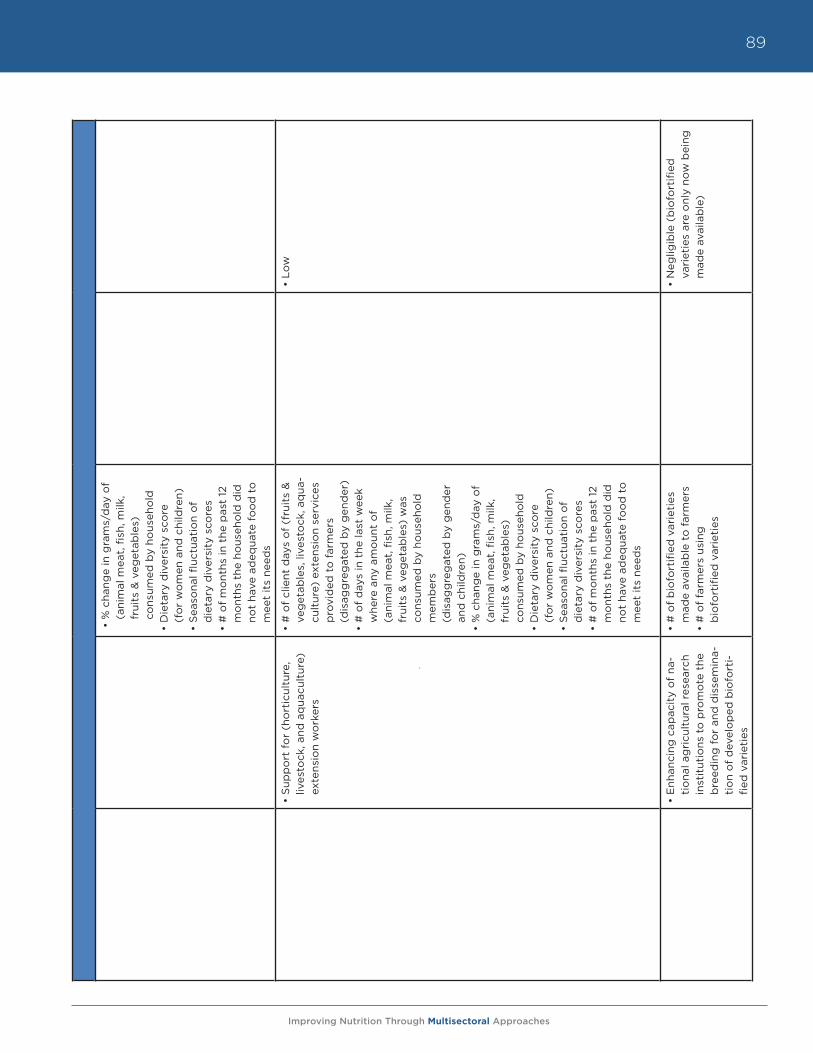
Improving Nutrition Through Multisectoral Approaches
89
• %
cha
nge
in g
ram
s/d
ay o
f (a
nim
al m
eat,
fish
, milk
, fr
uits
& v
eget
able
s)
cons
umed
by
hous
eho
ld•
Die
tary
div
ersi
ty s
core
(f
or
wo
men
and
chi
ldre
n)
• S
easo
nal fl
uctu
atio
n o
f
die
tary
div
ersi
ty s
core
s •
# o
f m
ont
hs in
the
pas
t 12
m
ont
hs t
he h
ous
eho
ld d
id
not
have
ad
equa
te f
oo
d t
o
mee
t it
s ne
eds
• S
upp
ort
fo
r (h
ort
icul
ture
, liv
esto
ck, a
nd a
qua
cult
ure)
ex
tens
ion
wo
rker
s
• #
of
clie
nt d
ays
of
(fru
its
&
veg
etab
les,
live
sto
ck, a
qua
-cu
ltur
e) e
xten
sio
n se
rvic
es
pro
vid
ed t
o f
arm
ers
(d
isag
gre
gat
ed b
y g
end
er)
• #
of
day
s in
the
last
wee
k w
here
any
am
oun
t o
f
(ani
mal
mea
t, fi
sh, m
ilk,
frui
ts &
veg
etab
les)
was
co
nsum
ed b
y ho
useh
old
m
emb
ers
(d
isag
gre
gat
ed b
y g
end
er
and
chi
ldre
n)
• %
cha
nge
in g
ram
s/d
ay o
f (a
nim
al m
eat,
fish
, milk
, fr
uits
& v
eget
able
s)
cons
umed
by
hous
eho
ld•
Die
tary
div
ersi
ty s
core
(f
or
wo
men
and
chi
ldre
n)
• S
easo
nal fl
uctu
atio
n o
f
die
tary
div
ersi
ty s
core
s •
# o
f m
ont
hs in
the
pas
t 12
m
ont
hs t
he h
ous
eho
ld d
id
not
have
ad
equa
te f
oo
d t
o
mee
t it
s ne
eds
• Lo
w
• E
nhan
cing
cap
acit
y o
f na
-ti
ona
l ag
ricu
ltur
al r
esea
rch
inst
itut
ions
to
pro
mo
te t
he
bre
edin
g f
or
and
dis
sem
ina-
tio
n o
f d
evel
op
ed b
iofo
rti-
fied
var
ieti
es
• #
of
bio
fort
ified
var
ieti
es
mad
e av
aila
ble
to
far
mer
s •
# o
f fa
rmer
s us
ing
b
iofo
rtifi
ed v
arie
ties
• N
eglig
ible
(b
iofo
rtifi
ed
vari
etie
s ar
e o
nly
now
bei
ng
mad
e av
aila
ble
)
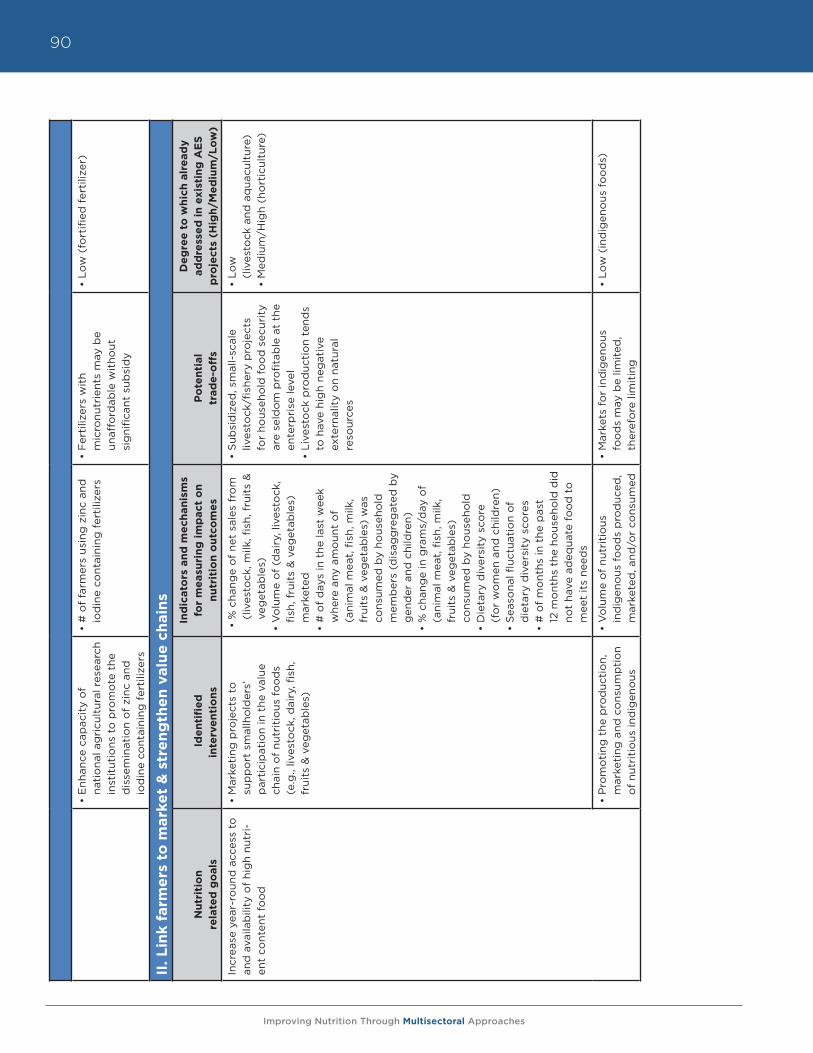
Improving Nutrition Through Multisectoral Approaches
90
• E
nhan
ce c
apac
ity
of
na
tio
nal a
gri
cult
ural
res
earc
h in
stit
utio
ns t
o p
rom
ote
the
d
isse
min
atio
n o
f zi
nc a
nd
iod
ine
cont
aini
ng f
erti
lizer
s
• #
of
farm
ers
usin
g z
inc
and
io
din
e co
ntai
ning
fer
tiliz
ers
• F
erti
lizer
s w
ith
m
icro
nutr
ient
s m
ay b
e
unaf
ford
able
wit
hout
si
gni
fican
t su
bsi
dy
• Lo
w (
fort
ified
fer
tiliz
er)
II. L
ink f
arm
ers
to
mark
et
& s
tre
ng
the
n v
alu
e c
hain
s
Nu
trit
ion
re
late
d g
oals
Id
en
tifi
ed
in
terv
en
tio
ns
Ind
icato
rs a
nd
me
chan
ism
s fo
r m
easu
rin
g i
mp
act
on
n
utr
itio
n o
utc
om
es
Po
ten
tial
tr
ad
e-o
ffs
De
gre
e t
o w
hic
h a
lre
ad
y
ad
dre
sse
d i
n e
xist
ing
AE
S
pro
ject
s (H
igh
/Me
diu
m/L
ow
)
Incr
ease
yea
r-ro
und
acc
ess
to
and
ava
ilab
ility
of
hig
h nu
tri-
ent
cont
ent
foo
d
• M
arke
ting
pro
ject
s to
su
pp
ort
sm
allh
old
ers’
p
arti
cip
atio
n in
the
val
ue
chai
n o
f nu
trit
ious
fo
od
s (e
.g.,
lives
tock
, dai
ry, fi
sh,
frui
ts &
veg
etab
les)
• %
cha
nge
of
net
sale
s fr
om
(l
ives
tock
, milk
, fish
, fru
its
&
veg
etab
les)
•
Vo
lum
e o
f (d
airy
, liv
esto
ck,
fish,
fru
its
& v
eget
able
s)m
arke
ted
• #
of
day
s in
the
last
wee
k w
here
any
am
oun
t o
f
(ani
mal
mea
t, fi
sh, m
ilk,
frui
ts &
veg
etab
les)
was
co
nsum
ed b
y ho
useh
old
m
emb
ers
(dis
agg
reg
ated
by
gen
der
and
chi
ldre
n)
• %
cha
nge
in g
ram
s/d
ay o
f (a
nim
al m
eat,
fish
, milk
, fr
uits
& v
eget
able
s)
cons
umed
by
hous
eho
ld
• D
ieta
ry d
iver
sity
sco
re
(fo
r w
om
en a
nd c
hild
ren)
• S
easo
nal fl
uctu
atio
n o
f
die
tary
div
ersi
ty s
core
s •
# o
f m
ont
hs in
the
pas
t
12 m
ont
hs t
he h
ous
eho
ld d
id
not
have
ad
equa
te f
oo
d t
o
mee
t it
s ne
eds
• S
ubsi
diz
ed, s
mal
l-sc
ale
lives
tock
/fish
ery
pro
ject
s fo
r ho
useh
old
fo
od
sec
urit
y ar
e se
ldo
m p
rofit
able
at
the
ente
rpri
se le
vel
• Li
vest
ock
pro
duc
tio
n te
nds
to h
ave
hig
h ne
gat
ive
ex
tern
alit
y o
n na
tura
l re
sour
ces
• Lo
w
(liv
esto
ck a
nd a
qua
cult
ure)
•
Med
ium
/Hig
h (h
ort
icul
ture
)
• P
rom
oti
ng t
he p
rod
ucti
on,
m
arke
ting
and
co
nsum
pti
on
of
nutr
itio
us in
dig
eno
us
• V
olu
me
of
nutr
itio
us
ind
igen
ous
fo
od
s p
rod
uced
, m
arke
ted
, and
/or
cons
umed
• M
arke
ts f
or
ind
igen
ous
fo
od
s m
ay b
e lim
ited
, th
eref
ore
lim
itin
g
• Lo
w (
ind
igen
ous
fo
od
s)
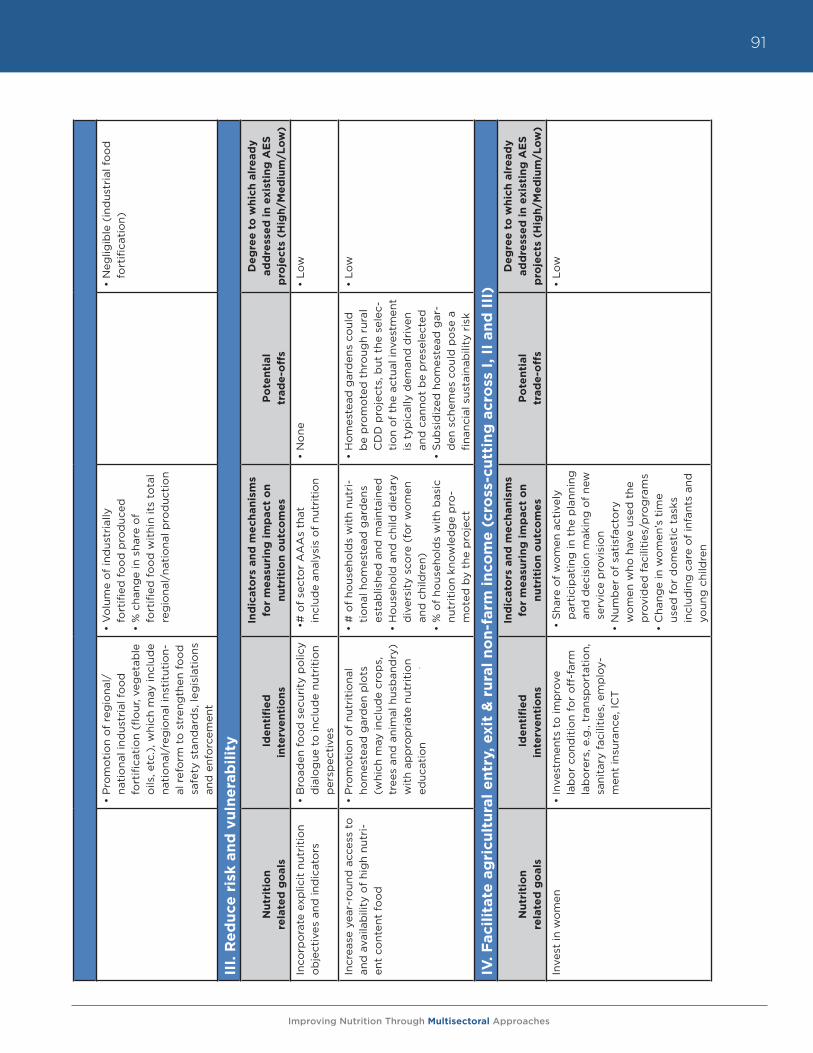
Improving Nutrition Through Multisectoral Approaches
91
• P
rom
oti
on
of
reg
iona
l/na
tio
nal i
ndus
tria
l fo
od
fo
rtifi
cati
on
(flo
ur, v
eget
able
o
ils, e
tc.)
, whi
ch m
ay in
clud
e na
tio
nal/
reg
iona
l ins
titu
tio
n-al
ref
orm
to
str
eng
then
fo
od
sa
fety
sta
ndar
ds,
leg
isla
tio
ns
and
enf
orc
emen
t
• V
olu
me
of
ind
ustr
ially
fo
rtifi
ed f
oo
d p
rod
uced
• %
cha
nge
in s
hare
of
fo
rtifi
ed f
oo
d w
ithi
n it
s to
tal
reg
iona
l/na
tio
nal p
rod
ucti
on
• N
eglig
ible
(in
dus
tria
l fo
od
fo
rtifi
cati
on)
III.
Re
du
ce r
isk a
nd
vu
lne
rab
ilit
y
Nu
trit
ion
re
late
d g
oals
Id
en
tifi
ed
in
terv
en
tio
ns
Ind
icato
rs a
nd
me
chan
ism
s fo
r m
easu
rin
g i
mp
act
on
n
utr
itio
n o
utc
om
es
Po
ten
tial
tr
ad
e-o
ffs
De
gre
e t
o w
hic
h a
lre
ad
y
ad
dre
sse
d i
n e
xist
ing
AE
S
pro
ject
s (H
igh
/Me
diu
m/L
ow
)
Inco
rpo
rate
exp
licit
nut
riti
on
ob
ject
ives
and
ind
icat
ors
• B
road
en f
oo
d s
ecur
ity
po
licy
dia
log
ue t
o in
clud
e nu
trit
ion
per
spec
tive
s
• #
of
sect
or
AA
As
that
in
clud
e an
alys
is o
f nu
trit
ion
•
No
ne•
Low
Incr
ease
yea
r-ro
und
acc
ess
to
and
ava
ilab
ility
of
hig
h nu
tri-
ent
cont
ent
foo
d
• P
rom
oti
on
of
nutr
itio
nal
hom
este
ad g
ard
en p
lots
(w
hich
may
incl
ude
cro
ps,
tr
ees
and
ani
mal
hus
ban
dry
) w
ith
app
rop
riat
e nu
trit
ion
educ
atio
n
• #
of
hous
eho
lds
wit
h nu
tri-
tio
nal h
om
este
ad g
ard
ens
esta
blis
hed
and
mai
ntai
ned
•
Ho
useh
old
and
chi
ld d
ieta
ry
div
ersi
ty s
core
(fo
r w
om
en
and
chi
ldre
n)•
% o
f ho
useh
old
s w
ith
bas
ic
nutr
itio
n kn
owle
dg
e p
ro-
mo
ted
by
the
pro
ject
• H
om
este
ad g
ard
ens
coul
d
be
pro
mo
ted
thr
oug
h ru
ral
CD
D p
roje
cts,
but
the
sel
ec-
tio
n o
f th
e ac
tual
inve
stm
ent
is t
ypic
ally
dem
and
dri
ven
and
can
not
be
pre
sele
cted
• S
ubsi
diz
ed h
om
este
ad g
ar-
den
sch
emes
co
uld
po
se a
fin
anci
al s
usta
inab
ility
ris
k
• Lo
w
IV. F
aci
lita
te a
gri
cult
ura
l e
ntr
y, e
xit
& r
ura
l n
on
-farm
in
com
e (
cro
ss-c
utt
ing
acr
oss
I, II
an
d I
II)
Nu
trit
ion
re
late
d g
oals
Id
en
tifi
ed
in
terv
en
tio
ns
Ind
icato
rs a
nd
me
chan
ism
s fo
r m
easu
rin
g i
mp
act
on
n
utr
itio
n o
utc
om
es
Po
ten
tial
tr
ad
e-o
ffs
De
gre
e t
o w
hic
h a
lre
ad
y
ad
dre
sse
d i
n e
xist
ing
AE
S
pro
ject
s (H
igh
/Me
diu
m/L
ow
)
Inve
st in
wo
men
• In
vest
men
ts t
o im
pro
ve
lab
or
cond
itio
n fo
r o
ff-f
arm
la
bo
rers
, e.g
., tr
ansp
ort
atio
n,
sani
tary
fac
iliti
es, e
mp
loy-
men
t in
sura
nce,
ICT
• S
hare
of
wo
men
act
ivel
y p
arti
cip
atin
g in
the
pla
nnin
g
and
dec
isio
n m
akin
g o
f ne
w
serv
ice
pro
visi
on
• N
umb
er o
f sa
tisf
acto
ry
wo
men
who
hav
e us
ed t
he
pro
vid
ed f
acili
ties
/pro
gra
ms
• C
hang
e in
wo
men
’s t
ime
used
fo
r d
om
esti
c ta
sks
incl
udin
g c
are
of
infa
nts
and
yo
ung
chi
ldre
n
• Lo
w
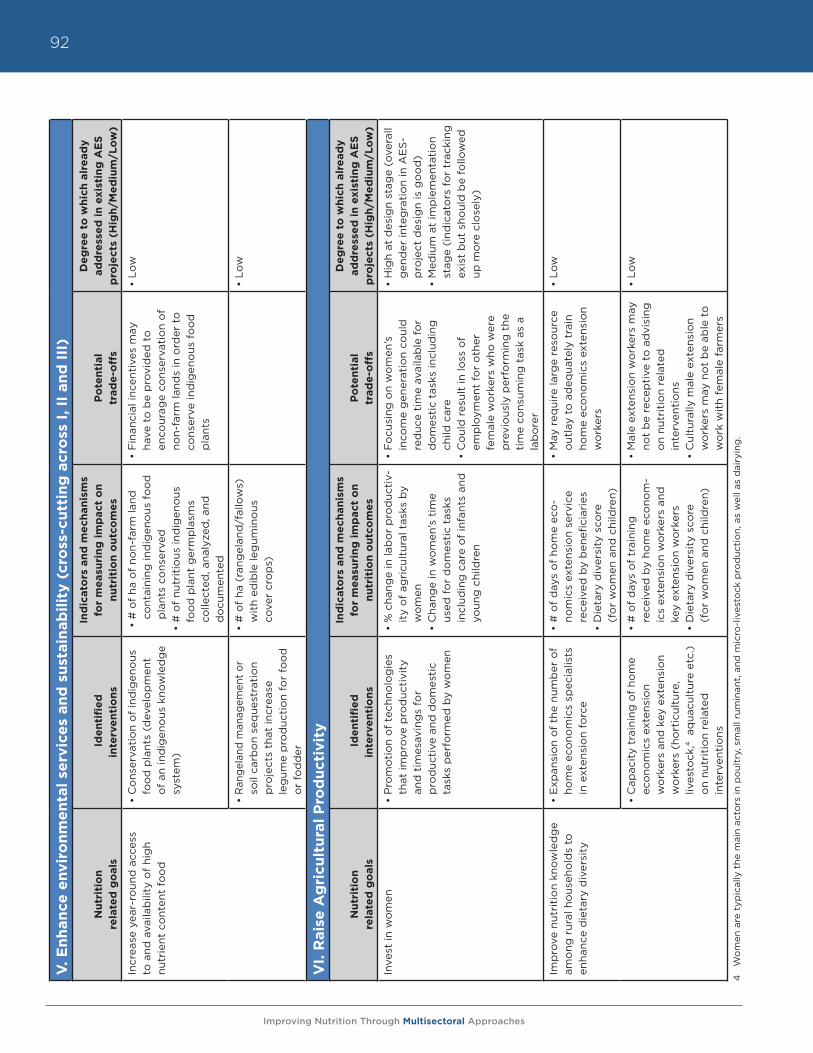
Improving Nutrition Through Multisectoral Approaches
92V
. E
nh
an
ce e
nv
iro
nm
en
tal
serv
ice
s an
d s
ust
ain
ab
ilit
y (
cro
ss-c
utt
ing
acr
oss
I, II
an
d I
II)
Nu
trit
ion
re
late
d g
oals
Id
en
tifi
ed
in
terv
en
tio
ns
Ind
icato
rs a
nd
me
chan
ism
s fo
r m
easu
rin
g i
mp
act
on
n
utr
itio
n o
utc
om
es
Po
ten
tial
tr
ad
e-o
ffs
De
gre
e t
o w
hic
h a
lre
ad
y
ad
dre
sse
d i
n e
xist
ing
AE
S
pro
ject
s (H
igh
/Me
diu
m/L
ow
)
Incr
ease
yea
r-ro
und
acc
ess
to
and
ava
ilab
ility
of
hig
h nu
trie
nt c
ont
ent
foo
d
• C
ons
erva
tio
n o
f in
dig
eno
us
foo
d p
lant
s (d
evel
op
men
t o
f an
ind
igen
ous
kno
wle
dg
e sy
stem
)
• #
of
ha o
f no
n-fa
rm la
nd
cont
aini
ng in
dig
eno
us f
oo
d
pla
nts
cons
erve
d•
# o
f nu
trit
ious
ind
igen
ous
fo
od
pla
nt g
erm
pla
sms
colle
cted
, ana
lyze
d, a
nd
do
cum
ente
d
• F
inan
cial
ince
ntiv
es m
ay
have
to
be
pro
vid
ed t
o
enco
urag
e co
nser
vati
on
of
non-
farm
land
s in
ord
er t
o
cons
erve
ind
igen
ous
fo
od
p
lant
s
• Lo
w
• R
ange
land
man
agem
ent
or
soil
carb
on
seq
uest
rati
on
pro
ject
s th
at in
crea
se
leg
ume
pro
duc
tio
n fo
r fo
od
o
r fo
dd
er
• #
of
ha (
rang
elan
d/f
allo
ws)
w
ith
edib
le le
gum
ino
us
cove
r cr
op
s)
• Lo
w
VI.
Rais
e A
gri
cult
ura
l P
rod
uct
ivit
y
Nu
trit
ion
re
late
d g
oals
Id
en
tifi
ed
in
terv
en
tio
ns
Ind
icato
rs a
nd
me
chan
ism
s fo
r m
easu
rin
g i
mp
act
on
n
utr
itio
n o
utc
om
es
Po
ten
tial
tr
ad
e-o
ffs
De
gre
e t
o w
hic
h a
lre
ad
y
ad
dre
sse
d i
n e
xist
ing
AE
S
pro
ject
s (H
igh
/Me
diu
m/L
ow
)
Inve
st in
wo
men
• P
rom
oti
on
of
tech
nolo
gie
s th
at im
pro
ve p
rod
ucti
vity
an
d t
imes
avin
gs
for
p
rod
ucti
ve a
nd d
om
esti
c ta
sks
per
form
ed b
y w
om
en
• %
cha
nge
in la
bo
r p
rod
ucti
v-it
y o
f ag
ricu
ltur
al t
asks
by
wo
men
•
Cha
nge
in w
om
en’s
tim
e us
ed f
or
do
mes
tic
task
s in
clud
ing
car
e o
f in
fant
s an
d
youn
g c
hild
ren
• F
ocu
sing
on
wo
men
’s
inco
me
gen
erat
ion
coul
d
red
uce
tim
e av
aila
ble
fo
r d
om
esti
c ta
sks
incl
udin
g
child
car
e•
Co
uld
res
ult
in lo
ss o
f
emp
loym
ent
for
oth
er
fem
ale
wo
rker
s w
ho w
ere
pre
vio
usly
per
form
ing
the
ti
me
cons
umin
g t
ask
as a
la
bo
rer
• H
igh
at d
esig
n st
age
(ove
rall
gen
der
inte
gra
tio
n in
AE
S-
pro
ject
des
ign
is g
oo
d)
• M
ediu
m a
t im
ple
men
tati
on
stag
e (i
ndic
ato
rs f
or
trac
king
ex
ist
but
sho
uld
be
follo
wed
up
mo
re c
lose
ly)
Imp
rove
nut
riti
on
know
led
ge
amo
ng r
ural
ho
useh
old
s to
en
hanc
e d
ieta
ry d
iver
sity
• E
xpan
sio
n o
f th
e nu
mb
er o
f ho
me
eco
nom
ics
spec
ialis
ts
in e
xten
sio
n fo
rce
• #
of
day
s o
f ho
me
eco
-no
mic
s ex
tens
ion
serv
ice
rece
ived
by
ben
efici
arie
s •
Die
tary
div
ersi
ty s
core
(f
or
wo
men
and
chi
ldre
n)
• M
ay r
equi
re la
rge
reso
urce
o
utla
y to
ad
equa
tely
tra
in
hom
e ec
ono
mic
s ex
tens
ion
wo
rker
s
• Lo
w
• C
apac
ity
trai
ning
of
hom
e ec
ono
mic
s ex
tens
ion
w
ork
ers
and
key
ext
ensi
on
wo
rker
s (h
ort
icul
ture
, liv
esto
ck,4
aq
uacu
ltur
e et
c.)
on
nutr
itio
n re
late
d
inte
rven
tio
ns
• #
of
day
s o
f tr
aini
ng
rece
ived
by
hom
e ec
ono
m-
ics
exte
nsio
n w
ork
ers
and
ke
y ex
tens
ion
wo
rker
s
• D
ieta
ry d
iver
sity
sco
re
(fo
r w
om
en a
nd c
hild
ren)
• M
ale
exte
nsio
n w
ork
ers
may
no
t b
e re
cep
tive
to
ad
visi
ng
on
nutr
itio
n re
late
d
inte
rven
tio
ns
• C
ultu
rally
mal
e ex
tens
ion
wo
rker
s m
ay n
ot
be
able
to
w
ork
wit
h fe
mal
e fa
rmer
s
• Lo
w
4
Wo
men
are
typ
ical
ly t
he m
ain
acto
rs in
po
ultr
y, s
mal
l rum
inan
t, a
nd m
icro
-liv
esto
ck p
rod
ucti
on,
as
wel
l as
dai
ryin
g.
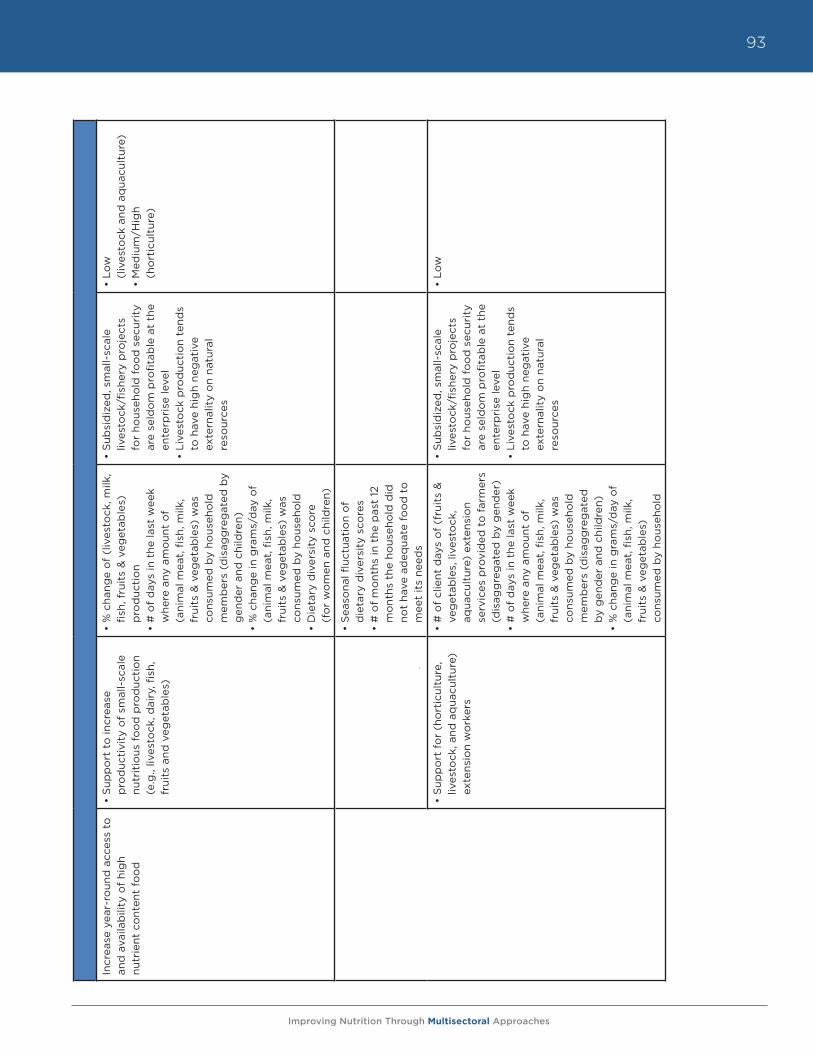
Improving Nutrition Through Multisectoral Approaches
93
Incr
ease
yea
r-ro
und
acc
ess
to
and
ava
ilab
ility
of
hig
h
nutr
ient
co
nten
t fo
od
• S
upp
ort
to
incr
ease
p
rod
ucti
vity
of
smal
l-sc
ale
nutr
itio
us f
oo
d p
rod
ucti
on
(e.g
., liv
esto
ck, d
airy
, fish
, fr
uits
and
veg
etab
les)
• %
cha
nge
of
(liv
esto
ck, m
ilk,
fish,
fru
its
& v
eget
able
s)
pro
duc
tio
n•
# o
f d
ays
in t
he la
st w
eek
whe
re a
ny a
mo
unt
of
(a
nim
al m
eat,
fish
, milk
, fr
uits
& v
eget
able
s) w
as
cons
umed
by
hous
eho
ld
mem
ber
s (d
isag
gre
gat
ed b
y g
end
er a
nd c
hild
ren)
• %
cha
nge
in g
ram
s/d
ay o
f (a
nim
al m
eat,
fish
, milk
, fr
uits
& v
eget
able
s) w
as
cons
umed
by
hous
eho
ld•
Die
tary
div
ersi
ty s
core
(f
or
wo
men
and
chi
ldre
n)
• S
ubsi
diz
ed, s
mal
l-sc
ale
lives
tock
/fish
ery
pro
ject
s fo
r ho
useh
old
fo
od
sec
urit
y ar
e se
ldo
m p
rofit
able
at
the
ente
rpri
se le
vel
• Li
vest
ock
pro
duc
tio
n te
nds
to h
ave
hig
h ne
gat
ive
ex
tern
alit
y o
n na
tura
l re
sour
ces
• Lo
w
(liv
esto
ck a
nd a
qua
cult
ure)
• M
ediu
m/H
igh
(h
ort
icul
ture
)
• S
easo
nal fl
uctu
atio
n o
f
die
tary
div
ersi
ty s
core
s•
# o
f m
ont
hs in
the
pas
t 12
m
ont
hs t
he h
ous
eho
ld d
id
not
have
ad
equa
te f
oo
d t
o
mee
t it
s ne
eds
• S
upp
ort
fo
r (h
ort
icul
ture
, liv
esto
ck, a
nd a
qua
cult
ure)
ex
tens
ion
wo
rker
s
• #
of
clie
nt d
ays
of
(fru
its
&
veg
etab
les,
live
sto
ck,
aqua
cult
ure)
ext
ensi
on
serv
ices
pro
vid
ed t
o f
arm
ers
(dis
agg
reg
ated
by
gen
der
) •
# o
f d
ays
in t
he la
st w
eek
whe
re a
ny a
mo
unt
of
(a
nim
al m
eat,
fish
, milk
, fr
uits
& v
eget
able
s) w
as
cons
umed
by
hous
eho
ld
mem
ber
s (d
isag
gre
gat
ed
by
gen
der
and
chi
ldre
n)
• %
cha
nge
in g
ram
s/d
ay o
f (a
nim
al m
eat,
fish
, milk
, fr
uits
& v
eget
able
s)
cons
umed
by
hous
eho
ld
• S
ubsi
diz
ed, s
mal
l-sc
ale
lives
tock
/fish
ery
pro
ject
s fo
r ho
useh
old
fo
od
sec
urit
y ar
e se
ldo
m p
rofit
able
at
the
ente
rpri
se le
vel
• Li
vest
ock
pro
duc
tio
n te
nds
to h
ave
hig
h ne
gat
ive
ex
tern
alit
y o
n na
tura
l re
sour
ces
• Lo
w
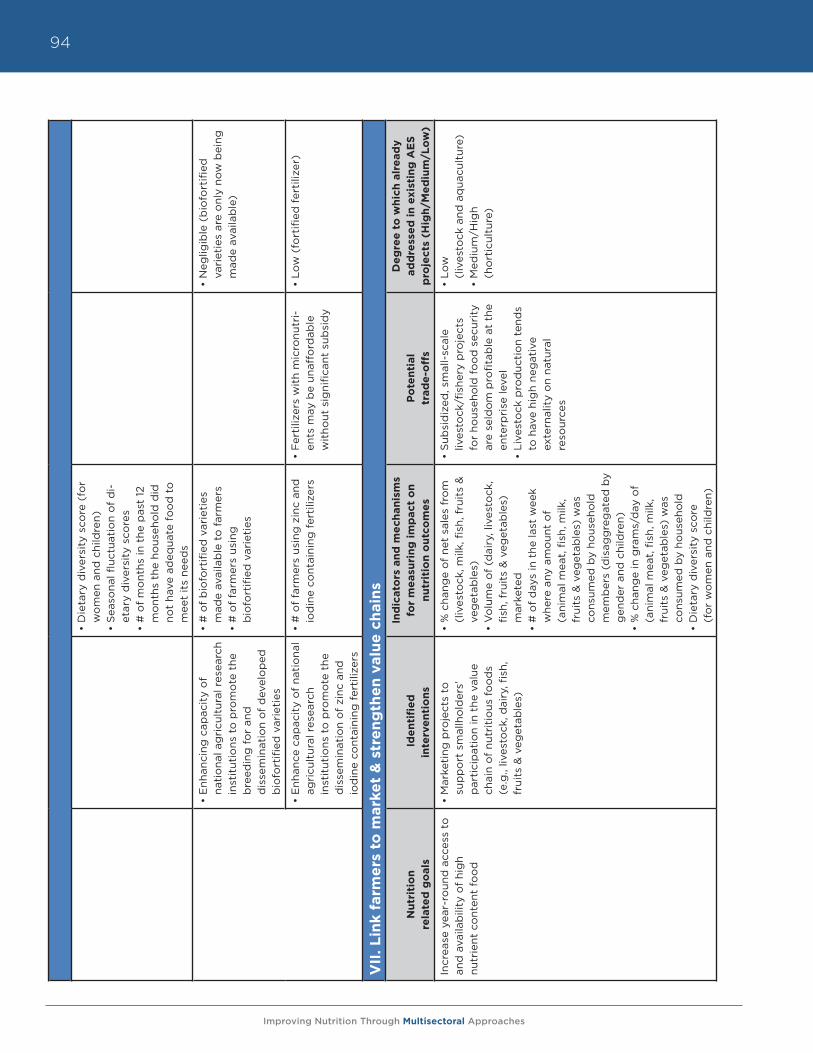
Improving Nutrition Through Multisectoral Approaches
94
• D
ieta
ry d
iver
sity
sco
re (
for
wo
men
and
chi
ldre
n)
• S
easo
nal fl
uctu
atio
n o
f d
i-et
ary
div
ersi
ty s
core
s •
# o
f m
ont
hs in
the
pas
t 12
m
ont
hs t
he h
ous
eho
ld d
id
not
have
ad
equa
te f
oo
d t
o
mee
t it
s ne
eds
• E
nhan
cing
cap
acit
y o
f
nati
ona
l ag
ricu
ltur
al r
esea
rch
inst
itut
ions
to
pro
mo
te t
he
bre
edin
g f
or
and
d
isse
min
atio
n o
f d
evel
op
ed
bio
fort
ified
var
ieti
es
• #
of
bio
fort
ified
var
ieti
es
mad
e av
aila
ble
to
far
mer
s •
# o
f fa
rmer
s us
ing
b
iofo
rtifi
ed v
arie
ties
• N
eglig
ible
(b
iofo
rtifi
ed
vari
etie
s ar
e o
nly
now
bei
ng
mad
e av
aila
ble
)
• E
nhan
ce c
apac
ity
of
nati
ona
l ag
ricu
ltur
al r
esea
rch
in
stit
utio
ns t
o p
rom
ote
the
d
isse
min
atio
n o
f zi
nc a
nd
iod
ine
cont
aini
ng f
erti
lizer
s
• #
of
farm
ers
usin
g z
inc
and
io
din
e co
ntai
ning
fer
tiliz
ers
• F
erti
lizer
s w
ith
mic
ronu
tri-
ents
may
be
unaf
ford
able
w
itho
ut s
igni
fican
t su
bsi
dy
• Lo
w (
fort
ified
fer
tiliz
er)
VII
. L
ink f
arm
ers
to
mark
et
& s
tre
ng
the
n v
alu
e c
hain
s
Nu
trit
ion
re
late
d g
oals
Id
en
tifi
ed
in
terv
en
tio
ns
Ind
icato
rs a
nd
me
chan
ism
s fo
r m
easu
rin
g i
mp
act
on
n
utr
itio
n o
utc
om
es
Po
ten
tial
tr
ad
e-o
ffs
De
gre
e t
o w
hic
h a
lre
ad
y
ad
dre
sse
d i
n e
xist
ing
AE
S
pro
ject
s (H
igh
/Me
diu
m/L
ow
)
Incr
ease
yea
r-ro
und
acc
ess
to
and
ava
ilab
ility
of
hig
h
nutr
ient
co
nten
t fo
od
• M
arke
ting
pro
ject
s to
su
pp
ort
sm
allh
old
ers’
p
arti
cip
atio
n in
the
val
ue
chai
n o
f nu
trit
ious
fo
od
s (e
.g.,
lives
tock
, dai
ry, fi
sh,
frui
ts &
veg
etab
les)
• %
cha
nge
of
net
sale
s fr
om
(l
ives
tock
, milk
, fish
, fru
its
&
veg
etab
les)
• V
olu
me
of
(dai
ry, l
ives
tock
, fis
h, f
ruit
s &
veg
etab
les)
m
arke
ted
• #
of
day
s in
the
last
wee
k w
here
any
am
oun
t o
f
(ani
mal
mea
t, fi
sh, m
ilk,
frui
ts &
veg
etab
les)
was
co
nsum
ed b
y ho
useh
old
m
emb
ers
(dis
agg
reg
ated
by
gen
der
and
chi
ldre
n)•
% c
hang
e in
gra
ms/
day
of
(ani
mal
mea
t, fi
sh, m
ilk,
frui
ts &
veg
etab
les)
was
co
nsum
ed b
y ho
useh
old
• D
ieta
ry d
iver
sity
sco
re
(fo
r w
om
en a
nd c
hild
ren)
• S
ubsi
diz
ed, s
mal
l-sc
ale
lives
tock
/fish
ery
pro
ject
s fo
r ho
useh
old
fo
od
sec
urit
y ar
e se
ldo
m p
rofit
able
at
the
ente
rpri
se le
vel
• Li
vest
ock
pro
duc
tio
n te
nds
to h
ave
hig
h ne
gat
ive
ex
tern
alit
y o
n na
tura
l re
sour
ces
• Lo
w
(liv
esto
ck a
nd a
qua
cult
ure)
• M
ediu
m/H
igh
(h
ort
icul
ture
)
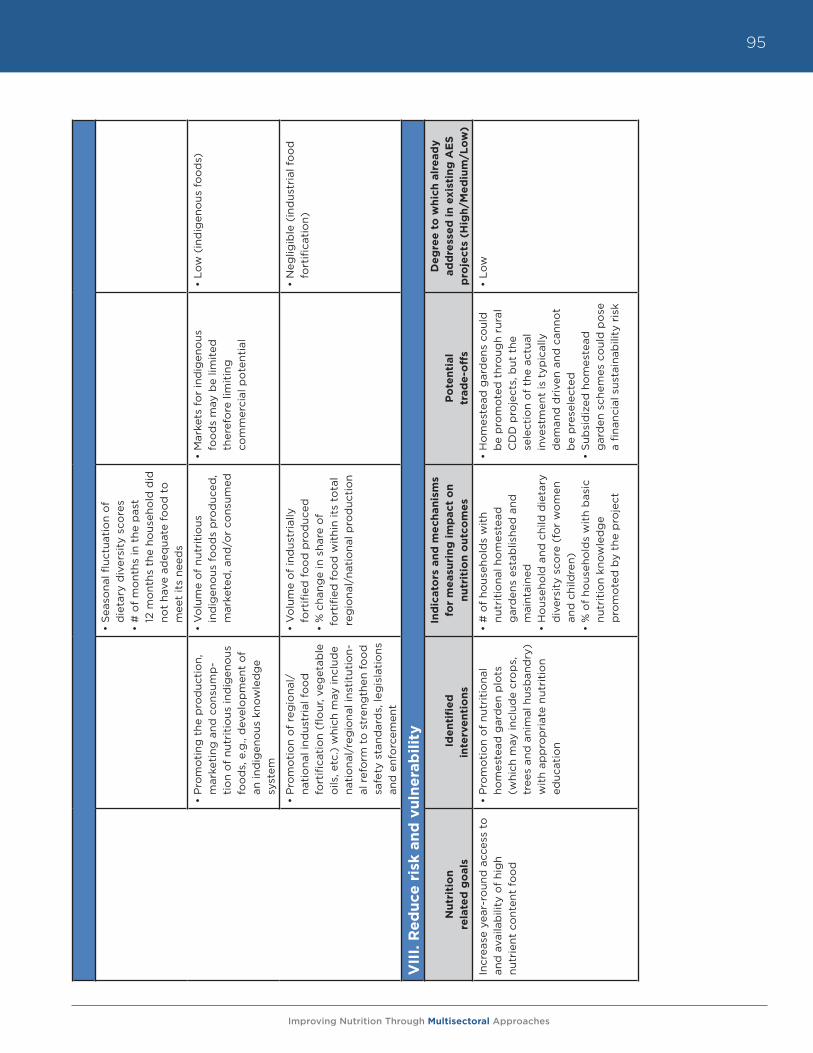
Improving Nutrition Through Multisectoral Approaches
95
• S
easo
nal fl
uctu
atio
n o
f
die
tary
div
ersi
ty s
core
s •
# o
f m
ont
hs in
the
pas
t
12 m
ont
hs t
he h
ous
eho
ld d
id
not
have
ad
equa
te f
oo
d t
o
mee
t it
s ne
eds
• P
rom
oti
ng t
he p
rod
ucti
on,
m
arke
ting
and
co
nsum
p-
tio
n o
f nu
trit
ious
ind
igen
ous
fo
od
s, e
.g.,
dev
elo
pm
ent
of
an in
dig
eno
us k
now
led
ge
syst
em
• V
olu
me
of
nutr
itio
us
ind
igen
ous
fo
od
s p
rod
uced
, m
arke
ted
, and
/or
cons
umed
• M
arke
ts f
or
ind
igen
ous
fo
od
s m
ay b
e lim
ited
th
eref
ore
lim
itin
g
com
mer
cial
po
tent
ial
• Lo
w (
ind
igen
ous
fo
od
s)
• P
rom
oti
on
of
reg
iona
l/
nati
ona
l ind
ustr
ial f
oo
d
fort
ifica
tio
n (fl
our
, veg
etab
le
oils
, etc
.) w
hich
may
incl
ude
nati
ona
l/re
gio
nal i
nsti
tuti
on-
al r
efo
rm t
o s
tren
gth
en f
oo
d
safe
ty s
tand
ard
s, le
gis
lati
ons
an
d e
nfo
rcem
ent
• V
olu
me
of
ind
ustr
ially
fo
rtifi
ed f
oo
d p
rod
uced
• %
cha
nge
in s
hare
of
fo
rtifi
ed f
oo
d w
ithi
n it
s to
tal
reg
iona
l/na
tio
nal p
rod
ucti
on
• N
eglig
ible
(in
dus
tria
l fo
od
fo
rtifi
cati
on)
VII
I. R
ed
uce
ris
k a
nd
vu
lne
rab
ilit
y
Nu
trit
ion
re
late
d g
oals
Id
en
tifi
ed
in
terv
en
tio
ns
Ind
icato
rs a
nd
me
chan
ism
s fo
r m
easu
rin
g i
mp
act
on
n
utr
itio
n o
utc
om
es
Po
ten
tial
tr
ad
e-o
ffs
De
gre
e t
o w
hic
h a
lre
ad
y
ad
dre
sse
d i
n e
xist
ing
AE
S
pro
ject
s (H
igh
/Me
diu
m/L
ow
)
Incr
ease
yea
r-ro
und
acc
ess
to
and
ava
ilab
ility
of
hig
h
nutr
ient
co
nten
t fo
od
• P
rom
oti
on
of
nutr
itio
nal
hom
este
ad g
ard
en p
lots
(w
hich
may
incl
ude
cro
ps,
tr
ees
and
ani
mal
hus
ban
dry
) w
ith
app
rop
riat
e nu
trit
ion
educ
atio
n
• #
of
hous
eho
lds
wit
h
nutr
itio
nal h
om
este
ad
gar
den
s es
tab
lishe
d a
nd
mai
ntai
ned
•
Ho
useh
old
and
chi
ld d
ieta
ry
div
ersi
ty s
core
(fo
r w
om
en
and
chi
ldre
n)•
% o
f ho
useh
old
s w
ith
bas
ic
nutr
itio
n kn
owle
dg
e
pro
mo
ted
by
the
pro
ject
• H
om
este
ad g
ard
ens
coul
d
be
pro
mo
ted
thr
oug
h ru
ral
CD
D p
roje
cts,
but
the
se
lect
ion
of
the
actu
al
inve
stm
ent
is t
ypic
ally
d
eman
d d
rive
n an
d c
anno
t b
e p
rese
lect
ed•
Sub
sid
ized
ho
mes
tead
g
ard
en s
chem
es c
oul
d p
ose
a
finan
cial
sus
tain
abili
ty r
isk
• Lo
w
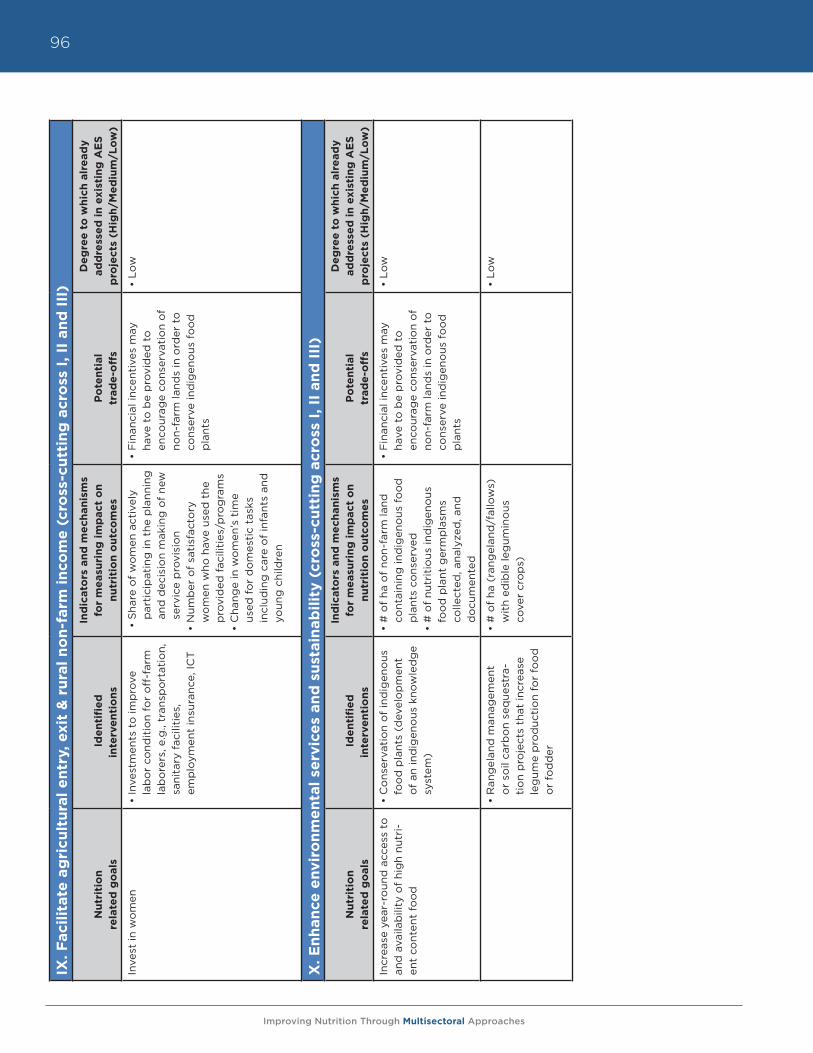
Improving Nutrition Through Multisectoral Approaches
96IX
. F
aci
lita
te a
gri
cult
ura
l e
ntr
y, e
xit
& r
ura
l n
on
-farm
in
com
e (
cro
ss-c
utt
ing
acr
oss
I, II
an
d I
II)
Nu
trit
ion
re
late
d g
oals
Id
en
tifi
ed
in
terv
en
tio
ns
Ind
icato
rs a
nd
me
chan
ism
s fo
r m
easu
rin
g i
mp
act
on
n
utr
itio
n o
utc
om
es
Po
ten
tial
tr
ad
e-o
ffs
De
gre
e t
o w
hic
h a
lre
ad
y
ad
dre
sse
d i
n e
xist
ing
AE
S
pro
ject
s (H
igh
/Me
diu
m/L
ow
)
Inve
st in
wo
men
• In
vest
men
ts t
o im
pro
ve
lab
or
cond
itio
n fo
r o
ff-f
arm
la
bo
rers
, e.g
., tr
ansp
ort
atio
n,
sani
tary
fac
iliti
es,
emp
loym
ent
insu
ranc
e, IC
T
• S
hare
of
wo
men
act
ivel
y p
arti
cip
atin
g in
the
pla
nnin
g
and
dec
isio
n m
akin
g o
f ne
w
serv
ice
pro
visi
on
• N
umb
er o
f sa
tisf
acto
ry
wo
men
who
hav
e us
ed t
he
pro
vid
ed f
acili
ties
/pro
gra
ms
• C
hang
e in
wo
men
’s t
ime
used
fo
r d
om
esti
c ta
sks
incl
udin
g c
are
of
infa
nts
and
yo
ung
chi
ldre
n
• F
inan
cial
ince
ntiv
es m
ay
have
to
be
pro
vid
ed t
o
enco
urag
e co
nser
vati
on
of
non-
farm
land
s in
ord
er t
o
cons
erve
ind
igen
ous
fo
od
p
lant
s
• Lo
w
X. E
nh
an
ce e
nv
iro
nm
en
tal
serv
ice
s an
d s
ust
ain
ab
ilit
y (
cro
ss-c
utt
ing
acr
oss
I, II
an
d I
II)
Nu
trit
ion
re
late
d g
oals
Id
en
tifi
ed
in
terv
en
tio
ns
Ind
icato
rs a
nd
me
chan
ism
s fo
r m
easu
rin
g i
mp
act
on
n
utr
itio
n o
utc
om
es
Po
ten
tial
tr
ad
e-o
ffs
De
gre
e t
o w
hic
h a
lre
ad
y
ad
dre
sse
d i
n e
xist
ing
AE
S
pro
ject
s (H
igh
/Me
diu
m/L
ow
)
Incr
ease
yea
r-ro
und
acc
ess
to
and
ava
ilab
ility
of
hig
h nu
tri-
ent
cont
ent
foo
d
• C
ons
erva
tio
n o
f in
dig
eno
us
foo
d p
lant
s (d
evel
op
men
t o
f an
ind
igen
ous
kno
wle
dg
e sy
stem
)
• #
of
ha o
f no
n-fa
rm la
nd
cont
aini
ng in
dig
eno
us f
oo
d
pla
nts
cons
erve
d
• #
of
nutr
itio
us in
dig
eno
us
foo
d p
lant
ger
mp
lasm
s co
llect
ed, a
naly
zed
, and
d
ocu
men
ted
• F
inan
cial
ince
ntiv
es m
ay
have
to
be
pro
vid
ed t
o
enco
urag
e co
nser
vati
on
of
non-
farm
land
s in
ord
er t
o
cons
erve
ind
igen
ous
fo
od
p
lant
s
• Lo
w
• R
ang
elan
d m
anag
emen
t o
r so
il ca
rbo
n se
que
stra
-ti
on
pro
ject
s th
at in
crea
se
leg
ume
pro
duc
tio
n fo
r fo
od
o
r fo
dd
er
• #
of
ha (
rang
elan
d/f
allo
ws)
w
ith
edib
le le
gum
ino
us
cove
r cr
op
s)
• Lo
w
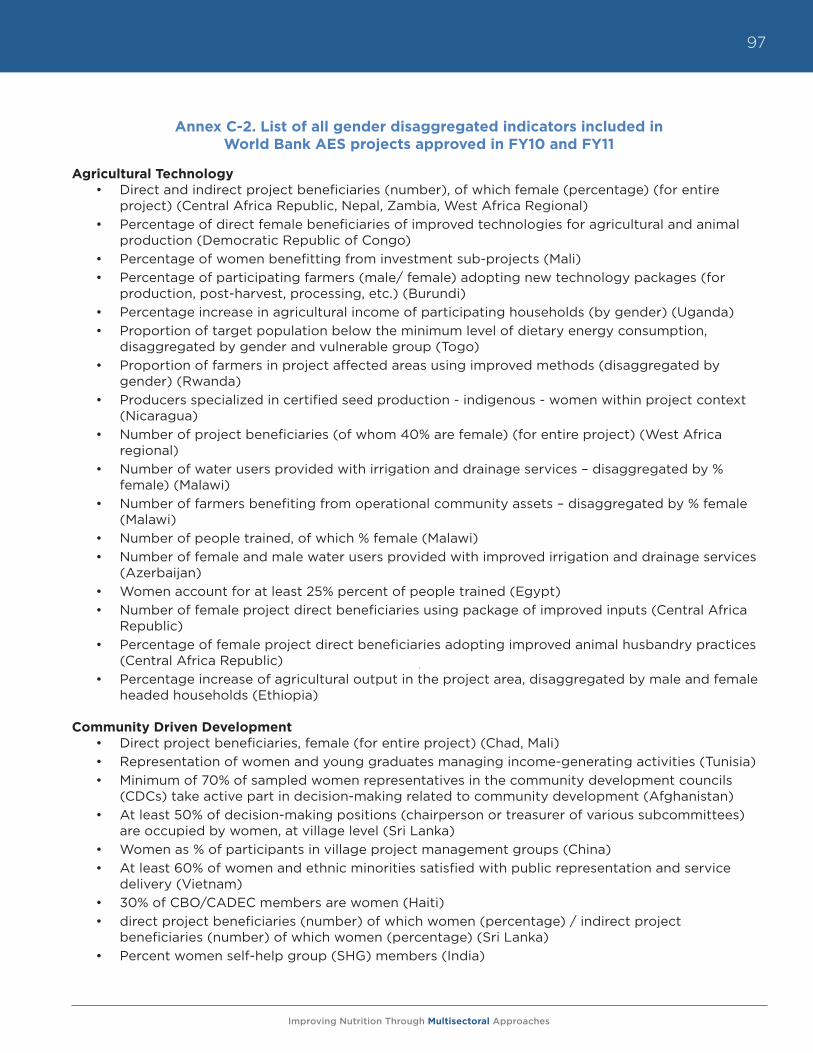
Improving Nutrition Through Multisectoral Approaches
97
Annex C-2. List of all gender disaggregated indicators included in World Bank AES projects approved in FY10 and FY11
Agricultural Technology• Direct and indirect project beneficiaries (number), of which female (percentage) (for entire
project) (Central Africa Republic, Nepal, Zambia, West Africa Regional)• Percentage of direct female beneficiaries of improved technologies for agricultural and animal
production (Democratic Republic of Congo)• Percentage of women benefitting from investment sub-projects (Mali)• Percentage of participating farmers (male/ female) adopting new technology packages (for
production, post-harvest, processing, etc.) (Burundi)• Percentage increase in agricultural income of participating households (by gender) (Uganda)• Proportion of target population below the minimum level of dietary energy consumption,
disaggregated by gender and vulnerable group (Togo)• Proportion of farmers in project affected areas using improved methods (disaggregated by
gender) (Rwanda)• Producers specialized in certified seed production - indigenous - women within project context
(Nicaragua)• Number of project beneficiaries (of whom 40% are female) (for entire project) (West Africa
regional)• Number of water users provided with irrigation and drainage services – disaggregated by %
female) (Malawi)• Number of farmers benefiting from operational community assets – disaggregated by % female
(Malawi)• Number of people trained, of which % female (Malawi)• Number of female and male water users provided with improved irrigation and drainage services
(Azerbaijan)• Women account for at least 25% percent of people trained (Egypt)• Number of female project direct beneficiaries using package of improved inputs (Central Africa
Republic)• Percentage of female project direct beneficiaries adopting improved animal husbandry practices
(Central Africa Republic)• Percentage increase of agricultural output in the project area, disaggregated by male and female
headed households (Ethiopia)
Community Driven Development• Direct project beneficiaries, female (for entire project) (Chad, Mali)• Representation of women and young graduates managing income-generating activities (Tunisia)• Minimum of 70% of sampled women representatives in the community development councils
(CDCs) take active part in decision-making related to community development (Afghanistan)• At least 50% of decision-making positions (chairperson or treasurer of various subcommittees)
are occupied by women, at village level (Sri Lanka)• Women as % of participants in village project management groups (China)• At least 60% of women and ethnic minorities satisfied with public representation and service
delivery (Vietnam)• 30% of CBO/CADEC members are women (Haiti)• direct project beneficiaries (number) of which women (percentage) / indirect project
beneficiaries (number) of which women (percentage) (Sri Lanka)• Percent women self-help group (SHG) members (India)
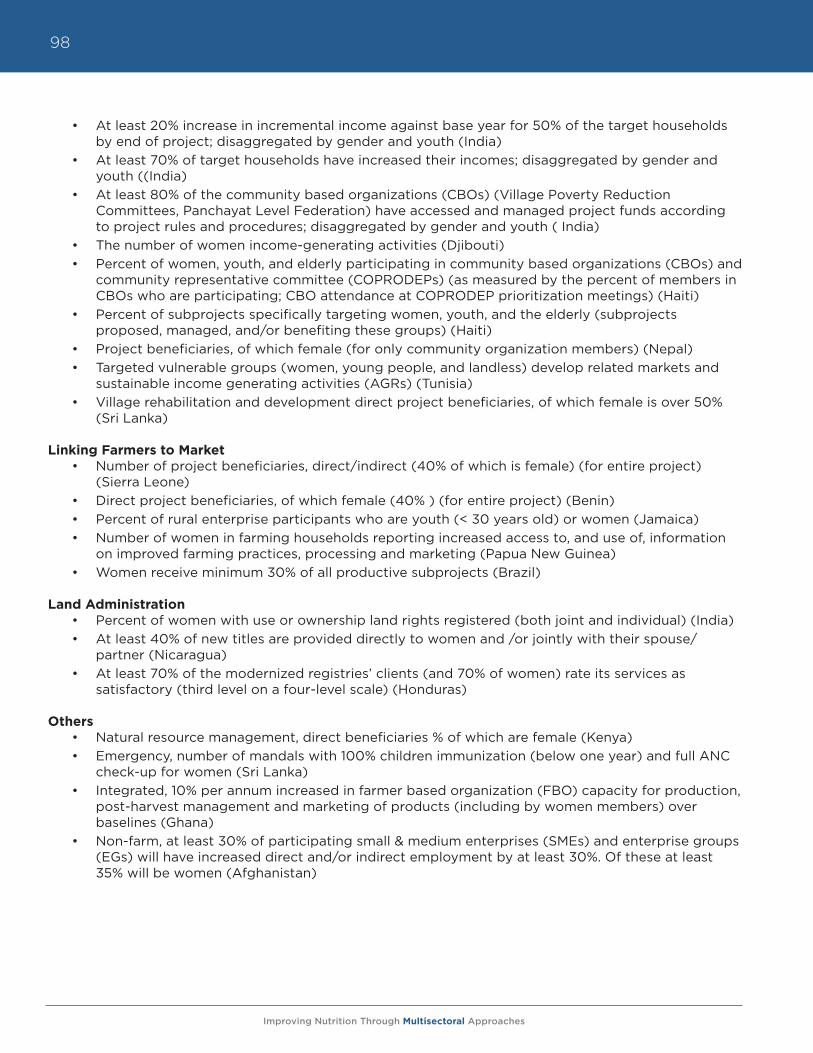
Improving Nutrition Through Multisectoral Approaches
98
• At least 20% increase in incremental income against base year for 50% of the target households by end of project; disaggregated by gender and youth (India)
• At least 70% of target households have increased their incomes; disaggregated by gender and youth ((India)
• At least 80% of the community based organizations (CBOs) (Village Poverty Reduction Committees, Panchayat Level Federation) have accessed and managed project funds according to project rules and procedures; disaggregated by gender and youth ( India)
• The number of women income-generating activities (Djibouti)• Percent of women, youth, and elderly participating in community based organizations (CBOs) and
community representative committee (COPRODEPs) (as measured by the percent of members in CBOs who are participating; CBO attendance at COPRODEP prioritization meetings) (Haiti)
• Percent of subprojects specifically targeting women, youth, and the elderly (subprojects proposed, managed, and/or benefiting these groups) (Haiti)
• Project beneficiaries, of which female (for only community organization members) (Nepal)• Targeted vulnerable groups (women, young people, and landless) develop related markets and
sustainable income generating activities (AGRs) (Tunisia)• Village rehabilitation and development direct project beneficiaries, of which female is over 50%
(Sri Lanka)
Linking Farmers to Market• Number of project beneficiaries, direct/indirect (40% of which is female) (for entire project)
(Sierra Leone)• Direct project beneficiaries, of which female (40% ) (for entire project) (Benin)• Percent of rural enterprise participants who are youth (< 30 years old) or women (Jamaica)• Number of women in farming households reporting increased access to, and use of, information
on improved farming practices, processing and marketing (Papua New Guinea)• Women receive minimum 30% of all productive subprojects (Brazil)
Land Administration• Percent of women with use or ownership land rights registered (both joint and individual) (India)• At least 40% of new titles are provided directly to women and /or jointly with their spouse/
partner (Nicaragua)• At least 70% of the modernized registries’ clients (and 70% of women) rate its services as
satisfactory (third level on a four-level scale) (Honduras)
Others• Natural resource management, direct beneficiaries % of which are female (Kenya)• Emergency, number of mandals with 100% children immunization (below one year) and full ANC
check-up for women (Sri Lanka)• Integrated, 10% per annum increased in farmer based organization (FBO) capacity for production,
post-harvest management and marketing of products (including by women members) over baselines (Ghana)
• Non-farm, at least 30% of participating small & medium enterprises (SMEs) and enterprise groups (EGs) will have increased direct and/or indirect employment by at least 30%. Of these at least 35% will be women (Afghanistan)
Improving Nutrition Through Multisectoral Approaches
99
Annex C-3. Food consumption indicators
a. Dietary Diversity Score (DDS)
Description. The dietary diversity score, developed by the USAID-funded Food and Nutrition Technical Assistance (FANTA) project and by FAO,1 consists of a simple count of the different food groups that a household or an individual has consumed over the preceding 24 hours. The household dietary diversity score is meant to reflect household access to a variety of foods, while individual scores are a proxy for nutrient adequacy of the diet of individuals. For example, the Women’s Dietary Diversity Score reflects the probability of micronutrient adequacy of the diet for women of reproductive age, and the Infant Dietary Diversity Score reflects the dietary quality of children aged 6–23 months.
Validation. The dietary diversity scores have been validated for several age and sex groups as proxy measures for macro and/or micronutrient adequacy of the diet. Scores have been positively correlated with adequate micronutrient density of complementary foods for infants and young children,2 and macronutrient and micronutrient adequacy of the diet for non-breastfed children,3,4,5,6 adolescents7 and adults.8,9
Use. Since the scores are used for different purposes, the calculations are based upon different numbers of food groups. Twelve food groups are commonly proposed for the household: nine for women and seven for infants.10 There are no established cut-off points in terms of number of food groups to indicate adequate or inadequate dietary diversity for the household or individual. Because of this, the mean score or distribution of scores is recommended for analytical purposes and to set appropriate program target values of the DDS. Moreover, the calculation of percentage of individuals or households consuming certain food groups or combinations of nutrient dense food groups can be another important analytical tool.
b. Food Consumption Scores (FCS)
Description. The Food Consumption Score (FCS) is a frequency-weighted diet diversity score that was developed by WFP as a proxy measure of food security. Information about frequency of consumption (in days) by a household over a recall period of the past seven days is collected from a country specific list of food groups.11 The consumption frequency of each food group is multiplied by an assigned weight that is based on its nutrient content; the values are summed to obtain the FCS.
1 Guidelines for measuring household and individual dietary diversity. FAO 2011; FANTA 2006. Household Dietary Diversity Score (HDDS) for Mea-surement of Household Food Access: Indicator Guide. Version 2.
2 FANTA. 2006. Developing and Validating Simple Indicators of Dietary Quality and Energy Intake of Infants and Young Children in Developing Countries: Summary of findings from analysis of 10 data sets. Working Group on Infant and Young Child Feeding Indicators. Food and Nutrition Technical Assistance (FANTA) Project, Academy for Educational Development (AED), Washington, D.C.
3 Hatloy, A., Torheim, L. & Oshaug, A. 1998. Food variety--a good indicator of nutritional adequacy of the diet? A case study from an urban area in Mali, West Africa. European Journal of Clinical Nutrition 52(12):891-8.
4 Ruel, M., Graham, J., Murphy, S. & Allen, L. 2004. Validating simple indicators of dietary diversity and animal source food intake that accurately reflect nutrient adequacy in developing countries. Report submitted to GL-CRSP.
5 Steyn, NP, Nel, J.H., Nantel, G., Kennedy, G., Labadarios, D. 2006. Food variety and dietary diversity scores in children: are they good indicators of dietary adequacy? Public Health Nutrition 9(5): 644-650.
6 Kennedy, G., Pedro, M.R., Seghieri, C., Nantel, G. & Brouwer, I. 2007. Dietary diversity score is a useful indicator of micronutrient intake in non breast-feeding Filipino children. Journal of Nutrition 137: 1-6.
7 Mirmiran, P., Azadbakht, L., Esmaillzadeh, A. & Azizi, F. 2004. Dietary diversity score in adolescents- a good indicator of the nutritional adequacy of diets: Tehran lipid and glucose study. Asia Pacific Journal of Clinical Nutrition 13(1): 56-60.
8 Foote, J., Murphy, S., Wilkens, L., Basiotis, P. & Carlson, A. 2004. Dietary variety increases the probability of nutrient adequacy among adults. Jour-nal of Nutrition 134: 1779-1785.
9 Arimond, M., Wiesmann, D., Becquey E., Carriquiry, A., Daniels, M., Deitchler, M., Fanou-Fogny, N., Joseph, M., Kennedy, G., Martin-Prevel, Y. & Torheim, L.E. 2010 Simple food group diversity indicators predict micronutrient adequacy of women’s diets in 5 diverse, resource-poor set-tings. Journal of Nutrition 140(11): 2059S-2069S.
10 FAO. 2011. Guidelines for measuring household and individual dietary diversity. Rome: FAO.11 World Food Programme. 2008. Technical Guidance Sheet - Food Consumption Analysis: Calculation and Use of the Food Consumption Score
in Food Security Analysis.
Improving Nutrition Through Multisectoral Approaches
100
Validation. International Food Policy Research Institute12 carried out validation of the FCS for three countries – Burundi, Haiti, and Sri Lanka.13 The study found that FCS is positively correlated with calorie consumption per capita and validated the FCS against several alternative indicators of household food security, such as the dietary diversity scores for different age and sex groups. Moreover, strong and expected correlation has been found between FCS and other proxy indicators of food consumption, food access, and food security (percentage expenditures on food, food procurement source, wealth index, asset index, number of meals eaten per day, harvest and production indicators) by using the data from Burundi and Mali.14 Similar results were also found from the Cameroon Comprehensive Food Security and Vulnerability Analysis (CFSVA) project.
Use. The FCS has been in use by the WFP as part of their community household surveillance and other data collection efforts. The FCS can be used to describe the general food consumption pattern and the current food security situation. In addition, the mean FCS and the mean number of days that different food groups in the food consumption clusters are consumed, can also be calculated to interpret the composition of the diet.
c. Months of Adequate Household Food Provisioning (MAHFP)
Description. MAHFP measures household food accessibility throughout the past year, and reflects the monthly and seasonality aspect of food security.15 To capture improvements in household food access accurately over time, data in MAHFP should be collected during the period of greatest food shortages (such as immediately prior to the harvest). This will increase the accuracy of recall for the number of months when the household did not have sufficient food. Subsequent data collection should be undertaken at the same time of year.
Validation. The MAHFP score has not been validated against other measures of food security or dietary intake, but one research paper found that MAHFP scores tracked with HFIAS scores in three different countries in Africa.16
Use. The MAHFP indicator captures changes in the household’s ability to address vulnerability in such a way as to ensure that food is available above a minimum level year round. Measuring the MAHFP has the advantage of capturing the combined effects of a range of interventions such as improved agricultural production, storage, and strategies to increase the household’s purchasing power. It has been incorporated as a standard impact indicator in all of Africare’s food security programs.
d. Household Food Insecurity Access Scale (HFIAS)
Description. HFIAS, developed by the USAID-funded Food and Nutrition Technical Assistance (FANTA) project, consists of nine items and four frequency responses.17 The HFIAS score is a continuous measure of the degree of food insecurity (i.e., access) in the household in the past four weeks (30 days), with the minimum score 0 and the maximum score 27. The higher the score, the more food insecurity the household experienced.
12 International Food Policy Research Institute (IFPRI). 2009. Validation of the world food program’s food consumption score and alternative indica-tors of household food security.
13 International Food Policy Research Institute (IFPRI). 2009. Validation of the world food program’s food consumption score and alternative indica-tors of household food security.
14 World Food Programme. 2008. Technical Guidance Sheet - Food Consumption Analysis: Calculation and Use of the Food Consumption Score in Food Security Analysis.
15 Bilinsky P, A. Swindale. 2010. Months of Adequate Household Food Provisioning (MAHFP) for Measurement of Household Food Access: Indicator Guide. Version 4. FANTA-2.
16 Remans R, Flynn DFB, DeClerck F, Diru W, Fanzo J, et al. 2011. Assessing Nutritional Diversity of Cropping Systems in African Villages. PLoS ONE 6(6): e21235. doi:10.1371/journal.pone.0021235
17 Coates, J, A Swindale, P Bilinsky. 2007. Household Food Insecurity Access Scale (HFIAS) for Measurement of Food Access: Indicator Guide. Ver-sion 3. FANTA.
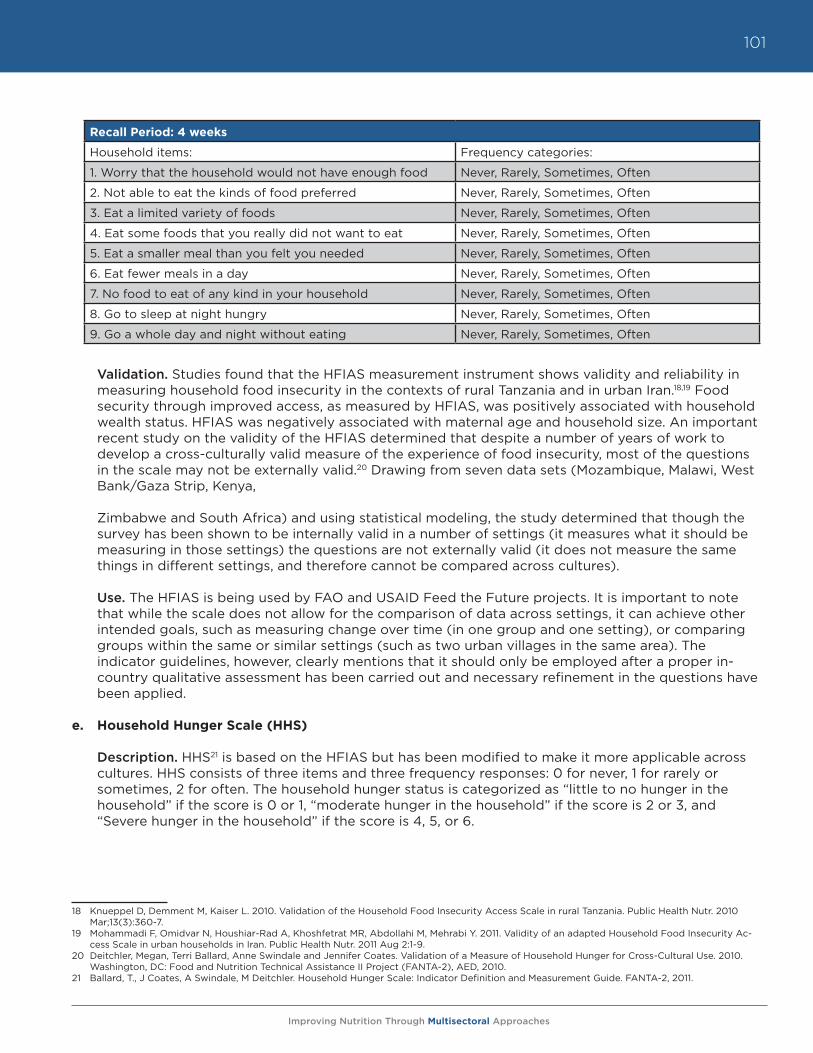
Improving Nutrition Through Multisectoral Approaches
101
Recall Period: 4 weeks
Household items: Frequency categories:
1. Worry that the household would not have enough food Never, Rarely, Sometimes, Often
2. Not able to eat the kinds of food preferred Never, Rarely, Sometimes, Often
3. Eat a limited variety of foods Never, Rarely, Sometimes, Often
4. Eat some foods that you really did not want to eat Never, Rarely, Sometimes, Often
5. Eat a smaller meal than you felt you needed Never, Rarely, Sometimes, Often
6. Eat fewer meals in a day Never, Rarely, Sometimes, Often
7. No food to eat of any kind in your household Never, Rarely, Sometimes, Often
8. Go to sleep at night hungry Never, Rarely, Sometimes, Often
9. Go a whole day and night without eating Never, Rarely, Sometimes, Often
Validation. Studies found that the HFIAS measurement instrument shows validity and reliability in measuring household food insecurity in the contexts of rural Tanzania and in urban Iran.18,19 Food security through improved access, as measured by HFIAS, was positively associated with household wealth status. HFIAS was negatively associated with maternal age and household size. An important recent study on the validity of the HFIAS determined that despite a number of years of work to develop a cross-culturally valid measure of the experience of food insecurity, most of the questions in the scale may not be externally valid.20 Drawing from seven data sets (Mozambique, Malawi, West Bank/Gaza Strip, Kenya,
Zimbabwe and South Africa) and using statistical modeling, the study determined that though the survey has been shown to be internally valid in a number of settings (it measures what it should be measuring in those settings) the questions are not externally valid (it does not measure the same things in different settings, and therefore cannot be compared across cultures).
Use. The HFIAS is being used by FAO and USAID Feed the Future projects. It is important to note that while the scale does not allow for the comparison of data across settings, it can achieve other intended goals, such as measuring change over time (in one group and one setting), or comparing groups within the same or similar settings (such as two urban villages in the same area). The indicator guidelines, however, clearly mentions that it should only be employed after a proper in-country qualitative assessment has been carried out and necessary refinement in the questions have been applied.
e. Household Hunger Scale (HHS)
Description. HHS21 is based on the HFIAS but has been modified to make it more applicable across cultures. HHS consists of three items and three frequency responses: 0 for never, 1 for rarely or sometimes, 2 for often. The household hunger status is categorized as “little to no hunger in the household” if the score is 0 or 1, “moderate hunger in the household” if the score is 2 or 3, and “Severe hunger in the household” if the score is 4, 5, or 6.
18 Knueppel D, Demment M, Kaiser L. 2010. Validation of the Household Food Insecurity Access Scale in rural Tanzania. Public Health Nutr. 2010 Mar;13(3):360-7.
19 Mohammadi F, Omidvar N, Houshiar-Rad A, Khoshfetrat MR, Abdollahi M, Mehrabi Y. 2011. Validity of an adapted Household Food Insecurity Ac-cess Scale in urban households in Iran. Public Health Nutr. 2011 Aug 2:1-9.
20 Deitchler, Megan, Terri Ballard, Anne Swindale and Jennifer Coates. Validation of a Measure of Household Hunger for Cross-Cultural Use. 2010. Washington, DC: Food and Nutrition Technical Assistance II Project (FANTA-2), AED, 2010.
21 Ballard, T., J Coates, A Swindale, M Deitchler. Household Hunger Scale: Indicator Definition and Measurement Guide. FANTA-2, 2011.
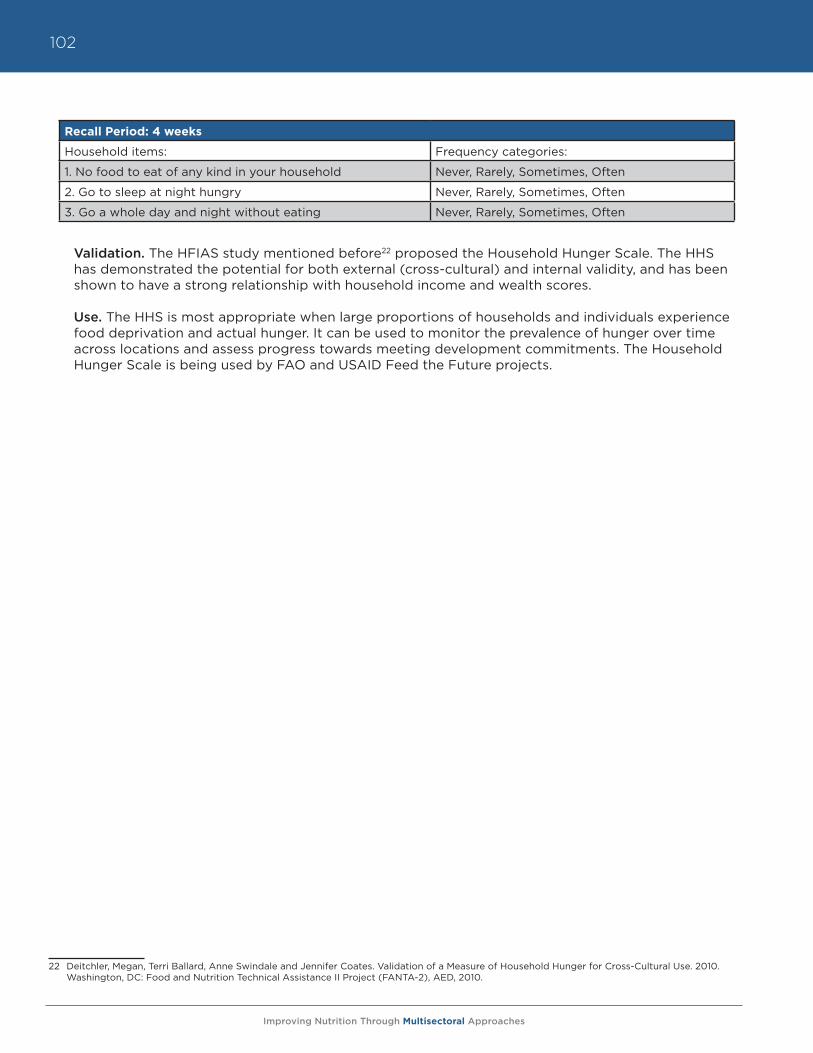
Improving Nutrition Through Multisectoral Approaches
102
Recall Period: 4 weeks
Household items: Frequency categories:
1. No food to eat of any kind in your household Never, Rarely, Sometimes, Often
2. Go to sleep at night hungry Never, Rarely, Sometimes, Often
3. Go a whole day and night without eating Never, Rarely, Sometimes, Often
Validation. The HFIAS study mentioned before22 proposed the Household Hunger Scale. The HHS has demonstrated the potential for both external (cross-cultural) and internal validity, and has been shown to have a strong relationship with household income and wealth scores.
Use. The HHS is most appropriate when large proportions of households and individuals experience food deprivation and actual hunger. It can be used to monitor the prevalence of hunger over time across locations and assess progress towards meeting development commitments. The Household Hunger Scale is being used by FAO and USAID Feed the Future projects.
22 Deitchler, Megan, Terri Ballard, Anne Swindale and Jennifer Coates. Validation of a Measure of Household Hunger for Cross-Cultural Use. 2010. Washington, DC: Food and Nutrition Technical Assistance II Project (FANTA-2), AED, 2010.
Improving Nutrition Through Multisectoral Approaches
103
Annex C-4. Suggested nutrition resources
The Human Development Network is currently establishing a Knowledge Exchange for Nutrition, which will provide key information on nutrition resources, including a list of nutrition specialists within the Bank, who could potentially assist agricultural TTLs in planning nutrition sensitive approaches in projects.
For TTLs to understand the basic nutrition situation in countries where they work, the following resources are useful:
World Bank Nutrition Country Profiles (2011) These are two-page profiles of the 68 highest-burden-of-malnutrition countries. They contain information on prevalence of malnutrition and its causes, how the country’s state of nutrition compares to countries with similar GDP or geography, information on current World Bank nutrition projects in the country, cost for scaling up core micronutrient interventions, and suggested actions. These profiles are useful for basic context assessment and for making the case to address nutrition through agricu lture in high-burden countries.http://www.worldbank.org/nutrition/profiles
UNICEF State of the World’s Children - data tables (2011)The data tables in UNICEF’s annual flagship report present major nutrition indicators, comparable across all countries, in a highly user-friendly format. It is updated annually.http://www.unicef.org/sowc2011/pdfs/SOWC-2011-Statistical-tables_12082010.pdf
UNICEF Tracking Progress on Child and Maternal Undernutrition (2009)This publication provides profiles of several high-burden-of-malnutrition countries, presenting information on nutrition indicators and what proportion of child deaths are due to malnutrition and other diseases.http://www.unicef.org/publications/files/Tracking_Progress_on_Child_and_Maternal_Nutrition_EN_110309.pdf
UNICEF ChildInfoThis allows country-by-country tracking of the MDG1 indicator on child underweight (Indicator 1.8: % of Children under 5 moderately or severely underweight), underweight prevalence by economic background, and underweight and stunting data (the same compiled in UNICEF State of the World’s Children reports).http://www.childinfo.org/undernutrition_mdgprogress.php
World Bank World Development IndicatorsWDI contains two indicators for malnutrition (stunting, underweight), as well as rural population and proportion of the population employed in agriculture, which can help to estimate likely risk of malnutrition among farmers.http://data.worldbank.org/
WHO nutrition databases (http://www.who.int/nutrition/databases/en/index.html)WHO maintains several databases on nutrition, including:
• Nutrition Landscape Information System (NLIS) – a web-based tool which provides nutrition and nutrition-related health and development data in the form of automated country profiles and user-defined downloadable data
• WHO Global Database on Body Mass Index – contains updated data on underweight, overweight and obesity, and related indicators for all countries.
Improving Nutrition Through Multisectoral Approaches
104
• National nutrition policies and programs - The Global Database on National Nutrition Policies and Programs was established in 1995, initially to monitor and evaluate the progress in implementing the World Declaration and Plan of Action for Nutrition. It has been further developed to monitor country progress in developing, strengthening and implementing national nutrition plans, policies, and programs, including multisectoral actions, development of dietary guidelines, undertaking of nutrition surveys, demographic, and epidemiological data.
• WHO Global Database on Child Growth and Malnutrition - an A-Z list from which users can choose a country to view available child malnutrition data and reference tables (in pdf). Caution: these tables are not easy to interpret for non-nutritionists. UNICEF SOWC (see above) contains similar information.
• Vitamin and Mineral Nutrition Information System (VMNIS) – contains most recent data for anemia, iodine deficiency disorders, and vitamin A deficiency. Caution: these tables are not easy to interpret for non-nutritionists. World Bank country nutrition profiles (see above) contain similar information for 68 countries.
Improving Nutrition Through Multisectoral Approaches
105
Annex C-5. Recent reviews and strategies to mainstream nutrition into agriculture
• A Synthesis of Guiding Principles on Agriculture Programming for Nutrition , of recommenda-tions in common among many different institutions, was recently supported by FAO. https:// www.securenutritionplatform.org/Pages/DisplayResources.aspx?RID=32
• The European Commission’s Reference document (September 2011) provides guidance to country teams on how to incorporate nutrition components into existing projects and programs. http://capacity4dev.ec.europa.eu/topic/fighting-hunger
• The DfID commissioned systematic evidence review (Masset et al., 2011) summarizes existing evidence and programme theory of agricultural interventions, and identifies gaps in knowledge. This document is available from: http://www.dfid.gov.uk/R4D/PDF/Outputs/SystematicReviews/Masset_etal_agriculture_and_nutrition.pdf. An abridged version is published in BMJ 2012, v. 344. Open access, available at: http://www.bmj.com/content/344/bmj.d8222
• The Bill and Melinda Gates Foundation published a statement of their approach to optimize nutrition impacts from agriculture, based on a review of evidence. http://www.gatesfoundation.org/agriculturaldevelopment/Pages/optimizing-nutrition-outcomes-from-investment-agriculture.aspx
• The World Bank’s From Agriculture to Nutrition (2007) document presents a review of evidence of agriculture interventions with a nutrition focus, and examines the changes in agriculture and nutrition that are affecting the operational contexts in which nutrition-focused agricultural interventions are carried out, and the institutional issues related to these. This document is available from: http://siteresources.worldbank.org/EXTARD/Resources/Final.pdf
• DfiD’s Nutrition Strategy (2010) focuses on four strategic objectives of mobilizing and coordinating the international response, prioritizing countries and populations most vulnerable to malnutrition, investing in a multiple sectors to improve nutrition, and using evidence and demonstrating results. This document is available from: http://collections.europarchive.org/tna/20100423085705/http:/dfid.gov.uk/Documents/publications/nutrition-strategy.pdf
• USAID’s IYCN Nutrition and Food Security Impact of Agriculture Projects Review of Experiences (2011) showcases nutrition and food security impacts separately, and then integrates the two for a comprehensive look and recommendations on sensitizing agricultural projects to be more nutrition friendly. This document is available from: http://www.iycn.org/2011/09/resources-for-agriculture-project-designers/
• FAO has a new corporate priority to mainstream nutrition into agriculture, reflected in several documents including Assisting the food and agriculture sector in addressing malnutrition and Investing in Food Security: Linking Agriculture to Nutrition Security (2009)http://www.fao.org/fileadmin/user_upload/agn/pdf/Food_and_Agr_sector_and_malnutrition.pdf. http://www.fao.org/fileadmin/templates/ag_portal/docs/i1230e00.pdf
• IFAD Strategic Framework 2011-2015: Enabling poor rural people to improve their food security and nutrition, raise their incomes and strengthen their resilience. http://www.ifad.org/pub/strategy/index.htm
• USAID Feed the Future Guide 2010 is available at http://www.feedthefuture.gov/resource/feed-future-guide, and the Feed the Future Indicator Handbook: Definition Sheets are also available online. http://www.feedthefuture.gov/resource/feed-future-handbook-indicator-definitions
• Action Against Hunger (ACF) operational document: “Maximizing the nutritional impact of food security and livelihoods interventions: a manual for field workers,” July 2011. http://www.actionagainsthunger.org/publication/2011/07/maximising-nutritional-impact-food-security-and-livelihoods-interventions
Improving Nutrition Through Multisectoral Approaches
106
• Save the Children UK’s “A Life Free from Hunger” includes a substantial section on “harnessing the potential of agriculture to tackle malnutrition.” http://www.savethechildren.org.uk/resources/online-library/life-free-hunger-tackling-child-malnutrition
• IFPRI’s 2020 International Conference on Leveraging Agriculture for Improving Nutrition and Health website (2011), which includes links to Conference Briefs on various aspects of the three main topics discussed: agriculture, health, and nutrition. The 2020 conference link is at http://2020conference.ifpri.info/publications/
• Highlights from the Leveraging Agriculture for Improving Nutrition and Health International Conference (IFPRI, 2011) includes key themes that emerged from this conference, including videos that capture some exciting and thought-provoking moments of the event, as well as a mini-documentary on the importance of bringing together agriculture, health, and nutrition. Videos and the highlights interactive booklet are available from: http://2020conference.ifpri.info/
• Bioversity International produced “a manual on implementing food systems field projects to assess and improve dietary diversity, and nutrition and health outcomes” (Oct 2011). http://www.bioversityinternational.org/fileadmin/bioversityDocs/Research/Nutrition__new_/Improving_Nutrition_with_agricultural_biodiversity.pdf
• The Lessons from the Mainstreaming Nutrition Initiative article (Pelletier et al., 2011), which presents the main findings from MNI’s country-level activities and provides concrete recommendations for nutrition agenda setting, policy formulation, and implementation. This article is available from: http://heapol.oxfordjournals.org/content/early/2011/02/03/heapol.czr011.full.pdf+html
• The Value Chains for Nutrition Brief (Hawkes and Ruel 2011), which provides a summary of the food supply chain, and the role that the agriculture sector can and should play between the production and consumption phases through “value-chain” concepts, analyses, and approaches. This was presented during IFPRI’s 2020 International conference, and the brief is available from: http://www.ifpri.org/sites/default/files/publications/2020anhconfbr04.pdf
• ZincWorld’s Zinc Crops Improving Crop Production and Human Health website (2007), includes links to presentations and posters presented during this conference, focusing on zinc and human nutrition, soil and crop management, zinc fertilizers and crop nutrition, and plant physiology, genetics, and molecular biology. The Zinc Crops conference link is http://www.zinc-crops.org/ZnCrops2007/page_session_1.htm.
Improving Nutrition Through Multisectoral Approaches
107
MODULE D. Improving Nutrition through Social ProtectionAlessandra Marini, Harold Alderman, Meera Shekar
I. Background
Nutrition is widely seen as a multisectorial issue. This guidance note builds on evidence to date regarding the links between social protection (SP) and nutrition outcomes, and aims to guide Bank Task Team Leaders (TTLs) and country level implementers in converting existing or future Bank operations in the SP sector in to more nutrition sensitive and nutrition specific programs (see Module A for more details).
The new World Bank Social Protection Strategy presents social protection systems as aimed at building resilience by ensuring that individuals and families are well-protected against the sudden shocks that are likely to overwhelm them. These systems improve equity at both national and global levels by reducing poverty and destitution. They also promote opportunities to improve people’s productivity and incomes by preserving and building their human capital, and facilitating access to better jobs and income, which can propel them out of poverty.
Investments in nutrition and early child development are increasingly recognized as integral components of a coherent social protection system to prevent the intergenerational transmission of poverty. In addition, they are key determinants of long-term economic growth. When child nutrition is improved the risk of mortality is reduced, future human capital is built, and productivity is increased. Thus, focusing on improving nutrition furthers the objective of increasing opportunities, enhancing both nutrition and social protection.
How can social protection interventions affect nutritional outcomes? Nutritional status reflects the interplay of food consumption, access to health and sanitation, and nutrition knowledge and care practices. Social protection programs typically increase income (linked to food access), as well as influence the timing, and to a degree, the control of this income. Additionally, such programs may have greater impact on nutrition by fostering linkages with health services or with sanitation programs, and specifically through activities that are related to nutrition education or micronutrient supplementation. Moreover, by taking into consideration the relatively narrow window of opportunity for investing in nutrition, programs can be targeted to enhance their impact on nutrition. The critical window opens during pregnancy and closes at about two years of age. These “1,000 days” offer the best opportunity to lock-in future human capital. Interventions during this period can potentially reduce undernutrition-related mortality and morbidity by 25 percent if implemented at scale.1 Figure D-1 illustrates the key pathways through which a social protection program is expected to have an impact on nutrition, grouped under three categories: transfers, links with health services, and targeting the most vulnerable.
1 The Lancet Series on Maternal and Child Undernutrition (2008), available at www.thelancet.com; Copenhagen Consensus Results 2008; available from www.copenhagenconsensus.com; World Bank, 2006. Repositioning Nutrition as Central to Development, the World Bank, Washington D.C.
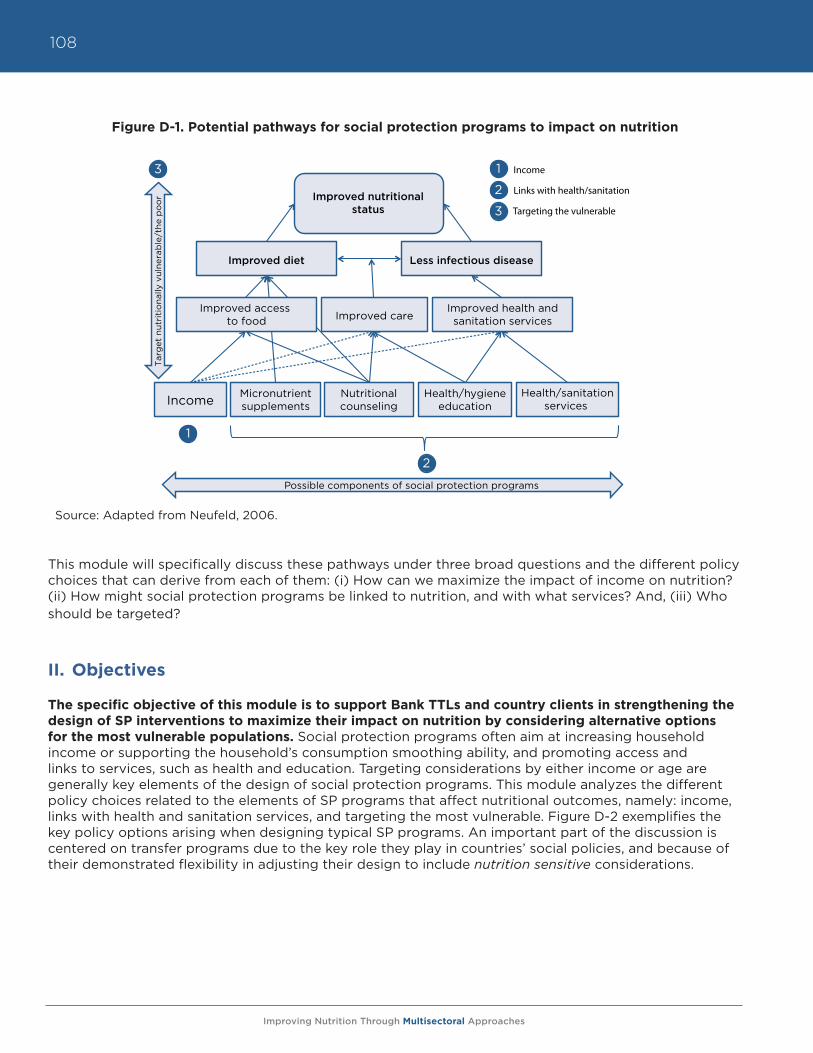
Improving Nutrition Through Multisectoral Approaches
108
Figure D-1. Potential pathways for social protection programs to impact on nutrition
Source: Adapted from Neufeld, 2006.
This module will specifically discuss these pathways under three broad questions and the different policy choices that can derive from each of them: (i) How can we maximize the impact of income on nutrition? (ii) How might social protection programs be linked to nutrition, and with what services? And, (iii) Who should be targeted?
II. Objectives
The specific objective of this module is to support Bank TTLs and country clients in strengthening the design of SP interventions to maximize their impact on nutrition by considering alternative options for the most vulnerable populations. Social protection programs often aim at increasing household income or supporting the household’s consumption smoothing ability, and promoting access and links to services, such as health and education. Targeting considerations by either income or age are generally key elements of the design of social protection programs. This module analyzes the different policy choices related to the elements of SP programs that affect nutritional outcomes, namely: income, links with health and sanitation services, and targeting the most vulnerable. Figure D-2 exemplifies the key policy options arising when designing typical SP programs. An important part of the discussion is centered on transfer programs due to the key role they play in countries’ social policies, and because of their demonstrated flexibility in adjusting their design to include nutrition sensitive considerations.
Improved nutritionalstatus
Figure 1: Impact pathways of social protection programs on nutrition
Income Micronutrientsupplements
Nutritionalcounseling
Health/hygieneeducation
Health/sanitationservices
1
2
Tar
get
nut
riti
ona
lly v
ulne
rab
le/t
he p
oo
r 3
Possible components of social protection programs
Income
Links with health/sanitation
Targeting the vulnerable
1
2
3
Improved diet Less infectious disease
Improved careImproved health andsanitation services
Improved access to food
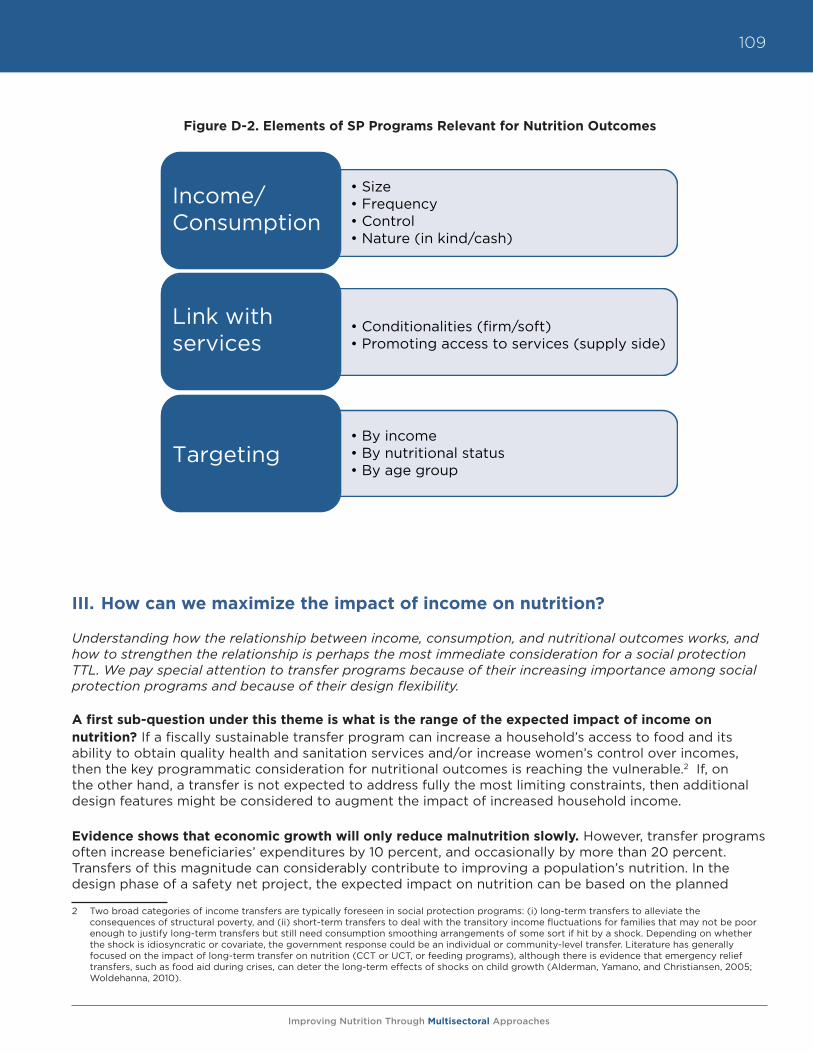
Improving Nutrition Through Multisectoral Approaches
109
Figure D-2. Elements of SP Programs Relevant for Nutrition Outcomes
III. How can we maximize the impact of income on nutrition?
Understanding how the relationship between income, consumption, and nutritional outcomes works, and how to strengthen the relationship is perhaps the most immediate consideration for a social protection TTL. We pay special attention to transfer programs because of their increasing importance among social protection programs and because of their design flexibility. A first sub-question under this theme is what is the range of the expected impact of income on nutrition? If a fiscally sustainable transfer program can increase a household’s access to food and its ability to obtain quality health and sanitation services and/or increase women’s control over incomes, then the key programmatic consideration for nutritional outcomes is reaching the vulnerable.2 If, on the other hand, a transfer is not expected to address fully the most limiting constraints, then additional design features might be considered to augment the impact of increased household income.
Evidence shows that economic growth will only reduce malnutrition slowly. However, transfer programs often increase beneficiaries’ expenditures by 10 percent, and occasionally by more than 20 percent. Transfers of this magnitude can considerably contribute to improving a population’s nutrition. In the design phase of a safety net project, the expected impact on nutrition can be based on the planned
2 Two broad categories of income transfers are typically foreseen in social protection programs: (i) long-term transfers to alleviate the consequences of structural poverty, and (ii) short-term transfers to deal with the transitory income fluctuations for families that may not be poor enough to justify long-term transfers but still need consumption smoothing arrangements of some sort if hit by a shock. Depending on whether the shock is idiosyncratic or covariate, the government response could be an individual or community-level transfer. Literature has generally focused on the impact of long-term transfer on nutrition (CCT or UCT, or feeding programs), although there is evidence that emergency relief transfers, such as food aid during crises, can deter the long-term effects of shocks on child growth (Alderman, Yamano, and Christiansen, 2005; Woldehanna, 2010).
Income/Consumption
Link with services
Targeting
Improving Nutrition Through Multisectoral Approaches
110
size of the transfer and data from household surveys; in the absence of such surveys, global experience on the determinants of nutrition can assist in planning. For example, Haddad (2003) confirms that income growth, even when evenly distributed over a population, has a positive, albeit relatively modest, impact on undernutrition rates. As a general rule, country level rates of undernutrition, measured as low weight-for-age, decline at roughly 50 percent of the rate that gross national product (GNP) per capita increases; household surveys show comparable rates of improvement in nutrition as incomes rise. Likewise, anemia—measured as hemoglobin levels below 10.9 g/dl—declines at roughly 25 percent of the rate of income growth.3 From another perspective, malnutrition rates among the richest 40 percent of the population in a country with high overall rates of malnutrition, such as India or Malawi, are only somewhat less than malnutrition rates for the poorest 40 percent. To illustrate, based on the most recent nutrition survey available for Pakistan, providing transfers or income growth to the poorest 40 percent of the population to attain the same wealth as the median family would virtually eliminate poverty in Pakistan. Nonetheless, over 38 percent of the entire population of children would still be malnourished.4
Despite the low growth-nutrition elasticity, for a subset of households, cash remains a binding constraint for inputs needed for good nutrition. There is evidence that transfers, even when unconditional, including food stamps, frequently have stronger impact on nutrition than other sources of additional income. That is, when income transfers are part of SP programs, they seem to change the budgeting process. This has been documented in some contexts, for example in the US food stamp program, and in cash transfers in Ecuador or take home rations for female students in Burkina Faso.5
A. Enhancing the role of income in transfer programs
Questions to consider when designing transfer programs:
• How much of a transfer would make a difference?• What is the role of payment frequency?• Would providing the income to women make a difference?• Do in-kind transfers have an advantage over cash transfers?• Can the role of income be strengthened by additional design features, including the
degree to which conditional transfers improve upon the performance of unconditional transfers?
• Can the program design accommodate social promotion campaigns on improved nutritional practices or micronutrient supplementation?
i. Size of “payment” or income transfers
The size of income payment and transfers matters. It is difficult to define what the best amount of transfer ought to be, whether it is compensating for expenses that relate to program participation or fulfillment of conditions, or whether it is an incentive to lift the household out of poverty. It is also difficult to separate the impact of the transfer from that of other program components. The experience of PRAF, Honduras’ conditional cash transfer program, where the relatively low impact of the program was linked to the limited size of the transfer, seems to suggest that the actual size of the transfer can 3 Alderman, H. and Sebastian L. 2009. “Anemia In Low Income Countries Is Unlikely to be Addressed by Economic Development without Additional
Programs,” Food and Nutrition Bulletin, 30 (3): 265-270.4 If household surveys that contain both anthropometric data and expenditures are available, they can be used to make country specific estimates
anywhere a transfer is being considered. However, because demographic and health (DHS) or UNICEF multiple indicator cluster surveys (MICS) data can only provide the basis for an ordinal ranking of wealth, some interpretation is still needed to estimate the impact of a given cash transfer. This limitation, however, is hardly insurmountable. If other data sets allow one to estimate income or expenditures by wealth quintiles, the two sources of complementary data allow an estimate of the impact of an income transfer on nutritional outcomes for the average household in a quintile.
5 Kazianga, H., de Walque, D. and H. Alderman. 2009. Educational and Health Impact of Two School Feeding Schemes: Evidence from a Random-ized Trial in Rural Burkina Faso. World Bank Policy Research Working Paper #4976; Breunig, R. and I. Dasgupta. 2005. “Do Intra-household Effects Generate the Food Stamp Cash-Out Puzzle? American Journal of Agricultural Economics. 87(3): 552-68; Fraker, T., Martini, A. and J. Ohls. 1995. “The Effect of Food Stamp Cashout on Food Expenditures: An Assessment of the Findings from Four Demonstrations,” Journal of Human Re-sources 30(4): 633-49; Paxson, C. and N. Schady. 2007. Does Money Matter? The Effects of Cash Transfers on Child Health and Cognitive Develop-ment in Rural Ecuador. World Bank Policy Research Working Paper 4226. Washington, D.C.: World Bank, 2007; P. Kooreman. 2000. “The Labeling Effect of a Child Benefit System,” American Economic Review 90(3): 571-583.
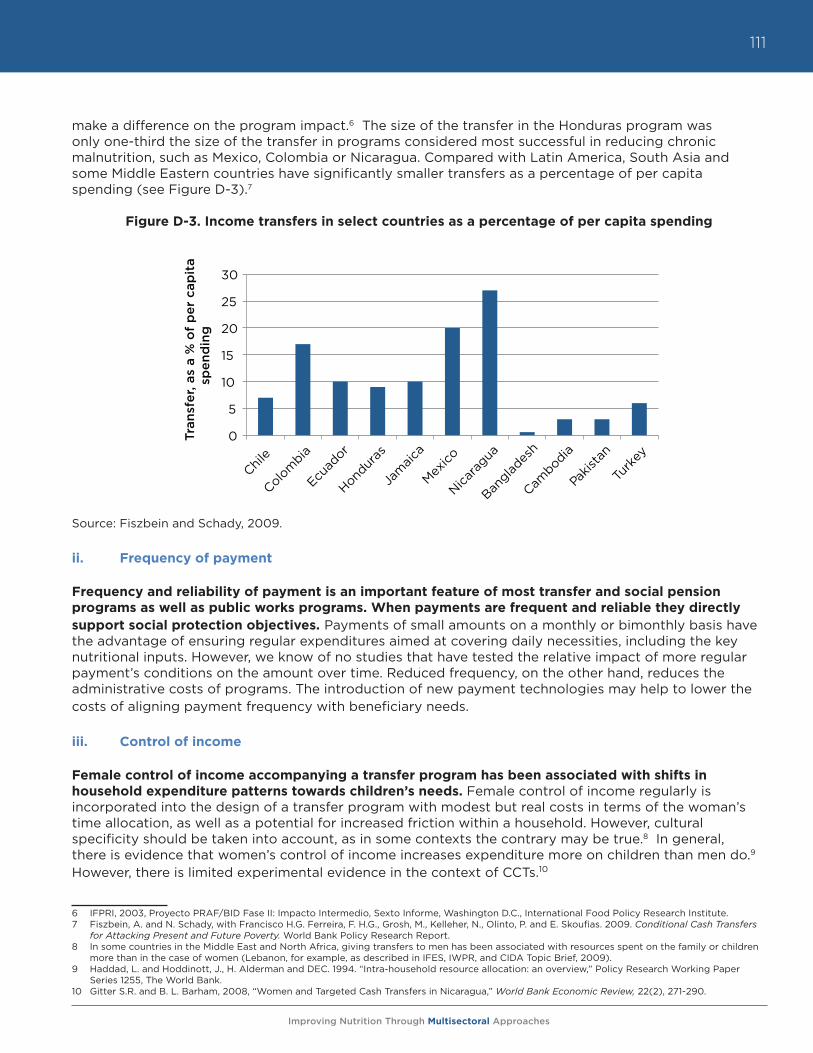
Improving Nutrition Through Multisectoral Approaches
111
make a difference on the program impact.6 The size of the transfer in the Honduras program was only one-third the size of the transfer in programs considered most successful in reducing chronic malnutrition, such as Mexico, Colombia or Nicaragua. Compared with Latin America, South Asia and some Middle Eastern countries have significantly smaller transfers as a percentage of per capita spending (see Figure D-3).7
Figure D-3. Income transfers in select countries as a percentage of per capita spending
Source: Fiszbein and Schady, 2009.
ii. Frequency of payment
Frequency and reliability of payment is an important feature of most transfer and social pension programs as well as public works programs. When payments are frequent and reliable they directly support social protection objectives. Payments of small amounts on a monthly or bimonthly basis have the advantage of ensuring regular expenditures aimed at covering daily necessities, including the key nutritional inputs. However, we know of no studies that have tested the relative impact of more regular payment’s conditions on the amount over time. Reduced frequency, on the other hand, reduces the administrative costs of programs. The introduction of new payment technologies may help to lower the costs of aligning payment frequency with beneficiary needs.
iii. Control of income
Female control of income accompanying a transfer program has been associated with shifts in household expenditure patterns towards children’s needs. Female control of income regularly is incorporated into the design of a transfer program with modest but real costs in terms of the woman’s time allocation, as well as a potential for increased friction within a household. However, cultural specificity should be taken into account, as in some contexts the contrary may be true.8 In general, there is evidence that women’s control of income increases expenditure more on children than men do.9 However, there is limited experimental evidence in the context of CCTs.10
6 IFPRI, 2003, Proyecto PRAF/BID Fase II: Impacto Intermedio, Sexto Informe, Washington D.C., International Food Policy Research Institute.7 Fiszbein, A. and N. Schady, with Francisco H.G. Ferreira, F. H.G., Grosh, M., Kelleher, N., Olinto, P. and E. Skoufias. 2009. Conditional Cash Transfers
for Attacking Present and Future Poverty. World Bank Policy Research Report.8 In some countries in the Middle East and North Africa, giving transfers to men has been associated with resources spent on the family or children
more than in the case of women (Lebanon, for example, as described in IFES, IWPR, and CIDA Topic Brief, 2009).9 Haddad, L. and Hoddinott, J., H. Alderman and DEC. 1994. “Intra-household resource allocation: an overview,” Policy Research Working Paper
Series 1255, The World Bank.10 Gitter S.R. and B. L. Barham, 2008, “Women and Targeted Cash Transfers in Nicaragua,” World Bank Economic Review, 22(2), 271-290.
0
5
10
15
20
25
30
Chile
Colom
bia
Ecuad
or
Hondur
as
Jam
aica
Mexico
Nicara
gua
Banglad
esh
Cambodia
Pakis
tan
Turk
ey
Tran
sfer
, as
a %
of
per
cap
ita
spen
din
g
Improving Nutrition Through Multisectoral Approaches
112
B. Nature of transfers: Cash versus in-kind transfers
Considerations when designing in-kind transfer programs
• How do food markets work (availability, procurement, distribution, etc.)?• Is there a food emergency?• Are food prices very volatile?• Carefully evaluate the nature of the food distributed versus the nutritional problem.• Carefully evaluate unexpected consequences on local markets.
Despite its importance for development assistance in low-income countries, there are few rigorous evaluations of the impact of food versus cash aid on households. Until recently, in-kind assistance was common in low-income countries, both to promote food consumption and because financial services were limited. However, cash-based programs are being developed that take advantage of information technology innovations for beneficiary identification and for delivering cash transfers. While transfer programs in LAC were among the first to shift from in-kind assistance (including subsidized food) to cash, new technology has allowed cash to reach beneficiaries in remote places such as pastoral communities of northern Kenya.
Both forms of assistance have advantages and disadvantages. Food-based transfers may perform better when markets for food do not function well or in the aftermath of a disaster. On the other hand, with proper monitoring, often enhanced by improvements in IT and mobile phone transfers, cash entails lower average logistical costs (therefore higher coverage), and gives beneficiary households greater freedom to respond to their own priority needs. The impact of in-kind transfers on nutrition depends in part on whether the commodity is provided in amounts smaller than would have been otherwise purchased (infra-marginal), in which case the impact is similar to a cash transfer of similar value.
In contrast, extra-marginal programs—transfers for an amount greater than the household would have consumed without the transfer—tend to increase food consumption. Studies in Bangladesh indicate that recipients of in-kind transfers show preference for that modality, while recipients of cash programs prefer their means of support. However, in times of price volatility, preference is generally for in-kind transfers as their real value is protected. This was noted in the Productive Safety Net Program (PSNP) for Ethiopia in 2008. Overall, because the advantages of in-kind food programs are often small, in non-emergency situations and especially when markets are working, the lower cost of cash distribution may be the deciding factor in choosing the form of transfer.
The Mexican Progresa (then Oportunidades) Program evaluated the possibility of delivering its food support component in cash or in-kind transfer from the beginning. Levy and Rodriguez (2005) concluded that considerations of efficiency and efficacy highlighted the convenience of delivering cash transfers, de-linked from consumption patterns, rather than in-kind transfers. Skoufias (2008), in a review of the food distribution program PAL in Mexico, found that while transfers have a large and positive impact on consumption and poverty reduction, irrespective of the nature of the transfer (cash or in-kind), cash transfers had higher impact on height-for-age z-scores of children younger than two years. Additionally, in-kind transfers in the context of populations that are not energy deficient should be carefully designed to ensure that they are not associated with an increase in energy consumption, as was the case for the in-kind transfer program PAL in Mexico.11 A final consideration demonstrates that in remote areas, a cash infusion may push up local prices, as seen in an example from Mexico.12 While this implies a need for monitoring in general, markets tend to be fairly well integrated.
11 Leroy, J.L., Gadsden, P., Rodríguez-Ramírez, S. and T. González de Cossío. 2010. “Cash and In-Kind Transfers in Poor Rural Communities in Mexico Increase Household Fruit, Vegetable, and Micronutrient Consumption but Also Lead to Excess Energy Consumption,” J. Nutr, 140 (3): 612-617.
12 Cunha, J.M., G. De Giorgi, and S. Jayachandran, The Price Effects of Cash Versus In-Kind Transfers, NBER Working Paper No. 17456.
Improving Nutrition Through Multisectoral Approaches
113
Coupons and food stamps serve an intermediary role. Relative to cash, coupons and food stamps have additional logistical costs related to their redemption system, but, as they use existing market channels, they have fewer direct costs than food distribution programs. In principle, tracking coupon redemptions offers an inherent means of monitoring, although this advantage, relative to cash distribution, is declining with improved technology for cash transfers.
Box D-1. Assessing the relative impacts of cash and food transfers on nutrition in Nepal
DfID and the World Bank are undertaking a two-stage research study to compare the relative impact of cash, food transfers, and enhanced nutrition counseling for women. The study will include an initial 2.5-year randomized controlled trial in the Terai region of Nepal to assess the relative impact of three interventions to reduce low birth weight and to improve maternal and neonatal health and nutrition compared to current approaches. If the efficacy trial proves successful, the most effective approach will then be tested in an effectiveness study under normal operating conditions, including in challenging geographical environments in South Asia, with the objective of developing scalable models. IFPRI and WFP are funding similar evaluations in other countries to assess the difference in impact between food and cash.
C. Including nutrition counseling or micronutrient supplementation components
If improving nutritional status is a key objective, an income or in-kind transfer alone may be insufficient. Specific design features can augment impact, such as including a nutrition counseling component, providing micronutrient supplements, or deworming drugs. The linking of a transfer with nutrition may be achieved through simple communication of the objectives of the transfer or through a more concerted strategy of raising public awareness via health/nutrition education programs that may accompany such transfers. Examples of this include group-based demonstration/education sessions, individual counseling or nutrition education, such as the one provided through community-based growth promotion programs (see Module E).
D. Enhancing the role of income in other social protection programs: Public works, insurance, and microfinance
Some considerations discussed previously for transfer programs, such as size and frequency of payment and control of income, apply to the design of other social protection programs. However, some elements that are specific to other programs’ design are worth discussing separately.
i. Accommodating time demands for women in public works programs
Questions to consider when designing public works programs
• Which payment would make a difference?• What is the role of frequency of payments?• Would including a crèche make a difference and attract more women?• Can the program design accommodate counseling on improved nutritional practices or
micronutrient supplementation?
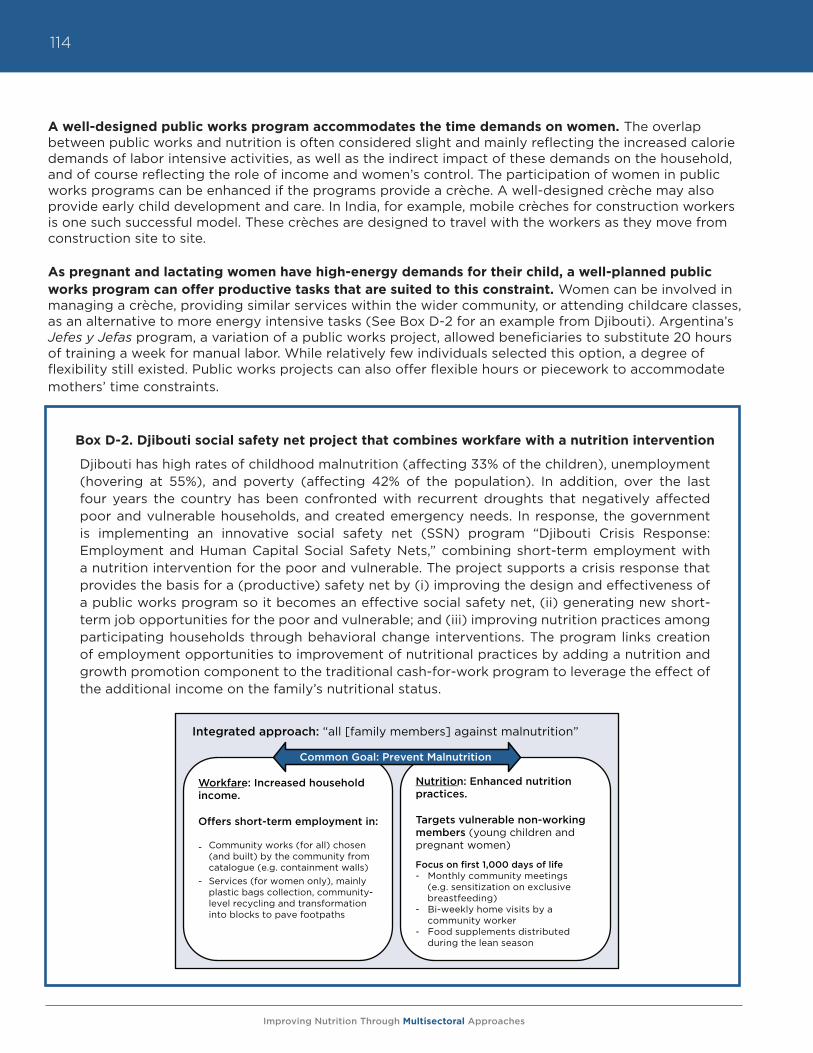
Improving Nutrition Through Multisectoral Approaches
114
A well-designed public works program accommodates the time demands on women. The overlap between public works and nutrition is often considered slight and mainly reflecting the increased calorie demands of labor intensive activities, as well as the indirect impact of these demands on the household, and of course reflecting the role of income and women’s control. The participation of women in public works programs can be enhanced if the programs provide a crèche. A well-designed crèche may also provide early child development and care. In India, for example, mobile crèches for construction workers is one such successful model. These crèches are designed to travel with the workers as they move from construction site to site.
As pregnant and lactating women have high-energy demands for their child, a well-planned public works program can offer productive tasks that are suited to this constraint. Women can be involved in managing a crèche, providing similar services within the wider community, or attending childcare classes, as an alternative to more energy intensive tasks (See Box D-2 for an example from Djibouti). Argentina’s Jefes y Jefas program, a variation of a public works project, allowed beneficiaries to substitute 20 hours of training a week for manual labor. While relatively few individuals selected this option, a degree of flexibility still existed. Public works projects can also offer flexible hours or piecework to accommodate mothers’ time constraints.
Box D-2. Djibouti social safety net project that combines workfare with a nutrition intervention
Djibouti has high rates of childhood malnutrition (affecting 33% of the children), unemployment (hovering at 55%), and poverty (affecting 42% of the population). In addition, over the last four years the country has been confronted with recurrent droughts that negatively affected poor and vulnerable households, and created emergency needs. In response, the government is implementing an innovative social safety net (SSN) program “Djibouti Crisis Response: Employment and Human Capital Social Safety Nets,” combining short-term employment with a nutrition intervention for the poor and vulnerable. The project supports a crisis response that provides the basis for a (productive) safety net by (i) improving the design and effectiveness of a public works program so it becomes an effective social safety net, (ii) generating new short-term job opportunities for the poor and vulnerable; and (iii) improving nutrition practices among participating households through behavioral change interventions. The program links creation of employment opportunities to improvement of nutritional practices by adding a nutrition and growth promotion component to the traditional cash-for-work program to leverage the effect of the additional income on the family’s nutritional status.
Integrated approach: “all [family members] against malnutrition”
Workfare: Increased household income.
Offers short-term employment in:
-
-
Nutrition: Enhanced nutrition practices.
Targets vulnerable non-working members (young children and pregnant women)
Common Goal: Prevent Malnutrition
Community works (for all) chosen (and built) by the community from catalogue (e.g. containment walls) Focus on first 1,000 days of life
- Monthly community meetings (e.g. sensitization on exclusive breastfeeding)
- Bi-weekly home visits by a community worker
- Food supplements distributed during the lean season
Services (for women only), mainly plastic bags collection, community-level recycling and transformation into blocks to pave footpaths
Improving Nutrition Through Multisectoral Approaches
115
ii. Strengthening the role of insurance by promoting utilization of services
Insurance is one way to smooth consumption over time and across households. Households hit by a shock face the dilemma of either conserving productive assets for future consumption or stabilizing consumption by drawing down assets. However, formal insurance plays a small role in the risk reduction strategy of low-income households. This in part is because of the lack of insurance markets, which reflects real structural aspects of incentives for clients and the costs of monitoring their losses. While innovations such as weather indexing have increased the range of instruments available, most evidence indicates that individual insurance for livelihoods that is actuarially fair and therefore attractive to private providers without subsidies, remains beyond the budgets of low-income households. If subsidies are considered, the issues of targeting are similar to those for transfer programs in general.
Weather index insurance to mitigate damage by droughts, cyclones, or floods may be viable at the community or similar aggregate level. Indeed, financial or self-insurance may be feasible at the national level. If so, the payout when there is a shock is also at the aggregate level, and a program or distribution rule is needed to get the benefits to the wider population. The decisions needed for this are similar to the programmatic decisions needed for assistance following a disaster or financial crisis. While health insurance may also play a role in income smoothing—health shocks often are a larger risk factor for impoverishment than are weather shocks. Health insurance differs from weather insurance in many essential features. For example, collective payouts or collective indices do not seem appropriate. More important, in addition to consumption smoothing, one objective for public involvement is to encourage utilization of services, especially preventative and primary health. Since children have a relatively low risk of incurring catastrophic health costs, the primary role of health insurance for children is promoting the use of health facilities. Targeted subsidies for health insurance and the linkage of insurance with conditional transfers, as in Ghana or Mexico, are means to link social protection with health insurance. Conceptually, fee waivers for children’s primary health needs can also serve this function, though in practice, fee waivers have a tendency to be under budgeted and thus starve health services of funds.
iii. Smoothing consumption by promoting microfinance
Microfinance–including savings promotion, some forms of insurance, and credit provision– can assist low-income households in entrepreneurial opportunities, as well as to smooth consumption. In some countries, as in Kenya, the private sector has designed financial products to serve the needs of rural low-income households, facilitated by cell phone access. In others, NGOs have taken the lead in broadening the access to financial services. To the degree that these efforts raise incomes or assist in consumption smoothing, they increase food and health security. Financial deepening is often accompanied by financial literacy enhancing programs. For example, group-lending programs may hold regular educational meetings for participants. In a few cases, communication on health and nutrition has been included in these meetings. These are similar to the training sessions that are part of some CCT programs (such as the platicas in Mexico’s Oportunidades). However, it is difficult to separate the role of access to credit and banking from the role of information, and there are still few evaluations of such programs. Transfer programs, however, have a different objective than financial deepening, and the balance of adding wider social objectives to the latter is largely unexplored.
IV. How can social protection programs promote the link with other services to increase their nutritional impact?
Access to services can be promoted through links with transfer programs or directly by promoting access to services at local level. The same principles of social inclusion that pervade most social protection programs underlie some nutrition interventions.
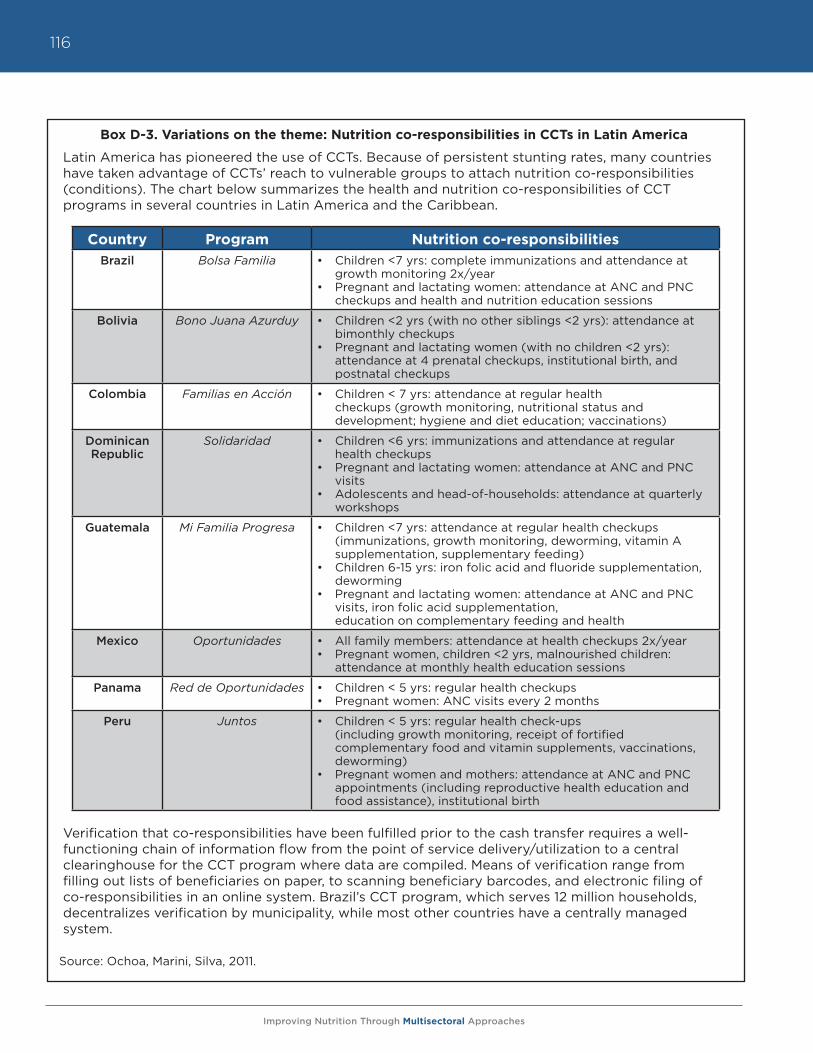
Improving Nutrition Through Multisectoral Approaches
116
Box D-3. Variations on the theme: Nutrition co-responsibilities in CCTs in Latin America
Latin America has pioneered the use of CCTs. Because of persistent stunting rates, many countries have taken advantage of CCTs’ reach to vulnerable groups to attach nutrition co-responsibilities (conditions). The chart below summarizes the health and nutrition co-responsibilities of CCT programs in several countries in Latin America and the Caribbean.
Verification that co-responsibilities have been fulfilled prior to the cash transfer requires a well-functioning chain of information flow from the point of service delivery/utilization to a central clearinghouse for the CCT program where data are compiled. Means of verification range from filling out lists of beneficiaries on paper, to scanning beneficiary barcodes, and electronic filing of co-responsibilities in an online system. Brazil’s CCT program, which serves 12 million households, decentralizes verification by municipality, while most other countries have a centrally managed system.
Source: Ochoa, Marini, Silva, 2011.
Country Program Nutrition co-responsibilitiesBrazil Bolsa Familia • Children <7 yrs: complete immunizations and attendance at
growth monitoring 2x/year• Pregnant and lactating women: attendance at ANC and PNC
checkups and health and nutrition education sessions
Bolivia Bono Juana Azurduy • Children <2 yrs (with no other siblings <2 yrs): attendance at bimonthly checkups
• Pregnant and lactating women (with no children <2 yrs): attendance at 4 prenatal checkups, institutional birth, and postnatal checkups
Colombia Familias en Acción • Children < 7 yrs: attendance at regular health checkups (growth monitoring, nutritional status and development; hygiene and diet education; vaccinations)
Dominican Republic
Solidaridad • Children <6 yrs: immunizations and attendance at regular health checkups
• Pregnant and lactating women: attendance at ANC and PNC visits
• Adolescents and head-of-households: attendance at quarterly workshops
Guatemala Mi Familia Progresa • Children <7 yrs: attendance at regular health checkups (immunizations, growth monitoring, deworming, vitamin A supplementation, supplementary feeding)
• Children 6-15 yrs: iron folic acid and fluoride supplementation, deworming
• Pregnant and lactating women: attendance at ANC and PNC visits, iron folic acid supplementation, education on complementary feeding and health
Mexico Oportunidades • All family members: attendance at health checkups 2x/year• Pregnant women, children <2 yrs, malnourished children:
attendance at monthly health education sessions
Panama Red de Oportunidades • Children < 5 yrs: regular health checkups• Pregnant women: ANC visits every 2 months
Peru Juntos • Children < 5 yrs: regular health check-ups (including growth monitoring, receipt of fortified complementary food and vitamin supplements, vaccinations, deworming)
• Pregnant women and mothers: attendance at ANC and PNC appointments (including reproductive health education and food assistance), institutional birth
Improving Nutrition Through Multisectoral Approaches
117
A. Conditioning transfers to access to services
Linking income transfers to compliance with a conditionality (or co-responsibility) can function as a powerful incentive for the use of health and nutrition services.
Questions to consider when designing conditional programs
• What is the role of the “condition”? Which objective is it trying to achieve?• What is the cost of monitoring conditions? Is it worth monitoring conditions “firmly”?• Does it make sense to “punish” households that do not comply with conditions?• What are the reasons behind non-compliance?• Is it worth introducing conditions at the community level?
Conditional Cash Transfers (CCT) are a well-known type of program that aims at reducing both present and future poverty. By linking a targeted transfer to health seeking behavior(s), or to participation in education through the “conditionalities” or “co-responsibilities,” CCTs can change the effective price of preventive health care and offset liquidity constraints that reduce investments in children. The co-responsibilities vary according to context, responding to the salient problems of each country, and taking into consideration the availability of services and the operational capacity to administer and manage the CCT (see Box D-3). Close links between the CCT administration and the health sector are generally very important, since the health sector must provide adequate coverage and quality of the services required as co-responsibilities. Health sector staff also often verify beneficiaries’ use of services.
The idea of conditioning transfers is not based on a paternalistic view that poor mothers do not know how to spend their money adequately. Rather, conditionalities are based on the expectations that they will have an impact on prices and preference ordering: even when people optimize their budget, lower prices have a strong impact on demand, possibly even stronger than the income effect itself. It is conceivable that these conditionalities (or co-responsibilities) may also allow poor mothers additional bargaining power in the use of these additional resources for the care of their young children.
The evidence indicates that most CCT programs achieve changes in service utilization. However, changes in outcomes seem less frequent, and when observed, they are less uniform.13,14 There are many reasons for this, including measurement challenges and the duration of the evaluations, but another concern is the quality of services. If a health CCT is conditioned on a pregnant woman receiving prenatal check-ups or bringing an infant to growth promotion sessions, the impact depends critically on whether anything happens at these visits other than simple measurement and whether the “promoted” services are accessible and available. Therefore, the design of these CCTs needs to balance the demand side (which is catalyzed by the CCTs) with the supply side of health, nutrition, and population (HNP) services and gender empowerment programs, ensuring that all the key pieces are in place and working well. A recent paper found that the Juntos CCT Program in Peru made a significant impact on nutritional status of the most malnourished children. It also found that conditional on being beneficiaries of the program, nutritional impact is correlated to the duration of exposure and to the education level of the mother.15
There is some evidence from education that the presence of conditions affects service utilization better than the transfer amount. That is, providing a large transfer increases service utilization marginally, compared to a small transfer. At this time, however, such evidence is only available from education programs and needs to be verified in health care.16
13 Because the first wave of CCTs was in Latin America, more evaluations exist from this region.14 Fiszbein, A., and N. Schady, with Ferreira, F.H.G., Grosh, M., Kelleher, N., Olinto, P. and E. Skoufias. 2009. Conditional Cash Transfers for Attacking
Present and Future Poverty. World Bank Policy Research Report.15 Jaramillo, M. and A. Sanchez. 2011. Impacto del Programa Juntos sobre nutricion temprana, GRADE Documento de Investigacion 61, Lima, Peru.16 Baird, S., McIntosh, D. and B. Ozler. 2010. Cash or Conditions? Evidence from a Cash Transfer Experiment; Filmer, D. and N. Schady. 2009. “Are
there diminishing returns to transfer size in conditional cash transfers?” Policy Research Working Paper Series 4999, The World Bank.
Improving Nutrition Through Multisectoral Approaches
118
Some programs are experimenting with conditions or co-responsibilities at the community level. The Indonesia Generasi program, for example, has introduced grants for communities to address health and education needs. In one pilot, communities that performed well in improving selected indicators were provided additional funds. The program builds on the successful experience of CDD programs, their existing effective machinery, and their social capital. The program constitutes an interesting example of results-based financing, by promoting results at the community level. While initial evaluation results do not indicate robust differences relative to the core program, the innovation is not particularly costly, and variations of the theme are under consideration and evaluation.
Even when the enhancement of service quality is not directly in the hands of a CCT program, the fact that a program presents health care as both a right and an obligation can address social exclusion. Such empowerment may stimulate improved health care, as was noted in a study of prenatal care in Mexico.17 In Peru, after technical assistance identified coverage gaps in services to beneficiaries of Peru’s Juntos CCT, a subsequent project aimed to rectify this imbalance by increasing demand for nutrition services by strengthening the operational effectiveness of the Juntos CCT program and at the same time improving the coverage and quality of the supply of basic preventive health and nutrition services in the targeted communities (see Box D-4 for more details).18
However, even programs that appear to combine all the essential ingredients seem to perform poorer than expected. Oportunidades in Mexico, for example, touches on nutrition by including: (i) a substantial in size-cash transfer, (ii) parental education, (iii) micronutrient supplementation, and (iv) linkage with health services in its program. However, many still argue that the impact on nutrition outcomes, particularly anemia, is less than one would have expected. Why is that the case? First, impact on height is limited, given the amount of time needed to detect such a change, which typically tends to be longer than the study’s period and/or length of programs.19 Second, it is important for any SP program to ensure that the different components are articulated and that nutritional knowledge is incorporated and tailored to the needs of the specific context. In Mexico, for example, the Oportunidades program is undergoing continuous modifications to reinforce its impact on nutritional outcomes, incorporating lessons learned from international best practices and from local evaluations. To increase acceptance and use of micronutrient supplements, minimize the costs, and decrease the undesired impact on overweight and obesity, the program recently implemented a new health and nutrition strategy that restructured the nutrition education, emphasizing training and introducing culturally adequate material, and replaced distribution of food supplements with micronutrient sprinkles in urban areas. This comprises an important example of how a program should continuously evaluate itself and stay abreast of the latest innovations in the nutrition sector.
B. Firm versus soft conditions
Even when they include only “soft” conditions, i.e., co-responsibilities that are advocated but not strictly enforced, CCTs can enhance the potential nutritional impact of a transfer program. These soft conditions may be considered a form of behavior promotion—one that is fairly explicit about the recommended actions.20 Firmer conditions to promote health-seeking behaviors, which monitor and enforce compliance, have an additional impact. This is not based on a patronizing view that the poor do not know how to spend their money wisely, as occasionally depicted. Rather, this derives from a simple expectation that lowering a price increases demand more than an equivalent income transfer does.
17 Barber, S. and P. Gertler. 2010. “Empowering women: how Mexico’s conditional cash transfer programme raised prenatal care quality and birth weight. Journal of Development Effectiveness,” 2 (1): 51-73.
18 World Bank. 2012. Building Resilience and Opportunity, The World Bank’s Social Protection and Labor Strategy 2012-2022. Washington DC.19 World Bank Independent Evaluation Group. 2010. What can we learn from nutrition impact evaluations? Washington, D.C.: World Bank.20 Another interesting example of soft condition comes from the Ecuador Bono de Desarrollo Humano (BDH) CCT program which introduced a ran-
domized verification of co-responsibilities in urban areas to reduce the cost of monitoring.
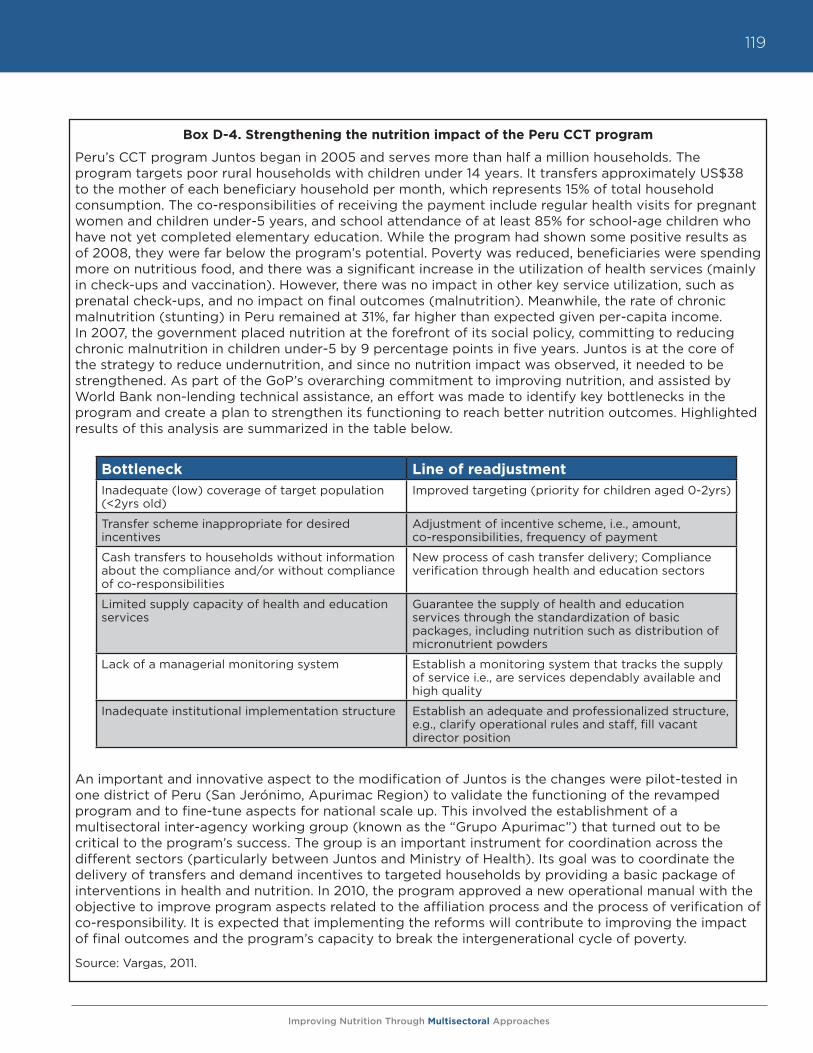
Improving Nutrition Through Multisectoral Approaches
119
Box D-4. Strengthening the nutrition impact of the Peru CCT program
Peru’s CCT program Juntos began in 2005 and serves more than half a million households. The program targets poor rural households with children under 14 years. It transfers approximately US$38 to the mother of each beneficiary household per month, which represents 15% of total household consumption. The co-responsibilities of receiving the payment include regular health visits for pregnant women and children under-5 years, and school attendance of at least 85% for school-age children who have not yet completed elementary education. While the program had shown some positive results as of 2008, they were far below the program’s potential. Poverty was reduced, beneficiaries were spending more on nutritious food, and there was a significant increase in the utilization of health services (mainly in check-ups and vaccination). However, there was no impact in other key service utilization, such as prenatal check-ups, and no impact on final outcomes (malnutrition). Meanwhile, the rate of chronic malnutrition (stunting) in Peru remained at 31%, far higher than expected given per-capita income. In 2007, the government placed nutrition at the forefront of its social policy, committing to reducing chronic malnutrition in children under-5 by 9 percentage points in five years. Juntos is at the core of the strategy to reduce undernutrition, and since no nutrition impact was observed, it needed to be strengthened. As part of the GoP’s overarching commitment to improving nutrition, and assisted by World Bank non-lending technical assistance, an effort was made to identify key bottlenecks in the program and create a plan to strengthen its functioning to reach better nutrition outcomes. Highlighted results of this analysis are summarized in the table below.
An important and innovative aspect to the modification of Juntos is the changes were pilot-tested in one district of Peru (San Jerónimo, Apurimac Region) to validate the functioning of the revamped program and to fine-tune aspects for national scale up. This involved the establishment of a multisectoral inter-agency working group (known as the “Grupo Apurimac”) that turned out to be critical to the program’s success. The group is an important instrument for coordination across the different sectors (particularly between Juntos and Ministry of Health). Its goal was to coordinate the delivery of transfers and demand incentives to targeted households by providing a basic package of interventions in health and nutrition. In 2010, the program approved a new operational manual with the objective to improve program aspects related to the affiliation process and the process of verification of co-responsibility. It is expected that implementing the reforms will contribute to improving the impact of final outcomes and the program’s capacity to break the intergenerational cycle of poverty.
Source: Vargas, 2011.
Bottleneck Line of readjustmentInadequate (low) coverage of target population (<2yrs old)
Improved targeting (priority for children aged 0-2yrs)
Transfer scheme inappropriate for desired incentives
Adjustment of incentive scheme, i.e., amount, co-responsibilities, frequency of payment
Cash transfers to households without information about the compliance and/or without compliance of co-responsibilities
New process of cash transfer delivery; Compliance verification through health and education sectors
Limited supply capacity of health and education services
Guarantee the supply of health and education services through the standardization of basic packages, including nutrition such as distribution of micronutrient powders
Lack of a managerial monitoring system Establish a monitoring system that tracks the supply of service i.e., are services dependably available and high quality
Inadequate institutional implementation structure Establish an adequate and professionalized structure, e.g., clarify operational rules and staff, fill vacant director position
Improving Nutrition Through Multisectoral Approaches
120
Some programs have introduced community-based conditionalities to generate social pressure on minimum utilization of services and to promote inclusion of the most vulnerable. In the case of Indonesia, the community set the program conditionalities, offering incentives to identify community problems, seeking solutions to improve specific health and education indicators, and increasing both usage and funding of community services.
C. Conditional versus unconditional transfers
When choosing between a conditional and an unconditional transfer, the key question to ask is, Are the expected gains worth the appreciable costs of monitoring and reporting? Monitoring conditions can be complex and expensive. Caldes (2006) estimates that the cost of monitoring conditionalities can range between 8 and 15 percent of the total budget of a program. An unconditional transfer assumes that preferred expenditures can be achieved simply by an increase in income, rather than by accompanying the income transfer with a lowered price. For example, the existence of a strong community-based growth promotion program in Senegal has created enough demand for nutrition activities that an unconditional transfer was considered enough to increase participation and change in practices. While no experiments compare health outcomes between a CCT and a UCT, a related experiment on school participation in Malawi found that while unconditional transfers increased schooling, the CCT had a much larger impact.21 A similar inference was made in regards to Ecuador and Mexico’s transfer programs based on whether the household was informed about the conditions or did not receive the forms to monitor the children’s attendance.22 Still, unconditional transfers can play an important role in contexts where the cost of monitoring compliance with co-responsibilities is very high. Their impact can be strengthened by ensuring a minimum set of conditions: e.g., by ensuring that the transfer is given to mothers, taking advantage of the beneficiary registry to target the most vulnerable with a specific nutrition education campaign or micronutrient supplementation, depending on the nature of the nutrition problem.
D. Conditional “in-kind” transfers: School feeding and school health and nutrition programs
School feeding programs—both school meals and take-home rations—can be viewed as conditional in-kind transfers. School meal programs can have a modest impact on household expenditures, but as they are untargeted within a school, they are generally smaller than targeted UCTs or CCTs. School feeding programs are conditioned on school attendance; thus, that is where their impact is most apparent, particularly in regards to girls’ attendance. School meal programs are not designed to address the most critical nutritional constraints in low-income settings, simply because they are not targeted at the most vulnerable period in child development. Nonetheless, the indirect effects of girls remaining in school can contribute to improved maternal and infant nutrition outcomes via delayed marriage and older age at first childbearing.
From a nutrition perspective, the highest payoff comes from reaching children before school age, but recent studies from Burkina Faso and Uganda23 have shown that school-feeding programs may have a positive impact on younger siblings. What in the past was termed leakage from the targeted school-aged child may in fact be sharing with more vulnerable family members. However, there is currently not enough evidence or experience to assess whether take-home rations or school meals have a higher potential to impact younger household members. This benefit is, nevertheless, indirect.
21 Baird, S., McIntosh, D. and B. Ozler. 2010. Cash or Conditions? Evidence from a Cash Transfer Experiment.22 Schady, N. and M.C. Araujo. 2008. “Cash Transfers, Conditions, and School Enrollment in Ecuador,” Economía 8 (2) 43–70; De Brauw, A. and J. Hod-
dinott. 2008. Must conditional cash transfer programs be conditioned to be effective? The impact of conditioning transfers on school Enrollment in Mexico, IFPRI Discussion Paper 57, Washington, D.C., International Food Policy Research Institute.
23 Alderman, H. and D. Bundy. “School Feeding Programs and Development: are we framing the question correctly?” World Bank Research Observer, forthcoming.
Improving Nutrition Through Multisectoral Approaches
121
School feeding programs can also contribute directly to nutrition of school-age children if the meals are fortified, particularly with iron and folic acid. While school feeding programs are not designed to improve nutrition status during the most vulnerable “1,000 days window of opportunity” from pregnancy to age two, they can contribute to improving nutrition status among school-age children. Individual school programs and populations require close attention; however, as emerging research suggests that rapid weight gain after the age of two may predispose previously undernourished children to obesity and non-communicable diseases later in life.
Further, while few school feeding programs currently use fortified foods, the range of appropriate technology has broadened with recent advances in extruder fortified rice, (which adds less than 5% to the cost of this staple), and a range of other fortification options, such as wheat flour and maize meal, and double fortified salt (salt fortified with iodine and iron). However, the potential for fortification is somewhat problematic with the increased focus on local sourcing of foods. Local foods are less likely to be centrally processed, and thus, less likely to be fortified at scale.
The use of premixed packages of micronutrients, such as a variant of micronutrient “sprinkles” that are designed for school-aged children may enhance the nutritional value of the meals. These premixes can be added to school meals, although their efficacy or doses for school settings is not yet determined since they originally were designed for home use with young children.
Alternatively, a school health program can provide deworming, and iron and folic acid supplements as part of a wider program of school health. The efficacy and benefit-cost ratios for such school-based vitamin and mineral supplementation programs is clearly demonstrated (especially when coupled with deworming), though the coverage and effectiveness of a full-scale program remains contingent on capacity and cross-sectoral programming. Safety net programs could help scale up these interventions with large potential benefits for nutrition at low marginal costs. However, some health ministries are reluctant to entrust this responsibility to educational staff, and some teachers are reluctant to accept it.
School-based health and nutrition programs can be vehicles for nutritional education. For example, meal programs can be linked to encouraging handwashing. Adding such encouragement to a school meal program costs little, while adding school feeding programs to a health promotion campaign may be costly and may make the benefits less persuasive.
In some cases, school meals can promote diet diversity. In other contexts, particularly in Latin America, school meal programs have introduced healthy diets to counter trends in childhood obesity, but the long-term contribution of these redesigned programs to preventing obesity is not yet determined.
Finally, creating a partnership between health and school administrations that would facilitate the provision of deworming medicines can be forged around school meals. Although deworming of children is undertaken on a biannual basis, which does not correspond to school-meal programs or take-home rations. Partnerships have proven to be effective for preschool as well as primary school-age children. Such programs, however, are not currently included within safety nets or wider social protection systems, despite strong evidence of impact on child growth in populations where worm infestations are endemic, a potential win-win situation.
E. Promoting access to services: Community-based growth promotion programs
Community-based growth promotion programs are based on the same principles of social inclusion that are applicable to most social protection programs. Several countries use a strategy of community-based growth promotion, which incorporates these key interventions and strengthens knowledge and capacity at the community level, as well as creates demand for health and nutrition services by bringing services closer to the communities. Such strategies have proven effective in improving mothers’
Improving Nutrition Through Multisectoral Approaches
122
knowledge, attitudes, and practices related to child nutrition, boosting family demand for health care and reducing malnutrition. In addition to linkages through CCTs, social protection projects have fostered community nutrition as part of their social inclusion strategy, even in the absence of a transfer program, like in the case of Honduras AIN-C.
Successful, large-scale child-growth promotion programs were established in the 1980s in Jamaica, India (Tamil Nadu Integrated Nutrition Project and others), and Tanzania (Iringa). Following these initial successes, community growth promotion has also been supported in Madagascar (Seecaline), Senegal (PRN), and Honduras (AIN-C), among others, achieving sharp declines in child malnutrition in the first five years, with a more gradual rate of decline in moderate and mild malnutrition thereafter.
The main characteristic of these initiatives is their community basis, which has allowed them to address a wide variety of malnutrition’s causes, often with a focus on women and children under age two. Main interventions include nutrition education or counseling, typically accompanying and based on child growth monitoring, linked to advice on and access to maternal care services during pregnancy, promotion of exclusive breastfeeding and appropriate and timely complementary feeding, and health and care practices and referral to health centers. Some programs also have provided micronutrient supplements for pregnant mothers and children, and immunization and related services. Program experiences have highlighted the importance of: (i) female community workers as service delivery agents; (ii) regular child growth monitoring (weight) paired with a well-trained agent providing counseling and communication to the mother, who benefits from effective and regular supervision in weighing, recording, and counseling; (iii) well-designed, culturally appropriate, and consistent nutrition education aimed at promoting specific nutrition practices.
Although community-based growth promotion programs offer a promising approach to addressing undernutrition, common problems related to agent training, support, and motivation, barriers faced by beneficiary mothers in implementing recommended behavior changes, and the cost-benefit of expensive food supplementation programs for mothers and children, remain as overarching challenges that merit further attention.24 Overall, results have been better when community-based growth promotion programs are linked to supply-side interventions that improve access to health services.
CDD projects and social funds can incorporate nutrition into basic service provision. The first generation of Bank supported social funds focused on countries with low capacity and transition economies. The main objective of such funds was to involve communities in prioritizing and constructing infrastructure. This model is still applied to fragile states and in post-conflict environments. In many other places, however, this model has evolved. The new objective is to strengthen local government in decentralized service delivery. Local governments may be the most practical place to achieve multisectoral integration, an elusive goal of integrated nutrition planning. Nutrition projects, such as the community-based growth promotion programs in Senegal, Madagascar or Central America can use techniques learned from social funds to enhance community participation.
V. Is there a role for targeting transfers to the nutritionally vulnerable?
Most social protection programs use some sort of poverty targeting. To strengthen the impact on nutrition outcomes, social programs typically have the choice of combining poverty targeting with targeting by demographic group, geographic area or by nutritional status. Targeting is a key operational feature of most social protection programs.
24 World Bank. 2006. Repositioning Nutrition as Central to Development, the World Bank, Washington D.C.; Marini, A., Bassett, L., Bortman, M., Flores, R., Griffiths, M. and M. Salazar. 2009. Promocion del Crecimiento para Prevenir la Desnutricion Cronica. Estrategias con Base Comunitaria en Centro America, the World Bank, Washington D.C.
Improving Nutrition Through Multisectoral Approaches
123
A. Targeting by demographic group
Clearly, age-based or group targeting can direct transfers to the most at-risk age groups. For example, most CCTs include children as a priority. In Africa, children affected by HIV/AIDS are often prioritized as a particular focus. Pregnant women are also a likely target group. Targeting young children and pregnant women is consistent with the global evidence indicating that the period between conception and the first two years of a child’s life is a critical window of opportunity during which good nutrition is decisive for healthy human development. After the age of two, most losses to human capital and future productivity attributable to undernutrition during this period are irreversible. However, when defining the details of a program, it is important to take into account potential unexpected effects of the incentive.
Some programs have a fixed per household transfer to avoid fertility effects. However, Peru’s Juntos CCT programs found that this served as a disincentive to register children in the program since the burden of co-responsibility increased with the number of children, but payment did not. Other programs increase payments in accord with the number of children eligible, but capped them at a maximum number of beneficiaries. This gives a family an incentive to register the child. Indeed, some programs make birth registration a co-responsibility. This can be aided by a monitoring system used to track participants in maternal health programs and in CCTs that include assisted births as a program activity.
A focus on this critical period serves to promote future earnings. Indeed, not only are prenatal services often included in CCTs, pregnant women can be particularly receptive to nutritional education and guidance on issues such as breastfeeding and provision of colostrum. Additionally, a few CCTs have been targeted towards adolescent girls, but these usually have schooling or prevention of sexually transmitted infections (STIs) as the main objectives (as in Malawi). To date, no nutritional outcomes have been reported for adolescents. Nevertheless, it is plausible to include education on child care, as well as the distribution of micronutrients in the design of a program targeted to adolescents, especially since iron and folic acid for adolescent girls is important for their healthy development and the future of their children.
Targeting unconditional transfers to the elderly can be an important poverty reduction policy; however, they are difficult to justify on the grounds of their positive impact on children. Some programs target unconditional transfers to the elderly partially because they are labor poor, and thus there are few disincentive issues for labor. However, an additional justification commonly voiced is that they spend their income on at risk children, which is based on a misinterpretation of the evidence. While it is the case that pensioners often do support children, as Duflo (2003) recorded, this study referred to an uncharacteristically large program. Moreover, it only found that spending on children pertained to female recipients. While an argument may be made for prioritizing elderly on equity grounds, justifying UCTs to the elderly based on the trickle down impact on children is disingenuous. This logic, in effect argues for accepting large amounts of leakage from the nominal target group of children in part because targeting the elderly is convenient. In the event that a social pension is a policy choice, and the program is targeted due to a limited budget, skipping generation households with direct responsibility for children would be a high priority due to the overlap of equity and the economic returns to investing in children. Generally, focusing on nutrition vulnerability will entail exclusion of some poor households with no children living in the household or with children who are outside the age associated with the greatest risk of malnutrition.
B. Targeting by nutritional status or risk
Targeting transfers to households with malnourished children has the conceptual advantage of being responsive to transitory shocks, unlike most indicators used to construct proxies for poverty, which are relatively static. This approach was used to prioritize nutrition programs in Tamil Nadu’s community nutrition program, but targeting malnourished children is not commonly used in safety net programs.
Improving Nutrition Through Multisectoral Approaches
124
One purported disadvantage of this approach is it may create an incentive for a family to keep a child malnourished. While such abuse is possible, verifying or disproving the extent of such behavior is difficult. This form of targeting also has the disadvantage of only reaching children who are malnourished or on the threshold, rather than being preventative.
Heightened risk is another basis of nutrition targeting. Many safety net strategies seek counter-cyclical programs that can be scaled up in the wake of weather, price, or financial shocks. Employing the same strategy, it may be possible to target a safety net scale up to the increased risk of malnutrition through preventive efforts in a population, leaving more clinical nutritional interventions to address observed cases of severe and acute forms of malnutrition. Even though the evidence on the consequence of price, financial or climatic shocks on nutrition is robust, assessing the impact of programs designed to offset these shocks is difficult, for both ethical and logistic reasons. Nevertheless, evidence on changes of food aid allocation attributed to rainfall deviations in Ethiopia or on rollout of supplementary feeding programs in response to Indonesia’s financial crisis, confirms that large-scale programs can prevent increases in malnutrition.
Box D-5. Targeting the needs of acutely malnourished children
Ready to use therapeutic foods (RUTFs) or ready to use supplementary foods (RUSF) may be employed successfully to mitigate the effects of such crises and to deal with children that are already malnourished. They function as a sort of targeted unconditional in-kind transfer. RUTFs are less susceptible to spoilage than powdered milk-based supplementary foods, do not require mixing with water, and can be used by community health workers to address acute malnutrition, especially in emergencies, or in situations when markets are failing. Various studies have shown that RUTF can be used to reduce mortality in a cost-effective manner for treating severe malnutrition (about $200/child/episode). However, distinguishing the intrinsic advantage of products promoted with RUTF from the advantages of the community-based management of care may be difficult, and in many situations it may be hard to provide such care at scale. Still, this curative function is only one dimension of their potential benefits of RUTF. Arguably, they can also be useful in preventing malnutrition within a safety net program. The practicality of distributing RUTFs to children at heightened risk of malnutrition, but who are not yet malnourished, remains controversial due in part to the costs of many of the products designed for use in therapeutic settings. Concerns also exist that RUTFs and especially RUSFs, may replace breastfeeding, thereby undermining one of the most cost-effective nutrition inputs. Further, the feasibility and the cost-effectiveness of RUSFs is still being researched, albeit new products such as lipid-based nutritional supplements show great promise.
Despite these concerns, distributing peanut or grain and soy-based RUTFs, geographically and temporally targeted to children in crises, may serve as a bridge between their well-established role in therapeutic feeding for the severely malnourished and their still controversial use to prevent malnutrition among the chronically poor. Reformulating the RUTFs so they are less expensive and nutrient dense, while retaining their convenience, may make the preventative approach more acceptable and feasible at scale.
Improving Nutrition Through Multisectoral Approaches
125
Box D-6. What should be monitored in SP programs to keep nutrition as a focus?
The relevant outcomes most commonly tracked within SP programs are consumption (or expenditures) and anthropometric measures of nutritional status of young children, both acute and chronic. A case can be made that tracking consumption is less important than monitoring the incidence of program participation. This implies that the main focus remains on monitoring the targeting efficiency in terms of the share of transfers that reach the poor, as well as the amount of upstream leakage from the program, if any. If transfers have a small impact on labor or on private remittances, as is generally the case, a dollar transferred to the poor will lead to a dollar of savings and consumption combined. It is difficult to argue that SP program objectives have a desired or target distribution for the share of savings or consumption out of this total. Arguably, welfare economics and an adherence to consumer sovereignty also imply that the household allocates its budget efficiently. To be sure, this point is debatable, but less so when intra-household allocation is already considered and the program targets female recipients. This said, tracking food expenditures within a SP program is politic. Monitoring food consumption is, however, data intensive especially in rural communities where self-production and seasonal fluctuations add to the challenge of data collection. Data on diet diversity or meal frequency often serve as a source of relatively easy indicators to monitor with the advantage that these can be collected for individuals in a target age group rather than for a household as a unit. Diet diversity is usually measured using a simple count of foods or food groups over a given reference period and has been found to be strongly associated with direct measures of malnutrition.
It should be noted, however, that from the standpoint of nutrition, consumption data reveal information about inputs into nutrition, albeit critical ones, and not outcomes. Nevertheless, food security measured by this and similar data is an issue of household welfare that is closely aligned with the social protection (SP) strategy and of intrinsic interest. SP programs, particularly CCTs, also track inputs such as participation in health activities including public awareness campaigns (for example, the platicas in Progresa) and attendance in clinics and vitamin A or deworming medicine distribution. Similarly, school feeding programs track enrollment and attendance within monitoring systems, and less commonly, school performance. The latter, however, is a key component of many impact evaluations, especially those that have a multi-year panel.
Malnutrition indicators are often collected on a regular basis with community health coverage, although self-selection into public health programs will influence the interpretation of these indicators. Anthropometric measures such as underweight or stunting as well as overweight are more commonly monitored than are measures of micronutrient status such as vitamin and mineral deficiencies. (See glossary/definitions). Stunting is low height-for-age because of prolonged inadequate nutrition or poor health. It implies long-term undernutrition and poor health. Underweight is measured as low weight-for-age; it could imply stunting and/or wasting, and is one of the indicators used in tracking MDG1c. Wasting is low weight-for-height and describes a recent or current severe process, usually a consequence of acute food deprivation or severe disease. All these indicators are commonly collected to gauge undernutrition among children; wasting data is especially useful in emergency situations and humanitarian crises. While obesity is often thought of as a correlate of affluence, the current professional opinion of the causes of obesity is that it often reflects early deprivation, including prenatal undernutrition.
Improving Nutrition Through Multisectoral Approaches
126
Box D-7. Priority objectives of nutrition sensitive social protection
1. Target activities to the most nutritionally vulnerable populations.
2. I nclude education activities within SP interventions to increase household awareness of care giving and health seeking behaviors.
3. Integrate nutrition services into SP interventions, e.g. growth monitoring and promotion, and/or activities for improved growth and diet quality.
4. Reduce the acute and long-term negative financial impacts of external financial, price, and weather shocks by scaling up programs in times of crises.
VI. Concluding remarks
While most safety net programs include an income transfer component, and many vulnerable households seem to lack adequate income to purchase key inputs for nutrition outcomes, the evidence shows that increased income alone is often insufficient to have a major impact on nutrition. Thus, other components, such as directing transfers to women, targeting the most vulnerable and the correct age group, adding nutrition education or a micronutrient supplementation or a deworming component can play an essential role in generating impact of both transfers and other types of social protection programs, such as welfare, pension or insurance. The priority objectives of SP interventions are outlined in Box D-7 below.
VII. Emerging operational research and knowledge gaps
While all projects need their results evaluated to a degree, given the resource costs for establishing a means to determine the causal impacts of innovative programs at scale and the time frame necessary for assessing cumulative impacts, research needs to be selective and prioritized. Some issues that might be considered as priority themes for the interaction of social protection and nutrition include:
• Evaluating the cost effectiveness of soft versus hard conditions in CCTs in LICs. What basic country systems are needed to be in place to implement conditionalities (or co-responsibilities) at scale? What is the cost of monitoring, and how will outcomes be improved by these expenditures? These modalities need to be compared in the same setting over the same time period and with the same amount of transfer offered.
• Designing results-based incentives or other means to increase community participation in the accountability of the supply of services linked to CCT programs.
• For CCTs with nutrition conditionalities, assessing the marginal benefits of different size of income transfers. Assessing the benefit-cost ratio for RUTF used to prevent malnutrition in response to drought or financial crises and developing and testing alternative and more cost-effective products.
• Improving targeting mechanisms/systems.
• Assessing the impact of full-scale programs for supplementation or fortification within home grown (local sourcing) for school feeding. This is a subset of the more general issue of the circumstances under which food based transfers may be appropriate. The general topic has been well researched (especially in regards to food aid), but under some circumstances, fortification (or home fortification pre-mixes) may provide value added to locally sourced in-kind assistance.
Improving Nutrition Through Multisectoral Approaches
127
• Also, for school feeding, the impact of programs aimed at preventing obesity or reducing its prevalence need to be assessed.
• Exploring the potential role of microfinance for improving nutrition outcomes for the poor.
VIII. Additional Resources
• Caldes, N, Coady, D. and J. Maluccio, 2006. “The cost of poverty alleviation transfer programs: a Comparative Analysis of three programs in Latin America, World Development 34 (5): 818-837.
• E. Duflo. 2003. “Grandmothers and Granddaughters: Old-Age Pensions and Intrahousehold Allocation in South Africa,” World Bank Economic Review, 17 (1): 1-25.
• Garrett, J., Bassett L. and A. Marini. 2009 “Designing CCT Programs to Improve Nutrition Impact: Principles, Evidence and Examples,” FAO Working Paper # 6.
• Grosh, M., Del Ninno, C., Tesliuc, E., A. Ouerghi. 2008. “For Protection and Promotion: the Design and Implementation of Effective Safety Nets.” World Bank.
• Haddad, L., Alderman, H., Appleton, S., Song, L., and Y. Yohannes. 2003. “Reducing Child Malnutrition: How Far Does Income Growth Take Us?” World Bank Economic Review, 17(1): 107-131.
• R. Hermosillo. 2007. Más Oportunidades para la Nutrición, Experiencia del Programa Oportunidades de México en el mejoramiento del impacto nutricional, Note for Discussion, Mexico, DF.
• Horton, S., Shekar, M., Ajay, M., McDonald, C. and J. Brooks. 2009. Scaling up Nutrition: what will it cost? World Bank.
• Levy S. and E. Rodríguez. 2005. Sin herencia de pobreza: el Programa Progresa - Oportunidades de México. Banco Interamericano de Desarrollo, Editorial Planeta Mexicana.
• Neufeld, Nutrition in the Oportunidades conditional cash transfer program: Strengths and challenges, presentation at the Third International CCT Conference, Istanbul, 29 June 2006.
• M. Ruel. 2003. “Operationalizing Dietary Diversity: A Review of Measurement Issues and Research Priorities,” Journal of Nutrition, 133 (11): 3911S-3926S.
• Skoufias E, Unar, M., T. González de Cossio. 2008. The impacts of cash and in-kind transfers on consumption and labor supply: experimental evidence from rural Mexico. World Bank Policy Research Working Paper WPS4778. Washington, D.C.: World Bank.
• Vakis, R. and E. Perova. 2011. The Longer the Better: Duration and Program Impact of Juntos in Peru, mimeo, World Bank, 2011.
• Vargas. 2011. Mejorando el diseño e implementación del Programa Juntos, 2008-2010.
• T. Woldehanna. 2010. Do pre-natal and post-natal economic shocks have a long-lasting effect on the height of 5-year old children? Evidence from 20 sentinel sites of rural and urban Ethiopia, Working Paper 60, Young Lives, Department of International Development, University of Oxford: Oxford.
• World Bank. 2009. Promoción del Crecimiento para Prevenir la Desnutrición Crónica, Washington, D.C.: World Bank
• World Bank. 2011. Juntos Results for Nutrition, Project Appraisal Document, Washington, D.C.: World Bank.
• Yamano, T., Alderman, H. and L. Christiansen. 2005. “Child Growth, Shocks, and Food Aid in Rural Ethiopia,” American Journal of Agricultural Economics, 87 (2): 273-88.

Improving Nutrition Through Multisectoral Approaches
128
Improving Nutrition Through Multisectoral Approaches
129
MODULE E. Improving Nutrition through HealthJulie Ruel-Bergeron, Leslie Elder, Anna Herforth
I. Objectives
The overall objective of this module is to assist World Bank staff in enhancing the nutrition impacts of current and pipeline health investments and policies, with a special focus on undernutrition among women and children under-two years of age in developing economies. This brief will inform World Bank Task Team Leaders (TTLs) and country-level implementers about the linkages between health and nutrition to encourage them to integrate nutrition specific interventions in health investments and policies. This will contribute to the decline of the global burden of hunger and poverty, help achieve the nutrition MDG1, as well as the child and maternal health-related MDGs 4 and 5, build future human capital, and enhance economic and social prospects at the global, regional, and country levels.
The specific objectives of this brief are to support Bank TTLs, partner agencies, and country clients in the following: (1) enhance the design of health investments and policies to maximize impact on nutrition outcomes for the poor; and (2) support governments in designing sustainable and coherent health policies and programs that provide explicit attention to nutrition issues in the context of the national health strategy.
II. Rationale
Undernutrition is the single largest cause of child death globally and in most low-income and lower middle-income countries. Responsible for over 35 percent of all child deaths, undernutrition increases the mortality rate from infectious disease.1,2,3 While severe wasting greatly increases the risk of death, starvation, and visible undernutrition as seen in famines, it is responsible for relatively few of all child deaths attributable to undernutrition. A much greater proportion of child deaths are due to moderate undernutrition because of its high prevalence. If children have poor nutritional status coupled with malaria, pneumonia, and other infectious diseases, they are much more likely to die than well-nourished children are.
There is a global resurgence of awareness and a concomitant increase in support for nutrition. The Scaling Up Nutrition movement, or SUN, is both a by-product and a major reason for this renewed interest and momentum. More than 100 agencies and institutions have endorsed the SUN Framework for Action, and there is rapid progress toward operationalizing the Framework at the national level in countries with some of the highest burdens of undernutrition in the world.
1 Pelletier, D.L., Frongillo, E.A. Jr., Schroeder, D. and J.P. Habicht. 1995. “The effects of malnutrition on child mortality in developing countries,” Bull World Health Org., 73: 443-48.
2 Caulfield L.E., de Onis M, Blossner M., and R.E. Black. 2004. “Undernutrition as an underlying cause of child deaths associated with diarrhea, pneumonia, malaria, and measles. AJCN, 80: 193-98.
3 Black, R.E., Allen, L.H., Bhutta, Z.A., Caulfield, L.E., de Onis, M., Ezzati, M., Mathers, C. and J. Rivera J. 2008. “Maternal and child undernutrition: global and regional exposures and health consequences,” Lancet 371: 243-60.
Improving Nutrition Through Multisectoral Approaches
130
A central tenet of the SUN Framework is the multisectoral nature of malnutrition and the need to invest in actions that will address undernutrition through a variety of sectors. The immediate causes of malnutrition are inadequate food and nutrient intake, and disease. The underlying causes stem from household food insecurity, poor maternal and child care practices, inadequate access to health care, lack of clean water, poor sanitation and hygiene, gender inequities, and low levels of education for girls, among others.
The more direct, nutrition specific interventions (usually delivered through the health sector) address the immediate causes of malnutrition through actions such as promotion of exclusive breastfeeding and administration of vitamin A supplements to young children. Nutrition sensitive interventions include actions delivered through sectors such as health, agriculture, and social protection, which are expected to yield positive results for nutrition (for example, reproductive health services to enable adequate birth spacing), or to reduce harmful impacts on nutritional status (for example, combining health-sector delivered counseling on the need for increased rest during pregnancy with agricultural projects that incorporate labor-saving devices for women to reduce excessive energy expenditure).
The highest priority target populations are pregnant women and children up to 24 months. This window of opportunity represents the crucial period in any individual’s life when poor nutrition can result in irreversible deficits in cognitive development and linear growth leading to reduced productivity as adults. In addition, there is some evidence that undernutrition in the first two years of life is related to adult conditions of obesity and non-communicable diseases such as diabetes and heart disease.
The delivery of nutrition interventions through the health sector is a familiar strategy, although the interventions are not always delivered effectively at scale, e.g., during contact points such as antenatal and postnatal care, well and sick child services, or community-based health outreach services.4 Health systems strengthening programs and public insurance mechanisms can also have increased impacts on nutrition. For example, nutrition specific activities are particularly relevant in two of the six building blocks of the 2007 WHO Health Systems Strengthening Framework for Action: delivery of health services and medical products, with the remaining four building blocks providing opportunities to affect nutrition and health outcomes indirectly through a high-performing workforce, a good health financing system, a well-functioning information system, and adequate leadership and governance of the health system (Figure E-1 and Annex E-3).
4 There is less known about the most effective approaches to preventing and treating overweight and obesity. A growing number of low- and mid-dle-income countries are facing a double burden of malnutrition. A shift in diet to overconsumption of energy-dense, nutrient-poor foods, high in fat, salt, and refined sugar, combined with lower levels of physical activity has resulted in overweight and obese adults and children. Paradoxically, undernutrition persists in the same communities as overnutrition, and even in the same households.
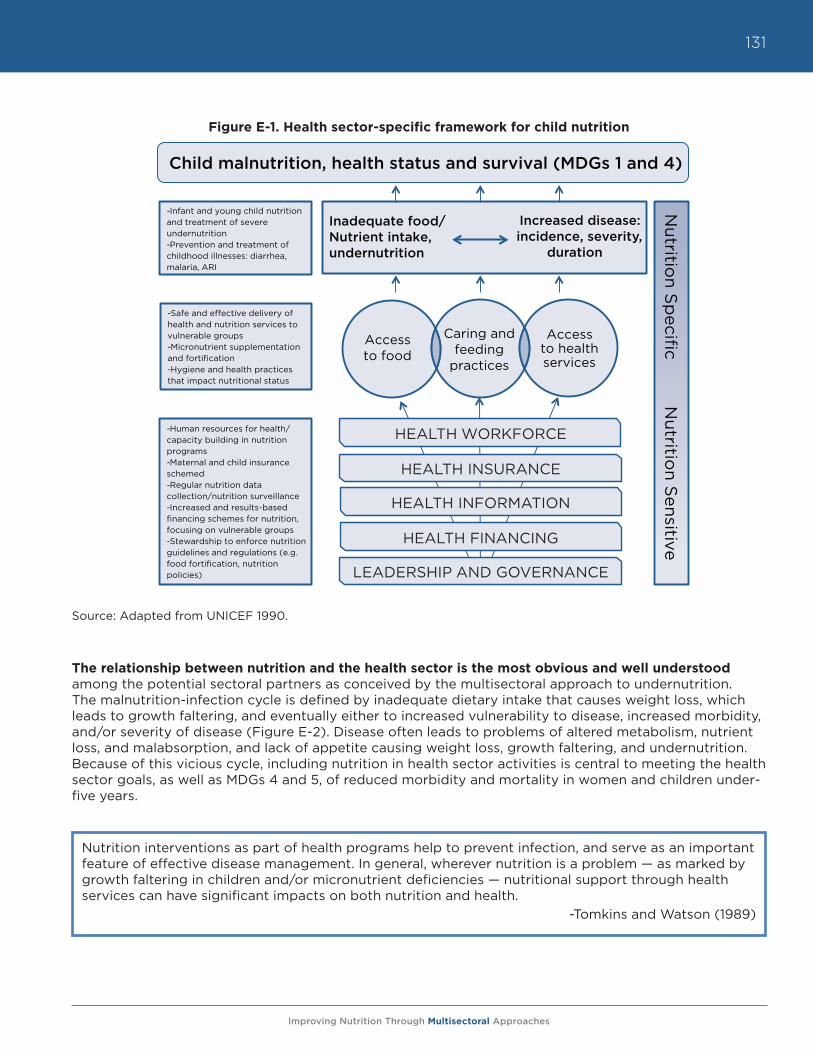
Improving Nutrition Through Multisectoral Approaches
131
Figure E-1. Health sector-specific framework for child nutrition
Source: Adapted from UNICEF 1990.
The relationship between nutrition and the health sector is the most obvious and well understood among the potential sectoral partners as conceived by the multisectoral approach to undernutrition. The malnutrition-infection cycle is defined by inadequate dietary intake that causes weight loss, which leads to growth faltering, and eventually either to increased vulnerability to disease, increased morbidity, and/or severity of disease (Figure E-2). Disease often leads to problems of altered metabolism, nutrient loss, and malabsorption, and lack of appetite causing weight loss, growth faltering, and undernutrition. Because of this vicious cycle, including nutrition in health sector activities is central to meeting the health sector goals, as well as MDGs 4 and 5, of reduced morbidity and mortality in women and children under-five years.
Source: Adapted from UNICEF 1990
Caring and feeding
practices
Access to health services
Access to food
-Infant and young child nutrition and treatment of severe undernutrition -Prevention and treatment of childhood illnesses: diarrhea, malaria, ARI
-Safe and effective delivery of health and nutrition services to vulnerable groups -Micronutrient supplementation and fortification -Hygiene and health practices that impact nutritional status
-Human resources for health/capacity building in nutrition programs -Maternal and child insurance schemed -Regular nutrition data collection/nutrition surveillance -Increased and results-based financing schemes for nutrition, focusing on vulnerable groups -Stewardship to enforce nutrition guidelines and regulations (e.g. food fortification, nutrition policies)
HEALTH WORKFORCE
HEALTH INSURANCE
HEALTH INFORMATION
LEADERSHIP AND GOVERNANCE
Inadequate food/Nutrient intake, undernutrition
Increased disease: incidence, severity,
duration
Child malnutrition, health status and survival (MDGs 1 and 4)
HEALTH FINANCING
Nutritio
n Sp
ecific N
utrition S
ensitive
Nutrition interventions as part of health programs help to prevent infection, and serve as an important feature of effective disease management. In general, wherever nutrition is a problem — as marked by growth faltering in children and/or micronutrient deficiencies — nutritional support through health services can have significant impacts on both nutrition and health.
-Tomkins and Watson (1989)
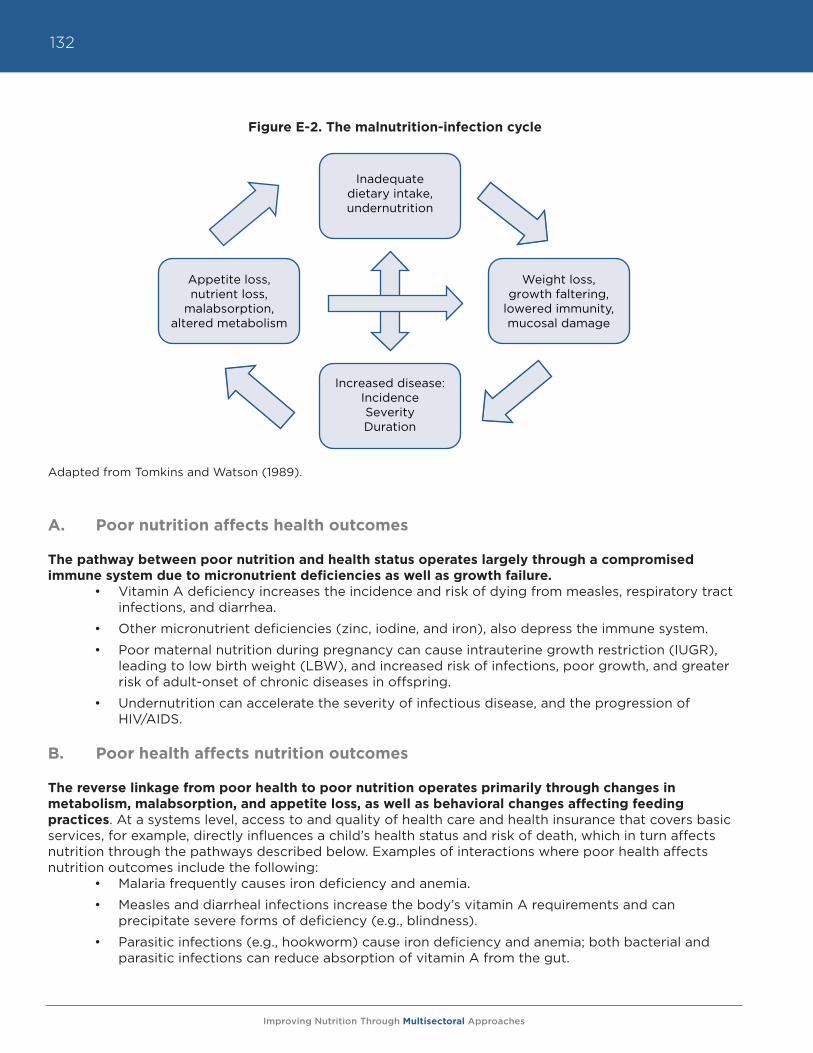
Improving Nutrition Through Multisectoral Approaches
132
Figure E-2. The malnutrition-infection cycle
Adapted from Tomkins and Watson (1989).
A. Poor nutrition affects health outcomes
The pathway between poor nutrition and health status operates largely through a compromised immune system due to micronutrient deficiencies as well as growth failure.
• Vitamin A deficiency increases the incidence and risk of dying from measles, respiratory tract infections, and diarrhea.
• Other micronutrient deficiencies (zinc, iodine, and iron), also depress the immune system.
• Poor maternal nutrition during pregnancy can cause intrauterine growth restriction (IUGR), leading to low birth weight (LBW), and increased risk of infections, poor growth, and greater risk of adult-onset of chronic diseases in offspring.
• Undernutrition can accelerate the severity of infectious disease, and the progression of HIV/AIDS.
B. Poor health affects nutrition outcomes
The reverse linkage from poor health to poor nutrition operates primarily through changes in metabolism, malabsorption, and appetite loss, as well as behavioral changes affecting feeding practices. At a systems level, access to and quality of health care and health insurance that covers basic services, for example, directly influences a child’s health status and risk of death, which in turn affects nutrition through the pathways described below. Examples of interactions where poor health affects nutrition outcomes include the following:
• Malaria frequently causes iron deficiency and anemia.
• Measles and diarrheal infections increase the body’s vitamin A requirements and can precipitate severe forms of deficiency (e.g., blindness).
• Parasitic infections (e.g., hookworm) cause iron deficiency and anemia; both bacterial and parasitic infections can reduce absorption of vitamin A from the gut.
Appetite loss, nutrient loss,
malabsorption, altered metabolism
Weight loss, growth faltering,
lowered immunity, mucosal damage
Inadequate dietary intake, undernutrition
Increased disease: Incidence SeverityDuration
Improving Nutrition Through Multisectoral Approaches
133
• Infections often suppress appetite and decrease the amount of food that is consumed, leading to lack of catch-up growth, weight loss, and micronutrient deficiencies.
• Maternal infections and poor health (e.g., HIV/AIDS, depression) that limit the ability of women to care properly for their children.
III. What are the key health sector interventions to improve nutrition, and what will they cost?
In 2008, The Lancet published the Maternal and Child Undernutrition Series,5 which estimated that more than one-third of all child deaths (3.5 million) are attributable to maternal and child undernutrition.
Paper #3 (What works? Interventions for maternal and child undernutrition and survival)6 lays out the results of an extensive review of interventions to address undernutrition in pregnant women and children, and identifies the most efficacious actions for reducing undernutrition and nutrition-related mortality. Those results form the basis of the recommended interventions outlined in this report, as well as the prioritization scheme outlined in Table E-1. The interventions are included in the SUN Framework for Action (2010), which was endorsed by over 100 international agencies, CSOs, universities, and bilateral organizations.7
The World Bank estimated the cost of delivering the 13 key interventions8 identified in The Lancet Paper #3. The interventions are grouped into three categories: behavior change, micronutrients and deworming, and preventive and therapeutic feeding. The total financing required to implement the 13 interventions is estimated at US$11.8 billion per year for 100 percent coverage of the target groups. Of this sum, $1.5 billion is expected to come from wealthier private households to cover costs for complementary and fortified foods, and the remaining $10.3 billion from public resources worldwide. The Bank’s estimate includes education, capacity building, and delivery mechanisms, in addition to the basic supplies needed for each intervention. The intervention costs are broken down as follows: $2.9 billion for behavior change programs; $1.5 billion for micronutrients and deworming; and $6.2 billion for preventive and therapeutic feeding, with the remainder ($1.2 billion) for capacity development and monitoring and evaluation (M&E).
The return on investment for these activities would be over one million child deaths prevented; 30 million disability adjusted life years (DALYs) saved; 30 million fewer stunted children under the age of five years (a 20% reduction from current rates); and a remarkable halving of the prevalence of severe acute malnutrition.9 Table E-1 represents these costs and cost:benefit ratio by intervention at an individual level, combined with contribution to mortality, and implementation feasibility.
5 This series is available from http://www.thelancet.com/series/maternal-and-child-undernutrition.6 Bhutta, Z.A., Ahmed, T., Black, R.E., Cousens, S., Dewey, K., Guigliani, E., Haider, B., Kirkwood, B., Morris, S.S., Sachdev, H.P.S. and M. Shekar. 2008.
“What works? Interventions for maternal and child undernutrition and survival,” Lancet, 371: 417-40.7 Scaling Up Nutrition: A Framework for Action from http://siteresources.worldbank.org/NUTRITION/Resources/281846-1131636806329/PolicyBrief-
Nutrition.pdf.8 Horton, S., Shekar, M., McDonald, C., Mahal, A. and J.K. Brooks. 2010. “Scaling Up Nutrition: What Will it Cost?” Washington D.C.: The World Bank.9 Ibid.
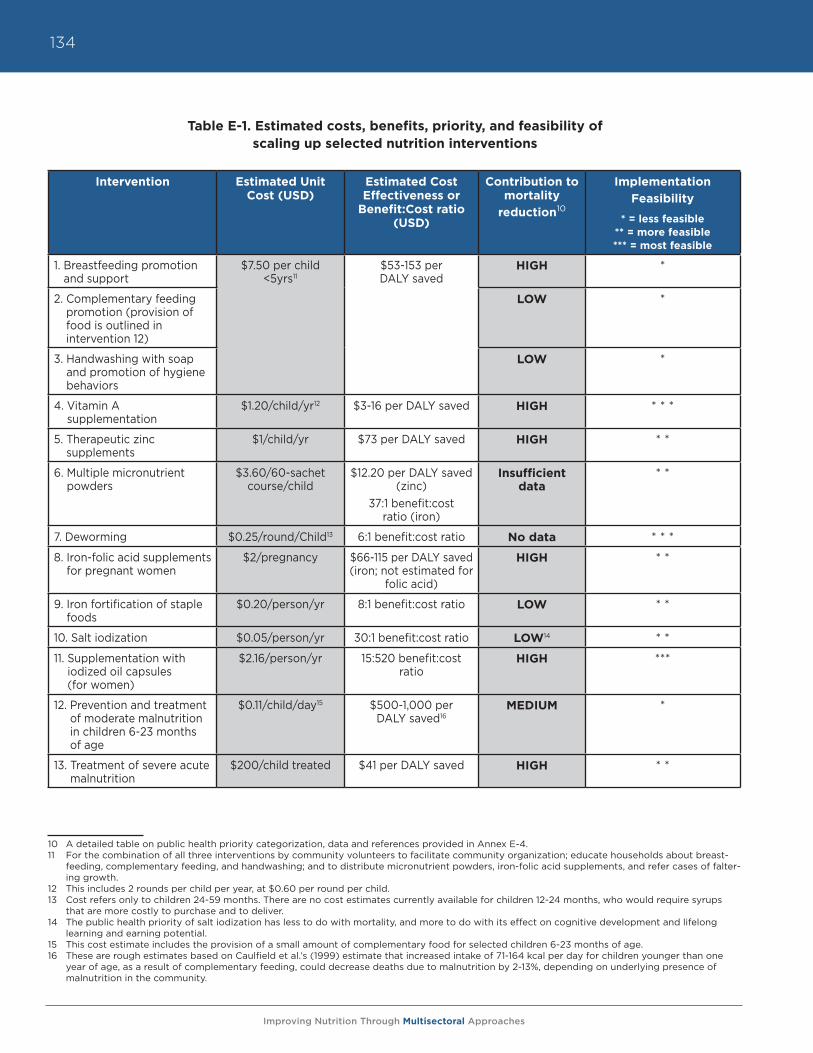
Improving Nutrition Through Multisectoral Approaches
134
Table E-1. Estimated costs, benefits, priority, and feasibility of scaling up selected nutrition interventions
37:1 benefit:cost ratio (iron) LOW * *7. Deworming $0.25/round/Child13 6:1 benefit:cost ratio No data * * *8. Iron-folic acid supplements for pregnant women $2/pregnancy $66-115 per DALY saved (iron; not estimated for folic acid) HIGH * *9. Iron fortification of staple foods $0.20/person/ yr 8:1 benefit:cost ratio LOW * *10. Salt iodization $0.05/person/ yr 30:1 benefit:cost ratio LOW * *11. Supplementation with iodized oil capsules (for women) $2.16/person/year 15:520 benefit:cost ratio HIGH ***12. Prevention14 and treatment of moderate malnutrition in children 6-23 months of age $0.11/child/ day15 $500-1,000 per DALY saved16 MEDIUM *13. Treatment of severe acute malnutrition $200/child treated $41 per DALY saved HIGH * *
10 A detailed table on public health priority categorization, data and references provided in Annex E-4.11 For the combination of all three interventions by community volunteers to facilitate community organization; educate households about breast-
feeding, complementary feeding, and handwashing; and to distribute micronutrient powders, iron-folic acid supplements, and refer cases of falter-ing growth.
12 This includes 2 rounds per child per year, at $0.60 per round per child.13 Cost refers only to children 24-59 months. There are no cost estimates currently available for children 12-24 months, who would require syrups
that are more costly to purchase and to deliver.14 The public health priority of salt iodization has less to do with mortality, and more to do with its effect on cognitive development and lifelong
learning and earning potential.15 This cost estimate includes the provision of a small amount of complementary food for selected children 6-23 months of age.16 These are rough estimates based on Caulfield et al.’s (1999) estimate that increased intake of 71-164 kcal per day for children younger than one
year of age, as a result of complementary feeding, could decrease deaths due to malnutrition by 2-13%, depending on underlying presence of malnutrition in the community.
Intervention Estimated Unit Cost (USD)
Estimated Cost Effectiveness or
Benefit:Cost ratio (USD)
Contribution to mortality
reduction10
Implementation Feasibility
* = less feasible** = more feasible*** = most feasible
1. Breastfeeding promotion and support
$7.50 per child <5yrs11
$53-153 per DALY saved
HIGH *
2. Complementary feeding promotion (provision of food is outlined in intervention 12)
LOW *
3. Handwashing with soap and promotion of hygiene behaviors
LOW *
4. Vitamin A supplementation
$1.20/child/yr12 $3-16 per DALY saved HIGH * * *
5. Therapeutic zinc supplements
$1/child/yr $73 per DALY saved HIGH * *
6. Multiple micronutrient powders
$3.60/60-sachet course/child
$12.20 per DALY saved (zinc)
37:1 benefit:cost ratio (iron)
Insufficient data
* *
7. Deworming $0.25/round/Child13 6:1 benefit:cost ratio No data * * *
8. Iron-folic acid supplements for pregnant women
$2/pregnancy $66-115 per DALY saved (iron; not estimated for
folic acid)
HIGH * *
9. Iron fortification of staple foods
$0.20/person/yr 8:1 benefit:cost ratio LOW * *
10. Salt iodization $0.05/person/yr 30:1 benefit:cost ratio LOW14 * *
11. Supplementation with iodized oil capsules (for women)
$2.16/person/yr 15:520 benefit:cost ratio
HIGH ***
12. Prevention and treatment of moderate malnutrition in children 6-23 months of age
$0.11/child/day15 $500-1,000 per DALY saved16
MEDIUM *
13. Treatment of severe acute malnutrition
$200/child treated $41 per DALY saved HIGH * *
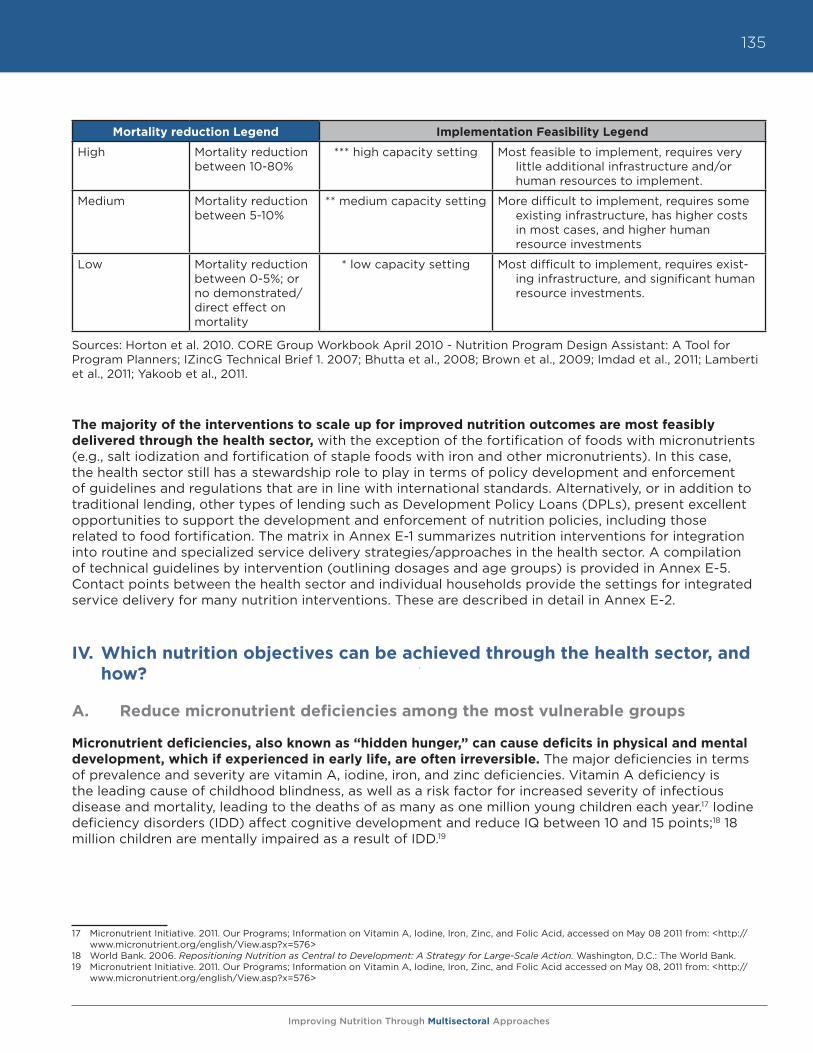
Improving Nutrition Through Multisectoral Approaches
135
Sources: Horton et al. 2010. CORE Group Workbook April 2010 - Nutrition Program Design Assistant: A Tool for Program Planners; IZincG Technical Brief 1. 2007; Bhutta et al., 2008; Brown et al., 2009; Imdad et al., 2011; Lamberti et al., 2011; Yakoob et al., 2011.
The majority of the interventions to scale up for improved nutrition outcomes are most feasibly delivered through the health sector, with the exception of the fortification of foods with micronutrients (e.g., salt iodization and fortification of staple foods with iron and other micronutrients). In this case, the health sector still has a stewardship role to play in terms of policy development and enforcement of guidelines and regulations that are in line with international standards. Alternatively, or in addition to traditional lending, other types of lending such as Development Policy Loans (DPLs), present excellent opportunities to support the development and enforcement of nutrition policies, including those related to food fortification. The matrix in Annex E-1 summarizes nutrition interventions for integration into routine and specialized service delivery strategies/approaches in the health sector. A compilation of technical guidelines by intervention (outlining dosages and age groups) is provided in Annex E-5. Contact points between the health sector and individual households provide the settings for integrated service delivery for many nutrition interventions. These are described in detail in Annex E-2.
IV. Which nutrition objectives can be achieved through the health sector, and how?
A. Reduce micronutrient deficiencies among the most vulnerable groups
Micronutrient deficiencies, also known as “hidden hunger,” can cause deficits in physical and mental development, which if experienced in early life, are often irreversible. The major deficiencies in terms of prevalence and severity are vitamin A, iodine, iron, and zinc deficiencies. Vitamin A deficiency is the leading cause of childhood blindness, as well as a risk factor for increased severity of infectious disease and mortality, leading to the deaths of as many as one million young children each year.17 Iodine deficiency disorders (IDD) affect cognitive development and reduce IQ between 10 and 15 points;18 18 million children are mentally impaired as a result of IDD.19
17 Micronutrient Initiative. 2011. Our Programs; Information on Vitamin A, Iodine, Iron, Zinc, and Folic Acid, accessed on May 08 2011 from: <http://
www.micronutrient.org/english/View.asp?x=576>18 World Bank. 2006. Repositioning Nutrition as Central to Development: A Strategy for Large-Scale Action. Washington, D.C.: The World Bank.19 Micronutrient Initiative. 2011. Our Programs; Information on Vitamin A, Iodine, Iron, Zinc, and Folic Acid accessed on May 08, 2011 from: <http://
www.micronutrient.org/english/View.asp?x=576>
Mortality reduction Legend Implementation Feasibility Legend
High Mortality reduction between 10-80%
*** high capacity setting Most feasible to implement, requires very little additional infrastructure and/or human resources to implement.
Medium Mortality reduction between 5-10%
** medium capacity setting More difficult to implement, requires some existing infrastructure, has higher costs in most cases, and higher human resource investments
Low Mortality reduction between 0-5%; or no demonstrated/direct effect on mortality
* low capacity setting Most difficult to implement, requires exist-ing infrastructure, and significant human resource investments.
Improving Nutrition Through Multisectoral Approaches
136
Iron deficiency is associated with fetal and child growth failure, compromised cognitive development (1.7 lower IQ points per 10g/L decrease in hemoglobin)20 in young children, lowered physical activity and labor productivity in adults, and increased maternal morbidity and mortality. Zinc deficiency is associated with stunting and increased incidence and duration of diarrhea and pneumonia.
Interventions in the health sector to address micronutrient deficiencies:a) Promote and ensure routine micronutrient supplementation
• Provide routine vitamin A supplementation to children • Provide multiple micronutrient supplements or powders (MNP) to young children• Provide iron-folate supplements to pregnant and lactating women. Provide routine iodized oil
capsules when iodized salt is not available, focusing on pregnant and lactating women and young children
b) Promote and provide stewardship for population-level consumption of locally available fortified staple foods• Steward the food fortification process (salt, flours, etc.), including legislation, marketing,
production, and quality assurance of fortified foods• Promote use of iodized salt if it is available• Promote the use of other fortified staple foods, such as oil and sugar, (vitamin A), flour (iron
and folate), rice (zinc, iron and folate)
c) Promote dietary diversification for children and pregnant/lactating women based on available and nutritionally rich foods through counseling at all routine health service contacts
d) Promote optimal infant and young child feeding practices through traditional and innovative behavior change methods, including mass media marketing of optimal behaviors, peer-to-peer counseling, and extension to other influential audiences such as fathers, grandmothers, and mothers-in-law, among others:• Exclusive breastfeeding from 0-6 months, including early initiation and use of colostrum • Continued breastfeeding and optimal complementary feeding using age-appropriate nutrient-
rich foods with adequate frequency, nutrient density, food diversity, and consistency21
e) Integrate micronutrient supplementation activities, such as vitamin A and iron supplementation (through iron supplements or MNPs) into a basic package of free services (through health insurance and/or government provision mechanisms).
20 Black, R.E., Allen, L.H., Bhutta, Z.A., Caulfield, L.E., de Onis, M., Ezzati, M., Mathers, C. and J. Rivera. 2008. “Maternal and child undernutrition: global and regional exposures and health consequences,” Lancet, 371: 243-60.
21 See PAHO/WHO. 2003. Guiding Principles of Complementary Feeding of the Breastfed Child. (Link provided in Annex E-3.)
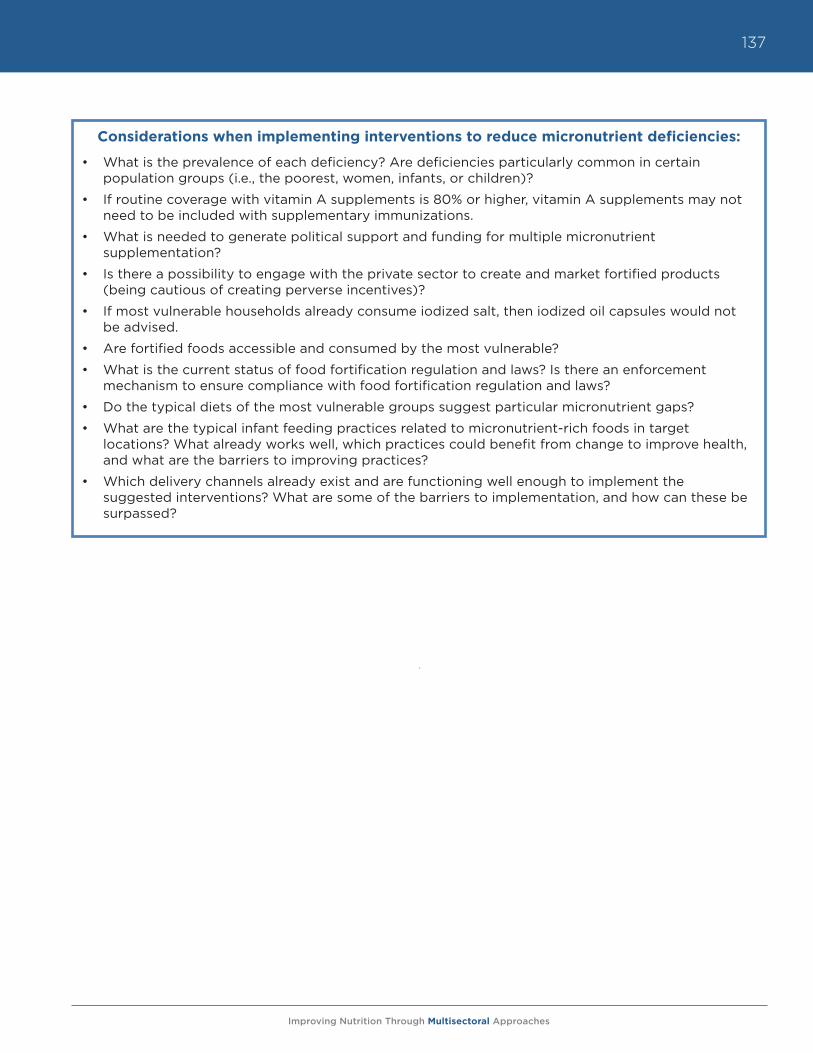
Improving Nutrition Through Multisectoral Approaches
137
Considerations when implementing interventions to reduce micronutrient deficiencies:
• What is the prevalence of each deficiency? Are deficiencies particularly common in certain population groups (i.e., the poorest, women, infants, or children)?
• If routine coverage with vitamin A supplements is 80% or higher, vitamin A supplements may not need to be included with supplementary immunizations.
• What is needed to generate political support and funding for multiple micronutrient supplementation?
• Is there a possibility to engage with the private sector to create and market fortified products (being cautious of creating perverse incentives)?
• If most vulnerable households already consume iodized salt, then iodized oil capsules would not be advised.
• Are fortified foods accessible and consumed by the most vulnerable?
• What is the current status of food fortification regulation and laws? Is there an enforcement mechanism to ensure compliance with food fortification regulation and laws?
• Do the typical diets of the most vulnerable groups suggest particular micronutrient gaps?
• What are the typical infant feeding practices related to micronutrient-rich foods in target locations? What already works well, which practices could benefit from change to improve health, and what are the barriers to improving practices?
• Which delivery channels already exist and are functioning well enough to implement the suggested interventions? What are some of the barriers to implementation, and how can these be surpassed?
Improving Nutrition Through Multisectoral Approaches
138
B. Reduce the prevalence of anemia in pregnant and lactating women and children 0-24 months
Iron deficiency is the most common preventable nutritional deficiency. It affects all nations and is found in all income groups. The WHO estimates that two billion individuals are anemic and up to five billion are iron deficient.22 The large majority of anemia is estimated to be caused by dietary deficiencies. Fifty percent of anemia is a direct result of iron deficiency (due to lack of sufficient consumption of high-iron containing foods, such as animal products and legumes), with the remainder due to other dietary deficiencies such as vitamin A deficiency, deficiencies of vitamin B12 and folate, and health conditions that interact negatively with iron status, such as malaria, HIV, other infectious diseases, sickle cell disease, and other inherited anemias.23 The consequences of anemia for children include increased morbidity and mortality, stunting, lower academic performance, cognitive delays, and apathy.24 In adults, anemia is associated with weakness and fatigue, lower productivity, and increased risk of maternal mortality associated with postpartum hemorrhage.
Interventions in the health sector to reduce the prevalence of anemia:a) Provide daily iron and folic acid supplements to pregnant and lactating women
b) Provide supplemental iron25 to children to prevent and treat iron deficiency anemia
c) Provide multiple micronutrient supplements or powders (and guidance for use) to young children
d) Promote and provide deworming treatments• Provide routine deworming treatments twice-yearly to children in high worm burden
communities• Provide deworming treatments for pregnant women (after the first trimester) in hookworm
endemic areas
e) Promote and provide stewardship for population-level consumption of locally-available iron-fortified staple foods such as wheat/soy/corn-based flours, and rice• Steward the food fortification process (salt, flours, etc.), including legislation, marketing,
production, and quality assurance of fortified foods
f) Prevent and treat malaria in malaria-endemic areas• Provide insecticide-treated nets (ITN) for pregnant and lactating women and children• Provide intermittent preventive treatment (IPT) for pregnant women (2 visits, 3 for
HIV+ women) • Identify and treat cases of malaria
g) Delay cord clamping at time of delivery. Immediate cord clamping has been shown to increase the incidence of iron deficiency and anemia during the first half of infancy, with lower birth weight infants and infants born to iron deficient mothers being at particular risk. Delayed cord clamping (clamping done after 2-3 minutes versus within ten seconds or less of birth) allows extra blood flow from the placenta to the fetus, thereby shoring up the infant’s iron stores from which it draws during the first six months of life.26 This effect was further confirmed by a recent study27 where cord clamping improved the iron status of infants, and the risk of iron deficiency was lower at four months of age compared to infants who did not receive the intervention.
22 M. Black. 2003. “Animal source foods to improve micronutrient nutrition and human function in developing countries: Micronutrient deficiencies
and cognitive functioning.” J.Nutr, 133: 3927S-3931S.23 Ibid.24 Children who suffer from anemia have an average of 1-2 lower IQ points per 10g/L decrease in hemoglobin levels, Black et al. 2008.25 Refer to the WHO statement on Iron supplementation of young children in regions where malaria transmission is intense and infectious disease
highly prevalent at http://www.who.int/child_adolescent_health/documents/pdfs/who_statement_iron.pdf for specific guidance on prevention and treatment of iron deficiency anemia in children in specific disease-context settings.
26 PAHO. Essential Delivery Care Practices for Maternal and Newborn Health and Nutrition.27 Andersson, O., Hellstrom-Westas, L., Andersson, D. and M. Domellof. 2011. “Effect of delayed versus early umbilical cord clamping on neonatal
outcomes and iron status at 4 months: a randomized control trial,” British Medical Journal, 343:d7157.
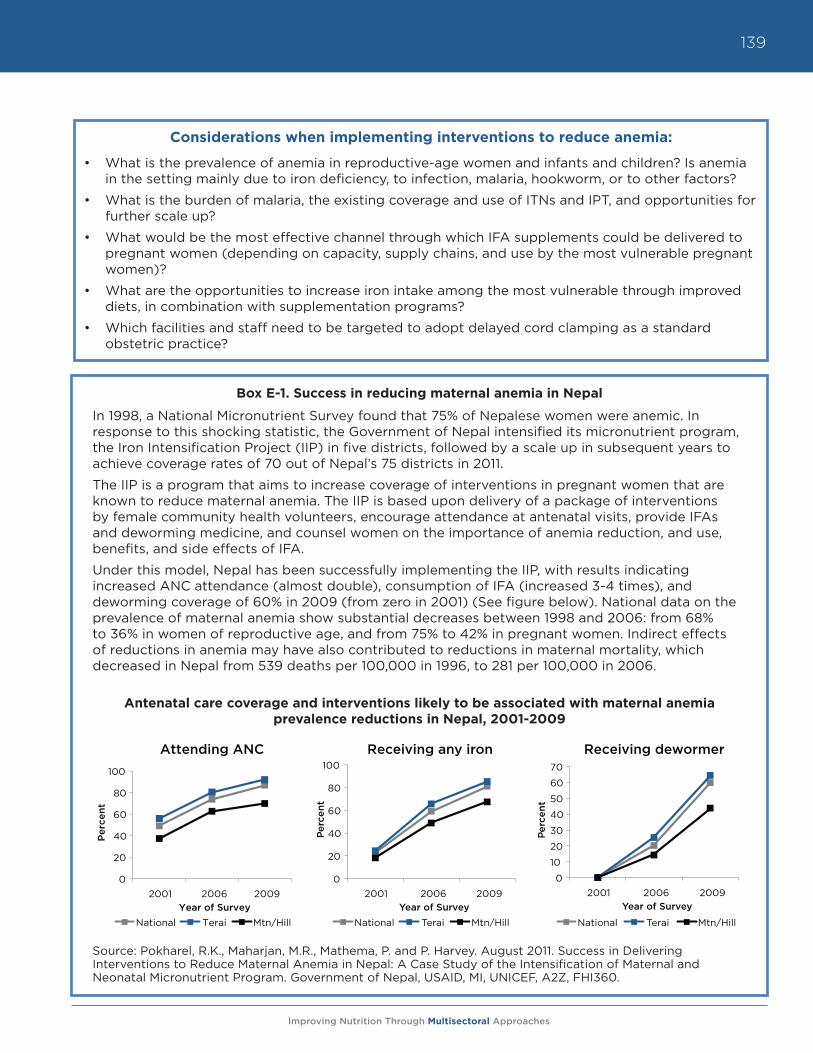
Improving Nutrition Through Multisectoral Approaches
139
Box E-1. Success in reducing maternal anemia in Nepal
In 1998, a National Micronutrient Survey found that 75% of Nepalese women were anemic. In response to this shocking statistic, the Government of Nepal intensified its micronutrient program, the Iron Intensification Project (IIP) in five districts, followed by a scale up in subsequent years to achieve coverage rates of 70 out of Nepal’s 75 districts in 2011.
The IIP is a program that aims to increase coverage of interventions in pregnant women that are known to reduce maternal anemia. The IIP is based upon delivery of a package of interventions by female community health volunteers, encourage attendance at antenatal visits, provide IFAs and deworming medicine, and counsel women on the importance of anemia reduction, and use, benefits, and side effects of IFA.
Under this model, Nepal has been successfully implementing the IIP, with results indicating increased ANC attendance (almost double), consumption of IFA (increased 3-4 times), and deworming coverage of 60% in 2009 (from zero in 2001) (See figure below). National data on the prevalence of maternal anemia show substantial decreases between 1998 and 2006: from 68% to 36% in women of reproductive age, and from 75% to 42% in pregnant women. Indirect effects of reductions in anemia may have also contributed to reductions in maternal mortality, which decreased in Nepal from 539 deaths per 100,000 in 1996, to 281 per 100,000 in 2006.
Antenatal care coverage and interventions likely to be associated with maternal anemia prevalence reductions in Nepal, 2001-2009
Source: Pokharel, R.K., Maharjan, M.R., Mathema, P. and P. Harvey. August 2011. Success in Delivering Interventions to Reduce Maternal Anemia in Nepal: A Case Study of the Intensification of Maternal and Neonatal Micronutrient Program. Government of Nepal, USAID, MI, UNICEF, A2Z, FHI360.
0
20
40
60
80
100
2001 2006 2009
Perc
ent
Year of Survey
Receiving any iron
National Terai Mtn/Hill
0
10
20
30
40
50
60
70
2001 2006 2009
Perc
ent
Year of Survey
Receiving dewormer
National Terai Mtn/Hill
0
20
40
60
80
100
2001 2006 2009
Per
cent
Year of Survey
Attending ANC
National Terai Mtn/Hill
Considerations when implementing interventions to reduce anemia:
• What is the prevalence of anemia in reproductive-age women and infants and children? Is anemia in the setting mainly due to iron deficiency, to infection, malaria, hookworm, or to other factors?
• What is the burden of malaria, the existing coverage and use of ITNs and IPT, and opportunities for further scale up?
• What would be the most effective channel through which IFA supplements could be delivered to pregnant women (depending on capacity, supply chains, and use by the most vulnerable pregnant women)?
• What are the opportunities to increase iron intake among the most vulnerable through improved diets, in combination with supplementation programs?
• Which facilities and staff need to be targeted to adopt delayed cord clamping as a standard obstetric practice?
Improving Nutrition Through Multisectoral Approaches
140
h) Integrate routine iron supplementation, intermittent preventive treatment of malaria, and distribution of ITNs into a basic package of free services for pregnant women and young children (through health insurance and/or government provision mechanisms).
C. Promote good feeding and nutritional care practices for the most vulnerable populations
Worldwide, 20 percent of children under five are underweight, and 32 percent of children under five are stunted. In most countries, poor children are more likely than richer children to suffer from stunting and other forms of undernutrition due to the strong influence of poverty on access to and availability of food, education, health, and a hygienic environment.28 However, this is not always the case. Undernutrition may directly reflect poor dietary choices and/or feeding practices among vulnerable groups despite available nutritionally rich and diverse foods. The intergenerational cycle of undernutrition begins when a child is born small. The child is more likely to suffer from undernutrition in childhood and through adolescence, leading to undernourished pregnant women giving birth to low birth weight infants, perpetuating the cycle. Other basic and underlying causes of undernutrition, such as environmental, economic, and sociopolitical contextual factors, are also important contributors to undernutrition across all societal levels.
Interventions in the health sector to promote good feeding and nutritional care practices:a) Promote dietary diversification and adequate
weight gain for pregnant women and children’s diets
b) Promote/protect early initiation and exclusive breastfeeding for the first six months of life (individual and group counseling) • Counsel pregnant women, partners,
mothers-in-law and other influential actors on optimal breastfeeding practices such as early initiation, use of colostrum, and exclusive breastfeeding for the first six months of the baby’s life
• Continue promotion/support of optimal breastfeeding through individual counseling of mothers; ensure that health-system support strategies align their messages with those of community-based breastfeeding promotion (e.g., mother-to-mother peer support groups, etc.).
• Support and implement the development of policies that protect optimal breastfeeding at the population level, including legislation and enforcement regarding breastmilk substitutes and hospital care (Baby-Friendly Hospital Initiative, for example).
28 Black, R.E., Allen, L.H., Bhutta, Z.A., Caulfield L.E., de Onis, M., Ezzati, M., Mathers, C. and J. Rivera. 2008. “Maternal and child undernutrition: global and regional exposures and health consequences,” Lancet, 371: 243-60.
Considerations when implementing interventions to improve feeding and
nutritional care of vulnerable populations:
• What are the existing opportunities to improve diets in the target population? Can improved knowledge be expected to overcome barriers to access?
• What are the infant feeding practices in target locations? Which positive existing practices could be promoted, and which practices could benefit from change to improve health?
• What are the main factors limiting exclusive breastfeeding: cultural norms, marketing of breastmilk substitutes, health staff, stigma, women’s work, etc.? How can these be overcome, and who would be the most ef-fective group to counsel in addition to new mothers (husbands, mothers-in-law, health staff, etc.)?
• What training is needed to improve staff capacity to deliver counseling messages?
• What training is needed to build nutrition capacity in country, including nutritionist training curricula, sensitization of high level policymakers and academics?
• How will the quality of counseling be monitored?
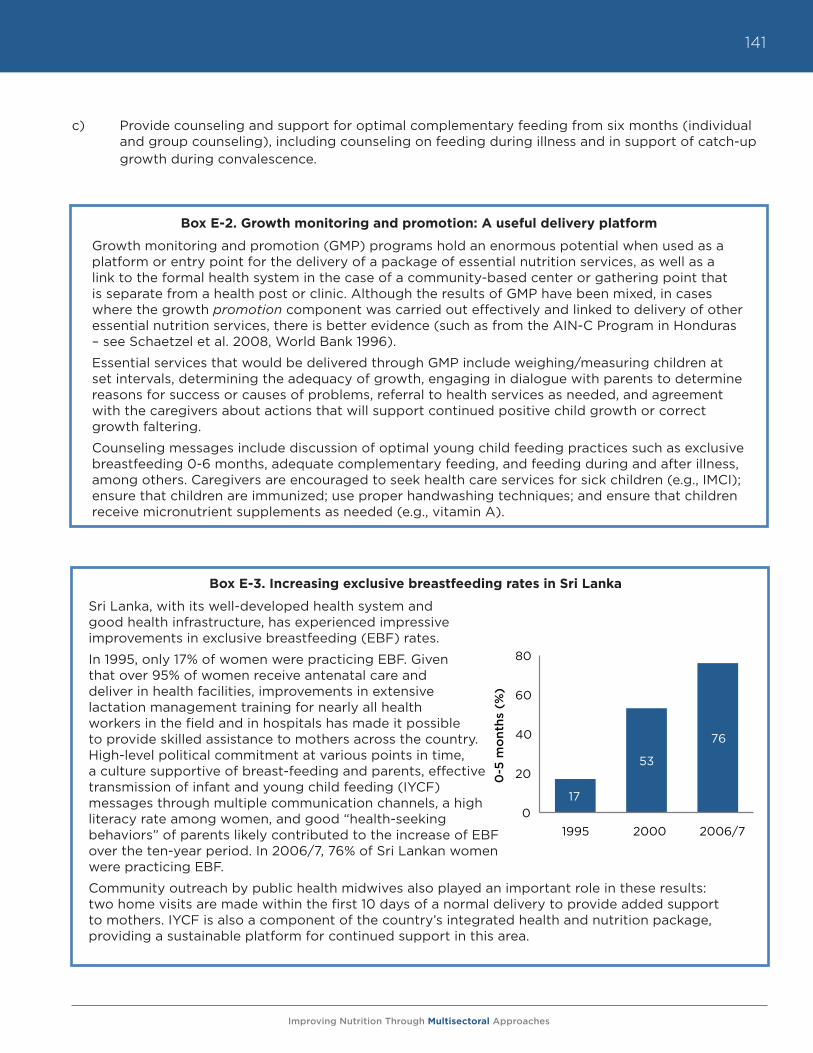
Improving Nutrition Through Multisectoral Approaches
141
c) Provide counseling and support for optimal complementary feeding from six months (individual and group counseling), including counseling on feeding during illness and in support of catch-up growth during convalescence.
Box E-2. Growth monitoring and promotion: A useful delivery platform
Growth monitoring and promotion (GMP) programs hold an enormous potential when used as a platform or entry point for the delivery of a package of essential nutrition services, as well as a link to the formal health system in the case of a community-based center or gathering point that is separate from a health post or clinic. Although the results of GMP have been mixed, in cases where the growth promotion component was carried out effectively and linked to delivery of other essential nutrition services, there is better evidence (such as from the AIN-C Program in Honduras – see Schaetzel et al. 2008, World Bank 1996).
Essential services that would be delivered through GMP include weighing/measuring children at set intervals, determining the adequacy of growth, engaging in dialogue with parents to determine reasons for success or causes of problems, referral to health services as needed, and agreement with the caregivers about actions that will support continued positive child growth or correct growth faltering.
Counseling messages include discussion of optimal young child feeding practices such as exclusive breastfeeding 0-6 months, adequate complementary feeding, and feeding during and after illness, among others. Caregivers are encouraged to seek health care services for sick children (e.g., IMCI); ensure that children are immunized; use proper handwashing techniques; and ensure that children receive micronutrient supplements as needed (e.g., vitamin A).
Box E-3. Increasing exclusive breastfeeding rates in Sri Lanka
Sri Lanka, with its well-developed health system and good health infrastructure, has experienced impressive improvements in exclusive breastfeeding (EBF) rates.
In 1995, only 17% of women were practicing EBF. Given that over 95% of women receive antenatal care and deliver in health facilities, improvements in extensive lactation management training for nearly all health workers in the field and in hospitals has made it possible to provide skilled assistance to mothers across the country. High-level political commitment at various points in time, a culture supportive of breast-feeding and parents, effective transmission of infant and young child feeding (IYCF) messages through multiple communication channels, a high literacy rate among women, and good “health-seeking behaviors” of parents likely contributed to the increase of EBF over the ten-year period. In 2006/7, 76% of Sri Lankan women were practicing EBF.
Community outreach by public health midwives also played an important role in these results: two home visits are made within the first 10 days of a normal delivery to provide added support to mothers. IYCF is also a component of the country’s integrated health and nutrition package, providing a sustainable platform for continued support in this area.
17
53
76
0
20
40
60
80
1995 2000 2006/7
0-5
mo
nths
(%
)
Improving Nutrition Through Multisectoral Approaches
142
D. Treat and prevent illness
Illness is a direct cause of undernutrition. Increasing access to high-quality health care, either through global-level health system improvements, government provision, or universal insurance mechanisms for vulnerable groups is a high priority to reduce the burden of undernutrition. Moreover, actions that directly target key infections that cause undernutrition in children, and women in some cases, and that often lead to mortality synergistically with undernutrition, are diarrhea, respiratory tract infections (including pneumonia), measles, malaria, and HIV/AIDS, and TB. Therefore, addressing these illnesses should be a high priority of the health sector. Hygiene interventions also often fall under the health umbrella; poor hygiene is strongly linked with nutrition through the pathway of an unsanitary environment, poor handwashing, and food preparation practices that increase the risk of parasitic infection and diarrhea.
Interventions in the health sector to prevent and treat illness: a) Provide coverage of a basic package of
essential health and nutrition services for pregnant women and children, e.g., immunizations, sick-child services, malaria treatment and prevention, etc.
b) Encourage/deliver full course of childhood immunizations
c) Provide quality sick-child care services, for example, IMCI29
d) Provide counseling and support for improved hygiene practices, including handwashing
e) Provide intermittent preventive treatment (IPT) and ITN to pregnant and lactating women to prevent malaria
f) Promote/protect early initiation and exclusive breastfeeding for first six months of life, including cases where the mother is HIV+, unless AFASS criteria can be met for replacement feeding (Is replacement feeding acceptable, feasible, affordable, sustainable, and safe?)30
g) Treat malaria
h) Provide therapeutic zinc supplements with oral rehydration salts (ORS) for diarrheal disease management
i) Identify and treat women who are HIV+ during pregnancy and ensure that both their clinical and nutritional needs are met (e.g., provision of ARVs, counseling on proper feeding practices, food support)
29 IMCI is a strategy combining improved management of childhood illness with aspects of nutrition, immunization, and other important disease prevention and health promotion activities. The objectives of IMCI are to reduce deaths and the frequency and severity of illness and disability, and to contribute to improved growth and development. Developed by the WHO and UNICEF, the strategy includes three main components: (1) Improvements in the case-management skills of health staff through the provision of locally adapted guidelines on IMCI, and through activities to promote their use; (2) Improvements in the health system required for effective management of childhood illness; and, (3) Improvements in family and community practices.
30 Outlined in WHO’s Guidelines on HIV and Infant Feeding, 2010.
Considerations when implementing interventions to treat and prevent illness:
• How often do parents use child health services when their children are sick, and what are the barriers to use?
• Based on capacity and client use, what are the most promising channels to deliver counseling on hygiene and other information?
• What is the prevalence of diarrhea, and through which channels could therapeutic zinc be delivered?
• How will an adequate supply of zinc supplements be ensured?
• What training is needed to improve staff capacity to deliver counseling messages?
• How will the quality of counseling be monitored?
Improving Nutrition Through Multisectoral Approaches
143
E. Reduce low birth weight
Low birth weight (< 2500g) often reflects the poor health and nutrition of mothers, and is associated with continued poor nutrition in infancy and childhood. Poor maternal nutrition (e.g., low body mass index/being too thin), and infections, including malaria,31 are associated with intrauterine growth restriction (IUGR), leading to poor fetal growth and low birth weight, which is associated with an increased risk of morbidity and mortality in the newborn period.32,33 Being stunted in utero increases the risk of stunting in infancy and childhood, which in turn increases the risk of short girls, who are more likely to give birth to children with low birth weight, thus perpetuating the intergenerational cycle of compromised growth. The consequences of being born undernourished are grave: IUGR infants suffer from impairment of most immune functions and face an increased risk of diarrhea and pneumonia, with a neonatal risk of death that is 10 times higher for infants weighing 2-2.5kg than for those weighing 3-3.5kg.34
Interventions in the health sector to reduce low birth weight:a) Ensure the provision of affordable (free or
low cost) health and nutrition services (such as those described below) through different mechanisms, including insurance schemes, social safety net programs, government provision, etc.
b) Prevent/treat maternal infections, e.g., malaria prophylaxis and treatment; testing and management of syphilis and other STIs
c) Provide counseling and support for increased dietary intake (quality and quantity) during pregnancy; reduced maternal workload; prevention and treatment of anemia; decreased indoor air pollution; reduced tobacco consumption; avoidance of gender violence; planning for contraception after delivery
d) In situations where food shortage for pregnant women is probable, provide maternal supplements of balanced energy and protein
e) Provide iron folate supplementation for pregnant women
31 Black, R.E., Allen, L.H., Bhutta, Z.A., Caulfield, L.E., de Onis, M., Ezzati, M., Mathers, C. and J. Rivera. 2008. “Maternal and child undernutrition: global and regional exposures and health consequences,” Lancet, 371: 243-60.
32 Elder, L and L. Kiess. 2004 Nuts and Bolts. Washington D.C.: The Human Development Network at the World Bank.33 Black, R.E., Allen, L.H., Bhutta, Z.A., Caulfield, L.E., de Onis, M., Ezzati, M., Mathers, C. and J. Rivera. 2008. “Maternal and child undernutrition: global
and regional exposures and health consequences,” Lancet, 371: 243-6034 Gillespie, S. and R. Flores. 2000. The Life Cycle of Malnutrition. Washington D.C.: The International Food Policy Research Institute.
Considerations when implementing interventions to reduce low birth weight:
• What is the prevalence of low birth weight, and what are the main factors behind it in the setting, e.g., smoking, too little food, excessive energy expenditure during pregnancy and maternal infections?
• Who are the key decision makers about nutrition and health care practices during pregnancy, e.g., women themselves, husbands, mothers-in-law?
• Can counseling be delivered to all key decision makers?
• What training is needed to improve staff capacity to deliver counseling messages?
• How will the quality of counseling be monitored?
• What infrastructure and funding is needed to provide access to health and nutrition services such as prenatal care and protein-energy supplementation to pregnant women? Is there a possibility of local sourcing of the food?
Improving Nutrition Through Multisectoral Approaches
144
F. Improve reproductive health and family planning
The nutritional status of women, particularly adolescents who are still growing and have higher nutritional requirements, age at first pregnancy, birth spacing, and sexually transmitted infections, affect fetal growth and the nutritional status of infants. Reproductive Health (RH) is therefore an underlying determinant of nutritional status, and RH interventions are important to reduce undernutrition of adolescents, women and children.
The age of a woman’s first pregnancy can have serious implications for both the mother and child’s health outcomes. Children born to women aged 15-19 years old are at highest risk of infant and child mortality, and there is a higher risk of morbidity and mortality for the young mother.35 Many health problems are particularly associated with negative outcomes of pregnancy during adolescence, including anemia, malaria, HIV and other STIs, postpartum hemorrhage, obstetric fistula, and mental disorders such as depression.36 Moreover, stillbirths and death in the first week and month of life are respectively 50 percent and 50-100 percent higher among babies born to adolescent mothers in comparison those born to a mother who is over 20 years old.37
The time between pregnancies is strongly associated with neonatal, infant and under-five mortality, low birth weight, and stunting and underweight in children. The longer the interval between birth and conception, the more time the mother has to recover nutritionally from her previous birth, and thus the better the nutritional and health outcomes for both mother and child. Moreover, the proper timing of a subsequent birth helps to prevent displacement of a young child from receiving breastmilk during his/her critical early growth period (0-24 months), reducing their risk of undernutrition and mortality. Child feeding practices are in fact protective against short birth intervals, as exclusive breastfeeding extends the period of lactational amenorrhea, lengthening the period between birth and the return to fertility.
Reproductive health and family planning interventions in the health sector:a) Include nutrition sensitive family-planning
and reproductive health services as an affordable (free or low cost) and accessible service as part of part of a basic insurance package or government provision for adolescent and pregnant women
b) Provide integrated postpartum family planning: Counseling on lactational amenorrhea method (LAM); use of progestin-only modern contraception after shift from LAM; healthy spacing of pregnancies
c) Promote and counsel adolescent women on delayed age of first pregnancy, birth spacing and modern contraceptive use
35 WHO. 2011. Making Pregnancy Safer: Adolescent Pregnancy. Geneva: WHO, accessed on February 9, 2012, http://www.who.int/maternal_child_adolescent/topics/maternal/adolescent_pregnancy/en/index.html
36 Ibid.37 Ibid.
Considerations when implementing interventions to improve reproductive
health and family planning:
• Is the use of contraceptives socially acceptable to women and to men?
• What barriers exist to contraceptive use (lack of access, lack of supply, stigma)?
• What are the current norms around adolescent pregnancy and birth spacing?
• Is LAM viable given breastfeeding norms?
• Who needs to be reached with counseling messages about delaying age at first pregnancy, adequate birth spacing and contraceptive use (women, men, adolescents, religious leaders, etc.)?
• What training is needed to improve staff capacity to deliver counseling messages?
• How will the quality of counseling be monitored?
Improving Nutrition Through Multisectoral Approaches
145
G. Treat moderate and severe acute undernutrition in children
Interventions to prevent undernutrition are well established and proven to be cost-effective; prevention is preferable and more effective than a curative approach in terms of both cost and recurrence of disease.38 However, acute undernutrition (moderate or severe wasting or low weight-for-height) affects as much as one-tenth of children under-five years globally, primarily in conditions of extreme poverty, in conflict settings, and during natural emergencies in developing countries. It is categorized according to severity, where severe acute malnutrition refers to children whose weight/height is a z-score below -3 standard deviations (SD), and moderate acute malnutrition refers to children whose z-score is below -2 SD. The risk of death or disability from childhood illnesses increases substantially with descending z-scores of weight for height. For example, a child whose weight for height is -3 SD has a risk of death that is 9.4 times higher than that of a child with a weight for height in the normal range (-1 SD and above), and 3 times higher for a child whose weight for height is between -2 to -3 SD. For both moderate and severe acute malnutrition, the overall case fatality rate ranges from 5 to 60 percent.39
For severe acute malnutrition (SAM) without complications, treatment in the community/outside of health facilities is preferred. Community-based management of severe acute malnutrition (CMAM) was made possible by the introduction of ready-to-use therapeutic foods (RUTF), which contain all of the needed nutrients for children to reverse growth failure and achieve catch-up growth, combined with the use of simple color-coded measuring tapes for middle-upper arm circumference, which allows community-based workers to diagnose acute malnutrition. The lipid-rich food (often peanut-based) is ready to eat directly from the sachet or container, requires no water for preparation, is good for 24 months after manufacture, and for up to 24 hours after opening.
For moderate acute malnutrition, children are treated with supplemental food that contains all the recommended daily allowance of micronutrients along with energy and protein for catch-up growth. Typically, this is a fortified cereal and legume blended flour.40 Fortified lipid-based spreads are being studied to treat moderate acute malnutrition in Africa, and there is ongoing experimentation with use of ready-to-use supplemental foods (RUSF) for this purpose.
Moderate and severe undernutrition treatment interventions in the health sector:a) Ensure that a national policy or protocol for
CMAM is in place and up-to-date and that community mechanisms and facilities are equipped to implement it
b) Ensure routine community-based screening of acute malnutrition using simple measures such as middle-upper arm circumference (MUAC) measurements
38 Ruel, M., Menon, P., Habicth, J-P., Loechl, C., Bergeron, G., Pelto, G., Arimond, M., Maluccio, J., Michaud, L. and B. Hankebo. 2008. “Age-based preventive targeting of food assistance and behavior change and communication for reduction of childhood undernutrition in Haiti: a cluster randomized trial, The Lancet, 371 (9612): 588-595.
39 Manary, M.J. and H.L. Sandige. 2008. “Management of acute moderate and severe childhood malnutrition, British Medical Journal, 337: 1227-1290.40 Bergeron, G. and T. Castleman. 2012. “Program responses to acute and chronic malnutrition: divergences and convergences,” Advances in
Nutrition, 3:1-8.
Considerations when implementing interventions to treat moderate and/or
severe acute malnutrition:
• What is the prevalence of moderate and severe acute undernutrition?
o Note that routine screening for SAM is only necessary in certain contexts and conditions, such as emergencies, shocks, or countries with chronically high levels of wasting
• What is the capacity to procure and deliver therapeutic feeding at the community level (funds, supply of therapeutic foods, accessible venues, and well-trained staff)?
• Where and how frequently is children’s nu-tritional status measured? Are there adequate referral systems for treatment?
Improving Nutrition Through Multisectoral Approaches
146
c) Implement community-based therapeutic feeding programs (ready-to-use therapeutic foods) for the treatment and case-management of severe acute malnutrition (<-3WAZ)
o In contexts with high rates of moderate acute malnutrition, community-based rather than health-sector based interventions comprise a more effective means of addressing the problem, through distributions of supplemental fortified or cereal/legume blends
d) Ensure that referral procedures for complications of acute malnutrition are established and utilized at community level
e) Monitor and maintain adequate stocks of drugs and medicines needed to treat severe acute malnutrition
f) Strengthen capacity-building of the health workforce to be adequately trained in the implementation of the CMAM model
V. What are the challenges and lessons learned for delivering improved nutrition through the health sector?
While a consensus is emerging on what to do to address malnutrition, evidence is weaker on how to implement key interventions, especially in light of a renewed focus on global health systems strengthening and universal health coverage. Part of this tentativeness reflects the predominant research focus on the efficacy rather than the effectiveness of interventions, and in some cases, a lack of distinction between the two. For example, the growth monitoring and promotion intervention platform may be interpreted as having low efficacy, when in fact poor results are due to suboptimal implementation. The lack of clear evidence on how to deliver interventions also reflects the real variations in circumstances and capacity across country and local settings, which makes it difficult to recommend any one mode of delivery to be universally applied. Annex E-2 gives brief definitions of important contact points in the health sector, and lists key nutrition interventions that could be delivered through each contact point, depending on local or national circumstances.
In addition to the general challenge of defining the how to mainstream nutrition activities into the health sector, a number of specific operational challenges have been identified by TTLs. These include:
• Lack of technical nutrition staff to support the integration, implementation, and supervision of nutrition projects. Both within the Bank at the country level, nutrition capacity is extremely limited. The number of technical nutrition experts that can be called upon to support project preparation and implementation of health projects that include nutrition components is largely insufficient. TTLs and country counterparts have specifically highlighted the lack of staff support as a barrier to integrating nutrition into their projects.
• Although this is slowly changing, a lack of awareness of nutrition and its critical role for human capital development, including in the health sector, limits the integration of nutrition activities in other sectors.
• Nutrition is not a priority for client governments; therefore, client demand for nutrition activities is generally lacking. A number of regions have increased demand for nutrition activities through high-level advocacy efforts, but awareness building is largely dependent on the presence of a “champion” for nutrition working either in that country or region (TTL, manager, etc.).
Improving Nutrition Through Multisectoral Approaches
147
• In this context, the implementation of nutrition activities is very often dependent on the presence of a “champion for nutrition” at the managerial level. Having the support for nutrition activities at a higher level is essential for applying the nutrition lens to Bank operations.
• Lack of recent data on nutrition limits the effect that nutrition “champions” can have in terms of advocacy to increase demand for nutrition activities. Although national-level basic nutrition data (anthropometric indicators, for example) are generally available, it is often collected at 5+ year intervals, which in many cases means that the only available data is as much as ten years old. Moreover, given the difficulty of measuring micronutrient deficiencies, data on such indicators tends to be either outdated (in some cases, up to 20 years old), or based on output-level indicators (number of vitamin A capsules distributed, rather than rate of vitamin A deficiency, for example).
• Nutrition activities are largely underfunded. Nutrition activities are mostly funded by trust funds, and comprise a minimal portion of the Bank’s budget. Tracking exact disbursements for nutrition is challenging because nutrition sensitive activities are not always coded correctly, which applies to projects that have objectives and specific activities related to improving nutritional status or food security at the household level. Therefore, funding for nutrition through trust funds is highly variable, and tracking is inconsistent.
• Difficulty in prioritization of interventions. Often, TTLs are faced with a long list of nutrition interventions, without guidance or information on how to prioritize them. This guidance note aims to address this challenge, and encourages TTLs to use available resources, such as the Nutrition Country Profiles,41 as well as the priority-setting matrix provided at the beginning of this note (based on effect of interventions on mortality).
• Identification of a core set of maternal and child health and nutrition indicators for effective nutrition outcomes, as appropriate for each context, is a challenge for TTLs. Process indicators are particularly important to monitor for assessment of implementation quality. While anthropometric indicators are useful for impact analysis, most are not fast changing enough for use as monitoring indicators.
Given those challenges, there are some broad lessons learned on effectively integrating nutrition into the health sector to reduce undernutrition:
• Interventions should be prioritized based on (1) what the primary nutrition problems are within a country or local context, and (2) the existing human and institutional capacity to implement health and nutrition programs. Refer to Box E-4 for a quick reference to tools that can support the prioritization of nutrition interventions based on country context.
• Existing health contacts (ANC, PNC, family planning, Child Health Days/Weeks, c-IMCI, etc.) are often effective entry points for integrating nutrition activities into the health system.
• Capacity building and training is critical at the community, clinic, educational (pre- and in-service) and national policy level. Capacity includes knowledge and motivation of health care workers, adequate staffing and physical space to deliver services, and supply chains for just-in-time delivery of products, equipment and maintenance. Programs that increase demand for a certain health or nutrition product (e.g., iron folic acid supplements for pregnant women), must ensure that the supply of commodities will meet increased demand.
41 Nutrition Country Profiles were done for 68 countries around the world with the worst nutrition indicators. These profiles are brief, two-page doc-
uments that contain a synopsis of the country’s nutrition situation based on relevant indicators. These also include key recommendations based on the country’s nutrition problems, as well as costing and cost-effectiveness calculations of scaling up core micronutrient interventions. See www.worldbank.org/nutrition/profiles
Improving Nutrition Through Multisectoral Approaches
148
• Community acceptance at a minimum, and ideally community participation in nutrition activities are important for effective uptake of interventions. Knowledgeable local health staff and/or formative research can assess the cultural acceptability of interventions and how they can work within existing norms for maximum comprehension and acceptability.
• Community health workers, especially those who are paid and trained, comprise an essential avenue for the expansion and delivery of nutrition services, particularly in terms of reaching the most vulnerable and geographically isolated populations.
• What gets measured gets managed—or more accurately—only what gets measured has a chance of being managed. Nutrition indicators, such as micronutrient program coverage indicators and nutritional status indicators, should be a part of HMIS systems and regularly compiled at levels where prompt action can be taken to improve delivery. Measuring nutrition can also generate political support for addressing demonstrated problems.
• Multisectoral planning, “thinking multisectorally” but acting sectorally, using a shared model of program delivery can achieve sustainability and synergies that improve nutrition outcomes. For example, micronutrient supplementation programs are often criticized for their reliance on long-term donor provision of commodities. Ideally, these programs are coupled with promotion of dietary change, fortification efforts, smallholder agriculture and home-gardening programs, and deworming activities that are delivered through other sectors, i.e., private sector, agriculture, and education, that contribute to achieving sustained dietary diversity and increased micronutrient intake.
• In the spirit of multisectoral planning and actions, the health sector should exercise its stewardship role to improve health and nutrition outcomes through the implementation of nutrition sensitive policies and programs in other sectors, as well as the monitoring and quality assurance of these. For example, the health sector has the capacity to legislate for food fortification, and should work with the private sector to market, produce, and distribute such products to the population, while maintaining the role and responsibility of product safety and quality.
VI. Conclusion
• Undernutrition is the largest contributor to child deaths, which has direct implications for the health sector’s goal of reducing child mortality.
• MDGs 1, 4, and 5 will not be reached if undernutrition is not addressed. The health sector is the best-placed sector to deliver most of the nutrition interventions that have been rigorously evaluated, recommended, and costed, and which would avert one million child deaths annually, and save 30 million DALYs annually.
• The cost for basic nutrition interventions is minimal in both real terms and when compared with returns on investment.
• The health sector can and should reduce undernutrition through interventions that target micronutrient deficiencies, optimal feeding and caring practices, treatment and prevention of illness, reduction of low birth weight, improvements in reproductive health and family planning, and treatment of moderate and severe malnutrition in children.
Improving Nutrition Through Multisectoral Approaches
149
• Health system strengthening can and should support nutrition through nutrition sensitive public insurance mechanisms, delivery of high quality services, availability and access to medical products (specifically, nutritional supplements and therapeutic foods), a high-performing workforce, a good health financing system, a well-functioning information system, and adequate leadership and governance of the health system. Prioritization of activities will depend on (1) what the source of nutritional problems are in the specific project/country setting, and (2) the capacity to implement nutrition programs given the available and existing delivery mechanisms/platforms for service delivery. A great number of needed interventions are included in the guidance above and organized in the following annexes; refer back to Table E-1 to assist in choosing priority interventions. The World Bank nutrition country profiles show the main nutritional problems and top five priority interventions specific to each of the 68 highest burden of undernutrition countries, are a resource to assist TTLs in prioritizing interventions for the contexts in which they work.
Box E-4. Tools for TTLs that can guide prioritization of nutrition investments
• Table E-1. Estimated Costs, Benefits, Priority, and Feasibility of Scaling Up Selected Nutrition Interventions. This table lists twelve evidence-based interventions, which can be selected on any of all of the following criteria: cost, cost:benefit ratio, public health priority based on deaths averted, implementation feasibility, and country status relative to public health cut-off points. Further information can be found in “Scaling Up Nutrition: What will it cost?” (World Bank 2010), available at www.worldbank.org/nutrition
• Nutrition Country Profiles: short, two-page documents that summarize the nutrition situation and key interventions needed for 68 of the highest nutrition burdened countries worldwide. These are available from www.worldbank.org/nutrition/profiles.
• Annex E-2: Menu of Actions to Address Undernutrition by Delivery Mechanism. Interventions can be prioritized based on presence of existing delivery platforms.
• Annex E-6: Suggested Nutrition Resources, which include links to databases containing the most recent nutritional data worldwide, as well as documents that take a global view of the nutrition situation.
• A new HNP Knowledge Exchange provides information on nutrition staff in the Bank and useful internal and external publications on nutrition. It is now available on HDN’s intranet site, or can be found by entering the friendly URL(FURL) HDKE.
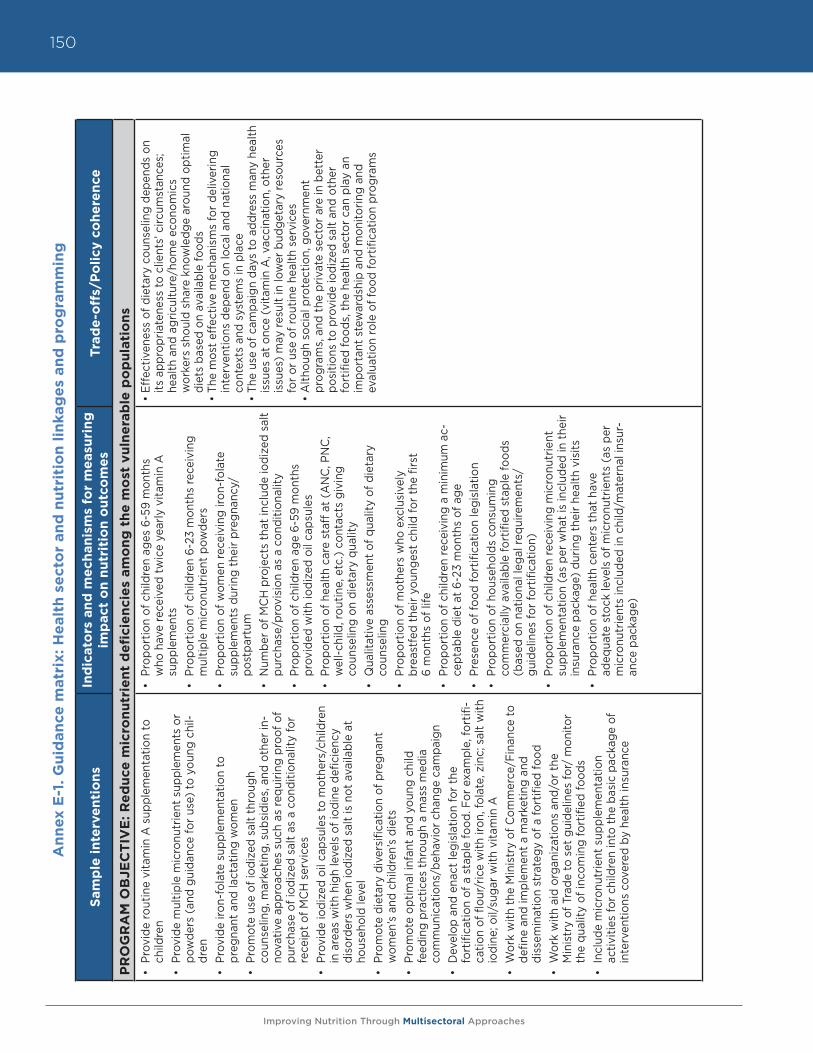
Improving Nutrition Through Multisectoral Approaches
150A
nn
ex E
-1. G
uid
an
ce m
atr
ix: H
ealt
h s
ect
or
an
d n
utr
itio
n l
inka
ge
s an
d p
rog
ram
min
g
Sam
ple
in
terv
en
tio
ns
Ind
icat
ors
an
d m
ech
anis
ms
for
me
asu
rin
g
imp
act
on
nu
trit
ion
ou
tco
me
sTr
ade
-off
s/P
oli
cy c
oh
ere
nce
PR
OG
RA
M O
BJE
CT
IVE
: R
ed
uce
mic
ron
utr
ien
t d
efi
cie
nci
es
am
on
g t
he
mo
st v
uln
era
ble
po
pu
lati
on
s
• Pr
ovid
e ro
utin
e vi
tam
in A
sup
plem
enta
tion
to
child
ren
• Pr
ovid
e m
ultip
le m
icro
nutr
ient
sup
plem
ents
or
pow
ders
(an
d gu
idan
ce fo
r us
e) to
you
ng c
hil-
dren
•
Prov
ide
iron-
fola
te s
uppl
emen
tatio
n to
pr
egna
nt a
nd la
ctat
ing
wom
en•
Prom
ote
use
of io
dize
d sa
lt th
roug
h
coun
selin
g, m
arke
ting,
sub
sidi
es, a
nd o
ther
in-
nova
tive
appr
oach
es s
uch
as re
quiri
ng p
roof
of
purc
hase
of i
odiz
ed s
alt
as a
con
ditio
nalit
y fo
r re
ceip
t of
MC
H s
ervi
ces
• Pr
ovid
e io
dize
d oi
l cap
sule
s to
mot
hers
/chi
ldre
n in
are
as w
ith h
igh
leve
ls o
f iod
ine
defic
ienc
y di
sord
ers
whe
n io
dize
d sa
lt is
not
ava
ilabl
e at
ho
useh
old
leve
l•
Prom
ote
diet
ary
dive
rsifi
catio
n of
pre
gnan
t w
omen
’s a
nd c
hild
ren’
s di
ets
• Pr
omot
e op
timal
infa
nt a
nd y
oung
chi
ld
feed
ing
prac
tices
thr
ough
a m
ass
med
ia
com
mun
icat
ions
/beh
avio
r ch
ange
cam
paig
n•
Dev
elop
and
ena
ct le
gisl
atio
n fo
r th
e
fort
ifica
tion
of a
sta
ple
food
. For
exa
mpl
e, fo
rtifi
-ca
tion
of fl
our/
rice
with
iron
, fol
ate,
zin
c; s
alt
with
io
dine
; oil/
suga
r w
ith v
itam
in A
• W
ork
with
the
Min
istr
y of
Com
mer
ce/F
inan
ce to
de
fine
and
impl
emen
t a
mar
ketin
g an
d
diss
emin
atio
n st
rate
gy o
f a fo
rtifi
ed fo
od•
Wor
k w
ith a
id o
rgan
izat
ions
and
/or
the
M
inis
try
of T
rade
to s
et g
uide
lines
for/
mon
itor
the
qual
ity o
f inc
omin
g fo
rtifi
ed fo
ods
• In
clud
e m
icro
nutr
ient
sup
plem
enta
tion
ac
tiviti
es fo
r ch
ildre
n in
to t
he b
asic
pac
kage
of
inte
rven
tions
cov
ered
by
heal
th in
sura
nce
• Pr
opor
tion
of c
hild
ren
ages
6-5
9 m
onth
s
who
hav
e re
ceiv
ed t
wic
e ye
arly
vita
min
A
supp
lem
ents
• Pr
opor
tion
of c
hild
ren
6-23
mon
ths
rece
ivin
g m
ultip
le m
icro
nutr
ient
pow
ders
• Pr
opor
tion
of w
omen
rece
ivin
g iro
n-fo
late
su
pple
men
ts d
urin
g th
eir
preg
nanc
y/
post
part
um•
Num
ber
of M
CH
pro
ject
s th
at in
clud
e io
dize
d sa
lt pu
rcha
se/p
rovi
sion
as
a co
nditi
onal
ity•
Prop
ortio
n of
chi
ldre
n ag
e 6-
59 m
onth
s
prov
ided
with
iodi
zed
oil c
apsu
les
• Pr
opor
tion
of h
ealth
car
e st
aff a
t (A
NC
, PN
C,
wel
l-chi
ld, r
outin
e, e
tc.)
cont
acts
giv
ing
co
unse
ling
on d
ieta
ry q
ualit
y•
Qua
litat
ive
asse
ssm
ent
of q
ualit
y of
die
tary
co
unse
ling
• Pr
opor
tion
of m
othe
rs w
ho e
xclu
sive
ly
brea
stfe
d th
eir
youn
gest
chi
ld fo
r th
e fir
st
6 m
onth
s of
life
• Pr
opor
tion
of c
hild
ren
rece
ivin
g a
min
imum
ac-
cept
able
die
t at
6-2
3 m
onth
s of
age
• Pr
esen
ce o
f foo
d fo
rtifi
catio
n le
gisl
atio
n•
Prop
ortio
n of
hou
seho
lds
cons
umin
g
com
mer
cial
ly a
vaila
ble
fort
ified
sta
ple
food
s (b
ased
on
natio
nal l
egal
requ
irem
ents
/ gu
idel
ines
for
fort
ifica
tion)
• Pr
opor
tion
of c
hild
ren
rece
ivin
g m
icro
nutr
ient
su
pple
men
tatio
n (a
s pe
r w
hat
is in
clud
ed in
the
ir in
sura
nce
pack
age)
dur
ing
thei
r he
alth
vis
its•
Prop
ortio
n of
hea
lth c
ente
rs t
hat
have
ad
equa
te s
tock
leve
ls o
f mic
ronu
trie
nts
(as
per
mic
ronu
trie
nts
incl
uded
in c
hild
/mat
erna
l ins
ur-
ance
pac
kage
)
• Ef
fect
iven
ess
of d
ieta
ry c
ouns
elin
g de
pend
s on
its
app
ropr
iate
ness
to c
lient
s’ c
ircum
stan
ces;
he
alth
and
agr
icul
ture
/hom
e ec
onom
ics
w
orke
rs s
houl
d sh
are
know
ledg
e ar
ound
opt
imal
di
ets
base
d on
ava
ilabl
e fo
ods
• Th
e m
ost
effe
ctiv
e m
echa
nism
s fo
r de
liver
ing
in
terv
entio
ns d
epen
d on
loca
l and
nat
iona
l co
ntex
ts a
nd s
yste
ms
in p
lace
• Th
e us
e of
cam
paig
n da
ys to
add
ress
man
y he
alth
is
sues
at
once
(vi
tam
in A
, vac
cina
tion,
oth
er
issu
es)
may
resu
lt in
low
er b
udge
tary
reso
urce
s fo
r or
use
of r
outin
e he
alth
ser
vice
s•
Alth
ough
soc
ial p
rote
ctio
n, g
over
nmen
t
prog
ram
s, a
nd t
he p
rivat
e se
ctor
are
in b
ette
r
posi
tions
to p
rovi
de io
dize
d sa
lt an
d ot
her
fo
rtifi
ed fo
ods,
the
hea
lth s
ecto
r ca
n pl
ay a
n
impo
rtan
t st
ewar
dshi
p an
d m
onito
ring
and
ev
alua
tion
role
of f
ood
fort
ifica
tion
prog
ram
s
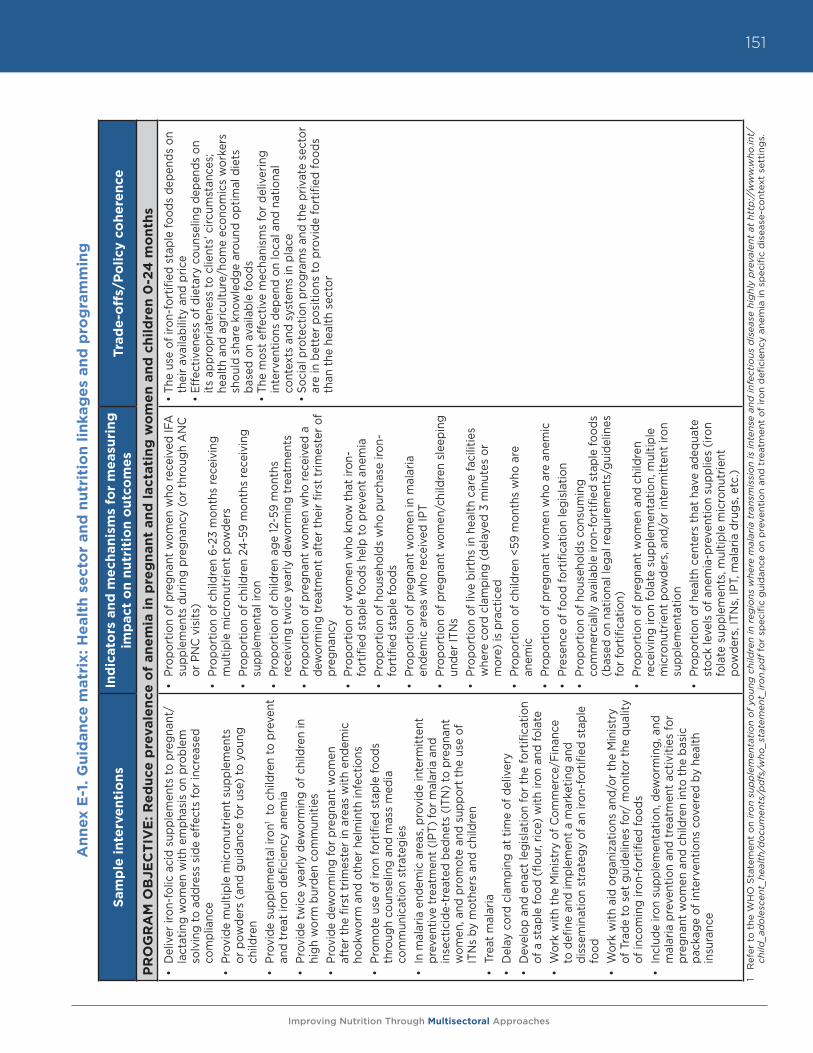
Improving Nutrition Through Multisectoral Approaches
151
An
nex
E-1
. G
uid
an
ce m
atr
ix: H
ealt
h s
ect
or
an
d n
utr
itio
n l
inka
ge
s an
d p
rog
ram
min
g
Sam
ple
in
terv
en
tio
ns
Ind
icat
ors
an
d m
ech
anis
ms
for
me
asu
rin
g
imp
act
on
nu
trit
ion
ou
tco
me
sTr
ade
-off
s/P
oli
cy c
oh
ere
nce
PR
OG
RA
M O
BJE
CT
IVE
: R
ed
uce
pre
vale
nce
of
an
em
ia i
n p
reg
nan
t an
d l
act
ati
ng
wo
me
n a
nd
ch
ild
ren
0-2
4 m
on
ths
• D
eliv
er ir
on-f
olic
aci
d su
pple
men
ts to
pre
gnan
t/la
ctat
ing
wom
en w
ith e
mph
asis
on
prob
lem
so
lvin
g to
add
ress
sid
e ef
fect
s fo
r in
crea
sed
com
plia
nce
• Pr
ovid
e m
ultip
le m
icro
nutr
ient
sup
plem
ents
or
pow
ders
(an
d gu
idan
ce fo
r us
e) to
you
ng
child
ren
• Pr
ovid
e su
pple
men
tal i
ron1
to c
hild
ren
to p
reve
nt
and
trea
t iro
n de
ficie
ncy
anem
ia
• Pr
ovid
e tw
ice
year
ly d
ewor
min
g of
chi
ldre
n in
hi
gh w
orm
bur
den
com
mun
ities
•
Prov
ide
dew
orm
ing
for
preg
nant
wom
en
afte
r th
e fir
st t
rimes
ter
in a
reas
with
end
emic
ho
okw
orm
and
oth
er h
elm
inth
infe
ctio
ns•
Prom
ote
use
of ir
on fo
rtifi
ed s
tapl
e fo
ods
thro
ugh
coun
selin
g an
d m
ass
med
ia
com
mun
icat
ion
stra
tegi
es•
In m
alar
ia e
ndem
ic a
reas
, pro
vide
inte
rmitt
ent
prev
entiv
e tr
eatm
ent
(IPT
) fo
r m
alar
ia a
nd
inse
ctic
ide-
trea
ted
bedn
ets
(ITN
) to
pre
gnan
t w
omen
, and
pro
mot
e an
d su
ppor
t th
e us
e of
IT
Ns
by m
othe
rs a
nd c
hild
ren
• Tr
eat
mal
aria
• D
elay
cor
d cl
ampi
ng a
t tim
e of
del
iver
y•
Dev
elop
and
ena
ct le
gisl
atio
n fo
r th
e fo
rtifi
catio
n of
a s
tapl
e fo
od (
flour
, ric
e) w
ith ir
on a
nd fo
late
• W
ork
with
the
Min
istr
y of
Com
mer
ce/F
inan
ce
to d
efine
and
impl
emen
t a
mar
ketin
g an
d di
ssem
inat
ion
stra
tegy
of a
n iro
n-fo
rtifi
ed s
tapl
e fo
od•
Wor
k w
ith a
id o
rgan
izat
ions
and
/or
the
Min
istr
y of
Tra
de to
set
gui
delin
es fo
r/ m
onito
r th
e qu
ality
of
inco
min
g iro
n-fo
rtifi
ed fo
ods
• In
clud
e iro
n su
pple
men
tatio
n, d
ewor
min
g, a
nd
mal
aria
pre
vent
ion
and
trea
tmen
t ac
tiviti
es fo
r pr
egna
nt w
omen
and
chi
ldre
n in
to t
he b
asic
pa
ckag
e of
inte
rven
tions
cov
ered
by
heal
th
insu
ranc
e
• Pr
opor
tion
of p
regn
ant
wom
en w
ho re
ceiv
ed IF
A
supp
lem
ents
dur
ing
preg
nanc
y (o
r th
roug
h A
NC
or
PN
C v
isits
)•
Prop
ortio
n of
chi
ldre
n 6-
23 m
onth
s re
ceiv
ing
mul
tiple
mic
ronu
trie
nt p
owde
rs•
Prop
ortio
n of
chi
ldre
n 24
-59
mon
ths
rece
ivin
g su
pple
men
tal i
ron
• Pr
opor
tion
of c
hild
ren
age
12-5
9 m
onth
s re
ceiv
ing
twic
e ye
arly
dew
orm
ing
trea
tmen
ts•
Prop
ortio
n of
pre
gnan
t w
omen
who
rece
ived
a
dew
orm
ing
trea
tmen
t af
ter
thei
r fir
st t
rimes
ter
of
preg
nanc
y •
Prop
ortio
n of
wom
en w
ho k
now
tha
t iro
n-fo
rtifi
ed s
tapl
e fo
ods
help
to p
reve
nt a
nem
ia•
Prop
ortio
n of
hou
seho
lds
who
pur
chas
e iro
n-fo
rtifi
ed s
tapl
e fo
ods
• Pr
opor
tion
of p
regn
ant
wom
en in
mal
aria
en
dem
ic a
reas
who
rece
ived
IPT
• Pr
opor
tion
of p
regn
ant
wom
en/c
hild
ren
slee
ping
un
der
ITN
s•
Prop
ortio
n of
live
birt
hs in
hea
lth c
are
faci
litie
s w
here
cor
d cl
ampi
ng (
dela
yed
3 m
inut
es o
r m
ore)
is p
ract
iced
• Pr
opor
tion
of c
hild
ren
<59
mon
ths
who
are
an
emic
• Pr
opor
tion
of p
regn
ant
wom
en w
ho a
re a
nem
ic•
Pres
ence
of f
ood
fort
ifica
tion
legi
slat
ion
• Pr
opor
tion
of h
ouse
hold
s co
nsum
ing
com
mer
cial
ly a
vaila
ble
iron-
fort
ified
sta
ple
food
s (b
ased
on
natio
nal l
egal
requ
irem
ents
/gui
delin
es
for
fort
ifica
tion)
• Pr
opor
tion
of p
regn
ant
wom
en a
nd c
hild
ren
rece
ivin
g iro
n fo
late
sup
plem
enta
tion,
mul
tiple
m
icro
nutr
ient
pow
ders
, and
/or
inte
rmitt
ent
iron
supp
lem
enta
tion
• Pr
opor
tion
of h
ealth
cen
ters
tha
t ha
ve a
dequ
ate
stoc
k le
vels
of a
nem
ia-p
reve
ntio
n su
pplie
s (ir
on
fola
te s
uppl
emen
ts, m
ultip
le m
icro
nutr
ient
po
wde
rs, I
TNs,
IPT,
mal
aria
dru
gs, e
tc.)
• Th
e us
e of
iron
-for
tified
sta
ple
food
s de
pend
s on
th
eir
avai
labi
lity
and
pric
e•
Effe
ctiv
enes
s of
die
tary
cou
nsel
ing
depe
nds
on
its a
ppro
pria
tene
ss to
clie
nts’
circ
umst
ance
s;
heal
th a
nd a
gric
ultu
re/h
ome
econ
omic
s w
orke
rs
shou
ld s
hare
kno
wle
dge
arou
nd o
ptim
al d
iets
ba
sed
on a
vaila
ble
food
s•
The
mos
t ef
fect
ive
mec
hani
sms
for
deliv
erin
g in
terv
entio
ns d
epen
d on
loca
l and
nat
iona
l co
ntex
ts a
nd s
yste
ms
in p
lace
• So
cial
pro
tect
ion
prog
ram
s an
d th
e pr
ivat
e se
ctor
ar
e in
bet
ter
posi
tions
to p
rovi
de fo
rtifi
ed fo
ods
than
the
hea
lth s
ecto
r
1 R
efer
to
the
WH
O S
tate
men
t o
n ir
on
sup
ple
men
tati
on
of
youn
g c
hild
ren
in r
egio
ns w
here
mal
aria
tra
nsm
issi
on
is in
tens
e an
d in
fect
ious
dis
ease
hig
hly
pre
vale
nt a
t ht
tp://
ww
w.w
ho.in
t/ch
ild_a
do
lesc
ent_
heal
th/d
ocu
men
ts/p
dfs
/who
_sta
tem
ent_
iro
n.p
df
for
spec
ific
gui
dan
ce o
n p
reve
ntio
n an
d t
reat
men
t o
f ir
on
defi
cien
cy a
nem
ia in
sp
ecifi
c d
isea
se-c
ont
ext
sett
ing
s.
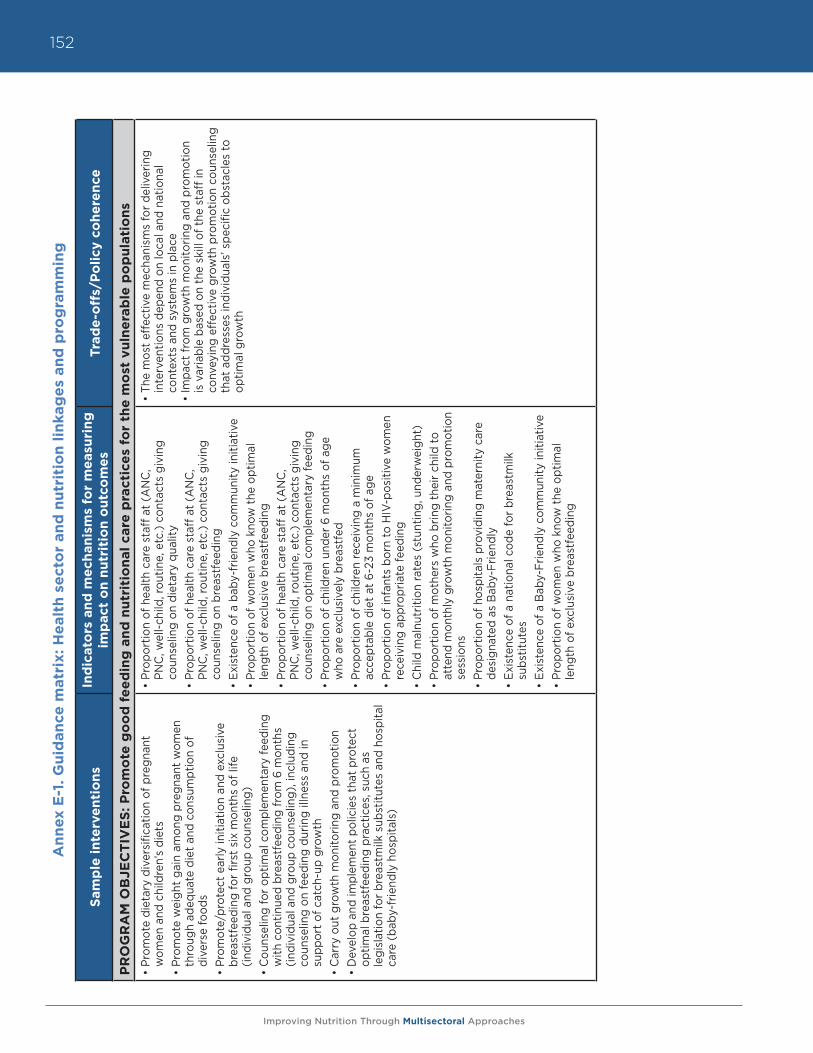
Improving Nutrition Through Multisectoral Approaches
152A
nn
ex E
-1. G
uid
an
ce m
atr
ix: H
ealt
h s
ect
or
an
d n
utr
itio
n l
inka
ge
s an
d p
rog
ram
min
g
Sam
ple
in
terv
en
tio
ns
Ind
icat
ors
an
d m
ech
anis
ms
for
me
asu
rin
g
imp
act
on
nu
trit
ion
ou
tco
me
sTr
ade
-off
s/P
oli
cy c
oh
ere
nce
PR
OG
RA
M O
BJE
CT
IVE
S: P
rom
ote
go
od
fe
ed
ing
an
d n
utr
itio
nal
care
pra
ctic
es
for
the
mo
st v
uln
era
ble
po
pu
lati
on
s
• Pr
omot
e di
etar
y di
vers
ifica
tion
of p
regn
ant
wom
en a
nd c
hild
ren’
s di
ets
• Pr
omot
e w
eigh
t ga
in a
mon
g pr
egna
nt w
omen
th
roug
h ad
equa
te d
iet
and
cons
umpt
ion
of
dive
rse
food
s•
Prom
ote/
prot
ect
early
initi
atio
n an
d ex
clus
ive
brea
stfe
edin
g fo
r fir
st s
ix m
onth
s of
life
(in
divi
dual
and
gro
up c
ouns
elin
g)
• C
ouns
elin
g fo
r op
timal
com
plem
enta
ry fe
edin
g w
ith c
ontin
ued
brea
stfe
edin
g fr
om 6
mon
ths
(indi
vidu
al a
nd g
roup
cou
nsel
ing)
, inc
ludi
ng
coun
selin
g on
feed
ing
durin
g ill
ness
and
in
supp
ort
of c
atch
-up
grow
th•
Car
ry o
ut g
row
th m
onito
ring
and
prom
otio
n•
Dev
elop
and
impl
emen
t po
licie
s th
at p
rote
ct
optim
al b
reas
tfee
ding
pra
ctic
es, s
uch
as
legi
slat
ion
for
brea
stm
ilk s
ubst
itute
s an
d ho
spita
l ca
re (
baby
-frie
ndly
hos
pita
ls)
• Pr
opor
tion
of h
ealth
car
e st
aff a
t (A
NC
, PN
C, w
ell-c
hild
, rou
tine,
etc
.) co
ntac
ts g
ivin
g co
unse
ling
on d
ieta
ry q
ualit
y•
Prop
ortio
n of
hea
lth c
are
staf
f at
(AN
C,
PNC
, wel
l-chi
ld, r
outin
e, e
tc.)
cont
acts
giv
ing
coun
selin
g on
bre
astf
eedi
ng•
Exis
tenc
e of
a b
aby-
frie
ndly
com
mun
ity in
itiat
ive
• Pr
opor
tion
of w
omen
who
kno
w t
he o
ptim
al
leng
th o
f exc
lusi
ve b
reas
tfee
ding
• Pr
opor
tion
of h
ealth
car
e st
aff a
t (A
NC
, PN
C, w
ell-c
hild
, rou
tine,
etc
.) co
ntac
ts g
ivin
g co
unse
ling
on o
ptim
al c
ompl
emen
tary
feed
ing
• Pr
opor
tion
of c
hild
ren
unde
r 6
mon
ths
of a
ge
who
are
exc
lusi
vely
bre
astf
ed•
Prop
ortio
n of
chi
ldre
n re
ceiv
ing
a m
inim
um
acce
ptab
le d
iet
at 6
-23
mon
ths
of a
ge•
Prop
ortio
n of
infa
nts
born
to H
IV-p
ositi
ve w
omen
re
ceiv
ing
appr
opria
te fe
edin
g•
Chi
ld m
alnu
triti
on ra
tes
(stu
ntin
g, u
nder
wei
ght)
• Pr
opor
tion
of m
othe
rs w
ho b
ring
thei
r ch
ild to
at
tend
mon
thly
gro
wth
mon
itorin
g an
d pr
omot
ion
sess
ions
• Pr
opor
tion
of h
ospi
tals
pro
vidi
ng m
ater
nity
car
e de
sign
ated
as
Bab
y-Fr
iend
ly
• Ex
iste
nce
of a
nat
iona
l cod
e fo
r br
east
milk
su
bstit
utes
• Ex
iste
nce
of a
Bab
y-Fr
iend
ly c
omm
unity
initi
ativ
e•
Prop
ortio
n of
wom
en w
ho k
now
the
opt
imal
le
ngth
of e
xclu
sive
bre
astf
eedi
ng
• Th
e m
ost
effe
ctiv
e m
echa
nism
s fo
r de
liver
ing
inte
rven
tions
dep
end
on lo
cal a
nd n
atio
nal
cont
exts
and
sys
tem
s in
pla
ce
• Im
pact
from
gro
wth
mon
itorin
g an
d pr
omot
ion
is v
aria
ble
base
d on
the
ski
ll of
the
sta
ff in
co
nvey
ing
effe
ctiv
e gr
owth
pro
mot
ion
coun
selin
g th
at a
ddre
sses
indi
vidu
als’
spe
cific
obs
tacl
es to
op
timal
gro
wth
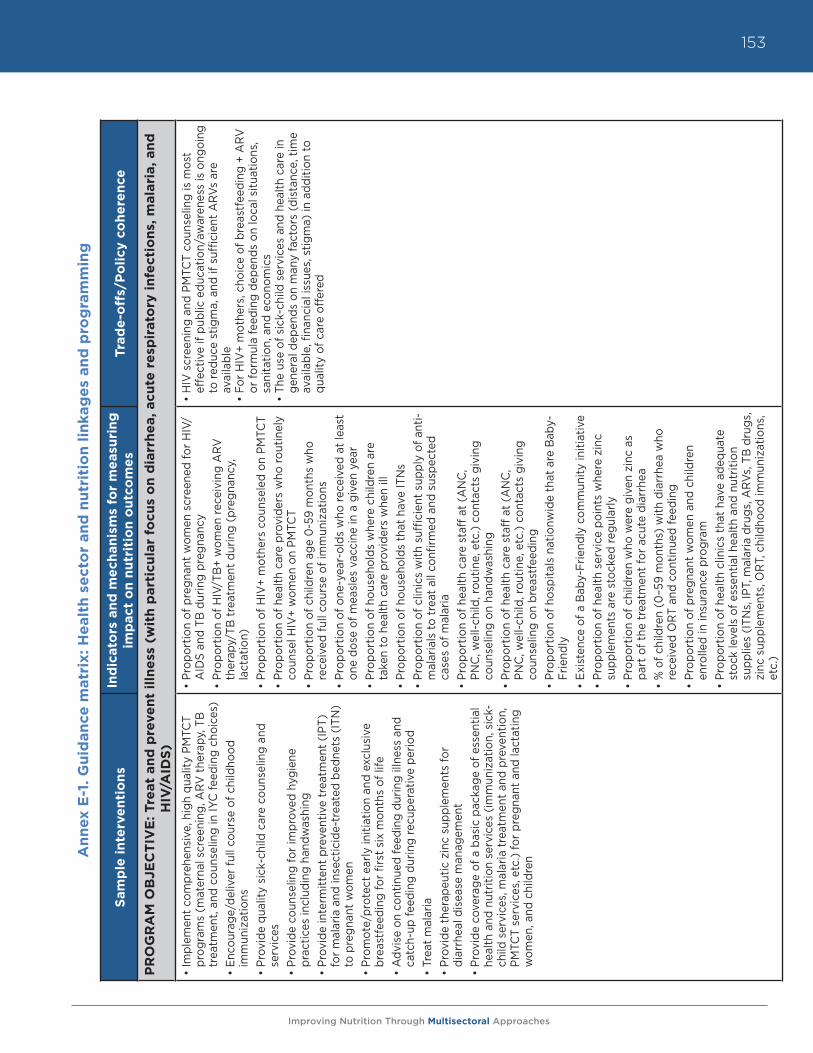
Improving Nutrition Through Multisectoral Approaches
153
An
nex
E-1
. G
uid
an
ce m
atr
ix: H
ealt
h s
ect
or
an
d n
utr
itio
n l
inka
ge
s an
d p
rog
ram
min
g
Sam
ple
in
terv
en
tio
ns
Ind
icat
ors
an
d m
ech
anis
ms
for
me
asu
rin
g
imp
act
on
nu
trit
ion
ou
tco
me
sTr
ade
-off
s/P
oli
cy c
oh
ere
nce
PR
OG
RA
M O
BJE
CT
IVE
: Tre
at
an
d p
reve
nt
illn
ess
(w
ith
part
icu
lar
focu
s o
n d
iarr
he
a, acu
te r
esp
irato
ry i
nfe
ctio
ns,
mala
ria, an
d
HIV
/AID
S)
• Im
plem
ent
com
preh
ensi
ve, h
igh
qual
ity P
MTC
T pr
ogra
ms
(mat
erna
l scr
eeni
ng, A
RV
the
rapy
, TB
tr
eatm
ent,
and
coun
selin
g in
IYC
feed
ing
choi
ces)
• En
cour
age/
deliv
er fu
ll co
urse
of c
hild
hood
im
mun
izat
ions
• Pr
ovid
e qu
ality
sic
k-ch
ild c
are
coun
selin
g an
d se
rvic
es•
Prov
ide
coun
selin
g fo
r im
prov
ed h
ygie
ne
prac
tices
incl
udin
g ha
ndw
ashi
ng
• Pr
ovid
e in
term
itten
t pr
even
tive
trea
tmen
t (I
PT)
for
mal
aria
and
inse
ctic
ide-
trea
ted
bedn
ets
(ITN
) to
pre
gnan
t w
omen
•
Prom
ote/
prot
ect
early
initi
atio
n an
d ex
clus
ive
brea
stfe
edin
g fo
r fir
st s
ix m
onth
s of
life
•
Adv
ise
on c
ontin
ued
feed
ing
durin
g ill
ness
and
ca
tch-
up fe
edin
g du
ring
recu
pera
tive
perio
d•
Trea
t m
alar
ia•
Prov
ide
ther
apeu
tic z
inc
supp
lem
ents
for
diar
rhea
l dis
ease
man
agem
ent
• Pr
ovid
e co
vera
ge o
f a b
asic
pac
kage
of e
ssen
tial
heal
th a
nd n
utrit
ion
serv
ices
(im
mun
izat
ion,
sic
k-ch
ild s
ervi
ces,
mal
aria
tre
atm
ent
and
prev
entio
n,
PMTC
T se
rvic
es, e
tc.)
for
preg
nant
and
lact
atin
g w
omen
, and
chi
ldre
n
• Pr
opor
tion
of p
regn
ant
wom
en s
cree
ned
for
HIV
/A
IDS
and
TB d
urin
g pr
egna
ncy
• Pr
opor
tion
of H
IV/T
B+
wom
en re
ceiv
ing
AR
V
ther
apy/
TB t
reat
men
t du
ring
(pre
gnan
cy,
lact
atio
n)•
Prop
ortio
n of
HIV
+ m
othe
rs c
ouns
eled
on
PMTC
T•
Prop
ortio
n of
hea
lth c
are
prov
ider
s w
ho ro
utin
ely
coun
sel H
IV+
wom
en o
n PM
TCT
• Pr
opor
tion
of c
hild
ren
age
0-5
9 m
onth
s w
ho
rece
ived
full
cour
se o
f im
mun
izat
ions
• Pr
opor
tion
of o
ne-y
ear-
olds
who
rece
ived
at
leas
t on
e do
se o
f mea
sles
vac
cine
in a
giv
en y
ear
• Pr
opor
tion
of h
ouse
hold
s w
here
chi
ldre
n ar
e ta
ken
to h
ealth
car
e pr
ovid
ers
whe
n ill
• Pr
opor
tion
of h
ouse
hold
s th
at h
ave
ITN
s•
Prop
ortio
n of
clin
ics
with
suf
ficie
nt s
uppl
y of
ant
i-m
alar
ials
to t
reat
all
confi
rmed
and
sus
pect
ed
case
s of
mal
aria
• Pr
opor
tion
of h
ealth
car
e st
aff a
t (A
NC
, PN
C, w
ell-c
hild
, rou
tine,
etc
.) co
ntac
ts g
ivin
g co
unse
ling
on h
andw
ashi
ng•
Prop
ortio
n of
hea
lth c
are
staf
f at
(AN
C,
PNC
, wel
l-chi
ld, r
outin
e, e
tc.)
cont
acts
giv
ing
coun
selin
g on
bre
astf
eedi
ng•
Prop
ortio
n of
hos
pita
ls n
atio
nwid
e th
at a
re B
aby-
Frie
ndly
• Ex
iste
nce
of a
Bab
y-Fr
iend
ly c
omm
unity
initi
ativ
e•
Prop
ortio
n of
hea
lth s
ervi
ce p
oint
s w
here
zin
c su
pple
men
ts a
re s
tock
ed re
gula
rly•
Prop
ortio
n of
chi
ldre
n w
ho w
ere
give
n zi
nc a
s pa
rt o
f the
tre
atm
ent
for
acut
e di
arrh
ea•
% o
f chi
ldre
n (0
–59
mon
ths)
with
dia
rrhe
a w
ho
rece
ived
OR
T an
d co
ntin
ued
feed
ing
• Pr
opor
tion
of p
regn
ant
wom
en a
nd c
hild
ren
enro
lled
in in
sura
nce
prog
ram
• Pr
opor
tion
of h
ealth
clin
ics
that
hav
e ad
equa
te
stoc
k le
vels
of e
ssen
tial h
ealth
and
nut
ritio
n su
pplie
s (I
TNs,
IPT,
mal
aria
dru
gs, A
RVs
, TB
dru
gs,
zinc
sup
plem
ents
, OR
T, c
hild
hood
imm
uniz
atio
ns,
etc.
)
• H
IV s
cree
ning
and
PM
TCT
coun
selin
g is
mos
t ef
fect
ive
if pu
blic
edu
catio
n/aw
aren
ess
is o
ngoi
ng
to re
duce
stig
ma,
and
if s
uffic
ient
AR
Vs a
re
avai
labl
e•
For
HIV
+ m
othe
rs, c
hoic
e of
bre
astf
eedi
ng +
AR
V
or fo
rmul
a fe
edin
g de
pend
s on
loca
l situ
atio
ns,
sani
tatio
n, a
nd e
cono
mic
s•
The
use
of s
ick-
child
ser
vice
s an
d he
alth
car
e in
ge
nera
l dep
ends
on
man
y fa
ctor
s (d
ista
nce,
tim
e av
aila
ble,
fina
ncia
l iss
ues,
stig
ma)
in a
dditi
on to
qu
ality
of c
are
offe
red
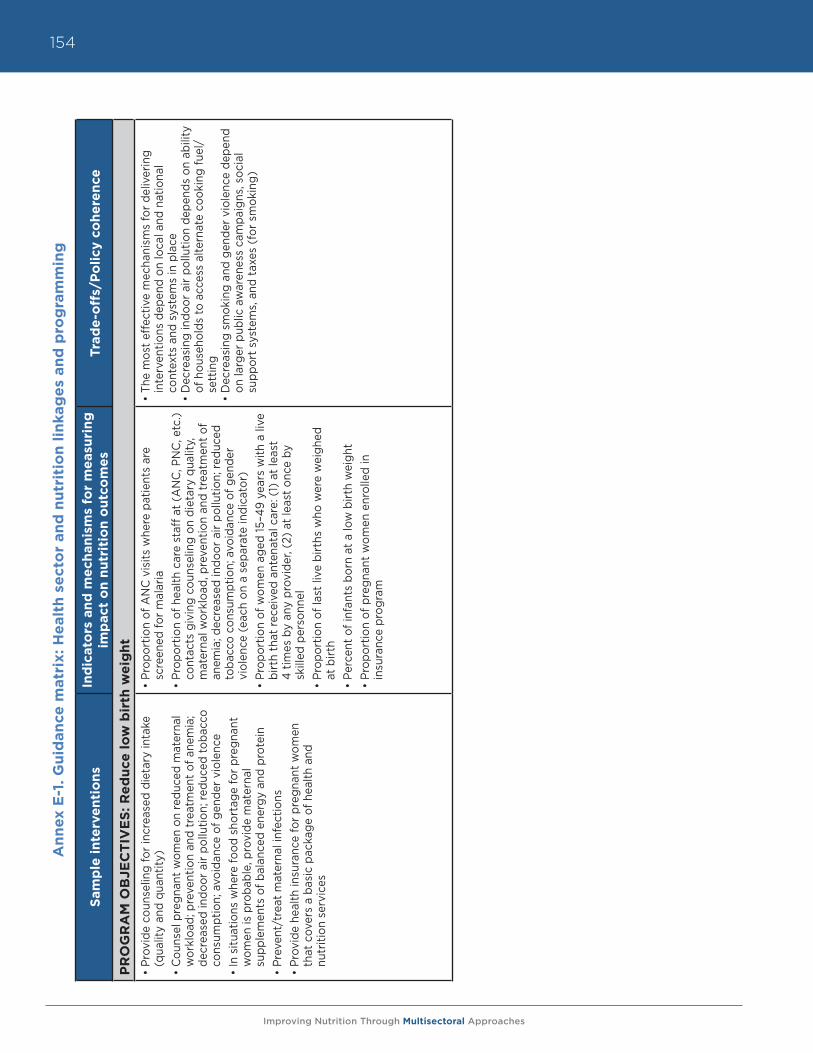
Improving Nutrition Through Multisectoral Approaches
154A
nn
ex E
-1. G
uid
an
ce m
atr
ix: H
ealt
h s
ect
or
an
d n
utr
itio
n l
inka
ge
s an
d p
rog
ram
min
g
Sam
ple
in
terv
en
tio
ns
Ind
icat
ors
an
d m
ech
anis
ms
for
me
asu
rin
g
imp
act
on
nu
trit
ion
ou
tco
me
sTr
ade
-off
s/P
oli
cy c
oh
ere
nce
PR
OG
RA
M O
BJE
CT
IVE
S: R
ed
uce
lo
w b
irth
we
igh
t
• Pr
ovid
e co
unse
ling
for
incr
ease
d di
etar
y in
take
(q
ualit
y an
d qu
antit
y)
• C
ouns
el p
regn
ant
wom
en o
n re
duce
d m
ater
nal
wor
kloa
d; p
reve
ntio
n an
d tr
eatm
ent
of a
nem
ia;
decr
ease
d in
door
air
pollu
tion;
redu
ced
toba
cco
cons
umpt
ion;
avo
idan
ce o
f gen
der
viol
ence
•
In s
ituat
ions
whe
re fo
od s
hort
age
for
preg
nant
w
omen
is p
roba
ble,
pro
vide
mat
erna
l su
pple
men
ts o
f bal
ance
d en
ergy
and
pro
tein
• Pr
even
t/tr
eat
mat
erna
l inf
ectio
ns
• Pr
ovid
e he
alth
insu
ranc
e fo
r pr
egna
nt w
omen
th
at c
over
s a
basi
c pa
ckag
e of
hea
lth a
nd
nutr
ition
ser
vice
s
• Pr
opor
tion
of A
NC
vis
its w
here
pat
ient
s ar
e sc
reen
ed fo
r m
alar
ia•
Prop
ortio
n of
hea
lth c
are
staf
f at
(AN
C, P
NC
, etc
.) co
ntac
ts g
ivin
g co
unse
ling
on d
ieta
ry q
ualit
y,
mat
erna
l wor
kloa
d, p
reve
ntio
n an
d tr
eatm
ent
of
anem
ia; d
ecre
ased
indo
or a
ir po
llutio
n; re
duce
d to
bacc
o co
nsum
ptio
n; a
void
ance
of g
ende
r vi
olen
ce (
each
on
a se
para
te in
dica
tor)
• Pr
opor
tion
of w
omen
age
d 15
–49
year
s w
ith a
live
bi
rth
that
rece
ived
ant
enat
al c
are:
(1)
at
leas
t
4 tim
es b
y an
y pr
ovid
er, (
2) a
t le
ast
once
by
skill
ed p
erso
nnel
• Pr
opor
tion
of la
st li
ve b
irths
who
wer
e w
eigh
ed
at b
irth
• Pe
rcen
t of
infa
nts
born
at
a lo
w b
irth
wei
ght
• Pr
opor
tion
of p
regn
ant
wom
en e
nrol
led
in
insu
ranc
e pr
ogra
m
• Th
e m
ost
effe
ctiv
e m
echa
nism
s fo
r de
liver
ing
inte
rven
tions
dep
end
on lo
cal a
nd n
atio
nal
cont
exts
and
sys
tem
s in
pla
ce•
Dec
reas
ing
indo
or a
ir po
llutio
n de
pend
s on
abi
lity
of h
ouse
hold
s to
acc
ess
alte
rnat
e co
okin
g fu
el/
sett
ing
• D
ecre
asin
g sm
okin
g an
d ge
nder
vio
lenc
e de
pend
on
larg
er p
ublic
aw
aren
ess
cam
paig
ns, s
ocia
l su
ppor
t sy
stem
s, a
nd t
axes
(fo
r sm
okin
g)
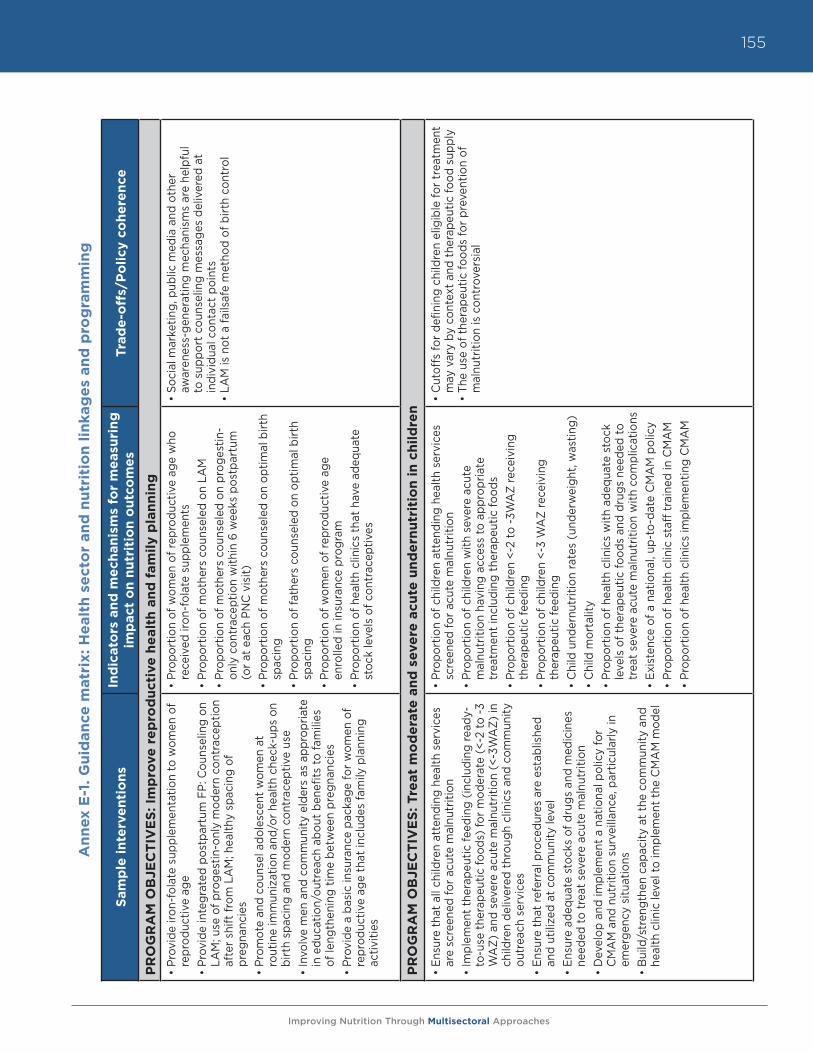
Improving Nutrition Through Multisectoral Approaches
155
An
nex
E-1
. G
uid
an
ce m
atr
ix: H
ealt
h s
ect
or
an
d n
utr
itio
n l
inka
ge
s an
d p
rog
ram
min
g
Sam
ple
in
terv
en
tio
ns
Ind
icat
ors
an
d m
ech
anis
ms
for
me
asu
rin
g
imp
act
on
nu
trit
ion
ou
tco
me
sTr
ade
-off
s/P
oli
cy c
oh
ere
nce
PR
OG
RA
M O
BJE
CT
IVE
S: Im
pro
ve r
ep
rod
uct
ive
he
alt
h a
nd
fam
ily p
lan
nin
g
• Pr
ovid
e iro
n-fo
late
sup
plem
enta
tion
to w
omen
of
repr
oduc
tive
age
• Pr
ovid
e in
tegr
ated
pos
tpar
tum
FP:
Cou
nsel
ing
on
LAM
; use
of p
roge
stin
-onl
y m
oder
n co
ntra
cept
ion
afte
r sh
ift fr
om L
AM
; hea
lthy
spac
ing
of
preg
nanc
ies
• Pr
omot
e an
d co
unse
l ado
lesc
ent
wom
en a
t ro
utin
e im
mun
izat
ion
and/
or h
ealth
che
ck-u
ps o
n bi
rth
spac
ing
and
mod
ern
cont
race
ptiv
e us
e•
Invo
lve
men
and
com
mun
ity e
lder
s as
app
ropr
iate
in
edu
catio
n/ou
trea
ch a
bout
ben
efits
to fa
mili
es
of le
ngth
enin
g tim
e be
twee
n pr
egna
ncie
s•
Prov
ide
a ba
sic
insu
ranc
e pa
ckag
e fo
r w
omen
of
repr
oduc
tive
age
that
incl
udes
fam
ily p
lann
ing
activ
ities
• Pr
opor
tion
of w
omen
of r
epro
duct
ive
age
who
re
ceiv
ed ir
on-f
olat
e su
pple
men
ts•
Prop
ortio
n of
mot
hers
cou
nsel
ed o
n LA
M•
Prop
ortio
n of
mot
hers
cou
nsel
ed o
n pr
oges
tin-
only
con
trac
eptio
n w
ithin
6 w
eeks
pos
tpar
tum
(o
r at
eac
h PN
C v
isit)
• Pr
opor
tion
of m
othe
rs c
ouns
eled
on
optim
al b
irth
spac
ing
• Pr
opor
tion
of fa
ther
s co
unse
led
on o
ptim
al b
irth
spac
ing
• Pr
opor
tion
of w
omen
of r
epro
duct
ive
age
enro
lled
in in
sura
nce
prog
ram
• Pr
opor
tion
of h
ealth
clin
ics
that
hav
e ad
equa
te
stoc
k le
vels
of c
ontr
acep
tives
• So
cial
mar
ketin
g, p
ublic
med
ia a
nd o
ther
aw
aren
ess-
gene
ratin
g m
echa
nism
s ar
e he
lpfu
l to
sup
port
cou
nsel
ing
mes
sage
s de
liver
ed a
t in
divi
dual
con
tact
poi
nts
• LA
M is
not
a fa
ilsaf
e m
etho
d of
birt
h co
ntro
l
PR
OG
RA
M O
BJE
CT
IVE
S: Tre
at
mo
de
rate
an
d s
eve
re a
cute
un
de
rnu
trit
ion
in
ch
ild
ren
• En
sure
tha
t al
l chi
ldre
n at
tend
ing
heal
th s
ervi
ces
are
scre
ened
for
acut
e m
alnu
triti
on•
Impl
emen
t th
erap
eutic
feed
ing
(incl
udin
g re
ady-
to-u
se t
hera
peut
ic fo
ods)
for
mod
erat
e (<
-2 to
-3
WA
Z) a
nd s
ever
e ac
ute
mal
nutr
ition
(<-
3WA
Z) in
ch
ildre
n de
liver
ed t
hrou
gh c
linic
s an
d co
mm
unity
ou
trea
ch s
ervi
ces
• En
sure
tha
t re
ferr
al p
roce
dure
s ar
e es
tabl
ishe
d an
d ut
ilize
d at
com
mun
ity le
vel
• En
sure
ade
quat
e st
ocks
of d
rugs
and
med
icin
es
need
ed to
tre
at s
ever
e ac
ute
mal
nutr
ition
• D
evel
op a
nd im
plem
ent
a na
tiona
l pol
icy
for
CM
AM
and
nut
ritio
n su
rvei
llanc
e, p
artic
ular
ly in
em
erge
ncy
situ
atio
ns•
Bui
ld/s
tren
gthe
n ca
paci
ty a
t th
e co
mm
unity
and
he
alth
clin
ic le
vel t
o im
plem
ent
the
CM
AM
mod
el
• Pr
opor
tion
of c
hild
ren
atte
ndin
g he
alth
ser
vice
s sc
reen
ed fo
r ac
ute
mal
nutr
ition
• Pr
opor
tion
of c
hild
ren
with
sev
ere
acut
e m
alnu
triti
on h
avin
g ac
cess
to a
ppro
pria
te
trea
tmen
t in
clud
ing
ther
apeu
tic fo
ods
• Pr
opor
tion
of c
hild
ren
<-2
to -3
WA
Z re
ceiv
ing
ther
apeu
tic fe
edin
g•
Prop
ortio
n of
chi
ldre
n <-
3 W
AZ
rece
ivin
g th
erap
eutic
feed
ing
• C
hild
und
ernu
triti
on ra
tes
(und
erw
eigh
t, w
astin
g)•
Chi
ld m
orta
lity
• Pr
opor
tion
of h
ealth
clin
ics
with
ade
quat
e st
ock
leve
ls o
f the
rape
utic
food
s an
d dr
ugs
need
ed to
tr
eat s
ever
e ac
ute
mal
nutr
ition
with
com
plic
atio
ns•
Exis
tenc
e of
a n
atio
nal,
up-t
o-da
te C
MA
M p
olic
y•
Prop
ortio
n of
hea
lth c
linic
sta
ff t
rain
ed in
CM
AM
• Pr
opor
tion
of h
ealth
clin
ics
impl
emen
ting
CM
AM
• C
utof
fs fo
r de
finin
g ch
ildre
n el
igib
le fo
r tr
eatm
ent
may
var
y by
con
text
and
the
rape
utic
food
sup
ply
• Th
e us
e of
the
rape
utic
food
s fo
r pr
even
tion
of
mal
nutr
ition
is c
ontr
over
sial

Improving Nutrition Through Multisectoral Approaches
156
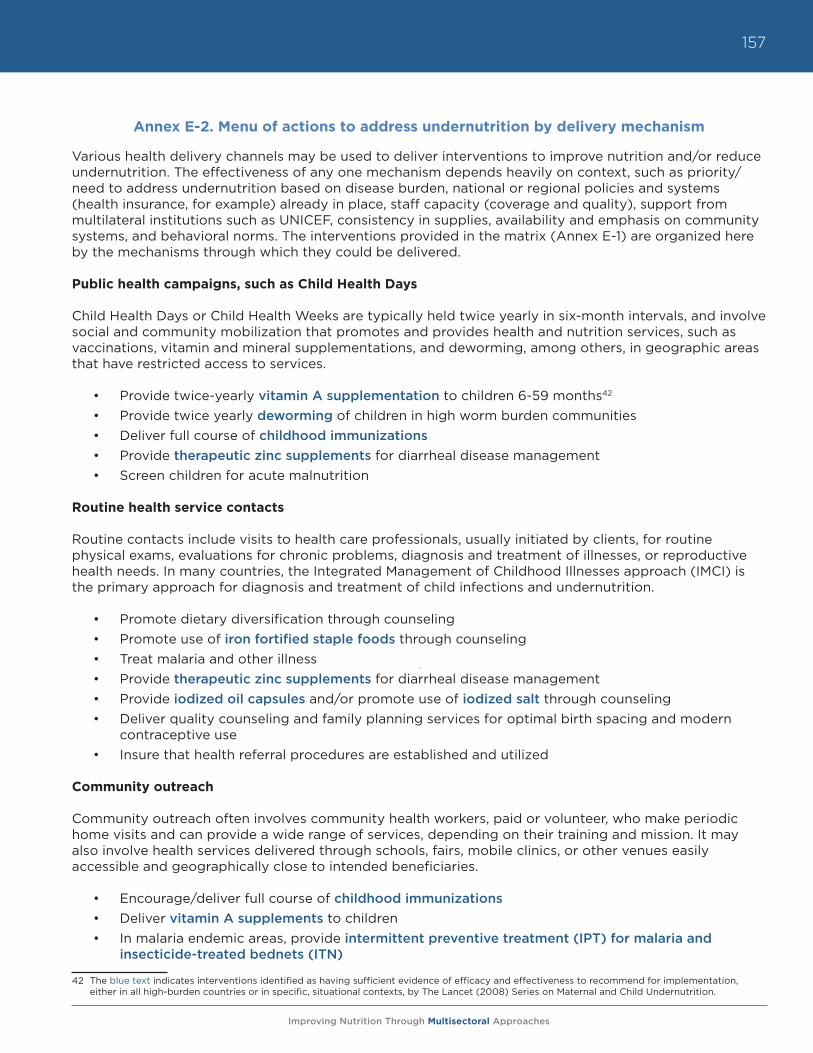
Improving Nutrition Through Multisectoral Approaches
157
Annex E-2. Menu of actions to address undernutrition by delivery mechanism
Various health delivery channels may be used to deliver interventions to improve nutrition and/or reduce undernutrition. The effectiveness of any one mechanism depends heavily on context, such as priority/need to address undernutrition based on disease burden, national or regional policies and systems (health insurance, for example) already in place, staff capacity (coverage and quality), support from multilateral institutions such as UNICEF, consistency in supplies, availability and emphasis on community systems, and behavioral norms. The interventions provided in the matrix (Annex E-1) are organized here by the mechanisms through which they could be delivered.
Public health campaigns, such as Child Health Days
Child Health Days or Child Health Weeks are typically held twice yearly in six-month intervals, and involve social and community mobilization that promotes and provides health and nutrition services, such as vaccinations, vitamin and mineral supplementations, and deworming, among others, in geographic areas that have restricted access to services.
• Provide twice-yearly vitamin A supplementation to children 6-59 months42 • Provide twice yearly deworming of children in high worm burden communities• Deliver full course of childhood immunizations• Provide therapeutic zinc supplements for diarrheal disease management• Screen children for acute malnutrition
Routine health service contacts
Routine contacts include visits to health care professionals, usually initiated by clients, for routine physical exams, evaluations for chronic problems, diagnosis and treatment of illnesses, or reproductive health needs. In many countries, the Integrated Management of Childhood Illnesses approach (IMCI) is the primary approach for diagnosis and treatment of child infections and undernutrition.
• Promote dietary diversification through counseling• Promote use of iron fortified staple foods through counseling• Treat malaria and other illness• Provide therapeutic zinc supplements for diarrheal disease management• Provide iodized oil capsules and/or promote use of iodized salt through counseling• Deliver quality counseling and family planning services for optimal birth spacing and modern
contraceptive use• Insure that health referral procedures are established and utilized
Community outreach
Community outreach often involves community health workers, paid or volunteer, who make periodic home visits and can provide a wide range of services, depending on their training and mission. It may also involve health services delivered through schools, fairs, mobile clinics, or other venues easily accessible and geographically close to intended beneficiaries.
• Encourage/deliver full course of childhood immunizations• Deliver vitamin A supplements to children • In malaria endemic areas, provide intermittent preventive treatment (IPT) for malaria and
insecticide-treated bednets (ITN)
42 The blue text indicates interventions identified as having sufficient evidence of efficacy and effectiveness to recommend for implementation, either in all high-burden countries or in specific, situational contexts, by The Lancet (2008) Series on Maternal and Child Undernutrition.
Improving Nutrition Through Multisectoral Approaches
158
• Deliver quality growth monitoring and promotion• Ensure that children are screened for acute malnutrition• Promote early initiation and exclusive breastfeeding for first six months of life• Provide counseling on:
o Optimal complementary feeding from six months (individual and group counseling)o Infant and young child feeding choices for PMTCTo Continued feeding during illness and catch-up feeding during recuperative periodo Improved hygiene practices including handwashingo Birth spacing and modern contraceptive use (to women, men, and adolescent girls)
• Provide therapeutic zinc supplements for diarrheal disease management• Ensure that health referral procedures are established and utilized at community level
Sick/well-child health contacts
Well-child health contacts usually occur on a regular schedule, often one that coincides with immunization schedules, to measure the growth and development of young children. Sick-child health contacts occur when a caretaker takes an ill child to a clinic, health post or hospital to receive assessment and therapeutic care. Community outreach may be used to refer and/or motivate caregivers to attend well-child visits and to seek care when children fall sick.
• Encourage/deliver full course of childhood immunizations• Treat malaria• Provide deworming of children in high worm burden communities• Deliver vitamin A supplements to children• Provide multiple micronutrient supplements or powders (and guidance for use)• Provide iodized oil capsules and/or promote use of iodized salt through counseling• Provide intermittent iron supplementation (syrup, tablets) to children to prevent and treat iron
deficiency anemia• Provide therapeutic zinc supplements for diarrheal disease management• Ensure that all children attending health services are screened for acute malnutrition• Provide counseling to promote:
o Dietary diversificationo Use of iron fortified staple foods o Early initiation and exclusive breastfeeding for first six months of life o Optimal complementary feeding from six months (individual and group counseling)o Continued feeding during illness and catch-up feeding during recuperative periodo Improved hygiene practices including handwashing
• Implement therapeutic feeding (including ready-to-use therapeutic foods) for moderate (<-2 to-3 WAZ) and severe acute malnutrition (<-3 WAZ) in children
Improving Nutrition Through Multisectoral Approaches
159
Antenatal care contact (ANC)
Pregnant women should receive at least four ANC visits, which may be at a clinic, hospital, birth center, or delivered by a nurse-midwife at home (as a form of community outreach). These visits serve to monitor maternal weight gain and/or fetal size, screen and treat pregnancy complications, provide supplements, and deliver key information about maintaining health in pregnancy and lactation and preparing for birth.
• Provide deworming for pregnant women after the first trimester in areas with endemic hookworm
• Deliver iron-folic acid supplements to pregnant women• Provide iodized oil capsules and/or promote use of iodized salt through counseling• In situations where food shortage for pregnant women is probable or where screening criteria are
established/used, provide maternal supplements of balanced energy and protein• Provide counseling for increased dietary intake (quality and quantity) during pregnancy; reduced
maternal workload; prevention and treatment of anemia; decreased indoor air pollution; reduced tobacco consumption; substance abuse; avoidance of gender violence
• Promote use of iron fortified staple foods through counseling• In malaria endemic areas, provide intermittent preventive treatment (IPT) for malaria and
insecticide-treated bednets (ITN)• Treat malaria• Prevent/treat maternal infections• Screen women for HIV and TB• For HIV/TB+ women, provide ARV and/or TB drugs and counseling on IYC feeding choices for
PMTCT
Intrapartum/Delivery care
Delivery (childbirth) attended by a skilled health professional may take place in a health facility or at home, and is an opportunity for timely interventions for maternal and neonatal health and nutrition.
• Delay cord clamping to improve infants’ iron stores• Promote/protect early initiation and exclusive breastfeeding for first six months of life• Provide counseling on LAM, the use of progestin-only modern contraception after shift from LAM
while lactating, and healthy spacing of pregnancies• Provide contraceptives
Postnatal care contact (PNC)
Postnatal care visits in the six weeks after delivery serve to monitor postpartum maternal and neonatal health and nutrition, and to deliver counseling and support for optimal IYCN, maternal nutrition, and prevention and treatment of infection or other health problems.
• Deliver iron-folic acid supplements to lactating women• Provide iodized oil capsules and/or promote use of iodized salt through counseling• Provide counseling to promote:
o Dietary diversificationo Use of iron fortified staple foods
Improving Nutrition Through Multisectoral Approaches
160
o Exclusive breastfeeding for first six months of life o Optimal complementary feeding from six months and beyond (individual and group
counseling)o Continued feeding during illness and catch-up feeding during recuperative periodo Improved hygiene practices including handwashing
• Screen women for HIV and TB• For HIV/TB+ women, provide ARV and/or TB drugs and counseling on IYC feeding choices for
PMTCT• Provide counseling on LAM; use of progestin-only modern contraception after shift from LAM
while lactating, and healthy spacing of pregnancies• Provide contraceptives
Emergency health services
Emergency services may be delivered through existing health posts/clinics or hospitals, or may require special setup of an expanded venue in the case of widespread famine or a natural disaster. They are often partnerships between national governments, UN agencies and other multilateral organizations, and/or CSOs.
• Implement therapeutic feeding (including ready-to-use therapeutic foods) for moderate (<-2 to -3WAZ) and severe acute malnutrition (<-3 WAZ) in children
Improving Nutrition Through Multisectoral Approaches
161
An
nex
E-3
. W
HO
’s h
ealt
h s
yste
ms
stre
ng
the
nin
g f
ram
ew
ork
an
d n
utr
itio
n
In 2
00
7, t
he W
orl
d H
ealt
h O
rgan
izat
ion
arti
cula
ted
a F
ram
ewo
rk f
or
Act
ion
on
Hea
lth
Syst
ems
Str
eng
then
ing
(H
SS)
as a
nec
essa
ry
acti
on
not
onl
y to
imp
rove
hea
lth
out
com
es, b
ut a
lso
to
rea
ch t
he M
illen
nium
Dev
elo
pm
ent
Go
als
(MD
Gs)
. WH
O’s
Hea
lth
Syst
ems
Str
eng
then
ing
Fra
mew
ork
is b
ased
on
six
bui
ldin
g b
lock
s, o
utlin
ed in
the
tab
le b
elow
. The
rel
atio
nshi
p b
etw
een
heal
th s
yste
ms
stre
ngth
enin
g a
nd n
utri
tio
n is
pre
sent
ed t
hro
ugh
thes
e si
x b
uild
ing
blo
cks
wit
h b
rief
des
crip
tio
ns o
r ex
amp
les
of
inte
rven
tio
ns t
hat
cont
rib
ute
to a
str
ong
er h
ealt
h sy
stem
tha
t is
bet
ter
pre
par
ed t
o a
dd
ress
und
ernu
trit
ion.
HS
S
Bu
ild
ing
Blo
ckD
esc
rip
tio
n o
f H
SS
Bu
ild
ing
Blo
ckW
he
re n
utr
itio
n f
alls
in
th
is b
uil
din
g b
lock
Hea
lth
Serv
ices
G
ood
heal
th s
ervi
ces
deliv
er e
ffec
tive,
saf
e, q
ualit
y pe
rson
al a
nd
non-
pers
onal
hea
lth in
terv
entio
ns to
tho
se t
hat
need
the
m, w
hen
and
whe
re n
eede
d, w
ith m
inim
um w
aste
of r
esou
rces
.
• U
se o
f com
mun
ity s
yste
ms
to e
xten
d nu
triti
on s
ervi
ces
and
mes
sage
s to
the
mos
t vu
lner
able
pop
ulat
ions
Hea
lth
Wo
rkfo
rce
A w
ell-p
erfo
rmin
g he
alth
wor
kfor
ce is
one
tha
t w
orks
in w
ays
that
ar
e re
spon
sive
, fai
r an
d ef
ficie
nt to
ach
ieve
the
bes
t he
alth
out
com
es
poss
ible
, giv
en a
vaila
ble
reso
urce
s an
d ci
rcum
stan
ces.
In o
ther
w
ords
, the
re a
re s
uffic
ient
sta
ff, fa
irly
dist
ribut
ed; t
hey
are
co
mpe
tent
, res
pons
ive,
and
pro
duct
ive.
• U
se o
f com
mun
ity s
yste
ms
to e
xten
d nu
triti
on s
ervi
ces
and
mes
sage
s to
the
mos
t vu
lner
able
pop
ulat
ions
• C
apac
ity b
uild
ing
of h
ealth
sta
ff fo
r th
e as
sess
men
t of
m
alnu
triti
on, a
s w
ell a
s un
ders
tand
ing
of k
ey n
utrit
ion
m
essa
ges
and
issu
es
Hea
lth
Info
rmat
ion
A w
ell-f
unct
ioni
ng h
ealth
info
rmat
ion
syst
em is
one
tha
t en
sure
s th
e pr
oduc
tion,
ana
lysi
s, d
isse
min
atio
n an
d us
e of
relia
ble
and
timel
y in
form
atio
n on
hea
lth d
eter
min
ants
, hea
lth s
yste
m p
erfo
rman
ce, a
nd
heal
th s
tatu
s.
• N
utrit
ion
surv
eilla
nce
activ
ities
(fo
r ac
ute
mal
nutr
ition
in
high
bur
den
coun
trie
s)•
Reg
ular
col
lect
ion
of a
nthr
opom
etric
indi
cato
rs to
info
rm
polic
y-m
akin
g an
d re
sour
ce a
lloca
tion
Med
ical
pro
duc
ts,
vacc
ines
, tec
hno
log
ies
A w
ell-f
unct
ioni
ng h
ealth
sys
tem
ens
ures
equ
itabl
e ac
cess
to
esse
ntia
l med
ical
pro
duct
s, v
acci
nes,
and
tech
nolo
gies
of a
ssur
ed
qual
ity, s
afet
y, e
ffica
cy a
nd c
ost
effe
ctiv
enes
s, a
nd t
heir
scie
ntifi
cally
so
und
and
cost
-eff
ectiv
e us
e.
• En
sure
ade
quat
e pr
ocur
emen
t an
d st
ock
of n
utrit
iona
l su
pplie
s an
d m
edic
ines
acr
oss
all t
ypes
of h
ealth
str
uctu
res
Hea
lth
Fin
anci
ng
A g
ood
heal
th fi
nanc
ing
syst
em ra
ises
ade
quat
e fu
nds
for
heal
th in
w
ays
that
ens
ure
peop
le c
an u
se n
eede
d se
rvic
es a
nd a
re p
rote
cted
fr
om fi
nanc
ial c
atas
trop
he o
r im
pove
rishm
ent
asso
ciat
ed w
ith h
avin
g to
pay
for
them
. It
prov
ides
ince
ntiv
es fo
r pr
ovid
ers
and
user
s to
be
effic
ient
.
• In
sura
nce
mec
hani
sms
that
incl
ude
basi
c an
d es
sent
ial
nutr
ition
ser
vice
s•
Use
of e
xter
nalit
ies
to in
crea
se fu
ndin
g fo
r nu
triti
on
(for
exa
mpl
e, d
roug
ht in
the
hor
n of
Afr
ica
that
lead
s to
in
crea
sed
aid
for
nutr
ition
act
iviti
es)
Lead
ersh
ip a
nd
gov
erna
nce
Lead
ersh
ip a
nd g
over
nanc
e in
volv
es e
nsur
ing
stra
tegi
c po
licy
fr
amew
orks
exi
st a
nd a
re c
ombi
ned
with
eff
ectiv
e ov
ersi
ght,
co
aliti
on b
uild
ing,
regu
latio
n, a
tten
tion
to s
yste
m d
esig
n an
d
acco
unta
bilit
y.
• D
evel
opm
ent
and
impl
emen
tatio
n of
nut
ritio
n po
licie
s an
d gu
idel
ines
(nu
triti
on p
olic
y, C
MA
M p
olic
y/gu
idel
ines
, foo
d fo
rtifi
catio
n le
gisl
atio
n)•
Qua
lity
assu
ranc
e/m
onito
ring
and
eval
uatio
n of
nat
iona
l-le
vel n
utrit
ion
spec
ific
guid
elin
es a
nd le
gisl
atio
n (f
or e
xam
ple,
sal
t io
diza
tion)

Improving Nutrition Through Multisectoral Approaches
162
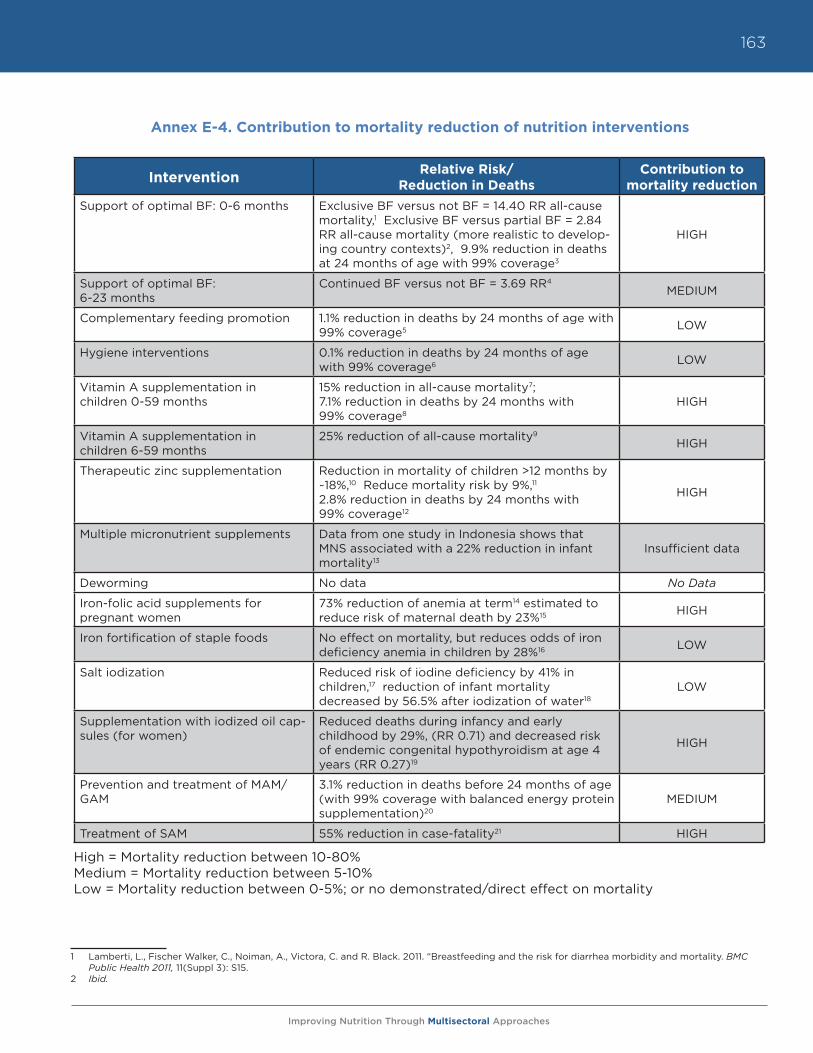
Improving Nutrition Through Multisectoral Approaches
163
Intervention Relative Risk/ Reduction in Deaths
Contribution to mortality reduction
Support of optimal BF: 0-6 months Exclusive BF versus not BF = 14.40 RR all-cause mortality,1 Exclusive BF versus partial BF = 2.84 RR all-cause mortality (more realistic to develop-ing country contexts)2, 9.9% reduction in deaths at 24 months of age with 99% coverage3
HIGH
Support of optimal BF: 6-23 months
Continued BF versus not BF = 3.69 RR4 MEDIUM
Complementary feeding promotion 1.1% reduction in deaths by 24 months of age with 99% coverage5 LOW
Hygiene interventions 0.1% reduction in deaths by 24 months of age with 99% coverage6 LOW
Vitamin A supplementation in children 0-59 months
15% reduction in all-cause mortality7; 7.1% reduction in deaths by 24 months with 99% coverage8
HIGH
Vitamin A supplementation in children 6-59 months
25% reduction of all-cause mortality9 HIGH
Therapeutic zinc supplementation Reduction in mortality of children >12 months by ~18%,10 Reduce mortality risk by 9%,11 2.8% reduction in deaths by 24 months with 99% coverage12
HIGH
Multiple micronutrient supplements Data from one study in Indonesia shows that MNS associated with a 22% reduction in infant mortality13
Insufficient data
Deworming No data No Data
Iron-folic acid supplements for pregnant women
73% reduction of anemia at term14 estimated to reduce risk of maternal death by 23%15 HIGH
Iron fortification of staple foods No effect on mortality, but reduces odds of iron deficiency anemia in children by 28%16 LOW
Salt iodization Reduced risk of iodine deficiency by 41% in children,17 reduction of infant mortality decreased by 56.5% after iodization of water18
LOW
Supplementation with iodized oil cap-sules (for women)
Reduced deaths during infancy and early childhood by 29%, (RR 0.71) and decreased risk of endemic congenital hypothyroidism at age 4 years (RR 0.27)19
HIGH
Prevention and treatment of MAM/GAM
3.1% reduction in deaths before 24 months of age (with 99% coverage with balanced energy protein supplementation)20
MEDIUM
Treatment of SAM 55% reduction in case-fatality21 HIGH
High = Mortality reduction between 10-80%Medium = Mortality reduction between 5-10%Low = Mortality reduction between 0-5%; or no demonstrated/direct effect on mortality
Annex E-4. Contribution to mortality reduction of nutrition interventions
1 Lamberti, L., Fischer Walker, C., Noiman, A., Victora, C. and R. Black. 2011. “Breastfeeding and the risk for diarrhea morbidity and mortality. BMC
Public Health 2011, 11(Suppl 3): S15.2 Ibid.
Improving Nutrition Through Multisectoral Approaches
164
3 Bhutta, Z., Ahmed, T., Black, R., Cousens, S., Dewey, K., Guigliani, E., Haider, B., Kirkwood, B., Morris, S., Sachdev, H. and M. Shekar. 2008. “For the Maternal and Child Undernutrition Study Group. What works? Interventions for maternal and child undernutrition and survival. The Lancet, 371: 417-40
4 Lamberti, L., Fischer Walker, C., Noiman, A., Victora, C. and R. Black. 2011. “Breastfeeding and the risk for diarrhea morbidity and mortality,” BMC Public Health, 11(Suppl 3): S15.
5 Bhutta, Z., Ahmed, T., Black, R., Cousens, S., Dewey, K., Guigliani, E., Haider, B., Kirkwood, B., Morris, S., Sachdev, H. and M. Shekar. 2008. “For the Maternal and Child Undernutrition Study Group. What works? Interventions for maternal and child undernutrition and survival. The Lancet, 371: 417-40.
6 Ibid.7 Imad, A., Yakoob, M., Sudfeld, C., Haider, B., Black, R., and Z. Bhutta. 2011. Impact of vitamin A supplementation on infant and childhood mortality,”
BMC Public Health, 11(Suppl 3): S20.8 Bhutta, Z., Ahmed, T., Black, R., Cousens, S., Dewey, K., Guigliani, E., Haider, B., Kirkwood, B., Morris, S., Sachdev, H. and M. Shekar. 2008. “For the
Maternal and Child Undernutrition Study Group. What works? Interventions for maternal and child undernutrition and survival. The Lancet, 371: 417-40.
9 Imad, A., Yakoob, M., Sudfeld, C., Haider, B., Black, R., and Z. Bhutta. 2011. Impact of vitamin A supplementation on infant and childhood mortality,” BMC Public Health, 11(Suppl 3): S20
10 Ibid11 Bhutta, Z., Ahmed, T., Black, R., Cousens, S., Dewey, K., Guigliani, E., Haider, B., Kirkwood, B., Morris, S., Sachdev, H. and M. Shekar. 2008. “For the
Maternal and Child Undernutrition Study Group. What works? Interventions for maternal and child undernutrition and survival. The Lancet, 371: 417-40.
12 Ibid13 Ibid14 Lamberti, L., Fischer Walker, C., Noiman, A., Victora, C. and R. Black. 2011. “Breastfeeding and the risk for diarrhea morbidity and mortality. BMC
Public Health 2011, 11(Suppl 3): S15.15 Ibid.16 Bhutta, Z., Ahmed, T., Black, R., Cousens, S., Dewey, K., Guigliani, E., Haider, B., Kirkwood, B., Morris, S., Sachdev, H. and M. Shekar. 2008. “For the
Maternal and Child Undernutrition Study Group. What works? Interventions for maternal and child undernutrition and survival. The Lancet, 371: 417-40
17 Bhutta, Z., Ahmed, T., Black, R., Cousens, S., Dewey, K., Guigliani, E., Haider, B., Kirkwood, B., Morris, S., Sachdev, H. and M. Shekar. 2008. “For the Maternal and Child Undernutrition Study Group. What works? Interventions for maternal and child undernutrition and survival. The Lancet, 371: 417-40.
18 Ibid.19 Imad, A., Yakoob, M., Sudfeld, C., Haider, B., Black, R., and Z. Bhutta. 2011. Impact of vitamin A supplementation on infant and childhood mortality,”
BMC Public Health, 11(Suppl 3): S20.20 Bhutta, Z., Ahmed, T., Black, R., Cousens, S., Dewey, K., Guigliani, E., Haider, B., Kirkwood, B., Morris, S., Sachdev, H. and M. Shekar. 2008. “For the
Maternal and Child Undernutrition Study Group. What works? Interventions for maternal and child undernutrition and survival. The Lancet, 371: 417-40.
21 Ibid.
Improving Nutrition Through Multisectoral Approaches
165
Annex E-5. Links to other key resources
Additional resources that have been consulted in the preparation of this guidance note and that may be useful for further analysis on specific topics include the following:
• What works? A Review of the Efficacy and Effectiveness of Nutrition Interventions (ACC/SCN, 2001), a series intended for countries, development partners, and scholars, stressing three central themes for targeting nutrition interventions, applying scientific evidence in program planning, and creating opportunities for and engaging public, private, and civil sector partnerships into programming and investments. This policy paper is available in segments, from http://www.unsystem.org/SCN/archives/npp19/begin.htm#Contents
• The Lancet Series on Maternal and Child Undernutrition (The Lancet, 2008), which includes a five-paper series focusing on undernutrition, vulnerable groups, consequences, proven interventions that work, and challenges in addressing maternal and child undernutrition. http://www.thelancet.com/series/maternal-and-child-undernutrition
• Scaling Up Nutrition: What Will it Cost? (Horton, S., Shekar, M., McDonald, C., Mahal, A., Brooks, J.K., 2010), a report that estimated the cost of scaling up a minimal package of 13 proven nutrition interventions from current coverage levels to full coverage of target populations in the 36 countries with the highest burden of undernutrition. http://siteresources.worldbank.org/HEALTHNUTRITIONANDPOPULATION/Resources/Peer-Reviewed-Publications/ScalingUpNutrition.pdf
• Facts for Life (UNICEF, 2010) is a handbook that provides vital messages and information for changing behaviors and employing best practices in health, nutrition, sanitation, child protection, among others, which can save and protect the lives of children and help them grow and develop to their full potential. http://www.factsforlifeglobal.org/resources/factsforlife-en-full.pdf
• The Global Strategy for Infant and Young Child Feeding (WHO and UNICEF, 2003) includes guidelines on appropriate feeding of infants and young children, highlighting the need for all health services to protect, promote, and support exclusive breastfeeding and timely and adequate complementary feeding, as a means of saving lives. http://whqlibdoc.who.int/publications/2003/9241562218.pdf
• Guiding Principles for Complementary Feeding of the Breastfed Child (PAHO, 2003), which can be used as the basis for developing recommendations on complementary feeding, and to set standards for practical dietary guidelines. http://whqlibdoc.who.int/paho/2003/a85622.pdf
• Iodine Requirements in Pregnancy and Infancy (ICCIDD, 2007), highlights the results of a consultation where consensus was reached on iodine requirements and monitoring in vulnerable age groups. This document includes success stories in iodine programming. http://www.iccidd.org/media/IDD%20Newsletter/2007-present/feb2007.pdf
• Reaching Optimal Iodine Nutrition in Pregnant and Lactating Women and Young Children (WHO and UNICEF, 2007), includes guidance on iodized salt evaluation at the country level, and the use of iodized oil as a means of reaching vulnerable groups, primarily women and children in areas of severe iodine deficiency where universal salt iodization cannot be or is not implemented. http://www.who.int/nutrition/publications/WHOStatement__IDD_pregnancy.pdf
• Global Prevalence of Vitamin A Deficiency in Populations at Risk 1995-2005 (WHO, 2009), provides an overview, etiology, consequences, and control of vitamin A deficiency. http://whqlibdoc.who.int/publications/2009/9789241598019_eng.pdf
• How to Add Deworming to Vitamin A Distribution (WHO and UNICEF, 2004), provides practical guidance for health planners to promote the deworming of preschool children where vitamin A
Improving Nutrition Through Multisectoral Approaches
166
distribution campaigns are conducted. This document includes general information on benefits and practical issues about deworming, dosages and costs, as well as country case studies. http://whqlibdoc.who.int/hq/2004/WHO_CDS_CPE_PVC_2004.11.pdf
• Vitamin A in Child Health Weeks (Micronutrient Initiative) is a toolkit developed to assist district-level managers to plan, implement and monitor child health weeks or similar regular twice-yearly events to reach the greatest number of children to improve their health and survival. http://www.micronutrient.org/CMFiles/What%20we%20do/Vitamin%20A/VASToolkit.pdf
• The Guidelines for the Use of Iron Supplements to Prevent and Treat Iron Deficiency Anemia (INACG, WHO, and UNICEF, 1998) provide recommendations for iron supplementation in anemia control programs at the local, district, or national levels. These guidelines also integrate recommendations for the use of antimalarial and anthelminthic medications, where appropriate, along with iron supplements to prevent and treat anemia. http://www.who.int/nutrition/publications/micronutrients/guidelines_for_Iron_supplementation.pdf
• Worldwide Prevalence of Anemia 1993-2005 (WHO, 2008) provides an overview of anemia as a public health problem, its etiology, health consequences, method of assessment, and control of anemia. http://whqlibdoc.who.int/publications/2008/9789241596657_eng.pdf
• Micronutrient Sprinkles for Use in Infants and Young Children (Sprinkles Global Health Initiative, 2008), provides a background on Sprinkles/multiple micronutrient powders, guidelines on recommendations for their use, and recommendations for program monitoring and evaluation. http://www.sghi.org/resource_centre/GuidelinesGen2008.pdf
• Implementing the New Recommendations on the Clinical Management of Diarrhea (WHO, 2006), presents revised recommendations for the use of ORS and zinc supplementation in the management of diarrheal disease, as well information on what is needed to introduce and/or scale up ORS and zinc supplementation in the clinical management of diarrheal diseases. http://whqlibdoc.who.int/publications/2006/9241594217_eng.pdf
• Guidelines on HIV and Infant Feeding (WHO, 2010) are based on evidence and include systematic reviews, GRADE evidence profiles, risk-benefit tables, and discussion on the potential impact of the recommendations on HIV and infant feeding, human rights issues, and costs. http://whqlibdoc.who.int/publications/2010/9789241599535_eng.pdf
• HIV/AIDS, Nutrition, and Food Security: What We Can Do (World Bank, 2007), is a synthesis of existing technical and international guidance on HIV, AIDS, nutrition, and food security from a broad range of UN, bilateral, research, and nongovernmental entities, aiming to provide guidance on how to integrate efforts in each of these sectors into nutrition projects and programs for HIV and AIDS. http://siteresources.worldbank.org/NUTRITION/Resources/281846-1100008431337/HIVAIDSNutritionFoodSecuritylowres.pdf.
• The European Commission’s Draft Reference document (October 2010), provides guidance to country teams on how to incorporate nutrition components into existing projects and programs. A link to this document is not yet available.
• Everybody’s Business: Strengthening Health Systems to Improve Health Outcomes: WHO’s Framework for Action (2007) addresses the urgent need to improve the performance of health systems as a means to improving health outcomes. This framework lays out the basic concept and fundamental building blocks of health systems for policy-makers within countries and in other agencies. http://www.who.int/healthsystems/strategy/everybodys_business.pdf
Improving Nutrition Through Multisectoral Approaches
167
Annex E-6. Suggested nutrition resources
The Human Development Network has established a Knowledge Exchange for nutrition, which provides key information on nutrition resources, including a list of nutrition specialists within the Bank, who could potentially assist health TTLs in planning nutrition specific and nutrition sensitive approaches in projects.
For TTLs to understand the basic nutrition situation in countries where they work, the following resources are useful:
World Bank Nutrition Country Profiles (2011) These are two-page profiles of the 68 highest-burden-of-malnutrition countries. They contain information on prevalence of malnutrition and its causes, how the country’s state of nutrition compares to countries with similar GDP or geography, information on current World Bank nutrition projects in the country, cost for scaling up core micronutrient interventions, and suggested actions. These profiles are useful for basic context assessment and for making the case to address nutrition through agriculture in high-burden countries. http://www.worldbank.org/nutrition/profiles
UNICEF State of the World’s Children - data tables (2011)The data tables in UNICEF’s annual flagship report present major nutrition indicators, comparable across all countries, in a highly user-friendly format. Updated annually.http://www.unicef.org/sowc2011/pdfs/SOWC-2011-Statistical-tables_12082010.pdf
UNICEF Tracking Progress on Child and Maternal Undernutrition (2009)This publication provides profiles of several high-burden-of-malnutrition countries, presenting information on nutrition indicators and what proportion of child deaths are due to malnutrition and other diseases. http://www.unicef.org/publications/files/Tracking_Progress_on_Child_and_Maternal_Nutrition_EN_110309.pdf
UNICEF ChildInfoThis allows country-by-country tracking of the MDG1 indicator on child underweight (Indicator 1.8: % of Children under 5 moderately or severely underweight), underweight prevalence by economic background, and underweight and stunting data (the same compiled in UNICEF State of the World’s Children reports).http://www.childinfo.org/undernutrition_mdgprogress.php
World Bank World Development IndicatorsWDI contains two indicators for malnutrition (stunting, underweight), as well as disease prevalence and health systems information, which can help to estimate likely risk of malnutrition among farmers.http://data.worldbank.org/
WHO nutrition databases (http://www.who.int/nutrition/databases/en/index.html)WHO maintains several databases on nutrition, including:
• Nutrition Landscape Information System (NLIS)—a web-based tool which provides nutrition and nutrition-related health and development data in the form of automated country profiles and user-defined downloadable data
• WHO Global Database on Body Mass Index—contains updated data on underweight, overweight and obesity, and related indicators for all countries.
• National nutrition policies and programs—The Global Database on National Nutrition Policies and
Improving Nutrition Through Multisectoral Approaches
168
Programs was established in 1995 initially to monitor and evaluate the progress in implementing the World Declaration and Plan of Action for Nutrition. It has been further developed to monitor country progress in developing, strengthening and implementing national nutrition plans, policies and programs, including multisectoral actions, development of dietary guidelines, undertaking of nutrition surveys, demographic, and epidemiological data.
• WHO Global Database on Child Growth and Malnutrition—an A-Z list from where users can choose a country to view available child malnutrition data and reference tables (in pdf). Caution: these tables are not easy to interpret for non-nutritionists. UNICEF SOWC (see above) contains similar information.
• Vitamin and Mineral Nutrition Information System (VMNIS)—contains most recent data for anemia, iodine deficiency disorders, and vitamin A deficiency. Caution: these tables are not easy to interpret for non-nutritionists. World Bank country nutrition profiles (see above) contain similar information for 68 countries.

Improving Nutrition Through Multisectoral Approaches

THE WORLD BANK