village of shorewood lean resource manual
TRANSCRIPT
VILLAGEOFSHOREWOODLEANRESOURCEMANUAL
Continuallyreducingwasteandimprovingworkflow

2
Page left blank intentionally
3
Table of Contents
PART1:LeanProcess&Methods Introduction 5Section1:SelectingaProject 8Section2:DefinePhase 10 ProblemStatement 10 SIPOC 11 A3Report 11 TeamCharter 12 FlowCharts 12Section3:MeasurePhase 14 DataCollectionPlanner 15 CheckSheets 16 ValueStreamMap 16 EliminatingWaste 17 SpaghettiDiagram 21Section4:AnalyzePhase 22 Cause&EffectDiagram 22 5WhysForm 23 Graphing/ParetoChart 24Section5:ImprovePhase 25 Brainstorm 25 DecisionMatrix 26 5SMethod 28 ActionPlanner 32 ProjectPresentation 32Section6:ControlPhase 33 StandardizeWork 33 ControlPlan 33 DecisionTree 35 PartII:OtherLeanMethodologies 36Kaizen 36Plan,Do,Check,Act 36 Appendix 38A MeetingGuidelinesform B ProblemStatementform C SIPOCDiagramtemplate D A3ReportTemplate E TeamCharterform F DataCollectionPlannerform G DataCollectionChecksheettemplate H ValueStreamMappingsymbols I ValueStreamMappingProcessStepTable J Cause&EffectDiagram K 5Whystemplate L DecisionMatrix M ActionPlanner N ControlPlanChecklist

4
Page left blank intentionally
5
PART1:LEANPROCESS&METHODS
IntroductionThe Village of Shorewood is seeking to identify ways to serve the community more effectively and less
expensively by utilizing Lean principles, practices and methods. The Lean Vision for the Village of
Shorewood is to expand on a culture where people contribute meaningful work to improve the internal
operations and build an organization where employees want to make a difference. Thinking deeply
about purpose, process, and people will guide a transformation.
WhatLeanIsLean involves a set of principles, practices and methods for designing, improving and managing
processes. It is aimed to improve efficiency by eliminating particular kinds of waste which absorb time
and resources but do not add value. A Lean process reflects the goal of continually reducing waste and
improving work flow to efficiently produce a product or service that is perceived to be of high value to
those who use it. Implementation of Lean involves systematic process assessment and analysis.
Six Sigma, like Lean, is a business management strategy used to improve the quality and efficiency of
operational processes. While Lean focuses on identifying ways to streamline processes and reduce
waste, Six Sigma aims predominantly to make processes more uniform and precise through the
application of statistical methods.
Various combinations of Lean and Six Sigma techniques have been developed, which frequently are
described as Lean Six Sigma approaches. The blended approach points to the common process‐centered
and data‐driven foundations of both Lean and Six Sigma. The combined approach benefits organizations
because it utilizes both the customer‐orientation and focus on eliminating waste inherent in Lean along
with the statistical tools used in Six Sigma.
WhatLeanIsNotLean is not a tactic or a cost reduction program, but a way of thinking and acting for an entire
organization. It is not about figuring out new ways to cut village personnel. “In America today we have
good people working in poor processes. What we want is good people working in great processes.” MIT
Professor Michael Hammer. The Village does not want to use this process to eliminate positions but
rather reduce waste and extra steps in significant processes.
A Lean organization utilizes the knowledge of all employees to create a high performance organization;
it searches for root causes, eliminates waste and reduces costs and resources required to do essential
6
non‐value‐added activities; and it is totally committed to continuous improvement. This takes a long‐
term perspective and systemic perseverance and requires commitment from all. Lean utilization
improves delivery of services using a disciplined, project‐based approach and using sound and consistent
methodology. If time is reduced to provide a service, it will serve customers better and make people feel
better about their work.
The word transformation or Lean transformation is often used to characterize an organization moving
from an old way of thinking to lean thinking. Shorewood is taking this first step in changing how we do
business.
LeanMethods
All Village Lean projects will utilize the process and tools outlined in this manual for problem solving and
continuous improvement, methodologies created for Lean Six Sigma. The DMAIC methodology is the
fundamental approach to begin the process. DMAIC and Lean (the combined methodologies are known
as Lean Six Sigma) complement each other as the foundation for continuous improvement and
eliminating waste.
There are two methodologies utilized in implementing Lean continuous improvement. One is DMAIC,
consisting of five steps: Define, Measure, Analyze, Improve and Control. The other method is PDCA,
which stands for Plan, Do, Check, Act.
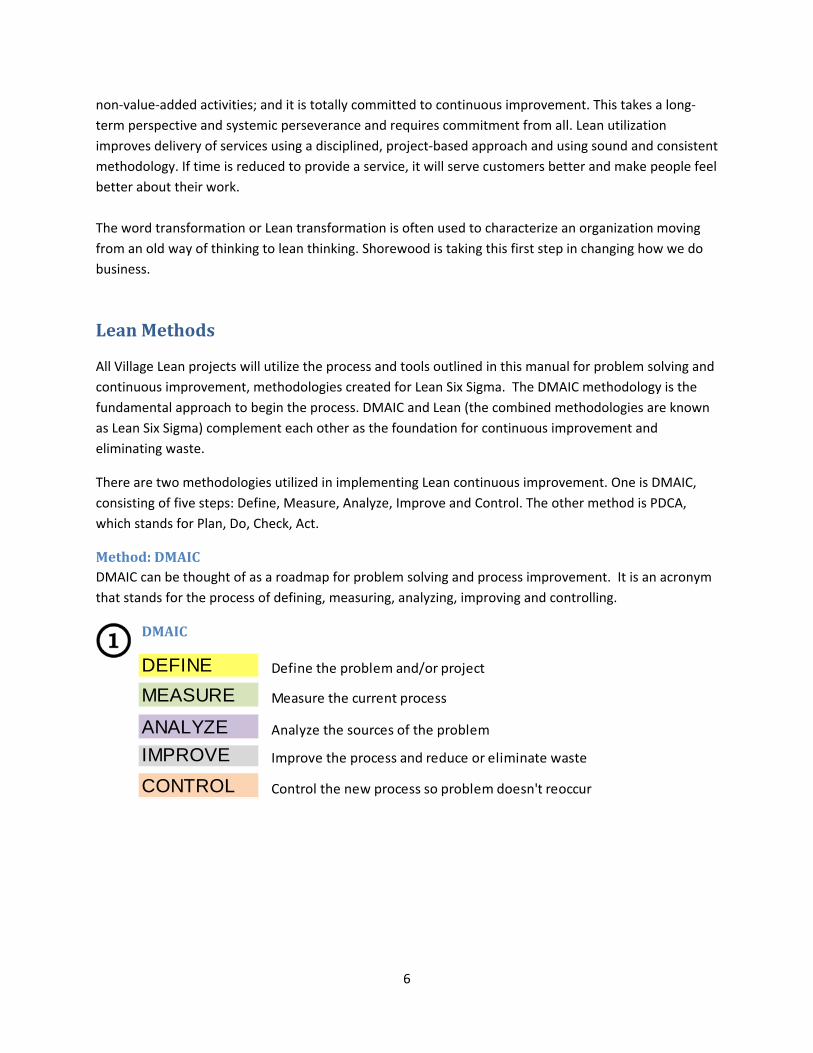
Method:DMAICDMAIC can be thought of as a roadmap for problem solving and process improvement. It is an acronym
that stands for the process of defining, measuring, analyzing, improving and controlling.
DMAIC
DEFINE Define the problem and/or project
MEASURE Measure the current process
ANALYZE Analyze the sources of the problem
IMPROVE Improve the process and reduce or eliminate waste
CONTROL Control the new process so problem doesn't reoccur
7
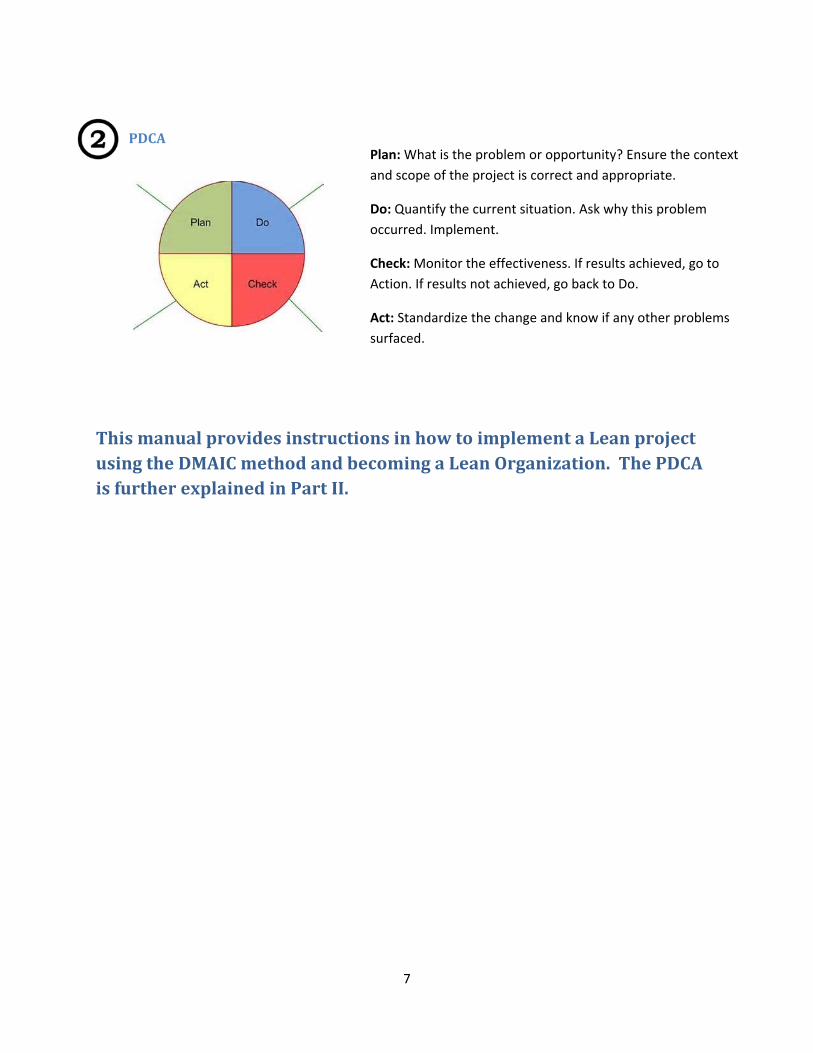
PDCA
ThismanualprovidesinstructionsinhowtoimplementaLeanprojectusingtheDMAICmethodandbecomingaLeanOrganization.ThePDCAisfurtherexplainedinPartII.
Plan: What is the problem or opportunity? Ensure the context
and scope of the project is correct and appropriate.
Do: Quantify the current situation. Ask why this problem
occurred. Implement.
Check: Monitor the effectiveness. If results achieved, go to
Action. If results not achieved, go back to Do.
Act: Standardize the change and know if any other problems
surfaced.
8
SECTION1:SELECTINGAPROJECT
Suggestions and ideas for projects are submitted and evaluated by the Process Improvement Resource (PIR) ‐
Corrective Investigative Team and recommendations are reviewed by the Steering Committee. If a particular
problem becomes a priority of a department manager, the manager works with the Steering Committee to initiate
a project and/or team as well.
ACTIONS: Once a project is decided on, a team is formed. At the first meeting, the team reviews the project to
see if it can be narrowed and all members sign the Meeting Guidelines (Appendix A) form.
NarrowingtheprojectOnce a project is chosen, further review is necessary. Most projects need to be broken down into subprojects.
Each one may feel small and not providing sufficient improvement; however, even with limited time applied, large
improvements come over time. Identify if there is something meaningful that can be improved in 90 days. Ask
these questions:
What are the subset issues of the problem?
Can you list the top three things that cause, or are parts of the problem?
Can you select one of the subset issues to work on? Will it still be meaningful?
For example‐ Original Project: Reduce the time to approve all purchase orders
Narrowed Project: Reduce the time to approve machine repair purchase orders
AttributesofGoodTeamsWhen a project team is formed and before the project begins, the team reviews meeting guidelines and each
member gives a signed copy of the form to the Steering Committee (appendix A). Meetings need to be closely
managed because we don’t have unlimited time. It’s important to keep the project results at maximum speed to
eliminate improper project scope expansion, focusing on minor items instead of the major ones, and minimizing
irrelevant conversations.
General Meeting Guidelines
1) Meetings are held only when necessary and effective to accomplish the objective.
2) Everyone ‘checks their titles at the door’ regardless of titles.
3) Appropriate people are notified as to who is in the meeting.
4) Agendas (if necessary) are sent out to team members in advance.
5) Meetings start on time.
6) Meetings are held with minimal interruption.
7) Meetings end on time.
9
Participation in meetings 8) No person(s) dominate the conversation.
9) Information required for discussion is proved in advance when expected or is complete when necessary to
bring to the meeting.
10) People are ‘present’ in the current meeting, one person talks at a time.
11) People are treated with respect.
12) Discussion is kept on task and on time.
13) Assignments are given and accepted where appropriate with the expectation of being completed when
agreed upon or the appropriate people are notified well in advance (as soon as realized) of the
anticipated due date.
14) A question of whether anyone else has input should be asked at the end of the meeting.
Decision making 15) Data is expected to be presented for decision making.
16) The team defers a decision to the most appropriate team member.
17) When appropriate, the three C’s of decision making employed (Command decisions, Consensus decisions,
and Consultative decisions) with ‘consultative’ being most used.
18) Meetings should employ decision making tools when appropriate.
10
SECTION2:DEFINEPHASE
The project starts with the Define Phase. In the first meeting, the team creates a specific definition of the
problem. Know the customer and their need. Begin project communications and meetings when appropriate. At
the end of each step, look for “low‐hanging fruit” and make safe, simple improvements where appropriate.
Define Actions: Complete a Problem Statement form and a SIPOC Diagram; start completing the A3 Report
sheet; complete a Team Charter and hand in to the Steering Committee; do a flowchart of the existing process
and use the SIPOC tool.
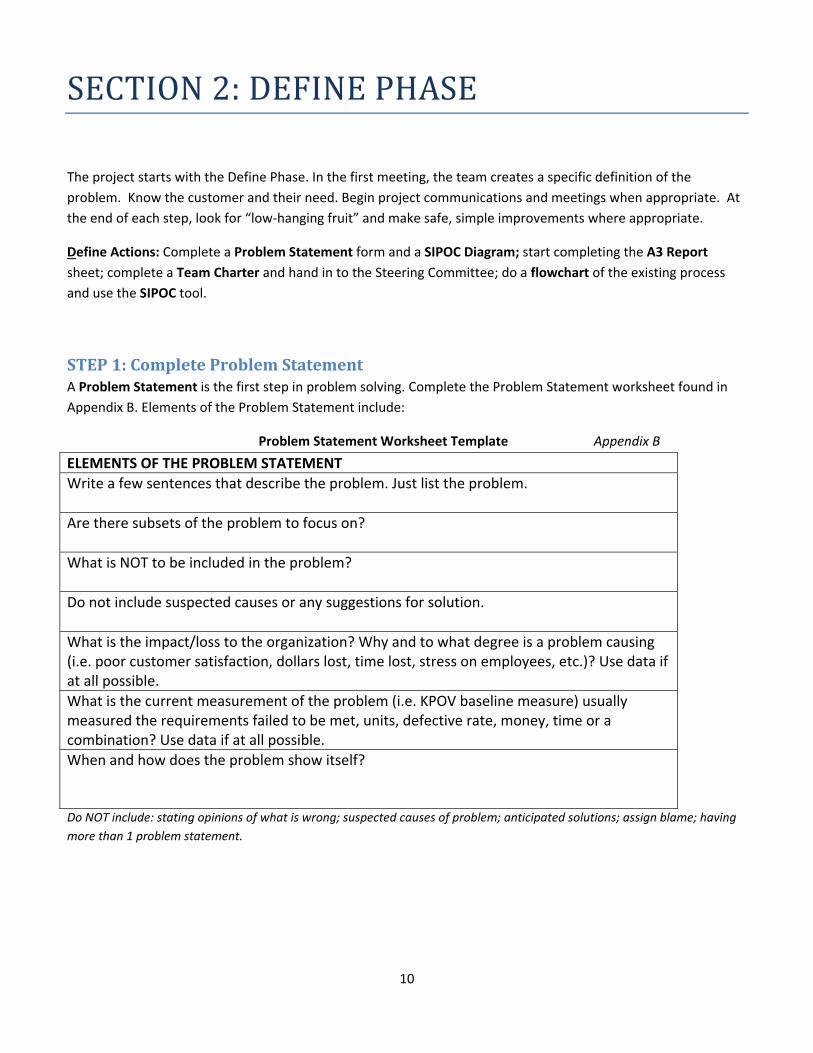
STEP1:CompleteProblemStatementA Problem Statement is the first step in problem solving. Complete the Problem Statement worksheet found in
Appendix B. Elements of the Problem Statement include:
Problem Statement Worksheet Template Appendix B
ELEMENTS OF THE PROBLEM STATEMENT
Write a few sentences that describe the problem. Just list the problem.
Are there subsets of the problem to focus on?
What is NOT to be included in the problem?
Do not include suspected causes or any suggestions for solution.
What is the impact/loss to the organization? Why and to what degree is a problem causing (i.e. poor customer satisfaction, dollars lost, time lost, stress on employees, etc.)? Use data if at all possible.
What is the current measurement of the problem (i.e. KPOV baseline measure) usually measured the requirements failed to be met, units, defective rate, money, time or a combination? Use data if at all possible.
When and how does the problem show itself? Do NOT include: stating opinions of what is wrong; suspected causes of problem; anticipated solutions; assign blame; having
more than 1 problem statement.
11
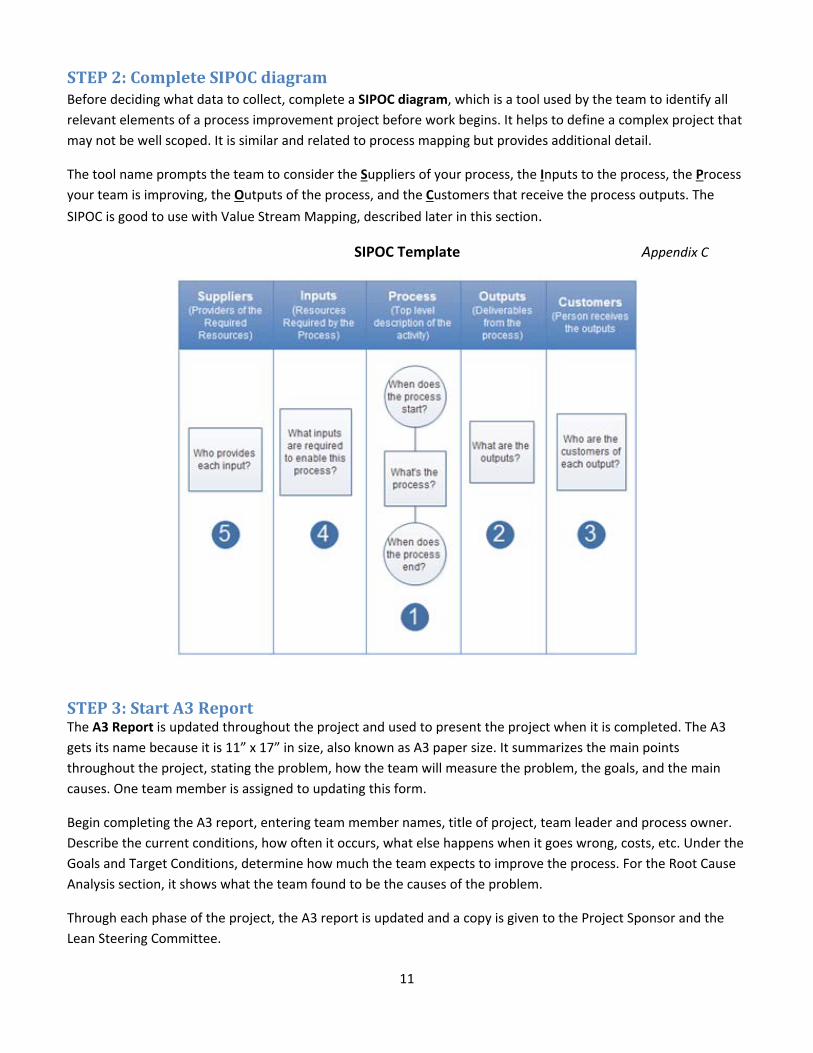
STEP2:CompleteSIPOCdiagram Before deciding what data to collect, complete a SIPOC diagram, which is a tool used by the team to identify all
relevant elements of a process improvement project before work begins. It helps to define a complex project that
may not be well scoped. It is similar and related to process mapping but provides additional detail.
The tool name prompts the team to consider the Suppliers of your process, the Inputs to the process, the Process
your team is improving, the Outputs of the process, and the Customers that receive the process outputs. The
SIPOC is good to use with Value Stream Mapping, described later in this section.
SIPOC Template Appendix C
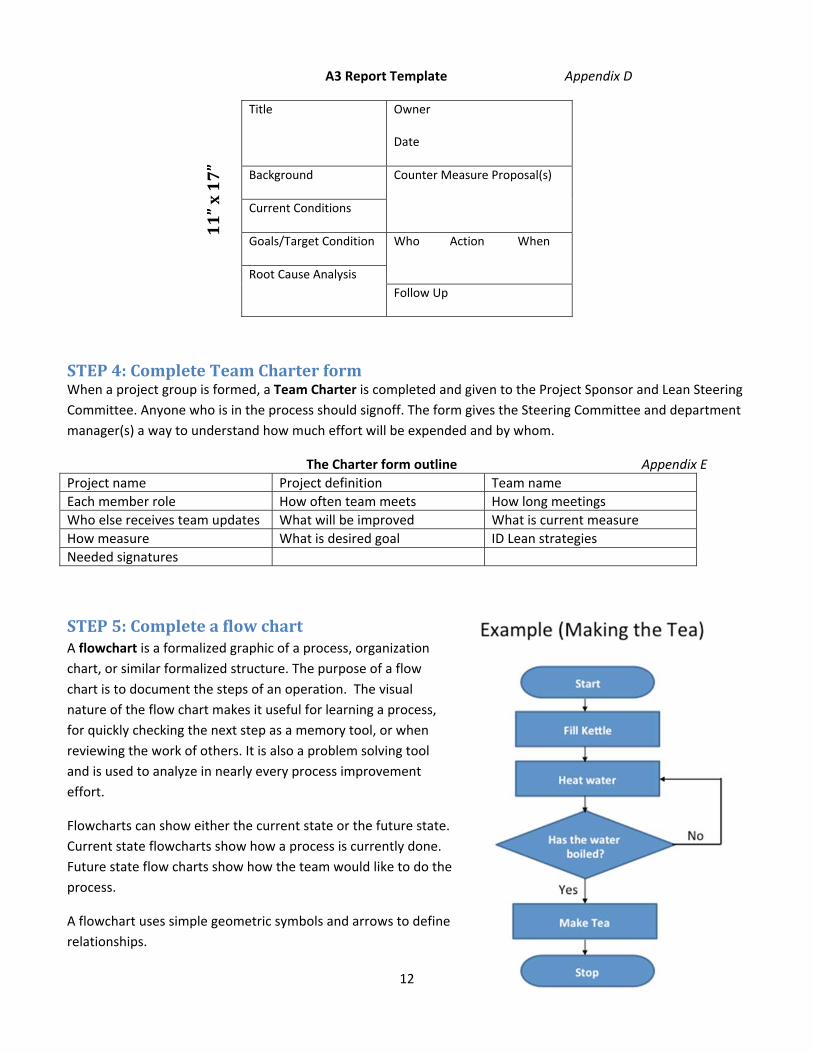
STEP3:StartA3Report The A3 Report is updated throughout the project and used to present the project when it is completed. The A3
gets its name because it is 11” x 17” in size, also known as A3 paper size. It summarizes the main points
throughout the project, stating the problem, how the team will measure the problem, the goals, and the main
causes. One team member is assigned to updating this form.
Begin completing the A3 report, entering team member names, title of project, team leader and process owner.
Describe the current conditions, how often it occurs, what else happens when it goes wrong, costs, etc. Under the
Goals and Target Conditions, determine how much the team expects to improve the process. For the Root Cause
Analysis section, it shows what the team found to be the causes of the problem.
Through each phase of the project, the A3 report is updated and a copy is given to the Project Sponsor and the
Lean Steering Committee.
12
A3 Report Template Appendix D
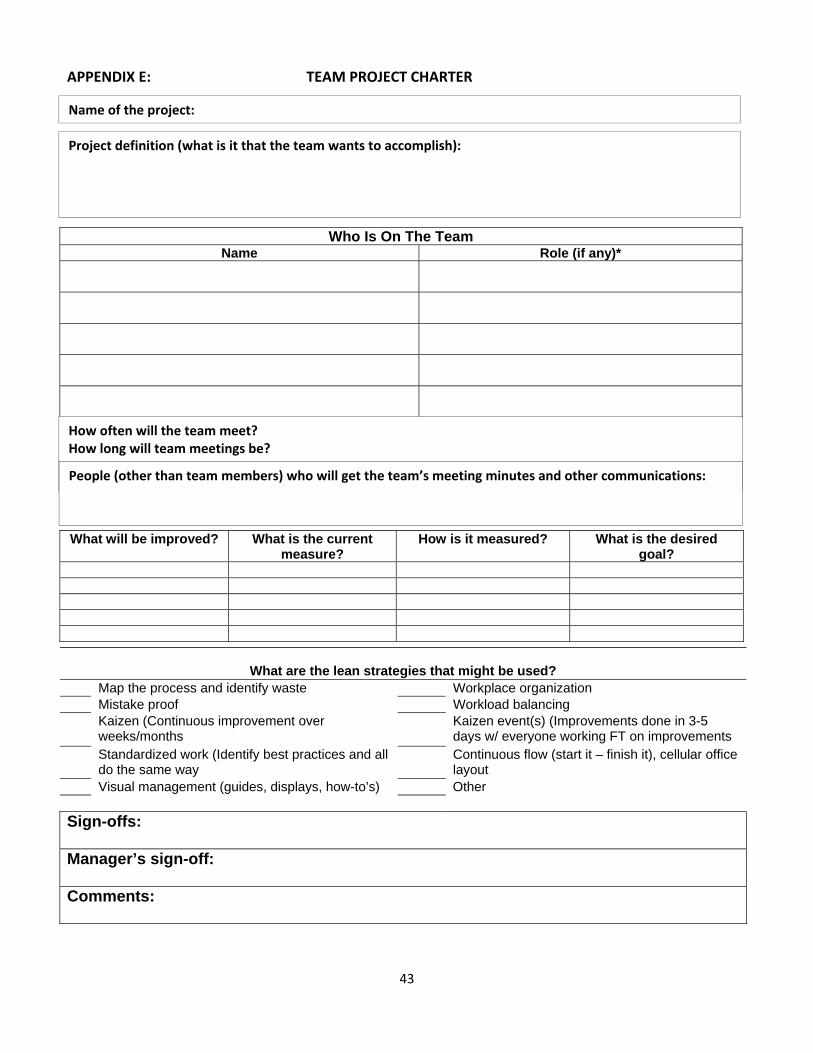
STEP4:CompleteTeamCharterform When a project group is formed, a Team Charter is completed and given to the Project Sponsor and Lean Steering
Committee. Anyone who is in the process should signoff. The form gives the Steering Committee and department
manager(s) a way to understand how much effort will be expended and by whom.
The Charter form outline Appendix E
Project name Project definition Team name
Each member role How often team meets How long meetings
Who else receives team updates What will be improved What is current measure
How measure What is desired goal ID Lean strategies
Needed signatures
STEP5:CompleteaflowchartA flowchart is a formalized graphic of a process, organization
chart, or similar formalized structure. The purpose of a flow
chart is to document the steps of an operation. The visual
nature of the flow chart makes it useful for learning a process,
for quickly checking the next step as a memory tool, or when
reviewing the work of others. It is also a problem solving tool
and is used to analyze in nearly every process improvement
effort.
Flowcharts can show either the current state or the future state.
Current state flowcharts show how a process is currently done.
Future state flow charts show how the team would like to do the
process.
A flowchart uses simple geometric symbols and arrows to define
relationships.
Title Owner
Date
Background Counter Measure Proposal(s)
Current Conditions
Goals/Target Condition Who Action When
Root Cause Analysis
Follow Up
11”x17”
13
Symbol Represents Example
Receive complaint
Receive request
Proposal
Yes/No
Agree/Disagree
Pass/Fail
Hold a meeting
Make a phone call
Send a request
Document Report is completed
Meeting minutes
Forms fi l led out
Connector Go to another page or
another part of the
flowchart
Delay Waiting for a service
Report sitting on a desk
Start/Stop
Decision Point
Activity
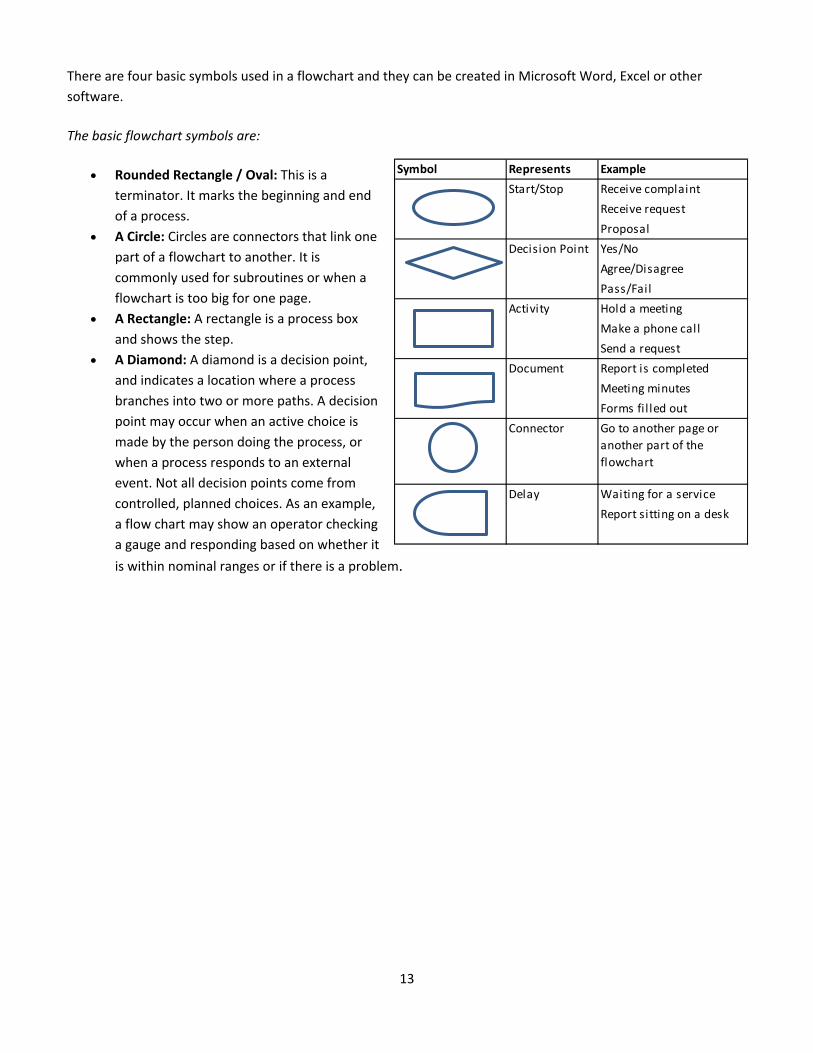
There are four basic symbols used in a flowchart and they can be created in Microsoft Word, Excel or other
software.
The basic flowchart symbols are:
Rounded Rectangle / Oval: This is a
terminator. It marks the beginning and end
of a process.
A Circle: Circles are connectors that link one
part of a flowchart to another. It is
commonly used for subroutines or when a
flowchart is too big for one page.
A Rectangle: A rectangle is a process box
and shows the step.
A Diamond: A diamond is a decision point,
and indicates a location where a process
branches into two or more paths. A decision
point may occur when an active choice is
made by the person doing the process, or
when a process responds to an external
event. Not all decision points come from
controlled, planned choices. As an example,
a flow chart may show an operator checking
a gauge and responding based on whether it
is within nominal ranges or if there is a problem.
14
SECTION3.MEASUREPHASE
The Measure Phase involves creating a measurement plan and collecting data. Measurement is critical throughout
the life of the project and as the team focuses on data collection, there are initially two focuses: determining the
start point or baseline of the process and looking for clues to understand the root cause of the process. Since data
collection takes time and effort it’s good to consider both at the start of the project.
MEASURE ACTIONS: The team schedules a meeting to determine metrics. Complete a Data Collection Planner
(Appendix F) and data collection Data Collection Checksheet (Appendix G) form and assign who will be collecting
the data. After the data is collected and if the project warrants, complete a Value Stream Map. A Spaghetti
Diagram may also be helpful to review process/paper flow.
Data must be collected a minimum of two weeks before any recommended changes take place.
The Process Improvement Measuring Team is available to assist with developing, collecting and analyzing data.
STEP1:IdentifywhatDatatoCollect&CompleteDataCollectionPlannerIt is important to get current baseline numbers on how the process performs or on the quality characteristics.
Often it is helpful to focus on a metric that is meaningful to the customer and another that will resonate with the
organizations goals. It is important to measure in years and not months, as part of the control phase (DMAIC). It’s
very important to properly explain why the data is being collected, how it will be used, and ensure all know how
to collect the data.
First, your team must establish the current state or the baseline of the process before making any changes. The
baseline becomes the standard against which any improvement is measured. This is a key step as the data
collected will be used throughout the life of the project.
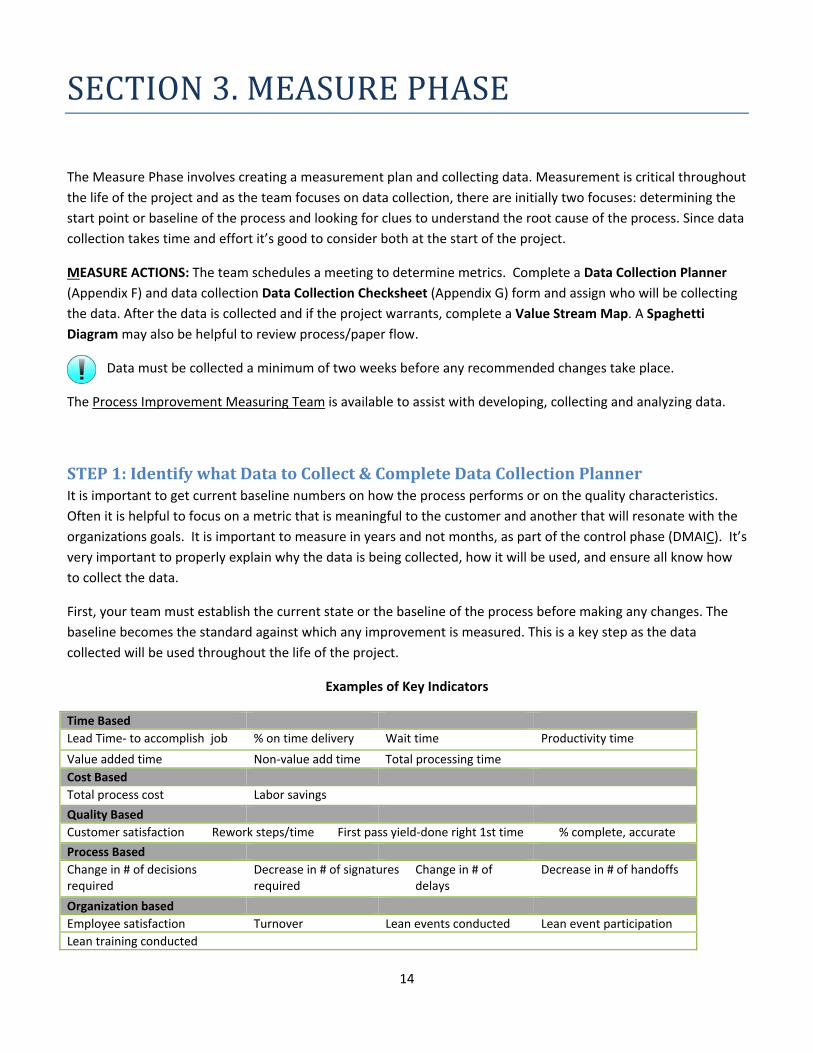
Examples of Key Indicators
Time Based
Lead Time‐ to accomplish job % on time delivery Wait time Productivity time
Value added time Non‐value add time Total processing time
Cost Based
Total process cost Labor savings
Quality Based
Customer satisfaction Rework steps/time First pass yield‐done right 1st time % complete, accurate
Process Based
Change in # of decisions required
Decrease in # of signatures required
Change in # of delays
Decrease in # of handoffs
Organization based
Employee satisfaction Turnover Lean events conducted Lean event participation
Lean training conducted
15
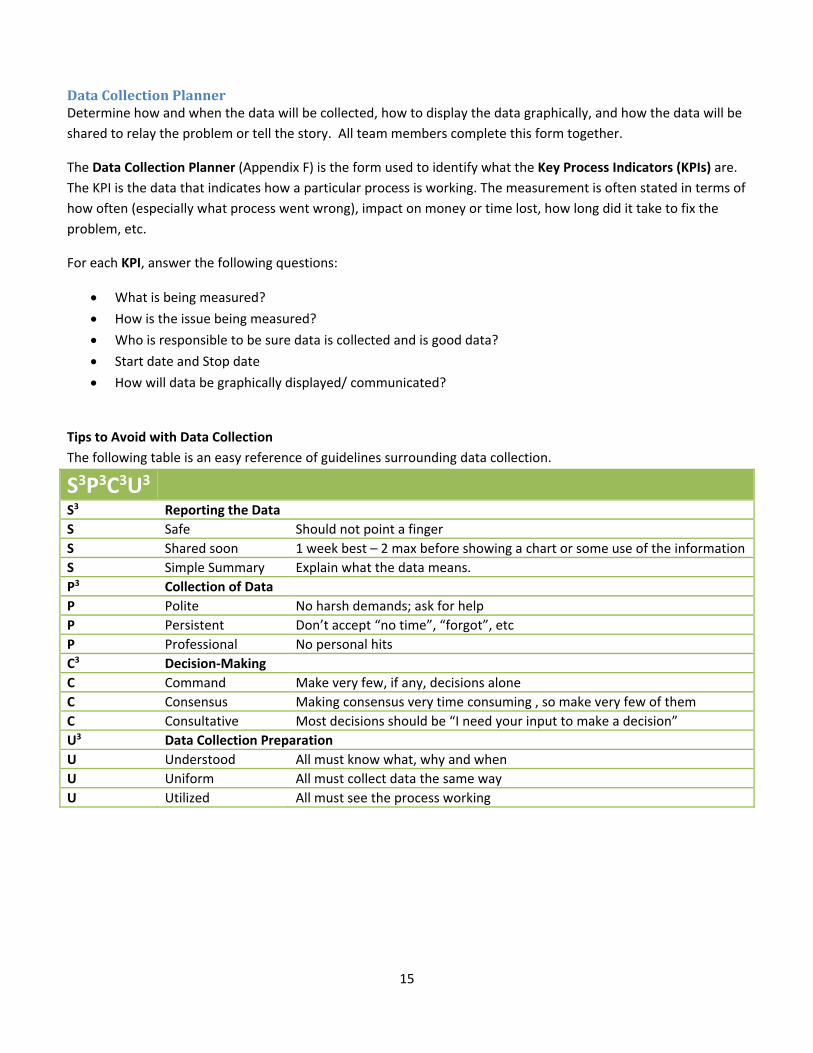
DataCollectionPlanner Determine how and when the data will be collected, how to display the data graphically, and how the data will be
shared to relay the problem or tell the story. All team members complete this form together.
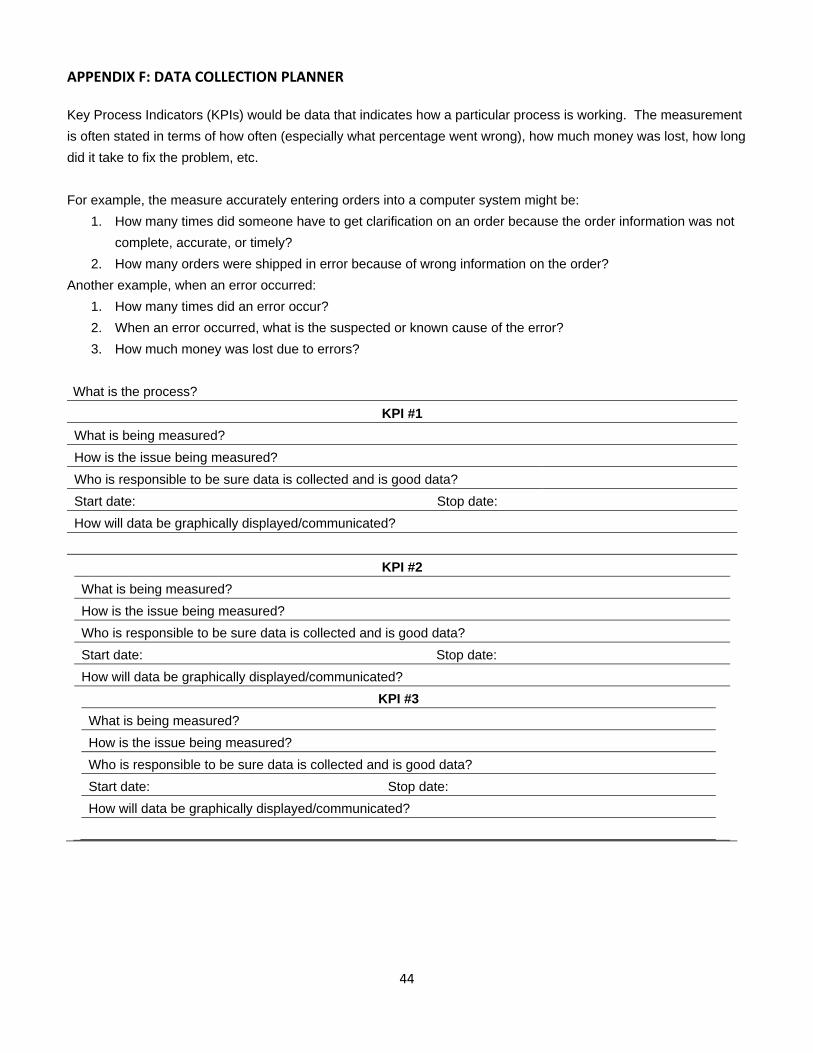
The Data Collection Planner (Appendix F) is the form used to identify what the Key Process Indicators (KPIs) are.
The KPI is the data that indicates how a particular process is working. The measurement is often stated in terms of
how often (especially what process went wrong), impact on money or time lost, how long did it take to fix the
problem, etc.
For each KPI, answer the following questions:
What is being measured?
How is the issue being measured?
Who is responsible to be sure data is collected and is good data?
Start date and Stop date
How will data be graphically displayed/ communicated?
Tips to Avoid with Data Collection
The following table is an easy reference of guidelines surrounding data collection.
S3P3C3U3
S3 Reporting the Data
S Safe Should not point a finger
S Shared soon 1 week best – 2 max before showing a chart or some use of the information
S Simple Summary Explain what the data means.
P3 Collection of Data
P Polite No harsh demands; ask for help
P Persistent Don’t accept “no time”, “forgot”, etc
P Professional No personal hits
C3 Decision‐Making
C Command Make very few, if any, decisions alone
C Consensus Making consensus very time consuming , so make very few of them
C Consultative Most decisions should be “I need your input to make a decision”
U3 Data Collection Preparation
U Understood All must know what, why and when
U Uniform All must collect data the same way
U Utilized All must see the process working
16
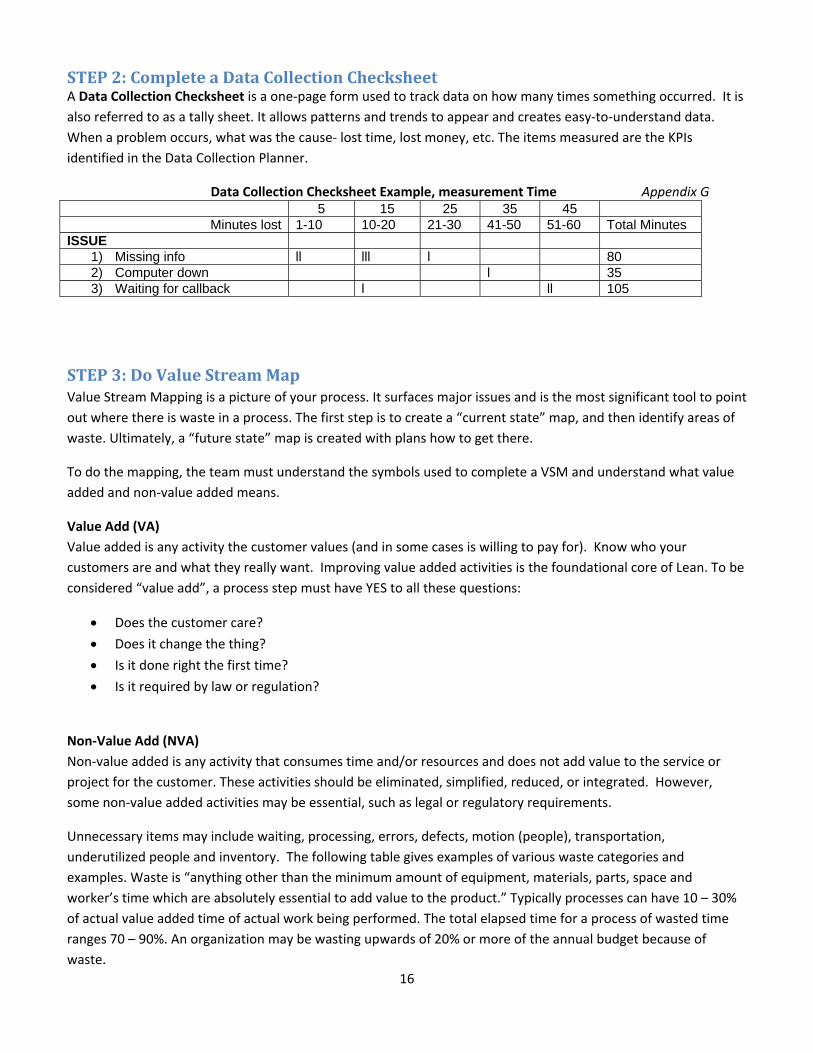
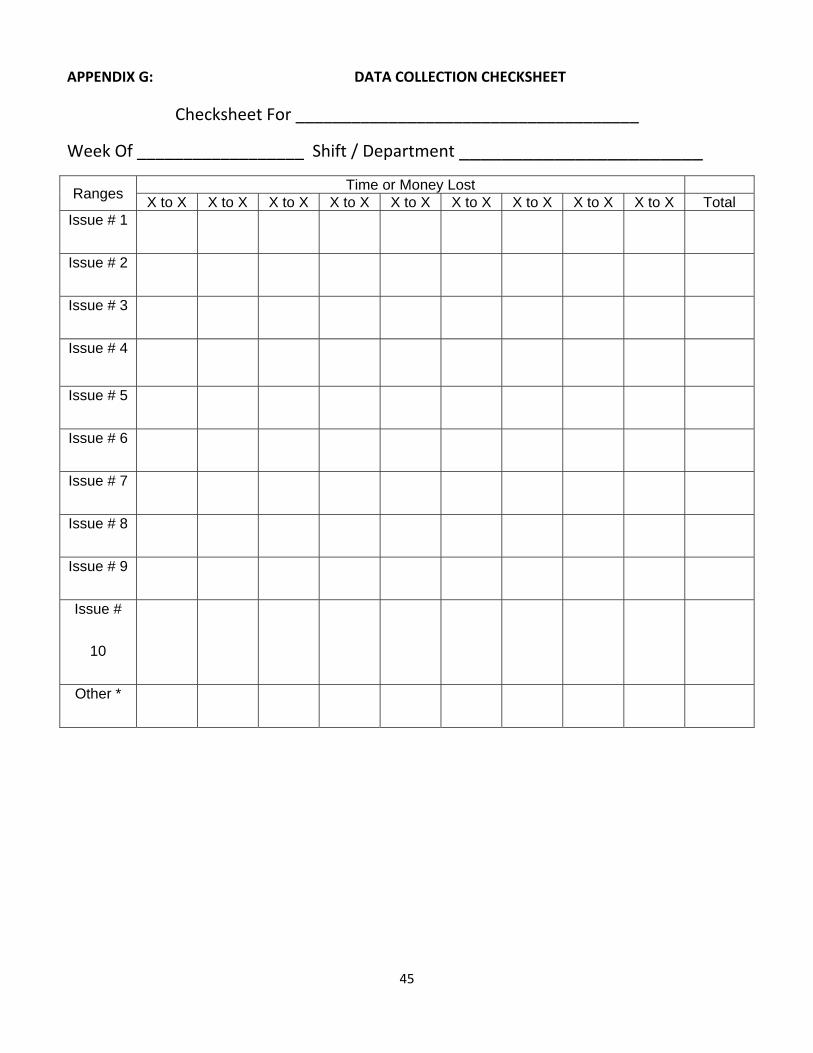
STEP2:CompleteaDataCollectionChecksheet A Data Collection Checksheet is a one‐page form used to track data on how many times something occurred. It is
also referred to as a tally sheet. It allows patterns and trends to appear and creates easy‐to‐understand data.
When a problem occurs, what was the cause‐ lost time, lost money, etc. The items measured are the KPIs
identified in the Data Collection Planner.
Data Collection Checksheet Example, measurement Time Appendix G 5 15 25 35 45
Minutes lost 1-10 10-20 21-30 41-50 51-60 Total Minutes ISSUE
1) Missing info ll lll l 80 2) Computer down l 35 3) Waiting for callback l ll 105
STEP3:DoValueStreamMapValue Stream Mapping is a picture of your process. It surfaces major issues and is the most significant tool to point
out where there is waste in a process. The first step is to create a “current state” map, and then identify areas of
waste. Ultimately, a “future state” map is created with plans how to get there.
To do the mapping, the team must understand the symbols used to complete a VSM and understand what value
added and non‐value added means.
Value Add (VA)
Value added is any activity the customer values (and in some cases is willing to pay for). Know who your
customers are and what they really want. Improving value added activities is the foundational core of Lean. To be
considered “value add”, a process step must have YES to all these questions:
Does the customer care?
Does it change the thing?
Is it done right the first time?
Is it required by law or regulation?
Non‐Value Add (NVA)
Non‐value added is any activity that consumes time and/or resources and does not add value to the service or
project for the customer. These activities should be eliminated, simplified, reduced, or integrated. However,
some non‐value added activities may be essential, such as legal or regulatory requirements.
Unnecessary items may include waiting, processing, errors, defects, motion (people), transportation,
underutilized people and inventory. The following table gives examples of various waste categories and
examples. Waste is “anything other than the minimum amount of equipment, materials, parts, space and
worker’s time which are absolutely essential to add value to the product.” Typically processes can have 10 – 30%
of actual value added time of actual work being performed. The total elapsed time for a process of wasted time
ranges 70 – 90%. An organization may be wasting upwards of 20% or more of the annual budget because of
waste.
17
People must work smarter, not harder, to accomplish more with less. Quality of work life suffers when “waste”
interferes with an employee performing effectively. The focus is to reduce or eliminate activities that mess you
up, slows you down, and keeps you from doing the right thing correctly the first time.
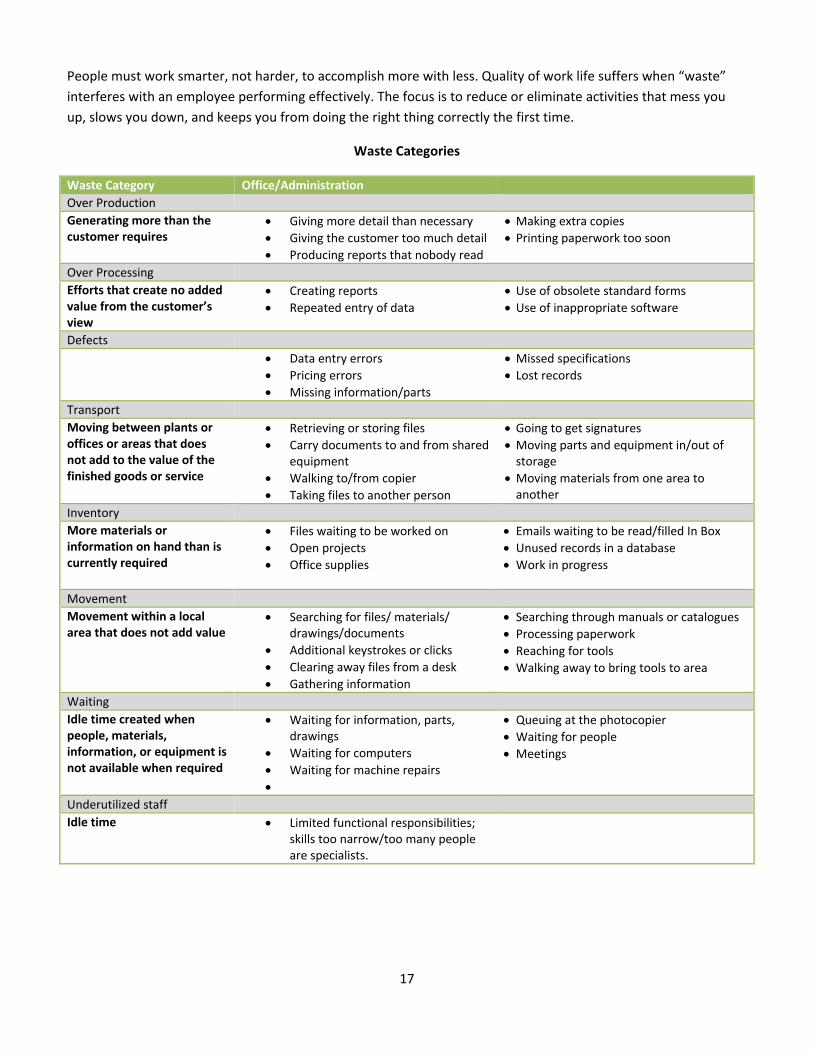
Waste Categories
Waste Category Office/Administration
Over Production
Generating more than the customer requires
Giving more detail than necessary
Giving the customer too much detail
Producing reports that nobody read
Making extra copies
Printing paperwork too soon
Over Processing
Efforts that create no added value from the customer’s view
Creating reports
Repeated entry of data
Use of obsolete standard forms
Use of inappropriate software
Defects
Data entry errors
Pricing errors
Missing information/parts
Missed specifications
Lost records
Transport
Moving between plants or offices or areas that does not add to the value of the finished goods or service
Retrieving or storing files
Carry documents to and from shared equipment
Walking to/from copier
Taking files to another person
Going to get signatures Moving parts and equipment in/out of storage
Moving materials from one area to another
Inventory
More materials or information on hand than is currently required
Files waiting to be worked on
Open projects
Office supplies
Emails waiting to be read/filled In Box
Unused records in a database Work in progress
Movement
Movement within a local area that does not add value
Searching for files/ materials/ drawings/documents
Additional keystrokes or clicks
Clearing away files from a desk
Gathering information
Searching through manuals or catalogues
Processing paperwork Reaching for tools Walking away to bring tools to area
Waiting
Idle time created when people, materials, information, or equipment is not available when required
Waiting for information, parts, drawings
Waiting for computers
Waiting for machine repairs
Queuing at the photocopier Waiting for people
Meetings
Underutilized staff
Idle time Limited functional responsibilities; skills too narrow/too many people are specialists.
18
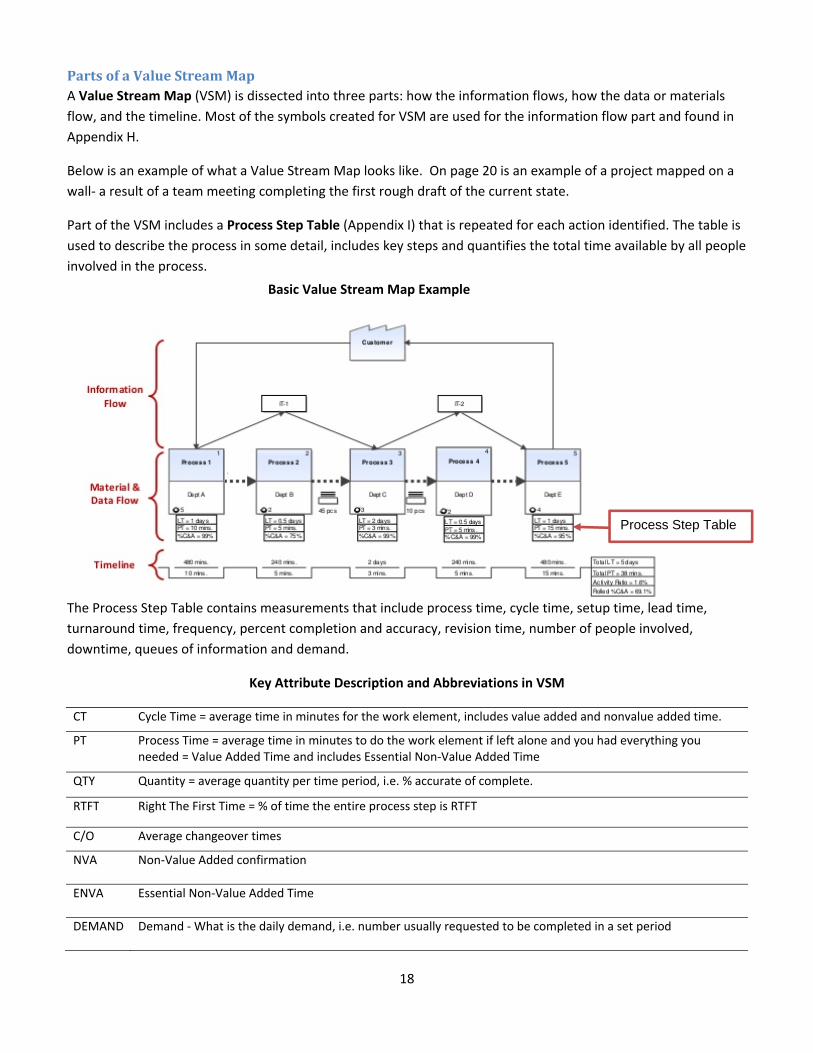
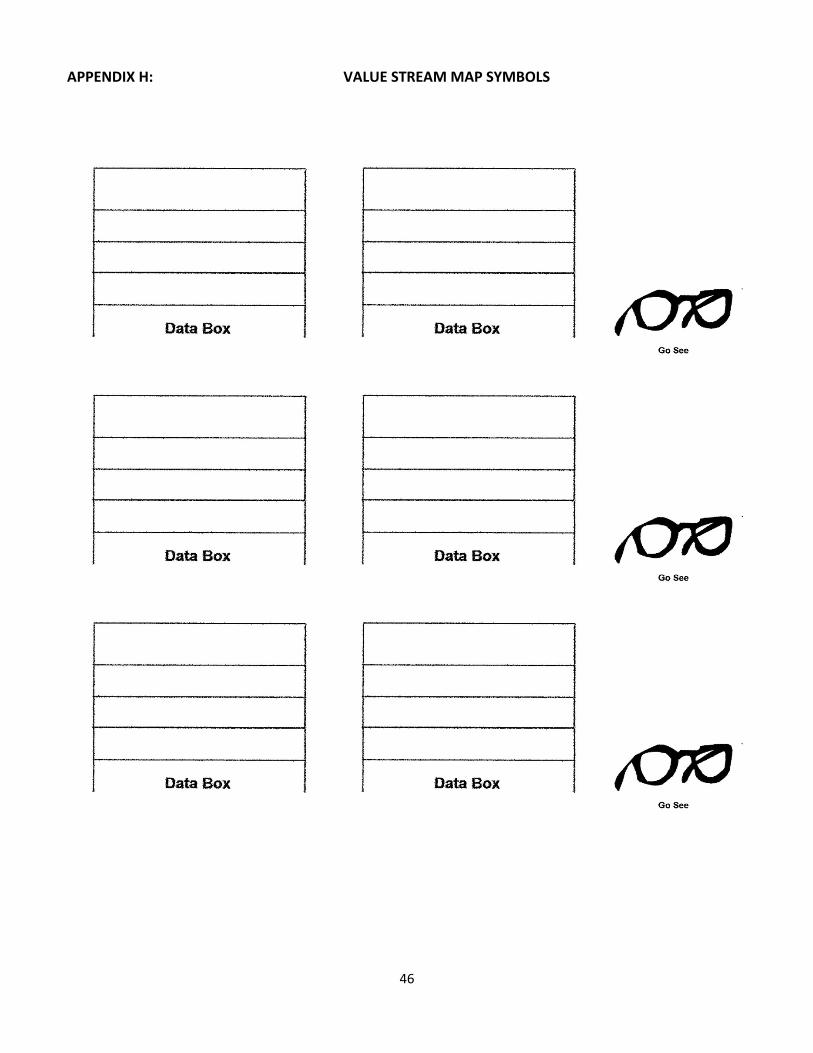
PartsofaValueStreamMapA Value Stream Map (VSM) is dissected into three parts: how the information flows, how the data or materials
flow, and the timeline. Most of the symbols created for VSM are used for the information flow part and found in
Appendix H.
Below is an example of what a Value Stream Map looks like. On page 20 is an example of a project mapped on a
wall‐ a result of a team meeting completing the first rough draft of the current state.
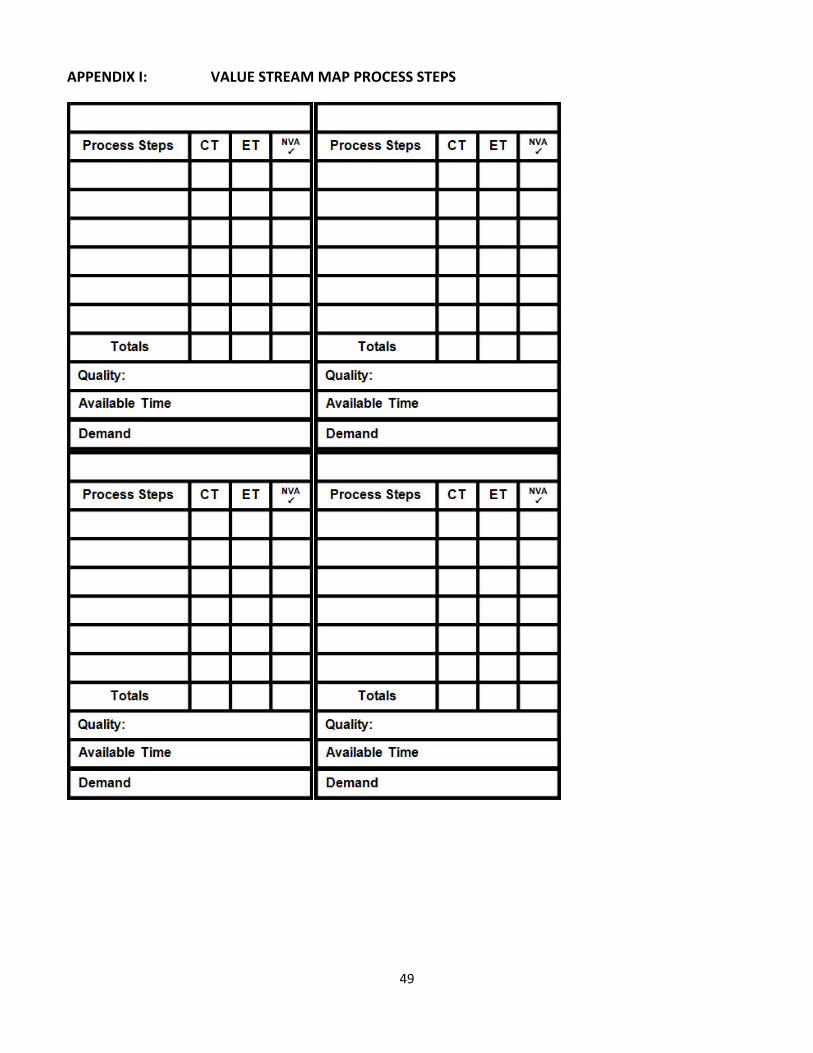
Part of the VSM includes a Process Step Table (Appendix I) that is repeated for each action identified. The table is
used to describe the process in some detail, includes key steps and quantifies the total time available by all people
involved in the process.
The Process Step Table contains measurements that include process time, cycle time, setup time, lead time,
turnaround time, frequency, percent completion and accuracy, revision time, number of people involved,
downtime, queues of information and demand.
Key Attribute Description and Abbreviations in VSM
CT Cycle Time = average time in minutes for the work element, includes value added and nonvalue added time.
PT Process Time = average time in minutes to do the work element if left alone and you had everything you needed = Value Added Time and includes Essential Non‐Value Added Time
QTY Quantity = average quantity per time period, i.e. % accurate of complete.
RTFT Right The First Time = % of time the entire process step is RTFT
C/O Average changeover times
NVA Non‐Value Added confirmation
ENVA Essential Non‐Value Added Time
DEMAND Demand ‐ What is the daily demand, i.e. number usually requested to be completed in a set period
Process Step Table
Basic Value Stream Map Example
19
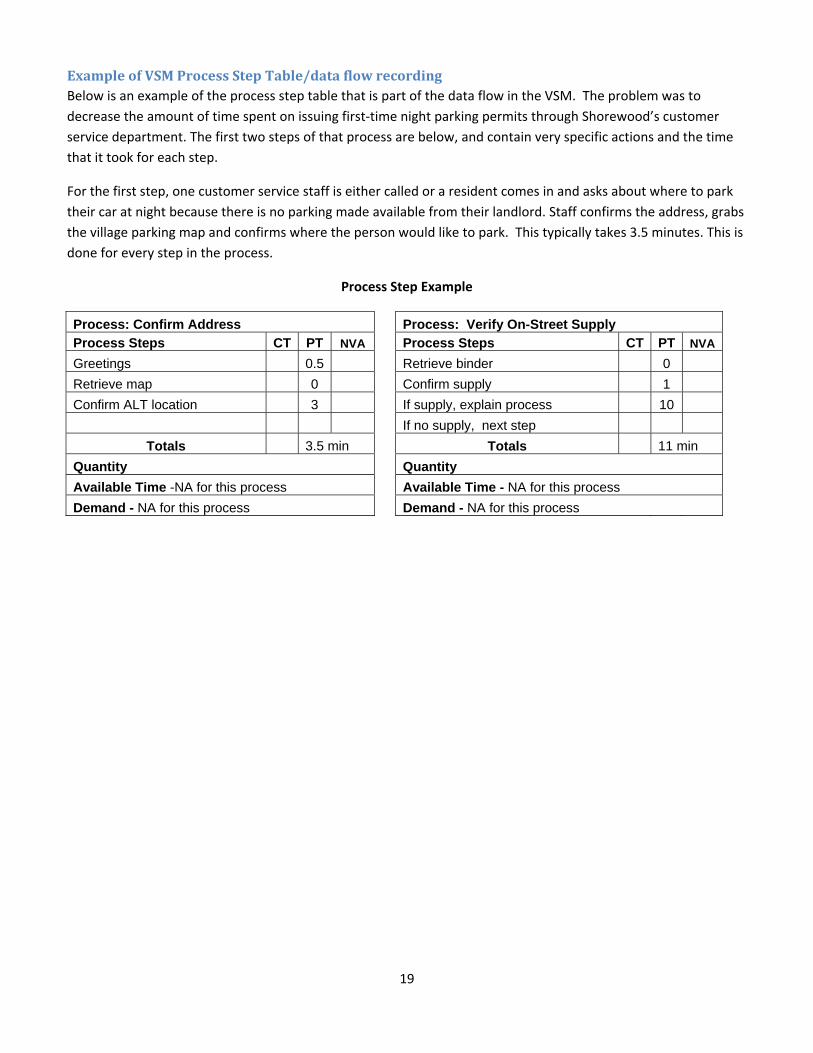
ExampleofVSMProcessStepTable/dataflowrecordingBelow is an example of the process step table that is part of the data flow in the VSM. The problem was to
decrease the amount of time spent on issuing first‐time night parking permits through Shorewood’s customer
service department. The first two steps of that process are below, and contain very specific actions and the time
that it took for each step.
For the first step, one customer service staff is either called or a resident comes in and asks about where to park
their car at night because there is no parking made available from their landlord. Staff confirms the address, grabs
the village parking map and confirms where the person would like to park. This typically takes 3.5 minutes. This is
done for every step in the process.
Process Step Example
Process: Confirm Address Process: Verify On-Street Supply
Process Steps CT PT NVA Process Steps CT PT NVA
Greetings 0.5 Retrieve binder 0
Retrieve map 0 Confirm supply 1
Confirm ALT location 3 If supply, explain process 10
If no supply, next step
Totals 3.5 min Totals 11 min
Quantity Quantity
Available Time -NA for this process Available Time - NA for this process
Demand - NA for this process Demand - NA for this process
20
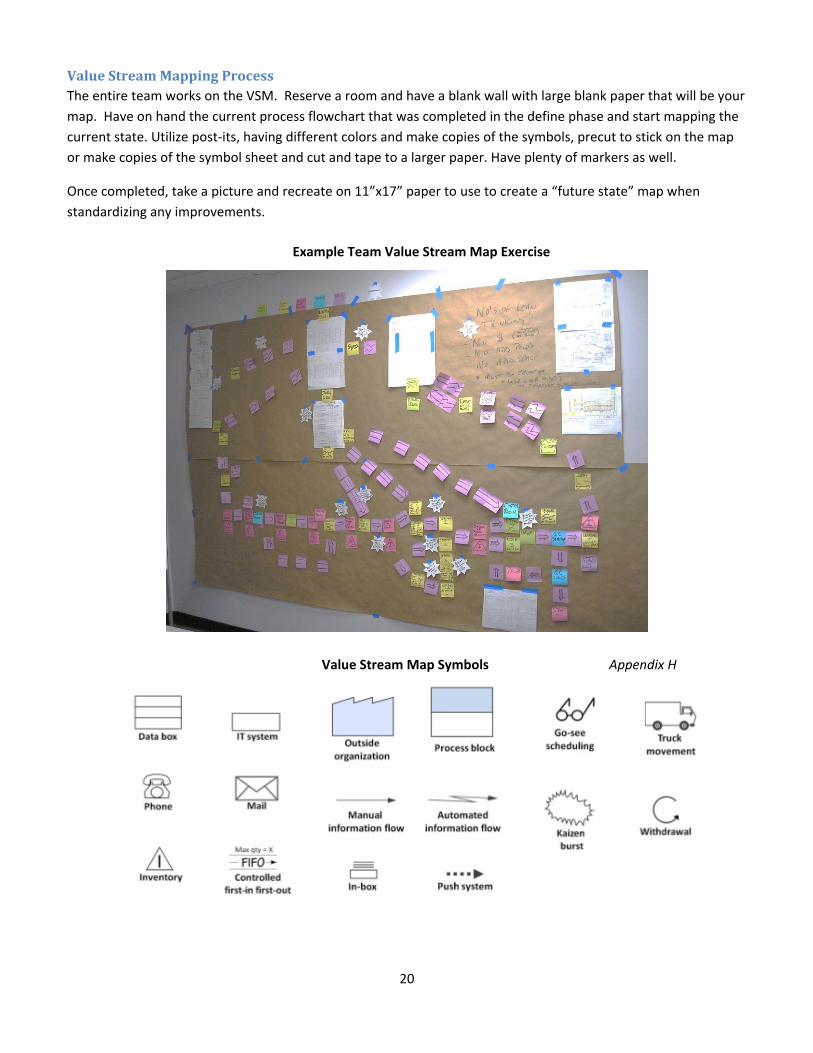
ValueStreamMappingProcessThe entire team works on the VSM. Reserve a room and have a blank wall with large blank paper that will be your
map. Have on hand the current process flowchart that was completed in the define phase and start mapping the
current state. Utilize post‐its, having different colors and make copies of the symbols, precut to stick on the map
or make copies of the symbol sheet and cut and tape to a larger paper. Have plenty of markers as well.
Once completed, take a picture and recreate on 11”x17” paper to use to create a “future state” map when
standardizing any improvements.
Example Team Value Stream Map Exercise
Value Stream Map Symbols Appendix H
21
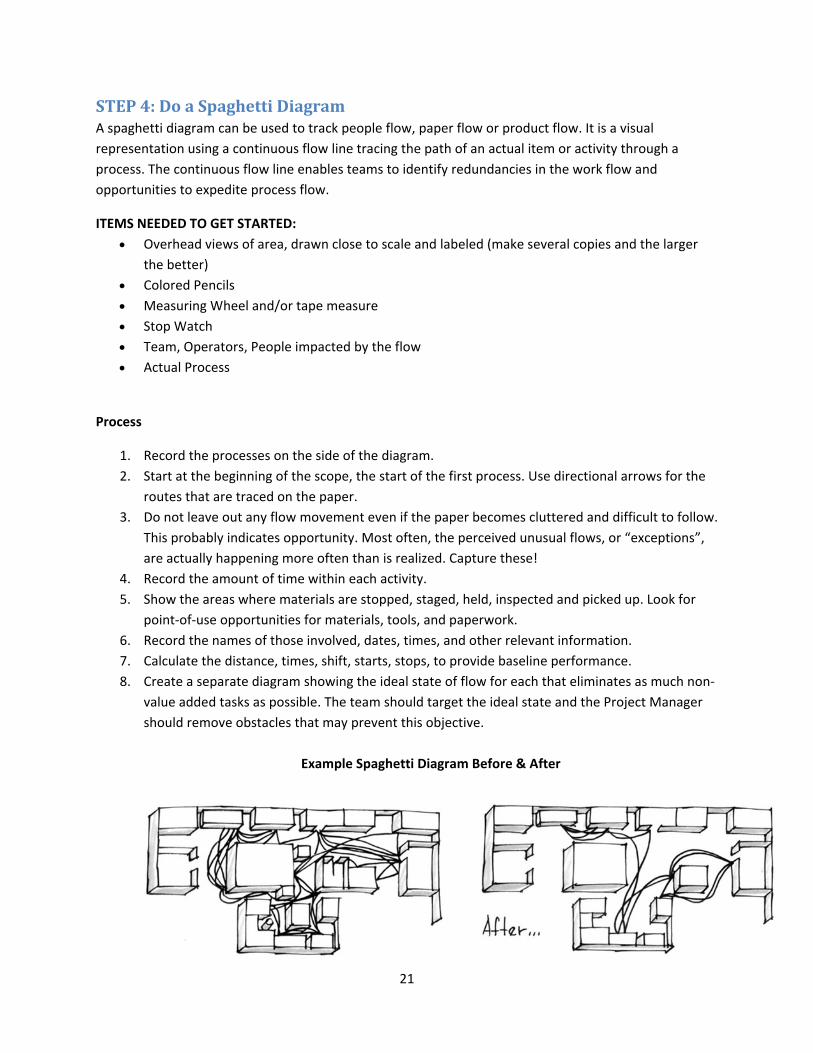
STEP4:DoaSpaghettiDiagramA spaghetti diagram can be used to track people flow, paper flow or product flow. It is a visual
representation using a continuous flow line tracing the path of an actual item or activity through a
process. The continuous flow line enables teams to identify redundancies in the work flow and
opportunities to expedite process flow.
ITEMS NEEDED TO GET STARTED:
Overhead views of area, drawn close to scale and labeled (make several copies and the larger
the better)
Colored Pencils
Measuring Wheel and/or tape measure
Stop Watch
Team, Operators, People impacted by the flow
Actual Process
Process
1. Record the processes on the side of the diagram.
2. Start at the beginning of the scope, the start of the first process. Use directional arrows for the
routes that are traced on the paper.
3. Do not leave out any flow movement even if the paper becomes cluttered and difficult to follow.
This probably indicates opportunity. Most often, the perceived unusual flows, or “exceptions”,
are actually happening more often than is realized. Capture these!
4. Record the amount of time within each activity.
5. Show the areas where materials are stopped, staged, held, inspected and picked up. Look for
point‐of‐use opportunities for materials, tools, and paperwork.
6. Record the names of those involved, dates, times, and other relevant information.
7. Calculate the distance, times, shift, starts, stops, to provide baseline performance.
8. Create a separate diagram showing the ideal state of flow for each that eliminates as much non‐
value added tasks as possible. The team should target the ideal state and the Project Manager
should remove obstacles that may prevent this objective.
Example Spaghetti Diagram Before & After
22
SECTION4:ANALYZEPHASE
In the DMAIC analyze phase, the team reviews data collected during the measure phase and analyzes it.
The focus turns to identifying the root causes for the problems the Village, the customer, and the
employees’ experience.
Analysis Actions: Use the Cause & Effect tool to analyze and histograms or Pareto charts to graph the
data. Use the 5 Whys to help identify root causes of the problem.
The Process Improvement Resource Measuring Team is able to assist with creating charts. The staff
intranet provides the Microsoft Excel worksheet that has formulas embedded that will automatically
generate graphics.
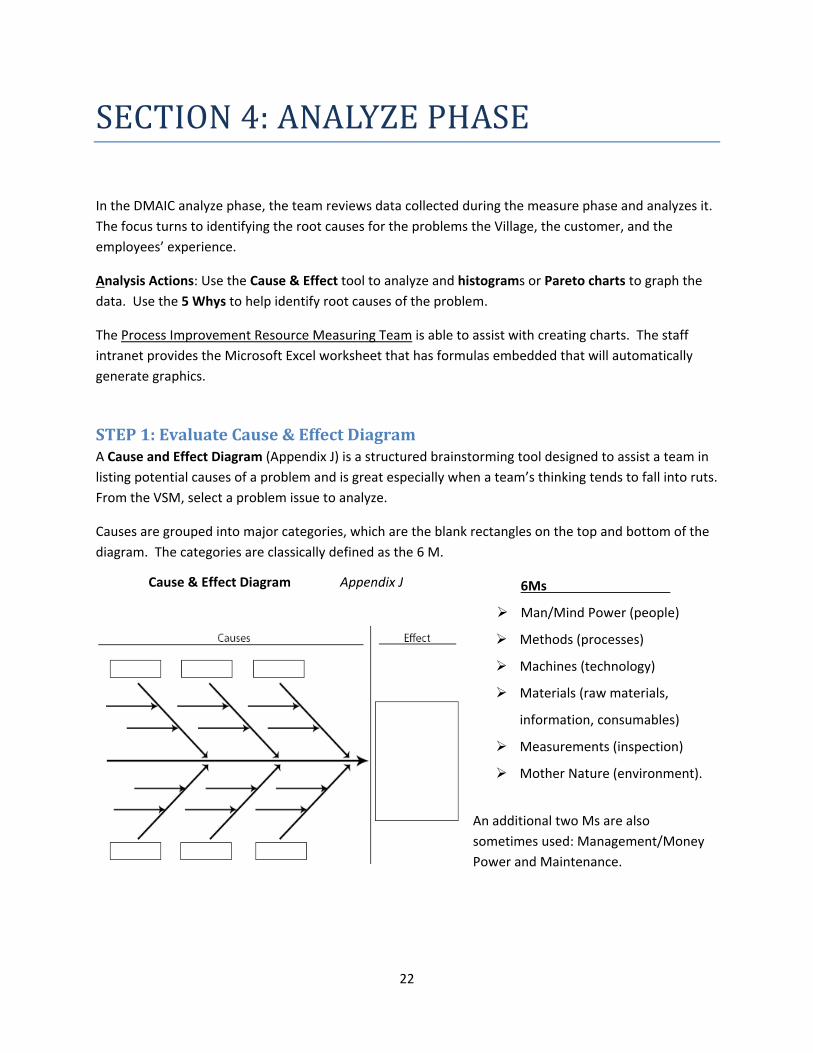
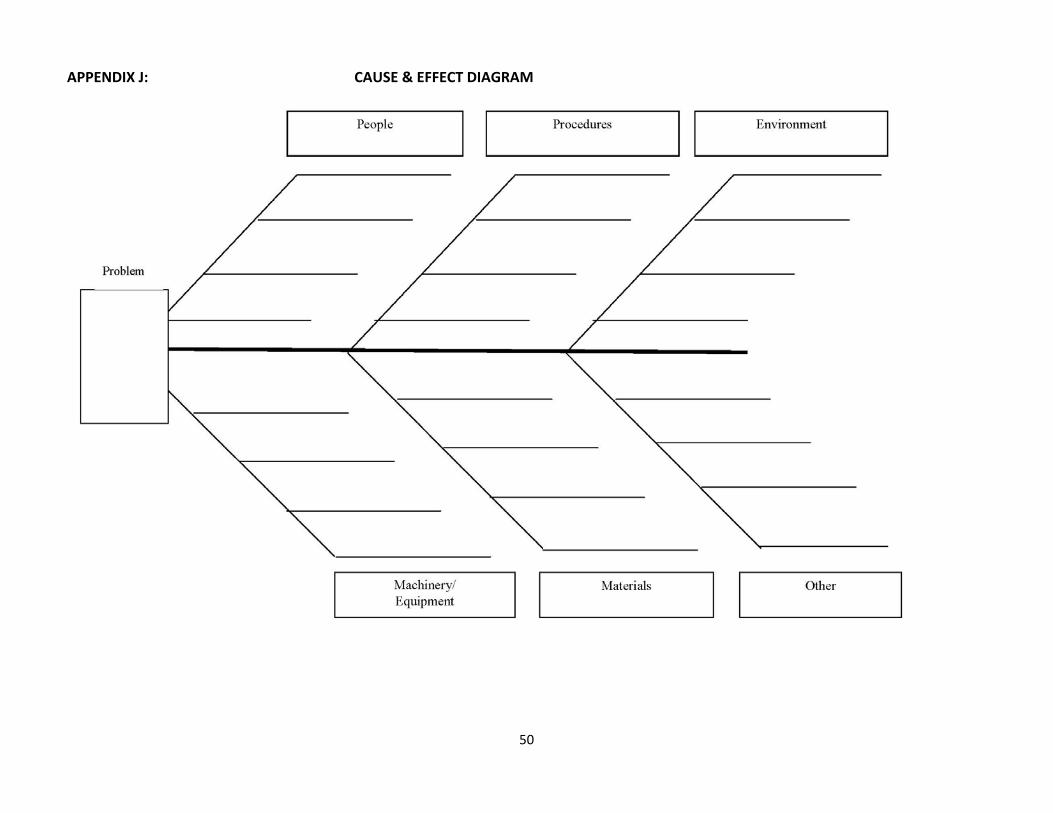
STEP1:EvaluateCause&EffectDiagramA Cause and Effect Diagram (Appendix J) is a structured brainstorming tool designed to assist a team in
listing potential causes of a problem and is great especially when a team’s thinking tends to fall into ruts.
From the VSM, select a problem issue to analyze.
Causes are grouped into major categories, which are the blank rectangles on the top and bottom of the
diagram. The categories are classically defined as the 6 M.
6Ms
Man/Mind Power (people)
Methods (processes)
Machines (technology)
Materials (raw materials,
information, consumables)
Measurements (inspection)
Mother Nature (environment).
An additional two Ms are also
sometimes used: Management/Money
Power and Maintenance.
Cause & Effect Diagram Appendix J
23
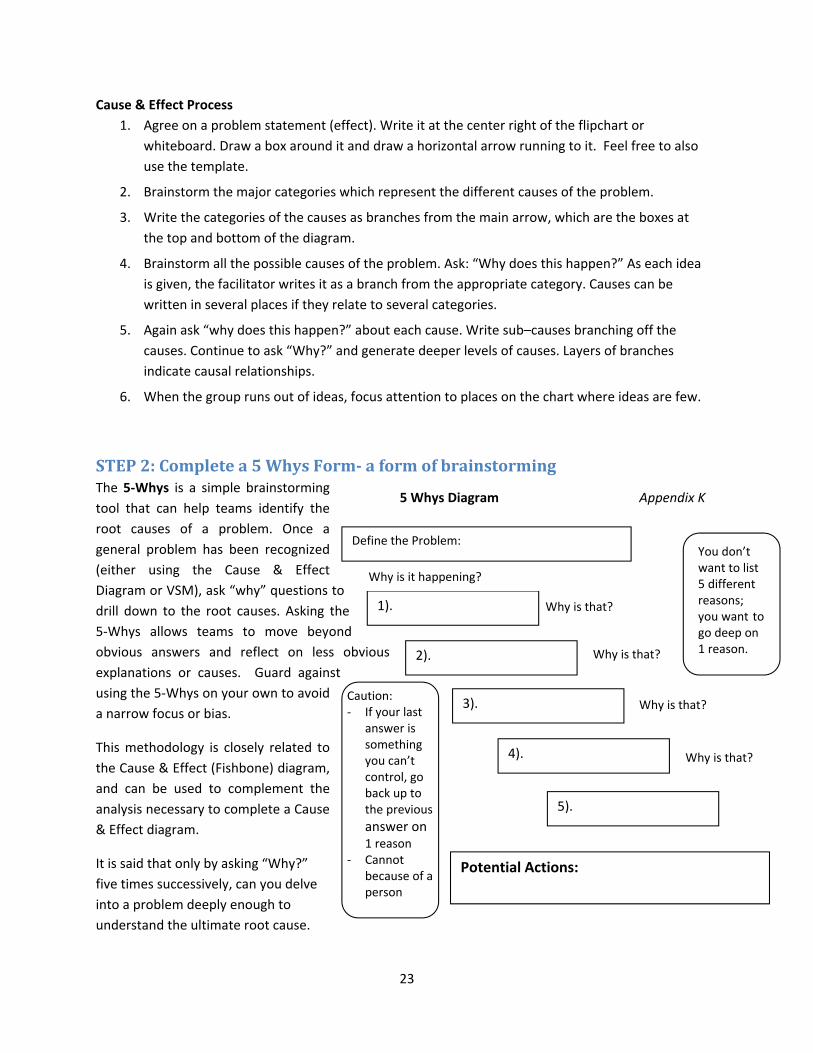
Define the Problem: You don’t want to list 5 different reasons; you want to go deep on 1 reason.
Why is that?
2).
1).
3).
4).
5).
Potential Actions:
Why is that?
Why is that?
Why is that?
Caution: ‐ If your last
answer is something you can’t control, go back up to the previous
answer on 1 reason
‐ Cannot because of a person
Why is it happening?
5 Whys Diagram Appendix K
Cause & Effect Process
1. Agree on a problem statement (effect). Write it at the center right of the flipchart or
whiteboard. Draw a box around it and draw a horizontal arrow running to it. Feel free to also
use the template.
2. Brainstorm the major categories which represent the different causes of the problem.
3. Write the categories of the causes as branches from the main arrow, which are the boxes at
the top and bottom of the diagram.
4. Brainstorm all the possible causes of the problem. Ask: “Why does this happen?” As each idea
is given, the facilitator writes it as a branch from the appropriate category. Causes can be
written in several places if they relate to several categories.
5. Again ask “why does this happen?” about each cause. Write sub–causes branching off the
causes. Continue to ask “Why?” and generate deeper levels of causes. Layers of branches
indicate causal relationships.
6. When the group runs out of ideas, focus attention to places on the chart where ideas are few.
STEP2:Completea5WhysForm‐aformofbrainstormingThe 5‐Whys is a simple brainstorming
tool that can help teams identify the
root causes of a problem. Once a
general problem has been recognized
(either using the Cause & Effect
Diagram or VSM), ask “why” questions to
drill down to the root causes. Asking the
5‐Whys allows teams to move beyond
obvious answers and reflect on less obvious
explanations or causes. Guard against
using the 5‐Whys on your own to avoid
a narrow focus or bias.
This methodology is closely related to
the Cause & Effect (Fishbone) diagram,
and can be used to complement the
analysis necessary to complete a Cause
& Effect diagram.
It is said that only by asking “Why?”
five times successively, can you delve
into a problem deeply enough to
understand the ultimate root cause.
24
5 Whys Process
Get into your team. From the Cause & Effect Diagram, select an issue.
1. State the problem you have identified as a strategic problem to work on.
2. Start asking “why” related to the problem. Like an inquisitive toddler, keep asking why in
response to each suggested cause.
3. Ask as many whys as you need in order to get insight at a level that can be addressed. You will
know you have reached your final “why” because it does not make logical sense to ask why
again. Ask 5 whys to see if you can get to a root cause.
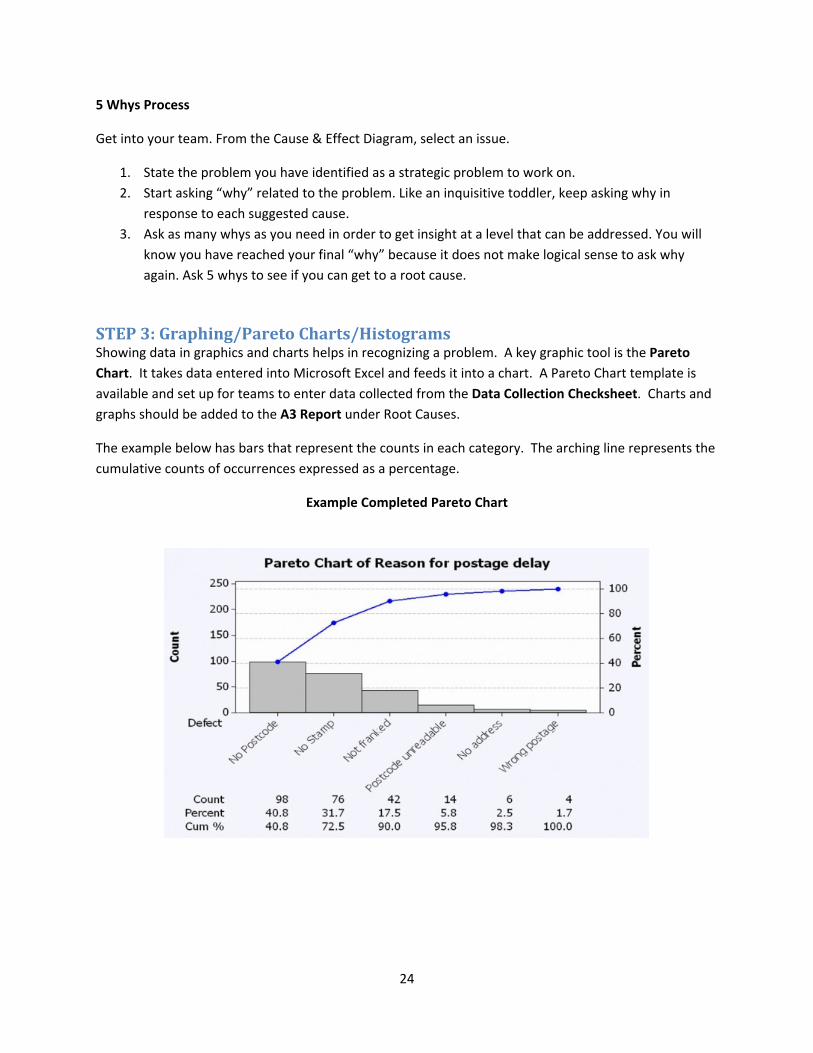
STEP3:Graphing/ParetoCharts/Histograms Showing data in graphics and charts helps in recognizing a problem. A key graphic tool is the Pareto
Chart. It takes data entered into Microsoft Excel and feeds it into a chart. A Pareto Chart template is
available and set up for teams to enter data collected from the Data Collection Checksheet. Charts and
graphs should be added to the A3 Report under Root Causes.
The example below has bars that represent the counts in each category. The arching line represents the
cumulative counts of occurrences expressed as a percentage.
Example Completed Pareto Chart
25
SECTION5:IMPROVEPHASE
Once the team is satisfied with the data, it’s time to move towards a solution. For each of the root
causes identified in the Analyze Phase, the team uses a brainstorming method to generate various
alternatives to overcome the problem. You’re most likely collecting improvement ideas throughout the
project, but a structured improvement effort can lead to innovative solutions.
Improvement Actions: Develop a comprehensive list of solutions by Brainstorming and then evaluate
the solutions using a Decision Matrix (Appendix L). Once a solution is identified, complete an Action
Planner (Appendix M) to identify remaining tasks to implement. Teams continue to meet during
implementation. Do a 5S event when appropriate. Remember to keep updating the A3 Report. When
completed all items in the Action Planner, present your project to your sponsor, the Steering Committee
and others directly impacted by the process improvement.
STEP1:CompleteaBrainstormeventThe team’s efforts at this stage are to produce as many ideas as possible based on the idea that from
quantity, comes quality. There’s many ways to brainstorm, but the process best for Lean involves the
following steps:
1. The problem is stated to the team and the current challenges. Others outside of the team may
join.
2. Supply paper/pen to each participant and have them write down as many ideas/solutions to the
problem.
3. Write ideas down, no more than 10 words per thought. Give enough time for everyone to
exhaust their list. Do in silence.
4. Select a facilitator who asks one team member at a time to share his/her first idea ‐ write on flip
chart and put a letter next to it, starting with the letter A.
5. Brainstorming rules apply: no discussion, judgment or criticism allowed (no noises and watch
body language). Facilitator enforces these rules.
6. Go around the circle of participants, each sharing one idea at a time, record and letter them as
fast as possible.
7. If a participant does not have an idea or an idea is already stated ‐ he / she says "pass."
8. Let members build on one another's idea ‐ "mental leap‐frog."
9. Continue until all ideas are recorded. Follow brainstorming rules throughout, particularly with
the last idea.
10. Combine similar ideas. Must get permission from both to consolidate.
11. Team reviews the solutions and decides which ones to pursue further.
26
STEP2:CompleteaDecisionMatrix Appendix L
The Decision Matrix enables the team to take top issues and rate them against multiple criteria,
especially if there are conflicting options. It allows the team, not one individual, to decide what’s
important.
The Decision Matrix template table is available in Microsoft Excel and is set up for teams to enter the
criteria, solutions and criteria weight. The following table is a template of the Decision Matrix.
Decision Matrix Process
1. Identify criteria and assign weights. Identify between three and five criteria and add to the
column of the matrix. Each criterion is assigned a weight value between 1 and 3 with 3 being the
more important criteria. The team determines what solutions are more valid or important, and
assigns them a weight of 3. The total weighted score for all criteria must equal 10.
The following are examples are criteria most commonly used. Choose from this list or create
new criteria to best fit your solutions. The underlined words and phrases are the criteria.
Criteria
Is the solution Goof Proof (easy and understandable)
Is the solution Quick &/or Easy to Do
Will the solution Improve Customer Satisfaction
Does the solution Simplify the Process
Does the solution Require Minimal Resources
Will the solution Increase Costs
Can the solution be Maintained
Is Training Involved
Is there Space Savings
Would there be Cultural Acceptance
Will it Reduce Stress
Will it improve Quality of Work Life
2. Add solution ideas. Take the agreed upon list of solutions generated through brainstorming or
other means and enter in the top row of the matrix.
3. Each member completes a Decision Matrix, entering a score between 1 and 5, with
1 = solution has no impact
2 = some impact
3 = strong impact
4= very strong impact
5 = extreme impact
27
4. Total team scores. Enter total scores in the Microsoft Excel table, which is set to tabulate the
scores for each listed solution. The solutions with the two highest scores are discussed to assess
feasibility and appropriateness of each of the solutions. The team may feel that some high
scoring solutions may not be feasible or appropriate, and so discard.
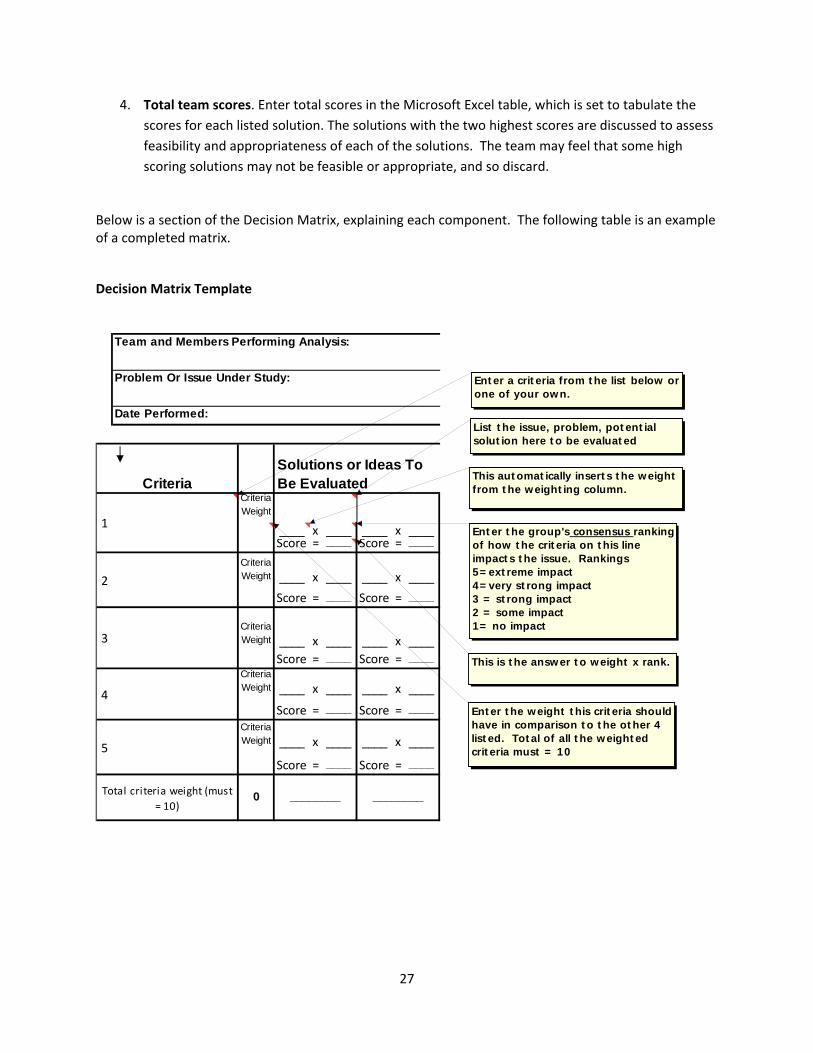
Below is a section of the Decision Matrix, explaining each component. The following table is an example of a completed matrix.
Decision Matrix Template
Criteria Weight
____ x ____ ____ x ____Score = ____ Score = ____
Criteria Weight ____ x ____ ____ x ____
Score = ____ Score = ____
Criteria Weight ____ x ____ ____ x ____
Score = ____ Score = ____Criteria Weight ____ x ____ ____ x ____
Score = ____ Score = ____
Criteria Weight ____ x ____ ____ x ____
Score = ____ Score = ____
________ ________
4
5
Total criteria weight (must
= 10)0
2
3
Team and Members Performing Analysis:
Problem Or Issue Under Study:
Date Performed:
CriteriaSolutions or Ideas To Be Evaluated
1
Enter a criteria from the list below or one of your own.
List the issue, problem, potential solution here to be evaluated
Enter the weight this criteria should have in comparison to the other 4 listed. Total of all the weighted criteria must = 10
This automatically inserts the weight from the weighting column.
Enter the group's consensus ranking of how the criteria on this line impacts the issue. Rankings5=extreme impact4=very strong impact3 = strong impact2 = some impact1= no impact
This is the answer to weight x rank.
28
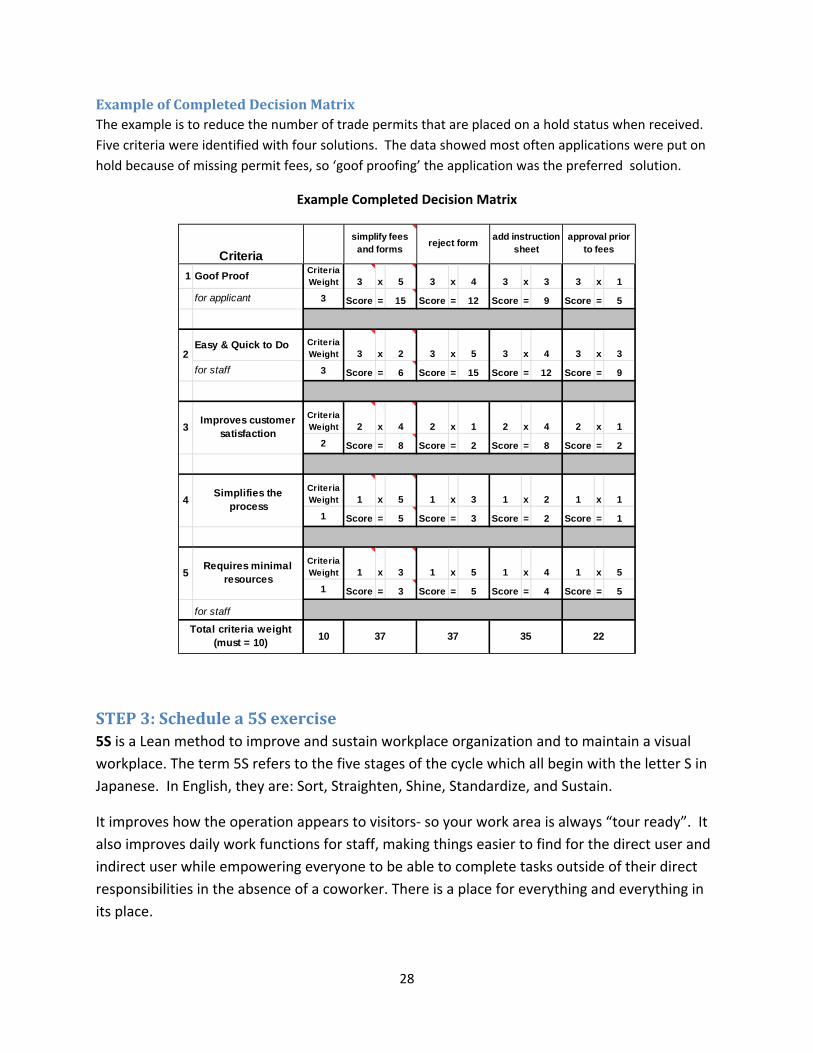
ExampleofCompletedDecisionMatrixThe example is to reduce the number of trade permits that are placed on a hold status when received.
Five criteria were identified with four solutions. The data showed most often applications were put on
hold because of missing permit fees, so ‘goof proofing’ the application was the preferred solution.
Example Completed Decision Matrix
STEP3:Schedulea5Sexercise5S is a Lean method to improve and sustain workplace organization and to maintain a visual
workplace. The term 5S refers to the five stages of the cycle which all begin with the letter S in
Japanese. In English, they are: Sort, Straighten, Shine, Standardize, and Sustain.
It improves how the operation appears to visitors‐ so your work area is always “tour ready”. It
also improves daily work functions for staff, making things easier to find for the direct user and
indirect user while empowering everyone to be able to complete tasks outside of their direct
responsibilities in the absence of a coworker. There is a place for everything and everything in
its place.
1 Goof ProofCriteria Weight 3 x 5 3 x 4 3 x 3 3 x 1
for applicant 3 Score = 15 Score = 12 Score = 9 Score = 5
Easy & Quick to Do Criteria Weight 3 x 2 3 x 5 3 x 4 3 x 3
for staff 3 Score = 6 Score = 15 Score = 12 Score = 9
Criteria Weight 2 x 4 2 x 1 2 x 4 2 x 1
2 Score = 8 Score = 2 Score = 8 Score = 2
Criteria Weight 1 x 5 1 x 3 1 x 2 1 x 1
1 Score = 5 Score = 3 Score = 2 Score = 1
Criteria Weight 1 x 3 1 x 5 1 x 4 1 x 5
1 Score = 3 Score = 5 Score = 4 Score = 5
for staff
Criteria
5Requires minimal
resources
Improves customer satisfaction
4Simplifies the
process
2
3737 3510
reject form
3
22
approval prior to fees
add instruction sheet
simplify fees and forms
Total criteria weight (must = 10)
29
Many companies have a standard that anything searched for must be able to be found within
30 to 60 seconds.
The 5S method is independent of analyzing problems; however, teams should discuss whether
they think their project might benefit from a 5S exercise. This tool will become an routine
method for the village to improve and sustain workplace organization.
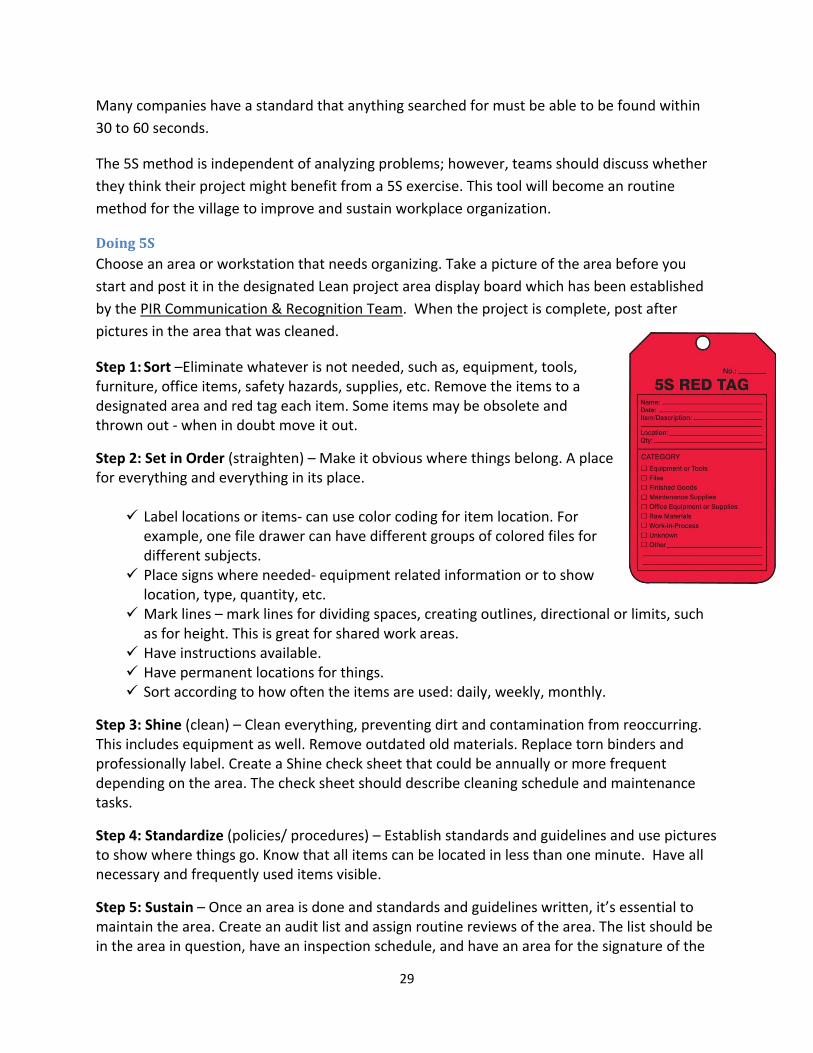
Doing5SChoose an area or workstation that needs organizing. Take a picture of the area before you
start and post it in the designated Lean project area display board which has been established
by the PIR Communication & Recognition Team. When the project is complete, post after
pictures in the area that was cleaned.
Step 1: Sort –Eliminate whatever is not needed, such as, equipment, tools, furniture, office items, safety hazards, supplies, etc. Remove the items to a designated area and red tag each item. Some items may be obsolete and thrown out ‐ when in doubt move it out.
Step 2: Set in Order (straighten) – Make it obvious where things belong. A place for everything and everything in its place.
Label locations or items‐ can use color coding for item location. For example, one file drawer can have different groups of colored files for different subjects.
Place signs where needed‐ equipment related information or to show location, type, quantity, etc.
Mark lines – mark lines for dividing spaces, creating outlines, directional or limits, such as for height. This is great for shared work areas.
Have instructions available. Have permanent locations for things. Sort according to how often the items are used: daily, weekly, monthly.
Step 3: Shine (clean) – Clean everything, preventing dirt and contamination from reoccurring. This includes equipment as well. Remove outdated old materials. Replace torn binders and professionally label. Create a Shine check sheet that could be annually or more frequent depending on the area. The check sheet should describe cleaning schedule and maintenance tasks.
Step 4: Standardize (policies/ procedures) – Establish standards and guidelines and use pictures to show where things go. Know that all items can be located in less than one minute. Have all necessary and frequently used items visible.
Step 5: Sustain – Once an area is done and standards and guidelines written, it’s essential to maintain the area. Create an audit list and assign routine reviews of the area. The list should be in the area in question, have an inspection schedule, and have an area for the signature of the
30
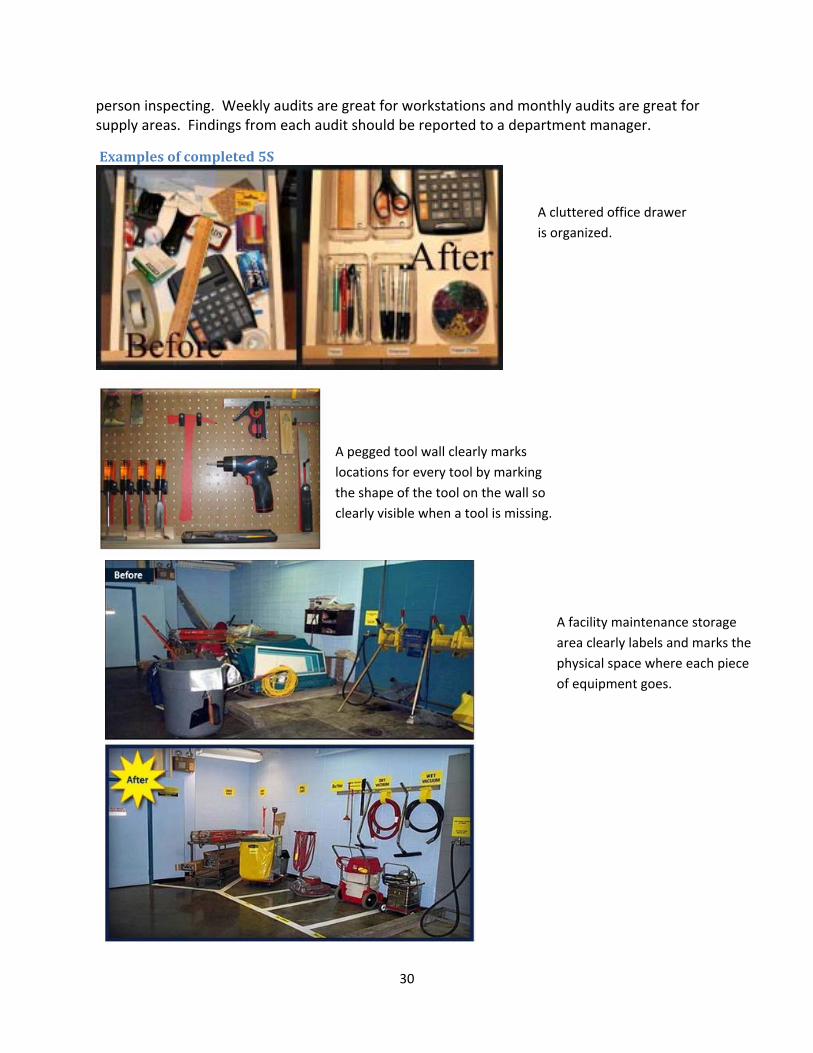
A cluttered office drawer
is organized.
A pegged tool wall clearly marks
locations for every tool by marking
the shape of the tool on the wall so
clearly visible when a tool is missing.
A facility maintenance storage
area clearly labels and marks the
physical space where each piece
of equipment goes.
person inspecting. Weekly audits are great for workstations and monthly audits are great for supply areas. Findings from each audit should be reported to a department manager.
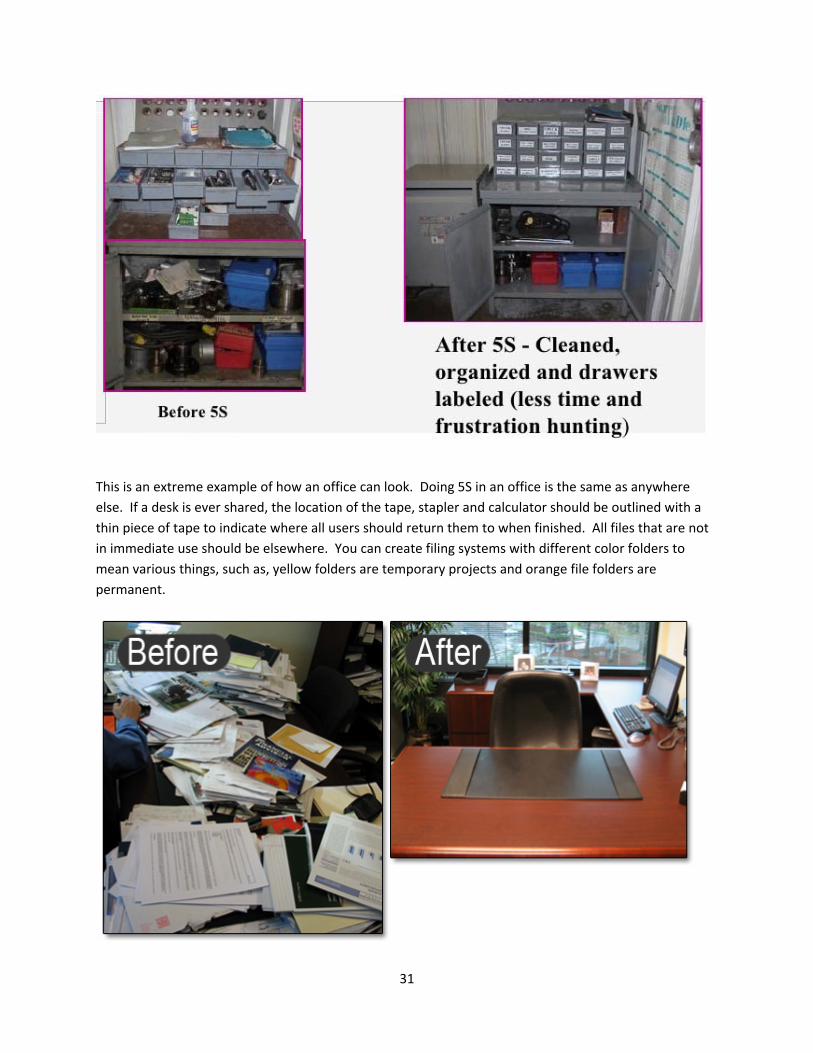
Examplesofcompleted5S
31
This is an extreme example of how an office can look. Doing 5S in an office is the same as anywhere
else. If a desk is ever shared, the location of the tape, stapler and calculator should be outlined with a
thin piece of tape to indicate where all users should return them to when finished. All files that are not
in immediate use should be elsewhere. You can create filing systems with different color folders to
mean various things, such as, yellow folders are temporary projects and orange file folders are
permanent.
32
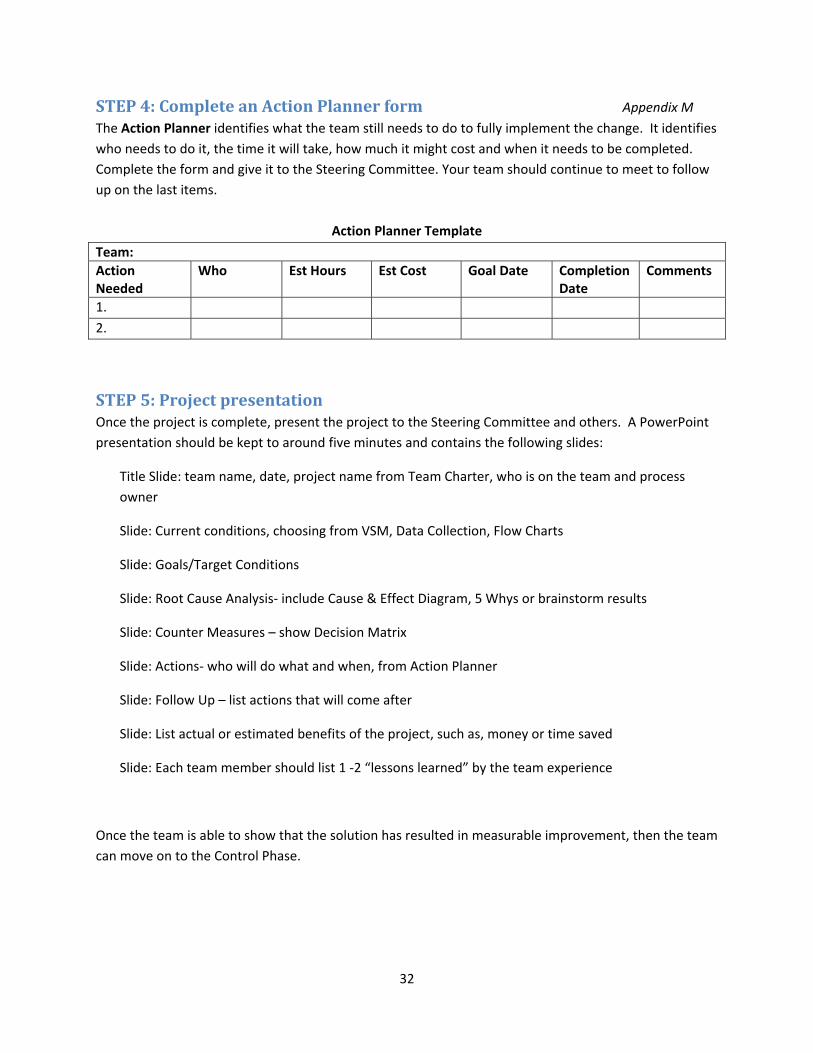
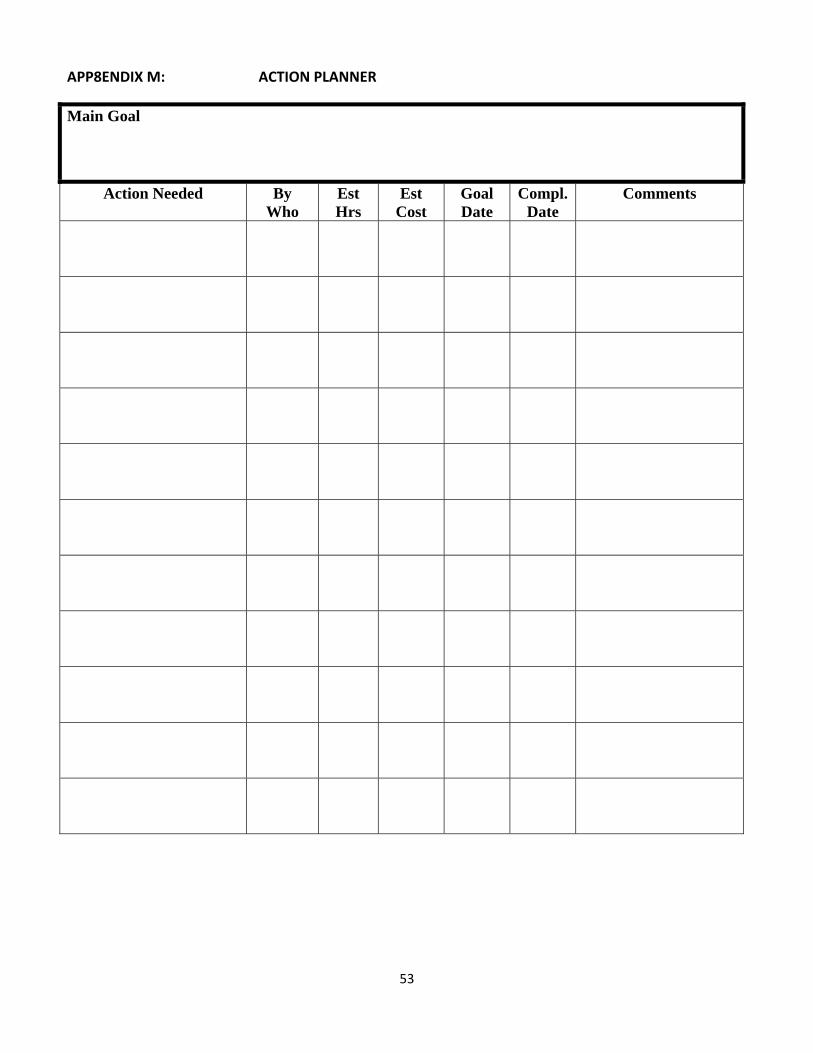
STEP4:CompleteanActionPlannerform Appendix M
The Action Planner identifies what the team still needs to do to fully implement the change. It identifies
who needs to do it, the time it will take, how much it might cost and when it needs to be completed.
Complete the form and give it to the Steering Committee. Your team should continue to meet to follow
up on the last items.
Action Planner Template
Team:
Action Needed
Who Est Hours Est Cost Goal Date Completion Date
Comments
1. 2.
STEP5:ProjectpresentationOnce the project is complete, present the project to the Steering Committee and others. A PowerPoint
presentation should be kept to around five minutes and contains the following slides:
Title Slide: team name, date, project name from Team Charter, who is on the team and process
owner
Slide: Current conditions, choosing from VSM, Data Collection, Flow Charts
Slide: Goals/Target Conditions
Slide: Root Cause Analysis‐ include Cause & Effect Diagram, 5 Whys or brainstorm results
Slide: Counter Measures – show Decision Matrix
Slide: Actions‐ who will do what and when, from Action Planner
Slide: Follow Up – list actions that will come after
Slide: List actual or estimated benefits of the project, such as, money or time saved
Slide: Each team member should list 1 ‐2 “lessons learned” by the team experience
Once the team is able to show that the solution has resulted in measurable improvement, then the team
can move on to the Control Phase.
33
SECTION6:CONTROLPHASE
The Control Phase is the fifth and final phase. This is the phase where you will see if the improvements
that you have implemented are working. The focus of this phase is to make sure that the action item
created in the Improve Phase is well‐implemented and maintained. One of the main reasons for
improvements not showing any sustainability is because this phase has been overlooked. Complacency
can set in for the sake of bringing closure; however, this can result in the process reverting to the former
performance levels and loss of some or all of the gains. Rigorous follow‐up and corrective action with
comprehensive yet simple documentation can increase the likelihood that the gains are sustained.
Control Actions: Once the improvements are identified, create a new process Flowchart and a Control
Plan and update the A3 Report.
The Process Improvement Resource Documentation Team is able to assist with creating Standard
Operating Procedures.
STEP1:StandardizeworkOnce a new process is established, the team creates a new process Flow Chart and a Standard
Operating Procedure (SOP) to standardize the work.
Revise the flowchart completed at the beginning of the project to reflect improvements. The changes
should quickly show a reduction in steps.
Standard Operating Procedures should be on file for each departments common and uncommon
processes and reviewed each to year to confirm consistency or if revisions are needed.
STEP2:CreateaControlPlan A Control Plan is a written summary description of the system for controlling a process and describes
actions required to maintain the desired state of the process, while minimizing process and product
variation. It lists all product and process points and is essential for maintaining process control over the
long run.
The Control Plan is completed by the team and used to foster an orderly transfer from the project team
to the process owner in order to maintain the gain. The plan is monitored by a designated person who is
involved in the process or close to the process.
34
There is a template for a Control Plan Checklist (Appendix N), but it can be modified and tailored for
each project. Examples of basic control plan items should answer the following questions:
1. What do you want to control?
2. How often do you need to measure the process?
3. Do you have an effective measurement system?
4. Identify if any costs to monitor.
5. Who needs to see the data?
6. What type of tool or chart is necessary to monitor the process?
7. Who will generate the data?
8. Who will control the process? Have they been properly trained?
9. Are there any system requirements for auditing and maintaining the improvement?
The Control Plan should be visible and evaluated.
35
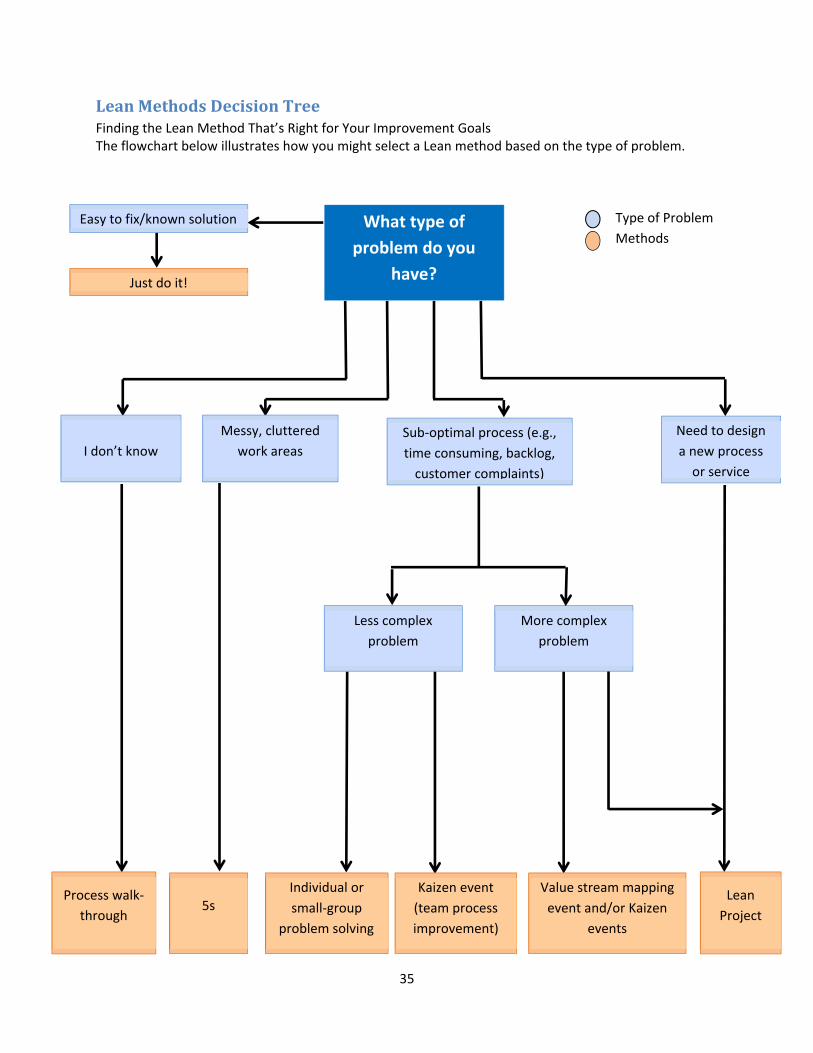
LeanMethodsDecisionTreeFinding the Lean Method That’s Right for Your Improvement Goals The flowchart below illustrates how you might select a Lean method based on the type of problem.
What type of
problem do you
have?
Easy to fix/known solution
Just do it!
I don’t know
Messy, cluttered
work areas
Sub‐optimal process (e.g.,
time consuming, backlog,
customer complaints)
Need to design
a new process
or service
Process walk‐
through 5s
Lean
Project
Less complex
problem
More complex
problem
Value stream mapping
event and/or Kaizen
events
Individual or
small‐group
problem solving
Kaizen event
(team process
improvement)
Type of Problem
Methods
36
PartII:OtherLeanMethodologies
Lean and Six Sigma are just two of numerous approaches that are in use for systematically analyzing and
improving process flow and efficiency within organizations. Other similar approaches and improvement
techniques include Kaizen and PDCA. The selection of a particular process improvement approach will
depend upon the specific circumstances and needs existing in a working environment, including the type
of processes, the improvement objectives, skills, knowledge, and resources available.
KaizenConceptKaizen is a process improvement concept. Kaizen, (Ky’zen) is a process of gradual, orderly, and
continuous improvement. Kaizen is Japanese: “Kai” stands for change and “Zen” means good or for the
better. Most often Kaizen is an event dedicated to process improvement and can take place over one
day or up to a week.
There’s also Kaizen moments, while going through any stage of the continuous improvement process,
one will identify a “no‐brainer” solution that can be implemented quickly. Completing 5S is an example
of a Kaizen improvement on a smaller scale.
10 Tips for KAIZEN
I. Discard conventional fixed ideas
II. Think of how to do it, not why it cannot be done.
III. Do not make excuses. Start by questioning current practices.
IV. Do not seek perfection. Do it right away even if for only 50% of target.
V. Correct it right away if you make a mistake.
VI. Do not spend money for KAIZEN, use your wisdom.
VII. Wisdom is brought out when faced with hardship.
VIII. Ask “WHY?” five times and seek root causes.
IX. Seek the wisdom of ten people rather than the knowledge of one.
X. KAIZEN ideas are infinite.
PDCAMethodologyAnother methodology used for process improvement is PDCA. It is a continuous loop of Planning, Doing,
Checking or studying, and Acting. The model is ideal for continuous improvement and implementation
of new projects or processes. It helps develop a newly improved process or service, can define
repetitive work processes, and used when implementing any change.
37
The cycle entails checking the implemented changes for consistency before adopting it across the board.
It allows breakdown of a project into small manageable steps and allows gradual incremental
improvements.
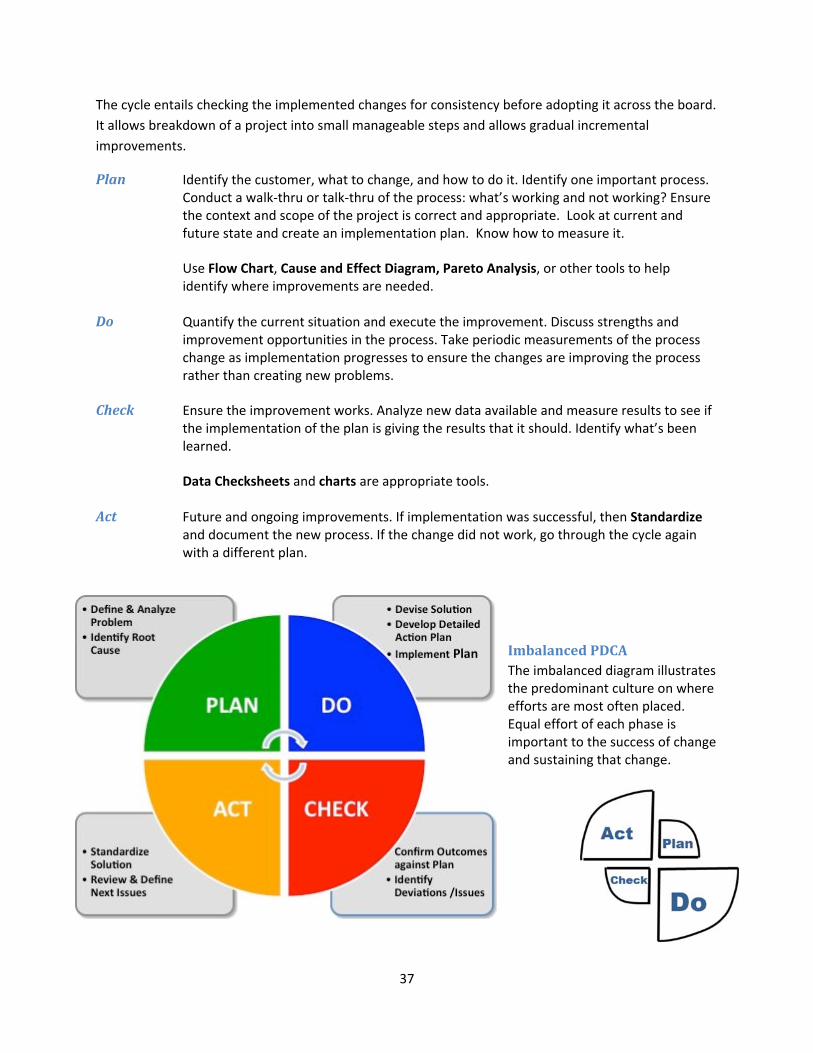
Plan Identify the customer, what to change, and how to do it. Identify one important process. Conduct a walk‐thru or talk‐thru of the process: what’s working and not working? Ensure the context and scope of the project is correct and appropriate. Look at current and future state and create an implementation plan. Know how to measure it.
Use Flow Chart, Cause and Effect Diagram, Pareto Analysis, or other tools to help identify where improvements are needed.
Do Quantify the current situation and execute the improvement. Discuss strengths and improvement opportunities in the process. Take periodic measurements of the process change as implementation progresses to ensure the changes are improving the process rather than creating new problems.
Check Ensure the improvement works. Analyze new data available and measure results to see if
the implementation of the plan is giving the results that it should. Identify what’s been learned.
Data Checksheets and charts are appropriate tools.
Act Future and ongoing improvements. If implementation was successful, then Standardize and document the new process. If the change did not work, go through the cycle again with a different plan.
ImbalancedPDCAThe imbalanced diagram illustrates the predominant culture on where efforts are most often placed. Equal effort of each phase is important to the success of change and sustaining that change.
38
APPENDICES
A Meeting Guidelines
B Problem Statement form
C SIPOC Diagram template
D A3 Report template reference
E Team Charter form
F Data Collection Planner form
G Data Collection Checksheet reference template
H Value Stream Mapping symbols
I Value Stream Mapping Process Step Table
J Cause & Effect Diagram form
K 5 Whys form
L Decision Matrix reference template
M Action Planner form
N Control Plan Checklist form
39
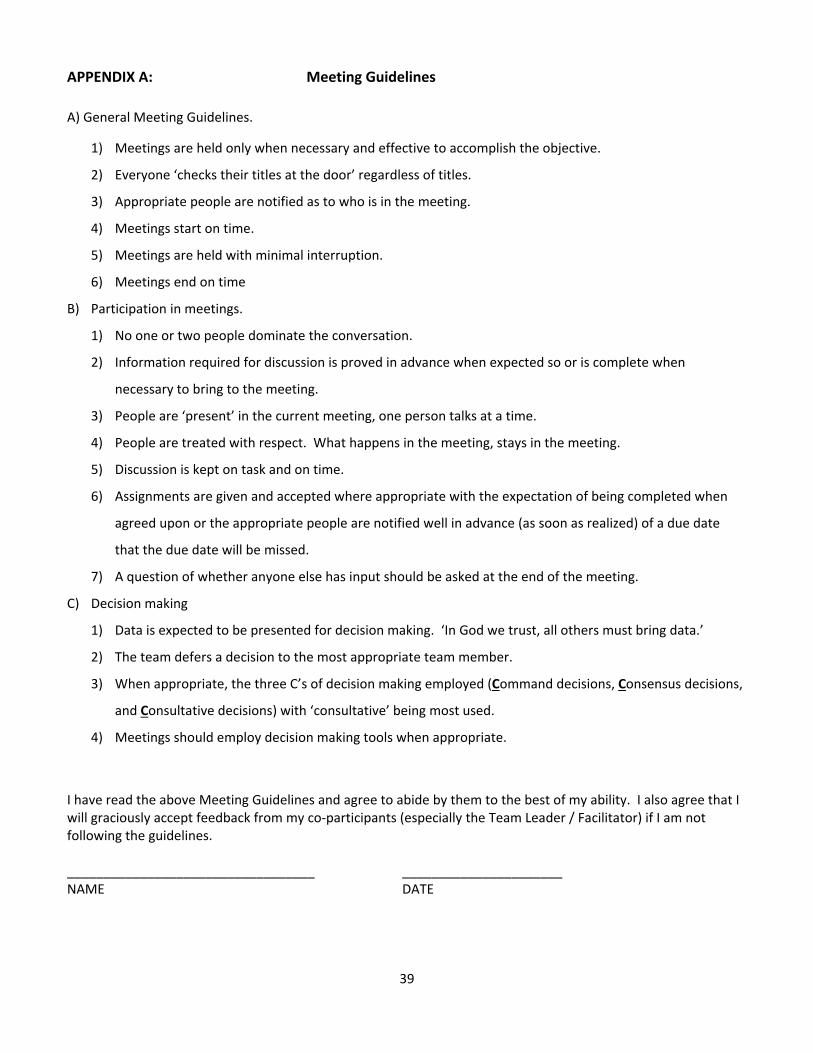
APPENDIX A: Meeting Guidelines
A) General Meeting Guidelines.
1) Meetings are held only when necessary and effective to accomplish the objective.
2) Everyone ‘checks their titles at the door’ regardless of titles.
3) Appropriate people are notified as to who is in the meeting.
4) Meetings start on time.
5) Meetings are held with minimal interruption.
6) Meetings end on time
B) Participation in meetings.
1) No one or two people dominate the conversation.
2) Information required for discussion is proved in advance when expected so or is complete when
necessary to bring to the meeting.
3) People are ‘present’ in the current meeting, one person talks at a time.
4) People are treated with respect. What happens in the meeting, stays in the meeting.
5) Discussion is kept on task and on time.
6) Assignments are given and accepted where appropriate with the expectation of being completed when
agreed upon or the appropriate people are notified well in advance (as soon as realized) of a due date
that the due date will be missed.
7) A question of whether anyone else has input should be asked at the end of the meeting.
C) Decision making
1) Data is expected to be presented for decision making. ‘In God we trust, all others must bring data.’
2) The team defers a decision to the most appropriate team member.
3) When appropriate, the three C’s of decision making employed (Command decisions, Consensus decisions,
and Consultative decisions) with ‘consultative’ being most used.
4) Meetings should employ decision making tools when appropriate.
I have read the above Meeting Guidelines and agree to abide by them to the best of my ability. I also agree that I will graciously accept feedback from my co‐participants (especially the Team Leader / Facilitator) if I am not following the guidelines. __________________________________ ______________________ NAME DATE
40
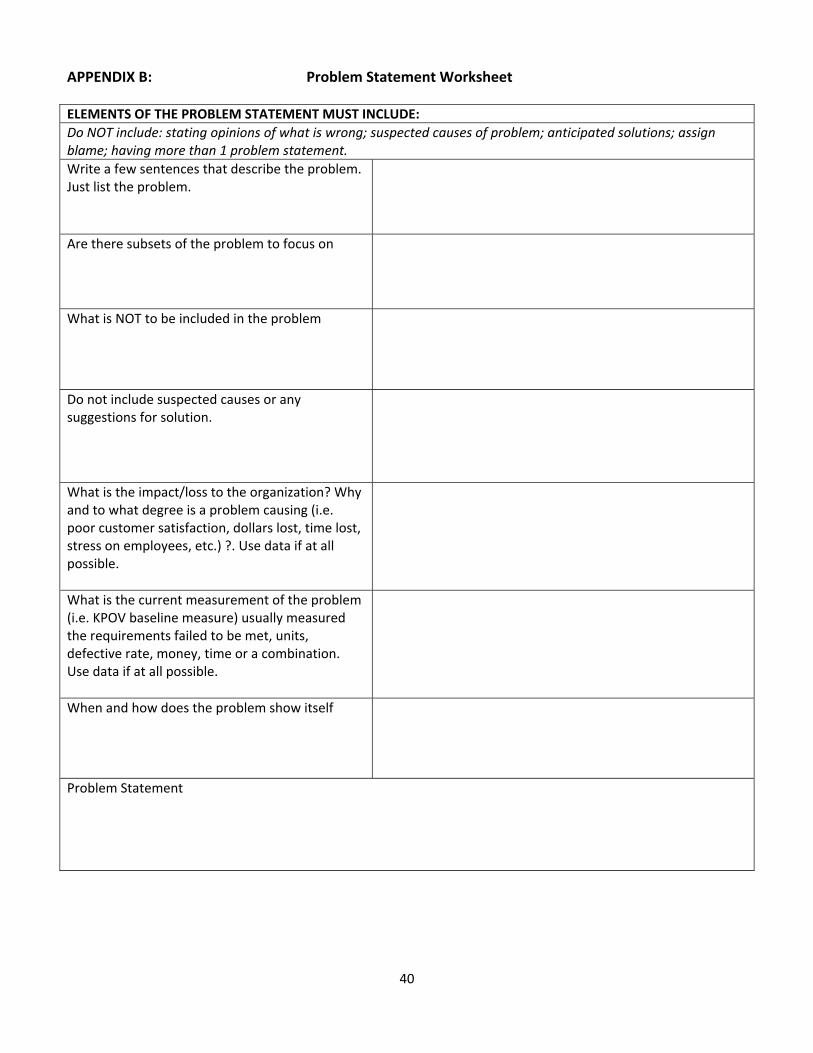
APPENDIX B: Problem Statement Worksheet
ELEMENTS OF THE PROBLEM STATEMENT MUST INCLUDE:
Do NOT include: stating opinions of what is wrong; suspected causes of problem; anticipated solutions; assign blame; having more than 1 problem statement.
Write a few sentences that describe the problem. Just list the problem.
Are there subsets of the problem to focus on
What is NOT to be included in the problem
Do not include suspected causes or any suggestions for solution.
What is the impact/loss to the organization? Why and to what degree is a problem causing (i.e. poor customer satisfaction, dollars lost, time lost, stress on employees, etc.) ?. Use data if at all possible.
What is the current measurement of the problem (i.e. KPOV baseline measure) usually measured the requirements failed to be met, units, defective rate, money, time or a combination. Use data if at all possible.
When and how does the problem show itself
Problem Statement
41
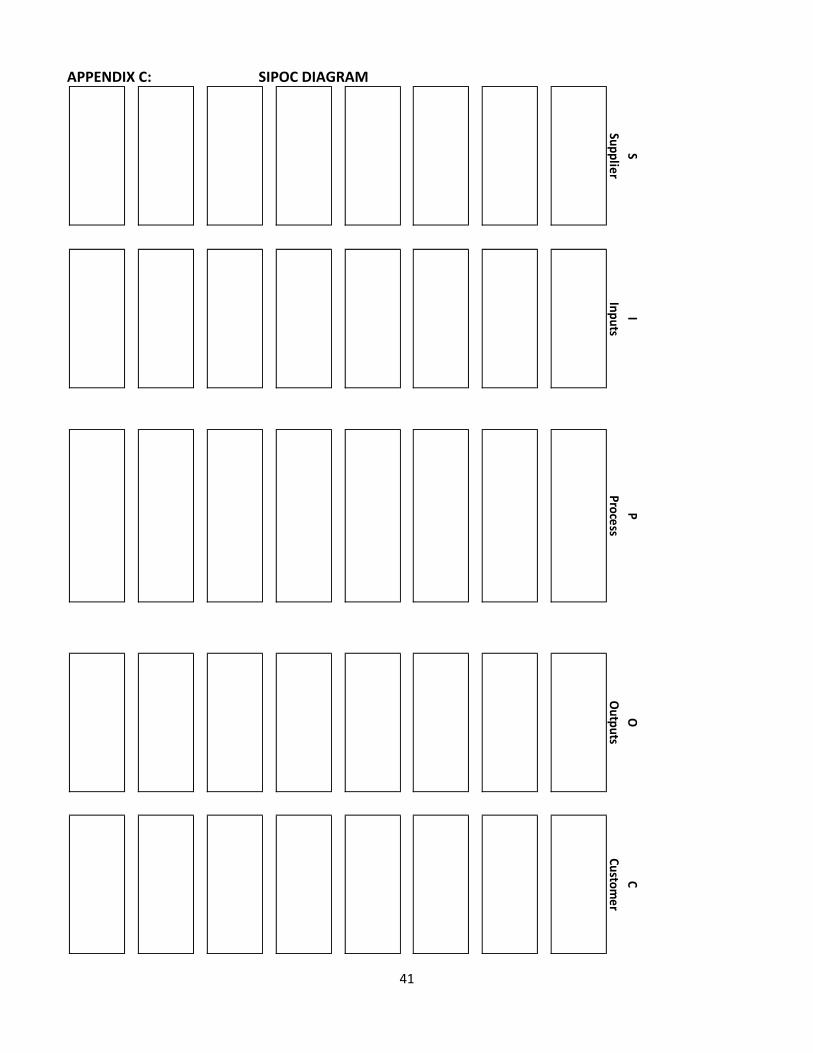
APPENDIX C: SIPOC DIAGRAM
SI
PO
C
Supplie
rInputs
Process
Outputs
Custo
mer
42
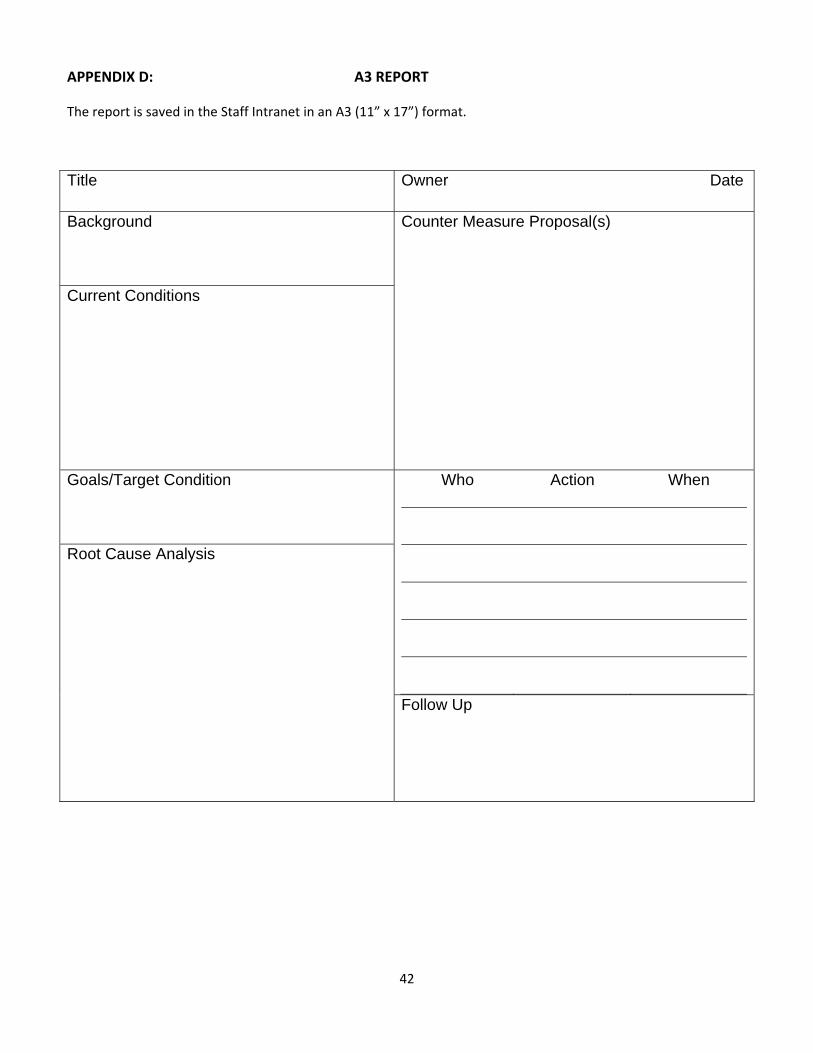
APPENDIX D: A3 REPORT
The report is saved in the Staff Intranet in an A3 (11” x 17”) format.
Title Owner Date
Background
Counter Measure Proposal(s)
Current Conditions
Goals/Target Condition
Who Action When
Root Cause Analysis
Follow Up
43
APPENDIX E: TEAM PROJECT CHARTER
Who Is On The Team Name Role (if any)*
What will be improved? What is the current measure?
How is it measured? What is the desired goal?
What are the lean strategies that might be used?
Map the process and identify waste Workplace organization Mistake proof Workload balancing Kaizen (Continuous improvement over
weeks/months Kaizen event(s) (Improvements done in 3-5
days w/ everyone working FT on improvements Standardized work (Identify best practices and all
do the same way Continuous flow (start it – finish it), cellular office
layout Visual management (guides, displays, how-to’s) Other
Sign-offs: Manager’s sign-off: Comments:
Name of the project:
Project definition (what is it that the team wants to accomplish):
How often will the team meet? How long will team meetings be?
People (other than team members) who will get the team’s meeting minutes and other communications:
44
APPENDIX F: DATA COLLECTION PLANNER
Key Process Indicators (KPIs) would be data that indicates how a particular process is working. The measurement
is often stated in terms of how often (especially what percentage went wrong), how much money was lost, how long
did it take to fix the problem, etc.
For example, the measure accurately entering orders into a computer system might be:
1. How many times did someone have to get clarification on an order because the order information was not
complete, accurate, or timely?
2. How many orders were shipped in error because of wrong information on the order?
Another example, when an error occurred:
1. How many times did an error occur?
2. When an error occurred, what is the suspected or known cause of the error?
3. How much money was lost due to errors?
What is the process?
KPI #1
What is being measured?
How is the issue being measured?
Who is responsible to be sure data is collected and is good data?
Start date: Stop date:
How will data be graphically displayed/communicated?
KPI #2
What is being measured?
How is the issue being measured?
Who is responsible to be sure data is collected and is good data?
Start date: Stop date:
How will data be graphically displayed/communicated?
KPI #3
What is being measured?
How is the issue being measured?
Who is responsible to be sure data is collected and is good data?
Start date: Stop date:
How will data be graphically displayed/communicated?
45
APPENDIX G: DATA COLLECTION CHECKSHEET
Checksheet For _____________________________________
Week Of __________________ Shift / Department _______________________
Ranges Time or Money Lost
X to X X to X X to X X to X X to X X to X X to X X to X X to X Total Issue # 1
Issue # 2
Issue # 3
Issue # 4
Issue # 5
Issue # 6
Issue # 7
Issue # 8
Issue # 9
Issue #
10
Other *
46
APPENDIX H: VALUE STREAM MAP SYMBOLS
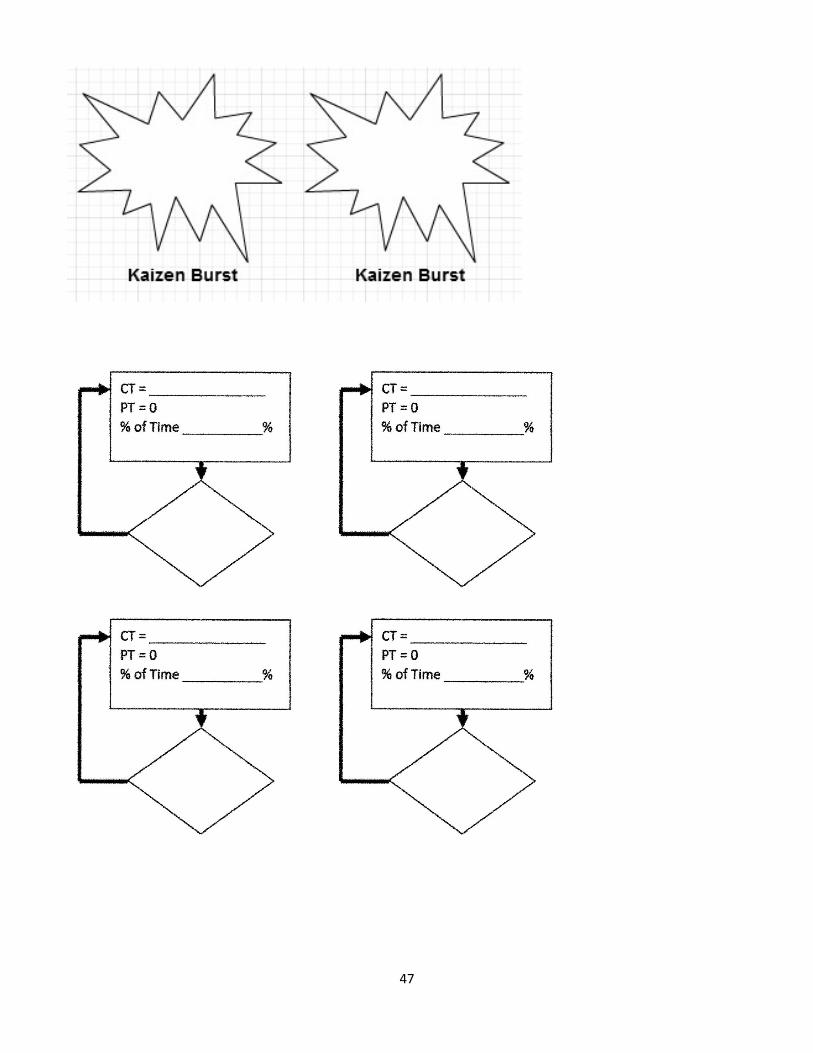
47
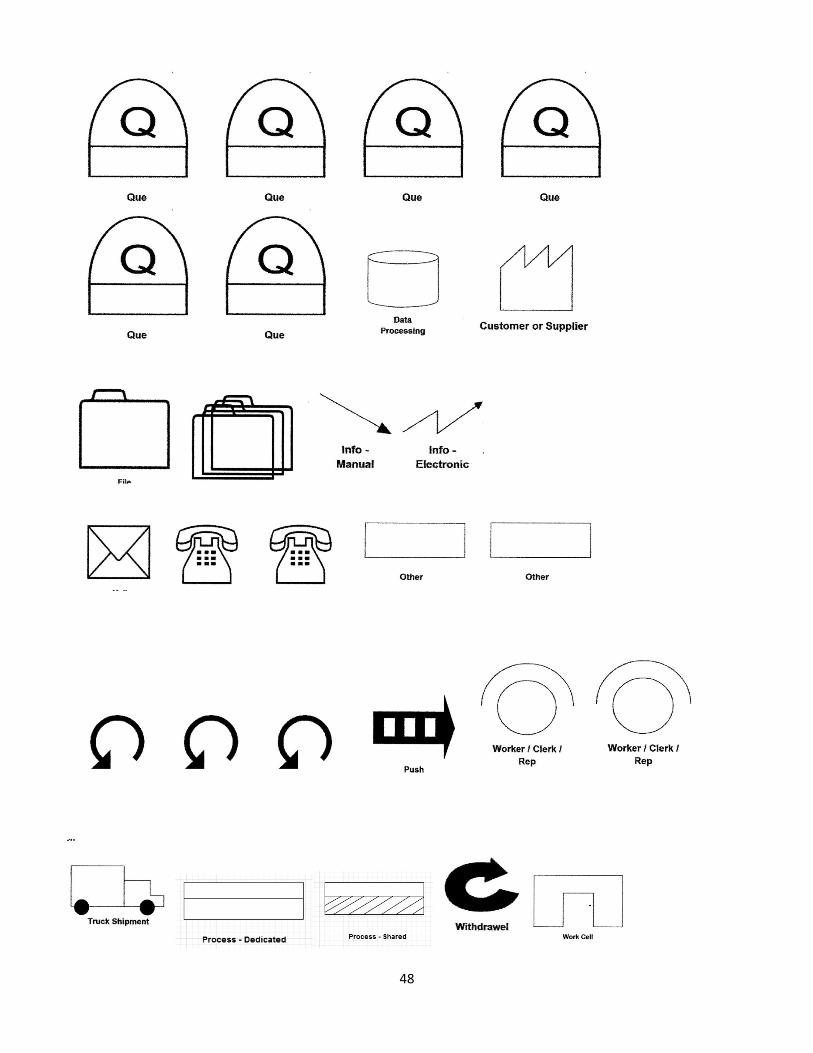
48
49
APPENDIX I: VALUE STREAM MAP PROCESS STEPS
50
APPENDIX J: CAUSE & EFFECT DIAGRAM
51
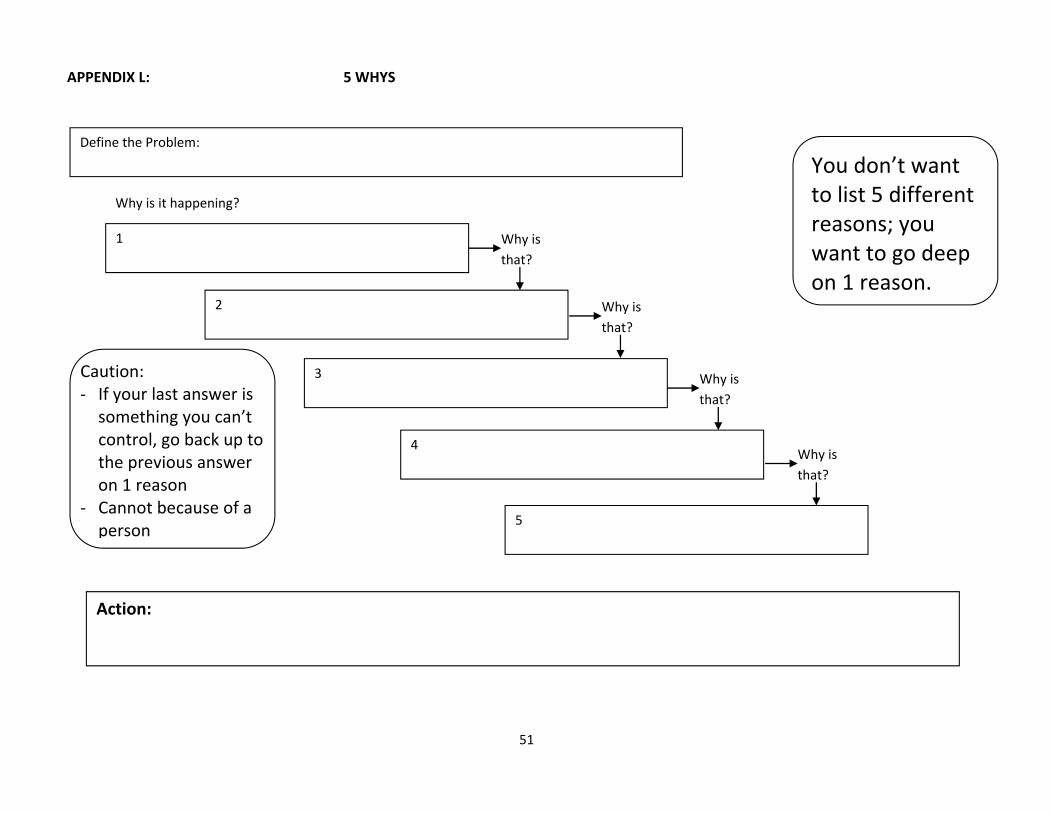
APPENDIX L: 5 WHYS
Define the Problem:
You don’t want to list 5 different reasons; you want to go deep on 1 reason.
Why is
that?
2
1
3
4
5
Action:
Why is
that?
Why is
that?
Why is
that?
Caution: ‐ If your last answer is something you can’t control, go back up to the previous answer on 1 reason
‐ Cannot because of a person
Why is it happening?
52
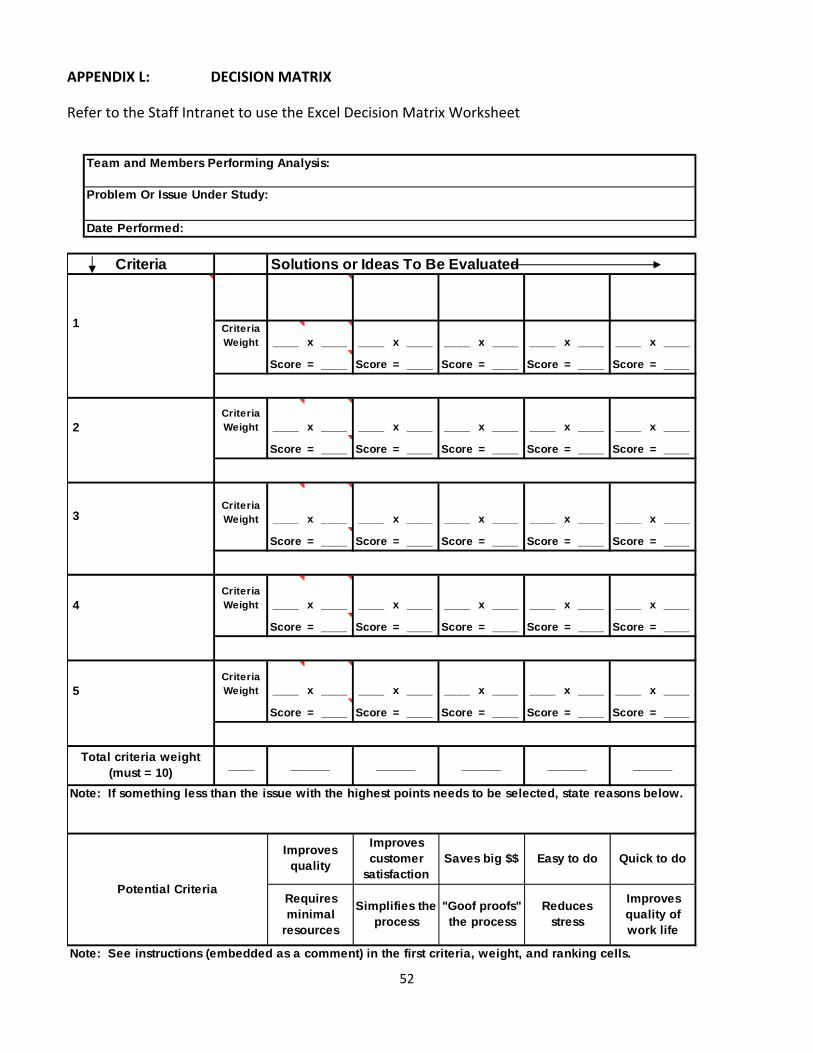
APPENDIX L: DECISION MATRIX
Refer to the Staff Intranet to use the Excel Decision Matrix Worksheet
Criteria Weight ____ x ____ ____ x ____ ____ x ____ ____ x ____ ____ x ____
Score = ____ Score = ____ Score = ____ Score = ____ Score = ____
Criteria Weight ____ x ____ ____ x ____ ____ x ____ ____ x ____ ____ x ____
Score = ____ Score = ____ Score = ____ Score = ____ Score = ____
Criteria Weight ____ x ____ ____ x ____ ____ x ____ ____ x ____ ____ x ____
Score = ____ Score = ____ Score = ____ Score = ____ Score = ____
Criteria Weight ____ x ____ ____ x ____ ____ x ____ ____ x ____ ____ x ____
Score = ____ Score = ____ Score = ____ Score = ____ Score = ____
Criteria Weight ____ x ____ ____ x ____ ____ x ____ ____ x ____ ____ x ____
Score = ____ Score = ____ Score = ____ Score = ____ Score = ____
Note: See instructions (embedded as a comment) in the first criteria, weight, and ranking cells.
Total criteria weight (must = 10)
1
______ ______
Easy to do
Note: If something less than the issue with the highest points needs to be selected, state reasons below.
______
Requires minimal
resources
______ ______
Simplifies the process
"Goof proofs" the process
Reduces stress
Team and Members Performing Analysis:
Date Performed:
Criteria Solutions or Ideas To Be Evaluated
Problem Or Issue Under Study:
Quick to do
Potential Criteria
4
2
3
Improves quality of work life
Improves quality
Improves customer
satisfaction
5
____
Saves big $$
53
APP8ENDIX M: ACTION PLANNER
Main Goal
Action Needed By Who
Est Hrs
Est Cost
Goal Date
Compl. Date
Comments
54
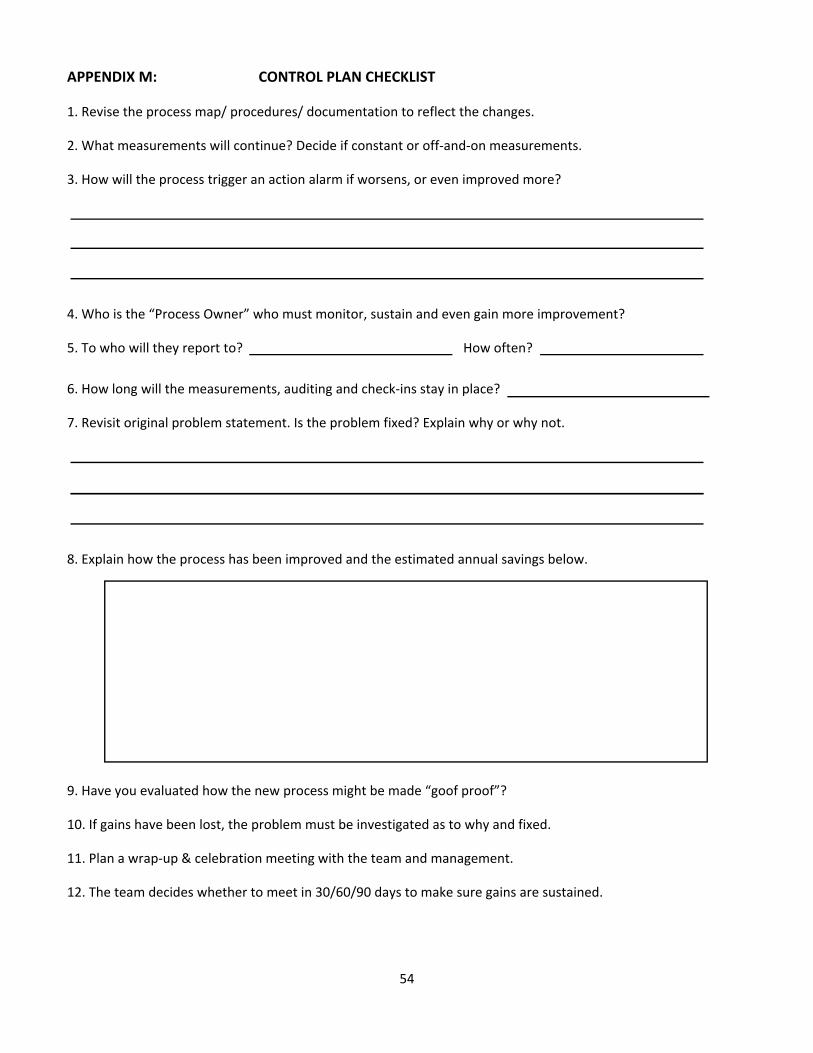
APPENDIX M: CONTROL PLAN CHECKLIST
1. Revise the process map/ procedures/ documentation to reflect the changes.
2. What measurements will continue? Decide if constant or off‐and‐on measurements.
3. How will the process trigger an action alarm if worsens, or even improved more?
4. Who is the “Process Owner” who must monitor, sustain and even gain more improvement?
5. To who will they report to? How often?
6. How long will the measurements, auditing and check‐ins stay in place?
7. Revisit original problem statement. Is the problem fixed? Explain why or why not.
8. Explain how the process has been improved and the estimated annual savings below.
9. Have you evaluated how the new process might be made “goof proof”?
10. If gains have been lost, the problem must be investigated as to why and fixed.
11. Plan a wrap‐up & celebration meeting with the team and management.
12. The team decides whether to meet in 30/60/90 days to make sure gains are sustained.

55