vibration detector based on gmr sensors
TRANSCRIPT
IEEE TRANSACTIONS ON INSTRUMENTATION AND MEASUREMENT, VOL. 58, NO. 3, MARCH 2009 707
Vibration Detector Based on GMR SensorsJosé Pelegrí Sebastiá, Member, IEEE, Jorge Alberola Lluch, J. Rafael Lajara Vizcaíno, and Jesus Santiso Bellon
Abstract—Up to now, vibrations have mostly been sensed bymeasuring displacement, velocity, and acceleration. The mostcommon types of vibration sensors are piezoelectric, capacitive,null-balance, strain gage, optoelectronic, resonance beam, andpiezoresistive. We present a low-cost and low-power vibrationdetector based on the measurement of magnetic field variationsinduced in a recent SS501 giant magnetoresistance (GMR) mag-netic sensor, for which has never been applied. Vibrations onsmall ferromagnetic pieces disturb the Earth’s magnetic field.These weak perturbations can be detected and measured overthe assumed constant Earth’s magnetic field, which is uniformover a wide area. A novel array configuration of three half-bridgeGMR sensors powered in chain is used to measure magnetic fieldvariations in the X -, Y -, and Z-axis with a very low powerconsumption. This paper includes a characterization of the novelGMR sensors and describes the practical design and implemen-tation of a vibration detector. Two examples demonstrate theutility of these sensors: one for measuring the rotating speed ofa small drilling machine and its vibrations at different speeds(in revolutions per minute) and the other one for measuring thecharacteristic 440-Hz vibration of a tuning fork (A key), whichis used to tune musical instruments. The results are shown anddiscussed.
Index Terms—Earth’s magnetic field, generalized impedanceconverter (GIC), giant magnetoresistance (GMR) array sensor,low power consumption, sensing vibrations.
I. INTRODUCTION
S INCE MAN began to build machines for industrial use,and particularly since motors have been used to power
them, vibration reduction and isolation have been a problemfor engineers. Gradually, as vibration isolation and reductiontechniques have become an integral part of machine design,the need for accurate measurement and analysis of mechanicalvibration has grown.
Vibration analysis, vibration troubleshooting, and diagnostictesting can be essential tools that can help isolate and identifymachine problems. Vibration signatures, mainly in their spec-tra, contain much information concerning the operating condi-tion of a machine. These signatures often provide indicationsof machine deterioration, such as unbalance, misalignment,eccentricity, mechanical looseness, and defective bearings.
Over the last 15 to 20 years, a whole new technology ofvibration measurement that is suitable for investigating modernhighly stressed and high-speed machinery has been developed.
Manuscript received July 5, 2007; revised July 22, 2008. First publishedOctober 10, 2008; current version published February 9, 2009. This work wassupported by the Generalitat Valenciana under R&D Project CTDIA/2002/50and Project GV05/043 through the I+D+I Program. The Associate Editorcoordinating the review process for this paper was Dr. Robert Gao.
The authors are with the Polytechnic University of Valencia, 46730 Grao deGandia, Spain (e-mail: [email protected]).
Digital Object Identifier 10.1109/TIM.2008.2005073
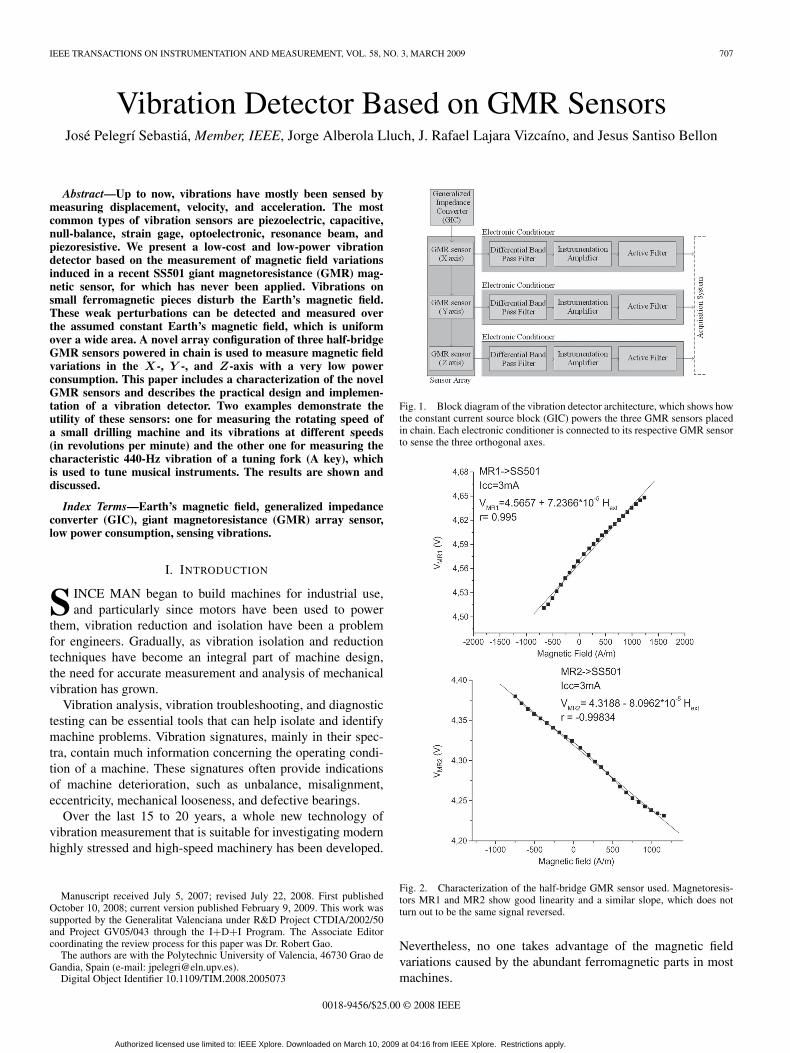
Fig. 1. Block diagram of the vibration detector architecture, which shows howthe constant current source block (GIC) powers the three GMR sensors placedin chain. Each electronic conditioner is connected to its respective GMR sensorto sense the three orthogonal axes.
Fig. 2. Characterization of the half-bridge GMR sensor used. Magnetoresis-tors MR1 and MR2 show good linearity and a similar slope, which does notturn out to be the same signal reversed.
Nevertheless, no one takes advantage of the magnetic fieldvariations caused by the abundant ferromagnetic parts in mostmachines.
0018-9456/$25.00 © 2008 IEEE
Authorized licensed use limited to: IEEE Xplore. Downloaded on March 10, 2009 at 04:16 from IEEE Xplore. Restrictions apply.
708 IEEE TRANSACTIONS ON INSTRUMENTATION AND MEASUREMENT, VOL. 58, NO. 3, MARCH 2009
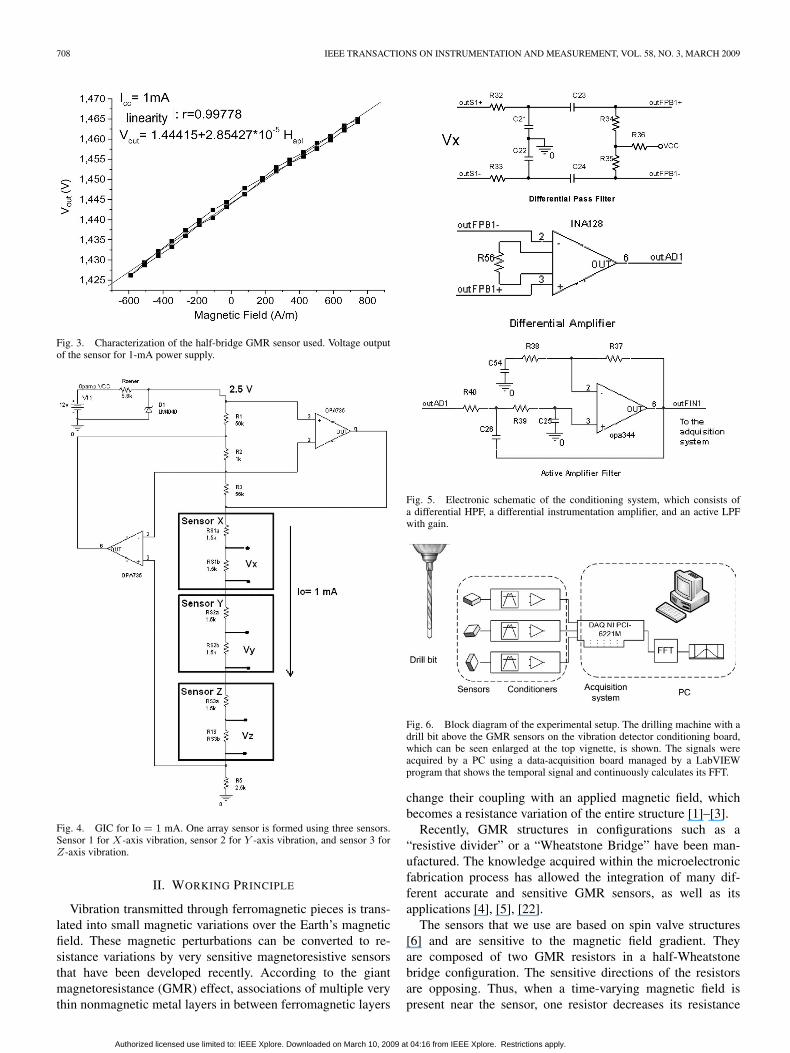
Fig. 3. Characterization of the half-bridge GMR sensor used. Voltage outputof the sensor for 1-mA power supply.
Fig. 4. GIC for Io = 1 mA. One array sensor is formed using three sensors.Sensor 1 for X-axis vibration, sensor 2 for Y -axis vibration, and sensor 3 forZ-axis vibration.
II. WORKING PRINCIPLE
Vibration transmitted through ferromagnetic pieces is trans-lated into small magnetic variations over the Earth’s magneticfield. These magnetic perturbations can be converted to re-sistance variations by very sensitive magnetoresistive sensorsthat have been developed recently. According to the giantmagnetoresistance (GMR) effect, associations of multiple verythin nonmagnetic metal layers in between ferromagnetic layers
Fig. 5. Electronic schematic of the conditioning system, which consists ofa differential HPF, a differential instrumentation amplifier, and an active LPFwith gain.
Fig. 6. Block diagram of the experimental setup. The drilling machine with adrill bit above the GMR sensors on the vibration detector conditioning board,which can be seen enlarged at the top vignette, is shown. The signals wereacquired by a PC using a data-acquisition board managed by a LabVIEWprogram that shows the temporal signal and continuously calculates its FFT.
change their coupling with an applied magnetic field, whichbecomes a resistance variation of the entire structure [1]–[3].
Recently, GMR structures in configurations such as a“resistive divider” or a “Wheatstone Bridge” have been man-ufactured. The knowledge acquired within the microelectronicfabrication process has allowed the integration of many dif-ferent accurate and sensitive GMR sensors, as well as itsapplications [4], [5], [22].
The sensors that we use are based on spin valve structures[6] and are sensitive to the magnetic field gradient. Theyare composed of two GMR resistors in a half-Wheatstonebridge configuration. The sensitive directions of the resistorsare opposing. Thus, when a time-varying magnetic field ispresent near the sensor, one resistor decreases its resistance
Authorized licensed use limited to: IEEE Xplore. Downloaded on March 10, 2009 at 04:16 from IEEE Xplore. Restrictions apply.
PELEGRÍ SEBASTIÁ et al.: VIBRATION DETECTOR BASED ON GMR SENSORS 709
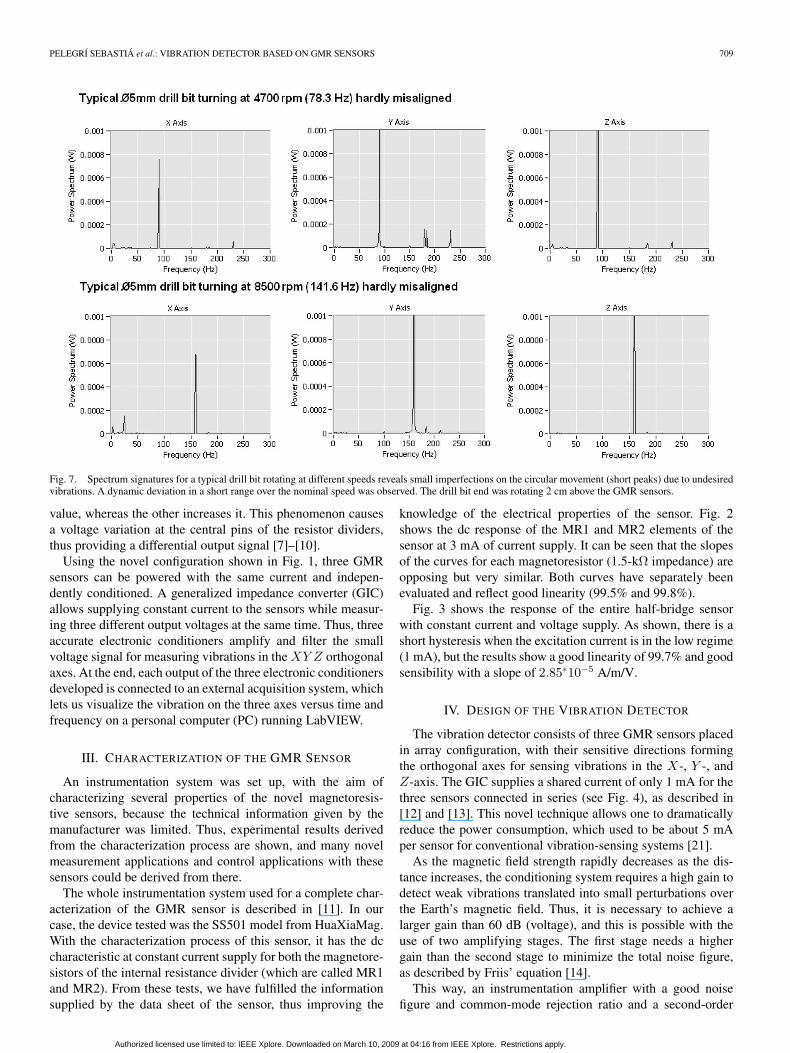
Fig. 7. Spectrum signatures for a typical drill bit rotating at different speeds reveals small imperfections on the circular movement (short peaks) due to undesiredvibrations. A dynamic deviation in a short range over the nominal speed was observed. The drill bit end was rotating 2 cm above the GMR sensors.
value, whereas the other increases it. This phenomenon causesa voltage variation at the central pins of the resistor dividers,thus providing a differential output signal [7]–[10].
Using the novel configuration shown in Fig. 1, three GMRsensors can be powered with the same current and indepen-dently conditioned. A generalized impedance converter (GIC)allows supplying constant current to the sensors while measur-ing three different output voltages at the same time. Thus, threeaccurate electronic conditioners amplify and filter the smallvoltage signal for measuring vibrations in the XY Z orthogonalaxes. At the end, each output of the three electronic conditionersdeveloped is connected to an external acquisition system, whichlets us visualize the vibration on the three axes versus time andfrequency on a personal computer (PC) running LabVIEW.
III. CHARACTERIZATION OF THE GMR SENSOR
An instrumentation system was set up, with the aim ofcharacterizing several properties of the novel magnetoresis-tive sensors, because the technical information given by themanufacturer was limited. Thus, experimental results derivedfrom the characterization process are shown, and many novelmeasurement applications and control applications with thesesensors could be derived from there.
The whole instrumentation system used for a complete char-acterization of the GMR sensor is described in [11]. In ourcase, the device tested was the SS501 model from HuaXiaMag.With the characterization process of this sensor, it has the dccharacteristic at constant current supply for both the magnetore-sistors of the internal resistance divider (which are called MR1and MR2). From these tests, we have fulfilled the informationsupplied by the data sheet of the sensor, thus improving the
knowledge of the electrical properties of the sensor. Fig. 2shows the dc response of the MR1 and MR2 elements of thesensor at 3 mA of current supply. It can be seen that the slopesof the curves for each magnetoresistor (1.5-kΩ impedance) areopposing but very similar. Both curves have separately beenevaluated and reflect good linearity (99.5% and 99.8%).
Fig. 3 shows the response of the entire half-bridge sensorwith constant current and voltage supply. As shown, there is ashort hysteresis when the excitation current is in the low regime(1 mA), but the results show a good linearity of 99.7% and goodsensibility with a slope of 2.85∗10−5 A/m/V.
IV. DESIGN OF THE VIBRATION DETECTOR
The vibration detector consists of three GMR sensors placedin array configuration, with their sensitive directions formingthe orthogonal axes for sensing vibrations in the X-, Y -, andZ-axis. The GIC supplies a shared current of only 1 mA for thethree sensors connected in series (see Fig. 4), as described in[12] and [13]. This novel technique allows one to dramaticallyreduce the power consumption, which used to be about 5 mAper sensor for conventional vibration-sensing systems [21].
As the magnetic field strength rapidly decreases as the dis-tance increases, the conditioning system requires a high gain todetect weak vibrations translated into small perturbations overthe Earth’s magnetic field. Thus, it is necessary to achieve alarger gain than 60 dB (voltage), and this is possible with theuse of two amplifying stages. The first stage needs a highergain than the second stage to minimize the total noise figure,as described by Friis’ equation [14].
This way, an instrumentation amplifier with a good noisefigure and common-mode rejection ratio and a second-order
Authorized licensed use limited to: IEEE Xplore. Downloaded on March 10, 2009 at 04:16 from IEEE Xplore. Restrictions apply.
710 IEEE TRANSACTIONS ON INSTRUMENTATION AND MEASUREMENT, VOL. 58, NO. 3, MARCH 2009
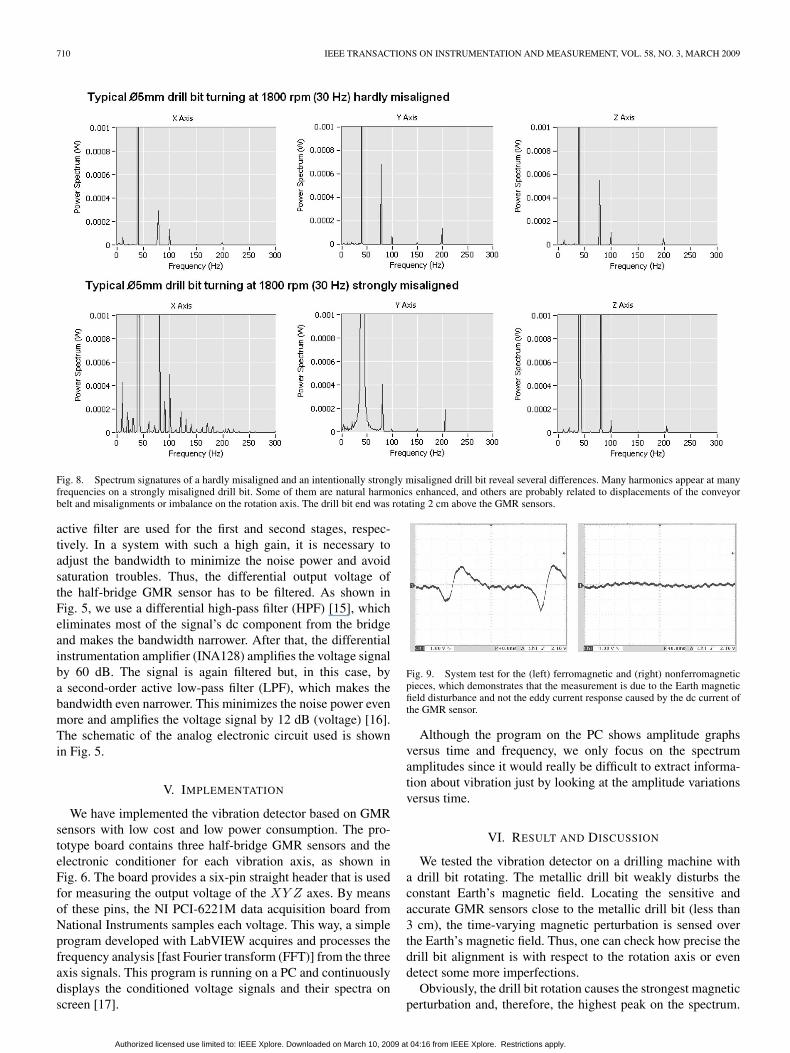
Fig. 8. Spectrum signatures of a hardly misaligned and an intentionally strongly misaligned drill bit reveal several differences. Many harmonics appear at manyfrequencies on a strongly misaligned drill bit. Some of them are natural harmonics enhanced, and others are probably related to displacements of the conveyorbelt and misalignments or imbalance on the rotation axis. The drill bit end was rotating 2 cm above the GMR sensors.
active filter are used for the first and second stages, respec-tively. In a system with such a high gain, it is necessary toadjust the bandwidth to minimize the noise power and avoidsaturation troubles. Thus, the differential output voltage ofthe half-bridge GMR sensor has to be filtered. As shown inFig. 5, we use a differential high-pass filter (HPF) [15], whicheliminates most of the signal’s dc component from the bridgeand makes the bandwidth narrower. After that, the differentialinstrumentation amplifier (INA128) amplifies the voltage signalby 60 dB. The signal is again filtered but, in this case, bya second-order active low-pass filter (LPF), which makes thebandwidth even narrower. This minimizes the noise power evenmore and amplifies the voltage signal by 12 dB (voltage) [16].The schematic of the analog electronic circuit used is shownin Fig. 5.
V. IMPLEMENTATION
We have implemented the vibration detector based on GMRsensors with low cost and low power consumption. The pro-totype board contains three half-bridge GMR sensors and theelectronic conditioner for each vibration axis, as shown inFig. 6. The board provides a six-pin straight header that is usedfor measuring the output voltage of the XY Z axes. By meansof these pins, the NI PCI-6221M data acquisition board fromNational Instruments samples each voltage. This way, a simpleprogram developed with LabVIEW acquires and processes thefrequency analysis [fast Fourier transform (FFT)] from the threeaxis signals. This program is running on a PC and continuouslydisplays the conditioned voltage signals and their spectra onscreen [17].
Fig. 9. System test for the (left) ferromagnetic and (right) nonferromagneticpieces, which demonstrates that the measurement is due to the Earth magneticfield disturbance and not the eddy current response caused by the dc current ofthe GMR sensor.
Although the program on the PC shows amplitude graphsversus time and frequency, we only focus on the spectrumamplitudes since it would really be difficult to extract informa-tion about vibration just by looking at the amplitude variationsversus time.
VI. RESULT AND DISCUSSION
We tested the vibration detector on a drilling machine witha drill bit rotating. The metallic drill bit weakly disturbs theconstant Earth’s magnetic field. Locating the sensitive andaccurate GMR sensors close to the metallic drill bit (less than3 cm), the time-varying magnetic perturbation is sensed overthe Earth’s magnetic field. Thus, one can check how precise thedrill bit alignment is with respect to the rotation axis or evendetect some more imperfections.
Obviously, the drill bit rotation causes the strongest magneticperturbation and, therefore, the highest peak on the spectrum.
Authorized licensed use limited to: IEEE Xplore. Downloaded on March 10, 2009 at 04:16 from IEEE Xplore. Restrictions apply.
PELEGRÍ SEBASTIÁ et al.: VIBRATION DETECTOR BASED ON GMR SENSORS 711
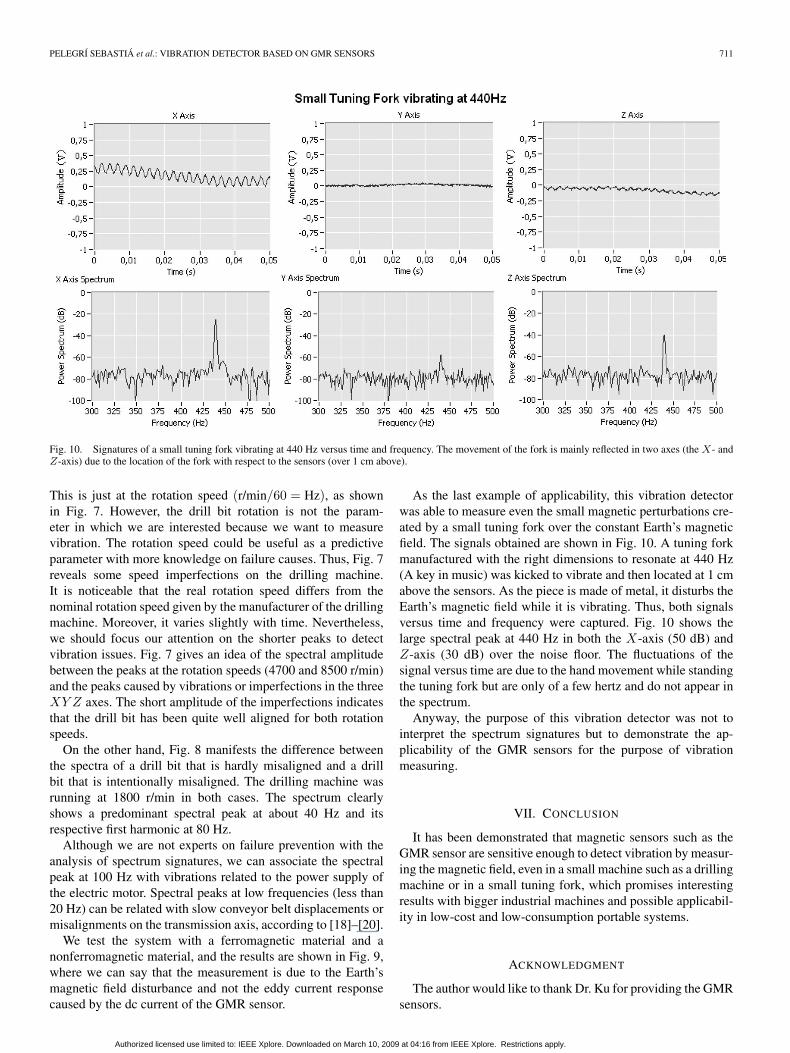
Fig. 10. Signatures of a small tuning fork vibrating at 440 Hz versus time and frequency. The movement of the fork is mainly reflected in two axes (the X- andZ-axis) due to the location of the fork with respect to the sensors (over 1 cm above).
This is just at the rotation speed (r/min/60 = Hz), as shownin Fig. 7. However, the drill bit rotation is not the param-eter in which we are interested because we want to measurevibration. The rotation speed could be useful as a predictiveparameter with more knowledge on failure causes. Thus, Fig. 7reveals some speed imperfections on the drilling machine.It is noticeable that the real rotation speed differs from thenominal rotation speed given by the manufacturer of the drillingmachine. Moreover, it varies slightly with time. Nevertheless,we should focus our attention on the shorter peaks to detectvibration issues. Fig. 7 gives an idea of the spectral amplitudebetween the peaks at the rotation speeds (4700 and 8500 r/min)and the peaks caused by vibrations or imperfections in the threeXY Z axes. The short amplitude of the imperfections indicatesthat the drill bit has been quite well aligned for both rotationspeeds.
On the other hand, Fig. 8 manifests the difference betweenthe spectra of a drill bit that is hardly misaligned and a drillbit that is intentionally misaligned. The drilling machine wasrunning at 1800 r/min in both cases. The spectrum clearlyshows a predominant spectral peak at about 40 Hz and itsrespective first harmonic at 80 Hz.
Although we are not experts on failure prevention with theanalysis of spectrum signatures, we can associate the spectralpeak at 100 Hz with vibrations related to the power supply ofthe electric motor. Spectral peaks at low frequencies (less than20 Hz) can be related with slow conveyor belt displacements ormisalignments on the transmission axis, according to [18]–[20].
We test the system with a ferromagnetic material and anonferromagnetic material, and the results are shown in Fig. 9,where we can say that the measurement is due to the Earth’smagnetic field disturbance and not the eddy current responsecaused by the dc current of the GMR sensor.
As the last example of applicability, this vibration detectorwas able to measure even the small magnetic perturbations cre-ated by a small tuning fork over the constant Earth’s magneticfield. The signals obtained are shown in Fig. 10. A tuning forkmanufactured with the right dimensions to resonate at 440 Hz(A key in music) was kicked to vibrate and then located at 1 cmabove the sensors. As the piece is made of metal, it disturbs theEarth’s magnetic field while it is vibrating. Thus, both signalsversus time and frequency were captured. Fig. 10 shows thelarge spectral peak at 440 Hz in both the X-axis (50 dB) andZ-axis (30 dB) over the noise floor. The fluctuations of thesignal versus time are due to the hand movement while standingthe tuning fork but are only of a few hertz and do not appear inthe spectrum.
Anyway, the purpose of this vibration detector was not tointerpret the spectrum signatures but to demonstrate the ap-plicability of the GMR sensors for the purpose of vibrationmeasuring.
VII. CONCLUSION
It has been demonstrated that magnetic sensors such as theGMR sensor are sensitive enough to detect vibration by measur-ing the magnetic field, even in a small machine such as a drillingmachine or in a small tuning fork, which promises interestingresults with bigger industrial machines and possible applicabil-ity in low-cost and low-consumption portable systems.
ACKNOWLEDGMENT
The author would like to thank Dr. Ku for providing the GMRsensors.
Authorized licensed use limited to: IEEE Xplore. Downloaded on March 10, 2009 at 04:16 from IEEE Xplore. Restrictions apply.
712 IEEE TRANSACTIONS ON INSTRUMENTATION AND MEASUREMENT, VOL. 58, NO. 3, MARCH 2009
REFERENCES
[1] R. L. White, “Giant magnetoresistance: A primer,” IEEE Trans. Magn.,vol. 28, no. 5, pp. 2482–2487, Jun. 1992.
[2] J. M. Daughton et al., “Giant magnetoresistance in narrow stripes,” IEEETrans. Magn., vol. 28, no. 5, pp. 2488–2493, Sep. 1992.
[3] J. L. Brown, “High sensitivity magnetic field sensor using GMR materialswith integrated electronics,” in Proc. Symp. Circuits Syst., Seattle, WA,Jan. 1995, pp. 1864–1867.
[4] D. Ramirez and J. Pelegri, “GMR sensors manage batteries,” EDN Mag.,no. 9, pp. 94–96, Sep. 1999.
[5] J. Pelegrí, J. B. Ejea, D. Ramírez, and P. P. Freitas, “Spin-valve currentsensor for industrial applications,” Sens. Actuators A, Phys., vol. 105,no. 2, pp. 132–136, Jul. 2003.
[6] J. Pelegrí, D. Ramírez, P. P. Freitas, and W. Ku, “A novel spin-valve bridgesensor for current sensing,” IEEE Trans. Instrum. Meas., vol. 53, no. 3,pp. 877–880, Jun. 2004.
[7] R. Pallas-Areny and J. G. Webster, Sensors and Signal Conditioning.New York: Wiley, 1991.
[8] J. Fraden, AIP Handbook of Modern Sensors. New York: Amer. Inst.Phys., 1995.
[9] J. Heremans, “Solid state magnetic field sensors and applications,”J. Phys. D, Appl. Phys., vol. 26, no. 8, pp. 1149–1168, Aug. 1993.
[10] R. Pallas-Areny and J. G. Webster, Analog Signal Processing.New York: Wiley-Interscience, 1999.
[11] D. Ramírez, J. Pelegrí, A. E. Navarro, and S. Casans, “Characterizationof giant magnetoresistance effect based sensors and its applications,” inProc. IEEE Instrum. Meas. Technol. Conf., Baltimore, MD, May 2000,pp. 571–574.
[12] D. Ramirez, S. Casans, and C. Reig, “Current loop generated from a gen-eralized impedance converter: A new sensor signal conditioning circuit,”Rev. Sci. Instrum., vol. 76, no. 6, p. 066 103, Jun. 2005.
[13] D. Ramírez et al., “Build a precise dc floating-current source,” EDN,no. 8, pp. 83–84, Aug. 2005.
[14] D. K. Cheng, Fundamentals of Engineering Electromagnetics.Englewood Cliffs, NJ: Prentice-Hall.
[15] O. Casas and R. Pallas-Areny, “Basics of analog differential filters,” IEEETrans. Instrum. Meas., vol. 45, no. 1, pp. 275–279, Feb. 1996.
[16] W. Bacharowski, Machinery Monitoring. Santa Clara, CA: NationalSemiconductor. Signal Path Designer no. 104.
[17] DAQ M Series User Manual, Nat. Instrum., Austin, TX, Nov. 2006.[Online]. Available: www.ni.com
[18] J. H. Sharp, Vibration Measurement. [Online]. Available: http://www.mech.gla.ac.uk/~sharpj/vibration.pdf
[19] Measuring Vibrations, Brüel & Kjaer, Nærum, Denmark, Sep. 1982.[Online]. Available: http://www.bksv.com/pdf/Measuring_Vibration.pdf
[20] J. Pelegri, J. Alberola, R. Lajara, and J. Santiso, “Vibration detector basedon GMR sensors,” in Proc. IEEE IMTC, Warsaw, Poland, pp. 1–5.
[21] Accelerometer 4570 Data Sheet, Nærum, Denmark: Brüel & Kjaer,May 2007. [Online]. Available: http://www.bksv.com
[22] J. Pelegrí, J. Alberola, and J. R. Lajara, “Signal conditioning for GMRmagnetic sensors: Applied to traffic speed monitoring GMR sensors,”Sens. Actuators A, Phys., vol. 137, no. 2, pp. 230–235, Jul. 2007.
José Pelegrí Sebastiá (M’06) received the M.Sc. degree in physics, the degreein electronic engineering, and the Ph.D. degree from the University of Valencia,Valencia, Spain, in 1994, 1998, and 2002, respectively. His thesis was on thestudy of GMR sensors and their applications.
He is currently an Associate Professor with the Department of ElectronicEngineering, Polytechnic University of Valencia, Grao de Gandia, Spain. Hisresearch interests include instrumentation systems, characterization sensors(particularly magnetic sensors and its industrial applications), and networksensors.
Jorge Alberola Lluch received the Ingeniero Técnico en Telecomunicacionesand Ingeniero en Automática y Electrónica Industrial degrees from the Poly-technic University of Valencia, Grao de Gandia, Spain, in 2003 and 2006,respectively.
Since 2003, he has been with the GSyM Research Group, PolytechnicUniversity of Valencia, where he has been working on magnetic sensors, RFID,ZigBee, and sensor–microcontroller interfaces.
J. Rafael Lajara Vizcaíno received the Ingeniero Técnico en Telecomunica-ciones degree from the Polytechnic University of Valencia, Grao de Gandia,Spain, in 2003 and the Ingeniero en Electrónica degree from the Universidadde Valencia, Valencia, Spain, in 2006.
Since 2003, he has been with the GSyM Research Group, PolytechnicUniversity of Valencia, where he has been working on embedded systems andvirtual instrumentation.
Jesus Santiso Bellon received the Ingeniero Técnico en Telecomunicacionesdegree from the Polytechnic University of Valencia, Grao de Gandia, Spain,in 2006.
Since 2005, he has been with the GSyM Research Group, PolytechnicUniversity of Valencia, where he has been working on fields like embeddedsystems.
Authorized licensed use limited to: IEEE Xplore. Downloaded on March 10, 2009 at 04:16 from IEEE Xplore. Restrictions apply.