validation of meshing gear pair backlash under various
TRANSCRIPT
* Corresponding authors: [email protected], [email protected], [email protected], [email protected]
A study on prediction & validation of meshing gear pair backlash under various manufacturing and assembly errors
Bahadır Karba1,*, Nihat Yıldırım1,* , Fatih Erdoğan2,*,and Mert Vardar2,*
1Mechanical Engineering Department, Gaziantep University, 27310, Gaziantep, Turkey 2AeroGDT Power Transmission Design and Test Systems Inc, 06370, Ankara, Turkey
Abstract. Backlash is a need for proper gear mesh but also a defect if not controlled closely. Few studies have focused on controlling backlash with some mechanical solutions that can be applied. Few other studies have shown interest in estimation of minimum / maximum variable backlash. The operating backlash of meshing gears is affected by many factors among which runouts, pitch errors and tooth thicknesses are the three most pronounced manufacturing errors. All these three parameters are the measurable ones once the gears are manufactured. Center distance and phasing of meshing gears are the examples of assembly errors which may affect the operating backlash. A software has been developed to predict likely maximum and minimum backlash of a gear pair selected arbitrarily and assembled together. For the validation of software predictions an experimental setup is needed for backlash measurements. Thus, a special test rig is designed and constructed for experimental measurements of the operating backlash under some manufacturing and assembly errors of a gear pair. Good agreements have been achieved between backlash predictions and measurements thus validating the in-house prepared software for backlash calculations.
1 Introduction
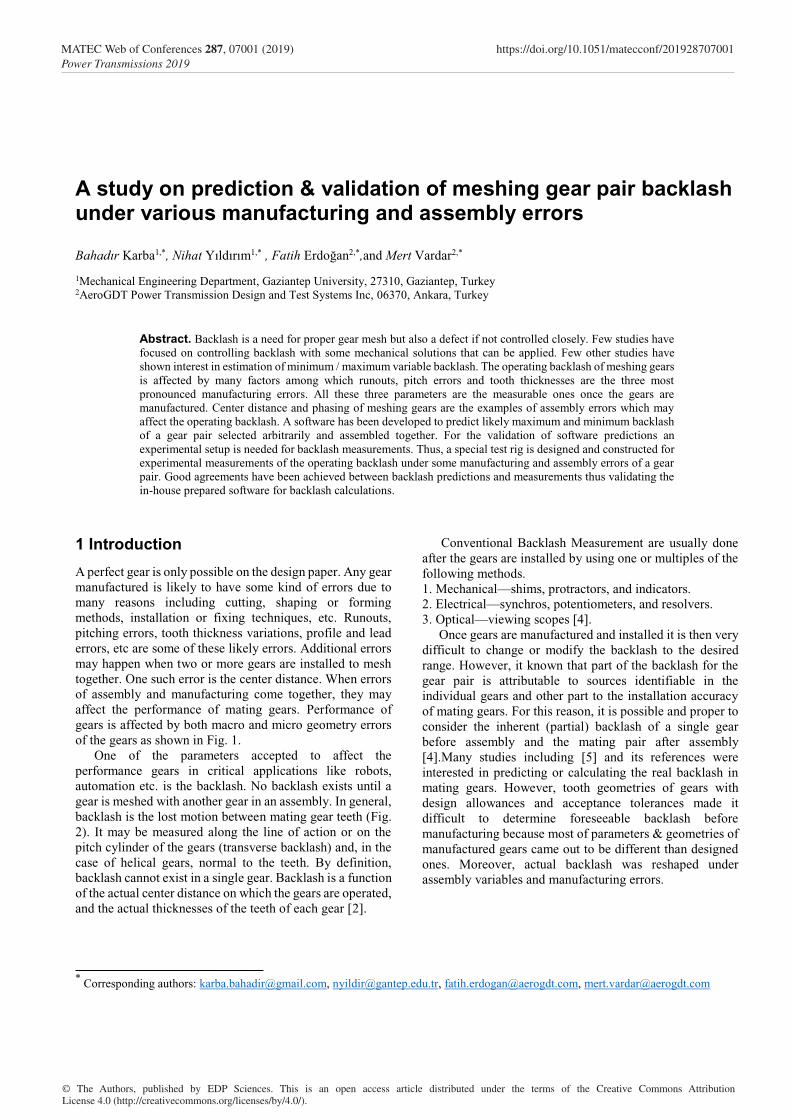
A perfect gear is only possible on the design paper. Any gear manufactured is likely to have some kind of errors due to many reasons including cutting, shaping or forming methods, installation or fixing techniques, etc. Runouts, pitching errors, tooth thickness variations, profile and lead errors, etc are some of these likely errors. Additional errors may happen when two or more gears are installed to mesh together. One such error is the center distance. When errors of assembly and manufacturing come together, they may affect the performance of mating gears. Performance of gears is affected by both macro and micro geometry errors of the gears as shown in Fig. 1.
One of the parameters accepted to affect the performance gears in critical applications like robots, automation etc. is the backlash. No backlash exists until a gear is meshed with another gear in an assembly. In general, backlash is the lost motion between mating gear teeth (Fig. 2). It may be measured along the line of action or on the pitch cylinder of the gears (transverse backlash) and, in the case of helical gears, normal to the teeth. By definition, backlash cannot exist in a single gear. Backlash is a function of the actual center distance on which the gears are operated, and the actual thicknesses of the teeth of each gear [2].
Conventional Backlash Measurement are usually done after the gears are installed by using one or multiples of the following methods. 1. Mechanical—shims, protractors, and indicators. 2. Electrical—synchros, potentiometers, and resolvers. 3. Optical—viewing scopes [4]. Once gears are manufactured and installed it is then very difficult to change or modify the backlash to the desired range. However, it known that part of the backlash for the gear pair is attributable to sources identifiable in the individual gears and other part to the installation accuracy of mating gears. For this reason, it is possible and proper to consider the inherent (partial) backlash of a single gear before assembly and the mating pair after assembly [4].Many studies including [5] and its references were interested in predicting or calculating the real backlash in mating gears. However, tooth geometries of gears with design allowances and acceptance tolerances made it difficult to determine foreseeable backlash before manufacturing because most of parameters & geometries of manufactured gears came out to be different than designed ones. Moreover, actual backlash was reshaped under assembly variables and manufacturing errors.
MATEC Web of Conferences 287, 07001 (2019) https://doi.org/10.1051/matecconf/201928707001Power Transmissions 2019
© The Authors, published by EDP Sciences. This is an open access article distributed under the terms of the Creative Commons Attribution License 4.0 (http://creativecommons.org/licenses/by/4.0/).
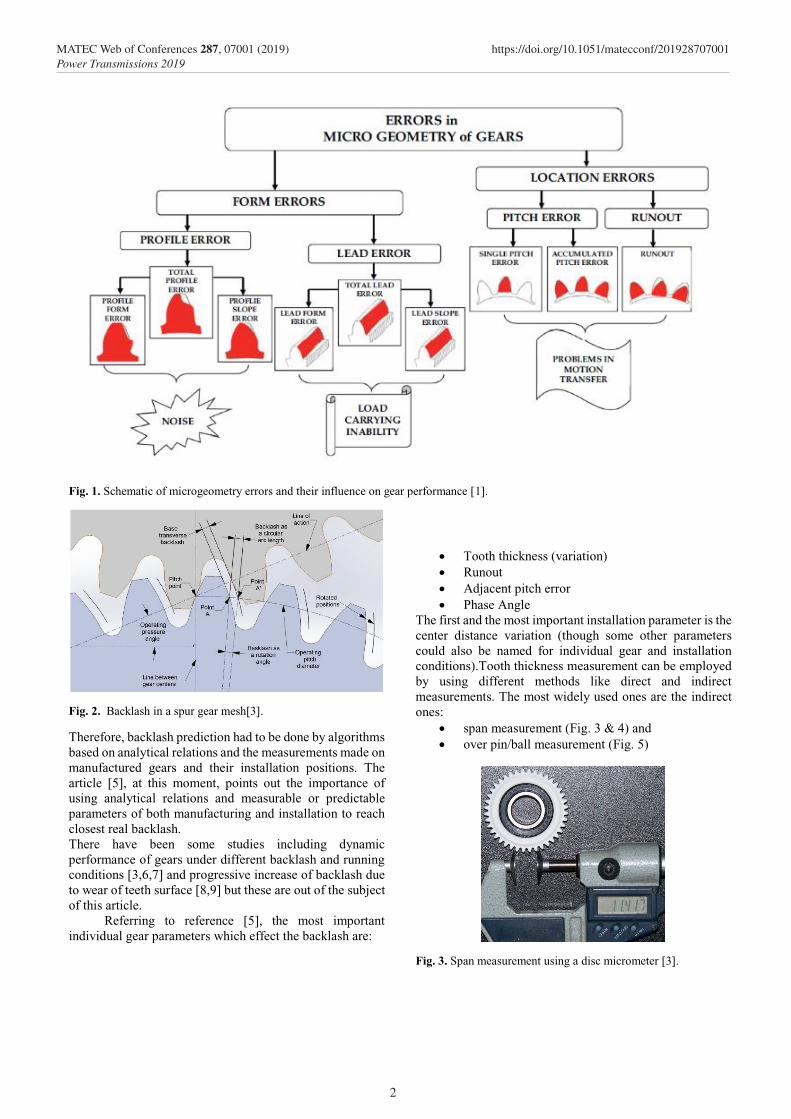
Fig. 1. Schematic of microgeometry errors and their influence on gear performance [1].
Fig. 2. Backlash in a spur gear mesh[3].
Therefore, backlash prediction had to be done by algorithms based on analytical relations and the measurements made on manufactured gears and their installation positions. The article [5], at this moment, points out the importance of using analytical relations and measurable or predictable parameters of both manufacturing and installation to reach closest real backlash. There have been some studies including dynamic performance of gears under different backlash and running conditions [3,6,7] and progressive increase of backlash due to wear of teeth surface [8,9] but these are out of the subject of this article.
Referring to reference [5], the most important individual gear parameters which effect the backlash are:
• Tooth thickness (variation) • Runout • Adjacent pitch error • Phase Angle
The first and the most important installation parameter is the center distance variation (though some other parameters could also be named for individual gear and installation conditions).Tooth thickness measurement can be employed by using different methods like direct and indirect measurements. The most widely used ones are the indirect ones:
• span measurement (Fig. 3 & 4) and • over pin/ball measurement (Fig. 5)
Fig. 3. Span measurement using a disc micrometer [3].
2
MATEC Web of Conferences 287, 07001 (2019) https://doi.org/10.1051/matecconf/201928707001Power Transmissions 2019
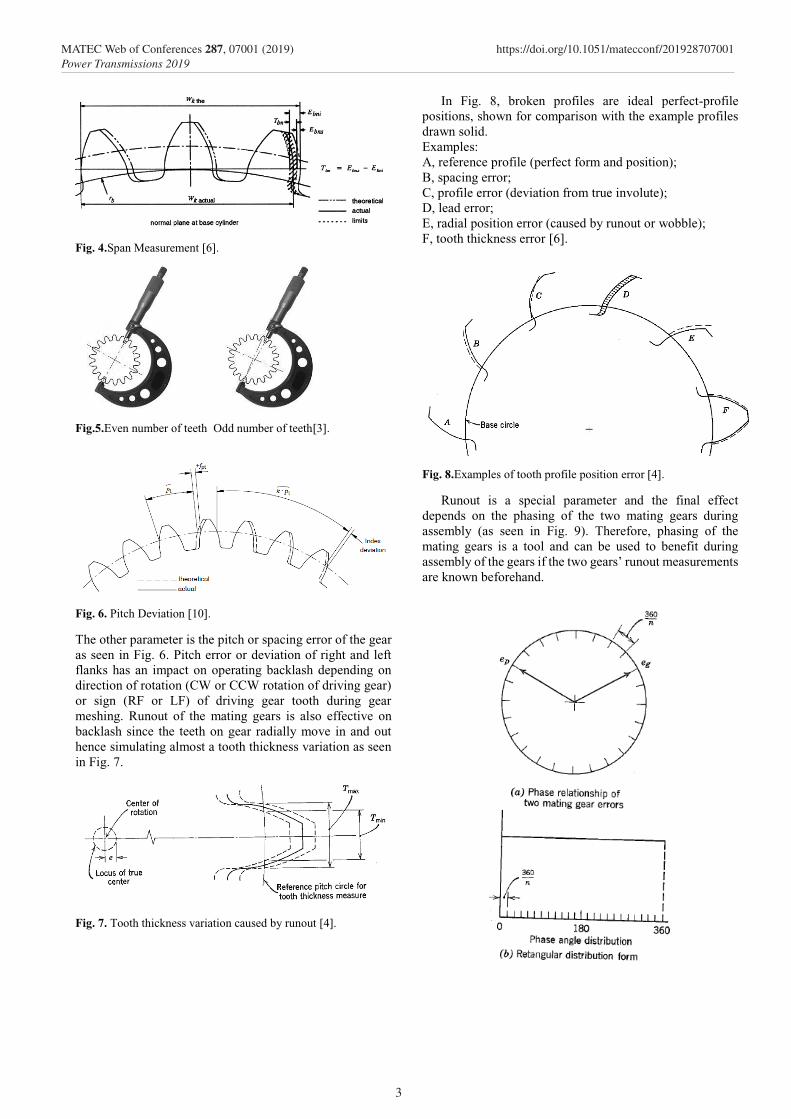
Fig. 1. Schematic of microgeometry errors and their influence on gear performance [1].
Fig. 2. Backlash in a spur gear mesh[3].
Therefore, backlash prediction had to be done by algorithms based on analytical relations and the measurements made on manufactured gears and their installation positions. The article [5], at this moment, points out the importance of using analytical relations and measurable or predictable parameters of both manufacturing and installation to reach closest real backlash. There have been some studies including dynamic performance of gears under different backlash and running conditions [3,6,7] and progressive increase of backlash due to wear of teeth surface [8,9] but these are out of the subject of this article.
Referring to reference [5], the most important individual gear parameters which effect the backlash are:
• Tooth thickness (variation) • Runout • Adjacent pitch error • Phase Angle
The first and the most important installation parameter is the center distance variation (though some other parameters could also be named for individual gear and installation conditions).Tooth thickness measurement can be employed by using different methods like direct and indirect measurements. The most widely used ones are the indirect ones:
• span measurement (Fig. 3 & 4) and • over pin/ball measurement (Fig. 5)
Fig. 3. Span measurement using a disc micrometer [3].
Fig. 4.Span Measurement [6].
Fig.5.Even number of teeth Odd number of teeth[3].
Fig. 6. Pitch Deviation [10].
The other parameter is the pitch or spacing error of the gear as seen in Fig. 6. Pitch error or deviation of right and left flanks has an impact on operating backlash depending on direction of rotation (CW or CCW rotation of driving gear) or sign (RF or LF) of driving gear tooth during gear meshing. Runout of the mating gears is also effective on backlash since the teeth on gear radially move in and out hence simulating almost a tooth thickness variation as seen in Fig. 7.
Fig. 7. Tooth thickness variation caused by runout [4].
In Fig. 8, broken profiles are ideal perfect-profile positions, shown for comparison with the example profiles drawn solid. Examples: A, reference profile (perfect form and position); B, spacing error; C, profile error (deviation from true involute); D, lead error; E, radial position error (caused by runout or wobble); F, tooth thickness error [6].
Fig. 8.Examples of tooth profile position error [4].
Runout is a special parameter and the final effect depends on the phasing of the two mating gears during assembly (as seen in Fig. 9). Therefore, phasing of the mating gears is a tool and can be used to benefit during assembly of the gears if the two gears’ runout measurements are known beforehand.
3
MATEC Web of Conferences 287, 07001 (2019) https://doi.org/10.1051/matecconf/201928707001Power Transmissions 2019
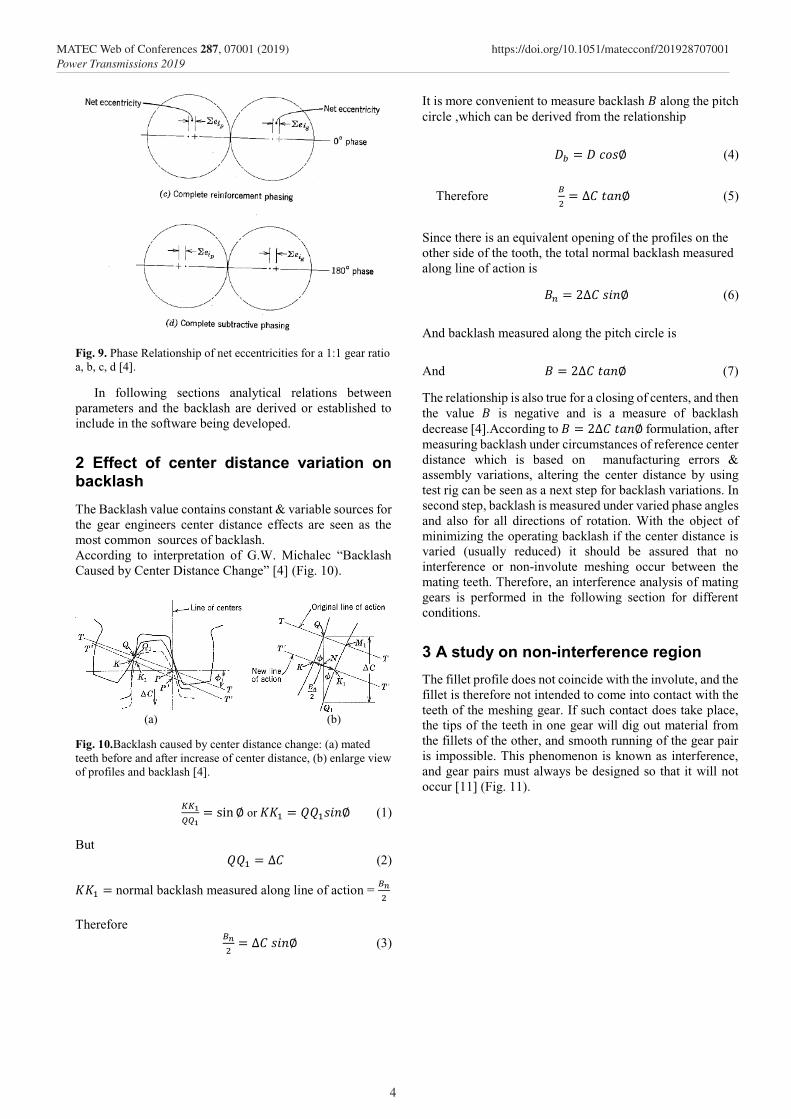
Fig. 9. Phase Relationship of net eccentricities for a 1:1 gear ratio a, b, c, d [4].
In following sections analytical relations between parameters and the backlash are derived or established to include in the software being developed.
2 Effect of center distance variation on backlash
The Backlash value contains constant & variable sources for the gear engineers center distance effects are seen as the most common sources of backlash. According to interpretation of G.W. Michalec “Backlash Caused by Center Distance Change” [4] (Fig. 10).
(a) (b)
Fig. 10.Backlash caused by center distance change: (a) mated teeth before and after increase of center distance, (b) enlarge view of profiles and backlash [4].
𝐾𝐾𝐾𝐾1𝑄𝑄𝑄𝑄1
= sin∅ or 𝐾𝐾𝐾𝐾1 = 𝑄𝑄𝑄𝑄1𝑠𝑠𝑠𝑠𝑠𝑠∅ (1)
But 𝑄𝑄𝑄𝑄1 = ∆𝐶𝐶 (2)
𝐾𝐾𝐾𝐾1 = normal backlash measured along line of action = 𝐵𝐵𝑛𝑛2
Therefore
𝐵𝐵𝑛𝑛2 = ∆𝐶𝐶 𝑠𝑠𝑠𝑠𝑠𝑠∅ (3)
It is more convenient to measure backlash 𝐵𝐵 along the pitch circle ,which can be derived from the relationship
𝐷𝐷𝑏𝑏 = 𝐷𝐷 𝑐𝑐𝑐𝑐𝑠𝑠∅ (4)
Therefore 𝐵𝐵2 = ∆𝐶𝐶 𝑡𝑡𝑡𝑡𝑠𝑠∅ (5)
Since there is an equivalent opening of the profiles on the other side of the tooth, the total normal backlash measured along line of action is
𝐵𝐵𝑛𝑛 = 2∆𝐶𝐶 𝑠𝑠𝑠𝑠𝑠𝑠∅ (6)
And backlash measured along the pitch circle is
And 𝐵𝐵 = 2∆𝐶𝐶 𝑡𝑡𝑡𝑡𝑠𝑠∅ (7)
The relationship is also true for a closing of centers, and then the value 𝐵𝐵 is negative and is a measure of backlash decrease [4].According to 𝐵𝐵 = 2∆𝐶𝐶 𝑡𝑡𝑡𝑡𝑠𝑠∅ formulation, after measuring backlash under circumstances of reference center distance which is based on manufacturing errors & assembly variations, altering the center distance by using test rig can be seen as a next step for backlash variations. In second step, backlash is measured under varied phase angles and also for all directions of rotation. With the object of minimizing the operating backlash if the center distance is varied (usually reduced) it should be assured that no interference or non-involute meshing occur between the mating teeth. Therefore, an interference analysis of mating gears is performed in the following section for different conditions.
3 A study on non-interference region
The fillet profile does not coincide with the involute, and the fillet is therefore not intended to come into contact with the teeth of the meshing gear. If such contact does take place, the tips of the teeth in one gear will dig out material from the fillets of the other, and smooth running of the gear pair is impossible. This phenomenon is known as interference, and gear pairs must always be designed so that it will not occur [11] (Fig. 11).
4
MATEC Web of Conferences 287, 07001 (2019) https://doi.org/10.1051/matecconf/201928707001Power Transmissions 2019
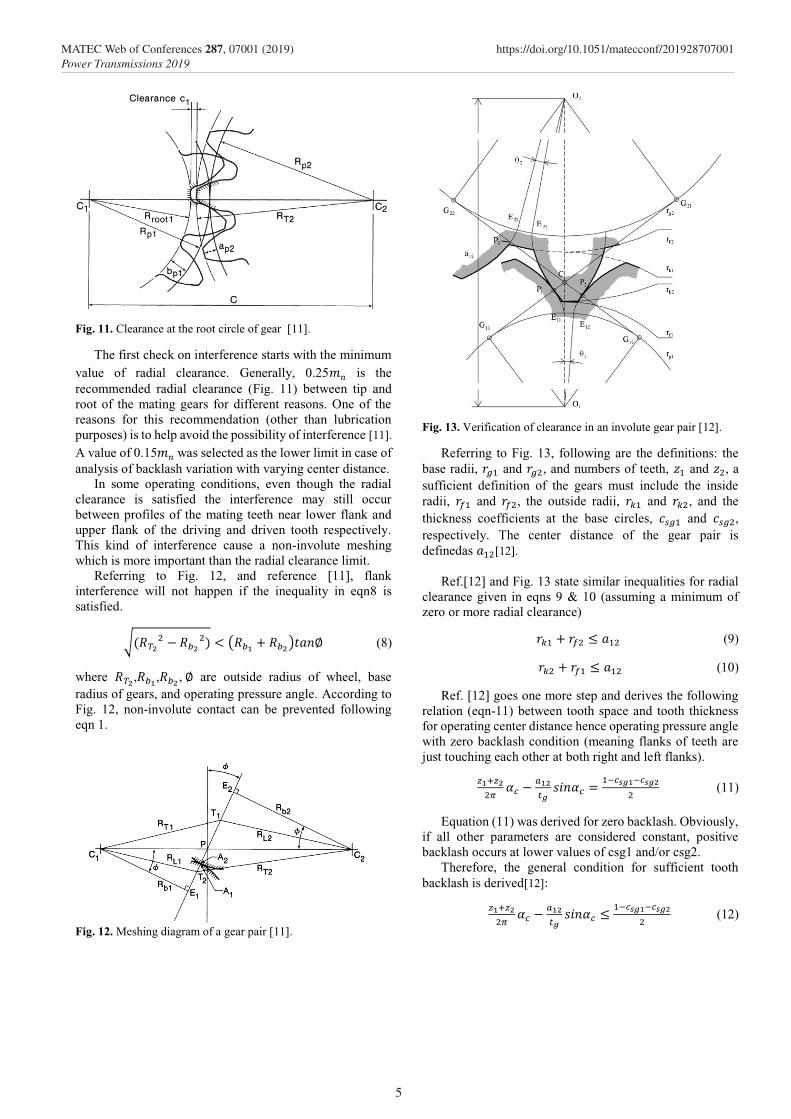
Fig. 9. Phase Relationship of net eccentricities for a 1:1 gear ratio a, b, c, d [4].
In following sections analytical relations between parameters and the backlash are derived or established to include in the software being developed.
2 Effect of center distance variation on backlash
The Backlash value contains constant & variable sources for the gear engineers center distance effects are seen as the most common sources of backlash. According to interpretation of G.W. Michalec “Backlash Caused by Center Distance Change” [4] (Fig. 10).
(a) (b)
Fig. 10.Backlash caused by center distance change: (a) mated teeth before and after increase of center distance, (b) enlarge view of profiles and backlash [4].
𝐾𝐾𝐾𝐾1𝑄𝑄𝑄𝑄1
= sin∅ or 𝐾𝐾𝐾𝐾1 = 𝑄𝑄𝑄𝑄1𝑠𝑠𝑠𝑠𝑠𝑠∅ (1)
But 𝑄𝑄𝑄𝑄1 = ∆𝐶𝐶 (2)
𝐾𝐾𝐾𝐾1 = normal backlash measured along line of action = 𝐵𝐵𝑛𝑛2
Therefore
𝐵𝐵𝑛𝑛2 = ∆𝐶𝐶 𝑠𝑠𝑠𝑠𝑠𝑠∅ (3)
It is more convenient to measure backlash 𝐵𝐵 along the pitch circle ,which can be derived from the relationship
𝐷𝐷𝑏𝑏 = 𝐷𝐷 𝑐𝑐𝑐𝑐𝑠𝑠∅ (4)
Therefore 𝐵𝐵2 = ∆𝐶𝐶 𝑡𝑡𝑡𝑡𝑠𝑠∅ (5)
Since there is an equivalent opening of the profiles on the other side of the tooth, the total normal backlash measured along line of action is
𝐵𝐵𝑛𝑛 = 2∆𝐶𝐶 𝑠𝑠𝑠𝑠𝑠𝑠∅ (6)
And backlash measured along the pitch circle is
And 𝐵𝐵 = 2∆𝐶𝐶 𝑡𝑡𝑡𝑡𝑠𝑠∅ (7)
The relationship is also true for a closing of centers, and then the value 𝐵𝐵 is negative and is a measure of backlash decrease [4].According to 𝐵𝐵 = 2∆𝐶𝐶 𝑡𝑡𝑡𝑡𝑠𝑠∅ formulation, after measuring backlash under circumstances of reference center distance which is based on manufacturing errors & assembly variations, altering the center distance by using test rig can be seen as a next step for backlash variations. In second step, backlash is measured under varied phase angles and also for all directions of rotation. With the object of minimizing the operating backlash if the center distance is varied (usually reduced) it should be assured that no interference or non-involute meshing occur between the mating teeth. Therefore, an interference analysis of mating gears is performed in the following section for different conditions.
3 A study on non-interference region
The fillet profile does not coincide with the involute, and the fillet is therefore not intended to come into contact with the teeth of the meshing gear. If such contact does take place, the tips of the teeth in one gear will dig out material from the fillets of the other, and smooth running of the gear pair is impossible. This phenomenon is known as interference, and gear pairs must always be designed so that it will not occur [11] (Fig. 11).
Fig. 11. Clearance at the root circle of gear [11].
The first check on interference starts with the minimum value of radial clearance. Generally, 0.25𝑚𝑚𝑛𝑛 is the recommended radial clearance (Fig. 11) between tip and root of the mating gears for different reasons. One of the reasons for this recommendation (other than lubrication purposes) is to help avoid the possibility of interference [11].
A value of 0.15𝑚𝑚𝑛𝑛 was selected as the lower limit in case of analysis of backlash variation with varying center distance.
In some operating conditions, even though the radial clearance is satisfied the interference may still occur between profiles of the mating teeth near lower flank and upper flank of the driving and driven tooth respectively. This kind of interference cause a non-involute meshing which is more important than the radial clearance limit.
Referring to Fig. 12, and reference [11], flank interference will not happen if the inequality in eqn8 is satisfied.
√(𝑅𝑅𝑇𝑇22 − 𝑅𝑅𝑏𝑏2
2) < (𝑅𝑅𝑏𝑏1 + 𝑅𝑅𝑏𝑏2)𝑡𝑡𝑡𝑡𝑛𝑛∅ (8)
where 𝑅𝑅𝑇𝑇2,𝑅𝑅𝑏𝑏1,𝑅𝑅𝑏𝑏2 , ∅ are outside radius of wheel, base radius of gears, and operating pressure angle. According to Fig. 12, non-involute contact can be prevented following eqn 1.
Fig. 12. Meshing diagram of a gear pair [11].
Fig. 13. Verification of clearance in an involute gear pair [12].
Referring to Fig. 13, following are the definitions: the base radii, 𝑟𝑟𝑔𝑔1 and 𝑟𝑟𝑔𝑔2, and numbers of teeth, 𝑧𝑧1 and 𝑧𝑧2, a sufficient definition of the gears must include the inside radii, 𝑟𝑟𝑓𝑓1 and 𝑟𝑟𝑓𝑓2, the outside radii, 𝑟𝑟𝑘𝑘1 and 𝑟𝑟𝑘𝑘2, and the thickness coefficients at the base circles, 𝑐𝑐𝑠𝑠𝑔𝑔1 and 𝑐𝑐𝑠𝑠𝑔𝑔2, respectively. The center distance of the gear pair is definedas 𝑡𝑡12[12].
Ref.[12] and Fig. 13 state similar inequalities for radial clearance given in eqns 9 & 10 (assuming a minimum of zero or more radial clearance)
𝑟𝑟𝑘𝑘1 + 𝑟𝑟𝑓𝑓2 ≤ 𝑡𝑡12 (9)
𝑟𝑟𝑘𝑘2 + 𝑟𝑟𝑓𝑓1 ≤ 𝑡𝑡12 (10)
Ref. [12] goes one more step and derives the following relation (eqn-11) between tooth space and tooth thickness for operating center distance hence operating pressure angle with zero backlash condition (meaning flanks of teeth are just touching each other at both right and left flanks).
𝑧𝑧1+𝑧𝑧22𝜋𝜋 𝛼𝛼𝑐𝑐 −
𝑎𝑎12𝑡𝑡𝑔𝑔𝑠𝑠𝑠𝑠𝑛𝑛𝛼𝛼𝑐𝑐 = 1−𝑐𝑐𝑠𝑠𝑔𝑔1−𝑐𝑐𝑠𝑠𝑔𝑔2
2 (11)
Equation (11) was derived for zero backlash. Obviously, if all other parameters are considered constant, positive backlash occurs at lower values of csg1 and/or csg2.
Therefore, the general condition for sufficient tooth backlash is derived[12]:
𝑧𝑧1+𝑧𝑧22𝜋𝜋 𝛼𝛼𝑐𝑐 −
𝑎𝑎12𝑡𝑡𝑔𝑔𝑠𝑠𝑠𝑠𝑛𝑛𝛼𝛼𝑐𝑐 ≤
1−𝑐𝑐𝑠𝑠𝑔𝑔1−𝑐𝑐𝑠𝑠𝑔𝑔22 (12)
5
MATEC Web of Conferences 287, 07001 (2019) https://doi.org/10.1051/matecconf/201928707001Power Transmissions 2019
A further simplification of eqn 13 leads to
𝑧𝑧1+𝑧𝑧2𝜋𝜋 (𝛼𝛼𝑐𝑐 − tan𝛼𝛼𝑐𝑐) ≤ 1 − 𝑐𝑐𝑠𝑠𝑠𝑠1 − 𝑐𝑐𝑠𝑠𝑠𝑠2 (13)
The thickness coefficient at the base circle, which relates the theoretical thickness of the tooth at its base circle, 𝑆𝑆𝑠𝑠, with the base pitch, 𝑡𝑡𝑠𝑠, according to the following relationship [12]:
𝑆𝑆𝑠𝑠 = 𝑐𝑐𝑠𝑠𝑠𝑠𝑡𝑡𝑠𝑠 (14)
Span measurement Wk is a practical measurement and can easily be employed for any manufactured gear with tooth thickness variations. Once Wk is measured practically on gear then Sgm (modified tooth thickness on base circle) can easily be determined from this measurement by using eqn 14 since tg is a fixed value.
𝑆𝑆𝑠𝑠𝑔𝑔 = 𝑊𝑊𝑘𝑘𝑔𝑔𝑚𝑚𝑚𝑚𝑠𝑠𝑚𝑚𝑚𝑚𝑚𝑚𝑚𝑚 − (𝑘𝑘 − 1)𝑡𝑡𝑠𝑠 (15)
Then Csgm1 and Csgm2 can easily be calculated for both gears by using Wk measurements.
𝐶𝐶𝑠𝑠𝑠𝑠𝑔𝑔𝑖𝑖 = 𝑆𝑆𝑔𝑔𝑔𝑔𝑖𝑖𝑡𝑡𝑔𝑔
(16)
or eqn 17 can be used to determine the limit center distance 𝑎𝑎12 to prevent any flank interference (zero backlash condition)
𝑧𝑧1+𝑧𝑧22𝜋𝜋 𝛼𝛼𝑐𝑐 −
𝑚𝑚12𝑡𝑡𝑔𝑔𝑠𝑠𝑠𝑠𝑠𝑠𝛼𝛼𝑐𝑐 = 1−𝑐𝑐𝑠𝑠𝑔𝑔𝑔𝑔1−𝑐𝑐𝑠𝑠𝑔𝑔𝑔𝑔2
2 (17)
All analytical relations derived above have been included within the in-house prepared software code to be able to predict any likely backlash between mating gears while checking different boundary conditions like radial clearance, non-involute meshing and limit center distance (flank interference) condition for zero backlash.
This study, based on the information and relations given above, contains both numerical predictions and experimental measurements of the backlash for specific case studies. Manufacturing errors of run out, adjacent pitch error and tooth thickness are taken into consideration while assembly errors of center distance and phasing of the two mating gears are considered. Below, first numerical comparison of results from in-house prepared software and two most commonly used commercial software are given. Next, an experimental measurement of backlash is performed with comparison of results from measurements and in-house prepared software.
4 Numerical validation of in-hose software
KISSsoft & Gear Rating Suite (AGMA) are two well-known software used in gear industries. A comparison of backlash predictions by different software will be a good start point.
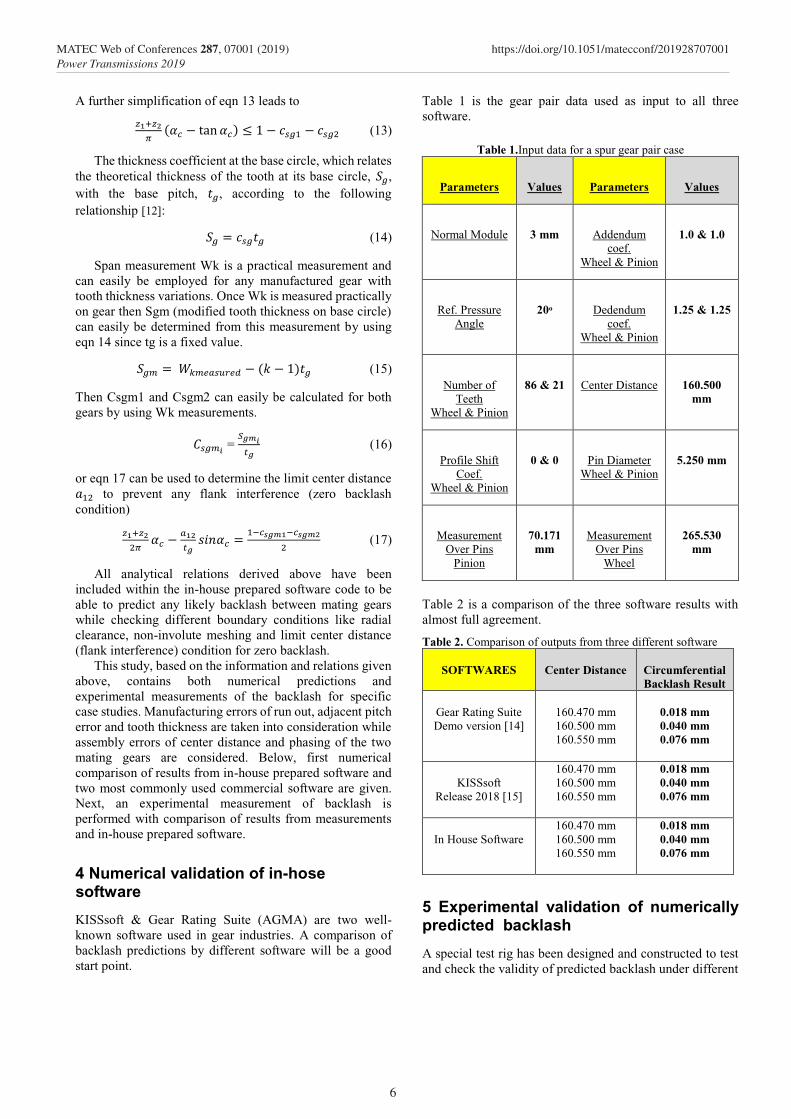
Table 1 is the gear pair data used as input to all three software.
Table 1.Input data for a spur gear pair case
Parameters Values Parameters Values
Normal Module 3 mm Addendum coef.
Wheel & Pinion
1.0 & 1.0
Ref. Pressure Angle
20ᵒ Dedendum coef.
Wheel & Pinion
1.25 & 1.25
Number of Teeth
Wheel & Pinion
86 & 21 Center Distance 160.500 mm
Profile Shift Coef.
Wheel & Pinion
0 & 0 Pin Diameter Wheel & Pinion
5.250 mm
Measurement Over Pins
Pinion
70.171 mm
Measurement Over Pins
Wheel
265.530 mm
Table 2 is a comparison of the three software results with almost full agreement.
Table 2. Comparison of outputs from three different software
SOFTWARES
Center Distance
Circumferential Backlash Result
Gear Rating Suite Demo version [14]
160.470 mm 160.500 mm 160.550 mm
0.018 mm 0.040 mm 0.076 mm
KISSsoft
Release 2018 [15]
160.470 mm 160.500 mm 160.550 mm
0.018 mm 0.040 mm 0.076 mm
In House Software
160.470 mm 160.500 mm 160.550 mm
0.018 mm 0.040 mm 0.076 mm
5 Experimental validation of numerically predicted backlash
A special test rig has been designed and constructed to test and check the validity of predicted backlash under different
6
MATEC Web of Conferences 287, 07001 (2019) https://doi.org/10.1051/matecconf/201928707001Power Transmissions 2019
A further simplification of eqn 13 leads to
𝑧𝑧1+𝑧𝑧2𝜋𝜋 (𝛼𝛼𝑐𝑐 − tan𝛼𝛼𝑐𝑐) ≤ 1 − 𝑐𝑐𝑠𝑠𝑠𝑠1 − 𝑐𝑐𝑠𝑠𝑠𝑠2 (13)
The thickness coefficient at the base circle, which relates the theoretical thickness of the tooth at its base circle, 𝑆𝑆𝑠𝑠, with the base pitch, 𝑡𝑡𝑠𝑠, according to the following relationship [12]:
𝑆𝑆𝑠𝑠 = 𝑐𝑐𝑠𝑠𝑠𝑠𝑡𝑡𝑠𝑠 (14)
Span measurement Wk is a practical measurement and can easily be employed for any manufactured gear with tooth thickness variations. Once Wk is measured practically on gear then Sgm (modified tooth thickness on base circle) can easily be determined from this measurement by using eqn 14 since tg is a fixed value.
𝑆𝑆𝑠𝑠𝑔𝑔 = 𝑊𝑊𝑘𝑘𝑔𝑔𝑚𝑚𝑚𝑚𝑠𝑠𝑚𝑚𝑚𝑚𝑚𝑚𝑚𝑚 − (𝑘𝑘 − 1)𝑡𝑡𝑠𝑠 (15)
Then Csgm1 and Csgm2 can easily be calculated for both gears by using Wk measurements.
𝐶𝐶𝑠𝑠𝑠𝑠𝑔𝑔𝑖𝑖 = 𝑆𝑆𝑔𝑔𝑔𝑔𝑖𝑖𝑡𝑡𝑔𝑔
(16)
or eqn 17 can be used to determine the limit center distance 𝑎𝑎12 to prevent any flank interference (zero backlash condition)
𝑧𝑧1+𝑧𝑧22𝜋𝜋 𝛼𝛼𝑐𝑐 −
𝑚𝑚12𝑡𝑡𝑔𝑔𝑠𝑠𝑠𝑠𝑠𝑠𝛼𝛼𝑐𝑐 = 1−𝑐𝑐𝑠𝑠𝑔𝑔𝑔𝑔1−𝑐𝑐𝑠𝑠𝑔𝑔𝑔𝑔2
2 (17)
All analytical relations derived above have been included within the in-house prepared software code to be able to predict any likely backlash between mating gears while checking different boundary conditions like radial clearance, non-involute meshing and limit center distance (flank interference) condition for zero backlash.
This study, based on the information and relations given above, contains both numerical predictions and experimental measurements of the backlash for specific case studies. Manufacturing errors of run out, adjacent pitch error and tooth thickness are taken into consideration while assembly errors of center distance and phasing of the two mating gears are considered. Below, first numerical comparison of results from in-house prepared software and two most commonly used commercial software are given. Next, an experimental measurement of backlash is performed with comparison of results from measurements and in-house prepared software.
4 Numerical validation of in-hose software
KISSsoft & Gear Rating Suite (AGMA) are two well-known software used in gear industries. A comparison of backlash predictions by different software will be a good start point.
Table 1 is the gear pair data used as input to all three software.
Table 1.Input data for a spur gear pair case
Parameters Values Parameters Values
Normal Module 3 mm Addendum coef.
Wheel & Pinion
1.0 & 1.0
Ref. Pressure Angle
20ᵒ Dedendum coef.
Wheel & Pinion
1.25 & 1.25
Number of Teeth
Wheel & Pinion
86 & 21 Center Distance 160.500 mm
Profile Shift Coef.
Wheel & Pinion
0 & 0 Pin Diameter Wheel & Pinion
5.250 mm
Measurement Over Pins
Pinion
70.171 mm
Measurement Over Pins
Wheel
265.530 mm
Table 2 is a comparison of the three software results with almost full agreement.
Table 2. Comparison of outputs from three different software
SOFTWARES
Center Distance
Circumferential Backlash Result
Gear Rating Suite Demo version [14]
160.470 mm 160.500 mm 160.550 mm
0.018 mm 0.040 mm 0.076 mm
KISSsoft
Release 2018 [15]
160.470 mm 160.500 mm 160.550 mm
0.018 mm 0.040 mm 0.076 mm
In House Software
160.470 mm 160.500 mm 160.550 mm
0.018 mm 0.040 mm 0.076 mm
5 Experimental validation of numerically predicted backlash
A special test rig has been designed and constructed to test and check the validity of predicted backlash under different
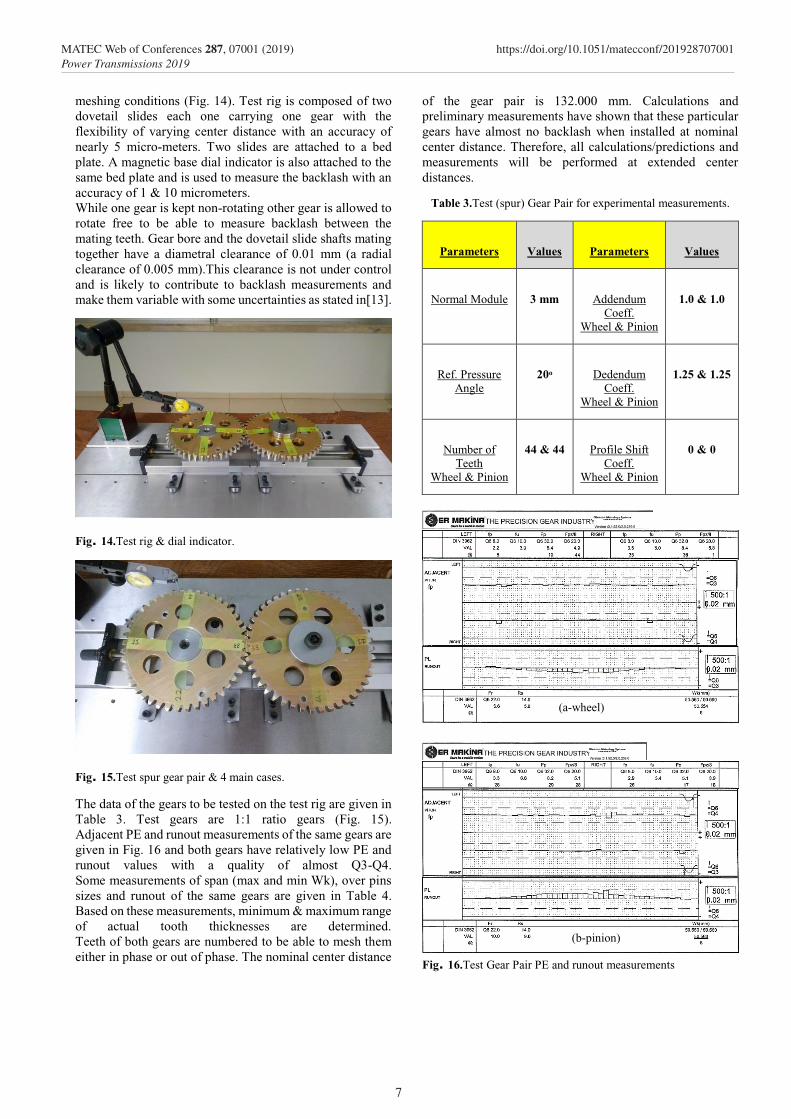
meshing conditions (Fig. 14). Test rig is composed of two dovetail slides each one carrying one gear with the flexibility of varying center distance with an accuracy of nearly 5 micro-meters. Two slides are attached to a bed plate. A magnetic base dial indicator is also attached to the same bed plate and is used to measure the backlash with an accuracy of 1 & 10 micrometers. While one gear is kept non-rotating other gear is allowed to rotate free to be able to measure backlash between the mating teeth. Gear bore and the dovetail slide shafts mating together have a diametral clearance of 0.01 mm (a radial clearance of 0.005 mm).This clearance is not under control and is likely to contribute to backlash measurements and make them variable with some uncertainties as stated in[13].
Fig. 14.Test rig & dial indicator.
Fig. 15.Test spur gear pair & 4 main cases.
The data of the gears to be tested on the test rig are given in Table 3. Test gears are 1:1 ratio gears (Fig. 15). Adjacent PE and runout measurements of the same gears are given in Fig. 16 and both gears have relatively low PE and runout values with a quality of almost Q3-Q4. Some measurements of span (max and min Wk), over pins sizes and runout of the same gears are given in Table 4. Based on these measurements, minimum & maximum range of actual tooth thicknesses are determined. Teeth of both gears are numbered to be able to mesh them either in phase or out of phase. The nominal center distance
of the gear pair is 132.000 mm. Calculations and preliminary measurements have shown that these particular gears have almost no backlash when installed at nominal center distance. Therefore, all calculations/predictions and measurements will be performed at extended center distances.
Table 3.Test (spur) Gear Pair for experimental measurements.
Parameters Values Parameters Values
Normal Module 3 mm Addendum Coeff.
Wheel & Pinion
1.0 & 1.0
Ref. Pressure Angle
20ᵒ Dedendum Coeff.
Wheel & Pinion
1.25 & 1.25
Number of Teeth
Wheel & Pinion
44 & 44 Profile Shift Coeff.
Wheel & Pinion
0 & 0
Fig. 16.Test Gear Pair PE and runout measurements
(b-pinion)
(a-wheel)
7
MATEC Web of Conferences 287, 07001 (2019) https://doi.org/10.1051/matecconf/201928707001Power Transmissions 2019
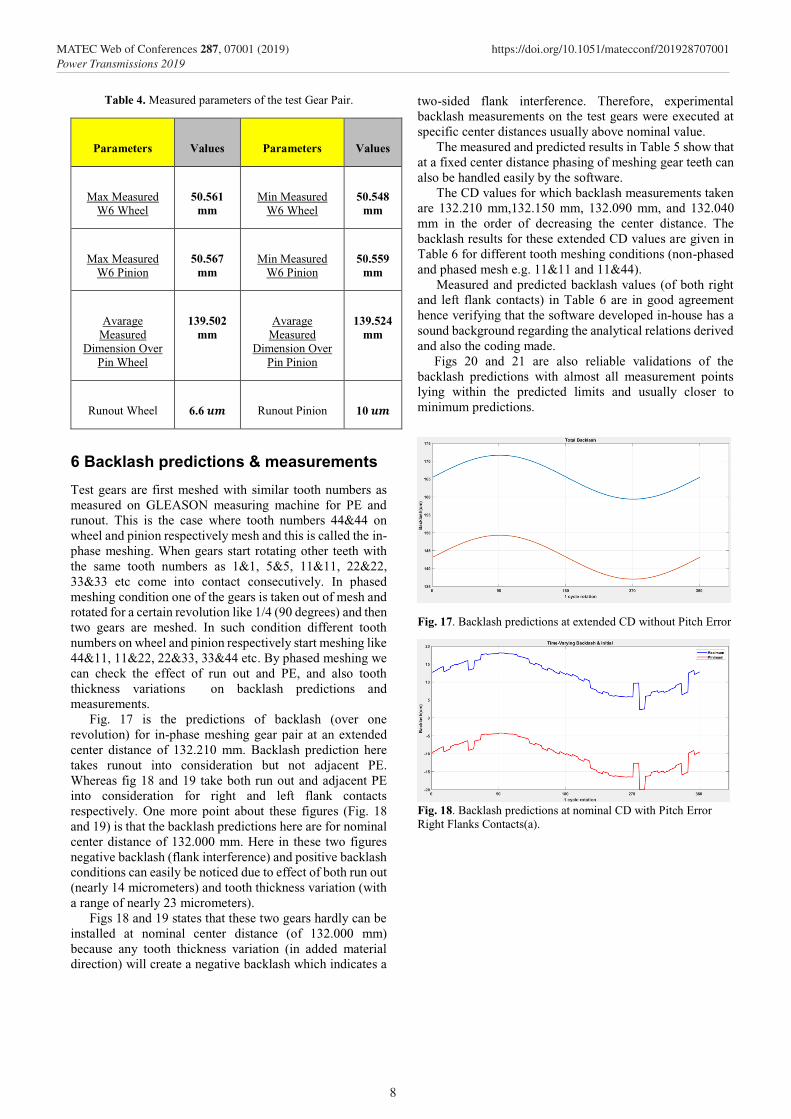
Table 4. Measured parameters of the test Gear Pair.
Parameters Values Parameters Values
Max Measured W6 Wheel
50.561 mm
Min Measured W6 Wheel
50.548 mm
Max Measured W6 Pinion
50.567 mm
Min Measured W6 Pinion
50.559 mm
Avarage Measured
Dimension Over Pin Wheel
139.502 mm
Avarage Measured
Dimension Over Pin Pinion
139.524 mm
Runout Wheel 6.6 𝒖𝒖𝒖𝒖 Runout Pinion 10 𝒖𝒖𝒖𝒖
6 Backlash predictions & measurements
Test gears are first meshed with similar tooth numbers as measured on GLEASON measuring machine for PE and runout. This is the case where tooth numbers 44&44 on wheel and pinion respectively mesh and this is called the in-phase meshing. When gears start rotating other teeth with the same tooth numbers as 1&1, 5&5, 11&11, 22&22, 33&33 etc come into contact consecutively. In phased meshing condition one of the gears is taken out of mesh and rotated for a certain revolution like 1/4 (90 degrees) and then two gears are meshed. In such condition different tooth numbers on wheel and pinion respectively start meshing like 44&11, 11&22, 22&33, 33&44 etc. By phased meshing we can check the effect of run out and PE, and also tooth thickness variations on backlash predictions and measurements.
Fig. 17 is the predictions of backlash (over one revolution) for in-phase meshing gear pair at an extended center distance of 132.210 mm. Backlash prediction here takes runout into consideration but not adjacent PE. Whereas fig 18 and 19 take both run out and adjacent PE into consideration for right and left flank contacts respectively. One more point about these figures (Fig. 18 and 19) is that the backlash predictions here are for nominal center distance of 132.000 mm. Here in these two figures negative backlash (flank interference) and positive backlash conditions can easily be noticed due to effect of both run out (nearly 14 micrometers) and tooth thickness variation (with a range of nearly 23 micrometers).
Figs 18 and 19 states that these two gears hardly can be installed at nominal center distance (of 132.000 mm) because any tooth thickness variation (in added material direction) will create a negative backlash which indicates a
two-sided flank interference. Therefore, experimental backlash measurements on the test gears were executed at specific center distances usually above nominal value.
The measured and predicted results in Table 5 show that at a fixed center distance phasing of meshing gear teeth can also be handled easily by the software.
The CD values for which backlash measurements taken are 132.210 mm,132.150 mm, 132.090 mm, and 132.040 mm in the order of decreasing the center distance. The backlash results for these extended CD values are given in Table 6 for different tooth meshing conditions (non-phased and phased mesh e.g. 11&11 and 11&44).
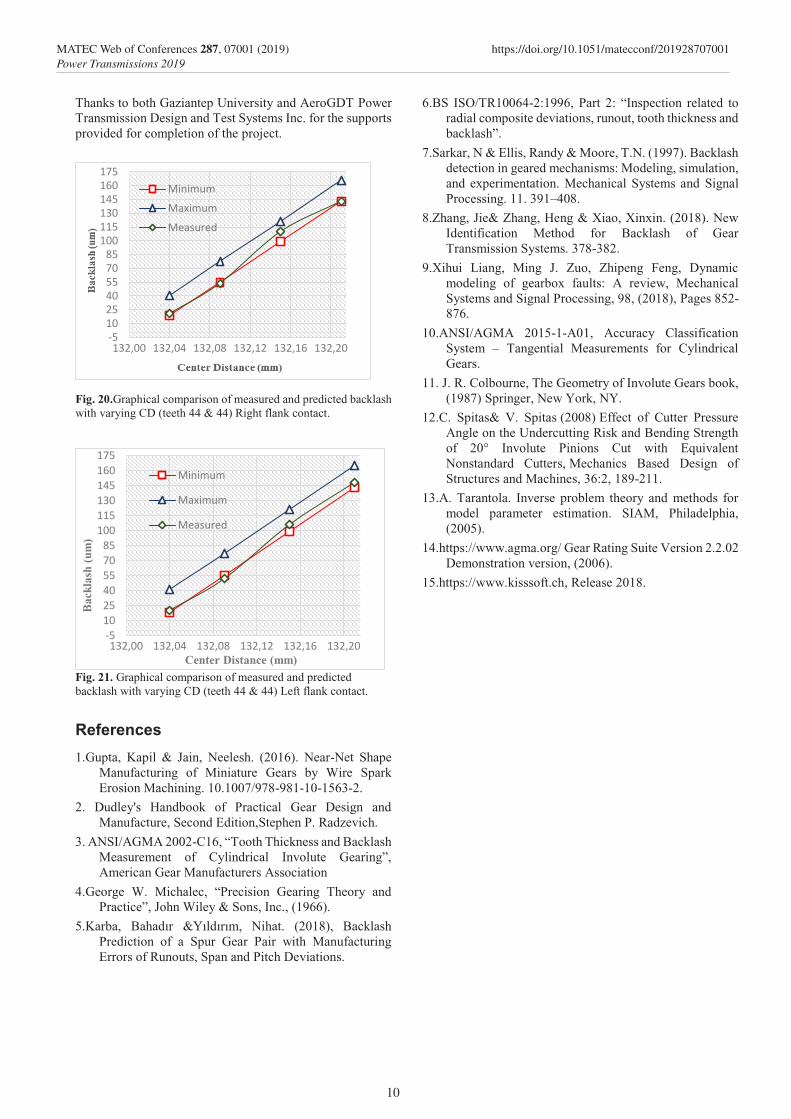
Measured and predicted backlash values (of both right and left flank contacts) in Table 6 are in good agreement hence verifying that the software developed in-house has a sound background regarding the analytical relations derived and also the coding made. Figs 20 and 21 are also reliable validations of the backlash predictions with almost all measurement points lying within the predicted limits and usually closer to minimum predictions.
Fig. 17. Backlash predictions at extended CD without Pitch Error
Fig. 18. Backlash predictions at nominal CD with Pitch Error Right Flanks Contacts(a).
8
MATEC Web of Conferences 287, 07001 (2019) https://doi.org/10.1051/matecconf/201928707001Power Transmissions 2019
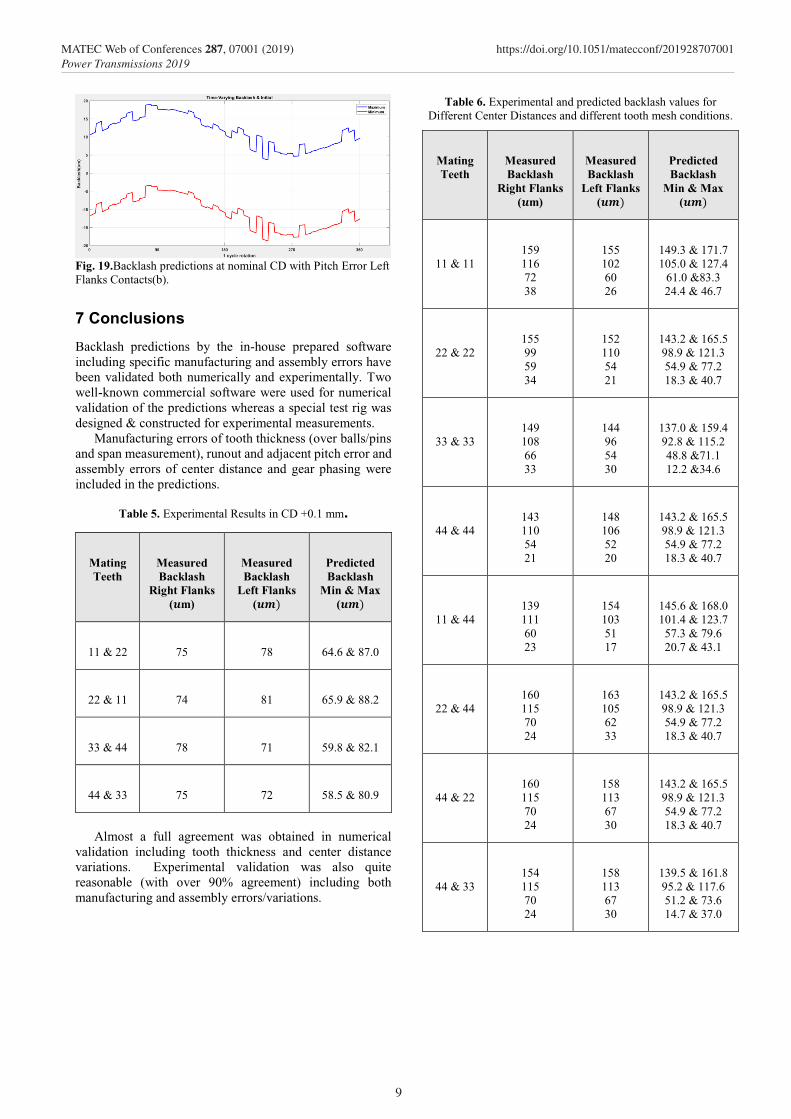
Table 4. Measured parameters of the test Gear Pair.
Parameters Values Parameters Values
Max Measured W6 Wheel
50.561 mm
Min Measured W6 Wheel
50.548 mm
Max Measured W6 Pinion
50.567 mm
Min Measured W6 Pinion
50.559 mm
Avarage Measured
Dimension Over Pin Wheel
139.502 mm
Avarage Measured
Dimension Over Pin Pinion
139.524 mm
Runout Wheel 6.6 𝒖𝒖𝒖𝒖 Runout Pinion 10 𝒖𝒖𝒖𝒖
6 Backlash predictions & measurements
Test gears are first meshed with similar tooth numbers as measured on GLEASON measuring machine for PE and runout. This is the case where tooth numbers 44&44 on wheel and pinion respectively mesh and this is called the in-phase meshing. When gears start rotating other teeth with the same tooth numbers as 1&1, 5&5, 11&11, 22&22, 33&33 etc come into contact consecutively. In phased meshing condition one of the gears is taken out of mesh and rotated for a certain revolution like 1/4 (90 degrees) and then two gears are meshed. In such condition different tooth numbers on wheel and pinion respectively start meshing like 44&11, 11&22, 22&33, 33&44 etc. By phased meshing we can check the effect of run out and PE, and also tooth thickness variations on backlash predictions and measurements.
Fig. 17 is the predictions of backlash (over one revolution) for in-phase meshing gear pair at an extended center distance of 132.210 mm. Backlash prediction here takes runout into consideration but not adjacent PE. Whereas fig 18 and 19 take both run out and adjacent PE into consideration for right and left flank contacts respectively. One more point about these figures (Fig. 18 and 19) is that the backlash predictions here are for nominal center distance of 132.000 mm. Here in these two figures negative backlash (flank interference) and positive backlash conditions can easily be noticed due to effect of both run out (nearly 14 micrometers) and tooth thickness variation (with a range of nearly 23 micrometers).
Figs 18 and 19 states that these two gears hardly can be installed at nominal center distance (of 132.000 mm) because any tooth thickness variation (in added material direction) will create a negative backlash which indicates a
two-sided flank interference. Therefore, experimental backlash measurements on the test gears were executed at specific center distances usually above nominal value.
The measured and predicted results in Table 5 show that at a fixed center distance phasing of meshing gear teeth can also be handled easily by the software.
The CD values for which backlash measurements taken are 132.210 mm,132.150 mm, 132.090 mm, and 132.040 mm in the order of decreasing the center distance. The backlash results for these extended CD values are given in Table 6 for different tooth meshing conditions (non-phased and phased mesh e.g. 11&11 and 11&44).
Measured and predicted backlash values (of both right and left flank contacts) in Table 6 are in good agreement hence verifying that the software developed in-house has a sound background regarding the analytical relations derived and also the coding made. Figs 20 and 21 are also reliable validations of the backlash predictions with almost all measurement points lying within the predicted limits and usually closer to minimum predictions.
Fig. 17. Backlash predictions at extended CD without Pitch Error
Fig. 18. Backlash predictions at nominal CD with Pitch Error Right Flanks Contacts(a).
Fig. 19.Backlash predictions at nominal CD with Pitch Error Left Flanks Contacts(b).
7 Conclusions
Backlash predictions by the in-house prepared software including specific manufacturing and assembly errors have been validated both numerically and experimentally. Two well-known commercial software were used for numerical validation of the predictions whereas a special test rig was designed & constructed for experimental measurements.
Manufacturing errors of tooth thickness (over balls/pins and span measurement), runout and adjacent pitch error and assembly errors of center distance and gear phasing were included in the predictions.
Table 5. Experimental Results in CD +0.1 mm.
Mating Teeth
Measured Backlash
Right Flanks (𝒖𝒖m)
Measured Backlash
Left Flanks (𝒖𝒖𝒖𝒖)
Predicted Backlash
Min & Max (𝒖𝒖𝒖𝒖)
11 & 22 75 78 64.6 & 87.0
22 & 11 74 81 65.9 & 88.2
33 & 44 78 71 59.8 & 82.1
44 & 33 75 72 58.5 & 80.9
Almost a full agreement was obtained in numerical
validation including tooth thickness and center distance variations. Experimental validation was also quite reasonable (with over 90% agreement) including both manufacturing and assembly errors/variations.
Table 6. Experimental and predicted backlash values for Different Center Distances and different tooth mesh conditions.
Mating Teeth
Measured Backlash
Right Flanks (𝒖𝒖m)
Measured Backlash
Left Flanks (𝒖𝒖𝒖𝒖)
Predicted Backlash
Min & Max (𝒖𝒖𝒖𝒖)
11 & 11
159 116 72 38
155 102 60 26
149.3 & 171.7 105.0 & 127.4
61.0 &83.3 24.4 & 46.7
22 & 22
155 99 59 34
152 110 54 21
143.2 & 165.5 98.9 & 121.3 54.9 & 77.2 18.3 & 40.7
33 & 33
149 108 66 33
144 96 54 30
137.0 & 159.4 92.8 & 115.2 48.8 &71.1 12.2 &34.6
44 & 44
143 110 54 21
148 106 52 20
143.2 & 165.5 98.9 & 121.3 54.9 & 77.2 18.3 & 40.7
11 & 44
139 111 60 23
154 103 51 17
145.6 & 168.0 101.4 & 123.7 57.3 & 79.6 20.7 & 43.1
22 & 44
160 115 70 24
163 105 62 33
143.2 & 165.5 98.9 & 121.3 54.9 & 77.2 18.3 & 40.7
44 & 22
160 115 70 24
158 113 67 30
143.2 & 165.5 98.9 & 121.3 54.9 & 77.2 18.3 & 40.7
44 & 33
154 115 70 24
158 113 67 30
139.5 & 161.8 95.2 & 117.6 51.2 & 73.6 14.7 & 37.0
9
MATEC Web of Conferences 287, 07001 (2019) https://doi.org/10.1051/matecconf/201928707001Power Transmissions 2019
Thanks to both Gaziantep University and AeroGDT Power Transmission Design and Test Systems Inc. for the supports provided for completion of the project.
Fig. 20.Graphical comparison of measured and predicted backlash with varying CD (teeth 44 & 44) Right flank contact.
Fig. 21. Graphical comparison of measured and predicted backlash with varying CD (teeth 44 & 44) Left flank contact.
References
1.Gupta, Kapil & Jain, Neelesh. (2016). Near-Net Shape Manufacturing of Miniature Gears by Wire Spark Erosion Machining. 10.1007/978-981-10-1563-2.
2. Dudley's Handbook of Practical Gear Design and Manufacture, Second Edition,Stephen P. Radzevich.
3. ANSI/AGMA 2002-C16, “Tooth Thickness and Backlash Measurement of Cylindrical Involute Gearing”, American Gear Manufacturers Association
4.George W. Michalec, “Precision Gearing Theory and Practice”, John Wiley & Sons, Inc., (1966).
5.Karba, Bahadır &Yıldırım, Nihat. (2018), Backlash Prediction of a Spur Gear Pair with Manufacturing Errors of Runouts, Span and Pitch Deviations.
6.BS ISO/TR10064-2:1996, Part 2: “Inspection related to radial composite deviations, runout, tooth thickness and backlash”.
7.Sarkar, N & Ellis, Randy & Moore, T.N. (1997). Backlash detection in geared mechanisms: Modeling, simulation, and experimentation. Mechanical Systems and Signal Processing. 11. 391–408.
8.Zhang, Jie& Zhang, Heng & Xiao, Xinxin. (2018). New Identification Method for Backlash of Gear Transmission Systems. 378-382.
9.Xihui Liang, Ming J. Zuo, Zhipeng Feng, Dynamic modeling of gearbox faults: A review, Mechanical Systems and Signal Processing, 98, (2018), Pages 852-876.
10.ANSI/AGMA 2015-1-A01, Accuracy Classification System – Tangential Measurements for Cylindrical Gears.
11. J. R. Colbourne, The Geometry of Involute Gears book, (1987) Springer, New York, NY.
12.C. Spitas& V. Spitas (2008) Effect of Cutter Pressure Angle on the Undercutting Risk and Bending Strength of 20° Involute Pinions Cut with Equivalent Nonstandard Cutters, Mechanics Based Design of Structures and Machines, 36:2, 189-211.
13.A. Tarantola. Inverse problem theory and methods for model parameter estimation. SIAM, Philadelphia, (2005).
14.https://www.agma.org/ Gear Rating Suite Version 2.2.02 Demonstration version, (2006).
15.https://www.kisssoft.ch, Release 2018.
-5102540557085
100115130145160175
132,00 132,04 132,08 132,12 132,16 132,20
MinimumMaximumMeasured
-5102540557085
100115130145160175
132,00 132,04 132,08 132,12 132,16 132,20
Bac
klas
h (u
m)
Center Distance (mm)
Minimum
Maximum
Measured
10
MATEC Web of Conferences 287, 07001 (2019) https://doi.org/10.1051/matecconf/201928707001Power Transmissions 2019