using simulation to design an automated underground system for transporting freight around schiphol...
TRANSCRIPT

Using Simulation to Design an AutomatedUnderground System for Transporting
Freight Around Schiphol Airport
M. C. van der Heijden • A. van Harten • M. J. R. EbbenUniversity of Twente, Faculty of Technology and Management, PO Box 217, 7500 AE Enschede, The Netherlands
Y. A. Saanen • E. C. Valentin • A. VerbraeckDelft University of Technology, Faculty of Technology, Policy and Management, PO Box 5,
2600 AA Delft, The [email protected] • [email protected] • [email protected]
• [email protected] • [email protected] • [email protected]
This paper was refereed.
To avoid road congestion, we are developing a highly automated underground transportsystem using automatic guided vehicles (AGVs) around Schiphol Airport. It is unique in itsscale, incorporating 16 to 25 km tubes connecting five to 20 terminals, and it includes 200 to400 AGVs to transport an estimated 3.5 million tons of cargo in 2020 with different orderingpriorities. According to the current plans, the system will run from 2006 on. Since 1997, wehave used object-oriented simulations to plan the dimensions of the system (number of AGVs,terminal sizes) and to design the layout (network, terminals). We showed that an investmentreduction of plus or minus 20 percent is feasible using periodically switched one-way tubesections. We developed a variety of logistics optimization algorithms and heuristics, includingallocating AGVs between terminals, scheduling terminals, and controlling traffic. We usedsimulation control structures to test prototype AGVs on a test site. Performing distributedsimulations with a mixture of simulated and real objects, we could reduce the risks of the newtechnology.{Simulation: applications. Transportation: models, networks.)
T he increase in cargo shipments worldwide is caus-ing congestion, especially around such traffic
hubs as airports and harbors. Good facilities for mov-ing cargo lead to a concentration of business activitiesand increasing volumes of inbound and outboundcargo. To accommodate increasing cargo, the mainhubs must be accessible. New infrastructure should ac-commodate increasing flows of cargo. Efficient andspeedy shipments are especially important for time-critical goods, such as air cargo (newspapers and per-ishables). Delays caused by congestion may decreasethe value of such time-critical goods. Tlie scarcity ofspace in densely populated areas hampers such clas-
sical solutions as simply enlarging the capacity ofroads.
Near Amsterdam, the increasing congestion forcedthe government, in cooperation with such businesspartners as Schiphol Airport, the world's largest flowerauction at Aalsmeer, and logistics service providers, toconsider underground construction. Using AGVs (au-tomatic guided vehicles) in underground tube systemsseemed an attractive possibility. Combined with au-tomated transport, loading and unloading, and logis-tics planning and control, AGVs in underground tubescan form an efficient, fast, flexible, and reliable cargotransport system. Therefore, the stakeholders, being
0092-2102/02/3204/0001 $05,001526-551X electronic ISSN
INTERFACES, © 2002 INFORMSVol. 32, No. 4, July-August 2002, pp. 1-19

VAN DER HEIJDEN, VAN HARTEN, EBBEN, SAANEN, VALENTIN, AND VERBRAECKAn Axitomaicd Underground System
the government and the major business partners, pro-vided research grants to an independent institute(Connekt) to carry out an in-depth investigation ofsuch a system's technical feasibility, its merits for re-liable logistics service, its environmental benefits, andits costs.
The system should be fully automated and competewith road transport. It should stimulate multimodaltransport to reduce pollution. It vdll connect the modesair, rail, and road and is called the OLS (the Dutchabbreviation for underground logistics system). Theinvestment required is between $250 million and $500million, depending on the system design and the net-work layout. We show three options out of many thathave been developed by a multidisciplinary expert
The planned tube length is 16 to 25km, connecting five to 20 terminals.
team, based on technical, logistic, constructional, andurbanistic issues (Figure lA-lC). Researchers fromseveral disciplines cooperated to assess the OLS, to op-timize the system design, and to explore its technolog-ical and economic viability. These disciplines includedunderground construction, AGV and mechatronics,automated docking and warehousing, information andcommunication technology, logistics, simulation, andeconomics.
In 1997, Connekt formed four multidisciplinary pro-ject teams, each focusing on a specific set of subprob-lems. A steering committee, consisting of the mainstakeholders, coordinated the activities and decidedupon issues that cross project-team boundaries. One ofthe project teams focused on transport technology andthe design of a control system. Therefore, FROG Nav-igation Systems, a well-known Dutch producer ofAGV control systems, was a member of the projectteam. Our simulation group belonged to this team aswell. Now, in 2001, the project teams are working onsome last design issues. Further, a project team isworking on the foundation of a public-private part-nership of government and major business partners forthe funding and the realization of the OLS. This part-nership will have the infrastructure built, and as itsowner, it will be responsible for its future maintenance.
It will rent the system to an exploitation company thatoperates the AGVs. We expect that they will make afinal decision on realization in 2002. The project teamprojects that the first phase of the OLS will be opera-tional in 2006.
Innovative Aspects and SystemCharacteristicsCompared with existing AGV systems for internaltransport, the OLS is to be much larger. The plannedtube length in the network is 16 to 25 km, connectingfive to 20 terminals, and it should transport 3.5 mil-lion tons of cargo in 2020. The OLS Project Organi-zation (2000) estimates that the revenues from logis-tics activities will be US $ 65 million in 2020. TheAGVs must travel fast to ensure short throughputtimes (six meters per second (m/s) in tubes and twom/s at terminals). An AGV should handle 10-foot air-craft pallets (Figure 2). Thus these AGVs must be con-siderably faster and larger than the AGVs currentlyused in warehousing and production systems (with alength of 1.5 to 2.0 meters and a speed of 0.5-1.0 m/s). Also, the tube diameter should be wide (five me-ters). Such tubes cost about $20 million per km, notincluding facilities for energy, maintenance, andsafety. Depending on the network layout, growth sce-nario, and throughput-time requirements, we expectit to require 200 to 400 AGVs.
We achieved flexibility by employing independentlyfree-ranging AGVs, that is, AGVs that can travel anyroute guided by a magnetic grid. Especially at the un-derground terminals, these AGVs make efficient use ofscarce space. Along with the magnetic grid, the AGVsuse sensors to control their distance from each other.They conform to the brick-wall principle, that is, theyshould be able to stop in time to avoid hitting theirpredecessor, even if that AGV halts instantaneously.Allowing for an emergency deceleration rate of twometers per square second (normally one m/s') andtaking into account some safety margin, the AGVs,when traveling at full speed, should leave a minimumdistance of 21.2 meters from the front of one to thefront of the next. The various technical requirementsfor the OLS project mean that a new design of AGVwill be needed. Irmovations will also be required in the
•* ' INTERFACES
Vol. 32, No. 4, July-August 2002

VAN DER HEIJDEN, VAN HARTEN, EBBEN, SAANEN, VALENTIN, AND VERBRAECKAll Automated Uiidergnnuid System
Copyright TravelManager, Andes BV—Eindhoven—Netherlands. Reprinted with permission.
Figure 1A: We considered several trajectories lor the OLS ttiat the project team on underground construction
developed. Ot these, we stiow ttiree trajectories, the trajectory preferred in 1997 (A), in 1998/1999 (B), and in
2000 and iater (C). Amsterdam Airport Schiphoi (AAS) is at the upper right, and the Fiower Auction Aaismeer
(VBA) is at the bottom right. During the project, the project team on underground construction proposed to move
the raii terminal (RT) trom Hootddorp to Schiphoi. in 1998, they introduced tuhe sections to he shared hy traffic
in two directions to reduce infrastructure investment. A puhlic-private partnership must decide which layout will
actually he implemented. At the moment ot writing, they preter option (C). As an indication ot the scale ot the
maps, the length ot the one-way tuhe section hetween AAS and VBA is 2,700 meters.
designs for terminals and automated loading docks.AGVs will have to be loaded and unloaded at docksvery quickly to minimize terminal size and invest-ment. A target for automated docking is to load or un-load an AGV within one minute. At that speed, a ter-minal might need one to 16 loading docks, dependingon the inbound and outbound flows of cargo.
To operate the new technology in a reliable and ef-ficient way, the complex would need an innovativeplanning and control system for logistics. It wouldneed to manage empty cars (prepositioning AGVs tomeet predicted demand), schedule terminals, and con-trol traffic. The new technology and the accompanyingcontrol systems would have to be tested. We tested the
INTERFACESVol. 32, No. 4, July-August 2002

VAN DER HEIJDEN, VAN HARTEN, EBBEN, SAANEN, VALENTIN, AND VERBRAECK
All Aiitomaleii Underground Si/sfcm
AalsmeerA a l s m e e r
Copyright TravelManagar, Andes BV—Eindhoven—Netherlands. Reprinted with permission.
Figure 1B.
prototype AGVs and the loading docks with their con-trol systems at a test site. The steering committeejudged this to be very important, especially becausethe high level of automation induces the risk of re-source failure (AGVs, loading docks, and control sys-tems). Simulation played an important role in theproject.
A Central Role for SimulationTo plan the system, a multidisciplinary team took intoaccount its technical, logistic, economical, and legal as-pects and made trade-offs. We used simulation modelsto provide decision makers with a common structure
for making trade-offs and to aid communication be-tween project teams. Our group, the simulation group,was part of the project team on transport technologyand control systems, which dealt with designing theinfrastructure (terminals, docks, track system), assess-ing logistics performance, and testing the control tech-nology. The project team designed terminals anddocks using an iterative process with the aid of oursimulation models. Given the functional requirementsdefined by the overall OLS steering committee, theproject team made decisions on technical design issuessubject to the approval of the steering committee. Wesupported issues involving several project teams withsimulation as well. For example, we used simulation
INTERFACESVol. 32, No. 4, July-August 2002

VAN DER HEIJDEN, VAN HARTEN, EBBEN, SAANEN, VALENTIN, AND VERBRAECKAll Autotmted Underground System
Copyright TravelManager, Andes BV—Eindhoven—Netherlands. Reprinted wilii permission.
Figure 1C.
to assess the impact of system layouts designed by theunderground construction team on logistics perfor-mance (throughput times and the fraction of ordersdelivered on time). Also, we measured energy use inour simulations for use as an input for an environ-mental study, comparing the OLS and traditional roadtransport.
Research QuestionsWe worked on many research problems and practicalissues using simulation, including the following re-search questions:
(1) How many AGVs and docks will be needed for
adequate logistics performance for different networklayouts? In particular, can capital investment be re-duced by inserting periodically switched one-way tubesections without damaging logistics performance?
(2) Which terminal and dock design will lead to anoptimal balance between terminal capacity, orderthroughput times, and space requirements?
(3) Which AGV failure rate should we use as a targetin designing vehicles?
(4) What way of providing energy (batteries or elec-tric wires in tubes) is best?
(5) Which structure for planning and controllinglogistics is appropriate for the OLS?
(6) How must we refine the control system to make
INTERFACES
Vol. 32, No. 4, July-August 2002
VAN DER HEIJDEN, VAN HARTEN, EBBEN, SAANEN, VALENTIN, AND VERBRAECKAn Automated Underground System
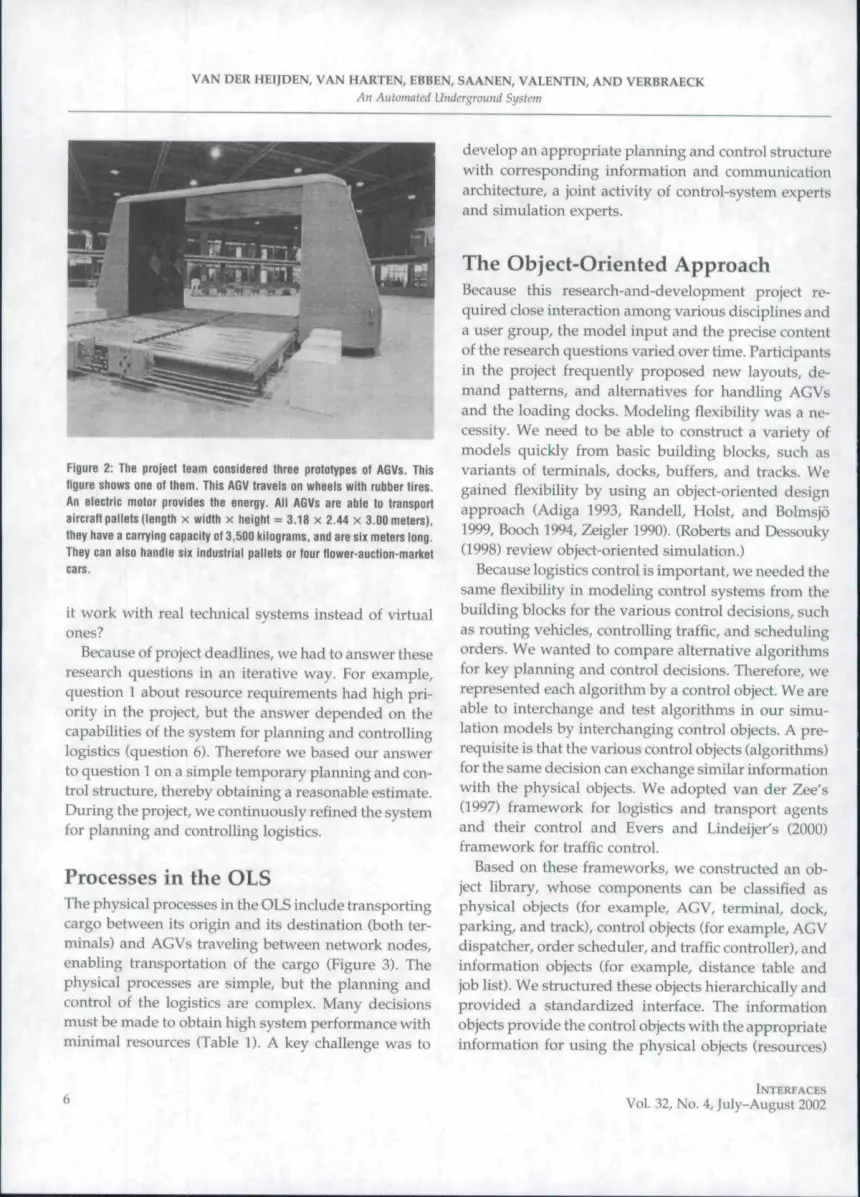
Figure 2: The proiect team considered three prototypes of AGVs. This
figure shows one of them. This AGV travels on wheels with rubber fires.
An elecfric motor provides Itie energy. All AGVs are able to transport
aircraft pallets (length x width x height = 3.18 x 2.44 x 3.00 meters),
fhey have a carrying capacity of 3,500 kilograms, and are six meters long.
They can also handle six industrial pallets or four flower-auGfion-market
cars.
it work with real technical systems instead of virtualones?
Because of project deadlines, we had to answer theseresearch questions in an iterative way. For example,question 1 about resource requirements had high pri-ority in the project, but the answer depended on thecapabilities of the system for planning and controllinglogistics (question 6). Therefore we based our answerto question 1 on a simple temporary planning and con-trol structure, thereby obtaining a reasonable estimate.During the project, we continuously refined the systemfor planning and controlling logistics.
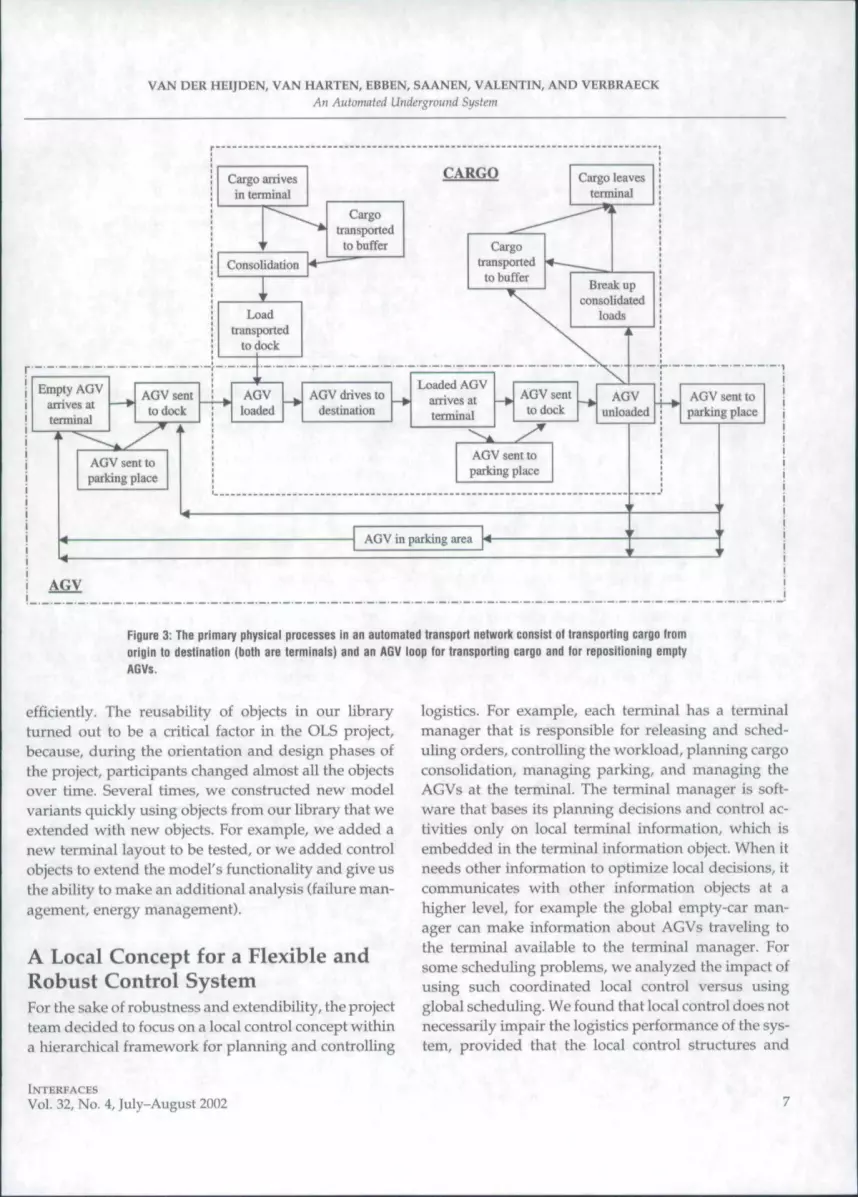
Processes in the OLSThe physical processes in the OLS include transportingcargo between its origin and its destination (both ter-minals) and AGVs traveling between network nodes,enabling transportation of the cargo (Figure 3). Thephysical processes are simple, but the planning andcontrol of the logistics are complex. Many decisionsmust be made to obtain high system performance withminimal resources (Table 1). A key challenge was to
develop an appropriate planning and control structurewith corresponding information and communicationarchitecture, a joint activity of control-system expertsand simulation experts.
The Object-Oriented ApproachBecause this research-and-development project re-quired close interaction among various disciplines anda user group, the model input and the precise contentof the research questions varied over time. Participantsin the project frequently proposed new layouts, de-mand patterns, and alternatives for handling AGVsand the loading docks. Modeling flexibility was a ne-cessity. We need to be able to construct a variety otmodels quickly from basic building blocks, such asvariants of terminals, docks, buffers, and tracks. Wegained flexibility by using an object-oriented designapproach (Adiga 1993, Randell, Hoist, and Bolmsjo1999, Booch 1994, Zeigler 1990). (Roberts and Dessouky(1998) review object-oriented simulation.)
Because logistics control is important, we needed thesame flexibility in modeling control systems from thebuilding blocks for the various control decisions, suchas routing vehicles, controlling traffic, and schedulingorders. We wanted to compare alternative algorithmsfor key planning and control decisions. Therefore, werepresented each algorithm by a control object. We areable to interchange and test algorithms in our simu-lation models by interchanging control objects. A pre-requisite is that the various control objects (algorithms)for the same decision can exchange similar informationwith the physical objects. We adopted van der Zee's(1997) framework for logistics and transport agentsand their control and Evers and Lindeijer's (2000)framework for traffic control.
Based on these frameworks, we constructed an ob-ject library, whose components can be classified asphysical objects (for example, AGV, terminal, dock,parking, and track), control objects (for example, AGVdispatcher, order scheduler, and traffic controller), andinformation objects (for example, distance table andjob list). We structured these objects hierarchically andprovided a standardized interface. The informationobjects provide the control objects with the appropriateinformation for using the physical objects (resources)
INTERFACESVol. 32, No. 4, July-August 2002
VAN DER HEIJDEN, VAN HARTEN, EBBEN, SAANEN, VALENTTN, AND VERBRAECKAn Automated Underground System
Cargo arrivesin terminal
CARGO
Consolidation
Cargotransported
to buffer
Cargo leavesterminal
Cargotransported
to buffer
Loadtransported
to dock
±:
Break upconsolidated
loads
Empty AGVarrives attenninal
AGV sentto dock
AGVloaded
AGV drives todestination
AGV sent toparking place
Loaded AGVarrives attenninal
AGV in parking area
AGV
Figure 3: The primary physical processes in an automatett transport tistworh consist of Iransporting cargo fromorigin to tiestinallon (both are terminals) anti an AGV loop ior transporting cargo and for repositioning emptyAGVi.
efficiently. The reusability of objects in our libraryturned out to be a critical factor in the OLS project,because, during the orientation and design phases ofthe project, participants changed almost all the objectsover time. Several times, we constructed new modelvariants quickly using objects from our library that weextended with new objects. For example, we added anew terminal layout to be tested, or we added controlobjects to extend the model's functionality and give usthe ability to make an additional analysis (failure man-agement, energy management).
A Local Concept for a Flexible andRobust Control SystemFor the sake of robustness and extendibility, the projectteam decided to focus on a local control concept withina hierarchical framework for planning and controlling
logistics. For example, each terminal has a terminalmanager that is responsible for releasing and sched-uling orders, controlling the workload, planning cargoconsolidation, managing parking, and managing theAGVs at the terminal. The terminal manager is soft-ware that bases its planning decisions and control ac-tivities only on local terminal information, which isembedded in the terminal information object. When itneeds other information to optimize local decisions, itcommunicates with other information objects at ahigher level, for example the global empty-car man-ager can make information about AGVs traveling tothe terminal available to the tenninal manager. Forsome scheduling problems, we analyzed the impact ofusing such coordinated local control versus usingglobal scheduling. We found that local control does notnecessarily impair the logistics performance of the sys-tem, provided that the local control structures and
INTERFACESVol. 32, No. 4, July-August 2002

VAN DER HEIJDEN, VAN HARTEN, EBBEN, SAANEN, VALENTIN, AND VERBRAECKAll Automated Underground Si/stem
Level Control Object Function
Network
Node: terminal,central parking,one-way tube
Resources
Demand forecastingGlobal empty-car managementSystem-failure manager
AGV routingOrder releaseOrder schedulingTerminal-workload controlOne-way-tube controlCargo-consolidation planning
Parking managerLocal empty-car management
AGV energy management
Resource-faiiure managerTraffic controi
Predicting future orders in various priority classesDistributing AGVs to terminais, based on predicted demandInitiating failure remediation, for exampie assigning a rescue vehicle to
tow away a broken vefiicieAssigning a route to an AGV, given its iocation and destinationGiving permission for an order to be scheduledAssigning an order to an AGV and a dock for loading or unloadingControlling the number of AGVs at the terminal to avoid congestionSetting the traffic direction for tubes shared by traffic going in both directionsConsolidating orders tor AGV loads, based on destination, weight, and release
and due timesAssigning vehicles to specific parking placesAssigning empty AGVs to iocations within a terminal (parkings or docks) or
dispatching vehicles on request to other terminaisDetermining when and where AGVs should change batteries (optionai, depending
on energy system)Prohibiting the use of failed AGVs and docks and redirecting assigned cargoControiiing intersections and prioritizing AGVs waiting for intersections
Table 1: By creating separate control objects wilh clear interfaces, we separated the logistics-planning-and-control structure from tbe physical system. In tbis way, we constructed a flexible library to test several alter-natives for tbe main planning and control issues. We distinguisbed tbree levels in the planning hierarcby:network, node (terminal, central parking, one-way tube), and resource (AGV. dock, track).
information exchange between objects are appropriate(Appendix). Also local control reduces the communi-cation needed for making decisions. Local controlworks well in a multiuser system, such as the OLS.
Two Statistically Linked ModelsThe questions to be covered in the OLS project rangefrom questions at the resource level about AGV designand traffic control to questions at the network levelabout layout, system dimensions, and allocation ofAGVs to terminals. In principle, it would be possibleto construct one huge model, incorporating all details,but it is not practical to do so because we need to main-tain the models and run them fairly quickly. Also, be-cause system performance may be influenced by AGVcharacteristics, such as the safety distance betweenAGVs, we decided to construct two statistically linkedsimulation models: a network model and a trafficmodel. These two models meet at the terminal level(Figure 4).
In the network model, AGVs travel in a simplifiedmanner, for example, they accelerate and decelerate
instantaneously and require no extensive traffic con-trol. We derived the effective driving speed at termi-nals, corrected to reflect the details of AGV behaviorand interactions at crossings and junctions, from thutraffic model as a statistical function of the number ofAGVs. Also, we controlled the distance between AGVsat a few critical locations (such as terminal entrancesand one-way tubes). On the other hand, the terminalin the traffic model uses the arrival patterns of AGVs
AGV arrivalpatterns atterminals
Network model
Traffic model
'Effective AGVspeed
•Distances betweenAGVs
Figure 4: We developed two simulation models: a network model, focusingon logistics network control, layout choice, and performance measure-ment; and a traffic model, focusing on traffic control, terminal and dockdesign, and AGV bebavior. Tbe models are linked by information ex-cbange: AGV and order information goes from the network model to thetraffic model, and the effective driving speed of AGVs and the loading andunloading times go from tbe traffic model to Ibe network model.
• ' ' .
INTERFACESVol. 32, No. 4, July-August 2002

VAN DER HEIJDEN, VAN HARTEN, EBBEN, SAANEN, VALENTIN, AND VERBRAECKAn Automated Underground System
and the loads derived from the network model. In thisway, we guaranteed consistency between the twomodels.
Calculating Required Resources forVarious Network Layouts (ResearchQuestion 1)To analyze and estimate the needed investment, wehad to estimate the needed resources, such as the num-ber of AGVs and the number of docks per terminal.We investigated the relationship between capacity andperformance using simulation. As input to the simu-lations, we used estimates of transport demand for theOLS for the next 20 years, derived from Dutch nationaltransport statistics (GTT 1997). As the reference pointfor deterniining the dimensions of the system, wechose the year 2020. We performed growth path anal-ysis as well. We included variations in volume overthe day and between days, because peaks affect systemperformance. We specified transport jobs by their duetimes and priority classes, defined by throughput-timerequirements (between 30 minutes and two hours).The main indicator for logistics service was the per-centage of cargo delivered on time. We generatedmany other performance indicators as well, such asthroughput-time distribution, resource utilization,buffer occupation, AGV queue sizes, energy consump-tion, and failure statistics. We estimated the major re-source requirements for various layouts (Table 2). Forthe layout shown in Figure lA, we found that the sys-tem could meet the required throughput times in 2020with 220 AGVs and five docks at terminal VBA, 12 atRT, and two at AAS. With these resources, 99 percentof orders would be delivered on time.
Docks per Terminal
Layout AGVs RT VBA AAS Orders On-Time
A, 1997 220 12 5 2 99%B, 1998/1999 360 12 12 3 97WoC, 2000 and on 250 8 8 1-2 99%
Table 2: Resource requirements and service levels depended on Ihe sys-tem layout (Figure 1) we used as input in calculating the required invest-ments.
Using an alternative layout (Figure IB), the projectcould save about $150 million on infrastructure (ini-tially $500 million). This layout includes three peri-odically switched one-way tubes on the long-distancelinks, with lengths of 2.7 km (VBA to AAS), 2.3 km(AAS to RT), and 0.75 km (between the terminals atAAS). The travel time for a single AGV through thesetubes is up to 7.5 minutes. This implies that AGVs atthe other end of the track would incur long waits. Thelogistics consequences of using this layout are (1) thattransport times would increase and would vary, (2)that convoys of up to 100 AGVs would be created dur-ing peak hours, causing heavily fluctuating work loadsat the terminals, and (3) that the one-way tubes wouldbe potential bottlenecks. Our simulations revealed thatthis layout would be feasible from a logistics perspec-tive if we used somewhat larger terminals and 140 ad-ditional AGVs, but the average throughput timewould increase by 15 minutes, reducing on-time ser-vice to 97.5 percent. Nevertheless, because docks andAGVs are cheaper than constructing undergroundtubes (an AGV costs about $75,000), this layout wouldguarantee profitability. Moreover, to use this layout,the system would need enough waiting space forAGVs at the entrances to terminals and one-way tubes(up to 700 m) because of congestion.
Later we investigated a third layout (Figure lG).This layout includes 18 miniterminals at AAS to facili-tate internal transport between the local warehouses ofthe cargo shippers and the providers of logistics ser-vice, and an alternative location near AAS for the railtenninal. Relocating the rail terminal reduces the dis-tance between it and Schiphol Airport by about fourkilometers and makes one one-way tubes unnecessary.A disadvantage is that the new rail terminal would bemore expensive, because it would have to be con-structed underground. Therefore, the space for equip-ment and buffering would be Hmited. To analyze thelogistics consequences of having only small buffers, wemodeled an approximation of the train arrival-and-departure processes. We found that, compared to thelayout in Figure IB, this layout would reduce through-put times to and from the rail terminal by about 15minutes, decrease the number of AGVs from 360 to250, and increase the on-time-service percentage to 99
INTERFACESVol. 32, No. 4, juIy-August 2002
VAN DER HEIJDEN, VAN HARTEN, EBBEN, SAANEN, VALENTIN, AND VERBRAECKAn Automated Underground System
percent. Investment calculations showed that this op-tion was preferable, especially because this systemwould be able to handle internal flows at Schiphol Air-port better than the other two layouts.
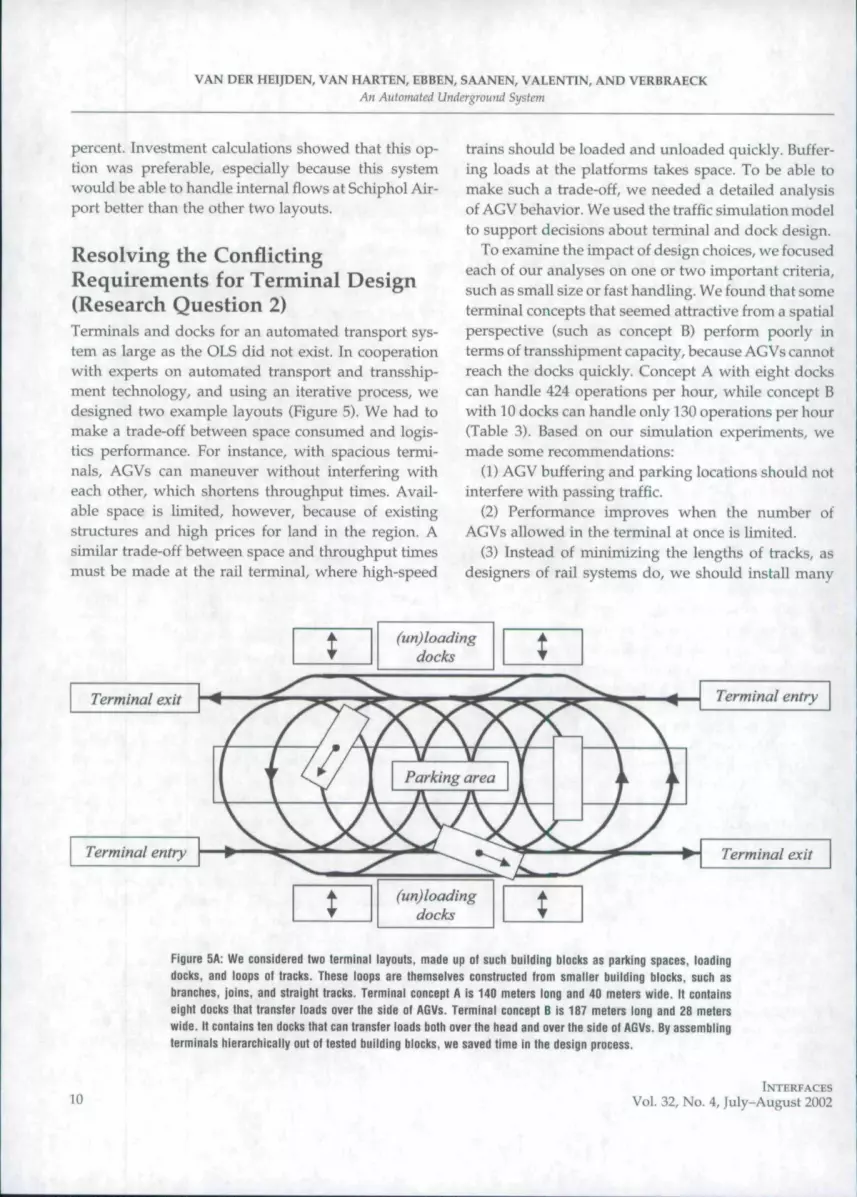
Resolving the ConflictingRequirements for Terminal Design(Research Question 2)Terminals and docks for an automated transport sys-tem as large as the OLS did not exist. In cooperationwith experts on automated transport and transship-ment technology, and using an iterative process, wedesigned two example layouts (Figure 5). We had tomake a trade-off between space consumed and logis-tics perforntance. For instance, with spacious termi-nals, AGVs can maneuver without interfering witheach other, which shortens throughput times. Avail-able space is limited, however, because of existingstructures and high prices for land in the region. Asimilar trade-off between space and throughput timesmust be made at the rail terminal, where high-speed
trains should be loaded and unloaded quickly. Buffer-ing loads at the platforms takes space. To be able tomake such a trade-off, we needed a detailed analysisof AGV behavior. We used the traffic simulation modelto support decisions about terminal and dock design.
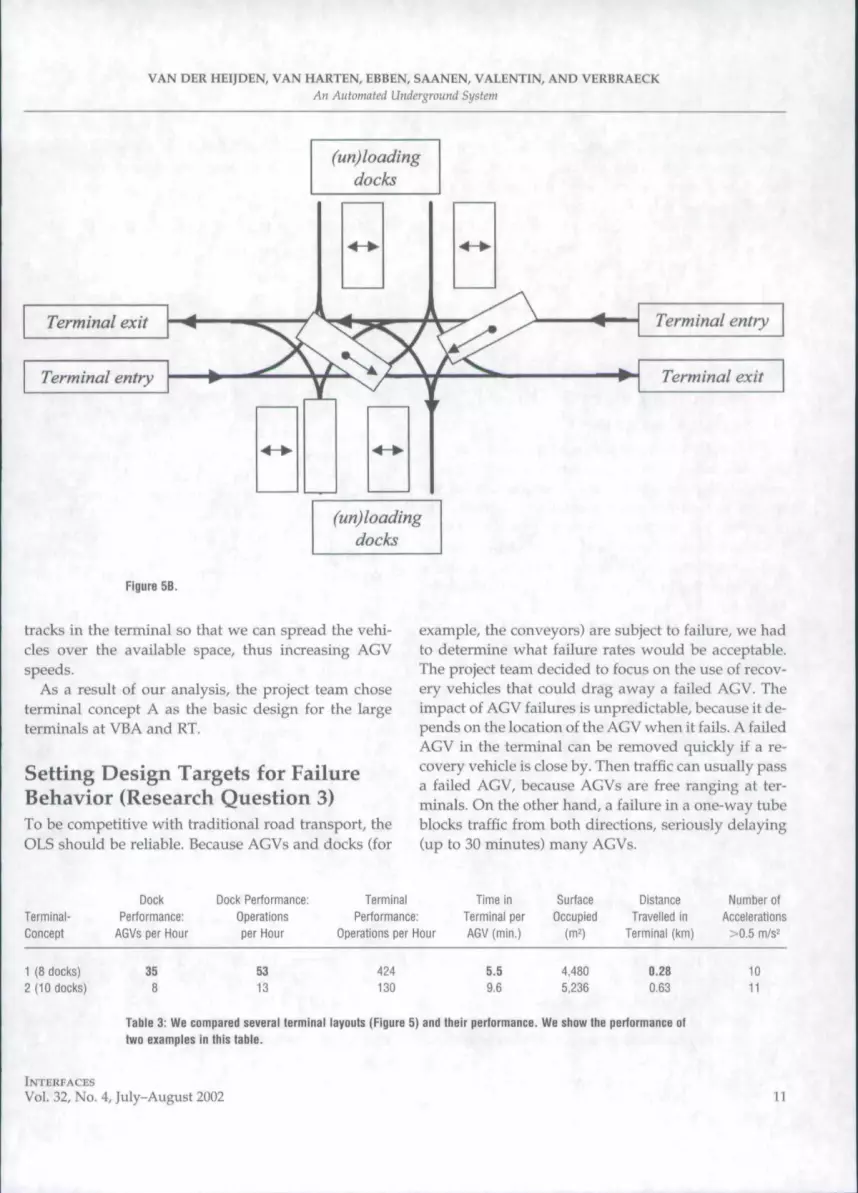
To examine the impact of design choices, we focusedeach of our analyses on one or two important criteria,such as small size or fast handling. We found that someterminal concepts that seemed attractive from a spatialperspective (such as concept B) perform poorly interms of transshipment capacity, because AGVs cannotreach the docks quickly. Concept A with eight dockscan handle 424 operations per hour, while concept Bwith 10 docks can handle only 130 operations per hour(Table 3). Based on our simulation experiments, wemade some recon\mendations:
(1) AGV buffering and parking locations should notinterfere with passing traffic.
(2) Performance improves when the number ofAGVs allowed in the terminal at once is limited.
(3) Instead of minimizing the lengths of tracks, asdesigners of rail systems do, we should install many
tTerminal exit
Terminal entry
t
(un) loadingdocks
Terminal entry
Terminal exit
(un) loadingdocks
Figure 5A: We considered two terminal layouts, made up ol such buiiding biocks as parking spaces, loading
docks, and loops ot tracks. Ttiese loops are ttiemselves constructed trom smaller building blocks, such as
branches, joins, and straight tracks. Terminal concept A is 140 meters long and 40 meters wide. It contains
eight docks that transter loads over the side ol AGVs. Terminal concept B is 187 meters long and 28 meters
wide. II contains ten docks that can transier loads both over the head and over the side ol AGVs. By assembling
terminals hierarchically out ot tested building blocks, we saved time in the design process.
10INTERFACES
Vol. 32, No. 4, July-August 2002
VAN DER HEIJDEN, VAN HARTEN, EBBEN, SAANEN, VALENTIN, AND VERBRAECKAn Automated Underground System
(un) loadingdocks
Terminal exit
Terminal entry
Terminal entry
Terminal exit
(un)loadingdocks
Figure 5B.
tracks in the terminal so that we can spread the vehi-cles over the available space, thus increasing AGVspeeds.
As a result of our analysis, the project team choseterminal concept A as the basic design for the largeterminals at VBA and RT.
Setting Design Targets for FailureBehavior (Research Question 3)To be competitive with traditional road transport, theOLS should be reliable. Because AGVs and docks (for
example, the conveyors) are subject to failure, we hadto determine what failure rates would be acceptable.The project team decided to focus on the use of recov-ery vehicles that could drag away a failed AGV. Theimpact of AGV failures is unpredictable, because it de-pends on the location of the AGV when it fails. A failedAGV in the terminal can be removed quickly if a re-covery vehicle is close by. Then traffic can usually passa failed AGV, because AGVs are free ranging at ter-minals. On the other hand, a failure in a one-way tubeblocks traffic from both directions, seriously delaying(up to 30 minutes) many AGVs.
Terminal-
Concept
1 (8 clocks)
2 (10 docks)
Dock
Performance:
AGVs per Hour
35
8
Dock Pertormance:
Operations
per Hour
53
13
Terminal
Performance:
Operations per Hour
mm
Time in
Terminal per
AGV{min,)
5.5
9.6
Surface
Occupied
W)
4,480
5.236
Distance
Travelled in
Terminal (km)
0.28
0.63
Number ol
Accelerations
>0.5 m/s^
10
11
Table 3; We compared several terminal layouts (Figure 5) and their performance. We show the performance ot
two examples in this table.
INTERFACES
Vol. 32, No. 4, July-August 2002 11

VAN DER HEIJDEN, VAN HARTEN, EBBEN, SAANEN, VALENTIN, AND VERBRAECKAn Automated Underground System
We found that dock failures would have little impacton terminals with multiple docks, whereas AGV fail-ures have greater impact. The simulations showed thatan AGV failure rate of once per 500 operating hourswould be acceptable. Experts judged that this failurerate would be technically feasible, and they adopted itas a design target. Still AGV failures would be a dailyissue given the number of AGVs in the system (200 to400), and failure management should be part of thestandard operations of the overall OLS control system.
Supporting the Design of a Systemfor Providing Energy for the AGVs(Research Question 4)The AGVs (1) travel using an electric motor (linear in-duction), and (2) range freely at the terminals. To movefreely at the terminals, the AGVs need to carry batter-ies. They could rely on charge rails in the tubes. Thedesign options include (1) various types of batteries(lead-acid or nickel-cadmium), and (2) various ways ofproviding electricity: either swapping batteries or us-ing charge rails in the tubes to recharge the batteries.Given that the charging time would be equal to thetraveling time, recharging batteries on board wouldnot be an option. For swapping batteries, we wouldhave to determine the number, size, and location ofswapping facilities and when and where AGVs shouldswap their batteries. We performed this analysis usingthe network model, because the various options wouldaffect global performance. The energy required woulddepend on AGV behavior, in that acceleration and de-celeration require more energy than traveling at a con-stant speed. The network n\odel uses statistics aboutenergy consumption from the traffic model.
Our experiments showed that the project would ob-tain the best logistics performance by using chargerails in the tube rather than battery swapping. Wefound that swapping times of five minutes for chang-ing batteries would require very large battery stationsif drastic effects on system performance were to beavoided. These stations would require large invest-ments. If we could reduce swap time to one minute,we could swap batteries at the docks while the AGVswere being loaded or unloaded. We also found thatlead-acid batteries were preferable to nickel-cadmium
batteries from a financial point of view, even thoughthey take longer to recharge and degrade faster.
Efficient Planning and Control(Research Question 5)We developed several variants of control objects (Table1) to analyze their impact on logistics performance. Wediscuss three control objects, one on each level in themodeling hierarchy: empty-car management, one-way-tube control, and traffic control (Appendix).
Managing empty cars (prepositioning AGVs to meetpredicted demand) is important, as are managingtruck and rail-wagon fleets (Powell et al. 1988, Powelland Carvalho 1998). Depending on known and ex-pected orders and their priorities, the manager wouldrelocate empty AGVs from terminals with excessAGVs to terminals with shortages, taking into accountthe scheduled arrival times of loaded AGVs. We con-sidered several methods, including (1) a simple first-come-first-serve (FGFS) method, (2) a coordinatedlook-ahead heuristic with information exchangeamong terminals, (3) a method based on logistics queu-ing networks (Powell and Carvalho 1998), and (4) aserial scheduling method. The serial schedulingmethod integrates empty-car management with orderscheduling. Therefore we could also compare local lo-gistics control and integral logistics control.
Comparing on-time-service percentages for allmethods (Appendix), we found that the coordinatedlook-ahead rule (method 2) and the serial schedulingmethod (method 4) work best. This shows that localcontrol is not necessarily worse in a practical sense
Buffering loads at the platforms takesspace.
than integral control. Serial scheduling performs betterthan coordinated look-ahead for some special casesand requires five to 10 percent fewer kilometers inmost instances. Because coordinated look-ahead fitsbetter with local control, we recommended it. We alsoinvestigated the impact of incorporating early infor-mation about orders (van der Heijden et al. 2002,Ebben 2001). We found that knowing about orders 30
12INTERFACES
Vol. 32, No. 4, July-August 20(12

VAN DER HEIJDEN, VAN HARTEN, EBBEN, SAANEN, VALENTIN, AND VERBRAECKAn Automated Underground System
minutes in advance is all that is required in that themaximum travel time between terminals is 30 minutes.Our results provicie input for decisions about the in-formation and control systems that are to be imple-mented. More information leads to better logistics per-formance and fewer required resources, but it may alsorequire more expensive information systems.
For one-w^ay-tube control, a simple solution is a"traffic-light" solution, in which the permitted direc-tion for travel in the one-way tube is switched peri-odically. However, we found this simple solution im-practical, because the logistics performance wassensitive to the switching frequency and because thenumber of AGVs per direction changes over the day
AGV failures would be a daily issue.
and may be asymmetric. Therefore we developed sev-eral adaptive rules for one-way-tube control, includingsimple rules based on the number of AGVs waiting ateach side of the tube, look-ahead rules, and dynamic-programming-based algorithms, all with the goal ofminimizing waiting times (Appendix). We found thatadaptive control rules perform well and are robust inthat they deal properly with changing workloads overthe day. Dynamic programming yields the best resultsbut also requires the most information. In fact, thetrade-off is between more advanced information sys-tems versus 10 additional AGVs. We provided our re-sults as input for the investment calculations.
Because of traffic interactions at crossings, accesslanes, and one-way tube entrances, the OLS will re-quire a new type of traffic-control system. The existingAGV traffic control technology is considered to be re-liable but inefficient in its use of space, and space is ascarce resource in our case (Evers and Lindeijer 1999,Evers et al. 2000). Therefore, we adapted the TRACES(Traffic Control Engineering System) concept, a new,intelligent AGV traffic-control framework developedby Evers and Lindeijer (1999). This traffic-control sys-tem is based on semaphores, that is, dynamic control-lers for the workload (number of AGVs) on each infra-structure section using a ticket system. Thus, thesystem avoids conflicts over section use. AGVs act ina decentralized way in deciding which route to takewhen they arrive at a decision point (for example, a
terminal entrance), so that the traffic-control systemprevents local congestion (Appendix).
As a step towards implementing TRACES, we usedsimulation in cooperation with FROG Navigation Sys-tems. The issues we had to solve to implement theTRACES principles in the simulation environment in-clude the following:
—We had to define claim areas to be guarded bysemaphores in such a way that we avoided AGVs be-coming deadlocked. Because AGVs make their claimsindependently, simultaneous claims by several AGVsmay lead to deadlocks. Therefore, we tested the lay-outs and their semaphores thoroughly until the lay-outs were free of deadlocks.
—Because of the time required for an AGV to com-municate its claim to use a section and for the traffic-control system to grant the claim, a second AGV maytry to claim the same area during this time. Therefore,we had to lock up the claim process with a so-calledcommunication semaphore.
—TRACES did not take into account the AGV brak-ing time. Because an AGV must be able to stop beforeentering the next area, the time for requesting entranceto that area must be scheduled to take the actual AGVspeed into account.
We found that TRACES provides a safe mechanismfor routing AGVs through a complex infrastructure.We used semaphores for small pieces of infrastructure,such as crossings and branches, and for large areas,such as terminals. To prevent congestion in the ter-minal, we restrict the number of AGVs in a terminalwith a semaphore. Such a terminal semaphore can re-duce AGV throughput times by 25 percent by pre-venting them from hindering each other.
Validating and Refining the Traffic-Control System at the Test Site(Research Question 6)Because the technology was new, we wanted to testthe equipment and control systems under laboratoryconditions. To this end, the steering committee orderedthe construction of a 40 m. X 40 m. test site in Delft,consisting of scale models and life-size prototypes ofAGVs and docks. The test site focuses on automatedtransport and loading, automated control systems, and
INTERFACESVol. 32, No. 4, July-August 2002 13

VAN DER HEIJDEN, VAN HARTEN, EBBEN, SAANEN, VALENTIN, AND VERBRAECKAn Auloimited Underground System
automated information exchange without human in-tervention. We used the traffic-simulation model as areal-time control system to test and refine TRACES.We did not use real-time simulations for our first fiveresearch questions, because we needed to get reliableindicators of system performance quickly. Since wecould implement only a small part of the OLS-systemat the test site, v̂ 'e had to simulate the other part of thesystem, including the physical equipment. Therefore,we linked the simulation to the test-site system for con-trolling AGVs and docks.
At the test site, our simulation libraries acted as pro-totypes for the real-time control system. We thusavoided spending the time needed to develop the realcontrol system, estimated to be between nine and 18months. However, replacing simulated componentswith real objects in our models implied a number ofconsequences:
—We found that in the simulation environment thecontrol object used information residing with thephysical objects without proper requests. This problemwould have to be resolved when the simulation modelused real objects.
—In contrast to simulated AGVs, real AGVs' failurescause deviations in the process, and the control systemmust be informed of such deviations. Therefore, wehad to define additional failure functions.
—In reality, AGVs skid, turn differently, and posi-tion themselves less exactly than software AGVs.These deviations caused deadlocks, so we had to de-fine extra margins for the semaphores. >•.
Lessons LearnedThe object-oriented approach we used appeared to befruitful for a complex design project like the OLS withits many uncertainties. We developed a basic objectlibrary to answer questions in the first phase of the
The models gave a clear direction tothe design process.
project. Later on, we refined the objects as the projectrequired. We could include new aspects, such as pro-viding energy, by adding the appropriate physical ob-
jects with corresponding information and control ob-jects, Our experience is in line with others' experiencesin object-oriented simulation (Roberts and Dessouky1998). Also our traffic-object library gave the terminal-and-dock-design subproject a real boost, facilitatingflexible experiments. Further, the models gave clear di-rection to the design process and fostered designers'creativity. During the terminal-design experiments, wesimulation experts spent about 40 percent of our timeon communication and on exchanging results withother members of the multidisciplinary design teams,which is worthwhile for building consensus.
Although we were very satisfied with the flexibilityoffered by the object-oriented approach, we also real-ized that a true object-oriented library is not as easy toconstruct as theory suggests. For example, we could
Cooperation in a multidisciplinaryteam provides great benefits.
not add failure behavior to our models by adding newobjects for failure management; we had to add func-tionality to many objects that should react to failures,such as the empty-car manager (send a new vehicle tohandle an order when an AGV fails) and the one-way-tube controller (do not switch the driving direction ina one-way tube section if a failed AGV is present).
Once we finished the object-oriented library, weshifted our attention to tuning control objects. Wefound that a new model constructed from our libraryran but showed poor logistics performance. For ex-ample, in the project phase, when we added physical,information, and control objects for one-way tube sec-tions to our library and models, our model ran, but ourempty-car manager handled the strong fluctuations inthroughput times that arose from waiting at the one-way tubes badly. We must design independent controlobjects but must also design control objects that arerobust. Even with an object-oriented approach, onemust adapt the existing control objects to cope withchanged requirements. In the end, logistics perfor-mance is determined by the contents and interactionof objects and not by the library structure.
The experiments at the test site proved to be a nec-essary step before building the real OLS system. As faras we know, no one has described linking virtual and
14INTERFACES
Vol. 32, No. 4, July-August 2002
VAN DER HEIJDEN, VAN HARTEN, EBBEN, SAANEN, VALENTIN, AND VERBRAECKAn Automati'd Undergrinitid SijMein
Methods of Managing Empty Cars Monday Tuesday Friday
First-come-first-sen/e (FCFS)
FCFS, order known 30 minutes in advance
Coordinated look-ahead heuristic
Logistics queuing network approach
Serial scheduling approach
94.7%
97.1%
99.8%
99.5%
99.9%
80.3%
89.9%
99.1%
97.7%
98.9%
85.5%
93.2%
99.7%
98.8%
99.6%
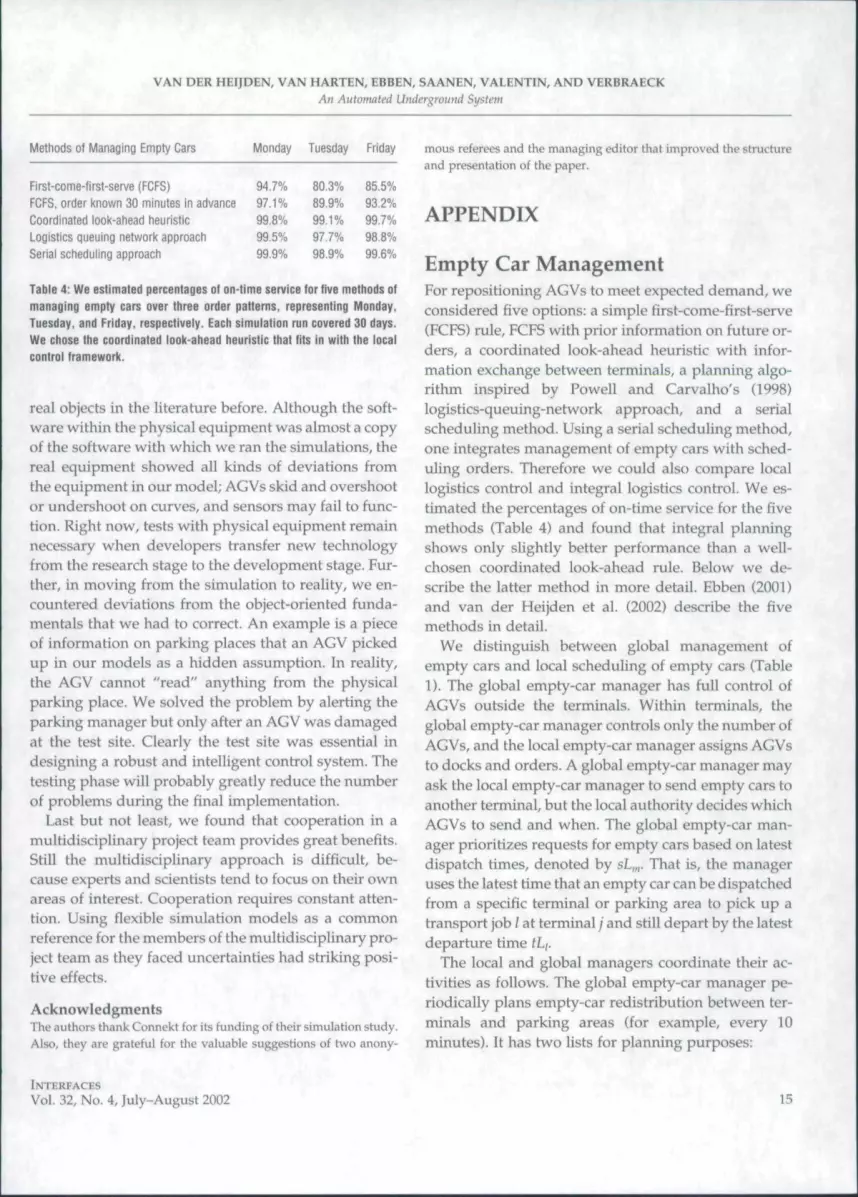
Table 4: We estimated percentages ot on-time service tor five mettiods ot
managing empty cars over three order patterns, representing Monday,
Tuesday, and Friday, respeclively. Each simulation run covered 30 days.
We ctiose ttie coordinated look-atiead tieuristic ttiat tits in with ttie local
control tramework.
real objects in the literature before. Although the soft-ware within the physical equipment was almost a copyof the software with which we ran the simulations, thereal equipment showed all kinds of deviations fromthe equipment in our model; AGVs skid and overshootor undershoot on curves, and sensors may fail to func-tion. Right now, tests with physical equipment remainnecessary when developers transfer new technologyfrom the research stage to the development stage. Fur-ther, in moving from the simulation to reality, we en-countered deviations from the object-oriented funda-mentals that we had to correct. An example is a pieceof information on parking places that an AGV pickedup in our models as a hidden assumption. Tn reality,the AGV cannot "read" anything from the physicalparking place. We solved the problem by alerting theparking manager but only after an AGV was damagedat the test site. Clearly the test site was essential indesigning a robust and intelligent control system. Thetesting phase will probably greatly reduce the numberof problems during the final implementation.
Last but not least, we found that cooperation in amultidisciplinary project team provides great benefits.Still the multidisciplinary approach is difficult, be-cause experts and scientists tend to focus on their ownareas of interest. Cooperation requires constant atten-tion. Using flexible simulation models as a commonreference for the members of the multidisciplinary pro-ject team as they faced uncertainties had striking posi-tive effects.
AcknowledgmentsThe authors thank Connekt for its funding of their simulation study.Also, they are grateful for the valuabte suggestions of two anony-
mous referees and the managing editor that improved the structureand presentation of the paper.
APPENDIX
Empty Car ManagementFor repositioning AGVs to meet expected demand, weconsidered five options: a simple first-come-first-serve(FCFS) rule, FCFS with prior inforn^ation on future or-ders, a coordinated look-ahead heuristic with infor-mation exchange between terminals, a planning algo-rithm inspired by Powell and Carvalho's (1998)logistics-queuing-network approach, and a serialscheduling method. Using a serial scheduling method,one integrates management of empty cars with sched-uling orders. Therefore we could also compare locallogistics control and integral logistics control. We es-timated the percentages of on-time service for the fivemethods (Table 4) and found that integral planningshows only slightly better performance than a well-chosen coordinated look-ahead rule. Below we de-scribe the latter method in more detail. Ebben (2001)and van der Heijden et al. (2002) describe the fivemethods in detail.
We distinguish between global management ofempty cars and local scheduHng of empty cars (TableI). The global empty-car manager has full control ofAGVs outside the terminals. Within terminals, theglobal empty-car manager controls only the number ofAGVs, and the local empty-car manager assigns AGVsto docks and orders. A global empty-car manager mayask the local empty-car manager to send empty cars toanother terminal, but the local authority decides whichAGVs to send and when. The global empty-car man-ager prioritizes requests for empty cars based on latestdispatch times, denoted by sL,,,. That is, the manageruses the latest time that an empty car can be dispatchedfrom a specific terminal or parking area to pick up atransport job / at terminal/ and still depart by the latestdeparture time tL,.
The local and global managers coordinate their ac-tivities as follows. The global empty-car manager pe-riodically plans empty-car redistribution between ter-minals and parking areas (for example, every 10minutes). It has two lists for planning purposes:
INTERFACESVol. 32, No. 4, July-August 2002 15

VAN DER HEIJDEN, VAN HARTEN, EBBEN, SAANEN, VALENTIN, AND VERBRAECK
All Automated Underground System
Metfiods for Controfling One-Way Tubes On-Time Service
Periodic controlAdaptive control, local informationAdaptive control, look-aheadDynamic programming (OP)
90.2%92.4%
93.5%99.1%
Table 5: Our analysis of four methods ol controMing travel directions inone-way tubes showed that dynamic programming yields the highest per-centage of on-time service. For both the look-ahead heuristic and dynamicprogramming, we assumed that AGV arrivals were known 25 minutes inadvance.
—A list of all known transport jobs at all terminals(present and underway) that have not yet been loaded.
—A list of all AGVs with their status (loaded orempty) and approximate Iocation.
The manager sorts the list of known transport jobsin increasing order of latest departure times fL/ andprocesses them sequentially. Iteratively the managerassigns the available AGV that can start transportingthe next job on the list at the earliest time, continuinguntil it has assigned all jobs or all AGVs. If the managerchooses AGV m at terminal / for job /, which must de-part from terminal / at time IL,, then terminal / willreceive a request for an empty AGV (not necessarilyin) to be sent to terminal / before time sL,,, (= tLi minusthe expected driving time from / to i).
A local empty-car manager assigns tasks to emptycars within a terminal, which may be (1) empty whenthey enter the terminal, or (2) empty after unloadingat a dock. The manager uses the following informationto assign tasks to available empty cars:
(1) A list of requests to dispatch empty cars withinthe terminal, sorted on latest dispatch time sL,„, m ^1, 2 , . . .
(2) A list of known transport jobs within the termi-nal, sorted on latest departure time fL,, / = 1,2,...,
The underlined variables refer to the respectivesorted lists. If sLj < tl,, the manager dispatches theAGV to the first destination on list 1; otherwise it as-signs it to the first transport job on list 2. Wheneverpossible, the manager combines jobs. That is, if a re-quest for an empty car at terminal / has highest priorityisLj < tLj), the manager looks for a transport job goingto the same terminal j with smallest latest departuretime tLj. lf such a transport job is available on the list
and a loading dock is also available, the managerschedules the job. Similarly, if a transport job going toterminal / has highest priority, the manager combinesthe job with a request to dispatch an empty car to ter-minal ;' (if it is available).
One-Way Tube ControlTo control the traveling direction in a one-w^ay tube,we considered periodic control, adaptive control, andoptimization using dynamic programming (DP). Forperiodic control, we developed a heuristic to estimatethe mean waiting time as a function of the traffic in-tensity for (compound) Poisson arrivals (van derHeijden et al. 2001). Our analysis of the logistics per-formance of these four methods showed that adaptivecontrol and dynamic programming performed best(Table 5) (Ebben et al. 2000).
Adaptive control can be based on local informationon queue sizes or, for the look-ahead variant, infor-mation on future AGV arrivals as well (Ebben et al.2000). We use the following notation:
T = the time a single AGV takes to travel throughthe one-way tube.
S = the minimum time between two successiveAGVs entering the one-way tube.
0̂ = the decision moment.CUQ) — the time allowed to clear the one-way tube
at ((), that is, the time needed for the last AGV travelingin a particular direction to leave the one-way tube.
t^i', t'i = the ith arrival at the right (left) side, wheref' it') < t(, if an AGV has already arrived.
q,ity- ^'iO = the number of AGVs in queue at theright (left) at time t.
If the current direction of travel is from left to right,the manager has two options: (1) to allow the queue atthe left to pass first (no change in direction), or (2) toallow the queue at the right to pass first (a change).The mean additional waiting times for the options, de-noted by Wf,ochange ar>d Wchange respectively, can be ex-pressed as follows:
Khar,8e = q%)(Cita) "F T -h 5 ' maxiqVo) - 1, 0}),
^nochnns,- ^ q^o^T ~ 0%) + 6 • max\(j'(to) - 1, 01),
The manager changes the direction immediately when
^change < ^rwchaugL- When the next AGV arrives, the
16INTERFACES
Vol. 32, No. 4, July-August 2002

VAN DER HEIJDEN, VAN HARTEN, EBBEN, SAANEN, VALENTIN, AND VERBRAECKAn Automated Underground Syi^tein
manager makes a new decision. The mean additionalwaiting time does not include waiting time alreadyincurred.
Using dynamic programming, the manager searchesfor the sequence of convoys that minimizes total wait-ing time. We denote by N, (N/̂ ) the number of AGVsfrom the left (right) within the information horizon atto and make the objective function
Min |/«(NL, N«, n i
Here we define /„((, /', 0 as the minimum total waitingtime for all AGVs present at the one-way tube or ar-riving within the horizon H, if at time t, i ACVs thattraveled through the one-way tube have alreadypassed from the left and / AGVs have passed from theright a = O,'\...,NL,J = 0, 1..., NR) and the last con-voy came from direction n in = L, R). Hence t* is apoint in time at which all known AGVs have been pro-cessed it* is just an auxiliary variable for the recursion).Given the initial conditions at the decision moment UQ),fn (0,0, fo = 0/ the cost functior\s/« (•) can be formulatedas follows:
, j - k2, t') = m in! / = '
+ 5
/«(/, /,
- ;• +
= min
- 2), 0} + /R(I - k,. j - k^, t)\
+ 5 - 2), 01 + 0, j - k2, f')},
with
and
f = T + m a x U + 6 • iqHt) ~ \, i]\
t" = T + maxlf + 5 • (qV) - 1, t^}.
Here we neglect the fact that AGVs might arrive whilethe queue is entering the one-way tubes.
TRACES: An Advanced Traffic-Control SystemTo succeed, the project teani must provide a safe trans-port system based on a safe and simple traffic-control
system. One of the mechanisms that shows promise isthe TRACES (Traffic Control Engineering System) con-cept, a new, generic, and layered AGV traffic-controlframework developed by Evers and Lindeijer (1999)and Evers et al. (2000). Local autonomy, scalability,and hierarchy are built into the TRACES framework.
The basic idea behind TRACES is that the vehiclesuse a formal language (gathered in a script) to deter-mine their movement through the infrastructure. Someof the statements in the language are responsible forexecuting actions, such as driving from one location toanother. Other statements help an AGV claim criticalpieces of the infrastructure where vehicles could easilycollide without a safety mechanism. They make theclaims for critical pieces of infrastructure using sema-phores. These semaphores are an extension of thesemaphores used in concurrent programming (Dijkstra1968, Tanenbaum 1990, Ben-Ari 1990) in that they canbe multivalued. Each semaphore has a number of 'tick-ets.' Simple semaphores contain only one ticket; moreadvanced semaphores contain several tickets.
The AGV gets its script from a script-dispatcher con-trol object, which has a virtual map of the terminal.When executing its script, the AGV requests access toconflict locations, such as joins or crossings, at localsemaphores. If successful, the AGV receives a ticket.
'critical areasemaphore SemBCFcapacity=1
Script for AGV1 to go from A to D: Script for AGV2 to go from E to D:
Exec AB
Insist SemBCF, 1
Exec BC, SemBCF, 1
Exec CD
Exec EF
Insist SemBCF, 1
Exec FC, SemBCF, 1
Exec CD
Figure 6: Basic principle ot TRACES (Evers and Lindaijer 1999). The AGVs
execute smaii individuai programs ('scripts") when driving. The scripts
contain commands for requesting one ticket to enter an intersection ( ' in-
sist ' ) , which are sent to a local intersection controiier at the iatesi mo-
ment. This local controiier grants access if no other vehicle has already
ciaimed the intersection. Next, the AGV passes ttiB intersection ('Exec")
and returns the ticket.
INTERFACESVol. 32, No. 4, July-August 2002 17

VAN DER HEIJDEN, VAN HARTEN, EBBEN, SAANEN, VALENTIN, AND VERBRAECKAn Automated Underground System
which it returns after leaving the conflict location (Fig-ure 6).
An AGV can see in its script that, before accessingthe conflict location ABC, it has to send a request tothe semaphore in that area for a ticket with a capacityof one "INSIST SemBCF,l." The semaphore SeniBCFguards the conflict location. After receiving the ticket,the AGV may access the conflict location for which itrequested a ticket in its previous statement. When theAGV has completely left the conflict location, the AGVreturns the ticket to the semaphore.
The script dispatcher control object can assignscripts based on a wide range of conditions, such asthe traffic density in different areas, the destination ofthe AGV, information about failures, and the actualstatus of the AGVs battery. Furthermore, it can addintelligence to the scripts, so that the AGV can selectthe least-congested route dynamically.
ReferencesAdiga, S. 1993. Object-Orienled Software for Manufacturing Systems.
Chapman and Hall, London, U.K.Ben-Ari, M. 1990. Principles of Concurrent and Distributed Program-
ming. Prentice-Ha II, New York.Booch, G. 1994. Object-Oriented Analysis and Design, with Applications.
Addison-Wesley, Reading, MA.CTT (Center for Transportation Technology). 1997. Definitiestudie on-
dergronds logistiek systeem. deelrapportages 1-5. Rotterdam, TheNetherlands.
Dijkstra, E. W. 1968. Co-operating sequential processes. F. Genuys,ed. Programming Languages. NATO Advanced Study Institute,London, U.K., 43-112.
Ebben, M. j . R. 2001. Logistics Control in Automated TransportationNefivorks. Twente University Press, Enschede, The Netherlands., D. J. Van der Zee, M. C. van der Heijden. 2000. Dynamic controlfor large scale automated transport systems. Working paper.Faculty of Technology and Management, University of Twente,The Netherlands.
Evers, J., D. G. Lindeijer. 1999. The agile traffic<ontrol and engi-neering system: TRACES. Working paper, TRAIL, Delft Uni-versity of Technology, The Netherlands., L. Loeve, D. G. Lindeijer. 2000. The service-oriented agile lo-gistics control and engineering system: SERVICES. Loglst. In-form. Management 13(2) 77-90.
OLS Project Organization. 2000, Business Case OLS Schiphol-Aalsmeer.Document L85-03-00.8012.R (in Dutch).
Powell, W. B., T. A. Carvalho. 1998. Dynamic irontrol of logisticsqueueing networks for large-scale fleet management. Transpor-tation Sci. 32(2) 90-109., Y. Sheffi, K. S. Nickerson, K Butterbaugh, S. Atherton. 1988.Maximizing profits for North American Van Lines' truckload
division: A new framework for pricing and operations. Inter-faces ISW 2^^^.
Randell, L. G., L. G. Hoist, G. S. Bolmsjo. 1999. Incremental systemdevelopment of large discrete-event simuiation models. Proc.1999 Winter Simulation Conf. Phoenix, AZ, 561-568.
Roberts, C. A., Y. M. Dessouky. 1998. An overview of object-orientedsimulation. Simulation 70(6) 359-368.
Tanenbaum, A. S. 1990. Structured Computer Organization, 3rd ed.Prentice-Hall International, London, U.K.
Van der Heijden, M. C, M. J. R. Ebben, N. Gademann, A. Van Har-ten. 2002. Scheduling vehicles in transport networks. OK Spek-tri/m 24(1) 31-58., A. Van Harten, M. J. R. Ebben. 2001. Waiting times at period-ically switched one-way traffic lanes—A periodic, two-queuepolling system with random setup times. Probab. Engrg. Inform.Sci. 15(4) 495-517.
Van der Zee, D. J. 1997. Simulation as a tool for logistics manage-ment. PhD dissertation. University of Twente, Enschede, TheNetherlands.
Zeigler, B. P. 1990. Object-Oriented Simulation toith Hierarchical, Mod-ular Models-Intelligent Agents and Endomorphic Systems. Aca-demic Press, San EHego, CA.
Jan Katgerman, Research coordinator OLS steeringcommittee. Chairman OLS steering committee, Con-nekt, Kluyverweg 4, 2629 HT Delft, The Netherlands,writes: "In our opinion the simulation group generatedimportant results to assess the merits of the plannedOLS system. From our point of view, information onthe price per kilometer, the logistical performance, thenecessary system dimensions and the environmentaleffects and energy consumption are essential ingredi-ents in such a complex decision process. Simulationgave us a lot of insight in this respect. To mention afew highlights, the impact of simulation on:•the choice for a less expensive system layout, in co-operation with the general project management,•appropriate terminal and dock design, in cooperationwith mechanical engineers from Delft University,•the design of an AGV control system in cooperationwith FROG Navigation Systems,
•the development of an object oriented logistical plan-ning and control network,• the provisioning of performance figures for an energystudy under the authority of the Dutch government tostudy environmental effects,•the logistical impact of various energy systems (bat-teries, electricity wires)
18INTERFACES
Vol. 32, No. 4, July-August 2002

VAN DER HEIJDEN, VAN HARTEN, EBBEN, SAANEN, VALENTIN, AND VERBRAECKAn Atitomaled Umiergraund Si/slcm
•system reliability as function of AGV and dockfailures.
"In this way, the simulation group played an im-portant role in our multidisciplinary project team. Theresults of the simulation group are basic for the AGVtest site, opened quite recently at Delft. Technologi-cally, we consider this test site as significant progresscompared with previous AGV test programs in theRotterdam area, an addition to the Dutch economywith considerable added value in its own respect.Commercially, the test site is a great facility to interestour future customers for this innovative initiative bySchiphol Airport and Flower Auction Aaismeer."
Rudi de Vos-Burchart, R&D director. Frog Naviga-tion Systems B.V., Cartesiusweg 120, 3534 BD Utrecht,The Netherlands, writes: "One of overall goals in thisproject was to show the feasibility of an AGV basedsolution for the large-scale transport problem arisingin the Schiphol area. The contribution of the simulationgroup was essential to analyze the logistical perfor-mance of the system.
"However, for our company the interaction with thesimulation group went far beyond this. In this project,we developed a new and innovative generation ofAGV control software. Simulation was extremely help-ful in developing and testing our new control system.A prototype of the control system has been evaluatedin a flexible object oriented simulation environment,revealing many opportunities for refinement and op-timization. Also, we got insight in the performance ofour control system in terms of AGV throughput timesat various types of tracks (intersections, access, andexit roads), docking behavior, radio communicationtraffic on terminals, etc. Because we could connect ourprototype AGVs as physical objects in the simulationmodel at a test site, we could evaluate the control sys-tem under real life circumstances in an early devel-opment stage. This also gave us the confidence that wehad chosen the right concept for our new controlsystem.
"As a consequence, our development time has been
reduced considerably. We are very satisfied to be ableto use this sort of simulation now at the AGV test-siteas an overall control tool to analyze realistic terminals.It is really an advantage for the costs of testing thatvirtual simulation objects and our real prototypeAGVs can be intermixed. Further, based on previousexperiences we consider this as an important achieve-ment to avoid future problems in the real system."
P. Luitjens, Project Leader, Schiphol OLS, StichtingInitiatiefgroep Het Ondergronds Logistiek Systeem(OLS), Postbus 7501, 1118 ZG Luchthaven Schiphol,The Netherlands, writes: "Simulation was very helpfulboth to analyze the logistical performance and to pro-vide input for our exploitation figures. Due to thiswork we feel confident that reliable service can beachieved with a system layout partly with single (oneway) underground tubes instead of double (two way)ones. This reduces the investment costs in the order ofmagnitude of 40%. Also, the simulation results pro-vided us input for a proper time-phased constructionplanning of the OLS, thereby saving considerable in-terest expenditures by postponing investments. More-over, we got well-founded data for our exploitationanalysis, such as number of AGVs depending on theirspeed, the size of the terminals and the parking, etc.Due to the flexibility of the simulations we were ableto optimize the system design, which altogether leadsto savings in the order of another 10% compared withour first guesses. Finally, it was important that thesimulation group showed that the sensitivity ofthroughput times for AGV and dock failures is not toolarge. This gave us confidence in the reliability of theOLS. Another benefit of the simulation we derived byusing the imagination. In convincing stakeholders andfuture users of the feasibility of the OLS concept ourarguments were strongly supported by the images.
"Altogether, it is my opinion that the simulation re-sults were very valuable as input in the decision pro-cess and, referring to the DSS for exploitation that arecurrently being developed, they will remain so in thenear future."
INTERFACES
Vol. 32, No. 4, July-August 2002 19
