metropolitan freight distribution by railways
TRANSCRIPT

Metropolitan Freight Distribution by Railways
A. Nuzzolo, U. Crisalli, A. [email protected]
11-13 July 2007, Crete, Greece (EU)
Session 6

Metropolitan freight distribution by railways 2
Summary
�Introduction
�The used methodology
�Application example to a real case (Sorrentina peninsula,
Sothern Italy)
�Conclusions

Metropolitan freight distribution by railways 3
Introduction
� Metropolitan freight distribution by railways using the
residual capacity of passenger services
� Technical and economic feasibility of proposals� Methodology
� Demand model system for the estimation of potential freight
flows
� Competitiveness and sustainability analysis of railways service
� Application to a real test case: the Sorrentina peninsula (Italy)

Metropolitan freight distribution by railways 4
Introduction
�Reduction of accessibility of particular urban centres to road
transport due to congestion
�Measures to mitigate environmental impacts in urban centres
use of railways infrastructure for freight transport within
metropolitan areas

Metropolitan freight distribution by railways 5
� Previous experiences in this field refer to� limited areas
� particular time periods or ages
� Examples:�Use of tram for the transportation of building goods in some
of East-Germany cities (e.g. Dresden), during the energetic
crisis in the seventy years (Lange, 2001)
�Restocking of some specific commercial activities shipping
particular products to cities served by railways services (Genta
et alii, 2006)
Introduction

Metropolitan freight distribution by railways 6
The used methodology
�Objective
Investigate the use of railways service as an alternative to
road transport for the freight distribution to retailers within
urban and metropolitan areas

Metropolitan freight distribution by railways 7
�Service structure
Outer TerminalCollection and connection between
freight transport by road in a short-
medium range and railways service
The used methodology
Inner TerminalDistribution within metropolitan area (low-
accessibility area) and picking/delivery
from/to the receivers/senders of this area
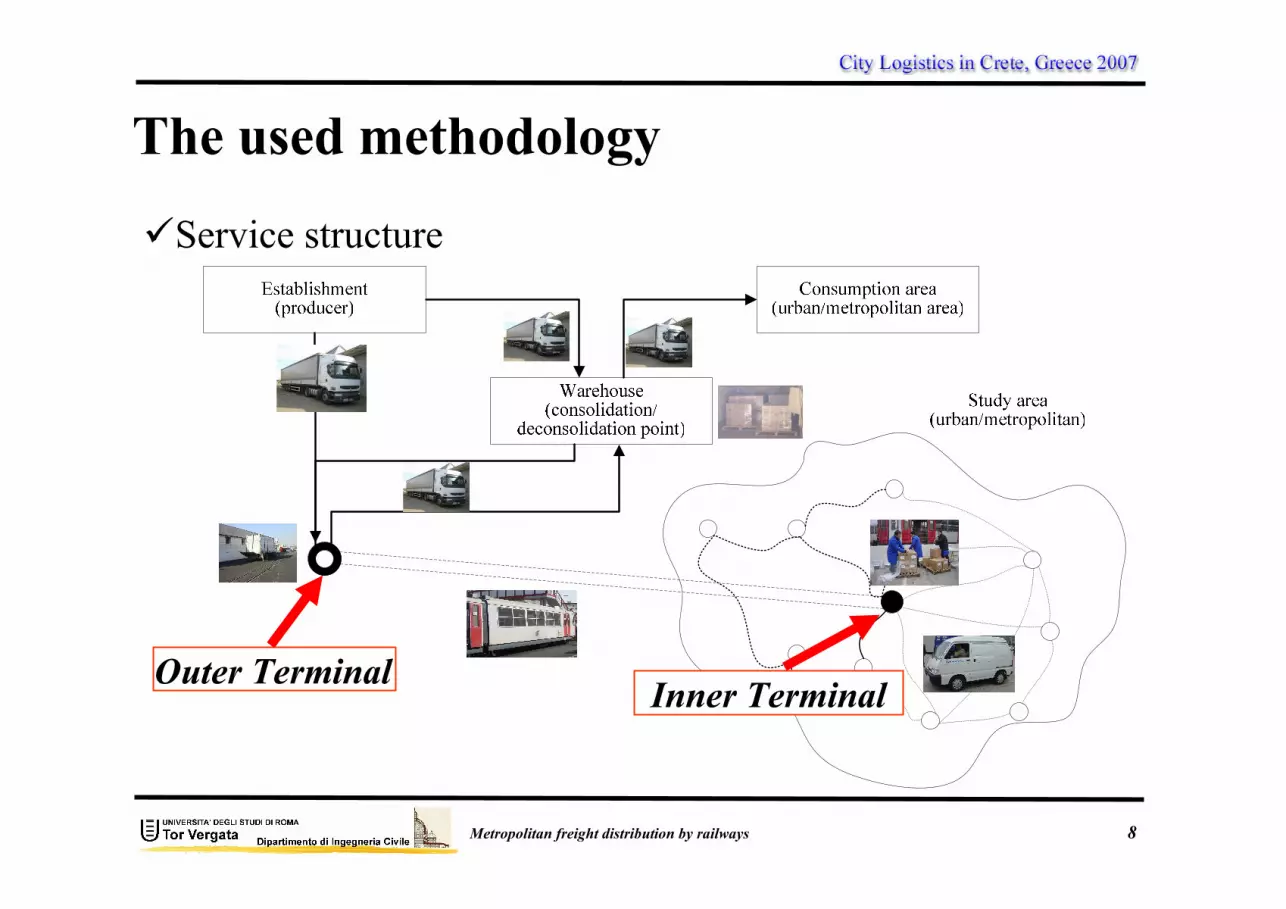
Metropolitan freight distribution by railways 8
Inner TerminalOuter Terminal
�Service structure
The used methodology

Metropolitan freight distribution by railways 9
�General framework
The used methodology

Metropolitan freight distribution by railways 10
�Study area (Sorrentina Peninsula)
Application to a real case
Main characteristics
80,000 inhabitants
6,000 trade employees
42% of activities refers to trade
∼ 800,000 tourists per year

Metropolitan freight distribution by railways 11
�Structure of methodology
The used methodology

Metropolitan freight distribution by railways 12
�Traffic surveys� traffic counts, both freight and
passengers
(july-october 2005)
�Truck driver interviews
(127 interviews)
�Surveys to potential service users
(e.g. retailers)
(106 interviews)
Freight demandSurveys and Counts
Cross section

Metropolitan freight distribution by railways 13
� Main results
Freight demandSurveys Delivery journey origins:
province of Naples about 75 %
About 50% of
deliveries is generated
of Naples
In the study area about 2.6
deliveries per vehicle are done
in the 56% of cases by light
goods vehicles (LGV)
0
5
10
15
20
25
30
35
40
6,30-6,45
7,00-7,15
7,30-7,45
8,00-8,15
8,30-8,45
9,00-9,15
9,30-9,45
10,00-10,15
10,30-10,45
11,00-11,15
11,30-11,45
12,00-12,15
12,30-12,45
13,00-13,15
13,30-13,45
14,00-14,15
14,30-14,45
15,00-15,15
15,30-15,45
16,00-16,15
16,30-16,45
17,00-17,15
17,30-17,45
18,00-18,15
%
PER
DA
37 %
6 %
37 %28 %
7%Peak hour:
7:00 a.m.– 8:00 a.m.
3:00 p.m. – 4:00 p.m.
Incidence of freight traffic:
Max 37%, Min 7%, average 15%
About 45% of deliveries is
done undertaking journeys with
only study area destinations

Metropolitan freight distribution by railways 14
Freight demandModel structure

Metropolitan freight distribution by railways 15
Freight demandO/D matrices (quantity)
Wholesalers, Distribution centersAttributes of Service Level T
ATTRACTION modelQ
sh.d
Economic Activities of zones
ACQUISITION modelpsh[o/d]
O/D matrices in quantityQ
shod
RESTOCKING modelps[m/od]
O/D matrices in quantity by retailer
Qshod [retailer]
O/D matrices in quantity by restocking center
Qshod [restocking center]
O/D matrices in quantity by carrier
Qshod [carrier]

Metropolitan freight distribution by railways 16
[ ] [ ] [ ]sh ssh sh
od .d = p o/d pQ m Q m/od
Qsh.d, average quantity of freight of type s attracted by zone d in time period h
psh [o/d], share of freight type s that, attracted by zone d in time period h,
comes from zone o (e.g. production place/firm, distribution centre,
warehouse, and so on)
ps [m/od], share of freight of type s transported by restocking type m from
zone o to zone d; we consider three main ways of restocking:- directly by the retailer (receiver) in own account (m = retailer)
- by the sender in own account (m = restocking centre)
- by a carrier (m = carrier)
Freight demandO/D matrices (quantity)
Attraction model
Acquisition model Restocking model

Metropolitan freight distribution by railways 17
Freight demandO/D matrices (quantity)
� Calibration results Attraction model
Acquisition model (logit)
Restocking model
( ) ( ) ( )s s
od 1 o 2 centre,od 3 od 4 od 5 centreV = β ln Ad + β ln T + β ln TV + β ASA + β ASA
n. wholesale employeesTravel time(in city centre) Travel time
o=d
o within city centre

Metropolitan freight distribution by railways 18
Freight demandO/D matrices (deliveries)

Metropolitan freight distribution by railways 19
[ ] [ ] [ ]s s
od o
h sh
d=ND q/ Q m qm m
Qshod [m], average freight quantity flows of type s, between zones o
and d, in time period h, transported with restocking type m (output of
the commodity level - 1st level)
qs [m], freight quantity delivered/picked (shipment size) with restocking type
m
Output 1st levelDelivered/picked
quantity
Freight demandO/D matrices (deliveries)

Metropolitan freight distribution by railways 20
� Calibration results
Delivered/picked quantity – Shipment size
Freight demandO/D matrices (deliveries)
[ ] ( )sq m = f s

Metropolitan freight distribution by railways 21
Freight demandO/D matrices (vehicles)
O/D matrices in deliveries by retailer
NDshod [retailer]
O/D matrices in deliveries by restocking center
NDshod[restocking center]
O/D matrices in deliveries by carrier
NDshod [carrier]
Vehicle typepsh[v/odq - retailer]
Vehicle typepsh[v/odq - restocking center]
Vehicle typepsh[odq - carrier]
O/D matrices in vehicles by retailer and vehicle vVC
shod [v, retailer, q]
O/D matrices in vehicles by restocking center and vehicle vVC
shod[v, restocking center,q]
O/D matrices in vehicles by carrier and vehicle vVC
shod [v, carrier, q]
Number of delivery for tripsnd
sod[v, dett/q]
Number of delivery for tripsnd
sod[v, rest./q]
Number of delivery for tripsndsod[v, car/q]

Metropolitan freight distribution by railways 22
� Base assumptions for restocking process� retailer brings all the freight within the same acquisition zone o
� wholesaler (or distributor) delivers freight within the same attraction zone d
� carrier brings all freight within the same acquisition zone o and delivers them inside
the same attraction zone d
Freight demandO/D matrices (vehicles)
[ ] [ ] [ ] [ ]sh s
od o
sh s
o dd ND q/= p v/odmVC v/ m q dmq n v/mq
NDshod [q/m], number of deliveries/collections of freight of type s on od
pair (output of the delivery level - 2nd level)
ps [v/odmq], vehicle type share
ndsod [v/mq], number of stops per trip (deliveries and collections)
Vehicle type model Stop modelOutput of 2nd level
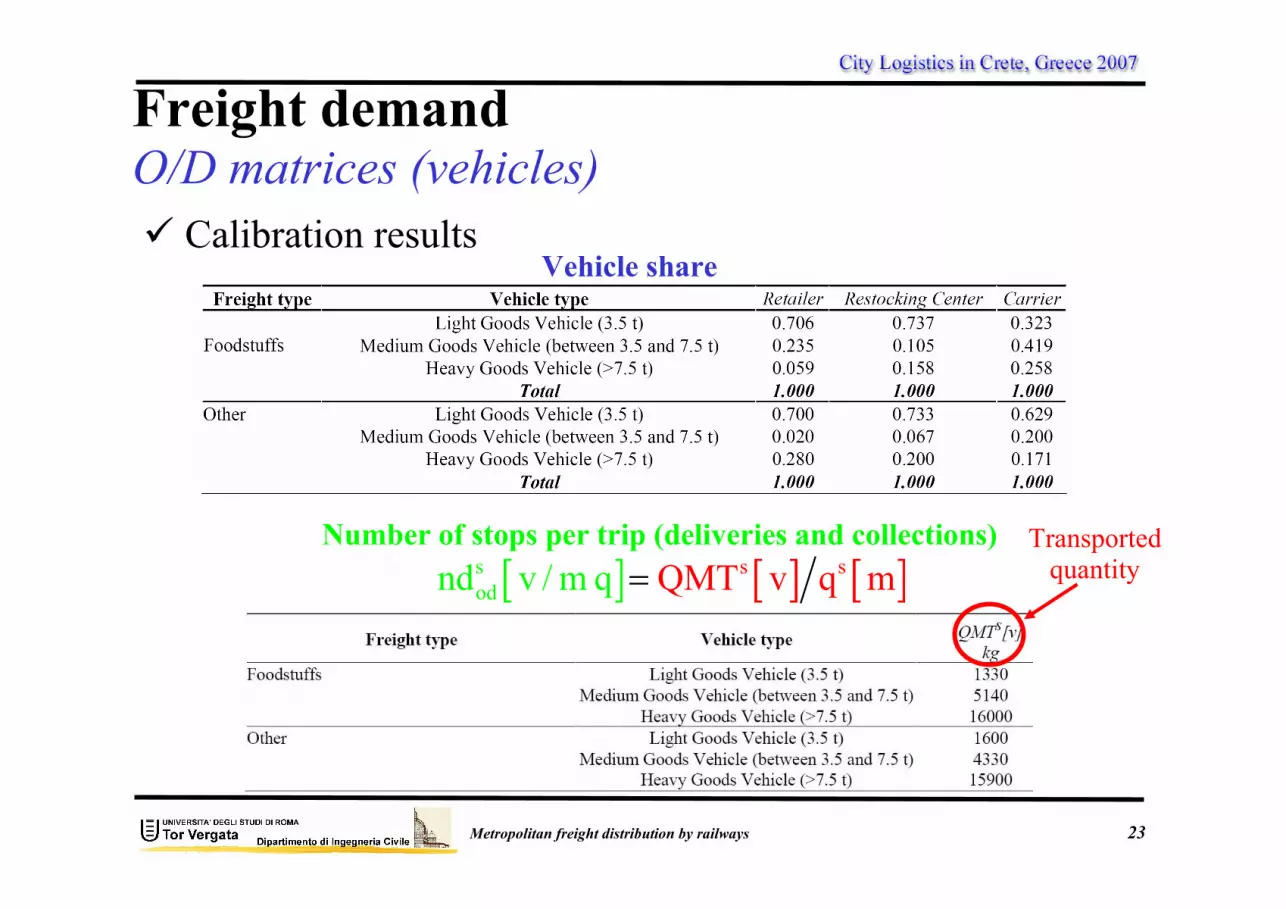
Metropolitan freight distribution by railways 23
� Calibration resultsVehicle share
Freight demandO/D matrices (vehicles)
Number of stops per trip (deliveries and collections)
[ ] [ ] [ ]s ss
odnd v /m q QMT v q m=
Transported quantity

Metropolitan freight distribution by railways 24
ORIGIN
prov. Caserta and Naples
about 85 % of attracted quantity
�Total quantity: about 1.800 t/day
�Freight type� Foodstuffs (44%)
�Household products (5%)
�Other (51%)
Freight demandAttraction in quantity

Metropolitan freight distribution by railways 25
Freight demandPotential
�Selection criteria
Potential freight demand: 110 t/day
ORIGIN
Journey from provinces
of Benevento and Caserta,
and from cities in the
North of Naples
Acquisition zones and
restocking types:
Round trip with destination
after Piano di Sorrento
Don’t consider the dangerous and refrigerated
freight, etc.

Metropolitan freight distribution by railways 26
� in order to define the design variables the 50% of potential
freight demand is considered.
This is due to the possible inertia of operators to change transport mode
towards the new distribution system in absence of any normative
limitations to the freight access to the study area
Freight demandTarget
Target freight demand: about 60 t/day
Potential freight demand: 110 t/day

Metropolitan freight distribution by railways 27
�Structure (existing railway system)
The used methodology

Metropolitan freight distribution by railways 28
�9 stations on Naples-Sorrento
railways line belongs to the choice
set of potential terminals
�Outer Terminal
San Giovanni a Teduccio station
�Inner Terminal
Piano di Sorrento station
Test applicationTerminal definitions
CONNECTION
FREIGHT
TRANSPORT
in study area
RAILWAY
TRANSPORT
:
Piano di Sorrento FS
S. Giovanni a Teduccio FS
FINAL
DISTRIBUTION

Metropolitan freight distribution by railways 29
�Outer Terminal� track length about 50 m (1 train)� storage area (~ 700 mq)�handling equipments• transfer road – railways → fork-lift• yard handling equipments → fork-lift, transpallet for horizontal handling operations
InfrastructuresTerminal characteristics
Storage area
Storage area

Metropolitan freight distribution by railways 30
�Inner Terminal
� track length about 50 m (1 train)
� storage area (~ 500 mq)
�handling equipments• transfer road – railways → fork-lift• yard handling equipments → fork-lift, transpallet for horizontal handling operations
Infrastructures Terminal characteristics

Metropolitan freight distribution by railways 31
�Standard equipment of Circumvesuviana: passenger train
type “T21”� adaptation with removal of specific passenger equipment• seats, inside doors, etc.
• horizontal on-board handling by transpallet
Rolling stock

Metropolitan freight distribution by railways 32
�Unit load
Pallet ISO1: 1200 x 800 x 1500 mm
GoodsPacking requirements

Metropolitan freight distribution by railways 33
�Potential service timetable
�Timetable not interested by passenger transport• before and after passenger morning (and afternoon) peak-hours
Transport by trainTimetable
Metropolitan freight distribution by railways 34
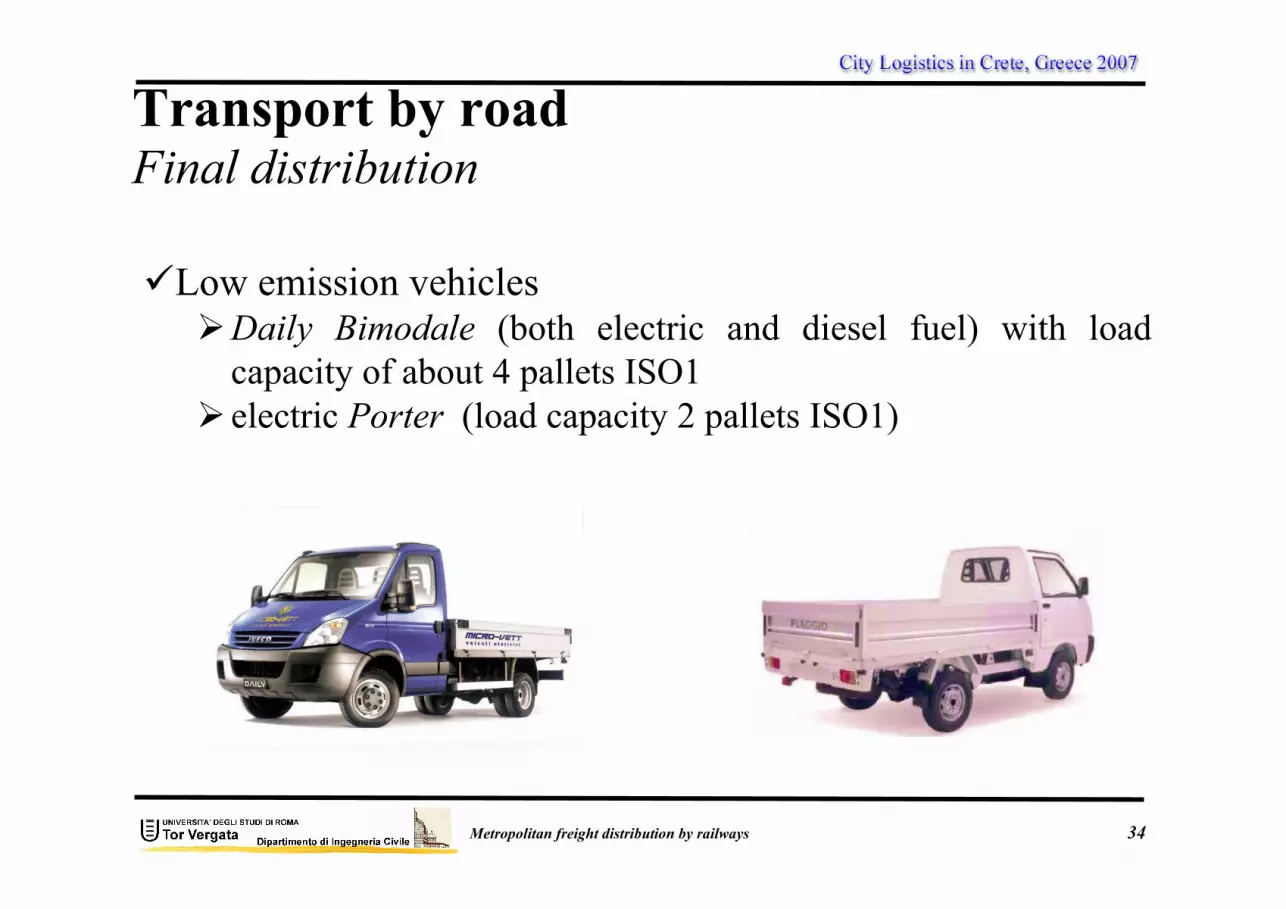
�Low emission vehicles�Daily Bimodale (both electric and diesel fuel) with load
capacity of about 4 pallets ISO1
� electric Porter (load capacity 2 pallets ISO1)
Transport by roadFinal distribution

Metropolitan freight distribution by railways 35
�Structure�System characteristics
The used methodology

Metropolitan freight distribution by railways 36
Service characteristics
�Multimodal transportation chain

Metropolitan freight distribution by railways 37
�Structure�Service competitiveness
The used methodology

Metropolitan freight distribution by railways 38
COSTS
1,850,000 1,200,000
650,000 Rail transport200,000 Handling and management software
1,200,000 Terminal1,000,000 Civil buildings/
exiting rolling stock adaptation
€/yearManagement€Investment
Investment and management costs

Metropolitan freight distribution by railways 39
�System performance�Average service transportation time
Technical feasibility
Loading beginning
Train departureDoor closingLoading operations
Unloading beginningTrain arrival
Loading vehicle beginningThe end of unloading operations
Loading of LGVs
Train departure
Final customersSpace
Time

Metropolitan freight distribution by railways 40
� Average transportation time
25.0min / pallet-Delivery average
0.5minFinal distribution
-Manoeuvre (LGV)
1.0min / pallet-Loading of distribution vehicles
0.8min / pallet-Train unloading
1.0minInner Terminal (Piano di Sorrento)
-Forward transition
0.5min / pallet-On-board handling
55.0minRailways transport
-Terminal-to-terminal
8.0min-Forward transition
0.9min /pallet-Train Loading
0.5minOuter Terminal (S. Giovanni a Teduccio)
-Manoeuvre (HGV)
avg valueunitactivity
Technical feasibility
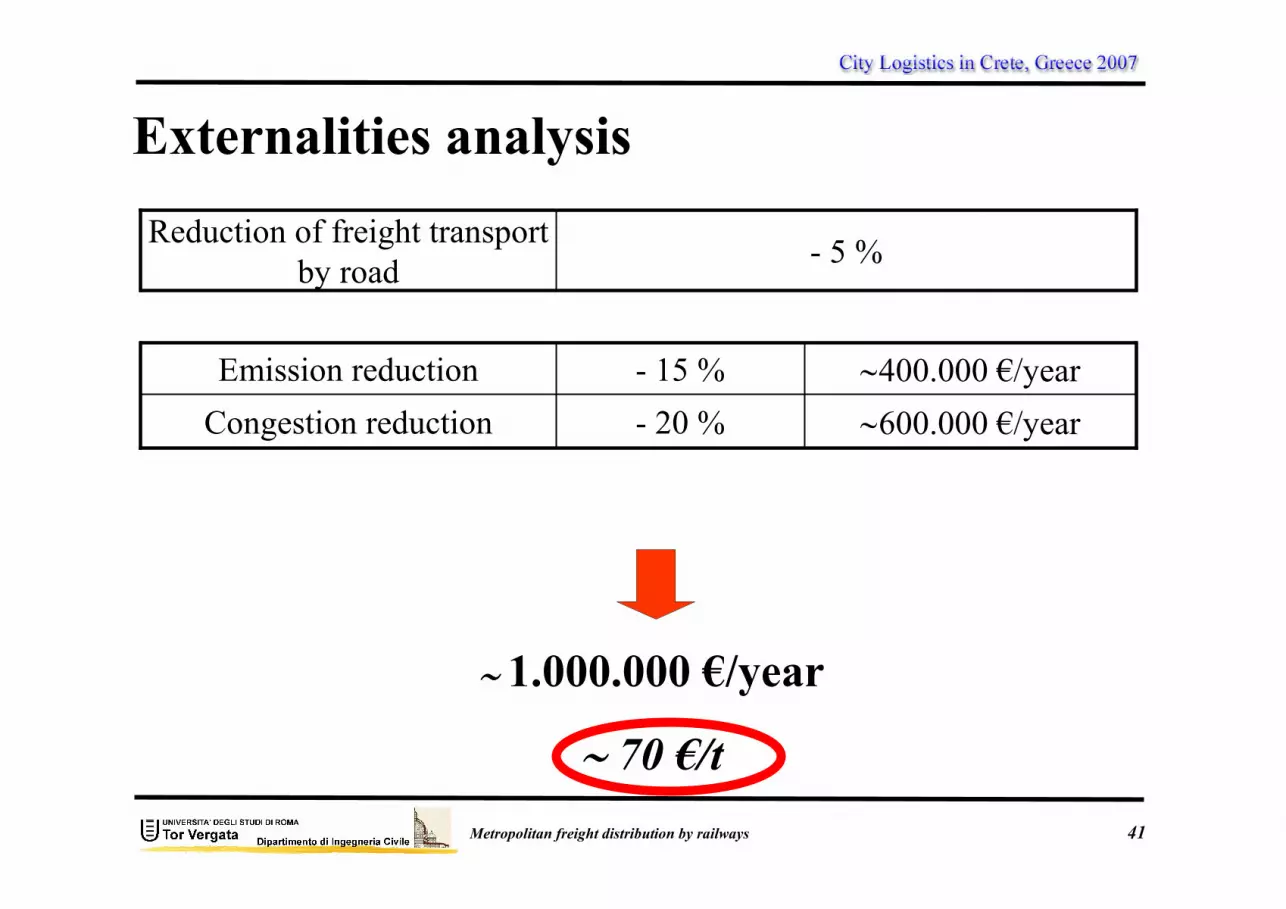
Metropolitan freight distribution by railways 41
Externalities analysis
∼∼∼∼ 1.000.000 €/year
∼∼∼∼ 70 €/t
- 5 %Reduction of freight transport
by road
∼600.000 €/year- 20 %Congestion reduction
∼400.000 €/year- 15 %Emission reduction

Metropolitan freight distribution by railways 42
Conclusions
�Comparison with scenario 0 (only road)
�Travel time (road): ∼ 90 min.
�Travel time (designed service): ∼ 90 min.
�Average transport cost (road): 60 €/t
�Average transport cost (designed service): 120 €/t
�Public authority intervention (balancing externalities): 70 €/t
�Cost reduction of transport for operators: 10 €/t

Metropolitan Freight Distribution by Railways
A. Nuzzolo, U. Crisalli, A. [email protected]
11-13 July 2007, Crete, Greece (EU)
Session 6