transcription factor binding sites are genetic determinants of retroviral integration in the human...
TRANSCRIPT
Transcription Factor Binding Sites Are GeneticDeterminants of Retroviral Integration in the HumanGenomeBarbara Felice1., Claudia Cattoglio2., Davide Cittaro3., Anna Testa4, Annarita Miccio5, Giuliana
Ferrari5,6, Lucilla Luzi1,7, Alessandra Recchia4, Fulvio Mavilio2,4*
1 IFOM, FIRC Institute of Molecular Oncology Foundation, Milan, Italy, 2 IIT Unit of Molecular Neuroscience, Istituto Scientifico H. San Raffaele, Milan, Italy, 3 Cogentech,
Consortium for Genomic Technologies, Milan, Italy, 4 Department of Biomedical Sciences, University of Modena and Reggio Emilia, Modena, Italy, 5 HSR-Telethon Institute
of Gene Therapy, Milan, Italy, 6 Vita-Salute University, Milan, Italy, 7 Department of Experimental Oncology, European Institute of Oncology, Milan, Italy
Abstract
Gamma-retroviruses and lentiviruses integrate non-randomly in mammalian genomes, with specific preferences for activechromatin, promoters and regulatory regions. Gene transfer vectors derived from gamma-retroviruses target at highfrequency genes involved in the control of growth, development and differentiation of the target cell, and may induceinsertional tumors or pre-neoplastic clonal expansions in patients treated by gene therapy. The gene expression program ofthe target cell is apparently instrumental in directing gamma-retroviral integration, although the molecular basis of thisphenomenon is poorly understood. We report a bioinformatic analysis of the distribution of transcription factor bindingsites (TFBSs) flanking .4,000 integrated proviruses in human hematopoietic and non-hematopoietic cells. We show thatgamma-retroviral, but not lentiviral vectors, integrate in genomic regions enriched in cell-type specific subsets of TFBSs,independently from their relative position with respect to genes and transcription start sites. Analysis of sequences flankingthe integration sites of Moloney leukemia virus (MLV)- and human immunodeficiency virus (HIV)-derived vectors carryingmutations in their long terminal repeats (LTRs), and of HIV vectors packaged with an MLV integrase, indicates that the MLVintegrase and LTR enhancer are the viral determinants of the selection of TFBS-rich regions in the genome. This studyidentifies TFBSs as differential genomic determinants of retroviral target site selection in the human genome, and suggeststhat transcription factors binding the LTR enhancer may synergize with the integrase in tethering retroviral pre-integrationcomplexes to transcriptionally active regulatory regions. Our data indicate that gamma-retroviruses and lentiviruses haveevolved dramatically different strategies to interact with the host cell chromatin, and predict a higher risk in using gamma-retroviral vs. lentiviral vectors for human gene therapy applications.
Citation: Felice B, Cattoglio C, Cittaro D, Testa A, Miccio A, et al. (2009) Transcription Factor Binding Sites Are Genetic Determinants of Retroviral Integration inthe Human Genome. PLoS ONE 4(2): e4571. doi:10.1371/journal.pone.0004571
Editor: Geraldine Butler, University College Dublin, Ireland
Received August 6, 2008; Accepted January 16, 2009; Published February 24, 2009
Copyright: � 2009 Felice et al. This is an open-access article distributed under the terms of the Creative Commons Attribution License, which permitsunrestricted use, distribution, and reproduction in any medium, provided the original author and source are credited.
Funding: This work was supported by grants from Telethon Italy (GGP06101 and TIGET), the Italian Association for Cancer Research (AIRC), the Sixth FrameworkProgram of the European Commission (CONSERT and EPITRON consortia), and Fondazione Cariplo. The funders had no role in study design, data collection andanalysis, decision to publish, or preparation of the manuscript.
Competing Interests: The authors have declared that no competing interests exist.
* E-mail: [email protected]
. These authors contributed equally to this work.
Introduction
Integration of viral cDNA into the host cell genome is an
essential step in the retroviral life cycle. After entering the cell, the
RNA genome is reverse transcribed into double-stranded DNA,
and assembled in pre-integration complexes (PICs) containing
viral as well as cellular proteins. Retroviral PICs may actively enter
the nucleus of non-dividing cells, as in the case of lentiviruses (LV),
or gain access to chromosomal DNA during mitosis, as in gamma-
retroviruses (RV). PICs associate with the host cell chromatin,
where the virally encoded integrase mediates proviral insertion
into the genomic DNA [1]. Different retroviruses show signifi-
cantly different integration preferences [2–4], implying that PICs
recognize components or features of the host cell chromatin in a
specific fashion [5–7]. Proteins interacting with the human
immunodeficiency virus (HIV) integrase have been identified by
biochemical or genetic analysis, and include components of the
SWI/SNF chromatin-remodeling [8] or DNA-repair [9] com-
plexes, Polycomb-group proteins [10], and lens epithelium-derived
growth factor (LEDGF) [11,12]. Much less is known about the RV
integrase, and the genetic and/or epigenetic determinants of RV
target site selection remain poorly understood.
Gene transfer vectors derived from the Moloney murine
leukemia virus (MLV) have been used in hundreds of gene
therapy clinical trials since 1991. These vectors were considered
relatively safe, until lymphoproliferative disorders were reported in
patients treated with MLV-transduced hematopoietic stem/
progenitor cells (HSCs) for X-linked severe combined immuno-
deficiency (X-SCID) [13]. These adverse outcomes indicated the
importance of understanding the molecular basis of retroviral
integration in order to design safer gene transfer vectors [14]. The
oncogenic potential of murine retroviruses has been known for
decades. Administration of replication-competent retroviruses to
susceptible mouse strains leads to tumor development, as a result
PLoS ONE | www.plosone.org 1 February 2009 | Volume 4 | Issue 2 | e4571
of multiple insertion events and the outgrowth of clones containing
one or more proviruses activating growth-controlling genes [15].
Replication-defective RV vectors were also reported to cause
insertional oncogenesis in mice [16], but such risk was estimated to
be low on the assumption that proviral integration into the
genome was random [1]. Recent studies have shown that MLV-
derived vectors integrate preferentially around transcription start
sites (TSSs) and CpG islands [3,4,17–20], where the insertion of
transcriptional enhancers contained in the viral long terminal
repeats (LTRs) has a high probability to interfere with gene
regulation [21]. Indeed, analysis of hematopoietic cells obtained
from SCID patients treated with gene therapy showed that the
vector integration characteristics increase the probability of
insertional activation of proto-oncogenes [22–25].
Analysis of RV and LV integration sites in human HSCs
showed an RV-specific propensity to integrate into hot spots and
to target genes involved in the control of growth, differentiation
and development of hematopoietic cells [26,27], suggesting that
the gene expression program of the target cells is instrumental in
directing RV integration. This may explain the frequency by
which RV integration induces activation of cell type-specific
growth regulators such as LMO2 or MDS1/EVI1, and lympho-
proliferative disorders in SCID patients [28,29] or clonal
expansion of hematopoietic progenitors in mice [30,31], non-
human primates [32], and man [33]. The molecular mechanisms
linking RV integration to gene expression programs are, however,
poorly understood. To investigate the role of transcriptional
regulatory networks in directing RV and LV integration, we
evaluated the local abundance and arrangement of putative
transcription factor binding sites (TFBSs) in the genomic regions
flanking (+/21,000 bp) MLV and HIV proviruses. We show that
RV, but not LV vectors integrate preferentially in genomic regions
flanked by specific subsets of TFBSs, independently from their
location with respect to genes or TSSs. Hierarchical clustering and
principal components analysis of TFBS motifs flanking integration
sites of different MLV and HIV mutants showed that the MLV
integrase and the MLV LTR enhancer have a causal role in
directing proviral integration in TFBS-rich regions of the genome.
Transcription factors binding LTR enhancers in the nucleus
before integration might therefore synergize with the integrase in
tethering retroviral PICs to enhancer-containing domains of
transcriptionally active chromatin.
Results
Retroviral vector integration sites in humanhematopoietic cells
Human cord blood-derived CD34+ HSCs were transduced
under cytokine stimulation with MLV-derived RV vectors
carrying a wild-type LTR, a DU3 (enhancer-less) LTR, or an
LTR from the spleen focus-forming RV (SFFV), and HIV-derived
LV vectors carrying a wild-type LTR, a DU3 LTR or an LTR
containing the MLV U3 enhancer (Figure 1). For each vector,
between 195 to 829 vector-genome junctions were cloned and
sequenced by linker-mediated polymerase chain reaction (LM-
PCR) and mapped onto the human genome. A collection of 795
sequences randomly cloned by LM-PCR and 100,000 computer-
generated random insertion sites were used as control groups.
Integration sites were annotated as TSS-proximal when occurring
within a distance of 65 kb from the TSS of any Known Gene
(UCSC definition), as intragenic when occurring into a gene at a
distance of .5 kb from the TSS, and as intergenic in all other
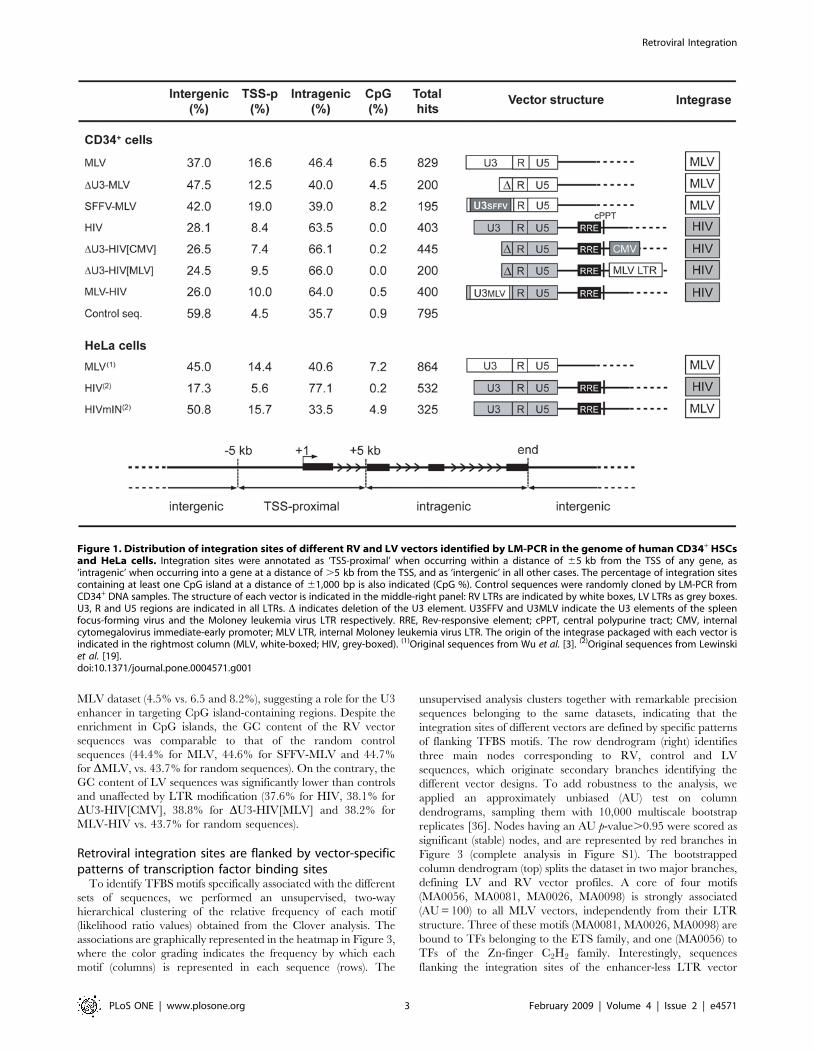
cases. As expected, all RV vectors showed a preference for
integration around TSSs, while LV vectors integrated preferen-
tially within genes, as compared to the control sequence set
(Figure 1). Over-representation of TSS-proximal integrations was
reduced in the DU3-MLV vector dataset (12.5% vs. 16.6 for
MLV), with a concomitant, significant increase in intergenic
integrations (47.5% vs. 37.0 for MLV, two-sample test for equality
of proportions with continuity correction, p,0.01). On the
contrary, similar LTR modifications (DU3-HIV[CMV], DU3-
HIV[MLV] and MLV-HIV) had no apparent consequence on the
LV integration preferences (Figure 1).
Transcription factor binding sites are over-represented insequences flanking RV integration sites
To investigate the role of transcription in mediating retroviral
target site selection, we evaluated the abundance of transcription
factor binding sites (TFBSs) in a 61,000-bp interval from the
integration sites of the RV and LV vectors in human HSCs. Based
on the annotation reported in Figure 1, we generated seven
weighted control groups of random sequences that reproduce, in
proportion, the integration preferences of each vector set (Table
S1). These sequences were used as pair-weighted background to
analyze the frequency of TFBS around insertion sites by the
Clover program, which screens DNA sequence sets against a
precompiled library of motifs and provides statistically significant
over- or under-representation compared to a background set of
sequences [34]. For this analysis, we used the JASPAR Core 2005
database, an open-access database of 123 annotated, matrix-based
TFBS motifs for multicellular eukaryotes [35]. Compared to other
databases (e.g., TRANSFAC), JASPAR motifs are non-redundant
and are derived exclusively from sets of nucleotide sequences
experimentally demonstrated to bind TFs. The number of motifs
enriched in each group of sequences with respect to its fitted
background is plotted in Figure 2. In all groups, motifs were
uniformly distributed through the 61,000-bp window (data not
shown), which was chosen as a reasonable compromise between
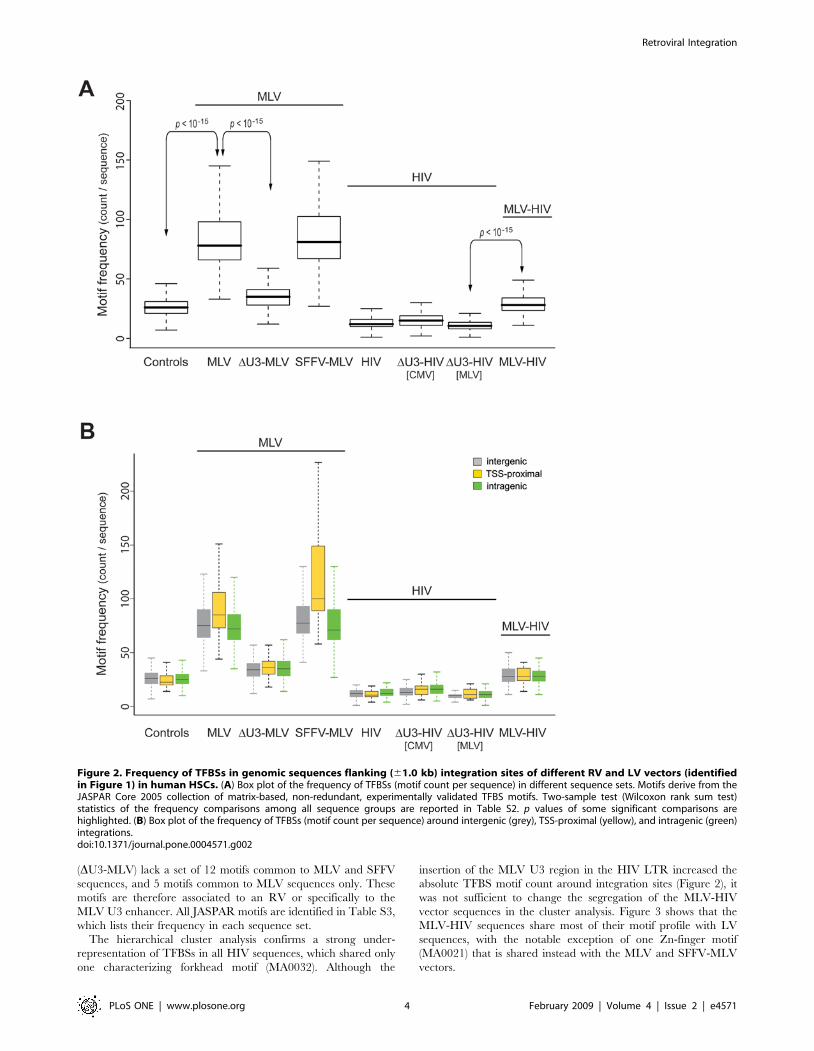
amount of information and heaviness of computation. The box
plots in Figure 2A indicate that RV vectors integrate in genomic
regions highly enriched in TFBSs (86.8 and 90.3 average TFBS
count per sequence for MLV and SFFV-MLV respectively vs. 27.2
for control sequences, Wilcoxon rank sum test, p,2.2e-16;
complete statistics in Table S2). The enrichment is independent
from the relative position of integration sites with respect to genes
and TSSs, since it is present in intergenic as well as in TSS-
proximal and intragenic integrations (grey, yellow and green box
plots respectively in Figure 2B). The RV LTR enhancer appears to
play an essential role in this selection, since deletion of the U3
region, but not its replacement with the SFFV enhancer, causes a
significant drop in the abundance of TFBSs around the integration
sites (35.4 for DU3-MLV vs. 86.8 for MLV). Conversely,
sequences around LV vector integration sites show a significantly
lower TFBS content compared to control sequences, (12.8 vs.
27.2). Interestingly, replacement of the HIV U3 by the MLV U3
enhancer in the HIV LTR (MLV-HIV vector in Figure 2) appears
to bias LV integration towards regions with an increased content
of TFBSs (from 12.8 of HIV to 29.1 of MLV-HIV, p,2.2e-16;
complete statistics in Table S2). The MLV U3 enhancer plays this
role only in the context of the LTR, as it has no apparent effect
when placed in an internal position within the LV vector (DU3-
HIV[MLV] vector in Figure 2).
Sequences flanking retroviral integration sites were tested also
for the presence of CpG islands. As expected from previous reports
[19], CpG island were enriched in all RV sequences with respect
to controls, while they were under-represented or completely
absent in LV sequences (Figure 1). Over-representation of CpG
islands was reduced in the DU3-MLV vs. the MLV and SFFV-
Retroviral Integration
PLoS ONE | www.plosone.org 2 February 2009 | Volume 4 | Issue 2 | e4571
MLV dataset (4.5% vs. 6.5 and 8.2%), suggesting a role for the U3
enhancer in targeting CpG island-containing regions. Despite the
enrichment in CpG islands, the GC content of the RV vector
sequences was comparable to that of the random control
sequences (44.4% for MLV, 44.6% for SFFV-MLV and 44.7%
for DMLV, vs. 43.7% for random sequences). On the contrary, the
GC content of LV sequences was significantly lower than controls
and unaffected by LTR modification (37.6% for HIV, 38.1% for
DU3-HIV[CMV], 38.8% for DU3-HIV[MLV] and 38.2% for
MLV-HIV vs. 43.7% for random sequences).
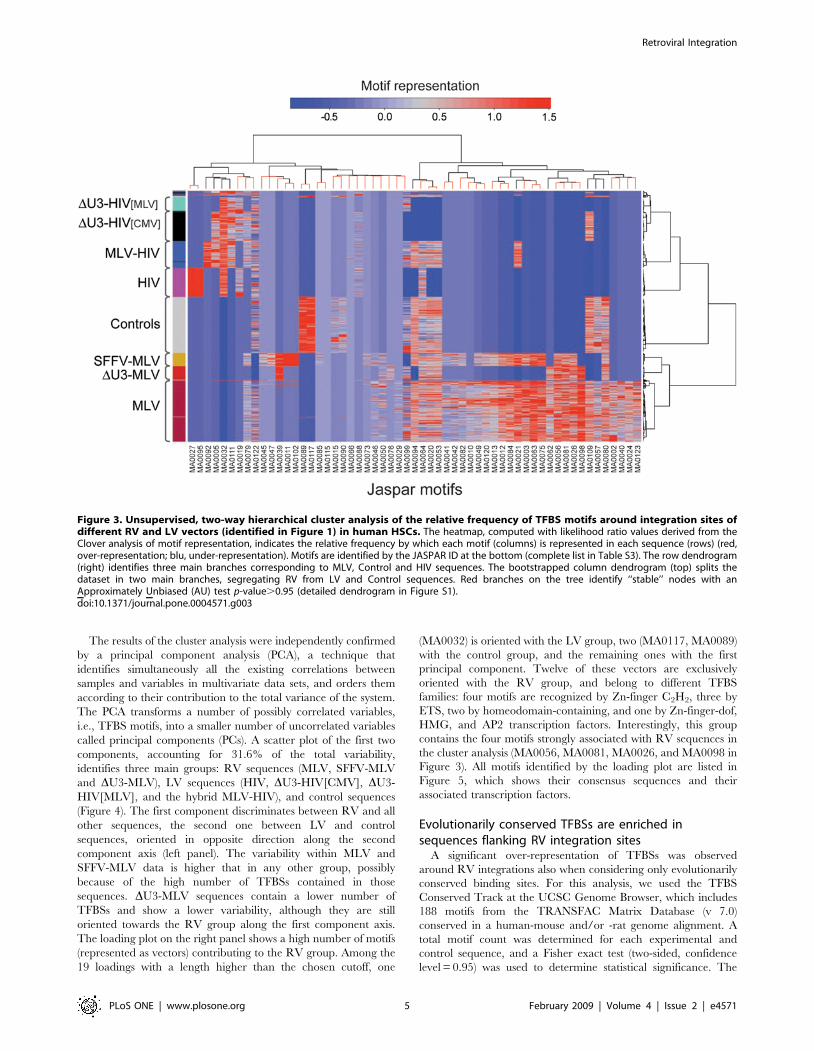
Retroviral integration sites are flanked by vector-specificpatterns of transcription factor binding sites
To identify TFBS motifs specifically associated with the different
sets of sequences, we performed an unsupervised, two-way
hierarchical clustering of the relative frequency of each motif
(likelihood ratio values) obtained from the Clover analysis. The
associations are graphically represented in the heatmap in Figure 3,
where the color grading indicates the frequency by which each
motif (columns) is represented in each sequence (rows). The
unsupervised analysis clusters together with remarkable precision
sequences belonging to the same datasets, indicating that the
integration sites of different vectors are defined by specific patterns
of flanking TFBS motifs. The row dendrogram (right) identifies
three main nodes corresponding to RV, control and LV
sequences, which originate secondary branches identifying the
different vector designs. To add robustness to the analysis, we
applied an approximately unbiased (AU) test on column
dendrograms, sampling them with 10,000 multiscale bootstrap
replicates [36]. Nodes having an AU p-value.0.95 were scored as
significant (stable) nodes, and are represented by red branches in
Figure 3 (complete analysis in Figure S1). The bootstrapped
column dendrogram (top) splits the dataset in two major branches,
defining LV and RV vector profiles. A core of four motifs
(MA0056, MA0081, MA0026, MA0098) is strongly associated
(AU = 100) to all MLV vectors, independently from their LTR
structure. Three of these motifs (MA0081, MA0026, MA0098) are
bound to TFs belonging to the ETS family, and one (MA0056) to
TFs of the Zn-finger C2H2 family. Interestingly, sequences
flanking the integration sites of the enhancer-less LTR vector
Figure 1. Distribution of integration sites of different RV and LV vectors identified by LM-PCR in the genome of human CD34+ HSCsand HeLa cells. Integration sites were annotated as ‘TSS-proximal’ when occurring within a distance of 65 kb from the TSS of any gene, as‘intragenic’ when occurring into a gene at a distance of .5 kb from the TSS, and as ‘intergenic’ in all other cases. The percentage of integration sitescontaining at least one CpG island at a distance of 61,000 bp is also indicated (CpG %). Control sequences were randomly cloned by LM-PCR fromCD34+ DNA samples. The structure of each vector is indicated in the middle-right panel: RV LTRs are indicated by white boxes, LV LTRs as grey boxes.U3, R and U5 regions are indicated in all LTRs. D indicates deletion of the U3 element. U3SFFV and U3MLV indicate the U3 elements of the spleenfocus-forming virus and the Moloney leukemia virus LTR respectively. RRE, Rev-responsive element; cPPT, central polypurine tract; CMV, internalcytomegalovirus immediate-early promoter; MLV LTR, internal Moloney leukemia virus LTR. The origin of the integrase packaged with each vector isindicated in the rightmost column (MLV, white-boxed; HIV, grey-boxed). (1)Original sequences from Wu et al. [3]. (2)Original sequences from Lewinskiet al. [19].doi:10.1371/journal.pone.0004571.g001
Retroviral Integration
PLoS ONE | www.plosone.org 3 February 2009 | Volume 4 | Issue 2 | e4571
(DU3-MLV) lack a set of 12 motifs common to MLV and SFFV
sequences, and 5 motifs common to MLV sequences only. These
motifs are therefore associated to an RV or specifically to the
MLV U3 enhancer. All JASPAR motifs are identified in Table S3,
which lists their frequency in each sequence set.
The hierarchical cluster analysis confirms a strong under-
representation of TFBSs in all HIV sequences, which shared only
one characterizing forkhead motif (MA0032). Although the
insertion of the MLV U3 region in the HIV LTR increased the
absolute TFBS motif count around integration sites (Figure 2), it
was not sufficient to change the segregation of the MLV-HIV
vector sequences in the cluster analysis. Figure 3 shows that the
MLV-HIV sequences share most of their motif profile with LV
sequences, with the notable exception of one Zn-finger motif
(MA0021) that is shared instead with the MLV and SFFV-MLV
vectors.
Figure 2. Frequency of TFBSs in genomic sequences flanking (61.0 kb) integration sites of different RV and LV vectors (identifiedin Figure 1) in human HSCs. (A) Box plot of the frequency of TFBSs (motif count per sequence) in different sequence sets. Motifs derive from theJASPAR Core 2005 collection of matrix-based, non-redundant, experimentally validated TFBS motifs. Two-sample test (Wilcoxon rank sum test)statistics of the frequency comparisons among all sequence groups are reported in Table S2. p values of some significant comparisons arehighlighted. (B) Box plot of the frequency of TFBSs (motif count per sequence) around intergenic (grey), TSS-proximal (yellow), and intragenic (green)integrations.doi:10.1371/journal.pone.0004571.g002
Retroviral Integration
PLoS ONE | www.plosone.org 4 February 2009 | Volume 4 | Issue 2 | e4571
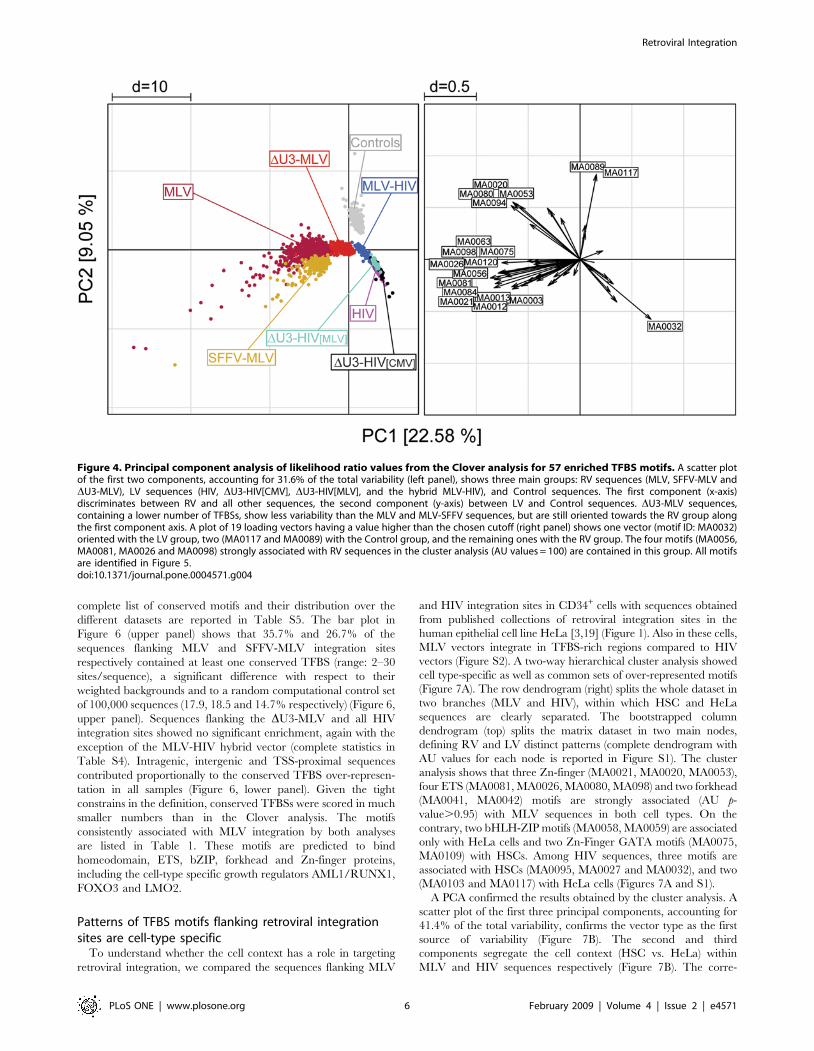
The results of the cluster analysis were independently confirmed
by a principal component analysis (PCA), a technique that
identifies simultaneously all the existing correlations between
samples and variables in multivariate data sets, and orders them
according to their contribution to the total variance of the system.
The PCA transforms a number of possibly correlated variables,
i.e., TFBS motifs, into a smaller number of uncorrelated variables
called principal components (PCs). A scatter plot of the first two
components, accounting for 31.6% of the total variability,
identifies three main groups: RV sequences (MLV, SFFV-MLV
and DU3-MLV), LV sequences (HIV, DU3-HIV[CMV], DU3-
HIV[MLV], and the hybrid MLV-HIV), and control sequences
(Figure 4). The first component discriminates between RV and all
other sequences, the second one between LV and control
sequences, oriented in opposite direction along the second
component axis (left panel). The variability within MLV and
SFFV-MLV data is higher that in any other group, possibly
because of the high number of TFBSs contained in those
sequences. DU3-MLV sequences contain a lower number of
TFBSs and show a lower variability, although they are still
oriented towards the RV group along the first component axis.
The loading plot on the right panel shows a high number of motifs
(represented as vectors) contributing to the RV group. Among the
19 loadings with a length higher than the chosen cutoff, one
(MA0032) is oriented with the LV group, two (MA0117, MA0089)
with the control group, and the remaining ones with the first
principal component. Twelve of these vectors are exclusively
oriented with the RV group, and belong to different TFBS
families: four motifs are recognized by Zn-finger C2H2, three by
ETS, two by homeodomain-containing, and one by Zn-finger-dof,
HMG, and AP2 transcription factors. Interestingly, this group
contains the four motifs strongly associated with RV sequences in
the cluster analysis (MA0056, MA0081, MA0026, and MA0098 in
Figure 3). All motifs identified by the loading plot are listed in
Figure 5, which shows their consensus sequences and their
associated transcription factors.
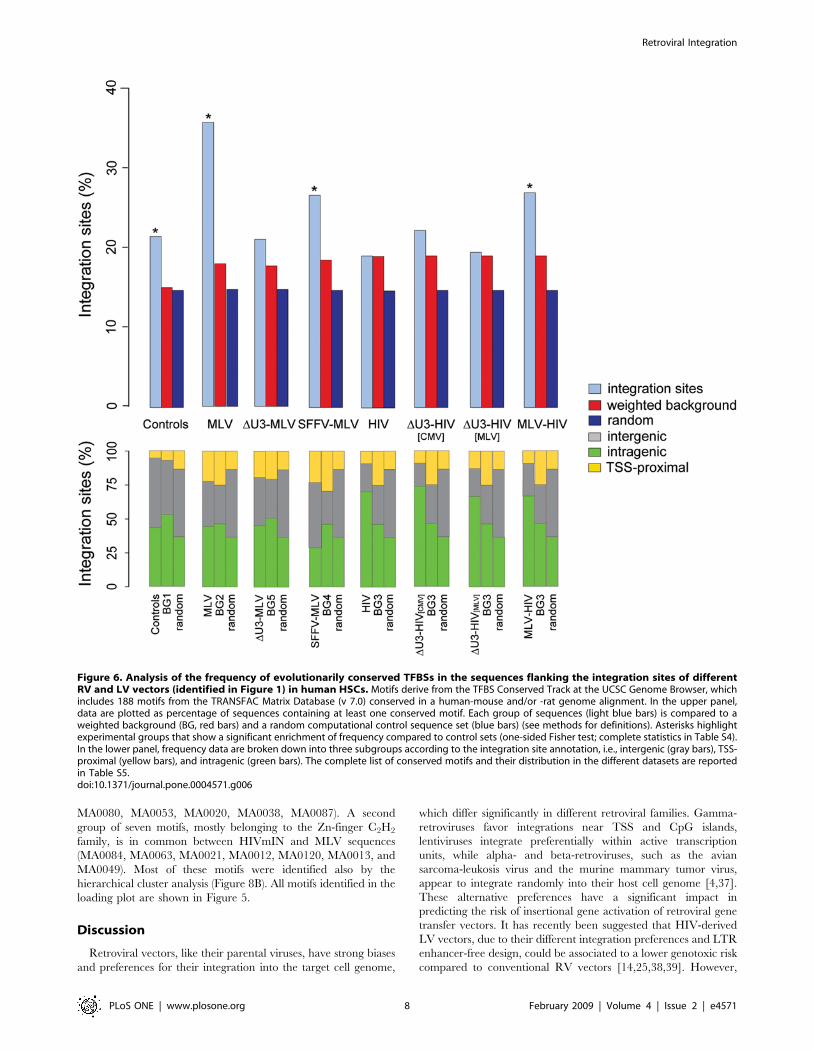
Evolutionarily conserved TFBSs are enriched insequences flanking RV integration sites
A significant over-representation of TFBSs was observed
around RV integrations also when considering only evolutionarily
conserved binding sites. For this analysis, we used the TFBS
Conserved Track at the UCSC Genome Browser, which includes
188 motifs from the TRANSFAC Matrix Database (v 7.0)
conserved in a human-mouse and/or -rat genome alignment. A
total motif count was determined for each experimental and
control sequence, and a Fisher exact test (two-sided, confidence
level = 0.95) was used to determine statistical significance. The
Figure 3. Unsupervised, two-way hierarchical cluster analysis of the relative frequency of TFBS motifs around integration sites ofdifferent RV and LV vectors (identified in Figure 1) in human HSCs. The heatmap, computed with likelihood ratio values derived from theClover analysis of motif representation, indicates the relative frequency by which each motif (columns) is represented in each sequence (rows) (red,over-representation; blu, under-representation). Motifs are identified by the JASPAR ID at the bottom (complete list in Table S3). The row dendrogram(right) identifies three main branches corresponding to MLV, Control and HIV sequences. The bootstrapped column dendrogram (top) splits thedataset in two main branches, segregating RV from LV and Control sequences. Red branches on the tree identify ‘‘stable’’ nodes with anApproximately Unbiased (AU) test p-value.0.95 (detailed dendrogram in Figure S1).doi:10.1371/journal.pone.0004571.g003
Retroviral Integration
PLoS ONE | www.plosone.org 5 February 2009 | Volume 4 | Issue 2 | e4571
complete list of conserved motifs and their distribution over the
different datasets are reported in Table S5. The bar plot in
Figure 6 (upper panel) shows that 35.7% and 26.7% of the
sequences flanking MLV and SFFV-MLV integration sites
respectively contained at least one conserved TFBS (range: 2–30
sites/sequence), a significant difference with respect to their
weighted backgrounds and to a random computational control set
of 100,000 sequences (17.9, 18.5 and 14.7% respectively) (Figure 6,
upper panel). Sequences flanking the DU3-MLV and all HIV
integration sites showed no significant enrichment, again with the
exception of the MLV-HIV hybrid vector (complete statistics in
Table S4). Intragenic, intergenic and TSS-proximal sequences
contributed proportionally to the conserved TFBS over-represen-
tation in all samples (Figure 6, lower panel). Given the tight
constrains in the definition, conserved TFBSs were scored in much
smaller numbers than in the Clover analysis. The motifs
consistently associated with MLV integration by both analyses
are listed in Table 1. These motifs are predicted to bind
homeodomain, ETS, bZIP, forkhead and Zn-finger proteins,
including the cell-type specific growth regulators AML1/RUNX1,
FOXO3 and LMO2.
Patterns of TFBS motifs flanking retroviral integrationsites are cell-type specific
To understand whether the cell context has a role in targeting
retroviral integration, we compared the sequences flanking MLV
and HIV integration sites in CD34+ cells with sequences obtained
from published collections of retroviral integration sites in the
human epithelial cell line HeLa [3,19] (Figure 1). Also in these cells,
MLV vectors integrate in TFBS-rich regions compared to HIV
vectors (Figure S2). A two-way hierarchical cluster analysis showed
cell type-specific as well as common sets of over-represented motifs
(Figure 7A). The row dendrogram (right) splits the whole dataset in
two branches (MLV and HIV), within which HSC and HeLa
sequences are clearly separated. The bootstrapped column
dendrogram (top) splits the matrix dataset in two main nodes,
defining RV and LV distinct patterns (complete dendrogram with
AU values for each node is reported in Figure S1). The cluster
analysis shows that three Zn-finger (MA0021, MA0020, MA0053),
four ETS (MA0081, MA0026, MA0080, MA098) and two forkhead
(MA0041, MA0042) motifs are strongly associated (AU p-
value.0.95) with MLV sequences in both cell types. On the
contrary, two bHLH-ZIP motifs (MA0058, MA0059) are associated
only with HeLa cells and two Zn-Finger GATA motifs (MA0075,
MA0109) with HSCs. Among HIV sequences, three motifs are
associated with HSCs (MA0095, MA0027 and MA0032), and two
(MA0103 and MA0117) with HeLa cells (Figures 7A and S1).
A PCA confirmed the results obtained by the cluster analysis. A
scatter plot of the first three principal components, accounting for
41.4% of the total variability, confirms the vector type as the first
source of variability (Figure 7B). The second and third
components segregate the cell context (HSC vs. HeLa) within
MLV and HIV sequences respectively (Figure 7B). The corre-
Figure 4. Principal component analysis of likelihood ratio values from the Clover analysis for 57 enriched TFBS motifs. A scatter plotof the first two components, accounting for 31.6% of the total variability (left panel), shows three main groups: RV sequences (MLV, SFFV-MLV andDU3-MLV), LV sequences (HIV, DU3-HIV[CMV], DU3-HIV[MLV], and the hybrid MLV-HIV), and Control sequences. The first component (x-axis)discriminates between RV and all other sequences, the second component (y-axis) between LV and Control sequences. DU3-MLV sequences,containing a lower number of TFBSs, show less variability than the MLV and MLV-SFFV sequences, but are still oriented towards the RV group alongthe first component axis. A plot of 19 loading vectors having a value higher than the chosen cutoff (right panel) shows one vector (motif ID: MA0032)oriented with the LV group, two (MA0117 and MA0089) with the Control group, and the remaining ones with the RV group. The four motifs (MA0056,MA0081, MA0026 and MA0098) strongly associated with RV sequences in the cluster analysis (AU values = 100) are contained in this group. All motifsare identified in Figure 5.doi:10.1371/journal.pone.0004571.g004
Retroviral Integration
PLoS ONE | www.plosone.org 6 February 2009 | Volume 4 | Issue 2 | e4571
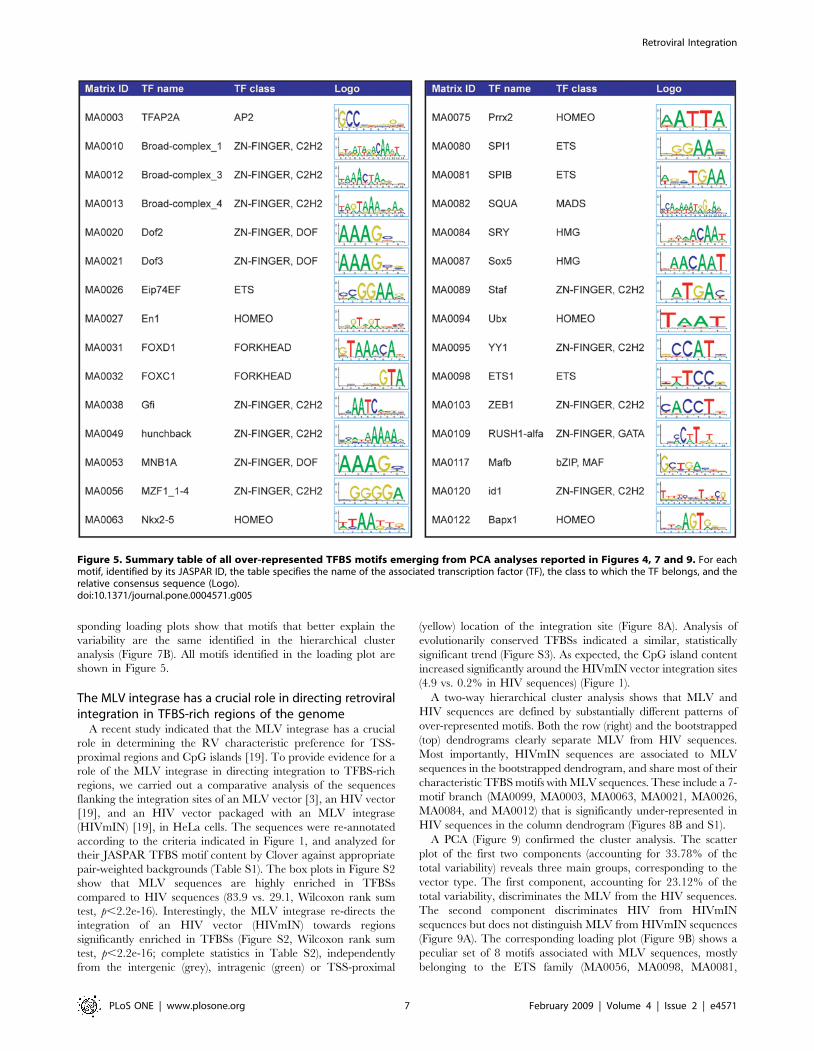
sponding loading plots show that motifs that better explain the
variability are the same identified in the hierarchical cluster
analysis (Figure 7B). All motifs identified in the loading plot are
shown in Figure 5.
The MLV integrase has a crucial role in directing retroviralintegration in TFBS-rich regions of the genome
A recent study indicated that the MLV integrase has a crucial
role in determining the RV characteristic preference for TSS-
proximal regions and CpG islands [19]. To provide evidence for a
role of the MLV integrase in directing integration to TFBS-rich
regions, we carried out a comparative analysis of the sequences
flanking the integration sites of an MLV vector [3], an HIV vector
[19], and an HIV vector packaged with an MLV integrase
(HIVmIN) [19], in HeLa cells. The sequences were re-annotated
according to the criteria indicated in Figure 1, and analyzed for
their JASPAR TFBS motif content by Clover against appropriate
pair-weighted backgrounds (Table S1). The box plots in Figure S2
show that MLV sequences are highly enriched in TFBSs
compared to HIV sequences (83.9 vs. 29.1, Wilcoxon rank sum
test, p,2.2e-16). Interestingly, the MLV integrase re-directs the
integration of an HIV vector (HIVmIN) towards regions
significantly enriched in TFBSs (Figure S2, Wilcoxon rank sum
test, p,2.2e-16; complete statistics in Table S2), independently
from the intergenic (grey), intragenic (green) or TSS-proximal
(yellow) location of the integration site (Figure 8A). Analysis of
evolutionarily conserved TFBSs indicated a similar, statistically
significant trend (Figure S3). As expected, the CpG island content
increased significantly around the HIVmIN vector integration sites
(4.9 vs. 0.2% in HIV sequences) (Figure 1).
A two-way hierarchical cluster analysis shows that MLV and
HIV sequences are defined by substantially different patterns of
over-represented motifs. Both the row (right) and the bootstrapped
(top) dendrograms clearly separate MLV from HIV sequences.
Most importantly, HIVmIN sequences are associated to MLV
sequences in the bootstrapped dendrogram, and share most of their
characteristic TFBS motifs with MLV sequences. These include a 7-
motif branch (MA0099, MA0003, MA0063, MA0021, MA0026,
MA0084, and MA0012) that is significantly under-represented in
HIV sequences in the column dendrogram (Figures 8B and S1).
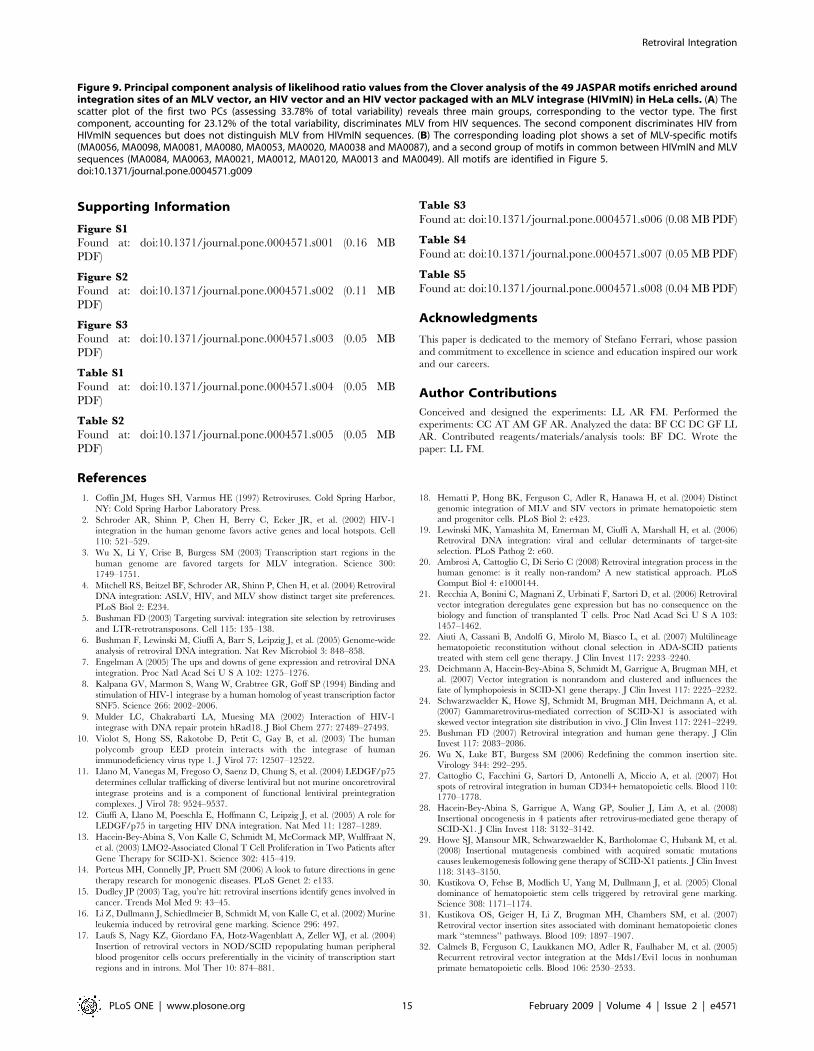
A PCA (Figure 9) confirmed the cluster analysis. The scatter
plot of the first two components (accounting for 33.78% of the
total variability) reveals three main groups, corresponding to the
vector type. The first component, accounting for 23.12% of the
total variability, discriminates the MLV from the HIV sequences.
The second component discriminates HIV from HIVmIN
sequences but does not distinguish MLV from HIVmIN sequences
(Figure 9A). The corresponding loading plot (Figure 9B) shows a
peculiar set of 8 motifs associated with MLV sequences, mostly
belonging to the ETS family (MA0056, MA0098, MA0081,
Figure 5. Summary table of all over-represented TFBS motifs emerging from PCA analyses reported in Figures 4, 7 and 9. For eachmotif, identified by its JASPAR ID, the table specifies the name of the associated transcription factor (TF), the class to which the TF belongs, and therelative consensus sequence (Logo).doi:10.1371/journal.pone.0004571.g005
Retroviral Integration
PLoS ONE | www.plosone.org 7 February 2009 | Volume 4 | Issue 2 | e4571
MA0080, MA0053, MA0020, MA0038, MA0087). A second
group of seven motifs, mostly belonging to the Zn-finger C2H2
family, is in common between HIVmIN and MLV sequences
(MA0084, MA0063, MA0021, MA0012, MA0120, MA0013, and
MA0049). Most of these motifs were identified also by the
hierarchical cluster analysis (Figure 8B). All motifs identified in the
loading plot are shown in Figure 5.
Discussion
Retroviral vectors, like their parental viruses, have strong biases
and preferences for their integration into the target cell genome,
which differ significantly in different retroviral families. Gamma-
retroviruses favor integrations near TSS and CpG islands,
lentiviruses integrate preferentially within active transcription
units, while alpha- and beta-retroviruses, such as the avian
sarcoma-leukosis virus and the murine mammary tumor virus,
appear to integrate randomly into their host cell genome [4,37].
These alternative preferences have a significant impact in
predicting the risk of insertional gene activation of retroviral gene
transfer vectors. It has recently been suggested that HIV-derived
LV vectors, due to their different integration preferences and LTR
enhancer-free design, could be associated to a lower genotoxic risk
compared to conventional RV vectors [14,25,38,39]. However,
Figure 6. Analysis of the frequency of evolutionarily conserved TFBSs in the sequences flanking the integration sites of differentRV and LV vectors (identified in Figure 1) in human HSCs. Motifs derive from the TFBS Conserved Track at the UCSC Genome Browser, whichincludes 188 motifs from the TRANSFAC Matrix Database (v 7.0) conserved in a human-mouse and/or -rat genome alignment. In the upper panel,data are plotted as percentage of sequences containing at least one conserved motif. Each group of sequences (light blue bars) is compared to aweighted background (BG, red bars) and a random computational control sequence set (blue bars) (see methods for definitions). Asterisks highlightexperimental groups that show a significant enrichment of frequency compared to control sets (one-sided Fisher test; complete statistics in Table S4).In the lower panel, frequency data are broken down into three subgroups according to the integration site annotation, i.e., intergenic (gray bars), TSS-proximal (yellow bars), and intragenic (green bars). The complete list of conserved motifs and their distribution in the different datasets are reportedin Table S5.doi:10.1371/journal.pone.0004571.g006
Retroviral Integration
PLoS ONE | www.plosone.org 8 February 2009 | Volume 4 | Issue 2 | e4571

the current poor understanding of the molecular mechanisms
underlying retroviral target site selection is a serious obstacle in the
rational design of safer and more efficient gene transfer
technology. Understanding in more detail the interactions between
retroviral PICs and the human genome, the viral and cellular
determinants of target site selection, and the role of the functional
vector components (enhancers, promoters, splicing and polyade-
nylation signals) in influencing integration and gene expression, is
crucial to assess the genotoxic characteristics of different vector
families and designs.
Our study identifies a previously unrecognized feature of the
regions targeted by RV PICs, i.e., an elevated content of
transcription factor binding sites. By analyzing the sequences
flanking the integration sites of MLV- and HIV-derived vectors in
human HSCs, and of mutants featuring deletions and replace-
ments of the LTR U3 enhancers, we show that integration in
TFBS-rich regions of the genome is a specific characteristic of an
RV vector with an LTR containing an RV enhancer (either MLV-
or SFFV-derived). Deletion of the U3 element eliminates the
TFBS over-representation around the insertion sites and reduces
the relative frequency of TSS-proximal integrations, indicating
that the U3 enhancer is an important viral determinant of RV
target site selection. A statistical analysis indicates that over-
representation of TFBSs is independent from the relative position
or distance of the integration sites with respect to transcription
units. This suggests that selection of TFBS-rich regions may in fact
underlie all known RV integration preferences, particularly that
for TSSs, CpG islands and DNase-I hypersensitive sites [3,4,17–
19,21,27], where TFBS-rich regulatory regions are highly
represented.
On the contrary, TFBS motifs are significantly under-
represented around LV integration sites, independently from the
presence of the HIV U3 element in the LTR. Replacement of the
HIV with an MLV U3 element in an LV vector removes this
negative bias, but is not sufficient to introduce a positive one like
that of MLV-based vectors. Interestingly, when we analyzed the
sequences around a previously published collection of integration
sites of MLV, HIV, and an HIV vector packaged with an MLV
integrase (HIVmIN) in HeLa cells [19], we discovered that the
MLV integrase re-directs the integration of an HIV vector towards
regions significantly enriched in TFBSs, again independently from
intergenic, intragenic or TSS-proximal annotation of the integra-
tion site. Increased targeting of TFBS-rich regions might in turn
underlie the increased targeting of TSSs, CpG islands and DNase-
I hypersensitive sites previously observed for the HIVmIN vector
[19]. We conclude that the MLV integrase and the LTR U3
region are the major viral determinants of the RV-specific
selection of TFBS-rich target sites into the genome.
The MLV U3 enhancer contains repeated binding sites for a
number of TFs, including members of the ETS, NFAT, C/EBP
and nuclear hormone receptor families, the AML1/RUNX1-
CBFB complex, and YY1. Bound transcription factors may very
well be the cellular mediators of the LTR-associated component of
RV integration preferences. Indeed, unintegrated retroviral
genomes, possibly including PICs, are transcriptionally active in
the target cell nuclei [40,41], and are therefore likely to bind at
least some of the TFs driving transcription of the integrated
proviral genomes. We propose that TFs binding the U3 enhancer
cooperate with the integrase in directing PICs towards regulatory
regions actively engaged by the transcriptional machinery.
Alternatively, unbound U3 elements in RV PICs engage
chromatin-associated TFs to direct integration. Cooperation
between TFs and the integrase may be seen as an evolution of
the mechanisms by which yeast retrotransposons target their
integration to specific genomic regions through tethering to host
cell proteins. In Saccharomyces cerevisiae, a specific domain of the
retrotransposase directs integration of the Ty3 retrotransposon to
promoters transcribed by the DNA polymerase III, by tethering to
Pol III-specific transcription factors (reviewed in [5]). This domain
is lacking in the RV integrases, which are otherwise related to
Table 1. TFBS motifs found significantly enriched in sequences flanking (61,000 bp) the integration sites of the MLV vector inhuman HSCs in both the JASPAR and the TRANSFAC conserved motif database.
JASPAR TRANSFAC (conserved)
Matrix ID TF Total counts Counts/seq (average) Counts/seq (range) Matrix AccNumb TF Total counts
MA0109 Rush 1a 530 0.63 0–3 M00278 LMO2 18
MA0046 TCF1 871 1.05 0–5 M00132 HNF1 12
MA0002 RUNX1 1,146 1.38 0–4 M00454 MRF2 16
MA0050 IRF-1 1,463 1.76 0–6 M00062 IRF-1 20
MA0012 broad complex_3 1,531 1.84 0–12 M00474 FOXO1 30
MA0123 ABI4 1,726 2.08 0–10 M00515 PPRG 6
MA0026 E74A 1,940 2.34 0–7 M00025 ELK1 4
MA0064 PBF 2,028 2.44 0–9 M00062 IRF-1 20
MA0042 FOXI1 2,217 2.67 0–11 M00289 FOXI1 8
MA0053 MNB1-A 2,246 2.70 0–9 M00062 IRF-1 20
MA0013 broad complex_4 2,297 2.77 0–20 M00477 FOXO3 30
MA0120 Id1 2,553 3.07 0–21 M00258 ISGF3 20
MA0079 Sp1 2,648 3.19 0–10 M00257 RREB1 6
MA0021 dof3 2,902 3.50 0–10 M00062 IRF-1 20
MA0020 dof2 3,201 3.86 0–10 M00062 IRF-1 20
Frequencies are listed as total counts, average counts per sequence, and range of counts per sequence (1st to 99th percentile) in the 829 MLV sequences. JASPAR andTRANSFAC motifs were matched by the STAMP software [55].doi:10.1371/journal.pone.0004571.t001
Retroviral Integration
PLoS ONE | www.plosone.org 9 February 2009 | Volume 4 | Issue 2 | e4571

Retroviral Integration
PLoS ONE | www.plosone.org 10 February 2009 | Volume 4 | Issue 2 | e4571
retrotransposases, and may have been functionally replaced by the
association with TFs bound to the LTR elements. As a result, RV
PICs are able to target a large collection of Pol II-specific, rather
than a few Pol III-specific, regulatory elements throughout the
genome.
A comparison between the TFBS motifs associated to RV
integration sites in HSCs and in the non-hematopoietic HeLa cells
shows a statistically significant association of specific motif patterns
to either cell type, together with motifs over-represented in both
cells. The existence of cell-specific and non-specific TFBS clusters
suggests that RV PICs interact with general components of the
enhancer-binding complexes (e.g., co-regulators, chromatin remod-
eling or mediator complexes) rather than with specific TFs or TF
families. Recent data indicate that the MLV integrase may interact
directly with chromatin-remodeling, DNA repair and transcription
factors [42], providing independent, biochemical support to this
hypothesis. Tethering of PICs to transcription factories, where
promoters and regulatory regions are relocated by cell-specific
mechanisms, may in turn be the cause of the RV-specific, high
frequency of integration hot spots and preferred targeting of genes
associated to cell-specific regulatory networks [21,27]. Indeed,
TFBSs specifically associated with RV integration in HSCs include
binding sites for HSC-specific regulators of cell proliferation,
differentiation or quiescence, such as LMO2, AML1/RUNX1,
and FOXO3. A mechanism coupling target site selection to gene
regulation may have evolved to maximize the probability for
gamma-retroviruses to be transcribed in the target cell genome, and
possibly to induce expansion of infected cells by insertional
activation of cell-specific growth regulators. Interestingly, integra-
tion of HIV does not favor, and possibly avoids, TFBS-rich regions,
suggesting the evolution of a different mechanism that targets open
chromatin regions while minimizing interference with the cell
transcriptional machinery. Recent data emerging from large
integration site datasets predict the association of HIV integration
sites with histone post-translational modifications specifically
associated to transcribed chromatin rather than to enhancers,
promoters and other regulatory regions [43]. Tethering via the
LEDGF/p75 chromatin component is likely to play a major role in
mediating this targeting strategy [12,44,45].
The different propensity of RV and LV vectors to target
regulatory regions has an obvious impact on the design of gene
transfer vectors for clinical applications. Although a self-inactivat-
ing (DU3) design is predicted, also by this analysis, to improve the
safety characteristics of MLV-based vectors, the activity of the
MLV integrase remains an undesirable enhancer of the frequency
by which an RV vector may target potentially dangerous regions
of the genome. This study also shows the importance of the cell
context in determining the frequency of integration into certain
genomic regions, and predicts that targeting of dominantly acting
proto-oncogenes may have a different likelihood in different cells.
As an example, the LMO2 locus is targeted at very high frequency
in HSCs [22,27] but not in T-cells where it is not expressed
(unpublished observation). On the contrary, the use of HIV-based
vectors would minimize insertional gene activation by generally
reducing integration in the proximity of active promoters and
enhancers. Analysis of TFBSs close to the integration sites provides
an additional readout to study the potential genotoxicity of vectors
containing different promoters, enhancers and regulatory elements
in a specific cell context.
Materials and Methods
Retroviral vectorsMLV-derived oncoretroviral vectors containing a green fluores-
cent protein (GFP) gene, an adenosine deaminase (ADA) or a cc
receptor cDNA under the control of a wild-type MLV LTRs were
the previously described LGSDN [46], GIADA [47] and MFG-cc
[48] vectors, respectively. The DU3-MLV vector carried a GFP
gene under the control of a DU3 (2413 to 262) LTR, and was
previously described as LGSDN-DCAAT [46]. The SFFV-MLV
vector expressed the GFP gene under the control of the SFFV LTR
in the previously described pSF91 MLV vector backbone [49] (a gift
from C. Baum, Hanover). HIV vectors with wild-type LTRs were
the previously described pHR2pptCMV-GFPwpre and
pHR2pptGSDN LV vectors [27], in which the HIV-1 wild-type
LTR drove the expression of the GFP gene. The DU3-HIV[CMV]
vector carried 2418 to 218 deletion in the U3 region and an
internal GFP expression cassette driven by the cytomegalovirus
(CMV) immediate-early promoter, and was previously described as
pRRLsin-18.pptCMV-GFPwpre [50]. The DU3-HIV[MLV] vec-
tor carried a 2418 to 240 U3 deletion and was obtained by
inserting an internal DLNGFR expression cassette driven by the full
MLV LTR into the pRRLsin-40.GFP vector [51]. The MLV-HIV
vector was built by inserting the PCR-amplified 2413 to 262
fragment of the MLV U3 region at position 240 in the HIV LTR of
the pRRLsin-40.GFP vector [51], and adding an internal SV40-
driven DLNGFR expression cassette.
RV vector supernatants were produced by transient transfection
of the amphotropic Phoenix packaging cell line. Infectious particle
titer was determined on the K562 human hematopoietic cell line.
The pSF91.eGFP.WPRE RV vector was VSV-G pseudotyped by
transient co-transfection of 293T cells with an MLV gag/pol
expression plasmid (a gift from C. Baum) and a VSV-G expression
plasmid. Infectious particle titer was determined on 293T cells.
VSV-G pseudotyped LV particles were prepared by transient co-
transfection of 293T cells, collected and concentrated as described
[52], and titrated on 293T cells. Transduction efficiency was
evaluated by scoring GFP and/or DLNGFR transgene expression
on target cells by flow cytometry. The ADA and cc receptor RV
vectors were produced as amphotropic or GaLV envelope-
pseudotyped particles from stable packaging cell lines, and titrated
as previously described [47,48].
Transduction of target cellsHuman CD34+ HSCs were purified from the Ficoll fraction of
donor cord blood, bone marrow or peripheral blood by the CD34
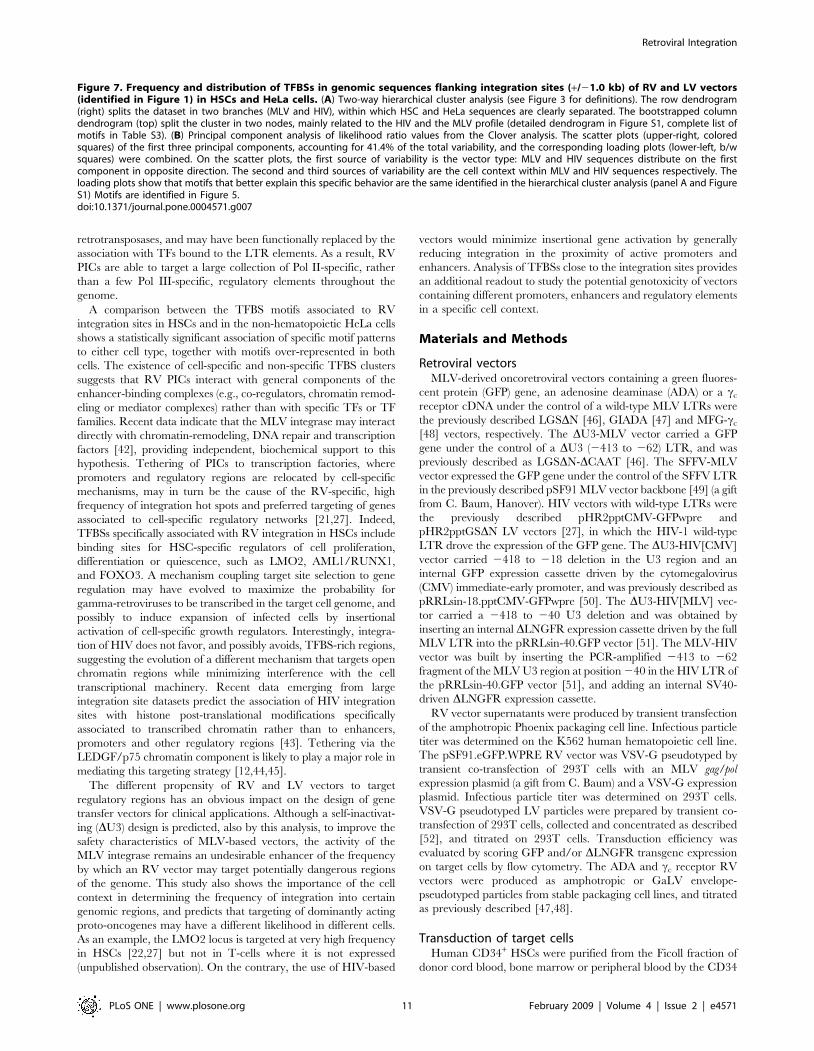
Figure 7. Frequency and distribution of TFBSs in genomic sequences flanking integration sites (+/21.0 kb) of RV and LV vectors(identified in Figure 1) in HSCs and HeLa cells. (A) Two-way hierarchical cluster analysis (see Figure 3 for definitions). The row dendrogram(right) splits the dataset in two branches (MLV and HIV), within which HSC and HeLa sequences are clearly separated. The bootstrapped columndendrogram (top) split the cluster in two nodes, mainly related to the HIV and the MLV profile (detailed dendrogram in Figure S1, complete list ofmotifs in Table S3). (B) Principal component analysis of likelihood ratio values from the Clover analysis. The scatter plots (upper-right, coloredsquares) of the first three principal components, accounting for 41.4% of the total variability, and the corresponding loading plots (lower-left, b/wsquares) were combined. On the scatter plots, the first source of variability is the vector type: MLV and HIV sequences distribute on the firstcomponent in opposite direction. The second and third sources of variability are the cell context within MLV and HIV sequences respectively. Theloading plots show that motifs that better explain this specific behavior are the same identified in the hierarchical cluster analysis (panel A and FigureS1) Motifs are identified in Figure 5.doi:10.1371/journal.pone.0004571.g007
Retroviral Integration
PLoS ONE | www.plosone.org 11 February 2009 | Volume 4 | Issue 2 | e4571
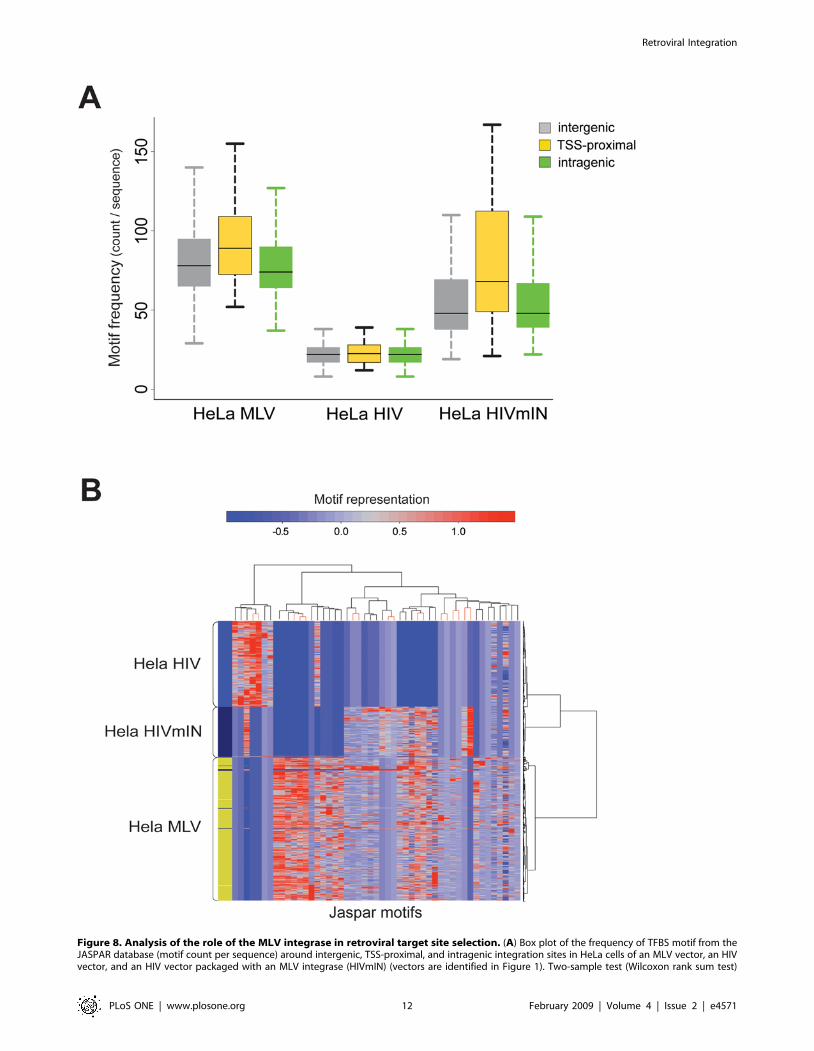
Figure 8. Analysis of the role of the MLV integrase in retroviral target site selection. (A) Box plot of the frequency of TFBS motif from theJASPAR database (motif count per sequence) around intergenic, TSS-proximal, and intragenic integration sites in HeLa cells of an MLV vector, an HIVvector, and an HIV vector packaged with an MLV integrase (HIVmIN) (vectors are identified in Figure 1). Two-sample test (Wilcoxon rank sum test)
Retroviral Integration
PLoS ONE | www.plosone.org 12 February 2009 | Volume 4 | Issue 2 | e4571
magnetic cell isolation kit (MiniMACS; Miltenyi, Auburn, CA)
and pre-stimulated for 24–48 hours at a density of 16106 cells/ml
in serum-free Iscove’s Modified Dulbecco’s Medium (IMDM;
BioWhittaker; Verviers, Belgium), supplemented with 20% BIT
serum substitute, recombinant human thrombopoietin, interleu-
kin-3, stem cell factor and Flt-3 ligand, as previously described
[27]. Transduction with RV vectors was performed by spinocula-
tion (3 rounds at 1,500 rpm for 45 min) in the presence of
retroviral supernatants and 4 mg/ml polybrene. Transduction with
LV vectors was performed by over-night incubation of CD34+
cells with vector stocks at a multiplicity of infection (MOI) of 200
in the presence of 4 mg/ml polybrene. Transduction efficiency was
evaluated by flow cytometry as described [27]. Transduced cells
were collected 5–12 days after infection and phenotyped with a
RPE-conjugated anti-human CD34 antibody (Becton Dickinson)
before DNA extraction.
SupT1 cells were grown in RPMI 1640 (BioWhittaker)
supplemented with 10% fetal bovine serum, and transduced with
MLV-HIV viral stocks at an MOI of 25 in the presence of 8 mg/
ml polybrene. After virus addition, cells were spinoculated for
1 hour (1,800 rpm, 4uC) and left at 4uC for another hour to ensure
a synchronous infection. Cells were then transferred to a 37uCincubator and cross-linked after 10 hours for chromatin immuno-
precipitation (ChIP) analysis on pre-integration complexes, or left
in culture for 2 additional weeks for ChIP analysis on integrated
proviruses.
Sequencing, mapping and annotation of retroviralintegration sites
Integration sites were cloned by linker-mediated PCR (LM-PCR)
as described [3,53]. Briefly, genomic DNA was extracted from 0.5–
56106 infected cells and digested with MseI and a second enzyme to
prevent amplification of internal 59 LTR fragments (PstI for RV
vectors and SacI/NarI for LV vectors). An MseI double-stranded linker
was then ligated and LM-PCR performed with nested primers
specific for the linker and the 39 LTR (MLV: 59- GACT-
TGTGGTCTCGCTGTTCCTTGG-39 and 59- GGTCTC-
CTCTGAGTGATTGACTACC-39; HIV: 59- AGTGCTTCAAG-
TAGTGTGTGCC-39 and 59- GTCTGTTGTGTGACTCTGG-
TAAC-39). PCR products were shotgun-cloned (TOPO TA cloning
kit, Invitrogen; Carlsbad, CA) into libraries of integration junctions,
which were then sequenced to saturation. A valid integration
contained the MLV or HIV nested primer, the entire MLV or
HIV genome up to a CA dinucleotide and the linker nested primer.
Sequences between the 39 LTR and the linker primers were mapped
onto the human genome (UCSC Human Genome Project Working
Draft, hg17) using Blat[54] requiring a 98% identity over the entire
sequence length and selecting the best hit. The absolute genomic
coordinates of the integration sites where defined as a result of the
combination of genomic alignment and vector relative orientation
data. Random genomic sequences originated by LM-PCR (genomic
MseI-MseI, PstI-MseI, NarI-MseI or SacI-MseI fragments) were mapped
by the same criteria, and used as experimental controls. All sequences
were annotated as ‘‘TSS-proximal’’ when occurring at a distance of
65 kb from the TSS of any Known Gene (UCSC definition),
‘‘intragenic’’ when occurring within the transcribed portion of at least
one Known Gene .5 kb from the TSS, and ‘‘intergenic’’ in all other
cases. Whenever multiple transcript variants exist, the most
represented and/or the longest isoform was chosen. Integration sites
from published datasets [3,19] were re-mapped and annotated
according to the same criteria.
Analysis of transcription factor binding sitesTFBS analysis was carried out on genomic sequences
encompassing each integration site with 61.0 kb of sequence
length. Based on the TSS-proximal/intragenic/intergenic anno-
tation of each integration site, we grouped datasets that do not
significantly differ from each other (two-sided test on equal
proportion) into seven groups of integration preferences, and
generated the same number of random weighted control groups of
sequences that reproduce, in proportion, the specific integration
preference of each vector. Each fitted background was composed
of 10,000 sequences of 2.0 kb in length derived from 100,000
randomly generated integration sites throughout the genome
(Table S1). TFBS enrichment analysis was carried out with the
Clover program [34], with dinucleotide randomization. Motif p-
value threshold was set to 0.05. TFBSs, described as positional-
weight matrices, were obtained from the JASPAR Core 2005
database of experimentally validated motifs [35]. Each sequence
set was paired with the appropriate weighted background. TFBSs
having a global p-value,0.05 were considered as significantly
enriched in the test sequences and selected for analysis. Motif
frequency was defined as the number of motif per sequence
significantly enriched in the Clover analysis, applying a one-sided
Wilcoxon rank sum test (alternative hypothesis: ‘‘greater’’). Motif
likelihood ratios, obtained by Clover, were used for cluster analysis
and PCA. Analysis of conserved TFBSs was performed using the
TFBS Conserved Track at UCSC Genome Browser, which
includes binding sites conserved between the human and mouse or
rat genome alignment (188 human matrices from the TRANS-
FAC Matrix Database v 7.0). After determination of the total
count of matrices that match in each 2.0-kb test sequence, random
and matched fitted backgrounds, a Fisher exact test (two-sided,
confidence level = 0.95) was used to determine statistical signifi-
cance. The STAMP tool-kit [55] was used to match JASPAR and
TRANSFAC matrices using default parameters.
For the hierarchical clustering analysis, data were scaled on
motifs columns before analysis. Column dendrograms were
sampled with 10,000 bootstrap replicates [36]. Nodes having an
Approximately Unbiased (AU) p-value.0.95 were scored as
significant and stable nodes. PCA was computed on correlation
matrix without factor rotation. For each bidimensional plane
considered, only loadings having a value higher than cos(p/
4),0.707 were considered as relevant: since all vectors have a
length = 1 in poly-dimensional space, we only see their projection
on the principal components plane, hence if the projection length
is longer than 0.707 the angle between the vector and the plane is
less than p/4 (45 degrees), meaning strong correlation between the
vector and the plane.
All statistical analyses were performed using the R language and
environment for statistical computing and graphics version 2.6.2
(http://www.R-project.org) and several contributed packages.
Hierarchical clustering used the pvclust package; PCA alysis used
ade4; parallel processing was implemented using the snow package.
Stats package was used for the others analysis.
statistics of the frequency comparisons among and within groups is reported in Table S2. (B) Two-way hierarchical cluster analysis (see Figure 3 fordefinitions). The row dendrogram (right) clearly separates MLV and HIV sequences. TFBSs are under-represented in HIV sequences compared to MLVsequences, while sequences from the HIVmIN vector share a 7–motif branch with those of the MLV vector in the column dendrogram (detaileddendrogram in Figure S1, complete list of motifs in Table S3).doi:10.1371/journal.pone.0004571.g008
Retroviral Integration
PLoS ONE | www.plosone.org 13 February 2009 | Volume 4 | Issue 2 | e4571
Retroviral Integration
PLoS ONE | www.plosone.org 14 February 2009 | Volume 4 | Issue 2 | e4571
Supporting Information
Figure S1
Found at: doi:10.1371/journal.pone.0004571.s001 (0.16 MB
PDF)
Figure S2
Found at: doi:10.1371/journal.pone.0004571.s002 (0.11 MB
PDF)
Figure S3
Found at: doi:10.1371/journal.pone.0004571.s003 (0.05 MB
PDF)
Table S1
Found at: doi:10.1371/journal.pone.0004571.s004 (0.05 MB
PDF)
Table S2
Found at: doi:10.1371/journal.pone.0004571.s005 (0.05 MB
PDF)
Table S3
Found at: doi:10.1371/journal.pone.0004571.s006 (0.08 MB PDF)
Table S4
Found at: doi:10.1371/journal.pone.0004571.s007 (0.05 MB PDF)
Table S5
Found at: doi:10.1371/journal.pone.0004571.s008 (0.04 MB PDF)
Acknowledgments
This paper is dedicated to the memory of Stefano Ferrari, whose passion
and commitment to excellence in science and education inspired our work
and our careers.
Author Contributions
Conceived and designed the experiments: LL AR FM. Performed the
experiments: CC AT AM GF AR. Analyzed the data: BF CC DC GF LL
AR. Contributed reagents/materials/analysis tools: BF DC. Wrote the
paper: LL FM.
References
1. Coffin JM, Huges SH, Varmus HE (1997) Retroviruses. Cold Spring Harbor,
NY: Cold Spring Harbor Laboratory Press.
2. Schroder AR, Shinn P, Chen H, Berry C, Ecker JR, et al. (2002) HIV-1
integration in the human genome favors active genes and local hotspots. Cell
110: 521–529.
3. Wu X, Li Y, Crise B, Burgess SM (2003) Transcription start regions in the
human genome are favored targets for MLV integration. Science 300:
1749–1751.
4. Mitchell RS, Beitzel BF, Schroder AR, Shinn P, Chen H, et al. (2004) Retroviral
DNA integration: ASLV, HIV, and MLV show distinct target site preferences.
PLoS Biol 2: E234.
5. Bushman FD (2003) Targeting survival: integration site selection by retroviruses
and LTR-retrotransposons. Cell 115: 135–138.
6. Bushman F, Lewinski M, Ciuffi A, Barr S, Leipzig J, et al. (2005) Genome-wide
analysis of retroviral DNA integration. Nat Rev Microbiol 3: 848–858.
7. Engelman A (2005) The ups and downs of gene expression and retroviral DNA
integration. Proc Natl Acad Sci U S A 102: 1275–1276.
8. Kalpana GV, Marmon S, Wang W, Crabtree GR, Goff SP (1994) Binding and
stimulation of HIV-1 integrase by a human homolog of yeast transcription factor
SNF5. Science 266: 2002–2006.
9. Mulder LC, Chakrabarti LA, Muesing MA (2002) Interaction of HIV-1
integrase with DNA repair protein hRad18. J Biol Chem 277: 27489–27493.
10. Violot S, Hong SS, Rakotobe D, Petit C, Gay B, et al. (2003) The human
polycomb group EED protein interacts with the integrase of human
immunodeficiency virus type 1. J Virol 77: 12507–12522.
11. Llano M, Vanegas M, Fregoso O, Saenz D, Chung S, et al. (2004) LEDGF/p75
determines cellular trafficking of diverse lentiviral but not murine oncoretroviral
integrase proteins and is a component of functional lentiviral preintegration
complexes. J Virol 78: 9524–9537.
12. Ciuffi A, Llano M, Poeschla E, Hoffmann C, Leipzig J, et al. (2005) A role for
LEDGF/p75 in targeting HIV DNA integration. Nat Med 11: 1287–1289.
13. Hacein-Bey-Abina S, Von Kalle C, Schmidt M, McCormack MP, Wulffraat N,
et al. (2003) LMO2-Associated Clonal T Cell Proliferation in Two Patients after
Gene Therapy for SCID-X1. Science 302: 415–419.
14. Porteus MH, Connelly JP, Pruett SM (2006) A look to future directions in gene
therapy research for monogenic diseases. PLoS Genet 2: e133.
15. Dudley JP (2003) Tag, you’re hit: retroviral insertions identify genes involved in
cancer. Trends Mol Med 9: 43–45.
16. Li Z, Dullmann J, Schiedlmeier B, Schmidt M, von Kalle C, et al. (2002) Murine
leukemia induced by retroviral gene marking. Science 296: 497.
17. Laufs S, Nagy KZ, Giordano FA, Hotz-Wagenblatt A, Zeller WJ, et al. (2004)
Insertion of retroviral vectors in NOD/SCID repopulating human peripheral
blood progenitor cells occurs preferentially in the vicinity of transcription start
regions and in introns. Mol Ther 10: 874–881.
18. Hematti P, Hong BK, Ferguson C, Adler R, Hanawa H, et al. (2004) Distinct
genomic integration of MLV and SIV vectors in primate hematopoietic stemand progenitor cells. PLoS Biol 2: e423.
19. Lewinski MK, Yamashita M, Emerman M, Ciuffi A, Marshall H, et al. (2006)Retroviral DNA integration: viral and cellular determinants of target-site
selection. PLoS Pathog 2: e60.
20. Ambrosi A, Cattoglio C, Di Serio C (2008) Retroviral integration process in thehuman genome: is it really non-random? A new statistical approach. PLoS
Comput Biol 4: e1000144.
21. Recchia A, Bonini C, Magnani Z, Urbinati F, Sartori D, et al. (2006) Retroviral
vector integration deregulates gene expression but has no consequence on thebiology and function of transplanted T cells. Proc Natl Acad Sci U S A 103:
1457–1462.
22. Aiuti A, Cassani B, Andolfi G, Mirolo M, Biasco L, et al. (2007) Multilineage
hematopoietic reconstitution without clonal selection in ADA-SCID patientstreated with stem cell gene therapy. J Clin Invest 117: 2233–2240.
23. Deichmann A, Hacein-Bey-Abina S, Schmidt M, Garrigue A, Brugman MH, et
al. (2007) Vector integration is nonrandom and clustered and influences thefate of lymphopoiesis in SCID-X1 gene therapy. J Clin Invest 117: 2225–2232.
24. Schwarzwaelder K, Howe SJ, Schmidt M, Brugman MH, Deichmann A, et al.(2007) Gammaretrovirus-mediated correction of SCID-X1 is associated with
skewed vector integration site distribution in vivo. J Clin Invest 117: 2241–2249.
25. Bushman FD (2007) Retroviral integration and human gene therapy. J ClinInvest 117: 2083–2086.
26. Wu X, Luke BT, Burgess SM (2006) Redefining the common insertion site.Virology 344: 292–295.
27. Cattoglio C, Facchini G, Sartori D, Antonelli A, Miccio A, et al. (2007) Hot
spots of retroviral integration in human CD34+ hematopoietic cells. Blood 110:1770–1778.
28. Hacein-Bey-Abina S, Garrigue A, Wang GP, Soulier J, Lim A, et al. (2008)Insertional oncogenesis in 4 patients after retrovirus-mediated gene therapy of
SCID-X1. J Clin Invest 118: 3132–3142.
29. Howe SJ, Mansour MR, Schwarzwaelder K, Bartholomae C, Hubank M, et al.(2008) Insertional mutagenesis combined with acquired somatic mutations
causes leukemogenesis following gene therapy of SCID-X1 patients. J Clin Invest
118: 3143–3150.
30. Kustikova O, Fehse B, Modlich U, Yang M, Dullmann J, et al. (2005) Clonaldominance of hematopoietic stem cells triggered by retroviral gene marking.
Science 308: 1171–1174.
31. Kustikova OS, Geiger H, Li Z, Brugman MH, Chambers SM, et al. (2007)
Retroviral vector insertion sites associated with dominant hematopoietic clonesmark ‘‘stemness’’ pathways. Blood 109: 1897–1907.
32. Calmels B, Ferguson C, Laukkanen MO, Adler R, Faulhaber M, et al. (2005)
Recurrent retroviral vector integration at the Mds1/Evi1 locus in nonhuman
primate hematopoietic cells. Blood 106: 2530–2533.
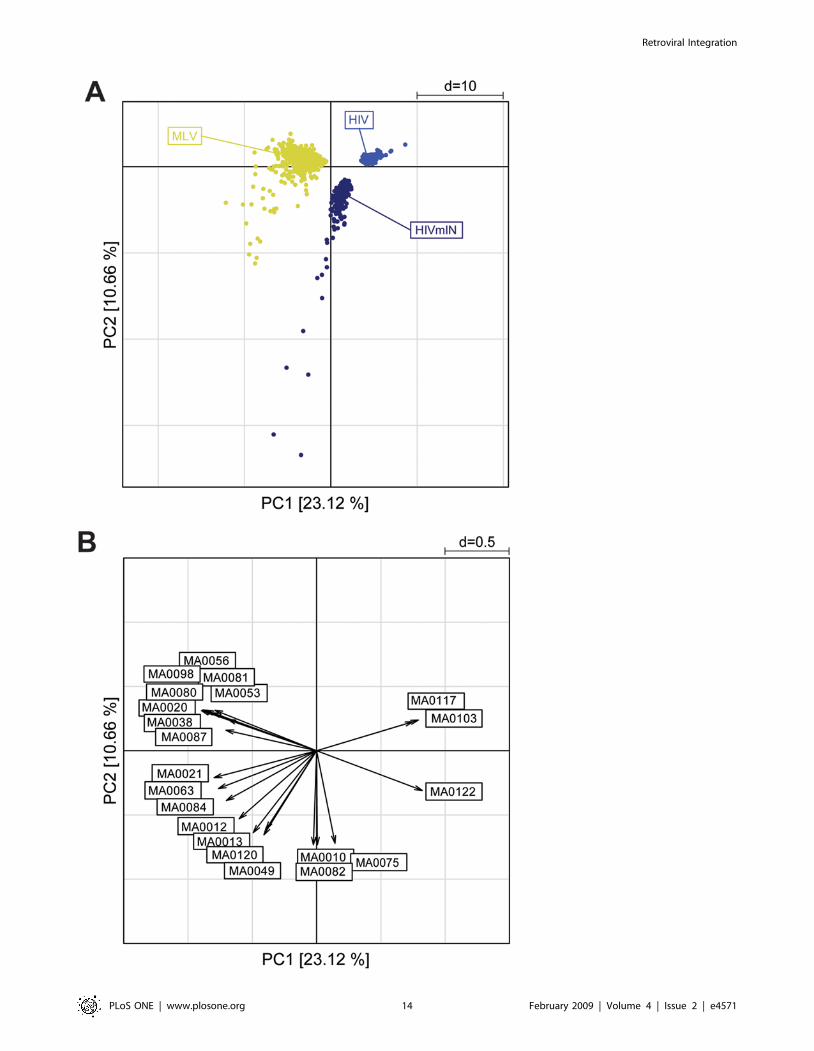
Figure 9. Principal component analysis of likelihood ratio values from the Clover analysis of the 49 JASPAR motifs enriched aroundintegration sites of an MLV vector, an HIV vector and an HIV vector packaged with an MLV integrase (HIVmIN) in HeLa cells. (A) Thescatter plot of the first two PCs (assessing 33.78% of total variability) reveals three main groups, corresponding to the vector type. The firstcomponent, accounting for 23.12% of the total variability, discriminates MLV from HIV sequences. The second component discriminates HIV fromHIVmIN sequences but does not distinguish MLV from HIVmIN sequences. (B) The corresponding loading plot shows a set of MLV-specific motifs(MA0056, MA0098, MA0081, MA0080, MA0053, MA0020, MA0038 and MA0087), and a second group of motifs in common between HIVmIN and MLVsequences (MA0084, MA0063, MA0021, MA0012, MA0120, MA0013 and MA0049). All motifs are identified in Figure 5.doi:10.1371/journal.pone.0004571.g009
Retroviral Integration
PLoS ONE | www.plosone.org 15 February 2009 | Volume 4 | Issue 2 | e4571

33. Ott MG, Schmidt M, Schwarzwaelder K, Stein S, Siler U, et al. (2006)
Correction of X-linked chronic granulomatous disease by gene therapy,
augmented by insertional activation of MDS1-EVI1, PRDM16 or SETBP1.
Nat Med 12: 401–409.
34. Frith MC, Fu Y, Yu L, Chen JF, Hansen U, et al. (2004) Detection of functional
DNA motifs via statistical over-representation. Nucleic Acids Res 32:
1372–1381.
35. Sandelin A, Alkema W, Engstrom P, Wasserman WW, Lenhard B (2004)
JASPAR: an open-access database for eukaryotic transcription factor binding
profiles. Nucleic Acids Res 32: D91–94.
36. Shimodaira H (2002) An approximately unbiased test of phylogenetic tree
selection. Syst Biol 51: 492–508.
37. Faschinger A, Rouault F, Sollner J, Lukas A, Salmons B, et al. (2008) Mouse
mammary tumor virus integration site selection in human and mouse genomes.
J Virol 82: 1360–1367.
38. Nienhuis AW, Dunbar CE, Sorrentino BP (2006) Genotoxicity of retroviral
integration in hematopoietic cells. Mol Ther 13: 1031–1049.
39. Baum C, Kustikova O, Modlich U, Li Z, Fehse B (2006) Mutagenesis and
oncogenesis by chromosomal insertion of gene transfer vectors. Hum Gene Ther
17: 253–263.
40. Lai L, Liu H, Wu X, Kappes JC (2001) Moloney murine leukemia virus
integrase protein augments viral DNA synthesis in infected cells. J Virol 75:
11365–11372.
41. Steinrigl A, Nosek D, Ertl R, Gunzburg WH, Salmons B, et al. (2007) Mutations
in the catalytic core or the C-terminus of murine leukemia virus (MLV) integrase
disrupt virion infectivity and exert diverse effects on reverse transcription.
Virology 362: 50–59.
42. Studamire B, Goff SP (2008) Host proteins interacting with the Moloney murine
leukemia virus integrase: multiple transcriptional regulators and chromatin
binding factors. Retrovirology 5: 48.
43. Wang GP, Ciuffi A, Leipzig J, Berry CC, Bushman FD (2007) HIV integration
site selection: analysis by massively parallel pyrosequencing reveals association
with epigenetic modifications. Genome Res 17: 1186–1194.
44. Marshall HM, Ronen K, Berry C, Llano M, Sutherland H, et al. (2007) Role of
PSIP1/LEDGF/p75 in lentiviral infectivity and integration targeting. PLoSONE 2: e1340.
45. Shun MC, Raghavendra NK, Vandegraaff N, Daigle JE, Hughes S, et al. (2007)
LEDGF/p75 functions downstream from preintegration complex formation toeffect gene-specific HIV-1 integration. Genes Dev 21: 1767–1778.
46. Testa A, Lotti F, Cairns L, Grande A, Ottolenghi S, et al. (2004) Deletion of anegatively acting sequence in a chimeric GATA-1 enhancer-long terminal
repeat greatly increases retrovirally mediated erythroid expression. J Biol Chem
279: 10523–10531.47. Aiuti A, Slavin S, Aker M, Ficara F, Deola S, et al. (2002) Correction of ADA-
SCID by stem cell gene therapy combined with nonmyeloablative conditioning.Science 296: 2410–2413.
48. Gaspar HB, Parsley KL, Howe S, King D, Gilmour KC, et al. (2004) Genetherapy of X-linked severe combined immunodeficiency by use of a pseudotyped
gammaretroviral vector. Lancet 364: 2181–2187.
49. Schambach A, Wodrich H, Hildinger M, Bohne J, Krausslich HG, et al. (2000)Context dependence of different modules for posttranscriptional enhancement of
gene expression from retroviral vectors. Mol Ther 2: 435–445.50. Follenzi A, Sabatino G, Lombardo A, Boccaccio C, Naldini L (2002) Efficient
gene delivery and targeted expression to hepatocytes in vivo by improved
lentiviral vectors. Hum Gene Ther 13: 243–260.51. Lotti F, Menguzzato E, Rossi C, Naldini L, Ailles L, et al. (2002) Transcriptional
targeting of lentiviral vectors by long terminal repeat enhancer replacement.J Virol 76: 3996–4007.
52. Dull T, Zufferey R, Kelly M, Mandel RJ, Nguyen M, et al. (1998) A third-generation lentivirus vector with a conditional packaging system. J Virol 72:
8463–8471.
53. Schmidt M, Hoffmann G, Wissler M, Lemke N, Mussig A, et al. (2001)Detection and direct genomic sequencing of multiple rare unknown flanking
DNA in highly complex samples. Hum Gene Ther 12: 743–749.54. Kent WJ (2002) BLAT–the BLAST-like alignment tool. Genome Res 12:
656–664.
55. Mahony S, Benos PV (2007) STAMP: a web tool for exploring DNA-bindingmotif similarities. Nucleic Acids Res 35: W253–258.
Retroviral Integration
PLoS ONE | www.plosone.org 16 February 2009 | Volume 4 | Issue 2 | e4571