transcad training 2 - caltrans training for travel demand
TRANSCRIPT

1
Cambridge Systematics, Inc.presented to presented by
TransCAD and the SCAG Model
Caltrans District 8
Sean McAtee, Ron West, Xuan LuiPresented September 21st and 22nd of 2016
Revisited February 15th and 16th of 2017

2
TopicsTransCAD Overview and NavigationFormatting and Viewing DataData Tables and Joining DataPrinting Maps using LayoutsLooking at SCAG Highway AssignmentRoadway Network EditingRoute System EditingRunning the SCAG ModelAdvanced Topics?

3
TransCAD Software OverviewTransportation data management and analysisGIS based transportation planning analysisTransCAD:» Let’s you store, retrieve, analyze, and visualize geographic
data in new and useful ways» Has tools to apply sophisticated transportation, operations
research, and statistical models. » GISDK (development computer programming language)Version & build» Version I have open: Version 6.0 r2 Build 9080 32-bit» 64-bit vs. 32-bit» Need 9250 to run the SCAG Model
4
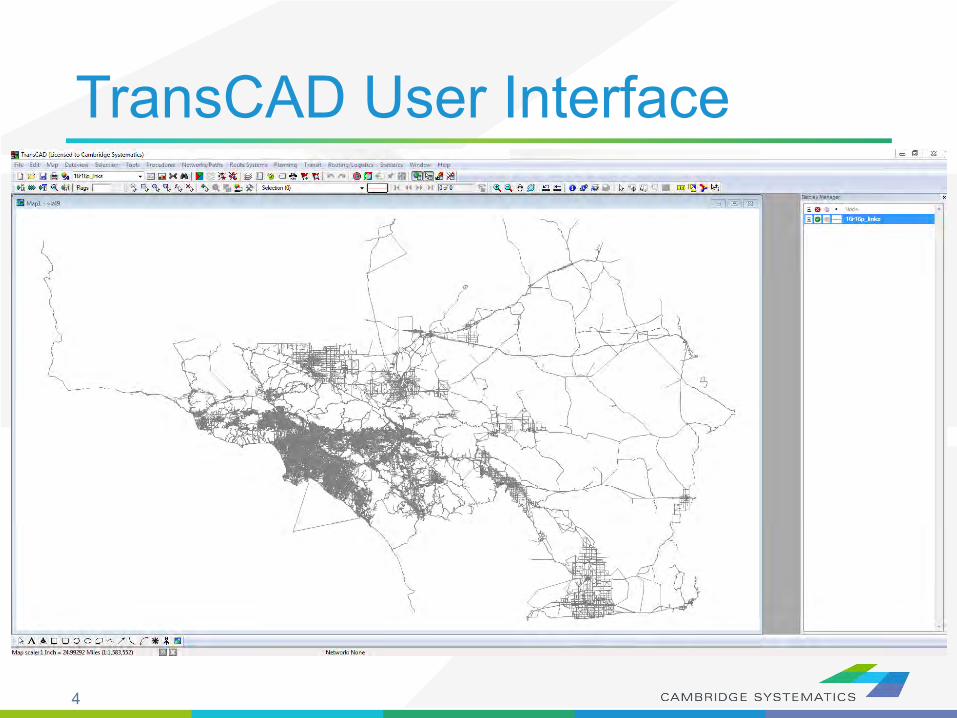
TransCAD User Interface

5
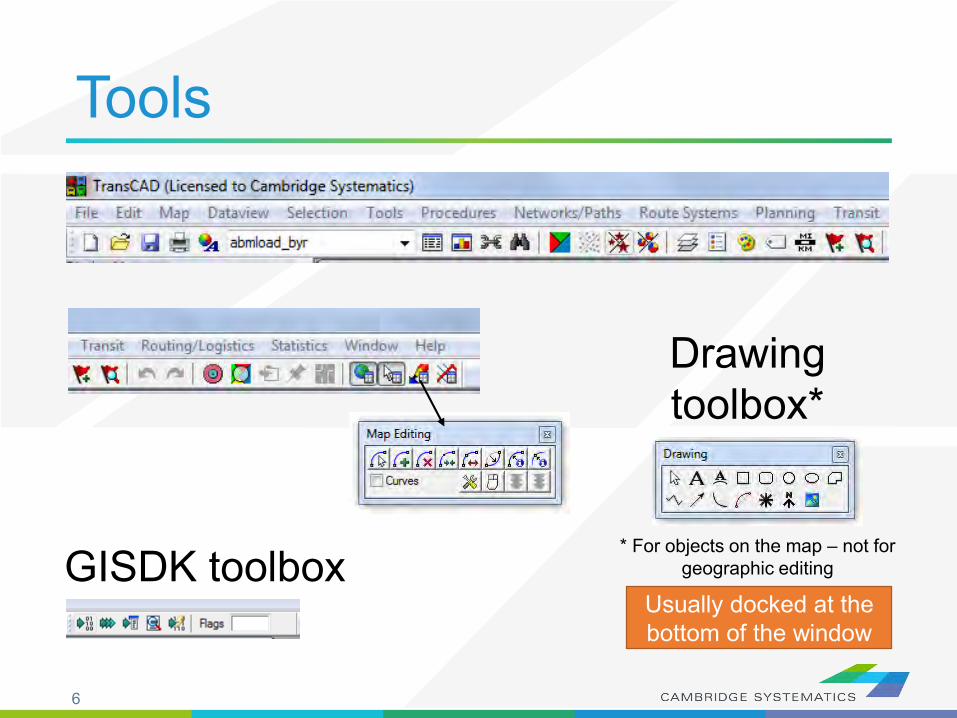
Tools
Zoom outZoom inPan
Prev. scaleMagnifier
Initial scaleInfo
Measure Measure size
Intersection Diagram
Most used
Multi-layer info
Selection toolbox
pointer Custom Labels
These can be docked at the top of the window!
6
Tools
Drawing toolbox*
* For objects on the map – not for geographic editingGISDK toolbox
Usually docked at the bottom of the window

7
TransCAD Software OverviewBuilt-In Forecasting Tools» 4-Step Travel Model» Model Calibration/Estimation Utilities» GIS-Based Roadway and Transit Data» Intermediate Results Analysis» Matrix Editor» Spatial Analysis Tools

8
Built In InterfaceProvides an interactive method of running a Travel Model
Very flexible, but can be a bit tedious to use
Is enhanced through use of customized “Add-Ins”
9
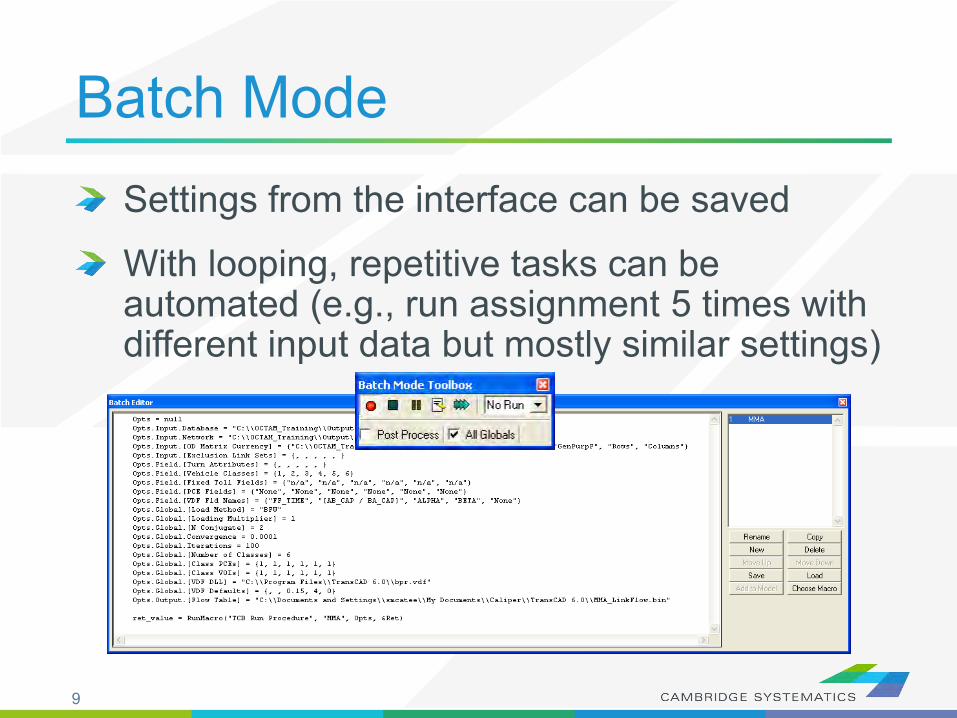
Settings from the interface can be saved
With looping, repetitive tasks can be automated (e.g., run assignment 5 times with different input data but mostly similar settings)
Batch Mode

10
Customized InterfacesCreated with the GISDK scripting languageUtilize Batch Mode to automate tasksUtilize customized code to streamline and customize model processesMakes running and analyzing scenarios easy and efficient

11
Open ArchitectureAllows for inclusion of any amount or type of data
Requires deliberate and careful definition of input data requirements
Almost any aggregate travel model algorithm that can be thought up can be implemented in TransCAD

12
Compatible File FormatsTransCAD can read and write data to/from many universally accepted file formats.» GIS (Shapefile, Geodatabase)» Spreadsheet» Database» Text» HTML (with add-in)» Traffic Software (with add-in)» Others

13
GIS ApplicationsUse TransCAD model results in ArcGIS to create high quality maps.
Link TransCAD networks to GIS-based analysis tools.

14
TransCAD Tips

15
File and Data TypesData Files actually contain information:» Tables (.bin, .DBF)» Geographic Files or Layers (.dbd, .shp)» Matrices (.mtx)

16
File and Data TypesSome files do not contain information:» Dataviews (.dvw)» Maps (.map) and workspaces (.wrk)» Matrix Views (.mvw)
These files refer to other file types that contain data» Same concept as a project file (.mxd) in ArcMAP
Never use File Save As “Dataview (.dvw)” or “Map (.map)”to save a copy for modification!

17
File and Data TypesGeographic Files (.dbd) are GIS layers and can be edited and viewed.» We use line layers as “roadway networks”
Route Systems (.rts) contain transit information» Route systems are linked to line layers
Routable Network Files (.net, .tnw) are routable networks used internally by TransCAD. » Routable network files must be created before running certain
tasks.» Separate networks for roadway and transit

18
Useful Features Saved Workspaces
Undo and Redo
Copy and Paste directly between TransCAD and other programs (e.g., Excel)
The Display Manager» Show it from
Map Display Manager
Multiple selection sets
Many more…
19
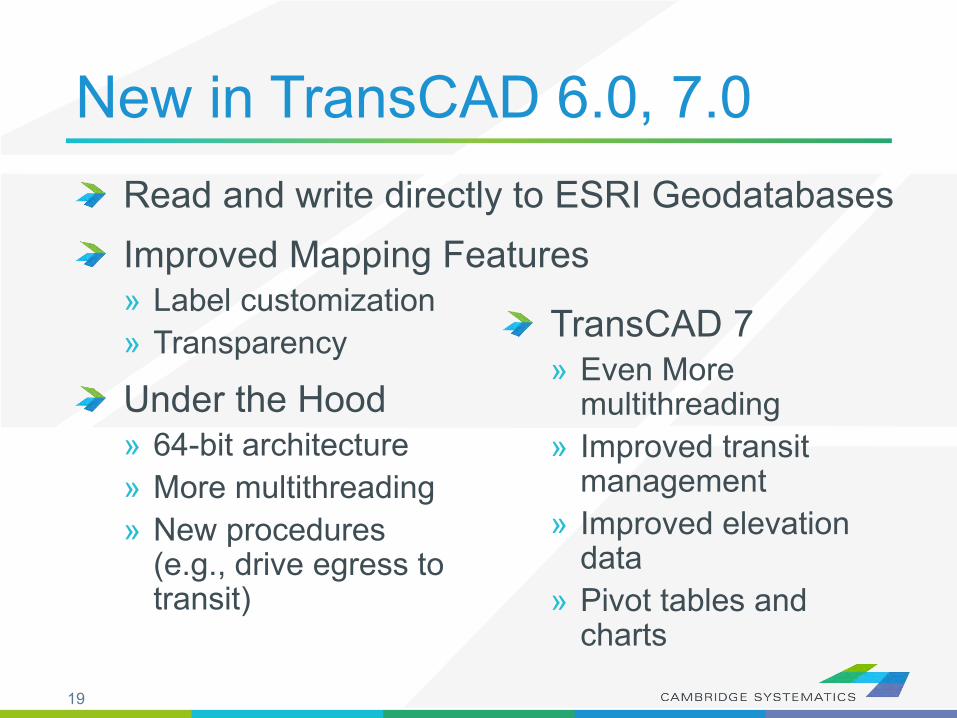
New in TransCAD 6.0, 7.0Read and write directly to ESRI GeodatabasesImproved Mapping Features» Label customization» Transparency
Under the Hood» 64-bit architecture» More multithreading» New procedures
(e.g., drive egress to transit)
TransCAD 7» Even More
multithreading» Improved transit
management» Improved elevation
data» Pivot tables and
charts

20
Map Basics: Visualizing
21
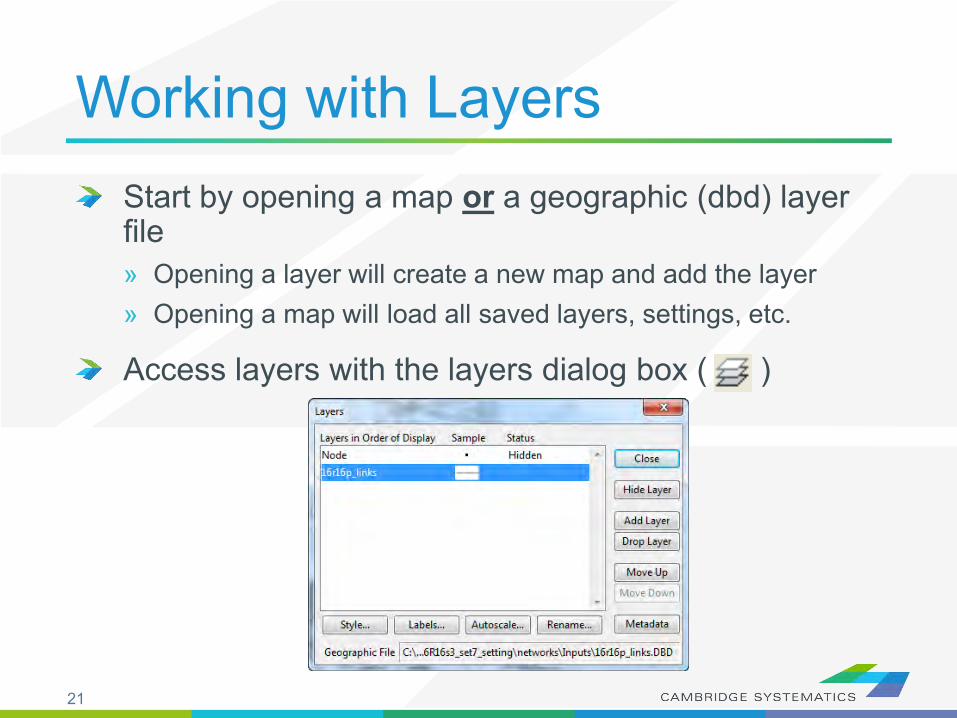
Working with LayersStart by opening a map or a geographic (dbd) layer file» Opening a layer will create a new map and add the layer» Opening a map will load all saved layers, settings, etc.
Access layers with the layers dialog box ( )

22
Working with Layers
Hide/show a layer
Add/Drop layers
Re-order layers
Change a layer style
Add/edit labels Automatically show/hide layers as certain scales
The Layers Dialog ( )

23
Working with Layers
Bottom layer (drawn last)
Layers are drawn from TOP to BOTTOM
Top layer (drawn first)

24
Display ManagerActivate from Map Display Manager
Quick access to layers, settings, etc.» Right-click for more settings, including make
working layerHide/show a
layer
Add/edit labels
Change a layer style
Bold text: links layer is active
Node layer is NOT active

25
Color Theme

26
Creating MapsCreate a new map by opening a Geographic File (*.dbd)
Add more layers if desired» then
Choose the active layer» Use the dropdown selector » Or use the display manager
Change the “default” styles for the layers» then , or , or use the display manager
Hide or show layers» or the display manager
27
Color and Pattern ThemesSet feature colors and styles based on attributes» Color Themes ( ) are often used to display
facility type on a roadway network» Pattern Themes (Map Pattern Theme…) is
sometimes used to display number of lanes on a roadway network
28
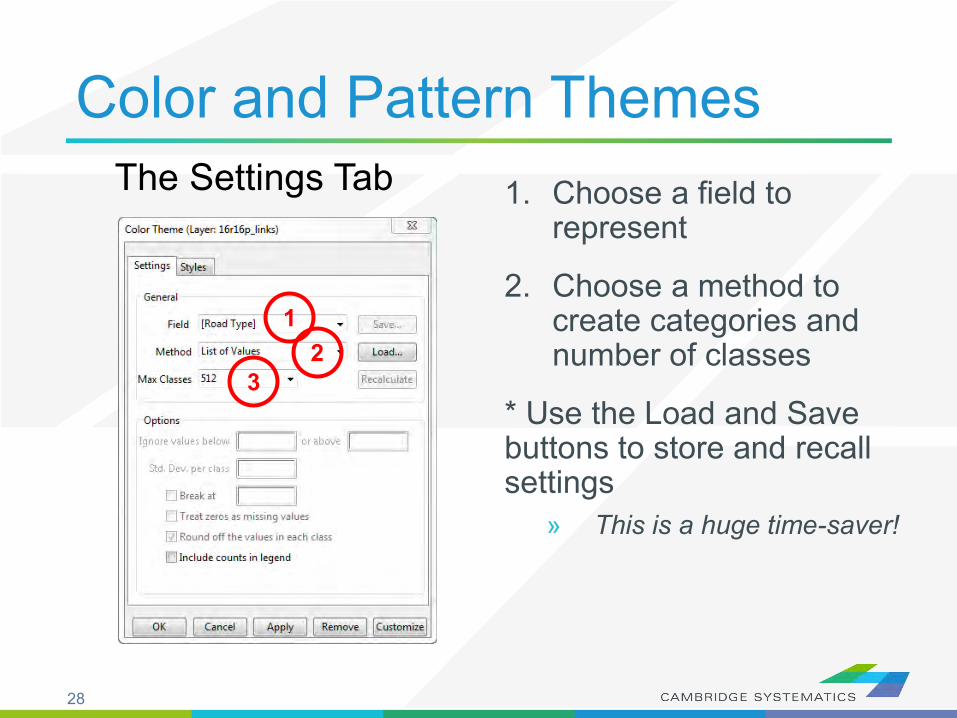
Color and Pattern Themes1. Choose a field to
represent
2. Choose a method to create categories and number of classes
* Use the Load and Save buttons to store and recall settings
» This is a huge time-saver!
The Settings Tab
12
3

29
Color and Pattern Themes1. Choose a style for
each class
2. Select a legend text for each class
3. Choose from pre-defined color settings if desired
The Styles Tab
1
2
3

30
Functional ClassPrimary Facility Type Secondary Facility Type Primary Facility Type Secondary Facility Type
1 Freeways 10 Freeway7 Minor Collector
70 Undivided2 HOV
20 HOV 2 71 Divided
21 HOV 3+ 72 Continuous Left Turn
22 HOV - HOV Connector 73 Posted Speed 253 Expressway / Parkway
30 Undivided 74 Posted Speed 15
31 Divided, Interrupted8 Ramps
80 Freeway to Freeway Connector
32 Divided, Uninterrupted 81 Freeway to arterial4 Principal Arterial
20 Undivided 82 Arterial to freeway
41 Divided 83 Ramp Distributor
42 Continuous Left Turn 84 Ramp from Arterial to HOV5 Minor Arterial
50 Undivided 85 Ramp from HOV to Arterial
51 Divided 86 Collector distributor
52 Continuous Left Turn 87 Shared HOV Ramps to MF6 Major Col lector
60 Undivided 88 Truck only
61 Divided 9 Trucks 90 Truck only
62 Continuous Left Turn 100 100 Centroid Connector - Tier 1
200 200 Centroid Connector - Tier 2Source: SCAG Model Documentation, Appendix A

31
Functional ClassTwo Digit FT Codes» Contained in AB_Facility_Type and BA_Facility_Type» Difficult to use for map editing setup (too many details)
One Digit FT Codes» Not stored on the network» Can be computed
TransCAD Formulas.txt
Note: We will discuss formulas in more detail in a later section

32
Practice 1: Create a color theme for line layer using IFC field
1. Open the SCAG Network File (16R16pl_links.dbd) FileOpen, then in the file type dropdown next to ‘File name:’ select Geographic File(*.cdf,.*dbd) option Browse to the location/folder where the geographic file is located and select the ‘16R16pl_links.dbd’ and click
‘Open’ button
2. Add the MAP_FT Formula Field DataviewFormula Fields Open TransCAD Formuals.txt in notepad, then copy the MAP_FT formula Paste the formula and name the formula MAP_FT Click OK
3. On the top ribbon, click it is called ‘color theme map wizard’
4. It opens up a dialog box with two tabs. In the first tab ‘Settings’ tab: Select the MAP_FT from the ‘Field’ drop down options Select the ‘List of Values’ from the ‘Method’ drop down options Max. Classes: Use the default value (512)
5. Go to the ‘Styles’ tab Observe the default styles Optional: Set a preferred style for each facility type (we will use a shortcut)
6. Go back to the Settings tab, click the Load button. Choose From Settings File Browse to and select SCAG Training\Settings.stg Choose MAP_FT and click OK Click OK again to complete the color theme dialog box
7. Save the settings (optional, method 1) Skip this step in training. Tools Geographic Utilties Geographic file Click Save Settings
1. Save the settings (optional, method 2) Use this method in training. File –Save As Save a Map file that you can open later with the settings applied

33
Labels
34
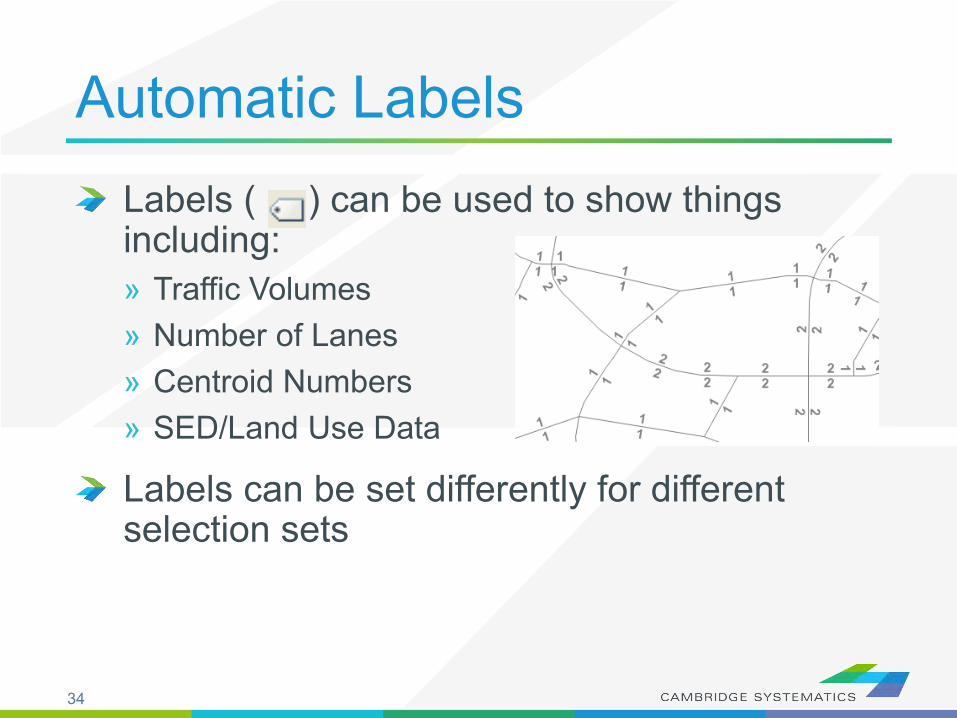
Automatic LabelsLabels ( ) can be used to show things including:» Traffic Volumes» Number of Lanes» Centroid Numbers» SED/Land Use Data
Labels can be set differently for different selection sets

35
Automatic Labels1. Select the field to use
for labels
2. Set label placement options» Note the “Allow
Duplicates” checkbox
3. Set the label style options
The Labels Tab
1
2
3

36
Automatic Labels
Overlapping labels can be allowed if desired
Different layers can have different priorities
Autoscale can turn labels on and off automatically
The Overlaps Tab

37
Automatic Labels
Shadows, halos, frames, or shields can be added to labels to create better looking and more informative maps
The Background Tab
38
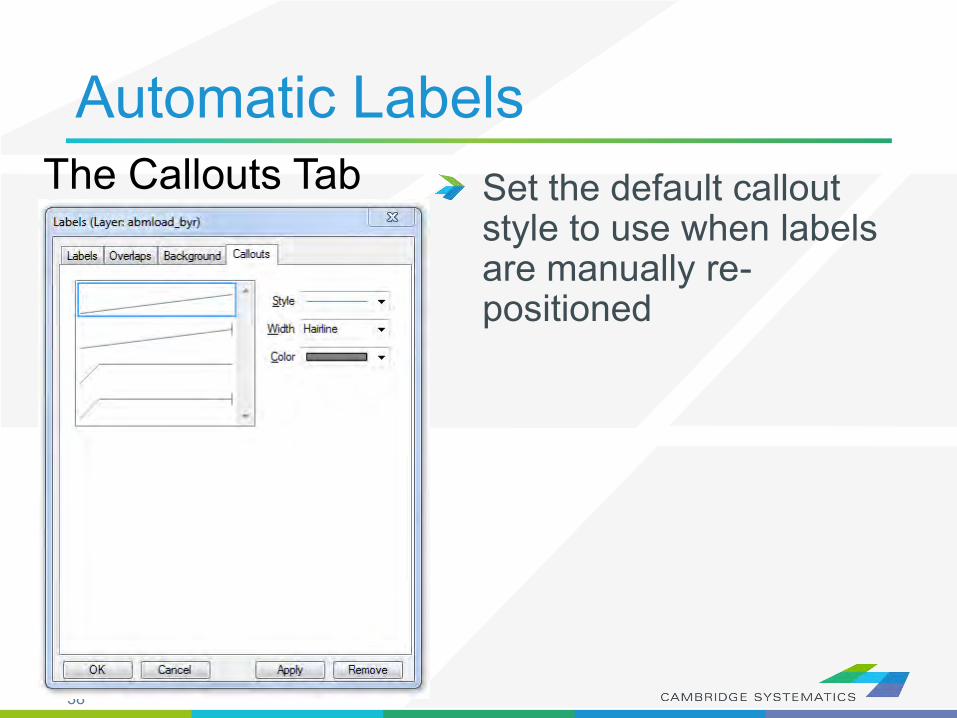
Automatic LabelsSet the default callout style to use when labels are manually re-positioned
The Callouts Tab

39
Practice 2: Add number of lanes labels
1. Start with the results from Practice 1 Open the saved map if needed
2. Use the and zoom-in tool ( ) to zoom in to the area of interest3. On the top ribbon, click the labels icon ( )
Select the [AB_AMLANES/BA_AMLANES] field Change the size and color to match your preference Change the format to have numbers by comma separated Click ‘OK’ button
In training, save the map for future use

40
Create Scaled Symbol Theme(also known as bandwidth map)
41
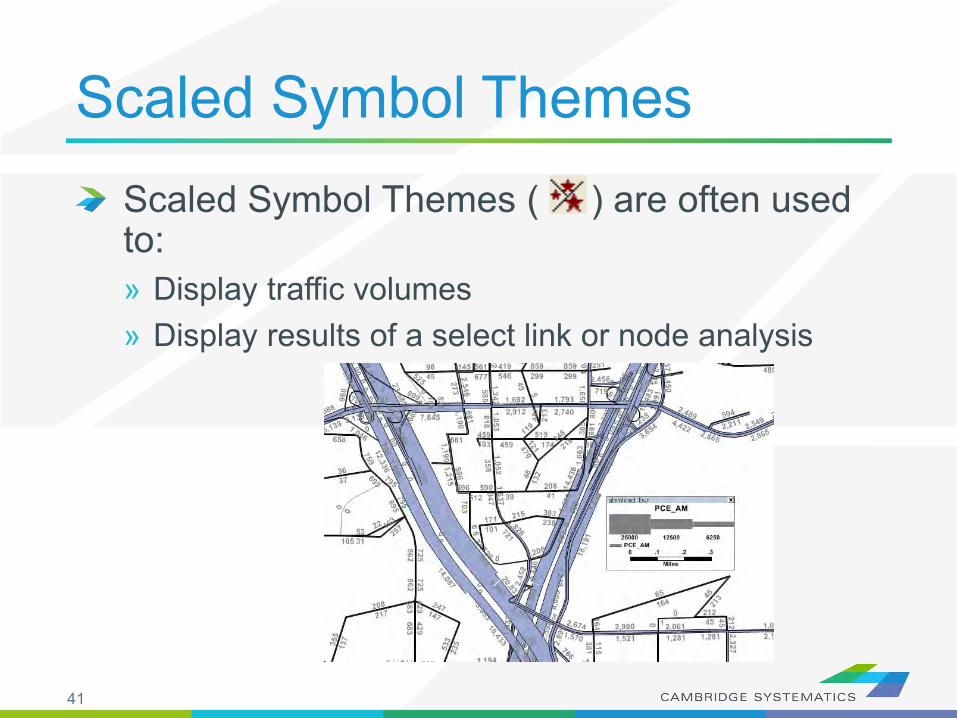
Scaled Symbol ThemesScaled Symbol Themes ( ) are often used to:» Display traffic volumes» Display results of a select link or node analysis
42
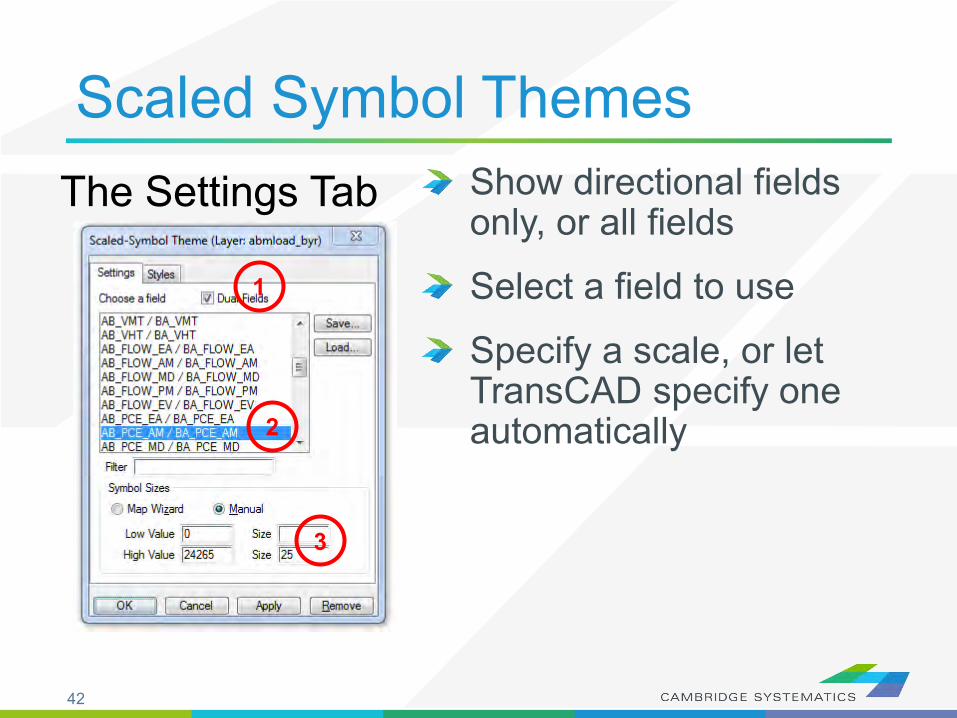
Scaled Symbol ThemesShow directional fields only, or all fields
Select a field to use
Specify a scale, or let TransCAD specify one automatically
The Settings Tab
1
2
3

43
Create Selection Sets

44
Selection SetsAdd additional formatting capabilityUseful for analysis and data processingUse the Selection Set Toolbox» Select items with a query » Select items by pointing» View the Selection Settings
One map can contain many selection sets» Show or hide selected items» Format selected items with different colors, styles,
and labels

45
Practice 3: Create selection sets and color and label them
Start with the results from Practice 2 Open the saved map if needed
1. Goto Tools and select ‘Selection’ or hit F9 This will show the selection toolbox shown to the right
Click select by condition ( ) to open the query builder
Type in condition: MAP_FT >= 100
Type the Set Name (Connectors)
2. Change the centroid connector lane labels Open selection settings (Selection Settings or )
Choose Connectors, then click Style
Set the color to “default gray) – this allows the color theme to override
Click Labels
Set the label to a smaller font size and different color
Close the selection settings
TIP: You can make other changes to multiple different selection sets, or can hide some features altogether!
In training, save the map for future use
46
Data Tables (“Dataviews”)
47
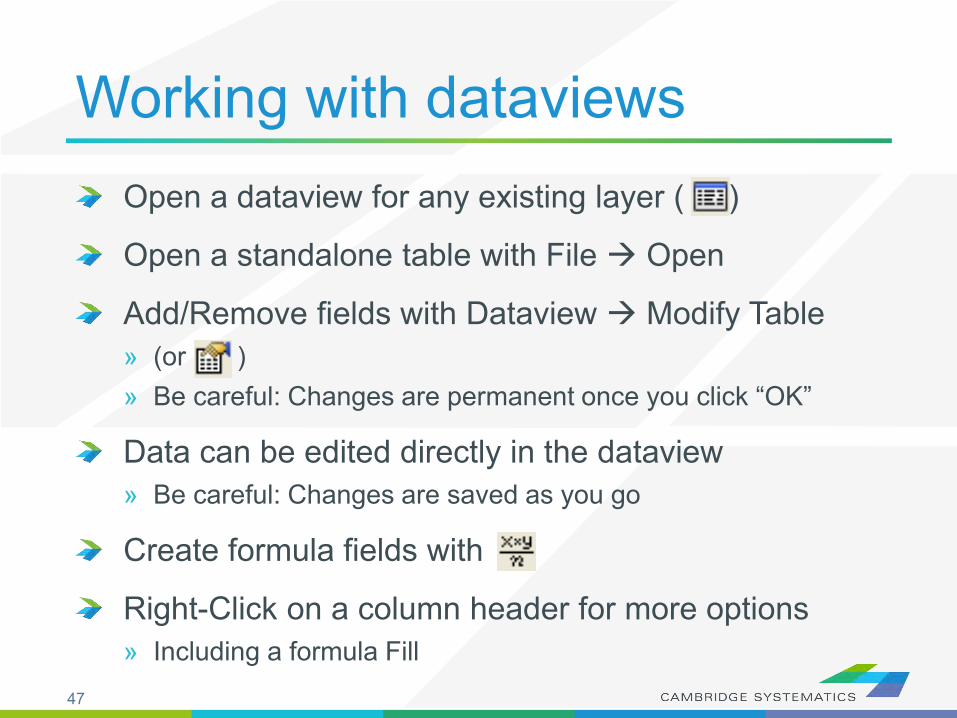
Working with dataviewsOpen a dataview for any existing layer ( )
Open a standalone table with File Open
Add/Remove fields with Dataview Modify Table » (or )» Be careful: Changes are permanent once you click “OK”
Data can be edited directly in the dataview» Be careful: Changes are saved as you go
Create formula fields with
Right-Click on a column header for more options» Including a formula Fill

48
Working with DataviewsFormula Field vs. Add Field & Formula Fill
» Formula Fill adds new data and saves values in the table» Formula Fields are updated when other values change, but are not
stored in the data table Formula fields are stored in a map, dataview (*.dvw), or workspace (*wrk)
1. Enter a formula
2. Use the Field List to find field names
3. Name the formula field
Tip: nz([Field]) converts nullvalues to zero values
1
2 3

49
Practice 4: Add total number of lanes in a NEW FIELD
Start with the results from Practice 3 Open the saved map if needed
1. On the top ribbon, click it will open the links layer daataview table
2. Use Dataview Modify Table or click Click ‘Add Field’
Name the field “TOT_LANES”
You can move the field position using Move Up and Move Down buttons to the right
Click ‘OK’
3. Go to ‘Dataview’ window Right click the top part of the ‘TOT_LANES’ field
Select ‘Fill’
Select the ‘Formula’ in the fill method options
Type: nz(AB_AMLANES) + nz(BA_AMLANES)
Alternatively you can use the formula builder
Click ‘OK’ button.
This fills in two-way number of lanes
Bonus: Try this example using a formula field instead!

50
Joining Data

51
Joining DataLayers have an associated data table ( )
Data can be joined ( ) to other tables» Roadway Network + Traffic Assignment results» TAZ layer + Land Use Data» Roadway Network + Lookup Table» More…
This is how traffic assignment results are viewed in TransCAD

52
Joining Data1. Select the Primary join table
» Be careful: Check the Field
2. Select the secondary join table
» Be careful: Check the Field
3. Create a name for the view, or use the default (do this last)
1
2
3
Tip: You can open a file from the join dialog box
53
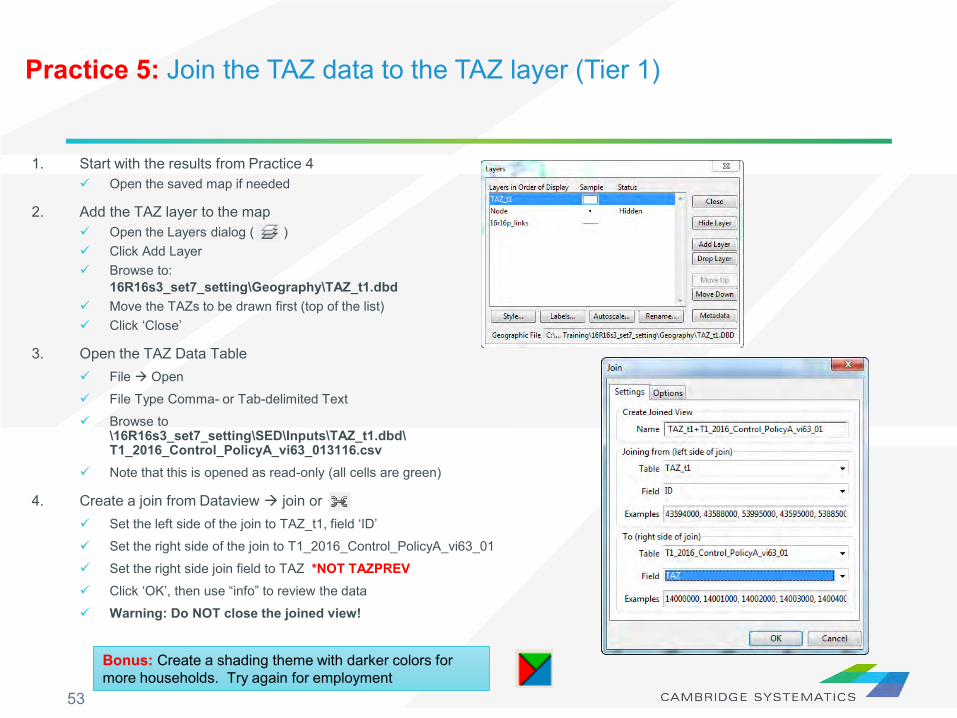
Practice 5: Join the TAZ data to the TAZ layer (Tier 1)
1. Start with the results from Practice 4 Open the saved map if needed
2. Add the TAZ layer to the map Open the Layers dialog ( ) Click Add Layer Browse to:
16R16s3_set7_setting\Geography\TAZ_t1.dbd Move the TAZs to be drawn first (top of the list) Click ‘Close’
3. Open the TAZ Data Table File Open
File Type Comma- or Tab-delimited Text
Browse to \16R16s3_set7_setting\SED\Inputs\TAZ_t1.dbd\T1_2016_Control_PolicyA_vi63_013116.csv
Note that this is opened as read-only (all cells are green)
4. Create a join from Dataview join or Set the left side of the join to TAZ_t1, field ‘ID’
Set the right side of the join to T1_2016_Control_PolicyA_vi63_01
Set the right side join field to TAZ *NOT TAZPREV Click ‘OK’, then use “info” to review the data
Warning: Do NOT close the joined view!
Bonus: Create a shading theme with darker colors for more households. Try again for employment

54
Printing Maps (Layouts)

55
LayoutsAllow users to create a page to be printed» Set paper size» Set a specific printer PDF writers work best!
Created from File New
Print maps, drawing items, tables, and insets
Add titles, legends, etc.

56
Practice 6: Create a Layout with your map
1. Start with the results from Practice 5 Open the saved map if needed
2. Create a new layout using File New or Check the page settings with File Properties or Select a printer and page size Set to landsape Important: Un-check Change size of items when page size changes
3. Add your map to the layout using Draw a box to place the map
Select Map, check ‘Use actual point sizes’
Optionally un-check ‘Keep map’s aspect ratio’
Click ‘OK’
4. Position and edit the legend Use the pointer tool ( )
Drag the legend to a good location
Double-click to edit legend text and contents
5. Add a legend title Use the ‘Freehand Text’ tool ( ), usually at the bottom of the
window
Drag a box, then type a title
Use the pointer to reposition, double-clicking to edit

57
More on Networks and Zones

58
User VariablesCreating your own variables» Additional fields can be added to links & nodes
layers» Field names can contain spaces and numbers, and
do not have a practical limit to the number of characters
» HOWEVER…

59
User VariablesCreating your own variables» It is preferable to:
Limit field names to 10 characters Avoid using spaces Avoid starting a field name with a number
» If these guidelines are followed, compatibility with other GIS programs will be improved Field names that do not follow these guidelines will have
truncated or confusing names when exported to a shapefile

60
CentroidsCentroids are special nodes that are linked to socioeconomic data» SCAG’s Model has three tiers of TAZs
Tier 1: Least amount of detail Tier 2: More detail Tier 3: Used for subarea models.
» TAZ numbers match the TAZ layer, data tables, and matrices Sometimes, files use sequential
TAZ numbers instead!

61
CentroidsNodes are identified as centroids using the following rules:
Field Name ContentsTier1TAZ User friendly nested TAZ ID numbers
(sequenced by county, type, etc)Tier2TAZZoneType_Tier1 Internal, External, Airport, or SeaportZoneType_Tier2Internal_sequence_id_T1 TAZ numbers used internally by
TransCAD – but important to model usersInternal_sequence_id_T2

62
Tiered TAZ StructureTier 1 Zones 4,192» Used in traffic
assignment» Results in 17.5
million cells per matrix
Tier 2 Zones 11,350» Used in trip
generation, distribution, and mode choice
» Results in 128.9 million cells per matrixFun with Math:
Why these models take so long
𝟒, 𝟏𝟗𝟐
𝟏𝟏, 𝟑𝟓𝟎= 𝟐. 𝟕
𝟏𝟕. 𝟓 𝒎
𝟏𝟐𝟖. 𝟗 𝒎= 𝟕. 𝟑
𝟐. 𝟕𝟐 = 𝟕. 𝟑

63
Recap

64
Learned by ExampleCreating maps
Adding layers
Setting layer styles, labels, and themes
Working with data tables
Joining Views
Creating layouts for printing

65
Insight into the SCAG modelSaw the SCAG network» Facility Type» Lanes
Saw the SCAG TAZ layer and data table» Various input SED values» Saw how to join to TAZs» Note: TAZ vs. SEQ (sequential TAZs)

66
Highway Assignment

67
Assignment ResultsBasic Volumes» Located on the Loaded Network» Assign\Output\scag_network_loaded.dbd
Volume and Travel Time for: » Each Period
(AM, MD, PM, NT, EVE)» Total daily

68
Assignment ResultsDetailed Results in a separate table» Join to the network using ID & ID1» By time period or daily» In the assign\Outputs folder
Processed version in ‘emission’» Adjusted as part of SCAG’s air quality
modeling process» Can be used if desired, but be
consistent within a project!

69
Assignment ResultsDetailed Results include:» Basics:
Total Flow Flow by class (e.g., drive alone, shared ride, truck) Travel time and speed (congested time by period)
» Extras / Statistics: VMT (called V_Dist_T) VHT Volume to Capacity Ratio (“VOC”) PCE Values
» Select Link / Zone Results Only present if mode was run with
assign\Inputs\SelectLink.qry
70
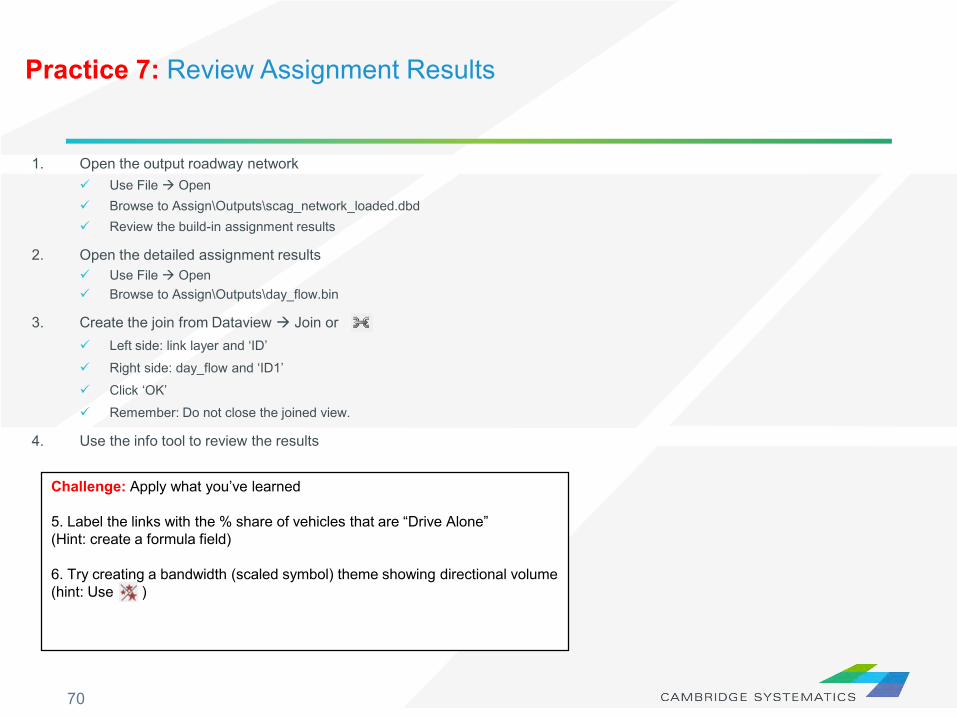
Practice 7: Review Assignment Results
1. Open the output roadway network Use File Open Browse to Assign\Outputs\scag_network_loaded.dbd Review the build-in assignment results
2. Open the detailed assignment results Use File Open Browse to Assign\Outputs\day_flow.bin
3. Create the join from Dataview Join or Left side: link layer and ‘ID’
Right side: day_flow and ‘ID1’
Click ‘OK’
Remember: Do not close the joined view.
4. Use the info tool to review the results
Challenge: Apply what you’ve learned
5. Label the links with the % share of vehicles that are “Drive Alone”(Hint: create a formula field)
6. Try creating a bandwidth (scaled symbol) theme showing directional volume(hint: Use )

71
Roadway Network Editing
72
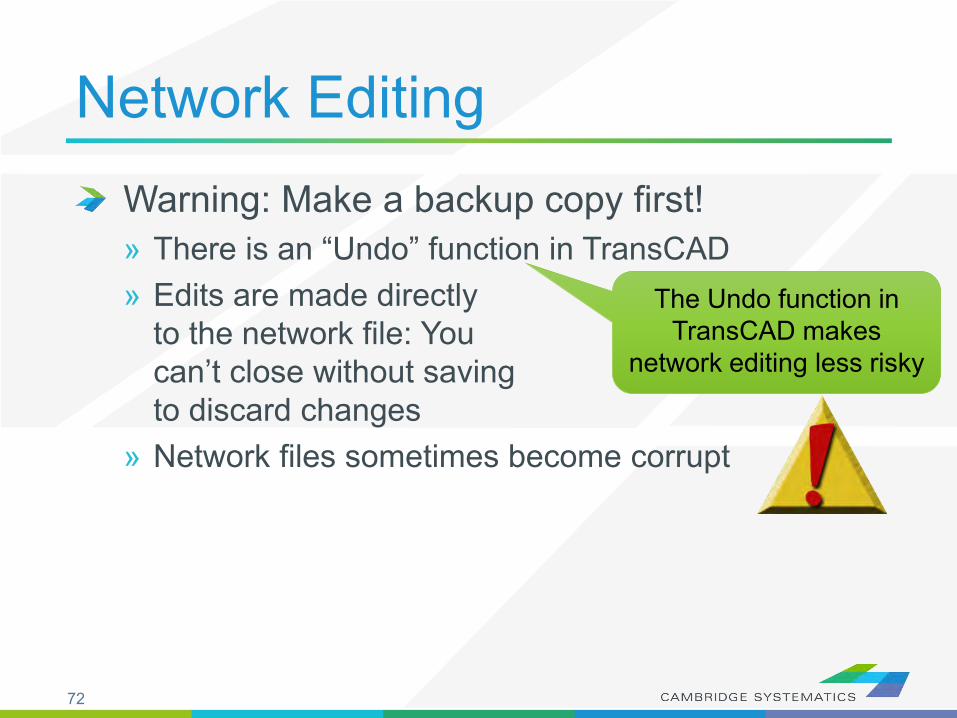
Network EditingWarning: Make a backup copy first!» There is an “Undo” function in TransCAD» Edits are made directly
to the network file: You can’t close without saving to discard changes
» Network files sometimes become corrupt
The Undo function in TransCAD makes
network editing less risky

73
Network EditingBacking up the Roadway Network Method 1 (recommended):» Open the network in TransCAD» Use Tools Geographic Utilities
Geographic File » Click Archive to save in a zip file
Method 2 (advanced):» Close all files in TransCAD» Create a zip file with the line layer
and route system files» Make sure to get all related files

74
Network EditingOnce you have made a backup, you can:» Edit attributes of existing links» Change data for a specific year or for multiple
years and alternatives» Add new links, delete existing links, or realign
existing links» Add data for a year not yet included in the network

75
Network EditingEdit attributes of existing links» Display settings can assist with editing
Additional labels and/or themes can be useful» Label # of lanes or other
values» Show Topology ( )
to see AB vs. BA
76
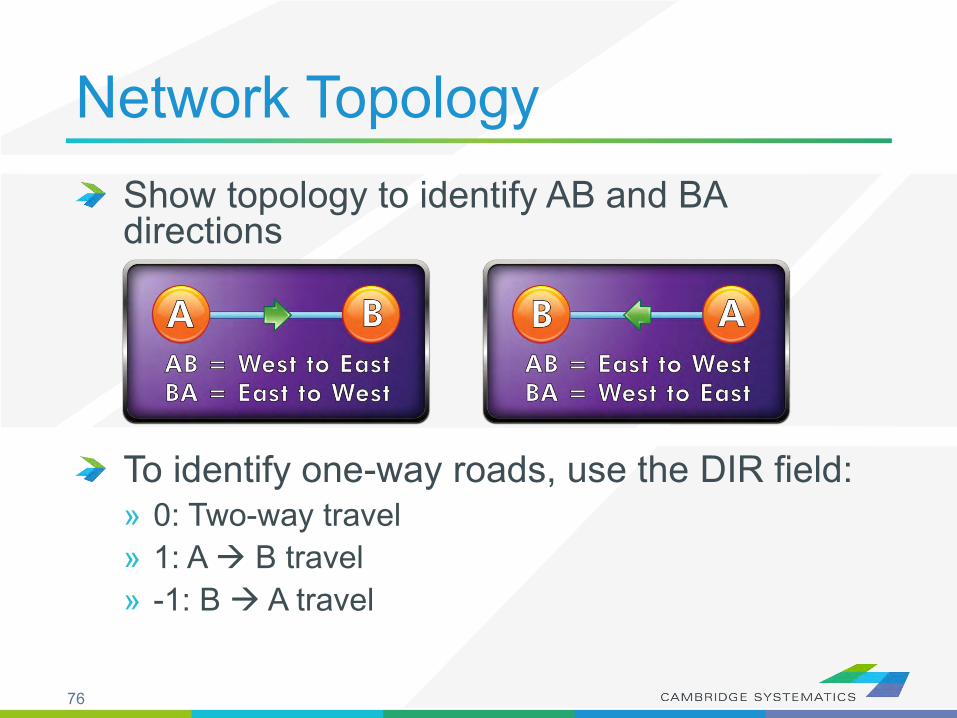
Network TopologyShow topology to identify AB and BA directions
To identify one-way roads, use the DIR field:» 0: Two-way travel» 1: A B travel» -1: B A travel

77
Network EditingEdit attributes of existing links – Method 1» To make most edits, use the information tool ( )
and edit text in the form that appears» Changes can be undone
Each edit action creates an undo point
» You can select and fill multiple links with the information tool Multiple values can be filled by
right-clicking on row names

78
Network Editing Alternate Method
Edit attributes of existing linksAlternate Method» Use the map editing toolbox ( )» Use the Edit Line Attributes ( ) button
Operation of this tool is similar to using the information button
» Edits are saved when the green light ( ) is clicked
» Use the red ( ) light to cancel all unsaved edits
» The Undo function will undo all edits that are saved at once with the green light

79
Network EditingWhat Fields do I Edit???» Facility Type
Facility type identifier» Lanes
Directional number of lanes, by time period Aux. lanes (freeway links only)
» Direction» Area Type
Use nearby links as a guide» MODE
2 for most links (other values are for transit)» Other fields as necessary

80
Network EditingWhat Fields do I Edit ??? (cont’d)» Toll coding guidelines
Use TOLL, Toll_flag See assign\inputs\toll_hot_penalty for toll and express
lane coding details
See the SCAG Model User’s Guide for more guidance

81
Practice: Network EditingOpen the input network file
Make a backup copy of this network in a folder called “Backup”» Use Tools Geographic Utilities Geographic
File and archive the network» Add the date to the backup filename» Edit the original network file
Try using the different editing approaches to:» Change the facility type» Widen a Road

82
Practice: Network EditingShow Topology on the network
Change a roadway to represent a different number of lanes in each direction
Change a different roadway to a one-way road» 0 = Two-Way» 1 = A to B» -1 = to A

83
Network EditingAdding new links» Use the map editing toolbox ( )» Add links using Add Line ( )
To work properly, links must be connected at nodes Existing links may need to be split Avoid splitting links if possible
» Make sure that links are connected by: Saving edits Moving a node around – do all of the attached links move
with it? Canceling the edit

84
Network EditingAdding New Links» New links need new data!» Copy data from an existing link with similar
characteristics Use the Edit Link Attributes ( ) button Click/shift-click on the new link(s) Shift-click on the similar old link Right-click on the data for the “old” link and choose “Copy
Values”» Splitting/Joining Links
Check the split/join settings Use the split/join tools ( ) New/moved links may be connected at new nodes Check data on split/joined links

85
Network EditingKeeping Transit up to date» Always add the route system to the network before
making edits (link additions, splits, or joins)» Add the route system from networks\Inputs
Note: Make sure to choose the Route System file type» Make the route system active after every few edits» TransCAD will prompt and update the transit network
based on your changes

86
Network Editing

87
Practice: Network EditingContinue editing the input network
Add, delete, and realign some links» Show topology: Note that the way a new
link is created defines its AB direction
Copy link values from an old road to newly created links
Split and join links » look at the data that appears on each half» Look at the network editor settings ( )

88
Network EditingThings to keep in mind:» When splitting links, make sure the data on both
pieces still makes sense» When adding new roadways, adjust centroid
connectors if necessary» Adding detail or making corrections?
You may need to make edits to base and forecast networks

89
Route Systems

90
Route System Components
Roadway Links
Roadway Nodes
Routes (Lines)
Route Stops

91
Route System» Travel Time and Distance» Walk and Drive Access
Roadway Links
Roadway Nodes
Routes (Lines)
Route Stops
92
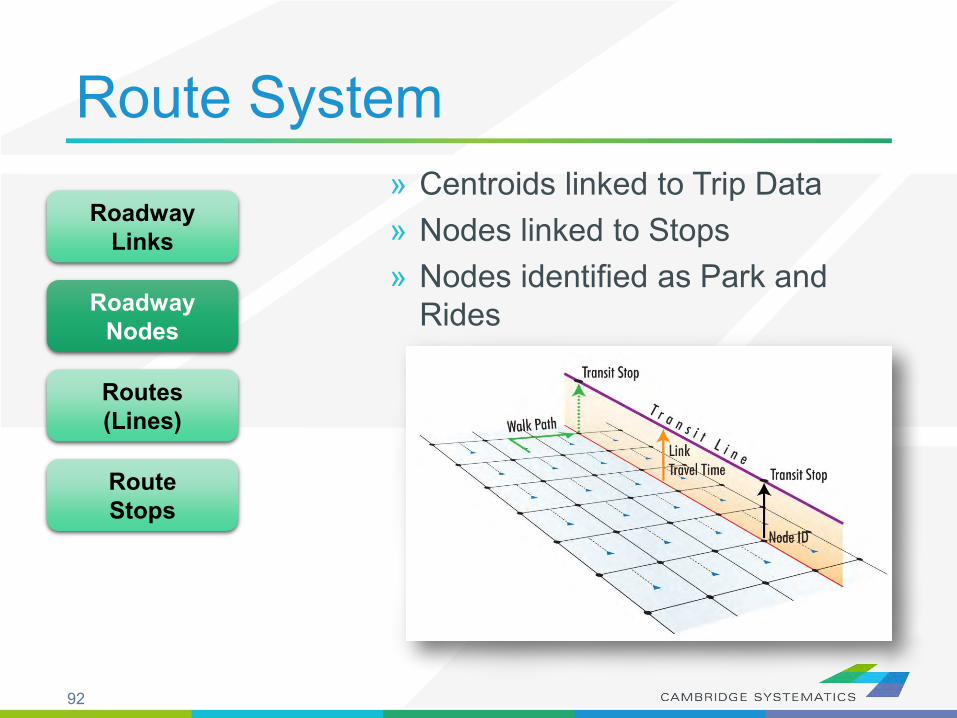
Route System» Centroids linked to Trip Data» Nodes linked to Stops» Nodes identified as Park and
Rides
Roadway Links
Roadway Nodes
Routes (Lines)
Route Stops

93
Route System» Routes follow roadway links
Roadways Centroid Connectors (possible, not
recommended) Transit only links (e.g., rail, BRT)
» Routes use link data Travel Time Distance
» Routes are stored in a “.rts” file
Roadway Links
Roadway Nodes
Routes (Lines)
Route Stops

94
Route SystemRoute Stops are stored in a pair of geographic files» managed from the route system» Physical Stops are common to all
routes crossing a node One required for each direction
» Route Stops are specific to one and only one route Must be associated with a physical
stop
Roadway Links
Roadway Nodes
Routes (Lines)
Route Stops

95
Route/Network LinkThe Route System is linked directly to the Roadway Network by Complete Filenames
If the network is moved or renamed, The Route System will fail to open unless:» The roadway network is opened first, or» The route system is re-linked to the roadway
network
96
Route/Network LinkRe-establishing a Link:» Route Systems Utilities Move
Open the dbd file, choose this menu item, then choose a route system
Checking the Link» Close all files» Open the route system in TransCAD» Verify that the expected network has been loaded
97
Start by opening the input route system» Make sure the correct line layer has been opened
Create a working “.net” network » Use default settings» Save this in the input directory» Use a temporary filename (e.g., net.net)
Start the Route Editing Toolbox» Route Systems Editing Toolbox
Route System Editing
Note – Check the active layer as you try each step

98
Route System DisplayMany routes can use the same corridor
Edit route styles ( ) to» Show Side by side» Show Topology
Use selection sets to show only a set of routes
Use screen real estate wisely

99
Example Editing Workspace
Toggle one/all routes

100
Example Editing Workspace
101
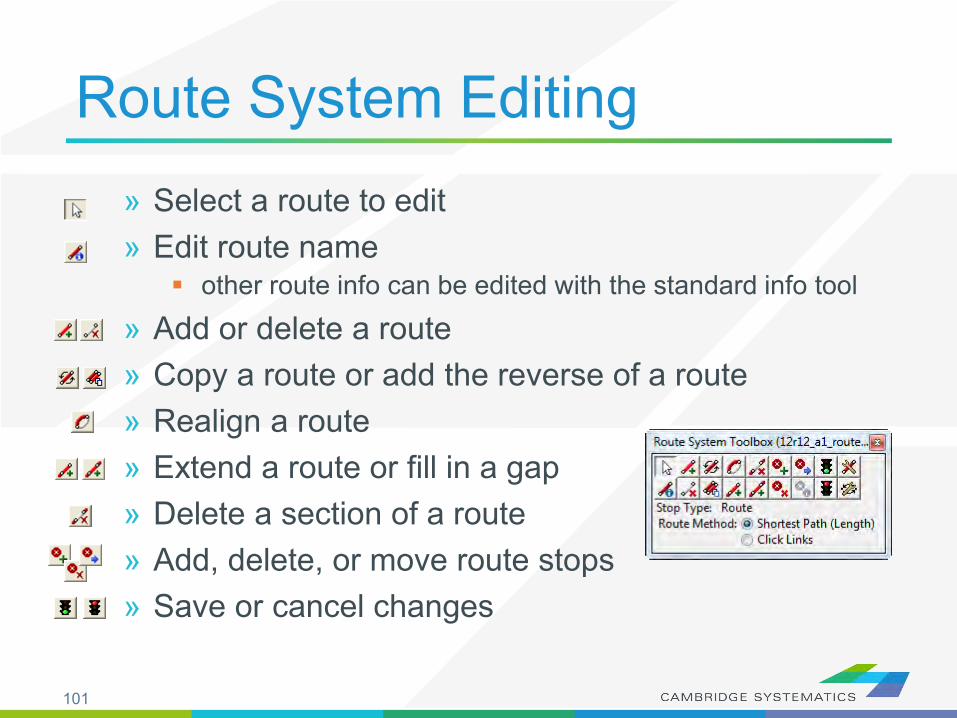
Route System Editing» Select a route to edit» Edit route name
other route info can be edited with the standard info tool
» Add or delete a route» Copy a route or add the reverse of a route» Realign a route» Extend a route or fill in a gap» Delete a section of a route» Add, delete, or move route stops» Save or cancel changes

102
Routes are usually edited by drawing paths» Click from node to node along a route» Only a few nodes along the route must be selected
Potential Problem: A route does not take the shortest path between two nodes:» Change from Shortest Path to Click Links» Link mode can be especially helpful on freeways
Route System Editing
103
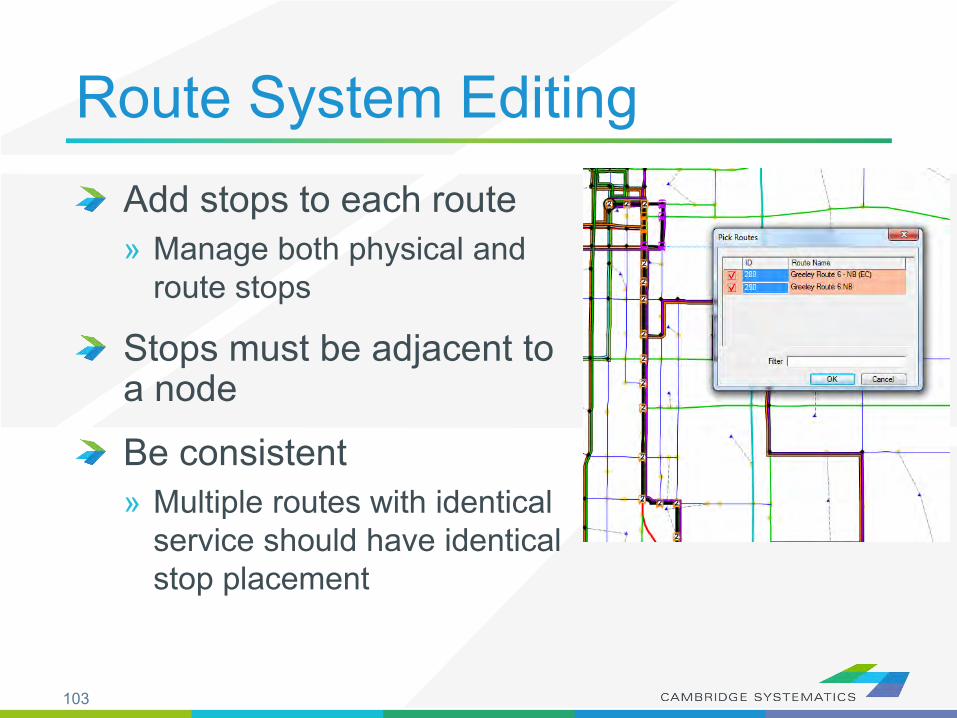
Route System EditingAdd stops to each route» Manage both physical and
route stops
Stops must be adjacent to a node
Be consistent» Multiple routes with identical
service should have identical stop placement
104
Use Route Systems Utilities Move to link the route system and network
Verify the link
Make some Changes:» Adjust a route headway» Add a new route» Add and/or remove route stops» Add a new Park and Ride
Practice: Route Editing

105
Running the SCAG Model

106
Preparing a Computer
TransCAD 6.0, » build 9215 or later» 64-bit verison required» TransCAD 7 not supported (yet)
Minimum System Requirements» 24GB RAM» 12 CPU cores» 500 GB free on system drive (C:\ Drive)» 800 GB free on model run drive (e.g., D:\ Drive)» 360 GB for model run storage

107
Requesting the SCAG Model
Request the model from SCAG» Go to:
http://www.scag.ca.gov/DataAndTools/Pages/Documents.aspx
» Download the Model Data Request Form» Fill out and submit as instructed
Cheryl Leising may be able to provide a Word version that is easier to fill out
108
Installing the SCAG Model
Install the User Interface (UI)» Follow Instructions provide by SCAG» See memo model installation v6.3.doc» You may need administrator privileges
Copy the model data and model table» Place in a user-specified location
Example: D:\SCAG» One directory for each scenario
Example: 16R16s3_set7_setting» Model table with scenario information
Example: SCAGModelv63q.bin

109
Running the SCAG ModelStart the Add-In» Tools Add-Ins
SCAG Model v 6.3
Setup a Scenario» Click “Setup”» Find the scenario to run
Example: 16R16s3 Make a copy (or work in place if you want)
» Set the correct directory on your system Check to make sure Input files are shown as “Exists”
» Click ‘OK’ (be patient while the system responds)
110
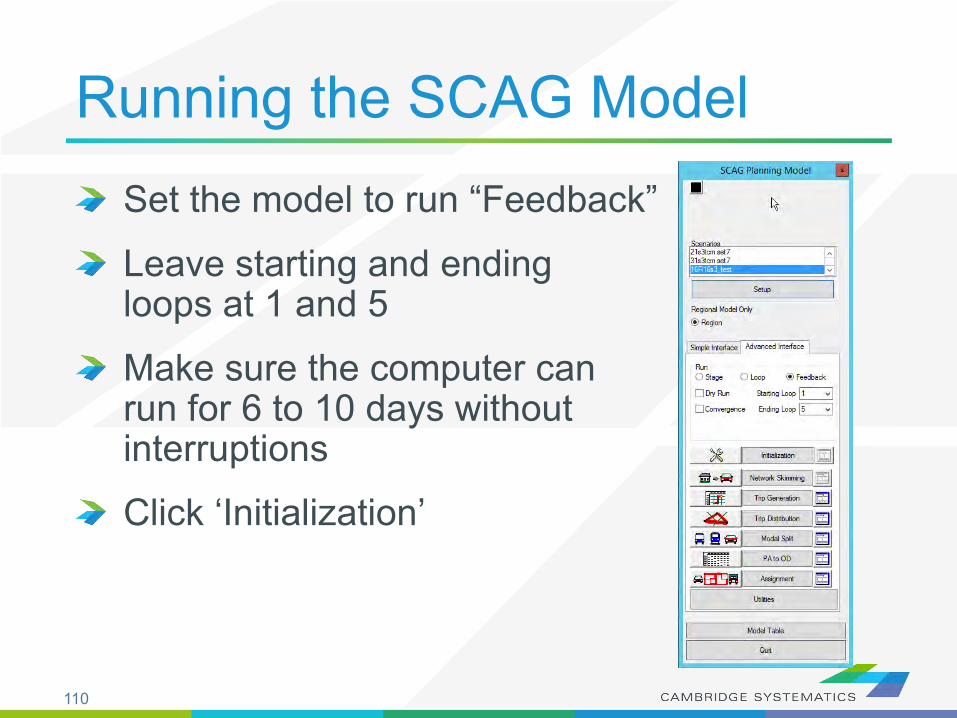
Running the SCAG ModelSet the model to run “Feedback”
Leave starting and ending loops at 1 and 5
Make sure the computer can run for 6 to 10 days without interruptions
Click ‘Initialization’
111
Running for ScenariosQuick Run with network changes only» Trip tables and mode choice does not change» Can be useful for:
Testing roadway network changes Running assignment again with select link / zone analysis
One-Loop Run» Run one complete feedback loop, starting with final
loop from a full model» Can be useful for:
Large roadway and/or transit scenarios
112
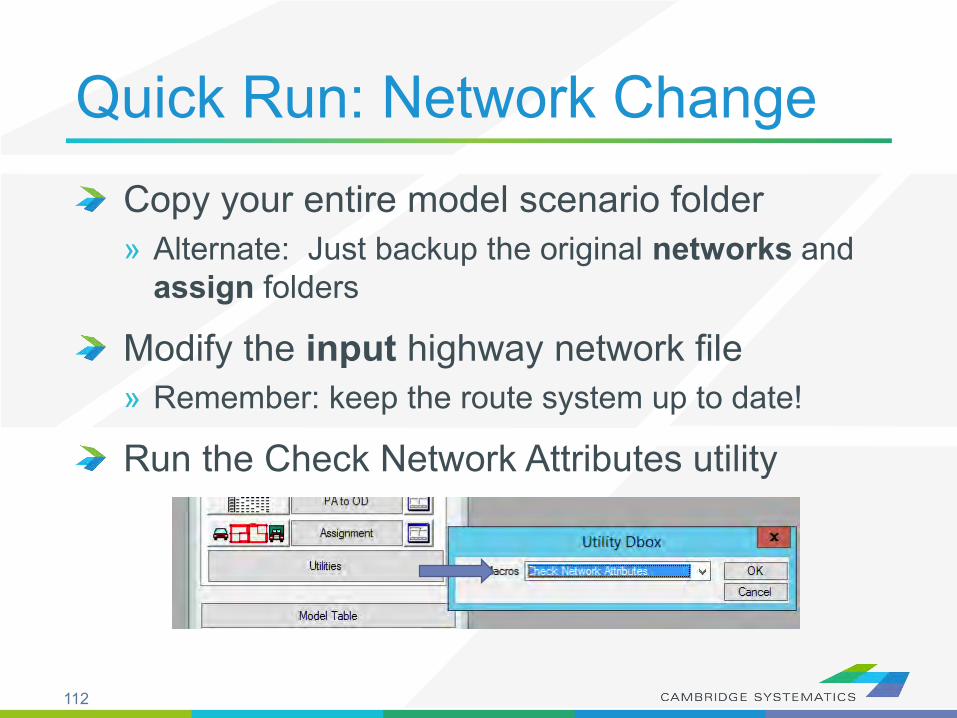
Quick Run: Network ChangeCopy your entire model scenario folder» Alternate: Just backup the original networks and
assign folders
Modify the input highway network file» Remember: keep the route system up to date!
Run the Check Network Attributes utility
113
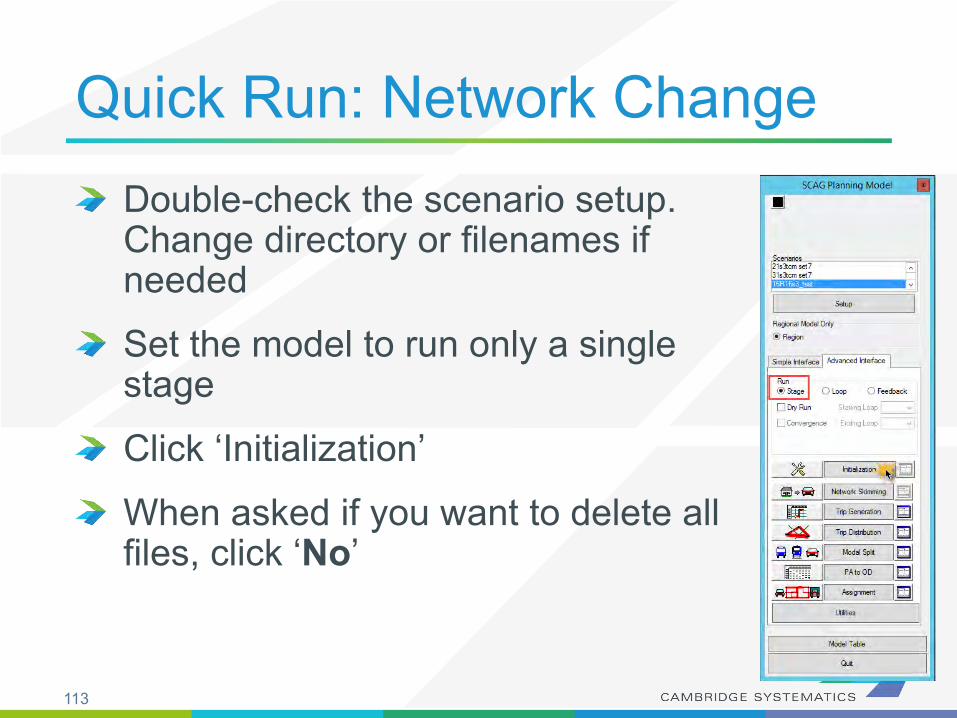
Quick Run: Network ChangeDouble-check the scenario setup. Change directory or filenames if needed
Set the model to run only a single stage
Click ‘Initialization’
When asked if you want to delete all files, click ‘No’

114
Quick Run: Network ChangeWhen initialization completes, click on the button next to assignment» Set steps as shown» Click OK
Click ‘Assignment’ to run traffic assignment» This will take several hours

115
One Loop RunCopy your entire model scenario folder
Modify the inputs» Highway network file» Route system File» Socioeconomic Data
Run the Check Network Attributes utility
Run the Mergenet Run utility» This merges speed feedback results with the
modified network

116
One-Loop runEdit the scenario (click Setup)» Set the Initial Time Option to a value of 2» Click OK

117
One-Loop runSet the dialog box to:» Run Feedback» Run loop 6 to 6 (Be careful – the drop-
downs can change unexpectedly)
Click the button next to Initialization» Set steps as shown» Click OK

118
One-Loop runClick the Initialization button to start the run» This should take about a day to complete
Did you get an error??» Try closing and restarting TransCAD, then picking
up where you left off.» Always double-check feedback settings and active
steps before starting a run

119
Advanced Topics
120
Advanced Topics
Matrix Files and OD Tables» Matching matrix files to zones/centroids» Visualizing trip table data
Desire Lines
Setting up Select Link and Zone Anlaysis» Creating a query file» Running assignment only with select analysis activated
Routable Networks» Creating and updating a “.net” Network» Interactive pathbuilding
Basic Scripting» Batch Recorder» Simple Macro Creation

121
Thank You!

122
Examples

123
Year 2035 Alternative 5C: Select Link Analysis Daily HHDTsSouthbound 710 Freeway Long Beach Blvd. Location (Pair A)
Los Angeles
Ports
Ontario
OriginsDestinations
San. Bern.
IndustryPomona
Fontana
Long Beach
Santa FeSprings
Anaheim
Santa Ana
Moreno ValleyRiverside
ComptonCorona
* Example only: not meant for reading the text in PowerPoint presentation format

124
Year 2035 Alternative 5C: Select Link Analysis Daily HHDTsLong Beach Blvd Location Bandwidth HHDT Volumes
Los Angeles
Ports
Ontario
San. Bern.
IndustryPomona
Fontana
Long Beach
Santa FeSprings
Anaheim
Santa Ana
Moreno ValleyRiverside
ComptonCorona
* Example only: not meant for reading the text in PowerPoint presentation format

125
Household And Employment Growth
Today
* Example only: not meant for reading the text in PowerPoint presentation format

126
Household And Employment Growth
Future
* Example only: not meant for reading the text in PowerPoint presentation format

127
Travel Patterns
Today
* Example only: not meant for reading the text in PowerPoint presentation format

128
Travel Patterns
Future
* Example only: not meant for reading the text in PowerPoint presentation format

129
Traffic Volumes And Congestion
Today
* Example only: not meant for reading the text in PowerPoint presentation format

130
Traffic Volumes And Congestion
Future
* Example only: not meant for reading the text in PowerPoint presentation format
131
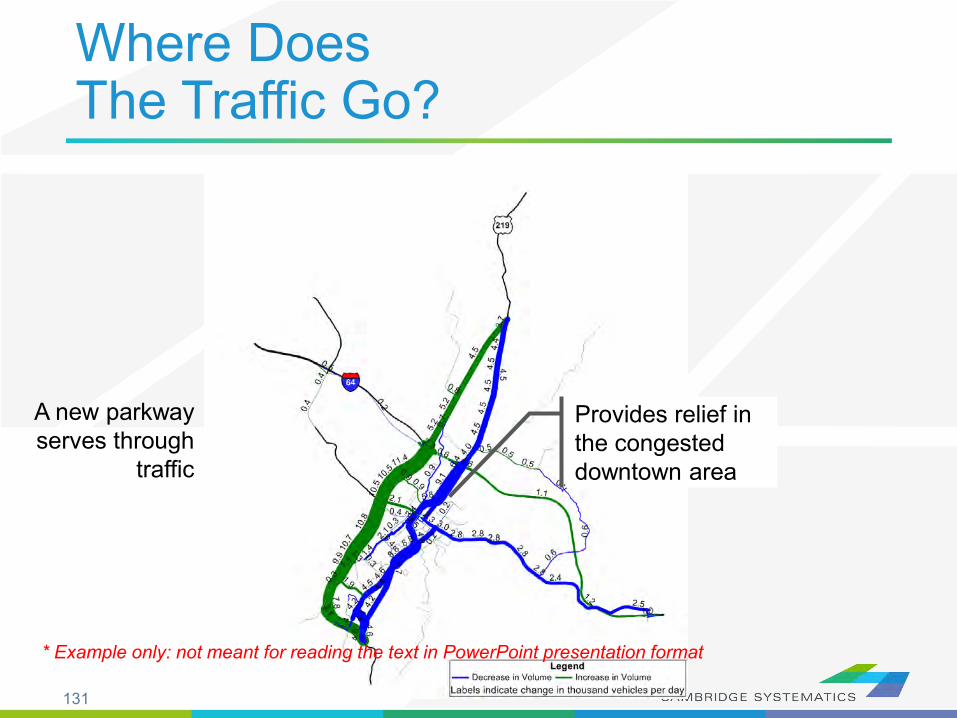
Where Does The Traffic Go?
A new parkway serves through
traffic
Provides relief in the congested downtown area
* Example only: not meant for reading the text in PowerPoint presentation format

132
Intersection LOS
* Example only: not meant for reading the text in PowerPoint presentation format
133
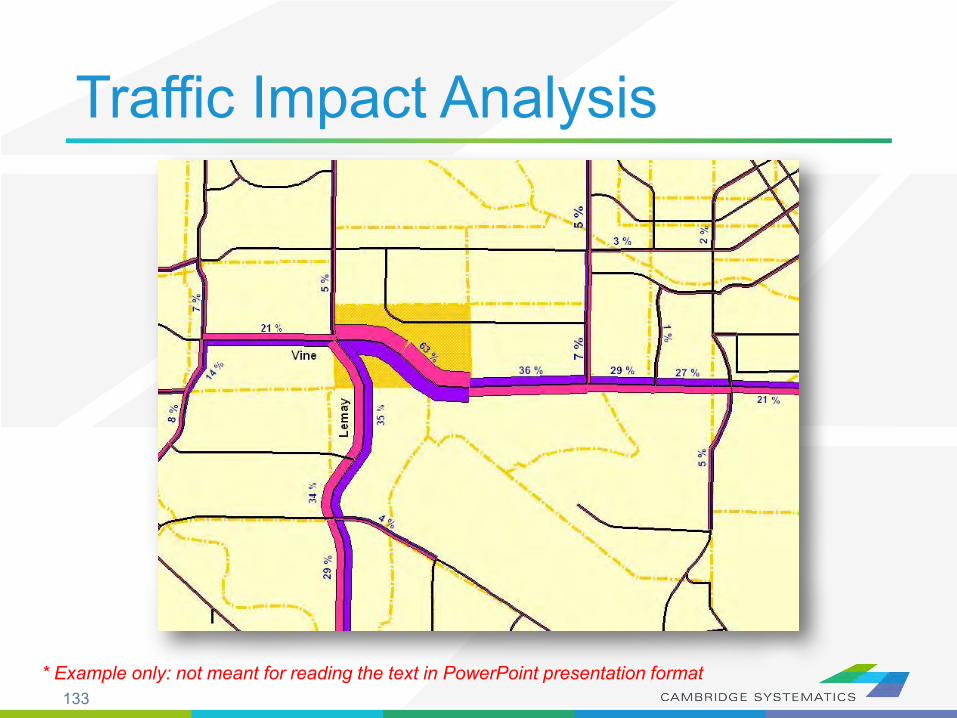
Traffic Impact Analysis
* Example only: not meant for reading the text in PowerPoint presentation format
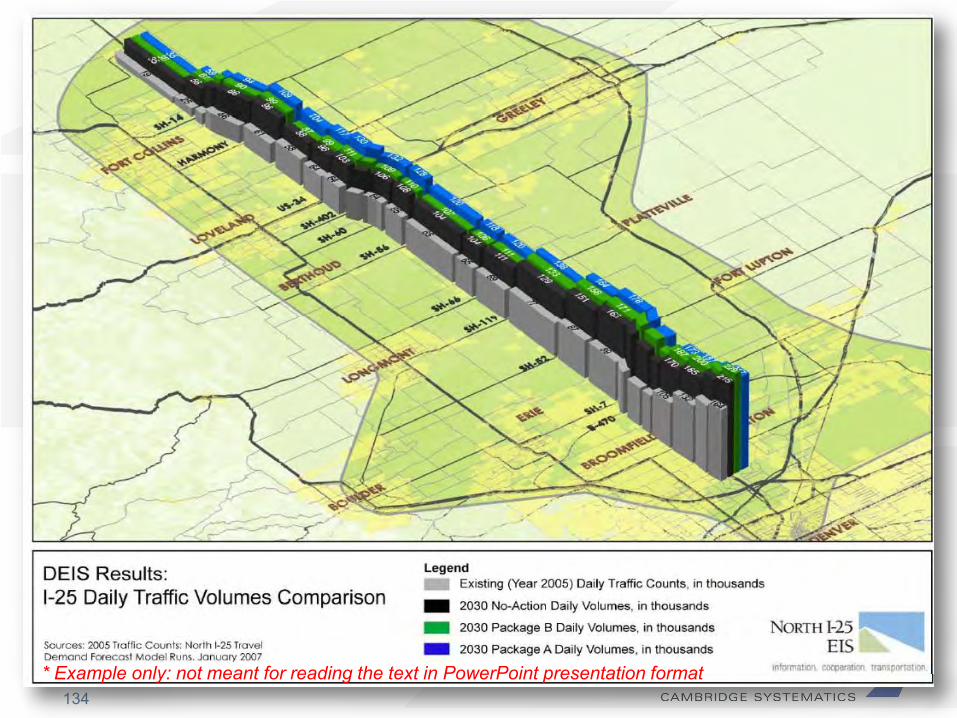
134* Example only: not meant for reading the text in PowerPoint presentation format

135

136* Example only: not meant for reading the text in PowerPoint presentation format

137
NOTE:This map was originally printed 11 x 17 for very technical audience and for technical discussions
* Example only: not meant for reading the text in PowerPoint presentation format

138
Thank you!

139
More TopicsGISDK
MMA
Select link/zone analysis
Subarea analysis
ODME
Model estimation
Other planning functions

140
Transit Networks

141
Transit NetworksContain all mode and pathbuilder settings» Mode.bin table contains mode-specific information» Modexfer.bin contains mode-to-mode values» Connection between link/node layers
Stops tagged to node
In-program:» Create a new transit network» Review transit network settings
New network Batch-created network
142
Transit NetworksPathbuilding» Build transit paths based on network settings
Interactive: Test specific paths and try various pathbuilder settings
Skim: Build zone-to-zone paths

143
Practice: Transit NetworksCreate a new transit network based on the route system» Review settings» Build a few paths interactively
Change the transit network to a generated file» Build similar paths – how are they different?» Try changing network settings and observe how
paths change Combination factor IVTT/OVTT weights