hydroacoustic effects of pile driving on fish - caltrans
TRANSCRIPT
Technical Guidancefor the Assessment of
Hydroacoustic Effectsof Pile Driving on Fish
October 2020
California Department of TransportationDivision of Environmental Analysis
Environmental EngineeringHazardous Waste, Air, Noise, Paleontology Office
© 2020 California Department of Transportation
2020UPDAT
E

This page intentionally left blank.
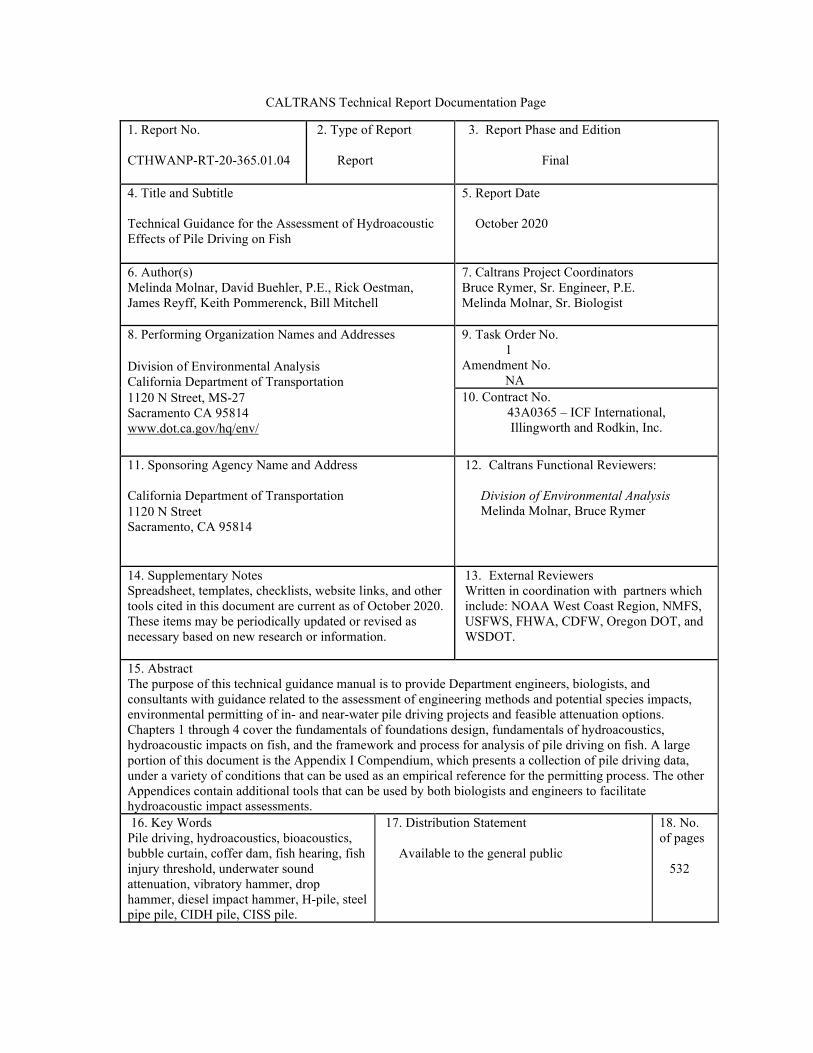
1. Report No. CTHWANP-RT-20-365.01.04
2. Type of Report Report
3. Report Phase and Edition
Final
4. Title and Subtitle Technical Guidance for the Assessment of Hydroacoustic Effects of Pile Driving on Fish
5. Report Date October 2020
6. Author(s) Melinda Molnar, David Buehler, P.E., Rick Oestman, James Reyff, Keith Pommerenck, Bill Mitchell
7. Caltrans Project Coordinators Bruce Rymer, Sr. Engineer, P.E. Melinda Molnar, Sr. Biologist
8. Performing Organization Names and Addresses Division of Environmental Analysis California Department of Transportation 1120 N Street, MS-27 Sacramento CA 95814 www.dot.ca.gov/hq/env/
9. Task Order No. 1 Amendment No. NA 10. Contract No.
43A0365 – ICF International, Illingworth and Rodkin, Inc.
11. Sponsoring Agency Name and Address California Department of Transportation 1120 N Street Sacramento, CA 95814
12. Caltrans Functional Reviewers:
Division of Environmental Analysis Melinda Molnar, Bruce Rymer
14. Supplementary Notes Spreadsheet, templates, checklists, website links, and other tools cited in this document are current as of October 2020. These items may be periodically updated or revised as necessary based on new research or information.
13. External Reviewers Written in coordination with partners which include: NOAA West Coast Region, NMFS, USFWS, FHWA, CDFW, Oregon DOT, and WSDOT.
15. Abstract The purpose of this technical guidance manual is to provide Department engineers, biologists, and consultants with guidance related to the assessment of engineering methods and potential species impacts, environmental permitting of in- and near-water pile driving projects and feasible attenuation options. Chapters 1 through 4 cover the fundamentals of foundations design, fundamentals of hydroacoustics, hydroacoustic impacts on fish, and the framework and process for analysis of pile driving on fish. A large portion of this document is the Appendix I Compendium, which presents a collection of pile driving data, under a variety of conditions that can be used as an empirical reference for the permitting process. The other Appendices contain additional tools that can be used by both biologists and engineers to facilitate hydroacoustic impact assessments. 16. Key Words Pile driving, hydroacoustics, bioacoustics, bubble curtain, coffer dam, fish hearing, fish injury threshold, underwater sound attenuation, vibratory hammer, drop hammer, diesel impact hammer, H-pile, steel pipe pile, CIDH pile, CISS pile.
17. Distribution Statement Available to the general public
18. No. of pages 532
CALTRANS Technical Report Documentation Page

This page intentionally left blank.

DEDICATION
This guidance manual represents almost two decades of ongoing work accomplished by engineers and biologists working together to investigate the
properties of pile driving underwater sound pressure and the impacts on protected fish species. It is dedicated to all the Caltrans personnel, resource
agencies, and consultants who contributed.
This updated 2020 guidance manual is also dedicated to Caltrans biologist Deborah McKee who passed away in 2019. Deborah played a key role at the
onset of hydroacoustic science related to bridge building and the effects of pile driving sound on fish. She brought together west coast resource agencies,
transportation agencies, research scientists, and consultants to evaluate science and data and to coordinate the establishment of groundbreaking criteria and
methods.

This page intentionally left blank.
Technical Guidance for the Assessment of the Hydroacoustic Effects of Pile Driving on Fish
California Department of Transportation Division of Environmental Analysis
Sacramento, CA Contact:
Melinda Molnar, Biology 707/445-6627
Bruce Rymer, Acoustics 916/653-6073
October 2020
This document is not an official policy, standard, specification, or regulation and should not be used as such. Its content is for informational purposes only. This information should not be used without first securing
competent advice with respect to its suitability for any general or specific application. Anyone utilizing this information assumes all liability arising from such use.
© 2020 California Department of Transportation

This page intentionally left blank.
Technical Guidance for Assessment of Hydroacoustic Effects of Pile Driving on Fish i
October 2020
Table of Contents
Page
Table of Contents ........................................................................................................................................... i List of Tables ........................................................................................................................................... iii List of Figures ........................................................................................................................................... iv List of Acronyms and Abbreviations ........................................................................................................... vi Chapter 1 Introduction and Background ...................................................................................... 1-1
Chapter 2 Fundamentals of Hydroacoustics ................................................................................. 2-1 2.1 Fundamental Principles of Hydroacoustics...................................................................... 2-1 2.2 Underwater Sound Pressure Propagation ....................................................................... 2-10 2.3 Measurement of Underwater Sound Pressure ................................................................ 2-12 2.4 Examples of Underwater Pile Driving Sound Pressure Levels ...................................... 2-15 2.5 Common Underwater Sound Attenuation Measures ..................................................... 2-17
2.5.1 Bubble Curtains ................................................................................................ 2-21 2.5.2 Cofferdams ....................................................................................................... 2-29 2.5.3 Vibratory Hammers .......................................................................................... 2-30 2.5.4 Isolation Casings and Other Sound Reduction Systems ................................... 2-31
2.6 References ...................................................................................................................... 2-32
Chapter 3 Fundamentals of Hydroacoustic Impacts on Fish ....................................................... 3-1 3.1 Introduction ...................................................................................................................... 3-1 3.2 Types of Fishes ................................................................................................................ 3-3 3.3 Sound Detection in Fish ................................................................................................... 3-4 3.4 Potential Effects of Underwater Sound Pressure on Fish Hearing .................................. 3-5 3.5 Potential Effects of Underwater Sound Pressure on Fish Anatomy and
Physiology ....................................................................................................................... 3-6 3.6 Life History Considerations ............................................................................................. 3-8 3.7 Behavioral Effects ............................................................................................................ 3-8 3.8 Environmental Factors to Consider in Analysis .............................................................. 3-9 3.9 References ........................................................................................................................ 3-9
Chapter 4 Framework and Process for Environmental Analysis of Pile Driving Impacts on Fish .............................................................................................................. 4-1
4.1 Introduction ...................................................................................................................... 4-1 4.2 Permits and Regulatory Requirements for In-Water and Near-Water Pile
Driving Activities ............................................................................................................ 4-2 4.3 Information Needed to Evaluate Impacts......................................................................... 4-4 4.4 Avoidance and Minimization Measures, Best Management Practices, and
Performance Standards .................................................................................................... 4-7 4.4.1 Avoidance and Minimization Measures ............................................................. 4-7 4.4.2 Attenuation Methods......................................................................................... 4-13 4.4.3 Performance Standards ..................................................................................... 4-15
4.5 Considerations for Assessing Impacts ........................................................................... 4-16 4.5.1 Habitat ............................................................................................................... 4-16 4.5.2 Sound Sensitivity .............................................................................................. 4-16 4.5.3 Behavior and Life History ................................................................................ 4-17 4.5.4 Protected Status................................................................................................. 4-17
Technical Guidance for Assessment of Hydroacoustic Effects of Pile Driving on Fish ii
October 2020
4.6 Impact Analysis ............................................................................................................. 4-18 4.6.1 Determining Ambient (Background) Sound Levels ......................................... 4-19 4.6.2 Determining Estimated Pile Driving Sound Pressure Levels ........................... 4-19 4.6.3 Calculating Underwater Sound Pressure Attenuation ....................................... 4-21 4.6.4 Interim Injury Thresholds ................................................................................. 4-24 4.6.5 Determining the Impact Areas .......................................................................... 4-31 4.6.6 Assessing Potential Impacts on Fish from Pile Driving Sound ........................ 4-42
4.7 Monitoring during Project Construction ........................................................................ 4-49 4.8 Lessons Learned ............................................................................................................ 4-50
4.8.1 Initiating Early Discussions with Resource Agencies ...................................... 4-50 4.8.2 Understanding the Issues .................................................................................. 4-50 4.8.3 Portraying Reasonable Worst-Case Conditions ................................................ 4-50 4.8.4 Understanding the Ramifications of Permit Conditions ................................... 4-51 4.8.5 Developing Mitigation under CESA ................................................................. 4-51
4.9 Conclusion ..................................................................................................................... 4-51 4.10 References ...................................................................................................................... 4-52
Glossary
Appendix I Compendium of Pile Driving Sound Data
Appendix II Procedures for Measuring Pile Driving Sound
Appendix III Tools for Preparing Biological Assessment
Appendix IV U.S. Patent for Underwater Energy Dampening Device

Technical Guidance for Assessment of Hydroacoustic Effects of Pile Driving on Fish iii
October 2020
List of Tables
Page
Table 2-1. Typical Sound Levels in Underwater Environments Where Pile Driving Normally Occurs .............................................................................................................. 2-3
Table 2-2. Single-Strike Sound Levels Associated with Different Piles (Measured at 10 Meters from Pile) .................................................................................................. 2-16
Table 2-3. Comparison of Piles Driven on Land to Piles Driven in Water ..................................... 2-19
Table 2-4. Example Underwater Sound Pressure Data by Pile Type and Size – With and Without Attenuation ................................................................................................ 2-20
Table 4-1. Federal and State Permits and Authorizations Typically Required for Projects Resulting in Underwater Sound Pressure from Pile Driving ............................. 4-3
Table 4-2. Information Needed for Evaluation of Hydroacoustic Effects of Pile Driving on Fish ................................................................................................................ 4-4
Table 4-3. Reported Ambient Underwater Sound Levels (dB re: 1 μPa) Recorded at Various Open Water Locations in the Western United States ....................................... 4-19
Table 4-4. Ground Vibration Attenuation Rates ............................................................................. 4-35
Table 4-5. Example Summary Table ............................................................................................... 4-48
Technical Guidance for Assessment of Hydroacoustic Effects of Pile Driving on Fish iv
October 2020
Figures
Page
Figure 1-1. California Fault Map ........................................................................................................ 1-2
Figure 2-1. Sound Level Metrics ........................................................................................................ 2-2
Figure 2-2. Peak Sound Pressure ........................................................................................................ 2-4
Figure 2-3. Signal Rise Time .............................................................................................................. 2-5
Figure 2-4. Acoustical Impulse .......................................................................................................... 2-5
Figure 2-5. Root Mean Square Sound Pressure Level ........................................................................ 2-6
Figure 2-6. Effective Sound Pressure Level ....................................................................................... 2-6
Figure 2-7. Sound Exposure Level for a Single Pile Driving Impulse ............................................... 2-7
Figure 2-8. Sound Exposure Level Calculation .................................................................................. 2-7
Figure 2-9. Sound Exposure Level ..................................................................................................... 2-8
Figure 2-10. Narrow-Band Frequency Sound Pressure Spectrum Level .............................................. 2-9
Figure 2-11. Underwater Sound Propagation Paths ........................................................................... 2-11
Figure 2-12. Underwater Sound Propagation in Shallow Water ........................................................ 2-11
Figure 2-13. Underwater Sound Propagation in Shallow Water Near the Surface ............................ 2-12
Figure 2-14. Basic Hydrophone System ............................................................................................. 2-13
Figure 2-15. Measurement System ..................................................................................................... 2-14
Figure 2-16. Pressure Sensors ............................................................................................................ 2-15
Figure 2-17. Calibration in the Field .................................................................................................. 2-15
Figure 2-18. Representative Pile Strike at 25 Meters from a 96-Inch-Diameter CISS Pile with a 500-Kilojoule Hydraulic Hammer ............................................................... 2-16
Figure 2-19. Example of Large Bridge that Spans Channel ............................................................... 2-18
Figure 2-20. Example of Small Bridge that Spans Channel ............................................................... 2-19
Figure 2-21. Typical 24-inch and 84-inch Piles ................................................................................. 2-20
Figure 2-22. Unconfined Air Bubble Curtain Systems ...................................................................... 2-22
Figure 2-23. Bubble Ring ................................................................................................................... 2-23
Figure 2-24. Dual-Stage Unconfined Air Bubble Curtain .................................................................. 2-23
Figure 2-25. San Francisco-Oakland Bay Bridge Re-Strike Air Bubble Curtain Waveforms ..................................................................................................................... 2-24
Figure 2-26. San Francisco-Oakland Bay Bridge Re-Strike Frequency Spectra ................................ 2-24
Figure 2-27. Multiple-Stage Unconfined Air Bubble Curtain System ............................................... 2-25
Figure 2-28. Benicia-Martinez Bridge Waveforms with Multiple-Stage Unconfined Air Bubble Curtain System ............................................................................................ 2-25
Figure 2-29. Benicia-Martinez Bridge Sound Pressure Reduction with Multiple-Stage Unconfined Air Bubble Curtain System ........................................................................ 2-26
Technical Guidance for Assessment of Hydroacoustic Effects of Pile Driving on Fish v
October 2020
Figure 2-30. Proprietary Confined Air Bubble Curtain System ......................................................... 2-26
Figure 2-31. Confined Air Bubble Curtain System Used at an Isolation Pile at the Benicia-Martinez Bridge ................................................................................................ 2-27
Figure 2-32. Confined Air Bubble Curtain System Used in an Isolation Pile at the Benicia-Martinez Bridge ................................................................................................ 2-27
Figure 2-33. Simple Confined Air Bubble Curtain System ................................................................ 2-28
Figure 2-34. Unconfined Bubble Curtain Deployed During Demolition of Concrete Foundations .................................................................................................................... 2-29
Figure 2-35. Typical Cofferdam Installations .................................................................................... 2-30
Figure 2-36. 24-inch Pile Being Installed with a Vibratory Pile Driver ............................................. 2-31
Figure 3-1. Barotrauma Continuum of Effects ................................................................................... 3-1
Figure 4-1. New Large Bridges that Span the Channel ...................................................................... 4-9
Figure 4-2. New Small Bridges that Span the Channel .................................................................... 4-10
Figure 4-3. Temporary Trestle and Barge Used During Bridge Construction ................................. 4-12
Figure 4-4. Mad River Bridge Isolation Nets and Fish Killed by Impingement on Isolation Nets ................................................................................................................. 4-27
Figure 4-5. Sound Energy Accumulation at the 35 Meter Cage ....................................................... 4-28
Figure 4-6. Pier E3 Demolition Bubble Curtain ............................................................................... 4-29
Figure 4-7. Action Area and Acoustic Impact Area in Open Water ................................................. 4-33
Figure 4-8. Action Area and Acoustic Impact Area in River ........................................................... 4-33
Figure 4-9. NMFS Pile Driving Spreadsheet Example Input Page .................................................. 4-41
Technical Guidance for Assessment of Hydroacoustic Effects of Pile Driving on Fish vi
October 2020
Acronyms and Abbreviations
µPa micro Pascal ABC Accelerated Bridge Construction AIP Agreement in Principal for Interim Criteria for Injury to Fish from Pile Driving Activities ANSI American National Standards Institute BA Biological Assessment BMPs best management practices Caltrans California Department of Transportation CCC California Coastal Commission CDFW California Department of Fish and Wildlife CEQA California Environmental Quality Act CESA California Endangered Species Act CIDH cast-in-drilled-hole CISS cast-in-shell steel Corps U.S. Army Corps of Engineers dB decibels DCH designated critical habitat EFH essential fish habitat FESA federal Endangered Species Act FHWA Federal Highway Administration FHWG Fisheries Hydroacoustic Working Group Hz hertz LPEAK peak sound pressure level MSFCMA Magnuson-Stevens Fishery Conservation and Management Act NEPA National Environmental Policy Act NMFS National Marine Fisheries Service NOAA National Oceanic and Atmospheric Administration PA&ED Project Approval and Environmental Document phase
Technical Guidance for Assessment of Hydroacoustic Effects of Pile Driving on Fish vii
October 2020
PFR Preliminary Foundation Report psi pounds per square inch PTS permanent threshold shift RMS root mean square SDC seismic design criteria SEL sound exposure level SELCUMULATIVE cumulative sound exposure level SER Standard Environmental Reference Structures Caltrans Division of Structures TEF total energy flux TTS temporary threshold shift USFWS U.S. Fish and Wildlife Service

This page intentionally left blank.
Technical Guidance for Assessment of Hydroacoustic Effects of Pile Driving on Fish 1-1
October 2020
Chapter 1 Introduction and Background
Nearly every bay, estuary, river and major stream in California provides habitat for fish species, many of which are listed as threatened or endangered under the federal Endangered Species Act (FESA), California Endangered Species Act (CESA), or provisions of the Magnuson-Stevens Fisheries Management and Conservation Act for species managed under the essential fish habitat (EFH). The potential for barotrauma injury or, in some limited cases, mortality to fish as a result of pile driving activities requires an impact analysis to determine potential site and project specific impacts. Project actions require development and deployment of avoidance and minimization measures that include reasonable and feasible attenuation methods and seasonal work windows to protect fish species listed under ESA and other regulatory requirements.
Underwater sound pressure that has the potential to injure fish or mask communication in pelagic fish may result from many anthropomorphic sources such as boat traffic in bays and estuaries, Army Corps of Engineers bank revetment project activities, in-water demolition work using a hoe ram or other impact tools, construction of boat docks, ramps and other floating facilities, and offshore wind energy projects. Pile driving for new bridges or foundation work and demolition activities are the sound-generating activities most commonly encountered by the California Department of Transportation (Caltrans) and city and county departments of transportation during bridge-building work.
The Caltrans Division of Structures Design and Engineering (Structures DES) is responsible for designing structures, geotechnical investigations and recommendations, and scour analysis for highway bridge projects. Structural foundations are a significant portion of the overall structural design effort, construction schedule timeline, and project cost. It is important that Structures engineers choose an appropriate foundation type and design because foundations are critical to the life, performance, and behavior of the structure, as well as to potential impacts to the environment, project costs and in-water work season schedule.
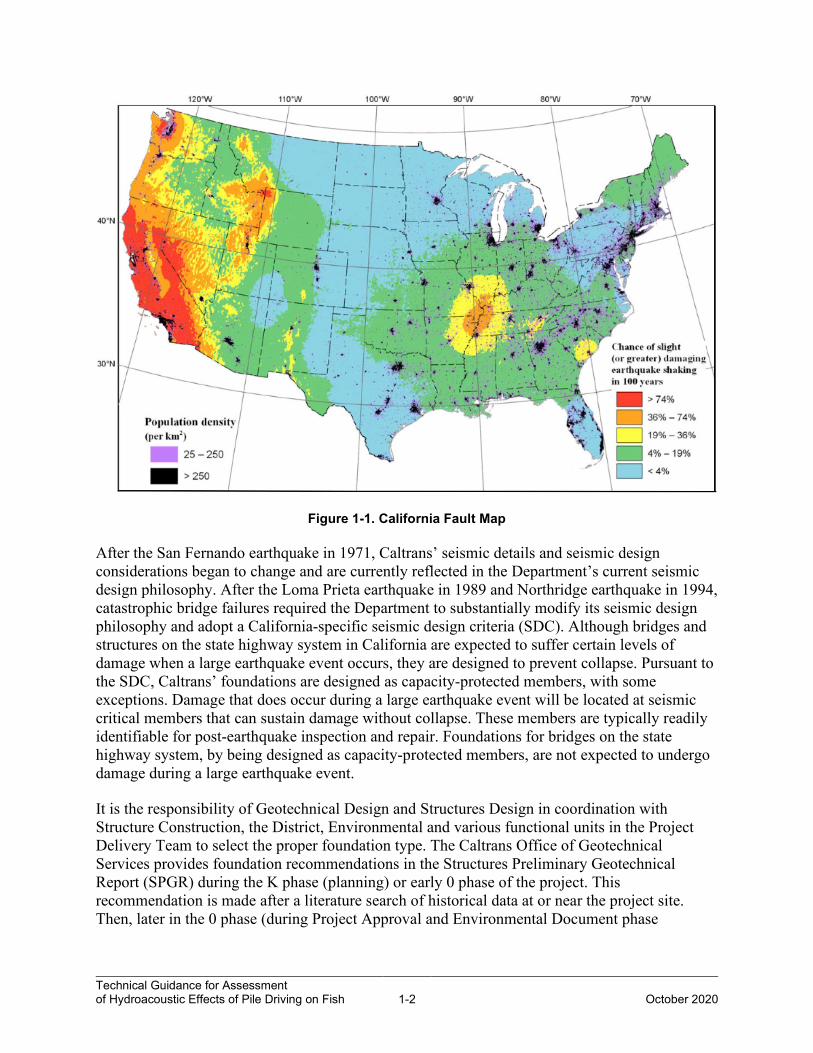
Foundation designs in California are much more complicated than foundation designs by transportation departments in most other states due to seismic design considerations that are specific to California. Foundation sizes and depths required on the State Highway System (SHS) have significantly increased within the state when compared to structures completed 30 or more years ago. The increased foundation sizes are required by the significant earthquake hazards that exist in California and the fact that many of Caltrans’s structures, which include bridges and walls, are located in high seismic regions. Figure 1-1 is the seismic hazard map published by the U.S. Geological Survey. This map shows the high seismic hazard risk in California relative to the rest of the U.S.
Technical Guidance for Assessment of Hydroacoustic Effects of Pile Driving on Fish 1-2
October 2020
Figure 1-1. California Fault Map
After the San Fernando earthquake in 1971, Caltrans’ seismic details and seismic design considerations began to change and are currently reflected in the Department’s current seismic design philosophy. After the Loma Prieta earthquake in 1989 and Northridge earthquake in 1994, catastrophic bridge failures required the Department to substantially modify its seismic design philosophy and adopt a California-specific seismic design criteria (SDC). Although bridges and structures on the state highway system in California are expected to suffer certain levels of damage when a large earthquake event occurs, they are designed to prevent collapse. Pursuant to the SDC, Caltrans’ foundations are designed as capacity-protected members, with some exceptions. Damage that does occur during a large earthquake event will be located at seismic critical members that can sustain damage without collapse. These members are typically readily identifiable for post-earthquake inspection and repair. Foundations for bridges on the state highway system, by being designed as capacity-protected members, are not expected to undergo damage during a large earthquake event.
It is the responsibility of Geotechnical Design and Structures Design in coordination with Structure Construction, the District, Environmental and various functional units in the Project Delivery Team to select the proper foundation type. The Caltrans Office of Geotechnical Services provides foundation recommendations in the Structures Preliminary Geotechnical Report (SPGR) during the K phase (planning) or early 0 phase of the project. This recommendation is made after a literature search of historical data at or near the project site. Then, later in the 0 phase (during Project Approval and Environmental Document phase
Technical Guidance for Assessment of Hydroacoustic Effects of Pile Driving on Fish 1-3
October 2020
[PA&ED]) of the project, geotechnical drilling is conducted at the project site so that a more accurate and site-specific geotechnical report for structure foundations may be completed.
This Preliminary Foundation Report (PFR) will provide specific construction considerations depending upon the type of foundation(s) Geotechnical Services may recommend. In the past, geotechnical drilling investigations have been performed after foundation type selection in the design phase of the project. However, information critical at the support locations is often lacking until project drilling has been completed. This information is vital in determining the appropriate foundation type early in the project delivery process, in order to assess potential impacts to federally listed, threatened and endangered species for permits and agreements that are required at PA&ED.
In the past, when drilling and appropriate foundation recommendations were not done during the PA&ED phase, foundations were often scoped for an infeasible foundation type. This required design changes at a later date as well as the need to reinitiate federal endangered species consultation. Also, when structure foundations are scoped inappropriately, problems may arise during construction that will delay the construction time and add additional scope of work to the project. Project environmental documents and any related permits and agreements prepared for the project prior to construction generally do not anticipate and include this type of additional scope of work. This causes further project re-work and delays.
The construction of the foundations poses some of the greatest risks for the project due to subsurface unknowns that are discovered during construction and require design changes. The risk for change orders, environmental and biological rework and delays during construction is minimized when sufficient geotechnical drilling information is provided prior to the design phase and the appropriate foundation types have been selected. Drilled shafts, shallow foundations, or spread footings may be the most appropriate foundation type when adequate space is available and when founded on rock or good competent soil not subjected to high scour or liquefaction. When there is no risk of scour, spread footings can have significant savings for both cost and time for a project, such as viaducts outside the high-water line or in areas of bedrock.
Deep foundations are divided into two major categories: drilled shafts and driven piles. Drilled shafts or cast-in-drilled-hole (CIDH) piles are not appropriate in scourable or liquefiable soil. Large diameter deep single pile elements or footing arrays are most appropriate for reaching deep soil strata or when piles that act as column extensions are required for the structural behavior of the bridge. Drilled shafts can be installed in very dense soils and through rock layers but are inappropriate and often infeasible in loose sands, highly saturated soils, and soft clay layers. When CIDH piles are installed in such unfavorable conditions, the risk for anomalies within the pile element is greatly increased as well as the potential for water quality discharges from the drilling effort or construction machinery in support of the drilling effort. The evaluation and repair of anomalous pile sections can have significant time impacts and add months to the in-water construction schedule. If appropriately chosen, driven pile foundations typically will have the least time impact when deep foundations are required (roughly one-third of the time required by drilled shafts). Driven piles can be easily installed through medium dense and loose sands and through silts and clay layers. Driven piles are typically inappropriate when required to penetrate through rock or fractured rock layers.
Technical Guidance for Assessment of Hydroacoustic Effects of Pile Driving on Fish 1-4
October 2020
The purpose of this technical guidance manual is to provide Caltrans engineers, biologists, and consultants with guidance related to the level of potential impacts from varied project actions and related environmental analysis and permitting of in-water pile driving project actions. Specifically, this manual provides discussions of guidance on the following topics.
• Fundamentals of hydroacoustics.
• Fundamentals of bridge foundations design.
• Hydroacoustic impacts on fish.
• Environmental documentation and permit applications required for pile driving actions.
• Assessment of estimated impacts on fish and their habitat from sound generated from pile driving.
• Attenuation and other measures to avoid and minimize pile driving impacts.
• Methods to assess impacts and compensate for unavoidable pile driving impacts on fish.
The chapters and appendices in this guidance manual are briefly described below.
Chapter 2, Fundamentals of Hydroacoustics, provides key information on the generation, propagation, and measurement of underwater sound from pile driving. Key terminology and metrics used to describe and measure underwater sound are provided, along with a discussion of methods used to attenuate underwater pile driving sound.
Chapter 3, Fundamentals of Hydroacoustic Impacts on Fish, discusses the types of impacts on fish and their habitat that could result from underwater sound pressure generated during pile driving. The chapter also describes how effects might vary depending on the location, species presence, physiological attributes of species, species life history and behavior, timing of activities, and other environmental conditions (e.g., channel morphology, depth of water, and tidal conditions).
Chapter 4, Framework and Process for Environmental Analysis of Pile Driving Impacts on Fish, provides guidance on the preparation of environmental documentation and species consultations and permit applications for projects involving pile driving. The chapter first explains what documentation, permits, or consultations will be required for projects with pile driving, based on the design and location of the project. The primary focus of this chapter is a description of how to comply with ESA and CESA. The chapter discusses applicable laws, avoidance and minimization measures, best management practices (BMPs), performance standards, and impact assessment methodology.
The Glossary provides definitions of key terms used in this manual.
Appendix I, Compendium of Pile Driving Sound Data, provides a summary of measured underwater sound levels for a variety of pile driving situations.
Appendix II, Procedures for Measuring Pile Driving Sound, provides guidance in measurement of underwater pile driving sound.

Technical Guidance for Assessment of Hydroacoustic Effects of Pile Driving on Fish 1-5
October 2020
Appendix III, Tools for Preparing Biological Assessment, provides tools and templates that are commonly used in the preparation of a project biological assessment (BA).
Appendix IV, U.S. Patent for Underwater Energy Dampening Device, is the Caltrans patent for a bubble curtain attenuation system.
A wide variety of pile types and pile driving methods are used on Department projects. Users of this manual should have a basic understanding of the types of piles and installation methods that are used. Rather than providing a detailed description of this information here, the reader is referred to the Department’s Foundation Manual.
The effects of pile driving sound on marine mammals also requires analysis for projects constructed in or near water where they may be present. The National Marine Fisheries Service (NMFS) has developed over-air and underwater thresholds for marine mammals, which are different from the thresholds for fish. However, the methods specified in this manual regarding the estimation of underwater sound pressure may potentially be used to assess the effects of pile driving sound on marine mammals. This guidance document does not specifically address the effects of pile driving sound on marine mammals. More information on this topic can be found at the National Oceanic and Atmospheric Administration (NOAA) Fisheries Southwest Fisheries Science Center website.

This page intentionally left blank.
Technical Guidance for Assessment of Hydroacoustic Effects of Pile Driving on Fish 2-1
October 2020
Chapter 2 Fundamentals of Hydroacoustics
This chapter summarizes information about underwater sound pressure generated by in-water pile driving. “In-water pile driving” is defined as use of an impact hammer in the placement of piles within the ordinary high-water mark or in saturated soils adjacent to the reach. This chapter contains the following main sections.
• Section 2.1, Fundamental Principles of Hydroacoustics.
• Section 2.2, Underwater Sound Pressure Propagation.
• Section 2.3, Measurement of Underwater Sound Pressure.
• Section 2.4, Examples of Underwater Pile Driving Sound Pressure Levels.
• Section 2.5, Common Underwater Sound Attenuation Measures.
This chapter is supplemented by Appendix I, Compendium of Pile Driving Sound Data, which provides an extensive summary of measured underwater sound pressure levels at many project sites, and Appendix II, Procedures for Measuring Pile Driving Sound, which provides guidance on how to measure underwater sound.
2.1 Fundamental Principles of Hydroacoustics
Sound is defined as small disturbances in a fluid from ambient conditions through which energy is transferred away from a source by progressive fluctuations of pressure (or sound waves). Sound waves are produced by vibrating objects. In this discussion, the vibrating object is a pile that has been struck by a pile driver. As the vibrating surface moves, it compresses the molecules in the adjacent medium, creating a high-pressure region. As the object vibrates back to its original position, the molecules in contact with the vibrating surface produce a low-pressure region. These areas are known as “compressions” and “rarefactions,” respectively. In fluids (e.g., gases and liquids), sound waves can only be longitudinal. In solids, sound can exist as either a longitudinal or a transverse wave. The pressure fluctuations are expressed in standard units of pressure (e.g., pounds per square inch [psi], Pascals, and bars).
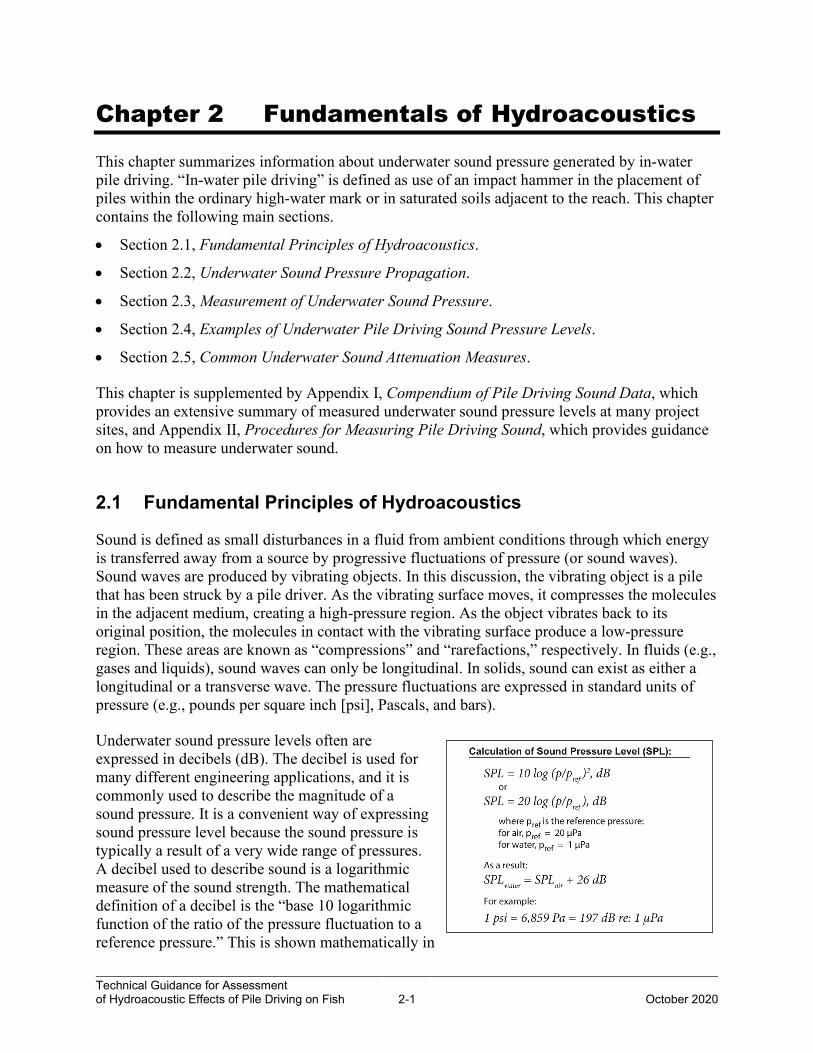
Underwater sound pressure levels often are expressed in decibels (dB). The decibel is used for many different engineering applications, and it is commonly used to describe the magnitude of a sound pressure. It is a convenient way of expressing sound pressure level because the sound pressure is typically a result of a very wide range of pressures. A decibel used to describe sound is a logarithmic measure of the sound strength. The mathematical definition of a decibel is the “base 10 logarithmic function of the ratio of the pressure fluctuation to a reference pressure.” This is shown mathematically in
Technical Guidance for Assessment of Hydroacoustic Effects of Pile Driving on Fish 2-2
October 2020
the Calculation of Sound Pressure Level box. Note that the reference pressure in air is different than the reference pressure in water . It is important to clearly state the reference pressure when expressing sound levels in decibels.
Three metrics are commonly used in evaluating hydroacoustic impacts on fish.
• Peak sound pressure level (LPEAK).
• Root mean square (RMS).
• Sound exposure level (SEL).
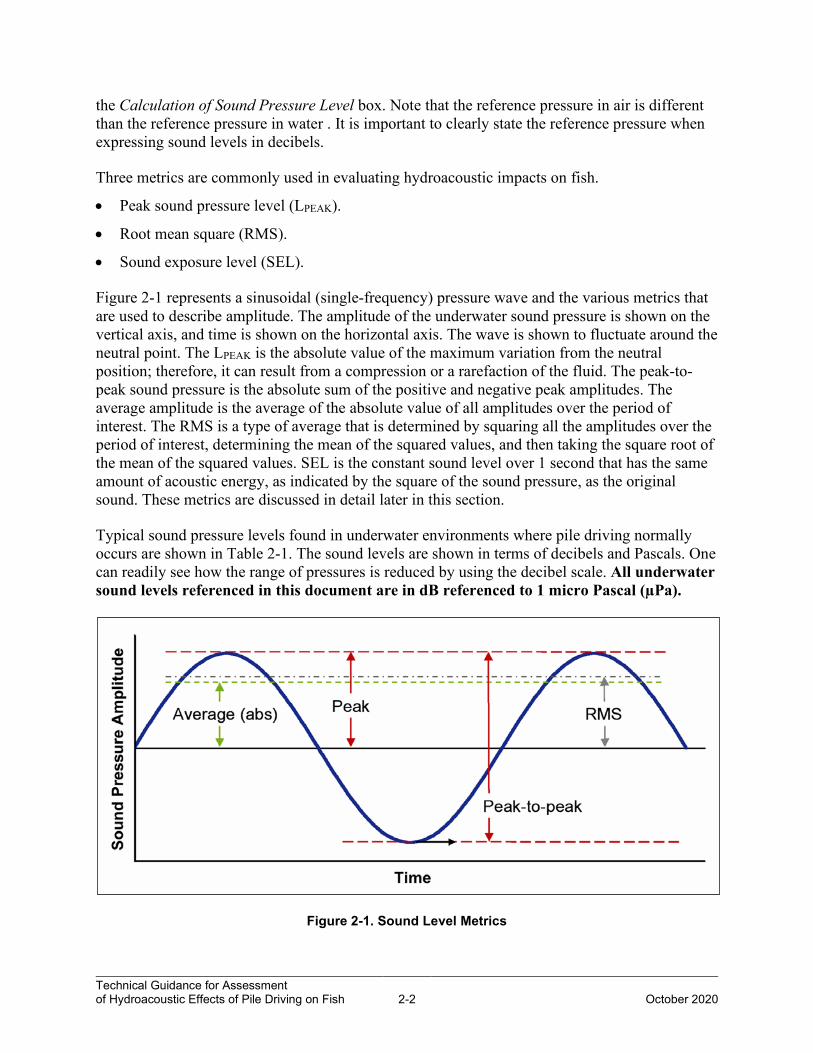
Figure 2-1 represents a sinusoidal (single-frequency) pressure wave and the various metrics that are used to describe amplitude. The amplitude of the underwater sound pressure is shown on the vertical axis, and time is shown on the horizontal axis. The wave is shown to fluctuate around the neutral point. The LPEAK is the absolute value of the maximum variation from the neutral position; therefore, it can result from a compression or a rarefaction of the fluid. The peak-to-peak sound pressure is the absolute sum of the positive and negative peak amplitudes. The average amplitude is the average of the absolute value of all amplitudes over the period of interest. The RMS is a type of average that is determined by squaring all the amplitudes over the period of interest, determining the mean of the squared values, and then taking the square root of the mean of the squared values. SEL is the constant sound level over 1 second that has the same amount of acoustic energy, as indicated by the square of the sound pressure, as the original sound. These metrics are discussed in detail later in this section.
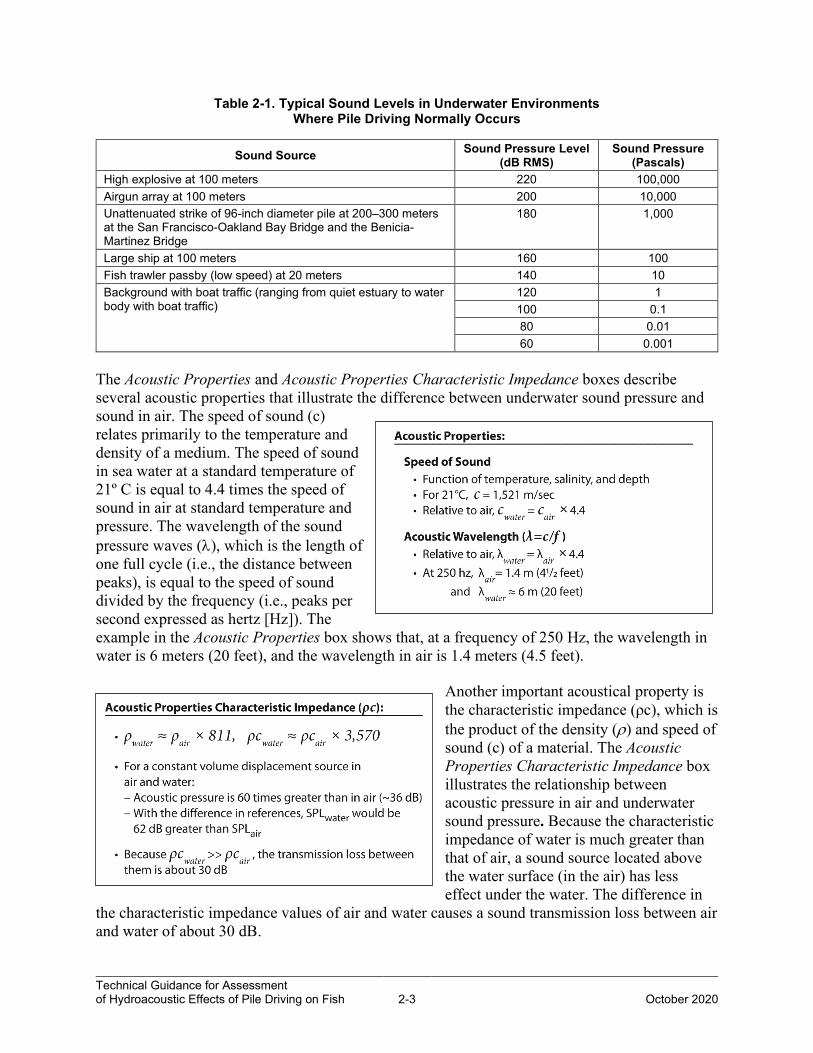
Typical sound pressure levels found in underwater environments where pile driving normally occurs are shown in Table 2-1. The sound levels are shown in terms of decibels and Pascals. One can readily see how the range of pressures is reduced by using the decibel scale. All underwater sound levels referenced in this document are in dB referenced to 1 micro Pascal (µPa).
Figure 2-1. Sound Level Metrics
Technical Guidance for Assessment of Hydroacoustic Effects of Pile Driving on Fish 2-3
October 2020
Table 2-1. Typical Sound Levels in Underwater Environments Where Pile Driving Normally Occurs
Sound Source Sound Pressure Level (dB RMS)
Sound Pressure (Pascals)
High explosive at 100 meters 220 100,000 Airgun array at 100 meters 200 10,000 Unattenuated strike of 96-inch diameter pile at 200–300 meters at the San Francisco-Oakland Bay Bridge and the Benicia-Martinez Bridge
180 1,000
Large ship at 100 meters 160 100 Fish trawler passby (low speed) at 20 meters 140 10 Background with boat traffic (ranging from quiet estuary to water body with boat traffic)
120 1 100 0.1 80 0.01 60 0.001
The Acoustic Properties and Acoustic Properties Characteristic Impedance boxes describe several acoustic properties that illustrate the difference between underwater sound pressure and sound in air. The speed of sound (c) relates primarily to the temperature and density of a medium. The speed of sound in sea water at a standard temperature of 21º C is equal to 4.4 times the speed of sound in air at standard temperature and pressure. The wavelength of the sound pressure waves (λ), which is the length of one full cycle (i.e., the distance between peaks), is equal to the speed of sound divided by the frequency (i.e., peaks per second expressed as hertz [Hz]). The example in the Acoustic Properties box shows that, at a frequency of 250 Hz, the wavelength in water is 6 meters (20 feet), and the wavelength in air is 1.4 meters (4.5 feet).
Another important acoustical property is the characteristic impedance (ρс), which is the product of the density (ρ) and speed of sound (c) of a material. The Acoustic Properties Characteristic Impedance box illustrates the relationship between acoustic pressure in air and underwater sound pressure. Because the characteristic impedance of water is much greater than that of air, a sound source located above the water surface (in the air) has less effect under the water. The difference in
the characteristic impedance values of air and water causes a sound transmission loss between air and water of about 30 dB.
Technical Guidance for Assessment of Hydroacoustic Effects of Pile Driving on Fish 2-4
October 2020
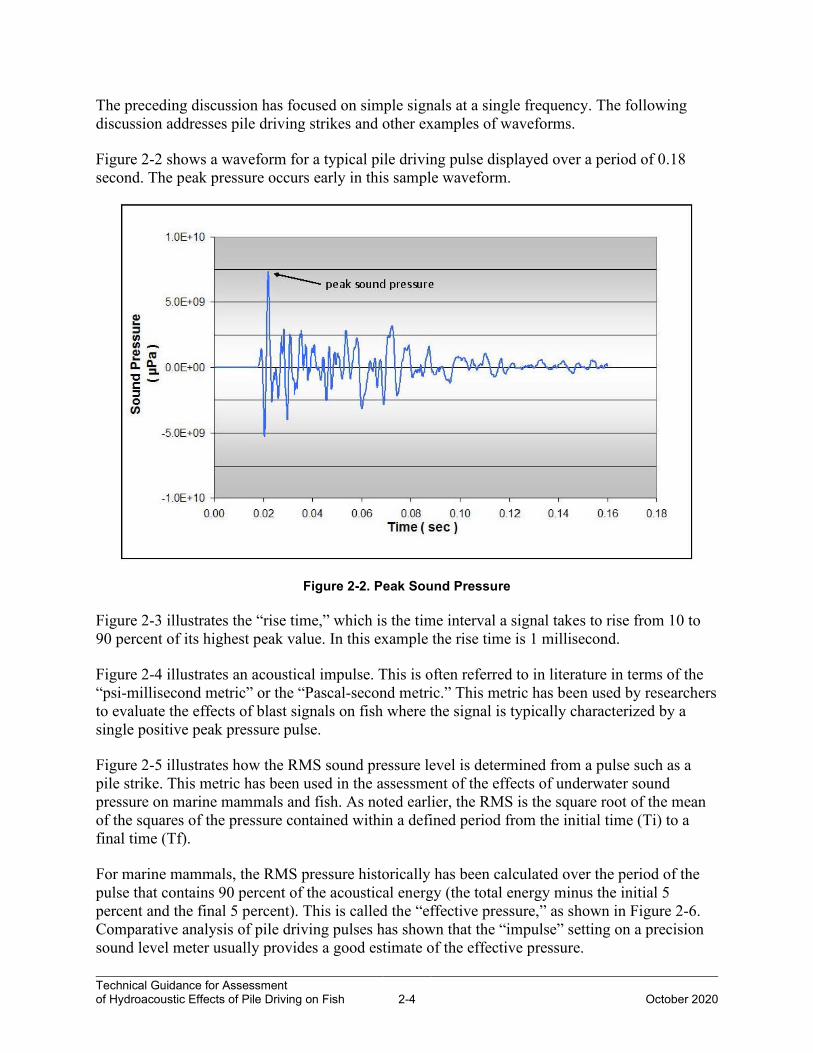
The preceding discussion has focused on simple signals at a single frequency. The following discussion addresses pile driving strikes and other examples of waveforms.
Figure 2-2 shows a waveform for a typical pile driving pulse displayed over a period of 0.18 second. The peak pressure occurs early in this sample waveform.
Figure 2-2. Peak Sound Pressure
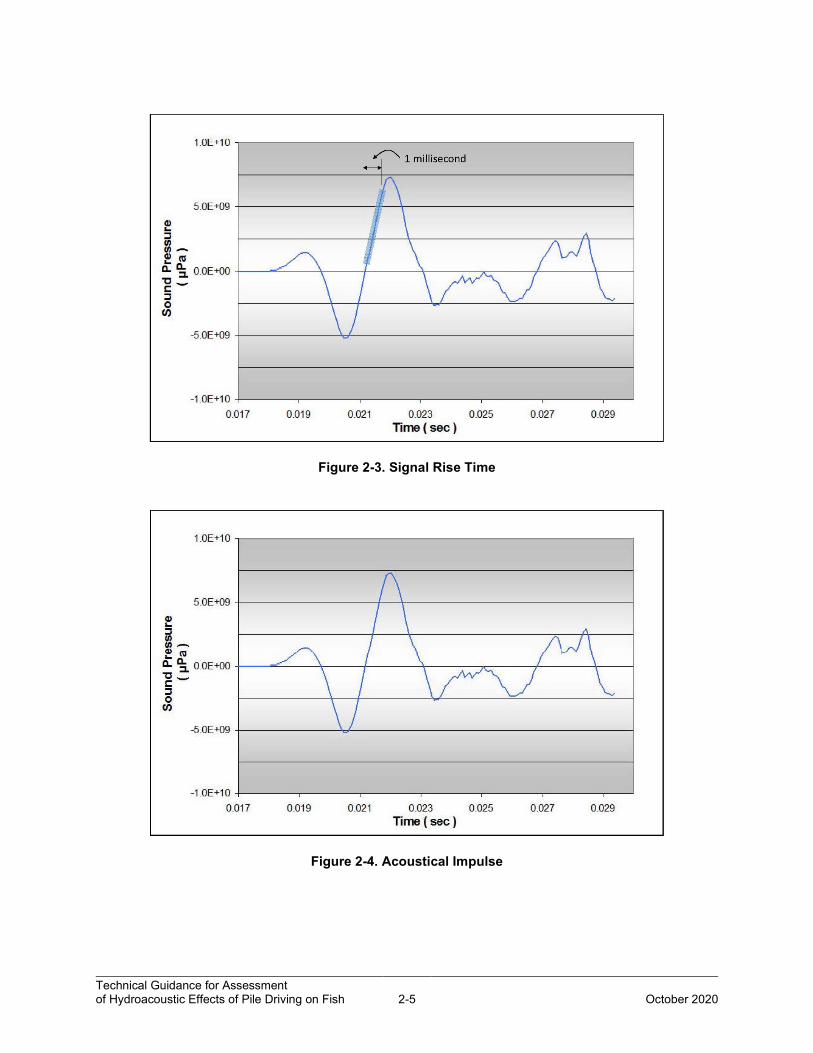
Figure 2-3 illustrates the “rise time,” which is the time interval a signal takes to rise from 10 to 90 percent of its highest peak value. In this example the rise time is 1 millisecond.
Figure 2-4 illustrates an acoustical impulse. This is often referred to in literature in terms of the “psi-millisecond metric” or the “Pascal-second metric.” This metric has been used by researchers to evaluate the effects of blast signals on fish where the signal is typically characterized by a single positive peak pressure pulse.
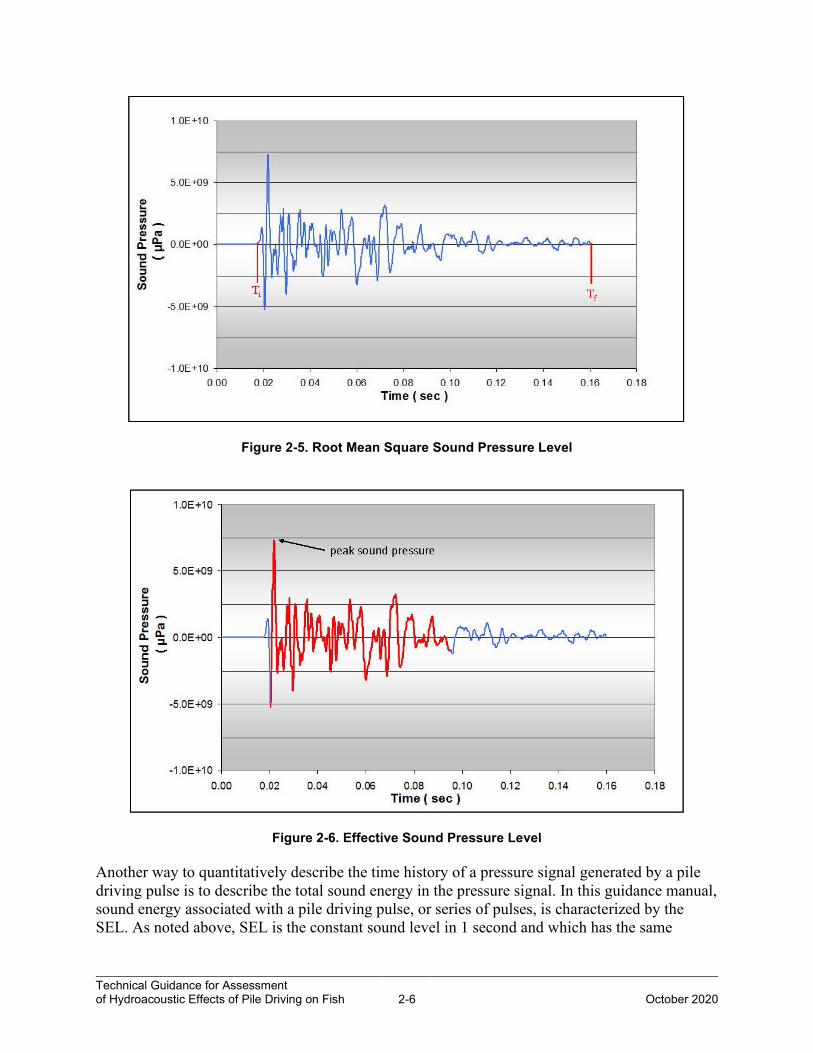
Figure 2-5 illustrates how the RMS sound pressure level is determined from a pulse such as a pile strike. This metric has been used in the assessment of the effects of underwater sound pressure on marine mammals and fish. As noted earlier, the RMS is the square root of the mean of the squares of the pressure contained within a defined period from the initial time (Ti) to a final time (Tf).
For marine mammals, the RMS pressure historically has been calculated over the period of the pulse that contains 90 percent of the acoustical energy (the total energy minus the initial 5 percent and the final 5 percent). This is called the “effective pressure,” as shown in Figure 2-6. Comparative analysis of pile driving pulses has shown that the “impulse” setting on a precision sound level meter usually provides a good estimate of the effective pressure.
Technical Guidance for Assessment of Hydroacoustic Effects of Pile Driving on Fish 2-5
October 2020
Figure 2-3. Signal Rise Time
Figure 2-4. Acoustical Impulse
Technical Guidance for Assessment of Hydroacoustic Effects of Pile Driving on Fish 2-6
October 2020
Figure 2-5. Root Mean Square Sound Pressure Level
Figure 2-6. Effective Sound Pressure Level
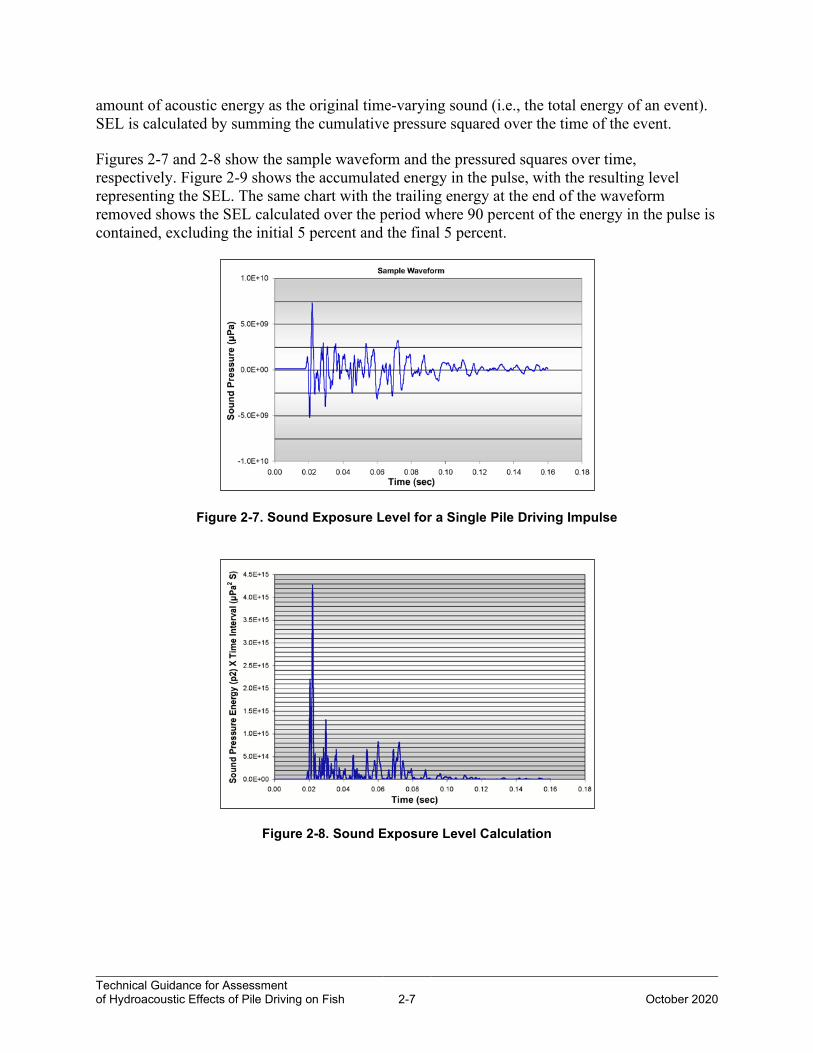
Another way to quantitatively describe the time history of a pressure signal generated by a pile driving pulse is to describe the total sound energy in the pressure signal. In this guidance manual, sound energy associated with a pile driving pulse, or series of pulses, is characterized by the SEL. As noted above, SEL is the constant sound level in 1 second and which has the same
Technical Guidance for Assessment of Hydroacoustic Effects of Pile Driving on Fish 2-7
October 2020
amount of acoustic energy as the original time-varying sound (i.e., the total energy of an event). SEL is calculated by summing the cumulative pressure squared over the time of the event.
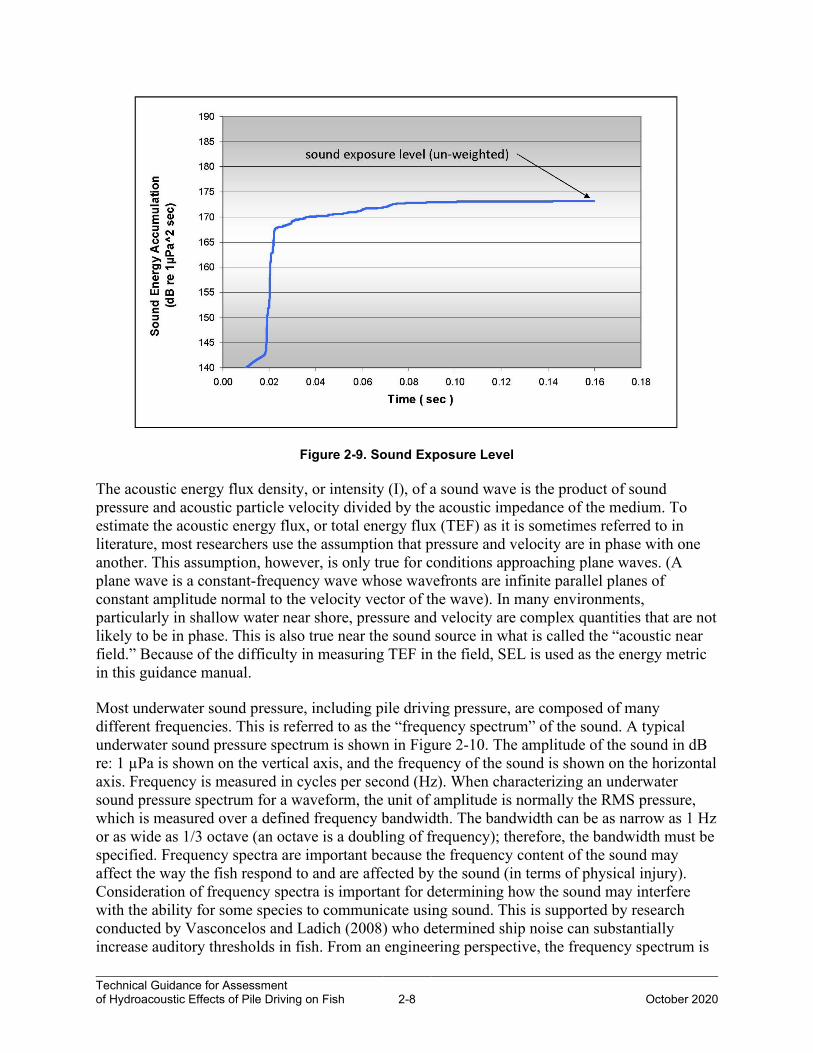
Figures 2-7 and 2-8 show the sample waveform and the pressured squares over time, respectively. Figure 2-9 shows the accumulated energy in the pulse, with the resulting level representing the SEL. The same chart with the trailing energy at the end of the waveform removed shows the SEL calculated over the period where 90 percent of the energy in the pulse is contained, excluding the initial 5 percent and the final 5 percent.
Figure 2-7. Sound Exposure Level for a Single Pile Driving Impulse
Figure 2-8. Sound Exposure Level Calculation
Technical Guidance for Assessment of Hydroacoustic Effects of Pile Driving on Fish 2-8
October 2020
Figure 2-9. Sound Exposure Level
The acoustic energy flux density, or intensity (I), of a sound wave is the product of sound pressure and acoustic particle velocity divided by the acoustic impedance of the medium. To estimate the acoustic energy flux, or total energy flux (TEF) as it is sometimes referred to in literature, most researchers use the assumption that pressure and velocity are in phase with one another. This assumption, however, is only true for conditions approaching plane waves. (A plane wave is a constant-frequency wave whose wavefronts are infinite parallel planes of constant amplitude normal to the velocity vector of the wave). In many environments, particularly in shallow water near shore, pressure and velocity are complex quantities that are not likely to be in phase. This is also true near the sound source in what is called the “acoustic near field.” Because of the difficulty in measuring TEF in the field, SEL is used as the energy metric in this guidance manual.
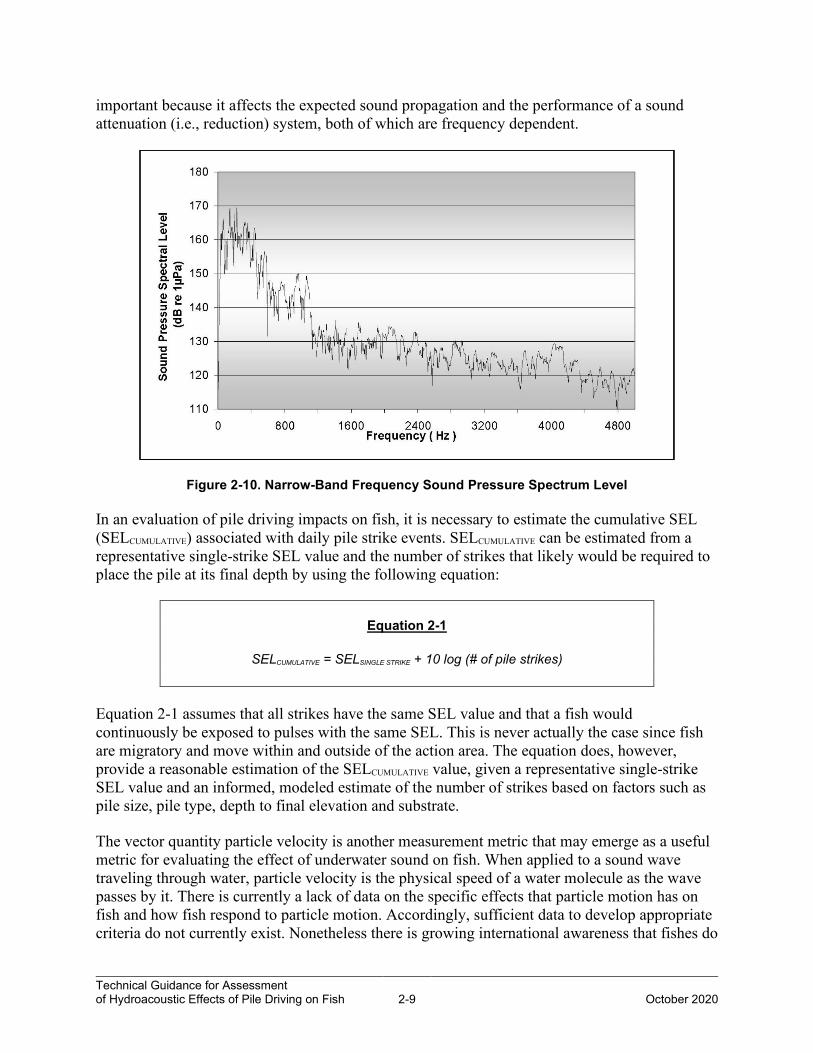
Most underwater sound pressure, including pile driving pressure, are composed of many different frequencies. This is referred to as the “frequency spectrum” of the sound. A typical underwater sound pressure spectrum is shown in Figure 2-10. The amplitude of the sound in dB re: 1 µPa is shown on the vertical axis, and the frequency of the sound is shown on the horizontal axis. Frequency is measured in cycles per second (Hz). When characterizing an underwater sound pressure spectrum for a waveform, the unit of amplitude is normally the RMS pressure, which is measured over a defined frequency bandwidth. The bandwidth can be as narrow as 1 Hz or as wide as 1/3 octave (an octave is a doubling of frequency); therefore, the bandwidth must be specified. Frequency spectra are important because the frequency content of the sound may affect the way the fish respond to and are affected by the sound (in terms of physical injury). Consideration of frequency spectra is important for determining how the sound may interfere with the ability for some species to communicate using sound. This is supported by research conducted by Vasconcelos and Ladich (2008) who determined ship noise can substantially increase auditory thresholds in fish. From an engineering perspective, the frequency spectrum is
Technical Guidance for Assessment of Hydroacoustic Effects of Pile Driving on Fish 2-9
October 2020
important because it affects the expected sound propagation and the performance of a sound attenuation (i.e., reduction) system, both of which are frequency dependent.
Figure 2-10. Narrow-Band Frequency Sound Pressure Spectrum Level
In an evaluation of pile driving impacts on fish, it is necessary to estimate the cumulative SEL (SELCUMULATIVE) associated with daily pile strike events. SELCUMULATIVE can be estimated from a representative single-strike SEL value and the number of strikes that likely would be required to place the pile at its final depth by using the following equation:
Equation 2-1
SELCUMULATIVE = SELSINGLE STRIKE + 10 log (# of pile strikes)
Equation 2-1 assumes that all strikes have the same SEL value and that a fish would continuously be exposed to pulses with the same SEL. This is never actually the case since fish are migratory and move within and outside of the action area. The equation does, however, provide a reasonable estimation of the SELCUMULATIVE value, given a representative single-strike SEL value and an informed, modeled estimate of the number of strikes based on factors such as pile size, pile type, depth to final elevation and substrate.
The vector quantity particle velocity is another measurement metric that may emerge as a useful metric for evaluating the effect of underwater sound on fish. When applied to a sound wave traveling through water, particle velocity is the physical speed of a water molecule as the wave passes by it. There is currently a lack of data on the specific effects that particle motion has on fish and how fish respond to particle motion. Accordingly, sufficient data to develop appropriate criteria do not currently exist. Nonetheless there is growing international awareness that fishes do
Technical Guidance for Assessment of Hydroacoustic Effects of Pile Driving on Fish 2-10
October 2020
possess particle motion receptors and that particle motion must eventually be considered in setting future criteria once data are available (Popper et al. 2019). Although it is clear that particle motion should be used in the future for establishing criteria, the lack of data on how particle motion impacts fishes, as well as the lack of easily used methods to measure particle motion, precludes the consideration of particle motion at this time (Popper et al. 2019).
2.2 Underwater Sound Pressure Propagation
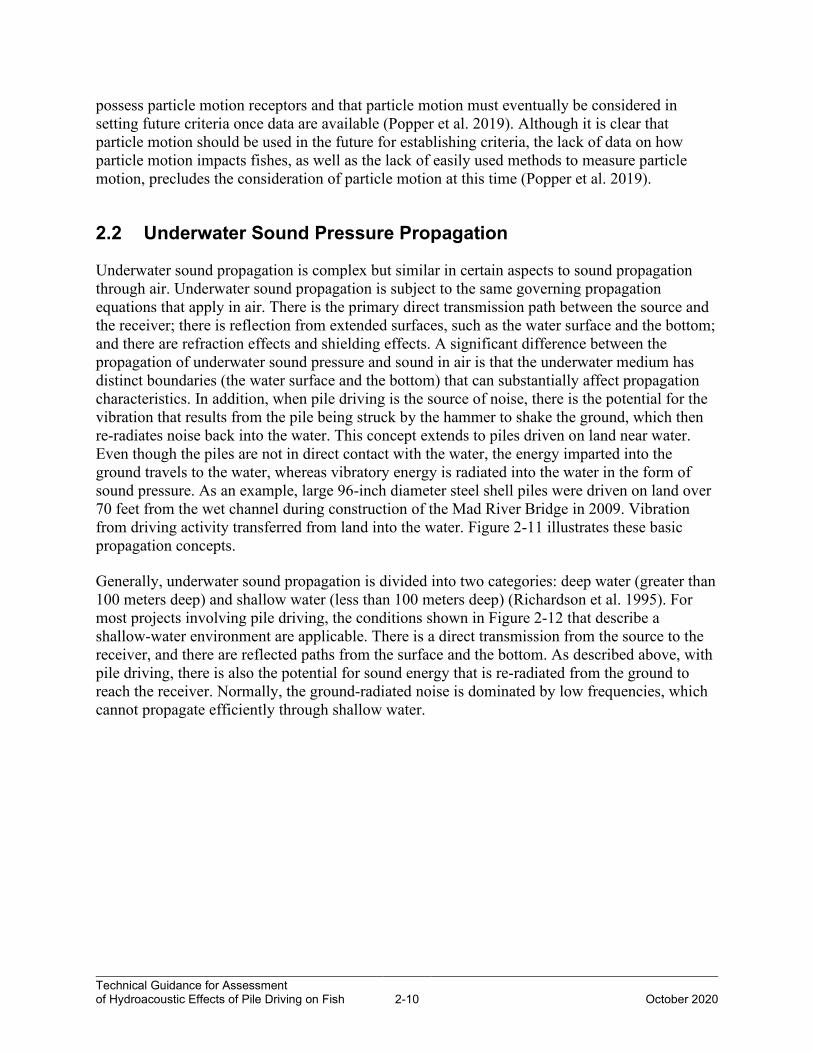
Underwater sound propagation is complex but similar in certain aspects to sound propagation through air. Underwater sound propagation is subject to the same governing propagation equations that apply in air. There is the primary direct transmission path between the source and the receiver; there is reflection from extended surfaces, such as the water surface and the bottom; and there are refraction effects and shielding effects. A significant difference between the propagation of underwater sound pressure and sound in air is that the underwater medium has distinct boundaries (the water surface and the bottom) that can substantially affect propagation characteristics. In addition, when pile driving is the source of noise, there is the potential for the vibration that results from the pile being struck by the hammer to shake the ground, which then re-radiates noise back into the water. This concept extends to piles driven on land near water. Even though the piles are not in direct contact with the water, the energy imparted into the ground travels to the water, whereas vibratory energy is radiated into the water in the form of sound pressure. As an example, large 96-inch diameter steel shell piles were driven on land over 70 feet from the wet channel during construction of the Mad River Bridge in 2009. Vibration from driving activity transferred from land into the water. Figure 2-11 illustrates these basic propagation concepts.
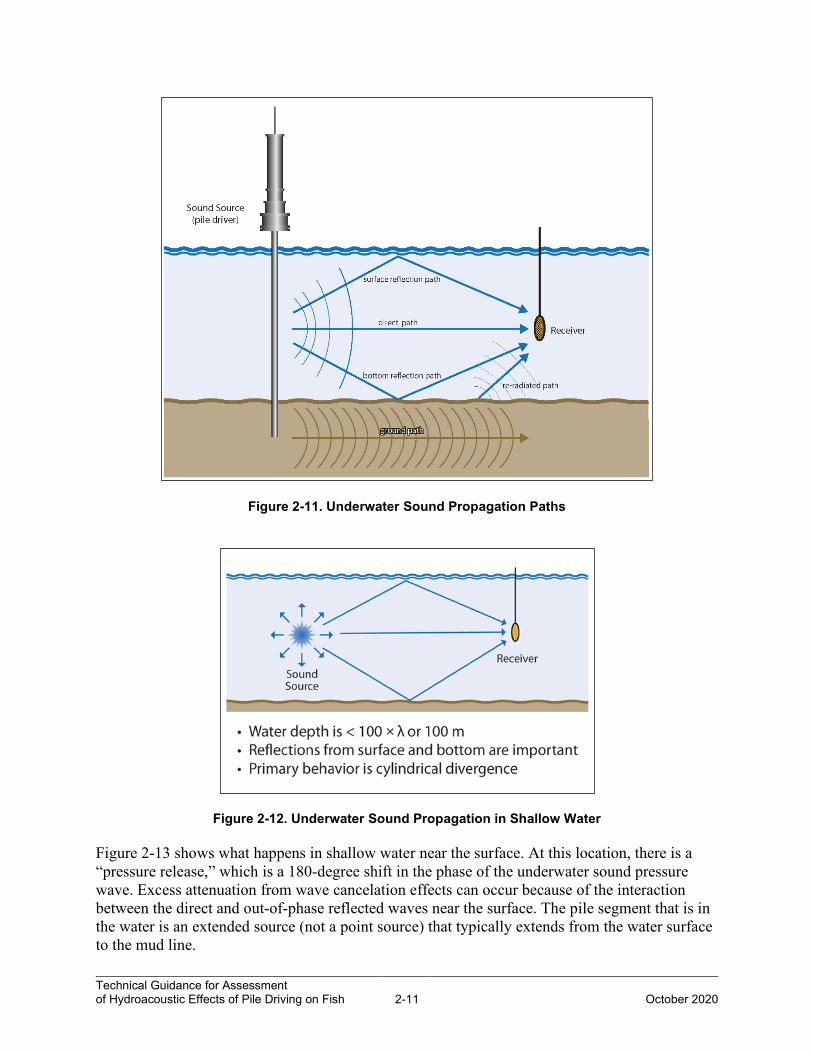
Generally, underwater sound propagation is divided into two categories: deep water (greater than 100 meters deep) and shallow water (less than 100 meters deep) (Richardson et al. 1995). For most projects involving pile driving, the conditions shown in Figure 2-12 that describe a shallow-water environment are applicable. There is a direct transmission from the source to the receiver, and there are reflected paths from the surface and the bottom. As described above, with pile driving, there is also the potential for sound energy that is re-radiated from the ground to reach the receiver. Normally, the ground-radiated noise is dominated by low frequencies, which cannot propagate efficiently through shallow water.
Technical Guidance for Assessment of Hydroacoustic Effects of Pile Driving on Fish 2-11
October 2020
Figure 2-11. Underwater Sound Propagation Paths
Figure 2-12. Underwater Sound Propagation in Shallow Water
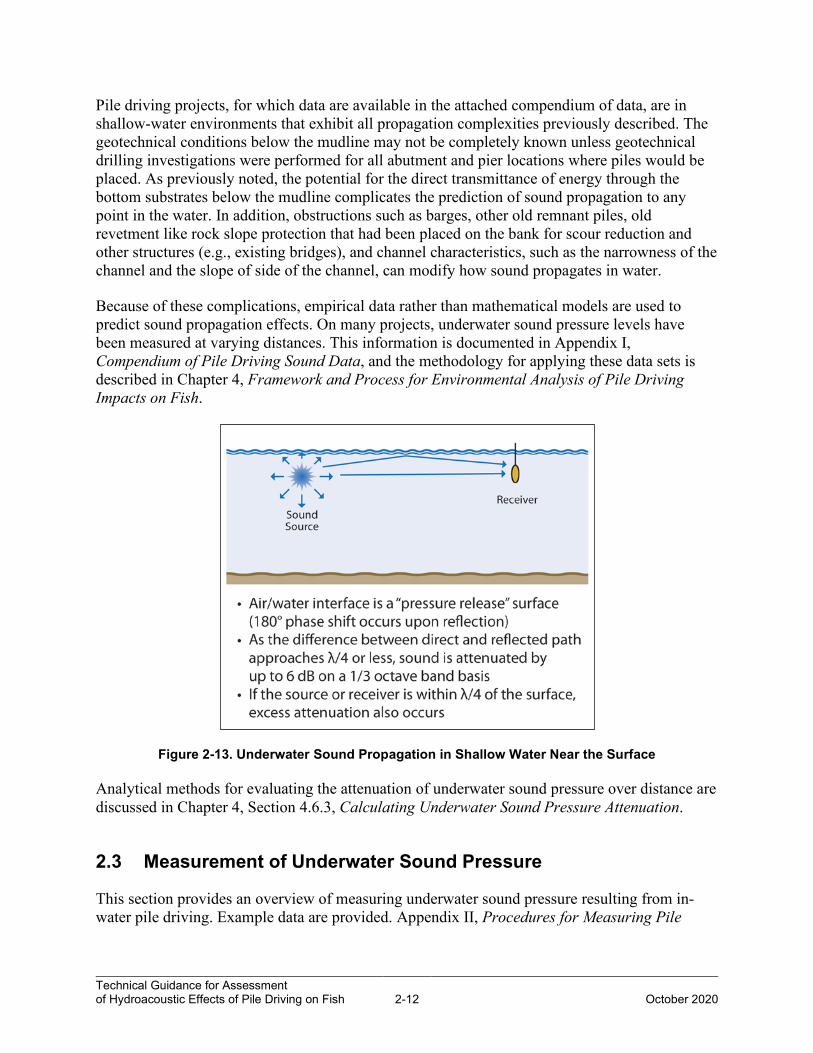
Figure 2-13 shows what happens in shallow water near the surface. At this location, there is a “pressure release,” which is a 180-degree shift in the phase of the underwater sound pressure wave. Excess attenuation from wave cancelation effects can occur because of the interaction between the direct and out-of-phase reflected waves near the surface. The pile segment that is in the water is an extended source (not a point source) that typically extends from the water surface to the mud line.
Technical Guidance for Assessment of Hydroacoustic Effects of Pile Driving on Fish 2-12
October 2020
Pile driving projects, for which data are available in the attached compendium of data, are in shallow-water environments that exhibit all propagation complexities previously described. The geotechnical conditions below the mudline may not be completely known unless geotechnical drilling investigations were performed for all abutment and pier locations where piles would be placed. As previously noted, the potential for the direct transmittance of energy through the bottom substrates below the mudline complicates the prediction of sound propagation to any point in the water. In addition, obstructions such as barges, other old remnant piles, old revetment like rock slope protection that had been placed on the bank for scour reduction and other structures (e.g., existing bridges), and channel characteristics, such as the narrowness of the channel and the slope of side of the channel, can modify how sound propagates in water.
Because of these complications, empirical data rather than mathematical models are used to predict sound propagation effects. On many projects, underwater sound pressure levels have been measured at varying distances. This information is documented in Appendix I, Compendium of Pile Driving Sound Data, and the methodology for applying these data sets is described in Chapter 4, Framework and Process for Environmental Analysis of Pile Driving Impacts on Fish.
Figure 2-13. Underwater Sound Propagation in Shallow Water Near the Surface
Analytical methods for evaluating the attenuation of underwater sound pressure over distance are discussed in Chapter 4, Section 4.6.3, Calculating Underwater Sound Pressure Attenuation.
2.3 Measurement of Underwater Sound Pressure
This section provides an overview of measuring underwater sound pressure resulting from in-water pile driving. Example data are provided. Appendix II, Procedures for Measuring Pile
Technical Guidance for Assessment of Hydroacoustic Effects of Pile Driving on Fish 2-13
October 2020
Driving Sound, provides a detailed procedure for conducting measurements of underwater sound pressure generated during pile driving events.
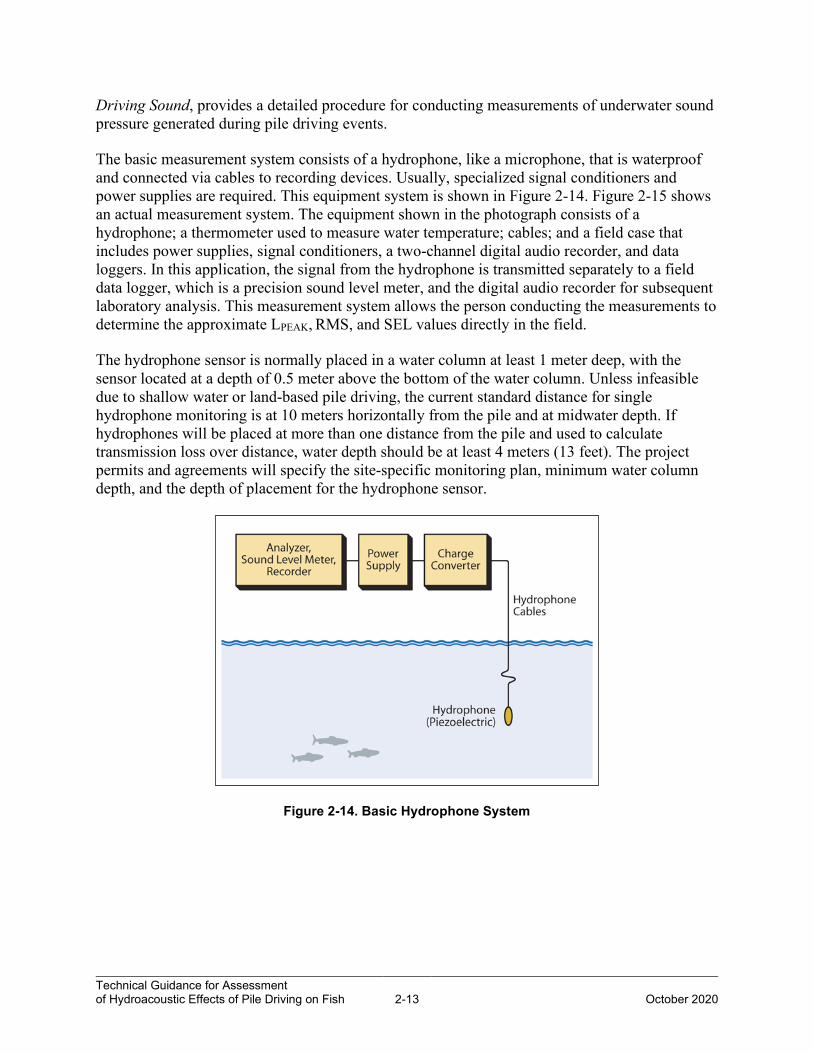
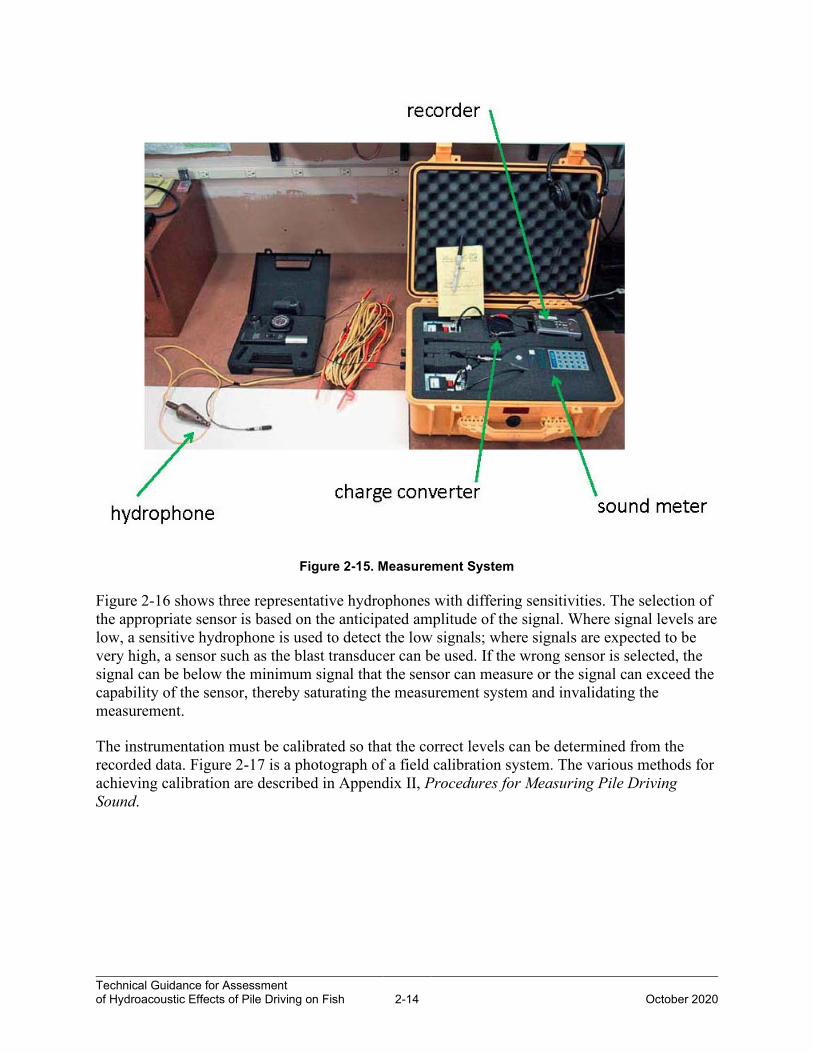
The basic measurement system consists of a hydrophone, like a microphone, that is waterproof and connected via cables to recording devices. Usually, specialized signal conditioners and power supplies are required. This equipment system is shown in Figure 2-14. Figure 2-15 shows an actual measurement system. The equipment shown in the photograph consists of a hydrophone; a thermometer used to measure water temperature; cables; and a field case that includes power supplies, signal conditioners, a two-channel digital audio recorder, and data loggers. In this application, the signal from the hydrophone is transmitted separately to a field data logger, which is a precision sound level meter, and the digital audio recorder for subsequent laboratory analysis. This measurement system allows the person conducting the measurements to determine the approximate LPEAK, RMS, and SEL values directly in the field.
The hydrophone sensor is normally placed in a water column at least 1 meter deep, with the sensor located at a depth of 0.5 meter above the bottom of the water column. Unless infeasible due to shallow water or land-based pile driving, the current standard distance for single hydrophone monitoring is at 10 meters horizontally from the pile and at midwater depth. If hydrophones will be placed at more than one distance from the pile and used to calculate transmission loss over distance, water depth should be at least 4 meters (13 feet). The project permits and agreements will specify the site-specific monitoring plan, minimum water column depth, and the depth of placement for the hydrophone sensor.
Figure 2-14. Basic Hydrophone System
Technical Guidance for Assessment of Hydroacoustic Effects of Pile Driving on Fish 2-14
October 2020
Figure 2-15. Measurement System
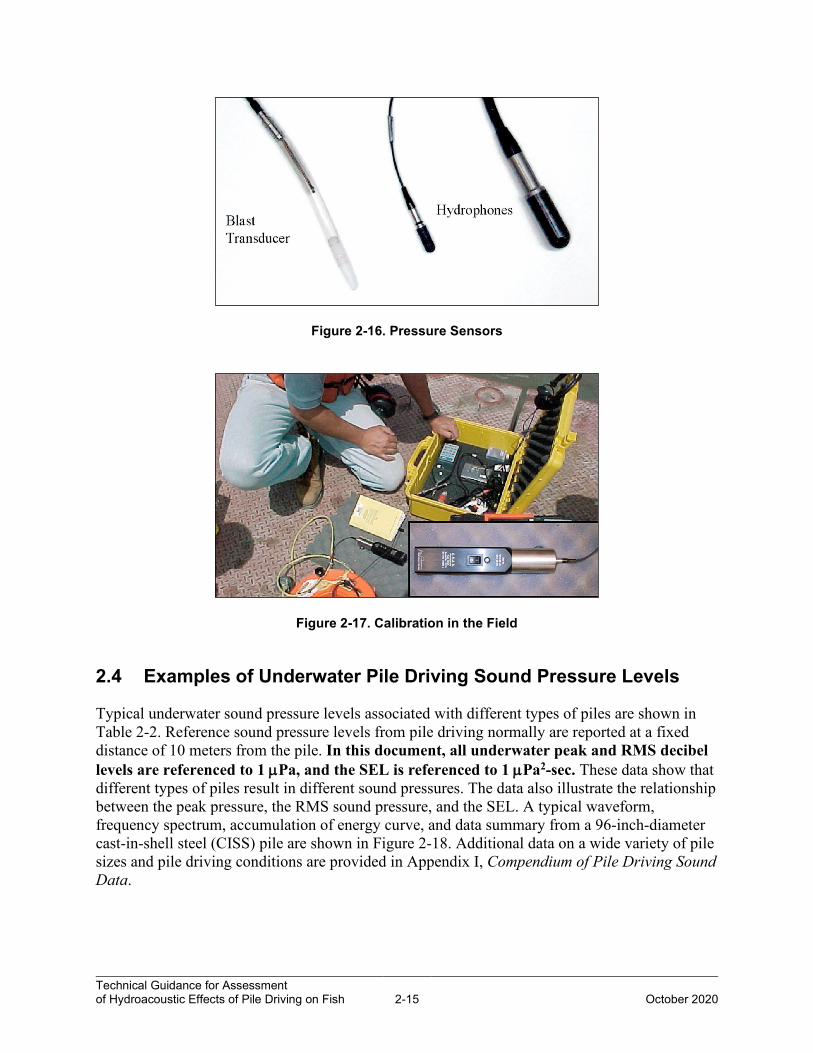
Figure 2-16 shows three representative hydrophones with differing sensitivities. The selection of the appropriate sensor is based on the anticipated amplitude of the signal. Where signal levels are low, a sensitive hydrophone is used to detect the low signals; where signals are expected to be very high, a sensor such as the blast transducer can be used. If the wrong sensor is selected, the signal can be below the minimum signal that the sensor can measure or the signal can exceed the capability of the sensor, thereby saturating the measurement system and invalidating the measurement.
The instrumentation must be calibrated so that the correct levels can be determined from the recorded data. Figure 2-17 is a photograph of a field calibration system. The various methods for achieving calibration are described in Appendix II, Procedures for Measuring Pile Driving Sound.
Technical Guidance for Assessment of Hydroacoustic Effects of Pile Driving on Fish 2-15
October 2020
Figure 2-16. Pressure Sensors
Figure 2-17. Calibration in the Field
2.4 Examples of Underwater Pile Driving Sound Pressure Levels
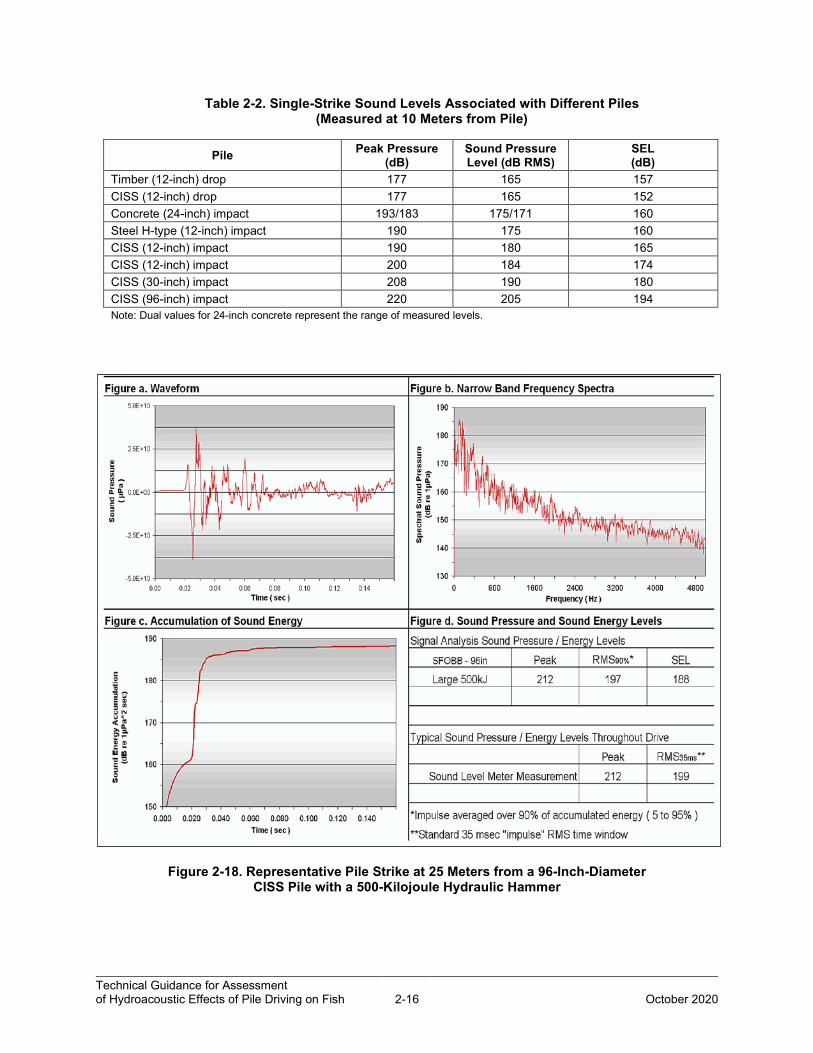
Typical underwater sound pressure levels associated with different types of piles are shown in Table 2-2. Reference sound pressure levels from pile driving normally are reported at a fixed distance of 10 meters from the pile. In this document, all underwater peak and RMS decibel levels are referenced to 1 µPa, and the SEL is referenced to 1 µPa2-sec. These data show that different types of piles result in different sound pressures. The data also illustrate the relationship between the peak pressure, the RMS sound pressure, and the SEL. A typical waveform, frequency spectrum, accumulation of energy curve, and data summary from a 96-inch-diameter cast-in-shell steel (CISS) pile are shown in Figure 2-18. Additional data on a wide variety of pile sizes and pile driving conditions are provided in Appendix I, Compendium of Pile Driving Sound Data.
Technical Guidance for Assessment of Hydroacoustic Effects of Pile Driving on Fish 2-16
October 2020
Table 2-2. Single-Strike Sound Levels Associated with Different Piles (Measured at 10 Meters from Pile)
Pile Peak Pressure (dB)
Sound Pressure Level (dB RMS)
SEL (dB)
Timber (12-inch) drop 177 165 157 CISS (12-inch) drop 177 165 152 Concrete (24-inch) impact 193/183 175/171 160 Steel H-type (12-inch) impact 190 175 160 CISS (12-inch) impact 190 180 165 CISS (12-inch) impact 200 184 174 CISS (30-inch) impact 208 190 180 CISS (96-inch) impact 220 205 194 Note: Dual values for 24-inch concrete represent the range of measured levels.
Figure 2-18. Representative Pile Strike at 25 Meters from a 96-Inch-Diameter CISS Pile with a 500-Kilojoule Hydraulic Hammer
Technical Guidance for Assessment of Hydroacoustic Effects of Pile Driving on Fish 2-17
October 2020
As discussed in Section 2.1, Fundamental Principles of Hydroacoustics, it may be necessary to estimate SELCUMULATIVE for a given pile driving scenario. Such an estimate requires an estimate of the representative single-strike SEL at a fixed distance from the pile and an estimate of the number of pile strikes needed to place the pile at its final elevation. The number of strikes needed to install a pile depends on many factors, such as the size and type of the pile, the type of substrate, and the size of the hammer. It may also be necessary to estimate the total number of strikes that may occur in a day if multiple piles are driven in the same location on the same day.
2.5 Common Underwater Sound Attenuation Measures
For any pile driving activity that has the potential to result in an underwater LPEAK that exceeds 206 dB, avoidance and minimization measures must be included because both CESA and FESA require Caltrans to avoid and minimize impacts to listed species when it is reasonable and feasible. The 206 dB peak threshold is discussed in detail in Chapter 4, Framework and Process for Environmental Analysis of Pile Driving Impacts on Fish. There are various avoidance and minimization methods and devices, described herein as attenuation measures, that have been developed for deployment with the objective of reducing underwater sound pressure. These methods and devices reduce, avoid, or significantly reduce transmission of underwater sound pressure that would otherwise propagate into the water during pile driving activities.
The most effective option for avoiding and minimizing underwater sound pressure during construction of deep-water foundations for new bridge construction is designing the new foundations to span the wet channel. This allows for construction methods to take place on dry land adjacent to the wet channel during the low-flow season. For work on small bridge foundations, it is typically feasible and reasonable to design the new bridge to span the wet channel. During low flow the piles would be driven on land, which would significantly reduce the amount of underwater sound energy that could transmit as either a pressure wave into the water column or as vibration from the ground into adjacent waters. In most instances where pile foundations are driven on land, the resultant vibration and transmission of underwater sound energy will not result in sound pressure that exceeds impact thresholds and will greatly reduce the amount of accumulated underwater sound pressure. For projects that occur on larger rivers, bays, and estuaries or projects involving retrofit work on existing foundations, land-based driving may not be an option. However, where it is feasible, land-based pile driving is an excellent approach to avoid and minimize impacts on the environment and greatly reduces the potential for additional mitigation under the CESA that might result from driving within the wet channel. The further away the pile is from the wet channel during construction, the more attenuation would be achieved through transmission loss as the energy from the pile moves through the land toward the wet channel. Although designing a longer bridge span to avoid placing piles in the water may prove more expensive, such a design also reduces off-site mitigation requirements and associated costs often associated with impacts to listed species that may occur when driving in the wet channel.
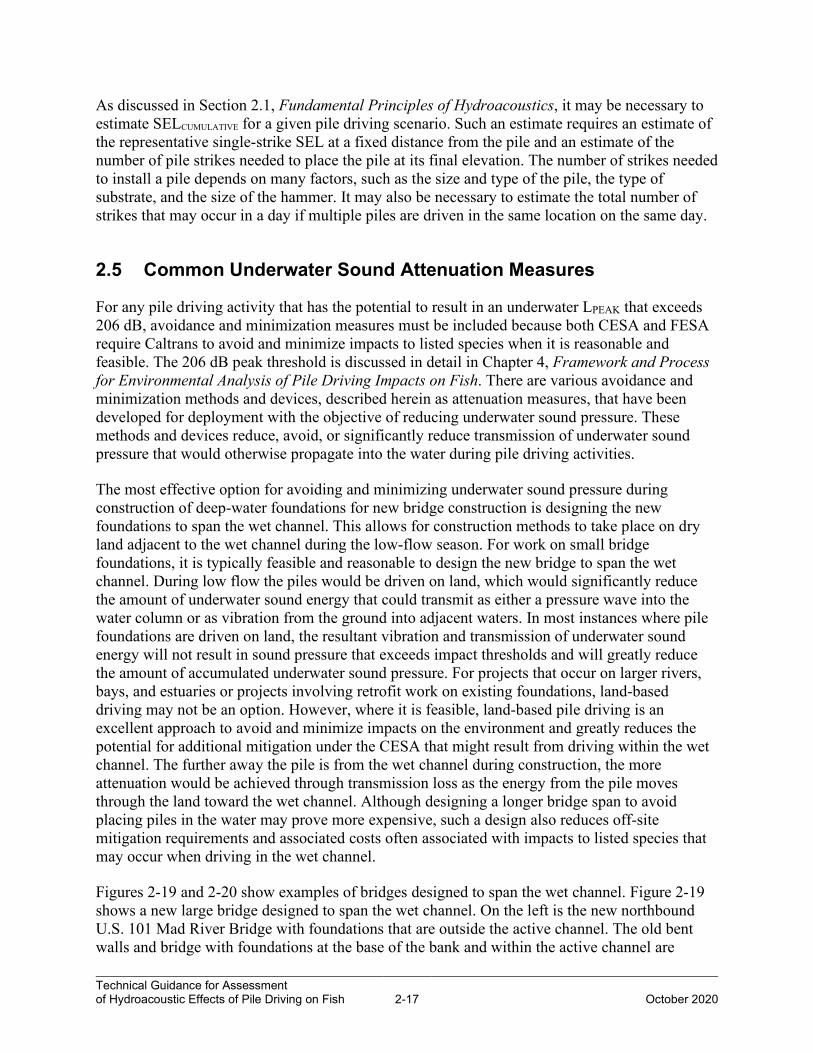
Figures 2-19 and 2-20 show examples of bridges designed to span the wet channel. Figure 2-19 shows a new large bridge designed to span the wet channel. On the left is the new northbound U.S. 101 Mad River Bridge with foundations that are outside the active channel. The old bent walls and bridge with foundations at the base of the bank and within the active channel are
Technical Guidance for Assessment of Hydroacoustic Effects of Pile Driving on Fish 2-18
October 2020
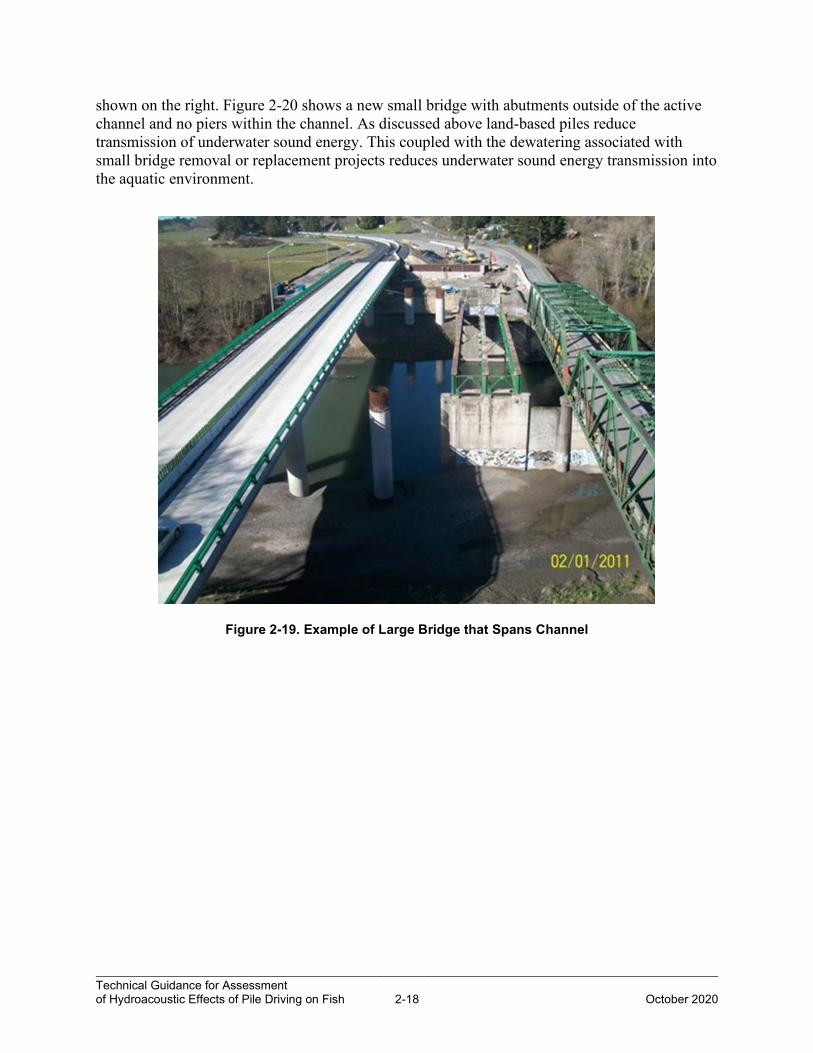
shown on the right. Figure 2-20 shows a new small bridge with abutments outside of the active channel and no piers within the channel. As discussed above land-based piles reduce transmission of underwater sound energy. This coupled with the dewatering associated with small bridge removal or replacement projects reduces underwater sound energy transmission into the aquatic environment.
Figure 2-19. Example of Large Bridge that Spans Channel
Technical Guidance for Assessment of Hydroacoustic Effects of Pile Driving on Fish 2-19
October 2020
Figure 2-20. Example of Small Bridge that Spans Channel
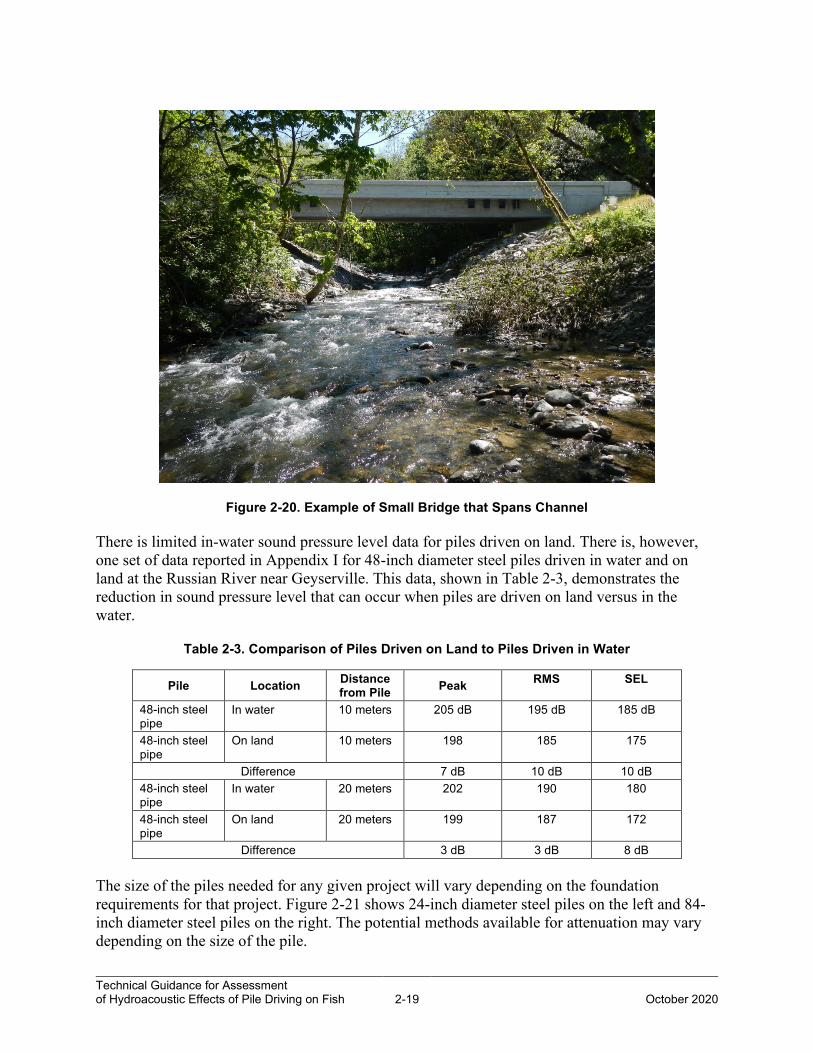
There is limited in-water sound pressure level data for piles driven on land. There is, however, one set of data reported in Appendix I for 48-inch diameter steel piles driven in water and on land at the Russian River near Geyserville. This data, shown in Table 2-3, demonstrates the reduction in sound pressure level that can occur when piles are driven on land versus in the water.
Table 2-3. Comparison of Piles Driven on Land to Piles Driven in Water
Pile Location Distance from Pile Peak RMS SEL
48-inch steel pipe
In water 10 meters 205 dB 195 dB 185 dB
48-inch steel pipe
On land 10 meters 198 185 175
Difference 7 dB 10 dB 10 dB 48-inch steel pipe
In water 20 meters 202 190 180
48-inch steel pipe
On land 20 meters 199 187 172
Difference 3 dB 3 dB 8 dB
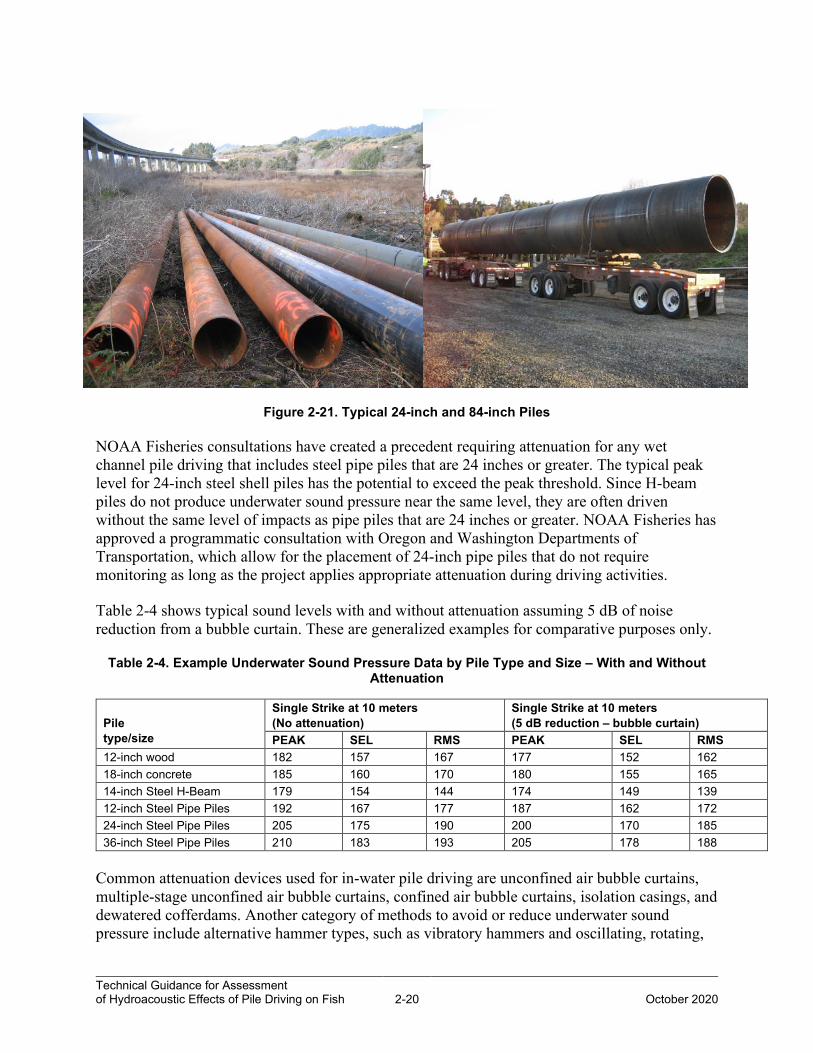
The size of the piles needed for any given project will vary depending on the foundation requirements for that project. Figure 2-21 shows 24-inch diameter steel piles on the left and 84-inch diameter steel piles on the right. The potential methods available for attenuation may vary depending on the size of the pile.
Technical Guidance for Assessment of Hydroacoustic Effects of Pile Driving on Fish 2-20
October 2020
Figure 2-21. Typical 24-inch and 84-inch Piles
NOAA Fisheries consultations have created a precedent requiring attenuation for any wet channel pile driving that includes steel pipe piles that are 24 inches or greater. The typical peak level for 24-inch steel shell piles has the potential to exceed the peak threshold. Since H-beam piles do not produce underwater sound pressure near the same level, they are often driven without the same level of impacts as pipe piles that are 24 inches or greater. NOAA Fisheries has approved a programmatic consultation with Oregon and Washington Departments of Transportation, which allow for the placement of 24-inch pipe piles that do not require monitoring as long as the project applies appropriate attenuation during driving activities.
Table 2-4 shows typical sound levels with and without attenuation assuming 5 dB of noise reduction from a bubble curtain. These are generalized examples for comparative purposes only.
Table 2-4. Example Underwater Sound Pressure Data by Pile Type and Size – With and Without Attenuation
Pile type/size
Single Strike at 10 meters (No attenuation)
Single Strike at 10 meters (5 dB reduction – bubble curtain)
PEAK SEL RMS PEAK SEL RMS 12-inch wood 182 157 167 177 152 162 18-inch concrete 185 160 170 180 155 165 14-inch Steel H-Beam 179 154 144 174 149 139 12-inch Steel Pipe Piles 192 167 177 187 162 172 24-inch Steel Pipe Piles 205 175 190 200 170 185 36-inch Steel Pipe Piles 210 183 193 205 178 188
Common attenuation devices used for in-water pile driving are unconfined air bubble curtains, multiple-stage unconfined air bubble curtains, confined air bubble curtains, isolation casings, and dewatered cofferdams. Another category of methods to avoid or reduce underwater sound pressure include alternative hammer types, such as vibratory hammers and oscillating, rotating,
Technical Guidance for Assessment of Hydroacoustic Effects of Pile Driving on Fish 2-21
October 2020
or press-in systems. These methods and their respective feasibility and effectiveness are described in the following discussion.
Information is currently available on the general effectiveness of various air bubble curtain systems and dewatered cofferdams in attenuating underwater sound. These data area discussed below and in Chapter 4, Framework and Process for Environmental Analysis of Pile Driving Impacts on Fish.
Vibratory hammers produce less peak sound pressure than impact hammers and are often employed as an avoidance and minimization measure in the initial placement of the pile by reducing the overall number of strikes necessary to drive the pile to the final elevation. There are no established injury criteria for vibratory pile driving, and resource agencies agree that vibratory pile driving results in reduced adverse effects on fish as compared to impulse pile driving. Sound data from vibration pile driving is provided in Appendix I.
As more measurement data become available for other pile installation methods, the data will be added to this document and the compendium of underwater sound data presented in Appendix I.
2.5.1 Bubble Curtains
The underlying mechanism of bubble curtains is changing the local impedance in the area where the bubbles are introduced. This change in impedance can have two effects.
• To act as a barrier for the sound to pass through once the sound is radiated from the pile.
• To reduce the radiation of sound from the pile into the water by having the low-density bubbles very close to the pile.
The first effect is assessed by modeling the attenuation as a simple underwater sound pressure transmission problem through multiple media (i.e., transmission from water, through a water/air mix, and back to water). For the water/air mix, consider the local density as a function of the percentage of air, or bubbles. The two parameters are then the bubble percentage and the thickness of the bubble curtain. Basically, attenuation increases with more bubbles and, to a point, a thicker bubble curtain.
For the second effect (changing the radiation from the pile), the sound energy radiated by the pile is directly proportional to the characteristic impedance of the media it is radiating into. The impedance for water is almost 4,000 times greater than for air. This means, in the extreme, that the potential exists for reductions up to 36 dB as the impedance of air is approached. But other factors would affect this result. An assessment of the actual potential effect must consider the effects of the different densities of water and air on the vibration of the pile, and the change in radiation efficiency in water due to the change in coincidence frequency in water.
Air bubble curtains can be confined or unconfined. In a confined system, the bubbles are confined to the area around the pile with a flexible material (plastic or cloth) or a rigid pipe. The material of the confining casing does not affect the overall sound reduction provided by the system (i.e., steel or cloth would work equally as well). Confined systems are most often used
Technical Guidance for Assessment of Hydroacoustic Effects of Pile Driving on Fish 2-22
October 2020
when there is potential for high water-current velocities to sweep the bubbles away from the pile and reduce the effectiveness of the bubbles. A confined system can also utilize a flexible sleeve or another larger pile to confine the bubbles to the immediate area around the pile.
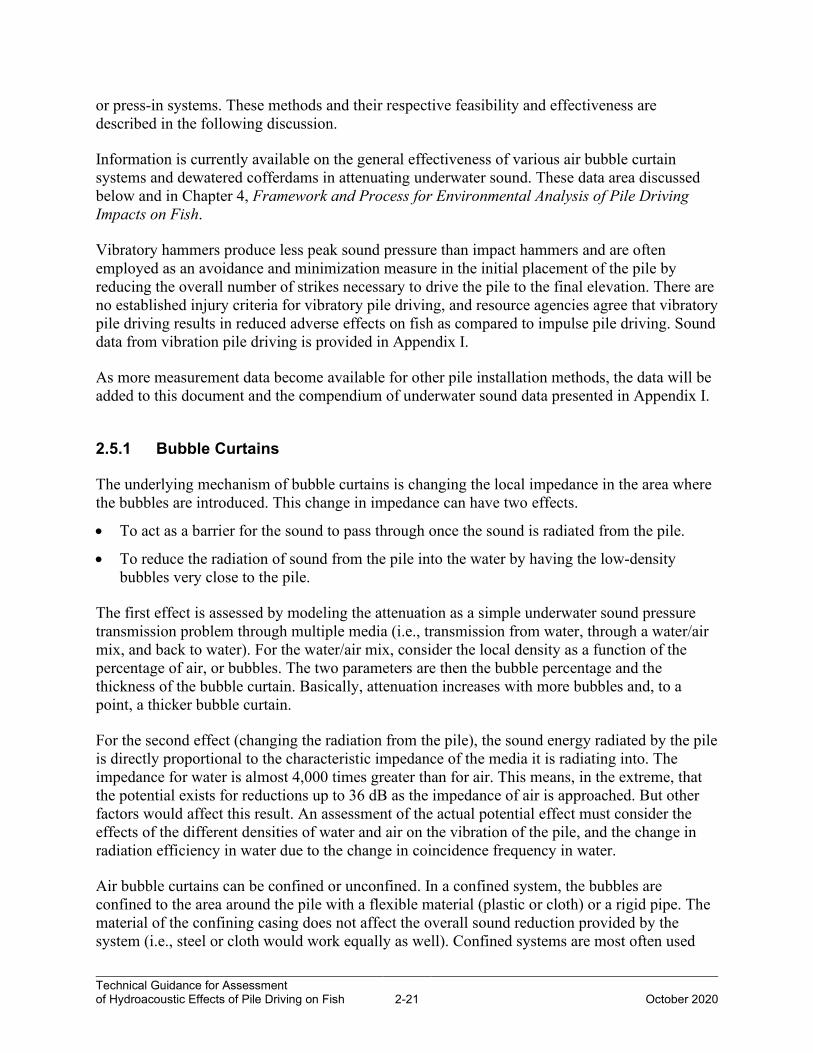
Unconfined systems have no such system for restraining the bubbles. The first known unconfined air bubble curtain system in California was used on the San Francisco-Oakland Bay Bridge Pile Installation Demonstration Project, shown in Figure 2-22. Because the diameter of the air bubble curtain system was large with respect to the pile, the bubble screen that this system generated was not immediately adjacent to the pile. This type of bubble screen has the disadvantage of allowing the sound pulse to propagate into the water. The bubble screen was also affected by the currents, which swept the bubbles away from the pile. This substantially reduced the effectiveness of the bubble curtain, which resulted in minimal measured attenuation of 0 to 2 dB. In a low current situation, a bubble curtain such as this has achieved 5 to 10 dB of noise reduction.
Figure 2-22. Unconfined Air Bubble Curtain Systems
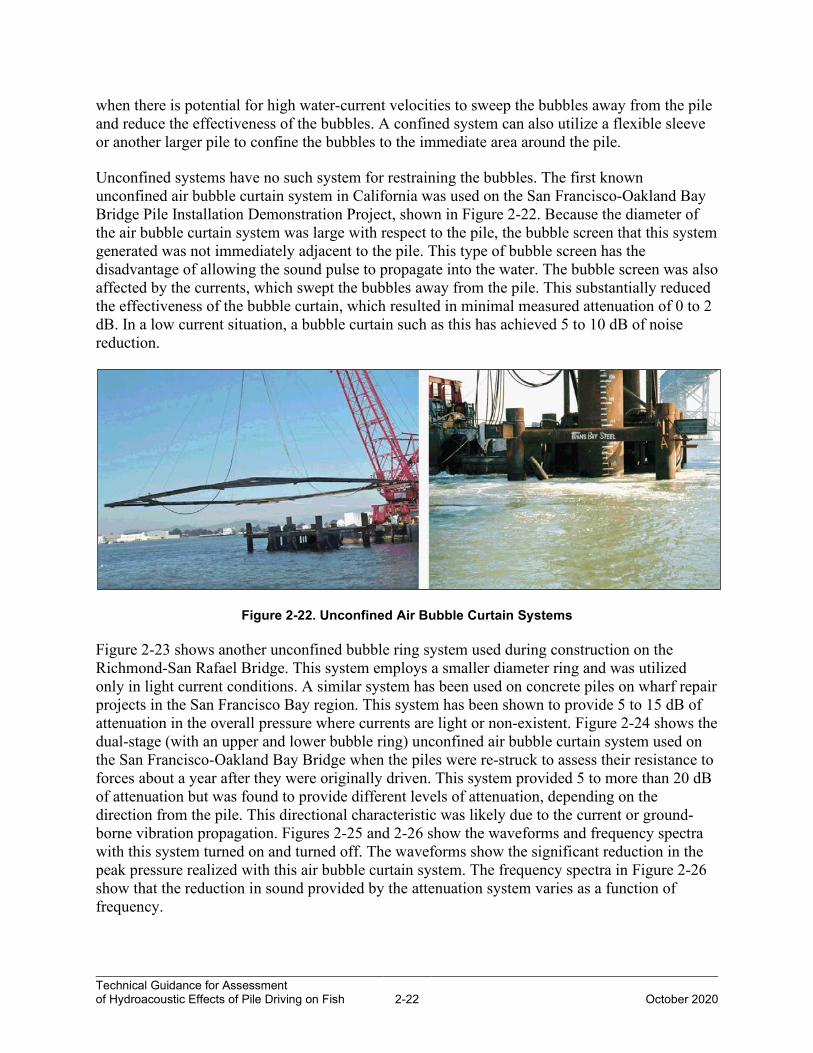
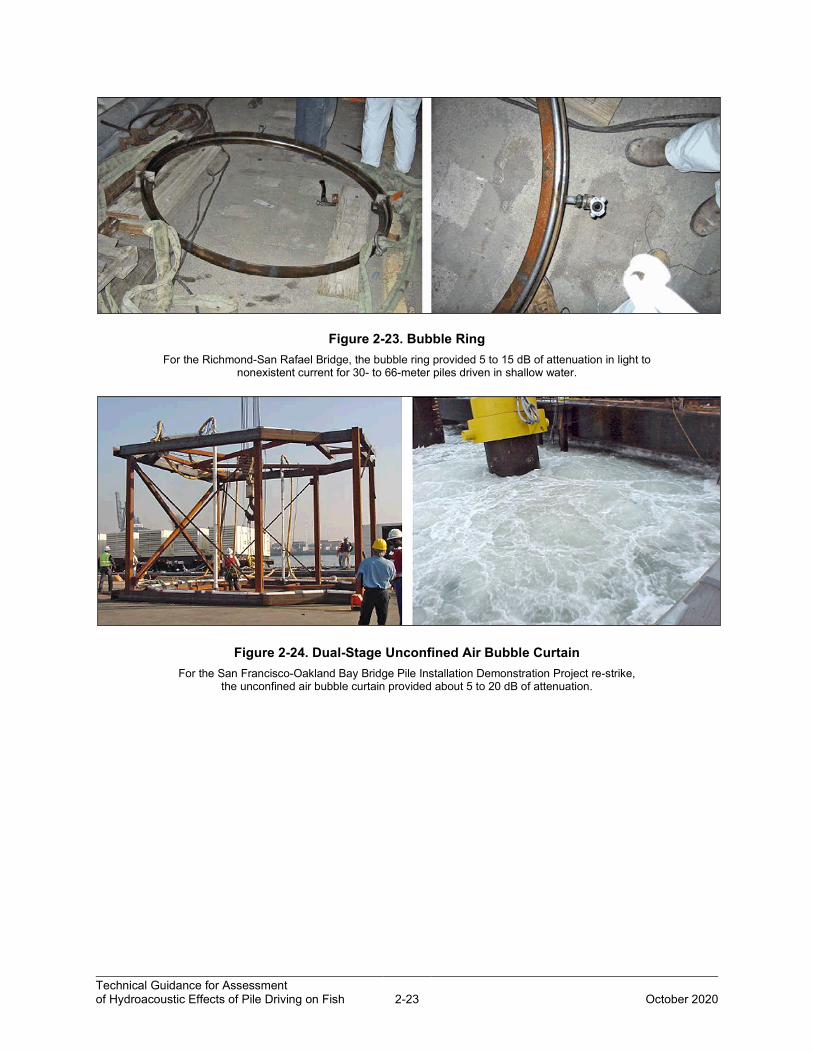
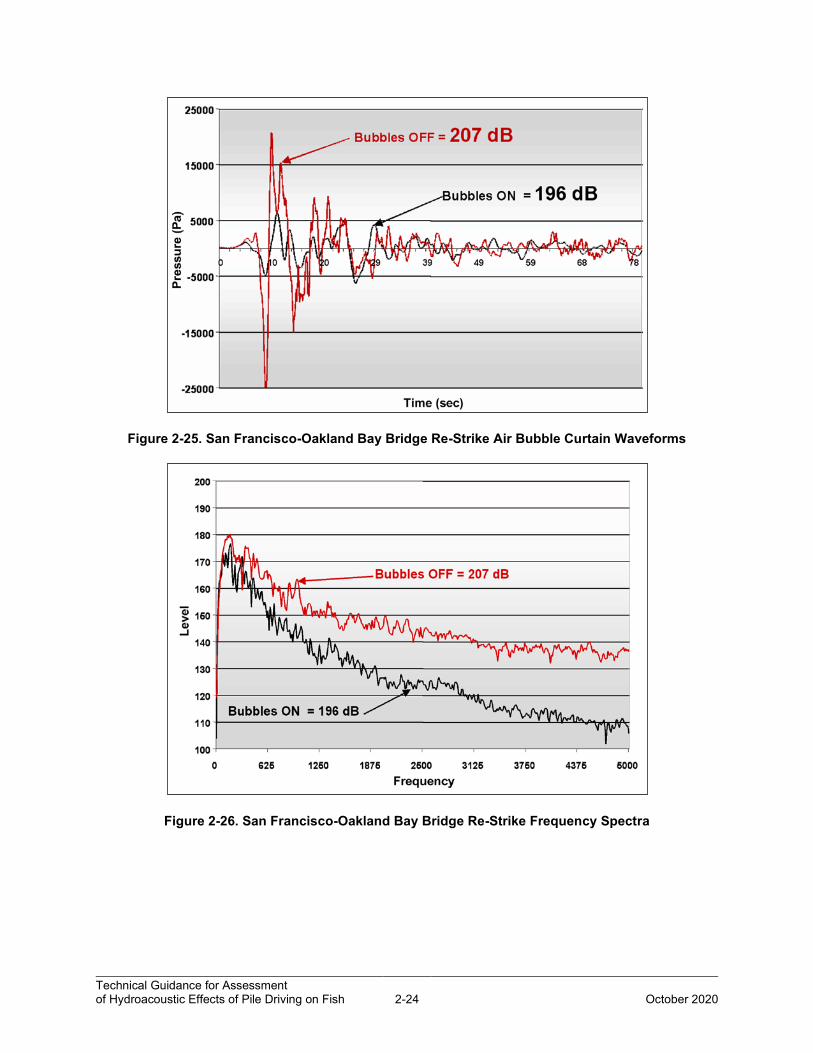
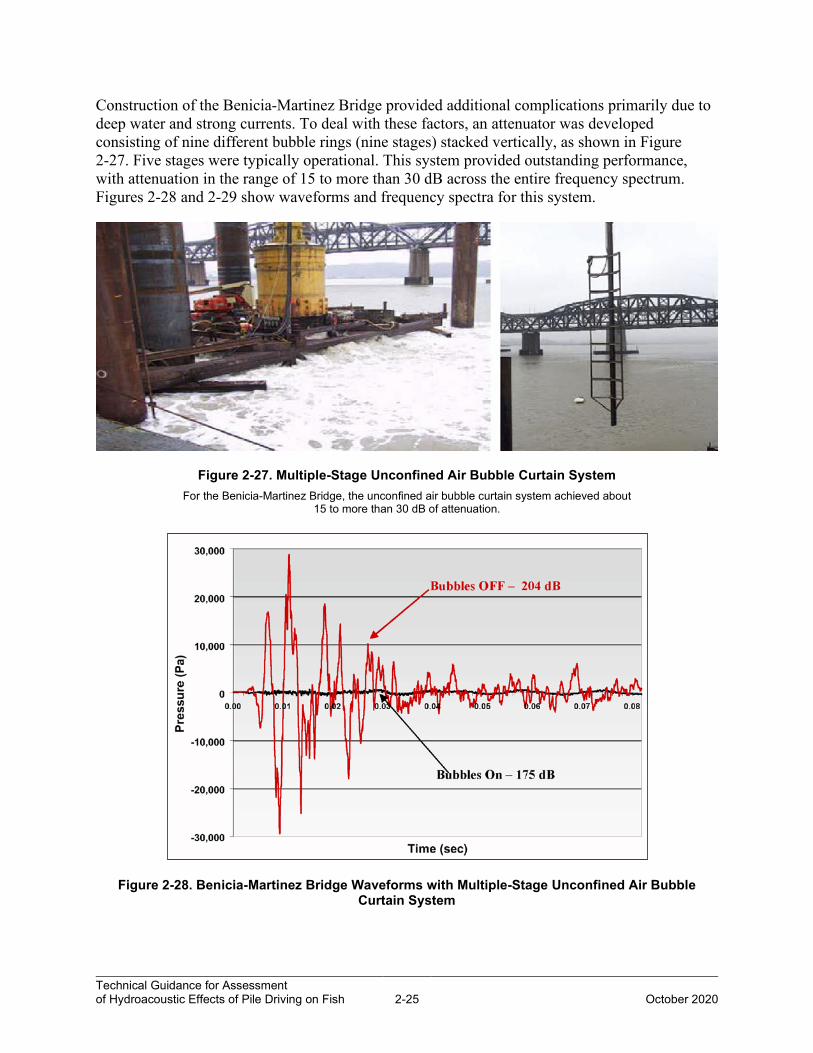
Figure 2-23 shows another unconfined bubble ring system used during construction on the Richmond-San Rafael Bridge. This system employs a smaller diameter ring and was utilized only in light current conditions. A similar system has been used on concrete piles on wharf repair projects in the San Francisco Bay region. This system has been shown to provide 5 to 15 dB of attenuation in the overall pressure where currents are light or non-existent. Figure 2-24 shows the dual-stage (with an upper and lower bubble ring) unconfined air bubble curtain system used on the San Francisco-Oakland Bay Bridge when the piles were re-struck to assess their resistance to forces about a year after they were originally driven. This system provided 5 to more than 20 dB of attenuation but was found to provide different levels of attenuation, depending on the direction from the pile. This directional characteristic was likely due to the current or ground-borne vibration propagation. Figures 2-25 and 2-26 show the waveforms and frequency spectra with this system turned on and turned off. The waveforms show the significant reduction in the peak pressure realized with this air bubble curtain system. The frequency spectra in Figure 2-26 show that the reduction in sound provided by the attenuation system varies as a function of frequency.
Technical Guidance for Assessment of Hydroacoustic Effects of Pile Driving on Fish 2-23
October 2020
Figure 2-23. Bubble Ring For the Richmond-San Rafael Bridge, the bubble ring provided 5 to 15 dB of attenuation in light to
nonexistent current for 30- to 66-meter piles driven in shallow water.
Figure 2-24. Dual-Stage Unconfined Air Bubble Curtain For the San Francisco-Oakland Bay Bridge Pile Installation Demonstration Project re-strike,
the unconfined air bubble curtain provided about 5 to 20 dB of attenuation.
Technical Guidance for Assessment of Hydroacoustic Effects of Pile Driving on Fish 2-24
October 2020
Figure 2-25. San Francisco-Oakland Bay Bridge Re-Strike Air Bubble Curtain Waveforms
Figure 2-26. San Francisco-Oakland Bay Bridge Re-Strike Frequency Spectra
Technical Guidance for Assessment of Hydroacoustic Effects of Pile Driving on Fish 2-25
October 2020
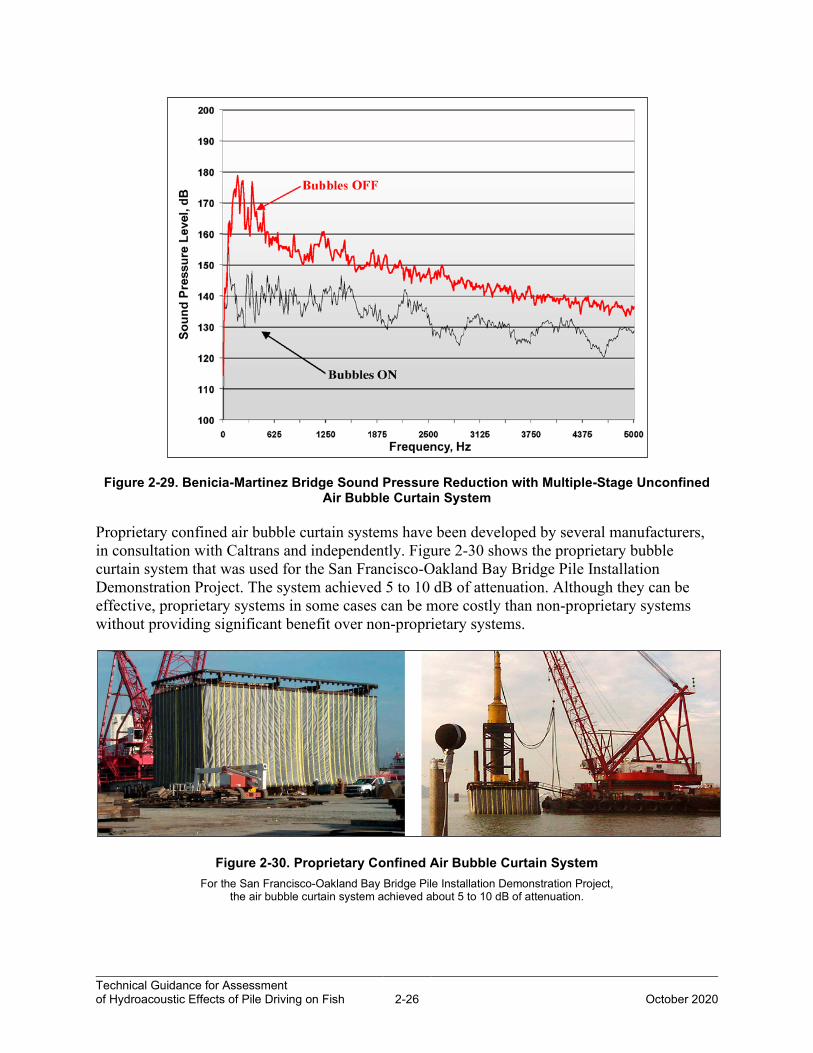
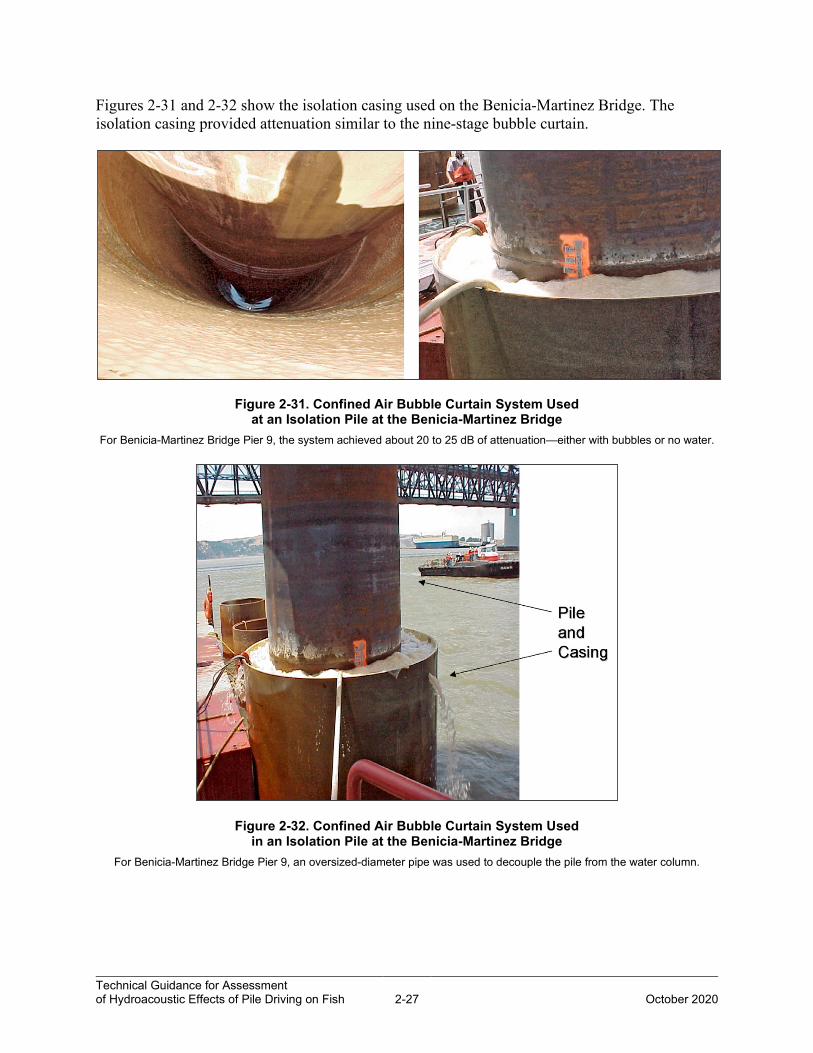
Construction of the Benicia-Martinez Bridge provided additional complications primarily due to deep water and strong currents. To deal with these factors, an attenuator was developed consisting of nine different bubble rings (nine stages) stacked vertically, as shown in Figure 2-27. Five stages were typically operational. This system provided outstanding performance, with attenuation in the range of 15 to more than 30 dB across the entire frequency spectrum. Figures 2-28 and 2-29 show waveforms and frequency spectra for this system.
Figure 2-27. Multiple-Stage Unconfined Air Bubble Curtain System For the Benicia-Martinez Bridge, the unconfined air bubble curtain system achieved about
15 to more than 30 dB of attenuation.
Figure 2-28. Benicia-Martinez Bridge Waveforms with Multiple-Stage Unconfined Air Bubble Curtain System
Technical Guidance for Assessment of Hydroacoustic Effects of Pile Driving on Fish 2-26
October 2020
Figure 2-29. Benicia-Martinez Bridge Sound Pressure Reduction with Multiple-Stage Unconfined Air Bubble Curtain System
Proprietary confined air bubble curtain systems have been developed by several manufacturers, in consultation with Caltrans and independently. Figure 2-30 shows the proprietary bubble curtain system that was used for the San Francisco-Oakland Bay Bridge Pile Installation Demonstration Project. The system achieved 5 to 10 dB of attenuation. Although they can be effective, proprietary systems in some cases can be more costly than non-proprietary systems without providing significant benefit over non-proprietary systems.
Figure 2-30. Proprietary Confined Air Bubble Curtain System For the San Francisco-Oakland Bay Bridge Pile Installation Demonstration Project,
the air bubble curtain system achieved about 5 to 10 dB of attenuation.
Technical Guidance for Assessment of Hydroacoustic Effects of Pile Driving on Fish 2-27
October 2020
Figures 2-31 and 2-32 show the isolation casing used on the Benicia-Martinez Bridge. The isolation casing provided attenuation similar to the nine-stage bubble curtain.
Figure 2-31. Confined Air Bubble Curtain System Used at an Isolation Pile at the Benicia-Martinez Bridge
For Benicia-Martinez Bridge Pier 9, the system achieved about 20 to 25 dB of attenuation—either with bubbles or no water.
Figure 2-32. Confined Air Bubble Curtain System Used in an Isolation Pile at the Benicia-Martinez Bridge
For Benicia-Martinez Bridge Pier 9, an oversized-diameter pipe was used to decouple the pile from the water column.
Technical Guidance for Assessment of Hydroacoustic Effects of Pile Driving on Fish 2-28
October 2020
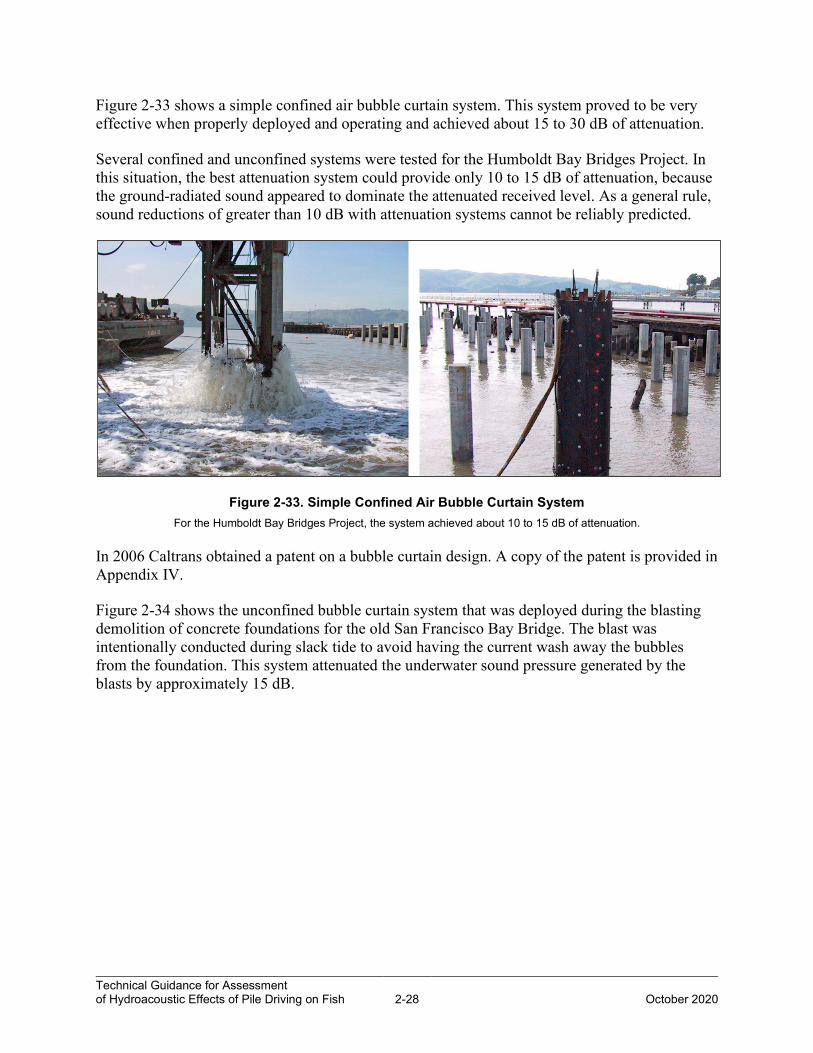
Figure 2-33 shows a simple confined air bubble curtain system. This system proved to be very effective when properly deployed and operating and achieved about 15 to 30 dB of attenuation.
Several confined and unconfined systems were tested for the Humboldt Bay Bridges Project. In this situation, the best attenuation system could provide only 10 to 15 dB of attenuation, because the ground-radiated sound appeared to dominate the attenuated received level. As a general rule, sound reductions of greater than 10 dB with attenuation systems cannot be reliably predicted.
Figure 2-33. Simple Confined Air Bubble Curtain System For the Humboldt Bay Bridges Project, the system achieved about 10 to 15 dB of attenuation.
In 2006 Caltrans obtained a patent on a bubble curtain design. A copy of the patent is provided in Appendix IV.
Figure 2-34 shows the unconfined bubble curtain system that was deployed during the blasting demolition of concrete foundations for the old San Francisco Bay Bridge. The blast was intentionally conducted during slack tide to avoid having the current wash away the bubbles from the foundation. This system attenuated the underwater sound pressure generated by the blasts by approximately 15 dB.
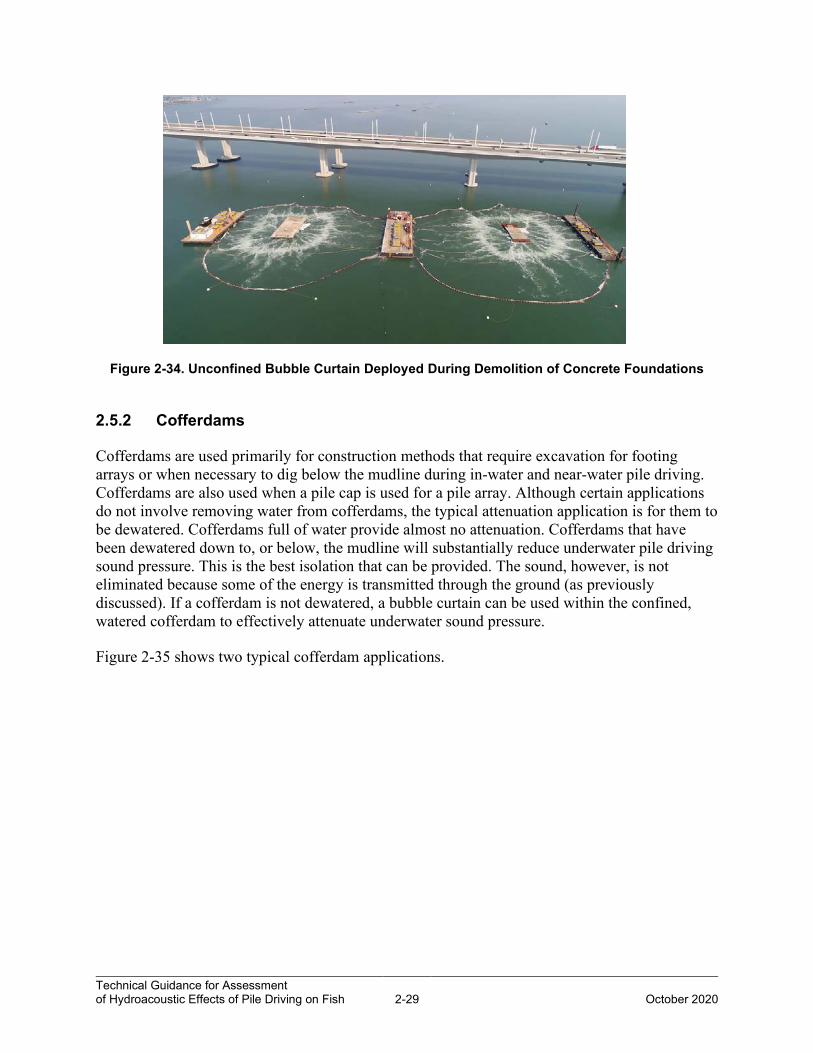
Technical Guidance for Assessment of Hydroacoustic Effects of Pile Driving on Fish 2-29
October 2020
Figure 2-34. Unconfined Bubble Curtain Deployed During Demolition of Concrete Foundations
2.5.2 Cofferdams
Cofferdams are used primarily for construction methods that require excavation for footing arrays or when necessary to dig below the mudline during in-water and near-water pile driving. Cofferdams are also used when a pile cap is used for a pile array. Although certain applications do not involve removing water from cofferdams, the typical attenuation application is for them to be dewatered. Cofferdams full of water provide almost no attenuation. Cofferdams that have been dewatered down to, or below, the mudline will substantially reduce underwater pile driving sound pressure. This is the best isolation that can be provided. The sound, however, is not eliminated because some of the energy is transmitted through the ground (as previously discussed). If a cofferdam is not dewatered, a bubble curtain can be used within the confined, watered cofferdam to effectively attenuate underwater sound pressure.
Figure 2-35 shows two typical cofferdam applications.
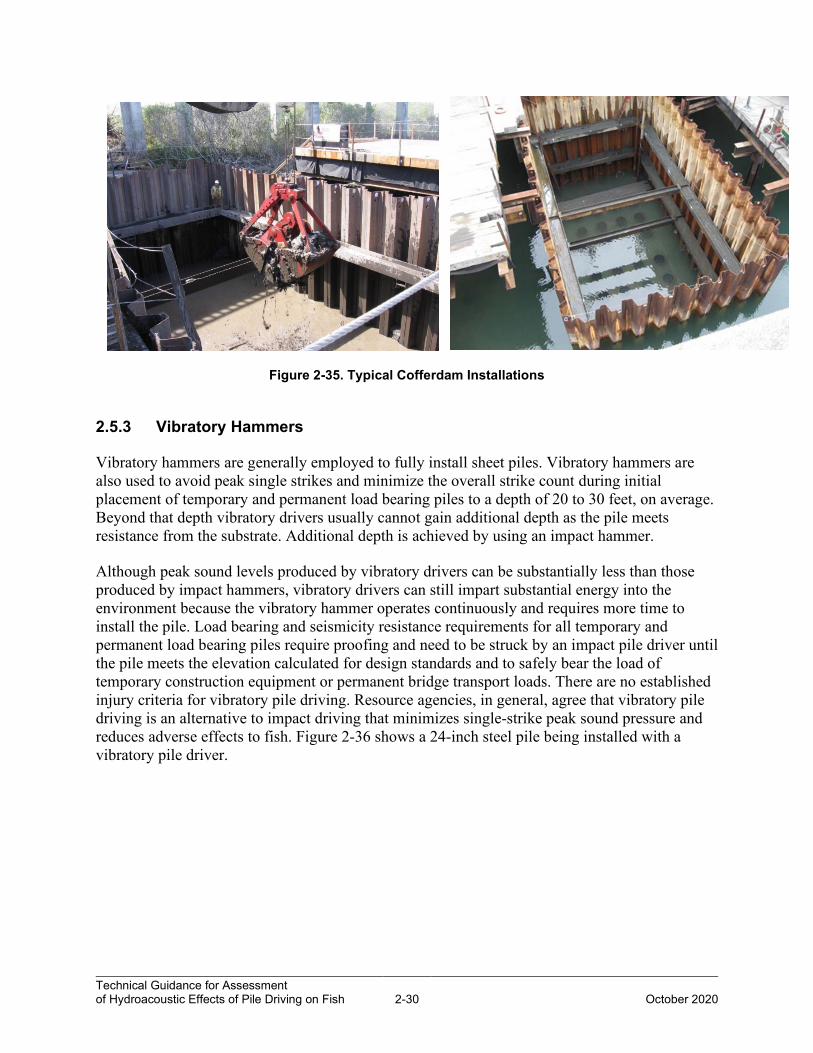
Technical Guidance for Assessment of Hydroacoustic Effects of Pile Driving on Fish 2-30
October 2020
Figure 2-35. Typical Cofferdam Installations
2.5.3 Vibratory Hammers
Vibratory hammers are generally employed to fully install sheet piles. Vibratory hammers are also used to avoid peak single strikes and minimize the overall strike count during initial placement of temporary and permanent load bearing piles to a depth of 20 to 30 feet, on average. Beyond that depth vibratory drivers usually cannot gain additional depth as the pile meets resistance from the substrate. Additional depth is achieved by using an impact hammer.
Although peak sound levels produced by vibratory drivers can be substantially less than those produced by impact hammers, vibratory drivers can still impart substantial energy into the environment because the vibratory hammer operates continuously and requires more time to install the pile. Load bearing and seismicity resistance requirements for all temporary and permanent load bearing piles require proofing and need to be struck by an impact pile driver until the pile meets the elevation calculated for design standards and to safely bear the load of temporary construction equipment or permanent bridge transport loads. There are no established injury criteria for vibratory pile driving. Resource agencies, in general, agree that vibratory pile driving is an alternative to impact driving that minimizes single-strike peak sound pressure and reduces adverse effects to fish. Figure 2-36 shows a 24-inch steel pile being installed with a vibratory pile driver.
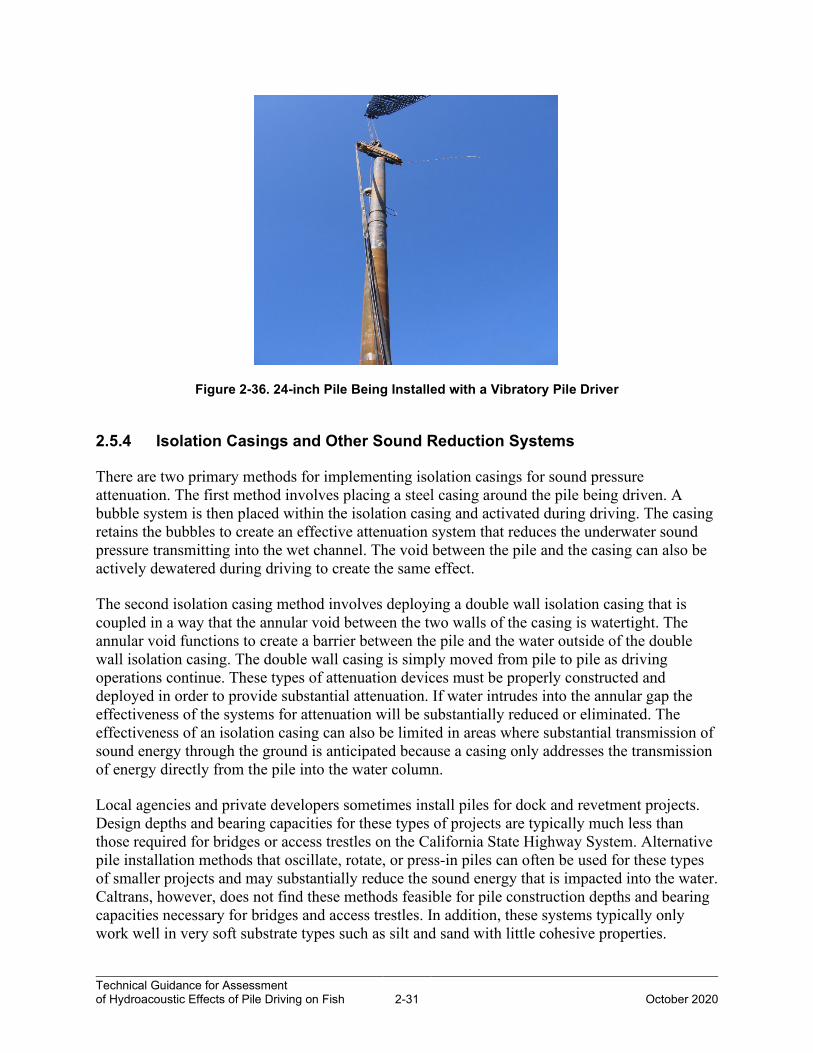
Technical Guidance for Assessment of Hydroacoustic Effects of Pile Driving on Fish 2-31
October 2020
Figure 2-36. 24-inch Pile Being Installed with a Vibratory Pile Driver
2.5.4 Isolation Casings and Other Sound Reduction Systems
There are two primary methods for implementing isolation casings for sound pressure attenuation. The first method involves placing a steel casing around the pile being driven. A bubble system is then placed within the isolation casing and activated during driving. The casing retains the bubbles to create an effective attenuation system that reduces the underwater sound pressure transmitting into the wet channel. The void between the pile and the casing can also be actively dewatered during driving to create the same effect.
The second isolation casing method involves deploying a double wall isolation casing that is coupled in a way that the annular void between the two walls of the casing is watertight. The annular void functions to create a barrier between the pile and the water outside of the double wall isolation casing. The double wall casing is simply moved from pile to pile as driving operations continue. These types of attenuation devices must be properly constructed and deployed in order to provide substantial attenuation. If water intrudes into the annular gap the effectiveness of the systems for attenuation will be substantially reduced or eliminated. The effectiveness of an isolation casing can also be limited in areas where substantial transmission of sound energy through the ground is anticipated because a casing only addresses the transmission of energy directly from the pile into the water column.
Local agencies and private developers sometimes install piles for dock and revetment projects. Design depths and bearing capacities for these types of projects are typically much less than those required for bridges or access trestles on the California State Highway System. Alternative pile installation methods that oscillate, rotate, or press-in piles can often be used for these types of smaller projects and may substantially reduce the sound energy that is impacted into the water. Caltrans, however, does not find these methods feasible for pile construction depths and bearing capacities necessary for bridges and access trestles. In addition, these systems typically only work well in very soft substrate types such as silt and sand with little cohesive properties.
Technical Guidance for Assessment of Hydroacoustic Effects of Pile Driving on Fish 2-32
October 2020
2.6 References
Popper A. N., A. D. Hawkins, and M. B. Halvorsen. 2019. Anthropogenic Sound and Fishes. Washington Department of Transportation. Olympia, WA.
Richardson, J. W., C. R. Greene, C. I. Malme, and D. H. Thomson. 1995. Marine Mammals and Noise. Academic Press, San Diego, CA.
Vasconcelos, R. O., and F. Ladich. 2008. Development of Vocalization, Auditory Sensitivity and Acoustic Communication in the Lusitanian Toadfish Halobatrachus Didactylus. Journal of Experimental Biology, 211(4), 502-509.
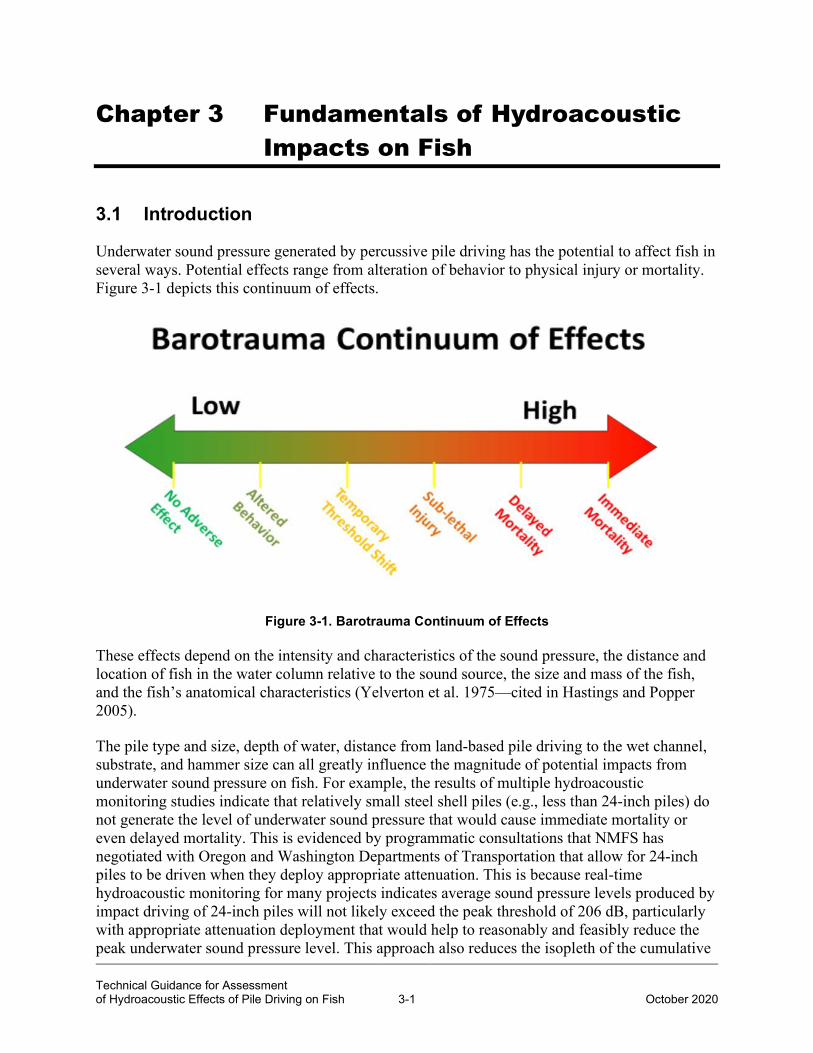
Technical Guidance for Assessment of Hydroacoustic Effects of Pile Driving on Fish 3-1
October 2020
Chapter 3 Fundamentals of Hydroacoustic Impacts on Fish
3.1 Introduction
Underwater sound pressure generated by percussive pile driving has the potential to affect fish in several ways. Potential effects range from alteration of behavior to physical injury or mortality. Figure 3-1 depicts this continuum of effects.
Figure 3-1. Barotrauma Continuum of Effects
These effects depend on the intensity and characteristics of the sound pressure, the distance and location of fish in the water column relative to the sound source, the size and mass of the fish, and the fish’s anatomical characteristics (Yelverton et al. 1975—cited in Hastings and Popper 2005).
The pile type and size, depth of water, distance from land-based pile driving to the wet channel, substrate, and hammer size can all greatly influence the magnitude of potential impacts from underwater sound pressure on fish. For example, the results of multiple hydroacoustic monitoring studies indicate that relatively small steel shell piles (e.g., less than 24-inch piles) do not generate the level of underwater sound pressure that would cause immediate mortality or even delayed mortality. This is evidenced by programmatic consultations that NMFS has negotiated with Oregon and Washington Departments of Transportation that allow for 24-inch piles to be driven when they deploy appropriate attenuation. This is because real-time hydroacoustic monitoring for many projects indicates average sound pressure levels produced by impact driving of 24-inch piles will not likely exceed the peak threshold of 206 dB, particularly with appropriate attenuation deployment that would help to reasonably and feasibly reduce the peak underwater sound pressure level. This approach also reduces the isopleth of the cumulative
Technical Guidance for Assessment of Hydroacoustic Effects of Pile Driving on Fish 3-2
October 2020
exposure level (SELCUMULATIVE). When feasible, projects should propose smaller piles, land-based piles, and attenuation for any pile, water or land-based, that has the potential to exceed the peak threshold of 206 dB. These avoidance and minimization measures should be incorporated into the project delivery process as the Project Delivery Team works with Structures foundation engineers and geotechnical experts. Once geotechnical investigation occurs (site specific drilling), Structures will be able to complete the Preliminary Foundations Report, which will provide a recommendation for the foundation type and include any potential alternative foundations that may be considered. It is important that biologists and environmental staff communicate regarding any sensitive fish species or habitats that are within the proposed project action area (e.g., salmon, steelhead, sturgeon, delta smelt, etc.) early in the design process so appropriate measures can be taken during foundations design to reasonably and feasibly avoid and minimize potential impacts.
In the event that the project is a larger bridge or the bridge exists in an area that indicates a greater likelihood of scour or liquification (prone to destabilization during seismic events), it may be necessary to build a foundation using larger piles to ensure that the structure can bear the calculated transportation load and withstand the seismic requirements. This approach has been codified and is required by the Caltrans SDC.
As pile size increases, more vibration is generated, and higher underwater sound pressure levels are produced. In 2001, in preparation for the replacement of the San Francisco–Oakland Bay Bridge, very large test piles (96-inch steel shell) approximately 100 meters in length were driven to an elevation of 100 meters (330 feet) in order to test and evaluate technical, engineering, and environmental factors associated with driving large, hollow steel piles in San Francisco Bay. Single strike sound levels produced by driving these piles were 213 dB-peak, 197 dB-RMS, and 188 dB-SEL at 25 meters. The is approximately equal to 220 dB-peak, 203 dB-RMS, and 194 dB-SEL at 10 meters. Because of the high levels of underwater sound pressure generated by the action of driving 96-inch piles, fish were observed floating near the action area as a result of direct mortality from the test project. In 2001, very little was known about which level of sound would harm or kill fish. As a result of the indicated harm to fish, the San Francisco–Oakland Bay Bridge project constructed and tested several attenuation methods, primarily bubble curtains. The design of some of these systems are still in use today. Bubble curtains are not always suitable to use within certain shallow or high velocity environments; however, they have proven to be very effective in protecting fish when deployed properly in the right project settings.
Because little was known about the effects of underwater pile driving noise on fish in 2001, Caltrans commissioned the preparation of several white papers to collect and evaluate literature that could be used to establish interim criteria for the analysis of pile driving impacts on fish. Hastings and Popper (2005) reviewed the literature on the effects of sound on fishes, and identified data gaps and potential studies that would be needed to address areas of uncertainty relative to the measurement of sound and the response of fishes to sound. This paper concluded that duel interim criteria were warranted, including criteria for single-strike peak pressure and criteria for single-strike accumulated pressure (i.e., SEL).
Because of the identified gaps in research and information available, the need to further research the applicability and use of the dual interim criteria led to the publication of two additional white papers, Popper et al. (2005) and Carlson et al. (2007), which ultimately led to the interagency
Technical Guidance for Assessment of Hydroacoustic Effects of Pile Driving on Fish 3-3
October 2020
Agreement in Principle for Interim Criteria for Injury to Fish from Pile Driving Activities (Fisheries Hydroacoustic Working Group [FHWG] 2008). The interim criteria agreement is discussed in Chapter 4, Framework and Process for Environmental Analysis of Pile Driving Impacts on Fish.
A technical report prepared by American National Standards Institute (ANSI)-Accredited Standards Committee S3/SC1, Sound Exposure Guidelines for Fishes and Sea Turtles (Popper et al. 2014), provides a significant update to the body of work related to the effects of pile driving sound on fish.
A technical report led by the Washington State Department of Transportation and supported by the Federal Highway Administration (FHWA), Caltrans, and Oregon Department of Transportation, Anthropogenic Sound and Fishes (Popper et al. 2019), provides an update on the effects of pile driving underwater sound pressure on fish. It summarizes the current best science and data and identified key research.
This chapter summarizes those papers’ discussions of the anatomy and physiology of fishes that are fundamental to understanding the types of impacts that could result from pile driving.
3.2 Types of Fishes
More than 29,000 fish species have been identified worldwide (Froese and Pauly 2005). With such a large and diverse group, there are many ways to classify fish species. One way is to distinguish between cartilaginous and bony fishes. Cartilaginous fishes include sharks and rays, while bony fishes compose the vast majority of fish species—including the more advanced family of teleosts (e.g., salmon, tuna, perch, sturgeon, and most commercially important species). Research completed thus far on hearing in fish has been based primarily on bony fishes.
Fish also can be categorized by the way they hear. All fish fall into two hearing categories: hearing generalists (such as salmon and trout) and hearing specialists (such as herring and shad). Hearing generalists sense sound directly through their inner ear but also sense sound energy from the swim bladder. Hearing specialists are more complex. Many of the hearing specialists have evolved several different mechanisms to couple the swim bladder (or other gas-filled structure) to the ear. The swim bladder is stimulated by the pressure of sound waves and serves as a transducer that re-radiates energy in the form of particle motion that is detected by the inner ear. This anatomy means that hearing specialists have greater hearing sensitivity than hearing generalists have and are more susceptible to impacts from underwater sound pressure.
Most teleost fishes maintain their buoyancy by inflating and deflating their swim bladder with air. Fish with swim bladders can be categorized into two groups. Physostomes are fish with ducted swim bladders (e.g., salmon, trout, pike, sturgeon, and catfish). In physostomous fish, the swim bladder is directly connected to the esophagus by a thin tube, allowing the fish to expel air from the swim bladder through this tube and out of the mouth. The second group, called physoclists (e.g., perch and tuna), have non-ducted swim bladders. Physoclistous fish fill their swim bladder by forcibly excreting oxygen from an area rich in arterial and venous blood vessels, called the gas gland, and reabsorbing gas into their bloodstream at a site called the oval.
Technical Guidance for Assessment of Hydroacoustic Effects of Pile Driving on Fish 3-4
October 2020
Some physostomous fish also have a gas gland or resorbant area in addition to the pneumatic duct, but these tend to be weakly developed in comparison with physoclistous fish.
The distinction between physostomes and physoclists has the potential to inform how fish are affected by underwater sound pressure. Tissue damage can occur when underwater sound pressure passes through a fluid tissue (e.g., muscle) into a gas void (swim bladder) because gas is more compressible. When a fish is exposed to a sound pressure wave, gas in the swim bladder expands more than surrounding tissue during periods of under pressure and contracts more than surrounding tissue during periods of overpressure. This expansion and contraction can result in swim bladder tissue damage, including rupture of the swim bladder (Alpin 1947, Coker and Hollis 1950, Gaspin 1975, Yelverton et al. 1975—all cited in Hastings and Popper 2005). Yelverton et al. (1975—cited in Hastings and Popper 2005) found that physostomous fish were just as vulnerable to injury and death due to underwater sound pressure impulses created by blasts as physoclistous fish. However, Hastings and Popper (2005) note that fish with ducted swim bladders may be able to respond to other types of underwater sound pressure with longer rise or fall times, which would allow more time to respond to the change in pressure by releasing air from the swim bladder.
3.3 Sound Detection in Fish
Sound is important in the lives of fishes (e.g., Hawkins 1993; Popper et al. 2001). Fishes may use sound for, among other things, communicating with one another, detecting prey and predators, navigating, and selecting appropriate habitats (e.g., Tavolga 1971; Hawkins and Myrberg 1983; Ladich and Winkler 2017). Moreover, even though many species do not produce sound, all species are likely to glean biologically important information about their environment by detecting and using what is called the “acoustic scene,” or soundscape (Fay and Popper 2000; Fay 2009; Slabbekoorn 2018). The term soundscape is used to characterize the ambient sound in terms of its spatial, temporal, and frequency attributes, as well as the types of sources contributing to the sound field. Sounds within a soundscape can be of either natural or anthropogenic origin. In effect, sound detection provides fishes with three-dimensional information from a larger space around them than is possible using other senses, thereby expanding their sensory world and enabling them to rapidly get important information even in dark and murky waters. Therefore, any disruption in the ability of fishes to detect biologically relevant sounds (e.g., those of a predator) may have deleterious effects on survival.
Two independent but related sensory systems in fish are used for “hearing,” the inner ear and the lateral line system. The primary auditory structures in a fish’s inner ear are sensory hair cells and otoliths. Otolithic organs are dense calcified structures that overlie a tissue layer containing numerous sensory hair cells. Because the body of a fish contains mostly water, and otoliths are stiffer and denser than the rest of the body, sound will penetrate the otoliths more slowly than the rest of the fish. The difference between the motion of sound pressure through the fish and the otoliths stimulates the sensory hair cells, resulting in detection of sound in the brain. Otolithic organs contain thousands of these sensory hair cells and can be damaged by exposures to intense underwater sound pressure. However, these hair cells continue to be produced throughout much of the fish’s life (Hastings and Popper 2005). There is also evidence that fish can replace or repair sensory hair cells that have been damaged in both the inner ear and lateral line (Meyers
Technical Guidance for Assessment of Hydroacoustic Effects of Pile Driving on Fish 3-5
October 2020
and Corwin 2008). Lombarte et al. (1994—cited in Meyers and Corwin 2008) showed that, when damaged by exposure to certain drugs, fish were able to produce new hair cells to replace the ones lost. More recently, Smith et al. (2006) demonstrated that goldfish with hair cells damaged by underwater sound pressure exposure were able to produce replacement hair cells to a level similar to the recovery seen in earlier studies.
Organs in the lateral line (neuromasts) can detect the relative motion of water past these organs when hair cells are stimulated by this movement. These cells detect water motion relative to the fish within a few body lengths of the animal (Coombs and Montgomery 1999, Popper et al. 2003—all cited in Hastings and Popper 2005). Underwater sound pressure passing through water creates particle motion, which is detected by the neuromasts and transmitted via neurons to the brain.
3.4 Potential Effects of Underwater Sound Pressure on Fish Hearing
Exposure to either intense or low levels of long-term underwater sound pressure may result in auditory tissue damage (damage to the sensory hair cells of the ear) or temporary hearing loss (referred to as a “temporary threshold shift” [TTS]). The level and duration of exposure that cause auditory tissue damage and TTS vary and can be affected by factors such as repetition rate of the underwater sound pressure level, frequency, duration, size and life history stage of the organism. Both LPEAK and SEL can affect hearing through auditory tissue damage or TTS. TTS will occur at lower levels than auditory tissue damage and is a recoverable injury, unlike auditory tissue damage. Vulnerability to non-auditory tissue damage increases as the mass of the fish decreases. Therefore, non-auditory tissue damage criteria differ depending on the mass of the fish. Carlson et al. (2007) proposed separate peak and SEL interim criteria for auditory tissue damage and TTS for both hearing generalists and hearing specialists (see Chapter 4, Framework and Process for Environmental Analysis of Pile Driving Impacts on Fish, for a complete description of proposed interim thresholds for pile driving).
By definition, hearing recovers after TTS. The extent of TTS (how many dB of hearing loss) depends on the variables listed above, among others. Fish may recover from TTS minutes to days following exposure. Popper et al. (2005) found that both hearing specialists and generalists were able to recover from varying levels of substantial TTS in less than 18 hours after exposure.
An additional possible effect on hearing from intense or continuous underwater sound pressure is referred to in the literature as a “permanent threshold shift” (PTS). PTS is a permanent loss of hearing that never recovered. Most often, PTS is associated with the death of the sensory hair cells of the ear and/or damage to the nerves innervating the ear (Liberman 2016). To date, there is no evidence of PTS in fishes as a result of exposure to high sound pressure, and it is considered unlikely to occur because fishes can replace damaged hair cells, precluding any permanent hearing loss (e.g., Smith 2016; Smith and Monroe 2016). It is also possible, however, that damage to the swim bladder or other organs involved in the detection of sounds might result in permanent changes to the hearing abilities of some fishes.
Technical Guidance for Assessment of Hydroacoustic Effects of Pile Driving on Fish 3-6
October 2020
Indirect effects of hearing loss in fish may relate to the fish’s reduced fitness, which may increase the animal’s vulnerability to predators and result in the reduction or elimination of the ability to locate prey, inability to communicate, and inability to sense the physical environment.
3.5 Potential Effects of Underwater Sound Pressure on Fish Anatomy and Physiology
Depending upon the sound source and distance from a source, barotrauma may result from compression or decompression. In effect, compression can be considered as squeezing a fish, and decompression can be considered a rapid release of all squeezing (pressure) on a fish (Popper et. al. 2019). Injuries can result from high amplitude positive overpressures, especially from a sound pressure pulse characterized by an initial positive pressure increase with a rapid rise time and high amplitude peak pressure, such as might occur from an explosion or when a fish is adjacent to a source of impulsive sounds (Cole 1948). Further, sources that can cause compression injuries at short distances have a high positive overpressure (Cole 1948). Negative sound pressures within the pulses from pile driving are enough to cause decompression injuries (Halvorsen et. al 2012).
It is widely known that exposure to sounds at high levels can alter the physiology and structure of terrestrial vertebrates (e.g., Fletcher and Busnel 1978, Saunders et al. 1991—all cited in Hastings and Popper 2005). Effects may include cellular changes, organ system changes, or stress level effects caused by exposure to sound.
Decompression injuries are caused by rapid release of pressure, which is observed, for example, in instances where physoclist fishes are quickly brought to the surface by anglers. Decompression injuries to fish may occur through two different mechanisms: one involves any gas bladder (e.g., swim bladder, bubble or gas) and the other involves dissolved gases in the blood and tissues of any fish. Impulsive signals, such as pile driving, occur in repeated succession and have an inherent “pulsing” characteristic, which means that compression and decompression are repeated in rapid succession on the fish’s body. (Popper et. al. 2019)
Carlson et al. (2007) found that the literature does not show a correlation between non-auditory tissue damage and LPEAK, but that barotrauma is related to the mechanical work (or force) exerted on tissue during compression and decompression, which can be estimated by SELCUMULATIVE.
The effect of the accumulated sound energy on a fish is dependent on the mass of the fish (see Chapter 4, Framework and Process for Environmental Analysis of Pile Driving Impacts on Fish, for a complete description of proposed interim thresholds for pile driving).
Decompression causes gas to come out of solution, which forms bubbles in blood that may rupture blood vessels, veins, and organs (Brown et al. 2009), causing lethal hemorrhaging (Brown et al. 2009; Brown et al. 2012; Halvorsen et al. 2012). Bubbles in the tissue show up often in the gills and block oxygen exchange, causing suffocation. Such bubbles can also lacerate organs (Govoni et al. 2003; Schreer et al. 2009). Barotrauma injuries are expressed externally and internally and range in severity from minor to mortal. A few examples of barotrauma caused
Technical Guidance for Assessment of Hydroacoustic Effects of Pile Driving on Fish 3-7
October 2020
by compression and decompression include bulging eyes, intestinal eversion (i.e., stomach protruding out of the mouth), and ruptured swim bladder (Gaspin 1975; Rummer and Bennett 2005; Brown et al. 2009; Brown et al. 2012; Halvorsen et al. 2012).
Halvorsen et al. (2011; 2012), described barotrauma injuries in fishes exposed to simulated pile driving sounds and presented a physiologically based injury classification. The studies were done in the laboratory, thereby mitigating many problems that are inherent to performing field studies and allowing for well-controlled exposure experiments. The pile driving signals were recorded in the field from steel pile driving at 10 meters from the source in terms of amplitudes, sound spectra, rise times, and energy levels. This was done by the development of an apparatus that allowed for controlled exposures, called the High Intensity Controlled Impedance–Fluid-Filled Wave Tube, which consisted of a stainless-steel tube (Popper et al. 2019).
In the initial study, Halvorsen et al. (2012) investigated the onset of tissue injury from exposure to impulsive pile driving signals on a physostomous fish, juvenile chinook salmon (Oncorhynchus tshawytscha), and examined the metrics most relevant to determine severity of impacts on fish. The study showed that the relationship between the number of injuries and their severity increased as the SELSINGLE STRIKE and SELCUMULATIVE increased. (Popper et al. 2019).
Because high-level transient sound can cause traumatic brain injury, it is suspected that fish with swim bladder projections or other air bubbles near the ear could be susceptible to neurotrauma when exposed to high sound pressure levels. In humans, effects can include instantaneous loss of consciousness, sustained feelings of anxiety and confusion, and amnesia, and may result in death (Elsayed 1997, Knudsen and Oen 2003—all cited in Hastings and Popper 2005). In several studies, Hastings (1990 and 1995—cited in Hastings and Popper 2005) reported “acoustic stunning” in four blue gouramis (Trichogaster trichopterus). The loss of consciousness exhibited by these fish could have been caused by neurotrauma, especially because a bubble of air in the mouth cavity located near the brain enhances the hearing capability of this species (Yan 1998, Ladich and Popper 2004—all cited in Hastings and Popper 2005).
Non-mortality effects may include temporary injury that heals, injury that leads to a slow death (e.g., breakdown of tissues in some organ system), temporary or permanent hearing loss, movement of fish away from feeding grounds, and—as discussed in Section 3.4, Potential Effects of Underwater Sound Pressure on Fish Hearing—effects such as reduced fitness, vulnerability to predators, reduction or elimination of the ability to locate prey, inability to communicate, and inability to sense the physical environment.
It is also important to consider the effects of cumulative exposures related to mortality, physiology, and behavior, including the effects of exposure to multiple impacts from pile driving and strike intermittency (e.g., one strike every few seconds to several per second). One issue in this regard is whether exposure to a very frequent sequence of high-level underwater sound pressure has a different effect than exposure to a sequence that allows some “recovery” time. Another aspect of cumulative exposure that needs consideration is the potential effect on a fish that is exposed to pile driving and then exposed again to pile driving sound pressure several hours, days, or weeks later.
Technical Guidance for Assessment of Hydroacoustic Effects of Pile Driving on Fish 3-8
October 2020
The FESA and the CESA consider that injury, even if it is recoverable, is still likely to cause harm. However, it is not clear whether FESA and CESA would continue to apply the term “harm” once a fish recovers from TTS or a minor physical barotrauma. Another question is whether, after injury is sustained from sound exposure, injuries worsen or improve. Studies have found that animals in a laboratory recovered from many injuries, and there did not appear to be further manifestation of injuries after exposure (Casper et al. 2012). The investigators were careful to point out, however, that recovery occurred in a laboratory environment where the fish were not subject to predation. In the field, animals with barotrauma injury may be less likely to avoid disease or predation.
3.6 Life History Considerations
Key variables that appear to control the physical interaction of sound with fishes include the size of the fish relative to the wavelength of sound, mass of the fish, anatomical variation, and location of the fish in the water column relative to the sound source (Yelverton et al. 1975—cited in Hastings and Popper 2005; Carlson et al. 2007).
Fish are typically not stationary; therefore, they move in and out of the project area. Unfortunately, the current NMFS impact assessment method, which is implemented with their calculator tool, assumes that fish are stationary throughout any pile driving activities. This assumption increases state-required mitigation under CESA, particularly within the SELCUMULATIVE estimated impact area. Other NMFS regions acknowledge migration and ongoing movement by fish and therefore do not use the SELCUMULATIVE criteria in consultations outside of California, Oregon, and Washington.
Whereas it is possible that some (although not all) species of fish would swim away from a sound source, thereby decreasing exposure to sound, larvae and eggs are often found at the mercy of currents or move very slowly. Eggs are also stationary and, thus, could be exposed to extensive human-generated sound if it is presented in the surrounding water column or substrate. Data are limited concerning the effects of sound on developing eggs and larvae. A study by Banner and Hyatt (1973) found increased mortality was found in eggs and embryos of sheepshead minnow (Cyprinodon variegates) exposed to broadband noise (100–1,000 Hz) that was about 15 dB above ambient sound level. However, the same study found that hatched fry of sheepshead minnow and fry of longnose killifish (Fundulus similes) were not affected by the same exposure.
3.7 Behavioral Effects
In support and consideration of recommendations for the 2008 interim thresholds, Hastings and Popper (2005) concluded that the studies available at that time provided only a preliminary indication of the potential impact of pile driving on fishes. Absent were studies to determine whether there were longer-term behavioral effects from pile driving that might alter the movement patterns of fish schools and affect feeding, behavior, response to predators, and mating and reproductive behavior. Additional studies have since been completed.
Technical Guidance for Assessment of Hydroacoustic Effects of Pile Driving on Fish 3-9
October 2020
Studies have demonstrated that fishes exposed to pile driving sounds may show alarm response. They may increase their swim speeds (often showing a directional response), change their ventilation and heart rates, and show startle responses. Such transient escape reflexes are unlikely to result in adverse impacts because the fish may rapidly return to their normal behavior. However, stronger more sustained responses may generate oxygen debt and place an energetic load on the fish (Popper et al. 2019).
The schooling of fishes, which includes their gathering into shoals, is often an important aspect of their behavior. Playback of pile driving sounds to pelagic fishes has been shown to cause both the break-up of fish schools and the consolidation of schools.
The presence of anthropogenic sounds may interfere with foraging behavior either by masking the relevant sounds or by resembling the sounds they prey may generate. The majority of studies so far have been conducted in laboratory tanks, but they have indicated that exposure to noise can result in decreased feeding efficiency by fishes. Additional noise in the environment can lead to reduced food consumption, although the effects are likely to be species specific (Popper et al. 2019).
Pile driving sound has the potential to produce longer-term impacts on behavior, such as the inability of fish to reach valuable habitat upstream of a continuous noise source or difficulty in locating mates or food due to continuous sounds from pile driving. These longer-term potential impacts on behavior have not been studied.
3.8 Environmental Factors to Consider in Analysis
Effects of sound on fish hearing and physiology likely will depend in part on the local environment, such as channel morphology, depth of water, and tidal conditions. Hastings and Popper (2005) state that the characteristics of the underwater sound field need to be investigated. Underwater sound propagation models need to be developed for locations of interest and integrated with pile structural acoustics models to estimate received levels of sound pressure and particle velocity in the vicinity of pile driving operations. These models will help to define zones of impact on fishes. Model results will need to be verified with field measurements of underwater sound pressure.
Chapter 4, Framework and Process for Environmental Analysis of Pile Driving Impacts on Fish, addresses the framework and process for the analysis of pile driving noise impacts based on current research and information.
3.9 References
Aplin, J. A. 1947. “The effect of explosives on marine life.” California Fish and Game 33, 23-30.
Banner, A. and M. Hyatt. 1973. Effects of Noise on Eggs and Larvae of Two Estuarine Fishes. Trans. Amer. Fish Soc., 1973, No. 1.
Technical Guidance for Assessment of Hydroacoustic Effects of Pile Driving on Fish 3-10
October 2020
Brown, R. S., T. J. Carlson, A. E. Welch, J. R. Stephenson, C. S. Abernethy, B. D. Ebberts, M. J. Langeslay, M. L. Ahmann, D. H. Feil, J. R. Skalski, and R. I. Townsend. 2009. Assessment of barotrauma from rapid decompression of depth-acclimated juvenile Chinook salmon bearing radiotelemetry transmitters. Transactions of the American Fisheries Society, 138(6), 1285-1301.
Brown, R. S., T. J. Carlson, A. J. Gingerich, J. R. Stephenson, B. D. Pflugrath, A. E. Welch, M. J. Langeslay, M. L. Ahmann, R. L. Johnson, J. R. Skalski, A. G. Seaburg, and R. L. and Townsend. 2012. Quantifying mortal injury of juvenile Chinook salmon exposed to simulated hydro-turbine passage. Transactions of the American Fisheries Society, 141(1), 147-157.
Carlson, T., M. Hastings, and A. N. Popper. 2007. Update on Recommendations for Revised Interim Sound Exposure Criteria for Fish during Pile Driving Activities. Memorandum to Suzanne Theiss (California Department of Transportation) and Paul Wagner (Washington Department of Transportation).
Casper, B. M., M. B. Halvorsen, and A. N. Popper. 2012. Are sharks even bothered by a noisy environment? In A. N. Popper & A. D. Hawkins (Eds.), The Effects of Noise on Aquatic Life (pp. 93-97). New York: Springer.
Coker, C. M., and E. H. Hollis. 1950. “Fish mortality caused by a series of heavy explosions in Chesapeake Bay.” J. Wildlife Manage. 14, 435-445.
Cole, R. 1948. Underwater Explosion. lst Ed. New Jersey: Princeton University Press.
Coombs, S., and J. C. Montgomery. 1999. “The enigmatic lateral line system.” In: Fay, R. R., and Popper, A. N. (eds.) Comparative Hearing: Fish and Amphibians, Springer-Verlag, New York, pp. 319-362.
Elsayed, N. M. 1997. "Toxicology of blast overpressure." Toxicology 121, 1-15.
Fay, R. R. 2009. Soundscapes and the sense of hearing of fishes. Integrative Zoology, 4(1), 26-32.
Fay, R. R., and A. N. Popper. 2000. Evolution of hearing in vertebrates: the inner ears and processing. Hearing Research, 149(1-2), 1-10.
Fisheries Hydroacoustic Working Group (FHWG). 2008. Agreement in Principal for Interim Criteria for Injury to Fish from Pile Driving Activities. Memorandum. June 12. Available at: http://www.dot.ca.gov/hq/env/bio/files/fhwgcriteria_agree.pdf.
Fletcher, J. L., and R. G. Busnel. 1978. "Effects of Noise on Wildlife." Academic Press, New York.
Froese, R., and D. Pauly (eds.). 2005. FishBase. Version 07/2005. Available at: http:\\www.fishbase.org.
Technical Guidance for Assessment of Hydroacoustic Effects of Pile Driving on Fish 3-11
October 2020
Gaspin, J. B. 1975. “Experimental investigations of the effects of underwater explosions on swimbladder fish, I: 1973 Chesapeake Bay tests.” Navel Surface Weapons Center Report NSWC/WOL/TR 75-58.
Govoni, J. J., L. R. Settle, and W. M.A. 2003. Trauma to juvenile pinfish and spot inflicted by submarine detonations. Journal of Aquatic Animal Health, 15, 111-119.
Halvorsen, M. B., B. M. Casper, C. M. Woodley, T. J. Carlson, and A. N. Popper. 2011. Hydroacoustic impacts on fish from pile installation. National Cooperative Highway Research Program Research Results Digest 363(October 2011).
Halvorsen, M. B., B. M. Casper, C. M. Woodley, T. J. Carlson, and A. N. Popper. 2012. Threshold for onset of injury in Chinook salmon from exposure to impulsive pile driving sounds. PLOS ONE, 7(6), e38968.
Hastings, M. C. 1990. "Effects of Underwater Sound on Fish." Document No. 46254-900206-01IM, Project No. 401775-1600, AT&T Bell Laboratories.
Hastings, M. C. 1995. "Physical effects of noise on fishes." Proceedings of INTER-NOISE 95, The 1995 International Congress on Noise Control Engineering, vol. II, pp. 979–984.
Hastings, M. C., and A. N. Popper. 2005. Effects of Sound on Fish. Prepared for Jones & Stokes and the California Department of Transportation. Sacramento, CA.
Hawkins, A. D. 1993. Underwater sound and fish behaviour. In T. J. Pitcher (Ed.), Behaviour of Teleost Fishes (pp. 114-153). London: Chapman and Hall.
Hawkins, A. D., and A. A. Myrberg Jr. 1983. Hearing and sound communication underwater. In B. Lewis (Ed.), Bioacoustics, a comparative approach (pp. 347- 405). New York: Academic Press.
Knudsen, S. K., and E. O. Oen. 2003. "Blast-induced neurotrauma in whales." Neurosci. Res. 46, 377-386.
Ladich, F., and A. N. Popper. 2004. "Parallel evolution in fish hearing organs." In Evolution of the Vertebrate Auditory System, edited by G. A. Manley, A. N. Popper, and R. R. Fay (Springer-Verlag, New York), 98-127.
Ladich, F., and H. Winkler. 2017. Acoustic communication in terrestrial and aquatic vertebrates. The Journal of Experimental Biology, 220(13), 2306-2317.
Liberman, M. C. 2016. Noise-induced hearing loss: Permanent versus temporary threshold shifts and the effects of hair cell versus neuronal degeneration. In A. N. Popper & A. D. Hawkins (Eds.), The Effects of Noise on Aquatic Life II (pp. 1-7). New York: Springer.

Technical Guidance for Assessment of Hydroacoustic Effects of Pile Driving on Fish 3-12
October 2020
Lombarte, A., and A.N. Popper. 1994. Quantitative analyses of postembryonic hair cell addition in the otolithic endorgans of the inner ear of the European hake, Merluccius merluccius (Gadiformes, Teleostei). J Comp Neurol 345:419-428.
Meyers, J. R., and J. T. Corwin. 2008. Morphological Correlates of Regeneration and Repair in the Inner Ear. In Springer Handbook of Auditory Research, Vol. 33: Hair Cell Regeneration, Repair, and Protection. R. J. Salvi, A. N. Popper, and R. R. Fay, eds.
Popper, A. N., M. Salmon, and K. W. Horch. 2001. Acoustic detection and communication by decapod crustaceans. Journal of Comparative Physiology A, 187(2), 83-89.
Popper, A. N., R. R. Fay, C. Platt, and O. Sand. 2003. Sound detection mechanisms and capabilities of teleost fishes. In S. P. Collin & N. J. Marshall (Eds.), Sensory Processing in Aquatic Environments (pp. 3-38). New York: Springer-Verlag.
Popper, A. N., M. E. Smith, P. A. Cott, B. W. Hanna, A. O. MacGillivray, M. E. Austin, and D. A. Mann. 2005. Effects of Exposure to Seismic Airgun Use on Hearing of Three Fish Species. J. Acoustic Soc. Am., 117:3958-3971.
Popper A. N., A. D. Hawkins, R. R. Fay, D. Mann, S. Bartol, Th. Carlson, S. Coombs, W. T. Ellison, R. Gentry, M. B. Halvorsen, S. Løkkeborg, P. Rogers, B. L. Southall, D. G. Zeddies, and W. N. Tavolga. 2014. Sound Exposure Guidelines for Fishes and Sea Turtles. A Technical Report prepared by ANSI-Accredited Standards Committee S3/SC1 and registered with ANSI.
Popper A. N., A. D. Hawkins, and M. B. Halvorsen. 2019. Anthropogenic Sound and Fishes. Washington Department of Transportation. Olympia, WA. Smith, M. E., A. B. Coffin, D. L. Miller, and A. N. Popper. 2006. Anatomical and Functional Recovery of the Goldfish (Carassius auratus) Ear following Noise Exposure. Journal of Experimental Biology 209 (Pt 21):4193–4202.
Rummer, J. L., and W. A. Bennett. 2005. Physiological effects of swim bladder overexpansion and catastrophic decompression on red snapper. Transactions of the American Fisheries Society, 134(6), 1457-1470.
Saunders, J. C., Y. E. Cohen, and Y. M. Szymko. 1991. "The structural and functional consequences of acoustic injury in the cochlea and peripheral auditory system: A five year update." J. Acoust. Soc. Am. 90, 147-155.
Schreer, J. F., J. Gokey, and V. J. DeGhett. 2009. The incidence and consequences of barotrauma in fish in the St. Lawrence River. North American Journal of Fisheries Management, 29(6), 1707-1713.
Slabbekoorn, H. 2018. Soundscape ecology of the Anthropocene. Acoustics Today, 14(1), 42-49.
Technical Guidance for Assessment of Hydroacoustic Effects of Pile Driving on Fish 3-13
October 2020
Smith, M. E. 2016. Relationship between hair cell loss and hearing loss in fishes. In A. N. Popper & A. D. Hawkins (Eds.), The Effects of Noise on Aquatic Life II (pp. 1067-1074). New York: Springer.
Smith, M. E., A. B. Coffin, D. L. Miller, and A. N. Popper. 2006. Anatomical and functional recovery of the goldfish (Carassius auratus) ear following noise exposure. The Journal of Experimental Biology, 209(Pt 21), 4193-4202.
Smith, M. E., and J. D. Monroe. 2016. Causes and consequences of sensory hair cell damage and recovery in fishes. In J. Sisneros (Ed.), Fish Hearing and Bioacoustics (pp. 393-417). New York: Springer.
Tavolga, W. N. 1977. Mechanisms for directional hearing in the sea catfish (Arius felis). Journal of Experimental Biology, 67, 97-115.
Yan, H. Y. 1998. “Auditory role of the suprabranchial chamber in gourami fish.” J. Comp. Physiol. A 183, 325-333.
Yelverton, J. T., D. R. Richmond, W. Hicks, H. Saunders, and E. R. Fletcher. 1975. The relationship between fish size and their response to underwater blast: Report DNA 3677T, Director, Defense Nuclear Agency, Washington, DC.

This page intentionally left blank.
Technical Guidance for Assessment of Hydroacoustic Effects of Pile Driving on Fish 4-1
October 2020
Chapter 4 Framework and Process for Environmental Analysis of Pile Driving Impacts on Fish
4.1 Introduction
Projects that involve driving piles in or near water typically require several federal, state, and local permits. Acquisition of these permits requires evaluation of the project and associated impacts to ensure its compliance with the laws and regulations pertaining to the environment and the geographical area of the project. This chapter focuses on the environmental and biological analysis required by regulatory authority to evaluate the effect on fish of underwater sound pressure generated by pile driving or other activities. This chapter addresses BMPs, avoidance and minimization measures, and performance standards and describes the permitting and regulatory requirements for pile driving activities, impacts associated with varied design and construction methods, as well as the information necessary, and impact analysis methods used, to evaluate potential project-related impacts. In addition to discussing the process for preparing an impact analysis, this chapter presents empirical data from projects involving pile driving and lessons learned from impact analyses conducted for prior projects.
To support project delivery efforts, action agencies including Caltrans and the Federal Highways Administration must prepare a BA that determines whether a proposed construction activity, using state or federal funding, is likely to adversely affect listed species, proposed listed species, or designated critical habitat (DCH), thereby resulting in incidental take.
When adverse effects are likely to occur, the participating Federal resource agency or agencies respond with a Biological Opinion that documents whether a federal action is likely to jeopardize the continued existence of listed species or result in the destruction or adverse modification of critical habitat. The Biological Opinion also provides the action agency with an exemption for Incidental Take. For CESA, the California Department of Fish and Wildlife (CDFW) responds with either a consistency determination (CD 2080.1) based on the biological opinion, or, if it does not agree with all measures in the biological opinion, CDFW requires an Incidental Take Permit (ITP 2081), which generally requires further measures to fully mitigate all impacts that cannot be completely avoided or minimized through reasonable and feasible methodologies.
Take is defined by FESA as “harass, harm, pursue, hunt, shoot, wound, kill, trap, capture, or collect any threatened or endangered species.” For the purposes of FESA, the regulatory agencies define harm as any act that actually kills or injures fish or wildlife and emphasizes that such acts may include significant habitat modification or degradation that impairs essential behavioral patterns or fish or wildlife. Take is defined by CESA as “harass, harm, pursue, hunt, shoot, wound, kill, trap, capture, or collect, or to attempt to engage in any such conduct.”
NOAA Fisheries applies a definition of take as “intentional or negligent action that has the potential to injure an animal or disrupt its normal behaviors to a point where such behaviors are
Technical Guidance for Assessment of Hydroacoustic Effects of Pile Driving on Fish 4-2
October 2020
abandoned or significantly altered.” In summary, resource agencies consider harm and harassment at the individual level; therefore, one affected protected individual has the potential to reach the threshold of harm or harassment.
Caltrans and FHWA recognize that the analysis of the effects of underwater sound pressure produced during pile driving on fish is not an exact science; it requires the best professional judgment based on scientific research and experience. In the absence of solid and specific supporting science, the Services will err in favor of the species, which may result in the incorporation of excessively conservative assumptions by all parties. The estimates prepared by project biologists and engineers form the basis of permit and agreement terms and conditions (limits and constraints) that will be placed on the project by resource agencies. Threshold exceedances during construction translate into project delays and cost increases and can contribute to strained relationships with agency partners and contractors.
Permit conditions related to pile driving may include a wide variety of requirements, such as daily and seasonal timing restrictions, peak and cumulative sound limitations, requirements for underwater sound attenuation systems, fish salvage or exclusion, hydroacoustic monitoring, fish monitoring and special studies, and mitigation plans for the take of state-listed species. There are substantial costs and time delays associated with implementation of these requirements, which are triggered by injury and behavioral criterial that were developed more than 10 years ago and based on a limited amount of qualified data.
4.2 Permits and Regulatory Requirements for In-Water and Near-Water Pile Driving Activities
Table 4-1 identifies the permits and approvals that typically require a description of activities and an evaluation of underwater sound pressure generated by pile driving. Also included are lists and examples of project specific information that are needed in the analysis and documentation in order to acquire the necessary permit for project efforts. For a complete discussion of biological permits and approvals required for Department projects and associated regulatory procedures, please refer to the Department Standard Environmental Reference (SER).
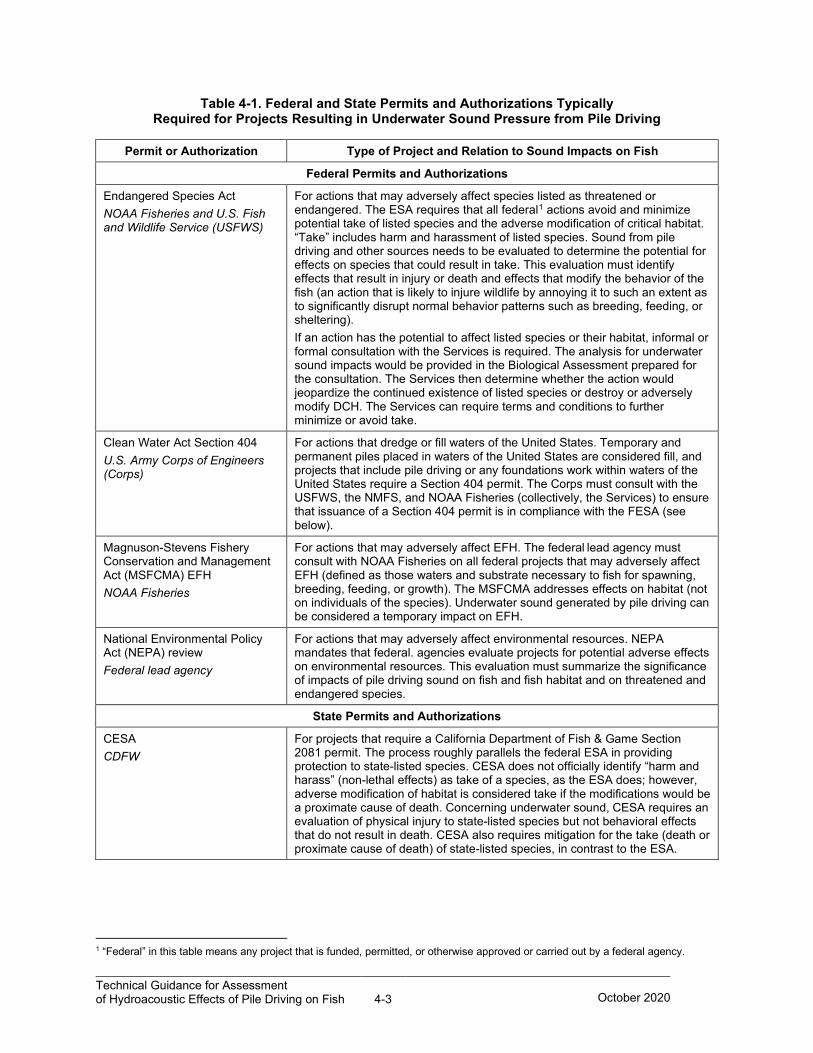
Technical Guidance for Assessment of Hydroacoustic Effects of Pile Driving on Fish 4-3
October 2020
Table 4-1. Federal and State Permits and Authorizations Typically Required for Projects Resulting in Underwater Sound Pressure from Pile Driving
Permit or Authorization Type of Project and Relation to Sound Impacts on Fish
Federal Permits and Authorizations
Endangered Species Act NOAA Fisheries and U.S. Fish and Wildlife Service (USFWS)
For actions that may adversely affect species listed as threatened or endangered. The ESA requires that all federal1 actions avoid and minimize potential take of listed species and the adverse modification of critical habitat. “Take” includes harm and harassment of listed species. Sound from pile driving and other sources needs to be evaluated to determine the potential for effects on species that could result in take. This evaluation must identify effects that result in injury or death and effects that modify the behavior of the fish (an action that is likely to injure wildlife by annoying it to such an extent as to significantly disrupt normal behavior patterns such as breeding, feeding, or sheltering). If an action has the potential to affect listed species or their habitat, informal or formal consultation with the Services is required. The analysis for underwater sound impacts would be provided in the Biological Assessment prepared for the consultation. The Services then determine whether the action would jeopardize the continued existence of listed species or destroy or adversely modify DCH. The Services can require terms and conditions to further minimize or avoid take.
Clean Water Act Section 404 U.S. Army Corps of Engineers (Corps)
For actions that dredge or fill waters of the United States. Temporary and permanent piles placed in waters of the United States are considered fill, and projects that include pile driving or any foundations work within waters of the United States require a Section 404 permit. The Corps must consult with the USFWS, the NMFS, and NOAA Fisheries (collectively, the Services) to ensure that issuance of a Section 404 permit is in compliance with the FESA (see below).
Magnuson-Stevens Fishery Conservation and Management Act (MSFCMA) EFH NOAA Fisheries
For actions that may adversely affect EFH. The federal lead agency must consult with NOAA Fisheries on all federal projects that may adversely affect EFH (defined as those waters and substrate necessary to fish for spawning, breeding, feeding, or growth). The MSFCMA addresses effects on habitat (not on individuals of the species). Underwater sound generated by pile driving can be considered a temporary impact on EFH.
National Environmental Policy Act (NEPA) review Federal lead agency
For actions that may adversely affect environmental resources. NEPA mandates that federal. agencies evaluate projects for potential adverse effects on environmental resources. This evaluation must summarize the significance of impacts of pile driving sound on fish and fish habitat and on threatened and endangered species.
State Permits and Authorizations
CESA CDFW
For projects that require a California Department of Fish & Game Section 2081 permit. The process roughly parallels the federal ESA in providing protection to state-listed species. CESA does not officially identify “harm and harass” (non-lethal effects) as take of a species, as the ESA does; however, adverse modification of habitat is considered take if the modifications would be a proximate cause of death. Concerning underwater sound, CESA requires an evaluation of physical injury to state-listed species but not behavioral effects that do not result in death. CESA also requires mitigation for the take (death or proximate cause of death) of state-listed species, in contrast to the ESA.
1 “Federal” in this table means any project that is funded, permitted, or otherwise approved or carried out by a federal agency.
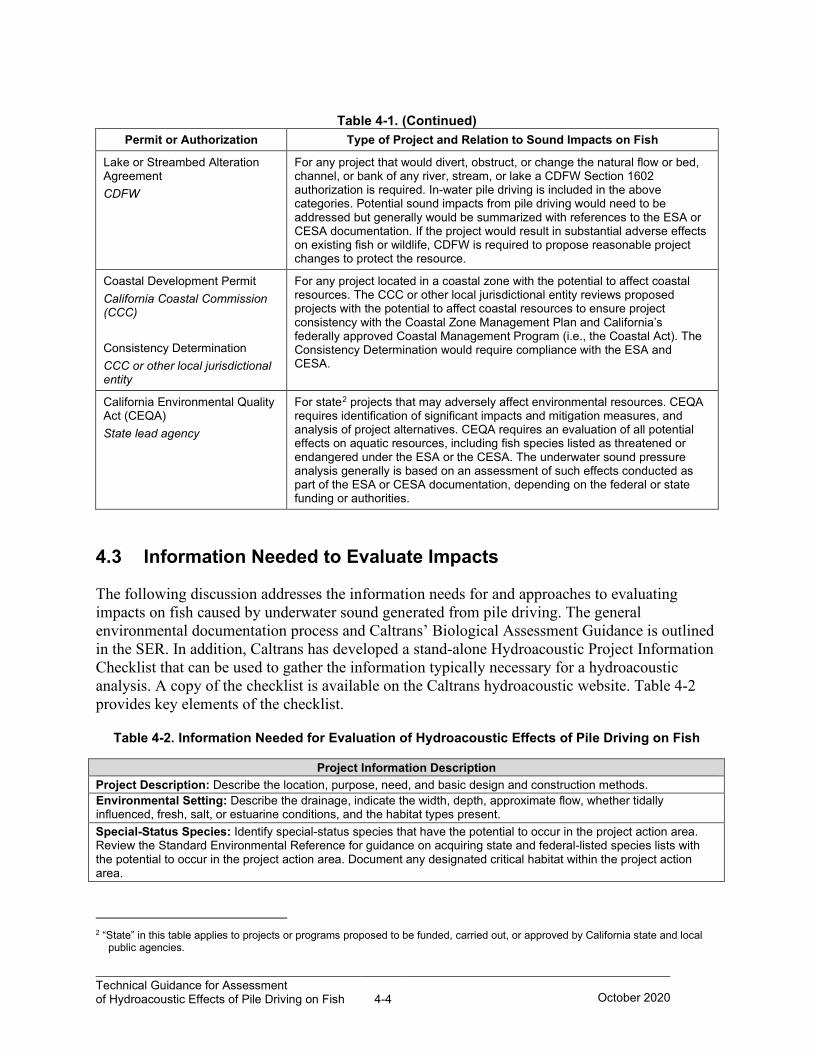
Technical Guidance for Assessment of Hydroacoustic Effects of Pile Driving on Fish 4-4
October 2020
Table 4-1. (Continued) Permit or Authorization Type of Project and Relation to Sound Impacts on Fish
Lake or Streambed Alteration Agreement CDFW
For any project that would divert, obstruct, or change the natural flow or bed, channel, or bank of any river, stream, or lake a CDFW Section 1602 authorization is required. In-water pile driving is included in the above categories. Potential sound impacts from pile driving would need to be addressed but generally would be summarized with references to the ESA or CESA documentation. If the project would result in substantial adverse effects on existing fish or wildlife, CDFW is required to propose reasonable project changes to protect the resource.
Coastal Development Permit California Coastal Commission (CCC) Consistency Determination CCC or other local jurisdictional entity
For any project located in a coastal zone with the potential to affect coastal resources. The CCC or other local jurisdictional entity reviews proposed projects with the potential to affect coastal resources to ensure project consistency with the Coastal Zone Management Plan and California’s federally approved Coastal Management Program (i.e., the Coastal Act). The Consistency Determination would require compliance with the ESA and CESA.
California Environmental Quality Act (CEQA) State lead agency
For state2 projects that may adversely affect environmental resources. CEQA requires identification of significant impacts and mitigation measures, and analysis of project alternatives. CEQA requires an evaluation of all potential effects on aquatic resources, including fish species listed as threatened or endangered under the ESA or the CESA. The underwater sound pressure analysis generally is based on an assessment of such effects conducted as part of the ESA or CESA documentation, depending on the federal or state funding or authorities.
4.3 Information Needed to Evaluate Impacts
The following discussion addresses the information needs for and approaches to evaluating impacts on fish caused by underwater sound generated from pile driving. The general environmental documentation process and Caltrans’ Biological Assessment Guidance is outlined in the SER. In addition, Caltrans has developed a stand-alone Hydroacoustic Project Information Checklist that can be used to gather the information typically necessary for a hydroacoustic analysis. A copy of the checklist is available on the Caltrans hydroacoustic website. Table 4-2 provides key elements of the checklist.
Table 4-2. Information Needed for Evaluation of Hydroacoustic Effects of Pile Driving on Fish
Project Information Description Project Description: Describe the location, purpose, need, and basic design and construction methods. Environmental Setting: Describe the drainage, indicate the width, depth, approximate flow, whether tidally influenced, fresh, salt, or estuarine conditions, and the habitat types present.
Special-Status Species: Identify special-status species that have the potential to occur in the project action area. Review the Standard Environmental Reference for guidance on acquiring state and federal-listed species lists with the potential to occur in the project action area. Document any designated critical habitat within the project action area.
2 “State” in this table applies to projects or programs proposed to be funded, carried out, or approved by California state and local
public agencies.
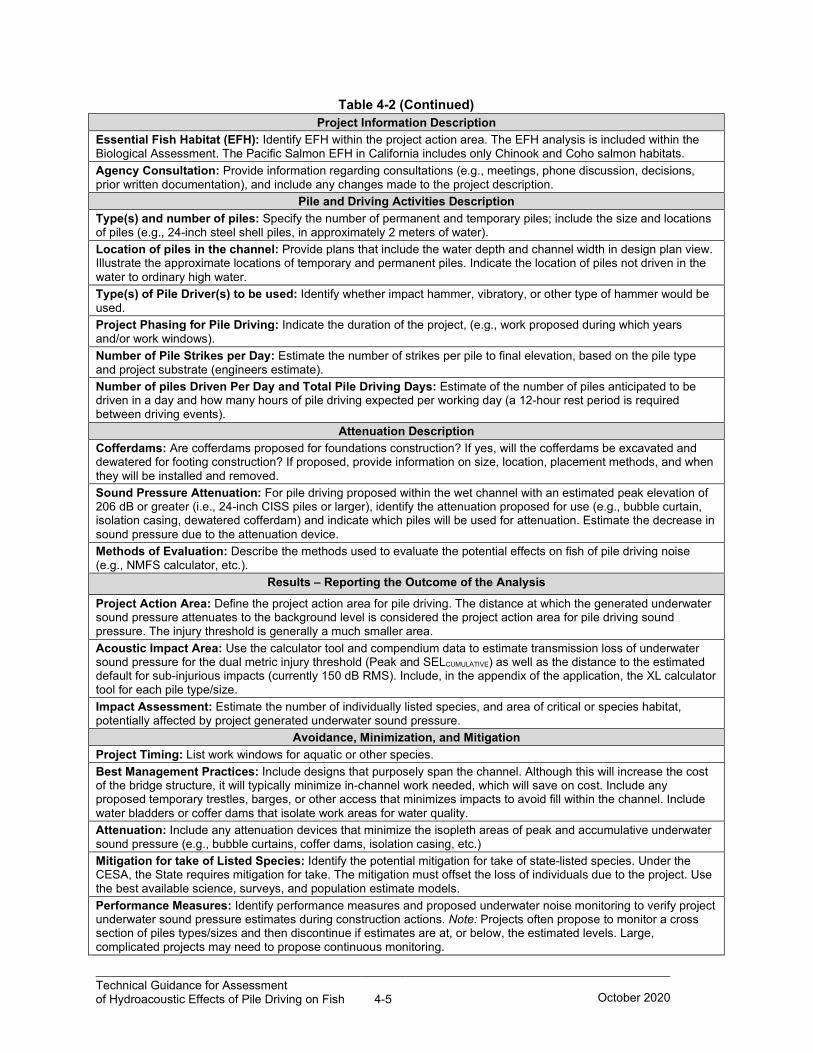
Technical Guidance for Assessment of Hydroacoustic Effects of Pile Driving on Fish 4-5
October 2020
Table 4-2 (Continued) Project Information Description
Essential Fish Habitat (EFH): Identify EFH within the project action area. The EFH analysis is included within the Biological Assessment. The Pacific Salmon EFH in California includes only Chinook and Coho salmon habitats. Agency Consultation: Provide information regarding consultations (e.g., meetings, phone discussion, decisions, prior written documentation), and include any changes made to the project description.
Pile and Driving Activities Description Type(s) and number of piles: Specify the number of permanent and temporary piles; include the size and locations of piles (e.g., 24-inch steel shell piles, in approximately 2 meters of water). Location of piles in the channel: Provide plans that include the water depth and channel width in design plan view. Illustrate the approximate locations of temporary and permanent piles. Indicate the location of piles not driven in the water to ordinary high water. Type(s) of Pile Driver(s) to be used: Identify whether impact hammer, vibratory, or other type of hammer would be used. Project Phasing for Pile Driving: Indicate the duration of the project, (e.g., work proposed during which years and/or work windows). Number of Pile Strikes per Day: Estimate the number of strikes per pile to final elevation, based on the pile type and project substrate (engineers estimate). Number of piles Driven Per Day and Total Pile Driving Days: Estimate of the number of piles anticipated to be driven in a day and how many hours of pile driving expected per working day (a 12-hour rest period is required between driving events).
Attenuation Description Cofferdams: Are cofferdams proposed for foundations construction? If yes, will the cofferdams be excavated and dewatered for footing construction? If proposed, provide information on size, location, placement methods, and when they will be installed and removed. Sound Pressure Attenuation: For pile driving proposed within the wet channel with an estimated peak elevation of 206 dB or greater (i.e., 24-inch CISS piles or larger), identify the attenuation proposed for use (e.g., bubble curtain, isolation casing, dewatered cofferdam) and indicate which piles will be used for attenuation. Estimate the decrease in sound pressure due to the attenuation device. Methods of Evaluation: Describe the methods used to evaluate the potential effects on fish of pile driving noise (e.g., NMFS calculator, etc.).
Results – Reporting the Outcome of the Analysis Project Action Area: Define the project action area for pile driving. The distance at which the generated underwater sound pressure attenuates to the background level is considered the project action area for pile driving sound pressure. The injury threshold is generally a much smaller area. Acoustic Impact Area: Use the calculator tool and compendium data to estimate transmission loss of underwater sound pressure for the dual metric injury threshold (Peak and SELCUMULATIVE) as well as the distance to the estimated default for sub-injurious impacts (currently 150 dB RMS). Include, in the appendix of the application, the XL calculator tool for each pile type/size. Impact Assessment: Estimate the number of individually listed species, and area of critical or species habitat, potentially affected by project generated underwater sound pressure.
Avoidance, Minimization, and Mitigation Project Timing: List work windows for aquatic or other species. Best Management Practices: Include designs that purposely span the channel. Although this will increase the cost of the bridge structure, it will typically minimize in-channel work needed, which will save on cost. Include any proposed temporary trestles, barges, or other access that minimizes impacts to avoid fill within the channel. Include water bladders or coffer dams that isolate work areas for water quality. Attenuation: Include any attenuation devices that minimize the isopleth areas of peak and accumulative underwater sound pressure (e.g., bubble curtains, coffer dams, isolation casing, etc.) Mitigation for take of Listed Species: Identify the potential mitigation for take of state-listed species. Under the CESA, the State requires mitigation for take. The mitigation must offset the loss of individuals due to the project. Use the best available science, surveys, and population estimate models. Performance Measures: Identify performance measures and proposed underwater noise monitoring to verify project underwater sound pressure estimates during construction actions. Note: Projects often propose to monitor a cross section of piles types/sizes and then discontinue if estimates are at, or below, the estimated levels. Large, complicated projects may need to propose continuous monitoring.
Technical Guidance for Assessment of Hydroacoustic Effects of Pile Driving on Fish 4-6
October 2020
The analysis will require a detailed project description that identifies the purpose and need for the project and the alternatives that were considered and rejected. The project components should be described in sufficient detail to support the analysis of pile driving effects on fish and aquatic habitats. This initial description should specify all pile driving activities associated with the project, including which piles (e.g., permanent and temporary piles, and cofferdams) would be in or near surface waters. A description of the construction methods that may be used (e.g., construction site isolation from water [cofferdams or water bladders], dewatering of the isolation structure, construction of footings, methods of demolition of the structure being replaced, temporary bridges or trestles, temporary fill, use of barges or tugs, and use of explosives) is important because these methods would contribute to the level, attenuation, and duration of underwater sound generation.
The information gathered with the checklist is required to estimate the underwater sound that the project is estimated to generate. The pile size, pile type, and pile driver type are factors for estimating the unattenuated LPEAK and single-strike SEL. These estimates require further refinement if some method of sound attenuation is planned (e.g., a bubble curtain, cofferdam, or isolation casing). The information for number of piles, number of strikes per pile, and phasing of pile driving activities is used to estimate the underwater sound pressure level that a fish might be exposed to through a pile driving event (e.g., one day of pile driving), which is referred to as accumulated SEL (SELCUMULATIVE). Despite fish being migratory and unlikely to stay in the project area for the entire driving event, it is currently a requirement in California, Washington, and Oregon to assume fish are exposed to the entire event over a 24 hour period. NMFS does not require the use of the dual criteria for the 47 other states, as staff in those state realize that the dual metric accumulated SEL and the assumption that fish do not move for an entire day is flawed.
Information on the consultation refers to consultation with NOAA Fisheries, CDFW, or U.S. Fish and Wildlife Service regarding project-related potential effects on federally listed or state-listed species and their habitat. It is particularly important to discuss any modifications to the project design or timing in response to federal, state, or local agency requirements or recommendations.
A list of project area specific special-status fish and aquatic species is required to determine which species and life histories may be exposed to and affected by underwater sound during pile driving. The project biologist should contact NOAA Fisheries, USFWS, and CDFW to determine which species to address for the watershed in which the project is located. The consultation should address federally listed and state-listed species and the potential presence of fish or other sensitive species in the project action area. The presence of EFH needs to be determined (see Section 4.5.4, Protected Status). Many of the listed species such as salmon, Steelhead, or sturgeon are anadromous, which means that spawning and juvenile rearing occurs within freshwater streams and rivers. After a year in the freshwater system, anadromous fish then migrate to the ocean until they reach reproductive maturity, after which adults then return to their natal freshwater areas to spawn. The location of the project in the watershed and the timing of the project are important factors in determining the presence and relative abundance of fish that could be exposed to pile driving underwater sound pressure. NOAA Fisheries, USFWS, and CDFW staff should be contacted to determine the approved in-water work windows during which pile driving can occur. The agencies have established these timing windows to minimize
Technical Guidance for Assessment of Hydroacoustic Effects of Pile Driving on Fish 4-7
October 2020
the potential for listed fish species to be present in the project area during construction activities. Work windows are another metric used to avoid and minimize impacts to listed species.
In some locations, sensitive fish species are present year-round. For instance, rearing coho salmon and steelhead can be present throughout the year, particularly in coastal streams. Green sturgeon is considered present year-round in the Bay-Delta and Sacramento River, and potentially the lower reaches of the San Joaquin River and tributaries of the two rivers. Eulachon, Sacramento splittail, and delta and longfin smelt may be present in San Francisco Bay and estuary year-round. Territorial species, such as tidewater gobies, also may be present year-round in specific estuaries. Other listed species occur year-round in specific habitats throughout the state.
The timing and duration of pile driving activities and the life history phase of fish exposed to underwater sound pressure generated by pile driving are important factors in determining potential effects, as well as reasonable and feasible avoidance and minimization measures for various species of fish that could be present during pile driving activities. The following section describes a suite of measures that can be incorporated into the design phase to avoid or minimize potential effects on species, BMPs that can be implemented in the field, and performance measures that can be used to ensure that potential project effects are minimized.
4.4 Avoidance and Minimization Measures, Best Management Practices, and Performance Standards
4.4.1 Avoidance and Minimization Measures
Avoidance and minimization measures should be incorporated into the project during the design phase; they include bridge foundation design that spans the channel, timing elements, and proper attenuation devices for all in-water pile driving work proposed for any piles that have the potential to exceed the peak threshold in order to avoid or minimize the potential exposure of fish to underwater sound pressure generated by pile driving. The following discussion addresses how innovative design, project timing, pile placement, equipment used, pile type, and pile size can avoid and minimize impacts on fish and their habitat.
4.4.1.1 Project Timing
Resource agencies typically establish in-water work windows for species or sensitive habitat areas to avoid or minimize the effects of construction on fish species or other aquatic species. The in-water work windows represent the periods with the least potential for a species, or a particular life history stage of a species, to be present in areas that might be affected by a project. Common work windows in California relate to the migratory patterns of salmon, steelhead, sturgeon and other threatened, endangered, or listed species. Although the specific timing can vary by location, species, and life stage of concern, in-water work windows for salmonids typically are outside the principal migration periods (Oct-June), which generally require work windows for construction in the summer from June to October. Local CDFW, USFWS, and NOAA Fisheries biologists should be contacted to coordinate on all project and construction
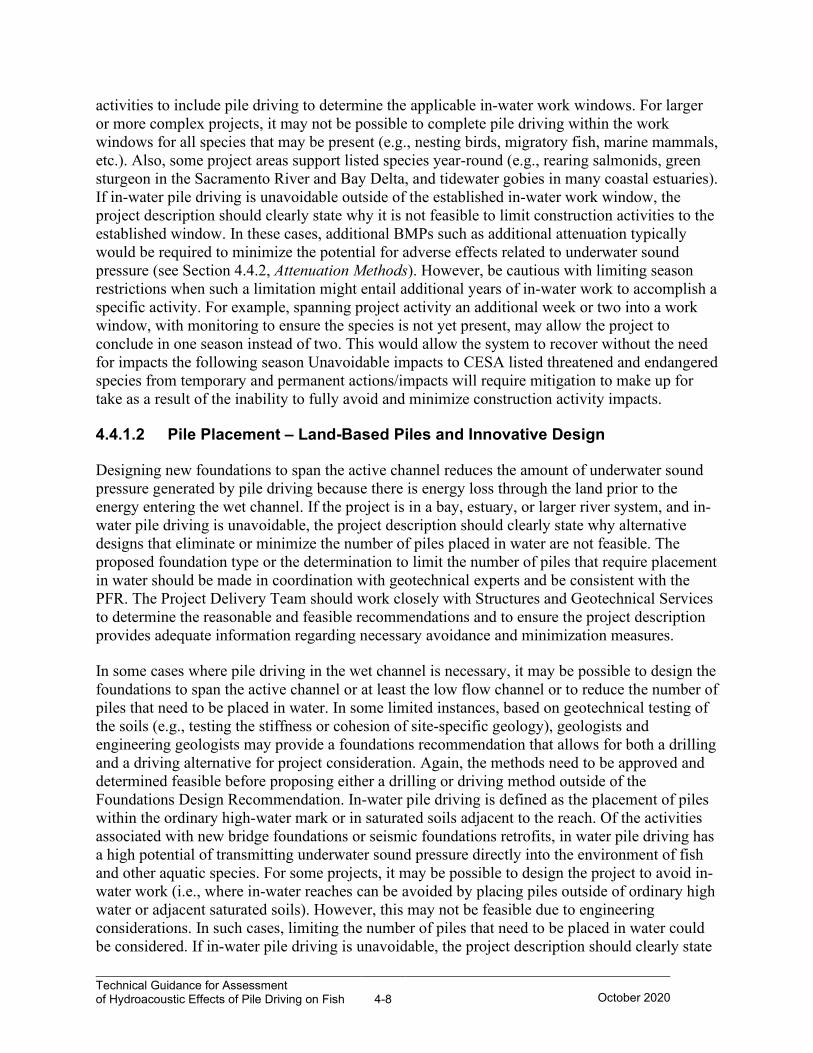
Technical Guidance for Assessment of Hydroacoustic Effects of Pile Driving on Fish 4-8
October 2020
activities to include pile driving to determine the applicable in-water work windows. For larger or more complex projects, it may not be possible to complete pile driving within the work windows for all species that may be present (e.g., nesting birds, migratory fish, marine mammals, etc.). Also, some project areas support listed species year-round (e.g., rearing salmonids, green sturgeon in the Sacramento River and Bay Delta, and tidewater gobies in many coastal estuaries). If in-water pile driving is unavoidable outside of the established in-water work window, the project description should clearly state why it is not feasible to limit construction activities to the established window. In these cases, additional BMPs such as additional attenuation typically would be required to minimize the potential for adverse effects related to underwater sound pressure (see Section 4.4.2, Attenuation Methods). However, be cautious with limiting season restrictions when such a limitation might entail additional years of in-water work to accomplish a specific activity. For example, spanning project activity an additional week or two into a work window, with monitoring to ensure the species is not yet present, may allow the project to conclude in one season instead of two. This would allow the system to recover without the need for impacts the following season Unavoidable impacts to CESA listed threatened and endangered species from temporary and permanent actions/impacts will require mitigation to make up for take as a result of the inability to fully avoid and minimize construction activity impacts.
4.4.1.2 Pile Placement – Land-Based Piles and Innovative Design
Designing new foundations to span the active channel reduces the amount of underwater sound pressure generated by pile driving because there is energy loss through the land prior to the energy entering the wet channel. If the project is in a bay, estuary, or larger river system, and in-water pile driving is unavoidable, the project description should clearly state why alternative designs that eliminate or minimize the number of piles placed in water are not feasible. The proposed foundation type or the determination to limit the number of piles that require placement in water should be made in coordination with geotechnical experts and be consistent with the PFR. The Project Delivery Team should work closely with Structures and Geotechnical Services to determine the reasonable and feasible recommendations and to ensure the project description provides adequate information regarding necessary avoidance and minimization measures.
In some cases where pile driving in the wet channel is necessary, it may be possible to design the foundations to span the active channel or at least the low flow channel or to reduce the number of piles that need to be placed in water. In some limited instances, based on geotechnical testing of the soils (e.g., testing the stiffness or cohesion of site-specific geology), geologists and engineering geologists may provide a foundations recommendation that allows for both a drilling and a driving alternative for project consideration. Again, the methods need to be approved and determined feasible before proposing either a drilling or driving method outside of the Foundations Design Recommendation. In-water pile driving is defined as the placement of piles within the ordinary high-water mark or in saturated soils adjacent to the reach. Of the activities associated with new bridge foundations or seismic foundations retrofits, in water pile driving has a high potential of transmitting underwater sound pressure directly into the environment of fish and other aquatic species. For some projects, it may be possible to design the project to avoid in-water work (i.e., where in-water reaches can be avoided by placing piles outside of ordinary high water or adjacent saturated soils). However, this may not be feasible due to engineering considerations. In such cases, limiting the number of piles that need to be placed in water could be considered. If in-water pile driving is unavoidable, the project description should clearly state
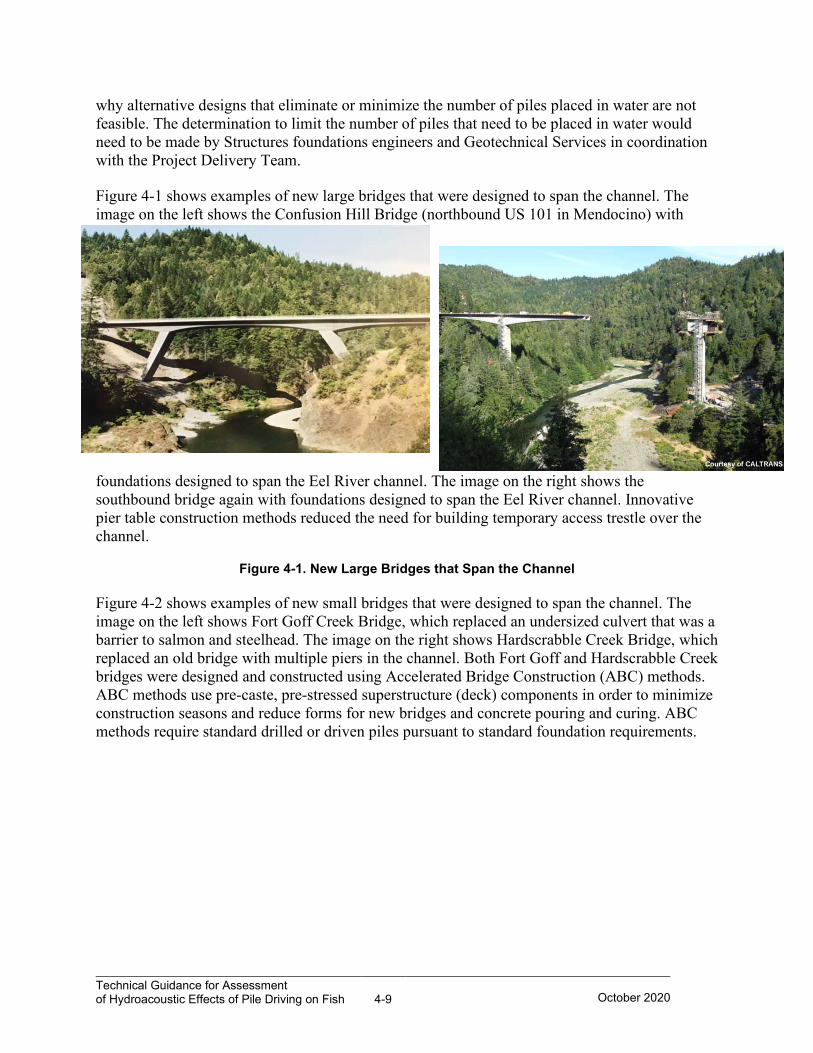
Technical Guidance for Assessment of Hydroacoustic Effects of Pile Driving on Fish 4-9
October 2020
why alternative designs that eliminate or minimize the number of piles placed in water are not feasible. The determination to limit the number of piles that need to be placed in water would need to be made by Structures foundations engineers and Geotechnical Services in coordination with the Project Delivery Team.
Figure 4-1 shows examples of new large bridges that were designed to span the channel. The image on the left shows the Confusion Hill Bridge (northbound US 101 in Mendocino) with
foundations designed to span the Eel River channel. The image on the right shows the southbound bridge again with foundations designed to span the Eel River channel. Innovative pier table construction methods reduced the need for building temporary access trestle over the channel.
Figure 4-1. New Large Bridges that Span the Channel
Figure 4-2 shows examples of new small bridges that were designed to span the channel. The image on the left shows Fort Goff Creek Bridge, which replaced an undersized culvert that was a barrier to salmon and steelhead. The image on the right shows Hardscrabble Creek Bridge, which replaced an old bridge with multiple piers in the channel. Both Fort Goff and Hardscrabble Creek bridges were designed and constructed using Accelerated Bridge Construction (ABC) methods. ABC methods use pre-caste, pre-stressed superstructure (deck) components in order to minimize construction seasons and reduce forms for new bridges and concrete pouring and curing. ABC methods require standard drilled or driven piles pursuant to standard foundation requirements.
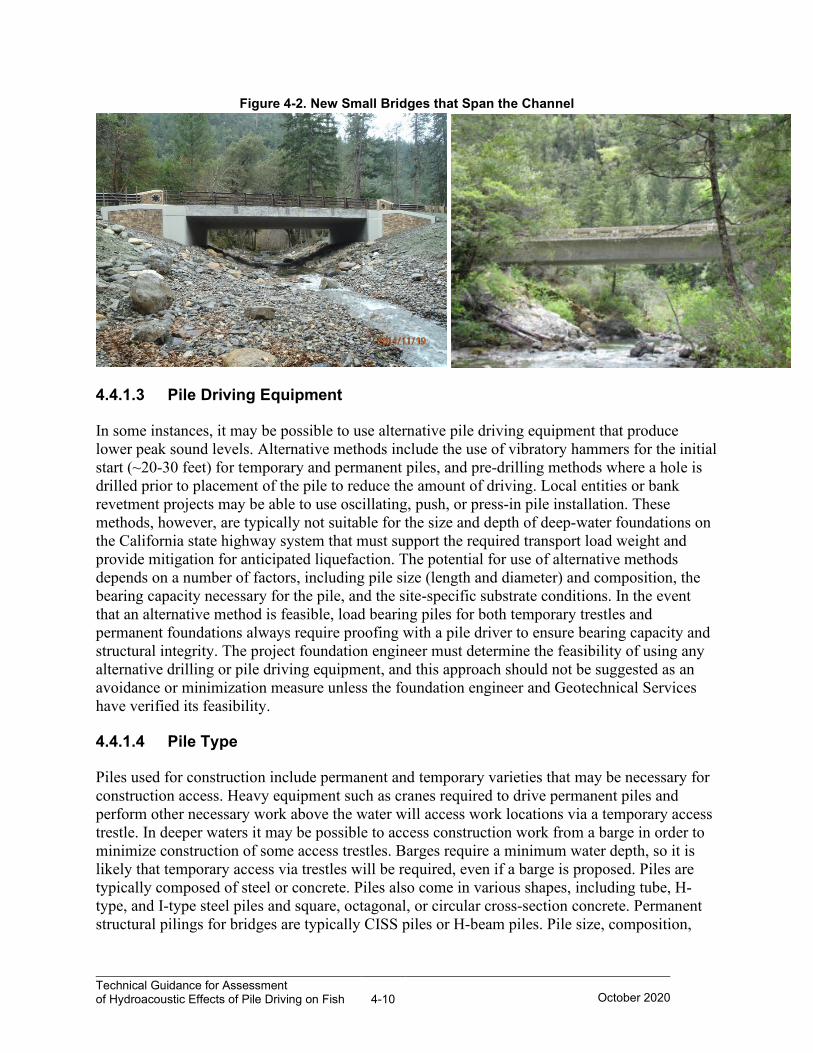
Technical Guidance for Assessment of Hydroacoustic Effects of Pile Driving on Fish 4-10
October 2020
Figure 4-2. New Small Bridges that Span the Channel
4.4.1.3 Pile Driving Equipment
In some instances, it may be possible to use alternative pile driving equipment that produce lower peak sound levels. Alternative methods include the use of vibratory hammers for the initial start (~20-30 feet) for temporary and permanent piles, and pre-drilling methods where a hole is drilled prior to placement of the pile to reduce the amount of driving. Local entities or bank revetment projects may be able to use oscillating, push, or press-in pile installation. These methods, however, are typically not suitable for the size and depth of deep-water foundations on the California state highway system that must support the required transport load weight and provide mitigation for anticipated liquefaction. The potential for use of alternative methods depends on a number of factors, including pile size (length and diameter) and composition, the bearing capacity necessary for the pile, and the site-specific substrate conditions. In the event that an alternative method is feasible, load bearing piles for both temporary trestles and permanent foundations always require proofing with a pile driver to ensure bearing capacity and structural integrity. The project foundation engineer must determine the feasibility of using any alternative drilling or pile driving equipment, and this approach should not be suggested as an avoidance or minimization measure unless the foundation engineer and Geotechnical Services have verified its feasibility.
4.4.1.4 Pile Type
Piles used for construction include permanent and temporary varieties that may be necessary for construction access. Heavy equipment such as cranes required to drive permanent piles and perform other necessary work above the water will access work locations via a temporary access trestle. In deeper waters it may be possible to access construction work from a barge in order to minimize construction of some access trestles. Barges require a minimum water depth, so it is likely that temporary access via trestles will be required, even if a barge is proposed. Piles are typically composed of steel or concrete. Piles also come in various shapes, including tube, H-type, and I-type steel piles and square, octagonal, or circular cross-section concrete. Permanent structural pilings for bridges are typically CISS piles or H-beam piles. Pile size, composition,

Technical Guidance for Assessment of Hydroacoustic Effects of Pile Driving on Fish 4-11
October 2020
and shape depend on several factors, including necessary bearing capacity, pile length and diameter, pile function, and substrate type.
Figure 4-3 shows temporary trestles and barges used during bridge construction. The image on the left shows a temporary trestle constructed to access shallow and mud flat areas during the Humboldt Bay Bridge seismic retrofit project. The image on the right shows a barge used for construction in deeper waters during the Humboldt Bay Bridge’s seismic retrofit project.
Technical Guidance for Assessment of Hydroacoustic Effects of Pile Driving on Fish 4-12
October 2020
Figure 4-3. Temporary Trestle and Barge Used During Bridge Construction
Alternative pile types may be possible in order to reduce underwater sound pressure levels. For example, if feasible, driving concrete or H-beam piles instead of steel shell piles would result in reduced underwater sound pressure from individual pile strikes (see Chapter 2, Fundamentals of Hydroacoustics, and Appendix I, Compendium of Pile Driving Sound Data). The use of an alternative pile type must be reviewed by the Structures foundations engineer and geotechnical experts for site-specific feasibility before any alternative method is proposed as an avoidance or minimization measure.
4.4.1.5 Pile Size
Use of smaller piles may be a consideration for construction in or close to sensitive habitats if engineering constraints do not limit smaller pile feasibility. For instance, if an over-water structure is constructed near an occupied sensitive habitat (e.g., high-quality occupied salmonid rearing habitat), reduction in the pile size may reduce LPEAK, which would attenuate to non-injurious levels before entering the habitat of concern. However, care should be taken in determining whether using smaller piles would be more protective than using larger ones. Use of smaller piles often requires that more piles be driven—resulting in a larger number of pile strikes than if larger piles were used. Therefore, even though peak underwater sound pressure values would be reduced by using smaller piles, SELCUMULATIVE values during a pile driving event could be greater with smaller piles than with larger ones. In addition, the Structures foundation engineer and geotechnical experts must verify that use of smaller piles as a sound reduction strategy is feasible before it is proposed to resource agencies.
Technical Guidance for Assessment of Hydroacoustic Effects of Pile Driving on Fish 4-13
October 2020
4.4.2 Attenuation Methods
Attenuation methods, such as the use of underwater sound pressure attenuation devices, are BMPs that are incorporated into the project during design, project development, and construction phases to avoid or minimize the exposure of fish and other aquatic species to underwater sound pressure generated during pile driving. Various measures have been developed to attenuate underwater sound generated by pile driving, such as designing foundations to span the wet channel, air bubble curtains, cofferdams, isolation casings, and use of smaller piles, if feasible. These measures are discussed in detail in Chapter 2, Fundamentals of Hydroacoustics, and are summarized below. The goal in the implementation of attenuation methods is to demonstrate the intent to reasonably reduce underwater sound pressure.
4.4.2.1 Air Bubble Curtains
Air bubble curtains infuse the area surrounding the pile with air bubbles, creating a bubble screen that inhibits the propagation of underwater sound pressure from the pile. Results of reducing sound pressure waves on the effectiveness of air bubble curtains are varied.
The data generally indicate that an air bubble curtain used on a steel or concrete pile with a maximum cross-section dimension of 24 inches or less will provide approximately 5 dB of sound reduction. Sound reduction tends to increase as pile size increases. It is reasonable to assume that a bubble curtain for any size of pile will provide at least 5 dB of sound reduction. Sound reduction greater than 5 dB should not be assumed unless the system being used has documented evidence of higher performance. Proper design and implementation of the air bubble curtain are key factors in the effectiveness of this strategy. For example, use of a bubble curtain in a channel with substantial current would not be effective without a sleeve around the pile to confine the bubbles to the area around the pile. Because of the uncertainties associated with the degree of attenuation that an air bubble curtain would provide, Caltrans recommends that the attenuation assumed for any attenuation device be limited to 5 dB.
4.4.2.2 Cofferdams
Cofferdams are temporary structures used to isolate an area that is either near the wet channel or submerged underwater from the water column. Cofferdams are most commonly fabricated from sheet piling. Inflatable water bladders can also be used to isolate and confine a portion of the channel from an area of flow or migration. When piles are driven in the water, cofferdams are often used to isolate the work area from the surrounding water column. Cofferdams typically are dewatered, which attenuates sound by providing an air space between the exposed pile and the water column. If a dewatered cofferdam is proposed for use, NOAA Fisheries or CDFW approve dewatering and, depending on the site, may require fish salvage protocols. Cofferdams that are not dewatered also can be used, but they provide very limited attenuation of underwater sound pressure. If the cofferdam cannot be effectively dewatered, additional attenuation can be achieved by using a bubble curtain inside a cofferdam. The project engineer must verify that use of a cofferdam is necessary for the foundation construction and that the method will provide a reasonable and feasible underwater sound reduction strategy before it is proposed to the resource agencies.
Technical Guidance for Assessment of Hydroacoustic Effects of Pile Driving on Fish 4-14
October 2020
Dewatered cofferdams generally can be expected to provide attenuation that is at least as great as the attenuation provided by air bubble curtains. Because of the uncertainties associated with degree of attenuation that would be provided by a cofferdam, it is recommended that attenuation assumed for any attenuation device be limited to 5 dB.
4.4.2.3 Isolation Casings
Double wall isolation casings are hollow casings slightly larger in diameter than the pile that is being driven, which have an annular gap between the two casings to create a barrier to transmission of underwater sound pressure directly into the water column. The casing, typically two larger hollow steel shell or steel corrugated pipes, are inserted into the water column and slightly pressed into the bottom substrate. If a single casing is proposed, then it must be dewatered, which can be a continuous struggle since water will continue to infiltrate from below. The pile would then be driven within the dewatered isolation casing. Isolation casings are similar to cofferdams in that they isolate the work area from the water column; however, they cannot be used to isolate large areas because isolation casings have a smaller footprint. In addition, because the air space is smaller between the pile and the casing, isolation casings do not have as much attenuation value as cofferdams. Dewatered isolation casings generally can be expected to provide attenuation that is at least as great as the attenuation provided by air bubble curtains. Because of the uncertainties associated with degree of attenuation that would be provided by isolation casings, Caltrans recommends that no more than 2 dB of attenuation be assumed.
4.4.2.4 Cushion Blocks
Cushion blocks are often used when driving wooden dock piles or concrete piles. Larger piles, like the ones driven on Caltrans projects, require a larger hammer with enough energy to drive the pile. Cushion blocks are repeatedly obliterated by the hammer when tested on larger piles. The obliterated cushion block ends up in the waterway below, and it is unsafe and infeasible for workers to repeatedly stop the driving activity to replace the cushion block and remove debris from the obliterated block from the water. Cushion blocks reduce the energy of each strike, which results in additional strikes at the lower decibel level in order to drive the pile to refusal. Therefore, if pile type and size are not expected to exceed the peak criterion, use of a cushion block would only increase the size of the area of accumulated sound pressure level.
The Washington Department of Transportation conducted a study to evaluate the effectiveness of various cushion block materials in reducing underwater sound during the driving of 12-inch diameter steel pipe piles generation (Washington Department of Transportation 2006). Because a pile cap is typically used for impact driving, the absolute sound level reductions indicated in the Washington Department of Transportation report do not represent the sound level reductions that can be expected by using any given pile cap. However, the results do indicate that wood is the most effective, and nylon the least effective, in reducing underwater sound pressure. Unfortunately, wood is less durable than nylon and polymer materials and is impractical to use during bridge construction.
Because of the limited nature of this study, it is recommended that use of pile caps not be considered a specific noise reduction treatment and that no specific sound level reduction credit be taken for the use of pile caps.
Technical Guidance for Assessment of Hydroacoustic Effects of Pile Driving on Fish 4-15
October 2020
4.4.3 Performance Standards
Performance standards based on measurable objectives consistent with a project’s regulatory or permitting requirements may define an acceptable level of environmental effect from project activities. For some project elements that are unknown at the time of an environmental assessment, it may be necessary to indicate what performance standards will need to be met even though there may some uncertainty as to how an activity will be performed or what measures will be implemented to avoid or minimize potential adverse effects. For example, if the type of equipment or construction method has not been determined or is subject to change, the Structures foundations engineer or biologist can specify the performance standards that will be monitored (or verified) during construction, and the measures that will be implemented if the standards are not met.
In the subsequent section, methods are presented to determine the potential impacts on fish from underwater sound pressure generated by pile driving. In the pre-project analysis, several assumptions are made regarding the duration of activities, the magnitude of sound propagation, natural sound attenuation (e.g., land-based driving and transmission loss over distance), and the effectiveness of sound attenuating devices used for pile installation. Performance standards required for pile driving can include monitoring the actual pile driving activity to verify the estimated underwater sound pressure levels at one or more distances, when warranted, from the pile driving activity.
The pile driving logs that are compiled during the actual pile driving activity provide useful information that can contribute to performance evaluations. The follow data may be recorded in these logs.
• Activity date
• Location of pile
• Depth, type, and diameter of pile
• Type of pile driver
• Start and completion time for each pile driven
• Actual drive time
• Blow counts
• Blow rates
• Energy of each blow
• Type of blow
• Downtime
These data can be compiled for an accurate record of activities and sound generation. In combination with sound monitoring (see Appendix II, Procedures for Measuring Pile Driving Sound), this information is useful for post-project evaluations.
Technical Guidance for Assessment of Hydroacoustic Effects of Pile Driving on Fish 4-16
October 2020
The scope of the sound monitoring studies depends on the specific activities, site-specific environmental conditions, and the type and sensitivity of the species and habitats in the vicinity of the project. Appendix II Procedures for Measuring Pile Driving Sound, discusses sound monitoring goals and objectives, and methods currently used to monitor sound associated with pile driving.
4.5 Considerations for Assessing Impacts
Fish can be found in nearly any marine, estuarine, and freshwater environment. Therefore, pile driving activities in or near any aquatic environment should be assessed for potential impacts on fish species and their habitats. Four factors generally should be considered when assessing impacts on different fish populations: habitat, sound sensitivity, behavior and life history, and protected status.
4.5.1 Habitat
California contains a variety of aquatic habitat types—from large bays and mainstem rivers to estuaries, lakes, and small headwater streams. A diverse assemblage of fish species uses these aquatic habitats. This document does not provide a comprehensive list of all the fish species that may be encountered in California waters but identifies the most common and those that are currently protected by state or federal regulations. The information provided here is intended to aid in determining what fish species may be present in a given aquatic habitat. After determining which species are likely to occur in the affected habitat, one must consider the potential for impacts on the species based on its sensitivity and probable exposure and response to pile driving sound. Refer to the SER for state and FESA consultation guidance.
4.5.2 Sound Sensitivity
Fish differ in regard to their sensitivity to underwater sound pressure. As discussed in Chapter 3, Fundamentals of Hydroacoustic Impacts on Fish, some species (e.g., herring, croakers, shad) are particularly sensitive to sound, possessing specialized structures and sensory systems to detect and, presumably, use sound to direct their activities and respond adaptively to their environment. Consequently, these species are likely most sensitive to pile driving and other anthropomorphic sources of underwater sound pressure such as boats, dock work, revetment and off-shore wind and energy projects. However, most species that may be encountered during pile driving projects in California do not have specialized structures or behavior related to underwater sound pressure.
Body size also affects the sensitivity of fish to sound. Smaller fish are generally more susceptible to physical injury from sound than larger fish. However, larger fish are generally more susceptible to TTS than smaller fish (see Section 4.6.4, Interim Injury Thresholds). The most comprehensive reviews of this information were conducted by Hastings and Popper (2005), Popper et al. (2006), and Carlson et al. (2007); these reviews are summarized in Chapter 3, Fundamentals of Hydroacoustic Impacts on Fish.
Technical Guidance for Assessment of Hydroacoustic Effects of Pile Driving on Fish 4-17
October 2020
4.5.3 Behavior and Life History
The behavior and life history of fish affect how they are exposed to underwater sound pressure generated by pile driving activities. Fish display a wide variety of behaviors that can affect their susceptibility to underwater sound exposure and their response to sound pressure or other disturbances. An understanding of these behaviors can help avoid impacts. For example, information about migration timing for different salmon runs can be used to determine the appropriate timing for pile driving activities to avoid or minimize exposure of migrating fish. Other species like tidewater goby are less mobile and are, therefore, potentially subject to longer periods or higher levels of exposure. Other fish may behave and use habitats differently; these factors must be considered when determining potential effects on fish present in the area of pile driving activities.
4.5.4 Protected Status
Some species have distinct legal status and require special protection. FESA and CESA regulate actions in aquatic environments related to specific listed fish or aquatic species. While there is considerable overlap in the species that are listed under the CESA and FESA, the lists do not coincide exactly. It is important to note that the listing status of these species can change at any time; therefore, updated species lists always should be requested from the regulatory agencies (NOAA Fisheries, USFWS, and CDFW) when planning a project involving pile driving in or near fish-bearing waters. Typically, official species lists expire after 180 days.
FESA requires designation of critical habitat for listed populations. DCH refers to areas that are considered necessary for the survival and recovery of a species federally listed as threatened or endangered. The USFWS Threatened and Endangered Species System database is an excellent source of all regulatory information for federally listed species, including listing and critical habitat information, recovery plans and other recovery documents, habitat conservation plans, candidate conservation agreements, and safe harbor agreements. The data for California species are updated regularly. Guidance for state and federal lists are provided in the SER.
Other habitats for commercially important fish species are protected under the MSFCA. As noted earlier, the MSFCA governs the conservation and management of EFH and “those waters and substrate necessary to fish for spawning, breeding, feeding, or growth to maturity.” EFH has been designated for 83 species of Pacific Coast groundfish, three species of salmon (two of which, Chinook salmon and coho salmon, are found in California), and five species of coastal pelagic fish and squid that are managed by the Pacific Fishery Management Council. EFH for rockfish, flatfish, skates, and sharks (groundfish) and for sardines, anchovy, mackerel, and squid (pelagic fish) is located along all areas of the California coast—from nearshore marine and estuarine waters to 200 miles offshore at the U.S. Economic Exclusion Zone boundary. EFH in estuarine and marine habitats for salmon consists of all coastal areas from Point Conception northward. For locations of Chinook and coho salmon freshwater EFH in California, and for general descriptions of species and recommended conservation and enhancement measures to consider, see the Pacific Fishery Management Council website and the NOAA habitat conservation website.
Technical Guidance for Assessment of Hydroacoustic Effects of Pile Driving on Fish 4-18
October 2020
4.6 Impact Analysis
Once the project has been described and the considerations have been determined, the impact analysis can proceed. This section describes the information necessary to assess potential impacts on fish from pile driving sound pressure. The discussion walks the reader through example assessments and the process used to determine anticipated ambient sound levels, the level of underwater sound generated by pile driving, the potential impact of the underwater sound pressure on fish, and the distance at which pile driving sound will attenuate to ambient levels or interim criteria levels for injury. The process of assessing sound impacts on fish from pile driving is complex and requires a high level of expertise and experience. The information in this document is intended to educate Department staff on the analysis process so that work conducted by experts in acoustic analysis can be effectively reviewed and evaluated.
The rate of sound attenuation through a body of water is used to predict the area that would be exposed to direct and indirect effects. This area is referred to as the “project action area” in FESA Section 7 consultations. The methods described below also can be used to evaluate the distance from a pile at which the sound would attenuate to the injury thresholds and areas of TTS or behavioral impact areas.
Depending on the species potentially present and environmental conditions, the information in the following sections can be used to determine the amount of species habitat affected. The area of potential affect is to be used as a surrogate for biologists to then determine the potential population estimates that would therefore be expected to be within site-specific areas based on current surveys or available population studies. A spreadsheet model developed by NOAA Fisheries as a very basic tool for impact analysis is presented for current use. The spreadsheet can be used to develop a first-order approximation of the habitat area in which fish may be exposed to injurious levels of underwater sound from pile driving. These methods describe the basic process for evaluating underwater sound pressure impacts and may not be appropriate for all situations.
The discussion of impact assessment factors and methodology addresses the following components:
• Determining ambient sound levels.
• Determining estimated pile driving underwater sound pressure levels.
• Determining reductions to underwater sound pressure from attenuation.
• Determining interim injury threshold distances.
• Determining behavioral threshold distances.
• Determining total project impact areas.
• Estimating potential impacts on fish within the project area from pile driving underwater sound pressure.
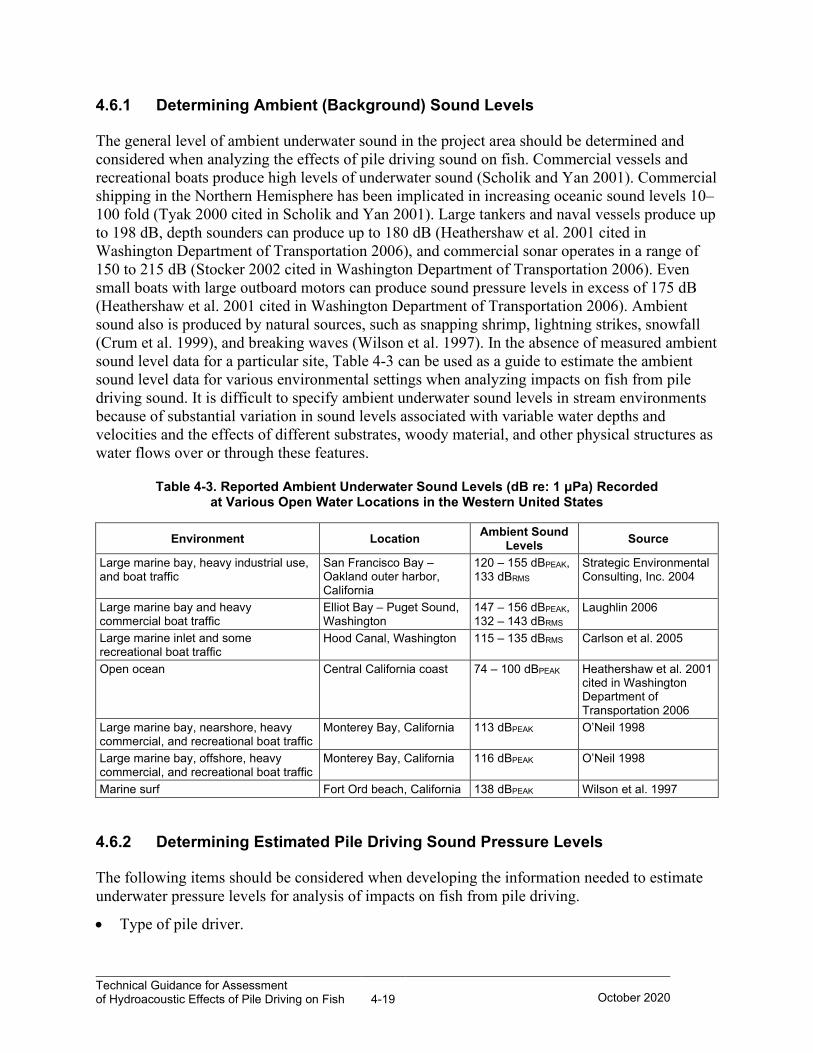
Technical Guidance for Assessment of Hydroacoustic Effects of Pile Driving on Fish 4-19
October 2020
4.6.1 Determining Ambient (Background) Sound Levels
The general level of ambient underwater sound in the project area should be determined and considered when analyzing the effects of pile driving sound on fish. Commercial vessels and recreational boats produce high levels of underwater sound (Scholik and Yan 2001). Commercial shipping in the Northern Hemisphere has been implicated in increasing oceanic sound levels 10–100 fold (Tyak 2000 cited in Scholik and Yan 2001). Large tankers and naval vessels produce up to 198 dB, depth sounders can produce up to 180 dB (Heathershaw et al. 2001 cited in Washington Department of Transportation 2006), and commercial sonar operates in a range of 150 to 215 dB (Stocker 2002 cited in Washington Department of Transportation 2006). Even small boats with large outboard motors can produce sound pressure levels in excess of 175 dB (Heathershaw et al. 2001 cited in Washington Department of Transportation 2006). Ambient sound also is produced by natural sources, such as snapping shrimp, lightning strikes, snowfall (Crum et al. 1999), and breaking waves (Wilson et al. 1997). In the absence of measured ambient sound level data for a particular site, Table 4-3 can be used as a guide to estimate the ambient sound level data for various environmental settings when analyzing impacts on fish from pile driving sound. It is difficult to specify ambient underwater sound levels in stream environments because of substantial variation in sound levels associated with variable water depths and velocities and the effects of different substrates, woody material, and other physical structures as water flows over or through these features.
Table 4-3. Reported Ambient Underwater Sound Levels (dB re: 1 μPa) Recorded at Various Open Water Locations in the Western United States
Environment Location Ambient Sound Levels Source
Large marine bay, heavy industrial use, and boat traffic
San Francisco Bay – Oakland outer harbor, California
120 – 155 dBPEAK, 133 dBRMS
Strategic Environmental Consulting, Inc. 2004
Large marine bay and heavy commercial boat traffic
Elliot Bay – Puget Sound, Washington
147 – 156 dBPEAK, 132 – 143 dBRMS
Laughlin 2006
Large marine inlet and some recreational boat traffic
Hood Canal, Washington 115 – 135 dBRMS Carlson et al. 2005
Open ocean Central California coast 74 – 100 dBPEAK Heathershaw et al. 2001 cited in Washington Department of Transportation 2006
Large marine bay, nearshore, heavy commercial, and recreational boat traffic
Monterey Bay, California 113 dBPEAK O’Neil 1998
Large marine bay, offshore, heavy commercial, and recreational boat traffic
Monterey Bay, California 116 dBPEAK O’Neil 1998
Marine surf Fort Ord beach, California 138 dBPEAK Wilson et al. 1997
4.6.2 Determining Estimated Pile Driving Sound Pressure Levels
The following items should be considered when developing the information needed to estimate underwater pressure levels for analysis of impacts on fish from pile driving.
• Type of pile driver.
Technical Guidance for Assessment of Hydroacoustic Effects of Pile Driving on Fish 4-20
October 2020
• Type and size of temporary and permanent piles.
• Type of attenuation proposed.
• Site-specific conditions such as channel dimensions, geometry, and substrate.
The compendium attached as Appendix I, Compendium of Pile Driving Sound Data, includes the studies cited in this chapter and additional information, such as underwater sound pressure measurements at a variety of distances and water depths, as well as underwater sound pressure measurements of pile driving with sound attenuation measures. Detailed data of underwater sound pressure levels produced by different pile types at different depths with and without attenuation measures also may be found in Illingworth & Rodkin (2001). Hammer and pile type descriptions are discussed in detail in the Caltrans Foundation Manual (Caltrans 2015).
4.6.2.1 Type of Pile Driver
Generally, two types of pile drivers may be used: vibratory and impact hammer pile drivers. The type and size of pile driving equipment can affect the underwater sound pressure generated during pile driving events.
Impact pile driving is the most commonly used pile driving method. Impact pile drivers are piston-type drivers that use various means (ignition, hydraulics, or steam) to lift a piston to a desired height and drop the piston (via gravity) against the head of the pile in order to drive it into the substrate. The size and type of impact driver used depend on the energy needed to drive a certain type of pile in various substrates to the necessary depth. The magnitude and characteristics of underwater sound generated by a pile strike depend on the energy of the strike, and the pile size and composition (see Table 2-1 in Chapter 2, Fundamentals of Hydroacoustics, and Appendix I, Compendium of Pile Driving Sound Data).
In some instances, a vibratory hammer may be used to drive sheet piles or foundation piles at the start of driving each pile until resistance is met and the vibratory driver is not making progress. Vibratory hammers use oscillatory hammers that vibrate the pile, causing the sediment surrounding the pile to liquefy and allow pile penetration. LPEAK for vibratory hammers can exceed 180 dB; however, the sound from these hammers rises relatively slowly. The vibratory hammer produces sound energy that is spread out over time and is generally 10 to 20 dB lower than impact pile driving. As discussed in Chapter 2, Fundamentals of Hydroacoustics, vibratory drivers generally produce less sound than impact hammers and are often employed as an avoidance and minimization measure to reduce the underwater sound pressure that transmits into the water. There are no established injury criteria for vibration pile driving, and resource agencies are less concerned that vibration pile driving will result in injury or other adverse effects on fish. Sound data from vibration pile driving is provided in Appendix I, Compendium of Pile Driving Sound Data. Although this method results in lower levels of sound generated during the driving of a pile, it cannot be used in all situations or to drive temporary trestle piles or permanent bridge foundation piles all the way to final resistance elevation (e.g., because of certain sediment conditions or load-bearing requirements). All load-bearing piles need to be driven with impact hammers to proof their load-bearing strength.
Technical Guidance for Assessment of Hydroacoustic Effects of Pile Driving on Fish 4-21
October 2020
4.6.2.2 Type and Size of Piles
Piles are generally fabricated out of concrete or steel. Plastic piles are sometimes used for fender piles in wharf construction but have limit applicability to Caltrans projects. The material used to fabricate a pile is an important consideration because of the differences in underwater sound pressure levels that are generated by driving piles constructed of different materials. Different types and diameters of piles produce different levels of underwater sound pressure when they are driven. The LPEAK from driving piles of different sizes and compositions have been measured from a standard distance of 10 meters from the pile; levels generally range from 177 dB (for a 12-inch steel pipe pile ) to 220 dB (for a 96-inch steel pile). Table 2-1 in Chapter 2, Fundamentals of Hydroacoustics, and Appendix I, Compendium of Pile Driving Sound Data, identify the anticipated underwater sound pressure levels produced by different pile types and sizes, with and without sound attenuation measures.
4.6.2.3 Type of Attenuation
Several types of sound attenuation methods can be used to increase sound attenuation and thus decrease the distance at which pile driving underwater sound pressure injury thresholds or behavioral thresholds would be anticipated or exceeded. Several methods, specifically, air bubble curtains, cofferdams, and isolation casings are described in Section 4.4.2, Attenuation Methods.
4.6.3 Calculating Underwater Sound Pressure Attenuation
An analysis of hydroacoustic effects on fish is complicated by a number of factors that include the type of water body (e.g., open water versus river or stream environments, deep versus shallow water), uncertainties associated with predicting ambient and pile driving sound pressure levels, and uncertainties associated with determining the mobility and behavioral responses of the fish being evaluated.
As discussed in Section 2.2 of Chapter 2, Fundamentals of Hydroacoustics, the propagation of pile driving underwater sound pressure is highly complex due to many factors including the fact that the river or ocean bed and the surface of the water are distinct boundaries that can affect propagation. In addition, the pile that is driven by an impact driver generates ground vibration in the substrate that can re-radiate underwater sound pressure energy back into the water.
In practice, it’s impractical to model all of the factors involved in the propagation of sound underwater. Simplified models often are used to predict sound levels at various distances from a pile and the distance at which pile driving underwater sound pressure attenuates to a specific threshold level. The practical spreading loss model is one such model and is typically used to estimate the attenuation of underwater sound pressure over distance in the context of a pile driving sound pressure analysis. The basic practical spreading loss model is provided in Equation 4-1.
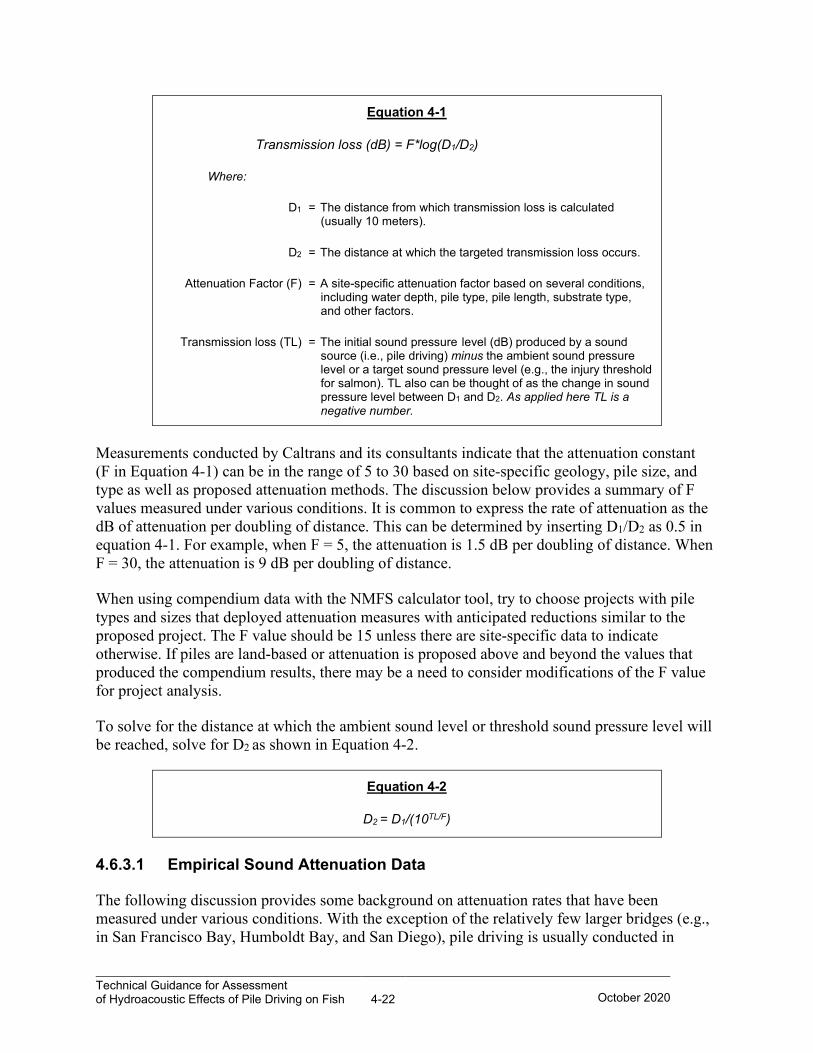
Technical Guidance for Assessment of Hydroacoustic Effects of Pile Driving on Fish 4-22
October 2020
Equation 4-1
Transmission loss (dB) = F*log(D1/D2)
Where:
D1 = The distance from which transmission loss is calculated (usually 10 meters).
D2 = The distance at which the targeted transmission loss occurs.
Attenuation Factor (F) = A site-specific attenuation factor based on several conditions, including water depth, pile type, pile length, substrate type, and other factors.
Transmission loss (TL) = The initial sound pressure level (dB) produced by a sound source (i.e., pile driving) minus the ambient sound pressure level or a target sound pressure level (e.g., the injury threshold for salmon). TL also can be thought of as the change in sound pressure level between D1 and D2. As applied here TL is a negative number.
Measurements conducted by Caltrans and its consultants indicate that the attenuation constant (F in Equation 4-1) can be in the range of 5 to 30 based on site-specific geology, pile size, and type as well as proposed attenuation methods. The discussion below provides a summary of F values measured under various conditions. It is common to express the rate of attenuation as the dB of attenuation per doubling of distance. This can be determined by inserting D1/D2 as 0.5 in equation 4-1. For example, when F = 5, the attenuation is 1.5 dB per doubling of distance. When F = 30, the attenuation is 9 dB per doubling of distance.
When using compendium data with the NMFS calculator tool, try to choose projects with pile types and sizes that deployed attenuation measures with anticipated reductions similar to the proposed project. The F value should be 15 unless there are site-specific data to indicate otherwise. If piles are land-based or attenuation is proposed above and beyond the values that produced the compendium results, there may be a need to consider modifications of the F value for project analysis.
To solve for the distance at which the ambient sound level or threshold sound pressure level will be reached, solve for D2 as shown in Equation 4-2.
Equation 4-2
D2 = D1/(10TL/F)
4.6.3.1 Empirical Sound Attenuation Data
The following discussion provides some background on attenuation rates that have been measured under various conditions. With the exception of the relatively few larger bridges (e.g., in San Francisco Bay, Humboldt Bay, and San Diego), pile driving is usually conducted in
Technical Guidance for Assessment of Hydroacoustic Effects of Pile Driving on Fish 4-23
October 2020
shallow water where depths are 15 meters or less. Much of the pile driving measured in California has been conducted in very shallow water where depths are less than 10 meters. Measured transmission loss rates in shallow water typical at pile driving sites have been found to vary considerably from site to site. The rates also vary somewhat between the different measurement metrics: peak SPL, RMS, and SEL. A logarithmic rate has provided the best fit to the data because underwater sound pressure waves spread out in a spherical pattern. The rate that sound attenuates over distance underwater is complicated by the air/water boundary and the bottom boundary conditions and substrate type. Over long distances (greater than 500 meters), linear correction factors accounting for excess attenuation have improved the prediction. Because hearing is frequency dependent and the transmission loss also is frequency dependent, predicting audibility (or detectability) with any certainty at distances beyond 500 to 1,000 meters is not possible.
Empirical data provide examples of underwater sound pressure attenuation with distance. Projects involving pile driving that were studied indicate that a base 10 logarithmic rate of attenuation is most appropriate. Examples of these projects are described below.
At the San Francisco-Oakland Bay Bridge Project, the transmission loss rates for unattenuated piles varied as a function of pile location and the direction of the measurement from the pile. Attenuation rates were in the range of 4.5 to almost 9 dB per doubling of distance (F values in the range of 15 to 30). When an air bubble curtain was in operation, the attenuation rate was somewhat higher. Measurements between 100 and 1,000 meters indicated F values of 19 and 18, respectively, for peak and RMS sound pressure levels. For distances between 10 and 100 meters from the source, F was found to be 20. When pile driving was conducted within a dewatered cofferdam, F was found to be 15.
Under each of these conditions, sound pressure levels measured at the same distance varied by at least 5 dB, even at positions close to the pile. As the measurement position was moved farther away from the pile, the variation in underwater sound pressure levels measured increased to 10 dB. For dewatered cofferdams, sound pressure levels either did not drop off or actually increased within 100 to 150 meters of the pile. Beyond that distance, sound pressure levels decreased, but at different rates for different directions. In some cases, the measured peak SPL at 500 meters in one direction was similar to the measured peak SPL within 100 meters of the pile.
At the Benicia-Martinez Bridge, numerous measurements were taken to document the variation in sound pressure level as a function of distance from an unattenuated pile. F values for distances between 100 and 500 meters from unattenuated piles were found to be 15, 16, and 17, respectively, for peak SPL, RMS, and SEL.
Greeneridge Sciences measured transmission loss at Port MacKenzie during the driving of 36-inch-diameter pipe piles. At distances between 60 and 1,000 meters from an unattenuated pile, F values were found to be in the following ranges.
• Fpeak = 18 to 21
• FRMS = 18 to 23
• FSEL = 16 to 22
Technical Guidance for Assessment of Hydroacoustic Effects of Pile Driving on Fish 4-24
October 2020
The range in F values was dependent on the depth of the water column, with lowest values at the deepest depths.
Measurements taken for pile driving at the Russian River near Geyserville reflect how the transmission loss varies with the depth of the pile. Because this project was in shallow water, the transmission loss through the saturated ground substrate was substantial. During the initial stages of driving the pile, sound pressure levels were greatest near the pile. As the pile was driven deeper, sound pressure levels near the pile (10 to 20 meters) decreased, but levels increased slightly at positions 50 meters farther away. However, sound pressure levels at 70 meters were much lower than at 50 meters and did not show much of a change through the entire driving period.
For pile driving sounds that are predominately high frequency (e.g., small-diameter steel pipe or steel H-type piles), the transmission loss can be higher than losses associated with piles that predominantly produce lower frequencies (e.g., larger diameter piles). Small-diameter steel H-type piles have been found to have high F values in the range of 20 to 30 near the pile (i.e., between 10 and 20 meters). Small unattenuated steel pipe piles show F values in the range of 15 to 25. Most measurements for concrete piles have been made about 10 meters from the pile. Some projects included limited measurements at 10 and 20 meter positions, and one project included measurements at 100 meters. The F value for concrete piles, based on these data, is about 15.
The use of attenuation systems such as air bubble curtains complicates the attenuation rate. These systems can be very effective at reducing underwater sound pressure where the primary source of sound is the pile in the water column. As one moves farther away from the pile, ground-borne sound generated from vibration at the tip of the pile may become the primary source of sound. Therefore, the attenuation rate may flatten out, or in some cases become positive (i.e., the underwater sound pressure level may increase with increasing distance) for a short distance.
These data indicate that determination of appropriate attenuation rates requires careful consideration of site-specific conditions and empirical sound attenuation data from pile driving in conditions similar to the project under consideration.
NOAA Fisheries has developed a spreadsheet model for evaluating underwater sound from pile driving. Guidance in this spreadsheet recommends that the practical spreading model with F =15 be used unless data are available to support a different model. When F = 15, the attenuation rate is 4.5 dB per doubling of distance. In the absence of data on site-specific attenuation rates, an attenuation rate of 4.5 dB per doubling of distance should be used for all projects.
4.6.4 Interim Injury Thresholds
4.6.4.1 Background
Since 2004 Caltrans has been at the forefront of efforts to understand the science related to underwater sound pressure impacts to fish and to help develop interim sound pressure level
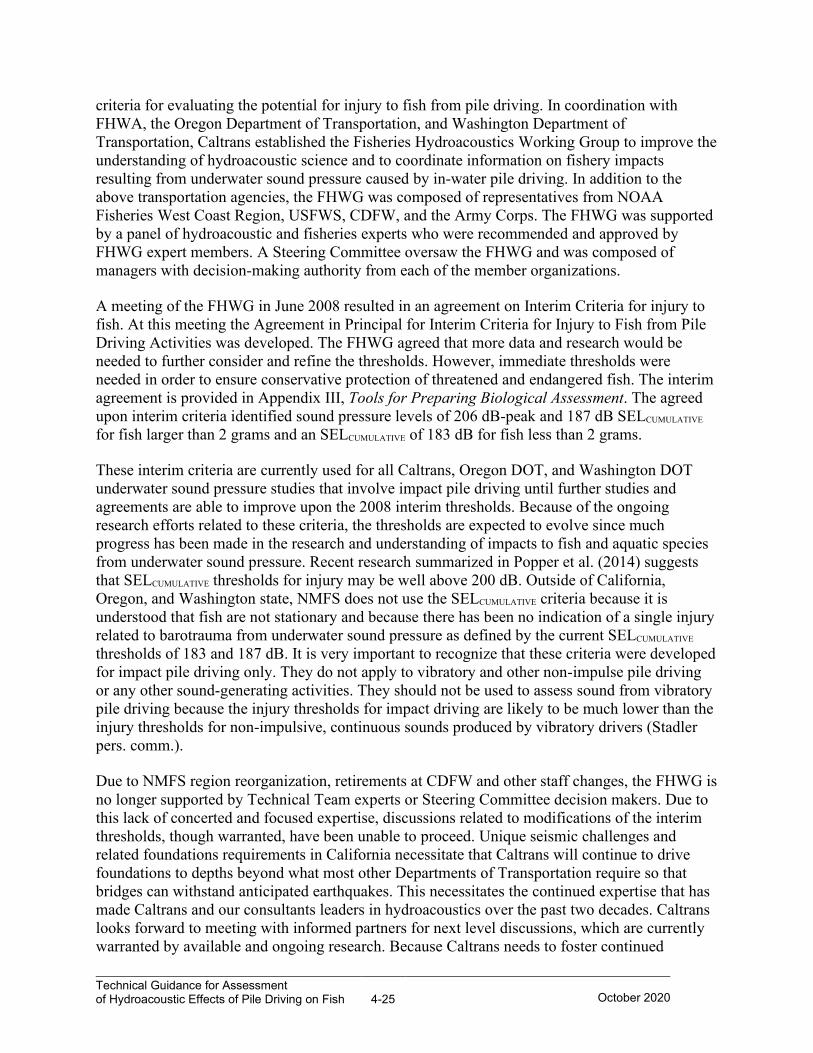
Technical Guidance for Assessment of Hydroacoustic Effects of Pile Driving on Fish 4-25
October 2020
criteria for evaluating the potential for injury to fish from pile driving. In coordination with FHWA, the Oregon Department of Transportation, and Washington Department of Transportation, Caltrans established the Fisheries Hydroacoustics Working Group to improve the understanding of hydroacoustic science and to coordinate information on fishery impacts resulting from underwater sound pressure caused by in-water pile driving. In addition to the above transportation agencies, the FHWG was composed of representatives from NOAA Fisheries West Coast Region, USFWS, CDFW, and the Army Corps. The FHWG was supported by a panel of hydroacoustic and fisheries experts who were recommended and approved by FHWG expert members. A Steering Committee oversaw the FHWG and was composed of managers with decision-making authority from each of the member organizations.
A meeting of the FHWG in June 2008 resulted in an agreement on Interim Criteria for injury to fish. At this meeting the Agreement in Principal for Interim Criteria for Injury to Fish from Pile Driving Activities was developed. The FHWG agreed that more data and research would be needed to further consider and refine the thresholds. However, immediate thresholds were needed in order to ensure conservative protection of threatened and endangered fish. The interim agreement is provided in Appendix III, Tools for Preparing Biological Assessment. The agreed upon interim criteria identified sound pressure levels of 206 dB-peak and 187 dB SELCUMULATIVE for fish larger than 2 grams and an SELCUMULATIVE of 183 dB for fish less than 2 grams.
These interim criteria are currently used for all Caltrans, Oregon DOT, and Washington DOT underwater sound pressure studies that involve impact pile driving until further studies and agreements are able to improve upon the 2008 interim thresholds. Because of the ongoing research efforts related to these criteria, the thresholds are expected to evolve since much progress has been made in the research and understanding of impacts to fish and aquatic species from underwater sound pressure. Recent research summarized in Popper et al. (2014) suggests that SELCUMULATIVE thresholds for injury may be well above 200 dB. Outside of California, Oregon, and Washington state, NMFS does not use the SELCUMULATIVE criteria because it is understood that fish are not stationary and because there has been no indication of a single injury related to barotrauma from underwater sound pressure as defined by the current SELCUMULATIVE thresholds of 183 and 187 dB. It is very important to recognize that these criteria were developed for impact pile driving only. They do not apply to vibratory and other non-impulse pile driving or any other sound-generating activities. They should not be used to assess sound from vibratory pile driving because the injury thresholds for impact driving are likely to be much lower than the injury thresholds for non-impulsive, continuous sounds produced by vibratory drivers (Stadler pers. comm.).
Due to NMFS region reorganization, retirements at CDFW and other staff changes, the FHWG is no longer supported by Technical Team experts or Steering Committee decision makers. Due to this lack of concerted and focused expertise, discussions related to modifications of the interim thresholds, though warranted, have been unable to proceed. Unique seismic challenges and related foundations requirements in California necessitate that Caltrans will continue to drive foundations to depths beyond what most other Departments of Transportation require so that bridges can withstand anticipated earthquakes. This necessitates the continued expertise that has made Caltrans and our consultants leaders in hydroacoustics over the past two decades. Caltrans looks forward to meeting with informed partners for next level discussions, which are currently warranted by available and ongoing research. Because Caltrans needs to foster continued
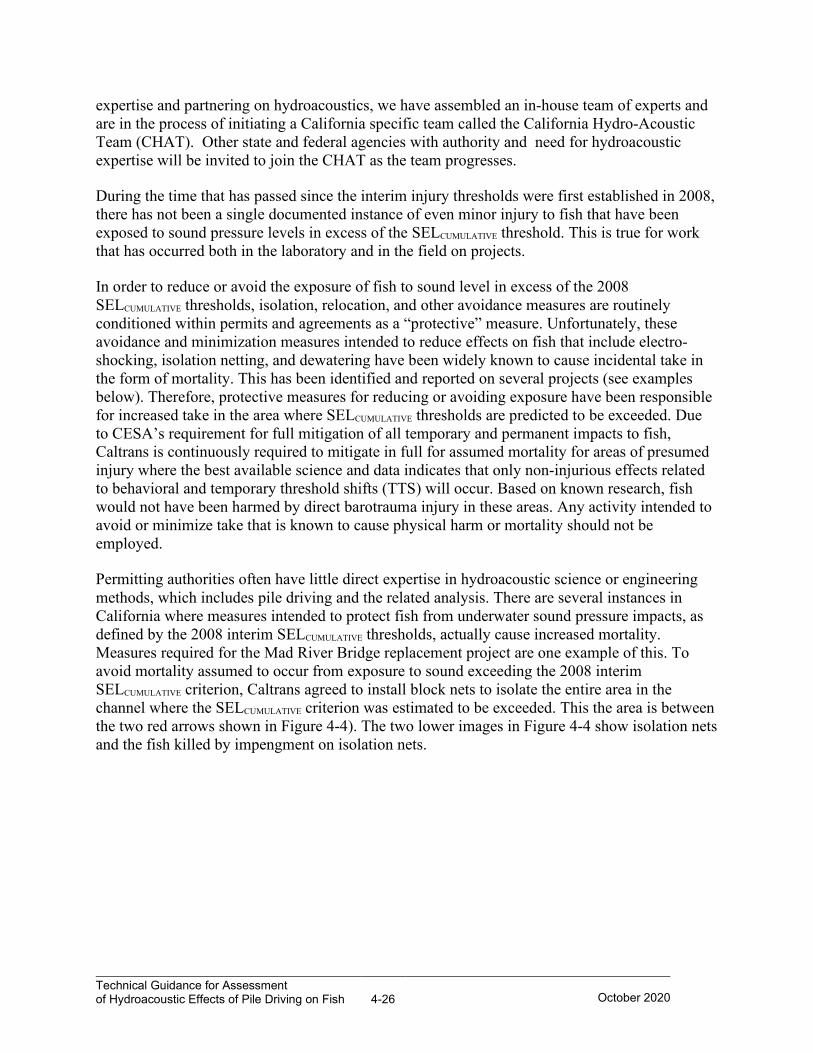
Technical Guidance for Assessment of Hydroacoustic Effects of Pile Driving on Fish 4-26
October 2020
expertise and partnering on hydroacoustics, we have assembled an in-house team of experts and are in the process of initiating a California specific team called the California Hydro-Acoustic Team (CHAT). Other state and federal agencies with authority and need for hydroacoustic expertise will be invited to join the CHAT as the team progresses.
During the time that has passed since the interim injury thresholds were first established in 2008, there has not been a single documented instance of even minor injury to fish that have been exposed to sound pressure levels in excess of the SELCUMULATIVE threshold. This is true for work that has occurred both in the laboratory and in the field on projects.
In order to reduce or avoid the exposure of fish to sound level in excess of the 2008 SELCUMULATIVE thresholds, isolation, relocation, and other avoidance measures are routinely conditioned within permits and agreements as a “protective” measure. Unfortunately, these avoidance and minimization measures intended to reduce effects on fish that include electro-shocking, isolation netting, and dewatering have been widely known to cause incidental take in the form of mortality. This has been identified and reported on several projects (see examples below). Therefore, protective measures for reducing or avoiding exposure have been responsible for increased take in the area where SELCUMULATIVE thresholds are predicted to be exceeded. Due to CESA’s requirement for full mitigation of all temporary and permanent impacts to fish, Caltrans is continuously required to mitigate in full for assumed mortality for areas of presumed injury where the best available science and data indicates that only non-injurious effects related to behavioral and temporary threshold shifts (TTS) will occur. Based on known research, fish would not have been harmed by direct barotrauma injury in these areas. Any activity intended to avoid or minimize take that is known to cause physical harm or mortality should not be employed.
Permitting authorities often have little direct expertise in hydroacoustic science or engineering methods, which includes pile driving and the related analysis. There are several instances in California where measures intended to protect fish from underwater sound pressure impacts, as defined by the 2008 interim SELCUMULATIVE thresholds, actually cause increased mortality. Measures required for the Mad River Bridge replacement project are one example of this. To avoid mortality assumed to occur from exposure to sound exceeding the 2008 interim SELCUMULATIVE criterion, Caltrans agreed to install block nets to isolate the entire area in the channel where the SELCUMULATIVE criterion was estimated to be exceeded. This the area is between the two red arrows shown in Figure 4-4). The two lower images in Figure 4-4 show isolation nets and the fish killed by impengment on isolation nets.
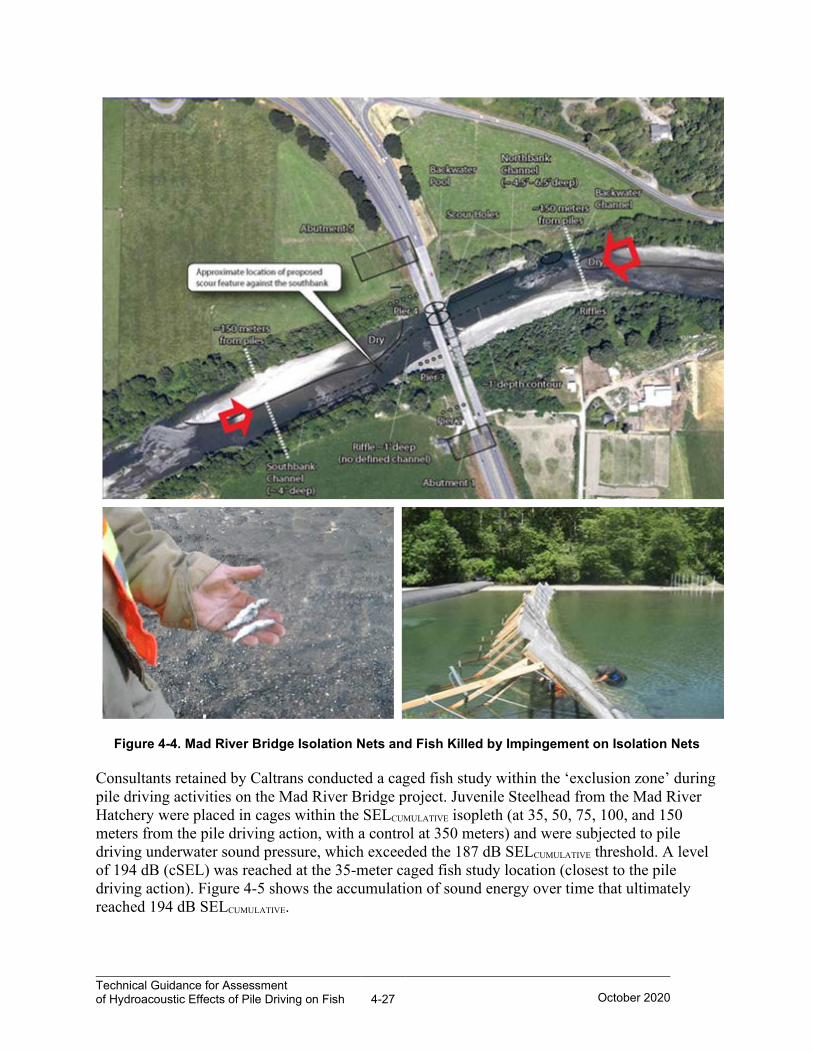
Technical Guidance for Assessment of Hydroacoustic Effects of Pile Driving on Fish 4-27
October 2020
Figure 4-4. Mad River Bridge Isolation Nets and Fish Killed by Impingement on Isolation Nets
Consultants retained by Caltrans conducted a caged fish study within the ‘exclusion zone’ during pile driving activities on the Mad River Bridge project. Juvenile Steelhead from the Mad River Hatchery were placed in cages within the SELCUMULATIVE isopleth (at 35, 50, 75, 100, and 150 meters from the pile driving action, with a control at 350 meters) and were subjected to pile driving underwater sound pressure, which exceeded the 187 dB SELCUMULATIVE threshold. A level of 194 dB (cSEL) was reached at the 35-meter caged fish study location (closest to the pile driving action). Figure 4-5 shows the accumulation of sound energy over time that ultimately reached 194 dB SELCUMULATIVE.
Technical Guidance for Assessment of Hydroacoustic Effects of Pile Driving on Fish 4-28
October 2020
An expert, who was selected and approved by Caltrans and the resource agencies, was retained to conduct necropsies on fish. The expert performed the necropsies in order to determine fin condition, visible visceral hemorrhage, and blood parameters that included cortisol and histopathology of the gills, liver, kidneys, swim bladder, muscles/skim, and brain/head. Ultimately, the expert found no physical trauma (barotrauma) or statistical differences between the exposed or control fish.
Figure 4-5. Sound Energy Accumulation at the 35 Meter Cage
Other similar findings were found in research conducted in 2011 (Halvorsen et al.) at the University of Maryland, where they used high intensity pile driving sound pressure in a lab setting using a wave tube.
The San Francisco-Oakland Bay Bridge project implemented innovative low-blast implosion techniques in combination with substantial bubble curtain attenuation devices to significantly reduce years of demolition that would have been needed if the original mechanized demolition methods and large coffer dams had been used. As part of the implosion demonstration, the project entailed a caged fish study, as well as a trawl study, with similar species impact findings, as previously described (San Francisco–Oakland Bay Bridge Pier E3 2016). In this instance, CDFW required the trawl study to demonstrate the impacts and mortality that the agency believed would occur within the accumulation threshold isopleth. CDFW trawled the project area
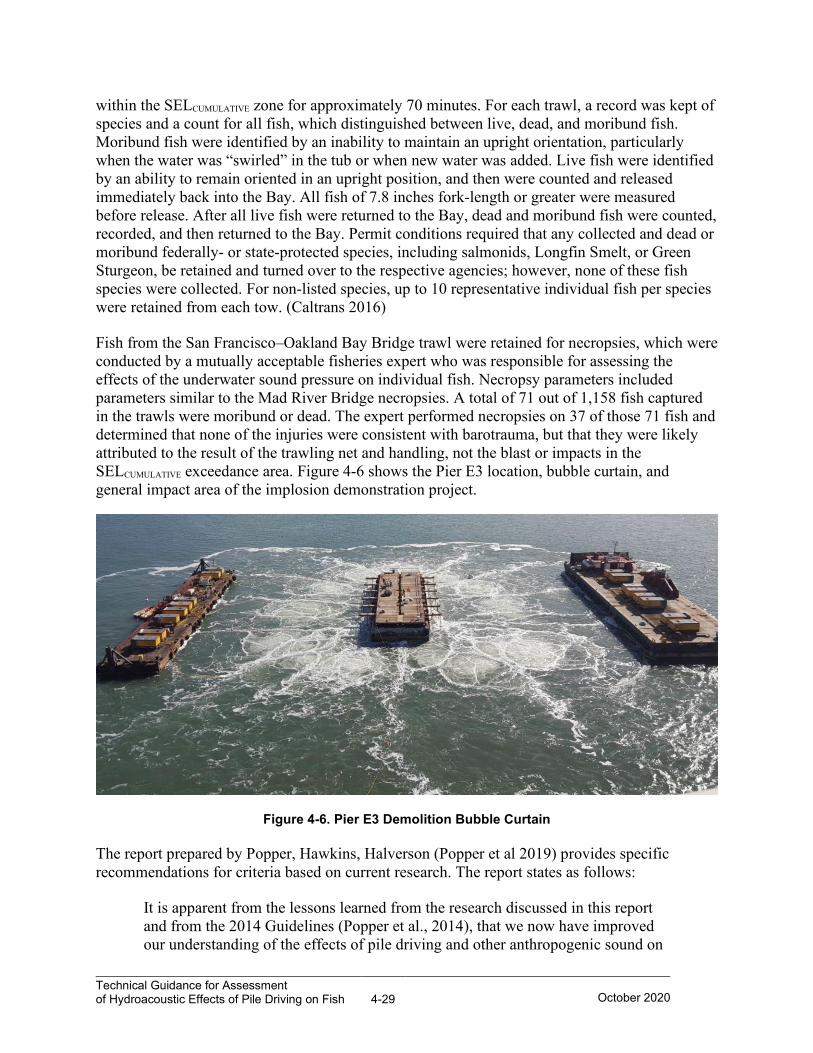
Technical Guidance for Assessment of Hydroacoustic Effects of Pile Driving on Fish 4-29
October 2020
within the SELCUMULATIVE zone for approximately 70 minutes. For each trawl, a record was kept of species and a count for all fish, which distinguished between live, dead, and moribund fish. Moribund fish were identified by an inability to maintain an upright orientation, particularly when the water was “swirled” in the tub or when new water was added. Live fish were identified by an ability to remain oriented in an upright position, and then were counted and released immediately back into the Bay. All fish of 7.8 inches fork-length or greater were measured before release. After all live fish were returned to the Bay, dead and moribund fish were counted, recorded, and then returned to the Bay. Permit conditions required that any collected and dead or moribund federally- or state-protected species, including salmonids, Longfin Smelt, or Green Sturgeon, be retained and turned over to the respective agencies; however, none of these fish species were collected. For non-listed species, up to 10 representative individual fish per species were retained from each tow. (Caltrans 2016)
Fish from the San Francisco–Oakland Bay Bridge trawl were retained for necropsies, which were conducted by a mutually acceptable fisheries expert who was responsible for assessing the effects of the underwater sound pressure on individual fish. Necropsy parameters included parameters similar to the Mad River Bridge necropsies. A total of 71 out of 1,158 fish captured in the trawls were moribund or dead. The expert performed necropsies on 37 of those 71 fish and determined that none of the injuries were consistent with barotrauma, but that they were likely attributed to the result of the trawling net and handling, not the blast or impacts in the SELCUMULATIVE exceedance area. Figure 4-6 shows the Pier E3 location, bubble curtain, and general impact area of the implosion demonstration project.
Figure 4-6. Pier E3 Demolition Bubble Curtain
The report prepared by Popper, Hawkins, Halverson (Popper et al 2019) provides specific recommendations for criteria based on current research. The report states as follows:
It is apparent from the lessons learned from the research discussed in this report and from the 2014 Guidelines (Popper et al., 2014), that we now have improved our understanding of the effects of pile driving and other anthropogenic sound on
Technical Guidance for Assessment of Hydroacoustic Effects of Pile Driving on Fish 4-30
October 2020
fishes since the promulgation of the 2008 Interim Criteria. Until onset is defined, and there are additional data on the sound levels that result in onset of effects, it is important to have an understanding of those sound levels that might result in onset even of a single mild injury in an individual animal. Because this level is likely to be variable based on factors as fish species and size, it is reasonable to suggest that agencies develop onset criteria for each consultation based, in part, on the anatomy and behavior of the species in question, as described in the 2014 Guidelines.
Table 7-3 in Popper et al. 2019 provides specific criteria recommendations for mortality and potential mortal injury, recoverable injury, TTS, masking, and behavior.
4.6.4.2 Behavioral Thresholds
FESA defines “harm” to include actions that would kill or injure fish or wildlife by significantly impairing essential behavioral patterns, including breeding, spawning, rearing, migrating, feeding, and sheltering. “Harass” is defined as any act that creates the likelihood of injury to a species to such an extent as to significantly disrupt normal behavior patterns such as feeding, breeding, or sheltering.
Little research was available in 2008 regarding the interim thresholds of behavioral effects, on the types of behavioral modification that may be considered harm or harassment, or even on levels that caused mortality from pile driving underwater sound pressure on fish. Based on many research studies and experiments to varied fish species, it is clear that fish can react to sudden underwater sound pressure with a startle or avoidance response, but they also may quickly habituate to the sound. Popper et al. 2019 states as follows:
Although questions about physical effects are important, the distance around the source that includes sounds of sufficient level to physically harm an animal is relatively small compared with the much greater areas that is potentially ensonified by the sound and heard by the fish. Following on from this, far fewer animals are likely to be directly harmed through injuries generated by the sound compared with the number of animals that may show changes in behavior due to the presence of the sound. Although many of these behavioral effects are likely to be minimal and have little or no impact on fish fitness and survival, any anthropogenic sounds that alter the ability of animals to hear natural sounds that are important to them (e.g., as a result of masking), cause temporary loss of hearing sensitivity (TTS) or frighten the fish away from preferred locales or from migration routes, could have substantial short and long-term impacts.
The AIP specifically does not address behavioral impacts on fish. Accordingly, at the time of this writing, there is no agreement on impact thresholds for behavior.
As a conservative measure, NOAA Fisheries and USFWS generally have used 150 dBRMS as the threshold for behavioral effects on FESA-listed fish species (salmon and bull trout) for most biological opinions evaluating pile driving, citing that sound pressure levels in excess of 150 dBRMS can cause temporary behavioral changes (startle and stress) that could decrease a fish’s
Technical Guidance for Assessment of Hydroacoustic Effects of Pile Driving on Fish 4-31
October 2020
ability to avoid predators. As of this writing, neither NOAA Fisheries nor USFWS has provided any research data or related citations to support this threshold. Nonetheless, until further research is conducted, it should be anticipated that NOAA Fisheries and USFWS will expect to see a discussion in BAs of the effects of pile driving on fish behavior, with reference to the 150 dBRMS threshold. NOAA Fisheries staff informally indicated at the June 2008 FHWG meeting that they do not expect exceedance of the 150 dBRMS behavior threshold to trigger any mitigation requirement (FHWG 2008).
There are a continuum of effects associated with barotrauma caused by underwater sound pressure. Based on the frequency and intensity of the action that creates the underwater sound pressure, these effects may include the following: no effect, altered behavior, TTS, sub-lethal injury, delayed mortality, and immediate mortality. Each action and protective measure must be well understood to ensure protective measures achieve the result of avoiding and minimizing underwater sound pressure that is transmitted into the environment.
4.6.5 Determining the Impact Areas
The project action area is defined as all areas that are predicted to be affected directly and indirectly by the federal action, not merely the immediate area involved in the action. NOAA Fisheries and USFWS require identification of a project action area for Section 7 consultation under the FESA. With regard to underwater sound pressure generated from pile driving, USFWS considers the project action area to be the underwater area where peak pile driving sound is predicted to exceed the ambient sound level. The project action area is therefore defined by the distance needed for the sound pressure level generated by pile driving activities to attenuate to a level that is equal to the ambient sound level. For the purposes of determining the project action area, the predicted RMS sound pressure level generated by pile driving should be compared with the background RMS sound pressure level. The determination of this distance is at best a rough approximation because of the uncertainties associated with determining the ambient sound level and the attenuation of sound over distance.
A similar process is used to estimate the acoustic impact area, which is based on the distance at which pile driving sound attenuates to a level that equals an injury threshold. If the threshold areas are predicted to extend beyond 10 meters from the pile, the acoustic impact area needs to be determined.
The following discussion describes the process used to determine the project action area and the acoustic impact area.
4.6.5.1 Underwater Sound Prediction Methods and Tools
NOAA Fisheries has developed a spreadsheet, typically referred to as the NMFS calculator tool, which was created to estimate the distance at which pile driving sound attenuates to the 2008 interim threshold levels. This spreadsheet and reference data from Appendix I, Compendium of Pile Driving Sound Data, are currently the primary tools required by the Services for estimating underwater sound levels from pile driving. Other tools used in preparing project BAs include the Caltrans Hydroacoustic Project Info Checklist, Caltrans’ BA Guidance, Caltrans’ Monitoring
Technical Guidance for Assessment of Hydroacoustic Effects of Pile Driving on Fish 4-32
October 2020
Plan Template, and the Caltrans Pile Driving Screening Tool. These tools are available on the Caltrans hydroacoustic website. A copy of the data entry form for the NMFS spreadsheet and a guide to the Caltrans Pile Driving Screening Tool are provided in Appendix III, Tools for Preparing Biological Assessment.
Appendix III also contains the Caltrans technical brief entitled Overview of the Evaluation of Pile Driving Impacts on Fish for the Permitting Process. The brief provides an abbreviated overview on the pile driving impact assessment process.
4.6.5.2 Project Action Area
The process of determining the project action area for in-water pile driving typically focuses on RMS sound pressure levels anticipated to be produced by the pile driving activity. The first step in the process is to estimate the typical RMS ambient sound level using measured data from a similar environment (refer to Table 4-3 for typical ambient sound pressure level data). In some cases, such as in the case of a large project within a sensitive habitat area that may have far-ranging potential impacts to species, it may be appropriate to actually measure the ambient sound level in the water at the project site, particularly if shipping routes or docks/ports are within or near the project area. As discussed above an attenuation rate of 4.5 dB per doubling of distance (F = 15) should be used for all projects unless data on site-specific attenuation rates are available. As a practical matter such data is rarely if ever available so an attenuation rate of 4.5 dB per doubling of distance is typically used. The predicted RMS pile driving sound pressure level, the attenuation factor, and the ambient sound pressure level are then used in Equation 4-2 to determine the distance at which the pile driving sound pressure level attenuates to a level that is equal to the ambient sound level. Examples below demonstrate how this calculation is typically done.
In some cases, only RMS or only peak ambient sound level data are available. The relationship between the peak ambient sound level and the RMS ambient sound level can be highly variable, depending on the nature of the underwater sound sources in the area. Accordingly, there is no fixed relationship between peak and RMS ambient sound pressure levels. For the purposes of determining the project action area, the peak pile driving sound pressure level can be estimated from the RMS ambient sound pressure level and vice versa. In many environments, peak ambient sound levels exceed the RMS ambient sound level by 5 to 10 dB. Accordingly, it may be appropriate in many situations to subtract 5 to 10 dB from the peak ambient sound level to estimate the RMS ambient sound level.
In open water conditions such as San Francisco Bay, the project action area typically will be defined by the distance at which the pile driving sound attenuates to a level that is equal to the ambient sound level in all directions or to landforms, whichever is encountered first (Figure 4-7). In rivers and streams, the project action area can extend bank to bank across the river and the distance upstream and downstream at which the pile driving sound attenuates to the ambient sound level (Figure 4-8).
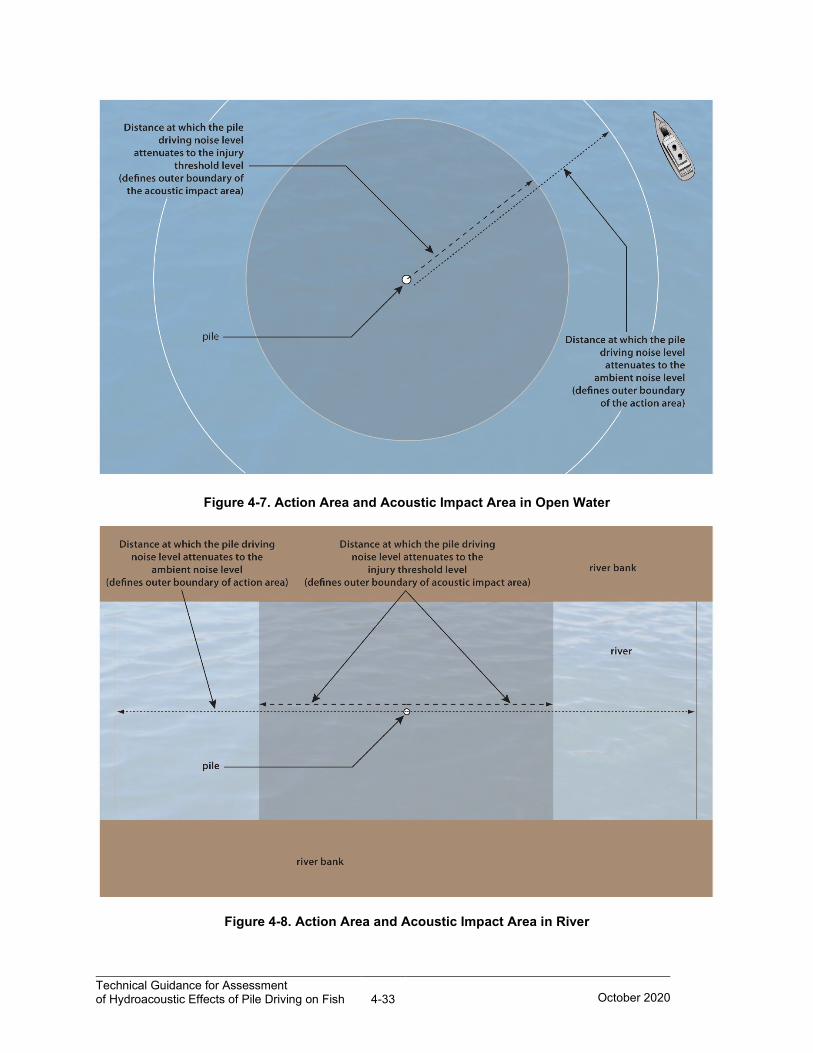
Technical Guidance for Assessment of Hydroacoustic Effects of Pile Driving on Fish 4-33
October 2020
Figure 4-7. Action Area and Acoustic Impact Area in Open Water
Figure 4-8. Action Area and Acoustic Impact Area in River
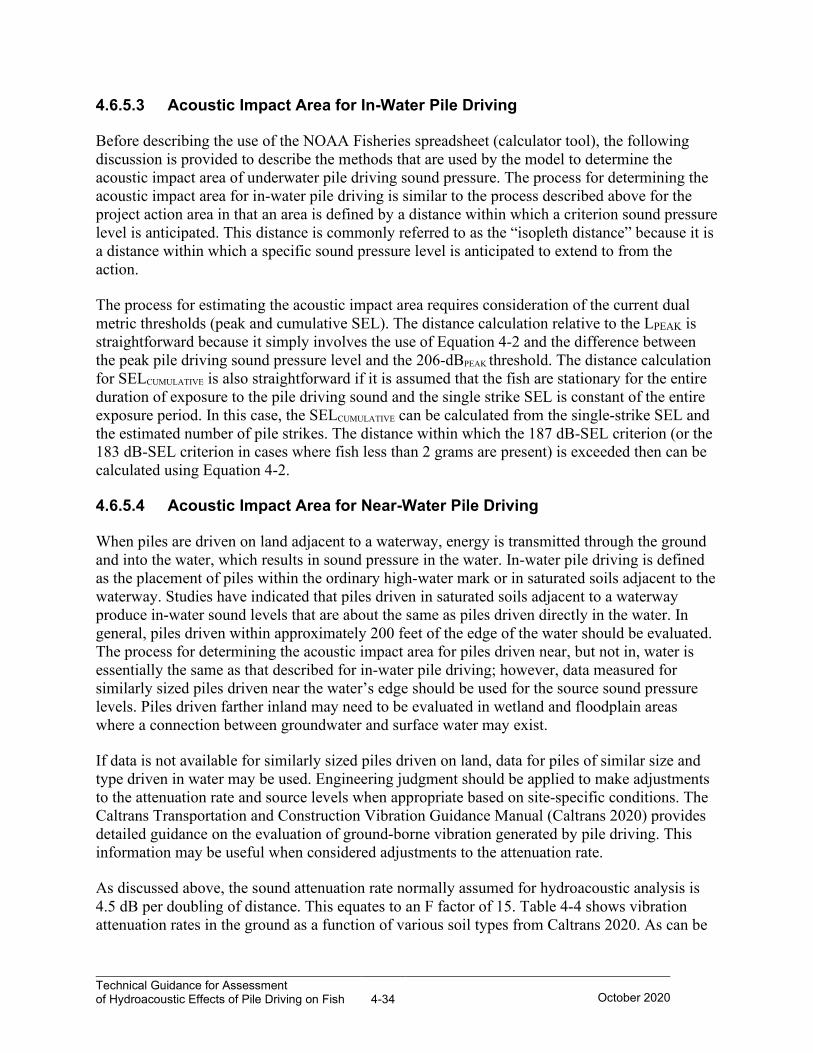
Technical Guidance for Assessment of Hydroacoustic Effects of Pile Driving on Fish 4-34
October 2020
4.6.5.3 Acoustic Impact Area for In-Water Pile Driving
Before describing the use of the NOAA Fisheries spreadsheet (calculator tool), the following discussion is provided to describe the methods that are used by the model to determine the acoustic impact area of underwater pile driving sound pressure. The process for determining the acoustic impact area for in-water pile driving is similar to the process described above for the project action area in that an area is defined by a distance within which a criterion sound pressure level is anticipated. This distance is commonly referred to as the “isopleth distance” because it is a distance within which a specific sound pressure level is anticipated to extend to from the action.
The process for estimating the acoustic impact area requires consideration of the current dual metric thresholds (peak and cumulative SEL). The distance calculation relative to the LPEAK is straightforward because it simply involves the use of Equation 4-2 and the difference between the peak pile driving sound pressure level and the 206-dBPEAK threshold. The distance calculation for SELCUMULATIVE is also straightforward if it is assumed that the fish are stationary for the entire duration of exposure to the pile driving sound and the single strike SEL is constant of the entire exposure period. In this case, the SELCUMULATIVE can be calculated from the single-strike SEL and the estimated number of pile strikes. The distance within which the 187 dB-SEL criterion (or the 183 dB-SEL criterion in cases where fish less than 2 grams are present) is exceeded then can be calculated using Equation 4-2.
4.6.5.4 Acoustic Impact Area for Near-Water Pile Driving
When piles are driven on land adjacent to a waterway, energy is transmitted through the ground and into the water, which results in sound pressure in the water. In-water pile driving is defined as the placement of piles within the ordinary high-water mark or in saturated soils adjacent to the waterway. Studies have indicated that piles driven in saturated soils adjacent to a waterway produce in-water sound levels that are about the same as piles driven directly in the water. In general, piles driven within approximately 200 feet of the edge of the water should be evaluated. The process for determining the acoustic impact area for piles driven near, but not in, water is essentially the same as that described for in-water pile driving; however, data measured for similarly sized piles driven near the water’s edge should be used for the source sound pressure levels. Piles driven farther inland may need to be evaluated in wetland and floodplain areas where a connection between groundwater and surface water may exist.
If data is not available for similarly sized piles driven on land, data for piles of similar size and type driven in water may be used. Engineering judgment should be applied to make adjustments to the attenuation rate and source levels when appropriate based on site-specific conditions. The Caltrans Transportation and Construction Vibration Guidance Manual (Caltrans 2020) provides detailed guidance on the evaluation of ground-borne vibration generated by pile driving. This information may be useful when considered adjustments to the attenuation rate.
As discussed above, the sound attenuation rate normally assumed for hydroacoustic analysis is 4.5 dB per doubling of distance. This equates to an F factor of 15. Table 4-4 shows vibration attenuation rates in the ground as a function of various soil types from Caltrans 2020. As can be
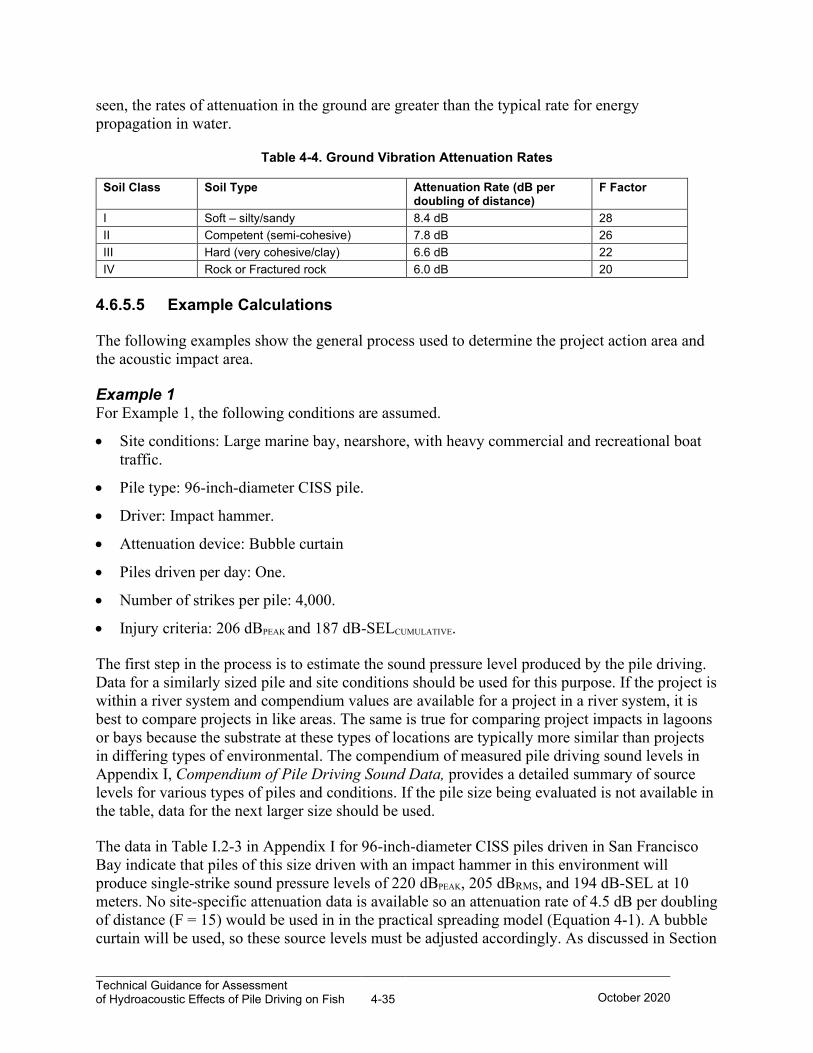
Technical Guidance for Assessment of Hydroacoustic Effects of Pile Driving on Fish 4-35
October 2020
seen, the rates of attenuation in the ground are greater than the typical rate for energy propagation in water.
Table 4-4. Ground Vibration Attenuation Rates
Soil Class Soil Type Attenuation Rate (dB per doubling of distance)
F Factor
I Soft – silty/sandy 8.4 dB 28 II Competent (semi-cohesive) 7.8 dB 26 III Hard (very cohesive/clay) 6.6 dB 22 IV Rock or Fractured rock 6.0 dB 20
4.6.5.5 Example Calculations
The following examples show the general process used to determine the project action area and the acoustic impact area.
Example 1 For Example 1, the following conditions are assumed.
• Site conditions: Large marine bay, nearshore, with heavy commercial and recreational boat traffic.
• Pile type: 96-inch-diameter CISS pile.
• Driver: Impact hammer.
• Attenuation device: Bubble curtain
• Piles driven per day: One.
• Number of strikes per pile: 4,000.
• Injury criteria: 206 dBPEAK and 187 dB-SELCUMULATIVE.
The first step in the process is to estimate the sound pressure level produced by the pile driving. Data for a similarly sized pile and site conditions should be used for this purpose. If the project is within a river system and compendium values are available for a project in a river system, it is best to compare projects in like areas. The same is true for comparing project impacts in lagoons or bays because the substrate at these types of locations are typically more similar than projects in differing types of environmental. The compendium of measured pile driving sound levels in Appendix I, Compendium of Pile Driving Sound Data, provides a detailed summary of source levels for various types of piles and conditions. If the pile size being evaluated is not available in the table, data for the next larger size should be used.
The data in Table I.2-3 in Appendix I for 96-inch-diameter CISS piles driven in San Francisco Bay indicate that piles of this size driven with an impact hammer in this environment will produce single-strike sound pressure levels of 220 dBPEAK, 205 dBRMS, and 194 dB-SEL at 10 meters. No site-specific attenuation data is available so an attenuation rate of 4.5 dB per doubling of distance (F = 15) would be used in in the practical spreading model (Equation 4-1). A bubble curtain will be used, so these source levels must be adjusted accordingly. As discussed in Section
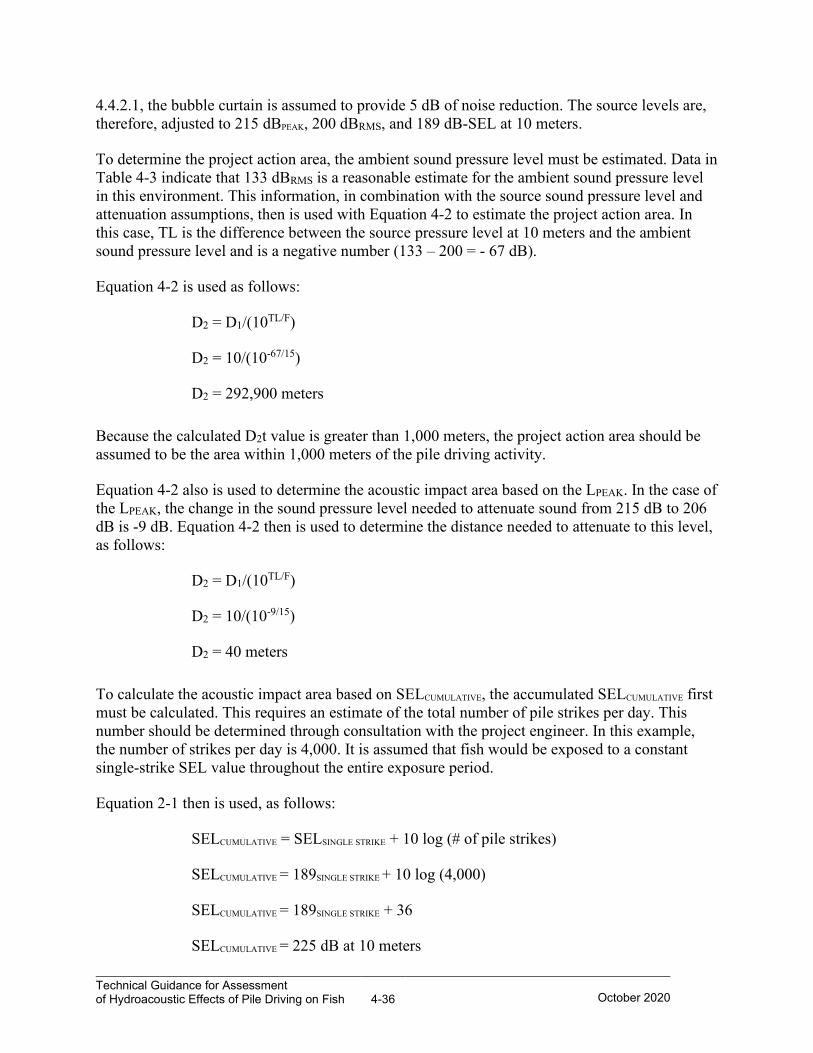
Technical Guidance for Assessment of Hydroacoustic Effects of Pile Driving on Fish 4-36
October 2020
4.4.2.1, the bubble curtain is assumed to provide 5 dB of noise reduction. The source levels are, therefore, adjusted to 215 dBPEAK, 200 dBRMS, and 189 dB-SEL at 10 meters.
To determine the project action area, the ambient sound pressure level must be estimated. Data in Table 4-3 indicate that 133 dBRMS is a reasonable estimate for the ambient sound pressure level in this environment. This information, in combination with the source sound pressure level and attenuation assumptions, then is used with Equation 4-2 to estimate the project action area. In this case, TL is the difference between the source pressure level at 10 meters and the ambient sound pressure level and is a negative number (133 – 200 = - 67 dB).
Equation 4-2 is used as follows:
D2 = D1/(10TL/F)
D2 = 10/(10-67/15)
D2 = 292,900 meters
Because the calculated D2t value is greater than 1,000 meters, the project action area should be assumed to be the area within 1,000 meters of the pile driving activity.
Equation 4-2 also is used to determine the acoustic impact area based on the LPEAK. In the case of the LPEAK, the change in the sound pressure level needed to attenuate sound from 215 dB to 206 dB is -9 dB. Equation 4-2 then is used to determine the distance needed to attenuate to this level, as follows:
D2 = D1/(10TL/F)
D2 = 10/(10-9/15)
D2 = 40 meters
To calculate the acoustic impact area based on SELCUMULATIVE, the accumulated SELCUMULATIVE first must be calculated. This requires an estimate of the total number of pile strikes per day. This number should be determined through consultation with the project engineer. In this example, the number of strikes per day is 4,000. It is assumed that fish would be exposed to a constant single-strike SEL value throughout the entire exposure period.
Equation 2-1 then is used, as follows:
SELCUMULATIVE = SELSINGLE STRIKE + 10 log (# of pile strikes)
SELCUMULATIVE = 189SINGLE STRIKE + 10 log (4,000)
SELCUMULATIVE = 189SINGLE STRIKE + 36
SELCUMULATIVE = 225 dB at 10 meters
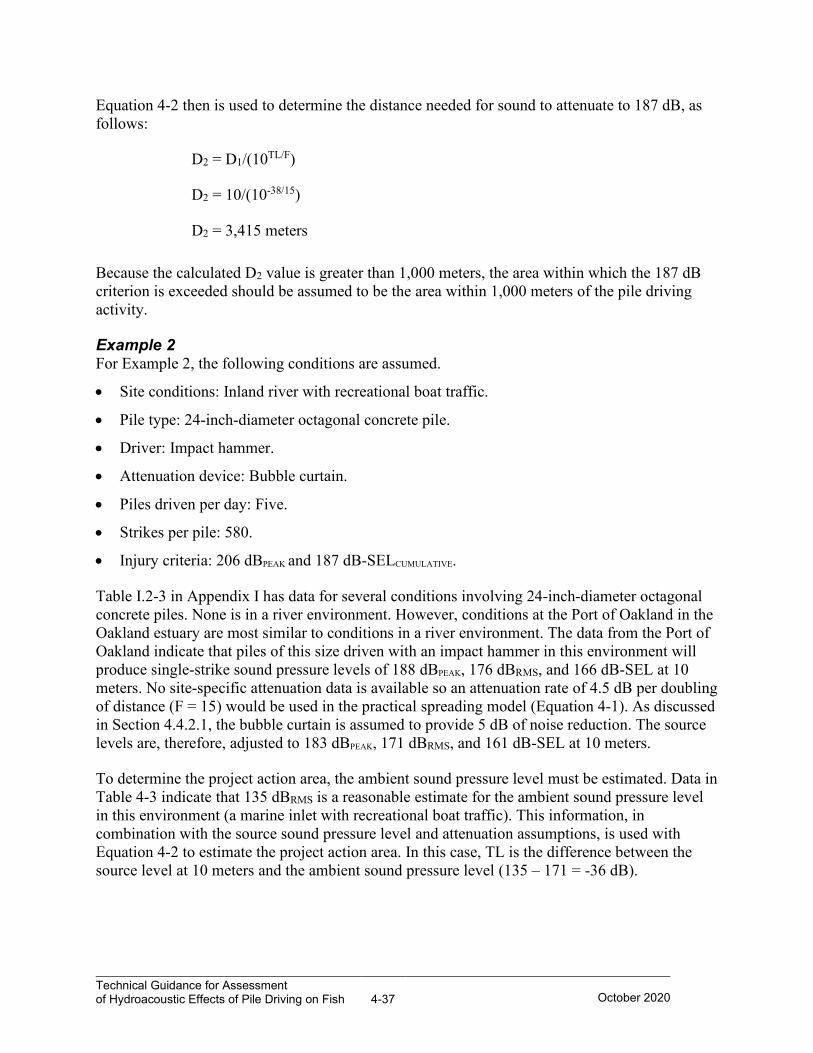
Technical Guidance for Assessment of Hydroacoustic Effects of Pile Driving on Fish 4-37
October 2020
Equation 4-2 then is used to determine the distance needed for sound to attenuate to 187 dB, as follows:
D2 = D1/(10TL/F)
D2 = 10/(10-38/15)
D2 = 3,415 meters
Because the calculated D2 value is greater than 1,000 meters, the area within which the 187 dB criterion is exceeded should be assumed to be the area within 1,000 meters of the pile driving activity.
Example 2 For Example 2, the following conditions are assumed.
• Site conditions: Inland river with recreational boat traffic.
• Pile type: 24-inch-diameter octagonal concrete pile.
• Driver: Impact hammer.
• Attenuation device: Bubble curtain.
• Piles driven per day: Five.
• Strikes per pile: 580.
• Injury criteria: 206 dBPEAK and 187 dB-SELCUMULATIVE.
Table I.2-3 in Appendix I has data for several conditions involving 24-inch-diameter octagonal concrete piles. None is in a river environment. However, conditions at the Port of Oakland in the Oakland estuary are most similar to conditions in a river environment. The data from the Port of Oakland indicate that piles of this size driven with an impact hammer in this environment will produce single-strike sound pressure levels of 188 dBPEAK, 176 dBRMS, and 166 dB-SEL at 10 meters. No site-specific attenuation data is available so an attenuation rate of 4.5 dB per doubling of distance (F = 15) would be used in the practical spreading model (Equation 4-1). As discussed in Section 4.4.2.1, the bubble curtain is assumed to provide 5 dB of noise reduction. The source levels are, therefore, adjusted to 183 dBPEAK, 171 dBRMS, and 161 dB-SEL at 10 meters.
To determine the project action area, the ambient sound pressure level must be estimated. Data in Table 4-3 indicate that 135 dBRMS is a reasonable estimate for the ambient sound pressure level in this environment (a marine inlet with recreational boat traffic). This information, in combination with the source sound pressure level and attenuation assumptions, is used with Equation 4-2 to estimate the project action area. In this case, TL is the difference between the source level at 10 meters and the ambient sound pressure level (135 – 171 = -36 dB).
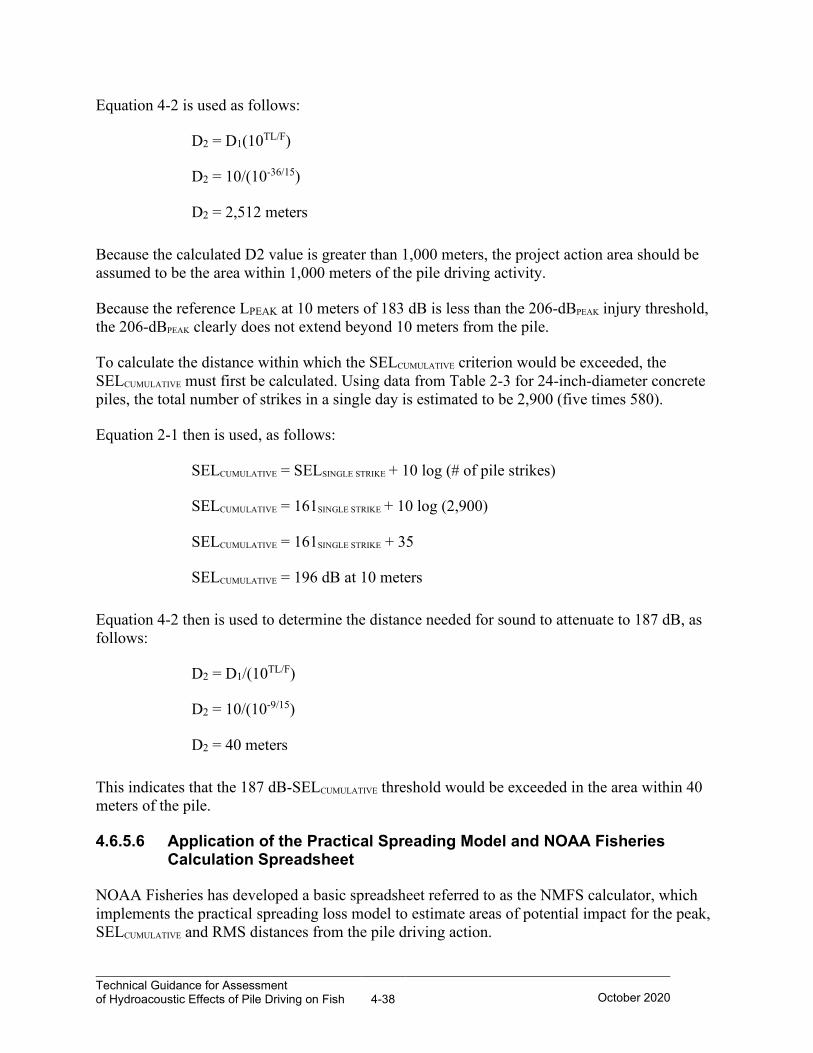
Technical Guidance for Assessment of Hydroacoustic Effects of Pile Driving on Fish 4-38
October 2020
Equation 4-2 is used as follows:
D2 = D1(10TL/F)
D2 = 10/(10-36/15)
D2 = 2,512 meters
Because the calculated D2 value is greater than 1,000 meters, the project action area should be assumed to be the area within 1,000 meters of the pile driving activity.
Because the reference LPEAK at 10 meters of 183 dB is less than the 206-dBPEAK injury threshold, the 206-dBPEAK clearly does not extend beyond 10 meters from the pile.
To calculate the distance within which the SELCUMULATIVE criterion would be exceeded, the SELCUMULATIVE must first be calculated. Using data from Table 2-3 for 24-inch-diameter concrete piles, the total number of strikes in a single day is estimated to be 2,900 (five times 580).
Equation 2-1 then is used, as follows:
SELCUMULATIVE = SELSINGLE STRIKE + 10 log (# of pile strikes)
SELCUMULATIVE = 161SINGLE STRIKE + 10 log (2,900)
SELCUMULATIVE = 161SINGLE STRIKE + 35
SELCUMULATIVE = 196 dB at 10 meters
Equation 4-2 then is used to determine the distance needed for sound to attenuate to 187 dB, as follows:
D2 = D1/(10TL/F)
D2 = 10/(10-9/15)
D2 = 40 meters
This indicates that the 187 dB-SELCUMULATIVE threshold would be exceeded in the area within 40 meters of the pile.
4.6.5.6 Application of the Practical Spreading Model and NOAA Fisheries Calculation Spreadsheet
NOAA Fisheries has developed a basic spreadsheet referred to as the NMFS calculator, which implements the practical spreading loss model to estimate areas of potential impact for the peak, SELCUMULATIVE and RMS distances from the pile driving action.
Technical Guidance for Assessment of Hydroacoustic Effects of Pile Driving on Fish 4-39
October 2020
The spreadsheet implements Equations 4-1 and 4-2 to develop distances within which specific thresholds are estimated. The spreadsheet is limited in that it assumes a condition in which fish are stationary throughout the daily activities relative to pile driving. An accurate site-specific estimate of pile strikes is necessary for accurate input of the required strike count metrics. Inaccurate estimates can significantly affect the outcome of the analysis and conditions for construction of the project. Structures foundations guidance recommend a pile driving analysis be performed that considers the pile type and size, as well as site-specific substrate, as indicated by geotechnical drilling investigations that are needed for PFRs. The Structures foundations engineer or geotechnical services are then able to model the site-specific estimated pile strike count using the GRL Wave Analysis Program software and provide a more accurate estimate for project evaluations.
Popper et al. 2019 provides the following various general observations regarding the NMFS assessment tool:
The calculations assume that all strikes have the same single strike SEL. Because the model (Woodbury and Stadler 2008) also assumes that fishes are stationary, the model does not account for any change in their actual exposure during pile driving operation (e.g., Krebs et al. 2016). In addition, the model does not consider potential recovery from effects during the time between strikes.
An important problem with the NOAA Fisheries Pile Driving Calculator is its approach to modeling sound propagation, and thus the determination of the ensonified area in which fish are exposed to sound levels that exceed the interim criteria. Although recognizing that propagation is complex and depends upon things like water depth and substrate. (Stadler and Woodbury 2009), these issues are not considered in the distance part of the equation, and the calculator uses a default attenuation rate of 4.5 dB per doubling of distance, although no basis for the use of this default attenuation is provided. Indeed, a recent analysis of a number of propagation models for pile driving suggests that the use of this constant is not correct (Lippert et al. 2018).
Moreover, Stadler and Woodbury claim that use of this constant will tend to overestimate the area being ensonified. Indeed, as discussed in a more recent modeling of sound propagation from pile driving on the Hudson River, the extent of sound propagation, and the attenuation over distance from the source, can vary not only in different directions from the source, but also as the sound travels in any one direction, with water depth and substrate parameters affecting propagation (MacGillivray et al. 2011; Martin et al. 2012). Clearly the modeling of underwater noise propagation from pile driving activities is far more complex than can be represented with a simple calculator. The nature of the bathymetry and bottom characteristics play a major role in actual results, although Lippert et al. (2018) demonstrated that the propagation simplifies close to the pile, where damped cylindrical spreading occurs. The simple NOAA Fisheries model was designed to be conservative in an attempt to account for many complex factors that a simple model cannot address. Pile driving propagation may be too complex to be dealt with by a single model to be used over a wide geographic range.
Technical Guidance for Assessment of Hydroacoustic Effects of Pile Driving on Fish 4-40
October 2020
Moreover, although the importance of sound emanating from the substrate is recognized in the papers discussing the modeling, the calculator does not take substrate transmission into consideration (Stadler and Woodbury 2009). It is clear that the substrate characteristics are very critical for the assessment and prediction of propagation in shallow waters (see page 30) (MacGillivray et al. 2011; Hazelwood 2012; Hazelwood and Macey 2016b; Hazelwood and Macey 2016a). Indeed, as shown in the Hudson River, other factors such as the presence of vessels associated with construction can also significantly affect sound propagation from a pile (Martin et al. 2012).
At the same time, it is understood that the current calculator is simple, and, as such, it can quickly be applied to projects in varying locations and site conditions. Given the complexity of sound propagation, a simple calculator is an important tool for ESA biologists (including those with NOAA Fisheries and USFWS) who typically are not acoustic experts. Accordingly, it would be appropriate to engage experts in acoustic propagation and modeling to examine the calculator, which was developed more than 11 years ago, to see if there is a way to incorporate new information and knowledge while retaining the calculator’s ease of use.
The spreadsheet allows input of single-strike peak, SEL, and RMS values; the number of pile strikes; and the attenuation constant (F). Appendix III shows the basic layout of the spreadsheet. Figure 4-9 provides an example of the spreadsheet input page.
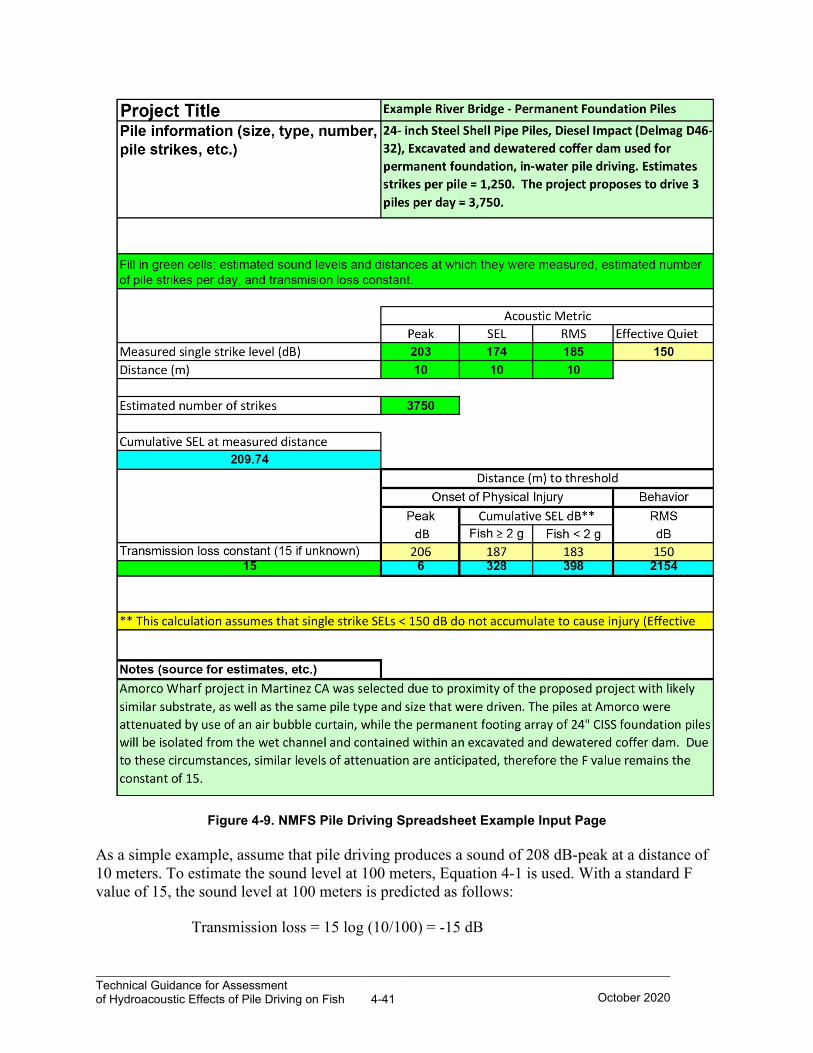
Technical Guidance for Assessment of Hydroacoustic Effects of Pile Driving on Fish 4-41
October 2020
Figure 4-9. NMFS Pile Driving Spreadsheet Example Input Page
As a simple example, assume that pile driving produces a sound of 208 dB-peak at a distance of 10 meters. To estimate the sound level at 100 meters, Equation 4-1 is used. With a standard F value of 15, the sound level at 100 meters is predicted as follows:
Transmission loss = 15 log (10/100) = -15 dB
Technical Guidance for Assessment of Hydroacoustic Effects of Pile Driving on Fish 4-42
October 2020
Peak sound level at 100 meters = 85 dB (100 dB – 15 dB)
To determine the distance at which the peak sound level attenuates to a specific criterion level (for example, 206 dB) Equation 4-2 is used. The difference between 206 dB and 208 dB is -2 dB (transmission loss is always a negative, as applied here). Therefore, -2 dB is the transmission loss needed to attenuate the sound to 206 dB. The distance to 206 dB is predicted as follows:
D2 =10 /(10-2//15) = 13.6 ~ 14 meters
These same equations can be used with SEL values and the number of pile strikes to evaluate the accumulated energy associated with pile driving. As an example, assuming that the single-strike SEL is 180 dB at 10 meters and the pile will be driven with 1,000 pile strikes, the SELCUMULATIVE is 210 dB using Equation 2-1. To determine the distance to a specific criterion level (for example, 187 dB SELCUMULATIVE), Equation 4-2 is once again used. The difference between 187 dB and 210 dB is -23 dB. The distance to 187 dB is predicted as follows:
D2 =10 /(1023/15) = 341 meters
The NOAA Fisheries spreadsheet introduces the concept of “effective quiet.” This concept assumes that energy from pile strikes that are less than 150 dB-SEL do not accumulate to cause injury. For any given condition, at some distance, sound attenuates to the level of effective quiet (i.e., 150 dB-SEL). Under the concept of effective quiet, this spreadsheet assumes that the distance to the accumulated criterion level cannot extend beyond the distance to effective quiet. Using the example above of a single-strike SEL value of 180 dB, the distance to the effective quiet level of 150 dB is 1,000 meters, based on Equation 4-2 and a transmission loss value of -30 dB. Therefore, the spreadsheet limits the distance to the SELCUMULATIVE criterion to 1,000 meters for these specific conditions. This corresponds to about 5,000 pile strikes. Consequently, if the number of pile strikes is greater than 5,000, the distance to the 187 dB SELCUMULATIVE does not increase.
4.6.6 Assessing Potential Impacts on Fish from Pile Driving Sound
The discussion above describes the analytical methods that can be used to estimate the acoustic footprint in which a fish could be exposed to underwater sound pressure that has the potential to exceed the interim criterion and produce injury.
It may be impractical to accurately predict the number of fish that could be exposed to sound pressure levels that exceed the injury threshold on larger projects such as the San Francisco Bay Bridge. Difficulties in predicting fish numbers generally relate to the high spatial and temporal variability of fish distribution and abundance in open water environments and the physical challenges of developing accurate estimates using standard fish sampling methods. A common approach for establishing regulatory limits on potential impacts is to use the estimated acoustic impact area as a surrogate for the number of fish that are likely to be within the impact area during pile driving activities and subject to harm from underwater sound pressure. For example, for the purposes of defining the allowable extent of incidental take resulting from injury or death of listed fish species, NOAA Fisheries typically requires use of the calculator tool for analysis,
Technical Guidance for Assessment of Hydroacoustic Effects of Pile Driving on Fish 4-43
October 2020
coupled with some site-specific surveys or known population abundance, in order to estimate the number of fish that may be harmed for a site-specific project location. In order to verify that the project analysis is in alignment with the pile driving activity, NMFS and CDFW require implementation of an approved hydroacoustic monitoring plan to ensure compliance. Underwater sound pressure levels are typically monitored at 10 meters from the pile. In larger and deeper waters, such as San Francisco Bay, Bodega Bay, Humboldt Bay, San Diego Harbor, or large river systems, there may be cause to deploy a second hydrophone at the injury isopleth distance. An underwater noise monitoring plan template is provided in Appendix III, Tools for Preparing Biological Assessment.
Compliance requirements during construction should always be based on actual measured sound pressure levels and not an estimated number of pile strikes per day or specified number of piles installed per day. There is enough variability in the field that true monitoring may allow for either more or less pile driving production within the thresholds. Estimates of pile strikes per day and piles installed per day are used to develop isopleth distances, but actual site conditions may be such that the assumed relationship between number of daily strikes and sound pressure level is not accurate. For example, if 2,000 strikes per day was assumed in the analysis, it would not be appropriate to stop work after 2,000 strikes if the measured sound level at the calculated isopleth distance is well below the injury threshold. It is also possible that the injury threshold at the isopleth distance could be exceeded with fewer than 2,000 strikes.
Estimation of the number of fish that may be injured, killed, or otherwise subject to potentially injurious pile driving sound may be feasible in some situations where existing information on fish migration timing, movements, and densities in the action area are available or can be reasonably estimated from surveys conducted in the action area prior to proposed pile driving activities. Analytical procedures will vary depending on the spatial and temporal scale of the data (e.g., site- versus reach-specific) and assumptions related to fish distribution and behavior. In general, these procedures will involve 1) estimation of the timing, duration, and rate of pile driving activities based on the proposed construction schedule, 2) estimation of acoustic impact area based on predicted SPLs or SELCUMULATIVE, and 3) estimation of the probable number of fish and duration of exposure based on their distribution, density, and behavior at the time of pile driving activities. The following section illustrates this general approach as applied to two scenarios, one in which fish are moving through the action area (in this case, migrating juvenile salmonids) and one in which the fish are stationary (e.g., summer rearing salmonids).
4.6.6.1 Impact Assessment for Construction during Migration Periods
Although in most cases in-water pile driving would be limited to the in-water work windows when migrating fish presence would be minimal, in some cases (e.g., large projects such as the Bay bridges retrofit projects), pile driving may be required during migration periods. In the case of evaluating pile driving projects in waters with migratory fishes and constrained channels, fish movement through the impact areas must be understood to estimate the impact. Many factors influence fish migration, both temporally and spatially. Temporally, salmon and steelhead have two migration periods each year: when young salmon and steelhead smolts migrate downstream to the ocean and when adult salmon and steelhead migrate upstream to their natal spawning grounds. Smolts typically migrate downstream in spring, and most adults migrate upstream in late summer to winter. Fisheries agencies should be consulted to determine the migration timing
Technical Guidance for Assessment of Hydroacoustic Effects of Pile Driving on Fish 4-44
October 2020
for the evolutionarily significant units of salmon and steelhead or other listed or sensitive species that potentially occur in the watershed where the project is planned. On a shorter time scale, river conditions such as water flow and water temperature may affect these migrations. For instance, returning adult salmon or steelhead may not enter small coastal streams in California until there is sufficient rainfall to increase flows and provide suitable passage conditions from the ocean to upstream spawning areas.
Spatially, migrating fish may occur within a particular portion of a river where conditions are more favorable to their migration. For instance, in the lower reaches of rivers in and near estuaries, fish may “prefer” migration in the deeper, swifter water within the thalweg (the deepest part of the channel) to accelerate their entry to the sea. This behavior was evident in acoustic tracking studies of Chinook salmon near the Richmond-San Rafael Bridge (U.S. Army Corps of Engineers 2007).
A simplistic model is presented below (Equation 4-3) to illustrate the basic concept in evaluating pile driving sound impacts on annual cohorts (year classes) of migrating fishes. The effects on cohorts of specific species are particularly important when evaluating population-level impacts. The model in Equation 4-3 may be used to assess the proportion of the population that may transit or enter the acoustic impact areas based on past (historical) data on migration timing and abundance in the project action area. It should be recognized that the model results may be subject to substantial uncertainty because of data limitations and assumptions that need to be made to address these limitations. However, such models may allow an evaluation of potential impacts based on a range of input parameters and conditions representing a reasonable range of uncertainty in fish migration timing and distribution, pile driving schedules, and environmental conditions affecting potential exposure to pile driving sound.
Equation 4-3 presents a basic conceptual model for estimating the proportion of migrating fish that transit acoustic impact areas.
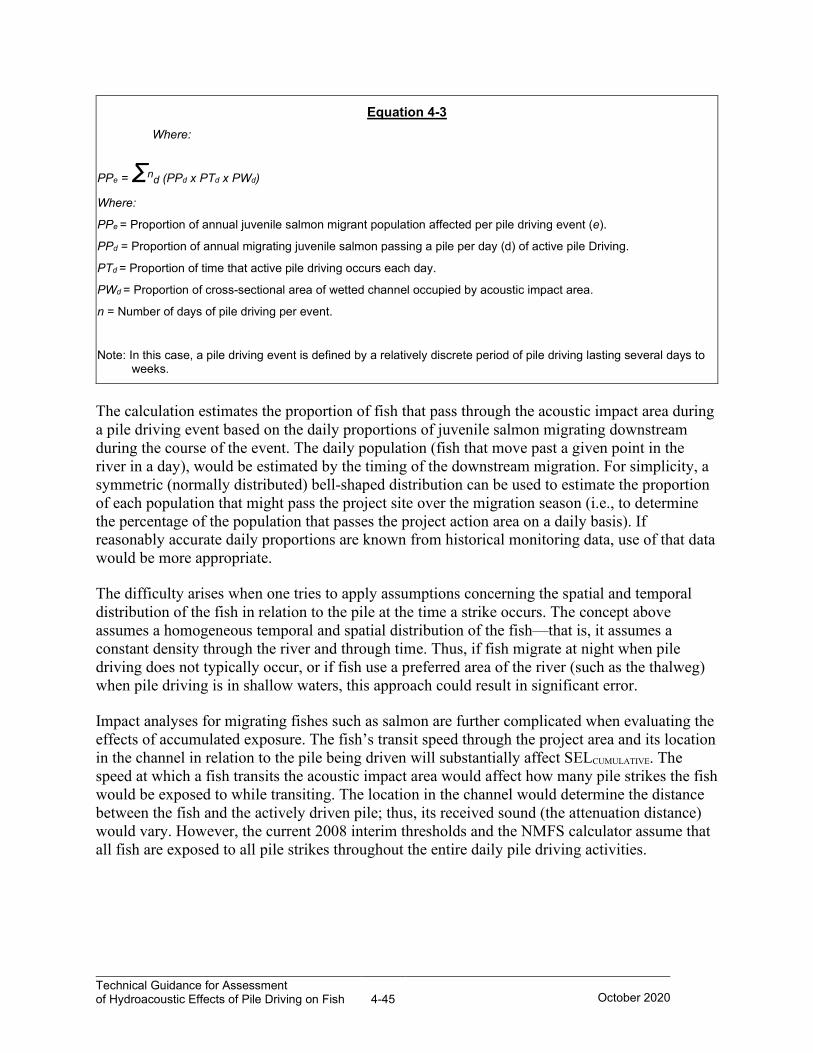
Technical Guidance for Assessment of Hydroacoustic Effects of Pile Driving on Fish 4-45
October 2020
Equation 4-3 Where:
PPe = Ʃnd (PPd x PTd x PWd)
Where:
PPe = Proportion of annual juvenile salmon migrant population affected per pile driving event (e).
PPd = Proportion of annual migrating juvenile salmon passing a pile per day (d) of active pile Driving.
PTd = Proportion of time that active pile driving occurs each day.
PWd = Proportion of cross-sectional area of wetted channel occupied by acoustic impact area.
n = Number of days of pile driving per event.
Note: In this case, a pile driving event is defined by a relatively discrete period of pile driving lasting several days to weeks.
The calculation estimates the proportion of fish that pass through the acoustic impact area during a pile driving event based on the daily proportions of juvenile salmon migrating downstream during the course of the event. The daily population (fish that move past a given point in the river in a day), would be estimated by the timing of the downstream migration. For simplicity, a symmetric (normally distributed) bell-shaped distribution can be used to estimate the proportion of each population that might pass the project site over the migration season (i.e., to determine the percentage of the population that passes the project action area on a daily basis). If reasonably accurate daily proportions are known from historical monitoring data, use of that data would be more appropriate.
The difficulty arises when one tries to apply assumptions concerning the spatial and temporal distribution of the fish in relation to the pile at the time a strike occurs. The concept above assumes a homogeneous temporal and spatial distribution of the fish—that is, it assumes a constant density through the river and through time. Thus, if fish migrate at night when pile driving does not typically occur, or if fish use a preferred area of the river (such as the thalweg) when pile driving is in shallow waters, this approach could result in significant error.
Impact analyses for migrating fishes such as salmon are further complicated when evaluating the effects of accumulated exposure. The fish’s transit speed through the project area and its location in the channel in relation to the pile being driven will substantially affect SELCUMULATIVE. The speed at which a fish transits the acoustic impact area would affect how many pile strikes the fish would be exposed to while transiting. The location in the channel would determine the distance between the fish and the actively driven pile; thus, its received sound (the attenuation distance) would vary. However, the current 2008 interim thresholds and the NMFS calculator assume that all fish are exposed to all pile strikes throughout the entire daily pile driving activities.
Technical Guidance for Assessment of Hydroacoustic Effects of Pile Driving on Fish 4-46
October 2020
In addition to the spatial and temporal issues associated with estimating fish exposure, accurately portraying pile driving operations is problematic. The actual drive times typically are less than the total operational time because of other activities between the time a pile is put into position and the time the operation is completed. Other activities could include dead blows (ineffective hammer strikes), equipment breakdown, welding sections of pipe piles to extend the length of the pile, environmental delays based on wind and tidal velocity, realigning piles, removing or relocating driving templates, installing pile driving followers, deploying attenuation devices from pile to pile, and adjusting hammer leads. Because of these other activities, using the total operation time to drive a pile would overestimate the exposure of fish to pile driving sound.
Until an accepted probabilistic model is developed that includes a realistic estimate for drive time, the assessment of pile driving on migrating fish will be a significant point of discussion, internally and with resource agencies, during project delivery and permitting. Agreement on assumptions and methods has taken from 6 to 10 months in the case of some of the large bridge projects. Proponents of projects located in waters with migrating fish should allow sufficient time in their permitting schedules for model development and negotiations, and consultation with the agencies should be initiated early in the process (see Section 4.8, Lessons Learned).
4.6.6.2 Impact Assessment for Construction during Non-Migration Periods or When Fish are Otherwise Present
Depending on the time of year and the location of the project, pile driving can occur in areas supporting summer-rearing salmonids (e.g., coho salmon and steelhead) or other summer-rearing fish, rather than migrating salmon. Pile driving may also occur in areas where other types of fish are permanent residents. An analysis would need to be conducted for all permanent and temporary piles driven in water and piles driven close to water where peak exceedances of underwater sound pressure might propagate into the water from the pile driving activity. An example analysis for a hypothetical bridge replacement project involving in-water pile driving is presented below. To analyze the exposure of stationary fish to pile driving sound, one can use the NOAA Fisheries model or create a relatively simple spreadsheet based on the equation presented in Section 4.6.3.1, Empirical Sound Attenuation Data.
In this simple example, construction of a new bridge project that requires two piers is proposed in a salmon-bearing river that supports summer rearing. Each pier consists of four 36-inch diameter steel piles. For simplicity, the example assumes that no permanent abutment piles or temporary trestle piles will be required for construction. If they were required, assessments would be needed for each.
The project engineer has estimated that 900 pile strikes would be required to drive each 36-inch diameter pile. Because up to two piles can be driven in 1 day, it is assumed that up to 1,800 strikes would occur during each pile driving day. Because there is no site-specific information to indicated otherwise, an attenuation rate of 4.5 dB per doubling of distance (F = 15) is assumed. A bubble curtain will be used that is assumed to provide 5 dB of attenuation.
The following source levels are assumed based on data for a similar project (Humboldt Bay Bridge) provided in Appendix I, Compendium of Pile Driving Sound Data.
Technical Guidance for Assessment of Hydroacoustic Effects of Pile Driving on Fish 4-47
October 2020
Single strike peak level: 210 dB at 10 meters.
Single strike SEL value: 183 dB at 10 meters.
Single strike RMS value: 193 dB at 10 meters.
Table 4-5 summarizes that data assumptions and the analysis results.
The results in Table 4-5 indicate that the 206 dB peak level would extend to 18 meters from the pile. The 187 dB injury threshold would extend to 341 meters and the 183 dB injury threshold would extend to 631 meters from the pile. The distance to 150 dB behavior threshold would extend to 3,415 meters.
For this example project, the river being crossed is 20 meters wide and 1 to 2 meters deep. Based on the estimated distance to attenuate to the SELCUMULATIVE criteria at 341 meters, it is estimated that an area of 13,640 (2 x 341 x 20) square meters would be subject to accumulated sound pressure levels above the 187 dB injury threshold during each pile driving day.
Depending on the waterbody, data to estimate summer salmonid rearing densities may, or may not be available. It is best to first consult the local area fisheries biologists with CDFW and the NOAA Fisheries. In some cases, river conditions are appropriate for conducting reconnaissance-level or more intensive snorkel surveys to gather reach-specific data. Snorkel surveys are generally not required but can be very effective in verifying the species and densities that might be affected.
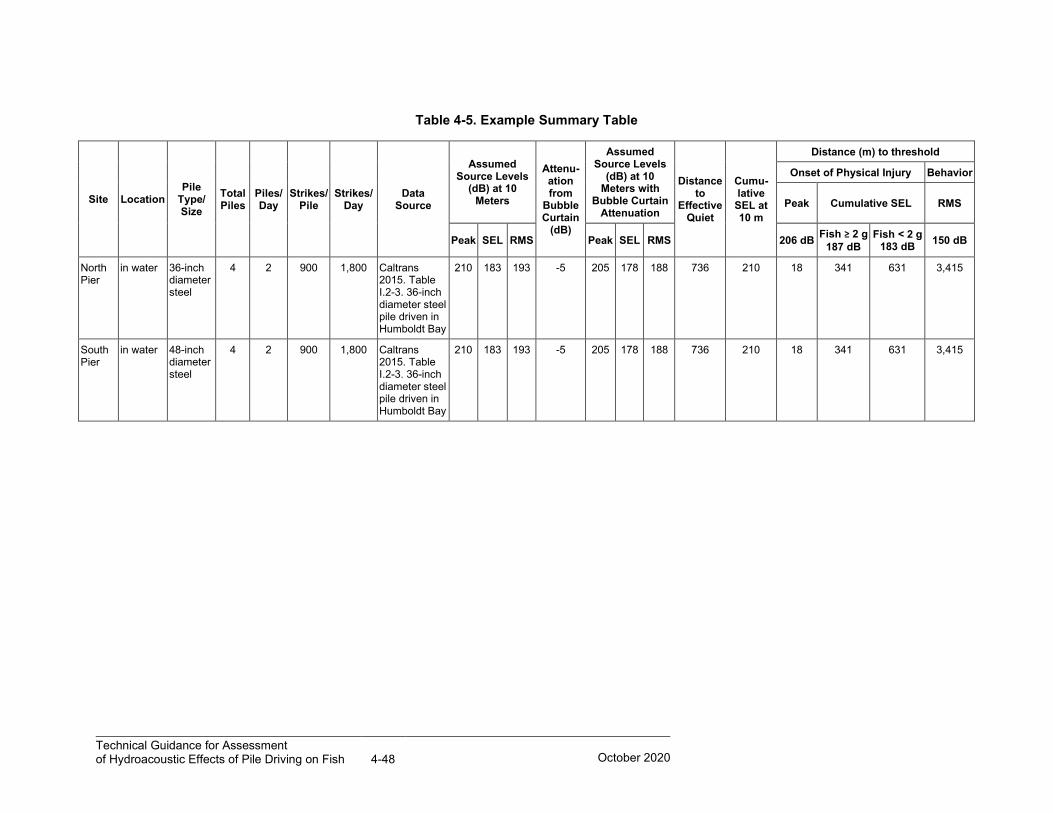
Technical Guidance for Assessment of Hydroacoustic Effects of Pile Driving on Fish 4-48
October 2020
Table 4-5. Example Summary Table
Site Location Pile
Type/ Size
Total Piles
Piles/ Day
Strikes/ Pile
Strikes/ Day
Data Source
Assumed Source Levels
(dB) at 10 Meters
Attenu- ation from
Bubble Curtain
(dB)
Assumed Source Levels
(dB) at 10 Meters with
Bubble Curtain Attenuation
Distance to
Effective Quiet
Cumu- lative
SEL at 10 m
Distance (m) to threshold
Onset of Physical Injury Behavior
Peak Cumulative SEL RMS
Peak SEL RMS Peak SEL RMS 206 dB Fish ≥ 2 g 187 dB
Fish < 2 g 183 dB 150 dB
North Pier
in water 36-inch diameter steel
4 2 900 1,800 Caltrans 2015. Table I.2-3. 36-inch diameter steel pile driven in Humboldt Bay
210 183 193 -5 205 178 188 736 210 18 341 631 3,415
South Pier
in water 48-inch diameter steel
4 2 900 1,800 Caltrans 2015. Table I.2-3. 36-inch diameter steel pile driven in Humboldt Bay
210 183 193 -5 205 178 188 736 210 18 341 631 3,415
Technical Guidance for Assessment of Hydroacoustic Effects of Pile Driving on Fish 4-49
October 2020
The example assumes that no scour holes or other habitat features would concentrate fish and that no other characteristics of the river would affect a uniform density. Based on data for this particular reach of river (or data from a similar river situation), the example assumes (again for simplicity) a density of the fish rearing in this reach of the river of one fish per 10 square meters. Assuming this density, approximately 1,364 fish could be exposed to SELCUMULATIVE above the interim criteria of 187 dB on each day of pile driving.
4.6.6.3 Screening Tool
Caltrans has developed a simple screening tool that can be used by biologists, planners, and engineers to make an initial determination as to whether or not pile driving sound will be a significant concern on a project. The tool is a spreadsheet that lists a typical range of pile types and the expected distance within which injury thresholds are expected to be exceeded. The number of strikes per day can be adjusted along with the assumed avoidance and minimization from an attenuation system, such as a dewatered cofferdam or a bubble curtain. The SELCUMULATIVE injury criterion (187 dB or 183 dB) may be selected as well.
Appendix III, Tools for Preparing Biological Assessment, provides results from the tool under various conditions. Table VI-1 provides results using the 187 dB SELCUMULATIVE criterion and no additional attenuation from an attenuation system. The tool indicates that an 18-inch concrete pile that is driven with fewer than 1,000 strikes in one day would not likely result in an injury distance that extends beyond 10 meters from the pile. On the other hand, driving of a 14-inch steel H pile would be expected to result in an injury distance that extends beyond 10 meters after only 10 strikes. Table VI-2 provides results based on 5 dB of attenuation from the use of a bubble curtain. As would be expected, the calculated distances and related impact areas are reduced with the addition of an attenuation system. Tables VI-3 and VI-4 show results using the 183 dB cumulative criterion. Tables VI-5 and IV-6 show results for pile driving on land.
4.7 Monitoring during Project Construction
Monitoring and reporting of underwater sound levels is typically required for most projects. The Underwater Sound Pressure Monitoring Template was developed for use during monitoring of the underwater sounds generated by pile driving. The current Caltrans monitoring template is an updated version of the original created by the FHWG in 2013. The template was updated primarily because the FHWG no longer exists. The goal of the template is to standardize collecting and reporting underwater sound pressure monitoring data, per the laws and requirements specific to California.
Technical Guidance for Assessment of Hydroacoustic Effects of Pile Driving on Fish 4-50
October 2020
4.8 Lessons Learned
4.8.1 Initiating Early Discussions with Resource Agencies
The permitting processes for projects involving pile driving in fish-bearing waters can take considerable time. To minimize the potential for project delays related to permitting, Department staff should initiate discussions with Structures foundations engineers, Geotechnical Services, the Project Delivery Team, and the appropriate resource agency staff as early as possible in the process. Understanding the requirements of foundations design and construction, as well as the agencies’ concerns regarding listed threatened and endangered species and their habitat, early in the process can facilitate the proper information exchange and timely permit processing by ensuring that the concerns are addressed in the permits and agreements.
4.8.2 Understanding the Issues
The evaluation of hydroacoustic impacts on fish from pile driving activities requires a clear understanding of construction methods, fish biology, and underwater acoustics. It is also important to recognize that the analysis of pile driving underwater sound pressure on fish is not an exact science; it requires best professional judgment based on scientific research and experience. Further, the knowledge regarding hydroacoustic assessments is evolving and it is important to keep current. The interim criteria should change as a result of the best available science related to past, current, and ongoing research efforts.
It is often the case that staff from regulatory agencies will not be familiar with, or have experience in, the varied construction methods or avoidance minimization or mitigation measures for this type of analysis or recommended additional conditions, which would be protective. It is important that the assumptions, analysis, and conclusions are clear and understandable in the documentation to the reviewing agencies and that Department and consultant experts are brought in to ensure quality analysis and permitting for construction implementation.
4.8.3 Portraying Reasonable Worst-Case Conditions
The hydroacoustic impact assessment is based on a number of assumptions that must be provided by the project design engineers. The assessment is based on assumptions regarding the number, size, and location of piles along with the number of impact pile strikes that could occur in a single day. It is typical that the design engineers will not be able to provide design level information at the time the assumptions are needed for the hydroacoustic impact assessment. Consequently, the Structures foundations engineers and geotechnical experts will need to provide reasonable worst-case assumptions to be used in the assessment. It is highly likely that these assumptions will form the basis of terms and conditions that will be placed on the project by resource agencies. Therefore, it is important for the Structures foundation engineers and geotechnical experts to estimate on the high side and provide upper boundary assumptions about size of piles and number of strikes per day. In short, the Project Delivery Team and ultimately
Technical Guidance for Assessment of Hydroacoustic Effects of Pile Driving on Fish 4-51
October 2020
the construction contractor will need to accept constructing the project within the upper boundary assumptions provided for the hydroacoustic impact assessment or run the risk of project delays associated with re-initiation of consultation with the resource agencies.
4.8.4 Understanding the Ramifications of Permit Conditions
Regulatory agencies can require that numerous terms and conditions be met prior to issuing permits and consultation documents. Permit conditions related to pile driving can be included in the Biological Opinion (terms and conditions), the 1602 Streambed Alteration Agreement, CESA consultation, the Coastal Development Permit, the Corps’ 404, and other permits and authorizations. Permit conditions related to pile driving can include a wide variety of requirements, such as the following: daily and seasonal timing restrictions; peak and cumulative sound limitations; requirements for underwater sound attenuation systems, hydroacoustic monitoring, fish monitoring, and special studies; and mitigation plans for the take of state-listed species.
It is important that Department staff understand the implications of permit conditions. It is always prudent to ask to review draft permit conditions from the permitting agency. Conditions that are not feasible, or that would significantly affect schedule, should be addressed and negotiated with the appropriate permitting agency.
4.8.5 Developing Mitigation under CESA
If the project results in the take of state-listed fish species, mitigation will be required. The CESA consultation must evaluate the effect of the project on listed species and the effect of the mitigation in offsetting that take, based on information from the federal consultation. The CESA consultation must also consider the best available science and data, which is not reflected in the 2008 interim criteria. Therefore, it is important to determine mitigation options while preparing the BA and to include an analysis of the mitigation as part of the BA. The BA also must provide statements committing Department funding to the mitigation plan.
4.9 Conclusion
The evaluation of potential effects of pile driving underwater sound pressure on fish is one of the most significant tasks associated with permitting bridge projects carried out by Caltrans and is probably the least understood. This guidance manual was developed to provide Department staff with up-to-date information regarding recent developments in the evaluation of pile driving underwater sound pressure and its potential effects on fish. Developing an understanding of this issue requires knowledge of the underlying acoustic principals related to sound generation and transmission of sound through water, the biology and behavior of fishes, the physical effects of sound on fish (both temporary and permanent), the regulatory framework in which the effects are evaluated, and the information and evaluation gaps. By providing this information to Department staff who are involved in permitting, it is hoped that Department staff become better informed
Technical Guidance for Assessment of Hydroacoustic Effects of Pile Driving on Fish 4-52
October 2020
regarding pile driving and its potential effects and, thus, can be better prepared to address resource agency requests and concerns during the permitting process.
4.10 References
Caltrans. 2015. Foundation Manual. Sacramento, CA.
Caltrans 2016. FINAL SFOBB Pier E3 Implosion Demonstration Project. Sacramento, CA.
Caltrans. 2020. The Caltrans Transportation and Construction Vibration Guidance Manual. Sacramento, CA.
Carlson, T. J., D. A. Woodruff, G. E. Johnson, N. P. Kohn, G. R. Plosky, M. A. Weiland, J. A. Southard, and S. L. Southard. 2005. Hydroacoustic Measurements during Pile Driving at the Hood Canal Bridge, September through November 2004. Battelle Marine Sciences Laboratory. Sequim, WA.
Carlson, T. J., M. Hastings, and A. N. Popper. 2007. Update on Recommendations for Revised Interim Sound Exposure Criteria for Fish during Pile Driving Activities. Memorandum to Suzanne Theiss (California Department of Transportation) and Paul Wagner (Washington Department of Transportation).
Crum, L. A., H. C. Pumphrey, R. A. Roy, and A. Prosperetti. 1999. The Underwater Sounds Produced by Impacting Snowflakes. The Journal of the Acoustical Society of America, Vol. 106, 4:1765–1770.
Fisheries Hydroacoustic Working Group (FHWG). 2008. Agreement in Principal for Interim Criteria for Injury to Fish from Pile Driving Activities. Memorandum dated June 12, 2008. Available online at: http://www.dot.ca.gov/hq/env/bio/files/fhwgcriteria_agree.pdf.
Halvorsen, M. B., B. M. Casper, C. M. Woodley, T. J. Carlson, and A. N. Popper. 2011. Hydroacoustic impacts on fish from pile installation. National Cooperative Highway Research Program Research Results Digest 363(October 2011).
Hastings, M. C. and A. N. Popper. 2005. Effects of Sound on Fish. (J&S 43A0139.) Prepared for the California Department of Transportation. Sacramento, CA.
Heathershaw, A. D., P. D. Ward, and A. M. David. 2001. The Environmental Impact of Underwater Sound. Proc. I.O.A. Vol. 23(4):1–13.
Illingworth & Rodkin. 2001. Noise and Vibration Measurements Associated with the Pile Installation Demonstration Project for the San Francisco-Oakland Bay Bridge East Span. Final Data Report, Task Order 2, Contract No. 43A0063.
Technical Guidance for Assessment of Hydroacoustic Effects of Pile Driving on Fish 4-53
October 2020
Laughlin, J. 2006. Ambient Underwater Sound Measurements in Elliot Bay, March 21, 2006. Washington Department of Transportation memorandum dated March 23, 2006. Olympia, WA.
O’Neil, D. M. 1998. Comparison of the Underwater Ambient Noise Measured in Three Large Exhibits at the Monterey Bay Aquarium and in the Inner Monterey Bay. Master’s thesis. Naval Postgraduate School, Department of Physics. Monterey, CA.
Popper, A. N., T. J. Carlson, A. D. Hawkins, B. L. Southall, and R. L. Gentry. 2006. Interim Criteria for Injury of Fish Exposed to Pile Driving Operations A white paper.
Popper A. N., A. D. Hawkins, R. R. Fay, D. Mann, S. Bartol, Th. Carlson, S. Coombs, W. T. Ellison, R. Gentry, M. B. Halvorsen, S. Løkkeborg, P. Rogers, B. L. Southall, D. G. Zeddies, W. N. Tavolga. 2014. Sound Exposure Guidelines for Fishes and Sea Turtles. A Technical Report prepared by ANSI-Accredited Standards Committee S3/SC1 and registered with ANSI.
Popper A. N., A. D. Hawkins, M. B. Halvorsen. 2019. Anthropogenic Sound and Fishes. Washington Department of Transportation. Olympia, WA. Scholik, A. R. and H. Y. Yan. 2001. The Effects of Underwater Noise on Auditory Sensitivity in Fish. Bioacoustics 12:186–188.
Scholik, A. R., and H. Y. Yan. 2001. "Effects of underwater noise on auditory sensitivity of a cyprinid fish." Hear. Res. 152, 17-24.
Stadler, John. Biologist. National Marine Fisheries Service, Northwest Regional Office. Email message to David Buehler, ICF Jones & Stokes. February 6, 2009.
Stocker, M. 2002. Fish Mollusks and other Sea Animals, and the Impact of Anthropogenic Noise in the Marine Acoustical Environment. Michael Stocker Associates for Earth Island Institute.
Strategic Environmental Consulting, Inc. 2004. Monitoring the Effects of Conventional Pile Driving on Three Species of Fish – Progress Report. San Rafael, CA.
U.S. Army Corps of Engineers. 2007. Juvenile Salmonid Outmigration and Distribution in the San Francisco Estuary. Draft Annual Report. San Francisco District, San Francisco, CA
Washington Department of Transportation. 2006. Biological Assessment Preparation for Transportation Projects – Advanced Training Manual. Olympia, WA.
Wilson, O. B, M. S. Stewart, J. H. Wilson, and R. H. Bourke. 1997. Noise Source Level Density due to Surf – Monterey Bay, California. Oceanic Engineering. Journal of IEEE 22(3):425–433.
Technical Guidance for Assessment of the Hydroacoustic Effects of Pile Driving on Fish G-1
June 2020
Glossary
acoustical pulse – Integral over time of the initial positive acoustic pressure pulse. This metric has been used by researchers to evaluate the effects of blast signals on fish where the signal is typically characterized by a single positive peak pressure pulse.
acoustic energy flux – The work done per unit area and per unit time by a sound wave on the medium as it propagates. The units of acoustic energy flux are joules per square meter per second (J/m2-s) or watts per square meter (W/m2). The acoustic energy flux is also called acoustic intensity.
acoustic particle velocity – The time rate of change of the displacement of fluid particles created by the forces exerted on the fluid by acoustic pressure in the presence of a sound wave. The units of velocity are meters per second (m/s).
air bubble curtain – A device that infuses the area surrounding a pile with air bubbles, creating a bubble screen that reduces peak underwater sound pressure levels.
ambient sound – Normal background noise in the environment that has no distinguishable sources.
ambient sound level – The background sound level, which is a composite of sound from all sources near and far. The normal or existing level of environmental sound at a given location. Distribution of sound pressure versus frequency for a waveform, dimension in root mean square pressure, and defined frequency bandwidth.
amplitude – The maximum deviation between the sound pressure and the ambient pressure.
bandwidth – The range of frequencies over which a sound is produced or received.
characteristic impedance (ρс) – The product of the density (ρ)and speed of sound (c) of a material. The difference in the characteristic impedance values in air and water causes a sound transmission loss between air and water of about 30 dB.
cofferdam – A temporary structure used to isolate an area generally submerged underwater from the water column.
critical habitat – Some listed fish populations also have legally protected habitat designated for the species. The federal Endangered Species Act requires designation of critical habitat for listed populations. Critical habitat refers to areas that are considered necessary for the survival and recovery of a species federally listed as threatened or endangered.
Technical Guidance for Assessment of the Hydroacoustic Effects of Pile Driving on Fish G-2
June 2020
cumulative sound exposure level (SELcumulative) – In an evaluation of pile driving impacts on fish, it may be necessary to estimate the cumulative SEL associated with a series of pile strike events. SELcumulative can be estimated from the single-strike SEL and the number of strikes that likely would be required to place the pile at its final depth by using the following equation:
SELcumulative = SELsingle strike + 10 log (# of pile strikes)
cushion block – A block of material placed atop a piling during pile driving to minimize the noise generated during pile driving. Materials typically used for cushioning include wood, nylon, and blocks.
dead blow – An ineffective hammer strike on the pile when the pile is advancing through soft soil.
decibel (dB) – A customary scale most commonly used for reporting levels of sound. A difference of 10 dB corresponds to a factor of 10 in sound power. A unit describing the amplitude of sound, equal to 20 times the logarithm to the base 10 of the ratio of the pressure of the sound measured to the reference pressure. The reference pressure for water is 1 micro-Pascal (µPa), and for air is 20 micro-Pascals (the threshold of healthy human audibility).
effective pressure – A measure of the square root of mean square (RMS) pressure. For pulses, the average of the squared pressures over the time that comprises that portion of the wave form containing 90 percent of the sound energy of the impulse. This measure historically has been used to calculate the RMS pressure for marine mammals.
essential fish habitat (EFH) – Habitat protected under the Magnuson-Stevens Fishery Conservation and Management Act and designated as those waters and substrate necessary to fish for spawning, breeding, feeding, or growth to maturity.
evolutionarily significant unit (ESU) – A Pacific salmon population or group of populations that is substantially reproductively isolated from other conspecific populations and that represents an important component of the evolutionary legacy of the species.
frequency – The number of complete pressure fluctuations per second above and below atmospheric pressure. Normal human hearing is between 20 and 20,000 hertz (Hz). Infrasonic sounds are below 20 Hz and ultrasonic sounds are above 20,000 Hz. Measured in cycles per second (Hz).
frequency spectrum – The distribution of frequencies from low to high that comprise a sound. Frequency spectra are important because the frequency content of the sound may affect the way the fish responds to the sound (in terms of physical injury as well as hearing loss). From an engineering perspective, the frequency spectrum is important because it affects the expected sound propagation and the performance of a sound attenuation (i.e., reduction) system, both being frequency dependent.
hearing generalists – Fish that sense sound directly through their inner ear. Other fish use their inner ear but also sense additional energy from the swim bladder.
Technical Guidance for Assessment of the Hydroacoustic Effects of Pile Driving on Fish G-3
June 2020
hearing specialists – Fish that have evolved any one of a number of different mechanisms to couple the swim bladder (or other gas-filled structure) to the ear. The swim bladder is stimulated by the pressure of sound waves and serves as a transducer that re-radiates energy in the form of particle motion that is detected by the inner ear. This increases hearing sensitivity compared with hearing generalists and, therefore, makes hearing specialists more susceptible to loud noises.
hertz (Hz) – The units of frequency where 1 hertz equals 1 cycle per second.
impulse level – Integral over time of the initial positive acoustic pressure pulse. A graphical plot illustrating the time history of positive and negative sound pressure of individual pile strikes shown as a plot of µPa versus time. Measured in Pascals milliseconds (Pa msec).
intensity (I) – The product of sound pressure and acoustic particle velocity divided by the acoustic impedance of the medium; also referred to as the acoustic energy flux density.
isolation casing – A hollow casing slightly larger in diameter than the piling to be driven that is inserted into the water column and bottom substrate. The casing is then dewatered, and the piling is driven within the dewatered isolation casing. Isolation casings are similar to cofferdams in that they isolate the work area from the water column; however, because isolation casings have a smaller footprint, they cannot be used to isolate large areas. In addition, because the air space is smaller between the pile and the casing, isolation casings do not have as great of an attenuation value as cofferdams have.
lateral line – A series of sensors along the body and head of fish that detects water motion.
otolith – A dense calcareous structure found in the otolithic end organs (i.e., the saccule, lagena, and utricle) of the ears of fishes. Otolithic organs overlie a tissue layer containing numerous sensory hair cells. Because the body of a fish contains mostly water, and otoliths are stiffer and denser than the rest of the body, sound will penetrate the otoliths more slowly than the rest of the fish.
peak sound pressure level (LPEAK) – The largest absolute value of the instantaneous sound pressure. This pressure is expressed as a decibel (referenced to a pressure of 1 micro-Pascal [µPa] for water and 20 µPa for air or in units of pressure, such as µPa or pounds per square inch [psi]).
permanent threshold shift (PTS) – A permanent loss of hearing caused by some kind of acoustic or drug trauma that is generally accompanied by death of the sensory hair cells of the ear.
physoclists – Fishes in which the swim bladder is not connected to the esophagus. Gas is added to the swim bladder using a highly specialized gas-secreting system called the rete mirabile that lies in the wall of the swim bladder and extracts gas from the blood using a counter-current system, like that of a kidney, to remove wastes from the blood.
Technical Guidance for Assessment of the Hydroacoustic Effects of Pile Driving on Fish G-4
June 2020
physostomes – Fish species in which the swim bladder is connected to the esophagus by a thin tube. Air to fill the swim bladder is swallowed by the fish and is directed to the swim bladder. Air removal from the swim bladder is by expulsion through this tube to the esophagus.
plane wave – A constant-frequency wave with wavefronts that are infinite parallel planes of constant amplitude normal to the velocity vector of the wave.
project action area – The area experiencing direct and indirect project-related effects.
resonance frequency – The frequency at which a system or structure will have maximum motion when excited by sound or an oscillatory force.
rise time – The time interval a signal takes to rise from 10 to 90 percent of its highest peak value (ANSI S12.7). Measured in milliseconds (msec).
root mean square (RMS) sound pressure level – Decibel measure of the square root of mean square (RMS) pressure. For impulses, the average of the squared pressures over the time that comprise that portion of the waveform containing 90 percent of the sound energy of the impulse.
sound – Small disturbances in a fluid from ambient conditions through which energy is transferred away from a source by progressive fluctuations of pressure (or sound waves).
sound exposure – The integral over all time of the square of the sound pressure of a transient waveform.
sound exposure level (SEL) – The time integral of frequency-weighted squared instantaneous sound pressures. Proportionally equivalent to the time integral of the pressure squared and can be described in terms of µPa2 sec over the duration of the impulse. Measured in dB re: 1 µPa2 sec. In this guidance manual, sound energy associated with a pile driving pulse, or series of pulses, is characterized by the SEL. SEL is the constant sound level in one second, which has the same amount of acoustic energy as the original time-varying sound (i.e., the total energy of an event). SEL is calculated by summing the cumulative pressure squared over the time of the event.
sound pressure level (SPL) – An expression of the sound pressure using the decibel (dB) scale and the standard reference pressures of 1 micro-Pascal (μPa) for water and biological tissues, and 20 μPa for air and other gases. Sound pressure is the sound force per unit area, usually expressed in micro-Pascals (or micro-Newtons per square meter), where 1 Pascal is the pressure resulting from a force of 1 Newton exerted over an area of 1 square meter. The SPL is expressed in decibels as 20 times the logarithm to the base 10 of the ratio between the pressure exerted by the sound to a reference sound pressure (e.g., 20 micro-Pascals). SPL is the quantity that is directly measured by a sound level meter. Measured in decibels (dB).
speed of sound (c) – The rate at which sound propagates through a medium. The speed of sound in sea water at a standard temperature of 21 ºC is equal to 4.4 times the speed of sound in air at standard temperature and pressure.
Technical Guidance for Assessment of the Hydroacoustic Effects of Pile Driving on Fish G-5
June 2020
swim bladder – A gas filled chamber found in the abdominal cavity of many species of bony fishes but not in cartilaginous fishes. The swim bladder serves in buoyancy control and may serve as a radiating device for sound production.
teleost fishes – Fishes that maintain their buoyancy by inflating and deflating their swim bladder with air.
temporary threshold shift (TTS) – A temporary loss of hearing as a result of exposure to sound over time. The level and duration of exposure that cause auditory tissue damage and TTS varies widely and can be affected by factors such as repetition rate of the sound, pressure level, frequency, duration, size and life history stage of the organism, and many other factors. Both peak sound pressure level and sound exposure level can affect hearing through auditory tissue damage or TSS. TSS will occur at lower levels than auditory tissue damage.
threshold – The lowest signal level an animal will detect in some statistically predetermined percent of presentation of a signal. Auditory thresholds are the lowest sound levels detected by an animal at the 50-percent level.
waveform – A graph obtained by plotting the instantaneous values of a periodic quantity against time.
wave length (λ) – The length of one full cycle (i.e., the distance between peaks) of a periodic quantity. The wave length is equal to the speed of sound divided by the frequency (i.e., peaks per second expressed as Hertz).
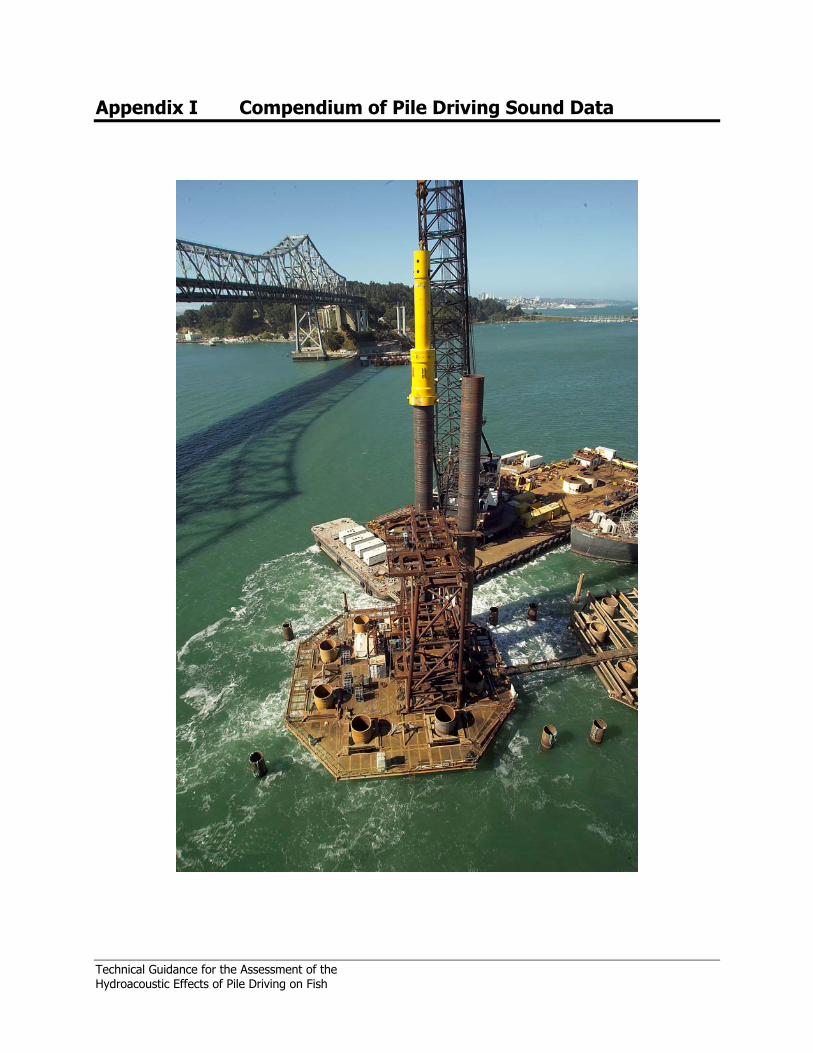
Technical Guidance for the Assessment of the Hydroacoustic Effects of Pile Driving on Fish
Appendix I Compendium of Pile Driving Sound Data

This page intentionally left blank.
Technical Guidance for the Assessment of the Hydroacoustic Effects of Pile Driving on Fish I-i October 2020
Table of Contents
I.1 Introduction ....................................................................................................................................I-1
I.2 Summary ........................................................................................................................................I-2
I.3 Steel Pipe or CISS Piles ...............................................................................................................I-19
I.4 Steel H-Piles ..............................................................................................................................I-128
I.5 Concrete Piles ............................................................................................................................I-149
I.6 Steel Sheet Piles .........................................................................................................................I-186
I.7 Timber Piles ...............................................................................................................................I-195
I.8 New Benicia-Martinez Bridge Project .......................................................................................I-203
I.9 San Francisco-Oakland Bay Bridge East Span Replacement Project ........................................I-216
I.10 Richmond-San Rafael Bridge Project ........................................................................................I-238
I.11 Humboldt Bay Bridges ..............................................................................................................I-249
I.12 Plastic Piles ................................................................................................................................I-259
I.13 Modified H-Piles, Steel Sheet Piles, and Steel Shell Piles—Ten Mile River Bridge Project, Fort Bragg, CA ..........................................................................................................................I-262
I.14 Impact Driving of Conductor Pipe for Exploratory Drilling Program – Anchor Point, Alaska ........................................................................................................................................I-270
I.15 Impact Driving of 20-Inch to 72-Inch Steel Shell Piles for Seismic Upgrade Project – Martinez, California ...................................................................................................................I-271
I.16 Impact Driving of 84-inch Piles with Diesel Impact Hammer for Bridge Rehabilitation Project – Healdsburg, California ................................................................................................I-274
I.17 Driving of 24 to 42-inch Steel Shell Piles with Diesel Impact Hammer for Maintenance Facility, Vallejo, California .......................................................................................................I-274
I.18 Driving of 24-inch Temporary Piles with Diesel Impact Hammer for Bridge Work Trestle, Contra Costa County, California...................................................................................I-276
I.19 Testing of Underwater Sound Attenuation Device, Honolulu Harbor, Hawaii .........................I-278
I.20 Impact Driving of Timber Piles, San Francisco Bay, California ...............................................I-279
Technical Guidance for the Assessment of the Hydroacoustic Effects of Pile Driving on Fish I-ii October 2020
I.21 Trenching and Winching Operations and Trusting Propeller Noise for Fiber-Optic Cable Laying, Alaska ...........................................................................................................................I-280
I.22 Impact Driving of 16-inch Square Concrete Piles, Bodega Bay, California..............................I-281
I.23 Impact Driving of 24-inch Steel Shell Piles for Wharf Repair, California ................................I-282
I.24 Trenching and Winching Operations and Trusting Propeller Noise for Fiber-Optic Cable Laying, Oliktok Point, Alaska ...................................................................................................I-283
I.25 Impact Driving for Reinstallation 36-inch Steel Shell Pile, Vallejo, California ........................I-284
I.26 Implosion of 13 Marine Piers for Dismantling of Bridge, San Francisco-Oakland, California ...................................................................................................................................I-285
I.27 Driving of 42 to 72-inch Piles with Diesel Impact Hammer for Terminal Replacement Project – Antioch, California .....................................................................................................I-288
I.28 Vibratory Installation of 24 to 36-inch Piles for Terminal Expansion Project – San Francisco, California ..................................................................................................................I-288
I.29 Driving of 24-inch Steel Shell Battered Piles with Diesel Impact Hammer for Seismic Retrofit of Terminal Facility – Richmond City, California .......................................................I-290
I.30 Driving of 30 and 66-inch Piles with Diesel Impact Hammer for Fender System Replacement Project – Redwood City, California ...........................................................................................I-291
I.31 Driving of 22-inch Steel Temporary Trestle Piles with Impact Hammer for Bridge Replacement – Yuba City and Marysville, California ...............................................................I-294
I.32 Driving of 24-inch Steel Shell Piles with Diesel Impact Hammer for Temporary Work Trestle – Larkspur, California ....................................................................................................I-295
I.33 Vibratory and Impact Pile Driving of Piles for Floating Dock – Los Angeles, California ........I-298
I.34 Vibratory and Impact Pile Driving of Piles for Chevron Long Wharf – Richmond, California ...................................................................................................................................I-300
I.35 On-Land Pile Driving of 10 x 54-Inch H Piles with Diesel Impact Hammer for Bridge Upgrade Project – Siskiyou County, California .........................................................................I-301
I.36 Pile Extraction, Installation, and Proofing for Wharf Reconstruction Project – Monterey, California ...................................................................................................................................I-303
I.37 Impact Pile Driving of 24 to 30-Inch Steel Shell Battered Piles for Terminal Retrofit Project – Martinez, California ....................................................................................................I-305
1.38 Impact Driving 14-inch nominal timber piles for Santa Cruz Wharf Repairs, Santa Cruz, CA ..............................................................................................................................................I-306
Technical Guidance for the Assessment of the Hydroacoustic Effects of Pile Driving on Fish I-iii October 2020
List of Tables
I.2-1 Summary of Sound Measurements for Marine Pile Driving ......................................................I-5
I.3-1 Summary of Sound Pressure Levels Measured for Driving 12-Inch-Diameter Steel Shell Piles– El Cerrito, CA .......................................................................................................I-19
I.3-2 Summary of Sound Pressure Levels Measured for Driving 60-Inch-Diameter CISS Piles – Noyo River Bridge Replacement, Fort Bragg, CA .......................................................I-20
I.3-3 Summary of Sound Pressure Levels Measured for Driving 12-Inch-Diameter Steel Shell Piles—Galilee Marina, Sausalito, CA .............................................................................I-21
I.3-4 Summary of Sound Pressure Levels Measured for Driving 13-Inch-Diameter Steel Shell Piles—Mad River Slough, Arcata, CA ............................................................................I-23
I.3-5 Summary of Sound Pressure Levels Measured for Vibratory Installation of 72-Inch-Diameter Steel Shell Piles—Richmond Inner Harbor, Richmond, CA ....................................I-24
I.3-6 Summary of Sound Pressure Levels Measured for Driving 24-Inch-Diameter Steel Pipe Piles—Conoco/Phillips Dock, Rodeo, CA .......................................................................I-25
I.3-7 Summary of Sound Pressure Levels Measured for 20-Inch-Diameter Trestle Piles in Water, Unattenuated—Stockton Wastewater Treatment Plant, Stockton, CA .........................I-28
I.3-8 Summary of Sound Pressure Levels Measured for 20-Inch-Diameter Trestle Piles on Land next to Water—Stockton Wastewater Treatment Plant, Stockton, CA ...........................I-29
I.3-9 Summary of Sound Pressure Levels Measured for 20-Inch-Diameter Trestle Piles in Water with Attenuation—Stockton Wastewater Treatment Plant, Stockton, CA ....................I-30
I.3-10 Summary of Sound Pressure Levels Measured for 36-Inch-Diameter Bent 4 Piles on Land—Stockton Wastewater Treatment Plant, Stockton, CA ..................................................I-31
I.3-11 Summary of Sound Pressure Levels Measured for 36-Inch-Diameter Bent 3 Piles in Water with Attenuation—Stockton Wastewater Treatment Plant, Stockton, CA ....................I-32
I.3-12 Summary of Sound Pressure Levels Measured for Driving 24-Inch-Diameter Steel Pipe Piles—Amorco Wharf Construction, Martinez, CA .........................................................I-34
I.3-13 Summary of Sound Pressure Levels Measured for Driving 24-Inch-Diameter Steel Pipe Piles—West Side of Geyserville Bridge, Russian River, CA ...................................................I-39
I.3-14 Summary of Sound Pressure Levels Measured for Driving 24-Inch-Diameter Steel Pipe Piles—East Side of Geyserville Bridge, Russian River, CA ....................................................I-39
I.3-15 Summary of Sound Pressure Levels Measured for Driving 48-Inch-Diameter CISS Piles on Land—Geyserville Bridge, Russian River, CA ..........................................................I-43
Technical Guidance for the Assessment of the Hydroacoustic Effects of Pile Driving on Fish I-iv October 2020
I.3-16 Summary of Sound Pressure Levels Measured for Driving 48-Inch-Diameter CISS Piles in Water (Bent 5)—Geyserville Bridge, Russian River, CA ...........................................I-45
I.3-17 Summary of Sound Pressure Levels Measured for Driving 40-Inch-Diameter Steel Piles in Water—Bay Ship and Yacht Dock, Alameda, CA ...............................................................I-48
I.3-18 Summary of Sound Pressure Levels Measured for Driving of 16-Inch-Diameter Steel Pipe Piles—Airport Road Bridge Replacement Project, Anderson, CA (January 29, 2008) .........................................................................................................................................I-51
I.3-19 Summary of Sound Pressure Levels Measured for Driving of 16-Inch-Diameter Steel Pipe Piles—Airport Road Bridge Replacement Project, Anderson, CA (January 30, 2008) .........................................................................................................................................I-52
I.3-20 Summary of Daily Peak Sound Pressure Levels and SEL at 10 Meters for Driving 22-Inch-Diameter Steel Pipe Piles—Bradshaw Bridge Project, Lathrop, CA ...............................I-53
I.3-21 Summary of Sound Pressure Levels Measured at 10 Meters (33 Feet) for the Driving of 24-Inch-Diameter Steel Shell Piles—Tongue Point Facility Pier, Astoria, OR .......................I-55
I.3-22 Summary of Sound Pressure Levels Measured at 20 Meters (65 Feet) for the Driving of 24-Inch Steel Shell Piles—Tongue Point Facility Pier, Astoria, OR .......................................I-56
I.3-23 Average Sound Pressure Levels with Different Impact Hammer Power Settings Bubble Rings on- Tongue Point Facility Pier, Astoria, OR ..................................................................I-56
I.3-24 Summary of Sound Pressure Levels Measured for Impact Driving 24-Inch-Diameter Steel Pipe Pile on October 28 and 29, 2008—Sacramento River, Shasta County ....................I-58
I.3-25 Summary of Sound Pressure Levels Measured for Vibratory Driving 24-Inch-Diameter Steel Pipe Pile on November 3, 2008- Sacramento River, Shasta County ...............................I-59
I.3-26 Summary of Sound Pressure Levels Measured at 10 Meters (33 Feet) for Driving 30-Inch-Diameter Steel Shell Pile - Siuslaw River Bridge, State Route 126, Florence, OR .........I-61
I.3-27 Summary of Sound Pressure Levels Measured for the Driving of 16- and 20-Inch-Diameter Steel Shell Piles—Stockton Marina 10 Meter and 2 to 5 Meter Positions ...............I-63
I.3-28 Summary of Sound Pressure Level Results for Vibratory Pile Removal of One 14-Inch-Diameter Steel Shell Pile- Richmond–San Rafael Bridge Pile Removal/Installation Project, Marin County, CA ......................................................................................................I-64
I.3-29 Summary of Sound Pressure Levels Measured for Impact Driving of Four 14-Inch-Diameter Steel Shell Piles - Richmond–San Rafael Bridge Pile Removal/Installation Project, Marin County, CA ......................................................................................................I-64
I.3-30 Summary of Sound Pressure Levels Measured for Driving of 72-Inch-Diameter Steel Shell Piles - Feather River Bridge Project, Sutter County, CA ................................................I-66
I.3-31 Summary of Sound Pressure Levels Measured for Driving of 24-Inch-Diameter Steel Shell Piles Place Over Steel H Piles - South Umpqua River Douglas County, OR .................I-69
Technical Guidance for the Assessment of the Hydroacoustic Effects of Pile Driving on Fish I-v October 2020
I.3-32 Summary of Daily Maximum and Average Peak and Single-Strike SEL ................................I-70
I.3-33 Summary of Underwater Sound Levels for Location C, Portage Bay. .....................................I-71
I.3-34 Summary of Underwater Sound Pressure Levels for Location A and B near Foster Island ........................................................................................................................................I-72
I.3-35 2010 Summary of Measures Sound Pressure Levels in dB Near Location (Site B and C) ......I-76
I.3-36 2010 Summary of Sound Levels in dB at Upstream Location (Site A) ....................................I-76
I-3-37 2011 Summary of Sound Pressure Levels in dB Measured at Upstream Location (Site B) ..............................................................................................................................................I-76
I.3-38 2011 Summary of Sound Pressure Levels in dB at Center Location (Site A) ..........................I-76
I.3-39 Average Levels Measured (in dB) and per Pile ........................................................................I-79
I.3-40 Summary of Sound Pressure Levels Measured for Vibratory Driving of 24-Inch-Diameter Steel Pipe Piles. - Trinidad Pier Reconstruction, Humboldt County, CA.................I-80
I.3-41 Summary Of Daily Maximum Sound Pressure Levels for Driving 24-Inch-Diameter Steel Pipe Piles - I-5 Willamette River Bridge Project, Eugene/Springfield, Oregon OR (September, 2009) ....................................................................................................................I-81
I.3-42 Summary of Daily Maximum Sound Pressure Levels for Driving 24-Inch-Diameter Steel Pipe Piles - I-5 Willamette River Bridge Project, Eugene/Springfield, Oregon OR (October 2010) ..........................................................................................................................I-82
I.3-43 Summary of Daily Maximum Sound Pressure Levels for Driving 24-Inch-Diameter Steel Pipe Piles - I-5 Willamette River Bridge Project, Eugene/Springfield, Oregon OR (April 2011) ..............................................................................................................................I-83
I.3-44 Summary of Measured Sound Pressure Levels for Impact Driving for 1.2-Meter (48-Inch) Anchor Piles at Pier 2 - Mad River Bridge Project, McKinleyville, CA ..................I-89
I.3-45a Summary of Measured Sound Levels for Impact Driving for 2.2-Meter (87-Inch) Production Piles at Pier 2 - Mad River Bridge Project, McKinleyville, CA ............................I-90
I.3-45b Summary of Measured Sound Levels for Impact Driving for 2.2-Meter (87-Inch) Production Piles at Pier 3 - Mad River Bridge Project, McKinleyville, CA ............................I-90
I.3-45c Summary of Measured Sound Levels for Impact Driving for 2.2-Meter (87-Inch) Production Piles at Pier 4 - Mad River Bridge Project, McKinleyville, CA ............................I-90
I.3-46a Summary of Measured Sound Levels for Impact Driving for 2.2-Meter (87-Inch) Production Piles at Pier 2 in 2011 - Mad River Bridge Project, McKinleyville, CA ...............I-91
I.3-46b Summary of Measured Sound Levels for Impact Driving for 2.2-Meter (87-Inch) Production Piles at Pier 3 in 2011 - Mad River Bridge Project, McKinleyville, CA ...............I-91
Technical Guidance for the Assessment of the Hydroacoustic Effects of Pile Driving on Fish I-vi October 2020
I.3-46c Summary of Measured Sound Levels for Impact Driving for 2.2-Meter (87-Inch) Production Piles at Pier 4 in 2011 - Mad River Bridge Project, McKinleyville, CA ...............I-91
I.3-46d Summary of Measured Sound Levels for Impact Driving for 2.2-Meter (87-Inch) Production Piles at Pier 3 and Pier 4 with the Fish Exclusion Zone in 2011- Mad River Bridge Project, McKinleyville, CA ..........................................................................................I-92
I.3-47a Summary of the Peak Measurement Results for December 8, 2011 ........................................I-94
I.3-47b Summary of the RMS Measurement Results for December 8, 2011 ........................................I-94
I.3-48a Summary of the Peak Measurement Results for December 13, 2011 ......................................I-95
I.3-48b Summary of the RMS Measurement Results for December 13, 2011 ......................................I-95
I.3-49a Summary of the Peak Measurement Results for January 18, 2012 ..........................................I-96
I.3-49b Summary of the RMS Measurement Results for January 18, 2012 ..........................................I-97
I.3-50a Summary of the Peak Measurement Results for July 6, 2012 ..................................................I-98
I.3-50b Summary of the RMS Measurement Results for July 6, 2012 .................................................I-98
I.3-50c Summary of the Single Strike SEL Measurement Results for July 6, 2012 .............................I-98
I.3-51a Summary of the Peak Measurement Results for July 10, 2012 ................................................I-99
I.3-51b Summary of the RMS Measurement Results for July 10, 2012 ...............................................I-99
I.3-51c Summary of the Single Strike SEL Measurement Results for July 10, 2012 ...........................I-99
I.3-52a Summary of the Peak Measurement Results for July 28, 2012 ..............................................I-100
I.3-52b Summary of the SEL Measurement Results for July 28, 2012 ...............................................I-101
I.3-53a Summary of the Peak Measurement Results for July 31, 2012 ..............................................I-101
I.3-53b Summary of the SEL Measurement Results for July 31, 2012 ...............................................I-102
I.3-54a Summary of the Peak Measurement Results for August 1, 2012 ..........................................I-102
I.3-54b Summary of the SEL Measurement Results for August 1, 2012 ............................................I-102
I.3-55a Summary of the Peak Measurement Results for February 11 2013 .......................................I-104
I.3-55b Summary of the RMS Measurement Results for February 11 2013 .......................................I-104
I.3-55c Summary of the Single Strike SEL Measurement Results for February 11 2013 ..................I-105
I.3-56a Summary of the Peak Measurement Results for February 13, 2013 ......................................I-105
I.3-56b Summary of the RMS Measurement Results for February 13, 2013 ......................................I-106
Technical Guidance for the Assessment of the Hydroacoustic Effects of Pile Driving on Fish I-vii October 2020
I.3-56c Summary of the Single Strike SEL Measurement Results for February 13, 2013 .................I-106
I.3-57 Summary of Average RMS Measurement Results for All Vibratory Pile Driving ................I-108
I.3-58a Summary of Average Peak Measurement Results for All Impact Pile Driving .....................I-109
I.3-58b Summary of Average RMS Measurement Results for All Impact Pile Driving .....................I-110
I.3-58c Summary of Average SEL Measurement Results for All Impact Pile Driving ......................I-111
I.3-59 Summary of the Measurements Results for the November 2012 Testing Period ...................I-116
I.3-60 Summary of the Measurement Results for the July 2013 Testing Period...............................I-117
I.3-61 Summary of the Measurement Results from May 21, 2013 ...................................................I-118
I.3-62 Summary of the Measurement Results from September 13, 2013 .........................................I-118
I.3-63 Summary of the Measurement Results from September 18, 2013 .........................................I-119
I.3-64 Summary of the Measurement Levels from July 2, 2013 .......................................................I-120
I.3-65 Summary of the Measurement Results July 10, 2013 ............................................................I-121
I.3-66 Measured Sound Levels ..........................................................................................................I-123
I.3-67 Summary of Vibratory Pile Driving of Unattenuated 18-, 24-, and 30-inch Steel Pipe Piles – Prichard Lake Pumping Plant .....................................................................................I-125
I.3-68 Summary of Impact Pile Driving of Unattenuated 24-inch Steel Pipe Piles – Prichard Lake Pumping Plant ................................................................................................................I-125
I.3-69 Summary of Impact Pile Driving of Attenuated 24-inch Steel Pipe Piles – Prichard Lake Pumping Plant ................................................................................................................I-125
I.4-1 Summary of Sound Pressure Levels Measured for Driving Steel H-Piles – Noyo River Bridge Replacement, Fort Bragg, CA .....................................................................................I-129
I.4-2 Summary of Sound Pressure Levels Measured for Driving 10-Inch-Diameter H- Piles – Seawall Construction, San Rafael, CA ...................................................................................I-129
I.4-3 Summary of Sound Pressure Levels Measured for Driving 15-Inch-Diameter Steel H-Piles – Ballena Isle Marina, Alameda, CA .............................................................................I-131
I.4-4 Summary of Sound Pressure Levels Measured for Driving Steel H-Piles – Platte River Bridge, Platte River, NB .........................................................................................................I-134
I.4-5 Maximum Sound Pressure Levels Measured for the Driving of Steel H-Piles for the Hazel Avenue Bridge – Sacramento County, CA ...................................................................I-136
I.4-6 Measured Sound Pressure Levels from Vibratory Driving of H-Piles Levels ........................I-137
Technical Guidance for the Assessment of the Hydroacoustic Effects of Pile Driving on Fish I-viii October 2020
I.4-7 Measured Sound Pressure Levels from Impact Driving of H-Piles Levels ............................I-137
I.4-8 Summary of Daily Maximum and Average Peak and Single-Strike SEL Sound Pressure Levels ............................................................................................................I-138
I.4-9 Measured Sound Pressure Levels (dB) from Vibratory Pile Driving .....................................I-140
I.4-10 Measured Sound Pressure Levels from Impact Pile Driving ..................................................I-141
I.4-11 Summary of Average Sound Pressure Levels Measured from Driving of 14-Inch H-Piles – Sacramento River, CA ................................................................................................I-141
I.4-12a Summary of the Measurement Peak Sound Pressure Level Results.......................................I-143
I.4-12b Summary of the Measurement RMS Sound Pressure Level Results ......................................I-143
I.4-12c Summary of the Measurement Single-Strike SEL Sound Pressure Level Results .................I-143
I.4-13a Summary of the Measurement Peak Sound Pressure Level Results.......................................I-145
I.4-13b Summary of the Measurement RMS Sound Pressure Level Results ......................................I-146
I.4-13c Summary of the Measurement Single-Strike SEL Sound Pressure Level Results .................I-147
I.5-1 Summary of Sound Pressures Measured for Driving Square Concrete Piles – Concord Naval Weapons Station, Concord, CA ...................................................................................I-150
I.5-2 Summary of Sound Pressure Levels Measured for Driving Octagonal Concrete Piles – Amports Pier, Benicia, CA .....................................................................................................I-153
I.5-3 Summary of Sound Pressures Measured for Driving Square Concrete Piles – Pier 40, San Francisco, CA ..................................................................................................................I-155
I.5-4 Summary of Sound Pressures Measured for Driving Octagonal Concrete Piles – Berth 22, Port of Oakland, CA .........................................................................................................I-156
I.5-5 Summary of Sound Pressures Measured for Driving Octagonal Concrete Piles on Land Adjacent to Water – Berth 22, Port of Oakland, CA ..............................................................I-158
I.5-6 Summary of Sound Pressures Measured for Driving Octagonal Concrete Piles – Berth 22, Port of Oakland, CA .........................................................................................................I-160
I.5-7 Summary of Sound Pressures Measured for Driving Octagonal Concrete Piles – Berth 32, Port of Oakland, CA .........................................................................................................I-161
I.5-8 Summary of Sound Pressures Measured for Driving Octagonal Concrete Piles – Berth 32, Oakland, CA .....................................................................................................................I-163
I.5-9 Summary of Sound Pressure Levels Measured for Driving 18-Inch Octagonal Concrete Piles – Berkeley Marina, Berkeley, CA ..................................................................................I-165
Technical Guidance for the Assessment of the Hydroacoustic Effects of Pile Driving on Fish I-ix October 2020
I.5-10 Summary of Measured Sound Pressure Levels for Driving 18-Inch Octagonal Piles – Berkeley Marina, Berkeley, CA .............................................................................................I-166
I.5-11 Summary of Measured Sound Levels for Pile Driving of Unattenuated 24-inch Octagonal Concrete Piles – Humboldt Bay, Eureka, CA .......................................................I-166
I.5-12 Summary of Sound Pressures Measured for the Driving of 12-Inch Square Concrete Piles – Willits, CA ..................................................................................................................I-167
I.5-13 Summary of the Measurements Results for October 9, 2012 .................................................I-169
I.5-14 Summary of the Measurement Results for October 10, 2012 .................................................I-169
I.5-15a Summary of the Measurement Peak Sound Pressure Level Results.......................................I-171
I.5–15b Summary of the Measurement RMS Sound Pressure Level Results ......................................I-172
I.5-15c Summary of the Measurement Single-Strike SEL Sound Pressure Level Results .................I-173
I.5.16 Summary of Pile Driving of Unattenuated and Attenuated 14-inch Square Concrete Piles – Noyo Harbor ...............................................................................................................I-175
I.5-17 Summary of Pile Driving at the “Near Field” (33 feet) Location ...........................................I-176
1.5-18 Summary of Type I Piles Measured at 33 Feet (measurement in dB re: 1µPa) .....................I-179
1.5-19 Summary of Type II Piles Measured at 33 Feet (measurement in dB re: 1µPa) ....................I-179
I.5-20 Summary of Pile-Driving Noise Monitoring ..........................................................................I-183
I.6-1 Summary of Sound Pressure Levels Measured for Driving Steel Sheet Piles –Berth 23, Port of Oakland, CA ...............................................................................................................I-187
I.6-2 Summary of Sound Pressure Levels Measured for Vibratory Driving of Steel Sheet Piles – Berth 30, Port of Oakland, CA ....................................................................................I-190
I.6-3 Summary of the Peak Measurement Results for July 30 and 31, 2012 ..................................I-192
I.6-4 Summary of the SEL Measurement Results for July 30 and 31, 2012 ...................................I-193
I.6-5 Summary of Impact Pile Driving of Unattenuated 24-inch Sheet Piles – Napa River Flood Control Project .............................................................................................................I-193
I.7-1 Typical Range of Sound Pressure Levels Measured for Driving Timber Piles – Ballena Bay Marina, Alameda, CA .....................................................................................................I-196
I.7-2 Summary of the Measurement Peak Sound Pressure Level Results.......................................I-198
I.7.3 Data Summary of RMS Vibratory Driving Levels for Timber piles (dB re: 1µPa) ...............I-201
I.8-1 Summary of Unattenuated Sound Pressure Levels Measured for the Benicia-Martinez Bridge .....................................................................................................................................I-204
Technical Guidance for the Assessment of the Hydroacoustic Effects of Pile Driving on Fish I-x October 2020
I.8-2 Measured Sound Levels for Various Depths – Benicia-Martinez Bridge .............................I-205
I.8-3 Measured Sound Levels for Cofferdam with Water – Benicia-Martinez Bridge ...................I-206
I.8-4 Measured Sound Levels for Isolation Casing Tests – Benicia-Martinez Bridge ....................I-207
I.8-5 Measured Sound Levels for Air Bubble Tree Tests – Pier 13 ................................................I-210
I.9-1 Summary of Sound Pressure Levels Measured for the 2000 Pile Installation Demonstration Project (PIDP) – San Francisco-Oakland Bay Bridge, East Span .................I-219
I.9-2 Summary of Sound Pressure Levels Measured for the 2003 Pile Installation Demonstration Project (PIDP) Re-Strike Using the MHU1700T Hammer at Full Energy – San Francisco-Oakland Bay Bridge, East Span ......................................................I-221
I.9-3 Summary of Measurements – Pier E6E Bubble Curtain On/Off Test, 11/21/2003 ................I-234
I.9-4 Summary of Measurements – Pier E3E Bubble Curtain On/Off Test, 1/24/2004 ..................I-234
I.9-5 Comparison of I&R and GS Data Monitored at Pier E6E, 11/21/2003 – Deep Sensor Position ...................................................................................................................................I-237
I.10-1 Typical Range of Sound Pressure Levels Measured for 14-Inch-Diameter Steel Pipe Piles for the Richmond-San Rafael Bridge .............................................................................I-239
I.10-2 Typical Sound Pressure Levels Measured for 30-Inch-Diameter Steel Pipe Piles – Unattenuated – Richmond-San Rafael Bridge ........................................................................I-241
I.10-3 Results of Air Bubble Curtain Test for 30-Inch-Diameter Piles at the Richmond-San Rafael Bridge ..........................................................................................................................I-242
I.10-4 Typical Sound Pressure Levels Measured for 66-Inch-Diameter CIDH Piles – Unattenuated – Richmond-San Rafael Bridge ........................................................................I-243
I.10-5 Results of Air Bubble Curtain Test for 30-Inch-Diameter Piles at the Richmond-San Rafael Bridge ..........................................................................................................................I-245
I.10-6 Typical Range of Sound Pressure Levels Measured for 126-Inch-Diameter CISS piles – Unattenuated – Richmond-San Rafael Bridge ........................................................................I-246
I.10-7 Typical Range of Sound Pressure Levels Measured for 150-Inch-Diameter CISS Piles – Unattenuated – Richmond-San Rafael Bridge ........................................................................I-247
I.11-1 Sound Pressure Levels Measured for 36-Inch-Diameter CISS Piles during Attenuator Testing – Humboldt Bay Bridges, Eureka, CA ......................................................................I-251
I.11-2 Sound Pressure Levels Measured for 60-Inch-Diameter CISS Piles at Pier S12, Samoa Channel – Humboldt Bay Bridges, Eureka, CA .....................................................................I-253
I.11-3 Sound Pressure Levels Measured for 36-Inch-Diameter CISS Piles at Pier M2, Middle Channel – Humboldt Bay Bridges, Eureka, CA .....................................................................I-256
Technical Guidance for the Assessment of the Hydroacoustic Effects of Pile Driving on Fish I-xi October 2020
I.11-4 Sound Pressure Levels Measured for 36-Inch-Diameter CISS Piles at Pier S3, Middle Channel – Humboldt Bay Bridges, Eureka, CA .....................................................................I-257
I.12-1 Typical Sound Pressure Levels Measured for Driving of Four Plastic Piles—Napa River Bridge Fender Repair, Solano County, CA ..................................................................I-260
I.13-1 Sound Pressure Levels Measured for Modified H-Piles with Isolation Casing. Ten Mile River Bridge, Fort Bragg, CA ........................................................................................I-264
I.13-2 Sound Pressure Levels Measured for Sheet Piles. Ten Mile River Bridge, Fort Bragg, CA .......................................................................................................................I-264
I.13-3 Sound Pressure Levels Measured for Steel Shell Permanent Piles. Ten Mile River Bridge, Fort Bragg, CA ..........................................................................................................I-266
I.14-1 Distance to Acoustic Thresholds for Conductor Pipe Driving – Anchor Point, Alaska .........I-270
1.15-1 Hydroacoustic Monitoring Results for Driving of 20 to 72-Inch-Diameter Steel Shell Piles—Martinez, CA ..............................................................................................................I-271
I.16-1 Hydroacoustic Monitoring Results for Impact Driving of 84-Inch-Diameter Piles—Healdsburg, CA ......................................................................................................................I-274
I.17-1 Hydroacoustic Monitoring Results for Driving of 24 to 42-Inch Steel Shell Piles—Vallejo, CA .............................................................................................................................I-275
I.18-1 Hydroacoustic Monitoring Results for Driving of 24-Inch Temporary Piles—Contra Costa County, CA ...................................................................................................................I-276
I.19-1a Summary of Underwater Sound Levels with the Bubble Curtain OFF ..................................I-279
I.19-1b Summary of Underwater Sound Levels with the Bubble Curtain ON ....................................I-279
I.20-1 Hydroacoustic Results for Driving of Timber Piles—San Francisco Bay, CA ......................I-279
I.22-1 Hydroacoustic Monitoring Results for Impact Driving of 16-Inch Square Concrete Piles, Bodega Bay, CA ...........................................................................................................I-282
I.23-1 Hydroacoustic Monitoring Results for Impact Driving of 24-Inch Steel Shell-Piles .............I-282
I.24-1a Hydroacoustic Results for Overall Ploughing Operations, Oliktok Point, Alaska .................I-283
I.24-1b Hydroacoustic Results for Individual Components of Ploughing Operations, Oliktok Point, Alaska ...........................................................................................................................I-283
I.25-1 Hydroacoustic Monitoring Results for Impact Driving of 36-Inch Steel Shell-Pile, Vallejo, CA .............................................................................................................................I-284
I.26-1 Hydroacoustic Monitoring Results for the Implosion of SFOBB Piers E6 through E18—San Francisco-Oakland, CA .........................................................................................I-287
Technical Guidance for the Assessment of the Hydroacoustic Effects of Pile Driving on Fish I-xii October 2020
I.27-1 Hydroacoustic Monitoring Results for Impact Driving of 42 to 72-Inch-Diameter Steel Shell Piles—Antioch, CA .......................................................................................................I-288
I.28-1 Hydroacoustic Monitoring Results for Vibratory Driving of 24 to 36-Inch Steel Shell-Piles—San Francisco, CA ......................................................................................................I-289
I.29-1 Hydroacoustic Monitoring Results for Impact Pile Driving of 24-Inch Steel Shell-Piles—Richmond, CA ............................................................................................................I-291
I.30-1a Hydroacoustic Monitoring Results for Vibratory Driving of 30 and 66-Inch Steel Shell-Piles—Redwood City, CA ......................................................................................................I-292
I.30-1b Hydroacoustic Monitoring Results for Impact Driving of 30 and 66-Inch Steel Shell-Piles—Redwood City, CA ......................................................................................................I-293
I.31-1 Hydroacoustic Monitoring Results for Driving of 22-Inch Temporary Steel Trestle Piles—Yuba City and Marysville, CA ...................................................................................I-294
I.32-1 Hydroacoustic Monitoring Results for Driving of 24-Inch Temporary Steel Shell Piles—Larkspur, CA ..............................................................................................................I-295
I.33-1 Hydroacoustic Monitoring Results for Vibratory and Impact Driving of Piles—Los Angeles, CA............................................................................................................................I-299
I.34-1 Hydroacoustic Monitoring Results for Vibratory and Impact Driving of Piles—Richmond, CA ........................................................................................................................I-300
I.35-1 Hydroacoustic Monitoring Results for On-Land Impact Driving of 10 x 54-Inch H Piles— Siskiyou County, CA .................................................................................................I-301
I.36-1a Hydroacoustic Monitoring Results for Pile Removal and Vibratory Installation— Monterey, CA .........................................................................................................................I-304
I.36-1b Hydroacoustic Monitoring Results for Pile Installation with an Impact Hammer— Monterey, CA .........................................................................................................................I-304
I.37-1 Hydroacoustic Monitoring Results for Impact Pile Driving of 24 to 30-Inch Steel Shell Piles with ICE D62-22 Diesel Impact Hammer — Sacramento, CA .....................................I-305
I.38-1 Summary of Measured Sound Levels for April 22, 2020 .......................................................I-306
Technical Guidance for the Assessment of the Hydroacoustic Effects of Pile Driving on Fish I-xiii October 2020
List of Figures
I.3-1 60-Inch Diameter CISS Piles Driven for the Noyo River Bridge Replacement Project...........I-20
I.3-2 Representative Signal Analyses for 12-Inch-Diameter Steel Shell Piles at Galilee Marina .......................................................................................................................................I-21
I.3-3 Installation of 13-Inch-Diameter Steel Pipe Piles with Confined Air Bubble Curtain System ......................................................................................................................................I-22
I.3-4a Pile Installation Using the APE Model “King Kong” Vibratory Driver/Extractor ..................I-23
I.3-4b Close-Up of I.3-4a ....................................................................................................................I-23
I.3-5 Representative Signal Analyses for Vibratory Installation of 72-Inch- Diameter Steel Shell Piles at Richmond Inner Harbor ......................................................................................I-24
I.3-6 Representative Signal Analyses for 24-Inch-Diameter Steel Pipe Piles at Conoco/Phillips Dock near San Pablo ......................................................................................I-26
I.3-7a Driving 20-Inch-Diameter Piles near Shore .............................................................................I-27
I.3-7b Driving 36-Inch-Diameter Pile with Attenuation .....................................................................I-27
I.3-8 Casing for the Confined Air Bubble Curtain System ...............................................................I-27
I.3-9 Representative Signal Analyses for 20-Inch-Diameter Piles Unattenuated in Water at Stockton Wastewater Treatment Plant ......................................................................................I-28
I.3-10 Representative Signal Analyses for 20-Inch-Diameter Piles on Land at Stockton Wastewater Treatment Plant .....................................................................................................I-29
I.3-11 Representative Signal Analyses for 20-Inch-Diameter Piles Attenuated in Water at Stockton Wastewater Treatment Plant ......................................................................................I-30
I.3-12 Representative Signal Analyses for 36-Inch Bent 4 Piles on Land at Stockton Wastewater Treatment Plant .....................................................................................................I-32
I.3-13 Representative Signal Analyses for 36-Inch-Diameter Bent 3 Piles Attenuated in Water at Stockton Wastewater Treatment Plant ..................................................................................I-33
I.3-14 Representative Signal Analyses for 24-Inch-Diameter Piles with and without Effective Air Bubble Curtain System at Amorco Wharf..........................................................................I-35
I.3-15 Representative Signal Analyses for 24-Inch-Diameter Piles Directional Measurements with Air Bubble Curtain System at Amorco Wharf .................................................................I-36
I.3-16 Representative Signal Analyses for 24-Inch-Diameter Piles Showing Pulse for Two Different Battered Piles with Air Bubble Curtain System at Amorco Wharf ...........................I-37
Technical Guidance for the Assessment of the Hydroacoustic Effects of Pile Driving on Fish I-xiv October 2020
I.3-17a Construction of the Temporary Trestle across the Russian River ............................................I-38
I.3-17b CISS Piles Driven to Support New Geyserville Bridge across the Russian River ...................I-38
I.3-18a Trestle Pile Driven on East Bank. Note trestle piles extend back several hundred feet. ..........I-38
I.3-18b Attempting to Stab Pile through Casing (Noise Control) on West Bank .................................I-38
I.3-19 Representative Signal Analyses for Temporary 24-Inch-Diameter Piles Driven 35 Meters (115 Feet) away on Land (at Shore) at the Russian River ............................................I-40
I.3-20 Representative Signal Analyses for Temporary 24-Inch Piles Driven 15 Meters (49 Feet) away on Land (at Shore) at the Russian River (1st Pile) .................................................I-41
I.3-21 Representative Signal Analyses for Temporary 24-Inch-Diameter Piles Driven 35 Meters (115 Feet) away on Land (at Shore) at the Russian River (2nd Pile) ..........I-41
I.3-22a Vibratory Installation of a Bent 4 Pile with Bent 3 and Bent 2 in the Background ..................I-42
I.3-22b Driving the Top Pile Section of Bent 5 Using a Dewatered Casing to Reduce Sound .............I-42
I.3-23 Representative Signal Analyses for 48-Inch-Diameter Piles Driven 20 Meters (65 Feet) away through Dewatered Casing in 2 Meters of Water—Beginning Portion of Drive at Geyserville Bridge, Russian River ...........................................................................................I-46
I.3-24 Same as Previous, Except Middle Portion of 48-Inch-Diameter Pile Drive at Geyserville Bridge, Russian River ...........................................................................................I-46
I.3-25 Same as Previous, Except Last Portion of 48-Inch-Diameter Pile Drive at Geyserville Bridge, Russian River ...............................................................................................................I-47
I.3-26a Driving 40-Inch-Diameter Piles with Air Bubble Curtain in Alameda, CA .............................I-48
I.3-26b Air Bubble Curtain Used at Bay Ship and Yacht, Alameda, CA .............................................I-48
I.3-27 Time History of Pile Driving Event for Pile 13 Where Levels Are Highest When Air Bubble Curtain System Is Raised Slightly above the Bottom—Alameda, CA .......................I-49
I.3-28 Representative Signal Analyses for 40-Inch-Diameter Piles during Test of Air Bubble Curtain System (On and Off) at Bay Ship and Yacht—Alameda, CA .....................................I-50
I.3-29 Steel Pipe Piles in Shallow Water, County of Shasta Airport Road Bridge Replacement .......I-51
I.3-30 22-Inch-Diameter Steel Pipe Piles, Bradshaw Bridge Project ..................................................I-53
I.3-31 One Level of the Multi-Stage Bubble Ring—Tongue Point Facility Pier ................................I-54
I.3-32 Deployment of the Bubble Rings—Tongue Point Facility Pier ...............................................I-54
I.3-33 Representative Signal Analyses for Tongue Point Facility Pier Astoria, OR (Unattenuated and Attenuated) .................................................................................................I-57
Technical Guidance for the Assessment of the Hydroacoustic Effects of Pile Driving on Fish I-xv October 2020
I.3-34 Swift Moving Sacramento River ..............................................................................................I-58
I.3-35 Isolation Casing with Bubble Rings Near Bottom....................................................................I-59
I.3-36 Bubble Ring In Operation .........................................................................................................I-60
I.3-37 Signal Analyses Showing No Reduction with the Bubble Curtain, Suislaw River Bridge ......I-61
I.3-38 Signal Analyses Showing Average Reduction with the Bubble Curtain, Suislaw River Bridge .......................................................................................................................................I-62
I.3-39 Pile Installation Using the ICE 66 Vibratory Driver ................................................................I-63
I.3-40 Signal Analyses of a Pile Driving Underwater Sound Pulse, Richmond–San Rafael Bridge .......................................................................................................................................I-65
I.3-41 Impact Driving of On-Land Steel Pipe piles ............................................................................I-66
I.3-42 Near Measurement Location in Feather River ..........................................................................I-66
I.3-43 Pile in Shallow River ................................................................................................................I-68
I.3-44 Example of Bubble Flux ...........................................................................................................I-68
I.3-45 Test Pile Driving in Mound Slough, Oakley, CA .....................................................................I-69
I.3-46a Attenuated vs. Unattenuated Waveforms, State Route 520 Bridge Replacement and HOV Project .............................................................................................................................I-73
I.3-46b Attenuated vs. Unattenuated Accumulation of Sound Energy, State Route 520 Bridge Replacement and HOV Project .................................................................................................I-73
I.3-46c Attenuated vs. Unattenuated Narrow Band Frequency Spectra, State Route 520 Bridge Replacement and HOV Project .................................................................................................I-74
I.3-47 Comparison of DNAP, Confined Bubble Ring and Unconfined Bubble Rings .......................I-74
I.3-48 66-Inch-Diameter Steel Shell Piles, Russian River Bridge Replacement Project ....................I-75
I-3.49 Attenuated vs. Unattenuated Narrow Band Frequency Spectra, Russian River Bridge Replacement .............................................................................................................................I-77
I.3-50 Temporary Piles on the West Side of the Willamette River .....................................................I-78
I.3-51 Bubble Ring Deployment .........................................................................................................I-78
I.3-52 Trinidad Pier Replacement Project Measured Noise Levels ....................................................I-80
I.3-53 Typical Signal Analyses for Pile Strike, Willamette River Bridge Project ..............................I-84
I.3-54 Attenuation System for the I-5 Willamette River Bridge Project, Eugene/Springfield, OR .............................................................................................................................................I-85
Technical Guidance for the Assessment of the Hydroacoustic Effects of Pile Driving on Fish I-xvi October 2020
I.3-55 Mad River Bridge Project Location ..........................................................................................I-86
I.3-56 Pier 2 Anchor Pile Hydrophone Locations ...............................................................................I-87
I.3-57 Pier 3 Location and Water Bladder ..........................................................................................I-88
I.3-58 Pier 3 and 4 Production Piles Hydrophone Locations ..............................................................I-90
I.3-59 Schuyler Heim Bridge ..............................................................................................................I-93
I.3-60 Driving of 24-inch Steel Shell Pile near Salcha, Alaska ........................................................I-100
I.3-61 Crew Drilling Through Ice to Place Hydrophone ...................................................................I-103
I.3-62 Underwater Acoustic Spreading Loss of Sound Pressure Levels for Impact Driving of 24-inch Piles ...........................................................................................................................I-112
I.3-63 Underwater Acoustic Spreading Loss of Sound Pressure Levels for Impact Driving of 36-inch Piles ...........................................................................................................................I-113
I.3-64 Underwater Acoustic Spreading Loss of Sound Pressure Levels for Impact Driving of 48-inch Piles ...........................................................................................................................I-114
I.3-65 Placement of 24-inch Steel Shell Pile at the Crescent City Inner Harbor Dock .....................I-115
I.3-66 Pile Driving Site for Willits Bypass Project ...........................................................................I-117
I.3-67 Placement of 36-inch Diameter Steel Shell Pile at North Payette River ................................I-120
I.3-68 Placement of 36-inch Diameter Steel Shell Pile at Coliseum Way Bridge ............................I-121
I.3-69 Pile Installation at the Straddle Crane Trestle ........................................................................I-122
I.3-70 Pile Installation at the Assembly Sled Trestle ........................................................................I-123
I.3-71 Prichart Lake Pumping Plant Site ...........................................................................................I-124
I.4-1a Impact Driving of On-Shore H-Piles ......................................................................................I-128
I.4-1b Impact Driving of In-Water H-Piles .......................................................................................I-128
I.4-2a Impact Driving of Battered H-Type Pile with Attenuation System, with Vertical Thin-Walled H-Piles in Foreground ................................................................................................I-130
I.4-2b Close-View of Confined Air Bubble Attenuation System next to Vertical H-Pile ................I-130
I.4-3 Representative Signal Analyses for Battered H-Piles with and without Air Bubble Curtain Attenuation System at Ballena Bay in Alameda, CA ....................................I-132
I.4-4 Representative Signal Analyses for Vertical H- Piles with and without the Air Bubble Curtain Attenuation System at Ballena Bay in Alameda, CA ....................................I-133
Technical Guidance for the Assessment of the Hydroacoustic Effects of Pile Driving on Fish I-xvii October 2020
I.4-5a H-Pile Driving at the Platte River in Nebraska.......................................................................I-134
I.4-5b Dewatered Cofferdam Excavated below Water Level ...........................................................I-134
I.4-6 Representative Signal Analyses for H-Piles Driven in the Platte River, Nebraska ................I-135
I.4-7a Impact Driving of In-Water H-Piles .......................................................................................I-136
I.4-7b Impact Driving of In-Water H-Piles .......................................................................................I-136
I.4-8 Representative Signal Analysis for Impact Driving H-Piles at Parson Slough, CA ...............I-138
I.4-9 Vibrating in a H-Pile South of the Barge ................................................................................I-139
I.4-10 H-Pile Installation at Weiser River Bridge .............................................................................I-142
I.5-1a Driving of 16-Inch-Square Piles .............................................................................................I-149
I.5-1b Simple Air Bubble Curtain System Used to Attenuate Noise ................................................I-149
I.5-2 Time History Analysis of Unattenuated and Attenuated Pile Strikes over an 8-Millisecond Period. Note initial low-frequency sounds followed by lower amplitude but higher frequency sounds. An air bubble curtain reduced the high-frequency content of these pulses. ........................................................................................................................I-151
I.5-3 Narrow Band Frequency Spectra for Pile Driving with Different Hammers and Bubble Curtain Conditions. Note that the bubble curtain at 10:00 a.m. was most effective when there was no effect from swift currents due to a slack tide condition.....................................I-151
I.5-4a 24-Inch Octagonal Piles Driven at Amports in Benicia, CA ..................................................I-152
I.5-4b “Bubbleator” Used to Attenuate Underwater Sound ..............................................................I-152
I.5-5 24-Inch-Square Piles at Pier 40 – San Francisco, CA ............................................................I-154
I.5-6 Driving of 24-Inch Octagonal Indicator Piles at Port of Oakland Berth 22. Pile being driven is in Row A, while Row E is at the shoreline. .............................................................I-156
I.5-7 Representative Signal Analyses for Two Pulses Associated with a 24-Inch Concrete Pile. Piles driven without attenuation system at Berth 22, Port of Oakland, CA during fish exposure study. ................................................................................................................I-157
I.5-8 Representative Signal Analyses for Two Pulses Associated with a 24-Inch Concrete Pile Driven at the Shoreline at Berth 22, Port of Oakland, CA ..............................................I-159
I.5-9 Pile Driving during Fish Exposure Study at Berth 22, Port of Oakland. Picture was taken 100 meters (330 feet) west of pile driving activity, while fish were being exposed at 10 meters (33 feet) from the pile. .......................................................................................I-160
I.5-10 Driving of 24-Inch Octagonal Piles at Berth 32, Port of Oakland, CA ..................................I-161
Technical Guidance for the Assessment of the Hydroacoustic Effects of Pile Driving on Fish I-xviii October 2020
I.5-11 Representative Signal Analyses for Two Pulses Associated with a 24-Inch Concrete Pile. Piles driven without attenuation system at Berth 32, Port of Oakland, CA ...................I-152
I.5-12 Driving of 24-Inch Octagonal Piles at Berth 32, Port of Oakland with an Air Bubble Curtain System to Attenuate Sounds ......................................................................................I-153
I.5-13 Representative Signal Analyses for Three Different Pulses Associated with a 24-Inch Concrete Pile. Air bubble curtain system was evaluated through on and off settings. Piles driven at Berth 32, Port of Oakland, CA........................................................................I-154
I.5-14 Signal Analyses of Typical Pile Strike, Berkeley Marina, CA ...............................................I-165
I.5-15 Upstream Measurement Site ...................................................................................................I-167
I.5-16 Wharf at Shell Martinez Refinery Marine Terminal Berths ...................................................I-168
I.5.18 Noyo Harbor ...........................................................................................................................I-174
I.5.19 Unattenuated and Attenuated 14-inch Square Concrete Piles – Noyo Harbor .......................I-175
I.5.20 Instrumentation used for Underwater Measurements .............................................................I-177
I.5.21 Location of 12 Test Piles ........................................................................................................I-178
I.5.22 Typical 1/3 Lzi (RMS) Octave Band Spectra for a 30-inch Type I Concrete Pile .................I-180
I.5.23 Typical 1/3 Lzi (RMS) Octave Band Spectra for a 30-inch Type II Concrete Pile ................I-180
I.5.24 Transmission Loss of Sound Pressure Levels (dB re: 1µPa) for Type I Piles ........................I-181
I.5.26 Transmission Loss of Sound Pressure Levels (dB re: 1µPa) for Type II Piles.......................I-182
I.6-1 Driving of Steel Sheet Pile Underwater Using Hammer Follower .........................................I-186
I.6-2 Representative Signal Analyses for Sheet Piles Driven with Impact Hammer at Berth 23, Port of Oakland. Pulses received at 10 and 20 meters (33 and 65 feet) parallel to sheet wall. ...............................................................................................................................I-188
I.6-3 Representative Signal Analyses for Sheet Piles Installed with Vibratory Driver/ Extractor at Berth 23, Port of Oakland. Pulses at 10 meters (33 feet) normal to sheet wall face. .................................................................................................................................I-189
I.6-4 Representative Signal Analyses for Sheet Piles Installed with Vibratory Driver/Extractor at Berth 30, Port of Oakland. Pulses at 10 meters (33 feet) normal to sheet wall face. Note low-frequency signal (blue) measured late in driving event. ..............I-191
I.6-5 Installation of Sheet Piles .......................................................................................................I-192
I.6-6 Sheet Pile 61 Driven with an Impact Hammer Measured at 10 meters (33 feet). October 15, 2014. Napa River Flood Project. ......................................................................................I-194
I.7-1 Driving of Timber Piles at Ballena Bay Marina Using a 3,000-Pound Drop Hammer ..........I-196
Technical Guidance for the Assessment of the Hydroacoustic Effects of Pile Driving on Fish I-xix October 2020
I.7-2 Representative Signal Analyses for Timber Pile Driven with a Drop Hammer at Ballena Bay Marina. Pulse received at 10 meters (33 feet) from the pile. ..........................................I-197
I.7-3 Wood Pile Installation at Port of Benicia ...............................................................................I-198
I.7-4 Installation of Timber Piles ....................................................................................................I-200
I.7-5 Average Leq Spectra for Timber piles .....................................................................................I-201
I.8-1 Construction of the New Benicia-Martinez Bridge ................................................................I-202
I.8-2 Relationship between Measured Sound Level and Distance from Pile – Unattenuated, Open Water .............................................................................................................................I-205
I.8-3 Cofferdam with Water Used for the Benicia-Martinez Bridge ...............................................I-206
I.8-4 Isolation Casing/Air Bubble Curtain System Tested for the Benicia-Martinez Bridge ..........I-206
I.8-5 Signal Analyses of Underwater Sound Pulses at 54 Meters (177 Feet) – Isolation Casing Tests ............................................................................................................................I-208
I.8-6 Air Bubble Curtain Tree System Used at the Benicia-Martinez Bridge .................................I-209
I.8-7 Results of Pier 13 Measurements Compared to Unattenuated Sound Levels .........................I-210
I.8-8 Signal Analyses of Underwater Sound Pulses at 95 Meters (310 Feet) West – Air Bubble Tree ............................................................................................................................I-210
I.8-9 Results of Pier 7 Measurements Compared to Unattenuated Sound Levels ...........................I-211
I.8-10 Results of Pier 11 Measurements Compared to Unattenuated Sound Levels .........................I-213
I.8-11 Results of Pier 12 Measurements Compared to Unattenuated Sound Levels .........................I-214
I.8-12 Results of Pier 15 Measurements Compared to Unattenuated Sound Levels .........................I-215
I.9-1 Artist Rendering of the New San Francisco-Oakland Bay Bridge East Span ........................I-216
I.9-2 Project Components—San Francisco-Oakland Bay Bridge East Span ..................................I-216
I.9-3a Small Hydraulic Hammer (MHU500T) Used for Much of the Pile Driving ..........................I-218
I.9-3b Large Hydraulic Hammer (MHU1700T) Hammer Used for Last Quarter of Pile Driving Where Resistance Was Greatest ................................................................................I-218
I.9-4a Simple Air Bubble Ring Used during Driving of PIDP Pile 2 ...............................................I-219
I.9-4b Proprietary Fabric Air Bubble Curtain (Proprietary) Used during Driving of PIDP Pile 3 .......................................................................................................................................I-219
I.9-5a Air Bubble Curtain System with Compressors in Background ..............................................I-220
Technical Guidance for the Assessment of the Hydroacoustic Effects of Pile Driving on Fish I-xx October 2020
I.9-5b Air Bubble Curtain System in Operation during the PIDP Re-Strike ....................................I-220
I.9-6 Representative Signal Analyses for PIDP Re-Strike Measurements Made at 100 Meters (330 Feet) from Three Different Piles with and without Air Bubble Curtain Attenuation – San Francisco-Oakland Bay Bridge, East Span ...................................................................I-222
I.9-7 SFOBB Pile Driving in Dewatered Cofferdam at Pier E7E (Deepest Cofferdam) Using Menck 1700MHU ...................................................................................................................I-224
I.9-8a Drop Off in Sound Pressure Levels with Dewatered Cofferdam in Southerly (Louder) Direction .................................................................................................................................I-225
I.9-8b Drop Off in Sound Pressure Levels with Dewatered Cofferdam in Other (Quieter) Directions................................................................................................................................I-225
I.9-9 Pulse from Pile Driven in Dewatered Cofferdam at Pier E16E (Very Shallow Water) Measured 50 Meters (164 Feet) from Pile – San Francisco-Oakland Bay Bridge East Span Replacement Project ............................................................I-226
I.9-10 Pulse from Pile Driven in Dewatered Cofferdam at Pier E16E (Very Shallow Water) Measured 95 Meters (311 Feet) from Pile – San Francisco-Oakland Bay Bridge East Span Replacement Project ............................................................I-227
I.9-11 Peak Pressure Levels Measured at Three Different Positions during the Course of Pile Driving in 1 Day at Pier E10E (Dewatered Cofferdam) – San Francisco-Oakland Bay Bridge East Span Replacement Project ..................................................................................I-228
I.9-12 Drop Off in Sound Pressure Levels with the Air Bubble Curtain System during In-Water Pile Driving – San Francisco-Oakland Bay Bridge East Span Replacement Project .....................................................................................................................................I-229
I.9-13 Pulse from Pile Driven in Water with Air Bubble Curtain at Pier E4E Measured 55 Meters (180 Feet) from Pile – San Francisco-Oakland Bay Bridge East Span Replacement Project ......................................................................................................I-230
I.9-14 Same as I.9-13, Except 110 Meters (360 Feet) from Pile – San Francisco-Oakland Bay Bridge East Span Replacement Project ..................................................................................I-231
I.9-15 Same as I.9-13, Except 570 Meters (1,870 Feet) from Pile – San Francisco-Oakland Bay Bridge East Span Replacement Project ...........................................................................I-231
I.9-16 Same as I.9-13, Except 1,400 Meters (4,590 Feet) from Pile – San Francisco-Oakland Bay Bridge East Span Replacement Project ...........................................................................I-232
I.9-17 Same as I.9-13, Except 2,200 Meters (7,220 Feet) from Pile – San Francisco-Oakland Bay Bridge East Span Replacement Project ...........................................................................I-232
I.9-18 Pulse for Attenuated and Unattenuated Piles Strikes during Air Bubble Curtain Test at Pier E3E Measured 50 Meters (164 Feet) from Pile – San Francisco-Oakland Bay Bridge East Span Replacement Project ............................................................I-235
Technical Guidance for the Assessment of the Hydroacoustic Effects of Pile Driving on Fish I-xxi October 2020
I.9-19 Pulses for Attenuated and Unattenuated Pile Strikes at Edge of Air Bubble Curtain System at Pier E5E Measured 7 Meters (23 Feet) from Pile – San Francisco-Oakland Bay Bridge East Span Replacement Project. Bubbles to south of pile were being washed away by tidal current. .......................................................................................I-236
I.10-1 Richmond-San Rafael Bridge viewed from San Rafael, CA ..................................................I-238
I.10-2 14-Inch-Diameter Pile Being Driven next to Pier at Richmond-San Rafael Bridge ..............I-239
I.10-3 Representative Signal Analyses for 14-Inch-Diameter Pile. Pulse received at 22 meters (72 feet) from the pile at Richmond-San Rafael Bridge. .......................................I-240
I.10-4 30-Inch-Diameter Pile Being Driven for Temporary Trestle at Richmond-San Rafael Bridge .....................................................................................................................................I-241
I.10-5 Representative Signal Analyses for 30-Inch-Diameter Pile. Pulse received at 30 meters (98 feet) from the pile at the Richmond-San Rafael Bridge. .................................I-242
I.10-6 Simple Air Bubble Curtain System Used To Attenuate Sounds for 30-Inch-Diameter Piles ........................................................................................................................................I-242
I.10-7 66-Inch-Diameter CIDH Pile Being Driven at Richmond-San Rafael Bridge .......................I-243
I.10-8 Representative Signal Analyses for 66-Inch-Diameter CIDH Pile. Pulse received at 30 meters (98 feet) from the pile at the Richmond-San Rafael Bridge. .....I-244
I.10-9 Bubble Pattern around the 66-Inch-Diameter CIDH Pile during Tidal Currents ...................I-245
I.10-10 126-Inch-Diameter CISS Pile Being Driven Underwater at the Richmond-San Rafael Bridge .....................................................................................................................................I-246
I.10-11 Representative Signal Analyses for 126-Inch-Diameter CISS Pile. Pulse received at 95 and 230 meters (311 and 755 feet) from the pile near end of driving event at the Richmond-San Rafael Bridge. ................................................................................................I-247
I.10-12 150-Inch-Diameter CISS Pile Being Driven Underwater at the Richmond-San Rafael Bridge .....................................................................................................................................I-247
I.10-13 Representative Signal Analyses for 150-Inch-Diameter CISS Pile. Pulse received at 20 meters (65 feet) midway and near the end of the driving event at the Richmond- San Rafael Bridge. .........................................................................................................................I-248
I.11-1 Humboldt Bay Bridges, Eureka, CA ......................................................................................I-249
I.11-2a Driving 36-Inch-Diameter Pile in a 5-Foot Casing with Inside Bubble Ring –Humboldt Bay Bridges, Eureka, CA........................................................................................................I-250
I.11-2b Unconfined Air Bubble Curtain Used at Slack Tide – Humboldt Bay Bridges, Eureka, CA ...........................................................................................................................................I-250
I.11-2c Double-Walled Attenuator –Humboldt Bay Bridges, Eureka, CA .........................................I-250
Technical Guidance for the Assessment of the Hydroacoustic Effects of Pile Driving on Fish I-xxii October 2020
I.11-3 Representative Signal Analyses for Unattenuated 30-Inch-Diameter Pile at 10 Meters (33 Feet) – Humboldt Bay Bridges, Eureka, CA ...................................................I-252
I.11-4 Representative Signal Analyses for Attenuated 30-Inch-Diameter Pile at 10 Meters (33 Feet) – Humboldt Bay Bridges, Eureka, CA ..........................................................................I-253
I.11-5 Driving 60-Inch Diameter Piles – Pier S12, Samoa Channel at Humboldt Bay, Eureka, CA ...........................................................................................................................................I-254
I.11-6 Trend in Measured Sound Levels for Driving of One Attenuated 60-Inch-Diameter Pile at 10 and 125 Meters (33 and 410 Feet) – Pier S12, Humboldt Bay Bridges, Eureka, CA ..........................................................................................................................................I-255
I.11-7 Representative Signal Analyses for Attenuated 60-Inch-Diameter Pile at 10 and 125 Meters (33 and 410 Feet) – Pier S12, Humboldt Bay Bridges, Eureka, CA....................I-255
I.11-8 Driving 36-Inch-Diameter Piles at Pier M2 with Isolation Casing and Bubble Curtain – Middle Channel at Humboldt Bay, Eureka, CA .....................................................................I-256
I.11-9 Representative Signal Analyses for Attenuated 36-Inch-Diameter Pile at 10, 20, and 40 Meters (33, 65, and 130 feet) – Pier S12, Humboldt Bay Bridges, Eureka, CA ....................I-257
I.11-10 Representative Signal Analyses for Attenuated 36-Inch-Diameter Pile at 20 Meters (65 Feet) – Pier S3, Humboldt Bay Bridges, Eureka, CA .............................................................I-258
I.12-1 Typical Installation of 13-Inch-Diameter Plastic Piles ...........................................................I-259
I.12-2 Signal Analysis for Plastic Pile 10 on January 14, 2008, Napa River Bridge Fender Repair, Solano County, CA ....................................................................................................I-261
I.13-1 Ten Mile River Bridge, Fort Bragg, CA .................................................................................I-262
I.13-2 Modified H-Piles ....................................................................................................................I-263
I.13-3a Taller Isolation Casing ............................................................................................................I-263
I.13-3b Shallow Water Isolation Casing .............................................................................................I-263
I.13-3c End View of Isolation Casing .................................................................................................I-263
I.13-3d Isolation Casing Being Installed .............................................................................................I-263
I.13-4 “Chaser” Attached to Diesel Impact Hammer Driving the Steel Shell Piles with the Bubble Ring on .......................................................................................................................I-265
I.13-5 Pier 5 Steel Shell Pile Layout in Cofferdam Typical of all Pier Locations ............................I-265
I.13-6a Representative Signal Analyses for Attenuated 30-inch Pile at 100 Meters (330 Feet) on Land in Cofferdam at Pier 5. Ten Mile Bridge – Fort Bragg, CA ...................I-267
I.13-6b Representative Signal Analyses for Attenuated 30-inch pile at 100 Meters (330 Feet) on Land in Cofferdam at Pier 6. Ten Mile Bridge – Fort Bragg, CA ..........................................I-267
Technical Guidance for the Assessment of the Hydroacoustic Effects of Pile Driving on Fish I-xxiii October 2020
I.13-6c Representative Signal Analyses for Attenuated 30-inchPile at 10 Meters (33 Feet) in Cofferdam ...........................................................................................................I-268
I.13-6d Representative Signal Analyses for Attenuated 30-inch Pile at 10 Meters (33 Feet) in Cofferdam at Pier 8. Ten Mile Bridge – Fort Bragg, CA....................................I-268
1.14-1 RMS Sound Pressure Level Versus Distance During Conductor Pipe Driving – Anchor Point, Alaska ........................................................................................................................... I-270
I.21-1a Regression Curve for Underwater Sound Levels Generated by Ship Thrusters and Propellers ................................................................................................................................ I-280
I.21-1b Regression Curve for Underwater Sound Levels Generated by Trenching and Winching Operations ...............................................................................................................................I-281
I.24-1 Fall Off Rate for Underwater Sound Levels Generated During Ploughing ............................I-284
I.26-1a Peak Pressure Level Trend Line for Implosions of SFOBB Piers E3 to E18 .........................I-286
I.26-1b SEL Trend Line for Implosions of SFOBB Piers E3 to E18 ..................................................I-286
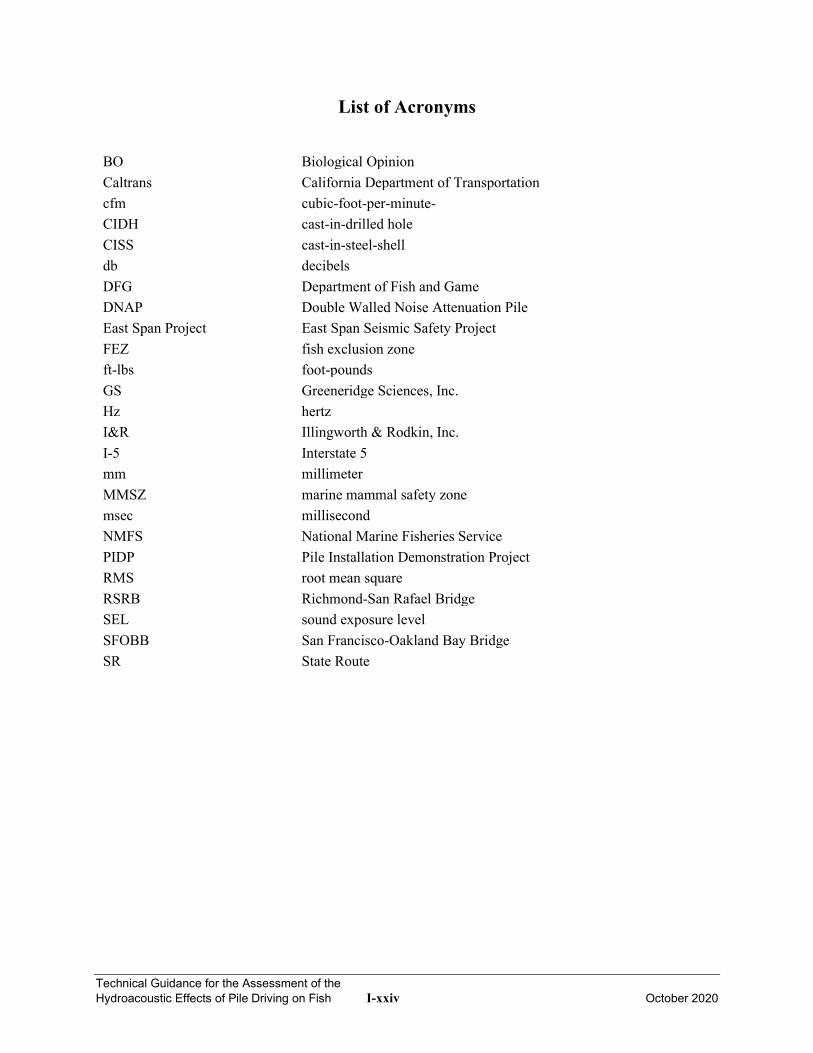
Technical Guidance for the Assessment of the Hydroacoustic Effects of Pile Driving on Fish I-xxiv October 2020
List of Acronyms
BO Biological Opinion Caltrans California Department of Transportation cfm cubic-foot-per-minute- CIDH cast-in-drilled hole CISS cast-in-steel-shell db decibels DFG Department of Fish and Game DNAP Double Walled Noise Attenuation Pile East Span Project East Span Seismic Safety Project FEZ fish exclusion zone ft-lbs foot-pounds GS Greeneridge Sciences, Inc. Hz hertz I&R Illingworth & Rodkin, Inc. I-5 Interstate 5 mm millimeter MMSZ marine mammal safety zone msec millisecond NMFS National Marine Fisheries Service PIDP Pile Installation Demonstration Project RMS root mean square RSRB Richmond-San Rafael Bridge SEL sound exposure level SFOBB San Francisco-Oakland Bay Bridge SR State Route
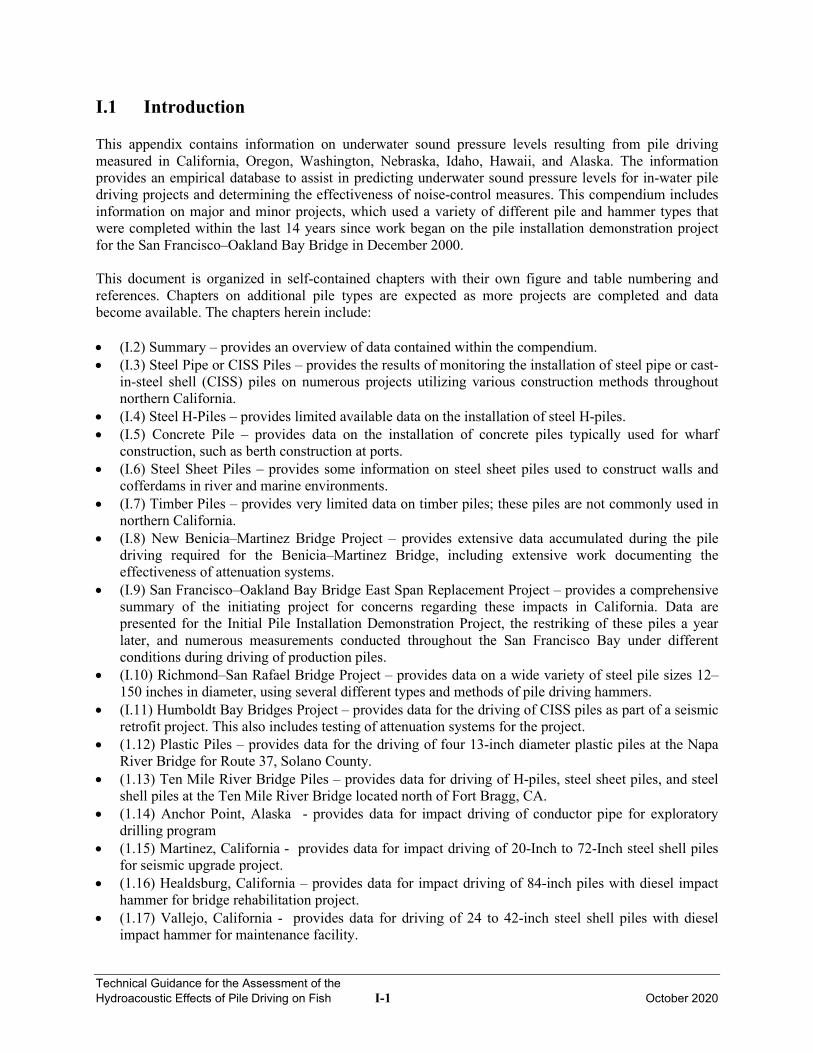
Technical Guidance for the Assessment of the Hydroacoustic Effects of Pile Driving on Fish I-1 October 2020
I.1 Introduction This appendix contains information on underwater sound pressure levels resulting from pile driving measured in California, Oregon, Washington, Nebraska, Idaho, Hawaii, and Alaska. The information provides an empirical database to assist in predicting underwater sound pressure levels for in-water pile driving projects and determining the effectiveness of noise-control measures. This compendium includes information on major and minor projects, which used a variety of different pile and hammer types that were completed within the last 14 years since work began on the pile installation demonstration project for the San Francisco–Oakland Bay Bridge in December 2000. This document is organized in self-contained chapters with their own figure and table numbering and references. Chapters on additional pile types are expected as more projects are completed and data become available. The chapters herein include: • (I.2) Summary – provides an overview of data contained within the compendium. • (I.3) Steel Pipe or CISS Piles – provides the results of monitoring the installation of steel pipe or cast-
in-steel shell (CISS) piles on numerous projects utilizing various construction methods throughout northern California.
• (I.4) Steel H-Piles – provides limited available data on the installation of steel H-piles. • (I.5) Concrete Pile – provides data on the installation of concrete piles typically used for wharf
construction, such as berth construction at ports. • (I.6) Steel Sheet Piles – provides some information on steel sheet piles used to construct walls and
cofferdams in river and marine environments. • (I.7) Timber Piles – provides very limited data on timber piles; these piles are not commonly used in
northern California. • (I.8) New Benicia–Martinez Bridge Project – provides extensive data accumulated during the pile
driving required for the Benicia–Martinez Bridge, including extensive work documenting the effectiveness of attenuation systems.
• (I.9) San Francisco–Oakland Bay Bridge East Span Replacement Project – provides a comprehensive summary of the initiating project for concerns regarding these impacts in California. Data are presented for the Initial Pile Installation Demonstration Project, the restriking of these piles a year later, and numerous measurements conducted throughout the San Francisco Bay under different conditions during driving of production piles.
• (I.10) Richmond–San Rafael Bridge Project – provides data on a wide variety of steel pile sizes 12–150 inches in diameter, using several different types and methods of pile driving hammers.
• (I.11) Humboldt Bay Bridges Project – provides data for the driving of CISS piles as part of a seismic retrofit project. This also includes testing of attenuation systems for the project.
• (1.12) Plastic Piles – provides data for the driving of four 13-inch diameter plastic piles at the Napa River Bridge for Route 37, Solano County.
• (1.13) Ten Mile River Bridge Piles – provides data for driving of H-piles, steel sheet piles, and steel shell piles at the Ten Mile River Bridge located north of Fort Bragg, CA.
• (1.14) Anchor Point, Alaska - provides data for impact driving of conductor pipe for exploratory drilling program
• (1.15) Martinez, California - provides data for impact driving of 20-Inch to 72-Inch steel shell piles for seismic upgrade project.
• (1.16) Healdsburg, California – provides data for impact driving of 84-inch piles with diesel impact hammer for bridge rehabilitation project.
• (1.17) Vallejo, California - provides data for driving of 24 to 42-inch steel shell piles with diesel impact hammer for maintenance facility.
Technical Guidance for the Assessment of the Hydroacoustic Effects of Pile Driving on Fish I-2 October 2020
• (1.18) Contra Costa County, California – provides data for driving of 24-inch temporary piles with diesel impact hammer for bridge work trestle.
• (1.19) Honolulu Harbor, Hawaii – provide testing of underwater sound attenuation device. • (1.20) San Francisco Bay, California – provides data for impact driving of timber piles. • (1.21) Alaska – provides data for trenching and winching operations and trusting propeller noise for
fiber-optic cable laying. • (1.22) Bodega Bay, California – provide data for impact driving of 16-inch square concrete piles. • (1.23) Martinez, Califorornia – provides data for impact driving of 24-inch steel shell piles for wharf
repair. • (1.24) Oliktok Point, Alaska – provides data for trenching and winching operations and trusting
propeller noise for Fiber-Optic Cable Laying. • (1.25) Vallejo, California – provides data for impact driving for reinstallation 36-inch steel shell pile. • (1.26) San Francisco-Oakland, California I.26 Implosion of 13 Marine Piers for Dismantling of
Bridge. • (1.27) Antioch, California – provides data for driving of 42 to 72-inch Piles with diesel impact
hammer for terminal replacement project (1.28) San Francisco, California – provides data for vibratory installation of 24 to 36-inch piles for terminal expansion project.
• (1.29) Richmond City, California – provides data for driving of 24-inch steel shell battered piles with diesel impact hammer for seismic retrofit of terminal facility.
• (1.30) Redwood City, California – provides data for driving of 30 and 66-inch piles with diesel impact hammer for fender system replacement project.
• (1.31) Yuba City and Marysville, California – provides data for driving of 22-inch steel temporary trestle piles with impact hammer for bridge replacement.
• (1.32) Larkspur, California – provides data for driving of 24-inch Steel shell piles with diesel impact hammer for temporary work trestle.
• (1.33) Los Angeles, California – provides data for vibratory and impact pile driving of piles for floating dock.
• (1.34) Richmond, California – provides data for vibratory and impact pile driving of piles for Chevron Long Wharf.
• (1.35) Siskiyou County, California – provides data for on-land pile driving of 10 x 54-inch H piles with diesel impact hammer for bridge upgrade project.
• (1.36) Monterey, California – provide data for pile extraction, installation, and proofing for wharf reconstruction project.
• (1.37) Martinez, California – provides data for impact pile driving of 24 to 30-Inch steel shell battered piles for terminal retrofit project.
• (1.38). Santa Cruz, California – provides data for impact driving of 14-inch nominal timber piles for Santa Cruz Wharf repairs.
I.2 Summary Generally, as one might intuitively expect, sound pressure levels from in-water pile driving depend on the size of the pile and the size of the hammer. Other factors, however, can cause large variations in measured sound pressure levels at a particular project site or between project sites. These factors include water depth, tidal conditions or currents if sound attenuation systems are used, and geotechnical conditions that determine how difficult it is to drive the pile. Table I.2-1 summarizes all pile driving sound levels reported in this compendium for both attenuated and unattenuated pile driving. These tables summarize results from pile driving at positions close to the pile and include the pile type; pile size; location of the project; water depth; distance from the pile where the
Technical Guidance for the Assessment of the Hydroacoustic Effects of Pile Driving on Fish I-3 October 2020
data were collected; measured peak, root mean square (RMS), and sound exposure level (SEL), when available; an approximation of the attenuation rate; and comments and photos when available. These data can be used as a ready reference and for comparative purposes when screening a project. Further acoustical information on specific pile types can be found in each chapter.

This page intentionally left blank.
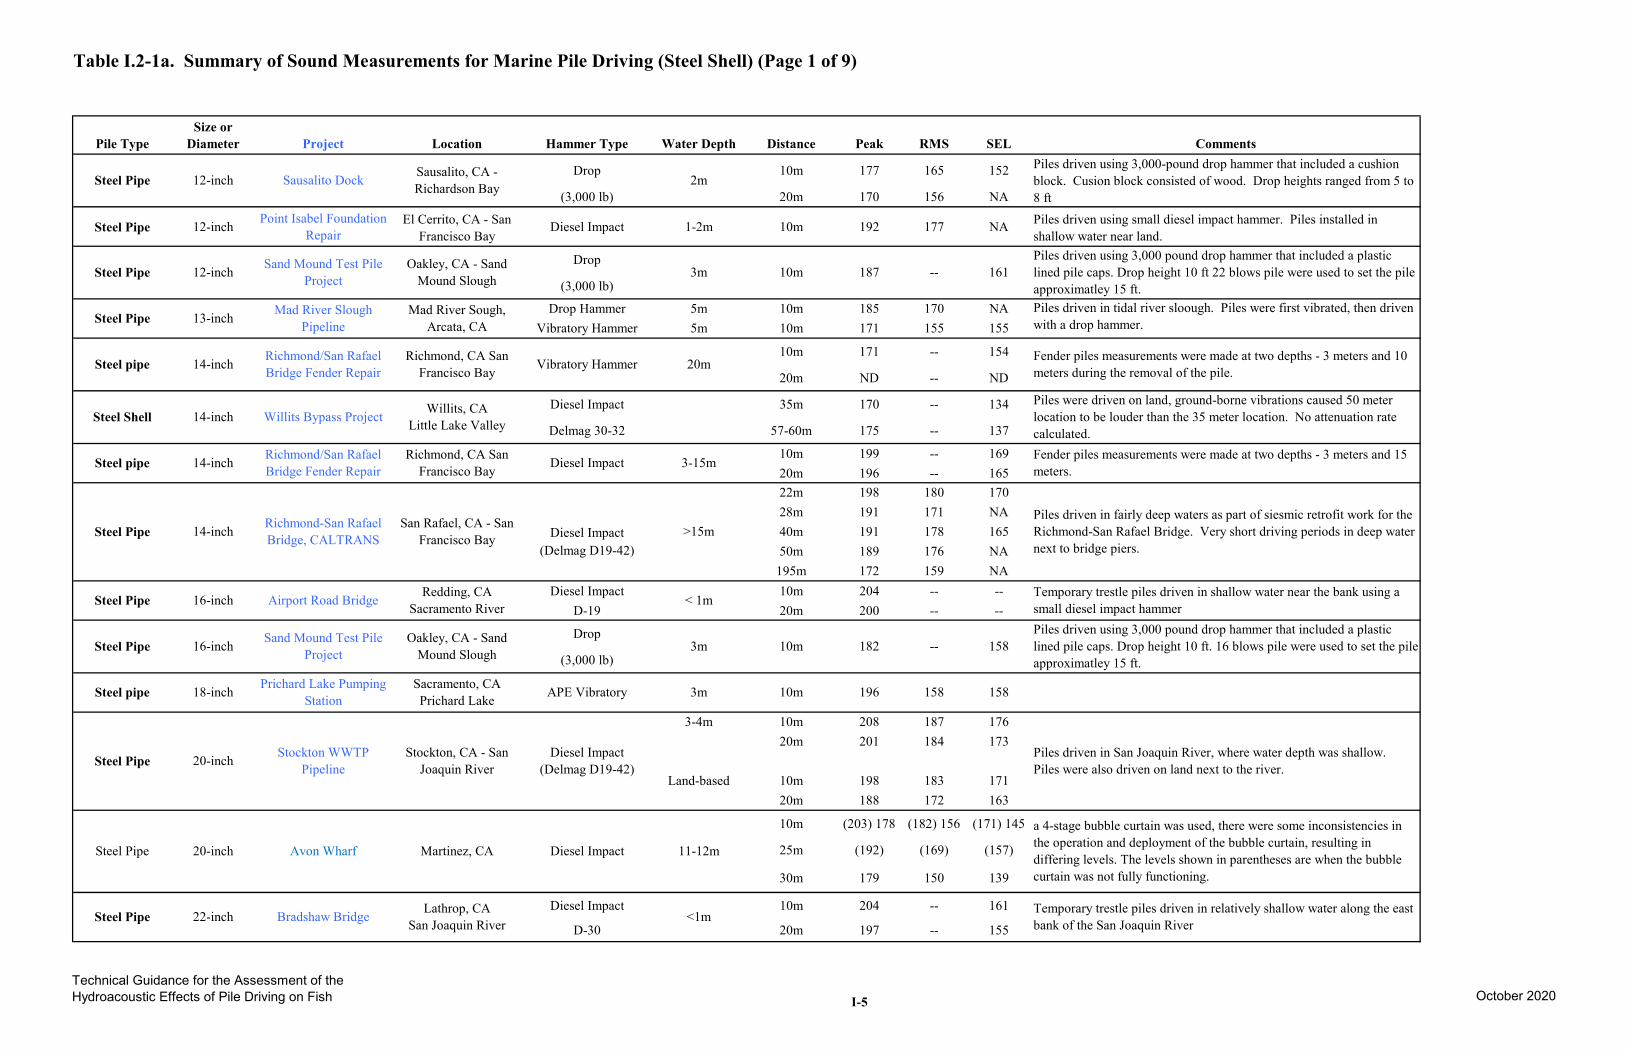
Table I.2-1a. Summary of Sound Measurements for Marine Pile Driving (Steel Shell) (Page 1 of 9)
Pile Type Size or
Diameter Project Location Hammer Type Water Depth Distance Peak RMS SEL Comments
Steel Pipe 12-inch Sausalito Dock Sausalito, CA -Richardson Bay
Drop
(3,000 lb) 2m
10m
20m
177
170
165
156
152
NA
Piles driven using 3,000-pound drop hammer that included a cushion block. Cusion block consisted of wood. Drop heights ranged from 5 to 8 ft
Steel Pipe 12-inch Point Isabel Foundation Repair
El Cerrito, CA - San Francisco Bay
Diesel Impact 1-2m 10m 192 177 NA Piles driven using small diesel impact hammer. Piles installed in shallow water near land.
Steel Pipe 12-inch Sand Mound Test Pile Project
Oakley, CA - Sand Mound Slough
Drop
(3,000 lb) 3m 10m 187 -- 161
Piles driven using 3,000 pound drop hammer that included a plastic lined pile caps. Drop height 10 ft 22 blows pile were used to set the pile approximatley 15 ft.
Steel Pipe 13-inch Mad River Slough Pipeline
Mad River Sough, Arcata, CA
Drop Hammer Vibratory Hammer
5m 5m
10m 10m
185 171
170 155
NA 155
Piles driven in tidal river sloough. Piles were first vibrated, then driven with a drop hammer.
Steel pipe 14-inch Richmond/San Rafael Bridge Fender Repair
Richmond, CA San Francisco Bay Vibratory Hammer 20m
10m
20m
171
ND
--
--
154
ND
Fender piles measurements were made at two depths - 3 meters and 10 meters during the removal of the pile.
Steel Shell 14-inch Willits Bypass Project Willits, CA Little Lake Valley
Diesel Impact
Delmag 30-32
35m
57-60m
170
175
--
--
134
137
Piles were driven on land, ground-borne vibrations caused 50 meter location to be louder than the 35 meter location. No attenuation rate calculated.
Steel pipe 14-inch Richmond/San Rafael Bridge Fender Repair
Richmond, CA San Francisco Bay Diesel Impact 3-15m
10m 20m
199 196
----
169 165
Fender piles measurements were made at two depths - 3 meters and 15 meters.
Steel Pipe 14-inch Richmond-San Rafael Bridge, CALTRANS
San Rafael, CA - San Francisco Bay Diesel Impact
(Delmag D19-42) >15m
22m 28m 40m 50m
195m
198 191 191 189 172
180 171 178 176 159
170 NA 165 NA NA
Piles driven in fairly deep waters as part of siesmic retrofit work for the Richmond-San Rafael Bridge. Very short driving periods in deep water next to bridge piers.
Steel Pipe 16-inch Airport Road Bridge Redding, CA Sacramento River
Diesel Impact D-19
< 1m 10m 20m
204 200
----
----
Temporary trestle piles driven in shallow water near the bank using a small diesel impact hammer
Steel Pipe 16-inch Sand Mound Test Pile Project
Oakley, CA - Sand Mound Slough
Drop
(3,000 lb) 3m 10m 182 -- 158
Piles driven using 3,000 pound drop hammer that included a plastic lined pile caps. Drop height 10 ft. 16 blows pile were used to set the pile approximatley 15 ft.
Steel pipe 18-inch Prichard Lake Pumping Station
Sacramento, CA Prichard Lake APE Vibratory 3m 10m 196 158 158
Steel Pipe 20-inch Stockton WWTP Pipeline
Stockton, CA - San Joaquin River
Diesel Impact (Delmag D19-42)
3-4m
Land-based
10m 20m
10m 20m
208 201
198 188
187 184
183 172
176 173
171 163
Piles driven in San Joaquin River, where water depth was shallow. Piles were also driven on land next to the river.
10m (203) 178 (182) 156 (171) 145 a 4-stage bubble curtain was used, there were some inconsistencies in
Steel Pipe 20-inch Avon Wharf Martinez, CA Diesel Impact 11-12m 25m (192) (169) (157) the operation and deployment of the bubble curtain, resulting in differing levels. The levels shown in parentheses are when the bubble
30m 179 150 139 curtain was not fully functioning.
Steel Pipe 22-inch Bradshaw Bridge Lathrop, CA San Joaquin River
Diesel Impact
D-30 <1m
10m
20m
204
197
--
--
161
155 Temporary trestle piles driven in relatively shallow water along the east bank of the San Joaquin River
Technical Guidance for the Assessment of the Hydroacoustic Effects of Pile Driving on Fish October 2020 I-5
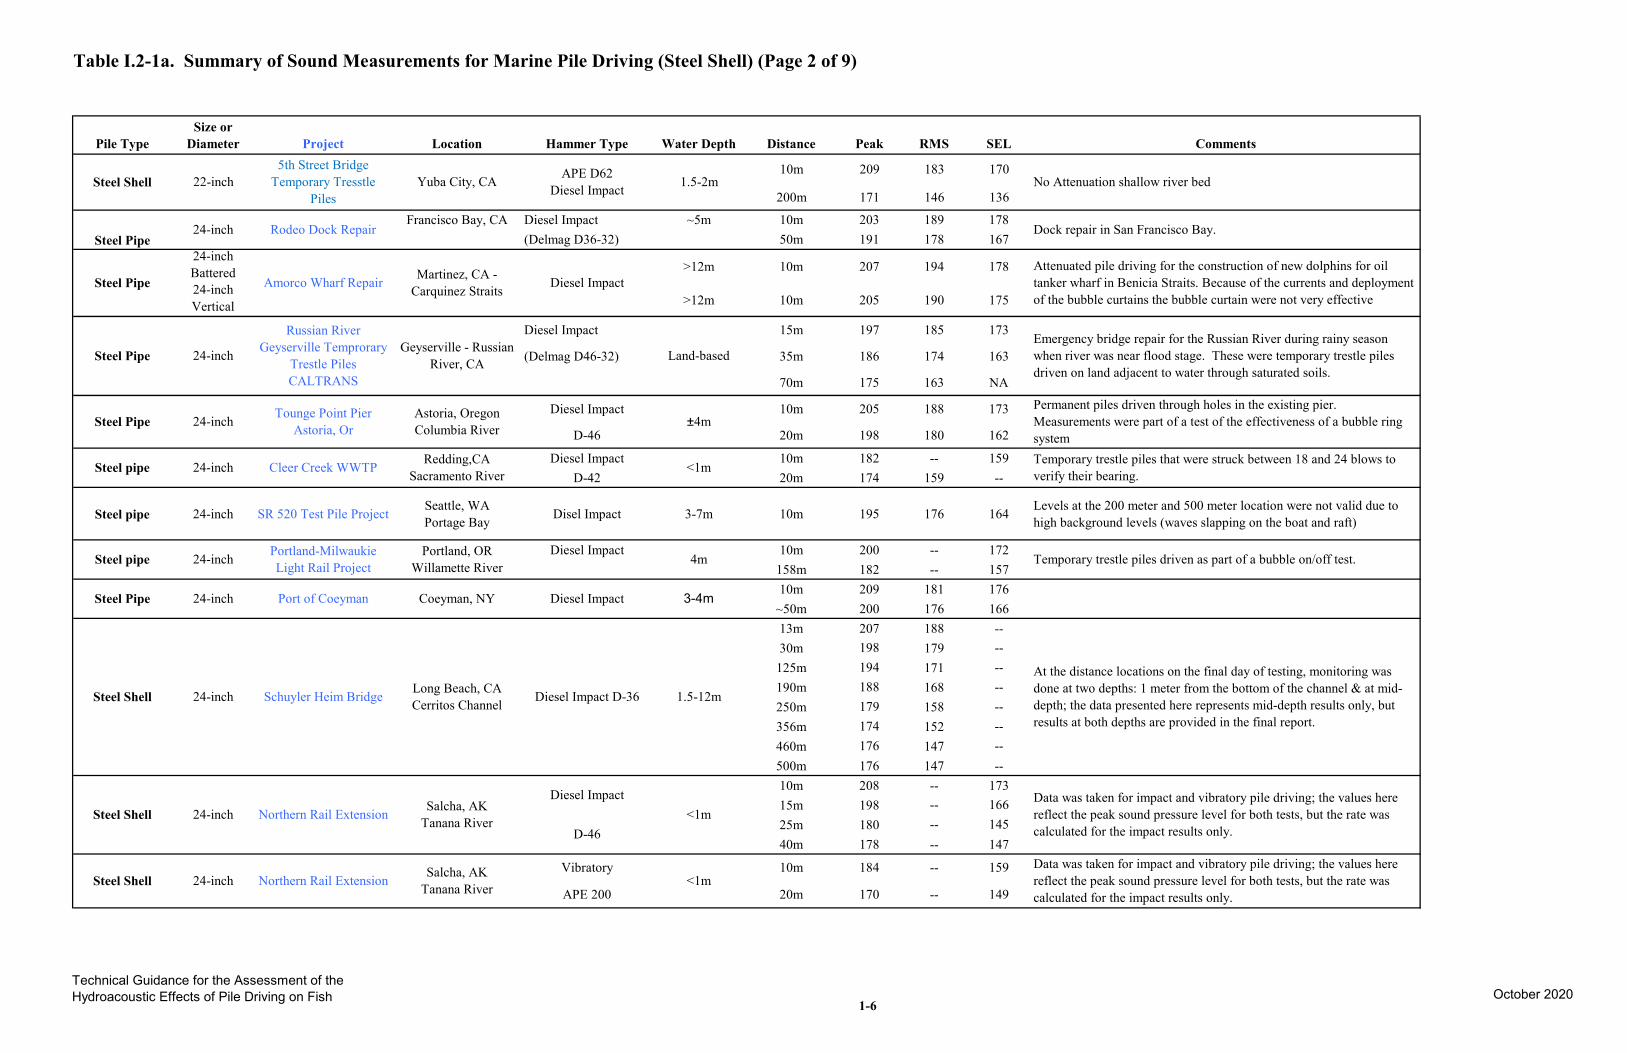
Table I.2-1a. Summary of Sound Measurements for Marine Pile Driving (Steel Shell) (Page 2 of 9)
Pile Type Size or
Diameter Project Location Hammer Type Water Depth Distance Peak RMS SEL Comments
Steel Shell 22-inch 5th Street Bridge
Temporary Tresstle Piles
Yuba City, CA APE D62 Diesel Impact 1.5-2m
10m
200m
209
171
183
146
170
136 No Attenuation shallow river bed
Steel Pipe 24-inch Rodeo Dock Repair
Francisco Bay, CA Diesel Impact (Delmag D36-32)
~5m 10m 50m
203 191
189 178
178 167
Dock repair in San Francisco Bay.
Steel Pipe
24-inch Battered 24-inch Vertical
Amorco Wharf Repair Martinez, CA -Carquinez Straits Diesel Impact
>12m
>12m
10m
10m
207
205
194
190
178
175
Attenuated pile driving for the construction of new dolphins for oil tanker wharf in Benicia Straits. Because of the currents and deployment of the bubble curtains the bubble curtain were not very effective
Steel Pipe 24-inch
Russian River Geyserville Temprorary
Trestle Piles CALTRANS
Geyserville - Russian River, CA
Diesel Impact
(Delmag D46-32) Land-based
15m
35m
70m
197
186
175
185
174
163
173
163
NA
Emergency bridge repair for the Russian River during rainy season when river was near flood stage. These were temporary trestle piles driven on land adjacent to water through saturated soils.
Steel Pipe 24-inch Tounge Point Pier Astoria, Or
Astoria, Oregon Columbia River
Diesel Impact
D-46 ±4m
10m
20m
205
198
188
180
173
162
Permanent piles driven through holes in the existing pier. Measurements were part of a test of the effectiveness of a bubble ring system
Steel pipe 24-inch Cleer Creek WWTP Redding,CA Sacramento River
Diesel Impact D-42
<1m 10m 20m
182 174
--159
159 --
Temporary trestle piles that were struck between 18 and 24 blows to verify their bearing.
Steel pipe 24-inch SR 520 Test Pile Project Seattle, WA Portage Bay Disel Impact 3-7m 10m 195 176 164 Levels at the 200 meter and 500 meter location were not valid due to
high background levels (waves slapping on the boat and raft)
Steel pipe 24-inch Portland-Milwaukie Light Rail Project
Portland, OR Willamette River
Diesel Impact 4m
10m 158m
200 182
----
172 157
Temporary trestle piles driven as part of a bubble on/off test.
Steel Pipe 24-inch Port of Coeyman Coeyman, NY Diesel Impact 3-4m 10m
~50m 209 200
176 1
181 176 66
13m 30m
125m 190m 250m 356m 460m 500m
207 198 194 188 179 174 176 176
188 179 171 168 158 152 147 147
----------------
Steel Shell 24-inch Schuyler Heim Bridge Long Beach, CA Cerritos Channel Diesel Impact D-36 1.5-12m
At the distance locations on the final day of testing, monitoring was done at two depths: 1 meter from the bottom of the channel & at mid-depth; the data presented here represents mid-depth results only, but results at both depths are provided in the final report.
Steel Shell 24-inch Northern Rail Extension Salcha, AK Tanana River
Diesel Impact
D-46 <1m
10m 15m 25m 40m
208 198 180 178
--------
173 166 145 147
Data was taken for impact and vibratory pile driving; the values here reflect the peak sound pressure level for both tests, but the rate was calculated for the impact results only.
Steel Shell 24-inch Northern Rail Extension Salcha, AK Tanana River
Vibratory
APE 200 <1m
10m
20m
184
170
--
--
159
149
Data was taken for impact and vibratory pile driving; the values here reflect the peak sound pressure level for both tests, but the rate was calculated for the impact results only.
Technical Guidance for the Assessment of the Hydroacoustic Effects of Pile Driving on Fish October 2020
1-6
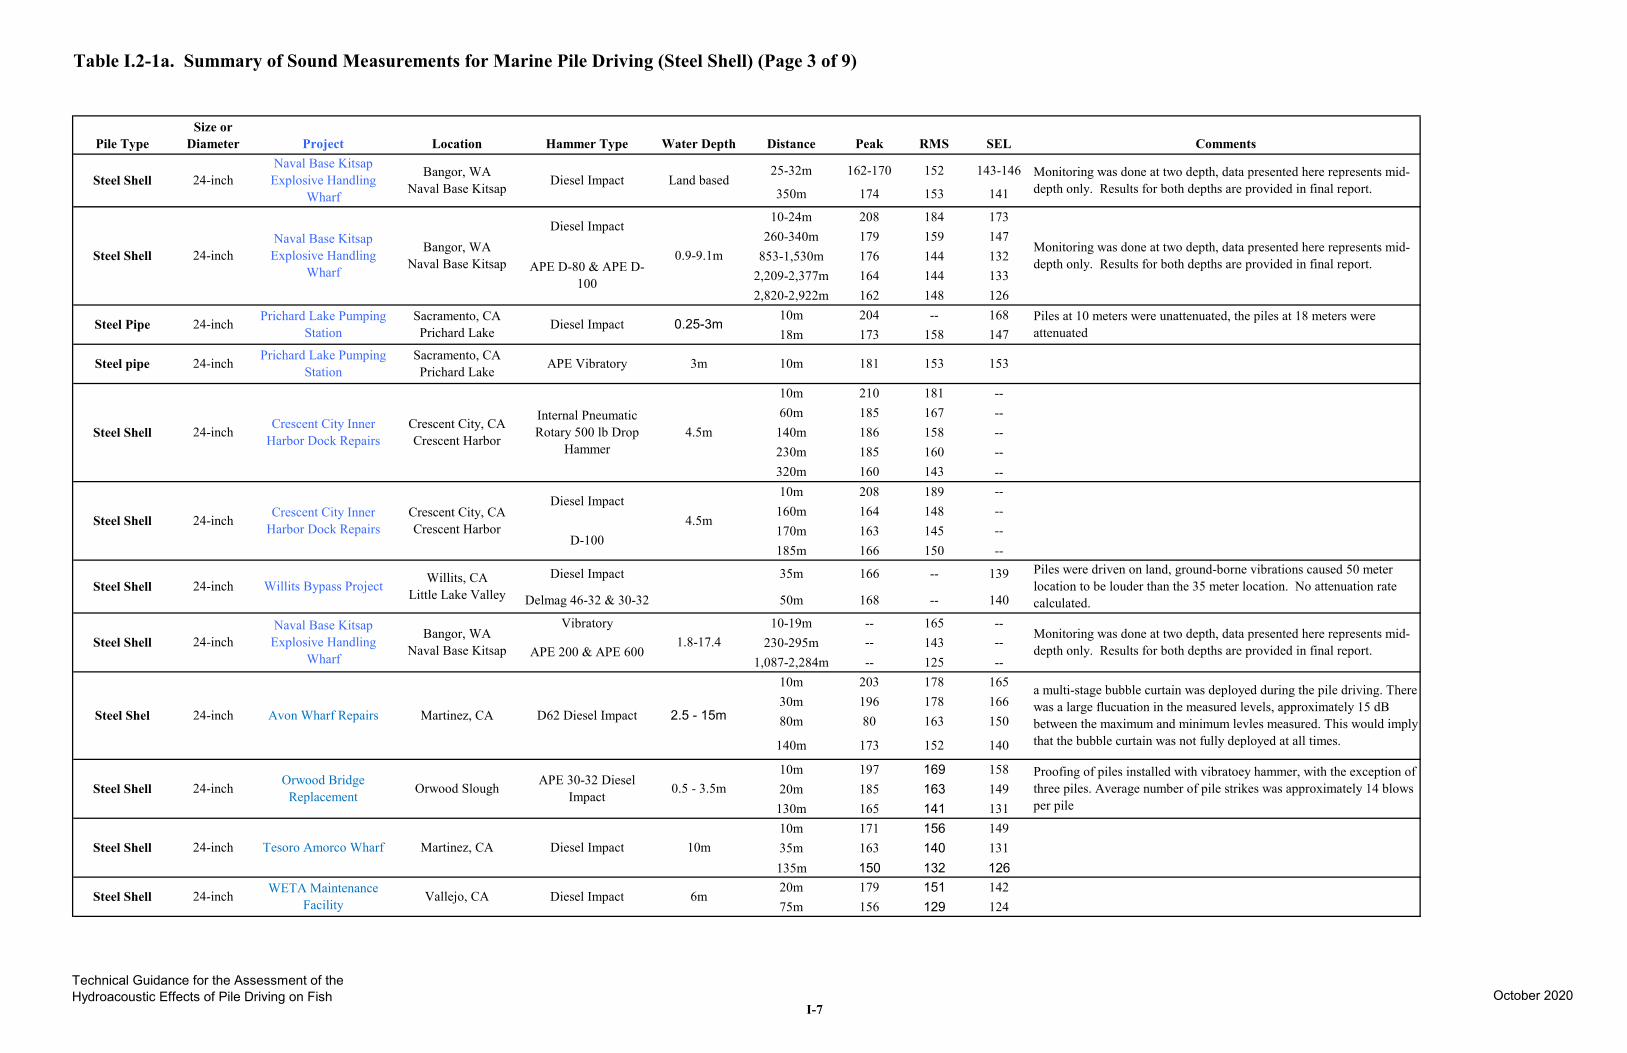
Table I.2-1a. Summary of Sound Measurements for Marine Pile Driving (Steel Shell) (Page 3 of 9)
Pile Type Size or
Diameter Project Location Hammer Type Water Depth Distance Peak RMS SEL Comments
Steel Shell 24-inch Naval Base Kitsap
Explosive Handling Wharf
Bangor, WA Naval Base Kitsap Diesel Impact Land based
25-32m
350m
162-170
174
152
153
143-146
141
Monitoring was done at two depth, data presented here represents mid-depth only. Results for both depths are provided in final report.
Steel Shell 24-inch Naval Base Kitsap
Explosive Handling Wharf
Bangor, WA Naval Base Kitsap
Diesel Impact
APE D-80 & APE D-100
0.9-9.1m
10-24m 260-340m
853-1,530m 2,209-2,377m 2,820-2,922m
208 179 176 164 162
184 159 144 144 148
173 147 132 133 126
Monitoring was done at two depth, data presented here represents mid-depth only. Results for both depths are provided in final report.
Steel Pipe 24-inch Prichard Lake Pumping Station
Sacramento, CA Prichard Lake Diesel Impact 0.25-3m
10m 18m
204 173
--158
168 147
Piles at 10 meters were unattenuated, the piles at 18 meters were attenuated
Steel pipe 24-inch Prichard Lake Pumping Station
Sacramento, CA Prichard Lake APE Vibratory 3m 10m 181 153 153
Steel Shell 24-inch Crescent City Inner Harbor Dock Repairs
Crescent City, CA Crescent Harbor
Internal Pneumatic Rotary 500 lb Drop
Hammer 4.5m
10m 60m
140m 230m 320m
210 185 186 185 160
181 167 158 160 143
----------
Steel Shell 24-inch Crescent City Inner Harbor Dock Repairs
Crescent City, CA Crescent Harbor
Diesel Impact
D-100 4.5m
10m 160m 170m 185m
208 164 163 166
189 148 145 150
--------
Steel Shell 24-inch Willits Bypass Project Willits, CA Little Lake Valley
Diesel Impact
Delmag 46-32 & 30-32
35m
50m
166
168
--
--
139
140
Piles were driven on land, ground-borne vibrations caused 50 meter location to be louder than the 35 meter location. No attenuation rate calculated.
Steel Shell 24-inch Naval Base Kitsap
Explosive Handling Wharf
Bangor, WA Naval Base Kitsap
Vibratory
APE 200 & APE 600 1.8-17.4
10-19m 230-295m
1,087-2,284m
------
165 143 125
------
Monitoring was done at two depth, data presented here represents mid-depth only. Results for both depths are provided in final report.
Steel Shel 24-inch Avon Wharf Repairs Martinez, CA D62 Diesel Impact 2.5 - 15m
10m 30m 80m
140m
203 196 80
173
178 178 163
152
165 166 150
140
a multi-stage bubble curtain was deployed during the pile driving. There was a large flucuation in the measured levels, approximately 15 dB between the maximum and minimum levles measured. This would imply that the bubble curtain was not fully deployed at all times.
Steel Shell 24-inch Orwood Bridge Replacement Orwood Slough APE 30-32 Diesel
Impact 0.5 - 3.5m 10m 20m
130m
197 185 165
169 163 141
158 149 131
Proofing of piles installed with vibratoey hammer, with the exception of three piles. Average number of pile strikes was approximately 14 blows per pile
10m 171 156 149 Steel Shell 24-inch Tesoro Amorco Wharf Martinez, CA Diesel Impact 10m 35m 163 140 131
135m 150 132 126
Steel Shell 24-inch WETA Maintenance Facility Vallejo, CA Diesel Impact 6m
20m 75m
179 156
151 129
142 124
Technical Guidance for the Assessment of the Hydroacoustic Effects of Pile Driving on Fish October 2020
I-7
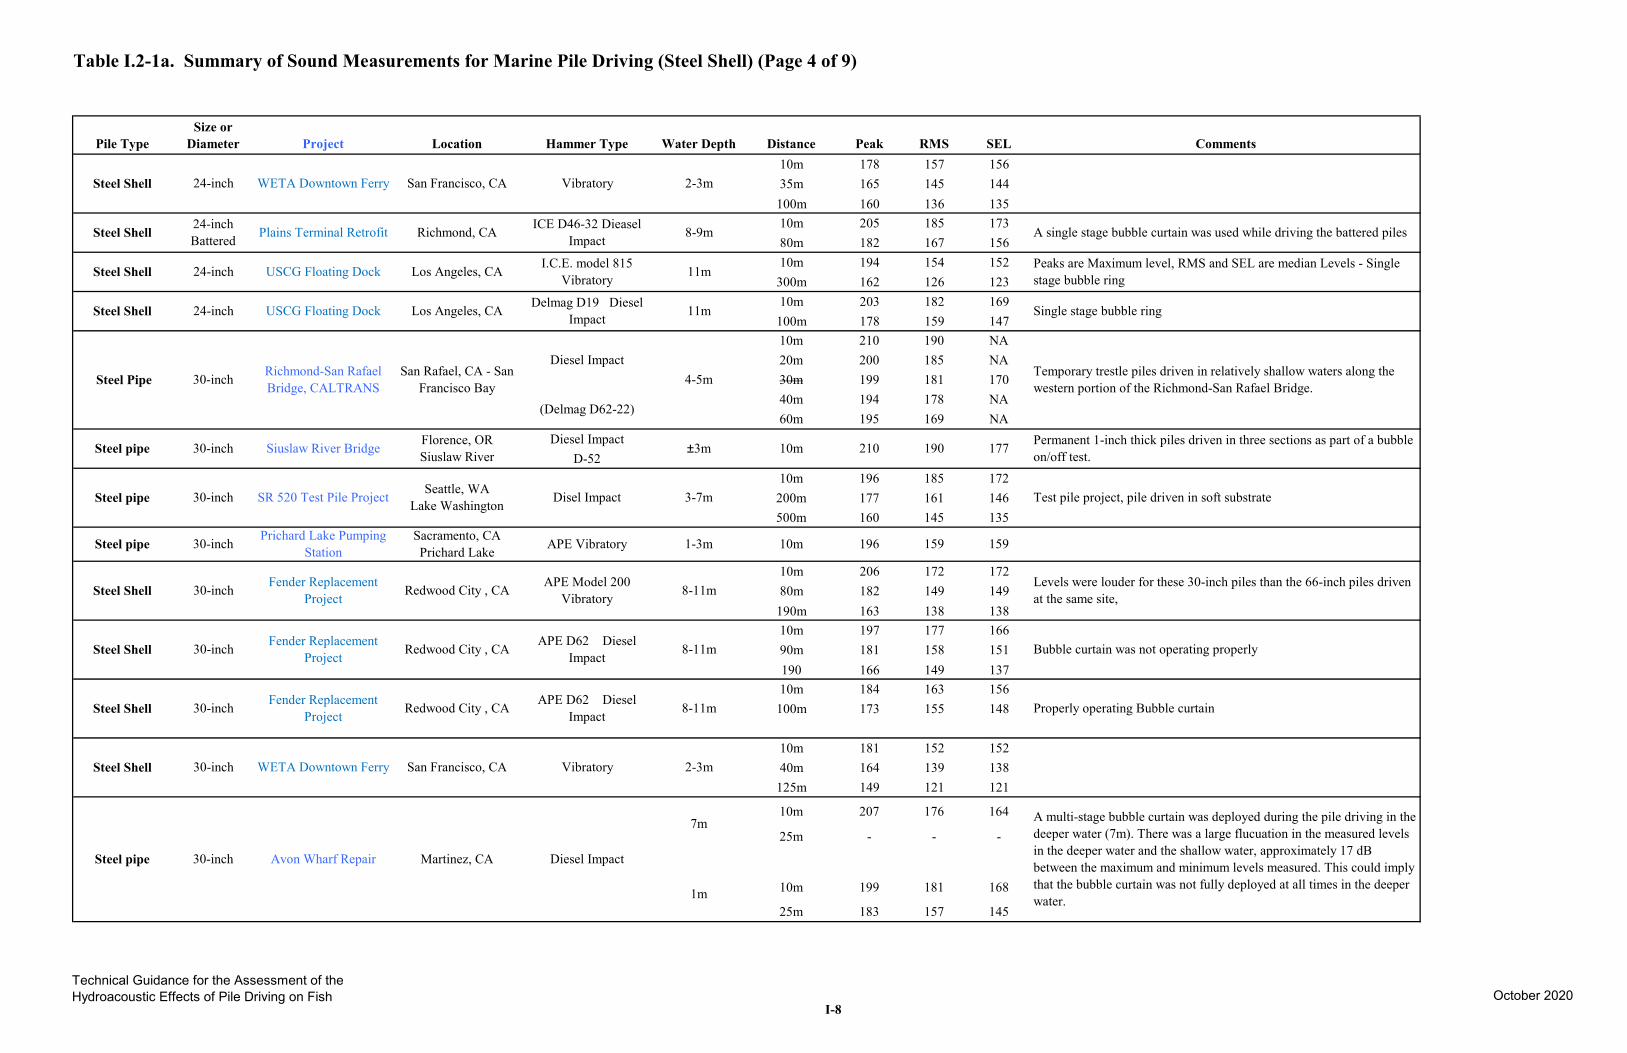
Table I.2-1a. Summary of Sound Measurements for Marine Pile Driving (Steel Shell) (Page 4 of 9)
Pile Type Size or
Diameter Project Location Hammer Type Water Depth Distance Peak RMS SEL Comments
Steel Shell 24-inch WETA Downtown Ferry San Francisco, CA Vibratory 2-3m10m 35m
100m
178 165 160
157 145 136
156 144 135
Steel Shell 24-inch Battered Plains Terminal Retrofit Richmond, CA ICE D46-32 Dieasel
Impact 8-9m 10m 80m
205 182
185 167
173 156
A single stage bubble curtain was used while driving the battered piles
Steel Shell 24-inch USCG Floating Dock Los Angeles, CA I.C.E. model 815 Vibratory 11m
10m 300m
194 162
154 126
152 123
Peaks are Maximum level, RMS and SEL are median Levels - Single stage bubble ring
Steel Shell 24-inch USCG Floating Dock Los Angeles, CA Delmag D19 Diesel Impact 11m
10m 100m
203 178
182 159
169 147
Single stage bubble ring
Steel Pipe 30-inch Richmond-San Rafael Bridge, CALTRANS
San Rafael, CA - San Francisco Bay
Diesel Impact
(Delmag D62-22)
4-5m
10m 20m 30m 40m 60m
210 200 199 194 195
190 185 181 178 169
NA NA 170 NA NA
Temporary trestle piles driven in relatively shallow waters along the western portion of the Richmond-San Rafael Bridge.
Steel pipe 30-inch Siuslaw River Bridge Florence, OR Siuslaw River
Diesel Impact D-52
±3m 10m 210 190 177 Permanent 1-inch thick piles driven in three sections as part of a bubble on/off test.
Steel pipe 30-inch SR 520 Test Pile Project Seattle, WA Lake Washington Disel Impact 3-7m
10m 200m 500m
196 177 160
185 161 145
172 146 135
Test pile project, pile driven in soft substrate
Steel pipe 30-inch Prichard Lake Pumping Station
Sacramento, CA Prichard Lake APE Vibratory 1-3m 10m 196 159 159
Steel Shell 30-inch Fender Replacement Project Redwood City , CA APE Model 200
Vibratory 8-11m 10m 80m
190m
206 182 163
172 149 138
172 149 138
Levels were louder for these 30-inch piles than the 66-inch piles driven at the same site,
Steel Shell 30-inch Fender Replacement Project Redwood City , CA APE D62 Diesel
Impact 8-11m 10m 90m 190
197 181 166
177 158 149
166 151 137
Bubble curtain was not operating properly
Steel Shell 30-inch Fender Replacement Project Redwood City , CA APE D62 Diesel
Impact 8-11m 10m
100m 184 173
163 155
156 148 Properly operating Bubble curtain
Steel Shell 30-inch WETA Downtown Ferry San Francisco, CA Vibratory 2-3m 10m 40m
125m
181 164 149
152 139 121
152 138 121
Steel pipe 30-inch Avon Wharf Repair Martinez, CA Diesel Impact
7m
1m
10m
25m
10m
25m
207
-
199
183
176
-
181
157
164
-
168
145
A multi-stage bubble curtain was deployed during the pile driving in the deeper water (7m). There was a large flucuation in the measured levels in the deeper water and the shallow water, approximately 17 dB between the maximum and minimum levels measured. This could imply that the bubble curtain was not fully deployed at all times in the deeper water.
Technical Guidance for the Assessment of the Hydroacoustic Effects of Pile Driving on Fish October 2020
I-8
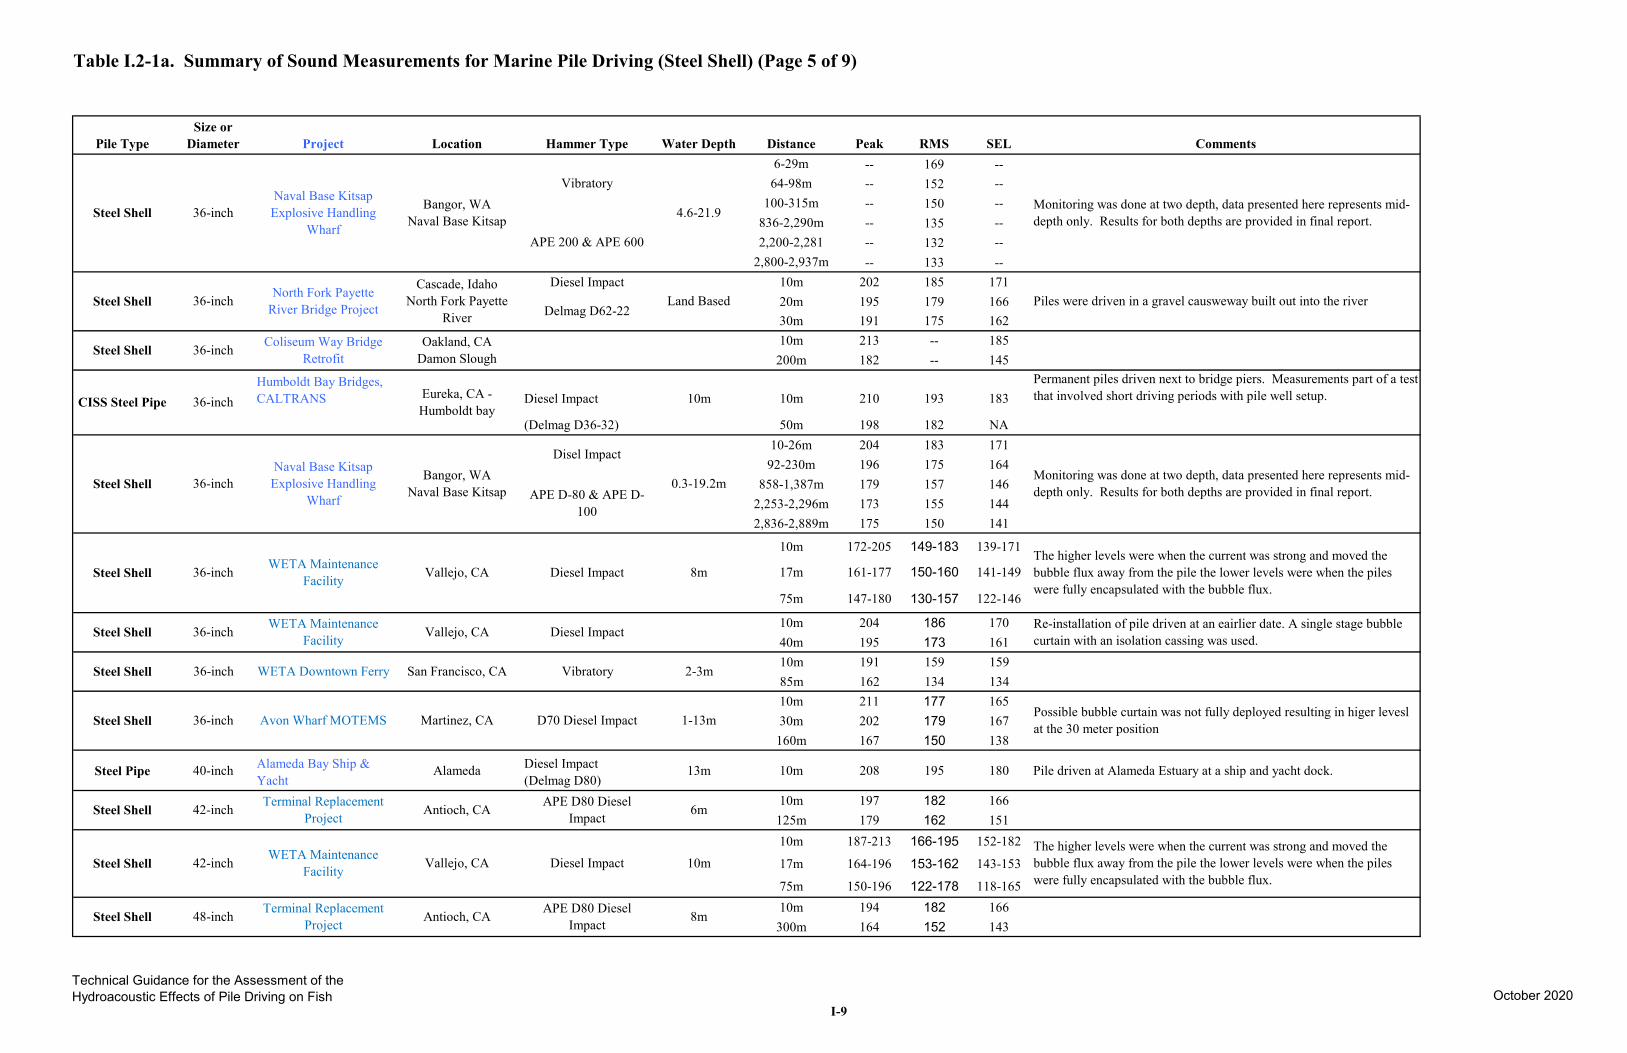
Table I.2-1a. Summary of Sound Measurements for Marine Pile Driving (Steel Shell) (Page 5 of 9)
Pile Type Size or
Diameter Project Location Hammer Type Water Depth Distance Peak RMS SEL Comments 6-29m -- 169 --
Steel Shell 36-inch Naval Base Kitsap
Explosive Handling Wharf
Bangor, WA Naval Base Kitsap
Vibratory
APE 200 & APE 600
4.6-21.9
64-98m 100-315m
836-2,290m 2,200-2,281
--------
152 150 135 132
--------
Monitoring was done at two depth, data presented here represents mid-depth only. Results for both depths are provided in final report.
2,800-2,937m -- 133 --
Steel Shell 36-inch North Fork Payette River Bridge Project
Cascade, Idaho North Fork Payette
River
Diesel Impact
Delmag D62-22 Land Based
10m 20m 30m
202 195 191
185 179 175
171 166 162
Piles were driven in a gravel causweway built out into the river
Steel Shell 36-inch Coliseum Way Bridge Retrofit
Oakland, CA Damon Slough
10m 200m
213 182
----
185 145
CISS Steel Pipe 36-inch Humboldt Bay Bridges, CALTRANS Eureka, CA -
Humboldt bay Diesel Impact
(Delmag D36-32)
10m 10m
50m
210
198
193
182
183
NA
Permanent piles driven next to bridge piers. Measurements part of a test that involved short driving periods with pile well setup.
Steel Shell 36-inch Naval Base Kitsap
Explosive Handling Wharf
Bangor, WA Naval Base Kitsap
Disel Impact
APE D-80 & APE D-100
0.3-19.2m
10-26m 92-230m
858-1,387m 2,253-2,296m 2,836-2,889m
204 196 179 173 175
183 175 157 155 150
171 164 146 144 141
Monitoring was done at two depth, data presented here represents mid-depth only. Results for both depths are provided in final report.
Steel Shell 36-inch WETA Maintenance Facility Vallejo, CA Diesel Impact 8m
10m
17m
75m
172-205
161-177
147-180
149-183
150-160
130-157
139-171
141-149
122-146
The higher levels were when the current was strong and moved the bubble flux away from the pile the lower levels were when the piles were fully encapsulated with the bubble flux.
Steel Shell 36-inch WETA Maintenance Facility Vallejo, CA Diesel Impact
10m 40m
204 195
186 173
170 161
Re-installation of pile driven at an eairlier date. A single stage bubble curtain with an isolation cassing was used.
Steel Shell 36-inch WETA Downtown Ferry San Francisco, CA Vibratory 2-3m 10m 85m
191 162
159 134
159 134
Steel Shell 36-inch Avon Wharf MOTEMS Martinez, CA D70 Diesel Impact 1-13m 10m 30m
160m
211 202 167
177 179 150
165 167 138
Possible bubble curtain was not fully deployed resulting in higer levesl at the 30 meter position
Steel Pipe 40-inch Alameda Bay Ship & Yacht
Alameda Diesel Impact (Delmag D80)
13m 10m 208 195 180 Pile driven at Alameda Estuary at a ship and yacht dock.
Steel Shell 42-inch Terminal Replacement Project Antioch, CA APE D80 Diesel
Impact 6m 10m
125m 197 179
182 162
166 151
Steel Shell 42-inch WETA Maintenance Facility Vallejo, CA Diesel Impact 10m
10m
17m
75m
187-213
164-196
150-196
166-195 153-162 122-178
152-182
143-153
118-165
The higher levels were when the current was strong and moved the bubble flux away from the pile the lower levels were when the piles were fully encapsulated with the bubble flux.
Steel Shell 48-inch Terminal Replacement Project Antioch, CA APE D80 Diesel
Impact 8m 10m
300m 194 164
182 152
166 143
Technical Guidance for the Assessment of the Hydroacoustic Effects of Pile Driving on Fish October 2020
I-9
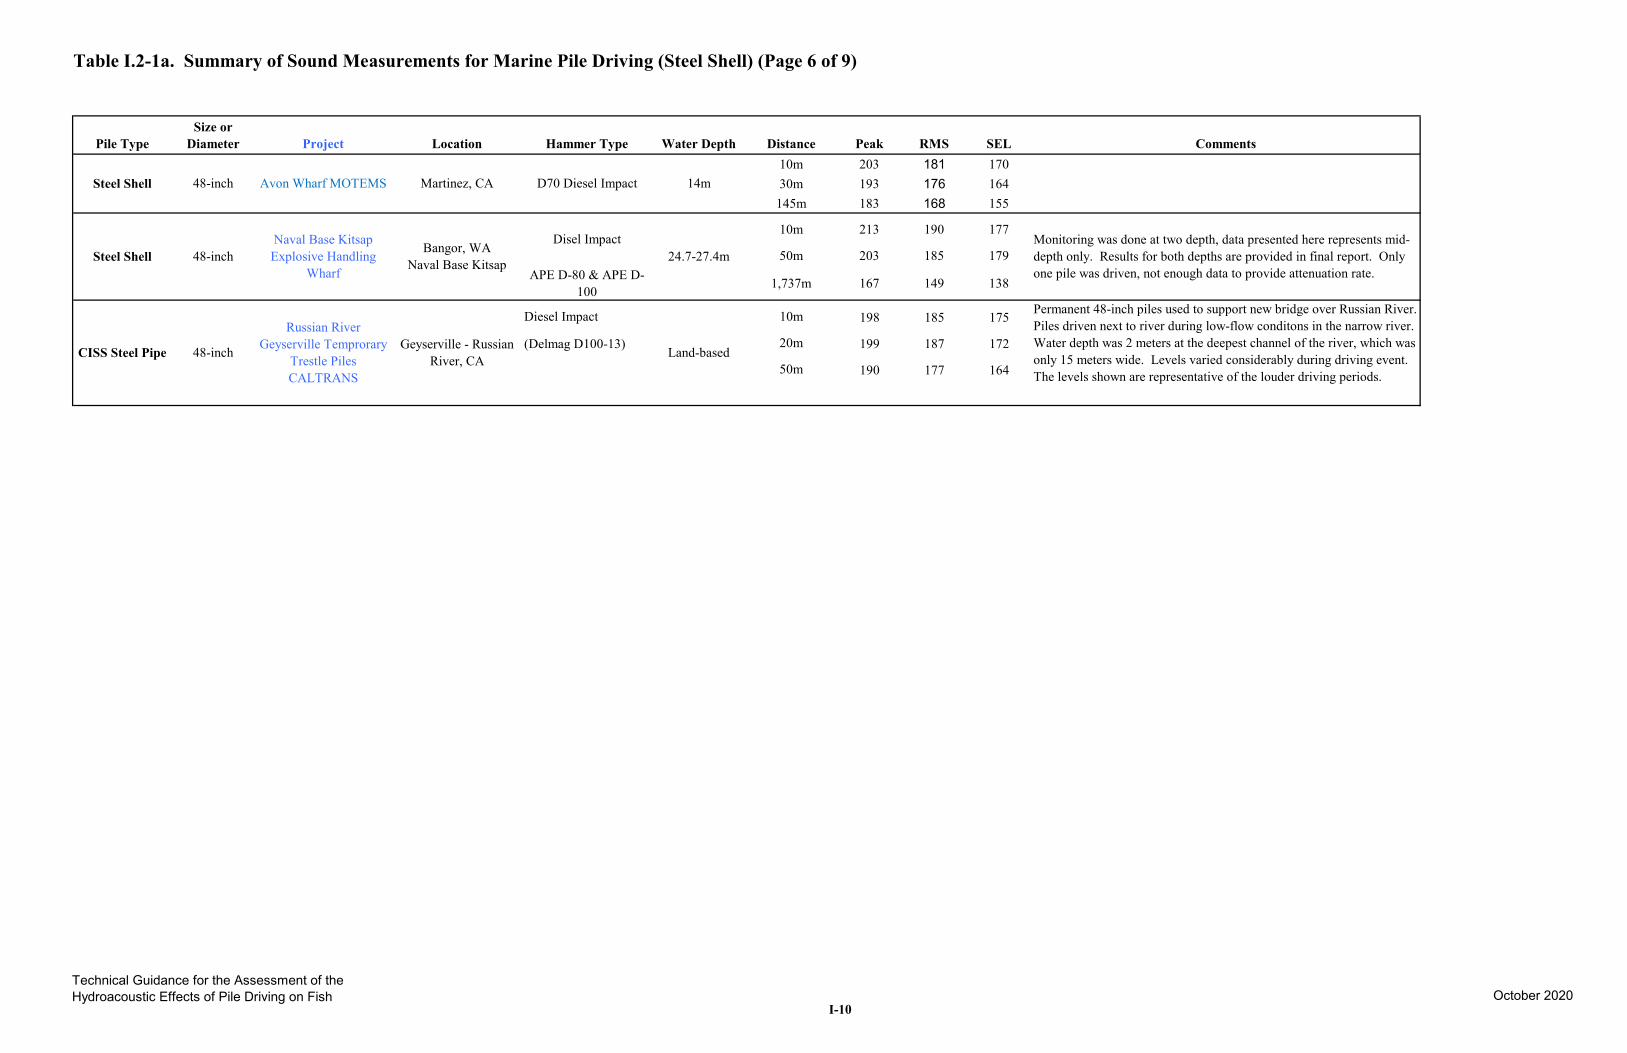
Table I.2-1a. Summary of Sound Measurements for Marine Pile Driving (Steel Shell) (Page 6 of 9)
Pile Type Size or
Diameter Project Location Hammer Type Water Depth Distance Peak RMS SEL Comments 10m 30m
145m
203 193 183
181 176 168
170 164 155
Steel Shell 48-inch Avon Wharf MOTEMS Martinez, CA D70 Diesel Impact 14m
Steel Shell 48-inch Naval Base Kitsap
Explosive Handling Wharf
Bangor, WA Naval Base Kitsap
Disel Impact
APE D-80 & APE D-100
24.7-27.4m
10m
50m
1,737m
213
203
167
190
185
149
177
179
138
Monitoring was done at two depth, data presented here represents mid-depth only. Results for both depths are provided in final report. Only one pile was driven, not enough data to provide attenuation rate.
Russian River Geyserville Temprorary Ge
Trestle Piles CALTRANS
Diesel Impact
(Delmag D100-13)
10m
20m
50m
198
199
190
185
187
177
175
172
164
Permanent 48-inch piles used to support new bridge over Russian River. Piles driven next to river during low-flow conditons in the narrow river. Water depth was 2 meters at the deepest channel of the river, which was only 15 meters wide. Levels varied considerably during driving event. The levels shown are representative of the louder driving periods.
CISS Steel Pipe 48-inch yserville - RussianRiver, CA Land-based
Technical Guidance for the Assessment of the Hydroacoustic Effects of Pile Driving on Fish October 2020
I-10
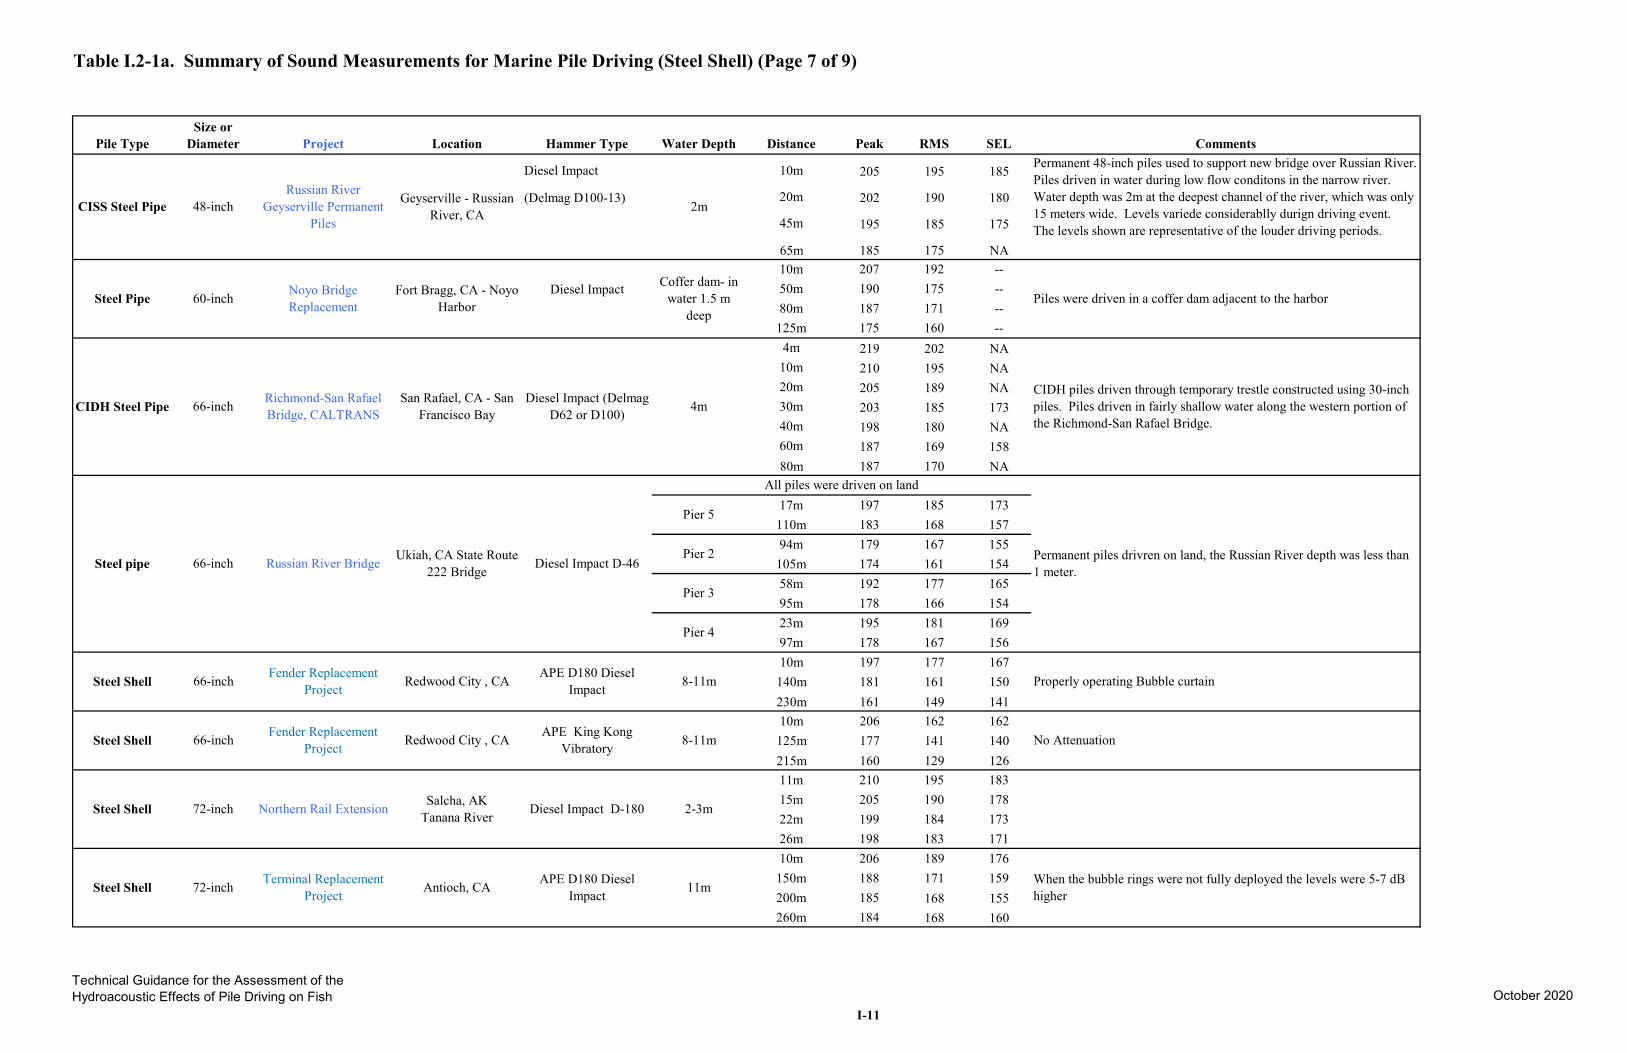
Table I.2-1a. Summary of Sound Measurements for Marine Pile Driving (Steel Shell) (Page 7 of 9)
Pile Type Size or
Diameter Project Location Hammer Type Water Depth Distance Peak RMS SEL Comments
CISS Steel Pipe 48-inch Russian River
Geyserville Permanent Piles
Geyserville - Russian River, CA
Diesel Impact
(Delmag D100-13) 2m
10m 205 195
20m 202 190
45m 195 185
65m 185 175
185
180
175
NA
Permanent 48-inch piles used to support new bridge over Russian River. Piles driven in water during low flow conditons in the narrow river. Water depth was 2m at the deepest channel of the river, which was only 15 meters wide. Levels variede considerablly durign driving event. The levels shown are representative of the louder driving periods.
Steel Pipe 60-inch Noyo Bridge Replacement
Fort Bragg, CA - Noyo Harbor
Diesel Impact Coffer dam- in water 1.5 m
deep
10m 207 192 50m 190 175 80m 187 171
125m 175 160
--------
Piles were driven in a coffer dam adjacent to the harbor
CIDH Steel Pipe 66-inch Richmond-San Rafael Bridge, CALTRANS
San Rafael, CA - San Francisco Bay
Diesel Impact (Delmag D62 or D100) 4m
4m 219 202 10m 210 195 20m 205 189 30m 203 185 40m 198 180 60m 187 169 80m 187 170
NA NA NA 173 NA 158 NA
CIDH piles driven through temporary trestle constructed using 30-inch piles. Piles driven in fairly shallow water along the western portion of the Richmond-San Rafael Bridge.
Steel pipe 66-inch Russian River Bridge Ukiah, CA State Route 222 Bridge Diesel Impact D-46
Pier 5
Pier 2
Pier 3
Pier 4
All piles were driven on land 17m 197 185
110m 183 168 94m 179 167
105m 174 161 58m 192 177 95m 178 166 23m 195 181 97m 178 167
173 157 155 154 165 154 169 156
Permanent piles drivren on land, the Russian River depth was less than 1 meter.
Steel Shell 66-inch Fender Replacement Project Redwood City , CA APE D180 Diesel
Impact 8-11m 10m 197 177
140m 181 161 230m 161 149
167 150 141
Properly operating Bubble curtain
Steel Shell 66-inch Fender Replacement Project Redwood City , CA APE King Kong
Vibratory 8-11m 10m 206 162
125m 177 141 215m 160 129
162 140 126
No Attenuation
Steel Shell 72-inch Northern Rail Extension Salcha, AK Tanana River Diesel Impact D-180 2-3m
11m 210 195 15m 205 190 22m 199 184 26m 198 183
183 178 173 171
Steel Shell 72-inch Terminal Replacement Project Antioch, CA APE D180 Diesel
Impact 11m
10m 206 189 150m 188 171 200m 185 168 260m 184 168
176 159 155 160
When the bubble rings were not fully deployed the levels were 5-7 dB higher
Technical Guidance for the Assessment of the Hydroacoustic Effects of Pile Driving on Fish October 2020
I-11
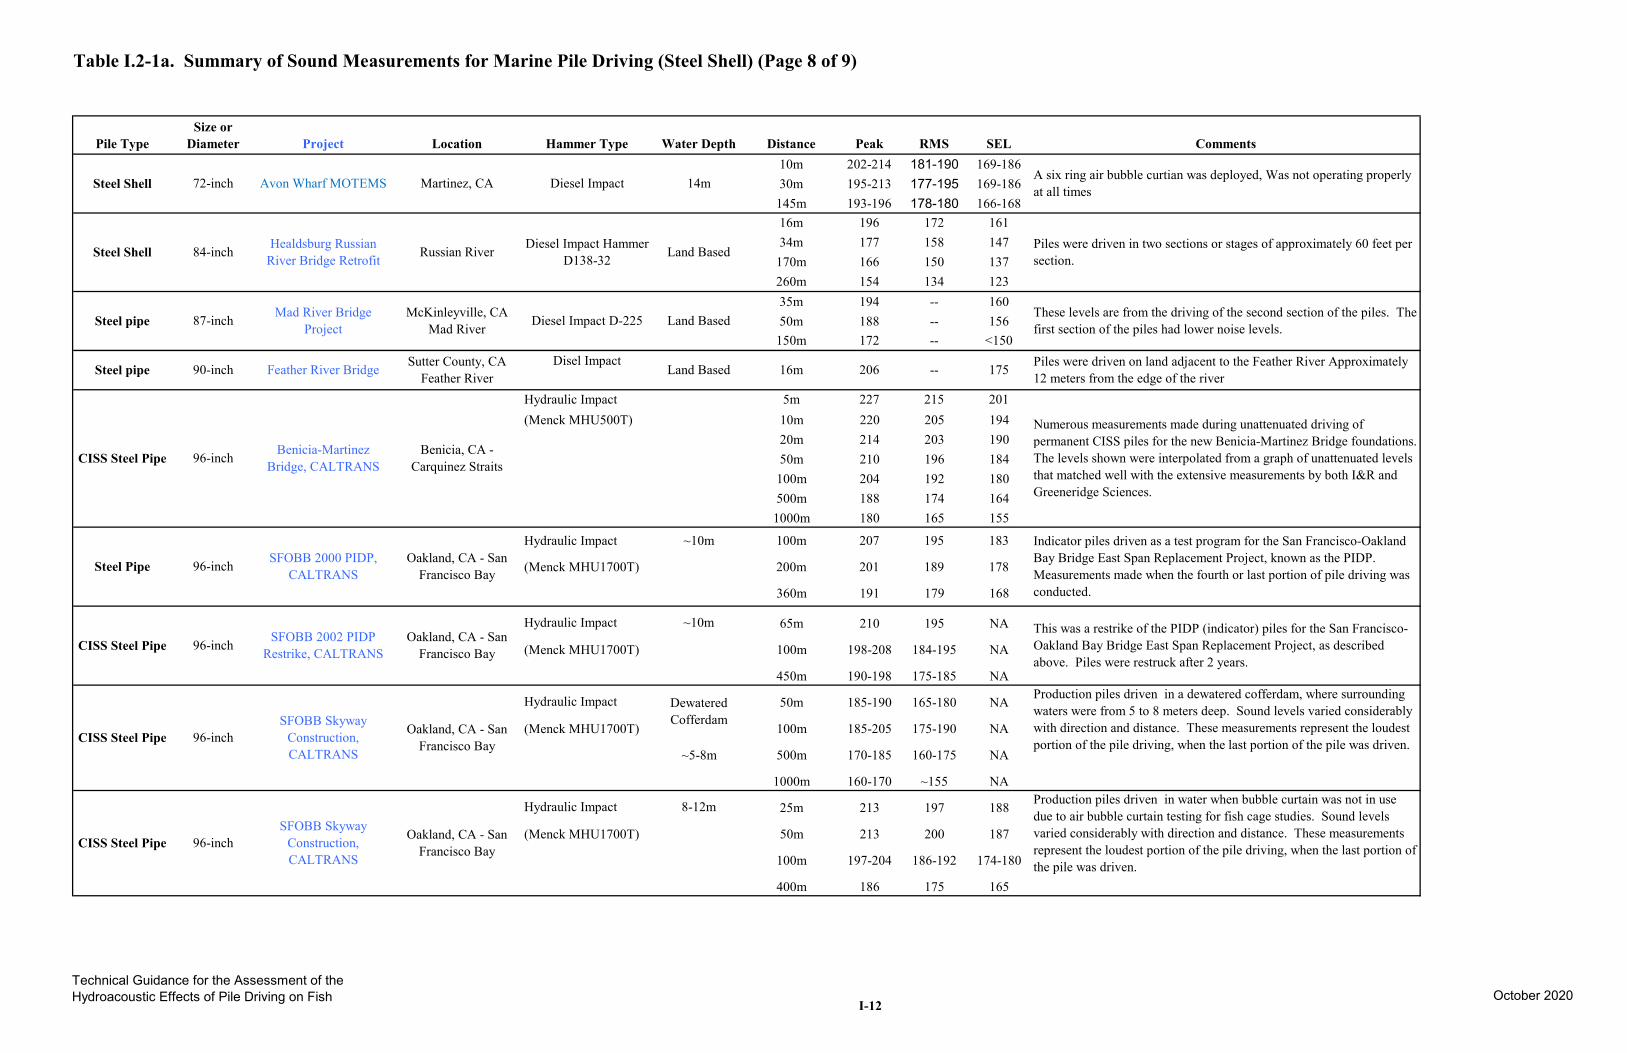
Table I.2-1a. Summary of Sound Measurements for Marine Pile Driving (Steel Shell) (Page 8 of 9)
Pile Type Size or
Diameter Project Location Hammer Type Water Depth Distance Peak RMS SEL Comments
Steel Shell 72-inch Avon Wharf MOTEMS Martinez, CA Diesel Impact 14m 10m 30m
145m
202-214 195-213 193-196
181-190 177-195 178-180
169-186 169-186 166-168
A six ring air bubble curtian was deployed, Was not operating properly at all times
Steel Shell 84-inch Healdsburg Russian River Bridge Retrofit Russian River Diesel Impact Hammer
D138-32 Land Based
16m 34m
170m 260m
196 177 166 154
172 158 150 134
161 147 137 123
Piles were driven in two sections or stages of approximately 60 feet per section.
Steel pipe 87-inch Mad River Bridge Project
McKinleyville, CA Mad River Diesel Impact D-225 Land Based
35m 50m
150m
194 188 172
------
160 156
<150
These levels are from the driving of the second section of the piles. The first section of the piles had lower noise levels.
Steel pipe 90-inch Feather River Bridge Sutter County, CA Feather River
Disel Impact Land Based 16m 206 -- 175 Piles were driven on land adjacent to the Feather River Approximately
12 meters from the edge of the river
CISS Steel Pipe 96-inch Benicia-Martinez Bridge, CALTRANS
Benicia, CA -Carquinez Straits
Hydraulic Impact (Menck MHU500T)
5m 10m 20m 50m
100m 500m
1000m
227 220 214 210 204 188 180
215 205 203 196 192 174 165
201 194 190 184 180 164 155
Numerous measurements made during unattenuated driving of permanent CISS piles for the new Benicia-Martinez Bridge foundations. The levels shown were interpolated from a graph of unattenuated levels that matched well with the extensive measurements by both I&R and Greeneridge Sciences.
Steel Pipe 96-inch SFOBB 2000 PIDP, CALTRANS
Oakland, CA - San Francisco Bay
Hydraulic Impact
(Menck MHU1700T)
~10m 100m
200m
360m
207
201
191
195
189
179
183
178
168
Indicator piles driven as a test program for the San Francisco-Oakland Bay Bridge East Span Replacement Project, known as the PIDP. Measurements made when the fourth or last portion of pile driving was conducted.
CISS Steel Pipe 96-inch SFOBB 2002 PIDP Restrike, CALTRANS
Oakland, CA - San Francisco Bay
Hydraulic Impact
(Menck MHU1700T)
~10m 65m
100m
450m
210
198-208
190-198
195
184-195
175-185
NA
NA
NA
This was a restrike of the PIDP (indicator) piles for the San Francisco-Oakland Bay Bridge East Span Replacement Project, as described above. Piles were restruck after 2 years.
CISS Steel Pipe 96-inch SFOBB Skyway
Construction, CALTRANS
Oakland, CA - San Francisco Bay
Hydraulic Impact
(Menck MHU1700T)
Dewatered Cofferdam
~5-8m
50m
100m
500m
1000m
185-190
185-205
170-185
160-170
165-180
175-190
160-175
~155
NA
NA
NA
NA
Production piles driven in a dewatered cofferdam, where surrounding waters were from 5 to 8 meters deep. Sound levels varied considerably with direction and distance. These measurements represent the loudest portion of the pile driving, when the last portion of the pile was driven.
CISS Steel Pipe 96-inch SFOBB Skyway
Construction, CALTRANS
Oakland, CA - San Francisco Bay
Hydraulic Impact
(Menck MHU1700T)
8-12m 25m
50m
100m
400m
213
213
197-204
186
197
200
186-192
175
188
187
174-180
165
Production piles driven in water when bubble curtain was not in use due to air bubble curtain testing for fish cage studies. Sound levels varied considerably with direction and distance. These measurements represent the loudest portion of the pile driving, when the last portion of the pile was driven.
Technical Guidance for the Assessment of the Hydroacoustic Effects of Pile Driving on Fish October 2020
I-12
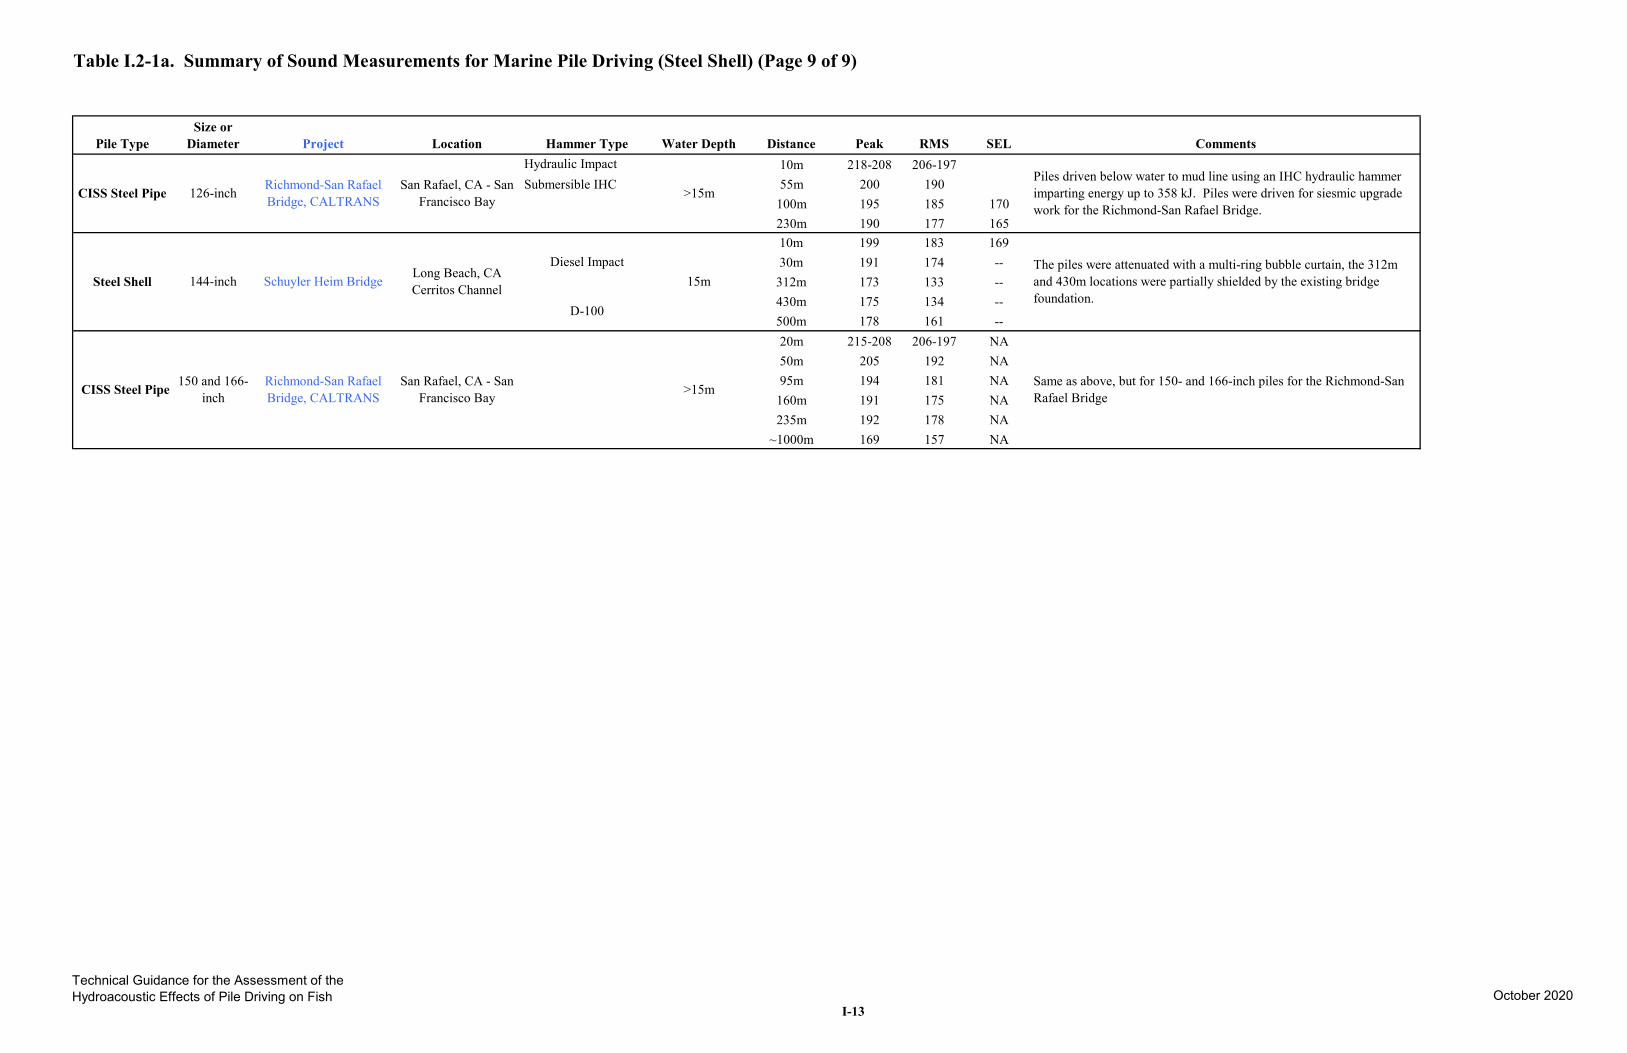
Table I.2-1a. Summary of Sound Measurements for Marine Pile Driving (Steel Shell) (Page 9 of 9)
Pile Type Size or
Diameter Project Location Hammer Type Water Depth Distance Peak RMS SEL Comments
CISS Steel Pipe 126-inch Richmond-San Rafael Bridge, CALTRANS
San Rafael, CA - San Francisco Bay
Hydraulic Impact Submersible IHC
>15m
10m 55m
100m 230m
218-208 200 195 190
206-197 190 185 177
170 165
Piles driven below water to mud line using an IHC hydraulic hammer imparting energy up to 358 kJ. Piles were driven for siesmic upgrade work for the Richmond-San Rafael Bridge.
10m 30m
312m 430m 500m
199 191 173 175 178
183 174 133 134 161
169 --------
Steel Shell 144-inch Schuyler Heim Bridge Long Beach, CA Cerritos Channel
Diesel Impact
D-100
15m The piles were attenuated with a multi-ring bubble curtain, the 312m and 430m locations were partially shielded by the existing bridge foundation.
CISS Steel Pipe 150 and 166-inch
Richmond-San Rafael Bridge, CALTRANS
San Rafael, CA - San Francisco Bay >15m
20m 50m 95m
160m 235m
~1000m
215-208 205 194 191 192 169
206-197 192 181 175 178 157
NA NA NA NA NA NA
Same as above, but for 150- and 166-inch piles for the Richmond-San Rafael Bridge
Technical Guidance for the Assessment of the Hydroacoustic Effects of Pile Driving on Fish October 2020
I-13
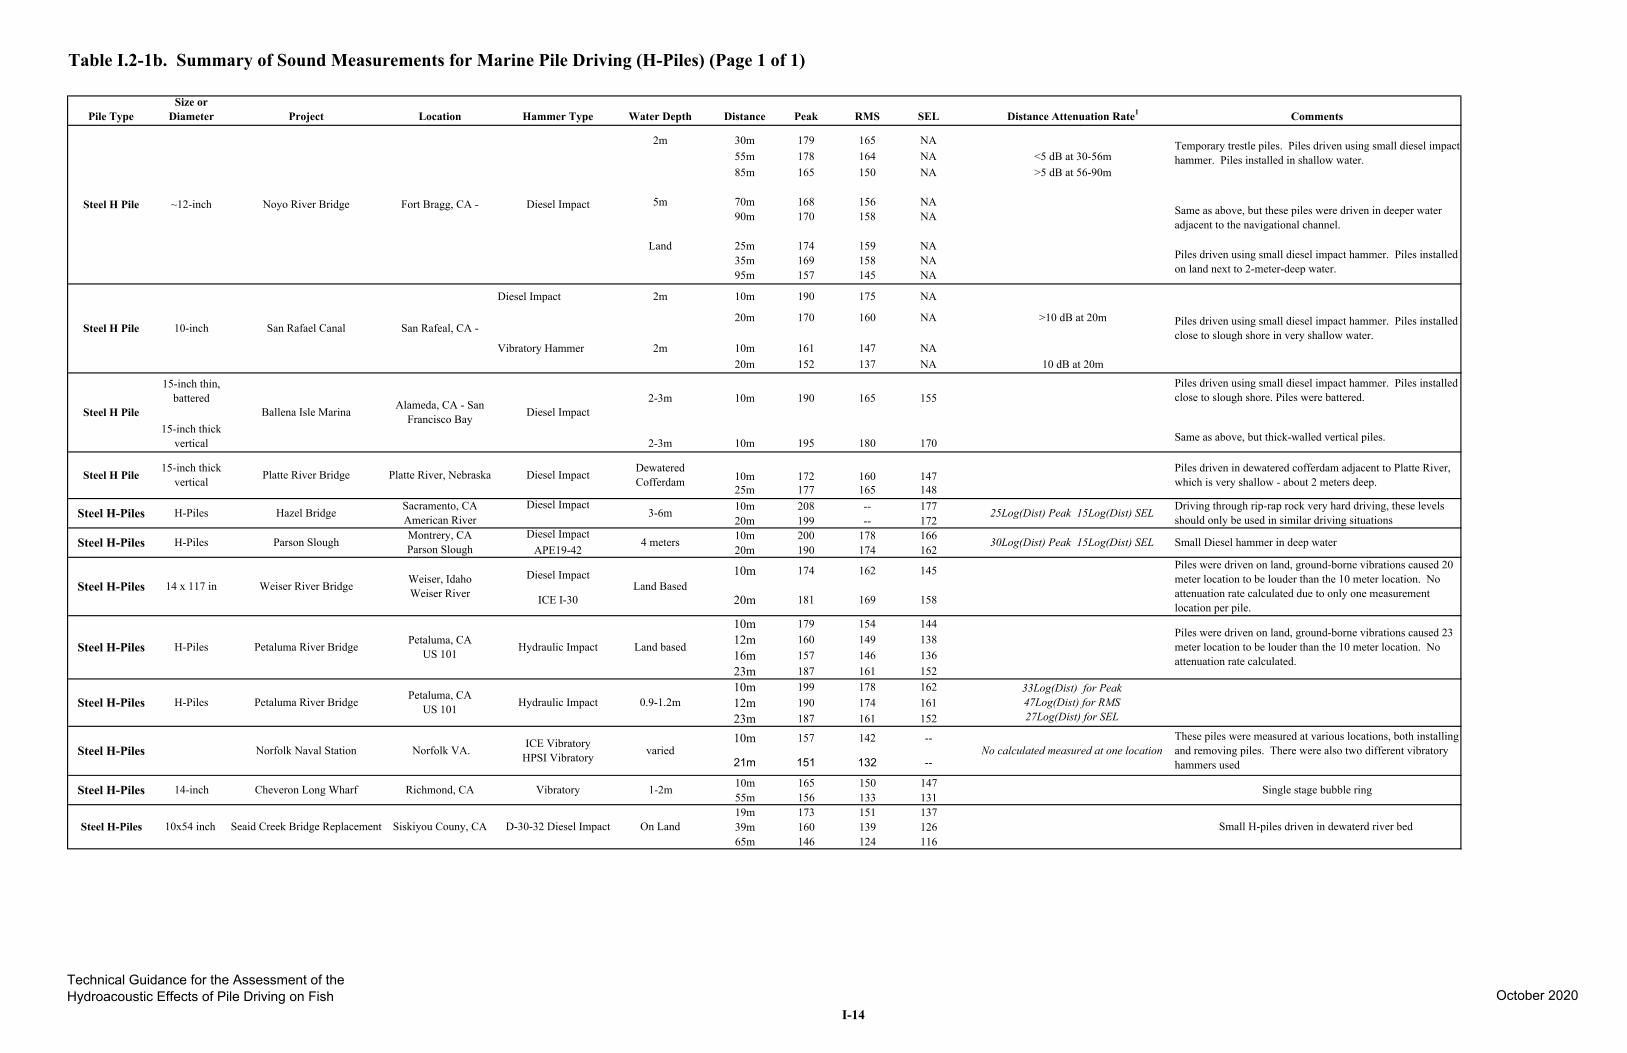
Table I.2-1b. Summary of Sound Measurements for Marine Pile Driving (H-Piles) (Page 1 of 1)
Pile Type Size or
Diameter Project Location Hammer Type Water Depth Distance Peak RMS SEL Distance Attenuation Rate1 Comments
Steel H Pile ~12-inch Noyo River Bridge Fort Bragg, CA - Diesel Impact
2m
5m
Land
30m 55m 85m
70m 90m
25m 35m 95m
179 178 165
168 170
174 169 157
165 164 150
156 158
159 158 145
NA NA NA
NA NA
NA NA NA
<5 dB at 30-56m >5 dB at 56-90m
Temporary trestle piles. Piles driven using small diesel impact hammer. Piles installed in shallow water.
Same as above, but these piles were driven in deeper water adjacent to the navigational channel.
Piles driven using small diesel impact hammer. Piles installed on land next to 2-meter-deep water.
Steel H Pile 10-inch San Rafael Canal San Rafeal, CA -
Diesel Impact
Vibratory Hammer
2m
2m
10m
20m
10m 20m
190
170
161 152
175
160
147 137
NA
NA
NA NA
>10 dB at 20m
10 dB at 20m
Piles driven using small diesel impact hammer. Piles installed close to slough shore in very shallow water.
Steel H Pile
15-inch thin, battered
15-inch thick vertical
Ballena Isle Marina Alameda, CA - San Francisco Bay Diesel Impact
2-3m
2-3m
10m
10m
190
195
165
180
155
170
Piles driven using small diesel impact hammer. Piles installed close to slough shore. Piles were battered.
Same as above, but thick-walled vertical piles.
Steel H Pile 15-inch thick vertical Platte River Bridge Platte River, Nebraska Diesel Impact Dewatered
Cofferdam 10m 25m
172 177
160 165
147 148
Piles driven in dewatered cofferdam adjacent to Platte River, which is very shallow - about 2 meters deep.
Steel H-Piles H-Piles Hazel Bridge Sacramento, CA American River
Diesel Impact 3-6m 10m
20m 208 199
----
177 172
25Log(Dist) Peak 15Log(Dist) SEL Driving through rip-rap rock very hard driving, these levels should only be used in similar driving situations
Steel H-Piles H-Piles Parson Slough Montrery, CA Parson Slough
Diesel Impact APE19-42
4 meters 10m 20m
200 190
178 174
166 162
30Log(Dist) Peak 15Log(Dist) SEL Small Diesel hammer in deep water
Steel H-Piles 14 x 117 in Weiser River Bridge Weiser, Idaho Weiser River
Diesel Impact
ICE I-30 Land Based
10m
20m
174
181
162
169
145
158
Piles were driven on land, ground-borne vibrations caused 20 meter location to be louder than the 10 meter location. No attenuation rate calculated due to only one measurement location per pile.
Steel H-Piles H-Piles Petaluma River Bridge Petaluma, CA US 101 Hydraulic Impact Land based
10m 12m 16m 23m
179 160 157 187
154 149 146 161
144 138 136 152
Piles were driven on land, ground-borne vibrations caused 23 meter location to be louder than the 10 meter location. No attenuation rate calculated.
Steel H-Piles H-Piles Petaluma River Bridge Petaluma, CA US 101 Hydraulic Impact 0.9-1.2m
10m 12m 23m
199 190 187
178 174 161
162 161 152
33Log(Dist) for Peak 47Log(Dist) for RMS 27Log(Dist) for SEL
Steel H-Piles Norfolk Naval Station Norfolk VA. ICE Vibratory HPSI Vibratory varied
10m
21m
157
151
142
132
--
--No calculated measured at one location
These piles were measured at various locations, both installing and removing piles. There were also two different vibratory hammers used
Steel H-Piles 14-inch Cheveron Long Wharf Richmond, CA Vibratory 1-2m 10m 55m
165 156
150 133
147 131
Single stage bubble ring
Steel H-Piles 10x54 inch Seaid Creek Bridge Replacement Siskiyou Couny, CA D-30-32 Diesel Impact On Land 19m 39m 65m
173 160 146
151 139 124
137 126 116
Small H-piles driven in dewaterd river bed
Technical Guidance for the Assessment of the Hydroacoustic Effects of Pile Driving on Fish October 2020
I-14
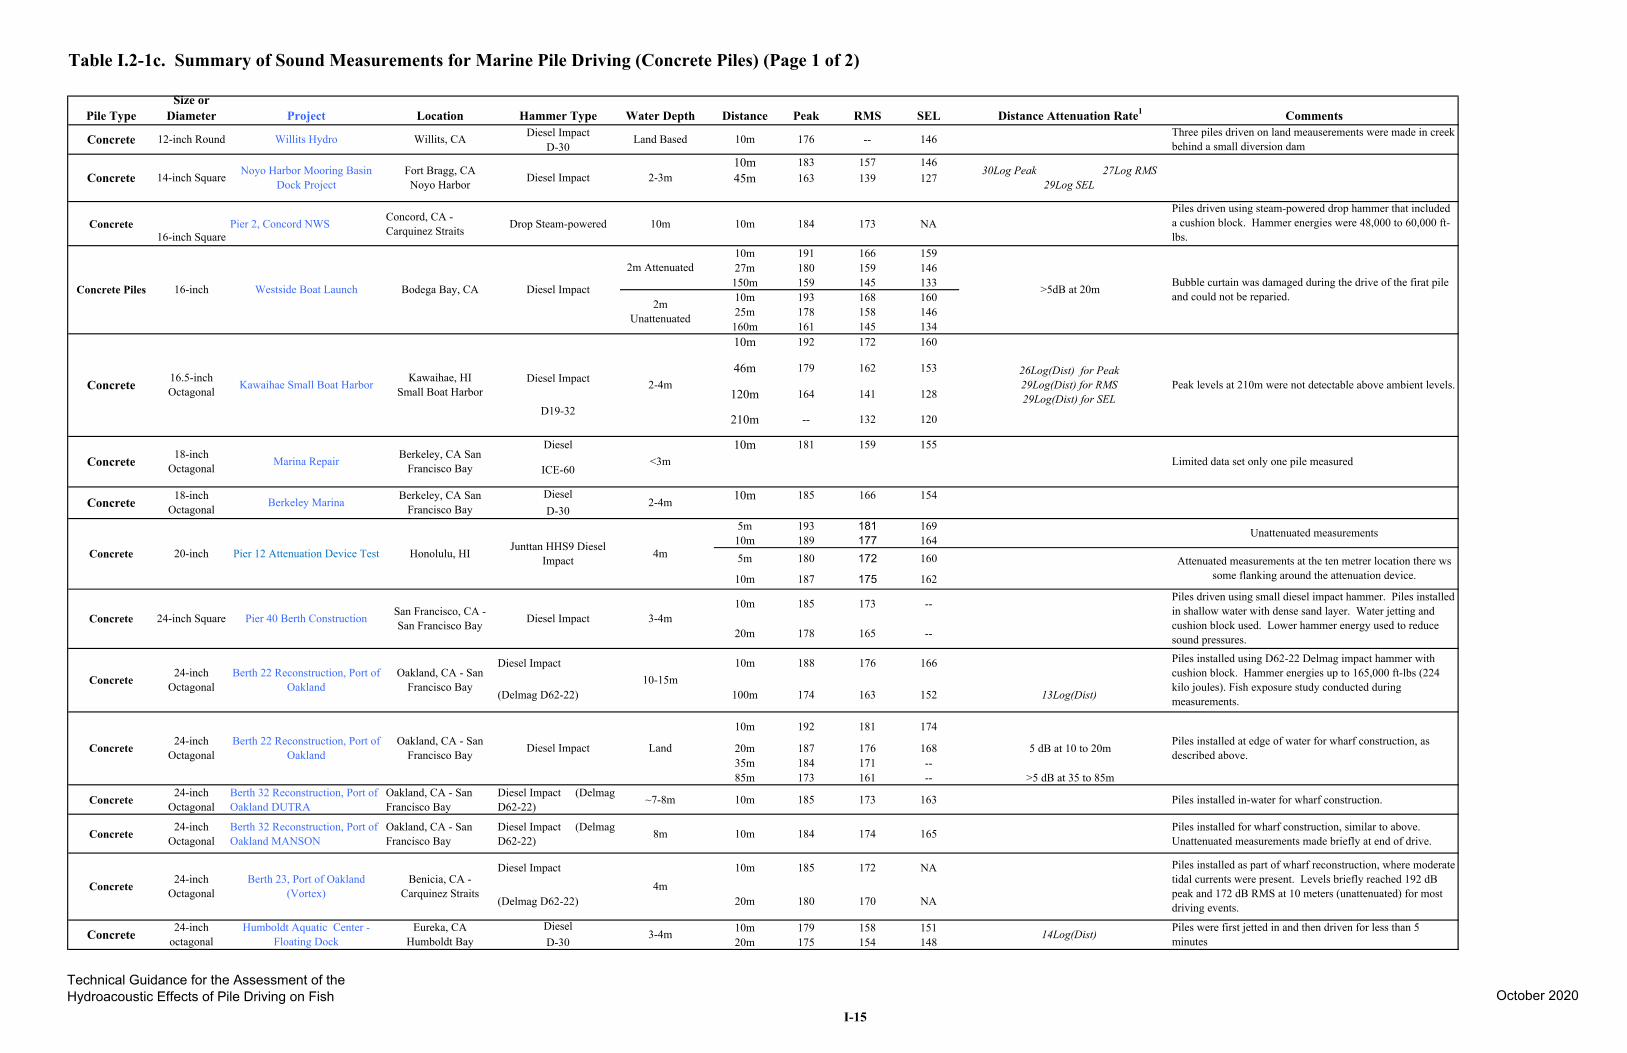
Table I.2-1c. Summary of Sound Measurements for Marine Pile Driving (Concrete Piles) (Page 1 of 2)
Pile Type Size or
Diameter Project Location Hammer Type Water Depth Distance Peak RMS SEL Distance Attenuation Rate1 Comments
Concrete
Concrete
12-inch Round
14-inch Square
Willits Hydro
Noyo Harbor Mooring Basin Dock Project
Willits, CA
Fort Bragg, CA Noyo Harbor
Diesel Impact D-30
Diesel Impact
Land Based
2-3m
10m
10m 45m
176
183 163
--
157 139
146
146 127
30Log Peak 27Log RMS 29Log SEL
Three piles driven on land meauserements were made in creek behind a small diversion dam
Concrete
Concrete Piles
Pier 2, Concord NWS 16-inch Square
16-inch Westside Boat Launch
Concord, CA - Carquinez Straits
Bodega Bay, CA
Drop Steam-powered
Diesel Impact
10m
2m Attenuated
2m Unattenuated
10m
10m 27m 150m 10m 25m 160m 10m
184
191 180 159 193 178 161 192
173
166 159 145 168 158 145 172
NA
159 146 133 160 146 134 160
>5dB at 20m
Piles driven using steam-powered drop hammer that included a cushion block. Hammer energies were 48,000 to 60,000 ft-lbs.
Bubble curtain was damaged during the drive of the firat pile and could not be reparied.
Concrete 16.5-inch Octagonal Kawaihae Small Boat Harbor Kawaihae, HI
Small Boat Harbor Diesel Impact
D19-32
2-4m 46m
120m
210m
179
164
--
162
141
132
153
128
120
26Log(Dist) for Peak 29Log(Dist) for RMS 29Log(Dist) for SEL
Peak levels at 210m were not detectable above ambient levels.
Concrete 18-inch Octagonal Marina Repair Berkeley, CA San
Francisco Bay
Diesel
ICE-60 <3m
10m 181 159 155 Limited data set only one pile measured
Concrete
Concrete
Concrete
18-inch Octagonal
20-inch
24-inch Square
Berkeley Marina
Pier 12 Attenuation Device Test
Pier 40 Berth Construction
Berkeley, CA San Francisco Bay
Honolulu, HI
San Francisco, CA - San Francisco Bay
Diesel D-30
Junttan HHS9 Diesel Impact
Diesel Impact
2-4m
4m
3-4m
10m
5m 10m 5m
10m
10m
20m
185
193 189 180
187
185
178
166
181 177 172
175
173
165
154
169 164 160
162
--
--
Unattenuated measurements
Attenuated measurements at the ten metrer location there ws some flanking around the attenuation device.
Piles driven using small diesel impact hammer. Piles installed in shallow water with dense sand layer. Water jetting and cushion block used. Lower hammer energy used to reduce sound pressures.
Concrete 24-inch Octagonal
Berth 22 Reconstruction, Port of Oakland
Oakland, CA - San Francisco Bay
Diesel Impact
(Delmag D62-22) 10-15m
10m
100m
188
174
176
163
166
152 13Log(Dist)
Piles installed using D62-22 Delmag impact hammer with cushion block. Hammer energies up to 165,000 ft-lbs (224 kilo joules). Fish exposure study conducted during measurements.
Concrete
Concrete
24-inch Octagonal
24-inch Octagonal
Berth 22 Reconstruction, Port of Oakland
Berth 32 Reconstruction, Port of Oakland DUTRA
Oakland, CA - San Francisco Bay
Oakland, CA - San Francisco Bay
Diesel Impact
Diesel Impact (Delmag D62-22)
Land
~7-8m
10m
20m 35m 85m
10m
192
187 184 173
185
181
176 171 161
173
174
168 ----
163
5 dB at 10 to 20m
>5 dB at 35 to 85m
Piles installed at edge of water for wharf construction, as described above.
Piles installed in-water for wharf construction.
Concrete 24-inch Octagonal
Berth 32 Reconstruction, Port of Oakland MANSON
Oakland, CA - San Francisco Bay
Diesel Impact D62-22)
(Delmag 8m 10m 184 174 165 Piles installed for wharf construction, similar to above. Unattenuated measurements made briefly at end of drive.
Concrete 24-inch Octagonal
Berth 23, Port of Oakland (Vortex)
Benicia, CA - Carquinez Straits
Diesel Impact
(Delmag D62-22) 4m
10m
20m
185
180
172
170
NA
NA
Piles installed as part of wharf reconstruction, where moderate tidal currents were present. Levels briefly reached 192 dB peak and 172 dB RMS at 10 meters (unattenuated) for most driving events.
Concrete 24-inch octagonal
Humboldt Aquatic Center - Floating Dock
Eureka, CA Humboldt Bay
Diesel D-30
3-4m 10m 20m
179 175
158 154
151 148
14Log(Dist) Piles were first jetted in and then driven for less than 5 minutes
Technical Guidance for the Assessment of the Hydroacoustic Effects of Pile Driving on Fish October 2020
I-15
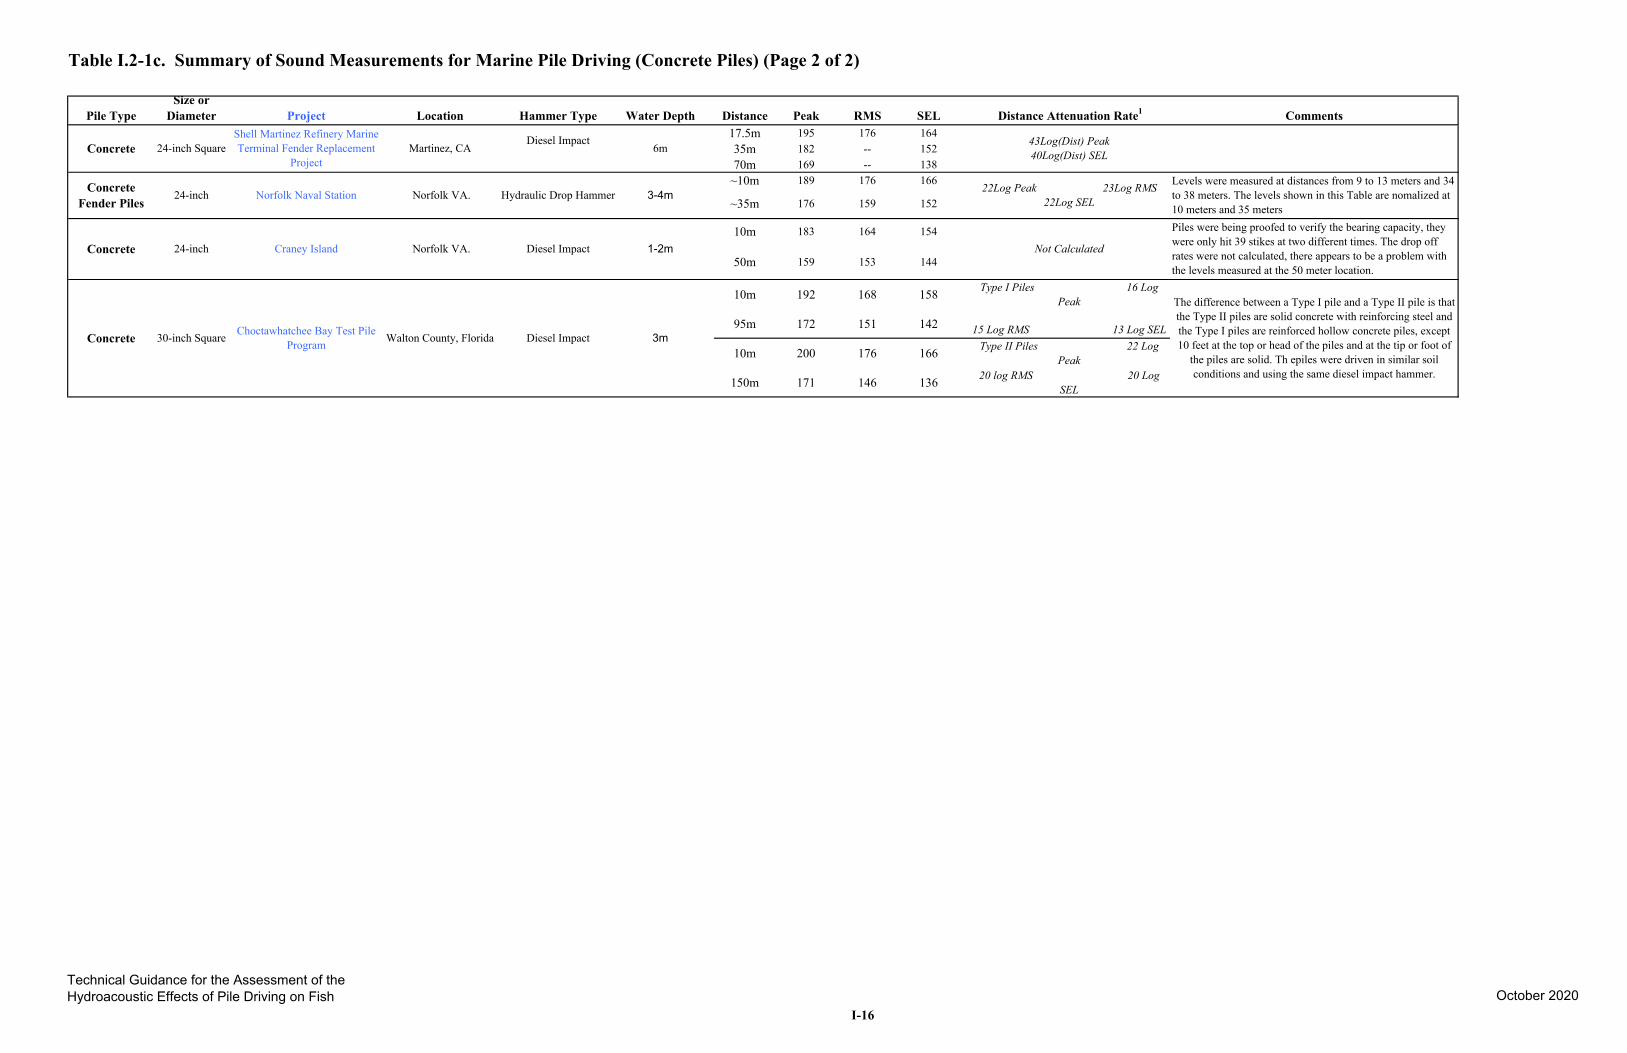
Table I.2-1c. Summary of Sound Measurements for Marine Pile Driving (Concrete Piles) (Page 2 of 2)
Concrete
Pile Type Size or
Diameter Project Location Hammer Type Water Depth Distance Peak RMS SEL Distance Attenuation Rate1 Comments
24-inch Square Shell Martinez Refinery Marine Terminal Fender Replacement
Project Martinez, CA
Diesel Impact 6m
17.5m 35m 70m
195 182 169
176 ----
164 152 138
43Log(Dist) Peak 40Log(Dist) SEL
Concrete Fender Piles
24-inch Norfolk Naval Station Norfolk VA. Hydraulic Drop Hammer 3-4m ~10m
~35m
189
176
176
159
166
152
Levels were measured at distances from 9 to 13 meters and 34 to 38 meters. The levels shown in this Table are nomalized at 10 meters and 35 meters
22Log Peak 23Log RMS 22Log SEL
Concrete 24-inch Craney Island Norfolk VA. Diesel Impact 1-2m 10m
50m
183
159
164
153
154
144
Piles were being proofed to verify the bearing capacity, they were only hit 39 stikes at two different times. The drop off rates were not calculated, there appears to be a problem with the levels measured at the 50 meter location.
Not Calculated
10m
95m
10m
150m
192
172
200
171
168
151
176
146
158
142
166
136
Type I Piles 16 Log Peak
15 Log RMS 13 Log SELType II Piles 22 Log
Peak 20 log RMS 20 Log
SEL
The difference between a Type I pile and a Type II pile is that the Type II piles are solid concrete with reinforcing steel and
the Type I piles are reinforced hollow concrete piles, except 10 feet at the top or head of the piles and at the tip or foot of
the piles are solid. Th epiles were driven in similar soil conditions and using the same diesel impact hammer.
Concrete 30-inch Square Choctawhatchee Bay Test Pile Program Walton County, Florida Diesel Impact 3m
Technical Guidance for the Assessment of the Hydroacoustic Effects of Pile Driving on Fish October 2020
I-16
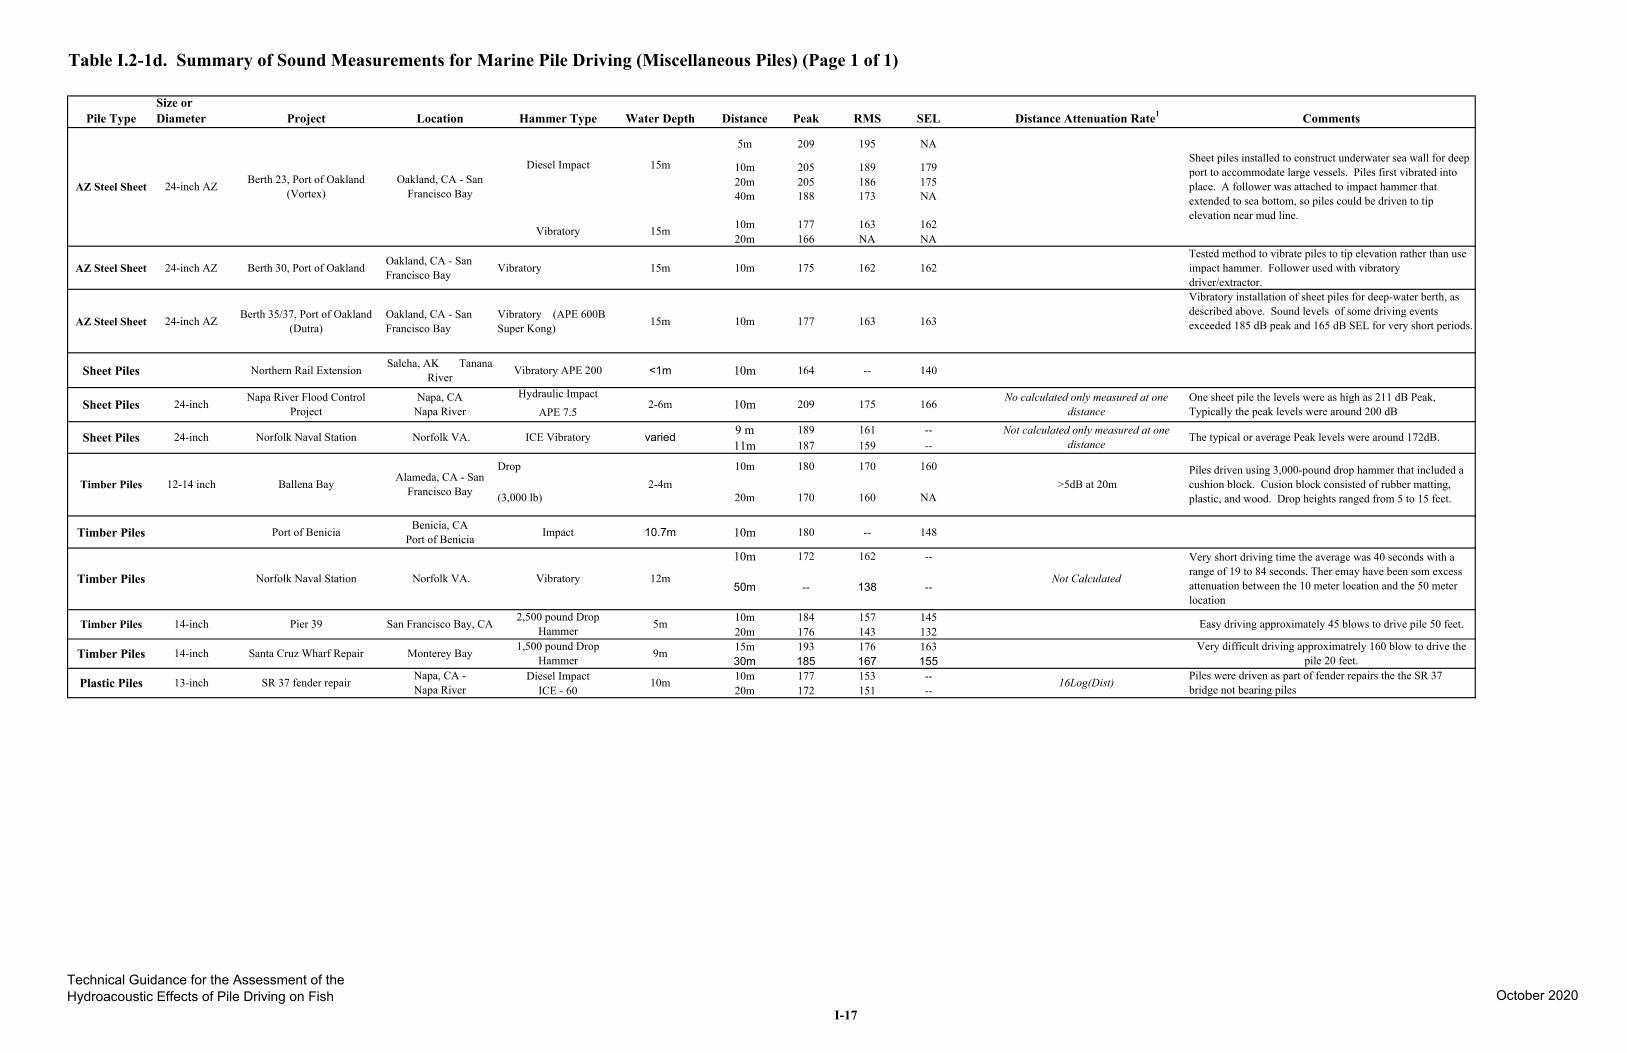
Table I.2-1d. Summary of Sound Measurements for Marine Pile Driving (Miscellaneous Piles) (Page 1 of 1)
Pile Type Size or Diameter Project Location Hammer Type Water Depth Distance Peak RMS SEL Distance Attenuation Rate1 Comments
5m 209 195 NA
AZ Steel Sheet 24-inch AZ Berth 23, Port of Oakland (Vortex)
Oakland, CA - San Francisco Bay
Diesel Impact 15m 10m 20m 40m
205 205 188
189 186 173
179 175 NA
Sheet piles installed to construct underwater sea wall for deep port to accommodate large vessels. Piles first vibrated into place. A follower was attached to impact hammer that extended to sea bottom, so piles could be driven to tip
Vibratory 15m 10m 20m
177 166
163 NA
162 NA
elevation near mud line.
AZ Steel Sheet 24-inch AZ Berth 30, Port of Oakland Oakland, CA - San Francisco Bay Vibratory 15m 10m 175 162 162
Tested method to vibrate piles to tip elevation rather than use impact hammer. Follower used with vibratory driver/extractor.
AZ Steel Sheet 24-inch AZ Berth 35/37, Port of Oakland (Dutra)
Oakland, CA - San Francisco Bay
Vibratory (APE 600B Super Kong) 15m 10m 177 163 163
Vibratory installation of sheet piles for deep-water berth, as described above. Sound levels of some driving events exceeded 185 dB peak and 165 dB SEL for very short periods.
Sheet Piles Northern Rail Extension Salcha, AK Tanana River Vibratory APE 200 <1m 10m 164 -- 140
Sheet Piles 24-inch Napa River Flood Control Project
Napa, CA Napa River
Hydraulic Impact APE 7.5
2-6m 10m 209 175 166 No calculated only measured at one distance
One sheet pile the levels were as high as 211 dB Peak, Typically the peak levels were around 200 dB
Sheet Piles 24-inch Norfolk Naval Station Norfolk VA. ICE Vibratory varied 9 m 11m
189 187
161 159
----
Not calculated only measured at one distance The typical or average Peak levels were around 172dB.
Timber Piles 12-14 inch Ballena Bay Alameda, CA - San Francisco Bay
Drop
(3,000 lb) 2-4m
10m
20m
180
170
170
160
160
NA >5dB at 20m
Piles driven using 3,000-pound drop hammer that included a cushion block. Cusion block consisted of rubber matting, plastic, and wood. Drop heights ranged from 5 to 15 feet.
Timber Piles Port of Benicia Benicia, CA Port of Benicia Impact 10.7m 10m 180 -- 148
10m 172 162 -- Very short driving time the average was 40 seconds with a
Timber Piles Norfolk Naval Station Norfolk VA. Vibratory 12m 50m -- 138 --
Not Calculated range of 19 to 84 seconds. Ther emay have been som excess attenuation between the 10 meter location and the 50 meter location
Timber Piles 14-inch Pier 39 San Francisco Bay, CA 2,500 pound Drop Hammer 5m 10m
20m 184 176
157 143
145 132
Easy driving approximately 45 blows to drive pile 50 feet.
Timber Piles 14-inch Santa Cruz Wharf Repair Monterey Bay 1,500 pound Drop Hammer 9m 15m
30m 193 185
176 167
163 155
Very difficult driving approximatrely 160 blow to drive the pile 20 feet.
Plastic Piles 13-inch SR 37 fender repair Napa, CA - Napa River
Diesel Impact ICE - 60
10m 10m 20m
177 172
153 151
----
16Log(Dist) Piles were driven as part of fender repairs the the SR 37 bridge not bearing piles
Technical Guidance for the Assessment of the Hydroacoustic Effects of Pile Driving on Fish October 2020
I-17

This page intentionally left blank.
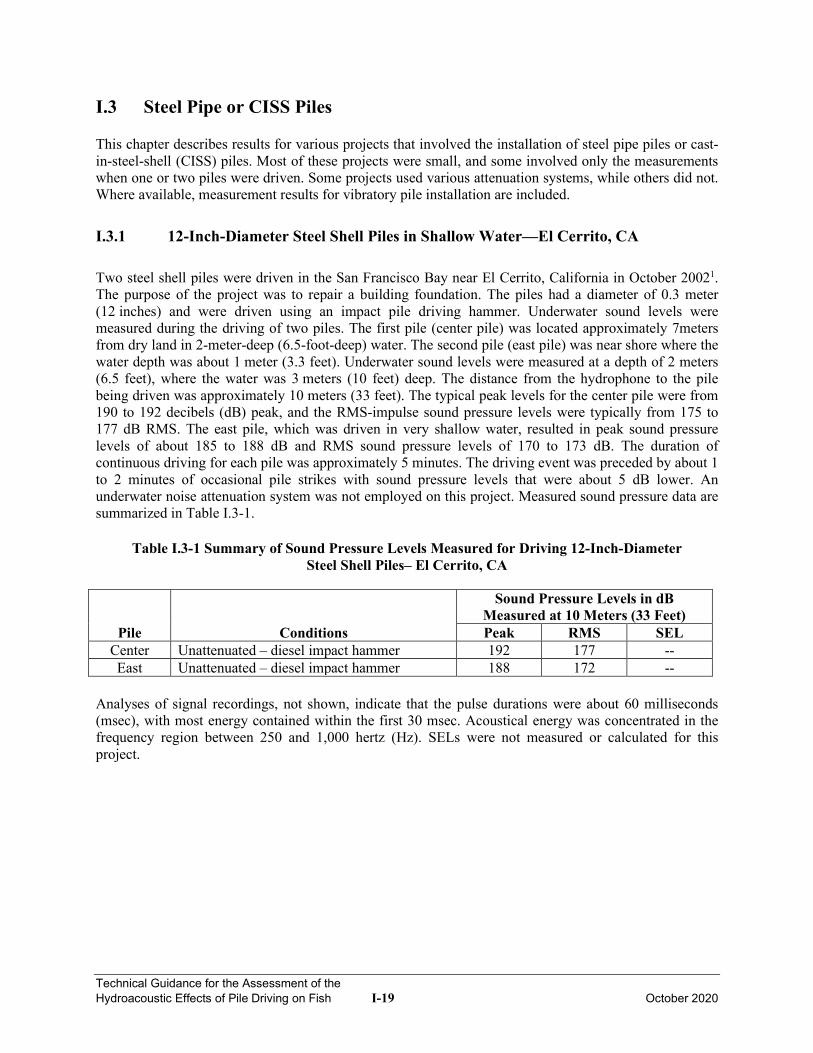
Technical Guidance for the Assessment of the Hydroacoustic Effects of Pile Driving on Fish I-19 October 2020
I.3 Steel Pipe or CISS Piles This chapter describes results for various projects that involved the installation of steel pipe piles or cast-in-steel-shell (CISS) piles. Most of these projects were small, and some involved only the measurements when one or two piles were driven. Some projects used various attenuation systems, while others did not. Where available, measurement results for vibratory pile installation are included.
I.3.1 12-Inch-Diameter Steel Shell Piles in Shallow Water—El Cerrito, CA
Two steel shell piles were driven in the San Francisco Bay near El Cerrito, California in October 20021. The purpose of the project was to repair a building foundation. The piles had a diameter of 0.3 meter (12 inches) and were driven using an impact pile driving hammer. Underwater sound levels were measured during the driving of two piles. The first pile (center pile) was located approximately 7meters from dry land in 2-meter-deep (6.5-foot-deep) water. The second pile (east pile) was near shore where the water depth was about 1 meter (3.3 feet). Underwater sound levels were measured at a depth of 2 meters (6.5 feet), where the water was 3 meters (10 feet) deep. The distance from the hydrophone to the pile being driven was approximately 10 meters (33 feet). The typical peak levels for the center pile were from 190 to 192 decibels (dB) peak, and the RMS-impulse sound pressure levels were typically from 175 to 177 dB RMS. The east pile, which was driven in very shallow water, resulted in peak sound pressure levels of about 185 to 188 dB and RMS sound pressure levels of 170 to 173 dB. The duration of continuous driving for each pile was approximately 5 minutes. The driving event was preceded by about 1 to 2 minutes of occasional pile strikes with sound pressure levels that were about 5 dB lower. An underwater noise attenuation system was not employed on this project. Measured sound pressure data are summarized in Table I.3-1.
Table I.3-1 Summary of Sound Pressure Levels Measured for Driving 12-Inch-Diameter Steel Shell Piles– El Cerrito, CA
Pile Conditions
Sound Pressure Levels in dB Measured at 10 Meters (33 Feet) Peak RMS SEL
Center Unattenuated – diesel impact hammer 192 177 -- East Unattenuated – diesel impact hammer 188 172 --
Analyses of signal recordings, not shown, indicate that the pulse durations were about 60 milliseconds (msec), with most energy contained within the first 30 msec. Acoustical energy was concentrated in the frequency region between 250 and 1,000 hertz (Hz). SELs were not measured or calculated for this project.
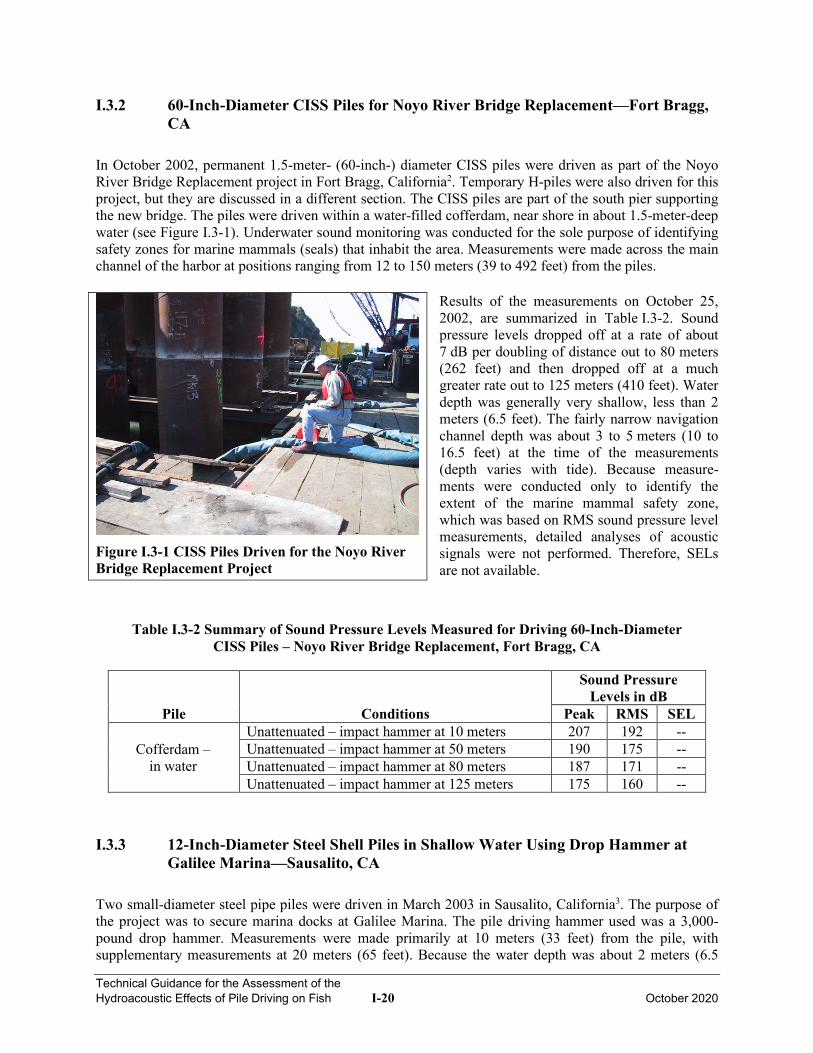
Technical Guidance for the Assessment of the Hydroacoustic Effects of Pile Driving on Fish I-20 October 2020
I.3.2 60-Inch-Diameter CISS Piles for Noyo River Bridge Replacement—Fort Bragg, CA
In October 2002, permanent 1.5-meter- (60-inch-) diameter CISS piles were driven as part of the Noyo River Bridge Replacement project in Fort Bragg, California2. Temporary H-piles were also driven for this project, but they are discussed in a different section. The CISS piles are part of the south pier supporting the new bridge. The piles were driven within a water-filled cofferdam, near shore in about 1.5-meter-deep water (see Figure I.3-1). Underwater sound monitoring was conducted for the sole purpose of identifying safety zones for marine mammals (seals) that inhabit the area. Measurements were made across the main channel of the harbor at positions ranging from 12 to 150 meters (39 to 492 feet) from the piles.
Results of the measurements on October 25, 2002, are summarized in Table I.3-2. Sound pressure levels dropped off at a rate of about 7 dB per doubling of distance out to 80 meters (262 feet) and then dropped off at a much greater rate out to 125 meters (410 feet). Water depth was generally very shallow, less than 2 meters (6.5 feet). The fairly narrow navigation channel depth was about 3 to 5 meters (10 to 16.5 feet) at the time of the measurements (depth varies with tide). Because measure-ments were conducted only to identify the extent of the marine mammal safety zone, which was based on RMS sound pressure level measurements, detailed analyses of acoustic signals were not performed. Therefore, SELs are not available.
Table I.3-2 Summary of Sound Pressure Levels Measured for Driving 60-Inch-Diameter CISS Piles – Noyo River Bridge Replacement, Fort Bragg, CA
Pile Conditions
Sound Pressure Levels in dB
Peak RMS SEL
Cofferdam – in water
Unattenuated – impact hammer at 10 meters 207 192 -- Unattenuated – impact hammer at 50 meters 190 175 -- Unattenuated – impact hammer at 80 meters 187 171 -- Unattenuated – impact hammer at 125 meters 175 160 --
I.3.3 12-Inch-Diameter Steel Shell Piles in Shallow Water Using Drop Hammer at Galilee Marina—Sausalito, CA
Two small-diameter steel pipe piles were driven in March 2003 in Sausalito, California3. The purpose of the project was to secure marina docks at Galilee Marina. The pile driving hammer used was a 3,000-pound drop hammer. Measurements were made primarily at 10 meters (33 feet) from the pile, with supplementary measurements at 20 meters (65 feet). Because the water depth was about 2 meters (6.5
Figure I.3-1 CISS Piles Driven for the Noyo River Bridge Replacement Project
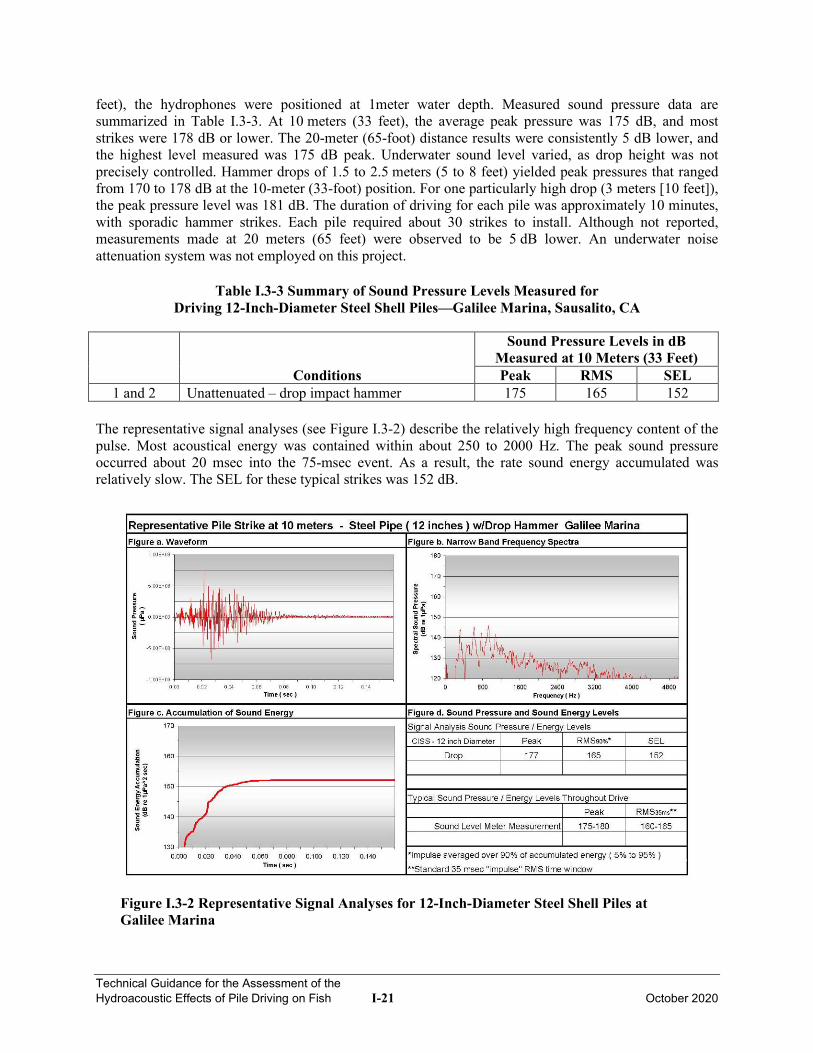
Technical Guidance for the Assessment of the Hydroacoustic Effects of Pile Driving on Fish I-21 October 2020
feet), the hydrophones were positioned at 1meter water depth. Measured sound pressure data are summarized in Table I.3-3. At 10 meters (33 feet), the average peak pressure was 175 dB, and most strikes were 178 dB or lower. The 20-meter (65-foot) distance results were consistently 5 dB lower, and the highest level measured was 175 dB peak. Underwater sound level varied, as drop height was not precisely controlled. Hammer drops of 1.5 to 2.5 meters (5 to 8 feet) yielded peak pressures that ranged from 170 to 178 dB at the 10-meter (33-foot) position. For one particularly high drop (3 meters [10 feet]), the peak pressure level was 181 dB. The duration of driving for each pile was approximately 10 minutes, with sporadic hammer strikes. Each pile required about 30 strikes to install. Although not reported, measurements made at 20 meters (65 feet) were observed to be 5 dB lower. An underwater noise attenuation system was not employed on this project.
Table I.3-3 Summary of Sound Pressure Levels Measured for Driving 12-Inch-Diameter Steel Shell Piles—Galilee Marina, Sausalito, CA
Conditions
Sound Pressure Levels in dB Measured at 10 Meters (33 Feet) Peak RMS SEL
1 and 2 Unattenuated – drop impact hammer 175 165 152 The representative signal analyses (see Figure I.3-2) describe the relatively high frequency content of the pulse. Most acoustical energy was contained within about 250 to 2000 Hz. The peak sound pressure occurred about 20 msec into the 75-msec event. As a result, the rate sound energy accumulated was relatively slow. The SEL for these typical strikes was 152 dB.
Figure I.3-2 Representative Signal Analyses for 12-Inch-Diameter Steel Shell Piles at Galilee Marina
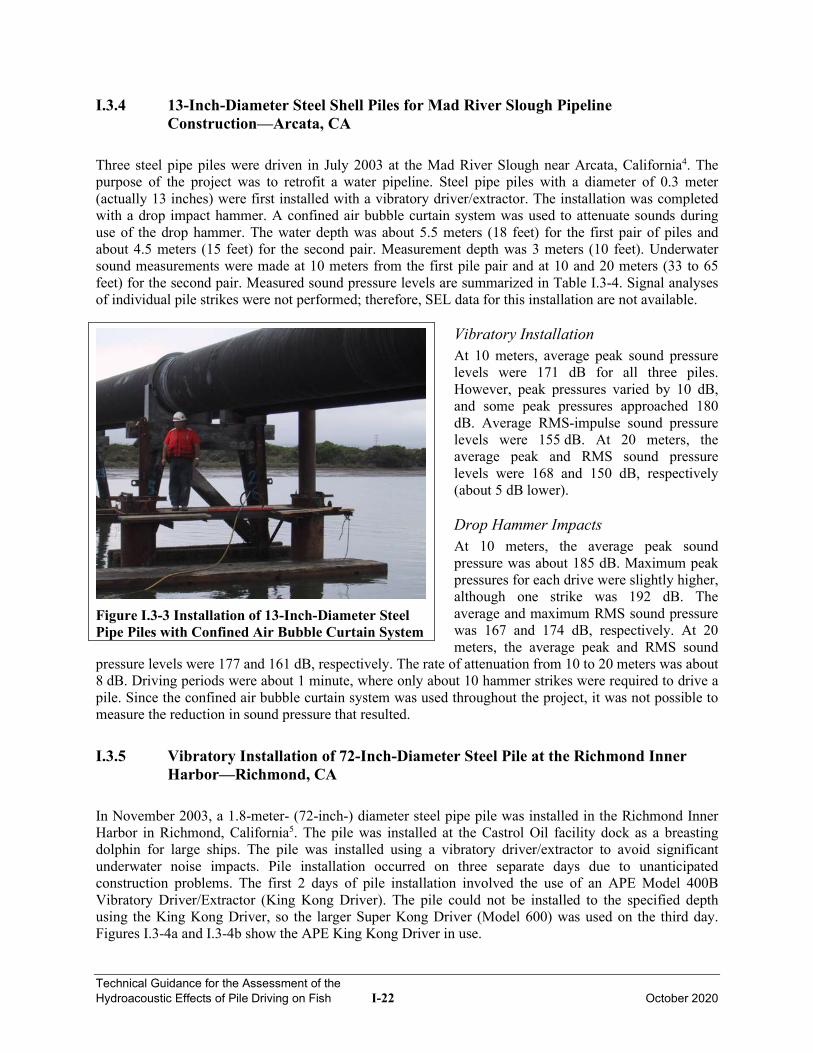
Technical Guidance for the Assessment of the Hydroacoustic Effects of Pile Driving on Fish I-22 October 2020
I.3.4 13-Inch-Diameter Steel Shell Piles for Mad River Slough Pipeline Construction—Arcata, CA
Three steel pipe piles were driven in July 2003 at the Mad River Slough near Arcata, California4. The purpose of the project was to retrofit a water pipeline. Steel pipe piles with a diameter of 0.3 meter (actually 13 inches) were first installed with a vibratory driver/extractor. The installation was completed with a drop impact hammer. A confined air bubble curtain system was used to attenuate sounds during use of the drop hammer. The water depth was about 5.5 meters (18 feet) for the first pair of piles and about 4.5 meters (15 feet) for the second pair. Measurement depth was 3 meters (10 feet). Underwater sound measurements were made at 10 meters from the first pile pair and at 10 and 20 meters (33 to 65 feet) for the second pair. Measured sound pressure levels are summarized in Table I.3-4. Signal analyses of individual pile strikes were not performed; therefore, SEL data for this installation are not available.
Vibratory Installation At 10 meters, average peak sound pressure levels were 171 dB for all three piles. However, peak pressures varied by 10 dB, and some peak pressures approached 180 dB. Average RMS-impulse sound pressure levels were 155 dB. At 20 meters, the average peak and RMS sound pressure levels were 168 and 150 dB, respectively (about 5 dB lower). Drop Hammer Impacts At 10 meters, the average peak sound pressure was about 185 dB. Maximum peak pressures for each drive were slightly higher, although one strike was 192 dB. The average and maximum RMS sound pressure was 167 and 174 dB, respectively. At 20 meters, the average peak and RMS sound
pressure levels were 177 and 161 dB, respectively. The rate of attenuation from 10 to 20 meters was about 8 dB. Driving periods were about 1 minute, where only about 10 hammer strikes were required to drive a pile. Since the confined air bubble curtain system was used throughout the project, it was not possible to measure the reduction in sound pressure that resulted.
I.3.5 Vibratory Installation of 72-Inch-Diameter Steel Pile at the Richmond Inner Harbor—Richmond, CA
In November 2003, a 1.8-meter- (72-inch-) diameter steel pipe pile was installed in the Richmond Inner Harbor in Richmond, California5. The pile was installed at the Castrol Oil facility dock as a breasting dolphin for large ships. The pile was installed using a vibratory driver/extractor to avoid significant underwater noise impacts. Pile installation occurred on three separate days due to unanticipated construction problems. The first 2 days of pile installation involved the use of an APE Model 400B Vibratory Driver/Extractor (King Kong Driver). The pile could not be installed to the specified depth using the King Kong Driver, so the larger Super Kong Driver (Model 600) was used on the third day. Figures I.3-4a and I.3-4b show the APE King Kong Driver in use.
Figure I.3-3 Installation of 13-Inch-Diameter Steel Pipe Piles with Confined Air Bubble Curtain System
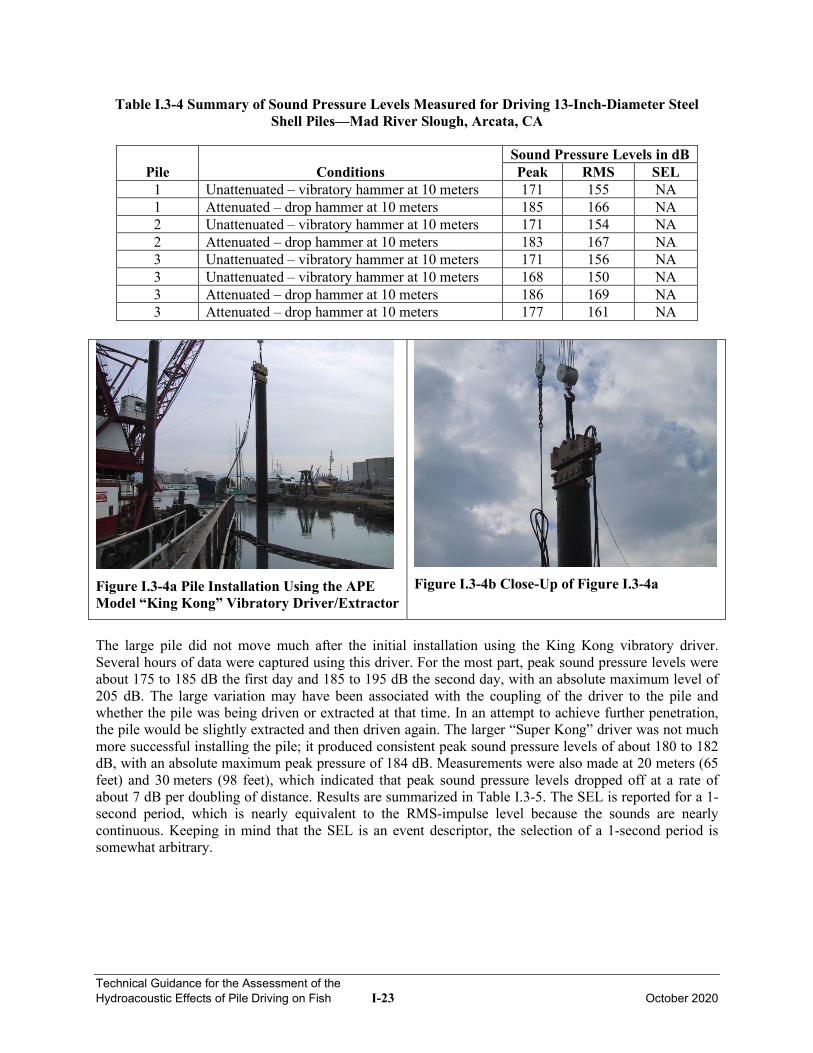
Technical Guidance for the Assessment of the Hydroacoustic Effects of Pile Driving on Fish I-23 October 2020
Table I.3-4 Summary of Sound Pressure Levels Measured for Driving 13-Inch-Diameter Steel Shell Piles—Mad River Slough, Arcata, CA
Pile Conditions Sound Pressure Levels in dB Peak RMS SEL
1 Unattenuated – vibratory hammer at 10 meters 171 155 NA 1 Attenuated – drop hammer at 10 meters 185 166 NA 2 Unattenuated – vibratory hammer at 10 meters 171 154 NA 2 Attenuated – drop hammer at 10 meters 183 167 NA 3 Unattenuated – vibratory hammer at 10 meters 171 156 NA 3 Unattenuated – vibratory hammer at 10 meters 168 150 NA 3 Attenuated – drop hammer at 10 meters 186 169 NA 3 Attenuated – drop hammer at 10 meters 177 161 NA
Figure I.3-4a Pile Installation Using the APE Model “King Kong” Vibratory Driver/Extractor
Figure I.3-4b Close-Up of Figure I.3-4a
The large pile did not move much after the initial installation using the King Kong vibratory driver. Several hours of data were captured using this driver. For the most part, peak sound pressure levels were about 175 to 185 dB the first day and 185 to 195 dB the second day, with an absolute maximum level of 205 dB. The large variation may have been associated with the coupling of the driver to the pile and whether the pile was being driven or extracted at that time. In an attempt to achieve further penetration, the pile would be slightly extracted and then driven again. The larger “Super Kong” driver was not much more successful installing the pile; it produced consistent peak sound pressure levels of about 180 to 182 dB, with an absolute maximum peak pressure of 184 dB. Measurements were also made at 20 meters (65 feet) and 30 meters (98 feet), which indicated that peak sound pressure levels dropped off at a rate of about 7 dB per doubling of distance. Results are summarized in Table I.3-5. The SEL is reported for a 1-second period, which is nearly equivalent to the RMS-impulse level because the sounds are nearly continuous. Keeping in mind that the SEL is an event descriptor, the selection of a 1-second period is somewhat arbitrary.
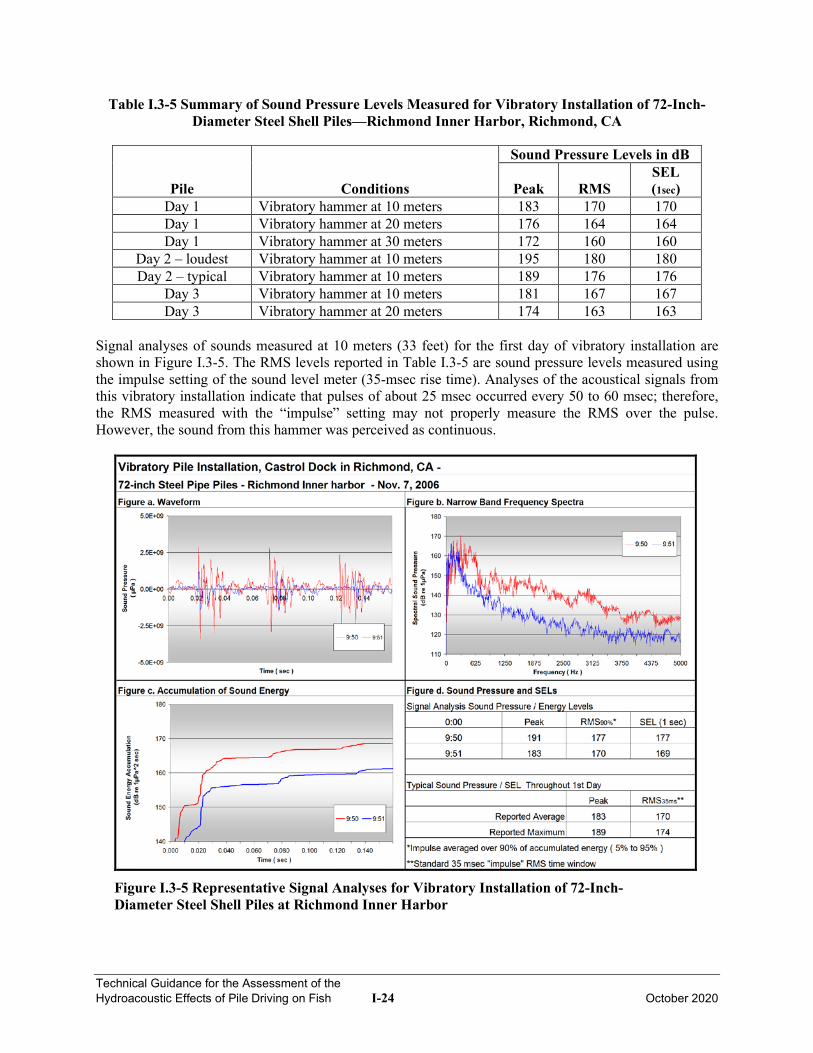
Technical Guidance for the Assessment of the Hydroacoustic Effects of Pile Driving on Fish I-24 October 2020
Table I.3-5 Summary of Sound Pressure Levels Measured for Vibratory Installation of 72-Inch-Diameter Steel Shell Piles—Richmond Inner Harbor, Richmond, CA
Pile Conditions
Sound Pressure Levels in dB
Peak RMS SEL (1sec)
Day 1 Vibratory hammer at 10 meters 183 170 170 Day 1 Vibratory hammer at 20 meters 176 164 164 Day 1 Vibratory hammer at 30 meters 172 160 160
Day 2 – loudest Vibratory hammer at 10 meters 195 180 180 Day 2 – typical Vibratory hammer at 10 meters 189 176 176
Day 3 Vibratory hammer at 10 meters 181 167 167 Day 3 Vibratory hammer at 20 meters 174 163 163
Signal analyses of sounds measured at 10 meters (33 feet) for the first day of vibratory installation are shown in Figure I.3-5. The RMS levels reported in Table I.3-5 are sound pressure levels measured using the impulse setting of the sound level meter (35-msec rise time). Analyses of the acoustical signals from this vibratory installation indicate that pulses of about 25 msec occurred every 50 to 60 msec; therefore, the RMS measured with the “impulse” setting may not properly measure the RMS over the pulse. However, the sound from this hammer was perceived as continuous.
Figure I.3-5 Representative Signal Analyses for Vibratory Installation of 72-Inch- Diameter Steel Shell Piles at Richmond Inner Harbor
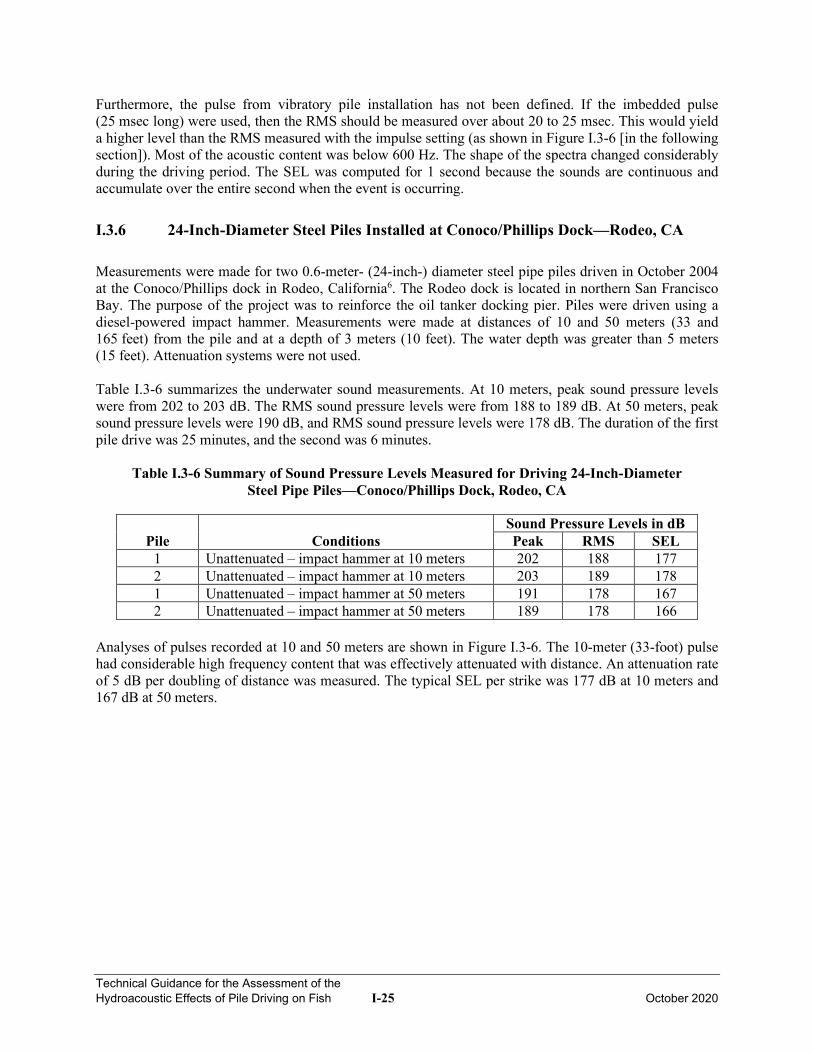
Technical Guidance for the Assessment of the Hydroacoustic Effects of Pile Driving on Fish I-25 October 2020
Furthermore, the pulse from vibratory pile installation has not been defined. If the imbedded pulse (25 msec long) were used, then the RMS should be measured over about 20 to 25 msec. This would yield a higher level than the RMS measured with the impulse setting (as shown in Figure I.3-6 [in the following section]). Most of the acoustic content was below 600 Hz. The shape of the spectra changed considerably during the driving period. The SEL was computed for 1 second because the sounds are continuous and accumulate over the entire second when the event is occurring.
I.3.6 24-Inch-Diameter Steel Piles Installed at Conoco/Phillips Dock—Rodeo, CA
Measurements were made for two 0.6-meter- (24-inch-) diameter steel pipe piles driven in October 2004 at the Conoco/Phillips dock in Rodeo, California6. The Rodeo dock is located in northern San Francisco Bay. The purpose of the project was to reinforce the oil tanker docking pier. Piles were driven using a diesel-powered impact hammer. Measurements were made at distances of 10 and 50 meters (33 and 165 feet) from the pile and at a depth of 3 meters (10 feet). The water depth was greater than 5 meters (15 feet). Attenuation systems were not used. Table I.3-6 summarizes the underwater sound measurements. At 10 meters, peak sound pressure levels were from 202 to 203 dB. The RMS sound pressure levels were from 188 to 189 dB. At 50 meters, peak sound pressure levels were 190 dB, and RMS sound pressure levels were 178 dB. The duration of the first pile drive was 25 minutes, and the second was 6 minutes.
Table I.3-6 Summary of Sound Pressure Levels Measured for Driving 24-Inch-Diameter Steel Pipe Piles—Conoco/Phillips Dock, Rodeo, CA
Pile Conditions Sound Pressure Levels in dB Peak RMS SEL
1 Unattenuated – impact hammer at 10 meters 202 188 177 2 Unattenuated – impact hammer at 10 meters 203 189 178 1 Unattenuated – impact hammer at 50 meters 191 178 167 2 Unattenuated – impact hammer at 50 meters 189 178 166
Analyses of pulses recorded at 10 and 50 meters are shown in Figure I.3-6. The 10-meter (33-foot) pulse had considerable high frequency content that was effectively attenuated with distance. An attenuation rate of 5 dB per doubling of distance was measured. The typical SEL per strike was 177 dB at 10 meters and 167 dB at 50 meters.
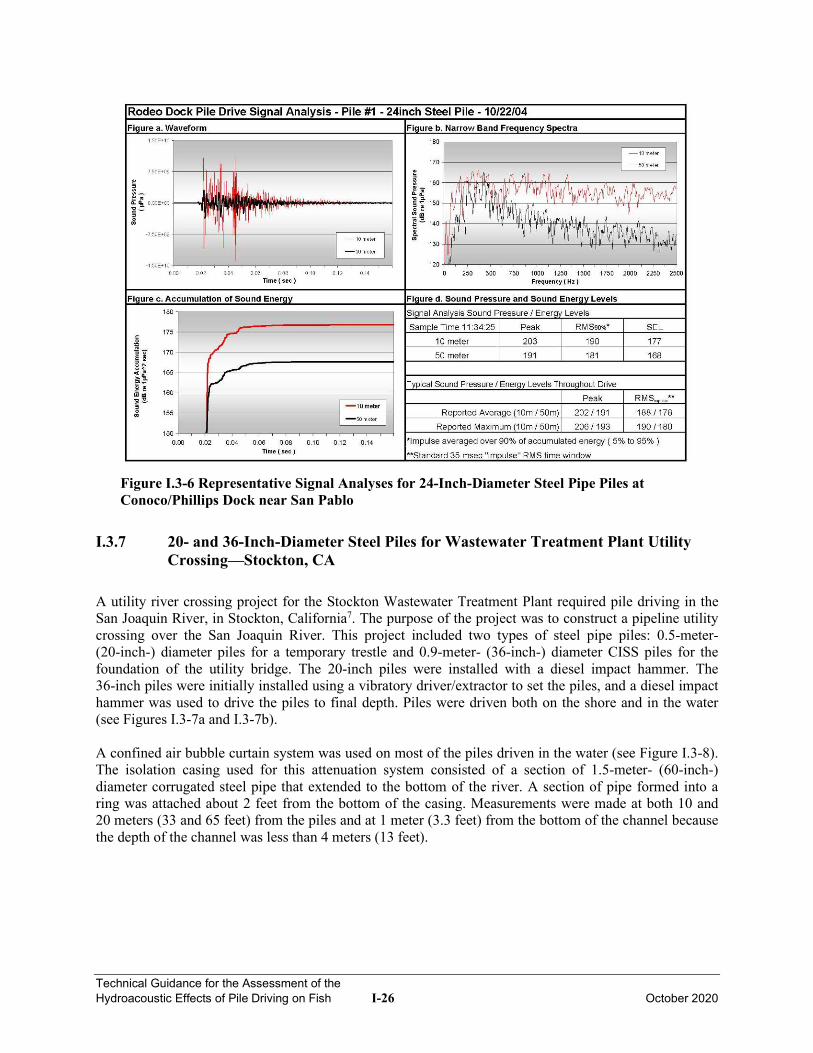
Technical Guidance for the Assessment of the Hydroacoustic Effects of Pile Driving on Fish I-26 October 2020
Figure I.3-6 Representative Signal Analyses for 24-Inch-Diameter Steel Pipe Piles at Conoco/Phillips Dock near San Pablo
I.3.7 20- and 36-Inch-Diameter Steel Piles for Wastewater Treatment Plant Utility Crossing—Stockton, CA
A utility river crossing project for the Stockton Wastewater Treatment Plant required pile driving in the San Joaquin River, in Stockton, California7. The purpose of the project was to construct a pipeline utility crossing over the San Joaquin River. This project included two types of steel pipe piles: 0.5-meter- (20-inch-) diameter piles for a temporary trestle and 0.9-meter- (36-inch-) diameter CISS piles for the foundation of the utility bridge. The 20-inch piles were installed with a diesel impact hammer. The 36-inch piles were initially installed using a vibratory driver/extractor to set the piles, and a diesel impact hammer was used to drive the piles to final depth. Piles were driven both on the shore and in the water (see Figures I.3-7a and I.3-7b). A confined air bubble curtain system was used on most of the piles driven in the water (see Figure I.3-8). The isolation casing used for this attenuation system consisted of a section of 1.5-meter- (60-inch-) diameter corrugated steel pipe that extended to the bottom of the river. A section of pipe formed into a ring was attached about 2 feet from the bottom of the casing. Measurements were made at both 10 and 20 meters (33 and 65 feet) from the piles and at 1 meter (3.3 feet) from the bottom of the channel because the depth of the channel was less than 4 meters (13 feet).
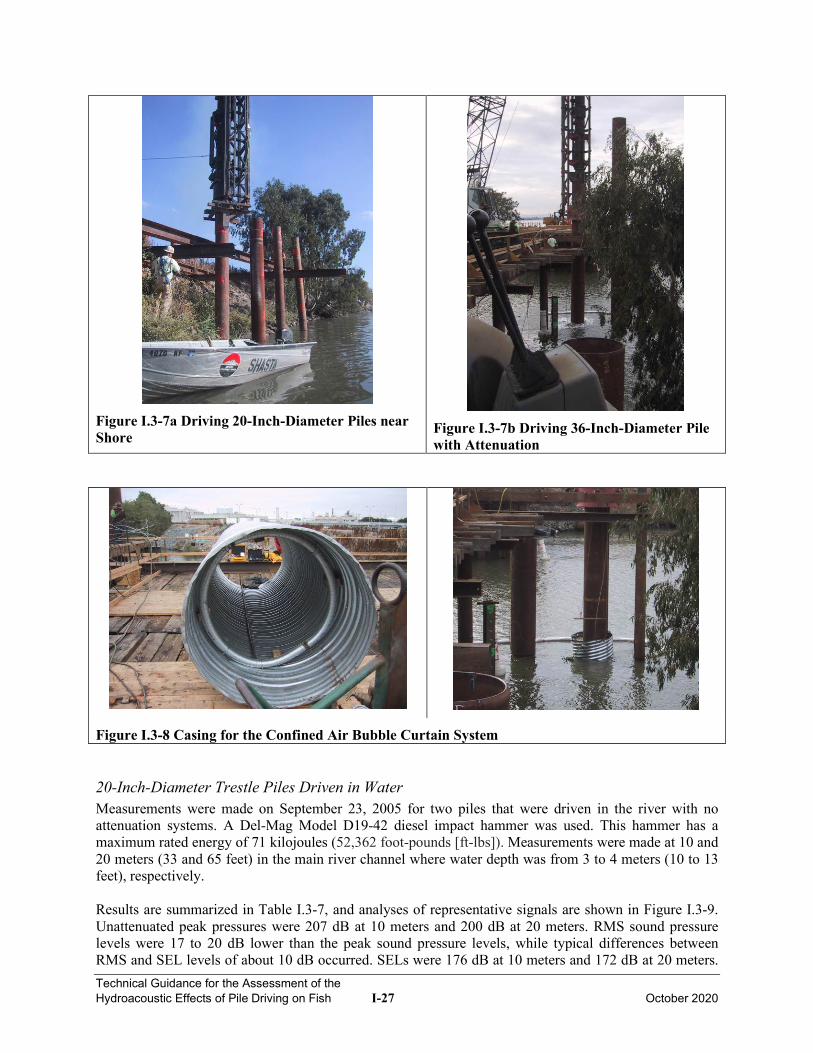
Technical Guidance for the Assessment of the Hydroacoustic Effects of Pile Driving on Fish I-27 October 2020
Figure I.3-7a Driving 20-Inch-Diameter Piles near Shore
Figure I.3-7b Driving 36-Inch-Diameter Pile with Attenuation
Figure I.3-8 Casing for the Confined Air Bubble Curtain System 20-Inch-Diameter Trestle Piles Driven in Water Measurements were made on September 23, 2005 for two piles that were driven in the river with no attenuation systems. A Del-Mag Model D19-42 diesel impact hammer was used. This hammer has a maximum rated energy of 71 kilojoules (52,362 foot-pounds [ft-lbs]). Measurements were made at 10 and 20 meters (33 and 65 feet) in the main river channel where water depth was from 3 to 4 meters (10 to 13 feet), respectively. Results are summarized in Table I.3-7, and analyses of representative signals are shown in Figure I.3-9. Unattenuated peak pressures were 207 dB at 10 meters and 200 dB at 20 meters. RMS sound pressure levels were 17 to 20 dB lower than the peak sound pressure levels, while typical differences between RMS and SEL levels of about 10 dB occurred. SELs were 176 dB at 10 meters and 172 dB at 20 meters.
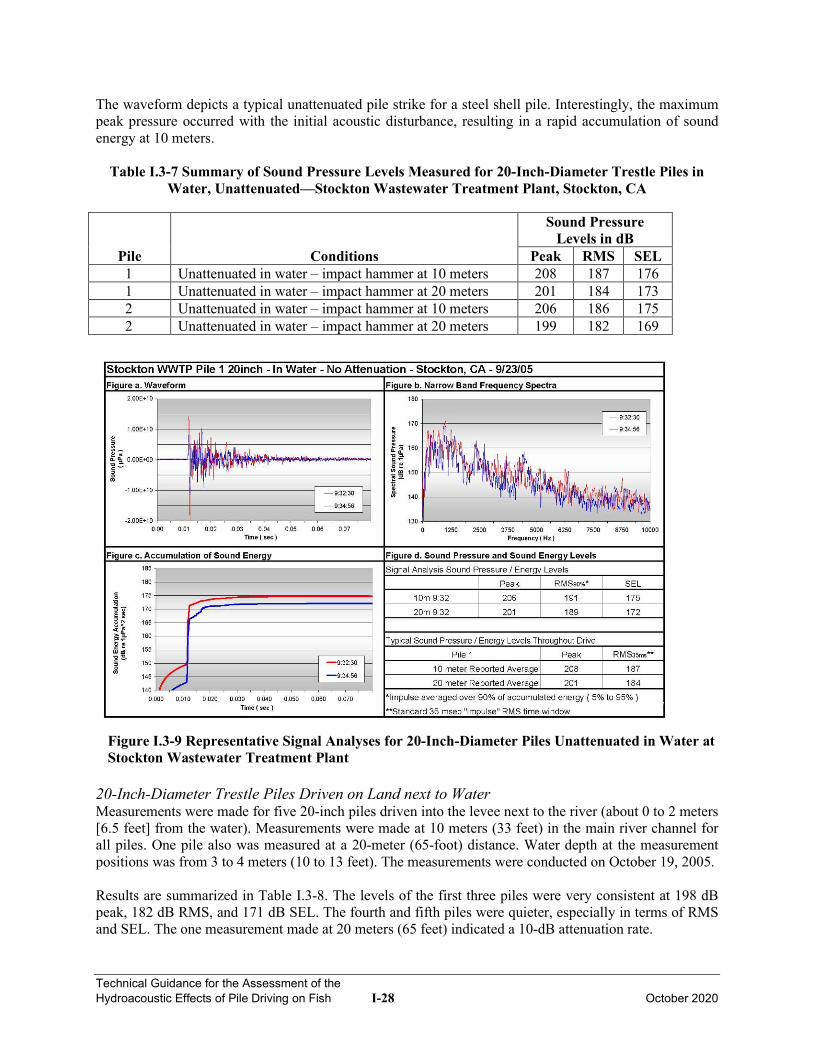
Technical Guidance for the Assessment of the Hydroacoustic Effects of Pile Driving on Fish I-28 October 2020
The waveform depicts a typical unattenuated pile strike for a steel shell pile. Interestingly, the maximum peak pressure occurred with the initial acoustic disturbance, resulting in a rapid accumulation of sound energy at 10 meters.
Table I.3-7 Summary of Sound Pressure Levels Measured for 20-Inch-Diameter Trestle Piles in Water, Unattenuated—Stockton Wastewater Treatment Plant, Stockton, CA
Pile Conditions
Sound Pressure Levels in dB
Peak RMS SEL 1 Unattenuated in water – impact hammer at 10 meters 208 187 176 1 Unattenuated in water – impact hammer at 20 meters 201 184 173 2 Unattenuated in water – impact hammer at 10 meters 206 186 175 2 Unattenuated in water – impact hammer at 20 meters 199 182 169
Figure I.3-9 Representative Signal Analyses for 20-Inch-Diameter Piles Unattenuated in Water at Stockton Wastewater Treatment Plant
20-Inch-Diameter Trestle Piles Driven on Land next to Water Measurements were made for five 20-inch piles driven into the levee next to the river (about 0 to 2 meters [6.5 feet] from the water). Measurements were made at 10 meters (33 feet) in the main river channel for all piles. One pile also was measured at a 20-meter (65-foot) distance. Water depth at the measurement positions was from 3 to 4 meters (10 to 13 feet). The measurements were conducted on October 19, 2005. Results are summarized in Table I.3-8. The levels of the first three piles were very consistent at 198 dB peak, 182 dB RMS, and 171 dB SEL. The fourth and fifth piles were quieter, especially in terms of RMS and SEL. The one measurement made at 20 meters (65 feet) indicated a 10-dB attenuation rate.
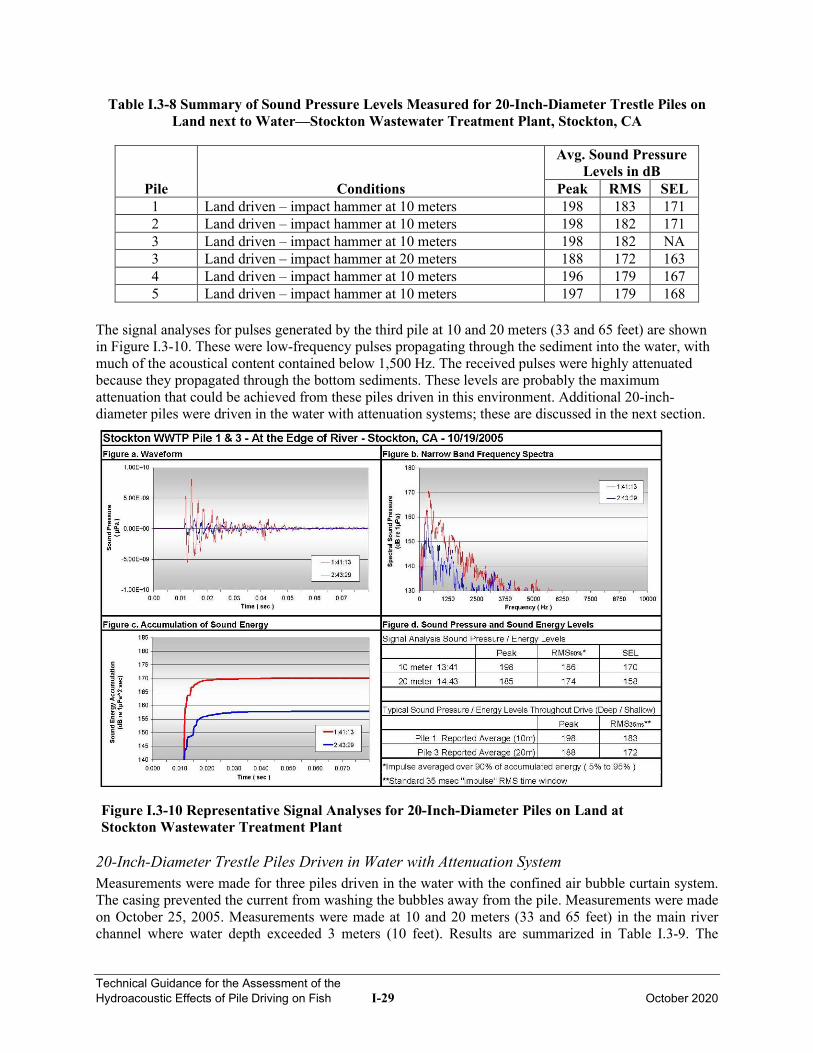
Technical Guidance for the Assessment of the Hydroacoustic Effects of Pile Driving on Fish I-29 October 2020
Table I.3-8 Summary of Sound Pressure Levels Measured for 20-Inch-Diameter Trestle Piles on Land next to Water—Stockton Wastewater Treatment Plant, Stockton, CA
Pile Conditions
Avg. Sound Pressure Levels in dB
Peak RMS SEL 1 Land driven – impact hammer at 10 meters 198 183 171 2 Land driven – impact hammer at 10 meters 198 182 171 3 Land driven – impact hammer at 10 meters 198 182 NA 3 Land driven – impact hammer at 20 meters 188 172 163 4 Land driven – impact hammer at 10 meters 196 179 167 5 Land driven – impact hammer at 10 meters 197 179 168
The signal analyses for pulses generated by the third pile at 10 and 20 meters (33 and 65 feet) are shown in Figure I.3-10. These were low-frequency pulses propagating through the sediment into the water, with much of the acoustical content contained below 1,500 Hz. The received pulses were highly attenuated because they propagated through the bottom sediments. These levels are probably the maximum attenuation that could be achieved from these piles driven in this environment. Additional 20-inch-diameter piles were driven in the water with attenuation systems; these are discussed in the next section.
Figure I.3-10 Representative Signal Analyses for 20-Inch-Diameter Piles on Land at Stockton Wastewater Treatment Plant
20-Inch-Diameter Trestle Piles Driven in Water with Attenuation System Measurements were made for three piles driven in the water with the confined air bubble curtain system. The casing prevented the current from washing the bubbles away from the pile. Measurements were made on October 25, 2005. Measurements were made at 10 and 20 meters (33 and 65 feet) in the main river channel where water depth exceeded 3 meters (10 feet). Results are summarized in Table I.3-9. The
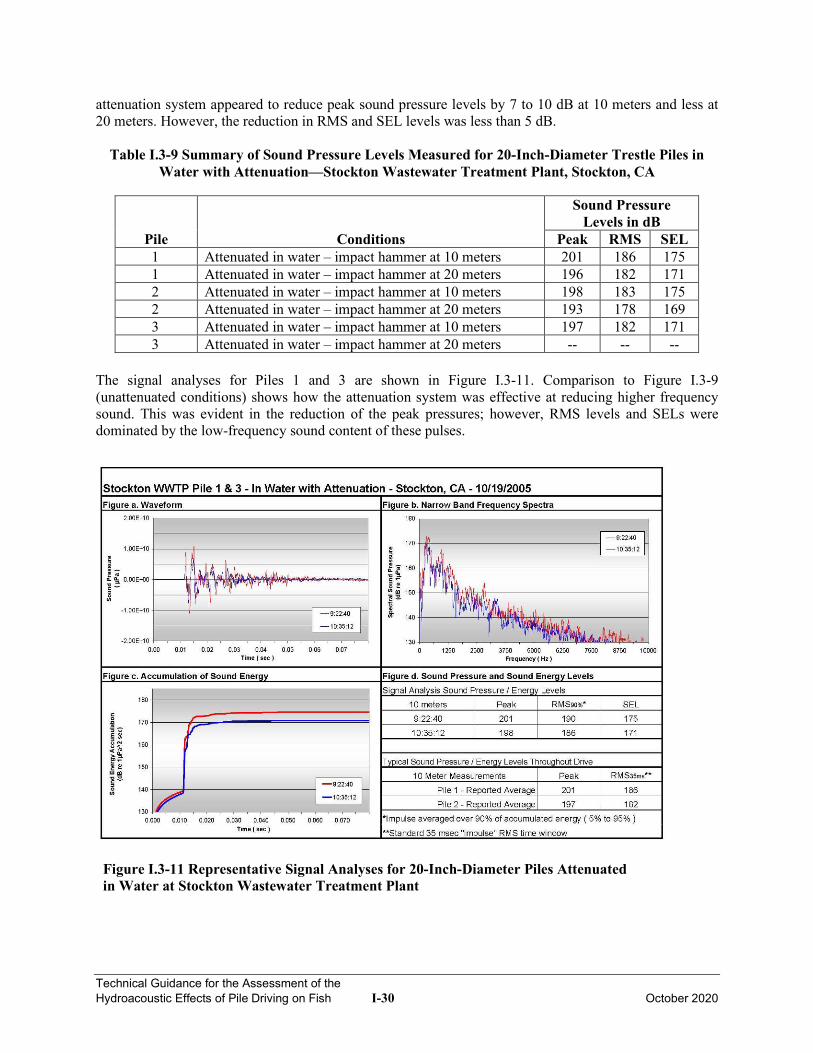
Technical Guidance for the Assessment of the Hydroacoustic Effects of Pile Driving on Fish I-30 October 2020
attenuation system appeared to reduce peak sound pressure levels by 7 to 10 dB at 10 meters and less at 20 meters. However, the reduction in RMS and SEL levels was less than 5 dB.
Table I.3-9 Summary of Sound Pressure Levels Measured for 20-Inch-Diameter Trestle Piles in Water with Attenuation—Stockton Wastewater Treatment Plant, Stockton, CA
Pile Conditions
Sound Pressure Levels in dB
Peak RMS SEL 1 Attenuated in water – impact hammer at 10 meters 201 186 175 1 Attenuated in water – impact hammer at 20 meters 196 182 171 2 Attenuated in water – impact hammer at 10 meters 198 183 175 2 Attenuated in water – impact hammer at 20 meters 193 178 169 3 Attenuated in water – impact hammer at 10 meters 197 182 171 3 Attenuated in water – impact hammer at 20 meters -- -- --
The signal analyses for Piles 1 and 3 are shown in Figure I.3-11. Comparison to Figure I.3-9 (unattenuated conditions) shows how the attenuation system was effective at reducing higher frequency sound. This was evident in the reduction of the peak pressures; however, RMS levels and SELs were dominated by the low-frequency sound content of these pulses.
Figure I.3-11 Representative Signal Analyses for 20-Inch-Diameter Piles Attenuated in Water at Stockton Wastewater Treatment Plant
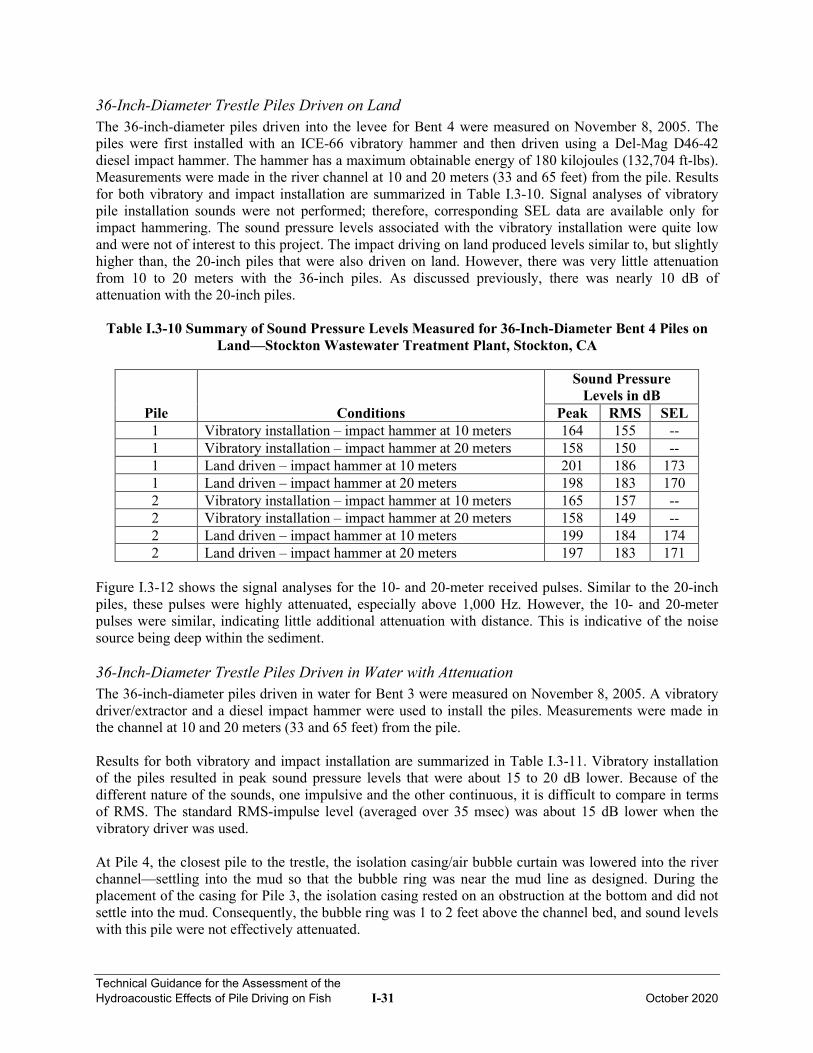
Technical Guidance for the Assessment of the Hydroacoustic Effects of Pile Driving on Fish I-31 October 2020
36-Inch-Diameter Trestle Piles Driven on Land The 36-inch-diameter piles driven into the levee for Bent 4 were measured on November 8, 2005. The piles were first installed with an ICE-66 vibratory hammer and then driven using a Del-Mag D46-42 diesel impact hammer. The hammer has a maximum obtainable energy of 180 kilojoules (132,704 ft-lbs). Measurements were made in the river channel at 10 and 20 meters (33 and 65 feet) from the pile. Results for both vibratory and impact installation are summarized in Table I.3-10. Signal analyses of vibratory pile installation sounds were not performed; therefore, corresponding SEL data are available only for impact hammering. The sound pressure levels associated with the vibratory installation were quite low and were not of interest to this project. The impact driving on land produced levels similar to, but slightly higher than, the 20-inch piles that were also driven on land. However, there was very little attenuation from 10 to 20 meters with the 36-inch piles. As discussed previously, there was nearly 10 dB of attenuation with the 20-inch piles.
Table I.3-10 Summary of Sound Pressure Levels Measured for 36-Inch-Diameter Bent 4 Piles on Land—Stockton Wastewater Treatment Plant, Stockton, CA
Pile Conditions
Sound Pressure Levels in dB
Peak RMS SEL 1 Vibratory installation – impact hammer at 10 meters 164 155 -- 1 Vibratory installation – impact hammer at 20 meters 158 150 -- 1 Land driven – impact hammer at 10 meters 201 186 173 1 Land driven – impact hammer at 20 meters 198 183 170 2 Vibratory installation – impact hammer at 10 meters 165 157 -- 2 Vibratory installation – impact hammer at 20 meters 158 149 -- 2 Land driven – impact hammer at 10 meters 199 184 174 2 Land driven – impact hammer at 20 meters 197 183 171
Figure I.3-12 shows the signal analyses for the 10- and 20-meter received pulses. Similar to the 20-inch piles, these pulses were highly attenuated, especially above 1,000 Hz. However, the 10- and 20-meter pulses were similar, indicating little additional attenuation with distance. This is indicative of the noise source being deep within the sediment. 36-Inch-Diameter Trestle Piles Driven in Water with Attenuation The 36-inch-diameter piles driven in water for Bent 3 were measured on November 8, 2005. A vibratory driver/extractor and a diesel impact hammer were used to install the piles. Measurements were made in the channel at 10 and 20 meters (33 and 65 feet) from the pile. Results for both vibratory and impact installation are summarized in Table I.3-11. Vibratory installation of the piles resulted in peak sound pressure levels that were about 15 to 20 dB lower. Because of the different nature of the sounds, one impulsive and the other continuous, it is difficult to compare in terms of RMS. The standard RMS-impulse level (averaged over 35 msec) was about 15 dB lower when the vibratory driver was used. At Pile 4, the closest pile to the trestle, the isolation casing/air bubble curtain was lowered into the river channel—settling into the mud so that the bubble ring was near the mud line as designed. During the placement of the casing for Pile 3, the isolation casing rested on an obstruction at the bottom and did not settle into the mud. Consequently, the bubble ring was 1 to 2 feet above the channel bed, and sound levels with this pile were not effectively attenuated.
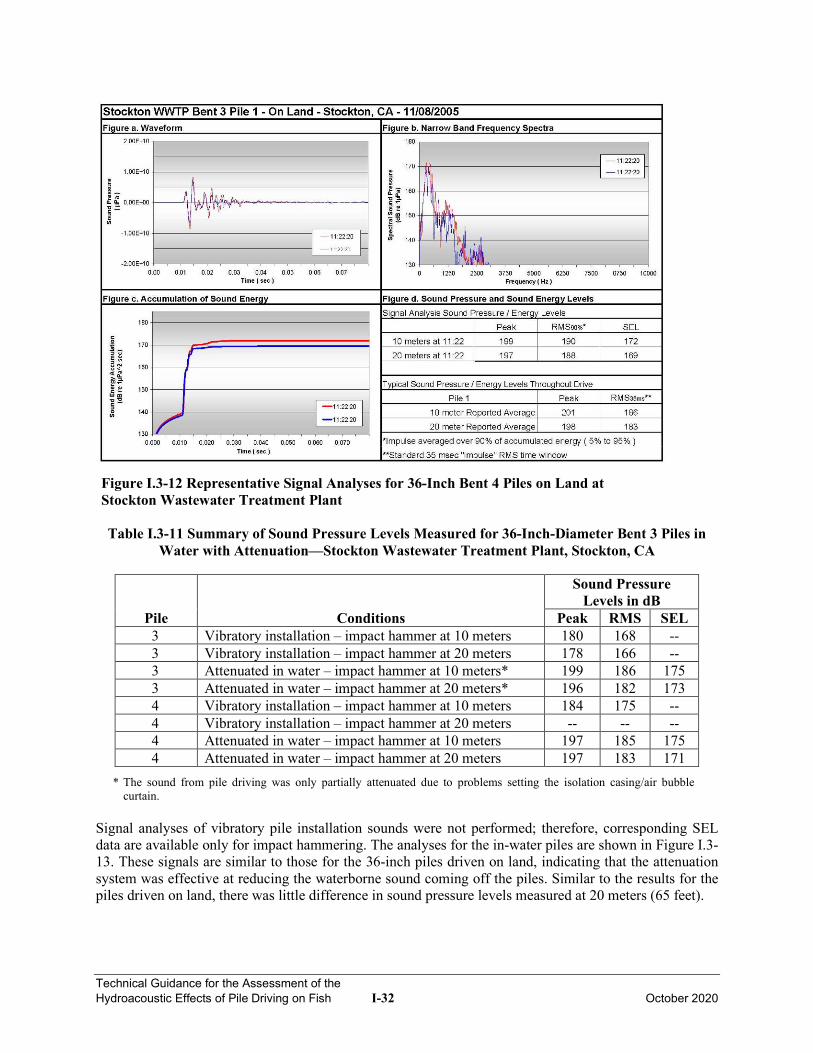
Technical Guidance for the Assessment of the Hydroacoustic Effects of Pile Driving on Fish I-32 October 2020
Figure I.3-12 Representative Signal Analyses for 36-Inch Bent 4 Piles on Land at Stockton Wastewater Treatment Plant
Table I.3-11 Summary of Sound Pressure Levels Measured for 36-Inch-Diameter Bent 3 Piles in
Water with Attenuation—Stockton Wastewater Treatment Plant, Stockton, CA
Pile Conditions
Sound Pressure Levels in dB
Peak RMS SEL 3 Vibratory installation – impact hammer at 10 meters 180 168 -- 3 Vibratory installation – impact hammer at 20 meters 178 166 -- 3 Attenuated in water – impact hammer at 10 meters* 199 186 175 3 Attenuated in water – impact hammer at 20 meters* 196 182 173 4 Vibratory installation – impact hammer at 10 meters 184 175 -- 4 Vibratory installation – impact hammer at 20 meters -- -- -- 4 Attenuated in water – impact hammer at 10 meters 197 185 175 4 Attenuated in water – impact hammer at 20 meters 197 183 171
* The sound from pile driving was only partially attenuated due to problems setting the isolation casing/air bubble curtain.
Signal analyses of vibratory pile installation sounds were not performed; therefore, corresponding SEL data are available only for impact hammering. The analyses for the in-water piles are shown in Figure I.3-13. These signals are similar to those for the 36-inch piles driven on land, indicating that the attenuation system was effective at reducing the waterborne sound coming off the piles. Similar to the results for the piles driven on land, there was little difference in sound pressure levels measured at 20 meters (65 feet).
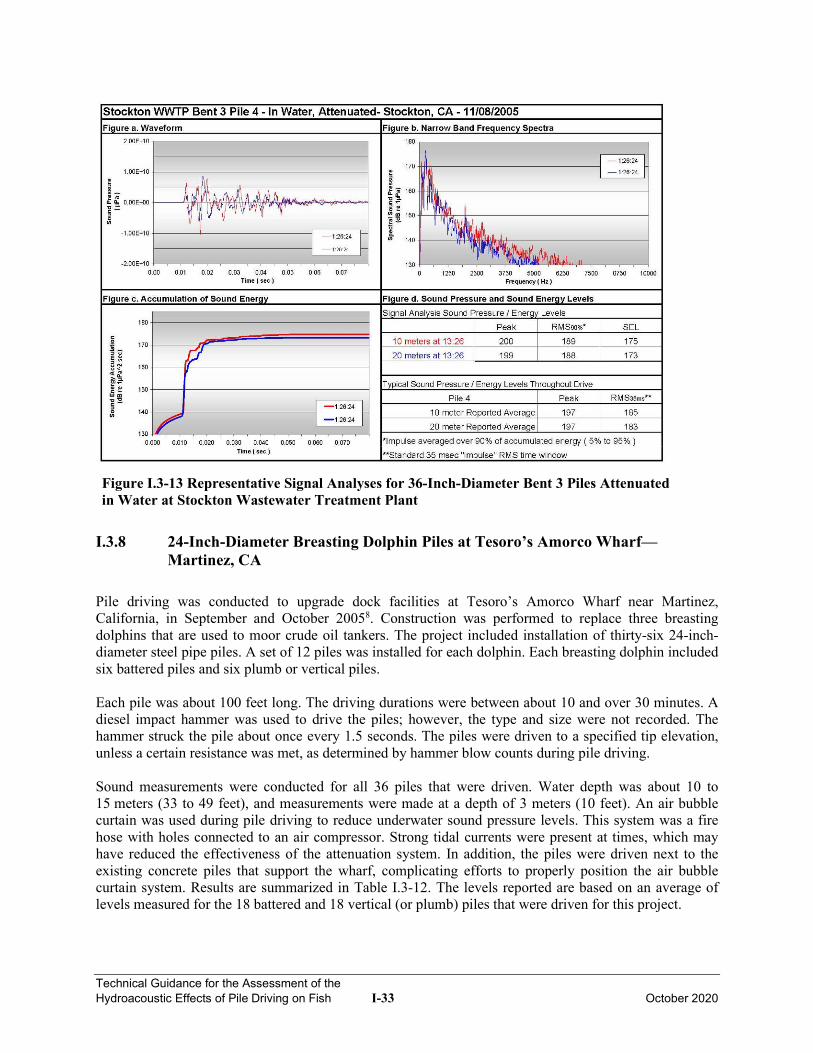
Technical Guidance for the Assessment of the Hydroacoustic Effects of Pile Driving on Fish I-33 October 2020
Figure I.3-13 Representative Signal Analyses for 36-Inch-Diameter Bent 3 Piles Attenuated in Water at Stockton Wastewater Treatment Plant
I.3.8 24-Inch-Diameter Breasting Dolphin Piles at Tesoro’s Amorco Wharf—Martinez, CA
Pile driving was conducted to upgrade dock facilities at Tesoro’s Amorco Wharf near Martinez, California, in September and October 20058. Construction was performed to replace three breasting dolphins that are used to moor crude oil tankers. The project included installation of thirty-six 24-inch-diameter steel pipe piles. A set of 12 piles was installed for each dolphin. Each breasting dolphin included six battered piles and six plumb or vertical piles. Each pile was about 100 feet long. The driving durations were between about 10 and over 30 minutes. A diesel impact hammer was used to drive the piles; however, the type and size were not recorded. The hammer struck the pile about once every 1.5 seconds. The piles were driven to a specified tip elevation, unless a certain resistance was met, as determined by hammer blow counts during pile driving. Sound measurements were conducted for all 36 piles that were driven. Water depth was about 10 to 15 meters (33 to 49 feet), and measurements were made at a depth of 3 meters (10 feet). An air bubble curtain was used during pile driving to reduce underwater sound pressure levels. This system was a fire hose with holes connected to an air compressor. Strong tidal currents were present at times, which may have reduced the effectiveness of the attenuation system. In addition, the piles were driven next to the existing concrete piles that support the wharf, complicating efforts to properly position the air bubble curtain system. Results are summarized in Table I.3-12. The levels reported are based on an average of levels measured for the 18 battered and 18 vertical (or plumb) piles that were driven for this project.
Technical Guidance for the Assessment of the Hydroacoustic Effects of Pile Driving on Fish I-34 October 2020
Table I.3-12 Summary of Sound Pressure Levels Measured for Driving 24-Inch-Diameter Steel Pipe Piles—Amorco Wharf Construction, Martinez, CA
Pile Conditions
Sound Pressure Levels in dB
Peak RMS SEL Group 1 – battered Attenuated – impact hammer at 10 meters 203 185 174 Group 1 – vertical Attenuated – impact hammer at 10 meters 200 185 178 Group 2 – battered Attenuated – impact hammer at 10 meters 202 185 175 Group 2 – vertical Attenuated – impact hammer at 10 meters 200 185 173 Group 3 – battered Attenuated – impact hammer at 10 meters 200 187 178 Group 3 – vertical Attenuated – impact hammer at 10 meters 195 185 178
Pile Group 1—East Breasting Dolphin The first group of piles was driven from September 25 to 27, 2005. Drive times were longer than expected due to a hard substrate, and were as long as 30 minutes for vertical piles and over 1 hour for some of the battered piles. Peak sound pressure levels at 10 meters (33 feet) ranged from less than 195 to a maximum of 209 dB. Average peak pressures for each driving event ranged from 194 to 206 dB, indicating a wide range of bubble curtain effectiveness. RMS levels were typically from 183 to 194 dB, and a sample of SELs ranged from 169 to 178 dB. Representative signal analyses for two different pile strikes are shown in Figure I.3-14. The high sound pressure levels measured in the field were indicative of poor air bubble curtain performance. As a result, the contractor made adjustments that resulted in a reduction of peak pressures by about 10 dB and a reduction of 5 dB for RMS and SEL sound pressure levels. The analyses shown in Figure I.3-14 indicate that the unattenuated peak pressure was associated with high-frequency sounds. This peak occurred about 10 msec into the event and appears to be the result of the pile “ringing.” These piles were driven in very resistant sediments, as evidenced by the increased driving times. The beginning of the first pile is considered an almost unattenuated condition (“ABC Raised”), while the second part of the drive is considered attenuated (“ABC Lowered”). Average sound peak pressures ranged from 194 to 203 dB, indicating about 10 dB of maximum attenuation provided by the air bubble curtain system for this group of piles. Pile Group 2 The second group of piles was driven on October 10 and 11, 2005. Drive times were considerably shorter than the first pile group, about 25 to 35 minutes for each pile. All primary measurements were made at approximately 10 meters (33 feet) to the south, with some additional spot measurements made at 10 meters in different directions for selected piles to assess the directionality. For battered piles, average and maximum sound pressure levels were 202 and 206 dB peak and 185 and 189 dB RMS, respectively. Typical SELs were 175 dB. There were some directionality differences. At 10 meters to the west, average and maximum sound levels were 190 and 192 dB peak and 176 and 178 dB RMS, respectively. At 10 meters to the east, average and maximum sound levels were 189 and 190 dB peak and 177 and 179 dB RMS, respectively. For the vertical piles, average and maximum sound pressure levels were 200 and 205 dB peak and 185 and 190 dB RMS, respectively. Typical SEL was 173 dB. At the two alternate locations, 10 meters to the north and east, average and maximum sound levels were 200 and 203 dB peak and 185 and 190 dB RMS, respectively. Spot measurements at 10 meters show that the sound level may differ as much as 10 dB during the driving of battered piles, depending on direction from pile. The sound levels produced by the vertically driven piles were consistent spatially.
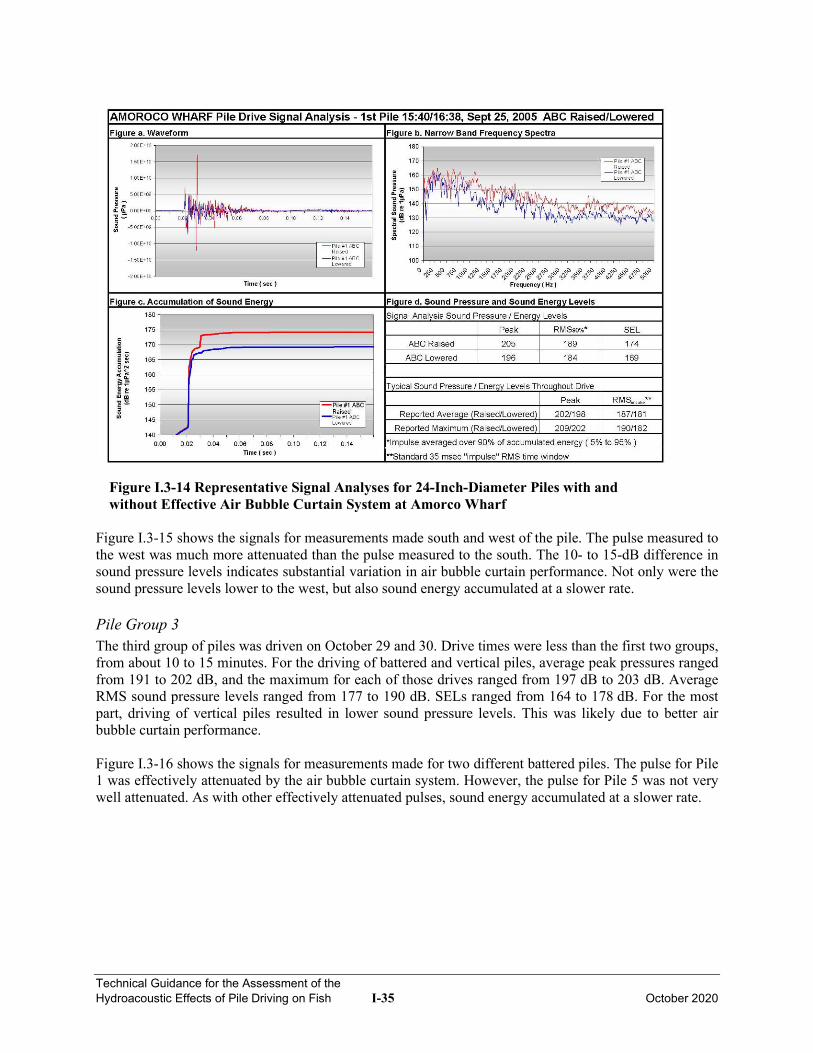
Technical Guidance for the Assessment of the Hydroacoustic Effects of Pile Driving on Fish I-35 October 2020
Figure I.3-14 Representative Signal Analyses for 24-Inch-Diameter Piles with and without Effective Air Bubble Curtain System at Amorco Wharf
Figure I.3-15 shows the signals for measurements made south and west of the pile. The pulse measured to the west was much more attenuated than the pulse measured to the south. The 10- to 15-dB difference in sound pressure levels indicates substantial variation in air bubble curtain performance. Not only were the sound pressure levels lower to the west, but also sound energy accumulated at a slower rate. Pile Group 3 The third group of piles was driven on October 29 and 30. Drive times were less than the first two groups, from about 10 to 15 minutes. For the driving of battered and vertical piles, average peak pressures ranged from 191 to 202 dB, and the maximum for each of those drives ranged from 197 dB to 203 dB. Average RMS sound pressure levels ranged from 177 to 190 dB. SELs ranged from 164 to 178 dB. For the most part, driving of vertical piles resulted in lower sound pressure levels. This was likely due to better air bubble curtain performance. Figure I.3-16 shows the signals for measurements made for two different battered piles. The pulse for Pile 1 was effectively attenuated by the air bubble curtain system. However, the pulse for Pile 5 was not very well attenuated. As with other effectively attenuated pulses, sound energy accumulated at a slower rate.
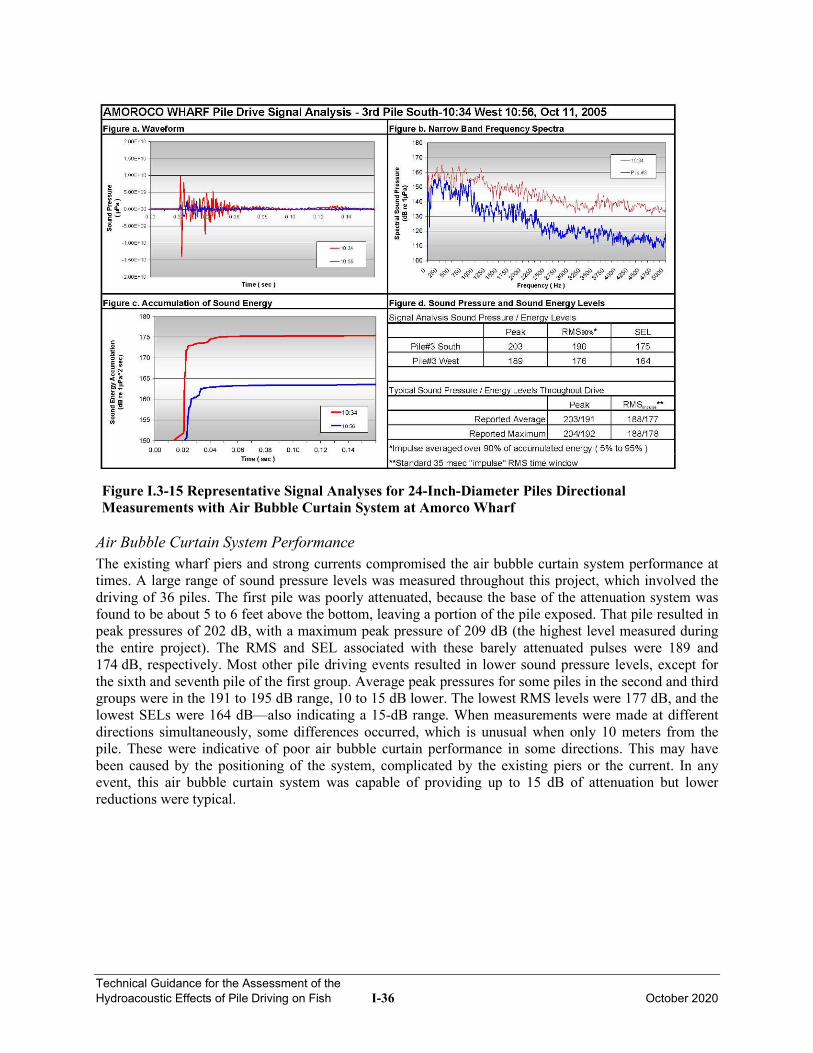
Technical Guidance for the Assessment of the Hydroacoustic Effects of Pile Driving on Fish I-36 October 2020
Figure I.3-15 Representative Signal Analyses for 24-Inch-Diameter Piles Directional Measurements with Air Bubble Curtain System at Amorco Wharf
Air Bubble Curtain System Performance The existing wharf piers and strong currents compromised the air bubble curtain system performance at times. A large range of sound pressure levels was measured throughout this project, which involved the driving of 36 piles. The first pile was poorly attenuated, because the base of the attenuation system was found to be about 5 to 6 feet above the bottom, leaving a portion of the pile exposed. That pile resulted in peak pressures of 202 dB, with a maximum peak pressure of 209 dB (the highest level measured during the entire project). The RMS and SEL associated with these barely attenuated pulses were 189 and 174 dB, respectively. Most other pile driving events resulted in lower sound pressure levels, except for the sixth and seventh pile of the first group. Average peak pressures for some piles in the second and third groups were in the 191 to 195 dB range, 10 to 15 dB lower. The lowest RMS levels were 177 dB, and the lowest SELs were 164 dB—also indicating a 15-dB range. When measurements were made at different directions simultaneously, some differences occurred, which is unusual when only 10 meters from the pile. These were indicative of poor air bubble curtain performance in some directions. This may have been caused by the positioning of the system, complicated by the existing piers or the current. In any event, this air bubble curtain system was capable of providing up to 15 dB of attenuation but lower reductions were typical.
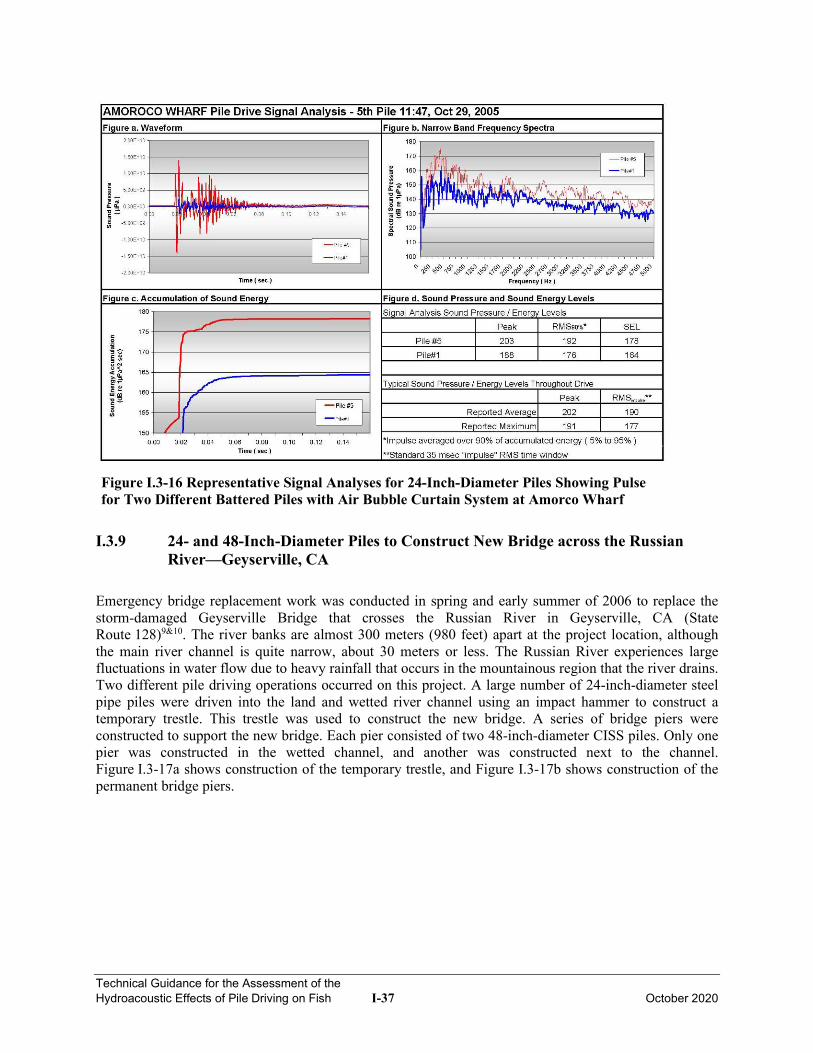
Technical Guidance for the Assessment of the Hydroacoustic Effects of Pile Driving on Fish I-37 October 2020
Figure I.3-16 Representative Signal Analyses for 24-Inch-Diameter Piles Showing Pulse for Two Different Battered Piles with Air Bubble Curtain System at Amorco Wharf
I.3.9 24- and 48-Inch-Diameter Piles to Construct New Bridge across the Russian River—Geyserville, CA
Emergency bridge replacement work was conducted in spring and early summer of 2006 to replace the storm-damaged Geyserville Bridge that crosses the Russian River in Geyserville, CA (State Route 128)9&10. The river banks are almost 300 meters (980 feet) apart at the project location, although the main river channel is quite narrow, about 30 meters or less. The Russian River experiences large fluctuations in water flow due to heavy rainfall that occurs in the mountainous region that the river drains. Two different pile driving operations occurred on this project. A large number of 24-inch-diameter steel pipe piles were driven into the land and wetted river channel using an impact hammer to construct a temporary trestle. This trestle was used to construct the new bridge. A series of bridge piers were constructed to support the new bridge. Each pier consisted of two 48-inch-diameter CISS piles. Only one pier was constructed in the wetted channel, and another was constructed next to the channel. Figure I.3-17a shows construction of the temporary trestle, and Figure I.3-17b shows construction of the permanent bridge piers.
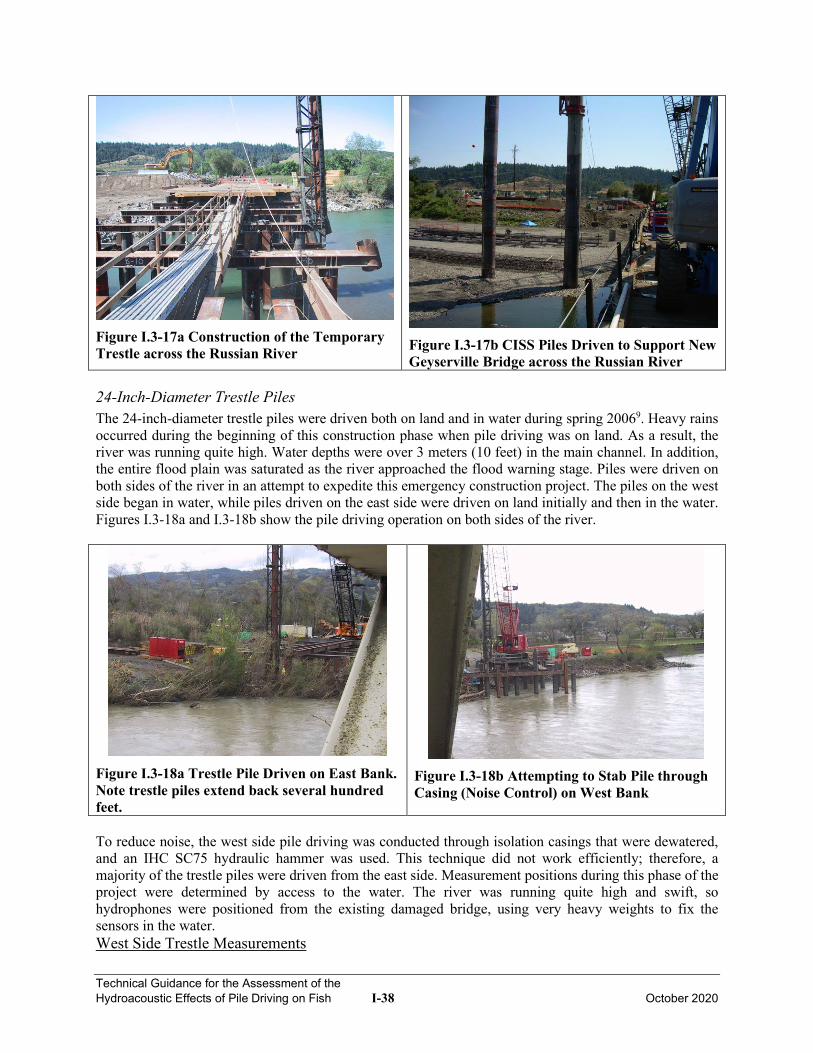
Technical Guidance for the Assessment of the Hydroacoustic Effects of Pile Driving on Fish I-38 October 2020
Figure I.3-17a Construction of the Temporary Trestle across the Russian River Figure I.3-17b CISS Piles Driven to Support New
Geyserville Bridge across the Russian River 24-Inch-Diameter Trestle Piles The 24-inch-diameter trestle piles were driven both on land and in water during spring 20069. Heavy rains occurred during the beginning of this construction phase when pile driving was on land. As a result, the river was running quite high. Water depths were over 3 meters (10 feet) in the main channel. In addition, the entire flood plain was saturated as the river approached the flood warning stage. Piles were driven on both sides of the river in an attempt to expedite this emergency construction project. The piles on the west side began in water, while piles driven on the east side were driven on land initially and then in the water. Figures I.3-18a and I.3-18b show the pile driving operation on both sides of the river.
Figure I.3-18a Trestle Pile Driven on East Bank. Note trestle piles extend back several hundred feet.
Figure I.3-18b Attempting to Stab Pile through Casing (Noise Control) on West Bank
To reduce noise, the west side pile driving was conducted through isolation casings that were dewatered, and an IHC SC75 hydraulic hammer was used. This technique did not work efficiently; therefore, a majority of the trestle piles were driven from the east side. Measurement positions during this phase of the project were determined by access to the water. The river was running quite high and swift, so hydrophones were positioned from the existing damaged bridge, using very heavy weights to fix the sensors in the water. West Side Trestle Measurements
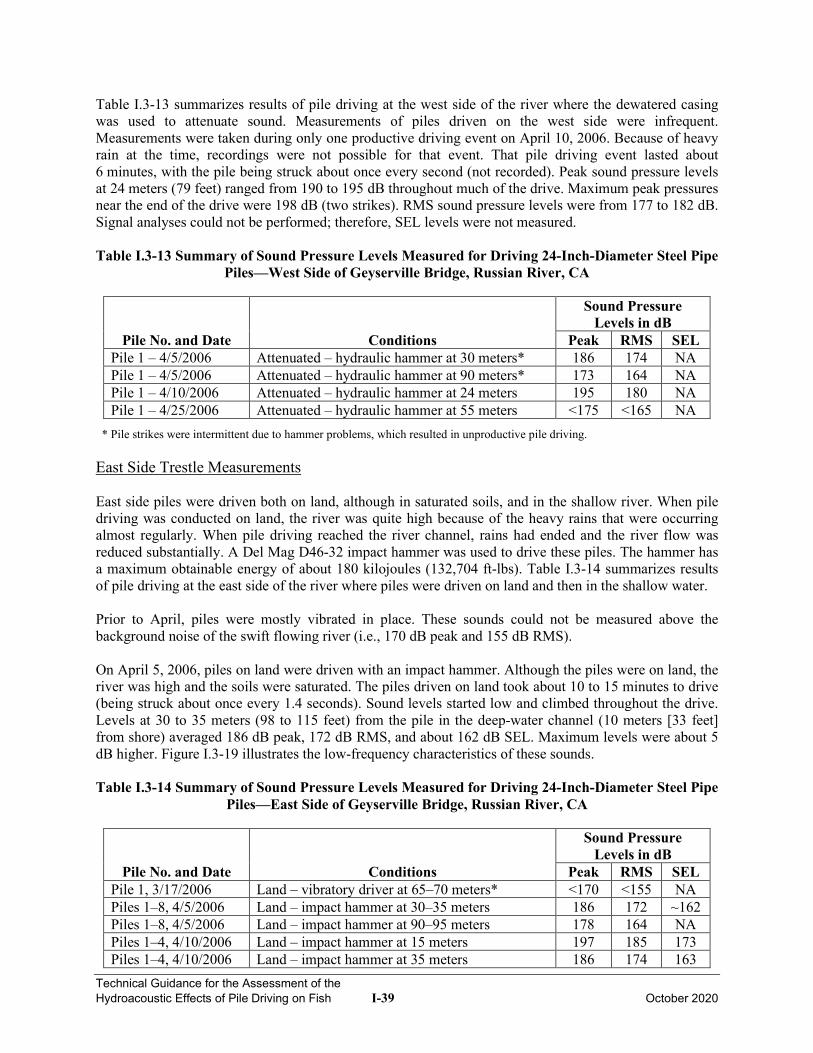
Technical Guidance for the Assessment of the Hydroacoustic Effects of Pile Driving on Fish I-39 October 2020
Table I.3-13 summarizes results of pile driving at the west side of the river where the dewatered casing was used to attenuate sound. Measurements of piles driven on the west side were infrequent. Measurements were taken during only one productive driving event on April 10, 2006. Because of heavy rain at the time, recordings were not possible for that event. That pile driving event lasted about 6 minutes, with the pile being struck about once every second (not recorded). Peak sound pressure levels at 24 meters (79 feet) ranged from 190 to 195 dB throughout much of the drive. Maximum peak pressures near the end of the drive were 198 dB (two strikes). RMS sound pressure levels were from 177 to 182 dB. Signal analyses could not be performed; therefore, SEL levels were not measured. Table I.3-13 Summary of Sound Pressure Levels Measured for Driving 24-Inch-Diameter Steel Pipe
Piles—West Side of Geyserville Bridge, Russian River, CA
Pile No. and Date Conditions
Sound Pressure Levels in dB
Peak RMS SEL Pile 1 – 4/5/2006 Attenuated – hydraulic hammer at 30 meters* 186 174 NA Pile 1 – 4/5/2006 Attenuated – hydraulic hammer at 90 meters* 173 164 NA Pile 1 – 4/10/2006 Attenuated – hydraulic hammer at 24 meters 195 180 NA Pile 1 – 4/25/2006 Attenuated – hydraulic hammer at 55 meters <175 <165 NA
* Pile strikes were intermittent due to hammer problems, which resulted in unproductive pile driving. East Side Trestle Measurements East side piles were driven both on land, although in saturated soils, and in the shallow river. When pile driving was conducted on land, the river was quite high because of the heavy rains that were occurring almost regularly. When pile driving reached the river channel, rains had ended and the river flow was reduced substantially. A Del Mag D46-32 impact hammer was used to drive these piles. The hammer has a maximum obtainable energy of about 180 kilojoules (132,704 ft-lbs). Table I.3-14 summarizes results of pile driving at the east side of the river where piles were driven on land and then in the shallow water. Prior to April, piles were mostly vibrated in place. These sounds could not be measured above the background noise of the swift flowing river (i.e., 170 dB peak and 155 dB RMS). On April 5, 2006, piles on land were driven with an impact hammer. Although the piles were on land, the river was high and the soils were saturated. The piles driven on land took about 10 to 15 minutes to drive (being struck about once every 1.4 seconds). Sound levels started low and climbed throughout the drive. Levels at 30 to 35 meters (98 to 115 feet) from the pile in the deep-water channel (10 meters [33 feet] from shore) averaged 186 dB peak, 172 dB RMS, and about 162 dB SEL. Maximum levels were about 5 dB higher. Figure I.3-19 illustrates the low-frequency characteristics of these sounds. Table I.3-14 Summary of Sound Pressure Levels Measured for Driving 24-Inch-Diameter Steel Pipe
Piles—East Side of Geyserville Bridge, Russian River, CA
Pile No. and Date Conditions
Sound Pressure Levels in dB
Peak RMS SEL Pile 1, 3/17/2006 Land – vibratory driver at 65–70 meters* <170 <155 NA Piles 1–8, 4/5/2006 Land – impact hammer at 30–35 meters 186 172 ~162 Piles 1–8, 4/5/2006 Land – impact hammer at 90–95 meters 178 164 NA Piles 1–4, 4/10/2006 Land – impact hammer at 15 meters 197 185 173 Piles 1–4, 4/10/2006 Land – impact hammer at 35 meters 186 174 163
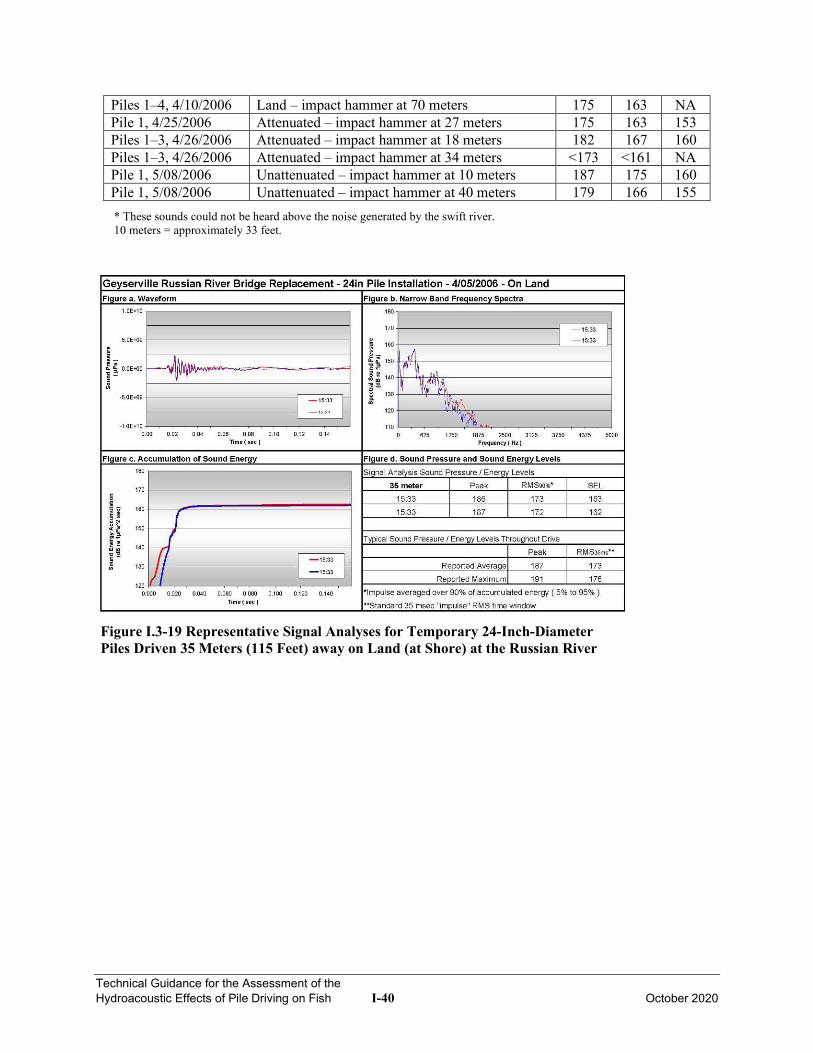
Technical Guidance for the Assessment of the Hydroacoustic Effects of Pile Driving on Fish I-40 October 2020
Piles 1–4, 4/10/2006 Land – impact hammer at 70 meters 175 163 NA Pile 1, 4/25/2006 Attenuated – impact hammer at 27 meters 175 163 153 Piles 1–3, 4/26/2006 Attenuated – impact hammer at 18 meters 182 167 160 Piles 1–3, 4/26/2006 Attenuated – impact hammer at 34 meters <173 <161 NA Pile 1, 5/08/2006 Unattenuated – impact hammer at 10 meters 187 175 160 Pile 1, 5/08/2006 Unattenuated – impact hammer at 40 meters 179 166 155 * These sounds could not be heard above the noise generated by the swift river. 10 meters = approximately 33 feet.
Figure I.3-19 Representative Signal Analyses for Temporary 24-Inch-Diameter Piles Driven 35 Meters (115 Feet) away on Land (at Shore) at the Russian River
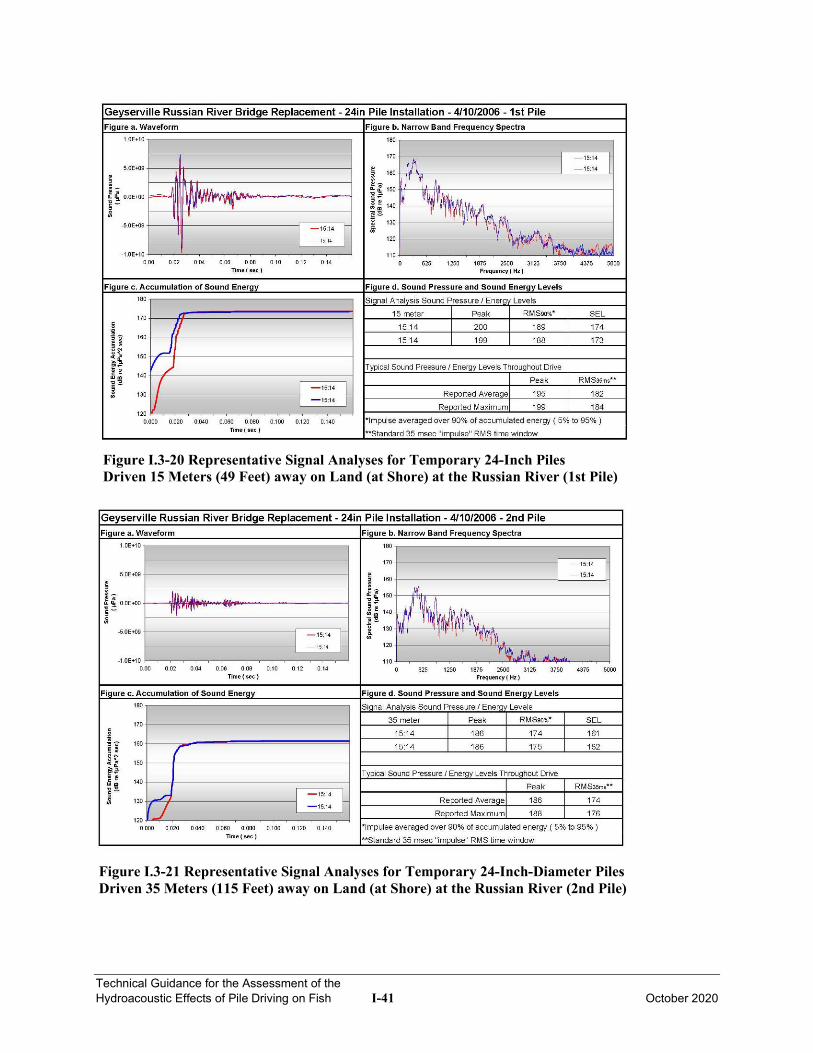
Technical Guidance for the Assessment of the Hydroacoustic Effects of Pile Driving on Fish I-41 October 2020
Figure I.3-20 Representative Signal Analyses for Temporary 24-Inch Piles Driven 15 Meters (49 Feet) away on Land (at Shore) at the Russian River (1st Pile)
Figure I.3-21 Representative Signal Analyses for Temporary 24-Inch-Diameter Piles Driven 35 Meters (115 Feet) away on Land (at Shore) at the Russian River (2nd Pile)
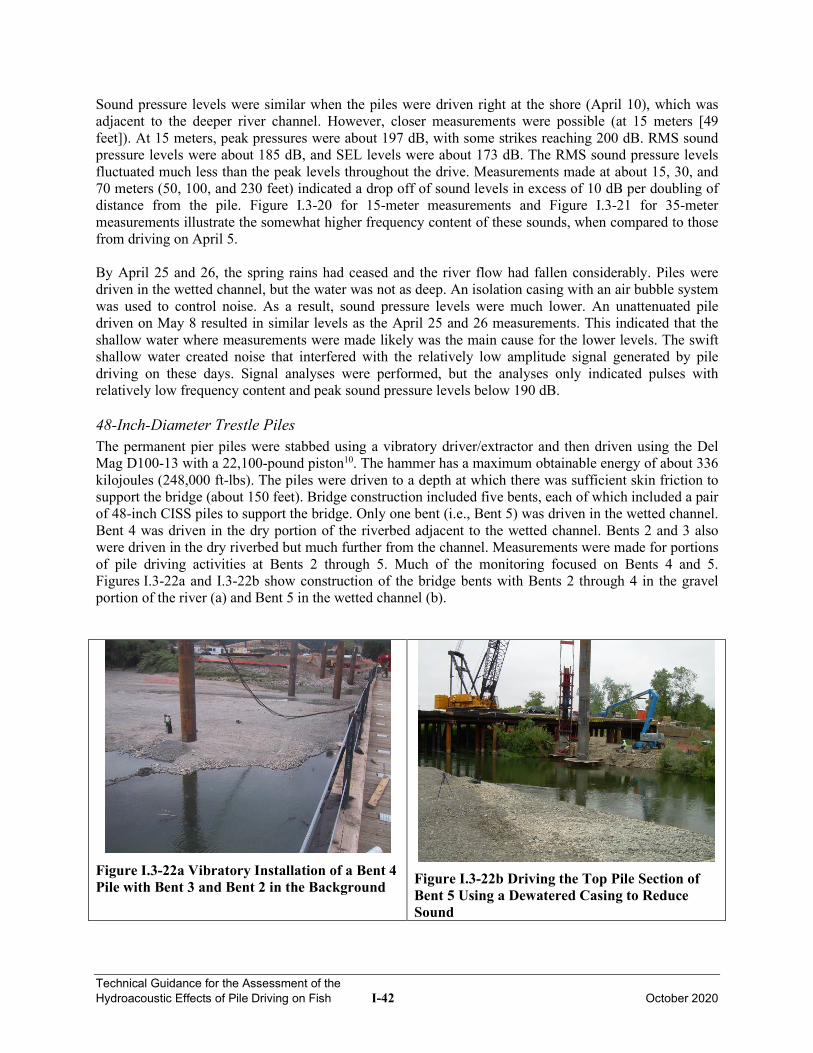
Technical Guidance for the Assessment of the Hydroacoustic Effects of Pile Driving on Fish I-42 October 2020
Sound pressure levels were similar when the piles were driven right at the shore (April 10), which was adjacent to the deeper river channel. However, closer measurements were possible (at 15 meters [49 feet]). At 15 meters, peak pressures were about 197 dB, with some strikes reaching 200 dB. RMS sound pressure levels were about 185 dB, and SEL levels were about 173 dB. The RMS sound pressure levels fluctuated much less than the peak levels throughout the drive. Measurements made at about 15, 30, and 70 meters (50, 100, and 230 feet) indicated a drop off of sound levels in excess of 10 dB per doubling of distance from the pile. Figure I.3-20 for 15-meter measurements and Figure I.3-21 for 35-meter measurements illustrate the somewhat higher frequency content of these sounds, when compared to those from driving on April 5. By April 25 and 26, the spring rains had ceased and the river flow had fallen considerably. Piles were driven in the wetted channel, but the water was not as deep. An isolation casing with an air bubble system was used to control noise. As a result, sound pressure levels were much lower. An unattenuated pile driven on May 8 resulted in similar levels as the April 25 and 26 measurements. This indicated that the shallow water where measurements were made likely was the main cause for the lower levels. The swift shallow water created noise that interfered with the relatively low amplitude signal generated by pile driving on these days. Signal analyses were performed, but the analyses only indicated pulses with relatively low frequency content and peak sound pressure levels below 190 dB. 48-Inch-Diameter Trestle Piles The permanent pier piles were stabbed using a vibratory driver/extractor and then driven using the Del Mag D100-13 with a 22,100-pound piston10. The hammer has a maximum obtainable energy of about 336 kilojoules (248,000 ft-lbs). The piles were driven to a depth at which there was sufficient skin friction to support the bridge (about 150 feet). Bridge construction included five bents, each of which included a pair of 48-inch CISS piles to support the bridge. Only one bent (i.e., Bent 5) was driven in the wetted channel. Bent 4 was driven in the dry portion of the riverbed adjacent to the wetted channel. Bents 2 and 3 also were driven in the dry riverbed but much further from the channel. Measurements were made for portions of pile driving activities at Bents 2 through 5. Much of the monitoring focused on Bents 4 and 5. Figures I.3-22a and I.3-22b show construction of the bridge bents with Bents 2 through 4 in the gravel portion of the river (a) and Bent 5 in the wetted channel (b).
Figure I.3-22a Vibratory Installation of a Bent 4 Pile with Bent 3 and Bent 2 in the Background
Figure I.3-22b Driving the Top Pile Section of Bent 5 Using a Dewatered Casing to Reduce Sound
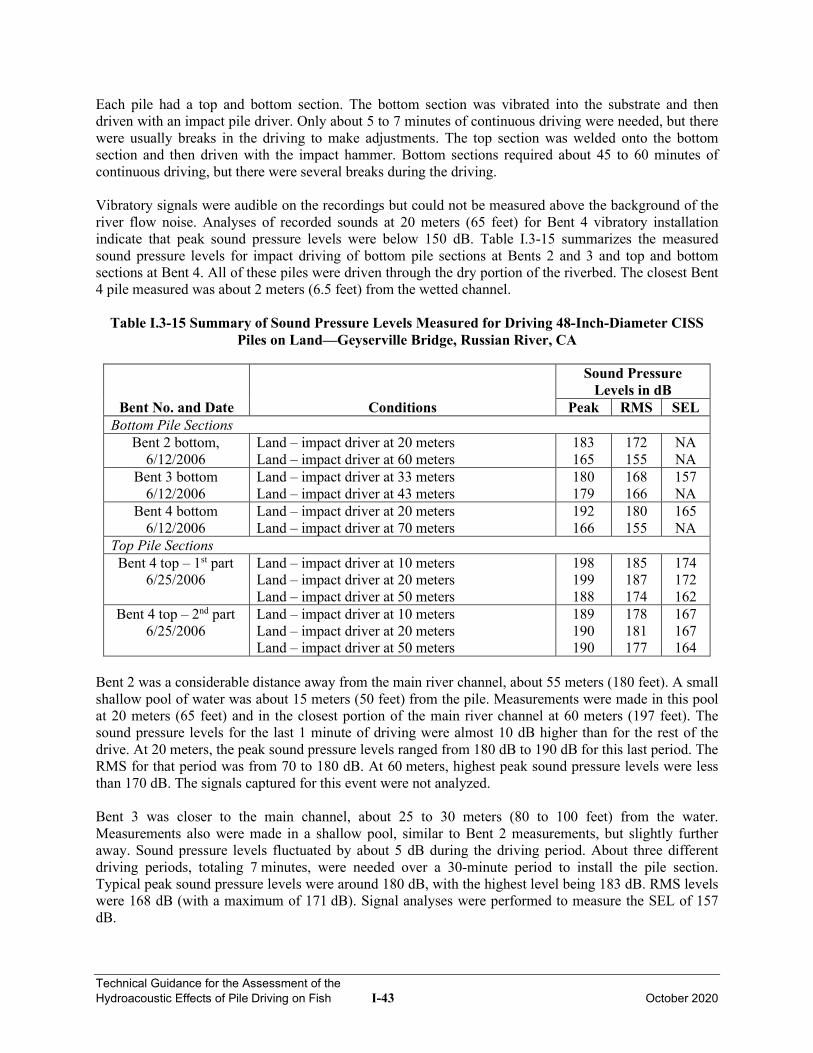
Technical Guidance for the Assessment of the Hydroacoustic Effects of Pile Driving on Fish I-43 October 2020
Each pile had a top and bottom section. The bottom section was vibrated into the substrate and then driven with an impact pile driver. Only about 5 to 7 minutes of continuous driving were needed, but there were usually breaks in the driving to make adjustments. The top section was welded onto the bottom section and then driven with the impact hammer. Bottom sections required about 45 to 60 minutes of continuous driving, but there were several breaks during the driving. Vibratory signals were audible on the recordings but could not be measured above the background of the river flow noise. Analyses of recorded sounds at 20 meters (65 feet) for Bent 4 vibratory installation indicate that peak sound pressure levels were below 150 dB. Table I.3-15 summarizes the measured sound pressure levels for impact driving of bottom pile sections at Bents 2 and 3 and top and bottom sections at Bent 4. All of these piles were driven through the dry portion of the riverbed. The closest Bent 4 pile measured was about 2 meters (6.5 feet) from the wetted channel.
Table I.3-15 Summary of Sound Pressure Levels Measured for Driving 48-Inch-Diameter CISS Piles on Land—Geyserville Bridge, Russian River, CA
Bent No. and Date Conditions
Sound Pressure Levels in dB
Peak RMS SEL Bottom Pile Sections
Bent 2 bottom, 6/12/2006
Land – impact driver at 20 meters Land – impact driver at 60 meters
183 165
172 155
NA NA
Bent 3 bottom 6/12/2006
Land – impact driver at 33 meters Land – impact driver at 43 meters
180 179
168 166
157 NA
Bent 4 bottom 6/12/2006
Land – impact driver at 20 meters Land – impact driver at 70 meters
192 166
180 155
165 NA
Top Pile Sections Bent 4 top – 1st part
6/25/2006 Land – impact driver at 10 meters Land – impact driver at 20 meters Land – impact driver at 50 meters
198 199 188
185 187 174
174 172 162
Bent 4 top – 2nd part 6/25/2006
Land – impact driver at 10 meters Land – impact driver at 20 meters Land – impact driver at 50 meters
189 190 190
178 181 177
167 167 164
Bent 2 was a considerable distance away from the main river channel, about 55 meters (180 feet). A small shallow pool of water was about 15 meters (50 feet) from the pile. Measurements were made in this pool at 20 meters (65 feet) and in the closest portion of the main river channel at 60 meters (197 feet). The sound pressure levels for the last 1 minute of driving were almost 10 dB higher than for the rest of the drive. At 20 meters, the peak sound pressure levels ranged from 180 dB to 190 dB for this last period. The RMS for that period was from 70 to 180 dB. At 60 meters, highest peak sound pressure levels were less than 170 dB. The signals captured for this event were not analyzed. Bent 3 was closer to the main channel, about 25 to 30 meters (80 to 100 feet) from the water. Measurements also were made in a shallow pool, similar to Bent 2 measurements, but slightly further away. Sound pressure levels fluctuated by about 5 dB during the driving period. About three different driving periods, totaling 7 minutes, were needed over a 30-minute period to install the pile section. Typical peak sound pressure levels were around 180 dB, with the highest level being 183 dB. RMS levels were 168 dB (with a maximum of 171 dB). Signal analyses were performed to measure the SEL of 157 dB.
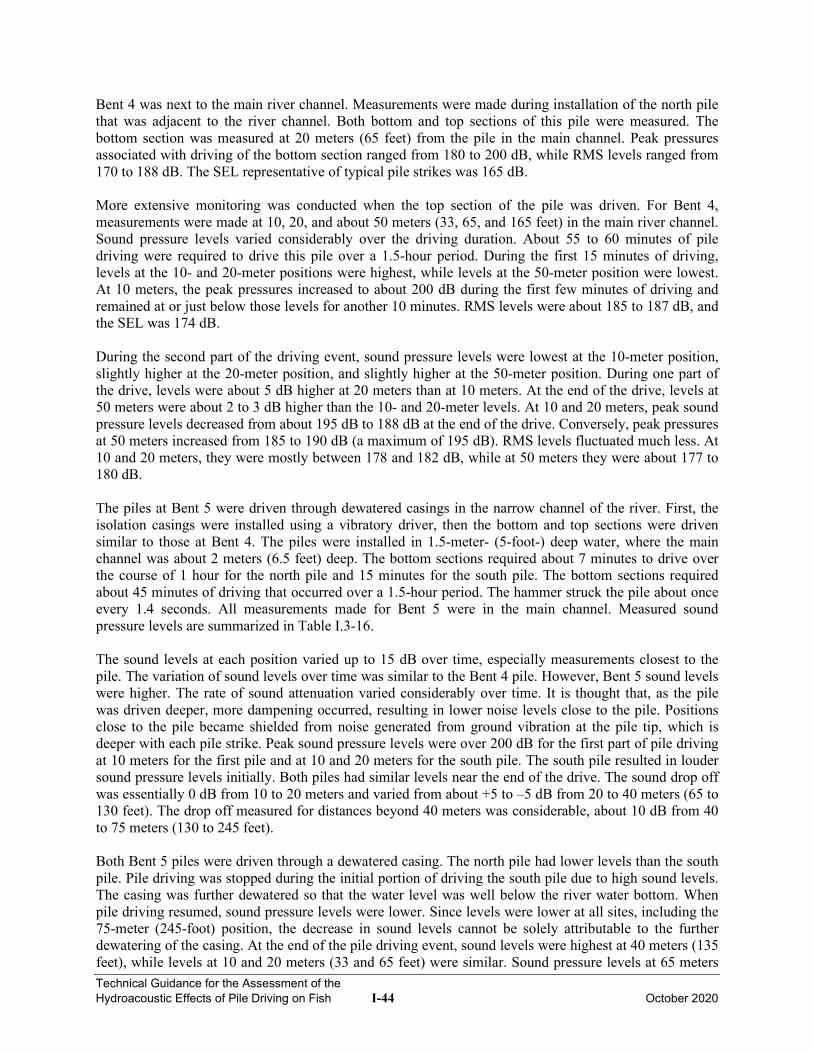
Technical Guidance for the Assessment of the Hydroacoustic Effects of Pile Driving on Fish I-44 October 2020
Bent 4 was next to the main river channel. Measurements were made during installation of the north pile that was adjacent to the river channel. Both bottom and top sections of this pile were measured. The bottom section was measured at 20 meters (65 feet) from the pile in the main channel. Peak pressures associated with driving of the bottom section ranged from 180 to 200 dB, while RMS levels ranged from 170 to 188 dB. The SEL representative of typical pile strikes was 165 dB. More extensive monitoring was conducted when the top section of the pile was driven. For Bent 4, measurements were made at 10, 20, and about 50 meters (33, 65, and 165 feet) in the main river channel. Sound pressure levels varied considerably over the driving duration. About 55 to 60 minutes of pile driving were required to drive this pile over a 1.5-hour period. During the first 15 minutes of driving, levels at the 10- and 20-meter positions were highest, while levels at the 50-meter position were lowest. At 10 meters, the peak pressures increased to about 200 dB during the first few minutes of driving and remained at or just below those levels for another 10 minutes. RMS levels were about 185 to 187 dB, and the SEL was 174 dB. During the second part of the driving event, sound pressure levels were lowest at the 10-meter position, slightly higher at the 20-meter position, and slightly higher at the 50-meter position. During one part of the drive, levels were about 5 dB higher at 20 meters than at 10 meters. At the end of the drive, levels at 50 meters were about 2 to 3 dB higher than the 10- and 20-meter levels. At 10 and 20 meters, peak sound pressure levels decreased from about 195 dB to 188 dB at the end of the drive. Conversely, peak pressures at 50 meters increased from 185 to 190 dB (a maximum of 195 dB). RMS levels fluctuated much less. At 10 and 20 meters, they were mostly between 178 and 182 dB, while at 50 meters they were about 177 to 180 dB. The piles at Bent 5 were driven through dewatered casings in the narrow channel of the river. First, the isolation casings were installed using a vibratory driver, then the bottom and top sections were driven similar to those at Bent 4. The piles were installed in 1.5-meter- (5-foot-) deep water, where the main channel was about 2 meters (6.5 feet) deep. The bottom sections required about 7 minutes to drive over the course of 1 hour for the north pile and 15 minutes for the south pile. The bottom sections required about 45 minutes of driving that occurred over a 1.5-hour period. The hammer struck the pile about once every 1.4 seconds. All measurements made for Bent 5 were in the main channel. Measured sound pressure levels are summarized in Table I.3-16. The sound levels at each position varied up to 15 dB over time, especially measurements closest to the pile. The variation of sound levels over time was similar to the Bent 4 pile. However, Bent 5 sound levels were higher. The rate of sound attenuation varied considerably over time. It is thought that, as the pile was driven deeper, more dampening occurred, resulting in lower noise levels close to the pile. Positions close to the pile became shielded from noise generated from ground vibration at the pile tip, which is deeper with each pile strike. Peak sound pressure levels were over 200 dB for the first part of pile driving at 10 meters for the first pile and at 10 and 20 meters for the south pile. The south pile resulted in louder sound pressure levels initially. Both piles had similar levels near the end of the drive. The sound drop off was essentially 0 dB from 10 to 20 meters and varied from about +5 to –5 dB from 20 to 40 meters (65 to 130 feet). The drop off measured for distances beyond 40 meters was considerable, about 10 dB from 40 to 75 meters (130 to 245 feet). Both Bent 5 piles were driven through a dewatered casing. The north pile had lower levels than the south pile. Pile driving was stopped during the initial portion of driving the south pile due to high sound levels. The casing was further dewatered so that the water level was well below the river water bottom. When pile driving resumed, sound pressure levels were lower. Since levels were lower at all sites, including the 75-meter (245-foot) position, the decrease in sound levels cannot be solely attributable to the further dewatering of the casing. At the end of the pile driving event, sound levels were highest at 40 meters (135 feet), while levels at 10 and 20 meters (33 and 65 feet) were similar. Sound pressure levels at 65 meters
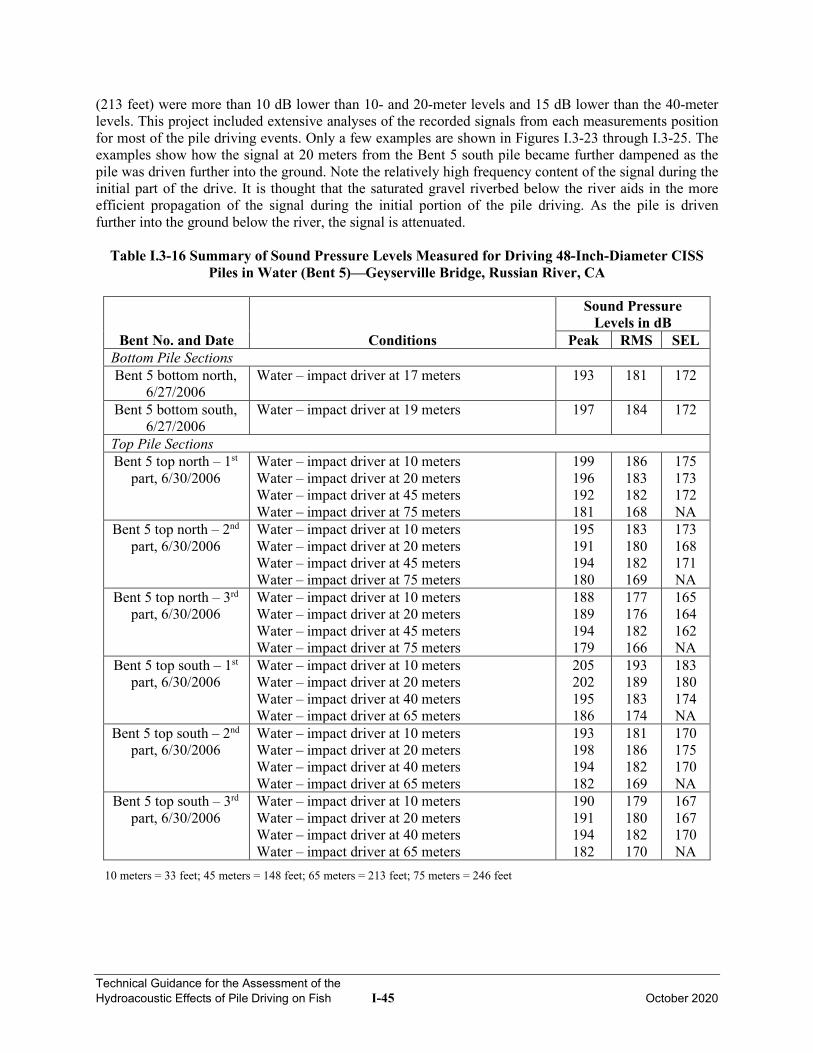
Technical Guidance for the Assessment of the Hydroacoustic Effects of Pile Driving on Fish I-45 October 2020
(213 feet) were more than 10 dB lower than 10- and 20-meter levels and 15 dB lower than the 40-meter levels. This project included extensive analyses of the recorded signals from each measurements position for most of the pile driving events. Only a few examples are shown in Figures I.3-23 through I.3-25. The examples show how the signal at 20 meters from the Bent 5 south pile became further dampened as the pile was driven further into the ground. Note the relatively high frequency content of the signal during the initial part of the drive. It is thought that the saturated gravel riverbed below the river aids in the more efficient propagation of the signal during the initial portion of the pile driving. As the pile is driven further into the ground below the river, the signal is attenuated.
Table I.3-16 Summary of Sound Pressure Levels Measured for Driving 48-Inch-Diameter CISS Piles in Water (Bent 5)—Geyserville Bridge, Russian River, CA
Bent No. and Date Conditions
Sound Pressure Levels in dB
Peak RMS SEL Bottom Pile Sections Bent 5 bottom north,
6/27/2006 Water – impact driver at 17 meters
193
181
172
Bent 5 bottom south, 6/27/2006
Water – impact driver at 19 meters
197
184
172
Top Pile Sections Bent 5 top north – 1st
part, 6/30/2006 Water – impact driver at 10 meters Water – impact driver at 20 meters Water – impact driver at 45 meters Water – impact driver at 75 meters
199 196 192 181
186 183 182 168
175 173 172 NA
Bent 5 top north – 2nd part, 6/30/2006
Water – impact driver at 10 meters Water – impact driver at 20 meters Water – impact driver at 45 meters Water – impact driver at 75 meters
195 191 194 180
183 180 182 169
173 168 171 NA
Bent 5 top north – 3rd part, 6/30/2006
Water – impact driver at 10 meters Water – impact driver at 20 meters Water – impact driver at 45 meters Water – impact driver at 75 meters
188 189 194 179
177 176 182 166
165 164 162 NA
Bent 5 top south – 1st part, 6/30/2006
Water – impact driver at 10 meters Water – impact driver at 20 meters Water – impact driver at 40 meters Water – impact driver at 65 meters
205 202 195 186
193 189 183 174
183 180 174 NA
Bent 5 top south – 2nd part, 6/30/2006
Water – impact driver at 10 meters Water – impact driver at 20 meters Water – impact driver at 40 meters Water – impact driver at 65 meters
193 198 194 182
181 186 182 169
170 175 170 NA
Bent 5 top south – 3rd part, 6/30/2006
Water – impact driver at 10 meters Water – impact driver at 20 meters Water – impact driver at 40 meters Water – impact driver at 65 meters
190 191 194 182
179 180 182 170
167 167 170 NA
10 meters = 33 feet; 45 meters = 148 feet; 65 meters = 213 feet; 75 meters = 246 feet
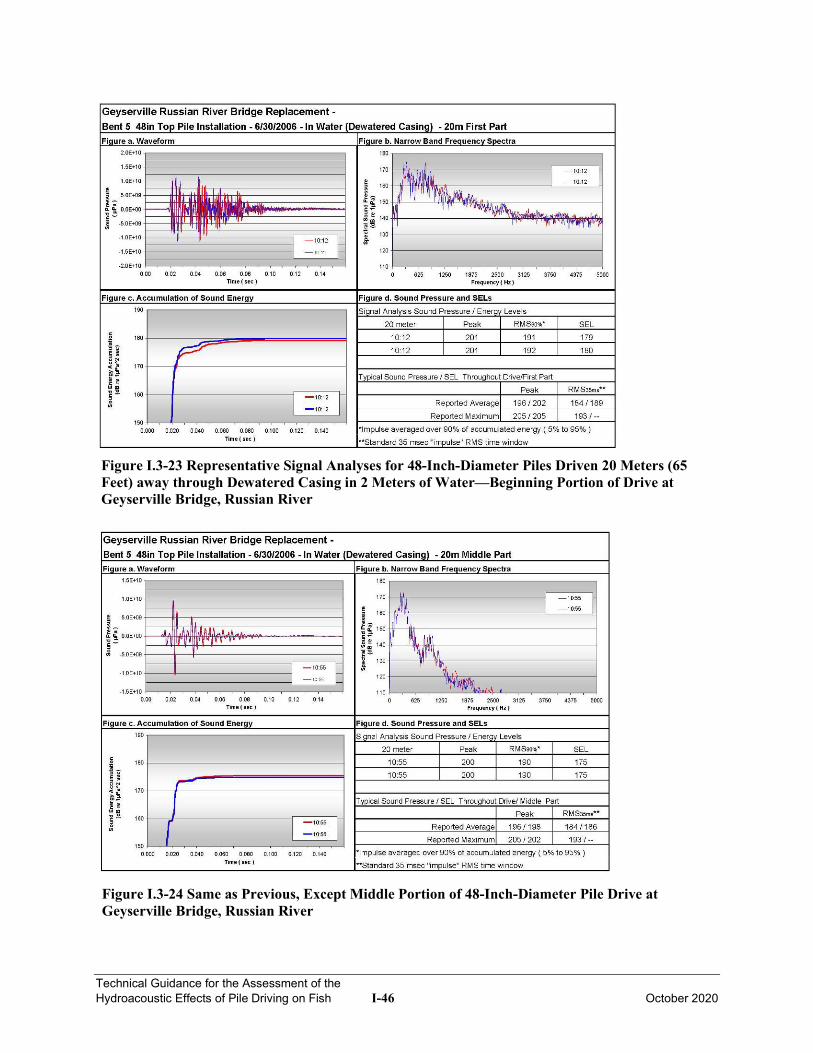
Technical Guidance for the Assessment of the Hydroacoustic Effects of Pile Driving on Fish I-46 October 2020
Figure I.3-23 Representative Signal Analyses for 48-Inch-Diameter Piles Driven 20 Meters (65 Feet) away through Dewatered Casing in 2 Meters of Water—Beginning Portion of Drive at Geyserville Bridge, Russian River
Figure I.3-24 Same as Previous, Except Middle Portion of 48-Inch-Diameter Pile Drive at Geyserville Bridge, Russian River
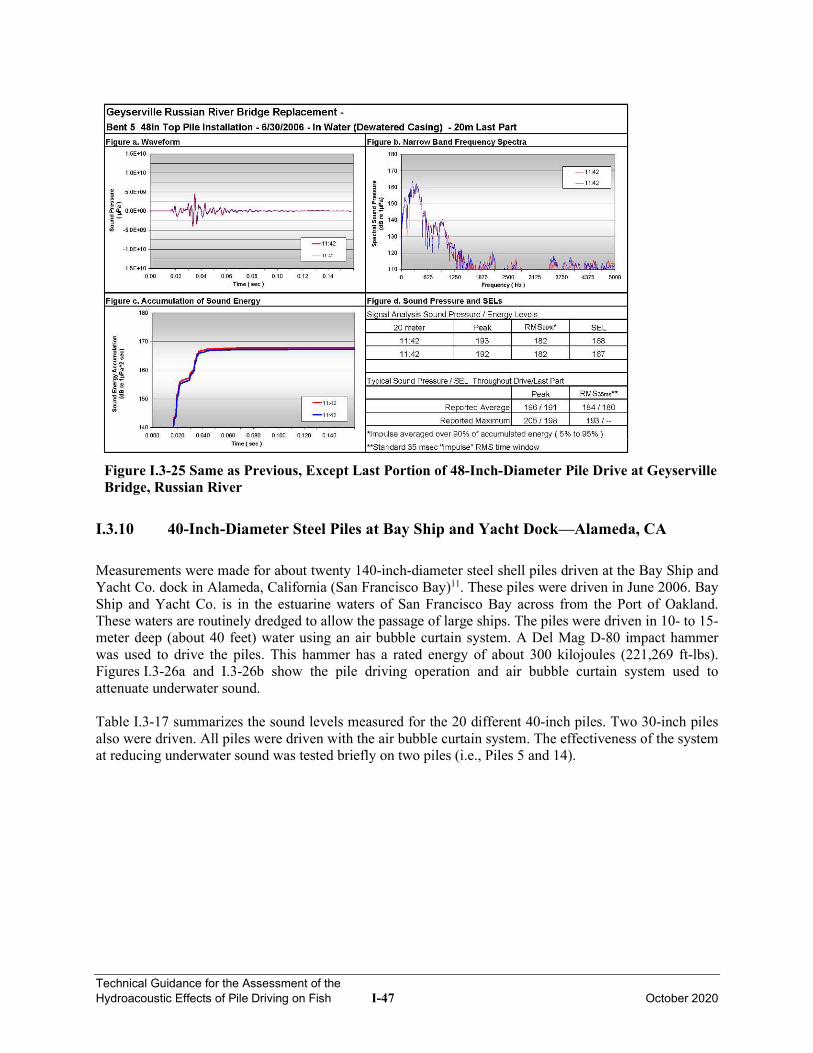
Technical Guidance for the Assessment of the Hydroacoustic Effects of Pile Driving on Fish I-47 October 2020
Figure I.3-25 Same as Previous, Except Last Portion of 48-Inch-Diameter Pile Drive at Geyserville Bridge, Russian River
I.3.10 40-Inch-Diameter Steel Piles at Bay Ship and Yacht Dock—Alameda, CA
Measurements were made for about twenty 140-inch-diameter steel shell piles driven at the Bay Ship and Yacht Co. dock in Alameda, California (San Francisco Bay)11. These piles were driven in June 2006. Bay Ship and Yacht Co. is in the estuarine waters of San Francisco Bay across from the Port of Oakland. These waters are routinely dredged to allow the passage of large ships. The piles were driven in 10- to 15-meter deep (about 40 feet) water using an air bubble curtain system. A Del Mag D-80 impact hammer was used to drive the piles. This hammer has a rated energy of about 300 kilojoules (221,269 ft-lbs). Figures I.3-26a and I.3-26b show the pile driving operation and air bubble curtain system used to attenuate underwater sound. Table I.3-17 summarizes the sound levels measured for the 20 different 40-inch piles. Two 30-inch piles also were driven. All piles were driven with the air bubble curtain system. The effectiveness of the system at reducing underwater sound was tested briefly on two piles (i.e., Piles 5 and 14).
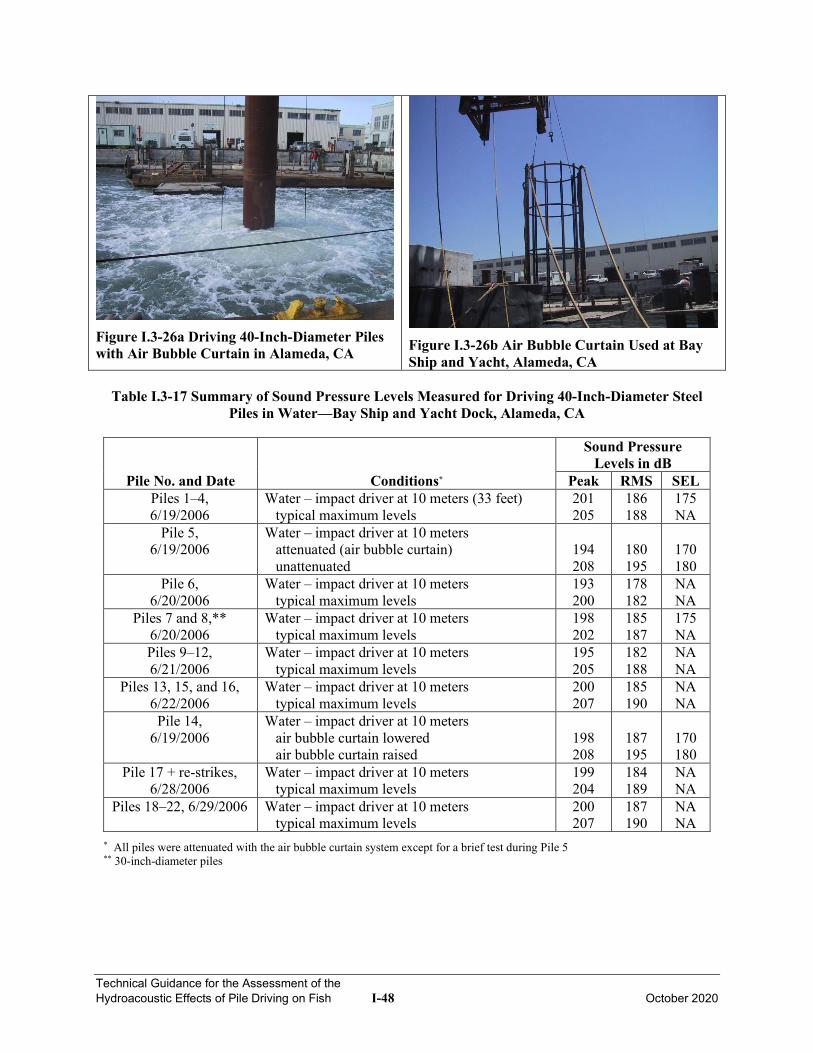
Technical Guidance for the Assessment of the Hydroacoustic Effects of Pile Driving on Fish I-48 October 2020
Figure I.3-26a Driving 40-Inch-Diameter Piles with Air Bubble Curtain in Alameda, CA
Figure I.3-26b Air Bubble Curtain Used at Bay Ship and Yacht, Alameda, CA
Table I.3-17 Summary of Sound Pressure Levels Measured for Driving 40-Inch-Diameter Steel
Piles in Water—Bay Ship and Yacht Dock, Alameda, CA
Pile No. and Date Conditions*
Sound Pressure Levels in dB
Peak RMS SEL Piles 1–4, 6/19/2006
Water – impact driver at 10 meters (33 feet) typical maximum levels
201 205
186 188
175 NA
Pile 5, 6/19/2006
Water – impact driver at 10 meters attenuated (air bubble curtain) unattenuated
194 208
180 195
170 180
Pile 6, 6/20/2006
Water – impact driver at 10 meters typical maximum levels
193 200
178 182
NA NA
Piles 7 and 8,** 6/20/2006
Water – impact driver at 10 meters typical maximum levels
198 202
185 187
175 NA
Piles 9–12, 6/21/2006
Water – impact driver at 10 meters typical maximum levels
195 205
182 188
NA NA
Piles 13, 15, and 16, 6/22/2006
Water – impact driver at 10 meters typical maximum levels
200 207
185 190
NA NA
Pile 14, 6/19/2006
Water – impact driver at 10 meters air bubble curtain lowered air bubble curtain raised
198 208
187 195
170 180
Pile 17 + re-strikes, 6/28/2006
Water – impact driver at 10 meters typical maximum levels
199 204
184 189
NA NA
Piles 18–22, 6/29/2006 Water – impact driver at 10 meters typical maximum levels
200 207
187 190
NA NA
* All piles were attenuated with the air bubble curtain system except for a brief test during Pile 5 ** 30-inch-diameter piles
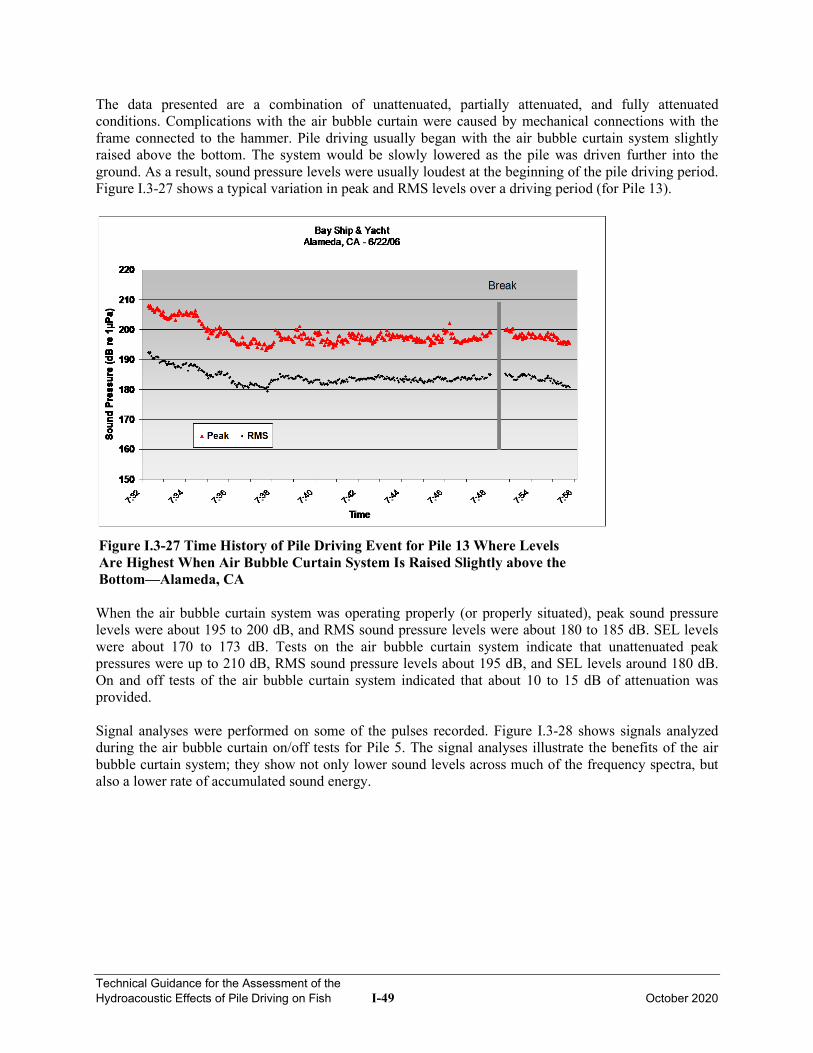
Technical Guidance for the Assessment of the Hydroacoustic Effects of Pile Driving on Fish I-49 October 2020
The data presented are a combination of unattenuated, partially attenuated, and fully attenuated conditions. Complications with the air bubble curtain were caused by mechanical connections with the frame connected to the hammer. Pile driving usually began with the air bubble curtain system slightly raised above the bottom. The system would be slowly lowered as the pile was driven further into the ground. As a result, sound pressure levels were usually loudest at the beginning of the pile driving period. Figure I.3-27 shows a typical variation in peak and RMS levels over a driving period (for Pile 13).
Figure I.3-27 Time History of Pile Driving Event for Pile 13 Where Levels Are Highest When Air Bubble Curtain System Is Raised Slightly above the Bottom—Alameda, CA When the air bubble curtain system was operating properly (or properly situated), peak sound pressure levels were about 195 to 200 dB, and RMS sound pressure levels were about 180 to 185 dB. SEL levels were about 170 to 173 dB. Tests on the air bubble curtain system indicate that unattenuated peak pressures were up to 210 dB, RMS sound pressure levels about 195 dB, and SEL levels around 180 dB. On and off tests of the air bubble curtain system indicated that about 10 to 15 dB of attenuation was provided. Signal analyses were performed on some of the pulses recorded. Figure I.3-28 shows signals analyzed during the air bubble curtain on/off tests for Pile 5. The signal analyses illustrate the benefits of the air bubble curtain system; they show not only lower sound levels across much of the frequency spectra, but also a lower rate of accumulated sound energy.
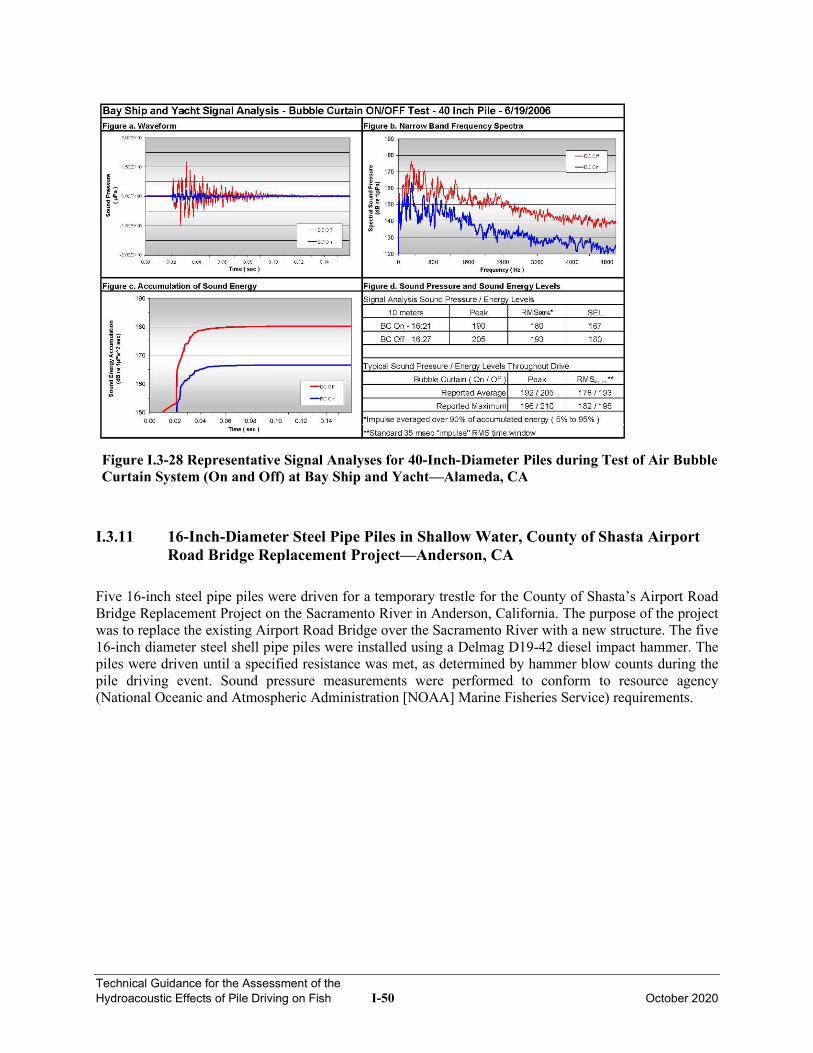
Technical Guidance for the Assessment of the Hydroacoustic Effects of Pile Driving on Fish I-50 October 2020
Figure I.3-28 Representative Signal Analyses for 40-Inch-Diameter Piles during Test of Air Bubble Curtain System (On and Off) at Bay Ship and Yacht—Alameda, CA
I.3.11 16-Inch-Diameter Steel Pipe Piles in Shallow Water, County of Shasta Airport Road Bridge Replacement Project—Anderson, CA
Five 16-inch steel pipe piles were driven for a temporary trestle for the County of Shasta’s Airport Road Bridge Replacement Project on the Sacramento River in Anderson, California. The purpose of the project was to replace the existing Airport Road Bridge over the Sacramento River with a new structure. The five 16-inch diameter steel shell pipe piles were installed using a Delmag D19-42 diesel impact hammer. The piles were driven until a specified resistance was met, as determined by hammer blow counts during the pile driving event. Sound pressure measurements were performed to conform to resource agency (National Oceanic and Atmospheric Administration [NOAA] Marine Fisheries Service) requirements.
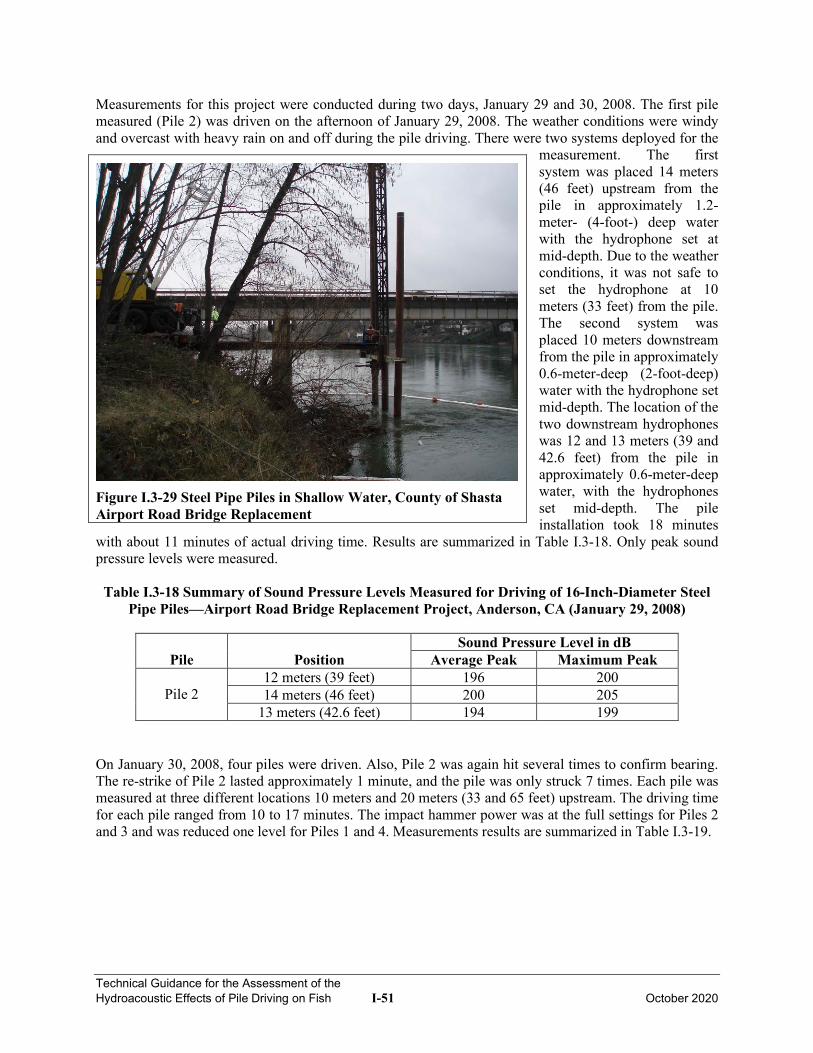
Technical Guidance for the Assessment of the Hydroacoustic Effects of Pile Driving on Fish I-51 October 2020
Measurements for this project were conducted during two days, January 29 and 30, 2008. The first pile measured (Pile 2) was driven on the afternoon of January 29, 2008. The weather conditions were windy and overcast with heavy rain on and off during the pile driving. There were two systems deployed for the
measurement. The first system was placed 14 meters (46 feet) upstream from the pile in approximately 1.2-meter- (4-foot-) deep water with the hydrophone set at mid-depth. Due to the weather conditions, it was not safe to set the hydrophone at 10 meters (33 feet) from the pile. The second system was placed 10 meters downstream from the pile in approximately 0.6-meter-deep (2-foot-deep) water with the hydrophone set mid-depth. The location of the two downstream hydrophones was 12 and 13 meters (39 and 42.6 feet) from the pile in approximately 0.6-meter-deep water, with the hydrophones set mid-depth. The pile installation took 18 minutes
with about 11 minutes of actual driving time. Results are summarized in Table I.3-18. Only peak sound pressure levels were measured.
Table I.3-18 Summary of Sound Pressure Levels Measured for Driving of 16-Inch-Diameter Steel Pipe Piles—Airport Road Bridge Replacement Project, Anderson, CA (January 29, 2008)
Pile Position Sound Pressure Level in dB
Average Peak Maximum Peak
Pile 2
12 meters (39 feet) 196 200 14 meters (46 feet) 200 205
13 meters (42.6 feet) 194 199
On January 30, 2008, four piles were driven. Also, Pile 2 was again hit several times to confirm bearing. The re-strike of Pile 2 lasted approximately 1 minute, and the pile was only struck 7 times. Each pile was measured at three different locations 10 meters and 20 meters (33 and 65 feet) upstream. The driving time for each pile ranged from 10 to 17 minutes. The impact hammer power was at the full settings for Piles 2 and 3 and was reduced one level for Piles 1 and 4. Measurements results are summarized in Table I.3-19.
Figure I.3-29 Steel Pipe Piles in Shallow Water, County of Shasta Airport Road Bridge Replacement
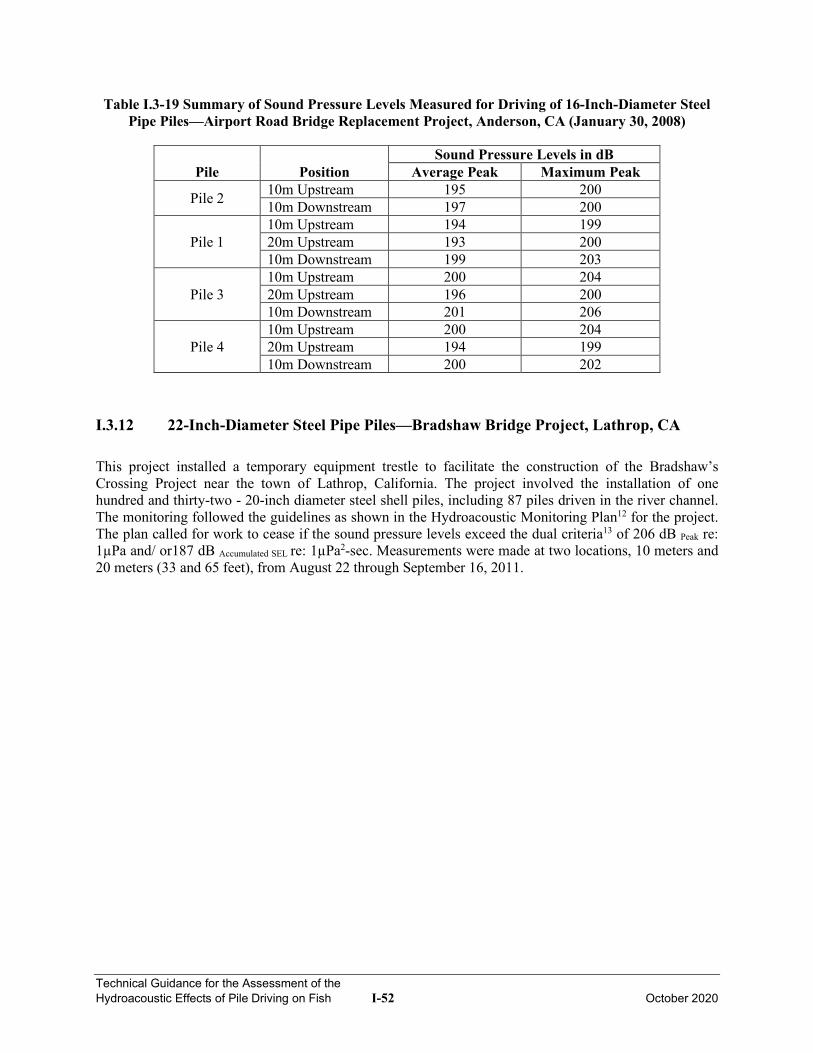
Technical Guidance for the Assessment of the Hydroacoustic Effects of Pile Driving on Fish I-52 October 2020
Table I.3-19 Summary of Sound Pressure Levels Measured for Driving of 16-Inch-Diameter Steel Pipe Piles—Airport Road Bridge Replacement Project, Anderson, CA (January 30, 2008)
Pile Position Sound Pressure Levels in dB
Average Peak Maximum Peak
Pile 2 10m Upstream 195 200 10m Downstream 197 200
Pile 1 10m Upstream 194 199 20m Upstream 193 200 10m Downstream 199 203
Pile 3 10m Upstream 200 204 20m Upstream 196 200 10m Downstream 201 206
Pile 4 10m Upstream 200 204 20m Upstream 194 199 10m Downstream 200 202
I.3.12 22-Inch-Diameter Steel Pipe Piles—Bradshaw Bridge Project, Lathrop, CA
This project installed a temporary equipment trestle to facilitate the construction of the Bradshaw’s Crossing Project near the town of Lathrop, California. The project involved the installation of one hundred and thirty-two - 20-inch diameter steel shell piles, including 87 piles driven in the river channel. The monitoring followed the guidelines as shown in the Hydroacoustic Monitoring Plan12 for the project. The plan called for work to cease if the sound pressure levels exceed the dual criteria13 of 206 dB Peak re: 1µPa and/ or187 dB Accumulated SEL re: 1µPa2-sec. Measurements were made at two locations, 10 meters and 20 meters (33 and 65 feet), from August 22 through September 16, 2011.
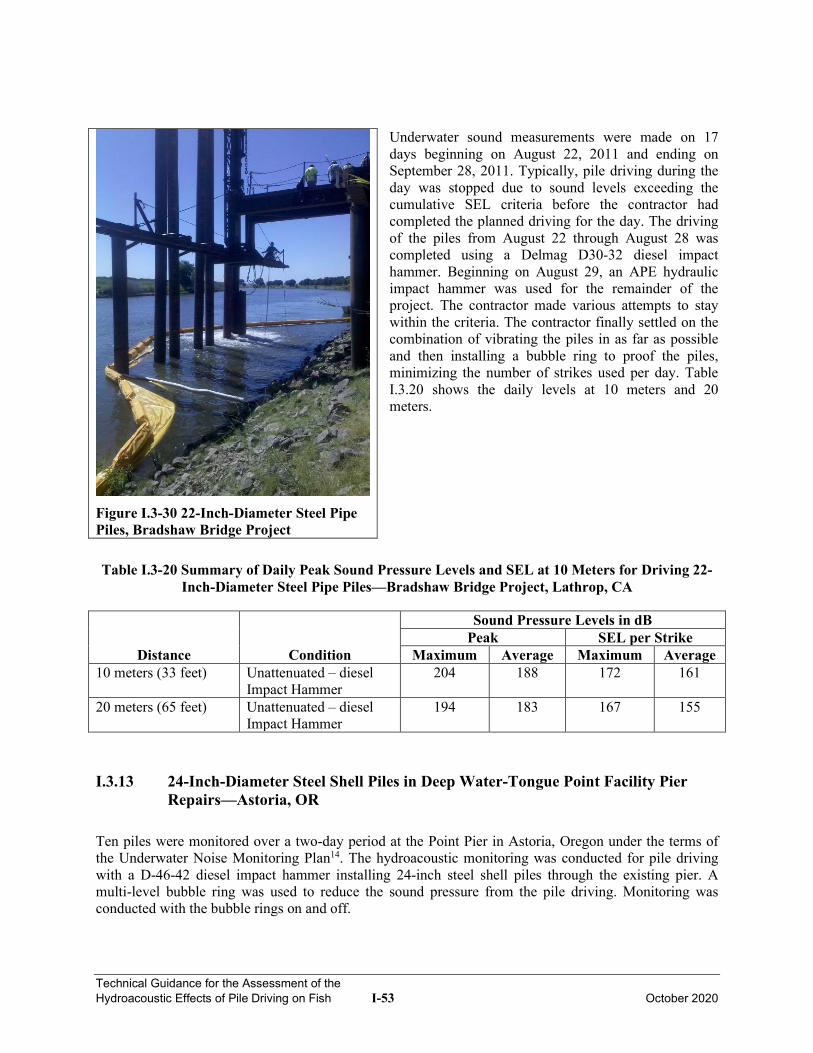
Technical Guidance for the Assessment of the Hydroacoustic Effects of Pile Driving on Fish I-53 October 2020
Underwater sound measurements were made on 17 days beginning on August 22, 2011 and ending on September 28, 2011. Typically, pile driving during the day was stopped due to sound levels exceeding the cumulative SEL criteria before the contractor had completed the planned driving for the day. The driving of the piles from August 22 through August 28 was completed using a Delmag D30-32 diesel impact hammer. Beginning on August 29, an APE hydraulic impact hammer was used for the remainder of the project. The contractor made various attempts to stay within the criteria. The contractor finally settled on the combination of vibrating the piles in as far as possible and then installing a bubble ring to proof the piles, minimizing the number of strikes used per day. Table I.3.20 shows the daily levels at 10 meters and 20 meters.
Table I.3-20 Summary of Daily Peak Sound Pressure Levels and SEL at 10 Meters for Driving 22-
Inch-Diameter Steel Pipe Piles—Bradshaw Bridge Project, Lathrop, CA
Distance Condition
Sound Pressure Levels in dB Peak SEL per Strike
Maximum Average Maximum Average 10 meters (33 feet) Unattenuated – diesel
Impact Hammer 204 188 172 161
20 meters (65 feet) Unattenuated – diesel Impact Hammer
194 183 167 155
I.3.13 24-Inch-Diameter Steel Shell Piles in Deep Water-Tongue Point Facility Pier Repairs—Astoria, OR
Ten piles were monitored over a two-day period at the Point Pier in Astoria, Oregon under the terms of the Underwater Noise Monitoring Plan14. The hydroacoustic monitoring was conducted for pile driving with a D-46-42 diesel impact hammer installing 24-inch steel shell piles through the existing pier. A multi-level bubble ring was used to reduce the sound pressure from the pile driving. Monitoring was conducted with the bubble rings on and off.
Figure I.3-30 22-Inch-Diameter Steel Pipe Piles, Bradshaw Bridge Project
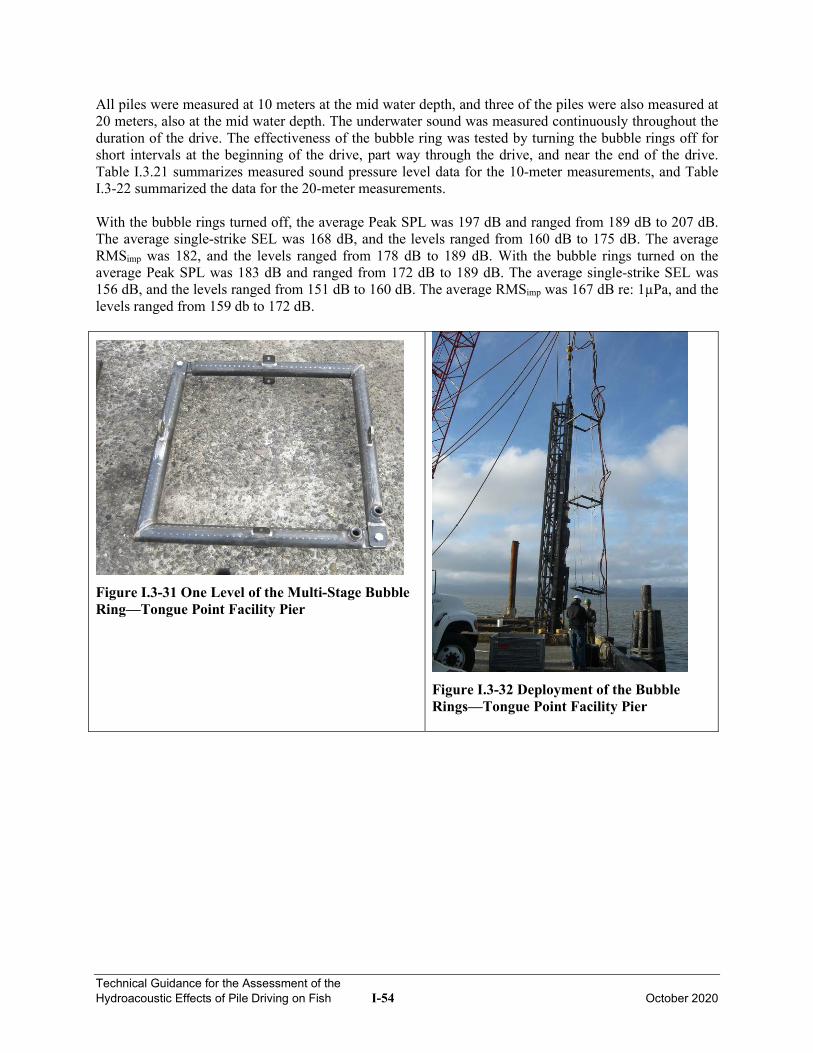
Technical Guidance for the Assessment of the Hydroacoustic Effects of Pile Driving on Fish I-54 October 2020
All piles were measured at 10 meters at the mid water depth, and three of the piles were also measured at 20 meters, also at the mid water depth. The underwater sound was measured continuously throughout the duration of the drive. The effectiveness of the bubble ring was tested by turning the bubble rings off for short intervals at the beginning of the drive, part way through the drive, and near the end of the drive. Table I.3.21 summarizes measured sound pressure level data for the 10-meter measurements, and Table I.3-22 summarized the data for the 20-meter measurements. With the bubble rings turned off, the average Peak SPL was 197 dB and ranged from 189 dB to 207 dB. The average single-strike SEL was 168 dB, and the levels ranged from 160 dB to 175 dB. The average RMSimp was 182, and the levels ranged from 178 dB to 189 dB. With the bubble rings turned on the average Peak SPL was 183 dB and ranged from 172 dB to 189 dB. The average single-strike SEL was 156 dB, and the levels ranged from 151 dB to 160 dB. The average RMSimp was 167 dB re: 1µPa, and the levels ranged from 159 db to 172 dB.
Figure I.3-31 One Level of the Multi-Stage Bubble Ring—Tongue Point Facility Pier
Figure I.3-32 Deployment of the Bubble Rings—Tongue Point Facility Pier
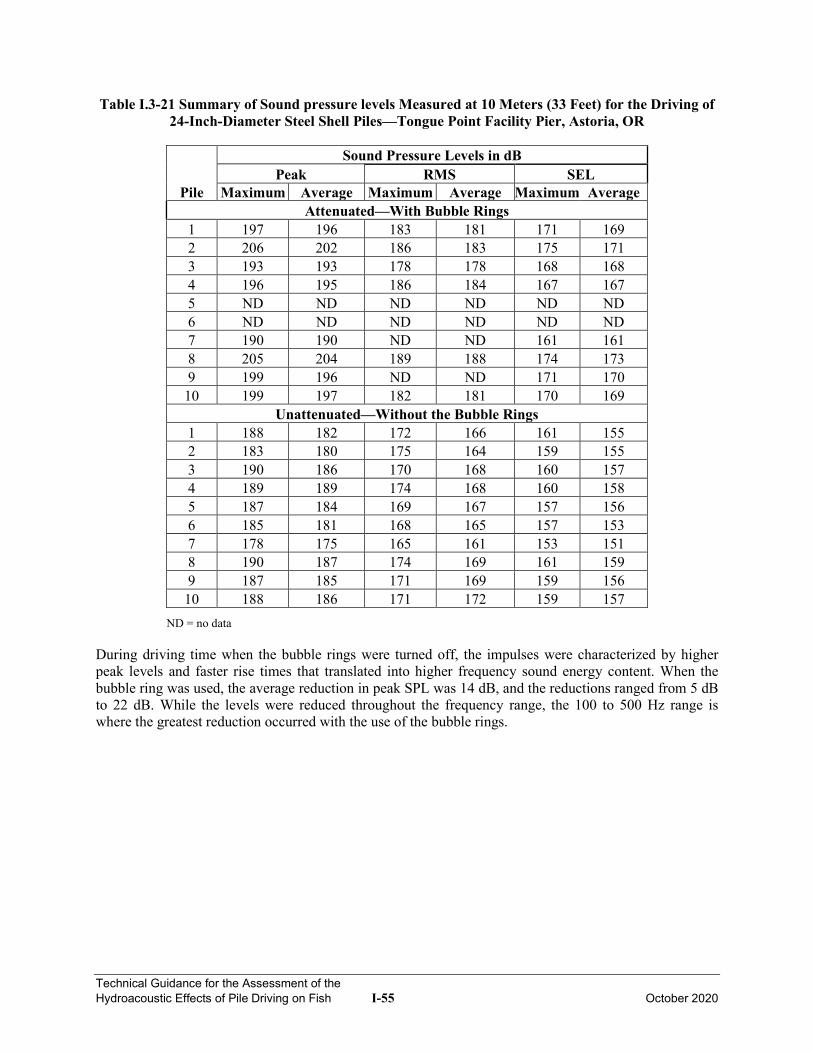
Technical Guidance for the Assessment of the Hydroacoustic Effects of Pile Driving on Fish I-55 October 2020
Table I.3-21 Summary of Sound pressure levels Measured at 10 Meters (33 Feet) for the Driving of 24-Inch-Diameter Steel Shell Piles—Tongue Point Facility Pier, Astoria, OR
Pile
Sound Pressure Levels in dB Peak RMS SEL
Maximum Average Maximum Average Maximum Average Attenuated—With Bubble Rings
1 197 196 183 181 171 169 2 206 202 186 183 175 171 3 193 193 178 178 168 168 4 196 195 186 184 167 167 5 ND ND ND ND ND ND 6 ND ND ND ND ND ND 7 190 190 ND ND 161 161 8 205 204 189 188 174 173 9 199 196 ND ND 171 170 10 199 197 182 181 170 169
Unattenuated—Without the Bubble Rings 1 188 182 172 166 161 155 2 183 180 175 164 159 155 3 190 186 170 168 160 157 4 189 189 174 168 160 158 5 187 184 169 167 157 156 6 185 181 168 165 157 153 7 178 175 165 161 153 151 8 190 187 174 169 161 159 9 187 185 171 169 159 156 10 188 186 171 172 159 157
ND = no data
During driving time when the bubble rings were turned off, the impulses were characterized by higher peak levels and faster rise times that translated into higher frequency sound energy content. When the bubble ring was used, the average reduction in peak SPL was 14 dB, and the reductions ranged from 5 dB to 22 dB. While the levels were reduced throughout the frequency range, the 100 to 500 Hz range is where the greatest reduction occurred with the use of the bubble rings.
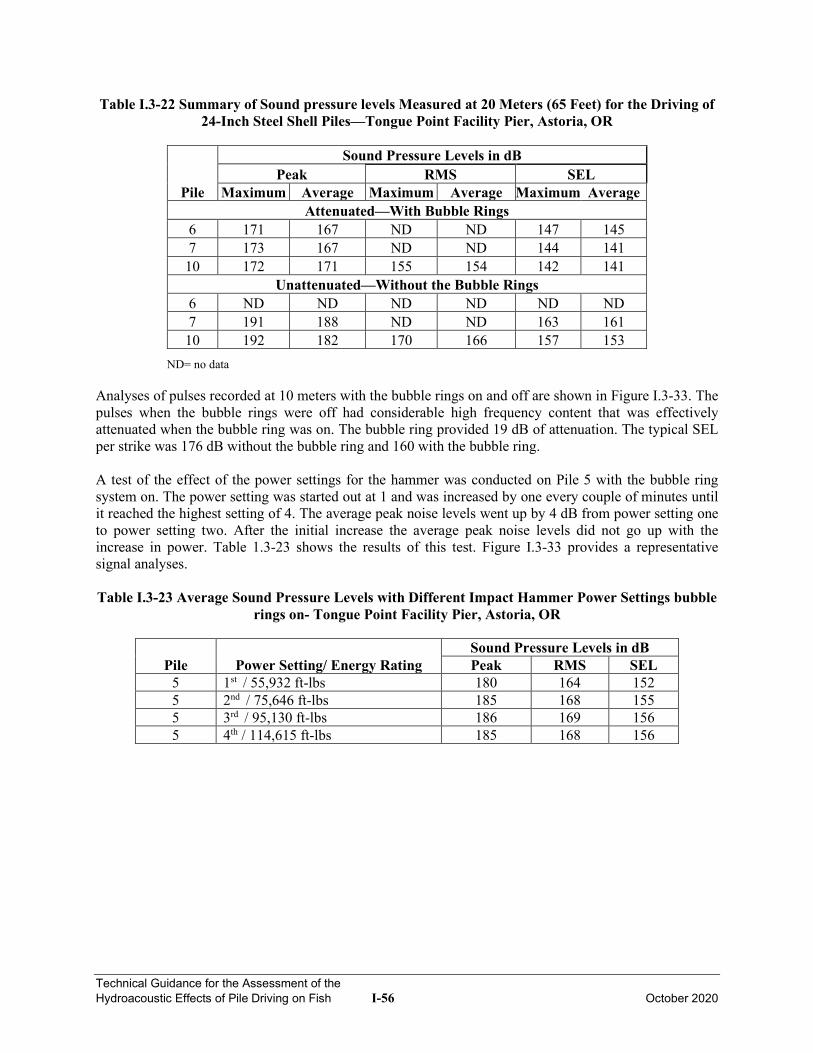
Technical Guidance for the Assessment of the Hydroacoustic Effects of Pile Driving on Fish I-56 October 2020
Table I.3-22 Summary of Sound pressure levels Measured at 20 Meters (65 Feet) for the Driving of 24-Inch Steel Shell Piles—Tongue Point Facility Pier, Astoria, OR
Pile
Sound Pressure Levels in dB Peak RMS SEL
Maximum Average Maximum Average Maximum Average Attenuated—With Bubble Rings
6 171 167 ND ND 147 145 7 173 167 ND ND 144 141
10 172 171 155 154 142 141 Unattenuated—Without the Bubble Rings
6 ND ND ND ND ND ND 7 191 188 ND ND 163 161
10 192 182 170 166 157 153 ND= no data
Analyses of pulses recorded at 10 meters with the bubble rings on and off are shown in Figure I.3-33. The pulses when the bubble rings were off had considerable high frequency content that was effectively attenuated when the bubble ring was on. The bubble ring provided 19 dB of attenuation. The typical SEL per strike was 176 dB without the bubble ring and 160 with the bubble ring. A test of the effect of the power settings for the hammer was conducted on Pile 5 with the bubble ring system on. The power setting was started out at 1 and was increased by one every couple of minutes until it reached the highest setting of 4. The average peak noise levels went up by 4 dB from power setting one to power setting two. After the initial increase the average peak noise levels did not go up with the increase in power. Table 1.3-23 shows the results of this test. Figure I.3-33 provides a representative signal analyses. Table I.3-23 Average Sound Pressure Levels with Different Impact Hammer Power Settings bubble
rings on- Tongue Point Facility Pier, Astoria, OR
Pile Power Setting/ Energy Rating Sound Pressure Levels in dB Peak RMS SEL
5 1st / 55,932 ft-lbs 180 164 152 5 2nd / 75,646 ft-lbs 185 168 155 5 3rd / 95,130 ft-lbs 186 169 156 5 4th / 114,615 ft-lbs 185 168 156
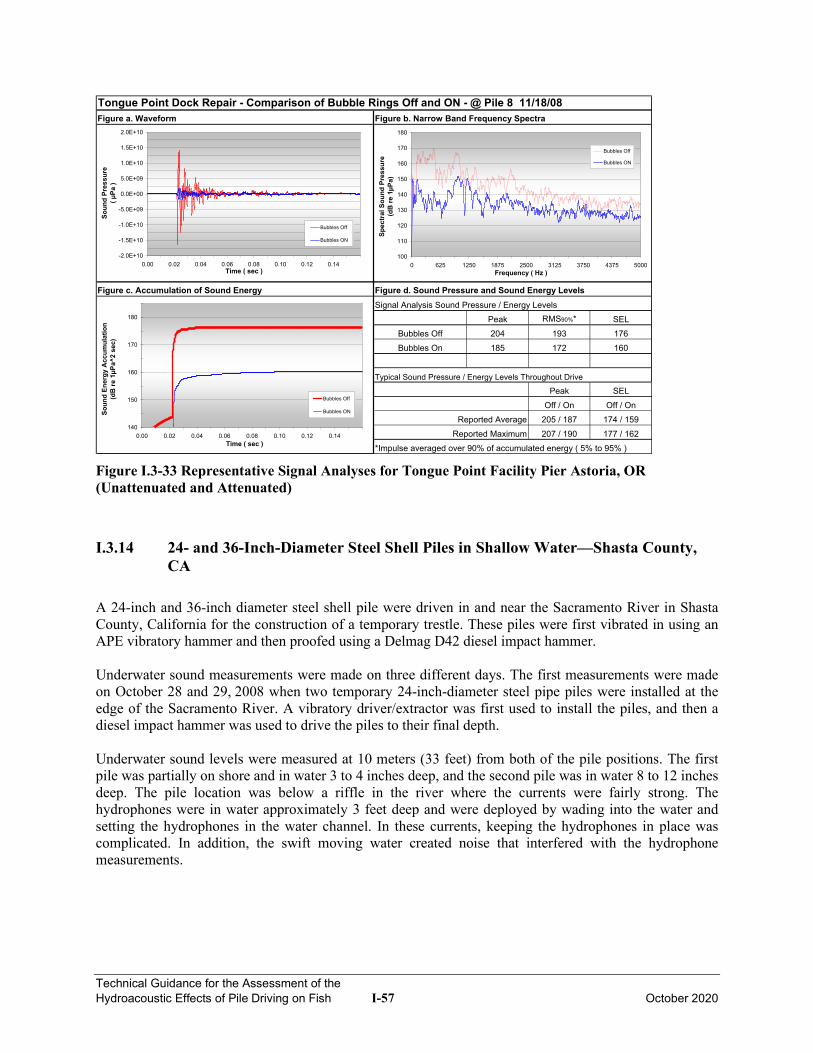
Technical Guidance for the Assessment of the Hydroacoustic Effects of Pile Driving on Fish I-57 October 2020
Peak RMS90%* SELBubbles Off 204 193 176Bubbles On 185 172 160
Peak SELOff / On Off / On
205 / 187 174 / 159207 / 190 177 / 162
Reported AverageReported Maximum
*Impulse averaged over 90% of accumulated energy ( 5% to 95% )
Tongue Point Dock Repair - Comparison of Bubble Rings Off and ON - @ Pile 8 11/18/08Figure a. Waveform Figure b. Narrow Band Frequency Spectra
Figure c. Accumulation of Sound Energy Figure d. Sound Pressure and Sound Energy LevelsSignal Analysis Sound Pressure / Energy Levels
Typical Sound Pressure / Energy Levels Throughout Drive
-2.0E+10
-1.5E+10
-1.0E+10
-5.0E+09
0.0E+00
5.0E+09
1.0E+10
1.5E+10
2.0E+10
0.00 0.02 0.04 0.06 0.08 0.10 0.12 0.14Time ( sec )
Soun
d Pr
essu
re
( µPa
)
Bubbles Off
Bubbles ON
100
110
120
130
140
150
160
170
180
0 625 1250 1875 2500 3125 3750 4375 5000Frequency ( Hz )
Spec
tral
Sou
nd P
ress
ure
(dB
re 1
µPa)
Bubbles Off
Bubbles ON
140
150
160
170
180
0.00 0.02 0.04 0.06 0.08 0.10 0.12 0.14Time ( sec )
Soun
d En
ergy
Acc
umul
atio
n (d
B re
1µP
a^2
sec)
Bubbles Off
Bubbles ON
Figure I.3-33 Representative Signal Analyses for Tongue Point Facility Pier Astoria, OR (Unattenuated and Attenuated)
I.3.14 24- and 36-Inch-Diameter Steel Shell Piles in Shallow Water—Shasta County, CA
A 24-inch and 36-inch diameter steel shell pile were driven in and near the Sacramento River in Shasta County, California for the construction of a temporary trestle. These piles were first vibrated in using an APE vibratory hammer and then proofed using a Delmag D42 diesel impact hammer. Underwater sound measurements were made on three different days. The first measurements were made on October 28 and 29, 2008 when two temporary 24-inch-diameter steel pipe piles were installed at the edge of the Sacramento River. A vibratory driver/extractor was first used to install the piles, and then a diesel impact hammer was used to drive the piles to their final depth. Underwater sound levels were measured at 10 meters (33 feet) from both of the pile positions. The first pile was partially on shore and in water 3 to 4 inches deep, and the second pile was in water 8 to 12 inches deep. The pile location was below a riffle in the river where the currents were fairly strong. The hydrophones were in water approximately 3 feet deep and were deployed by wading into the water and setting the hydrophones in the water channel. In these currents, keeping the hydrophones in place was complicated. In addition, the swift moving water created noise that interfered with the hydrophone measurements.
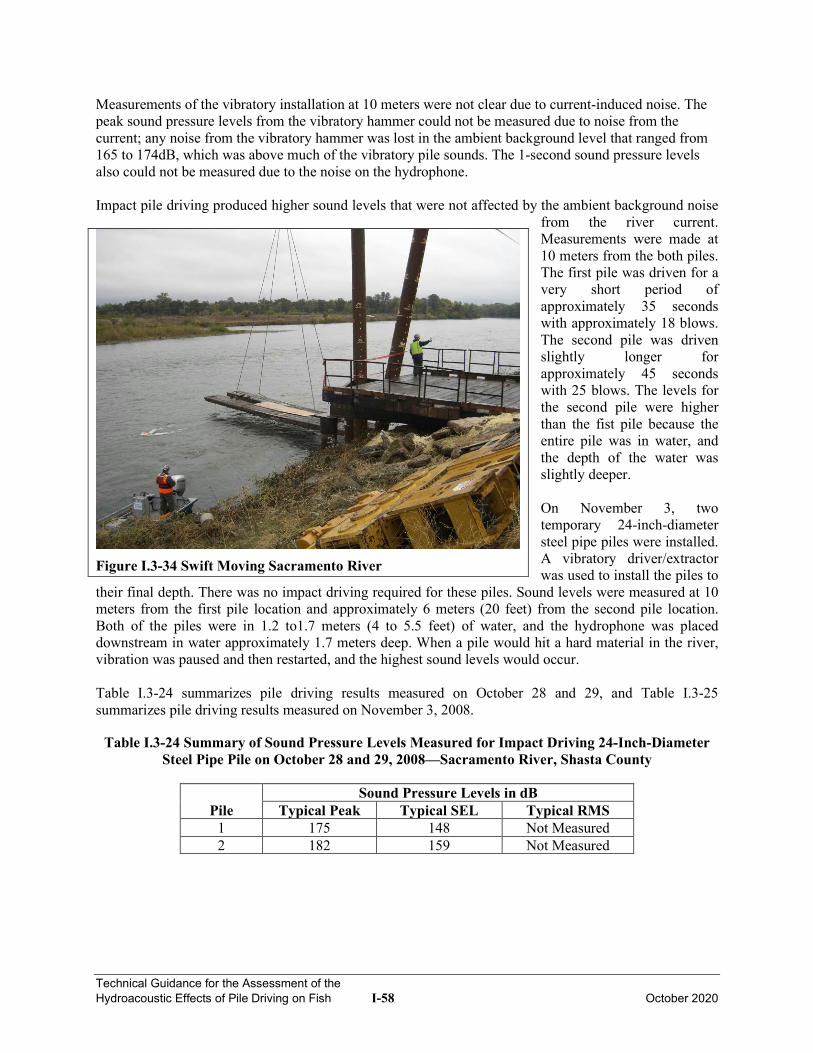
Technical Guidance for the Assessment of the Hydroacoustic Effects of Pile Driving on Fish I-58 October 2020
Measurements of the vibratory installation at 10 meters were not clear due to current-induced noise. The peak sound pressure levels from the vibratory hammer could not be measured due to noise from the current; any noise from the vibratory hammer was lost in the ambient background level that ranged from 165 to 174dB, which was above much of the vibratory pile sounds. The 1-second sound pressure levels also could not be measured due to the noise on the hydrophone. Impact pile driving produced higher sound levels that were not affected by the ambient background noise
from the river current. Measurements were made at 10 meters from the both piles. The first pile was driven for a very short period of approximately 35 seconds with approximately 18 blows. The second pile was driven slightly longer for approximately 45 seconds with 25 blows. The levels for the second pile were higher than the fist pile because the entire pile was in water, and the depth of the water was slightly deeper. On November 3, two temporary 24-inch-diameter steel pipe piles were installed. A vibratory driver/extractor was used to install the piles to
their final depth. There was no impact driving required for these piles. Sound levels were measured at 10 meters from the first pile location and approximately 6 meters (20 feet) from the second pile location. Both of the piles were in 1.2 to1.7 meters (4 to 5.5 feet) of water, and the hydrophone was placed downstream in water approximately 1.7 meters deep. When a pile would hit a hard material in the river, vibration was paused and then restarted, and the highest sound levels would occur. Table I.3-24 summarizes pile driving results measured on October 28 and 29, and Table I.3-25 summarizes pile driving results measured on November 3, 2008.
Table I.3-24 Summary of Sound Pressure Levels Measured for Impact Driving 24-Inch-Diameter Steel Pipe Pile on October 28 and 29, 2008—Sacramento River, Shasta County
Pile Sound Pressure Levels in dB
Typical Peak Typical SEL Typical RMS 1 175 148 Not Measured 2 182 159 Not Measured
Figure I.3-34 Swift Moving Sacramento River
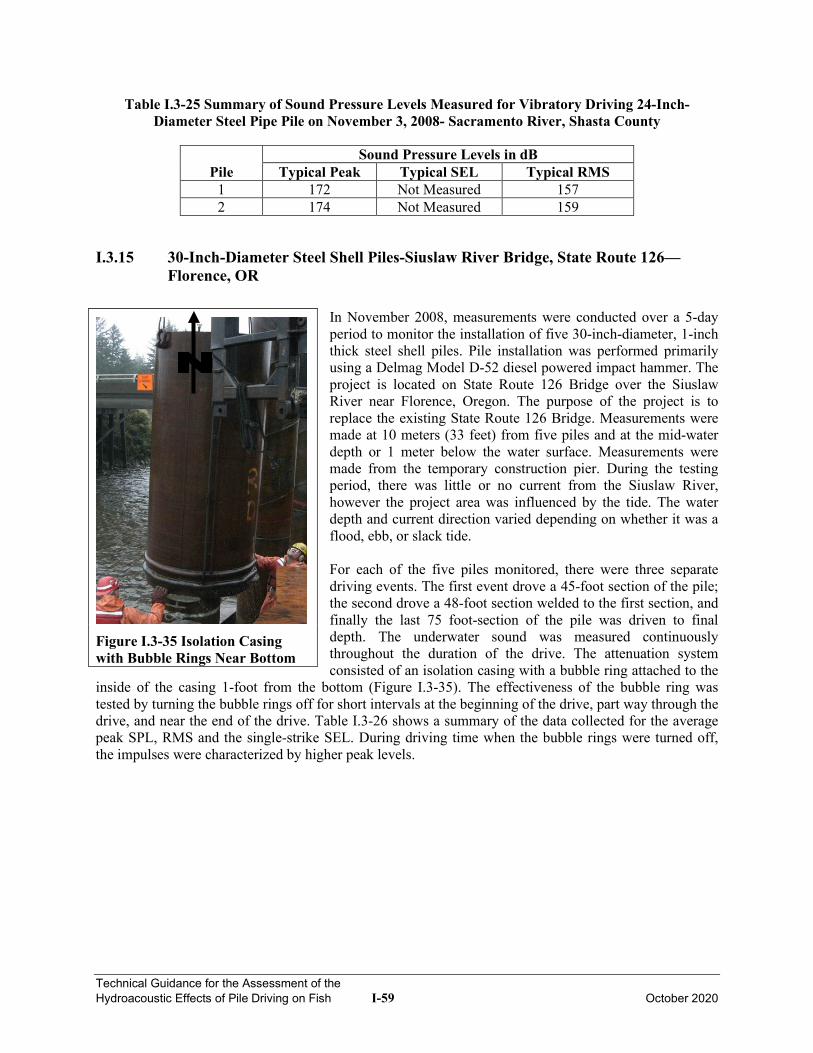
Technical Guidance for the Assessment of the Hydroacoustic Effects of Pile Driving on Fish I-59 October 2020
Table I.3-25 Summary of Sound Pressure Levels Measured for Vibratory Driving 24-Inch-Diameter Steel Pipe Pile on November 3, 2008- Sacramento River, Shasta County
Pile Sound Pressure Levels in dB
Typical Peak Typical SEL Typical RMS 1 172 Not Measured 157 2 174 Not Measured 159
I.3.15 30-Inch-Diameter Steel Shell Piles-Siuslaw River Bridge, State Route 126—Florence, OR
In November 2008, measurements were conducted over a 5-day period to monitor the installation of five 30-inch-diameter, 1-inch thick steel shell piles. Pile installation was performed primarily using a Delmag Model D-52 diesel powered impact hammer. The project is located on State Route 126 Bridge over the Siuslaw River near Florence, Oregon. The purpose of the project is to replace the existing State Route 126 Bridge. Measurements were made at 10 meters (33 feet) from five piles and at the mid-water depth or 1 meter below the water surface. Measurements were made from the temporary construction pier. During the testing period, there was little or no current from the Siuslaw River, however the project area was influenced by the tide. The water depth and current direction varied depending on whether it was a flood, ebb, or slack tide. For each of the five piles monitored, there were three separate driving events. The first event drove a 45-foot section of the pile; the second drove a 48-foot section welded to the first section, and finally the last 75 foot-section of the pile was driven to final depth. The underwater sound was measured continuously throughout the duration of the drive. The attenuation system consisted of an isolation casing with a bubble ring attached to the
inside of the casing 1-foot from the bottom (Figure I.3-35). The effectiveness of the bubble ring was tested by turning the bubble rings off for short intervals at the beginning of the drive, part way through the drive, and near the end of the drive. Table I.3-26 shows a summary of the data collected for the average peak SPL, RMS and the single-strike SEL. During driving time when the bubble rings were turned off, the impulses were characterized by higher peak levels.
Figure I.3-35 Isolation Casing with Bubble Rings Near Bottom
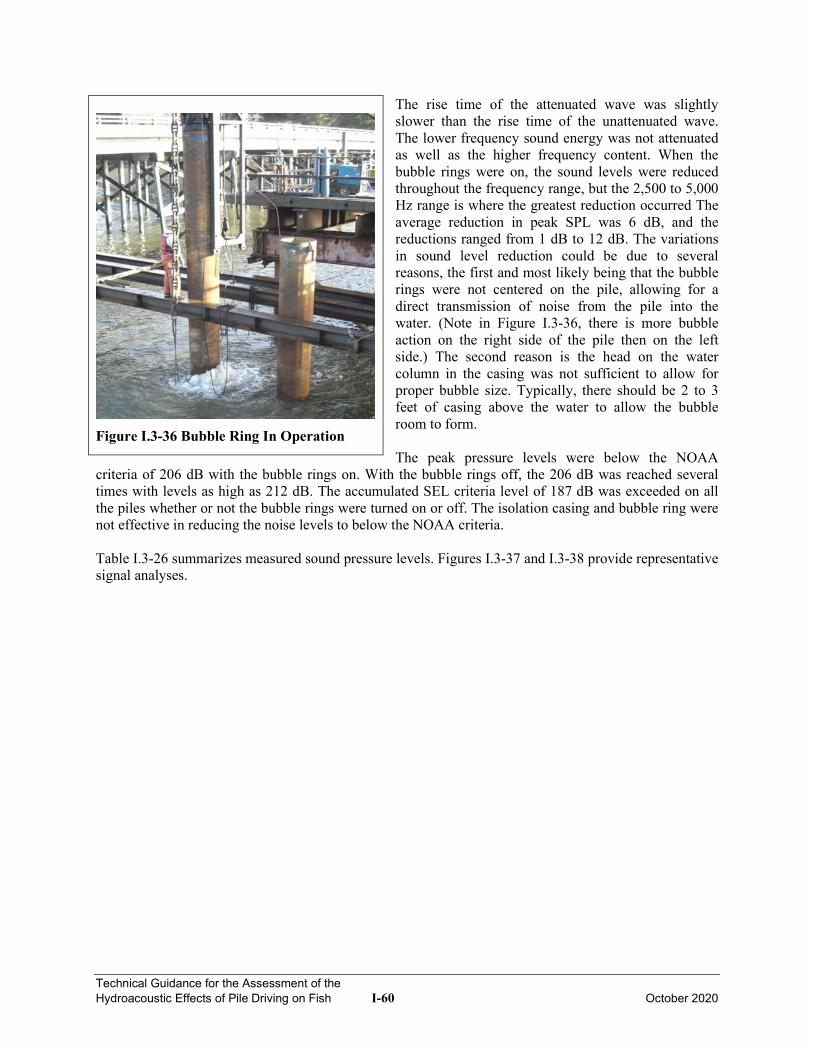
Technical Guidance for the Assessment of the Hydroacoustic Effects of Pile Driving on Fish I-60 October 2020
The rise time of the attenuated wave was slightly slower than the rise time of the unattenuated wave. The lower frequency sound energy was not attenuated as well as the higher frequency content. When the bubble rings were on, the sound levels were reduced throughout the frequency range, but the 2,500 to 5,000 Hz range is where the greatest reduction occurred The average reduction in peak SPL was 6 dB, and the reductions ranged from 1 dB to 12 dB. The variations in sound level reduction could be due to several reasons, the first and most likely being that the bubble rings were not centered on the pile, allowing for a direct transmission of noise from the pile into the water. (Note in Figure I.3-36, there is more bubble action on the right side of the pile then on the left side.) The second reason is the head on the water column in the casing was not sufficient to allow for proper bubble size. Typically, there should be 2 to 3 feet of casing above the water to allow the bubble room to form. The peak pressure levels were below the NOAA
criteria of 206 dB with the bubble rings on. With the bubble rings off, the 206 dB was reached several times with levels as high as 212 dB. The accumulated SEL criteria level of 187 dB was exceeded on all the piles whether or not the bubble rings were turned on or off. The isolation casing and bubble ring were not effective in reducing the noise levels to below the NOAA criteria. Table I.3-26 summarizes measured sound pressure levels. Figures I.3-37 and I.3-38 provide representative signal analyses.
Figure I.3-36 Bubble Ring In Operation
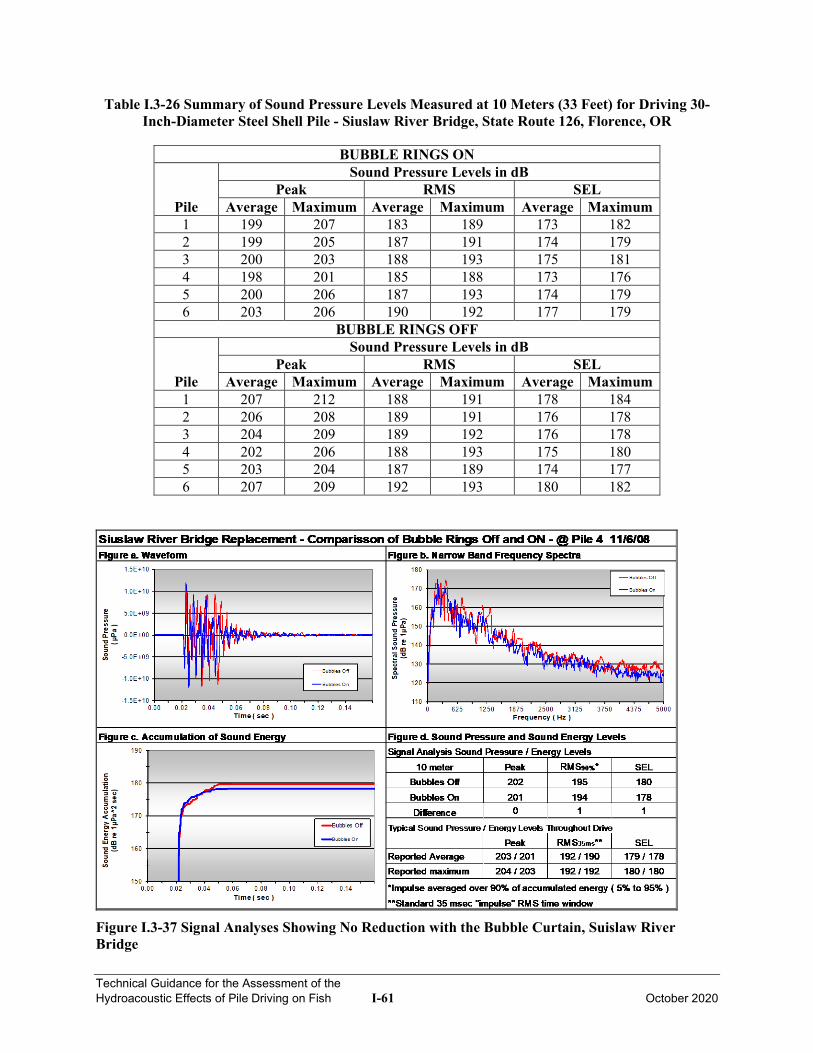
Technical Guidance for the Assessment of the Hydroacoustic Effects of Pile Driving on Fish I-61 October 2020
Table I.3-26 Summary of Sound Pressure Levels Measured at 10 Meters (33 Feet) for Driving 30-Inch-Diameter Steel Shell Pile - Siuslaw River Bridge, State Route 126, Florence, OR
BUBBLE RINGS ON
Pile
Sound Pressure Levels in dB Peak RMS SEL
Average Maximum Average Maximum Average Maximum 1 199 207 183 189 173 182 2 199 205 187 191 174 179 3 200 203 188 193 175 181 4 198 201 185 188 173 176 5 200 206 187 193 174 179 6 203 206 190 192 177 179
BUBBLE RINGS OFF
Pile
Sound Pressure Levels in dB Peak RMS SEL
Average Maximum Average Maximum Average Maximum 1 207 212 188 191 178 184 2 206 208 189 191 176 178 3 204 209 189 192 176 178 4 202 206 188 193 175 180 5 203 204 187 189 174 177 6 207 209 192 193 180 182
Figure I.3-37 Signal Analyses Showing No Reduction with the Bubble Curtain, Suislaw River Bridge
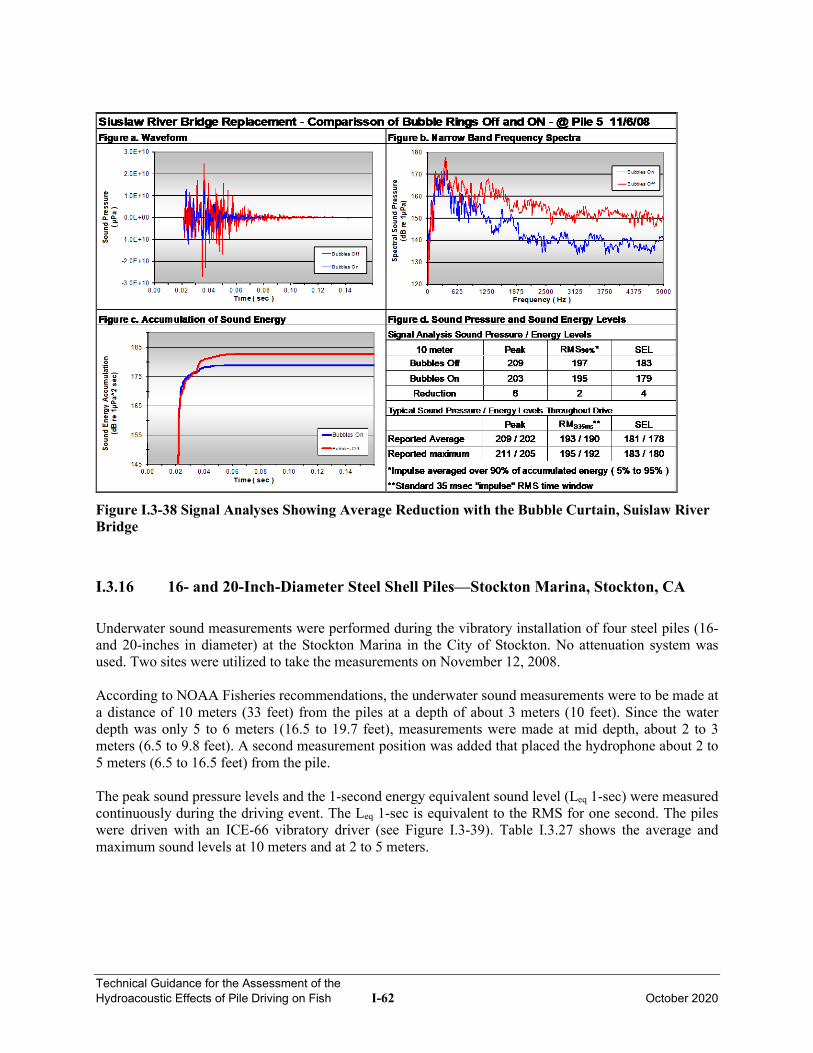
Technical Guidance for the Assessment of the Hydroacoustic Effects of Pile Driving on Fish I-62 October 2020
Figure I.3-38 Signal Analyses Showing Average Reduction with the Bubble Curtain, Suislaw River Bridge
I.3.16 16- and 20-Inch-Diameter Steel Shell Piles—Stockton Marina, Stockton, CA
Underwater sound measurements were performed during the vibratory installation of four steel piles (16- and 20-inches in diameter) at the Stockton Marina in the City of Stockton. No attenuation system was used. Two sites were utilized to take the measurements on November 12, 2008. According to NOAA Fisheries recommendations, the underwater sound measurements were to be made at a distance of 10 meters (33 feet) from the piles at a depth of about 3 meters (10 feet). Since the water depth was only 5 to 6 meters (16.5 to 19.7 feet), measurements were made at mid depth, about 2 to 3 meters (6.5 to 9.8 feet). A second measurement position was added that placed the hydrophone about 2 to 5 meters (6.5 to 16.5 feet) from the pile. The peak sound pressure levels and the 1-second energy equivalent sound level (Leq 1-sec) were measured continuously during the driving event. The Leq 1-sec is equivalent to the RMS for one second. The piles were driven with an ICE-66 vibratory driver (see Figure I.3-39). Table I.3.27 shows the average and maximum sound levels at 10 meters and at 2 to 5 meters.
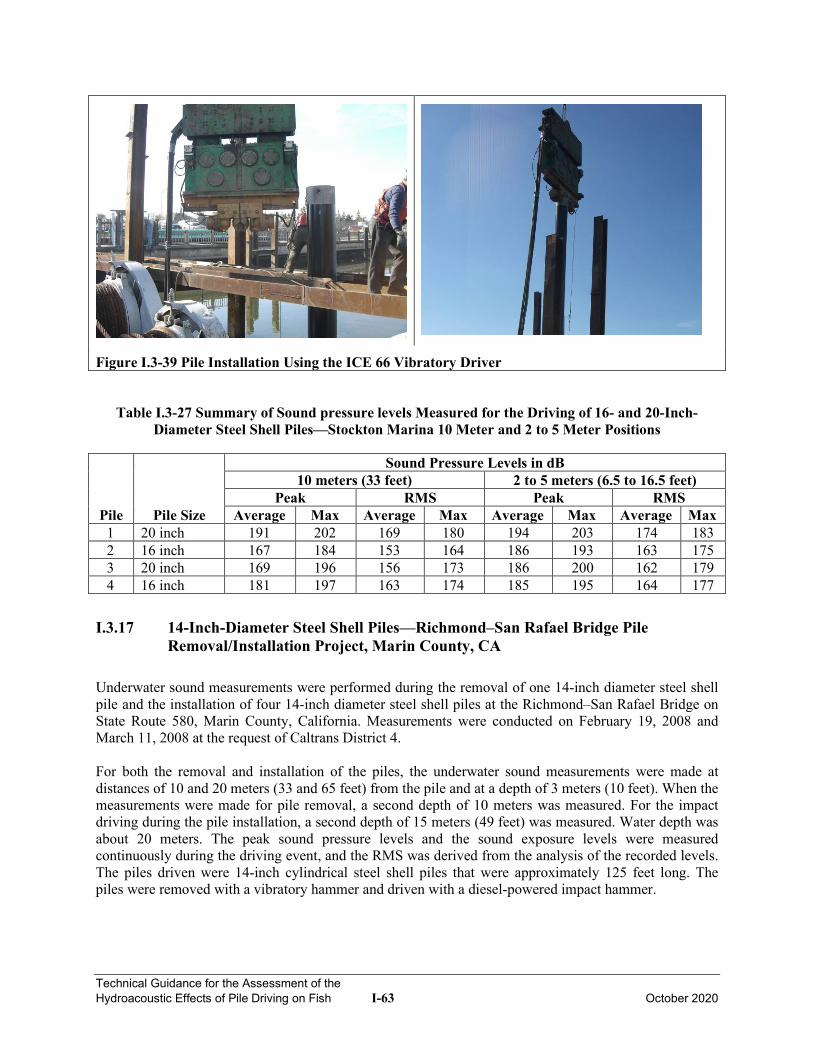
Technical Guidance for the Assessment of the Hydroacoustic Effects of Pile Driving on Fish I-63 October 2020
Figure I.3-39 Pile Installation Using the ICE 66 Vibratory Driver
Table I.3-27 Summary of Sound pressure levels Measured for the Driving of 16- and 20-Inch-Diameter Steel Shell Piles—Stockton Marina 10 Meter and 2 to 5 Meter Positions
Pile Pile Size
Sound Pressure Levels in dB 10 meters (33 feet) 2 to 5 meters (6.5 to 16.5 feet)
Peak RMS Peak RMS Average Max Average Max Average Max Average Max
1 20 inch 191 202 169 180 194 203 174 183 2 16 inch 167 184 153 164 186 193 163 175 3 20 inch 169 196 156 173 186 200 162 179 4 16 inch 181 197 163 174 185 195 164 177
I.3.17 14-Inch-Diameter Steel Shell Piles—Richmond–San Rafael Bridge Pile Removal/Installation Project, Marin County, CA
Underwater sound measurements were performed during the removal of one 14-inch diameter steel shell pile and the installation of four 14-inch diameter steel shell piles at the Richmond–San Rafael Bridge on State Route 580, Marin County, California. Measurements were conducted on February 19, 2008 and March 11, 2008 at the request of Caltrans District 4. For both the removal and installation of the piles, the underwater sound measurements were made at distances of 10 and 20 meters (33 and 65 feet) from the pile and at a depth of 3 meters (10 feet). When the measurements were made for pile removal, a second depth of 10 meters was measured. For the impact driving during the pile installation, a second depth of 15 meters (49 feet) was measured. Water depth was about 20 meters. The peak sound pressure levels and the sound exposure levels were measured continuously during the driving event, and the RMS was derived from the analysis of the recorded levels. The piles driven were 14-inch cylindrical steel shell piles that were approximately 125 feet long. The piles were removed with a vibratory hammer and driven with a diesel-powered impact hammer.
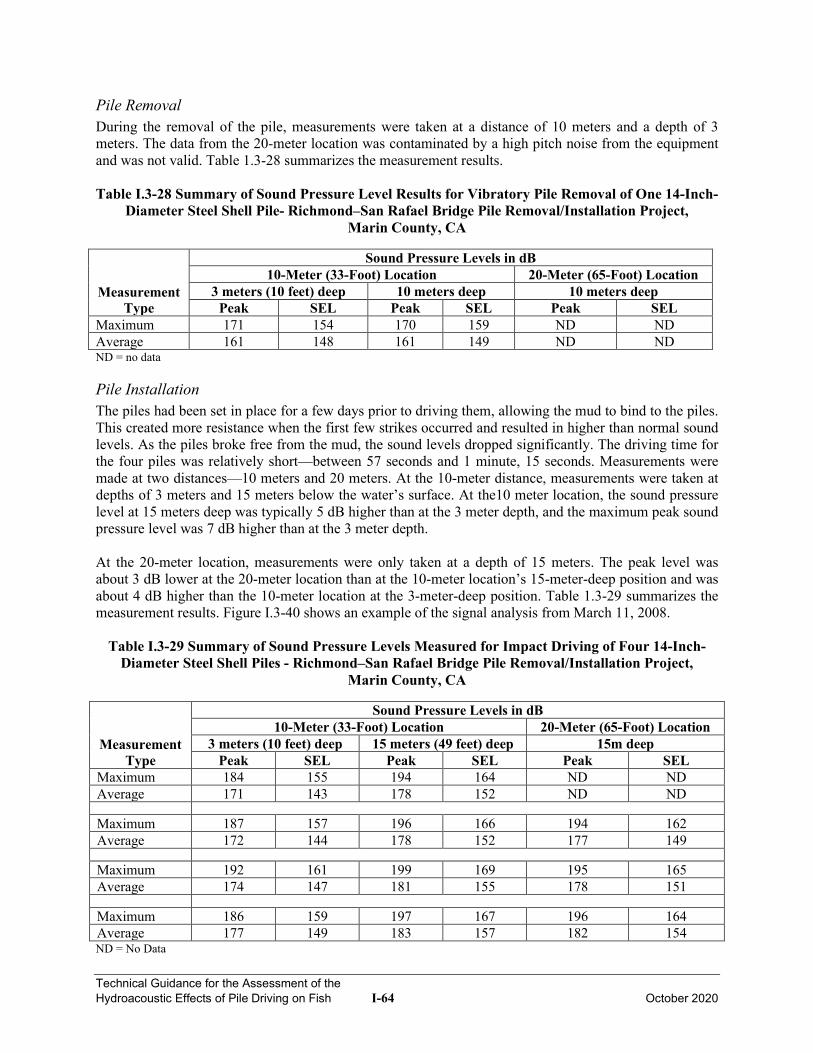
Technical Guidance for the Assessment of the Hydroacoustic Effects of Pile Driving on Fish I-64 October 2020
Pile Removal During the removal of the pile, measurements were taken at a distance of 10 meters and a depth of 3 meters. The data from the 20-meter location was contaminated by a high pitch noise from the equipment and was not valid. Table 1.3-28 summarizes the measurement results. Table I.3-28 Summary of Sound Pressure Level Results for Vibratory Pile Removal of One 14-Inch-
Diameter Steel Shell Pile- Richmond–San Rafael Bridge Pile Removal/Installation Project, Marin County, CA
Measurement Type
Sound Pressure Levels in dB 10-Meter (33-Foot) Location 20-Meter (65-Foot) Location
3 meters (10 feet) deep 10 meters deep 10 meters deep Peak SEL Peak SEL Peak SEL
Maximum 171 154 170 159 ND ND Average 161 148 161 149 ND ND ND = no data
Pile Installation The piles had been set in place for a few days prior to driving them, allowing the mud to bind to the piles. This created more resistance when the first few strikes occurred and resulted in higher than normal sound levels. As the piles broke free from the mud, the sound levels dropped significantly. The driving time for the four piles was relatively short—between 57 seconds and 1 minute, 15 seconds. Measurements were made at two distances—10 meters and 20 meters. At the 10-meter distance, measurements were taken at depths of 3 meters and 15 meters below the water’s surface. At the10 meter location, the sound pressure level at 15 meters deep was typically 5 dB higher than at the 3 meter depth, and the maximum peak sound pressure level was 7 dB higher than at the 3 meter depth. At the 20-meter location, measurements were only taken at a depth of 15 meters. The peak level was about 3 dB lower at the 20-meter location than at the 10-meter location’s 15-meter-deep position and was about 4 dB higher than the 10-meter location at the 3-meter-deep position. Table 1.3-29 summarizes the measurement results. Figure I.3-40 shows an example of the signal analysis from March 11, 2008.
Table I.3-29 Summary of Sound Pressure Levels Measured for Impact Driving of Four 14-Inch-Diameter Steel Shell Piles - Richmond–San Rafael Bridge Pile Removal/Installation Project,
Marin County, CA
Measurement Type
Sound Pressure Levels in dB 10-Meter (33-Foot) Location 20-Meter (65-Foot) Location
3 meters (10 feet) deep 15 meters (49 feet) deep 15m deep Peak SEL Peak SEL Peak SEL
Maximum 184 155 194 164 ND ND Average 171 143 178 152 ND ND
Maximum 187 157 196 166 194 162 Average 172 144 178 152 177 149
Maximum 192 161 199 169 195 165 Average 174 147 181 155 178 151
Maximum 186 159 197 167 196 164 Average 177 149 183 157 182 154 ND = No Data
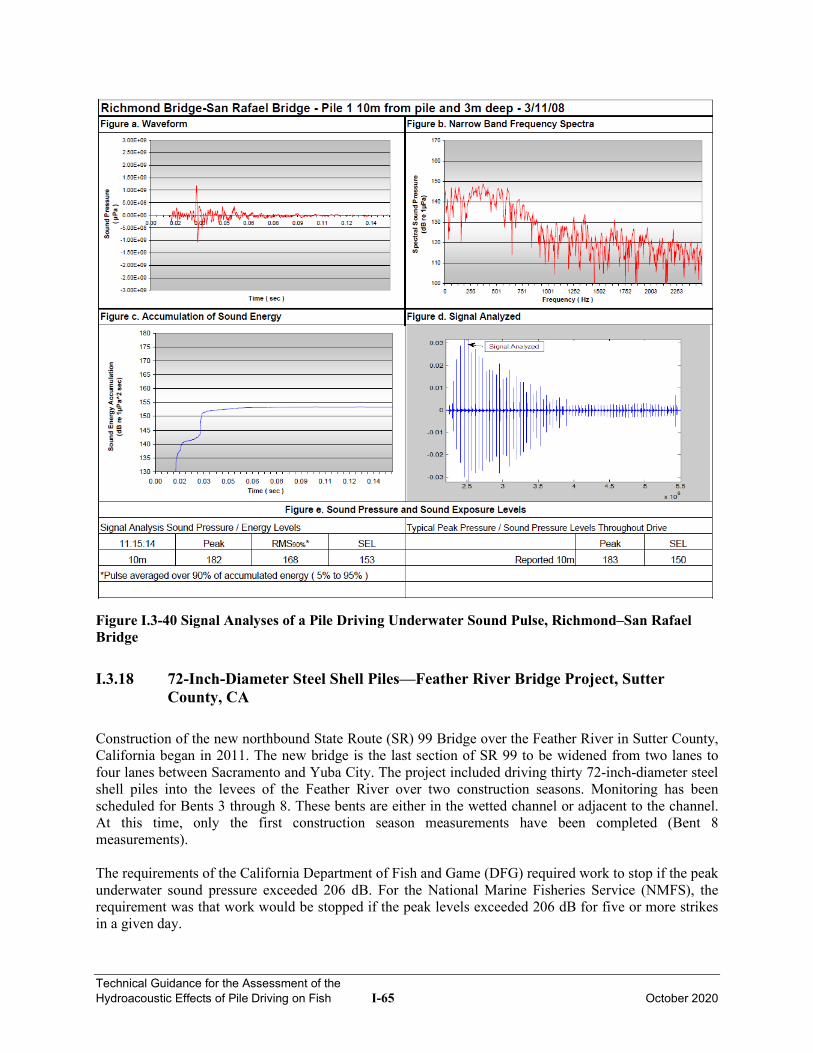
Technical Guidance for the Assessment of the Hydroacoustic Effects of Pile Driving on Fish I-65 October 2020
Figure I.3-40 Signal Analyses of a Pile Driving Underwater Sound Pulse, Richmond–San Rafael Bridge
I.3.18 72-Inch-Diameter Steel Shell Piles—Feather River Bridge Project, Sutter County, CA
Construction of the new northbound State Route (SR) 99 Bridge over the Feather River in Sutter County, California began in 2011. The new bridge is the last section of SR 99 to be widened from two lanes to four lanes between Sacramento and Yuba City. The project included driving thirty 72-inch-diameter steel shell piles into the levees of the Feather River over two construction seasons. Monitoring has been scheduled for Bents 3 through 8. These bents are either in the wetted channel or adjacent to the channel. At this time, only the first construction season measurements have been completed (Bent 8 measurements). The requirements of the California Department of Fish and Game (DFG) required work to stop if the peak underwater sound pressure exceeded 206 dB. For the National Marine Fisheries Service (NMFS), the requirement was that work would be stopped if the peak levels exceeded 206 dB for five or more strikes in a given day.
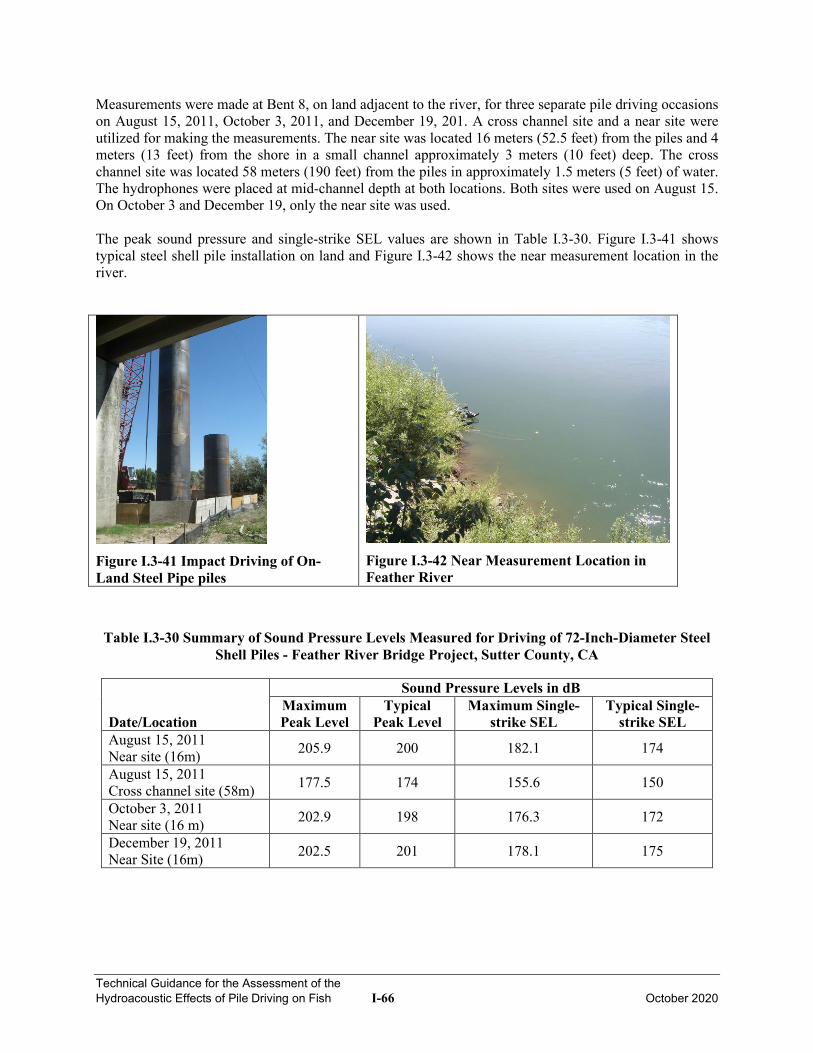
Technical Guidance for the Assessment of the Hydroacoustic Effects of Pile Driving on Fish I-66 October 2020
Measurements were made at Bent 8, on land adjacent to the river, for three separate pile driving occasions on August 15, 2011, October 3, 2011, and December 19, 201. A cross channel site and a near site were utilized for making the measurements. The near site was located 16 meters (52.5 feet) from the piles and 4 meters (13 feet) from the shore in a small channel approximately 3 meters (10 feet) deep. The cross channel site was located 58 meters (190 feet) from the piles in approximately 1.5 meters (5 feet) of water. The hydrophones were placed at mid-channel depth at both locations. Both sites were used on August 15. On October 3 and December 19, only the near site was used. The peak sound pressure and single-strike SEL values are shown in Table I.3-30. Figure I.3-41 shows typical steel shell pile installation on land and Figure I.3-42 shows the near measurement location in the river.
Figure I.3-41 Impact Driving of On-Land Steel Pipe piles
Figure I.3-42 Near Measurement Location in Feather River
Table I.3-30 Summary of Sound Pressure Levels Measured for Driving of 72-Inch-Diameter Steel
Shell Piles - Feather River Bridge Project, Sutter County, CA
Date/Location
Sound Pressure Levels in dB Maximum Peak Level
Typical Peak Level
Maximum Single-strike SEL
Typical Single-strike SEL
August 15, 2011 Near site (16m) 205.9 200 182.1 174
August 15, 2011 Cross channel site (58m) 177.5 174 155.6 150
October 3, 2011 Near site (16 m) 202.9 198 176.3 172
December 19, 2011 Near Site (16m) 202.5 201 178.1 175
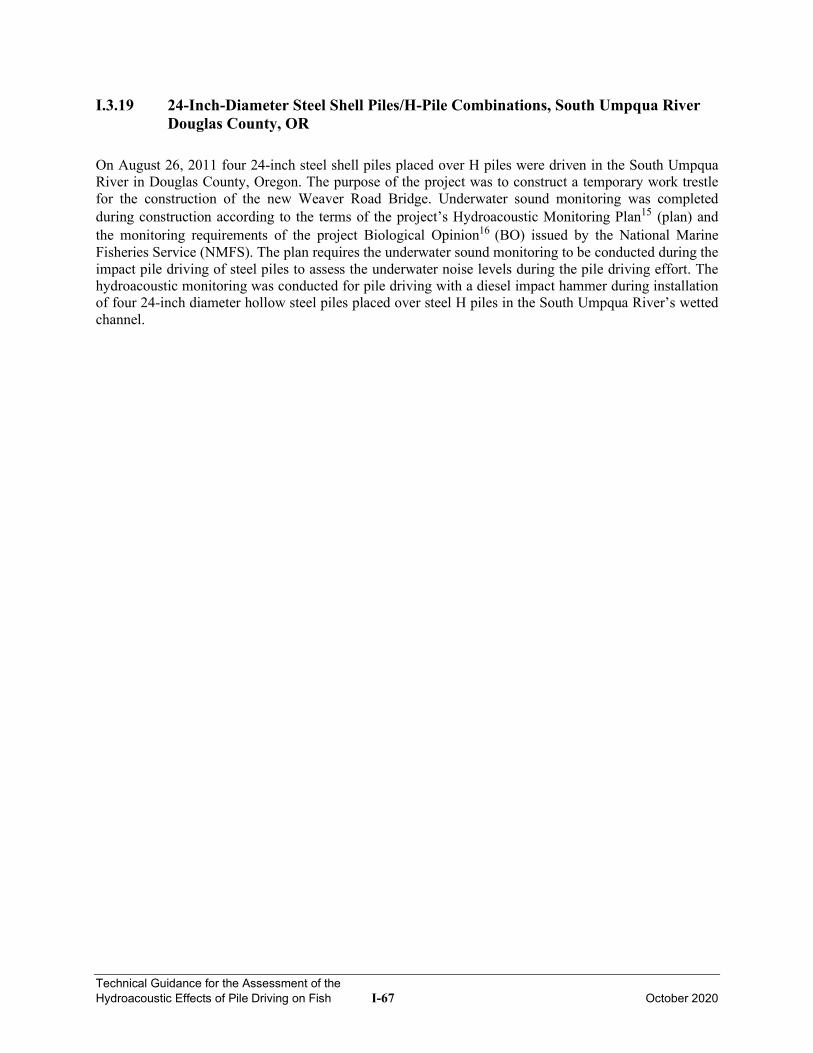
Technical Guidance for the Assessment of the Hydroacoustic Effects of Pile Driving on Fish I-67 October 2020
I.3.19 24-Inch-Diameter Steel Shell Piles/H-Pile Combinations, South Umpqua River Douglas County, OR
On August 26, 2011 four 24-inch steel shell piles placed over H piles were driven in the South Umpqua River in Douglas County, Oregon. The purpose of the project was to construct a temporary work trestle for the construction of the new Weaver Road Bridge. Underwater sound monitoring was completed during construction according to the terms of the project’s Hydroacoustic Monitoring Plan15 (plan) and the monitoring requirements of the project Biological Opinion16 (BO) issued by the National Marine Fisheries Service (NMFS). The plan requires the underwater sound monitoring to be conducted during the impact pile driving of steel piles to assess the underwater noise levels during the pile driving effort. The hydroacoustic monitoring was conducted for pile driving with a diesel impact hammer during installation of four 24-inch diameter hollow steel piles placed over steel H piles in the South Umpqua River’s wetted channel.
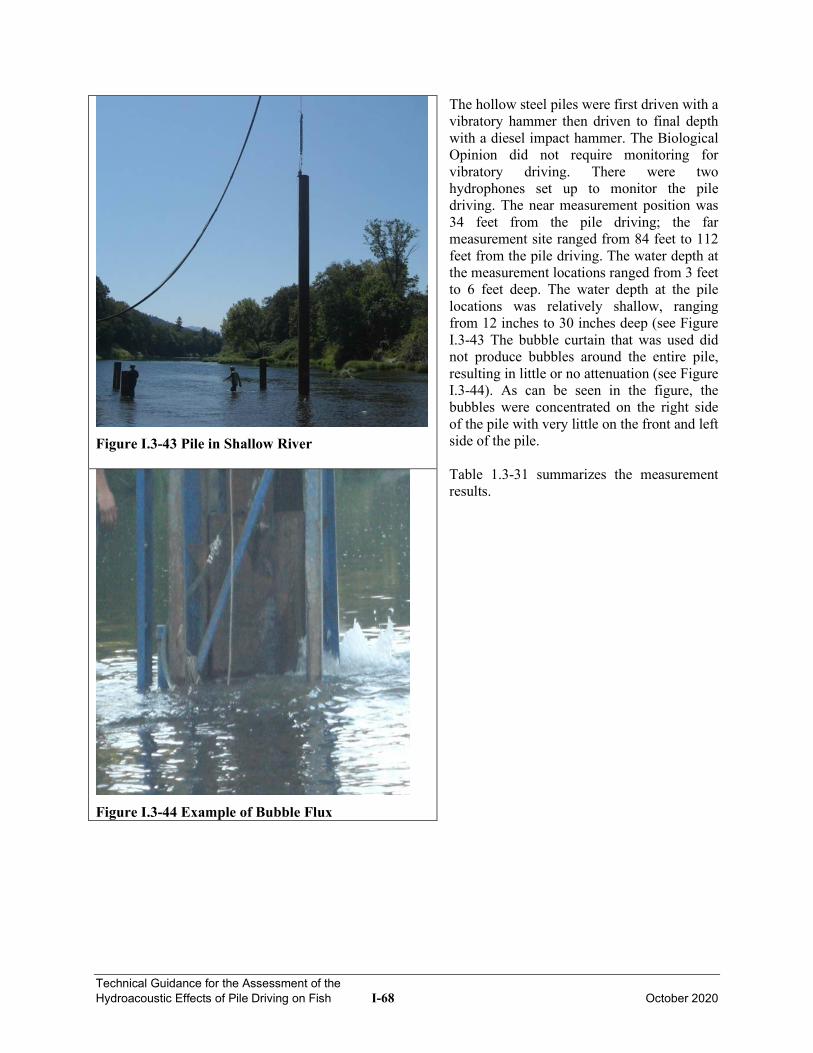
Technical Guidance for the Assessment of the Hydroacoustic Effects of Pile Driving on Fish I-68 October 2020
The hollow steel piles were first driven with a vibratory hammer then driven to final depth with a diesel impact hammer. The Biological Opinion did not require monitoring for vibratory driving. There were two hydrophones set up to monitor the pile driving. The near measurement position was 34 feet from the pile driving; the far measurement site ranged from 84 feet to 112 feet from the pile driving. The water depth at the measurement locations ranged from 3 feet to 6 feet deep. The water depth at the pile locations was relatively shallow, ranging from 12 inches to 30 inches deep (see Figure I.3-43 The bubble curtain that was used did not produce bubbles around the entire pile, resulting in little or no attenuation (see Figure I.3-44). As can be seen in the figure, the bubbles were concentrated on the right side of the pile with very little on the front and left side of the pile. Table 1.3-31 summarizes the measurement results.
Figure I.3-43 Pile in Shallow River
Figure I.3-44 Example of Bubble Flux
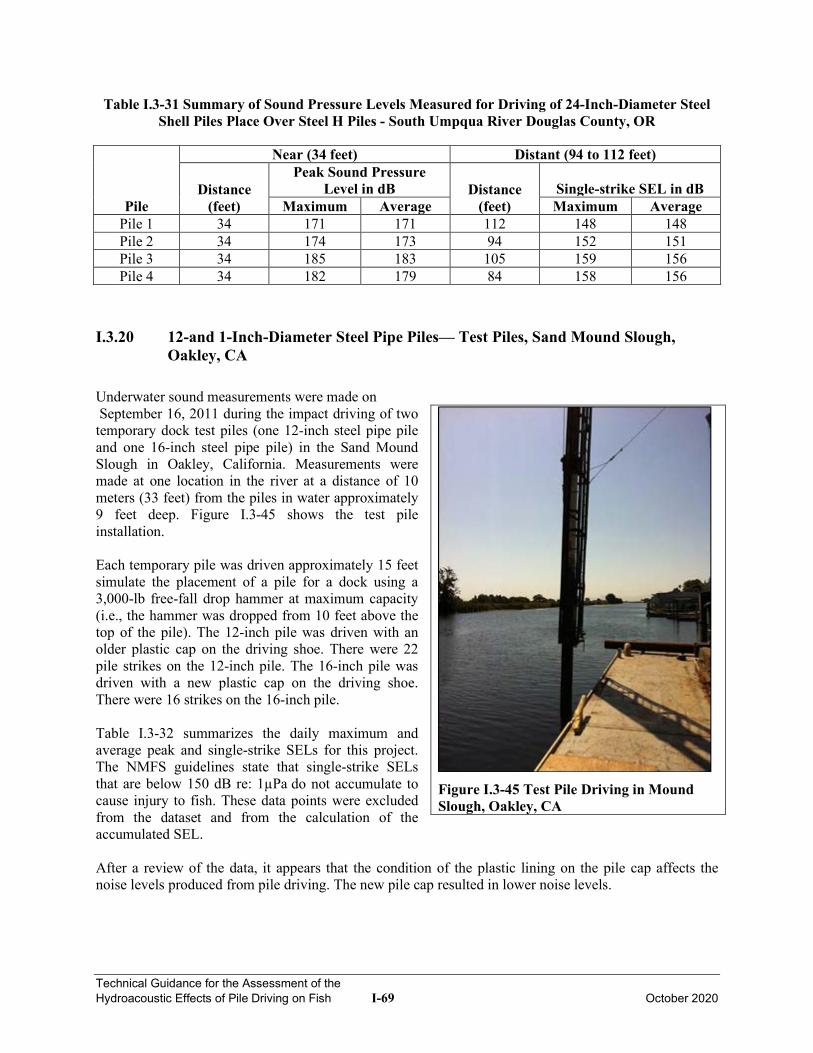
Technical Guidance for the Assessment of the Hydroacoustic Effects of Pile Driving on Fish I-69 October 2020
Table I.3-31 Summary of Sound Pressure Levels Measured for Driving of 24-Inch-Diameter Steel Shell Piles Place Over Steel H Piles - South Umpqua River Douglas County, OR
Pile
Near (34 feet) Distant (94 to 112 feet)
Distance (feet)
Peak Sound Pressure Level in dB Distance
(feet) Single-strike SEL in dB
Maximum Average Maximum Average Pile 1 34 171 171 112 148 148 Pile 2 34 174 173 94 152 151 Pile 3 34 185 183 105 159 156 Pile 4 34 182 179 84 158 156
I.3.20 12-and 1-Inch-Diameter Steel Pipe Piles— Test Piles, Sand Mound Slough, Oakley, CA
Underwater sound measurements were made on September 16, 2011 during the impact driving of two temporary dock test piles (one 12-inch steel pipe pile and one 16-inch steel pipe pile) in the Sand Mound Slough in Oakley, California. Measurements weremade at one location in the river at a distance of 10 meters (33 feet) from the piles in water approximately 9 feet deep. Figure I.3-45 shows the test pileinstallation.
Each temporary pile was driven approximately 15 feet simulate the placement of a pile for a dock using a 3,000-lb free-fall drop hammer at maximum capacity (i.e., the hammer was dropped from 10 feet above the top of the pile). The 12-inch pile was driven with an older plastic cap on the driving shoe. There were 22 pile strikes on the 12-inch pile. The 16-inch pile was driven with a new plastic cap on the driving shoe. There were 16 strikes on the 16-inch pile. Table I.3-32 summarizes the daily maximum and average peak and single-strike SELs for this project. The NMFS guidelines state that single-strike SELs that are below 150 dB re: 1µPa do not accumulate to cause injury to fish. These data points were excluded from the dataset and from the calculation of the accumulated SEL. After a review of the data, it appears that the condition of the plastic lining on the pile cap affects the noise levels produced from pile driving. The new pile cap resulted in lower noise levels.
Figure I.3-45 Test Pile Driving in Mound Slough, Oakley, CA
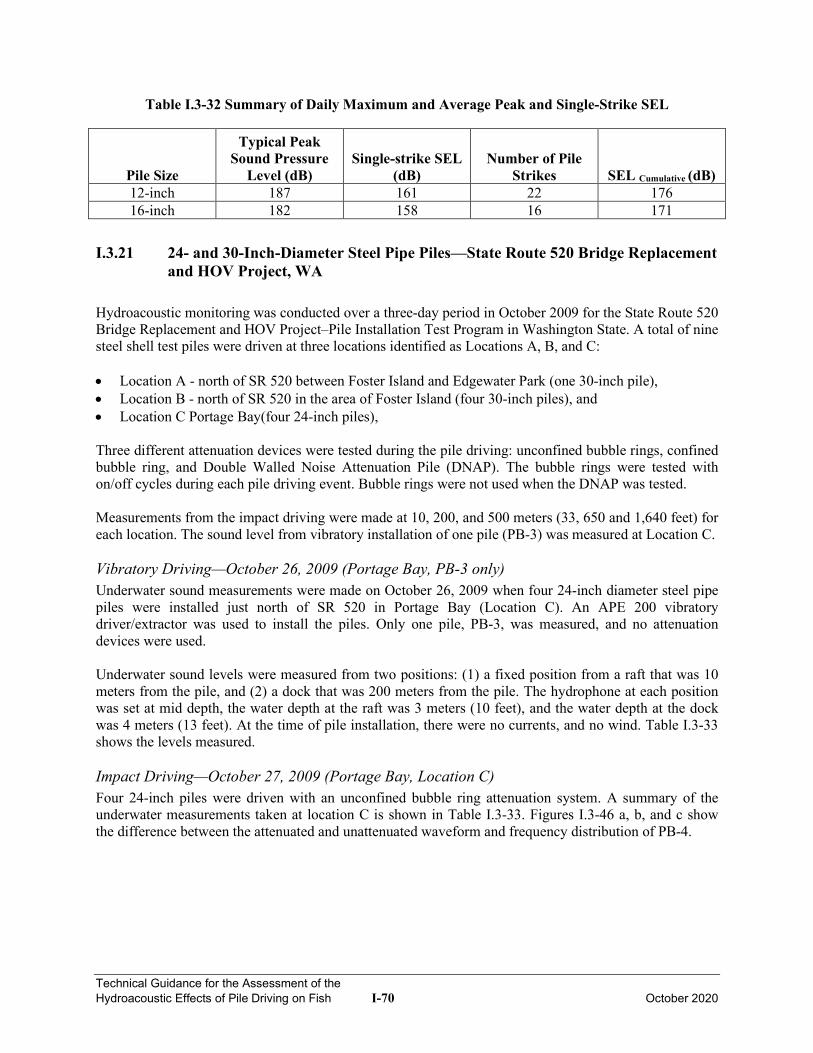
Technical Guidance for the Assessment of the Hydroacoustic Effects of Pile Driving on Fish I-70 October 2020
Table I.3-32 Summary of Daily Maximum and Average Peak and Single-Strike SEL
Pile Size
Typical Peak Sound Pressure
Level (dB) Single-strike SEL
(dB) Number of Pile
Strikes SEL Cumulative (dB) 12-inch 187 161 22 176 16-inch 182 158 16 171
I.3.21 24- and 30-Inch-Diameter Steel Pipe Piles—State Route 520 Bridge Replacement and HOV Project, WA
Hydroacoustic monitoring was conducted over a three-day period in October 2009 for the State Route 520 Bridge Replacement and HOV Project–Pile Installation Test Program in Washington State. A total of nine steel shell test piles were driven at three locations identified as Locations A, B, and C: • Location A - north of SR 520 between Foster Island and Edgewater Park (one 30-inch pile), • Location B - north of SR 520 in the area of Foster Island (four 30-inch piles), and • Location C Portage Bay(four 24-inch piles), Three different attenuation devices were tested during the pile driving: unconfined bubble rings, confined bubble ring, and Double Walled Noise Attenuation Pile (DNAP). The bubble rings were tested with on/off cycles during each pile driving event. Bubble rings were not used when the DNAP was tested. Measurements from the impact driving were made at 10, 200, and 500 meters (33, 650 and 1,640 feet) for each location. The sound level from vibratory installation of one pile (PB-3) was measured at Location C. Vibratory Driving—October 26, 2009 (Portage Bay, PB-3 only) Underwater sound measurements were made on October 26, 2009 when four 24-inch diameter steel pipe piles were installed just north of SR 520 in Portage Bay (Location C). An APE 200 vibratory driver/extractor was used to install the piles. Only one pile, PB-3, was measured, and no attenuation devices were used. Underwater sound levels were measured from two positions: (1) a fixed position from a raft that was 10 meters from the pile, and (2) a dock that was 200 meters from the pile. The hydrophone at each position was set at mid depth, the water depth at the raft was 3 meters (10 feet), and the water depth at the dock was 4 meters (13 feet). At the time of pile installation, there were no currents, and no wind. Table I.3-33 shows the levels measured. Impact Driving—October 27, 2009 (Portage Bay, Location C) Four 24-inch piles were driven with an unconfined bubble ring attenuation system. A summary of the underwater measurements taken at location C is shown in Table I.3-33. Figures I.3-46 a, b, and c show the difference between the attenuated and unattenuated waveform and frequency distribution of PB-4.
Technical Guidance for the Assessment of the Hydroacoustic Effects of Pile Driving on Fish I-71 October 2020
Table I.3-33 Summary of Underwater Sound Levels for Location C, Portage Bay.
Pile Date Hammer
Type Distance
(meters/feet) Mitigation
Sound Pressure Levels in dB Peak Single-strike
SEL2 RMS2 Maximum Average Location C - 24-inch Steel Shell Piles With Unconfined Bubble Rings
PB3 10/26 Vibratory 10/33 None 170 157 144 144
PB1 10/27 Impact 12/39 On1 190 187 159 170 Off 199 198 171 183
PB21 10/27 Impact 12/39 Off 183 178 153 165 On1 181 181 153 165
PB3 10/27 Impact 10/33
On 165 161 137 148 Off 193 192 165 177 On 164 161 136 146 Off 186 182 155 167
PB4 10/27 Impact 10/33 Off 194 190 164 176 On 161 160 136 147 Off 188 183 157 169
1 The Bubble Rings were never fully in use due to problems controlling the airflow 2 Average levels Impact Driving—October 29, 2009 (Near Foster Island, Location A and B) On October 29, the barges were moved to a new location where the three mitigation methods mentioned earlier were tested during the driving of five 30-inch steel shell piles. The piles were driven in shallow water (3 to 7 meters [10 to 23 feet]) and the hydrophones were placed at mid depth. Three positions were used to measure the levels. Two were manned, one at approximately 10 meters and one at 200 meters. The third was unmanned and anchored at 500 meters. For Pile WAB3, only the DNAP mitigation method was tested. Table I-3.34 shows a summary of the measured levels.
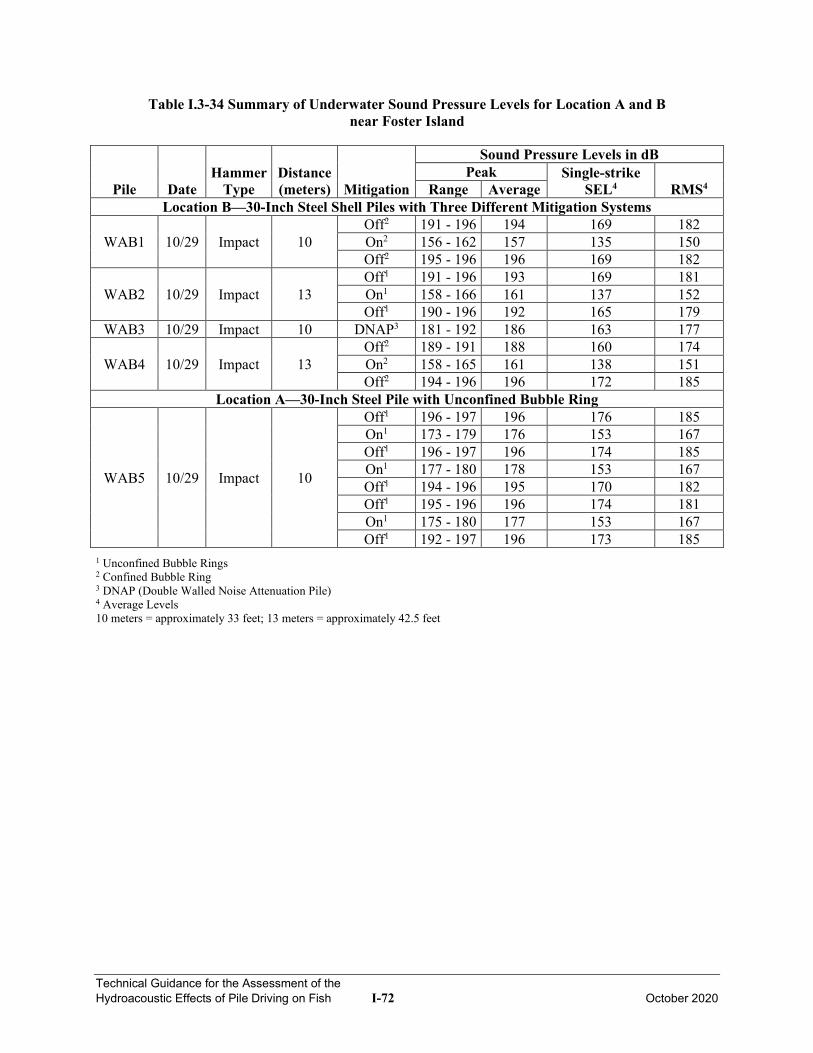
Technical Guidance for the Assessment of the Hydroacoustic Effects of Pile Driving on Fish I-72 October 2020
Table I.3-34 Summary of Underwater Sound Pressure Levels for Location A and B near Foster Island
Pile Date Hammer
Type Distance (meters) Mitigation
Sound Pressure Levels in dB Peak Single-strike
SEL4 RMS4 Range Average Location B—30-Inch Steel Shell Piles with Three Different Mitigation Systems
WAB1 10/29 Impact 10 Off2 191 - 196 194 169 182 On2 156 - 162 157 135 150 Off2 195 - 196 196 169 182
WAB2 10/29 Impact 13 Off1 191 - 196 193 169 181 On1 158 - 166 161 137 152 Off1 190 - 196 192 165 179
WAB3 10/29 Impact 10 DNAP3 181 - 192 186 163 177
WAB4 10/29 Impact 13 Off2 189 - 191 188 160 174 On2 158 - 165 161 138 151 Off2 194 - 196 196 172 185
Location A—30-Inch Steel Pile with Unconfined Bubble Ring
WAB5 10/29 Impact 10
Off1 196 - 197 196 176 185 On1 173 - 179 176 153 167 Off1 196 - 197 196 174 185 On1 177 - 180 178 153 167 Off1 194 - 196 195 170 182 Off1 195 - 196 196 174 181 On1 175 - 180 177 153 167 Off1 192 - 197 196 173 185
1 Unconfined Bubble Rings 2 Confined Bubble Ring 3 DNAP (Double Walled Noise Attenuation Pile) 4 Average Levels 10 meters = approximately 33 feet; 13 meters = approximately 42.5 feet
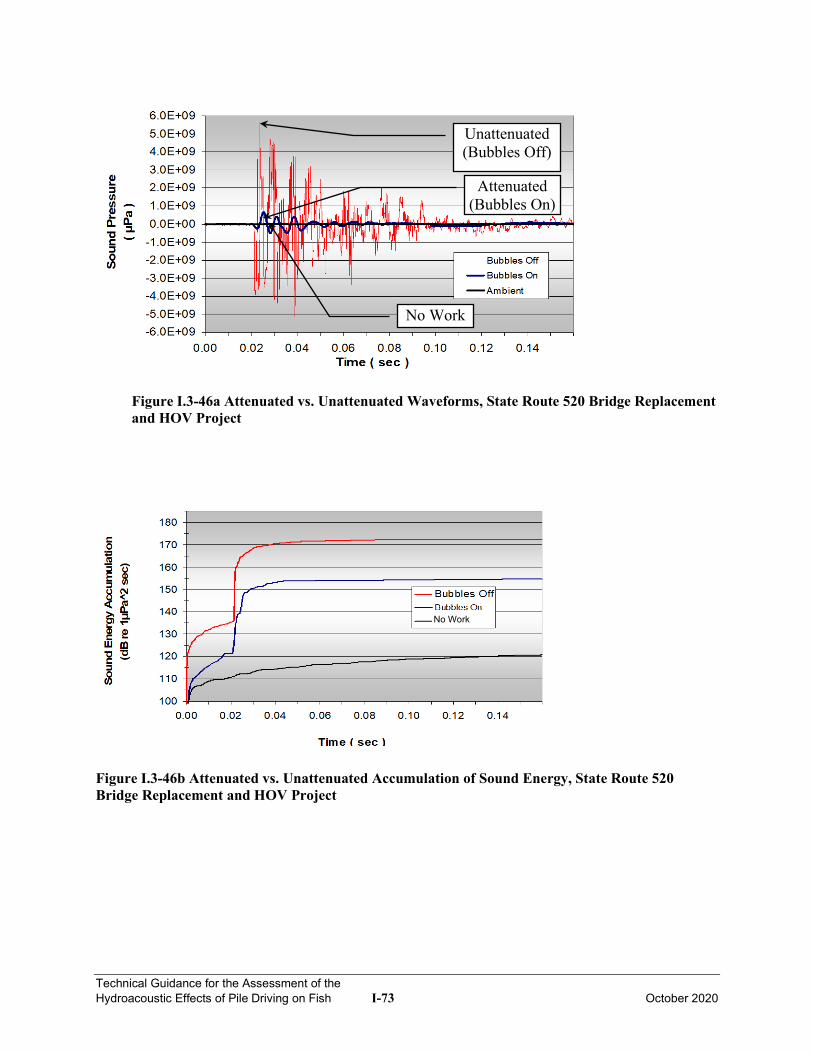
Technical Guidance for the Assessment of the Hydroacoustic Effects of Pile Driving on Fish I-73 October 2020
Figure I.3-46a Attenuated vs. Unattenuated Waveforms, State Route 520 Bridge Replacement and HOV Project
Figure I.3-46b Attenuated vs. Unattenuated Accumulation of Sound Energy, State Route 520 Bridge Replacement and HOV Project
Attenuated (Bubbles On)
Unattenuated (Bubbles Off)
No Work
No Work
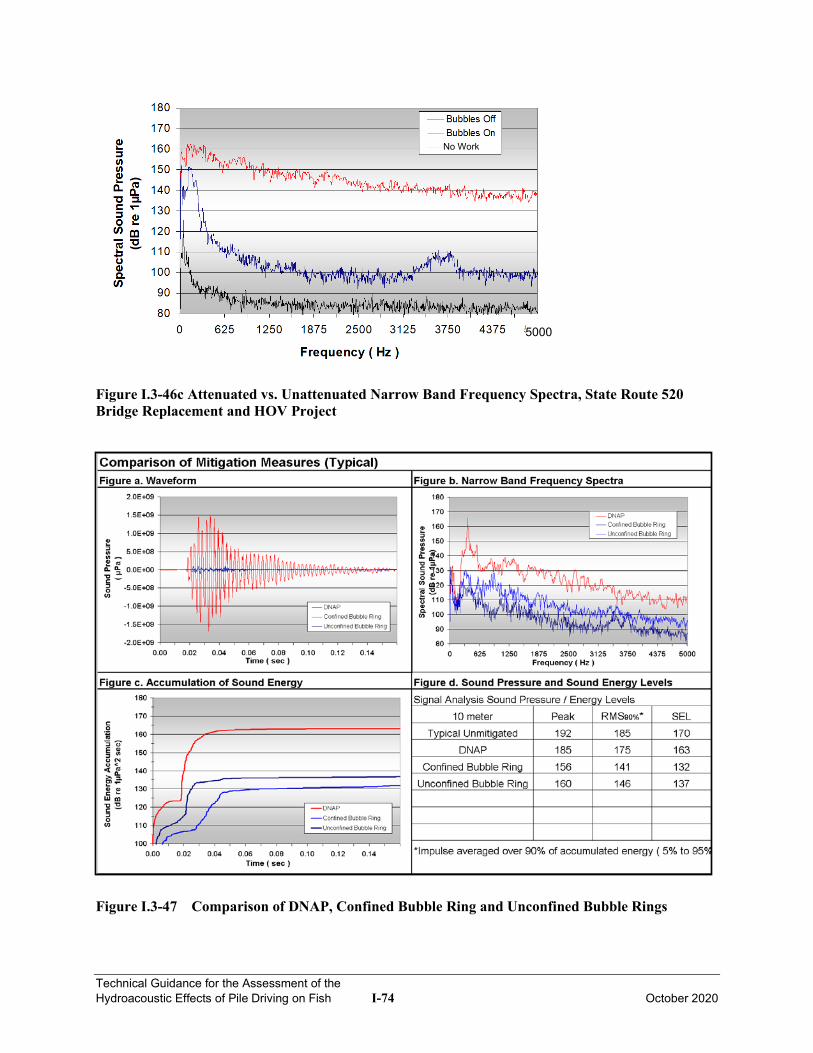
Technical Guidance for the Assessment of the Hydroacoustic Effects of Pile Driving on Fish I-74 October 2020
Figure I.3-46c Attenuated vs. Unattenuated Narrow Band Frequency Spectra, State Route 520 Bridge Replacement and HOV Project
Figure I.3-47 Comparison of DNAP, Confined Bubble Ring and Unconfined Bubble Rings
5000
No Work
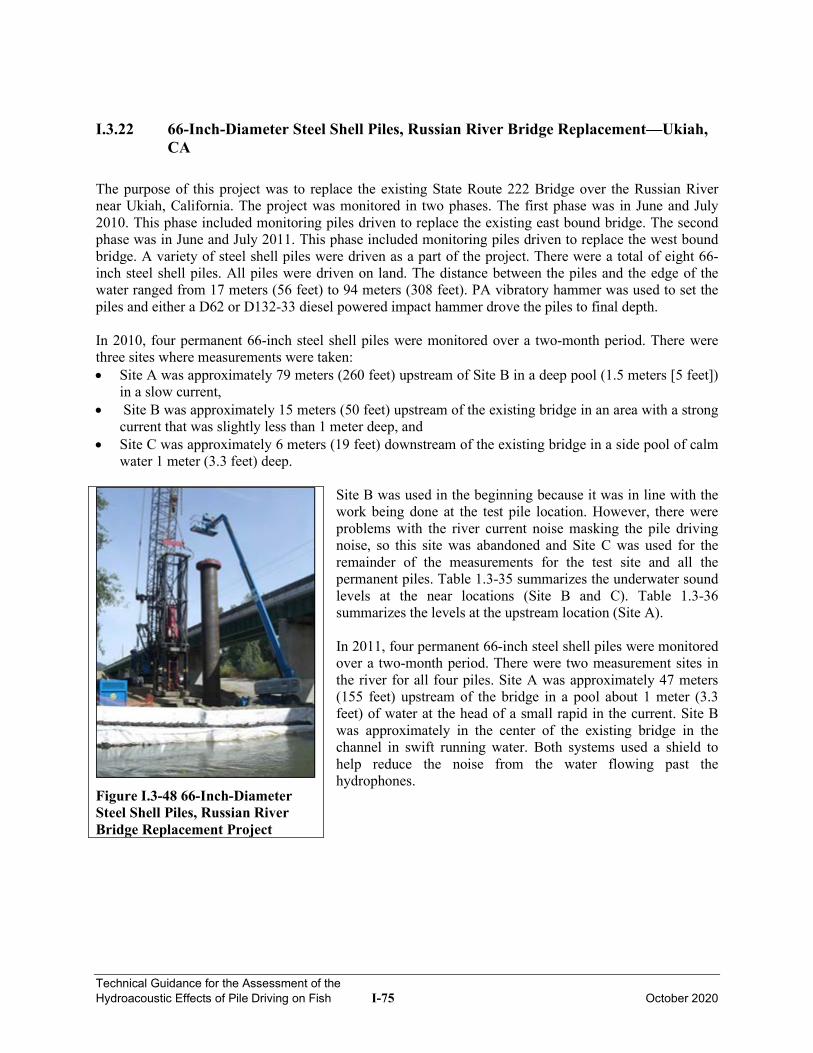
Technical Guidance for the Assessment of the Hydroacoustic Effects of Pile Driving on Fish I-75 October 2020
I.3.22 66-Inch-Diameter Steel Shell Piles, Russian River Bridge Replacement—Ukiah, CA
The purpose of this project was to replace the existing State Route 222 Bridge over the Russian River near Ukiah, California. The project was monitored in two phases. The first phase was in June and July 2010. This phase included monitoring piles driven to replace the existing east bound bridge. The second phase was in June and July 2011. This phase included monitoring piles driven to replace the west bound bridge. A variety of steel shell piles were driven as a part of the project. There were a total of eight 66-inch steel shell piles. All piles were driven on land. The distance between the piles and the edge of the water ranged from 17 meters (56 feet) to 94 meters (308 feet). PA vibratory hammer was used to set the piles and either a D62 or D132-33 diesel powered impact hammer drove the piles to final depth. In 2010, four permanent 66-inch steel shell piles were monitored over a two-month period. There were three sites where measurements were taken: • Site A was approximately 79 meters (260 feet) upstream of Site B in a deep pool (1.5 meters [5 feet])
in a slow current, • Site B was approximately 15 meters (50 feet) upstream of the existing bridge in an area with a strong
current that was slightly less than 1 meter deep, and • Site C was approximately 6 meters (19 feet) downstream of the existing bridge in a side pool of calm
water 1 meter (3.3 feet) deep.
Site B was used in the beginning because it was in line with the work being done at the test pile location. However, there were problems with the river current noise masking the pile driving noise, so this site was abandoned and Site C was used for the remainder of the measurements for the test site and all the permanent piles. Table 1.3-35 summarizes the underwater sound levels at the near locations (Site B and C). Table 1.3-36 summarizes the levels at the upstream location (Site A). In 2011, four permanent 66-inch steel shell piles were monitored over a two-month period. There were two measurement sites in the river for all four piles. Site A was approximately 47 meters (155 feet) upstream of the bridge in a pool about 1 meter (3.3 feet) of water at the head of a small rapid in the current. Site B was approximately in the center of the existing bridge in the channel in swift running water. Both systems used a shield to help reduce the noise from the water flowing past the hydrophones.
Figure I.3-48 66-Inch-Diameter Steel Shell Piles, Russian River Bridge Replacement Project
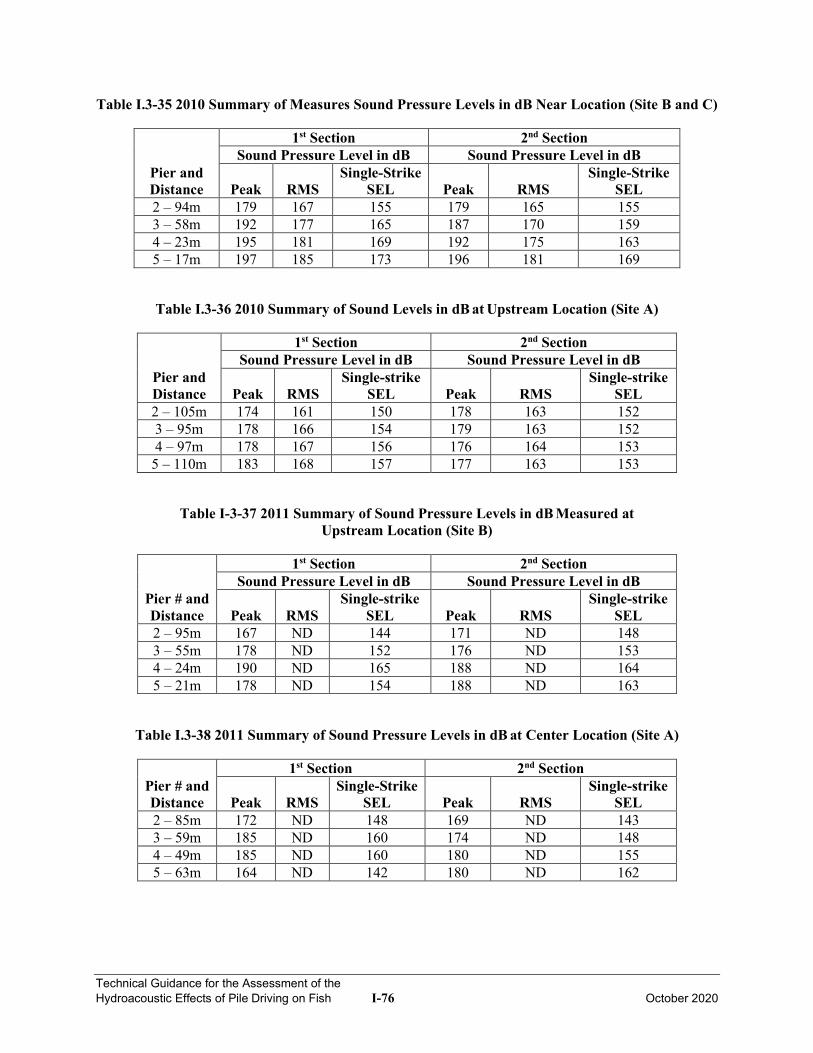
Technical Guidance for the Assessment of the Hydroacoustic Effects of Pile Driving on Fish I-76 October 2020
Table I.3-35 2010 Summary of Measures Sound Pressure Levels in dB Near Location (Site B and C)
Pier and Distance
1st Section Sound Pressure Level in dB
2nd Section Sound Pressure Level in dB
Peak RMS Single-Strike
SEL Peak RMS Single-Strike
SEL 2 – 94m 179 167 155 179 165 155 3 – 58m 192 177 165 187 170 159 4 – 23m 195 181 169 192 175 163 5 – 17m 197 185 173 196 181 169
Table I.3-36 2010 Summary of Sound Levels in dB at Upstream Location (Site A)
Pier and Distance
1st Section Sound Pressure Level in dB
2nd Section Sound Pressure Level in dB
Peak RMS Single-strike
SEL Peak RMS Single-strike
SEL 2 – 105m 174 161 150 178 163 152 3 – 95m 178 166 154 179 163 152 4 – 97m 178 167 156 176 164 153
5 – 110m 183 168 157 177 163 153
Table I-3-37 2011 Summary of Sound Pressure Levels in dB Measured at Upstream Location (Site B)
Pier # and Distance
1st Section Sound Pressure Level in dB
2nd Section Sound Pressure Level in dB
Peak RMS Single-strike
SEL Peak RMS Single-strike
SEL 2 – 95m 167 ND 144 171 ND 148 3 – 55m 178 ND 152 176 ND 153 4 – 24m 190 ND 165 188 ND 164 5 – 21m 178 ND 154 188 ND 163
Table I.3-38 2011 Summary of Sound Pressure Levels in dB at Center Location (Site A)
Pier # and Distance
1st Section 2nd Section
Peak RMS Single-Strike
SEL Peak RMS Single-strike
SEL 2 – 85m 172 ND 148 169 ND 143 3 – 59m 185 ND 160 174 ND 148 4 – 49m 185 ND 160 180 ND 155 5 – 63m 164 ND 142 180 ND 162
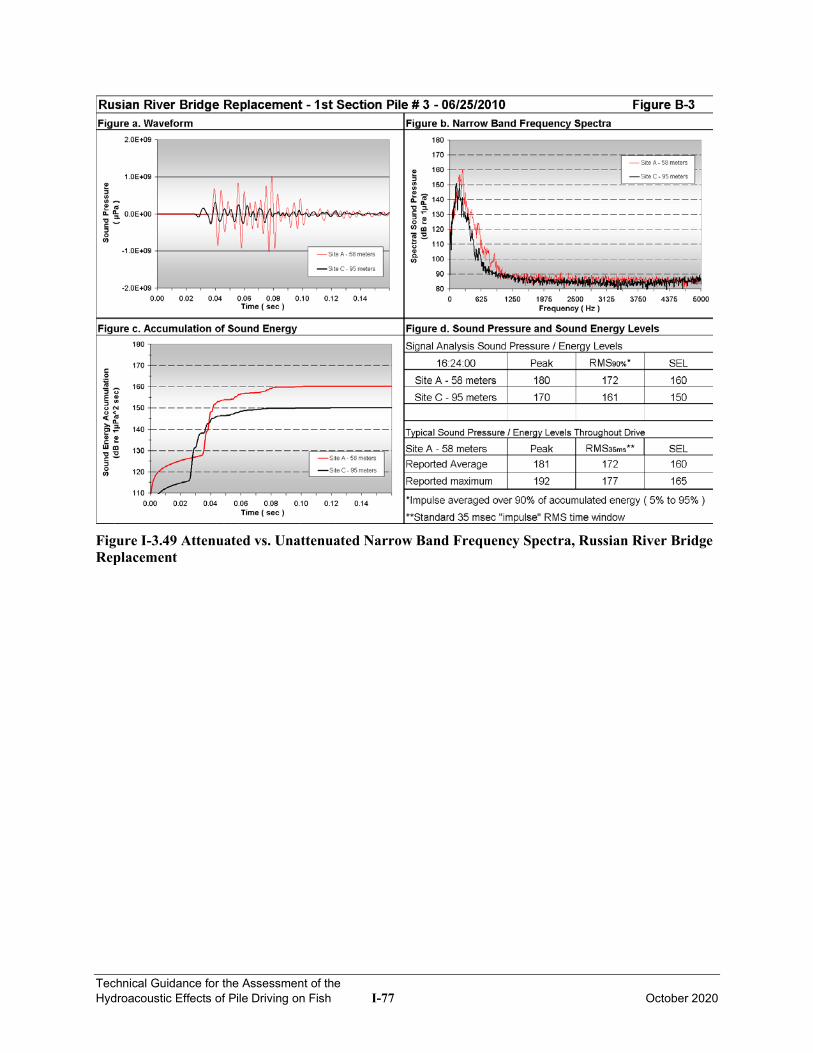
Technical Guidance for the Assessment of the Hydroacoustic Effects of Pile Driving on Fish I-77 October 2020
Figure I-3.49 Attenuated vs. Unattenuated Narrow Band Frequency Spectra, Russian River Bridge Replacement
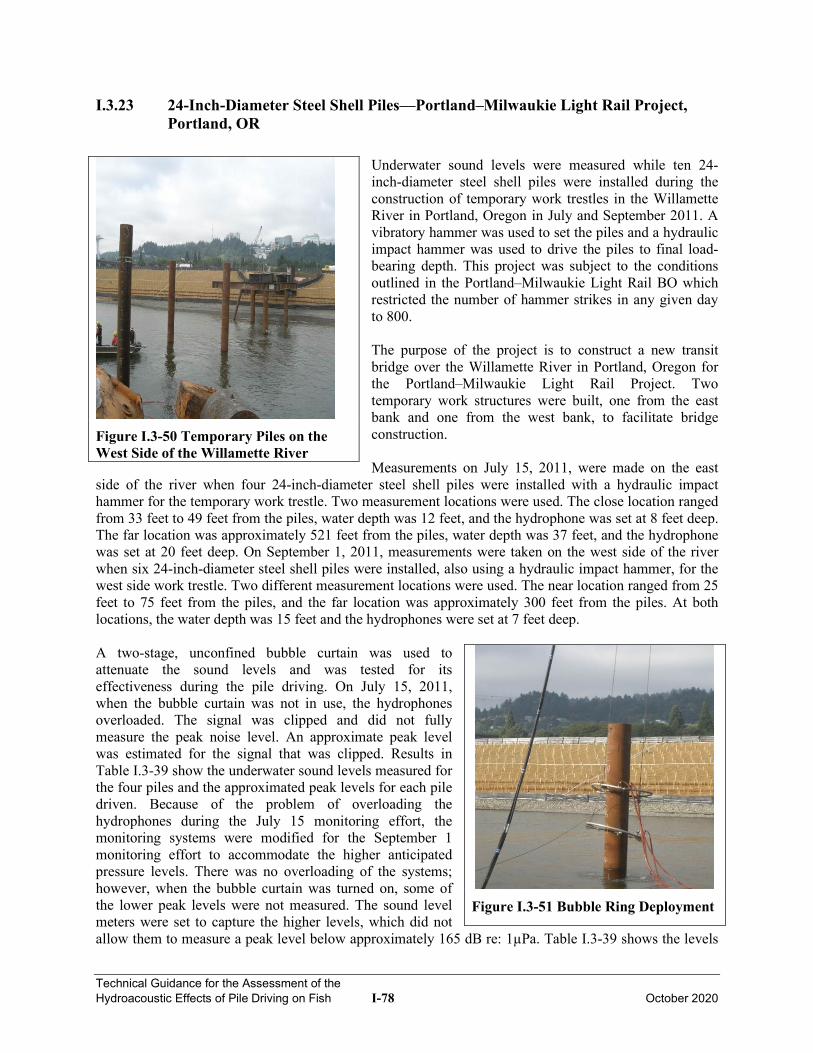
Technical Guidance for the Assessment of the Hydroacoustic Effects of Pile Driving on Fish I-78 October 2020
I.3.23 24-Inch-Diameter Steel Shell Piles—Portland–Milwaukie Light Rail Project, Portland, OR
Underwater sound levels were measured while ten 24-inch-diameter steel shell piles were installed during the construction of temporary work trestles in the Willamette River in Portland, Oregon in July and September 2011. A vibratory hammer was used to set the piles and a hydraulic impact hammer was used to drive the piles to final load-bearing depth. This project was subject to the conditions outlined in the Portland–Milwaukie Light Rail BO which restricted the number of hammer strikes in any given day to 800. The purpose of the project is to construct a new transit bridge over the Willamette River in Portland, Oregon for the Portland–Milwaukie Light Rail Project. Two temporary work structures were built, one from the east bank and one from the west bank, to facilitate bridge construction. Measurements on July 15, 2011, were made on the east
side of the river when four 24-inch-diameter steel shell piles were installed with a hydraulic impact hammer for the temporary work trestle. Two measurement locations were used. The close location ranged from 33 feet to 49 feet from the piles, water depth was 12 feet, and the hydrophone was set at 8 feet deep. The far location was approximately 521 feet from the piles, water depth was 37 feet, and the hydrophone was set at 20 feet deep. On September 1, 2011, measurements were taken on the west side of the river when six 24-inch-diameter steel shell piles were installed, also using a hydraulic impact hammer, for the west side work trestle. Two different measurement locations were used. The near location ranged from 25 feet to 75 feet from the piles, and the far location was approximately 300 feet from the piles. At both locations, the water depth was 15 feet and the hydrophones were set at 7 feet deep. A two-stage, unconfined bubble curtain was used to attenuate the sound levels and was tested for its effectiveness during the pile driving. On July 15, 2011, when the bubble curtain was not in use, the hydrophones overloaded. The signal was clipped and did not fully measure the peak noise level. An approximate peak level was estimated for the signal that was clipped. Results in Table I.3-39 show the underwater sound levels measured for the four piles and the approximated peak levels for each pile driven. Because of the problem of overloading the hydrophones during the July 15 monitoring effort, the monitoring systems were modified for the September 1 monitoring effort to accommodate the higher anticipated pressure levels. There was no overloading of the systems; however, when the bubble curtain was turned on, some of the lower peak levels were not measured. The sound level meters were set to capture the higher levels, which did not allow them to measure a peak level below approximately 165 dB re: 1µPa. Table I.3-39 shows the levels
Figure I.3-50 Temporary Piles on the West Side of the Willamette River
Figure I.3-51 Bubble Ring Deployment
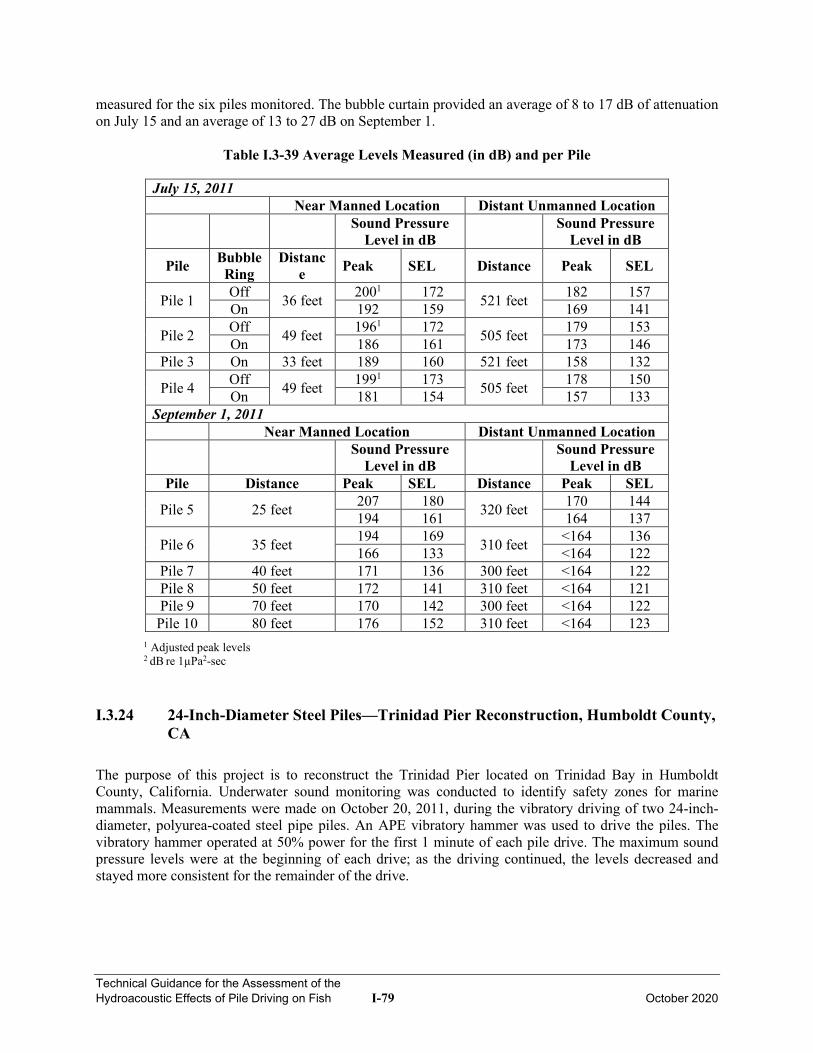
Technical Guidance for the Assessment of the Hydroacoustic Effects of Pile Driving on Fish I-79 October 2020
measured for the six piles monitored. The bubble curtain provided an average of 8 to 17 dB of attenuation on July 15 and an average of 13 to 27 dB on September 1.
Table I.3-39 Average Levels Measured (in dB) and per Pile
July 15, 2011 Near Manned Location Distant Unmanned Location
Sound Pressure Level in dB Sound Pressure
Level in dB
Pile Bubble Ring
Distance Peak SEL Distance Peak SEL
Pile 1 Off 36 feet 2001 172 521 feet 182 157 On 192 159 169 141
Pile 2 Off 49 feet 1961 172 505 feet 179 153 On 186 161 173 146
Pile 3 On 33 feet 189 160 521 feet 158 132
Pile 4 Off 49 feet 1991 173 505 feet 178 150 On 181 154 157 133
September 1, 2011 Near Manned Location Distant Unmanned Location
Sound Pressure Level in dB Sound Pressure
Level in dB Pile Distance Peak SEL Distance Peak SEL
Pile 5 25 feet 207 180 320 feet 170 144 194 161 164 137
Pile 6 35 feet 194 169 310 feet <164 136 166 133 <164 122
Pile 7 40 feet 171 136 300 feet <164 122 Pile 8 50 feet 172 141 310 feet <164 121 Pile 9 70 feet 170 142 300 feet <164 122
Pile 10 80 feet 176 152 310 feet <164 123 1 Adjusted peak levels 2 dB re 1µPa2-sec
I.3.24 24-Inch-Diameter Steel Piles—Trinidad Pier Reconstruction, Humboldt County, CA
The purpose of this project is to reconstruct the Trinidad Pier located on Trinidad Bay in Humboldt County, California. Underwater sound monitoring was conducted to identify safety zones for marine mammals. Measurements were made on October 20, 2011, during the vibratory driving of two 24-inch-diameter, polyurea-coated steel pipe piles. An APE vibratory hammer was used to drive the piles. The vibratory hammer operated at 50% power for the first 1 minute of each pile drive. The maximum sound pressure levels were at the beginning of each drive; as the driving continued, the levels decreased and stayed more consistent for the remainder of the drive.
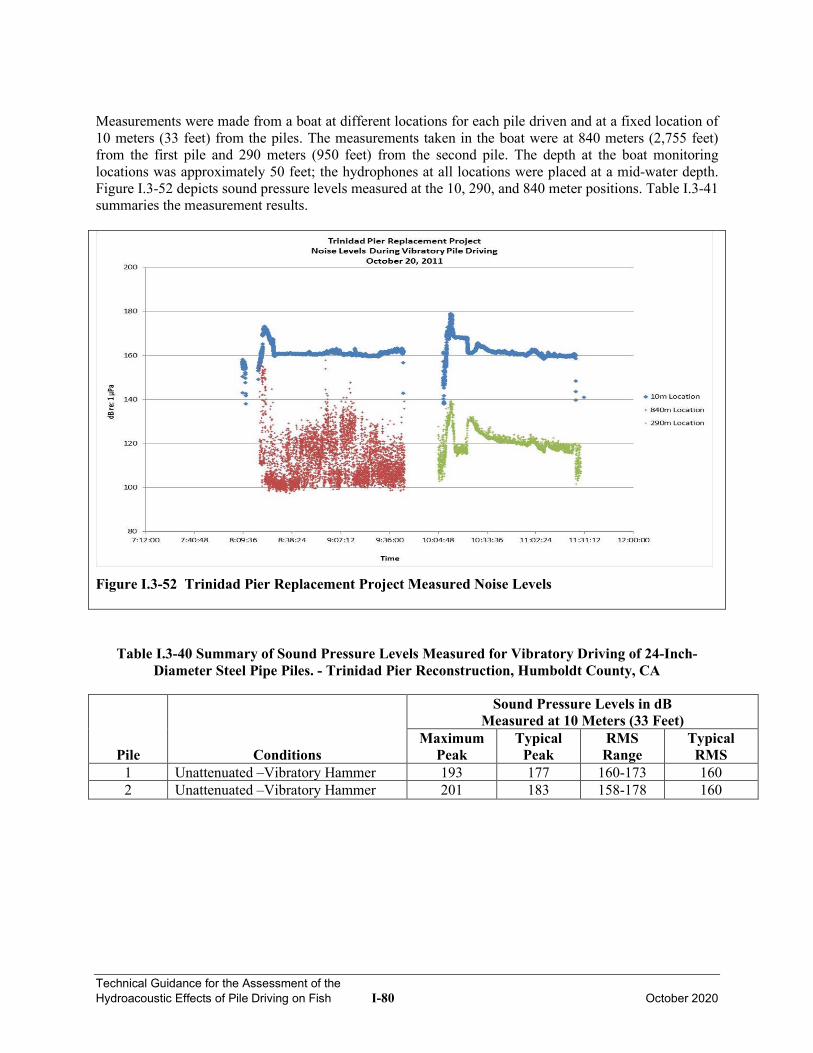
Technical Guidance for the Assessment of the Hydroacoustic Effects of Pile Driving on Fish I-80 October 2020
Measurements were made from a boat at different locations for each pile driven and at a fixed location of 10 meters (33 feet) from the piles. The measurements taken in the boat were at 840 meters (2,755 feet) from the first pile and 290 meters (950 feet) from the second pile. The depth at the boat monitoring locations was approximately 50 feet; the hydrophones at all locations were placed at a mid-water depth. Figure I.3-52 depicts sound pressure levels measured at the 10, 290, and 840 meter positions. Table I.3-41 summaries the measurement results.
Figure I.3-52 Trinidad Pier Replacement Project Measured Noise Levels
Table I.3-40 Summary of Sound Pressure Levels Measured for Vibratory Driving of 24-Inch-Diameter Steel Pipe Piles. - Trinidad Pier Reconstruction, Humboldt County, CA
Pile Conditions
Sound Pressure Levels in dB Measured at 10 Meters (33 Feet)
Maximum Peak
Typical Peak
RMS Range
Typical RMS
1 Unattenuated –Vibratory Hammer 193 177 160-173 160 2 Unattenuated –Vibratory Hammer 201 183 158-178 160
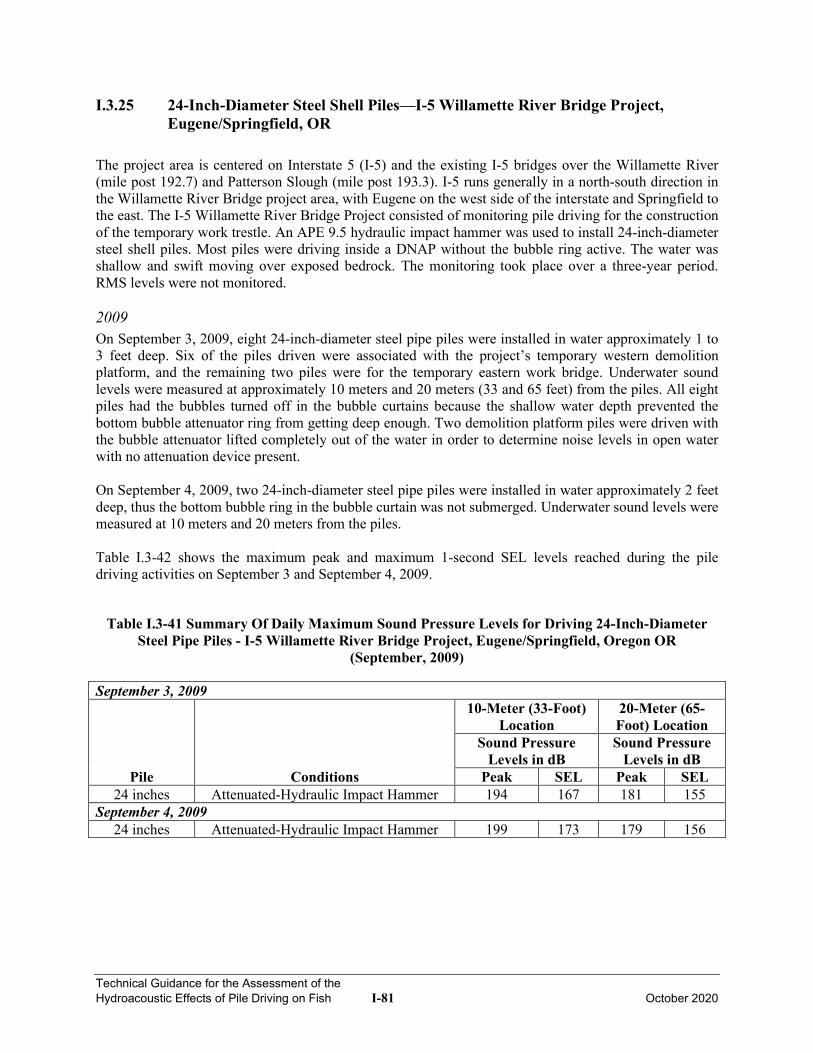
Technical Guidance for the Assessment of the Hydroacoustic Effects of Pile Driving on Fish I-81 October 2020
I.3.25 24-Inch-Diameter Steel Shell Piles—I-5 Willamette River Bridge Project, Eugene/Springfield, OR
The project area is centered on Interstate 5 (I-5) and the existing I-5 bridges over the Willamette River (mile post 192.7) and Patterson Slough (mile post 193.3). I-5 runs generally in a north-south direction in the Willamette River Bridge project area, with Eugene on the west side of the interstate and Springfield to the east. The I-5 Willamette River Bridge Project consisted of monitoring pile driving for the construction of the temporary work trestle. An APE 9.5 hydraulic impact hammer was used to install 24-inch-diameter steel shell piles. Most piles were driving inside a DNAP without the bubble ring active. The water was shallow and swift moving over exposed bedrock. The monitoring took place over a three-year period. RMS levels were not monitored. 2009 On September 3, 2009, eight 24-inch-diameter steel pipe piles were installed in water approximately 1 to 3 feet deep. Six of the piles driven were associated with the project’s temporary western demolition platform, and the remaining two piles were for the temporary eastern work bridge. Underwater sound levels were measured at approximately 10 meters and 20 meters (33 and 65 feet) from the piles. All eight piles had the bubbles turned off in the bubble curtains because the shallow water depth prevented the bottom bubble attenuator ring from getting deep enough. Two demolition platform piles were driven with the bubble attenuator lifted completely out of the water in order to determine noise levels in open water with no attenuation device present. On September 4, 2009, two 24-inch-diameter steel pipe piles were installed in water approximately 2 feet deep, thus the bottom bubble ring in the bubble curtain was not submerged. Underwater sound levels were measured at 10 meters and 20 meters from the piles. Table I.3-42 shows the maximum peak and maximum 1-second SEL levels reached during the pile driving activities on September 3 and September 4, 2009.
Table I.3-41 Summary Of Daily Maximum Sound Pressure Levels for Driving 24-Inch-Diameter Steel Pipe Piles - I-5 Willamette River Bridge Project, Eugene/Springfield, Oregon OR
(September, 2009)
September 3, 2009
Pile Conditions
10-Meter (33-Foot) Location
Sound Pressure Levels in dB
20-Meter (65-Foot) Location Sound Pressure
Levels in dB
Peak SEL Peak SEL 24 inches Attenuated-Hydraulic Impact Hammer 194 167 181 155
September 4, 2009 24 inches Attenuated-Hydraulic Impact Hammer 199 173 179 156
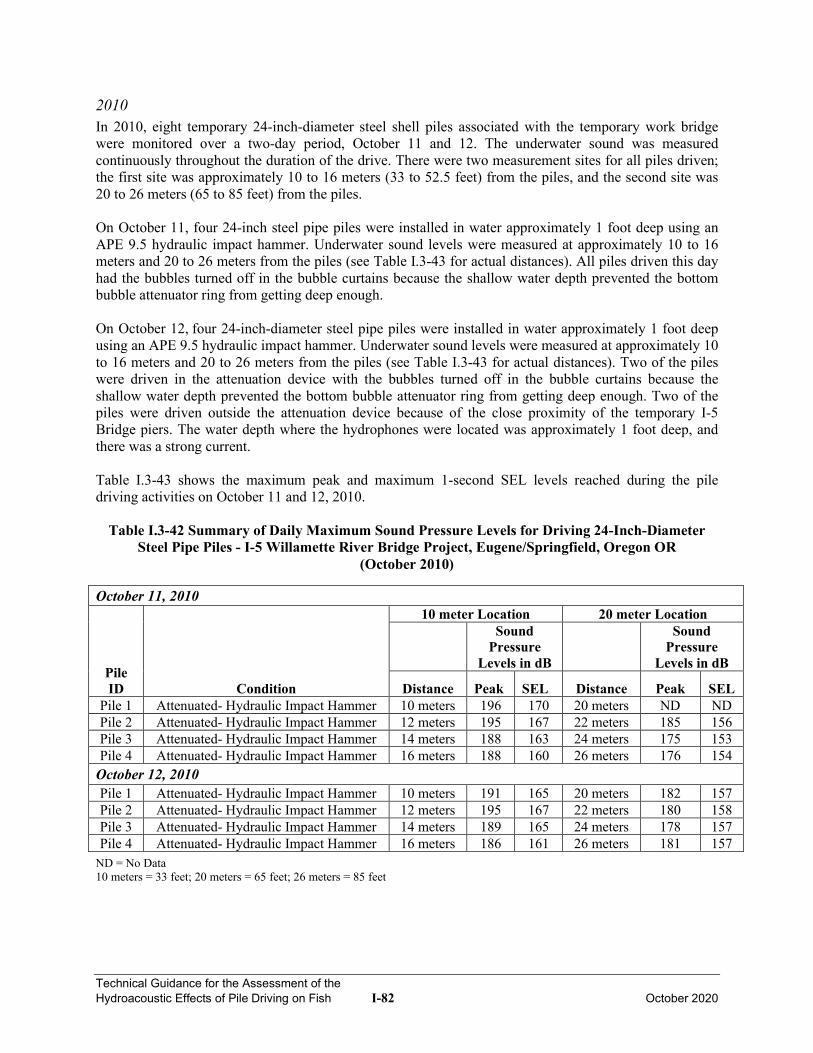
Technical Guidance for the Assessment of the Hydroacoustic Effects of Pile Driving on Fish I-82 October 2020
2010 In 2010, eight temporary 24-inch-diameter steel shell piles associated with the temporary work bridge were monitored over a two-day period, October 11 and 12. The underwater sound was measured continuously throughout the duration of the drive. There were two measurement sites for all piles driven; the first site was approximately 10 to 16 meters (33 to 52.5 feet) from the piles, and the second site was 20 to 26 meters (65 to 85 feet) from the piles. On October 11, four 24-inch steel pipe piles were installed in water approximately 1 foot deep using an APE 9.5 hydraulic impact hammer. Underwater sound levels were measured at approximately 10 to 16 meters and 20 to 26 meters from the piles (see Table I.3-43 for actual distances). All piles driven this day had the bubbles turned off in the bubble curtains because the shallow water depth prevented the bottom bubble attenuator ring from getting deep enough. On October 12, four 24-inch-diameter steel pipe piles were installed in water approximately 1 foot deep using an APE 9.5 hydraulic impact hammer. Underwater sound levels were measured at approximately 10 to 16 meters and 20 to 26 meters from the piles (see Table I.3-43 for actual distances). Two of the piles were driven in the attenuation device with the bubbles turned off in the bubble curtains because the shallow water depth prevented the bottom bubble attenuator ring from getting deep enough. Two of the piles were driven outside the attenuation device because of the close proximity of the temporary I-5 Bridge piers. The water depth where the hydrophones were located was approximately 1 foot deep, and there was a strong current. Table I.3-43 shows the maximum peak and maximum 1-second SEL levels reached during the pile driving activities on October 11 and 12, 2010.
Table I.3-42 Summary of Daily Maximum Sound Pressure Levels for Driving 24-Inch-Diameter Steel Pipe Piles - I-5 Willamette River Bridge Project, Eugene/Springfield, Oregon OR
(October 2010)
October 11, 2010
Pile ID Condition
10 meter Location 20 meter Location
Sound Pressure
Levels in dB
Sound Pressure
Levels in dB
Distance Peak SEL Distance Peak SEL Pile 1 Attenuated- Hydraulic Impact Hammer 10 meters 196 170 20 meters ND ND Pile 2 Attenuated- Hydraulic Impact Hammer 12 meters 195 167 22 meters 185 156 Pile 3 Attenuated- Hydraulic Impact Hammer 14 meters 188 163 24 meters 175 153 Pile 4 Attenuated- Hydraulic Impact Hammer 16 meters 188 160 26 meters 176 154
October 12, 2010 Pile 1 Attenuated- Hydraulic Impact Hammer 10 meters 191 165 20 meters 182 157 Pile 2 Attenuated- Hydraulic Impact Hammer 12 meters 195 167 22 meters 180 158 Pile 3 Attenuated- Hydraulic Impact Hammer 14 meters 189 165 24 meters 178 157 Pile 4 Attenuated- Hydraulic Impact Hammer 16 meters 186 161 26 meters 181 157
ND = No Data 10 meters = 33 feet; 20 meters = 65 feet; 26 meters = 85 feet
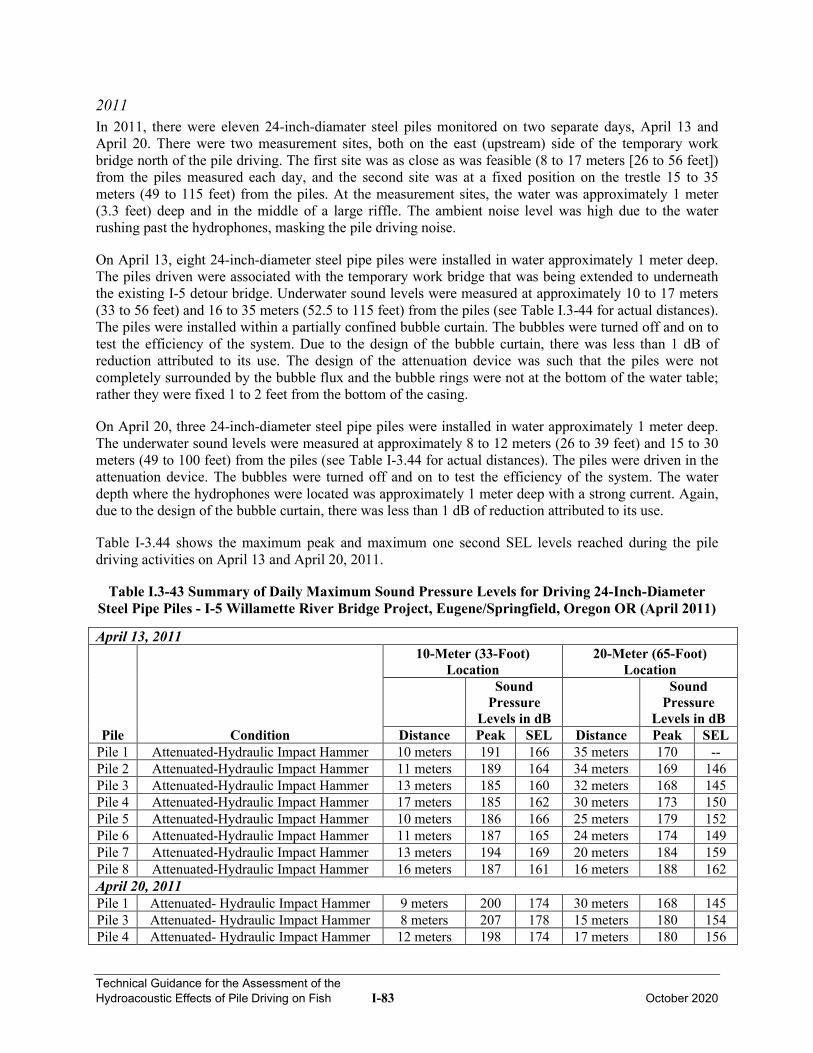
Technical Guidance for the Assessment of the Hydroacoustic Effects of Pile Driving on Fish I-83 October 2020
2011 In 2011, there were eleven 24-inch-diamater steel piles monitored on two separate days, April 13 and April 20. There were two measurement sites, both on the east (upstream) side of the temporary work bridge north of the pile driving. The first site was as close as was feasible (8 to 17 meters [26 to 56 feet]) from the piles measured each day, and the second site was at a fixed position on the trestle 15 to 35 meters (49 to 115 feet) from the piles. At the measurement sites, the water was approximately 1 meter (3.3 feet) deep and in the middle of a large riffle. The ambient noise level was high due to the water rushing past the hydrophones, masking the pile driving noise. On April 13, eight 24-inch-diameter steel pipe piles were installed in water approximately 1 meter deep. The piles driven were associated with the temporary work bridge that was being extended to underneath the existing I-5 detour bridge. Underwater sound levels were measured at approximately 10 to 17 meters (33 to 56 feet) and 16 to 35 meters (52.5 to 115 feet) from the piles (see Table I.3-44 for actual distances). The piles were installed within a partially confined bubble curtain. The bubbles were turned off and on to test the efficiency of the system. Due to the design of the bubble curtain, there was less than 1 dB of reduction attributed to its use. The design of the attenuation device was such that the piles were not completely surrounded by the bubble flux and the bubble rings were not at the bottom of the water table; rather they were fixed 1 to 2 feet from the bottom of the casing. On April 20, three 24-inch-diameter steel pipe piles were installed in water approximately 1 meter deep. The underwater sound levels were measured at approximately 8 to 12 meters (26 to 39 feet) and 15 to 30 meters (49 to 100 feet) from the piles (see Table I-3.44 for actual distances). The piles were driven in the attenuation device. The bubbles were turned off and on to test the efficiency of the system. The water depth where the hydrophones were located was approximately 1 meter deep with a strong current. Again, due to the design of the bubble curtain, there was less than 1 dB of reduction attributed to its use. Table I-3.44 shows the maximum peak and maximum one second SEL levels reached during the pile driving activities on April 13 and April 20, 2011.
Table I.3-43 Summary of Daily Maximum Sound Pressure Levels for Driving 24-Inch-Diameter Steel Pipe Piles - I-5 Willamette River Bridge Project, Eugene/Springfield, Oregon OR (April 2011)
April 13, 2011
Pile Condition
10-Meter (33-Foot) Location
20-Meter (65-Foot) Location
Sound Pressure
Levels in dB
Sound Pressure
Levels in dB Distance Peak SEL Distance Peak SEL
Pile 1 Attenuated-Hydraulic Impact Hammer 10 meters 191 166 35 meters 170 -- Pile 2 Attenuated-Hydraulic Impact Hammer 11 meters 189 164 34 meters 169 146 Pile 3 Attenuated-Hydraulic Impact Hammer 13 meters 185 160 32 meters 168 145 Pile 4 Attenuated-Hydraulic Impact Hammer 17 meters 185 162 30 meters 173 150 Pile 5 Attenuated-Hydraulic Impact Hammer 10 meters 186 166 25 meters 179 152 Pile 6 Attenuated-Hydraulic Impact Hammer 11 meters 187 165 24 meters 174 149 Pile 7 Attenuated-Hydraulic Impact Hammer 13 meters 194 169 20 meters 184 159 Pile 8 Attenuated-Hydraulic Impact Hammer 16 meters 187 161 16 meters 188 162 April 20, 2011 Pile 1 Attenuated- Hydraulic Impact Hammer 9 meters 200 174 30 meters 168 145 Pile 3 Attenuated- Hydraulic Impact Hammer 8 meters 207 178 15 meters 180 154 Pile 4 Attenuated- Hydraulic Impact Hammer 12 meters 198 174 17 meters 180 156
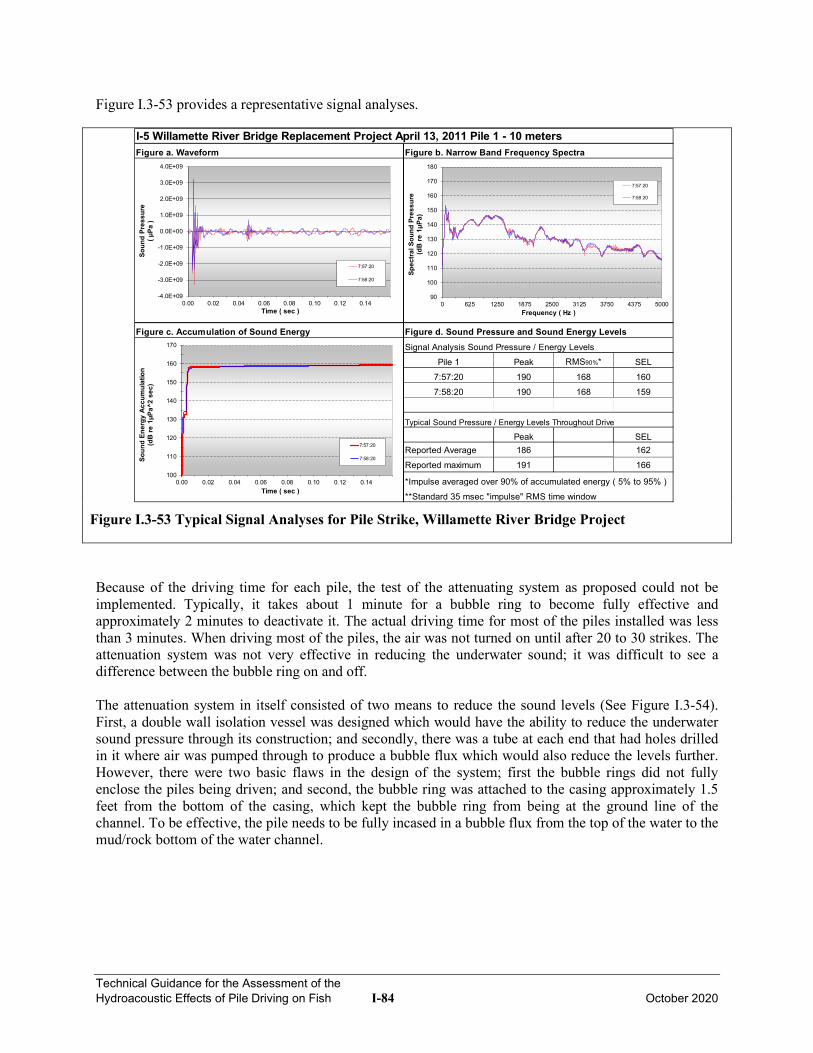
Technical Guidance for the Assessment of the Hydroacoustic Effects of Pile Driving on Fish I-84 October 2020
Figure I.3-53 provides a representative signal analyses.
Pile 1 Peak RMS90%* SEL7:57:20 190 168 1607:58:20 190 168 159
Peak SELReported Average 186 162Reported maximum 191 166
*Impulse averaged over 90% of accumulated energy ( 5% to 95% )
Signal Analysis Sound Pressure / Energy Levels
Typical Sound Pressure / Energy Levels Throughout Drive
**Standard 35 msec "impulse" RMS time window
Figure c. Accumulation of Sound Energy Figure d. Sound Pressure and Sound Energy Levels
I-5 Willamette River Bridge Replacement Project April 13, 2011 Pile 1 - 10 metersFigure a. Waveform Figure b. Narrow Band Frequency Spectra
-4.0E+09
-3.0E+09
-2.0E+09
-1.0E+09
0.0E+00
1.0E+09
2.0E+09
3.0E+09
4.0E+09
0.00 0.02 0.04 0.06 0.08 0.10 0.12 0.14
Soun
d Pr
essu
re
( µPa
)
Time ( sec )
7:57:20
7:58:20
90
100
110
120
130
140
150
160
170
180
0 625 1250 1875 2500 3125 3750 4375 5000
Spec
tral S
ound
Pre
ssur
e(d
B re
1µP
a)
Frequency ( Hz )
7:57:20
7:58:20
100
110
120
130
140
150
160
170
0.00 0.02 0.04 0.06 0.08 0.10 0.12 0.14
Soun
d En
ergy
Acc
umul
atio
n (d
B re
1µP
a^2
sec)
Time ( sec )
7:57:20
7:58:20
Figure I.3-53 Typical Signal Analyses for Pile Strike, Willamette River Bridge Project
Because of the driving time for each pile, the test of the attenuating system as proposed could not be implemented. Typically, it takes about 1 minute for a bubble ring to become fully effective and approximately 2 minutes to deactivate it. The actual driving time for most of the piles installed was less than 3 minutes. When driving most of the piles, the air was not turned on until after 20 to 30 strikes. The attenuation system was not very effective in reducing the underwater sound; it was difficult to see a difference between the bubble ring on and off. The attenuation system in itself consisted of two means to reduce the sound levels (See Figure I.3-54). First, a double wall isolation vessel was designed which would have the ability to reduce the underwater sound pressure through its construction; and secondly, there was a tube at each end that had holes drilled in it where air was pumped through to produce a bubble flux which would also reduce the levels further. However, there were two basic flaws in the design of the system; first the bubble rings did not fully enclose the piles being driven; and second, the bubble ring was attached to the casing approximately 1.5 feet from the bottom of the casing, which kept the bubble ring from being at the ground line of the channel. To be effective, the pile needs to be fully incased in a bubble flux from the top of the water to the mud/rock bottom of the water channel.
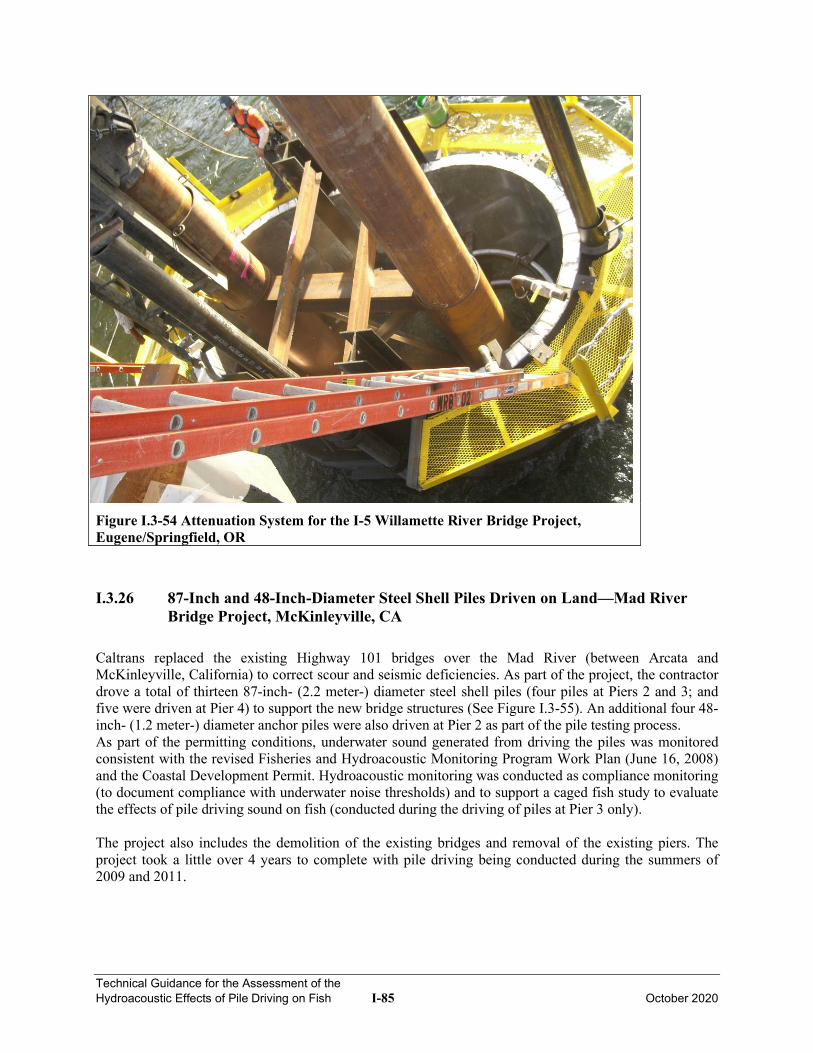
Technical Guidance for the Assessment of the Hydroacoustic Effects of Pile Driving on Fish I-85 October 2020
Figure I.3-54 Attenuation System for the I-5 Willamette River Bridge Project, Eugene/Springfield, OR
I.3.26 87-Inch and 48-Inch-Diameter Steel Shell Piles Driven on Land—Mad River Bridge Project, McKinleyville, CA
Caltrans replaced the existing Highway 101 bridges over the Mad River (between Arcata and McKinleyville, California) to correct scour and seismic deficiencies. As part of the project, the contractor drove a total of thirteen 87-inch- (2.2 meter-) diameter steel shell piles (four piles at Piers 2 and 3; and five were driven at Pier 4) to support the new bridge structures (See Figure I.3-55). An additional four 48-inch- (1.2 meter-) diameter anchor piles were also driven at Pier 2 as part of the pile testing process. As part of the permitting conditions, underwater sound generated from driving the piles was monitored consistent with the revised Fisheries and Hydroacoustic Monitoring Program Work Plan (June 16, 2008) and the Coastal Development Permit. Hydroacoustic monitoring was conducted as compliance monitoring (to document compliance with underwater noise thresholds) and to support a caged fish study to evaluate the effects of pile driving sound on fish (conducted during the driving of piles at Pier 3 only). The project also includes the demolition of the existing bridges and removal of the existing piers. The project took a little over 4 years to complete with pile driving being conducted during the summers of 2009 and 2011.
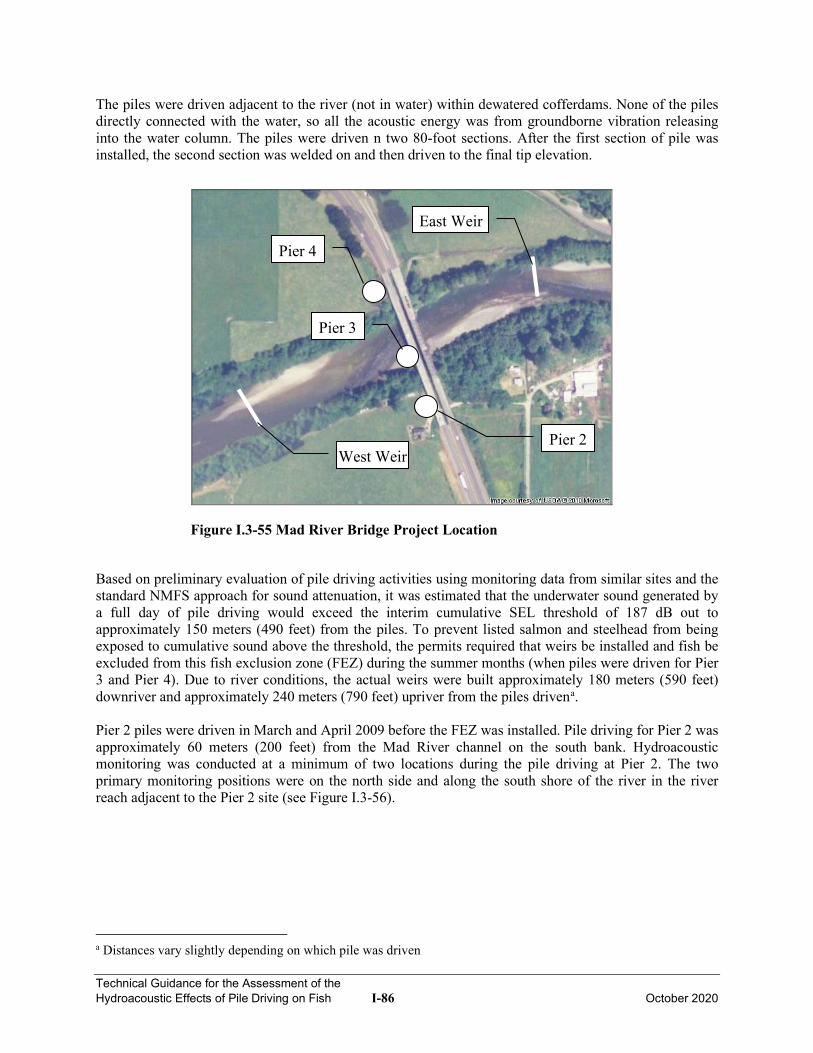
Technical Guidance for the Assessment of the Hydroacoustic Effects of Pile Driving on Fish I-86 October 2020
The piles were driven adjacent to the river (not in water) within dewatered cofferdams. None of the piles directly connected with the water, so all the acoustic energy was from groundborne vibration releasing into the water column. The piles were driven n two 80-foot sections. After the first section of pile was installed, the second section was welded on and then driven to the final tip elevation.
Pier 4
West Weir
East Weir
Pier 3
Pier 2
Figure I.3-55 Mad River Bridge Project Location Based on preliminary evaluation of pile driving activities using monitoring data from similar sites and the standard NMFS approach for sound attenuation, it was estimated that the underwater sound generated by a full day of pile driving would exceed the interim cumulative SEL threshold of 187 dB out to approximately 150 meters (490 feet) from the piles. To prevent listed salmon and steelhead from being exposed to cumulative sound above the threshold, the permits required that weirs be installed and fish be excluded from this fish exclusion zone (FEZ) during the summer months (when piles were driven for Pier 3 and Pier 4). Due to river conditions, the actual weirs were built approximately 180 meters (590 feet) downriver and approximately 240 meters (790 feet) upriver from the piles drivena. Pier 2 piles were driven in March and April 2009 before the FEZ was installed. Pile driving for Pier 2 was approximately 60 meters (200 feet) from the Mad River channel on the south bank. Hydroacoustic monitoring was conducted at a minimum of two locations during the pile driving at Pier 2. The two primary monitoring positions were on the north side and along the south shore of the river in the river reach adjacent to the Pier 2 site (see Figure I.3-56).
a Distances vary slightly depending on which pile was driven
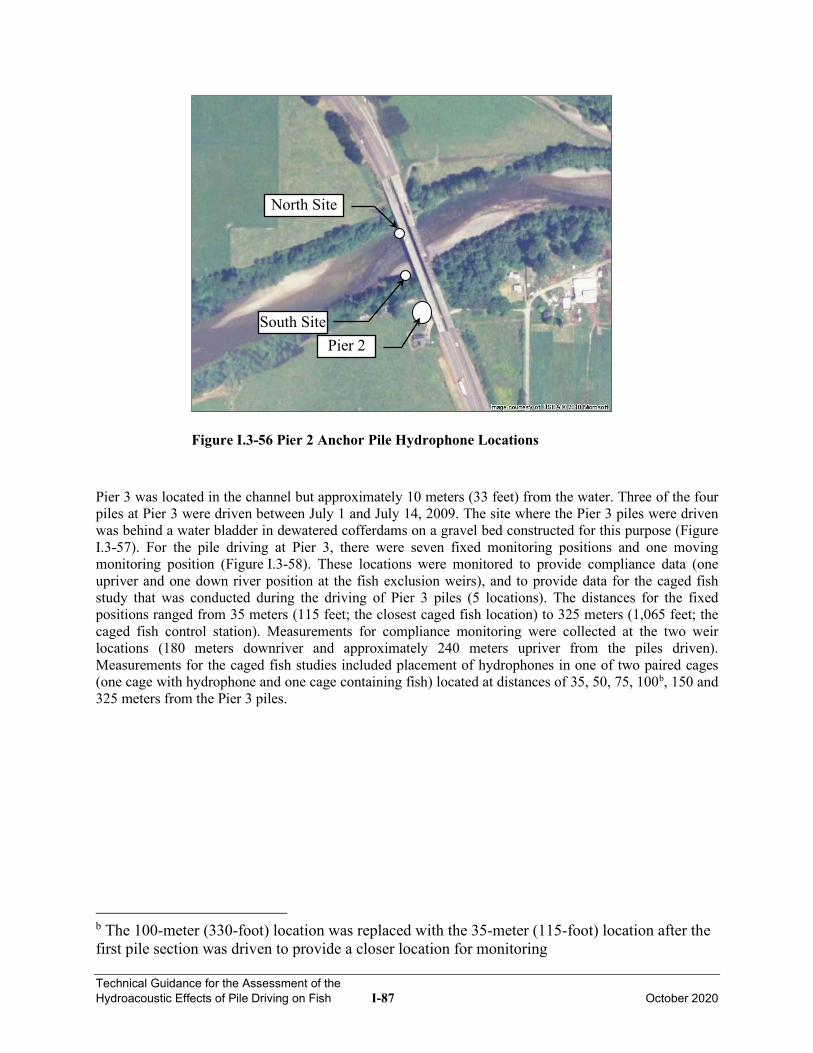
Technical Guidance for the Assessment of the Hydroacoustic Effects of Pile Driving on Fish I-87 October 2020
Figure I.3-56 Pier 2 Anchor Pile Hydrophone Locations
Pier 3 was located in the channel but approximately 10 meters (33 feet) from the water. Three of the four piles at Pier 3 were driven between July 1 and July 14, 2009. The site where the Pier 3 piles were driven was behind a water bladder in dewatered cofferdams on a gravel bed constructed for this purpose (Figure I.3-57). For the pile driving at Pier 3, there were seven fixed monitoring positions and one moving monitoring position (Figure I.3-58). These locations were monitored to provide compliance data (one upriver and one down river position at the fish exclusion weirs), and to provide data for the caged fish study that was conducted during the driving of Pier 3 piles (5 locations). The distances for the fixed positions ranged from 35 meters (115 feet; the closest caged fish location) to 325 meters (1,065 feet; the caged fish control station). Measurements for compliance monitoring were collected at the two weir locations (180 meters downriver and approximately 240 meters upriver from the piles driven). Measurements for the caged fish studies included placement of hydrophones in one of two paired cages (one cage with hydrophone and one cage containing fish) located at distances of 35, 50, 75, 100b, 150 and 325 meters from the Pier 3 piles.
b The 100-meter (330-foot) location was replaced with the 35-meter (115-foot) location after the first pile section was driven to provide a closer location for monitoring
Pier 2 South Site
North Site
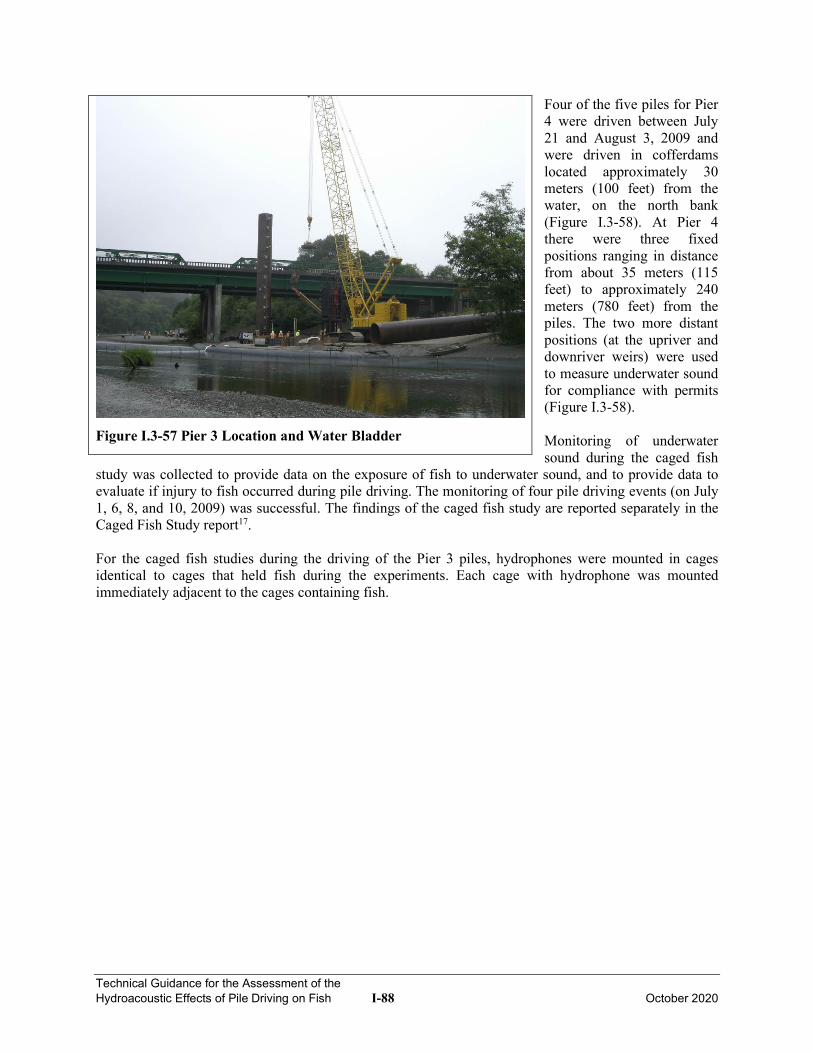
Technical Guidance for the Assessment of the Hydroacoustic Effects of Pile Driving on Fish I-88 October 2020
Four of the five piles for Pier 4 were driven between July 21 and August 3, 2009 and were driven in cofferdams located approximately 30 meters (100 feet) from the water, on the north bank (Figure I.3-58). At Pier 4 there were three fixed positions ranging in distance from about 35 meters (115 feet) to approximately 240 meters (780 feet) from the piles. The two more distant positions (at the upriver and downriver weirs) were used to measure underwater sound for compliance with permits (Figure I.3-58). Monitoring of underwater sound during the caged fish
study was collected to provide data on the exposure of fish to underwater sound, and to provide data to evaluate if injury to fish occurred during pile driving. The monitoring of four pile driving events (on July 1, 6, 8, and 10, 2009) was successful. The findings of the caged fish study are reported separately in the Caged Fish Study report17. For the caged fish studies during the driving of the Pier 3 piles, hydrophones were mounted in cages identical to cages that held fish during the experiments. Each cage with hydrophone was mounted immediately adjacent to the cages containing fish.
Figure I.3-57 Pier 3 Location and Water Bladder
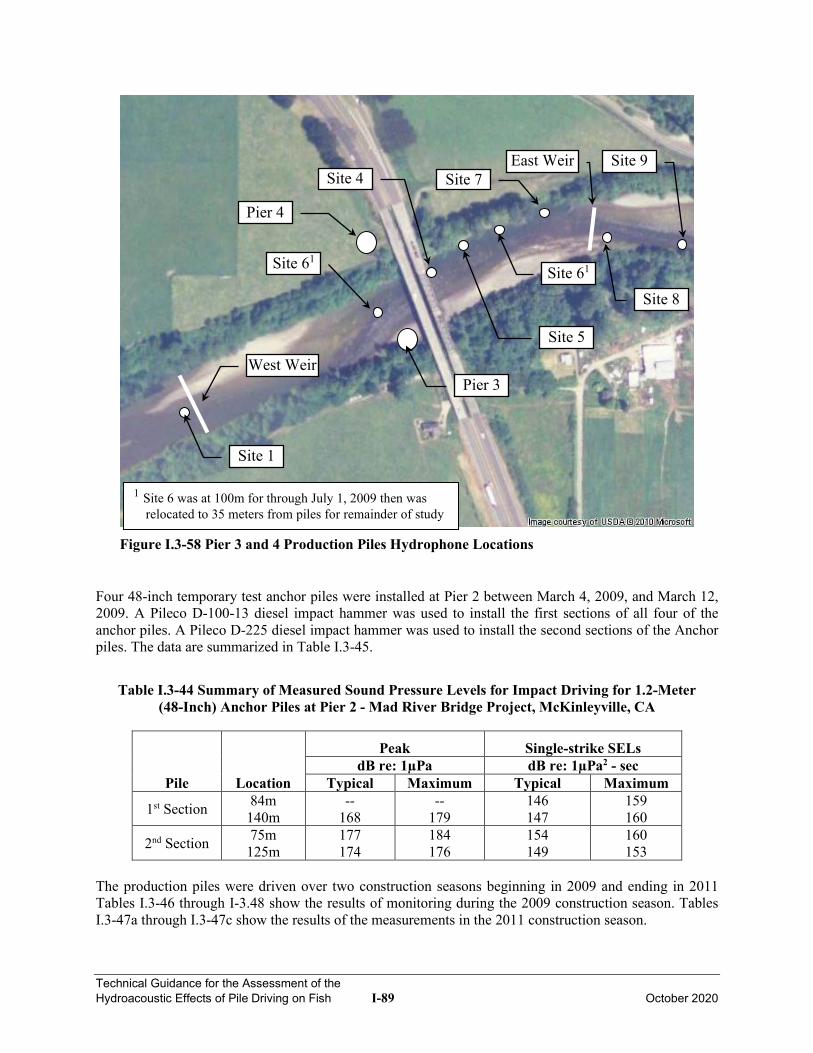
Technical Guidance for the Assessment of the Hydroacoustic Effects of Pile Driving on Fish I-89 October 2020
Site 61
Site 7
Site 8
Site 9
Site 5
Site 1
Pier 4
Site 4 East Weir
West Weir
Site 61
Pier 3
1 Site 6 was at 100m for through July 1, 2009 then was relocated to 35 meters from piles for remainder of study
Figure I.3-58 Pier 3 and 4 Production Piles Hydrophone Locations Four 48-inch temporary test anchor piles were installed at Pier 2 between March 4, 2009, and March 12, 2009. A Pileco D-100-13 diesel impact hammer was used to install the first sections of all four of the anchor piles. A Pileco D-225 diesel impact hammer was used to install the second sections of the Anchor piles. The data are summarized in Table I.3-45.
Table I.3-44 Summary of Measured Sound Pressure Levels for Impact Driving for 1.2-Meter
(48-Inch) Anchor Piles at Pier 2 - Mad River Bridge Project, McKinleyville, CA
Pile Location
Peak dB re: 1µPa
Single-strike SELs dB re: 1µPa2 - sec
Typical Maximum Typical Maximum
1st Section 84m 140m
-- 168
-- 179
146 147
159 160
2nd Section 75m 125m
177 174
184 176
154 149
160 153
The production piles were driven over two construction seasons beginning in 2009 and ending in 2011 Tables I.3-46 through I-3.48 show the results of monitoring during the 2009 construction season. Tables I.3-47a through I.3-47c show the results of the measurements in the 2011 construction season.
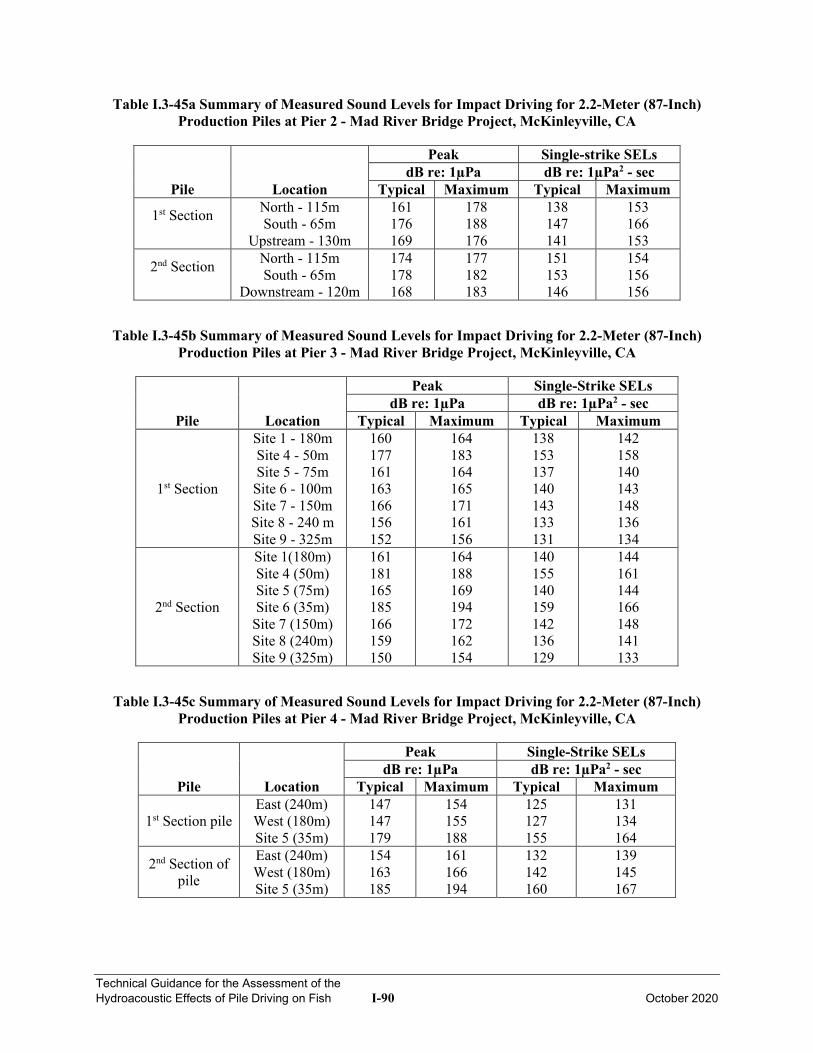
Technical Guidance for the Assessment of the Hydroacoustic Effects of Pile Driving on Fish I-90 October 2020
Table I.3-45a Summary of Measured Sound Levels for Impact Driving for 2.2-Meter (87-Inch) Production Piles at Pier 2 - Mad River Bridge Project, McKinleyville, CA
Pile Location
Peak dB re: 1µPa
Single-strike SELs dB re: 1µPa2 - sec
Typical Maximum Typical Maximum
1st Section
North - 115m South - 65m
Upstream - 130m
161 176 169
178 188 176
138 147 141
153 166 153
2nd Section
North - 115m South - 65m
Downstream - 120m
174 178 168
177 182 183
151 153 146
154 156 156
Table I.3-45b Summary of Measured Sound Levels for Impact Driving for 2.2-Meter (87-Inch)
Production Piles at Pier 3 - Mad River Bridge Project, McKinleyville, CA
Pile Location
Peak dB re: 1µPa
Single-Strike SELs dB re: 1µPa2 - sec
Typical Maximum Typical Maximum
1st Section
Site 1 - 180m Site 4 - 50m Site 5 - 75m Site 6 - 100m Site 7 - 150m Site 8 - 240 m Site 9 - 325m
160 177 161 163 166 156 152
164 183 164 165 171 161 156
138 153 137 140 143 133 131
142 158 140 143 148 136 134
2nd Section
Site 1(180m) Site 4 (50m) Site 5 (75m) Site 6 (35m) Site 7 (150m) Site 8 (240m) Site 9 (325m)
161 181 165 185 166 159 150
164 188 169 194 172 162 154
140 155 140 159 142 136 129
144 161 144 166 148 141 133
Table I.3-45c Summary of Measured Sound Levels for Impact Driving for 2.2-Meter (87-Inch)
Production Piles at Pier 4 - Mad River Bridge Project, McKinleyville, CA
Pile
Location
Peak dB re: 1µPa
Single-Strike SELs dB re: 1µPa2 - sec
Typical Maximum Typical Maximum
1st Section pile East (240m) West (180m) Site 5 (35m)
147 147 179
154 155 188
125 127 155
131 134 164
2nd Section of pile
East (240m) West (180m) Site 5 (35m)
154 163 185
161 166 194
132 142 160
139 145 167
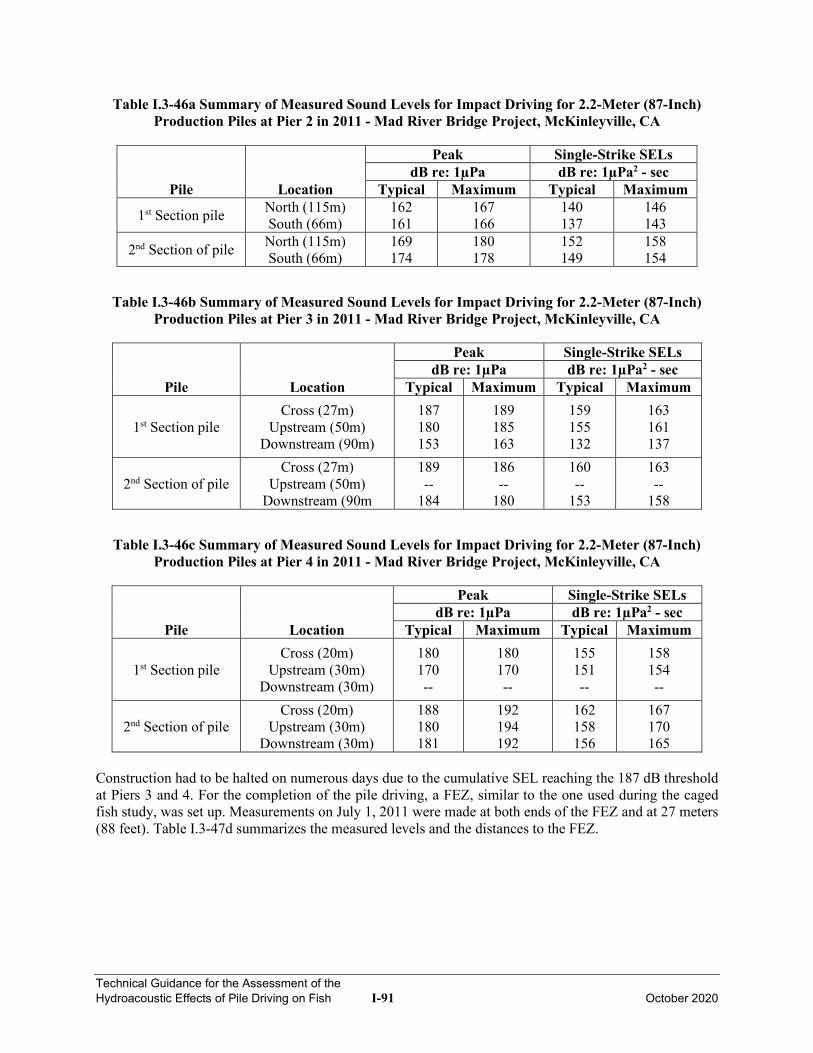
Technical Guidance for the Assessment of the Hydroacoustic Effects of Pile Driving on Fish I-91 October 2020
Table I.3-46a Summary of Measured Sound Levels for Impact Driving for 2.2-Meter (87-Inch) Production Piles at Pier 2 in 2011 - Mad River Bridge Project, McKinleyville, CA
Pile Location
Peak dB re: 1µPa
Single-Strike SELs dB re: 1µPa2 - sec
Typical Maximum Typical Maximum
1st Section pile North (115m) South (66m)
162 161
167 166
140 137
146 143
2nd Section of pile North (115m) South (66m)
169 174
180 178
152 149
158 154
Table I.3-46b Summary of Measured Sound Levels for Impact Driving for 2.2-Meter (87-Inch)
Production Piles at Pier 3 in 2011 - Mad River Bridge Project, McKinleyville, CA
Pile Location
Peak dB re: 1µPa
Single-Strike SELs dB re: 1µPa2 - sec
Typical Maximum Typical Maximum
1st Section pile Cross (27m)
Upstream (50m) Downstream (90m)
187 180 153
189 185 163
159 155 132
163 161 137
2nd Section of pile Cross (27m)
Upstream (50m) Downstream (90m
189 --
184
186 --
180
160 --
153
163 --
158
Table I.3-46c Summary of Measured Sound Levels for Impact Driving for 2.2-Meter (87-Inch)
Production Piles at Pier 4 in 2011 - Mad River Bridge Project, McKinleyville, CA
Pile Location
Peak dB re: 1µPa
Single-Strike SELs dB re: 1µPa2 - sec
Typical Maximum Typical Maximum
1st Section pile Cross (20m)
Upstream (30m) Downstream (30m)
180 170 --
180 170 --
155 151 --
158 154 --
2nd Section of pile Cross (20m)
Upstream (30m) Downstream (30m)
188 180 181
192 194 192
162 158 156
167 170 165
Construction had to be halted on numerous days due to the cumulative SEL reaching the 187 dB threshold at Piers 3 and 4. For the completion of the pile driving, a FEZ, similar to the one used during the caged fish study, was set up. Measurements on July 1, 2011 were made at both ends of the FEZ and at 27 meters (88 feet). Table I.3-47d summarizes the measured levels and the distances to the FEZ.
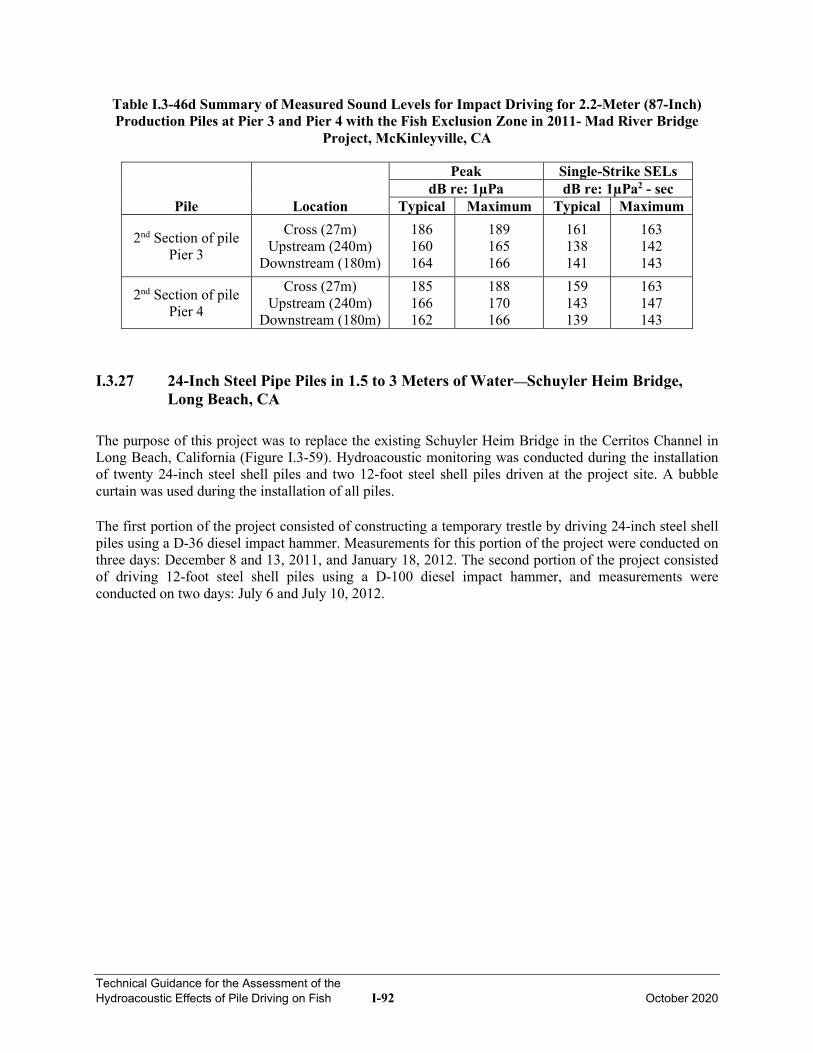
Technical Guidance for the Assessment of the Hydroacoustic Effects of Pile Driving on Fish I-92 October 2020
Table I.3-46d Summary of Measured Sound Levels for Impact Driving for 2.2-Meter (87-Inch) Production Piles at Pier 3 and Pier 4 with the Fish Exclusion Zone in 2011- Mad River Bridge
Project, McKinleyville, CA
Pile Location
Peak dB re: 1µPa
Single-Strike SELs dB re: 1µPa2 - sec
Typical Maximum Typical Maximum
2nd Section of pile Pier 3
Cross (27m) Upstream (240m)
Downstream (180m)
186 160 164
189 165 166
161 138 141
163 142 143
2nd Section of pile Pier 4
Cross (27m) Upstream (240m)
Downstream (180m)
185 166 162
188 170 166
159 143 139
163 147 143
I.3.27 24-Inch Steel Pipe Piles in 1.5 to 3 Meters of Water—Schuyler Heim Bridge, Long Beach, CA
The purpose of this project was to replace the existing Schuyler Heim Bridge in the Cerritos Channel in Long Beach, California (Figure I.3-59). Hydroacoustic monitoring was conducted during the installation of twenty 24-inch steel shell piles and two 12-foot steel shell piles driven at the project site. A bubble curtain was used during the installation of all piles. The first portion of the project consisted of constructing a temporary trestle by driving 24-inch steel shell piles using a D-36 diesel impact hammer. Measurements for this portion of the project were conducted on three days: December 8 and 13, 2011, and January 18, 2012. The second portion of the project consisted of driving 12-foot steel shell piles using a D-100 diesel impact hammer, and measurements were conducted on two days: July 6 and July 10, 2012.
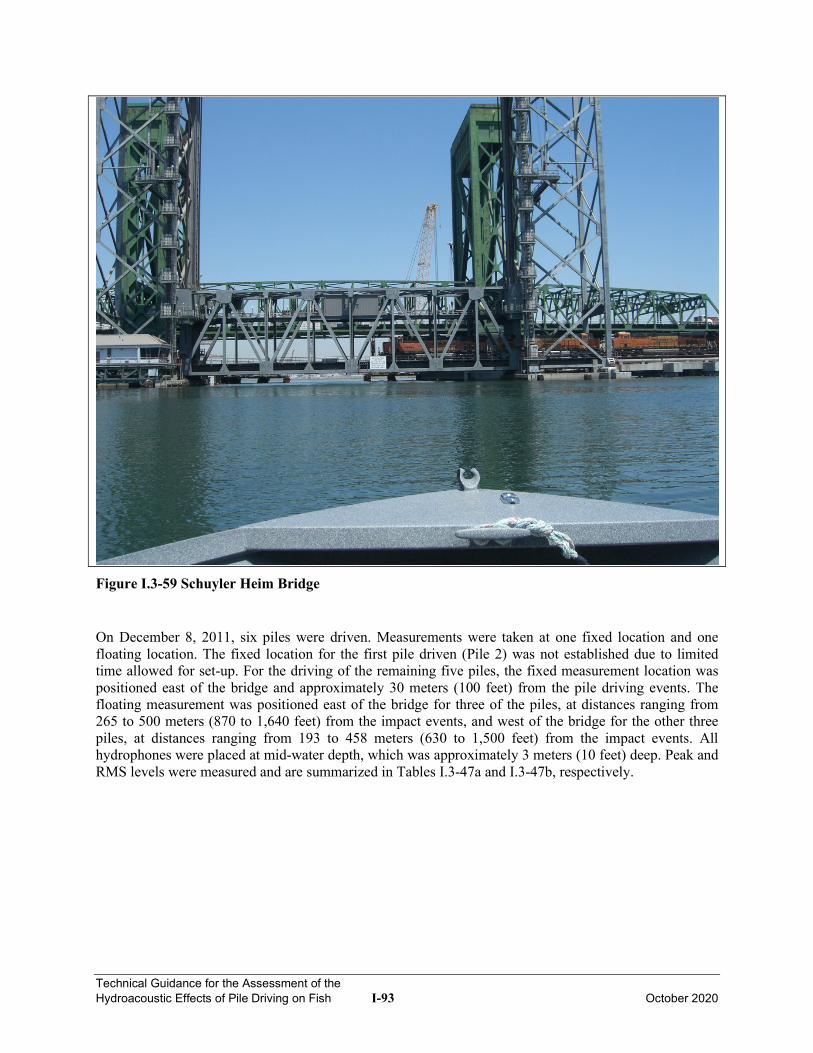
Technical Guidance for the Assessment of the Hydroacoustic Effects of Pile Driving on Fish I-93 October 2020
Figure I.3-59 Schuyler Heim Bridge On December 8, 2011, six piles were driven. Measurements were taken at one fixed location and one floating location. The fixed location for the first pile driven (Pile 2) was not established due to limited time allowed for set-up. For the driving of the remaining five piles, the fixed measurement location was positioned east of the bridge and approximately 30 meters (100 feet) from the pile driving events. The floating measurement was positioned east of the bridge for three of the piles, at distances ranging from 265 to 500 meters (870 to 1,640 feet) from the impact events, and west of the bridge for the other three piles, at distances ranging from 193 to 458 meters (630 to 1,500 feet) from the impact events. All hydrophones were placed at mid-water depth, which was approximately 3 meters (10 feet) deep. Peak and RMS levels were measured and are summarized in Tables I.3-47a and I.3-47b, respectively.
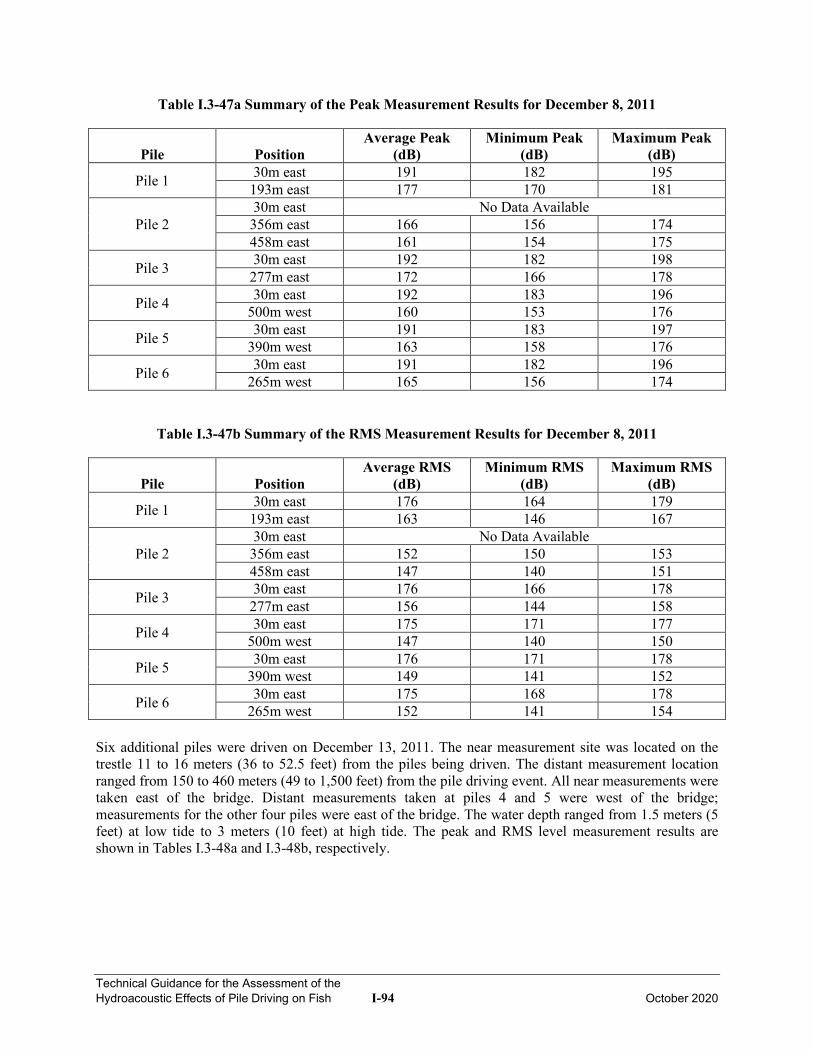
Technical Guidance for the Assessment of the Hydroacoustic Effects of Pile Driving on Fish I-94 October 2020
Table I.3-47a Summary of the Peak Measurement Results for December 8, 2011
Pile Position Average Peak
(dB) Minimum Peak
(dB) Maximum Peak
(dB)
Pile 1 30m east 191 182 195 193m east 177 170 181
Pile 2 30m east No Data Available 356m east 166 156 174 458m east 161 154 175
Pile 3 30m east 192 182 198 277m east 172 166 178
Pile 4 30m east 192 183 196 500m west 160 153 176
Pile 5 30m east 191 183 197 390m west 163 158 176
Pile 6 30m east 191 182 196 265m west 165 156 174
Table I.3-47b Summary of the RMS Measurement Results for December 8, 2011
Pile Position Average RMS
(dB) Minimum RMS
(dB) Maximum RMS
(dB)
Pile 1 30m east 176 164 179 193m east 163 146 167
Pile 2 30m east No Data Available 356m east 152 150 153 458m east 147 140 151
Pile 3 30m east 176 166 178 277m east 156 144 158
Pile 4 30m east 175 171 177 500m west 147 140 150
Pile 5 30m east 176 171 178 390m west 149 141 152
Pile 6 30m east 175 168 178 265m west 152 141 154
Six additional piles were driven on December 13, 2011. The near measurement site was located on the trestle 11 to 16 meters (36 to 52.5 feet) from the piles being driven. The distant measurement location ranged from 150 to 460 meters (49 to 1,500 feet) from the pile driving event. All near measurements were taken east of the bridge. Distant measurements taken at piles 4 and 5 were west of the bridge; measurements for the other four piles were east of the bridge. The water depth ranged from 1.5 meters (5 feet) at low tide to 3 meters (10 feet) at high tide. The peak and RMS level measurement results are shown in Tables I.3-48a and I.3-48b, respectively.
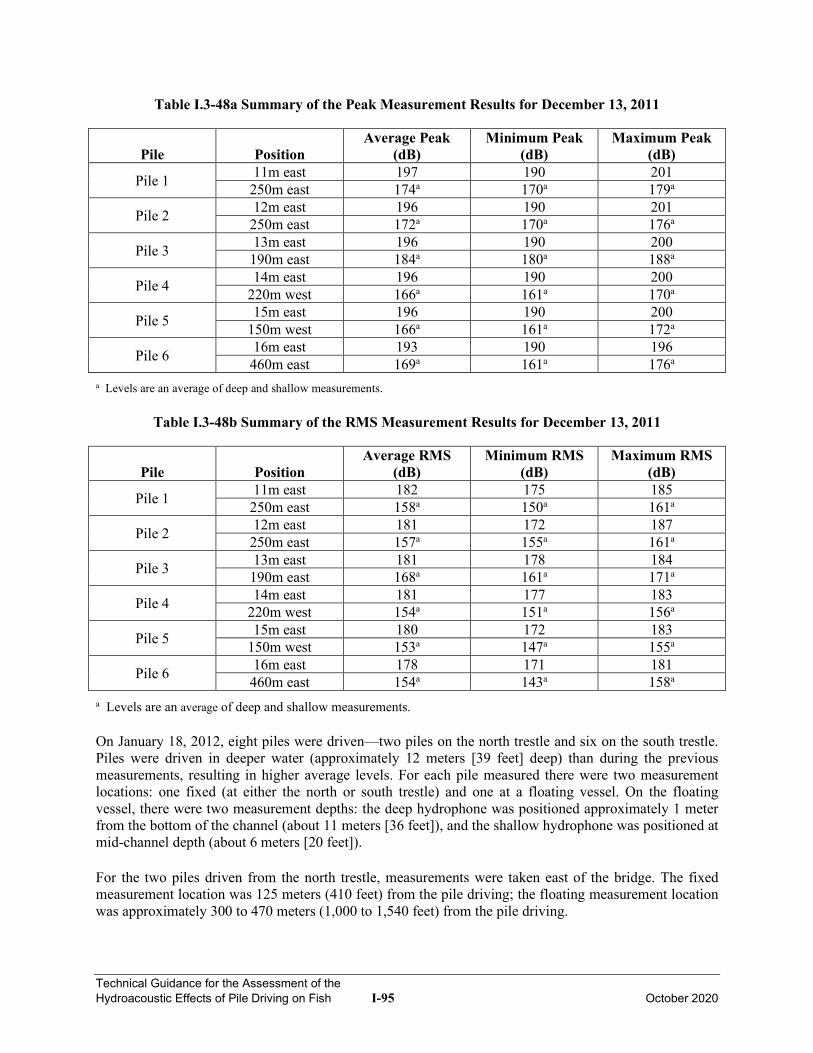
Technical Guidance for the Assessment of the Hydroacoustic Effects of Pile Driving on Fish I-95 October 2020
Table I.3-48a Summary of the Peak Measurement Results for December 13, 2011
Pile Position Average Peak
(dB) Minimum Peak
(dB) Maximum Peak
(dB)
Pile 1 11m east 197 190 201 250m east 174a 170a 179a
Pile 2 12m east 196 190 201 250m east 172a 170a 176a
Pile 3 13m east 196 190 200 190m east 184a 180a 188a
Pile 4 14m east 196 190 200 220m west 166a 161a 170a
Pile 5 15m east 196 190 200 150m west 166a 161a 172a
Pile 6 16m east 193 190 196 460m east 169a 161a 176a
a Levels are an average of deep and shallow measurements.
Table I.3-48b Summary of the RMS Measurement Results for December 13, 2011
Pile Position Average RMS
(dB) Minimum RMS
(dB) Maximum RMS
(dB)
Pile 1 11m east 182 175 185 250m east 158a 150a 161a
Pile 2 12m east 181 172 187 250m east 157a 155a 161a
Pile 3 13m east 181 178 184 190m east 168a 161a 171a
Pile 4 14m east 181 177 183 220m west 154a 151a 156a
Pile 5 15m east 180 172 183 150m west 153a 147a 155a
Pile 6 16m east 178 171 181 460m east 154a 143a 158a
a Levels are an average of deep and shallow measurements. On January 18, 2012, eight piles were driven—two piles on the north trestle and six on the south trestle. Piles were driven in deeper water (approximately 12 meters [39 feet] deep) than during the previous measurements, resulting in higher average levels. For each pile measured there were two measurement locations: one fixed (at either the north or south trestle) and one at a floating vessel. On the floating vessel, there were two measurement depths: the deep hydrophone was positioned approximately 1 meter from the bottom of the channel (about 11 meters [36 feet]), and the shallow hydrophone was positioned at mid-channel depth (about 6 meters [20 feet]). For the two piles driven from the north trestle, measurements were taken east of the bridge. The fixed measurement location was 125 meters (410 feet) from the pile driving; the floating measurement location was approximately 300 to 470 meters (1,000 to 1,540 feet) from the pile driving.
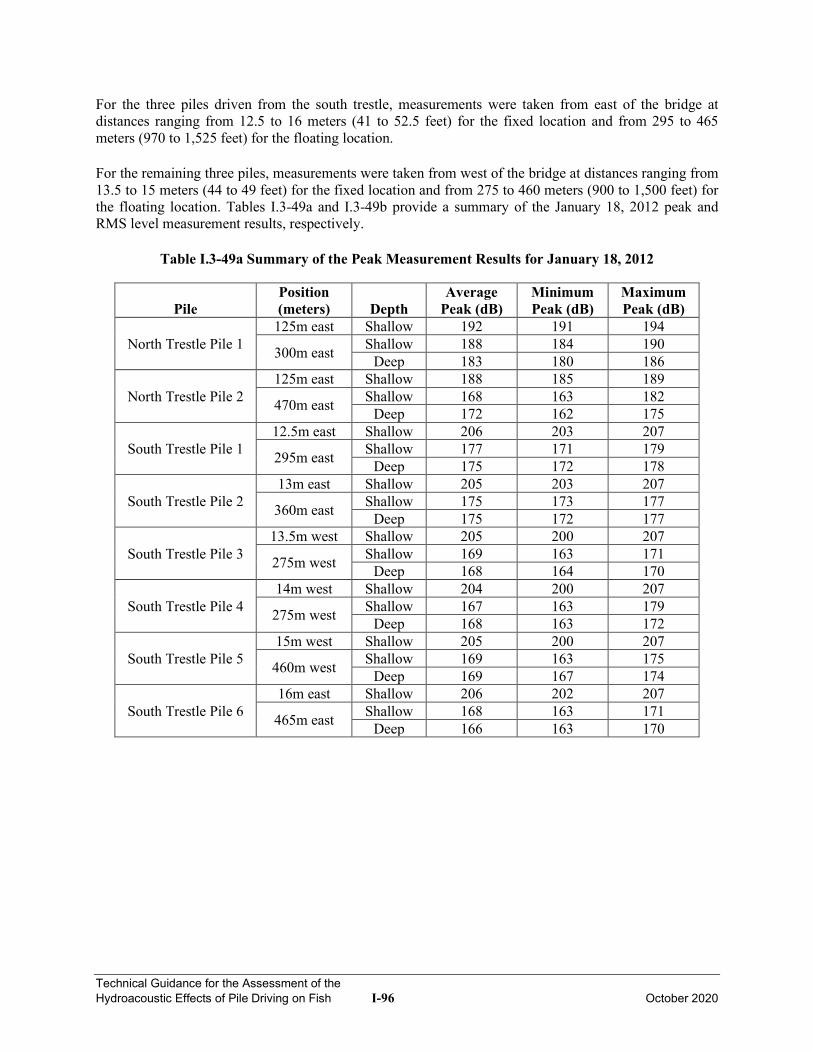
Technical Guidance for the Assessment of the Hydroacoustic Effects of Pile Driving on Fish I-96 October 2020
For the three piles driven from the south trestle, measurements were taken from east of the bridge at distances ranging from 12.5 to 16 meters (41 to 52.5 feet) for the fixed location and from 295 to 465 meters (970 to 1,525 feet) for the floating location. For the remaining three piles, measurements were taken from west of the bridge at distances ranging from 13.5 to 15 meters (44 to 49 feet) for the fixed location and from 275 to 460 meters (900 to 1,500 feet) for the floating location. Tables I.3-49a and I.3-49b provide a summary of the January 18, 2012 peak and RMS level measurement results, respectively.
Table I.3-49a Summary of the Peak Measurement Results for January 18, 2012
Pile Position (meters) Depth
Average Peak (dB)
Minimum Peak (dB)
Maximum Peak (dB)
North Trestle Pile 1 125m east Shallow 192 191 194
300m east Shallow 188 184 190 Deep 183 180 186
North Trestle Pile 2 125m east Shallow 188 185 189
470m east Shallow 168 163 182 Deep 172 162 175
South Trestle Pile 1 12.5m east Shallow 206 203 207
295m east Shallow 177 171 179 Deep 175 172 178
South Trestle Pile 2 13m east Shallow 205 203 207
360m east Shallow 175 173 177 Deep 175 172 177
South Trestle Pile 3 13.5m west Shallow 205 200 207
275m west Shallow 169 163 171 Deep 168 164 170
South Trestle Pile 4 14m west Shallow 204 200 207
275m west Shallow 167 163 179 Deep 168 163 172
South Trestle Pile 5 15m west Shallow 205 200 207
460m west Shallow 169 163 175 Deep 169 167 174
South Trestle Pile 6 16m east Shallow 206 202 207
465m east Shallow 168 163 171 Deep 166 163 170
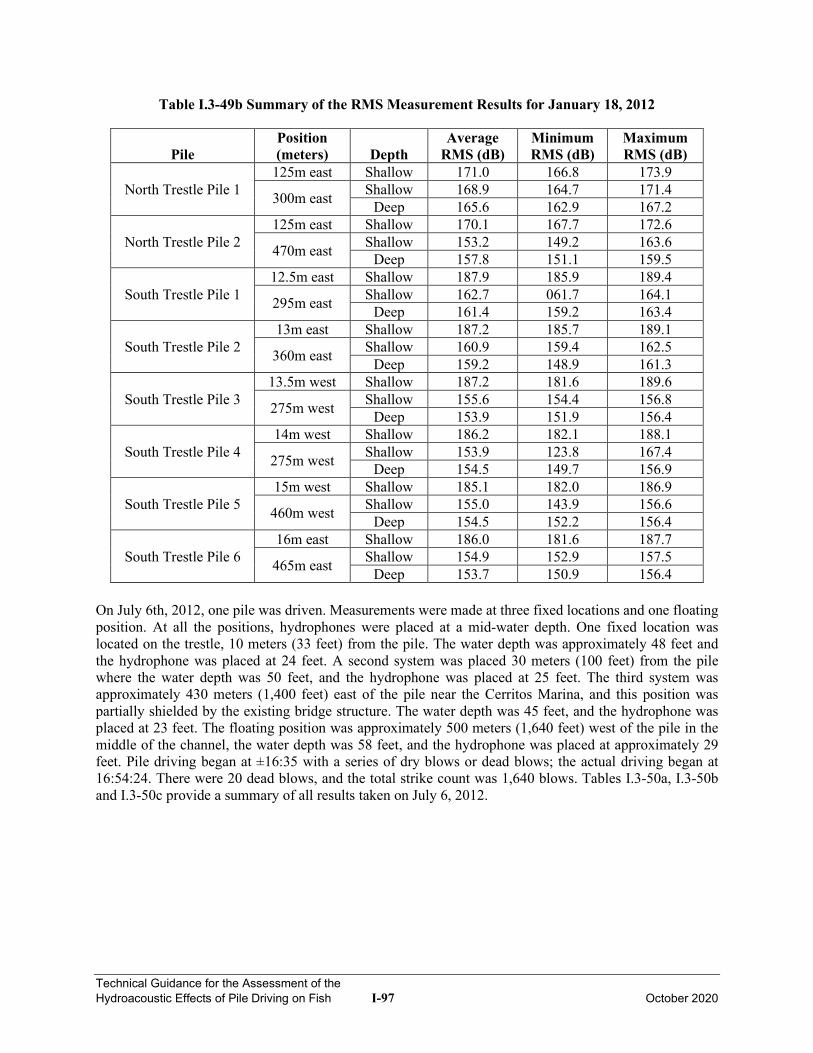
Technical Guidance for the Assessment of the Hydroacoustic Effects of Pile Driving on Fish I-97 October 2020
Table I.3-49b Summary of the RMS Measurement Results for January 18, 2012
Pile Position (meters) Depth
Average RMS (dB)
Minimum RMS (dB)
Maximum RMS (dB)
North Trestle Pile 1 125m east Shallow 171.0 166.8 173.9
300m east Shallow 168.9 164.7 171.4 Deep 165.6 162.9 167.2
North Trestle Pile 2 125m east Shallow 170.1 167.7 172.6
470m east Shallow 153.2 149.2 163.6 Deep 157.8 151.1 159.5
South Trestle Pile 1 12.5m east Shallow 187.9 185.9 189.4
295m east Shallow 162.7 061.7 164.1 Deep 161.4 159.2 163.4
South Trestle Pile 2 13m east Shallow 187.2 185.7 189.1
360m east Shallow 160.9 159.4 162.5 Deep 159.2 148.9 161.3
South Trestle Pile 3 13.5m west Shallow 187.2 181.6 189.6
275m west Shallow 155.6 154.4 156.8 Deep 153.9 151.9 156.4
South Trestle Pile 4 14m west Shallow 186.2 182.1 188.1
275m west Shallow 153.9 123.8 167.4 Deep 154.5 149.7 156.9
South Trestle Pile 5 15m west Shallow 185.1 182.0 186.9
460m west Shallow 155.0 143.9 156.6 Deep 154.5 152.2 156.4
South Trestle Pile 6 16m east Shallow 186.0 181.6 187.7
465m east Shallow 154.9 152.9 157.5 Deep 153.7 150.9 156.4
On July 6th, 2012, one pile was driven. Measurements were made at three fixed locations and one floating position. At all the positions, hydrophones were placed at a mid-water depth. One fixed location was located on the trestle, 10 meters (33 feet) from the pile. The water depth was approximately 48 feet and the hydrophone was placed at 24 feet. A second system was placed 30 meters (100 feet) from the pile where the water depth was 50 feet, and the hydrophone was placed at 25 feet. The third system was approximately 430 meters (1,400 feet) east of the pile near the Cerritos Marina, and this position was partially shielded by the existing bridge structure. The water depth was 45 feet, and the hydrophone was placed at 23 feet. The floating position was approximately 500 meters (1,640 feet) west of the pile in the middle of the channel, the water depth was 58 feet, and the hydrophone was placed at approximately 29 feet. Pile driving began at ±16:35 with a series of dry blows or dead blows; the actual driving began at 16:54:24. There were 20 dead blows, and the total strike count was 1,640 blows. Tables I.3-50a, I.3-50b and I.3-50c provide a summary of all results taken on July 6, 2012.
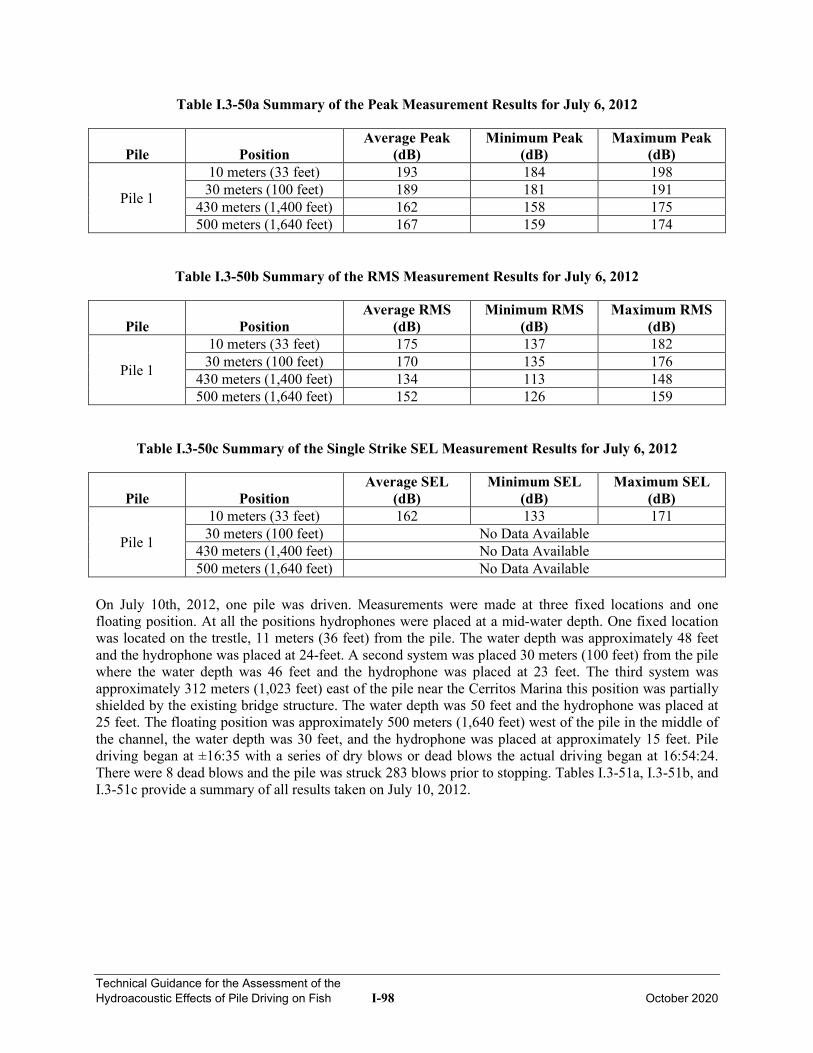
Technical Guidance for the Assessment of the Hydroacoustic Effects of Pile Driving on Fish I-98 October 2020
Table I.3-50a Summary of the Peak Measurement Results for July 6, 2012
Pile Position Average Peak
(dB) Minimum Peak
(dB) Maximum Peak
(dB)
Pile 1
10 meters (33 feet) 193 184 198 30 meters (100 feet) 189 181 191
430 meters (1,400 feet) 162 158 175 500 meters (1,640 feet) 167 159 174
Table I.3-50b Summary of the RMS Measurement Results for July 6, 2012
Pile Position Average RMS
(dB) Minimum RMS
(dB) Maximum RMS
(dB)
Pile 1
10 meters (33 feet) 175 137 182 30 meters (100 feet) 170 135 176
430 meters (1,400 feet) 134 113 148 500 meters (1,640 feet) 152 126 159
Table I.3-50c Summary of the Single Strike SEL Measurement Results for July 6, 2012
Pile Position Average SEL
(dB) Minimum SEL
(dB) Maximum SEL
(dB)
Pile 1
10 meters (33 feet) 162 133 171 30 meters (100 feet) No Data Available
430 meters (1,400 feet) No Data Available 500 meters (1,640 feet) No Data Available
On July 10th, 2012, one pile was driven. Measurements were made at three fixed locations and one floating position. At all the positions hydrophones were placed at a mid-water depth. One fixed location was located on the trestle, 11 meters (36 feet) from the pile. The water depth was approximately 48 feet and the hydrophone was placed at 24-feet. A second system was placed 30 meters (100 feet) from the pile where the water depth was 46 feet and the hydrophone was placed at 23 feet. The third system was approximately 312 meters (1,023 feet) east of the pile near the Cerritos Marina this position was partially shielded by the existing bridge structure. The water depth was 50 feet and the hydrophone was placed at 25 feet. The floating position was approximately 500 meters (1,640 feet) west of the pile in the middle of the channel, the water depth was 30 feet, and the hydrophone was placed at approximately 15 feet. Pile driving began at ±16:35 with a series of dry blows or dead blows the actual driving began at 16:54:24. There were 8 dead blows and the pile was struck 283 blows prior to stopping. Tables I.3-51a, I.3-51b, and I.3-51c provide a summary of all results taken on July 10, 2012.
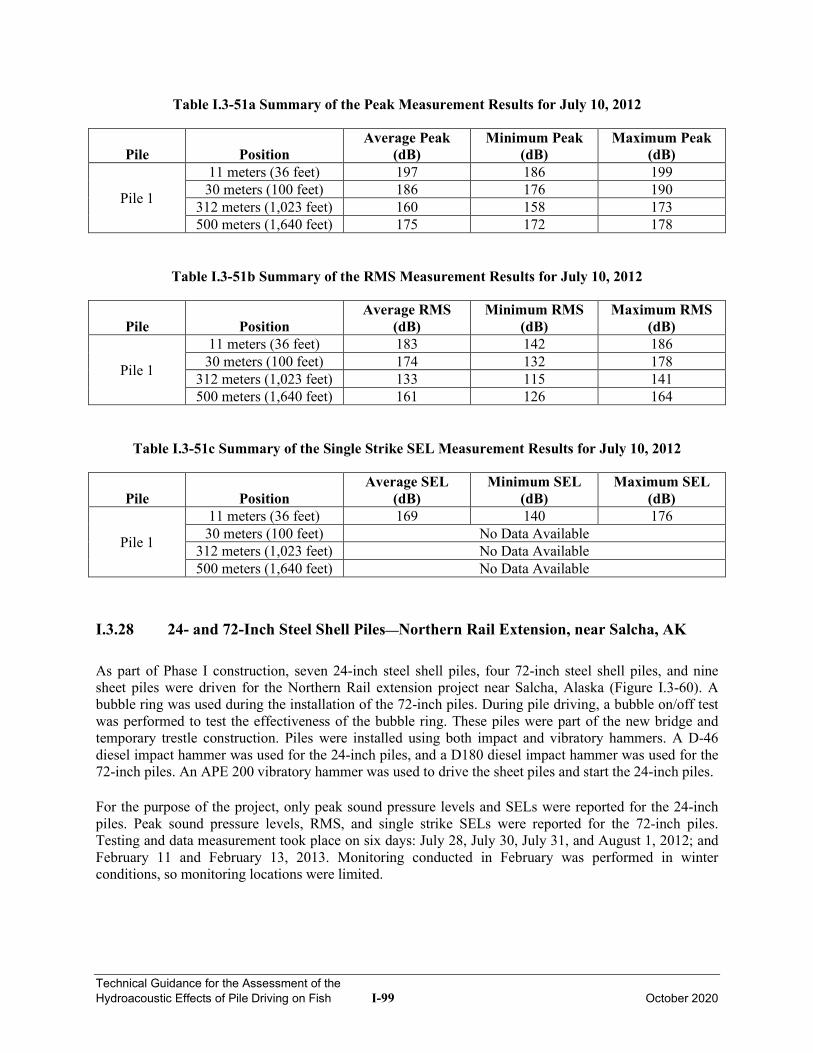
Technical Guidance for the Assessment of the Hydroacoustic Effects of Pile Driving on Fish I-99 October 2020
Table I.3-51a Summary of the Peak Measurement Results for July 10, 2012
Pile Position Average Peak
(dB) Minimum Peak
(dB) Maximum Peak
(dB)
Pile 1
11 meters (36 feet) 197 186 199 30 meters (100 feet) 186 176 190
312 meters (1,023 feet) 160 158 173 500 meters (1,640 feet) 175 172 178
Table I.3-51b Summary of the RMS Measurement Results for July 10, 2012
Pile Position Average RMS
(dB) Minimum RMS
(dB) Maximum RMS
(dB)
Pile 1
11 meters (36 feet) 183 142 186 30 meters (100 feet) 174 132 178
312 meters (1,023 feet) 133 115 141 500 meters (1,640 feet) 161 126 164
Table I.3-51c Summary of the Single Strike SEL Measurement Results for July 10, 2012
Pile Position Average SEL
(dB) Minimum SEL
(dB) Maximum SEL
(dB)
Pile 1
11 meters (36 feet) 169 140 176 30 meters (100 feet) No Data Available
312 meters (1,023 feet) No Data Available 500 meters (1,640 feet) No Data Available
I.3.28 24- and 72-Inch Steel Shell Piles—Northern Rail Extension, near Salcha, AK
As part of Phase I construction, seven 24-inch steel shell piles, four 72-inch steel shell piles, and nine sheet piles were driven for the Northern Rail extension project near Salcha, Alaska (Figure I.3-60). A bubble ring was used during the installation of the 72-inch piles. During pile driving, a bubble on/off test was performed to test the effectiveness of the bubble ring. These piles were part of the new bridge and temporary trestle construction. Piles were installed using both impact and vibratory hammers. A D-46 diesel impact hammer was used for the 24-inch piles, and a D180 diesel impact hammer was used for the 72-inch piles. An APE 200 vibratory hammer was used to drive the sheet piles and start the 24-inch piles. For the purpose of the project, only peak sound pressure levels and SELs were reported for the 24-inch piles. Peak sound pressure levels, RMS, and single strike SELs were reported for the 72-inch piles. Testing and data measurement took place on six days: July 28, July 30, July 31, and August 1, 2012; and February 11 and February 13, 2013. Monitoring conducted in February was performed in winter conditions, so monitoring locations were limited.
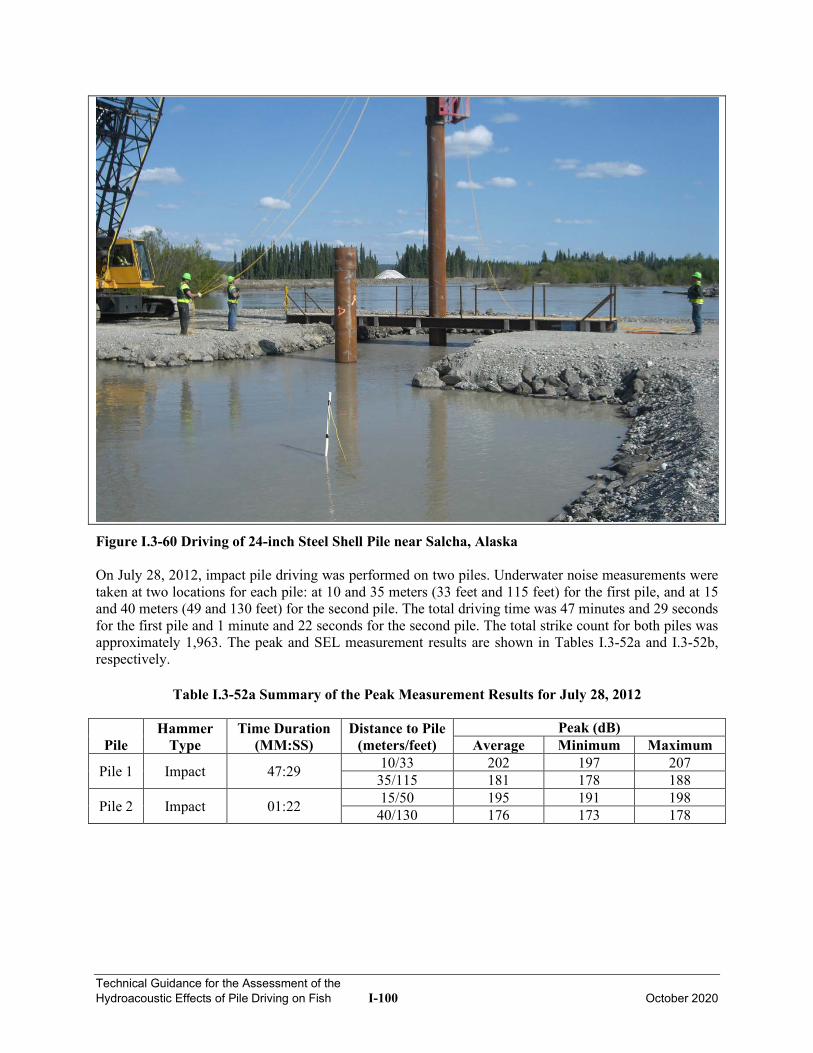
Technical Guidance for the Assessment of the Hydroacoustic Effects of Pile Driving on Fish I-100 October 2020
Figure I.3-60 Driving of 24-inch Steel Shell Pile near Salcha, Alaska On July 28, 2012, impact pile driving was performed on two piles. Underwater noise measurements were taken at two locations for each pile: at 10 and 35 meters (33 feet and 115 feet) for the first pile, and at 15 and 40 meters (49 and 130 feet) for the second pile. The total driving time was 47 minutes and 29 seconds for the first pile and 1 minute and 22 seconds for the second pile. The total strike count for both piles was approximately 1,963. The peak and SEL measurement results are shown in Tables I.3-52a and I.3-52b, respectively.
Table I.3-52a Summary of the Peak Measurement Results for July 28, 2012
Pile Hammer
Type Time Duration
(MM:SS) Distance to Pile
(meters/feet) Peak (dB)
Average Minimum Maximum
Pile 1 Impact 47:29 10/33 202 197 207 35/115 181 178 188
Pile 2 Impact 01:22 15/50 195 191 198 40/130 176 173 178
Technical Guidance for the Assessment of the Hydroacoustic Effects of Pile Driving on Fish I-101 October 2020
Table I.3-52b Summary of the SEL Measurement Results for July 28, 2012
Pile Hammer
Type Time Duration
(MM:SS) Distance to Pile
(meters/feet) SEL (dB)
Average Minimum Maximum
Pile 1 Impact 47:29 10/33 171 151 176 35/115 154 144 171
Pile 2 Impact 01:22 15/50 166 157 169 40/130 147 140 149
On July 30, 2012, five sheet piles were driven using a vibratory hammer. Four additional sheet piles were vibrated the morning of July 31, 2012. Results for these sheet piles can be found in Section I.6.3. In the afternoon of July 31, 2012, two 24-inch steel shell piles were installed adjacent to the piles for the temporary trestle. The piles were first vibrated and then driven with the D-46 diesel impact hammer. For the first pile, measurement locations were at 10 and 40 meters (33 and 130 feet) from the pile, the hydrophones were positioned at a depth of approximately 0.6 meter (2 feet). The total time duration for the vibratory driving was approximately 18 minutes and 51 seconds, with numerous starts and stops. The impact pile driving took approximately 12 minutes and 11 seconds. The strike count for the first pile was about 493. Measurements for the second pile were taken at distances of 10 and 20 meters (33 and 65 feet) at a depth of approximately 0.6 meter. The total time duration for the vibratory driving was 11 minutes and 33 seconds, with numerous starts and stops. The impact pile driving took approximately 13 minutes and 44 seconds. The strike count for the second pile was 612. The peak and SEL measurement results are shown in Tables I.3-53a and I.3-53b, respectively.
Table I.3-53a Summary of the Peak Measurement Results for July 31, 2012
Pile Hammer
Type Time Duration
(MM:SS) Distance to Pile
(meters/feet) Peak (dB)
Average Minimum Maximum
Pile 1 Vibratory 18:51 10/33 172 161 184
40/130 --a --a --a
Impact 12:11 10/33 200 194 207 40/130 170 169 176
Pile 2 Vibratory 11:33 10/33 171 163 179
20/65 166 164 170
Impact 13:44 10/33 200 193 208 20/65 190 176 200
a Levels were below the sound level meter peak detector.
Technical Guidance for the Assessment of the Hydroacoustic Effects of Pile Driving on Fish I-102 October 2020
Table I.3-53b Summary of the SEL Measurement Results for July 31, 2012
Pile Hammer
Type Time Duration
(MM:SS) Distance to Pile
(meters/feet) SEL (dB)
Average Minimum Maximum
Pile 1 Vibratory 18:51 10/33 159 145 166
40/130 --a --a --a
Impact 12:11 10/33 173 163 177 40/130 142 135 146
Pile 2 Vibratory 11:33 10/33 155 145 161
20/65 149 135 153
Impact 13:44 10/33 170 160 175 20/65 162 148 169
a Levels were below the sound level meter peak detector. The last day of pile driving was August 1, 2012. Three 24-inch steel shell piles were driven to their final tip elevation (driven 1.5 to 2.4 meters) using a diesel impact hammer. Measurements were taken at two measurement positions for each pile: measurements were taken at distances of 16 and 26 meters from the first pile, 15 and 25 meters for the second pile, and 10 and 20 meters for the third pile. Time durations of 2 minutes and 39 seconds, 7 minutes and 49 seconds, and 10 minutes and 38 seconds were recorded for each pile, respectively. The strike count for these piles was not provided. The peak and SEL measurement results are shown in Tables I.3-54a and I.3-54b, respectively.
Table I.3-54a: Summary of the Peak Measurement Results for August 1, 2012
Pile Hammer
Type Time Duration
(MM:SS) Distance to Pile
(meters/feet) Peak (dB)
Average Minimum Maximum
Pile 1 Impact 02:39 16/52.5 185 180 191 26/85 174 170 181
Pile 2 Impact 07:49 15/50 187 179 192 25/82 174 169 180
Pile 3 Impact 10:38 10/33 199 193 207 20/65 183 179 188
Table I.3-54b: Summary of the SEL Measurement Results for August 1, 2012
Pile Hammer
Type Time Duration
(MM:SS) Distance to Pile
(meters/feet) SEL (dB)
Average Minimum Maximum
Pile 1 Impact 02:39 16/52.5 156 150 161 26/85 145 139 149
Pile 2 Impact 07:49 15/50 158 151 163 25/82 145 140 151
Pile 3 Impact 10:38 10/33 167 159 171 20/65 155 146 159
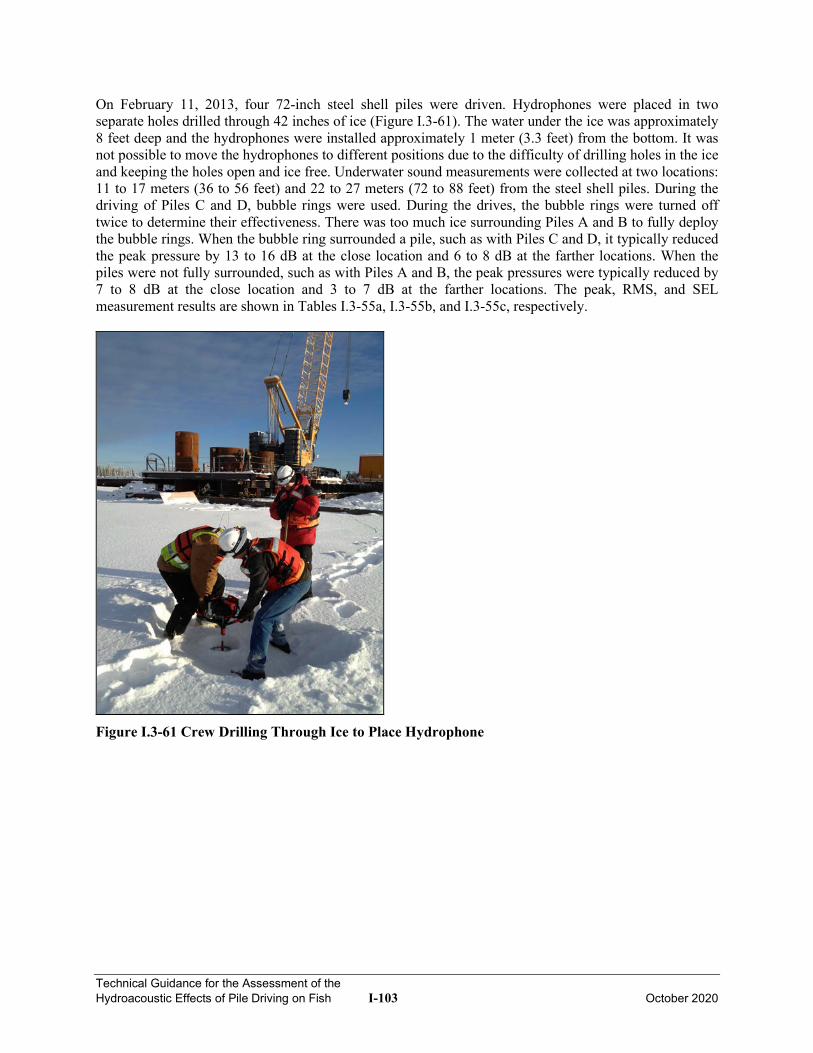
Technical Guidance for the Assessment of the Hydroacoustic Effects of Pile Driving on Fish I-103 October 2020
On February 11, 2013, four 72-inch steel shell piles were driven. Hydrophones were placed in two separate holes drilled through 42 inches of ice (Figure I.3-61). The water under the ice was approximately 8 feet deep and the hydrophones were installed approximately 1 meter (3.3 feet) from the bottom. It was not possible to move the hydrophones to different positions due to the difficulty of drilling holes in the ice and keeping the holes open and ice free. Underwater sound measurements were collected at two locations: 11 to 17 meters (36 to 56 feet) and 22 to 27 meters (72 to 88 feet) from the steel shell piles. During the driving of Piles C and D, bubble rings were used. During the drives, the bubble rings were turned off twice to determine their effectiveness. There was too much ice surrounding Piles A and B to fully deploy the bubble rings. When the bubble ring surrounded a pile, such as with Piles C and D, it typically reduced the peak pressure by 13 to 16 dB at the close location and 6 to 8 dB at the farther locations. When the piles were not fully surrounded, such as with Piles A and B, the peak pressures were typically reduced by 7 to 8 dB at the close location and 3 to 7 dB at the farther locations. The peak, RMS, and SEL measurement results are shown in Tables I.3-55a, I.3-55b, and I.3-55c, respectively.
Figure I.3-61 Crew Drilling Through Ice to Place Hydrophone
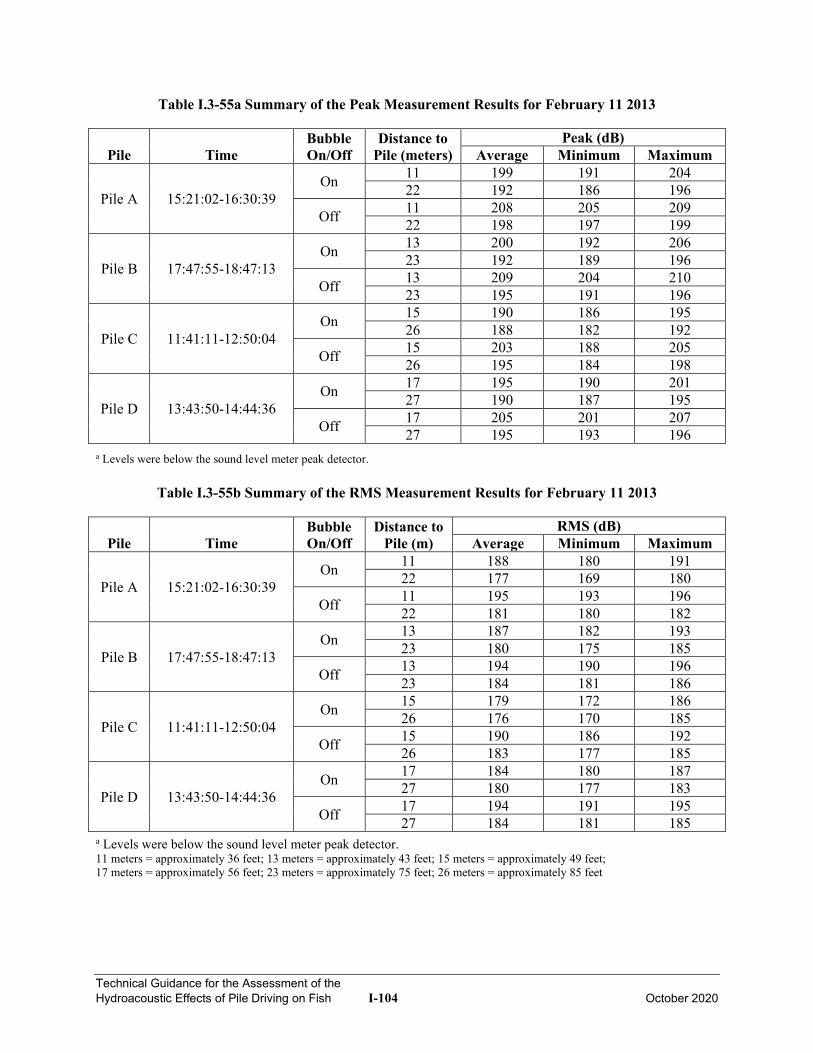
Technical Guidance for the Assessment of the Hydroacoustic Effects of Pile Driving on Fish I-104 October 2020
Table I.3-55a Summary of the Peak Measurement Results for February 11 2013
Pile Time Bubble On/Off
Distance to Pile (meters)
Peak (dB) Average Minimum Maximum
Pile A 15:21:02-16:30:39 On 11 199 191 204
22 192 186 196
Off 11 208 205 209 22 198 197 199
Pile B 17:47:55-18:47:13 On 13 200 192 206
23 192 189 196
Off 13 209 204 210 23 195 191 196
Pile C 11:41:11-12:50:04 On 15 190 186 195
26 188 182 192
Off 15 203 188 205 26 195 184 198
Pile D 13:43:50-14:44:36 On 17 195 190 201
27 190 187 195
Off 17 205 201 207 27 195 193 196
a Levels were below the sound level meter peak detector.
Table I.3-55b Summary of the RMS Measurement Results for February 11 2013
Pile Time Bubble On/Off
Distance to Pile (m)
RMS (dB) Average Minimum Maximum
Pile A 15:21:02-16:30:39 On 11 188 180 191
22 177 169 180
Off 11 195 193 196 22 181 180 182
Pile B 17:47:55-18:47:13 On 13 187 182 193
23 180 175 185
Off 13 194 190 196 23 184 181 186
Pile C 11:41:11-12:50:04 On 15 179 172 186
26 176 170 185
Off 15 190 186 192 26 183 177 185
Pile D 13:43:50-14:44:36 On 17 184 180 187
27 180 177 183
Off 17 194 191 195 27 184 181 185
a Levels were below the sound level meter peak detector. 11 meters = approximately 36 feet; 13 meters = approximately 43 feet; 15 meters = approximately 49 feet; 17 meters = approximately 56 feet; 23 meters = approximately 75 feet; 26 meters = approximately 85 feet
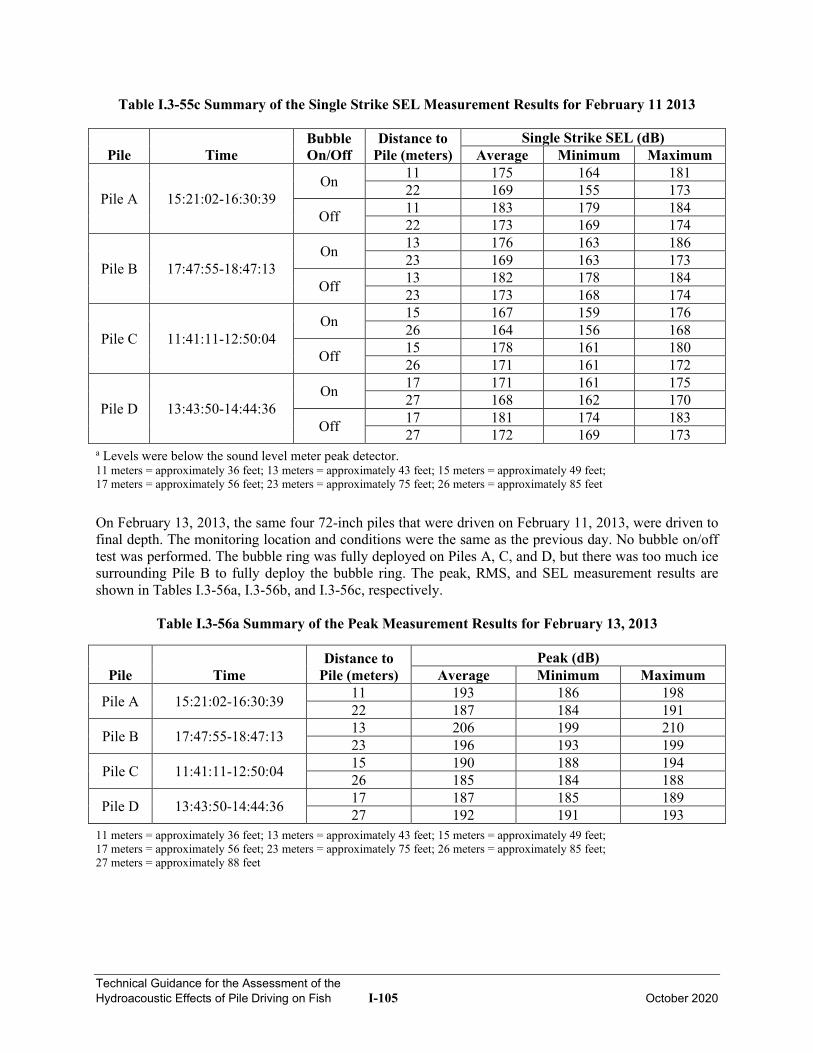
Technical Guidance for the Assessment of the Hydroacoustic Effects of Pile Driving on Fish I-105 October 2020
Table I.3-55c Summary of the Single Strike SEL Measurement Results for February 11 2013
Pile Time Bubble On/Off
Distance to Pile (meters)
Single Strike SEL (dB) Average Minimum Maximum
Pile A 15:21:02-16:30:39 On 11 175 164 181
22 169 155 173
Off 11 183 179 184 22 173 169 174
Pile B 17:47:55-18:47:13 On 13 176 163 186
23 169 163 173
Off 13 182 178 184 23 173 168 174
Pile C 11:41:11-12:50:04 On 15 167 159 176
26 164 156 168
Off 15 178 161 180 26 171 161 172
Pile D 13:43:50-14:44:36 On 17 171 161 175
27 168 162 170
Off 17 181 174 183 27 172 169 173
a Levels were below the sound level meter peak detector. 11 meters = approximately 36 feet; 13 meters = approximately 43 feet; 15 meters = approximately 49 feet; 17 meters = approximately 56 feet; 23 meters = approximately 75 feet; 26 meters = approximately 85 feet
On February 13, 2013, the same four 72-inch piles that were driven on February 11, 2013, were driven to final depth. The monitoring location and conditions were the same as the previous day. No bubble on/off test was performed. The bubble ring was fully deployed on Piles A, C, and D, but there was too much ice surrounding Pile B to fully deploy the bubble ring. The peak, RMS, and SEL measurement results are shown in Tables I.3-56a, I.3-56b, and I.3-56c, respectively.
Table I.3-56a Summary of the Peak Measurement Results for February 13, 2013
Pile Time Distance to
Pile (meters) Peak (dB)
Average Minimum Maximum
Pile A 15:21:02-16:30:39 11 193 186 198 22 187 184 191
Pile B 17:47:55-18:47:13 13 206 199 210 23 196 193 199
Pile C 11:41:11-12:50:04 15 190 188 194 26 185 184 188
Pile D 13:43:50-14:44:36 17 187 185 189 27 192 191 193
11 meters = approximately 36 feet; 13 meters = approximately 43 feet; 15 meters = approximately 49 feet; 17 meters = approximately 56 feet; 23 meters = approximately 75 feet; 26 meters = approximately 85 feet; 27 meters = approximately 88 feet
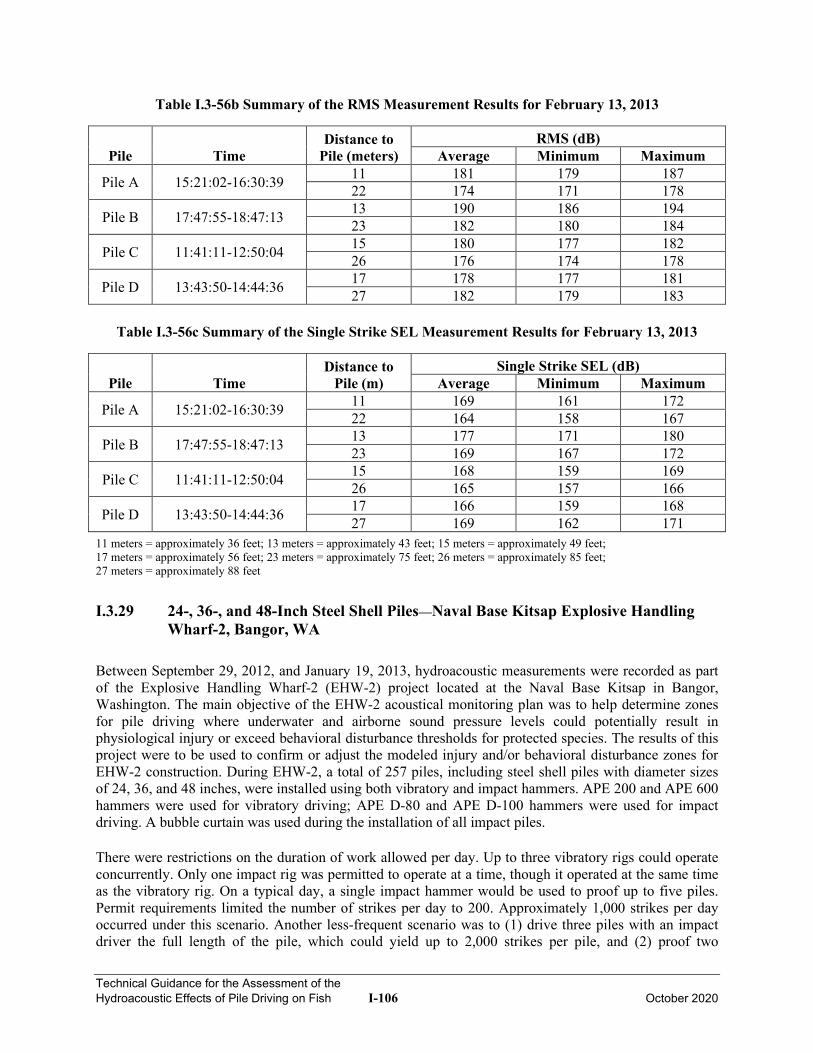
Technical Guidance for the Assessment of the Hydroacoustic Effects of Pile Driving on Fish I-106 October 2020
Table I.3-56b Summary of the RMS Measurement Results for February 13, 2013
Pile Time Distance to
Pile (meters) RMS (dB)
Average Minimum Maximum
Pile A 15:21:02-16:30:39 11 181 179 187 22 174 171 178
Pile B 17:47:55-18:47:13 13 190 186 194 23 182 180 184
Pile C 11:41:11-12:50:04 15 180 177 182 26 176 174 178
Pile D 13:43:50-14:44:36 17 178 177 181 27 182 179 183
Table I.3-56c Summary of the Single Strike SEL Measurement Results for February 13, 2013
Pile Time Distance to
Pile (m) Single Strike SEL (dB)
Average Minimum Maximum
Pile A 15:21:02-16:30:39 11 169 161 172 22 164 158 167
Pile B 17:47:55-18:47:13 13 177 171 180 23 169 167 172
Pile C 11:41:11-12:50:04 15 168 159 169 26 165 157 166
Pile D 13:43:50-14:44:36 17 166 159 168 27 169 162 171
11 meters = approximately 36 feet; 13 meters = approximately 43 feet; 15 meters = approximately 49 feet; 17 meters = approximately 56 feet; 23 meters = approximately 75 feet; 26 meters = approximately 85 feet; 27 meters = approximately 88 feet
I.3.29 24-, 36-, and 48-Inch Steel Shell Piles—Naval Base Kitsap Explosive Handling Wharf-2, Bangor, WA
Between September 29, 2012, and January 19, 2013, hydroacoustic measurements were recorded as part of the Explosive Handling Wharf-2 (EHW-2) project located at the Naval Base Kitsap in Bangor, Washington. The main objective of the EHW-2 acoustical monitoring plan was to help determine zones for pile driving where underwater and airborne sound pressure levels could potentially result in physiological injury or exceed behavioral disturbance thresholds for protected species. The results of this project were to be used to confirm or adjust the modeled injury and/or behavioral disturbance zones for EHW-2 construction. During EHW-2, a total of 257 piles, including steel shell piles with diameter sizes of 24, 36, and 48 inches, were installed using both vibratory and impact hammers. APE 200 and APE 600 hammers were used for vibratory driving; APE D-80 and APE D-100 hammers were used for impact driving. A bubble curtain was used during the installation of all impact piles. There were restrictions on the duration of work allowed per day. Up to three vibratory rigs could operate concurrently. Only one impact rig was permitted to operate at a time, though it operated at the same time as the vibratory rig. On a typical day, a single impact hammer would be used to proof up to five piles. Permit requirements limited the number of strikes per day to 200. Approximately 1,000 strikes per day occurred under this scenario. Another less-frequent scenario was to (1) drive three piles with an impact driver the full length of the pile, which could yield up to 2,000 strikes per pile, and (2) proof two
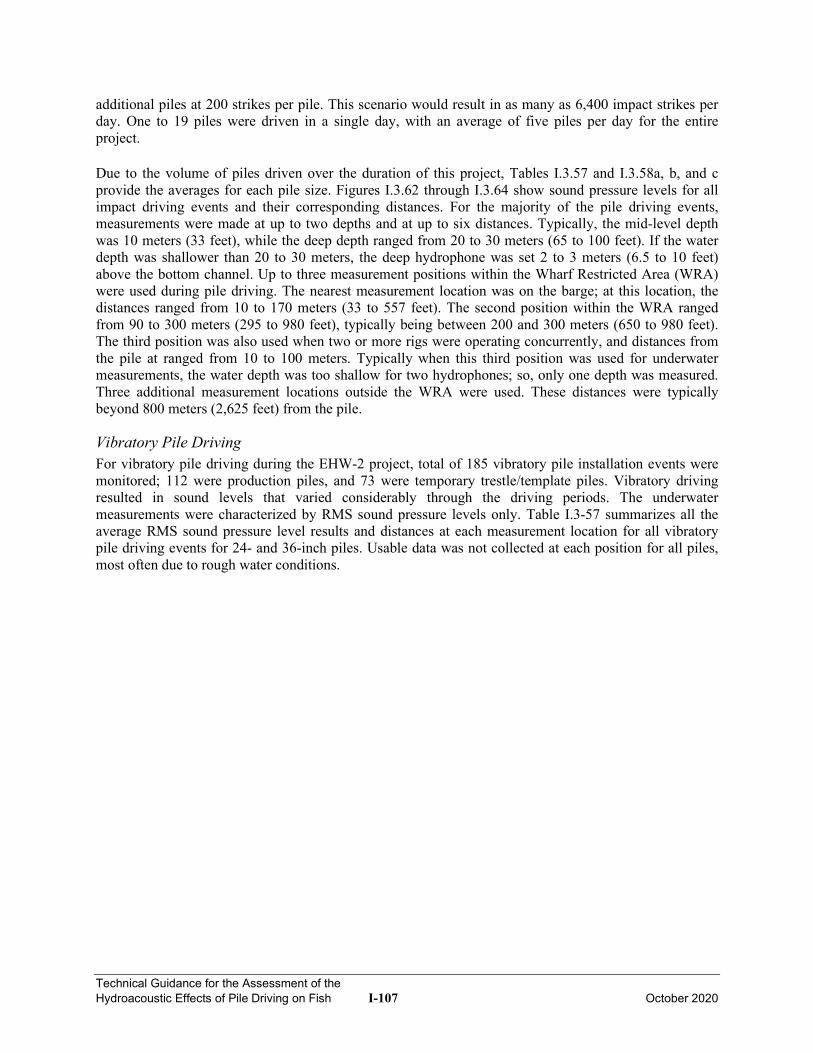
Technical Guidance for the Assessment of the Hydroacoustic Effects of Pile Driving on Fish I-107 October 2020
additional piles at 200 strikes per pile. This scenario would result in as many as 6,400 impact strikes per day. One to 19 piles were driven in a single day, with an average of five piles per day for the entire project. Due to the volume of piles driven over the duration of this project, Tables I.3.57 and I.3.58a, b, and c provide the averages for each pile size. Figures I.3.62 through I.3.64 show sound pressure levels for all impact driving events and their corresponding distances. For the majority of the pile driving events, measurements were made at up to two depths and at up to six distances. Typically, the mid-level depth was 10 meters (33 feet), while the deep depth ranged from 20 to 30 meters (65 to 100 feet). If the water depth was shallower than 20 to 30 meters, the deep hydrophone was set 2 to 3 meters (6.5 to 10 feet) above the bottom channel. Up to three measurement positions within the Wharf Restricted Area (WRA) were used during pile driving. The nearest measurement location was on the barge; at this location, the distances ranged from 10 to 170 meters (33 to 557 feet). The second position within the WRA ranged from 90 to 300 meters (295 to 980 feet), typically being between 200 and 300 meters (650 to 980 feet). The third position was also used when two or more rigs were operating concurrently, and distances from the pile at ranged from 10 to 100 meters. Typically when this third position was used for underwater measurements, the water depth was too shallow for two hydrophones; so, only one depth was measured. Three additional measurement locations outside the WRA were used. These distances were typically beyond 800 meters (2,625 feet) from the pile.
Vibratory Pile Driving For vibratory pile driving during the EHW-2 project, total of 185 vibratory pile installation events were monitored; 112 were production piles, and 73 were temporary trestle/template piles. Vibratory driving resulted in sound levels that varied considerably through the driving periods. The underwater measurements were characterized by RMS sound pressure levels only. Table I.3-57 summarizes all the average RMS sound pressure level results and distances at each measurement location for all vibratory pile driving events for 24- and 36-inch piles. Usable data was not collected at each position for all piles, most often due to rough water conditions.
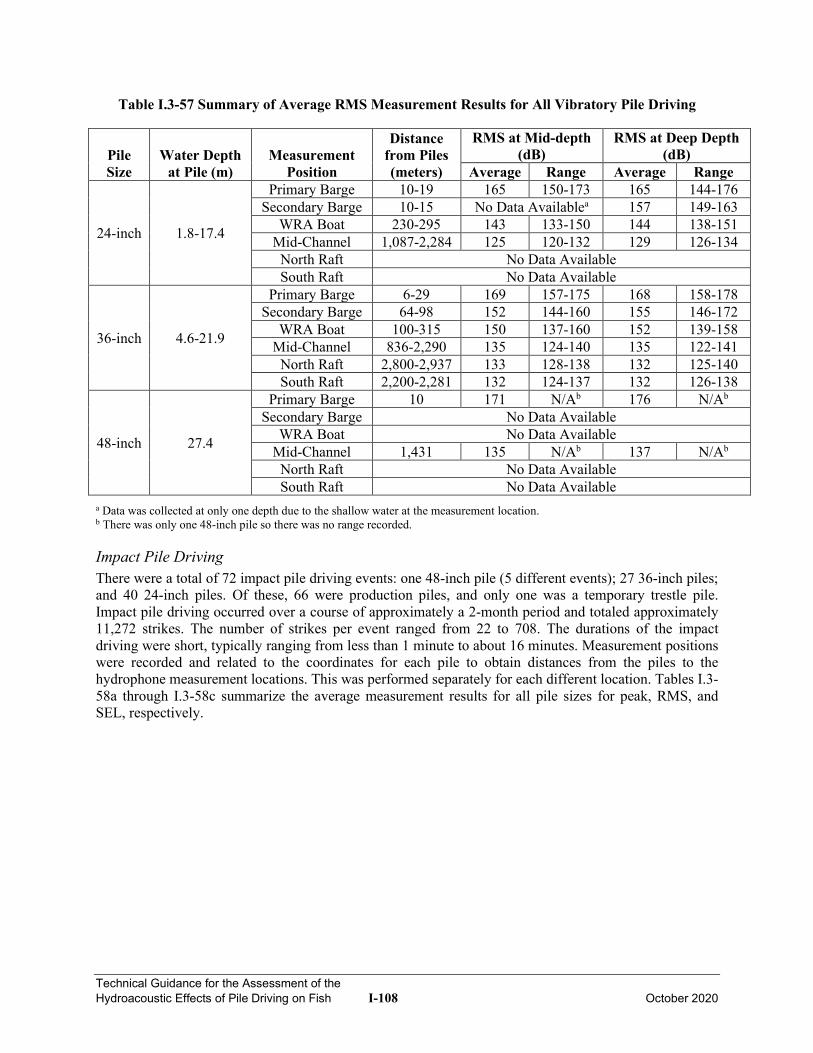
Technical Guidance for the Assessment of the Hydroacoustic Effects of Pile Driving on Fish I-108 October 2020
Table I.3-57 Summary of Average RMS Measurement Results for All Vibratory Pile Driving
Pile Size
Water Depth at Pile (m)
Measurement Position
Distance from Piles (meters)
RMS at Mid-depth (dB)
RMS at Deep Depth (dB)
Average Range Average Range
24-inch 1.8-17.4
Primary Barge 10-19 165 150-173 165 144-176 Secondary Barge 10-15 No Data Availablea 157 149-163
WRA Boat 230-295 143 133-150 144 138-151 Mid-Channel 1,087-2,284 125 120-132 129 126-134
North Raft No Data Available South Raft No Data Available
36-inch 4.6-21.9
Primary Barge 6-29 169 157-175 168 158-178 Secondary Barge 64-98 152 144-160 155 146-172
WRA Boat 100-315 150 137-160 152 139-158 Mid-Channel 836-2,290 135 124-140 135 122-141
North Raft 2,800-2,937 133 128-138 132 125-140 South Raft 2,200-2,281 132 124-137 132 126-138
48-inch 27.4
Primary Barge 10 171 N/Ab 176 N/Ab
Secondary Barge No Data Available WRA Boat No Data Available
Mid-Channel 1,431 135 N/Ab 137 N/Ab North Raft No Data Available South Raft No Data Available
a Data was collected at only one depth due to the shallow water at the measurement location. b There was only one 48-inch pile so there was no range recorded.
Impact Pile Driving There were a total of 72 impact pile driving events: one 48-inch pile (5 different events); 27 36-inch piles; and 40 24-inch piles. Of these, 66 were production piles, and only one was a temporary trestle pile. Impact pile driving occurred over a course of approximately a 2-month period and totaled approximately 11,272 strikes. The number of strikes per event ranged from 22 to 708. The durations of the impact driving were short, typically ranging from less than 1 minute to about 16 minutes. Measurement positions were recorded and related to the coordinates for each pile to obtain distances from the piles to the hydrophone measurement locations. This was performed separately for each different location. Tables I.3-58a through I.3-58c summarize the average measurement results for all pile sizes for peak, RMS, and SEL, respectively.
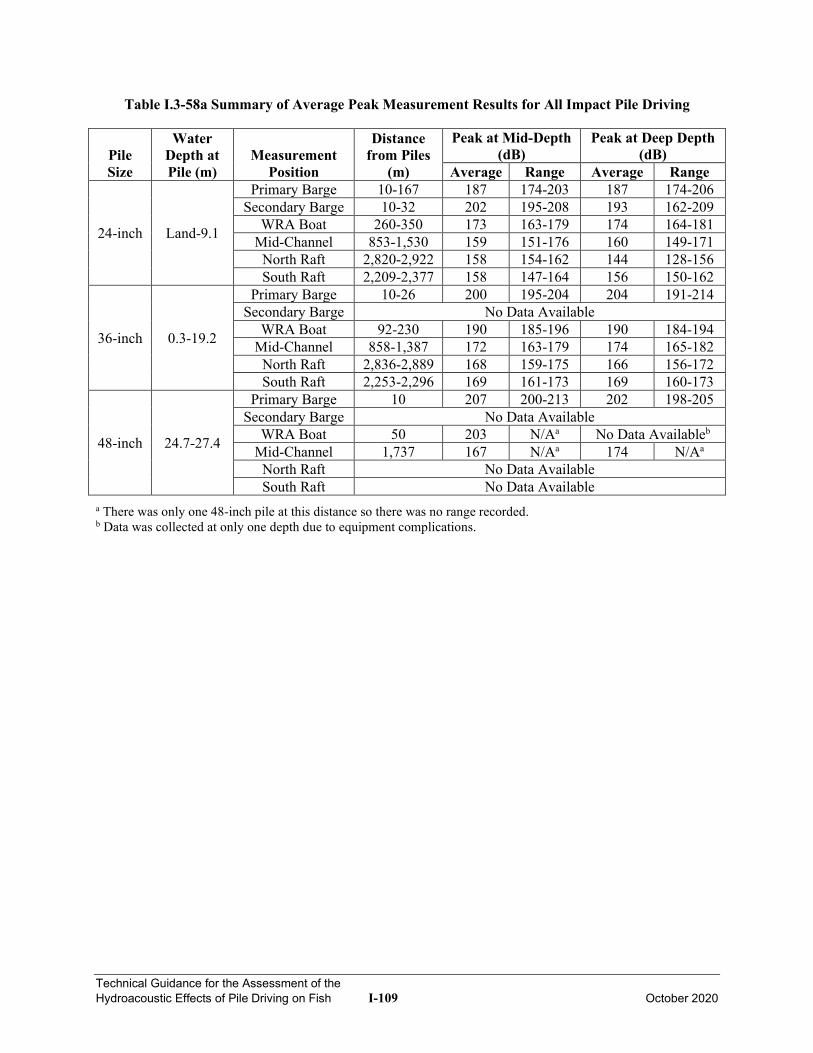
Technical Guidance for the Assessment of the Hydroacoustic Effects of Pile Driving on Fish I-109 October 2020
Table I.3-58a Summary of Average Peak Measurement Results for All Impact Pile Driving
Pile Size
Water Depth at Pile (m)
Measurement Position
Distance from Piles
(m)
Peak at Mid-Depth (dB)
Peak at Deep Depth (dB)
Average Range Average Range
24-inch Land-9.1
Primary Barge 10-167 187 174-203 187 174-206 Secondary Barge 10-32 202 195-208 193 162-209
WRA Boat 260-350 173 163-179 174 164-181 Mid-Channel 853-1,530 159 151-176 160 149-171
North Raft 2,820-2,922 158 154-162 144 128-156 South Raft 2,209-2,377 158 147-164 156 150-162
36-inch 0.3-19.2
Primary Barge 10-26 200 195-204 204 191-214 Secondary Barge No Data Available
WRA Boat 92-230 190 185-196 190 184-194 Mid-Channel 858-1,387 172 163-179 174 165-182
North Raft 2,836-2,889 168 159-175 166 156-172 South Raft 2,253-2,296 169 161-173 169 160-173
48-inch 24.7-27.4
Primary Barge 10 207 200-213 202 198-205 Secondary Barge No Data Available
WRA Boat 50 203 N/Aa No Data Availableb Mid-Channel 1,737 167 N/Aa 174 N/Aa
North Raft No Data Available South Raft No Data Available
a There was only one 48-inch pile at this distance so there was no range recorded. b Data was collected at only one depth due to equipment complications.
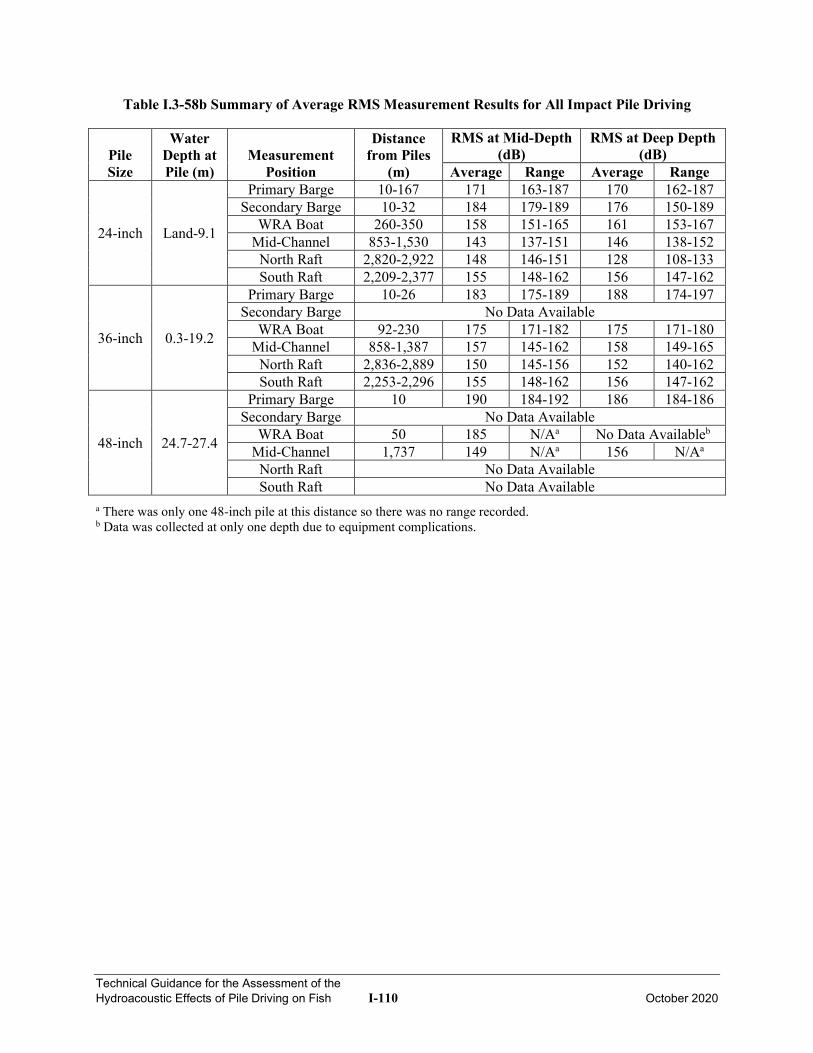
Technical Guidance for the Assessment of the Hydroacoustic Effects of Pile Driving on Fish I-110 October 2020
Table I.3-58b Summary of Average RMS Measurement Results for All Impact Pile Driving
Pile Size
Water Depth at Pile (m)
Measurement Position
Distance from Piles
(m)
RMS at Mid-Depth (dB)
RMS at Deep Depth (dB)
Average Range Average Range
24-inch Land-9.1
Primary Barge 10-167 171 163-187 170 162-187 Secondary Barge 10-32 184 179-189 176 150-189
WRA Boat 260-350 158 151-165 161 153-167 Mid-Channel 853-1,530 143 137-151 146 138-152
North Raft 2,820-2,922 148 146-151 128 108-133 South Raft 2,209-2,377 155 148-162 156 147-162
36-inch 0.3-19.2
Primary Barge 10-26 183 175-189 188 174-197 Secondary Barge No Data Available
WRA Boat 92-230 175 171-182 175 171-180 Mid-Channel 858-1,387 157 145-162 158 149-165
North Raft 2,836-2,889 150 145-156 152 140-162 South Raft 2,253-2,296 155 148-162 156 147-162
48-inch 24.7-27.4
Primary Barge 10 190 184-192 186 184-186 Secondary Barge No Data Available
WRA Boat 50 185 N/Aa No Data Availableb Mid-Channel 1,737 149 N/Aa 156 N/Aa
North Raft No Data Available South Raft No Data Available
a There was only one 48-inch pile at this distance so there was no range recorded. b Data was collected at only one depth due to equipment complications.

Technical Guidance for the Assessment of the Hydroacoustic Effects of Pile Driving on Fish I-111 October 2020
Table I.3-58c Summary of Average SEL Measurement Results for All Impact Pile Driving
Pile Size
Water Depth at Pile (m)
Measurement Position
Distance from Piles
(m)
SEL at Mid-Depth (dB)
SEL at Deep Depth (dB)
Average Range Average Range
24-inch Land-9.1
Primary Barge 10-167 159 151-175 158 149-176 Secondary Barge 10-32 172 167-178 165 143-178
WRA Boat 260-350 146 139-153 149 140-155 Mid-Channel 853-1,530 131 121-139 135 127-143
North Raft 2,820-2,922 126 125-128 121 108-125 South Raft 2,209-2,377 133 126-140 132 129-136
36-inch 0.3-19.2
Primary Barge 10-26 171 163-178 176 163-184 Secondary Barge No Data Available
WRA Boat 92-230 164 160-170 164 159-169 Mid-Channel 858-1,387 146 134-152 147 137-153
North Raft 2,836-2,889 141 131-149 142 131-151 South Raft 2,253-2,296 144 137-151 145 136-151
48-inch 24.7-27.4
Primary Barge 10 177 172-180 175 174-177 Secondary Barge No Data Available
WRA Boat 50 179 N/Aa No Data Availableb Mid-Channel 1,737 138 N/Aa 145 N/Aa
North Raft No Data Available South Raft No Data Available
a There was only one 48-inch pile at this distance so there was no range recorded. b Data was collected at only one depth due to equipment complications.
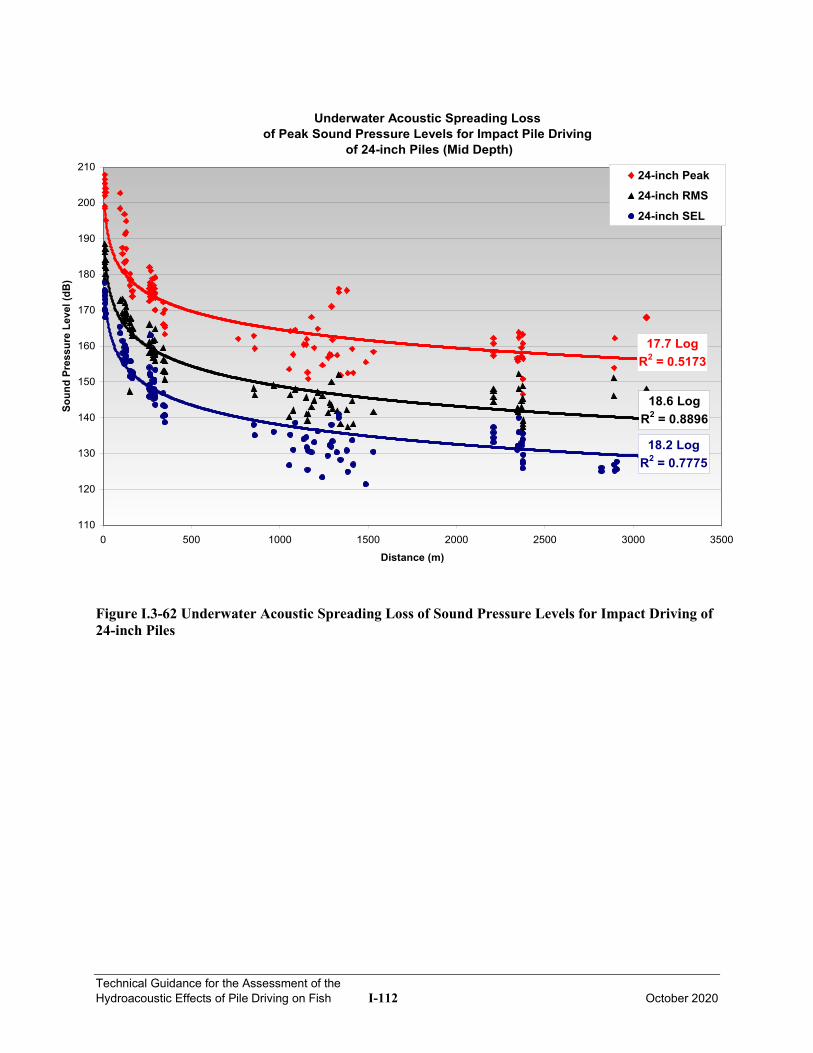
Technical Guidance for the Assessment of the Hydroacoustic Effects of Pile Driving on Fish I-112 October 2020
Figure I.3-62 Underwater Acoustic Spreading Loss of Sound Pressure Levels for Impact Driving of 24-inch Piles
Underwater Acoustic Spreading Loss of Peak Sound Pressure Levels for Impact Pile Driving
of 24-inch Piles (Mid Depth)
17.7 LogR2 = 0.5173
18.6 LogR2 = 0.8896
18.2 LogR2 = 0.7775
110
120
130
140
150
160
170
180
190
200
210
0 500 1000 1500 2000 2500 3000 3500
Distance (m)
Soun
d Pr
essu
re L
evel
(dB)
24-inch Peak24-inch RMS24-inch SEL
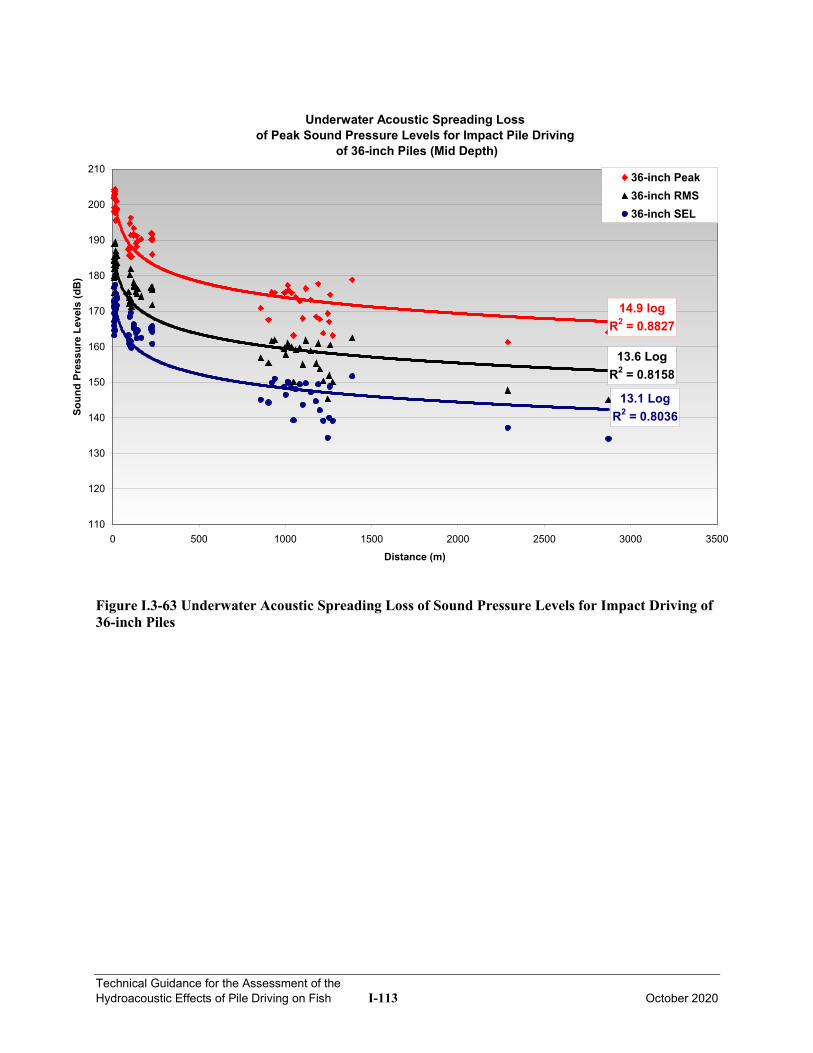
Technical Guidance for the Assessment of the Hydroacoustic Effects of Pile Driving on Fish I-113 October 2020
Figure I.3-63 Underwater Acoustic Spreading Loss of Sound Pressure Levels for Impact Driving of 36-inch Piles
Underwater Acoustic Spreading Loss of Peak Sound Pressure Levels for Impact Pile Driving
of 36-inch Piles (Mid Depth)
14.9 logR2 = 0.8827
13.6 LogR2 = 0.8158
13.1 LogR2 = 0.8036
110
120
130
140
150
160
170
180
190
200
210
0 500 1000 1500 2000 2500 3000 3500
Distance (m)
Soun
d Pr
essu
re L
evel
s (d
B)
36-inch Peak36-inch RMS36-inch SEL
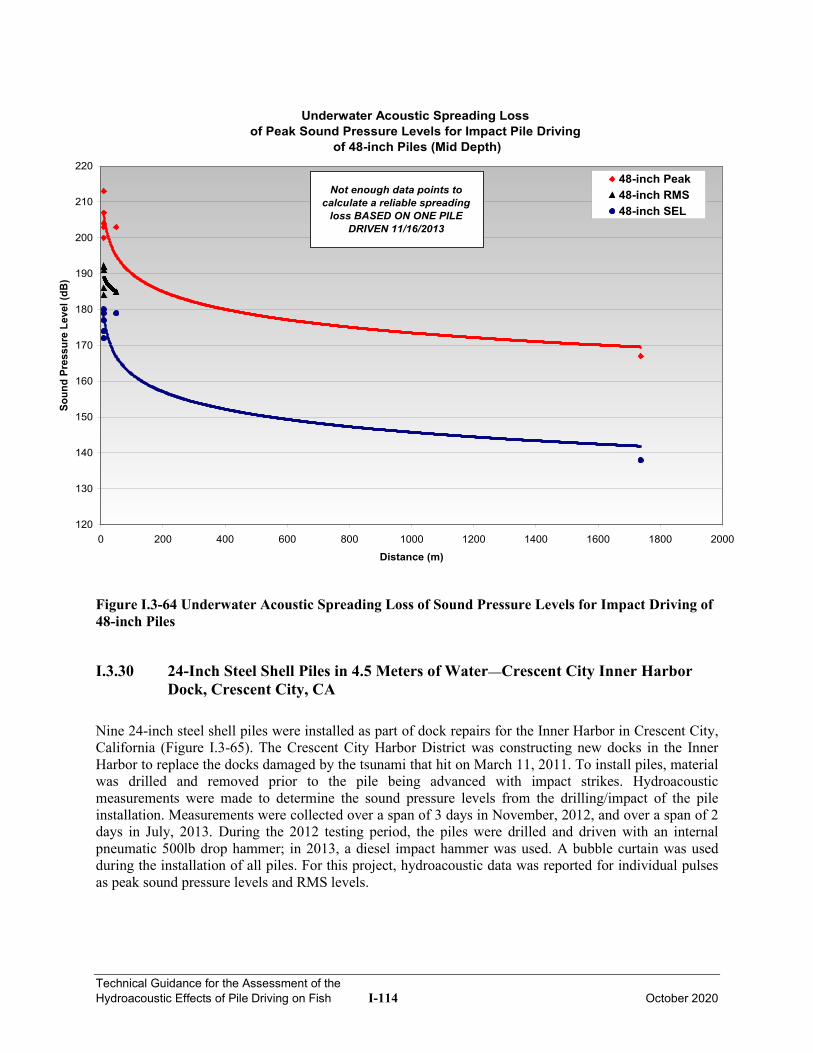
Technical Guidance for the Assessment of the Hydroacoustic Effects of Pile Driving on Fish I-114 October 2020
Figure I.3-64 Underwater Acoustic Spreading Loss of Sound Pressure Levels for Impact Driving of 48-inch Piles
I.3.30 24-Inch Steel Shell Piles in 4.5 Meters of Water—Crescent City Inner Harbor Dock, Crescent City, CA
Nine 24-inch steel shell piles were installed as part of dock repairs for the Inner Harbor in Crescent City, California (Figure I.3-65). The Crescent City Harbor District was constructing new docks in the Inner Harbor to replace the docks damaged by the tsunami that hit on March 11, 2011. To install piles, material was drilled and removed prior to the pile being advanced with impact strikes. Hydroacoustic measurements were made to determine the sound pressure levels from the drilling/impact of the pile installation. Measurements were collected over a span of 3 days in November, 2012, and over a span of 2 days in July, 2013. During the 2012 testing period, the piles were drilled and driven with an internal pneumatic 500lb drop hammer; in 2013, a diesel impact hammer was used. A bubble curtain was used during the installation of all piles. For this project, hydroacoustic data was reported for individual pulses as peak sound pressure levels and RMS levels.
Underwater Acoustic Spreading Loss of Peak Sound Pressure Levels for Impact Pile Driving
of 48-inch Piles (Mid Depth)
120
130
140
150
160
170
180
190
200
210
220
0 200 400 600 800 1000 1200 1400 1600 1800 2000
Distance (m)
Soun
d Pr
essu
re L
evel
(dB)
48-inch Peak48-inch RMS48-inch SEL
Not enough data points to calculate a reliable spreading
loss BASED ON ONE PILE DRIVEN 11/16/2013
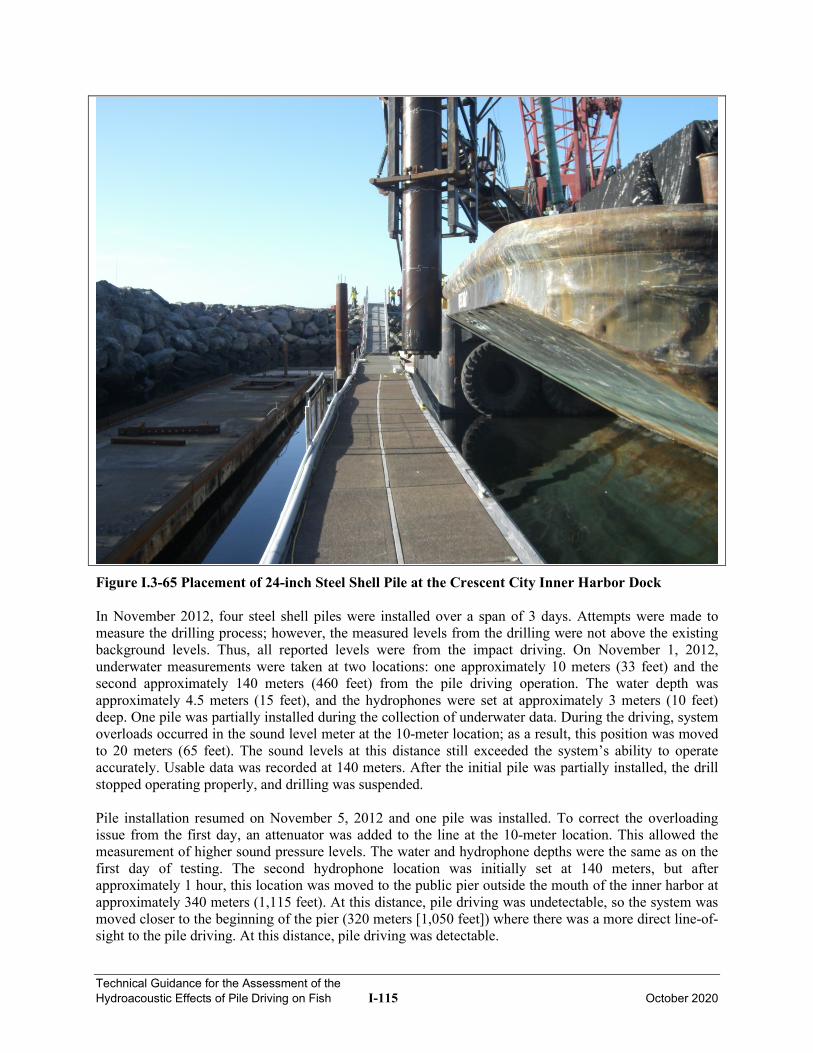
Technical Guidance for the Assessment of the Hydroacoustic Effects of Pile Driving on Fish I-115 October 2020
Figure I.3-65 Placement of 24-inch Steel Shell Pile at the Crescent City Inner Harbor Dock In November 2012, four steel shell piles were installed over a span of 3 days. Attempts were made to measure the drilling process; however, the measured levels from the drilling were not above the existing background levels. Thus, all reported levels were from the impact driving. On November 1, 2012, underwater measurements were taken at two locations: one approximately 10 meters (33 feet) and the second approximately 140 meters (460 feet) from the pile driving operation. The water depth was approximately 4.5 meters (15 feet), and the hydrophones were set at approximately 3 meters (10 feet) deep. One pile was partially installed during the collection of underwater data. During the driving, system overloads occurred in the sound level meter at the 10-meter location; as a result, this position was moved to 20 meters (65 feet). The sound levels at this distance still exceeded the system’s ability to operate accurately. Usable data was recorded at 140 meters. After the initial pile was partially installed, the drill stopped operating properly, and drilling was suspended. Pile installation resumed on November 5, 2012 and one pile was installed. To correct the overloading issue from the first day, an attenuator was added to the line at the 10-meter location. This allowed the measurement of higher sound pressure levels. The water and hydrophone depths were the same as on the first day of testing. The second hydrophone location was initially set at 140 meters, but after approximately 1 hour, this location was moved to the public pier outside the mouth of the inner harbor at approximately 340 meters (1,115 feet). At this distance, pile driving was undetectable, so the system was moved closer to the beginning of the pier (320 meters [1,050 feet]) where there was a more direct line-of-sight to the pile driving. At this distance, pile driving was detectable.
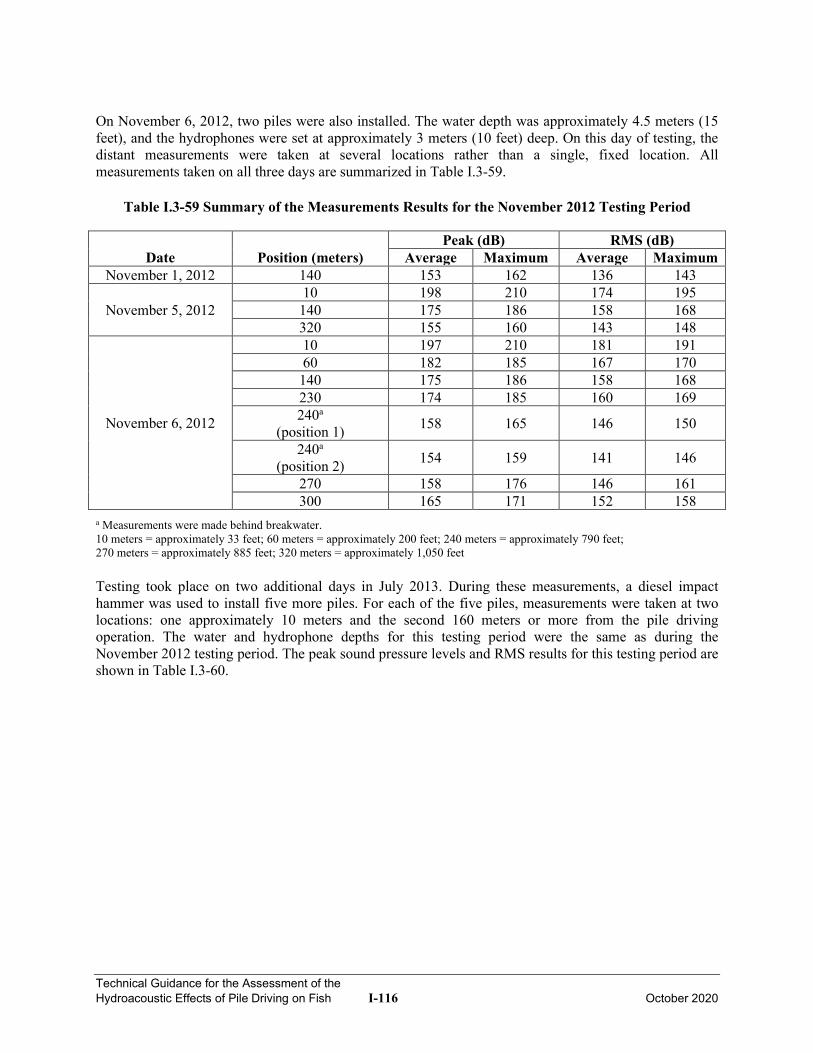
Technical Guidance for the Assessment of the Hydroacoustic Effects of Pile Driving on Fish I-116 October 2020
On November 6, 2012, two piles were also installed. The water depth was approximately 4.5 meters (15 feet), and the hydrophones were set at approximately 3 meters (10 feet) deep. On this day of testing, the distant measurements were taken at several locations rather than a single, fixed location. All measurements taken on all three days are summarized in Table I.3-59.
Table I.3-59 Summary of the Measurements Results for the November 2012 Testing Period
Date Position (meters) Peak (dB) RMS (dB)
Average Maximum Average Maximum November 1, 2012 140 153 162 136 143
November 5, 2012 10 198 210 174 195 140 175 186 158 168 320 155 160 143 148
November 6, 2012
10 197 210 181 191 60 182 185 167 170 140 175 186 158 168 230 174 185 160 169 240a
(position 1) 158 165 146 150
240a (position 2) 154 159 141 146
270 158 176 146 161 300 165 171 152 158
a Measurements were made behind breakwater. 10 meters = approximately 33 feet; 60 meters = approximately 200 feet; 240 meters = approximately 790 feet; 270 meters = approximately 885 feet; 320 meters = approximately 1,050 feet Testing took place on two additional days in July 2013. During these measurements, a diesel impact hammer was used to install five more piles. For each of the five piles, measurements were taken at two locations: one approximately 10 meters and the second 160 meters or more from the pile driving operation. The water and hydrophone depths for this testing period were the same as during the November 2012 testing period. The peak sound pressure levels and RMS results for this testing period are shown in Table I.3-60.
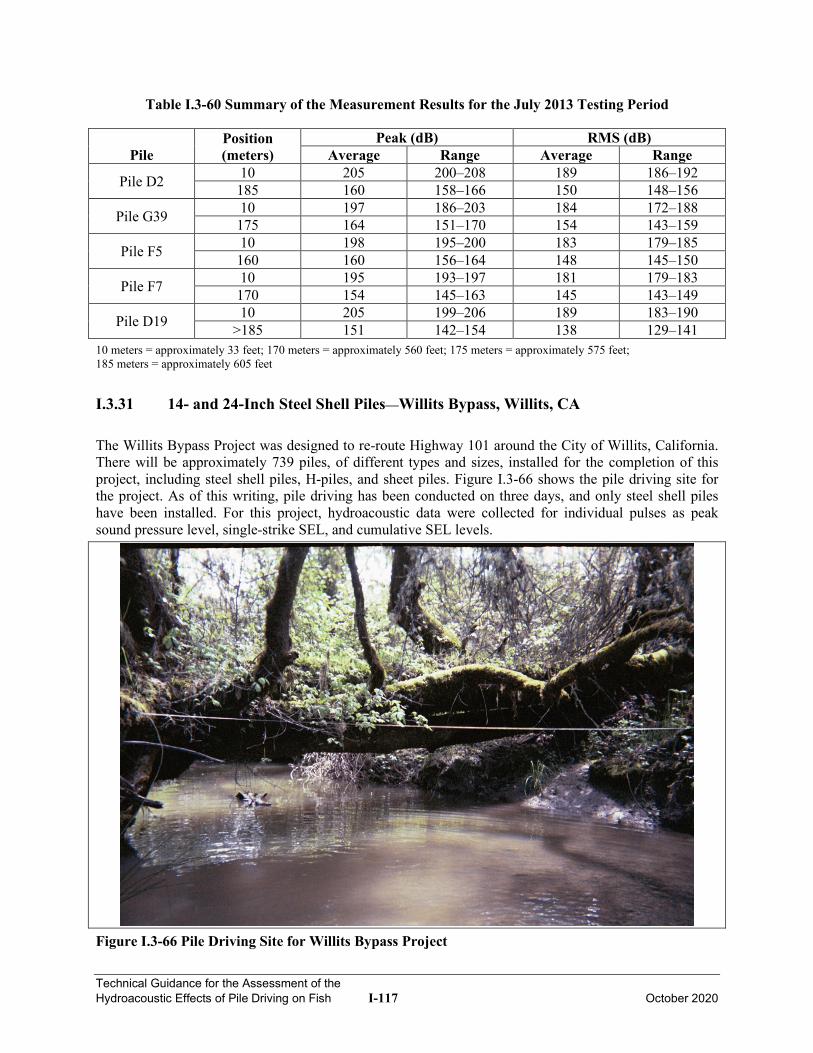
Technical Guidance for the Assessment of the Hydroacoustic Effects of Pile Driving on Fish I-117 October 2020
Table I.3-60 Summary of the Measurement Results for the July 2013 Testing Period
Pile Position (meters)
Peak (dB) RMS (dB) Average Range Average Range
Pile D2 10 205 200–208 189 186–192 185 160 158–166 150 148–156
Pile G39 10 197 186–203 184 172–188 175 164 151–170 154 143–159
Pile F5 10 198 195–200 183 179–185 160 160 156–164 148 145–150
Pile F7 10 195 193–197 181 179–183 170 154 145–163 145 143–149
Pile D19 10 205 199–206 189 183–190 >185 151 142–154 138 129–141
10 meters = approximately 33 feet; 170 meters = approximately 560 feet; 175 meters = approximately 575 feet; 185 meters = approximately 605 feet
I.3.31 14- and 24-Inch Steel Shell Piles—Willits Bypass, Willits, CA
The Willits Bypass Project was designed to re-route Highway 101 around the City of Willits, California. There will be approximately 739 piles, of different types and sizes, installed for the completion of this project, including steel shell piles, H-piles, and sheet piles. Figure I.3-66 shows the pile driving site for the project. As of this writing, pile driving has been conducted on three days, and only steel shell piles have been installed. For this project, hydroacoustic data were collected for individual pulses as peak sound pressure level, single-strike SEL, and cumulative SEL levels.
Figure I.3-66 Pile Driving Site for Willits Bypass Project
Technical Guidance for the Assessment of the Hydroacoustic Effects of Pile Driving on Fish I-118 October 2020
On May 21, 2013, one 24-inch steel shell test pile was driven in Bent 23 using a Delmag 46-32 diesel impact hammer. The pile was installed on dry land approximately 20 meters (65 feet) from the wetted channel. There were approximately 758 pile strikes used to drive the pile 27.4 meters (90 feet). The driving began at 9:04:38 and concluded at 10:06:04, with two breaks during the drive. Underwater measurements were made at two locations, the first at 35 meters (115 feet) and the second at 50 meters (165 feet) from the pile driving operations. Peak and single-strike SEL was measured, and results are summarized in Table I.3-61.
Table I.3-61 Summary of the Measurement Results from May 21, 2013
Pile
Total Time of Drive
(HH:MM:SS) Number
of Strikes Position (meters)
Peak (dB) Single-Strike SEL (dB)
Average Maximum Average Maximum
Pile 1 00:24:53 758 35 159 166 139 144 50 163 168 140 145
On September 13, 2013, five 24-inch steel shell piles were monitored in Bent 4. The piles were driven with a Delmag 30-32 diesel impact hammer. At the time of testing, stream bed conditions only presented one “pool” downstream that was suitable for underwater monitoring. The creek was completely dry upstream of the pile driving installation. The measurement location was positioned 50 meters downstream of the pile driving. Table I.3-62 shows the peak sound pressure level and single-strike SEL results.
Table I.3-62 Summary of the Measurement Results from September 13, 2013
Pile
Total Time of Drive
(HH:MM:SS) Position (meters)
Peak (dB) Single-Strike SEL (dB)
Average Maximum Average Maximum Pile 1 00:12:29 50 153 158 132 147 Pile 2 00:15:40 50 154 156 132 143 Pile 3 00:11:44 50 155 159 133 144 Pile 4 00:25:18 50 154 159 132 148 Pile 5 00:13:24 50 154 158 132 148
Average for the Full Day 01:18:3 50 154 159 132 148
50 meters = approximately 165 feet On September 18, 2013, six 14-inch steel shell piles were monitored. The piles were driven with a Delmag 30-32 diesel impact hammer. Underwater measurements were made at two locations—the first approximately 35 to 38 meters (115 to 125 feet) upstream of the pile and the second approximately 57 to 60 meters (187 to 197 feet) downstream of the pile. The strike count on this day was unavailable. Table I.3-63 provides a summary of the peak and single-strike SEL results.
Technical Guidance for the Assessment of the Hydroacoustic Effects of Pile Driving on Fish I-119 October 2020
Table I.3-63 Summary of the Measurement Results from September 18, 2013
Pile
Total Time of Drive
(HH:MM:SS) Position (meters)
Peak (dB) Single-Strike SEL (dB)
Average Maximum Average Maximum
Pile 1 00:09:36 35–38 163 170 135 139 57–60 165 173 136 142
Pile 2 00:11:01 35–38 162 169 135 138 57–60 164 172 134 140
Pile 3 00:32:47 35–38 160 167 134 137 57–60 168 174 137 141
Pile 4 00:11:02 35–38 162 168 134 137 57–60 169 174 138 142
Pile 5 00:10:11 35–38 162 170 133 139 57–60 168 175 137 144
Pile 6 00:11:22 35–38 163 169 134 138 57–60 167 174 137 144
Average for the Full Day 01:25:59 35–38 162 170 134 139
57–60 167 175 137 144
35 meters = approximately 115 feet; 38 meters = approximately 125 feet; 57 meters = approximately 187 feet; 60 meters = approximately 197 feet
I.3.32 36-Inch Steel Shell Piles—North Fork Payette River Bridge, near Cascade, ID
Hydroacoustic monitoring was conducted on July 2, 2013, for the North Fork Payette River Bridge replacement project near Cascade, Idaho. For this project, two 36-inch diameter close-ended steel shell piles were driven through a gravel pad and into approximately 9 to 10.7 meters (30 to 35 feet) of saturated, medium-dense to dense sand (SPT N-value in the range of 20 to 45). This project was one of several contracted by the Idaho Transportation Department to assist in identifying potential impacts of pile driving on threatened and endangered species in the Idaho waterways. The second project conducted as part of these efforts was at the Weiser River Bridge in Weiser, Idaho, on August 27, 2013. For the Weiser River Bridge project, four H-piles were installed; discussion of the H-pile installation can be found in Section I.4-10. The two steel shell piles installed at the North Fork Payette River Bridge were capped at the bottom of the pile, and a guide was welded to the base to assist in keeping the piles from drifting out of the proper location during the start of the drive. The guide was required because capped steel shell piles can compress and displace the soil, unlike non-displacement piles, such as H-piles. Because the end of the pile was capped, an extremely high number of pile strikes or blows per foot were required to place the pile. The impact pile driving was conducted with a diesel impact hammer Delmag D62-22. Hydroacoustic data were reported for individual pulses as peak sound pressure level, RMS, single-strike SEL, and cumulative SEL levels.
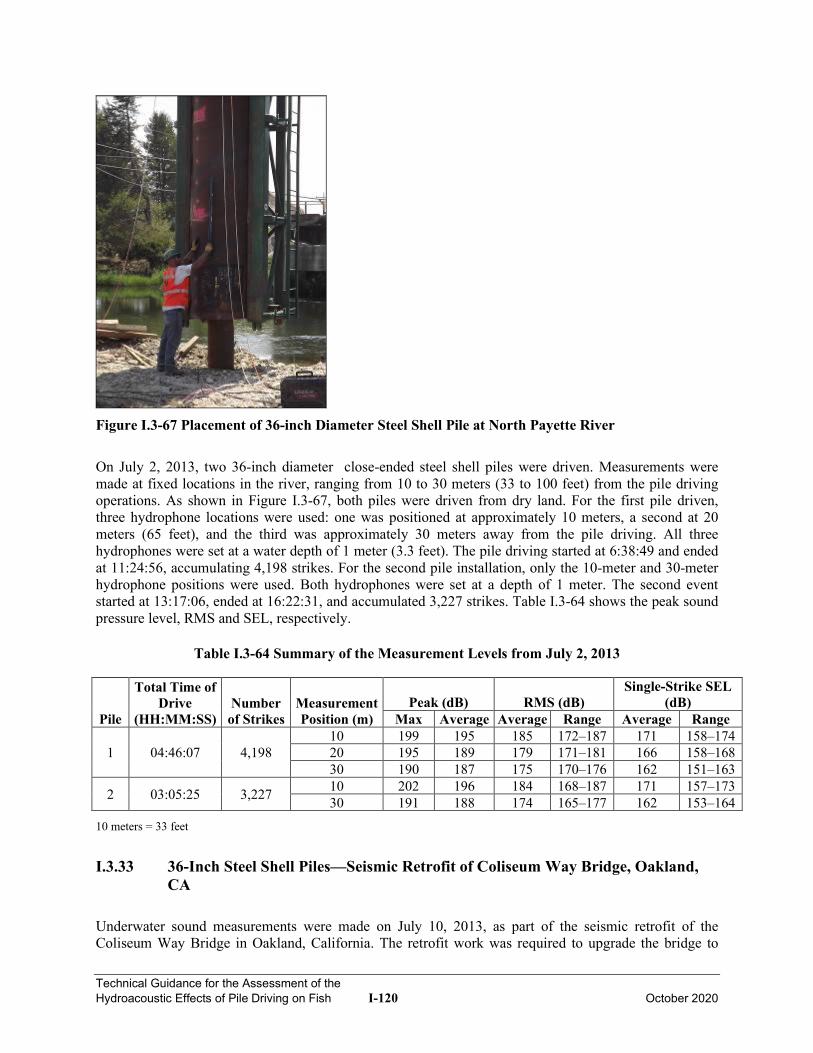
Technical Guidance for the Assessment of the Hydroacoustic Effects of Pile Driving on Fish I-120 October 2020
Figure I.3-67 Placement of 36-inch Diameter Steel Shell Pile at North Payette River
On July 2, 2013, two 36-inch diameter close-ended steel shell piles were driven. Measurements were made at fixed locations in the river, ranging from 10 to 30 meters (33 to 100 feet) from the pile driving operations. As shown in Figure I.3-67, both piles were driven from dry land. For the first pile driven, three hydrophone locations were used: one was positioned at approximately 10 meters, a second at 20 meters (65 feet), and the third was approximately 30 meters away from the pile driving. All three hydrophones were set at a water depth of 1 meter (3.3 feet). The pile driving started at 6:38:49 and ended at 11:24:56, accumulating 4,198 strikes. For the second pile installation, only the 10-meter and 30-meter hydrophone positions were used. Both hydrophones were set at a depth of 1 meter. The second event started at 13:17:06, ended at 16:22:31, and accumulated 3,227 strikes. Table I.3-64 shows the peak sound pressure level, RMS and SEL, respectively.
Table I.3-64 Summary of the Measurement Levels from July 2, 2013
Pile
Total Time of Drive
(HH:MM:SS) Number of Strikes
Measurement Position (m)
Peak (dB) RMS (dB) Single-Strike SEL
(dB) Max Average Average Range Average Range
1 04:46:07 4,198 10 199 195 185 172–187 171 158–174 20 195 189 179 171–181 166 158–168 30 190 187 175 170–176 162 151–163
2 03:05:25 3,227 10 202 196 184 168–187 171 157–173 30 191 188 174 165–177 162 153–164
10 meters = 33 feet
I.3.33 36-Inch Steel Shell Piles—Seismic Retrofit of Coliseum Way Bridge, Oakland, CA
Underwater sound measurements were made on July 10, 2013, as part of the seismic retrofit of the Coliseum Way Bridge in Oakland, California. The retrofit work was required to upgrade the bridge to
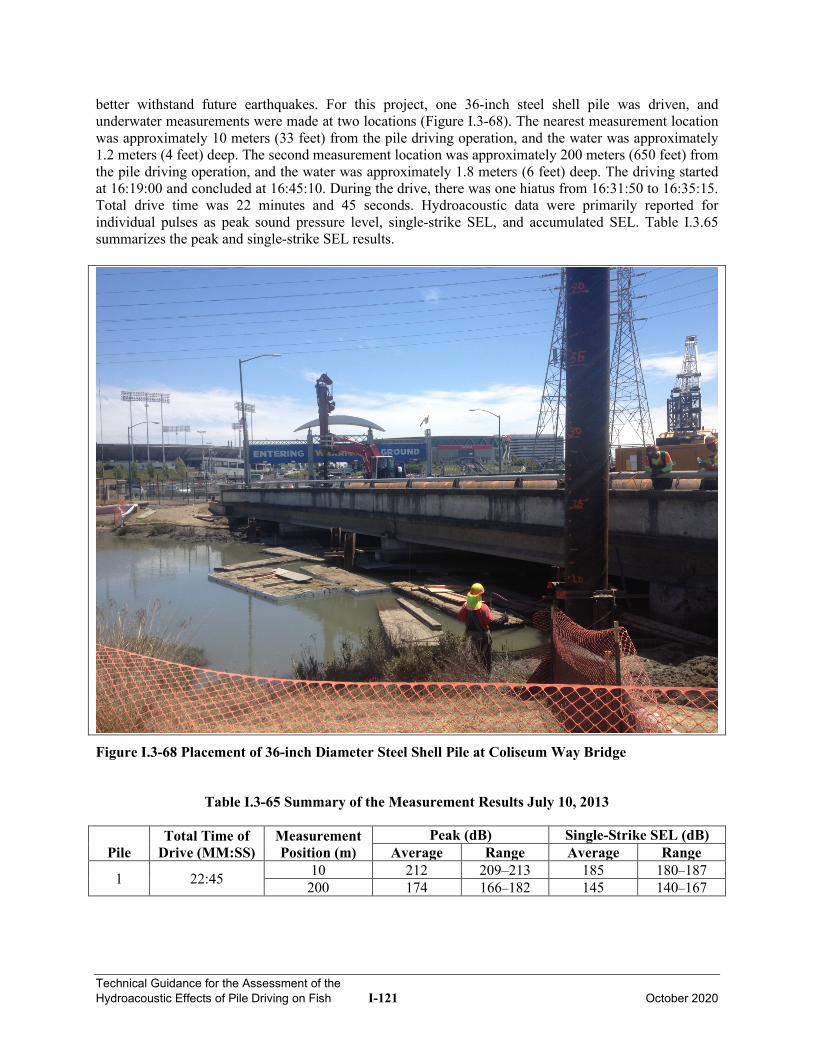
Technical Guidance for the Assessment of the Hydroacoustic Effects of Pile Driving on Fish I-121 October 2020
better withstand future earthquakes. For this project, one 36-inch steel shell pile was driven, and underwater measurements were made at two locations (Figure I.3-68). The nearest measurement location was approximately 10 meters (33 feet) from the pile driving operation, and the water was approximately 1.2 meters (4 feet) deep. The second measurement location was approximately 200 meters (650 feet) from the pile driving operation, and the water was approximately 1.8 meters (6 feet) deep. The driving started at 16:19:00 and concluded at 16:45:10. During the drive, there was one hiatus from 16:31:50 to 16:35:15. Total drive time was 22 minutes and 45 seconds. Hydroacoustic data were primarily reported for individual pulses as peak sound pressure level, single-strike SEL, and accumulated SEL. Table I.3.65 summarizes the peak and single-strike SEL results.
Figure I.3-68 Placement of 36-inch Diameter Steel Shell Pile at Coliseum Way Bridge
Table I.3-65 Summary of the Measurement Results July 10, 2013
Pile Total Time of
Drive (MM:SS) Measurement Position (m)
Peak (dB) Single-Strike SEL (dB) Average Range Average Range
1 22:45 10 212 209–213 185 180–187 200 174 166–182 145 140–167
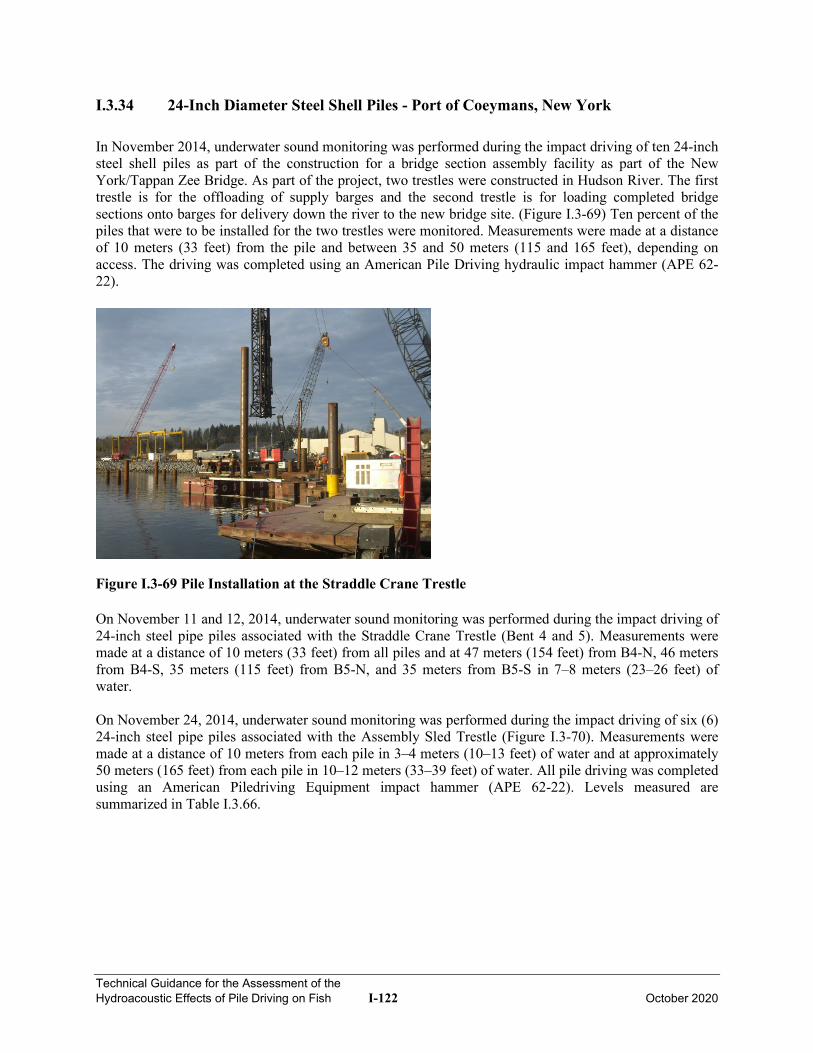
Technical Guidance for the Assessment of the Hydroacoustic Effects of Pile Driving on Fish I-122 October 2020
I.3.34 24-Inch Diameter Steel Shell Piles - Port of Coeymans, New York
In November 2014, underwater sound monitoring was performed during the impact driving of ten 24-inch steel shell piles as part of the construction for a bridge section assembly facility as part of the New York/Tappan Zee Bridge. As part of the project, two trestles were constructed in Hudson River. The first trestle is for the offloading of supply barges and the second trestle is for loading completed bridge sections onto barges for delivery down the river to the new bridge site. (Figure I.3-69) Ten percent of the piles that were to be installed for the two trestles were monitored. Measurements were made at a distance of 10 meters (33 feet) from the pile and between 35 and 50 meters (115 and 165 feet), depending on access. The driving was completed using an American Pile Driving hydraulic impact hammer (APE 62-22).
Figure I.3-69 Pile Installation at the Straddle Crane Trestle On November 11 and 12, 2014, underwater sound monitoring was performed during the impact driving of 24-inch steel pipe piles associated with the Straddle Crane Trestle (Bent 4 and 5). Measurements were made at a distance of 10 meters (33 feet) from all piles and at 47 meters (154 feet) from B4-N, 46 meters from B4-S, 35 meters (115 feet) from B5-N, and 35 meters from B5-S in 7–8 meters (23–26 feet) of water. On November 24, 2014, underwater sound monitoring was performed during the impact driving of six (6) 24-inch steel pipe piles associated with the Assembly Sled Trestle (Figure I.3-70). Measurements were made at a distance of 10 meters from each pile in 3–4 meters (10–13 feet) of water and at approximately 50 meters (165 feet) from each pile in 10–12 meters (33–39 feet) of water. All pile driving was completed using an American Piledriving Equipment impact hammer (APE 62-22). Levels measured are summarized in Table I.3.66.
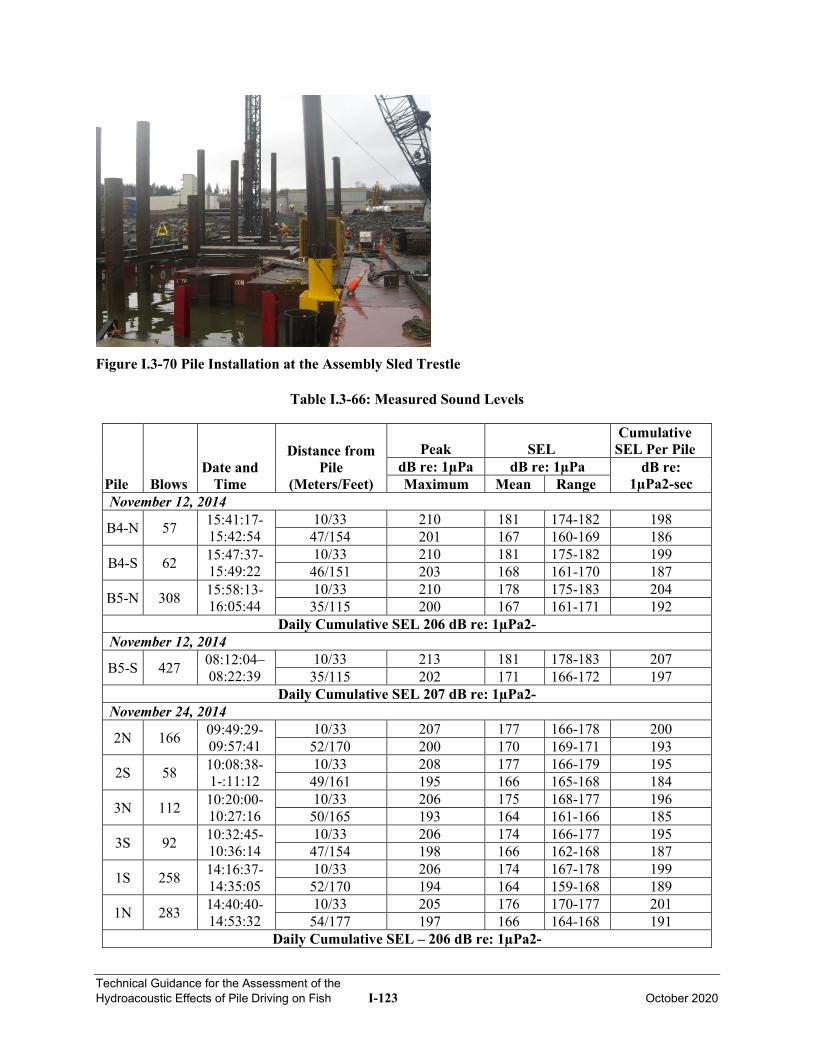
Technical Guidance for the Assessment of the Hydroacoustic Effects of Pile Driving on Fish I-123 October 2020
Figure I.3-70 Pile Installation at the Assembly Sled Trestle
Table I.3-66: Measured Sound Levels
Pile Blows Date and
Time
Distance from Pile
(Meters/Feet)
Peak dB re: 1µPa Maximum
SEL dB re: 1µPa
Cumulative SEL Per Pile
dB re: 1µPa2-sec Mean Range
November 12, 2014
B4-N 57 15:41:17-15:42:54
10/33 210 181 174-182 198 47/154 201 167 160-169 186
B4-S 62 15:47:37-15:49:22
10/33 210 181 175-182 199 46/151 203 168 161-170 187
B5-N 308 15:58:13-16:05:44
10/33 210 178 175-183 204 35/115 200 167 161-171 192
Daily Cumulative SEL 206 dB re: 1µPa2- November 12, 2014
B5-S 427 08:12:04–08:22:39
10/33 213 181 178-183 207 35/115 202 171 166-172 197
Daily Cumulative SEL 207 dB re: 1µPa2- November 24, 2014
2N 166 09:49:29-09:57:41
10/33 207 177 166-178 200 52/170 200 170 169-171 193
2S 58 10:08:38-1-:11:12
10/33 208 177 166-179 195 49/161 195 166 165-168 184
3N 112 10:20:00-10:27:16
10/33 206 175 168-177 196 50/165 193 164 161-166 185
3S 92 10:32:45-10:36:14
10/33 206 174 166-177 195 47/154 198 166 162-168 187
1S 258 14:16:37-14:35:05
10/33 206 174 167-178 199 52/170 194 164 159-168 189
1N 283 14:40:40-14:53:32
10/33 205 176 170-177 201 54/177 197 166 164-168 191
Daily Cumulative SEL – 206 dB re: 1µPa2-
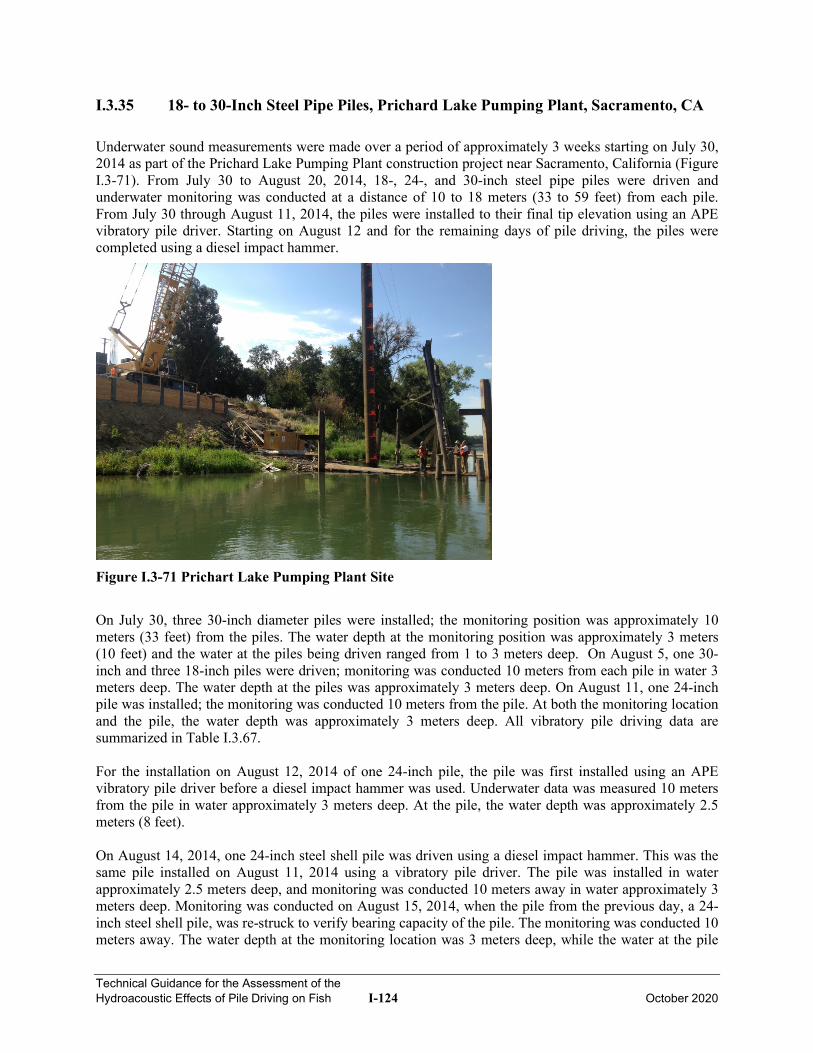
Technical Guidance for the Assessment of the Hydroacoustic Effects of Pile Driving on Fish I-124 October 2020
I.3.35 18- to 30-Inch Steel Pipe Piles, Prichard Lake Pumping Plant, Sacramento, CA
Underwater sound measurements were made over a period of approximately 3 weeks starting on July 30, 2014 as part of the Prichard Lake Pumping Plant construction project near Sacramento, California (Figure I.3-71). From July 30 to August 20, 2014, 18-, 24-, and 30-inch steel pipe piles were driven and underwater monitoring was conducted at a distance of 10 to 18 meters (33 to 59 feet) from each pile. From July 30 through August 11, 2014, the piles were installed to their final tip elevation using an APE vibratory pile driver. Starting on August 12 and for the remaining days of pile driving, the piles were completed using a diesel impact hammer.
Figure I.3-71 Prichart Lake Pumping Plant Site
On July 30, three 30-inch diameter piles were installed; the monitoring position was approximately 10 meters (33 feet) from the piles. The water depth at the monitoring position was approximately 3 meters (10 feet) and the water at the piles being driven ranged from 1 to 3 meters deep. On August 5, one 30-inch and three 18-inch piles were driven; monitoring was conducted 10 meters from each pile in water 3 meters deep. The water depth at the piles was approximately 3 meters deep. On August 11, one 24-inch pile was installed; the monitoring was conducted 10 meters from the pile. At both the monitoring location and the pile, the water depth was approximately 3 meters deep. All vibratory pile driving data are summarized in Table I.3.67. For the installation on August 12, 2014 of one 24-inch pile, the pile was first installed using an APE vibratory pile driver before a diesel impact hammer was used. Underwater data was measured 10 meters from the pile in water approximately 3 meters deep. At the pile, the water depth was approximately 2.5 meters (8 feet). On August 14, 2014, one 24-inch steel shell pile was driven using a diesel impact hammer. This was the same pile installed on August 11, 2014 using a vibratory pile driver. The pile was installed in water approximately 2.5 meters deep, and monitoring was conducted 10 meters away in water approximately 3 meters deep. Monitoring was conducted on August 15, 2014, when the pile from the previous day, a 24-inch steel shell pile, was re-struck to verify bearing capacity of the pile. The monitoring was conducted 10 meters away. The water depth at the monitoring location was 3 meters deep, while the water at the pile
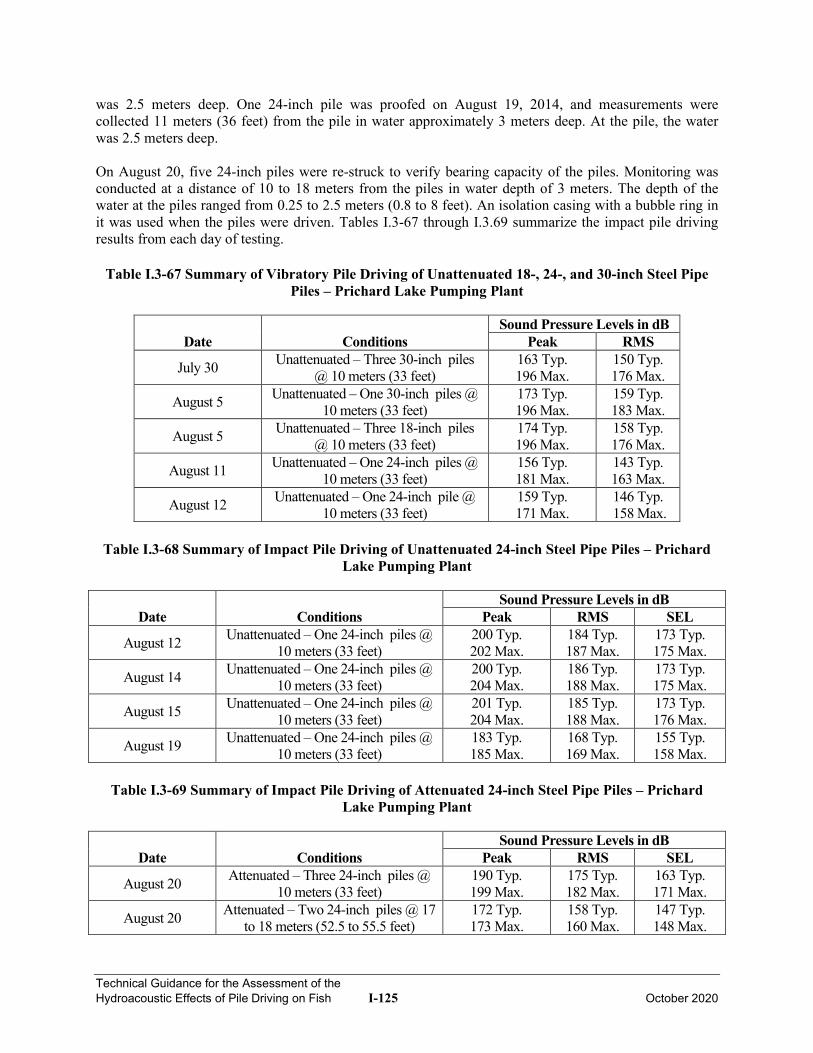
Technical Guidance for the Assessment of the Hydroacoustic Effects of Pile Driving on Fish I-125 October 2020
was 2.5 meters deep. One 24-inch pile was proofed on August 19, 2014, and measurements were collected 11 meters (36 feet) from the pile in water approximately 3 meters deep. At the pile, the water was 2.5 meters deep. On August 20, five 24-inch piles were re-struck to verify bearing capacity of the piles. Monitoring was conducted at a distance of 10 to 18 meters from the piles in water depth of 3 meters. The depth of the water at the piles ranged from 0.25 to 2.5 meters (0.8 to 8 feet). An isolation casing with a bubble ring in it was used when the piles were driven. Tables I.3-67 through I.3.69 summarize the impact pile driving results from each day of testing.
Table I.3-67 Summary of Vibratory Pile Driving of Unattenuated 18-, 24-, and 30-inch Steel Pipe Piles – Prichard Lake Pumping Plant
Date Conditions Sound Pressure Levels in dB
Peak RMS
July 30 Unattenuated – Three 30-inch piles @ 10 meters (33 feet)
163 Typ. 196 Max.
150 Typ. 176 Max.
August 5 Unattenuated – One 30-inch piles @ 10 meters (33 feet)
173 Typ. 196 Max.
159 Typ. 183 Max.
August 5 Unattenuated – Three 18-inch piles @ 10 meters (33 feet)
174 Typ. 196 Max.
158 Typ. 176 Max.
August 11 Unattenuated – One 24-inch piles @ 10 meters (33 feet)
156 Typ. 181 Max.
143 Typ. 163 Max.
August 12 Unattenuated – One 24-inch pile @ 10 meters (33 feet)
159 Typ. 171 Max.
146 Typ. 158 Max.
Table I.3-68 Summary of Impact Pile Driving of Unattenuated 24-inch Steel Pipe Piles – Prichard
Lake Pumping Plant
Date Conditions Sound Pressure Levels in dB
Peak RMS SEL
August 12 Unattenuated – One 24-inch piles @ 10 meters (33 feet)
200 Typ. 202 Max.
184 Typ. 187 Max.
173 Typ. 175 Max.
August 14 Unattenuated – One 24-inch piles @ 10 meters (33 feet)
200 Typ. 204 Max.
186 Typ. 188 Max.
173 Typ. 175 Max.
August 15 Unattenuated – One 24-inch piles @ 10 meters (33 feet)
201 Typ. 204 Max.
185 Typ. 188 Max.
173 Typ. 176 Max.
August 19 Unattenuated – One 24-inch piles @ 10 meters (33 feet)
183 Typ. 185 Max.
168 Typ. 169 Max.
155 Typ. 158 Max.
Table I.3-69 Summary of Impact Pile Driving of Attenuated 24-inch Steel Pipe Piles – Prichard
Lake Pumping Plant
Date Conditions Sound Pressure Levels in dB
Peak RMS SEL
August 20 Attenuated – Three 24-inch piles @ 10 meters (33 feet)
190 Typ. 199 Max.
175 Typ. 182 Max.
163 Typ. 171 Max.
August 20 Attenuated – Two 24-inch piles @ 17 to 18 meters (52.5 to 55.5 feet)
172 Typ. 173 Max.
158 Typ. 160 Max.
147 Typ. 148 Max.
Technical Guidance for the Assessment of the Hydroacoustic Effects of Pile Driving on Fish I-126 October 2020
I.3.36 References
1. California Department of Transportation. 2010. Mad River Bridges Replacement Project: Effects of Pile Driving Sound on Juvenile Steelhead. March 24.
2. Coast Guard Civil Engineering Unit. 2008. Tongue Point Facility Pier Repairs, Astoria, Oregon – Underwater Noise Monitoring Plan. Oakland, California. June.
3. Illingworth & Rodkin, Inc. 2002. Point Isabel Foundation Repair El Cerrito, California – Report of Underwater Sound Level Measurements Resulting from Pile Driving. October 24.
4. Illingworth & Rodkin, Inc. 2003. Underwater Sound Levels Associated with Pile Driving Activities Associated with Construction of the Noyo Bridge. Report to Caltrans dated March 18 and revised April 9, 2003.
5. Illingworth & Rodkin, Inc. 2003. Letter to Les Shorter reporting Underwater Sound Measurement Results for Sausalito Dock Construction Pile Driving. Revised April 30, 2003.
6. Illingworth & Rodkin, Inc. 2003. Letter to Gary Lester (Winzler & Kelly Consulting Engineers) reporting Underwater Sound Measurement Results (7/21/2003) for Mad River Slough Construction Pile Driving. August 25.
7. Illingworth & Rodkin, Inc. 2003. Letter to Michael Cheney reporting results of underwater sound measurements – Castrol Pile Installation at Richmond Inner harbor. November 9.
8. Illingworth & Rodkin, Inc. 2004. Letter to Roy Neal of Conoco/Phillips from Clayton R. Anderson, reporting the results of underwater sound measurements. November 9.
9. Illingworth & Rodkin, Inc. 2006. Results of Underwater Sound Measurements for the Construction of Utility Crossing at Stockton Regional Wastewater Control Facility. Report to CH2M Hill dated April 17.
10. Illingworth & Rodkin, Inc. 2005. Letter to Sharon Lim (Tesoro) reporting results of underwater sound measurements –Amorco Wharf 24-Inch Steel Pipe Pile Installation. December 21.
11. Illingworth & Rodkin, Inc. 2006. Russian River at Geyserville – Underwater Sound Measurements Data, Driving of Steel Pipe Piles for Construction of a Temporary Trestle. Report to Caltrans District 4 (Chuck Morton), dated June 7.
12. Illingworth & Rodkin, Inc. 2006. Russian River Replacement Bridge at Geyserville – Underwater Sound Measurements Data for Driving Permanent 48-Inch CISS Piles. Report to Caltrans District 4 (Chuck Morton), dated August 3.
13. Illingworth & Rodkin, Inc. 2006. Letter to Bill Cooke (Manson Construction Co.) reporting results of underwater sound measurements – Impact Driving of 40- and 30-Inch Steel Piles. August 14.
14. Illingworth & Rodkin, Inc. 2011. Bradshaw’s Crossing Project Hydroacoustic Monitoring Plan. July.
Technical Guidance for the Assessment of the Hydroacoustic Effects of Pile Driving on Fish I-127 October 2020
15. Illingworth & Rodkin, Inc. 2014. Memo to Elena Barnett (HDR, Inc.) transmitting Underwater Sound Measurement Results for Port of Coeymans Pile Driving. November 21 and December 2.
16. Illingworth & Rodkin, Inc. 2014. Series of Memos to Jerimy Borchardt (CH2M Hill) transmitting Underwater Sound Measurement Results for Prichard Lake Pumping Station Construction Pile Driving. July 31 through August 21.
17. Mason, Bruce & Girard, Inc. 2011. Weaver Road Interchange and Bridge Project – Hydroacoustic Monitoring Plan. Portland, Oregon. July.
18. National Marine Fisheries Service. 2010. Endangered Species Act Biological Opinion and Magnuson-Stevens Fishery Conservation and Management Act Essential Fish Habitat Conservation Recommendations for the Weaver Road Interchange and Bridge, South Umpqua River. (6th field HUC: 171003021001-Judd Creek), Douglas County, Oregon [(Federal ID # C019 (32)] (Key Number #14085). June 11.
19. National Oceanic and Atmospheric Administration Fisheries, U.S. Fish and Wildlife Service, California Department of Fish and Game, U.S. Federal Highway Administration, and the California/Washington/Oregon Departments of Transportation. 2008. Memorandum of Understanding from the Fisheries Hydroacoustic Working Group. June 12.
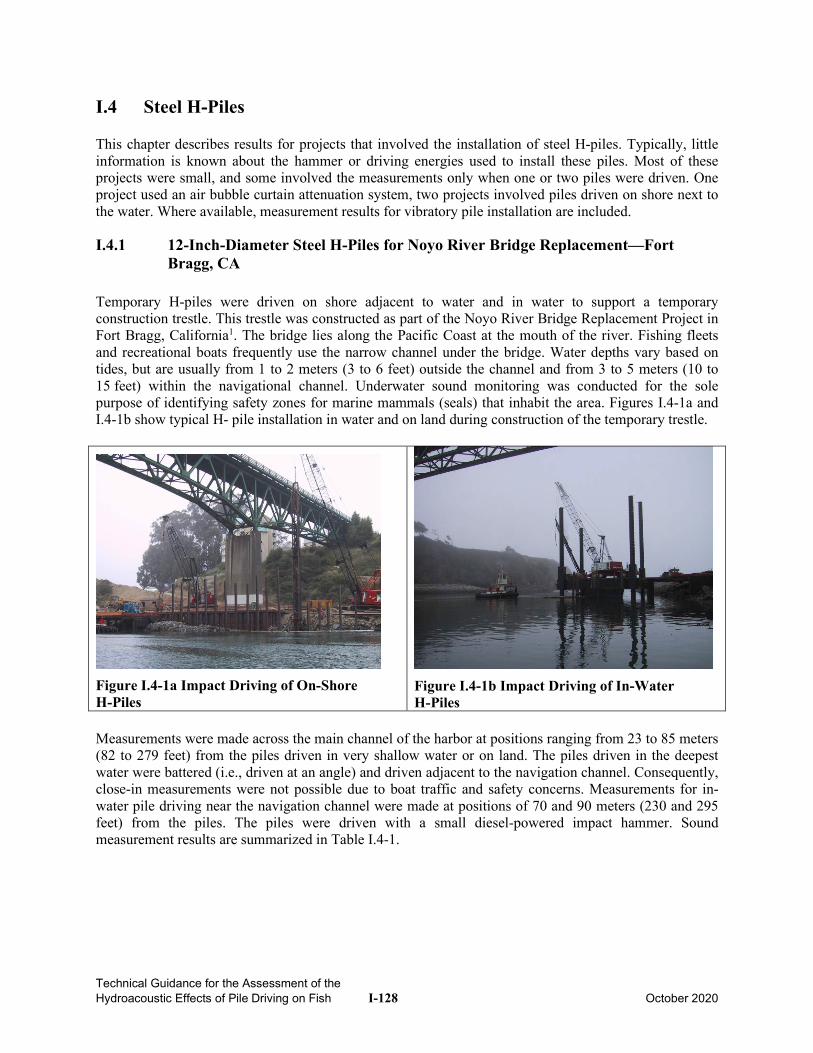
Technical Guidance for the Assessment of the Hydroacoustic Effects of Pile Driving on Fish I-128 October 2020
I.4 Steel H-Piles This chapter describes results for projects that involved the installation of steel H-piles. Typically, little information is known about the hammer or driving energies used to install these piles. Most of these projects were small, and some involved the measurements only when one or two piles were driven. One project used an air bubble curtain attenuation system, two projects involved piles driven on shore next to the water. Where available, measurement results for vibratory pile installation are included.
I.4.1 12-Inch-Diameter Steel H-Piles for Noyo River Bridge Replacement—Fort Bragg, CA
Temporary H-piles were driven on shore adjacent to water and in water to support a temporary construction trestle. This trestle was constructed as part of the Noyo River Bridge Replacement Project in Fort Bragg, California1. The bridge lies along the Pacific Coast at the mouth of the river. Fishing fleets and recreational boats frequently use the narrow channel under the bridge. Water depths vary based on tides, but are usually from 1 to 2 meters (3 to 6 feet) outside the channel and from 3 to 5 meters (10 to 15 feet) within the navigational channel. Underwater sound monitoring was conducted for the sole purpose of identifying safety zones for marine mammals (seals) that inhabit the area. Figures I.4-1a and I.4-1b show typical H- pile installation in water and on land during construction of the temporary trestle.
Figure I.4-1a Impact Driving of On-Shore H-Piles
Figure I.4-1b Impact Driving of In-Water H-Piles
Measurements were made across the main channel of the harbor at positions ranging from 23 to 85 meters (82 to 279 feet) from the piles driven in very shallow water or on land. The piles driven in the deepest water were battered (i.e., driven at an angle) and driven adjacent to the navigation channel. Consequently, close-in measurements were not possible due to boat traffic and safety concerns. Measurements for in-water pile driving near the navigation channel were made at positions of 70 and 90 meters (230 and 295 feet) from the piles. The piles were driven with a small diesel-powered impact hammer. Sound measurement results are summarized in Table I.4-1.
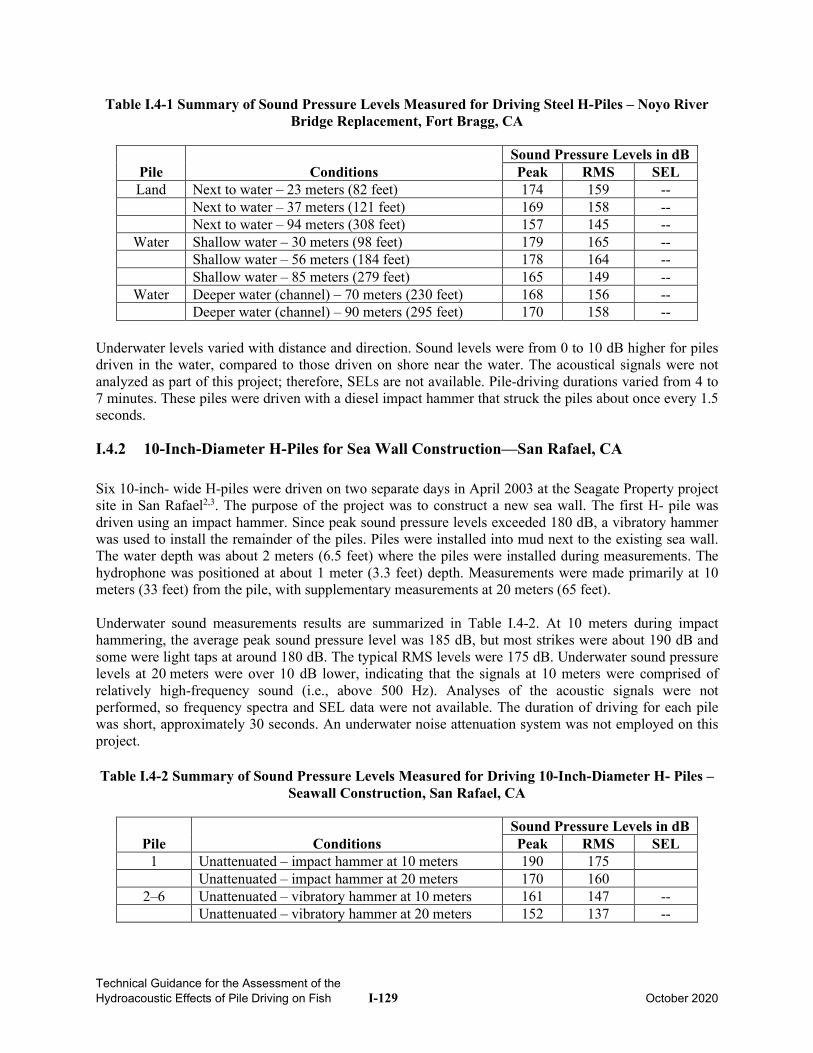
Technical Guidance for the Assessment of the Hydroacoustic Effects of Pile Driving on Fish I-129 October 2020
Table I.4-1 Summary of Sound Pressure Levels Measured for Driving Steel H-Piles – Noyo River Bridge Replacement, Fort Bragg, CA
Pile Conditions Sound Pressure Levels in dB Peak RMS SEL
Land Next to water – 23 meters (82 feet) 174 159 -- Next to water – 37 meters (121 feet) 169 158 -- Next to water – 94 meters (308 feet) 157 145 --
Water Shallow water – 30 meters (98 feet) 179 165 -- Shallow water – 56 meters (184 feet) 178 164 -- Shallow water – 85 meters (279 feet) 165 149 --
Water Deeper water (channel) – 70 meters (230 feet) 168 156 -- Deeper water (channel) – 90 meters (295 feet) 170 158 --
Underwater levels varied with distance and direction. Sound levels were from 0 to 10 dB higher for piles driven in the water, compared to those driven on shore near the water. The acoustical signals were not analyzed as part of this project; therefore, SELs are not available. Pile-driving durations varied from 4 to 7 minutes. These piles were driven with a diesel impact hammer that struck the piles about once every 1.5 seconds.
I.4.2 10-Inch-Diameter H-Piles for Sea Wall Construction—San Rafael, CA Six 10-inch- wide H-piles were driven on two separate days in April 2003 at the Seagate Property project site in San Rafael2,3. The purpose of the project was to construct a new sea wall. The first H- pile was driven using an impact hammer. Since peak sound pressure levels exceeded 180 dB, a vibratory hammer was used to install the remainder of the piles. Piles were installed into mud next to the existing sea wall. The water depth was about 2 meters (6.5 feet) where the piles were installed during measurements. The hydrophone was positioned at about 1 meter (3.3 feet) depth. Measurements were made primarily at 10 meters (33 feet) from the pile, with supplementary measurements at 20 meters (65 feet). Underwater sound measurements results are summarized in Table I.4-2. At 10 meters during impact hammering, the average peak sound pressure level was 185 dB, but most strikes were about 190 dB and some were light taps at around 180 dB. The typical RMS levels were 175 dB. Underwater sound pressure levels at 20 meters were over 10 dB lower, indicating that the signals at 10 meters were comprised of relatively high-frequency sound (i.e., above 500 Hz). Analyses of the acoustic signals were not performed, so frequency spectra and SEL data were not available. The duration of driving for each pile was short, approximately 30 seconds. An underwater noise attenuation system was not employed on this project. Table I.4-2 Summary of Sound Pressure Levels Measured for Driving 10-Inch-Diameter H- Piles –
Seawall Construction, San Rafael, CA
Pile Conditions Sound Pressure Levels in dB Peak RMS SEL
1 Unattenuated – impact hammer at 10 meters 190 175 Unattenuated – impact hammer at 20 meters 170 160
2–6 Unattenuated – vibratory hammer at 10 meters 161 147 -- Unattenuated – vibratory hammer at 20 meters 152 137 --
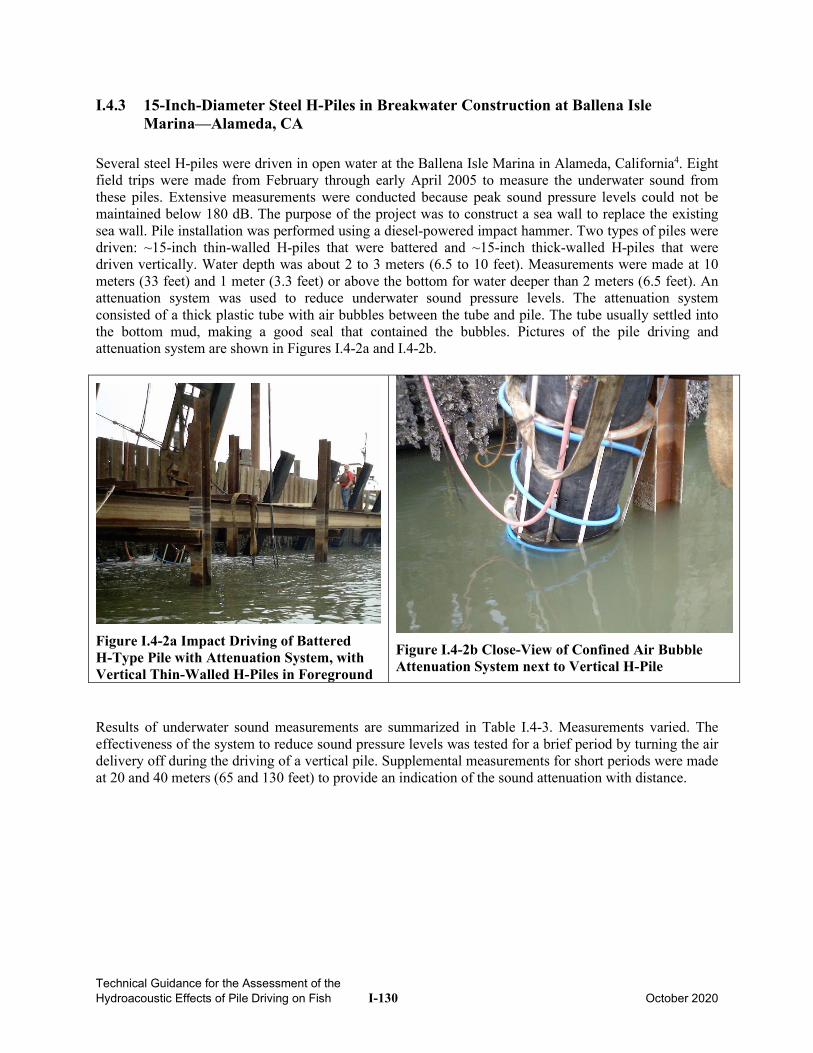
Technical Guidance for the Assessment of the Hydroacoustic Effects of Pile Driving on Fish I-130 October 2020
I.4.3 15-Inch-Diameter Steel H-Piles in Breakwater Construction at Ballena Isle Marina—Alameda, CA
Several steel H-piles were driven in open water at the Ballena Isle Marina in Alameda, California4. Eight field trips were made from February through early April 2005 to measure the underwater sound from these piles. Extensive measurements were conducted because peak sound pressure levels could not be maintained below 180 dB. The purpose of the project was to construct a sea wall to replace the existing sea wall. Pile installation was performed using a diesel-powered impact hammer. Two types of piles were driven: ~15-inch thin-walled H-piles that were battered and ~15-inch thick-walled H-piles that were driven vertically. Water depth was about 2 to 3 meters (6.5 to 10 feet). Measurements were made at 10 meters (33 feet) and 1 meter (3.3 feet) or above the bottom for water deeper than 2 meters (6.5 feet). An attenuation system was used to reduce underwater sound pressure levels. The attenuation system consisted of a thick plastic tube with air bubbles between the tube and pile. The tube usually settled into the bottom mud, making a good seal that contained the bubbles. Pictures of the pile driving and attenuation system are shown in Figures I.4-2a and I.4-2b.
Figure I.4-2a Impact Driving of Battered H-Type Pile with Attenuation System, with Vertical Thin-Walled H-Piles in Foreground
Figure I.4-2b Close-View of Confined Air Bubble Attenuation System next to Vertical H-Pile
Results of underwater sound measurements are summarized in Table I.4-3. Measurements varied. The effectiveness of the system to reduce sound pressure levels was tested for a brief period by turning the air delivery off during the driving of a vertical pile. Supplemental measurements for short periods were made at 20 and 40 meters (65 and 130 feet) to provide an indication of the sound attenuation with distance.
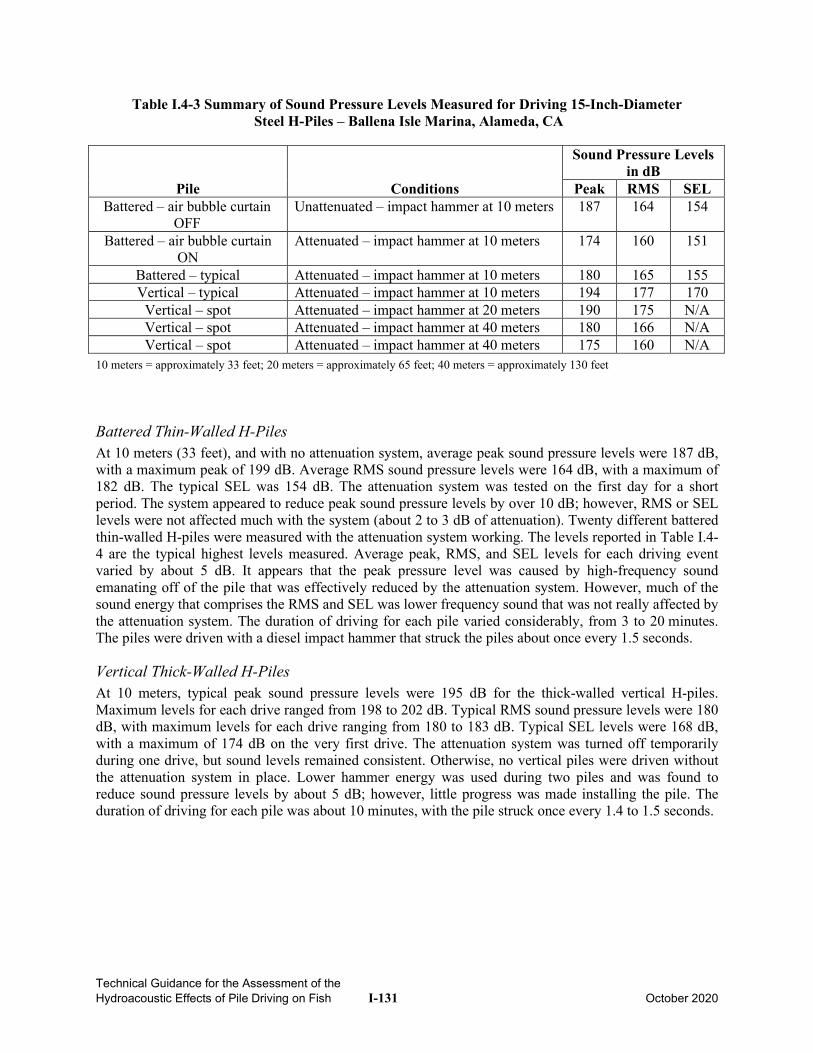
Technical Guidance for the Assessment of the Hydroacoustic Effects of Pile Driving on Fish I-131 October 2020
Table I.4-3 Summary of Sound Pressure Levels Measured for Driving 15-Inch-Diameter Steel H-Piles – Ballena Isle Marina, Alameda, CA
Pile Conditions
Sound Pressure Levels in dB
Peak RMS SEL Battered – air bubble curtain
OFF Unattenuated – impact hammer at 10 meters 187 164 154
Battered – air bubble curtain ON
Attenuated – impact hammer at 10 meters 174 160 151
Battered – typical Attenuated – impact hammer at 10 meters 180 165 155 Vertical – typical Attenuated – impact hammer at 10 meters 194 177 170
Vertical – spot Attenuated – impact hammer at 20 meters 190 175 N/A Vertical – spot Attenuated – impact hammer at 40 meters 180 166 N/A Vertical – spot Attenuated – impact hammer at 40 meters 175 160 N/A
10 meters = approximately 33 feet; 20 meters = approximately 65 feet; 40 meters = approximately 130 feet
Battered Thin-Walled H-Piles At 10 meters (33 feet), and with no attenuation system, average peak sound pressure levels were 187 dB, with a maximum peak of 199 dB. Average RMS sound pressure levels were 164 dB, with a maximum of 182 dB. The typical SEL was 154 dB. The attenuation system was tested on the first day for a short period. The system appeared to reduce peak sound pressure levels by over 10 dB; however, RMS or SEL levels were not affected much with the system (about 2 to 3 dB of attenuation). Twenty different battered thin-walled H-piles were measured with the attenuation system working. The levels reported in Table I.4-4 are the typical highest levels measured. Average peak, RMS, and SEL levels for each driving event varied by about 5 dB. It appears that the peak pressure level was caused by high-frequency sound emanating off of the pile that was effectively reduced by the attenuation system. However, much of the sound energy that comprises the RMS and SEL was lower frequency sound that was not really affected by the attenuation system. The duration of driving for each pile varied considerably, from 3 to 20 minutes. The piles were driven with a diesel impact hammer that struck the piles about once every 1.5 seconds.
Vertical Thick-Walled H-Piles At 10 meters, typical peak sound pressure levels were 195 dB for the thick-walled vertical H-piles. Maximum levels for each drive ranged from 198 to 202 dB. Typical RMS sound pressure levels were 180 dB, with maximum levels for each drive ranging from 180 to 183 dB. Typical SEL levels were 168 dB, with a maximum of 174 dB on the very first drive. The attenuation system was turned off temporarily during one drive, but sound levels remained consistent. Otherwise, no vertical piles were driven without the attenuation system in place. Lower hammer energy was used during two piles and was found to reduce sound pressure levels by about 5 dB; however, little progress was made installing the pile. The duration of driving for each pile was about 10 minutes, with the pile struck once every 1.4 to 1.5 seconds.
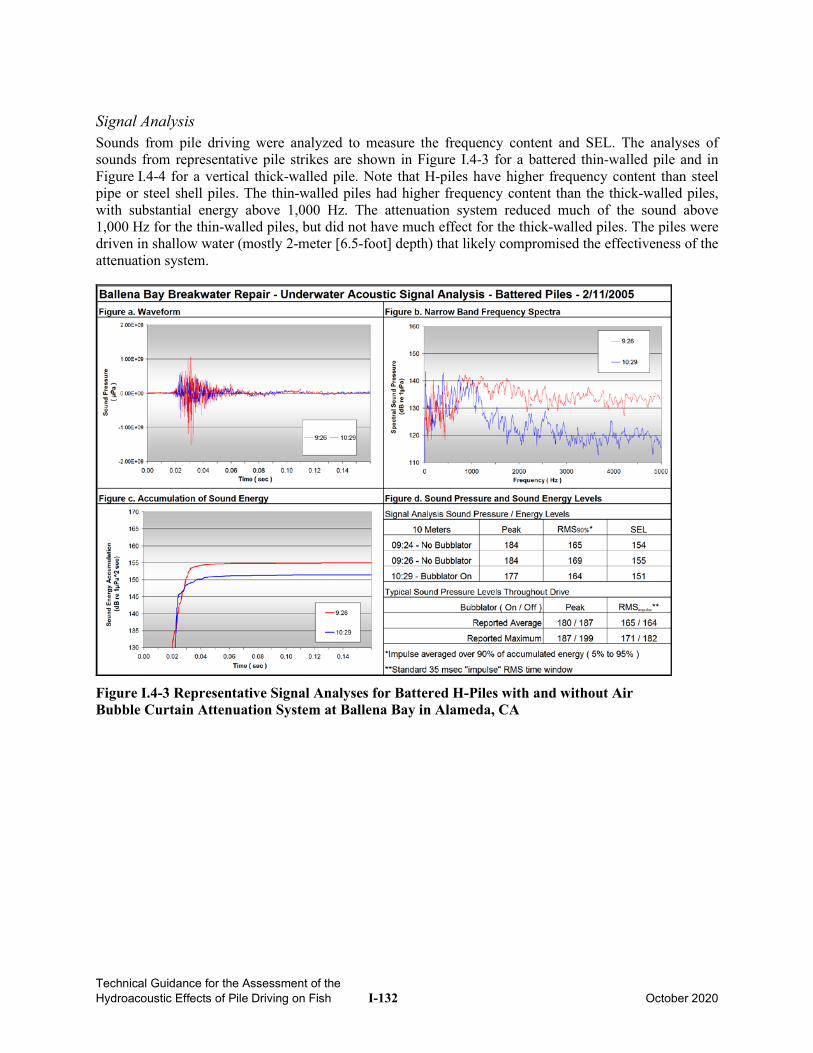
Technical Guidance for the Assessment of the Hydroacoustic Effects of Pile Driving on Fish I-132 October 2020
Signal Analysis Sounds from pile driving were analyzed to measure the frequency content and SEL. The analyses of sounds from representative pile strikes are shown in Figure I.4-3 for a battered thin-walled pile and in Figure I.4-4 for a vertical thick-walled pile. Note that H-piles have higher frequency content than steel pipe or steel shell piles. The thin-walled piles had higher frequency content than the thick-walled piles, with substantial energy above 1,000 Hz. The attenuation system reduced much of the sound above 1,000 Hz for the thin-walled piles, but did not have much effect for the thick-walled piles. The piles were driven in shallow water (mostly 2-meter [6.5-foot] depth) that likely compromised the effectiveness of the attenuation system.
Figure I.4-3 Representative Signal Analyses for Battered H-Piles with and without Air Bubble Curtain Attenuation System at Ballena Bay in Alameda, CA
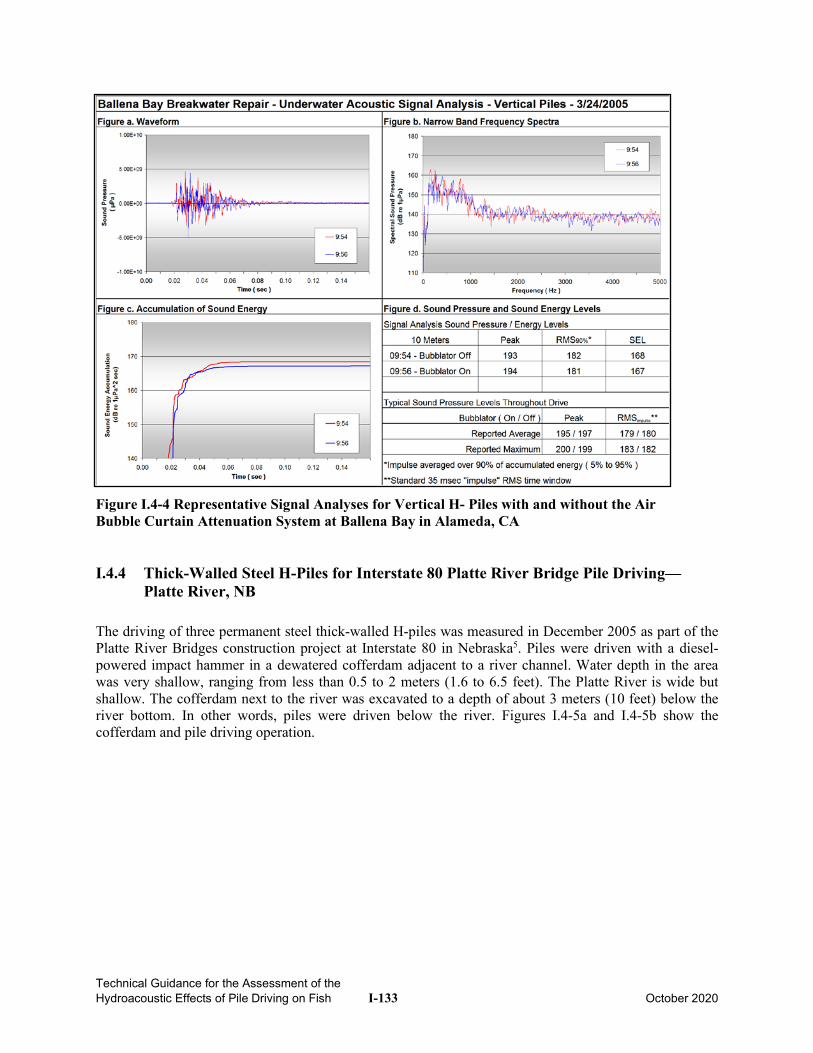
Technical Guidance for the Assessment of the Hydroacoustic Effects of Pile Driving on Fish I-133 October 2020
Figure I.4-4 Representative Signal Analyses for Vertical H- Piles with and without the Air Bubble Curtain Attenuation System at Ballena Bay in Alameda, CA
I.4.4 Thick-Walled Steel H-Piles for Interstate 80 Platte River Bridge Pile Driving—Platte River, NB
The driving of three permanent steel thick-walled H-piles was measured in December 2005 as part of the Platte River Bridges construction project at Interstate 80 in Nebraska5. Piles were driven with a diesel-powered impact hammer in a dewatered cofferdam adjacent to a river channel. Water depth in the area was very shallow, ranging from less than 0.5 to 2 meters (1.6 to 6.5 feet). The Platte River is wide but shallow. The cofferdam next to the river was excavated to a depth of about 3 meters (10 feet) below the river bottom. In other words, piles were driven below the river. Figures I.4-5a and I.4-5b show the cofferdam and pile driving operation.
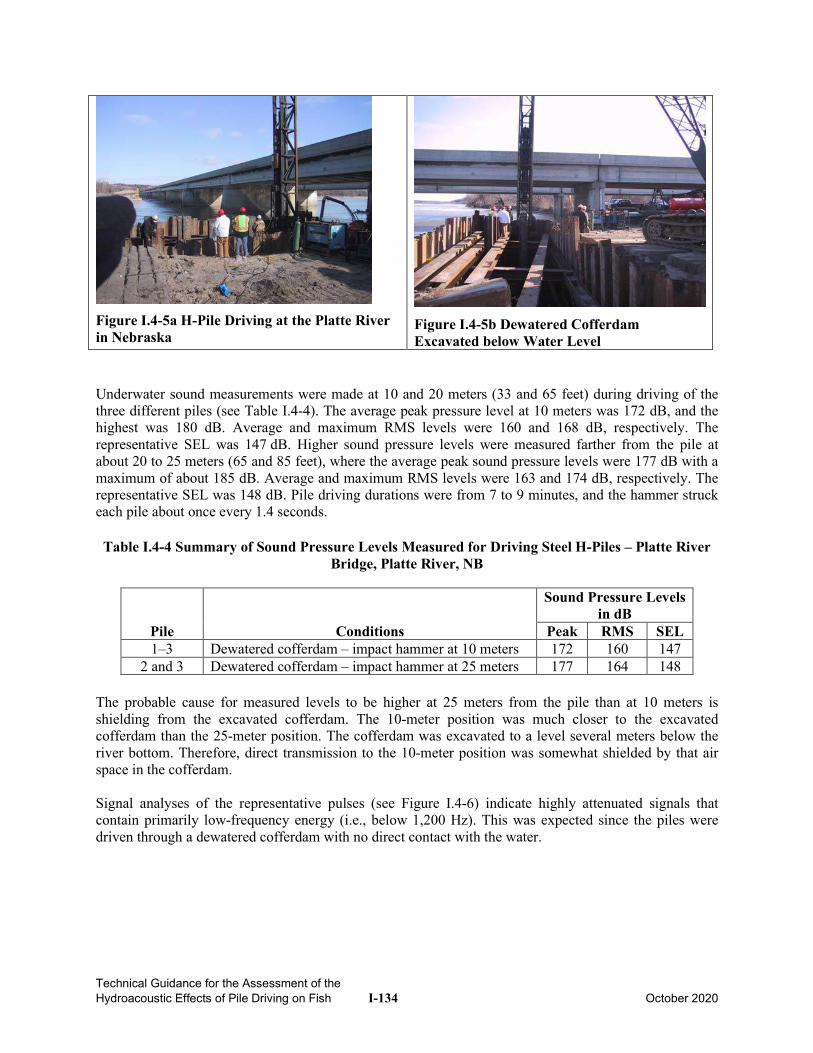
Technical Guidance for the Assessment of the Hydroacoustic Effects of Pile Driving on Fish I-134 October 2020
Figure I.4-5a H-Pile Driving at the Platte River in Nebraska
Figure I.4-5b Dewatered Cofferdam Excavated below Water Level
Underwater sound measurements were made at 10 and 20 meters (33 and 65 feet) during driving of the three different piles (see Table I.4-4). The average peak pressure level at 10 meters was 172 dB, and the highest was 180 dB. Average and maximum RMS levels were 160 and 168 dB, respectively. The representative SEL was 147 dB. Higher sound pressure levels were measured farther from the pile at about 20 to 25 meters (65 and 85 feet), where the average peak sound pressure levels were 177 dB with a maximum of about 185 dB. Average and maximum RMS levels were 163 and 174 dB, respectively. The representative SEL was 148 dB. Pile driving durations were from 7 to 9 minutes, and the hammer struck each pile about once every 1.4 seconds. Table I.4-4 Summary of Sound Pressure Levels Measured for Driving Steel H-Piles – Platte River
Bridge, Platte River, NB
Pile Conditions
Sound Pressure Levels in dB
Peak RMS SEL 1–3 Dewatered cofferdam – impact hammer at 10 meters 172 160 147
2 and 3 Dewatered cofferdam – impact hammer at 25 meters 177 164 148 The probable cause for measured levels to be higher at 25 meters from the pile than at 10 meters is shielding from the excavated cofferdam. The 10-meter position was much closer to the excavated cofferdam than the 25-meter position. The cofferdam was excavated to a level several meters below the river bottom. Therefore, direct transmission to the 10-meter position was somewhat shielded by that air space in the cofferdam. Signal analyses of the representative pulses (see Figure I.4-6) indicate highly attenuated signals that contain primarily low-frequency energy (i.e., below 1,200 Hz). This was expected since the piles were driven through a dewatered cofferdam with no direct contact with the water.
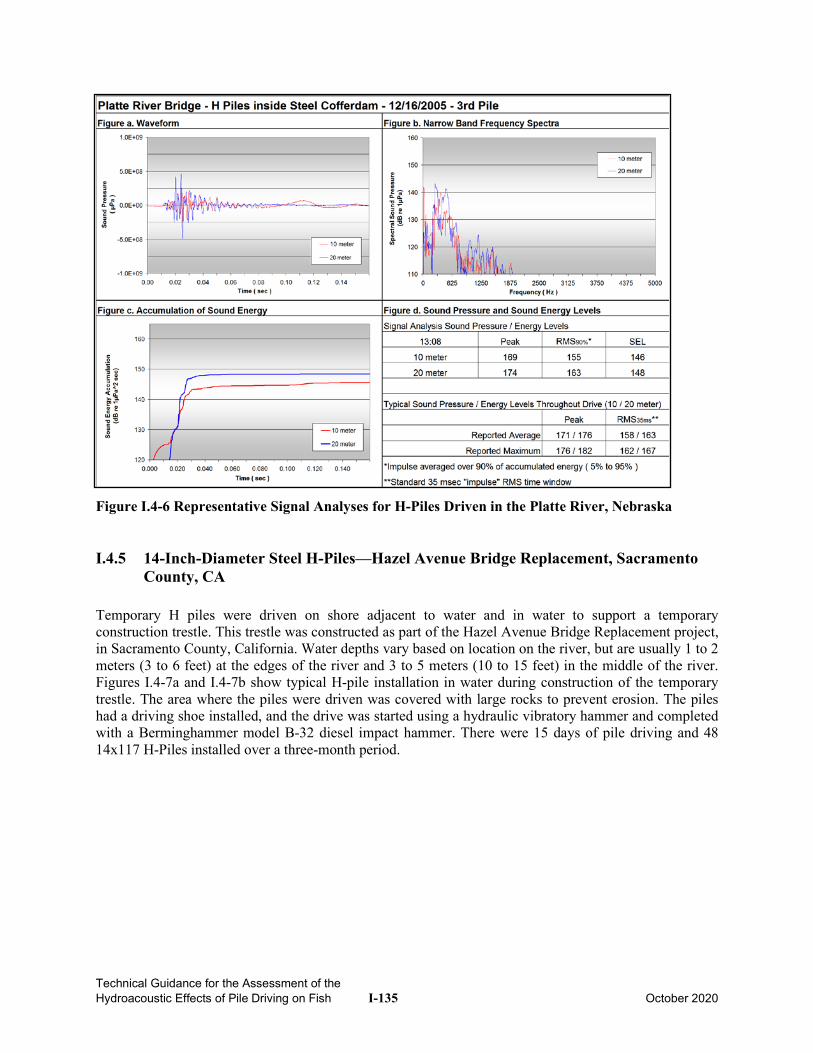
Technical Guidance for the Assessment of the Hydroacoustic Effects of Pile Driving on Fish I-135 October 2020
Figure I.4-6 Representative Signal Analyses for H-Piles Driven in the Platte River, Nebraska
I.4.5 14-Inch-Diameter Steel H-Piles—Hazel Avenue Bridge Replacement, Sacramento County, CA
Temporary H piles were driven on shore adjacent to water and in water to support a temporary construction trestle. This trestle was constructed as part of the Hazel Avenue Bridge Replacement project, in Sacramento County, California. Water depths vary based on location on the river, but are usually 1 to 2 meters (3 to 6 feet) at the edges of the river and 3 to 5 meters (10 to 15 feet) in the middle of the river. Figures I.4-7a and I.4-7b show typical H-pile installation in water during construction of the temporary trestle. The area where the piles were driven was covered with large rocks to prevent erosion. The piles had a driving shoe installed, and the drive was started using a hydraulic vibratory hammer and completed with a Berminghammer model B-32 diesel impact hammer. There were 15 days of pile driving and 48 14x117 H-Piles installed over a three-month period.
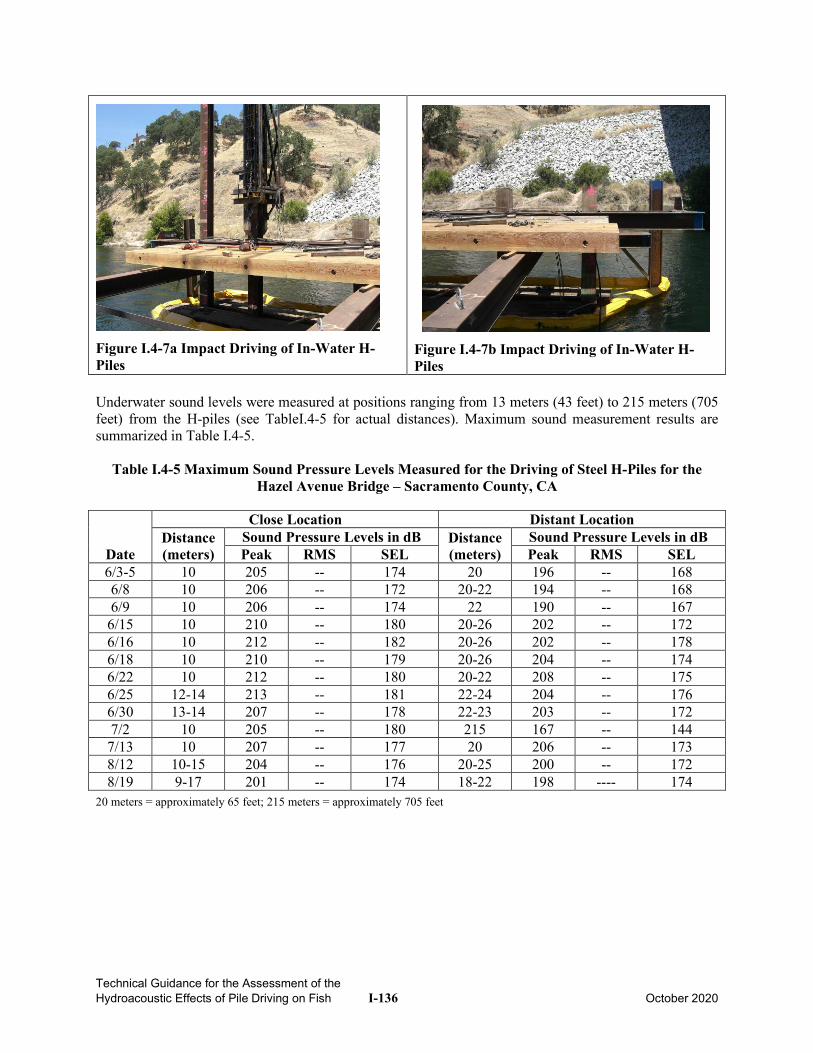
Technical Guidance for the Assessment of the Hydroacoustic Effects of Pile Driving on Fish I-136 October 2020
Figure I.4-7a Impact Driving of In-Water H-Piles
Figure I.4-7b Impact Driving of In-Water H-Piles
Underwater sound levels were measured at positions ranging from 13 meters (43 feet) to 215 meters (705 feet) from the H-piles (see TableI.4-5 for actual distances). Maximum sound measurement results are summarized in Table I.4-5.
Table I.4-5 Maximum Sound Pressure Levels Measured for the Driving of Steel H-Piles for the Hazel Avenue Bridge – Sacramento County, CA
Date
Close Location Distant Location Distance (meters)
Sound Pressure Levels in dB Distance (meters)
Sound Pressure Levels in dB Peak RMS SEL Peak RMS SEL
6/3-5 10 205 -- 174 20 196 -- 168 6/8 10 206 -- 172 20-22 194 -- 168 6/9 10 206 -- 174 22 190 -- 167
6/15 10 210 -- 180 20-26 202 -- 172 6/16 10 212 -- 182 20-26 202 -- 178 6/18 10 210 -- 179 20-26 204 -- 174 6/22 10 212 -- 180 20-22 208 -- 175 6/25 12-14 213 -- 181 22-24 204 -- 176 6/30 13-14 207 -- 178 22-23 203 -- 172 7/2 10 205 -- 180 215 167 -- 144
7/13 10 207 -- 177 20 206 -- 173 8/12 10-15 204 -- 176 20-25 200 -- 172 8/19 9-17 201 -- 174 18-22 198 ---- 174
20 meters = approximately 65 feet; 215 meters = approximately 705 feet
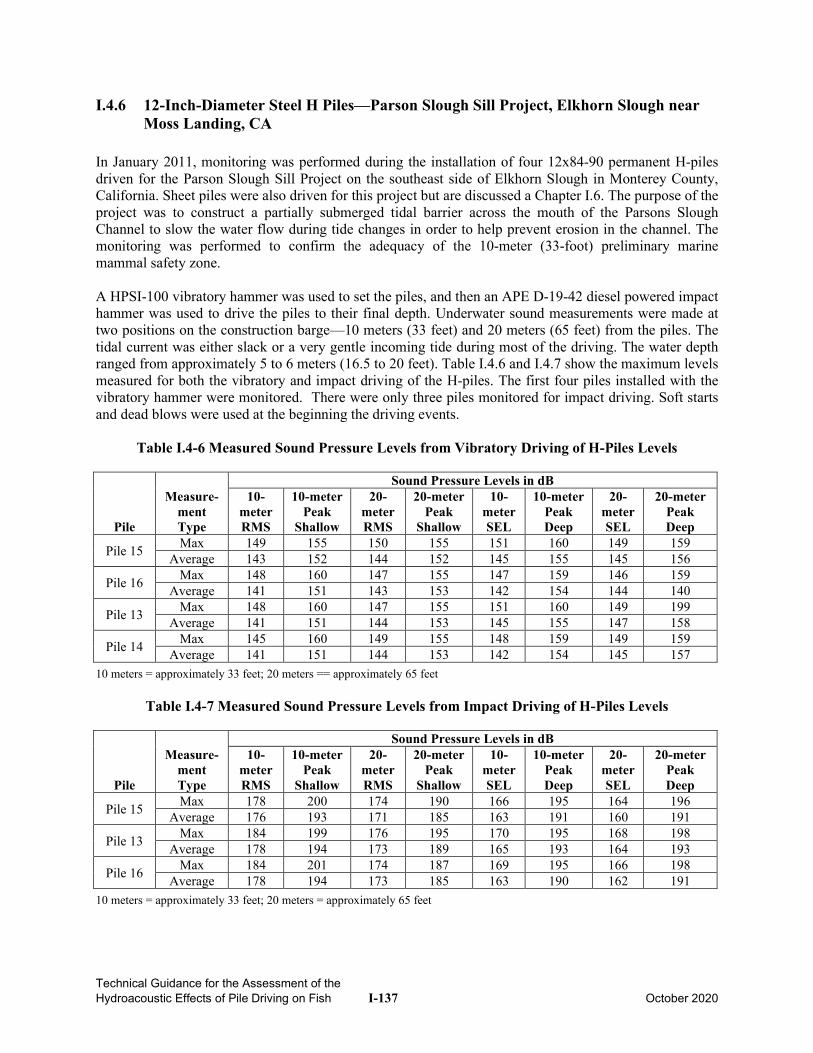
Technical Guidance for the Assessment of the Hydroacoustic Effects of Pile Driving on Fish I-137 October 2020
I.4.6 12-Inch-Diameter Steel H Piles—Parson Slough Sill Project, Elkhorn Slough near Moss Landing, CA
In January 2011, monitoring was performed during the installation of four 12x84-90 permanent H-piles driven for the Parson Slough Sill Project on the southeast side of Elkhorn Slough in Monterey County, California. Sheet piles were also driven for this project but are discussed a Chapter I.6. The purpose of the project was to construct a partially submerged tidal barrier across the mouth of the Parsons Slough Channel to slow the water flow during tide changes in order to help prevent erosion in the channel. The monitoring was performed to confirm the adequacy of the 10-meter (33-foot) preliminary marine mammal safety zone. A HPSI-100 vibratory hammer was used to set the piles, and then an APE D-19-42 diesel powered impact hammer was used to drive the piles to their final depth. Underwater sound measurements were made at two positions on the construction barge—10 meters (33 feet) and 20 meters (65 feet) from the piles. The tidal current was either slack or a very gentle incoming tide during most of the driving. The water depth ranged from approximately 5 to 6 meters (16.5 to 20 feet). Table I.4.6 and I.4.7 show the maximum levels measured for both the vibratory and impact driving of the H-piles. The first four piles installed with the vibratory hammer were monitored. There were only three piles monitored for impact driving. Soft starts and dead blows were used at the beginning the driving events.
Table I.4-6 Measured Sound Pressure Levels from Vibratory Driving of H-Piles Levels
Pile
Measure-ment Type
Sound Pressure Levels in dB 10-
meter RMS
10-meter Peak
Shallow
20-meter RMS
20-meter Peak
Shallow
10-meter SEL
10-meter Peak Deep
20-meter SEL
20-meter Peak Deep
Pile 15 Max 149 155 150 155 151 160 149 159 Average 143 152 144 152 145 155 145 156
Pile 16 Max 148 160 147 155 147 159 146 159 Average 141 151 143 153 142 154 144 140
Pile 13 Max 148 160 147 155 151 160 149 199 Average 141 151 144 153 145 155 147 158
Pile 14 Max 145 160 149 155 148 159 149 159 Average 141 151 144 153 142 154 145 157
10 meters = approximately 33 feet; 20 meters == approximately 65 feet
Table I.4-7 Measured Sound Pressure Levels from Impact Driving of H-Piles Levels
Pile
Measure-ment Type
Sound Pressure Levels in dB 10-
meter RMS
10-meter Peak
Shallow
20-meter RMS
20-meter Peak
Shallow
10-meter SEL
10-meter Peak Deep
20-meter SEL
20-meter Peak Deep
Pile 15 Max 178 200 174 190 166 195 164 196 Average 176 193 171 185 163 191 160 191
Pile 13 Max 184 199 176 195 170 195 168 198 Average 178 194 173 189 165 193 164 193
Pile 16 Max 184 201 174 187 169 195 166 198 Average 178 194 173 185 163 190 162 191
10 meters = approximately 33 feet; 20 meters = approximately 65 feet
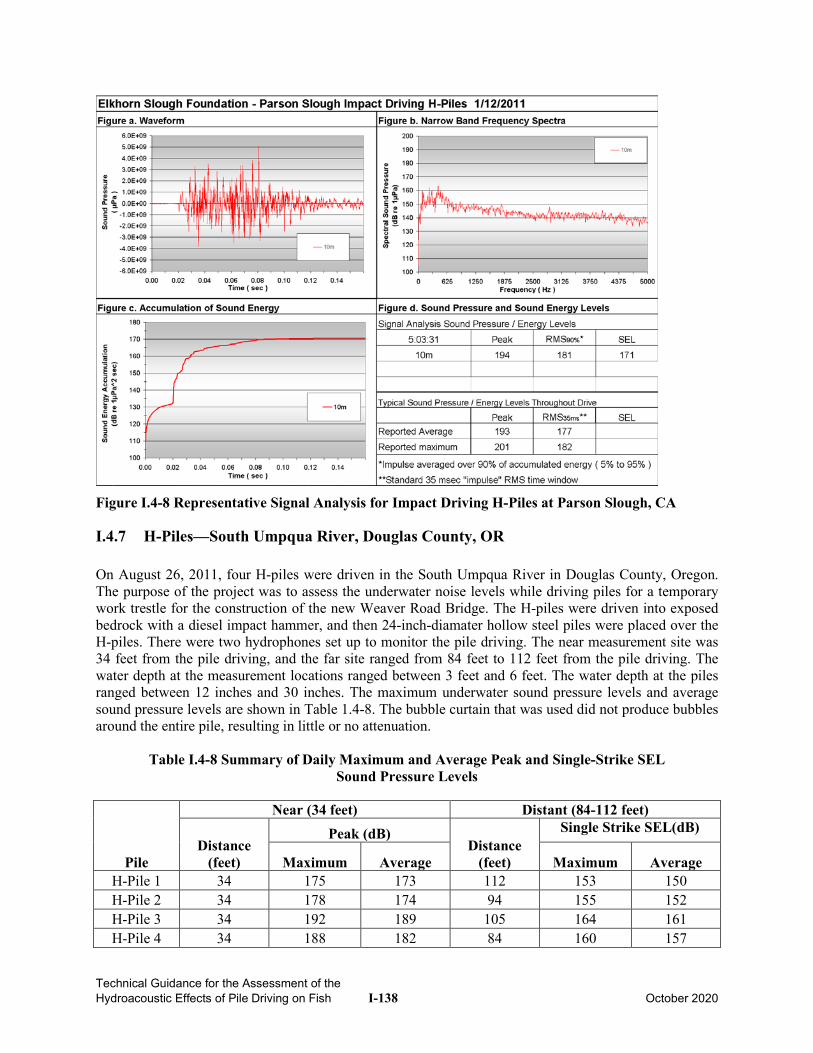
Technical Guidance for the Assessment of the Hydroacoustic Effects of Pile Driving on Fish I-138 October 2020
Figure I.4-8 Representative Signal Analysis for Impact Driving H-Piles at Parson Slough, CA
I.4.7 H-Piles—South Umpqua River, Douglas County, OR On August 26, 2011, four H-piles were driven in the South Umpqua River in Douglas County, Oregon. The purpose of the project was to assess the underwater noise levels while driving piles for a temporary work trestle for the construction of the new Weaver Road Bridge. The H-piles were driven into exposed bedrock with a diesel impact hammer, and then 24-inch-diamater hollow steel piles were placed over the H-piles. There were two hydrophones set up to monitor the pile driving. The near measurement site was 34 feet from the pile driving, and the far site ranged from 84 feet to 112 feet from the pile driving. The water depth at the measurement locations ranged between 3 feet and 6 feet. The water depth at the piles ranged between 12 inches and 30 inches. The maximum underwater sound pressure levels and average sound pressure levels are shown in Table 1.4-8. The bubble curtain that was used did not produce bubbles around the entire pile, resulting in little or no attenuation.
Table I.4-8 Summary of Daily Maximum and Average Peak and Single-Strike SEL Sound Pressure Levels
Pile
Near (34 feet) Distant (84-112 feet)
Distance (feet)
Peak (dB) Distance
(feet)
Single Strike SEL(dB)
Maximum Average Maximum Average H-Pile 1 34 175 173 112 153 150 H-Pile 2 34 178 174 94 155 152 H-Pile 3 34 192 189 105 164 161 H-Pile 4 34 188 182 84 160 157
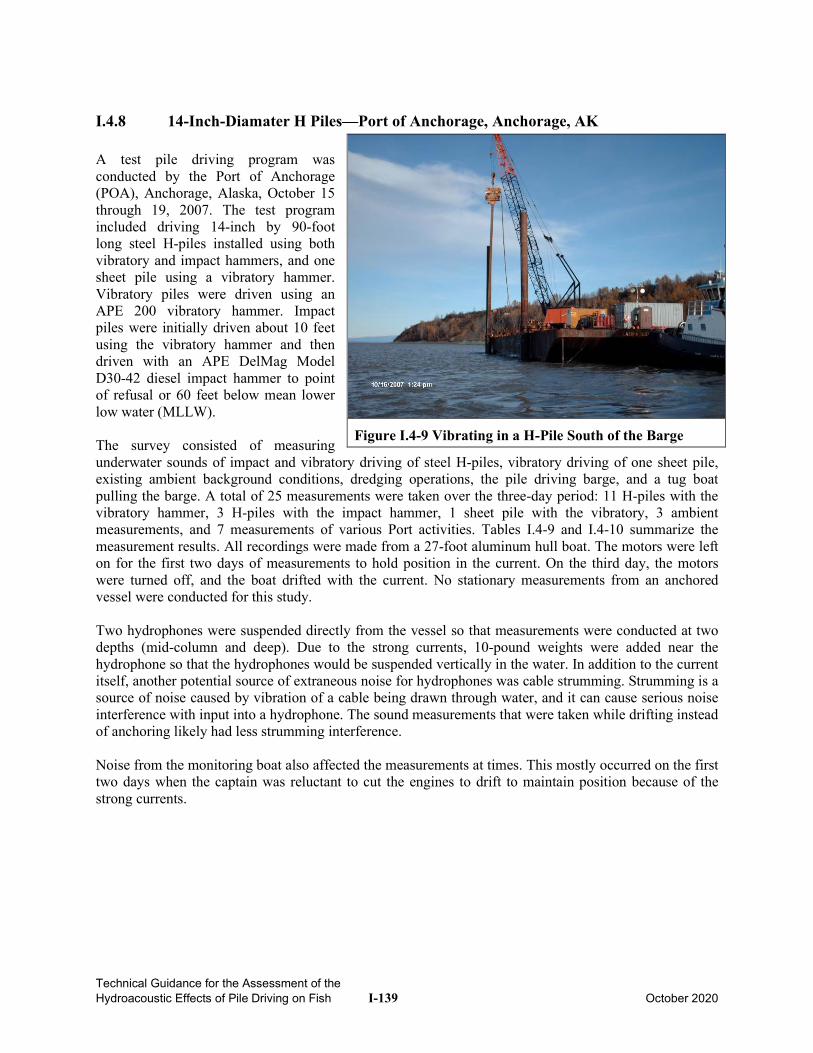
Technical Guidance for the Assessment of the Hydroacoustic Effects of Pile Driving on Fish I-139 October 2020
I.4.8 14-Inch-Diamater H Piles—Port of Anchorage, Anchorage, AK A test pile driving program was conducted by the Port of Anchorage (POA), Anchorage, Alaska, October 15 through 19, 2007. The test program included driving 14-inch by 90-foot long steel H-piles installed using both vibratory and impact hammers, and one sheet pile using a vibratory hammer. Vibratory piles were driven using an APE 200 vibratory hammer. Impact piles were initially driven about 10 feet using the vibratory hammer and then driven with an APE DelMag Model D30-42 diesel impact hammer to point of refusal or 60 feet below mean lower low water (MLLW). The survey consisted of measuring underwater sounds of impact and vibratory driving of steel H-piles, vibratory driving of one sheet pile, existing ambient background conditions, dredging operations, the pile driving barge, and a tug boat pulling the barge. A total of 25 measurements were taken over the three-day period: 11 H-piles with the vibratory hammer, 3 H-piles with the impact hammer, 1 sheet pile with the vibratory, 3 ambient measurements, and 7 measurements of various Port activities. Tables I.4-9 and I.4-10 summarize the measurement results. All recordings were made from a 27-foot aluminum hull boat. The motors were left on for the first two days of measurements to hold position in the current. On the third day, the motors were turned off, and the boat drifted with the current. No stationary measurements from an anchored vessel were conducted for this study. Two hydrophones were suspended directly from the vessel so that measurements were conducted at two depths (mid-column and deep). Due to the strong currents, 10-pound weights were added near the hydrophone so that the hydrophones would be suspended vertically in the water. In addition to the current itself, another potential source of extraneous noise for hydrophones was cable strumming. Strumming is a source of noise caused by vibration of a cable being drawn through water, and it can cause serious noise interference with input into a hydrophone. The sound measurements that were taken while drifting instead of anchoring likely had less strumming interference. Noise from the monitoring boat also affected the measurements at times. This mostly occurred on the first two days when the captain was reluctant to cut the engines to drift to maintain position because of the strong currents.
Figure I.4-9 Vibrating in a H-Pile South of the Barge
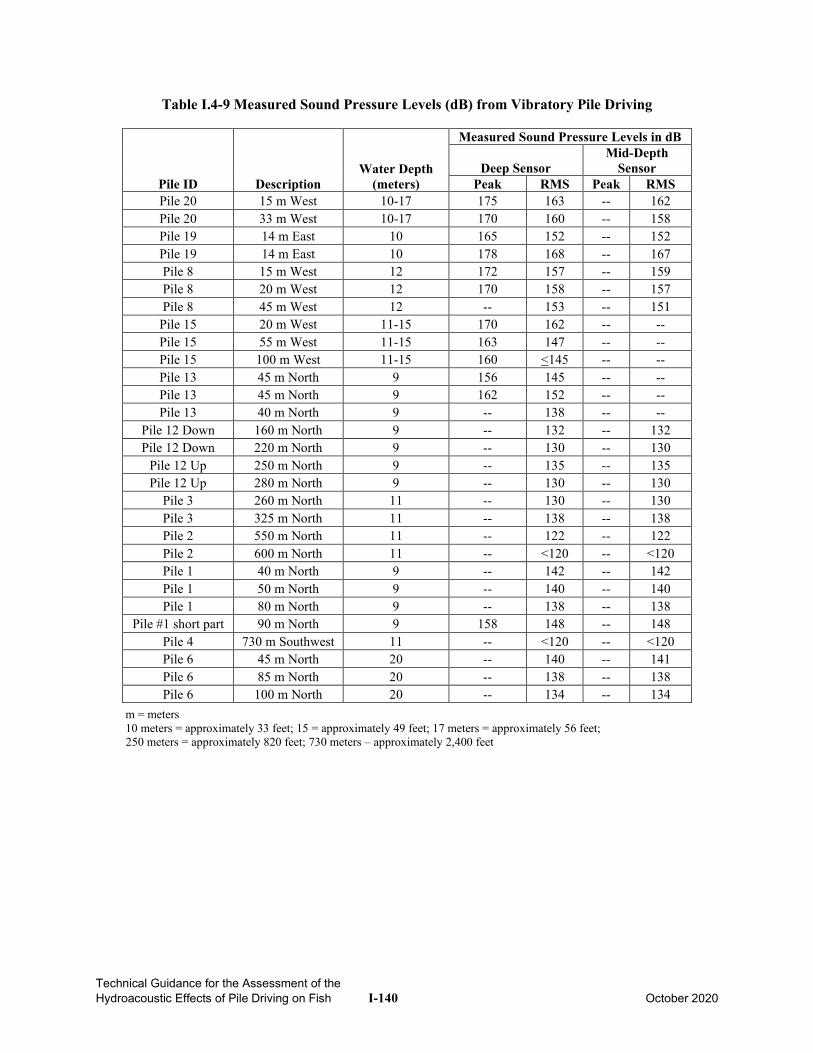
Technical Guidance for the Assessment of the Hydroacoustic Effects of Pile Driving on Fish I-140 October 2020
Table I.4-9 Measured Sound Pressure Levels (dB) from Vibratory Pile Driving
Pile ID Description Water Depth
(meters)
Measured Sound Pressure Levels in dB
Deep Sensor Mid-Depth
Sensor Peak RMS Peak RMS
Pile 20 15 m West 10-17 175 163 -- 162 Pile 20 33 m West 10-17 170 160 -- 158 Pile 19 14 m East 10 165 152 -- 152 Pile 19 14 m East 10 178 168 -- 167 Pile 8 15 m West 12 172 157 -- 159 Pile 8 20 m West 12 170 158 -- 157 Pile 8 45 m West 12 -- 153 -- 151
Pile 15 20 m West 11-15 170 162 -- -- Pile 15 55 m West 11-15 163 147 -- -- Pile 15 100 m West 11-15 160 <145 -- -- Pile 13 45 m North 9 156 145 -- -- Pile 13 45 m North 9 162 152 -- -- Pile 13 40 m North 9 -- 138 -- --
Pile 12 Down 160 m North 9 -- 132 -- 132 Pile 12 Down 220 m North 9 -- 130 -- 130
Pile 12 Up 250 m North 9 -- 135 -- 135 Pile 12 Up 280 m North 9 -- 130 -- 130
Pile 3 260 m North 11 -- 130 -- 130 Pile 3 325 m North 11 -- 138 -- 138 Pile 2 550 m North 11 -- 122 -- 122 Pile 2 600 m North 11 -- <120 -- <120 Pile 1 40 m North 9 -- 142 -- 142 Pile 1 50 m North 9 -- 140 -- 140 Pile 1 80 m North 9 -- 138 -- 138
Pile #1 short part 90 m North 9 158 148 -- 148 Pile 4 730 m Southwest 11 -- <120 -- <120 Pile 6 45 m North 20 -- 140 -- 141 Pile 6 85 m North 20 -- 138 -- 138 Pile 6 100 m North 20 -- 134 -- 134
m = meters 10 meters = approximately 33 feet; 15 = approximately 49 feet; 17 meters = approximately 56 feet; 250 meters = approximately 820 feet; 730 meters – approximately 2,400 feet
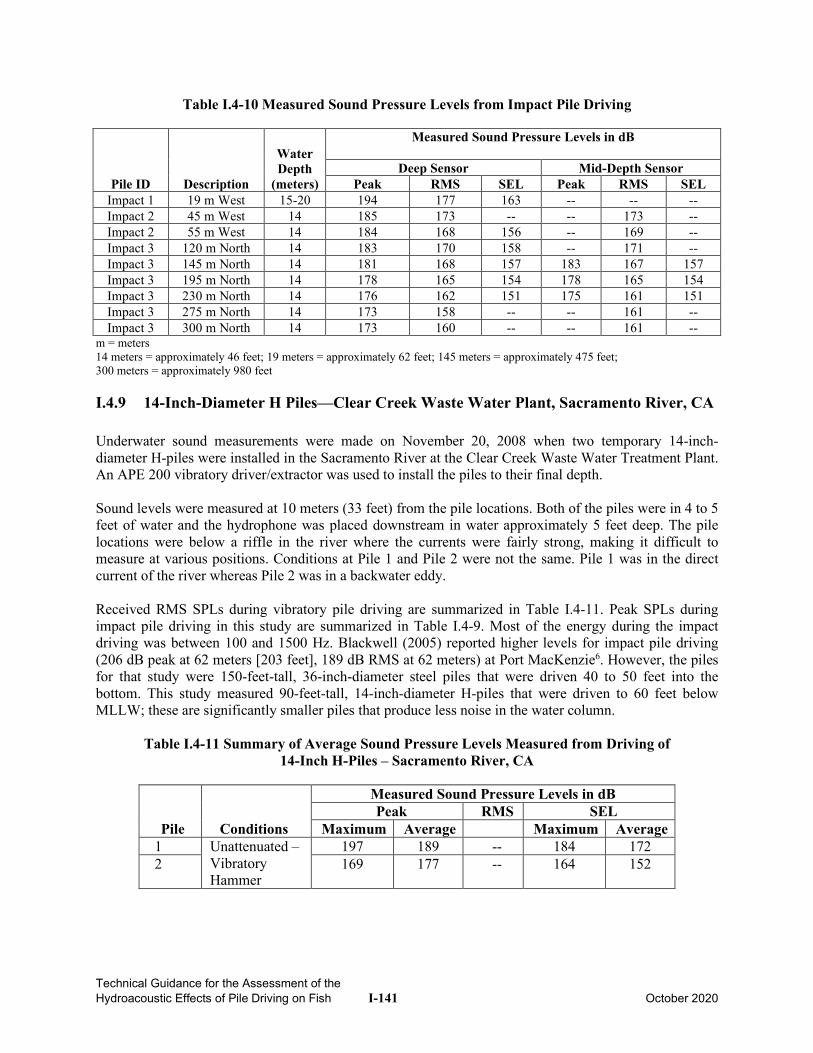
Technical Guidance for the Assessment of the Hydroacoustic Effects of Pile Driving on Fish I-141 October 2020
Table I.4-10 Measured Sound Pressure Levels from Impact Pile Driving
Pile ID Description
Water Depth
(meters)
Measured Sound Pressure Levels in dB
Deep Sensor Mid-Depth Sensor Peak RMS SEL Peak RMS SEL
Impact 1 19 m West 15-20 194 177 163 -- -- -- Impact 2 45 m West 14 185 173 -- -- 173 -- Impact 2 55 m West 14 184 168 156 -- 169 -- Impact 3 120 m North 14 183 170 158 -- 171 -- Impact 3 145 m North 14 181 168 157 183 167 157 Impact 3 195 m North 14 178 165 154 178 165 154 Impact 3 230 m North 14 176 162 151 175 161 151 Impact 3 275 m North 14 173 158 -- -- 161 -- Impact 3 300 m North 14 173 160 -- -- 161 --
m = meters 14 meters = approximately 46 feet; 19 meters = approximately 62 feet; 145 meters = approximately 475 feet; 300 meters = approximately 980 feet
I.4.9 14-Inch-Diameter H Piles—Clear Creek Waste Water Plant, Sacramento River, CA Underwater sound measurements were made on November 20, 2008 when two temporary 14-inch-diameter H-piles were installed in the Sacramento River at the Clear Creek Waste Water Treatment Plant. An APE 200 vibratory driver/extractor was used to install the piles to their final depth. Sound levels were measured at 10 meters (33 feet) from the pile locations. Both of the piles were in 4 to 5 feet of water and the hydrophone was placed downstream in water approximately 5 feet deep. The pile locations were below a riffle in the river where the currents were fairly strong, making it difficult to measure at various positions. Conditions at Pile 1 and Pile 2 were not the same. Pile 1 was in the direct current of the river whereas Pile 2 was in a backwater eddy. Received RMS SPLs during vibratory pile driving are summarized in Table I.4-11. Peak SPLs during impact pile driving in this study are summarized in Table I.4-9. Most of the energy during the impact driving was between 100 and 1500 Hz. Blackwell (2005) reported higher levels for impact pile driving (206 dB peak at 62 meters [203 feet], 189 dB RMS at 62 meters) at Port MacKenzie6. However, the piles for that study were 150-feet-tall, 36-inch-diameter steel piles that were driven 40 to 50 feet into the bottom. This study measured 90-feet-tall, 14-inch-diameter H-piles that were driven to 60 feet below MLLW; these are significantly smaller piles that produce less noise in the water column.
Table I.4-11 Summary of Average Sound Pressure Levels Measured from Driving of 14-Inch H-Piles – Sacramento River, CA
Pile Conditions
Measured Sound Pressure Levels in dB Peak RMS SEL
Maximum Average Maximum Average 1 Unattenuated –
Vibratory Hammer
197 189 -- 184 172 2 169 177 -- 164 152
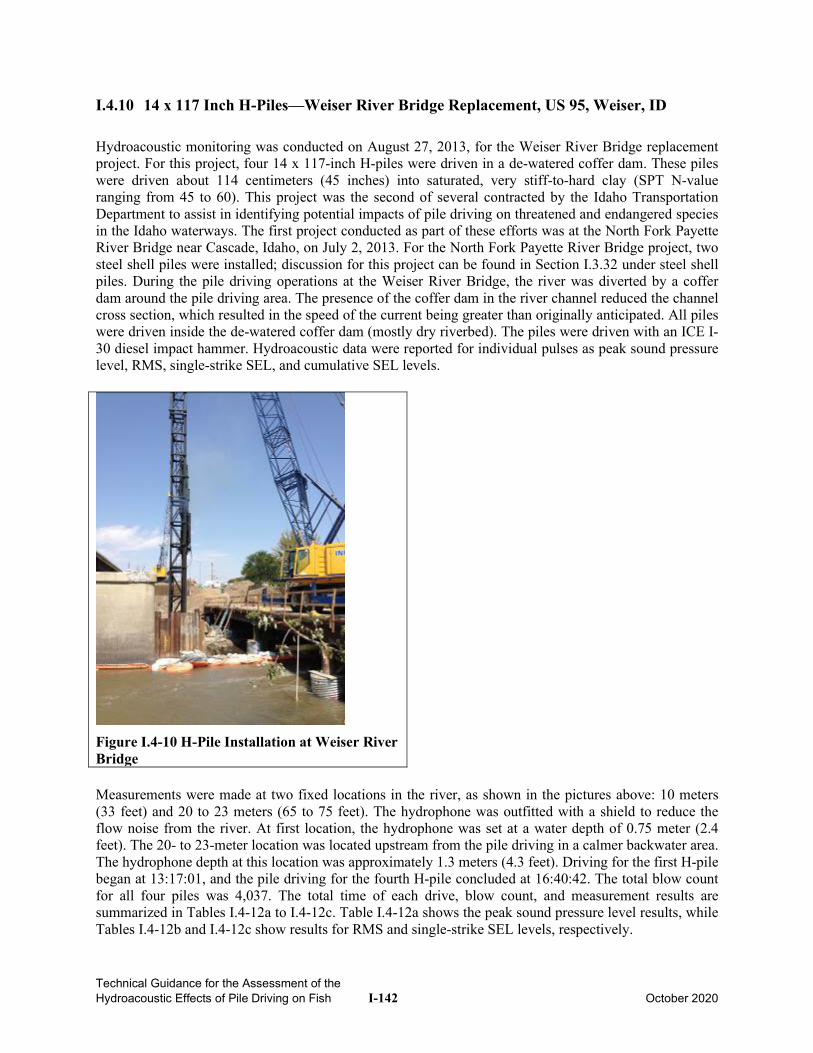
Technical Guidance for the Assessment of the Hydroacoustic Effects of Pile Driving on Fish I-142 October 2020
I.4.10 14 x 117 Inch H-Piles—Weiser River Bridge Replacement, US 95, Weiser, ID
Hydroacoustic monitoring was conducted on August 27, 2013, for the Weiser River Bridge replacement project. For this project, four 14 x 117-inch H-piles were driven in a de-watered coffer dam. These piles were driven about 114 centimeters (45 inches) into saturated, very stiff-to-hard clay (SPT N-value ranging from 45 to 60). This project was the second of several contracted by the Idaho Transportation Department to assist in identifying potential impacts of pile driving on threatened and endangered species in the Idaho waterways. The first project conducted as part of these efforts was at the North Fork Payette River Bridge near Cascade, Idaho, on July 2, 2013. For the North Fork Payette River Bridge project, two steel shell piles were installed; discussion for this project can be found in Section I.3.32 under steel shell piles. During the pile driving operations at the Weiser River Bridge, the river was diverted by a coffer dam around the pile driving area. The presence of the coffer dam in the river channel reduced the channel cross section, which resulted in the speed of the current being greater than originally anticipated. All piles were driven inside the de-watered coffer dam (mostly dry riverbed). The piles were driven with an ICE I-30 diesel impact hammer. Hydroacoustic data were reported for individual pulses as peak sound pressure level, RMS, single-strike SEL, and cumulative SEL levels.
Figure I.4-10 H-Pile Installation at Weiser River Bridge Measurements were made at two fixed locations in the river, as shown in the pictures above: 10 meters (33 feet) and 20 to 23 meters (65 to 75 feet). The hydrophone was outfitted with a shield to reduce the flow noise from the river. At first location, the hydrophone was set at a water depth of 0.75 meter (2.4 feet). The 20- to 23-meter location was located upstream from the pile driving in a calmer backwater area. The hydrophone depth at this location was approximately 1.3 meters (4.3 feet). Driving for the first H-pile began at 13:17:01, and the pile driving for the fourth H-pile concluded at 16:40:42. The total blow count for all four piles was 4,037. The total time of each drive, blow count, and measurement results are summarized in Tables I.4-12a to I.4-12c. Table I.4-12a shows the peak sound pressure level results, while Tables I.4-12b and I.4-12c show results for RMS and single-strike SEL levels, respectively.
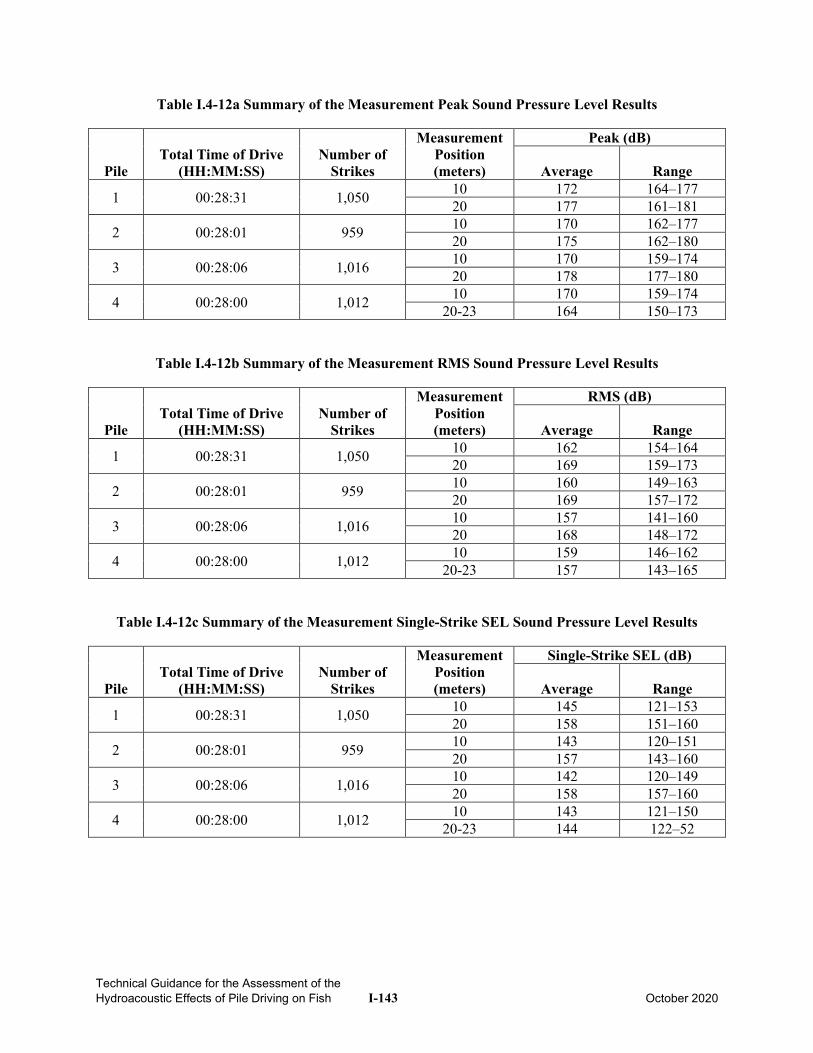
Technical Guidance for the Assessment of the Hydroacoustic Effects of Pile Driving on Fish I-143 October 2020
Table I.4-12a Summary of the Measurement Peak Sound Pressure Level Results
Pile Total Time of Drive
(HH:MM:SS) Number of
Strikes
Measurement Position (meters)
Peak (dB)
Average Range
1 00:28:31 1,050 10 172 164–177 20 177 161–181
2 00:28:01 959 10 170 162–177 20 175 162–180
3 00:28:06 1,016 10 170 159–174 20 178 177–180
4 00:28:00 1,012 10 170 159–174 20-23 164 150–173
Table I.4-12b Summary of the Measurement RMS Sound Pressure Level Results
Pile Total Time of Drive
(HH:MM:SS) Number of
Strikes
Measurement Position (meters)
RMS (dB)
Average Range
1 00:28:31 1,050 10 162 154–164 20 169 159–173
2 00:28:01 959 10 160 149–163 20 169 157–172
3 00:28:06 1,016 10 157 141–160 20 168 148–172
4 00:28:00 1,012 10 159 146–162 20-23 157 143–165
Table I.4-12c Summary of the Measurement Single-Strike SEL Sound Pressure Level Results
Pile Total Time of Drive
(HH:MM:SS) Number of
Strikes
Measurement Position (meters)
Single-Strike SEL (dB)
Average Range
1 00:28:31 1,050 10 145 121–153 20 158 151–160
2 00:28:01 959 10 143 120–151 20 157 143–160
3 00:28:06 1,016 10 142 120–149 20 158 157–160
4 00:28:00 1,012 10 143 121–150 20-23 144 122–52
Technical Guidance for the Assessment of the Hydroacoustic Effects of Pile Driving on Fish I-144 October 2020
I.4.11 H-Piles—Petaluma River Bridge, US 101, Petaluma, CA
Underwater sound measurements were conducted between August 1 and August 7, 2013, for the construction of the US 101 Bridge over Petaluma River in Petaluma, California. The Marin Sonoma Narrows HOV Widening Contract B2 Project was proposed to upgrade the existing US 101 four-lane expressway into a full-access 6-lane freeway. Thirty-one H-piles were driven both on land (in the mud flats during low tide) and in water. A hydraulic impact hammer was used to drive the piles, and hydroacoustic data were primarily reported for individual pulses as peak sound pressure level, RMS, single-strike SEL, and cumulative SEL. Measurements were made at fixed locations in a boat, ranging from 10 to 23 meters (33 to 75 feet) from the pile driving operation. When the distance between the hydrophone and the piles exceeded 10 meters, it was under low tide conditions and the piles were driven on land. One hydrophone was deployed at depths ranging from 1.2 to 2 meters (4 to 6.5 feet) below the water surface. On August 1, 2013, eight piles were driven. Pile driving began at 7:01:38, and concluded at 11:11:58. The first four H-piles were driven during low tide, so the piles were driven on land. The final four piles were driven in water approximately 0.9 meter (3 feet) deep. On August 2, 2013, five additional H-piles were driven, starting at 1:43:38 and ending at 13:59:06. Piles 1 through 4 were driven on land, while the fifth pile was driven in water approximately 0.9 meter (3 feet) deep. On August 3, 2013, thirteen H-piles were driven. The first pile driving event started at 7:56:11 and ended at 16:13:43. All piles driven in water were inside a de-watered attenuation casing, except the last pile of the day, which was driven within a coffer dam. On August 5, 2013, one H-pile was driven. Pile driving started at 14:49:33 and ended at 16:23:56. This pile was driven inside a de-watered attenuation casing within a coffer dam. On August 6 2013, two piles were driven. Pile driving started at 11:20:32, and ended at 15:18:05. Both piles were driven inside a de-watered attenuation casing within a coffer dam. On August 7, 2013, two piles were driven. Pile driving started at 11:47:29 and ended at 14:09:44. Both piles were driven inside a de-watered attenuation casing within a coffer dam. Hydroacoustic data were reported for individual pulses as peak sound pressure level, RMS, single-strike SEL, and cumulative SEL levels. All peak sound pressure level data is summarized in Table I.7-13, while Tables I.7-13 and I.7-13 summarize RMS and single-strike SEL data, respectively.
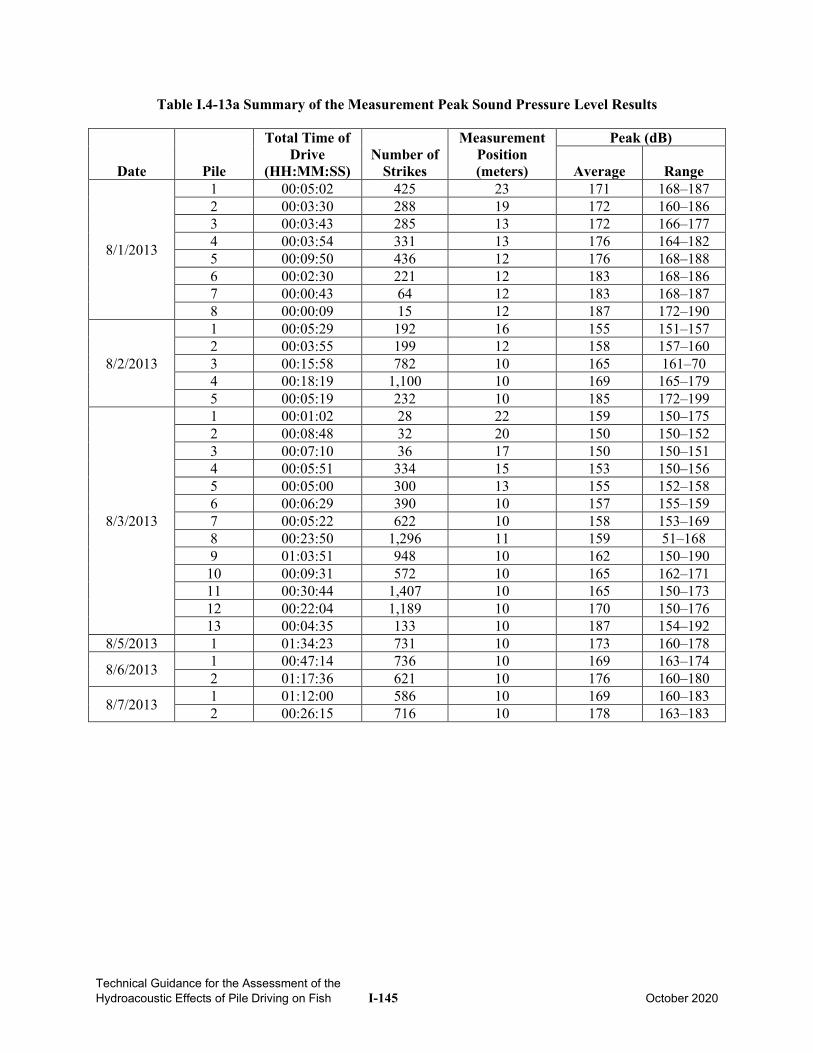
Technical Guidance for the Assessment of the Hydroacoustic Effects of Pile Driving on Fish I-145 October 2020
Table I.4-13a Summary of the Measurement Peak Sound Pressure Level Results
Date Pile
Total Time of Drive
(HH:MM:SS) Number of
Strikes
Measurement Position (meters)
Peak (dB)
Average Range
8/1/2013
1 00:05:02 425 23 171 168–187 2 00:03:30 288 19 172 160–186 3 00:03:43 285 13 172 166–177 4 00:03:54 331 13 176 164–182 5 00:09:50 436 12 176 168–188 6 00:02:30 221 12 183 168–186 7 00:00:43 64 12 183 168–187 8 00:00:09 15 12 187 172–190
8/2/2013
1 00:05:29 192 16 155 151–157 2 00:03:55 199 12 158 157–160 3 00:15:58 782 10 165 161–70 4 00:18:19 1,100 10 169 165–179 5 00:05:19 232 10 185 172–199
8/3/2013
1 00:01:02 28 22 159 150–175 2 00:08:48 32 20 150 150–152 3 00:07:10 36 17 150 150–151 4 00:05:51 334 15 153 150–156 5 00:05:00 300 13 155 152–158 6 00:06:29 390 10 157 155–159 7 00:05:22 622 10 158 153–169 8 00:23:50 1,296 11 159 51–168 9 01:03:51 948 10 162 150–190
10 00:09:31 572 10 165 162–171 11 00:30:44 1,407 10 165 150–173 12 00:22:04 1,189 10 170 150–176 13 00:04:35 133 10 187 154–192
8/5/2013 1 01:34:23 731 10 173 160–178
8/6/2013 1 00:47:14 736 10 169 163–174 2 01:17:36 621 10 176 160–180
8/7/2013 1 01:12:00 586 10 169 160–183 2 00:26:15 716 10 178 163–183
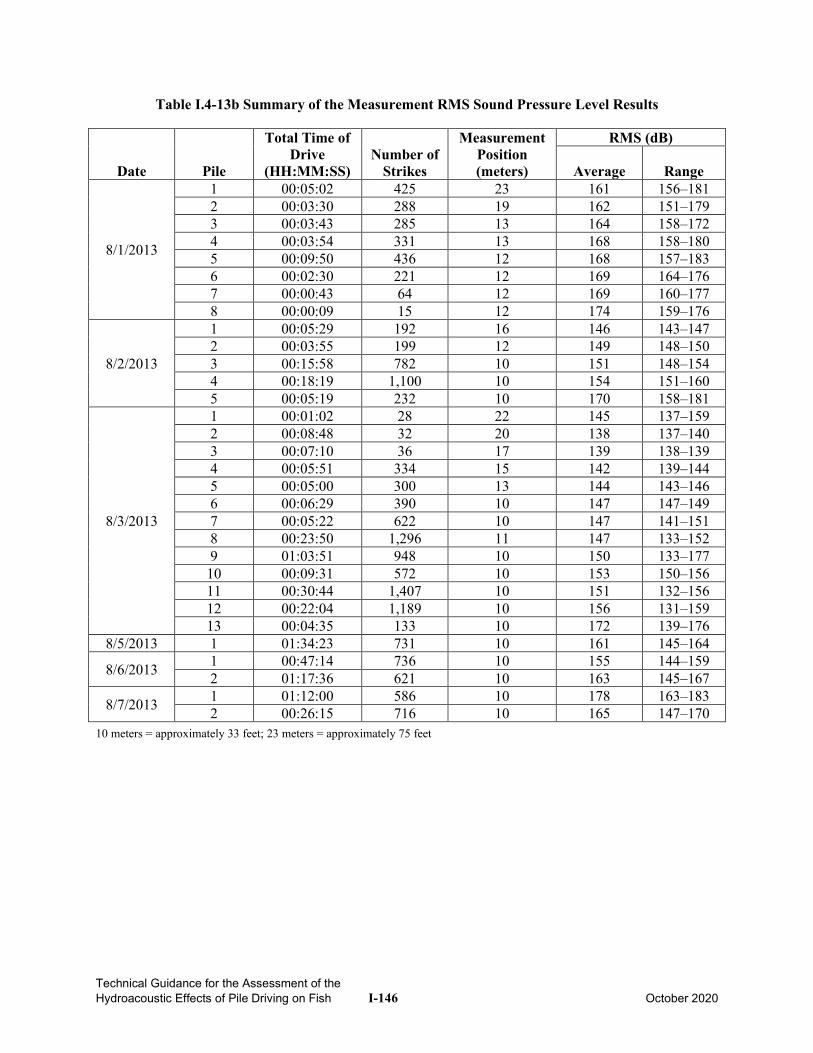
Technical Guidance for the Assessment of the Hydroacoustic Effects of Pile Driving on Fish I-146 October 2020
Table I.4-13b Summary of the Measurement RMS Sound Pressure Level Results
Date Pile
Total Time of Drive
(HH:MM:SS) Number of
Strikes
Measurement Position (meters)
RMS (dB)
Average Range
8/1/2013
1 00:05:02 425 23 161 156–181 2 00:03:30 288 19 162 151–179 3 00:03:43 285 13 164 158–172 4 00:03:54 331 13 168 158–180 5 00:09:50 436 12 168 157–183 6 00:02:30 221 12 169 164–176 7 00:00:43 64 12 169 160–177 8 00:00:09 15 12 174 159–176
8/2/2013
1 00:05:29 192 16 146 143–147 2 00:03:55 199 12 149 148–150 3 00:15:58 782 10 151 148–154 4 00:18:19 1,100 10 154 151–160 5 00:05:19 232 10 170 158–181
8/3/2013
1 00:01:02 28 22 145 137–159 2 00:08:48 32 20 138 137–140 3 00:07:10 36 17 139 138–139 4 00:05:51 334 15 142 139–144 5 00:05:00 300 13 144 143–146 6 00:06:29 390 10 147 147–149 7 00:05:22 622 10 147 141–151 8 00:23:50 1,296 11 147 133–152 9 01:03:51 948 10 150 133–177
10 00:09:31 572 10 153 150–156 11 00:30:44 1,407 10 151 132–156 12 00:22:04 1,189 10 156 131–159 13 00:04:35 133 10 172 139–176
8/5/2013 1 01:34:23 731 10 161 145–164
8/6/2013 1 00:47:14 736 10 155 144–159 2 01:17:36 621 10 163 145–167
8/7/2013 1 01:12:00 586 10 178 163–183 2 00:26:15 716 10 165 147–170
10 meters = approximately 33 feet; 23 meters = approximately 75 feet
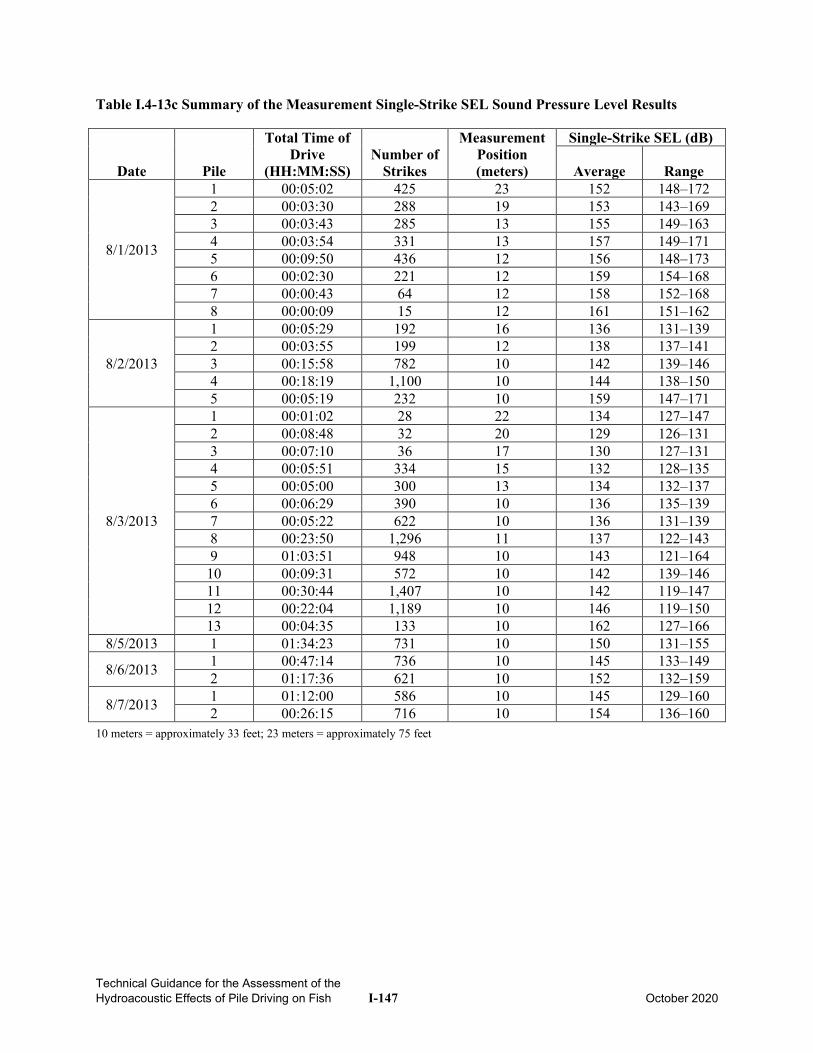
Technical Guidance for the Assessment of the Hydroacoustic Effects of Pile Driving on Fish I-147 October 2020
Table I.4-13c Summary of the Measurement Single-Strike SEL Sound Pressure Level Results
Date Pile
Total Time of Drive
(HH:MM:SS) Number of
Strikes
Measurement Position (meters)
Single-Strike SEL (dB)
Average Range
8/1/2013
1 00:05:02 425 23 152 148–172 2 00:03:30 288 19 153 143–169 3 00:03:43 285 13 155 149–163 4 00:03:54 331 13 157 149–171 5 00:09:50 436 12 156 148–173 6 00:02:30 221 12 159 154–168 7 00:00:43 64 12 158 152–168 8 00:00:09 15 12 161 151–162
8/2/2013
1 00:05:29 192 16 136 131–139 2 00:03:55 199 12 138 137–141 3 00:15:58 782 10 142 139–146 4 00:18:19 1,100 10 144 138–150 5 00:05:19 232 10 159 147–171
8/3/2013
1 00:01:02 28 22 134 127–147 2 00:08:48 32 20 129 126–131 3 00:07:10 36 17 130 127–131 4 00:05:51 334 15 132 128–135 5 00:05:00 300 13 134 132–137 6 00:06:29 390 10 136 135–139 7 00:05:22 622 10 136 131–139 8 00:23:50 1,296 11 137 122–143 9 01:03:51 948 10 143 121–164
10 00:09:31 572 10 142 139–146 11 00:30:44 1,407 10 142 119–147 12 00:22:04 1,189 10 146 119–150 13 00:04:35 133 10 162 127–166
8/5/2013 1 01:34:23 731 10 150 131–155
8/6/2013 1 00:47:14 736 10 145 133–149 2 01:17:36 621 10 152 132–159
8/7/2013 1 01:12:00 586 10 145 129–160 2 00:26:15 716 10 154 136–160
10 meters = approximately 33 feet; 23 meters = approximately 75 feet
Technical Guidance for the Assessment of the Hydroacoustic Effects of Pile Driving on Fish I-148 October 2020
I.4.12 References
1. Blackwell, Susanna B. Underwater measurements of pile-driving sounds during the Port MacKenzie dock modifications, 13-16 August 2004. Rep. from Greeneridge Sciences, Inc., Goleta, CA, and LGL Alaska Research Associates, Inc., Anchorage, AK, in association with HDR Alaska, Inc., Anchorage, AK, for Knik Arm Bridge and Toll Authority, Anchorage, AK, Department of Transportation and Public Facilities, Anchorage, AK, and Federal Highway Administration, Juneau, AK. 33 p.
2. Blackwell, S.B. 2004. Underwater Measurements of Pile Driving Sound during the Port
MacKenzie Dock Modifications, 13-16 August 2004. Rep. from Greeneridge Sciences, Inc., Goleta, CA, and LGL Alaska Research Associates, Inc., Anchorage, AK, in association with HDR Alaska, Inc., Anchorage, AK, for Knik Arm Bridge and Toll Authority, Anchorage, AK, Department of Transportation and Public Facilities, Anchorage, AK, and Federal Highway Administration, Juneau, AK. 33 p.
3. Illingworth & Rodkin, Inc. 2003. Underwater Sound Levels Associated with Pile Driving Activities Associated with Construction of the Noyo Bridge. Report to Caltrans dated March 18 and revised April 9, 2003.
4. Illingworth & Rodkin, Inc. 2003. Letter to Justin Baxter (Jeff Luchetti Construction) reporting
Underwater Sound Measurement Results for Seagate Property, San Rafael Canal Construction Pile Driving. April 4, 2003.
5. Illingworth & Rodkin, Inc. 2003. Letter to Justin Baxter (Jeff Luchetti Construction) reporting
Underwater Sound Measurement Results for Seagate Property, San Rafael Canal Construction Pile Driving. April 9, 2003.
6. Illingworth & Rodkin, Inc. 2005. Letter to Bill Chase (Ballena Isle Marina) reporting Results of
Underwater Sound Measurements for H-Type Piles at Ballena Isle Marina Breakwater Repair. May 13, 2005.
7. Illingworth & Rodkin, Inc. 2006. Results of Underwater Sound Measurements for the Driving of “H” Piles – Interstate 80 Platte River Bridges. Prepared for the Nebraska Department of Roads. March 24.
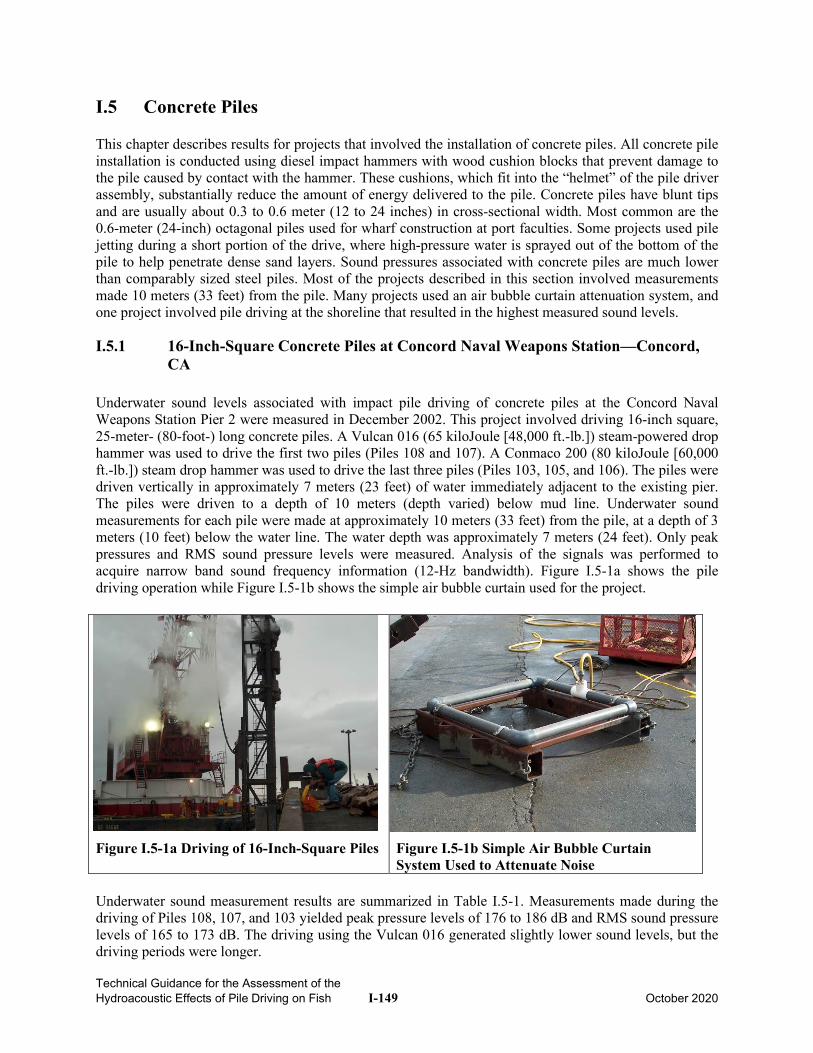
Technical Guidance for the Assessment of the Hydroacoustic Effects of Pile Driving on Fish I-149 October 2020
I.5 Concrete Piles This chapter describes results for projects that involved the installation of concrete piles. All concrete pile installation is conducted using diesel impact hammers with wood cushion blocks that prevent damage to the pile caused by contact with the hammer. These cushions, which fit into the “helmet” of the pile driver assembly, substantially reduce the amount of energy delivered to the pile. Concrete piles have blunt tips and are usually about 0.3 to 0.6 meter (12 to 24 inches) in cross-sectional width. Most common are the 0.6-meter (24-inch) octagonal piles used for wharf construction at port faculties. Some projects used pile jetting during a short portion of the drive, where high-pressure water is sprayed out of the bottom of the pile to help penetrate dense sand layers. Sound pressures associated with concrete piles are much lower than comparably sized steel piles. Most of the projects described in this section involved measurements made 10 meters (33 feet) from the pile. Many projects used an air bubble curtain attenuation system, and one project involved pile driving at the shoreline that resulted in the highest measured sound levels.
I.5.1 16-Inch-Square Concrete Piles at Concord Naval Weapons Station—Concord, CA
Underwater sound levels associated with impact pile driving of concrete piles at the Concord Naval Weapons Station Pier 2 were measured in December 2002. This project involved driving 16-inch square, 25-meter- (80-foot-) long concrete piles. A Vulcan 016 (65 kiloJoule [48,000 ft.-lb.]) steam-powered drop hammer was used to drive the first two piles (Piles 108 and 107). A Conmaco 200 (80 kiloJoule [60,000 ft.-lb.]) steam drop hammer was used to drive the last three piles (Piles 103, 105, and 106). The piles were driven vertically in approximately 7 meters (23 feet) of water immediately adjacent to the existing pier. The piles were driven to a depth of 10 meters (depth varied) below mud line. Underwater sound measurements for each pile were made at approximately 10 meters (33 feet) from the pile, at a depth of 3 meters (10 feet) below the water line. The water depth was approximately 7 meters (24 feet). Only peak pressures and RMS sound pressure levels were measured. Analysis of the signals was performed to acquire narrow band sound frequency information (12-Hz bandwidth). Figure I.5-1a shows the pile driving operation while Figure I.5-1b shows the simple air bubble curtain used for the project.
Figure I.5-1a Driving of 16-Inch-Square Piles
Figure I.5-1b Simple Air Bubble Curtain System Used to Attenuate Noise
Underwater sound measurement results are summarized in Table I.5-1. Measurements made during the driving of Piles 108, 107, and 103 yielded peak pressure levels of 176 to 186 dB and RMS sound pressure levels of 165 to 173 dB. The driving using the Vulcan 016 generated slightly lower sound levels, but the driving periods were longer.
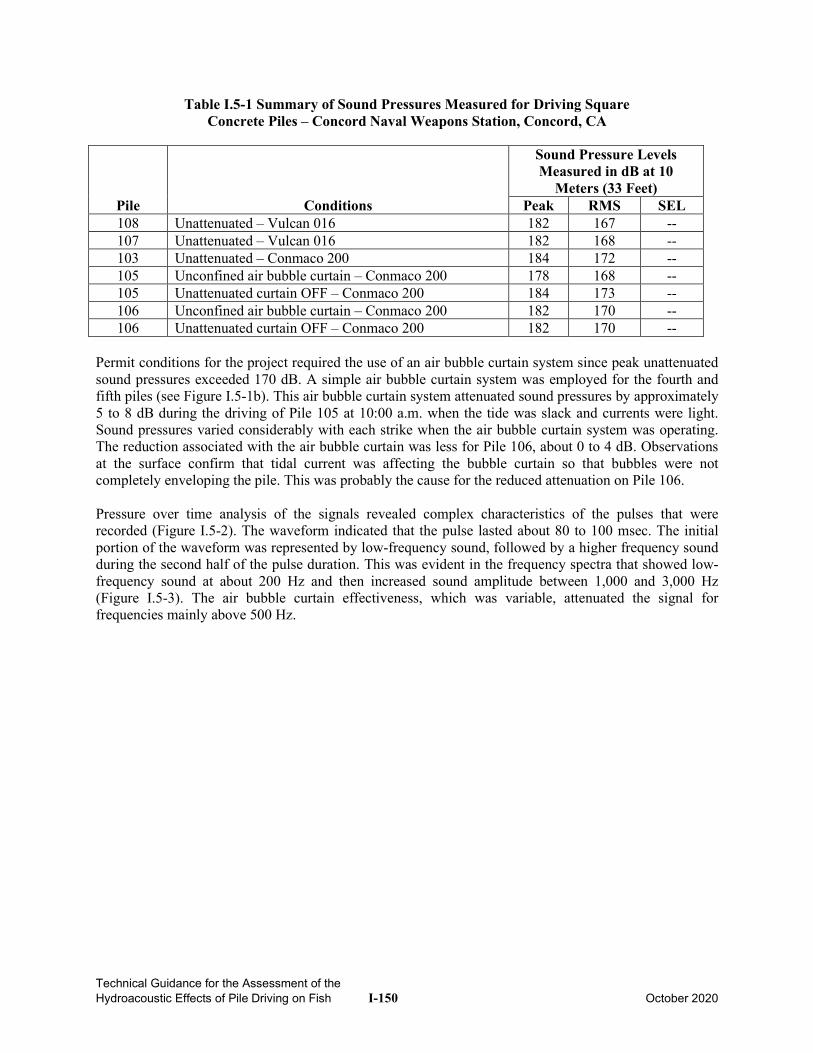
Technical Guidance for the Assessment of the Hydroacoustic Effects of Pile Driving on Fish I-150 October 2020
Table I.5-1 Summary of Sound Pressures Measured for Driving Square Concrete Piles – Concord Naval Weapons Station, Concord, CA
Pile Conditions
Sound Pressure Levels Measured in dB at 10
Meters (33 Feet) Peak RMS SEL
108 Unattenuated – Vulcan 016 182 167 -- 107 Unattenuated – Vulcan 016 182 168 -- 103 Unattenuated – Conmaco 200 184 172 -- 105 Unconfined air bubble curtain – Conmaco 200 178 168 -- 105 Unattenuated curtain OFF – Conmaco 200 184 173 -- 106 Unconfined air bubble curtain – Conmaco 200 182 170 -- 106 Unattenuated curtain OFF – Conmaco 200 182 170 --
Permit conditions for the project required the use of an air bubble curtain system since peak unattenuated sound pressures exceeded 170 dB. A simple air bubble curtain system was employed for the fourth and fifth piles (see Figure I.5-1b). This air bubble curtain system attenuated sound pressures by approximately 5 to 8 dB during the driving of Pile 105 at 10:00 a.m. when the tide was slack and currents were light. Sound pressures varied considerably with each strike when the air bubble curtain system was operating. The reduction associated with the air bubble curtain was less for Pile 106, about 0 to 4 dB. Observations at the surface confirm that tidal current was affecting the bubble curtain so that bubbles were not completely enveloping the pile. This was probably the cause for the reduced attenuation on Pile 106. Pressure over time analysis of the signals revealed complex characteristics of the pulses that were recorded (Figure I.5-2). The waveform indicated that the pulse lasted about 80 to 100 msec. The initial portion of the waveform was represented by low-frequency sound, followed by a higher frequency sound during the second half of the pulse duration. This was evident in the frequency spectra that showed low-frequency sound at about 200 Hz and then increased sound amplitude between 1,000 and 3,000 Hz (Figure I.5-3). The air bubble curtain effectiveness, which was variable, attenuated the signal for frequencies mainly above 500 Hz.
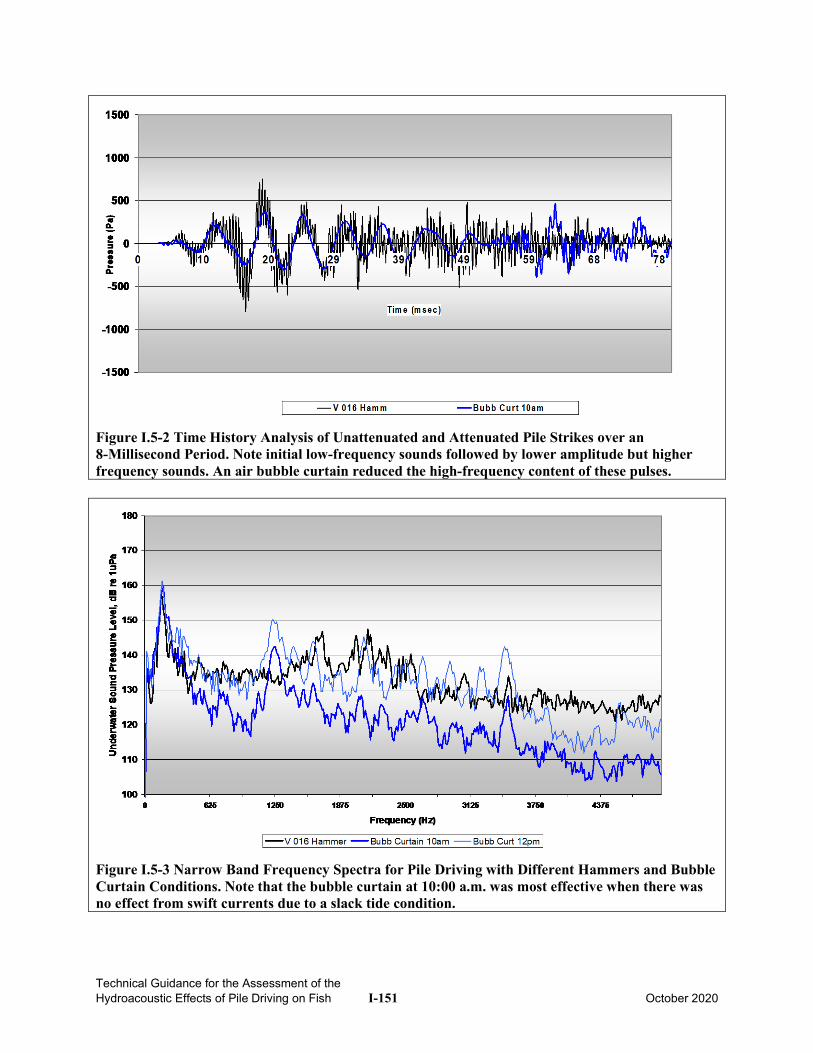
Technical Guidance for the Assessment of the Hydroacoustic Effects of Pile Driving on Fish I-151 October 2020
Figure I.5-2 Time History Analysis of Unattenuated and Attenuated Pile Strikes over an 8-Millisecond Period. Note initial low-frequency sounds followed by lower amplitude but higher frequency sounds. An air bubble curtain reduced the high-frequency content of these pulses.
Figure I.5-3 Narrow Band Frequency Spectra for Pile Driving with Different Hammers and Bubble Curtain Conditions. Note that the bubble curtain at 10:00 a.m. was most effective when there was no effect from swift currents due to a slack tide condition.
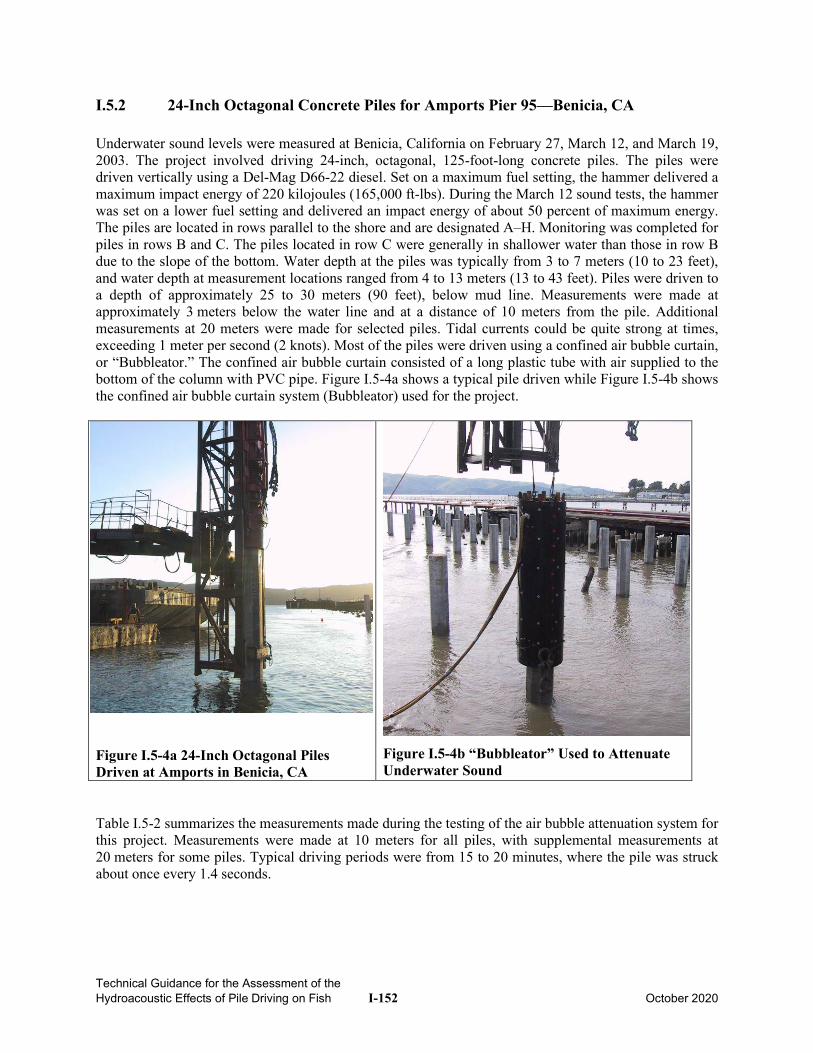
Technical Guidance for the Assessment of the Hydroacoustic Effects of Pile Driving on Fish I-152 October 2020
I.5.2 24-Inch Octagonal Concrete Piles for Amports Pier 95—Benicia, CA Underwater sound levels were measured at Benicia, California on February 27, March 12, and March 19, 2003. The project involved driving 24-inch, octagonal, 125-foot-long concrete piles. The piles were driven vertically using a Del-Mag D66-22 diesel. Set on a maximum fuel setting, the hammer delivered a maximum impact energy of 220 kilojoules (165,000 ft-lbs). During the March 12 sound tests, the hammer was set on a lower fuel setting and delivered an impact energy of about 50 percent of maximum energy. The piles are located in rows parallel to the shore and are designated A–H. Monitoring was completed for piles in rows B and C. The piles located in row C were generally in shallower water than those in row B due to the slope of the bottom. Water depth at the piles was typically from 3 to 7 meters (10 to 23 feet), and water depth at measurement locations ranged from 4 to 13 meters (13 to 43 feet). Piles were driven to a depth of approximately 25 to 30 meters (90 feet), below mud line. Measurements were made at approximately 3 meters below the water line and at a distance of 10 meters from the pile. Additional measurements at 20 meters were made for selected piles. Tidal currents could be quite strong at times, exceeding 1 meter per second (2 knots). Most of the piles were driven using a confined air bubble curtain, or “Bubbleator.” The confined air bubble curtain consisted of a long plastic tube with air supplied to the bottom of the column with PVC pipe. Figure I.5-4a shows a typical pile driven while Figure I.5-4b shows the confined air bubble curtain system (Bubbleator) used for the project.
Figure I.5-4a 24-Inch Octagonal Piles Driven at Amports in Benicia, CA
Figure I.5-4b “Bubbleator” Used to Attenuate Underwater Sound
Table I.5-2 summarizes the measurements made during the testing of the air bubble attenuation system for this project. Measurements were made at 10 meters for all piles, with supplemental measurements at 20 meters for some piles. Typical driving periods were from 15 to 20 minutes, where the pile was struck about once every 1.4 seconds.
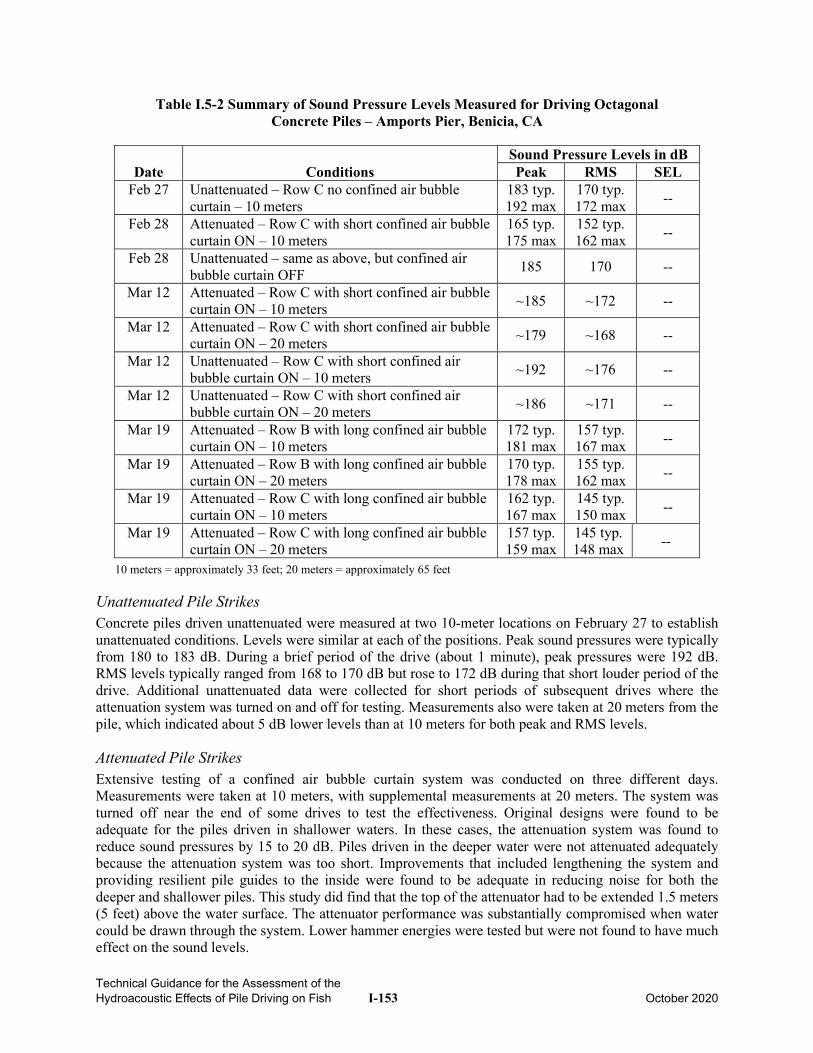
Technical Guidance for the Assessment of the Hydroacoustic Effects of Pile Driving on Fish I-153 October 2020
Table I.5-2 Summary of Sound Pressure Levels Measured for Driving Octagonal Concrete Piles – Amports Pier, Benicia, CA
Date Conditions Sound Pressure Levels in dB Peak RMS SEL
Feb 27 Unattenuated – Row C no confined air bubble curtain – 10 meters
183 typ. 192 max
170 typ. 172 max --
Feb 28 Attenuated – Row C with short confined air bubble curtain ON – 10 meters
165 typ. 175 max
152 typ. 162 max --
Feb 28 Unattenuated – same as above, but confined air bubble curtain OFF 185 170 --
Mar 12 Attenuated – Row C with short confined air bubble curtain ON – 10 meters ~185 ~172 --
Mar 12 Attenuated – Row C with short confined air bubble curtain ON – 20 meters ~179 ~168 --
Mar 12 Unattenuated – Row C with short confined air bubble curtain ON – 10 meters ~192 ~176 --
Mar 12 Unattenuated – Row C with short confined air bubble curtain ON – 20 meters ~186 ~171 --
Mar 19 Attenuated – Row B with long confined air bubble curtain ON – 10 meters
172 typ. 181 max
157 typ. 167 max --
Mar 19 Attenuated – Row B with long confined air bubble curtain ON – 20 meters
170 typ. 178 max
155 typ. 162 max --
Mar 19 Attenuated – Row C with long confined air bubble curtain ON – 10 meters
162 typ. 167 max
145 typ. 150 max --
Mar 19 Attenuated – Row C with long confined air bubble curtain ON – 20 meters
157 typ. 159 max
145 typ. 148 max --
10 meters = approximately 33 feet; 20 meters = approximately 65 feet
Unattenuated Pile Strikes Concrete piles driven unattenuated were measured at two 10-meter locations on February 27 to establish unattenuated conditions. Levels were similar at each of the positions. Peak sound pressures were typically from 180 to 183 dB. During a brief period of the drive (about 1 minute), peak pressures were 192 dB. RMS levels typically ranged from 168 to 170 dB but rose to 172 dB during that short louder period of the drive. Additional unattenuated data were collected for short periods of subsequent drives where the attenuation system was turned on and off for testing. Measurements also were taken at 20 meters from the pile, which indicated about 5 dB lower levels than at 10 meters for both peak and RMS levels.
Attenuated Pile Strikes Extensive testing of a confined air bubble curtain system was conducted on three different days. Measurements were taken at 10 meters, with supplemental measurements at 20 meters. The system was turned off near the end of some drives to test the effectiveness. Original designs were found to be adequate for the piles driven in shallower waters. In these cases, the attenuation system was found to reduce sound pressures by 15 to 20 dB. Piles driven in the deeper water were not attenuated adequately because the attenuation system was too short. Improvements that included lengthening the system and providing resilient pile guides to the inside were found to be adequate in reducing noise for both the deeper and shallower piles. This study did find that the top of the attenuator had to be extended 1.5 meters (5 feet) above the water surface. The attenuator performance was substantially compromised when water could be drawn through the system. Lower hammer energies were tested but were not found to have much effect on the sound levels.
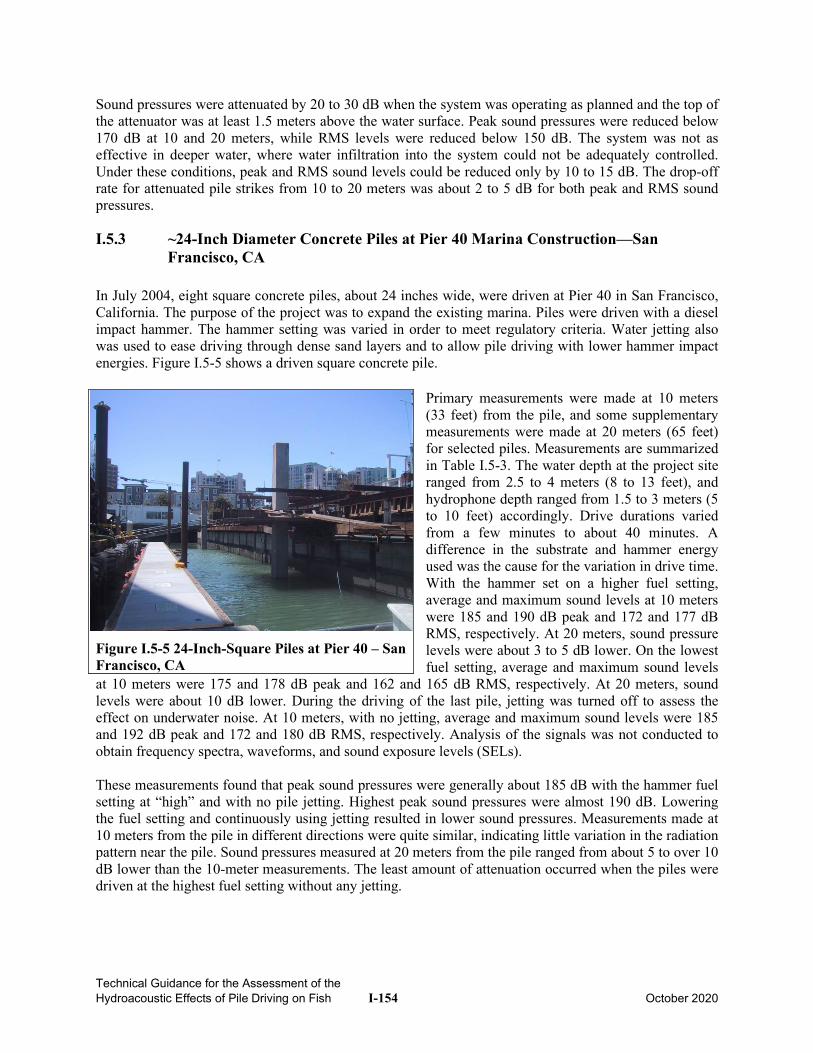
Technical Guidance for the Assessment of the Hydroacoustic Effects of Pile Driving on Fish I-154 October 2020
Sound pressures were attenuated by 20 to 30 dB when the system was operating as planned and the top of the attenuator was at least 1.5 meters above the water surface. Peak sound pressures were reduced below 170 dB at 10 and 20 meters, while RMS levels were reduced below 150 dB. The system was not as effective in deeper water, where water infiltration into the system could not be adequately controlled. Under these conditions, peak and RMS sound levels could be reduced only by 10 to 15 dB. The drop-off rate for attenuated pile strikes from 10 to 20 meters was about 2 to 5 dB for both peak and RMS sound pressures.
I.5.3 ~24-Inch Diameter Concrete Piles at Pier 40 Marina Construction—San Francisco, CA
In July 2004, eight square concrete piles, about 24 inches wide, were driven at Pier 40 in San Francisco, California. The purpose of the project was to expand the existing marina. Piles were driven with a diesel impact hammer. The hammer setting was varied in order to meet regulatory criteria. Water jetting also was used to ease driving through dense sand layers and to allow pile driving with lower hammer impact energies. Figure I.5-5 shows a driven square concrete pile.
Primary measurements were made at 10 meters (33 feet) from the pile, and some supplementary measurements were made at 20 meters (65 feet) for selected piles. Measurements are summarized in Table I.5-3. The water depth at the project site ranged from 2.5 to 4 meters (8 to 13 feet), and hydrophone depth ranged from 1.5 to 3 meters (5 to 10 feet) accordingly. Drive durations varied from a few minutes to about 40 minutes. A difference in the substrate and hammer energy used was the cause for the variation in drive time. With the hammer set on a higher fuel setting, average and maximum sound levels at 10 meters were 185 and 190 dB peak and 172 and 177 dB RMS, respectively. At 20 meters, sound pressure levels were about 3 to 5 dB lower. On the lowest fuel setting, average and maximum sound levels
at 10 meters were 175 and 178 dB peak and 162 and 165 dB RMS, respectively. At 20 meters, sound levels were about 10 dB lower. During the driving of the last pile, jetting was turned off to assess the effect on underwater noise. At 10 meters, with no jetting, average and maximum sound levels were 185 and 192 dB peak and 172 and 180 dB RMS, respectively. Analysis of the signals was not conducted to obtain frequency spectra, waveforms, and sound exposure levels (SELs). These measurements found that peak sound pressures were generally about 185 dB with the hammer fuel setting at “high” and with no pile jetting. Highest peak sound pressures were almost 190 dB. Lowering the fuel setting and continuously using jetting resulted in lower sound pressures. Measurements made at 10 meters from the pile in different directions were quite similar, indicating little variation in the radiation pattern near the pile. Sound pressures measured at 20 meters from the pile ranged from about 5 to over 10 dB lower than the 10-meter measurements. The least amount of attenuation occurred when the piles were driven at the highest fuel setting without any jetting.
Figure I.5-5 24-Inch-Square Piles at Pier 40 – San Francisco, CA
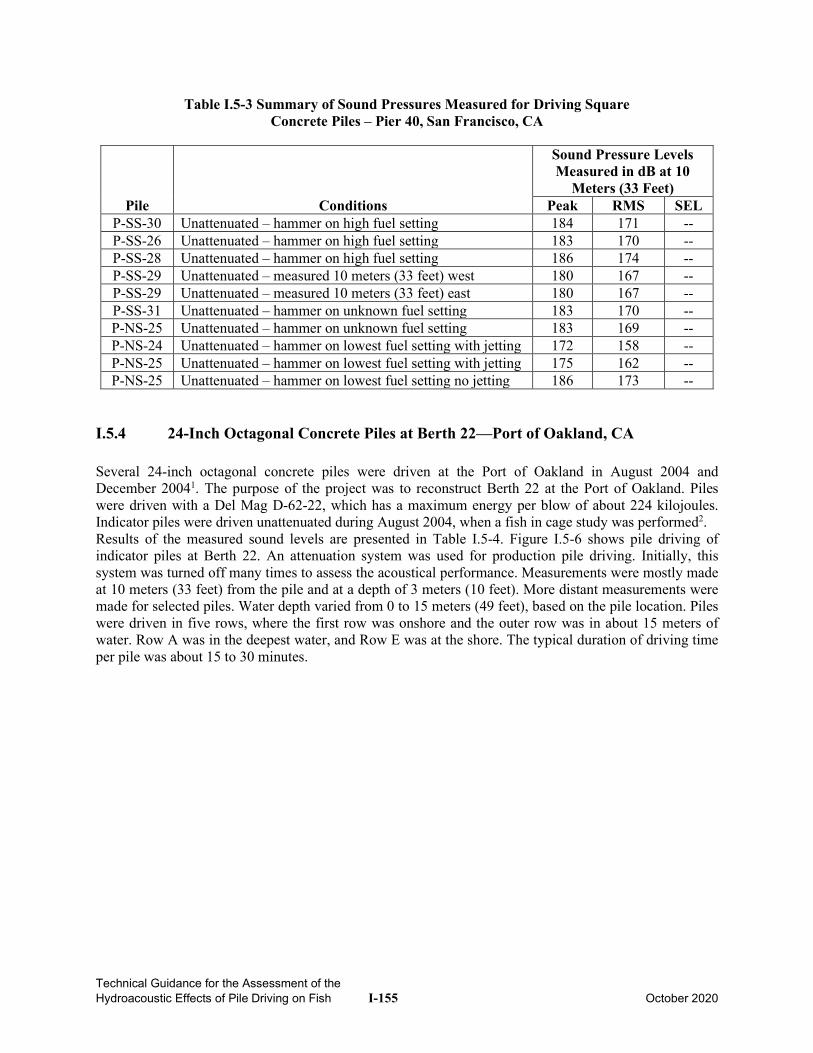
Technical Guidance for the Assessment of the Hydroacoustic Effects of Pile Driving on Fish I-155 October 2020
Table I.5-3 Summary of Sound Pressures Measured for Driving Square Concrete Piles – Pier 40, San Francisco, CA
Pile Conditions
Sound Pressure Levels Measured in dB at 10
Meters (33 Feet) Peak RMS SEL
P-SS-30 Unattenuated – hammer on high fuel setting 184 171 -- P-SS-26 Unattenuated – hammer on high fuel setting 183 170 -- P-SS-28 Unattenuated – hammer on high fuel setting 186 174 -- P-SS-29 Unattenuated – measured 10 meters (33 feet) west 180 167 -- P-SS-29 Unattenuated – measured 10 meters (33 feet) east 180 167 -- P-SS-31 Unattenuated – hammer on unknown fuel setting 183 170 -- P-NS-25 Unattenuated – hammer on unknown fuel setting 183 169 -- P-NS-24 Unattenuated – hammer on lowest fuel setting with jetting 172 158 -- P-NS-25 Unattenuated – hammer on lowest fuel setting with jetting 175 162 -- P-NS-25 Unattenuated – hammer on lowest fuel setting no jetting 186 173 --
I.5.4 24-Inch Octagonal Concrete Piles at Berth 22—Port of Oakland, CA Several 24-inch octagonal concrete piles were driven at the Port of Oakland in August 2004 and December 20041. The purpose of the project was to reconstruct Berth 22 at the Port of Oakland. Piles were driven with a Del Mag D-62-22, which has a maximum energy per blow of about 224 kilojoules. Indicator piles were driven unattenuated during August 2004, when a fish in cage study was performed2. Results of the measured sound levels are presented in Table I.5-4. Figure I.5-6 shows pile driving of indicator piles at Berth 22. An attenuation system was used for production pile driving. Initially, this system was turned off many times to assess the acoustical performance. Measurements were mostly made at 10 meters (33 feet) from the pile and at a depth of 3 meters (10 feet). More distant measurements were made for selected piles. Water depth varied from 0 to 15 meters (49 feet), based on the pile location. Piles were driven in five rows, where the first row was onshore and the outer row was in about 15 meters of water. Row A was in the deepest water, and Row E was at the shore. The typical duration of driving time per pile was about 15 to 30 minutes.
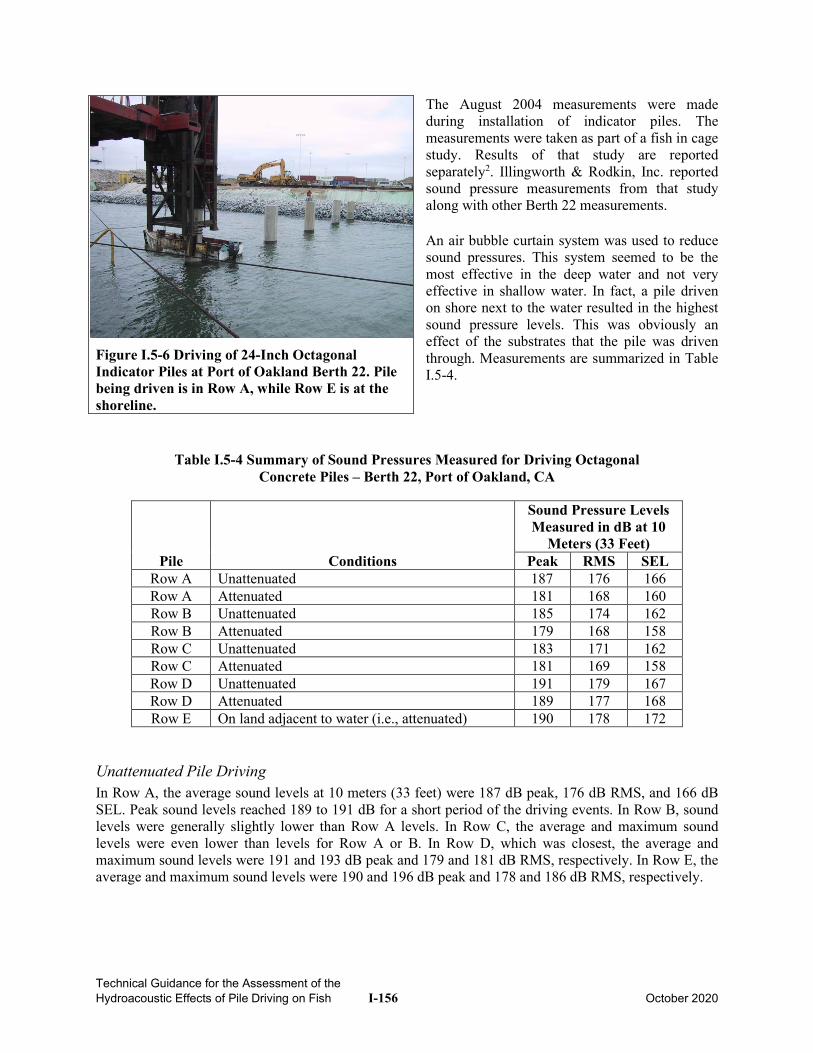
Technical Guidance for the Assessment of the Hydroacoustic Effects of Pile Driving on Fish I-156 October 2020
The August 2004 measurements were made during installation of indicator piles. The measurements were taken as part of a fish in cage study. Results of that study are reported separately2. Illingworth & Rodkin, Inc. reported sound pressure measurements from that study along with other Berth 22 measurements. An air bubble curtain system was used to reduce sound pressures. This system seemed to be the most effective in the deep water and not very effective in shallow water. In fact, a pile driven on shore next to the water resulted in the highest sound pressure levels. This was obviously an effect of the substrates that the pile was driven through. Measurements are summarized in Table I.5-4.
Table I.5-4 Summary of Sound Pressures Measured for Driving Octagonal Concrete Piles – Berth 22, Port of Oakland, CA
Pile Conditions
Sound Pressure Levels Measured in dB at 10
Meters (33 Feet) Peak RMS SEL
Row A Unattenuated 187 176 166 Row A Attenuated 181 168 160 Row B Unattenuated 185 174 162 Row B Attenuated 179 168 158 Row C Unattenuated 183 171 162 Row C Attenuated 181 169 158 Row D Unattenuated 191 179 167 Row D Attenuated 189 177 168 Row E On land adjacent to water (i.e., attenuated) 190 178 172
Unattenuated Pile Driving In Row A, the average sound levels at 10 meters (33 feet) were 187 dB peak, 176 dB RMS, and 166 dB SEL. Peak sound levels reached 189 to 191 dB for a short period of the driving events. In Row B, sound levels were generally slightly lower than Row A levels. In Row C, the average and maximum sound levels were even lower than levels for Row A or B. In Row D, which was closest, the average and maximum sound levels were 191 and 193 dB peak and 179 and 181 dB RMS, respectively. In Row E, the average and maximum sound levels were 190 and 196 dB peak and 178 and 186 dB RMS, respectively.
Figure I.5-6 Driving of 24-Inch Octagonal Indicator Piles at Port of Oakland Berth 22. Pile being driven is in Row A, while Row E is at the shoreline.
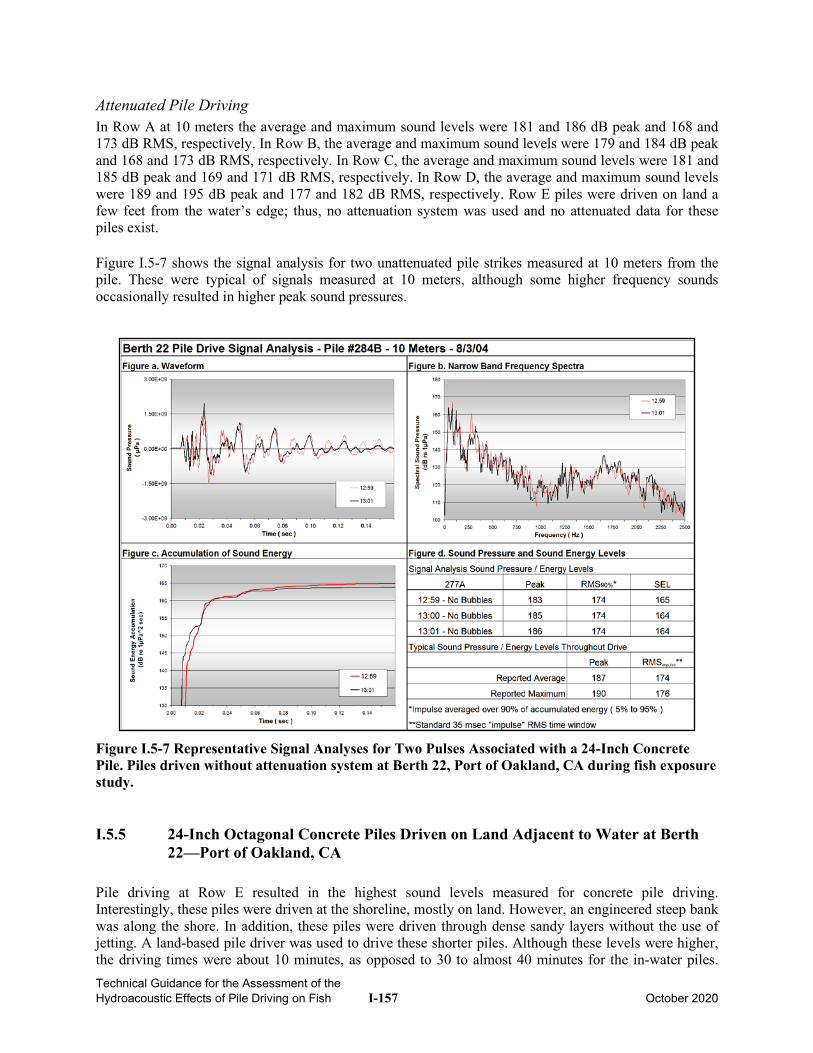
Technical Guidance for the Assessment of the Hydroacoustic Effects of Pile Driving on Fish I-157 October 2020
Attenuated Pile Driving In Row A at 10 meters the average and maximum sound levels were 181 and 186 dB peak and 168 and 173 dB RMS, respectively. In Row B, the average and maximum sound levels were 179 and 184 dB peak and 168 and 173 dB RMS, respectively. In Row C, the average and maximum sound levels were 181 and 185 dB peak and 169 and 171 dB RMS, respectively. In Row D, the average and maximum sound levels were 189 and 195 dB peak and 177 and 182 dB RMS, respectively. Row E piles were driven on land a few feet from the water’s edge; thus, no attenuation system was used and no attenuated data for these piles exist. Figure I.5-7 shows the signal analysis for two unattenuated pile strikes measured at 10 meters from the pile. These were typical of signals measured at 10 meters, although some higher frequency sounds occasionally resulted in higher peak sound pressures.
Figure I.5-7 Representative Signal Analyses for Two Pulses Associated with a 24-Inch Concrete Pile. Piles driven without attenuation system at Berth 22, Port of Oakland, CA during fish exposure study.
I.5.5 24-Inch Octagonal Concrete Piles Driven on Land Adjacent to Water at Berth 22—Port of Oakland, CA
Pile driving at Row E resulted in the highest sound levels measured for concrete pile driving. Interestingly, these piles were driven at the shoreline, mostly on land. However, an engineered steep bank was along the shore. In addition, these piles were driven through dense sandy layers without the use of jetting. A land-based pile driver was used to drive these shorter piles. Although these levels were higher, the driving times were about 10 minutes, as opposed to 30 to almost 40 minutes for the in-water piles.
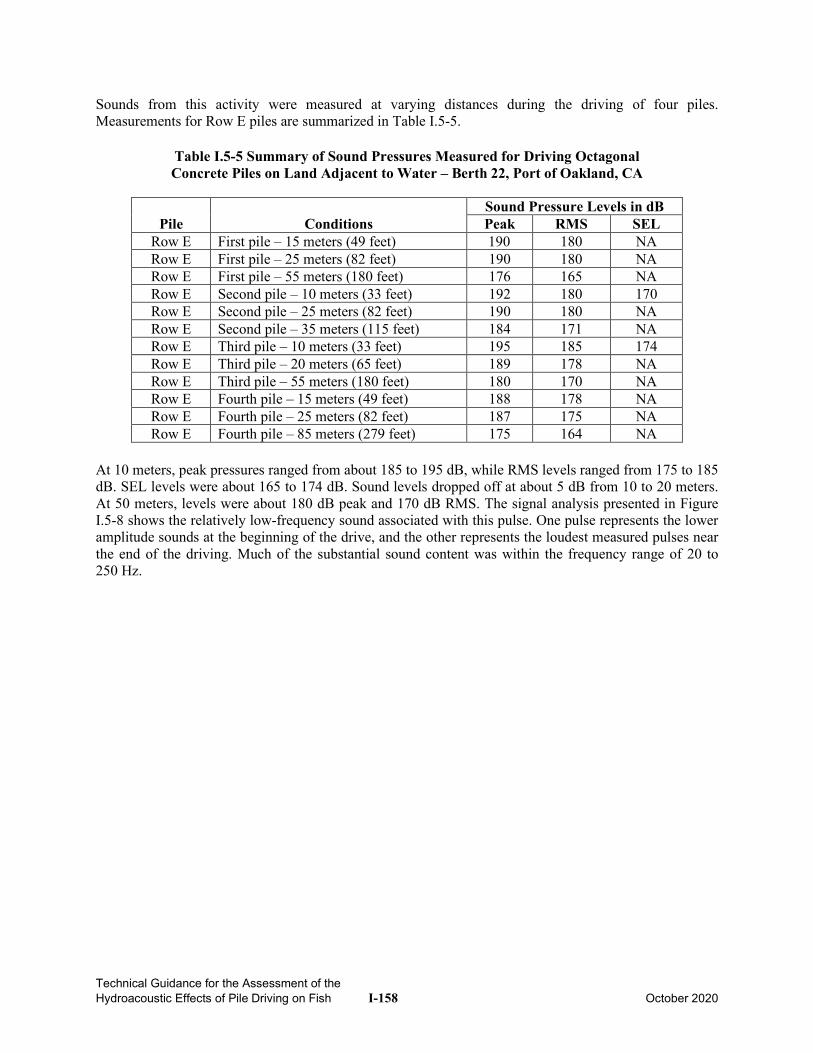
Technical Guidance for the Assessment of the Hydroacoustic Effects of Pile Driving on Fish I-158 October 2020
Sounds from this activity were measured at varying distances during the driving of four piles. Measurements for Row E piles are summarized in Table I.5-5.
Table I.5-5 Summary of Sound Pressures Measured for Driving Octagonal Concrete Piles on Land Adjacent to Water – Berth 22, Port of Oakland, CA
Pile Conditions Sound Pressure Levels in dB Peak RMS SEL
Row E First pile – 15 meters (49 feet) 190 180 NA Row E First pile – 25 meters (82 feet) 190 180 NA Row E First pile – 55 meters (180 feet) 176 165 NA Row E Second pile – 10 meters (33 feet) 192 180 170 Row E Second pile – 25 meters (82 feet) 190 180 NA Row E Second pile – 35 meters (115 feet) 184 171 NA Row E Third pile – 10 meters (33 feet) 195 185 174 Row E Third pile – 20 meters (65 feet) 189 178 NA Row E Third pile – 55 meters (180 feet) 180 170 NA Row E Fourth pile – 15 meters (49 feet) 188 178 NA Row E Fourth pile – 25 meters (82 feet) 187 175 NA Row E Fourth pile – 85 meters (279 feet) 175 164 NA
At 10 meters, peak pressures ranged from about 185 to 195 dB, while RMS levels ranged from 175 to 185 dB. SEL levels were about 165 to 174 dB. Sound levels dropped off at about 5 dB from 10 to 20 meters. At 50 meters, levels were about 180 dB peak and 170 dB RMS. The signal analysis presented in Figure I.5-8 shows the relatively low-frequency sound associated with this pulse. One pulse represents the lower amplitude sounds at the beginning of the drive, and the other represents the loudest measured pulses near the end of the driving. Much of the substantial sound content was within the frequency range of 20 to 250 Hz.
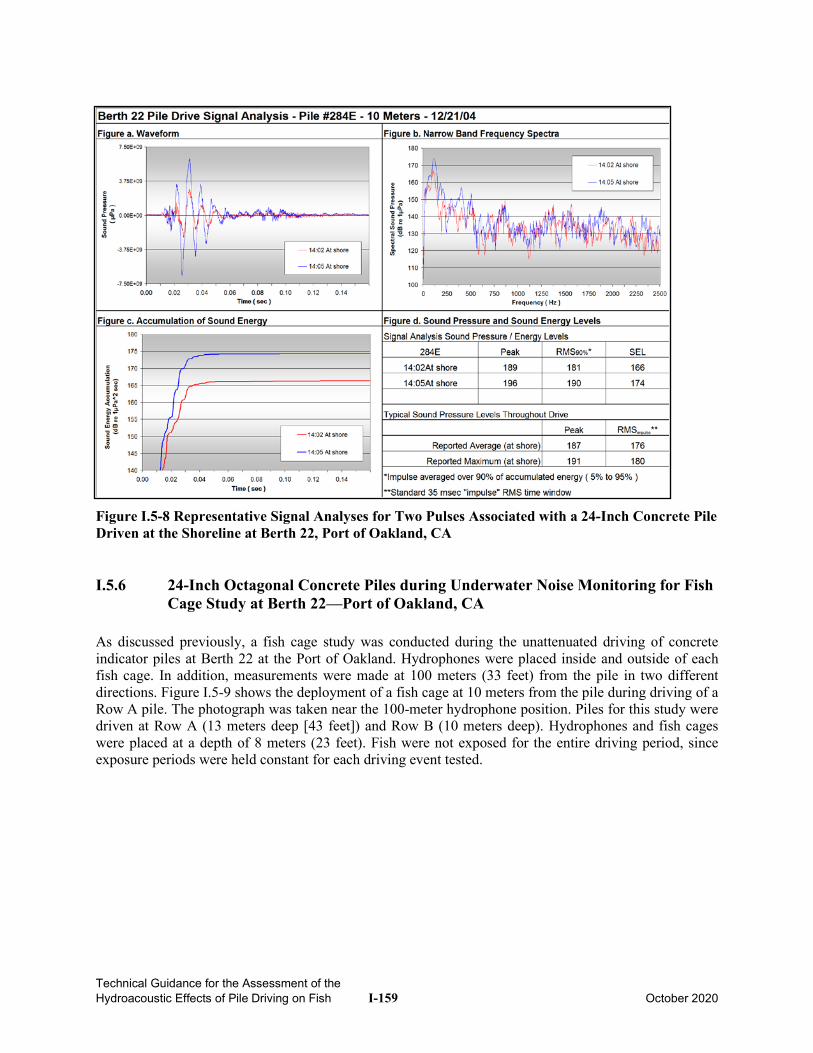
Technical Guidance for the Assessment of the Hydroacoustic Effects of Pile Driving on Fish I-159 October 2020
Figure I.5-8 Representative Signal Analyses for Two Pulses Associated with a 24-Inch Concrete Pile Driven at the Shoreline at Berth 22, Port of Oakland, CA
I.5.6 24-Inch Octagonal Concrete Piles during Underwater Noise Monitoring for Fish Cage Study at Berth 22—Port of Oakland, CA
As discussed previously, a fish cage study was conducted during the unattenuated driving of concrete indicator piles at Berth 22 at the Port of Oakland. Hydrophones were placed inside and outside of each fish cage. In addition, measurements were made at 100 meters (33 feet) from the pile in two different directions. Figure I.5-9 shows the deployment of a fish cage at 10 meters from the pile during driving of a Row A pile. The photograph was taken near the 100-meter hydrophone position. Piles for this study were driven at Row A (13 meters deep [43 feet]) and Row B (10 meters deep). Hydrophones and fish cages were placed at a depth of 8 meters (23 feet). Fish were not exposed for the entire driving period, since exposure periods were held constant for each driving event tested.
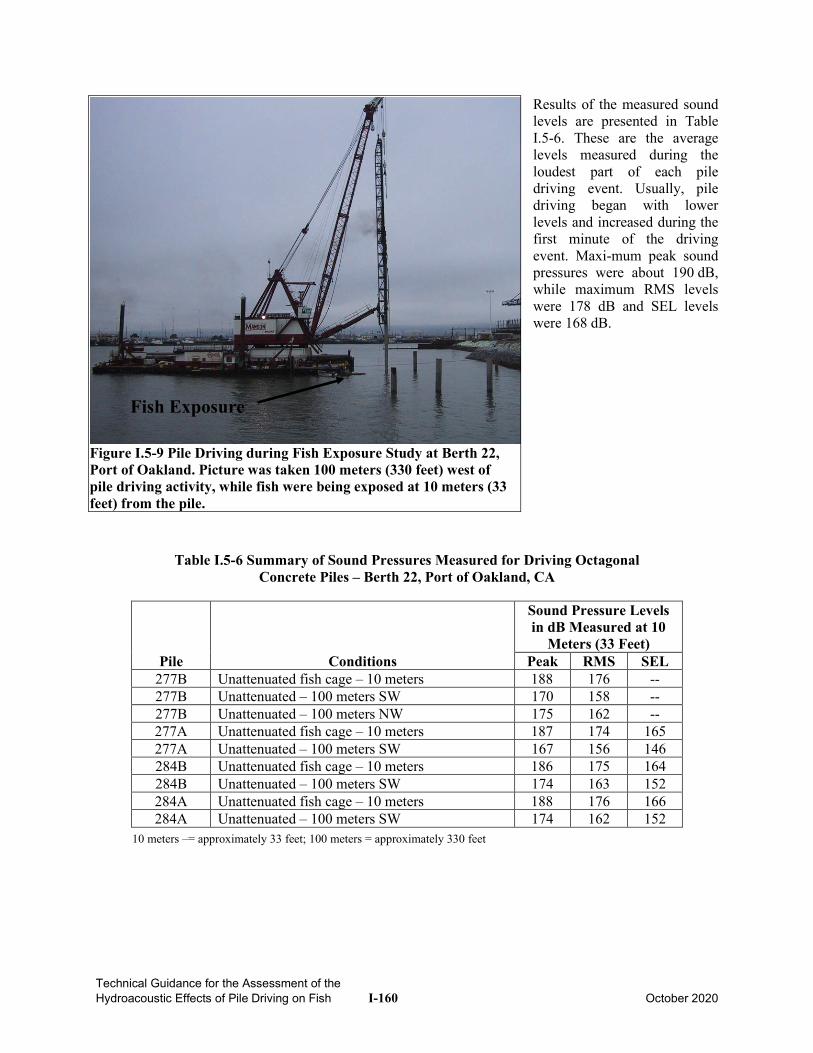
Technical Guidance for the Assessment of the Hydroacoustic Effects of Pile Driving on Fish I-160 October 2020
Results of the measured sound levels are presented in Table I.5-6. These are the average levels measured during the loudest part of each pile driving event. Usually, pile driving began with lower levels and increased during the first minute of the driving event. Maxi-mum peak sound pressures were about 190 dB, while maximum RMS levels were 178 dB and SEL levels were 168 dB.
Table I.5-6 Summary of Sound Pressures Measured for Driving Octagonal Concrete Piles – Berth 22, Port of Oakland, CA
Pile Conditions
Sound Pressure Levels in dB Measured at 10
Meters (33 Feet) Peak RMS SEL
277B Unattenuated fish cage – 10 meters 188 176 -- 277B Unattenuated – 100 meters SW 170 158 -- 277B Unattenuated – 100 meters NW 175 162 -- 277A Unattenuated fish cage – 10 meters 187 174 165 277A Unattenuated – 100 meters SW 167 156 146 284B Unattenuated fish cage – 10 meters 186 175 164 284B Unattenuated – 100 meters SW 174 163 152 284A Unattenuated fish cage – 10 meters 188 176 166 284A Unattenuated – 100 meters SW 174 162 152
10 meters –= approximately 33 feet; 100 meters = approximately 330 feet
Fish Exposure
Figure I.5-9 Pile Driving during Fish Exposure Study at Berth 22, Port of Oakland. Picture was taken 100 meters (330 feet) west of pile driving activity, while fish were being exposed at 10 meters (33 feet) from the pile.
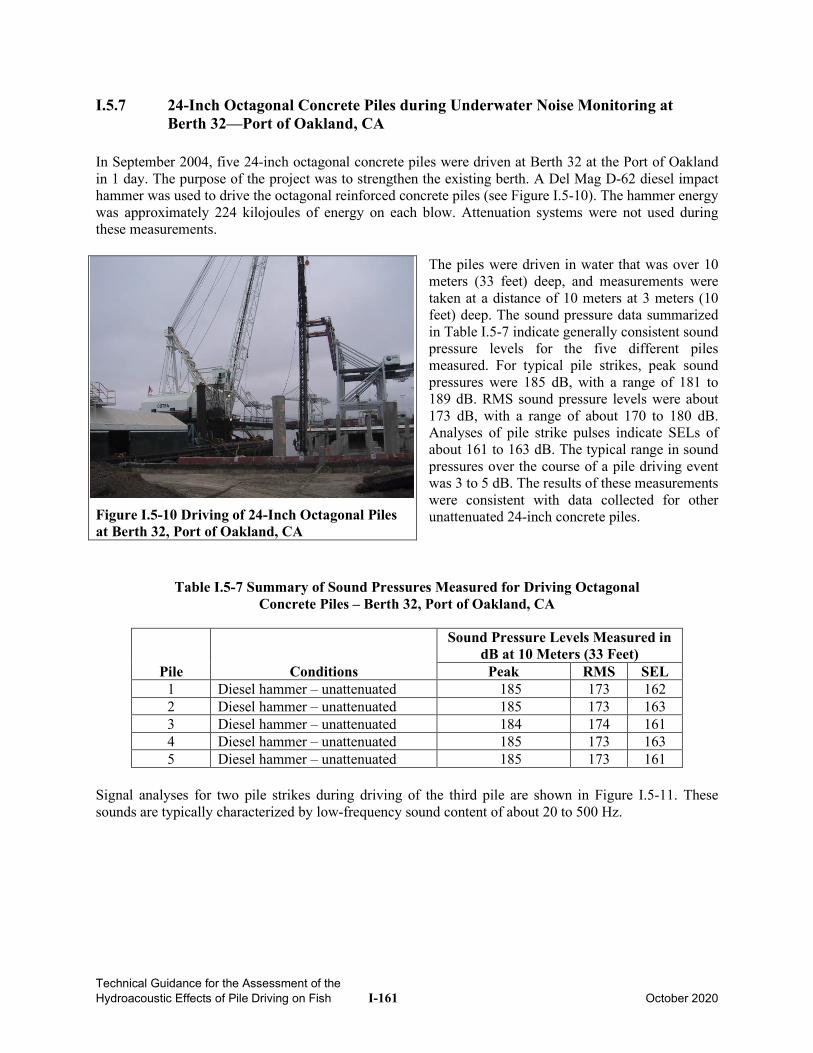
Technical Guidance for the Assessment of the Hydroacoustic Effects of Pile Driving on Fish I-161 October 2020
I.5.7 24-Inch Octagonal Concrete Piles during Underwater Noise Monitoring at Berth 32—Port of Oakland, CA
In September 2004, five 24-inch octagonal concrete piles were driven at Berth 32 at the Port of Oakland in 1 day. The purpose of the project was to strengthen the existing berth. A Del Mag D-62 diesel impact hammer was used to drive the octagonal reinforced concrete piles (see Figure I.5-10). The hammer energy was approximately 224 kilojoules of energy on each blow. Attenuation systems were not used during these measurements.
The piles were driven in water that was over 10 meters (33 feet) deep, and measurements were taken at a distance of 10 meters at 3 meters (10 feet) deep. The sound pressure data summarized in Table I.5-7 indicate generally consistent sound pressure levels for the five different piles measured. For typical pile strikes, peak sound pressures were 185 dB, with a range of 181 to 189 dB. RMS sound pressure levels were about 173 dB, with a range of about 170 to 180 dB. Analyses of pile strike pulses indicate SELs of about 161 to 163 dB. The typical range in sound pressures over the course of a pile driving event was 3 to 5 dB. The results of these measurements were consistent with data collected for other unattenuated 24-inch concrete piles.
Table I.5-7 Summary of Sound Pressures Measured for Driving Octagonal Concrete Piles – Berth 32, Port of Oakland, CA
Pile Conditions
Sound Pressure Levels Measured in dB at 10 Meters (33 Feet)
Peak RMS SEL 1 Diesel hammer – unattenuated 185 173 162 2 Diesel hammer – unattenuated 185 173 163 3 Diesel hammer – unattenuated 184 174 161 4 Diesel hammer – unattenuated 185 173 163 5 Diesel hammer – unattenuated 185 173 161
Signal analyses for two pile strikes during driving of the third pile are shown in Figure I.5-11. These sounds are typically characterized by low-frequency sound content of about 20 to 500 Hz.
Figure I.5-10 Driving of 24-Inch Octagonal Piles at Berth 32, Port of Oakland, CA
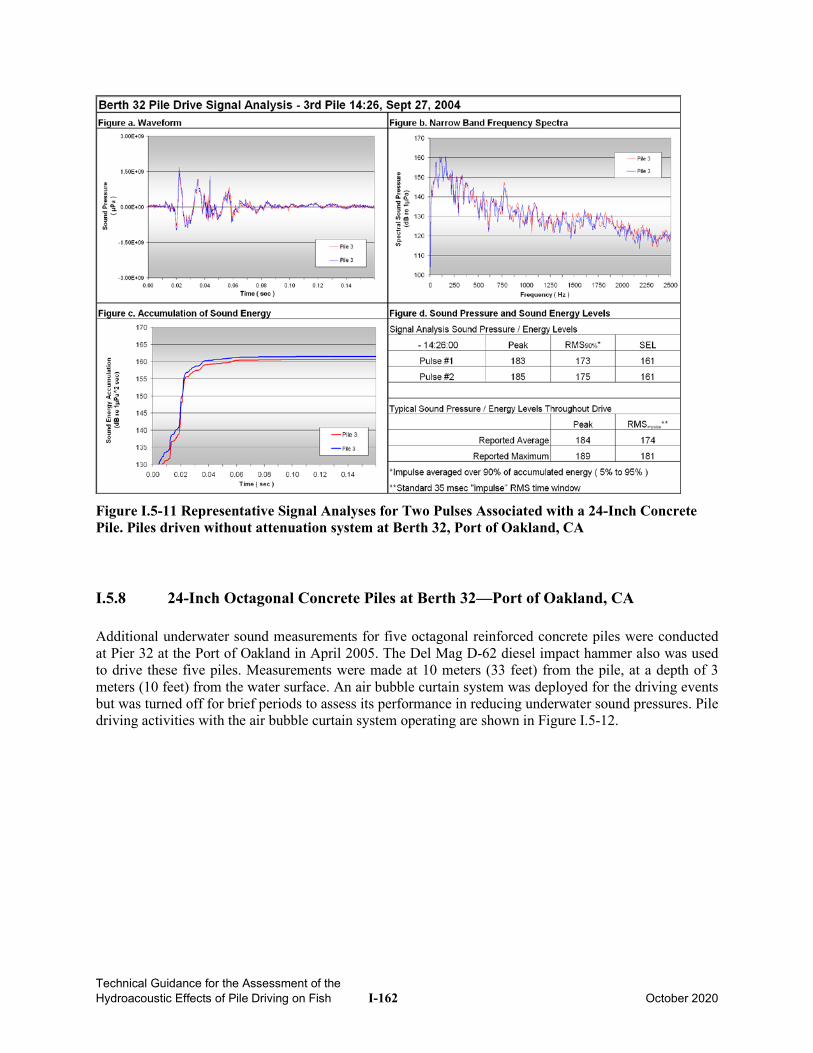
Technical Guidance for the Assessment of the Hydroacoustic Effects of Pile Driving on Fish I-162 October 2020
Figure I.5-11 Representative Signal Analyses for Two Pulses Associated with a 24-Inch Concrete Pile. Piles driven without attenuation system at Berth 32, Port of Oakland, CA
I.5.8 24-Inch Octagonal Concrete Piles at Berth 32—Port of Oakland, CA Additional underwater sound measurements for five octagonal reinforced concrete piles were conducted at Pier 32 at the Port of Oakland in April 2005. The Del Mag D-62 diesel impact hammer also was used to drive these five piles. Measurements were made at 10 meters (33 feet) from the pile, at a depth of 3 meters (10 feet) from the water surface. An air bubble curtain system was deployed for the driving events but was turned off for brief periods to assess its performance in reducing underwater sound pressures. Pile driving activities with the air bubble curtain system operating are shown in Figure I.5-12.
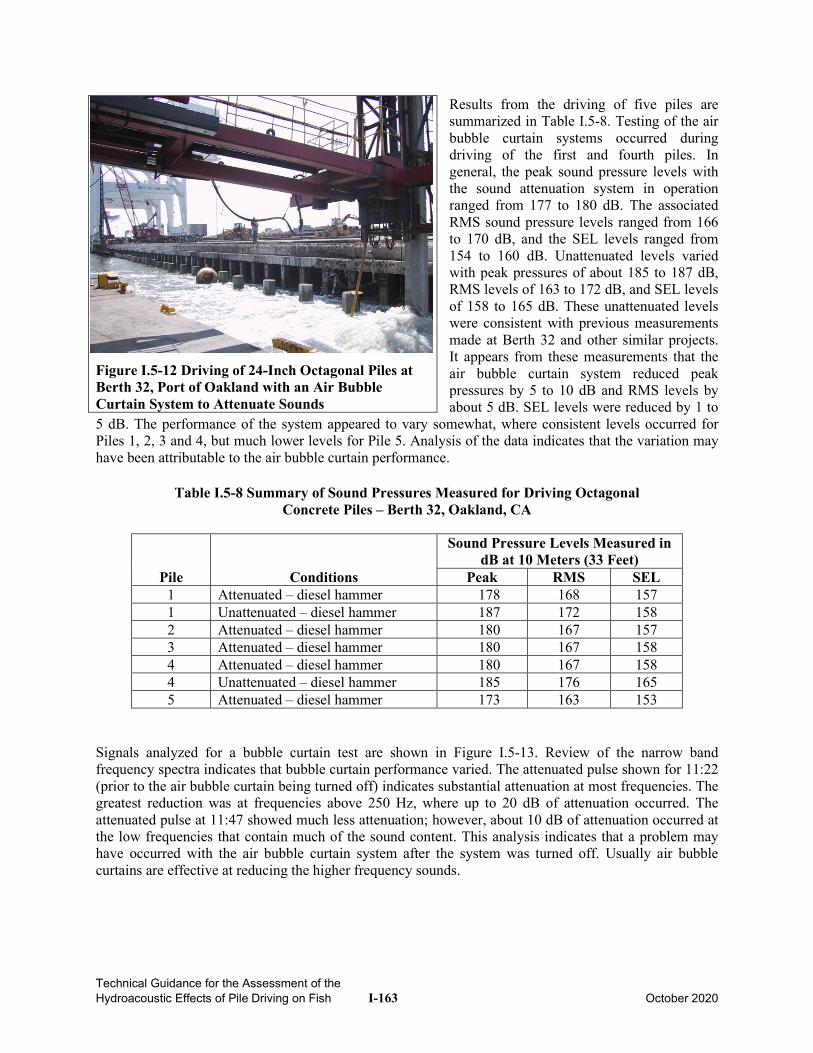
Technical Guidance for the Assessment of the Hydroacoustic Effects of Pile Driving on Fish I-163 October 2020
Results from the driving of five piles are summarized in Table I.5-8. Testing of the air bubble curtain systems occurred during driving of the first and fourth piles. In general, the peak sound pressure levels with the sound attenuation system in operation ranged from 177 to 180 dB. The associated RMS sound pressure levels ranged from 166 to 170 dB, and the SEL levels ranged from 154 to 160 dB. Unattenuated levels varied with peak pressures of about 185 to 187 dB, RMS levels of 163 to 172 dB, and SEL levels of 158 to 165 dB. These unattenuated levels were consistent with previous measurements made at Berth 32 and other similar projects. It appears from these measurements that the air bubble curtain system reduced peak pressures by 5 to 10 dB and RMS levels by about 5 dB. SEL levels were reduced by 1 to
5 dB. The performance of the system appeared to vary somewhat, where consistent levels occurred for Piles 1, 2, 3 and 4, but much lower levels for Pile 5. Analysis of the data indicates that the variation may have been attributable to the air bubble curtain performance.
Table I.5-8 Summary of Sound Pressures Measured for Driving Octagonal Concrete Piles – Berth 32, Oakland, CA
Pile Conditions
Sound Pressure Levels Measured in dB at 10 Meters (33 Feet)
Peak RMS SEL 1 Attenuated – diesel hammer 178 168 157 1 Unattenuated – diesel hammer 187 172 158 2 Attenuated – diesel hammer 180 167 157 3 Attenuated – diesel hammer 180 167 158 4 Attenuated – diesel hammer 180 167 158 4 Unattenuated – diesel hammer 185 176 165 5 Attenuated – diesel hammer 173 163 153
Signals analyzed for a bubble curtain test are shown in Figure I.5-13. Review of the narrow band frequency spectra indicates that bubble curtain performance varied. The attenuated pulse shown for 11:22 (prior to the air bubble curtain being turned off) indicates substantial attenuation at most frequencies. The greatest reduction was at frequencies above 250 Hz, where up to 20 dB of attenuation occurred. The attenuated pulse at 11:47 showed much less attenuation; however, about 10 dB of attenuation occurred at the low frequencies that contain much of the sound content. This analysis indicates that a problem may have occurred with the air bubble curtain system after the system was turned off. Usually air bubble curtains are effective at reducing the higher frequency sounds.
Figure I.5-12 Driving of 24-Inch Octagonal Piles at Berth 32, Port of Oakland with an Air Bubble Curtain System to Attenuate Sounds
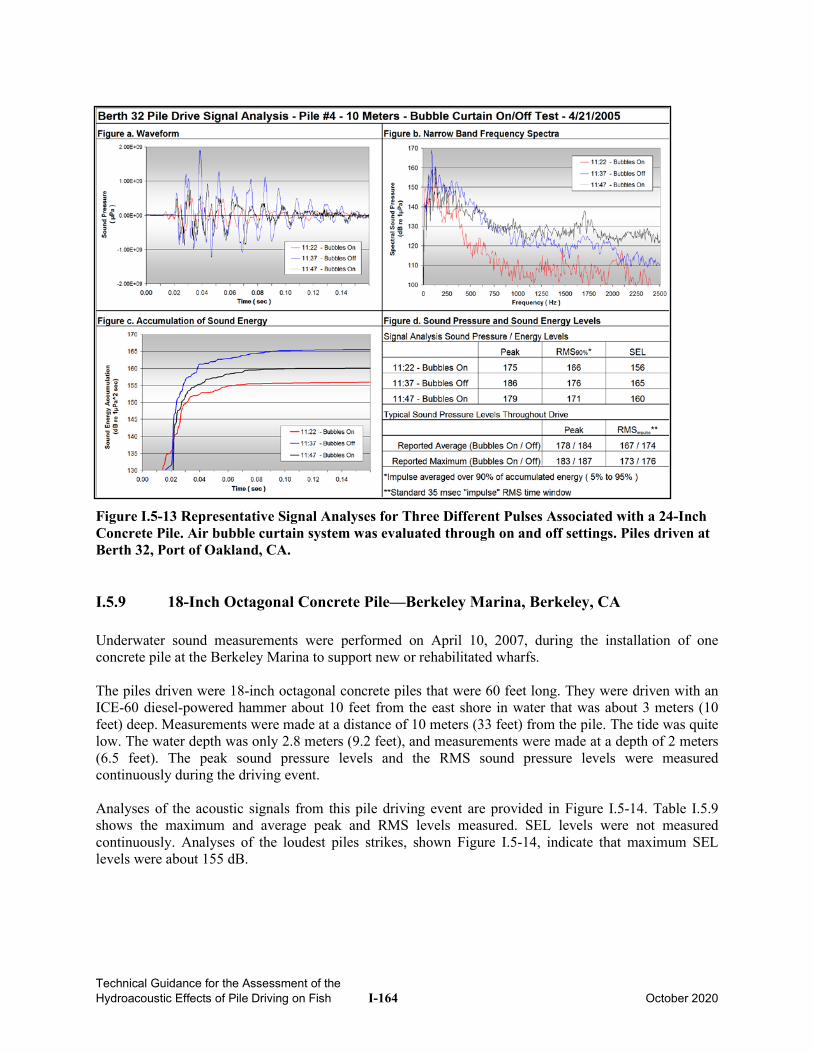
Technical Guidance for the Assessment of the Hydroacoustic Effects of Pile Driving on Fish I-164 October 2020
Figure I.5-13 Representative Signal Analyses for Three Different Pulses Associated with a 24-Inch Concrete Pile. Air bubble curtain system was evaluated through on and off settings. Piles driven at Berth 32, Port of Oakland, CA.
I.5.9 18-Inch Octagonal Concrete Pile—Berkeley Marina, Berkeley, CA Underwater sound measurements were performed on April 10, 2007, during the installation of one concrete pile at the Berkeley Marina to support new or rehabilitated wharfs. The piles driven were 18-inch octagonal concrete piles that were 60 feet long. They were driven with an ICE-60 diesel-powered hammer about 10 feet from the east shore in water that was about 3 meters (10 feet) deep. Measurements were made at a distance of 10 meters (33 feet) from the pile. The tide was quite low. The water depth was only 2.8 meters (9.2 feet), and measurements were made at a depth of 2 meters (6.5 feet). The peak sound pressure levels and the RMS sound pressure levels were measured continuously during the driving event. Analyses of the acoustic signals from this pile driving event are provided in Figure I.5-14. Table I.5.9 shows the maximum and average peak and RMS levels measured. SEL levels were not measured continuously. Analyses of the loudest piles strikes, shown Figure I.5-14, indicate that maximum SEL levels were about 155 dB.
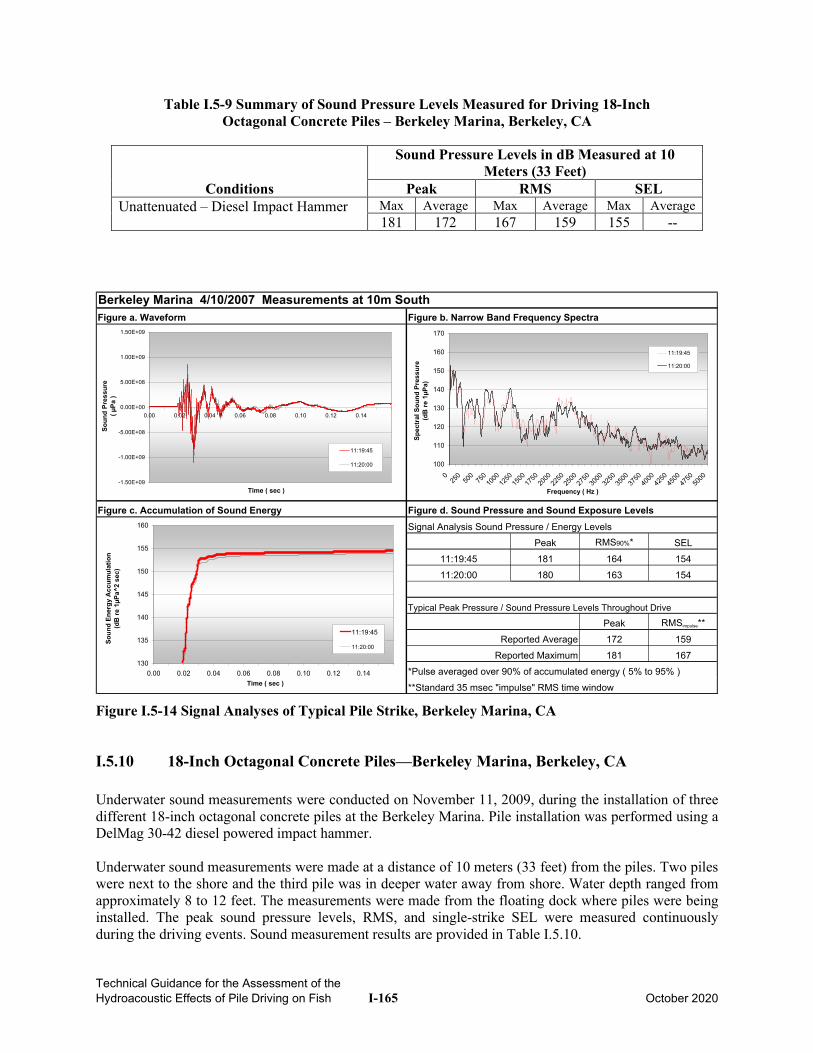
Technical Guidance for the Assessment of the Hydroacoustic Effects of Pile Driving on Fish I-165 October 2020
Table I.5-9 Summary of Sound Pressure Levels Measured for Driving 18-Inch Octagonal Concrete Piles – Berkeley Marina, Berkeley, CA
Conditions
Sound Pressure Levels in dB Measured at 10 Meters (33 Feet)
Peak RMS SEL Unattenuated – Diesel Impact Hammer Max
181 Average
172 Max 167
Average159
Max 155
Average --
Peak RMS90%* SEL11:19:45 181 164 15411:20:00 180 163 154
Peak RMSimpulse**
172 159181 167Reported Maximum
*Pulse averaged over 90% of accumulated energy ( 5% to 95% )
Signal Analysis Sound Pressure / Energy Levels
Typical Peak Pressure / Sound Pressure Levels Throughout Drive
Reported Average
**Standard 35 msec "impulse" RMS time window
Berkeley Marina 4/10/2007 Measurements at 10m SouthFigure a. Waveform Figure b. Narrow Band Frequency Spectra
Figure c. Accumulation of Sound Energy Figure d. Sound Pressure and Sound Exposure Levels
-1.50E+09
-1.00E+09
-5.00E+08
0.00E+00
5.00E+08
1.00E+09
1.50E+09
0.00 0.02 0.04 0.06 0.08 0.10 0.12 0.14
Time ( sec )
Soun
d Pr
essu
re
( µPa
)
11:19:45
11:20:00 100
110
120
130
140
150
160
170
025
050
075
010
0012
5015
0017
5020
0022
5025
0027
5030
0032
5035
0037
5040
0042
5045
0047
5050
00
Frequency ( Hz )
Spec
tral
Sou
nd P
ress
ure
(dB
re 1
µPa)
11:19:45
11:20:00
130
135
140
145
150
155
160
0.00 0.02 0.04 0.06 0.08 0.10 0.12 0.14Time ( sec )
Soun
d En
ergy
Acc
umul
atio
n (d
B re
1µP
a^2
sec)
11:19:45
11:20:00
Figure I.5-14 Signal Analyses of Typical Pile Strike, Berkeley Marina, CA
I.5.10 18-Inch Octagonal Concrete Piles—Berkeley Marina, Berkeley, CA Underwater sound measurements were conducted on November 11, 2009, during the installation of three different 18-inch octagonal concrete piles at the Berkeley Marina. Pile installation was performed using a DelMag 30-42 diesel powered impact hammer. Underwater sound measurements were made at a distance of 10 meters (33 feet) from the piles. Two piles were next to the shore and the third pile was in deeper water away from shore. Water depth ranged from approximately 8 to 12 feet. The measurements were made from the floating dock where piles were being installed. The peak sound pressure levels, RMS, and single-strike SEL were measured continuously during the driving events. Sound measurement results are provided in Table I.5.10.
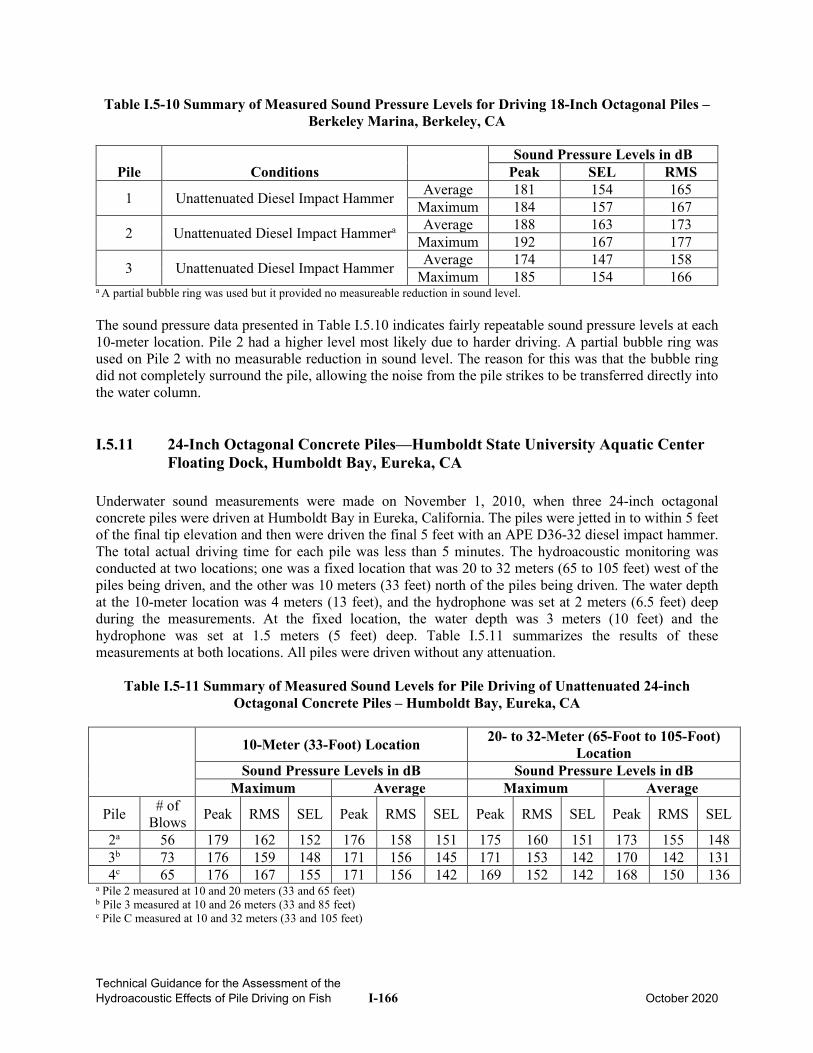
Technical Guidance for the Assessment of the Hydroacoustic Effects of Pile Driving on Fish I-166 October 2020
Table I.5-10 Summary of Measured Sound Pressure Levels for Driving 18-Inch Octagonal Piles – Berkeley Marina, Berkeley, CA
Pile Conditions Sound Pressure Levels in dB
Peak SEL RMS
1 Unattenuated Diesel Impact Hammer Average 181 154 165 Maximum 184 157 167
2 Unattenuated Diesel Impact Hammera Average 188 163 173 Maximum 192 167 177
3 Unattenuated Diesel Impact Hammer Average 174 147 158 Maximum 185 154 166
a A partial bubble ring was used but it provided no measureable reduction in sound level. The sound pressure data presented in Table I.5.10 indicates fairly repeatable sound pressure levels at each 10-meter location. Pile 2 had a higher level most likely due to harder driving. A partial bubble ring was used on Pile 2 with no measurable reduction in sound level. The reason for this was that the bubble ring did not completely surround the pile, allowing the noise from the pile strikes to be transferred directly into the water column.
I.5.11 24-Inch Octagonal Concrete Piles—Humboldt State University Aquatic Center Floating Dock, Humboldt Bay, Eureka, CA
Underwater sound measurements were made on November 1, 2010, when three 24-inch octagonal concrete piles were driven at Humboldt Bay in Eureka, California. The piles were jetted in to within 5 feet of the final tip elevation and then were driven the final 5 feet with an APE D36-32 diesel impact hammer. The total actual driving time for each pile was less than 5 minutes. The hydroacoustic monitoring was conducted at two locations; one was a fixed location that was 20 to 32 meters (65 to 105 feet) west of the piles being driven, and the other was 10 meters (33 feet) north of the piles being driven. The water depth at the 10-meter location was 4 meters (13 feet), and the hydrophone was set at 2 meters (6.5 feet) deep during the measurements. At the fixed location, the water depth was 3 meters (10 feet) and the hydrophone was set at 1.5 meters (5 feet) deep. Table I.5.11 summarizes the results of these measurements at both locations. All piles were driven without any attenuation.
Table I.5-11 Summary of Measured Sound Levels for Pile Driving of Unattenuated 24-inch Octagonal Concrete Piles – Humboldt Bay, Eureka, CA
10-Meter (33-Foot) Location
Sound Pressure Levels in dB
20- to 32-Meter (65-Foot to 105-Foot) Location
Sound Pressure Levels in dB Maximum Average Maximum Average
Pile # of Blows Peak RMS SEL Peak RMS SEL Peak RMS SEL Peak RMS SEL
2a 56 179 162 152 176 158 151 175 160 151 173 155 148 3b 73 176 159 148 171 156 145 171 153 142 170 142 131 4c 65 176 167 155 171 156 142 169 152 142 168 150 136
a Pile 2 measured at 10 and 20 meters (33 and 65 feet) b Pile 3 measured at 10 and 26 meters (33 and 85 feet) c Pile C measured at 10 and 32 meters (33 and 105 feet)
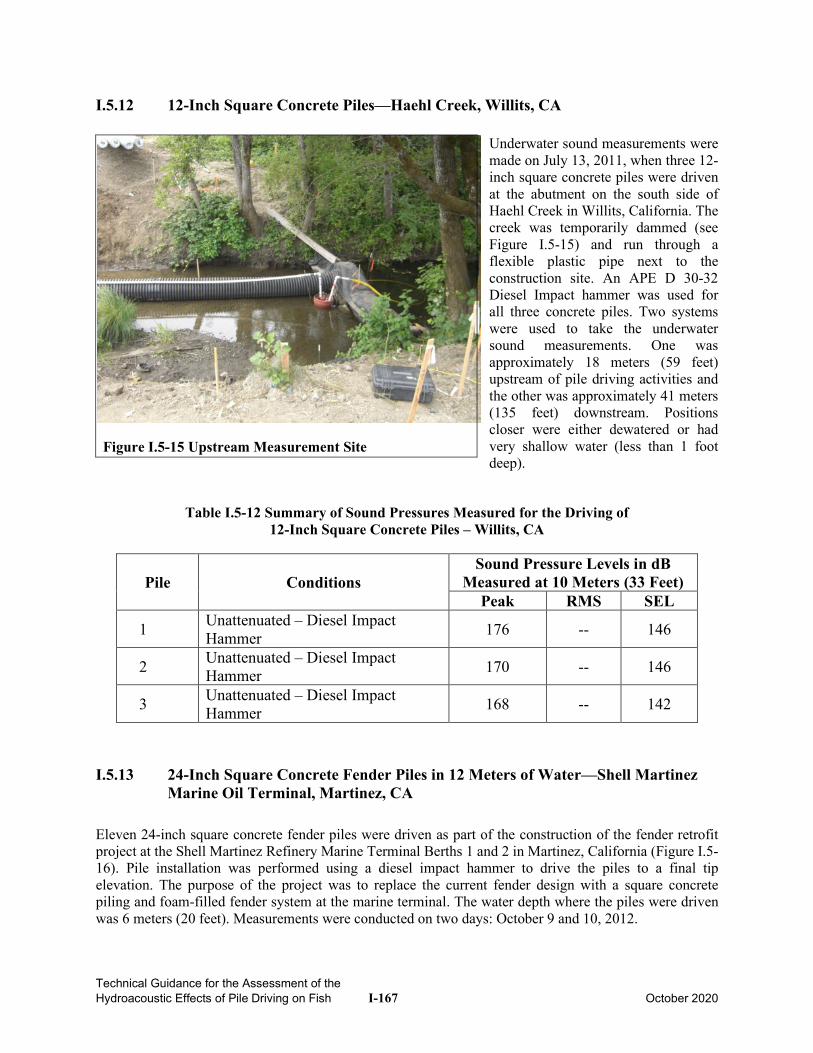
Technical Guidance for the Assessment of the Hydroacoustic Effects of Pile Driving on Fish I-167 October 2020
I.5.12 12-Inch Square Concrete Piles—Haehl Creek, Willits, CA
Underwater sound measurements were made on July 13, 2011, when three 12-inch square concrete piles were driven at the abutment on the south side of Haehl Creek in Willits, California. The creek was temporarily dammed (see Figure I.5-15) and run through a flexible plastic pipe next to the construction site. An APE D 30-32 Diesel Impact hammer was used for all three concrete piles. Two systems were used to take the underwater sound measurements. One was approximately 18 meters (59 feet) upstream of pile driving activities and the other was approximately 41 meters (135 feet) downstream. Positions closer were either dewatered or had very shallow water (less than 1 foot deep).
Table I.5-12 Summary of Sound Pressures Measured for the Driving of 12-Inch Square Concrete Piles – Willits, CA
Pile Conditions Sound Pressure Levels in dB
Measured at 10 Meters (33 Feet) Peak RMS SEL
1 Unattenuated – Diesel Impact Hammer 176 -- 146
2 Unattenuated – Diesel Impact Hammer 170 -- 146
3 Unattenuated – Diesel Impact Hammer 168 -- 142
I.5.13 24-Inch Square Concrete Fender Piles in 12 Meters of Water—Shell Martinez Marine Oil Terminal, Martinez, CA
Eleven 24-inch square concrete fender piles were driven as part of the construction of the fender retrofit project at the Shell Martinez Refinery Marine Terminal Berths 1 and 2 in Martinez, California (Figure I.5-16). Pile installation was performed using a diesel impact hammer to drive the piles to a final tip elevation. The purpose of the project was to replace the current fender design with a square concrete piling and foam-filled fender system at the marine terminal. The water depth where the piles were driven was 6 meters (20 feet). Measurements were conducted on two days: October 9 and 10, 2012.
Figure I.5-15 Upstream Measurement Site
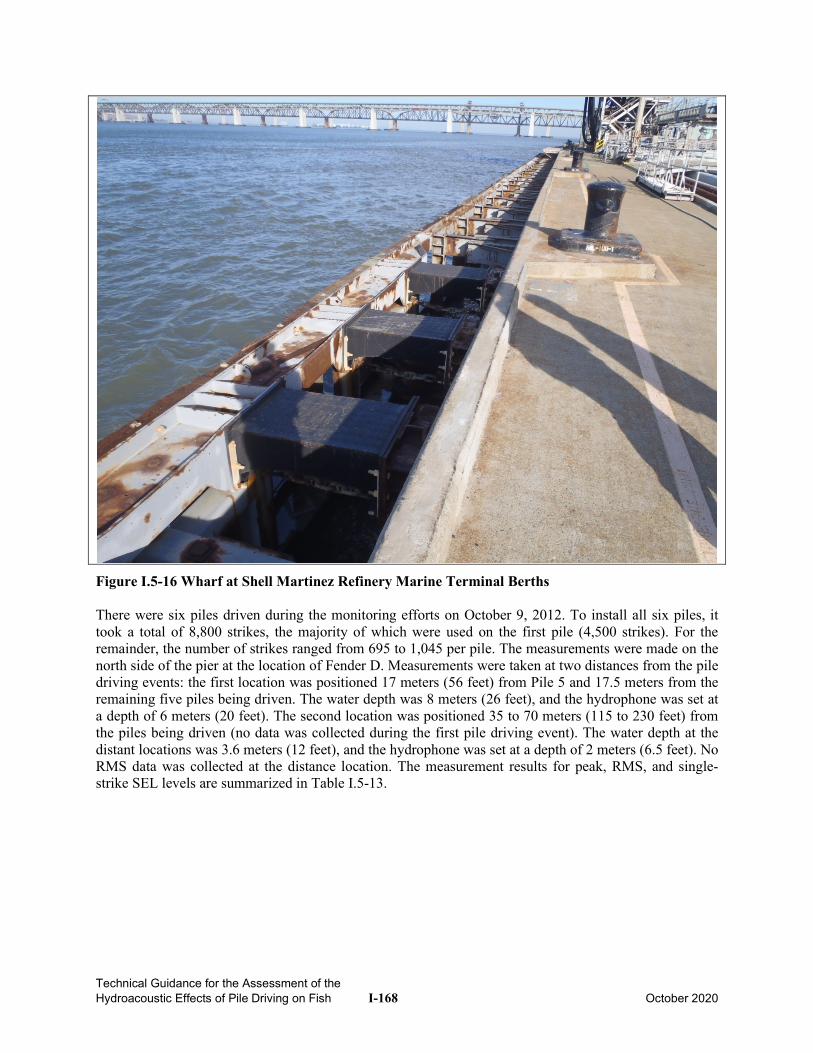
Technical Guidance for the Assessment of the Hydroacoustic Effects of Pile Driving on Fish I-168 October 2020
Figure I.5-16 Wharf at Shell Martinez Refinery Marine Terminal Berths There were six piles driven during the monitoring efforts on October 9, 2012. To install all six piles, it took a total of 8,800 strikes, the majority of which were used on the first pile (4,500 strikes). For the remainder, the number of strikes ranged from 695 to 1,045 per pile. The measurements were made on the north side of the pier at the location of Fender D. Measurements were taken at two distances from the pile driving events: the first location was positioned 17 meters (56 feet) from Pile 5 and 17.5 meters from the remaining five piles being driven. The water depth was 8 meters (26 feet), and the hydrophone was set at a depth of 6 meters (20 feet). The second location was positioned 35 to 70 meters (115 to 230 feet) from the piles being driven (no data was collected during the first pile driving event). The water depth at the distant locations was 3.6 meters (12 feet), and the hydrophone was set at a depth of 2 meters (6.5 feet). No RMS data was collected at the distance location. The measurement results for peak, RMS, and single-strike SEL levels are summarized in Table I.5-13.
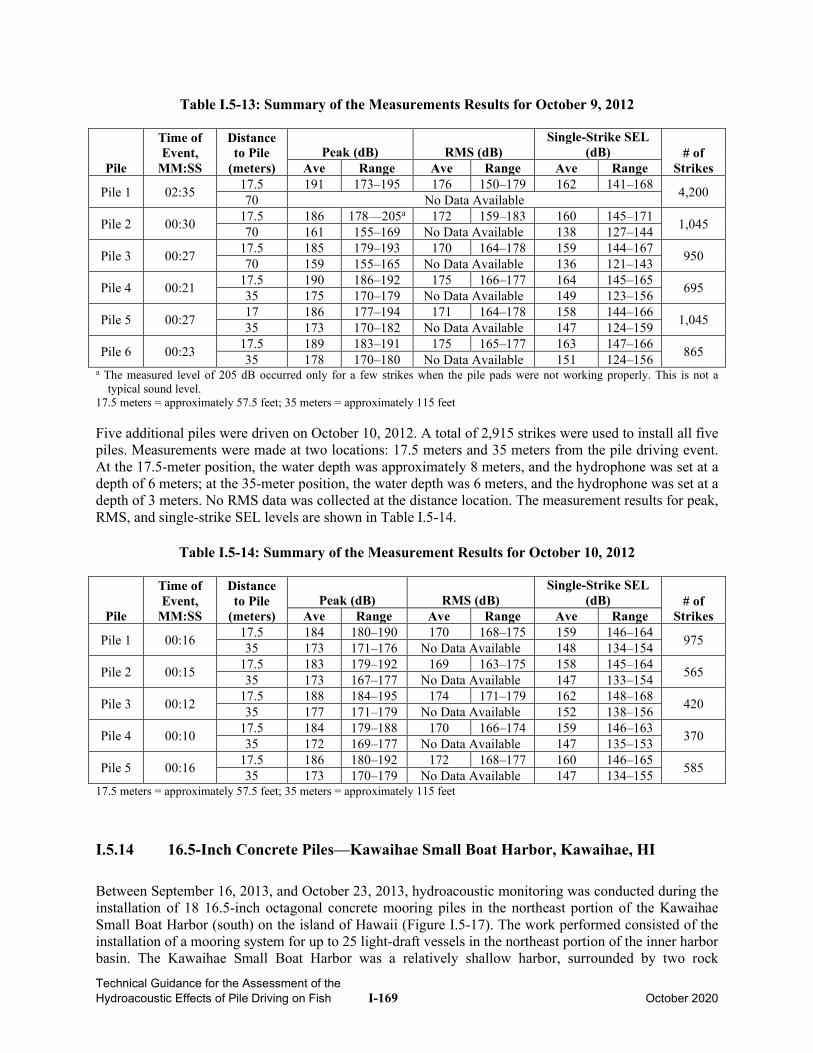
Technical Guidance for the Assessment of the Hydroacoustic Effects of Pile Driving on Fish I-169 October 2020
Table I.5-13: Summary of the Measurements Results for October 9, 2012
Pile
Time of Event,
MM:SS
Distance to Pile
(meters) Peak (dB) RMS (dB)
Single-Strike SEL (dB) # of
Strikes Ave Range Ave Range Ave Range
Pile 1 02:35 17.5 191 173–195 176 150–179 162 141–168 4,200 70 No Data Available
Pile 2 00:30 17.5 186 178––205a 172 159–183 160 145–171 1,045 70 161 155–169 No Data Available 138 127–144
Pile 3 00:27 17.5 185 179–193 170 164–178 159 144–167 950 70 159 155–165 No Data Available 136 121–143
Pile 4 00:21 17.5 190 186–192 175 166–177 164 145–165 695 35 175 170–179 No Data Available 149 123–156
Pile 5 00:27 17 186 177–194 171 164–178 158 144–166 1,045 35 173 170–182 No Data Available 147 124–159
Pile 6 00:23 17.5 189 183–191 175 165–177 163 147–166 865 35 178 170–180 No Data Available 151 124–156a The measured level of 205 dB occurred only for a few strikes when the pile pads were not working properly. This is not a
typical sound level. 17.5 meters = approximately 57.5 feet; 35 meters = approximately 115 feet
Five additional piles were driven on October 10, 2012. A total of 2,915 strikes were used to install all five piles. Measurements were made at two locations: 17.5 meters and 35 meters from the pile driving event. At the 17.5-meter position, the water depth was approximately 8 meters, and the hydrophone was set at a depth of 6 meters; at the 35-meter position, the water depth was 6 meters, and the hydrophone was set at a depth of 3 meters. No RMS data was collected at the distance location. The measurement results for peak, RMS, and single-strike SEL levels are shown in Table I.5-14.
Table I.5-14: Summary of the Measurement Results for October 10, 2012
Pile
Time of Event,
MM:SS
Distance to Pile
(meters) Peak (dB) RMS (dB)
Single-Strike SEL (dB) # of
Strikes Ave Range Ave Range Ave Range
Pile 1 00:16 17.5 184 180–190 170 168–175 159 146–164 975 35 173 171–176 No Data Available 148 134–154
Pile 2 00:15 17.5 183 179–192 169 163–175 158 145–164 565 35 173 167–177 No Data Available 147 133–154
Pile 3 00:12 17.5 188 184–195 174 171–179 162 148–168 420 35 177 171–179 No Data Available 152 138–156
Pile 4 00:10 17.5 184 179–188 170 166–174 159 146–163 370 35 172 169–177 No Data Available 147 135–153
Pile 5 00:16 17.5 186 180–192 172 168–177 160 146–165 585 35 173 170–179 No Data Available 147 134–15517.5 meters = approximately 57.5 feet; 35 meters = approximately 115 feet
I.5.14 16.5-Inch Concrete Piles—Kawaihae Small Boat Harbor, Kawaihae, HI
Between September 16, 2013, and October 23, 2013, hydroacoustic monitoring was conducted during the installation of 18 16.5-inch octagonal concrete mooring piles in the northeast portion of the Kawaihae Small Boat Harbor (south) on the island of Hawaii (Figure I.5-17). The work performed consisted of the installation of a mooring system for up to 25 light-draft vessels in the northeast portion of the inner harbor basin. The Kawaihae Small Boat Harbor was a relatively shallow harbor, surrounded by two rock
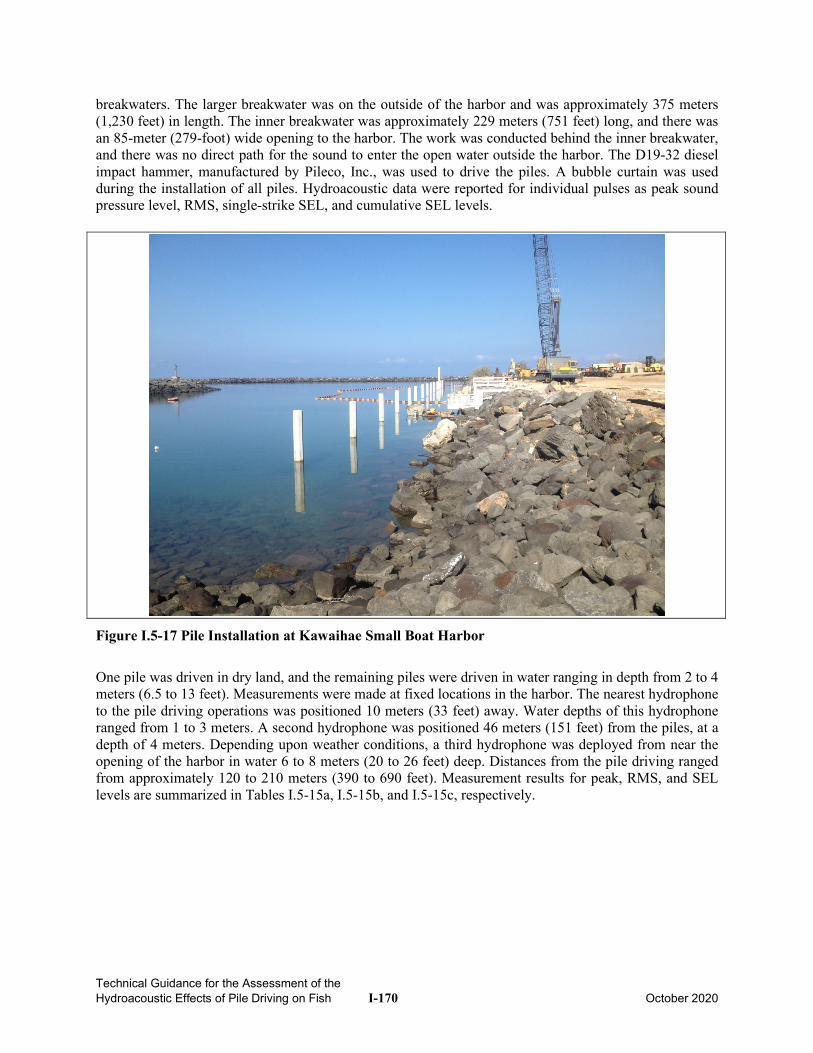
Technical Guidance for the Assessment of the Hydroacoustic Effects of Pile Driving on Fish I-170 October 2020
breakwaters. The larger breakwater was on the outside of the harbor and was approximately 375 meters (1,230 feet) in length. The inner breakwater was approximately 229 meters (751 feet) long, and there was an 85-meter (279-foot) wide opening to the harbor. The work was conducted behind the inner breakwater, and there was no direct path for the sound to enter the open water outside the harbor. The D19-32 diesel impact hammer, manufactured by Pileco, Inc., was used to drive the piles. A bubble curtain was used during the installation of all piles. Hydroacoustic data were reported for individual pulses as peak sound pressure level, RMS, single-strike SEL, and cumulative SEL levels.
Figure I.5-17 Pile Installation at Kawaihae Small Boat Harbor
One pile was driven in dry land, and the remaining piles were driven in water ranging in depth from 2 to 4 meters (6.5 to 13 feet). Measurements were made at fixed locations in the harbor. The nearest hydrophone to the pile driving operations was positioned 10 meters (33 feet) away. Water depths of this hydrophone ranged from 1 to 3 meters. A second hydrophone was positioned 46 meters (151 feet) from the piles, at a depth of 4 meters. Depending upon weather conditions, a third hydrophone was deployed from near the opening of the harbor in water 6 to 8 meters (20 to 26 feet) deep. Distances from the pile driving ranged from approximately 120 to 210 meters (390 to 690 feet). Measurement results for peak, RMS, and SEL levels are summarized in Tables I.5-15a, I.5-15b, and I.5-15c, respectively.
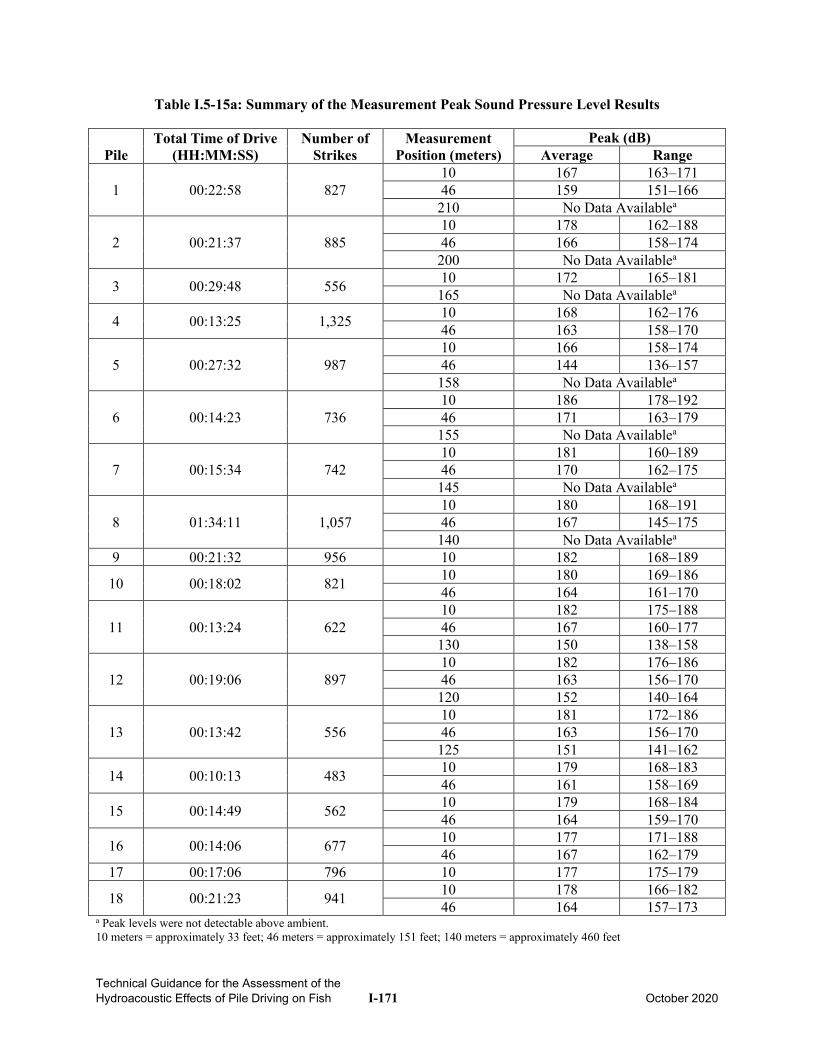
Technical Guidance for the Assessment of the Hydroacoustic Effects of Pile Driving on Fish I-171 October 2020
Table I.5-15a: Summary of the Measurement Peak Sound Pressure Level Results
Pile Total Time of Drive
(HH:MM:SS) Number of
Strikes Measurement
Position (meters) Peak (dB)
Average Range
1 00:22:58 827 10 167 163–171 46 159 151–166 210 No Data Availablea
2 00:21:37 885 10 178 162–188 46 166 158–174 200 No Data Availablea
3 00:29:48 556 10 172 165–181 165 No Data Availablea
4 00:13:25 1,325 10 168 162–176 46 163 158–170
5 00:27:32 987 10 166 158–174 46 144 136–157 158 No Data Availablea
6 00:14:23 736 10 186 178–192 46 171 163–179 155 No Data Availablea
7 00:15:34 742 10 181 160–189 46 170 162–175 145 No Data Availablea
8 01:34:11 1,057 10 180 168–191 46 167 145–175 140 No Data Availablea
9 00:21:32 956 10 182 168–189
10 00:18:02 821 10 180 169–186 46 164 161–170
11 00:13:24 622 10 182 175–188 46 167 160–177 130 150 138–158
12 00:19:06 897 10 182 176–186 46 163 156–170 120 152 140–164
13 00:13:42 556 10 181 172–186 46 163 156–170 125 151 141–162
14 00:10:13 483 10 179 168–183 46 161 158–169
15 00:14:49 562 10 179 168–184 46 164 159–170
16 00:14:06 677 10 177 171–188 46 167 162–179
17 00:17:06 796 10 177 175–179
18 00:21:23 941 10 178 166–182 46 164 157–173
a Peak levels were not detectable above ambient. 10 meters = approximately 33 feet; 46 meters = approximately 151 feet; 140 meters = approximately 460 feet
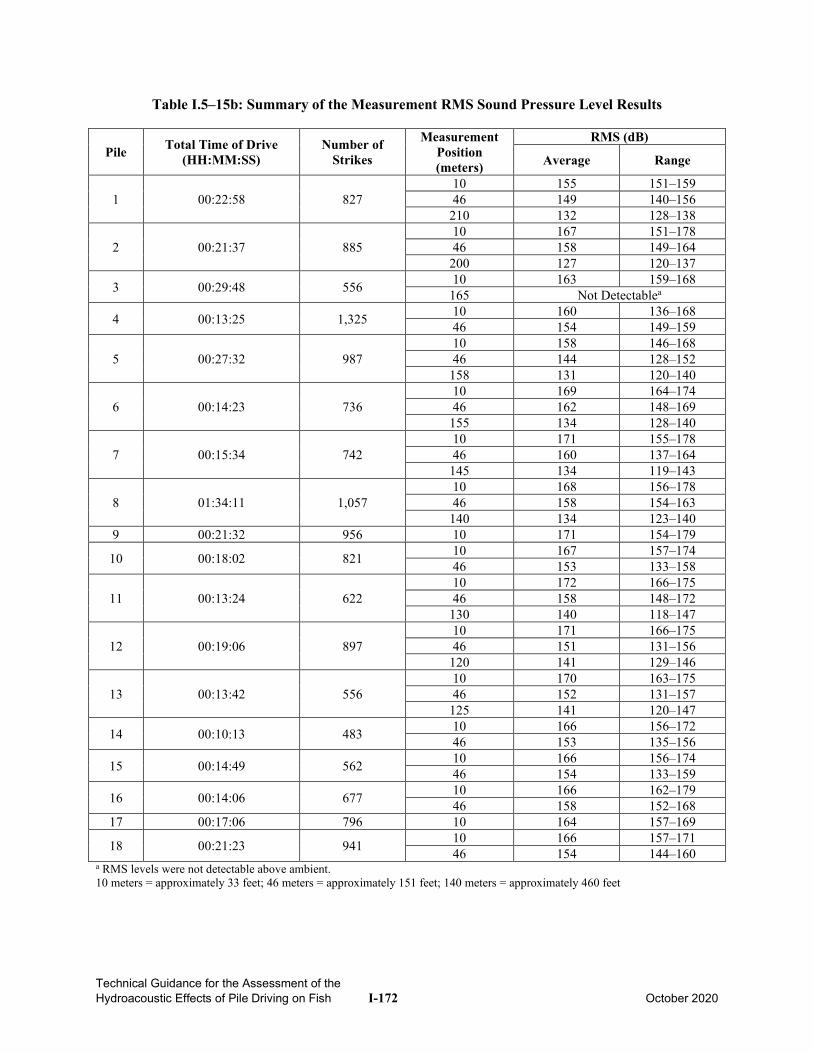
Technical Guidance for the Assessment of the Hydroacoustic Effects of Pile Driving on Fish I-172 October 2020
Table I.5–15b: Summary of the Measurement RMS Sound Pressure Level Results
Pile Total Time of Drive (HH:MM:SS)
Number of Strikes
Measurement Position (meters)
RMS (dB)
Average Range
1 00:22:58 827 10 155 151–159 46 149 140–156
210 132 128–138
2 00:21:37 885 10 167 151–178 46 158 149–164
200 127 120–137
3 00:29:48 556 10 163 159–168 165 Not Detectablea
4 00:13:25 1,325 10 160 136–168 46 154 149–159
5 00:27:32 987 10 158 146–168 46 144 128–152
158 131 120–140
6 00:14:23 736 10 169 164–174 46 162 148–169
155 134 128–140
7 00:15:34 742 10 171 155–178 46 160 137–164
145 134 119–143
8 01:34:11 1,057 10 168 156–178 46 158 154–163
140 134 123–140 9 00:21:32 956 10 171 154–179
10 00:18:02 821 10 167 157–174 46 153 133–158
11 00:13:24 622 10 172 166–175 46 158 148–172
130 140 118–147
12 00:19:06 897 10 171 166–175 46 151 131–156
120 141 129–146
13 00:13:42 556 10 170 163–175 46 152 131–157
125 141 120–147
14 00:10:13 483 10 166 156–172 46 153 135–156
15 00:14:49 562 10 166 156–174 46 154 133–159
16 00:14:06 677 10 166 162–179 46 158 152–168
17 00:17:06 796 10 164 157–169
18 00:21:23 941 10 166 157–171 46 154 144–160
a RMS levels were not detectable above ambient. 10 meters = approximately 33 feet; 46 meters = approximately 151 feet; 140 meters = approximately 460 feet
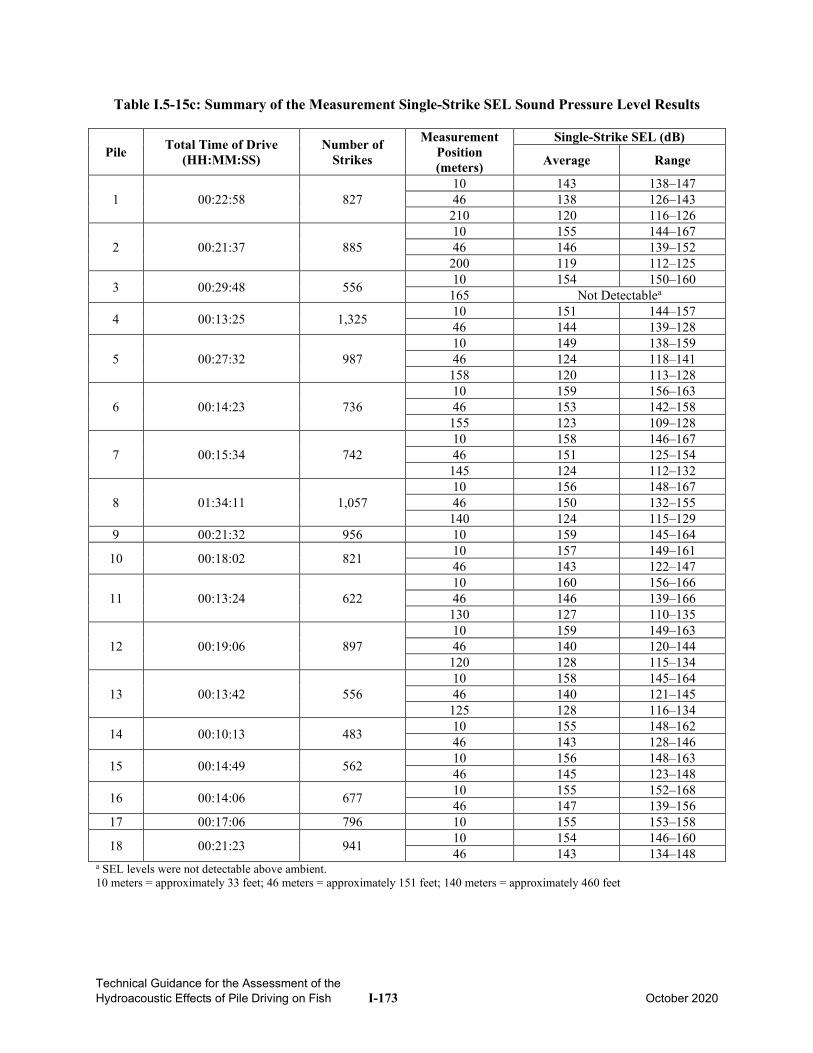
Technical Guidance for the Assessment of the Hydroacoustic Effects of Pile Driving on Fish I-173 October 2020
Table I.5-15c: Summary of the Measurement Single-Strike SEL Sound Pressure Level Results
Pile Total Time of Drive (HH:MM:SS)
Number of Strikes
Measurement Position (meters)
Single-Strike SEL (dB)
Average Range
1 00:22:58 827 10 143 138–147 46 138 126–143
210 120 116–126
2 00:21:37 885 10 155 144–167 46 146 139–152
200 119 112–125
3 00:29:48 556 10 154 150–160 165 Not Detectablea
4 00:13:25 1,325 10 151 144–157 46 144 139–128
5 00:27:32 987 10 149 138–159 46 124 118–141
158 120 113–128
6 00:14:23 736 10 159 156–163 46 153 142–158
155 123 109–128
7 00:15:34 742 10 158 146–167 46 151 125–154
145 124 112–132
8 01:34:11 1,057 10 156 148–167 46 150 132–155
140 124 115–129 9 00:21:32 956 10 159 145–164
10 00:18:02 821 10 157 149–161 46 143 122–147
11 00:13:24 622 10 160 156–166 46 146 139–166
130 127 110–135
12 00:19:06 897 10 159 149–163 46 140 120–144
120 128 115–134
13 00:13:42 556 10 158 145–164 46 140 121–145
125 128 116–134
14 00:10:13 483 10 155 148–162 46 143 128–146
15 00:14:49 562 10 156 148–163 46 145 123–148
16 00:14:06 677 10 155 152–168 46 147 139–156
17 00:17:06 796 10 155 153–158
18 00:21:23 941 10 154 146–160 46 143 134–148
a SEL levels were not detectable above ambient. 10 meters = approximately 33 feet; 46 meters = approximately 151 feet; 140 meters = approximately 460 feet
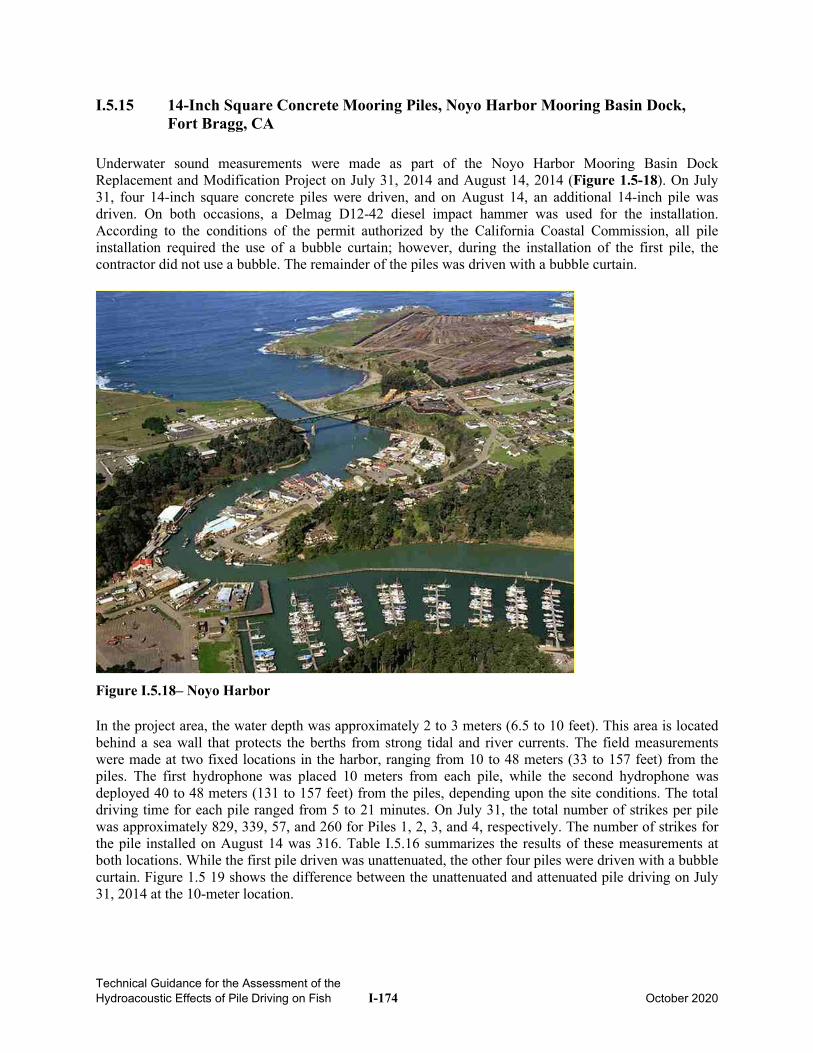
Technical Guidance for the Assessment of the Hydroacoustic Effects of Pile Driving on Fish I-174 October 2020
I.5.15 14-Inch Square Concrete Mooring Piles, Noyo Harbor Mooring Basin Dock, Fort Bragg, CA
Underwater sound measurements were made as part of the Noyo Harbor Mooring Basin Dock Replacement and Modification Project on July 31, 2014 and August 14, 2014 (Figure 1.5-18). On July 31, four 14-inch square concrete piles were driven, and on August 14, an additional 14-inch pile was driven. On both occasions, a Delmag D12-42 diesel impact hammer was used for the installation. According to the conditions of the permit authorized by the California Coastal Commission, all pile installation required the use of a bubble curtain; however, during the installation of the first pile, the contractor did not use a bubble. The remainder of the piles was driven with a bubble curtain.
Figure I.5.18– Noyo Harbor In the project area, the water depth was approximately 2 to 3 meters (6.5 to 10 feet). This area is located behind a sea wall that protects the berths from strong tidal and river currents. The field measurements were made at two fixed locations in the harbor, ranging from 10 to 48 meters (33 to 157 feet) from the piles. The first hydrophone was placed 10 meters from each pile, while the second hydrophone was deployed 40 to 48 meters (131 to 157 feet) from the piles, depending upon the site conditions. The total driving time for each pile ranged from 5 to 21 minutes. On July 31, the total number of strikes per pile was approximately 829, 339, 57, and 260 for Piles 1, 2, 3, and 4, respectively. The number of strikes for the pile installed on August 14 was 316. Table I.5.16 summarizes the results of these measurements at both locations. While the first pile driven was unattenuated, the other four piles were driven with a bubble curtain. Figure 1.5 19 shows the difference between the unattenuated and attenuated pile driving on July 31, 2014 at the 10-meter location.
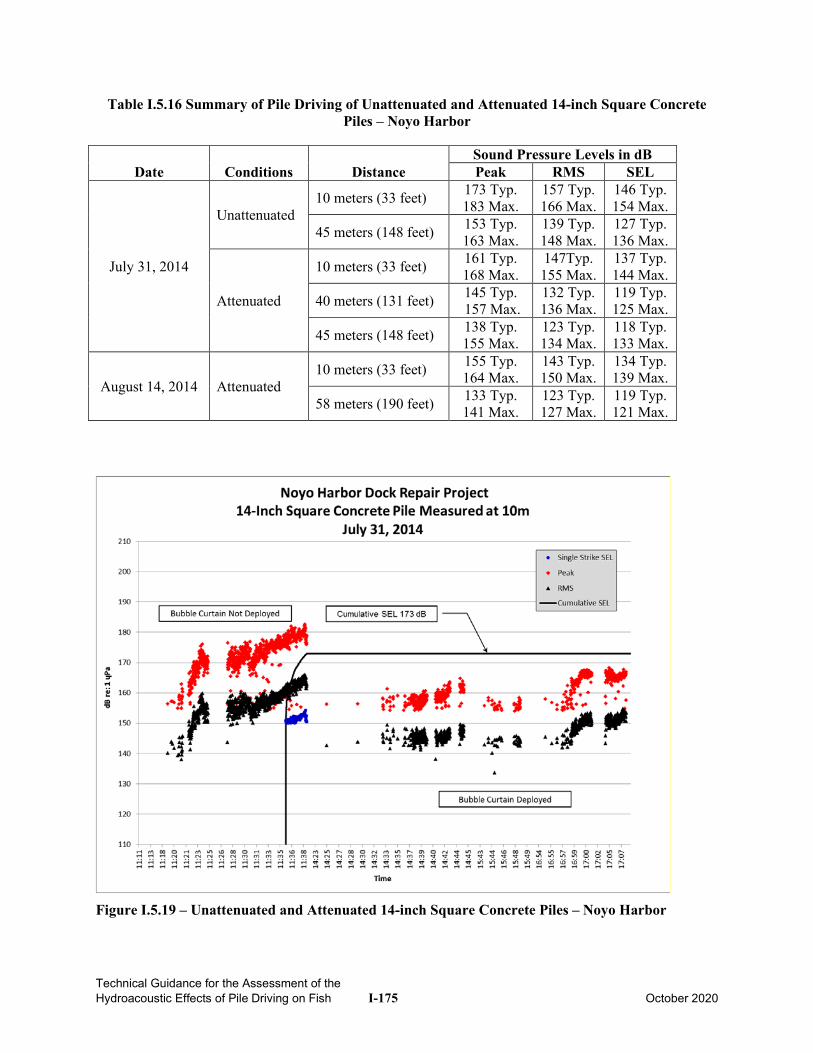
Technical Guidance for the Assessment of the Hydroacoustic Effects of Pile Driving on Fish I-175 October 2020
Table I.5.16 Summary of Pile Driving of Unattenuated and Attenuated 14-inch Square Concrete Piles – Noyo Harbor
Date Conditions Distance Sound Pressure Levels in dB Peak RMS SEL
July 31, 2014
Unattenuated 10 meters (33 feet) 173 Typ.
183 Max. 157 Typ. 166 Max.
146 Typ. 154 Max.
45 meters (148 feet) 153 Typ. 163 Max.
139 Typ. 148 Max.
127 Typ. 136 Max.
Attenuated
10 meters (33 feet) 161 Typ. 168 Max.
147Typ. 155 Max.
137 Typ. 144 Max.
40 meters (131 feet) 145 Typ. 157 Max.
132 Typ. 136 Max.
119 Typ. 125 Max.
45 meters (148 feet) 138 Typ. 155 Max.
123 Typ. 134 Max.
118 Typ. 133 Max.
August 14, 2014 Attenuated 10 meters (33 feet) 155 Typ.
164 Max. 143 Typ. 150 Max.
134 Typ. 139 Max.
58 meters (190 feet) 133 Typ. 141 Max.
123 Typ. 127 Max.
119 Typ. 121 Max.
Figure I.5.19 – Unattenuated and Attenuated 14-inch Square Concrete Piles – Noyo Harbor
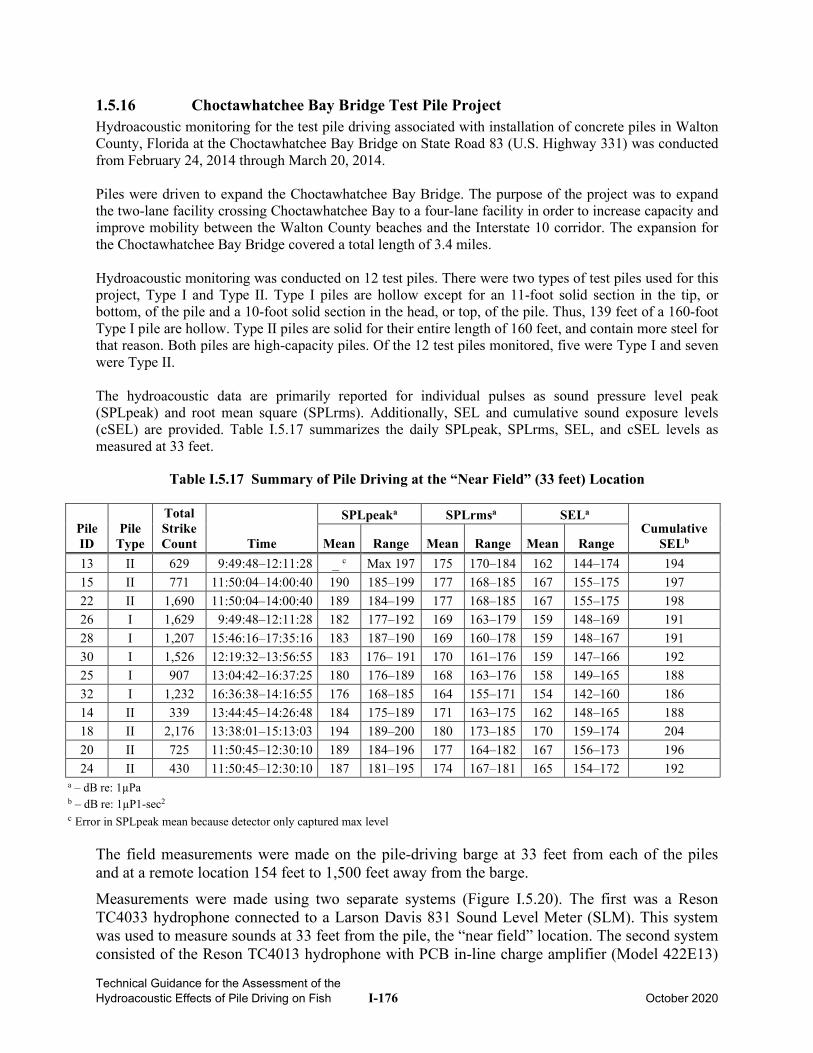
Technical Guidance for the Assessment of the Hydroacoustic Effects of Pile Driving on Fish I-176 October 2020
1.5.16 Choctawhatchee Bay Bridge Test Pile Project Hydroacoustic monitoring for the test pile driving associated with installation of concrete piles in Walton County, Florida at the Choctawhatchee Bay Bridge on State Road 83 (U.S. Highway 331) was conducted from February 24, 2014 through March 20, 2014. Piles were driven to expand the Choctawhatchee Bay Bridge. The purpose of the project was to expand the two-lane facility crossing Choctawhatchee Bay to a four-lane facility in order to increase capacity and improve mobility between the Walton County beaches and the Interstate 10 corridor. The expansion for the Choctawhatchee Bay Bridge covered a total length of 3.4 miles. Hydroacoustic monitoring was conducted on 12 test piles. There were two types of test piles used for this project, Type I and Type II. Type I piles are hollow except for an 11-foot solid section in the tip, or bottom, of the pile and a 10-foot solid section in the head, or top, of the pile. Thus, 139 feet of a 160-foot Type I pile are hollow. Type II piles are solid for their entire length of 160 feet, and contain more steel for that reason. Both piles are high-capacity piles. Of the 12 test piles monitored, five were Type I and seven were Type II. The hydroacoustic data are primarily reported for individual pulses as sound pressure level peak (SPLpeak) and root mean square (SPLrms). Additionally, SEL and cumulative sound exposure levels (cSEL) are provided. Table I.5.17 summarizes the daily SPLpeak, SPLrms, SEL, and cSEL levels as measured at 33 feet.
Table I.5.17 Summary of Pile Driving at the “Near Field” (33 feet) Location
Pile ID
Pile Type
Total Strike Count Time
SPLpeaka SPLrmsa SELa
Cumulative SELb Mean Range Mean Range Mean Range
13 II 629 9:49:48–12:11:28 _ c Max 197 175 170–184 162 144–174 194 15 II 771 11:50:04–14:00:40 190 185–199 177 168–185 167 155–175 197 22 II 1,690 11:50:04–14:00:40 189 184–199 177 168–185 167 155–175 198 26 I 1,629 9:49:48–12:11:28 182 177–192 169 163–179 159 148–169 191 28 I 1,207 15:46:16–17:35:16 183 187–190 169 160–178 159 148–167 191 30 I 1,526 12:19:32–13:56:55 183 176– 191 170 161–176 159 147–166 192 25 I 907 13:04:42–16:37:25 180 176–189 168 163–176 158 149–165 188 32 I 1,232 16:36:38–14:16:55 176 168–185 164 155–171 154 142–160 186 14 II 339 13:44:45–14:26:48 184 175–189 171 163–175 162 148–165 188 18 II 2,176 13:38:01–15:13:03 194 189–200 180 173–185 170 159–174 204 20 II 725 11:50:45–12:30:10 189 184–196 177 164–182 167 156–173 196 24 II 430 11:50:45–12:30:10 187 181–195 174 167–181 165 154–172 192
a – dB re: 1µPa b – dB re: 1µP1-sec2
c Error in SPLpeak mean because detector only captured max level
The field measurements were made on the pile-driving barge at 33 feet from each of the piles and at a remote location 154 feet to 1,500 feet away from the barge. Measurements were made using two separate systems (Figure I.5.20). The first was a Reson TC4033 hydrophone connected to a Larson Davis 831 Sound Level Meter (SLM). This system was used to measure sounds at 33 feet from the pile, the “near field” location. The second system consisted of the Reson TC4013 hydrophone with PCB in-line charge amplifier (Model 422E13)
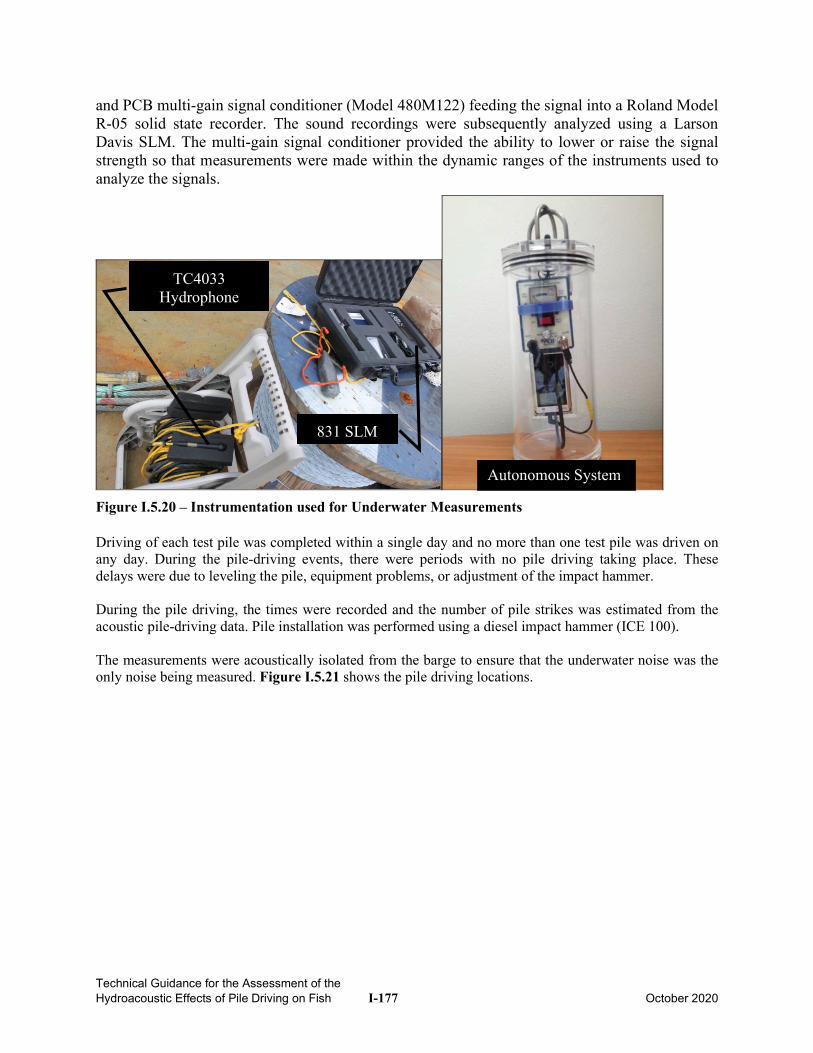
Technical Guidance for the Assessment of the Hydroacoustic Effects of Pile Driving on Fish I-177 October 2020
and PCB multi-gain signal conditioner (Model 480M122) feeding the signal into a Roland Model R-05 solid state recorder. The sound recordings were subsequently analyzed using a Larson Davis SLM. The multi-gain signal conditioner provided the ability to lower or raise the signal strength so that measurements were made within the dynamic ranges of the instruments used to analyze the signals.
831 SLM
TC4033 Hydrophone
Autonomous System
Figure I.5.20 – Instrumentation used for Underwater Measurements Driving of each test pile was completed within a single day and no more than one test pile was driven on any day. During the pile-driving events, there were periods with no pile driving taking place. These delays were due to leveling the pile, equipment problems, or adjustment of the impact hammer. During the pile driving, the times were recorded and the number of pile strikes was estimated from the acoustic pile-driving data. Pile installation was performed using a diesel impact hammer (ICE 100). The measurements were acoustically isolated from the barge to ensure that the underwater noise was the only noise being measured. Figure I.5.21 shows the pile driving locations.
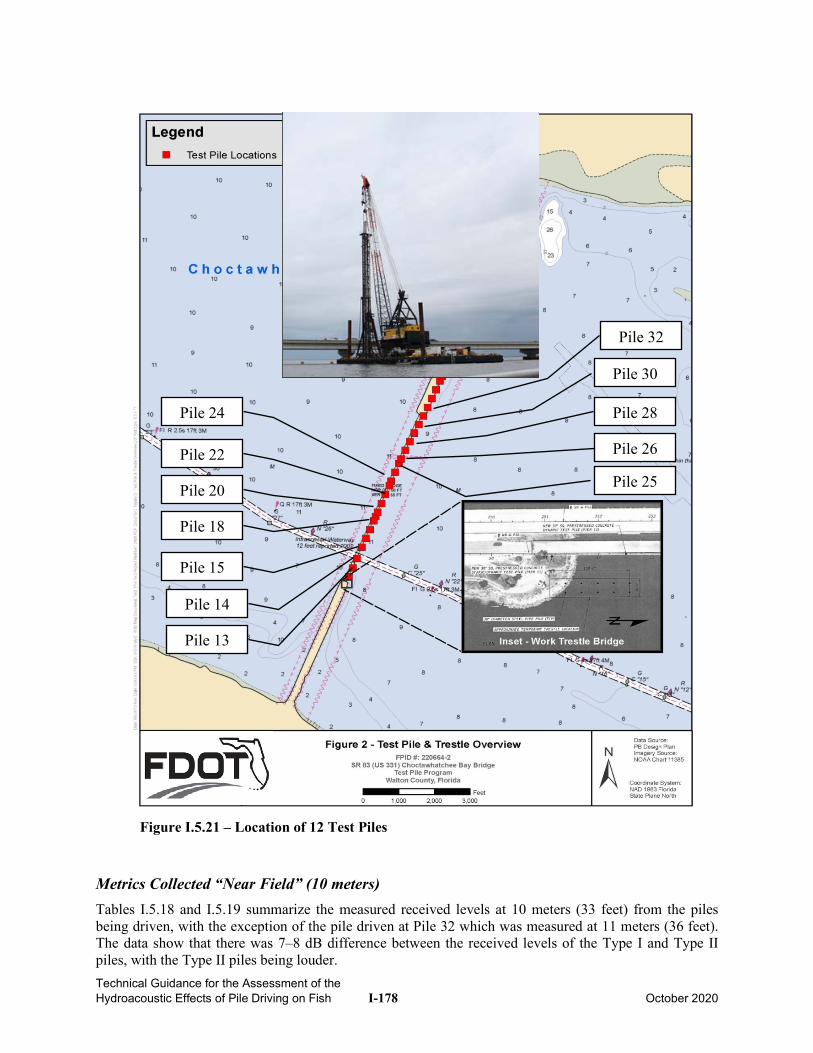
Technical Guidance for the Assessment of the Hydroacoustic Effects of Pile Driving on Fish I-178 October 2020
Pile 13
Pile 15
Pile 14
Pile 18
Pile 20
Pile 22
Pile 24
Pile 25
Pile 26
Pile 28
Pile 32
Pile 30
Figure I.5.21 – Location of 12 Test Piles
Metrics Collected “Near Field” (10 meters) Tables I.5.18 and I.5.19 summarize the measured received levels at 10 meters (33 feet) from the piles being driven, with the exception of the pile driven at Pile 32 which was measured at 11 meters (36 feet). The data show that there was 7–8 dB difference between the received levels of the Type I and Type II piles, with the Type II piles being louder.
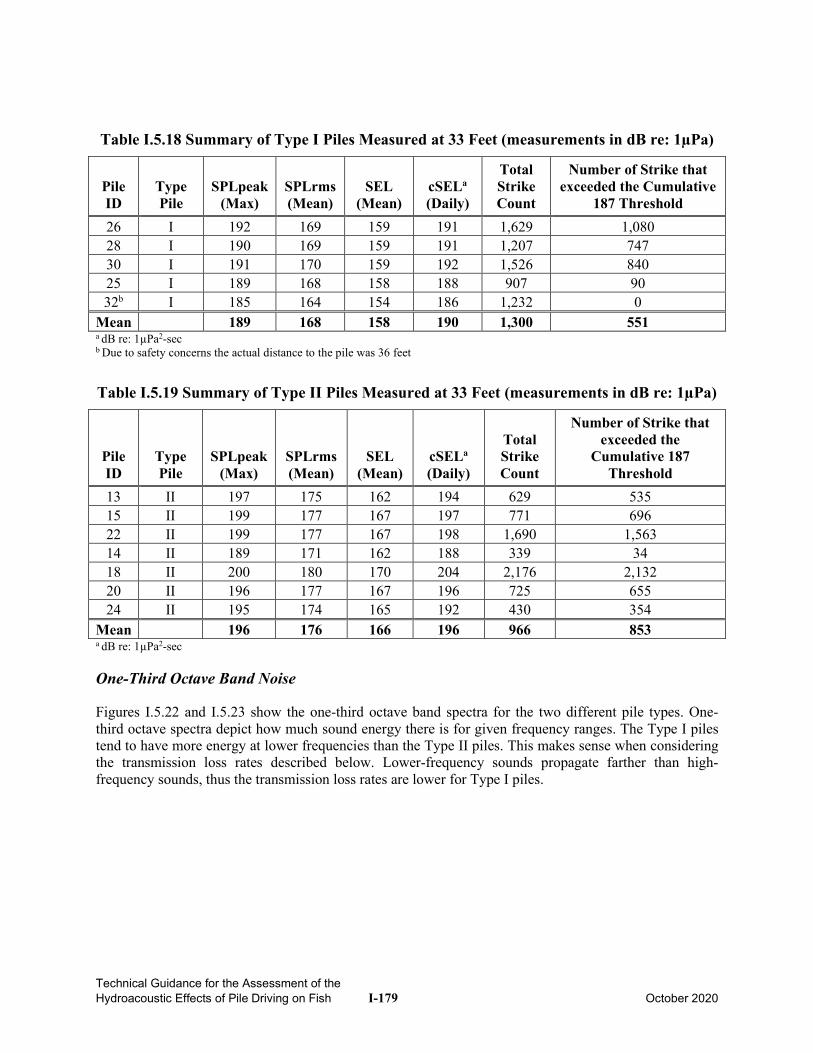
Technical Guidance for the Assessment of the Hydroacoustic Effects of Pile Driving on Fish I-179 October 2020
Table I.5.18 Summary of Type I Piles Measured at 33 Feet (measurements in dB re: 1µPa)
Pile ID
Type Pile
SPLpeak (Max)
SPLrms (Mean)
SEL (Mean)
cSELa (Daily)
Total Strike Count
Number of Strike that exceeded the Cumulative
187 Threshold 26 I 192 169 159 191 1,629 1,080 28 I 190 169 159 191 1,207 747 30 I 191 170 159 192 1,526 840 25 I 189 168 158 188 907 90 32b I 185 164 154 186 1,232 0
Mean 189 168 158 190 1,300 551 a dB re: 1µPa2-sec b Due to safety concerns the actual distance to the pile was 36 feet
Table I.5.19 Summary of Type II Piles Measured at 33 Feet (measurements in dB re: 1µPa)
Pile ID
Type Pile
SPLpeak (Max)
SPLrms (Mean)
SEL (Mean)
cSELa (Daily)
Total Strike Count
Number of Strike that exceeded the
Cumulative 187 Threshold
13 II 197 175 162 194 629 535 15 II 199 177 167 197 771 696 22 II 199 177 167 198 1,690 1,563 14 II 189 171 162 188 339 34 18 II 200 180 170 204 2,176 2,132 20 II 196 177 167 196 725 655 24 II 195 174 165 192 430 354
Mean 196 176 166 196 966 853 a dB re: 1µPa2-sec
One-Third Octave Band Noise
Figures I.5.22 and I.5.23 show the one-third octave band spectra for the two different pile types. One-third octave spectra depict how much sound energy there is for given frequency ranges. The Type I piles tend to have more energy at lower frequencies than the Type II piles. This makes sense when considering the transmission loss rates described below. Lower-frequency sounds propagate farther than high-frequency sounds, thus the transmission loss rates are lower for Type I piles.
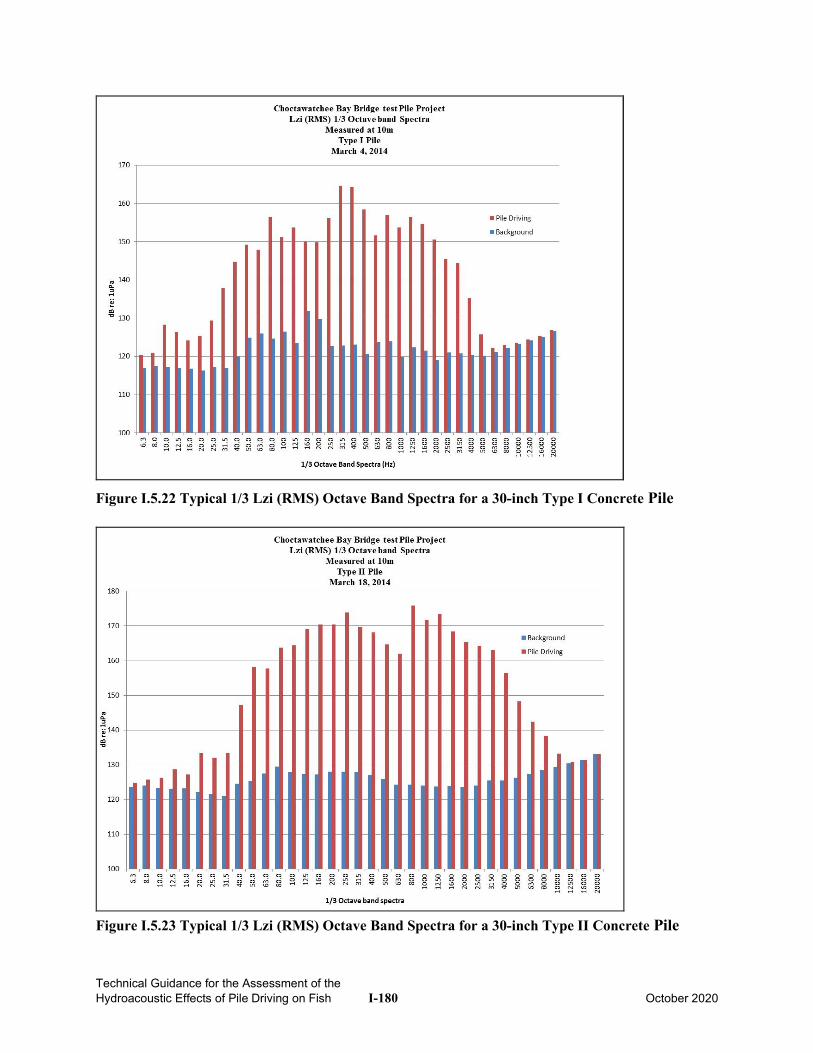
Technical Guidance for the Assessment of the Hydroacoustic Effects of Pile Driving on Fish I-180 October 2020
Figure I.5.22 Typical 1/3 Lzi (RMS) Octave Band Spectra for a 30-inch Type I Concrete Pile
Figure I.5.23 Typical 1/3 Lzi (RMS) Octave Band Spectra for a 30-inch Type II Concrete Pile
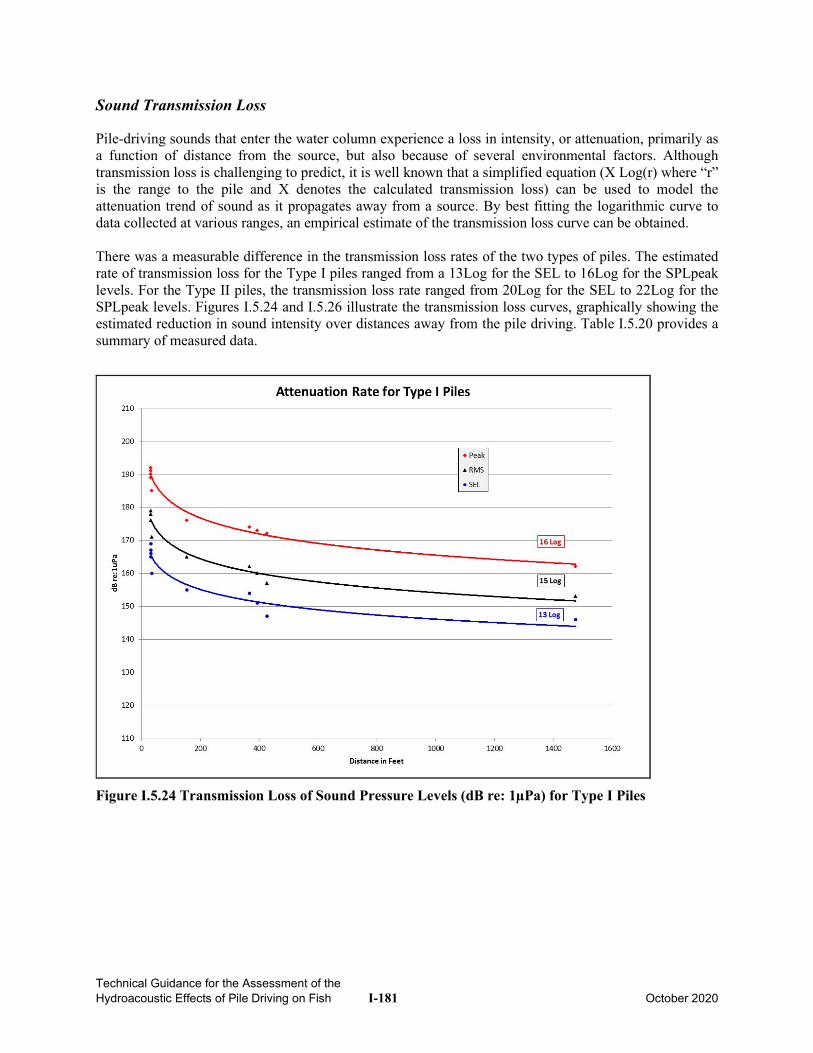
Technical Guidance for the Assessment of the Hydroacoustic Effects of Pile Driving on Fish I-181 October 2020
Sound Transmission Loss
Pile-driving sounds that enter the water column experience a loss in intensity, or attenuation, primarily as a function of distance from the source, but also because of several environmental factors. Although transmission loss is challenging to predict, it is well known that a simplified equation (X Log(r) where “r” is the range to the pile and X denotes the calculated transmission loss) can be used to model the attenuation trend of sound as it propagates away from a source. By best fitting the logarithmic curve to data collected at various ranges, an empirical estimate of the transmission loss curve can be obtained. There was a measurable difference in the transmission loss rates of the two types of piles. The estimated rate of transmission loss for the Type I piles ranged from a 13Log for the SEL to 16Log for the SPLpeak levels. For the Type II piles, the transmission loss rate ranged from 20Log for the SEL to 22Log for the SPLpeak levels. Figures I.5.24 and I.5.26 illustrate the transmission loss curves, graphically showing the estimated reduction in sound intensity over distances away from the pile driving. Table I.5.20 provides a summary of measured data.
Figure I.5.24 Transmission Loss of Sound Pressure Levels (dB re: 1µPa) for Type I Piles
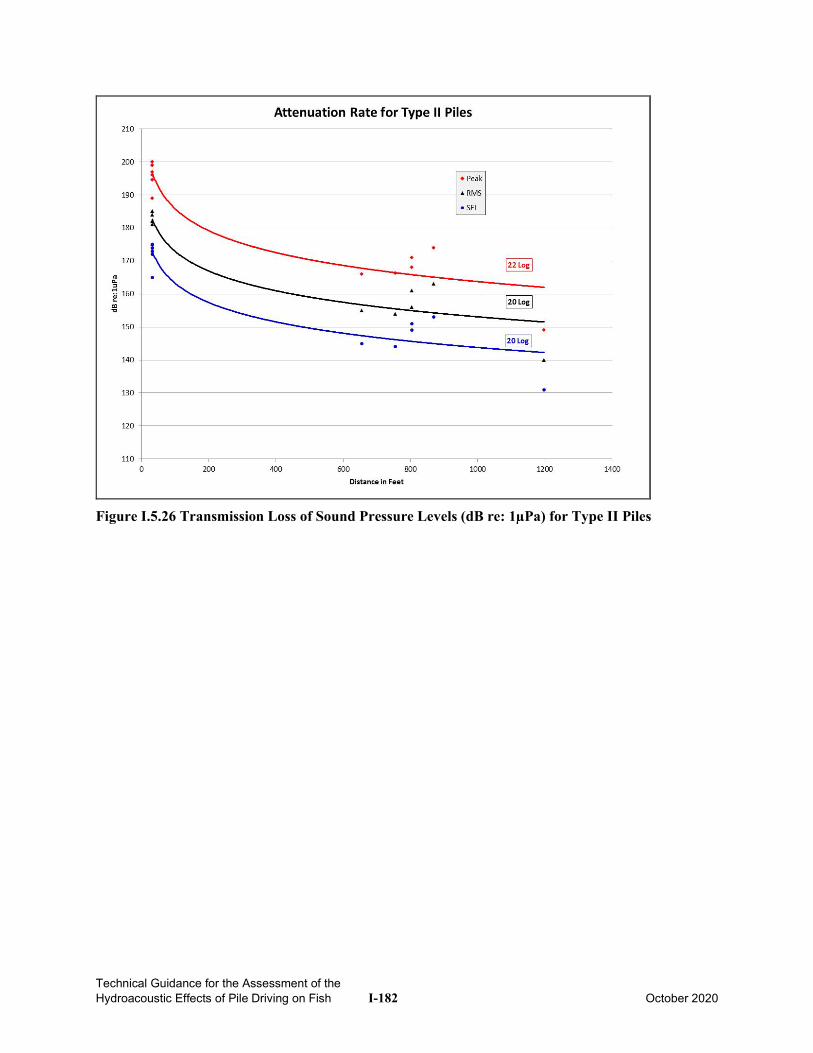
Technical Guidance for the Assessment of the Hydroacoustic Effects of Pile Driving on Fish I-182 October 2020
Figure I.5.26 Transmission Loss of Sound Pressure Levels (dB re: 1µPa) for Type II Piles

Technical Guidance for the Assessment of the Hydroacoustic Effects of Pile Driving on Fish I-183 October 2020
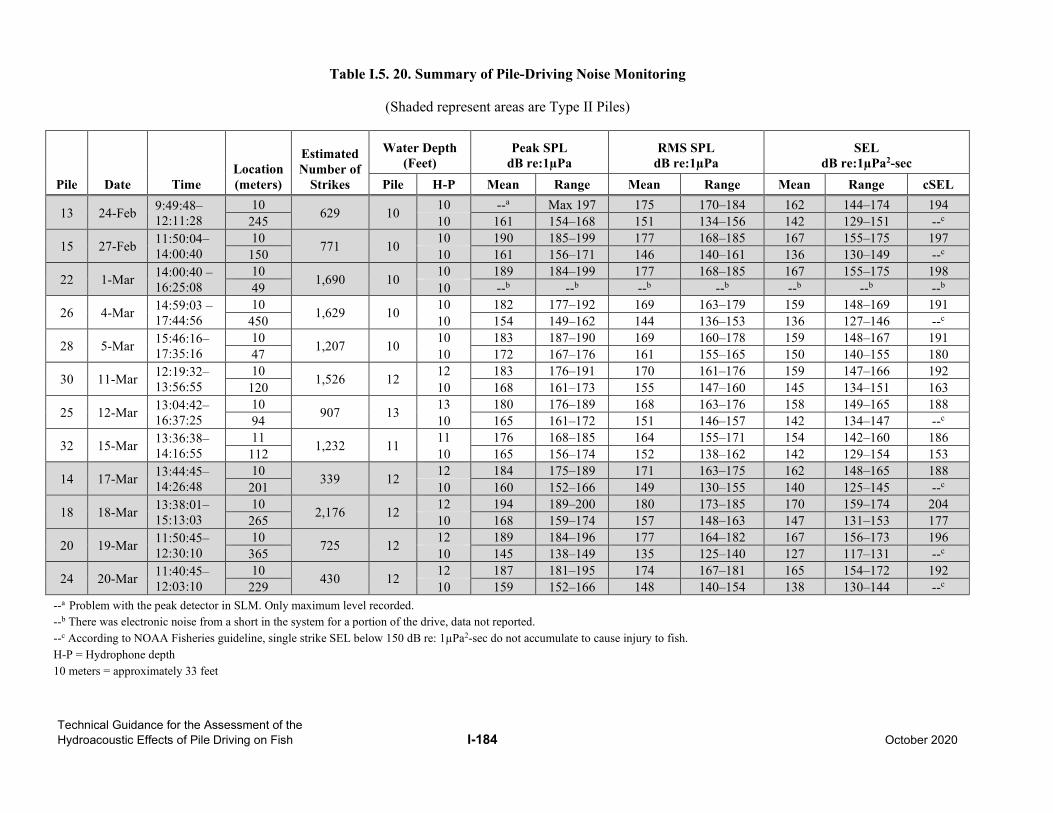
Technical Guidance for the Assessment of the Hydroacoustic Effects of Pile Driving on Fish I-184 October 2020
Table I.5. 20. Summary of Pile-Driving Noise Monitoring
(Shaded represent areas are Type II Piles)
Pile Date Time Location (meters)
Estimated Number of
Strikes
Water Depth (Feet)
Peak SPL dB re:1µPa
RMS SPL dB re:1µPa
SEL dB re:1µPa2-sec
Pile H-P Mean Range Mean Range Mean Range cSEL
13 24-Feb 9:49:48– 12:11:28
10 629 10 10 --a Max 197 175 170–184 162 144–174 194 245 10 161 154–168 151 134–156 142 129–151 --c
15 27-Feb 11:50:04– 14:00:40
10 771 10 10 190 185–199 177 168–185 167 155–175 197 150 10 161 156–171 146 140–161 136 130–149 --c
22 1-Mar 14:00:40 – 16:25:08
10 1,690 10 10 189 184–199 177 168–185 167 155–175 198 49 10 --b --b --b --b --b --b --b
26 4-Mar 14:59:03 – 17:44:56
10 1,629 10 10 182 177–192 169 163–179 159 148–169 191 450 10 154 149–162 144 136–153 136 127–146 --c
28 5-Mar 15:46:16– 17:35:16
10 1,207 10 10 183 187–190 169 160–178 159 148–167 191 47 10 172 167–176 161 155–165 150 140–155 180
30 11-Mar 12:19:32– 13:56:55
10 1,526 12 12 183 176–191 170 161–176 159 147–166 192 120 10 168 161–173 155 147–160 145 134–151 163
25 12-Mar 13:04:42– 16:37:25
10 907 13 13 180 176–189 168 163–176 158 149–165 188 94 10 165 161–172 151 146–157 142 134–147 --c
32 15-Mar 13:36:38– 14:16:55
11 1,232 11 11 176 168–185 164 155–171 154 142–160 186 112 10 165 156–174 152 138–162 142 129–154 153
14 17-Mar 13:44:45– 14:26:48
10 339 12 12 184 175–189 171 163–175 162 148–165 188 201 10 160 152–166 149 130–155 140 125–145 --c
18 18-Mar 13:38:01– 15:13:03
10 2,176 12 12 194 189–200 180 173–185 170 159–174 204 265 10 168 159–174 157 148–163 147 131–153 177
20 19-Mar 11:50:45– 12:30:10
10 725 12 12 189 184–196 177 164–182 167 156–173 196 365 10 145 138–149 135 125–140 127 117–131 --c
24 20-Mar 11:40:45–12:03:10
10 430 12 12 187 181–195 174 167–181 165 154–172 192 229 10 159 152–166 148 140–154 138 130–144 --c
--a Problem with the peak detector in SLM. Only maximum level recorded. --b There was electronic noise from a short in the system for a portion of the drive, data not reported. --c According to NOAA Fisheries guideline, single strike SEL below 150 dB re: 1µPa2-sec do not accumulate to cause injury to fish. H-P = Hydrophone depth 10 meters = approximately 33 feet
Technical Guidance for the Assessment of the Hydroacoustic Effects of Pile Driving on Fish I-185 October 2020
I.5.17 References
1. Illingworth & Rodkin, Inc. 2003. Structural Repairs to Pier 2 Naval Weapons Station, Concord, California – Report of Underwater Sound Level Measurements Resulting from Pile Driving. Report to Miller Thompson Constructors dated January 17, 2003.
2. Illingworth & Rodkin, Inc. 2003. Reconstruction of Pier 95 (Amports), Port of Benicia – Report of Underwater Sound Level Measurements Resulting from Pile Driving. Report to Manson Construction Company dated April 17, 2003.
3. Illingworth & Rodkin, Inc. 2004. Letter to Steve Hutchinson at Dutra Construction – Subject: Underwater Sound Measurement Results – Pier 40 Construction Pile Driving (Concrete Piles), dated July 13, 2004.
4. Illingworth & Rodkin, Inc. 2004. Port of Oakland Berth 22 Underwater Sound Measurement Data for Pile Driving Activity, August 2–4, 2004. Report to Manson Construction Co. dated August 18, 2004.
5. Illingworth & Rodkin, Inc. 2005. Port of Oakland Berth 22 Underwater Sound Measurement Data for the Driving of Octagonal Concrete Piles, August 2, 2004 – February 14, 2005. Report to Manson Construction dated April 4, 2005.
6. Illingworth and Rodkin. 2014. State Road 83 (United States Highway 331) Choctawhatchee Bay Bridge Hydroacoustic Monitoring Report. Draft Report. Submitted to Florida Department of Transportation, Chipley, Florida, under Contract No. C-9B22 – Amendment No. 3, issued to HDR Inc., Tampa, Florida. Petaluma, California.
7. Illingworth & Rodkin, Inc. 2004. Letter to Todd Bruce at Dutra Construction – Subject: Port of Oakland Berth 32 Concrete Pile Installation – Results of Underwater Sound Measurements, dated October 25, 2004.
8. Illingworth & Rodkin, Inc. 2005. Port of Oakland Berth 32 Underwater Sound Measurement Data for the Driving of Octagonal Concrete Piles, April 18 and 21, 2005. Report to Manson Construction Company dated June 10, 2005.
9. Strategic Environmental Consulting (SEC). 2005. Monitoring the Effects of Conventional Pile Driving on Three Species of Fish. April 8, 2005.
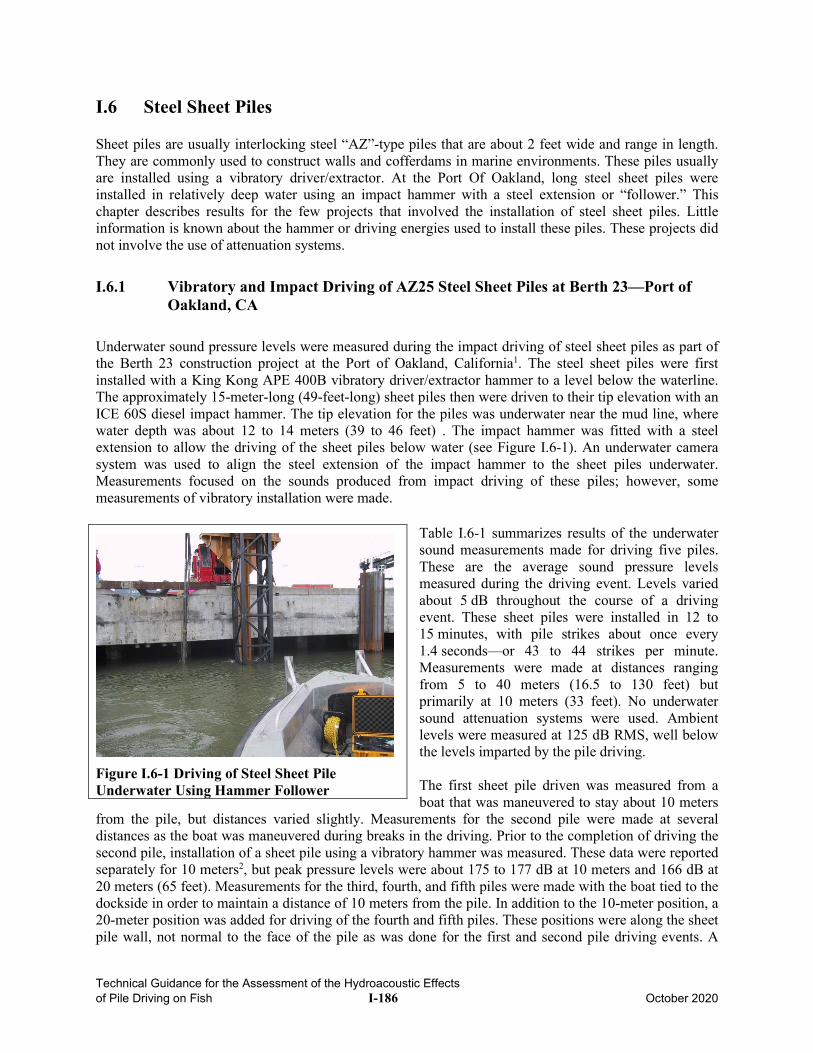
Technical Guidance for the Assessment of the Hydroacoustic Effects of Pile Driving on Fish I-186 October 2020
I.6 Steel Sheet Piles Sheet piles are usually interlocking steel “AZ”-type piles that are about 2 feet wide and range in length. They are commonly used to construct walls and cofferdams in marine environments. These piles usually are installed using a vibratory driver/extractor. At the Port Of Oakland, long steel sheet piles were installed in relatively deep water using an impact hammer with a steel extension or “follower.” This chapter describes results for the few projects that involved the installation of steel sheet piles. Little information is known about the hammer or driving energies used to install these piles. These projects did not involve the use of attenuation systems.
I.6.1 Vibratory and Impact Driving of AZ25 Steel Sheet Piles at Berth 23—Port of Oakland, CA
Underwater sound pressure levels were measured during the impact driving of steel sheet piles as part of the Berth 23 construction project at the Port of Oakland, California1. The steel sheet piles were first installed with a King Kong APE 400B vibratory driver/extractor hammer to a level below the waterline. The approximately 15-meter-long (49-feet-long) sheet piles then were driven to their tip elevation with an ICE 60S diesel impact hammer. The tip elevation for the piles was underwater near the mud line, where water depth was about 12 to 14 meters (39 to 46 feet) . The impact hammer was fitted with a steel extension to allow the driving of the sheet piles below water (see Figure I.6-1). An underwater camera system was used to align the steel extension of the impact hammer to the sheet piles underwater. Measurements focused on the sounds produced from impact driving of these piles; however, some measurements of vibratory installation were made.
Table I.6-1 summarizes results of the underwater sound measurements made for driving five piles. These are the average sound pressure levels measured during the driving event. Levels varied about 5 dB throughout the course of a driving event. These sheet piles were installed in 12 to 15 minutes, with pile strikes about once every 1.4 seconds—or 43 to 44 strikes per minute. Measurements were made at distances ranging from 5 to 40 meters (16.5 to 130 feet) but primarily at 10 meters (33 feet). No underwater sound attenuation systems were used. Ambient levels were measured at 125 dB RMS, well below the levels imparted by the pile driving. The first sheet pile driven was measured from a boat that was maneuvered to stay about 10 meters
from the pile, but distances varied slightly. Measurements for the second pile were made at several distances as the boat was maneuvered during breaks in the driving. Prior to the completion of driving the second pile, installation of a sheet pile using a vibratory hammer was measured. These data were reported separately for 10 meters2, but peak pressure levels were about 175 to 177 dB at 10 meters and 166 dB at 20 meters (65 feet). Measurements for the third, fourth, and fifth piles were made with the boat tied to the dockside in order to maintain a distance of 10 meters from the pile. In addition to the 10-meter position, a 20-meter position was added for driving of the fourth and fifth piles. These positions were along the sheet pile wall, not normal to the face of the pile as was done for the first and second pile driving events. A
Figure I.6-1 Driving of Steel Sheet Pile Underwater Using Hammer Follower
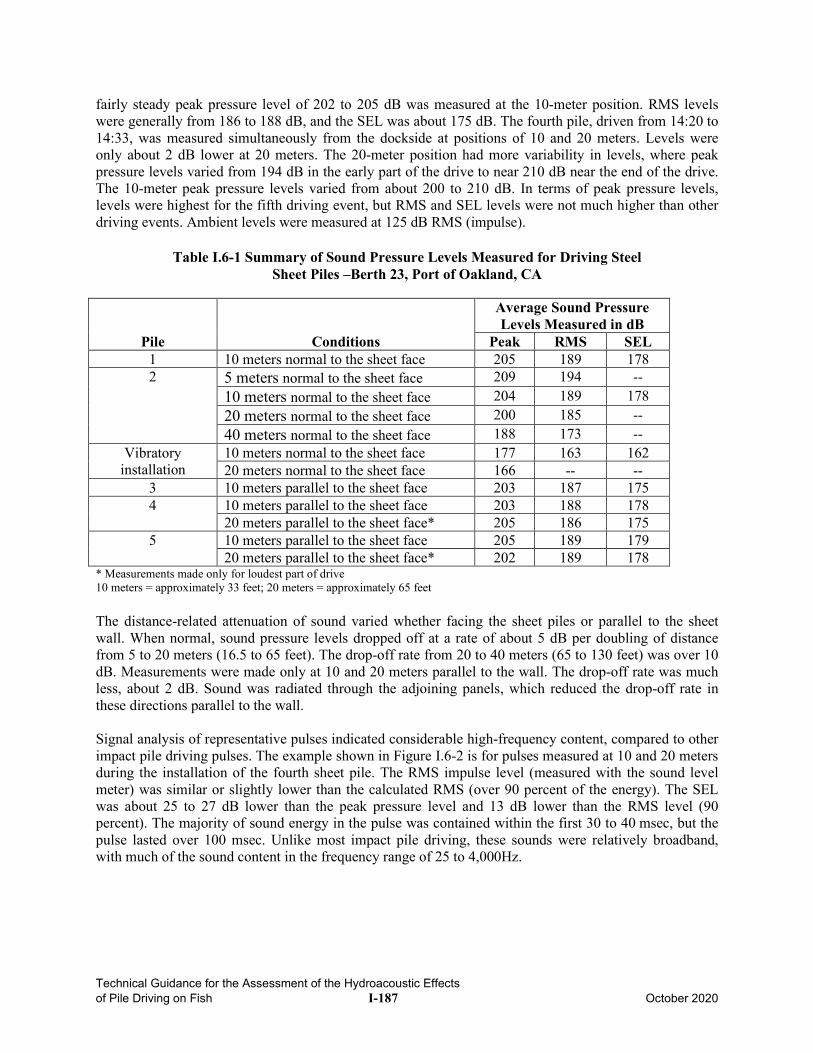
Technical Guidance for the Assessment of the Hydroacoustic Effects of Pile Driving on Fish I-187 October 2020
fairly steady peak pressure level of 202 to 205 dB was measured at the 10-meter position. RMS levels were generally from 186 to 188 dB, and the SEL was about 175 dB. The fourth pile, driven from 14:20 to 14:33, was measured simultaneously from the dockside at positions of 10 and 20 meters. Levels were only about 2 dB lower at 20 meters. The 20-meter position had more variability in levels, where peak pressure levels varied from 194 dB in the early part of the drive to near 210 dB near the end of the drive. The 10-meter peak pressure levels varied from about 200 to 210 dB. In terms of peak pressure levels, levels were highest for the fifth driving event, but RMS and SEL levels were not much higher than other driving events. Ambient levels were measured at 125 dB RMS (impulse).
Table I.6-1 Summary of Sound Pressure Levels Measured for Driving Steel Sheet Piles –Berth 23, Port of Oakland, CA
Pile Conditions
Average Sound Pressure Levels Measured in dB
Peak RMS SEL 1 10 meters normal to the sheet face 205 189 178 2 5 meters normal to the sheet face 209 194 --
10 meters normal to the sheet face 204 189 178 20 meters normal to the sheet face 200 185 -- 40 meters normal to the sheet face 188 173 --
Vibratory installation
10 meters normal to the sheet face 177 163 162 20 meters normal to the sheet face 166 -- --
3 10 meters parallel to the sheet face 203 187 175 4 10 meters parallel to the sheet face 203 188 178
20 meters parallel to the sheet face* 205 186 175 5 10 meters parallel to the sheet face 205 189 179
20 meters parallel to the sheet face* 202 189 178 * Measurements made only for loudest part of drive 10 meters = approximately 33 feet; 20 meters = approximately 65 feet The distance-related attenuation of sound varied whether facing the sheet piles or parallel to the sheet wall. When normal, sound pressure levels dropped off at a rate of about 5 dB per doubling of distance from 5 to 20 meters (16.5 to 65 feet). The drop-off rate from 20 to 40 meters (65 to 130 feet) was over 10 dB. Measurements were made only at 10 and 20 meters parallel to the wall. The drop-off rate was much less, about 2 dB. Sound was radiated through the adjoining panels, which reduced the drop-off rate in these directions parallel to the wall. Signal analysis of representative pulses indicated considerable high-frequency content, compared to other impact pile driving pulses. The example shown in Figure I.6-2 is for pulses measured at 10 and 20 meters during the installation of the fourth sheet pile. The RMS impulse level (measured with the sound level meter) was similar or slightly lower than the calculated RMS (over 90 percent of the energy). The SEL was about 25 to 27 dB lower than the peak pressure level and 13 dB lower than the RMS level (90 percent). The majority of sound energy in the pulse was contained within the first 30 to 40 msec, but the pulse lasted over 100 msec. Unlike most impact pile driving, these sounds were relatively broadband, with much of the sound content in the frequency range of 25 to 4,000Hz.
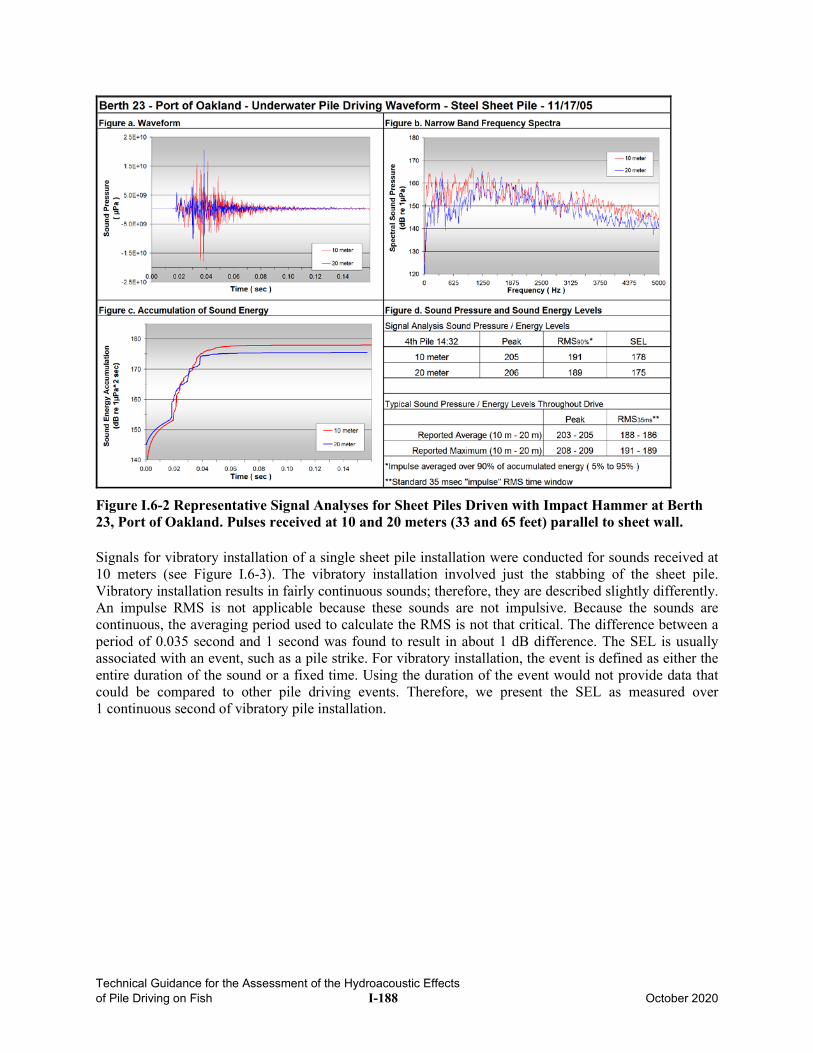
Technical Guidance for the Assessment of the Hydroacoustic Effects of Pile Driving on Fish I-188 October 2020
Figure I.6-2 Representative Signal Analyses for Sheet Piles Driven with Impact Hammer at Berth 23, Port of Oakland. Pulses received at 10 and 20 meters (33 and 65 feet) parallel to sheet wall. Signals for vibratory installation of a single sheet pile installation were conducted for sounds received at 10 meters (see Figure I.6-3). The vibratory installation involved just the stabbing of the sheet pile. Vibratory installation results in fairly continuous sounds; therefore, they are described slightly differently. An impulse RMS is not applicable because these sounds are not impulsive. Because the sounds are continuous, the averaging period used to calculate the RMS is not that critical. The difference between a period of 0.035 second and 1 second was found to result in about 1 dB difference. The SEL is usually associated with an event, such as a pile strike. For vibratory installation, the event is defined as either the entire duration of the sound or a fixed time. Using the duration of the event would not provide data that could be compared to other pile driving events. Therefore, we present the SEL as measured over 1 continuous second of vibratory pile installation.
Technical Guidance for the Assessment of the Hydroacoustic Effects of Pile Driving on Fish I-189 October 2020
160 163
Figure I.6-3 Representative Signal Analyses for Sheet Piles Installed with Vibratory Driver/ Extractor at Berth 23, Port of Oakland. Pulses at 10 meters (33 feet) normal to sheet wall face. The signal analysis shows the fairly continuous broadband sound. Much of the sound content is contained over the frequency range of 400 to 2,500 Hz. The hammer frequency is 23 Hz; therefore, distinct very low-frequency tones are associated with the rapid pile strikes. SEL accumulates throughout this continuous sound event.
I.6.2 Vibratory Installation of AZ25 Steel Sheet Piles at Berth 30—Port of Oakland, CA
Underwater sound levels associated with the installation of steel sheet piles were measured in March 2006 at Berth 30 at the Port of Oakland3. This operation was similar to that described above for Berth 23, except a method was tested involving a vibratory driver/extractor to avoid high-amplitude sounds. The model APE 400B King Kong hydraulic vibratory hammer was used to drive the steel sheet piles. The hammer was fitted with a steel extension (follower) to allow driving of the piles below the water line. Pile lengths were about 15 meters (49 feet), and water depth was about 12 meters (39 feet). Measured sound pressure level data for the installation of five piles is presented in Table I.6-2. These piles had been stabbed and driven to the point where a follower had to be used. Two measurement systems were used at 10 meters (33 feet) with different positions and depths. Both systems measured an ambient sound pressure level of 132 dB (RMS) when the nearby workboat motor was running. Levels between the two sensors varied by 0 to 7 dB over the course of the five driving events. The deeper sensor (5-meter [16.5-foot] depth) measured higher sound levels. The required sensor depth was 3 meters (10 feet).
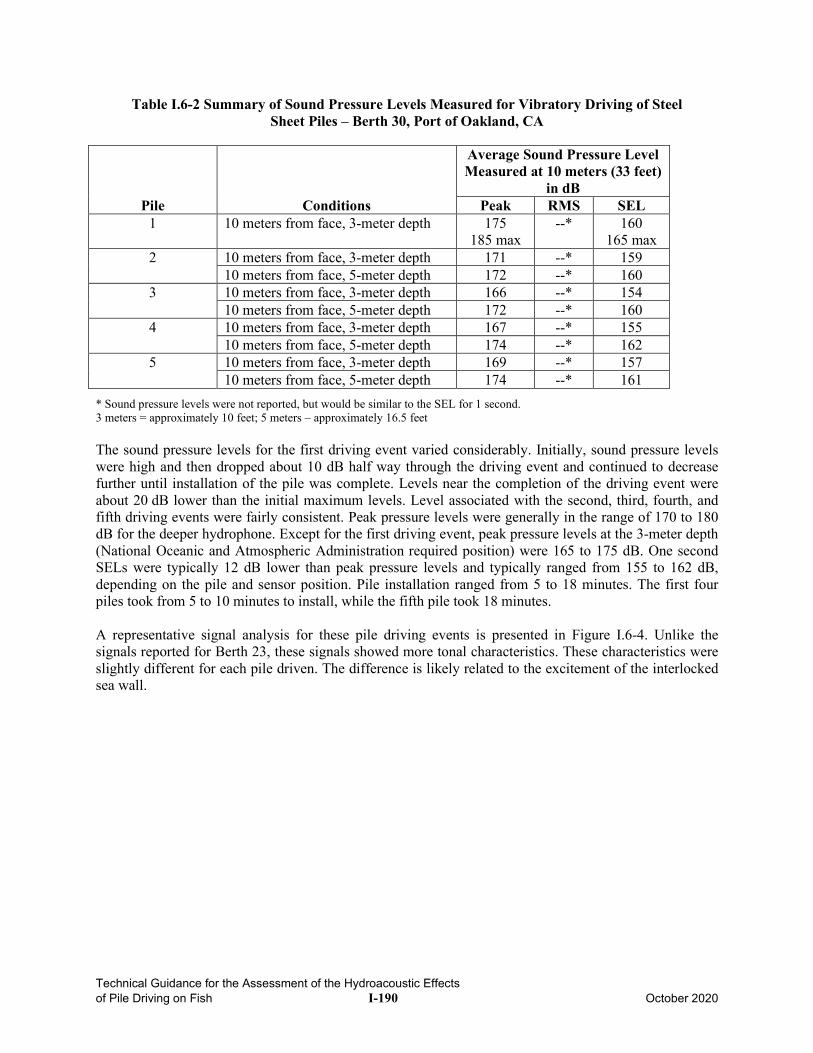
Technical Guidance for the Assessment of the Hydroacoustic Effects of Pile Driving on Fish I-190 October 2020
Table I.6-2 Summary of Sound Pressure Levels Measured for Vibratory Driving of Steel Sheet Piles – Berth 30, Port of Oakland, CA
Pile Conditions
Average Sound Pressure Level Measured at 10 meters (33 feet)
in dB Peak RMS SEL
1 10 meters from face, 3-meter depth 175 185 max
--* 160 165 max
2 10 meters from face, 3-meter depth 171 --* 159 10 meters from face, 5-meter depth 172 --* 160
3 10 meters from face, 3-meter depth 166 --* 154 10 meters from face, 5-meter depth 172 --* 160
4 10 meters from face, 3-meter depth 167 --* 155 10 meters from face, 5-meter depth 174 --* 162
5 10 meters from face, 3-meter depth 169 --* 157 10 meters from face, 5-meter depth 174 --* 161
* Sound pressure levels were not reported, but would be similar to the SEL for 1 second. 3 meters = approximately 10 feet; 5 meters – approximately 16.5 feet The sound pressure levels for the first driving event varied considerably. Initially, sound pressure levels were high and then dropped about 10 dB half way through the driving event and continued to decrease further until installation of the pile was complete. Levels near the completion of the driving event were about 20 dB lower than the initial maximum levels. Level associated with the second, third, fourth, and fifth driving events were fairly consistent. Peak pressure levels were generally in the range of 170 to 180 dB for the deeper hydrophone. Except for the first driving event, peak pressure levels at the 3-meter depth (National Oceanic and Atmospheric Administration required position) were 165 to 175 dB. One second SELs were typically 12 dB lower than peak pressure levels and typically ranged from 155 to 162 dB, depending on the pile and sensor position. Pile installation ranged from 5 to 18 minutes. The first four piles took from 5 to 10 minutes to install, while the fifth pile took 18 minutes. A representative signal analysis for these pile driving events is presented in Figure I.6-4. Unlike the signals reported for Berth 23, these signals showed more tonal characteristics. These characteristics were slightly different for each pile driven. The difference is likely related to the excitement of the interlocked sea wall.
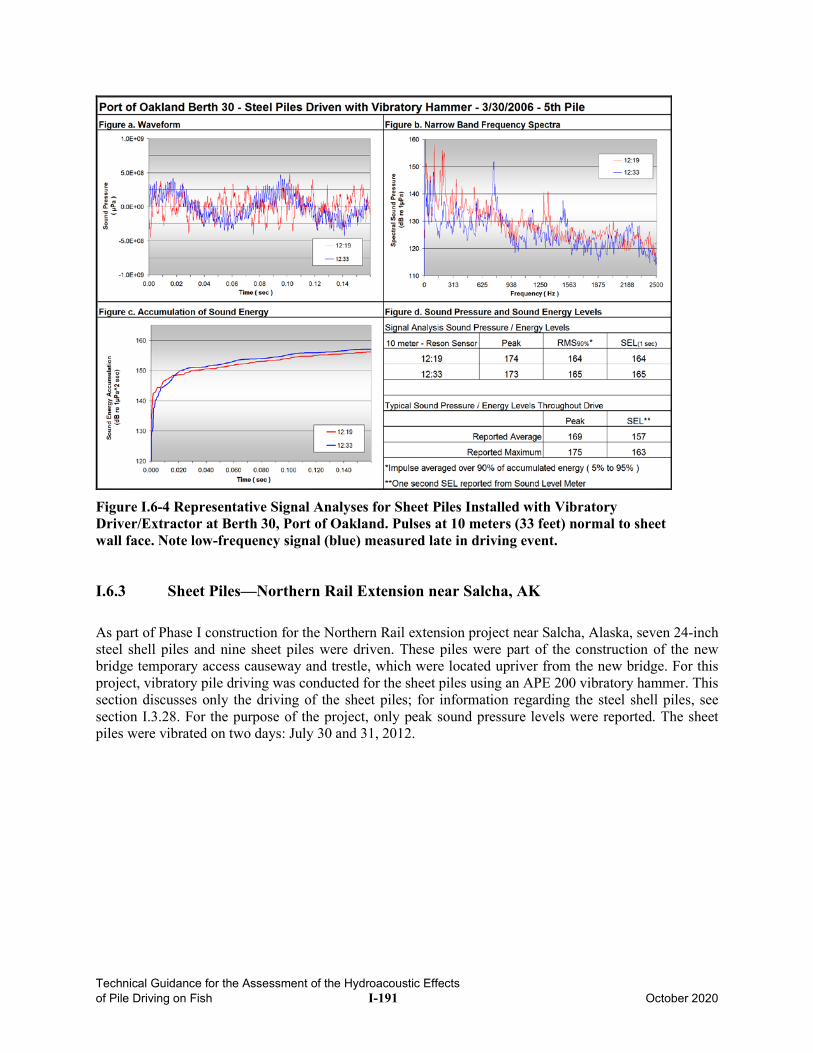
Technical Guidance for the Assessment of the Hydroacoustic Effects of Pile Driving on Fish I-191 October 2020
Figure I.6-4 Representative Signal Analyses for Sheet Piles Installed with Vibratory Driver/Extractor at Berth 30, Port of Oakland. Pulses at 10 meters (33 feet) normal to sheet wall face. Note low-frequency signal (blue) measured late in driving event.
I.6.3 Sheet Piles—Northern Rail Extension near Salcha, AK
As part of Phase I construction for the Northern Rail extension project near Salcha, Alaska, seven 24-inch steel shell piles and nine sheet piles were driven. These piles were part of the construction of the new bridge temporary access causeway and trestle, which were located upriver from the new bridge. For this project, vibratory pile driving was conducted for the sheet piles using an APE 200 vibratory hammer. This section discusses only the driving of the sheet piles; for information regarding the steel shell piles, see section I.3.28. For the purpose of the project, only peak sound pressure levels were reported. The sheet piles were vibrated on two days: July 30 and 31, 2012.
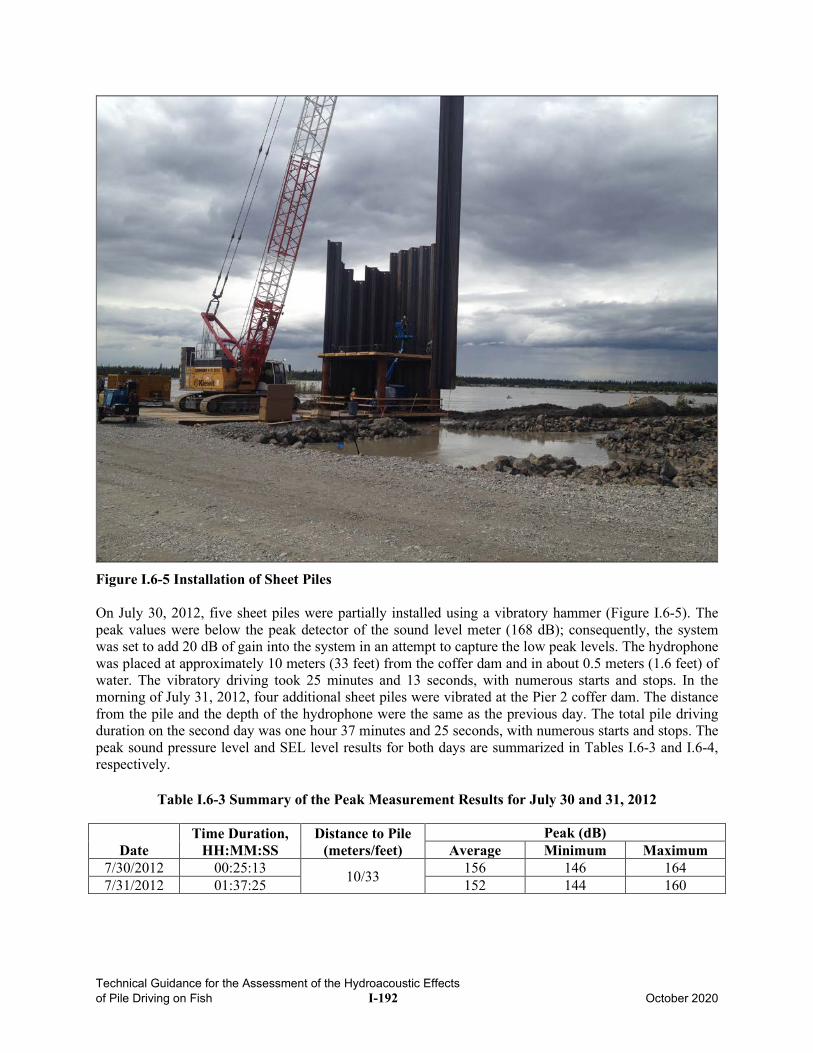
Technical Guidance for the Assessment of the Hydroacoustic Effects of Pile Driving on Fish I-192 October 2020
Figure I.6-5 Installation of Sheet Piles On July 30, 2012, five sheet piles were partially installed using a vibratory hammer (Figure I.6-5). The peak values were below the peak detector of the sound level meter (168 dB); consequently, the system was set to add 20 dB of gain into the system in an attempt to capture the low peak levels. The hydrophone was placed at approximately 10 meters (33 feet) from the coffer dam and in about 0.5 meters (1.6 feet) of water. The vibratory driving took 25 minutes and 13 seconds, with numerous starts and stops. In the morning of July 31, 2012, four additional sheet piles were vibrated at the Pier 2 coffer dam. The distance from the pile and the depth of the hydrophone were the same as the previous day. The total pile driving duration on the second day was one hour 37 minutes and 25 seconds, with numerous starts and stops. The peak sound pressure level and SEL level results for both days are summarized in Tables I.6-3 and I.6-4, respectively.
Table I.6-3 Summary of the Peak Measurement Results for July 30 and 31, 2012
Date Time Duration,
HH:MM:SS Distance to Pile
(meters/feet) Peak (dB)
Average Minimum Maximum 7/30/2012 00:25:13 10/33 156 146 164 7/31/2012 01:37:25 152 144 160
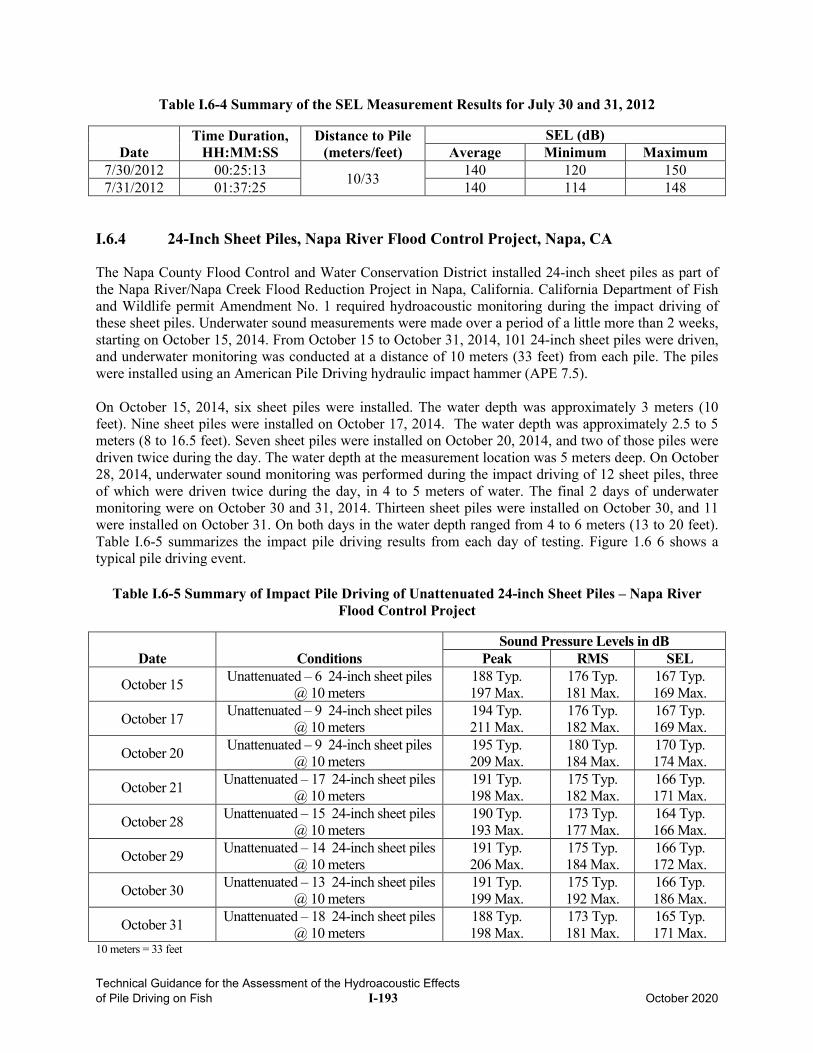
Technical Guidance for the Assessment of the Hydroacoustic Effects of Pile Driving on Fish I-193 October 2020
Table I.6-4 Summary of the SEL Measurement Results for July 30 and 31, 2012
Date Time Duration,
HH:MM:SS Distance to Pile
(meters/feet) SEL (dB)
Average Minimum Maximum 7/30/2012 00:25:13 10/33 140 120 150 7/31/2012 01:37:25 140 114 148
I.6.4 24-Inch Sheet Piles, Napa River Flood Control Project, Napa, CA The Napa County Flood Control and Water Conservation District installed 24-inch sheet piles as part of the Napa River/Napa Creek Flood Reduction Project in Napa, California. California Department of Fish and Wildlife permit Amendment No. 1 required hydroacoustic monitoring during the impact driving of these sheet piles. Underwater sound measurements were made over a period of a little more than 2 weeks, starting on October 15, 2014. From October 15 to October 31, 2014, 101 24-inch sheet piles were driven, and underwater monitoring was conducted at a distance of 10 meters (33 feet) from each pile. The piles were installed using an American Pile Driving hydraulic impact hammer (APE 7.5). On October 15, 2014, six sheet piles were installed. The water depth was approximately 3 meters (10 feet). Nine sheet piles were installed on October 17, 2014. The water depth was approximately 2.5 to 5 meters (8 to 16.5 feet). Seven sheet piles were installed on October 20, 2014, and two of those piles were driven twice during the day. The water depth at the measurement location was 5 meters deep. On October 28, 2014, underwater sound monitoring was performed during the impact driving of 12 sheet piles, three of which were driven twice during the day, in 4 to 5 meters of water. The final 2 days of underwater monitoring were on October 30 and 31, 2014. Thirteen sheet piles were installed on October 30, and 11 were installed on October 31. On both days in the water depth ranged from 4 to 6 meters (13 to 20 feet). Table I.6-5 summarizes the impact pile driving results from each day of testing. Figure 1.6 6 shows a typical pile driving event.
Table I.6-5 Summary of Impact Pile Driving of Unattenuated 24-inch Sheet Piles – Napa River Flood Control Project
Date Conditions Sound Pressure Levels in dB
Peak RMS SEL
October 15 Unattenuated – 6 24-inch sheet piles @ 10 meters
188 Typ. 197 Max.
176 Typ. 181 Max.
167 Typ. 169 Max.
October 17 Unattenuated – 9 24-inch sheet piles @ 10 meters
194 Typ. 211 Max.
176 Typ. 182 Max.
167 Typ. 169 Max.
October 20 Unattenuated – 9 24-inch sheet piles @ 10 meters
195 Typ. 209 Max.
180 Typ. 184 Max.
170 Typ. 174 Max.
October 21 Unattenuated – 17 24-inch sheet piles @ 10 meters
191 Typ. 198 Max.
175 Typ. 182 Max.
166 Typ. 171 Max.
October 28 Unattenuated – 15 24-inch sheet piles @ 10 meters
190 Typ. 193 Max.
173 Typ. 177 Max.
164 Typ. 166 Max.
October 29 Unattenuated – 14 24-inch sheet piles @ 10 meters
191 Typ. 206 Max.
175 Typ. 184 Max.
166 Typ. 172 Max.
October 30 Unattenuated – 13 24-inch sheet piles @ 10 meters
191 Typ. 199 Max.
175 Typ. 192 Max.
166 Typ. 186 Max.
October 31 Unattenuated – 18 24-inch sheet piles @ 10 meters
188 Typ. 198 Max.
173 Typ. 181 Max.
165 Typ. 171 Max.
10 meters = 33 feet
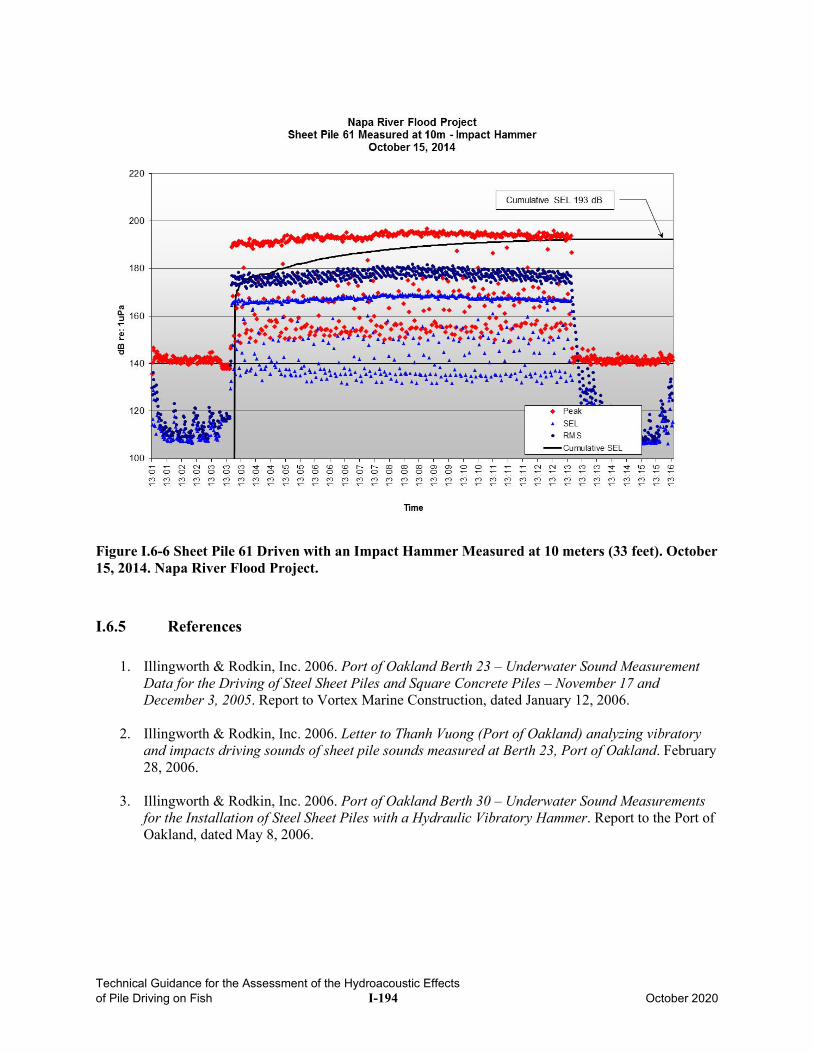
Technical Guidance for the Assessment of the Hydroacoustic Effects of Pile Driving on Fish I-194 October 2020
Figure I.6-6 Sheet Pile 61 Driven with an Impact Hammer Measured at 10 meters (33 feet). October 15, 2014. Napa River Flood Project.
I.6.5 References
1. Illingworth & Rodkin, Inc. 2006. Port of Oakland Berth 23 – Underwater Sound Measurement Data for the Driving of Steel Sheet Piles and Square Concrete Piles – November 17 and December 3, 2005. Report to Vortex Marine Construction, dated January 12, 2006.
2. Illingworth & Rodkin, Inc. 2006. Letter to Thanh Vuong (Port of Oakland) analyzing vibratory
and impacts driving sounds of sheet pile sounds measured at Berth 23, Port of Oakland. February 28, 2006.
3. Illingworth & Rodkin, Inc. 2006. Port of Oakland Berth 30 – Underwater Sound Measurements
for the Installation of Steel Sheet Piles with a Hydraulic Vibratory Hammer. Report to the Port of Oakland, dated May 8, 2006.
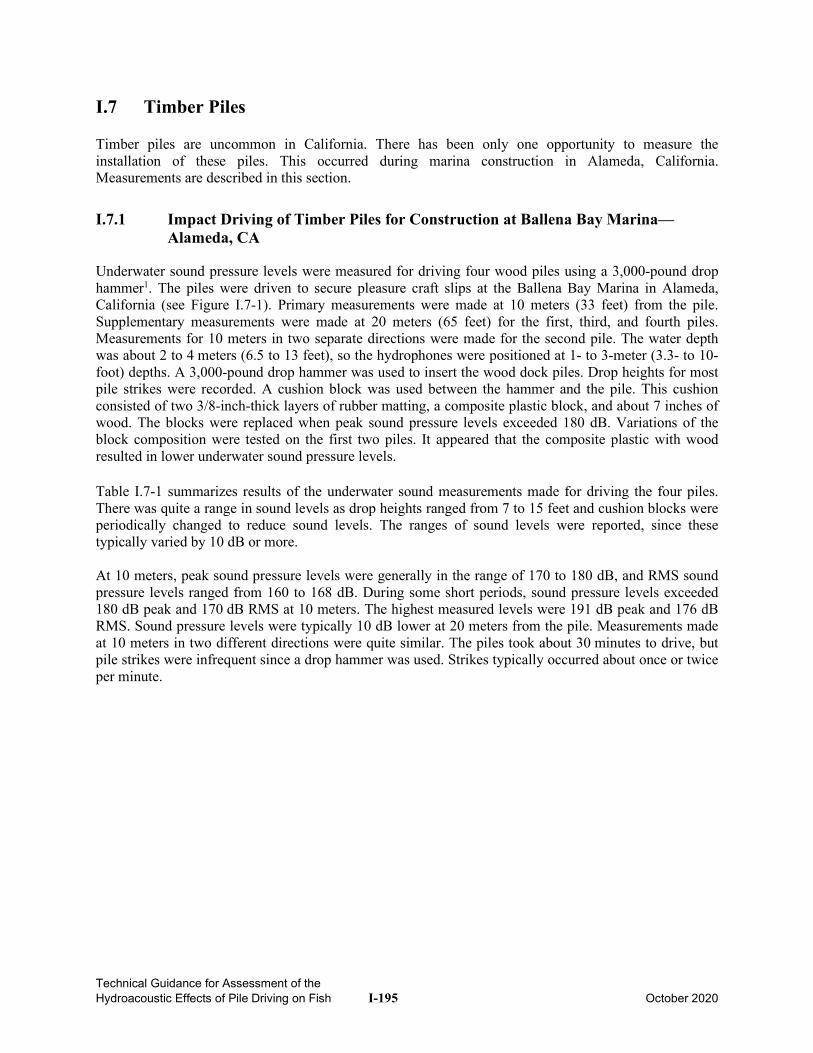
Technical Guidance for Assessment of the Hydroacoustic Effects of Pile Driving on Fish I-195 October 2020
I.7 Timber Piles Timber piles are uncommon in California. There has been only one opportunity to measure the installation of these piles. This occurred during marina construction in Alameda, California. Measurements are described in this section.
I.7.1 Impact Driving of Timber Piles for Construction at Ballena Bay Marina—Alameda, CA
Underwater sound pressure levels were measured for driving four wood piles using a 3,000-pound drop hammer1. The piles were driven to secure pleasure craft slips at the Ballena Bay Marina in Alameda, California (see Figure I.7-1). Primary measurements were made at 10 meters (33 feet) from the pile. Supplementary measurements were made at 20 meters (65 feet) for the first, third, and fourth piles. Measurements for 10 meters in two separate directions were made for the second pile. The water depth was about 2 to 4 meters (6.5 to 13 feet), so the hydrophones were positioned at 1- to 3-meter (3.3- to 10-foot) depths. A 3,000-pound drop hammer was used to insert the wood dock piles. Drop heights for most pile strikes were recorded. A cushion block was used between the hammer and the pile. This cushion consisted of two 3/8-inch-thick layers of rubber matting, a composite plastic block, and about 7 inches of wood. The blocks were replaced when peak sound pressure levels exceeded 180 dB. Variations of the block composition were tested on the first two piles. It appeared that the composite plastic with wood resulted in lower underwater sound pressure levels. Table I.7-1 summarizes results of the underwater sound measurements made for driving the four piles. There was quite a range in sound levels as drop heights ranged from 7 to 15 feet and cushion blocks were periodically changed to reduce sound levels. The ranges of sound levels were reported, since these typically varied by 10 dB or more. At 10 meters, peak sound pressure levels were generally in the range of 170 to 180 dB, and RMS sound pressure levels ranged from 160 to 168 dB. During some short periods, sound pressure levels exceeded 180 dB peak and 170 dB RMS at 10 meters. The highest measured levels were 191 dB peak and 176 dB RMS. Sound pressure levels were typically 10 dB lower at 20 meters from the pile. Measurements made at 10 meters in two different directions were quite similar. The piles took about 30 minutes to drive, but pile strikes were infrequent since a drop hammer was used. Strikes typically occurred about once or twice per minute.
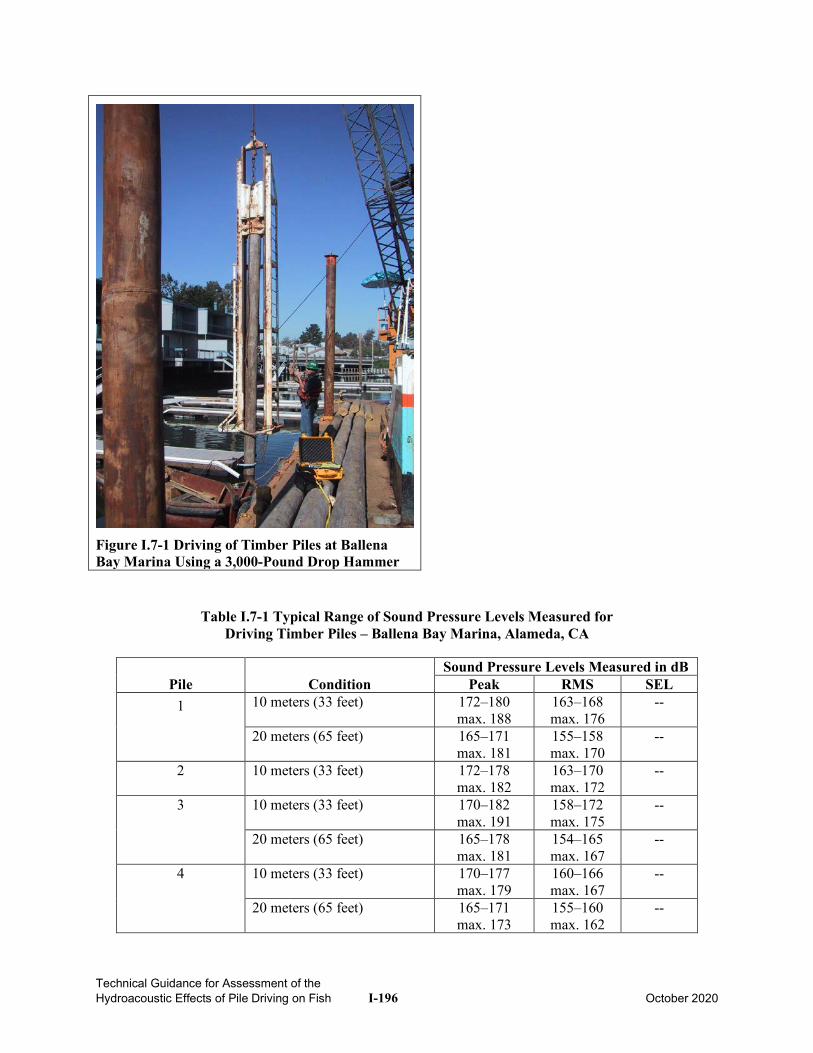
Technical Guidance for Assessment of the Hydroacoustic Effects of Pile Driving on Fish I-196 October 2020
Table I.7-1 Typical Range of Sound Pressure Levels Measured for Driving Timber Piles – Ballena Bay Marina, Alameda, CA
Pile Condition Sound Pressure Levels Measured in dB
Peak RMS SEL 1 10 meters (33 feet) 172–180
max. 188 163–168 max. 176
--
20 meters (65 feet) 165–171 max. 181
155–158 max. 170
--
2 10 meters (33 feet) 172–178 max. 182
163–170 max. 172
--
3 10 meters (33 feet) 170–182 max. 191
158–172 max. 175
--
20 meters (65 feet) 165–178 max. 181
154–165 max. 167
--
4 10 meters (33 feet) 170–177 max. 179
160–166 max. 167
--
20 meters (65 feet) 165–171 max. 173
155–160 max. 162
--
Figure I.7-1 Driving of Timber Piles at Ballena Bay Marina Using a 3,000-Pound Drop Hammer
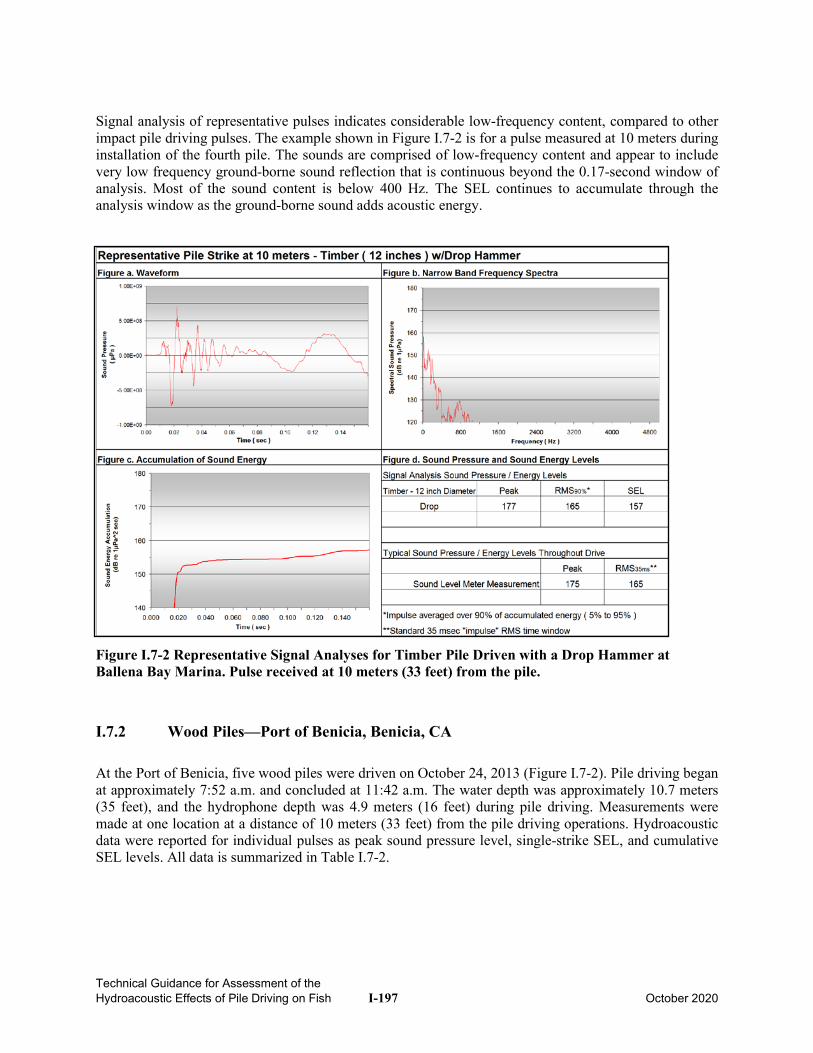
Technical Guidance for Assessment of the Hydroacoustic Effects of Pile Driving on Fish I-197 October 2020
Signal analysis of representative pulses indicates considerable low-frequency content, compared to other impact pile driving pulses. The example shown in Figure I.7-2 is for a pulse measured at 10 meters during installation of the fourth pile. The sounds are comprised of low-frequency content and appear to include very low frequency ground-borne sound reflection that is continuous beyond the 0.17-second window of analysis. Most of the sound content is below 400 Hz. The SEL continues to accumulate through the analysis window as the ground-borne sound adds acoustic energy.
Figure I.7-2 Representative Signal Analyses for Timber Pile Driven with a Drop Hammer at Ballena Bay Marina. Pulse received at 10 meters (33 feet) from the pile.
I.7.2 Wood Piles—Port of Benicia, Benicia, CA
At the Port of Benicia, five wood piles were driven on October 24, 2013 (Figure I.7-2). Pile driving began at approximately 7:52 a.m. and concluded at 11:42 a.m. The water depth was approximately 10.7 meters (35 feet), and the hydrophone depth was 4.9 meters (16 feet) during pile driving. Measurements were made at one location at a distance of 10 meters (33 feet) from the pile driving operations. Hydroacoustic data were reported for individual pulses as peak sound pressure level, single-strike SEL, and cumulative SEL levels. All data is summarized in Table I.7-2.
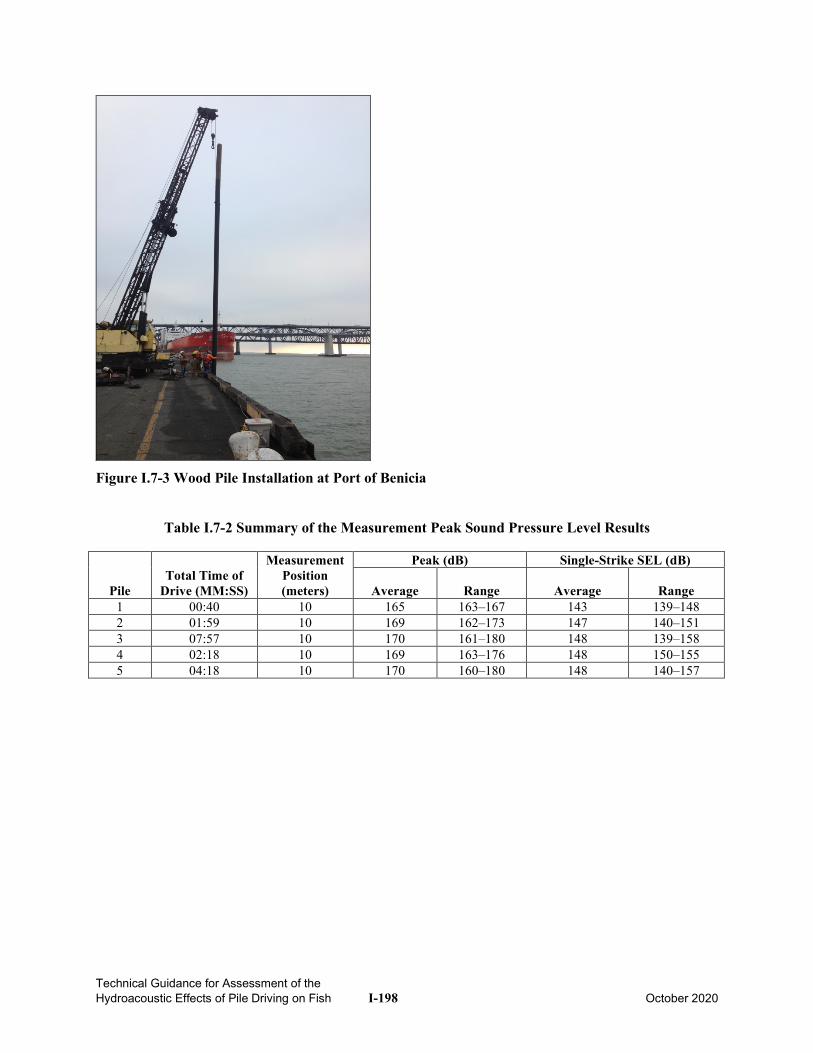
Technical Guidance for Assessment of the Hydroacoustic Effects of Pile Driving on Fish I-198 October 2020
Figure I.7-3 Wood Pile Installation at Port of Benicia
Table I.7-2 Summary of the Measurement Peak Sound Pressure Level Results
Pile Total Time of
Drive (MM:SS)
Measurement Position (meters)
Peak (dB) Single-Strike SEL (dB)
Average Range Average Range 1 00:40 10 165 163–167 143 139–148 2 01:59 10 169 162–173 147 140–151 3 07:57 10 170 161–180 148 139–158 4 02:18 10 169 163–176 148 150–155 5 04:18 10 170 160–180 148 140–157
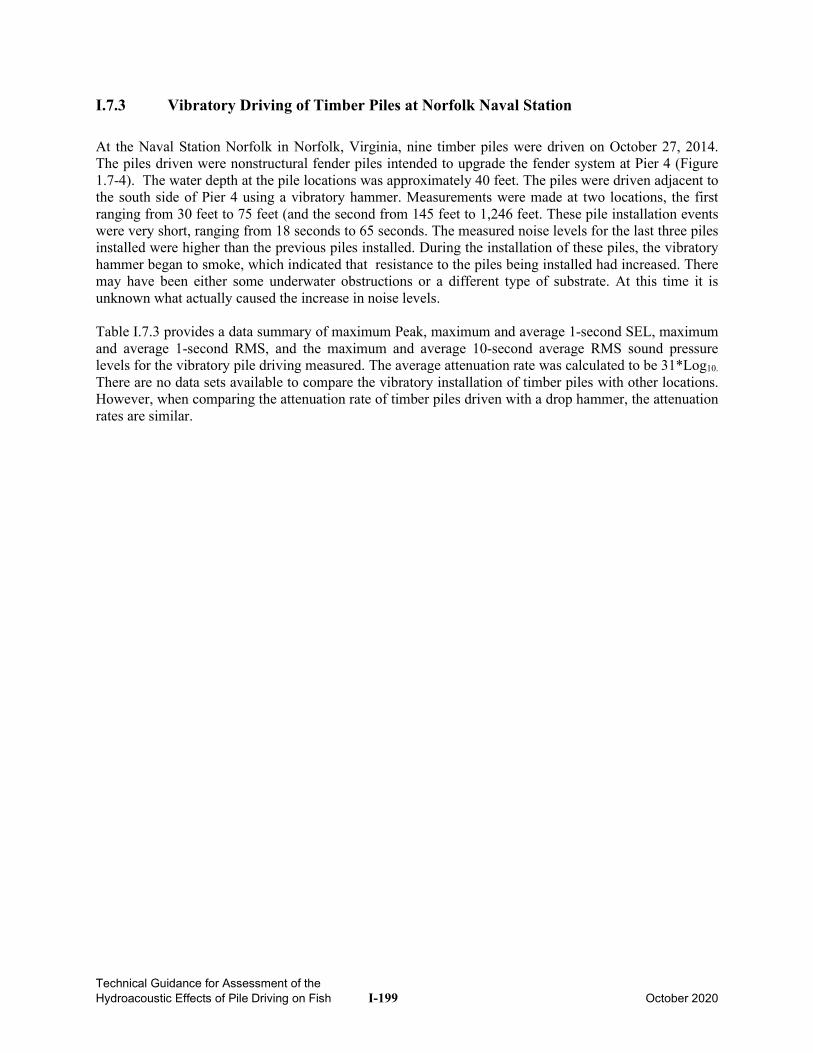
Technical Guidance for Assessment of the Hydroacoustic Effects of Pile Driving on Fish I-199 October 2020
I.7.3 Vibratory Driving of Timber Piles at Norfolk Naval Station
At the Naval Station Norfolk in Norfolk, Virginia, nine timber piles were driven on October 27, 2014. The piles driven were nonstructural fender piles intended to upgrade the fender system at Pier 4 (Figure 1.7-4). The water depth at the pile locations was approximately 40 feet. The piles were driven adjacent to the south side of Pier 4 using a vibratory hammer. Measurements were made at two locations, the first ranging from 30 feet to 75 feet (and the second from 145 feet to 1,246 feet. These pile installation events were very short, ranging from 18 seconds to 65 seconds. The measured noise levels for the last three piles installed were higher than the previous piles installed. During the installation of these piles, the vibratory hammer began to smoke, which indicated that resistance to the piles being installed had increased. There may have been either some underwater obstructions or a different type of substrate. At this time it is unknown what actually caused the increase in noise levels. Table I.7.3 provides a data summary of maximum Peak, maximum and average 1-second SEL, maximum and average 1-second RMS, and the maximum and average 10-second average RMS sound pressure levels for the vibratory pile driving measured. The average attenuation rate was calculated to be 31*Log10.
There are no data sets available to compare the vibratory installation of timber piles with other locations. However, when comparing the attenuation rate of timber piles driven with a drop hammer, the attenuation rates are similar.
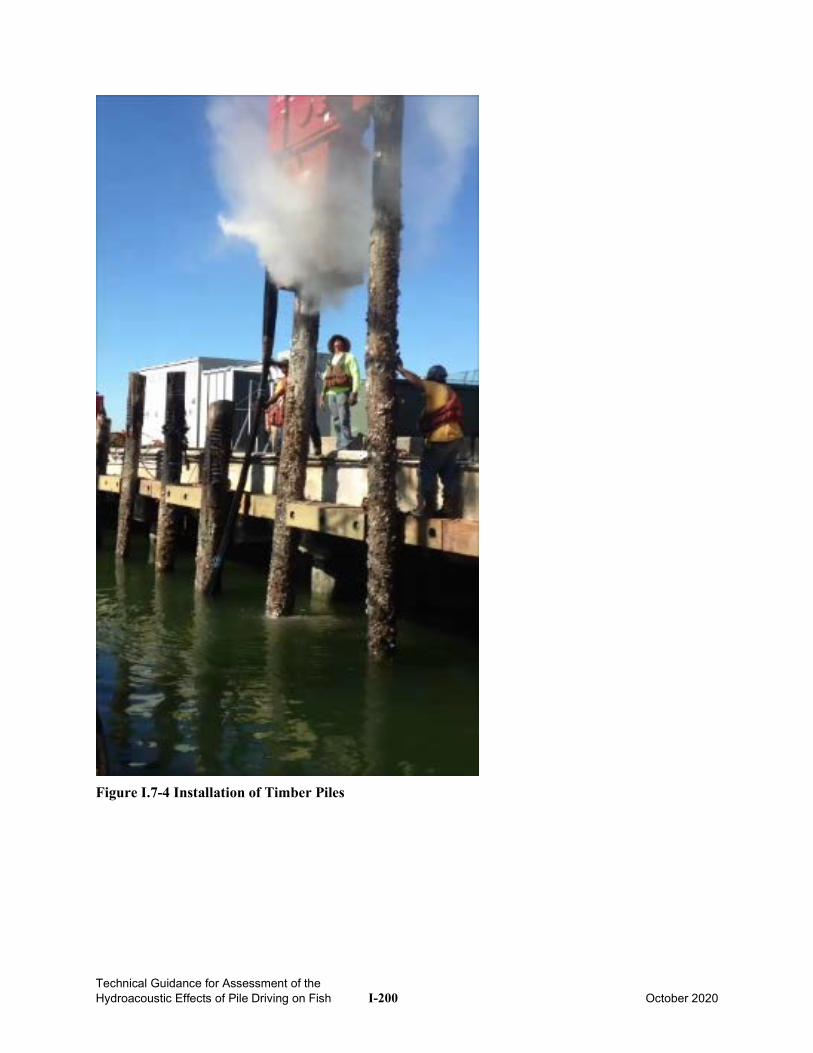
Technical Guidance for Assessment of the Hydroacoustic Effects of Pile Driving on Fish I-200 October 2020
Figure I.7-4 Installation of Timber Piles
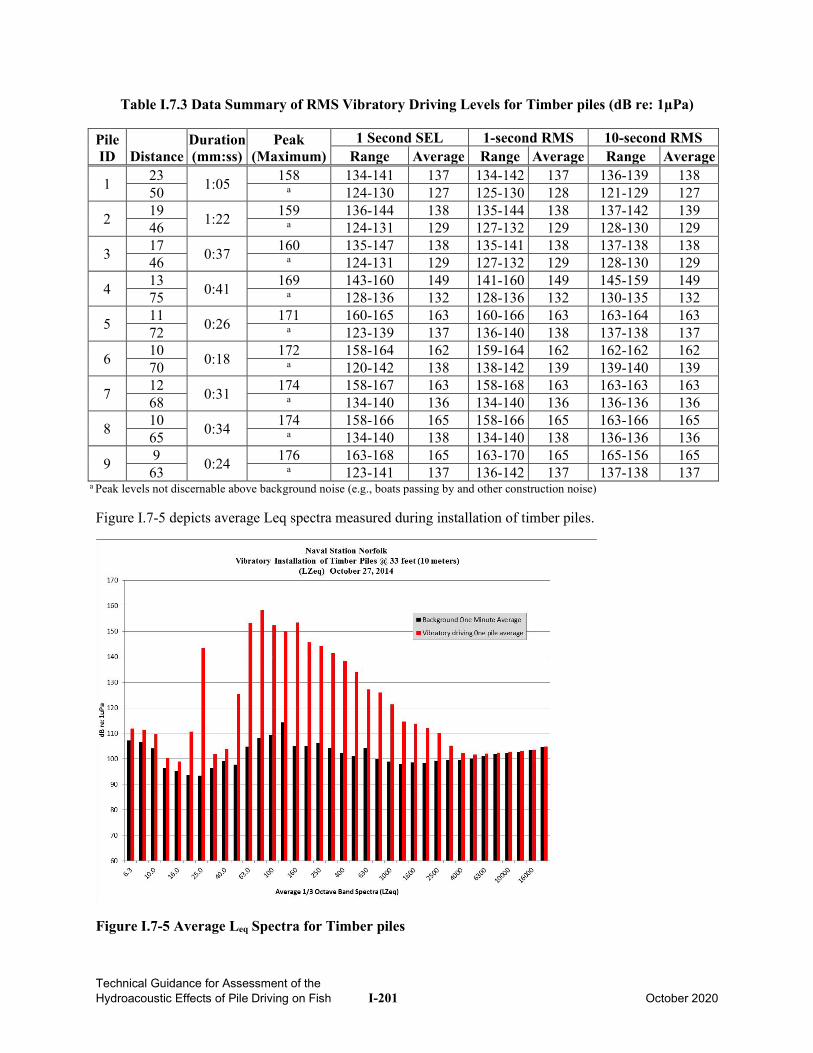
Technical Guidance for Assessment of the Hydroacoustic Effects of Pile Driving on Fish I-201 October 2020
Table I.7.3 Data Summary of RMS Vibratory Driving Levels for Timber piles (dB re: 1µPa)
Pile ID Distance
Duration (mm:ss)
Peak (Maximum)
1 Second SEL 1-second RMS 10-second RMS Range Average Range Average Range Average
1 23 1:05 158 134-141 137 134-142 137 136-139 138 50 a 124-130 127 125-130 128 121-129 127
2 19 1:22 159 136-144 138 135-144 138 137-142 139 46 a 124-131 129 127-132 129 128-130 129
3 17 0:37 160 135-147 138 135-141 138 137-138 138 46 a 124-131 129 127-132 129 128-130 129
4 13 0:41 169 143-160 149 141-160 149 145-159 149 75 a 128-136 132 128-136 132 130-135 132
5 11 0:26 171 160-165 163 160-166 163 163-164 163 72 a 123-139 137 136-140 138 137-138 137
6 10 0:18 172 158-164 162 159-164 162 162-162 162 70 a 120-142 138 138-142 139 139-140 139
7 12 0:31 174 158-167 163 158-168 163 163-163 163 68 a 134-140 136 134-140 136 136-136 136
8 10 0:34 174 158-166 165 158-166 165 163-166 165 65 a 134-140 138 134-140 138 136-136 136
9 9 0:24 176 163-168 165 163-170 165 165-156 165 63 a 123-141 137 136-142 137 137-138 137
a Peak levels not discernable above background noise (e.g., boats passing by and other construction noise) Figure I.7-5 depicts average Leq spectra measured during installation of timber piles.
Figure I.7-5 Average Leq Spectra for Timber piles
Technical Guidance for Assessment of the Hydroacoustic Effects of Pile Driving on Fish I-202 October 2020
I.7.4 References
1. Illingworth & Rodkin, Inc. 2004. Letter to Jon Marty (Western Dock Enterprises) transmitting Underwater Sound Measurement Results for Ballena Bay Dock Construction Pile Driving (Wood Piles). March 25, 2004
2. Illingworth & Rodkin, Inc. 2015. Hydroacoustic and Airborne Noise Monitoring at the Naval
Station Norfolk during Pile Driving – Interim Report 21 October through 27 October 2014. Report to HDR Environmental, Operations and Construction, Inc. February.
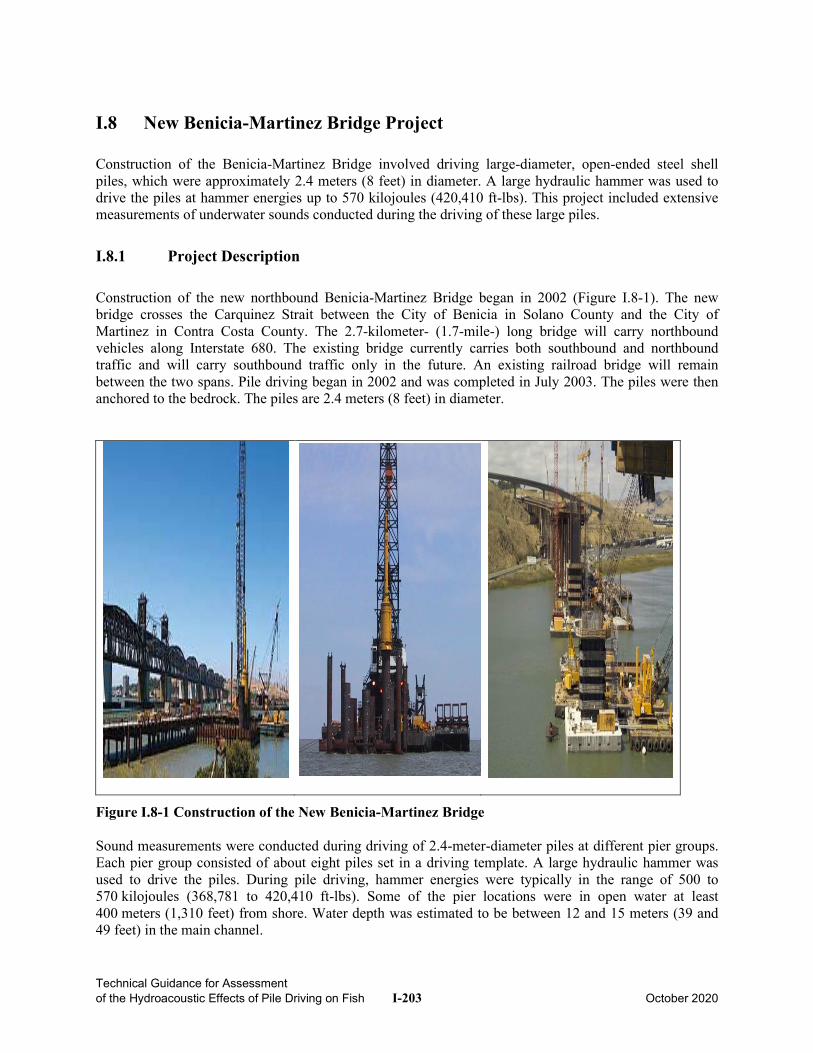
Technical Guidance for Assessment of the Hydroacoustic Effects of Pile Driving on Fish I-203 October 2020
I.8 New Benicia-Martinez Bridge Project Construction of the Benicia-Martinez Bridge involved driving large-diameter, open-ended steel shell piles, which were approximately 2.4 meters (8 feet) in diameter. A large hydraulic hammer was used to drive the piles at hammer energies up to 570 kilojoules (420,410 ft-lbs). This project included extensive measurements of underwater sounds conducted during the driving of these large piles.
I.8.1 Project Description
Construction of the new northbound Benicia-Martinez Bridge began in 2002 (Figure I.8-1). The new bridge crosses the Carquinez Strait between the City of Benicia in Solano County and the City of Martinez in Contra Costa County. The 2.7-kilometer- (1.7-mile-) long bridge will carry northbound vehicles along Interstate 680. The existing bridge currently carries both southbound and northbound traffic and will carry southbound traffic only in the future. An existing railroad bridge will remain between the two spans. Pile driving began in 2002 and was completed in July 2003. The piles were then anchored to the bedrock. The piles are 2.4 meters (8 feet) in diameter.
Figure I.8-1 Construction of the New Benicia-Martinez Bridge Sound measurements were conducted during driving of 2.4-meter-diameter piles at different pier groups. Each pier group consisted of about eight piles set in a driving template. A large hydraulic hammer was used to drive the piles. During pile driving, hammer energies were typically in the range of 500 to 570 kilojoules (368,781 to 420,410 ft-lbs). Some of the pier locations were in open water at least 400 meters (1,310 feet) from shore. Water depth was estimated to be between 12 and 15 meters (39 and 49 feet) in the main channel.
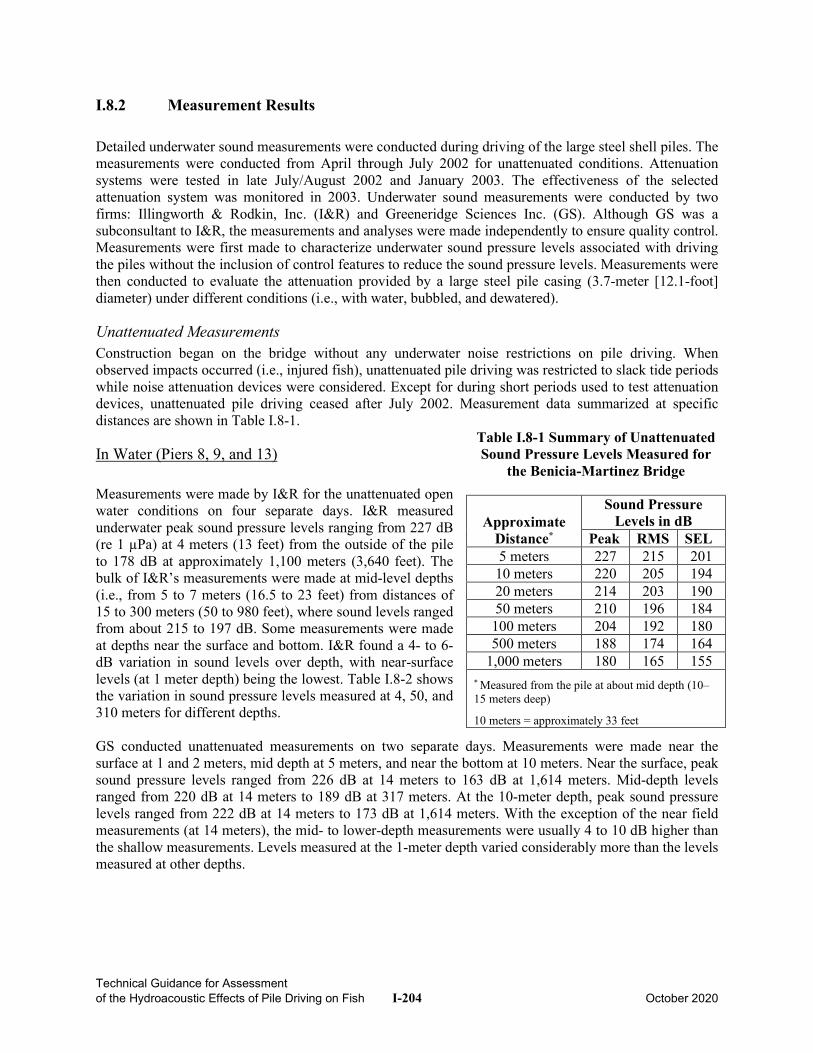
Technical Guidance for Assessment of the Hydroacoustic Effects of Pile Driving on Fish I-204 October 2020
I.8.2 Measurement Results
Detailed underwater sound measurements were conducted during driving of the large steel shell piles. The measurements were conducted from April through July 2002 for unattenuated conditions. Attenuation systems were tested in late July/August 2002 and January 2003. The effectiveness of the selected attenuation system was monitored in 2003. Underwater sound measurements were conducted by two firms: Illingworth & Rodkin, Inc. (I&R) and Greeneridge Sciences Inc. (GS). Although GS was a subconsultant to I&R, the measurements and analyses were made independently to ensure quality control. Measurements were first made to characterize underwater sound pressure levels associated with driving the piles without the inclusion of control features to reduce the sound pressure levels. Measurements were then conducted to evaluate the attenuation provided by a large steel pile casing (3.7-meter [12.1-foot] diameter) under different conditions (i.e., with water, bubbled, and dewatered).
Unattenuated Measurements Construction began on the bridge without any underwater noise restrictions on pile driving. When observed impacts occurred (i.e., injured fish), unattenuated pile driving was restricted to slack tide periods while noise attenuation devices were considered. Except for during short periods used to test attenuation devices, unattenuated pile driving ceased after July 2002. Measurement data summarized at specific distances are shown in Table I.8-1.
In Water (Piers 8, 9, and 13) Measurements were made by I&R for the unattenuated open water conditions on four separate days. I&R measured underwater peak sound pressure levels ranging from 227 dB (re 1 µPa) at 4 meters (13 feet) from the outside of the pile to 178 dB at approximately 1,100 meters (3,640 feet). The bulk of I&R’s measurements were made at mid-level depths (i.e., from 5 to 7 meters (16.5 to 23 feet) from distances of 15 to 300 meters (50 to 980 feet), where sound levels ranged from about 215 to 197 dB. Some measurements were made at depths near the surface and bottom. I&R found a 4- to 6-dB variation in sound levels over depth, with near-surface levels (at 1 meter depth) being the lowest. Table I.8-2 shows the variation in sound pressure levels measured at 4, 50, and 310 meters for different depths. GS conducted unattenuated measurements on two separate days. Measurements were made near the surface at 1 and 2 meters, mid depth at 5 meters, and near the bottom at 10 meters. Near the surface, peak sound pressure levels ranged from 226 dB at 14 meters to 163 dB at 1,614 meters. Mid-depth levels ranged from 220 dB at 14 meters to 189 dB at 317 meters. At the 10-meter depth, peak sound pressure levels ranged from 222 dB at 14 meters to 173 dB at 1,614 meters. With the exception of the near field measurements (at 14 meters), the mid- to lower-depth measurements were usually 4 to 10 dB higher than the shallow measurements. Levels measured at the 1-meter depth varied considerably more than the levels measured at other depths.
Table I.8-1 Summary of Unattenuated Sound Pressure Levels Measured for
the Benicia-Martinez Bridge
Approximate Distance*
Sound Pressure Levels in dB
Peak RMS SEL 5 meters 227 215 201 10 meters 220 205 194 20 meters 214 203 190 50 meters 210 196 184
100 meters 204 192 180 500 meters 188 174 164
1,000 meters 180 165 155 * Measured from the pile at about mid depth (10–15 meters deep)
10 meters = approximately 33 feet
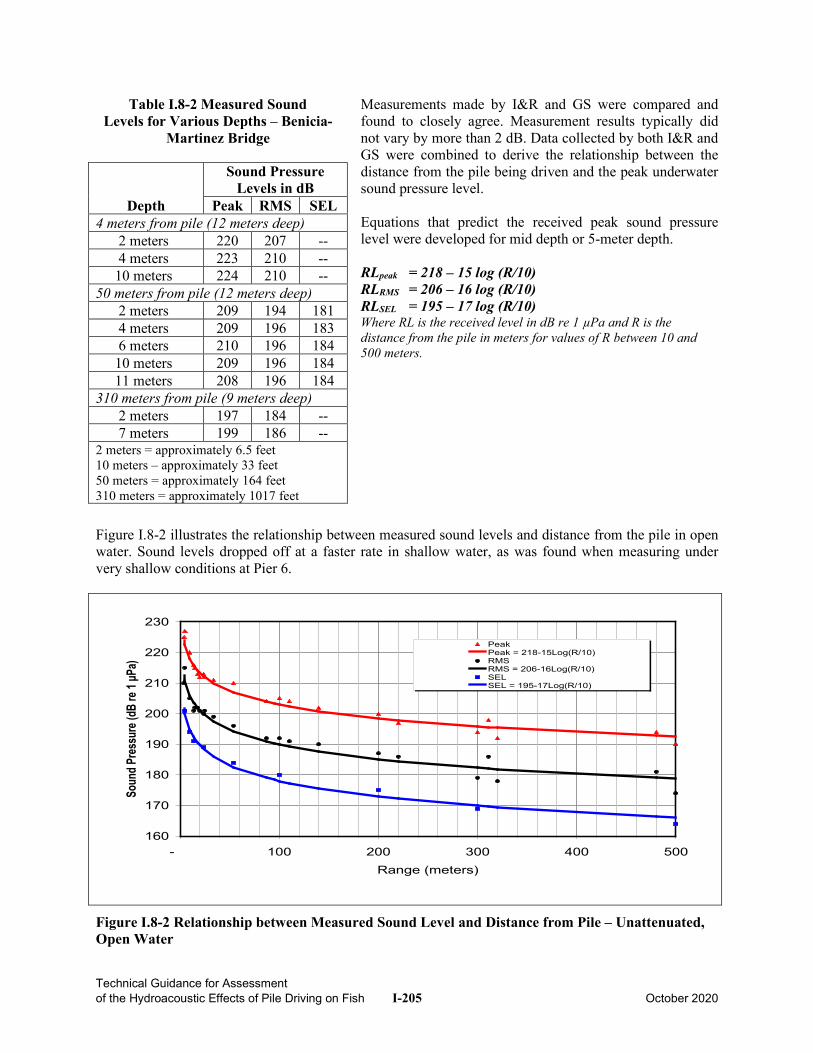
Technical Guidance for Assessment of the Hydroacoustic Effects of Pile Driving on Fish I-205 October 2020
Measurements made by I&R and GS were compared and found to closely agree. Measurement results typically did not vary by more than 2 dB. Data collected by both I&R and GS were combined to derive the relationship between the distance from the pile being driven and the peak underwater sound pressure level. Equations that predict the received peak sound pressure level were developed for mid depth or 5-meter depth. RLpeak = 218 – 15 log (R/10) RLRMS = 206 – 16 log (R/10) RLSEL = 195 – 17 log (R/10) Where RL is the received level in dB re 1 µPa and R is the distance from the pile in meters for values of R between 10 and 500 meters.
Figure I.8-2 illustrates the relationship between measured sound levels and distance from the pile in open water. Sound levels dropped off at a faster rate in shallow water, as was found when measuring under very shallow conditions at Pier 6.
Figure I.8-2 Relationship between Measured Sound Level and Distance from Pile – Unattenuated, Open Water
Table I.8-2 Measured Sound Levels for Various Depths – Benicia-
Martinez Bridge
Depth
Sound Pressure Levels in dB
Peak RMS SEL 4 meters from pile (12 meters deep)
2 meters 220 207 -- 4 meters 223 210 --
10 meters 224 210 -- 50 meters from pile (12 meters deep)
2 meters 209 194 181 4 meters 209 196 183 6 meters 210 196 184
10 meters 209 196 184 11 meters 208 196 184
310 meters from pile (9 meters deep) 2 meters 197 184 -- 7 meters 199 186 --
2 meters = approximately 6.5 feet 10 meters – approximately 33 feet 50 meters = approximately 164 feet 310 meters = approximately 1017 feet
160
170
180
190
200
210
220
230
- 100 200 300 400 500Range (meters)
Soun
d Pres
sure
(dB re
1 µP
a)
PeakPeak = 218-15Log(R/10)RMSRMS = 206-16Log(R/10)SELSEL = 195-17Log(R/10)
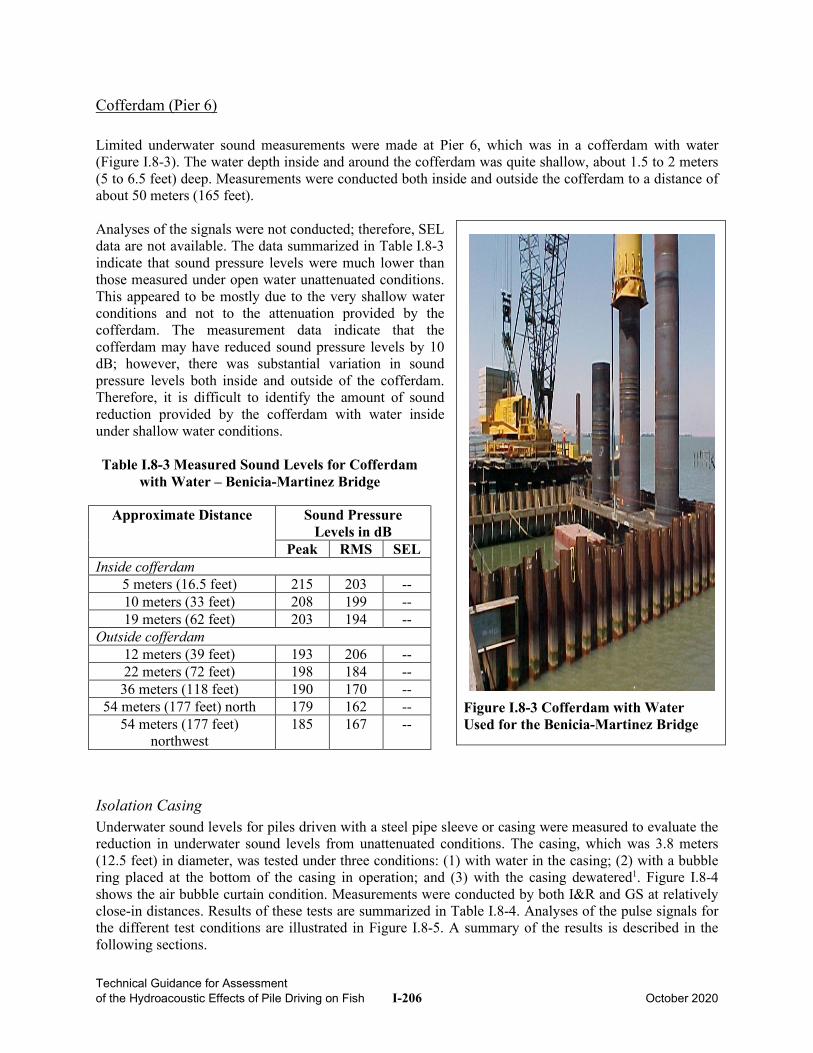
Technical Guidance for Assessment of the Hydroacoustic Effects of Pile Driving on Fish I-206 October 2020
Cofferdam (Pier 6) Limited underwater sound measurements were made at Pier 6, which was in a cofferdam with water (Figure I.8-3). The water depth inside and around the cofferdam was quite shallow, about 1.5 to 2 meters (5 to 6.5 feet) deep. Measurements were conducted both inside and outside the cofferdam to a distance of about 50 meters (165 feet). Analyses of the signals were not conducted; therefore, SEL data are not available. The data summarized in Table I.8-3 indicate that sound pressure levels were much lower than those measured under open water unattenuated conditions. This appeared to be mostly due to the very shallow water conditions and not to the attenuation provided by the cofferdam. The measurement data indicate that the cofferdam may have reduced sound pressure levels by 10 dB; however, there was substantial variation in sound pressure levels both inside and outside of the cofferdam. Therefore, it is difficult to identify the amount of sound reduction provided by the cofferdam with water inside under shallow water conditions.
Isolation Casing Underwater sound levels for piles driven with a steel pipe sleeve or casing were measured to evaluate the reduction in underwater sound levels from unattenuated conditions. The casing, which was 3.8 meters (12.5 feet) in diameter, was tested under three conditions: (1) with water in the casing; (2) with a bubble ring placed at the bottom of the casing in operation; and (3) with the casing dewatered1. Figure I.8-4 shows the air bubble curtain condition. Measurements were conducted by both I&R and GS at relatively close-in distances. Results of these tests are summarized in Table I.8-4. Analyses of the pulse signals for the different test conditions are illustrated in Figure I.8-5. A summary of the results is described in the following sections.
Figure I.8-3 Cofferdam with Water Used for the Benicia-Martinez Bridge
Table I.8-3 Measured Sound Levels for Cofferdam with Water – Benicia-Martinez Bridge
Approximate Distance Sound Pressure Levels in dB
Peak RMS SEL Inside cofferdam
5 meters (16.5 feet) 215 203 -- 10 meters (33 feet) 208 199 -- 19 meters (62 feet) 203 194 --
Outside cofferdam 12 meters (39 feet) 193 206 -- 22 meters (72 feet) 198 184 -- 36 meters (118 feet) 190 170 --
54 meters (177 feet) north 179 162 -- 54 meters (177 feet)
northwest 185 167 --
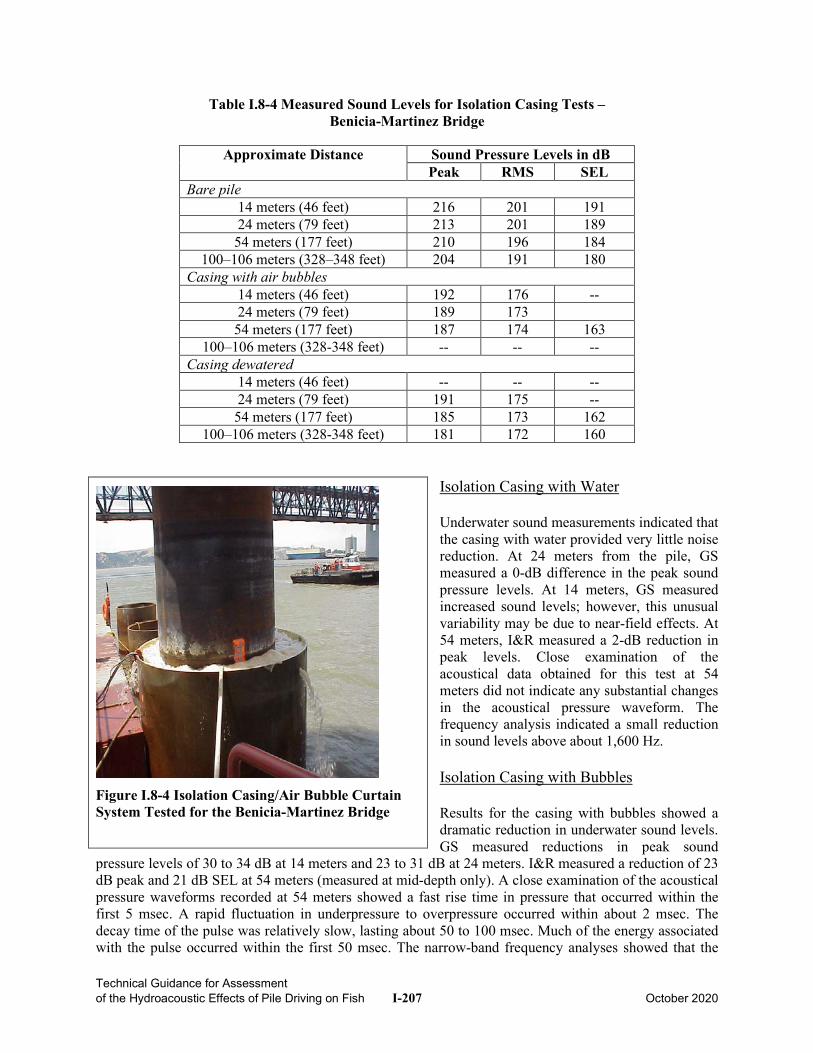
Technical Guidance for Assessment of the Hydroacoustic Effects of Pile Driving on Fish I-207 October 2020
Table I.8-4 Measured Sound Levels for Isolation Casing Tests – Benicia-Martinez Bridge
Approximate Distance Sound Pressure Levels in dB Peak RMS SEL
Bare pile 14 meters (46 feet) 216 201 191 24 meters (79 feet) 213 201 189
54 meters (177 feet) 210 196 184 100–106 meters (328–348 feet) 204 191 180
Casing with air bubbles 14 meters (46 feet) 192 176 -- 24 meters (79 feet) 189 173
54 meters (177 feet) 187 174 163 100–106 meters (328-348 feet) -- -- --
Casing dewatered 14 meters (46 feet) -- -- -- 24 meters (79 feet) 191 175 --
54 meters (177 feet) 185 173 162 100–106 meters (328-348 feet) 181 172 160
Isolation Casing with Water Underwater sound measurements indicated that the casing with water provided very little noise reduction. At 24 meters from the pile, GS measured a 0-dB difference in the peak sound pressure levels. At 14 meters, GS measured increased sound levels; however, this unusual variability may be due to near-field effects. At 54 meters, I&R measured a 2-dB reduction in peak levels. Close examination of the acoustical data obtained for this test at 54 meters did not indicate any substantial changes in the acoustical pressure waveform. The frequency analysis indicated a small reduction in sound levels above about 1,600 Hz. Isolation Casing with Bubbles Results for the casing with bubbles showed a dramatic reduction in underwater sound levels. GS measured reductions in peak sound
pressure levels of 30 to 34 dB at 14 meters and 23 to 31 dB at 24 meters. I&R measured a reduction of 23 dB peak and 21 dB SEL at 54 meters (measured at mid-depth only). A close examination of the acoustical pressure waveforms recorded at 54 meters showed a fast rise time in pressure that occurred within the first 5 msec. A rapid fluctuation in underpressure to overpressure occurred within about 2 msec. The decay time of the pulse was relatively slow, lasting about 50 to 100 msec. Much of the energy associated with the pulse occurred within the first 50 msec. The narrow-band frequency analyses showed that the
Figure I.8-4 Isolation Casing/Air Bubble Curtain System Tested for the Benicia-Martinez Bridge
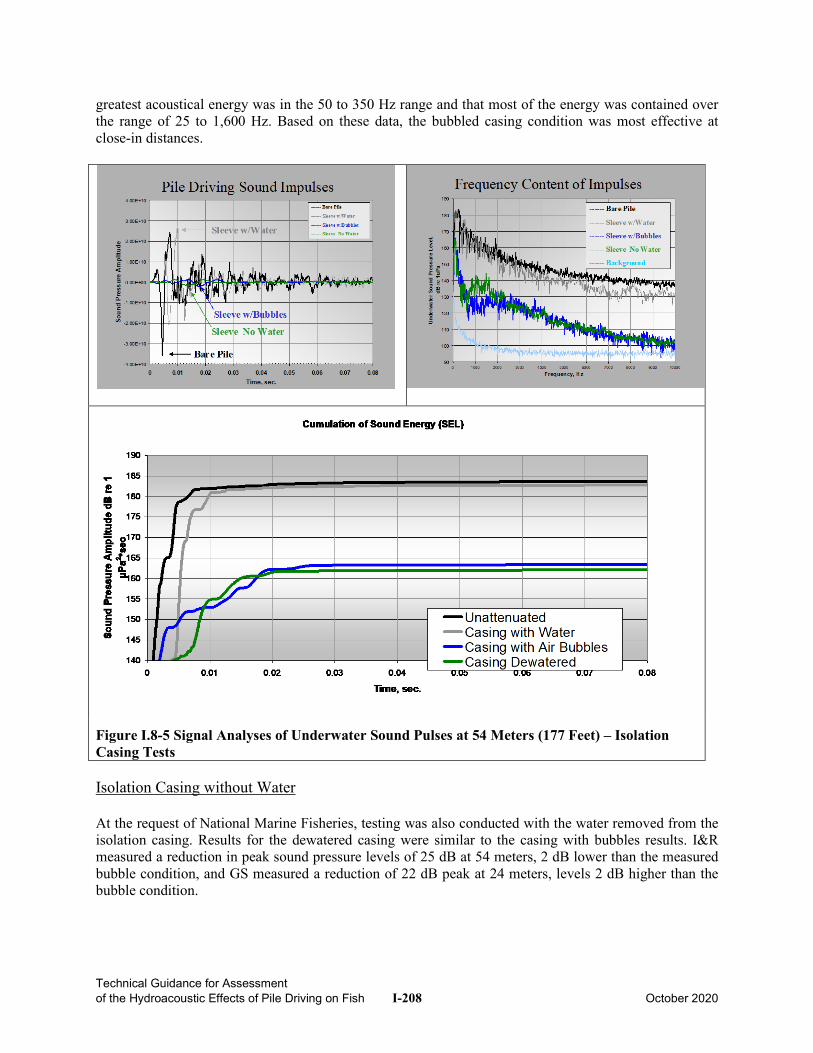
Technical Guidance for Assessment of the Hydroacoustic Effects of Pile Driving on Fish I-208 October 2020
greatest acoustical energy was in the 50 to 350 Hz range and that most of the energy was contained over the range of 25 to 1,600 Hz. Based on these data, the bubbled casing condition was most effective at close-in distances.
Figure I.8-5 Signal Analyses of Underwater Sound Pulses at 54 Meters (177 Feet) – Isolation Casing Tests Isolation Casing without Water At the request of National Marine Fisheries, testing was also conducted with the water removed from the isolation casing. Results for the dewatered casing were similar to the casing with bubbles results. I&R measured a reduction in peak sound pressure levels of 25 dB at 54 meters, 2 dB lower than the measured bubble condition, and GS measured a reduction of 22 dB peak at 24 meters, levels 2 dB higher than the bubble condition.
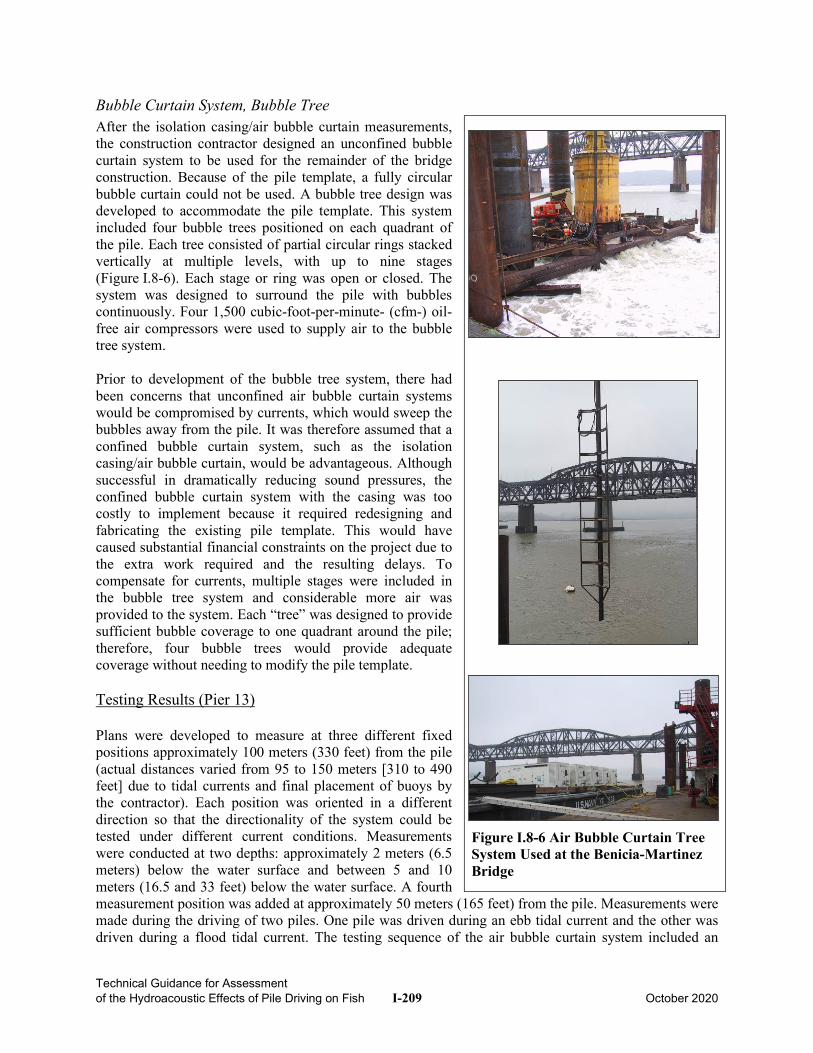
Technical Guidance for Assessment of the Hydroacoustic Effects of Pile Driving on Fish I-209 October 2020
Bubble Curtain System, Bubble Tree After the isolation casing/air bubble curtain measurements, the construction contractor designed an unconfined bubble curtain system to be used for the remainder of the bridge construction. Because of the pile template, a fully circular bubble curtain could not be used. A bubble tree design was developed to accommodate the pile template. This system included four bubble trees positioned on each quadrant of the pile. Each tree consisted of partial circular rings stacked vertically at multiple levels, with up to nine stages (Figure I.8-6). Each stage or ring was open or closed. The system was designed to surround the pile with bubbles continuously. Four 1,500 cubic-foot-per-minute- (cfm-) oil-free air compressors were used to supply air to the bubble tree system. Prior to development of the bubble tree system, there had been concerns that unconfined air bubble curtain systems would be compromised by currents, which would sweep the bubbles away from the pile. It was therefore assumed that a confined bubble curtain system, such as the isolation casing/air bubble curtain, would be advantageous. Although successful in dramatically reducing sound pressures, the confined bubble curtain system with the casing was too costly to implement because it required redesigning and fabricating the existing pile template. This would have caused substantial financial constraints on the project due to the extra work required and the resulting delays. To compensate for currents, multiple stages were included in the bubble tree system and considerable more air was provided to the system. Each “tree” was designed to provide sufficient bubble coverage to one quadrant around the pile; therefore, four bubble trees would provide adequate coverage without needing to modify the pile template. Testing Results (Pier 13) Plans were developed to measure at three different fixed positions approximately 100 meters (330 feet) from the pile (actual distances varied from 95 to 150 meters [310 to 490 feet] due to tidal currents and final placement of buoys by the contractor). Each position was oriented in a different direction so that the directionality of the system could be tested under different current conditions. Measurements were conducted at two depths: approximately 2 meters (6.5 meters) below the water surface and between 5 and 10 meters (16.5 and 33 feet) below the water surface. A fourth measurement position was added at approximately 50 meters (165 feet) from the pile. Measurements were made during the driving of two piles. One pile was driven during an ebb tidal current and the other was driven during a flood tidal current. The testing sequence of the air bubble curtain system included an
Figure I.8-6 Air Bubble Curtain Tree System Used at the Benicia-Martinez Bridge
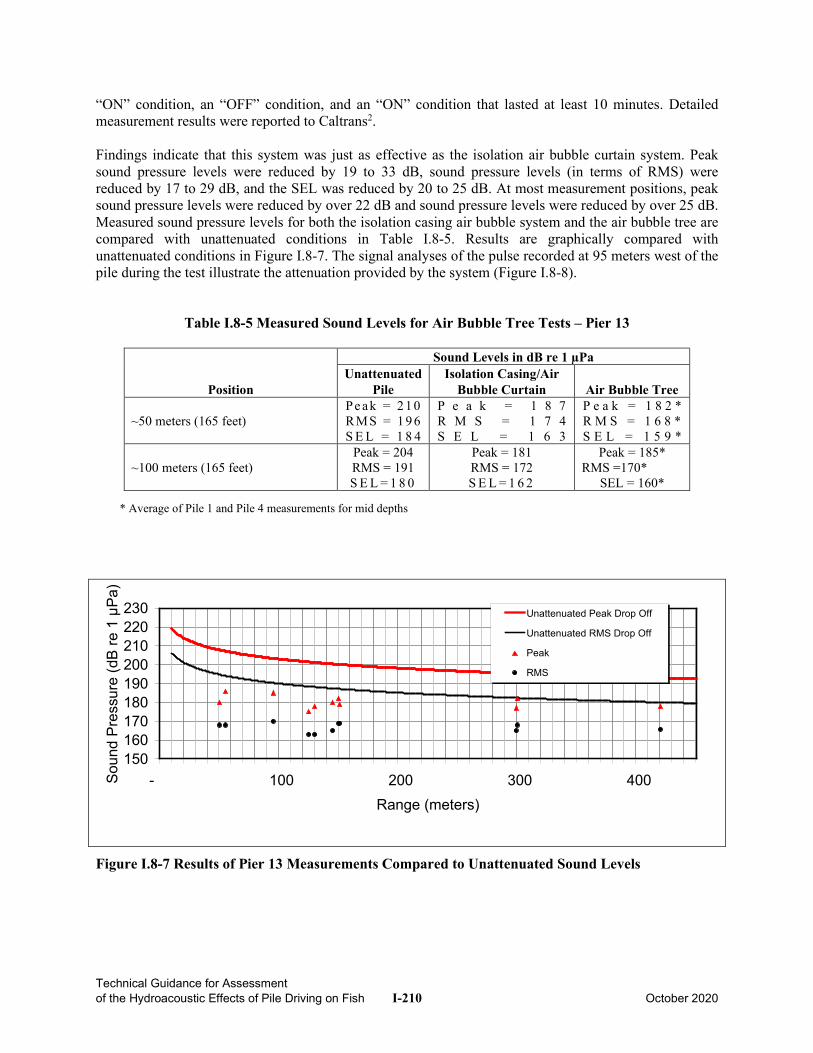
Technical Guidance for Assessment of the Hydroacoustic Effects of Pile Driving on Fish I-210 October 2020
“ON” condition, an “OFF” condition, and an “ON” condition that lasted at least 10 minutes. Detailed measurement results were reported to Caltrans2. Findings indicate that this system was just as effective as the isolation air bubble curtain system. Peak sound pressure levels were reduced by 19 to 33 dB, sound pressure levels (in terms of RMS) were reduced by 17 to 29 dB, and the SEL was reduced by 20 to 25 dB. At most measurement positions, peak sound pressure levels were reduced by over 22 dB and sound pressure levels were reduced by over 25 dB. Measured sound pressure levels for both the isolation casing air bubble system and the air bubble tree are compared with unattenuated conditions in Table I.8-5. Results are graphically compared with unattenuated conditions in Figure I.8-7. The signal analyses of the pulse recorded at 95 meters west of the pile during the test illustrate the attenuation provided by the system (Figure I.8-8).
Table I.8-5 Measured Sound Levels for Air Bubble Tree Tests – Pier 13
Position
Sound Levels in dB re 1 µPa Unattenuated
Pile Isolation Casing/Air
Bubble Curtain Air Bubble Tree
~50 meters (165 feet) Pe ak = 2 1 0 RMS = 1 9 6 S E L = 1 8 4
P e a k = 1 8 7 R M S = 1 7 4 S E L = 1 6 3
P e a k = 1 8 2 * R M S = 1 6 8 * S E L = 1 5 9 *
~100 meters (165 feet) Peak = 204 RMS = 191 S E L = 1 8 0
Peak = 181 RMS = 172 S E L = 1 6 2
Peak = 185* RMS =170*
SEL = 160*
* Average of Pile 1 and Pile 4 measurements for mid depths
Figure I.8-7 Results of Pier 13 Measurements Compared to Unattenuated Sound Levels
150160170180190200210220230
- 100 200 300 400Range (meters)
Soun
d Pr
essu
re (d
B re
1 µ
Pa)
Unattenuated Peak Drop Off
Unattenuated RMS Drop Off
Peak
RMS
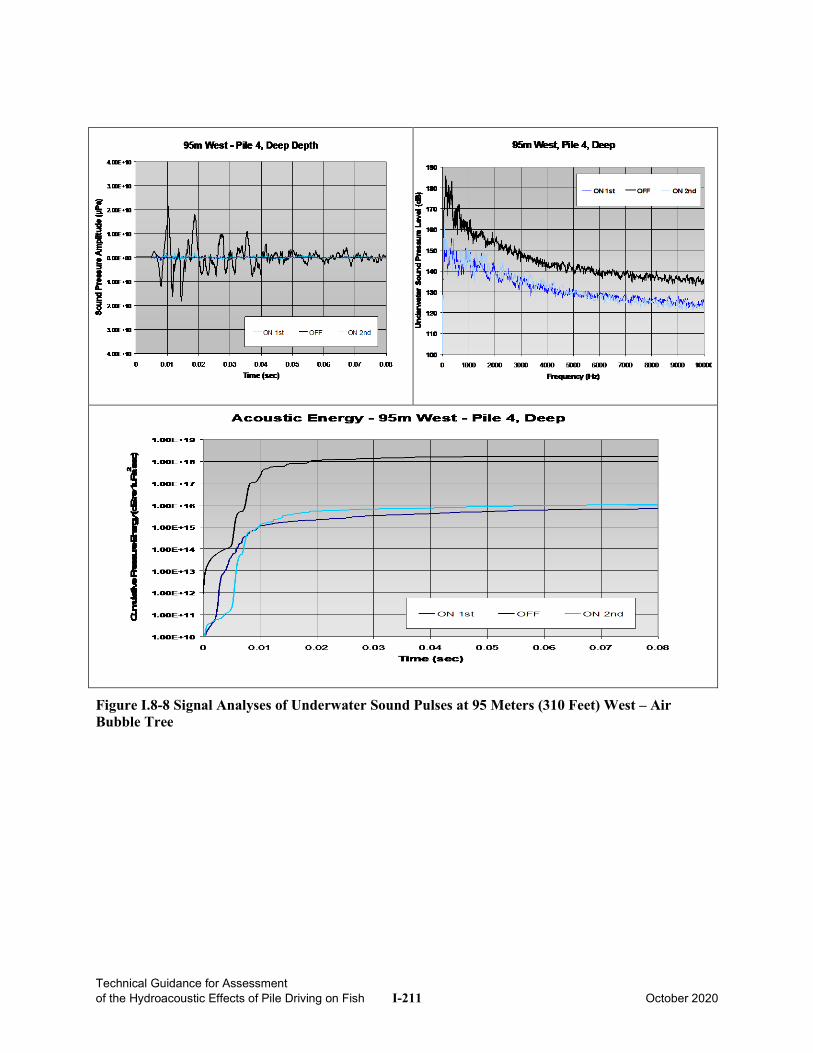
Technical Guidance for Assessment of the Hydroacoustic Effects of Pile Driving on Fish I-211 October 2020
Figure I.8-8 Signal Analyses of Underwater Sound Pulses at 95 Meters (310 Feet) West – Air Bubble Tree
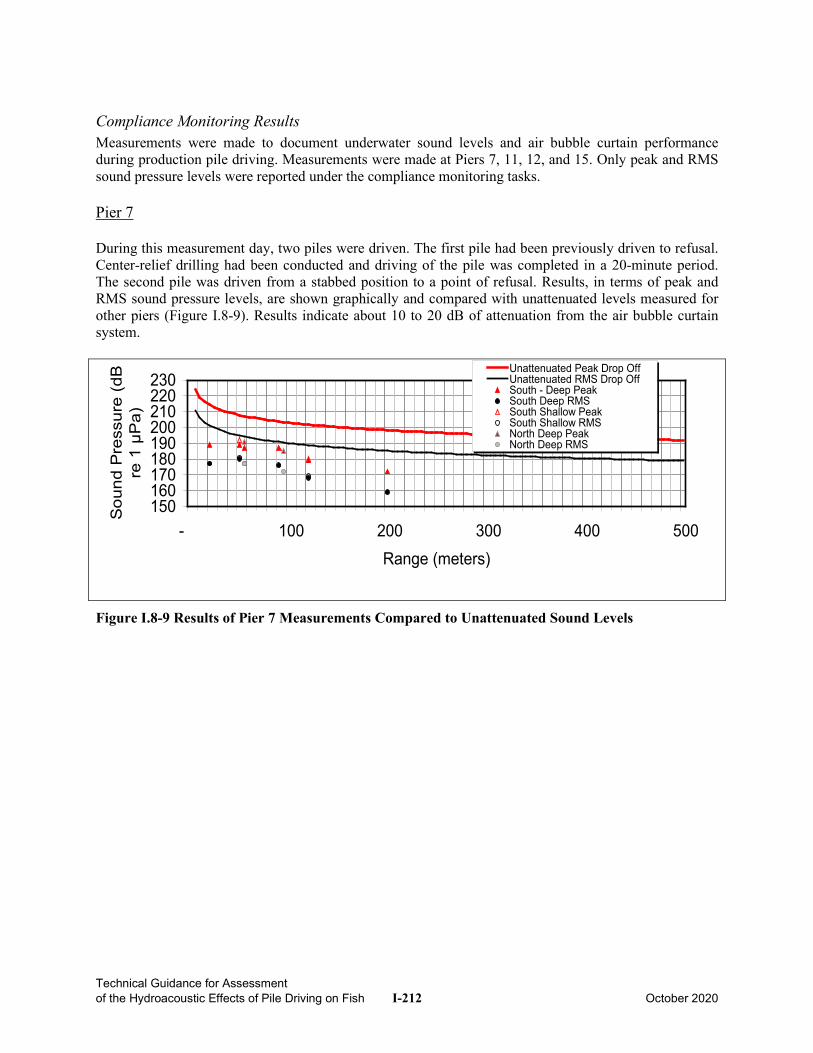
Technical Guidance for Assessment of the Hydroacoustic Effects of Pile Driving on Fish I-212 October 2020
Compliance Monitoring Results Measurements were made to document underwater sound levels and air bubble curtain performance during production pile driving. Measurements were made at Piers 7, 11, 12, and 15. Only peak and RMS sound pressure levels were reported under the compliance monitoring tasks. Pier 7 During this measurement day, two piles were driven. The first pile had been previously driven to refusal. Center-relief drilling had been conducted and driving of the pile was completed in a 20-minute period. The second pile was driven from a stabbed position to a point of refusal. Results, in terms of peak and RMS sound pressure levels, are shown graphically and compared with unattenuated levels measured for other piers (Figure I.8-9). Results indicate about 10 to 20 dB of attenuation from the air bubble curtain system.
Figure I.8-9 Results of Pier 7 Measurements Compared to Unattenuated Sound Levels
150160170180190200210220230
- 100 200 300 400 500Range (meters)
Sou
nd P
ress
ure
(dB
re
1 µ
Pa)
Unattenuated Peak Drop Off Unattenuated RMS Drop OffSouth - Deep PeakSouth Deep RMSSouth Shallow PeakSouth Shallow RMSNorth Deep PeakNorth Deep RMS
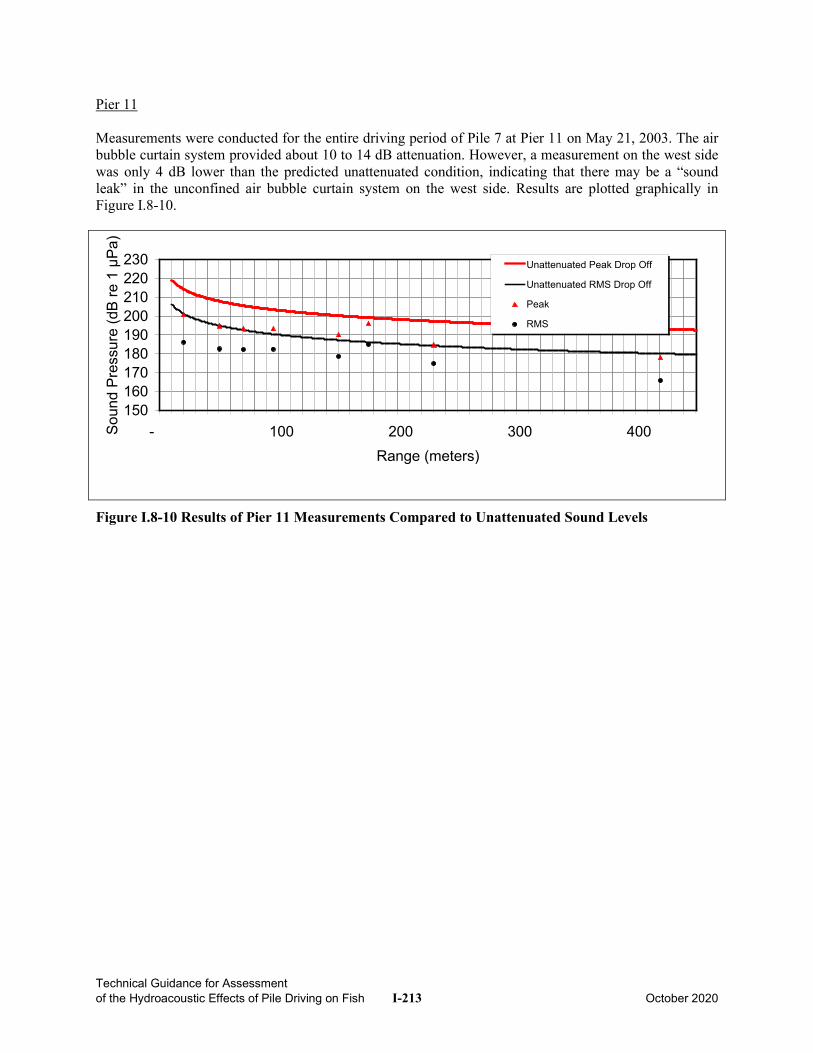
Technical Guidance for Assessment of the Hydroacoustic Effects of Pile Driving on Fish I-213 October 2020
Pier 11 Measurements were conducted for the entire driving period of Pile 7 at Pier 11 on May 21, 2003. The air bubble curtain system provided about 10 to 14 dB attenuation. However, a measurement on the west side was only 4 dB lower than the predicted unattenuated condition, indicating that there may be a “sound leak” in the unconfined air bubble curtain system on the west side. Results are plotted graphically in Figure I.8-10.
Figure I.8-10 Results of Pier 11 Measurements Compared to Unattenuated Sound Levels
150160170180190200210220230
- 100 200 300 400Range (meters)
Soun
d Pr
essu
re (d
B re
1 µ
Pa)
Unattenuated Peak Drop Off
Unattenuated RMS Drop Off
Peak
RMS
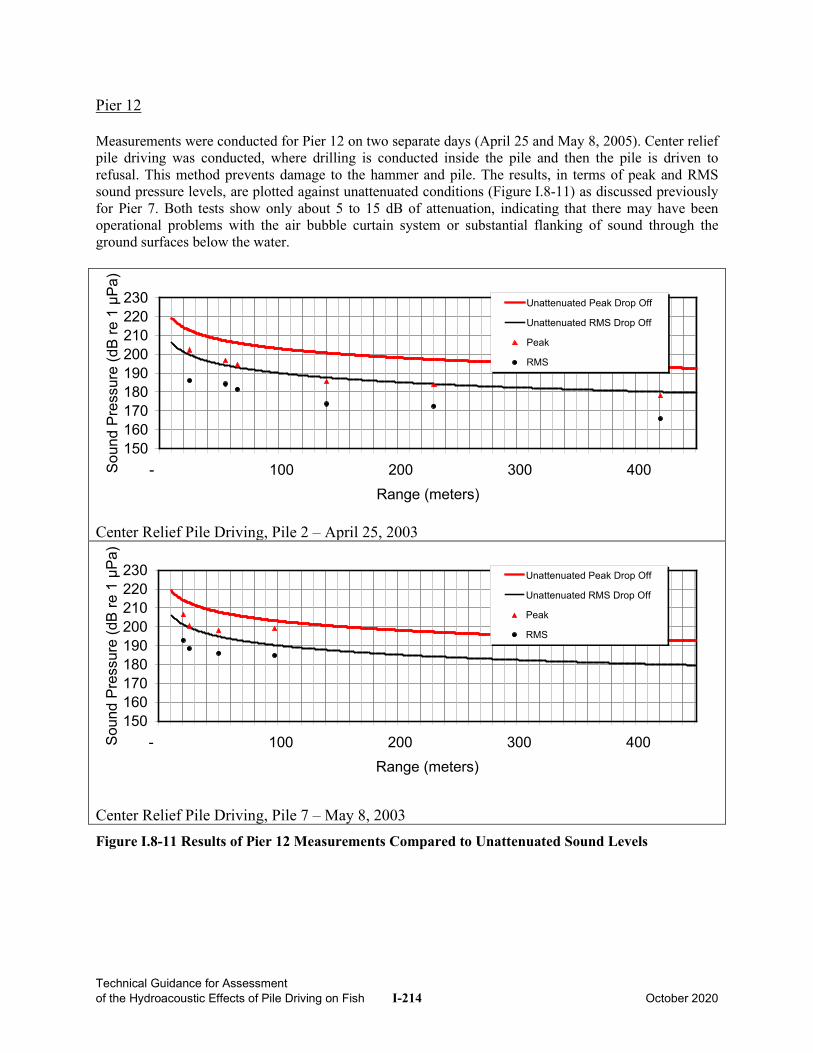
Technical Guidance for Assessment of the Hydroacoustic Effects of Pile Driving on Fish I-214 October 2020
Pier 12 Measurements were conducted for Pier 12 on two separate days (April 25 and May 8, 2005). Center relief pile driving was conducted, where drilling is conducted inside the pile and then the pile is driven to refusal. This method prevents damage to the hammer and pile. The results, in terms of peak and RMS sound pressure levels, are plotted against unattenuated conditions (Figure I.8-11) as discussed previously for Pier 7. Both tests show only about 5 to 15 dB of attenuation, indicating that there may have been operational problems with the air bubble curtain system or substantial flanking of sound through the ground surfaces below the water.
Center Relief Pile Driving, Pile 2 – April 25, 2003
Center Relief Pile Driving, Pile 7 – May 8, 2003 Figure I.8-11 Results of Pier 12 Measurements Compared to Unattenuated Sound Levels
150160170180190200210220230
- 100 200 300 400Range (meters)
Soun
d Pr
essu
re (d
B re
1 µ
Pa)
Unattenuated Peak Drop Off
Unattenuated RMS Drop Off
Peak
RMS
150160170180190200210220230
- 100 200 300 400Range (meters)
Soun
d Pr
essu
re (d
B re
1 µ
Pa)
Unattenuated Peak Drop Off
Unattenuated RMS Drop Off
Peak
RMS
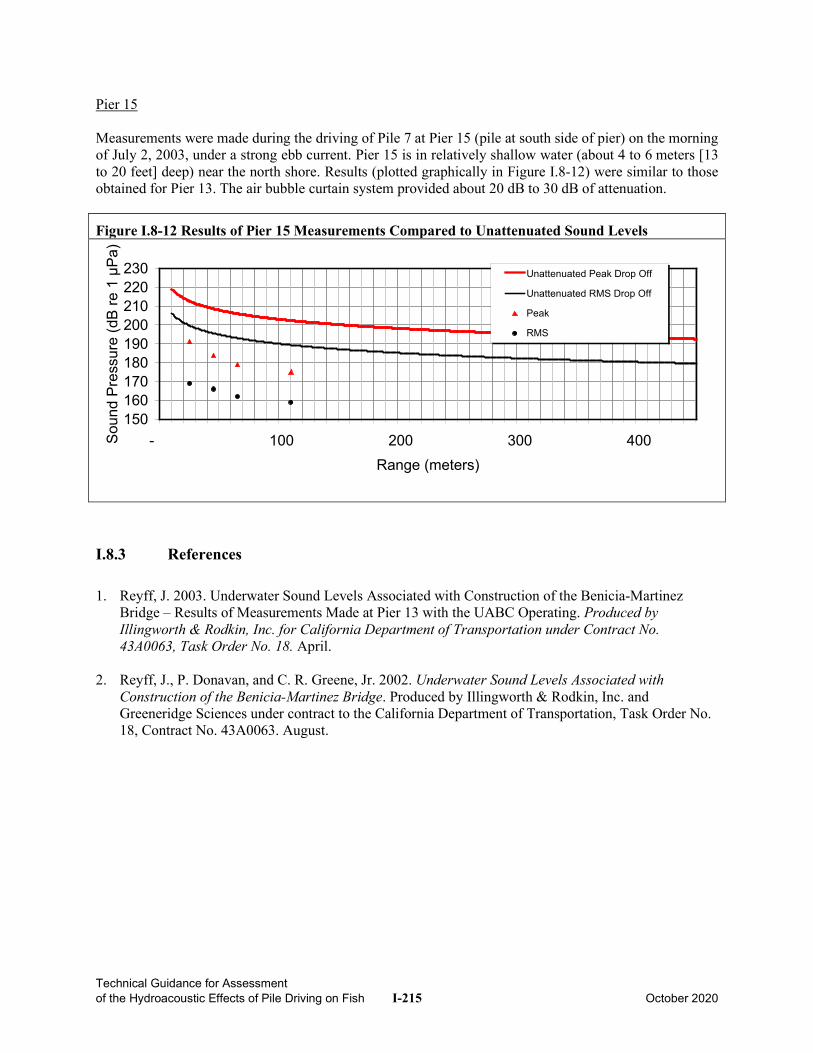
Technical Guidance for Assessment of the Hydroacoustic Effects of Pile Driving on Fish I-215 October 2020
Pier 15 Measurements were made during the driving of Pile 7 at Pier 15 (pile at south side of pier) on the morning of July 2, 2003, under a strong ebb current. Pier 15 is in relatively shallow water (about 4 to 6 meters [13 to 20 feet] deep) near the north shore. Results (plotted graphically in Figure I.8-12) were similar to those obtained for Pier 13. The air bubble curtain system provided about 20 dB to 30 dB of attenuation.
Figure I.8-12 Results of Pier 15 Measurements Compared to Unattenuated Sound Levels
I.8.3 References
1. Reyff, J. 2003. Underwater Sound Levels Associated with Construction of the Benicia-Martinez Bridge – Results of Measurements Made at Pier 13 with the UABC Operating. Produced by Illingworth & Rodkin, Inc. for California Department of Transportation under Contract No. 43A0063, Task Order No. 18. April.
2. Reyff, J., P. Donavan, and C. R. Greene, Jr. 2002. Underwater Sound Levels Associated with Construction of the Benicia-Martinez Bridge. Produced by Illingworth & Rodkin, Inc. and Greeneridge Sciences under contract to the California Department of Transportation, Task Order No. 18, Contract No. 43A0063. August.
150160170180190200210220230
- 100 200 300 400Range (meters)
Soun
d Pr
essu
re (d
B re
1 µ
Pa)
Unattenuated Peak Drop Off
Unattenuated RMS Drop Off
Peak
RMS
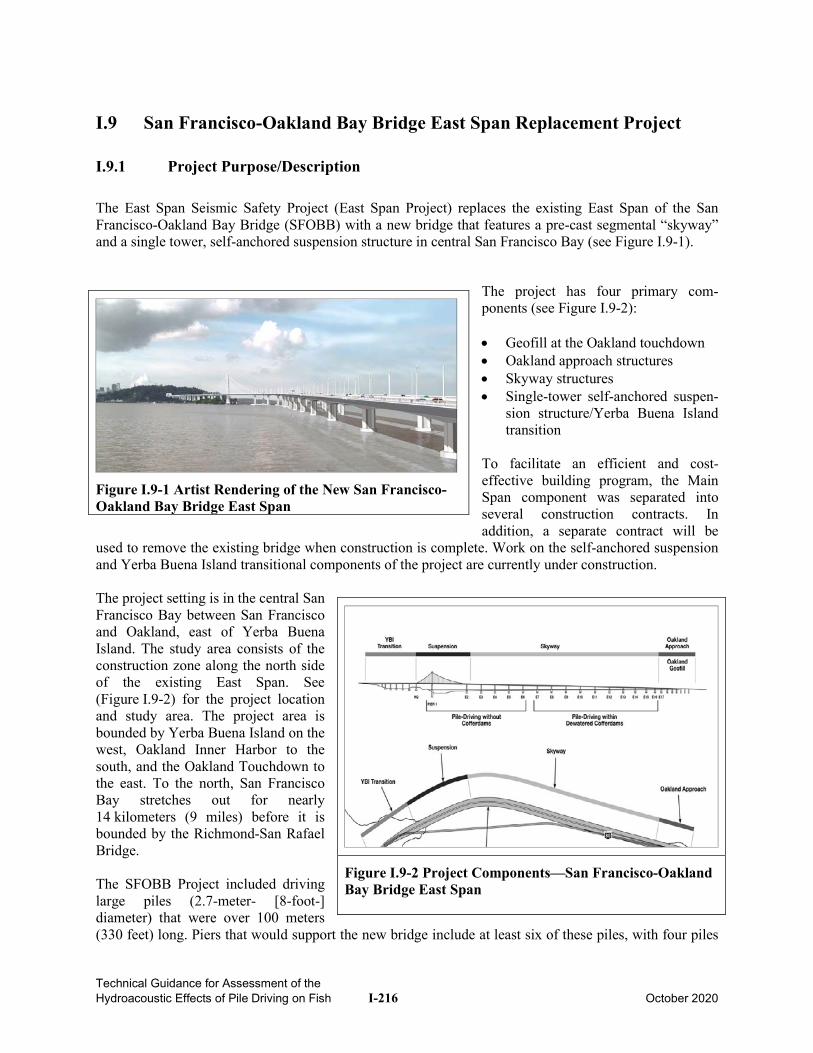
Technical Guidance for Assessment of the Hydroacoustic Effects of Pile Driving on Fish I-216 October 2020
I.9 San Francisco-Oakland Bay Bridge East Span Replacement Project
I.9.1 Project Purpose/Description
The East Span Seismic Safety Project (East Span Project) replaces the existing East Span of the San Francisco-Oakland Bay Bridge (SFOBB) with a new bridge that features a pre-cast segmental “skyway” and a single tower, self-anchored suspension structure in central San Francisco Bay (see Figure I.9-1).
The project has four primary com-ponents (see Figure I.9-2): • Geofill at the Oakland touchdown • Oakland approach structures • Skyway structures • Single-tower self-anchored suspen-
sion structure/Yerba Buena Island transition
To facilitate an efficient and cost-effective building program, the Main Span component was separated into several construction contracts. In addition, a separate contract will be
used to remove the existing bridge when construction is complete. Work on the self-anchored suspension and Yerba Buena Island transitional components of the project are currently under construction. The project setting is in the central San Francisco Bay between San Francisco and Oakland, east of Yerba Buena Island. The study area consists of the construction zone along the north side of the existing East Span. See (Figure I.9-2) for the project location and study area. The project area is bounded by Yerba Buena Island on the west, Oakland Inner Harbor to the south, and the Oakland Touchdown to the east. To the north, San Francisco Bay stretches out for nearly 14 kilometers (9 miles) before it is bounded by the Richmond-San Rafael Bridge. The SFOBB Project included driving large piles (2.7-meter- [8-foot-] diameter) that were over 100 meters (330 feet) long. Piers that would support the new bridge include at least six of these piles, with four piles
Figure I.9-1 Artist Rendering of the New San Francisco-Oakland Bay Bridge East Span
Figure I.9-2 Project Components—San Francisco-Oakland Bay Bridge East Span
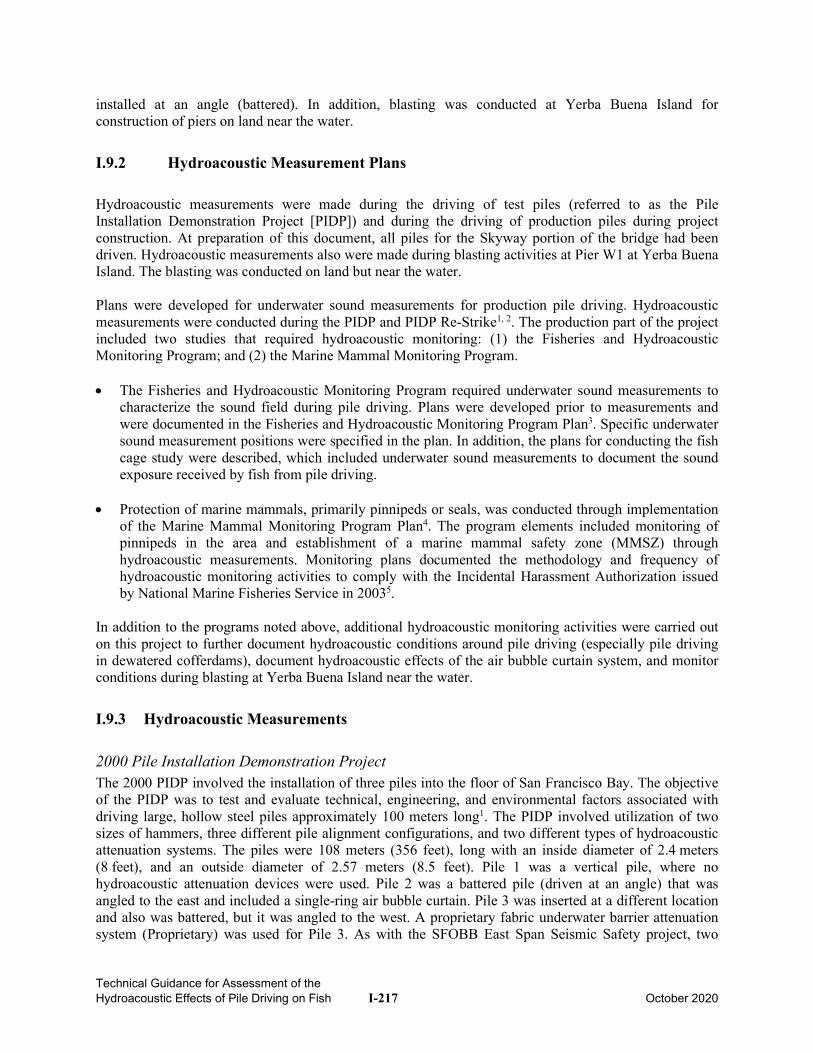
Technical Guidance for Assessment of the Hydroacoustic Effects of Pile Driving on Fish I-217 October 2020
installed at an angle (battered). In addition, blasting was conducted at Yerba Buena Island for construction of piers on land near the water.
I.9.2 Hydroacoustic Measurement Plans
Hydroacoustic measurements were made during the driving of test piles (referred to as the Pile Installation Demonstration Project [PIDP]) and during the driving of production piles during project construction. At preparation of this document, all piles for the Skyway portion of the bridge had been driven. Hydroacoustic measurements also were made during blasting activities at Pier W1 at Yerba Buena Island. The blasting was conducted on land but near the water. Plans were developed for underwater sound measurements for production pile driving. Hydroacoustic measurements were conducted during the PIDP and PIDP Re-Strike1, 2. The production part of the project included two studies that required hydroacoustic monitoring: (1) the Fisheries and Hydroacoustic Monitoring Program; and (2) the Marine Mammal Monitoring Program. • The Fisheries and Hydroacoustic Monitoring Program required underwater sound measurements to
characterize the sound field during pile driving. Plans were developed prior to measurements and were documented in the Fisheries and Hydroacoustic Monitoring Program Plan3. Specific underwater sound measurement positions were specified in the plan. In addition, the plans for conducting the fish cage study were described, which included underwater sound measurements to document the sound exposure received by fish from pile driving.
• Protection of marine mammals, primarily pinnipeds or seals, was conducted through implementation
of the Marine Mammal Monitoring Program Plan4. The program elements included monitoring of pinnipeds in the area and establishment of a marine mammal safety zone (MMSZ) through hydroacoustic measurements. Monitoring plans documented the methodology and frequency of hydroacoustic monitoring activities to comply with the Incidental Harassment Authorization issued by National Marine Fisheries Service in 20035.
In addition to the programs noted above, additional hydroacoustic monitoring activities were carried out on this project to further document hydroacoustic conditions around pile driving (especially pile driving in dewatered cofferdams), document hydroacoustic effects of the air bubble curtain system, and monitor conditions during blasting at Yerba Buena Island near the water.
I.9.3 Hydroacoustic Measurements
2000 Pile Installation Demonstration Project The 2000 PIDP involved the installation of three piles into the floor of San Francisco Bay. The objective of the PIDP was to test and evaluate technical, engineering, and environmental factors associated with driving large, hollow steel piles approximately 100 meters long1. The PIDP involved utilization of two sizes of hammers, three different pile alignment configurations, and two different types of hydroacoustic attenuation systems. The piles were 108 meters (356 feet), long with an inside diameter of 2.4 meters (8 feet), and an outside diameter of 2.57 meters (8.5 feet). Pile 1 was a vertical pile, where no hydroacoustic attenuation devices were used. Pile 2 was a battered pile (driven at an angle) that was angled to the east and included a single-ring air bubble curtain. Pile 3 was inserted at a different location and also was battered, but it was angled to the west. A proprietary fabric underwater barrier attenuation system (Proprietary) was used for Pile 3. As with the SFOBB East Span Seismic Safety project, two
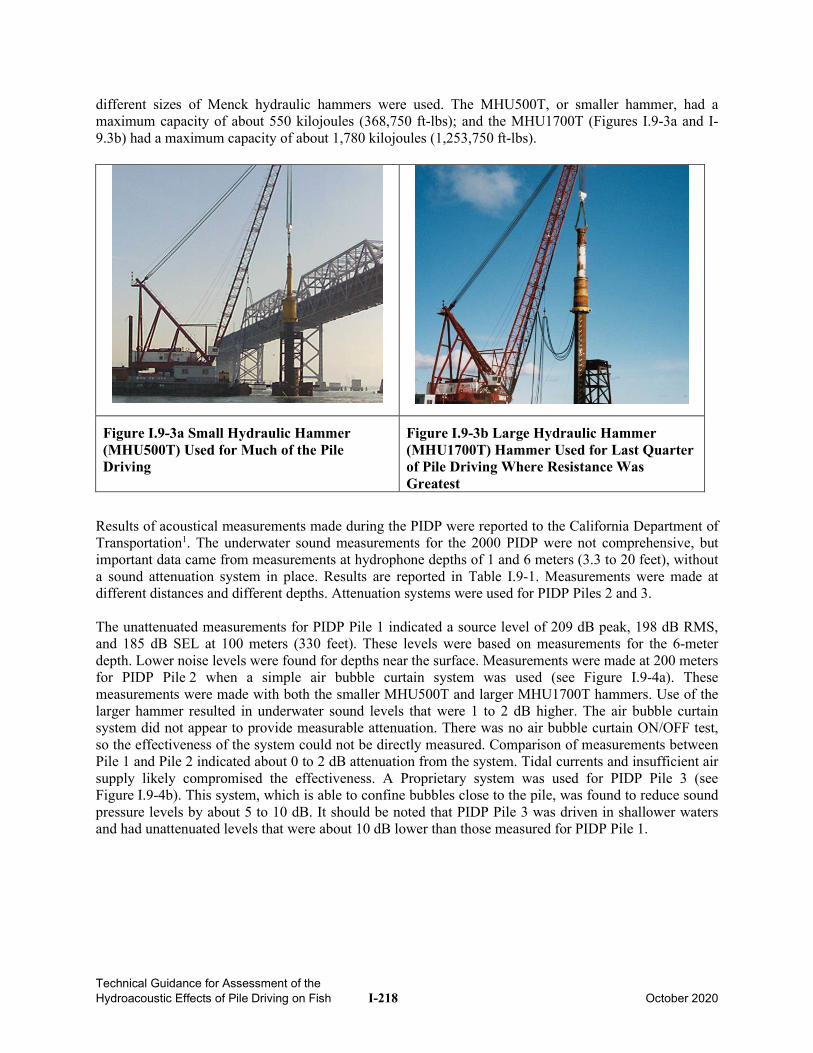
Technical Guidance for Assessment of the Hydroacoustic Effects of Pile Driving on Fish I-218 October 2020
different sizes of Menck hydraulic hammers were used. The MHU500T, or smaller hammer, had a maximum capacity of about 550 kilojoules (368,750 ft-lbs); and the MHU1700T (Figures I.9-3a and I-9.3b) had a maximum capacity of about 1,780 kilojoules (1,253,750 ft-lbs).
Figure I.9-3a Small Hydraulic Hammer (MHU500T) Used for Much of the Pile Driving
Figure I.9-3b Large Hydraulic Hammer (MHU1700T) Hammer Used for Last Quarter of Pile Driving Where Resistance Was Greatest
Results of acoustical measurements made during the PIDP were reported to the California Department of Transportation1. The underwater sound measurements for the 2000 PIDP were not comprehensive, but important data came from measurements at hydrophone depths of 1 and 6 meters (3.3 to 20 feet), without a sound attenuation system in place. Results are reported in Table I.9-1. Measurements were made at different distances and different depths. Attenuation systems were used for PIDP Piles 2 and 3. The unattenuated measurements for PIDP Pile 1 indicated a source level of 209 dB peak, 198 dB RMS, and 185 dB SEL at 100 meters (330 feet). These levels were based on measurements for the 6-meter depth. Lower noise levels were found for depths near the surface. Measurements were made at 200 meters for PIDP Pile 2 when a simple air bubble curtain system was used (see Figure I.9-4a). These measurements were made with both the smaller MHU500T and larger MHU1700T hammers. Use of the larger hammer resulted in underwater sound levels that were 1 to 2 dB higher. The air bubble curtain system did not appear to provide measurable attenuation. There was no air bubble curtain ON/OFF test, so the effectiveness of the system could not be directly measured. Comparison of measurements between Pile 1 and Pile 2 indicated about 0 to 2 dB attenuation from the system. Tidal currents and insufficient air supply likely compromised the effectiveness. A Proprietary system was used for PIDP Pile 3 (see Figure I.9-4b). This system, which is able to confine bubbles close to the pile, was found to reduce sound pressure levels by about 5 to 10 dB. It should be noted that PIDP Pile 3 was driven in shallower waters and had unattenuated levels that were about 10 dB lower than those measured for PIDP Pile 1.
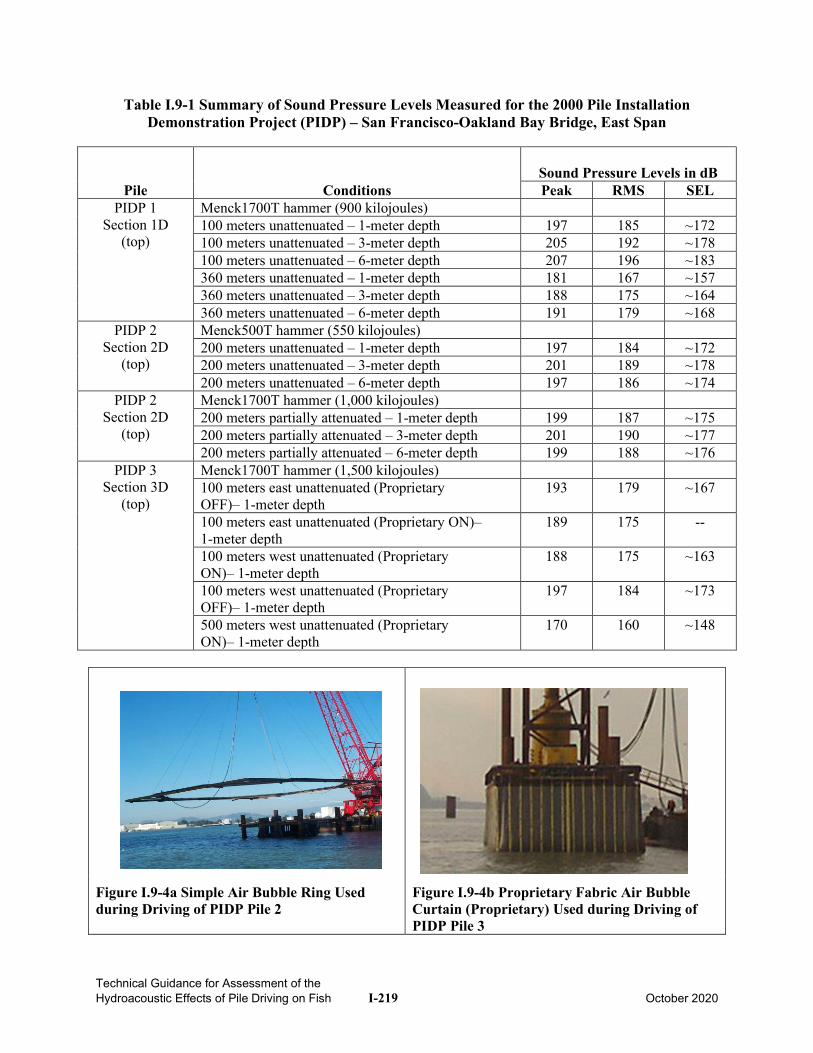
Technical Guidance for Assessment of the Hydroacoustic Effects of Pile Driving on Fish I-219 October 2020
Table I.9-1 Summary of Sound Pressure Levels Measured for the 2000 Pile Installation Demonstration Project (PIDP) – San Francisco-Oakland Bay Bridge, East Span
Pile Conditions
Sound Pressure Levels in dB Peak RMS SEL
PIDP 1 Section 1D
(top)
Menck1700T hammer (900 kilojoules) 100 meters unattenuated – 1-meter depth 197 185 ~172 100 meters unattenuated – 3-meter depth 205 192 ~178 100 meters unattenuated – 6-meter depth 207 196 ~183 360 meters unattenuated – 1-meter depth 181 167 ~157 360 meters unattenuated – 3-meter depth 188 175 ~164 360 meters unattenuated – 6-meter depth 191 179 ~168
PIDP 2 Section 2D
(top)
Menck500T hammer (550 kilojoules) 200 meters unattenuated – 1-meter depth 197 184 ~172 200 meters unattenuated – 3-meter depth 201 189 ~178 200 meters unattenuated – 6-meter depth 197 186 ~174
PIDP 2 Section 2D
(top)
Menck1700T hammer (1,000 kilojoules) 200 meters partially attenuated – 1-meter depth 199 187 ~175 200 meters partially attenuated – 3-meter depth 201 190 ~177 200 meters partially attenuated – 6-meter depth 199 188 ~176
PIDP 3 Section 3D
(top)
Menck1700T hammer (1,500 kilojoules) 100 meters east unattenuated (Proprietary OFF)– 1-meter depth
193 179 ~167
100 meters east unattenuated (Proprietary ON)– 1-meter depth
189 175 --
100 meters west unattenuated (Proprietary ON)– 1-meter depth
188 175 ~163
100 meters west unattenuated (Proprietary OFF)– 1-meter depth
197 184 ~173
500 meters west unattenuated (Proprietary ON)– 1-meter depth
170 160 ~148
Figure I.9-4a Simple Air Bubble Ring Used during Driving of PIDP Pile 2
Figure I.9-4b Proprietary Fabric Air Bubble Curtain (Proprietary) Used during Driving of PIDP Pile 3
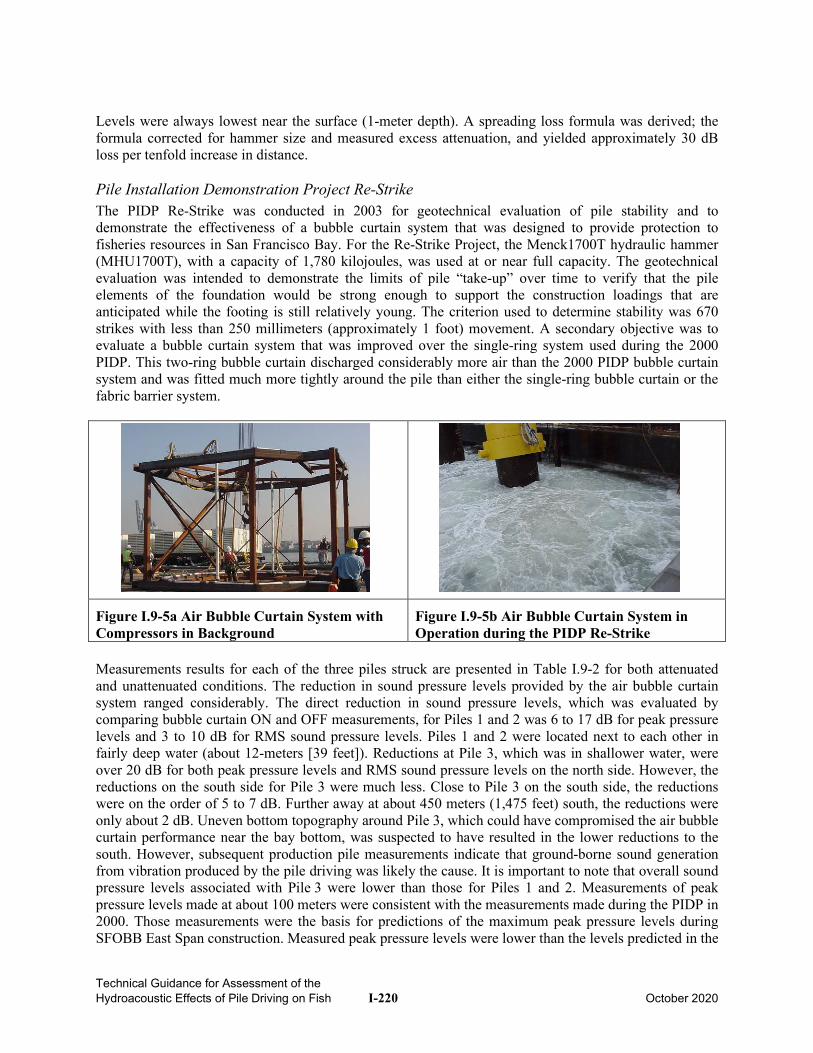
Technical Guidance for Assessment of the Hydroacoustic Effects of Pile Driving on Fish I-220 October 2020
Levels were always lowest near the surface (1-meter depth). A spreading loss formula was derived; the formula corrected for hammer size and measured excess attenuation, and yielded approximately 30 dB loss per tenfold increase in distance. Pile Installation Demonstration Project Re-Strike The PIDP Re-Strike was conducted in 2003 for geotechnical evaluation of pile stability and to demonstrate the effectiveness of a bubble curtain system that was designed to provide protection to fisheries resources in San Francisco Bay. For the Re-Strike Project, the Menck1700T hydraulic hammer (MHU1700T), with a capacity of 1,780 kilojoules, was used at or near full capacity. The geotechnical evaluation was intended to demonstrate the limits of pile “take-up” over time to verify that the pile elements of the foundation would be strong enough to support the construction loadings that are anticipated while the footing is still relatively young. The criterion used to determine stability was 670 strikes with less than 250 millimeters (approximately 1 foot) movement. A secondary objective was to evaluate a bubble curtain system that was improved over the single-ring system used during the 2000 PIDP. This two-ring bubble curtain discharged considerably more air than the 2000 PIDP bubble curtain system and was fitted much more tightly around the pile than either the single-ring bubble curtain or the fabric barrier system.
Figure I.9-5a Air Bubble Curtain System with Compressors in Background
Figure I.9-5b Air Bubble Curtain System in Operation during the PIDP Re-Strike
Measurements results for each of the three piles struck are presented in Table I.9-2 for both attenuated and unattenuated conditions. The reduction in sound pressure levels provided by the air bubble curtain system ranged considerably. The direct reduction in sound pressure levels, which was evaluated by comparing bubble curtain ON and OFF measurements, for Piles 1 and 2 was 6 to 17 dB for peak pressure levels and 3 to 10 dB for RMS sound pressure levels. Piles 1 and 2 were located next to each other in fairly deep water (about 12-meters [39 feet]). Reductions at Pile 3, which was in shallower water, were over 20 dB for both peak pressure levels and RMS sound pressure levels on the north side. However, the reductions on the south side for Pile 3 were much less. Close to Pile 3 on the south side, the reductions were on the order of 5 to 7 dB. Further away at about 450 meters (1,475 feet) south, the reductions were only about 2 dB. Uneven bottom topography around Pile 3, which could have compromised the air bubble curtain performance near the bay bottom, was suspected to have resulted in the lower reductions to the south. However, subsequent production pile measurements indicate that ground-borne sound generation from vibration produced by the pile driving was likely the cause. It is important to note that overall sound pressure levels associated with Pile 3 were lower than those for Piles 1 and 2. Measurements of peak pressure levels made at about 100 meters were consistent with the measurements made during the PIDP in 2000. Those measurements were the basis for predictions of the maximum peak pressure levels during SFOBB East Span construction. Measured peak pressure levels were lower than the levels predicted in the
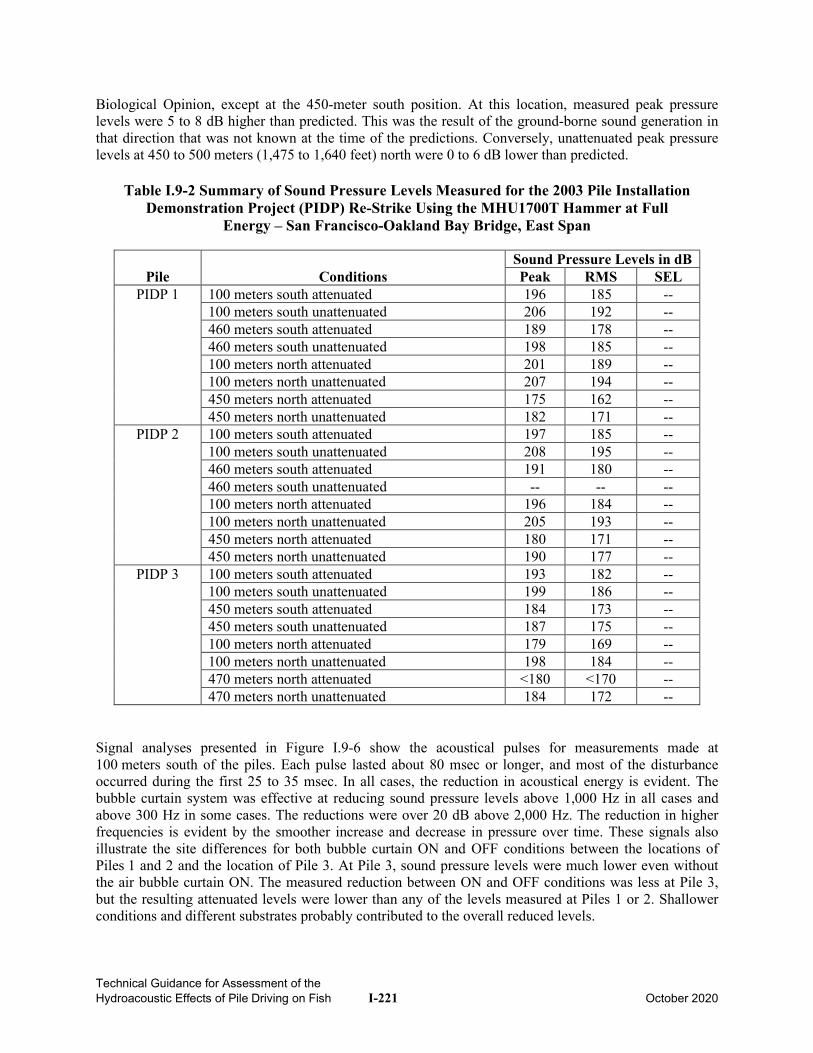
Technical Guidance for Assessment of the Hydroacoustic Effects of Pile Driving on Fish I-221 October 2020
Biological Opinion, except at the 450-meter south position. At this location, measured peak pressure levels were 5 to 8 dB higher than predicted. This was the result of the ground-borne sound generation in that direction that was not known at the time of the predictions. Conversely, unattenuated peak pressure levels at 450 to 500 meters (1,475 to 1,640 feet) north were 0 to 6 dB lower than predicted.
Table I.9-2 Summary of Sound Pressure Levels Measured for the 2003 Pile Installation Demonstration Project (PIDP) Re-Strike Using the MHU1700T Hammer at Full
Energy – San Francisco-Oakland Bay Bridge, East Span
Pile Conditions Sound Pressure Levels in dB Peak RMS SEL
PIDP 1
100 meters south attenuated 196 185 -- 100 meters south unattenuated 206 192 -- 460 meters south attenuated 189 178 -- 460 meters south unattenuated 198 185 -- 100 meters north attenuated 201 189 -- 100 meters north unattenuated 207 194 -- 450 meters north attenuated 175 162 -- 450 meters north unattenuated 182 171 --
PIDP 2
100 meters south attenuated 197 185 -- 100 meters south unattenuated 208 195 -- 460 meters south attenuated 191 180 -- 460 meters south unattenuated -- -- -- 100 meters north attenuated 196 184 -- 100 meters north unattenuated 205 193 -- 450 meters north attenuated 180 171 -- 450 meters north unattenuated 190 177 --
PIDP 3
100 meters south attenuated 193 182 -- 100 meters south unattenuated 199 186 -- 450 meters south attenuated 184 173 -- 450 meters south unattenuated 187 175 -- 100 meters north attenuated 179 169 -- 100 meters north unattenuated 198 184 -- 470 meters north attenuated <180 <170 -- 470 meters north unattenuated 184 172 --
Signal analyses presented in Figure I.9-6 show the acoustical pulses for measurements made at 100 meters south of the piles. Each pulse lasted about 80 msec or longer, and most of the disturbance occurred during the first 25 to 35 msec. In all cases, the reduction in acoustical energy is evident. The bubble curtain system was effective at reducing sound pressure levels above 1,000 Hz in all cases and above 300 Hz in some cases. The reductions were over 20 dB above 2,000 Hz. The reduction in higher frequencies is evident by the smoother increase and decrease in pressure over time. These signals also illustrate the site differences for both bubble curtain ON and OFF conditions between the locations of Piles 1 and 2 and the location of Pile 3. At Pile 3, sound pressure levels were much lower even without the air bubble curtain ON. The measured reduction between ON and OFF conditions was less at Pile 3, but the resulting attenuated levels were lower than any of the levels measured at Piles 1 or 2. Shallower conditions and different substrates probably contributed to the overall reduced levels.
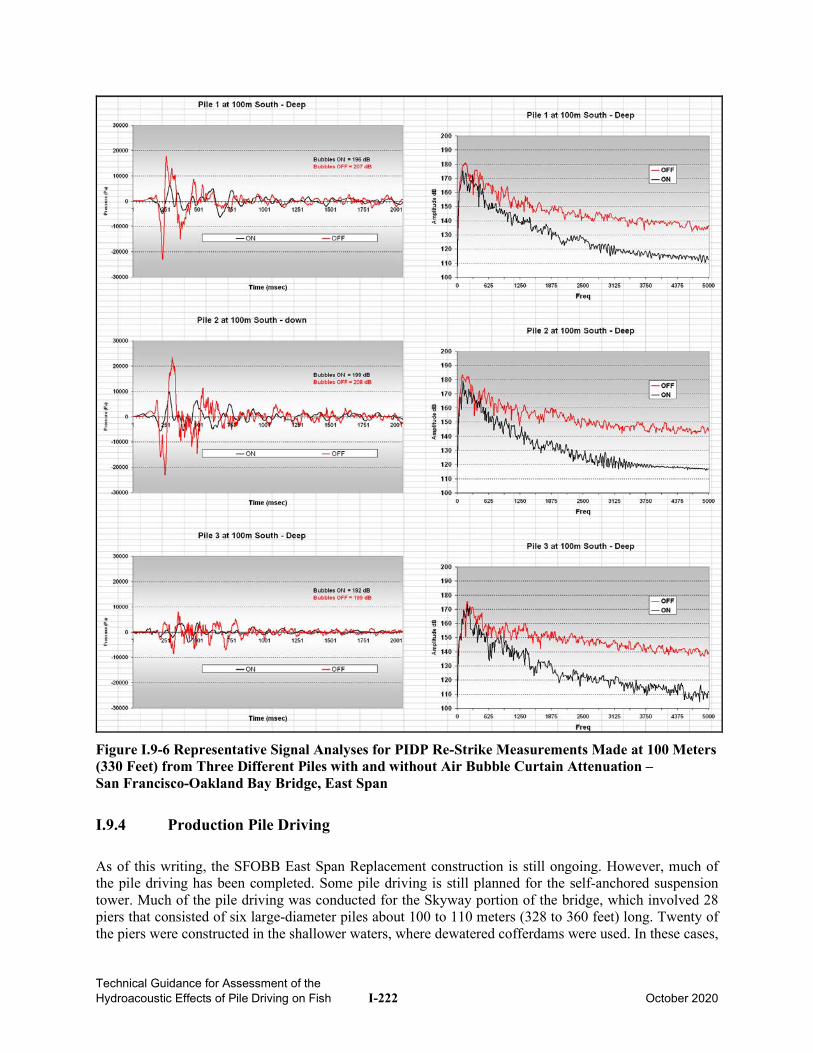
Technical Guidance for Assessment of the Hydroacoustic Effects of Pile Driving on Fish I-222 October 2020
Figure I.9-6 Representative Signal Analyses for PIDP Re-Strike Measurements Made at 100 Meters (330 Feet) from Three Different Piles with and without Air Bubble Curtain Attenuation – San Francisco-Oakland Bay Bridge, East Span
I.9.4 Production Pile Driving
As of this writing, the SFOBB East Span Replacement construction is still ongoing. However, much of the pile driving has been completed. Some pile driving is still planned for the self-anchored suspension tower. Much of the pile driving was conducted for the Skyway portion of the bridge, which involved 28 piers that consisted of six large-diameter piles about 100 to 110 meters (328 to 360 feet) long. Twenty of the piers were constructed in the shallower waters, where dewatered cofferdams were used. In these cases,
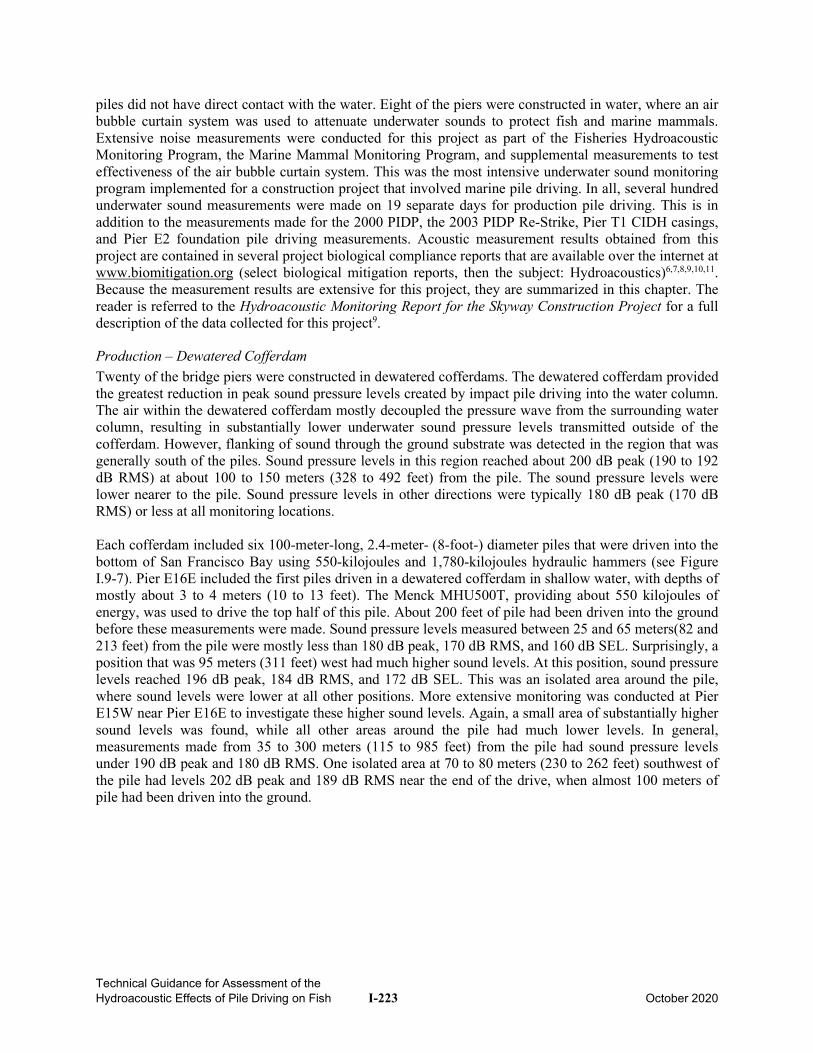
Technical Guidance for Assessment of the Hydroacoustic Effects of Pile Driving on Fish I-223 October 2020
piles did not have direct contact with the water. Eight of the piers were constructed in water, where an air bubble curtain system was used to attenuate underwater sounds to protect fish and marine mammals. Extensive noise measurements were conducted for this project as part of the Fisheries Hydroacoustic Monitoring Program, the Marine Mammal Monitoring Program, and supplemental measurements to test effectiveness of the air bubble curtain system. This was the most intensive underwater sound monitoring program implemented for a construction project that involved marine pile driving. In all, several hundred underwater sound measurements were made on 19 separate days for production pile driving. This is in addition to the measurements made for the 2000 PIDP, the 2003 PIDP Re-Strike, Pier T1 CIDH casings, and Pier E2 foundation pile driving measurements. Acoustic measurement results obtained from this project are contained in several project biological compliance reports that are available over the internet at www.biomitigation.org (select biological mitigation reports, then the subject: Hydroacoustics)6,7,8,9,10,11. Because the measurement results are extensive for this project, they are summarized in this chapter. The reader is referred to the Hydroacoustic Monitoring Report for the Skyway Construction Project for a full description of the data collected for this project9.
Production – Dewatered Cofferdam Twenty of the bridge piers were constructed in dewatered cofferdams. The dewatered cofferdam provided the greatest reduction in peak sound pressure levels created by impact pile driving into the water column. The air within the dewatered cofferdam mostly decoupled the pressure wave from the surrounding water column, resulting in substantially lower underwater sound pressure levels transmitted outside of the cofferdam. However, flanking of sound through the ground substrate was detected in the region that was generally south of the piles. Sound pressure levels in this region reached about 200 dB peak (190 to 192 dB RMS) at about 100 to 150 meters (328 to 492 feet) from the pile. The sound pressure levels were lower nearer to the pile. Sound pressure levels in other directions were typically 180 dB peak (170 dB RMS) or less at all monitoring locations. Each cofferdam included six 100-meter-long, 2.4-meter- (8-foot-) diameter piles that were driven into the bottom of San Francisco Bay using 550-kilojoules and 1,780-kilojoules hydraulic hammers (see Figure I.9-7). Pier E16E included the first piles driven in a dewatered cofferdam in shallow water, with depths of mostly about 3 to 4 meters (10 to 13 feet). The Menck MHU500T, providing about 550 kilojoules of energy, was used to drive the top half of this pile. About 200 feet of pile had been driven into the ground before these measurements were made. Sound pressure levels measured between 25 and 65 meters(82 and 213 feet) from the pile were mostly less than 180 dB peak, 170 dB RMS, and 160 dB SEL. Surprisingly, a position that was 95 meters (311 feet) west had much higher sound levels. At this position, sound pressure levels reached 196 dB peak, 184 dB RMS, and 172 dB SEL. This was an isolated area around the pile, where sound levels were lower at all other positions. More extensive monitoring was conducted at Pier E15W near Pier E16E to investigate these higher sound levels. Again, a small area of substantially higher sound levels was found, while all other areas around the pile had much lower levels. In general, measurements made from 35 to 300 meters (115 to 985 feet) from the pile had sound pressure levels under 190 dB peak and 180 dB RMS. One isolated area at 70 to 80 meters (230 to 262 feet) southwest of the pile had levels 202 dB peak and 189 dB RMS near the end of the drive, when almost 100 meters of pile had been driven into the ground.
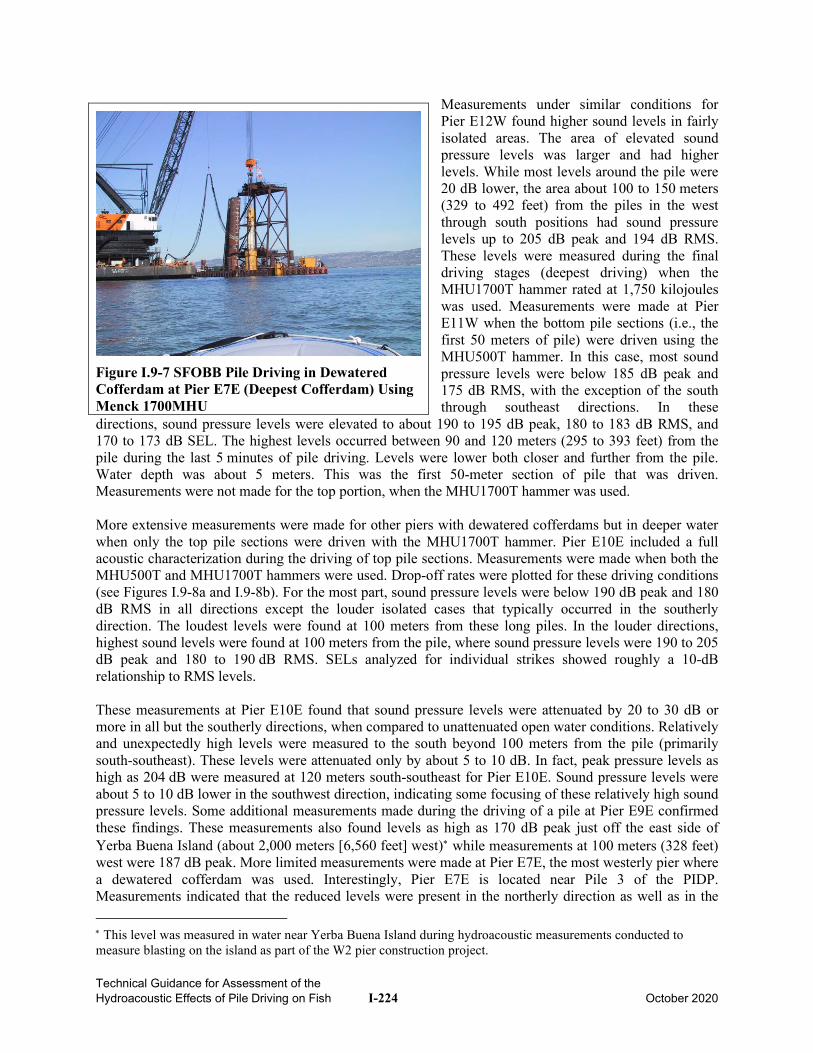
Technical Guidance for Assessment of the Hydroacoustic Effects of Pile Driving on Fish I-224 October 2020
Measurements under similar conditions for Pier E12W found higher sound levels in fairly isolated areas. The area of elevated sound pressure levels was larger and had higher levels. While most levels around the pile were 20 dB lower, the area about 100 to 150 meters (329 to 492 feet) from the piles in the west through south positions had sound pressure levels up to 205 dB peak and 194 dB RMS. These levels were measured during the final driving stages (deepest driving) when the MHU1700T hammer rated at 1,750 kilojoules was used. Measurements were made at Pier E11W when the bottom pile sections (i.e., the first 50 meters of pile) were driven using the MHU500T hammer. In this case, most sound pressure levels were below 185 dB peak and 175 dB RMS, with the exception of the south through southeast directions. In these
directions, sound pressure levels were elevated to about 190 to 195 dB peak, 180 to 183 dB RMS, and 170 to 173 dB SEL. The highest levels occurred between 90 and 120 meters (295 to 393 feet) from the pile during the last 5 minutes of pile driving. Levels were lower both closer and further from the pile. Water depth was about 5 meters. This was the first 50-meter section of pile that was driven. Measurements were not made for the top portion, when the MHU1700T hammer was used. More extensive measurements were made for other piers with dewatered cofferdams but in deeper water when only the top pile sections were driven with the MHU1700T hammer. Pier E10E included a full acoustic characterization during the driving of top pile sections. Measurements were made when both the MHU500T and MHU1700T hammers were used. Drop-off rates were plotted for these driving conditions (see Figures I.9-8a and I.9-8b). For the most part, sound pressure levels were below 190 dB peak and 180 dB RMS in all directions except the louder isolated cases that typically occurred in the southerly direction. The loudest levels were found at 100 meters from these long piles. In the louder directions, highest sound levels were found at 100 meters from the pile, where sound pressure levels were 190 to 205 dB peak and 180 to 190 dB RMS. SELs analyzed for individual strikes showed roughly a 10-dB relationship to RMS levels. These measurements at Pier E10E found that sound pressure levels were attenuated by 20 to 30 dB or more in all but the southerly directions, when compared to unattenuated open water conditions. Relatively and unexpectedly high levels were measured to the south beyond 100 meters from the pile (primarily south-southeast). These levels were attenuated only by about 5 to 10 dB. In fact, peak pressure levels as high as 204 dB were measured at 120 meters south-southeast for Pier E10E. Sound pressure levels were about 5 to 10 dB lower in the southwest direction, indicating some focusing of these relatively high sound pressure levels. Some additional measurements made during the driving of a pile at Pier E9E confirmed these findings. These measurements also found levels as high as 170 dB peak just off the east side of Yerba Buena Island (about 2,000 meters [6,560 feet] west)∗ while measurements at 100 meters (328 feet) west were 187 dB peak. More limited measurements were made at Pier E7E, the most westerly pier where a dewatered cofferdam was used. Interestingly, Pier E7E is located near Pile 3 of the PIDP. Measurements indicated that the reduced levels were present in the northerly direction as well as in the
∗ This level was measured in water near Yerba Buena Island during hydroacoustic measurements conducted to measure blasting on the island as part of the W2 pier construction project.
Figure I.9-7 SFOBB Pile Driving in Dewatered Cofferdam at Pier E7E (Deepest Cofferdam) Using Menck 1700MHU
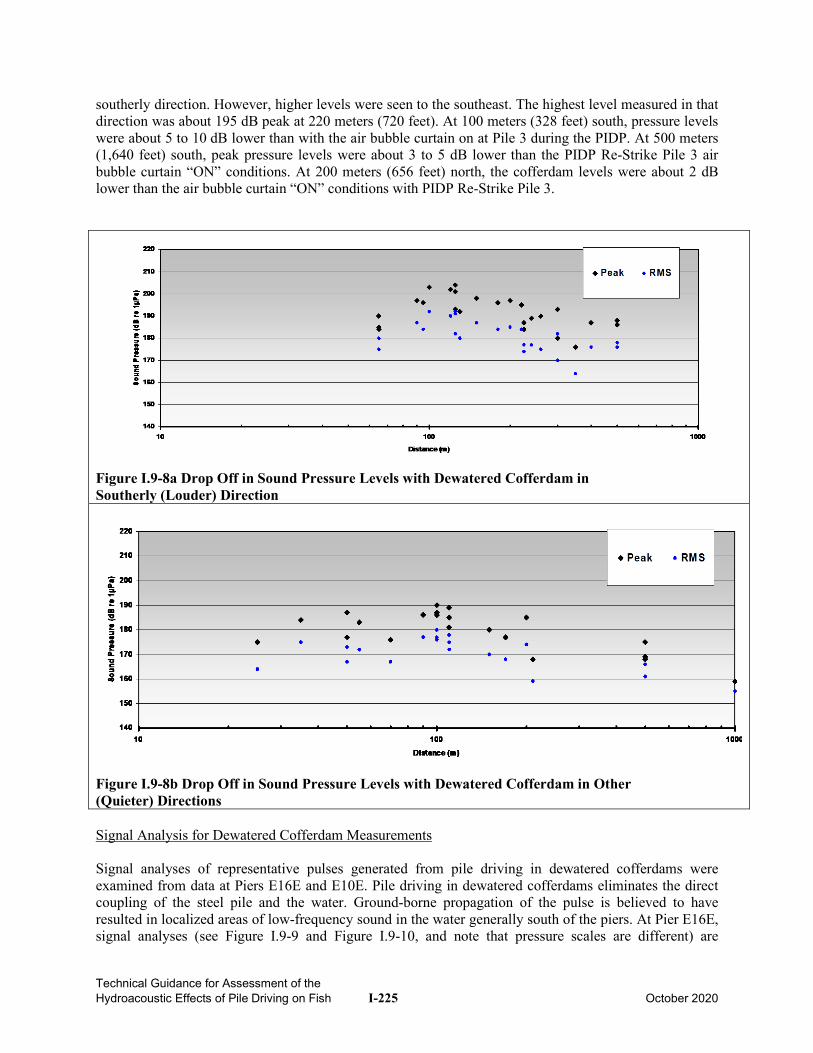
Technical Guidance for Assessment of the Hydroacoustic Effects of Pile Driving on Fish I-225 October 2020
southerly direction. However, higher levels were seen to the southeast. The highest level measured in that direction was about 195 dB peak at 220 meters (720 feet). At 100 meters (328 feet) south, pressure levels were about 5 to 10 dB lower than with the air bubble curtain on at Pile 3 during the PIDP. At 500 meters (1,640 feet) south, peak pressure levels were about 3 to 5 dB lower than the PIDP Re-Strike Pile 3 air bubble curtain “ON” conditions. At 200 meters (656 feet) north, the cofferdam levels were about 2 dB lower than the air bubble curtain “ON” conditions with PIDP Re-Strike Pile 3.
Figure I.9-8a Drop Off in Sound Pressure Levels with Dewatered Cofferdam in Southerly (Louder) Direction
Figure I.9-8b Drop Off in Sound Pressure Levels with Dewatered Cofferdam in Other (Quieter) Directions Signal Analysis for Dewatered Cofferdam Measurements Signal analyses of representative pulses generated from pile driving in dewatered cofferdams were examined from data at Piers E16E and E10E. Pile driving in dewatered cofferdams eliminates the direct coupling of the steel pile and the water. Ground-borne propagation of the pulse is believed to have resulted in localized areas of low-frequency sound in the water generally south of the piers. At Pier E16E, signal analyses (see Figure I.9-9 and Figure I.9-10, and note that pressure scales are different) are
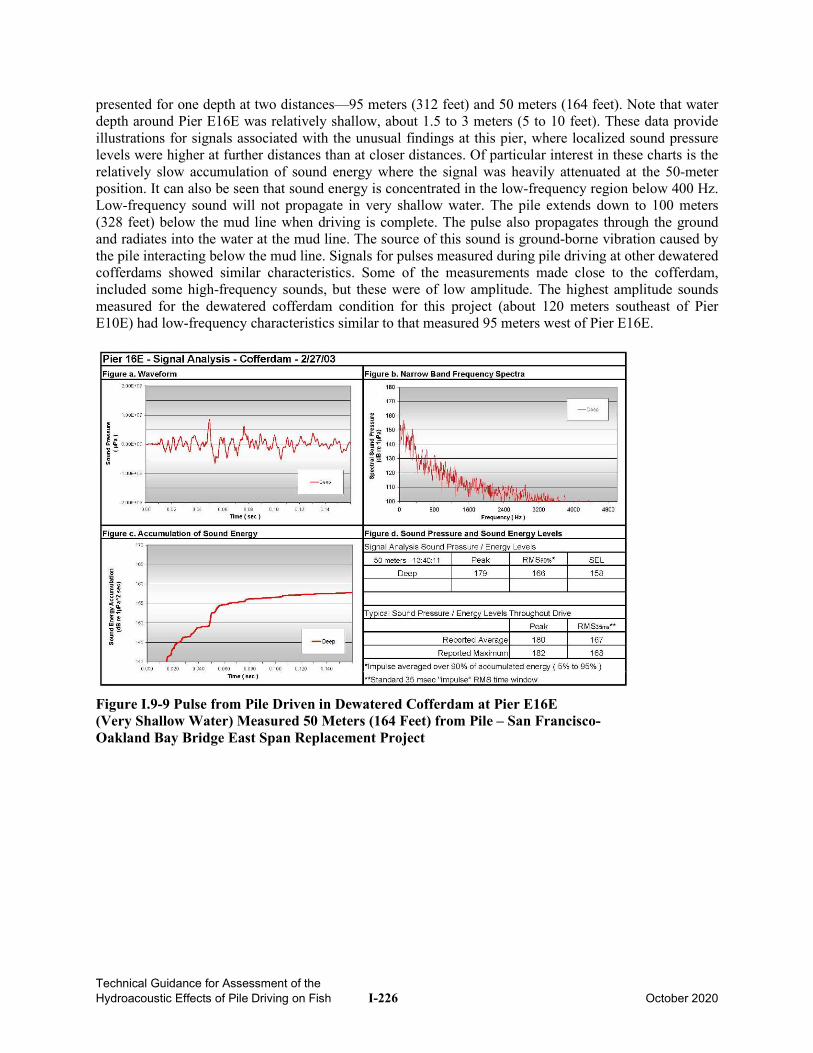
Technical Guidance for Assessment of the Hydroacoustic Effects of Pile Driving on Fish I-226 October 2020
presented for one depth at two distances—95 meters (312 feet) and 50 meters (164 feet). Note that water depth around Pier E16E was relatively shallow, about 1.5 to 3 meters (5 to 10 feet). These data provide illustrations for signals associated with the unusual findings at this pier, where localized sound pressure levels were higher at further distances than at closer distances. Of particular interest in these charts is the relatively slow accumulation of sound energy where the signal was heavily attenuated at the 50-meter position. It can also be seen that sound energy is concentrated in the low-frequency region below 400 Hz. Low-frequency sound will not propagate in very shallow water. The pile extends down to 100 meters (328 feet) below the mud line when driving is complete. The pulse also propagates through the ground and radiates into the water at the mud line. The source of this sound is ground-borne vibration caused by the pile interacting below the mud line. Signals for pulses measured during pile driving at other dewatered cofferdams showed similar characteristics. Some of the measurements made close to the cofferdam, included some high-frequency sounds, but these were of low amplitude. The highest amplitude sounds measured for the dewatered cofferdam condition for this project (about 120 meters southeast of Pier E10E) had low-frequency characteristics similar to that measured 95 meters west of Pier E16E.
Figure I.9-9 Pulse from Pile Driven in Dewatered Cofferdam at Pier E16E (Very Shallow Water) Measured 50 Meters (164 Feet) from Pile – San Francisco-Oakland Bay Bridge East Span Replacement Project
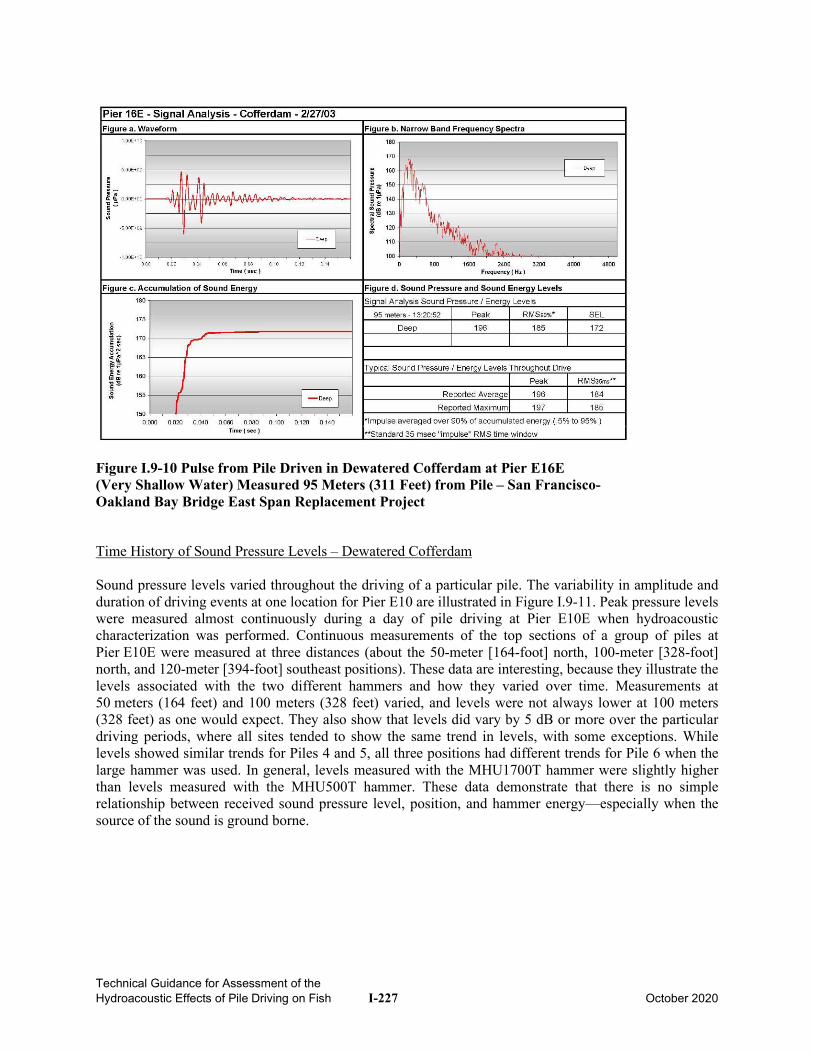
Technical Guidance for Assessment of the Hydroacoustic Effects of Pile Driving on Fish I-227 October 2020
Figure I.9-10 Pulse from Pile Driven in Dewatered Cofferdam at Pier E16E (Very Shallow Water) Measured 95 Meters (311 Feet) from Pile – San Francisco-Oakland Bay Bridge East Span Replacement Project
Time History of Sound Pressure Levels – Dewatered Cofferdam Sound pressure levels varied throughout the driving of a particular pile. The variability in amplitude and duration of driving events at one location for Pier E10 are illustrated in Figure I.9-11. Peak pressure levels were measured almost continuously during a day of pile driving at Pier E10E when hydroacoustic characterization was performed. Continuous measurements of the top sections of a group of piles at Pier E10E were measured at three distances (about the 50-meter [164-foot] north, 100-meter [328-foot] north, and 120-meter [394-foot] southeast positions). These data are interesting, because they illustrate the levels associated with the two different hammers and how they varied over time. Measurements at 50 meters (164 feet) and 100 meters (328 feet) varied, and levels were not always lower at 100 meters (328 feet) as one would expect. They also show that levels did vary by 5 dB or more over the particular driving periods, where all sites tended to show the same trend in levels, with some exceptions. While levels showed similar trends for Piles 4 and 5, all three positions had different trends for Pile 6 when the large hammer was used. In general, levels measured with the MHU1700T hammer were slightly higher than levels measured with the MHU500T hammer. These data demonstrate that there is no simple relationship between received sound pressure level, position, and hammer energy—especially when the source of the sound is ground borne.
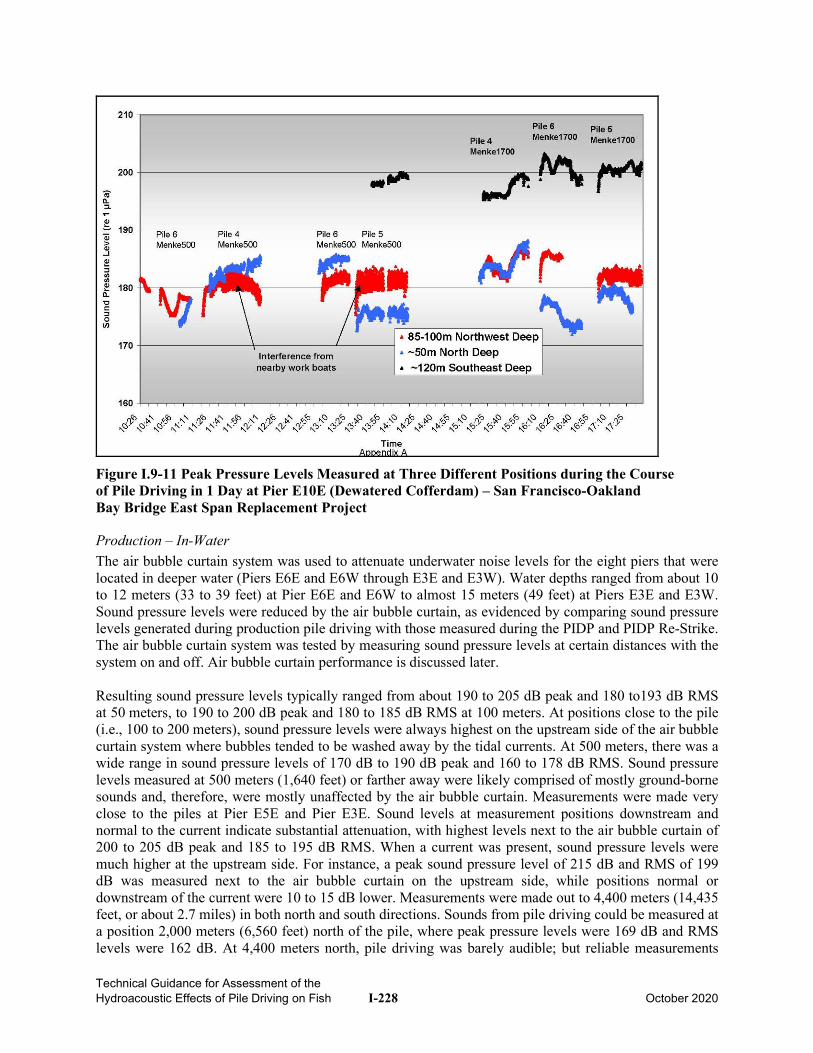
Technical Guidance for Assessment of the Hydroacoustic Effects of Pile Driving on Fish I-228 October 2020
Figure I.9-11 Peak Pressure Levels Measured at Three Different Positions during the Course of Pile Driving in 1 Day at Pier E10E (Dewatered Cofferdam) – San Francisco-Oakland Bay Bridge East Span Replacement Project
Production – In-Water The air bubble curtain system was used to attenuate underwater noise levels for the eight piers that were located in deeper water (Piers E6E and E6W through E3E and E3W). Water depths ranged from about 10 to 12 meters (33 to 39 feet) at Pier E6E and E6W to almost 15 meters (49 feet) at Piers E3E and E3W. Sound pressure levels were reduced by the air bubble curtain, as evidenced by comparing sound pressure levels generated during production pile driving with those measured during the PIDP and PIDP Re-Strike. The air bubble curtain system was tested by measuring sound pressure levels at certain distances with the system on and off. Air bubble curtain performance is discussed later. Resulting sound pressure levels typically ranged from about 190 to 205 dB peak and 180 to193 dB RMS at 50 meters, to 190 to 200 dB peak and 180 to 185 dB RMS at 100 meters. At positions close to the pile (i.e., 100 to 200 meters), sound pressure levels were always highest on the upstream side of the air bubble curtain system where bubbles tended to be washed away by the tidal currents. At 500 meters, there was a wide range in sound pressure levels of 170 dB to 190 dB peak and 160 to 178 dB RMS. Sound pressure levels measured at 500 meters (1,640 feet) or farther away were likely comprised of mostly ground-borne sounds and, therefore, were mostly unaffected by the air bubble curtain. Measurements were made very close to the piles at Pier E5E and Pier E3E. Sound levels at measurement positions downstream and normal to the current indicate substantial attenuation, with highest levels next to the air bubble curtain of 200 to 205 dB peak and 185 to 195 dB RMS. When a current was present, sound pressure levels were much higher at the upstream side. For instance, a peak sound pressure level of 215 dB and RMS of 199 dB was measured next to the air bubble curtain on the upstream side, while positions normal or downstream of the current were 10 to 15 dB lower. Measurements were made out to 4,400 meters (14,435 feet, or about 2.7 miles) in both north and south directions. Sounds from pile driving could be measured at a position 2,000 meters (6,560 feet) north of the pile, where peak pressure levels were 169 dB and RMS levels were 162 dB. At 4,400 meters north, pile driving was barely audible; but reliable measurements
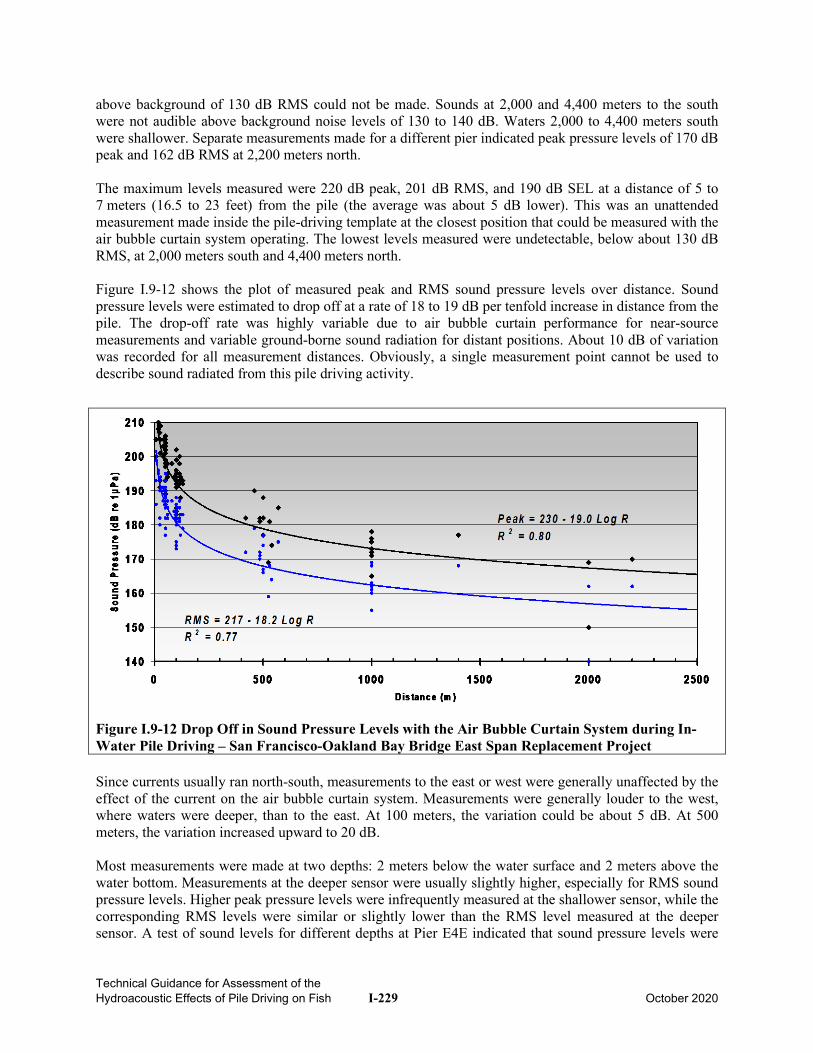
Technical Guidance for Assessment of the Hydroacoustic Effects of Pile Driving on Fish I-229 October 2020
above background of 130 dB RMS could not be made. Sounds at 2,000 and 4,400 meters to the south were not audible above background noise levels of 130 to 140 dB. Waters 2,000 to 4,400 meters south were shallower. Separate measurements made for a different pier indicated peak pressure levels of 170 dB peak and 162 dB RMS at 2,200 meters north. The maximum levels measured were 220 dB peak, 201 dB RMS, and 190 dB SEL at a distance of 5 to 7 meters (16.5 to 23 feet) from the pile (the average was about 5 dB lower). This was an unattended measurement made inside the pile-driving template at the closest position that could be measured with the air bubble curtain system operating. The lowest levels measured were undetectable, below about 130 dB RMS, at 2,000 meters south and 4,400 meters north. Figure I.9-12 shows the plot of measured peak and RMS sound pressure levels over distance. Sound pressure levels were estimated to drop off at a rate of 18 to 19 dB per tenfold increase in distance from the pile. The drop-off rate was highly variable due to air bubble curtain performance for near-source measurements and variable ground-borne sound radiation for distant positions. About 10 dB of variation was recorded for all measurement distances. Obviously, a single measurement point cannot be used to describe sound radiated from this pile driving activity.
Figure I.9-12 Drop Off in Sound Pressure Levels with the Air Bubble Curtain System during In-Water Pile Driving – San Francisco-Oakland Bay Bridge East Span Replacement Project Since currents usually ran north-south, measurements to the east or west were generally unaffected by the effect of the current on the air bubble curtain system. Measurements were generally louder to the west, where waters were deeper, than to the east. At 100 meters, the variation could be about 5 dB. At 500 meters, the variation increased upward to 20 dB. Most measurements were made at two depths: 2 meters below the water surface and 2 meters above the water bottom. Measurements at the deeper sensor were usually slightly higher, especially for RMS sound pressure levels. Higher peak pressure levels were infrequently measured at the shallower sensor, while the corresponding RMS levels were similar or slightly lower than the RMS level measured at the deeper sensor. A test of sound levels for different depths at Pier E4E indicated that sound pressure levels were
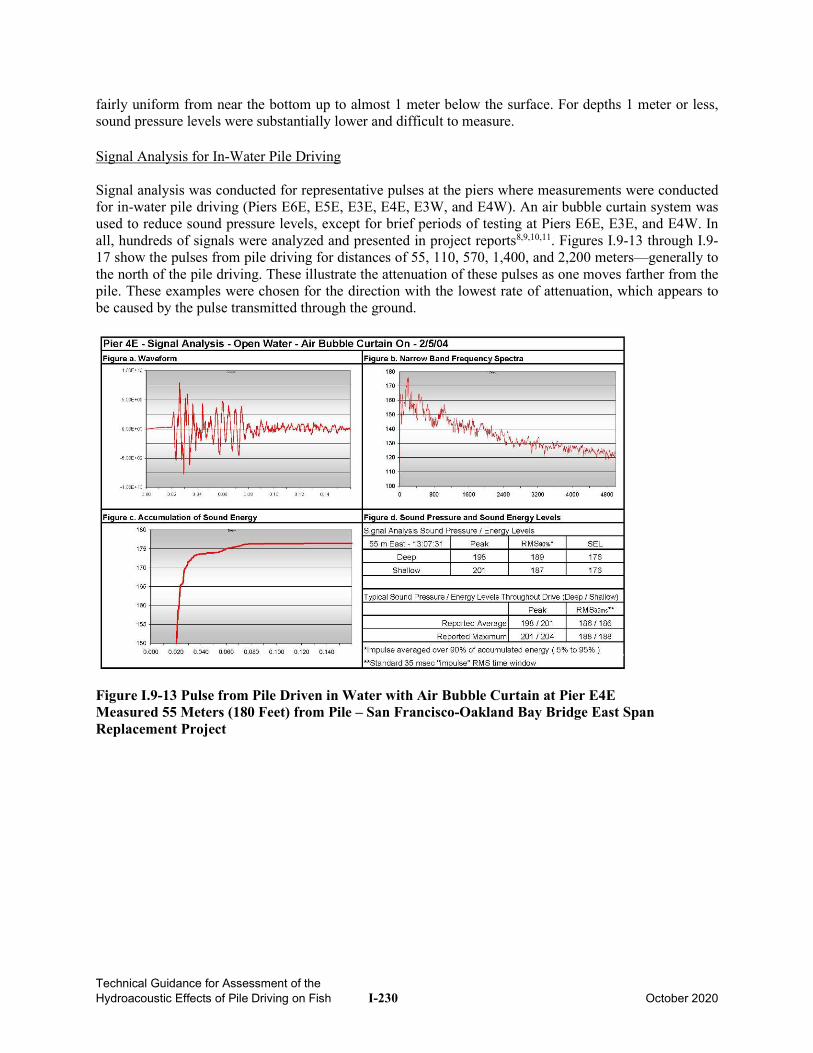
Technical Guidance for Assessment of the Hydroacoustic Effects of Pile Driving on Fish I-230 October 2020
fairly uniform from near the bottom up to almost 1 meter below the surface. For depths 1 meter or less, sound pressure levels were substantially lower and difficult to measure. Signal Analysis for In-Water Pile Driving Signal analysis was conducted for representative pulses at the piers where measurements were conducted for in-water pile driving (Piers E6E, E5E, E3E, E4E, E3W, and E4W). An air bubble curtain system was used to reduce sound pressure levels, except for brief periods of testing at Piers E6E, E3E, and E4W. In all, hundreds of signals were analyzed and presented in project reports8,9,10,11. Figures I.9-13 through I.9-17 show the pulses from pile driving for distances of 55, 110, 570, 1,400, and 2,200 meters—generally to the north of the pile driving. These illustrate the attenuation of these pulses as one moves farther from the pile. These examples were chosen for the direction with the lowest rate of attenuation, which appears to be caused by the pulse transmitted through the ground.
Figure I.9-13 Pulse from Pile Driven in Water with Air Bubble Curtain at Pier E4E Measured 55 Meters (180 Feet) from Pile – San Francisco-Oakland Bay Bridge East Span Replacement Project
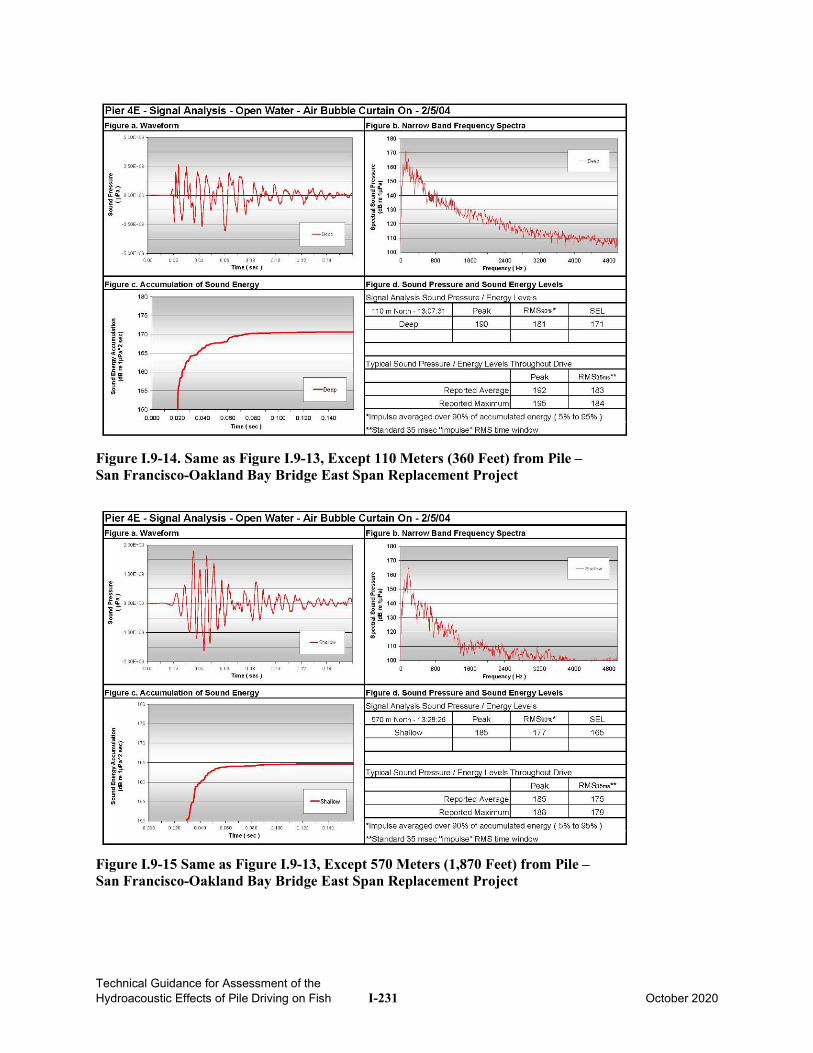
Technical Guidance for Assessment of the Hydroacoustic Effects of Pile Driving on Fish I-231 October 2020
Figure I.9-14. Same as Figure I.9-13, Except 110 Meters (360 Feet) from Pile – San Francisco-Oakland Bay Bridge East Span Replacement Project
Figure I.9-15 Same as Figure I.9-13, Except 570 Meters (1,870 Feet) from Pile – San Francisco-Oakland Bay Bridge East Span Replacement Project
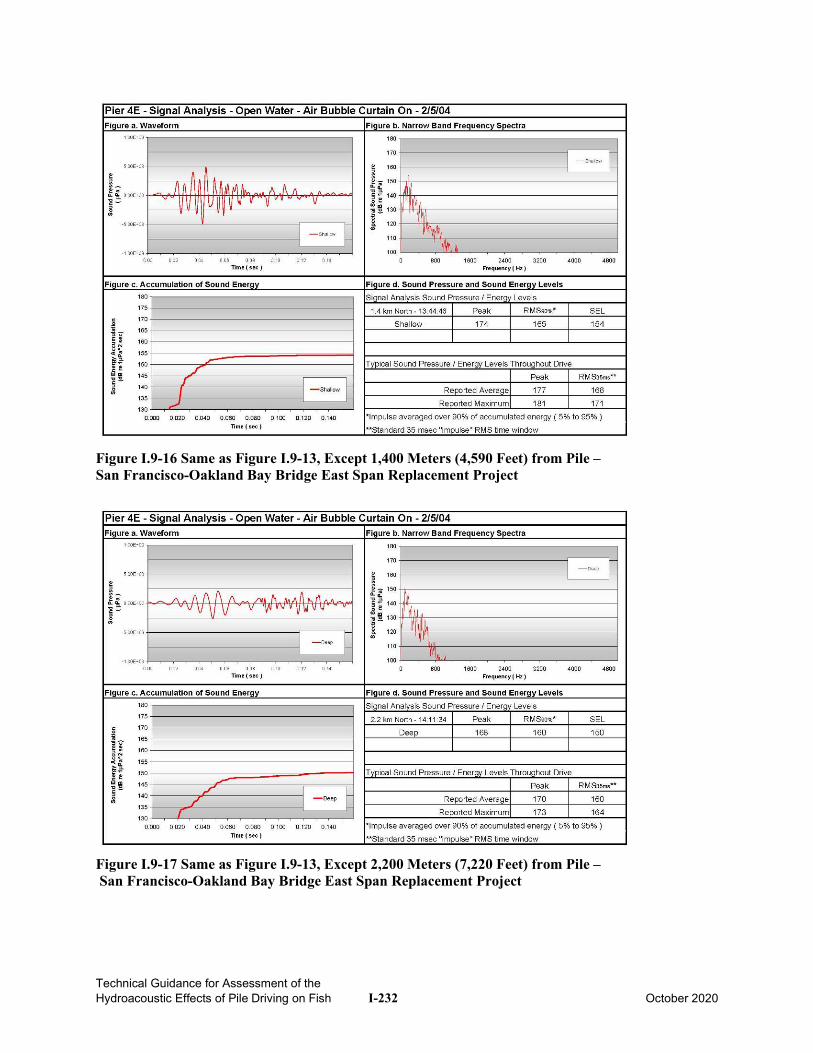
Technical Guidance for Assessment of the Hydroacoustic Effects of Pile Driving on Fish I-232 October 2020
Figure I.9-16 Same as Figure I.9-13, Except 1,400 Meters (4,590 Feet) from Pile – San Francisco-Oakland Bay Bridge East Span Replacement Project
Figure I.9-17 Same as Figure I.9-13, Except 2,200 Meters (7,220 Feet) from Pile – San Francisco-Oakland Bay Bridge East Span Replacement Project
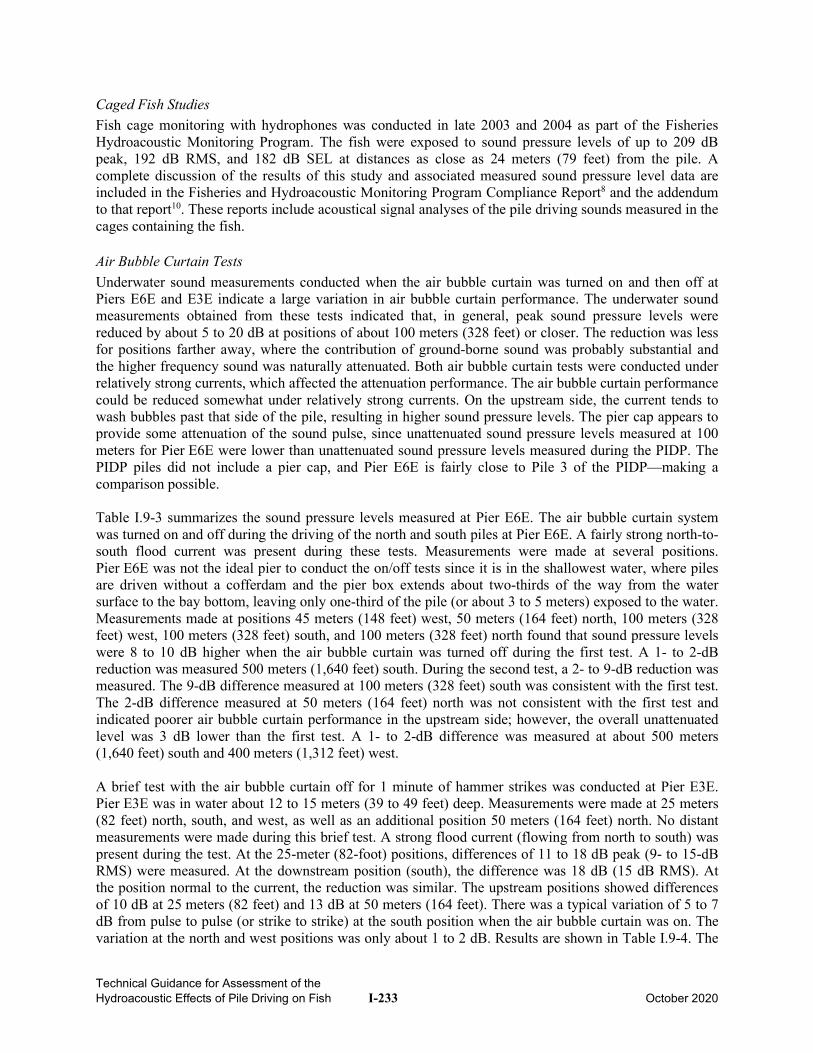
Technical Guidance for Assessment of the Hydroacoustic Effects of Pile Driving on Fish I-233 October 2020
Caged Fish Studies Fish cage monitoring with hydrophones was conducted in late 2003 and 2004 as part of the Fisheries Hydroacoustic Monitoring Program. The fish were exposed to sound pressure levels of up to 209 dB peak, 192 dB RMS, and 182 dB SEL at distances as close as 24 meters (79 feet) from the pile. A complete discussion of the results of this study and associated measured sound pressure level data are included in the Fisheries and Hydroacoustic Monitoring Program Compliance Report8 and the addendum to that report10. These reports include acoustical signal analyses of the pile driving sounds measured in the cages containing the fish. Air Bubble Curtain Tests Underwater sound measurements conducted when the air bubble curtain was turned on and then off at Piers E6E and E3E indicate a large variation in air bubble curtain performance. The underwater sound measurements obtained from these tests indicated that, in general, peak sound pressure levels were reduced by about 5 to 20 dB at positions of about 100 meters (328 feet) or closer. The reduction was less for positions farther away, where the contribution of ground-borne sound was probably substantial and the higher frequency sound was naturally attenuated. Both air bubble curtain tests were conducted under relatively strong currents, which affected the attenuation performance. The air bubble curtain performance could be reduced somewhat under relatively strong currents. On the upstream side, the current tends to wash bubbles past that side of the pile, resulting in higher sound pressure levels. The pier cap appears to provide some attenuation of the sound pulse, since unattenuated sound pressure levels measured at 100 meters for Pier E6E were lower than unattenuated sound pressure levels measured during the PIDP. The PIDP piles did not include a pier cap, and Pier E6E is fairly close to Pile 3 of the PIDP—making a comparison possible. Table I.9-3 summarizes the sound pressure levels measured at Pier E6E. The air bubble curtain system was turned on and off during the driving of the north and south piles at Pier E6E. A fairly strong north-to-south flood current was present during these tests. Measurements were made at several positions. Pier E6E was not the ideal pier to conduct the on/off tests since it is in the shallowest water, where piles are driven without a cofferdam and the pier box extends about two-thirds of the way from the water surface to the bay bottom, leaving only one-third of the pile (or about 3 to 5 meters) exposed to the water. Measurements made at positions 45 meters (148 feet) west, 50 meters (164 feet) north, 100 meters (328 feet) west, 100 meters (328 feet) south, and 100 meters (328 feet) north found that sound pressure levels were 8 to 10 dB higher when the air bubble curtain was turned off during the first test. A 1- to 2-dB reduction was measured 500 meters (1,640 feet) south. During the second test, a 2- to 9-dB reduction was measured. The 9-dB difference measured at 100 meters (328 feet) south was consistent with the first test. The 2-dB difference measured at 50 meters (164 feet) north was not consistent with the first test and indicated poorer air bubble curtain performance in the upstream side; however, the overall unattenuated level was 3 dB lower than the first test. A 1- to 2-dB difference was measured at about 500 meters (1,640 feet) south and 400 meters (1,312 feet) west. A brief test with the air bubble curtain off for 1 minute of hammer strikes was conducted at Pier E3E. Pier E3E was in water about 12 to 15 meters (39 to 49 feet) deep. Measurements were made at 25 meters (82 feet) north, south, and west, as well as an additional position 50 meters (164 feet) north. No distant measurements were made during this brief test. A strong flood current (flowing from north to south) was present during the test. At the 25-meter (82-foot) positions, differences of 11 to 18 dB peak (9- to 15-dB RMS) were measured. At the downstream position (south), the difference was 18 dB (15 dB RMS). At the position normal to the current, the reduction was similar. The upstream positions showed differences of 10 dB at 25 meters (82 feet) and 13 dB at 50 meters (164 feet). There was a typical variation of 5 to 7 dB from pulse to pulse (or strike to strike) at the south position when the air bubble curtain was on. The variation at the north and west positions was only about 1 to 2 dB. Results are shown in Table I.9-4. The
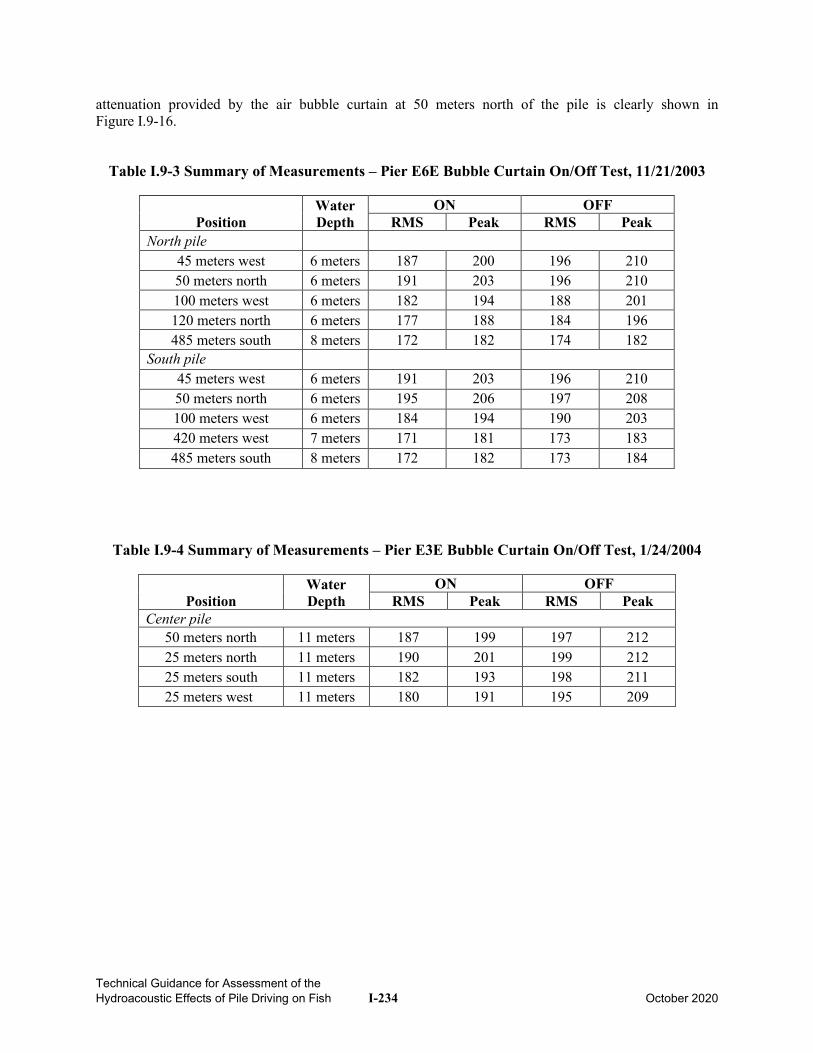
Technical Guidance for Assessment of the Hydroacoustic Effects of Pile Driving on Fish I-234 October 2020
attenuation provided by the air bubble curtain at 50 meters north of the pile is clearly shown in Figure I.9-16.
Table I.9-3 Summary of Measurements – Pier E6E Bubble Curtain On/Off Test, 11/21/2003
Position Water Depth
ON OFF RMS Peak RMS Peak
North pile 45 meters west 6 meters 187 200 196 210 50 meters north 6 meters 191 203 196 210 100 meters west 6 meters 182 194 188 201 120 meters north 6 meters 177 188 184 196 485 meters south 8 meters 172 182 174 182
South pile 45 meters west 6 meters 191 203 196 210 50 meters north 6 meters 195 206 197 208 100 meters west 6 meters 184 194 190 203 420 meters west 7 meters 171 181 173 183 485 meters south 8 meters 172 182 173 184
Table I.9-4 Summary of Measurements – Pier E3E Bubble Curtain On/Off Test, 1/24/2004
Position Water Depth
ON OFF RMS Peak RMS Peak
Center pile 50 meters north 11 meters 187 199 197 212 25 meters north 11 meters 190 201 199 212 25 meters south 11 meters 182 193 198 211 25 meters west 11 meters 180 191 195 209
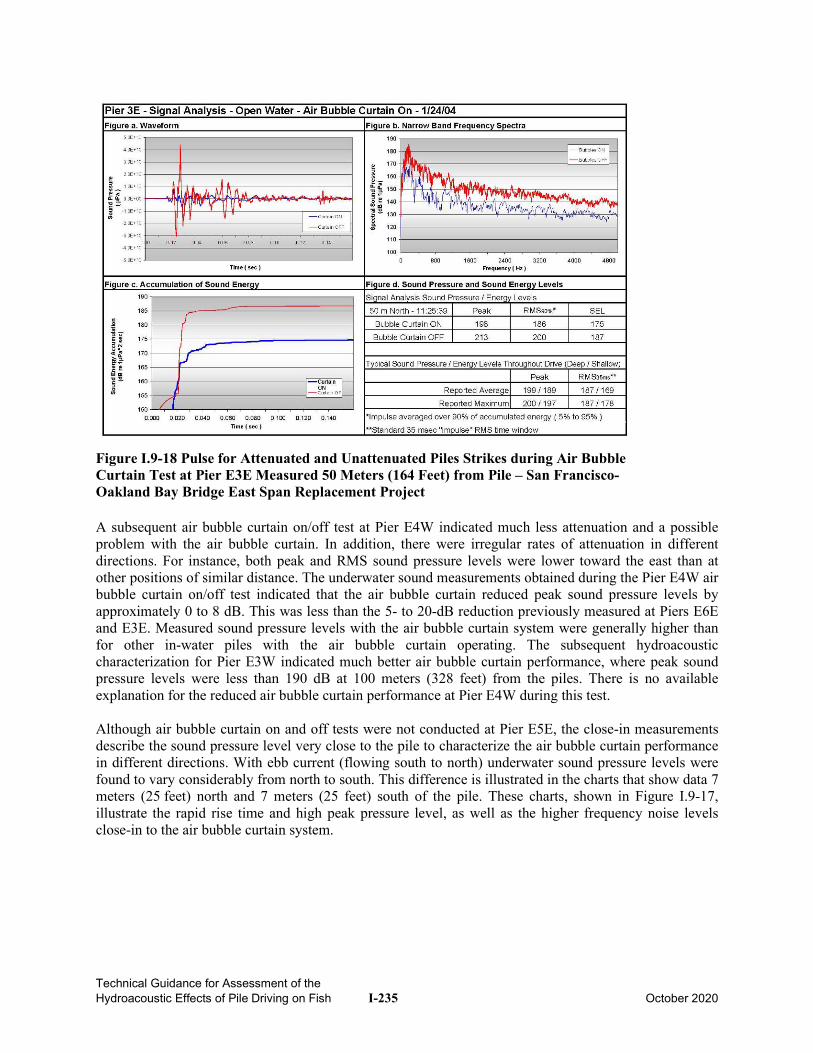
Technical Guidance for Assessment of the Hydroacoustic Effects of Pile Driving on Fish I-235 October 2020
Figure I.9-18 Pulse for Attenuated and Unattenuated Piles Strikes during Air Bubble Curtain Test at Pier E3E Measured 50 Meters (164 Feet) from Pile – San Francisco-Oakland Bay Bridge East Span Replacement Project A subsequent air bubble curtain on/off test at Pier E4W indicated much less attenuation and a possible problem with the air bubble curtain. In addition, there were irregular rates of attenuation in different directions. For instance, both peak and RMS sound pressure levels were lower toward the east than at other positions of similar distance. The underwater sound measurements obtained during the Pier E4W air bubble curtain on/off test indicated that the air bubble curtain reduced peak sound pressure levels by approximately 0 to 8 dB. This was less than the 5- to 20-dB reduction previously measured at Piers E6E and E3E. Measured sound pressure levels with the air bubble curtain system were generally higher than for other in-water piles with the air bubble curtain operating. The subsequent hydroacoustic characterization for Pier E3W indicated much better air bubble curtain performance, where peak sound pressure levels were less than 190 dB at 100 meters (328 feet) from the piles. There is no available explanation for the reduced air bubble curtain performance at Pier E4W during this test. Although air bubble curtain on and off tests were not conducted at Pier E5E, the close-in measurements describe the sound pressure level very close to the pile to characterize the air bubble curtain performance in different directions. With ebb current (flowing south to north) underwater sound pressure levels were found to vary considerably from north to south. This difference is illustrated in the charts that show data 7 meters (25 feet) north and 7 meters (25 feet) south of the pile. These charts, shown in Figure I.9-17, illustrate the rapid rise time and high peak pressure level, as well as the higher frequency noise levels close-in to the air bubble curtain system.
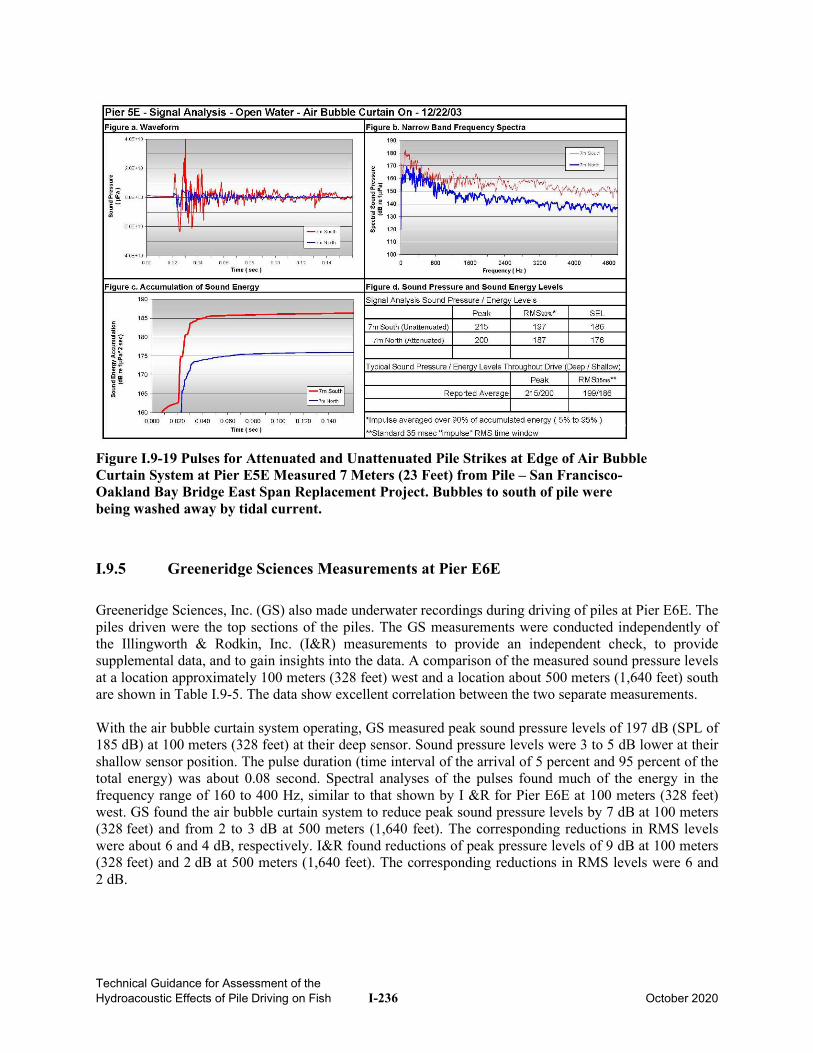
Technical Guidance for Assessment of the Hydroacoustic Effects of Pile Driving on Fish I-236 October 2020
Figure I.9-19 Pulses for Attenuated and Unattenuated Pile Strikes at Edge of Air Bubble Curtain System at Pier E5E Measured 7 Meters (23 Feet) from Pile – San Francisco-Oakland Bay Bridge East Span Replacement Project. Bubbles to south of pile were being washed away by tidal current.
I.9.5 Greeneridge Sciences Measurements at Pier E6E
Greeneridge Sciences, Inc. (GS) also made underwater recordings during driving of piles at Pier E6E. The piles driven were the top sections of the piles. The GS measurements were conducted independently of the Illingworth & Rodkin, Inc. (I&R) measurements to provide an independent check, to provide supplemental data, and to gain insights into the data. A comparison of the measured sound pressure levels at a location approximately 100 meters (328 feet) west and a location about 500 meters (1,640 feet) south are shown in Table I.9-5. The data show excellent correlation between the two separate measurements. With the air bubble curtain system operating, GS measured peak sound pressure levels of 197 dB (SPL of 185 dB) at 100 meters (328 feet) at their deep sensor. Sound pressure levels were 3 to 5 dB lower at their shallow sensor position. The pulse duration (time interval of the arrival of 5 percent and 95 percent of the total energy) was about 0.08 second. Spectral analyses of the pulses found much of the energy in the frequency range of 160 to 400 Hz, similar to that shown by I &R for Pier E6E at 100 meters (328 feet) west. GS found the air bubble curtain system to reduce peak sound pressure levels by 7 dB at 100 meters (328 feet) and from 2 to 3 dB at 500 meters (1,640 feet). The corresponding reductions in RMS levels were about 6 and 4 dB, respectively. I&R found reductions of peak pressure levels of 9 dB at 100 meters (328 feet) and 2 dB at 500 meters (1,640 feet). The corresponding reductions in RMS levels were 6 and 2 dB.
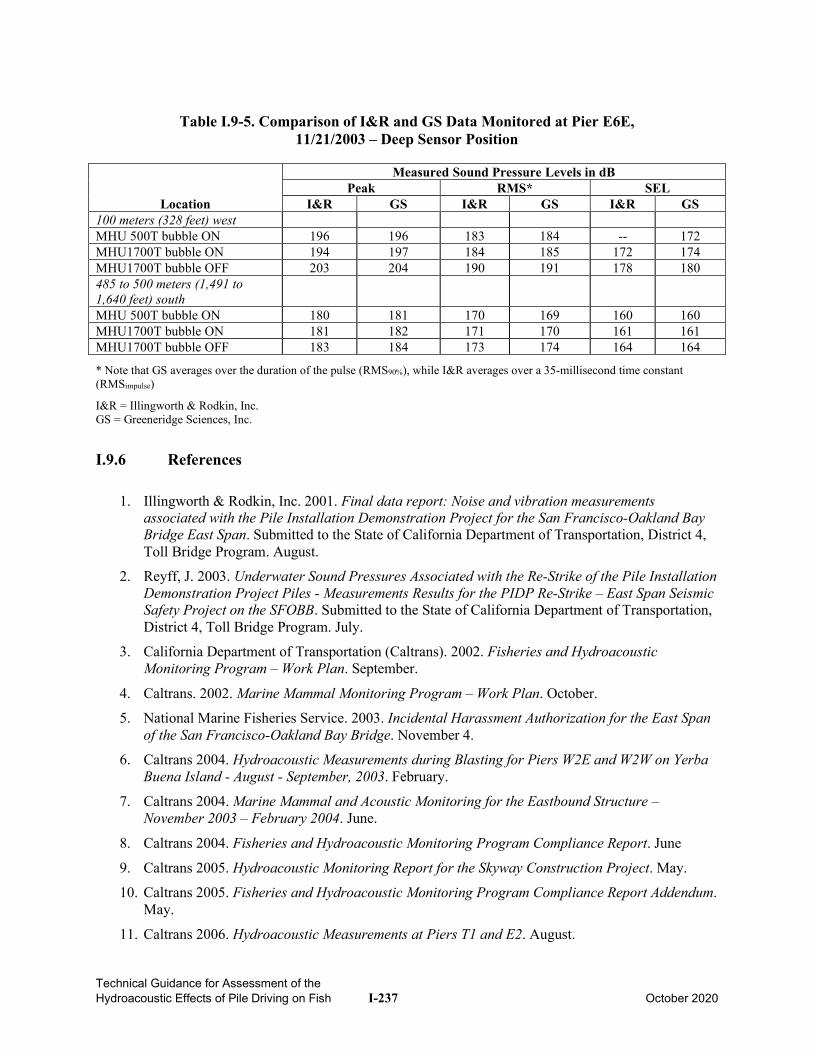
Technical Guidance for Assessment of the Hydroacoustic Effects of Pile Driving on Fish I-237 October 2020
Table I.9-5. Comparison of I&R and GS Data Monitored at Pier E6E,
11/21/2003 – Deep Sensor Position
Location
Measured Sound Pressure Levels in dB Peak RMS* SEL
I&R GS I&R GS I&R GS 100 meters (328 feet) west MHU 500T bubble ON 196 196 183 184 -- 172 MHU1700T bubble ON 194 197 184 185 172 174 MHU1700T bubble OFF 203 204 190 191 178 180 485 to 500 meters (1,491 to 1,640 feet) south
MHU 500T bubble ON 180 181 170 169 160 160 MHU1700T bubble ON 181 182 171 170 161 161 MHU1700T bubble OFF 183 184 173 174 164 164
* Note that GS averages over the duration of the pulse (RMS90%), while I&R averages over a 35-millisecond time constant (RMSimpulse)
I&R = Illingworth & Rodkin, Inc. GS = Greeneridge Sciences, Inc.
I.9.6 References
1. Illingworth & Rodkin, Inc. 2001. Final data report: Noise and vibration measurements associated with the Pile Installation Demonstration Project for the San Francisco-Oakland Bay Bridge East Span. Submitted to the State of California Department of Transportation, District 4, Toll Bridge Program. August.
2. Reyff, J. 2003. Underwater Sound Pressures Associated with the Re-Strike of the Pile Installation Demonstration Project Piles - Measurements Results for the PIDP Re-Strike – East Span Seismic Safety Project on the SFOBB. Submitted to the State of California Department of Transportation, District 4, Toll Bridge Program. July.
3. California Department of Transportation (Caltrans). 2002. Fisheries and Hydroacoustic Monitoring Program – Work Plan. September.
4. Caltrans. 2002. Marine Mammal Monitoring Program – Work Plan. October.
5. National Marine Fisheries Service. 2003. Incidental Harassment Authorization for the East Span of the San Francisco-Oakland Bay Bridge. November 4.
6. Caltrans 2004. Hydroacoustic Measurements during Blasting for Piers W2E and W2W on Yerba Buena Island - August - September, 2003. February.
7. Caltrans 2004. Marine Mammal and Acoustic Monitoring for the Eastbound Structure – November 2003 – February 2004. June.
8. Caltrans 2004. Fisheries and Hydroacoustic Monitoring Program Compliance Report. June
9. Caltrans 2005. Hydroacoustic Monitoring Report for the Skyway Construction Project. May.
10. Caltrans 2005. Fisheries and Hydroacoustic Monitoring Program Compliance Report Addendum. May.
11. Caltrans 2006. Hydroacoustic Measurements at Piers T1 and E2. August.
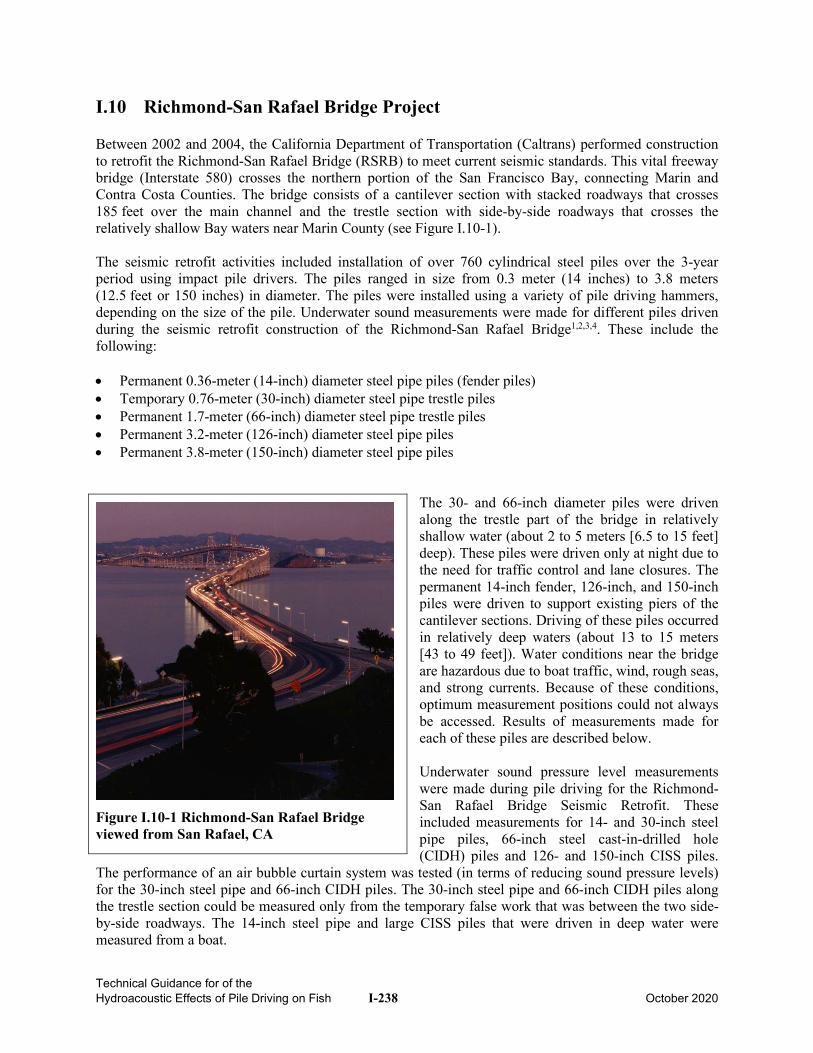
Technical Guidance for of the Hydroacoustic Effects of Pile Driving on Fish I-238 October 2020
I.10 Richmond-San Rafael Bridge Project Between 2002 and 2004, the California Department of Transportation (Caltrans) performed construction to retrofit the Richmond-San Rafael Bridge (RSRB) to meet current seismic standards. This vital freeway bridge (Interstate 580) crosses the northern portion of the San Francisco Bay, connecting Marin and Contra Costa Counties. The bridge consists of a cantilever section with stacked roadways that crosses 185 feet over the main channel and the trestle section with side-by-side roadways that crosses the relatively shallow Bay waters near Marin County (see Figure I.10-1). The seismic retrofit activities included installation of over 760 cylindrical steel piles over the 3-year period using impact pile drivers. The piles ranged in size from 0.3 meter (14 inches) to 3.8 meters (12.5 feet or 150 inches) in diameter. The piles were installed using a variety of pile driving hammers, depending on the size of the pile. Underwater sound measurements were made for different piles driven during the seismic retrofit construction of the Richmond-San Rafael Bridge1,2,3,4. These include the following: • Permanent 0.36-meter (14-inch) diameter steel pipe piles (fender piles) • Temporary 0.76-meter (30-inch) diameter steel pipe trestle piles • Permanent 1.7-meter (66-inch) diameter steel pipe trestle piles • Permanent 3.2-meter (126-inch) diameter steel pipe piles • Permanent 3.8-meter (150-inch) diameter steel pipe piles
The 30- and 66-inch diameter piles were driven along the trestle part of the bridge in relatively shallow water (about 2 to 5 meters [6.5 to 15 feet] deep). These piles were driven only at night due to the need for traffic control and lane closures. The permanent 14-inch fender, 126-inch, and 150-inch piles were driven to support existing piers of the cantilever sections. Driving of these piles occurred in relatively deep waters (about 13 to 15 meters [43 to 49 feet]). Water conditions near the bridge are hazardous due to boat traffic, wind, rough seas, and strong currents. Because of these conditions, optimum measurement positions could not always be accessed. Results of measurements made for each of these piles are described below. Underwater sound pressure level measurements were made during pile driving for the Richmond-San Rafael Bridge Seismic Retrofit. These included measurements for 14- and 30-inch steel pipe piles, 66-inch steel cast-in-drilled hole (CIDH) piles and 126- and 150-inch CISS piles.
The performance of an air bubble curtain system was tested (in terms of reducing sound pressure levels) for the 30-inch steel pipe and 66-inch CIDH piles. The 30-inch steel pipe and 66-inch CIDH piles along the trestle section could be measured only from the temporary false work that was between the two side-by-side roadways. The 14-inch steel pipe and large CISS piles that were driven in deep water were measured from a boat.
Figure I.10-1 Richmond-San Rafael Bridge viewed from San Rafael, CA
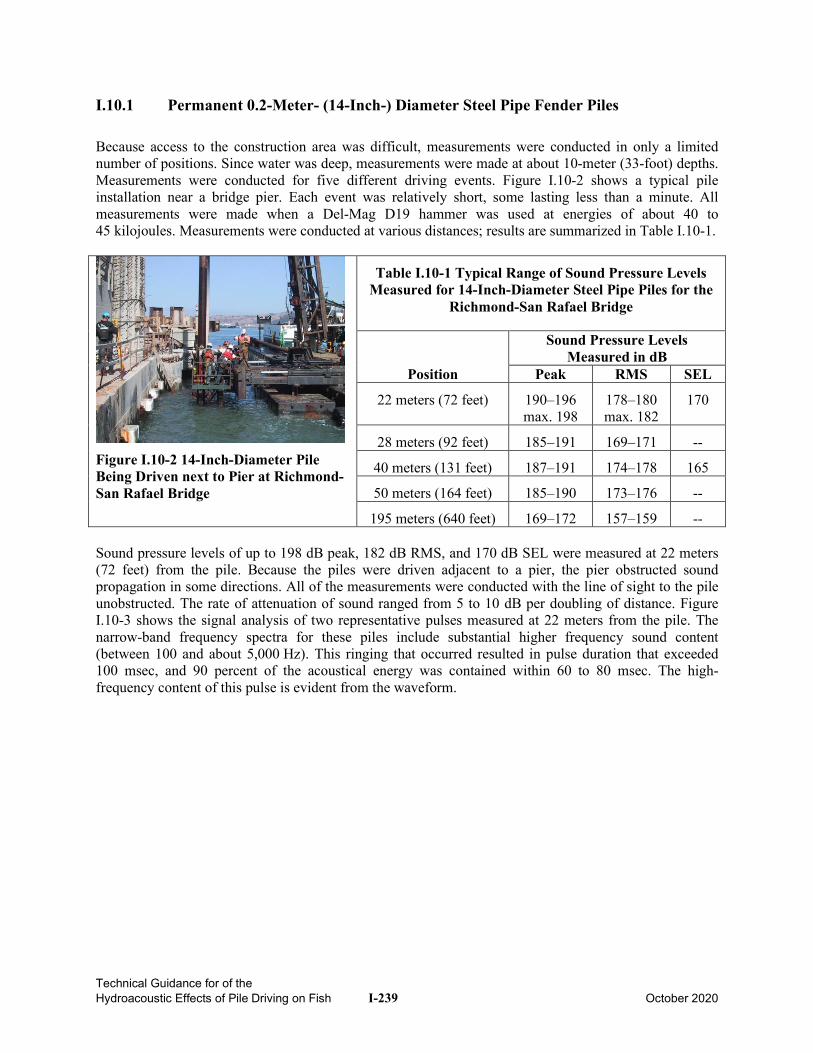
Technical Guidance for of the Hydroacoustic Effects of Pile Driving on Fish I-239 October 2020
I.10.1 Permanent 0.2-Meter- (14-Inch-) Diameter Steel Pipe Fender Piles
Because access to the construction area was difficult, measurements were conducted in only a limited number of positions. Since water was deep, measurements were made at about 10-meter (33-foot) depths. Measurements were conducted for five different driving events. Figure I.10-2 shows a typical pile installation near a bridge pier. Each event was relatively short, some lasting less than a minute. All measurements were made when a Del-Mag D19 hammer was used at energies of about 40 to 45 kilojoules. Measurements were conducted at various distances; results are summarized in Table I.10-1.
Figure I.10-2 14-Inch-Diameter Pile Being Driven next to Pier at Richmond-San Rafael Bridge
Table I.10-1 Typical Range of Sound Pressure Levels Measured for 14-Inch-Diameter Steel Pipe Piles for the
Richmond-San Rafael Bridge
Position
Sound Pressure Levels Measured in dB
Peak RMS SEL
22 meters (72 feet) 190–196 max. 198
178–180 max. 182
170
28 meters (92 feet) 185–191 169–171 --
40 meters (131 feet) 187–191 174–178 165
50 meters (164 feet) 185–190 173–176 --
195 meters (640 feet) 169–172 157–159 -- Sound pressure levels of up to 198 dB peak, 182 dB RMS, and 170 dB SEL were measured at 22 meters (72 feet) from the pile. Because the piles were driven adjacent to a pier, the pier obstructed sound propagation in some directions. All of the measurements were conducted with the line of sight to the pile unobstructed. The rate of attenuation of sound ranged from 5 to 10 dB per doubling of distance. Figure I.10-3 shows the signal analysis of two representative pulses measured at 22 meters from the pile. The narrow-band frequency spectra for these piles include substantial higher frequency sound content (between 100 and about 5,000 Hz). This ringing that occurred resulted in pulse duration that exceeded 100 msec, and 90 percent of the acoustical energy was contained within 60 to 80 msec. The high-frequency content of this pulse is evident from the waveform.
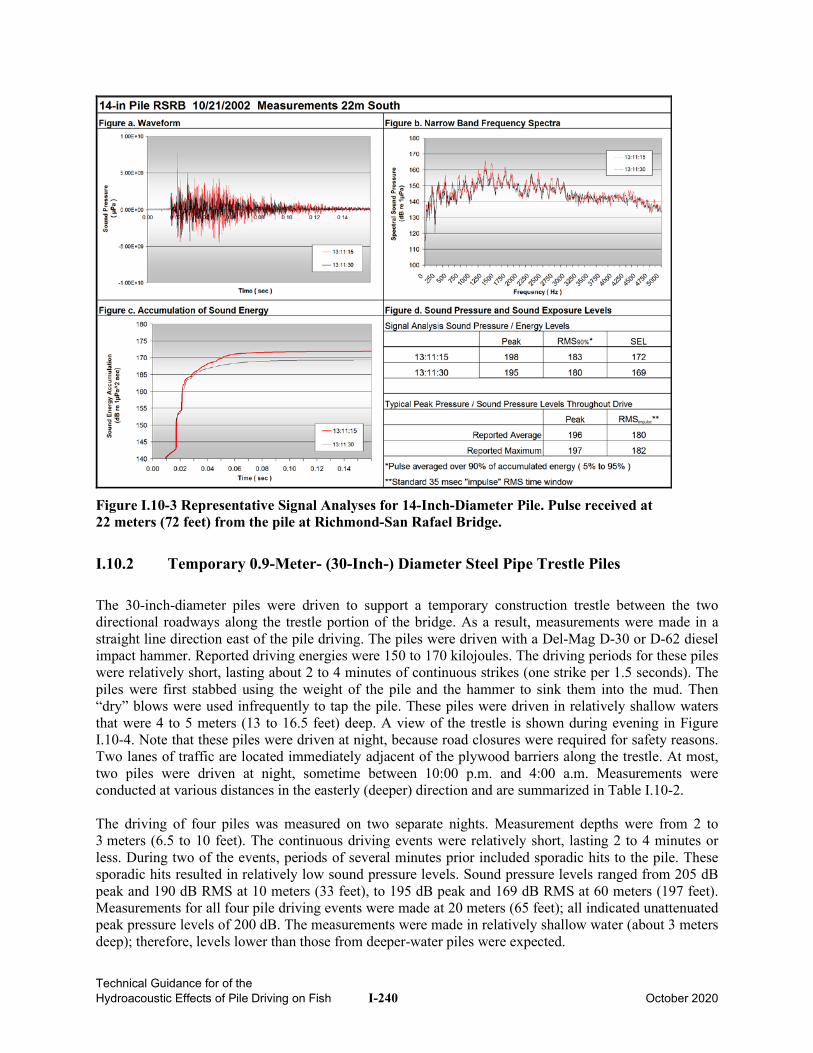
Technical Guidance for of the Hydroacoustic Effects of Pile Driving on Fish I-240 October 2020
Figure I.10-3 Representative Signal Analyses for 14-Inch-Diameter Pile. Pulse received at 22 meters (72 feet) from the pile at Richmond-San Rafael Bridge.
I.10.2 Temporary 0.9-Meter- (30-Inch-) Diameter Steel Pipe Trestle Piles
The 30-inch-diameter piles were driven to support a temporary construction trestle between the two directional roadways along the trestle portion of the bridge. As a result, measurements were made in a straight line direction east of the pile driving. The piles were driven with a Del-Mag D-30 or D-62 diesel impact hammer. Reported driving energies were 150 to 170 kilojoules. The driving periods for these piles were relatively short, lasting about 2 to 4 minutes of continuous strikes (one strike per 1.5 seconds). The piles were first stabbed using the weight of the pile and the hammer to sink them into the mud. Then “dry” blows were used infrequently to tap the pile. These piles were driven in relatively shallow waters that were 4 to 5 meters (13 to 16.5 feet) deep. A view of the trestle is shown during evening in Figure I.10-4. Note that these piles were driven at night, because road closures were required for safety reasons. Two lanes of traffic are located immediately adjacent of the plywood barriers along the trestle. At most, two piles were driven at night, sometime between 10:00 p.m. and 4:00 a.m. Measurements were conducted at various distances in the easterly (deeper) direction and are summarized in Table I.10-2. The driving of four piles was measured on two separate nights. Measurement depths were from 2 to 3 meters (6.5 to 10 feet). The continuous driving events were relatively short, lasting 2 to 4 minutes or less. During two of the events, periods of several minutes prior included sporadic hits to the pile. These sporadic hits resulted in relatively low sound pressure levels. Sound pressure levels ranged from 205 dB peak and 190 dB RMS at 10 meters (33 feet), to 195 dB peak and 169 dB RMS at 60 meters (197 feet). Measurements for all four pile driving events were made at 20 meters (65 feet); all indicated unattenuated peak pressure levels of 200 dB. The measurements were made in relatively shallow water (about 3 meters deep); therefore, levels lower than those from deeper-water piles were expected.
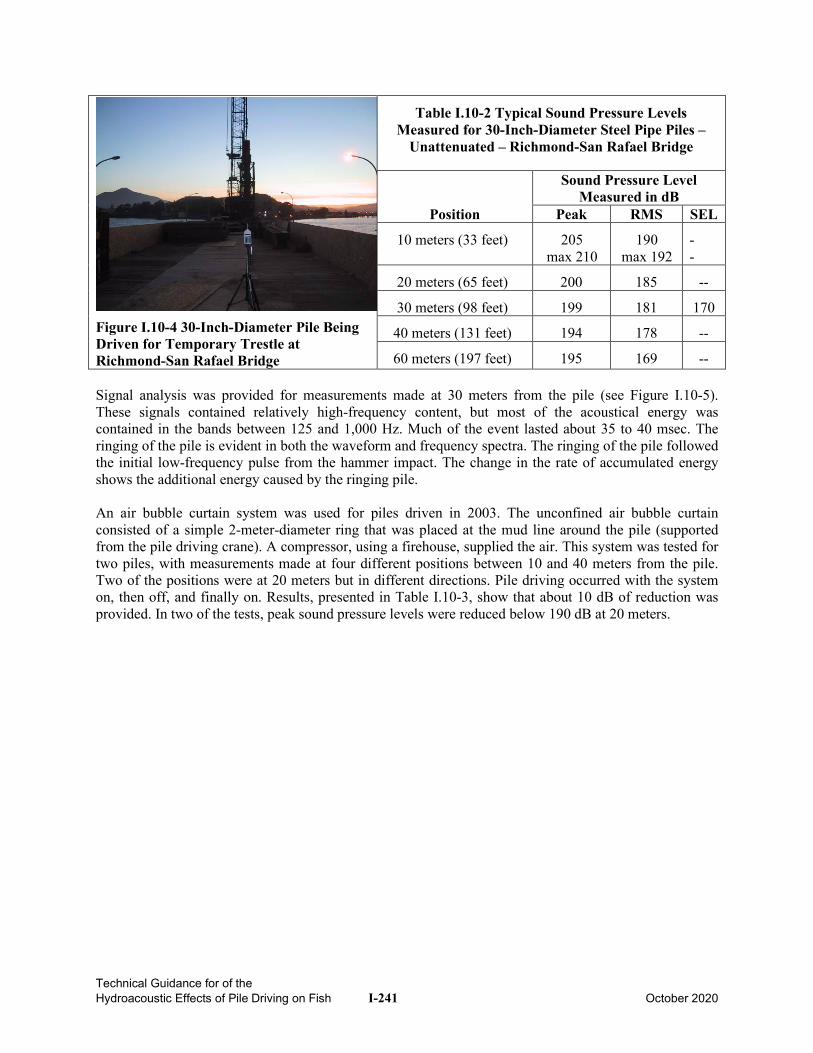
Technical Guidance for of the Hydroacoustic Effects of Pile Driving on Fish I-241 October 2020
Figure I.10-4 30-Inch-Diameter Pile Being Driven for Temporary Trestle at Richmond-San Rafael Bridge
Table I.10-2 Typical Sound Pressure Levels Measured for 30-Inch-Diameter Steel Pipe Piles –
Unattenuated – Richmond-San Rafael Bridge
Position
Sound Pressure Level Measured in dB
Peak RMS SEL
10 meters (33 feet) 205 max 210
190 max 192
--
20 meters (65 feet) 200 185 --
30 meters (98 feet) 199 181 170
40 meters (131 feet) 194 178 --
60 meters (197 feet) 195 169 -- Signal analysis was provided for measurements made at 30 meters from the pile (see Figure I.10-5). These signals contained relatively high-frequency content, but most of the acoustical energy was contained in the bands between 125 and 1,000 Hz. Much of the event lasted about 35 to 40 msec. The ringing of the pile is evident in both the waveform and frequency spectra. The ringing of the pile followed the initial low-frequency pulse from the hammer impact. The change in the rate of accumulated energy shows the additional energy caused by the ringing pile. An air bubble curtain system was used for piles driven in 2003. The unconfined air bubble curtain consisted of a simple 2-meter-diameter ring that was placed at the mud line around the pile (supported from the pile driving crane). A compressor, using a firehouse, supplied the air. This system was tested for two piles, with measurements made at four different positions between 10 and 40 meters from the pile. Two of the positions were at 20 meters but in different directions. Pile driving occurred with the system on, then off, and finally on. Results, presented in Table I.10-3, show that about 10 dB of reduction was provided. In two of the tests, peak sound pressure levels were reduced below 190 dB at 20 meters.
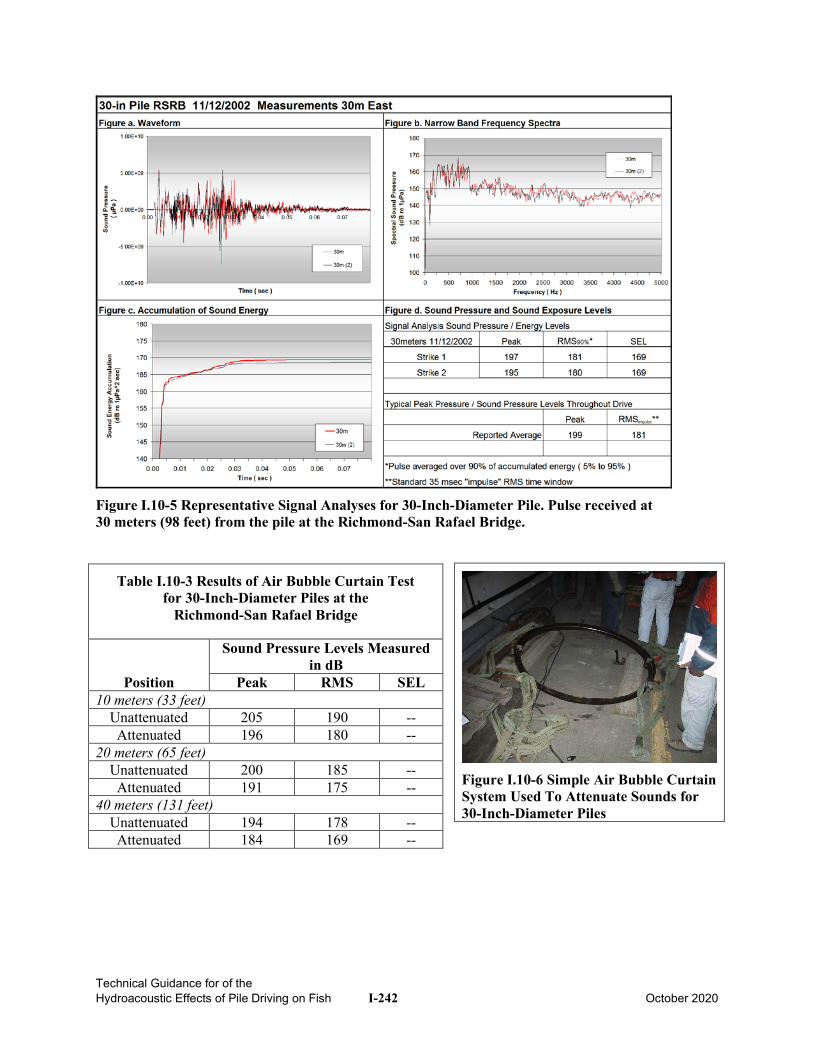
Technical Guidance for of the Hydroacoustic Effects of Pile Driving on Fish I-242 October 2020
Figure I.10-5 Representative Signal Analyses for 30-Inch-Diameter Pile. Pulse received at 30 meters (98 feet) from the pile at the Richmond-San Rafael Bridge.
Table I.10-3 Results of Air Bubble Curtain Test for 30-Inch-Diameter Piles at the
Richmond-San Rafael Bridge
Position
Sound Pressure Levels Measured in dB
Peak RMS SEL 10 meters (33 feet)
Unattenuated 205 190 -- Attenuated 196 180 --
20 meters (65 feet) Unattenuated 200 185 -- Attenuated 191 175 --
40 meters (131 feet) Unattenuated 194 178 -- Attenuated 184 169 --
Figure I.10-6 Simple Air Bubble Curtain System Used To Attenuate Sounds for 30-Inch-Diameter Piles
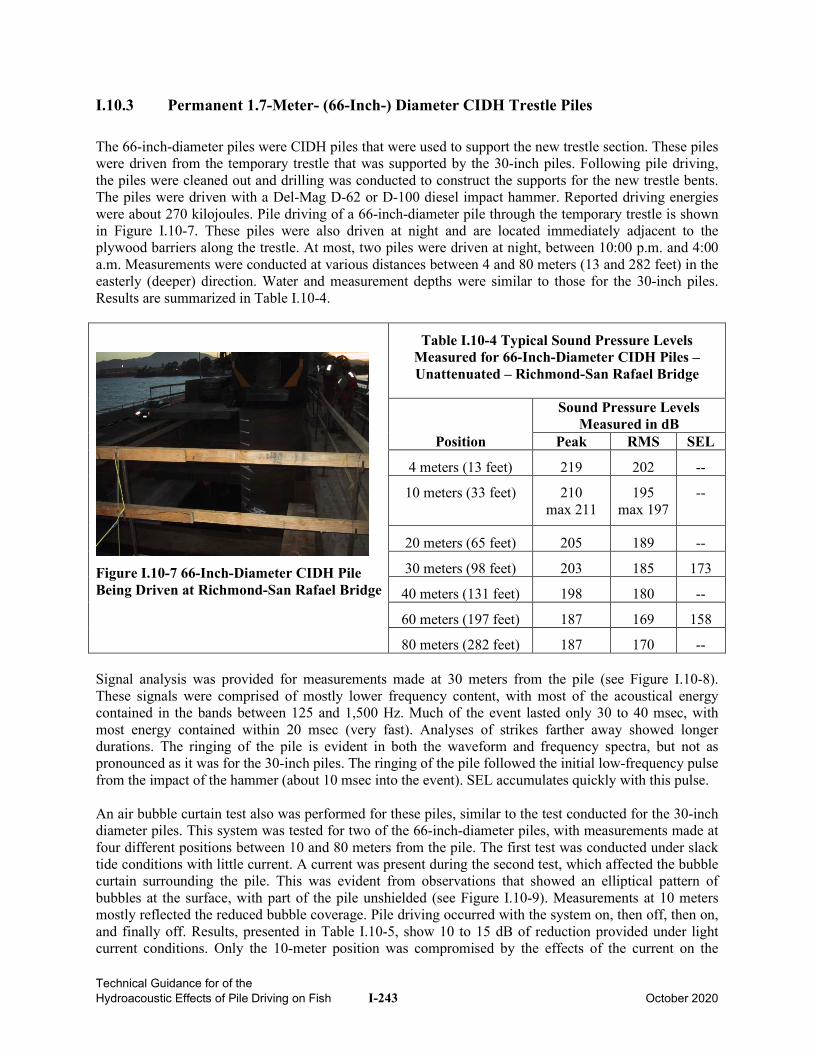
Technical Guidance for of the Hydroacoustic Effects of Pile Driving on Fish I-243 October 2020
I.10.3 Permanent 1.7-Meter- (66-Inch-) Diameter CIDH Trestle Piles
The 66-inch-diameter piles were CIDH piles that were used to support the new trestle section. These piles were driven from the temporary trestle that was supported by the 30-inch piles. Following pile driving, the piles were cleaned out and drilling was conducted to construct the supports for the new trestle bents. The piles were driven with a Del-Mag D-62 or D-100 diesel impact hammer. Reported driving energies were about 270 kilojoules. Pile driving of a 66-inch-diameter pile through the temporary trestle is shown in Figure I.10-7. These piles were also driven at night and are located immediately adjacent to the plywood barriers along the trestle. At most, two piles were driven at night, between 10:00 p.m. and 4:00 a.m. Measurements were conducted at various distances between 4 and 80 meters (13 and 282 feet) in the easterly (deeper) direction. Water and measurement depths were similar to those for the 30-inch piles. Results are summarized in Table I.10-4.
Figure I.10-7 66-Inch-Diameter CIDH Pile Being Driven at Richmond-San Rafael Bridge
Table I.10-4 Typical Sound Pressure Levels Measured for 66-Inch-Diameter CIDH Piles – Unattenuated – Richmond-San Rafael Bridge
Position
Sound Pressure Levels Measured in dB
Peak RMS SEL
4 meters (13 feet) 219 202 --
10 meters (33 feet)
210 max 211
195 max 197
--
20 meters (65 feet) 205 189 --
30 meters (98 feet) 203 185 173
40 meters (131 feet) 198 180 --
60 meters (197 feet) 187 169 158
80 meters (282 feet) 187 170 -- Signal analysis was provided for measurements made at 30 meters from the pile (see Figure I.10-8). These signals were comprised of mostly lower frequency content, with most of the acoustical energy contained in the bands between 125 and 1,500 Hz. Much of the event lasted only 30 to 40 msec, with most energy contained within 20 msec (very fast). Analyses of strikes farther away showed longer durations. The ringing of the pile is evident in both the waveform and frequency spectra, but not as pronounced as it was for the 30-inch piles. The ringing of the pile followed the initial low-frequency pulse from the impact of the hammer (about 10 msec into the event). SEL accumulates quickly with this pulse. An air bubble curtain test also was performed for these piles, similar to the test conducted for the 30-inch diameter piles. This system was tested for two of the 66-inch-diameter piles, with measurements made at four different positions between 10 and 80 meters from the pile. The first test was conducted under slack tide conditions with little current. A current was present during the second test, which affected the bubble curtain surrounding the pile. This was evident from observations that showed an elliptical pattern of bubbles at the surface, with part of the pile unshielded (see Figure I.10-9). Measurements at 10 meters mostly reflected the reduced bubble coverage. Pile driving occurred with the system on, then off, then on, and finally off. Results, presented in Table I.10-5, show 10 to 15 dB of reduction provided under light current conditions. Only the 10-meter position was compromised by the effects of the current on the
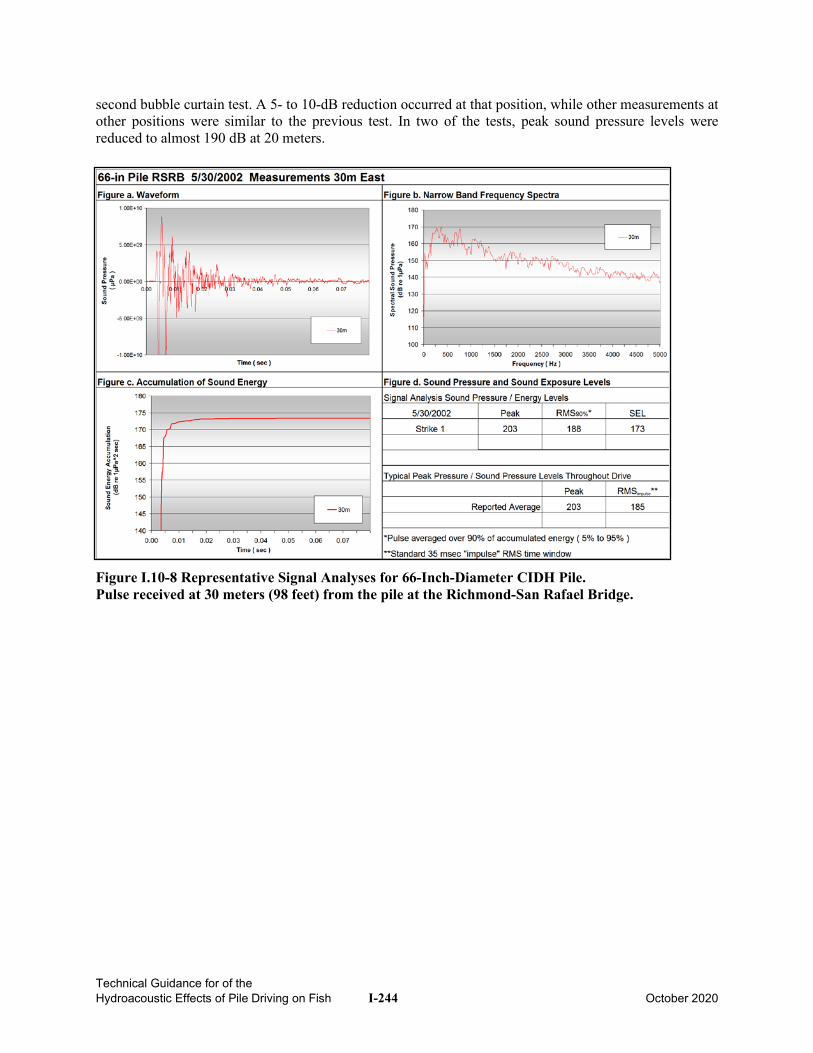
Technical Guidance for of the Hydroacoustic Effects of Pile Driving on Fish I-244 October 2020
second bubble curtain test. A 5- to 10-dB reduction occurred at that position, while other measurements at other positions were similar to the previous test. In two of the tests, peak sound pressure levels were reduced to almost 190 dB at 20 meters.
Figure I.10-8 Representative Signal Analyses for 66-Inch-Diameter CIDH Pile. Pulse received at 30 meters (98 feet) from the pile at the Richmond-San Rafael Bridge.
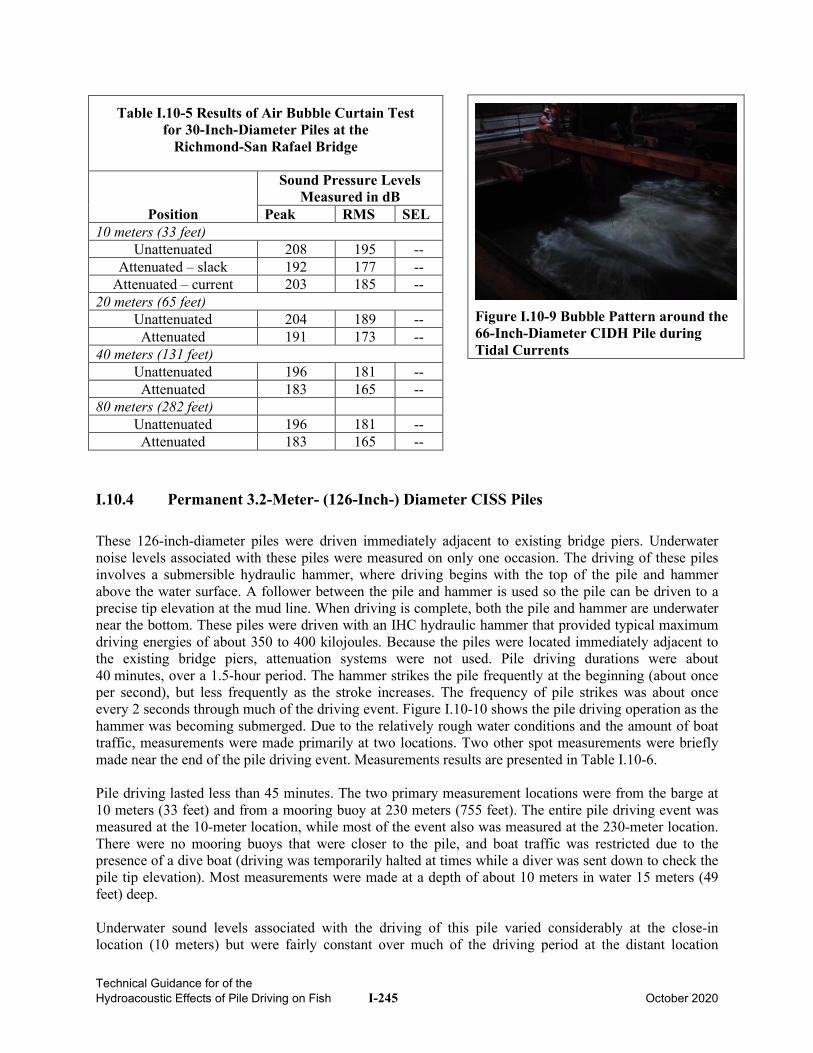
Technical Guidance for of the Hydroacoustic Effects of Pile Driving on Fish I-245 October 2020
I.10.4 Permanent 3.2-Meter- (126-Inch-) Diameter CISS Piles
These 126-inch-diameter piles were driven immediately adjacent to existing bridge piers. Underwater noise levels associated with these piles were measured on only one occasion. The driving of these piles involves a submersible hydraulic hammer, where driving begins with the top of the pile and hammer above the water surface. A follower between the pile and hammer is used so the pile can be driven to a precise tip elevation at the mud line. When driving is complete, both the pile and hammer are underwater near the bottom. These piles were driven with an IHC hydraulic hammer that provided typical maximum driving energies of about 350 to 400 kilojoules. Because the piles were located immediately adjacent to the existing bridge piers, attenuation systems were not used. Pile driving durations were about 40 minutes, over a 1.5-hour period. The hammer strikes the pile frequently at the beginning (about once per second), but less frequently as the stroke increases. The frequency of pile strikes was about once every 2 seconds through much of the driving event. Figure I.10-10 shows the pile driving operation as the hammer was becoming submerged. Due to the relatively rough water conditions and the amount of boat traffic, measurements were made primarily at two locations. Two other spot measurements were briefly made near the end of the pile driving event. Measurements results are presented in Table I.10-6. Pile driving lasted less than 45 minutes. The two primary measurement locations were from the barge at 10 meters (33 feet) and from a mooring buoy at 230 meters (755 feet). The entire pile driving event was measured at the 10-meter location, while most of the event also was measured at the 230-meter location. There were no mooring buoys that were closer to the pile, and boat traffic was restricted due to the presence of a dive boat (driving was temporarily halted at times while a diver was sent down to check the pile tip elevation). Most measurements were made at a depth of about 10 meters in water 15 meters (49 feet) deep. Underwater sound levels associated with the driving of this pile varied considerably at the close-in location (10 meters) but were fairly constant over much of the driving period at the distant location
Table I.10-5 Results of Air Bubble Curtain Test for 30-Inch-Diameter Piles at the
Richmond-San Rafael Bridge
Position
Sound Pressure Levels Measured in dB
Peak RMS SEL 10 meters (33 feet)
Unattenuated 208 195 -- Attenuated – slack 192 177 --
Attenuated – current 203 185 -- 20 meters (65 feet)
Unattenuated 204 189 -- Attenuated 191 173 --
40 meters (131 feet) Unattenuated 196 181 -- Attenuated 183 165 --
80 meters (282 feet) Unattenuated 196 181 -- Attenuated 183 165 --
Figure I.10-9 Bubble Pattern around the 66-Inch-Diameter CIDH Pile during Tidal Currents
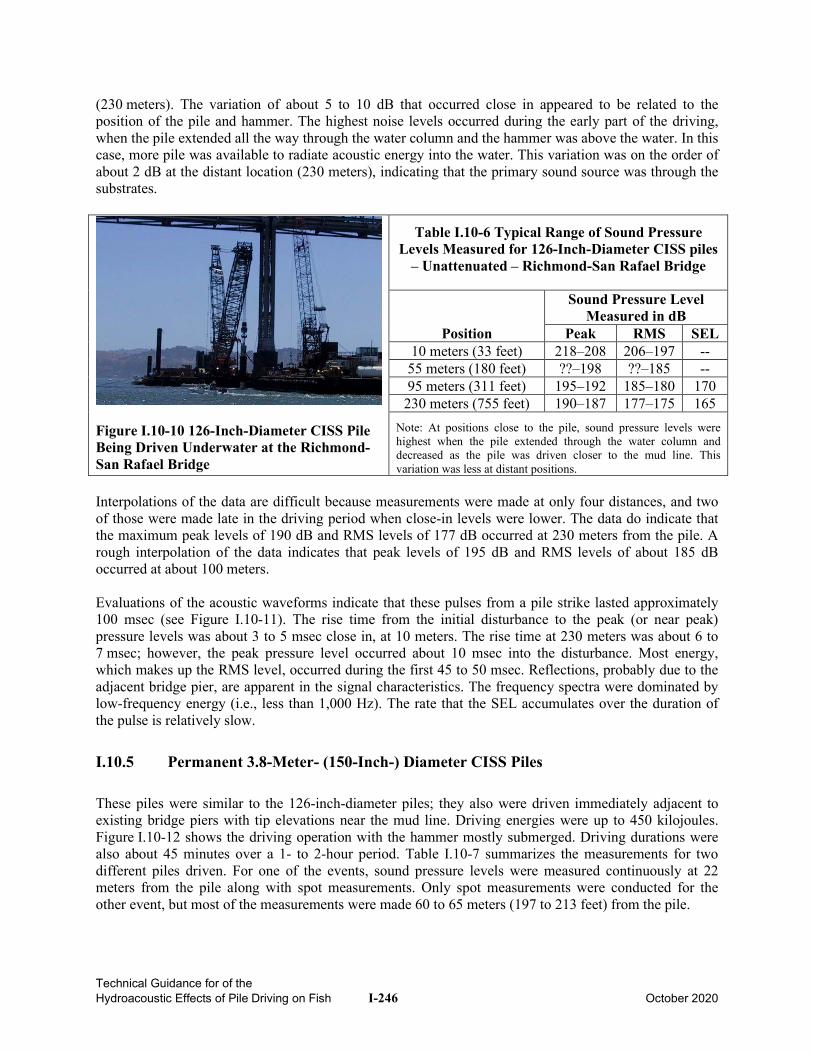
Technical Guidance for of the Hydroacoustic Effects of Pile Driving on Fish I-246 October 2020
(230 meters). The variation of about 5 to 10 dB that occurred close in appeared to be related to the position of the pile and hammer. The highest noise levels occurred during the early part of the driving, when the pile extended all the way through the water column and the hammer was above the water. In this case, more pile was available to radiate acoustic energy into the water. This variation was on the order of about 2 dB at the distant location (230 meters), indicating that the primary sound source was through the substrates.
Figure I.10-10 126-Inch-Diameter CISS Pile Being Driven Underwater at the Richmond-San Rafael Bridge
Table I.10-6 Typical Range of Sound Pressure Levels Measured for 126-Inch-Diameter CISS piles
– Unattenuated – Richmond-San Rafael Bridge
Position
Sound Pressure Level Measured in dB
Peak RMS SEL 10 meters (33 feet) 218–208 206–197 -- 55 meters (180 feet) ??–198 ??–185 -- 95 meters (311 feet) 195–192 185–180 170
230 meters (755 feet) 190–187 177–175 165 Note: At positions close to the pile, sound pressure levels were highest when the pile extended through the water column and decreased as the pile was driven closer to the mud line. This variation was less at distant positions.
Interpolations of the data are difficult because measurements were made at only four distances, and two of those were made late in the driving period when close-in levels were lower. The data do indicate that the maximum peak levels of 190 dB and RMS levels of 177 dB occurred at 230 meters from the pile. A rough interpolation of the data indicates that peak levels of 195 dB and RMS levels of about 185 dB occurred at about 100 meters. Evaluations of the acoustic waveforms indicate that these pulses from a pile strike lasted approximately 100 msec (see Figure I.10-11). The rise time from the initial disturbance to the peak (or near peak) pressure levels was about 3 to 5 msec close in, at 10 meters. The rise time at 230 meters was about 6 to 7 msec; however, the peak pressure level occurred about 10 msec into the disturbance. Most energy, which makes up the RMS level, occurred during the first 45 to 50 msec. Reflections, probably due to the adjacent bridge pier, are apparent in the signal characteristics. The frequency spectra were dominated by low-frequency energy (i.e., less than 1,000 Hz). The rate that the SEL accumulates over the duration of the pulse is relatively slow.
I.10.5 Permanent 3.8-Meter- (150-Inch-) Diameter CISS Piles
These piles were similar to the 126-inch-diameter piles; they also were driven immediately adjacent to existing bridge piers with tip elevations near the mud line. Driving energies were up to 450 kilojoules. Figure I.10-12 shows the driving operation with the hammer mostly submerged. Driving durations were also about 45 minutes over a 1- to 2-hour period. Table I.10-7 summarizes the measurements for two different piles driven. For one of the events, sound pressure levels were measured continuously at 22 meters from the pile along with spot measurements. Only spot measurements were conducted for the other event, but most of the measurements were made 60 to 65 meters (197 to 213 feet) from the pile.
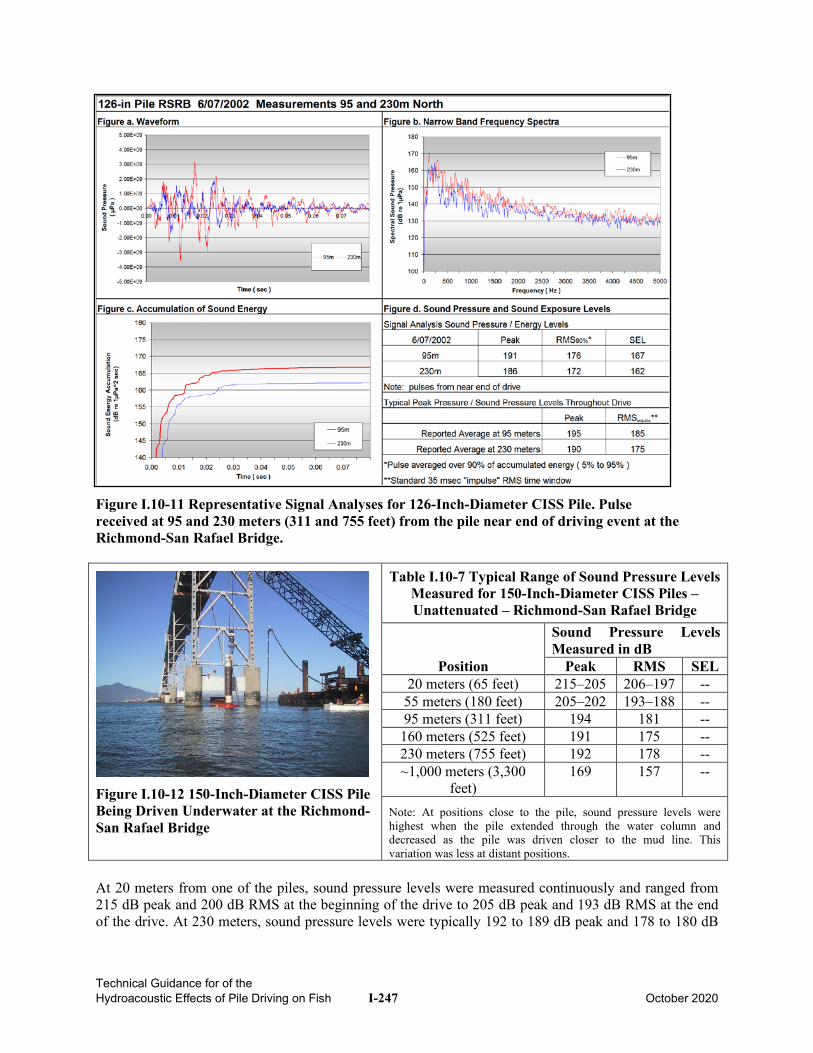
Technical Guidance for of the Hydroacoustic Effects of Pile Driving on Fish I-247 October 2020
Figure I.10-11 Representative Signal Analyses for 126-Inch-Diameter CISS Pile. Pulse received at 95 and 230 meters (311 and 755 feet) from the pile near end of driving event at the Richmond-San Rafael Bridge.
Figure I.10-12 150-Inch-Diameter CISS Pile Being Driven Underwater at the Richmond-San Rafael Bridge
Table I.10-7 Typical Range of Sound Pressure Levels Measured for 150-Inch-Diameter CISS Piles – Unattenuated – Richmond-San Rafael Bridge
Position
Sound Pressure Levels Measured in dB
Peak RMS SEL 20 meters (65 feet) 215–205 206–197 --
55 meters (180 feet) 205–202 193–188 -- 95 meters (311 feet) 194 181 --
160 meters (525 feet) 191 175 -- 230 meters (755 feet) 192 178 -- ~1,000 meters (3,300
feet) 169 157 --
Note: At positions close to the pile, sound pressure levels were highest when the pile extended through the water column and decreased as the pile was driven closer to the mud line. This variation was less at distant positions.
At 20 meters from one of the piles, sound pressure levels were measured continuously and ranged from 215 dB peak and 200 dB RMS at the beginning of the drive to 205 dB peak and 193 dB RMS at the end of the drive. At 230 meters, sound pressure levels were typically 192 to 189 dB peak and 178 to 180 dB
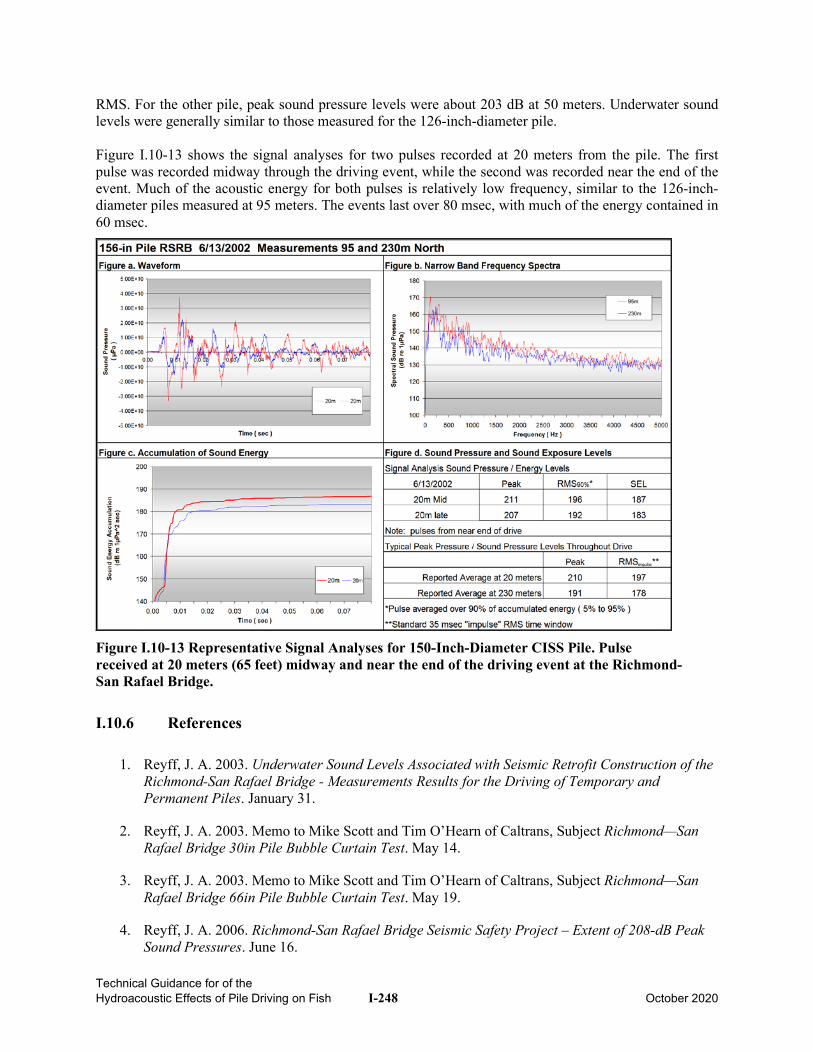
Technical Guidance for of the Hydroacoustic Effects of Pile Driving on Fish I-248 October 2020
RMS. For the other pile, peak sound pressure levels were about 203 dB at 50 meters. Underwater sound levels were generally similar to those measured for the 126-inch-diameter pile. Figure I.10-13 shows the signal analyses for two pulses recorded at 20 meters from the pile. The first pulse was recorded midway through the driving event, while the second was recorded near the end of the event. Much of the acoustic energy for both pulses is relatively low frequency, similar to the 126-inch-diameter piles measured at 95 meters. The events last over 80 msec, with much of the energy contained in 60 msec.
Figure I.10-13 Representative Signal Analyses for 150-Inch-Diameter CISS Pile. Pulse received at 20 meters (65 feet) midway and near the end of the driving event at the Richmond- San Rafael Bridge.
I.10.6 References
1. Reyff, J. A. 2003. Underwater Sound Levels Associated with Seismic Retrofit Construction of the Richmond-San Rafael Bridge - Measurements Results for the Driving of Temporary and Permanent Piles. January 31.
2. Reyff, J. A. 2003. Memo to Mike Scott and Tim O’Hearn of Caltrans, Subject Richmond—San Rafael Bridge 30in Pile Bubble Curtain Test. May 14.
3. Reyff, J. A. 2003. Memo to Mike Scott and Tim O’Hearn of Caltrans, Subject Richmond—San Rafael Bridge 66in Pile Bubble Curtain Test. May 19.
4. Reyff, J. A. 2006. Richmond-San Rafael Bridge Seismic Safety Project – Extent of 208-dB Peak Sound Pressures. June 16.
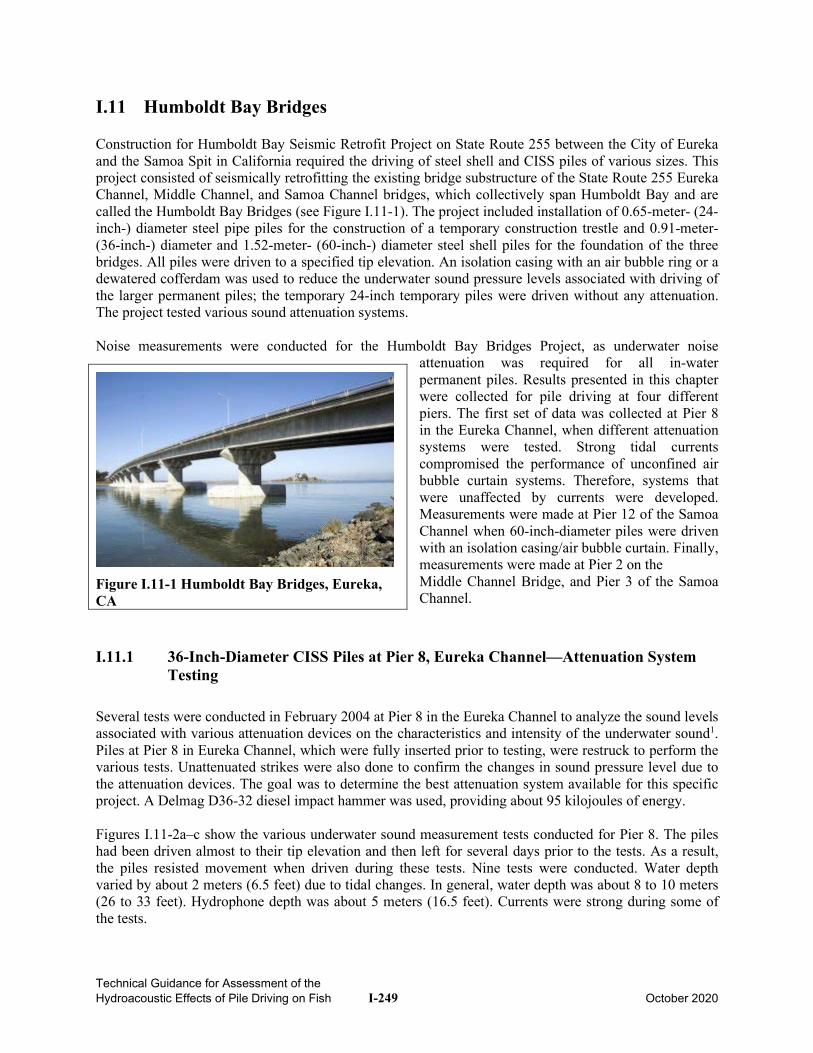
Technical Guidance for Assessment of the Hydroacoustic Effects of Pile Driving on Fish I-249 October 2020
I.11 Humboldt Bay Bridges Construction for Humboldt Bay Seismic Retrofit Project on State Route 255 between the City of Eureka and the Samoa Spit in California required the driving of steel shell and CISS piles of various sizes. This project consisted of seismically retrofitting the existing bridge substructure of the State Route 255 Eureka Channel, Middle Channel, and Samoa Channel bridges, which collectively span Humboldt Bay and are called the Humboldt Bay Bridges (see Figure I.11-1). The project included installation of 0.65-meter- (24-inch-) diameter steel pipe piles for the construction of a temporary construction trestle and 0.91-meter- (36-inch-) diameter and 1.52-meter- (60-inch-) diameter steel shell piles for the foundation of the three bridges. All piles were driven to a specified tip elevation. An isolation casing with an air bubble ring or a dewatered cofferdam was used to reduce the underwater sound pressure levels associated with driving of the larger permanent piles; the temporary 24-inch temporary piles were driven without any attenuation. The project tested various sound attenuation systems. Noise measurements were conducted for the Humboldt Bay Bridges Project, as underwater noise
attenuation was required for all in-water permanent piles. Results presented in this chapter were collected for pile driving at four different piers. The first set of data was collected at Pier 8 in the Eureka Channel, when different attenuation systems were tested. Strong tidal currents compromised the performance of unconfined air bubble curtain systems. Therefore, systems that were unaffected by currents were developed. Measurements were made at Pier 12 of the Samoa Channel when 60-inch-diameter piles were driven with an isolation casing/air bubble curtain. Finally, measurements were made at Pier 2 on the Middle Channel Bridge, and Pier 3 of the Samoa Channel.
I.11.1 36-Inch-Diameter CISS Piles at Pier 8, Eureka Channel—Attenuation System Testing
Several tests were conducted in February 2004 at Pier 8 in the Eureka Channel to analyze the sound levels associated with various attenuation devices on the characteristics and intensity of the underwater sound1. Piles at Pier 8 in Eureka Channel, which were fully inserted prior to testing, were restruck to perform the various tests. Unattenuated strikes were also done to confirm the changes in sound pressure level due to the attenuation devices. The goal was to determine the best attenuation system available for this specific project. A Delmag D36-32 diesel impact hammer was used, providing about 95 kilojoules of energy. Figures I.11-2a–c show the various underwater sound measurement tests conducted for Pier 8. The piles had been driven almost to their tip elevation and then left for several days prior to the tests. As a result, the piles resisted movement when driven during these tests. Nine tests were conducted. Water depth varied by about 2 meters (6.5 feet) due to tidal changes. In general, water depth was about 8 to 10 meters (26 to 33 feet). Hydrophone depth was about 5 meters (16.5 feet). Currents were strong during some of the tests.
Figure I.11-1 Humboldt Bay Bridges, Eureka, CA
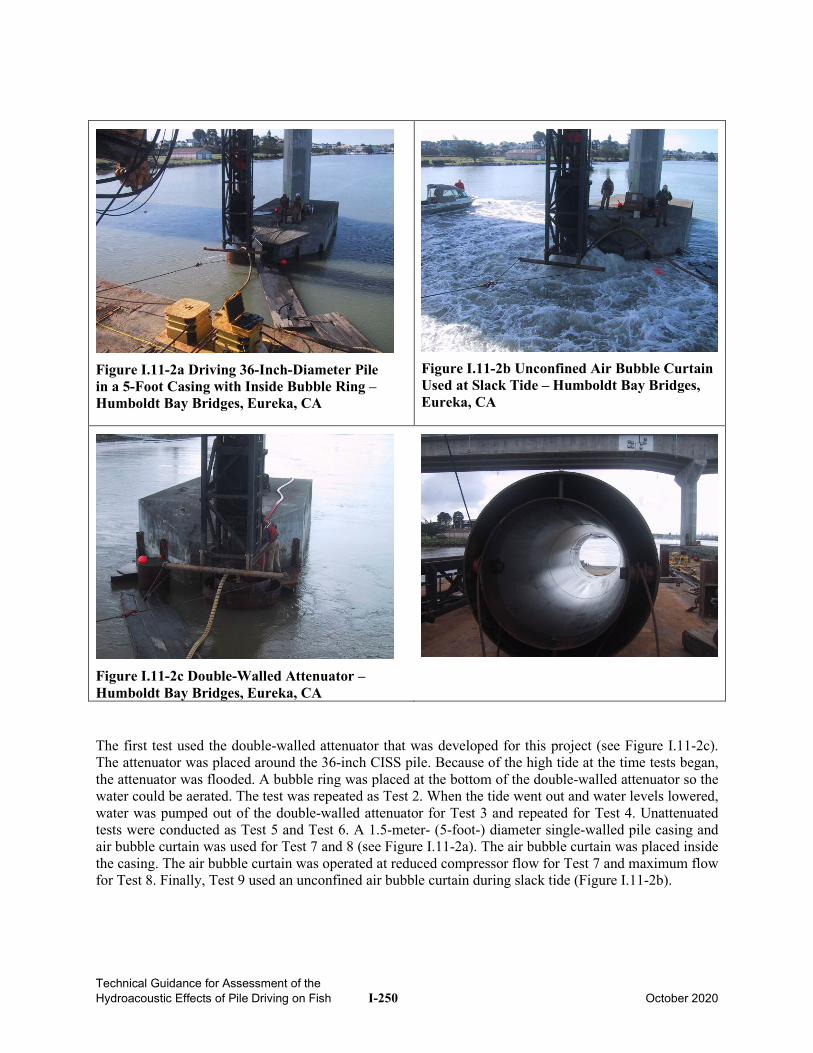
Technical Guidance for Assessment of the Hydroacoustic Effects of Pile Driving on Fish I-250 October 2020
The first test used the double-walled attenuator that was developed for this project (see Figure I.11-2c). The attenuator was placed around the 36-inch CISS pile. Because of the high tide at the time tests began, the attenuator was flooded. A bubble ring was placed at the bottom of the double-walled attenuator so the water could be aerated. The test was repeated as Test 2. When the tide went out and water levels lowered, water was pumped out of the double-walled attenuator for Test 3 and repeated for Test 4. Unattenuated tests were conducted as Test 5 and Test 6. A 1.5-meter- (5-foot-) diameter single-walled pile casing and air bubble curtain was used for Test 7 and 8 (see Figure I.11-2a). The air bubble curtain was placed inside the casing. The air bubble curtain was operated at reduced compressor flow for Test 7 and maximum flow for Test 8. Finally, Test 9 used an unconfined air bubble curtain during slack tide (Figure I.11-2b).
Figure I.11-2a Driving 36-Inch-Diameter Pile in a 5-Foot Casing with Inside Bubble Ring –Humboldt Bay Bridges, Eureka, CA
Figure I.11-2b Unconfined Air Bubble Curtain Used at Slack Tide – Humboldt Bay Bridges, Eureka, CA
Figure I.11-2c Double-Walled Attenuator –Humboldt Bay Bridges, Eureka, CA
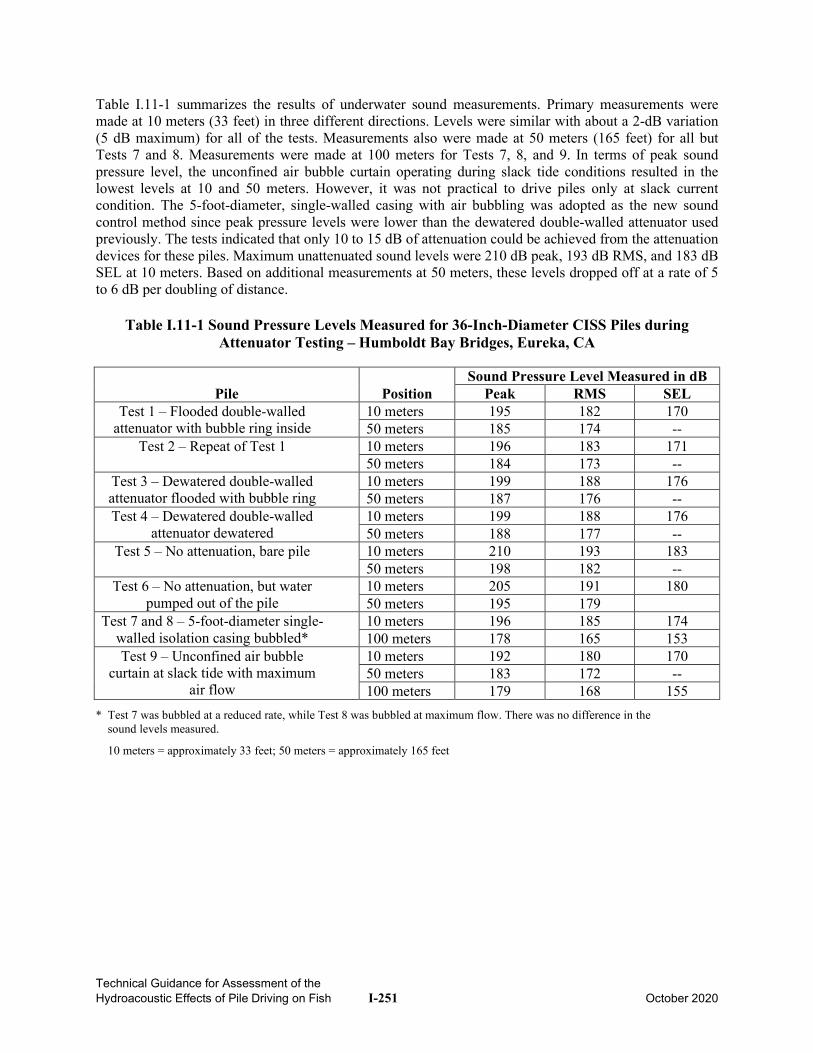
Technical Guidance for Assessment of the Hydroacoustic Effects of Pile Driving on Fish I-251 October 2020
Table I.11-1 summarizes the results of underwater sound measurements. Primary measurements were made at 10 meters (33 feet) in three different directions. Levels were similar with about a 2-dB variation (5 dB maximum) for all of the tests. Measurements also were made at 50 meters (165 feet) for all but Tests 7 and 8. Measurements were made at 100 meters for Tests 7, 8, and 9. In terms of peak sound pressure level, the unconfined air bubble curtain operating during slack tide conditions resulted in the lowest levels at 10 and 50 meters. However, it was not practical to drive piles only at slack current condition. The 5-foot-diameter, single-walled casing with air bubbling was adopted as the new sound control method since peak pressure levels were lower than the dewatered double-walled attenuator used previously. The tests indicated that only 10 to 15 dB of attenuation could be achieved from the attenuation devices for these piles. Maximum unattenuated sound levels were 210 dB peak, 193 dB RMS, and 183 dB SEL at 10 meters. Based on additional measurements at 50 meters, these levels dropped off at a rate of 5 to 6 dB per doubling of distance.
Table I.11-1 Sound Pressure Levels Measured for 36-Inch-Diameter CISS Piles during Attenuator Testing – Humboldt Bay Bridges, Eureka, CA
Pile Position Sound Pressure Level Measured in dB
Peak RMS SEL Test 1 – Flooded double-walled
attenuator with bubble ring inside 10 meters 195 182 170 50 meters 185 174 --
Test 2 – Repeat of Test 1 10 meters 196 183 171 50 meters 184 173 --
Test 3 – Dewatered double-walled attenuator flooded with bubble ring
10 meters 199 188 176 50 meters 187 176 --
Test 4 – Dewatered double-walled attenuator dewatered
10 meters 199 188 176 50 meters 188 177 --
Test 5 – No attenuation, bare pile 10 meters 210 193 183 50 meters 198 182 --
Test 6 – No attenuation, but water pumped out of the pile
10 meters 205 191 180 50 meters 195 179
Test 7 and 8 – 5-foot-diameter single-walled isolation casing bubbled*
10 meters 196 185 174 100 meters 178 165 153
Test 9 – Unconfined air bubble curtain at slack tide with maximum
air flow
10 meters 192 180 170 50 meters 183 172 -- 100 meters 179 168 155
* Test 7 was bubbled at a reduced rate, while Test 8 was bubbled at maximum flow. There was no difference in the sound levels measured.
10 meters = approximately 33 feet; 50 meters = approximately 165 feet
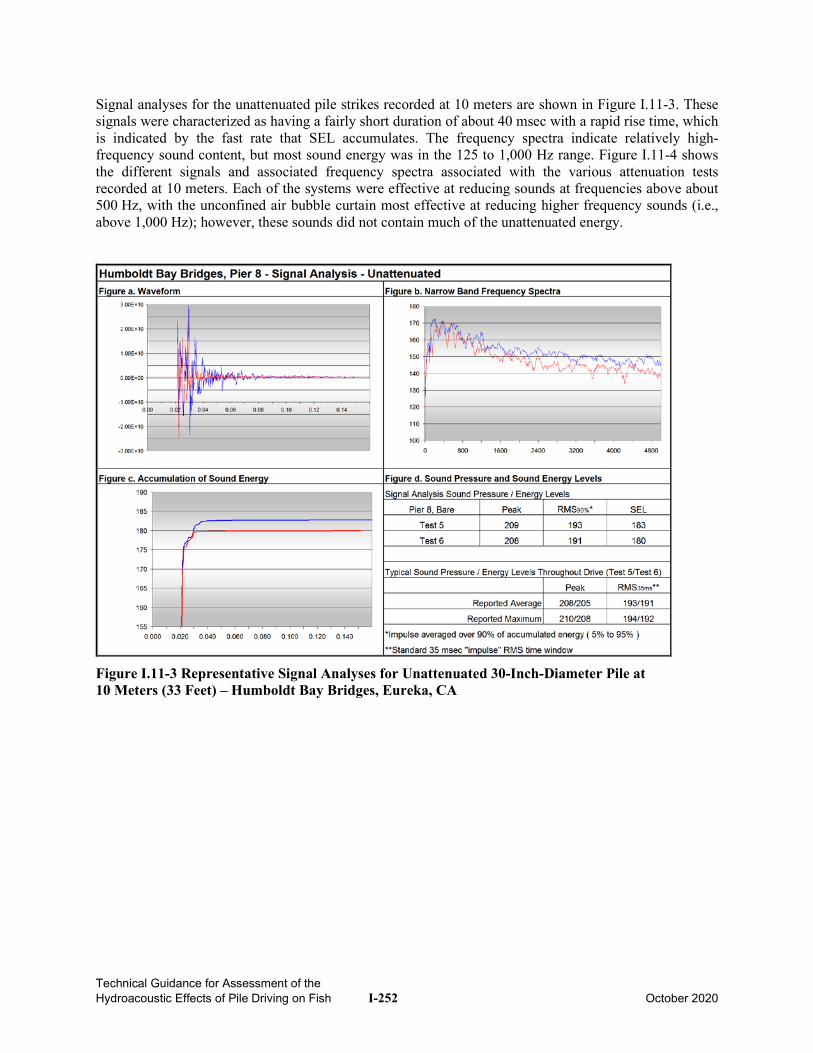
Technical Guidance for Assessment of the Hydroacoustic Effects of Pile Driving on Fish I-252 October 2020
Signal analyses for the unattenuated pile strikes recorded at 10 meters are shown in Figure I.11-3. These signals were characterized as having a fairly short duration of about 40 msec with a rapid rise time, which is indicated by the fast rate that SEL accumulates. The frequency spectra indicate relatively high-frequency sound content, but most sound energy was in the 125 to 1,000 Hz range. Figure I.11-4 shows the different signals and associated frequency spectra associated with the various attenuation tests recorded at 10 meters. Each of the systems were effective at reducing sounds at frequencies above about 500 Hz, with the unconfined air bubble curtain most effective at reducing higher frequency sounds (i.e., above 1,000 Hz); however, these sounds did not contain much of the unattenuated energy.
Figure I.11-3 Representative Signal Analyses for Unattenuated 30-Inch-Diameter Pile at 10 Meters (33 Feet) – Humboldt Bay Bridges, Eureka, CA
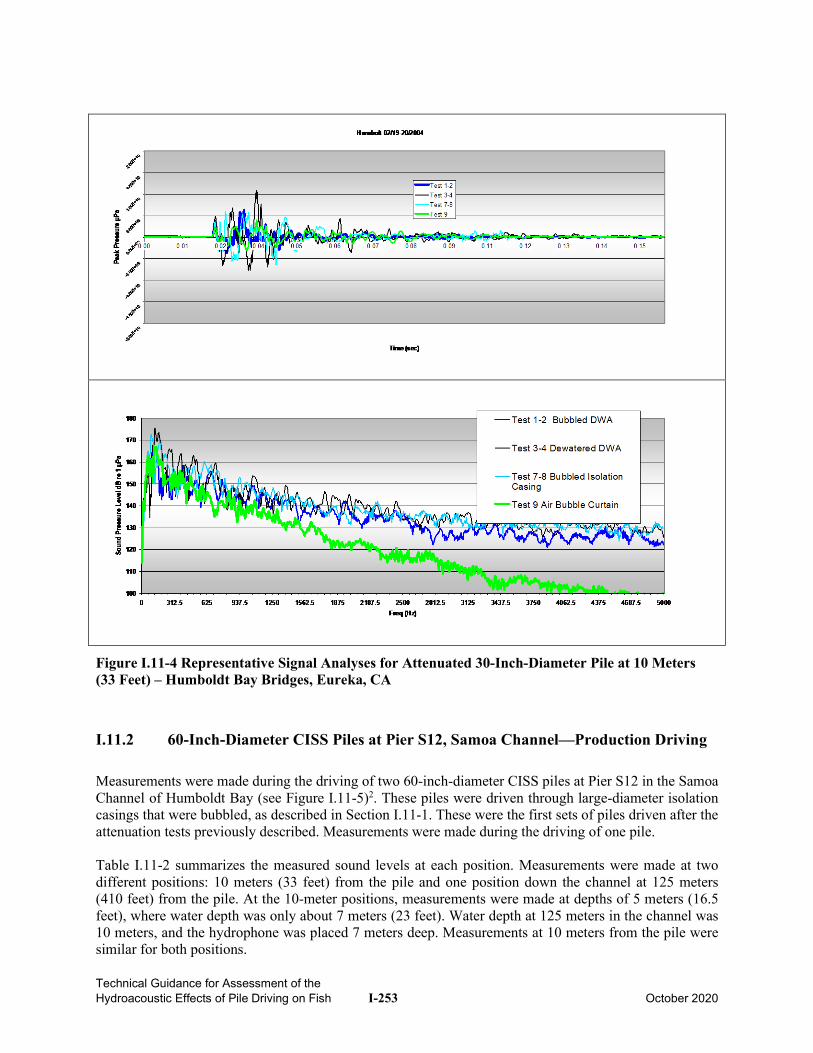
Technical Guidance for Assessment of the Hydroacoustic Effects of Pile Driving on Fish I-253 October 2020
Figure I.11-4 Representative Signal Analyses for Attenuated 30-Inch-Diameter Pile at 10 Meters (33 Feet) – Humboldt Bay Bridges, Eureka, CA
I.11.2 60-Inch-Diameter CISS Piles at Pier S12, Samoa Channel—Production Driving
Measurements were made during the driving of two 60-inch-diameter CISS piles at Pier S12 in the Samoa Channel of Humboldt Bay (see Figure I.11-5)2. These piles were driven through large-diameter isolation casings that were bubbled, as described in Section I.11-1. These were the first sets of piles driven after the attenuation tests previously described. Measurements were made during the driving of one pile. Table I.11-2 summarizes the measured sound levels at each position. Measurements were made at two different positions: 10 meters (33 feet) from the pile and one position down the channel at 125 meters (410 feet) from the pile. At the 10-meter positions, measurements were made at depths of 5 meters (16.5 feet), where water depth was only about 7 meters (23 feet). Water depth at 125 meters in the channel was 10 meters, and the hydrophone was placed 7 meters deep. Measurements at 10 meters from the pile were similar for both positions.
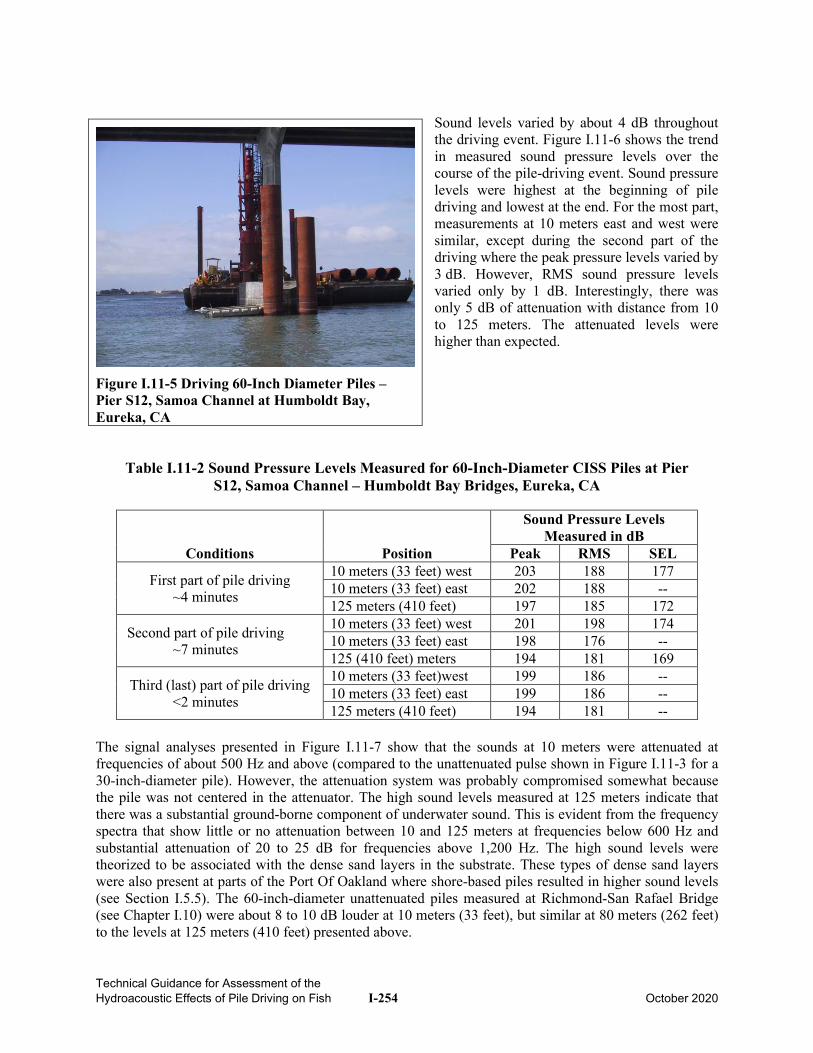
Technical Guidance for Assessment of the Hydroacoustic Effects of Pile Driving on Fish I-254 October 2020
Sound levels varied by about 4 dB throughout the driving event. Figure I.11-6 shows the trend in measured sound pressure levels over the course of the pile-driving event. Sound pressure levels were highest at the beginning of pile driving and lowest at the end. For the most part, measurements at 10 meters east and west were similar, except during the second part of the driving where the peak pressure levels varied by 3 dB. However, RMS sound pressure levels varied only by 1 dB. Interestingly, there was only 5 dB of attenuation with distance from 10 to 125 meters. The attenuated levels were higher than expected.
Table I.11-2 Sound Pressure Levels Measured for 60-Inch-Diameter CISS Piles at Pier S12, Samoa Channel – Humboldt Bay Bridges, Eureka, CA
Conditions Position
Sound Pressure Levels Measured in dB
Peak RMS SEL
First part of pile driving ~4 minutes
10 meters (33 feet) west 203 188 177 10 meters (33 feet) east 202 188 -- 125 meters (410 feet) 197 185 172
Second part of pile driving ~7 minutes
10 meters (33 feet) west 201 198 174 10 meters (33 feet) east 198 176 -- 125 (410 feet) meters 194 181 169
Third (last) part of pile driving <2 minutes
10 meters (33 feet)west 199 186 -- 10 meters (33 feet) east 199 186 -- 125 meters (410 feet) 194 181 --
The signal analyses presented in Figure I.11-7 show that the sounds at 10 meters were attenuated at frequencies of about 500 Hz and above (compared to the unattenuated pulse shown in Figure I.11-3 for a 30-inch-diameter pile). However, the attenuation system was probably compromised somewhat because the pile was not centered in the attenuator. The high sound levels measured at 125 meters indicate that there was a substantial ground-borne component of underwater sound. This is evident from the frequency spectra that show little or no attenuation between 10 and 125 meters at frequencies below 600 Hz and substantial attenuation of 20 to 25 dB for frequencies above 1,200 Hz. The high sound levels were theorized to be associated with the dense sand layers in the substrate. These types of dense sand layers were also present at parts of the Port Of Oakland where shore-based piles resulted in higher sound levels (see Section I.5.5). The 60-inch-diameter unattenuated piles measured at Richmond-San Rafael Bridge (see Chapter I.10) were about 8 to 10 dB louder at 10 meters (33 feet), but similar at 80 meters (262 feet) to the levels at 125 meters (410 feet) presented above.
Figure I.11-5 Driving 60-Inch Diameter Piles – Pier S12, Samoa Channel at Humboldt Bay, Eureka, CA
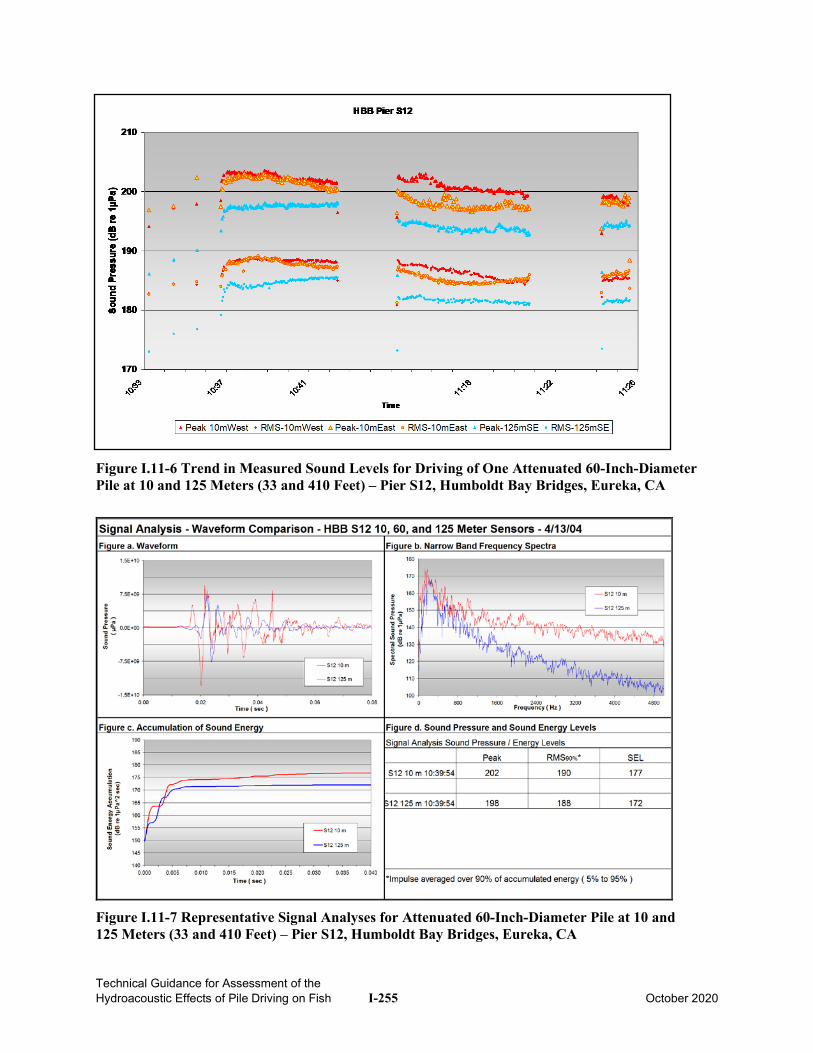
Technical Guidance for Assessment of the Hydroacoustic Effects of Pile Driving on Fish I-255 October 2020
Figure I.11-6 Trend in Measured Sound Levels for Driving of One Attenuated 60-Inch-Diameter Pile at 10 and 125 Meters (33 and 410 Feet) – Pier S12, Humboldt Bay Bridges, Eureka, CA
Figure I.11-7 Representative Signal Analyses for Attenuated 60-Inch-Diameter Pile at 10 and 125 Meters (33 and 410 Feet) – Pier S12, Humboldt Bay Bridges, Eureka, CA
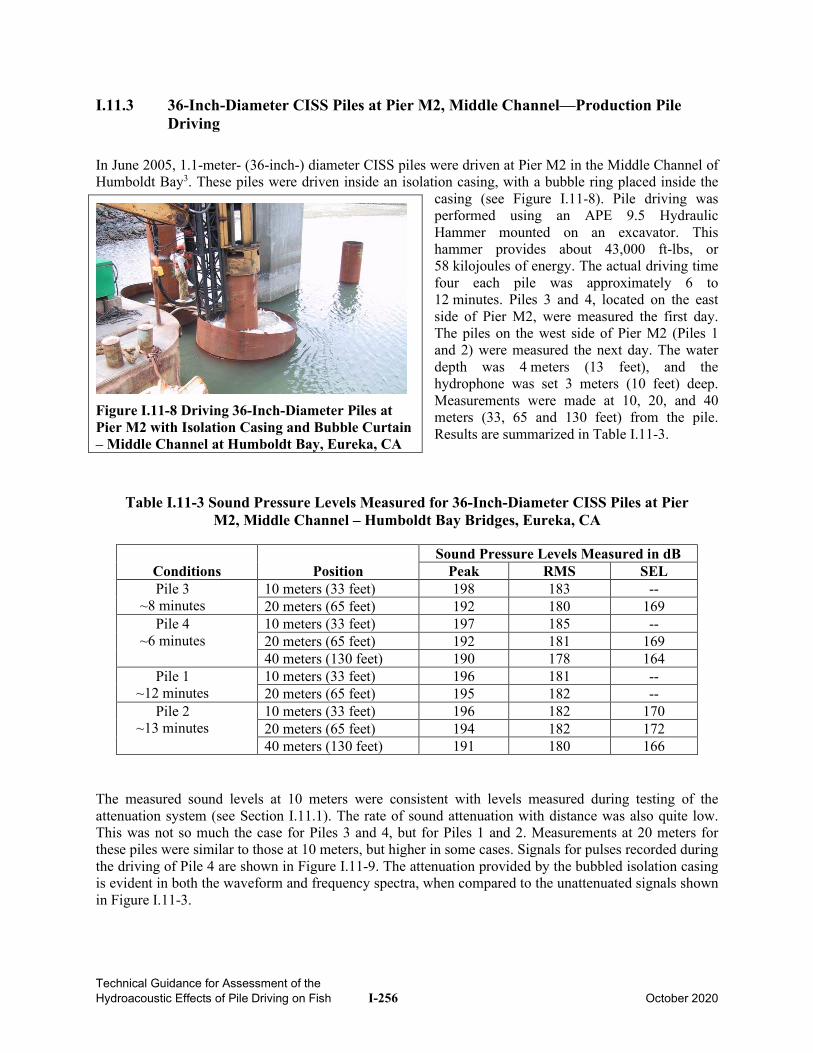
Technical Guidance for Assessment of the Hydroacoustic Effects of Pile Driving on Fish I-256 October 2020
I.11.3 36-Inch-Diameter CISS Piles at Pier M2, Middle Channel—Production Pile Driving
In June 2005, 1.1-meter- (36-inch-) diameter CISS piles were driven at Pier M2 in the Middle Channel of Humboldt Bay3. These piles were driven inside an isolation casing, with a bubble ring placed inside the
casing (see Figure I.11-8). Pile driving was performed using an APE 9.5 Hydraulic Hammer mounted on an excavator. This hammer provides about 43,000 ft-lbs, or 58 kilojoules of energy. The actual driving time four each pile was approximately 6 to 12 minutes. Piles 3 and 4, located on the east side of Pier M2, were measured the first day. The piles on the west side of Pier M2 (Piles 1 and 2) were measured the next day. The water depth was 4 meters (13 feet), and the hydrophone was set 3 meters (10 feet) deep. Measurements were made at 10, 20, and 40 meters (33, 65 and 130 feet) from the pile. Results are summarized in Table I.11-3.
Table I.11-3 Sound Pressure Levels Measured for 36-Inch-Diameter CISS Piles at Pier M2, Middle Channel – Humboldt Bay Bridges, Eureka, CA
Conditions Position Sound Pressure Levels Measured in dB
Peak RMS SEL Pile 3
~8 minutes 10 meters (33 feet) 198 183 -- 20 meters (65 feet) 192 180 169
Pile 4 ~6 minutes
10 meters (33 feet) 197 185 -- 20 meters (65 feet) 192 181 169 40 meters (130 feet) 190 178 164
Pile 1 ~12 minutes
10 meters (33 feet) 196 181 -- 20 meters (65 feet) 195 182 --
Pile 2 ~13 minutes
10 meters (33 feet) 196 182 170 20 meters (65 feet) 194 182 172 40 meters (130 feet) 191 180 166
The measured sound levels at 10 meters were consistent with levels measured during testing of the attenuation system (see Section I.11.1). The rate of sound attenuation with distance was also quite low. This was not so much the case for Piles 3 and 4, but for Piles 1 and 2. Measurements at 20 meters for these piles were similar to those at 10 meters, but higher in some cases. Signals for pulses recorded during the driving of Pile 4 are shown in Figure I.11-9. The attenuation provided by the bubbled isolation casing is evident in both the waveform and frequency spectra, when compared to the unattenuated signals shown in Figure I.11-3.
Figure I.11-8 Driving 36-Inch-Diameter Piles at Pier M2 with Isolation Casing and Bubble Curtain – Middle Channel at Humboldt Bay, Eureka, CA
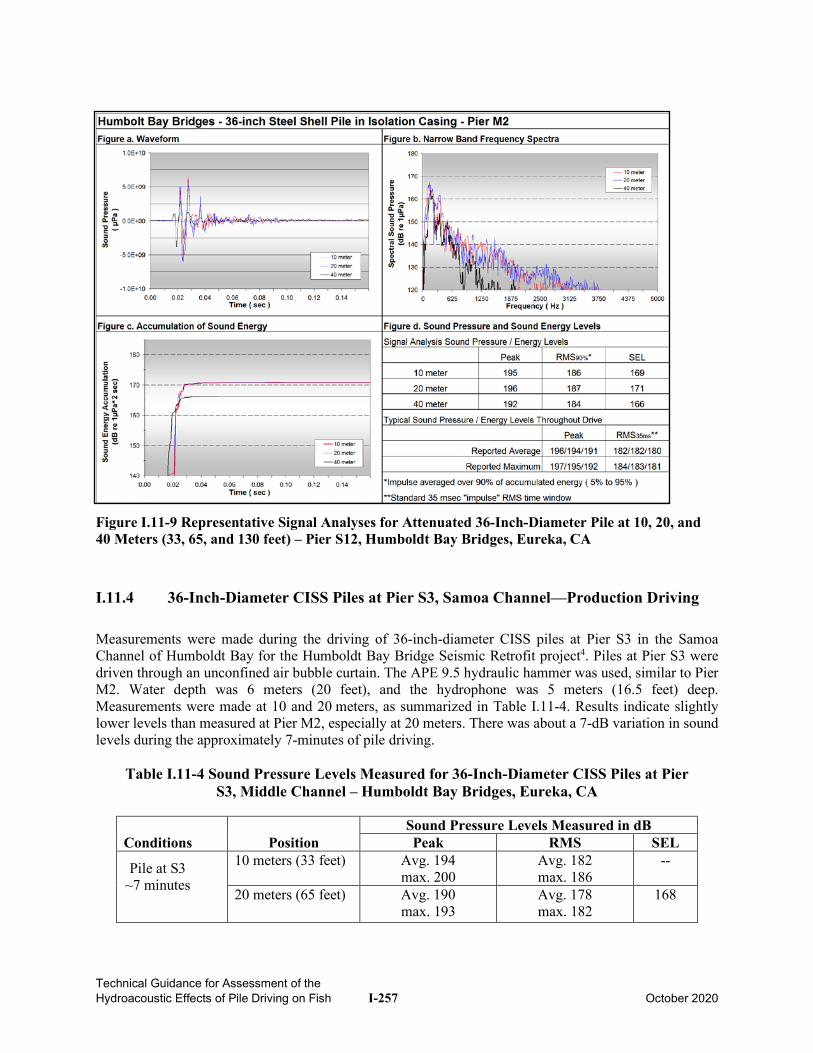
Technical Guidance for Assessment of the Hydroacoustic Effects of Pile Driving on Fish I-257 October 2020
Figure I.11-9 Representative Signal Analyses for Attenuated 36-Inch-Diameter Pile at 10, 20, and 40 Meters (33, 65, and 130 feet) – Pier S12, Humboldt Bay Bridges, Eureka, CA
I.11.4 36-Inch-Diameter CISS Piles at Pier S3, Samoa Channel—Production Driving
Measurements were made during the driving of 36-inch-diameter CISS piles at Pier S3 in the Samoa Channel of Humboldt Bay for the Humboldt Bay Bridge Seismic Retrofit project4. Piles at Pier S3 were driven through an unconfined air bubble curtain. The APE 9.5 hydraulic hammer was used, similar to Pier M2. Water depth was 6 meters (20 feet), and the hydrophone was 5 meters (16.5 feet) deep. Measurements were made at 10 and 20 meters, as summarized in Table I.11-4. Results indicate slightly lower levels than measured at Pier M2, especially at 20 meters. There was about a 7-dB variation in sound levels during the approximately 7-minutes of pile driving.
Table I.11-4 Sound Pressure Levels Measured for 36-Inch-Diameter CISS Piles at Pier S3, Middle Channel – Humboldt Bay Bridges, Eureka, CA
Conditions Position Sound Pressure Levels Measured in dB Peak RMS SEL
Pile at S3 ~7 minutes
10 meters (33 feet) Avg. 194 max. 200
Avg. 182 max. 186
--
20 meters (65 feet) Avg. 190 max. 193
Avg. 178 max. 182
168
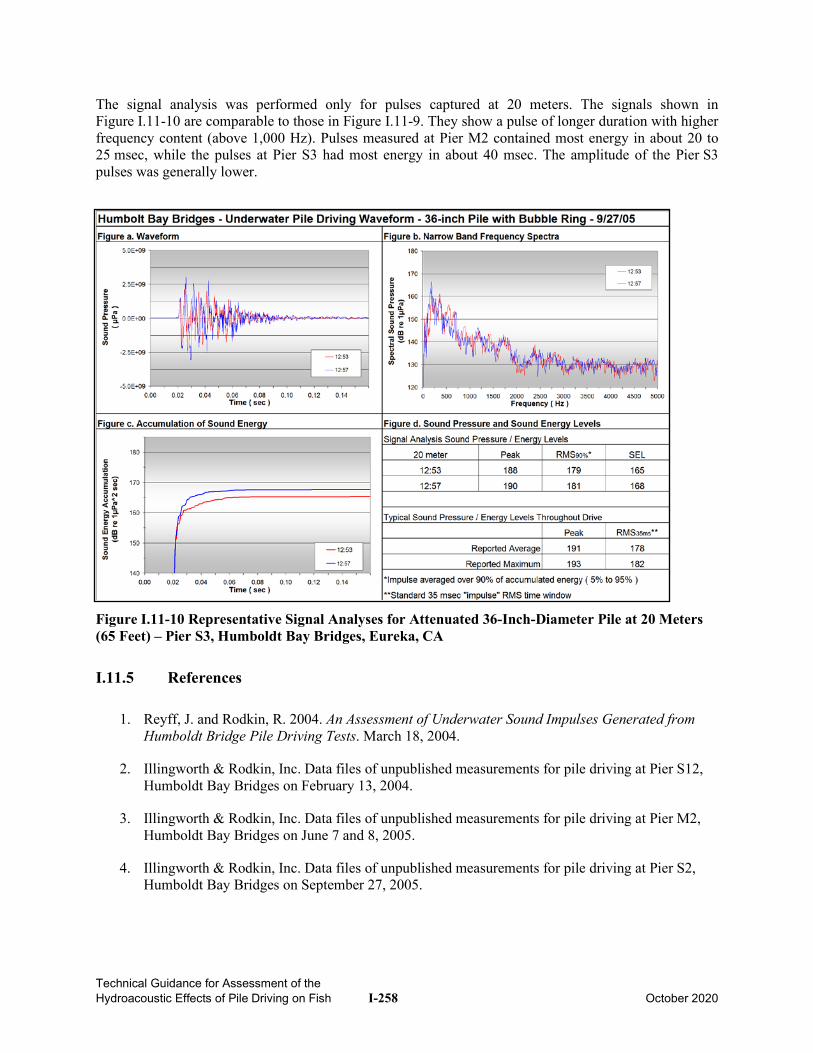
Technical Guidance for Assessment of the Hydroacoustic Effects of Pile Driving on Fish I-258 October 2020
The signal analysis was performed only for pulses captured at 20 meters. The signals shown in Figure I.11-10 are comparable to those in Figure I.11-9. They show a pulse of longer duration with higher frequency content (above 1,000 Hz). Pulses measured at Pier M2 contained most energy in about 20 to 25 msec, while the pulses at Pier S3 had most energy in about 40 msec. The amplitude of the Pier S3 pulses was generally lower.
Figure I.11-10 Representative Signal Analyses for Attenuated 36-Inch-Diameter Pile at 20 Meters (65 Feet) – Pier S3, Humboldt Bay Bridges, Eureka, CA
I.11.5 References
1. Reyff, J. and Rodkin, R. 2004. An Assessment of Underwater Sound Impulses Generated from Humboldt Bridge Pile Driving Tests. March 18, 2004.
2. Illingworth & Rodkin, Inc. Data files of unpublished measurements for pile driving at Pier S12, Humboldt Bay Bridges on February 13, 2004.
3. Illingworth & Rodkin, Inc. Data files of unpublished measurements for pile driving at Pier M2, Humboldt Bay Bridges on June 7 and 8, 2005.
4. Illingworth & Rodkin, Inc. Data files of unpublished measurements for pile driving at Pier S2, Humboldt Bay Bridges on September 27, 2005.
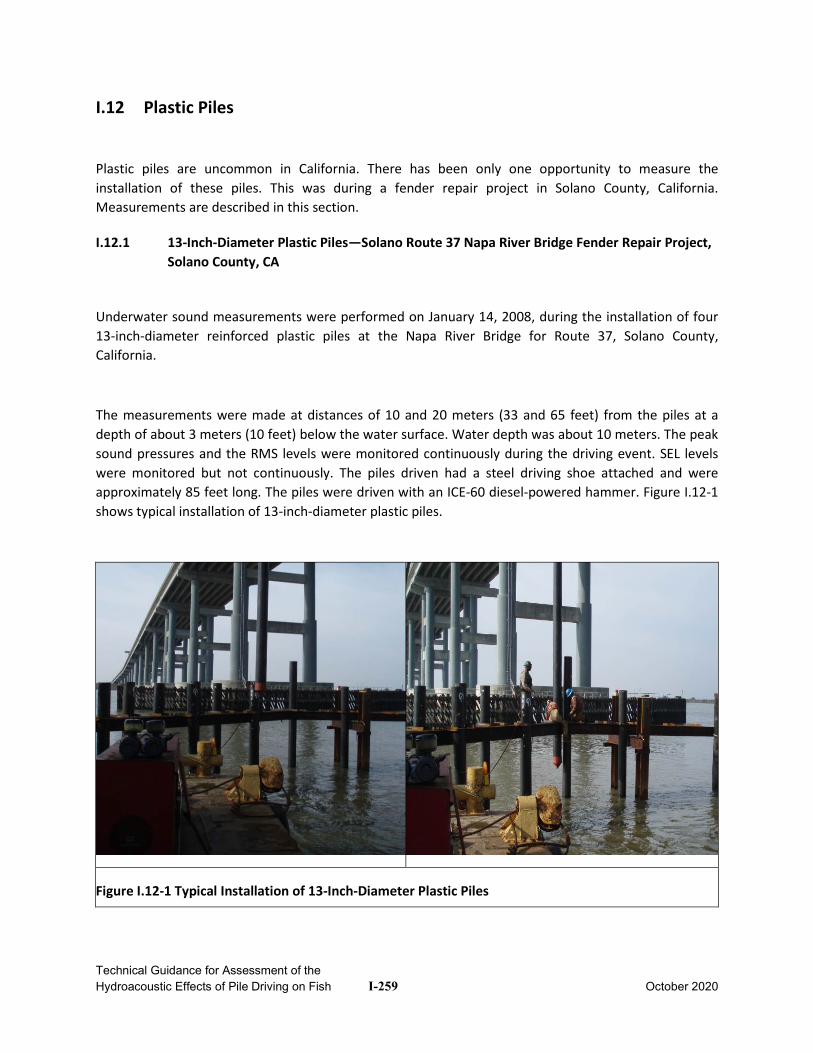
Technical Guidance for Assessment of the Hydroacoustic Effects of Pile Driving on Fish I-259 October 2020
I.12 Plastic Piles
Plastic piles are uncommon in California. There has been only one opportunity to measure the installation of these piles. This was during a fender repair project in Solano County, California. Measurements are described in this section.
I.12.1 13-Inch-Diameter Plastic Piles—Solano Route 37 Napa River Bridge Fender Repair Project, Solano County, CA
Underwater sound measurements were performed on January 14, 2008, during the installation of four 13-inch-diameter reinforced plastic piles at the Napa River Bridge for Route 37, Solano County, California.
The measurements were made at distances of 10 and 20 meters (33 and 65 feet) from the piles at a depth of about 3 meters (10 feet) below the water surface. Water depth was about 10 meters. The peak sound pressures and the RMS levels were monitored continuously during the driving event. SEL levels were monitored but not continuously. The piles driven had a steel driving shoe attached and were approximately 85 feet long. The piles were driven with an ICE-60 diesel-powered hammer. Figure I.12-1 shows typical installation of 13-inch-diameter plastic piles.
Figure I.12-1 Typical Installation of 13-Inch-Diameter Plastic Piles
Technical Guidance for Assessment of the Hydroacoustic Effects of Pile Driving on Fish I-260 October 2020
Four different piles were measured—Piles 10, 11, 12, and 13. The water current during the driving of Piles 12 and 13 was fairly strong and may have compromised the accuracy of some of the sound readings. Pile 11 was driven during a slack tide with little current. Typical sound pressure levels were 168 dB peak, and the maximum peak sound pressure level was 173 dB at 10 meters. The typical RMS sound pressure level was 156 dB with a maximum of 159 dB. Sound levels at 20 meters were about 2 to 3 dB lower than at 10 meters, an indication that substantial sound energy emanated from below the water bottom (i.e., pile tip). Table I.12-1 summarizes the maximum and average peak and RMS sound pressure levels measured during driving of the four plastic piles.
Table I.12-1 Typical Sound Pressure Levels Measured for Driving of Four Plastic Piles—Napa River Bridge Fender Repair, Solano County, CA
Conditions Distance
Measured Sound Pressure Levels in dB
Peak RMS
Maximum Average Maximum Average
Unattenuated – Diesel Impact
Hammer
10 meters (33 feet)
177 166 159 153
20 meters (65 feet)
172 163 157 151
For Pile 10, there was little difference in the signals measured at 10 and 20 meters. Only a slight decrease in the higher frequencies (above 1000 Hz) was noted for the 20-meter signals. The sounds were made up of very low frequency sound energy, mostly below 1000 Hz. Dominant tones were at about 200 Hz. Measured SEL values were in the range of 135 to 145 dB. Each pile-driving event lasted about 2 minutes with the hammer striking the pile about once per second or almost 120 times per driving event. Figure I.12-2 show individual pulses from the driving events for Pile 10.
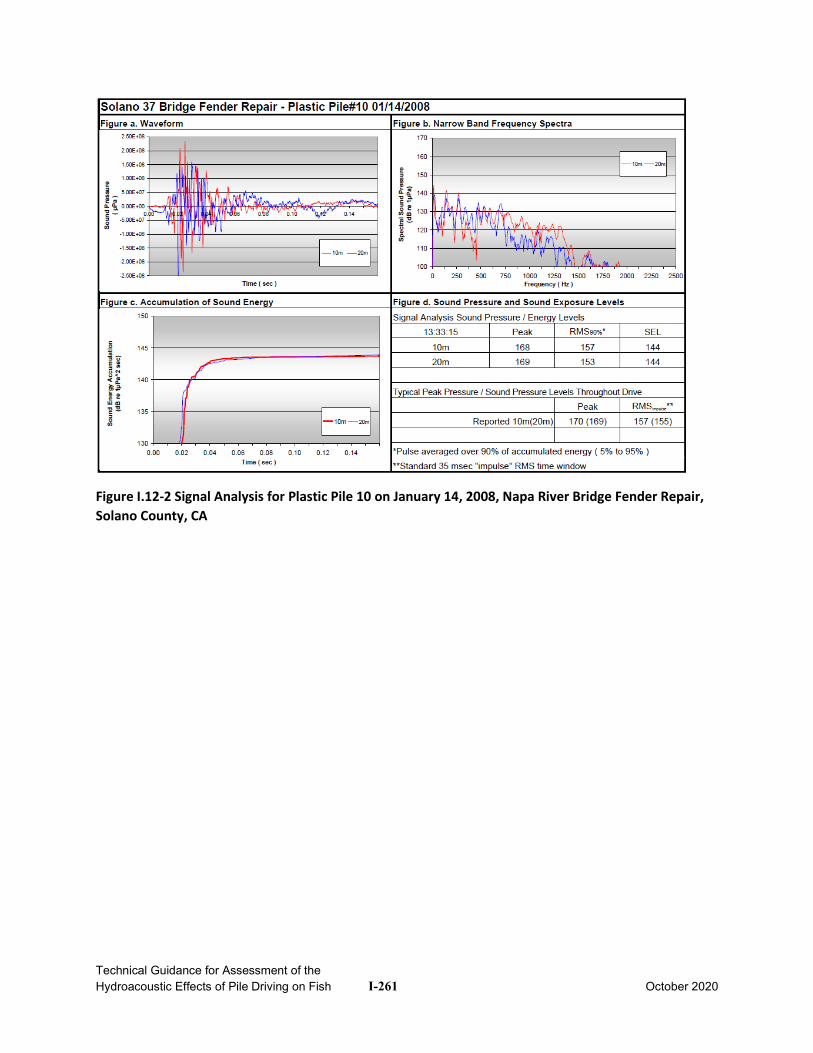
Technical Guidance for Assessment of the Hydroacoustic Effects of Pile Driving on Fish I-261 October 2020
Figure I.12-2 Signal Analysis for Plastic Pile 10 on January 14, 2008, Napa River Bridge Fender Repair, Solano County, CA
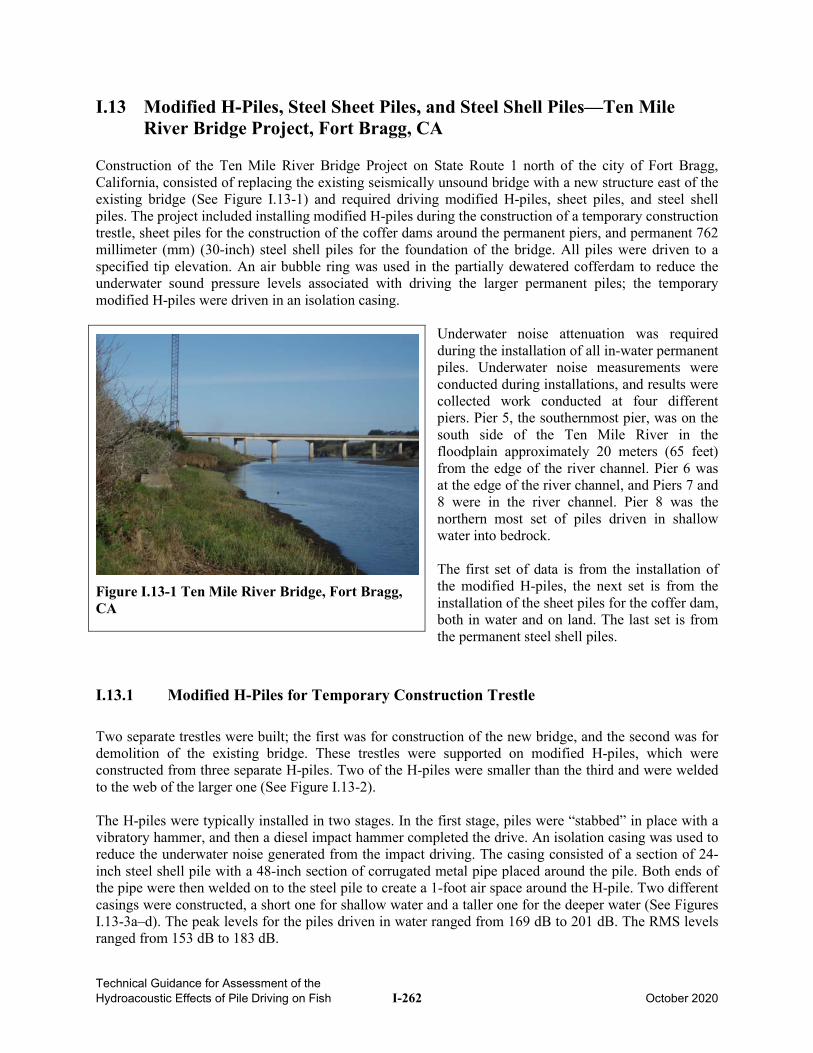
Technical Guidance for Assessment of the Hydroacoustic Effects of Pile Driving on Fish I-262 October 2020
I.13 Modified H-Piles, Steel Sheet Piles, and Steel Shell Piles—Ten Mile River Bridge Project, Fort Bragg, CA
Construction of the Ten Mile River Bridge Project on State Route 1 north of the city of Fort Bragg, California, consisted of replacing the existing seismically unsound bridge with a new structure east of the existing bridge (See Figure I.13-1) and required driving modified H-piles, sheet piles, and steel shell piles. The project included installing modified H-piles during the construction of a temporary construction trestle, sheet piles for the construction of the coffer dams around the permanent piers, and permanent 762 millimeter (mm) (30-inch) steel shell piles for the foundation of the bridge. All piles were driven to a specified tip elevation. An air bubble ring was used in the partially dewatered cofferdam to reduce the underwater sound pressure levels associated with driving the larger permanent piles; the temporary modified H-piles were driven in an isolation casing.
Underwater noise attenuation was required during the installation of all in-water permanent piles. Underwater noise measurements were conducted during installations, and results were collected work conducted at four different piers. Pier 5, the southernmost pier, was on the south side of the Ten Mile River in the floodplain approximately 20 meters (65 feet) from the edge of the river channel. Pier 6 was at the edge of the river channel, and Piers 7 and 8 were in the river channel. Pier 8 was the northern most set of piles driven in shallow water into bedrock. The first set of data is from the installation of the modified H-piles, the next set is from the installation of the sheet piles for the coffer dam, both in water and on land. The last set is from the permanent steel shell piles.
I.13.1 Modified H-Piles for Temporary Construction Trestle
Two separate trestles were built; the first was for construction of the new bridge, and the second was for demolition of the existing bridge. These trestles were supported on modified H-piles, which were constructed from three separate H-piles. Two of the H-piles were smaller than the third and were welded to the web of the larger one (See Figure I.13-2). The H-piles were typically installed in two stages. In the first stage, piles were “stabbed” in place with a vibratory hammer, and then a diesel impact hammer completed the drive. An isolation casing was used to reduce the underwater noise generated from the impact driving. The casing consisted of a section of 24-inch steel shell pile with a 48-inch section of corrugated metal pipe placed around the pile. Both ends of the pipe were then welded on to the steel pile to create a 1-foot air space around the H-pile. Two different casings were constructed, a short one for shallow water and a taller one for the deeper water (See Figures I.13-3a–d). The peak levels for the piles driven in water ranged from 169 dB to 201 dB. The RMS levels ranged from 153 dB to 183 dB.
Figure I.13-1 Ten Mile River Bridge, Fort Bragg, CA
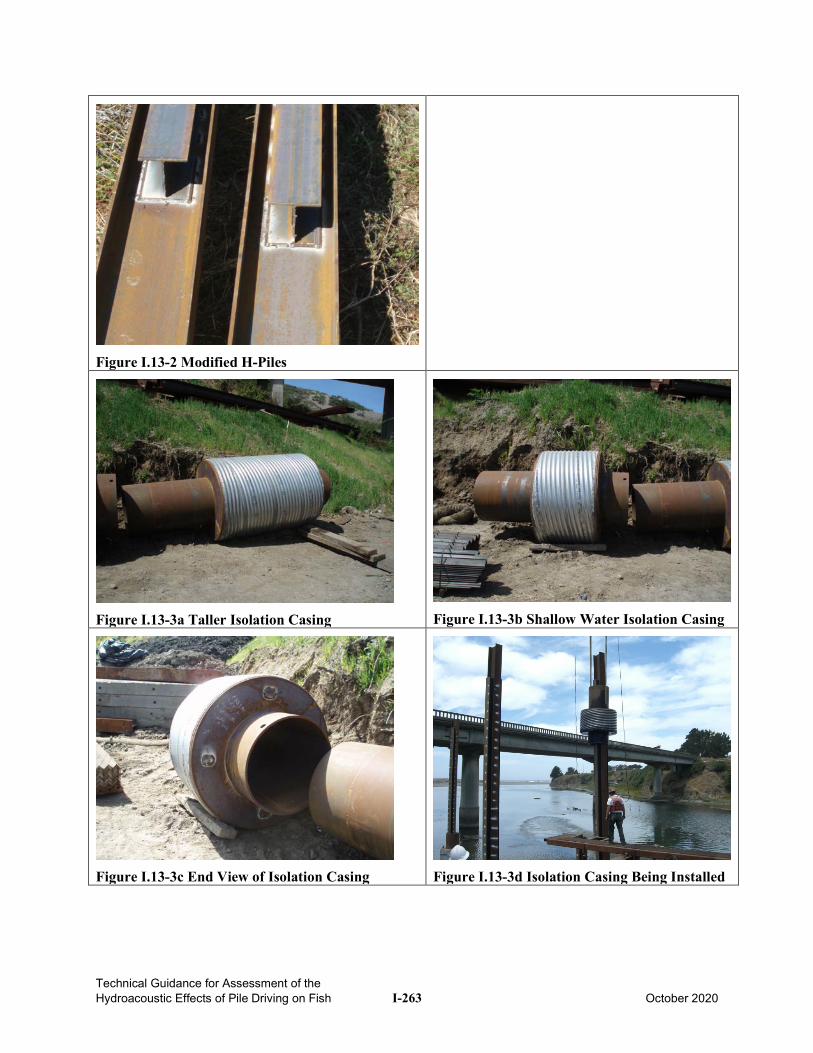
Technical Guidance for Assessment of the Hydroacoustic Effects of Pile Driving on Fish I-263 October 2020
Figure I.13-2 Modified H-Piles
Figure I.13-3a Taller Isolation Casing
Figure I.13-3b Shallow Water Isolation Casing
Figure I.13-3c End View of Isolation Casing
Figure I.13-3d Isolation Casing Being Installed
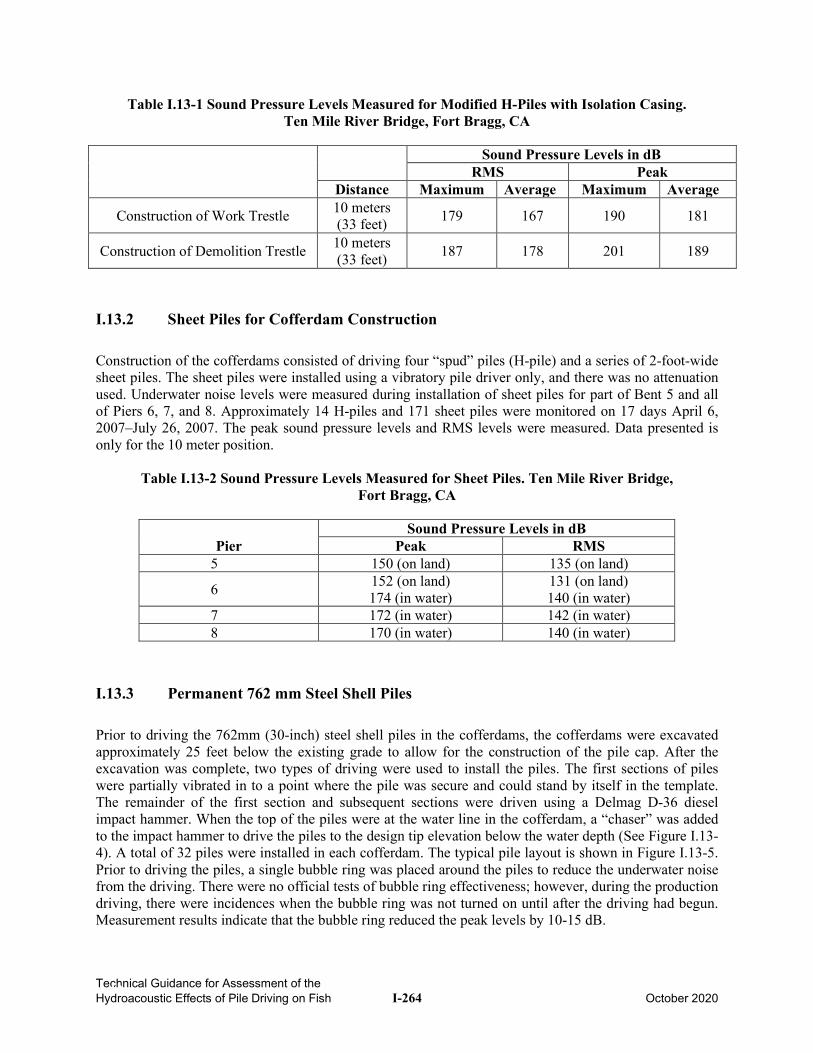
Technical Guidance for Assessment of the Hydroacoustic Effects of Pile Driving on Fish I-264 October 2020
Table I.13-1 Sound Pressure Levels Measured for Modified H-Piles with Isolation Casing. Ten Mile River Bridge, Fort Bragg, CA
Sound Pressure Levels in dB RMS Peak
Distance Maximum Average Maximum Average
Construction of Work Trestle 10 meters (33 feet) 179 167 190 181
Construction of Demolition Trestle 10 meters (33 feet) 187 178 201 189
I.13.2 Sheet Piles for Cofferdam Construction
Construction of the cofferdams consisted of driving four “spud” piles (H-pile) and a series of 2-foot-wide sheet piles. The sheet piles were installed using a vibratory pile driver only, and there was no attenuation used. Underwater noise levels were measured during installation of sheet piles for part of Bent 5 and all of Piers 6, 7, and 8. Approximately 14 H-piles and 171 sheet piles were monitored on 17 days April 6, 2007–July 26, 2007. The peak sound pressure levels and RMS levels were measured. Data presented is only for the 10 meter position.
Table I.13-2 Sound Pressure Levels Measured for Sheet Piles. Ten Mile River Bridge, Fort Bragg, CA
Pier Sound Pressure Levels in dB
Peak RMS 5 150 (on land) 135 (on land)
6 152 (on land) 174 (in water)
131 (on land) 140 (in water)
7 172 (in water) 142 (in water) 8 170 (in water) 140 (in water)
I.13.3 Permanent 762 mm Steel Shell Piles
Prior to driving the 762mm (30-inch) steel shell piles in the cofferdams, the cofferdams were excavated approximately 25 feet below the existing grade to allow for the construction of the pile cap. After the excavation was complete, two types of driving were used to install the piles. The first sections of piles were partially vibrated in to a point where the pile was secure and could stand by itself in the template. The remainder of the first section and subsequent sections were driven using a Delmag D-36 diesel impact hammer. When the top of the piles were at the water line in the cofferdam, a “chaser” was added to the impact hammer to drive the piles to the design tip elevation below the water depth (See Figure I.13-4). A total of 32 piles were installed in each cofferdam. The typical pile layout is shown in Figure I.13-5. Prior to driving the piles, a single bubble ring was placed around the piles to reduce the underwater noise from the driving. There were no official tests of bubble ring effectiveness; however, during the production driving, there were incidences when the bubble ring was not turned on until after the driving had begun. Measurement results indicate that the bubble ring reduced the peak levels by 10-15 dB.
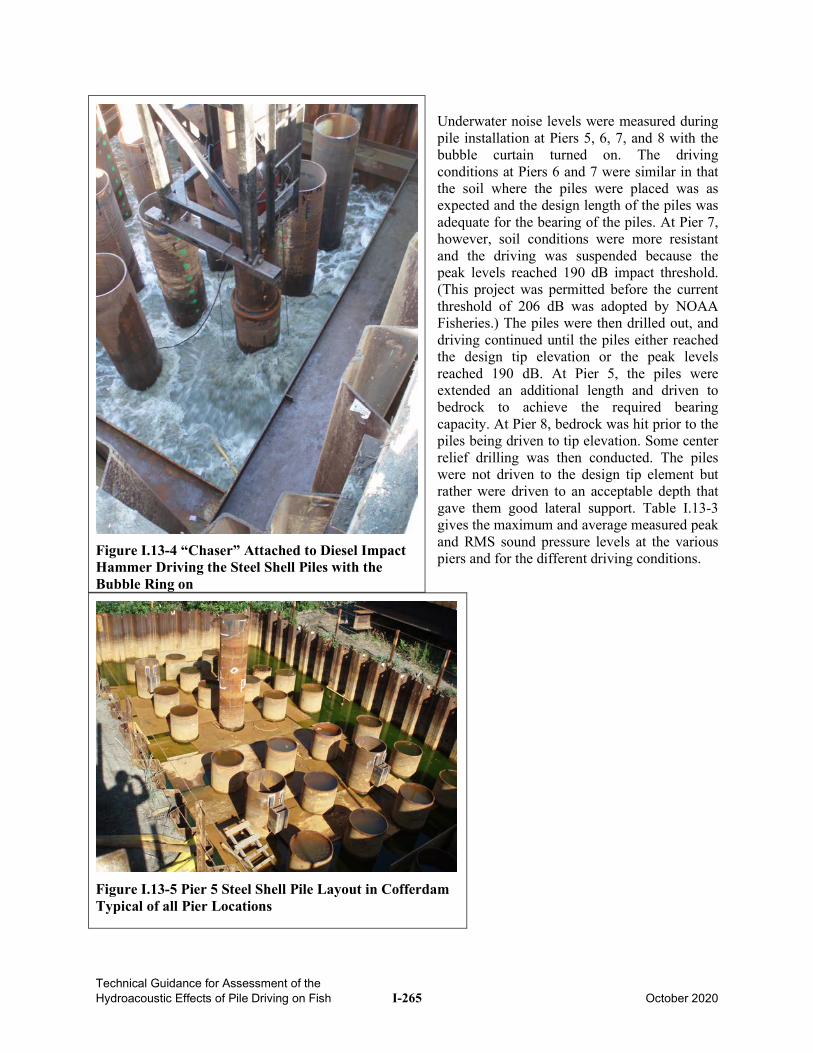
Technical Guidance for Assessment of the Hydroacoustic Effects of Pile Driving on Fish I-265 October 2020
Underwater noise levels were measured during pile installation at Piers 5, 6, 7, and 8 with the bubble curtain turned on. The driving conditions at Piers 6 and 7 were similar in that the soil where the piles were placed was as expected and the design length of the piles was adequate for the bearing of the piles. At Pier 7, however, soil conditions were more resistant and the driving was suspended because the peak levels reached 190 dB impact threshold. (This project was permitted before the current threshold of 206 dB was adopted by NOAA Fisheries.) The piles were then drilled out, and driving continued until the piles either reached the design tip elevation or the peak levels reached 190 dB. At Pier 5, the piles were extended an additional length and driven to bedrock to achieve the required bearing capacity. At Pier 8, bedrock was hit prior to the piles being driven to tip elevation. Some center relief drilling was then conducted. The piles were not driven to the design tip element but rather were driven to an acceptable depth that gave them good lateral support. Table I.13-3 gives the maximum and average measured peak and RMS sound pressure levels at the various piers and for the different driving conditions.
Figure I.13-4 “Chaser” Attached to Diesel Impact Hammer Driving the Steel Shell Piles with the Bubble Ring on
Figure I.13-5 Pier 5 Steel Shell Pile Layout in Cofferdam Typical of all Pier Locations
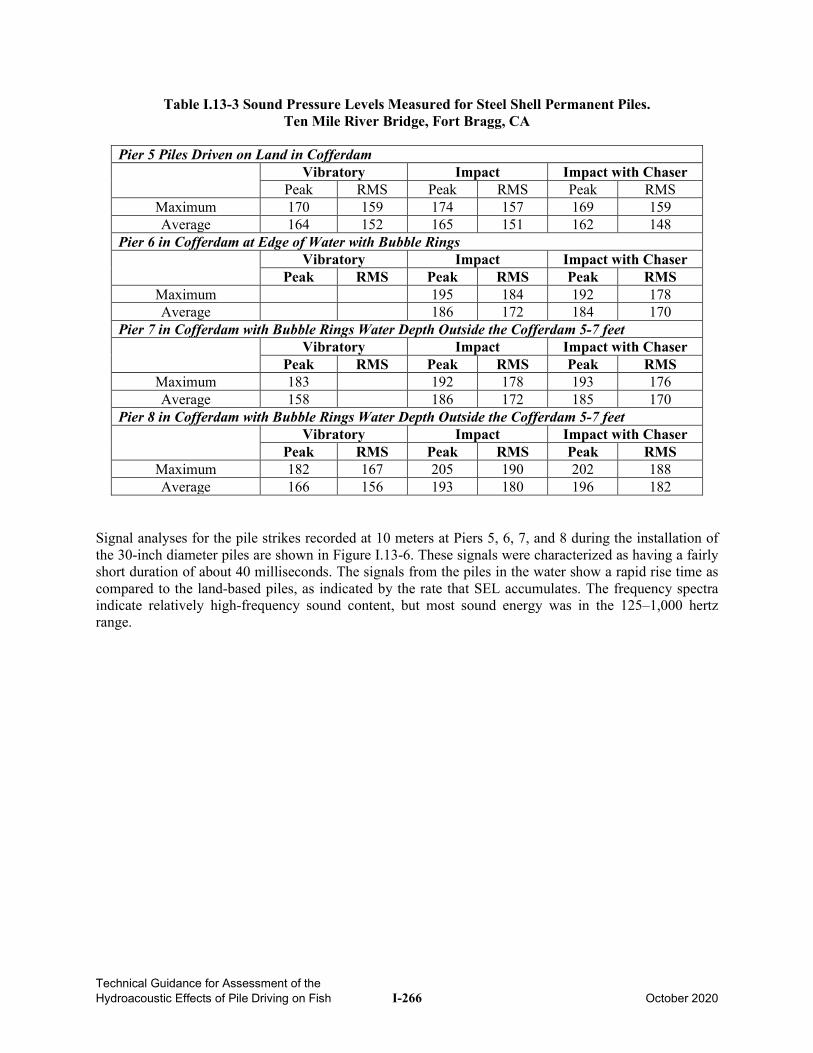
Technical Guidance for Assessment of the Hydroacoustic Effects of Pile Driving on Fish I-266 October 2020
Table I.13-3 Sound Pressure Levels Measured for Steel Shell Permanent Piles. Ten Mile River Bridge, Fort Bragg, CA
Pier 5 Piles Driven on Land in Cofferdam
Vibratory Impact Impact with Chaser Peak RMS Peak RMS Peak RMS
Maximum 170 159 174 157 169 159 Average 164 152 165 151 162 148
Pier 6 in Cofferdam at Edge of Water with Bubble Rings
Vibratory Impact Impact with Chaser Peak RMS Peak RMS Peak RMS
Maximum 195 184 192 178 Average 186 172 184 170
Pier 7 in Cofferdam with Bubble Rings Water Depth Outside the Cofferdam 5-7 feet
Vibratory Impact Impact with Chaser Peak RMS Peak RMS Peak RMS
Maximum 183 192 178 193 176 Average 158 186 172 185 170
Pier 8 in Cofferdam with Bubble Rings Water Depth Outside the Cofferdam 5-7 feet
Vibratory Impact Impact with Chaser Peak RMS Peak RMS Peak RMS
Maximum 182 167 205 190 202 188 Average 166 156 193 180 196 182
Signal analyses for the pile strikes recorded at 10 meters at Piers 5, 6, 7, and 8 during the installation of the 30-inch diameter piles are shown in Figure I.13-6. These signals were characterized as having a fairly short duration of about 40 milliseconds. The signals from the piles in the water show a rapid rise time as compared to the land-based piles, as indicated by the rate that SEL accumulates. The frequency spectra indicate relatively high-frequency sound content, but most sound energy was in the 125–1,000 hertz range.
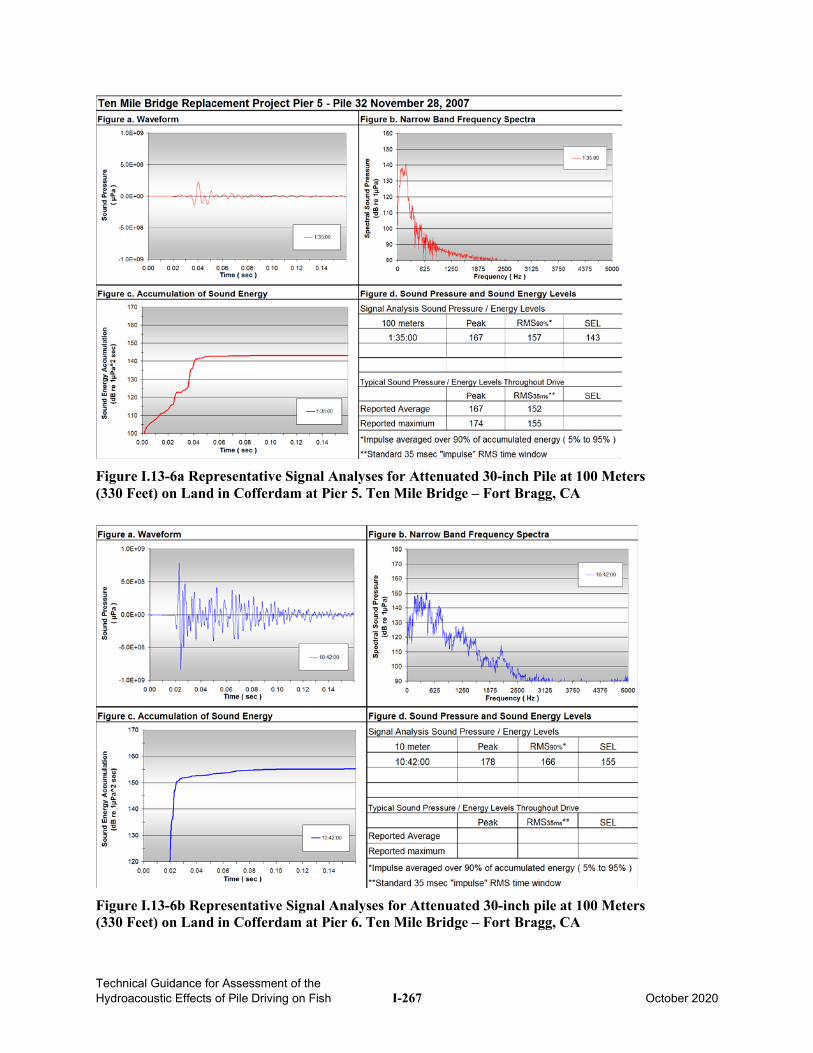
Technical Guidance for Assessment of the Hydroacoustic Effects of Pile Driving on Fish I-267 October 2020
Figure I.13-6a Representative Signal Analyses for Attenuated 30-inch Pile at 100 Meters (330 Feet) on Land in Cofferdam at Pier 5. Ten Mile Bridge – Fort Bragg, CA
Figure I.13-6b Representative Signal Analyses for Attenuated 30-inch pile at 100 Meters (330 Feet) on Land in Cofferdam at Pier 6. Ten Mile Bridge – Fort Bragg, CA
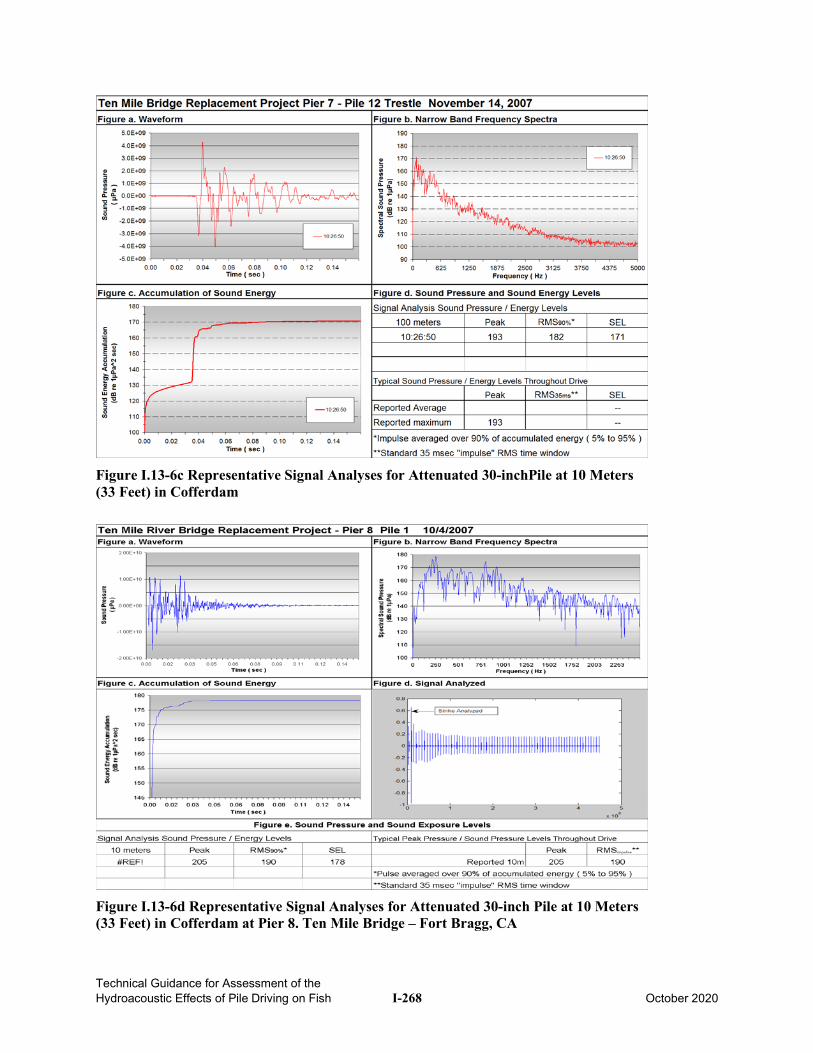
Technical Guidance for Assessment of the Hydroacoustic Effects of Pile Driving on Fish I-268 October 2020
Figure I.13-6c Representative Signal Analyses for Attenuated 30-inchPile at 10 Meters (33 Feet) in Cofferdam
Figure I.13-6d Representative Signal Analyses for Attenuated 30-inch Pile at 10 Meters (33 Feet) in Cofferdam at Pier 8. Ten Mile Bridge – Fort Bragg, CA
Technical Guidance for Assessment of the Hydroacoustic Effects of Pile Driving on Fish I-269 October 2020
I.13.4 References
1. Pommerenck, K and Rodkin, R. 2010. Underwater Sound Levels Associated with Pile Driving at the Ten Mile River Bridge Replacement Project. December 2010.
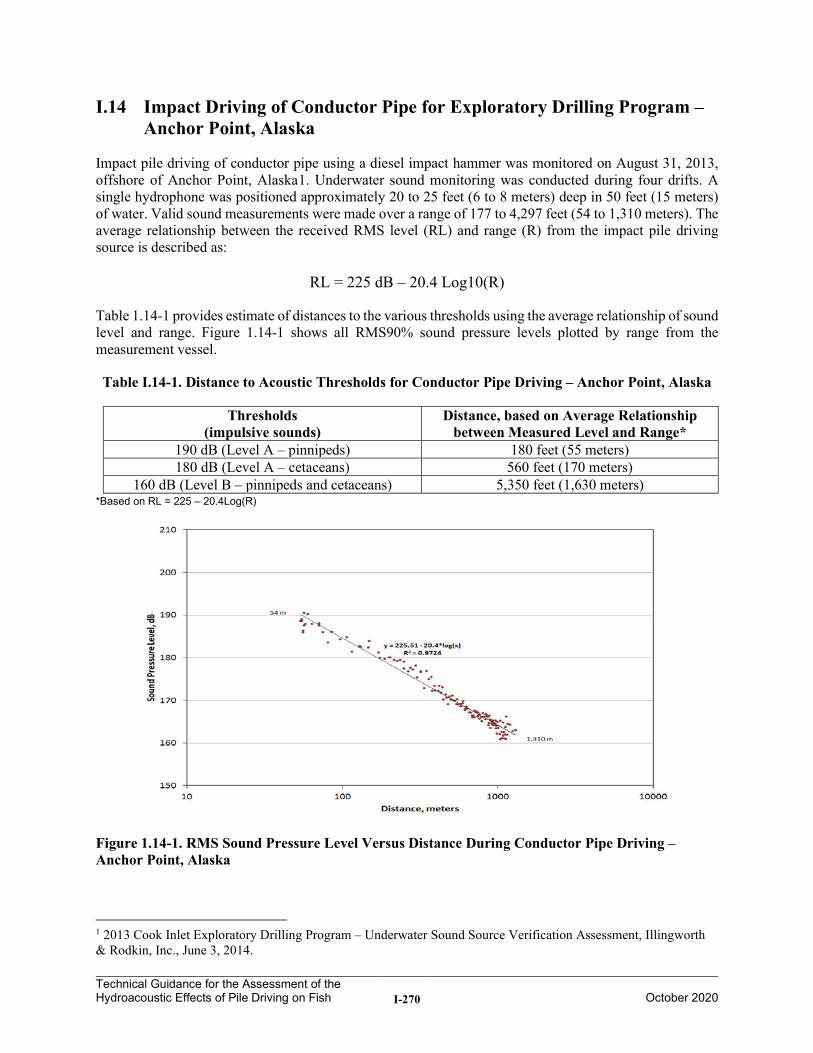
Technical Guidance for the Assessment of the Hydroacoustic Effects of Pile Driving on Fish I-270
October 2020
I.14 Impact Driving of Conductor Pipe for Exploratory Drilling Program – Anchor Point, Alaska
Impact pile driving of conductor pipe using a diesel impact hammer was monitored on August 31, 2013, offshore of Anchor Point, Alaska1. Underwater sound monitoring was conducted during four drifts. A single hydrophone was positioned approximately 20 to 25 feet (6 to 8 meters) deep in 50 feet (15 meters) of water. Valid sound measurements were made over a range of 177 to 4,297 feet (54 to 1,310 meters). The average relationship between the received RMS level (RL) and range (R) from the impact pile driving source is described as:
RL = 225 dB – 20.4 Log10(R)
Table 1.14-1 provides estimate of distances to the various thresholds using the average relationship of sound level and range. Figure 1.14-1 shows all RMS90% sound pressure levels plotted by range from the measurement vessel.
Table I.14-1. Distance to Acoustic Thresholds for Conductor Pipe Driving – Anchor Point, Alaska
Thresholds (impulsive sounds)
Distance, based on Average Relationship between Measured Level and Range*
190 dB (Level A – pinnipeds) 180 feet (55 meters) 180 dB (Level A – cetaceans) 560 feet (170 meters)
160 dB (Level B – pinnipeds and cetaceans) 5,350 feet (1,630 meters) *Based on RL = 225 – 20.4Log(R)
Figure 1.14-1. RMS Sound Pressure Level Versus Distance During Conductor Pipe Driving – Anchor Point, Alaska
1 2013 Cook Inlet Exploratory Drilling Program – Underwater Sound Source Verification Assessment, Illingworth & Rodkin, Inc., June 3, 2014.
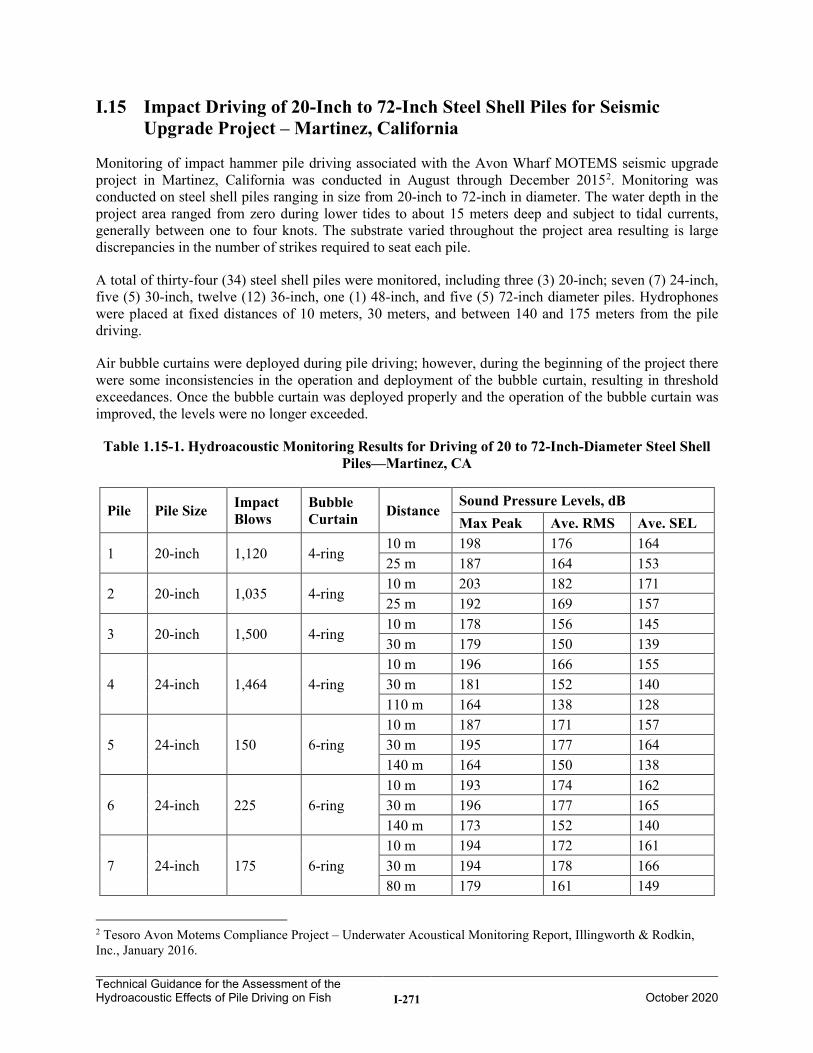
Technical Guidance for the Assessment of the Hydroacoustic Effects of Pile Driving on Fish I-271
October 2020
I.15 Impact Driving of 20-Inch to 72-Inch Steel Shell Piles for Seismic Upgrade Project – Martinez, California
Monitoring of impact hammer pile driving associated with the Avon Wharf MOTEMS seismic upgrade project in Martinez, California was conducted in August through December 20152. Monitoring was conducted on steel shell piles ranging in size from 20-inch to 72-inch in diameter. The water depth in the project area ranged from zero during lower tides to about 15 meters deep and subject to tidal currents, generally between one to four knots. The substrate varied throughout the project area resulting is large discrepancies in the number of strikes required to seat each pile.
A total of thirty-four (34) steel shell piles were monitored, including three (3) 20-inch; seven (7) 24-inch, five (5) 30-inch, twelve (12) 36-inch, one (1) 48-inch, and five (5) 72-inch diameter piles. Hydrophones were placed at fixed distances of 10 meters, 30 meters, and between 140 and 175 meters from the pile driving.
Air bubble curtains were deployed during pile driving; however, during the beginning of the project there were some inconsistencies in the operation and deployment of the bubble curtain, resulting in threshold exceedances. Once the bubble curtain was deployed properly and the operation of the bubble curtain was improved, the levels were no longer exceeded.
Table 1.15-1. Hydroacoustic Monitoring Results for Driving of 20 to 72-Inch-Diameter Steel Shell Piles—Martinez, CA
Pile Pile Size Impact Blows
Bubble Curtain Distance
Sound Pressure Levels, dB Max Peak Ave. RMS Ave. SEL
1 20-inch 1,120 4-ring 10 m 198 176 164 25 m 187 164 153
2 20-inch 1,035 4-ring 10 m 203 182 171 25 m 192 169 157
3 20-inch 1,500 4-ring 10 m 178 156 145 30 m 179 150 139
4 24-inch 1,464 4-ring 10 m 196 166 155 30 m 181 152 140 110 m 164 138 128
5 24-inch 150 6-ring 10 m 187 171 157 30 m 195 177 164 140 m 164 150 138
6 24-inch 225 6-ring 10 m 193 174 162 30 m 196 177 165 140 m 173 152 140
7 24-inch 175 6-ring 10 m 194 172 161 30 m 194 178 166 80 m 179 161 149
2 Tesoro Avon Motems Compliance Project – Underwater Acoustical Monitoring Report, Illingworth & Rodkin, Inc., January 2016.
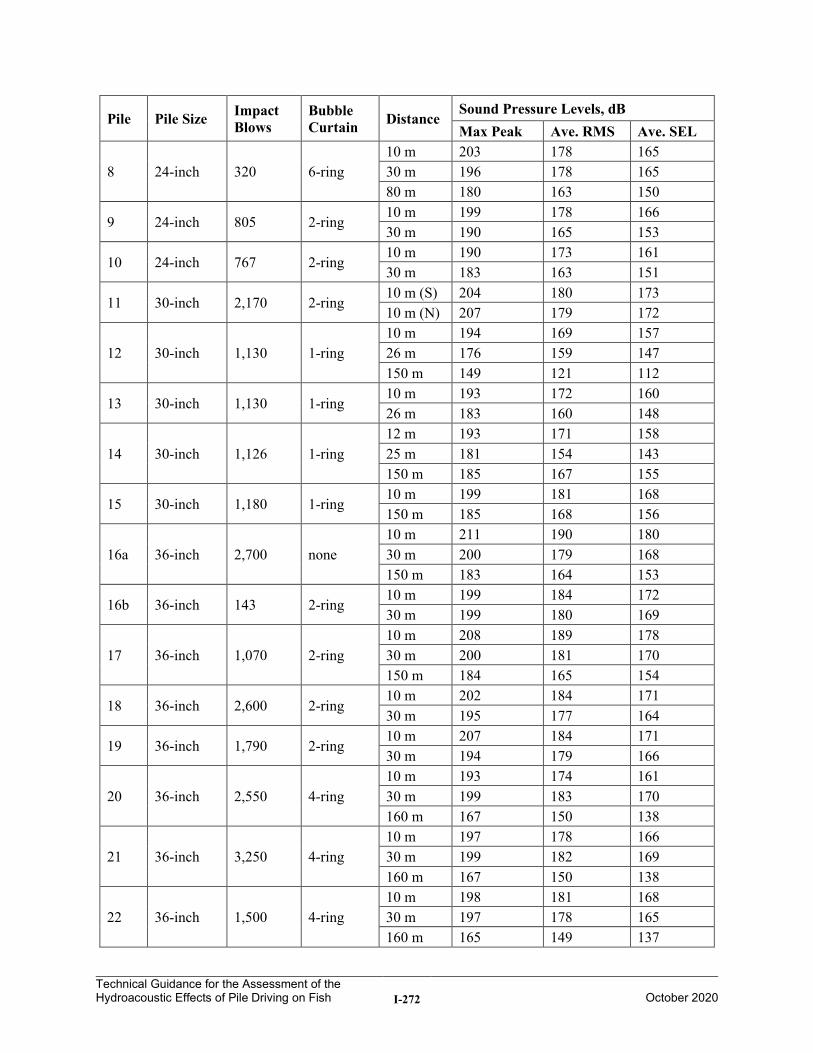
Technical Guidance for the Assessment of the Hydroacoustic Effects of Pile Driving on Fish I-272
October 2020
Pile Pile Size Impact Blows
Bubble Curtain Distance
Sound Pressure Levels, dB Max Peak Ave. RMS Ave. SEL
8 24-inch 320 6-ring 10 m 203 178 165 30 m 196 178 165 80 m 180 163 150
9 24-inch 805 2-ring 10 m 199 178 166 30 m 190 165 153
10 24-inch 767 2-ring 10 m 190 173 161 30 m 183 163 151
11 30-inch 2,170 2-ring 10 m (S) 204 180 173 10 m (N) 207 179 172
12 30-inch 1,130 1-ring 10 m 194 169 157 26 m 176 159 147 150 m 149 121 112
13 30-inch 1,130 1-ring 10 m 193 172 160 26 m 183 160 148
14 30-inch 1,126 1-ring 12 m 193 171 158 25 m 181 154 143 150 m 185 167 155
15 30-inch 1,180 1-ring 10 m 199 181 168 150 m 185 168 156
16a 36-inch 2,700 none 10 m 211 190 180 30 m 200 179 168 150 m 183 164 153
16b 36-inch 143 2-ring 10 m 199 184 172 30 m 199 180 169
17 36-inch 1,070 2-ring 10 m 208 189 178 30 m 200 181 170 150 m 184 165 154
18 36-inch 2,600 2-ring 10 m 202 184 171 30 m 195 177 164
19 36-inch 1,790 2-ring 10 m 207 184 171 30 m 194 179 166
20 36-inch 2,550 4-ring 10 m 193 174 161 30 m 199 183 170 160 m 167 150 138
21 36-inch 3,250 4-ring 10 m 197 178 166 30 m 199 182 169 160 m 167 150 138
22 36-inch 1,500 4-ring 10 m 198 181 168 30 m 197 178 165 160 m 165 149 137
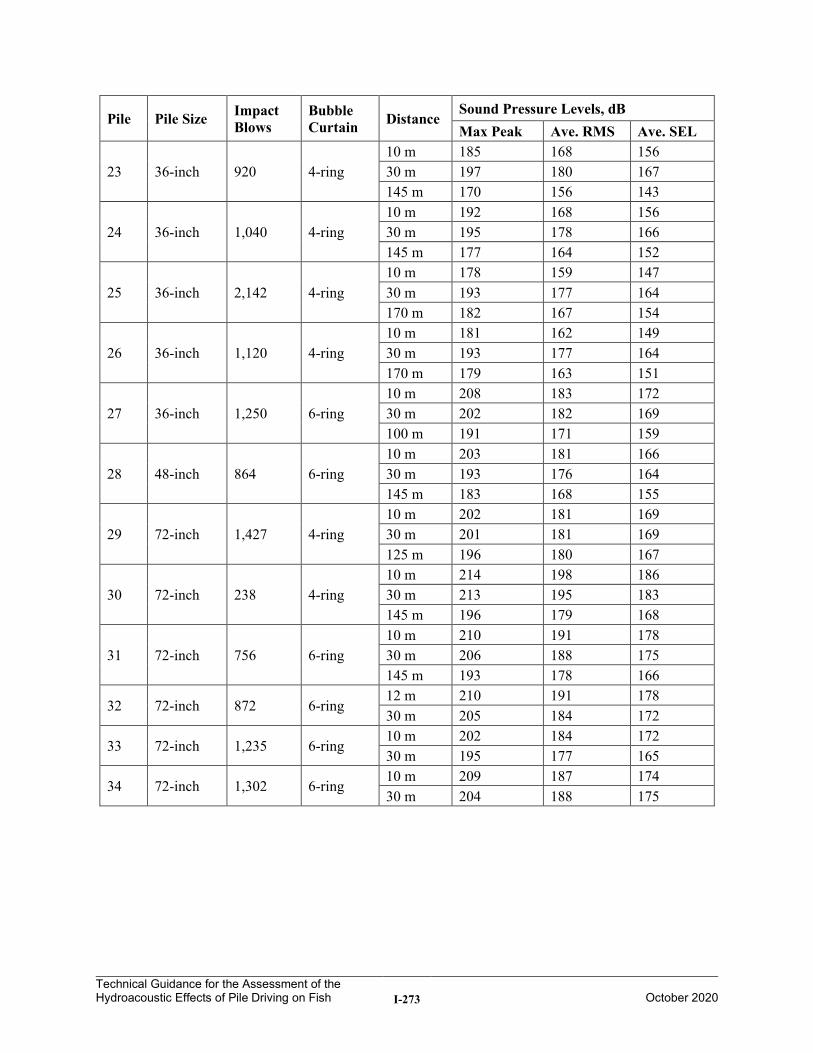
Technical Guidance for the Assessment of the Hydroacoustic Effects of Pile Driving on Fish I-273
October 2020
Pile Pile Size Impact Blows
Bubble Curtain Distance
Sound Pressure Levels, dB Max Peak Ave. RMS Ave. SEL
23 36-inch 920 4-ring 10 m 185 168 156 30 m 197 180 167 145 m 170 156 143
24 36-inch 1,040 4-ring 10 m 192 168 156 30 m 195 178 166 145 m 177 164 152
25 36-inch 2,142 4-ring 10 m 178 159 147 30 m 193 177 164 170 m 182 167 154
26 36-inch 1,120 4-ring 10 m 181 162 149 30 m 193 177 164 170 m 179 163 151
27 36-inch 1,250 6-ring 10 m 208 183 172 30 m 202 182 169 100 m 191 171 159
28 48-inch 864 6-ring 10 m 203 181 166 30 m 193 176 164 145 m 183 168 155
29 72-inch 1,427 4-ring 10 m 202 181 169 30 m 201 181 169 125 m 196 180 167
30 72-inch 238 4-ring 10 m 214 198 186 30 m 213 195 183 145 m 196 179 168
31 72-inch 756 6-ring 10 m 210 191 178 30 m 206 188 175 145 m 193 178 166
32 72-inch 872 6-ring 12 m 210 191 178 30 m 205 184 172
33 72-inch 1,235 6-ring 10 m 202 184 172 30 m 195 177 165
34 72-inch 1,302 6-ring 10 m 209 187 174 30 m 204 188 175
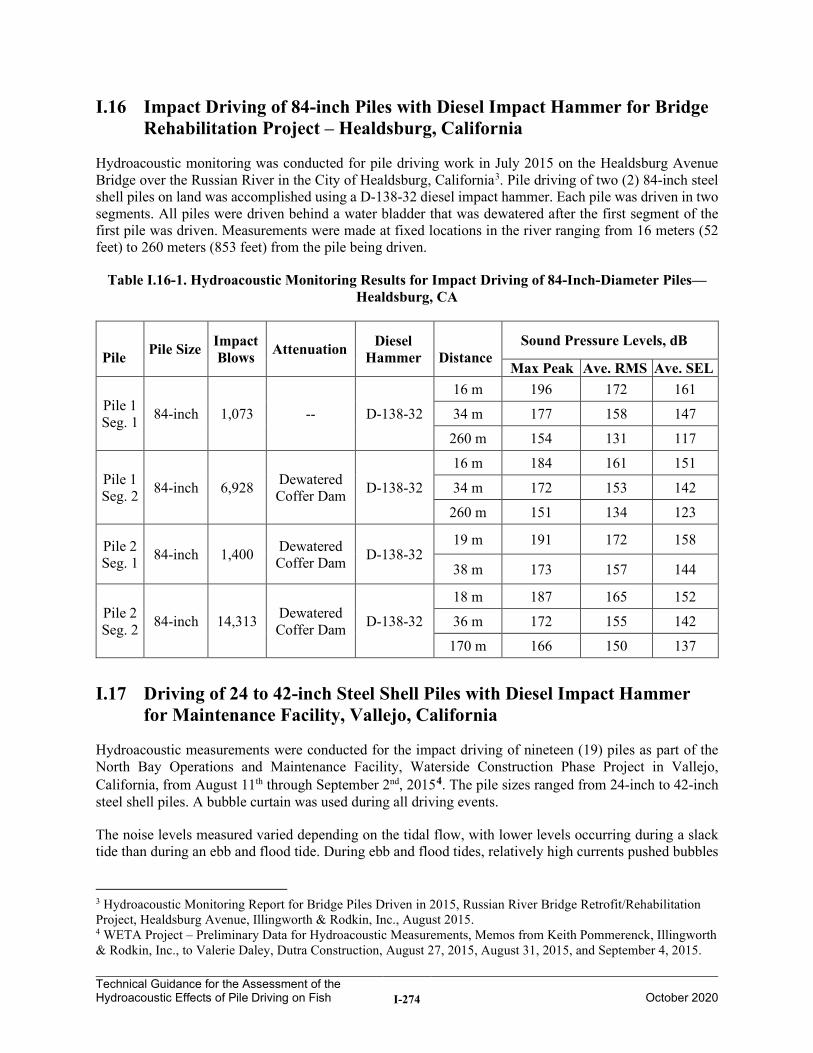
Technical Guidance for the Assessment of the Hydroacoustic Effects of Pile Driving on Fish I-274
October 2020
I.16 Impact Driving of 84-inch Piles with Diesel Impact Hammer for Bridge Rehabilitation Project – Healdsburg, California
Hydroacoustic monitoring was conducted for pile driving work in July 2015 on the Healdsburg Avenue Bridge over the Russian River in the City of Healdsburg, California3. Pile driving of two (2) 84-inch steel shell piles on land was accomplished using a D-138-32 diesel impact hammer. Each pile was driven in two segments. All piles were driven behind a water bladder that was dewatered after the first segment of the first pile was driven. Measurements were made at fixed locations in the river ranging from 16 meters (52 feet) to 260 meters (853 feet) from the pile being driven.
Table I.16-1. Hydroacoustic Monitoring Results for Impact Driving of 84-Inch-Diameter Piles—Healdsburg, CA
Pile Pile Size Impact
Blows Attenuation Diesel Hammer
Distance
Sound Pressure Levels, dB
Max Peak Ave. RMS Ave. SEL
Pile 1 Seg. 1 84-inch 1,073 -- D-138-32
16 m 196 172 161
34 m 177 158 147
260 m 154 131 117
Pile 1 Seg. 2 84-inch 6,928 Dewatered
Coffer Dam D-138-32
16 m 184 161 151
34 m 172 153 142
260 m 151 134 123
Pile 2 Seg. 1 84-inch 1,400 Dewatered
Coffer Dam D-138-32 19 m 191 172 158
38 m 173 157 144
Pile 2 Seg. 2 84-inch 14,313 Dewatered
Coffer Dam D-138-32
18 m 187 165 152
36 m 172 155 142
170 m 166 150 137
I.17 Driving of 24 to 42-inch Steel Shell Piles with Diesel Impact Hammer for Maintenance Facility, Vallejo, California
Hydroacoustic measurements were conducted for the impact driving of nineteen (19) piles as part of the North Bay Operations and Maintenance Facility, Waterside Construction Phase Project in Vallejo, California, from August 11th through September 2nd, 20154. The pile sizes ranged from 24-inch to 42-inch steel shell piles. A bubble curtain was used during all driving events.
The noise levels measured varied depending on the tidal flow, with lower levels occurring during a slack tide than during an ebb and flood tide. During ebb and flood tides, relatively high currents pushed bubbles
3 Hydroacoustic Monitoring Report for Bridge Piles Driven in 2015, Russian River Bridge Retrofit/Rehabilitation Project, Healdsburg Avenue, Illingworth & Rodkin, Inc., August 2015. 4 WETA Project – Preliminary Data for Hydroacoustic Measurements, Memos from Keith Pommerenck, Illingworth & Rodkin, Inc., to Valerie Daley, Dutra Construction, August 27, 2015, August 31, 2015, and September 4, 2015.
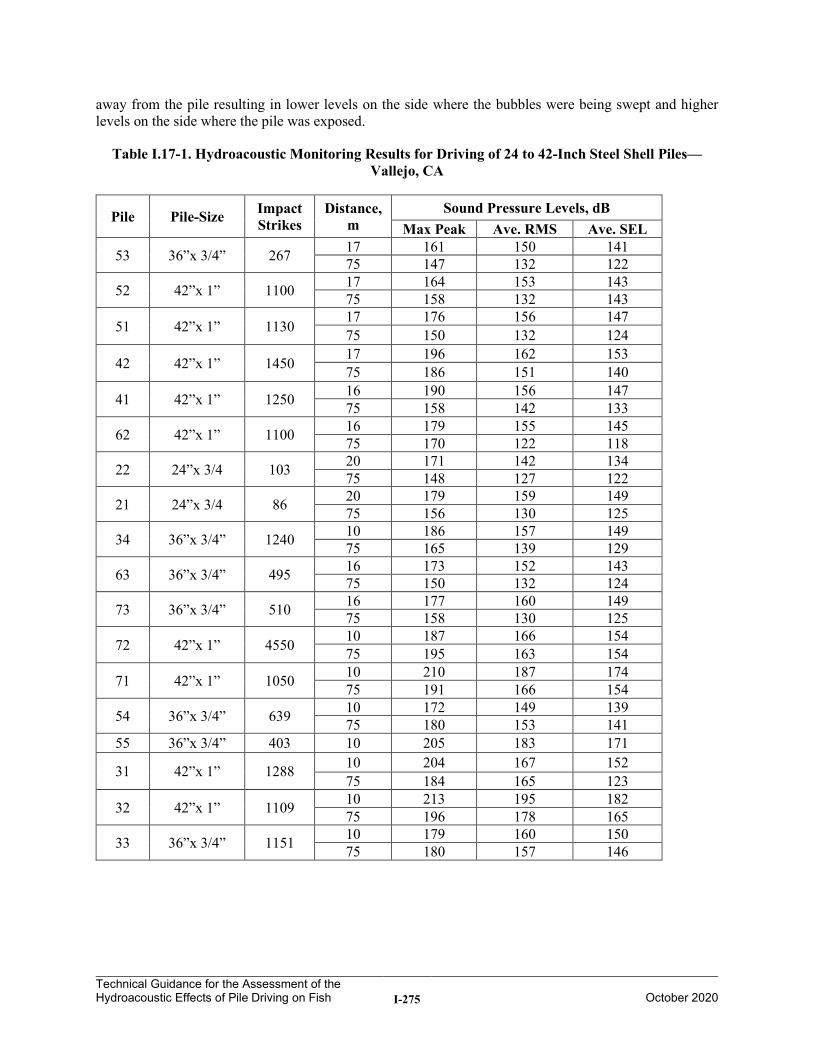
Technical Guidance for the Assessment of the Hydroacoustic Effects of Pile Driving on Fish I-275
October 2020
away from the pile resulting in lower levels on the side where the bubbles were being swept and higher levels on the side where the pile was exposed.
Table I.17-1. Hydroacoustic Monitoring Results for Driving of 24 to 42-Inch Steel Shell Piles—Vallejo, CA
Pile Pile-Size Impact Strikes
Distance, m
Sound Pressure Levels, dB Max Peak Ave. RMS Ave. SEL
53 36”x 3/4” 267 17 161 150 141 75 147 132 122
52 42”x 1” 1100 17 164 153 143 75 158 132 143
51 42”x 1” 1130 17 176 156 147 75 150 132 124
42 42”x 1” 1450 17 196 162 153 75 186 151 140
41 42”x 1” 1250 16 190 156 147 75 158 142 133
62 42”x 1” 1100 16 179 155 145 75 170 122 118
22 24”x 3/4 103 20 171 142 134 75 148 127 122
21 24”x 3/4 86 20 179 159 149 75 156 130 125
34 36”x 3/4” 1240 10 186 157 149 75 165 139 129
63 36”x 3/4” 495 16 173 152 143 75 150 132 124
73 36”x 3/4” 510 16 177 160 149 75 158 130 125
72 42”x 1” 4550 10 187 166 154 75 195 163 154
71 42”x 1” 1050 10 210 187 174 75 191 166 154
54 36”x 3/4” 639 10 172 149 139 75 180 153 141
55 36”x 3/4” 403 10 205 183 171
31 42”x 1” 1288 10 204 167 152 75 184 165 123
32 42”x 1” 1109 10 213 195 182 75 196 178 165
33 36”x 3/4” 1151 10 179 160 150 75 180 157 146
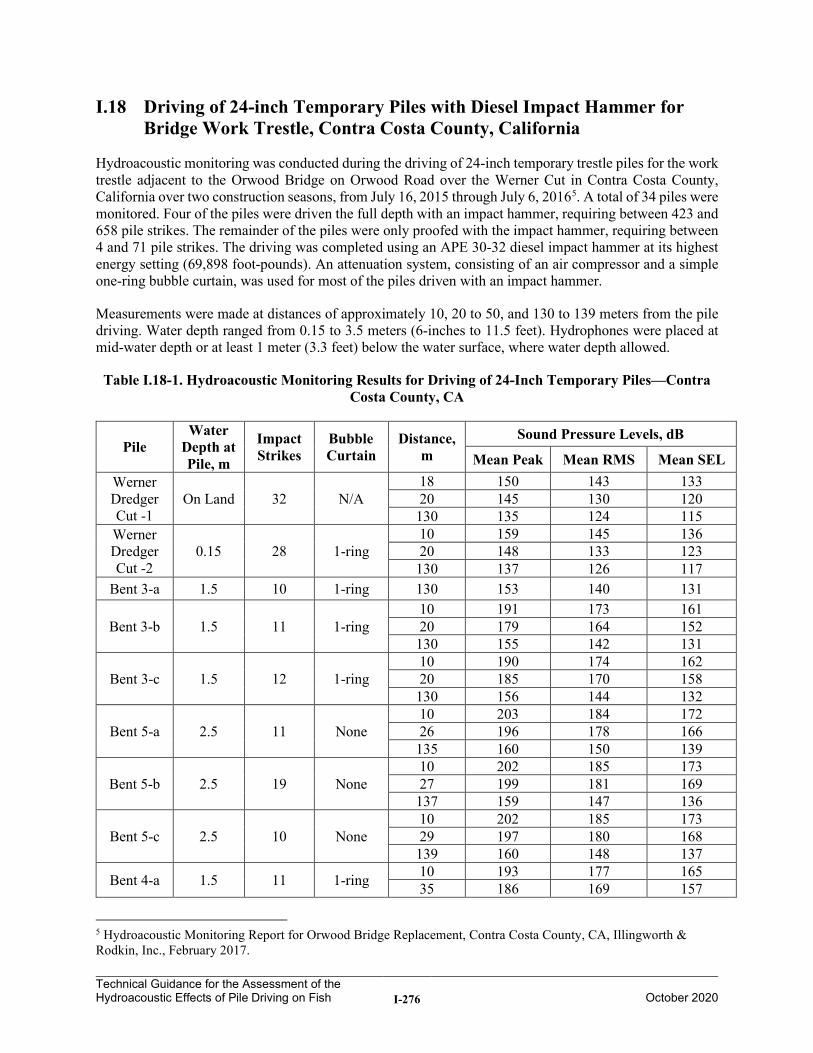
Technical Guidance for the Assessment of the Hydroacoustic Effects of Pile Driving on Fish I-276
October 2020
I.18 Driving of 24-inch Temporary Piles with Diesel Impact Hammer for Bridge Work Trestle, Contra Costa County, California
Hydroacoustic monitoring was conducted during the driving of 24-inch temporary trestle piles for the work trestle adjacent to the Orwood Bridge on Orwood Road over the Werner Cut in Contra Costa County, California over two construction seasons, from July 16, 2015 through July 6, 20165. A total of 34 piles were monitored. Four of the piles were driven the full depth with an impact hammer, requiring between 423 and 658 pile strikes. The remainder of the piles were only proofed with the impact hammer, requiring between 4 and 71 pile strikes. The driving was completed using an APE 30-32 diesel impact hammer at its highest energy setting (69,898 foot-pounds). An attenuation system, consisting of an air compressor and a simple one-ring bubble curtain, was used for most of the piles driven with an impact hammer.
Measurements were made at distances of approximately 10, 20 to 50, and 130 to 139 meters from the pile driving. Water depth ranged from 0.15 to 3.5 meters (6-inches to 11.5 feet). Hydrophones were placed at mid-water depth or at least 1 meter (3.3 feet) below the water surface, where water depth allowed.
Table I.18-1. Hydroacoustic Monitoring Results for Driving of 24-Inch Temporary Piles—Contra Costa County, CA
Pile Water
Depth at Pile, m
Impact Strikes
Bubble Curtain
Distance, m
Sound Pressure Levels, dB
Mean Peak Mean RMS Mean SEL Werner Dredger Cut -1
On Land 32 N/A 18 150 143 133 20 145 130 120
130 135 124 115 Werner Dredger Cut -2
0.15 28 1-ring 10 159 145 136 20 148 133 123
130 137 126 117 Bent 3-a 1.5 10 1-ring 130 153 140 131
Bent 3-b 1.5 11 1-ring 10 191 173 161 20 179 164 152
130 155 142 131
Bent 3-c 1.5 12 1-ring 10 190 174 162 20 185 170 158
130 156 144 132
Bent 5-a 2.5 11 None 10 203 184 172 26 196 178 166
135 160 150 139
Bent 5-b 2.5 19 None 10 202 185 173 27 199 181 169
137 159 147 136
Bent 5-c 2.5 10 None 10 202 185 173 29 197 180 168
139 160 148 137
Bent 4-a 1.5 11 1-ring 10 193 177 165 35 186 169 157
5 Hydroacoustic Monitoring Report for Orwood Bridge Replacement, Contra Costa County, CA, Illingworth & Rodkin, Inc., February 2017.
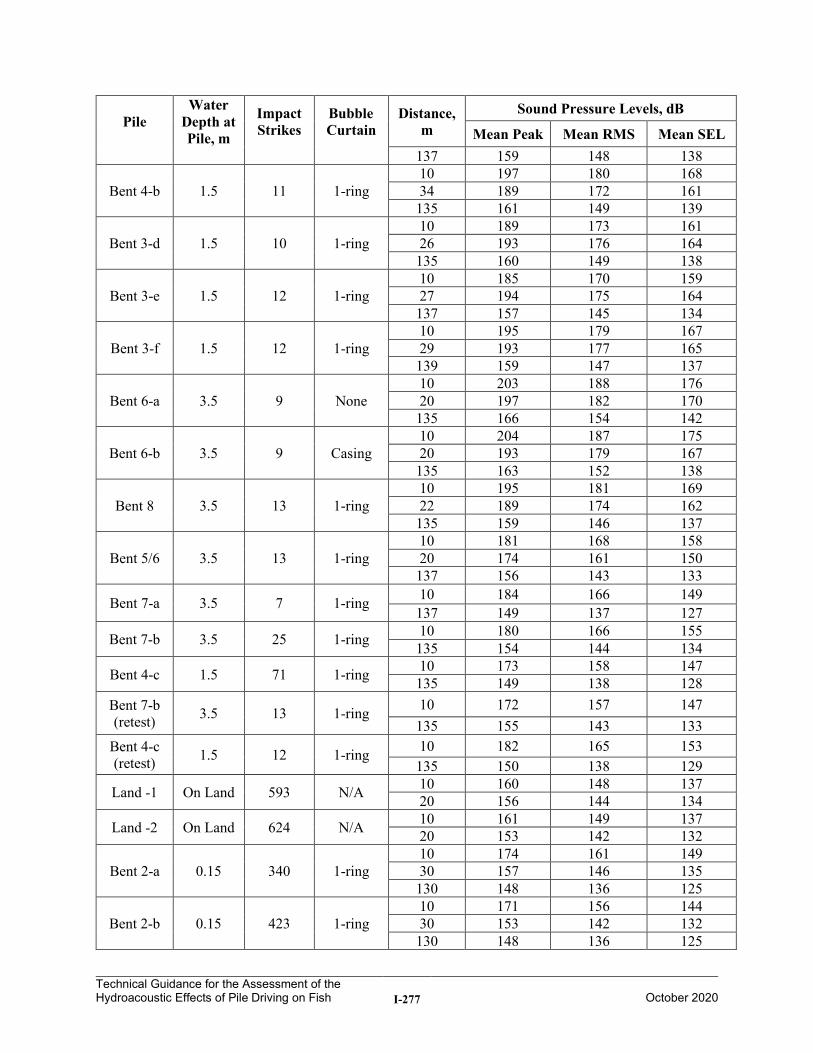
Technical Guidance for the Assessment of the Hydroacoustic Effects of Pile Driving on Fish I-277
October 2020
Pile Water
Depth at Pile, m
Impact Strikes
Bubble Curtain
Distance, m
Sound Pressure Levels, dB
Mean Peak Mean RMS Mean SEL 137 159 148 138
Bent 4-b 1.5 11 1-ring 10 197 180 168 34 189 172 161
135 161 149 139
Bent 3-d 1.5 10 1-ring 10 189 173 161 26 193 176 164
135 160 149 138
Bent 3-e 1.5 12 1-ring 10 185 170 159 27 194 175 164
137 157 145 134
Bent 3-f 1.5 12 1-ring 10 195 179 167 29 193 177 165
139 159 147 137
Bent 6-a 3.5 9 None 10 203 188 176 20 197 182 170
135 166 154 142
Bent 6-b 3.5 9 Casing 10 204 187 175 20 193 179 167
135 163 152 138
Bent 8 3.5 13 1-ring 10 195 181 169 22 189 174 162
135 159 146 137
Bent 5/6 3.5 13 1-ring 10 181 168 158 20 174 161 150
137 156 143 133
Bent 7-a 3.5 7 1-ring 10 184 166 149 137 149 137 127
Bent 7-b 3.5 25 1-ring 10 180 166 155 135 154 144 134
Bent 4-c 1.5 71 1-ring 10 173 158 147 135 149 138 128
Bent 7-b (retest) 3.5 13 1-ring 10 172 157 147
135 155 143 133 Bent 4-c (retest) 1.5 12 1-ring 10 182 165 153
135 150 138 129
Land -1 On Land 593 N/A 10 160 148 137 20 156 144 134
Land -2 On Land 624 N/A 10 161 149 137 20 153 142 132
Bent 2-a 0.15 340 1-ring 10 174 161 149 30 157 146 135
130 148 136 125
Bent 2-b 0.15 423 1-ring 10 171 156 144 30 153 142 132
130 148 136 125
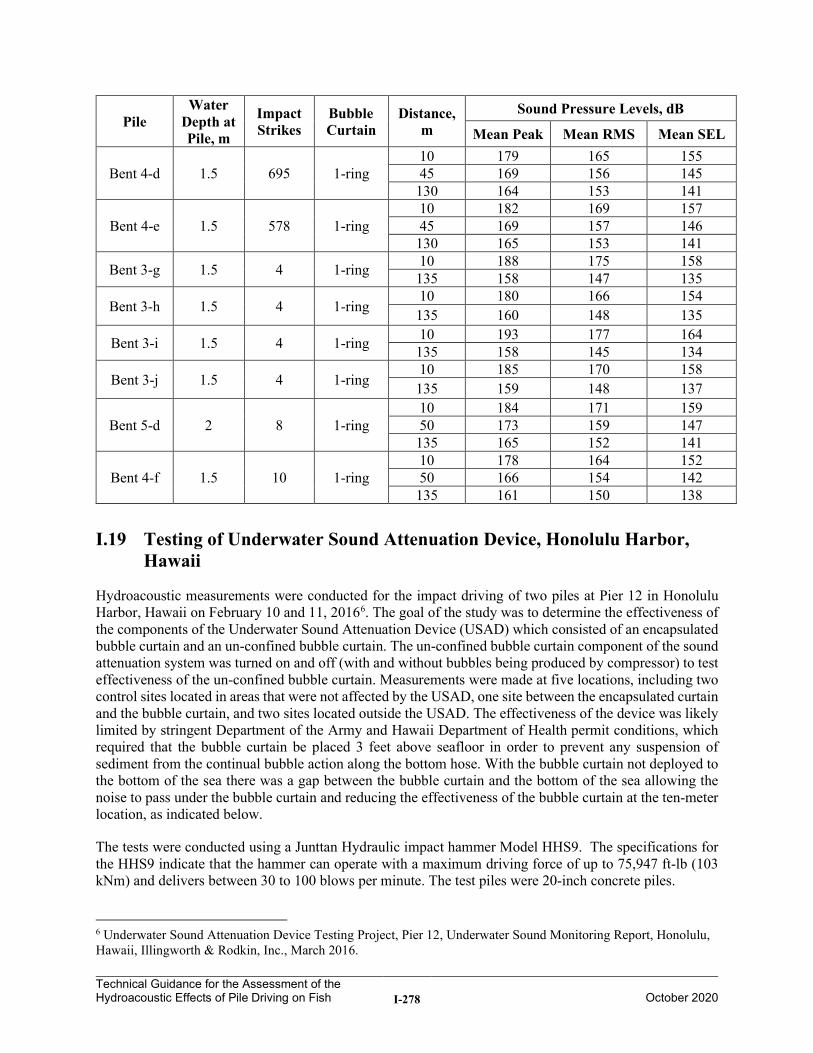
Technical Guidance for the Assessment of the Hydroacoustic Effects of Pile Driving on Fish I-278
October 2020
Pile Water
Depth at Pile, m
Impact Strikes
Bubble Curtain
Distance, m
Sound Pressure Levels, dB
Mean Peak Mean RMS Mean SEL
Bent 4-d 1.5 695 1-ring 10 179 165 155 45 169 156 145
130 164 153 141
Bent 4-e 1.5 578 1-ring 10 182 169 157 45 169 157 146
130 165 153 141
Bent 3-g 1.5 4 1-ring 10 188 175 158 135 158 147 135
Bent 3-h 1.5 4 1-ring 10 180 166 154
135 160 148 135
Bent 3-i 1.5 4 1-ring 10 193 177 164 135 158 145 134
Bent 3-j 1.5 4 1-ring 10 185 170 158
135 159 148 137
Bent 5-d 2 8 1-ring 10 184 171 159 50 173 159 147
135 165 152 141
Bent 4-f 1.5 10 1-ring 10 178 164 152 50 166 154 142
135 161 150 138
I.19 Testing of Underwater Sound Attenuation Device, Honolulu Harbor, Hawaii
Hydroacoustic measurements were conducted for the impact driving of two piles at Pier 12 in Honolulu Harbor, Hawaii on February 10 and 11, 20166. The goal of the study was to determine the effectiveness of the components of the Underwater Sound Attenuation Device (USAD) which consisted of an encapsulated bubble curtain and an un-confined bubble curtain. The un-confined bubble curtain component of the sound attenuation system was turned on and off (with and without bubbles being produced by compressor) to test effectiveness of the un-confined bubble curtain. Measurements were made at five locations, including two control sites located in areas that were not affected by the USAD, one site between the encapsulated curtain and the bubble curtain, and two sites located outside the USAD. The effectiveness of the device was likely limited by stringent Department of the Army and Hawaii Department of Health permit conditions, which required that the bubble curtain be placed 3 feet above seafloor in order to prevent any suspension of sediment from the continual bubble action along the bottom hose. With the bubble curtain not deployed to the bottom of the sea there was a gap between the bubble curtain and the bottom of the sea allowing the noise to pass under the bubble curtain and reducing the effectiveness of the bubble curtain at the ten-meter location, as indicated below.
The tests were conducted using a Junttan Hydraulic impact hammer Model HHS9. The specifications for the HHS9 indicate that the hammer can operate with a maximum driving force of up to 75,947 ft-lb (103 kNm) and delivers between 30 to 100 blows per minute. The test piles were 20-inch concrete piles.
6 Underwater Sound Attenuation Device Testing Project, Pier 12, Underwater Sound Monitoring Report, Honolulu, Hawaii, Illingworth & Rodkin, Inc., March 2016.
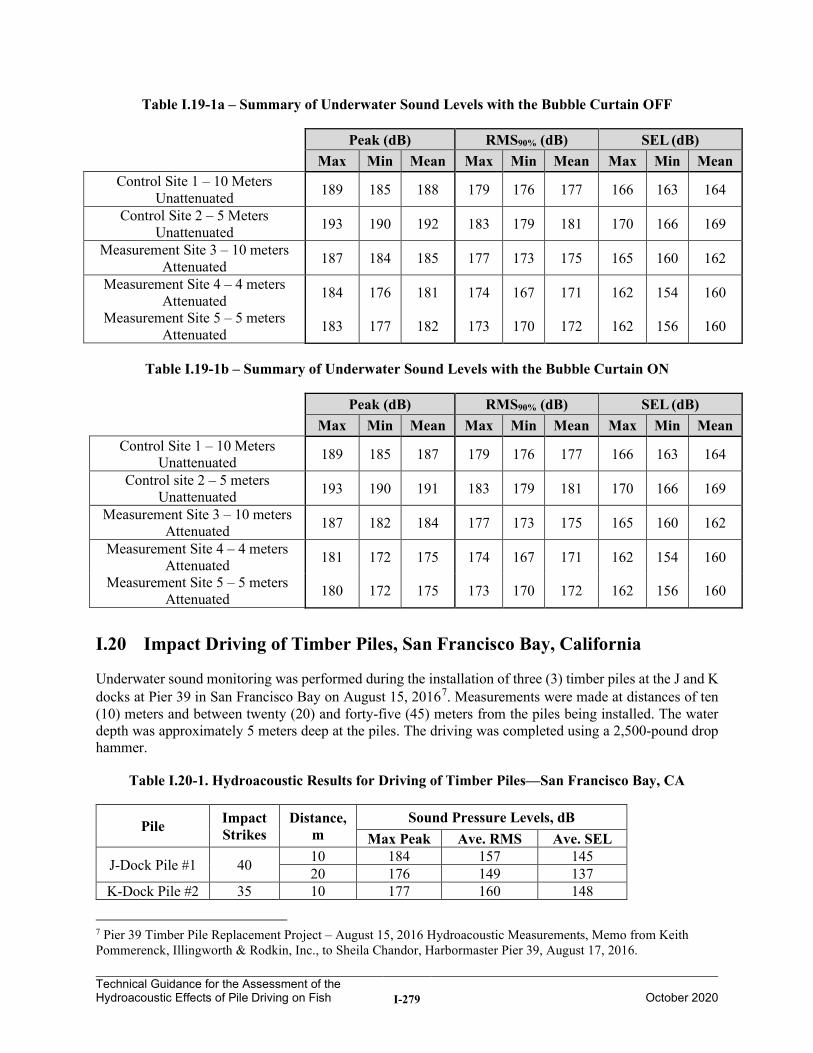
Technical Guidance for the Assessment of the Hydroacoustic Effects of Pile Driving on Fish I-279
October 2020
Table I.19-1a – Summary of Underwater Sound Levels with the Bubble Curtain OFF
Peak (dB) RMS90% (dB) SEL (dB)
Max Min Mean Max Min Mean Max Min Mean Control Site 1 – 10 Meters
Unattenuated 189 185 188 179 176 177 166 163 164
Control Site 2 – 5 Meters Unattenuated 193 190 192 183 179 181 170 166 169
Measurement Site 3 – 10 meters Attenuated 187 184 185 177 173 175 165 160 162
Measurement Site 4 – 4 meters Attenuated 184 176 181 174 167 171 162 154 160
Measurement Site 5 – 5 meters Attenuated 183 177 182 173 170 172 162 156 160
Table I.19-1b – Summary of Underwater Sound Levels with the Bubble Curtain ON
Peak (dB) RMS90% (dB) SEL (dB)
Max Min Mean Max Min Mean Max Min Mean Control Site 1 – 10 Meters
Unattenuated 189 185 187 179 176 177 166 163 164
Control site 2 – 5 meters Unattenuated 193 190 191 183 179 181 170 166 169
Measurement Site 3 – 10 meters Attenuated 187 182 184 177 173 175 165 160 162
Measurement Site 4 – 4 meters Attenuated 181 172 175 174 167 171 162 154 160
Measurement Site 5 – 5 meters Attenuated 180 172 175 173 170 172 162 156 160
I.20 Impact Driving of Timber Piles, San Francisco Bay, California
Underwater sound monitoring was performed during the installation of three (3) timber piles at the J and K docks at Pier 39 in San Francisco Bay on August 15, 20167. Measurements were made at distances of ten (10) meters and between twenty (20) and forty-five (45) meters from the piles being installed. The water depth was approximately 5 meters deep at the piles. The driving was completed using a 2,500-pound drop hammer.
Table I.20-1. Hydroacoustic Results for Driving of Timber Piles—San Francisco Bay, CA
Pile Impact Strikes
Distance, m
Sound Pressure Levels, dB Max Peak Ave. RMS Ave. SEL
J-Dock Pile #1 40 10 184 157 145 20 176 149 137
K-Dock Pile #2 35 10 177 160 148
7 Pier 39 Timber Pile Replacement Project – August 15, 2016 Hydroacoustic Measurements, Memo from Keith Pommerenck, Illingworth & Rodkin, Inc., to Sheila Chandor, Harbormaster Pier 39, August 17, 2016.
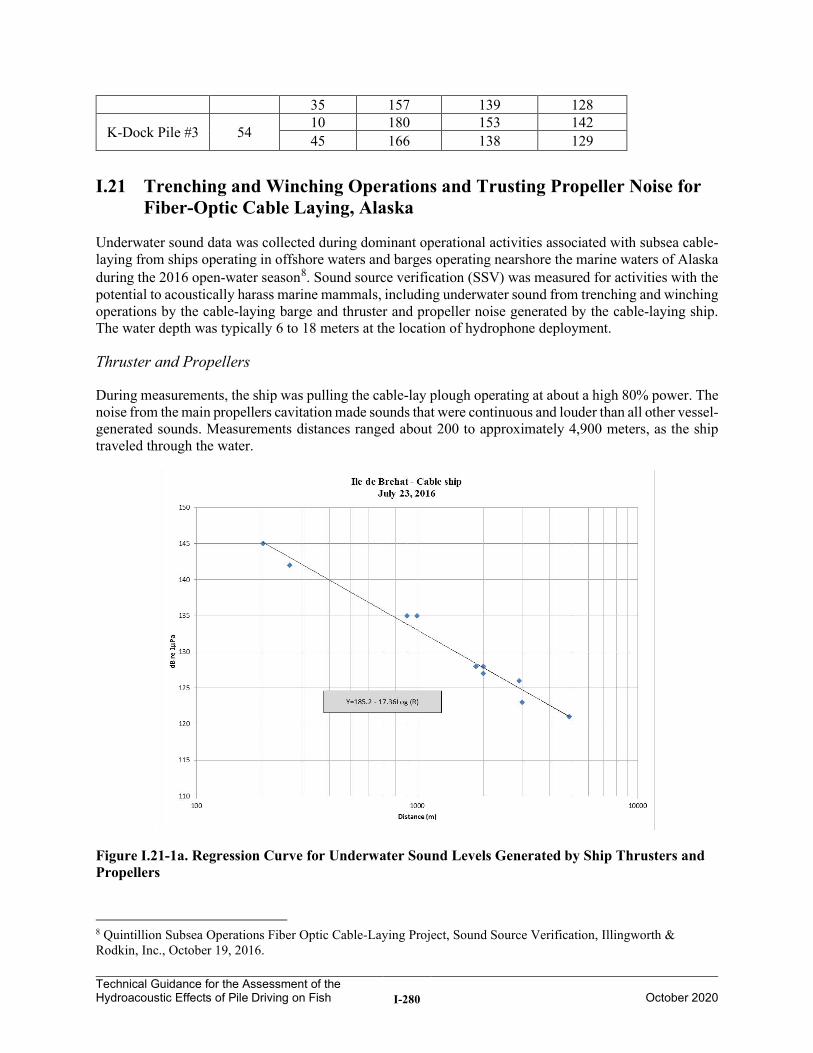
Technical Guidance for the Assessment of the Hydroacoustic Effects of Pile Driving on Fish I-280
October 2020
35 157 139 128
K-Dock Pile #3 54 10 180 153 142 45 166 138 129
I.21 Trenching and Winching Operations and Trusting Propeller Noise for Fiber-Optic Cable Laying, Alaska
Underwater sound data was collected during dominant operational activities associated with subsea cable-laying from ships operating in offshore waters and barges operating nearshore the marine waters of Alaska during the 2016 open-water season8. Sound source verification (SSV) was measured for activities with the potential to acoustically harass marine mammals, including underwater sound from trenching and winching operations by the cable-laying barge and thruster and propeller noise generated by the cable-laying ship. The water depth was typically 6 to 18 meters at the location of hydrophone deployment.
Thruster and Propellers
During measurements, the ship was pulling the cable-lay plough operating at about a high 80% power. The noise from the main propellers cavitation made sounds that were continuous and louder than all other vessel-generated sounds. Measurements distances ranged about 200 to approximately 4,900 meters, as the ship traveled through the water.
Figure I.21-1a. Regression Curve for Underwater Sound Levels Generated by Ship Thrusters and Propellers
8 Quintillion Subsea Operations Fiber Optic Cable-Laying Project, Sound Source Verification, Illingworth & Rodkin, Inc., October 19, 2016.
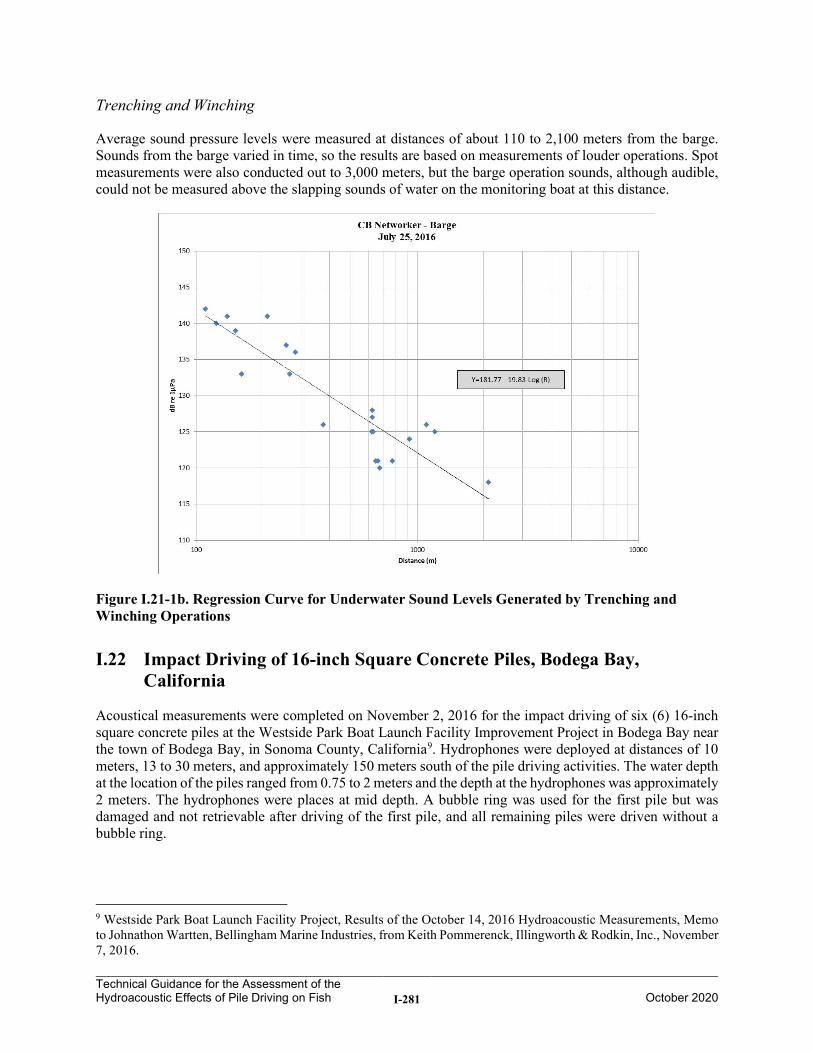
Technical Guidance for the Assessment of the Hydroacoustic Effects of Pile Driving on Fish I-281
October 2020
Trenching and Winching
Average sound pressure levels were measured at distances of about 110 to 2,100 meters from the barge. Sounds from the barge varied in time, so the results are based on measurements of louder operations. Spot measurements were also conducted out to 3,000 meters, but the barge operation sounds, although audible, could not be measured above the slapping sounds of water on the monitoring boat at this distance.
Figure I.21-1b. Regression Curve for Underwater Sound Levels Generated by Trenching and Winching Operations
I.22 Impact Driving of 16-inch Square Concrete Piles, Bodega Bay, California
Acoustical measurements were completed on November 2, 2016 for the impact driving of six (6) 16-inch square concrete piles at the Westside Park Boat Launch Facility Improvement Project in Bodega Bay near the town of Bodega Bay, in Sonoma County, California9. Hydrophones were deployed at distances of 10 meters, 13 to 30 meters, and approximately 150 meters south of the pile driving activities. The water depth at the location of the piles ranged from 0.75 to 2 meters and the depth at the hydrophones was approximately 2 meters. The hydrophones were places at mid depth. A bubble ring was used for the first pile but was damaged and not retrievable after driving of the first pile, and all remaining piles were driven without a bubble ring.
9 Westside Park Boat Launch Facility Project, Results of the October 14, 2016 Hydroacoustic Measurements, Memo to Johnathon Wartten, Bellingham Marine Industries, from Keith Pommerenck, Illingworth & Rodkin, Inc., November 7, 2016.
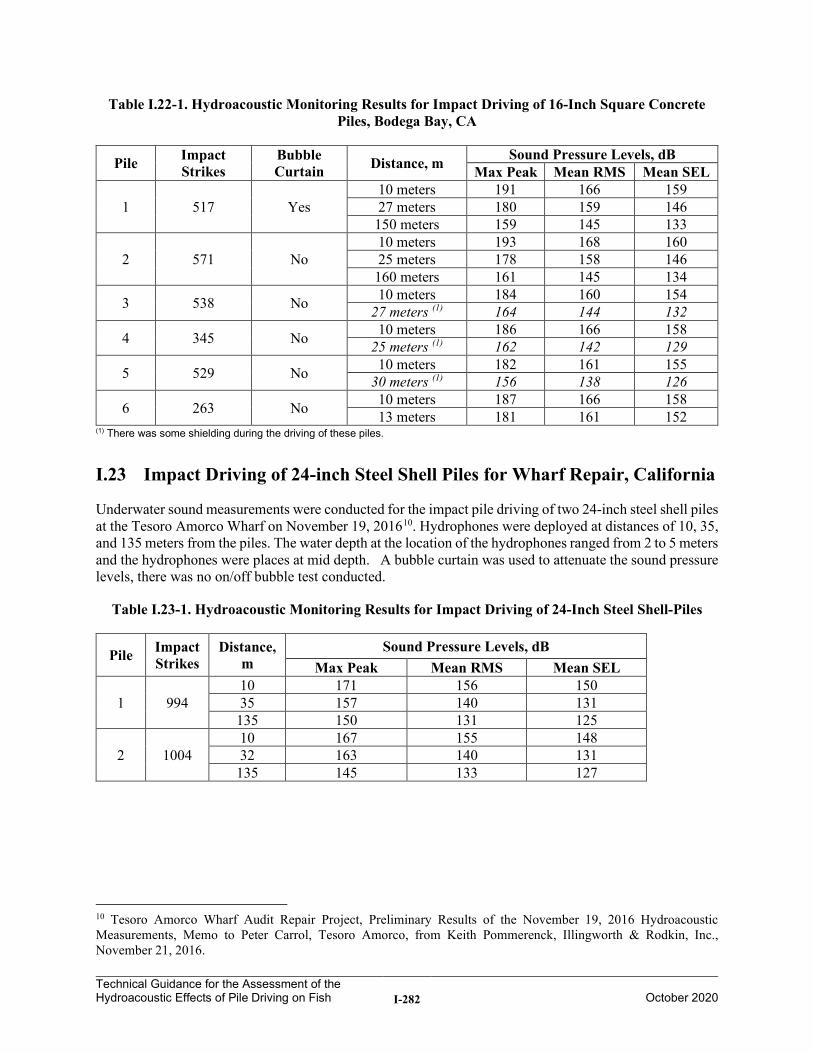
Technical Guidance for the Assessment of the Hydroacoustic Effects of Pile Driving on Fish I-282
October 2020
Table I.22-1. Hydroacoustic Monitoring Results for Impact Driving of 16-Inch Square Concrete Piles, Bodega Bay, CA
Pile Impact Strikes
Bubble Curtain Distance, m Sound Pressure Levels, dB
Max Peak Mean RMS Mean SEL
1 517 Yes 10 meters 191 166 159 27 meters 180 159 146 150 meters 159 145 133
2 571 No 10 meters 193 168 160 25 meters 178 158 146 160 meters 161 145 134
3 538 No 10 meters 184 160 154 27 meters (1) 164 144 132
4 345 No 10 meters 186 166 158 25 meters (1) 162 142 129
5 529 No 10 meters 182 161 155 30 meters (1) 156 138 126
6 263 No 10 meters 187 166 158 13 meters 181 161 152
(1) There was some shielding during the driving of these piles.
I.23 Impact Driving of 24-inch Steel Shell Piles for Wharf Repair, California
Underwater sound measurements were conducted for the impact pile driving of two 24-inch steel shell piles at the Tesoro Amorco Wharf on November 19, 201610. Hydrophones were deployed at distances of 10, 35, and 135 meters from the piles. The water depth at the location of the hydrophones ranged from 2 to 5 meters and the hydrophones were places at mid depth. A bubble curtain was used to attenuate the sound pressure levels, there was no on/off bubble test conducted.
Table I.23-1. Hydroacoustic Monitoring Results for Impact Driving of 24-Inch Steel Shell-Piles
Pile Impact Strikes
Distance, m
Sound Pressure Levels, dB Max Peak Mean RMS Mean SEL
1 994 10 171 156 150 35 157 140 131 135 150 131 125
2 1004 10 167 155 148 32 163 140 131 135 145 133 127
10 Tesoro Amorco Wharf Audit Repair Project, Preliminary Results of the November 19, 2016 Hydroacoustic Measurements, Memo to Peter Carrol, Tesoro Amorco, from Keith Pommerenck, Illingworth & Rodkin, Inc., November 21, 2016.
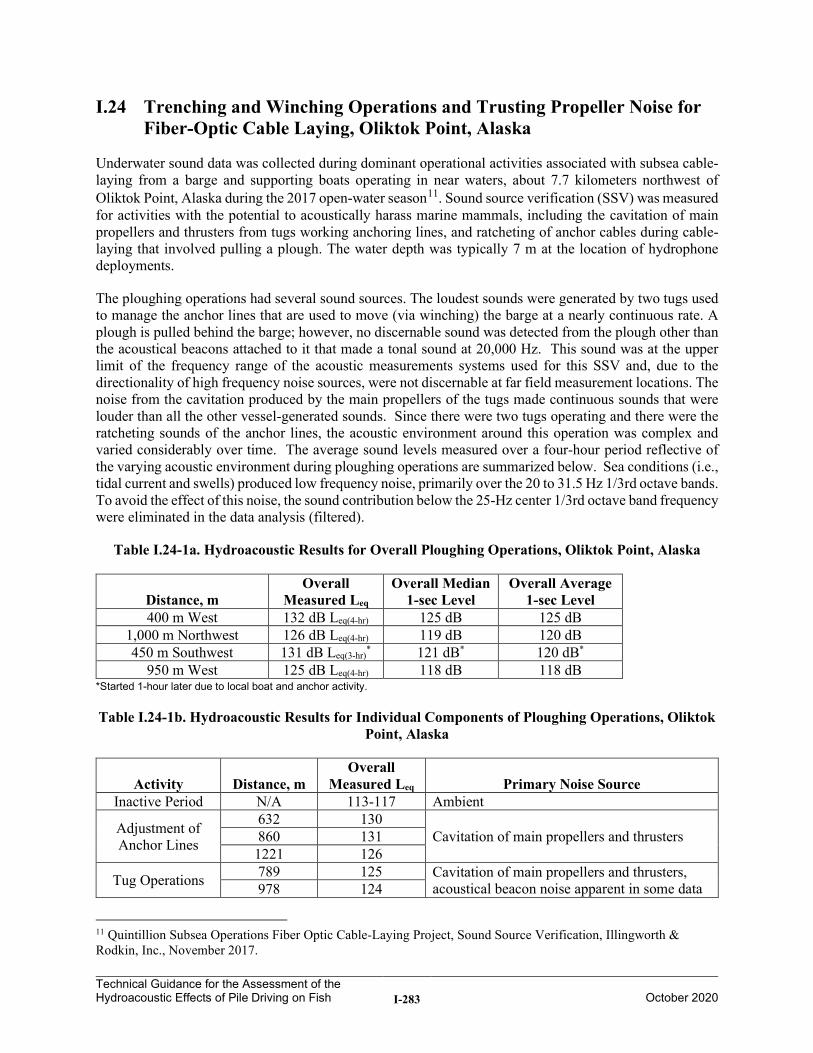
Technical Guidance for the Assessment of the Hydroacoustic Effects of Pile Driving on Fish I-283 October 2020
I.24 Trenching and Winching Operations and Trusting Propeller Noise forFiber-Optic Cable Laying, Oliktok Point, Alaska
Underwater sound data was collected during dominant operational activities associated with subsea cable-laying from a barge and supporting boats operating in near waters, about 7.7 kilometers northwest of Oliktok Point, Alaska during the 2017 open-water season11. Sound source verification (SSV) was measured for activities with the potential to acoustically harass marine mammals, including the cavitation of main propellers and thrusters from tugs working anchoring lines, and ratcheting of anchor cables during cable-laying that involved pulling a plough. The water depth was typically 7 m at the location of hydrophone deployments.
The ploughing operations had several sound sources. The loudest sounds were generated by two tugs used to manage the anchor lines that are used to move (via winching) the barge at a nearly continuous rate. A plough is pulled behind the barge; however, no discernable sound was detected from the plough other than the acoustical beacons attached to it that made a tonal sound at 20,000 Hz. This sound was at the upper limit of the frequency range of the acoustic measurements systems used for this SSV and, due to the directionality of high frequency noise sources, were not discernable at far field measurement locations. The noise from the cavitation produced by the main propellers of the tugs made continuous sounds that were louder than all the other vessel-generated sounds. Since there were two tugs operating and there were the ratcheting sounds of the anchor lines, the acoustic environment around this operation was complex and varied considerably over time. The average sound levels measured over a four-hour period reflective of the varying acoustic environment during ploughing operations are summarized below. Sea conditions (i.e., tidal current and swells) produced low frequency noise, primarily over the 20 to 31.5 Hz 1/3rd octave bands. To avoid the effect of this noise, the sound contribution below the 25-Hz center 1/3rd octave band frequency were eliminated in the data analysis (filtered).
Table I.24-1a. Hydroacoustic Results for Overall Ploughing Operations, Oliktok Point, Alaska
Distance, m Overall
Measured Leq Overall Median
1-sec LevelOverall Average
1-sec Level400 m West 132 dB Leq(4-hr) 125 dB 125 dB
1,000 m Northwest 126 dB Leq(4-hr) 119 dB 120 dB 450 m Southwest 131 dB Leq(3-hr)
* 121 dB* 120 dB* 950 m West 125 dB Leq(4-hr) 118 dB 118 dB
*Started 1-hour later due to local boat and anchor activity.
Table I.24-1b. Hydroacoustic Results for Individual Components of Ploughing Operations, OliktokPoint, Alaska
Activity Distance, m Overall
Measured Leq Primary Noise Source Inactive Period N/A 113-117 Ambient
Adjustment of Anchor Lines
632 130 Cavitation of main propellers and thrusters 860 131
1221 126
Tug Operations 789 125 Cavitation of main propellers and thrusters, acoustical beacon noise apparent in some data 978 124
11 Quintillion Subsea Operations Fiber Optic Cable-Laying Project, Sound Source Verification, Illingworth & Rodkin, Inc., November 2017.
Technical Guidance for the Assessment of the Hydroacoustic Effects of Pile Driving on Fish I-284 October 2020
Activity Distance, m Overall
Measured Leq Primary Noise Source 1010 123 1321 119
Figure I.24-1. Fall Off Rate for Underwater Sound Levels Generated During Ploughing
I.25 Impact Driving for Reinstallation 36-inch Steel Shell Pile, Vallejo,California
Underwater noise measurements were conducted for impact pile driving to reinstall a 36-inch steel shell pile as part of the North Bay Operations and Maintenance Facility, Pile Reconfiguration Project in Vallejo, California12. The sound attenuation system used consisted of a single stage bubble ring in an isolation casing to prevent the bubble flux from being pushed away from the pile during the tidal flow.
Table I.25-1. Hydroacoustic Monitoring Results for Impact Driving of 36-Inch Steel Shell-Pile, Vallejo, CA
Pile Impact Strikes
Distance, m
Sound Pressure Levels, dB Max Peak Mean RMS Mean SEL
Pile 73 36”x3/4” 820 10 204 186 170
40 195 173 161
12 WETA Project – Preliminary Data for October 28, 2017 Hydroacoustic Measurements, Memo to Jeff Casey, R.E. Staite Engineering, Inc., from Keith Pommerenck, Illingworth & Rodkin, Inc., November 2, 2017.
Tug Operations see above
Technical Guidance for the Assessment of the Hydroacoustic Effects of Pile Driving on Fish I-285
October 2020
I.26 Implosion of 13 Marine Piers for Dismantling of Bridge, San Francisco-Oakland, California
The California Department of Transportation imploded 13 marine piers, Piers E6 through E18, of the San Francisco–Oakland Bay Bridge (SFOBB) original east span in 6 controlled blast events between September 2, 2017 and November 11, 2017. Hydroacoustic monitoring of the 6 blast events was conducted to verify and evaluate distances to specific fish, marine mammal, and diving bird noise impact criteria13. Blast events included single or multiple piers being removed within an event. All Piers were encircled with a blast attenuation system (BAS) operating at the time of the implosion.
The durations of each implosion event varied based on the dimensions and construction of the individual piers; this includes the number of individual detonations, the total weight of explosives, and the maximum charge weight (i.e., the largest individual charge weight used). Hydroacoustic monitoring was performed during the implosions at 3 to 4 near field locations and 4 far field locations. When multiple piers were imploded in a single event, distances were measured from the nearest corner of the pier that generated the highest peak pressure. Due to the high peak pressures expected within 500 feet from each blast event, pressure transducers were required for data acquisition in these locations, instead of the conventional hydrophones. Transducers and hydrophones were positioned halfway between the water surface and the mud line. All monitoring was conducted outside of the BAS.
Near field locations were at distances of approximately 200, 500, 800, and/or 1,000 feet in the south direction, with sensor depths ranging from 7 to 17 feet. Actual deployment distances varied somewhat for each near field location, as shown in Table I.18-1. Far field locations included unattended monitoring distances of approximately 1,500, 3,000, and 6,000 feet in the north direction and attended monitoring at an additional 1,500-foot location, with hydrophone depths ranging from 6 to 20 feet below the water surface.
The trend line produced by all of the peak pressure levels for Piers E3 to E5 (documented in a prior report) and E6 through E18 is shown in Figure I.26-1a and the trend line for the cSEL values is shown in Figure I.26-1b. Table I.26-1 shows the results of the monitoring.
13 Hydroacoustic Monitoring Results, Marine Foundation Removal Project, San Francisco-Oakland Bay Bridge East Span Seismic Safety Project, Illingworth & Rodkin, Inc., 2017.
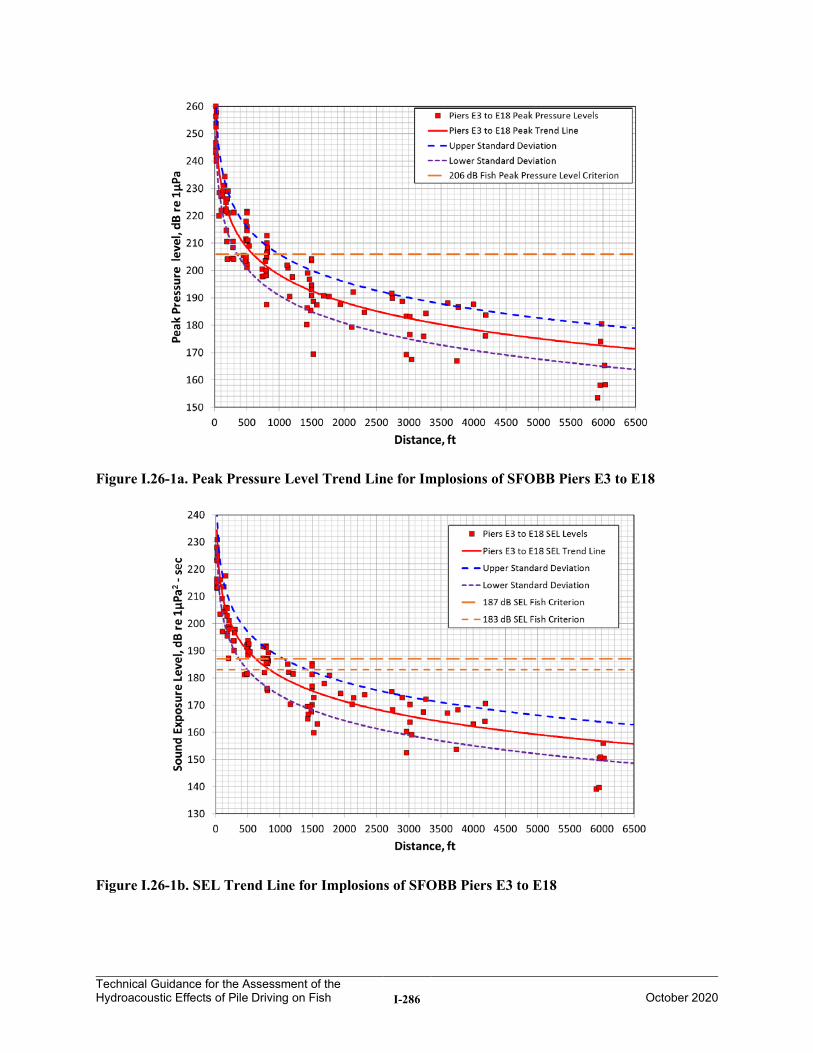
Technical Guidance for the Assessment of the Hydroacoustic Effects of Pile Driving on Fish I-286
October 2020
Figure I.26-1a. Peak Pressure Level Trend Line for Implosions of SFOBB Piers E3 to E18
Figure I.26-1b. SEL Trend Line for Implosions of SFOBB Piers E3 to E18
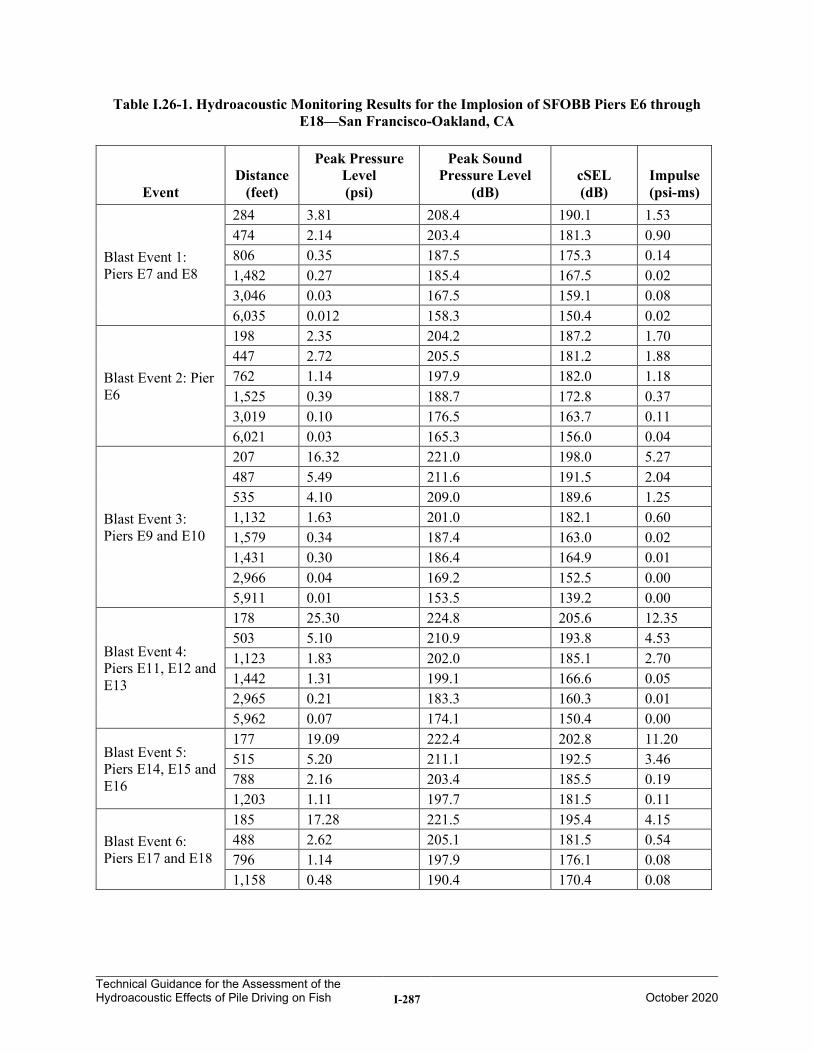
Technical Guidance for the Assessment of the Hydroacoustic Effects of Pile Driving on Fish I-287
October 2020
Table I.26-1. Hydroacoustic Monitoring Results for the Implosion of SFOBB Piers E6 through E18—San Francisco-Oakland, CA
Event Distance
(feet)
Peak Pressure Level (psi)
Peak Sound Pressure Level
(dB) cSEL (dB)
Impulse (psi-ms)
Blast Event 1: Piers E7 and E8
284 3.81 208.4 190.1 1.53 474 2.14 203.4 181.3 0.90 806 0.35 187.5 175.3 0.14 1,482 0.27 185.4 167.5 0.02 3,046 0.03 167.5 159.1 0.08 6,035 0.012 158.3 150.4 0.02
Blast Event 2: Pier E6
198 2.35 204.2 187.2 1.70 447 2.72 205.5 181.2 1.88 762 1.14 197.9 182.0 1.18 1,525 0.39 188.7 172.8 0.37 3,019 0.10 176.5 163.7 0.11 6,021 0.03 165.3 156.0 0.04
Blast Event 3: Piers E9 and E10
207 16.32 221.0 198.0 5.27 487 5.49 211.6 191.5 2.04 535 4.10 209.0 189.6 1.25 1,132 1.63 201.0 182.1 0.60 1,579 0.34 187.4 163.0 0.02 1,431 0.30 186.4 164.9 0.01 2,966 0.04 169.2 152.5 0.00 5,911 0.01 153.5 139.2 0.00
Blast Event 4: Piers E11, E12 and E13
178 25.30 224.8 205.6 12.35 503 5.10 210.9 193.8 4.53 1,123 1.83 202.0 185.1 2.70 1,442 1.31 199.1 166.6 0.05 2,965 0.21 183.3 160.3 0.01 5,962 0.07 174.1 150.4 0.00
Blast Event 5: Piers E14, E15 and E16
177 19.09 222.4 202.8 11.20 515 5.20 211.1 192.5 3.46 788 2.16 203.4 185.5 0.19 1,203 1.11 197.7 181.5 0.11
Blast Event 6: Piers E17 and E18
185 17.28 221.5 195.4 4.15 488 2.62 205.1 181.5 0.54 796 1.14 197.9 176.1 0.08 1,158 0.48 190.4 170.4 0.08
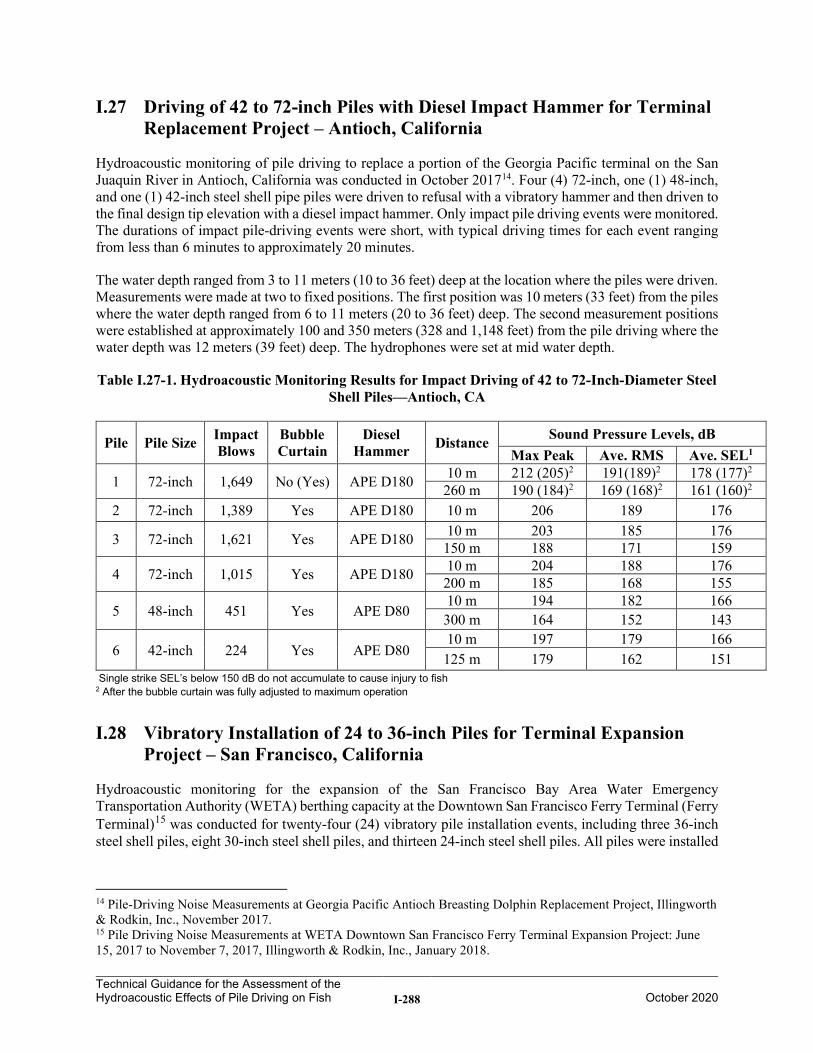
Technical Guidance for the Assessment of the Hydroacoustic Effects of Pile Driving on Fish I-288
October 2020
I.27 Driving of 42 to 72-inch Piles with Diesel Impact Hammer for Terminal Replacement Project – Antioch, California
Hydroacoustic monitoring of pile driving to replace a portion of the Georgia Pacific terminal on the San Juaquin River in Antioch, California was conducted in October 201714. Four (4) 72-inch, one (1) 48-inch, and one (1) 42-inch steel shell pipe piles were driven to refusal with a vibratory hammer and then driven to the final design tip elevation with a diesel impact hammer. Only impact pile driving events were monitored. The durations of impact pile-driving events were short, with typical driving times for each event ranging from less than 6 minutes to approximately 20 minutes.
The water depth ranged from 3 to 11 meters (10 to 36 feet) deep at the location where the piles were driven. Measurements were made at two to fixed positions. The first position was 10 meters (33 feet) from the piles where the water depth ranged from 6 to 11 meters (20 to 36 feet) deep. The second measurement positions were established at approximately 100 and 350 meters (328 and 1,148 feet) from the pile driving where the water depth was 12 meters (39 feet) deep. The hydrophones were set at mid water depth.
Table I.27-1. Hydroacoustic Monitoring Results for Impact Driving of 42 to 72-Inch-Diameter Steel Shell Piles—Antioch, CA
Pile Pile Size Impact Blows
Bubble Curtain
Diesel Hammer Distance Sound Pressure Levels, dB
Max Peak Ave. RMS Ave. SEL1
1 72-inch 1,649 No (Yes) APE D180 10 m 212 (205)2 191(189)2 178 (177)2 260 m 190 (184)2 169 (168)2 161 (160)2
2 72-inch 1,389 Yes APE D180 10 m 206 189 176
3 72-inch 1,621 Yes APE D180 10 m 203 185 176 150 m 188 171 159
4 72-inch 1,015 Yes APE D180 10 m 204 188 176 200 m 185 168 155
5 48-inch 451 Yes APE D80 10 m 194 182 166
300 m 164 152 143
6 42-inch 224 Yes APE D80 10 m 197 179 166
125 m 179 162 151 Single strike SEL’s below 150 dB do not accumulate to cause injury to fish 2 After the bubble curtain was fully adjusted to maximum operation
I.28 Vibratory Installation of 24 to 36-inch Piles for Terminal Expansion Project – San Francisco, California
Hydroacoustic monitoring for the expansion of the San Francisco Bay Area Water Emergency Transportation Authority (WETA) berthing capacity at the Downtown San Francisco Ferry Terminal (Ferry Terminal)15 was conducted for twenty-four (24) vibratory pile installation events, including three 36-inch steel shell piles, eight 30-inch steel shell piles, and thirteen 24-inch steel shell piles. All piles were installed
14 Pile-Driving Noise Measurements at Georgia Pacific Antioch Breasting Dolphin Replacement Project, Illingworth & Rodkin, Inc., November 2017. 15 Pile Driving Noise Measurements at WETA Downtown San Francisco Ferry Terminal Expansion Project: June 15, 2017 to November 7, 2017, Illingworth & Rodkin, Inc., January 2018.
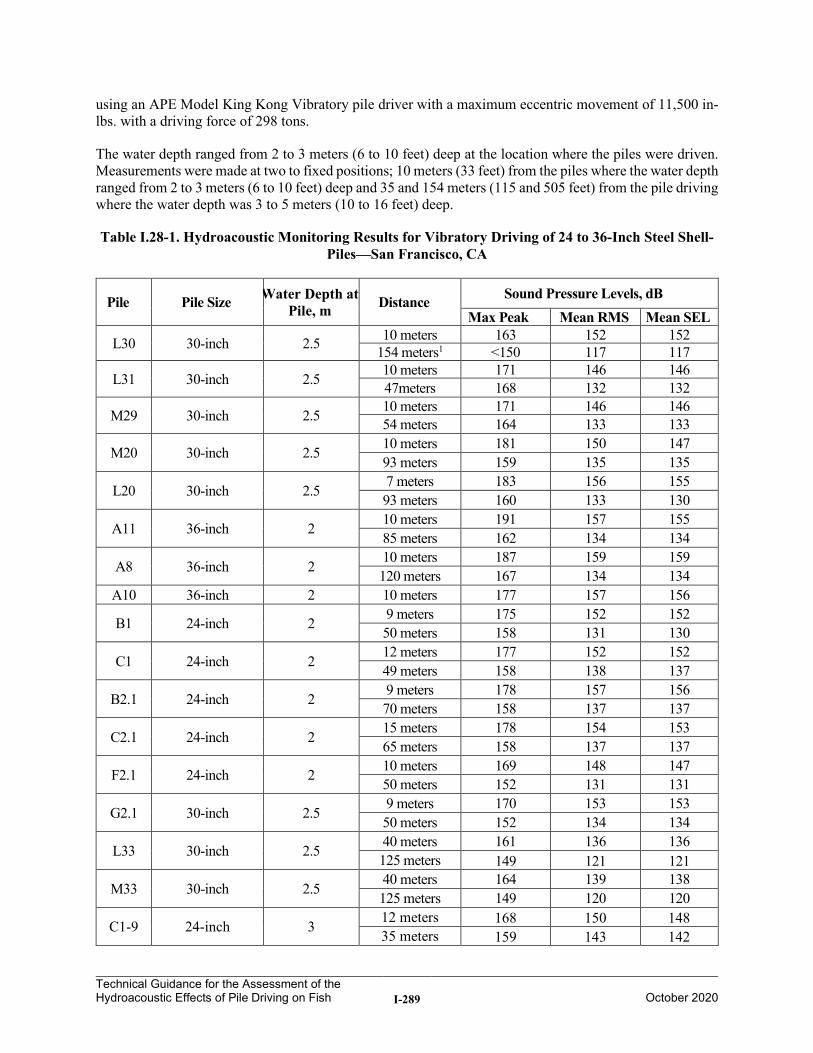
Technical Guidance for the Assessment of the Hydroacoustic Effects of Pile Driving on Fish I-289
October 2020
using an APE Model King Kong Vibratory pile driver with a maximum eccentric movement of 11,500 in-lbs. with a driving force of 298 tons.
The water depth ranged from 2 to 3 meters (6 to 10 feet) deep at the location where the piles were driven. Measurements were made at two to fixed positions; 10 meters (33 feet) from the piles where the water depth ranged from 2 to 3 meters (6 to 10 feet) deep and 35 and 154 meters (115 and 505 feet) from the pile driving where the water depth was 3 to 5 meters (10 to 16 feet) deep.
Table I.28-1. Hydroacoustic Monitoring Results for Vibratory Driving of 24 to 36-Inch Steel Shell-Piles—San Francisco, CA
Pile Pile Size Water Depth at Pile, m Distance Sound Pressure Levels, dB
Max Peak Mean RMS Mean SEL
L30 30-inch 2.5 10 meters 163 152 152 154 meters1 <150 117 117
L31 30-inch 2.5 10 meters 171 146 146 47meters 168 132 132
M29 30-inch 2.5 10 meters 171 146 146 54 meters 164 133 133
M20 30-inch 2.5 10 meters 181 150 147 93 meters 159 135 135
L20 30-inch 2.5 7 meters 183 156 155 93 meters 160 133 130
A11 36-inch 2 10 meters 191 157 155 85 meters 162 134 134
A8 36-inch 2 10 meters 187 159 159 120 meters 167 134 134
A10 36-inch 2 10 meters 177 157 156
B1 24-inch 2 9 meters 175 152 152 50 meters 158 131 130
C1 24-inch 2 12 meters 177 152 152 49 meters 158 138 137
B2.1 24-inch 2 9 meters 178 157 156 70 meters 158 137 137
C2.1 24-inch 2 15 meters 178 154 153 65 meters 158 137 137
F2.1 24-inch 2 10 meters 169 148 147 50 meters 152 131 131
G2.1 30-inch 2.5 9 meters 170 153 153 50 meters 152 134 134
L33 30-inch 2.5 40 meters 161 136 136 125 meters 149 121 121
M33 30-inch 2.5 40 meters 164 139 138 125 meters 149 120 120
C1-9 24-inch 3 12 meters 168 150 148 35 meters 159 143 142
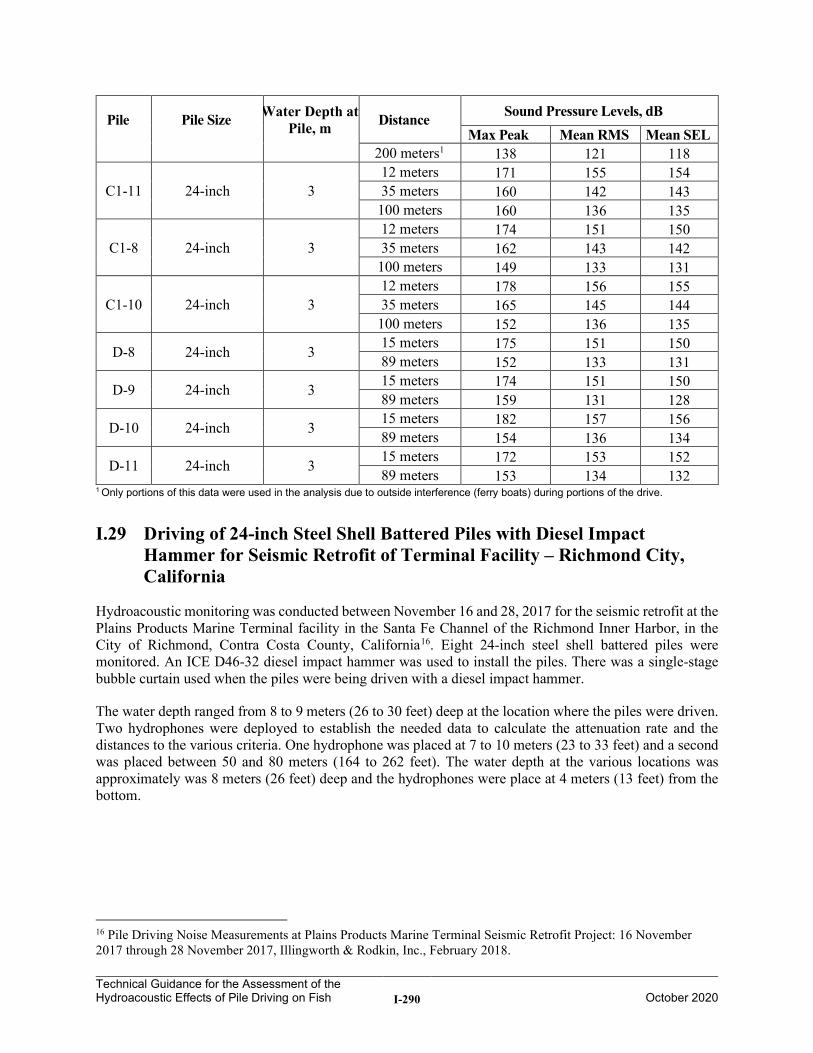
Technical Guidance for the Assessment of the Hydroacoustic Effects of Pile Driving on Fish I-290
October 2020
Pile Pile Size Water Depth at Pile, m Distance Sound Pressure Levels, dB
Max Peak Mean RMS Mean SEL 200 meters1 138 121 118
C1-11 24-inch 3 12 meters 171 155 154 35 meters 160 142 143 100 meters 160 136 135
C1-8 24-inch 3 12 meters 174 151 150 35 meters 162 143 142 100 meters 149 133 131
C1-10 24-inch 3 12 meters 178 156 155 35 meters 165 145 144 100 meters 152 136 135
D-8 24-inch 3 15 meters 175 151 150 89 meters 152 133 131
D-9 24-inch 3 15 meters 174 151 150 89 meters 159 131 128
D-10 24-inch 3 15 meters 182 157 156 89 meters 154 136 134
D-11 24-inch 3 15 meters 172 153 152 89 meters 153 134 132
1 Only portions of this data were used in the analysis due to outside interference (ferry boats) during portions of the drive.
I.29 Driving of 24-inch Steel Shell Battered Piles with Diesel Impact Hammer for Seismic Retrofit of Terminal Facility – Richmond City, California
Hydroacoustic monitoring was conducted between November 16 and 28, 2017 for the seismic retrofit at the Plains Products Marine Terminal facility in the Santa Fe Channel of the Richmond Inner Harbor, in the City of Richmond, Contra Costa County, California16. Eight 24-inch steel shell battered piles were monitored. An ICE D46-32 diesel impact hammer was used to install the piles. There was a single-stage bubble curtain used when the piles were being driven with a diesel impact hammer.
The water depth ranged from 8 to 9 meters (26 to 30 feet) deep at the location where the piles were driven. Two hydrophones were deployed to establish the needed data to calculate the attenuation rate and the distances to the various criteria. One hydrophone was placed at 7 to 10 meters (23 to 33 feet) and a second was placed between 50 and 80 meters (164 to 262 feet). The water depth at the various locations was approximately was 8 meters (26 feet) deep and the hydrophones were place at 4 meters (13 feet) from the bottom.
16 Pile Driving Noise Measurements at Plains Products Marine Terminal Seismic Retrofit Project: 16 November 2017 through 28 November 2017, Illingworth & Rodkin, Inc., February 2018.
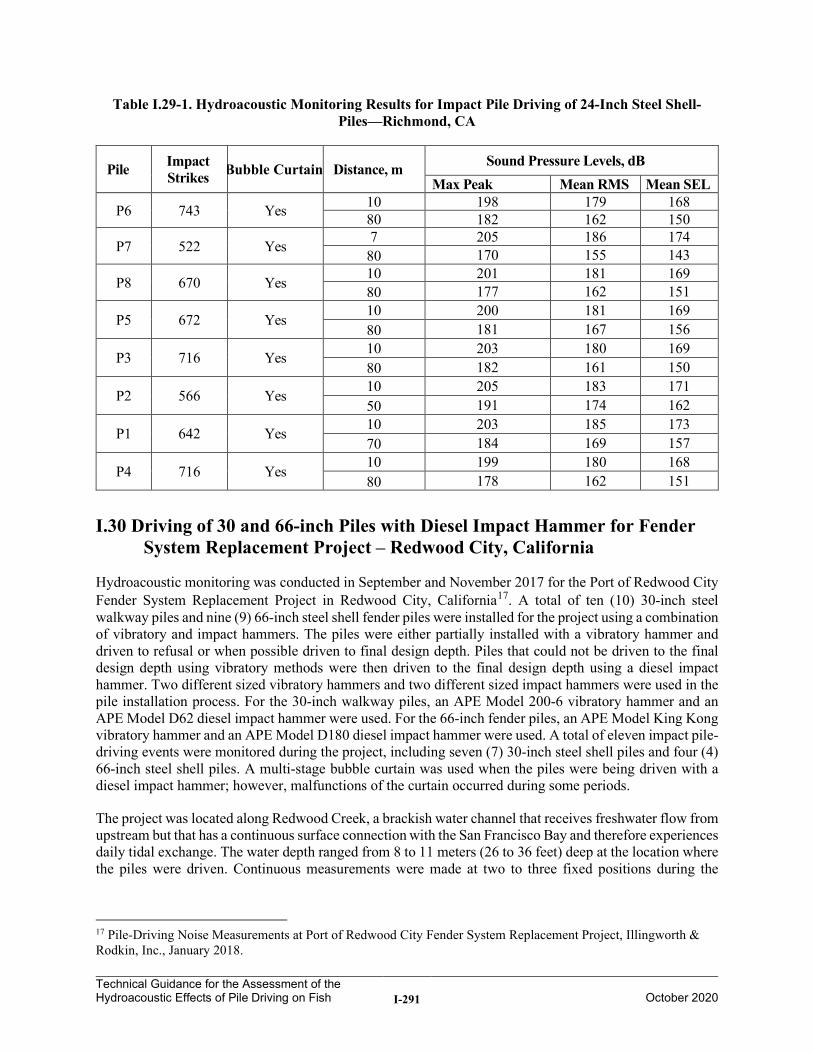
Technical Guidance for the Assessment of the Hydroacoustic Effects of Pile Driving on Fish I-291
October 2020
Table I.29-1. Hydroacoustic Monitoring Results for Impact Pile Driving of 24-Inch Steel Shell-Piles—Richmond, CA
Pile Impact Strikes Bubble Curtain Distance, m Sound Pressure Levels, dB
Max Peak Mean RMS Mean SEL
P6 743 Yes 10 198 179 168 80 182 162 150
P7 522 Yes 7 205 186 174 80 170 155 143
P8 670 Yes 10 201 181 169 80 177 162 151
P5 672 Yes 10 200 181 169 80 181 167 156
P3 716 Yes 10 203 180 169 80 182 161 150
P2 566 Yes 10 205 183 171 50 191 174 162
P1 642 Yes 10 203 185 173 70 184 169 157
P4 716 Yes 10 199 180 168 80 178 162 151
I.30 Driving of 30 and 66-inch Piles with Diesel Impact Hammer for Fender System Replacement Project – Redwood City, California
Hydroacoustic monitoring was conducted in September and November 2017 for the Port of Redwood City Fender System Replacement Project in Redwood City, California17. A total of ten (10) 30-inch steel walkway piles and nine (9) 66-inch steel shell fender piles were installed for the project using a combination of vibratory and impact hammers. The piles were either partially installed with a vibratory hammer and driven to refusal or when possible driven to final design depth. Piles that could not be driven to the final design depth using vibratory methods were then driven to the final design depth using a diesel impact hammer. Two different sized vibratory hammers and two different sized impact hammers were used in the pile installation process. For the 30-inch walkway piles, an APE Model 200-6 vibratory hammer and an APE Model D62 diesel impact hammer were used. For the 66-inch fender piles, an APE Model King Kong vibratory hammer and an APE Model D180 diesel impact hammer were used. A total of eleven impact pile-driving events were monitored during the project, including seven (7) 30-inch steel shell piles and four (4) 66-inch steel shell piles. A multi-stage bubble curtain was used when the piles were being driven with a diesel impact hammer; however, malfunctions of the curtain occurred during some periods.
The project was located along Redwood Creek, a brackish water channel that receives freshwater flow from upstream but that has a continuous surface connection with the San Francisco Bay and therefore experiences daily tidal exchange. The water depth ranged from 8 to 11 meters (26 to 36 feet) deep at the location where the piles were driven. Continuous measurements were made at two to three fixed positions during the
17 Pile-Driving Noise Measurements at Port of Redwood City Fender System Replacement Project, Illingworth & Rodkin, Inc., January 2018.
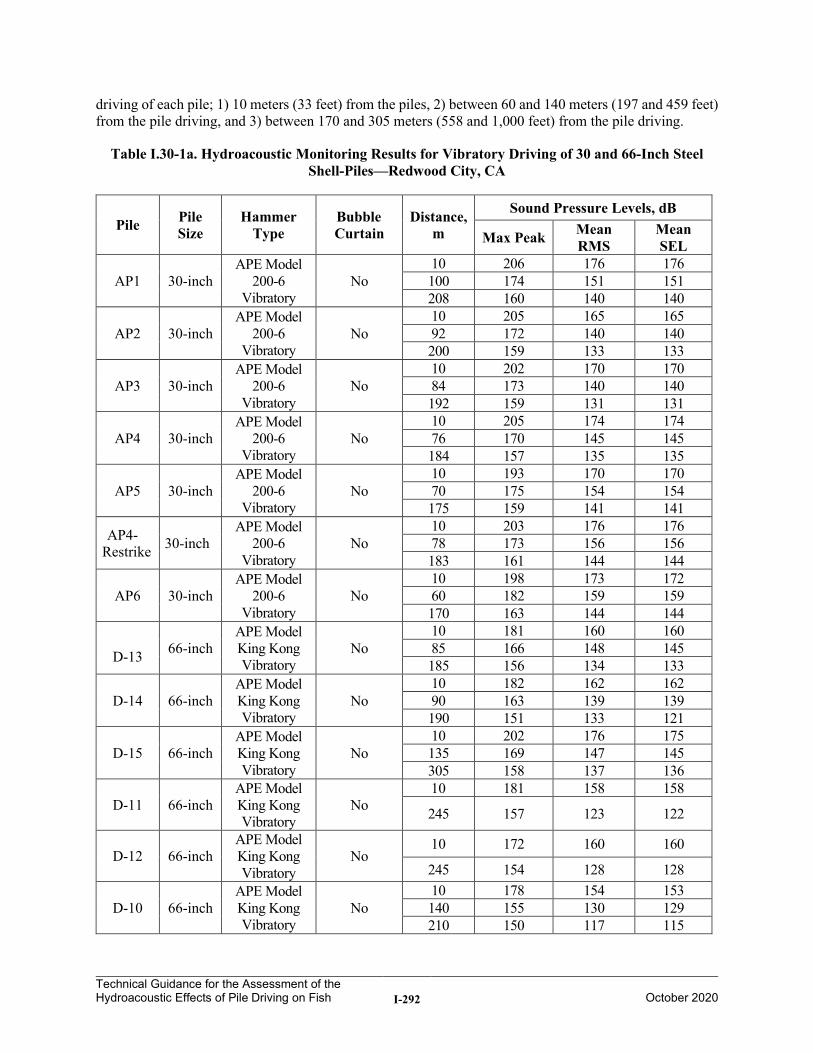
Technical Guidance for the Assessment of the Hydroacoustic Effects of Pile Driving on Fish I-292
October 2020
driving of each pile; 1) 10 meters (33 feet) from the piles, 2) between 60 and 140 meters (197 and 459 feet) from the pile driving, and 3) between 170 and 305 meters (558 and 1,000 feet) from the pile driving.
Table I.30-1a. Hydroacoustic Monitoring Results for Vibratory Driving of 30 and 66-Inch Steel Shell-Piles—Redwood City, CA
Pile Pile Size
Hammer Type
Bubble Curtain
Distance, m
Sound Pressure Levels, dB
Max Peak Mean RMS
Mean SEL
AP1 30-inch APE Model
200-6 Vibratory
No 10 206 176 176 100 174 151 151 208 160 140 140
AP2 30-inch APE Model
200-6 Vibratory
No 10 205 165 165 92 172 140 140 200 159 133 133
AP3 30-inch APE Model
200-6 Vibratory
No 10 202 170 170 84 173 140 140 192 159 131 131
AP4 30-inch APE Model
200-6 Vibratory
No 10 205 174 174 76 170 145 145 184 157 135 135
AP5 30-inch APE Model
200-6 Vibratory
No 10 193 170 170 70 175 154 154 175 159 141 141
AP4-Restrike 30-inch
APE Model 200-6
Vibratory No
10 203 176 176 78 173 156 156 183 161 144 144
AP6 30-inch APE Model
200-6 Vibratory
No 10 198 173 172 60 182 159 159 170 163 144 144
D-13 66-inch
APE Model King Kong Vibratory
No 10 181 160 160 85 166 148 145 185 156 134 133
D-14 66-inch APE Model King Kong Vibratory
No 10 182 162 162 90 163 139 139 190 151 133 121
D-15 66-inch APE Model King Kong Vibratory
No 10 202 176 175 135 169 147 145 305 158 137 136
D-11 66-inch APE Model King Kong Vibratory
No 10 181 158 158
245 157 123 122
D-12 66-inch APE Model King Kong Vibratory
No 10 172 160 160
245 154 128 128
D-10 66-inch APE Model King Kong Vibratory
No 10 178 154 153 140 155 130 129 210 150 117 115
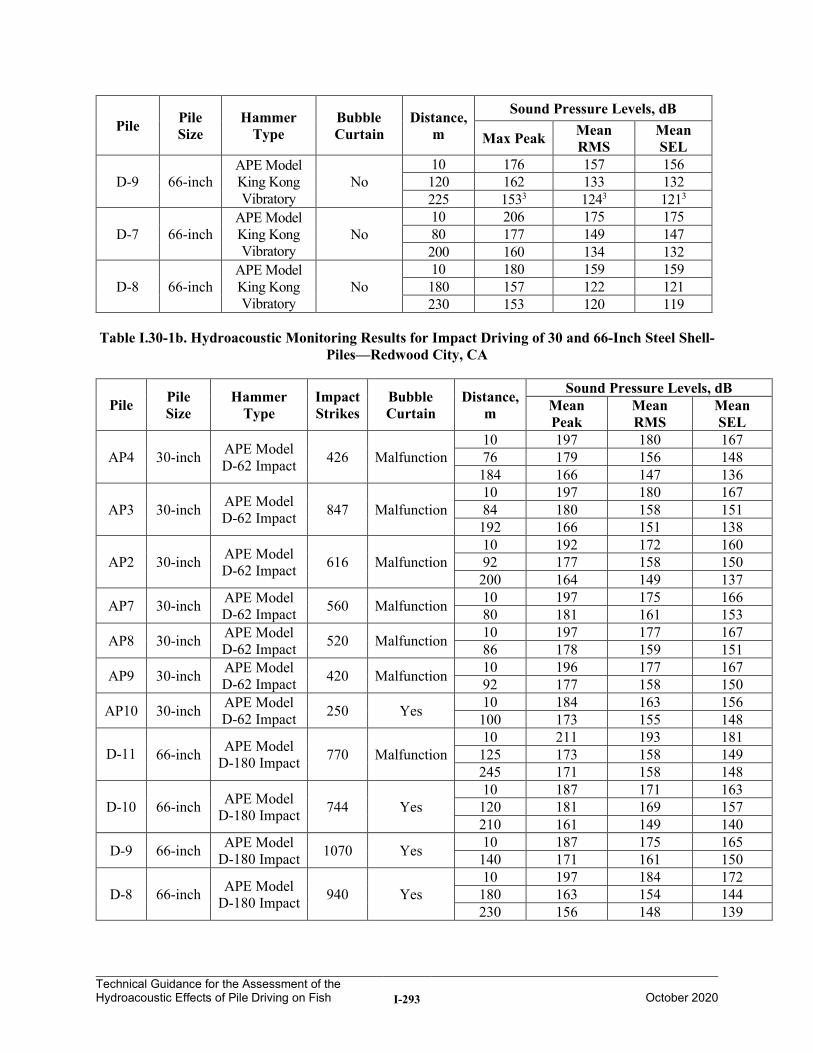
Technical Guidance for the Assessment of the Hydroacoustic Effects of Pile Driving on Fish I-293
October 2020
Pile Pile Size
Hammer Type
Bubble Curtain
Distance, m
Sound Pressure Levels, dB
Max Peak Mean RMS
Mean SEL
D-9 66-inch APE Model King Kong Vibratory
No 10 176 157 156 120 162 133 132 225 1533 1243 1213
D-7 66-inch APE Model King Kong Vibratory
No 10 206 175 175 80 177 149 147 200 160 134 132
D-8 66-inch APE Model King Kong Vibratory
No 10 180 159 159 180 157 122 121 230 153 120 119
Table I.30-1b. Hydroacoustic Monitoring Results for Impact Driving of 30 and 66-Inch Steel Shell-Piles—Redwood City, CA
Pile Pile Size
Hammer Type
Impact Strikes
Bubble Curtain
Distance, m
Sound Pressure Levels, dB Mean Peak
Mean RMS
Mean SEL
AP4 30-inch APE Model D-62 Impact 426 Malfunction
10 197 180 167 76 179 156 148
184 166 147 136
AP3 30-inch APE Model D-62 Impact 847 Malfunction
10 197 180 167 84 180 158 151
192 166 151 138
AP2 30-inch APE Model D-62 Impact 616 Malfunction
10 192 172 160 92 177 158 150
200 164 149 137
AP7 30-inch APE Model D-62 Impact 560 Malfunction 10 197 175 166
80 181 161 153
AP8 30-inch APE Model D-62 Impact 520 Malfunction 10 197 177 167
86 178 159 151
AP9 30-inch APE Model D-62 Impact 420 Malfunction 10 196 177 167
92 177 158 150
AP10 30-inch APE Model D-62 Impact 250 Yes 10 184 163 156
100 173 155 148
D-11 66-inch APE Model D-180 Impact 770 Malfunction
10 211 193 181 125 173 158 149 245 171 158 148
D-10 66-inch APE Model D-180 Impact 744 Yes
10 187 171 163 120 181 169 157 210 161 149 140
D-9 66-inch APE Model D-180 Impact 1070 Yes 10 187 175 165
140 171 161 150
D-8 66-inch APE Model D-180 Impact 940 Yes
10 197 184 172 180 163 154 144 230 156 148 139
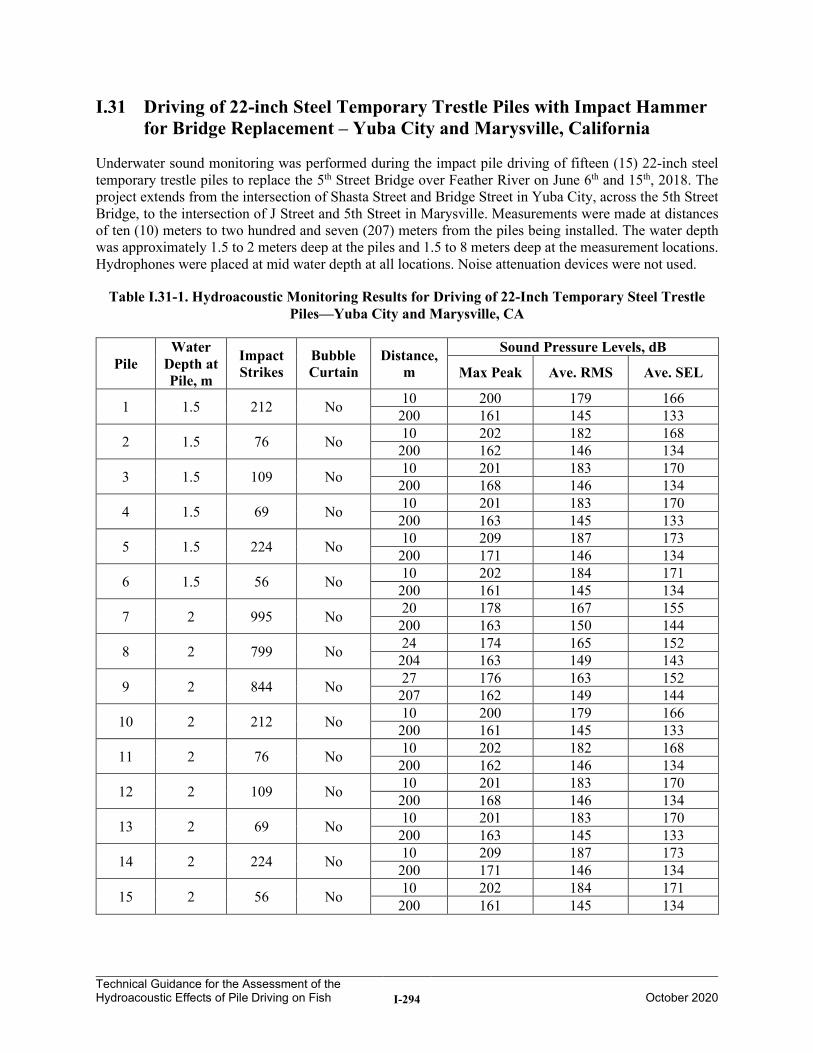
Technical Guidance for the Assessment of the Hydroacoustic Effects of Pile Driving on Fish I-294
October 2020
I.31 Driving of 22-inch Steel Temporary Trestle Piles with Impact Hammer for Bridge Replacement – Yuba City and Marysville, California
Underwater sound monitoring was performed during the impact pile driving of fifteen (15) 22-inch steel temporary trestle piles to replace the 5th Street Bridge over Feather River on June 6th and 15th, 2018. The project extends from the intersection of Shasta Street and Bridge Street in Yuba City, across the 5th Street Bridge, to the intersection of J Street and 5th Street in Marysville. Measurements were made at distances of ten (10) meters to two hundred and seven (207) meters from the piles being installed. The water depth was approximately 1.5 to 2 meters deep at the piles and 1.5 to 8 meters deep at the measurement locations. Hydrophones were placed at mid water depth at all locations. Noise attenuation devices were not used.
Table I.31-1. Hydroacoustic Monitoring Results for Driving of 22-Inch Temporary Steel Trestle Piles—Yuba City and Marysville, CA
Pile Water
Depth at Pile, m
Impact Strikes
Bubble Curtain
Distance, m
Sound Pressure Levels, dB
Max Peak Ave. RMS Ave. SEL
1 1.5 212 No 10 200 179 166 200 161 145 133
2 1.5 76 No 10 202 182 168 200 162 146 134
3 1.5 109 No 10 201 183 170 200 168 146 134
4 1.5 69 No 10 201 183 170 200 163 145 133
5 1.5 224 No 10 209 187 173 200 171 146 134
6 1.5 56 No 10 202 184 171 200 161 145 134
7 2 995 No 20 178 167 155 200 163 150 144
8 2 799 No 24 174 165 152 204 163 149 143
9 2 844 No 27 176 163 152 207 162 149 144
10 2 212 No 10 200 179 166 200 161 145 133
11 2 76 No 10 202 182 168 200 162 146 134
12 2 109 No 10 201 183 170 200 168 146 134
13 2 69 No 10 201 183 170 200 163 145 133
14 2 224 No 10 209 187 173 200 171 146 134
15 2 56 No 10 202 184 171 200 161 145 134
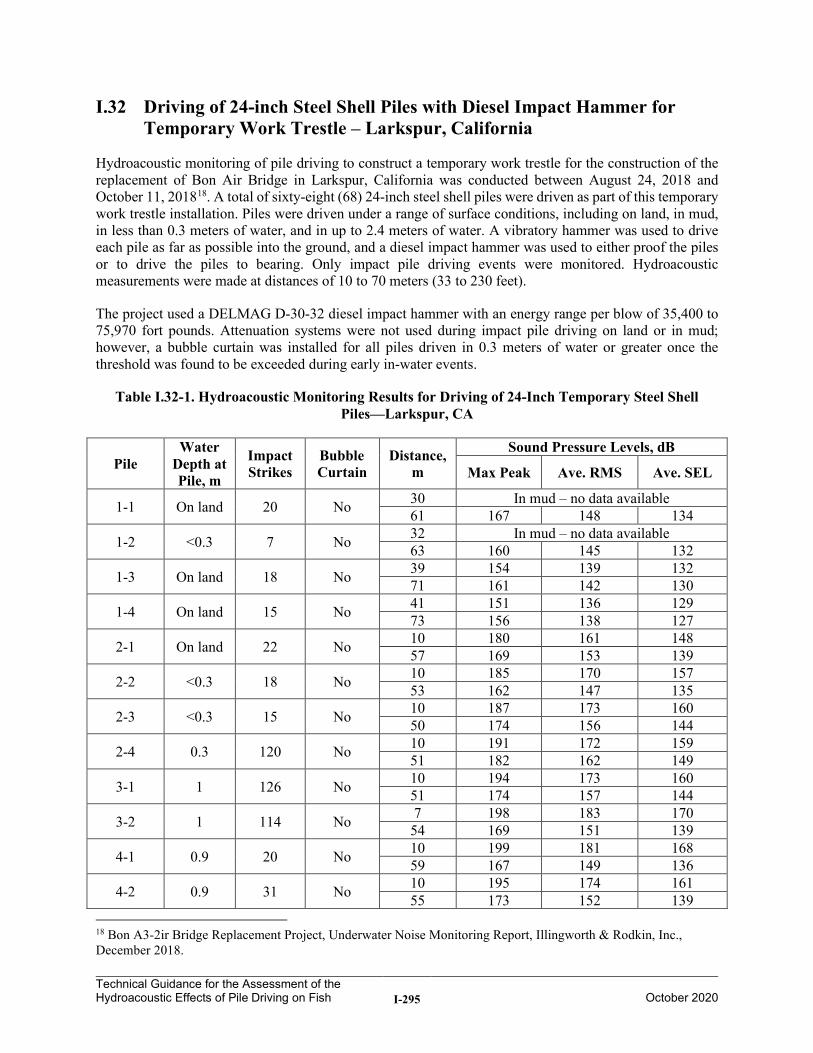
Technical Guidance for the Assessment of the Hydroacoustic Effects of Pile Driving on Fish I-295
October 2020
I.32 Driving of 24-inch Steel Shell Piles with Diesel Impact Hammer for Temporary Work Trestle – Larkspur, California
Hydroacoustic monitoring of pile driving to construct a temporary work trestle for the construction of the replacement of Bon Air Bridge in Larkspur, California was conducted between August 24, 2018 and October 11, 201818. A total of sixty-eight (68) 24-inch steel shell piles were driven as part of this temporary work trestle installation. Piles were driven under a range of surface conditions, including on land, in mud, in less than 0.3 meters of water, and in up to 2.4 meters of water. A vibratory hammer was used to drive each pile as far as possible into the ground, and a diesel impact hammer was used to either proof the piles or to drive the piles to bearing. Only impact pile driving events were monitored. Hydroacoustic measurements were made at distances of 10 to 70 meters (33 to 230 feet).
The project used a DELMAG D-30-32 diesel impact hammer with an energy range per blow of 35,400 to 75,970 fort pounds. Attenuation systems were not used during impact pile driving on land or in mud; however, a bubble curtain was installed for all piles driven in 0.3 meters of water or greater once the threshold was found to be exceeded during early in-water events.
Table I.32-1. Hydroacoustic Monitoring Results for Driving of 24-Inch Temporary Steel Shell Piles—Larkspur, CA
Pile Water
Depth at Pile, m
Impact Strikes
Bubble Curtain
Distance, m
Sound Pressure Levels, dB
Max Peak Ave. RMS Ave. SEL
1-1 On land 20 No 30 In mud – no data available 61 167 148 134
1-2 <0.3 7 No 32 In mud – no data available 63 160 145 132
1-3 On land 18 No 39 154 139 132 71 161 142 130
1-4 On land 15 No 41 151 136 129 73 156 138 127
2-1 On land 22 No 10 180 161 148 57 169 153 139
2-2 <0.3 18 No 10 185 170 157 53 162 147 135
2-3 <0.3 15 No 10 187 173 160 50 174 156 144
2-4 0.3 120 No 10 191 172 159 51 182 162 149
3-1 1 126 No 10 194 173 160 51 174 157 144
3-2 1 114 No 7 198 183 170 54 169 151 139
4-1 0.9 20 No 10 199 181 168 59 167 149 136
4-2 0.9 31 No 10 195 174 161 55 173 152 139
18 Bon A3-2ir Bridge Replacement Project, Underwater Noise Monitoring Report, Illingworth & Rodkin, Inc., December 2018.
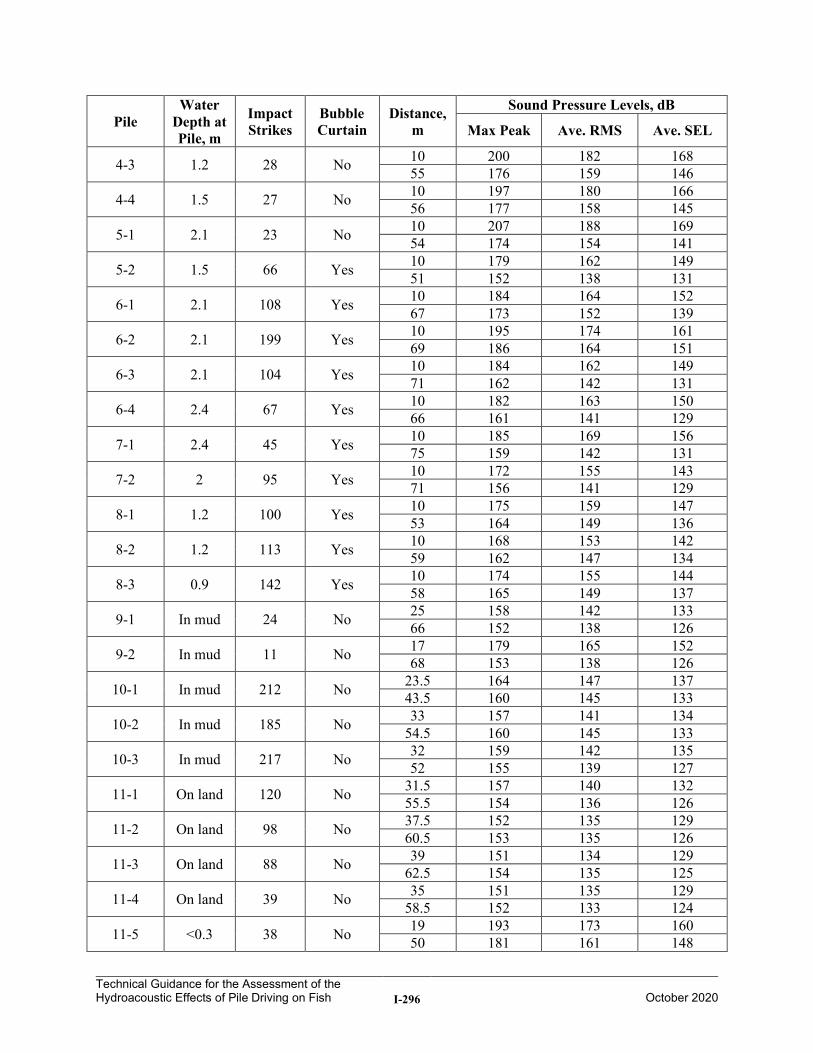
Technical Guidance for the Assessment of the Hydroacoustic Effects of Pile Driving on Fish I-296
October 2020
Pile Water
Depth at Pile, m
Impact Strikes
Bubble Curtain
Distance, m
Sound Pressure Levels, dB
Max Peak Ave. RMS Ave. SEL
4-3 1.2 28 No 10 200 182 168 55 176 159 146
4-4 1.5 27 No 10 197 180 166 56 177 158 145
5-1 2.1 23 No 10 207 188 169 54 174 154 141
5-2 1.5 66 Yes 10 179 162 149 51 152 138 131
6-1 2.1 108 Yes 10 184 164 152 67 173 152 139
6-2 2.1 199 Yes 10 195 174 161 69 186 164 151
6-3 2.1 104 Yes 10 184 162 149 71 162 142 131
6-4 2.4 67 Yes 10 182 163 150 66 161 141 129
7-1 2.4 45 Yes 10 185 169 156 75 159 142 131
7-2 2 95 Yes 10 172 155 143 71 156 141 129
8-1 1.2 100 Yes 10 175 159 147 53 164 149 136
8-2 1.2 113 Yes 10 168 153 142 59 162 147 134
8-3 0.9 142 Yes 10 174 155 144 58 165 149 137
9-1 In mud 24 No 25 158 142 133 66 152 138 126
9-2 In mud 11 No 17 179 165 152 68 153 138 126
10-1 In mud 212 No 23.5 164 147 137 43.5 160 145 133
10-2 In mud 185 No 33 157 141 134 54.5 160 145 133
10-3 In mud 217 No 32 159 142 135 52 155 139 127
11-1 On land 120 No 31.5 157 140 132 55.5 154 136 126
11-2 On land 98 No 37.5 152 135 129 60.5 153 135 126
11-3 On land 88 No 39 151 134 129 62.5 154 135 125
11-4 On land 39 No 35 151 135 129 58.5 152 133 124
11-5 <0.3 38 No 19 193 173 160 50 181 161 148
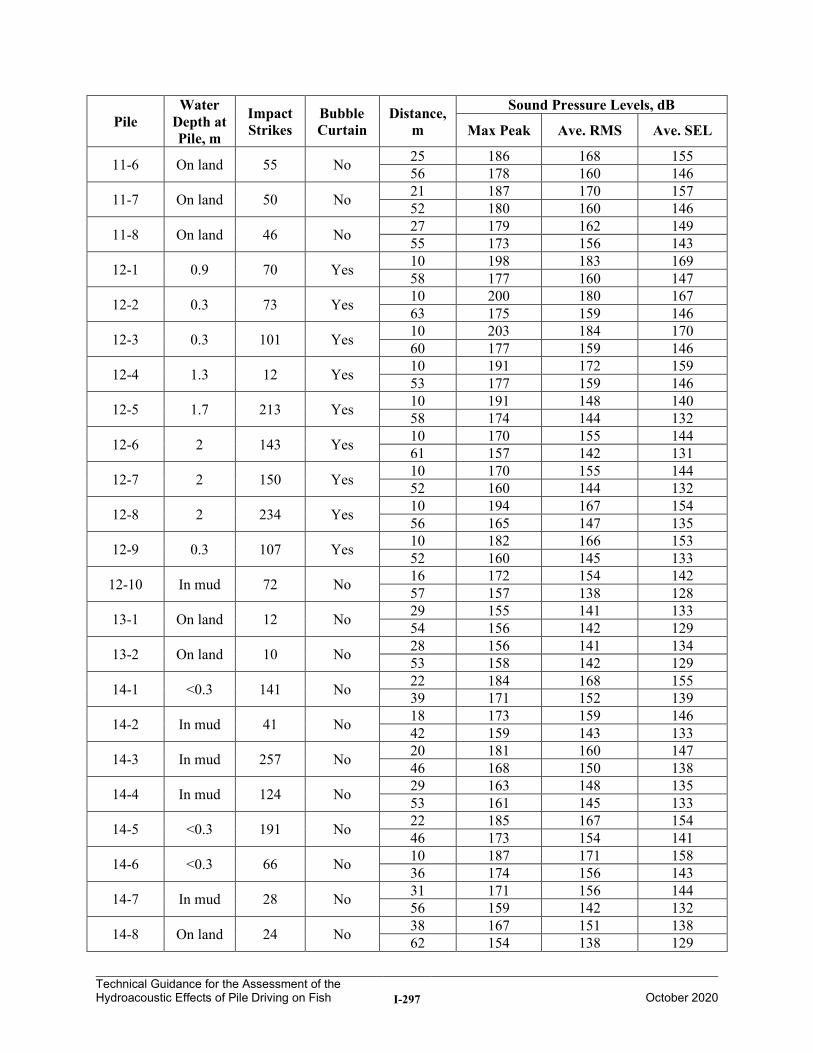
Technical Guidance for the Assessment of the Hydroacoustic Effects of Pile Driving on Fish I-297
October 2020
Pile Water
Depth at Pile, m
Impact Strikes
Bubble Curtain
Distance, m
Sound Pressure Levels, dB
Max Peak Ave. RMS Ave. SEL
11-6 On land 55 No 25 186 168 155 56 178 160 146
11-7 On land 50 No 21 187 170 157 52 180 160 146
11-8 On land 46 No 27 179 162 149 55 173 156 143
12-1 0.9 70 Yes 10 198 183 169 58 177 160 147
12-2 0.3 73 Yes 10 200 180 167 63 175 159 146
12-3 0.3 101 Yes 10 203 184 170 60 177 159 146
12-4 1.3 12 Yes 10 191 172 159 53 177 159 146
12-5 1.7 213 Yes 10 191 148 140 58 174 144 132
12-6 2 143 Yes 10 170 155 144 61 157 142 131
12-7 2 150 Yes 10 170 155 144 52 160 144 132
12-8 2 234 Yes 10 194 167 154 56 165 147 135
12-9 0.3 107 Yes 10 182 166 153 52 160 145 133
12-10 In mud 72 No 16 172 154 142 57 157 138 128
13-1 On land 12 No 29 155 141 133 54 156 142 129
13-2 On land 10 No 28 156 141 134 53 158 142 129
14-1 <0.3 141 No 22 184 168 155 39 171 152 139
14-2 In mud 41 No 18 173 159 146 42 159 143 133
14-3 In mud 257 No 20 181 160 147 46 168 150 138
14-4 In mud 124 No 29 163 148 135 53 161 145 133
14-5 <0.3 191 No 22 185 167 154 46 173 154 141
14-6 <0.3 66 No 10 187 171 158 36 174 156 143
14-7 In mud 28 No 31 171 156 144 56 159 142 132
14-8 On land 24 No 38 167 151 138 62 154 138 129
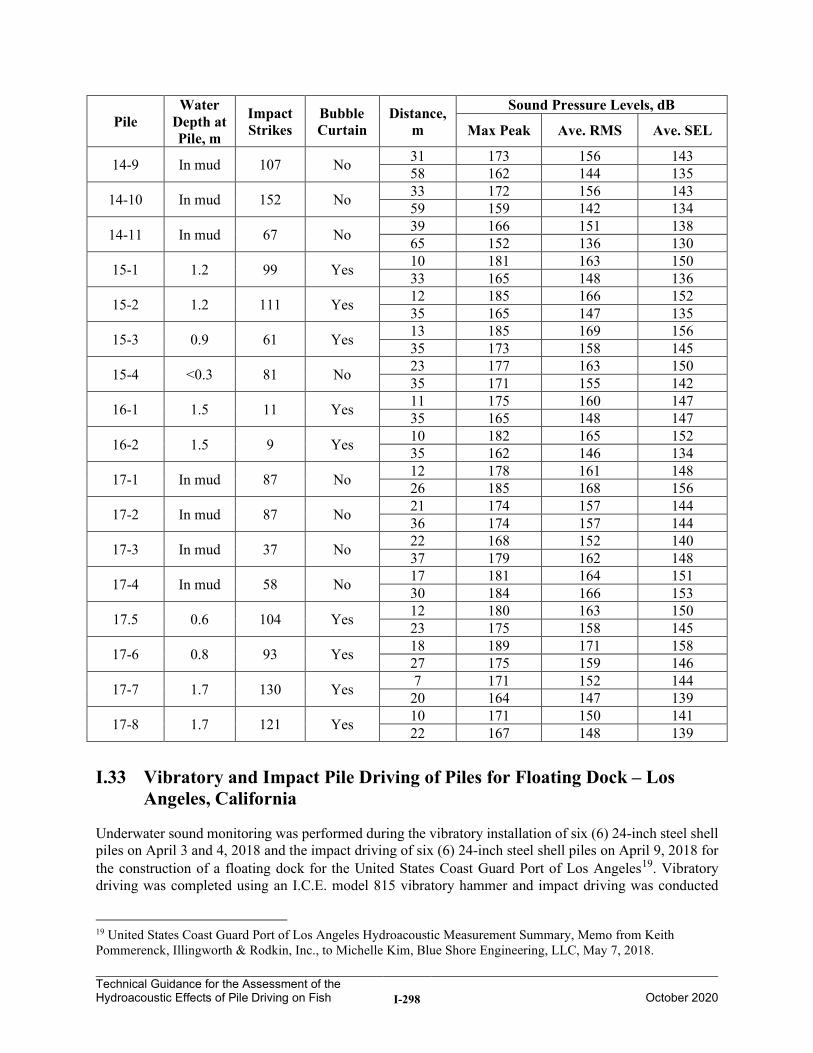
Technical Guidance for the Assessment of the Hydroacoustic Effects of Pile Driving on Fish I-298
October 2020
Pile Water
Depth at Pile, m
Impact Strikes
Bubble Curtain
Distance, m
Sound Pressure Levels, dB
Max Peak Ave. RMS Ave. SEL
14-9 In mud 107 No 31 173 156 143 58 162 144 135
14-10 In mud 152 No 33 172 156 143 59 159 142 134
14-11 In mud 67 No 39 166 151 138 65 152 136 130
15-1 1.2 99 Yes 10 181 163 150 33 165 148 136
15-2 1.2 111 Yes 12 185 166 152 35 165 147 135
15-3 0.9 61 Yes 13 185 169 156 35 173 158 145
15-4 <0.3 81 No 23 177 163 150 35 171 155 142
16-1 1.5 11 Yes 11 175 160 147 35 165 148 147
16-2 1.5 9 Yes 10 182 165 152 35 162 146 134
17-1 In mud 87 No 12 178 161 148 26 185 168 156
17-2 In mud 87 No 21 174 157 144 36 174 157 144
17-3 In mud 37 No 22 168 152 140 37 179 162 148
17-4 In mud 58 No 17 181 164 151 30 184 166 153
17.5 0.6 104 Yes 12 180 163 150 23 175 158 145
17-6 0.8 93 Yes 18 189 171 158 27 175 159 146
17-7 1.7 130 Yes 7 171 152 144 20 164 147 139
17-8 1.7 121 Yes 10 171 150 141 22 167 148 139
I.33 Vibratory and Impact Pile Driving of Piles for Floating Dock – Los Angeles, California
Underwater sound monitoring was performed during the vibratory installation of six (6) 24-inch steel shell piles on April 3 and 4, 2018 and the impact driving of six (6) 24-inch steel shell piles on April 9, 2018 for the construction of a floating dock for the United States Coast Guard Port of Los Angeles19. Vibratory driving was completed using an I.C.E. model 815 vibratory hammer and impact driving was conducted
19 United States Coast Guard Port of Los Angeles Hydroacoustic Measurement Summary, Memo from Keith Pommerenck, Illingworth & Rodkin, Inc., to Michelle Kim, Blue Shore Engineering, LLC, May 7, 2018.
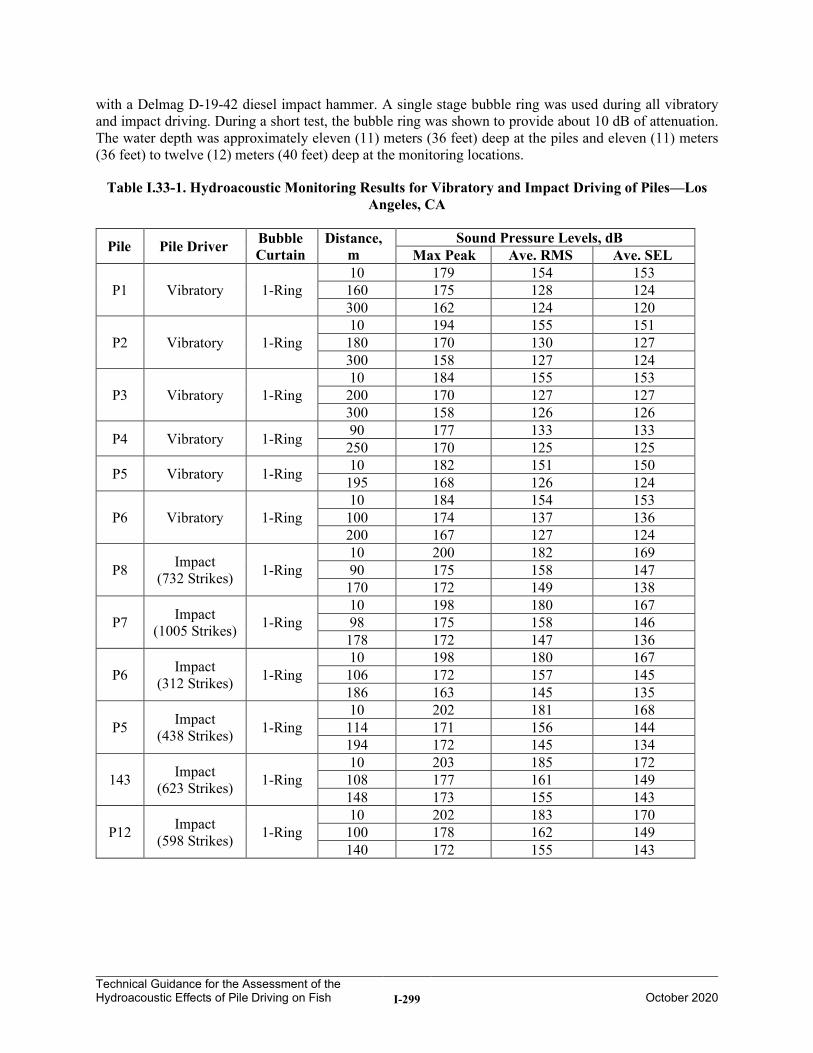
Technical Guidance for the Assessment of the Hydroacoustic Effects of Pile Driving on Fish I-299
October 2020
with a Delmag D-19-42 diesel impact hammer. A single stage bubble ring was used during all vibratory and impact driving. During a short test, the bubble ring was shown to provide about 10 dB of attenuation. The water depth was approximately eleven (11) meters (36 feet) deep at the piles and eleven (11) meters (36 feet) to twelve (12) meters (40 feet) deep at the monitoring locations.
Table I.33-1. Hydroacoustic Monitoring Results for Vibratory and Impact Driving of Piles—Los Angeles, CA
Pile Pile Driver Bubble Curtain
Distance, m
Sound Pressure Levels, dB Max Peak Ave. RMS Ave. SEL
P1 Vibratory 1-Ring 10 179 154 153
160 175 128 124 300 162 124 120
P2 Vibratory 1-Ring 10 194 155 151
180 170 130 127 300 158 127 124
P3 Vibratory 1-Ring 10 184 155 153
200 170 127 127 300 158 126 126
P4 Vibratory 1-Ring 90 177 133 133 250 170 125 125
P5 Vibratory 1-Ring 10 182 151 150 195 168 126 124
P6 Vibratory 1-Ring 10 184 154 153
100 174 137 136 200 167 127 124
P8 Impact (732 Strikes) 1-Ring
10 200 182 169 90 175 158 147
170 172 149 138
P7 Impact (1005 Strikes) 1-Ring
10 198 180 167 98 175 158 146
178 172 147 136
P6 Impact (312 Strikes) 1-Ring
10 198 180 167 106 172 157 145 186 163 145 135
P5 Impact (438 Strikes) 1-Ring
10 202 181 168 114 171 156 144 194 172 145 134
143 Impact (623 Strikes) 1-Ring
10 203 185 172 108 177 161 149 148 173 155 143
P12 Impact (598 Strikes) 1-Ring
10 202 183 170 100 178 162 149 140 172 155 143
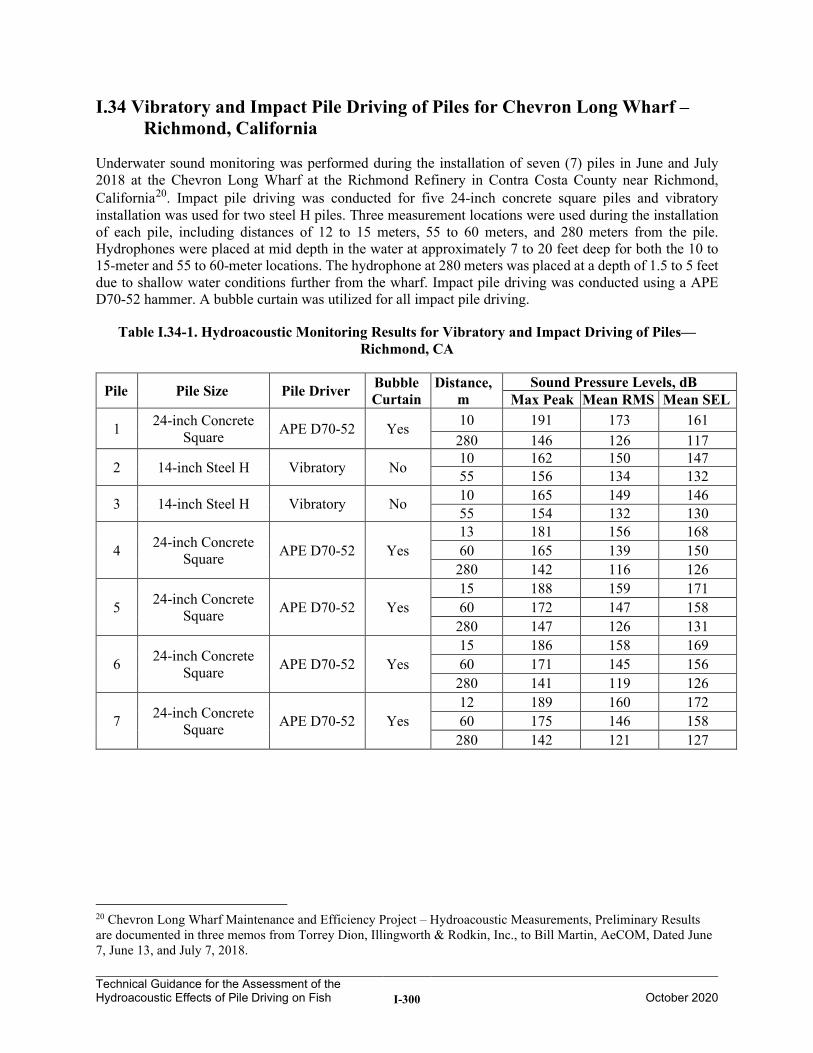
Technical Guidance for the Assessment of the Hydroacoustic Effects of Pile Driving on Fish I-300
October 2020
I.34 Vibratory and Impact Pile Driving of Piles for Chevron Long Wharf – Richmond, California
Underwater sound monitoring was performed during the installation of seven (7) piles in June and July 2018 at the Chevron Long Wharf at the Richmond Refinery in Contra Costa County near Richmond, California20. Impact pile driving was conducted for five 24-inch concrete square piles and vibratory installation was used for two steel H piles. Three measurement locations were used during the installation of each pile, including distances of 12 to 15 meters, 55 to 60 meters, and 280 meters from the pile. Hydrophones were placed at mid depth in the water at approximately 7 to 20 feet deep for both the 10 to 15-meter and 55 to 60-meter locations. The hydrophone at 280 meters was placed at a depth of 1.5 to 5 feet due to shallow water conditions further from the wharf. Impact pile driving was conducted using a APE D70-52 hammer. A bubble curtain was utilized for all impact pile driving.
Table I.34-1. Hydroacoustic Monitoring Results for Vibratory and Impact Driving of Piles—Richmond, CA
Pile Pile Size Pile Driver Bubble Curtain
Distance, m
Sound Pressure Levels, dB Max Peak Mean RMS Mean SEL
1 24-inch Concrete Square APE D70-52 Yes 10 191 173 161
280 146 126 117
2 14-inch Steel H Vibratory No 10 162 150 147 55 156 134 132
3 14-inch Steel H Vibratory No 10 165 149 146 55 154 132 130
4 24-inch Concrete Square APE D70-52 Yes
13 181 156 168 60 165 139 150
280 142 116 126
5 24-inch Concrete Square APE D70-52 Yes
15 188 159 171 60 172 147 158
280 147 126 131
6 24-inch Concrete Square APE D70-52 Yes
15 186 158 169 60 171 145 156
280 141 119 126
7 24-inch Concrete Square APE D70-52 Yes
12 189 160 172 60 175 146 158
280 142 121 127
20 Chevron Long Wharf Maintenance and Efficiency Project – Hydroacoustic Measurements, Preliminary Results are documented in three memos from Torrey Dion, Illingworth & Rodkin, Inc., to Bill Martin, AeCOM, Dated June 7, June 13, and July 7, 2018.
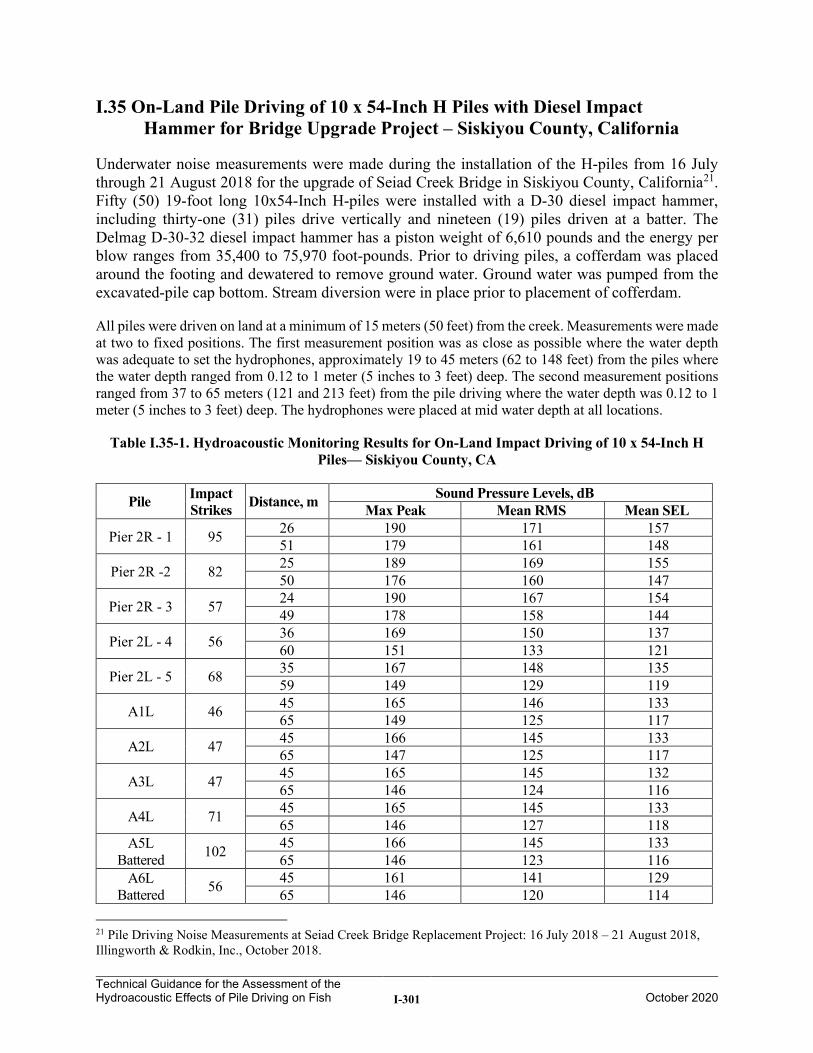
Technical Guidance for the Assessment of the Hydroacoustic Effects of Pile Driving on Fish I-301
October 2020
I.35 On-Land Pile Driving of 10 x 54-Inch H Piles with Diesel Impact Hammer for Bridge Upgrade Project – Siskiyou County, California
Underwater noise measurements were made during the installation of the H-piles from 16 July through 21 August 2018 for the upgrade of Seiad Creek Bridge in Siskiyou County, California21. Fifty (50) 19-foot long 10x54-Inch H-piles were installed with a D-30 diesel impact hammer, including thirty-one (31) piles drive vertically and nineteen (19) piles driven at a batter. The Delmag D-30-32 diesel impact hammer has a piston weight of 6,610 pounds and the energy per blow ranges from 35,400 to 75,970 foot-pounds. Prior to driving piles, a cofferdam was placed around the footing and dewatered to remove ground water. Ground water was pumped from the excavated-pile cap bottom. Stream diversion were in place prior to placement of cofferdam.
All piles were driven on land at a minimum of 15 meters (50 feet) from the creek. Measurements were made at two to fixed positions. The first measurement position was as close as possible where the water depth was adequate to set the hydrophones, approximately 19 to 45 meters (62 to 148 feet) from the piles where the water depth ranged from 0.12 to 1 meter (5 inches to 3 feet) deep. The second measurement positions ranged from 37 to 65 meters (121 and 213 feet) from the pile driving where the water depth was 0.12 to 1 meter (5 inches to 3 feet) deep. The hydrophones were placed at mid water depth at all locations.
Table I.35-1. Hydroacoustic Monitoring Results for On-Land Impact Driving of 10 x 54-Inch H Piles— Siskiyou County, CA
Pile Impact Strikes Distance, m Sound Pressure Levels, dB
Max Peak Mean RMS Mean SEL
Pier 2R - 1 95 26 190 171 157 51 179 161 148
Pier 2R -2 82 25 189 169 155 50 176 160 147
Pier 2R - 3 57 24 190 167 154 49 178 158 144
Pier 2L - 4 56 36 169 150 137 60 151 133 121
Pier 2L - 5 68 35 167 148 135 59 149 129 119
A1L 46 45 165 146 133 65 149 125 117
A2L 47 45 166 145 133 65 147 125 117
A3L 47 45 165 145 132 65 146 124 116
A4L 71 45 165 145 133 65 146 127 118
A5L Battered 102 45 166 145 133
65 146 123 116 A6L
Battered 56 45 161 141 129 65 146 120 114
21 Pile Driving Noise Measurements at Seiad Creek Bridge Replacement Project: 16 July 2018 – 21 August 2018, Illingworth & Rodkin, Inc., October 2018.
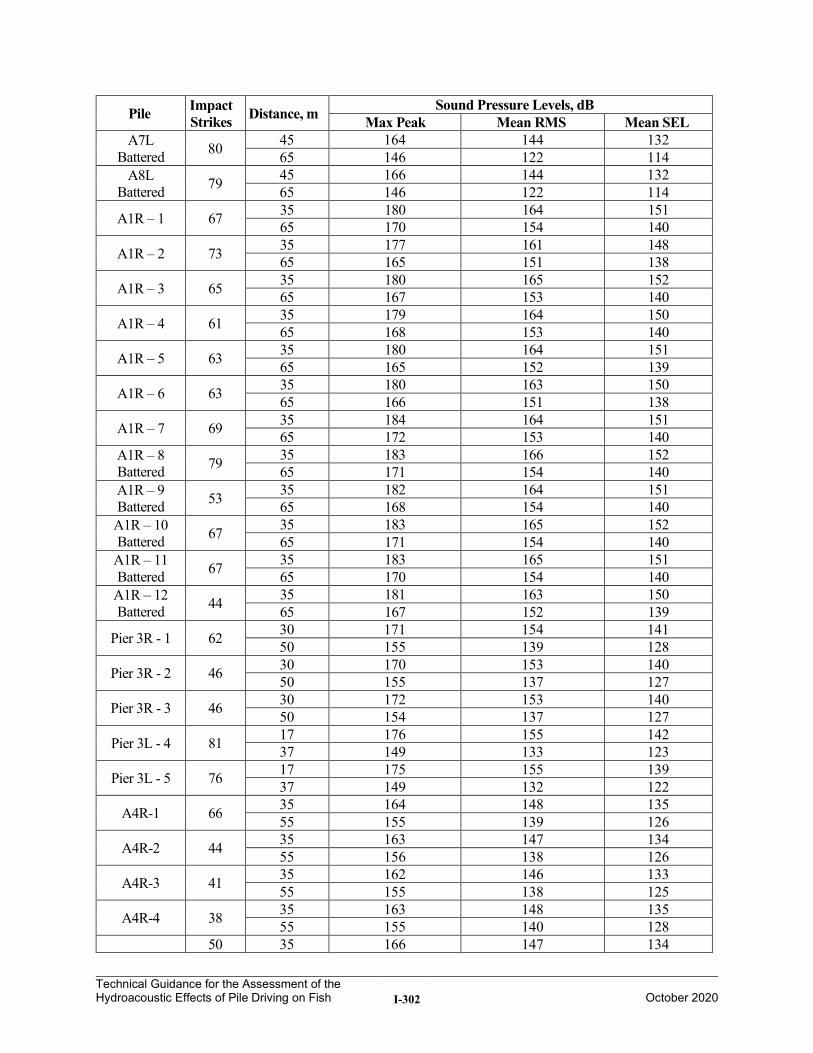
Technical Guidance for the Assessment of the Hydroacoustic Effects of Pile Driving on Fish I-302
October 2020
Pile Impact Strikes Distance, m Sound Pressure Levels, dB
Max Peak Mean RMS Mean SEL A7L
Battered 80 45 164 144 132 65 146 122 114
A8L Battered 79 45 166 144 132
65 146 122 114
A1R – 1 67 35 180 164 151 65 170 154 140
A1R – 2 73 35 177 161 148 65 165 151 138
A1R – 3 65 35 180 165 152 65 167 153 140
A1R – 4 61 35 179 164 150 65 168 153 140
A1R – 5 63 35 180 164 151 65 165 152 139
A1R – 6 63 35 180 163 150 65 166 151 138
A1R – 7 69 35 184 164 151 65 172 153 140
A1R – 8 Battered 79 35 183 166 152
65 171 154 140 A1R – 9 Battered 53 35 182 164 151
65 168 154 140 A1R – 10 Battered 67 35 183 165 152
65 171 154 140 A1R – 11 Battered 67 35 183 165 151
65 170 154 140 A1R – 12 Battered 44 35 181 163 150
65 167 152 139
Pier 3R - 1 62 30 171 154 141 50 155 139 128
Pier 3R - 2 46 30 170 153 140 50 155 137 127
Pier 3R - 3 46 30 172 153 140 50 154 137 127
Pier 3L - 4 81 17 176 155 142 37 149 133 123
Pier 3L - 5 76 17 175 155 139 37 149 132 122
A4R-1 66 35 164 148 135 55 155 139 126
A4R-2 44 35 163 147 134 55 156 138 126
A4R-3 41 35 162 146 133 55 155 138 125
A4R-4 38 35 163 148 135 55 155 140 128
50 35 166 147 134
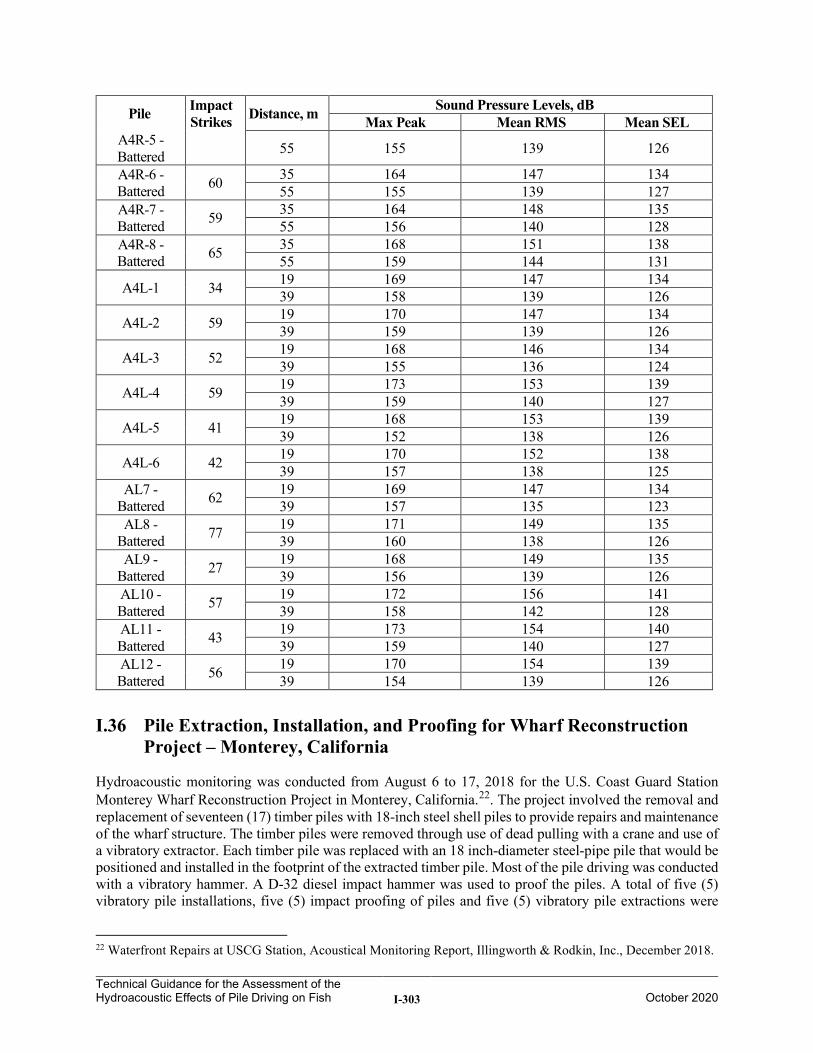
Technical Guidance for the Assessment of the Hydroacoustic Effects of Pile Driving on Fish I-303
October 2020
Pile Impact Strikes Distance, m Sound Pressure Levels, dB
Max Peak Mean RMS Mean SEL A4R-5 -Battered 55 155 139 126
A4R-6 -Battered 60 35 164 147 134
55 155 139 127 A4R-7 -Battered 59 35 164 148 135
55 156 140 128 A4R-8 -Battered 65 35 168 151 138
55 159 144 131
A4L-1 34 19 169 147 134 39 158 139 126
A4L-2 59 19 170 147 134 39 159 139 126
A4L-3 52 19 168 146 134 39 155 136 124
A4L-4 59 19 173 153 139 39 159 140 127
A4L-5 41 19 168 153 139 39 152 138 126
A4L-6 42 19 170 152 138 39 157 138 125
AL7 -Battered 62 19 169 147 134
39 157 135 123 AL8 -
Battered 77 19 171 149 135 39 160 138 126
AL9 -Battered 27 19 168 149 135
39 156 139 126 AL10 -Battered 57 19 172 156 141
39 158 142 128 AL11 -Battered 43 19 173 154 140
39 159 140 127 AL12 -Battered 56 19 170 154 139
39 154 139 126
I.36 Pile Extraction, Installation, and Proofing for Wharf Reconstruction Project – Monterey, California
Hydroacoustic monitoring was conducted from August 6 to 17, 2018 for the U.S. Coast Guard Station Monterey Wharf Reconstruction Project in Monterey, California.22. The project involved the removal and replacement of seventeen (17) timber piles with 18-inch steel shell piles to provide repairs and maintenance of the wharf structure. The timber piles were removed through use of dead pulling with a crane and use of a vibratory extractor. Each timber pile was replaced with an 18 inch-diameter steel-pipe pile that would be positioned and installed in the footprint of the extracted timber pile. Most of the pile driving was conducted with a vibratory hammer. A D-32 diesel impact hammer was used to proof the piles. A total of five (5) vibratory pile installations, five (5) impact proofing of piles and five (5) vibratory pile extractions were
22 Waterfront Repairs at USCG Station, Acoustical Monitoring Report, Illingworth & Rodkin, Inc., December 2018.
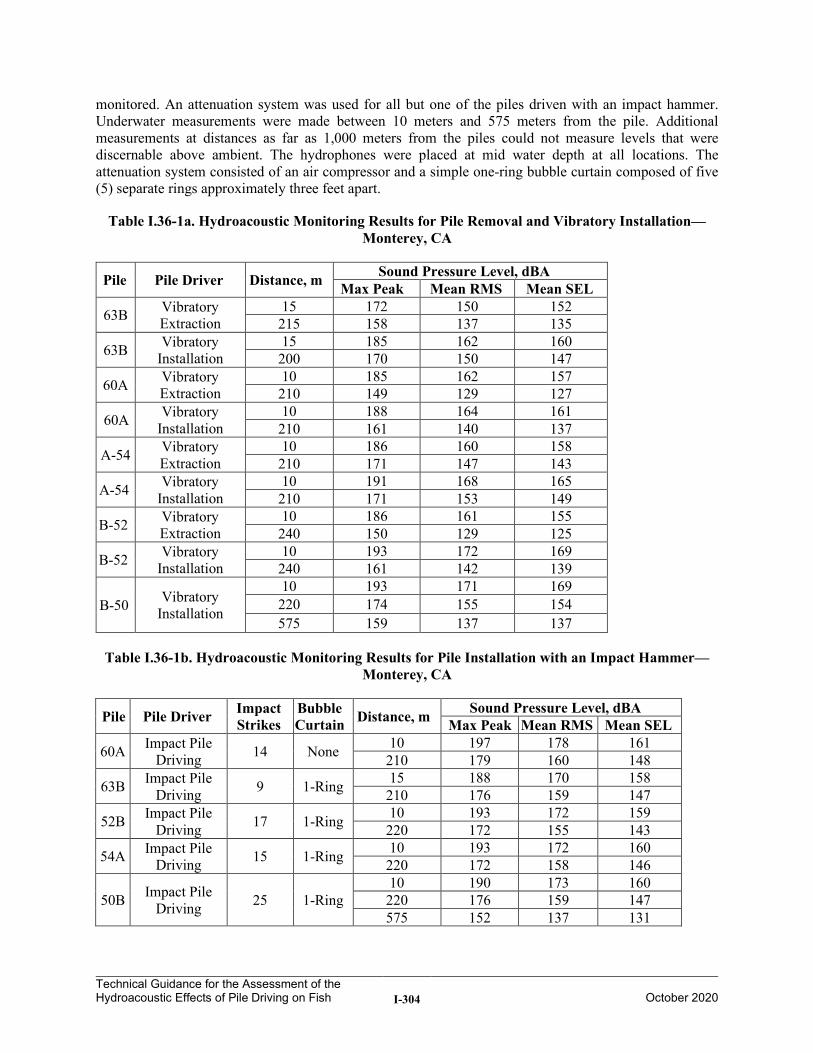
Technical Guidance for the Assessment of the Hydroacoustic Effects of Pile Driving on Fish I-304
October 2020
monitored. An attenuation system was used for all but one of the piles driven with an impact hammer. Underwater measurements were made between 10 meters and 575 meters from the pile. Additional measurements at distances as far as 1,000 meters from the piles could not measure levels that were discernable above ambient. The hydrophones were placed at mid water depth at all locations. The attenuation system consisted of an air compressor and a simple one-ring bubble curtain composed of five (5) separate rings approximately three feet apart.
Table I.36-1a. Hydroacoustic Monitoring Results for Pile Removal and Vibratory Installation— Monterey, CA
Pile Pile Driver Distance, m Sound Pressure Level, dBA Max Peak Mean RMS Mean SEL
63B Vibratory Extraction
15 172 150 152 215 158 137 135
63B Vibratory Installation
15 185 162 160 200 170 150 147
60A Vibratory Extraction
10 185 162 157 210 149 129 127
60A Vibratory Installation
10 188 164 161 210 161 140 137
A-54 Vibratory Extraction
10 186 160 158 210 171 147 143
A-54 Vibratory Installation
10 191 168 165 210 171 153 149
B-52 Vibratory Extraction
10 186 161 155 240 150 129 125
B-52 Vibratory Installation
10 193 172 169 240 161 142 139
B-50 Vibratory Installation
10 193 171 169 220 174 155 154 575 159 137 137
Table I.36-1b. Hydroacoustic Monitoring Results for Pile Installation with an Impact Hammer— Monterey, CA
Pile Pile Driver Impact Strikes
Bubble Curtain Distance, m Sound Pressure Level, dBA
Max Peak Mean RMS Mean SEL
60A Impact Pile Driving 14 None 10 197 178 161
210 179 160 148
63B Impact Pile Driving 9 1-Ring 15 188 170 158
210 176 159 147
52B Impact Pile Driving 17 1-Ring 10 193 172 159
220 172 155 143
54A Impact Pile Driving 15 1-Ring 10 193 172 160
220 172 158 146
50B Impact Pile Driving 25 1-Ring
10 190 173 160 220 176 159 147 575 152 137 131
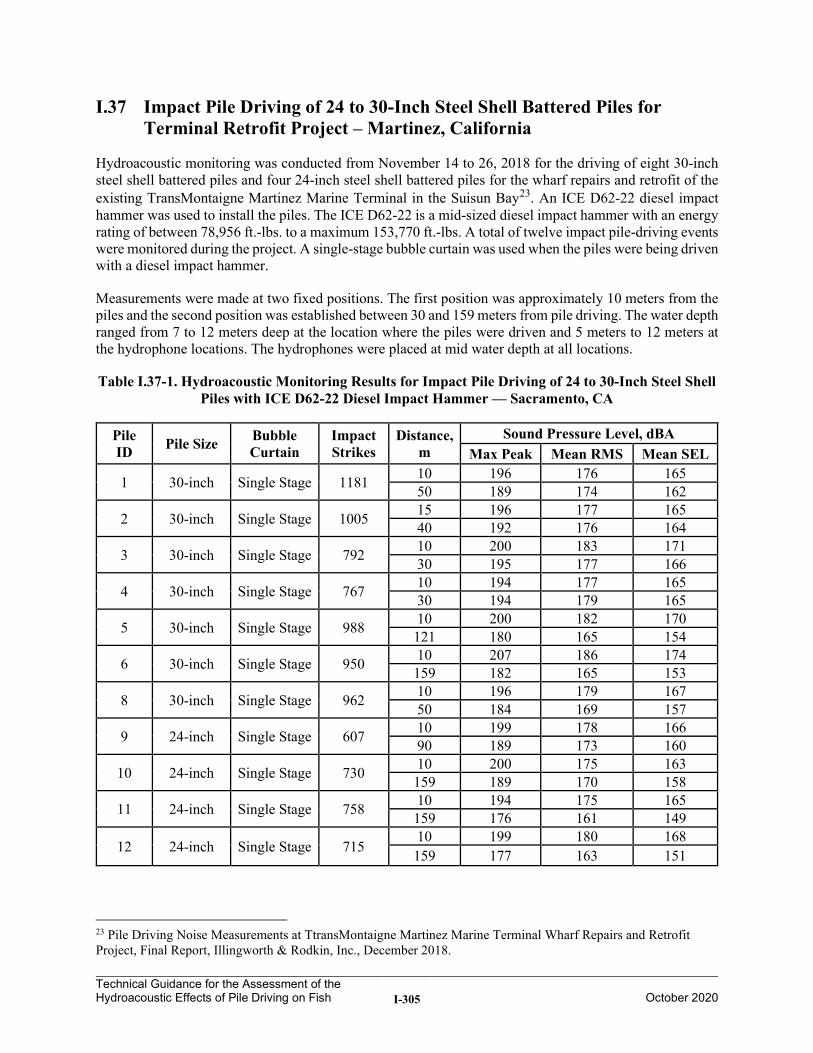
Technical Guidance for the Assessment of the Hydroacoustic Effects of Pile Driving on Fish I-305
October 2020
I.37 Impact Pile Driving of 24 to 30-Inch Steel Shell Battered Piles for Terminal Retrofit Project – Martinez, California
Hydroacoustic monitoring was conducted from November 14 to 26, 2018 for the driving of eight 30-inch steel shell battered piles and four 24-inch steel shell battered piles for the wharf repairs and retrofit of the existing TransMontaigne Martinez Marine Terminal in the Suisun Bay23. An ICE D62-22 diesel impact hammer was used to install the piles. The ICE D62-22 is a mid-sized diesel impact hammer with an energy rating of between 78,956 ft.-lbs. to a maximum 153,770 ft.-lbs. A total of twelve impact pile-driving events were monitored during the project. A single-stage bubble curtain was used when the piles were being driven with a diesel impact hammer.
Measurements were made at two fixed positions. The first position was approximately 10 meters from the piles and the second position was established between 30 and 159 meters from pile driving. The water depth ranged from 7 to 12 meters deep at the location where the piles were driven and 5 meters to 12 meters at the hydrophone locations. The hydrophones were placed at mid water depth at all locations.
Table I.37-1. Hydroacoustic Monitoring Results for Impact Pile Driving of 24 to 30-Inch Steel Shell Piles with ICE D62-22 Diesel Impact Hammer — Sacramento, CA
Pile ID Pile Size Bubble
Curtain Impact Strikes
Distance, m
Sound Pressure Level, dBA Max Peak Mean RMS Mean SEL
1 30-inch Single Stage 1181 10 196 176 165 50 189 174 162
2 30-inch Single Stage 1005 15 196 177 165 40 192 176 164
3 30-inch Single Stage 792 10 200 183 171 30 195 177 166
4 30-inch Single Stage 767 10 194 177 165 30 194 179 165
5 30-inch Single Stage 988 10 200 182 170 121 180 165 154
6 30-inch Single Stage 950 10 207 186 174 159 182 165 153
8 30-inch Single Stage 962 10 196 179 167 50 184 169 157
9 24-inch Single Stage 607 10 199 178 166 90 189 173 160
10 24-inch Single Stage 730 10 200 175 163 159 189 170 158
11 24-inch Single Stage 758 10 194 175 165 159 176 161 149
12 24-inch Single Stage 715 10 199 180 168 159 177 163 151
23 Pile Driving Noise Measurements at TtransMontaigne Martinez Marine Terminal Wharf Repairs and Retrofit Project, Final Report, Illingworth & Rodkin, Inc., December 2018.
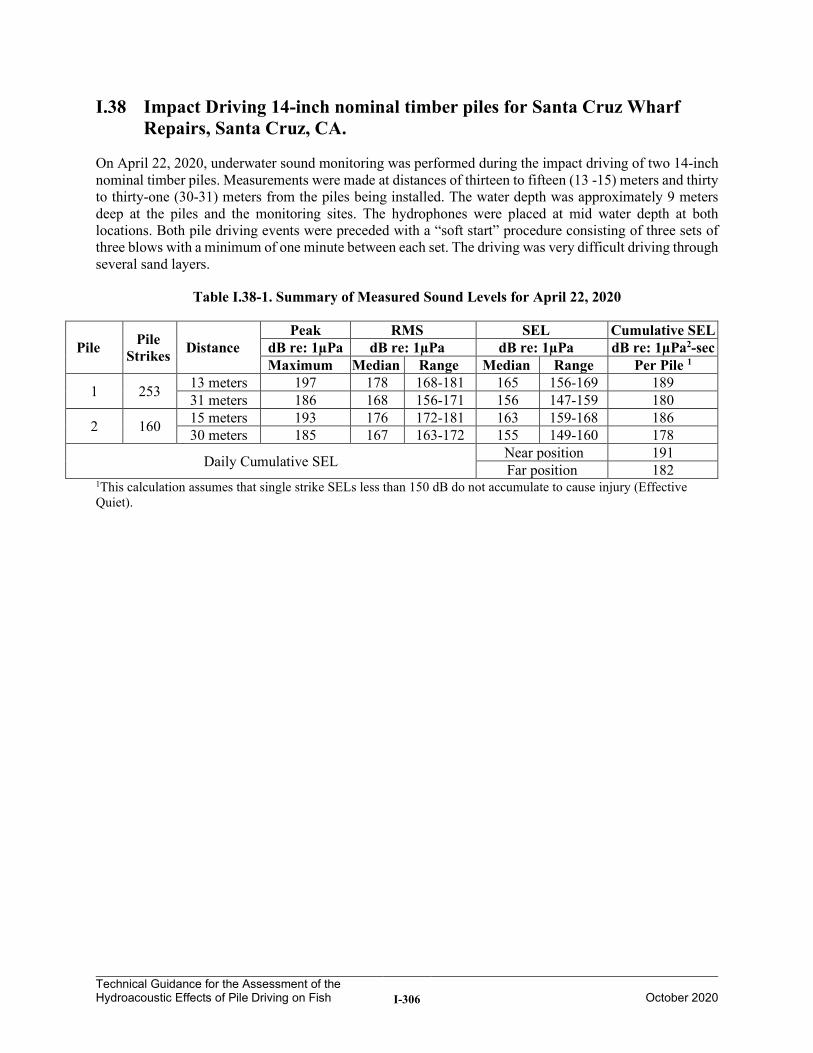
Technical Guidance for the Assessment of the Hydroacoustic Effects of Pile Driving on Fish I-306
October 2020
I.38 Impact Driving 14-inch nominal timber piles for Santa Cruz Wharf Repairs, Santa Cruz, CA.
On April 22, 2020, underwater sound monitoring was performed during the impact driving of two 14-inch nominal timber piles. Measurements were made at distances of thirteen to fifteen (13 -15) meters and thirty to thirty-one (30-31) meters from the piles being installed. The water depth was approximately 9 meters deep at the piles and the monitoring sites. The hydrophones were placed at mid water depth at both locations. Both pile driving events were preceded with a “soft start” procedure consisting of three sets of three blows with a minimum of one minute between each set. The driving was very difficult driving through several sand layers.
Table I.38-1. Summary of Measured Sound Levels for April 22, 2020
Pile Pile Strikes Distance
Peak dB re: 1µPa Maximum
RMS dB re: 1µPa
SEL dB re: 1µPa
Cumulative SEL dB re: 1µPa2-sec
Per Pile 1 Median Range Median Range
1 253 13 meters 197 178 168-181 165 156-169 189 31 meters 186 168 156-171 156 147-159 180
2 160 15 meters 193 176 172-181 163 159-168 186 30 meters 185 167 163-172 155 149-160 178
Daily Cumulative SEL Near position 191 Far position 182
1This calculation assumes that single strike SELs less than 150 dB do not accumulate to cause injury (Effective Quiet).
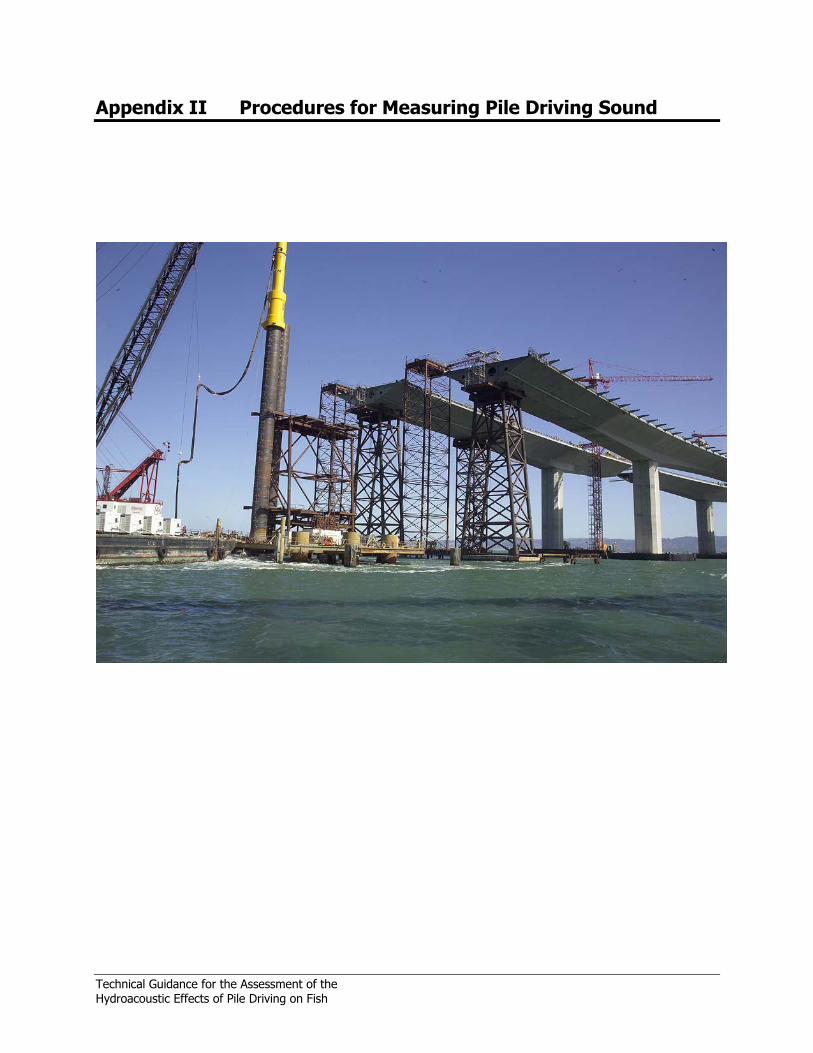
Technical Guidance for the Assessment of the Hydroacoustic Effects of Pile Driving on Fish
Appendix II Procedures for Measuring Pile Driving Sound

This page intentionally left blank.
Technical Guidance for the Assessment of the Hydroacoustic Effects of Pile Driving on Fish II-i October 2020
Table of Contents
II.1 Introduction ........................................................................................ II-1
II.2 Noise Descriptors ................................................................................ II-2
II.3 Underwater Sound Measurement Methodology ................................. II-6 II.3.1 Measurement Equipment ............................................................................................................. II-6 II.3.2 Measurement Sampling Positions ................................................................................................ II-9 II.3.3 Procedures .................................................................................................................................. II-10
II.3.3.1 Instrumentation Field Calibration .......................................................................... II-10 II.3.3.2 Setup and Locations ............................................................................................... II-11 II.3.3.3 Safety ...................................................................................................................... II-13 II.3.3.4 Field Logbooks ....................................................................................................... II-13
II.4 Analysis of Data and Recorded Sounds ............................................ II-13 II.4.1 Real-Time (Live) Data ............................................................................................................... II-14 II.4.2 Recorded Data ............................................................................................................................ II-15
II.5 Quality Control .................................................................................. II-17 II.5.1 Measurement Systems ............................................................................................................... II-17 II.5.2 Field Logbooks .......................................................................................................................... II-18 II.5.3 Supervision ................................................................................................................................ II-18
II.6 Reporting .......................................................................................... II-19
Technical Guidance for the Assessment of the Hydroacoustic Effects of Pile Driving on Fish II-ii October 2020
List of Tables
Table II-1. Common Airborne Noise Descriptors..................................................................................... II-2
List of Figures
Figure II-1. Acoustical Descriptors Associated with a Pile Driving Waveform ....................................... II-4
Figure II-2. Sample Narrowband Frequency Spectrum ............................................................................ II-5
Figure II-3. Schematic of a Basic Hydrophone System ............................................................................ II-7
Figure II-4. Example of a Field Measurement Setup ................................................................................ II-8
Figure II-5. Example of Different Pressure Sensors ................................................................................. II-8
Figure II-6. Calibration in the Field ........................................................................................................ II-12
Figure II-7. Example of 1 Day of Pile Driving Data from a Sound Level Meter (Five Events) ............. II-14
Figure II-8. Example of Peak and RMS Pressures for a Single Pile Driving Event ............................... II-15
Figure II-9. Series of Pile Strikes in the Time Domain ........................................................................... II-16
Figure II-10. Peak Sound Pressure of a Sample Pile Driving Pulse ....................................................... II-17
Figure II-11a–d. Example Four-Panel Display ....................................................................................... II-18
Technical Guidance for the Assessment of the Hydroacoustic Effects of Pile Driving on Fish II-iii October 2020
List of Acronyms
µPa micro-Pascal(s)
dB decibel(s)
Department California Department of Transportation
FFT Fast-Fourier Transform
Hz hertz
kHz kilohertz
Ldn day/night noise level
Leq equivalent noise level
Lmax maximum noise level
Lx statistical descriptor
RMS root mean square
RMS90% effective root mean square sound pressure level
SEL sound exposure level
TeNS Technical Noise Supplement
TNAP Traffic Noise Analysis Protocol

This page intentionally left blank.
Technical Guidance for the Assessment of the Hydroacoustic Effects of Pile Driving on Fish II-1 October 2020
Appendix II Procedures for Measuring Pile Driving Sound
II.1 Introduction
This appendix describes a proposed methodology for measuring the sounds associated with underwater pile driving. Several key issues complicate the measurement of pile driving noise, including:
• A lack of uniform terminology, • Variables in oceanic conditions during surveys and monitoring, and • Differing approaches to field measurement and resultant data.
Different measurement descriptors are used to describe underwater sounds as they may affect marine resources. Accordingly, it is critical when making underwater sound measurements to adequately define the descriptors. It is useful, and sometimes required, to collect “real-time” data and report it immediately after a monitoring event. If this is necessary, it is important to select a descriptor that can be readily measured in the field. The underwater noise environment surrounding pile driving is typically very complex because of variable water depths and currents, combined with numerous physical obstructions and interfering noise sources that can affect noise measurements.
Researchers and resource agencies are trying to understand the impacts of pile driving in marine environments through use of field measurement data gathered from various projects and from a variety of research agencies. It is therefore imperative that the data arising out of such field measurements are consistent in terms of quality and content to allow meaningful comparisons between projects.
Since 2000, numerous measurements of underwater sound from pile driving have been collected at the request of the California Department of Transportation (the Department), constructors, and other stakeholders. Experiences and the data obtained from these measurements have provided a basis for development of a standardized measurement methodology. Proper, safe, and efficient methods were established based on familiarity with the many problems associated with conducting such measurements in a marine construction environment. The methodology outlined in this document establishes standard measurement distances and depths for hydroacoustic monitoring, monitoring durations, proper calibration, and field documentation methods. In addition, requirements for the analysis of underwater signals are described, including the capability requirements for the instrumentation, noise metrics that must be evaluated both in the time and frequency domains, and suggested data presentation templates. A range of information is provided so that instrumentation specifications necessary to accurately measure underwater sound levels from pile driving can be developed.
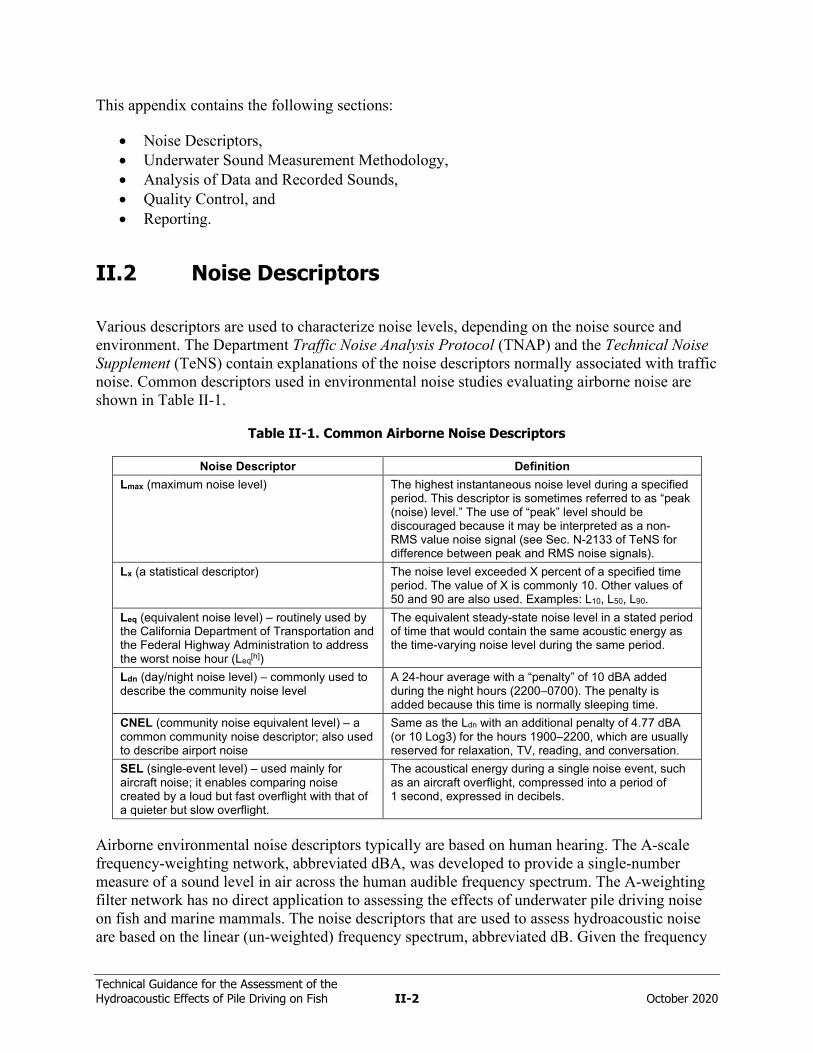
Technical Guidance for the Assessment of the Hydroacoustic Effects of Pile Driving on Fish II-2 October 2020
This appendix contains the following sections:
• Noise Descriptors, • Underwater Sound Measurement Methodology, • Analysis of Data and Recorded Sounds, • Quality Control, and • Reporting.
II.2 Noise Descriptors
Various descriptors are used to characterize noise levels, depending on the noise source and environment. The Department Traffic Noise Analysis Protocol (TNAP) and the Technical Noise Supplement (TeNS) contain explanations of the noise descriptors normally associated with traffic noise. Common descriptors used in environmental noise studies evaluating airborne noise are shown in Table II-1.
Table II-1. Common Airborne Noise Descriptors
Noise Descriptor Definition Lmax (maximum noise level) The highest instantaneous noise level during a specified
period. This descriptor is sometimes referred to as “peak (noise) level.” The use of “peak” level should be discouraged because it may be interpreted as a non-RMS value noise signal (see Sec. N-2133 of TeNS for difference between peak and RMS noise signals).
Lx (a statistical descriptor) The noise level exceeded X percent of a specified time period. The value of X is commonly 10. Other values of 50 and 90 are also used. Examples: L10, L50, L90.
Leq (equivalent noise level) – routinely used by the California Department of Transportation and the Federal Highway Administration to address the worst noise hour (Leq[h])
The equivalent steady-state noise level in a stated period of time that would contain the same acoustic energy as the time-varying noise level during the same period.
Ldn (day/night noise level) – commonly used to describe the community noise level
A 24-hour average with a “penalty” of 10 dBA added during the night hours (2200–0700). The penalty is added because this time is normally sleeping time.
CNEL (community noise equivalent level) – a common community noise descriptor; also used to describe airport noise
Same as the Ldn with an additional penalty of 4.77 dBA (or 10 Log3) for the hours 1900–2200, which are usually reserved for relaxation, TV, reading, and conversation.
SEL (single-event level) – used mainly for aircraft noise; it enables comparing noise created by a loud but fast overflight with that of a quieter but slow overflight.
The acoustical energy during a single noise event, such as an aircraft overflight, compressed into a period of 1 second, expressed in decibels.
Airborne environmental noise descriptors typically are based on human hearing. The A-scale frequency-weighting network, abbreviated dBA, was developed to provide a single-number measure of a sound level in air across the human audible frequency spectrum. The A-weighting filter network has no direct application to assessing the effects of underwater pile driving noise on fish and marine mammals. The noise descriptors that are used to assess hydroacoustic noise are based on the linear (un-weighted) frequency spectrum, abbreviated dB. Given the frequency
Technical Guidance for the Assessment of the Hydroacoustic Effects of Pile Driving on Fish II-3 October 2020
content of the pile driving pulses and the limitations of instrumentation that is commonly available to noise analysts, the un-weighted frequency spectrum is limited to the frequency range of 20 hertz (Hz) to 10 kilohertz (kHz) to accommodate the data acquisition of pile driving pulses from a wide variety of pile types and conditions.
All sound levels represented in decibels are related to a reference pressure. For airborne sound, the reference pressure is 20 micro-Pascals (µPa) (threshold of hearing human). For underwater sound, the reference pressure is 1 µPa. The 1- µPa reference pressure is mathematically convenient but results in a mathematical offset of +26 dB when compared to decibels based on the 20-µPa reference pressure.
When a pile driving hammer strikes a pile, a vibratory motion is created that propagates through the pile and radiates a pulse into the water and the ground substrate, as well as into the air. The rise and fall of the sound pressure pulse, represented in the time domain, is referred to as the waveform. The peak pressure is the highest absolute value of the measured waveform, and can be a negative or positive pressure peak. The root mean square (RMS) level for the pulse is calculated by computing the average of the squared pressures over the time that comprises the portion of the waveform containing 90 percent of the sound energy.1 This RMS term is described as the effective RMS level and is abbreviated RMS90% in this report. The RMS90% level can be approximated for impact pile driving by measuring the signal with a precision sound level meter set to the “impulse” RMS setting All peak pressures and RMS sound pressure levels are expressed in decibels referenced to 1 µPa (dB re: 1µPa). Another measure of the pressure waveform that can be used to describe the pulse is the sound energy in the pulse. The total sound energy in the pulse is described using various terms. Assuming plane wave propagation, the total sound energy can be considered equivalent to the un-weighted sound exposure level (SEL), a common unit of sound energy used in airborne acoustics to describe short-duration events. The unit for SEL is dB re: 1µPa2-sec.
Figure II-1 shows a sample pile driving waveform and the various acoustical descriptions associated with the signal.
1 Richardson, Greene, Malone & Thomson, Marine Mammals and Noise, Academic Press, 1995; and Greene, personal communication.
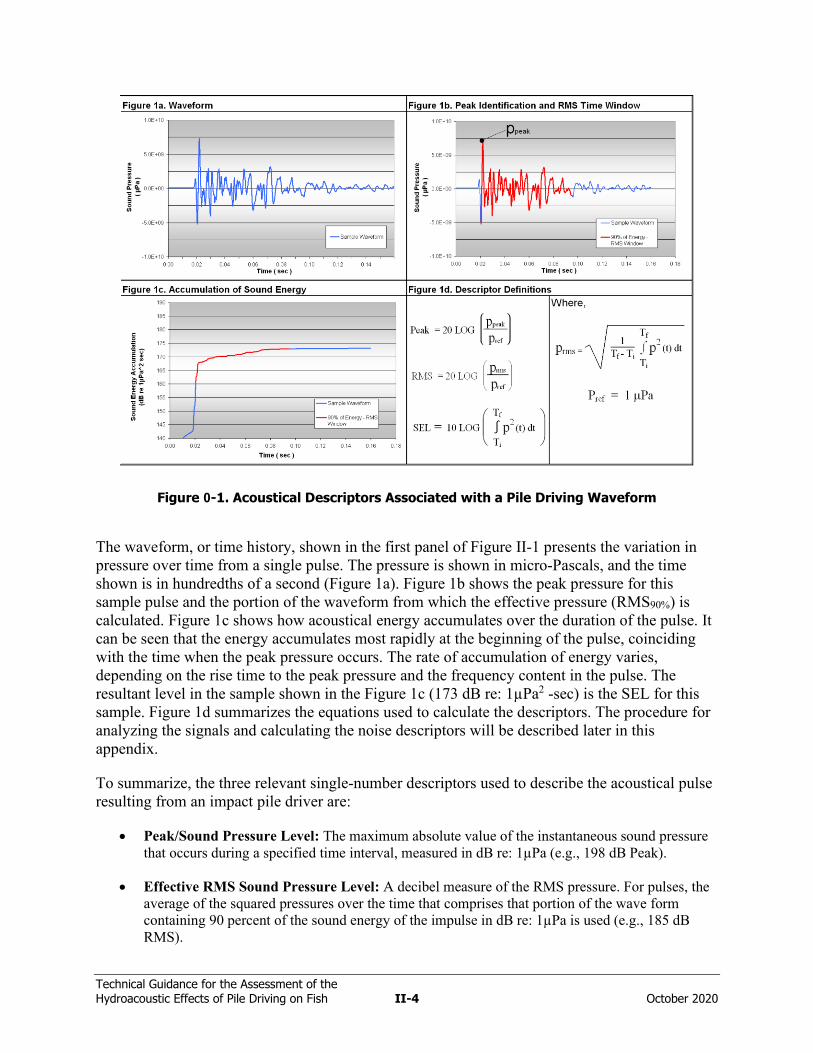
Technical Guidance for the Assessment of the Hydroacoustic Effects of Pile Driving on Fish II-4 October 2020
Figure 0-1. Acoustical Descriptors Associated with a Pile Driving Waveform
The waveform, or time history, shown in the first panel of Figure II-1 presents the variation in pressure over time from a single pulse. The pressure is shown in micro-Pascals, and the time shown is in hundredths of a second (Figure 1a). Figure 1b shows the peak pressure for this sample pulse and the portion of the waveform from which the effective pressure (RMS90%) is calculated. Figure 1c shows how acoustical energy accumulates over the duration of the pulse. It can be seen that the energy accumulates most rapidly at the beginning of the pulse, coinciding with the time when the peak pressure occurs. The rate of accumulation of energy varies, depending on the rise time to the peak pressure and the frequency content in the pulse. The resultant level in the sample shown in the Figure 1c (173 dB re: 1µPa2 -sec) is the SEL for this sample. Figure 1d summarizes the equations used to calculate the descriptors. The procedure for analyzing the signals and calculating the noise descriptors will be described later in this appendix.
To summarize, the three relevant single-number descriptors used to describe the acoustical pulse resulting from an impact pile driver are:
• Peak/Sound Pressure Level: The maximum absolute value of the instantaneous sound pressure that occurs during a specified time interval, measured in dB re: 1µPa (e.g., 198 dB Peak).
• Effective RMS Sound Pressure Level: A decibel measure of the RMS pressure. For pulses, the average of the squared pressures over the time that comprises that portion of the wave form containing 90 percent of the sound energy of the impulse in dB re: 1µPa is used (e.g., 185 dB RMS).
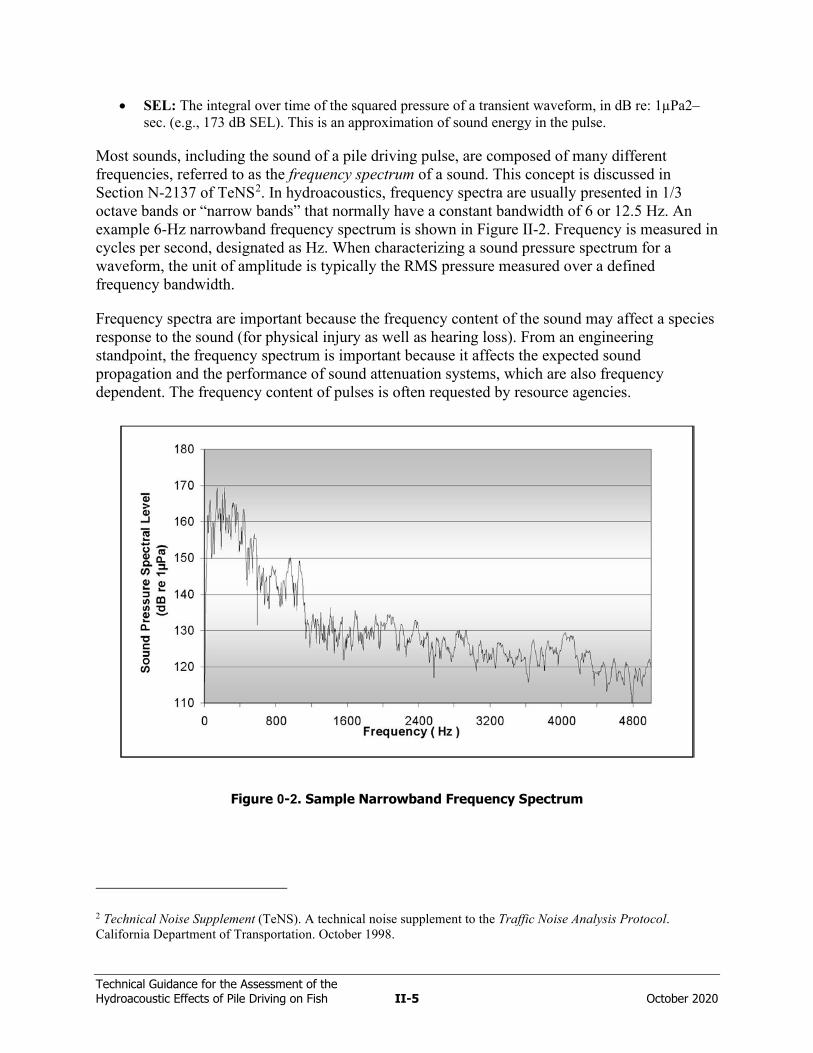
Technical Guidance for the Assessment of the Hydroacoustic Effects of Pile Driving on Fish II-5 October 2020
• SEL: The integral over time of the squared pressure of a transient waveform, in dB re: 1µPa2–sec. (e.g., 173 dB SEL). This is an approximation of sound energy in the pulse.
Most sounds, including the sound of a pile driving pulse, are composed of many different frequencies, referred to as the frequency spectrum of a sound. This concept is discussed in Section N-2137 of TeNS2. In hydroacoustics, frequency spectra are usually presented in 1/3 octave bands or “narrow bands” that normally have a constant bandwidth of 6 or 12.5 Hz. An example 6-Hz narrowband frequency spectrum is shown in Figure II-2. Frequency is measured in cycles per second, designated as Hz. When characterizing a sound pressure spectrum for a waveform, the unit of amplitude is typically the RMS pressure measured over a defined frequency bandwidth.
Frequency spectra are important because the frequency content of the sound may affect a species response to the sound (for physical injury as well as hearing loss). From an engineering standpoint, the frequency spectrum is important because it affects the expected sound propagation and the performance of sound attenuation systems, which are also frequency dependent. The frequency content of pulses is often requested by resource agencies.
Figure 0-2. Sample Narrowband Frequency Spectrum
2 Technical Noise Supplement (TeNS). A technical noise supplement to the Traffic Noise Analysis Protocol. California Department of Transportation. October 1998.
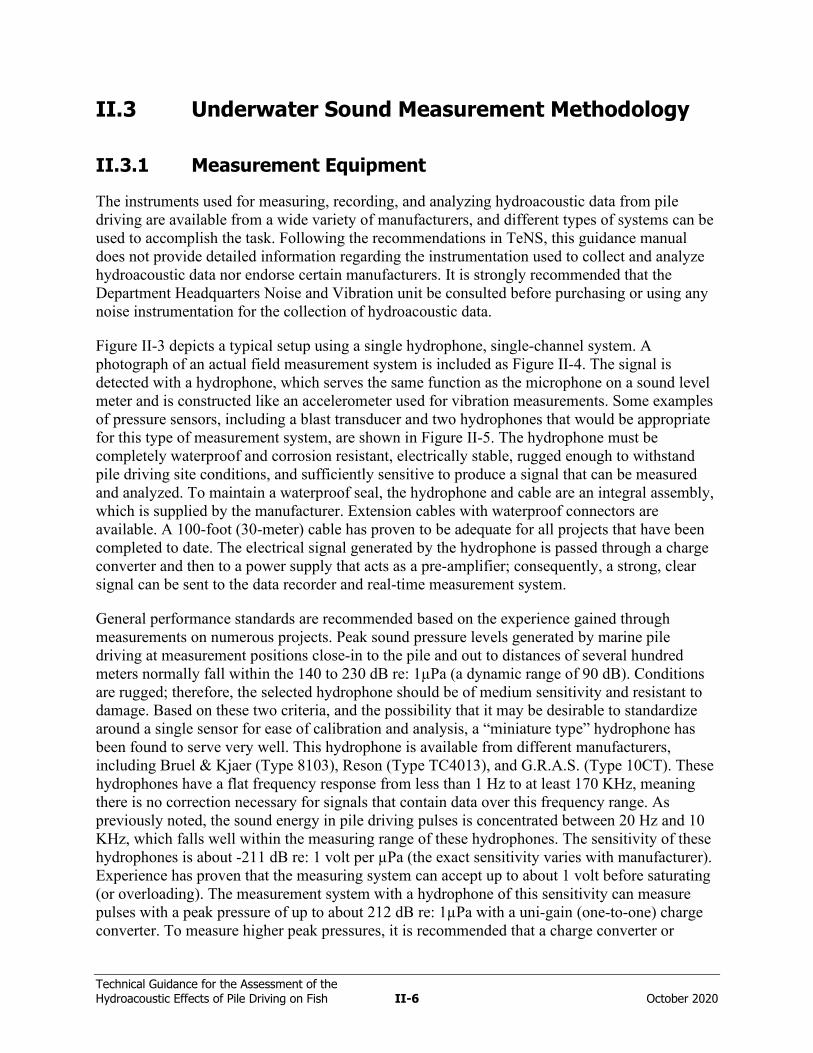
Technical Guidance for the Assessment of the Hydroacoustic Effects of Pile Driving on Fish II-6 October 2020
II.3 Underwater Sound Measurement Methodology
II.3.1 Measurement Equipment
The instruments used for measuring, recording, and analyzing hydroacoustic data from pile driving are available from a wide variety of manufacturers, and different types of systems can be used to accomplish the task. Following the recommendations in TeNS, this guidance manual does not provide detailed information regarding the instrumentation used to collect and analyze hydroacoustic data nor endorse certain manufacturers. It is strongly recommended that the Department Headquarters Noise and Vibration unit be consulted before purchasing or using any noise instrumentation for the collection of hydroacoustic data.
Figure II-3 depicts a typical setup using a single hydrophone, single-channel system. A photograph of an actual field measurement system is included as Figure II-4. The signal is detected with a hydrophone, which serves the same function as the microphone on a sound level meter and is constructed like an accelerometer used for vibration measurements. Some examples of pressure sensors, including a blast transducer and two hydrophones that would be appropriate for this type of measurement system, are shown in Figure II-5. The hydrophone must be completely waterproof and corrosion resistant, electrically stable, rugged enough to withstand pile driving site conditions, and sufficiently sensitive to produce a signal that can be measured and analyzed. To maintain a waterproof seal, the hydrophone and cable are an integral assembly, which is supplied by the manufacturer. Extension cables with waterproof connectors are available. A 100-foot (30-meter) cable has proven to be adequate for all projects that have been completed to date. The electrical signal generated by the hydrophone is passed through a charge converter and then to a power supply that acts as a pre-amplifier; consequently, a strong, clear signal can be sent to the data recorder and real-time measurement system.
General performance standards are recommended based on the experience gained through measurements on numerous projects. Peak sound pressure levels generated by marine pile driving at measurement positions close-in to the pile and out to distances of several hundred meters normally fall within the 140 to 230 dB re: 1µPa (a dynamic range of 90 dB). Conditions are rugged; therefore, the selected hydrophone should be of medium sensitivity and resistant to damage. Based on these two criteria, and the possibility that it may be desirable to standardize around a single sensor for ease of calibration and analysis, a “miniature type” hydrophone has been found to serve very well. This hydrophone is available from different manufacturers, including Bruel & Kjaer (Type 8103), Reson (Type TC4013), and G.R.A.S. (Type 10CT). These hydrophones have a flat frequency response from less than 1 Hz to at least 170 KHz, meaning there is no correction necessary for signals that contain data over this frequency range. As previously noted, the sound energy in pile driving pulses is concentrated between 20 Hz and 10 KHz, which falls well within the measuring range of these hydrophones. The sensitivity of these hydrophones is about -211 dB re: 1 volt per µPa (the exact sensitivity varies with manufacturer). Experience has proven that the measuring system can accept up to about 1 volt before saturating (or overloading). The measurement system with a hydrophone of this sensitivity can measure pulses with a peak pressure of up to about 212 dB re: 1µPa with a uni-gain (one-to-one) charge converter. To measure higher peak pressures, it is recommended that a charge converter or
Technical Guidance for the Assessment of the Hydroacoustic Effects of Pile Driving on Fish II-7 October 2020
charge amplifier be used that can attenuate the signal from the hydrophone. An inexpensive charge converter with 20-dB step attenuation built into it can replace the uni-gain charge converter and accomplish this task. The power supply should include amplifiers that can be adjusted in accurate discrete steps (e.g., 6 dB or 20 dB) to amplify the signal. This allows low-level signals to be accurately recorded. Suitable power supplies are available from Bruel & Kjaer, G.R.A.S., PCB, and other manufacturers.
Figure 0-3. Schematic of a Basic Hydrophone System
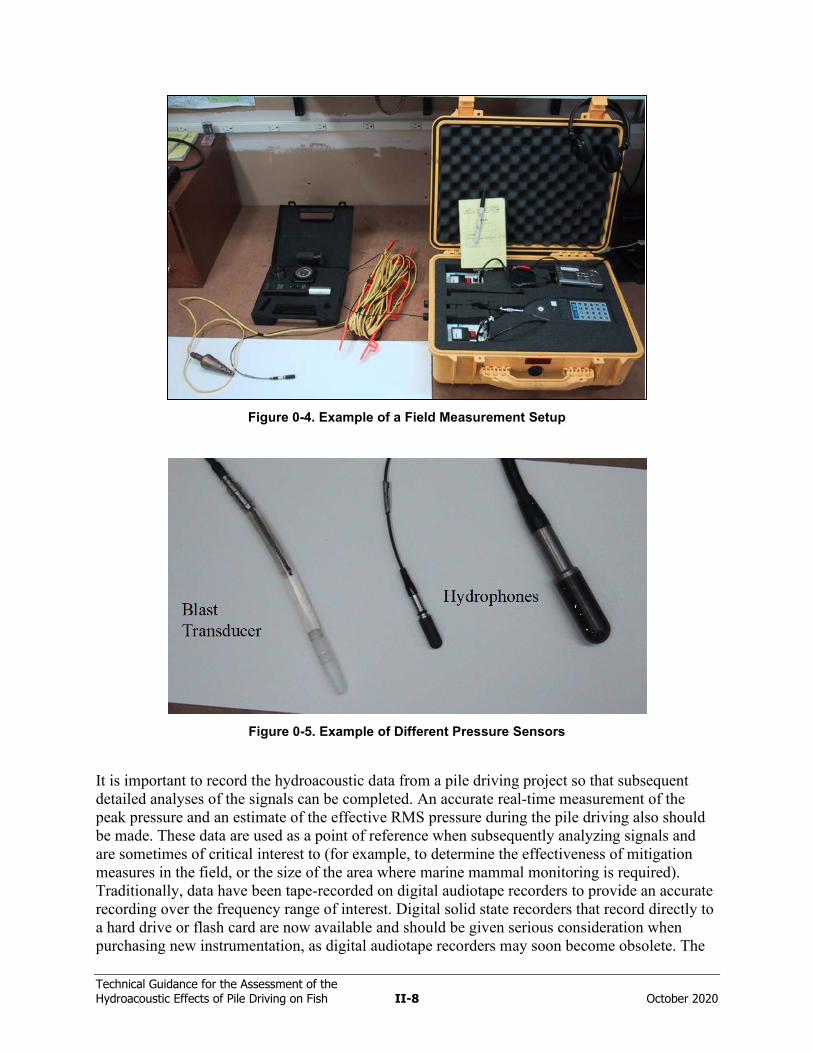
Technical Guidance for the Assessment of the Hydroacoustic Effects of Pile Driving on Fish II-8 October 2020
Figure 0-4. Example of a Field Measurement Setup
Figure 0-5. Example of Different Pressure Sensors
It is important to record the hydroacoustic data from a pile driving project so that subsequent detailed analyses of the signals can be completed. An accurate real-time measurement of the peak pressure and an estimate of the effective RMS pressure during the pile driving also should be made. These data are used as a point of reference when subsequently analyzing signals and are sometimes of critical interest to (for example, to determine the effectiveness of mitigation measures in the field, or the size of the area where marine mammal monitoring is required). Traditionally, data have been tape-recorded on digital audiotape recorders to provide an accurate recording over the frequency range of interest. Digital solid state recorders that record directly to a hard drive or flash card are now available and should be given serious consideration when purchasing new instrumentation, as digital audiotape recorders may soon become obsolete. The
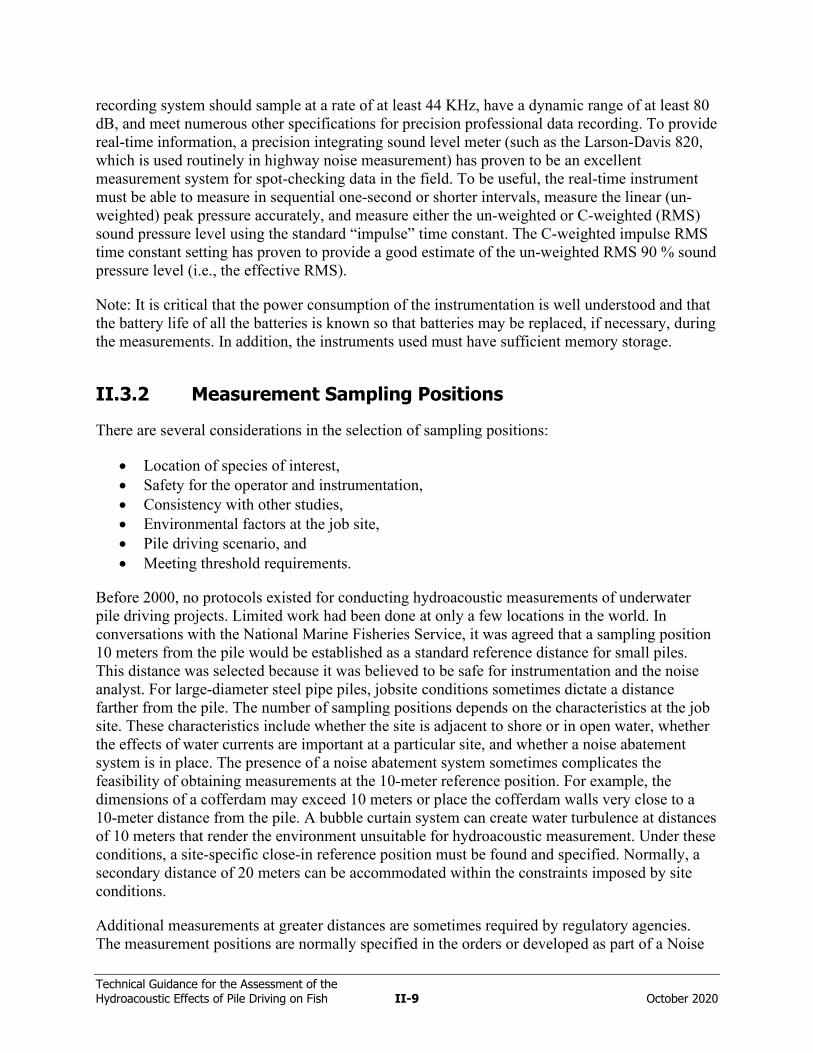
Technical Guidance for the Assessment of the Hydroacoustic Effects of Pile Driving on Fish II-9 October 2020
recording system should sample at a rate of at least 44 KHz, have a dynamic range of at least 80 dB, and meet numerous other specifications for precision professional data recording. To provide real-time information, a precision integrating sound level meter (such as the Larson-Davis 820, which is used routinely in highway noise measurement) has proven to be an excellent measurement system for spot-checking data in the field. To be useful, the real-time instrument must be able to measure in sequential one-second or shorter intervals, measure the linear (un-weighted) peak pressure accurately, and measure either the un-weighted or C-weighted (RMS) sound pressure level using the standard “impulse” time constant. The C-weighted impulse RMS time constant setting has proven to provide a good estimate of the un-weighted RMS 90 % sound pressure level (i.e., the effective RMS).
Note: It is critical that the power consumption of the instrumentation is well understood and that the battery life of all the batteries is known so that batteries may be replaced, if necessary, during the measurements. In addition, the instruments used must have sufficient memory storage.
II.3.2 Measurement Sampling Positions
There are several considerations in the selection of sampling positions:
• Location of species of interest, • Safety for the operator and instrumentation, • Consistency with other studies, • Environmental factors at the job site, • Pile driving scenario, and • Meeting threshold requirements.
Before 2000, no protocols existed for conducting hydroacoustic measurements of underwater pile driving projects. Limited work had been done at only a few locations in the world. In conversations with the National Marine Fisheries Service, it was agreed that a sampling position 10 meters from the pile would be established as a standard reference distance for small piles. This distance was selected because it was believed to be safe for instrumentation and the noise analyst. For large-diameter steel pipe piles, jobsite conditions sometimes dictate a distance farther from the pile. The number of sampling positions depends on the characteristics at the job site. These characteristics include whether the site is adjacent to shore or in open water, whether the effects of water currents are important at a particular site, and whether a noise abatement system is in place. The presence of a noise abatement system sometimes complicates the feasibility of obtaining measurements at the 10-meter reference position. For example, the dimensions of a cofferdam may exceed 10 meters or place the cofferdam walls very close to a 10-meter distance from the pile. A bubble curtain system can create water turbulence at distances of 10 meters that render the environment unsuitable for hydroacoustic measurement. Under these conditions, a site-specific close-in reference position must be found and specified. Normally, a secondary distance of 20 meters can be accommodated within the constraints imposed by site conditions.
Additional measurements at greater distances are sometimes required by regulatory agencies. The measurement positions are normally specified in the orders or developed as part of a Noise
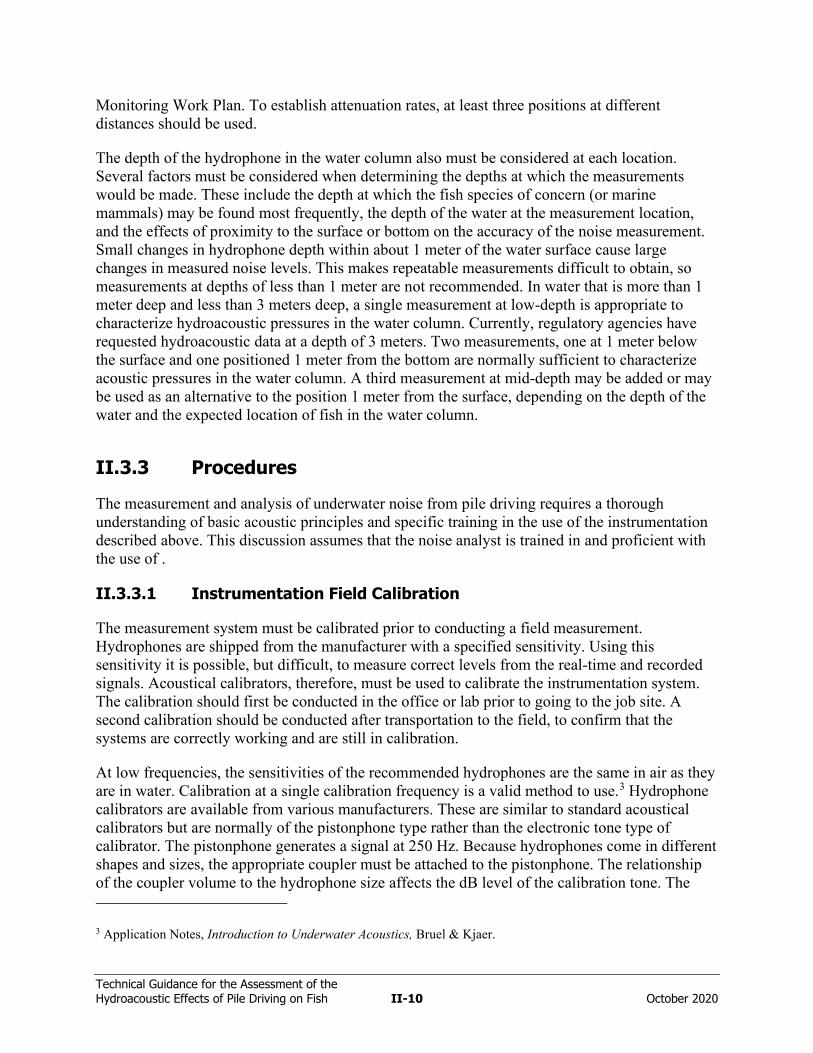
Technical Guidance for the Assessment of the Hydroacoustic Effects of Pile Driving on Fish II-10 October 2020
Monitoring Work Plan. To establish attenuation rates, at least three positions at different distances should be used.
The depth of the hydrophone in the water column also must be considered at each location. Several factors must be considered when determining the depths at which the measurements would be made. These include the depth at which the fish species of concern (or marine mammals) may be found most frequently, the depth of the water at the measurement location, and the effects of proximity to the surface or bottom on the accuracy of the noise measurement. Small changes in hydrophone depth within about 1 meter of the water surface cause large changes in measured noise levels. This makes repeatable measurements difficult to obtain, so measurements at depths of less than 1 meter are not recommended. In water that is more than 1 meter deep and less than 3 meters deep, a single measurement at low-depth is appropriate to characterize hydroacoustic pressures in the water column. Currently, regulatory agencies have requested hydroacoustic data at a depth of 3 meters. Two measurements, one at 1 meter below the surface and one positioned 1 meter from the bottom are normally sufficient to characterize acoustic pressures in the water column. A third measurement at mid-depth may be added or may be used as an alternative to the position 1 meter from the surface, depending on the depth of the water and the expected location of fish in the water column.
II.3.3 Procedures
The measurement and analysis of underwater noise from pile driving requires a thorough understanding of basic acoustic principles and specific training in the use of the instrumentation described above. This discussion assumes that the noise analyst is trained in and proficient with the use of .
II.3.3.1 Instrumentation Field Calibration
The measurement system must be calibrated prior to conducting a field measurement. Hydrophones are shipped from the manufacturer with a specified sensitivity. Using this sensitivity it is possible, but difficult, to measure correct levels from the real-time and recorded signals. Acoustical calibrators, therefore, must be used to calibrate the instrumentation system. The calibration should first be conducted in the office or lab prior to going to the job site. A second calibration should be conducted after transportation to the field, to confirm that the systems are correctly working and are still in calibration.
At low frequencies, the sensitivities of the recommended hydrophones are the same in air as they are in water. Calibration at a single calibration frequency is a valid method to use.3 Hydrophone calibrators are available from various manufacturers. These are similar to standard acoustical calibrators but are normally of the pistonphone type rather than the electronic tone type of calibrator. The pistonphone generates a signal at 250 Hz. Because hydrophones come in different shapes and sizes, the appropriate coupler must be attached to the pistonphone. The relationship of the coupler volume to the hydrophone size affects the dB level of the calibration tone. The
3 Application Notes, Introduction to Underwater Acoustics, Bruel & Kjaer.
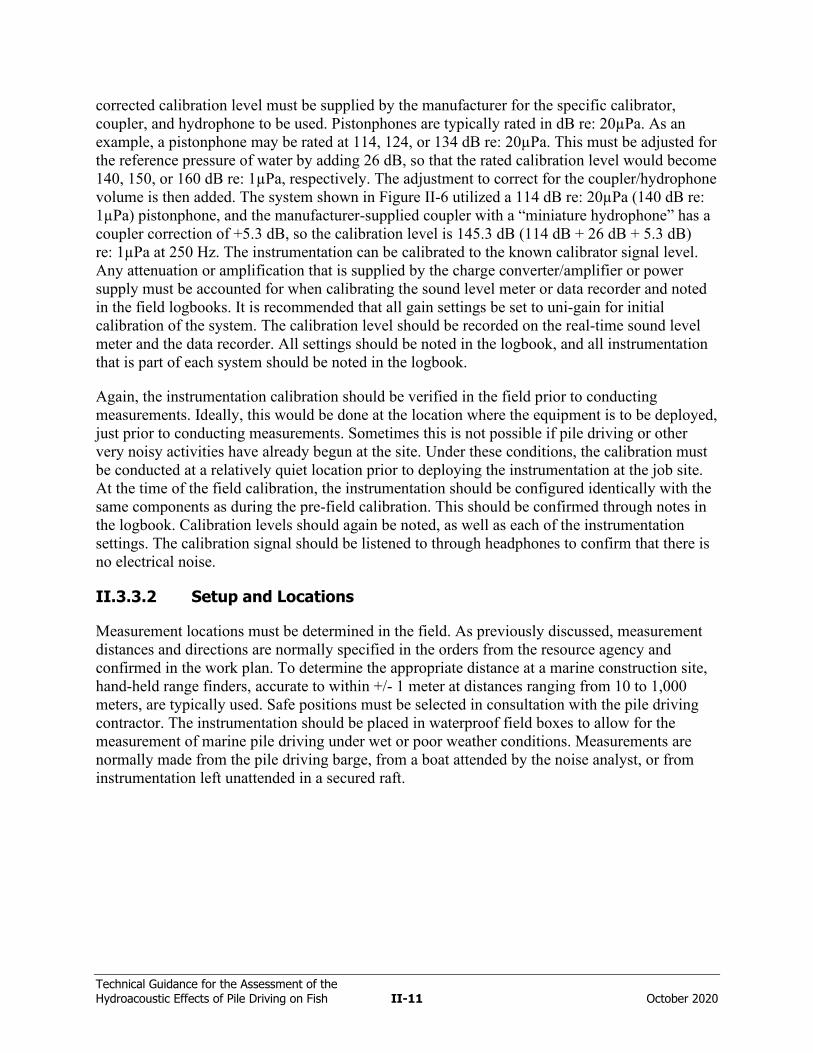
Technical Guidance for the Assessment of the Hydroacoustic Effects of Pile Driving on Fish II-11 October 2020
corrected calibration level must be supplied by the manufacturer for the specific calibrator, coupler, and hydrophone to be used. Pistonphones are typically rated in dB re: 20µPa. As an example, a pistonphone may be rated at 114, 124, or 134 dB re: 20µPa. This must be adjusted for the reference pressure of water by adding 26 dB, so that the rated calibration level would become 140, 150, or 160 dB re: 1µPa, respectively. The adjustment to correct for the coupler/hydrophone volume is then added. The system shown in Figure II-6 utilized a 114 dB re: 20µPa (140 dB re: 1µPa) pistonphone, and the manufacturer-supplied coupler with a “miniature hydrophone” has a coupler correction of +5.3 dB, so the calibration level is 145.3 dB (114 dB + 26 dB + 5.3 dB) re: 1µPa at 250 Hz. The instrumentation can be calibrated to the known calibrator signal level. Any attenuation or amplification that is supplied by the charge converter/amplifier or power supply must be accounted for when calibrating the sound level meter or data recorder and noted in the field logbooks. It is recommended that all gain settings be set to uni-gain for initial calibration of the system. The calibration level should be recorded on the real-time sound level meter and the data recorder. All settings should be noted in the logbook, and all instrumentation that is part of each system should be noted in the logbook.
Again, the instrumentation calibration should be verified in the field prior to conducting measurements. Ideally, this would be done at the location where the equipment is to be deployed, just prior to conducting measurements. Sometimes this is not possible if pile driving or other very noisy activities have already begun at the site. Under these conditions, the calibration must be conducted at a relatively quiet location prior to deploying the instrumentation at the job site. At the time of the field calibration, the instrumentation should be configured identically with the same components as during the pre-field calibration. This should be confirmed through notes in the logbook. Calibration levels should again be noted, as well as each of the instrumentation settings. The calibration signal should be listened to through headphones to confirm that there is no electrical noise.
II.3.3.2 Setup and Locations
Measurement locations must be determined in the field. As previously discussed, measurement distances and directions are normally specified in the orders from the resource agency and confirmed in the work plan. To determine the appropriate distance at a marine construction site, hand-held range finders, accurate to within +/- 1 meter at distances ranging from 10 to 1,000 meters, are typically used. Safe positions must be selected in consultation with the pile driving contractor. The instrumentation should be placed in waterproof field boxes to allow for the measurement of marine pile driving under wet or poor weather conditions. Measurements are normally made from the pile driving barge, from a boat attended by the noise analyst, or from instrumentation left unattended in a secured raft.
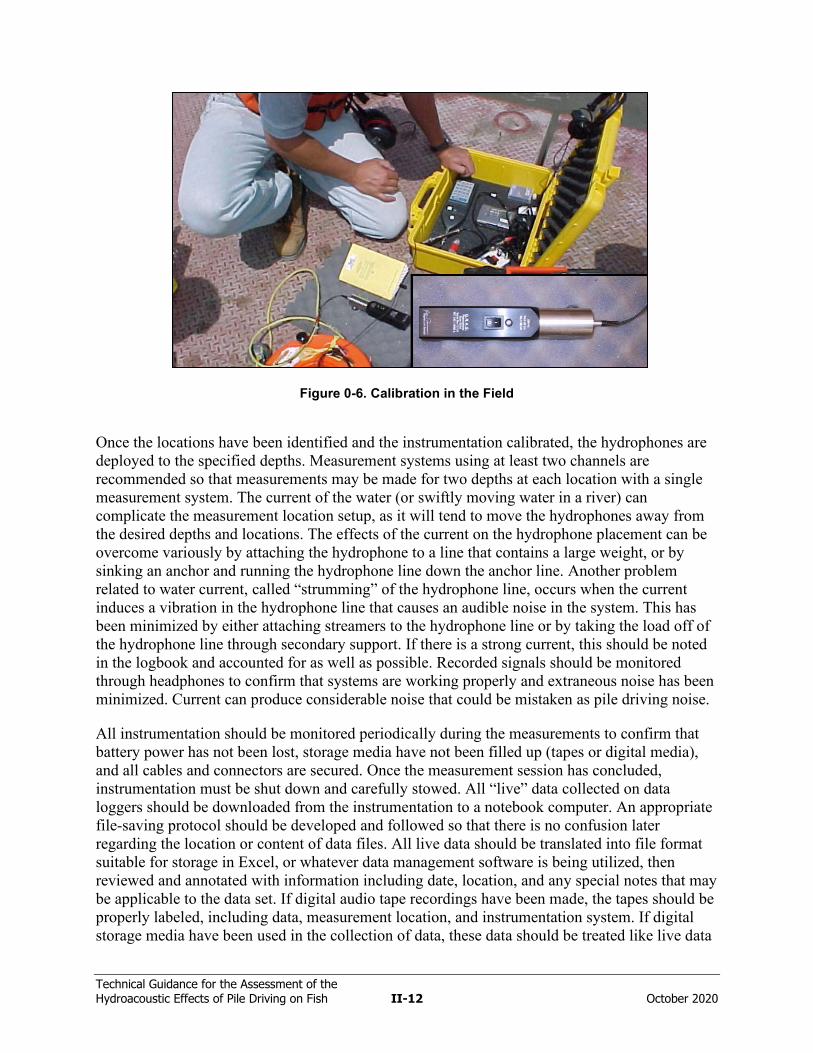
Technical Guidance for the Assessment of the Hydroacoustic Effects of Pile Driving on Fish II-12 October 2020
Figure 0-6. Calibration in the Field
Once the locations have been identified and the instrumentation calibrated, the hydrophones are deployed to the specified depths. Measurement systems using at least two channels are recommended so that measurements may be made for two depths at each location with a single measurement system. The current of the water (or swiftly moving water in a river) can complicate the measurement location setup, as it will tend to move the hydrophones away from the desired depths and locations. The effects of the current on the hydrophone placement can be overcome variously by attaching the hydrophone to a line that contains a large weight, or by sinking an anchor and running the hydrophone line down the anchor line. Another problem related to water current, called “strumming” of the hydrophone line, occurs when the current induces a vibration in the hydrophone line that causes an audible noise in the system. This has been minimized by either attaching streamers to the hydrophone line or by taking the load off of the hydrophone line through secondary support. If there is a strong current, this should be noted in the logbook and accounted for as well as possible. Recorded signals should be monitored through headphones to confirm that systems are working properly and extraneous noise has been minimized. Current can produce considerable noise that could be mistaken as pile driving noise.
All instrumentation should be monitored periodically during the measurements to confirm that battery power has not been lost, storage media have not been filled up (tapes or digital media), and all cables and connectors are secured. Once the measurement session has concluded, instrumentation must be shut down and carefully stowed. All “live” data collected on data loggers should be downloaded from the instrumentation to a notebook computer. An appropriate file-saving protocol should be developed and followed so that there is no confusion later regarding the location or content of data files. All live data should be translated into file format suitable for storage in Excel, or whatever data management software is being utilized, then reviewed and annotated with information including date, location, and any special notes that may be applicable to the data set. If digital audio tape recordings have been made, the tapes should be properly labeled, including data, measurement location, and instrumentation system. If digital storage media have been used in the collection of data, these data should be treated like live data
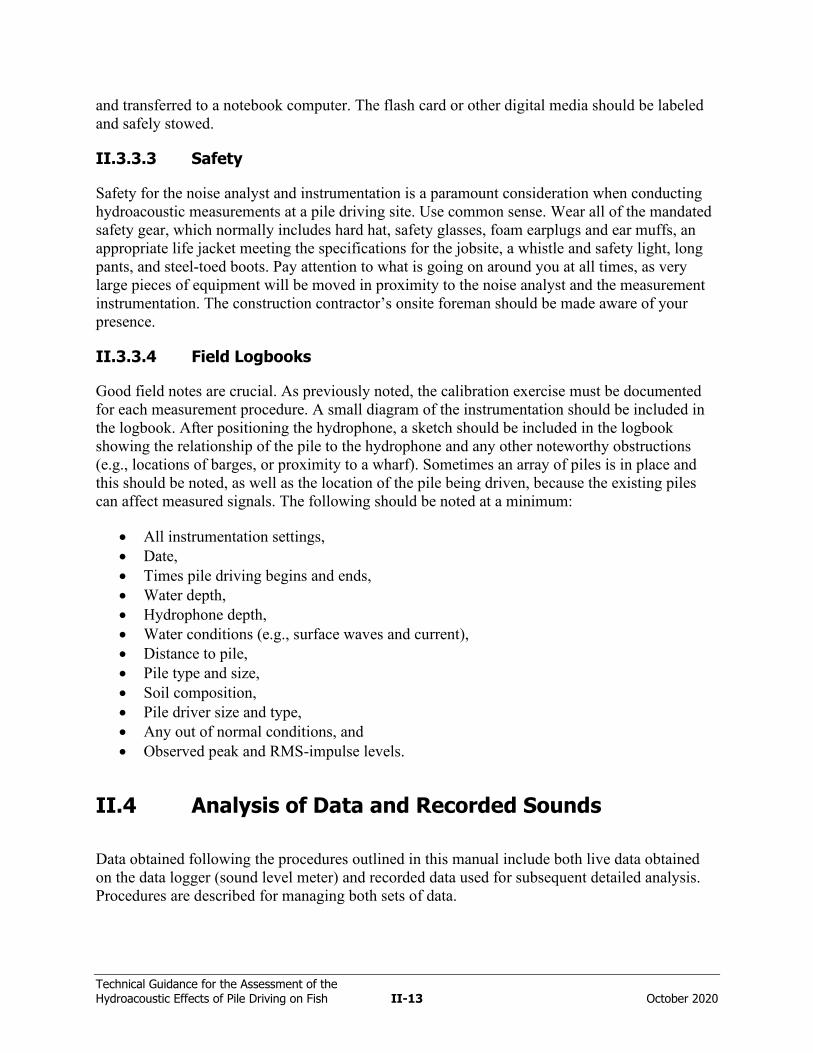
Technical Guidance for the Assessment of the Hydroacoustic Effects of Pile Driving on Fish II-13 October 2020
and transferred to a notebook computer. The flash card or other digital media should be labeled and safely stowed.
II.3.3.3 Safety
Safety for the noise analyst and instrumentation is a paramount consideration when conducting hydroacoustic measurements at a pile driving site. Use common sense. Wear all of the mandated safety gear, which normally includes hard hat, safety glasses, foam earplugs and ear muffs, an appropriate life jacket meeting the specifications for the jobsite, a whistle and safety light, long pants, and steel-toed boots. Pay attention to what is going on around you at all times, as very large pieces of equipment will be moved in proximity to the noise analyst and the measurement instrumentation. The construction contractor’s onsite foreman should be made aware of your presence.
II.3.3.4 Field Logbooks
Good field notes are crucial. As previously noted, the calibration exercise must be documented for each measurement procedure. A small diagram of the instrumentation should be included in the logbook. After positioning the hydrophone, a sketch should be included in the logbook showing the relationship of the pile to the hydrophone and any other noteworthy obstructions (e.g., locations of barges, or proximity to a wharf). Sometimes an array of piles is in place and this should be noted, as well as the location of the pile being driven, because the existing piles can affect measured signals. The following should be noted at a minimum:
• All instrumentation settings, • Date, • Times pile driving begins and ends, • Water depth, • Hydrophone depth, • Water conditions (e.g., surface waves and current), • Distance to pile, • Pile type and size, • Soil composition, • Pile driver size and type, • Any out of normal conditions, and • Observed peak and RMS-impulse levels.
II.4 Analysis of Data and Recorded Sounds
Data obtained following the procedures outlined in this manual include both live data obtained on the data logger (sound level meter) and recorded data used for subsequent detailed analysis. Procedures are described for managing both sets of data.
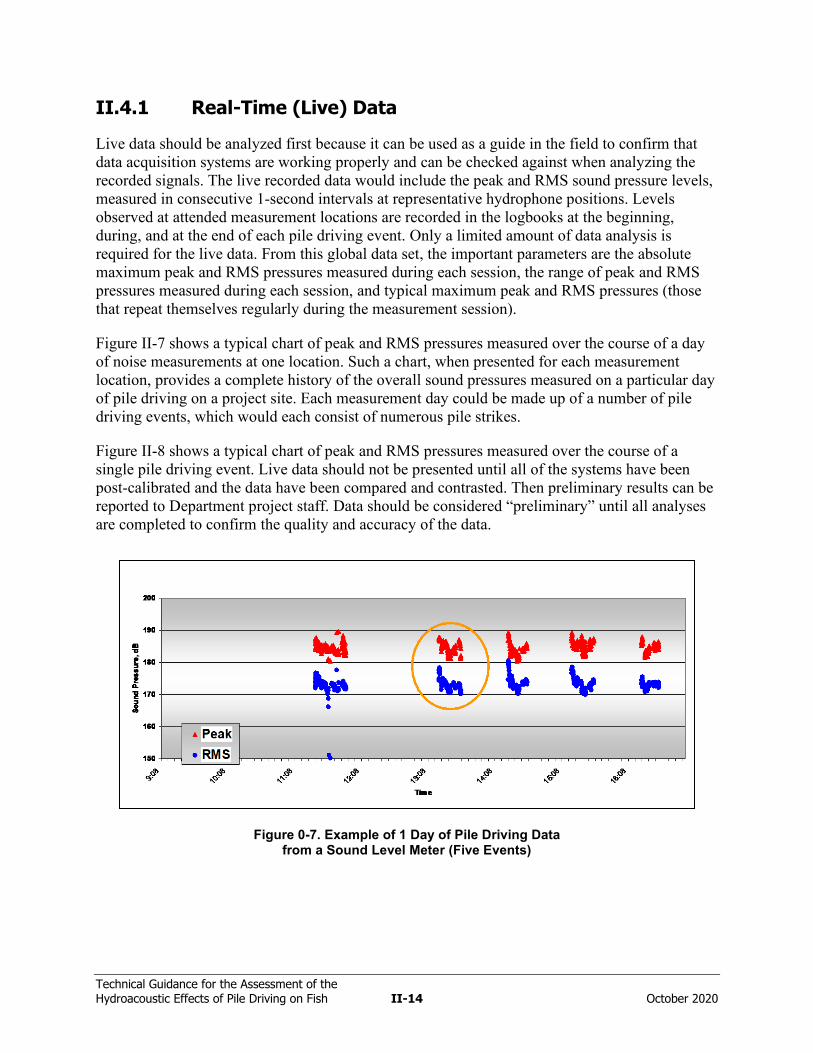
Technical Guidance for the Assessment of the Hydroacoustic Effects of Pile Driving on Fish II-14 October 2020
II.4.1 Real-Time (Live) Data
Live data should be analyzed first because it can be used as a guide in the field to confirm that data acquisition systems are working properly and can be checked against when analyzing the recorded signals. The live recorded data would include the peak and RMS sound pressure levels, measured in consecutive 1-second intervals at representative hydrophone positions. Levels observed at attended measurement locations are recorded in the logbooks at the beginning, during, and at the end of each pile driving event. Only a limited amount of data analysis is required for the live data. From this global data set, the important parameters are the absolute maximum peak and RMS pressures measured during each session, the range of peak and RMS pressures measured during each session, and typical maximum peak and RMS pressures (those that repeat themselves regularly during the measurement session).
Figure II-7 shows a typical chart of peak and RMS pressures measured over the course of a day of noise measurements at one location. Such a chart, when presented for each measurement location, provides a complete history of the overall sound pressures measured on a particular day of pile driving on a project site. Each measurement day could be made up of a number of pile driving events, which would each consist of numerous pile strikes.
Figure II-8 shows a typical chart of peak and RMS pressures measured over the course of a single pile driving event. Live data should not be presented until all of the systems have been post-calibrated and the data have been compared and contrasted. Then preliminary results can be reported to Department project staff. Data should be considered “preliminary” until all analyses are completed to confirm the quality and accuracy of the data.
Figure 0-7. Example of 1 Day of Pile Driving Data from a Sound Level Meter (Five Events)
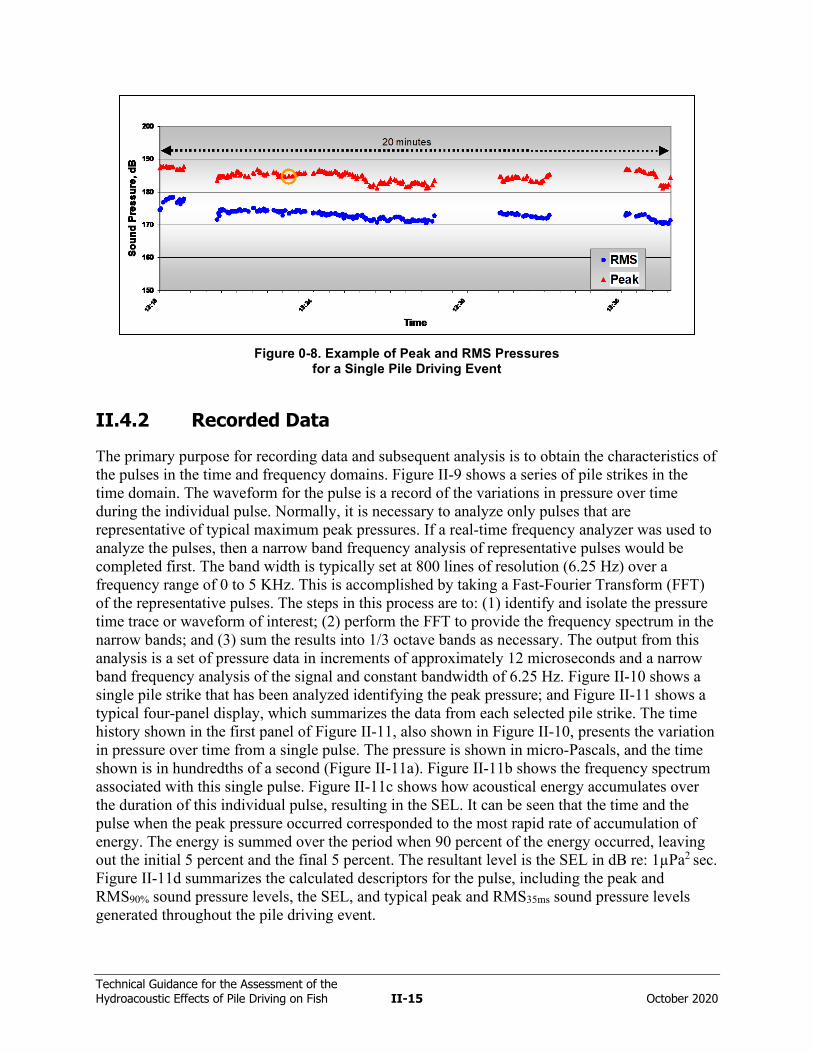
Technical Guidance for the Assessment of the Hydroacoustic Effects of Pile Driving on Fish II-15 October 2020
Figure 0-8. Example of Peak and RMS Pressures for a Single Pile Driving Event
II.4.2 Recorded Data
The primary purpose for recording data and subsequent analysis is to obtain the characteristics of the pulses in the time and frequency domains. Figure II-9 shows a series of pile strikes in the time domain. The waveform for the pulse is a record of the variations in pressure over time during the individual pulse. Normally, it is necessary to analyze only pulses that are representative of typical maximum peak pressures. If a real-time frequency analyzer was used to analyze the pulses, then a narrow band frequency analysis of representative pulses would be completed first. The band width is typically set at 800 lines of resolution (6.25 Hz) over a frequency range of 0 to 5 KHz. This is accomplished by taking a Fast-Fourier Transform (FFT) of the representative pulses. The steps in this process are to: (1) identify and isolate the pressure time trace or waveform of interest; (2) perform the FFT to provide the frequency spectrum in the narrow bands; and (3) sum the results into 1/3 octave bands as necessary. The output from this analysis is a set of pressure data in increments of approximately 12 microseconds and a narrow band frequency analysis of the signal and constant bandwidth of 6.25 Hz. Figure II-10 shows a single pile strike that has been analyzed identifying the peak pressure; and Figure II-11 shows a typical four-panel display, which summarizes the data from each selected pile strike. The time history shown in the first panel of Figure II-11, also shown in Figure II-10, presents the variation in pressure over time from a single pulse. The pressure is shown in micro-Pascals, and the time shown is in hundredths of a second (Figure II-11a). Figure II-11b shows the frequency spectrum associated with this single pulse. Figure II-11c shows how acoustical energy accumulates over the duration of this individual pulse, resulting in the SEL. It can be seen that the time and the pulse when the peak pressure occurred corresponded to the most rapid rate of accumulation of energy. The energy is summed over the period when 90 percent of the energy occurred, leaving out the initial 5 percent and the final 5 percent. The resultant level is the SEL in dB re: 1µPa2 sec. Figure II-11d summarizes the calculated descriptors for the pulse, including the peak and RMS90% sound pressure levels, the SEL, and typical peak and RMS35ms sound pressure levels generated throughout the pile driving event.
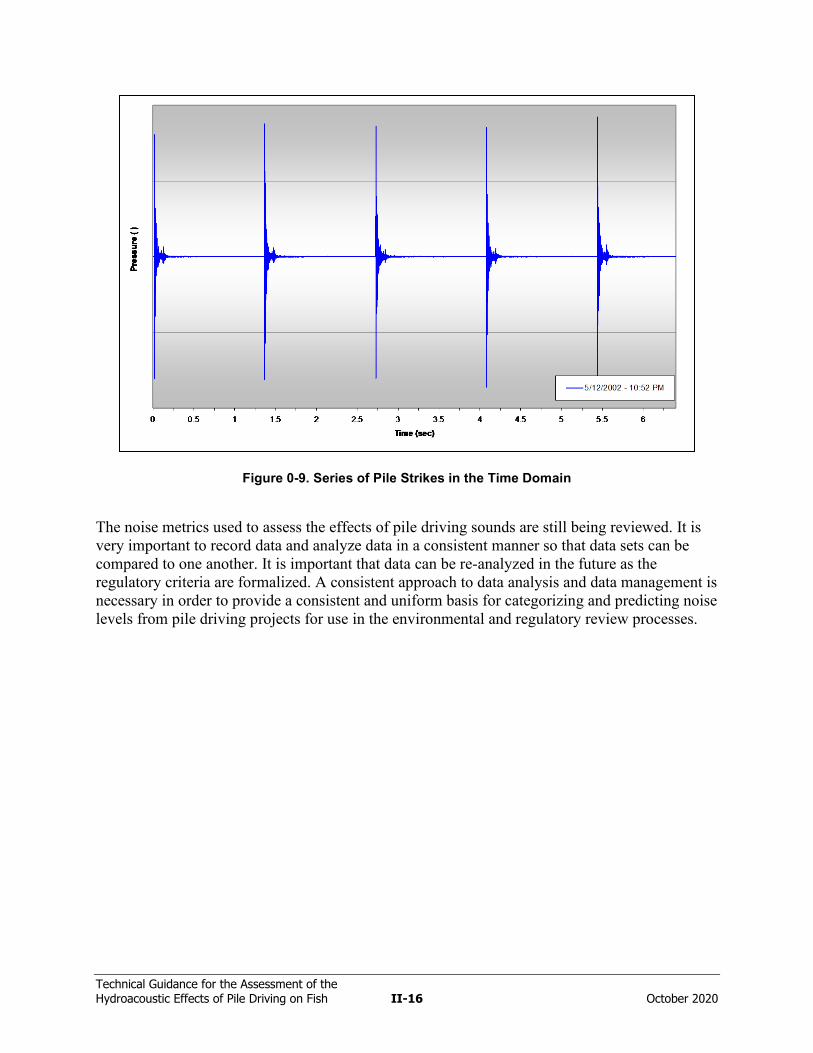
Technical Guidance for the Assessment of the Hydroacoustic Effects of Pile Driving on Fish II-16 October 2020
Figure 0-9. Series of Pile Strikes in the Time Domain
The noise metrics used to assess the effects of pile driving sounds are still being reviewed. It is very important to record data and analyze data in a consistent manner so that data sets can be compared to one another. It is important that data can be re-analyzed in the future as the regulatory criteria are formalized. A consistent approach to data analysis and data management is necessary in order to provide a consistent and uniform basis for categorizing and predicting noise levels from pile driving projects for use in the environmental and regulatory review processes.
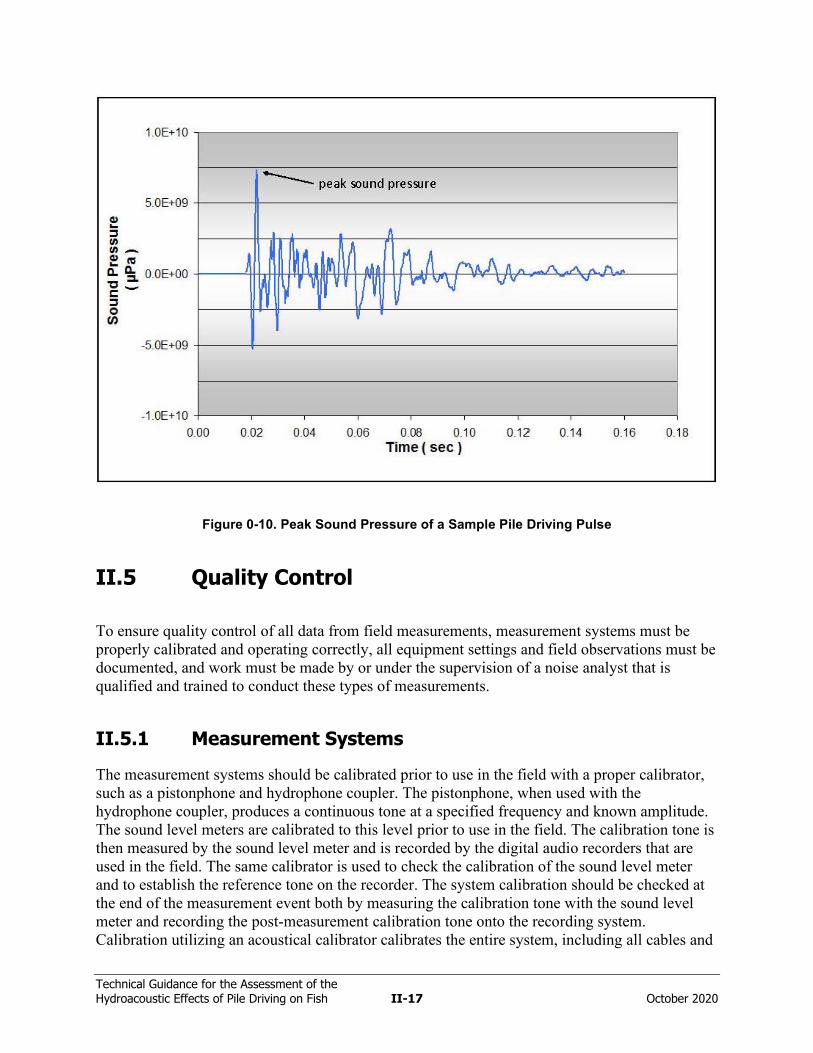
Technical Guidance for the Assessment of the Hydroacoustic Effects of Pile Driving on Fish II-17 October 2020
Figure 0-10. Peak Sound Pressure of a Sample Pile Driving Pulse
II.5 Quality Control
To ensure quality control of all data from field measurements, measurement systems must be properly calibrated and operating correctly, all equipment settings and field observations must be documented, and work must be made by or under the supervision of a noise analyst that is qualified and trained to conduct these types of measurements.
II.5.1 Measurement Systems
The measurement systems should be calibrated prior to use in the field with a proper calibrator, such as a pistonphone and hydrophone coupler. The pistonphone, when used with the hydrophone coupler, produces a continuous tone at a specified frequency and known amplitude. The sound level meters are calibrated to this level prior to use in the field. The calibration tone is then measured by the sound level meter and is recorded by the digital audio recorders that are used in the field. The same calibrator is used to check the calibration of the sound level meter and to establish the reference tone on the recorder. The system calibration should be checked at the end of the measurement event both by measuring the calibration tone with the sound level meter and recording the post-measurement calibration tone onto the recording system. Calibration utilizing an acoustical calibrator calibrates the entire system, including all cables and
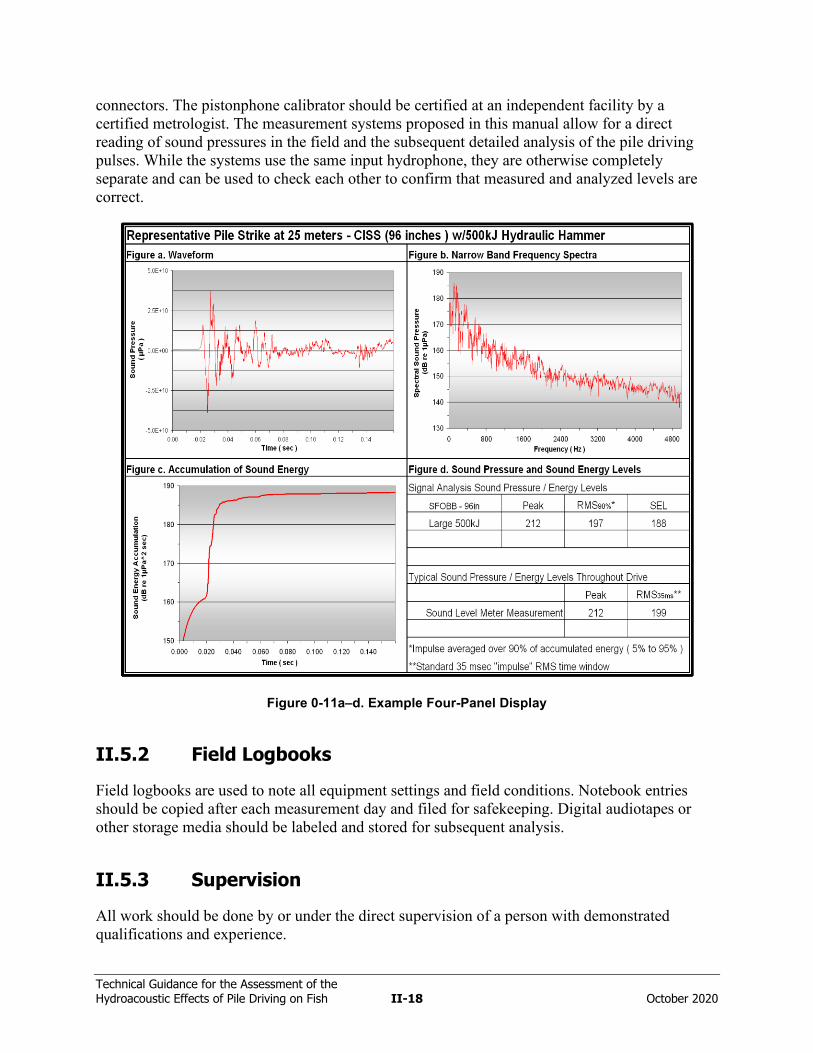
Technical Guidance for the Assessment of the Hydroacoustic Effects of Pile Driving on Fish II-18 October 2020
connectors. The pistonphone calibrator should be certified at an independent facility by a certified metrologist. The measurement systems proposed in this manual allow for a direct reading of sound pressures in the field and the subsequent detailed analysis of the pile driving pulses. While the systems use the same input hydrophone, they are otherwise completely separate and can be used to check each other to confirm that measured and analyzed levels are correct.
Figure 0-11a–d. Example Four-Panel Display
II.5.2 Field Logbooks
Field logbooks are used to note all equipment settings and field conditions. Notebook entries should be copied after each measurement day and filed for safekeeping. Digital audiotapes or other storage media should be labeled and stored for subsequent analysis.
II.5.3 Supervision
All work should be done by or under the direct supervision of a person with demonstrated qualifications and experience.
Technical Guidance for the Assessment of the Hydroacoustic Effects of Pile Driving on Fish II-19 October 2020
II.6 Reporting
Data reporting normally occurs at the end of a series of events of pre-established benchmarks during a construction project. Interim data reports typically include discussion of all of the relevant information for each pile drive that had been noted in the logbooks and described in the field logbooks section of this report. A chart similar to Figure II-11, which shows a four-panel display used to summarize data from each pile driving event, should be created and presented for each hydrophone during each pile driving event. The real-time data that was displayed in Figure II-7 also should be summarized for each measurement location for each day of monitoring. Any unusual events that affected the measured data should be noted in summary paragraphs describing the reported data. Verbal reports should be made only if proper protocols have been established for the project.
At the conclusion of a project, a final report is prepared. The final report includes an introduction describing the project; a methodology section that describes measurement positions, measurement equipment, underwater sound descriptors, and the methods used to manage measurement data; a complete report of measured data; a report of the performance of attenuation systems, if applicable; and an analysis of the data with respect to orders from regulatory agencies.

This page intentionally left blank.
Technical Guidance for Assessment of the Hydroacoustic Effects of Pile Driving on Fish
Appendix III Tools for Preparing Biological Assessment
Section 1. Agreement in Principal for Interim Criteria for Injury to Fish from Pile Driving
Section 2. NMFS Pile Driving Calculator
Section 3. Caltrans Pile Driving Screening Tool
Section 4. Caltrans Engineering Technical Brief – Overview of the Evaluation of Pile Driving Impacts on Fish for the Permitting Process

This page intentionally left blank.
Technical Guidance for Assessment of the Hydroacoustic Effects of Pile Driving on Fish
Appendix III – Section 1. Agreement in Principle for Interim Criteria for Injury to Fish from Pile Driving Activities

This page intentionally left blank.
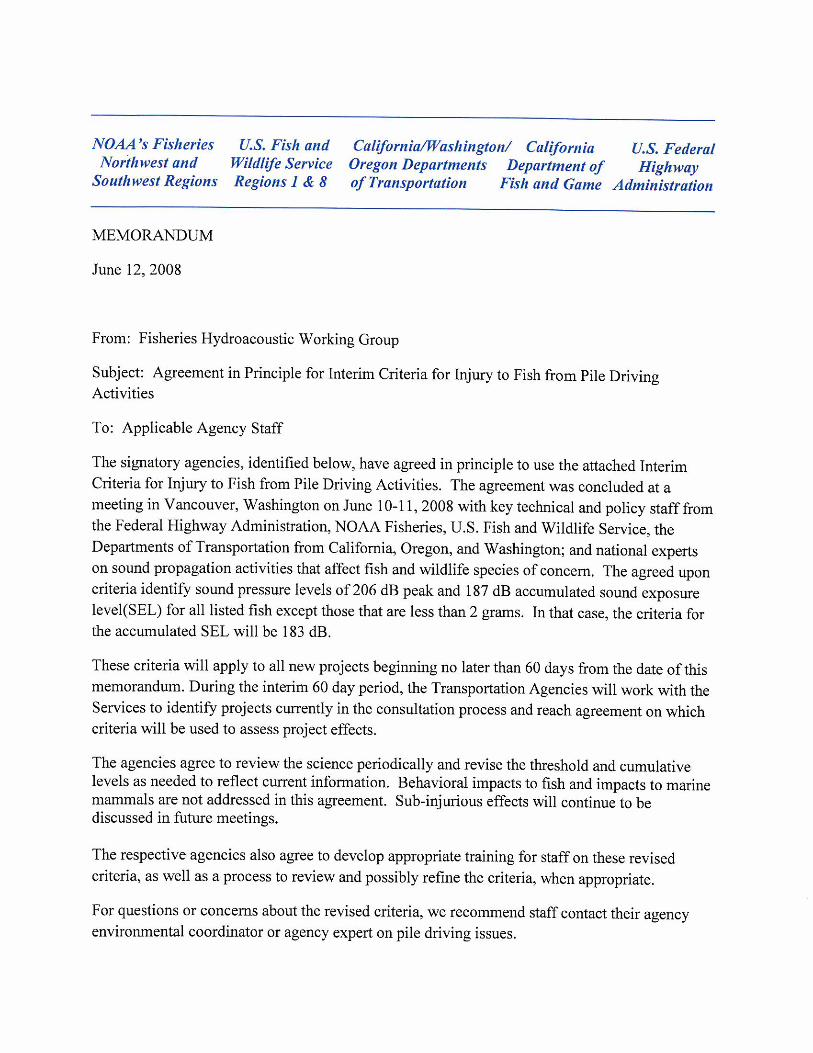
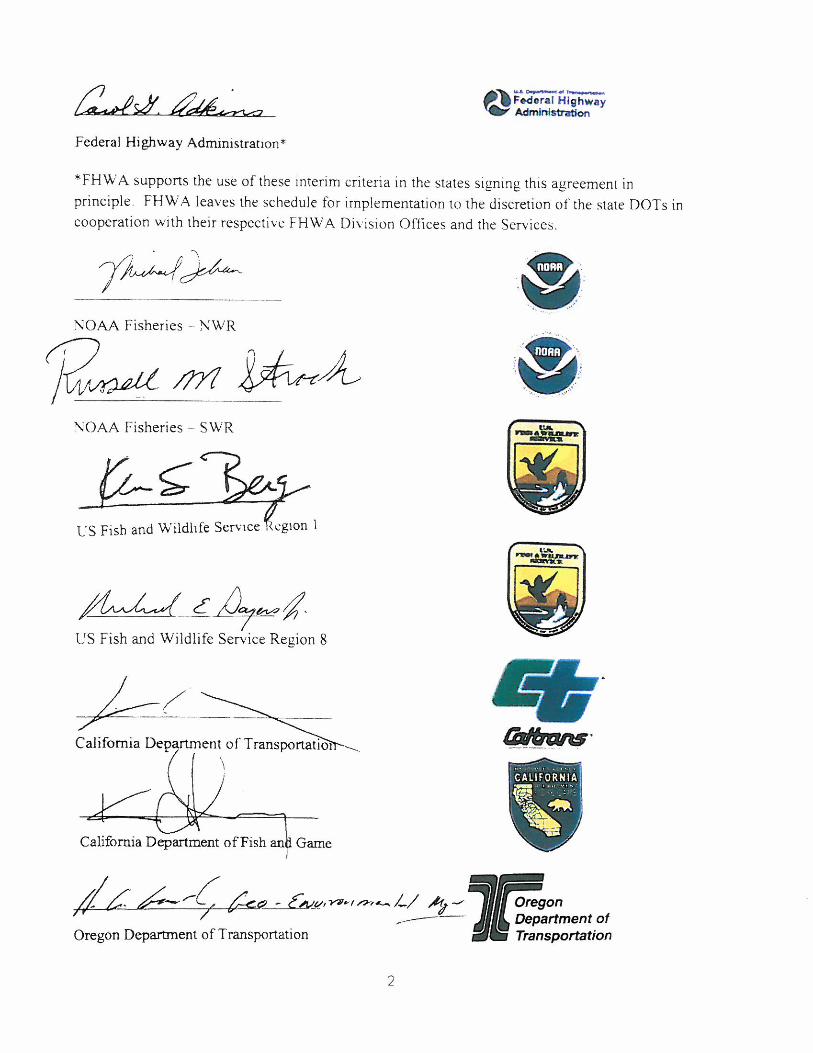

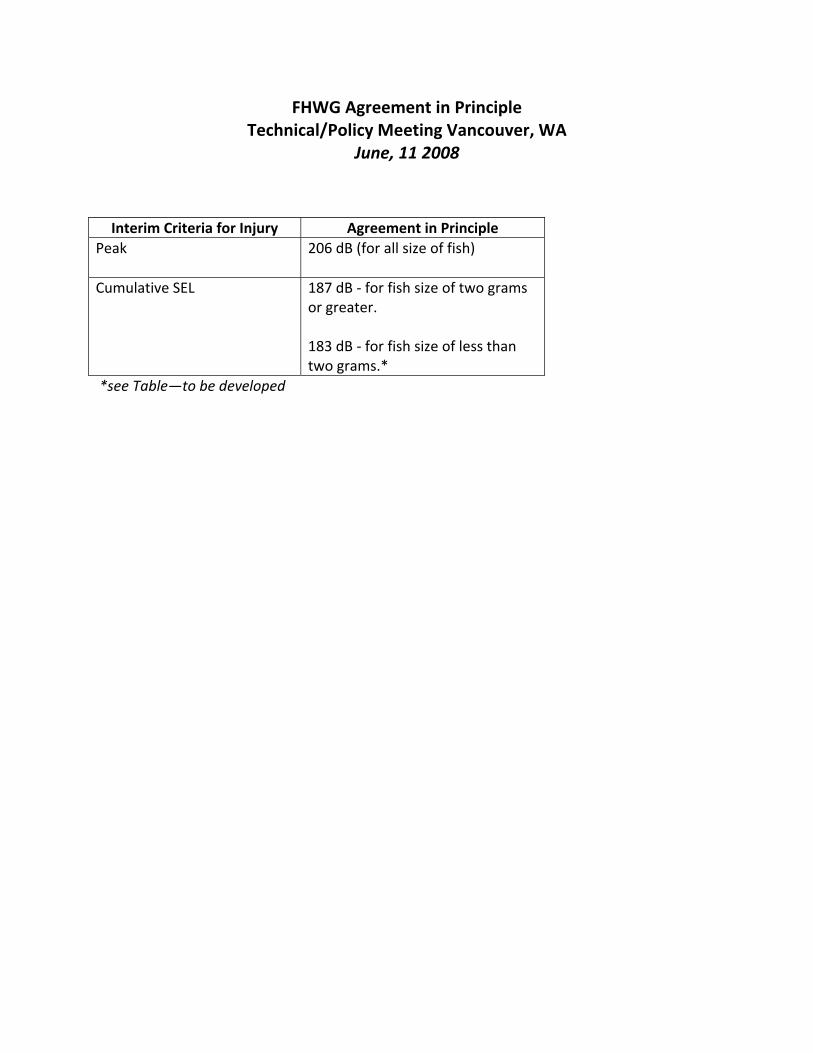
FHWG Agreement in Principle Technical/Policy Meeting Vancouver, WA
June, 11 2008
Interim Criteria for Injury Agreement in Principle Peak 206 dB (for all size of fish)
Cumulative SEL 187 dB ‐ for fish size of two grams
or greater. 183 dB ‐ for fish size of less than two grams.*
*see Table—to be developed

Technical Guidance for Assessment of the Hydroacoustic Effects of Pile Driving on Fish
Appendix III – Section 2. NMFS Pile Driving Calculator

This page intentionally left blank.
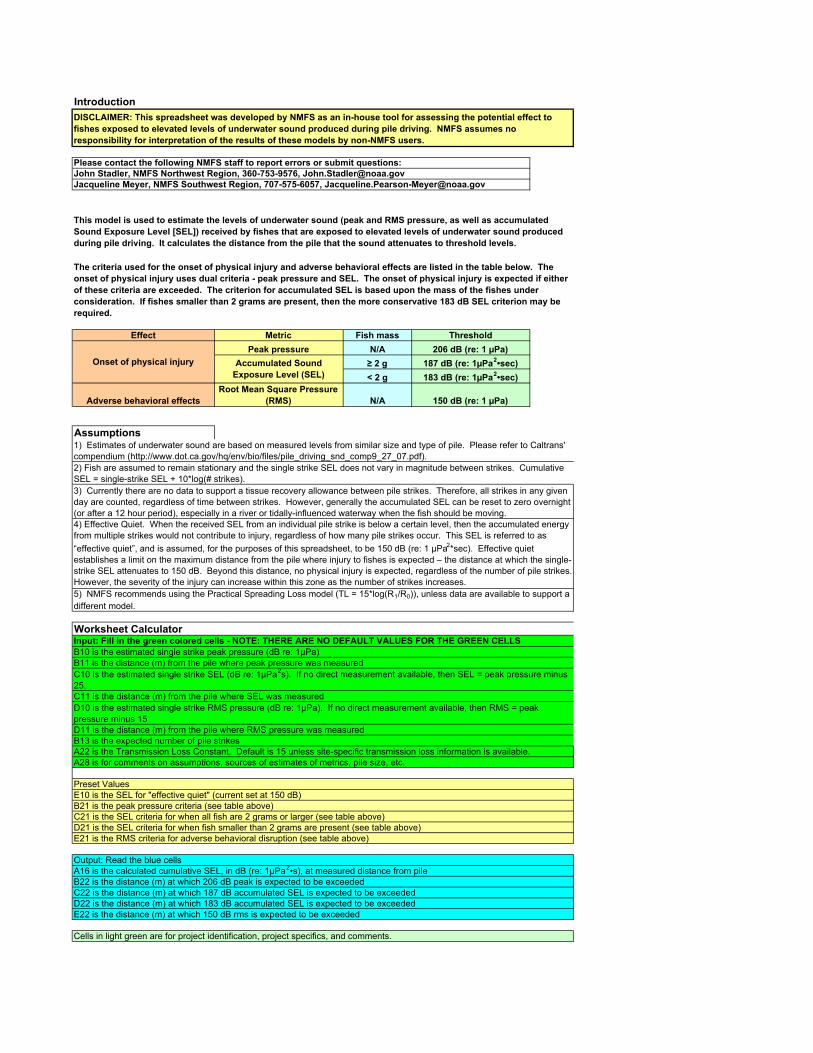
Introduction
Effect Metric Fish mass ThresholdPeak pressure
Accumulated Sound Exposure Level (SEL)
N/A≥ 2 g< 2 g
206 dB (re: 1 µPa)187 dB (re: 1µPa2•sec)183 dB (re: 1µPa2•sec)
Adverse behavioral effectsRoot Mean Square Pressure
(RMS) N/A 150 dB (re: 1 µPa)
Assumptions
Input: Fill in the green colored cells - NOTE: THERE ARE NO DEFAULT VALUES FOR THE GREEN CELLS
DISCLAIMER: This spreadsheet was developed by NMFS as an in-house tool for assessing the potential effect to fishes exposed to elevated levels of underwater sound produced during pile driving. NMFS assumes no responsibility for interpretation of the results of these models by non-NMFS users.
This model is used to estimate the levels of underwater sound (peak and RMS pressure, as well as accumulated Sound Exposure Level [SEL]) received by fishes that are exposed to elevated levels of underwater sound produced during pile driving. It calculates the distance from the pile that the sound attenuates to threshold levels.
The criteria used for the onset of physical injury and adverse behavioral effects are listed in the table below. The onset of physical injury uses dual criteria - peak pressure and SEL. The onset of physical injury is expected if either of these criteria are exceeded. The criterion for accumulated SEL is based upon the mass of the fishes under consideration. If fishes smaller than 2 grams are present, then the more conservative 183 dB SEL criterion may be required.
3) Currently there are no data to support a tissue recovery allowance between pile strikes. Therefore, all strikes in any given day are counted, regardless of time between strikes. However, generally the accumulated SEL can be reset to zero overnight (or after a 12 hour period), especially in a river or tidally-influenced waterway when the fish should be moving.
Please contact the following NMFS staff to report errors or submit questions: John Stadler, NMFS Northwest Region, 360-753-9576, [email protected] Jacqueline Meyer, NMFS Southwest Region, 707-575-6057, [email protected]
Onset of physical injury
E10 is the SEL for "effective quiet" (current set at 150 dB)B21 is the peak pressure criteria (see table above)C21 is the SEL criteria for when all fish are 2 grams or larger (see table above)D21 is the SEL criteria for when fish smaller than 2 grams are present (see table above)E21 is the RMS criteria for adverse behavioral disruption (see table above)
Preset Values
2) Fish are assumed to remain stationary and the single strike SEL does not vary in magnitude between strikes. Cumulative SEL = single-strike SEL + 10*log(# strikes).
1) Estimates of underwater sound are based on measured levels from similar size and type of pile. Please refer to Caltrans' compendium (http://www.dot.ca.gov/hq/env/bio/files/pile_driving_snd_comp9_27_07.pdf).
B10 is the estimated single strike peak pressure (dB re: 1µPa)B11 is the distance (m) from the pile where peak pressure was measuredC10 is the estimated single strike SEL (dB re: 1µPa2s). If no direct measurement available, then SEL = peak pressure minus 25.C11 is the distance (m) from the pile where SEL was measuredD10 is the estimated single strike RMS pressure (dB re: 1µPa). If no direct measurement available, then RMS = peak pressure minus 15D11 is the distance (m) from the pile where RMS pressure was measuredB13 is the expected number of pile strikes A22 is the Transmission Loss Constant. Default is 15 unless site-specific transmission loss information is available.A28 is for comments on assumptions, sources of estimates of metrics, pile size, etc.
4) Effective Quiet. When the received SEL from an individual pile strike is below a certain level, then the accumulated energy from multiple strikes would not contribute to injury, regardless of how many pile strikes occur. This SEL is referred to as “effective quiet”, and is assumed, for the purposes of this spreadsheet, to be 150 dB (re: 1 µPa2*sec). Effective quiet establishes a limit on the maximum distance from the pile where injury to fishes is expected – the distance at which the single-strike SEL attenuates to 150 dB. Beyond this distance, no physical injury is expected, regardless of the number of pile strikes. However, the severity of the injury can increase within this zone as the number of strikes increases.5) NMFS recommends using the Practical Spreading Loss model (TL = 15*log(R1/R0)), unless data are available to support a different model.
Worksheet Calculator
Cells in light green are for project identification, project specifics, and comments.
Output: Read the blue cellsA16 is the calculated cumulative SEL, in dB (re: 1µPa2•s), at measured distance from pileB22 is the distance (m) at which 206 dB peak is expected to be exceededC22 is the distance (m) at which 187 dB accumulated SEL is expected to be exceededD22 is the distance (m) at which 183 dB accumulated SEL is expected to be exceededE22 is the distance (m) at which 150 dB rms is expected to be exceeded
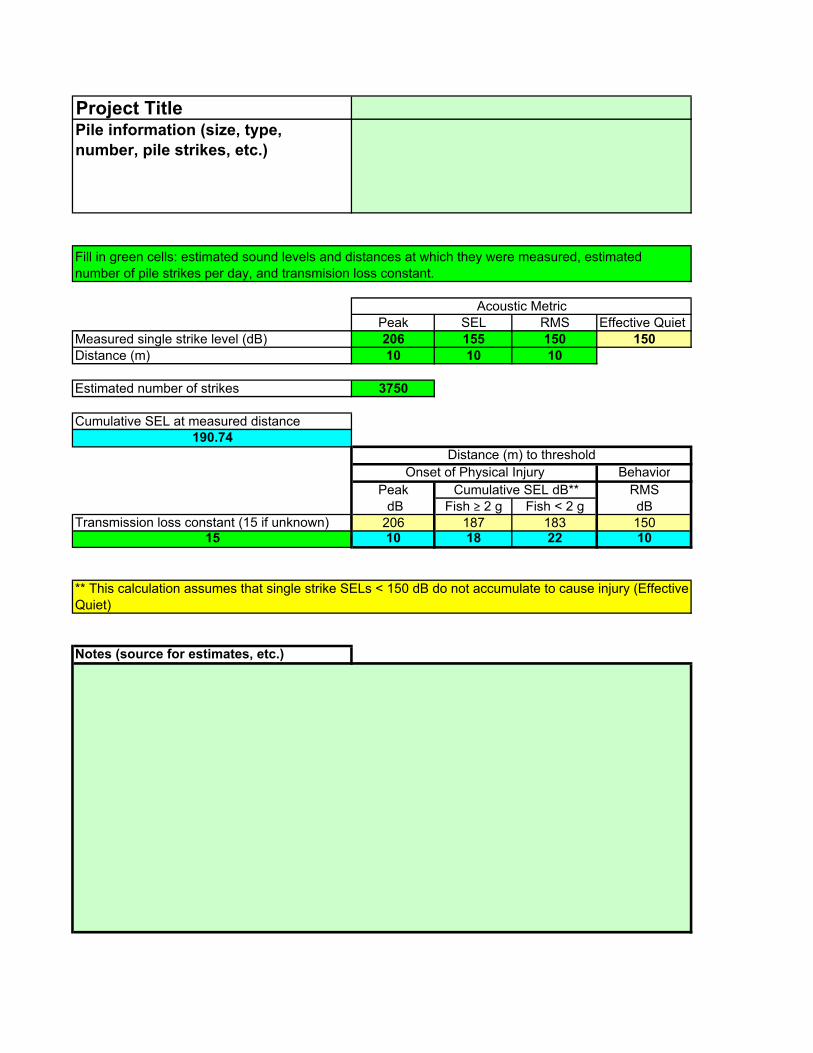
Project TitlePile information (size, type, number, pile strikes, etc.)
Peak SEL RMS Effective QuietMeasured single strike level (dB) 206 155 150 150Distance (m) 10 10 10
Estimated number of strikes 3750
Cumulative SEL at measured distance190.74
BehaviorPeak RMS dB Fish ≥ 2 g Fish < 2 g dB
Transmission loss constant (15 if unknown) 206 187 183 15015 10 18 22 10
Notes (source for estimates, etc.)
Fill in green cells: estimated sound levels and distances at which they were measured, estimated number of pile strikes per day, and transmision loss constant.
** This calculation assumes that single strike SELs < 150 dB do not accumulate to cause injury (Effective Quiet)
Acoustic Metric
Distance (m) to threshold
Cumulative SEL dB**Onset of Physical Injury
Technical Guidance for the Assessment of the Hydroacoustic Effects of Pile Driving on Fish
Appendix III – Section 3. Caltrans Pile Driving Screening Tool

This page intentionally left blank.
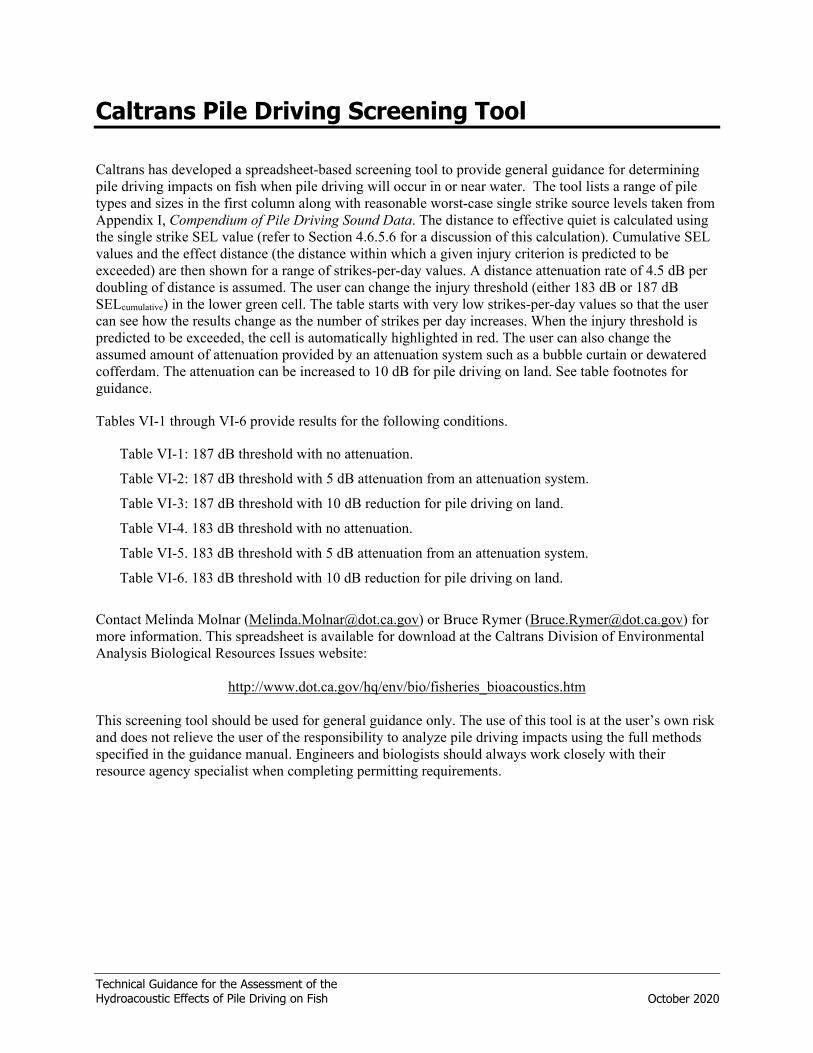
Technical Guidance for the Assessment of the Hydroacoustic Effects of Pile Driving on Fish October 2020
Caltrans Pile Driving Screening Tool
Caltrans has developed a spreadsheet-based screening tool to provide general guidance for determining pile driving impacts on fish when pile driving will occur in or near water. The tool lists a range of pile types and sizes in the first column along with reasonable worst-case single strike source levels taken from Appendix I, Compendium of Pile Driving Sound Data. The distance to effective quiet is calculated using the single strike SEL value (refer to Section 4.6.5.6 for a discussion of this calculation). Cumulative SEL values and the effect distance (the distance within which a given injury criterion is predicted to be exceeded) are then shown for a range of strikes-per-day values. A distance attenuation rate of 4.5 dB per doubling of distance is assumed. The user can change the injury threshold (either 183 dB or 187 dB SELcumulative) in the lower green cell. The table starts with very low strikes-per-day values so that the user can see how the results change as the number of strikes per day increases. When the injury threshold is predicted to be exceeded, the cell is automatically highlighted in red. The user can also change the assumed amount of attenuation provided by an attenuation system such as a bubble curtain or dewatered cofferdam. The attenuation can be increased to 10 dB for pile driving on land. See table footnotes for guidance.
Tables VI-1 through VI-6 provide results for the following conditions.
Table VI-1: 187 dB threshold with no attenuation.
Table VI-2: 187 dB threshold with 5 dB attenuation from an attenuation system.
Table VI-3: 187 dB threshold with 10 dB reduction for pile driving on land.
Table VI-4. 183 dB threshold with no attenuation.
Table VI-5. 183 dB threshold with 5 dB attenuation from an attenuation system.
Table VI-6. 183 dB threshold with 10 dB reduction for pile driving on land.
Contact Melinda Molnar ([email protected]) or Bruce Rymer ([email protected]) for more information. This spreadsheet is available for download at the Caltrans Division of Environmental Analysis Biological Resources Issues website:
http://www.dot.ca.gov/hq/env/bio/fisheries_bioacoustics.htm
This screening tool should be used for general guidance only. The use of this tool is at the user’s own risk and does not relieve the user of the responsibility to analyze pile driving impacts using the full methods specified in the guidance manual. Engineers and biologists should always work closely with their resource agency specialist when completing permitting requirements.

This page intentionally left blank.
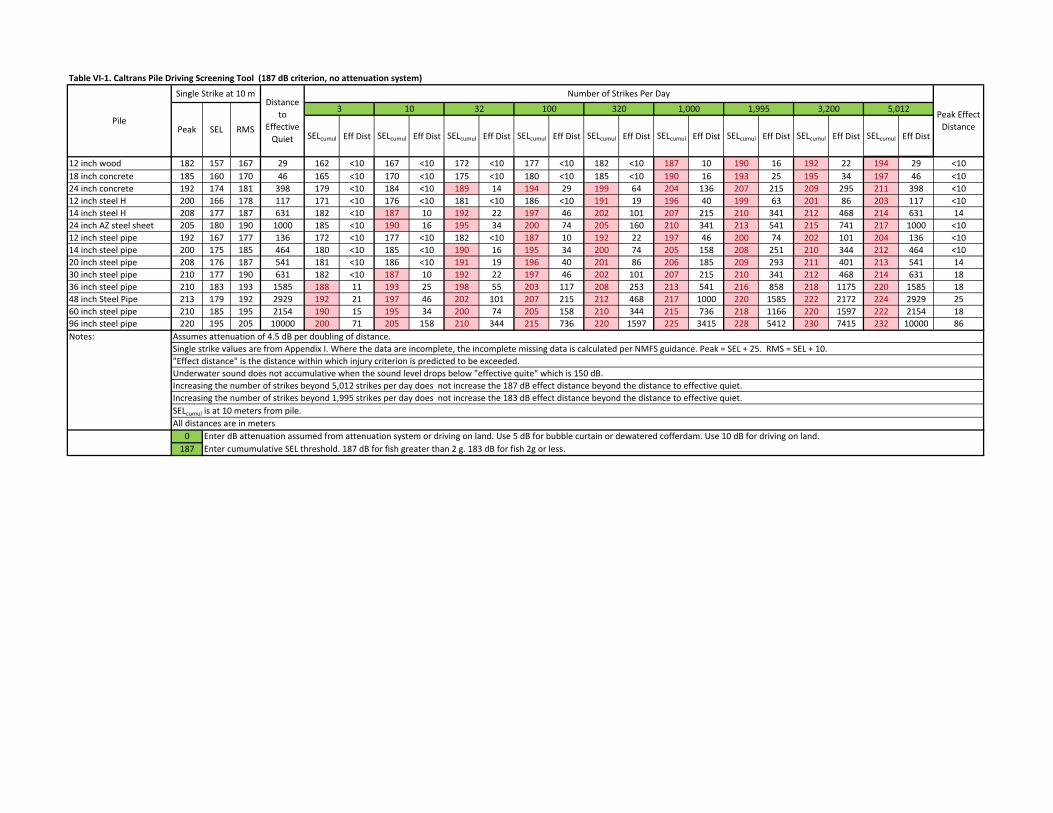
Table VI‐1. Caltrans Pile Driving Screening Tool (187 dB criterion, no attenuation system)
SELcumul Eff Dist SELcumul Eff Dist SELcumul Eff Dist SELcumul Eff Dist SELcumul Eff Dist SELcumul Eff Dist SELcumul Eff Dist SELcumul Eff Dist SELcumul Eff Dist
12 inch wood 182 157 167 29 162 <10 167 <10 172 <10 177 <10 182 <10 187 10 190 16 192 22 194 29 <1018 inch concrete 185 160 170 46 165 <10 170 <10 175 <10 180 <10 185 <10 190 16 193 25 195 34 197 46 <1024 inch concrete 192 174 181 398 179 <10 184 <10 189 14 194 29 199 64 204 136 207 215 209 295 211 398 <1012 inch steel H 200 166 178 117 171 <10 176 <10 181 <10 186 <10 191 19 196 40 199 63 201 86 203 117 <1014 inch steel H 208 177 187 631 182 <10 187 10 192 22 197 46 202 101 207 215 210 341 212 468 214 631 1424 inch AZ steel sheet 205 180 190 1000 185 <10 190 16 195 34 200 74 205 160 210 341 213 541 215 741 217 1000 <1012 inch steel pipe 192 167 177 136 172 <10 177 <10 182 <10 187 10 192 22 197 46 200 74 202 101 204 136 <1014 inch steel pipe 200 175 185 464 180 <10 185 <10 190 16 195 34 200 74 205 158 208 251 210 344 212 464 <1020 inch steel pipe 208 176 187 541 181 <10 186 <10 191 19 196 40 201 86 206 185 209 293 211 401 213 541 1430 inch steel pipe 210 177 190 631 182 <10 187 10 192 22 197 46 202 101 207 215 210 341 212 468 214 631 1836 inch steel pipe 210 183 193 1585 188 11 193 25 198 55 203 117 208 253 213 541 216 858 218 1175 220 1585 1848 inch Steel Pipe 213 179 192 2929 192 21 197 46 202 101 207 215 212 468 217 1000 220 1585 222 2172 224 2929 2560 inch steel pipe 210 185 195 2154 190 15 195 34 200 74 205 158 210 344 215 736 218 1166 220 1597 222 2154 1896 inch steel pipe 220 195 205 10000 200 71 205 158 210 344 215 736 220 1597 225 3415 228 5412 230 7415 232 10000 86Notes: Assumes attenuation of 4.5 dB per doubling of distance.
Single strike values are from Appendix I. Where the data are incomplete, the incomplete missing data is calculated per NMFS guidance. Peak = SEL + 25. RMS = SEL + 10. "Effect distance" is the distance within which injury criterion is predicted to be exceeded. Underwater sound does not accumulative when the sound level drops below "effective quite" which is 150 dB. Increasing the number of strikes beyond 5,012 strikes per day does not increase the 187 dB effect distance beyond the distance to effective quiet. Increasing the number of strikes beyond 1,995 strikes per day does not increase the 183 dB effect distance beyond the distance to effective quiet. SELcumul is at 10 meters from pile. All distances are in meters
0 Enter dB attenuation assumed from attenuation system or driving on land. Use 5 dB for bubble curtain or dewatered cofferdam. Use 10 dB for driving on land. 187 Enter cumumulative SEL threshold. 187 dB for fish greater than 2 g. 183 dB for fish 2g or less.
Pile10 32 100 320
Single Strike at 10 mDistance
to Effective Quiet
Number of Strikes Per Day
Peak Effect DistancePeak SEL RMS
3 3,200 5,0121,000 1,995

Table VI‐2. Caltrans Pile Driving Screening Tool (187 dB criterion, attenuation system with 5 dB of attenuation included)
SELcumul Eff Dist SELcumul Eff Dist SELcumul Eff Dist SELcumul Eff Dist SELcumul Eff Dist SELcumul Eff Dist SELcumul Eff Dist SELcumul Eff Dist SELcumul Eff Dist
12 inch wood 177 152 162 14 157 <10 162 <10 167 <10 172 <10 177 <10 182 <10 185 <10 187 10 189 14 <1018 inch concrete 180 155 165 22 160 <10 165 <10 170 <10 175 <10 180 <10 185 <10 188 12 190 16 192 22 <1024 inch concrete 187 169 176 185 174 <10 179 <10 184 <10 189 14 194 30 199 63 202 100 204 137 206 185 <1012 inch steel H 195 161 173 54 166 <10 171 <10 176 <10 181 <10 186 <10 191 18 194 29 196 40 198 54 <1014 inch steel H 203 172 182 293 177 <10 182 <10 187 10 192 22 197 47 202 100 205 158 207 217 209 293 <1024 inch AZ steel sheet 200 175 185 464 180 <10 185 <10 190 16 195 34 200 74 205 158 208 251 210 344 212 464 <1012 inch steel pipe 187 162 172 63 167 <10 172 <10 177 <10 182 <10 187 10 192 22 195 34 197 47 199 63 <1014 inch steel pipe 195 170 180 215 175 <10 180 <10 185 <10 190 16 195 34 200 74 203 117 205 160 207 215 <1020 inch steel pipe 203 171 182 251 176 <10 181 <10 186 <10 191 18 196 40 201 86 204 136 206 186 208 251 <1030 inch steel pipe 205 172 185 293 177 <10 182 <10 187 10 192 22 197 47 202 100 205 158 207 217 209 293 <1036 inch steel pipe 205 178 188 736 183 <10 188 12 193 25 198 54 203 118 208 251 211 398 213 545 215 736 <1048 inch Steel Pipe 208 174 187 2929 192 21 197 46 202 101 207 215 212 468 217 1000 220 1585 222 2172 224 2929 2560 inch steel pipe 205 185 190 2154 190 15 195 34 200 74 205 158 210 344 215 736 218 1166 220 1597 222 2154 <1096 inch steel pipe 215 190 200 4642 195 33 200 74 205 160 210 341 215 741 220 1585 223 2512 225 3442 227 4642 40Notes: Assumes attenuation of 4.5 dB per doubling of distance.
Single strike values are from Appendix I. Where the data are incomplete, the incomplete missing data is calculated per NMFS guidance. Peak = SEL + 25. RMS = SEL + 10. "Effect distance" is the distance within which injury criterion is predicted to be exceeded. Underwater sound does not accumulative when the sound level drops below "effective quite" which is 150 dB. Increasing the number of strikes beyond 5,012 strikes per day does not increase the 187 dB effect distance beyond the distance to effective quiet. Increasing the number of strikes beyond 1,995 strikes per day does not increase the 183 dB effect distance beyond the distance to effective quiet. SELcumul is at 10 meters from pile. All distances are in meters
5 Enter dB attenuation assumed from attenuation system or driving on land. Use 5 dB for bubble curtain or dewatered cofferdam. Use 10 dB for driving on land. 187 Enter cumumulative SEL threshold. 187 dB for fish greater than 2 g. 183 dB for fish 2g or less.
Pile10 32 100 320
Single Strike at 10 mDistance
to Effective Quiet
Number of Strikes Per Day
Peak Effect DistancePeak SEL RMS
3 3,200 5,0121,000 1,995
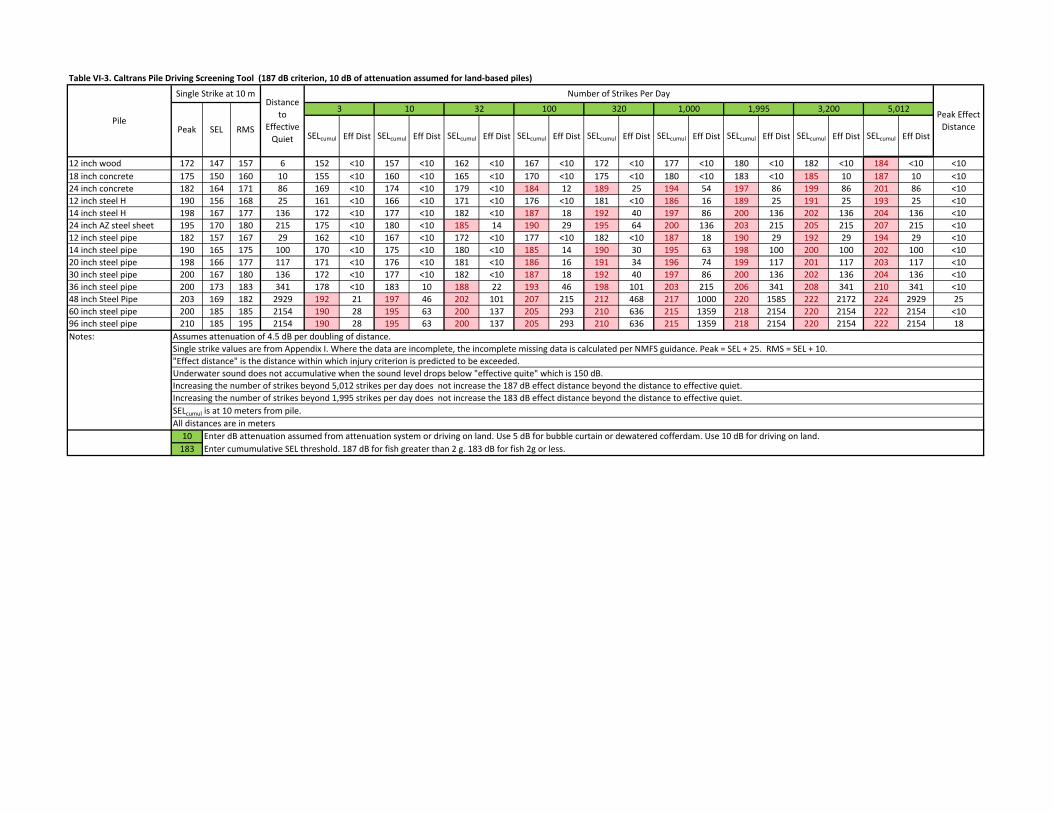
Table VI‐3. Caltrans Pile Driving Screening Tool (187 dB criterion, 10 dB of attenuation assumed for land‐based piles)
SELcumul Eff Dist SELcumul Eff Dist SELcumul Eff Dist SELcumul Eff Dist SELcumul Eff Dist SELcumul Eff Dist SELcumul Eff Dist SELcumul Eff Dist SELcumul Eff Dist
12 inch wood 172 147 157 6 152 <10 157 <10 162 <10 167 <10 172 <10 177 <10 180 <10 182 <10 184 <10 <1018 inch concrete 175 150 160 10 155 <10 160 <10 165 <10 170 <10 175 <10 180 <10 183 <10 185 10 187 10 <1024 inch concrete 182 164 171 86 169 <10 174 <10 179 <10 184 12 189 25 194 54 197 86 199 86 201 86 <1012 inch steel H 190 156 168 25 161 <10 166 <10 171 <10 176 <10 181 <10 186 16 189 25 191 25 193 25 <1014 inch steel H 198 167 177 136 172 <10 177 <10 182 <10 187 18 192 40 197 86 200 136 202 136 204 136 <1024 inch AZ steel sheet 195 170 180 215 175 <10 180 <10 185 14 190 29 195 64 200 136 203 215 205 215 207 215 <1012 inch steel pipe 182 157 167 29 162 <10 167 <10 172 <10 177 <10 182 <10 187 18 190 29 192 29 194 29 <1014 inch steel pipe 190 165 175 100 170 <10 175 <10 180 <10 185 14 190 30 195 63 198 100 200 100 202 100 <1020 inch steel pipe 198 166 177 117 171 <10 176 <10 181 <10 186 16 191 34 196 74 199 117 201 117 203 117 <1030 inch steel pipe 200 167 180 136 172 <10 177 <10 182 <10 187 18 192 40 197 86 200 136 202 136 204 136 <1036 inch steel pipe 200 173 183 341 178 <10 183 10 188 22 193 46 198 101 203 215 206 341 208 341 210 341 <1048 inch Steel Pipe 203 169 182 2929 192 21 197 46 202 101 207 215 212 468 217 1000 220 1585 222 2172 224 2929 2560 inch steel pipe 200 185 185 2154 190 28 195 63 200 137 205 293 210 636 215 1359 218 2154 220 2154 222 2154 <1096 inch steel pipe 210 185 195 2154 190 28 195 63 200 137 205 293 210 636 215 1359 218 2154 220 2154 222 2154 18Notes: Assumes attenuation of 4.5 dB per doubling of distance.
Single strike values are from Appendix I. Where the data are incomplete, the incomplete missing data is calculated per NMFS guidance. Peak = SEL + 25. RMS = SEL + 10. "Effect distance" is the distance within which injury criterion is predicted to be exceeded. Underwater sound does not accumulative when the sound level drops below "effective quite" which is 150 dB. Increasing the number of strikes beyond 5,012 strikes per day does not increase the 187 dB effect distance beyond the distance to effective quiet. Increasing the number of strikes beyond 1,995 strikes per day does not increase the 183 dB effect distance beyond the distance to effective quiet. SELcumul is at 10 meters from pile. All distances are in meters10 Enter dB attenuation assumed from attenuation system or driving on land. Use 5 dB for bubble curtain or dewatered cofferdam. Use 10 dB for driving on land. 183 Enter cumumulative SEL threshold. 187 dB for fish greater than 2 g. 183 dB for fish 2g or less.
Pile10 32 100 320
Single Strike at 10 mDistance
to Effective Quiet
Number of Strikes Per Day
Peak Effect DistancePeak SEL RMS
3 3,200 5,0121,000 1,995
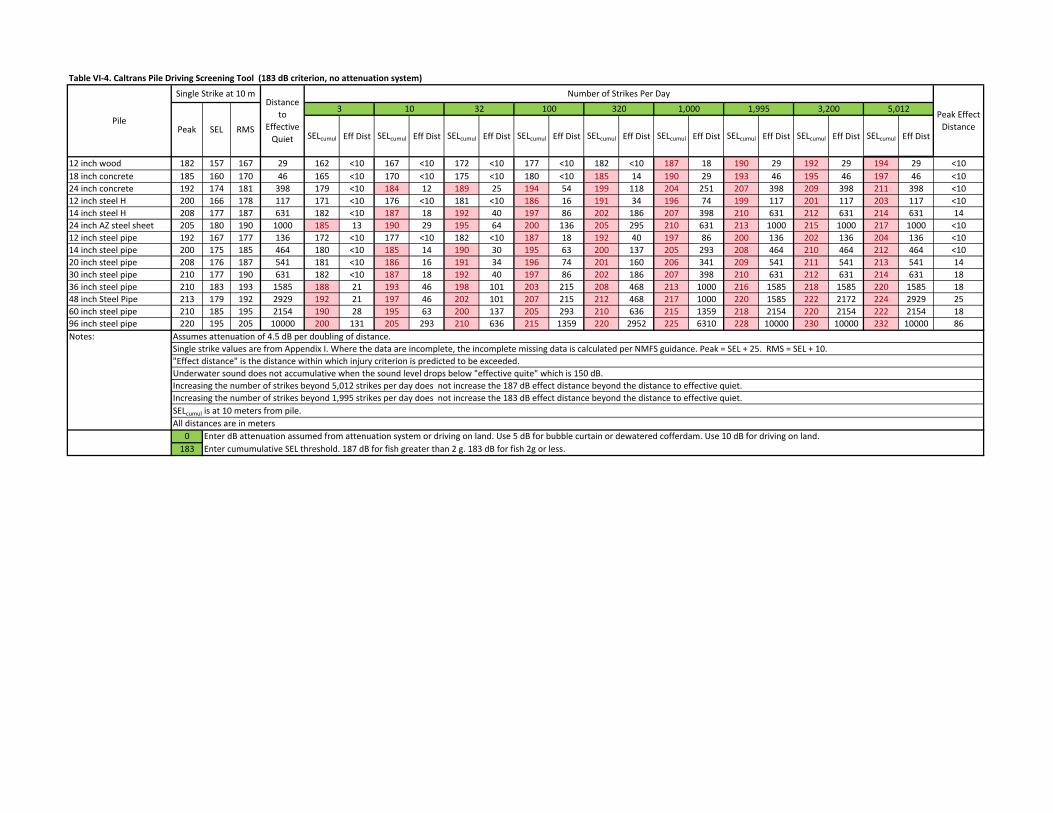
Table VI‐4. Caltrans Pile Driving Screening Tool (183 dB criterion, no attenuation system)
SELcumul Eff Dist SELcumul Eff Dist SELcumul Eff Dist SELcumul Eff Dist SELcumul Eff Dist SELcumul Eff Dist SELcumul Eff Dist SELcumul Eff Dist SELcumul Eff Dist
12 inch wood 182 157 167 29 162 <10 167 <10 172 <10 177 <10 182 <10 187 18 190 29 192 29 194 29 <1018 inch concrete 185 160 170 46 165 <10 170 <10 175 <10 180 <10 185 14 190 29 193 46 195 46 197 46 <1024 inch concrete 192 174 181 398 179 <10 184 12 189 25 194 54 199 118 204 251 207 398 209 398 211 398 <1012 inch steel H 200 166 178 117 171 <10 176 <10 181 <10 186 16 191 34 196 74 199 117 201 117 203 117 <1014 inch steel H 208 177 187 631 182 <10 187 18 192 40 197 86 202 186 207 398 210 631 212 631 214 631 1424 inch AZ steel sheet 205 180 190 1000 185 13 190 29 195 64 200 136 205 295 210 631 213 1000 215 1000 217 1000 <1012 inch steel pipe 192 167 177 136 172 <10 177 <10 182 <10 187 18 192 40 197 86 200 136 202 136 204 136 <1014 inch steel pipe 200 175 185 464 180 <10 185 14 190 30 195 63 200 137 205 293 208 464 210 464 212 464 <1020 inch steel pipe 208 176 187 541 181 <10 186 16 191 34 196 74 201 160 206 341 209 541 211 541 213 541 1430 inch steel pipe 210 177 190 631 182 <10 187 18 192 40 197 86 202 186 207 398 210 631 212 631 214 631 1836 inch steel pipe 210 183 193 1585 188 21 193 46 198 101 203 215 208 468 213 1000 216 1585 218 1585 220 1585 1848 inch Steel Pipe 213 179 192 2929 192 21 197 46 202 101 207 215 212 468 217 1000 220 1585 222 2172 224 2929 2560 inch steel pipe 210 185 195 2154 190 28 195 63 200 137 205 293 210 636 215 1359 218 2154 220 2154 222 2154 1896 inch steel pipe 220 195 205 10000 200 131 205 293 210 636 215 1359 220 2952 225 6310 228 10000 230 10000 232 10000 86Notes: Assumes attenuation of 4.5 dB per doubling of distance.
Single strike values are from Appendix I. Where the data are incomplete, the incomplete missing data is calculated per NMFS guidance. Peak = SEL + 25. RMS = SEL + 10. "Effect distance" is the distance within which injury criterion is predicted to be exceeded. Underwater sound does not accumulative when the sound level drops below "effective quite" which is 150 dB. Increasing the number of strikes beyond 5,012 strikes per day does not increase the 187 dB effect distance beyond the distance to effective quiet. Increasing the number of strikes beyond 1,995 strikes per day does not increase the 183 dB effect distance beyond the distance to effective quiet. SELcumul is at 10 meters from pile. All distances are in meters
0 Enter dB attenuation assumed from attenuation system or driving on land. Use 5 dB for bubble curtain or dewatered cofferdam. Use 10 dB for driving on land. 183 Enter cumumulative SEL threshold. 187 dB for fish greater than 2 g. 183 dB for fish 2g or less.
Pile10 32 100 320
Single Strike at 10 mDistance
to Effective Quiet
Number of Strikes Per Day
Peak Effect DistancePeak SEL RMS
3 3,200 5,0121,000 1,995
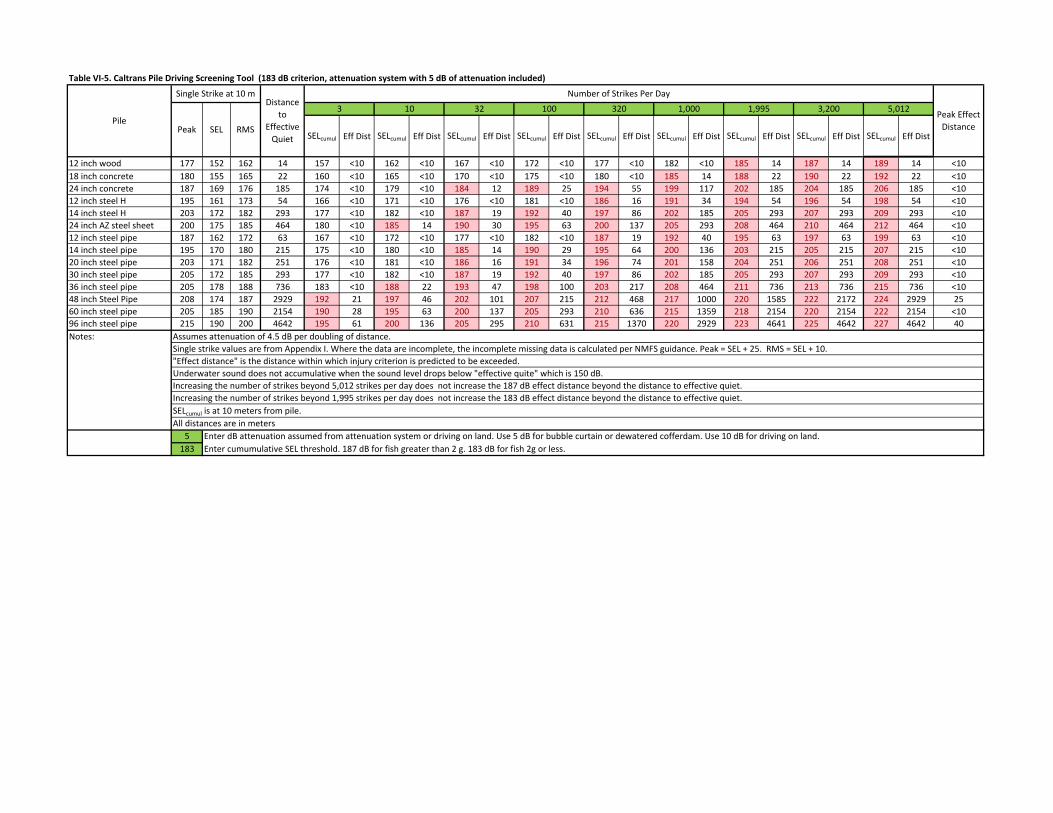
Table VI‐5. Caltrans Pile Driving Screening Tool (183 dB criterion, attenuation system with 5 dB of attenuation included)
SELcumul Eff Dist SELcumul Eff Dist SELcumul Eff Dist SELcumul Eff Dist SELcumul Eff Dist SELcumul Eff Dist SELcumul Eff Dist SELcumul Eff Dist SELcumul Eff Dist
12 inch wood 177 152 162 14 157 <10 162 <10 167 <10 172 <10 177 <10 182 <10 185 14 187 14 189 14 <1018 inch concrete 180 155 165 22 160 <10 165 <10 170 <10 175 <10 180 <10 185 14 188 22 190 22 192 22 <1024 inch concrete 187 169 176 185 174 <10 179 <10 184 12 189 25 194 55 199 117 202 185 204 185 206 185 <1012 inch steel H 195 161 173 54 166 <10 171 <10 176 <10 181 <10 186 16 191 34 194 54 196 54 198 54 <1014 inch steel H 203 172 182 293 177 <10 182 <10 187 19 192 40 197 86 202 185 205 293 207 293 209 293 <1024 inch AZ steel sheet 200 175 185 464 180 <10 185 14 190 30 195 63 200 137 205 293 208 464 210 464 212 464 <1012 inch steel pipe 187 162 172 63 167 <10 172 <10 177 <10 182 <10 187 19 192 40 195 63 197 63 199 63 <1014 inch steel pipe 195 170 180 215 175 <10 180 <10 185 14 190 29 195 64 200 136 203 215 205 215 207 215 <1020 inch steel pipe 203 171 182 251 176 <10 181 <10 186 16 191 34 196 74 201 158 204 251 206 251 208 251 <1030 inch steel pipe 205 172 185 293 177 <10 182 <10 187 19 192 40 197 86 202 185 205 293 207 293 209 293 <1036 inch steel pipe 205 178 188 736 183 <10 188 22 193 47 198 100 203 217 208 464 211 736 213 736 215 736 <1048 inch Steel Pipe 208 174 187 2929 192 21 197 46 202 101 207 215 212 468 217 1000 220 1585 222 2172 224 2929 2560 inch steel pipe 205 185 190 2154 190 28 195 63 200 137 205 293 210 636 215 1359 218 2154 220 2154 222 2154 <1096 inch steel pipe 215 190 200 4642 195 61 200 136 205 295 210 631 215 1370 220 2929 223 4641 225 4642 227 4642 40Notes: Assumes attenuation of 4.5 dB per doubling of distance.
Single strike values are from Appendix I. Where the data are incomplete, the incomplete missing data is calculated per NMFS guidance. Peak = SEL + 25. RMS = SEL + 10. "Effect distance" is the distance within which injury criterion is predicted to be exceeded. Underwater sound does not accumulative when the sound level drops below "effective quite" which is 150 dB. Increasing the number of strikes beyond 5,012 strikes per day does not increase the 187 dB effect distance beyond the distance to effective quiet. Increasing the number of strikes beyond 1,995 strikes per day does not increase the 183 dB effect distance beyond the distance to effective quiet. SELcumul is at 10 meters from pile. All distances are in meters
5 Enter dB attenuation assumed from attenuation system or driving on land. Use 5 dB for bubble curtain or dewatered cofferdam. Use 10 dB for driving on land. 183 Enter cumumulative SEL threshold. 187 dB for fish greater than 2 g. 183 dB for fish 2g or less.
Pile10 32 100 320
Single Strike at 10 mDistance
to Effective Quiet
Number of Strikes Per Day
Peak Effect DistancePeak SEL RMS
3 3,200 5,0121,000 1,995

Table VI‐6. Caltrans Pile Driving Screening Tool (183 dB criterion, 10 dB of attenuation assumed for land‐based piles)
SELcumul Eff Dist SELcumul Eff Dist SELcumul Eff Dist SELcumul Eff Dist SELcumul Eff Dist SELcumul Eff Dist SELcumul Eff Dist SELcumul Eff Dist SELcumul Eff Dist
12 inch wood 172 147 157 6 152 <10 157 <10 162 <10 167 <10 172 <10 177 <10 180 <10 182 <10 184 <10 <1018 inch concrete 175 150 160 10 155 <10 160 <10 165 <10 170 <10 175 <10 180 <10 183 <10 185 10 187 10 <1024 inch concrete 182 164 171 86 169 <10 174 <10 179 <10 184 12 189 25 194 54 197 86 199 86 201 86 <1012 inch steel H 190 156 168 25 161 <10 166 <10 171 <10 176 <10 181 <10 186 16 189 25 191 25 193 25 <1014 inch steel H 198 167 177 136 172 <10 177 <10 182 <10 187 18 192 40 197 86 200 136 202 136 204 136 <1024 inch AZ steel sheet 195 170 180 215 175 <10 180 <10 185 14 190 29 195 64 200 136 203 215 205 215 207 215 <1012 inch steel pipe 182 157 167 29 162 <10 167 <10 172 <10 177 <10 182 <10 187 18 190 29 192 29 194 29 <1014 inch steel pipe 190 165 175 100 170 <10 175 <10 180 <10 185 14 190 30 195 63 198 100 200 100 202 100 <1020 inch steel pipe 198 166 177 117 171 <10 176 <10 181 <10 186 16 191 34 196 74 199 117 201 117 203 117 <1030 inch steel pipe 200 167 180 136 172 <10 177 <10 182 <10 187 18 192 40 197 86 200 136 202 136 204 136 <1036 inch steel pipe 200 173 183 341 178 <10 183 10 188 22 193 46 198 101 203 215 206 341 208 341 210 341 <1048 inch Steel Pipe 203 169 182 2929 192 21 197 46 202 101 207 215 212 468 217 1000 220 1585 222 2172 224 2929 2560 inch steel pipe 200 185 185 2154 190 28 195 63 200 137 205 293 210 636 215 1359 218 2154 220 2154 222 2154 <1096 inch steel pipe 210 185 195 2154 190 28 195 63 200 137 205 293 210 636 215 1359 218 2154 220 2154 222 2154 18Notes: Assumes attenuation of 4.5 dB per doubling of distance.
Single strike values are from Appendix I. Where the data are incomplete, the incomplete missing data is calculated per NMFS guidance. Peak = SEL + 25. RMS = SEL + 10. "Effect distance" is the distance within which injury criterion is predicted to be exceeded. Underwater sound does not accumulative when the sound level drops below "effective quite" which is 150 dB. Increasing the number of strikes beyond 5,012 strikes per day does not increase the 187 dB effect distance beyond the distance to effective quiet. Increasing the number of strikes beyond 1,995 strikes per day does not increase the 183 dB effect distance beyond the distance to effective quiet. SELcumul is at 10 meters from pile. All distances are in meters10 Enter dB attenuation assumed from attenuation system or driving on land. Use 5 dB for bubble curtain or dewatered cofferdam. Use 10 dB for driving on land. 183 Enter cumumulative SEL threshold. 187 dB for fish greater than 2 g. 183 dB for fish 2g or less.
Peak Effect DistancePeak SEL RMS
3 3,200 5,0121,000 1,995Pile
10 32 100 320
Single Strike at 10 mDistance
to Effective Quiet
Number of Strikes Per Day
Technical Guidance for the Assessment of the Hydroacoustic Effects of Pile Driving on Fish
Appendix III – Section 4. Caltrans Engineering Technical Brief Overview of the Evaluation of Pile Driving Impacts on Fish for the Permitting Process

This page intentionally left blank.
Technical Advisory, Hydroacoustic Analysis TAH‐15‐01
Page 1 of 7
California Department of Transportation
Division of Environmental Analysis
Environmental Engineering
Hazardous Waste, Air, Noise, Paleontology Office
CALTRANS Engineering Technical Brief
OVERVIEW OF THE EVALUTION OF PILE DRIVING IMPACTS
ON FISH FOR THE PERMITTING PROCESS
Technical Advisory, Hydroacoustic Analysis
TAH‐15‐01
October 16, 2015
Prepared by:
David Buehler, P.E. – Caltrans Consultant (ICF International)
Bruce Rymer, P.E. – Caltrans Senior Transportation Engineer
Melina Molnar – Caltrans Senior Environmental Planner
© 2015 California Department of Transportation
This document is not an official policy, standard, specification or regulation and should not be used as such. Its contents are for informational purposes only. Any views
expressed in this advisory reflect those of the authors.
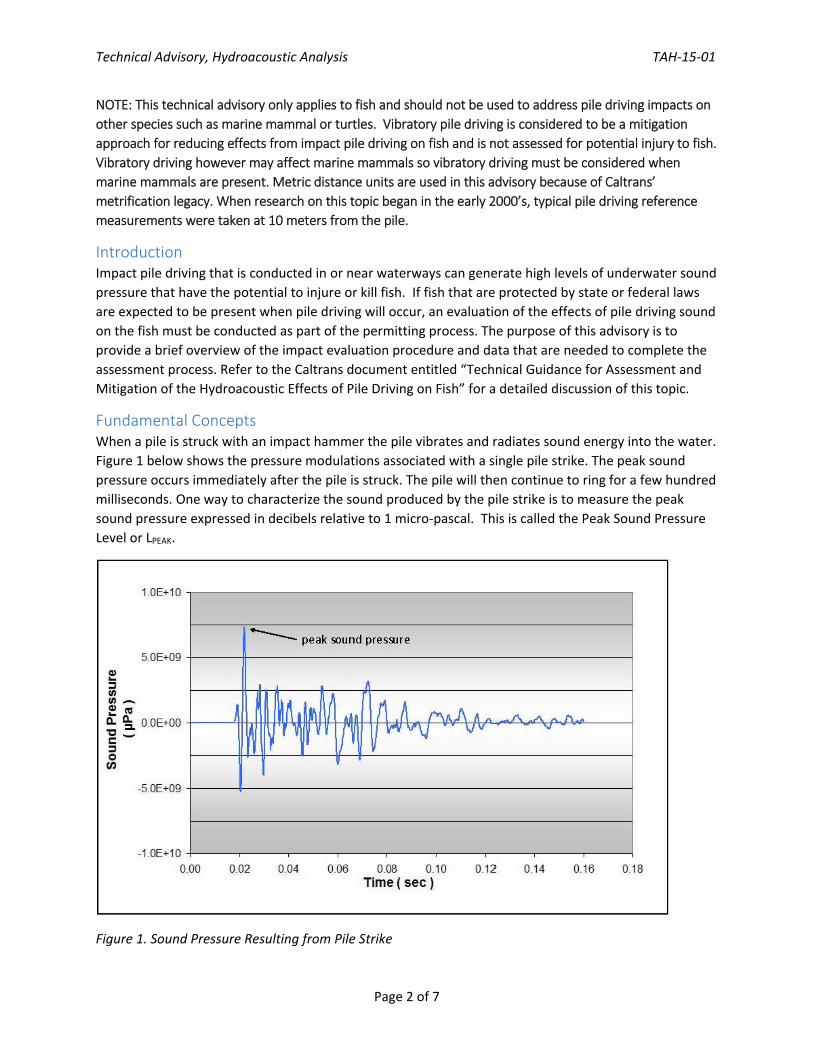
Technical Advisory, Hydroacoustic Analysis TAH‐15‐01
Page 2 of 7
NOTE: This technical advisory only applies to fish and should not be used to address pile driving impacts on
other species such as marine mammal or turtles. Vibratory pile driving is considered to be a mitigation
approach for reducing effects from impact pile driving on fish and is not assessed for potential injury to fish.
Vibratory driving however may affect marine mammals so vibratory driving must be considered when
marine mammals are present. Metric distance units are used in this advisory because of Caltrans’
metrification legacy. When research on this topic began in the early 2000’s, typical pile driving reference
measurements were taken at 10 meters from the pile.
Introduction Impact pile driving that is conducted in or near waterways can generate high levels of underwater sound pressure that have the potential to injure or kill fish. If fish that are protected by state or federal laws are expected to be present when pile driving will occur, an evaluation of the effects of pile driving sound on the fish must be conducted as part of the permitting process. The purpose of this advisory is to provide a brief overview of the impact evaluation procedure and data that are needed to complete the assessment process. Refer to the Caltrans document entitled “Technical Guidance for Assessment and Mitigation of the Hydroacoustic Effects of Pile Driving on Fish” for a detailed discussion of this topic.
Fundamental Concepts When a pile is struck with an impact hammer the pile vibrates and radiates sound energy into the water. Figure 1 below shows the pressure modulations associated with a single pile strike. The peak sound pressure occurs immediately after the pile is struck. The pile will then continue to ring for a few hundred milliseconds. One way to characterize the sound produced by the pile strike is to measure the peak sound pressure expressed in decibels relative to 1 micro‐pascal. This is called the Peak Sound Pressure Level or LPEAK.
Figure 1. Sound Pressure Resulting from Pile Strike
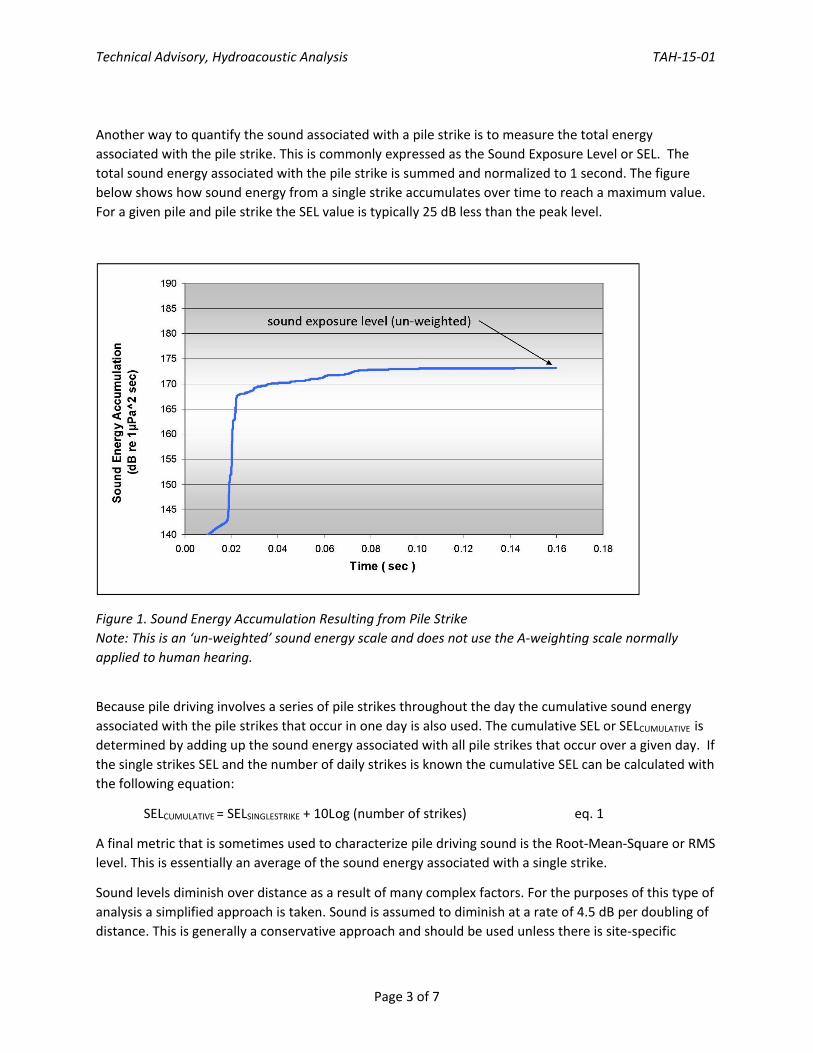
Technical Advisory, Hydroacoustic Analysis TAH‐15‐01
Page 3 of 7
Another way to quantify the sound associated with a pile strike is to measure the total energy associated with the pile strike. This is commonly expressed as the Sound Exposure Level or SEL. The total sound energy associated with the pile strike is summed and normalized to 1 second. The figure below shows how sound energy from a single strike accumulates over time to reach a maximum value. For a given pile and pile strike the SEL value is typically 25 dB less than the peak level.
Figure 1. Sound Energy Accumulation Resulting from Pile Strike
Note: This is an ‘un‐weighted’ sound energy scale and does not use the A‐weighting scale normally
applied to human hearing.
Because pile driving involves a series of pile strikes throughout the day the cumulative sound energy associated with the pile strikes that occur in one day is also used. The cumulative SEL or SELCUMULATIVE is determined by adding up the sound energy associated with all pile strikes that occur over a given day. If the single strikes SEL and the number of daily strikes is known the cumulative SEL can be calculated with the following equation:
SELCUMULATIVE = SELSINGLESTRIKE + 10L og (number of strikes) eq. 1
A final metric that is sometimes used to characterize pile driving sound is the Root‐Mean‐Square or RMS level. This is essentially an average of the sound energy associated with a single strike.
Sound levels diminish over distance as a result of many complex factors. For the purposes of this type of analysis a simplified approach is taken. Sound is assumed to diminish at a rate of 4.5 dB per doubling of distance. This is generally a conservative approach and should be used unless there is site‐specific
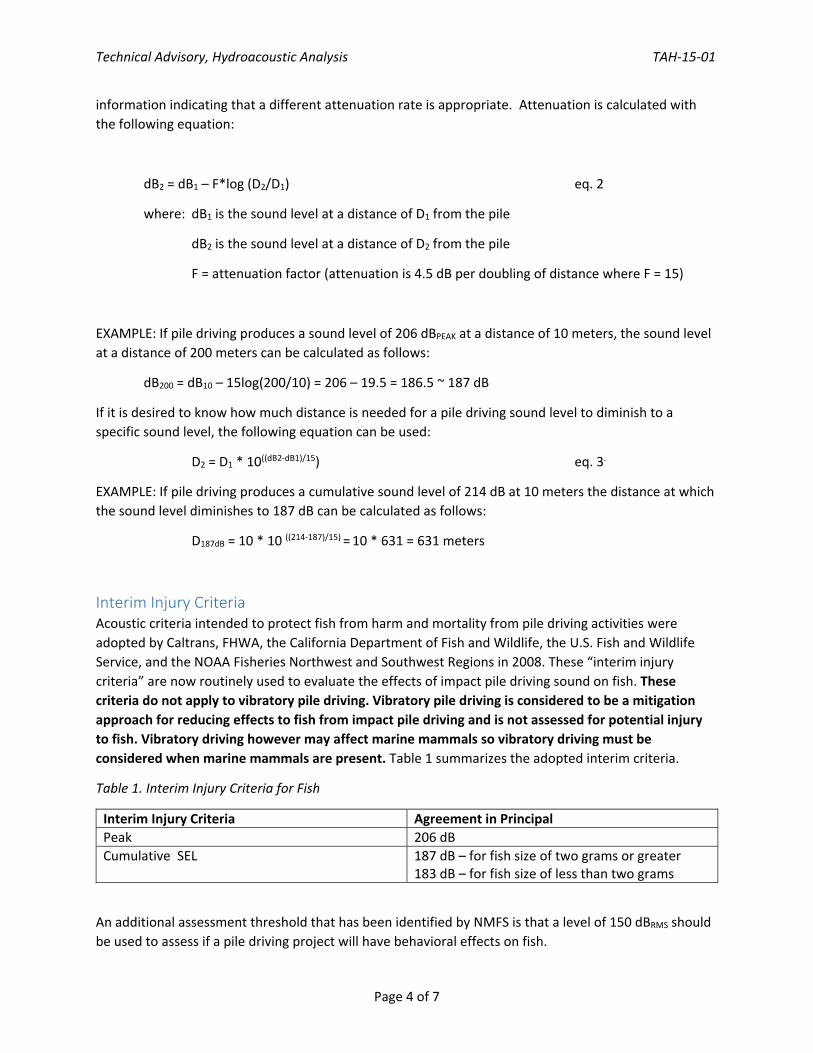
Technical Advisory, Hydroacoustic Analysis TAH‐15‐01
Page 4 of 7
information indicating that a different attenuation rate is appropriate. Attenuation is calculated with the following equation:
dB2 = dB1 – F*log (D2/D1) eq. 2
where: dB1 is the sound level at a distance of D1 from the pile
dB2 is the sound level at a distance of D2 from the pile
F = attenuation factor (attenuation is 4.5 dB per doubling of distance where F = 15)
EXAMPLE: If pile driving produces a sound level of 206 dBPEAK at a distance of 10 meters, the sound level at a distance of 200 meters can be calculated as follows:
dB200 = dB10 – 15log(200/10) = 206 – 19.5 = 186.5 ~ 187 dB
If it is desired to know how much distance is needed for a pile driving sound level to diminish to a specific sound level, the following equation can be used:
D2 = D * 10((dB2‐dB1)/151 ) eq. 3.
EXAMPLE: If pile driving produces a cumulative sound level of 214 dB at 10 meters the distance at which the sound level diminishes to 187 dB can be calculated as follows:
D187dB = 10 * 10 ((214‐187)/15) = 10 * 631 = 631 meters
Interim Injury Criteria Acoustic criteria intended to protect fish from harm and mortality from pile driving activities were adopted by Caltrans, FHWA, the California Department of Fish and Wildlife, the U.S. Fish and Wildlife Service, and the NOAA Fisheries Northwest and Southwest Regions in 2008. These “interim injury criteria” are now routinely used to evaluate the effects of impact pile driving sound on fish. These criteria do not apply to vibratory pile driving. Vibratory pile driving is considered to be a mitigation approach for reducing effects to fish from impact pile driving and is not assessed for potential injury to fish. Vibratory driving however may affect marine mammals so vibratory driving must be considered when marine mammals are present. Table 1 summarizes the adopted interim criteria.
Table 1. Interim Injury Criteria for Fish
Interim Injury Criteria Agreement in Principal Peak 206 dB Cumulative SEL 187 dB – for fish size of two grams or greater
183 dB – for fish size of less than two grams
An additional assessment threshold that has been identified by NMFS is that a level of 150 dBRMS should be used to assess if a pile driving project will have behavioral effects on fish.
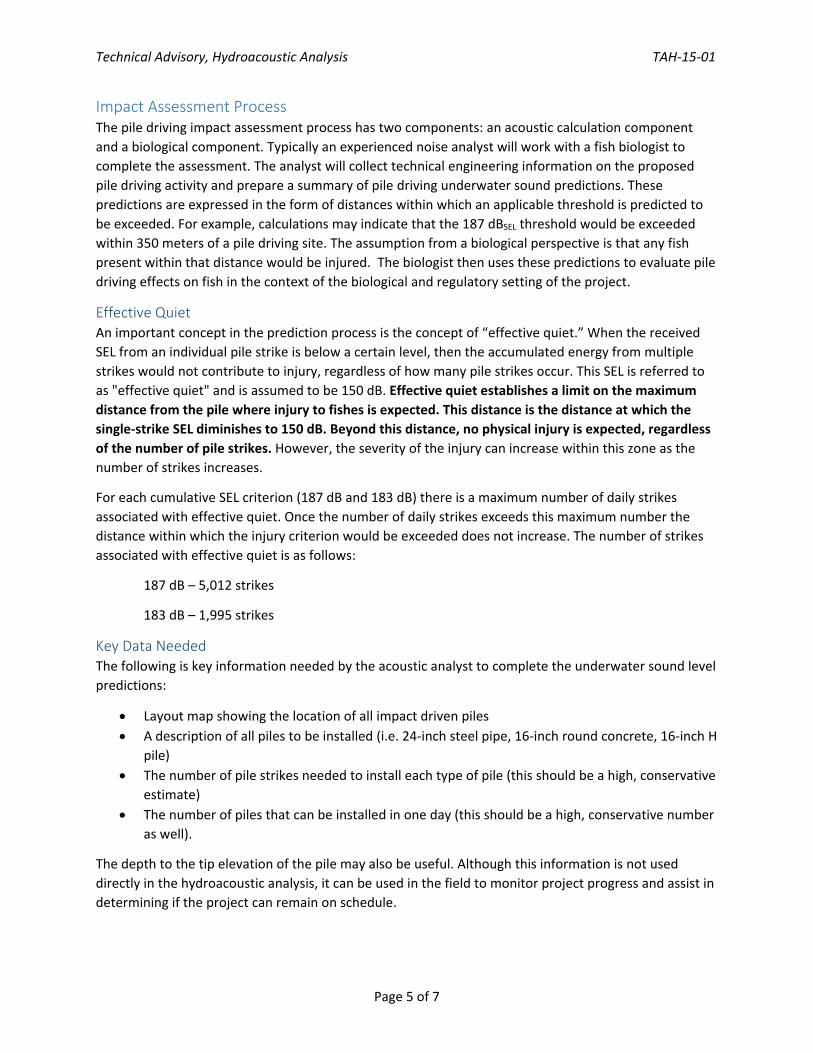
Technical Advisory, Hydroacoustic Analysis TAH‐15‐01
Page 5 of 7
Impact Assessment Process The pile driving impact assessment process has two components: an acoustic calculation component and a biological component. Typically an experienced noise analyst will work with a fish biologist to complete the assessment. The analyst will collect technical engineering information on the proposed pile driving activity and prepare a summary of pile driving underwater sound predictions. These predictions are expressed in the form of distances within which an applicable threshold is predicted to be exceeded. For example, calculations may indicate that the 187 dBSEL threshold would be exceeded within 350 meters of a pile driving site. The assumption from a biological perspective is that any fish present within that distance would be injured. The biologist then uses these predictions to evaluate pile driving effects on fish in the context of the biological and regulatory setting of the project.
Effective Quiet An important concept in the prediction process is the concept of “effective quiet.” When the received SEL from an individual pile strike is below a certain level, then the accumulated energy from multiple strikes would not contribute to injury, regardless of how many pile strikes occur. This SEL is referred to as "effective quiet" and is assumed to be 150 dB. Effective quiet establishes a limit on the maximum distance from the pile where injury to fishes is expected. This distance is the distance at which the single‐strike SEL diminishes to 150 dB. Beyond this distance, no physical injury is expected, regardless of the number of pile strikes. However, the severity of the injury can increase within this zone as the number of strikes increases.
For each cumulative SEL criterion (187 dB and 183 dB) there is a maximum number of daily strikes associated with effective quiet. Once the number of daily strikes exceeds this maximum number the distance within which the injury criterion would be exceeded does not increase. The number of strikes associated with effective quiet is as follows:
187 dB – 5,012 strikes
183 dB – 1,995 strikes
Key Data Needed The following is key information needed by the acoustic analyst to complete the underwater sound level predictions:
Layout map showing the location of all impact driven piles A description of all piles to be installed (i.e. 24‐inch steel pipe, 16‐inch round concrete, 16‐inch H
pile) The number of pile strikes needed to install each type of pile (this should be a high, conservative
estimate) The number of piles that can be installed in one day (this should be a high, conservative number
as well).
The depth to the tip elevation of the pile may also be useful. Although this information is not used directly in the hydroacoustic analysis, it can be used in the field to monitor project progress and assist in determining if the project can remain on schedule.
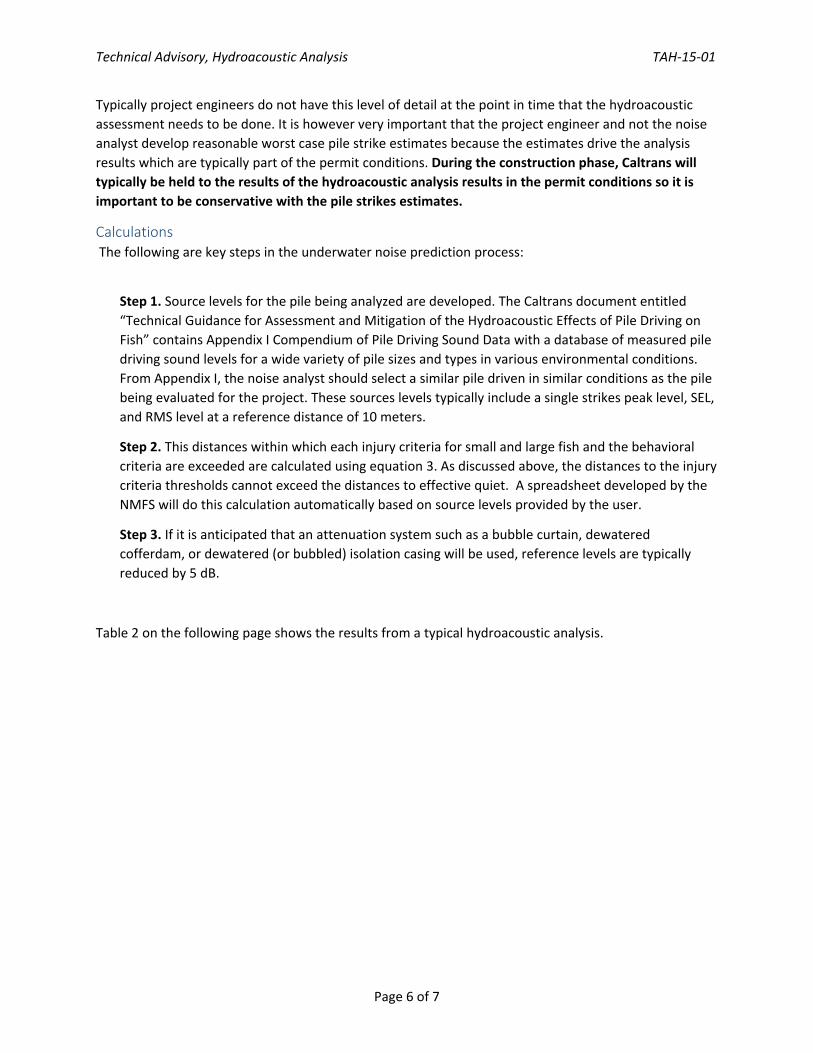
Technical Advisory, Hydroacoustic Analysis TAH‐15‐01
Page 6 of 7
Typically project engineers do not have this level of detail at the point in time that the hydroacoustic assessment needs to be done. It is however very important that the project engineer and not the noise analyst develop reasonable worst case pile strike estimates because the estimates drive the analysis results which are typically part of the permit conditions. During the construction phase, Caltrans will typically be held to the results of the hydroacoustic analysis results in the permit conditions so it is important to be conservative with the pile strikes estimates.
Calculations The following are key steps in the underwater noise prediction process:
Step 1. Source levels for the pile being analyzed are developed. The Caltrans document entitled “Technical Guidance for Assessment and Mitigation of the Hydroacoustic Effects of Pile Driving on Fish” contains Appendix I Compendium of Pile Driving Sound Data with a database of measured pile driving sound levels for a wide variety of pile sizes and types in various environmental conditions. From Appendix I, the noise analyst should select a similar pile driven in similar conditions as the pile being evaluated for the project. These sources levels typically include a single strikes peak level, SEL, and RMS level at a reference distance of 10 meters.
Step 2. This distances within which each injury criteria for small and large fish and the behavioral criteria are exceeded are calculated using equation 3. As discussed above, the distances to the injury criteria thresholds cannot exceed the distances to effective quiet. A spreadsheet developed by the NMFS will do this calculation automatically based on source levels provided by the user.
Step 3. If it is anticipated that an attenuation system such as a bubble curtain, dewatered cofferdam, or dewatered (or bubbled) isolation casing will be used, reference levels are typically reduced by 5 dB.
Table 2 on the following page shows the results from a typical hydroacoustic analysis.
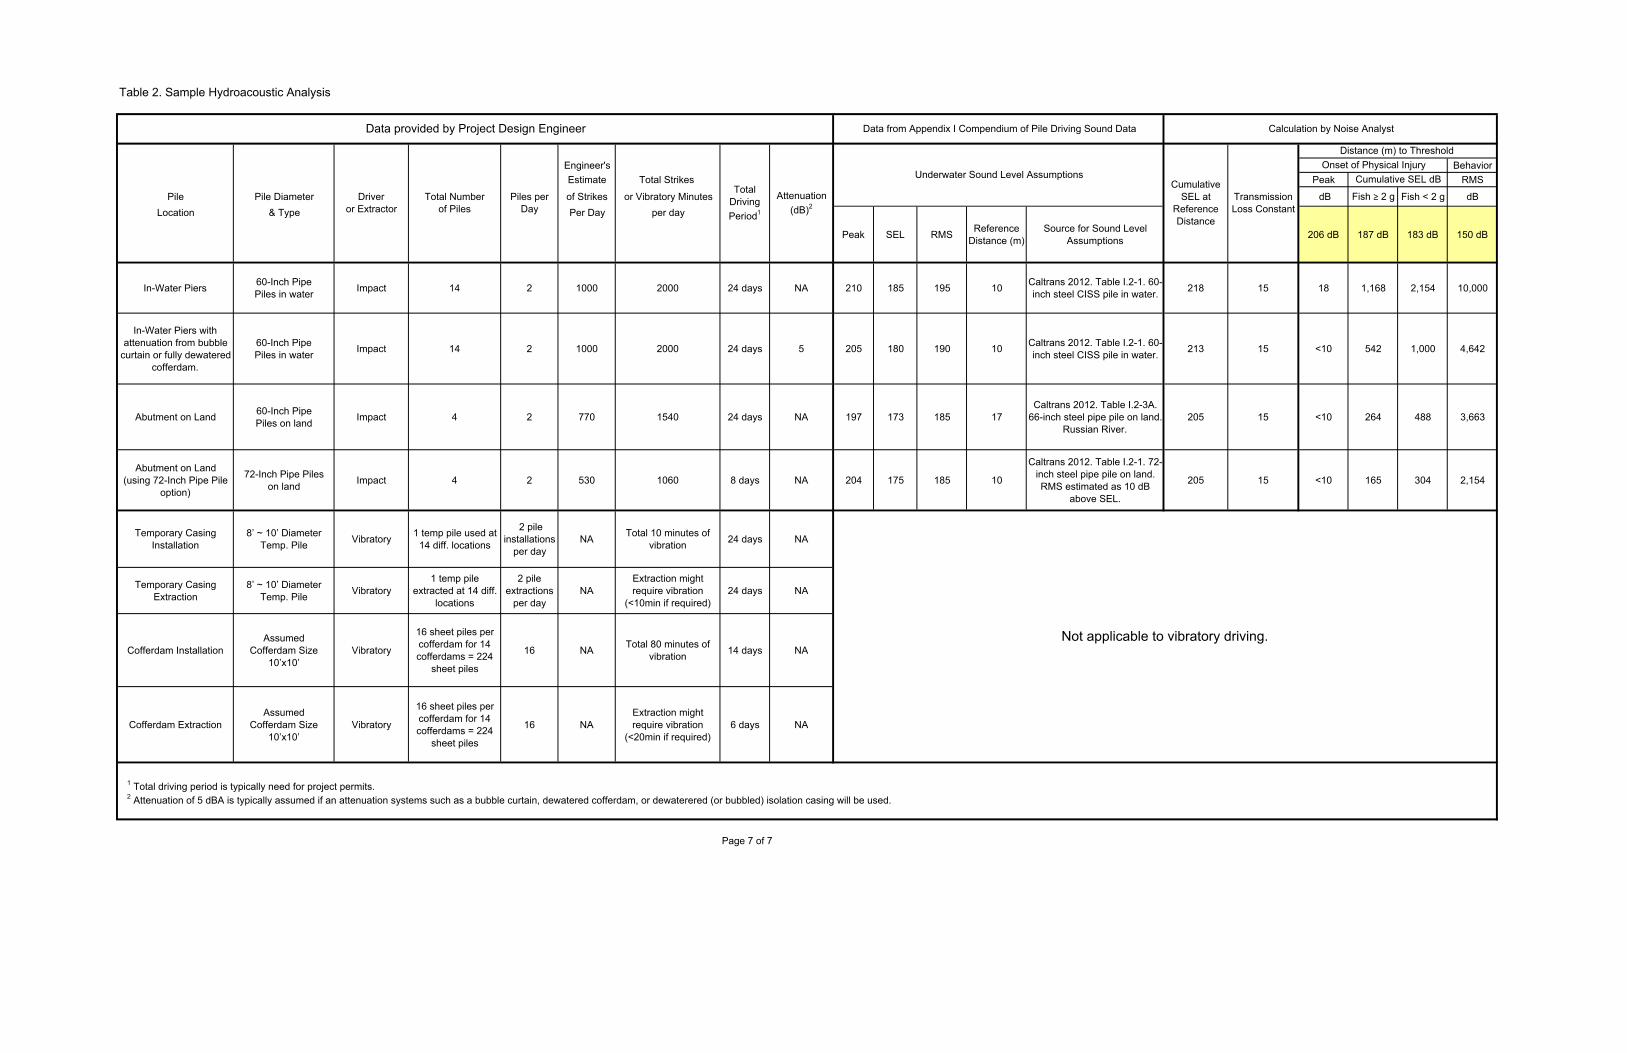
Table 2. Sample Hydroacoustic Analysis
Engineer's BehaviorEstimate Total Strikes Peak RMS
Pile Pile Diameter of Strikes or Vibratory Minutes dB Fish ≥ 2 g Fish < 2 g dBLocation & Type Per Day per day
Peak SEL RMS Reference Distance (m)
Source for Sound Level Assumptions 206 dB 187 dB 183 dB 150 dB
In-Water Piers 60-Inch Pipe Piles in water Impact 14 2 1000 2000 24 days NA 210 185 195 10 Caltrans 2012. Table I.2-1. 60-
inch steel CISS pile in water. 218 15 18 1,168 2,154 10,000
In-Water Piers with attenuation from bubble
curtain or fully dewatered cofferdam.
60-Inch Pipe Piles in water Impact 14 2 1000 2000 24 days 5 205 180 190 10 Caltrans 2012. Table I.2-1. 60-
inch steel CISS pile in water. 213 15 <10 542 1,000 4,642
Abutment on Land 60-Inch Pipe Piles on land Impact 4 2 770 1540 24 days NA 197 173 185 17
Caltrans 2012. Table I.2-3A. 66-inch steel pipe pile on land.
Russian River. 205 15 <10 264 488 3,663
Abutment on Land (using 72-Inch Pipe Pile
option)
72-Inch Pipe Piles on land Impact 4 2 530 1060 8 days NA 204 175 185 10
Caltrans 2012. Table I.2-1. 72-inch steel pipe pile on land. RMS estimated as 10 dB
above SEL.
205 15 <10 165 304 2,154
Temporary Casing Installation
8’ ~ 10’ Diameter Temp. Pile Vibratory 1 temp pile used at
14 diff. locations
2 pile installations
per dayNA Total 10 minutes of
vibration 24 days NA
Temporary Casing Extraction
8’ ~ 10’ Diameter Temp. Pile Vibratory
1 temp pile extracted at 14 diff.
locations
2 pile extractions
per dayNA
Extraction might require vibration
(<10min if required) 24 days NA
Cofferdam Installation Assumed
Cofferdam Size 10’x10’
Vibratory
16 sheet piles per cofferdam for 14 cofferdams = 224
sheet piles
16 NA Total 80 minutes of vibration 14 days NA
Cofferdam ExtractionAssumed
Cofferdam Size 10’x10’
Vibratory
16 sheet piles per cofferdam for 14 cofferdams = 224
sheet piles
16 NAExtraction might require vibration
(<20min if required) 6 days NA
1 Total driving period is typically need for project permits.2 Attenuation of 5 dBA is typically assumed if an attenuation systems such as a bubble curtain, dewatered cofferdam, or dewaterered (or bubbled) isolation casing will be used.
Page 7 of 7
Not applicable to vibratory driving.
Cumulative SEL at
Reference Distance
Transmission Loss Constant
Cumulative SEL dBOnset of Physical Injury
Driver or Extractor
Underwater Sound Level Assumptions
Distance (m) to Threshold
Total Number of Piles
Piles per Day
Total Driving Period1
Attenuation (dB)2
Data from Appendix I Compendium of Pile Driving Sound Data Calculation by Noise AnalystData provided by Project Design Engineer

This page intentionally left blank.
Technical Guidance for the Assessment of the Hydroacoustic Effects of Pile Driving on Fish
Appendix IV U.S. Patent for Underwater Energy Dampening Device

This page intentionally left blank.
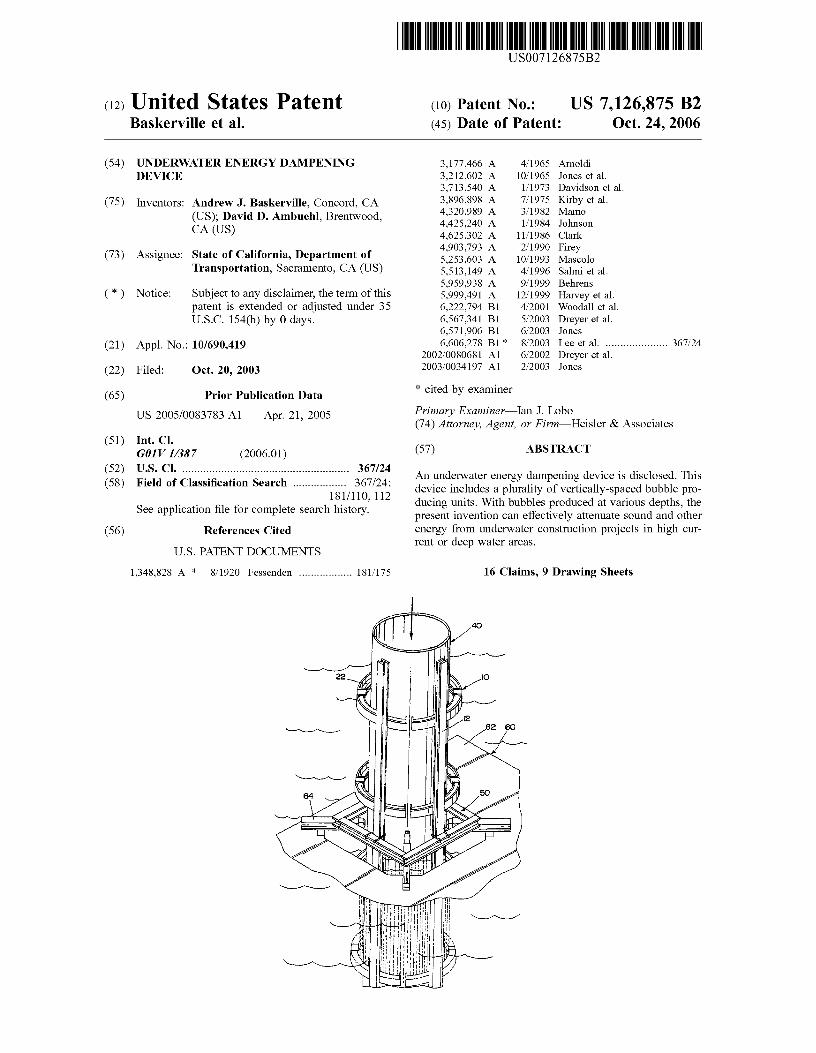
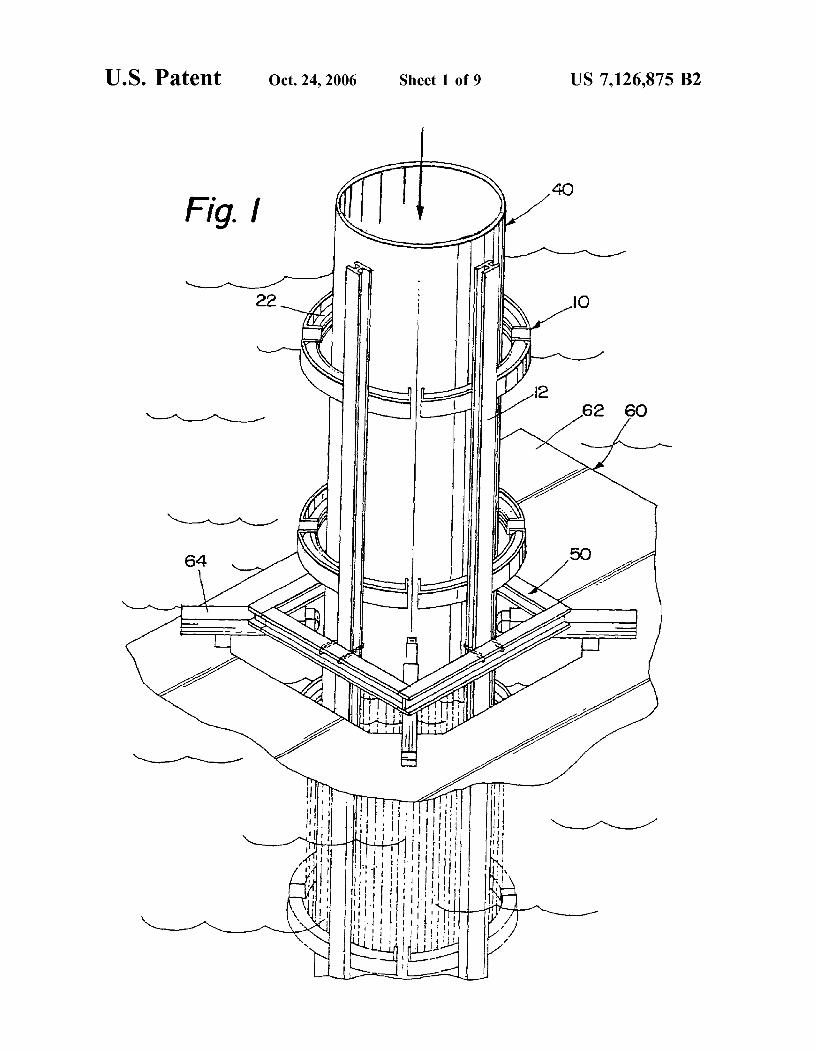
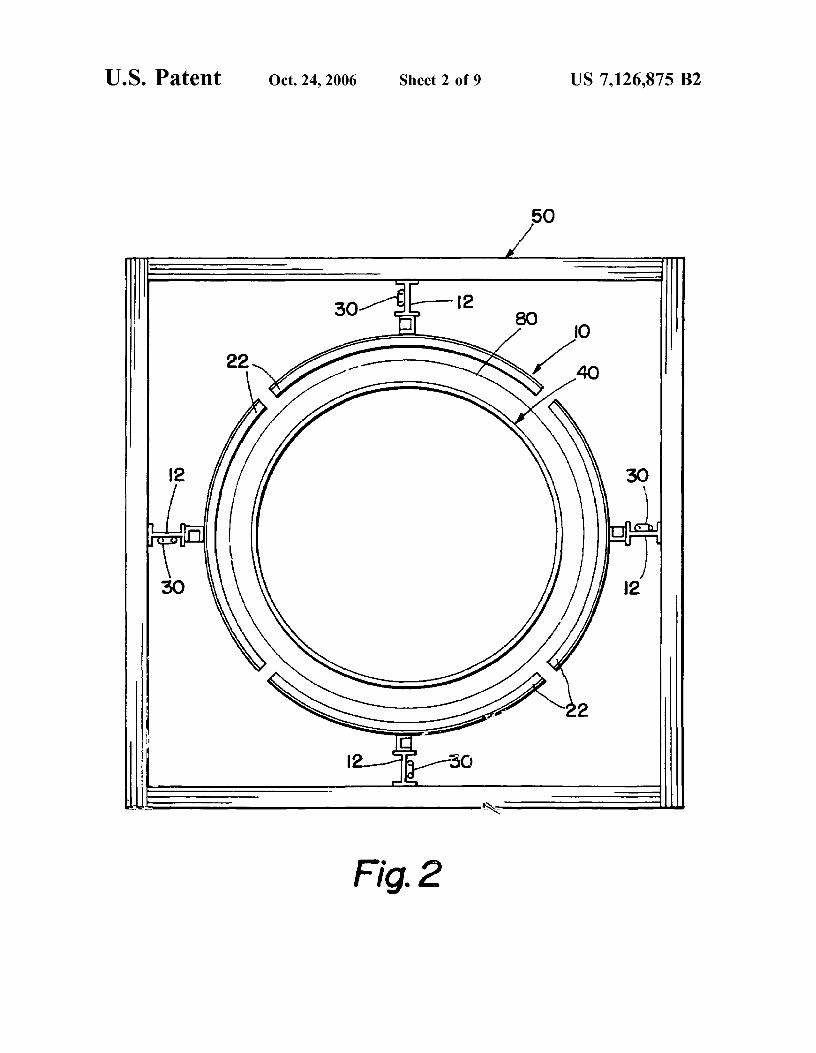
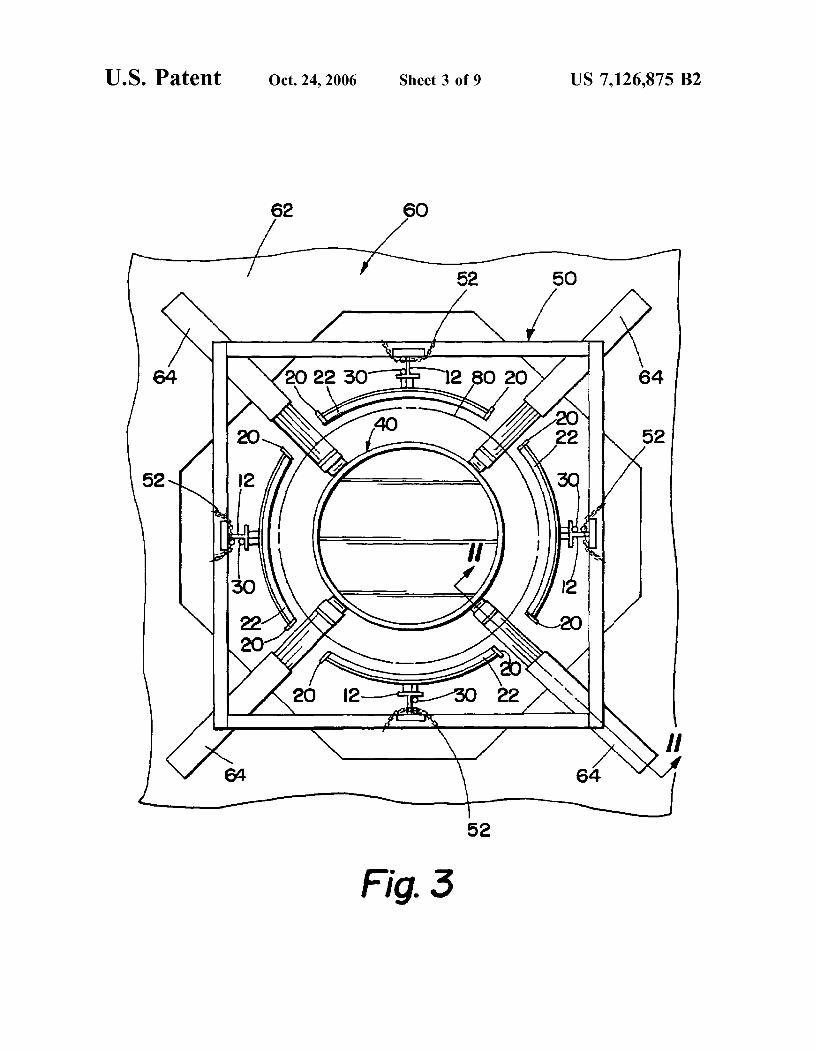
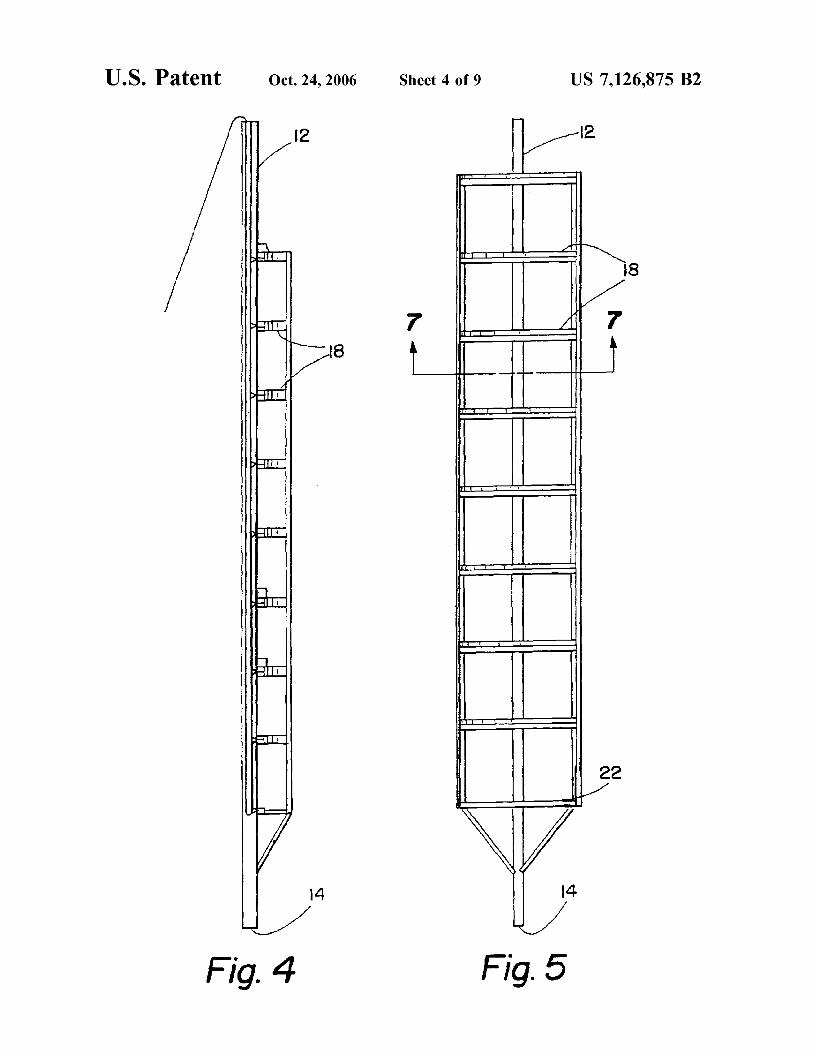
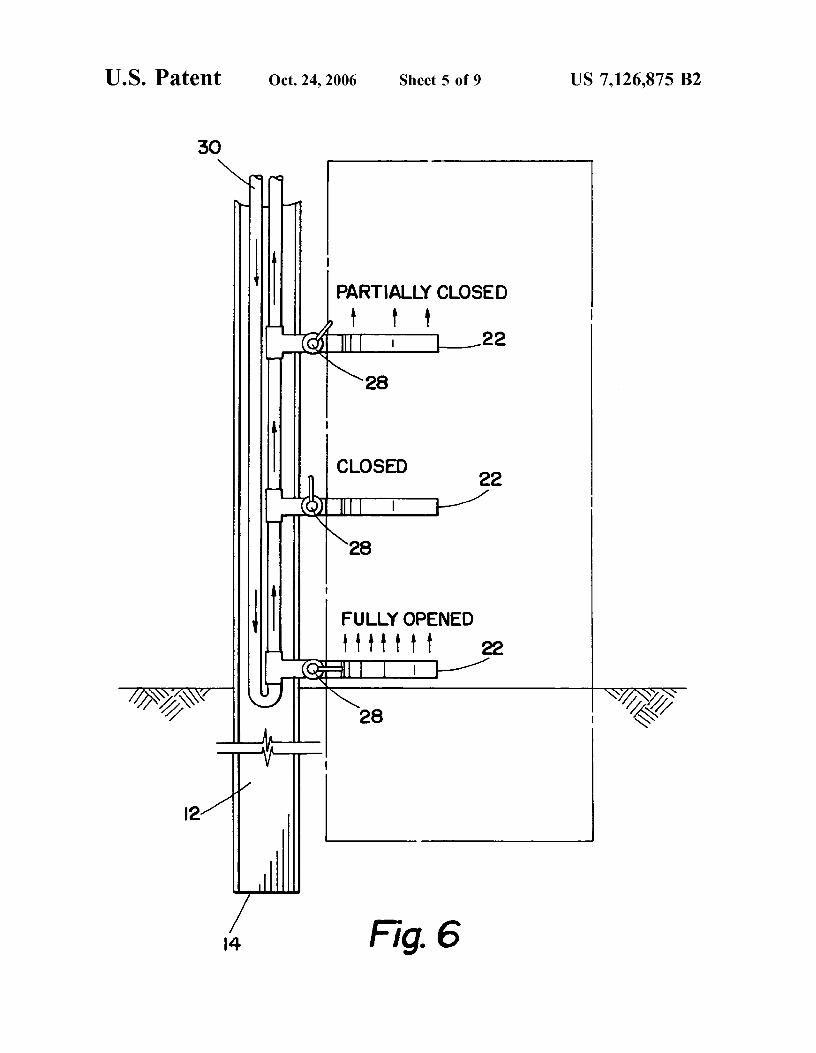
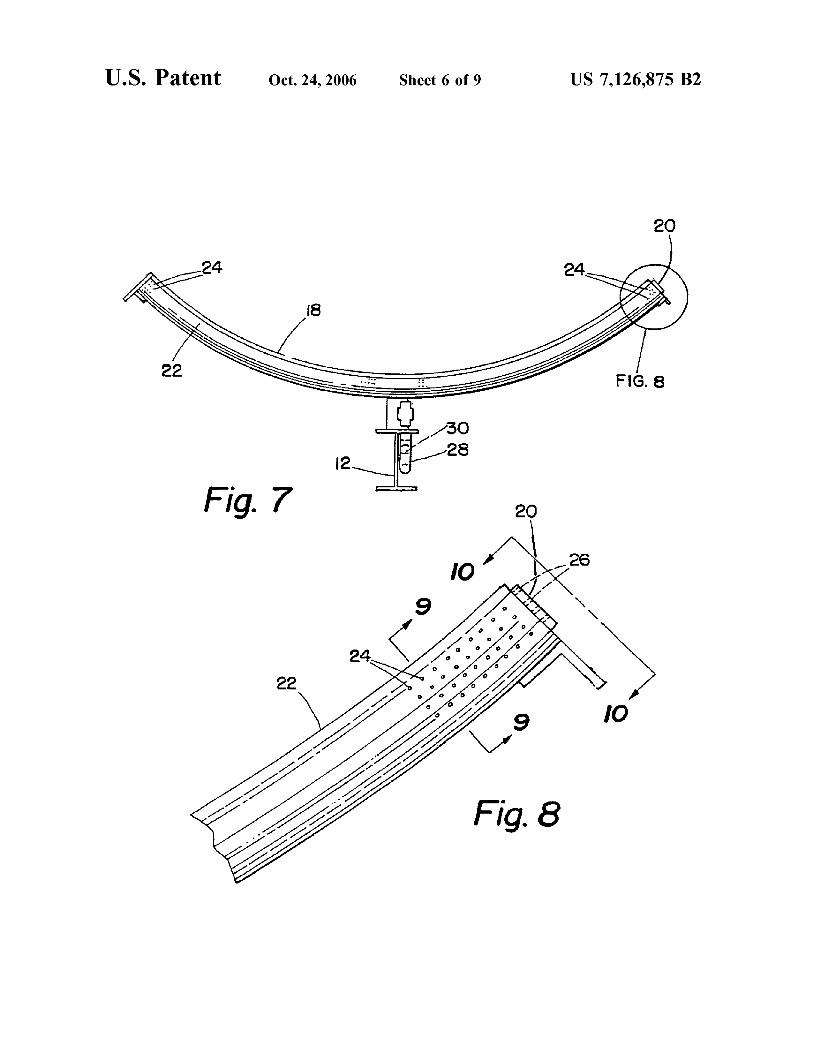
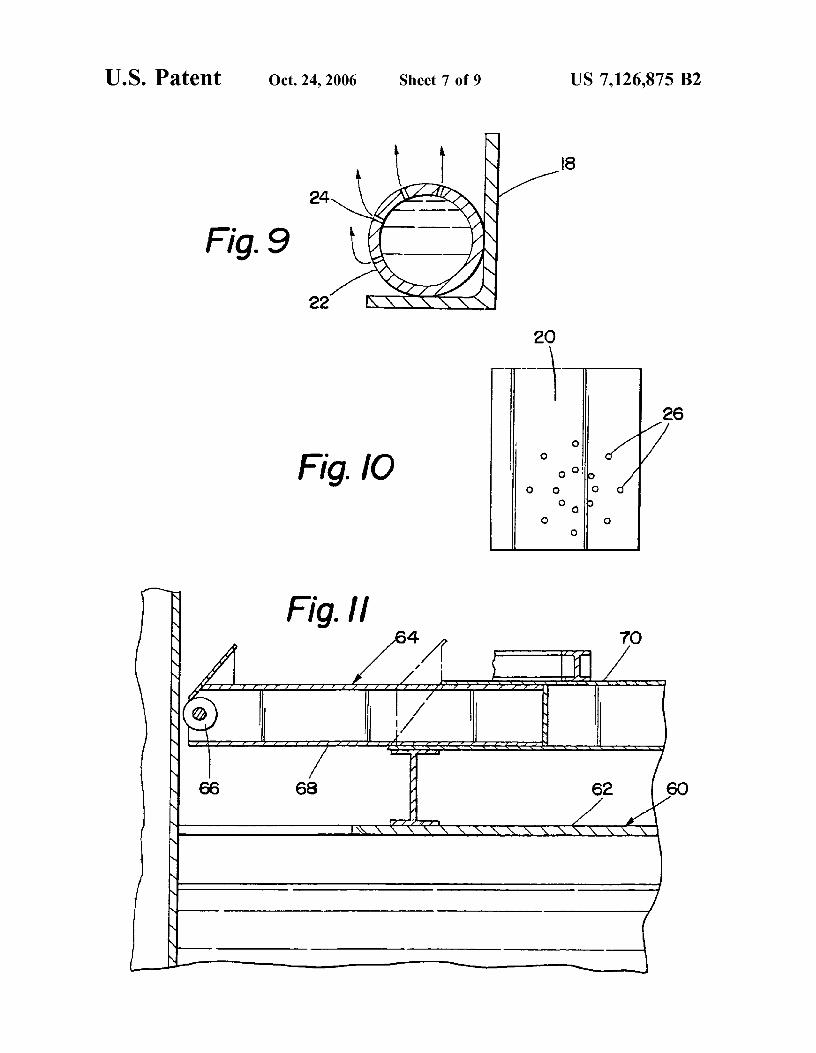
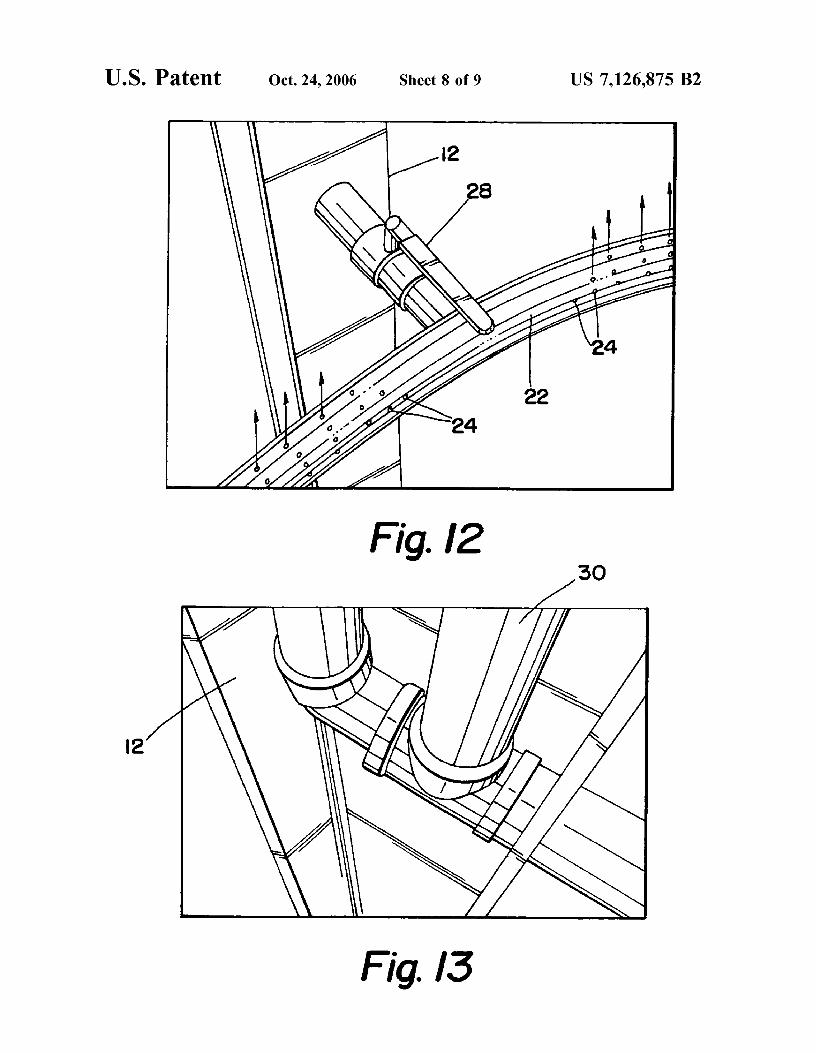
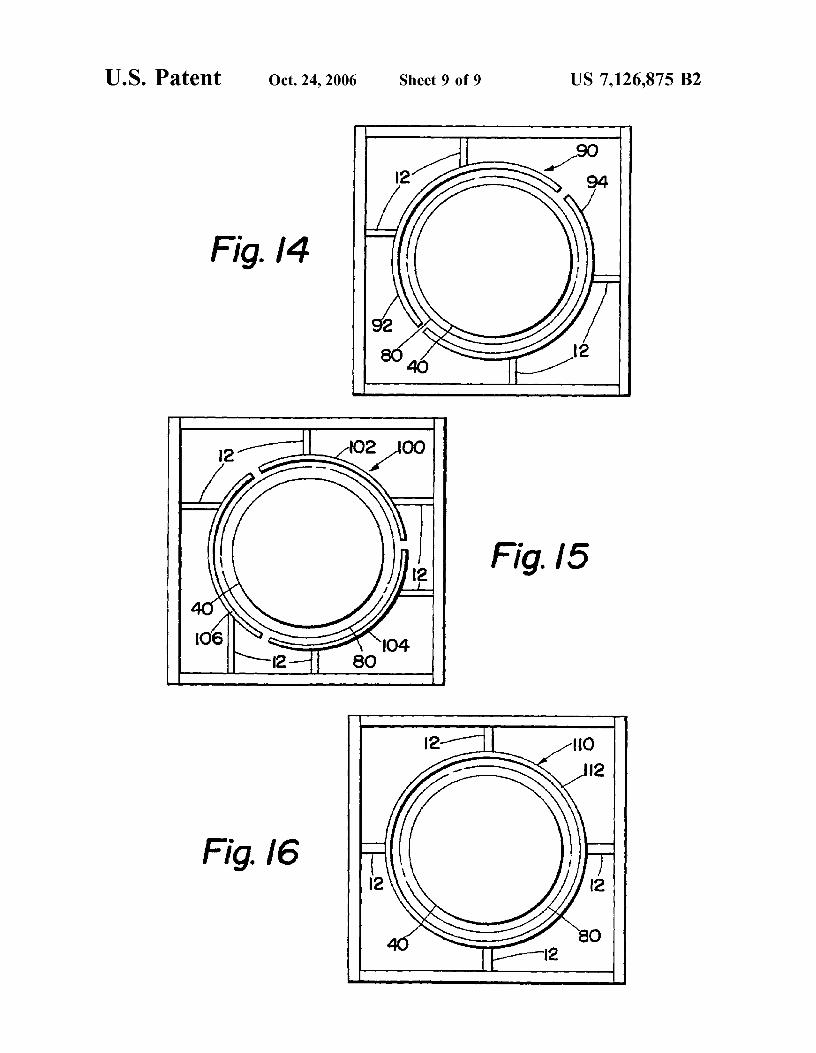
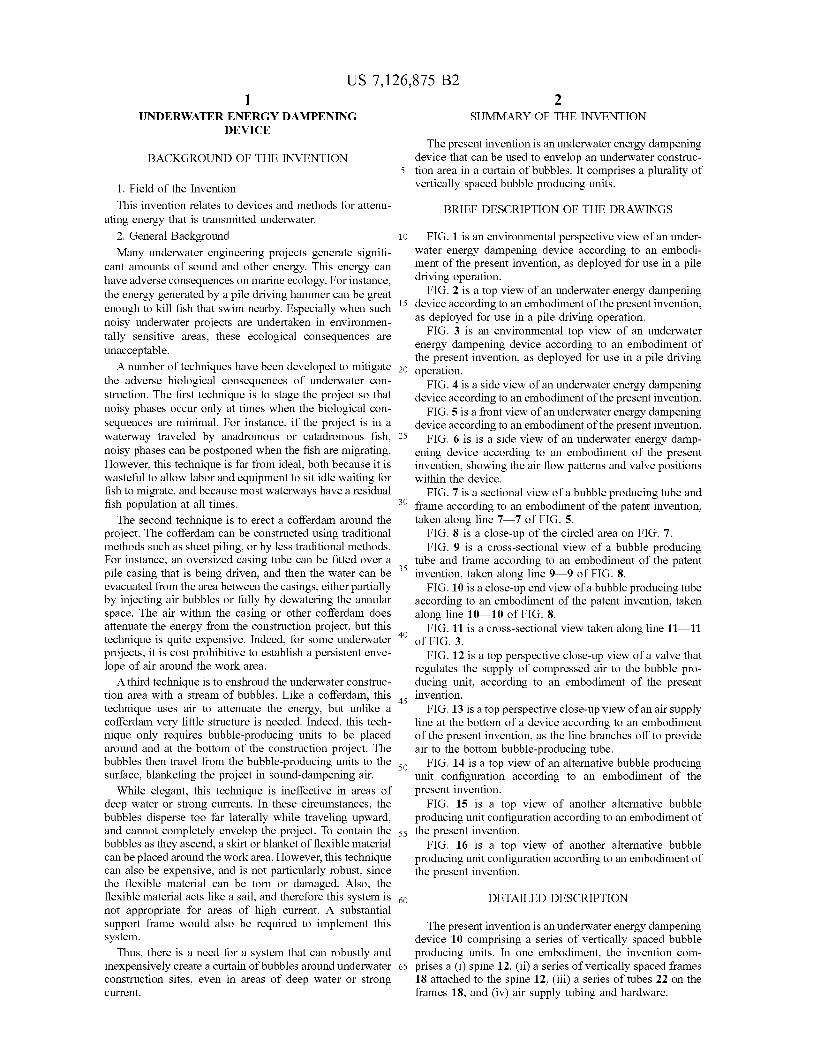
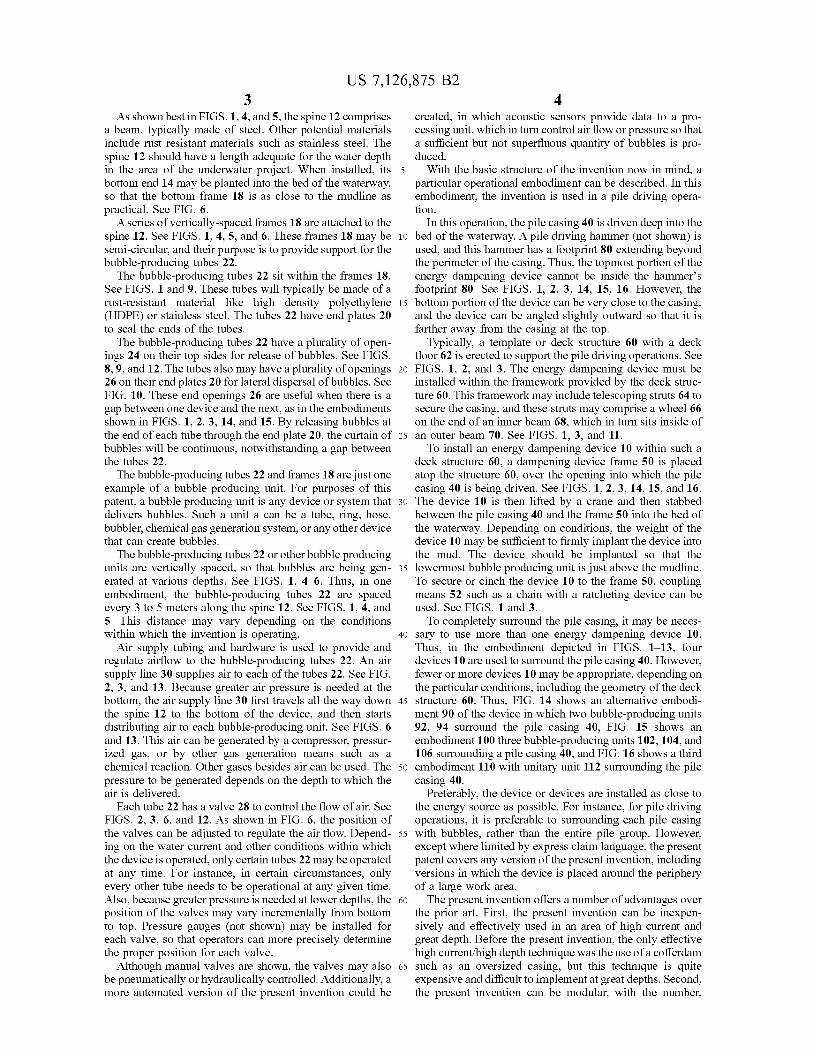
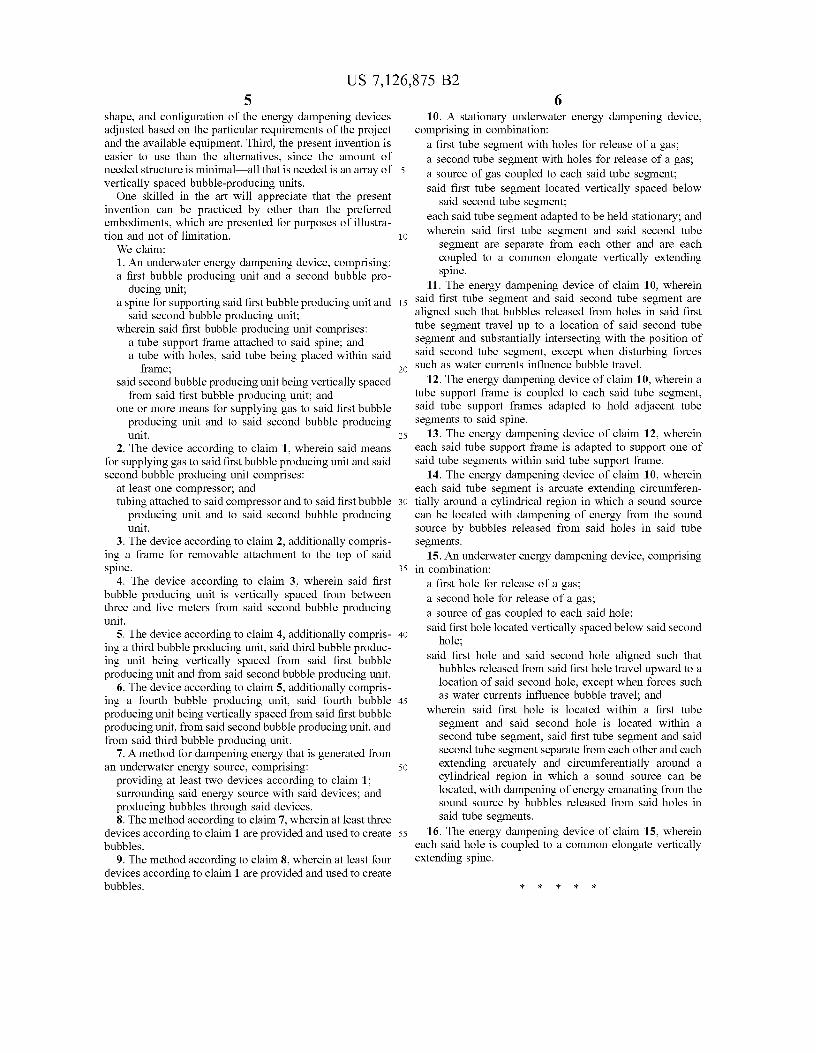

This page intentionally left blank.

California Department of TransportationDivision of Environmental AnalysisEnvironmental EngineeringHazardous Waste, Air, Noise, Paleontology Office
© 2020 California Department of Transportation