afta travel trends
TRANSCRIPT

January
AFTA Travel Trends November 2016 Results
© AFTA Travel Trends Report 2017
Inbound Report
Introduction
These snapshots provide an
overview of the performance of the
Australian inbound tourism sector.
It uses information provided by the
Australian Bureau of Statistics (ABS)
Overseas Arrivals and Departures
(OAD) data set.
Performance indicators are provided
for each market and month.
A neutral rating is provided for
markets which have a year on year
variation of (+/-) 2%.
Where are our participants?
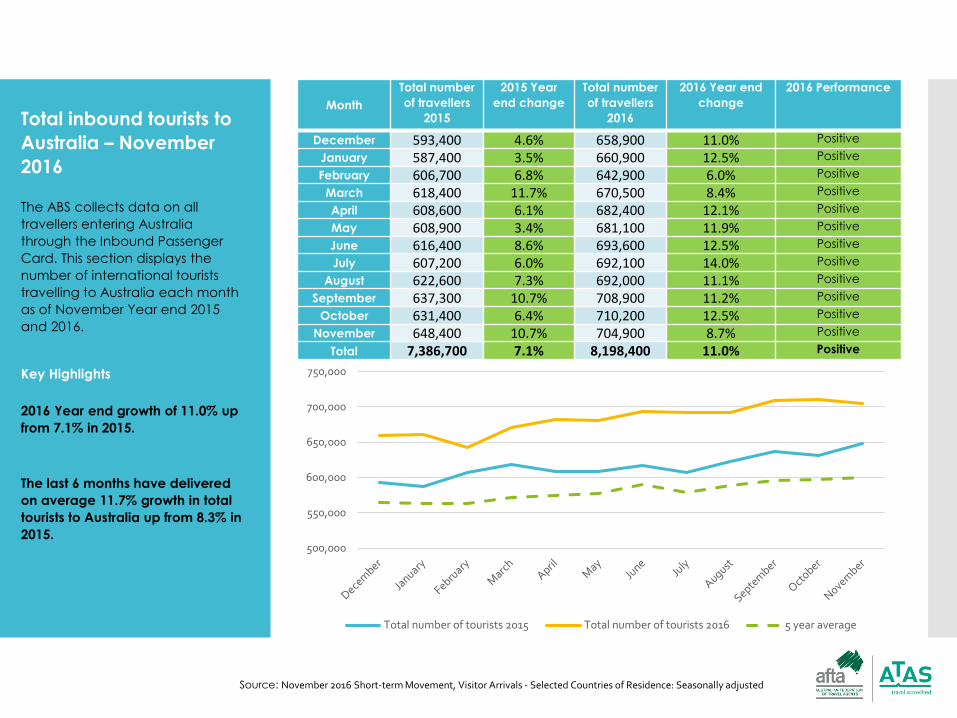
Total inbound tourists to
Australia – November
2016
The ABS collects data on all
travellers entering Australia
through the Inbound Passenger
Card. This section displays the
number of international tourists
travelling to Australia each month
as of November Year end 2015
and 2016.
Month
Total number
of travellers
2015
2015 Year
end change
Total number
of travellers
2016
2016 Year end
change
2016 Performance
December 593,400 4.6% 658,900 11.0% Positive
January 587,400 3.5% 660,900 12.5% Positive
February 606,700 6.8% 642,900 6.0% Positive
March 618,400 11.7% 670,500 8.4% Positive
April 608,600 6.1% 682,400 12.1% Positive
May 608,900 3.4% 681,100 11.9% Positive
June 616,400 8.6% 693,600 12.5% Positive
July 607,200 6.0% 692,100 14.0% Positive
August 622,600 7.3% 692,000 11.1% Positive
September 637,300 10.7% 708,900 11.2% Positive
October 631,400 6.4% 710,200 12.5% Positive
November 648,400 10.7% 704,900 8.7% Positive
Total 7,386,700 7.1% 8,198,400 11.0% Positive
Key Highlights
2016 Year end growth of 11.0% up
from 7.1% in 2015.
The last 6 months have delivered
on average 11.7% growth in total
tourists to Australia up from 8.3% in
2015.
Source: November 2016 Short-term Movement, Visitor Arrivals - Selected Countries of Residence: Seasonally adjusted
500,000
550,000
600,000
650,000
700,000
750,000
Total number of tourists 2015 Total number of tourists 2016 5 year average
Where are our participants?
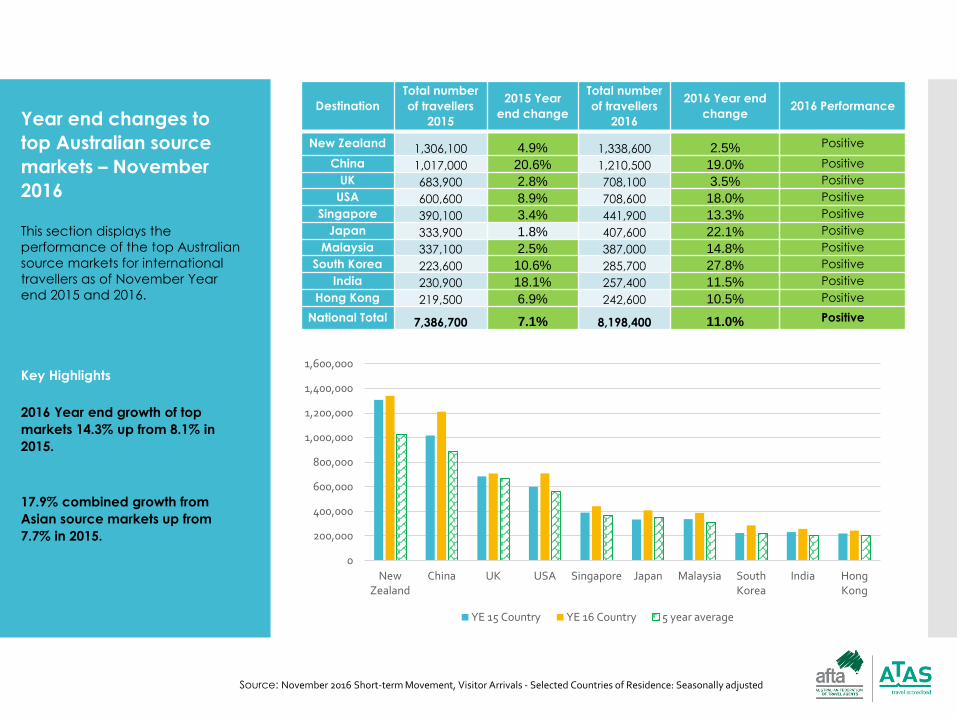
Year end changes to
top Australian source
markets – November
2016
This section displays the
performance of the top Australian
source markets for international
travellers as of November Year
end 2015 and 2016.
Source: October 2016 Short-term Movement, Visitor Arrivals - Selected Countries of Residence: Seasonally adjusted
Destination
Total number
of travellers
2015
2015 Year
end change
Total number
of travellers
2016
2016 Year end
change2016 Performance
New Zealand 1,306,100 4.9% 1,338,600 2.5% Positive
China 1,017,000 20.6% 1,210,500 19.0% Positive
UK 683,900 2.8% 708,100 3.5% Positive
USA 600,600 8.9% 708,600 18.0% Positive
Singapore 390,100 3.4% 441,900 13.3% Positive
Japan 333,900 1.8% 407,600 22.1% Positive
Malaysia 337,100 2.5% 387,000 14.8% Positive
South Korea 223,600 10.6% 285,700 27.8% Positive
India 230,900 18.1% 257,400 11.5% Positive
Hong Kong 219,500 6.9% 242,600 10.5% Positive
National Total 7,386,700 7.1% 8,198,400 11.0% Positive
Key Highlights
2016 Year end growth of top
markets 14.3% up from 8.1% in
2015.
17.9% combined growth from
Asian source markets up from
7.7% in 2015.
Source: November 2016 Short-term Movement, Visitor Arrivals - Selected Countries of Residence: Seasonally adjusted
0
200,000
400,000
600,000
800,000
1,000,000
1,200,000
1,400,000
1,600,000
NewZealand
China UK USA Singapore Japan Malaysia SouthKorea
India HongKong
YE 15 Country YE 16 Country 5 year average
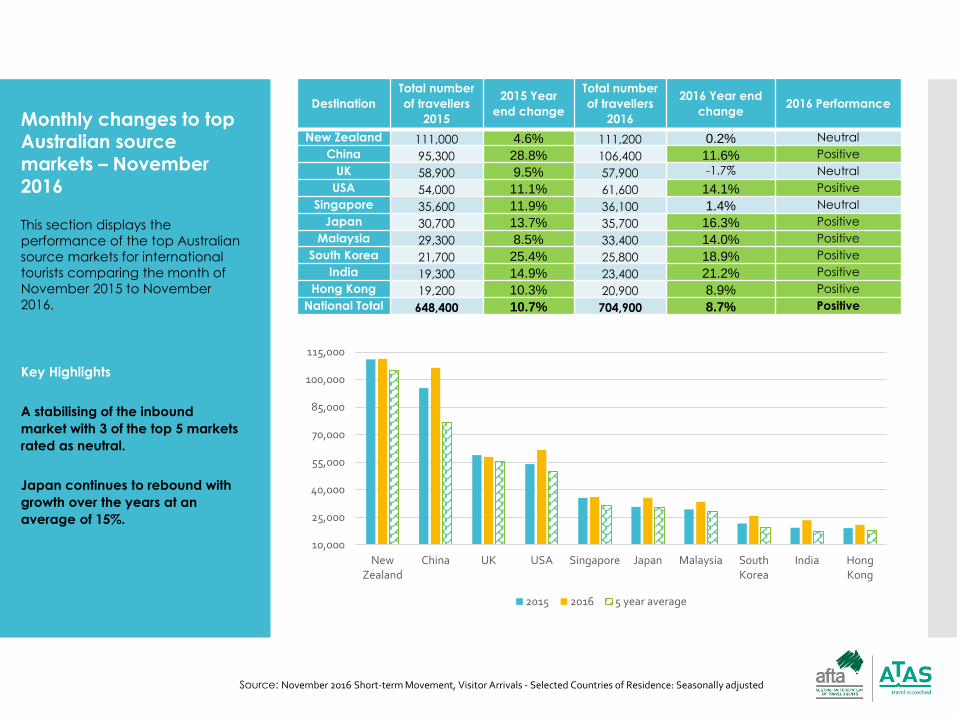
Where are our participants?
Monthly changes to top Australian source markets – November 2016
This section displays the
performance of the top Australian
source markets for international
tourists comparing the month of
November 2015 to November
2016.
Key Highlights
A stabilising of the inbound
market with 3 of the top 5 markets
rated as neutral.
Japan continues to rebound with
growth over the years at an
average of 15%.
Destination
Total number
of travellers
2015
2015 Year
end change
Total number
of travellers
2016
2016 Year end
change2016 Performance
New Zealand 111,000 4.6% 111,200 0.2% Neutral
China 95,300 28.8% 106,400 11.6% Positive
UK 58,900 9.5% 57,900 -1.7% Neutral
USA 54,000 11.1% 61,600 14.1% Positive
Singapore 35,600 11.9% 36,100 1.4% Neutral
Japan 30,700 13.7% 35,700 16.3% Positive
Malaysia 29,300 8.5% 33,400 14.0% Positive
South Korea 21,700 25.4% 25,800 18.9% Positive
India 19,300 14.9% 23,400 21.2% Positive
Hong Kong 19,200 10.3% 20,900 8.9% Positive
National Total 648,400 10.7% 704,900 8.7% Positive
Source: November 2016 Short-term Movement, Visitor Arrivals - Selected Countries of Residence: Seasonally adjusted
10,000
25,000
40,000
55,000
70,000
85,000
100,000
115,000
NewZealand
China UK USA Singapore Japan Malaysia SouthKorea
India HongKong
2015 2016 5 year average
OutboundReport
Introduction
This snapshot provides an overview
of the performance of the Australian
outbound travel sector.
It uses information provided by the
Australian Bureau of Statistics (ABS)
Overseas Arrivals and Departures
(OAD) data set. Performance
indicators are provided for each
market.
A neutral rating is provided for
markets which have a year on year
variation of (+/-) 2%.
Source: November 2016 Short-term Movement, Resident Departures - Selected Destinations: Seasonally adjusted
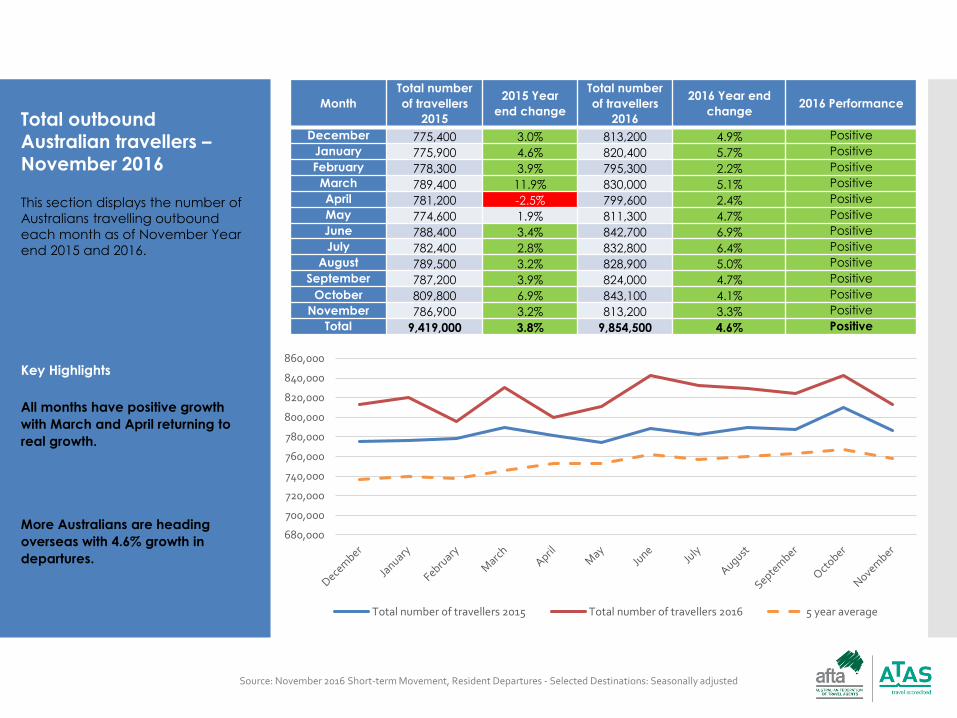
Total outbound Australian travellers –November 2016
This section displays the number of
Australians travelling outbound
each month as of November Year
end 2015 and 2016.
Key Highlights
All months have positive growth
with March and April returning to
real growth.
More Australians are heading
overseas with 4.6% growth in
departures.
Month
Total number
of travellers
2015
2015 Year
end change
Total number
of travellers
2016
2016 Year end
change2016 Performance
December 775,400 3.0% 813,200 4.9% Positive
January 775,900 4.6% 820,400 5.7% Positive
February 778,300 3.9% 795,300 2.2% Positive
March 789,400 11.9% 830,000 5.1% Positive
April 781,200 -2.5% 799,600 2.4% Positive
May 774,600 1.9% 811,300 4.7% Positive
June 788,400 3.4% 842,700 6.9% Positive
July 782,400 2.8% 832,800 6.4% Positive
August 789,500 3.2% 828,900 5.0% Positive
September 787,200 3.9% 824,000 4.7% Positive
October 809,800 6.9% 843,100 4.1% Positive
November 786,900 3.2% 813,200 3.3% Positive
Total 9,419,000 3.8% 9,854,500 4.6% Positive
680,000
700,000
720,000
740,000
760,000
780,000
800,000
820,000
840,000
860,000
Total number of travellers 2015 Total number of travellers 2016 5 year average
Destination
Total number
of travellers
2015
2015 Year
end change
Total number
of travellers
2016
2016 Year end
change2016 Performance
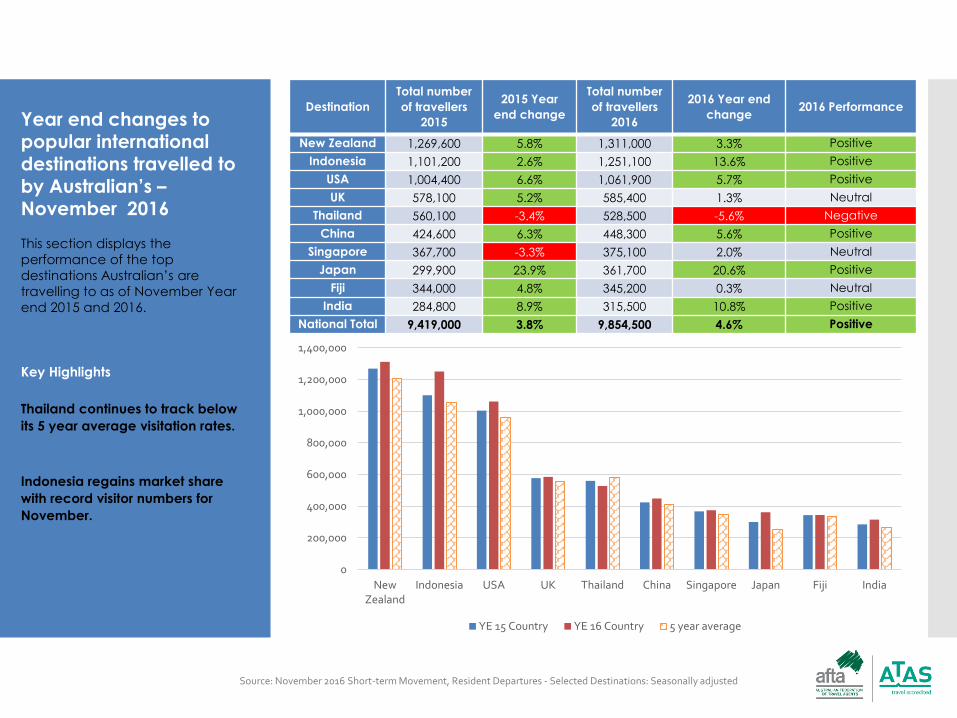
New Zealand 1,269,600 5.8% 1,311,000 3.3% Positive
Indonesia 1,101,200 2.6% 1,251,100 13.6% Positive
USA 1,004,400 6.6% 1,061,900 5.7% Positive
UK 578,100 5.2% 585,400 1.3% Neutral
Thailand 560,100 -3.4% 528,500 -5.6% Negative
China 424,600 6.3% 448,300 5.6% Positive
Singapore 367,700 -3.3% 375,100 2.0% Neutral
Japan 299,900 23.9% 361,700 20.6% Positive
Fiji 344,000 4.8% 345,200 0.3% Neutral
India 284,800 8.9% 315,500 10.8% Positive
National Total 9,419,000 3.8% 9,854,500 4.6% Positive
Year end changes to popular international destinations travelled to by Australian’s –November 2016
This section displays the
performance of the top
destinations Australian’s are
travelling to as of November Year
end 2015 and 2016.
Key Highlights
Thailand continues to track below
its 5 year average visitation rates.
Indonesia regains market share
with record visitor numbers for
November.
Source: November 2016 Short-term Movement, Resident Departures - Selected Destinations: Seasonally adjusted
0
200,000
400,000
600,000
800,000
1,000,000
1,200,000
1,400,000
NewZealand
Indonesia USA UK Thailand China Singapore Japan Fiji India
YE 15 Country YE 16 Country 5 year average
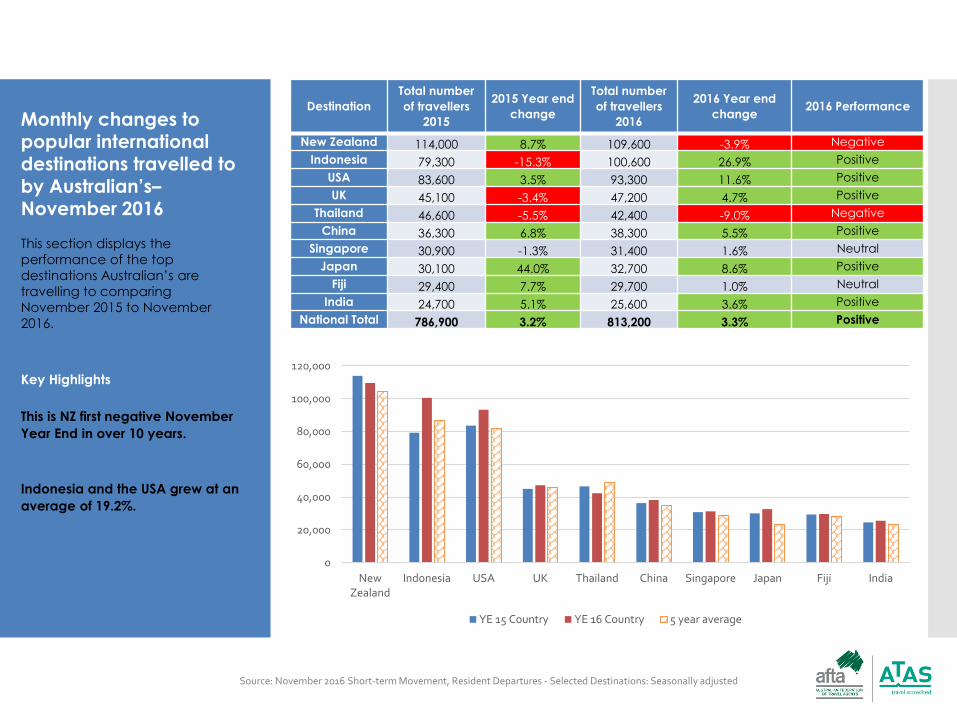
Monthly changes to popular international destinations travelled to by Australian’s–November 2016
This section displays the
performance of the top
destinations Australian’s are
travelling to comparing
November 2015 to November
2016.
Destination
Total number
of travellers
2015
2015 Year end
change
Total number
of travellers
2016
2016 Year end
change2016 Performance
New Zealand 114,000 8.7% 109,600 -3.9% Negative
Indonesia 79,300 -15.3% 100,600 26.9% Positive
USA 83,600 3.5% 93,300 11.6% Positive
UK 45,100 -3.4% 47,200 4.7% Positive
Thailand 46,600 -5.5% 42,400 -9.0% Negative
China 36,300 6.8% 38,300 5.5% Positive
Singapore 30,900 -1.3% 31,400 1.6% Neutral
Japan 30,100 44.0% 32,700 8.6% Positive
Fiji 29,400 7.7% 29,700 1.0% Neutral
India 24,700 5.1% 25,600 3.6% Positive
National Total 786,900 3.2% 813,200 3.3% Positive
Key Highlights
This is NZ first negative November
Year End in over 10 years.
Indonesia and the USA grew at an
average of 19.2%.
Source: November 2016 Short-term Movement, Resident Departures - Selected Destinations: Seasonally adjusted
0
20,000
40,000
60,000
80,000
100,000
120,000
NewZealand
Indonesia USA UK Thailand China Singapore Japan Fiji India
YE 15 Country YE 16 Country 5 year average
For further information please contact:
Dean Long
AFTA’s National Manager – Strategy and Policy
Ph: 02 9287 9900
© AFTA Travel Trends Report 2017