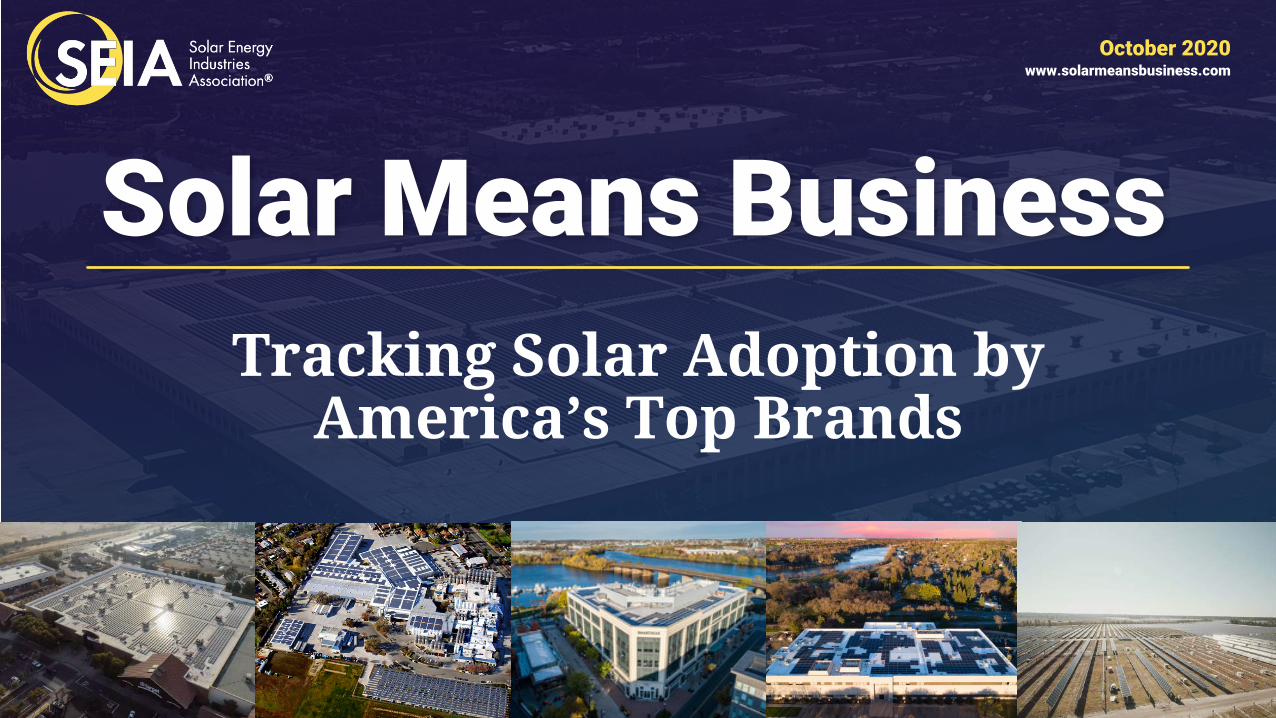
tracking solar adoption by america's top brands
TRANSCRIPT
2019 Solar Means Business Report www.solarmeansbusiness.com
October 2020www.solarmeansbusiness.com
Solar Means BusinessTracking Solar Adoption by
America’s Top Brands
2019 Solar Means Business Report www.solarmeansbusiness.com
Table of Contents
About SEIA
Methodology
Key Findings
America’s Top Corporate Solar Users
Corporate Solar Coast to Coast
Trends in Corporate Solar Procurement
Sources and Acknowledgments
2019 Solar Means Business Report www.solarmeansbusiness.com
About SEIA
The Solar Energy Industries Association® (SEIA) is leading the transformation to a clean energy economy, creating the framework for solar to achieve 20% of U.S. electricity generation by 2030. SEIA works with its 1,000 member companies and other strategic partners to fight for policies that create jobs in every community and shape fair market
rules that promote competition and the growth of reliable, low-cost solar power. Founded in 1974, SEIA is a national trade association building a
comprehensive vision for the Solar+ Decade through research, education and advocacy.
Learn more at www.seia.org
2019 Solar Means Business Report www.solarmeansbusiness.com
About this ReportSolar Means Business tracks U.S. solar photovoltaic (PV) installations that support commercial activities at U.S. facilities.
• The report focuses on America’s largest companies, but includes available data for companies of all sizes
• Systems can be located on-site and provide electricity to the facility directly, or off-site and offset electricity costs for a company through virtual net metering or similar financial relationship
• Both company-owned and third party-owned (PPA or lease) systems are included
• Report covers commercial systems installed by the end of 2019
This is the 8th annual edition of this report. You can find previous versions at www.seia.org/solar-means-business-report.
This report does not capture data on every commercial solar installation in the U.S., but every attempt has been made to ensure that the solar portfolios of America’s largest corporate users are accurately represented.
• Rankings and analysis are based on system-level data for over 38,000 commercial solar PV systems
• Data in this report captures nearly 70% of all U.S. commercial solar capacity through the end of 2019
• Prior to the 2018 report, only on-site installations were tracked. For the second consecutive year, our rankings include both on-site and off-site solar projects
Data comes from a variety of sources:• Directly from the system owners or hosts
• From installers, with permission of system owners or hosts
• From publicly available data sources such as state regulatory bodies, press reports and research reports
All data in this report can be cited to SEIA Solar Means Business 2019, unless otherwise noted.
2019 Solar Means Business Report www.solarmeansbusiness.com
Key Findings• Accounting for all on-site and off-site solar installed
through the end of 2019, Apple remains at the top of the Solar Means Business rankings for the second year in a row, with 398.3 megawatts (MW) installed • Amazon remains in the second spot with 369 MW
installed but narrowed the gap to the top spot by installing 39 MW in 2019
• Walmart makes a jump from fourth to third with their largest year ever, bringing their total to 331 MW
• 2019 ranks as the second-largest year for commercial solar installations, with 1,286 MW installed, up 10% from 2018• Almost half of all corporate solar capacity has been
installed in the last three years
• With more than 8 gigawatts (GW) installed across 38,000 installations, corporate solar deployment is 15 times larger today than it was a decade ago
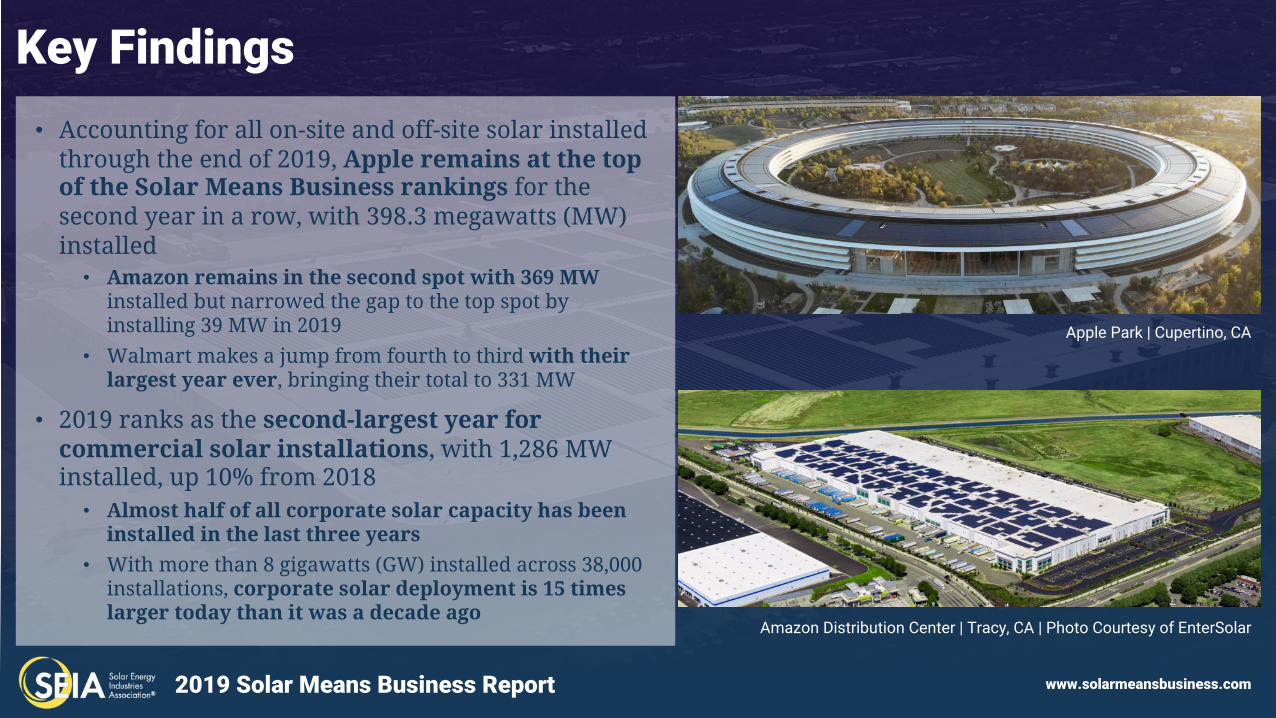
Apple Park | Cupertino, CA
Amazon Distribution Center | Tracy, CA | Photo Courtesy of EnterSolar
2019 Solar Means Business Report www.solarmeansbusiness.com
Key Findings• The systems tracked in this report generate 12.7 million megawatt-hours
of electricity annually, enough to power 1.6 million homes
• The solar generation from these systems offsets 8.9 million metric tons of CO2 every year, equivalent to taking 1.9 million cars off the road
• Growth in corporate solar has been led by two primary factors
• The price to install solar has declined by 30% in the last 5 years
• Corporates continue to announce more ambitious climate. 15 of the top 25 companies ranked in this report have committed to goals that include 100% renewable energy or better
• Off-site corporate solar, a space that didn’t exist before 2015, now represents nearly a quarter of all installed commercial capacity
• An additional 5 GW of off-site capacity is expected to come online in the next several years, more than doubling the amount installed at the end of 2019
• COVID-19 hasn’t had major impacts on U.S. business interest in solar
• Off-site projects continue to be built and procured with only minor disruption
• Some smaller companies have postponed 2020 rooftop installations, but the pause is only expected to be temporary
• Larger corporates report that the pandemic has not caused them to change or delay their renewable energy goals
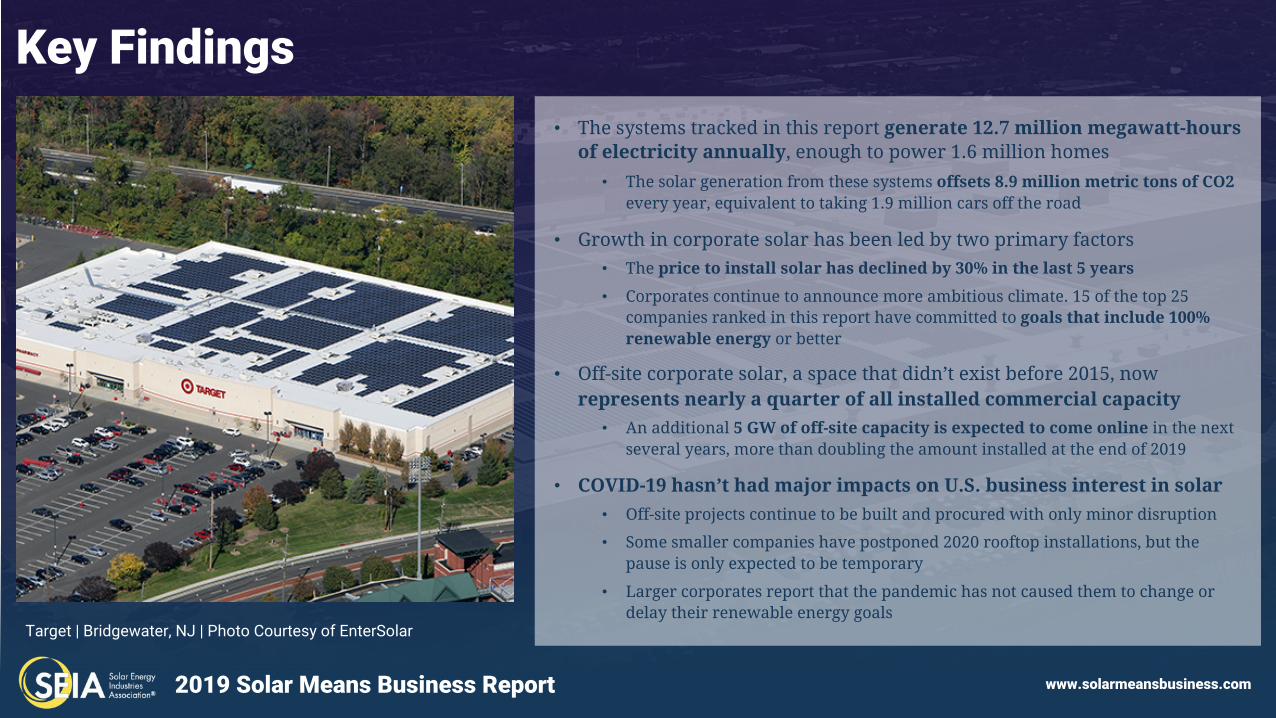
Target | Bridgewater, NJ | Photo Courtesy of EnterSolar
2019 Solar Means Business Report www.solarmeansbusiness.com
America’s Top Corporate Solar Users
Many of the most recognizable global brands recognize the economic and environmental benefits of investing in solar and are demonstrating leadership in clean energy development.
2019 Solar Means Business Report www.solarmeansbusiness.com
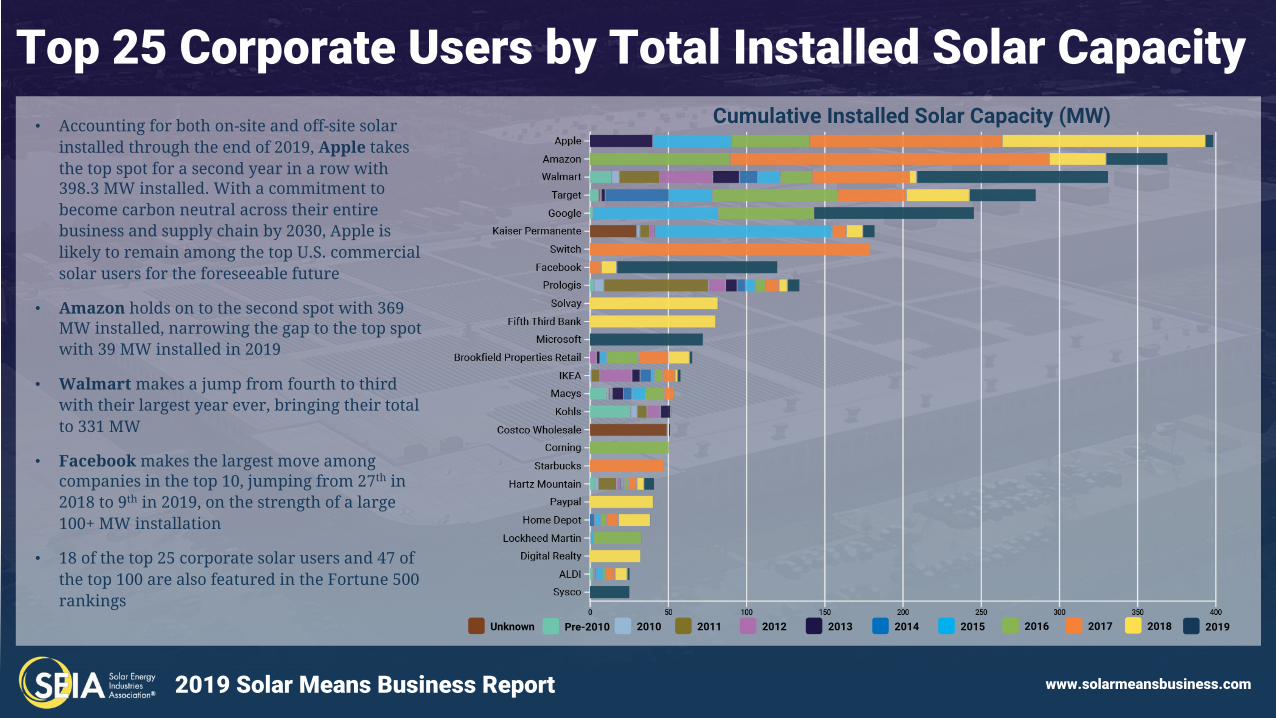
Top 25 Corporate Users by Total Installed Solar Capacity• Accounting for both on-site and off-site solar
installed through the end of 2019, Apple takes the top spot for a second year in a row with 398.3 MW installed. With a commitment to become carbon neutral across their entire business and supply chain by 2030, Apple is likely to remain among the top U.S. commercial solar users for the foreseeable future
• Amazon holds on to the second spot with 369 MW installed, narrowing the gap to the top spot with 39 MW installed in 2019
• Walmart makes a jump from fourth to third with their largest year ever, bringing their total to 331 MW
• Facebook makes the largest move among companies in the top 10, jumping from 27th in 2018 to 9th in 2019, on the strength of a large 100+ MW installation
• 18 of the top 25 corporate solar users and 47 of the top 100 are also featured in the Fortune 500 rankings
Cumulative Installed Solar Capacity (MW)
Unknown Pre-2010 2010 2011 2012 2013 2014 2015 2016 2017 2018 2019
2019 Solar Means Business Report www.solarmeansbusiness.com
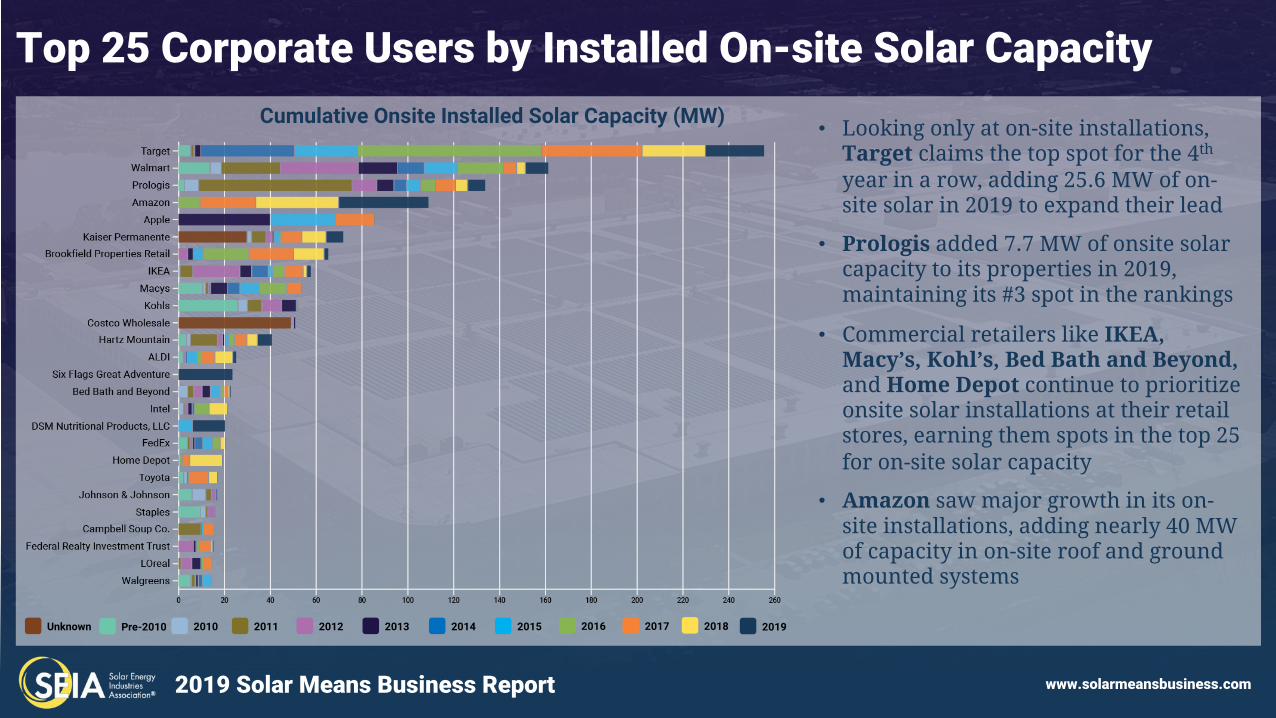
Top 25 Corporate Users by Installed On-site Solar Capacity
• Looking only at on-site installations, Target claims the top spot for the 4th
year in a row, adding 25.6 MW of on-site solar in 2019 to expand their lead
• Prologis added 7.7 MW of onsite solar capacity to its properties in 2019, maintaining its #3 spot in the rankings
• Commercial retailers like IKEA, Macy’s, Kohl’s, Bed Bath and Beyond, and Home Depot continue to prioritize onsite solar installations at their retail stores, earning them spots in the top 25 for on-site solar capacity
• Amazon saw major growth in its on-site installations, adding nearly 40 MW of capacity in on-site roof and ground mounted systems
Cumulative Onsite Installed Solar Capacity (MW)
Unknown Pre-2010 2010 2011 2012 2013 2014 2015 2016 2017 2018 2019
2019 Solar Means Business Report www.solarmeansbusiness.com
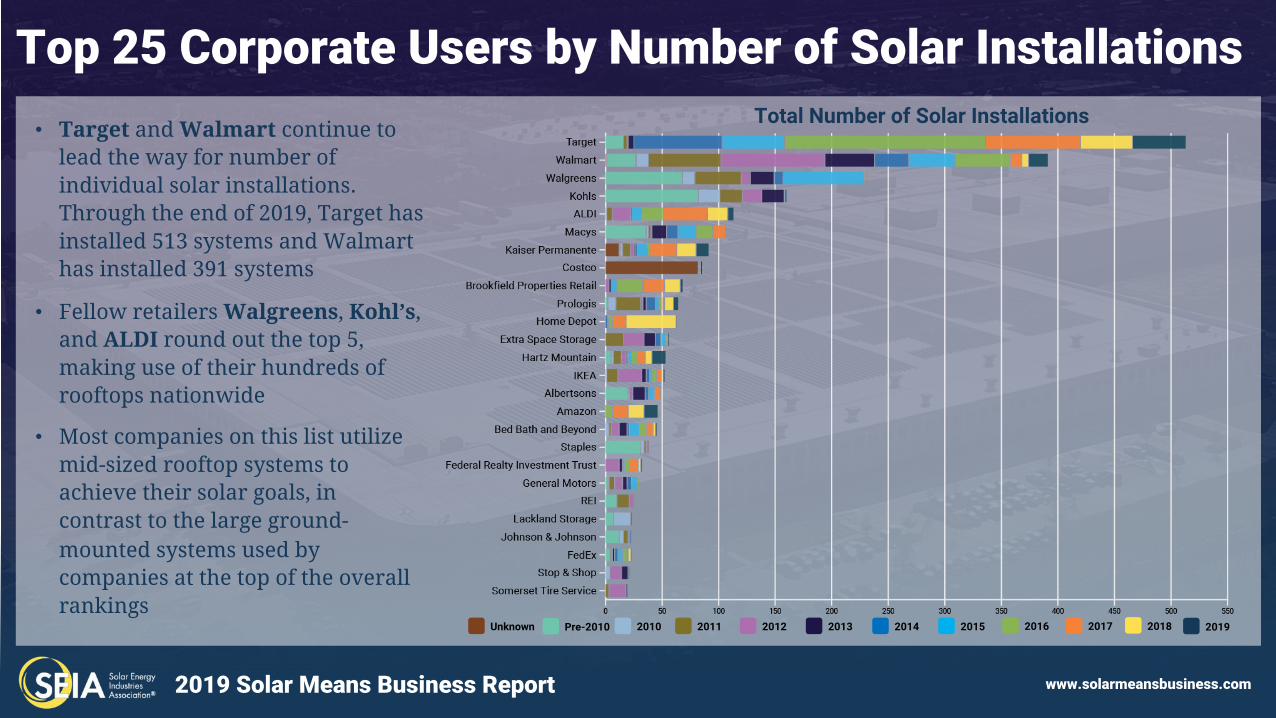
Top 25 Corporate Users by Number of Solar Installations• Target and Walmart continue to
lead the way for number of individual solar installations. Through the end of 2019, Target has installed 513 systems and Walmart has installed 391 systems
• Fellow retailers Walgreens, Kohl’s, and ALDI round out the top 5, making use of their hundreds of rooftops nationwide
• Most companies on this list utilize mid-sized rooftop systems to achieve their solar goals, in contrast to the large ground-mounted systems used by companies at the top of the overall rankings
Total Number of Solar Installations
Unknown Pre-2010 2010 2011 2012 2013 2014 2015 2016 2017 2018 2019
2019 Solar Means Business Report www.solarmeansbusiness.com
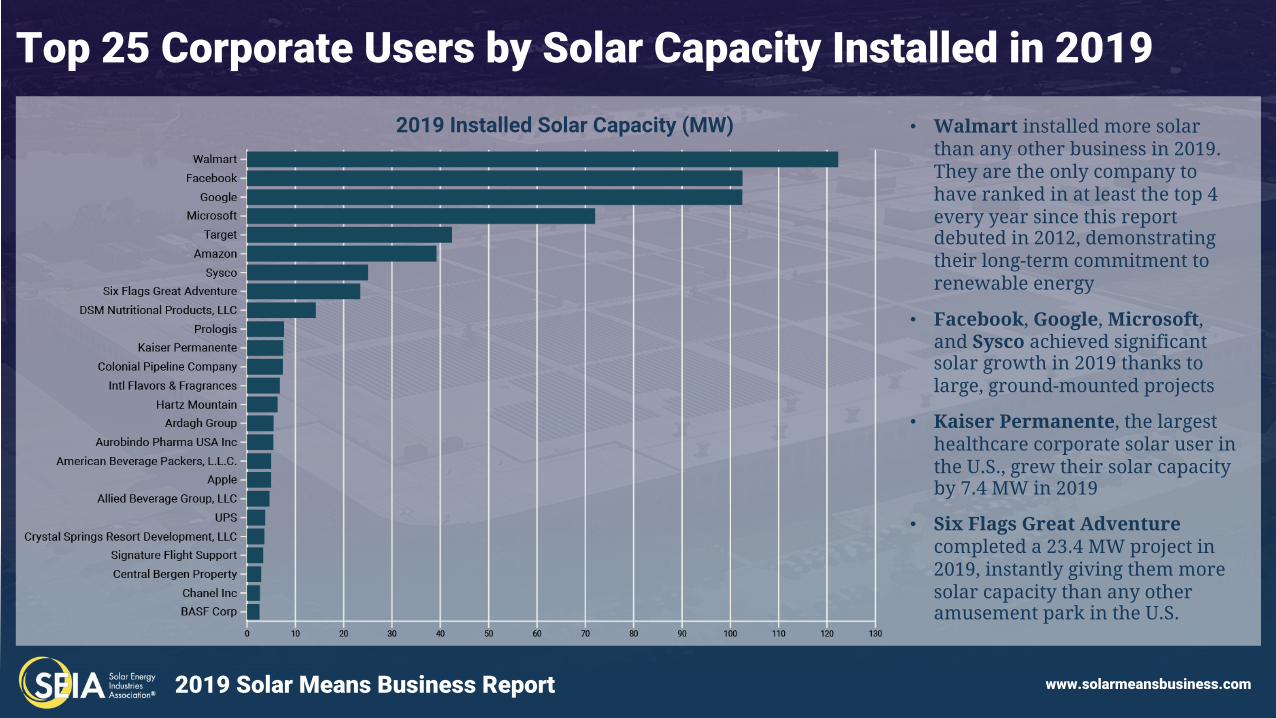
Top 25 Corporate Users by Solar Capacity Installed in 2019• Walmart installed more solar
than any other business in 2019. They are the only company to have ranked in at least the top 4 every year since this report debuted in 2012, demonstrating their long-term commitment to renewable energy
• Facebook, Google, Microsoft, and Sysco achieved significant solar growth in 2019 thanks to large, ground-mounted projects
• Kaiser Permanente, the largest healthcare corporate solar user in the U.S., grew their solar capacity by 7.4 MW in 2019
• Six Flags Great Adventure completed a 23.4 MW project in 2019, instantly giving them more solar capacity than any other amusement park in the U.S.
2019 Installed Solar Capacity (MW)
2019 Solar Means Business Report www.solarmeansbusiness.com
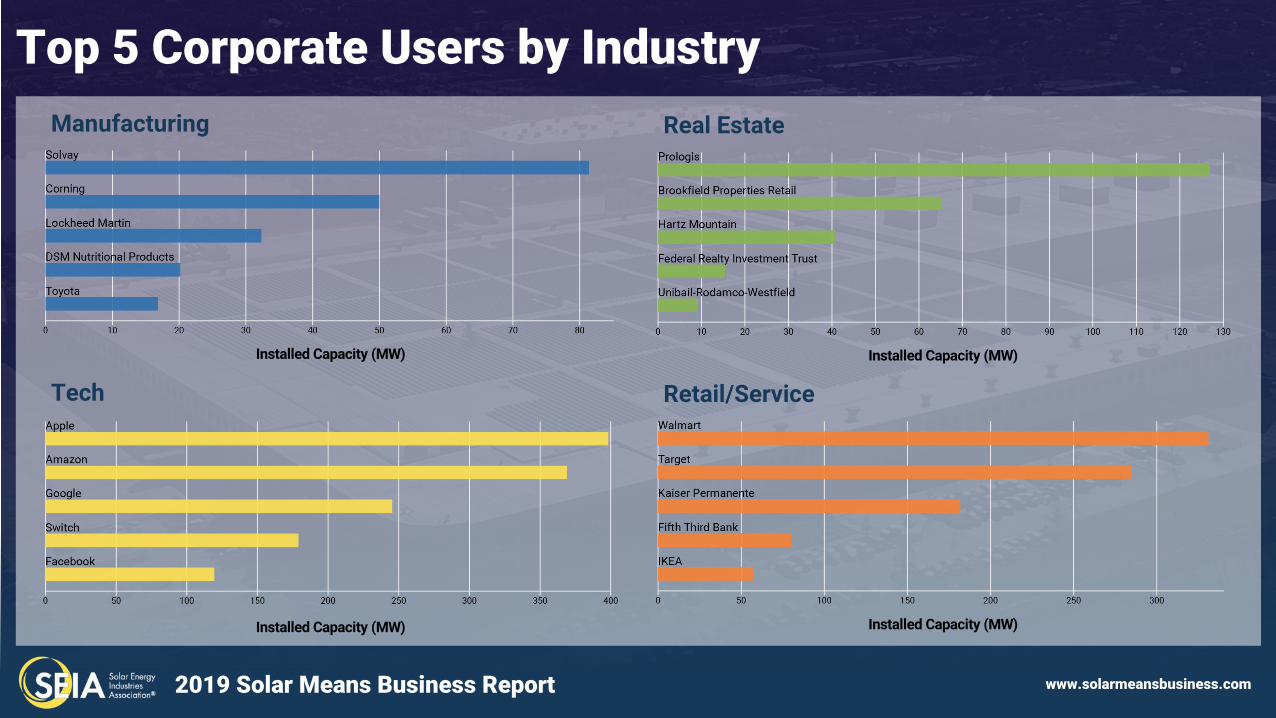
Top 5 Corporate Users by IndustryManufacturing
Installed Capacity (MW)
Tech
Installed Capacity (MW)
Real Estate
Installed Capacity (MW)
Retail/Service
Installed Capacity (MW)
2019 Solar Means Business Report www.solarmeansbusiness.com
Corporate Solar Coast to Coast
Across the U.S., private companies are installing solar energy systems to power their facilities, contributing to statewide clean energy goals and national efforts to address climate change.
2019 Solar Means Business Report www.solarmeansbusiness.com
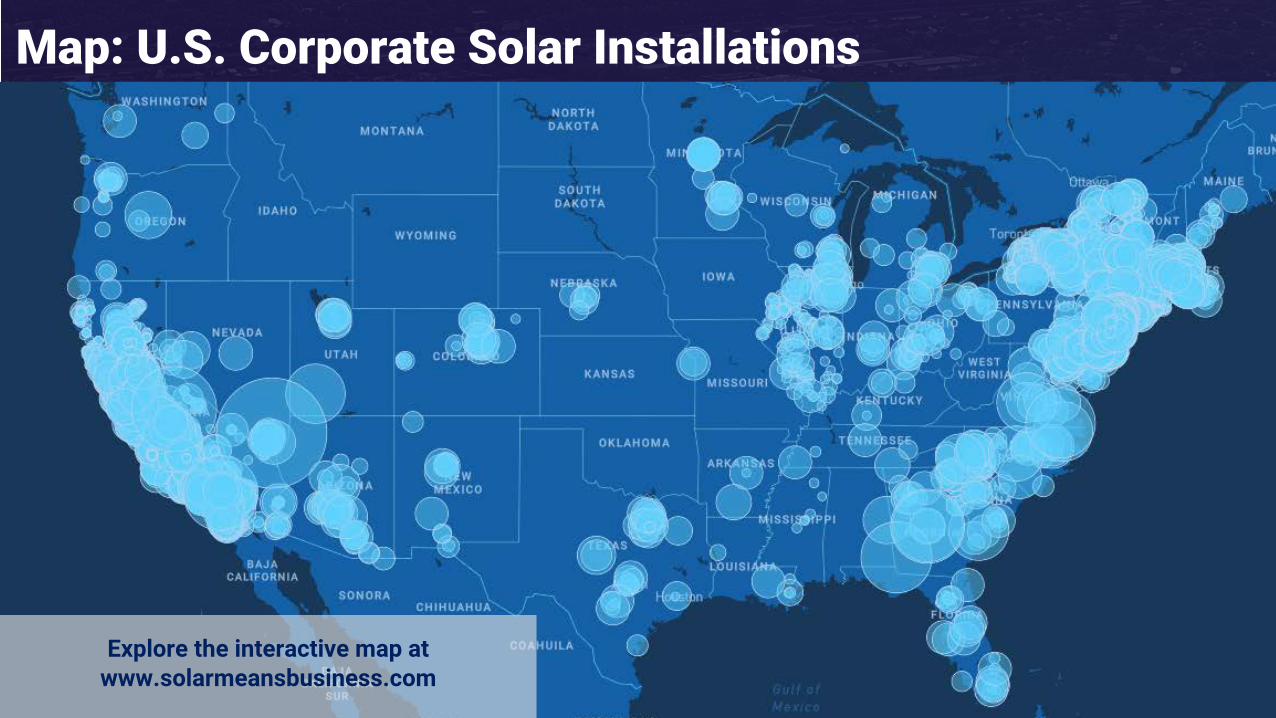
Map: U.S. Corporate Solar Installations
Explore the interactive map at www.solarmeansbusiness.com
2019 Solar Means Business Report www.solarmeansbusiness.com
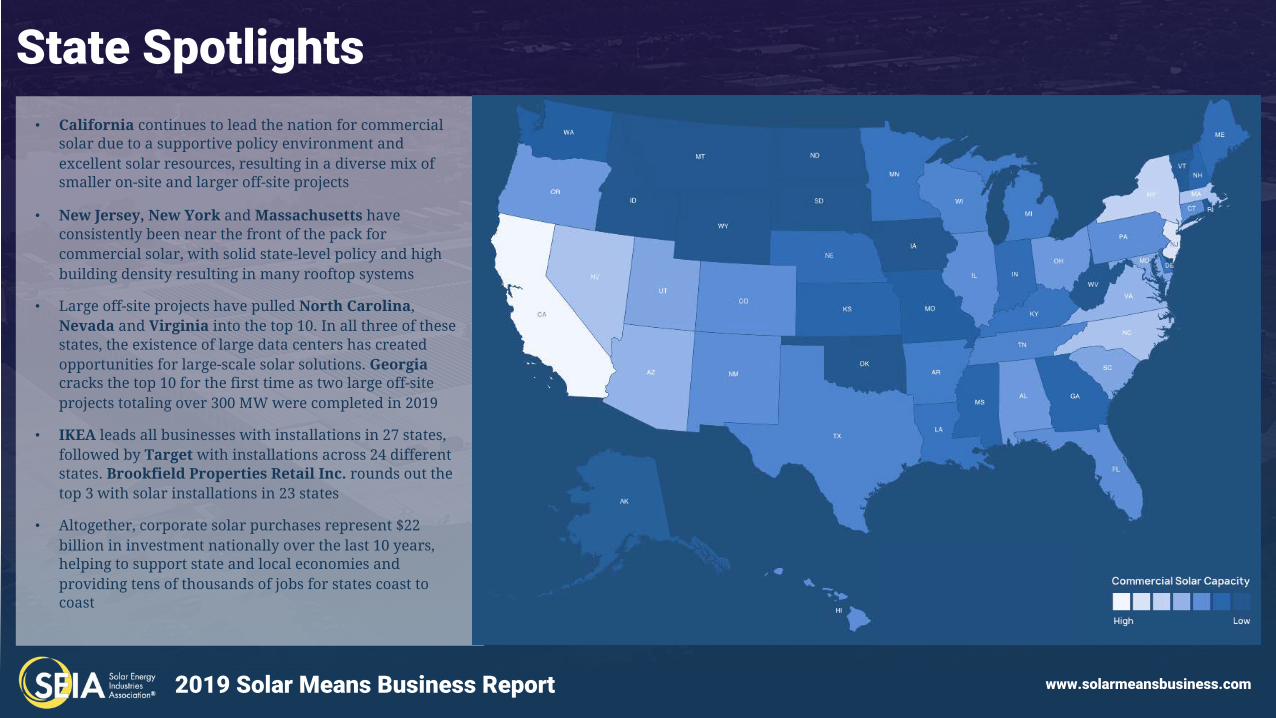
State Spotlights• California continues to lead the nation for commercial
solar due to a supportive policy environment and excellent solar resources, resulting in a diverse mix of smaller on-site and larger off-site projects
• New Jersey, New York and Massachusetts have consistently been near the front of the pack for commercial solar, with solid state-level policy and high building density resulting in many rooftop systems
• Large off-site projects have pulled North Carolina, Nevada and Virginia into the top 10. In all three of these states, the existence of large data centers has created opportunities for large-scale solar solutions. Georgiacracks the top 10 for the first time as two large off-site projects totaling over 300 MW were completed in 2019
• IKEA leads all businesses with installations in 27 states, followed by Target with installations across 24 different states. Brookfield Properties Retail Inc. rounds out the top 3 with solar installations in 23 states
• Altogether, corporate solar purchases represent $22 billion in investment nationally over the last 10 years, helping to support state and local economies and providing tens of thousands of jobs for states coast to coast
2019 Solar Means Business Report www.solarmeansbusiness.com
Trends in Corporate Solar Procurement
Solar adoption by corporations has surged in the last several years as private companies take the lead in decarbonizing the economy. Over the next five years, an additional 5 GW of corporate off-site solar projects are slated to come online.
2019 Solar Means Business Report www.solarmeansbusiness.com
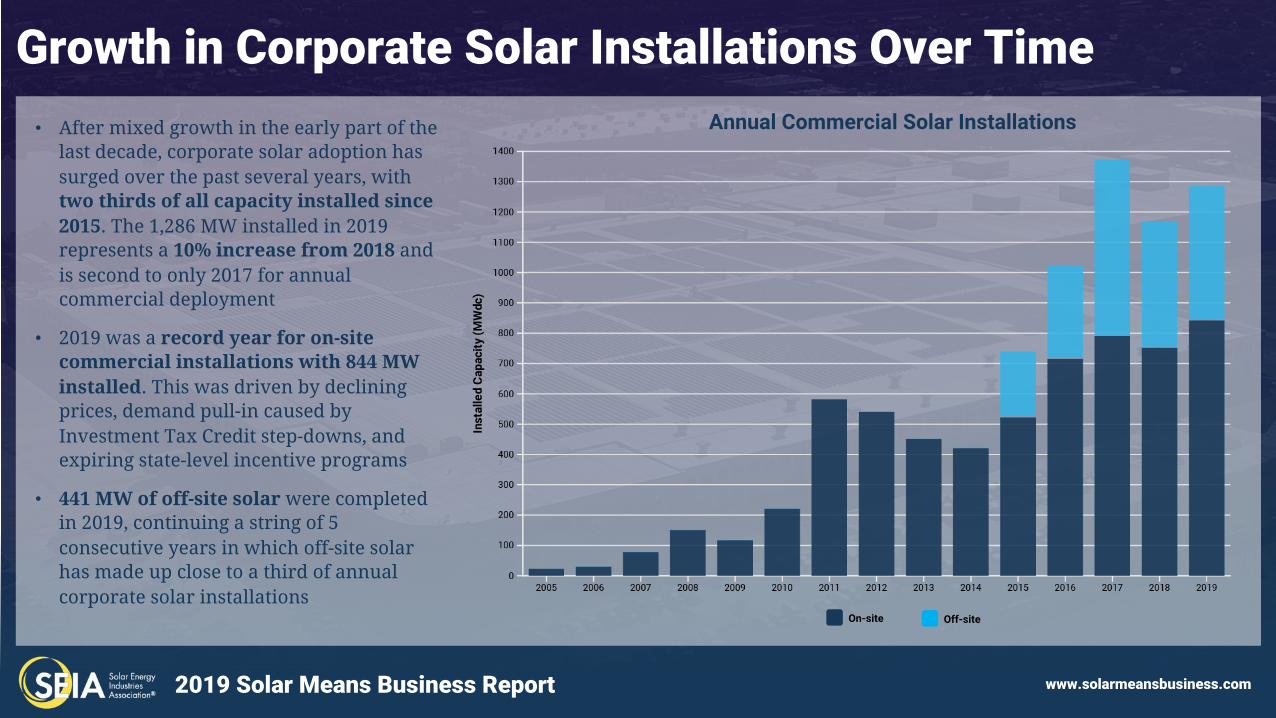
Growth in Corporate Solar Installations Over Time• After mixed growth in the early part of the
last decade, corporate solar adoption has surged over the past several years, with two thirds of all capacity installed since 2015. The 1,286 MW installed in 2019 represents a 10% increase from 2018 and is second to only 2017 for annual commercial deployment
• 2019 was a record year for on-site commercial installations with 844 MW installed. This was driven by declining prices, demand pull-in caused by Investment Tax Credit step-downs, and expiring state-level incentive programs
• 441 MW of off-site solar were completed in 2019, continuing a string of 5 consecutive years in which off-site solar has made up close to a third of annual corporate solar installations
Annual Commercial Solar Installations
On-site Off-site
2019 Solar Means Business Report www.solarmeansbusiness.com
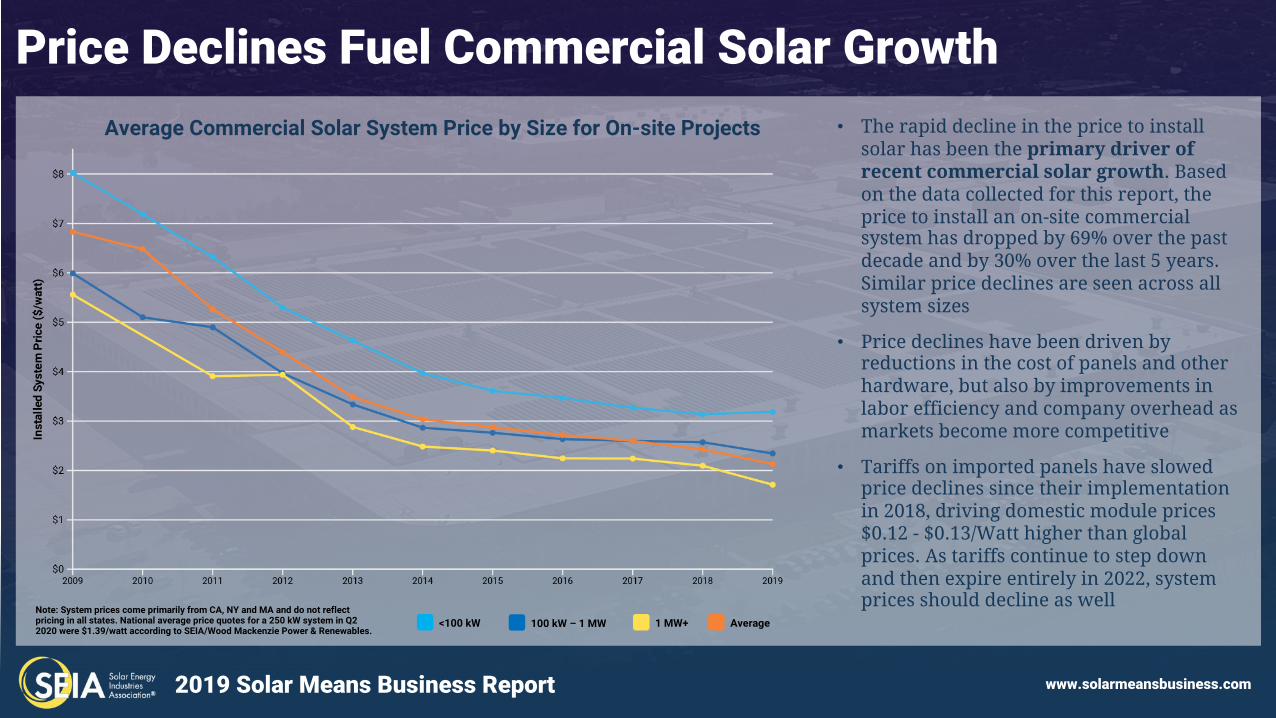
Price Declines Fuel Commercial Solar Growth• The rapid decline in the price to install
solar has been the primary driver of recent commercial solar growth. Based on the data collected for this report, the price to install an on-site commercial system has dropped by 69% over the past decade and by 30% over the last 5 years. Similar price declines are seen across all system sizes
• Price declines have been driven by reductions in the cost of panels and other hardware, but also by improvements in labor efficiency and company overhead as markets become more competitive
• Tariffs on imported panels have slowed price declines since their implementation in 2018, driving domestic module prices $0.12 - $0.13/Watt higher than global prices. As tariffs continue to step down and then expire entirely in 2022, system prices should decline as well
Average Commercial Solar System Price by Size for On-site Projects
<100 kW 100 kW – 1 MW 1 MW+ AverageNote: System prices come primarily from CA, NY and MA and do not reflect pricing in all states. National average price quotes for a 250 kW system in Q2 2020 were $1.39/watt according to SEIA/Wood Mackenzie Power & Renewables.
2019 Solar Means Business Report www.solarmeansbusiness.com
Corporate Clean Energy Goals• A secondary driver of increased corporate solar use has been the
proliferation of explicit renewable energy and carbon goals among the world’s largest companies
• 23 of the top 25 companies in our rankings have publicly
committed to a clean energy goal, with 15 of those companies committing to 100% renewables targets or better
• Corporate Renewables Initiatives have seen their membership grow, with RE 100 now boasting 261 members, at least 30 of
which are also included in our rankings
• A sampling of these commitments:
• Walmart will be emissions-free across its global operations by 2030
• Facebook will be net-zero across their global supply chain by 2030
• Switch met its commitment to run its data centers on 100% renewable energy by January 1, 2016 and is committed to maintaining 100%
renewable energy to power its data centers
Photo courtesy of Verizon Wireless
2019 Solar Means Business Report www.solarmeansbusiness.com
Climate Benefits Accrue as U.S. Businesses Turn to Solar
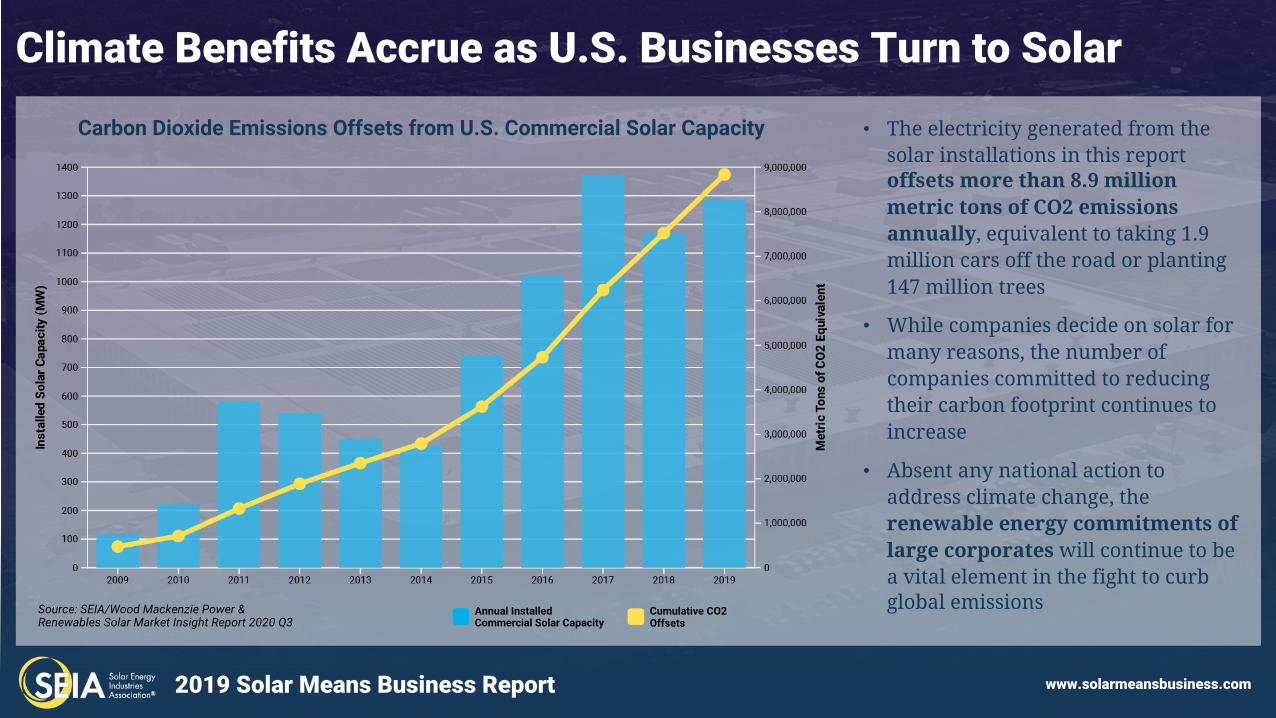
• The electricity generated from the solar installations in this report offsets more than 8.9 million metric tons of CO2 emissions annually, equivalent to taking 1.9 million cars off the road or planting 147 million trees
• While companies decide on solar for many reasons, the number of companies committed to reducing their carbon footprint continues to increase
• Absent any national action to address climate change, the renewable energy commitments of large corporates will continue to be a vital element in the fight to curb global emissions
Carbon Dioxide Emissions Offsets from U.S. Commercial Solar Capacity
Annual Installed Commercial Solar Capacity
Cumulative CO2 Offsets
Source: SEIA/Wood Mackenzie Power & Renewables Solar Market Insight Report 2020 Q3
2019 Solar Means Business Report www.solarmeansbusiness.com
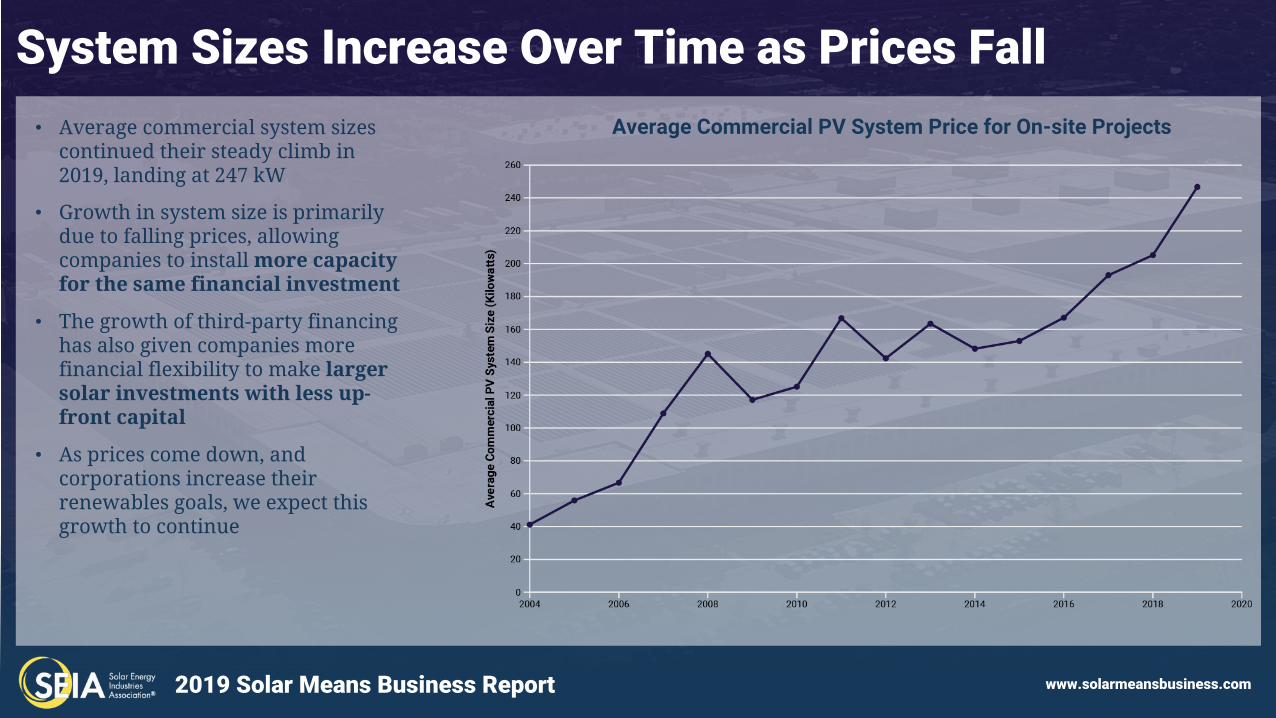
System Sizes Increase Over Time as Prices Fall• Average commercial system sizes
continued their steady climb in 2019, landing at 247 kW
• Growth in system size is primarily due to falling prices, allowing companies to install more capacity for the same financial investment
• The growth of third-party financing has also given companies more financial flexibility to make larger solar investments with less up-front capital
• As prices come down, and corporations increase their renewables goals, we expect this growth to continue
Average Commercial PV System Price for On-site Projects
2019 Solar Means Business Report www.solarmeansbusiness.com
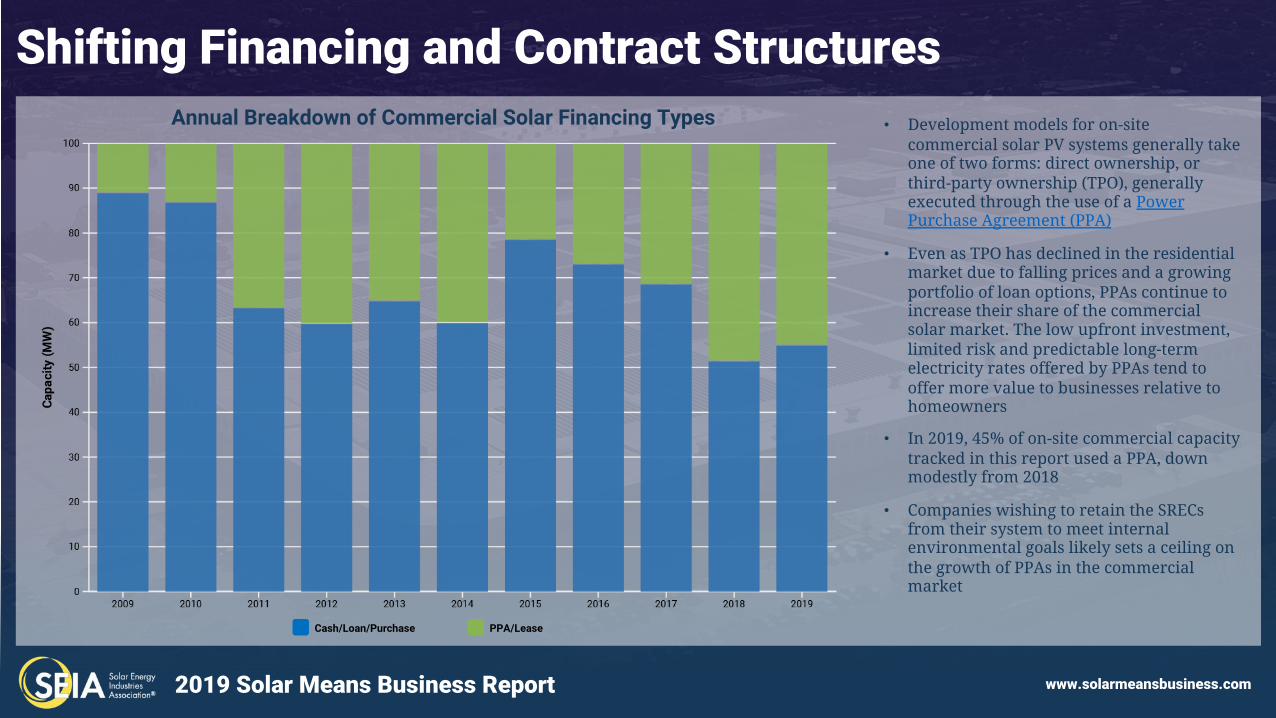
Shifting Financing and Contract Structures• Development models for on-site
commercial solar PV systems generally take one of two forms: direct ownership, or third-party ownership (TPO), generally executed through the use of a Power Purchase Agreement (PPA)
• Even as TPO has declined in the residential market due to falling prices and a growing portfolio of loan options, PPAs continue to increase their share of the commercial solar market. The low upfront investment, limited risk and predictable long-term electricity rates offered by PPAs tend to offer more value to businesses relative to homeowners
• In 2019, 45% of on-site commercial capacity tracked in this report used a PPA, down modestly from 2018
• Companies wishing to retain the SRECs from their system to meet internal environmental goals likely sets a ceiling on the growth of PPAs in the commercial market
Annual Breakdown of Commercial Solar Financing Types
Cash/Loan/Purchase PPA/Lease
2019 Solar Means Business Report www.solarmeansbusiness.com
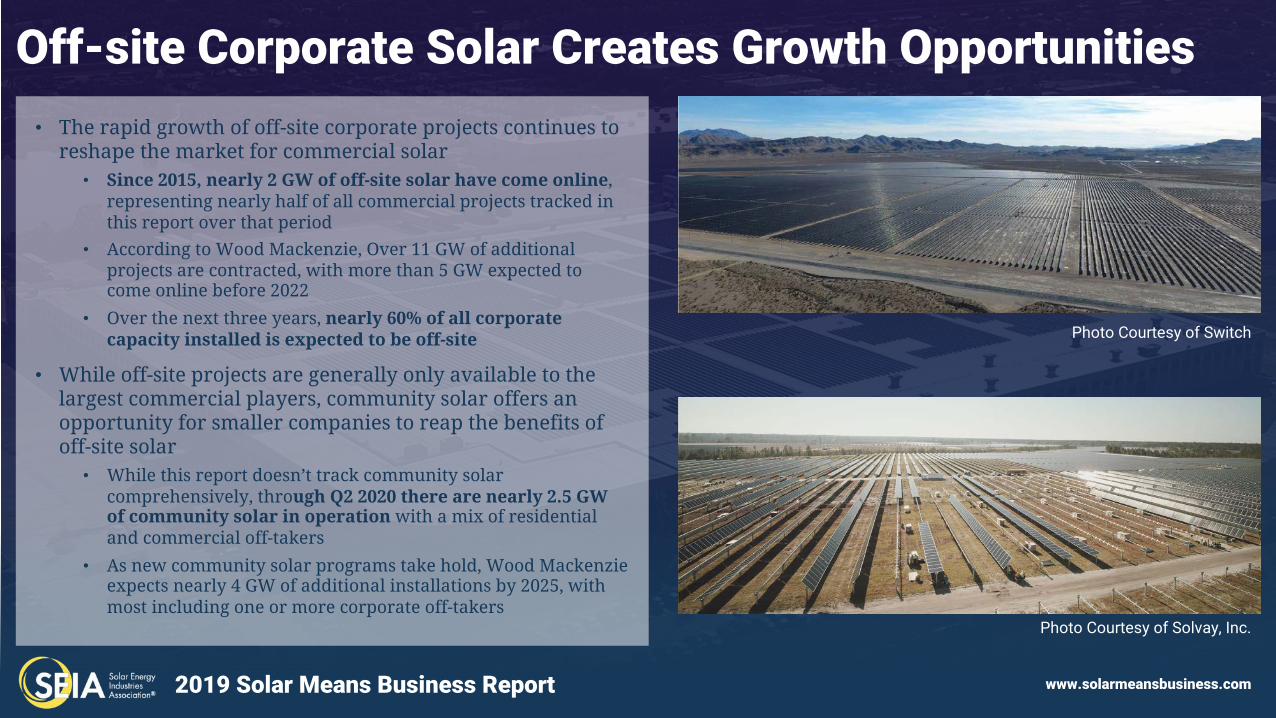
Off-site Corporate Solar Creates Growth Opportunities• The rapid growth of off-site corporate projects continues to
reshape the market for commercial solar• Since 2015, nearly 2 GW of off-site solar have come online,
representing nearly half of all commercial projects tracked in this report over that period
• According to Wood Mackenzie, Over 11 GW of additional projects are contracted, with more than 5 GW expected to come online before 2022
• Over the next three years, nearly 60% of all corporate capacity installed is expected to be off-site
• While off-site projects are generally only available to the largest commercial players, community solar offers an opportunity for smaller companies to reap the benefits of off-site solar• While this report doesn’t track community solar
comprehensively, through Q2 2020 there are nearly 2.5 GW of community solar in operation with a mix of residential and commercial off-takers
• As new community solar programs take hold, Wood Mackenzie expects nearly 4 GW of additional installations by 2025, with most including one or more corporate off-takers
Photo Courtesy of Switch
Photo Courtesy of Solvay, Inc.
2019 Solar Means Business Report www.solarmeansbusiness.com
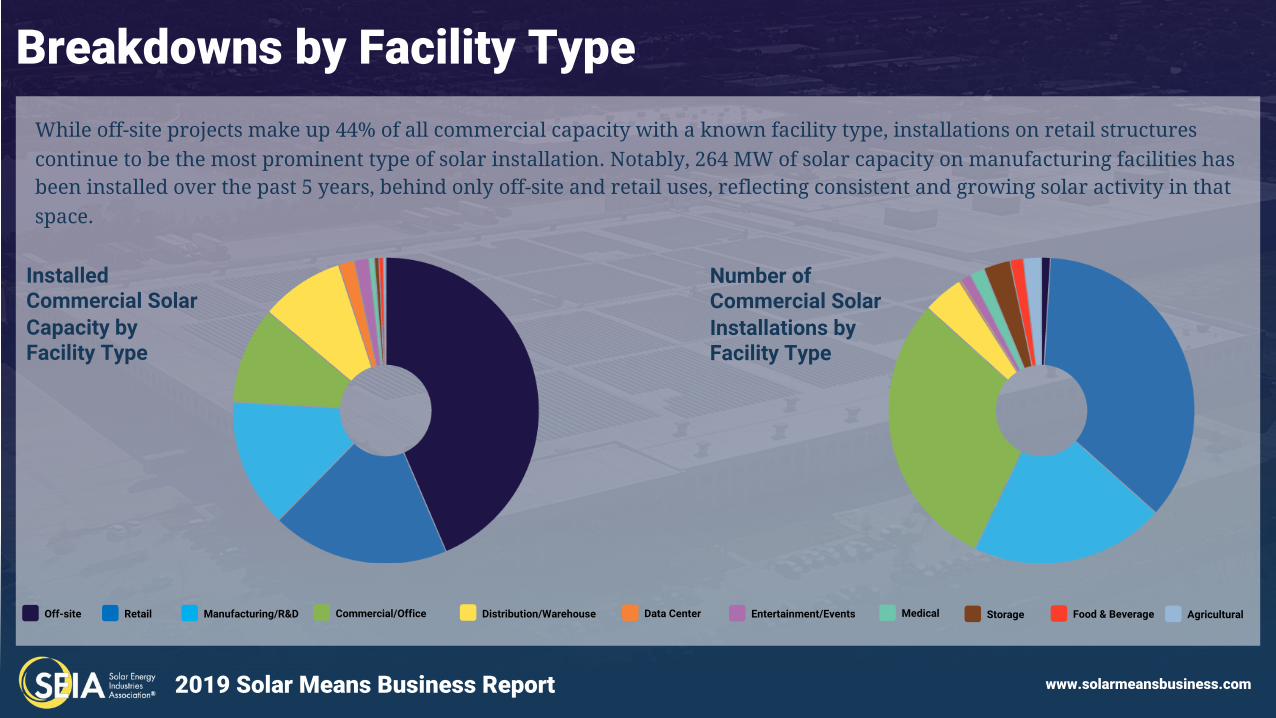
Breakdowns by Facility TypeWhile off-site projects make up 44% of all commercial capacity with a known facility type, installations on retail structures
continue to be the most prominent type of solar installation. Notably, 264 MW of solar capacity on manufacturing facilities has been installed over the past 5 years, behind only off-site and retail uses, reflecting consistent and growing solar activity in that
space.
Off-site Retail Manufacturing/R&D Commercial/Office Data CenterDistribution/Warehouse Entertainment/Events Medical Storage Food & Beverage Agricultural
Installed Commercial Solar Capacity by Facility Type
Number of Commercial Solar Installations by Facility Type
2019 Solar Means Business Report www.solarmeansbusiness.com
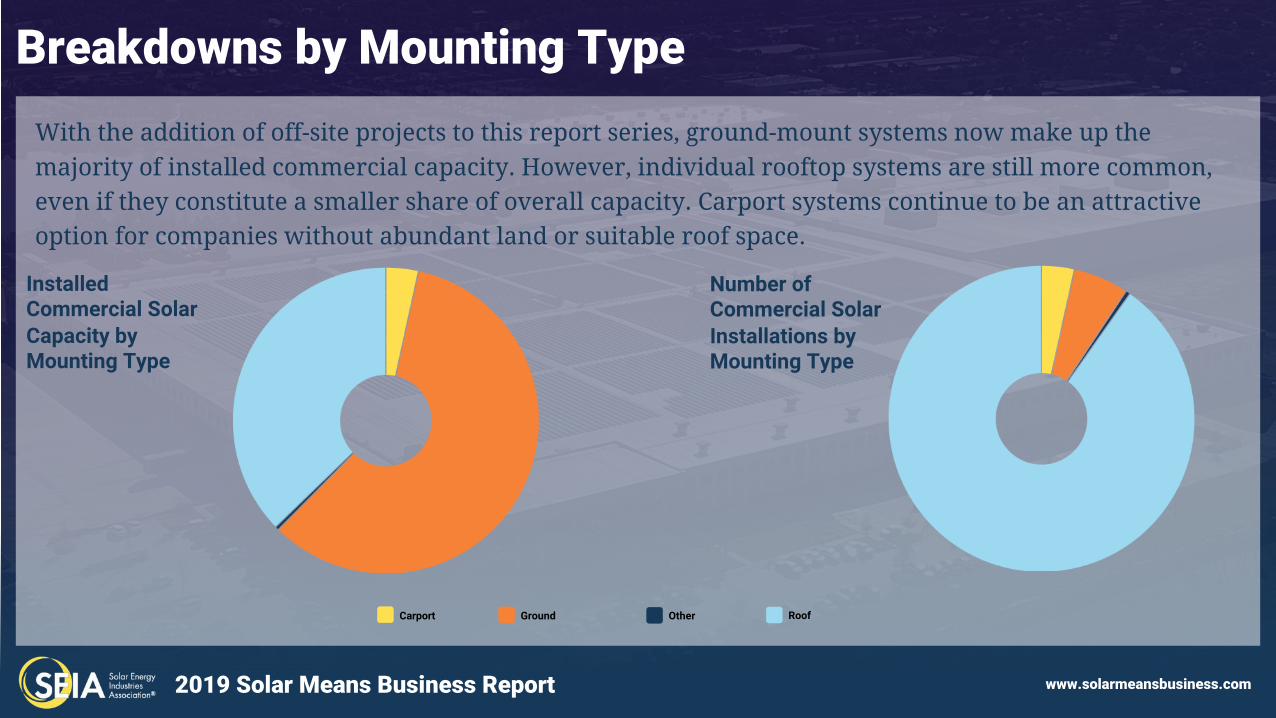
Breakdowns by Mounting TypeWith the addition of off-site projects to this report series, ground-mount systems now make up the majority of installed commercial capacity. However, individual rooftop systems are still more common, even if they constitute a smaller share of overall capacity. Carport systems continue to be an attractive option for companies without abundant land or suitable roof space.
GroundCarport Other Roof
Installed Commercial Solar Capacity by Mounting Type
Number of Commercial Solar Installations by Mounting Type
2019 Solar Means Business Report www.solarmeansbusiness.com
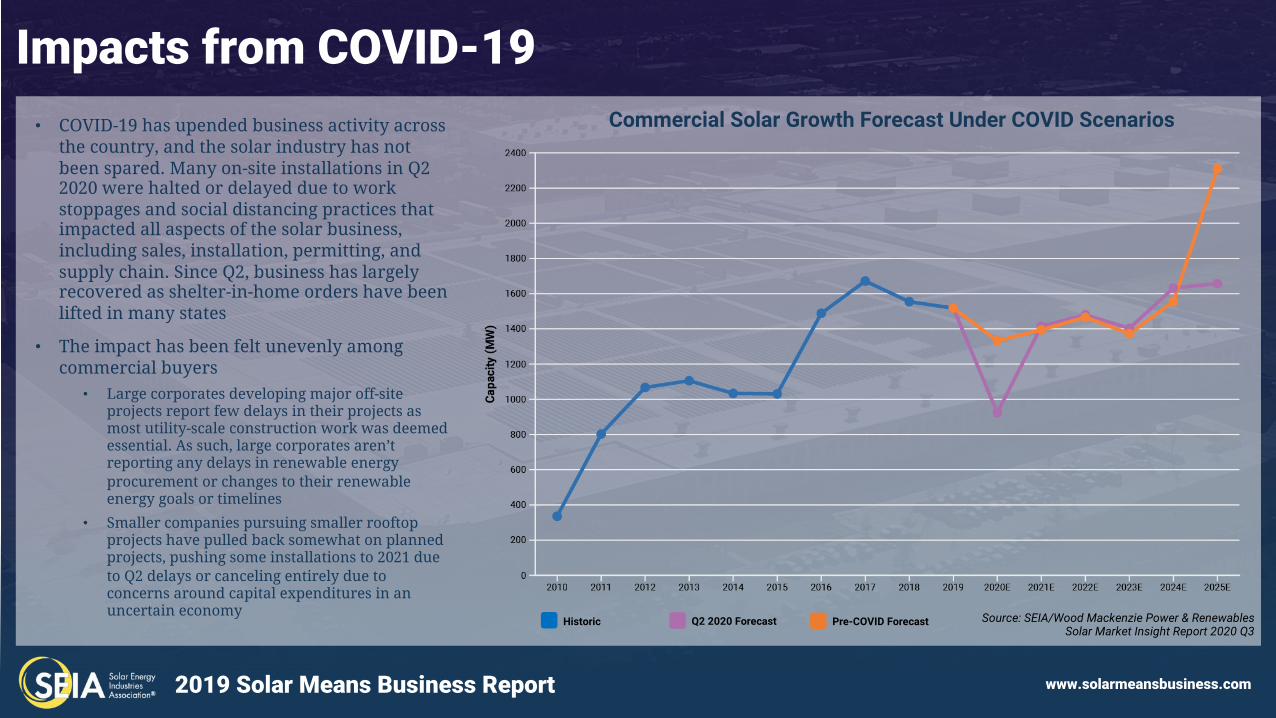
Impacts from COVID-19• COVID-19 has upended business activity across
the country, and the solar industry has not been spared. Many on-site installations in Q2 2020 were halted or delayed due to work stoppages and social distancing practices that impacted all aspects of the solar business, including sales, installation, permitting, and supply chain. Since Q2, business has largely recovered as shelter-in-home orders have been lifted in many states
• The impact has been felt unevenly among commercial buyers
• Large corporates developing major off-site projects report few delays in their projects as most utility-scale construction work was deemed essential. As such, large corporates aren’t reporting any delays in renewable energy procurement or changes to their renewable energy goals or timelines
• Smaller companies pursuing smaller rooftop projects have pulled back somewhat on planned projects, pushing some installations to 2021 due to Q2 delays or canceling entirely due to concerns around capital expenditures in an uncertain economy
Commercial Solar Growth Forecast Under COVID Scenarios
Q2 2020 ForecastHistoric Pre-COVID Forecast Source: SEIA/Wood Mackenzie Power & Renewables Solar Market Insight Report 2020 Q3
2019 Solar Means Business Report www.solarmeansbusiness.com
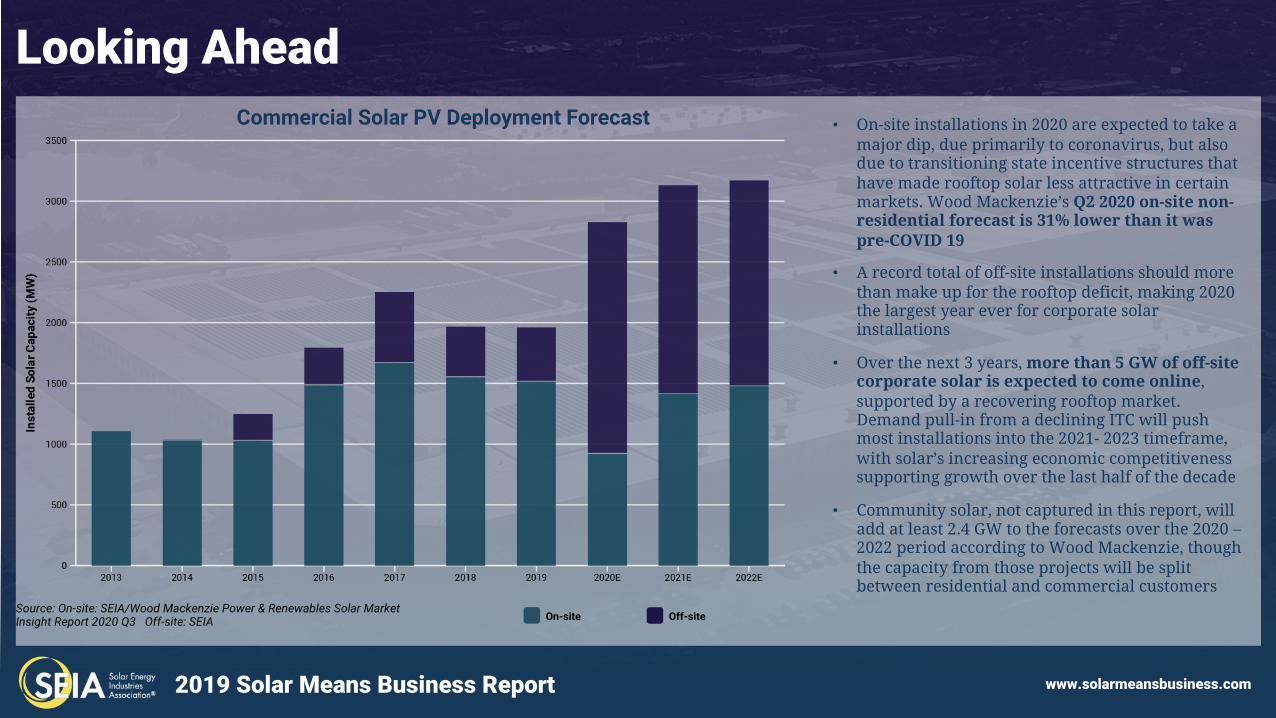
Looking Ahead• On-site installations in 2020 are expected to take a
major dip, due primarily to coronavirus, but also due to transitioning state incentive structures that have made rooftop solar less attractive in certain markets. Wood Mackenzie’s Q2 2020 on-site non-residential forecast is 31% lower than it was pre-COVID 19
• A record total of off-site installations should more than make up for the rooftop deficit, making 2020 the largest year ever for corporate solar installations
• Over the next 3 years, more than 5 GW of off-site corporate solar is expected to come online, supported by a recovering rooftop market. Demand pull-in from a declining ITC will push most installations into the 2021- 2023 timeframe, with solar’s increasing economic competitiveness supporting growth over the last half of the decade
• Community solar, not captured in this report, will add at least 2.4 GW to the forecasts over the 2020 –2022 period according to Wood Mackenzie, though the capacity from those projects will be split between residential and commercial customers
Commercial Solar PV Deployment Forecast
Source: On-site: SEIA/Wood Mackenzie Power & Renewables Solar Market Insight Report 2020 Q3 Off-site: SEIA On-site Off-site
2019 Solar Means Business Report www.solarmeansbusiness.com
Acknowledgments
Many Thanks to Our Corporate Data Providers:
Additional Special Thanks to Wood Mackenzie Power & Renewables
2019 Solar Means Business Report www.solarmeansbusiness.com
To access interactive data from this report, visit www.solarmeansbusiness.com
Send Us Your Data Access the Full Dataset
Notice something missing? Click here to submit additional data on commercial solar projects to be included in this report.
SEIA Members have access to the full Solar Means Business dataset, including detailed project-level information. Contact us to receive the dataset or learn more about becoming a SEIA Member.