natural gas: fueling america's future
TRANSCRIPT

2009 ANNUAL REPORT CHESAPEAKE ENERGY CORPORATION
NATURAL GAS:FUELING AMERICA’S FUTURE

ON THE COVER
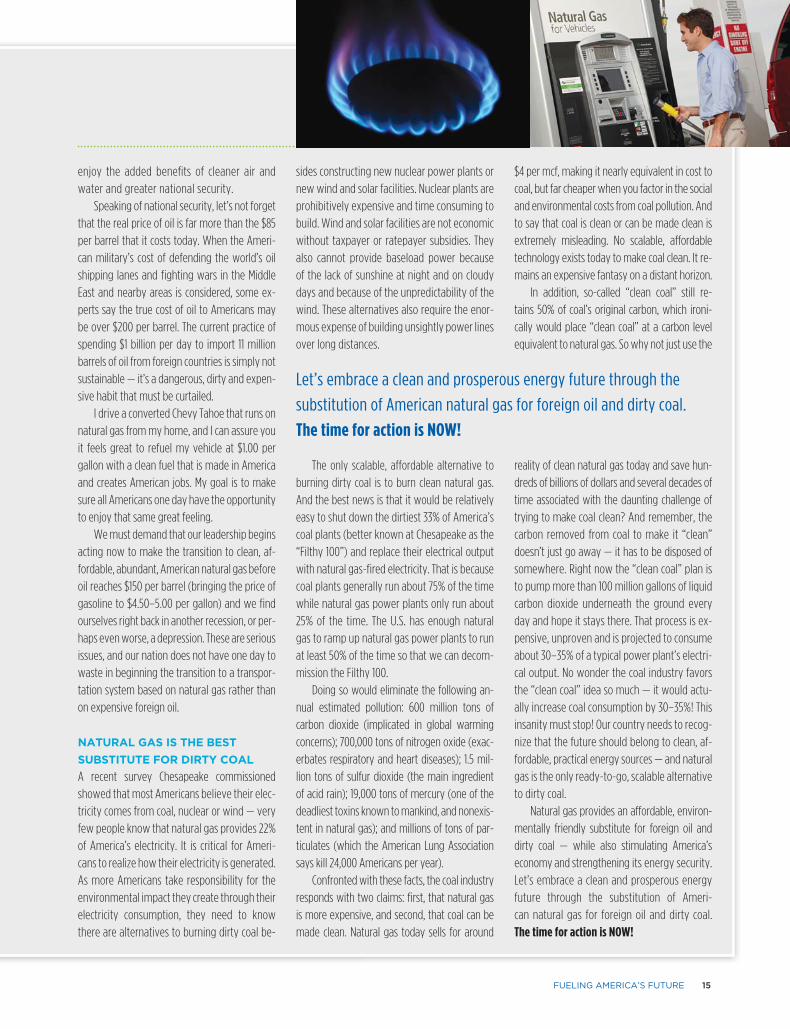
Scenes from the field to the natural gas fueling station depict how Chesapeake explores for, produces and advocates the expanded use of natural gas — the clean, affordable, abundant energy resource that is Fueling America’s Future.
CONTENTS
1 FINANCIAL REVIEW
4 LETTER TO SHAREHOLDERS
14 FUELING AMERICA’S FUTURE
16 OPERATING AREAS
20 INVESTOR Q&A
22 SOCIAL RESPONSIBILITY
24 COMMUNITY RELATIONS
26 ENVIRONMENTAL, HEALTH
& SAFETY
28 BOARD OF DIRECTORS
28 GOVERNANCE
29 OFFICERS
30 EMPLOYEES
45 FORM 10-K
INSIDE BACK COVER
CORPORATE INFORMATION
Chesapeake Energy Corporation is the second-largest producer of natural gas and the most active driller of new
wells in the U.S. Headquartered in Oklahoma City, the company’s operations are focused on discovering and
developing unconventional natural gas and oil fields onshore in the U.S. Chesapeake owns leading positions in
the Barnett, Fayetteville, Haynesville, Marcellus and Bossier natural gas shale plays and in the Eagle Ford, Granite
Wash and various other unconventional oil plays. The company has also vertically integrated its operations and
owns substantial midstream, compression, drilling and oilfield service assets. Chesapeake’s stock is listed on the
New York Stock Exchange under the symbol CHK. Further information is available at www.chk.com.
CORPORATE PROFILE
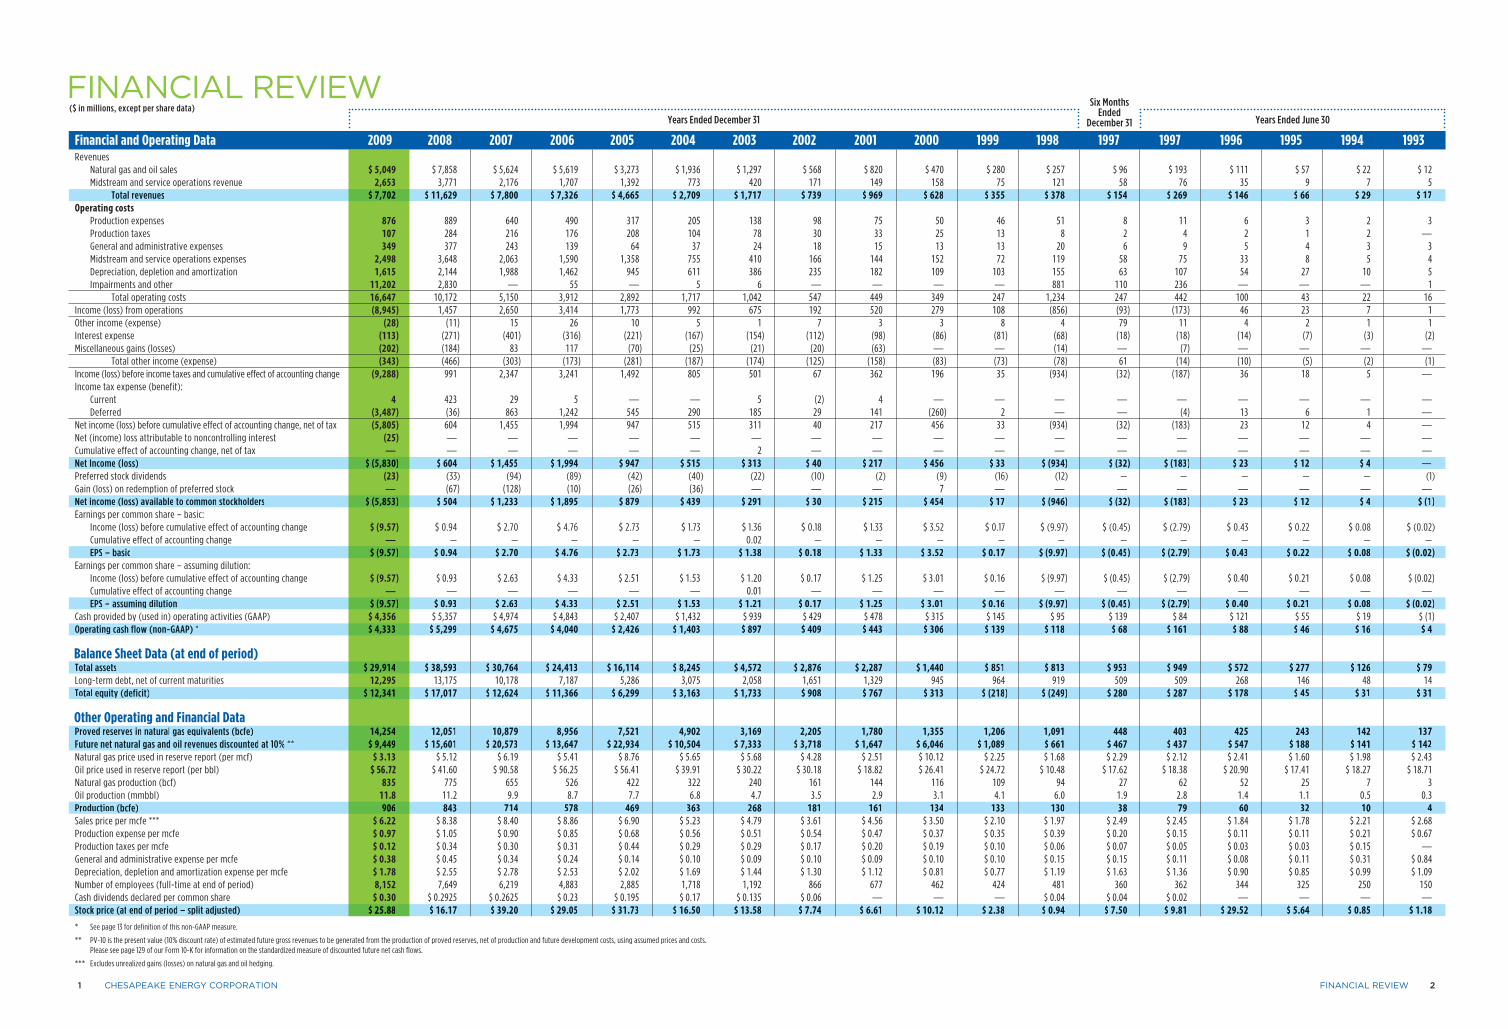
Revenues Natural gas and oil sales $ 5,049 $ 7,858 $ 5,624 $ 5,619 $ 3,273 $ 1,936 $ 1,297 $ 568 $ 820 $ 470 $ 280 $ 257 $ 96 $ 193 $ 111 $ 57 $ 22 $ 12 Midstream and service operations revenue 2,653 3,771 2,176 1,707 1,392 773 420 171 149 158 75 121 58 76 35 9 7 5 Total revenues $ 7,702 $ 11,629 $ 7,800 $ 7,326 $ 4,665 $ 2,709 $ 1,717 $ 739 $ 969 $ 628 $ 355 $ 378 $ 154 $ 269 $ 146 $ 66 $ 29 $ 17Operating costs Production expenses 876 889 640 490 317 205 138 98 75 50 46 51 8 11 6 3 2 3 Production taxes 107 284 216 176 208 104 78 30 33 25 13 8 2 4 2 1 2 — General and administrative expenses 349 377 243 139 64 37 24 18 15 13 13 20 6 9 5 4 3 3 Midstream and service operations expenses 2,498 3,648 2,063 1,590 1,358 755 410 166 144 152 72 119 58 75 33 8 5 4 Depreciation, depletion and amortization 1,615 2,144 1,988 1,462 945 611 386 235 182 109 103 155 63 107 54 27 10 5 Impairments and other 11,202 2,830 — 55 — 5 6 — — — — 881 110 236 — — — 1 Total operating costs 16,647 10,172 5,150 3,912 2,892 1,717 1,042 547 449 349 247 1,234 247 442 100 43 22 16Income (loss) from operations (8,945 ) 1,457 2,650 3,414 1,773 992 675 192 520 279 108 (856 ) (93 ) (173 ) 46 23 7 1Other income (expense) (28 ) (11 ) 15 26 10 5 1 7 3 3 8 4 79 11 4 2 1 1Interest expense (113 ) (271 ) (401 ) (316 ) (221 ) (167 ) (154 ) (112 ) (98 ) (86 ) (81 ) (68 ) (18 ) (18 ) (14 ) (7 ) (3 ) (2 )Miscellaneous gains (losses) (202 ) (184 ) 83 117 (70 ) (25 ) (21 ) (20 ) (63 ) — — (14 ) — (7 ) — — — — Total other income (expense) (343 ) (466 ) (303 ) (173 ) (281 ) (187 ) (174 ) (125 ) (158 ) (83 ) (73 ) (78 ) 61 (14 ) (10 ) (5 ) (2 ) (1 )Income (loss) before income taxes and cumulative effect of accounting change (9,288 ) 991 2,347 3,241 1,492 805 501 67 362 196 35 (934 ) (32 ) (187 ) 36 18 5 —Income tax expense (benefit): Current 4 423 29 5 — — 5 (2 ) 4 — — — — — — — — — Deferred (3,487 ) (36 ) 863 1,242 545 290 185 29 141 (260 ) 2 — — (4 ) 13 6 1 —Net income (loss) before cumulative effect of accounting change, net of tax (5,805 ) 604 1,455 1,994 947 515 311 40 217 456 33 (934 ) (32 ) (183 ) 23 12 4 —Net (income) loss attributable to noncontrolling interest (25 ) — — — — — — — — — — — — — — — — —Cumulative effect of accounting change, net of tax — — — — — — 2 — — — — — — — — — — —Net Income (loss) $ (5,830 ) $ 604 $ 1,455 $ 1,994 $ 947 $ 515 $ 313 $ 40 $ 217 $ 456 $ 33 $ (934 ) $ (32 ) $ (183 ) $ 23 $ 12 $ 4 —Preferred stock dividends (23 ) (33 ) (94 ) (89 ) (42 ) (40 ) (22 ) (10 ) (2 ) (9 ) (16 ) (12 ) — — — — — (1 )Gain (loss) on redemption of preferred stock — (67 ) (128 ) (10 ) (26 ) (36 ) — — — 7 — — — — — — — —Net income (loss) available to common stockholders $ (5,853 ) $ 504 $ 1,233 $ 1,895 $ 879 $ 439 $ 291 $ 30 $ 215 $ 454 $ 17 $ (946 ) $ (32 ) $ (183 ) $ 23 $ 12 $ 4 $ (1 )Earnings per common share – basic: Income (loss) before cumulative effect of accounting change $ (9.57 ) $ 0.94 $ 2.70 $ 4.76 $ 2.73 $ 1.73 $ 1.36 $ 0.18 $ 1.33 $ 3.52 $ 0.17 $ (9.97 ) $ (0.45 ) $ (2.79 ) $ 0.43 $ 0.22 $ 0.08 $ (0.02 ) Cumulative effect of accounting change — — — — — — 0.02 — — — — — — — — — — — EPS – basic $ (9.57 ) $ 0.94 $ 2.70 $ 4.76 $ 2.73 $ 1.73 $ 1.38 $ 0.18 $ 1.33 $ 3.52 $ 0.17 $ (9.97 ) $ (0.45 ) $ (2.79 ) $ 0.43 $ 0.22 $ 0.08 $ (0.02 )Earnings per common share – assuming dilution: Income (loss) before cumulative effect of accounting change $ (9.57 ) $ 0.93 $ 2.63 $ 4.33 $ 2.51 $ 1.53 $ 1.20 $ 0.17 $ 1.25 $ 3.01 $ 0.16 $ (9.97 ) $ (0.45 ) $ (2.79 ) $ 0.40 $ 0.21 $ 0.08 $ (0.02 ) Cumulative effect of accounting change — — — — — — 0.01 — — — — — — — — — — — EPS – assuming dilution $ (9.57 ) $ 0.93 $ 2.63 $ 4.33 $ 2.51 $ 1.53 $ 1.21 $ 0.17 $ 1.25 $ 3.01 $ 0.16 $ (9.97 ) $ (0.45 ) $ (2.79 ) $ 0.40 $ 0.21 $ 0.08 $ (0.02 )Cash provided by (used in) operating activities (GAAP) $ 4,356 $ 5,357 $ 4,974 $ 4,843 $ 2,407 $ 1,432 $ 939 $ 429 $ 478 $ 315 $ 145 $ 95 $ 139 $ 84 $ 121 $ 55 $ 19 $ (1 )Operating cash flow (non-GAAP) * $ 4,333 $ 5,299 $ 4,675 $ 4,040 $ 2,426 $ 1,403 $ 897 $ 409 $ 443 $ 306 $ 139 $ 118 $ 68 $ 161 $ 88 $ 46 $ 16 $ 4
Balance Sheet Data (at end of period)Total assets $ 29,914 $ 38,593 $ 30,764 $ 24,413 $ 16,114 $ 8,245 $ 4,572 $ 2,876 $ 2,287 $ 1,440 $ 851 $ 813 $ 953 $ 949 $ 572 $ 277 $ 126 $ 79Long-term debt, net of current maturities 12,295 13,175 10,178 7,187 5,286 3,075 2,058 1,651 1,329 945 964 919 509 509 268 146 48 14Total equity (deficit) $ 12,341 $ 17,017 $ 12,624 $ 11,366 $ 6,299 $ 3,163 $ 1,733 $ 908 $ 767 $ 313 $ (218 ) $ (249 ) $ 280 $ 287 $ 178 $ 45 $ 31 $ 31
Other Operating and Financial DataProved reserves in natural gas equivalents (bcfe) 14,254 12,051 10,879 8,956 7,521 4,902 3,169 2,205 1,780 1,355 1,206 1,091 448 403 425 243 142 137Future net natural gas and oil revenues discounted at 10% ** $ 9,449 $ 15,601 $ 20,573 $ 13,647 $ 22,934 $ 10,504 $ 7,333 $ 3,718 $ 1,647 $ 6,046 $ 1,089 $ 661 $ 467 $ 437 $ 547 $ 188 $ 141 $ 142Natural gas price used in reserve report (per mcf) $ 3.13 $ 5.12 $ 6.19 $ 5.41 $ 8.76 $ 5.65 $ 5.68 $ 4.28 $ 2.51 $ 10.12 $ 2.25 $ 1.68 $ 2.29 $ 2.12 $ 2.41 $ 1.60 $ 1.98 $ 2.43Oil price used in reserve report (per bbl) $ 56.72 $ 41.60 $ 90.58 $ 56.25 $ 56.41 $ 39.91 $ 30.22 $ 30.18 $ 18.82 $ 26.41 $ 24.72 $ 10.48 $ 17.62 $ 18.38 $ 20.90 $ 17.41 $ 18.27 $ 18.71Natural gas production (bcf) 835 775 655 526 422 322 240 161 144 116 109 94 27 62 52 25 7 3Oil production (mmbbl) 11.8 11.2 9.9 8.7 7.7 6.8 4.7 3.5 2.9 3.1 4.1 6.0 1.9 2.8 1.4 1.1 0.5 0.3Production (bcfe) 906 843 714 578 469 363 268 181 161 134 133 130 38 79 60 32 10 4Sales price per mcfe *** $ 6.22 $ 8.38 $ 8.40 $ 8.86 $ 6.90 $ 5.23 $ 4.79 $ 3.61 $ 4.56 $ 3.50 $ 2.10 $ 1.97 $ 2.49 $ 2.45 $ 1.84 $ 1.78 $ 2.21 $ 2.68Production expense per mcfe $ 0.97 $ 1.05 $ 0.90 $ 0.85 $ 0.68 $ 0.56 $ 0.51 $ 0.54 $ 0.47 $ 0.37 $ 0.35 $ 0.39 $ 0.20 $ 0.15 $ 0.11 $ 0.11 $ 0.21 $ 0.67Production taxes per mcfe $ 0.12 $ 0.34 $ 0.30 $ 0.31 $ 0.44 $ 0.29 $ 0.29 $ 0.17 $ 0.20 $ 0.19 $ 0.10 $ 0.06 $ 0.07 $ 0.05 $ 0.03 $ 0.03 $ 0.15 —General and administrative expense per mcfe $ 0.38 $ 0.45 $ 0.34 $ 0.24 $ 0.14 $ 0.10 $ 0.09 $ 0.10 $ 0.09 $ 0.10 $ 0.10 $ 0.15 $ 0.15 $ 0.11 $ 0.08 $ 0.11 $ 0.31 $ 0.84Depreciation, depletion and amortization expense per mcfe $ 1.78 $ 2.55 $ 2.78 $ 2.53 $ 2.02 $ 1.69 $ 1.44 $ 1.30 $ 1.12 $ 0.81 $ 0.77 $ 1.19 $ 1.63 $ 1.36 $ 0.90 $ 0.85 $ 0.99 $ 1.09Number of employees (full-time at end of period) 8,152 7,649 6,219 4,883 2,885 1,718 1,192 866 677 462 424 481 360 362 344 325 250 150Cash dividends declared per common share $ 0.30 $ 0.2925 $ 0.2625 $ 0.23 $ 0.195 $ 0.17 $ 0.135 $ 0.06 — — — $ 0.04 $ 0.04 $ 0.02 — — — —Stock price (at end of period – split adjusted) $ 25.88 $ 16.17 $ 39.20 $ 29.05 $ 31.73 $ 16.50 $ 13.58 $ 7.74 $ 6.61 $ 10.12 $ 2.38 $ 0.94 $ 7.50 $ 9.81 $ 29.52 $ 5.64 $ 0.85 $ 1.18
* See page 13 for definition of this non-GAAP measure.
** PV-10 is the present value (10% discount rate) of estimated future gross revenues to be generated from the production of proved reserves, net of production and future development costs, using assumed prices and costs.Please see page 129 of our Form 10-K for information on the standardized measure of discounted future net cash flows.
*** Excludes unrealized gains (losses) on natural gas and oil hedging.
Six MonthsEnded
December 31
FINANCIAL REVIEW 2
Stock price (at end of period – split adjusted) $ 25.88 $ 16.17 $ 39.20 $ 29.05 $ 31.73 $ 16.50 $ 13.58 $ 7.74 $ 6.61 $ 10.12 $ 2.38 $ 0.94 $ 7.50 $ 9.81 $ 29.52 $ 5.64 $ 0.85 $ 1.18
Production (bcfe) 906 843 714 578 469 363 268 181 161 134 133 130 38 79 60 32 10 4
Proved reserves in natural gas equivalents (bcfe) 14,254 12,051 10,879 8,956 7,521 4,902 3,169 2,205 1,780 1,355 1,206 1,091 448 403 425 243 142 137Future net natural gas and oil revenues discounted at 10% ** $ 9,449 $ 15,601 $ 20,573 $ 13,647 $ 22,934 $ 10,504 $ 7,333 $ 3,718 $ 1,647 $ 6,046 $ 1,089 $ 661 $ 467 $ 437 $ 547 $ 188 $ 141 $ 142
Total equity (deficit) $ 12,341 $ 17,017 $ 12,624 $ 11,366 $ 6,299 $ 3,163 $ 1,733 $ 908 $ 767 $ 313 $ (218) $ (249) $ 280 $ 287 $ 178 $ 45 $ 31 $ 31
Total assets $ 29,914 $ 38,593 $ 30,764 $ 24,413 $ 16,114 $ 8,245 $ 4,572 $ 2,876 $ 2,287 $ 1,440 $ 851 $ 813 $ 953 $ 949 $ 572 $ 277 $ 126 $ 79
Operating cash flow (non-GAAP) * $ 4,333 $ 5,299 $ 4,675 $ 4,040 $ 2,426 $ 1,403 $ 897 $ 409 $ 443 $ 306 $ 139 $ 118 $ 68 $ 161 $ 88 $ 46 $ 16 $ 4
EPS – assuming dilution $ (9.57) $ 0.93 $ 2.63 $ 4.33 $ 2.51 $ 1.53 $ 1.21 $ 0.17 $ 1.25 $ 3.01 $ 0.16 $ (9.97) $ (0.45) $ (2.79) $ 0.40 $ 0.21 $ 0.08 $ (0.02)
EPS – basic $ (9.57) $ 0.94 $ 2.70 $ 4.76 $ 2.73 $ 1.73 $ 1.38 $ 0.18 $ 1.33 $ 3.52 $ 0.17 $ (9.97) $ (0.45) $ (2.79) $ 0.43 $ 0.22 $ 0.08 $ (0.02)
Net income (loss) available to common stockholders $ (5,853) $ 504 $ 1,233 $ 1,895 $ 879 $ 439 $ 291 $ 30 $ 215 $ 454 $ 17 $ (946) $ (32) $ (183) $ 23 $ 12 $ 4 $ (1)
Net Income (loss) $ (5,830) $ 604 $ 1,455 $ 1,994 $ 947 $ 515 $ 313 $ 40 $ 217 $ 456 $ 33 $ (934) $ (32) $ (183) $ 23 $ 12 $ 4 —
Total revenues $ 7,702 $ 11,629 $ 7,800 $ 7,326 $ 4,665 $ 2,709 $ 1,717 $ 739 $ 969 $ 628 $ 355 $ 378 $ 154 $ 269 $ 146 $ 66 $ 29 $ 17
Years Ended December 31 Years Ended June 30
FINANCIAL REVIEW($ in millions, except per share data)
Financial and Operating Data 2009 2008 2007 2006 2005 2004 2003 2002 2001 2000 1999 1998 1997 1997 1996 1995 1994 1993
1 CHESAPEAKE ENERGY CORPORATION
FINANCIAL REVIEW 3
$ 0
$ 10
$ 20
$ 30
$ 40
$ 50
$ 60
$ 70
$ 0
$ 2.50
$ 5.00
$ 7.50
$ 10.00
$ 12.50
$ 15.00
$ 17.50
JAN 99 JAN 00 JAN 01 JAN 02 JAN 03 JAN 04 JAN 05 JAN 06 JAN 07 JAN 08 JAN 09
CHK
Stoc
k Pr
ice
$/m
cf
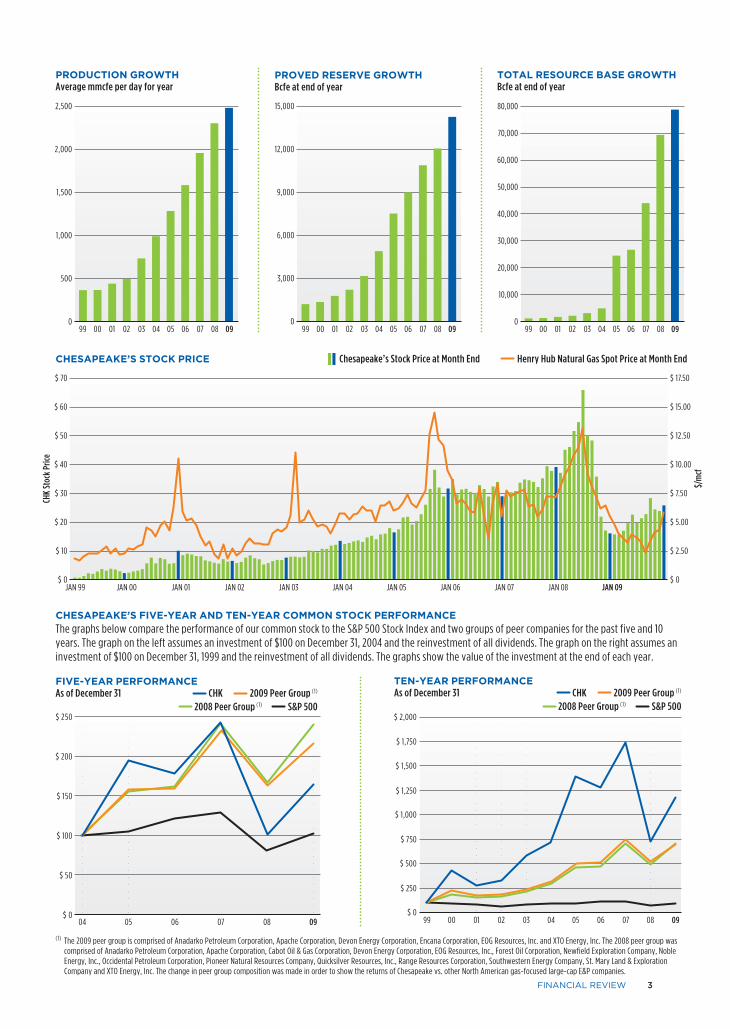
CHESAPEAKE’S STOCK PRICE Chesapeake’s Stock Price at Month End Henry Hub Natural Gas Spot Price at Month End
(1) The 2009 peer group is comprised of Anadarko Petroleum Corporation, Apache Corporation, Devon Energy Corporation, Encana Corporation, EOG Resources, Inc. and XTO Energy, Inc. The 2008 peer group was comprised of Anadarko Petroleum Corporation, Apache Corporation, Cabot Oil & Gas Corporation, Devon Energy Corporation, EOG Resources, Inc., Forest Oil Corporation, Newfield Exploration Company, Noble Energy, Inc., Occidental Petroleum Corporation, Pioneer Natural Resources Company, Quicksilver Resources, Inc., Range Resources Corporation, Southwestern Energy Company, St. Mary Land & Exploration Company and XTO Energy, Inc. The change in peer group composition was made in order to show the returns of Chesapeake vs. other North American gas-focused large-cap E&P companies.
CHESAPEAKE’S FIVE-YEAR AND TEN-YEAR COMMON STOCK PERFORMANCE
The graphs below compare the performance of our common stock to the S&P 500 Stock Index and two groups of peer companies for the past five and 10 years. The graph on the left assumes an investment of $100 on December 31, 2004 and the reinvestment of all dividends. The graph on the right assumes an investment of $100 on December 31, 1999 and the reinvestment of all dividends. The graphs show the value of the investment at the end of each year.
99 00 01 02 03 04 05 06 07 08 090
10,000
20,000
30,000
40,000
50,000
60,000
70,000
80,000
0
3,000
6,000
9,000
12,000
15,000
99 00 01 02 03 04 05 06 07 08 0999 00 01 02 03 04 05 06 07 08 090
500
1,000
1,500
2,000
2,500
PROVED RESERVE GROWTHBcfe at end of year
PRODUCTION GROWTHAverage mmcfe per day for year
TOTAL RESOURCE BASE GROWTHBcfe at end of year
$ 0
$ 500
$ 250
$ 750
$ 1,250
$ 1,750
$ 1,000
$ 1,500
$ 2,000
99 0403020100 05 06 07 08 09$ 0
$ 50
$ 100
$ 150
$ 200
$ 250
04 05 06 07 08 09
FIVE-YEAR PERFORMANCEAs of December 31 CHK 2009 Peer Group (1) 2008 Peer Group (1) S&P 500
TEN-YEAR PERFORMANCEAs of December 31 CHK 2009 Peer Group (1) 2008 Peer Group (1) S&P 500
Average daily natural gas and oil production increased 8% from 2.3 billion cubic feet of natural gas equivalent (bcfe) in 2008 to 2.5 bcfe in 2009;
Proved natural gas and oil reserves increased 18% in 2009, from 12.1 trillion cubic feet of natural gas equivalent (tcfe) to 14.3 tcfe;
Reserve replacement for the year reached 343% at a drilling and net acquisition cost of only $0.74 per thousand cubic feet of natural gas equivalent (mcfe) (1);
Cash hedging gains were $2.3 billion;
Our stock price increased 60% in 2009, from $16.17 to $25.88;
Revenues totaled $7.7 billion;
Adjusted ebitda (2) was $4.4 billion;
Operating cash flow(2) totaled $4.3 billion; and
Adjusted earnings per fully diluted share (2) were $2.55.
THE PAST AS PROLOGUE
In May 1989, I co-founded Chesapeake to take
advantage of a newly developed technology called
horizontal drilling. At the time, my business partner
Tom Ward and I were two self-employed landmen
working together to develop prospects for other
companies to drill. These prospects were located in
southern Oklahoma and in South Texas where we as-
sembled large land positions that were underlain by
fractured carbonates — reservoirs which were not at
the time considered economic to develop using con-
ventional vertical drilling technologies.
Convinced the conventional wisdom about
these formations was wrong, we started develop-
ing the prospects ourselves using horizontal drilling.
We didn’t know it then, but those prospects today
would be called unconventional reservoirs (so-called
because they are generally nonproductive without
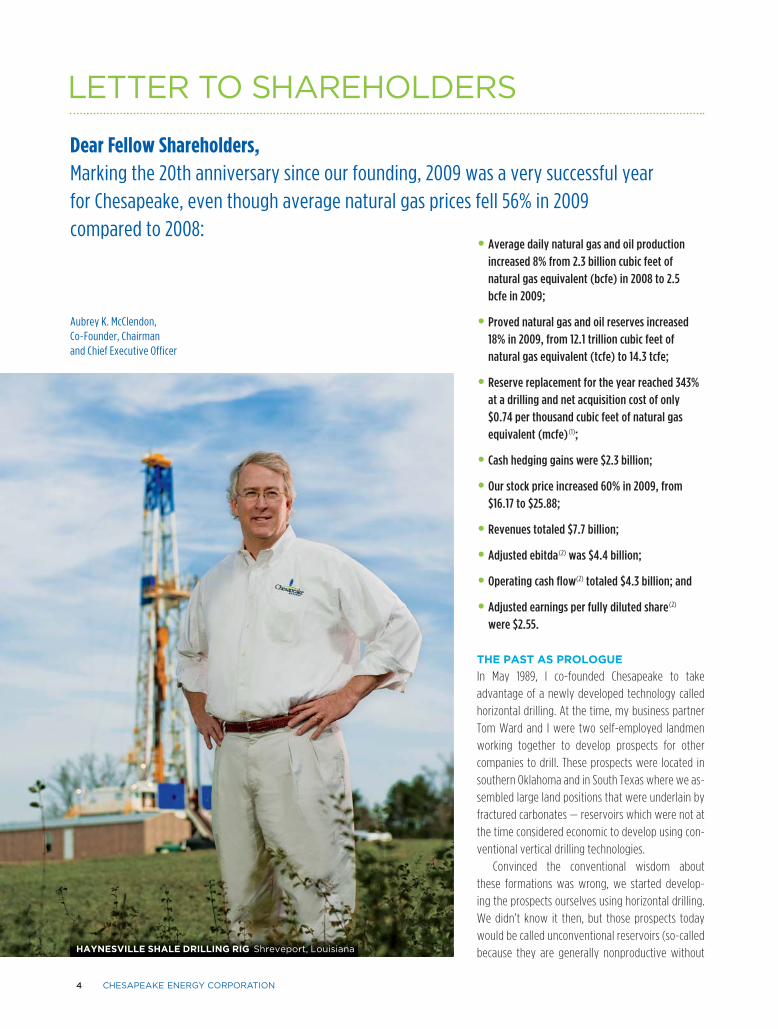
Dear Fellow Shareholders,Marking the 20th anniversary since our founding, 2009 was a very successful year for Chesapeake, even though average natural gas prices fell 56% in 2009 compared to 2008:
LETTER TO SHAREHOLDERS
Aubrey K. McClendon, Co-Founder, Chairman and Chief Executive Officer
HAYNESVILLE SHALE DRILLING RIG Shreveport, Louisiana
4 CHESAPEAKE ENERGY CORPORATION

LETTER TO SHAREHOLDERS 5
significance of the play until early 2004. We then
made our first two property acquisitions in Johnson
County and set our sights on what we called the
“doughnut hole” — Tarrant County, the home of Fort
Worth and more than 60 other municipalities.
Most in the industry knew Tarrant County lay
above the best Barnett rock in the entire play.
What was unclear was how to develop it beneath
a metropolitan area of almost two million people.
After analyzing the challenges and opportuni-
ties of urban and suburban drilling, we concluded
that while most of our competitors would not want
to deal with these complexities, Chesapeake’s
operational and land acquisition skills would be
especially well suited for successful urban develop-
ment in the Barnett.
Consequently, in 2005 we began leasing in earnest
in Tarrant County, and today we own approximately
200,000 leases, on which we estimate we could drill
up to 2,400 future net wells in addition to our 1,100 net
wells currently producing.
Our most exciting development in the Barnett
Shale during 2009 was the signing of our fourth natu-
ral gas shale joint venture agreement.
This agreement closed in January 2010
and involved Chesapeake selling 25% of
its assets in the Barnett to Paris-based
Total, S.A., the world’s fifth-largest
oil company. Total paid $2.25 bil-
lion in cash and drilling carries for its
25% stake in the Barnett and we are
extremely proud to welcome Total as
one of our four highly valued joint ven-
ture partners.
the implementation of advanced horizontal drilling
and fracture stimulation technologies). To us, it was
simply a very logical way to combine a new technol-
ogy with our land acquisition skills to crack the code
for economically developing large scale projects that
could be company-makers.
Ironically, that is precisely what Chesapeake does
today — uses its cutting-edge technological capa-
bilities and industry-leading land acquisition skills
to develop new unconventional reservoirs that have
recently become some of the largest, most active and
most highly valued natural gas development projects
in the world.
While I am proud of our humble beginnings, I am
also proud that during its 20-year existence, Chesa-
peake has built an unparalleled asset portfolio, an
industry-leading technological position and a deep
sense of environmental stewardship to become the
nation’s second-largest natural gas producer, most
active driller of new wells and most vocal proponent
of natural gas as the best way to fuel America’s clean
energy future.
OUR POWERFUL ASSETS
What will drive Chesapeake’s strong growth in the
future? It will be our industry-leading position in the
“Big 6” major natural gas shale plays in the U.S. — the
Barnett, Fayetteville, Haynesville, Marcellus, Bossier
and Eagle Ford shales — plus our emerging unconven-
tional oil plays. The Big 6 shale plays form the founda-
tion of the American natural gas shale revolution and
they will create substantial value for Chesapeake’s
shareholders for decades to come. And because those
key shale plays are dominated by only 15 or so public
companies, we believe this group of shale pioneers
will emerge as the industry’s biggest winners
in the years ahead. Chesapeake’s Top 2 position
in five of the Big 6 shale plays (with no other
company having more than one Top 2 position)
should ensure that Chesapeake will emerge as
the biggest winner of all from the Big 6 shale
land rush.
BARNETT SHALE
Discovered in the 1990s, the Barnett is the
granddaddy of all shale plays. Chesapeake
acquired its first assets in the Barnett in 2001,
but did not fully appreciate the potential
Hard work, high-tech drilling rigs and gas-laden shale pro- vide a formula for success. Employees of Nomac Drilling, a Chesapeake subsidiary, operate the largest rig fleet in the exploration and produc-tion industry as they drill for natural gas in America’s Big 6 shale plays.

6 CHESAPEAKE ENERGY CORPORATION
The Haynesville Shale in Northwest Louisiana and East Texas
is the shale play of which we are most proud because it was
discovered by Chesapeake’s own geoscientists and engineers.
GRANITE WASH High-volume natural gas with a bonus of oil and natural gas liquids give the Granite Wash outstanding returns.BARNETT SHALE The massive Barnett in north- central Texas is the granddaddy of all natural gas shale plays.FAYETTEVILLE SHALE Scenic central Arkansas is home to the prolific Fayetteville Shale.MARCELLUS SHALE Deep beneath northern Appalachia, Marcellus Shale natural gas will revitalize the region. HAYNESVILLE SHALE Chesapeake’s discovery of the Haynesville makes the play’s success even sweeter.
GRANITE WASH
play of which we are most proud because it was
discovered by Chesapeake’s own geoscientists and
engineers. We began our geoscientific investigation
of the Haynesville in 2005–06 and tested our theo-
ries through drilling in 2007. In 2008, we formed an
innovative joint venture with our well-respected
industry partner, Houston-based Plains Exploration
& Production Company, to which we sold 20% of
our Haynesville assets for $3.2 billion in cash and
drilling carries.
The Haynesville Shale is now the nation’s second-
largest producing shale play. It is so large (more than
twice the size of the Barnett core area) and so over-
pressured (holding more gas in place per square mile
than the Barnett) that we believe it will likely surpass
the Barnett by 2014 to become the largest natural
gas producing field in the U.S. Ultimate recoveries
from the Haynesville could exceed 250 tcfe, making it
potentially one of the five largest natural gas fields in
the world. Today, we are producing from more than
200 net wells in the Haynesville on our 520,000 net
leasehold acres and estimate we could drill up to
6,500 additional net wells in the years ahead.
FAYETTEVILLE SHALE
The Fayetteville Shale of central Arkansas emerged
as the second important U.S. shale play in early 2005.
Chesapeake had already developed a presence in the
Woodford Shale of southeastern Oklahoma in 2004,
so when we learned in 2005 of initial success in the
Fayetteville, we aggressively jumped into Arkansas,
acquiring approximately 550,000 net acres of prime
Fayetteville acreage by mid-year 2008. Our drill-
ing success came quickly in the Fayetteville as our
knowledge of shale development from the Barnett
and Woodford plays helped establish Chesapeake as
the second-largest player in the Fayetteville.
A key to Chesapeake’s Fayetteville success has
been our September 2008 joint venture with London-
based BP, the world’s second-largest oil company.
In this joint venture, we sold 25% of our
assets in the Fayetteville to BP for $1.9
billion in cash and drilling carries. To-
day, we are producing from more than
500 net wells in the Fayetteville on our
460,000 net acres and estimate we could
drill up to 5,200 additional net wells in
the years ahead.
HAYNESVILLE SHALE
The Haynesville Shale in Northwest
Louisiana and East Texas is the shale
BARNETT SHALE MARCELLUS SHALEFAYETTEVILLE SHALE
LETTER TO SHAREHOLDERS 7
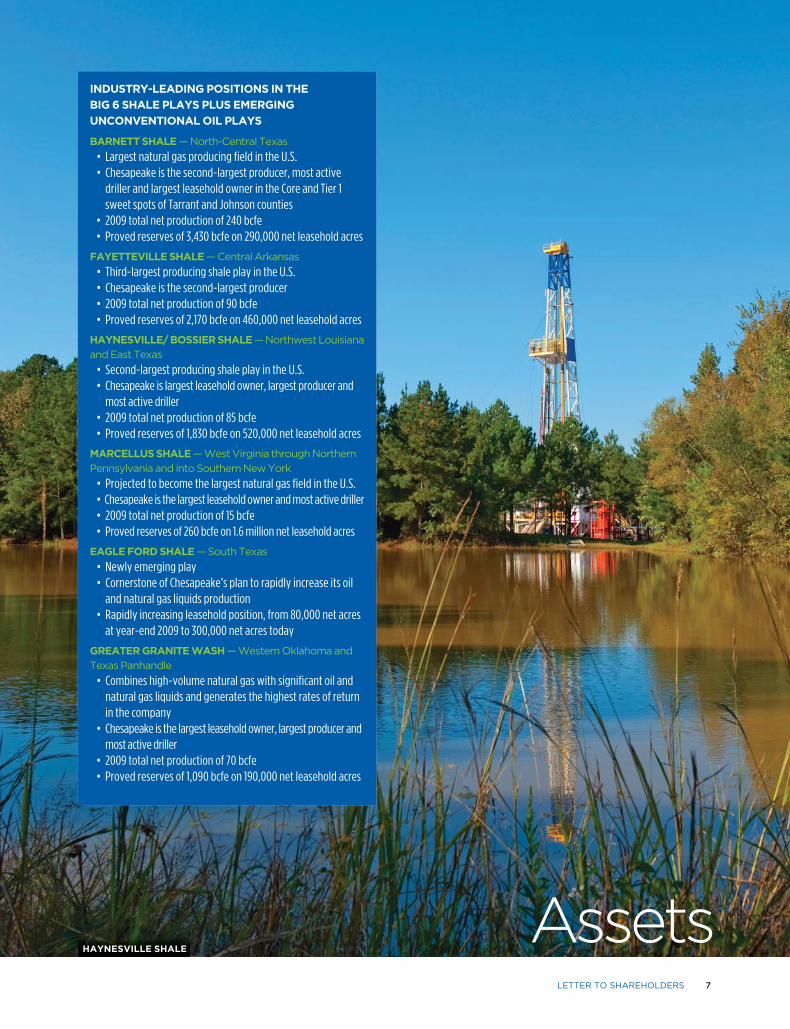
INDUSTRY-LEADING POSITIONS IN THE
BIG 6 SHALE PLAYS PLUS EMERGING
UNCONVENTIONAL OIL PLAYS
BARNETT SHALE — North-Central Texas
• Largest natural gas producing field in the U.S. • Chesapeake is the second-largest producer, most active
driller and largest leasehold owner in the Core and Tier 1 sweet spots of Tarrant and Johnson counties
• 2009 total net production of 240 bcfe • Proved reserves of 3,430 bcfe on 290,000 net leasehold acres
FAYETTEVILLE SHALE — Central Arkansas
• Third-largest producing shale play in the U.S. • Chesapeake is the second-largest producer • 2009 total net production of 90 bcfe • Proved reserves of 2,170 bcfe on 460,000 net leasehold acres
HAYNESVILLE/ BOSSIER SHALE — Northwest Louisiana
and East Texas
• Second-largest producing shale play in the U.S. • Chesapeake is largest leasehold owner, largest producer and
most active driller • 2009 total net production of 85 bcfe • Proved reserves of 1,830 bcfe on 520,000 net leasehold acres
MARCELLUS SHALE — West Virginia through Northern
Pennsylvania and into Southern New York
• Projected to become the largest natural gas field in the U.S. • Chesapeake is the largest leasehold owner and most active driller • 2009 total net production of 15 bcfe • Proved reserves of 260 bcfe on 1.6 million net leasehold acres
EAGLE FORD SHALE — South Texas
• Newly emerging play • Cornerstone of Chesapeake’s plan to rapidly increase its oil
and natural gas liquids production • Rapidly increasing leasehold position, from 80,000 net acres
at year-end 2009 to 300,000 net acres today
GREATER GRANITE WASH — Western Oklahoma and
Texas Panhandle
• Combines high-volume natural gas with significant oil and natural gas liquids and generates the highest rates of return in the company
• Chesapeake is the largest leasehold owner, largest producer and most active driller
• 2009 total net production of 70 bcfe • Proved reserves of 1,090 bcfe on 190,000 net leasehold acres
AssetsHAYNESVILLE SHALE

8 CHESAPEAKE ENERGY CORPORATION
MARCELLUS SHALE
We first became aware of the Marcellus in 2005 when
we were negotiating our $2.2 billion acquisition of
Appalachia’s second-largest natural gas producer,
Columbia Natural Resources, LLC (CNR). Although CNR
was not actively developing the Marcellus at the
time of our acquisition, Chesapeake’s geoscientists
recognized that CNR’s industry-leading leasehold
position in Appalachia would overlay a signifi-
cant portion of the Marcellus in northwestern West
Virginia and southern New York (CNR had unfor-
tunately previously sold its Pennsylvania assets).
In 2007, we aggressively accelerated our Marcellus
leasehold acquisition efforts in Pennsylvania and
began to prepare for our first drilling activities. By
early 2008, we had determined the Marcellus could
be prospective over an area of approximately 15 mil-
lion net acres (approximately five times larger than
the prospective Haynesville core area and 10 times
larger than the Barnett core area).
After acquiring 1.8 million net acres, we entered
into a joint venture in late 2008 with Oslo, Norway-
based Statoil, one of the largest and most respected
Technology
European energy companies. In this transaction, we
sold Statoil 32.5% of our Marcellus assets for $3.375
billion in cash and drilling carries. In addition, we
have joined with Statoil in the search for other shale
plays around the world in a 50/50 partnership. We
are excited by the opportunity to extend our natural
gas shale expertise from the U.S. to other parts of the
world through our Statoil joint venture. Today, we
are producing from more than 150 net wells in the
Marcellus on our 1.6 million net acres and estimate
we could drill up to 20,000 additional net wells in
the years ahead.
BOSSIER SHALE
The Bossier Shale is one of the two new shale
plays that expanded our “Big 4” shale plays
from 2008 into the “Big 6” of 2009. The Bossi-
er overlays a portion of the Haynesville Shale
and is perhaps the “sleeper” of the Big 6 shale
plays. The reason is that in Louisiana, leases
often restrict the lessee (i.e., the producer) to only
holding future drilling rights down through the
deepest formation drilled. Because the Bossier
TECHNOLOGY
Associate Geologist Emiko Bogard takes a closer look at the microscopic qualities of shale. HORIZONTAL DRILLING Chesapeake’s expertise in horizontal drilling has been a key factor in its success.CORE ANALYSIS Scientists in the company’s Reservoir Technology Center study core samples to unlock the secrets of shale gas.
HORIZONTAL DRILLING
CORE ANALYSIS

LETTER TO SHAREHOLDERS 9
prices more than 3.5 times higher today than natural
gas prices on an energy equivalent basis, it makes
powerful economic sense to increase our efforts
toward finding, leasing and developing large scale
unconventional oil projects using the skills we have
developed in unconventional natural gas projects.
This challenge is especially difficult because oil
molecules and wet natural gas molecules are larger
than dry natural gas molecules and therefore much
more difficult to produce from ultra-tight unconven-
tional reservoirs.
We kicked off this “gas to oil” initiative two
years ago, and to date, have already had initial
success in 10 new oil plays. We also are working on
additional oil play concepts. If these plays and con-
cepts prove commercial on a large scale, then we be-
lieve Chesapeake owns more than four billion barrels
of unrecognized oil resources that will substantially
increase the company’s value as they are developed.
Because early drilling results need to remain con-
fidential as we acquire more leasehold in these new
oil plays, we are being guarded with our oil drilling
results disclosures. As 2010 progresses, however, we
look forward to revealing more about the potential
of Chesapeake’s oil upside. I believe these oil dis-
coveries could prove to be the most significant value
creation uplift for the company since our gas shale
discoveries of the past few years.
lies above the Haynesville, horizontal wells drilled
just to the Bossier may not always hold Haynesville
rights. Therefore, Chesapeake and other producers
are drilling aggressively to hold all rights through
the Haynesville before the typical three-year-term
initial leases expire, so not much Bossier drilling is yet
underway. However, once our leases are HBP (held
by production) by Haynesville drilling, we will begin
developing the Bossier Shale more aggressively in
2013. In the Bossier play, we own 180,000 net acres on
which we estimate we could drill up to 2,250 net wells
in the years ahead.
EAGLE FORD SHALE
The Eagle Ford Shale of South Texas was the second
addition to our Big 6 inventory in 2009. The Eagle
Ford is different from the other Big 6 shale plays
because it has three distinct elements: a dry gas play,
an oil play and a wet gas play. Chesapeake has acquired
approximately 300,000 net acres to date, all of which
are in the oil and wet gas portions of the play. Given
that oil and natural gas liquids are valued much more
highly than natural gas, we are focusing all of our Eagle
Ford leasing efforts in the oil and wet gas portions of
the play. Our first three wells have been successful, and
we expect to accelerate our drilling in the Eagle Ford in
2010 and beyond. Our leasehold position could support
the drilling of up to 2,000 additional net wells.
LOOKING FOR MORE OIL
In addition to further developing our Big 6 natural
gas shale plays, another important goal of the com-
pany in 2010 is to find more oil. Oil comprised only
8% of Chesapeake’s 2009 production, and with oil
In addition to further developing our Big 6 natural gas shale
plays, another important goal of the company in 2010 is to
find more oil.
INNOVATIVE TECHNOLOGY AND SHARED KNOWLEDGE
In the natural gas exploration and production business, success is predicated on knowledge: knowing where to drill, how to complete and how to transfer the expertise gained in one play to the next.
Using 3-D seismic, Chesapeake’s geoscientists and reservoir engineers study the geologic structures of plays and potential drillsites. They also collaborate with world class petrophysicists in our unique Reservoir Technology Center to analyze core samples and evaluate the most effective completion techniques to maximize recovery of each well.
Chesapeake is among the few industry participants with an internal technology group that works with engineering, unconventional, petrophysical, reservoir and asset management teams to leverage the experience and knowledge gained in one big play to the next — optimizing and improving performance in every area in which we operate.
3-D SEISMIC
3-D SEISMIC This rap-idly advancing technology has been critical in enabling Chesapeake’s geoscientists to steer our horizontal wells into the best shale rock.

10 CHESAPEAKE ENERGY CORPORATION
CLEAN The growing number of natural gas- powered electrical generation plants is testimony to their environmental and economic advantages. AFFORDABLE Consumers filling their tanks with com-pressed natural gas (CNG) often save 50% over the cost of gasoline. ABUNDANT Natural gas pipelines transport Ameri-ca into the “Age of Natural Gas” with almost a 200-year supply.AMERICAN Workers like Aaron Harris, Nomac Derrickman, help supply ap-proximately 90% of America’s natural gas needs from domes-tic sources.
AMERICANABUNDANTAFFORDABLE
returns of 100–150% and generally reach payout in less
than a year.
We are already producing from approximately 100
net Granite Wash wells and estimate we could drill
up to 1,200 additional net wells on our 190,000 net
acres of leasehold in the years ahead. Based on cur-
rent NYMEX futures prices for natural gas and oil, each
Granite Wash well should generate approximately
$8–11 million of present value per well (or $10–13 bil-
lion for all 1,200 wells), making it obvious that finding,
leasing and developing more oil plays with Granite
Wash-type returns will be Chesapeake’s number one
priority for 2010.
OUR PEOPLE
Great assets would not and cannot exist with-
out great people, so we take great pride in hiring,
training, motivating, rewarding and retaining great
people. From our beginning 20 years ago with 10
employees in Oklahoma to employing 8,600 people
in 16 states today, Chesapeake has always focused on
GRANITE WASH PLAYS
The Colony and Texas Panhandle Granite Wash plays
provide insight into what could happen if Chesa-
peake is successful in finding new unconventional
oil plays. As good as the per-well Big 6 gas shale
economics are, the economics are even better in the
Colony Wash and Texas Panhandle Granite Wash plays
because they possess the best of both worlds: high-
volume natural gas production as in the Big 6 gas shale
plays, along with significant volumes of oil and natu-
ral gas liquids that dramatically increase investment
returns. For example, while our per-well economics for
Big 6 shale wells generally provide returns of 20–60%,
wells drilled in these two Granite Wash plays provide
We are already producing from approximately 100 net Granite
Wash wells and estimate we could drill up to 1,200 additional net
wells on our 190,000 net acres of leasehold in the years ahead.
CLEAN
ANGA: A NEW NATIONAL VOICE FOR NATURAL GAS
In March 2009, Chesapeake joined with a group of the nation’s leading independent producers to create one dynamic voice for increasing demand for American natural gas. The mission of America’s Natural Gas Alliance (ANGA) is to increase understanding and appreciation for the environmental, economic and national security benefits of clean, abun-dant, dependable and cost-efficient American natural gas. Its 34 members represent more than 40% of the total U.S. natural gas supply, producing about nine trillion cubic feet per year.
Chesapeake has long been a champion for natural gas. We are proud to be a founding member of ANGA and share its core belief that America’s clean energy future will increasingly be fueled by the enormous domestic natural gas resources now available to generate electricity, power industry, provide energy for heating and cooking, and offer a cleaner, more affordable fuel for transportation vehicles.
For more information, please visit www.anga.us.
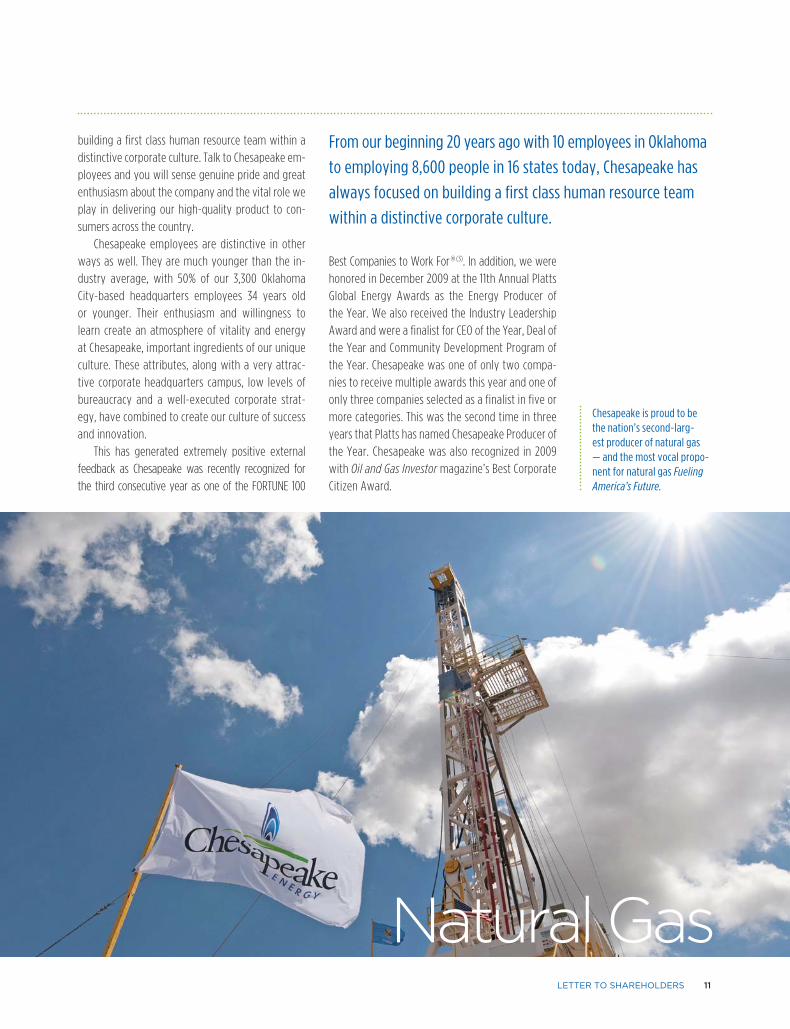
Chesapeake is proud to be the nation’s second-larg-est producer of natural gas — and the most vocal propo-nent for natural gas Fueling America’s Future.
Natural Gas LETTER TO SHAREHOLDERS 11
Best Companies to Work For ® (3). In addition, we were
honored in December 2009 at the 11th Annual Platts
Global Energy Awards as the Energy Producer of
the Year. We also received the Industry Leadership
Award and were a finalist for CEO of the Year, Deal of
the Year and Community Development Program of
the Year. Chesapeake was one of only two compa-
nies to receive multiple awards this year and one of
only three companies selected as a finalist in five or
more categories. This was the second time in three
years that Platts has named Chesapeake Producer of
the Year. Chesapeake was also recognized in 2009
with Oil and Gas Investor magazine’s Best Corporate
Citizen Award.
building a first class human resource team within a
distinctive corporate culture. Talk to Chesapeake em-
ployees and you will sense genuine pride and great
enthusiasm about the company and the vital role we
play in delivering our high-quality product to con-
sumers across the country.
Chesapeake employees are distinctive in other
ways as well. They are much younger than the in-
dustry average, with 50% of our 3,300 Oklahoma
City-based headquarters employees 34 years old
or younger. Their enthusiasm and willingness to
learn create an atmosphere of vitality and energy
at Chesapeake, important ingredients of our unique
culture. These attributes, along with a very attrac-
tive corporate headquarters campus, low levels of
bureaucracy and a well-executed corporate strat-
egy, have combined to create our culture of success
and innovation.
This has generated extremely positive external
feedback as Chesapeake was recently recognized for
the third consecutive year as one of the FORTUNE 100
From our beginning 20 years ago with 10 employees in Oklahoma
to employing 8,600 people in 16 states today, Chesapeake has
always focused on building a first class human resource team
within a distinctive corporate culture.
12 CHESAPEAKE ENERGY CORPORATION
Environment
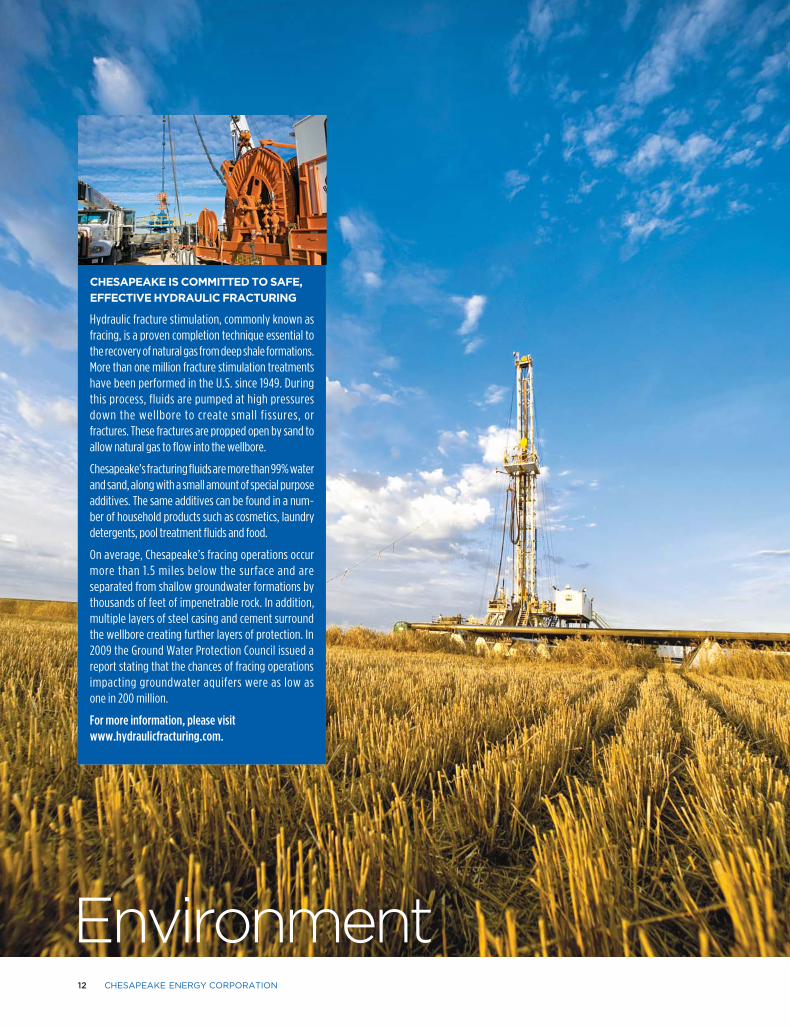
CHESAPEAKE IS COMMITTED TO SAFE,
EFFECTIVE HYDRAULIC FRACTURING
Hydraulic fracture stimulation, commonly known as fracing, is a proven completion technique essential to the recovery of natural gas from deep shale formations. More than one million fracture stimulation treatments have been performed in the U.S. since 1949. During this process, fluids are pumped at high pressures down the wellbore to create small fissures, or fractures. These fractures are propped open by sand to allow natural gas to flow into the wellbore.
Chesapeake’s fracturing fluids are more than 99% water and sand, along with a small amount of special purpose additives. The same additives can be found in a num-ber of household products such as cosmetics, laundry detergents, pool treatment fluids and food.
On average, Chesapeake’s fracing operations occur more than 1.5 miles below the surface and are separated from shallow groundwater formations by thousands of feet of impenetrable rock. In addition, multiple layers of steel casing and cement surround the wellbore creating further layers of protection. In 2009 the Ground Water Protection Council issued a report stating that the chances of fracing operations impacting groundwater aquifers were as low as one in 200 million.
For more information, please visit www.hydraulicfracturing.com.
LETTER TO SHAREHOLDERS 13
natural gas shale plays now more fully understood,
it should become increasingly clear that the U.S. has a
huge competitive advantage in the world.
On the economic front, U.S. natural gas prices are
among the lowest in the industrialized world and are
likely to remain so for an extended period because of
the discovery of the Big 6 shale natural gas resources.
On the environmental front, the U.S. can regain its
leadership in environmental best practices by burn-
ing more clean natural gas and less dirty coal to make
our electricity. And finally, natural gas can enable the
U.S. to transition its transportation system away from
dangerous and expensive foreign oil to cheaper and
cleaner American natural gas.
To capture the important advantages the Big 6
shale plays can provide, U.S. leaders must recog-
nize the “Age of Natural Gas” has arrived and that it
will remain with us for decades to come. A better,
brighter and more prosperous future awaits us if we
pursue the full potential of natural gas for Fueling America’s Future.
FUELING AMERICA’S CLEAN ENERGY
FUTURE
Because of a series of insights into the future, fol-
lowed by good decisions and hard work, Chesapeake
has grown from a small startup company 20 years
ago into an industry leader today. Along the way, we
have built the industry’s highest quality asset base in
the Big 6 natural gas shale plays. These shale plays
have dramatically changed how we can solve our
nation’s most important energy and environmental
challenges in the years ahead, while also creating
millions of truly green jobs that pay well and do not
need taxpayer or ratepayer subsidies. They also can
improve America’s national security by reducing our
dependence on foreign oil.
There has never really been any debate about
whether natural gas is a good fuel — its carbon-light
molecular structure guarantees that. The issue has al-
ways been whether there is enough of it to begin mov-
ing our electrical generation system more aggressively
away from dirty coal and whether it is the right time
to begin moving our transportation system away from
expensive foreign oil. With the enormity of the Big 6
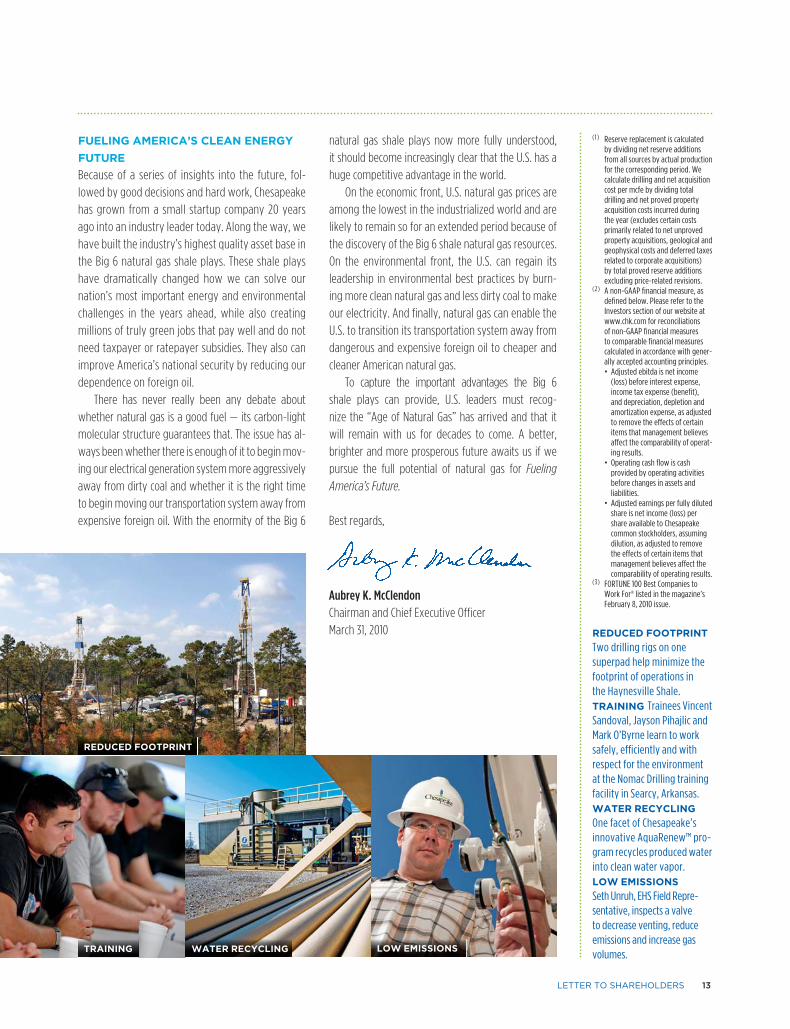
REDUCED FOOTPRINT Two drilling rigs on one superpad help minimize the footprint of operations in the Haynesville Shale.TRAINING Trainees Vincent Sandoval, Jayson Pihajlic and Mark O’Byrne learn to work safely, efficiently and with respect for the environment at the Nomac Drilling training facility in Searcy, Arkansas.WATER RECYCLING One facet of Chesapeake’s innovative AquaRenew™ pro-gram recycles produced water into clean water vapor.LOW EMISSIONS Seth Unruh, EHS Field Repre-sentative, inspects a valve to decrease venting, reduce emissions and increase gas volumes.
LOW EMISSIONSWATER RECYCLINGTRAINING
Best regards,
Aubrey K. McClendonChairman and Chief Executive Officer
March 31, 2010
(1 ) Reserve replacement is calculated by dividing net reserve additions from all sources by actual production for the corresponding period. We calculate drilling and net acquisition cost per mcfe by dividing total drilling and net proved property acquisition costs incurred during the year (excludes certain costs primarily related to net unproved property acquisitions, geological and geophysical costs and deferred taxes related to corporate acquisitions) by total proved reserve additions excluding price-related revisions.
(2) A non-GAAP financial measure, as defined below. Please refer to the Investors section of our website at www.chk.com for reconciliations of non-GAAP financial measures to comparable financial measures calculated in accordance with gener-ally accepted accounting principles.
• Adjusted ebitda is net income (loss) before interest expense, income tax expense (benefit), and depreciation, depletion and amortization expense, as adjusted to remove the effects of certain items that management believes affect the comparability of operat-ing results.
• Operating cash flow is cash provided by operating activities before changes in assets and liabilities.
• Adjusted earnings per fully diluted share is net income (loss) per share available to Chesapeake common stockholders, assuming dilution, as adjusted to remove the effects of certain items that management believes affect the comparability of operating results.
(3) FORTUNE 100 Best Companies to Work For® listed in the magazine’s February 8, 2010 issue.
REDUCED FOOTPRINT
14 CHESAPEAKE ENERGY CORPORATION
The enormous potential of the 21st cen-
tury’s “Age of Natural Gas” is now fully in
view. Vast new reserves of natural gas in
shale reservoirs deep beneath our country have
been discovered in the past five years. These
shale reservoirs are now estimated to contain
more than two quadrillion cubic feet of natural
gas, more than doubling America’s previously
estimated natural gas reserves, and giving us
close to a 200-year supply of clean, affordable,
American natural gas. These unconventional
reservoirs are a remarkable addition to Amer-
ica’s bountiful natural resource endowment.
They are also essential to retaining our
nation’s prosperity. Because of our reli-
ance on dangerous and expensive foreign
oil to power our cars and trucks and on
dirty coal to produce 50% of our electricity,
America’s position of global economic and
environmental leadership for the next cen-
tury is unfortunately in doubt. It need not be.
Underneath many parts of the U.S. lies a
buried treasure of natural gas that is quickly
becoming the envy of the world — it’s clean,
affordable, abundant, American, and brought
to you by public independent natural gas pro-
ducers such as Chesapeake.
Two quadrillion cubic feet of America’s
natural gas represent more energy than Saudi
Arabia’s 200 billion barrels of oil reserves — but
America’s natural gas is much cleaner and 70%
cheaper than Saudi oil. In 2009, the U.S. passed
Russia as the biggest producer of natural gas
in the world, but how many Americans real-
ize this remarkable achievement? Our political
leadership must begin to acknowledge and
celebrate this tremendous accomplishment
and to recognize the strategic and practical
benefits of more aggressively using our enor-
mous new reserves of natural gas.
NATURAL GAS IS THE BEST
SUBSTITUTE FOR FOREIGN OIL
The U.S. imports approximately 60% of the oil
that we consume — a dangerous addiction
that costs our country $1 billion per day. This
percentage will likely rise in the years ahead
as oil prices inevitably increase to choke off
demand in the industrialized countries to
make room for burgeoning oil demand from
rapidly developing countries in Asia, the
Middle East and in South America. This is an
addiction America cannot afford in good eco-
nomic times and certainly not in the tough
economic times the nation is facing today.
But if our political leadership would awaken
and recognize that this addiction could be
overcome by converting some of the current
demand for foreign oil to new demand for do-
mestic natural gas, America’s economic future
would be much stronger and our environmental
outlook would be brighter. Natural gas has only
50% of the carbon that gasoline has, but more
importantly, natural gas vehicles emit little to
no harmful pollutants such as carbon monox-
ide (CO), nitrogen oxide (NOx), and toxic volatile
organic compounds (VOCs) that gasoline and
diesel consumption currently produce.
The best way to begin breaking this foreign
oil addiction is to endorse the NAT GAS Act (H.R.
1835 and S. 1408) now pending in Congress. For
details on these bills, please visit www.cngnow.
com. These bills would gradually and efficiently
introduce clean, American natural gas as the fuel
of choice for heavy-, medium- and light-duty
truck fleets in the U.S., replacing diesel refined
from expensive foreign oil.
Once truck fleets have been converted
to natural gas (in the form of liquefied natu-
ral gas, or “LNG”) and natural gas refueling
pumps have been added to many of our na-
tion’s truck stops, we can then begin convert-
ing passenger cars to natural gas (in the form
of compressed natural gas, or “CNG”). This
conversion process would save American con-
sumers billions of dollars because natural gas
is 70% cheaper than oil. Americans also would
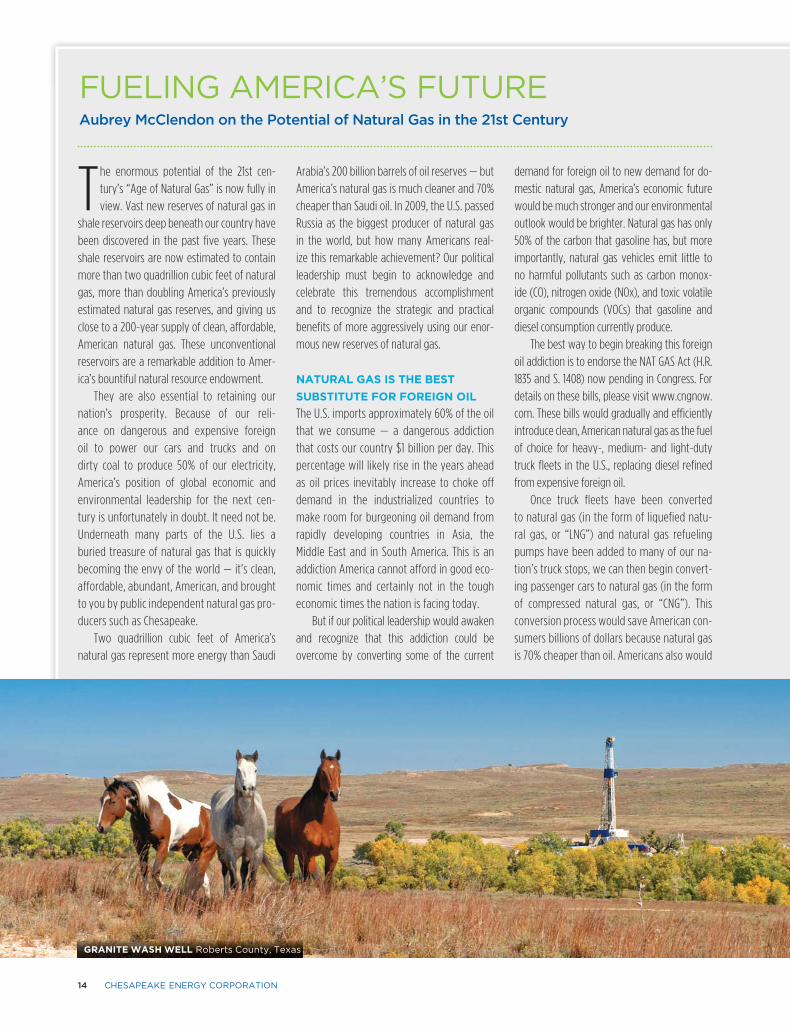
FUELING AMERICA’S FUTUREAubrey McClendon on the Potential of Natural Gas in the 21st Century
GRANITE WASH WELL Roberts County, Texas
FUELING AMERICA’S FUTURE 15
enjoy the added benefits of cleaner air and
water and greater national security.
Speaking of national security, let’s not forget
that the real price of oil is far more than the $85
per barrel that it costs today. When the Ameri-
can military’s cost of defending the world’s oil
shipping lanes and fighting wars in the Middle
East and nearby areas is considered, some ex-
perts say the true cost of oil to Americans may
be over $200 per barrel. The current practice of
spending $1 billion per day to import 11 million
barrels of oil from foreign countries is simply not
sustainable — it’s a dangerous, dirty and expen-
sive habit that must be curtailed.
I drive a converted Chevy Tahoe that runs on
natural gas from my home, and I can assure you
it feels great to refuel my vehicle at $1.00 per
gallon with a clean fuel that is made in America
and creates American jobs. My goal is to make
sure all Americans one day have the opportunity
to enjoy that same great feeling.
We must demand that our leadership begins
acting now to make the transition to clean, af-
fordable, abundant, American natural gas before
oil reaches $150 per barrel (bringing the price of
gasoline to $4.50–5.00 per gallon) and we find
ourselves right back in another recession, or per-
haps even worse, a depression. These are serious
issues, and our nation does not have one day to
waste in beginning the transition to a transpor-
tation system based on natural gas rather than
on expensive foreign oil.
NATURAL GAS IS THE BEST
SUBSTITUTE FOR DIRTY COAL
A recent survey Chesapeake commissioned
showed that most Americans believe their elec-
tricity comes from coal, nuclear or wind — very
few people know that natural gas provides 22%
of America’s electricity. It is critical for Ameri-
cans to realize how their electricity is generated.
As more Americans take responsibility for the
environmental impact they create through their
electricity consumption, they need to know
there are alternatives to burning dirty coal be-
sides constructing new nuclear power plants or
new wind and solar facilities. Nuclear plants are
prohibitively expensive and time consuming to
build. Wind and solar facilities are not economic
without taxpayer or ratepayer subsidies. They
also cannot provide baseload power because
of the lack of sunshine at night and on cloudy
days and because of the unpredictability of the
wind. These alternatives also require the enor-
mous expense of building unsightly power lines
over long distances.
The only scalable, affordable alternative to
burning dirty coal is to burn clean natural gas.
And the best news is that it would be relatively
easy to shut down the dirtiest 33% of America’s
coal plants (better known at Chesapeake as the
“Filthy 100”) and replace their electrical output
with natural gas-fired electricity. That is because
coal plants generally run about 75% of the time
while natural gas power plants only run about
25% of the time. The U.S. has enough natural
gas to ramp up natural gas power plants to run
at least 50% of the time so that we can decom-
mission the Filthy 100.
Doing so would eliminate the following an-
nual estimated pollution: 600 million tons of
carbon dioxide (implicated in global warming
concerns); 700,000 tons of nitrogen oxide (exac-
erbates respiratory and heart diseases); 1.5 mil-
lion tons of sulfur dioxide (the main ingredient
of acid rain); 19,000 tons of mercury (one of the
deadliest toxins known to mankind, and nonexis-
tent in natural gas); and millions of tons of par-
ticulates (which the American Lung Association
says kill 24,000 Americans per year).
Confronted with these facts, the coal industry
responds with two claims: first, that natural gas
is more expensive, and second, that coal can be
made clean. Natural gas today sells for around
$4 per mcf, making it nearly equivalent in cost to
coal, but far cheaper when you factor in the social
and environmental costs from coal pollution. And
to say that coal is clean or can be made clean is
extremely misleading. No scalable, affordable
technology exists today to make coal clean. It re-
mains an expensive fantasy on a distant horizon.
In addition, so-called “clean coal” still re-
tains 50% of coal’s original carbon, which ironi-
cally would place “clean coal” at a carbon level
equivalent to natural gas. So why not just use the
reality of clean natural gas today and save hun-
dreds of billions of dollars and several decades of
time associated with the daunting challenge of
trying to make coal clean? And remember, the
carbon removed from coal to make it “clean”
doesn’t just go away — it has to be disposed of
somewhere. Right now the “clean coal” plan is
to pump more than 100 million gallons of liquid
carbon dioxide underneath the ground every
day and hope it stays there. That process is ex-
pensive, unproven and is projected to consume
about 30–35% of a typical power plant’s electri-
cal output. No wonder the coal industry favors
the “clean coal” idea so much — it would actu-
ally increase coal consumption by 30–35%! This
insanity must stop! Our country needs to recog-
nize that the future should belong to clean, af-
fordable, practical energy sources — and natural
gas is the only ready-to-go, scalable alternative
to dirty coal.
Natural gas provides an affordable, environ-
mentally friendly substitute for foreign oil and
dirty coal — while also stimulating America’s
economy and strengthening its energy security.
Let’s embrace a clean and prosperous energy
future through the substitution of Ameri-
can natural gas for foreign oil and dirty coal.
The time for action is NOW!
Let’s embrace a clean and prosperous energy future through the
substitution of American natural gas for foreign oil and dirty coal.
The time for action is NOW!
16 CHESAPEAKE ENERGY CORPORATION
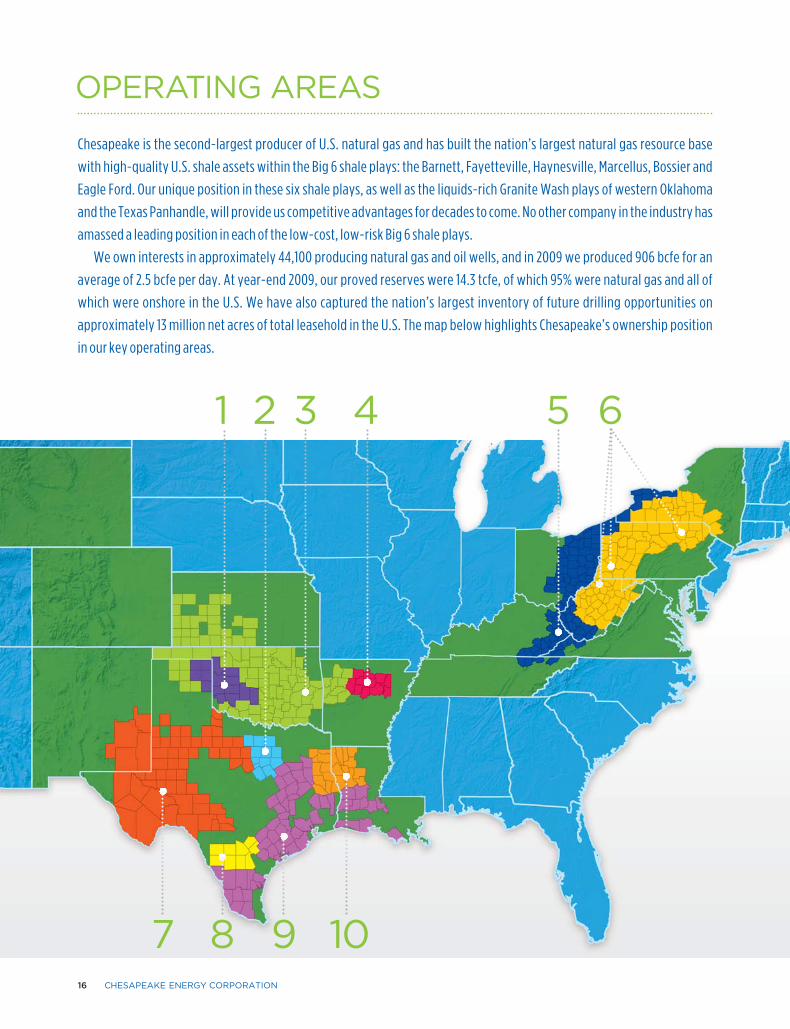
Chesapeake is the second-largest producer of U.S. natural gas and has built the nation’s largest natural gas resource base
with high-quality U.S. shale assets within the Big 6 shale plays: the Barnett, Fayetteville, Haynesville, Marcellus, Bossier and
Eagle Ford. Our unique position in these six shale plays, as well as the liquids-rich Granite Wash plays of western Oklahoma
and the Texas Panhandle, will provide us competitive advantages for decades to come. No other company in the industry has
amassed a leading position in each of the low-cost, low-risk Big 6 shale plays.
We own interests in approximately 44,100 producing natural gas and oil wells, and in 2009 we produced 906 bcfe for an
average of 2.5 bcfe per day. At year-end 2009, our proved reserves were 14.3 tcfe, of which 95% were natural gas and all of
which were onshore in the U.S. We have also captured the nation’s largest inventory of future drilling opportunities on
approximately 13 million net acres of total leasehold in the U.S. The map below highlights Chesapeake’s ownership position
in our key operating areas.
OPERATING AREAS
108 97
421 3 65
OPERATING AREAS 18
6
8
9
2
3
4
5
7
1
10
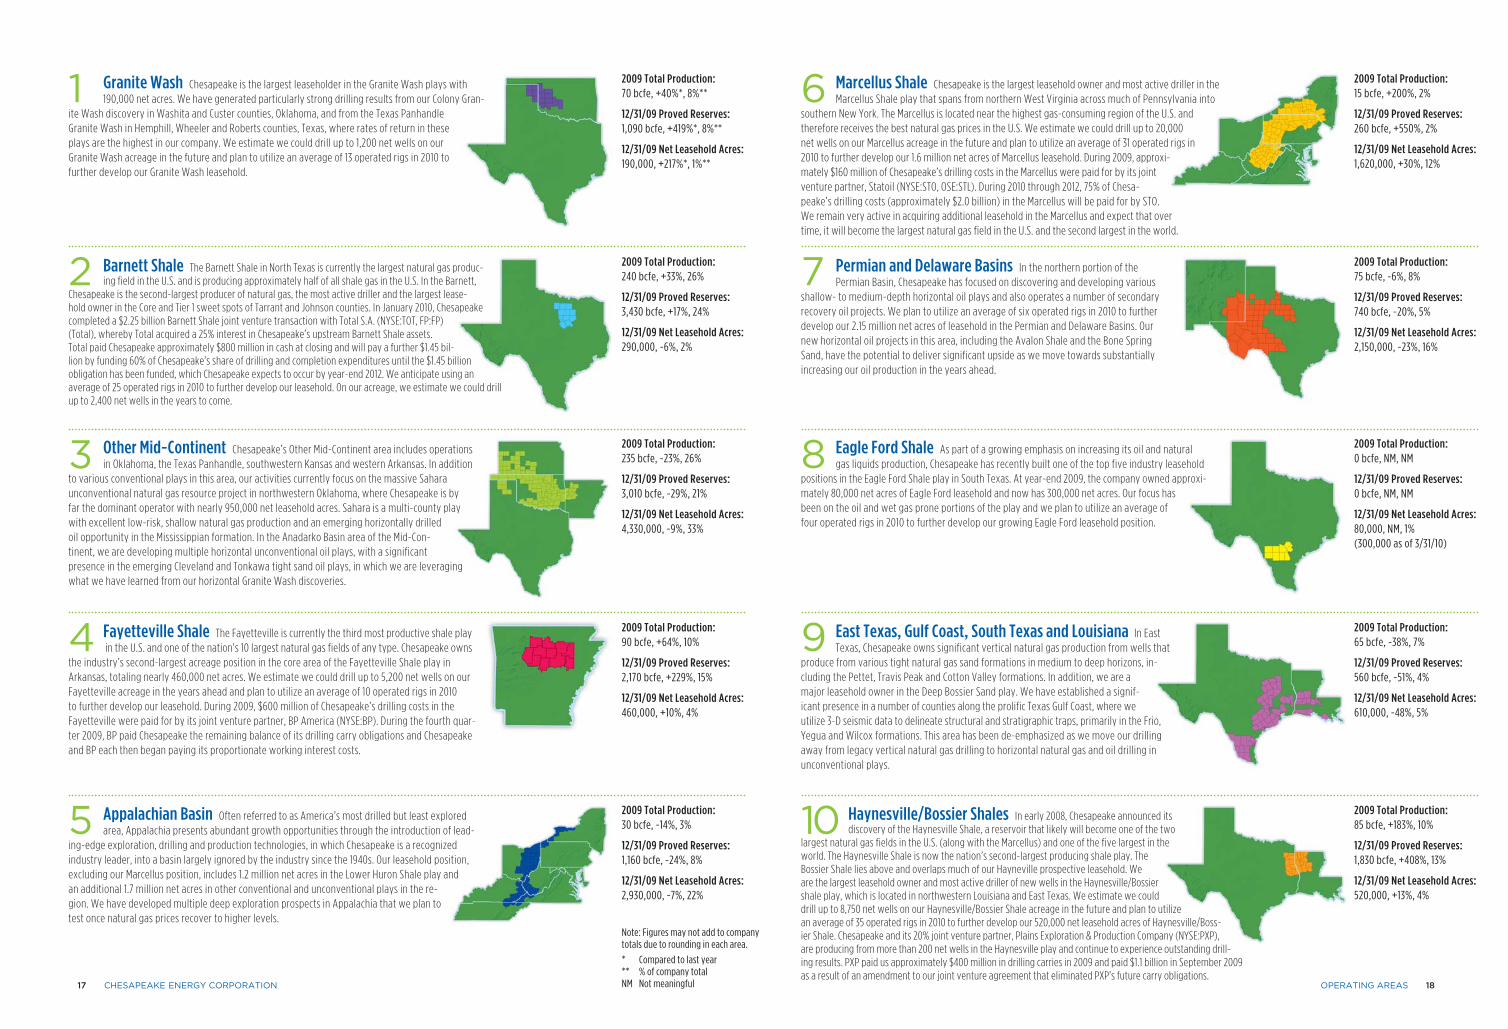
East Texas, Gulf Coast, South Texas and Louisiana In East Texas, Chesapeake owns significant vertical natural gas production from wells that
produce from various tight natural gas sand formations in medium to deep horizons, in-cluding the Pettet, Travis Peak and Cotton Valley formations. In addition, we are a major leasehold owner in the Deep Bossier Sand play. We have established a signif- icant presence in a number of counties along the prolific Texas Gulf Coast, where we utilize 3-D seismic data to delineate structural and stratigraphic traps, primarily in the Frio, Yegua and Wilcox formations. This area has been de-emphasized as we move our drilling away from legacy vertical natural gas drilling to horizontal natural gas and oil drilling in unconventional plays.
Fayetteville Shale The Fayetteville is currently the third most productive shale play in the U.S. and one of the nation’s 10 largest natural gas fields of any type. Chesapeake owns
the industry’s second-largest acreage position in the core area of the Fayetteville Shale play in Arkansas, totaling nearly 460,000 net acres. We estimate we could drill up to 5,200 net wells on our Fayetteville acreage in the years ahead and plan to utilize an average of 10 operated rigs in 2010 to further develop our leasehold. During 2009, $600 million of Chesapeake’s drilling costs in the Fayetteville were paid for by its joint venture partner, BP America (NYSE:BP). During the fourth quar-ter 2009, BP paid Chesapeake the remaining balance of its drilling carry obligations and Chesapeake and BP each then began paying its proportionate working interest costs.
Barnett Shale The Barnett Shale in North Texas is currently the largest natural gas produc-ing field in the U.S. and is producing approximately half of all shale gas in the U.S. In the Barnett,
Chesapeake is the second-largest producer of natural gas, the most active driller and the largest lease-hold owner in the Core and Tier 1 sweet spots of Tarrant and Johnson counties. In January 2010, Chesapeake completed a $2.25 billion Barnett Shale joint venture transaction with Total S.A. (NYSE:TOT, FP:FP) (Total), whereby Total acquired a 25% interest in Chesapeake’s upstream Barnett Shale assets. Total paid Chesapeake approximately $800 million in cash at closing and will pay a further $1.45 bil-lion by funding 60% of Chesapeake’s share of drilling and completion expenditures until the $1.45 billion obligation has been funded, which Chesapeake expects to occur by year-end 2012. We anticipate using an average of 25 operated rigs in 2010 to further develop our leasehold. On our acreage, we estimate we could drill up to 2,400 net wells in the years to come.
Haynesville/Bossier Shales In early 2008, Chesapeake announced its discovery of the Haynesville Shale, a reservoir that likely will become one of the two
largest natural gas fields in the U.S. (along with the Marcellus) and one of the five largest in the world. The Haynesville Shale is now the nation’s second-largest producing shale play. The Bossier Shale lies above and overlaps much of our Hayneville prospective leasehold. We are the largest leasehold owner and most active driller of new wells in the Haynesville/Bossier shale play, which is located in northwestern Louisiana and East Texas. We estimate we could drill up to 8,750 net wells on our Haynesville/Bossier Shale acreage in the future and plan to utilize an average of 35 operated rigs in 2010 to further develop our 520,000 net leasehold acres of Haynesville/Boss-ier Shale. Chesapeake and its 20% joint venture partner, Plains Exploration & Production Company (NYSE:PXP), are producing from more than 200 net wells in the Haynesville play and continue to experience outstanding drill- ing results. PXP paid us approximately $400 million in drilling carries in 2009 and paid $1.1 billion in September 2009 as a result of an amendment to our joint venture agreement that eliminated PXP’s future carry obligations.
Marcellus Shale Chesapeake is the largest leasehold owner and most active driller in the Marcellus Shale play that spans from northern West Virginia across much of Pennsylvania into
southern New York. The Marcellus is located near the highest gas-consuming region of the U.S. and therefore receives the best natural gas prices in the U.S. We estimate we could drill up to 20,000 net wells on our Marcellus acreage in the future and plan to utilize an average of 31 operated rigs in 2010 to further develop our 1.6 million net acres of Marcellus leasehold. During 2009, approxi-mately $160 million of Chesapeake’s drilling costs in the Marcellus were paid for by its joint venture partner, Statoil (NYSE:STO, OSE:STL). During 2010 through 2012, 75% of Chesa-peake’s drilling costs (approximately $2.0 billion) in the Marcellus will be paid for by STO. We remain very active in acquiring additional leasehold in the Marcellus and expect that over time, it will become the largest natural gas field in the U.S. and the second largest in the world.
Eagle Ford Shale As part of a growing emphasis on increasing its oil and natural gas liquids production, Chesapeake has recently built one of the top five industry leasehold
positions in the Eagle Ford Shale play in South Texas. At year-end 2009, the company owned approxi- mately 80,000 net acres of Eagle Ford leasehold and now has 300,000 net acres. Our focus has been on the oil and wet gas prone portions of the play and we plan to utilize an average of four operated rigs in 2010 to further develop our growing Eagle Ford leasehold position.
Granite Wash Chesapeake is the largest leaseholder in the Granite Wash plays with 190,000 net acres. We have generated particularly strong drilling results from our Colony Gran-
ite Wash discovery in Washita and Custer counties, Oklahoma, and from the Texas Panhandle Granite Wash in Hemphill, Wheeler and Roberts counties, Texas, where rates of return in these plays are the highest in our company. We estimate we could drill up to 1,200 net wells on our Granite Wash acreage in the future and plan to utilize an average of 13 operated rigs in 2010 to further develop our Granite Wash leasehold.
Other Mid-Continent Chesapeake’s Other Mid-Continent area includes operations in Oklahoma, the Texas Panhandle, southwestern Kansas and western Arkansas. In addition
to various conventional plays in this area, our activities currently focus on the massive Sahara unconventional natural gas resource project in northwestern Oklahoma, where Chesapeake is by far the dominant operator with nearly 950,000 net leasehold acres. Sahara is a multi-county play with excellent low-risk, shallow natural gas production and an emerging horizontally drilled oil opportunity in the Mississippian formation. In the Anadarko Basin area of the Mid-Con-tinent, we are developing multiple horizontal unconventional oil plays, with a significant presence in the emerging Cleveland and Tonkawa tight sand oil plays, in which we are leveraging what we have learned from our horizontal Granite Wash discoveries.
Permian and Delaware Basins In the northern portion of the Permian Basin, Chesapeake has focused on discovering and developing various
shallow- to medium-depth horizontal oil plays and also operates a number of secondary recovery oil projects. We plan to utilize an average of six operated rigs in 2010 to further develop our 2.15 million net acres of leasehold in the Permian and Delaware Basins. Our new horizontal oil projects in this area, including the Avalon Shale and the Bone Spring Sand, have the potential to deliver significant upside as we move towards substantially increasing our oil production in the years ahead.
Appalachian Basin Often referred to as America’s most drilled but least explored area, Appalachia presents abundant growth opportunities through the introduction of lead-
ing-edge exploration, drilling and production technologies, in which Chesapeake is a recognized industry leader, into a basin largely ignored by the industry since the 1940s. Our leasehold position, excluding our Marcellus position, includes 1.2 million net acres in the Lower Huron Shale play and an additional 1.7 million net acres in other conventional and unconventional plays in the re-gion. We have developed multiple deep exploration prospects in Appalachia that we plan to test once natural gas prices recover to higher levels.
2009 Total Production: 0 bcfe, NM, NM
12/31/09 Proved Reserves: 0 bcfe, NM, NM
12/31/09 Net Leasehold Acres: 80,000, NM, 1% (300,000 as of 3/31/10)
2009 Total Production: 75 bcfe, -6%, 8%
12/31/09 Proved Reserves: 740 bcfe, -20%, 5%
12/31/09 Net Leasehold Acres: 2,150,000, -23%, 16%
2009 Total Production: 85 bcfe, +183%, 10%
12/31/09 Proved Reserves: 1,830 bcfe, +408%, 13%
12/31/09 Net Leasehold Acres: 520,000, +13%, 4%
2009 Total Production: 15 bcfe, +200%, 2%
12/31/09 Proved Reserves: 260 bcfe, +550%, 2%
12/31/09 Net Leasehold Acres: 1,620,000, +30%, 12%
2009 Total Production: 65 bcfe, -38%, 7%
12/31/09 Proved Reserves: 560 bcfe, -51%, 4%
12/31/09 Net Leasehold Acres: 610,000, -48%, 5%
2009 Total Production: 240 bcfe, +33%, 26%
12/31/09 Proved Reserves: 3,430 bcfe, +17%, 24%
12/31/09 Net Leasehold Acres: 290,000, -6%, 2%
Note: Figures may not add to company totals due to rounding in each area.
* Compared to last year** % of company totalNM Not meaningful
2009 Total Production: 70 bcfe, +40%*, 8%**
12/31/09 Proved Reserves: 1,090 bcfe, +419%*, 8%**
12/31/09 Net Leasehold Acres: 190,000, +217%*, 1%**
2009 Total Production: 235 bcfe, -23%, 26%
12/31/09 Proved Reserves: 3,010 bcfe, -29%, 21%
12/31/09 Net Leasehold Acres: 4,330,000, -9%, 33%
2009 Total Production: 90 bcfe, +64%, 10%
12/31/09 Proved Reserves: 2,170 bcfe, +229%, 15%
12/31/09 Net Leasehold Acres: 460,000, +10%, 4%
2009 Total Production: 30 bcfe, -14%, 3%
12/31/09 Proved Reserves: 1,160 bcfe, -24%, 8%
12/31/09 Net Leasehold Acres: 2,930,000, -7%, 22%
17 CHESAPEAKE ENERGY CORPORATION

OPERATING AREAS 19
Skilled crews keep Chesapeake rigs turning to the right every day. Pictured here are Michael Smith and Brandon Winsett, Roughnecks on Nomac rig 12 in the Northern Mid-Continent District.

Texas Panhandle and Colony Granite Washes,
the Cleveland, Tonkawa and Mississippian plays
in western Oklahoma and the Bone Spring and
Avalon shale plays in the Permian Basin. In each
of these 10 plays, we have drilled successful wells
and established very large leasehold positions.
We are now in the process of reallocating capital
expenditures from some of our natural gas plays
and increasing drilling activity in each of these
emerging liquids-rich plays.
These new plays could enable Chesapeake
to substantially increase its percentage of pro-
duction of liquids from 8% in 2009 to perhaps as
much as 20% over the next few years. If we are
able to achieve this objective, our percentage of
revenue from liquids production could approach
the 50% balance we are seeking.
What makes CHK a great place to work? MARTHA BURGER: There’s not a set formula
for creating a great place to work. Instead, it
evolves out of a corporate culture which dem-
onstrates commitment to making and keeping
its employees happy and motivated. At Chesa-
peake, we work hard to create an environment
where people feel valued, are challenged and
are part of something special.
Chesapeake provides a wide array of ben-
efits to employees. To name a few, we have:
an on-site health and dental clinic at our head-
quarters, a 72,000-square-foot best-in-class
fitness center, stock and bonuses awarded
twice a year, a generous 401(k) match of up to
15% of pay, adoption and fertility benefits and
a flexible work week schedule.
We believe the Chesapeake culture is
unique. It starts from the top and disseminates
throughout the organization. New employees
experience this very quickly during the com-
pany’s New Employee Orientation program,
which is a half-day session led by our CEO
Aubrey McClendon. Our employees are em-
powered to make decisions without getting
caught up in bureaucracy and are encouraged
to create innovation along the way.
We expect industry-leading performance
and results from employees, and that means
What is CHK doing to increase its percentage of oil and natural gas liquids production?STEVE DIXON: While the exact timing of
a peak in worldwide oil production remains a
great debate, the vast majority of investors and
industry professionals would agree that a peak
in worldwide natural gas production is much
further away. We believe this is reflected in the
current market price of oil relative to natural gas
— today, oil is priced more than 3.5 times higher
than natural gas on an energy equivalent basis.
Compared to natural gas, oil is harder to find
and even more challenging to move through
and produce from tight reservoir rocks. One of
the few strategic weaknesses of Chesapeake is
the relatively small percentage of our produc-
tion that comes from oil and natural gas liquids
— that, however, is on the verge of changing.
Over the past two years, Chesapeake’s
world class unconventional resource teams
have been quietly working to develop oil-
focused projects in the U.S. where our exper-
tise in identifying, analyzing and commercial-
izing unconventional natural gas reservoirs
could be transferred to tight rock oil reservoirs.
Innovative horizontal drilling and well comple-
tion techniques enable our geoscientists and
engineers to extract oil and natural gas liquids
from pore spaces in rocks that are more than 300
times smaller in diameter than a human hair.
Our efforts to crack the code on these dif-
ficult, but very lucrative, liquids-rich plays have
greatly benefited from our state-of-the-art
Reservoir Technology Center (RTC). This unique,
proprietary core laboratory has enabled us to
quickly analyze rock properties, model comple-
tion techniques and assess fluid movement
properties in multiple tight rock formations. It
has also helped Chesapeake minimize resources
and capital spent on leasing and drilling pro-
grams in many plays that are likely to prove
uneconomic.
The company has now established a strong
leasehold position and made substantial
progress in commercializing 10 liquids-rich plays,
including the Eagle Ford Shale in South Texas,
the Niobrara and Frontier plays in Wyoming, the
INVESTOR Q&A
that we must do our part by providing them
with the best tools, a motivating environment
and the space to grow and learn. Employees at
Chesapeake have access to first-class resources,
such as large dual-screen monitor work stations
in every office, the safest, most modern trucks,
rigs and equipment in the field. This commit-
ment inspires our employees to perform to the
best of their ability.
We pride ourselves on our efforts to be
a great neighbor, employer and corporate
citizen. Chesapeake’s campus is a landmark
in Oklahoma City with immaculate landscaped
grounds, three full-service restaurants, a res-
ervoir technology center and an athletic field
for team sports and individual exercise. The
company’s high work environment standards
extend beyond its corporate headquarters to
every wellsite, field and subsidiary office.
For the third consecutive year, Chesapeake
has been named to FORTUNE magazine’s 100
Best Companies to Work For® list. This year the
company jumped from #73 to #34. Two-thirds of
a company’s score is based on an extensive third-
party administered employee survey, which is
sent to a random sample of employees. The sur-
vey asks questions related to employee attitudes
about management’s credibility, job satisfaction
and corporate culture. We are thrilled again to
be awarded this prestigious honor because it re-
affirms that our employees believe Chesapeake
is one of the best places to work in America.
Why does CHK monetize assets and what additional opportunities are possible?MARC ROWLAND: Chesapeake has always
been a growth company and has amassed an
abundance of attractive investment oppor-
tunities that will keep us growing for years to
come. To fully benefit from these opportunities,
we make substantial capital investments each
year and work proactively to arrange the most
attractive funding alternatives for these invest-
ments. We reinvest our operating cash flow pri-
marily in our drilling program and in our mid-
stream, compression, drilling and oilfield service
subsidiaries. We also make investments for fu-
20 CHESAPEAKE ENERGY CORPORATION

ture growth largely in new leasehold in emerg-
ing plays and to further solidify our leasehold
position in our existing plays. As part of our pro-
gram to fund our leasehold investments while
reducing our financial leverage, we periodically
sell or monetize non-core assets. Our goal is to
secure proceeds from asset sales well in excess
of our reinvestment needs in order to provide
cash for debt reduction. We believe this finan-
cial strategy will enable Chesapeake to become
an investment-grade company.
In just the past two years, we have success-
fully monetized $10.7 billion of assets (in which
our cost basis was only $2.7 billion) by selling
minority joint venture interests in four of our
shale plays. In addition, we have sold producing
assets through volumetric production payment
transactions and also smaller packages of non-
core assets that did not compete well for capital
in our overall investment program. We plan to
pursue similar asset sales in the years ahead,
possibly including a joint venture in the Eagle
Ford Shale, additional volumetric production
payments and partial monetization of our mid-
stream and other non-E&P assets.
Why have world-class energy companies chosen to do joint ventures with CHK?DOUG JACOBSON: Chesapeake’s industry-
leading position in U.S. shale gas plays has at-
tracted the interest of numerous world class
energy companies, including three European in-
tegrated oil companies: London-based BP, Oslo-
based Statoil and Paris-based Total, which have
a combined market capitalization of $400 billion.
We believe these joint ventures are also great
investments for our joint venture partners, who
benefit from Chesapeake’s expertise in iden-
tifying and leasing prime shale gas assets, our
industry-leading drilling program that efficiently
converts leasehold to producing assets, our scale
and purchasing power with service providers
and our vertically integrated operations. Our
partners are also able to make substantial low-
risk investments over multi-year periods with
minimal commitment of their own personnel.
These benefits have enabled Chesapeake to
secure premium valuations for its assets though
joint venture transactions and generate attrac-
tive returns for Chesapeake’s shareholders.
Will shale gas plays permanently oversupply U.S. natural gas markets?JEFF MOBLEY: The rise of shale gas plays
in the U.S. has led to substantial growth in
natural gas supplies and much lower natural
gas prices for consumers. More importantly,
this new abundant and affordable resource
provides consumers with long-term supply
visibility and reliability to meet market de-
mands and dampen price volatility. However,
shale gas only accounts for approximately
15% of total U.S. natural gas production.
Currently, 85% of U.S. natural gas produc-
tion comes from non-shale plays, the vast
majority of which have substantially higher
finding and development costs than the major
U.S. shale gas plays. Without new drilling,
production from virtually all natural gas fields
declines approximately 20% or more per year
INVESTOR Q&A 21
through normal depletion. Chesapeake believes
this depletion, combined with reduced drilling
activity in high-cost, non-shale gas fields will
make way for further growth in production
from the low-cost shale plays to perhaps as
much as 30–40% of total U.S. natural gas
production over the next few years.
Will this lead to a permanent oversupply?
We don’t believe so. Rather, the market will be
balanced over time through reduced drilling
on marginal, high-cost production, probably in
the range of $6–7 per mcf. The abundance of
low-cost shale gas will likely lead to a lower
ultimate cost of gas supplies to consumers,
but we believe that natural gas prices will be
sustained at high enough levels to profitably
develop shale gas.
Chesapeake was early to recognize this
structural change in the natural gas industry
and strategically invested to capture the larg-
est leasehold position in the Big 6 shale plays.
This unique position in the industry should
make Chesapeake one of the greatest ben-
eficiaries of the shale gas revolution and the
more stable price of natural gas in the future.
STEVEN C. DIXON Executive Vice President – Operations and Geosciences and Chief Operating OfficerMARTHA A. BURGER Senior Vice President – Human and Corporate ResourcesMARCUS C. ROWLAND Executive Vice President and Chief Financial OfficerDOUGLAS J. JACOBSON Executive Vice President – Acquisitions and DivestituresJEFFREY L. MOBLEY Senior Vice President – Investor Relations and Research
DIXON BURGER ROWLAND MOBLEYJACOBSON

22 CHESAPEAKE ENERGY CORPORATION
We believe the true success of our company extends beyond our
reserve report, income statement and balance sheet to our employees,
neighbors, partner communities and the environment.
SOCIAL RESPONSIBILITY
H.E.L.P. INITIATIVE Roustabout Sean Cook trades his drilling tools for building tools as part of his team’s community service project in Arkansas. DISCOVERING TOMORROW’S
LEADERS Katie McCullin, Coordinator – Administration, with an honoree from East Texas. The program recognizes stu-dents for leadership and community service. CORPORATE CHALLENGE From track and field events to basketball tournaments, this business-to- business athletic challenge encour- ages health and team building. H.E.L.P. INITIATIVE Blue-shirted H.E.L.P. volunteers take a break after renovating a West Virginia playground.
H.E.L.P. INITIATIVE West Virginia
H.E.L.P. INITIATIVE Arkansas DISCOVERING TOMORROW’S LEADERS Texas
CORPORATE CHALLENGE Oklahoma

MENTORING Oklahoma
REBUILDING TOGETHER Oklahoma
MENTORING Reservoir Engineer Brian Bounds mentors a student at Horace Mann Elementary in Oklahoma City. REBUILDING TOGETHER Applications Developer/ Analyst Diane Cloud carries her share of the load in the annual event that repairs homes for the needy. H.E.L.P. INITIATIVE Nick Sentell, Field Technician, helps renovate the home of a 74-year-old woman in Sligo, Louisiana.
SOCIAL RESPONSIBILITY 23
H.E.L.P. INITIATIVE Louisiana

24 CHESAPEAKE ENERGY CORPORATION
FUELING THE ECONOMY
While most of the country has been experienc-
ing a slow economy, the natural gas industry
has remained steady and even grown in some
regions. As the country’s most active driller of
new wells, Chesapeake’s presence in an area
increases business activity and creates well-
paying jobs that improve people’s lives and
stimulate local economies.
In addition to our activities’ impact on
local economies, the company’s tax con-
tributions are substantial: in 2009, Chesa-
peake paid more than $730 million in total
state and local taxes, including ad valorem,
severance, sales and use, employee with-
holding and unemployment, corporate in-
come and franchise taxes. These taxes are
used for building and maintaining schools,
recreational facilities, parks and roads — and at
a time when state and local governments are
feeling the pinch of recession. We are proud to
support America’s economy with our growth
while we also help to reduce the country’s de-
pendence on expensive foreign oil.
In addition to stimulating the economy,
Chesapeake makes strategic donations to
help improve lives and local economies in cit-
ies where we operate. In 2009 the company
announced a donation of $5 million to build a
four-story Finish Line Tower in the Boathouse
District of downtown Oklahoma City. We led the
way in developing this emerging area of the
city with the completion of the first boathouse
on the Oklahoma River in 2005. Today, there
are several more boathouses under construc-
tion, and upon their completion, five state-
of-the-art boathouses will confirm Oklahoma
City’s international recognition as the nation’s
premier canoeing, rowing and kayaking
venue. Recently, USA Canoe/Kayak moved its
headquarters to Oklahoma City. With the Okla-
As Chesapeake continues Fueling America’s Future with clean, affordable, abundant American natural gas,
we also place a priority on fueling the communities where we live, work and play. In 2009 we gave more
than $21 million to charitable organizations and projects across our operating areas, primarily focusing
on community development, education, health and medical and social services.
Community Relations
homa River serving as an official U.S. Olympic
Training site, Oklahoma City is now a strong
contender for the upcoming 2012 Olympic
canoe/kayak trials.
FUELING THE NEXT GENERATION
Preparing tomorrow’s leaders today is impera-
tive to building and sustaining a competitive
work force. In 2009, Chesapeake supported
universities, schools, academic chairs, scholar-
ships and other educational programs with
contributions of $4.5 million. The backbone
of a strong country in today’s competitive
economy is education, and by investing in it
today, we are fueling a brighter future for the
next generation.
More than $1.3 million of the company’s
educational contributions helped fund higher
education tuition for nearly 400 students.
Chesapeake scholarships help recruit the best
and brightest students and provide educational
opportunities in communities where we operate.
In Northwest Louisiana, for example, we
provided scholarships to 25 students at five
universities and colleges based on need and
community leadership. To increase diversity
in the energy industry, Chesapeake partnered
with the Fort Valley State University’s (Fort Val-
ley, Georgia) Cooperative Developmental Energy
Program (CDEP) to award scholarships to minor-
ity students pursuing geoscience and petroleum
engineering degrees. Last year, over 50 students
benefited from our CDEP contributions.
In Texas, Chesapeake established a new
scholarship program, which will benefit qualified
Johnson County high school graduates through
five annual gifts totaling $125,000, available to
qualifying seniors through 2013. With another
foundation matching Chesapeake’s contribu-
tions, a total of $250,000 will be available to
support Johnson County scholars.
CHESAPEAKE’S $21 MILLION OF CHARITABLE GIVING IN 2009
59%
21%
12%
8%
Community Development
Education
Health and Medical
Social Services
Painting pumpkins at Fall Fest on the Chesapeake campus in Oklahoma City are Associate Help Desk Specialist Branden Killingsworth and his daughter Bryelle. The event, which was open to the community, raised funds for United Way with carnival games and a hay maze.

SOCIAL RESPONSIBILITY 25
We also award scholarships to students
pursuing degrees in energy-related fields
such as geology, engineering, land and law.
Through the Peak Program in Oklahoma, ju-
nior- and senior-level scholarship recipients
are paired with Chesapeake employee men-
tors who help develop students’ knowledge
and provide career advice. There are currently
30 mentors and 39 scholarship recipients par-
ticipating in the Peak Program. These num-
bers are expected to increase in the upcoming
years as the program is extended to universi-
ties outside Oklahoma.
University science departments are cen-
ters for research to find the best approaches
for meeting society’s energy needs while re-
ducing environmental costs. To further such
efforts, the company funded $1.5 million to
endow two Chesapeake Energy Chairs in the
field of Climate Studies in the School of Meteo-
rology of the University of Oklahoma College
of Atmospheric and Geographic Sciences. For
the past five years, Chesapeake’s meteorolog-
ical team in Chicago has provided the company
with long-range forecasting that has been very
helpful to the success of its natural gas hedg-
ing program.
FUELING OUR COMMUNITIES
Volunteerism has always been at the core of
the company’s culture. In 2009 as part of Ches-
apeake’s 20th anniversary celebration, a com-
pany-wide project was launched through an
employee volunteer program — the H.E.L.P.
Initiative (Helping Energize Local Progress).
Many employees volunteer year-round,
but this past summer employees were chal-
lenged to complete 20,000 hours of community
service in five weeks. Chesapeake also permit-
ted employees to use four hours of company
time to complete this task. From renovating
playgrounds in West Virginia to building a Habi-
tat for Humanity house in Texas, employees
responded in full force. In just five weeks, Ches-
apeake employees exceeded the company’s
goal by 30%, donating 26,134 hours of service
to 575 organizations in more than 70 communi-
ties across the country. The hours they worked
would be comparable to a full-time employee
working 40 hours a week for 13 years! Employ-
ees and communities responded with such en-
thusiasm that the volunteer push will become
an annual event.
We listen to our communities to ensure
we are providing services they really need.
In addition to the more than $21 million in
charitable donations given last year, we also
made numerous in-kind donations of
computers, reconditioned Chesapeake
fleet vehicles and subsidized office space.
With the slow economy affecting mon-
etary donations, many nonprofit groups
found themselves struggling to meet
basic administrative costs with some
on the verge of closing. To alleviate this
burden, we opened the Chesapeake
Community Plaza in Oklahoma City, pro-
viding more than 67,000 square feet of
office space at low monthly rates. To date,
10 nonprofit groups ranging from the Okla-
homa Visual Arts Coalition to Citizens Caring
for Children have relocated offices to the space
and are now more able to focus on their mis-
sion rather than worry about how to pay rent.
Chesapeake partners with other compa-
nies and groups in hundreds of communities
to meet basic needs. One example is in North
Texas where we partnered with eye care com-
panies to provide vision screenings, exams
and glasses to children in Tarrant County public
schools. So far 2,700 students have been test-
ed with many receiving prescription glasses at
no cost.
Regardless of the size of our contributions,
Chesapeake and its employees are honored to
work in local communities and partner with
nonprofit groups and organizations to make
a difference — fueling development and im-
proving the communities that our employees,
royalty owners and contractors all call home.
(Upper right) Production Assistant Julie Miller carries food as part of her team’s volunteer work with Operation Blessing in Cleburne, Texas. (Lower left) Monica Stroman, Compliance Analyst, mentors students at Horace Mann Elementary in Oklahoma City. (Far right) Andrew Sprouse, Senior Applications Developer/Analyst, is one of more than 200 Chesa-peake volunteers who helped out at last year’s Rebuilding Together workday in Oklahoma City.
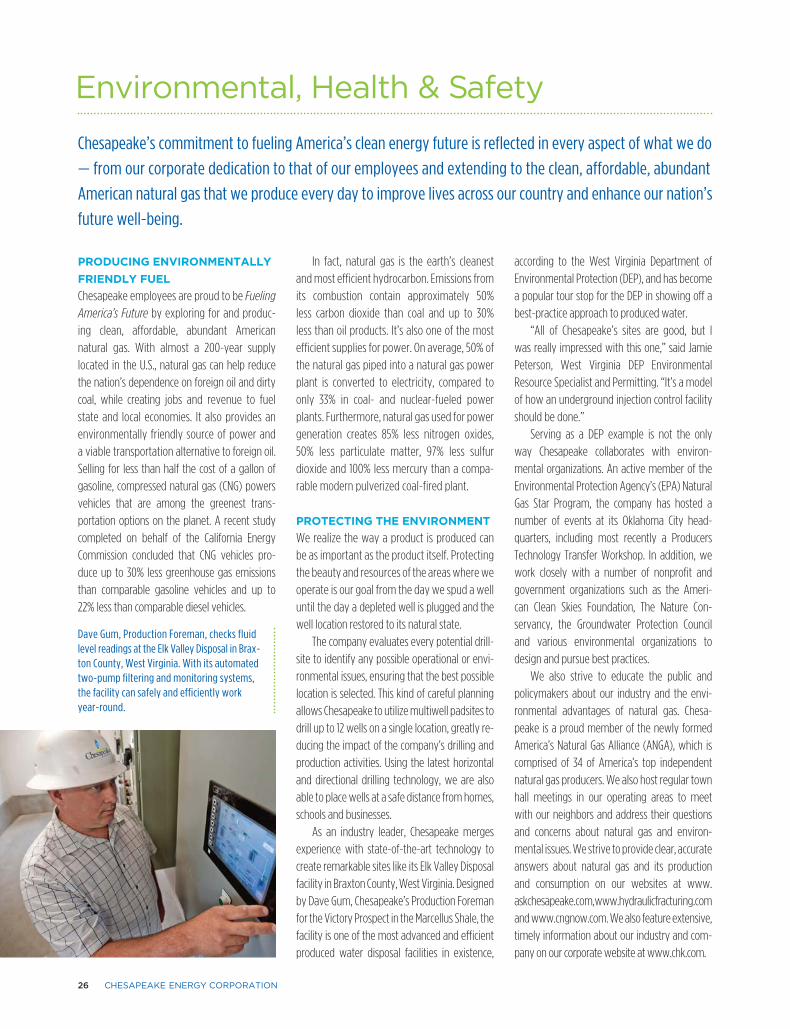
26 CHESAPEAKE ENERGY CORPORATION
according to the West Virginia Department of
Environmental Protection (DEP), and has become
a popular tour stop for the DEP in showing off a
best-practice approach to produced water.
“All of Chesapeake’s sites are good, but I
was really impressed with this one,” said Jamie
Peterson, West Virginia DEP Environmental
Resource Specialist and Permitting. “It’s a model
of how an underground injection control facility
should be done.”
Serving as a DEP example is not the only
way Chesapeake collaborates with environ-
mental organizations. An active member of the
Environmental Protection Agency’s (EPA) Natural
Gas Star Program, the company has hosted a
number of events at its Oklahoma City head-
quarters, including most recently a Producers
Technology Transfer Workshop. In addition, we
work closely with a number of nonprofit and
government organizations such as the Ameri-
can Clean Skies Foundation, The Nature Con-
servancy, the Groundwater Protection Council
and various environmental organizations to
design and pursue best practices.
We also strive to educate the public and
policymakers about our industry and the envi-
ronmental advantages of natural gas. Chesa-
peake is a proud member of the newly formed
America’s Natural Gas Alliance (ANGA), which is
comprised of 34 of America’s top independent
natural gas producers. We also host regular town
hall meetings in our operating areas to meet
with our neighbors and address their questions
and concerns about natural gas and environ-
mental issues. We strive to provide clear, accurate
answers about natural gas and its production
and consumption on our websites at www.
askchesapeake.com, www.hydraulicfracturing.com
and www.cngnow.com. We also feature extensive,
timely information about our industry and com-
pany on our corporate website at www.chk.com.
PRODUCING ENVIRONMENTALLY
FRIENDLY FUEL
Chesapeake employees are proud to be Fueling America’s Future by exploring for and produc-
ing clean, affordable, abundant American
natural gas. With almost a 200-year supply
located in the U.S., natural gas can help reduce
the nation’s dependence on foreign oil and dirty
coal, while creating jobs and revenue to fuel
state and local economies. It also provides an
environmentally friendly source of power and
a viable transportation alternative to foreign oil.
Selling for less than half the cost of a gallon of
gasoline, compressed natural gas (CNG) powers
vehicles that are among the greenest trans-
portation options on the planet. A recent study
completed on behalf of the California Energy
Commission concluded that CNG vehicles pro-
duce up to 30% less greenhouse gas emissions
than comparable gasoline vehicles and up to
22% less than comparable diesel vehicles.
Environmental, Health & Safety
In fact, natural gas is the earth’s cleanest
and most efficient hydrocarbon. Emissions from
its combustion contain approximately 50%
less carbon dioxide than coal and up to 30%
less than oil products. It’s also one of the most
efficient supplies for power. On average, 50% of
the natural gas piped into a natural gas power
plant is converted to electricity, compared to
only 33% in coal- and nuclear-fueled power
plants. Furthermore, natural gas used for power
generation creates 85% less nitrogen oxides,
50% less particulate matter, 97% less sulfur
dioxide and 100% less mercury than a compa-
rable modern pulverized coal-fired plant.
PROTECTING THE ENVIRONMENT
We realize the way a product is produced can
be as important as the product itself. Protecting
the beauty and resources of the areas where we
operate is our goal from the day we spud a well
until the day a depleted well is plugged and the
well location restored to its natural state.
The company evaluates every potential drill-
site to identify any possible operational or envi-
ronmental issues, ensuring that the best possible
location is selected. This kind of careful planning
allows Chesapeake to utilize multiwell padsites to
drill up to 12 wells on a single location, greatly re-
ducing the impact of the company’s drilling and
production activities. Using the latest horizontal
and directional drilling technology, we are also
able to place wells at a safe distance from homes,
schools and businesses.
As an industry leader, Chesapeake merges
experience with state-of-the-art technology to
create remarkable sites like its Elk Valley Disposal
facility in Braxton County, West Virginia. Designed
by Dave Gum, Chesapeake’s Production Foreman
for the Victory Prospect in the Marcellus Shale, the
facility is one of the most advanced and efficient
produced water disposal facilities in existence,
Dave Gum, Production Foreman, checks fluid level readings at the Elk Valley Disposal in Brax-ton County, West Virginia. With its automated two-pump filtering and monitoring systems, the facility can safely and efficiently work year-round.
Chesapeake’s commitment to fueling America’s clean energy future is reflected in every aspect of what we do
— from our corporate dedication to that of our employees and extending to the clean, affordable, abundant
American natural gas that we produce every day to improve lives across our country and enhance our nation’s
future well-being.
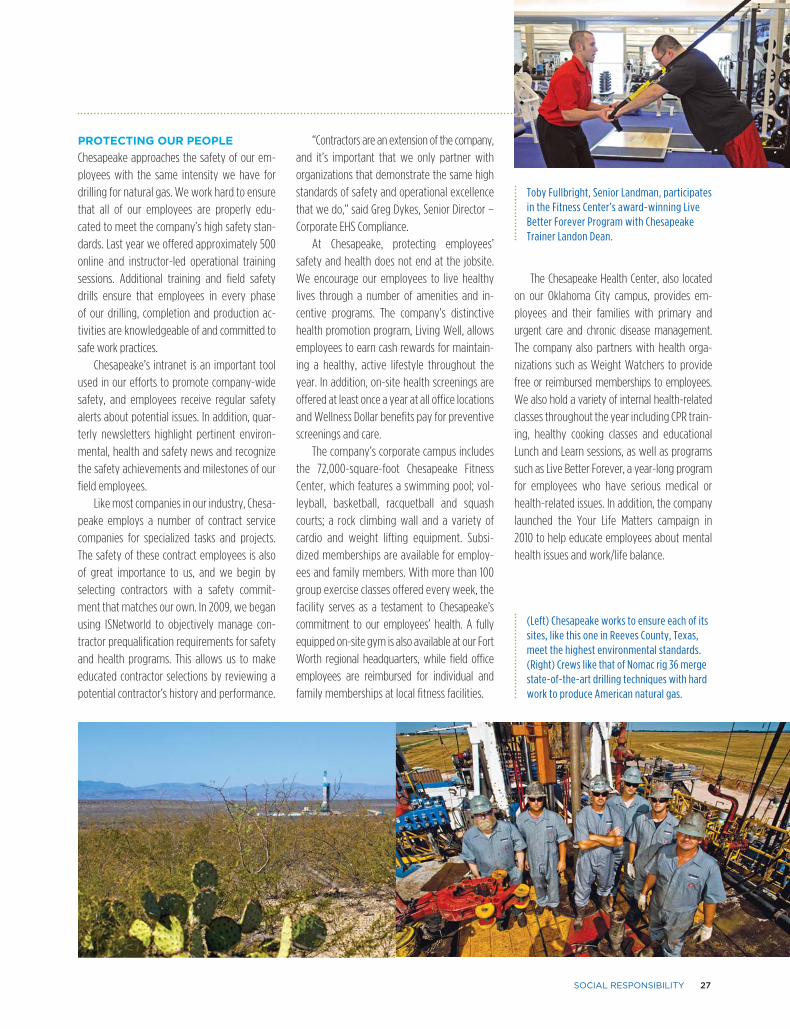
SOCIAL RESPONSIBILITY 27
PROTECTING OUR PEOPLE
Chesapeake approaches the safety of our em-
ployees with the same intensity we have for
drilling for natural gas. We work hard to ensure
that all of our employees are properly edu-
cated to meet the company’s high safety stan-
dards. Last year we offered approximately 500
online and instructor-led operational training
sessions. Additional training and field safety
drills ensure that employees in every phase
of our drilling, completion and production ac-
tivities are knowledgeable of and committed to
safe work practices.
Chesapeake’s intranet is an important tool
used in our efforts to promote company-wide
safety, and employees receive regular safety
alerts about potential issues. In addition, quar-
terly newsletters highlight pertinent environ-
mental, health and safety news and recognize
the safety achievements and milestones of our
field employees.
Like most companies in our industry, Chesa-
peake employs a number of contract service
companies for specialized tasks and projects.
The safety of these contract employees is also
of great importance to us, and we begin by
selecting contractors with a safety commit-
ment that matches our own. In 2009, we began
using ISNetworld to objectively manage con-
tractor prequalification requirements for safety
and health programs. This allows us to make
educated contractor selections by reviewing a
potential contractor’s history and performance.
“Contractors are an extension of the company,
and it’s important that we only partner with
organizations that demonstrate the same high
standards of safety and operational excellence
that we do,” said Greg Dykes, Senior Director –
Corporate EHS Compliance.
At Chesapeake, protecting employees’
safety and health does not end at the jobsite.
We encourage our employees to live healthy
lives through a number of amenities and in-
centive programs. The company’s distinctive
health promotion program, Living Well, allows
employees to earn cash rewards for maintain-
ing a healthy, active lifestyle throughout the
year. In addition, on-site health screenings are
offered at least once a year at all office locations
and Wellness Dollar benefits pay for preventive
screenings and care.
The company’s corporate campus includes
the 72,000-square-foot Chesapeake Fitness
Center, which features a swimming pool; vol-
leyball, basketball, racquetball and squash
courts; a rock climbing wall and a variety of
cardio and weight lifting equipment. Subsi-
dized memberships are available for employ-
ees and family members. With more than 100
group exercise classes offered every week, the
facility serves as a testament to Chesapeake’s
commitment to our employees’ health. A fully
equipped on-site gym is also available at our Fort
Worth regional headquarters, while field office
employees are reimbursed for individual and
family memberships at local fitness facilities.
The Chesapeake Health Center, also located
on our Oklahoma City campus, provides em-
ployees and their families with primary and
urgent care and chronic disease management.
The company also partners with health orga-
nizations such as Weight Watchers to provide
free or reimbursed memberships to employees.
We also hold a variety of internal health-related
classes throughout the year including CPR train-
ing, healthy cooking classes and educational
Lunch and Learn sessions, as well as programs
such as Live Better Forever, a year-long program
for employees who have serious medical or
health-related issues. In addition, the company
launched the Your Life Matters campaign in
2010 to help educate employees about mental
health issues and work/life balance.
(Left) Chesapeake works to ensure each of its sites, like this one in Reeves County, Texas, meet the highest environmental standards. (Right) Crews like that of Nomac rig 36 merge state-of-the-art drilling techniques with hard work to produce American natural gas.
Toby Fullbright, Senior Landman, participates in the Fitness Center’s award-winning Live Better Forever Program with Chesapeake Trainer Landon Dean.

28 CHESAPEAKE ENERGY CORPORATION
( 1 ) Audit Committee(2) Compensation Committee(3) Nominating and Corporate Governance Committee
BOARD OF DIRECTORS
RICHARD K.
DAVIDSON ( 1)
Former CEO and Chairman Union Pacific Corporation Bonita Springs, Florida
AUBREY K.
McCLENDON
Chairman of the Board and Chief Executive Officer Chesapeake Energy Corporation Oklahoma City, Oklahoma
MERRILL A.
“PETE” MILLER, JR. ( 1)
Chairman, President and CEO National Oilwell Varco, Inc. Houston, Texas
DON L. NICKLES (3)
Former U.S. Senator, Oklahoma Founder and President The Nickles Group Washington, D.C.
V. BURNS HARGIS ( 1)
President Oklahoma State University Stillwater, Oklahoma
STANDING (LEFT TO RIGHT)
GovernanceOur Board of Directors is responsible to our shareholders for the oversight of the company and for the implementation and operation of
an effective and sound corporate governance environment. We believe that effective corporate governance contributes to long-term
corporate performance. An effective governance structure should reinforce a culture of corporate integrity, foster the company’s pursuit
of long-term strategic goals of growth and profit and ensure quality and continuity of corporate leadership. Our directors will continue to be
diligent in their efforts to preserve the public trust while fostering the long-term success of the company.
FREDERICK B.
WHITTEMORE (2,3)
Advisory Director Morgan Stanley New York, New York
CHARLES T.
MAXWELL (2)
Senior Energy AnalystWeeden & Co.Greenwich, Connecticut
FRANK KEATING (2,3)
Former Governor, Oklahoma President and CEO American Council of Life Insurers Washington, D.C.
SEATED (LEFT TO RIGHT)

BOARD OF DIRECTORS AND OFFICERS 29
OFFICERS
JEFFREY A. FISHER
Senior Vice President – Production
MICHAEL A. JOHNSON
Senior Vice President – Accounting, Controller and Chief Accounting Officer
J. MIKE STICE
Senior Vice President – Natural Gas Projects and Chief Executive Officer Chesapeake Midstream Partners, L.P.
MARCUS C. ROWLAND
Executive Vice President and Chief Financial Officer
JENNIFER M. GRIGSBY
Senior Vice President,Treasurer and Corporate Secretary
CATHY L. TOMPKINS
Senior Vice President – Information Technologyand Chief Information Officer
STEPHEN W. MILLER
Senior Vice President – Drilling
STEVEN C. DIXON
Executive Vice President – Operations and Geosciences and Chief Operating Officer
HENRY J. HOOD
Senior Vice President – Land and Legal and General Counsel
JEFFREY L. MOBLEY
Senior Vice President – Investor Relations and Research
DOUGLAS J. JACOBSON
Executive Vice President – Acquisitions and Divestitures
MARTHA A. BURGER
Senior Vice President – Human and Corporate Resources
JAMES C. JOHNSON
Senior Vice President – Energy Marketing
THOMAS S. PRICE, JR.
Senior Vice President – Corporate Development and Government Relations
AUBREY K. McCLENDON
Chairman of the Board and Chief Executive Officer
J. MARK LESTER
Executive Vice President – Exploration (retired January 2010)
30 CHESAPEAKE ENERGY CORPORATION
1989 (4)Mark LesterKinney LouthanAubrey McClendonPatsy Watters
1990 (3)Kevin DeckerDavid HigginsCindi Williams
1991 (5)Steve DixonMarilyn PollardPatti SchlegelJohn StriplinJulie Washam
1992 (2)Tom PriceMelanie Weaver
1993 (6)Ralph BallDavid DeSalvoMike JohnsonRandy PierceMarc RowlandDave Wittman
1994 (15)Barbara BaleMartha BurgerMichael ColesTraci CookRon GoffGreg KnightDan LeDonneSteve W. MillerTommy MorphewPat PopeDanny RutledgeStephanie SheddenRonnie WardShelly WhiteGerald Zgabay
1995 (29)Richey AlbrightPaula AsherEric AshmoreRandy BorlaugShelli ButlerMelissa ChambersDale CookTed DavisMandy DuaneSteve GaskinsJennifer GrigsbyGayle HarrisHenry HoodLorrie JacobsMike JohnstonBarry LanghamCindy LeBlancLeland Murray
Fred PortilloJohn QuallsPat RollaHank ScheelCharles W. ScholzCharles SmithStan StinnettBrenda StrembleGreg WeinschenkBrian WinterJim Wright
1996 (29)Heather L. AndersonJamie CarterJasen DavisGeorge DennyTim DennyGary DunlapLaurie EckJan FairBarbara FraileyLinda GardnerCharlene GloverRandy GobenJim GomezMelissa GruenewaldDoug JohnsonJim JohnsonTaylor KempMike LebsackSteve LepretreLarry LunardiJohn MarksSandi MichalickaLiz MuskratAngela PortsTommy PutzBryan SagebielKurt SchrantzPhyllis TrammellAllan Waldroup
1997 (32)Linda AllenKarla AllfordSara CaldwellSteve CodyKristine ConwayRandy CornelsenMichelle CullenBruce DixonGreg DrwenskiMark EvansJoy FranklinRob GilkesShane HamiltonMichael HornEric HughesDavid B. JonesCarolyn LindmarkMike LudlowSarah LumenLauren MatlockSam McCaskillBob Neely
Bob PopeErick PorterJolene SchurApril SmithWilma SmithFrank UnsickerIvajean WallaceCraig WhiteDori WilliamsCurtis Williford
1998 (65)Stephen AdamsCrae BarrFrancy BeesleyJoel BennettLeonard Berry Jr.Susan BradfordMark BrownRandy BrownLori BuddeTerry CaldwellBob CampbellTed CampbellJesse CanaanSherri ChildersTana ClarkJennifer CopelandDavid CraycraftIris DrakeMac DrakeGary EggerSteve EmickDan EstesDennis FrickRandy GasawayStacy GilbertJim GowensKelsey HammitTresa HammondJeff L. HarrisDebbie HulettJulie IngramTammy KellnRose KimSteve KingMike LancasterChris LeeCarrie Lewis-CrawfordCraig MadsenJohn MarshallKim MasseyAllen MayDennis McGeeAllen MillerBill MillerCarey MilliganDavid MobleyWesley MyersBud Neff Jr.Kathy NowlinDon PannellMichael ParkMandy PenaMatt RockersKelly Ruminer
Dan ScottGreg SmallBill SnyderGeorge SotoDan SparksLinda SteenBecky ThomasJennifer Van MeirRusty WalkerLynn WhippleMandy Whipple
1999 (23)Jonathan BallMel BarkerSue BlackDory DouglasMark EdgeJenny FergusonJeanie FullerDan GarveySusan GreenYamei HouDoug JacobsonJim KelleyLynn LooperDea MengersMichael J. MillerTammy NguyenLaCosta RawlsLarry ShipleyMichelle SmithConnie TurnerCourtney TysonTonya VallerandTobin Yocham
2000 (43)Shellie AshworthJohnnie BartlettDoug BellisJan BentonBobby BoltonJeff BrooksBecky CasselRachel ClappDebbie CurtisJennifer DeesTammy FieldsPam FordRobin GonzalezAnnie HamiltonMary HartmanTwila HinesEric HoffmanRonnie HowellJim KuhlmanDon LeeDebbie LloydJay May Jr.Andrea McCallCindy McClintockCollin McElrathCourtney MoadGeorgia MollerChantelle Porter
Edward PuffinbargerMike SawatzkyCindy SchwiegerBrent ScruggsVance ShiresStuart SkeltonDavid W. SmithCatherine StairsJerry TownleyNick WaversBrenda WheelerBob WhitmanDavid WhittenBrent WilliamsBob Woodside
2001 (103)Jerry AebiKaren Albornoz CranfordJeremy AllisonDavid AndersonTerry AshtonBetsy BallGloria BatesMichelle BenderBruce BoeckmanBoyce BoelenSharon BradfordVon BrinkleyDeanne BrooksMarty ByrdCarlos CaraveoBiff CarterJohn CarterKeith CaseMarika ChambersKristi ClemmensJohn CookTim CookJuanita CooperJim CorsoroLeigh Ann CrainBrian CunninghamGarry CurryShawn DowneyJeff EagerRichard EasterlyTommy EdlerAmanda ElamBrian ExlineAlex Gallardo Jr.Matt GambillRoy GentrySuzie GoolsbyRandy GraysonRichard D. GreenKajsa GreenhowardJackie GrossJohnny HarrisJeremiah JacksonKrista JacobsonJustin JohnsonKeith JohnsonRob JonesJohn KapchinskeGinni Kennedy
Edward KillenJulie KnoxDaniel KoehnKennetta LeeJeff LenockerJulia LillardDarwin LindenmuthTravis LongPeter ManterRita MarpleJim MazzaJim McHenryDebbie McKeeDon MesserlyJ. C. MorrisMelinda NeherLee NelsonKevin NewberryTim NewvilleDeborah O’NealRicky PettyDianne PickardCatherine RatliffLynn RegoubyGina RomanoJohn RomineLarry RossMike RossiterDon RozzellLarry SettleDee Smith Jr.Patrick SmithChris SorrellsDennis SplanJason StamperCindy StevensBill StillwellGary StonerHoward StoutLisa StrackbeinTim N. TaylorJason ThaxtonAlvin ThomasRudy ThomasJames ThrashLarry WattersPaige WhiteheadConnie WilliamsFreda WilliamsDawn WilsonBrandon WinsettMarvin Winter Jr.Larry WoodruffAmanda Young
2002 (142)Paula AblaNicole AdamsJenny AdkinsRoger AldrichJimmy AlexanderBrian BabbCharlie BagleyBob BakerLynard BarreraCindy Barrios
Shane BarronDennis BassJames BeaversRandy BergenLeonard BlackwillPaul BowyerTroy BradfordRobert BradleyDon BredyJim BrockCindy BrownKathy BrownLynn BroylesJason BuddeGreg BurchettAaron BushErnest ByrdChris CarterPaul ChildersJackie Cooper Jr.Lori CrabtreeCary Crusinbery Jr.James DavisKurt DavisCathy DeGiustiTrent DelanoCheryl DelzerLarry DillSherry DixonChristopher DudgeonStephanie DuganEldon EaganEric EdwardsMichael FalenMark FalkShawn FieldsTom FlesherViel FloresJustin FoustAdam GaskillTamara GathersFred GipsonLisa GloverCornelio GomezDavid GoukerSteve HallMelvin HarperJohn HenryKathy HenryJohn R. HornsbyJohn HurstTodd IceRhonda IngleBud JacksonJay JarvisDanny JechJim JinkinsGary JohnsonWilliam D. JohnsonChris JonesJoe JonesMike KeeDax KimbleNancy KnoxGreg KochenowerJeremie Koehn
Chesapeake is pleased to list all 8,152 of its talented, hard-working employees who contributed to
our company’s success in 2009. Because we think they are the best team in the industry, we want
Chesapeake to be the best employer in the industry, with a corporate culture that rewards their
efforts and inspires their future. In 2009, Chesapeake was honored to be included as #34 in the
FORTUNE 100 Best Companies to Work For® list, our third consecutive year for this prestigious award.
EMPLOYEES

EMPLOYEES 31
Spencer LandSteve LarmanRicky LasterCasidy LeeKen LeedyStephen LobaughBilly LongShawn MarshRichard MartinezAndrew McCalmontMitch McNeillRichard MieserSteve MillsSidney MitchellClaudia MolinaNathan MorrisonTodd MurphyCindy MurrayJeff NewbyRick NunleyJohn OrtizDavid ParkerRobert PennelRyan PhillipsSharon PoolBob PortmanEric PowellMike L. ReddickRonald ReidleMartin Robertson IIA.D. RobisonRandy RodrigueVern Roe Jr.Danny SchmidtKary SchnebergerStacy SettlesDewayne ShawMichael SherwoodWill ShislerJim ShoptawGreg SkilesChad SmithJesse SmithRobin SmithDuff SnowMaria StrainJosh SwiftOscar ThiemsChris TownsendMichelle TownsendRyan TurnerRodney VaethFred VasquezRuben Vega Jr.Al WarnerJames WarnerMichael WeeseHazel WelchLeslie WertzEddie WhiteheadJohn WilkenGary WillefordMark WillsonJerry WilsonRobert WilsonRoy Wilson
2003 (226)Ronald AaronPat AblaLisa BagwellCorky BakerStaci Barentine-BogleCharlie BatemanMike BechtelJohn BiggsBruce BoydTammi BradfordGeorge BradleyKim BradySerena BranchDavid BrannenJerry BrayAron BridgesRonald BromlowJennifer BroomfieldBryan BrownJeff BrownHeather Brunker
Kenneth BrunsonJohn BullardBayley BurnsCyndy BurrisBuster Burton Jr.Ara BushLori ByrdKeith CameronBob O. CampbellPat CarsonGary CarterDennis CernyDavid ChisumMike ChurchwellTony ClarkMichael ClintonMatthew ColbertTom CorleyBrian Cox Jr.Bryan CoxMichael CramerAnn CroanJarod CunninghamWendy CunninghamJohn DavisJon DavisRyan DeanScott DicksonDennis DixDerek DixonSteve DonleyShanon DunlapJody DunnGary DurkeeJack ElliottJimmy EmberyCharlene ErnestKeith ErvinJim FansherUrsula FausCarol FehrenbacherMark FerbracheJeff FisherMitch FlorescaTommy FoustT. R. FoxJustin FroehlichEdd GabbartFred GagliardiTim GalleglyTravis GeorgeB.K. GibsonKenneth GideonDana GinanniJohn GistRandy GladdenDavid GodseyJeff GortonJim GovenlockLarry GreyPablo Hadzeriga Jr.Paul HagemeierBuck HallMichael HallRonnie HaneyJessie HardinGraham HarrisRoger HarrodRich HearstPancho HendricksTara HenryGlen HensleySue Ann HenthornCatherine HesterLanny HolmanMisty HoltgrefePaul HouseBrian L. HowardRoy HoweDonna HuffRosie HuttonAngela IngargiolaJames InmanJohn JacksonDave JohnsTommy JohnsonJoseph KennedyDavid KerriganMelissa Ketchum
Joe KidwellNeil KincadeDanny KingMelvin KingcadeMatthew KlaassenJennifer KnottPete Lane Jr.Jeff LasaterAl LavenueKathy LeasureDustin LenhartNick LittleDustin LockeGeorge LomanClint LordJason LowreyJack LowrySergio LujanShane Lukasek Jr.Sharon LuttrellLewis LynchMark MabeAli MallettJeremy MarpleShelly MartinAlfredo MartinezAlex McCalmontKenneth McGuire Sr.Menecca McHoneCarol McKenzieRyan MeachamRandy Mefferd IIEddie MerkelR.T. MillerBrent MillsJay MonroeAlfredo MontielLucretia MorrisHuey MortonLarry MossmanPaul MundingMaureen NelsonJason NicholsTal OdenTony OlivierRena OwenAshley PaineTobin ParisNancy ParkerGary ParksGale ParmanKellie PattersonDonnie Patton Sr.Andrea PatzkowskyMichael PhillipsRonnie PittsBrent PletcherJerry PrestonJennifer PryseRegan RaffKen RechlinWes ReddingJim ReischMindi RichardsonMatt RobertsJody RobertsonAnita RobinsonKristen RogstadDoug RomeroMark RussoBeverly SampsonLarry SavageBob SchmickerDave SchoonmakerKim ScottKily SeamanJanet SellingKeith ShahanClay ShamblinKelly ShipleyAaron SiemersStacy SmithBlake StacyJoyce StanmireScott StearmanRick StongMarla StrackLuke StricklandMichelle Surratt
Blake SurrellDanielle SydnorJaime TatroAmber ThomasChevy ThomasonJerry ToddScottie TrejoSeth UnruhJulio VasquezLarry VentrisJohnny VothKeith WagnonMarty WallJosh WanglerBrad WatkinsNoel WayDan WelchDavid WernliDe Ann WilliamsNicole WilliamsDavid B. WillisBill Wince Jr.Martin WiseJames Worsham Jr.Todd WrightLinn YouseyLori Zang
2004 (353)Greg AdamsJustin AdamsCarol AdlerGary AllenStephanie AllsburyTim AndrewsChad AntonRonald BabersKristi BaconJeffrey BaileyBobby BakerJeff BallardEric BarbeePaul BareselTina BarnhillDamon BeasleyGeoff BeaulieuTerrye BellCurtis BlakeLorraine BlanchardBradley BlevinsLee BlevinsAaron BloedowCourtney BloodDeborah BondBrian BookerTad BooneKristin BottomThomas BoucherAngela BoulwareDavid BowesDarrel BransonRudy Bravo Jr.Avis BrayJeff BrayDustin BrinkleyJeff BrinleeTerri BristowDarren BrittainAnita BrodrickDonald BromlowBrad BrownDan BrownDiana BrownHarlan BrownJason BrownPamela S. BrownRonnie BrownTravis BrownAaron BuchananCraig BuckKingsley BurkeJackie BurksJosh BurrisTim ButkusAmber ButlerJuan CalbilloMike CampbellChristopher CantrellRandy Cantwell
Larry CarterLupe CastroJana CathersMichael ChesterYong ChoTony ChurchillCherokee ClarkJustin ClarkCarolyn CobleBrenda CoffmanRich ColbertPaul ColemanCraig CollinsAndrea ConnerHershel ConradJennifer CookseyMelissa CostelloDanielle CostillaLorrie CottamCole CoursonPatrick CrainSharon CrainTim CrissupKizzy CrowellJustin CruseCathy CurtisRyan CurtisGlenn CushenberyClint DailyEvelyn DanielJennifer DavisRobbie DeanLuke Del GrecoDavid DeLaOAlene DoKelly DobbsJohna DodsonKirk DoughertyDustin DrewChuck DuginskiPeggi ElliottBrian EllithorpCarlos EvansRobin EvansSheila EvenRon EverettLibby FanningErik FaresFred FerbracheDustin FickJeremy FinefrockJeff FinnellJarod FiteWalter FletcherTommy Ford Jr.Anville Francis
Linda FriesTerry FrohnapfelGary GarrisonJohn GarrisonGuy GaskillPaul GeisingerRonnie GivensJosh GlancyJohn GlynnLinda GoodMichael GoossenJennifer GrangerAngie GreenCoty GreerBonnie GriggsMark HadlockVictor HaleyMark HamiltonKaty HamptonRachael HanochAndrew HanscomJoel HarrisRobert HartMelanie HarveyLinda HavrillaHeather HawkinsRebecca HendersonTim HenleyChris HenryFrancisco HernandezRandy HerringJ. D. HertweckMelissa HeuselHolly Hicks-BlackAlvin HighfillKevin HillDanny HinkRandy HodgeBuz HollowayLatania HoltAlan HortonDoug HowethWill HubbardLauren HumphreyCristy HutchensAdam HutchinsonMark HyltonJamie JacksonRandy JacksonJeff JamesRyan JamesonJayson JanesAmanda JeantetSam JohnsonJeffrey L. JonesSteven Jones
John KeelingShamara KeithLindsay KellerBill KerbyJason KneedyBrenda KnightBrett KnightJosh KomarekMatt KopfPam KoscinskiJennifer LandersJames LardnerKelsey LattaCory LewisShea LewisBrent LightseyMelvin LikeRichard LoftinHarold LopezJustin LucasBarbara LydickLuke LyonsStanley MajorMichael MarkerTara MartinLolo MartinezRoqelio MartinezBill McBrayerJohn McCartneyKelly McConnellDuane McDowellMike McGinnisDonna McGriffNatalie McNeilRyan McNeilCliff MerrittMatthew MilledgePat MillsSheldon MillsRodolfo MolinaElton MonroeKendra MonroePenny MontgomeryDana MooreSteve MooreAdria MorganSim MorganJimmy MorrisElisa MountMark MurrayTim MurrayChuck MyersTodd NanceMichael NewRich NewtonMatthew Nowlin
20,000 VOLUNTEER HOURS Oklahoma
Keeping score, corporate staff employees celebrate 26,134 hours of service donated to organizations in more than 70 communities throughout the company’s operating areas as part of its 20th anniversary festivities.
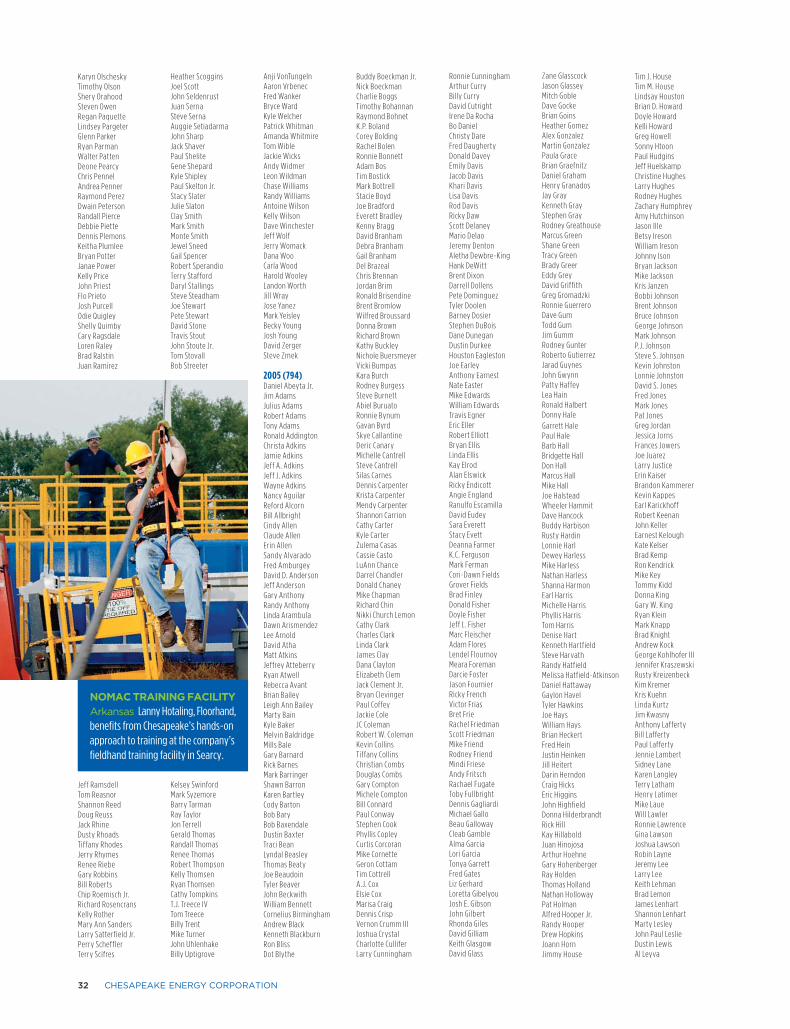
32 CHESAPEAKE ENERGY CORPORATION
Karyn OlscheskyTimothy OlsonShery OrahoodSteven OwenRegan PaquetteLindsey PargeterGlenn ParkerRyan ParmanWalter PattenDeone PearcyChris PennelAndrea PennerRaymond PerezDwain PetersonRandall PierceDebbie PietteDennis PlemonsKeitha PlumleeBryan PotterJanae PowerKelly PriceJohn PriestFlo PrietoJosh PurcellOdie QuigleyShelly QuimbyCary RagsdaleLoren RaleyBrad RalstinJuan Ramirez
Jeff RamsdellTom ReasnorShannon ReedDoug ReussJack RhineDusty RhoadsTiffany RhodesJerry RhymesRenee RiebeGary RobbinsBill RobertsChip Roemisch Jr.Richard RosencransKelly RotherMary Ann SandersLarry Satterfield Jr.Perry SchefflerTerry Scifres
Heather ScogginsJoel ScottJohn SeldenrustJuan SernaSteve SernaAuggie SetiadarmaJohn SharpJack ShaverPaul SheliteGene ShepardKyle ShipleyPaul Skelton Jr.Stacy SlaterJulie SlatonClay SmithMark SmithMonte SmithJewel SneedGail SpencerRobert SperandioTerry StaffordDaryl StallingsSteve SteadhamJoe StewartPete StewartDavid StoneTravis StoutJohn Stoute Jr.Tom StovallBob Streeter
Kelsey SwinfordMark SyzemoreBarry TarmanRay TaylorJon TerrellGerald ThomasRandall ThomasRenee ThomasRobert ThompsonKelly ThomsenRyan ThomsenCathy TompkinsT.J. Treece IVTom TreeceBilly TrentMike TurnerJohn UhlenhakeBilly Uptigrove
Anji VonTungelnAaron VrbenecFred WankerBryce WardKyle WelcherPatrick WhitmanAmanda WhitmireTom WibleJackie WicksAndy WidmerLeon WildmanChase WilliamsRandy WilliamsAntoine WilsonKelly WilsonDave WinchesterJeff WolfJerry WomackDana WooCarla WoodHarold WooleyLandon WorthJill WrayJose YanezMark YeisleyBecky YoungJosh YoungDavid ZergerSteve Zmek
2005 (794)Daniel Abeyta Jr.Jim AdamsJulius AdamsRobert AdamsTony AdamsRonald AddingtonChrista AdkinsJamie AdkinsJeff A. AdkinsJeff J. AdkinsWayne AdkinsNancy AguilarReford AlcornBill AllbrightCindy AllenClaude AllenErin AllenSandy AlvaradoFred AmburgeyDavid D. AndersonJeff AndersonGary AnthonyRandy AnthonyLinda ArambulaDawn ArismendezLee ArnoldDavid AthaMatt AtkinsJeffrey AtteberryRyan AtwellRebecca AvantBrian BaileyLeigh Ann BaileyMarty BainKyle BakerMelvin BaldridgeMills BaleGary BarnardRick BarnesMark BarringerShawn BarronKaren BartleyCody BartonBob BaryBob BaxendaleDustin BaxterTraci BeanLyndal BeasleyThomas BeatyJoe BeaudoinTyler BeaverJohn BeckwithWilliam BennettCornelius BirminghamAndrew BlackKenneth BlackburnRon BlissDot Blythe
Buddy Boeckman Jr.Nick BoeckmanCharlie BoggsTimothy BohannanRaymond BohnetK.P. BolandCorey BoldingRachel BolenRonnie BonnettAdam BosTim BostickMark BottrellStacie BoydJoe BradfordEverett BradleyKenny BraggDavid BranhamDebra BranhamGail BranhamDel BrazealChris BrennanJordan BrimRonald BrisendineBrent BromlowWilfred BroussardDonna BrownRichard BrownKathy BuckleyNichole BuersmeyerVicki BumpasKara BurchRodney BurgessSteve BurnettAbiel BuruatoRonnie BynumGavan ByrdSkye CallantineDeric CanaryMichelle CantrellSteve CantrellSilas CarnesDennis CarpenterKrista CarpenterMendy CarpenterShannon CarrionCathy CarterKyle CarterZulema CasasCassie CastoLuAnn ChanceDarrel ChandlerDonald ChaneyMike ChapmanRichard ChinNikki Church LemonCathy ClarkCharles ClarkLinda ClarkJames ClayDana ClaytonElizabeth ClemJack Clement Jr.Bryan ClevingerPaul CoffeyJackie ColeJC ColemanRobert W. ColemanKevin CollinsTiffany CollinsChristian CombsDouglas CombsGary ComptonMichele ComptonBill ConnardPaul ConwayStephen CookPhyllis CopleyCurtis CorcoranMike CornetteGeron CottamTim CottrellA.J. CoxElsie CoxMarisa CraigDennis CrispVernon Crumm IIIJoshua CrystalCharlotte CulliferLarry Cunningham
Ronnie CunninghamArthur CurryBilly CurryDavid CutrightIrene Da RochaBo DanielChristy DareFred DaughertyDonald DaveyEmily DavisJacob DavisKhari DavisLisa DavisRod DavisRicky DawScott DelaneyMario DelaoJeremy DentonAletha Dewbre-KingHank DeWittBrent DixonDarrell DollensPete DominguezTyler DoolenBarney DosierStephen DuBoisDane DuneganDustin DurkeeHouston EaglestonJoe EarleyAnthony EarnestNate EasterMike EdwardsWilliam EdwardsTravis EgnerEric EllerRobert ElliottBryan EllisLinda EllisKay ElrodAlan ElswickRicky EndicottAngie EnglandRanulfo EscamillaDavid EudeySara EverettStacy EvettDeanna FarmerK.C. FergusonMark FermanCori-Dawn FieldsGrover FieldsBrad FinleyDonald FisherDoyle FisherJeff L. FisherMarc FleischerAdam FloresLendel FlournoyMeara ForemanDarcie FosterJason FournierRicky FrenchVictor FriasBret FrieRachel FriedmanScott FriedmanMike FriendRodney FriendMindi FrieseAndy FritschRachael FugateToby FullbrightDennis GagliardiMichael GalloBeau GallowayCleab GambleAlma GarciaLori GarciaTonya GarrettFred GatesLiz GerhardLoretta GibelyouJosh E. GibsonJohn GilbertRhonda GilesDavid GilliamKeith GlasgowDavid Glass
Zane GlasscockJason GlasseyMitch GobleDave GockeBrian GoinsHeather GomezAlex GonzalezMartin GonzalezPaula GraceBrian GraefnitzDaniel GrahamHenry GranadosJay GrayKenneth GrayStephen GrayRodney GreathouseMarcus GreenShane GreenTracy GreenBrady GreerEddy GreyDavid GriffithGreg GromadzkiRonnie GuerreroDave GumTodd GumJim GummRodney GunterRoberto GutierrezJarad GuynesJohn GwynnPatty HaffeyLea HainRonald HalbertDonny HaleGarrett HalePaul HaleBarb HallBridgette HallDon HallMarcus HallMike HallJoe HalsteadWheeler HammitDave HancockBuddy HarbisonRusty HardinLonnie HarlDewey HarlessMike HarlessNathan HarlessShanna HarmonEarl HarrisMichelle HarrisPhyllis HarrisTom HarrisDenise HartKenneth HartfieldSteve HarvathRandy HatfieldMelissa Hatfield-AtkinsonDaniel HattawayGaylon HavelTyler HawkinsJoe HaysWilliam HaysBrian HeckertFred HeinJustin HeinkenJill HeitertDarin HerndonCraig HicksEric HigginsJohn HighfieldDonna HilderbrandtRick HillKay HillaboldJuan HinojosaArthur HoehneGary HohenbergerRay HoldenThomas HollandNathan HollowayPat HolmanAlfred Hooper Jr.Randy HooperDrew HopkinsJoann HornJimmy House
Tim J. HouseTim M. HouseLindsay HoustonBrian D. HowardDoyle HowardKelli HowardGreg HowellSonny HtoonPaul HudginsJeff HuelskampChristine HughesLarry HughesRodney HughesZachary HumphreyAmy HutchinsonJason IlleBetsy IresonWilliam IresonJohnny IsonBryan JacksonMike JacksonKris JanzenBobbi JohnsonBrent JohnsonBruce JohnsonGeorge JohnsonMark JohnsonP.J. JohnsonSteve S. JohnsonKevin JohnstonLonnie JohnstonDavid S. JonesFred JonesMark JonesPat JonesGreg JordanJessica JornsFrances JowersJoe JuarezLarry JusticeErin KaiserBrandon KammererKevin KappesEarl KarickhoffRobert KeenanJohn KellerEarnest KeloughKate KelserBrad KempRon KendrickMike KeyTommy KiddDonna KingGary W. KingRyan KleinMark KnappBrad KnightAndrew KockGeorge Kohlhofer IIIJennifer KraszewskiRusty KreizenbeckKim KremerKris KuehnLinda KurtzJim KwasnyAnthony LaffertyBill LaffertyPaul LaffertyJennie LambertSidney LaneKaren LangleyTerry LathamHenry LatimerMike LaueWill LawlerRonnie LawrenceGina LawsonJoshua LawsonRobin LayneJeremy LeeLarry LeeKeith LehmanBrad LemonJames LenhartShannon LenhartMarty LesleyJohn Paul LeslieDustin LewisAl Leyva
NOMAC TRAINING FACILITY Arkansas Lanny Hotaling, Floorhand, benefits from Chesapeake’s hands-on approach to training at the company’s fieldhand training facility in Searcy.

EMPLOYEES 33
Jason LierleWayne Light Jr.Dan J. LopataBecky LortonMichael LovelaceMichael LoveroAlison LoweDwayne LoweJason LundyPaul LupardusShauna LyonSean MaciasAngie MackeyCraig ManaughAmy MarburgerRobert Marsh IIIJace MarshallBilly MartinDanny MartinDeb MartinJames MartinRandy MartinRobert MartinThomas A. MartinChema MartinezHomer MartinezEmily MasseyBill MathewsThomson MathewsMack MatthewsBruce MattheyJeff MaxwellMike MayJames MaynardAndrea MaysVicki McCabeKatrina McCaslinDax McCauleyChris McClaineMike McClellanJackie McComasThomas McComasMeri McCorkleJohnny McCoy Jr.Rocky McCoyCasey McDonoughVanessa McDougalWilliam McFaddenTerry McGradyJeff McGuireDonny McHenryAmy McIlhennyStacy McKayArlie McKeeKeith McKeeNick McKenzieBill McKinneyDoug McPhersonDirk McReynoldsDonnie MeadeMelissa MeekerDan MelcherBruce MeltonOscar MendozaSaxon MesaPaul MesserCasey MillerCathy MillerDaryl MillerJeff MillerKelli MillerMark MillerEligah MillsTom MillsMaya MimsKyle MinyardGreg MitchumJeff MobleyCheryn MokStephen MollettJim MooreMichael L. MooreSherrie MooreTeresa MooreDave MorehouseJose Moreno IIIPhil MoserJim MottesheardDoug Mullins
Jaime MunozDan MuretSean MurphyJustin MurrayBhavin NaikTim NanceTim NapierRusty NashJames Neal Jr.Scott NeaseTommy NeatheryDonna NeelJarrod NewberryKena NewmanRoger Newsome Jr.Robert NiavezSid NilesJustin NimrodKelly NixCurtis Nixon Jr.Kenneth NolanGreg NorthernRodney O’BrienAdam Olivares Jr.Michele OliverJohn O’NealDara OneyCharles OsbornBilly OsendottBryan OttKary OttKatie OvertonTony PadgettJoe PaetzoldWray PaineBill G. ParkerMatthew ParkerMichael ParkerToni Parks-PayneAmanda ParsonsTrisha PateHoot PattersonKevin PattersonKenneth PayneDeborah Payne-SherwoodTom PepperBrooks PerryGena PerryJody PerryMike PerryDenvard PetersJoe PetersonDonald Petzold Jr.Teresa PexaKevin PfisterGreg PichlerMichael PickensSusan PickensJoe PierceBilly PillarsJosh PittsSteve Poe Jr.Harold PorterJohnny PorterLaTonya PorterLeon PotterJared PoundsCara PourtorkanLarry PraterReco PreeceBob PriceJohn Prichard Jr.Jennifer PrinceMartin ProvinceBobby PutmanJeff RainesWeldon RaineyLarry RaleighKyle RangeKeith RasmussenBilly RatliffJennifer RatliffPeter RauscherDonna RayLonnie RayVickie RayGavin ReedKenneth ReedMelissa Reed
Nathan ReedStevie ReedBrian ReederLorrie RenfroPhilip RennerR.J. RetzerJeffery RhoadesStewart RhoadesJerad RhodesMike RiceRay RiceBill RichardsonChad RichardsonJoni RichardsonRalph Riffle Jr.Johndetta RileyJohney RileySteven RileyBrandon RipleyAJ RisnerNakita RizzoBen RobinsonCarole RobinsonJohn RobinsonRusty RobinsonPedro RodriguezBrad RogersCliff RogersDionne RogersJohn F. RogersChuck RoseDayton RoseKristin RoseHargis RossLloyd RubottomGary RussellGeorge RussellJim RussellJohn RyzaScott SachsClinton SalyersGary SandersJason SarakatsannisCarl SargentJay SavillBrandon SchefflerRob SchindlerDoug SchmidtRandall SchultzGreg SchwerdtfegerKathy ScottBart SeamanJennifer SeboLarry SegarSteve SeliquiniIvan SemienPerry SettlesGail ShackelfordTommy ShafferArco Sharp Jr.Jackie ShaverStan ShawDonald ShelleyMarvin ShepherdJohn ShifflettGreg ShingletonTammy ShingletonMike ShortJohn Shreve IIOdie ShreveLee ShrevesDerrick SierBob Simmons IIBrian SimmonsJustin SimontonBilly Sims Jr.Cami SimsLeo Sinnott Jr.Brian SkidmoreRalph Skinner Jr.Charles SloanMalcom SloneMiranda SmallEric SmithJohn SmithJonathan SmithLindsey SmithRoy SmithScott Smith
Stephen SmithRonald Snyder Jr.Manuel Soriano Jr.Myron SowardsShellee SpencerJames SpillerKeith SpitzenbergerLarry StacyBriana SteelmanTarza SteinerRobert SticklerRobert Stickler IIJason StidhamJustin StinsonJayson StockJack StocktonBrandon StrackLola StricklandCallie StuckeyDave StumboScott SullivanTravis SullivanTodd SwartzbaughAnthony SweeneyCharles Switzer Jr.Amanda TalmichJim TampkePhilip TannerMike TarpleyBrian TatroGearold TaylorJody TaylorStephen TaylorEric TennantSteve TharpJoe ThomasLawrence ThomasVal ThomasWillie Thompson Jr.Mike TignerJackie TilleryBilly TimmonsKelly TorriCheryl TramellHuy TranMatej TriskaScott TruesdaleVernetta TubbsKristi TurnerMatt TurnerSusan TuterKenna UlderichSharon UlmerJason UpdegraffDana VadenJoseph Valerio IIBanner VanderpoolJakie VaughanRyan VeirsSuzanne VictoriaLupe Villarreal Jr.Tammie VoelkerLindsey Von TungelnCarol WagnerKenneth WagonerJay WalkerBenny WallaceCharles WallenRichard WallsLeonard WaltersJustin WardropBrian WasingerKaren WatsonJohn WeaverGinny WebbThomas WebbLisa Webb JohnsonShae WeddleJeff WeidesKeith WellsLee WescottKyle WhiteLarry WhiteMallorie WhiteDan WhitmarshValerie WibleCharles WilburnDale WildmanBrooke Wiley
Mark Wiley IILisa WilkinsonDallas WilliamsDavid S. WilliamsNancy WilliamsTerry WilliamsB.J. Williamson Jr.Jason WilliamsonHack WillisRonnie WillisKent WilloughbyBrian WinesKelli WitteBrad WittrockJustin WollenbergJulie WoodardDonald WoodyRicky WorkmanLeann WrightYandy YarbroughDoug YeagerDanna YearginBo Youngblood IIIJustin Zerkle
2006 (1254)Gary AbbottRussell AblesJessica AckerClaude AdamsJames AdamsKelli AdamsWilliam AdkisonEthan AdlerRohit AggarwalDoyal AkersKris AldridgeDaniel AlfordKenny AlfordJames AllenJamie AllenJason AllenJoshua AllenJimmy AllredRichard AllumsBilly AlvenJoe AlyJames AmelungBob AmyxCarol AndersonGary AndersonOtis AndersonRandy AndersonShelby AndrewMelanie AndrewsHoward ArnoldZachary ArnoldDavid ArringtonLiz ArthurThad AshcraftKevin AshleyAmy AskewMicah AssulinRoger AverittDavid AveryEd BackMisty BaezaTim BagbyAllen BagleyMichael BahrenburgAllison BaileyRonald BaileyButch BairdCharles BakerDennis R. BakerSitaraman BalakrishnanBoomi BalasubramaniyanLeonardo Baldonado Jr.Christa BallMichael T. BallLisa BallardJanice BallietMichael BaneWilliam BarkerDean BarnesKeith BarrettCecelia BarringtonJoshua BartonLorie Barton
Brandon BashawAdam BasquezWarren BassDouglas BaughmanTammy BaxterLarry BeardTim BeardJohnny BeasleyJesse BeasonTiffany BeaverTerri BeckerSteven BeckettJim BedfordClint BeebySteve BeesonDanny BeetsBo Bekendam
Robyn BelewPaige BenedictCheryl BennettGarrett BentonJohn BergmanSharon BerkleyEric BessRobert BevelAmar BhaktaRandy Bickel Jr.Liz BicoyJacob BiernackiPam BillingsleyMatthew BirchJeremy BlackDavid Black Jr.Willis Blaker IIIPhillip BlankenshipEmily BlaschkeTony BlasierJimmy BlevinsDoug BohlenRichard BoldingMarvin BondBrandi BonnerDaniel BorowskiJohn Bottrell IIBrian BoundsBarbara BowersoxDeven BowlesDonald BowmanDrew BoyerErnest BozarthPhillip Bradford IIIJohn BradshawMark BrannonMatthew BransonJames BrantonKrystal BrauchiZora BraunJames Bray
Michael BrenizerBradie BrewtonH. BriantMelvin Bright Jr.Wesley BrogdinBilly BromlowDavid BrooksVernon BroomfieldRob BrottJay BrownJP BrownNatascha BrownRodney Brown Sr.T. BrownTyanne BruceTimothy BrummageGreg Bruton
Cheryl BryanJ.D. BryantMarria BrydonKala BuergerJoshua BuieTodd BulesClifton BullardBlair BunchNiki BurchRoger BurfordDarrel BurghardtJohn Burkhouse Jr.Jake BurnettJim BurnettAaron BurnsBurton BurnsCharles BurnsworthRichard BurrhusPhil BurrowJoseph BurtonDustin BushnellEric BynumTom A. BynumTom W. BynumKorey ByrdScott ByrumStephanie CahillJerry CaldwellRickie Callender IIIJorge CamachoJason CameronJohnnie CampbellKaren CampbellKenneth CampbellShanna CampbellJohn CanarySteven CarderBryan CareyColt CarpenterConnie CarpenterOctavio Carpio
FATHER/DAUGHTER DANCE Oklahoma Ken Thompson, Manager – Barnett Shale field, and his daughters enjoy an evening of dinner, dancing and horse carriage rides around campus at this very special annual event.

34 CHESAPEAKE ENERGY CORPORATION
Deborah CarrollJames CarrollStephan CarrollJames CarterAlex CasiasBernardino Castaneda Jr.Charles CastelliJose CasteloJose CastilloAaron CastoBrandon CatesScott CavnerGregory CavnessCassie CawyerRosa ChaconTim ChaloupekHarvey ChamblissPaul CharlesDavid ChavarriaOscar ChavezKathy CheesmanJames CheshireHenry ChildressRichard ChildressStephanie Choate
Rodney ChristianTwila ChristyKerry ClappSuzanne ClapperBrandon ClarkDavid ClarkDustin ClarkJames W. ClarkLeon ClarkStacey ClarkSteve ClarkJason ClaunchBrad ClaypoolErin ClaytonJesse ClaytonCathi ClementsEric ClementsJeff ClemonsMichael ClevengerRonald CliftLindy CochranRobert CochranTimothy Cockerham IIBrent CockrellLauren CocoVirgil ColemanDavy CollinsKatie Collins
Dee CombsJason ConawayGreg CondrayJeffery ConleyAndy ConyersBlayne CookJim CookJacob CooperLinda CooperScott CopelandJeff CorneliusJustin CornellSteve CornettPreston CorpDiego CortezMario CortezJanice CoryBob CostelloBobby CostelloCody CostelloLarry CostelloStoney CostelloWilliam CostonCrystal CottrellJereme Cowan
Jeffory CowgerChris CoxJeremy CoxSteven CoxDonnie CraftTina Craft GrantTravis CraigDenise CramerBud CraveyJoe CreechRicky CriderScott CrimJimmy CroneJohn D. CrooksMurphy CrosbyPaul CrowCasey CulpepperMelissa A. CummensRay Cunningham IIDouglas CzakoAaron DaharshLaurie DamronMichael DamronDavid DaniAlvin Danley Jr.David DanleyJoseph DarrBeverly Dart
Jeffrie DavidsonBetsy DavisChad DavisGarry DavisKathy DavisMegan DavisRodger DavisRon DavisKenny DawsonRobert DayGreg DeanLandon DeanStanley DeanKevin DeedsMatthew DeelTim DeffenbaughDonald DeForest Jr.Gary DennisMark DeShazoKarl DexterGianny DiazAndrew DickinsEd DillardDavid DisonRobert DisonLinda DixonMichelle DoddNicolas DominguezGary DonleyDonald DotsonStephanie DotyDawn DouglasGreg DouglasLorie DouglasJohnny DowdyJohn DowningTammy DresserAlfonso DuenezDustin DunlapRegina DunlapCurtis Dunn Jr.Larry DurantPaul DurenJim DurstDustin DyeTammy EatonRobin EbarbMichael EddinsJohnny Egnor Sr.Craig ElderJammie ElderJeff ElderEbbin Elliott Jr.Jordan ElliottMelanie EllisDarrell EnderlinJon EnglishRichard EnoffSteven EppsJarrod EsparzaJonathan EubankDee Eubank-SwigerDavid B. EvansGary EvansJody EvansRicky EvansRonald EvansLeann EversRonnie EzernackRicky FarnsworthAndrew FarrisMarcie FarrisShyla FastBryan FergusonKeith FergusonTessie FergusonPerry Fields IIITommy FillmanThomas FinchBrent FinleySteven FisbeckDavid FisherJerry FisherJohn FisherMichael FiteChris FlanaganMichael FlaneryMatt FleischerBrenda Flesher
Jose Flores Jr.Garrett FlowersTerry Floyd Jr.Thomas Flynn Jr.Danny FordMartha FordJimmy ForsythAnthony FosterClarence FosterRobert FosterClayton FoutchJulie FoxJason FranzeAnnie FredricksonTravis FrelsNicole FritzLarry FrostSam FrydenlundJames FrymanEvan Fuqua Jr.Christy FurbeeCarol GaddisFrank GagliardiSarah GainerJunior Garcia Jr.Martin Garcia Sr.April GardnerChris GardnerGeorge GarfieldLisa GarrettMark GarrettJavier GarzaJavier Garza Jr.Joel GarzaRaul GarzesJohn GasawayDouglas GastonScott GastonBrian GaunttKennie GayAnne GeorgeRachel GerlachJim GerstnerBobby GibsonSteven GiddingsTimothy GiddingsJon GiffinAnthony GilliamMandie GilliamCameron GilmerJim Gipson Jr.Ryan GlennJesse GomezLindi GomezZac GonsiorEric GonzalesAlberto GonzalezApril GonzalezEdgar GonzalezJulio GonzalezBilly GoodnightJustin GoodsonLacey GoodwinElijah GordonDonn GossLindsay GowanMitch GrantKenneth W. GravesBilly GravittRon GrayGabe GreenDylan GreyCamm GrimLane Grimes IIIBradley GrimmRafael GuerraDonald GunnoeHenry Gutierrez Jr.Ricardo GuzmanDarryl HaasScott HackworthLance HaffnerLarry HagelbergRobert HagerdonWayne HaireFreddy HaleKim HaleyBilly HallmanJohn Hamilton
Joy HamiltonNathan HamiltonNathan HanksJoe HannaRobert HannaTony HansenRandy HansfordDustin HansonJosh HardieDean HardingFawn HardmanJames HardwayRyan HarkinsJames HarmanCody HarrelJohn Harrington Jr.Bryan HarrisMike HarrisRobert HarrisTerry HarrisSamuel HarroffDarrel HartDonald HartKevin HartlRoger HartleyBobby HarveySteven R. HarveyDon HarvilleTimmy HassDarcy HawkinsCarroll HayesEric HayesChristopher HaywardRobert HaywardTeresa HearnBrad HeathVirginia HebertSabrina HedrickDaniel HendersonGeorge HendersonNicholas HendersonMary HenningMark HenryDan HensleyArmando HernandezRafael HernandezMatthew HerrinJamie HibbsJoe HicksSid HicksTerry HicksJennifer HigginsMichelle HilemanChad HillJames HillClyde HinsonMark HlatkyChad HledikJustin HobbsJimmy HodgesJoseph HodgesJustin HodgesPatty HoeckerEric HoehneChad HoffmanHenry HoffmanLisa HoffmanBradley HollandTom HollandMichelle HollisMike HollisBradley HolmanWilliam Holman Jr.Bryce HolmesTimothy HolmesMichael HolsonLarry HoltDustin HomesleyMichael HommertzheimBill HooperKevin HooperDavid HooverMelissa HoppeRonnie HoskinsBonnie HouseDebbie HoustonSeth HoustonMatt HowardScott Howard
Seth HowardJason HoweKenneth HubbardRachel HubbardCheryl HudakChase HuddlestonJarel HughesJustin HughesMark HughesMarshall HughesKirk HungerfordFrankie HuntBret HunterTami HunterElbert IdlettJustin IdlettLoyd IdlettPete IrbyJeff IvenSherry IzellChristopher JacksJoe JacksonLindsay JacksonMarianne Jackson
Pamela JacksonTroy JacobsJavey JamisonLance JamisonTodd JamisonChristopher JanzenAnthony JeansonneTravis JenkinsEric JenkinsonJessica JenningsJon JerniganDavid JirousekAlex JohnsonDonald JohnsonJeannie JohnsonRandy JohnsonSteve G. JohnsonWilliam JohnsonJeri JohnstonJoy JohnstonCindy JonesGary JonesKyle JonesTravis JonesBev JordanDoug JordanLauren JordanJeffery JuddNicholas JuddHunter KamPaul KarstensHemant KatariaTroy KeelMarvin Keeling Jr.Kenneth KeetonBelo Kellam IIILarry KellerDiana KelleyTommy KelleyTracy KeltingSammy KendallKris KendrickJosh KennedyJoe KetznerGil KiahaRussell KiddJohn KieschnickJeff KikerWayne KimberlingJohn KimbletonFay KincherJessica KingRichard KingNathan KirtleyJeffrey KlingelAaron KnappBuzz KnappAllen KnippersJeff KnoblockCharles KnottsSteve KnowlesLaurie KnoxSanjay KodamDenise KogerBlake Koonce
Nathan KressMuhamed KuburicSunita KuburicCameron KuykendallHoang LamJane LamTony LamasDennis Lambert Jr.Jerry Lambert Jr.Corbin LandSandra LandgrafBob LangdonB.J. LarmanChris LauhonJohn Lawman Jr.Johnny LawrenceKelly LawsonTom LaymanJames LeBouefRyan LeeSamuel LeeStanley LeeDave LeopoldJustin LewellenCindy LewisFred LewisPeter LewisKaren LilesJim LindleyJill LinkenaugerTrey LittauCharles LivingstonRonald LoefflerClayton LongEllen LongTeresa LongJames LooneyDavid LopezJaime LopezNiles LoudenslagerCandice LoveMorgan LoveDustin LovellJennifer LowtherSilvano Lozada-LunaAllen LuderDavid LukeCharlie Lumpkin IIIBrent LurryJosh LyonsEmily LytleJeffrey MacKayKevin MackeyJamie MaddyGlenda MahoneyJorge MaldonadoJuan MaldonadoRamon MaldonadoMonica MalkeyJames ManningJuan ManriquezJimmy ManryKerry ManuelLaura MarcellusMarkus MarrPatty MartinBraulio MartinezMark MartinezValente MartinezMissy MartiniMichael MarunowskiBobby MatthewsNicholas MatthewsMaya MaximovaDelores MaxwellGreg MayMichael MayfieldMonty MayfieldAngela McAlisterDerald McAlisterJulie McCannRich McClanahanKatie McCordChris McCormackLacy McCornackGarrett McCulloughShaun McDanielStephen McDonaldDavid McDougal
H.E.L.P. INITIATIVE Oklahoma
Mark Lester, Executive Vice President – Exploration, gives a pat on the back to Mark Orgren, the company’s first H.E.L.P. Champion, for exemplifying Chesapeake’s commitment as a good neighbor. Orgren organized volunteers to renovate the auditorium of Harding Charter Preparatory High School in Oklahoma City.

EMPLOYEES 35
Jenni McEachernKelle McEwenRay McFarlandHarry McGarrMeghan McGheeTodd McGinleyChristopher L. McGinnisJohn McGowenRichard L. McGuireCurtis McIntyreIrma McIntyreChad McKamieDennis McKamieJohn McKayPatrick McKimHeather McLainJessica McLainAmy McLanahanWalter McLaughlinAaron McLeanCaleb McLoudMatthew McMahonSteve McMillenBeau McMillinMatt McMurryHeather McNeilRobert McNuttDanny McRaeJames McWhirterDonnie McWhorterEd MeadeTom MeadowsFernando MedinaDennis MeigsJunior MelendezDouglas MeltonWes MerchantCurtis MerilattWilliam MerkelJarod MerleJustin MetzSteven MeyerBarry MichelsAllen MiddlemanAllen Miller IIGreg MillerGregory MillerMatthew MillerRonald MillerToni MillicanAudrey MimbsBenjamin MinerJerame MinkDustin MintonSantiago MirandaGeorge Moats Jr.Chris MobleyJanice ModisetteKeith MoffattMohammad MoinuddinJohn MolesAngela MonigerAndrew MontgomeryTom MooneyDeanne MooreLarry MooreMichael S. MooreWalter G. MooreArturo MoralesGuillermo MoralesHector MoralesGuillermo Morales-MataCharles MorckelCarroll MorganJay MorganRoger MorganNick MorlandTim MorphisJames MorrisMike MorrisNicholas MorrisRalph MorrisBilly MorskoJeffery MortashedJoseph MortashedJason MoxleyJohnathan MuellerGregory Mumme IILewis Munn
Danny MurrayMatt MurryAntoinette NellBree NelsonJW NelsonLaverne NelsonRodney NelsonLacey NeumanKyle NevelsJere NewberryTravis NewberryEric Newman Jr.Shane NewmanHolly NewsomLori NguyenThomas NguyenNick NiemannDrew NugentDavid O’BrienMarvin OdermattJason OffermanMichael OgletreeDennis O’HandleyAnthony OlivasMichael J. OliverMark OrgrenChristy OroscoRandy OrsburnDon OsbornDarrel OvergaardCasey OverhultzDe OverstreetTammie OwensChris PaceThomas PaceLindsay PalazzoloJanie PalmaKurt PalmerRobert Palmer Jr.Betty PaoliniCandy ParkerEdwin ParkerJulie ParkerCarla ParrishUmesh PatelMonte PattersonJohn PaulMichael PayneRickey PaytonDaniel PearceBlain PearsonChester PearsonKim PearsonAriel PenaDanielle PenlandTerry PerdueJoe PerezAddie PeschePaul PhillipsAlan PierceJennifer PierceMarty PierceJames PineMatt PinionJeff PinterRoger Pippins Jr.Lara PitchfordBrooke PittardMichael PittserFilemon Plascencia-AcevesLori PlumleyRichard PogueDavid PoindexterRandy PoindexterRichard PoindexterDavid PolveMatthew PompaDavid PonceTaos PoolTimothy PooleRaymond PoseyNick PottmeyerJordan PowellKelli PrattSindy PrescottJoseph PresockMarsha PresockRicky PryorRonald Putman
Matt QueenMaria QuezadaMary QuinnBarbie Quinn DavisTyson RaaschDaren RaderMark RaidtJohnny RainsHermenegildo RamirezPeter Ramirez Jr.Raul RamirezBonnie RamonArturo RamosJessie RamosCody RamseyGary RamseyGreg RamseyRoy RashAaron ReamRoger RedmondGalen ReedRaymond ReeseJacob ReevesChristopher Register Sr.Keith ReightlerJohn ReinhartBrad RekietaAllen RemmersSanthanaraj RengaiahMatt ReserAaron ReyburnJorge ReyesRoger ReyesJustin ReynoldsChris RiceBeth RichardsHenry RiffeSandi RileyLarry RitterGregory RiveraCourtney RobertsJosh RobertsMatthew RobertsRaymond RobertsStacy RobertsVincent RobertsDaniel RobertsonMichael RobertsonScott RobertsonScott RobinsonPaul RodesneyAndrew Rodriguez IIIJoel RodriguezMaria RodriguezRobert RodriguezRuben RodriguezSarah RodriguezJuan Rodriguez-HuertaJon RogersBailey RollinsDanielle RoperLeonard RoperVinson RoperGlenn RoseRichard RossRobert RossTommy RossGreg RossmanScott RotruckLoni RowanDavid RowlandJackie RoyDaniel RuckerEric RuckerMichael RushingDena RussellDon RussellJackie RussellDusty RustTracy RustJason RuthMatthew RutledgeGurpreet SalujaKelly SandersMatthew B. SandersDale SandersonJohn Satterfield IITerry SaurbornPhillip Saxon
Perry ScalesDavid Schmidt Jr.Shawn SchmidtKaren SchmuhlErnest SchroederMichael SchulzEarnest SconyersBannon ScottJoseph ScottKrystle ScottLarry ScottKevin ScovilleStoney ScrivnerDavid SearlsScott SecrestDusty SeigerDebbie SeiverlingDale SelfKenneth SellJobey SellersJon SelzerLouis SenkyrikClint SepulvadoAmanda SernaJ.C. SettlesBrooke ShannonDouglas Shannon Jr.Jimmy Sharp Jr.Wendie SharpFarley ShawFrederick Shaw Jr.Carroll ShearerDavid ShellstromMichael ShermanMichael ShiersKurt ShipleySteve ShireCarl ShorterAllen ShuemakerGregorio SilvaTerry SimmonsC.J. SimsChristopher SimsMary SimsRandy B. SimsRandy S. SimsRickie SimsRudy Sims Jr.Ward Sims Jr.Trevor SinclairJames SinghisenRicky SingletaryDanny SingletonAmanda SiskWilliam SissonCharles SittonMichael SlamickBryan SloanNathan SmarrEric SmeltzerBrian E. SmithDeane SmithDenise SmithEmily SmithErnest SmithJason SmithJustin E. SmithKade SmithMichael C. SmithMichael E. SmithMitzi SmithMonte K. SmithRusty SmithTommy SmithTroy SmithWaylon SmithBrian SniderChad SnowRich Snyder Jr.Pam SoltaniBecky SoutherlandPete Spadafora IIRodney SpencerLou SpitznogleDerek SpreierRene St. PierreSteve StaffordCraig StaleyJason Staley
Don Stanley Jr.Ronnie StattonJohn StephensPeter StephensRobby StevensRoger StevensLyvonne StewartJason StollingsMichael StoneRichard Stotler Jr.Andy StrealyRussell StreeterJohn StricklandRonnie StrohPerry StudebakerTeresa SullivanHeidi SuriJohn SuterRoger SutterfieldAnastasia SvecRick SvorJayce SwartzJoshua SwartzKevin SwigerColby TackettKevin TannerRonnie TarverDonny Taulbee Jr.Alan TaylorDavid TaylorJack TaylorMatthew TaylorMike TaylorRick TaylorSarah TaylorAndrew TencerNicholas TerechDaniel TerryRoss TerrySamson TesfaselassieGwen ThomasJason D. Thomas
Lacey ThomasPaul ThomasRichard ThompsonTravis ThompsonElmo TillisAndrew TiptonMikki TomlinsonScott TomlinsonJerry ToneyJohn ToneyBrandon TreeIgnacio Trevino Jr.Juan TrevinoDominic TrivittMatthew TroupDanny TrowbridgeDaniel TruongIrina TuckerSteve TurkChris Turner Jr.Corey TurnerJaffe TurnerDonald TusseyJoshua TycerJames Van AlstineJeffrey Van GrevenhofClyde VanceShawna VanceMartha VasekDakota VaughtBrandt VawterGerardo VelezRandy VillaireDustin VinsonBrenda VitatoeJonathan VogelCurtis VoylesRobert WagonerHuey WagstaffWillie WainmanErin L. WalkerNoah WalkerChristopher WallaceDonnie WallisMatthew WaltersElmer WarnickMatt Warren
Wil WarrenKeith WashingtonMatt WatkinsDusty WatsonJames WatsonLuke WatsonMatthew B. WatsonRod WeatherbyLauren WebbJohn WeberJohn WebsterBrad WechslerDonald WeedJody WeidnerThomas WeidnerMatt WeinreichJohn Weir Jr.Michael WelchToyia WellsAnn WendorffLeonard WesleyLuke WestfahlSam WhitakerRobert WhitbeckBilly WhiteJames B. WhiteJames K. WhiteJerry D. WhiteJerry D. White Jr.Christy WhitedBernice WhiteshirtJoe WhitesideJames WilhiteKent WilkinsonCynthia WilliamsEric WilliamsJim WilliamsJoshua WilliamsJustin WilliamsMarlene WilliamsRashaw WilliamsThad WilliamsZachary WilliamsCalvin Williamson Jr.Jeff WillisTyler WillyardAndrew WilsonBrent Wilson
Chad WilsonJulie WilsonSteve WilsonTrista WilsonWarren WilsonJim WimmlerFranklin WindhamAmos WiseCraig WittenhagenIvan WolanskiMike WoodTaunya Wood
Henry WoodruffTara WoodsMegan WoodworthDan WoodzellShawn WreathBradley WrightErran WrightMary WrightMichael WrightGreg WyattKeith YankowskyKevin YarbroughScott A. YoungMina ZaheriBrigido ZaldivarSimon ZavalaJason ZielkeJeff ZigaJody Zigler
2007 (1362)Kenneth Aaron IIRobert AbbottMichael AbilaClifton AblesRodney AcostaChris AdairChristopher AdairDavid M. AdamsJeremy AdamsVictoria AdamsJamie AdamsonKevin AgeeRoberto Aguilar-GarzaYemi AjijolaiyaClint AkeRaymond AkinsAdrian AlanizIsrael Alaniz Jr.Leonardo Alcantar-LopezJohn AlcortaDebbie AllenRonnie AllenTucker AllenRyan AllisonJacob AllynArdy AminJeff Amos
Boz AndersonCody AndersonDusty AndersonMaribeth AndersonRick AndersonWayne AndersonClenda AndrewsMoises AnguianoGreg ArcherSteve ArcherKolby ArnoldRoger Arnold Jr.
FORTUNE PARTY Oklahoma
Employees enjoy a party with a live band and dinner to celebrate Chesapeake’s third consecutive inclusion in the FORTUNE 100 Best Companies to Work For® list.

36 CHESAPEAKE ENERGY CORPORATION
Tyrerei AshcraftJerry AshleyRobert AtchisonJoseph AtkinsRickey AveryNoa AvilaWilliam AycockWilliam Bagley Jr.Chris BaileyKevin BaileyChris BakerDavid L. BakerDavid M. BakerGarrett BakerJeremy BakerJoe BakerLeslie BakerTeddy BakerChad BakkeRick BallRobert BallCindy BalslyJeremy BanesAmy BanuFreddie BarelaJudson BarkerBeata BarnaCraig BarnardSharon BarnettJorge BarronJulie BarronRedmond Barry IIIWayne BartlettTravis BasingerAdam P. Basquez Jr.
Stacey BatyLaura BauerBenjamin BaxKimberly BealDavid BeardBecky BearmanJustin BeattyCory BeckLarry BeckwithArianna BedellJason BedowSam BedriRodney BelcherBen BellChristy BellScott BenderAndrew BennettBrooks BennettLaura BennettNathan BergBarry Bergstrom
Ty BermeaPam BertJon BiegelMarvin BiggarBryce BiggsRandy B. BillingsRandy T. BillingsRyan BillingsEd BirdsheadJeremy BirkesWes BishopRobert BitnerQuinton BlackShawn BlackCraig BlackburnTimothy BlackmonJerry BlairJohn Blake Jr.Jared BlakleyBrandon L. BlevinsSammie BlevinsBlake BoeckingDebbie BoggsJosh BogleMercedes BolenRichard BoltGreg BommerJustin BondDustin BooneJared BorenRyan BoseJimmy BourlonAlana BouseRonald BowdenClayton Bowerman
Lesley BowmanMike BowndsChris BoydDiana BoydEddie BoydstonGene BoyerKyle BradfordCasey BradyDanny BranchJordan BrandenburgEugene BranhamJoe BranhamDanny Bratcher IIErika BraverDennis BreakfieldDarryl BrelandLance BrelandJeff BridgwaterEric BrittonKeri BrockTanner Broomfield
Deanna BrouilletteAaron BrownDavid G. BrownEddie BrownJason BrownKenneth Brown Jr.Scott BrownJeff BrowningJames BrumleyKasey BryanJoshua BryantRusty BryceJonathan BrysonTanna BuieKenton BulsonShannon BunnerPhilip BuntingStephen BurginJohn BurksTracy BurlesonTom BurnettJerry BurnhamJerry BurnsSundee BusbyLouis BushieyRocky ButlerKurt BynumDavid ByrneMatt CagigalRaymond CagleJonathan CaldwellNathan CaldwellAlan CallahanMatthew CallahanJames Calloway
Andria CampbellIan CampbellJeffrey CampbellRichard CampbellAdrianne CannonJuan CanoJon CantuChris CarenderAlicia CareyTerry CarikerGrant CarlisleJohn CarneyMark CarpenterEarl CarrCraig CarteDarry Carter Sr.Holly CaryBen CaseAlex CastanedaJose CastellanoRicardo Castillo
John CastoJeremy CaywoodCurtis Celestine Jr.Crystal CelsurWilliam ChambersKathy ChandlerGordon ChannelPhilip ChapmanRyan ChappellWard Chase Jr.Jamie ChastainLisa ChastainArmando Chavez Jr.Steve ChiperaPhillip ChismShandie ChoateMorgan ChrismanRonnie ChristopherRichard ChumleyJohn ChurchwellRosa CisnerosBeth ClantonDarin ClantonMatt ClarkSheridan ClarkDusty ClaytonCharles ClevengerColt ClinesmithThomas Clouette IIWayne CloutetAndrew CludiusRyan CoalmerTobie CoffeyDon CogarStephanie CoilKyle ColdironAdam ColeAshley ColeDustin ColeBob J. ColemanRobert T. ColemanMark CollierDustin CollinsJoshua CollinsStephen CollinsBrad CollisonDenise CondosDustin ConleySteven ConnBill ConnorDamon ConnorDustin ConnorBrandon CookNathan CookDouglas CooperMisty CooperCatie CoppageIsmael CorreaAnthony Corso IIChad CorwinDennis Cottrill Jr.William CouddingMichael Counts Jr.Todd CoursonCarl CoveyBrian K. CoxJennifer CoxStephen CrabbRobert CrankRex CravensMelanie CrawfordTracy CrawfordBrently CreelGary CrenshawDaniel CrihfieldJeffrey CrihfieldTimothy CrinerHeath CrissSteve CrockerJade CrockettZachary CromerK.W. CryerJulia CuiksaRobert Cumberland Jr.Terry CumberledgeJered CunninghamTimothy CurnutteTasie DahlMonte Dain
Steve DanielJohn DanielsHaley DarkJosh DarrDavid DavisDavy DavisDonald DavisGayl DavisKevin DavisLynsey DavisNathan DavisNicole DavisButch Day IIRoque De La TorreKristine DearmonDuane DeckerNick DelaloyeJeff DelancyEric DennenyWilliam DennyHolly DeRousseJerry DerrLisa DeSpainTracey DeveraDewey DevilleAdam DeVriesTrey DewaldBryan DilgerKaye DillinghamDonald DobbsKristopher DobbsMartin DobsonJensen DobyDustin DoerrChelly DolinarChad DomeWilliam Donahoe IIIKevin DonaldsonMichael DonischAdam DotyGary DriskellJ.P. DubeJed DudleyTim DuganShannon DulinBuck DuncanJacob DupuyBunky Dussetschleger Jr.Brian DuvallLaren EasleyRandall EasleyJustin EasonRuss EasonDan EatonJoseph Eddy Jr.Glenn EdwardsJason ElderJames Ellard Jr.Ricky EllingtonSteven EllingtonBilly ElliottCatey ElliottJohn ElliottLauren ElliottMurphy ElliottPaige ElliottAdam EllisLaci ElmoreKeith ElroyBryan ElyAmber EmbreyAlex EmersonJeremy EnglesSef EscajedaTom EsparzaJoseph EtheredgeBobby EtheridgeDavid EvansMegan EvansMichelle EvansDaphne EverettJohn EverettDavid FancherRosa FariasKeith FarisGary FarnumTim FarringtonJames FaulknerSteven Feisal
Susan FellAmy FergusonChristina FergusonDavid FergusonJoe FergusonWilliam FerrebeeFaith FieldsWayne FilesJill FisherRanson FisherSuzanne FitzpatrickSam FlamingKenny FlanaganStephanie FleetMatt FletcherArmando FloresOtoniel FloresJames ForcucciHoyt FordRob FordChristopher ForeKodi ForemanJim ForneyJake ForrestDouglas Fortney IIRussell ForyDanny FosterJerry Foster Jr.Daniel FoulkeJake FowlerSonia FowlerTamara FoxPatrick FranklinDaron FredricksonTeri FreelandHolly FreemanPhillip FreemanAmanda FrieseJoel FulenwiderMark FulkersonKimberly FullerWilliam FullerDavid GaddyRandy GaffordBenjamen GainesJuan Gallegos Jr.Danny GamesFelipe GarciaMelissa GardnerBilly GaryDon Gatewood
Todd GatewoodBill GeeJames GeiserMatthew GelnarJoseph Genovese Jr.Charles GerlichMarissa GibbsChristi GibsonJonathan GillEric GillespieBrian GilliamDaniel GilmoreDavid GilmoreShane GlasseyBarry GoberNeva GodwinAmy GonzalesAlfonso Gonzalez Jr.Francisco GonzalezHector Gonzalez Jr.Robert Gooch Jr.Bill GoodeCarl GoodnightDavid GordonAshlynn GosnellCody GossPreston GotesJacob GrafaZach GraggDavid GrahamJamie GrahamJane GrahamTim GrahamLee GramppAmanda GravesKenneth C. GravesKevin GravesD’Angelo Gray
Jimmy GrayKevin GrayTyler GrayMarcus A. GreenRandy GreenRichard W. GreenJustin GreenfieldBruce GriffinDevyn GriffinTony Grigsby Jr.Justin GroveDave GrumieauxRoy GuerraBrianne GungollDonald Gunnoe IIGilbert Gutierrez Jr.Jose GutierrezDerrick GuzmanSummer GwinnTimothy HaackGreg HaddockClarence HadleyJosh HalbertLindsay HaleTrey Hale IIICary HallRob HallRobert HamZaid HamdokhJeremy HamillHeather HamiltonWeston HamiltonCarolyn HancockSheila HarderMelanie HarlessMichael HarmanCharlie HarringtonAaron HarrisAmy HarrisDustin HarrisJeff A. HarrisJohn HarrisMichael HarrisMark HarrisonDaniel HartDavid HartDavid HattonJerry HausmanShane HaydenAmanda HayesCharles HayesKelly HayesPatrick HayesStephanie HayesDoug HaymakerMike HaynesDustin HaysThomas HaysTyler HaysKenneth HazelwoodJames HeadAnne HeatlyGary HeinenLindsey HeintzChristopher HeiskillKelly HelmKim HelveyRob HembreeKim HendersonKristi HendersonRon HendersonTJ Henderson IIGreg HenryWilliam HenryDave HensonAlvaro HernandezFrancisco HernandezMario HernandezMarisol HernandezRomualdo Hernandez Jr.Jude HerringRichard HessClaudus Hester Jr.Anna HibbardDouglas HicksJosh HicksWilliam HigginbothamHillary HigginsShawn Hignite
SCREEN ON THE GREEN Oklahoma Employees and their families roll out the picnic blankets and unfold the lawn chairs to enjoy an outdoor movie, carnival and dinner on the company’s athletic field at its headquarters in Oklahoma City.

EMPLOYEES 37
Shane HilliardAngelo HiltonWeston HintonKeasha HobbsCharles HodgesMissy HoehnJoe HoferDuston HoffmanEli HohnEric HolcombDan HoldenAdam HollandColby HollandJanice HollowayAdrianne HolmesDennis HolmesDon HoltKyle HoltSheldon HoltTiffany HopkinsGreg HopperRyan HornTim HorneMatthew HortonBud HoseltonErin HowardNicole HowardJoe HowellJohn HowellRonnie HubbardMelissa HuddlestonTara HudsonMont Huff Jr.Barry HugginsKeystone HughesOmar HuizarTracy HulseyMatthew HumphreyJoe HunleyDanny HuntSteven Hutchens Jr.Daniel HyattSteven HyattAngela IbaraKaty IgartaGerald Irwin IIIErnie IsenhartKate IveyMonsuru IyandaLucio IzguerraAlan JacksonAngela JacksonBeverly JacksonCara JacksonRoger JacksonLarry JacobsCody JacowayJose JacquezJeremy JamesKen JamesTommy JamisonVictor JaramilloStephanie JaronekBilly JeffersClint JenningsBlu JerniganLi JettPablo JimenezBilly T. JohnsonBrenda JohnsonDannie JohnsonJason JohnsonKyle JohnsonKyle R. JohnsonRandell JohnsonStephen JohnsonTyler JohnsonPerry JohnstonAaron JonesAnne JonesJ. Scott JonesJeff L. JonesMarvin Jones Jr.Chad JongelingChris JordanRigo JuarezAndy KapchinskeAndrew KarberTiffanie Karber
James KarrakerDoug KatholRita KearyChip Keating IIIBradley KeechClayton KeenanBill KellerKarin KellerKim KellerAmber KelleyJason KelleyJohn KernsPamela KerrMark KincaidFreddie King Jr.Lanney KingNelson KingRyan KintnerDayna KirkTimothy KirkwoodDale KisnerRobert KitchensKasey KliewerRobert KlineMegan KlusmeyerAnthony KnuppelMichael KossAllison KrittenbrinkRyan KrittenbrinkAlischa KrystyniakDan KucabMiranda LaceySteve LadnerMiranda LairTodd LambKelly LamoreauxMindy LamprichClay LanconJason LandisNikki LandsbergerDustin LangleyAbel LaraLindel Larison Jr.Toby LatteaAaron LaubhanEugene LauricellaAndy LawrenceWallace LawrenceCheryl LawsonToni LawsonLuke LawverReagan LeaGreg LedbetterJ. LeeMelissa LeeTony LeeWarren LeeJeremy LegerBrandon LehoskiTim LeiererDan LeiphartLogan LemleyLuis LermaChrista LevescyJoshua LewellenChelsea LewisGreg LewisStacey LewisJohn LibhartChuck LillyJennifer LindseyLaura LinnCory ListenJeremy LittonBrian LockartNicole LogsdonAngie LohnerEthel LongJames LongAlfred LoperJavier LopezEric LoudenslagerT.D. LouisKarson LoveMichael LoveShirley LoveladyBrandon LovellMichael LovellLu Lovett-Voss
Benjamin Lucas Jr.Dustin LucasElyse LuccheseShane LuckettGerardo LugoMatthew LunaRichard LussDavid LynchPenny MaciasColeen MagnessRhonda MaguireCharlie MalcolmJohn ManesKarissa MannTerry MannMark ManosChris MarbleShawn MaricelliKeith MarinTravis MarkerNathan MarksLeeAnn MarleySteve MarpleAdrian MarquezJamie MarriottRebecca MarshallPaul Marti Jr.Dustin MartinHugh Martin Jr.Thomas E. MartinAbel Martinez IVJoe M. MartinezArmando Martinez-BarreraOscar Martinez-BarreraLaura MartiniDavid MasikerJames MasonRyan MasonSteve MasonJohn MastersonMatt MatosDarrick MatthewsBobby MatticeJared MausPeggy MaxellJoseph MayBenjamin MayerAnthony MazeChristopher McAlvainHarold McArthurJim McCall Jr.Michael McCannMichael McClanahanJosh McClaryJosh McCollomRandy McCollumElizabeth McCormickJames McCormick Jr.Jay McCormick Jr.Wayne McCormickJeffrey McCoyLarry McCoyFadoua McCrayJoshua McCrayRobert McCueJohn McCulloughMichael McDanielMiles McDanielRobert McDanielDustin McDaugaleDebby McElreathJon McEntireJuan McFaddenCharles McFarlandJulie McGillJP McGinleyBilly McKamieJake McKeeverMark McKelveyChristopher McKownStuart McLainJim McLaughlinRandy McLaughlin Jr.Jonathan McLendonJohn McLeodDon McMahonTerry McMinnTyrel McNattNathan McRae
Joe McShaneJosh McWhirterKacee MeadowsRobert MecomDavid MedcalfMichael MedcalfSalvador MedinaJessica MeekLindsey MelottJoe MeltonGuadalupe MendezRenea MerchantJames MerrellDavid MesserJennifer MesserRenee MetcalfMegan MeyerJonice MeziereTiffany MikelJody MiklesLynn MilerAnna MilledgeDrew MillerJohn MillerJulie MillerMarc MillerMaurey MillerRodney MillerJames Mills Jr.Brad MinickGregg MirandaMike MirandaDexter MitchellChristopher MoonKenneth MooneyAdam MooreAndrew MooreRon MooreScotty MooreCarl MootzBilly MoranCoby MoranRoger MoreauDwight MoreyMichael MoreyDanney MorganGrant MorganHeather MorganJohn MorozukChad MorrisJared MorrisMarc MorrisMelinda MorrisSteve MorrisRoxanna MorrowJean MortDon MosherSteve MossorRichard MullicanDaniel MuncyRon MunyonMatt Murphy IIAngie MurrayCarl MurrayChris MurrayJason MurrayLaura MurrayRyan MurrayLee MustardDanny MyersPatrick MyersChris NarteyAlvaro NatividadDavid NelsonRoger NelsonCathy NesterBob NewportCary NewtonSean NguyenJoshua NicholsThomas NicholsonTodd NickelsJason NielsenTimothy NolandDerec NormanTommy NormanScott NorrisAlvonne NuallKristin Nugent
Jennifer NunnDenny Nurkiewicz Jr.Chima NzewunwahSteven OakesChad O’BrienJames OcholikJessica O’DanielAndrew OdellJames OlsonMike OlsonClint OltmannChristina OntiverosDavid OrtegaMichael OrtegoDavid OrthIsmael OrtizVicki OteyCraig OvercashAaron OverturfJeff OwensMichael PainterVictor PalaciosPatrick ParishGrant ParkerShaphan ParkerRobert ParrieBenjie ParsonsJeffrey ParsonsJonn ParsonsMatthew ParsonsChip Patton IIILaura PattonMark PattonCarissa PatzkowskyAlly PayneJames PeaceDanny PeachSeth PearrowTom PearsonTy PeckJohn Peek Sr.Brandon Peffer
Scott PeggMichael PennerNick PennerKellie PenningtonNathan PeppersFernando PerezHugo Perez NajeraRichard PerkinsGene PerryMelissa PettyPhilip PfisterLisa PhelpsJames PhillipsJoseph PilcherJonathan PiperBrad PipinsClay PittsBrian PlumCarl Poe Jr.Neal PoindexterRandy PonsDennis PoolEddie PoseyJ.P. PotterFred PowellJerry Powell Jr.Troy PowellKenneth Prangler Jr.Judy PrattMitra PrattDavid PrenattElizabeth PriceKristopher PriceAmanda PriestJerry Pritchard Jr.Amanda ProctorAdrian ProudfootClint ProvinceKristin PrudhomGary PruettBarkley PruittElizabeth PrykrylJohn Pugh IIIBrett PurvineBill QueenSylvia QuintanaJames Rachal
H.E.L.P. INITIATIVE Texas
Kristin Ballard, Office Services Repre- sentative, makes new friends while volunteering at Broadway Baptist Church in Fort Worth.
Adam RackisJon RadkaMark RainesHeather RamseyRobert RandolphBrandy RatcliffGlenda RatcliffeClint RatkeAnne RawlinsEric RayIsmael RealKen ReardonWilliam Reather Jr.Mike L. Reddick Jr.Robert RedhatBrittany RedmondJerriann ReederRobin ReeseNathan RemediesJaime ResendizGregorio ReyesAlyse ReynoldsJoy ReynoldsCraig RhodesJames RichardsStan RichardsDrew RichardsonZachary RichardsonVernon RickettsChristopher RicksBrent RiggsRandy RileyJesus RivasJoseph Rivers Jr.Jerri RobbinsKaty RobbinsJesse RobertsJustin RobertsLuke RobertsRoyce RobertsDean Robertson Jr.Amber RobinsonHeath RobinsonArmando RochaDavid RodgersAmanda RodriguezArt RodriguezJuan RodriguezJohnny RodriquezMelanie RoeMichael RogersRichard RogersTommy RogersAlan RogstadGrant RohlmeierClint RolandCarlos RomoJeffrey RonckJustin RoperJames RoshtoAchley RossDan Ross IIIMichael RossMichelle RossAmber RosserYury RoubaGreg RowlandJimmie Rowland
Matt RuckerRaul RuizClarence Russell IITim RutherfordBrian RyelSteve Salter IIMatthew SandersRyan SandersWilliam SandersKevin SandersonRamon SandovalChad SatterfieldScott SayreBryce ScalfCody SchaedigRobert ScheetzJohn SchieberChris SchmitzJohn SchneiderCharles Scholz Jr.Klint SchroederJeff ScogginsJon ScolamieroAmanda ScottDavid ScottGina ScottJon ScottJustin ScottMason ScottNathanial Scott IIHilary SeagravesSteven SearsNick SentellKeith SentiRodger SettleDavid SeylerHoward ShamblinCharles ShannonJohn F. SharpSharon SharpJim ShawBrian SheltonJerry SheltonKerri SheltonPaul SheltonMatt SheppardJerry ShifflettDavid Shinn Jr.Taylor ShinnDavid Shirley Jr.Josh ShirleyAmber ShockleyRachel ShorttLarone SiemsenCorey SimmonsCynthia SimmsChris SingletonClay SkochKamberly SkochJames SlatenFred SlaughterLarry SmallwoodPat SmelleyAmy SmithBonnie SmithBradley SmithBrooke SmithBryan Smith

38 CHESAPEAKE ENERGY CORPORATION
Clovis SmithDarrell SmithJonathan L. SmithKirk SmithMichael W. SmithMonte W. SmithShane SmithSharla SmithBoyce SmithsonAnna SnedekerRandy SnowJason SolleyJane SouthardDouglas SparksVictor SpikesPaul SpoonChristopher SprattChris SpruteColby StaatsGary StacyJoshua StandiferCarl StandleyJohnny Stanford
Travis StankorbTodd StarkeyCharles SteavesonGreg SteeleMichael SteinhourBerk StephensDarrell StephensJames StephensRodney StephensonCarly StevensSara StevensScott StevensonBrian StewartRebecca StewartRyan StewartSteve StillJason StinsonKen StinsonJoe StocktonNatalie StocktonWilliam StokesMichael StoreyMark StrackJason StrawserKevin StrawserOrdare StriblingJessica StricklinRyan StricklinSarah StruckTerry StuckIsaac Stump Jr.Damon SudermanCasey SullivanTeri SwarenginJonathan SwarthoutMichael SwongerAuna TackettPaul Tackett
Kiel TalbertJason TannehillRyan TannerChristie TaylorRobert TaylorRoberta TaylorS. Kyle TaylorTheressa TaylorTom D. Taylor IIITom W. TaylorAnthony ThomasDanny ThomasDennis ThomasLaDonna ThomasMark ThomasThaddius ThomasTrista ThomasKhristen ThomasonCameron ThompsonCharlie ThompsonHarold ThompsonKen ThompsonMatt B. Thompson
Raymond ThompsonLaura TiffanyBrandon TindleMichael TingleRonny TinkerAdam TinneyDavid TollanThomas TollettDavid TollisonMatt ToppinsKatie TorresMary Anne TownsonKeith TranVan TranGuy TrentTyler TrentLauren TrullAdam TuckerWilliam TuinstraJon TullerOttie Turner Jr.Lane UmstedChris UnwinRick UrashKristin VafadarMiguel Valero-EsparzaJohn Vankirk Jr.Shawn VasseurMerrilee VeresRonald VeselyKristen VickreyNathan ViggersTara VothAlexa WadeJosh WalkerKristen WalkerJohnny WallBrandon Wallace
Laura WallaceCatalina WalloMonica WallsAdam WalshChelsey WalstadLori WaltersMichael WaltersKyle WaltispergerDanny WardRobert Warren IIINick WatkinsMatthew L. WatsonJason WaybournKelly WeaverJeremy WeeksLinda WeeksLogan WehlingCody WeirJody WeirAlison WeisMelissa WellsGary WenclBrandi WesselYukino WestLaura WhaleyBuck WheatDavid WheelerRebekah WheelerLauren WhitakerGary WhiteJennifer WhiteLain WhiteMike WhiteRandall WhiteRobert WhiteRoger WhiteSara WhiteTodd WhiteJim Whitefield Jr.Wendy Whitfill-EmbryJoni WhitneyKiley WiewelAllen WileyWayne WileyColton WilkinsonAllison WilliamsAmy M. WilliamsChristopher WilliamsDavid C. WilliamsDerek WilliamsJason WilliamsJerry WilliamsJoe A. WilliamsJoe L. WilliamsSherwin WilliamsShelli WilliamsonDavid Willis IIPaul WillisBruce WillmottCraig WilsonLacie WilsonMatt WilsonRobert WilsonSabreena WilsonChasta WimmerKyle WinklerLaura WinklerRory WinterLane WittDallas WoodDan WoodDavid WoodRick WoodTara WoodEric WoodardCameron WoodsTyler WoodsSean WoolvertonTammy WorrellDarren WraspirLacey WrightMagan WrightShalen WyattMark WyckoffMike YarbroughShaun YatesNathan YeatsDavid YellePreston Young
Jesse YuleErvin ZachariasJacob ZachariasTravis ZamoraJenny ZhangLester ZitkusKathryn Zynda
2008 (1883)Ricky AaronJerad AbbottRichard AbelKacy AbneyJose AdameJuan AdameDarla AdamsDavid AdamsJeremiah AdamsJohn AdcockMatt AderholdDoug AdkinsDouglas AdkinsAdam AguirreJeffery AinsworthAmber AlcornDennis AlderJulie AlderChrista AldermanGreg AlexanderKaren AlexanderChristopher AllenSondra AllenJustin AllertBeth AllgoodDavid AllienKevin AllisonReno AltonJerame AlyManuel AmayaDerek AmyxHeather M. AndersonMatt D. AndersonMatt S. AndersonMilton Anderson Jr.Shannon AndersonSteven AndersonMara AndrewsShari AnnuschatBrian ArcherLucy ArebaloDann ArmourDawn ArnhartChris ArnoldJason ArnoldMatt ArnoldTim ArnoldBilly Arnolds Jr.Bryan ArrantAmber ArterberryLauren AryJason AshleyJohnny AshtonErin AustinJesus Avila TorresCrystal BaconRichard BadenJesse BaileyJoshua BaileyPatrick BaileyTommy BaileyJimmy Bailey IIBlake BakerCharles Baker Jr.Dashawn BakerDonnie BakerKrista BakerLarry BakerRonald BakerDennis BalentineAllison BalesKristen BallaKristin BallardLevi BallardMelissa BaneRon Baranski Jr.Garry BarbeeJoshua BarkerAshley BarlowAdam Barnes
Ryan BarnesDan BarnettJoshua BarronJeff BarryJenni BartelSteve BarwickT.D. BaskinChris BaslerSusannah BatchelorSton BattistoBrooke BattleGil BayerLuke BazeTimothy BeachJason BeagleDavid BeanRinda BeardMatthew BeasonBen BeaverZac BeaversCarla BeavesKate BeavinRobert BeckwithJohn BedgoodJordan BedwellRyan BellewAlifonso BeltranEdmund BeltranTroy BendingCynthia BenfordLeticia BenitezBob BennettBrandon BennettDustin BennettJohnny BennettCody BensonBrett BentleyJerry BentleyJim BentonKevin BernisSteve BerryDave BertTodd BevinsTony BiasattiEugene BickelBob BickhamJoseph BillingsDonnie BishopTim BishopGalyn BlackJeremy T. BlackBradford BlackcrowJoshua BlackwellJames BlankenshipKevin BlankenshipTimmy BlankenshipDamon BlasingameKenny BlaylockBrandon M. BlevinsShane BlevinsChris BlockcolskiDavid BlytheEmily BoeckingDustin BoeckmanKenton BoeversEmiko BogardMichael BoilesCasey BolandMisty BolanosKelly BondMichael BoneMitchell BooneErnesto Bordayo Jr.Dan BorumJohn BostwickBruce BoudmanChristopher BouletGinny BourkeSteve BourkeCooper BourneVeronica BowieJohnny BowmanKen BowmanBrandon BoydDonald BoydTony BoydAmanda BoyleChris BradyMatt Brady
James BrakefieldJason BramletteMichael BrannumRodger BrattonBrett BraytonNeal BreazealeAimee BreezeRobert BrevelleHeath BrewerGrady BrileyKatie BrinleeRock BriscoeSammy BriscoeBull BristerPam BrocatoStacey BrodakCandace BrooksJohnny BrooksTimothy BrooksTom BrooksDallion BroomfieldBrenda BrothertonHugh BrowerBlaire BrownBrandon BrownDonald Brown IIIDonita BrownHunter BrownJanet BrownLaura BrownSteven BrownJustin BrowningJerry BrumfieldElaine BrummettDaniel BrunsmanCody BrutonSteve BrutonJeremy BryanFrankie BucknerDavid BuffingtonCharli BullardRussel Bumgardner IIRose BunkleyGrant BuralAmy BurchCatherine BurdgEmily BurgessEddie BurkKristen BurkeLaura BurkeDianna BurksAmber BurlisonJason BurnettTyler BurrisJosh BurroughsDaShawn BurseKelley BusbyRyan BushmanAdam ButkusRicky ButlerJoseph ButtonMichael ButtonTimothy ButtonWilliam BuzanSteven Byers Sr.Alan ByrnesFrancis CaffeyLacy CagleSharon CahillJames CainJamie CaldwellJesse CaldwellBrandon CalhounCrystal CallahanChad CallenderAndrea CalvaneseJoe Camacho Jr.Rafael CambronKody CammackGrover CampbellBrandon CantrellAlexander CardenasBillie CarenderMike CarlsonJeffrey CarpenterSandy CarpenterHarold CarrWilliam CarrellAndre Carrethers
Jose CarrizalesJason CarrollTommy CarrollTrent CarrollEdward CarsonKathy CarsonTami CarsonCam CarterEric CarterKevin CarterRainey CarterWilliam CarterLaQuitta Carter-PearsonTerry CasbeerToby CaseyKeith CaslinBaige CastoBobby CaswellDavid CatesJarrod CauseyDavid CerezoVinicio CerezoAlejandro ChaconElliot ChambersTory ChamblissJay Chancey Jr.Joe ChandlerJerri Chapin-TerrazasBrian ChapmanCaleb ChapmanJustin ChapmanReaford CharlsonAlfred ChavezMayra ChavezRaven ChavezBradley ChervenkaCourtney ChildressLisa Christmas-PretlowRobert CisnerosBritnee ClappAndrew ClarkCassie ClarkJames M. ClarkReino ClarkThadeus ClarkThomas ClarkWilliam C. ClarkSteven ClarkeShelia ClaytonJames ClemAllen CliftKelsey ClinesmithTerry ClintonDiane CloudWesley CoatsEric CobbWesley CoferJohn CogarRick CogarBrandon ColbertAdam A. ColeMike ColeChris ColemanMatt CollingsworthTyler CollinsMelinda ColquittKeith ColwellAntonio CompeanDaniel ConardRichard ConleyBennie ConnollyLeslie ConnorJason ConwayToney Conway Jr.Christopher CookDianna CookLandon CookNate CookSean CookSherri CookJim CooperLarry D. CooperWill CooperJames CopeSteffany CopelandPaul Cornelius IVJosh CornellJessica CornettDaryl Correll
RIG TOUR Oklahoma
Office employees learn from field employees how the company explores for and produces natural gas through drilling location tours.

EMPLOYEES 39
Terry CortezJim CostinJeffery CothermanCole CoulterRandy CountsMario Coutino-SilvaZach CowdenAaron CoxBilly CoxChristopher W. CoxJohn CoxMicah CoxOrrin CoxJimmie CraigKurt CraigCasey CrawfordJerry Crawford Jr.Kasi CrawfordPaul CrawfordThomas CreecyRosalinda CrespoDale CritesThomas CritesNicky CrockerDavid CrooksKathleen CrooksChristi CrotsleyJennifer CrouchNick CrouchDavid CrouserEusebio CruzRudy CruzDaniel Cruz-MoraDodie CullenJane CunninghamKent CurranRaymond DabneyBruce DakeCody D’AlessandroColleen DameKiran DarapureddyRaymond DaughertyTyler DavidChet DaviesBrandon DavisCayla DavisCharles Davis IIIDavid L. DavisFrancis DavisGreg DavisJoshua DavisMark DavisFranklin DawsJason DayJill DayTim DealAshley DeanRobert DeanPhillip DeatonBelinda DebterSam DeFoorTim Dehan IINick Dell’Osso Jr.Pam DeLongDrew DeLozierJennifer DemelKenneth DeMoneyToney DempseyJaci DeterdingBenjamin DevilleKolby DeVilleMichael DewCurt DewbreDavid DeWittDonald DiamondMelissa DickeyMichael DickinsonRobert DicksonWade DietzmanChad DiffeyTiffany DigginsKevin DigneyScottie DillR.B. Dillard Jr.Bryan DisherTom DivineShane DixonAllen DoanJoshua Doane
Dwayne DockensKen DodsonJimmy Doolittle Jr.James DorseyZach DorseyJerry Dotson Jr.Rod DotsonBilly DoughertyPaige DoughertyJosette DoughtyEric DouglasJerrod DovellJames DowdellBobby DownsBrett DreyerReginald DrummerOscar DuarteDanny DudleyMatthew DudleyMichelle DuganAmy DukeDana DukeRichard DunaganVallie DunklinJason DunlapChris DunnJean Ann DunnLesley DunnaganTadd DunnahoeEricka DurhamChris DybvigAlicia DyeBenjamin DyneRon DysartErick EadsJonathan EasterMonte EastmanSean EastonBryan EddingtonTravis EddsJacob EdsterChris EdwardsJames Edwards IIKyle EdwardsPaul EdwardsWill EdwardsTyler EilersJanna EllenburgBrad EllettShane ElliJake ElliottStephen ElliottTroy ElliottErin EllisShawn EllisBo EmbreyMyron Emmons Jr.Matthew EnkoffTimothy EnnisEmil Enoff Jr.Tonya EnriquezKitty EnsmingerClinton ErwinWilliams EspinoChristian EstepJeremy EstepCrystal EvansJay EvansAlisha FagalaTravis FarmerFred FarndonDonovan FarrowJonathan FaughtenberryMark FaulknerGary FavorErin FayRob FellCarl FendersonEdgar FernandezGabe FerrellPaul FeslerReginald FieldingKeri FienoMatt FinneyNeil FisherChad FitzgeraldDerek FlesnerJoel FloresKevin Flores
Pete FloresLora FlorezDavid FloydChristopher ForcucciLeonard ForemanPatrick ForemanDebbie ForesterDavid FosheeJonathan FouseCassidy FoutsBill FowlerBrandon FoxPhil FoxMike FranklinBelinda FrankoGordon Frayne Jr.Gregory FrazierAllen FrederickJoseph FreeArmando FriasNorris FriendPhilip FriesenPaula FriessSteve FrostGilberto Fuentes-PerezBobby FurrJoe GabrielWilliam GageBlaine GalbreathKasha GallaCole GallawayNicole GanawayKevin GantFrancisco GaonaEliseo GarciaLeonel GarciaDan GardnerTim GareyMatt GarlingtonJennifer GarnerJunior GarnesRick Garnett IIIJohnny Garrard Jr.Bryant GarrettDonny GarrettAsael GarzaHerman GarzaAustin GaspardSarah GatelyCody GatesYelena GatewoodEshetu GebretsadikKatie GenoveseMel GeorgeMike GialousisMike GibsonJeffery GilderMike GileChad GillDavid GilleyTom GilmoreTrasey GipsonTyler GizziBlake GladhillBrent GlasgowJeff GlennLarry GlimeBrian GloverChad GloverRobert Gober Jr.Robert Goff Jr.Tami GoikeSandy GoinsWayne GoldmanRyan GoltzJustin GomesJose GomezJuan GomezNate GomezEleuterio Gomez-MartinezRachel GonserHector M. GonzalezPete GonzalezChristopher GoodinCindy GoodwinDaniel GoodwinKat GoodwinCarol GordonTony Gore
Gary GouldTommy GraceCorey GrahamJulie GrahamLindsey GrahamNeil GranberryRobert Grant Jr.Chris GrayShane GrayMichael GredlerBilly Green Jr.David GreenJerod GreenKenny Green Jr.Mark GreenMattie GreenTeddy Green Jr.Chris GreeneEdgar GregoryKevin GregoryLarry Gregory IIMichael GregorySarah GriffisOwen GrimesKenneth GrimsleyDakota GringLarry GrissomMike GroomsKenneth GrotheTyler GrovesRamana GudapatiEduardo GuerraMiguel GuillenJohn GuilloryGreg GuinnJacob GuinnJohnathan GuthManuel GutierrezCharley GwinDJ HackneyRichard HaertleinBrooke HagedornTim HaladayMichelle HaleRick HaleRusty HaleJulie HaleyBrad Hall IIDavid HallJeff HallLindsey HallRandall HallRichard HallRon HallDale HalletTyler HamJoe HambyLauren HammJimmie Hammontree Jr.Melvin HamptonDebra HaneyHeather HanmerLee Hanna Jr.Mike HansonMark HardingNicholas HardwickClarence HardyCleophus HardyDale HardyJames Hardy IIBrett HargroveJimmie HargroveLoretta HarkinsChristopher HarmanJordan HarmorJennifer HarmsCasey HarrellBen HarrisJeannie HarrisLee HarrisMark A. HarrisMark L. HarrisTimothy HarrisonDrew HarroldKenneth HarshCurtis HartleyRowdy HartleySteven C. HarveyJeremy Harvill
Eric HaskinsRex HassFloyd Hathaway Jr.Kevin HathawayChalis HattonNathan HattonAshley HausmanRon HawkinsRonald HawkinsJames HayJames HayesWesley HayesRay HayfordKevin HaygoodTerry HaynesDonnie HaysTerry HeardTimothy HearnsbergerKevin HeflinLesa HeilheckerTony HellarNorman HelmickJeffrey HelwickJohn HemmingsMegan HendricksCory HendricksonEric HendrixJohnie HenesseeJimmy HeningtonCurtis HenryHayden D. HenryHayden F. HenryKeith HenryPatrick HeringerAlex HernandezAndres HernandezLeslie HernandezNorman HerreraShawn HerringJoan HessSteven HeyThea Hibbard Jr.
Charles HicksClint HicksFreddy Hicks Jr.Mike HicksNicolai HicksNigel HicksRaquel HicksRyan HicksAdam HillAmy HillJennifer HillLisa HillMegan HillZach HillGwen HillhouseJusten HinkleGlenn HivelyRobert HixonTerry HobockSally HochEdward HodgesJoannie HodgesDanielle HoeltzelEjli HofeldtStephen HoffCraig HoffmanIra HoffmanAustin HollandJim HollandMolly HolleyJeffrey HollidayCrystal HolsingerJohn HoltMegan HoneycuttWilliam Hood Jr.Wesley HooperDeidre HopkinsJohnny HornCliff HornsbyBen HortonChad HortonJanna HoskinsTrevor HoustonVeda HowellJared HowertonChloe HowlettClay Hubbard
Mark HuckabyLevon HudmanLyle HudnallChris HueyBrian HuffJohn HuffBryan HuffakerDaniel HughesDerrek HughesKennith HughesWalter HughesDaniel HumphriesKasey HundtNick HunleyHolly HunterMichael HunterJared HurstPatrick HurstRobert HurtChad HutchesJessica HutsonBrian HydenJesse HyltonJose Ibarra
Braxton ImkeBrian IngallsMarcus IngramNeil IngramSteven IrelandLiesl IrwinRyan IrwinMisty IsaacsKoby IveyPaul IveyDavid IvyAdam JacksonDarrell JacksonDwight JacksonRandall JacksonIsaac JacobsonTravis JacobsonSkip JacotClifford JamesKyle JamesScott JamesRenner JantzTimothy JanzenCarly JaroHolly JarolimScott Jeffrey
Brent JenkinsMatthew JenkinsJoseph JenningsBrandi JohnsonDawn JohnsonJake JohnsonJeremy JohnsonJeremy S. JohnsonJoseph JohnsonLindsey JohnsonManny JohnsonMichael C. JohnsonRickey JohnsonMichael A. JohnstonMichael Johnston IICarrie JonesCindy M. JonesCody JonesDenton JonesDustin JonesGrant JonesJenny JonesJody JonesJohnny Jones
RJ JonesStacey JonesTim JonesJoshua JordanSteve JordanSarie JoubertKevin JuddLogan JuddMichael JusticeJeanne KaminskiSylvie KaoMatt KarlJohn KastelicLauren KastnerRichard KastnerRussell KatiganChristopher KeithAngi KelleyKim KelleySteven KelleyPam KellyJosh KempJames KennedyWalter KennedyClint KennerShane Kennon
HOLIDAY LIGHTS Oklahoma
Beautifully lit trees on and around the Chesapeake campus create a holiday landmark each year in Oklahoma City.

40 CHESAPEAKE ENERGY CORPORATION
Sonia KeplerBruce KesslerChuck KettermanBranden KillingsworthKristopher KillmanIsaac KimbroughAaron King Jr.Justin KingLeah KingRachelle KingJade KingcadeKyle KinneyJames KirbyBruce KirklandTimothy KirlDon KirschenerSteve KlassenStephen KleinJake KlingenbergGordon KlundtBobby KnappShayne KnappBlake KnightTamara KnightTripp KnightDouglas KnightenHenry KonanGlennette KoonJustin KoonceRyan KoontzRandy Kopisch Jr.Chuck Kordis Jr.Steven KosciukSue KoskelaScott KueckRick KuperDustin KurtzKade KusikJeff LagalyMelissa LambertNelson LaneMichael LangfordSam LangleyNicole LanphearLawrence LaPlanteAndy LargeBobby LasterRyan LasterChris LaughlinMatthew LawrenceMichael LawrenceJeffery LawsonKenneth Lawson Jr.Dustin LeavinsNick Leber
Blake LeBlancAndrew LeeJesse LeeJoshua LeeKent LeeKing LeeHomer Leger Sr.Tiesa LeggettFrederick Lembach IIIGregory LemleyPamela LemleyRobert LemonsJohn LennonCarmen LentzTiffany LeschberJacob LesterDonald LeverichChristopher LewisJerry Lewis IIKent LewisMicah LewisNathan LewisCody LightWes LilesKelli LindseyBrian LingerJohn LingleSandy ListerTravis LittleRick Little AxeMark LocklearAngela LoestPhil LogsdonBryan LohoffJoshua LongRichard Long Jr.Blake LooneyKristi LooperAndy LopezLuis LopezPaul LopezRobert LopezSusan LorenzenDavid LoweCody LucasMikel LucasHector Lujan-JuradoRobert LumleyCecil LuttrullDonald LynchTerra MacAloneyGrant MacdonaldGlen MackieGreg MacksoodMichael Madar
Rafael MadridRichard MahlockTroy MahurinMichael MajorGeorge MaloneTim ManghamRico ManjarrezJonathan ManningMike MannschreckJoe ManshackMatt MantellTyler ManwellAlberto ManzanoMichael MappBritt MarchbanksRonald MarchbanksPaul Mares Jr.Dennis MarshGary MarshClint MartinJimmie MartinMary MartinMichael A. MartinMichael MartinStacy MartinTimothy MartinFabio MartinezL. Joe MartinezLeo MartinezLuis MartinezRodolfo MartinezTony MartinezCorina Martinez-MalonePam MasseyJenn MastersLauren MastersMike MathisTimothy MathisBryan MatthewsMatt MatthewsWilliam Matthews Jr.Brian MatulaBrett MaughanAngel MaxwellDavid MayJohnny MayDennis MayoMelissa MaysJoseph McalisterKim McAuliffeGarret McBrainAllison McBrideRay McCallisterGary McCartneyDakota McCartyRandy McCartyRoy McCaslandBranden McClainAlan McClureScott McCollumKevin McCotterDennis McCoyDon McCoyLance McCoyTommy McCoyJamie McCrackenJeffrey McCroskeyRick McCurdyBrandy McDanielJustin McDanielAlvin McDonaldEmily McDonaldMatt McDonaldShannon McDonaldDanny McDowellTony McEntyreJulie McFarlandBecky McGeeJamie McGeeRoderick McGeeLonell McGhanKiley McGlothlinKeri McGuireJason McIntoshCharles McIntyreTaylor McIntyreMarshal McKeeRandy McKeeThomas McKee
Leslie McKeeverRussell McKibbenBrandon McKinleyWillie McKinleyAlicia McLaughlinCody McLaughlinKippy McLellandMichele McLemoreAron McPikeEdward McQuaideCami McQuerryChad MeadowsAndrew MeadvilleJohn MeaseJames MeekRonnie MeeksDerrick MegliRyan MehanCody MeierAraceli MejiaAndy MeltonZeke MeltonJohn Melville IIITaron MendezKevin MendozaTatiana MercerCarter MesserStanley MesserKenneth MethenyAlan MetzJosh MeyAdam MeyerTroy MeyersGordan MichaelisKevin MickMichael Mikulenka Jr.Alex MillerDrew MillerEmily MillerJeanna MillerJosh MillerRickey MillerSteve A. MillerDan MillsScott MillsNichole MinnickTabb MinorKathy MiresD’Antae MitchellJuliet MitchellJeremy MixonT-Roy MizeBrennan MoatesJeffrey MohsGilbert MoncivaisMark MongoldJohn MontgomeryMyron Montoya Jr.Christie MoodyAmanda MooreLeland Moore IIMichael L. MooreRex MooreRoy MooreTimothy MooreWalter C. MooreMatthew MoranMandy MorenoRenita MorenoBrandon MorganCharles MorganEufaula MorganShanon MorrisHillary MoseleyTerri MosherTyson MoulderMichael MowrerKevin MoxleyPat MullenLester MullinsClint MullisAdam MuncyRicky MuncyBond MunsonRafael Murillo Del AngelElise MurlinBridget MurphyChasidy MurrayJerome Murray
Kevin MurraySteve MurrayKatrina MyersHeather MyresShane NafeGavin NailonTrebor NallBobby Nance IIICrystal NanceJames NeelyKyle NeuenschwanderMike NewkirkCasey NewmanDana NewmanJoshua NewportSteven Newton Jr.Chi NguyenDerek NicholasDerek NicholsRome NicholsSusan NicholsBrandon NicholsonDiane NickelMark NipperGary NixHenry NixonChad NolandJoseph NormanChase NorrisTony NorrisJohn NuckolsAimee NullThomas NunleyFred NunnCassi NunneryJane NyeJason OblanderJessica OckershauserRay OfosuDane O’GleeKyle O’KelleyLeah O’KelleyJill OlneyBrett OlsonNate OlsonChad O’NealAndy OpellaDillon OrrFausto OrtizPedro OrtizJames OsbornGregory OsbourneLindsey OswaltJeremy OtahalPatricia OteroRay OujeskyAimee OwenCourtney OwensSavanna Owens Sr.Jon PaceLupe PachecoAndrea PainterKim PainterBrenda PalaciosTyler PalesanoEmerson PalmerJames Palmer IIMatt PalmerJay ParhamChase ParisBrad ParkerDrew ParkerJoshua ParkerTaylor ParkerTommy ParkerWhaquine ParkerJordan ParmerRobley ParmerErcil ParsonsJason ParsonsStuart ParsonsRanita PatelAlex PattonTravis PattyJason PayneHenry PaytonMatt PaytonMatthew PeachJim Pearman
Josh PearmanDarby PearrowJarrod PearrowJoe PeckKip PeckTonia PeckChristopher PenaChristina PendarvisEric PendletonTim PendletonAaron PenixKeith PeppersAngela PerezCharles PerezFrancisco PerezJuan PerezJesus Perez-GarciaRichard PerimanJerry PerkinsKeera Perkins
Jamie PerotMelvin PerrinCharlie Perry Jr.Farron PerryMicah PerryNicole PetersGina PetersonMarie PetersonJarred PettijohnThao PhanSteven PhathongRicky PhillipsVernon Phillips Jr.Charles PhilyawSam PickettChristopher PilgreenKevin PinkstonLindsey PittCindy PittmanAaron PlaceNorval Place Jr.Jeff PlangmanWilliam PlantArturo PlascenciaCharles PlattAdam PleasantRyan PlummerPaul PlunkettAdam PodschunErryn PollockEverett PooleJordan PopeKevin PostalwaitMaria PostmanBrian PotockiStacy PotterMicheal PottsJackie PotvinRandell Powell Jr.Rowland PowellTiburcio PradoJosh PraterRoger Prater IIPaul PrattFrankie PrestonMike PriestLisa PritchardSade ProbyAaron ProcellChristen ProctorBarry Pruitt Jr.Duane PufferCody PuffinbargerNathan PumphreyJody PurcellBrian PutnamRoger PutnamRandy PyleT.J. PyleAmber QeramaMatt QuadeJacque QuallsRandall RadcliffJoseph RagsdaleTJ RagsdaleFrank RainbowRyan RainerWilliam RaineyHector Ramirez
Jose RamosNelson RamosDavid RamseyDerrek RamseyDina RamseyPaul RamspergerRoy Randolph IIIJared RanumJenn RauberShawn RawlsLeif RayburnAmy ReamesScott ReddickAustin ReedJamie ReedJim ReedJerry ReevesKent RegensAndy RehmJason ReidMark ReinhardtDanny RenoJames RetherfordAlisha ReynoldsJackie ReynoldsChris RialAmanda RiceDon RichardMark RichardsPat RichardsRichard RichardsHeath RichmondDale RiddleShane RidenourJill RidleyWilliam Rieg Jr.Bob RieserJulie RigsbyChad RileyClaude Riley Jr.Matthew RileyAllen RoachBill RoachAdam RobertsEric RobertsLarry Roberts Jr.Megan RobertsRhett RobertsRonnie Roberts IIBill RobinsonCharles RobinsonClarence RobinsonDustin RobinsonJonathan RobinsonMeg RobinsonRob RobinsonRobbie RobinsonTim RobinsonClayton RobisonJustin RobyBertha RodartePaul Rodgers Jr.Eric RodriguezEsdras RodriguezEustaquio RodriguezRaul RodriguezEddy RodriquezRoberto Rodriquez Jr.James RogersMichael B. RogersNathan RogersTimothy Rogers Sr.Kiley RollinsJohn RoneyRebecca RoperTrey Roper IIIManuel RosasTeresa RoseJack RosenbergDee RossChris RossonHarvey Rotramel Jr.Rusty RoushStaci RowellJason RowlandJenny RowlandMark RowoldDavid RoyRebecca Roy
BIKING FOR A CAUSE Oklahoma Martha Burger, Senior Vice President – Human and Corporate Resources, cheers for Bobby Bolton, Chesapeake Land Manager – Anadarko District, who rode more than 130 miles to help buy new uniforms and equipment for the Erick–Sweetwater Public Schools.

EMPLOYEES 41
Jeremy RubioBrad RuhmanGuadalupe RuizMike Ruiz IIBen RussJames RussellJamie RussellRandy RussellTommy Russell Jr.Bryan RyanJohn RychtarikDaniel RyersonJames SafleyBaldemar SalazarBaldemar Salazar Jr.Ricardo SalazarFederico SamoraMcKenzie SampsonChristy SamuelsMichele SamuelsEma SanchezSteven C. SandersWoody SandlinPedro Santana Jr.Daniel SatterwhiteCathy SaundersDonnie SavageSteve SavellJessica SavicWayne SavoryBrynn ScalfKevin ScaremSusie ScastaJason SchaferJohn SchaferDeborah SchaffnerTravis SchenkersHeather SchevettoBoyd SchneiderJake SchoefflerDavid SchollRegan SchraderRebekah SchultzClint SchwarzJay Scogin Jr.Dustin SconyersGerald ScottMary ScottSteve ScottClifford ScrogginsMike ScrogginsRoby ScruggsBrooke SecorErin SedbrookBrad SeelbackSteven SegrestTerry SellsChellee SemonHayet SerradjiCharlie Sewell Jr.Susan SeymoreMitcheal ShackelfordBrian ShadwickCharles ShadwickBindu ShahJerry ShamblinTodd ShamblinMichael ShanbourAaron ShannonNeil ShannonJacob SharpKevin ShawLisa SheldenJennifer ShelineCheri ShepardEb ShepherdJesse SheppardKeith Shields Jr.Brock ShindlerAshley ShirleyThomas ShockJoseph ShofnerJason ShookAshis ShresthaJ.R. ShullAmanda SiebertVince SifuentesCheryl SilerJose Silva
Gary SimerDavid SimillyPatrick SimmonsEula SimmsJ.J. Simonsen Jr.Alan SimpsonRick Simpson Jr.Brad SinorSteve SistrunkJerimy SitesJon SivertsonTyler SkeltonJustin SloanRyan SlossonJoel SmallwoodDrew SmartJake SmedleyHeather SmileyAaron SmithAdam SmithBeth SmithDale Smith IIIDawn SmithGreg SmithGwyn SmithJeffery SmithJerry S. SmithJimmee SmithJoseph SmithJulie SmithJustin T. SmithMilton SmithRandy SmithStephanie SmithSteve SmithVincent SmithZac SmithJeffrey SnellDavid SnethenJason SnyderClarky SociaMatt SolomonJaclyn SommavillaGary SonsJoshua SoutherlandPavlina SovakBrian SpaethJeremy SpalvieriLindsay SparksShawn SpencerJason SprayberryJefferson SpringerAndrew SprouseHeather SpurlockGentry SquiresFrancis StaatRobin StaffordPaul StagerMichael StairDavid StamperTim StanselLaura SteenNathan SteffeeBumper StegallGay StephensJamie StephensJoshua StephensLaura StephensCody StephensonGlenn StetsonJoseph Stevens Jr.Patrick StevensRichard Stevens Jr.Chad StewartDarren StewartHaleigh StewartJames StewartMike SticeAutumn StillCorey StillCorey StockertHarvey StockmanMichael StollJaneen StonebrakerBrian StoopsBob StoweAshleigh StrahlerAllie Street IVSam Stroder
Monica StromanHolli StrongRobert StroudNick StrunkJason StrykerEdwin StubbertDonna StubbsDaniel StumboDoug SubletteJordan SudhoffBrandy SullensStephanie SullivanChristopher SummerfieldJody SummersJohn SwansonJason TackettRocky TaliaferroJason TalkingtonCaleb TallentJoshua TannerKristin TarbushJulie TarpJustin TarverAaron TasierBrian TateTate TatemCasey TaylorChristy TaylorMonty TaylorTim A. TaylorJosh TedderJason TellShawn TenneyBridget ThedorffMatt TheriotCody ThiessenAbbie ThomasBrad ThomasDenver ThomasBritton ThomasonJoseph ThomasonAdam ThompsonDiane ThompsonFrank ThompsonJon ThompsonMatt R. ThompsonMitcheal ThompsonSharon ThompsonWilliam ThompsonStephanie ThornAshley ThorntonScott ThorntonPreston ThurmanTodd TigertIsidro TijerinaW. E. TinklerCody TiptonTanner TiptonJim ToddKyle TolerRichard TollisonSuzette TomlinGreg Tompkins Sr.Frankie Tovar IIISteve TrammellRick TreemanSarah TriboutNick TricinellaJoseph TriplettChuck TrippSteve TrotterWesley TroubDaniel TrumanMike TrussellChance TurnerKevin TwymanMark TylerPerry UlicnikBerto UlloaKathleen UnderwoodTanner UpchurchJose UrbinaJustin UrenaKen UttonBobby VallerySteve Van StrienDonnette VandersypenDeloris VanLandinghamJames Varner
Crystal VasquezJeff VasquezSilver Vasquez IIIDarren VaughnJames VaughnMatt VaughnNick VaughnRandy VaughnRusty VaughnMaria VelezMiguel VencesJose VergaraJavier VillaJuan VillarrealDonna VillersLink VodronTerri VogtJennifer VoisinTerry Von AllmanIke VorheisHaley VoylesTodd WaddleJustin WadeDonald Waggoner IIIFred Wagner Jr.Steven WagnerWillie WaldenKen WaldroopChase WaldropChris WalkerDanny WalkerErin Lee WalkerMatthew WalkerTiffany WalkerTyler WalkerAva WallaceBrandi WallisJimmie Walters Jr.Michael WanzerKevin WardTara WardRich WareKent WarfieldDoug WarminskiDennis WarnerBJ WarrenBrian WarrenChristian WarrenJohn WarrenRay WarrenBritni WatsonCody WatsonJohn WatsonMike WatsonGary WattsKelli WaxmanGuy WeathermanJeff WeaverMichael WebbNathan WeberRyan WeberCody WeissGeorge WeissmanBill WelchBrandon WelchBrent WelchKip WelchMelanie WelchBrenna WellsGeff WelshTommy WessonDrew WestKris WestNathan WestScott WestColt WestbrookBuck WheatonJeric WheelerTodd WhisennandShawn WhitakerDennis WhiteLisa WhiteSuzy WhiteTodd C. WhiteDanny WhiteheadDarien WhitehurstGary WhitleyKody WhitleyKyra Whitt
Darrell WhittemoreBobby Whittington IISam WhitworthRachael WickeryLeeAnn WidnerDavid Wiist Jr.Terrence WilhoitBrent M. WilliamsBrian WilliamsCody WilliamsDavid L. WilliamsFrankie Williams Jr.Mike WilliamsSheila WilliamsWhitney WilliamsForest Willis IVAdam WilsonB.C. WilsonDarrel WilsonDon WilsonErica WilsonJerry W. WilsonJonathan WilsonKayla WilsonKendal WilsonKevin WilsonLance WilsonSugar Ray WilsonTerry M. WilsonTerry T. WilsonTodd WilsonClayton WinklerGary WinnKeith WinsauerRhett WinterCrystal WitcherNikki WitcherDavid WitteKenneth WoechanKen WolfRay WolfGlen Wolford
Luke WoodKim WoodallTravis WoodardRichard WoodbeckMike WoodfinKevin WoodsKyle WoodsMonty WoodsDavid WoolsBecky WootenBilly WootenJamie WordDaniel WorthamLindsey WorthamEmily WorthenDarren K. WraspirBrandon J. WrightDan WrightKandice WrightMike R. WrightRyan WrightTom WrightChad WyattCarolynn WylderJennifer YeahquoTonya YorkAndrew YostKevin YostScot YoungTerri YoungTammi YountJuan Zapata Jr.Robert ZeilerDebra ZimmermanLinda ZimmermanMelvin ZinkeGerry ZiriaxeRigoberto Zubia
2009 (1778)Timothy AbshireTimothy O. AbshireEthan AcevedoDaman AckermanJoshua AckleyJeremy AdamChristopher Adams
DeAnn AdamsDoyle AdamsHeath AdamsKyle AdamsPeter AdamsMark AdkinsMichael AdkinsonDavid AdkisonAaron AguilarDavid AinsworthEdward AinsworthTasha AkersGavin AlbrightMarco AlemanCurtis AlexanderStephen AlexanderBart AlfordAlbert Allen III
Cathy AllenDavid AllenJames M. AllenJared AllenKane AllenMike AllenPaul AllenTommy AllenSondra AllisonMaria Almanza De GarciaReginald AlstonJacob AlvarezJames AlvisJoe AlyBrandon AmatoMatt AndersenAndrew AndersonJeremy AndersonRondal Anderson Jr.Tyler AndersonVictor AndersonAustin AndrewsDustin AndrewsJame Andrews Jr.Bradly AndrusTony AngeloChristopher AnglinGary AnsleyRob AnthonyDavid Applegarth Jr.Sam Arambula Jr.Tony ArandaSteven ArmentroutGregory ArmsteadJoshua ArmsteadBrian ArmstrongBubba ArmstrongDavid ArmstrongPriscella ArnettKyle ArnoldDaniel ArySamantha AshMike AtchieBilly Atkinson
Michael AtkinsonKelly BabbAlberto BaezaRodney Baggett Jr.Joey BagnaroBill BaileyGordon BaileyJamie BaileyJustin BaileyKenneth BaileyT.J. BaileyBrett BakerBryan BakerHeath BaldwinMichael D. BallMike BallJonathan BallardLilli Ballinger
Diana BaneKim BarbayLinda BarberSeth BarkocyDylan BarnesMarcus BarnesRyan BarnhartBen BarresiShane BarrettJoshua BartholomewJohnny BartonWhitney BashGeorge BassJustin BassMelissa BassettBrian BastedoBarry BatemanAllen BatesChristopher BatesEverett BatesHope BaumgarnerJames BaumgarnerMatt BayneKara BealCoby BealsJonathan BeamBucky BeaverRussell Beavers IIIAdam BeckMelissa BednarcykBrandon BeechlyJed Beegle Jr.A.J. BeetsJeremy BegemanKyle BehnkeChristopher BellDustin BellJason BellessDana BennettRyan BennettTodd BennettTyron BennettAllison BentleyDaniel Bentley
20TH ANNIVERSARY PARTY
Louisiana Across all its operating areas, Chesapeake employees celebrated the company’s 20th anniversary this year.

42 CHESAPEAKE ENERGY CORPORATION
Merideth BentleyMatthew BereuterJonas BergmanSherry BernsteinJacob BerryKevyn BerrySteven BerryMichael BerrymanChris BeuchawJared BeutlerCarl BeyorAmber BezdekCole BieberDannye BillieJames Billings
Justin BillingsBrian BilykChris BirdAndrew BischoffCarmen BishopJames BishopRyan BishopKevin BlackShyla Blackketter DwyerJohnathan BlackstenKent BlackwelderDarrell BlaggRaymond BlankenshipTobey BlaylockJoshua BlewerScott BlomgrenJason BloseMargaret BlountBenjamin BlueDan BlytheVictor BoatwrightDennis BodeJonathan BodineTravis BohannonRyan BohnetJeremy BoitnottJen BookwalterChristopher BoomgardenCurtis BooneJustin BoopMike BordesRichard BostickNathan BottiKent Bowman Jr.Sonny Bowman IIChristopher BoylesShad BrackinArla BradfordBlair BradleyColt Bradley
Dennis BradleyMatt BradleyLeon Bradshaw IIBen Brallier Jr.Justin BrayRick BrayChristopher BrelandRawlins BrelandRandall BrewerDawn BrickJason BridgesScott BridgesLindsay BridgwaterKeith BriggsKenny Briley
Brian BristolBryan BrittJames BrittBecky BrittainClint BrooksGerald BrooksJoe BrooksLandon BrooksMartin BrooksShannon BrooksJonathan BroomeLeslie BrossSarah BrothersCharles Brown IIDavid B. BrownMatthew BrownMike BrownRobert BrownTimothy BrownRobert BrowningMary BruceBenjamin BruletHeather BruletJennifer BrumageChris BrummettJeremy M. BryanScottie BryanJeffrey BryantNathan BryantRon BryantMegan BryceDavid BrysonJared BuchanJamie BuchananJohn BunnerSteve BurnleyJeffery BurnsLonnie BurnsChristopher BurrisAmy Burrous-Medina
Sylvia BustamanteJeff ButlerByron Button Jr.John BylerSteve ByrdBradley CagleChristopher CainMike CaldwellStephen CallahanCraig CallasJames CallenderJuan CamachoMartin CamachoJeremy CamburnDavid CameroKim CameronStephen Cammann Jr.Jimmy CampDerek CampbellJC CampbellScott CampbellSteven CanadaLuis CanalesMichael CaneenSteve CanfieldIrene CantuJames CarbaryCasey CardinCody CarlisleNathan CarlsonLonnie CarpenterLuke CarpenterJeremy CarrawayBobby CarterCharles Carter IIIJeremy CarterToby CashionKen CasonJefferson CastieChris CastleberryJimmie CastoMelissa CatesThomas Caton Jr.Ken CavnerScott CazabatBrad ChambersErin ChancellorRocky ChapmanChris ChappellChuck CharlestonDedra ChavezLonnie ChevallierEugene ChildersLindsay ChoateAmanda ClarkChristopher ClarkWilliam G. ClarkTom ClarkeJane ClementsChristopher ClevengerChad CliffordMegan ClinkenbeardMichael T. ClintonJason CoatesAnthony CochranRandall CochranLloyd CockrellMike CodyMerrick CoeMerle Coffman Jr.Christopher CogswellDustin CogswellJoe ColadipietroGlenn ColbertKaren ColbertJohn ColeJustin ColegroveBob V. ColemanJuri ColemanJustin CollierNathan CollinsRick CollinsTom ComerRon ComesAmanda ConsbruckPaul ContiDave CookJud CookRickey Cook
Dustin CooperChad CorcoranJon CorleyAdam CornellJose CorralejoBenjamin CorsoAgustin CortesMarcus CorvinoKeith CowellDavid CoxStephen CoxJosh CraigJulie CraigBrandon CramerAndrea CrawfordCory CrawfordJonathan CreaganRobbie CrosierDerik CrossMichael CrossJohnathon CrossenWillard CrossenCorinne CroucherPam CrumErasmo CuellarJeremy CummingsDavid CunninghamDwight CunninghamNatalie CunninghamBryan CurtisJimmy Cyrus IITiffany DaileyDurwood DaltonJeffery DanielBecky DankerJoe DarnellAdam DaughertyBrian DaughertyJoe DaughertyRick DaughertyPat DavenportOrin DavidBen DavidsonRobert DavidsonAndrew DavisDarryl DavisDaryl DavisDustin DavisGary DavisJoel DavisJohn W. DavisKerri DavisLandon DavisSteven DavisTim DavisWilliam DavisDavid DawsonBrian DeanRyan V. DeanShane DeanEric DeckerEric DeeterWilliam DeFoor IIIDavid Dehn Jr.Bradley DeinesBillie DemottGregory DesperBrian DevaneyDanny DevilleFnu DezvitaValente DiazChase DickensBentley DillJerry Dilley IIJerry Dilley Sr.Nicholas DimauroDrew DixonLee DixonJeb DobbsAmy DobkinBrandon DodgenRenee DollarChuy DominguezCrystal DotyMarshall DoughertyKarl Doughty Jr.Terry DoughtyIrene DougreyAnna Dovedan
Dewey DowdyCheryl DowisJohn Dozer Jr.Michael DrakeWilliam DraperGreg DuffyWill DuffyBryan DukeConnie DukeRobert DukeJustin DulaneyChad DuncanCody DuncanJIm DunhamChris DuntonJeffery DurhamCory DurigChris DuroyChase DwigginsGreg Dykes Sr.Joe EadesAllison EarlShannon EarleyJacob EasthamJeremy EastonBilly EastwoodJanelle EatonTammie EbertLayna EddJoseph Eddy IIIJarrod EdensChristopher EdgeMichael EdieJeremy EdmisterKelly EdsonRaymond EdwardsDaniel EidtLuis ElizondoJohn ElkinsJohn EllardBenjamin ElliottChad ElliottDon ElliottCodey EllisGilbert EllisJim EllisJames EllsburyBrandon EmberyAmanda EmbryJoseph EmersonGary EmmertTyler EmrichColton EnsmingerThomas ErpZacarias EscalanteChristopher EscherJevon EscobarCraig EstesKeith EubanksDon EvansJames EvansJason EvenerGuy EwartLyric EwingRichard FariesRyan FarleyChristopher FarrarKameron FarrisChris FeazellZachary FegleyJon FennelAmy N. FergusonRonnie FergusonTyler FergusonMaria FernandezMichael FesmireLinette FibigerBrandin FieldsCasey FieldsJamie FieldsKevin FieldsPeggy FieldsJeremy FindleyBrett FinleyAmanda FinneyJesse FisherJohn E. FisherMike FisherPete Fisher
Timothy FisherRandy FiteBilly FittWilliam FitzgeraldJared FlesherRonald FletcherVernon Fletcher Jr.David Montes FloresDonald FloresMichael FloresToni FlowersKevin FloydDave FogelmanRobert FolandWilliam FordTim FordenbacherRhonda FortuinBlake FosterJustin FosterChris Fournier
Bobby FowlerBuddy FoxJohn FoxSandra FraleyJoshua FranksChris FrazierLeeAnn FrazierBilly FreelandLynn FrenchGreg FritzeTina FrugeTyler GageDarren GagliardiWayne Galliher IICecil GambleMatthew GammonJim GannAlfonso GarciaJames GarciaJoshua GarcieKenneth GarlandGreg GarrisonDan GarwoodAlan GaryNaomi GarzaFreddie GatesLynda GearheartWarren GeionetyNicole GeisingerRyan GeorgeTodd GeorgeMark GeurkinkBert GibsonFred GibsonJosh D. GibsonRobert GiffordMichael GilbertRobert GillJennifer GilliamEllen GillilandFlorence Gills Jr.James GilpinTim GilpinNed GipsonShannon GlancyTravis GlauserMichael GleasonBradley GlosupMitchell GodbeyKarl GoebelDarrell GoeringerDevin GoldenJessie GonzalesJose GonzalesCirilo GonzalezErnest GoodenMark GoodinRichard GoodrichDaniel GorhamJulian GormanRyan GormanShawn GossAdam GossenJoseph GottschallMike GradyIke GrahamInna GrahamJamie GrangerCaleb Grantges
Matt GrassmyerKristel GravesMike GravesJames Gray Jr.Stanford GrayTrey Graybill IIILance GreenMike GreenSheri GreenWhit GreenAllan GreenawaltDustin GreenwayJames GreenwoodJosh GrellnerJason GriffisLambert GrimBrian GroggBrian GroveChristopher GuajardoRich GuentherGlenda GuerraRene GuerraAngel GuerreroIsela GuerreroBrian GunsaulisBoJames GunterChristopher GustavusPaul GuttaSarah HackerAugust HadwigerRyan HaffnerDavid HagadornPaul HagertyKeith HaggardStephen HaggertyGreg HakmanBrian HaleBrandon HallDustin HallJessie HallRenee HallRick HallZach HallClint HamiltonJames HamiltonWilliam HanNick HancockKristi HannaSean HansenDavid HarbinDaniel Hardy IIStephen HardyEddie HareJustin HargettTubby Hargrove Sr.Alysia HargusAaron HarperAdam HarperChristopher HarperGregory HarperCharles HarrisJackie HarrisJerry HarrisBerlin HarrisonMark R. HarrisonCharles HartKevin HartRandal HartLarry HartgraveKenneth HarveyMichael HarveyMatthew HarvilleLeonard Harzinski Jr.Jon HaskinsHeath HatcherMarshall HatcherErin HathawayJohn HattonThomas HaunMichael HausvaterRobert Havens Jr.William Hawkins Jr.Rick HawthorneD.J. Haydon Jr.Adam HaynesKenneth HaysAllen HeadGarry HeadrickJennie Heard
HALLOWEEN UNITED WAY FUNDRAISER Oklahoma
Bringing out the fun-loving aspect of our people, a costume party drew more than 3,000 Chesapeake Oklahoma City corporate staff employees with lunch and prizes for costumes and skits — while raising funds for United Way.

EMPLOYEES 43
Jonathan HearitigeGreg HeaterKellie HefnerAnthony HeggenstallerCory HeidJeremiah HeldrethJames HendersonRob Hendle Jr.Cory HendrixSandra HendrixDavid HennessyDavid HenryEarl Henry Jr.Marcus HenryMatthew HenryPhil HensleyJames HensonParish HensonBrandi HernandezJose HernandezRaymond Herndon IIIMike HershbergerKurt HibbardSean HibbardAlyssa HickeySonny HickmanCarlos HicksDanny HicksGary HicksJacala HicksJason HicksMichael HicksDean HigganbothamDuke HightowerChristopher HillWilliam HillierJames HiltAlina HinesAshley HinesChase HinesEdgar HinojosKerry HinsleyCory HixsonMark Hlatky Jr.Angi HodgeSteven HodgesRussell HogueDustin HolbenBrandon HolleyJohn HollisterJolene HollomanLaura HolmesClay HoltGene HoltKevin HoltPT HoneycuttThomas HoodMatt HoopsWes HopeAmy HopmannDenver Horn IIJason HornJennifer HorriganSherry HoseyLanny HotalingNicolas HoughSara HowardSherry HowellEddie HowenMatthew HudmanMorgan HudsonStacy HudsonDaniel HudspethNathaniel HuggansBraxton HughesLori HughesHayley HumpertJeremy HunterAlberto Huron Jr.Eddie HurstEdward HurstKollin HurtKyle HurtLisa HutchersonAllen HutchinsKevin HutchinsJon HydeWesley HydeDerek Hyre
Dennis IdlettNeal ImpsonDonnie IngramPatrick InnesEric InskeepOrlando IsaiasLaramie IsleySteve IwersenRobert IzellBlake JacksonBrian JacksonCody JacksonMark JacksonShawn JacksonStephen JacksonHillary JacobsonDon JamesKenneth James IILarry JamesLamont JanzRyan JarrattCalvin JarrellJonathan JarvisRobert JarvisVictor Jarvis Jr.Chance JenkinsDavid JenningsErinn JenningsBob JoestBradford JohnsonBraydn JohnsonBrian JohnsonElmer JohnsonFranklin JohnsonGary W. JohnsonJimmy JohnsonKevin JohnsonLarry JohnsonMatt JohnsonMichael M. JohnsonMykal JohnsonRich Johnson IIScott JohnsonSteve M. JohnsonAmy JonesBobby JonesBrady JonesCyndi JonesDan JonesDaniel JonesEmily JonesHunter JonesJennifer JonesJeremy JonesJoshua JonesJulie JonesW. Scott JonesWhitney JonesXavier JonesJohn JordanWill JordanEd JozwickRon JuratovacRonald JusticeJared KaleyAlex KarimJustin KayClint KeatingCale KeimMark KeitzLynne M. KellerShawn KellerChad KelleyJordan KelleyMatthew KellumSteven KellyMatt KemperJosh KendrickGreg KennedyMatthew KentCheryl KerrJeffery KesnerJohn KiehlmeierJohn KilgallonChristopher KimbleColby KingGary R. KingJeremy KingParker King
Melissa KingryWill KingtonWoody KinneyMichael KinseyKenny KipperCarey KirbyBeth KirchnerWayne Kirk Jr.Whitney KirkKerry KirksmithHeidi KirschJohn KitchenShayna KjellsenJosh KlingZackery KnellAaron KnightChuck KnightJames KnightJohn G. KnoxJohn M. KnoxTodd KreamerTravis KunkleIsaac KurtzJohn KurtzJulia LaBellaBen LacyJV LaffitteJohn LairDaniel LamarDaniel LancasterBobby Landrum Jr.Mark Landrum IIKim LandryDavid LaneRichard LaneClay LangleyMike LangleyJimmie LaninghamCraig LankfordClaudia LaPlanteDaniel LaraCorey LasleyJoe LathamBrian LaymanTed LaytonLucy LazosCourtney LeachEric LeatherwoodCeleste LeBlancScott LedbetterAaron LeeAlexa LeeChristopher LeeClayton LeeDale LeeTot Lee IIIWill Lee Jr.Micah LeGallBryan LeggMarie LeifheitWesley LemensCruz LemusJared LesemanAndy LevineMark LevingstonChad LewisTim LewisSam LiebhartFrederick LigonsEric LindbergJeffrey LindseyLindsay LineLarry LinesAndrew LinquistRosie LintonJohn LittleMichael LittleRobby LittleMichael LivingstonNeil LloydLogan LobueScott LocklearCasey LoganTony LogueLyndel LomanAngie LongCarson LongDavid LongDiana Long
Eddy LongOrval LongDan C. LopataColby LoperAndres LopezJohn LorentzJames LouisoOwen LoveJoseph LowerySteve LowtherFrancisco LozanoOmar LozanoPetra Lozano De ThompsonBonnie LucasCody J. LucasHarvey Lucas Jr.Derek LueallenTyler LumpkinDonald LundyBill LuskDavid LuttrellDustin LynnCain MackenzieGerald Mackenzie Jr.Mathew MackeyShad MacNaughtonAshley MadisonAnthony MaesDaniel MaffeiMarissa MahanNicolas MahanDamon MaikellTimothy MajorBob MaleckiJim Malone Jr.Dale ManahanNathan ManhartMichael MannSid ManningJoe MarecicAdolfo MarinRodrigo Marin RuizRickie Marks Jr.Aaron MarlowStanley MarlowPedro MarquezMichael Mars IIDusty MarshLester MarshEvan MarshallTammy MarstonDan MartinJohn Martin Jr.Michael L. MartinRick MartinRicky MartinShane MartinStephen MartinJoe M. MartinezJoel Martinez Jr.Justin MartinezRick MartinezPaul MartonGraycen MashburnJerry Massey Jr.Shain MastersonEfraim MataChristopher MatthewsBrandon MattisonRoger Mattox Jr.Tamara MaukJess MaulsbyMatt MayhewKevin McBeeGary McBrideJesse McCabeThomas McCambridgeStu McCarthyBrad McCartyMichael McCartyJeff McCathernMichael McClinticOG McClinton Jr.Bill McClureGlen McConnellWilliam McConnellChad McCoolBrian McCoy
Gregory McCoyTierra McCraryKatie McCullinJeremy McCumbersCrystal McCuskerCalvin McDanielKelly McDanielDave McDiffittBryan McDonaldMickey McDonald Jr.Eric McEntyreDavid McFallChristopher W. McGinnisMike McGlothlin IITravis McGloughlinGerald McGuireRichard W. McGuireJasen McKayJames McKeeMike McKeeNathan McKeehanStephanie McLaughlinSteve McLaughlinKeegan McManusMatt McMillanNathan McMullenJanie McNabbKyle McNayrDan McNickolBrandon McReynoldsThomas MeaselKayla MedinaRobby MehdiFidel MendozaTay MendozaTravis MenearLeah MerciezDamon MerrittMatt MeyerRyan MeyerRandal MickTravis Miles
Chris MillerJustin MillerKen MillerKenneth MillerKirby MillerMarianne MillerMichael MillerMike Miller Sr.Roger MillerSedrick MillerTim MillerVernon MillerWilliam MillerCharles Mills IIIDanya MillsKaren MillsJarrod MinkRichard MinshewDanelle MintonTommy MitchChris MitchelRandall MitchellRyan MixonJames ModeDarin MoloneCirilo MondragonCorey MontgomeryRobert MontgomeryGlen MoodyCharlene MooreCliff MooreDakota MooreDaylan MooreDelbert Moore Jr.Densel Moore Jr.Densel Moore Sr.Joel MooreJohn MooreMargaret MoorePhilip MooreErik MoormanJerry MoralesAbel Morales-MaciasKevin MoreheadDuane MorelandArmando MorenoChristopher Morgan
James MorganJustin MorganNathan MorganSloane MorganWillie MorganDavid MorrisDavid Morris Jr.Joseph MorrisLonza MorrisSydney MorrisJoshua MorrisonShannon MosbyJason MosleyJames MossorKelley MowdyJustin MoxleyMark Muegge Jr.Jared MuellerStacey MullenaxLevi MullinsLawrence MunseyBrian MurnahanLauren MurphyRobert Murphy Jr.Steven MurphyChristopher MusgraveDonald MuthKathy MyersLouis NagelMike Narcavage IIIRobbi NarteyTyrel NaugleAmy NealGary NealMichael NealFreddy NeighborsRick Neiswonger
Terry NeitzlerJohnathon NelsonLisa NelsonSky NelsonLuke NettrouerMatthew NeubertBenjamin NevillColin NewhouseMarcus NewmanCheyenne NewsomeO’Ryan NewtonJessica NguyenChris NicholsJonathan NicholsLuke NicholsSean NicholsBarry NicholsonKenneth NickesonCassie NiemannJason NieuwenhuisRyan NixWinston Noel
Justin NormanJustin NorrisAdam NorwoodJames NovakConnie NowellSelena NunezJoseph NunnJared NutterMark OByrneDaniel OdellPeter OdimaDean OgdenCharles OhlsonVictor OkehJohn OleshJames OliveMichael S. OliverDoug OlivierJames Olson Jr.Blake O’NeillBrent OpferAmanda O’QuinnPam OrthJason OrwanRobert Ostrander Jr.Gregg OuditAshley Overstreet IIRyan OvertonStacey OwenJesse OwensKevin PackMeosha PaigeAllen PairCristian ParauBill F. ParkerNicholas ParkerLaura Parrish
Eddie ParsonsKevin ParsonsReema PatelDavid Patterson IIKathleen PattonBen PaughJoseph PaupBrian PeeryKathleen PennSiva PennabadiBradley PentecostJames PenzoClifford PepperJames PerkinsJoshua PerkinsChris PersellinCatherine PetersonRenee PetersonJay PetreeJ R Pettijohn Jr.Tu PhanHeather Phelps
SAFETY IN THE FIELD Pennsylvania Nomac rig 7 employees rig up their safety gear as they do their part to maintain a safe work environment.

44 CHESAPEAKE ENERGY CORPORATION
Knut PhilippiDaniel PhillipsDustin PhillipsLyn PhillipsRichard PhillipsAlex PierceJayson PihajlicTimothy PlaceMonte PlummerJohn PoarchLevi PoeChris PoirotVenkat PokkuluriAngie PoolCharles PooleDustin PooleKerry PooleTy PorcheKenneth PorterAdia PowellDale PowellNathan PowellNatalie PralleErin PrattChad PrestonJerren PrestonKyle PrestonJames PriceJeffrey PriceDavid PritchardJames PritchardChase PritchettJustin PritchettAlan ProcellMichael ProctorEstevan PuenteKyle PuffinbargerMichael PughBob PurgasonMickle PutnamStony QueenVenicia QueenStephanie QuinnRobert QuinteroAaron RachallJeff RaganAnthony Rahm
Keith RahmMichael RaisigJuan Ramirez Jr.Tim RamirezTimothy RamseyCathy RaneyJeffrey RankinBoyd RansomWill RatcliffeGerald RatliffJason RatliffCharles RattsDavid RauhChristopher RayDavid RayJoseph RaybonReid ReaganBurt ReedJerry ReelRoy ReelFlint ReeveDamon ReevesDavid ReevesReagan RegisterAndy ReinertJohn ReppRobert RevillaBrandon ReyesLeonard ReyezUdel ReynaJimmy RhodesJohn RhodesRory RicePatrice RichBobby Richards Jr.Rene RichardsJames RichardsonJoseph RichardsonLuke RichardsonJackie Riddle Jr.Dustin RiderJames Riffle IIIRodney RiffleRichard RigginsJonathan RiggleJohn RiggsJames Riley
Levi RiojasAmanda RiosFreddy RiosOscar RiveracanoCassie RiversSandon RoathCandace RobertMichael RobertJoseph RobertsRonald RobertsDiana RobertsonRandall RobertsonBrian RobinsonChad Robinson IVShae RobinsonSarah Robinson-GarciaKaylan RobyWoodrow Rodgers Jr.Michael RodriguesChance RodriguezGustavo RodriguezJohn RodriguezDawayne RoehrickJohn RogersKathy RogersMike RogersMark RohrboughRobert RollinsMarc RomeDomingo Romero-LunaJacque RossJessica RossRhonda Ross Sr.Paige RoweTerry RoweHarold RowellJulie RoyChris RoyseRicky RuckerAustin RupardRick RupardMichael RuppJason RuppertJoanna RusRon Rush Jr.Jackie Rutherford Jr.Jeffrey RutherfordStacy RutledgePeter Rutt Jr.Danny Ryan Jr.Thom RycheckyArnoldo SaenzJesus SalinasGary SalingFrancis SalleeGene SampsonZack SamuelsLucio SanchezChase SandersDaniela SandersDavid SandersMarc SandersSteven J. SandersBrad SandiferVincent SandovalKara SardisJames SaultzJohn Saxon Jr.Harley ScanlonGabe ScheerMatthew SchellhaseJess SchenkJames SchlarbCrystal SchmeckenbecherJason SchmitzEric SchneiderAshton SchoapsRobert Schoenfeldt Jr.Greg SchoffnerCassie SchoshkeEli SchrockPhillip SchroederTony SchroederChris SchumanMichael SchweighartBrandon ScogginsJoshua SconyersBrian ScottJesse Scott
Kelby ScottCandace ScudderTanner SealJames SearsCharles SechlerStephen SeibertJohn Seifreid IIIJosh SentyzBrandon SepulvadoRaquel ShacklettJames ShamblinAlton SharpJeffery SharpWillie SharpDan SharpeShea ShelbyJason ShelhamerTom Sheme Jr.William Shepardson IVJustin ShieldsJustin ShireySherri ShirleyRob ShoresJesse ShortTroy Short IITim ShueJames ShullLynette ShultsClayton ShumwayAnthony ShusterDarren SilcottAndrew SilvestriJason SimpsonNicholas SimsGreg SingletonRobert SiscaJonathan SiskBuddy Sissom Jr.Pat SkinnerRandy SkinnerKristy SkiroReggie SloanTimothy SloneDavid SmarkuskyAnthony SmithBrian SmithBryan L. SmithCody SmithJ.D. SmithJarrett SmithJeffrey SmithJerry W. SmithJohn D. SmithJosh SmithJoshua SmithKatherine SmithMatthew SmithMichael G. SmithMichael W. SmithMike R. SmithMike SmithRicky J. SmithRicky L. SmithShawn SmithWill SmithAmy SnedekerCasey SnowCory SnyderKendel SnyderRichard SnyderStephen SochaJason SonnemaFrank SopherDanielle SouthallLawerance SoutherlandBobby Sparkman Jr.Jack Sparks Jr.Rick SparksGary Spencer IILevi SpencerRick SpicerDave SpigelmyerShelly SpitznogleShane SpradlinJustin SpruellCurtis SpruillLoni StaatsStan Stacy Jr.Timothy Stamper
Ryan StampsRandall StancilRichard StandageAmy StanleyHarold StarrHancel SteenMichael StephensDaniel SteppeTeena SterlingBilly Stevens Jr.Jeremiah StevensEric StewartJeffrey StewartJoshua StilesMike StiversHeath StocktonDillon StorerKim StovallEugene StradleySean StrangeElizabeth StrawnTyler SturmFrank SullivanJake SwansonSherrie SwiftTamara SzczerbackiJimmie Tabor Jr.Steven TaladaDavid TalleyKevin TapiaSteven TatroJonathan TatumRyan TatumAmanda TaylorB. Kyle TaylorBarbara TaylorBrad TaylorChad TaylorChaya TaylorDarrell TaylorDennis Taylor IIDudley Taylor IIJason TaylorJeremy TaylorJohn TaylorSimone TaylorJessica TedderJeffrey Tedesco Jr.Wossen TeferaDavid TempletAmy TennisonErin TewellCody TheimerColby TherwhangerAshley ThomasDennis ThomasRay ThomasTaylor ThomasTommy ThomasBruce ThompsonCole ThompsonJeff ThompsonJustin ThompsonKristi ThompsonSchon ThorneCody ThorntonRene’ ThurmanJames TillmanJoseph TinglerMatt TinkleTaylor TisdalGregory TomlinsonPhilp TomlinsonJustin ToneyJeffrey TootAlfredo TorresDonald Torres Jr.Rogelio TorresRichard TrachtaVirgil TrammelRichard TrammellDonie TreadawayJoshua TredwayTyler TreeceAlejandro TrejoMarsela TreskaJoshua TriplettAddie TriskaCody Trisler
Cole TroupScott TroutmanMichael TuckerRandy TullosBronson TurleyMichael TurnerJesse TuthillJackie Tuttle IINick TylerJack TyreDon TysonChristopher UnderwoodRussell VadasKie Vander SysKeith VanliewStephanie VannMark VannasdallPhillip VanoverRoger VanRyn IIIFabio VargasJoseph VargasAndrew VargesonTodd Varner IIStephanie VaughanPeyton VaughnChris VeazeyMarcelo VeraRaymond VerhoevenKate ViaRick VickersDanny VickeryDerek ViljoenDarren VincentMichael VincentTravis VinsekBilly Vo
Gregory VogelBen VoigtMatthew VolnerCasey VossJT VothAlyssa VowellRobert WaggonerWalter WaiteJason WaldenvilleConnie WaldropAudie WalkerChristopher WalkerDoyle WalkerJames WalkerPatrick WalkerBill WalkoBilly WallaceBrandon WallaceJason WallaceJoshua WallaceKristin WallaceMichael WallaceKaren WaltersScotty WaltonTony WardCraig WarrenJoseph WarrenLarry WarrenMichael WarrenTanya WartchowEarl WaterburyRobert WatesJerry WatkinsRocky Watkins Jr.Brent WatsonStephen WattsRusty WebbVance Webster IIBlake WedelDarren WeedCharles WegmanCutter WeiandJared WeingartnerJason WeingartnerDennis WelchRalph Welch Jr.EuJene WellbornDerek WellsSean WellsDamon WestDavid WestLee WestTommy White
Zach WhiteJimmy WhiteheadDaniel WhitemanGary WhitisTaylor WhitisCole WhitmanEmily WhitneyTyler WhitsettEarston WhyelJeremy WiedenmannJames WigginsMichael WigginsOpie WiggintonTodd WilfongJesse WilkinsonDustin WillbanksRalph Willett Jr.Aaron WilliamsAmy WilliamsClifford Williams IIHoyt WilliamsJeff WilliamsJordan WilliamsJoseph WilliamsKevin WilliamsLarry WilliamsLisa WilliamsMonte Williams Jr.Stephanie WilliamsTy WilliamsJosh WilliamsonDoug WillitsKendra WilmethAlan WilsonColton WilsonJaime WilsonKory WilsonPreston WilsonChristopher WiltByron WindhamBernard WinnWilliam WinsteadBrandon WintersCo WisdomTravis WishonAri WoleverAndrew Wolfe Ronald Wolfe Kenneth Wood Jana Woodard Luke Woodard Robbie Woodard Sterling Woodard JR Woodfin Joshua Woods Katie Wooten Larry Wooten Andrew Work Rick Worley Brandon Wright Brian Wright John Wright Mike W. Wright Sammy Wyatt Dwayne Wylie Steve Wyman Larry Yawn Amanda Yeager James Young Jason Young Randy Young Brett Yourish Art Ysaguirre Jr.Sam Yule Doug Yurek Mark Zabala Gregory Zacharias Megan Zachary Matthew Zeman John Zimmerman Jr.
A REVVING GOOD PARTNERSHIP Oklahoma
The drilling crew of Nomac rig 42 poses with Paul Teutul, Sr., founder of Orange County Choppers and star of the television series “American Chopper,” with whom Chesapeake collaborated to develop the world’s first natural gas-powered chopper.
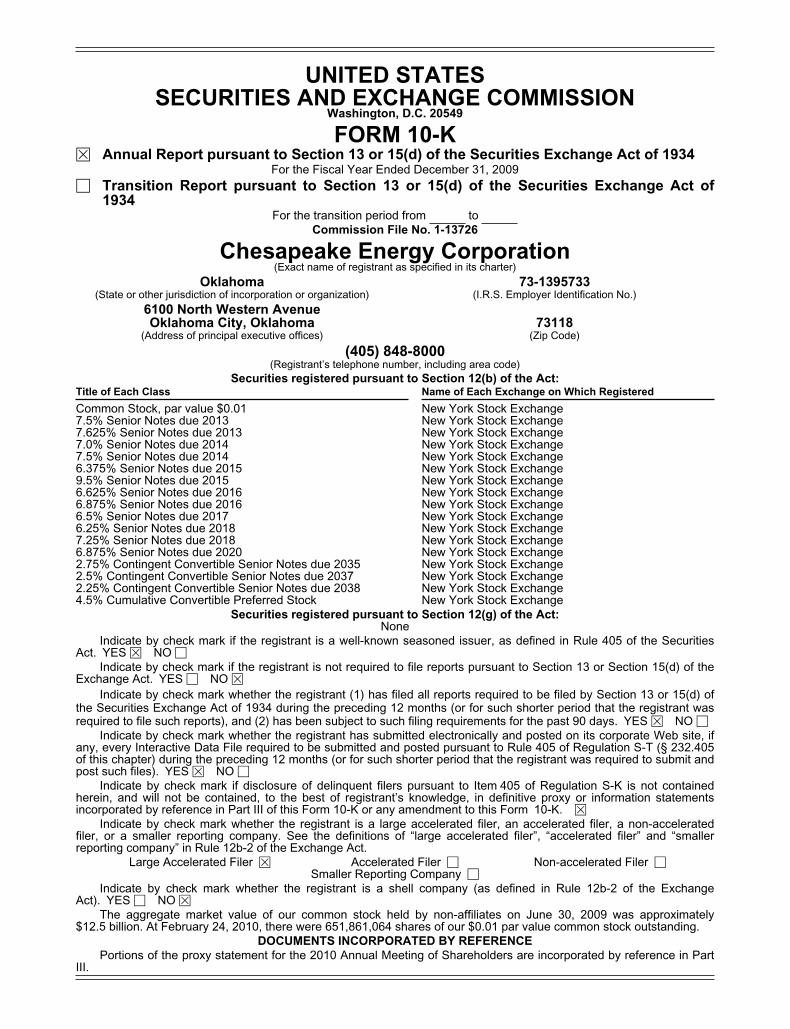
UNITED STATESSECURITIES AND EXCHANGE COMMISSION
Washington, D.C. 20549
FORM 10-KÈ Annual Report pursuant to Section 13 or 15(d) of the Securities Exchange Act of 1934
For the Fiscal Year Ended December 31, 2009
‘ Transition Report pursuant to Section 13 or 15(d) of the Securities Exchange Act of1934
For the transition period from toCommission File No. 1-13726
Chesapeake Energy Corporation(Exact name of registrant as specified in its charter)
Oklahoma 73-1395733(State or other jurisdiction of incorporation or organization) (I.R.S. Employer Identification No.)
6100 North Western AvenueOklahoma City, Oklahoma 73118
(Address of principal executive offices) (Zip Code)
(405) 848-8000(Registrant’s telephone number, including area code)
Securities registered pursuant to Section 12(b) of the Act:Title of Each Class Name of Each Exchange on Which Registered
Common Stock, par value $0.01 New York Stock Exchange7.5% Senior Notes due 2013 New York Stock Exchange7.625% Senior Notes due 2013 New York Stock Exchange7.0% Senior Notes due 2014 New York Stock Exchange7.5% Senior Notes due 2014 New York Stock Exchange6.375% Senior Notes due 2015 New York Stock Exchange9.5% Senior Notes due 2015 New York Stock Exchange6.625% Senior Notes due 2016 New York Stock Exchange6.875% Senior Notes due 2016 New York Stock Exchange6.5% Senior Notes due 2017 New York Stock Exchange6.25% Senior Notes due 2018 New York Stock Exchange7.25% Senior Notes due 2018 New York Stock Exchange6.875% Senior Notes due 2020 New York Stock Exchange2.75% Contingent Convertible Senior Notes due 2035 New York Stock Exchange2.5% Contingent Convertible Senior Notes due 2037 New York Stock Exchange2.25% Contingent Convertible Senior Notes due 2038 New York Stock Exchange4.5% Cumulative Convertible Preferred Stock New York Stock Exchange
Securities registered pursuant to Section 12(g) of the Act:None
Indicate by check mark if the registrant is a well-known seasoned issuer, as defined in Rule 405 of the SecuritiesAct. YES È NO ‘
Indicate by check mark if the registrant is not required to file reports pursuant to Section 13 or Section 15(d) of theExchange Act. YES ‘ NO È
Indicate by check mark whether the registrant (1) has filed all reports required to be filed by Section 13 or 15(d) ofthe Securities Exchange Act of 1934 during the preceding 12 months (or for such shorter period that the registrant wasrequired to file such reports), and (2) has been subject to such filing requirements for the past 90 days. YES È NO ‘
Indicate by check mark whether the registrant has submitted electronically and posted on its corporate Web site, ifany, every Interactive Data File required to be submitted and posted pursuant to Rule 405 of Regulation S-T (§ 232.405of this chapter) during the preceding 12 months (or for such shorter period that the registrant was required to submit andpost such files). YES È NO ‘
Indicate by check mark if disclosure of delinquent filers pursuant to Item 405 of Regulation S-K is not containedherein, and will not be contained, to the best of registrant’s knowledge, in definitive proxy or information statementsincorporated by reference in Part III of this Form 10-K or any amendment to this Form 10-K. È
Indicate by check mark whether the registrant is a large accelerated filer, an accelerated filer, a non-acceleratedfiler, or a smaller reporting company. See the definitions of “large accelerated filer”, “accelerated filer” and “smallerreporting company” in Rule 12b-2 of the Exchange Act.
Large Accelerated Filer È Accelerated Filer ‘ Non-accelerated Filer ‘Smaller Reporting Company ‘
Indicate by check mark whether the registrant is a shell company (as defined in Rule 12b-2 of the ExchangeAct). YES ‘ NO È
The aggregate market value of our common stock held by non-affiliates on June 30, 2009 was approximately$12.5 billion. At February 24, 2010, there were 651,861,064 shares of our $0.01 par value common stock outstanding.
DOCUMENTS INCORPORATED BY REFERENCE
Portions of the proxy statement for the 2010 Annual Meeting of Shareholders are incorporated by reference in PartIII.

CHESAPEAKE ENERGY CORPORATION AND SUBSIDIARIES
2009 ANNUAL REPORT ON FORM 10-K
TABLE OF CONTENTS
PART I Page
Item 1. Business . . . . . . . . . . . . . . . . . . . . . . . . . . . . . . . . . . . . . . . . . . . . . . . . . . . . . . . . . . . . . 1
Item 1A. Risk Factors . . . . . . . . . . . . . . . . . . . . . . . . . . . . . . . . . . . . . . . . . . . . . . . . . . . . . . . . . . 27
Item 1B. Unresolved Staff Comments . . . . . . . . . . . . . . . . . . . . . . . . . . . . . . . . . . . . . . . . . . . . . 35
Item 2. Properties . . . . . . . . . . . . . . . . . . . . . . . . . . . . . . . . . . . . . . . . . . . . . . . . . . . . . . . . . . . . 35
Item 3. Legal Proceedings . . . . . . . . . . . . . . . . . . . . . . . . . . . . . . . . . . . . . . . . . . . . . . . . . . . . . 35
Item 4. Reserved . . . . . . . . . . . . . . . . . . . . . . . . . . . . . . . . . . . . . . . . . . . . . . . . . . . . . . . . . . . . 36
PART II
Item 5. Market for Registrant’s Common Equity, Related Stockholder Matters and Issuer
Purchases of Equity Securities . . . . . . . . . . . . . . . . . . . . . . . . . . . . . . . . . . . . . . . . . 37
Item 6. Selected Financial Data . . . . . . . . . . . . . . . . . . . . . . . . . . . . . . . . . . . . . . . . . . . . . . . . . 38
Item 7. Management’s Discussion and Analysis of Financial Condition and Results of
Operations . . . . . . . . . . . . . . . . . . . . . . . . . . . . . . . . . . . . . . . . . . . . . . . . . . . . . . . . . . 40
Item 7A. Quantitative and Qualitative Disclosures About Market Risk . . . . . . . . . . . . . . . . . . . 68
Item 8. Financial Statements and Supplementary Data . . . . . . . . . . . . . . . . . . . . . . . . . . . . . . 76
Item 9. Changes in and Disagreements with Accountants on Accounting and Financial
Disclosure . . . . . . . . . . . . . . . . . . . . . . . . . . . . . . . . . . . . . . . . . . . . . . . . . . . . . . . . . . 150
Item 9A. Controls and Procedures . . . . . . . . . . . . . . . . . . . . . . . . . . . . . . . . . . . . . . . . . . . . . . . . 150
Item 9B. Other Information . . . . . . . . . . . . . . . . . . . . . . . . . . . . . . . . . . . . . . . . . . . . . . . . . . . . . . 150
PART III
Item 10. Directors, Executive Officers and Corporate Governance . . . . . . . . . . . . . . . . . . . . . . 151
Item 11. Executive Compensation . . . . . . . . . . . . . . . . . . . . . . . . . . . . . . . . . . . . . . . . . . . . . . . . 151
Item 12. Security Ownership of Certain Beneficial Owners and Management and Related
Stockholder Matters . . . . . . . . . . . . . . . . . . . . . . . . . . . . . . . . . . . . . . . . . . . . . . . . . . 151
Item 13. Certain Relationships and Related Transactions and Director Independence . . . . . . 151
Item 14. Principal Accountant Fees and Services . . . . . . . . . . . . . . . . . . . . . . . . . . . . . . . . . . . 151
PART IV
Item 15. Exhibits and Financial Statement Schedules . . . . . . . . . . . . . . . . . . . . . . . . . . . . . . . 152
Part I
ITEM 1. Business
General
We are the second-largest producer of natural gas in the United States. We own interests in
approximately 44,100 producing natural gas and oil wells that are currently producing approximately
2.4 billion cubic feet equivalent, or bcfe, per day, 93% of which is natural gas. Our strategy is focused
on discovering, acquiring and developing conventional and unconventional natural gas reserves
onshore in the U.S., primarily in our “Big 6” natural gas shale plays: the Barnett Shale in the Fort Worth
Basin of north-central Texas, the Haynesville and Bossier Shales in the Ark-La-Tex area of
northwestern Louisiana and East Texas, the Fayetteville Shale in the Arkoma Basin of central
Arkansas, the Marcellus Shale in the northern Appalachian Basin of West Virginia, Pennsylvania and
New York and the Eagle Ford Shale in South Texas. We also have substantial operations in the
Granite Wash Plays of western Oklahoma and the Texas Panhandle regions as well as various other
plays, both conventional and unconventional, in the Mid-Continent, Appalachian Basin, Permian Basin,
Delaware Basin, South Texas, Texas Gulf Coast and Ark-La-Tex regions of the U.S.
We have been developing expertise in horizontal drilling technology since shortly after our
inception in 1989 and have focused almost exclusively on developing natural gas properties in the U.S.
since 2000. We were one of the first companies to recognize the potential of unconventional natural
gas properties, especially shales, in the U.S. during the early part of the prior decade. During the past
five years, we have grown from the eighth-largest natural gas producer in the U.S. to the second-
largest natural gas producer, in large part as a result of our success in finding and developing
unconventional natural gas assets. We have recently announced that we are extending our strategy to
apply the horizontal drilling expertise we have gained in our natural gas shale plays to unconventional
oil reservoirs. We expect to begin increasing our production of oil and natural gas liquids in 2010 in
new developing unconventional oil plays, particularly in the Granite Wash and Eagle Ford.
During 2009, our estimated proved reserves grew from 12.051 trillion cubic feet equivalent, or tcfe,
to 14.254 tcfe, of which 95% were natural gas, 58% were proved developed and 100% were onshore
in the U.S. We replaced our 906 bcfe of production with an estimated 3.109 tcfe of new proved
reserves for a reserve replacement rate of 343%. Reserve replacement through the drillbit was 3.296
tcfe, or 364% of production, including 445 bcfe of downward revisions resulting from changes to
previous estimates and 952 bcfe of downward revisions resulting from lower natural gas prices using
the average 12-month price in 2009 compared to the spot price as of December 31, 2008. During
2009, we acquired 33 bcfe of estimated proved reserves and divested 220 bcfe of estimated proved
reserves.
Chesapeake continued the industry’s most active drilling program in 2009 and drilled 1,212 gross
operated wells (885 net) and participated in another 994 gross wells operated by other companies (118
net). The company’s drilling success rate was 99% for company-operated wells and 98% for
non-operated wells. Also during 2009, we invested $2.941 billion in operated wells (using an average
of 104 operated rigs) and $439 million in non-operated wells (using an average of 60 non-operated
rigs) for total drilling, completing and equipping costs of $3.380 billion.
1
During the second half of 2008 and in early 2010, we entered into joint venture arrangements that
monetized a portion of our investment in five of our shale plays and provided drilling cost carries for our
retained interest. The following table provides information about our joint ventures ($ in millions):
ShalePlay
Joint VenturePartner(a)
Joint VentureDate
ProceedsReceivedat Closing
TotalDrillingCarries
DrillingCarries
Remaining
Haynesville and Bossier PXP July 2008 $ 1,650 $ 1,508(b) $ —
Fayetteville BP September 2008 1,100 800 —
Marcellus STO November 2008 1,250 2,125 1,963(c)
Barnett TOT January 2010 800 1,450 1,450(d)
$ 4,800 $ 5,883 $ 3,413
(a) Joint venture partners include Plains Exploration & Production Company (PXP), BP America (BP), Statoil
(STO) and Total S.A. (TOT).
(b) In September of 2009, PXP accelerated the payment of its remaining joint venture carries in exchange for an
approximate 12% reduction to the total amount of drilling carry obligations due to Chesapeake.
(c) As of December 31, 2009
(d) As of January 26, 2010
Collectively, in these four joint ventures, we received upfront cash payments of $4.8 billion and
future drilling cost carries of up to $5.9 billion for total consideration of up to $10.7 billion against a cost
basis of approximately $2.7 billion in the property interests we sold. Moreover, Chesapeake retained
an 80% interest in the Haynesville and Bossier Shale properties, a 75% interest in the Fayetteville
Shale properties, a 67.5% interest in the Marcellus Shale properties and a 75% interest in the Barnett
Shale properties.
In September 2009, we formed a joint venture with Global Infrastructure Partners (GIP), a New
York-based private equity fund, to own and operate natural gas midstream assets. As part of the
transaction, we contributed substantially all of our midstream assets in the Barnett Shale and also the
majority of our non-shale midstream assets in the Arkoma, Anadarko, Delaware and Permian Basins to
a new entity, Chesapeake Midstream Partners, L.L.C. (CMP), and GIP purchased a 50% interest in
CMP for $588 million in cash.
Our principal executive offices are located at 6100 North Western Avenue, Oklahoma City,
Oklahoma 73118 and our main telephone number at that location is (405) 848-8000. We make
available free of charge on our website at www.chk.com our annual reports on Form 10-K, quarterly
reports on Form 10-Q, current reports on Form 8-K, and amendments to those reports as soon as
reasonably practicable after we electronically file such material with, or furnish it to, the Securities and
Exchange Commission. From time to time, we also post announcements, updates and investor
information on our website in addition to copies of all recent press releases. References to “us”, “we”
and “our” in this report refer to Chesapeake Energy Corporation together with its subsidiaries.
Business Strategy
Since our inception in 1989, Chesapeake’s goal has been to create value for investors by building
one of the largest onshore natural gas resource bases in the United States. For the past twelve years,
our strategy to accomplish this goal has been to focus on developing unconventional plays onshore in
the U.S., where we believe we can generate the most attractive risk-adjusted returns. In building our
industry-leading natural gas resource base during the period from 1998 to 2009, we integrated an
aggressive and technologically-advanced drilling program with an active property consolidation
program focused on small to medium-sized corporate and property acquisitions. During the past three
2
years, we have shifted our strategy from drilling inventory capture to drilling inventory conversion and
monetization. In doing so, we have de-emphasized acquisitions of proved properties, further
emphasizing our industry-leading drilling program to convert our substantial backlog of drilling
opportunities into proved developed producing reserves through the drillbit and also focused on
capturing value by selling a portion of our leasehold and producing properties. Key elements of this
business strategy are further explained below.
Grow Through the Drillbit. We believe that our most distinctive characteristic is our commitment
and ability to grow production and reserves organically through the drillbit. We are currently utilizing
118 operated drilling rigs and 70 non-operated drilling rigs to conduct the most active drilling program
in the U.S. We are active in most of the unconventional plays in the U.S., where we drill more
horizontal wells than any other company in the industry. For several years, we have been actively
investing in leasehold, 3-D seismic information and human capital to take full advantage of our capacity
to grow through the drillbit. We are one of the few large-cap independent natural gas and oil
companies that have been able to consistently increase production, which we have successfully
achieved for the past 20 consecutive years. We believe the key elements of the success and scale of
our drilling programs have been our recognition earlier than most of our competitors that new
horizontal drilling and completion techniques would enable development of previously uneconomic
natural gas and oil reservoirs and that, as a consequence, various shale formations could be
recognized and developed as potentially prolific natural gas and oil reservoirs rather than just as
source rocks for conventional reservoirs. In response to our early recognition of these trends, we have
proactively hired thousands of new employees and have built the nation’s largest onshore leasehold
and 3-D seismic inventories. These stand as the building blocks of our successful large-scale drilling
program and the foundation of value creation for our company.
Control Substantial Land and Drilling Location Inventories. After we identified the trends
discussed above, we initiated a plan to build and maintain the largest inventory of onshore drilling
opportunities in the U.S. Recognizing that better horizontal drilling and completion technologies when
applied to various new shale plays would likely create a unique opportunity to capture decades worth
of drilling opportunities, we embarked on a very aggressive lease acquisition program which we have
referred to as the “land rush”. We believed that the winner of the land rush would enjoy a distinctive
competitive advantage for decades to come as other companies would be locked out of the best new
shale plays in the U.S. We believe that we have executed our land acquisition strategy with particular
distinction. At December 31, 2009, we owned approximately 13.2 million net acres of leasehold in the
U.S. and have identified approximately 35,750 drilling opportunities on this leasehold. We believe this
deep backlog of drilling, more than ten years worth at current drilling levels, provides unusual
confidence and transparency into our future growth capabilities.
Develop Proprietary Technological Advantages. In addition to our industry-leading leasehold
position, we have developed a number of proprietary technological advantages. First, we have
acquired what we believe is the nation’s largest inventory of three-dimensional (3-D) seismic
information. Possessing this 3-D seismic data enables us to image reservoirs of natural gas that might
otherwise remain undiscovered and to drill our horizontal wells more accurately inside the targeted
shale formation and avoid various underground geohazards such as faults and karsts. In addition, we
have developed an industry-leading information-gathering program that gives us insight into new plays
and competitor activity. As a result of our initiatives, we now produce approximately 4% of the nation’s
natural gas, drill approximately 12% of its wells and participate in almost an equal number of wells
drilled by others. By gathering this information on a real-time basis, then quickly assimilating and
analyzing the information, we are able to react quickly to opportunities that are created through our
drilling program and those of our competitors. Furthermore, we have established a unique
state-of-the-art Reservoir Technology Center (RTC) in Oklahoma City. The RTC enables us to more
quickly, accurately and confidentially analyze core data from shale wells on a proprietary basis and
3
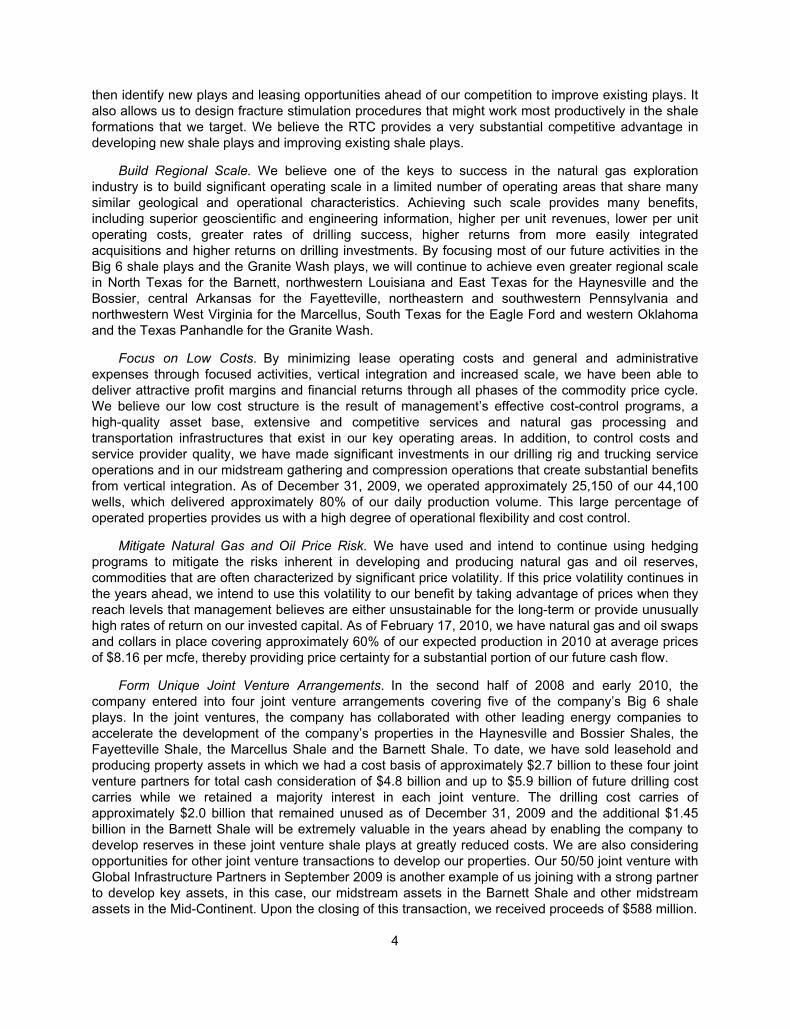
then identify new plays and leasing opportunities ahead of our competition to improve existing plays. It
also allows us to design fracture stimulation procedures that might work most productively in the shale
formations that we target. We believe the RTC provides a very substantial competitive advantage in
developing new shale plays and improving existing shale plays.
Build Regional Scale. We believe one of the keys to success in the natural gas exploration
industry is to build significant operating scale in a limited number of operating areas that share many
similar geological and operational characteristics. Achieving such scale provides many benefits,
including superior geoscientific and engineering information, higher per unit revenues, lower per unit
operating costs, greater rates of drilling success, higher returns from more easily integrated
acquisitions and higher returns on drilling investments. By focusing most of our future activities in the
Big 6 shale plays and the Granite Wash plays, we will continue to achieve even greater regional scale
in North Texas for the Barnett, northwestern Louisiana and East Texas for the Haynesville and the
Bossier, central Arkansas for the Fayetteville, northeastern and southwestern Pennsylvania and
northwestern West Virginia for the Marcellus, South Texas for the Eagle Ford and western Oklahoma
and the Texas Panhandle for the Granite Wash.
Focus on Low Costs. By minimizing lease operating costs and general and administrative
expenses through focused activities, vertical integration and increased scale, we have been able to
deliver attractive profit margins and financial returns through all phases of the commodity price cycle.
We believe our low cost structure is the result of management’s effective cost-control programs, a
high-quality asset base, extensive and competitive services and natural gas processing and
transportation infrastructures that exist in our key operating areas. In addition, to control costs and
service provider quality, we have made significant investments in our drilling rig and trucking service
operations and in our midstream gathering and compression operations that create substantial benefits
from vertical integration. As of December 31, 2009, we operated approximately 25,150 of our 44,100
wells, which delivered approximately 80% of our daily production volume. This large percentage of
operated properties provides us with a high degree of operational flexibility and cost control.
Mitigate Natural Gas and Oil Price Risk. We have used and intend to continue using hedging
programs to mitigate the risks inherent in developing and producing natural gas and oil reserves,
commodities that are often characterized by significant price volatility. If this price volatility continues in
the years ahead, we intend to use this volatility to our benefit by taking advantage of prices when they
reach levels that management believes are either unsustainable for the long-term or provide unusually
high rates of return on our invested capital. As of February 17, 2010, we have natural gas and oil swaps
and collars in place covering approximately 60% of our expected production in 2010 at average prices
of $8.16 per mcfe, thereby providing price certainty for a substantial portion of our future cash flow.
Form Unique Joint Venture Arrangements. In the second half of 2008 and early 2010, the
company entered into four joint venture arrangements covering five of the company’s Big 6 shale
plays. In the joint ventures, the company has collaborated with other leading energy companies to
accelerate the development of the company’s properties in the Haynesville and Bossier Shales, the
Fayetteville Shale, the Marcellus Shale and the Barnett Shale. To date, we have sold leasehold and
producing property assets in which we had a cost basis of approximately $2.7 billion to these four joint
venture partners for total cash consideration of $4.8 billion and up to $5.9 billion of future drilling cost
carries while we retained a majority interest in each joint venture. The drilling cost carries of
approximately $2.0 billion that remained unused as of December 31, 2009 and the additional $1.45
billion in the Barnett Shale will be extremely valuable in the years ahead by enabling the company to
develop reserves in these joint venture shale plays at greatly reduced costs. We are also considering
opportunities for other joint venture transactions to develop our properties. Our 50/50 joint venture with
Global Infrastructure Partners in September 2009 is another example of us joining with a strong partner
to develop key assets, in this case, our midstream assets in the Barnett Shale and other midstream
assets in the Mid-Continent. Upon the closing of this transaction, we received proceeds of $588 million.
4
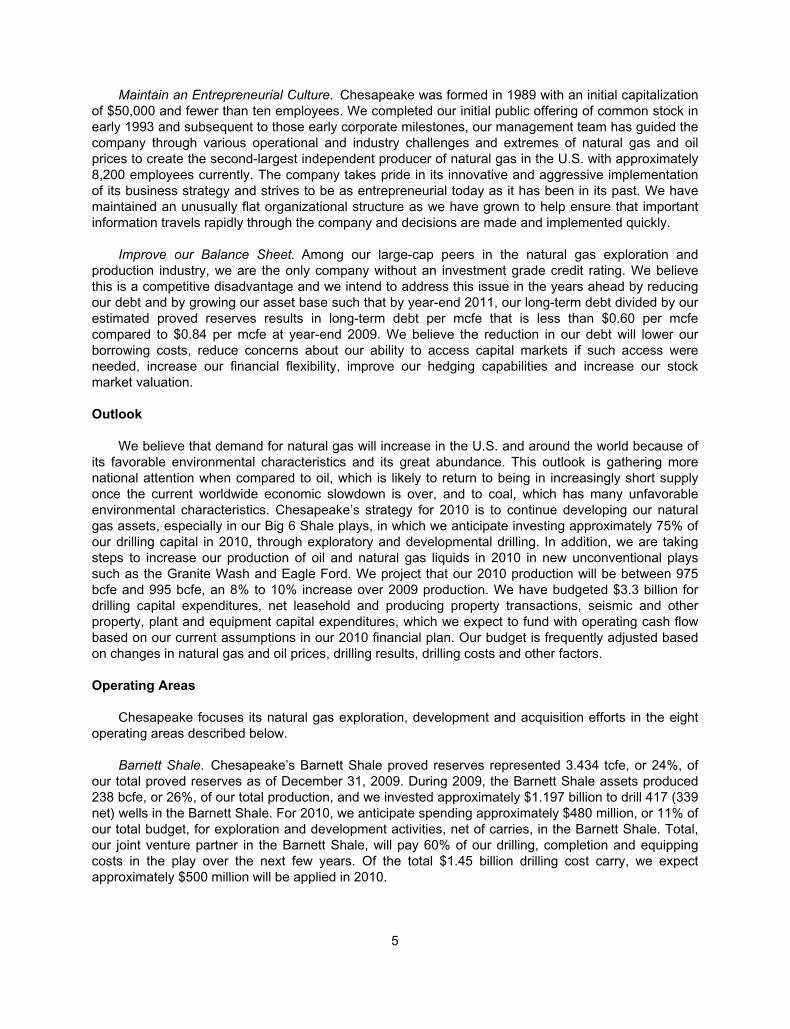
Maintain an Entrepreneurial Culture. Chesapeake was formed in 1989 with an initial capitalization
of $50,000 and fewer than ten employees. We completed our initial public offering of common stock in
early 1993 and subsequent to those early corporate milestones, our management team has guided the
company through various operational and industry challenges and extremes of natural gas and oil
prices to create the second-largest independent producer of natural gas in the U.S. with approximately
8,200 employees currently. The company takes pride in its innovative and aggressive implementation
of its business strategy and strives to be as entrepreneurial today as it has been in its past. We have
maintained an unusually flat organizational structure as we have grown to help ensure that important
information travels rapidly through the company and decisions are made and implemented quickly.
Improve our Balance Sheet. Among our large-cap peers in the natural gas exploration and
production industry, we are the only company without an investment grade credit rating. We believe
this is a competitive disadvantage and we intend to address this issue in the years ahead by reducing
our debt and by growing our asset base such that by year-end 2011, our long-term debt divided by our
estimated proved reserves results in long-term debt per mcfe that is less than $0.60 per mcfe
compared to $0.84 per mcfe at year-end 2009. We believe the reduction in our debt will lower our
borrowing costs, reduce concerns about our ability to access capital markets if such access were
needed, increase our financial flexibility, improve our hedging capabilities and increase our stock
market valuation.
Outlook
We believe that demand for natural gas will increase in the U.S. and around the world because of
its favorable environmental characteristics and its great abundance. This outlook is gathering more
national attention when compared to oil, which is likely to return to being in increasingly short supply
once the current worldwide economic slowdown is over, and to coal, which has many unfavorable
environmental characteristics. Chesapeake’s strategy for 2010 is to continue developing our natural
gas assets, especially in our Big 6 Shale plays, in which we anticipate investing approximately 75% of
our drilling capital in 2010, through exploratory and developmental drilling. In addition, we are taking
steps to increase our production of oil and natural gas liquids in 2010 in new unconventional plays
such as the Granite Wash and Eagle Ford. We project that our 2010 production will be between 975
bcfe and 995 bcfe, an 8% to 10% increase over 2009 production. We have budgeted $3.3 billion for
drilling capital expenditures, net leasehold and producing property transactions, seismic and other
property, plant and equipment capital expenditures, which we expect to fund with operating cash flow
based on our current assumptions in our 2010 financial plan. Our budget is frequently adjusted based
on changes in natural gas and oil prices, drilling results, drilling costs and other factors.
Operating Areas
Chesapeake focuses its natural gas exploration, development and acquisition efforts in the eight
operating areas described below.
Barnett Shale. Chesapeake’s Barnett Shale proved reserves represented 3.434 tcfe, or 24%, of
our total proved reserves as of December 31, 2009. During 2009, the Barnett Shale assets produced
238 bcfe, or 26%, of our total production, and we invested approximately $1.197 billion to drill 417 (339
net) wells in the Barnett Shale. For 2010, we anticipate spending approximately $480 million, or 11% of
our total budget, for exploration and development activities, net of carries, in the Barnett Shale. Total,
our joint venture partner in the Barnett Shale, will pay 60% of our drilling, completion and equipping
costs in the play over the next few years. Of the total $1.45 billion drilling cost carry, we expect
approximately $500 million will be applied in 2010.
5
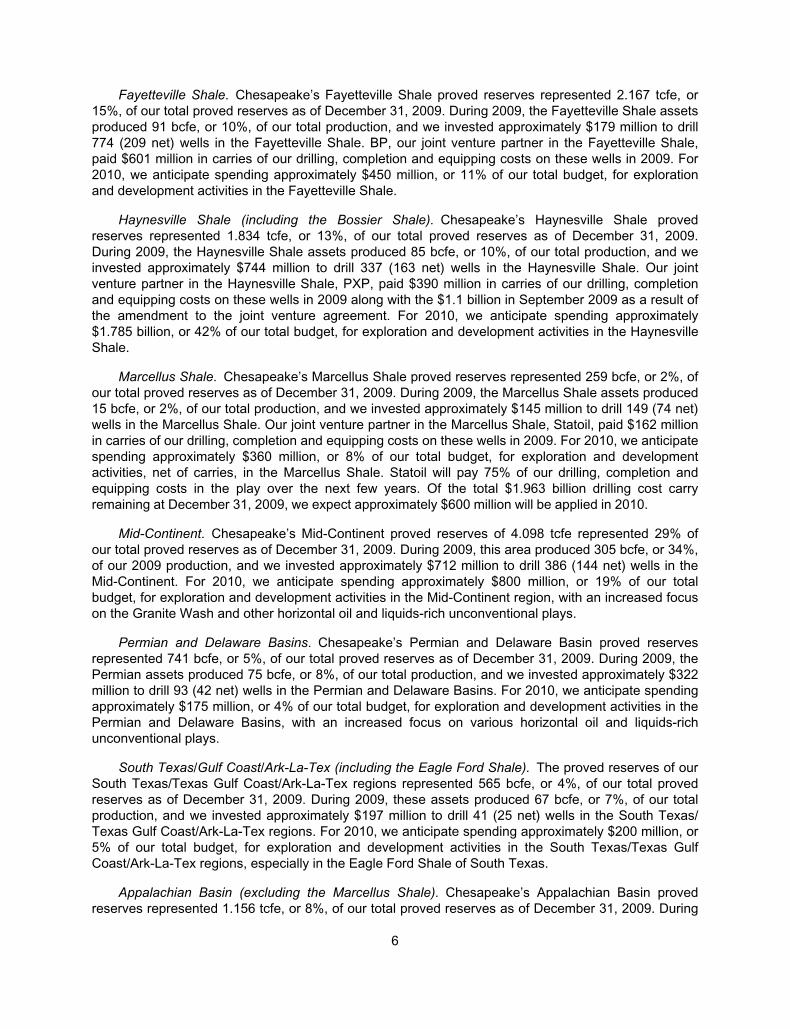
Fayetteville Shale. Chesapeake’s Fayetteville Shale proved reserves represented 2.167 tcfe, or
15%, of our total proved reserves as of December 31, 2009. During 2009, the Fayetteville Shale assets
produced 91 bcfe, or 10%, of our total production, and we invested approximately $179 million to drill
774 (209 net) wells in the Fayetteville Shale. BP, our joint venture partner in the Fayetteville Shale,
paid $601 million in carries of our drilling, completion and equipping costs on these wells in 2009. For
2010, we anticipate spending approximately $450 million, or 11% of our total budget, for exploration
and development activities in the Fayetteville Shale.
Haynesville Shale (including the Bossier Shale). Chesapeake’s Haynesville Shale proved
reserves represented 1.834 tcfe, or 13%, of our total proved reserves as of December 31, 2009.
During 2009, the Haynesville Shale assets produced 85 bcfe, or 10%, of our total production, and we
invested approximately $744 million to drill 337 (163 net) wells in the Haynesville Shale. Our joint
venture partner in the Haynesville Shale, PXP, paid $390 million in carries of our drilling, completion
and equipping costs on these wells in 2009 along with the $1.1 billion in September 2009 as a result of
the amendment to the joint venture agreement. For 2010, we anticipate spending approximately
$1.785 billion, or 42% of our total budget, for exploration and development activities in the Haynesville
Shale.
Marcellus Shale. Chesapeake’s Marcellus Shale proved reserves represented 259 bcfe, or 2%, of
our total proved reserves as of December 31, 2009. During 2009, the Marcellus Shale assets produced
15 bcfe, or 2%, of our total production, and we invested approximately $145 million to drill 149 (74 net)
wells in the Marcellus Shale. Our joint venture partner in the Marcellus Shale, Statoil, paid $162 million
in carries of our drilling, completion and equipping costs on these wells in 2009. For 2010, we anticipate
spending approximately $360 million, or 8% of our total budget, for exploration and development
activities, net of carries, in the Marcellus Shale. Statoil will pay 75% of our drilling, completion and
equipping costs in the play over the next few years. Of the total $1.963 billion drilling cost carry
remaining at December 31, 2009, we expect approximately $600 million will be applied in 2010.
Mid-Continent. Chesapeake’s Mid-Continent proved reserves of 4.098 tcfe represented 29% of
our total proved reserves as of December 31, 2009. During 2009, this area produced 305 bcfe, or 34%,
of our 2009 production, and we invested approximately $712 million to drill 386 (144 net) wells in the
Mid-Continent. For 2010, we anticipate spending approximately $800 million, or 19% of our total
budget, for exploration and development activities in the Mid-Continent region, with an increased focus
on the Granite Wash and other horizontal oil and liquids-rich unconventional plays.
Permian and Delaware Basins. Chesapeake’s Permian and Delaware Basin proved reserves
represented 741 bcfe, or 5%, of our total proved reserves as of December 31, 2009. During 2009, the
Permian assets produced 75 bcfe, or 8%, of our total production, and we invested approximately $322
million to drill 93 (42 net) wells in the Permian and Delaware Basins. For 2010, we anticipate spending
approximately $175 million, or 4% of our total budget, for exploration and development activities in the
Permian and Delaware Basins, with an increased focus on various horizontal oil and liquids-rich
unconventional plays.
South Texas/Gulf Coast/Ark-La-Tex (including the Eagle Ford Shale). The proved reserves of our
South Texas/Texas Gulf Coast/Ark-La-Tex regions represented 565 bcfe, or 4%, of our total proved
reserves as of December 31, 2009. During 2009, these assets produced 67 bcfe, or 7%, of our total
production, and we invested approximately $197 million to drill 41 (25 net) wells in the South Texas/
Texas Gulf Coast/Ark-La-Tex regions. For 2010, we anticipate spending approximately $200 million, or
5% of our total budget, for exploration and development activities in the South Texas/Texas Gulf
Coast/Ark-La-Tex regions, especially in the Eagle Ford Shale of South Texas.
Appalachian Basin (excluding the Marcellus Shale). Chesapeake’s Appalachian Basin proved
reserves represented 1.156 tcfe, or 8%, of our total proved reserves as of December 31, 2009. During
6
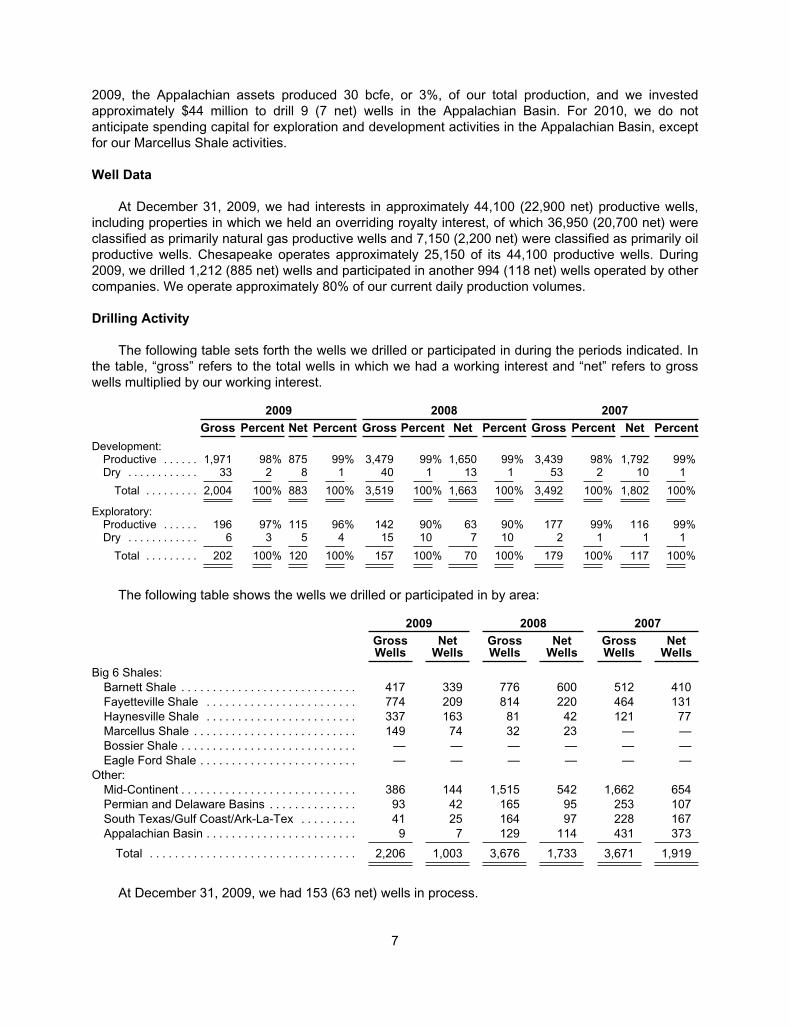
2009, the Appalachian assets produced 30 bcfe, or 3%, of our total production, and we invested
approximately $44 million to drill 9 (7 net) wells in the Appalachian Basin. For 2010, we do not
anticipate spending capital for exploration and development activities in the Appalachian Basin, except
for our Marcellus Shale activities.
Well Data
At December 31, 2009, we had interests in approximately 44,100 (22,900 net) productive wells,
including properties in which we held an overriding royalty interest, of which 36,950 (20,700 net) were
classified as primarily natural gas productive wells and 7,150 (2,200 net) were classified as primarily oil
productive wells. Chesapeake operates approximately 25,150 of its 44,100 productive wells. During
2009, we drilled 1,212 (885 net) wells and participated in another 994 (118 net) wells operated by other
companies. We operate approximately 80% of our current daily production volumes.
Drilling Activity
The following table sets forth the wells we drilled or participated in during the periods indicated. In
the table, “gross” refers to the total wells in which we had a working interest and “net” refers to gross
wells multiplied by our working interest.
2009 2008 2007
Gross Percent Net Percent Gross Percent Net Percent Gross Percent Net Percent
Development:Productive . . . . . . 1,971 98% 875 99% 3,479 99% 1,650 99% 3,439 98% 1,792 99%Dry . . . . . . . . . . . . 33 2 8 1 40 1 13 1 53 2 10 1
Total . . . . . . . . . 2,004 100% 883 100% 3,519 100% 1,663 100% 3,492 100% 1,802 100%
Exploratory:Productive . . . . . . 196 97% 115 96% 142 90% 63 90% 177 99% 116 99%Dry . . . . . . . . . . . . 6 3 5 4 15 10 7 10 2 1 1 1
Total . . . . . . . . . 202 100% 120 100% 157 100% 70 100% 179 100% 117 100%
The following table shows the wells we drilled or participated in by area:
2009 2008 2007
GrossWells
NetWells
GrossWells
NetWells
GrossWells
NetWells
Big 6 Shales:
Barnett Shale . . . . . . . . . . . . . . . . . . . . . . . . . . . . 417 339 776 600 512 410
Fayetteville Shale . . . . . . . . . . . . . . . . . . . . . . . . 774 209 814 220 464 131
Haynesville Shale . . . . . . . . . . . . . . . . . . . . . . . . 337 163 81 42 121 77
Marcellus Shale . . . . . . . . . . . . . . . . . . . . . . . . . . 149 74 32 23 — —
Bossier Shale . . . . . . . . . . . . . . . . . . . . . . . . . . . . — — — — — —
Eagle Ford Shale . . . . . . . . . . . . . . . . . . . . . . . . . — — — — — —
Other:
Mid-Continent . . . . . . . . . . . . . . . . . . . . . . . . . . . . 386 144 1,515 542 1,662 654
Permian and Delaware Basins . . . . . . . . . . . . . . 93 42 165 95 253 107
South Texas/Gulf Coast/Ark-La-Tex . . . . . . . . . 41 25 164 97 228 167
Appalachian Basin . . . . . . . . . . . . . . . . . . . . . . . . 9 7 129 114 431 373
Total . . . . . . . . . . . . . . . . . . . . . . . . . . . . . . . . . 2,206 1,003 3,676 1,733 3,671 1,919
At December 31, 2009, we had 153 (63 net) wells in process.
7
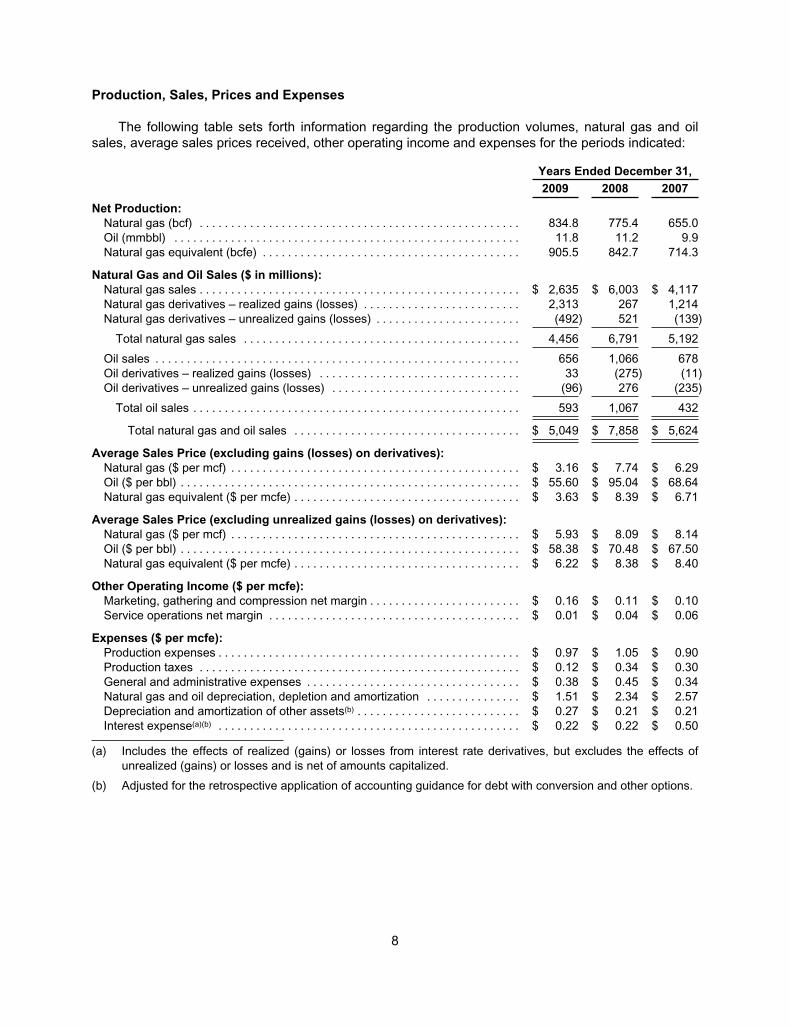
Production, Sales, Prices and Expenses
The following table sets forth information regarding the production volumes, natural gas and oil
sales, average sales prices received, other operating income and expenses for the periods indicated:
Years Ended December 31,
2009 2008 2007
Net Production:
Natural gas (bcf) . . . . . . . . . . . . . . . . . . . . . . . . . . . . . . . . . . . . . . . . . . . . . . . . . . . 834.8 775.4 655.0
Oil (mmbbl) . . . . . . . . . . . . . . . . . . . . . . . . . . . . . . . . . . . . . . . . . . . . . . . . . . . . . . . 11.8 11.2 9.9
Natural gas equivalent (bcfe) . . . . . . . . . . . . . . . . . . . . . . . . . . . . . . . . . . . . . . . . . 905.5 842.7 714.3
Natural Gas and Oil Sales ($ in millions):
Natural gas sales . . . . . . . . . . . . . . . . . . . . . . . . . . . . . . . . . . . . . . . . . . . . . . . . . . . $ 2,635 $ 6,003 $ 4,117
Natural gas derivatives – realized gains (losses) . . . . . . . . . . . . . . . . . . . . . . . . . 2,313 267 1,214
Natural gas derivatives – unrealized gains (losses) . . . . . . . . . . . . . . . . . . . . . . . (492) 521 (139)
Total natural gas sales . . . . . . . . . . . . . . . . . . . . . . . . . . . . . . . . . . . . . . . . . . . . 4,456 6,791 5,192
Oil sales . . . . . . . . . . . . . . . . . . . . . . . . . . . . . . . . . . . . . . . . . . . . . . . . . . . . . . . . . . 656 1,066 678
Oil derivatives – realized gains (losses) . . . . . . . . . . . . . . . . . . . . . . . . . . . . . . . . 33 (275) (11)
Oil derivatives – unrealized gains (losses) . . . . . . . . . . . . . . . . . . . . . . . . . . . . . . (96) 276 (235)
Total oil sales . . . . . . . . . . . . . . . . . . . . . . . . . . . . . . . . . . . . . . . . . . . . . . . . . . . . 593 1,067 432
Total natural gas and oil sales . . . . . . . . . . . . . . . . . . . . . . . . . . . . . . . . . . . . $ 5,049 $ 7,858 $ 5,624
Average Sales Price (excluding gains (losses) on derivatives):
Natural gas ($ per mcf) . . . . . . . . . . . . . . . . . . . . . . . . . . . . . . . . . . . . . . . . . . . . . . $ 3.16 $ 7.74 $ 6.29
Oil ($ per bbl) . . . . . . . . . . . . . . . . . . . . . . . . . . . . . . . . . . . . . . . . . . . . . . . . . . . . . . $ 55.60 $ 95.04 $ 68.64
Natural gas equivalent ($ per mcfe) . . . . . . . . . . . . . . . . . . . . . . . . . . . . . . . . . . . . $ 3.63 $ 8.39 $ 6.71
Average Sales Price (excluding unrealized gains (losses) on derivatives):
Natural gas ($ per mcf) . . . . . . . . . . . . . . . . . . . . . . . . . . . . . . . . . . . . . . . . . . . . . . $ 5.93 $ 8.09 $ 8.14
Oil ($ per bbl) . . . . . . . . . . . . . . . . . . . . . . . . . . . . . . . . . . . . . . . . . . . . . . . . . . . . . . $ 58.38 $ 70.48 $ 67.50
Natural gas equivalent ($ per mcfe) . . . . . . . . . . . . . . . . . . . . . . . . . . . . . . . . . . . . $ 6.22 $ 8.38 $ 8.40
Other Operating Income ($ per mcfe):
Marketing, gathering and compression net margin . . . . . . . . . . . . . . . . . . . . . . . . $ 0.16 $ 0.11 $ 0.10
Service operations net margin . . . . . . . . . . . . . . . . . . . . . . . . . . . . . . . . . . . . . . . . $ 0.01 $ 0.04 $ 0.06
Expenses ($ per mcfe):
Production expenses . . . . . . . . . . . . . . . . . . . . . . . . . . . . . . . . . . . . . . . . . . . . . . . . $ 0.97 $ 1.05 $ 0.90
Production taxes . . . . . . . . . . . . . . . . . . . . . . . . . . . . . . . . . . . . . . . . . . . . . . . . . . . $ 0.12 $ 0.34 $ 0.30
General and administrative expenses . . . . . . . . . . . . . . . . . . . . . . . . . . . . . . . . . . $ 0.38 $ 0.45 $ 0.34
Natural gas and oil depreciation, depletion and amortization . . . . . . . . . . . . . . . $ 1.51 $ 2.34 $ 2.57
Depreciation and amortization of other assets(b) . . . . . . . . . . . . . . . . . . . . . . . . . . $ 0.27 $ 0.21 $ 0.21
Interest expense(a)(b) . . . . . . . . . . . . . . . . . . . . . . . . . . . . . . . . . . . . . . . . . . . . . . . . $ 0.22 $ 0.22 $ 0.50
(a) Includes the effects of realized (gains) or losses from interest rate derivatives, but excludes the effects of
unrealized (gains) or losses and is net of amounts capitalized.
(b) Adjusted for the retrospective application of accounting guidance for debt with conversion and other options.
8
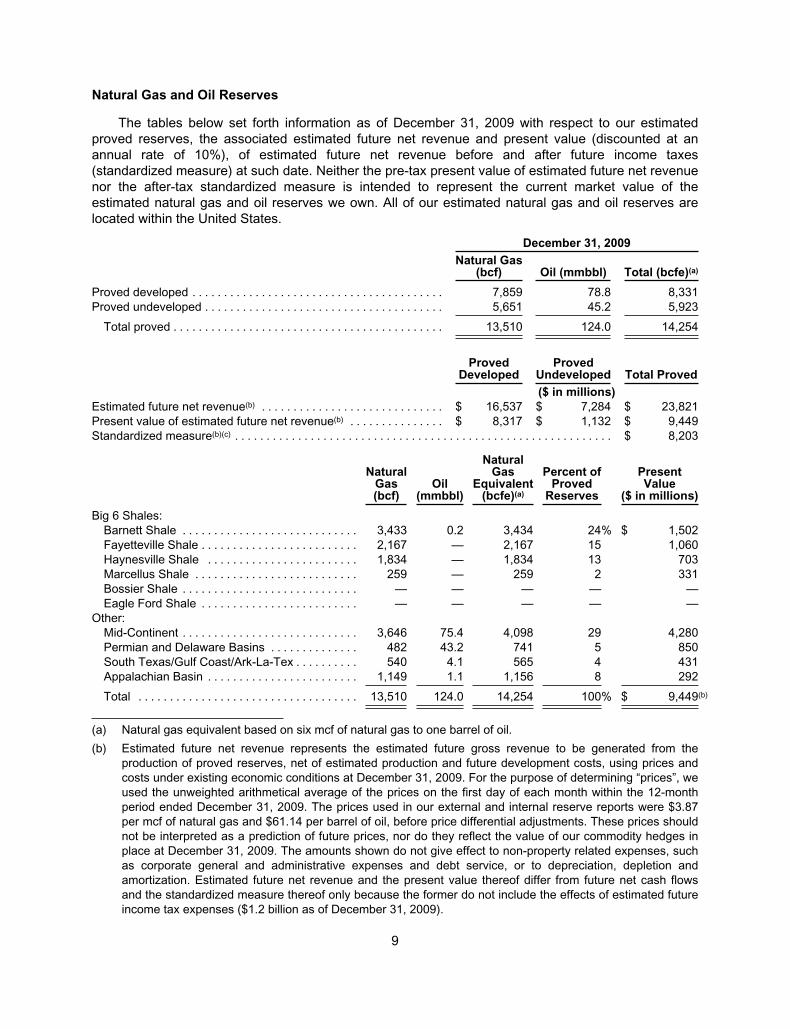
Natural Gas and Oil Reserves
The tables below set forth information as of December 31, 2009 with respect to our estimated
proved reserves, the associated estimated future net revenue and present value (discounted at an
annual rate of 10%), of estimated future net revenue before and after future income taxes
(standardized measure) at such date. Neither the pre-tax present value of estimated future net revenue
nor the after-tax standardized measure is intended to represent the current market value of the
estimated natural gas and oil reserves we own. All of our estimated natural gas and oil reserves are
located within the United States.
December 31, 2009
Natural Gas(bcf) Oil (mmbbl) Total (bcfe)(a)
Proved developed . . . . . . . . . . . . . . . . . . . . . . . . . . . . . . . . . . . . . . . . 7,859 78.8 8,331
Proved undeveloped . . . . . . . . . . . . . . . . . . . . . . . . . . . . . . . . . . . . . . 5,651 45.2 5,923
Total proved . . . . . . . . . . . . . . . . . . . . . . . . . . . . . . . . . . . . . . . . . . . 13,510 124.0 14,254
ProvedDeveloped
ProvedUndeveloped Total Proved
($ in millions)
Estimated future net revenue(b) . . . . . . . . . . . . . . . . . . . . . . . . . . . . . $ 16,537 $ 7,284 $ 23,821
Present value of estimated future net revenue(b) . . . . . . . . . . . . . . . $ 8,317 $ 1,132 $ 9,449
Standardized measure(b)(c) . . . . . . . . . . . . . . . . . . . . . . . . . . . . . . . . . . . . . . . . . . . . . . . . . . . . . . . . . . . . $ 8,203
NaturalGas(bcf)
Oil(mmbbl)
NaturalGas
Equivalent(bcfe)(a)
Percent ofProved
Reserves
PresentValue
($ in millions)
Big 6 Shales:
Barnett Shale . . . . . . . . . . . . . . . . . . . . . . . . . . . . 3,433 0.2 3,434 24% $ 1,502
Fayetteville Shale . . . . . . . . . . . . . . . . . . . . . . . . . 2,167 — 2,167 15 1,060
Haynesville Shale . . . . . . . . . . . . . . . . . . . . . . . . 1,834 — 1,834 13 703
Marcellus Shale . . . . . . . . . . . . . . . . . . . . . . . . . . 259 — 259 2 331
Bossier Shale . . . . . . . . . . . . . . . . . . . . . . . . . . . . — — — — —
Eagle Ford Shale . . . . . . . . . . . . . . . . . . . . . . . . . — — — — —
Other:
Mid-Continent . . . . . . . . . . . . . . . . . . . . . . . . . . . . 3,646 75.4 4,098 29 4,280
Permian and Delaware Basins . . . . . . . . . . . . . . 482 43.2 741 5 850
South Texas/Gulf Coast/Ark-La-Tex . . . . . . . . . . 540 4.1 565 4 431
Appalachian Basin . . . . . . . . . . . . . . . . . . . . . . . . 1,149 1.1 1,156 8 292
Total . . . . . . . . . . . . . . . . . . . . . . . . . . . . . . . . . . . 13,510 124.0 14,254 100% $ 9,449(b)
(a) Natural gas equivalent based on six mcf of natural gas to one barrel of oil.
(b) Estimated future net revenue represents the estimated future gross revenue to be generated from the
production of proved reserves, net of estimated production and future development costs, using prices and
costs under existing economic conditions at December 31, 2009. For the purpose of determining “prices”, we
used the unweighted arithmetical average of the prices on the first day of each month within the 12-month
period ended December 31, 2009. The prices used in our external and internal reserve reports were $3.87
per mcf of natural gas and $61.14 per barrel of oil, before price differential adjustments. These prices should
not be interpreted as a prediction of future prices, nor do they reflect the value of our commodity hedges in
place at December 31, 2009. The amounts shown do not give effect to non-property related expenses, such
as corporate general and administrative expenses and debt service, or to depreciation, depletion and
amortization. Estimated future net revenue and the present value thereof differ from future net cash flows
and the standardized measure thereof only because the former do not include the effects of estimated future
income tax expenses ($1.2 billion as of December 31, 2009).
9
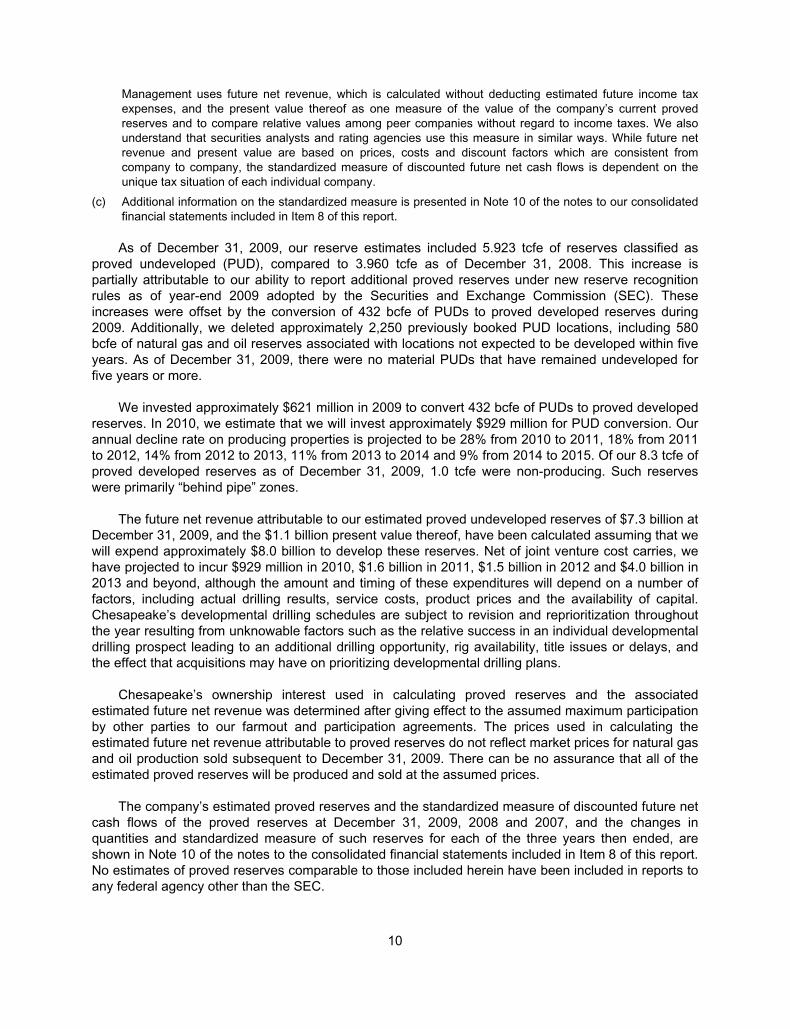
Management uses future net revenue, which is calculated without deducting estimated future income tax
expenses, and the present value thereof as one measure of the value of the company’s current proved
reserves and to compare relative values among peer companies without regard to income taxes. We also
understand that securities analysts and rating agencies use this measure in similar ways. While future net
revenue and present value are based on prices, costs and discount factors which are consistent from
company to company, the standardized measure of discounted future net cash flows is dependent on the
unique tax situation of each individual company.
(c) Additional information on the standardized measure is presented in Note 10 of the notes to our consolidated
financial statements included in Item 8 of this report.
As of December 31, 2009, our reserve estimates included 5.923 tcfe of reserves classified as
proved undeveloped (PUD), compared to 3.960 tcfe as of December 31, 2008. This increase is
partially attributable to our ability to report additional proved reserves under new reserve recognition
rules as of year-end 2009 adopted by the Securities and Exchange Commission (SEC). These
increases were offset by the conversion of 432 bcfe of PUDs to proved developed reserves during
2009. Additionally, we deleted approximately 2,250 previously booked PUD locations, including 580
bcfe of natural gas and oil reserves associated with locations not expected to be developed within five
years. As of December 31, 2009, there were no material PUDs that have remained undeveloped for
five years or more.
We invested approximately $621 million in 2009 to convert 432 bcfe of PUDs to proved developed
reserves. In 2010, we estimate that we will invest approximately $929 million for PUD conversion. Our
annual decline rate on producing properties is projected to be 28% from 2010 to 2011, 18% from 2011
to 2012, 14% from 2012 to 2013, 11% from 2013 to 2014 and 9% from 2014 to 2015. Of our 8.3 tcfe of
proved developed reserves as of December 31, 2009, 1.0 tcfe were non-producing. Such reserves
were primarily “behind pipe” zones.
The future net revenue attributable to our estimated proved undeveloped reserves of $7.3 billion at
December 31, 2009, and the $1.1 billion present value thereof, have been calculated assuming that we
will expend approximately $8.0 billion to develop these reserves. Net of joint venture cost carries, we
have projected to incur $929 million in 2010, $1.6 billion in 2011, $1.5 billion in 2012 and $4.0 billion in
2013 and beyond, although the amount and timing of these expenditures will depend on a number of
factors, including actual drilling results, service costs, product prices and the availability of capital.
Chesapeake’s developmental drilling schedules are subject to revision and reprioritization throughout
the year resulting from unknowable factors such as the relative success in an individual developmental
drilling prospect leading to an additional drilling opportunity, rig availability, title issues or delays, and
the effect that acquisitions may have on prioritizing developmental drilling plans.
Chesapeake’s ownership interest used in calculating proved reserves and the associated
estimated future net revenue was determined after giving effect to the assumed maximum participation
by other parties to our farmout and participation agreements. The prices used in calculating the
estimated future net revenue attributable to proved reserves do not reflect market prices for natural gas
and oil production sold subsequent to December 31, 2009. There can be no assurance that all of the
estimated proved reserves will be produced and sold at the assumed prices.
The company’s estimated proved reserves and the standardized measure of discounted future net
cash flows of the proved reserves at December 31, 2009, 2008 and 2007, and the changes in
quantities and standardized measure of such reserves for each of the three years then ended, are
shown in Note 10 of the notes to the consolidated financial statements included in Item 8 of this report.
No estimates of proved reserves comparable to those included herein have been included in reports to
any federal agency other than the SEC.
10
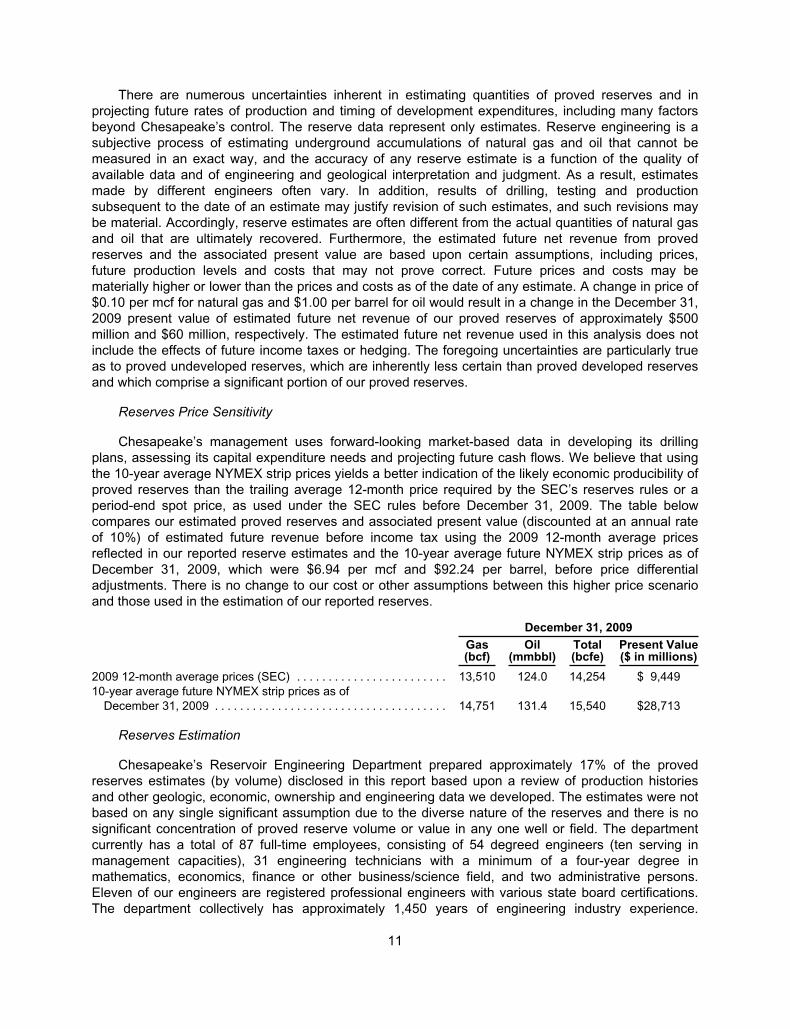
There are numerous uncertainties inherent in estimating quantities of proved reserves and in
projecting future rates of production and timing of development expenditures, including many factors
beyond Chesapeake’s control. The reserve data represent only estimates. Reserve engineering is a
subjective process of estimating underground accumulations of natural gas and oil that cannot be
measured in an exact way, and the accuracy of any reserve estimate is a function of the quality of
available data and of engineering and geological interpretation and judgment. As a result, estimates
made by different engineers often vary. In addition, results of drilling, testing and production
subsequent to the date of an estimate may justify revision of such estimates, and such revisions may
be material. Accordingly, reserve estimates are often different from the actual quantities of natural gas
and oil that are ultimately recovered. Furthermore, the estimated future net revenue from proved
reserves and the associated present value are based upon certain assumptions, including prices,
future production levels and costs that may not prove correct. Future prices and costs may be
materially higher or lower than the prices and costs as of the date of any estimate. A change in price of
$0.10 per mcf for natural gas and $1.00 per barrel for oil would result in a change in the December 31,
2009 present value of estimated future net revenue of our proved reserves of approximately $500
million and $60 million, respectively. The estimated future net revenue used in this analysis does not
include the effects of future income taxes or hedging. The foregoing uncertainties are particularly true
as to proved undeveloped reserves, which are inherently less certain than proved developed reserves
and which comprise a significant portion of our proved reserves.
Reserves Price Sensitivity
Chesapeake’s management uses forward-looking market-based data in developing its drilling
plans, assessing its capital expenditure needs and projecting future cash flows. We believe that using
the 10-year average NYMEX strip prices yields a better indication of the likely economic producibility of
proved reserves than the trailing average 12-month price required by the SEC’s reserves rules or a
period-end spot price, as used under the SEC rules before December 31, 2009. The table below
compares our estimated proved reserves and associated present value (discounted at an annual rate
of 10%) of estimated future revenue before income tax using the 2009 12-month average prices
reflected in our reported reserve estimates and the 10-year average future NYMEX strip prices as of
December 31, 2009, which were $6.94 per mcf and $92.24 per barrel, before price differential
adjustments. There is no change to our cost or other assumptions between this higher price scenario
and those used in the estimation of our reported reserves.
December 31, 2009
Gas(bcf)
Oil(mmbbl)
Total(bcfe)
Present Value($ in millions)
2009 12-month average prices (SEC) . . . . . . . . . . . . . . . . . . . . . . . . 13,510 124.0 14,254 $ 9,449
10-year average future NYMEX strip prices as of
December 31, 2009 . . . . . . . . . . . . . . . . . . . . . . . . . . . . . . . . . . . . . 14,751 131.4 15,540 $28,713
Reserves Estimation
Chesapeake’s Reservoir Engineering Department prepared approximately 17% of the proved
reserves estimates (by volume) disclosed in this report based upon a review of production histories
and other geologic, economic, ownership and engineering data we developed. The estimates were not
based on any single significant assumption due to the diverse nature of the reserves and there is no
significant concentration of proved reserve volume or value in any one well or field. The department
currently has a total of 87 full-time employees, consisting of 54 degreed engineers (ten serving in
management capacities), 31 engineering technicians with a minimum of a four-year degree in
mathematics, economics, finance or other business/science field, and two administrative persons.
Eleven of our engineers are registered professional engineers with various state board certifications.
The department collectively has approximately 1,450 years of engineering industry experience.
11
Chesapeake maintains a continuous education program for engineers and technicians on new
technologies and industry advancements and also offers refresher training on basic skill sets.
Chesapeake maintains internal controls such as the following to ensure the reliability of reserves
estimations:
• No employee’s compensation is tied to the amount of reserves booked.
• We follow comprehensive SEC-compliant internal policies to determine and report proved
reserves. Reserves estimates are made by experienced reservoir engineers or under their
direct supervision.
• The Reservoir Engineering Department reviews all the company’s reported proved reserves
at the close of each quarter.
• Each quarter, Reservoir Engineering Department managers, the Vice President of Reservoir
Engineering, the Senior Vice President of Production and the Chief Operating Officer review
all significant reserve changes and all new proved undeveloped reserves additions.
• The Reservoir Engineering Department reports independently of any of our operating
divisions.
Chesapeake’s Vice President of Reservoir Engineering is the technical person primarily
responsible for overseeing the preparation of the company’s reserve estimates. His qualifications
include the following:
• 34 years of practical experience in petroleum engineering with 31 years of this experience
being in the estimation and evaluation of reserves
• certified professional engineer in the state of Oklahoma
• Bachelor of Science degree in Petroleum Engineering
• member in good standing of the Society of Petroleum Engineers
We engaged four third-party engineering firms to prepare portions of our reserve estimates
comprising approximately 83% of our estimated proved reserves (by volume) at year-end 2009. The
portion of our estimated proved reserves prepared by each of our third-party engineering firms as of
December 31, 2009 is presented below.
% Prepared(by Volume) Principal Properties
Netherland, Sewell & Associates, Inc. . . . . . . . . . . 59% Barnett Shale
Fayetteville Shale
Haynesville Shale
Mid-Continent (portions)
Permian and Delaware Basins
Ark-La-Tex (portions)
Lee Keeling and Associates, Inc. . . . . . . . . . . . . . . 10% Mid-Continent
South Texas/ Texas Gulf Coast (portions)
Data and Consulting Services, Division of
Schlumberger Technology Corporation . . . . . . .7% Marcellus Shale
Appalachian Basin
Ryder Scott Company, L.P. . . . . . . . . . . . . . . . . . . 7% Mid-Continent (portions)
South Texas/ Texas Gulf Coast (portions)
12
Copies of the reports issued by the engineering firms are filed with this report as Exhibits 99.1 –
99.4. The qualifications of the technical person at each of these firms primarily responsible for
overseeing his firm’s preparation of the company’s reserve estimates are set forth below.
Netherland, Sewell & Associates, Inc.:
• over 30 years of practical experience in petroleum engineering, with over 29 years of this
experience being in the estimation and evaluation of reserves
• a registered professional engineer in the state of Texas
• Bachelor of Science Degree in Chemical Engineering
Lee Keeling and Associates, Inc.:
• over 45 years of practical experience in petroleum engineering and in the estimation and
evaluation of reserves
• a certified professional engineer in the state of Oklahoma
• Bachelor of Science Degree in Petroleum Engineering
Data and Consulting Services, Division of Schlumberger Technology Corporation:
• over 20 years of practical experience in petroleum geology and in the estimation and
evaluation of reserves
• registered professional geologist license in the commonwealth of Pennsylvania
• certified petroleum geologist of the American Association of Petroleum Geologists
• Bachelor of Science Degree in Geological Sciences
• member in good standing of the Society of Petroleum Engineers and the Society of Petroleum
Evaluation Engineers
Ryder Scott Company, L.P.:
• over 30 years of practical experience in the estimation and evaluation of reserves
• registered professional engineer in the state of Texas
• Bachelor of Science Degree in Electrical Engineering
• member in good standing of the Society of Petroleum Engineers and the Society of Petroleum
Evaluation Engineers
13
Exploration and Development, Acquisition and Divestiture Activities
The following table sets forth historical cost information regarding our exploration and
development acquisition and divestiture activities during the periods indicated:
December 31,
2009 2008 2007
($ in millions)
Development and exploration costs:
Development drilling(a) . . . . . . . . . . . . . . . . . . . . . . . . . . . . . . . . . . . . . . . . . . . . . . . . . $ 2,729 $ 5,185 $ 4,402
Exploratory drilling . . . . . . . . . . . . . . . . . . . . . . . . . . . . . . . . . . . . . . . . . . . . . . . . . . . . 651 612 653
Geological and geophysical costs(b)(c) . . . . . . . . . . . . . . . . . . . . . . . . . . . . . . . . . . . . . 162 314 343
Asset retirement obligation and other . . . . . . . . . . . . . . . . . . . . . . . . . . . . . . . . . . . . . (2) 10 29
Total . . . . . . . . . . . . . . . . . . . . . . . . . . . . . . . . . . . . . . . . . . . . . . . . . . . . . . . . . . . . . . 3,540 6,121 5,427
Acquisition costs:
Unproved properties(d) . . . . . . . . . . . . . . . . . . . . . . . . . . . . . . . . . . . . . . . . . . . . . . . . . 2,793 8,250 2,507
Proved properties . . . . . . . . . . . . . . . . . . . . . . . . . . . . . . . . . . . . . . . . . . . . . . . . . . . . . 61 355 671
Deferred income taxes . . . . . . . . . . . . . . . . . . . . . . . . . . . . . . . . . . . . . . . . . . . . . . . . . — 13 131
Total . . . . . . . . . . . . . . . . . . . . . . . . . . . . . . . . . . . . . . . . . . . . . . . . . . . . . . . . . . . . . . 2,854 8,618 3,309
Proceeds from divestitures:
Unproved properties . . . . . . . . . . . . . . . . . . . . . . . . . . . . . . . . . . . . . . . . . . . . . . . . . . . (1,265) (5,302) —
Proved properties . . . . . . . . . . . . . . . . . . . . . . . . . . . . . . . . . . . . . . . . . . . . . . . . . . . . . (461) (2,433) (1,142)
Total . . . . . . . . . . . . . . . . . . . . . . . . . . . . . . . . . . . . . . . . . . . . . . . . . . . . . . . . . . . . . . $ 4,668 $ 7,004 $ 7,594
(a) Includes capitalized internal costs of $332 million, $326 million and $243 million, respectively.
(b) Includes capitalized internal costs of $22 million, $26 million and $19 million, respectively.
(c) Includes $29 million, $25 million and $16 million of related capitalized interest, respectively.
(d) Includes $598 million, $561 million and $296 million of related capitalized interest, respectively.
Our development costs included $621 million, $1.5 billion and $1.5 billion in 2009, 2008 and 2007,
respectively, related to properties carried as proved undeveloped locations in the prior year’s reserve
reports.
14
A summary of our exploration and development, acquisition and divestiture activities in 2009 by
operating area is as follows:
GrossWellsDrilled
NetWellsDrilled
Explorationand
Development
Acquisitionof
UnprovedProperties
Acquisitionof ProvedProperties
Sales ofUnproved
Properties(a)
Sales ofProved
Properties(a) Total
($ in millions)Big 6 Shales:
BarnettShale . . . . . . . 417 339 $ 1,197 $ 209 $ 1 $ — $ — $1,407
FayettevilleShale . . . . . . . 774 209 179 56 — — 3 238
HaynesvilleShale . . . . . . . 337 163 744 1,270 42 (1,074) — 982
MarcellusShale . . . . . . . 149 74 145 1,038 15 (176) — 1,022
BossierShale . . . . . . . — — — — — — — —
Eagle FordShale . . . . . . . — — — — — — — —
Other:Mid-Continent . . 386 144 712 120 3 11 109 955Permian and
DelawareBasins . . . . . . 93 42 322 31 — (3) (2) 348
South Texas/Gulf Coast/Ark-La-Tex . . 41 25 197 69 — (23) (571) (328)
AppalachianBasin . . . . . . . 9 7 44 — — — — 44
Total . . . . . . . 2,206 1,003 $ 3,540 $ 2,793 $ 61 $ (1,265) $ (461) $4,668
(a) Balance includes payments and remaining accruals for post-closing adjustments due to title defects in connection with
certain 2008 joint venture and divestiture transactions.
Acreage
The following table sets forth as of December 31, 2009 the gross and net acres of both developed
and undeveloped natural gas and oil leases which we hold. “Gross” acres are the total number of acres
in which we own a working interest. “Net” acres refer to gross acres multiplied by our fractional working
interest. Acreage numbers do not include our options to acquire additional acreage which have not
been exercised.
Developed Undeveloped Total
GrossAcres
NetAcres
GrossAcres
NetAcres
GrossAcres
NetAcres
Big 6 Shales:Barnett Shale . . . . . . . . . . . . . . . . 194,477 160,277 202,493 129,595 396,970 289,872Fayetteville Shale . . . . . . . . . . . . 276,148 123,384 2,078,125 1,033,437 2,354,273 1,156,821Haynesville Shale(a) . . . . . . . . . . . 215,754 151,439 545,240 362,806 760,994 514,245Marcellus Shale . . . . . . . . . . . . . . 426,101 215,958 2,802,937 1,407,147 3,229,038 1,623,105Eagle Ford Shale . . . . . . . . . . . . . 106 106 86,360 79,862 86,466 79,968
Other:Mid-Continent . . . . . . . . . . . . . . . . 4,396,456 2,206,548 2,873,781 1,614,026 7,270,237 3,820,574Permian and Delaware
Basins . . . . . . . . . . . . . . . . . . . . 469,067 267,195 3,046,170 1,884,421 3,515,237 2,151,616South Texas/Gulf Coast/
Ark-La-Tex . . . . . . . . . . . . . . . . 527,081 311,430 509,894 295,441 1,036,975 606,871Appalachian Basin . . . . . . . . . . . . 1,696,871 1,483,204 3,214,139 1,448,205 4,911,010 2,931,409
Total . . . . . . . . . . . . . . . . . . . . . 8,202,061 4,919,541 15,359,139 8,254,940 23,561,200 13,174,481
(a) The Bossier Shale acreage overlaps the Haynesville Shale acreage and is included within the Haynesville Shale totals.
15
Marketing, Gathering and Compression
Marketing
Chesapeake Energy Marketing, Inc., one of our wholly-owned subsidiaries, provides natural gas
and oil marketing services, including commodity price structuring, contract administration and
nomination services for Chesapeake, its partners and other producers. We attempt to enhance the
value of our natural gas production by aggregating natural gas to be sold to natural gas marketers and
pipelines. This aggregation allows us to attract larger, more creditworthy customers that in turn assist
in maximizing the prices received for our production.
Our oil production is generally sold under market sensitive or spot price contracts. The revenue we
receive from the sale of natural gas liquids is included in oil sales.
Our natural gas production is sold to purchasers under percentage-of-proceeds contracts,
percentage-of-index contracts or spot price contracts. By the terms of the percentage-of-proceeds
contracts, we receive a percentage of the resale price received by the purchaser for sales of residue
gas and natural gas liquids recovered after transportation and processing of our natural gas. These
purchasers sell the residue gas and natural gas liquids based primarily on spot market prices. Under
percentage-of-index contracts, the price per mmbtu we receive for our natural gas is tied to indexes
published in Inside FERC or Gas Daily. Although exact percentages vary daily, as of February 2010,
approximately 80% of our natural gas production was sold under short-term contracts at market-
sensitive prices.
During 2009, sales to EDF Trading North America LLC (formerly Eagle Energy Partners, I, L.P.) of
$571 million accounted for 10% of our total revenues (excluding gains (losses) on derivatives). In 2007,
we sold our 33% limited partnership interest in Eagle Energy Partners I, L.P., which we first acquired in
2003, for proceeds of $124 million and a gain of $83 million. Management believes that the loss of this
customer would not have a material adverse effect on our results of operations or our financial position.
No other customer accounted for more than 10% of total revenues (excluding gains (losses) on
derivatives) in 2009.
Our marketing activities constitute a reportable segment under accounting guidance for disclosure
about segments of an enterprise and related information. See Note 17 of the notes to our consolidated
financial statements in Item 8.
Midstream Gathering Operations
Chesapeake invests in gathering systems and processing facilities to complement our natural gas
operations in regions where we have significant production and additional infrastructure is required. By
doing so, we are better able to manage the value received for and the costs of, gathering, treating and
processing natural gas. These systems are designed primarily to gather company production for
delivery into major intrastate or interstate pipelines. In addition, our midstream business provides
services to third-party customers. Chesapeake generates revenues from its gathering, treating and
compression activities through fixed-rate fee structures. The company also processes a portion of its
natural gas at various third-party plants.
Our midstream assets were held in various wholly-owned subsidiaries of Chesapeake until
February 2008 when we transferred our non-Appalachian midstream assets to our wholly-owned
subsidiary Chesapeake Midstream Development, L.P. (CMD) and its subsidiaries. In September 2009,
we formed a joint venture with Global Infrastructure Partners (GIP) to own and operate natural gas
midstream assets. As part of the transaction, we contributed certain natural gas gathering systems that
16
had been held by CMD and its subsidiaries to a new entity, Chesapeake Midstream Partners, L.L.C.
(CMP) and GIP purchased a 50% interest in CMP for $588 million in cash. The accounting for the joint
venture is described in Note 11 of the consolidated financial statements included in this report. The
assets we contributed to the joint venture were substantially all of our midstream assets in the Barnett
Shale and also the majority of our non-shale midstream assets in the Arkoma, Anadarko, Delaware
and Permian Basins. Together, these assets constituted approximately 57% of our total midstream
assets as of September 30, 2009.
Subsidiaries of CMD continue to operate our midstream assets outside of the CMP joint venture.
These include natural gas gathering assets in the Fayetteville Shale, Haynesville Shale, Marcellus
Shale and other areas in Appalachia. Compared to the Barnett Shale and Mid-Continent areas where
the CMP midstream assets are located, these are less developed areas and will require significant
build-out capital expenditures. A source of liquidity for this business is the $250 million revolving credit
facility described under Liquidity and Capital Resources in Item 7 below. The CMD systems, which are
located in Oklahoma, Texas, Colorado, New Mexico, New York, Ohio, Maryland, Louisiana, Arkansas,
Pennsylvania and West Virginia, consist of approximately 1,500 miles of gathering pipelines, servicing
over 900 natural gas wells.
On February 16, 2010, Chesapeake Midstream Partners, L.P. (the Partnership) filed a registration
statement on Form S-1 with the SEC relating to a proposed underwritten initial public offering of
common units, representing limited partnership interests in the Partnership. The Partnership was
formed by Chesapeake and GIP, equal indirect owners of the general partner of the Partnership, to
own, operate, develop and acquire midstream assets. Upon the closing of the offering, Chesapeake
and GIP will contribute CMP’s interests to the Partnership and the Partnership will continue CMP’s
business. It is expected that the Partnership will succeed to CMP’s $500 million revolving credit facility,
with certain amendments, and a portion of the proceeds of the offering will be used to repay the
outstanding borrowings under the midstream joint venture revolving credit facility described under
Liquidity and Capital Resources in Item 7 below.
Compression
Since 2003, Chesapeake has expanded its compression business. Our wholly-owned subsidiary,
MidCon Compression, L.L.C., operates wellhead and system compressors to facilitate the
transportation of our natural gas production. In a series of transactions in 2007, 2008 and 2009,
MidCon sold a significant portion of its compressor fleet, consisting of 1,685 compressors, for $370
million and entered into a master lease agreement. These transactions were recorded as sales and
operating leasebacks. During 2010, we expect to take delivery of 324 new compressors that are on
order for approximately $100 million, and we intend to simultaneously enter into sale/leaseback
transactions with financial counterparties as the compressors are delivered, if acceptable leasing
arrangements are available to us.
Service Operations
Drilling
Securing available rigs is an integral part of the exploration process and therefore owning our own
drilling company is a strategic advantage for Chesapeake. In 2001, Chesapeake formed its wholly-
owned drilling subsidiary, Nomac Drilling Corporation, with an investment of $26 million to build and
refurbish five drilling rigs. As of December 31, 2009, Chesapeake had invested approximately $897
million to build or acquire 98 drilling rigs. In a series of transactions in 2006, 2007 and 2008, our drilling
subsidiaries sold 83 rigs for $677 million and subsequently leased back the rigs through 2018. The
drilling rigs have depth ratings between 3,000 and 25,000 feet and range in drilling horsepower from
17
525 to 2,000. These drilling rigs are currently operating in Oklahoma, Texas, Arkansas, Louisiana and
Appalachia. Chesapeake is the fourth largest drilling rig contractor in the U.S.
Trucking
In 2006, Chesapeake expanded its service operations by acquiring two privately-owned oilfield
trucking service companies. We now own one of the largest oilfield and heavy haul transportation
companies in the industry. Our trucking business is utilized primarily to transport drilling rigs for both
Chesapeake and third parties. Through this ownership, we are better able to manage the movement of
our rigs. As of December 31, 2009, our fleet included 255 trucks and 19 cranes, which mainly service
the Mid-Continent, Barnett Shale and Appalachian regions.
Seasonal Nature of Business
Generally, the demand for natural gas decreases during the summer months and increases during
the winter months. Seasonal anomalies such as mild winters or hot summers can lessen or intensify
this fluctuation. In addition, pipelines, utilities, local distribution companies and industrial users utilize
natural gas storage facilities and purchase some of their anticipated winter requirements during the
summer. This can lessen seasonal demand fluctuations. World weather and resultant prices for LNG
can also affect deliveries of competing LNG into this country from abroad, affecting the price of
domestically produced natural gas.
Competition
We compete with both major integrated and other independent natural gas and oil companies in
acquiring desirable leasehold acreage, producing properties and the equipment and expertise
necessary to explore, develop and operate our properties and market our production. Some of our
competitors may have larger financial and other resources than ours. The natural gas and oil industry
also faces competition from alternative fuel sources, including other fossil fuels such as coal and
imported LNG. Competitive conditions may be affected by future legislation and regulations as the U.S.
develops new energy and climate-related policies. In addition, some of our larger competitors may
have a competitive advantage when responding to factors that affect demand for natural gas and oil
production, such as changing prices, domestic and foreign political conditions, weather conditions, the
price and availability of alternative fuels, the proximity and capacity of gas pipelines and other
transportation facilities, and overall economic conditions. We believe that our technological expertise,
our exploration, land, drilling and production capabilities and the experience of our management
generally enable us to compete effectively.
Hedging Activities
We utilize hedging strategies to hedge the price of a portion of our future natural gas and oil
production and to manage interest rate exposure. See Item 7A. Quantitative and Qualitative
Disclosures About Market Risk.
Regulation
General. All of our operations are conducted onshore in the United States. The U.S. natural gas
and oil industry is regulated at the federal, state and local levels, and some of the laws, rules and
regulations that govern our operations carry substantial penalties for noncompliance. These regulatory
burdens increase our cost of doing business and, consequently, affect our profitability.
Regulation of Natural Gas and Oil Operations. Our exploration and production operations are
subject to various types of regulation at the U.S. federal, state and local levels. Such regulation
18
includes requirements for permits to drill and to conduct other operations and for provision of financial
assurances (such as bonds) covering drilling and well operations. Other activities subject to regulation
include, but are not limited to:
• the location of wells;
• the method of drilling and completing wells;
• the surface use and restoration of properties upon which wells are drilled;
• the plugging and abandoning of wells;
• the disposal of fluids used or other wastes generated in connection with operations;
• the marketing, transportation and reporting of production; and
• the valuation and payment of royalties.
Our operations are also subject to various conservation regulations. These include the regulation
of the size of drilling and spacing units (regarding the density of wells that may be drilled in a particular
area) and the unitization or pooling of natural gas and oil properties. In this regard, some states, such
as Oklahoma, allow the forced pooling or integration of tracts to facilitate exploration, while other
states, such as Texas and New Mexico rely on voluntary pooling of lands and leases. In areas where
pooling is voluntary, it may be more difficult to form units and therefore, more difficult to fully develop a
project if the operator owns less than 100% of the leasehold. In addition, state conservation laws
establish maximum rates of production from natural gas and oil wells, generally prohibit the venting or
flaring of natural gas and impose certain requirements regarding the ratability of production. The effect
of these regulations is to limit the amount of natural gas and oil we can produce and to limit the number
of wells and the locations at which we can drill.
Chesapeake operates a number of natural gas gathering systems. The U.S. Department of
Transportation and certain state agencies regulate the safety and operating aspects of the
transportation and storage activities of these facilities. There is currently no price regulation of the
company’s sales of oil, natural gas liquids and natural gas, although governmental agencies may elect
in the future to regulate certain sales.
We do not anticipate that compliance with existing laws and regulations governing exploration,
production and natural gas gathering will have a material adverse effect upon our capital expenditures,
earnings or competitive position.
Environmental, Health and Safety Regulation. The business operations of the company and its
ownership and operation of natural gas and oil interests are subject to various federal, state and local
environmental, health and safety laws and regulations pertaining to the release, emission or discharge
of materials into the environment, the generation, storage, transportation, handling and disposal of
materials (including solid and hazardous wastes), the safety of employees, or otherwise relating to
pollution, preservation, remediation or protection of human health and safety, natural resources, wildlife
or the environment. We must take into account the cost of complying with environmental regulations in
planning, designing, constructing, drilling, operating and abandoning wells and related surface facilities.
In most instances, the regulatory frameworks relate to the handling of drilling and production materials,
the disposal of drilling and production wastes, and the protection of water and air. In addition, our
operations may require us to obtain permits for, among other things,
• air emissions;
• the construction and operation of underground injection wells to dispose of produced
saltwater and other non-hazardous oilfield wastes; and
• the construction and operation of surface pits to contain drilling muds and other
non-hazardous fluids associated with drilling operations.
19
Federal, state and local laws may require us to remove or remediate previously disposed wastes,
including wastes disposed of or released by us or prior owners or operators in accordance with current
laws or otherwise, to suspend or cease operations at contaminated areas, or to perform remedial well
plugging operations or response actions to reduce the risk of future contamination. Federal laws,
including the Comprehensive Environmental Response, Compensation, and Liability Act, or CERCLA,
and analogous state laws impose joint and several liability, without regard to fault or legality of the
original conduct, on classes of persons who are considered responsible for releases of a hazardous
substance into the environment. These persons include the owner or operator of the site where the
release occurred, and persons that disposed of or arranged for the disposal of hazardous substances
at the site. CERCLA and analogous state laws also authorize the U.S. Environmental Protection
Agency (EPA), state environmental agencies and, in some cases, third parties to take action to prevent
or respond to threats to human health or the environment and to seek to recover from responsible
classes of persons the costs of such actions.
Other federal and state laws, in particular the federal Resource Conservation and Recovery Act,
regulate hazardous and non-hazardous wastes. Under a longstanding legal framework, certain wastes
generated by our natural gas and oil operations are not subject to federal regulations governing
hazardous wastes, though they may be regulated under other federal and state laws. These wastes
may in the future be designated as hazardous wastes and may thus become subject to more rigorous
and costly compliance and disposal requirements.
Vast quantities of natural gas deposits exist in deep shale and other formations. It is customary in
our industry to recover natural gas from these deep shale formations through the use of hydraulic
fracturing, combined with sophisticated horizontal drilling. Hydraulic fracturing is the process of creating
or expanding cracks, or fractures, in formations underground where water, sand and other additives
are pumped under high pressure into a shale gas formation. These formations are generally
geologically separated and isolated from fresh ground water supplies by protective rock layers. Our
well construction practices include installation of multiple layers of protective steel casing surrounded
by cement that are specifically designed and installed to protect freshwater aquifers by preventing the
migration of fracturing fluids into aquifers. Legislative and regulatory efforts at the federal level and in
some states have sought to render permitting and compliance requirements more stringent for
hydraulic fracturing. If passed into law, such efforts could have an adverse effect on our operations.
Federal and state occupational safety and health laws require us to organize and maintain
information about hazardous materials used, released or produced in our operations. Certain portions of
this information must be provided to employees, state and local governmental authorities and local
citizens. We are also subject to the requirements and reporting set forth in federal workplace standards.
We have made and will continue to make expenditures to comply with environmental, health and
safety regulations and requirements. These are necessary business costs in the natural gas and oil
industry. Although we are not fully insured against all environmental, health and safety risks, and our
insurance does not cover any penalties or fines that may be issued by a governmental authority, we
maintain insurance coverage which we believe is customary in the industry. Moreover, it is possible
that other developments, such as stricter and more comprehensive environmental, health and safety
laws and regulations, as well as claims for damages to property or persons, resulting from company
operations, could result in substantial costs and liabilities, including civil and criminal penalties, to
Chesapeake. We believe that we are in material compliance with existing environmental, health and
safety regulations. We believe that the cost of maintaining compliance with these existing regulations
will not have a material adverse effect on our business, financial position and results of operation, but
new or more stringent regulations could increase the cost of doing business.
Climate Change. On December 15, 2009, the EPA officially published its findings that emissions of
carbon dioxide, methane and other “greenhouse gases” present an endangerment to human health and
20
the environment because emissions of such gases are, according to the EPA, contributing to warming of
the earth’s atmosphere and other climatic changes. These findings by the EPA allow the agency to
proceed with the adoption and implementation of regulations that would restrict emissions of greenhouse
gases under existing provisions of the federal Clean Air Act. The EPA has proposed two sets of
regulations that would require a reduction in emissions of greenhouse gases from motor vehicles and
these regulations, if finalized, could lead to the imposition of greenhouse gas emission limitations in
Clean Air Act permits for certain stationary sources. In addition, on September 22, 2009, the EPA issued
a final rule requiring the reporting of greenhouse gas emissions from specified large greenhouse gas
emission sources in the United States beginning in 2011 for emissions occurring in 2010. The adoption
and implementation of regulations governing or limiting emissions of greenhouse gases from our
equipment and operations could require us to incur additional operating costs and could adversely affect
demand for the natural gas and oil we sell.
The United States Congress has been considering various bills that would establish an economy-
wide cap-and-trade program to reduce U.S. emissions of greenhouse gases, including carbon dioxide
and methane. Such a program, if enacted, could require phased reductions in greenhouse gas
emissions over several or many years and could authorize the issuance of a declining number of
tradable allowances to sources of these emissions so that they may continue to emit greenhouse
gases into the atmosphere. The creation of such a program remains uncertain, as do the timing and
degree of reduction in emissions and the costs associated with any tradable emissions allowances.
Although it is not possible at this time to predict the outcome of Congressional consideration of
legislation concerning greenhouse gas emissions, any future federal laws or implementing regulations
that may be enacted concerning greenhouse gas emissions could require us to incur increased
operating costs and could adversely affect demand for the natural gas and oil we sell.
The potential increase in the costs of our operations resulting from any legislation or regulation to
restrict emissions of greenhouse gases could include new or increased costs to operate and maintain
our equipment and facilities, install new emission controls on our equipment and facilities, acquire
allowances to authorize our greenhouse gas emissions, pay taxes related to our greenhouse gas
emissions and administer and manage a greenhouse gas emissions program. Moreover, incentives to
conserve energy or use alternative energy sources could reduce demand for natural gas and oil.
Title to Properties
Our title to properties is subject to royalty, overriding royalty, carried, net profits, working and other
similar interests and contractual arrangements customary in the natural gas and oil industry, to liens for
current taxes not yet due and to other encumbrances. As is customary in the industry in the case of
undeveloped properties, only cursory investigation of record title is made at the time of acquisition.
Drilling title opinions are usually prepared before commencement of drilling operations. We believe we
have satisfactory title to substantially all of our active properties in accordance with standards generally
accepted in the natural gas and oil industry. Nevertheless, we are involved in title disputes from time to
time which result in litigation.
Operating Hazards and Insurance
The natural gas and oil business involves a variety of operating risks, including the risk of fire,
explosions, blow-outs, pipe failure, abnormally pressured formations and environmental hazards such
as oil spills, natural gas leaks, ruptures or discharges of toxic gases. If any of these should occur,
Chesapeake could suffer substantial losses due to injury or loss of life, severe damage to or
destruction of property, natural resources and equipment, pollution or other environmental damage,
clean-up responsibilities, regulatory investigation and penalties, and suspension of operations. Our
horizontal and deep drilling activities involve greater risk of mechanical problems than vertical and
shallow drilling operations.
21
Chesapeake maintains a $50 million control of well policy that insures against certain sudden and
accidental risks associated with drilling, completing and operating our wells. There is no assurance that
this insurance will be adequate to cover all losses or exposure to liability. Chesapeake also carries a
$350 million comprehensive general liability umbrella policy and a $100 million pollution liability policy.
We provide workers’ compensation insurance coverage to employees in all states in which we operate.
While we believe these policies are customary in the industry, they do not provide complete coverage
against all operating risks.
Facilities
Chesapeake owns an office complex in Oklahoma City and we continue to construct additional
buildings in Oklahoma City and in our operating areas as needed to accommodate our ongoing growth.
We also own or lease various field or administrative offices in the areas in which we conduct
operations.
Employees
Chesapeake had approximately 8,200 employees as of December 31, 2009.
Glossary of Natural Gas and Oil Terms
The terms defined in this section are used throughout this Form 10-K.
Bcf. Billion cubic feet.
Bcfe. Billion cubic feet of natural gas equivalent.
Bbl. One stock tank barrel, or 42 U.S. gallons liquid volume, used herein in reference to crude oil
or other liquid hydrocarbons.
Bbtu. One billion British thermal units.
Btu. British thermal unit, which is the heat required to raise the temperature of a one-pound mass
of water from 58.5 to 59.5 degrees Fahrenheit.
Commercial Well; Commercially Productive Well. A natural gas and oil well which produces
natural gas and oil in sufficient quantities such that proceeds from the sale of such production exceed
production expenses and taxes.
Conventional Reserves. Natural gas and oil occurring as discrete accumulations in structural and
stratigraphic traps.
Developed Acreage. The number of acres which are allocated or assignable to producing wells or
wells capable of production.
Development Well. A well drilled within the proved area of an oil or natural gas reservoir to the
depth of a stratigraphic horizon known to be productive.
Drilling Carry Obligation. An obligation of one party to pay certain well costs attributable to another
party.
Dry Hole; Dry Well. A well found to be incapable of producing either oil or natural gas in sufficient
quantities to justify completion as a natural gas or oil well.
22
Exploratory Well. A well drilled to find a new field or to find a new reservoir in a field previously
found to be productive of natural gas or oil in another reservoir.
Farmout. An assignment of an interest in a drilling location and related acreage conditional upon
the drilling of a well on that location.
Formation. A succession of sedimentary beds that were deposited under the same general
geologic conditions.
Full-Cost Pool. The full-cost pool consists of all costs associated with property acquisition,
exploration and development activities for a company using the full-cost method of accounting.
Additionally, any internal costs that can be directly identified with acquisition, exploration and
development activities are included. Any costs related to production, general corporate overhead or
similar activities are not included.
Gross Acres or Gross Wells. The total acres or wells, as the case may be, in which a working
interest is owned.
Horizontal Wells. Wells which are drilled at angles greater than 70 degrees from vertical.
Infill Drilling. Drilling wells between established producing wells on a lease; a drilling program to
reduce the spacing between wells in order to increase production and/or recovery of in-place
hydrocarbons from the lease.
Karst. An area of irregular limestone in which erosion has produced fissures, sinkholes,
underground streams and caverns.
Mbbl. One thousand barrels of crude oil or other liquid hydrocarbons.
Mbtu. One thousand btus.
Mcf. One thousand cubic feet.
Mcfe. One thousand cubic feet of natural gas equivalent.
Mmbbl. One million barrels of crude oil or other liquid hydrocarbons.
Mmbtu. One million btus.
Mmcf. One million cubic feet.
Mmcfe. One million cubic feet of natural gas equivalent.
Net Acres or Net Wells. The sum of the fractional working interests owned in gross acres or gross
wells.
NYMEX. New York Mercantile Exchange.
Play. A term applied to a portion of the exploration and production cycle following the identification
by geologists and geophysicists of areas with potential natural gas and oil reserves.
Present Value or PV-10. When used with respect to natural gas and oil reserves, present value,
or PV-10 means the estimated future gross revenue to be generated from the production of proved
23
reserves, net of estimated production and future development costs, using prices calculated as the
average natural gas and oil price during the preceding 12-month period prior to the end of the current
reporting period, (determined as the unweighted arithmetical average of prices on the first day of each
month within the 12-month period) and costs in effect at the determination date, without giving effect to
non-property related expenses such as general and administrative expenses, debt service and future
income tax expense or to depreciation, depletion and amortization, discounted using an annual
discount rate of 10%.
Price Differential. The difference in the price of natural gas or oil received at the sales point and
the New York Mercantile Exchange (NYMEX).
Productive Well. A well that is not a dry well. Productive wells include producing wells and wells
that are mechanically capable of production.
Proved Developed Reserves. Proved reserves that can be expected to be recovered through
existing wells with existing equipment and operating methods or in which the cost of the required
equipment is relatively minor compared to the cost of a new well.
Proved Properties. Properties with proved reserves.
Proved Reserves. Proved natural gas and oil reserves are those quantities of natural gas and oil,
which, by analysis of geoscience and engineering data, can be estimated with reasonable certainty to
be economically producible – from a given date forward, from known reservoirs, and under existing
economic conditions, operating methods, and government regulations – prior to the time at which
contracts providing the right to operate expire, unless evidence indicates that renewal is reasonably
certain, regardless of whether deterministic or probabilistic methods are used for the estimation. The
project to extract the hydrocarbons must have commenced or the operator must be reasonably certain
that it will commence the project within a reasonable time. The area of a reservoir considered as
proved includes (a) the area indentified by drilling and limited by fluid contacts, if any, and (b) adjacent
undrilled portions of the reservoir that can, with reasonable certainty, be judged to be continuous with it
and to contain economically producible natural gas or oil on the basis of available geoscience and
engineering data. In the absence of information on fluid contacts, proved quantities in a reservoir are
limited by the lowest known hydrocarbons (LKH) as seen in a well penetration unless geoscience,
engineering, or performance data and reliable technology establishes a lower contact with reasonable
certainty. Where direct observation from well penetrations has defined a highest known oil (HKO)
elevation and the potential exists for an associated gas cap, proved oil reserves may be assigned in
the structurally higher portions of the reservoir only if geoscience, engineering, or performance data
and reliable technology establish the higher contact with reasonable certainty. Reserves which can be
produced economically through application of improved recovery techniques (including, but not limited
to, fluid injection) are included in the proved classification when (a) successful testing by a pilot project
in an area of the reservoir with properties no more favorable than in the reservoir as a whole, the
operation of an installed program in the reservoir or an analogous reservoir, or other evidence using
reliable technology establishes the reasonable certainty of the engineering analysis on which the
project or program was based and (b) the project has been approved for development by all necessary
parties and entities, including governmental entities. Existing economic conditions include prices and
costs at which economic producibility from a reservoir is to be determined. The price shall be the
average price during the 12-month period prior to the ending date of the period covered by the report,
determined as an unweighted arithmetic average of the first-day-of-the-month price for each month
within such period, unless prices are defined by contractual arrangements, excluding escalations
based upon future conditions.
Proved Undeveloped Location. A site on which a development well can be drilled consistent with
spacing rules for purposes of recovering proved undeveloped reserves.
24
Proved Undeveloped Reserves. Proved reserves that are expected to be recovered from new
wells on undrilled acreage, or from existing wells where a relatively major expenditure is required for
recompletion. Reserves on undrilled acreage shall be limited to those directly offsetting development
spacing areas that are reasonably certain of production when drilled, unless evidence using reliable
technology exists that establishes reasonable certainty of economic producibility at greater distances.
Undrilled locations can be classified as having undeveloped reserves only if a development plan has
been adopted indicating that they are scheduled to be drilled within five years, unless the specific
circumstances, justify a longer time. Estimates for proved undeveloped reserves are not attributed to
any acreage for which an application of fluid injection or other improved recovery technique is
contemplated, unless such techniques have been proved effective by actual projects in the same
reservoir or an analogous reservoir, or by other evidence using reliable technology establishing
reasonable certainty.
Reserve Replacement. Calculated by dividing the sum of reserve additions from all sources
(revisions, extensions, discoveries and other additions and acquisitions) by the actual production for the
corresponding period. The values for these reserve additions are derived directly from the proved
reserves table located in Note 10 of the notes to our consolidated financial statements. In calculating
reserve replacement, we do not use unproved reserve quantities or proved reserve additions attributable
to less than wholly-owned consolidated entities or investments accounted for using the equity method.
Management uses the reserve replacement ratio as an indicator of the company’s ability to replenish
annual production volumes and grow its reserves, thereby providing some information on the sources of
future production. It should be noted that the reserve replacement ratio is a statistical indicator that has
limitations. As an annual measure, the ratio is limited because it typically varies widely based on the
extent and timing of new discoveries and property acquisitions. Its predictive and comparative value is
also limited for the same reasons. In addition, since the ratio does not imbed the cost or timing of future
production of new reserves, it cannot be used as a measure of value creation.
Royalty Interest. An interest in a natural gas and oil property entitling the owner to a share of oil or
natural gas production free of costs of production.
Seismic. An exploration method of sending energy waves or sound waves into the earth and
recording the wave reflections to indicate the type, size, shape and depth of subsurface rock formation
(3-D seismic provides three-dimensional pictures).
Shale. Fine-grained sedimentary rock composed mostly of consolidated clay or mud. Shale is the
most frequently occurring sedimentary rock.
Standardized Measure of Discounted Future Net Cash Flows. The discounted future net cash
flows relating to proved reserves based on the prices used in estimating the proved reserves, year-end
costs and statutory tax rates (adjusted for permanent differences) and a 10-percent annual discount
rate.
Tcf. One trillion cubic feet.
Tcfe. One trillion cubic feet of natural gas equivalent.
Unconventional Reserves. Natural gas and oil occurring in regionally pervasive accumulations
with low matrix permeability and close association with source rocks.
Undeveloped Acreage. Acreage on which wells have not been drilled or completed to a point that
would permit the production of economic quantities of natural gas and oil regardless of whether such
acreage contains proved reserves.
25
Unproved Properties. Properties with no proved reserves.
VPP. As we use the term, a volumetric production payment represents a limited-term overriding
royalty interest in natural gas and oil reserves that (i) entitles the purchaser to receive production
volumes over a period of time from specific lease interests; (ii) is free and clear of all associated future
production costs and capital expenditures; (iii) is nonrecourse to the seller (i.e., the purchaser’s only
recourse is to the reserves acquired); (iv) transfers title of the reserves to the purchaser; and (v) allows
the seller to retain the remaining reserves after the production volumes have been delivered.
Working Interest. The operating interest which gives the owner the right to drill, produce and
conduct operating activities on the property and a share of production.
26
ITEM 1A. Risk Factors
Natural gas and oil prices fluctuate widely, and lower prices for an extended period of time
are likely to have a material adverse effect on our business.
Our revenues, operating results, profitability and ability to grow depend primarily upon the prices
we receive for the natural gas and oil we sell. We require substantial expenditures to replace reserves,
sustain production and fund our business plans. Lower natural gas or oil prices can negatively affect
the amount of cash flow available for capital expenditures and our ability to borrow money or raise
additional capital and, as a result, could have a material adverse effect on our financial condition,
results of operations and reserves. In addition, lower prices may result in ceiling test write-downs of our
natural gas and oil properties. We urge you to read the risk factors below for a more detailed
description of each of these risks.
Historically, the markets for natural gas and oil have been volatile and they are likely to continue to
be volatile. Wide fluctuations in natural gas and oil prices may result from relatively minor changes in
the supply of and demand for natural gas and oil, market uncertainty and other factors that are beyond
our control, including:
• domestic and worldwide supplies of natural gas, natural gas liquids and oil, including U.S.
inventories of natural gas and oil reserves;
• weather conditions;
• changes in the level of consumer demand;
• the price and availability of alternative fuels;
• the availability, proximity and capacity of pipelines, other transportation facilities and
processing facilities;
• the level and effect of trading in commodity futures markets, including by commodity price
speculators and others;
• the price and level of foreign imports;
• the nature and extent of domestic and foreign governmental regulations and taxes;
• the ability of the members of the Organization of Petroleum Exporting Countries to agree to
and maintain oil price and production controls;
• political instability or armed conflict in oil and gas producing regions; and
• overall domestic and global economic conditions.
These factors and the volatility of the energy markets make it extremely difficult to predict future
natural gas and oil price movements with any certainty. Further, natural gas and oil prices do not
necessarily move in tandem. Because approximately 95% of our reserves at December 31, 2009 were
natural gas reserves, we are more affected by movements in natural gas prices.
Our level of indebtedness may limit our financial flexibility.
As of December 31, 2009, we had long-term indebtedness of approximately $12.3 billion, and our
net indebtedness represented 49% of our total book capitalization. We had $1.936 billion and
$1.250 billion of outstanding borrowings drawn under our revolving bank credit facilities at
December 31, 2009 and February 26, 2010, respectively.
27
Our level of indebtedness affects our operations in several ways, including the following:
• a portion of our cash flows from operating activities must be used to service our indebtedness
and is not available for other purposes;
• we may be at a competitive disadvantage as compared to similar companies that have less
debt;
• the covenants contained in the agreements governing our outstanding indebtedness and
future indebtedness may limit our ability to borrow additional funds, pay dividends and make
certain investments and may also affect our flexibility in planning for, and reacting to, changes
in the economy and in our industry;
• the revolving bank credit facilities of our midstream subsidiary and our midstream joint venture
restrict the payment of dividends or distributions to Chesapeake;
• additional financing in the future for working capital, capital expenditures, acquisitions, general
corporate or other purposes may have higher costs and more restrictive covenants; and
• changes in the credit ratings of our debt may negatively affect the cost, terms, conditions and
availability of future financing, and lower ratings will increase the interest rate and fees we pay
on our revolving bank credit facilities.
The borrowing base of our corporate revolving bank credit facility is subject to periodic
redetermination. A lowering of our borrowing base could require us to repay indebtedness in excess of
the borrowing base, or we might need to further secure the lenders with additional collateral. We may
incur additional debt, including secured indebtedness, in order to develop our properties and make
future acquisitions. A higher level of indebtedness increases the risk that we may default on our
obligations. Our ability to meet our debt obligations and to reduce our level of indebtedness depends
on our future performance. General economic conditions, natural gas and oil prices and financial,
business and other factors affect our operations and our future performance. Many of these factors are
beyond our control. Factors that will affect our ability to raise cash through an offering of our capital
stock or a refinancing of our debt include financial market conditions, the value of our assets and our
performance at the time we need capital.
Low natural gas prices throughout 2009 resulted in a write-down of our asset carrying
values, and further price declines could result in additional write-downs in the future.
We utilize the full-cost method of accounting for costs related to our natural gas and oil properties.
Under this method, all such costs (for both productive and nonproductive properties) are capitalized
and amortized on an aggregate basis over the estimated lives of the properties using the
unit-of-production method. However, these capitalized costs are subject to a ceiling test which limits
such pooled costs to the aggregate of the present value of future net revenues attributable to proved
natural gas and oil reserves discounted at 10% plus the lower of cost or market value of unproved
properties. The full-cost ceiling is evaluated at the end of each quarter using the unweighted
arithmetical average of the prices on the first day of each month within the 12-month period ending in
the quarter, adjusted for the impact of derivatives accounted for as cash flow hedges.
Natural gas prices were depressed throughout 2009, resulting in a write-down of our natural gas and
oil property asset carrying value. Our financial statements for the year ended December 31, 2009 reflect
an impairment of approximately $6.9 billion, net of income tax, of our natural gas and oil properties. We
also had an after-tax non-cash impairment charge to certain investments and fixed assets of
approximately $183 million in 2009 as a result of lower asset valuation estimates.
The risk that we will be required to further write-down the carrying value of our natural gas and oil
properties increases when natural gas and oil prices are low or volatile. We may experience further
ceiling test write-downs or other impairments in the future.
28
Significant capital expenditures are required to replace our reserves.
Our exploration, development and acquisition activities require substantial capital expenditures.
Historically, we have funded our capital expenditures through a combination of cash flows from
operations, our corporate revolving bank credit facility and debt and equity issuances. Beginning in late
2007, we have also had significant cash proceeds from a number of asset monetization transactions.
Future cash flows are subject to a number of variables, such as the level of production from existing
wells, prices of natural gas and oil, our success in developing and producing new reserves, the orderly
functioning of credit and capital markets and our ability to complete additional planned asset
monetization transactions. If revenues were to decrease as a result of lower natural gas and oil prices
or decreased production, and our access to capital were limited, we would have a reduced ability to
replace our reserves. If our cash flow from operations is not sufficient to fund our capital expenditure
budget, we may not be able to access additional bank debt, debt or equity or other methods of
financing on an economic basis to meet these requirements.
If we are not able to replace reserves, we may not be able to sustain production.
Our future success depends largely upon our ability to find, develop or acquire additional natural
gas and oil reserves that are economically recoverable. Unless we replace the reserves we produce
through successful development, exploration or acquisition activities, our proved reserves and
production will decline over time. In addition, approximately 42% of our total estimated proved reserves
(by volume) at December 31, 2009 were undeveloped. By their nature, estimates of proved
undeveloped reserves are less certain. Recovery of such reserves will require significant capital
expenditures and successful drilling operations. Our reserve estimates reflect that our production rate
on producing properties will decline approximately 28% from 2010 to 2011. Thus, our future natural
gas and oil reserves and production and, therefore, our cash flow and income are highly dependent on
our success in efficiently developing and exploiting our current reserves and economically finding or
acquiring additional recoverable reserves.
The actual quantities and present value of our proved reserves may prove to be lower than
we have estimated.
This report contains estimates of our proved reserves and the estimated future net revenues from
our proved reserves. These estimates are based upon various assumptions, including assumptions
required by the SEC relating to natural gas and oil prices, drilling and operating expenses, capital
expenditures, taxes and availability of funds. The process of estimating natural gas and oil reserves is
complex. The process involves significant decisions and assumptions in the evaluation of available
geological, geophysical, engineering and economic data for each reservoir. Therefore, these estimates
are inherently imprecise.
Actual future production, natural gas and oil prices, revenues, taxes, development expenditures,
operating expenses and quantities of recoverable natural gas and oil reserves most likely will vary from
these estimates. Such variations may be significant and could materially affect the estimated quantities
and present value of our proved reserves. In addition, we may adjust estimates of proved reserves to
reflect production history, results of exploration and development drilling, prevailing natural gas and oil
prices and other factors, many of which are beyond our control. Our properties may also be susceptible
to hydrocarbon drainage from production by operators on adjacent properties.
At December 31, 2009, approximately 42% of our estimated proved reserves (by volume) were
undeveloped. These reserve estimates reflect our plans to make significant capital expenditures to
convert our proved undeveloped reserves into proved developed reserves, including approximately
$929 million in 2010. You should be aware that the estimated development costs may not be accurate,
development may not occur as scheduled and results may not be as estimated.
29
You should not assume that the present values referred to in this report represent the current
market value of our estimated natural gas and oil reserves. In accordance with SEC requirements, the
estimates of our present values are based on prices and costs as of the date of the estimates. The
price on the date of estimate is calculated as the average natural gas and oil price during the 12
months ending in the current reporting period, determined as the unweighted arithmetical average of
prices on the first day of each month within the 12-month period. The December 31, 2009 present
value is based on $3.87 per mcf of natural gas and $61.14 per barrel of oil before price differential
adjustments. Actual future prices and costs may be materially higher or lower than the prices and costs
as of the date of an estimate.
Any changes in consumption by natural gas and oil purchasers or in governmental regulations or
taxation will also affect the actual future net cash flows from our production.
The timing of both the production and the expenses from the development and production of
natural gas and oil properties will affect both the timing of actual future net cash flows from our proved
reserves and their present value. In addition, the 10% discount factor which is required by the SEC to
be used in calculating discounted future net cash flows for reporting purposes is not necessarily the
most accurate discount factor. The effective interest rate at various times and the risks associated with
our business or the natural gas and oil industry in general will affect the accuracy of the 10% discount
factor.
Our 2009 year-end reserve estimates are not directly comparable to prior estimates
because of new reporting rules, and our interpretations of the new rules may differ materially
from future guidance or comments issued by the SEC.
The year-end 2009 proved reserves estimates presented in this report have been prepared using
new SEC disclosure rules that differ in a number of respects from prior rules. As a result of changes in
the reporting rules, our reserve estimates beginning with year-end 2009 will not be directly comparable
to our previously-reported reserves.
The SEC has not reviewed our or any reporting company’s reserve estimates under the new rules
and has released only limited interpretive guidance regarding reporting of reserve estimates under the
new rules. Accordingly, while the estimates of our proved reserves at December 31, 2009 included in
this report have been prepared based on what we and our independent reserve engineers believe to
be reasonable interpretations of the new SEC rules, those estimates could differ materially from any
estimates we might prepare applying more specific SEC interpretive guidance.
Our development and exploratory drilling efforts and our well operations may not be
profitable or achieve our targeted returns.
We acquire significant amounts of unproved property in order to further our development efforts.
Development and exploratory drilling and production activities are subject to many risks, including the
risk that no commercially productive reservoirs will be discovered. We acquire unproved properties and
lease undeveloped acreage that we believe will enhance our growth potential and increase our
earnings over time. However, we cannot assure you that all prospects will be economically viable or
that we will not abandon our initial investments. Additionally, there can be no assurance that unproved
property acquired by us or undeveloped acreage leased by us will be profitably developed, that new
wells drilled by us in prospects that we pursue will be productive or that we will recover all or any
portion of our investment in such unproved property or wells.
Drilling for natural gas and oil may involve unprofitable efforts, not only from dry wells but also
from wells that are productive but do not produce sufficient commercial quantities to cover the drilling,
operating and other costs. The cost of drilling, completing and operating a well is often uncertain, and
30
many factors can adversely affect the economics of a well or property. Drilling operations may be
curtailed, delayed or canceled as a result of unexpected drilling conditions, equipment failures or
accidents, shortages of equipment or personnel, environmental issues and for other reasons. In
addition, wells that are profitable may not meet our internal return targets, which are dependent upon
the current and future market prices for natural gas and crude oil, costs associated with producing
natural gas and oil and our ability to add reserves at an acceptable cost. We rely to a significant extent
on seismic data and other advanced technologies in identifying unproved property prospects and in
conducting our exploration activities. The seismic data and other technologies we use do not allow us
to know conclusively, prior to acquisition of unproved property or drilling a well, whether natural gas or
oil is present or may be produced economically. The use of seismic data and other technologies also
requires greater pre-drilling expenditures than traditional drilling strategies. Drilling results in our newer
shale plays may be more uncertain than in shale plays that are more developed and have longer
established production histories, and we can provide no assurance that drilling and completion
techniques that have proven to be successful in other shale formations to maximize recoveries will be
ultimately successful when used in new shall formations.
Certain of our undeveloped leasehold assets are subject to leases that will expire over the
next several years unless production is established on units containing the acreage.
As of December 31, 2009, we had leases on approximately 0.51 million and 1.62 million net acres,
respectively, in the Haynesville and Marcellus Shale areas. A sizeable portion of this acreage is not
currently held by production. Unless production in paying quantities is established on units containing
these leases during their terms, the leases will expire. If our leases expire and we are unable to renew
the leases, we will lose our right to develop the related properties. While the company intends to drill
sufficient wells to hold the vast majority of its leasehold in all its major plays, our drilling plans for these
areas are subject to change based upon various factors, including drilling results, natural gas and oil
prices, the availability and cost of capital, drilling and production costs, availability of drilling services
and equipment, gathering system and pipeline transportation constraints and regulatory approvals.
Our hedging activities may reduce the realized prices received for our natural gas and oil
sales, require us to provide collateral for hedging liabilities and involve risk that our
counterparties may be unable to satisfy their obligations to us.
In order to manage our exposure to price volatility in marketing our natural gas and oil, we enter
into natural gas and oil price risk management arrangements for a portion of our expected production.
Commodity price hedging may limit the prices we actually realize and therefore reduce natural gas and
oil revenues in the future. Our commodity hedging activities will impact our earnings in various ways,
including recognition of certain mark-to-market gains and losses on derivative instruments. The fair
value of our natural gas and oil derivative instruments can fluctuate significantly between periods. In
addition, our commodity price risk management transactions may expose us to the risk of financial loss
in certain circumstances, including instances in which:
• our production is less than expected;
• there is a widening of price differentials between delivery points for our production and the
delivery point assumed in the hedge arrangement; or
• the counterparties to our contracts fail to perform under the contracts.
Hedging transactions involve the risk that counterparties, which are generally financial institutions,
may be unable to satisfy their obligations to us. Although our counterparties to our multi-counterparty
secured hedge facility are required to secure their hedging obligations to us under certain scenarios, if
any of our counterparties were to default on its obligations to us under the hedging contracts or seek
bankruptcy protection, it could have an adverse effect on our ability to fund our planned activities and
31
could result in a larger percentage of our future production being subject to commodity price changes.
The risk of counterparty default is heightened in a poor economic environment.
A substantial portion of our natural gas and oil derivative contracts are with the 13 counterparties
to our multi-counterparty hedging facility. Our obligations under the facility are secured by natural gas
and oil proved reserves, the value of which must cover the fair value of the transactions outstanding
under the facility by at least 1.65 times. If the collateral value falls below the coverage designated, we
would be required to post cash or letters of credit with the counterparties if we did not have sufficient
unencumbered natural gas and oil properties available to cover the shortfall. Future collateral
requirements are dependent to a great extent on natural gas and oil prices.
Lower natural gas and oil prices could negatively impact our ability to borrow or raise
additional capital.
Our corporate revolving bank credit facility limits our borrowings to the lesser of the borrowing
base and the total commitments. Currently both are $3.5 billion, although one lender, Lehman Brothers
Commercial Bank, has not funded its share (2.1%) of our borrowings under the facility beginning in the
third quarter of 2008, and we do not expect that it would fund any future borrowings. The borrowing
base is determined periodically at the discretion of the banks and is based in part on natural gas and
oil prices. Additionally, some of our indentures contain covenants limiting our ability to incur
indebtedness in addition to that incurred under our corporate revolving bank credit facility. These
indentures limit our ability to incur additional indebtedness unless we meet one of two alternative tests.
The first alternative is based on our adjusted consolidated net tangible assets (as defined in all of our
indentures), which is determined using discounted future net revenues from proved natural gas and oil
reserves as of the determination date. The second alternative is based on the ratio of our adjusted
consolidated EBITDA (as defined in the relevant indentures) to our adjusted consolidated interest
expense (as defined in the relevant indentures) over a trailing 12-month period. Currently, we are
permitted to incur additional indebtedness under the second incurrence test but not the first test. Lower
natural gas and oil prices in the future could reduce our adjusted consolidated EBITDA, as well as our
adjusted consolidated net tangible assets, and thus could reduce our ability to incur additional
indebtedness.
Natural gas and oil drilling and producing operations can be hazardous and may expose us
to liabilities, including environmental liabilities.
Natural gas and oil operations are subject to many risks, including well blowouts, cratering and
explosions, pipe failures, fires, formations with abnormal pressures, uncontrollable flows of natural gas,
oil, brine or well fluids and other environmental hazards and risks. Our drilling operations involve risks
from high pressures and from mechanical difficulties such as stuck pipes, collapsed casings and
separated cables. If any of these risks occurs, we could sustain substantial losses as a result of:
• injury or loss of life;
• severe damage to or destruction of property, natural resources or equipment;
• pollution or other environmental damage;
• clean-up responsibilities;
• regulatory investigations and administrative, civil and criminal penalties; and
• injunctions resulting in limitation or suspension of operations.
There is inherent risk of incurring significant environmental costs and liabilities in our exploration
and production operations due to our generation, handling and disposal of materials, including wastes
and petroleum hydrocarbons. We may incur joint and several, strict liability under applicable U.S.
32
federal and state environmental laws in connection with releases of petroleum hydrocarbons and other
hazardous substances at, on, under or from our leased or owned properties, some of which have been
used for natural gas and oil exploration and production activities for a number of years, often by third
parties not under our control. For our non-operated properties, we are dependent on the operator for
operational and regulatory compliance. While we may maintain insurance against some, but not all, of
the risks described above, our insurance may not be adequate to cover casualty losses or liabilities,
and our insurance does not cover penalties or fines that may be assessed by a governmental authority.
Also, in the future we may not be able to obtain insurance at premium levels that justify its purchase.
Potential legislative and regulatory actions could increase our costs, reduce our revenue
and cash flow from natural gas and oil sales, reduce our liquidity or otherwise alter the way we
conduct our business.
The activities of exploration and production companies operating in the United States are subject
to extensive regulation at the federal, state and local levels. Changes to existing laws and regulations
or new laws and regulations such as those described below could, if adopted, have an adverse effect
on our business.
Federal Taxation of Independent Producers
Federal budget proposals would potentially increase and accelerate the payment of federal
income taxes of independent producers of natural gas and oil. Proposals that would significantly affect
us would repeal the expensing of intangible drilling costs, repeal the percentage depletion allowance
and increase the amortization period of geological and geophysical expenses. These changes, if
enacted, will make it more costly for us to explore for and develop our natural gas and oil resources.
Derivatives Trading
The U.S. Congress is considering measures aimed at increasing the transparency and stability of
the over-the-counter (OTC) derivative markets and preventing excessive speculation. We maintain an
active price and basis protection hedging program related to the natural gas and oil we produce to
manage the risk of low commodity prices and to predict with greater certainty the cash flow from our
hedged production. We have used the OTC market exclusively for our natural gas and oil derivative
contracts. Some proposals being considered would impose clearing and standardization requirements
for all OTC derivatives and restrict trading positions in the energy futures markets. Such changes
would likely materially reduce our hedging opportunities and could negatively affect our revenues and
cash flow during periods of low commodity prices.
Hydraulic Fracturing
It is customary in our industry that most natural gas and oil wells use the hydraulic fracturing
process. Certain environmental and other groups have suggested that additional laws and regulations
may be needed to more closely regulate the hydraulic fracturing process, and legislation has been
proposed by some members of Congress to provide for such regulation. We cannot predict whether
any such federal or state legislation or regulation will be enacted and if so, what its provisions would
be. If additional levels of regulation and permits were required through the adoption of new laws and
regulations, our business and operations could be subject to delays, increased operating and
compliance costs and process prohibitions.
Climate Change
The U.S. government is considering enacting new legislation or promulgating new regulations
governing or restricting the emission of greenhouse gases from stationary sources such as our
equipment and operations. The EPA has already made findings and issued proposed regulations that
33
could lead to the imposition of restrictions on greenhouse gas emissions from stationary sources such
as ours. In addition, the U.S. Congress has been considering various bills that would establish an
economy-wide cap-and-trade program to reduce U.S. emissions of greenhouse gases, including
carbon dioxide and methane. Such a program, if enacted, could require phased reductions in
greenhouse gas emissions over several or many years as could the issuance of a declining number of
tradable allowances to sources of these emissions so that they may continue to emit greenhouse
gases into the atmosphere. Legislative and regulatory proposals for restricting greenhouse gas
emissions or otherwise addressing climate change could require us to incur additional operating costs
and could aversely affect demand for the natural gas and oil that we sell. The potential increase in our
operating costs could include new or increased costs to operate and maintain our equipment and
facilities, install new emission controls on our equipment and facilities, acquire allowances to authorize
our greenhouse gas emissions, pay taxes related to our greenhouse gas emissions and administer and
manage a greenhouse gas emissions program. Moreover, incentives to conserve energy or use
alternative energy sources could reduce demand for natural gas and oil.
The recent decline in general economic, business or industry conditions and the current
economic uncertainty may have a material adverse effect on our results of operations, liquidity
and financial condition.
Recently, concerns over inflation, energy costs, geopolitical issues, the availability and cost of
credit, the U.S. mortgage market and a declining real estate market in the United States have
contributed to increased economic uncertainty and diminished expectations for the global economy.
These factors, combined with volatile natural gas and oil prices, the recent decline in business and
consumer confidence and increased unemployment, have precipitated an economic slowdown and a
recession. Concerns about global economic growth have had a significant adverse impact on global
financial markets and commodity prices. If the economic climate in the United States or abroad
deteriorates further, demand for petroleum products could continue to diminish and prices for natural
gas and oil could continue to decrease, which could adversely impact our results of operations, liquidity
and financial condition.
Our cash flow from operations, our revolving bank credit facilities and cash on hand historically
have not been sufficient to fund all of our expenditures, and we have relied on the capital markets and
asset monetization transactions to provide us with additional capital. Poor economic conditions may
negatively affect:
• our ability to access the capital markets at a time when we would like, or need, to raise capital;
• the number of participants in our proposed asset monetization transactions or the values we
are able to realize in those transactions, making them uneconomic or harder or impossible to
consummate;
• the collectability of our trade receivables could cause our commodity hedging arrangements
to be ineffective if our counterparties are unable to perform their obligations or seek
bankruptcy protection; or
• the ability of our joint venture partners to meet their obligations to fund a portion of our drilling
costs in the Marcellus or Barnett Shale plays as agreed under our joint venture arrangements.
Our ability to sell natural gas and/or receive market prices for our natural gas may be
adversely affected by pipeline and gathering system capacity constraints and various
transportation interruptions.
If drilling in the Haynesville and Marcellus Shales continues to be successful, the amount of
natural gas being produced by us and others could exceed the capacity of the various gathering and
34
intrastate or interstate transportation pipelines currently available in these areas. If this occurs, it will be
necessary for new pipelines and gathering systems to be built. Because of the current economic
climate, certain pipeline projects that are planned for the Haynesville and Marcellus Shale areas may
not occur for lack of financing. In addition, capital constraints could limit our ability to build intrastate
gathering systems necessary to transport our gas to interstate pipelines. In such event, we might have
to shut in our wells awaiting a pipeline connection or capacity and/or sell natural gas production at
significantly lower prices than those quoted on NYMEX or than we currently project, which would
adversely affect our results of operations.
A portion of our natural gas and oil production in any region may be interrupted, or shut in, from
time to time for numerous reasons, including as a result of weather conditions, accidents, loss of
pipeline or gathering system access, field labor issues or strikes, or we might voluntarily curtail
production in response to market conditions. If a substantial amount of our production is interrupted at
the same time, it could temporarily adversely affect our cash flow.
ITEM 1B. Unresolved Staff Comments
None.
ITEM 2. Properties
Information regarding our properties is included in Item 1 and in Note 10 of the notes to our
consolidated financial statements included in Item 8 of this report.
ITEM 3. Legal Proceedings
Litigation
On February 25, 2009, a putative class action was filed in the U.S. District Court for the Southern
District of New York against the company and certain of its officers and directors along with certain
underwriters of the company’s July 2008 common stock offering. Following the appointment of a lead
plaintiff and counsel, the plaintiff filed an amended complaint on September 11, 2009 alleging that the
registration statement for the offering contained material misstatements and omissions and seeking
damages under Sections 11, 12 and 15 of the Securities Act of 1933 of an unspecified amount and
rescission. The action was transferred to the U.S. District Court for the Western District of Oklahoma
on October 13, 2009. The company has filed a motion to dismiss which has not been fully briefed. A
derivative action was also filed in the District Court of Oklahoma County, Oklahoma on March 10, 2009
against the company’s directors and certain of its officers alleging breaches of fiduciary duties relating
to the disclosure matters alleged in the securities case.
On March 26, 2009, a shareholder filed a petition in the District Court of Oklahoma County,
Oklahoma seeking to compel inspection of company books and records relating to compensation of the
company’s CEO. On August 20, 2009, the court denied the inspection demand, dismissed the petition
and entered judgment in favor of Chesapeake. The shareholder is appealing the court’s ruling.
Three derivative actions were filed in the District Court of Oklahoma County, Oklahoma on
April 28, May 7, and May 20, 2009 against the company’s directors alleging breaches of fiduciary
duties relating to compensation of the company’s CEO and alleged insider trading, among other things,
and seeking unspecified damages, equitable relief and disgorgement. These three derivative actions
were consolidated and a Consolidated Derivative Shareholder Petition was filed on June 23, 2009.
Chesapeake is named as a nominal defendant. Chesapeake has filed a motion to dismiss which was
heard on February 1, 2010. On February 26, 2010, the court ordered that plaintiffs’ claims be
dismissed and granted plaintiffs leave to file an amended petition within 90 days.
35
It is inherently difficult to predict the outcome of litigation, and we are currently unable to estimate
the amount of any potential liabilities associated with the foregoing cases, which are all in preliminary
stages.
Chesapeake is also involved in various other lawsuits and disputes incidental to its business
operations, including commercial disputes, personal injury claims, claims for underpayment of
royalties, property damage claims and contract actions. With regard to the latter, several mineral or
leasehold owners have filed lawsuits against us seeking specific performance to require us to acquire
their oil and natural gas interests and pay acreage bonus payments, damages based on breach of
contract and/or, in certain cases, punitive damages based on alleged fraud. The company has
satisfactorily resolved several of the suits but some remain pending. The remaining leasehold
acquisition cases are in various stages of discovery. The company believes that it has substantial
defenses to the claims made in all these cases.
ITEM 4. Reserved.
36
Part II
ITEM 5. Market for Registrant’s Common Equity, Related Stockholder Matters and Issuer
Purchases of Equity Securities
Price Range of Common Stock
Our common stock trades on the New York Stock Exchange under the symbol “CHK”. The
following table sets forth, for the periods indicated, the high and low sales prices per share of our
common stock as reported by the New York Stock Exchange:
Common Stock
High Low
Year ended December 31, 2009:
Fourth Quarter . . . . . . . . . . . . . . . . . . . . . . . . . . . . . . . . . . . . . . . . . . . . . . . . . . . . . . . . . . . . . . . . . $30.00 $22.06
Third Quarter . . . . . . . . . . . . . . . . . . . . . . . . . . . . . . . . . . . . . . . . . . . . . . . . . . . . . . . . . . . . . . . . . . . $29.49 $16.92
Second Quarter . . . . . . . . . . . . . . . . . . . . . . . . . . . . . . . . . . . . . . . . . . . . . . . . . . . . . . . . . . . . . . . . $24.66 $16.43
First Quarter . . . . . . . . . . . . . . . . . . . . . . . . . . . . . . . . . . . . . . . . . . . . . . . . . . . . . . . . . . . . . . . . . . . $20.13 $13.27
Year ended December 31, 2008:
Fourth Quarter . . . . . . . . . . . . . . . . . . . . . . . . . . . . . . . . . . . . . . . . . . . . . . . . . . . . . . . . . . . . . . . . . $35.46 $ 9.84
Third Quarter . . . . . . . . . . . . . . . . . . . . . . . . . . . . . . . . . . . . . . . . . . . . . . . . . . . . . . . . . . . . . . . . . . . $74.00 $31.15
Second Quarter . . . . . . . . . . . . . . . . . . . . . . . . . . . . . . . . . . . . . . . . . . . . . . . . . . . . . . . . . . . . . . . . $68.10 $45.25
First Quarter . . . . . . . . . . . . . . . . . . . . . . . . . . . . . . . . . . . . . . . . . . . . . . . . . . . . . . . . . . . . . . . . . . . $49.87 $34.42
At February 23, 2010, there were approximately 2,050 holders of record of our common stock and
approximately 466,700 beneficial owners.
Dividends
The following table sets forth the amount of dividends per share declared on Chesapeake
common stock during 2009 and 2008:
2009 2008
Fourth Quarter . . . . . . . . . . . . . . . . . . . . . . . . . . . . . . . . . . . . . . . . . . . . . . . . . . . . . . . . . . . . . . . . . . $0.075 $ 0.075
Third Quarter . . . . . . . . . . . . . . . . . . . . . . . . . . . . . . . . . . . . . . . . . . . . . . . . . . . . . . . . . . . . . . . . . . . $0.075 $ 0.075
Second Quarter . . . . . . . . . . . . . . . . . . . . . . . . . . . . . . . . . . . . . . . . . . . . . . . . . . . . . . . . . . . . . . . . . $0.075 $ 0.075
First Quarter . . . . . . . . . . . . . . . . . . . . . . . . . . . . . . . . . . . . . . . . . . . . . . . . . . . . . . . . . . . . . . . . . . . . $0.075 $0.0675
While we expect to continue to pay dividends on our common stock, the payment of future cash
dividends is subject to the discretion of our Board of Directors and will depend upon, among other
things, our financial condition, our funds from operations, the level of our capital and development
expenditures, our future business prospects, contractual restrictions and other factors considered
relevant by the Board of Directors.
In addition, our corporate revolving bank credit facility and the indentures governing certain of our
outstanding senior notes contain restrictions on our ability to declare and pay cash dividends. Under
the corporate revolving bank credit facility and these indentures, we may not pay any cash dividends
on our common or preferred stock if an event of default has occurred. These indentures further restrict
cash dividends if we have not met one of the two debt incurrence tests set forth in the indentures, or if
immediately after giving effect to the dividend payment, we have paid total dividends and made other
restricted payments in excess of the permitted amounts. As of December 31, 2009, our coverage ratio
for purposes of the debt incurrence test under the relevant indentures was 5.33 to 1, compared to a
minimum of 2.25 to 1 required in such indentures. Our adjusted consolidated net tangible assets did
not exceed 200% of our total indebtedness.
37
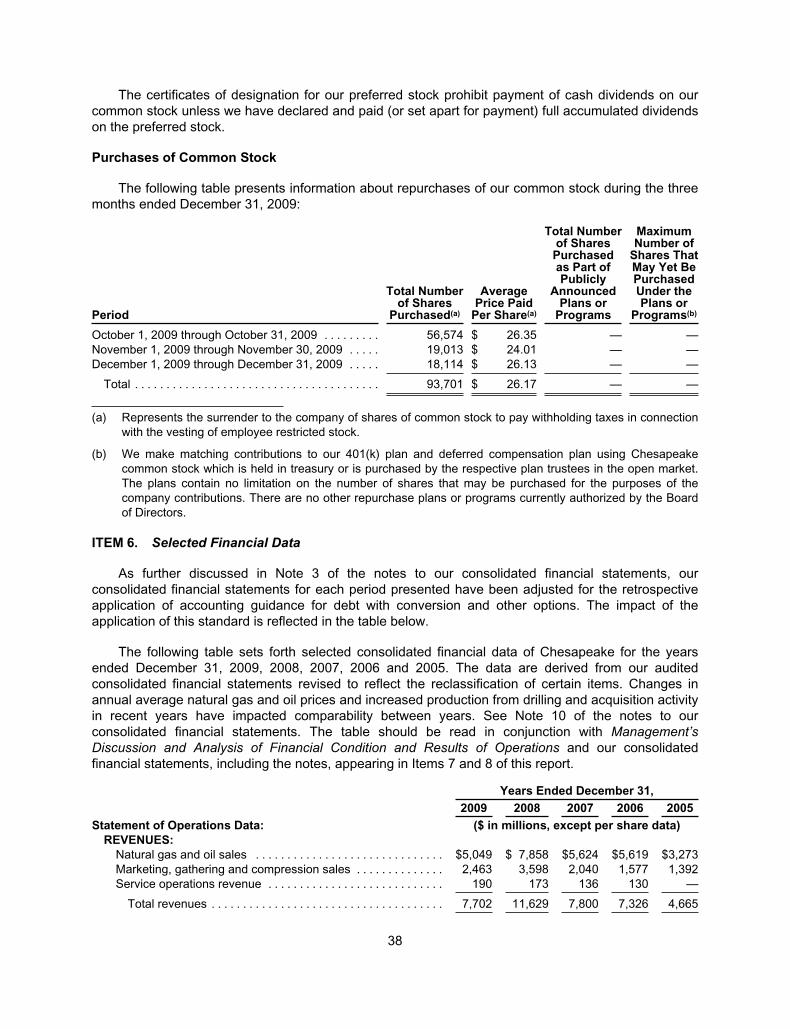
The certificates of designation for our preferred stock prohibit payment of cash dividends on our
common stock unless we have declared and paid (or set apart for payment) full accumulated dividends
on the preferred stock.
Purchases of Common Stock
The following table presents information about repurchases of our common stock during the three
months ended December 31, 2009:
Period
Total Numberof Shares
Purchased(a)
AveragePrice Paid
Per Share(a)
Total Numberof SharesPurchasedas Part ofPublicly
AnnouncedPlans or
Programs
MaximumNumber of
Shares ThatMay Yet BePurchasedUnder thePlans or
Programs(b)
October 1, 2009 through October 31, 2009 . . . . . . . . . 56,574 $ 26.35 — —
November 1, 2009 through November 30, 2009 . . . . . 19,013 $ 24.01 — —
December 1, 2009 through December 31, 2009 . . . . . 18,114 $ 26.13 — —
Total . . . . . . . . . . . . . . . . . . . . . . . . . . . . . . . . . . . . . . . 93,701 $ 26.17 — —
(a) Represents the surrender to the company of shares of common stock to pay withholding taxes in connection
with the vesting of employee restricted stock.
(b) We make matching contributions to our 401(k) plan and deferred compensation plan using Chesapeake
common stock which is held in treasury or is purchased by the respective plan trustees in the open market.
The plans contain no limitation on the number of shares that may be purchased for the purposes of the
company contributions. There are no other repurchase plans or programs currently authorized by the Board
of Directors.
ITEM 6. Selected Financial Data
As further discussed in Note 3 of the notes to our consolidated financial statements, our
consolidated financial statements for each period presented have been adjusted for the retrospective
application of accounting guidance for debt with conversion and other options. The impact of the
application of this standard is reflected in the table below.
The following table sets forth selected consolidated financial data of Chesapeake for the years
ended December 31, 2009, 2008, 2007, 2006 and 2005. The data are derived from our audited
consolidated financial statements revised to reflect the reclassification of certain items. Changes in
annual average natural gas and oil prices and increased production from drilling and acquisition activity
in recent years have impacted comparability between years. See Note 10 of the notes to our
consolidated financial statements. The table should be read in conjunction with Management’s
Discussion and Analysis of Financial Condition and Results of Operations and our consolidated
financial statements, including the notes, appearing in Items 7 and 8 of this report.
Years Ended December 31,
2009 2008 2007 2006 2005
Statement of Operations Data: ($ in millions, except per share data)
REVENUES:
Natural gas and oil sales . . . . . . . . . . . . . . . . . . . . . . . . . . . . . . $5,049 $ 7,858 $5,624 $5,619 $3,273
Marketing, gathering and compression sales . . . . . . . . . . . . . . 2,463 3,598 2,040 1,577 1,392
Service operations revenue . . . . . . . . . . . . . . . . . . . . . . . . . . . . 190 173 136 130 —
Total revenues . . . . . . . . . . . . . . . . . . . . . . . . . . . . . . . . . . . . . 7,702 11,629 7,800 7,326 4,665
38
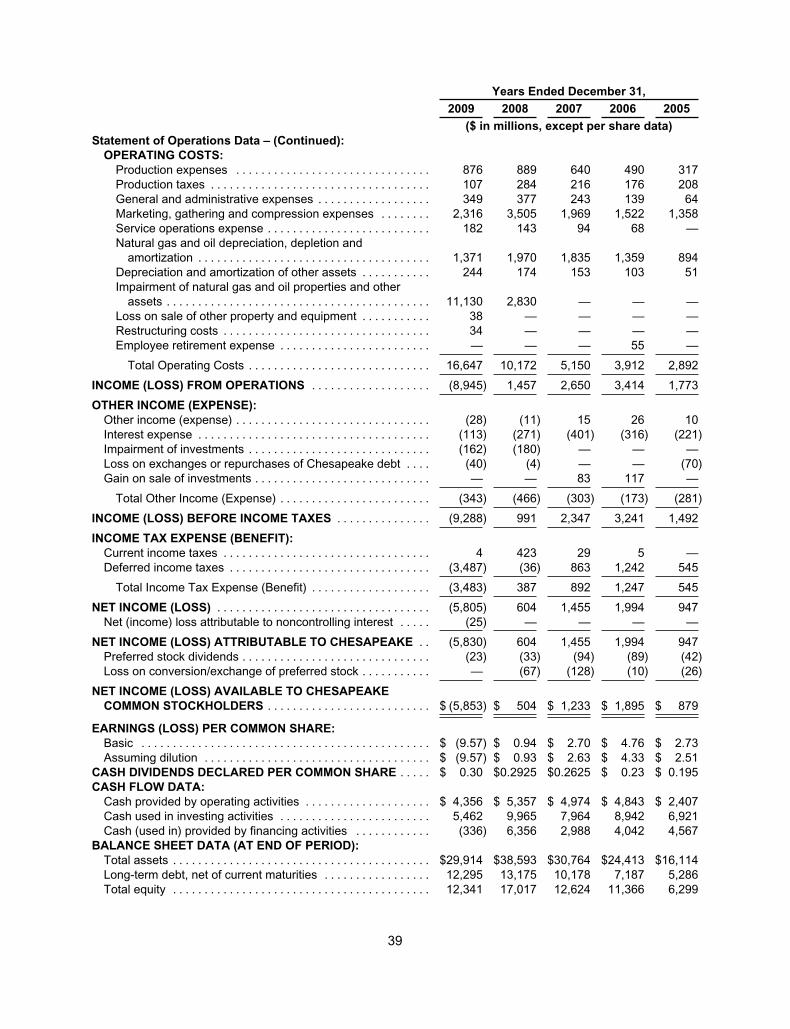
Years Ended December 31,
2009 2008 2007 2006 2005
($ in millions, except per share data)
Statement of Operations Data – (Continued):
OPERATING COSTS:
Production expenses . . . . . . . . . . . . . . . . . . . . . . . . . . . . . . . 876 889 640 490 317
Production taxes . . . . . . . . . . . . . . . . . . . . . . . . . . . . . . . . . . . 107 284 216 176 208
General and administrative expenses . . . . . . . . . . . . . . . . . . 349 377 243 139 64
Marketing, gathering and compression expenses . . . . . . . . 2,316 3,505 1,969 1,522 1,358
Service operations expense . . . . . . . . . . . . . . . . . . . . . . . . . . 182 143 94 68 —
Natural gas and oil depreciation, depletion and
amortization . . . . . . . . . . . . . . . . . . . . . . . . . . . . . . . . . . . . . 1,371 1,970 1,835 1,359 894
Depreciation and amortization of other assets . . . . . . . . . . . 244 174 153 103 51
Impairment of natural gas and oil properties and other
assets . . . . . . . . . . . . . . . . . . . . . . . . . . . . . . . . . . . . . . . . . . 11,130 2,830 — — —
Loss on sale of other property and equipment . . . . . . . . . . . 38 — — — —
Restructuring costs . . . . . . . . . . . . . . . . . . . . . . . . . . . . . . . . . 34 — — — —
Employee retirement expense . . . . . . . . . . . . . . . . . . . . . . . . — — — 55 —
Total Operating Costs . . . . . . . . . . . . . . . . . . . . . . . . . . . . . 16,647 10,172 5,150 3,912 2,892
INCOME (LOSS) FROM OPERATIONS . . . . . . . . . . . . . . . . . . . (8,945) 1,457 2,650 3,414 1,773
OTHER INCOME (EXPENSE):
Other income (expense) . . . . . . . . . . . . . . . . . . . . . . . . . . . . . . . (28) (11) 15 26 10
Interest expense . . . . . . . . . . . . . . . . . . . . . . . . . . . . . . . . . . . . . (113) (271) (401) (316) (221)
Impairment of investments . . . . . . . . . . . . . . . . . . . . . . . . . . . . . (162) (180) — — —
Loss on exchanges or repurchases of Chesapeake debt . . . . (40) (4) — — (70)
Gain on sale of investments . . . . . . . . . . . . . . . . . . . . . . . . . . . . — — 83 117 —
Total Other Income (Expense) . . . . . . . . . . . . . . . . . . . . . . . . (343) (466) (303) (173) (281)
INCOME (LOSS) BEFORE INCOME TAXES . . . . . . . . . . . . . . . (9,288) 991 2,347 3,241 1,492
INCOME TAX EXPENSE (BENEFIT):
Current income taxes . . . . . . . . . . . . . . . . . . . . . . . . . . . . . . . . . 4 423 29 5 —
Deferred income taxes . . . . . . . . . . . . . . . . . . . . . . . . . . . . . . . . (3,487) (36) 863 1,242 545
Total Income Tax Expense (Benefit) . . . . . . . . . . . . . . . . . . . (3,483) 387 892 1,247 545
NET INCOME (LOSS) . . . . . . . . . . . . . . . . . . . . . . . . . . . . . . . . . . (5,805) 604 1,455 1,994 947
Net (income) loss attributable to noncontrolling interest . . . . . (25) — — — —
NET INCOME (LOSS) ATTRIBUTABLE TO CHESAPEAKE . . (5,830) 604 1,455 1,994 947
Preferred stock dividends . . . . . . . . . . . . . . . . . . . . . . . . . . . . . . (23) (33) (94) (89) (42)
Loss on conversion/exchange of preferred stock . . . . . . . . . . . — (67) (128) (10) (26)
NET INCOME (LOSS) AVAILABLE TO CHESAPEAKE
COMMON STOCKHOLDERS . . . . . . . . . . . . . . . . . . . . . . . . . . $ (5,853) $ 504 $ 1,233 $ 1,895 $ 879
EARNINGS (LOSS) PER COMMON SHARE:
Basic . . . . . . . . . . . . . . . . . . . . . . . . . . . . . . . . . . . . . . . . . . . . . . $ (9.57) $ 0.94 $ 2.70 $ 4.76 $ 2.73
Assuming dilution . . . . . . . . . . . . . . . . . . . . . . . . . . . . . . . . . . . . $ (9.57) $ 0.93 $ 2.63 $ 4.33 $ 2.51
CASH DIVIDENDS DECLARED PER COMMON SHARE . . . . . $ 0.30 $0.2925 $0.2625 $ 0.23 $ 0.195
CASH FLOW DATA:
Cash provided by operating activities . . . . . . . . . . . . . . . . . . . . $ 4,356 $ 5,357 $ 4,974 $ 4,843 $ 2,407
Cash used in investing activities . . . . . . . . . . . . . . . . . . . . . . . . 5,462 9,965 7,964 8,942 6,921
Cash (used in) provided by financing activities . . . . . . . . . . . . (336) 6,356 2,988 4,042 4,567
BALANCE SHEET DATA (AT END OF PERIOD):
Total assets . . . . . . . . . . . . . . . . . . . . . . . . . . . . . . . . . . . . . . . . . $29,914 $38,593 $30,764 $24,413 $16,114
Long-term debt, net of current maturities . . . . . . . . . . . . . . . . . 12,295 13,175 10,178 7,187 5,286
Total equity . . . . . . . . . . . . . . . . . . . . . . . . . . . . . . . . . . . . . . . . . 12,341 17,017 12,624 11,366 6,299
39
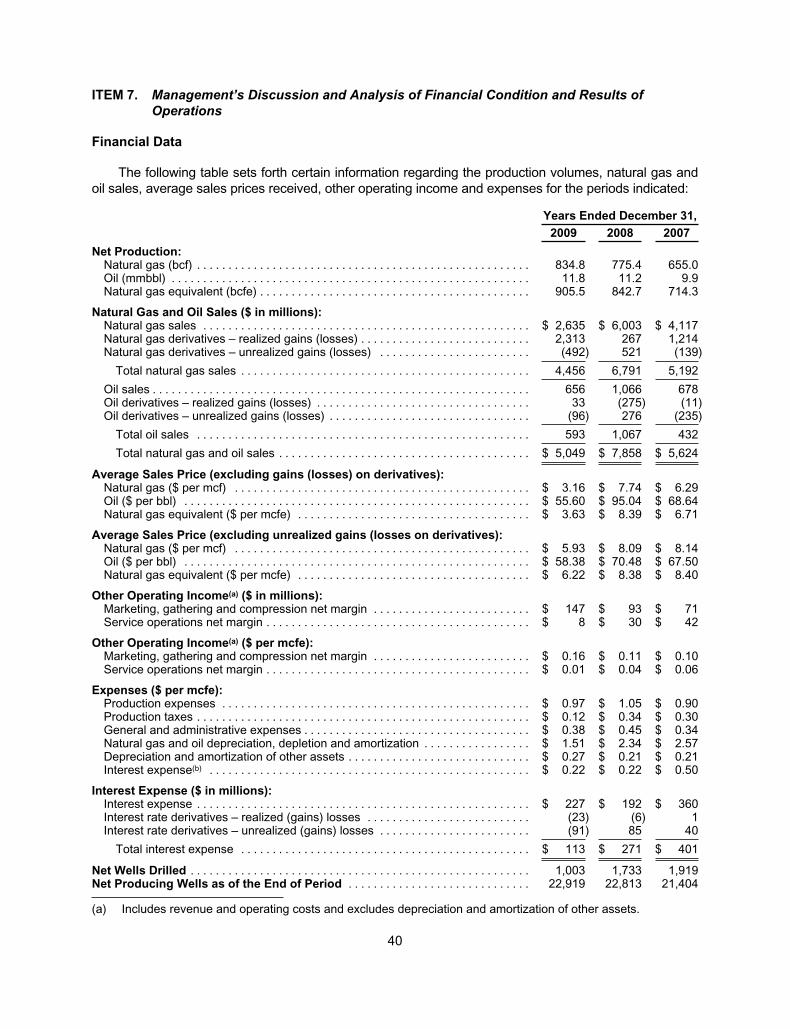
ITEM 7. Management’s Discussion and Analysis of Financial Condition and Results of
Operations
Financial Data
The following table sets forth certain information regarding the production volumes, natural gas and
oil sales, average sales prices received, other operating income and expenses for the periods indicated:
Years Ended December 31,
2009 2008 2007
Net Production:Natural gas (bcf) . . . . . . . . . . . . . . . . . . . . . . . . . . . . . . . . . . . . . . . . . . . . . . . . . . . . . 834.8 775.4 655.0Oil (mmbbl) . . . . . . . . . . . . . . . . . . . . . . . . . . . . . . . . . . . . . . . . . . . . . . . . . . . . . . . . . 11.8 11.2 9.9Natural gas equivalent (bcfe) . . . . . . . . . . . . . . . . . . . . . . . . . . . . . . . . . . . . . . . . . . . 905.5 842.7 714.3
Natural Gas and Oil Sales ($ in millions):Natural gas sales . . . . . . . . . . . . . . . . . . . . . . . . . . . . . . . . . . . . . . . . . . . . . . . . . . . . $ 2,635 $ 6,003 $ 4,117Natural gas derivatives – realized gains (losses) . . . . . . . . . . . . . . . . . . . . . . . . . . . 2,313 267 1,214Natural gas derivatives – unrealized gains (losses) . . . . . . . . . . . . . . . . . . . . . . . . (492) 521 (139)
Total natural gas sales . . . . . . . . . . . . . . . . . . . . . . . . . . . . . . . . . . . . . . . . . . . . . . 4,456 6,791 5,192
Oil sales . . . . . . . . . . . . . . . . . . . . . . . . . . . . . . . . . . . . . . . . . . . . . . . . . . . . . . . . . . . . 656 1,066 678Oil derivatives – realized gains (losses) . . . . . . . . . . . . . . . . . . . . . . . . . . . . . . . . . . 33 (275) (11)Oil derivatives – unrealized gains (losses) . . . . . . . . . . . . . . . . . . . . . . . . . . . . . . . . (96) 276 (235)
Total oil sales . . . . . . . . . . . . . . . . . . . . . . . . . . . . . . . . . . . . . . . . . . . . . . . . . . . . . 593 1,067 432
Total natural gas and oil sales . . . . . . . . . . . . . . . . . . . . . . . . . . . . . . . . . . . . . . . . $ 5,049 $ 7,858 $ 5,624
Average Sales Price (excluding gains (losses) on derivatives):Natural gas ($ per mcf) . . . . . . . . . . . . . . . . . . . . . . . . . . . . . . . . . . . . . . . . . . . . . . . $ 3.16 $ 7.74 $ 6.29Oil ($ per bbl) . . . . . . . . . . . . . . . . . . . . . . . . . . . . . . . . . . . . . . . . . . . . . . . . . . . . . . . $ 55.60 $ 95.04 $ 68.64Natural gas equivalent ($ per mcfe) . . . . . . . . . . . . . . . . . . . . . . . . . . . . . . . . . . . . . $ 3.63 $ 8.39 $ 6.71
Average Sales Price (excluding unrealized gains (losses on derivatives):Natural gas ($ per mcf) . . . . . . . . . . . . . . . . . . . . . . . . . . . . . . . . . . . . . . . . . . . . . . . $ 5.93 $ 8.09 $ 8.14Oil ($ per bbl) . . . . . . . . . . . . . . . . . . . . . . . . . . . . . . . . . . . . . . . . . . . . . . . . . . . . . . . $ 58.38 $ 70.48 $ 67.50Natural gas equivalent ($ per mcfe) . . . . . . . . . . . . . . . . . . . . . . . . . . . . . . . . . . . . . $ 6.22 $ 8.38 $ 8.40
Other Operating Income(a) ($ in millions):Marketing, gathering and compression net margin . . . . . . . . . . . . . . . . . . . . . . . . . $ 147 $ 93 $ 71Service operations net margin . . . . . . . . . . . . . . . . . . . . . . . . . . . . . . . . . . . . . . . . . . $ 8 $ 30 $ 42
Other Operating Income(a) ($ per mcfe):Marketing, gathering and compression net margin . . . . . . . . . . . . . . . . . . . . . . . . . $ 0.16 $ 0.11 $ 0.10Service operations net margin . . . . . . . . . . . . . . . . . . . . . . . . . . . . . . . . . . . . . . . . . . $ 0.01 $ 0.04 $ 0.06
Expenses ($ per mcfe):Production expenses . . . . . . . . . . . . . . . . . . . . . . . . . . . . . . . . . . . . . . . . . . . . . . . . . $ 0.97 $ 1.05 $ 0.90Production taxes . . . . . . . . . . . . . . . . . . . . . . . . . . . . . . . . . . . . . . . . . . . . . . . . . . . . . $ 0.12 $ 0.34 $ 0.30General and administrative expenses . . . . . . . . . . . . . . . . . . . . . . . . . . . . . . . . . . . . $ 0.38 $ 0.45 $ 0.34Natural gas and oil depreciation, depletion and amortization . . . . . . . . . . . . . . . . . $ 1.51 $ 2.34 $ 2.57Depreciation and amortization of other assets . . . . . . . . . . . . . . . . . . . . . . . . . . . . . $ 0.27 $ 0.21 $ 0.21Interest expense(b) . . . . . . . . . . . . . . . . . . . . . . . . . . . . . . . . . . . . . . . . . . . . . . . . . . . $ 0.22 $ 0.22 $ 0.50
Interest Expense ($ in millions):Interest expense . . . . . . . . . . . . . . . . . . . . . . . . . . . . . . . . . . . . . . . . . . . . . . . . . . . . . $ 227 $ 192 $ 360Interest rate derivatives – realized (gains) losses . . . . . . . . . . . . . . . . . . . . . . . . . . (23) (6) 1Interest rate derivatives – unrealized (gains) losses . . . . . . . . . . . . . . . . . . . . . . . . (91) 85 40
Total interest expense . . . . . . . . . . . . . . . . . . . . . . . . . . . . . . . . . . . . . . . . . . . . . . $ 113 $ 271 $ 401
Net Wells Drilled . . . . . . . . . . . . . . . . . . . . . . . . . . . . . . . . . . . . . . . . . . . . . . . . . . . . . . 1,003 1,733 1,919Net Producing Wells as of the End of Period . . . . . . . . . . . . . . . . . . . . . . . . . . . . . 22,919 22,813 21,404
(a) Includes revenue and operating costs and excludes depreciation and amortization of other assets.
40
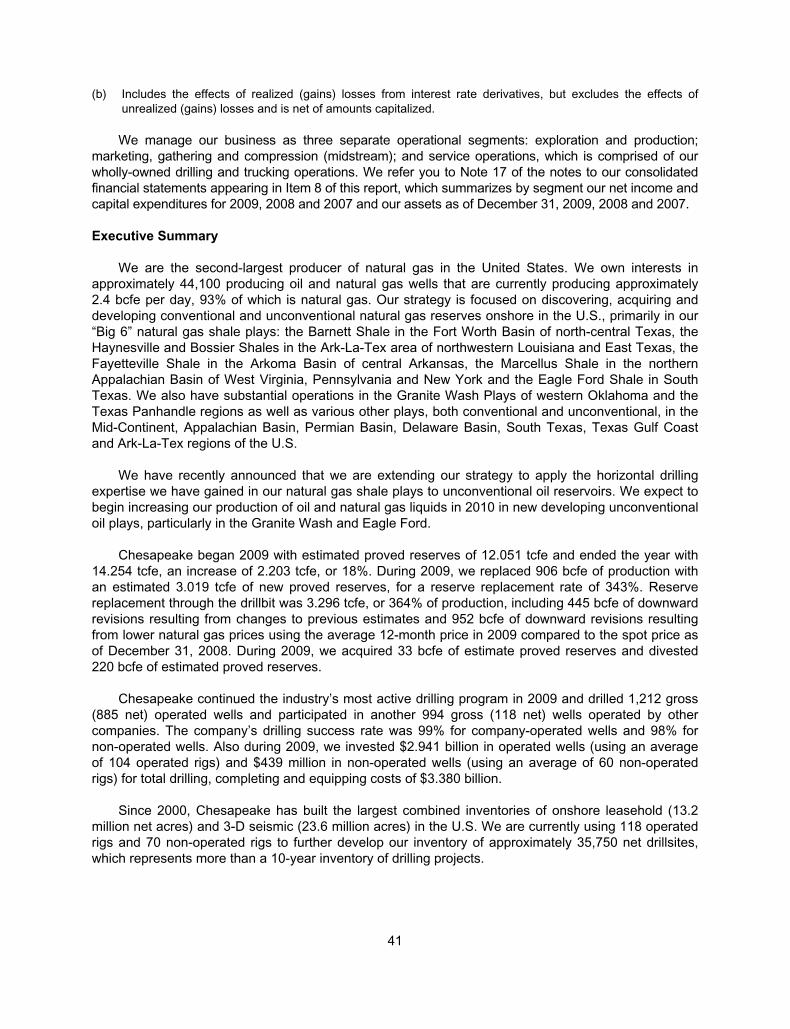
(b) Includes the effects of realized (gains) losses from interest rate derivatives, but excludes the effects of
unrealized (gains) losses and is net of amounts capitalized.
We manage our business as three separate operational segments: exploration and production;
marketing, gathering and compression (midstream); and service operations, which is comprised of our
wholly-owned drilling and trucking operations. We refer you to Note 17 of the notes to our consolidated
financial statements appearing in Item 8 of this report, which summarizes by segment our net income and
capital expenditures for 2009, 2008 and 2007 and our assets as of December 31, 2009, 2008 and 2007.
Executive Summary
We are the second-largest producer of natural gas in the United States. We own interests in
approximately 44,100 producing oil and natural gas wells that are currently producing approximately
2.4 bcfe per day, 93% of which is natural gas. Our strategy is focused on discovering, acquiring and
developing conventional and unconventional natural gas reserves onshore in the U.S., primarily in our
“Big 6” natural gas shale plays: the Barnett Shale in the Fort Worth Basin of north-central Texas, the
Haynesville and Bossier Shales in the Ark-La-Tex area of northwestern Louisiana and East Texas, the
Fayetteville Shale in the Arkoma Basin of central Arkansas, the Marcellus Shale in the northern
Appalachian Basin of West Virginia, Pennsylvania and New York and the Eagle Ford Shale in South
Texas. We also have substantial operations in the Granite Wash Plays of western Oklahoma and the
Texas Panhandle regions as well as various other plays, both conventional and unconventional, in the
Mid-Continent, Appalachian Basin, Permian Basin, Delaware Basin, South Texas, Texas Gulf Coast
and Ark-La-Tex regions of the U.S.
We have recently announced that we are extending our strategy to apply the horizontal drilling
expertise we have gained in our natural gas shale plays to unconventional oil reservoirs. We expect to
begin increasing our production of oil and natural gas liquids in 2010 in new developing unconventional
oil plays, particularly in the Granite Wash and Eagle Ford.
Chesapeake began 2009 with estimated proved reserves of 12.051 tcfe and ended the year with
14.254 tcfe, an increase of 2.203 tcfe, or 18%. During 2009, we replaced 906 bcfe of production with
an estimated 3.019 tcfe of new proved reserves, for a reserve replacement rate of 343%. Reserve
replacement through the drillbit was 3.296 tcfe, or 364% of production, including 445 bcfe of downward
revisions resulting from changes to previous estimates and 952 bcfe of downward revisions resulting
from lower natural gas prices using the average 12-month price in 2009 compared to the spot price as
of December 31, 2008. During 2009, we acquired 33 bcfe of estimate proved reserves and divested
220 bcfe of estimated proved reserves.
Chesapeake continued the industry’s most active drilling program in 2009 and drilled 1,212 gross
(885 net) operated wells and participated in another 994 gross (118 net) wells operated by other
companies. The company’s drilling success rate was 99% for company-operated wells and 98% for
non-operated wells. Also during 2009, we invested $2.941 billion in operated wells (using an average
of 104 operated rigs) and $439 million in non-operated wells (using an average of 60 non-operated
rigs) for total drilling, completing and equipping costs of $3.380 billion.
Since 2000, Chesapeake has built the largest combined inventories of onshore leasehold (13.2
million net acres) and 3-D seismic (23.6 million acres) in the U.S. We are currently using 118 operated
rigs and 70 non-operated rigs to further develop our inventory of approximately 35,750 net drillsites,
which represents more than a 10-year inventory of drilling projects.
41
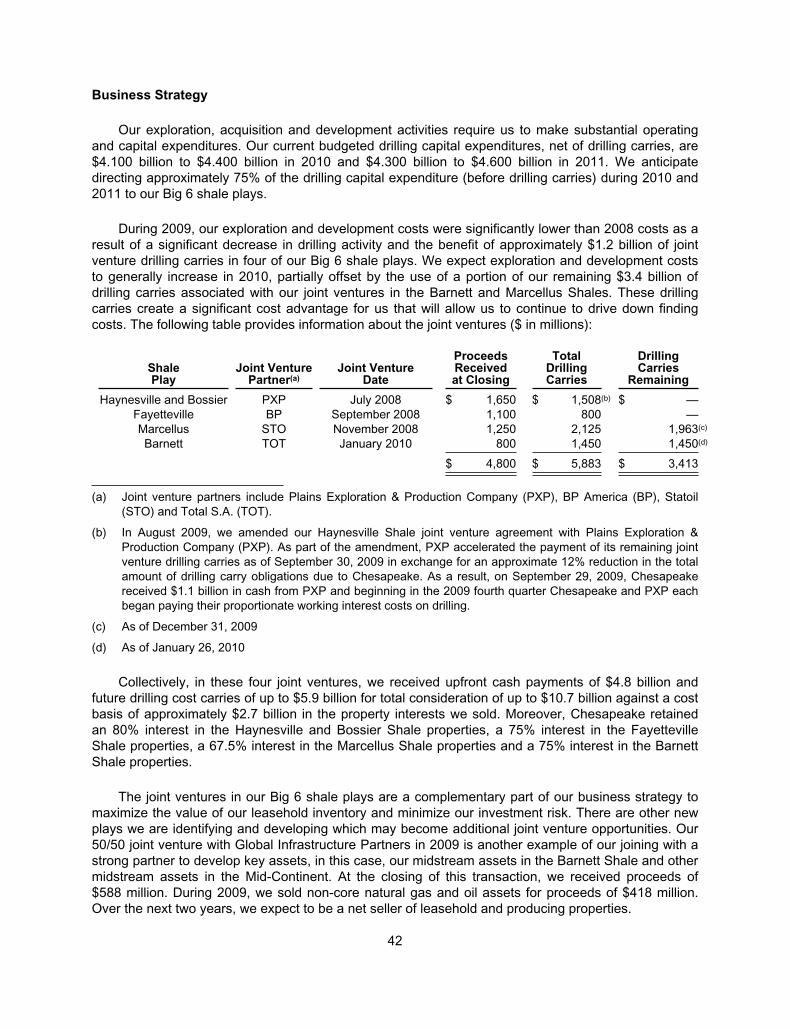
Business Strategy
Our exploration, acquisition and development activities require us to make substantial operating
and capital expenditures. Our current budgeted drilling capital expenditures, net of drilling carries, are
$4.100 billion to $4.400 billion in 2010 and $4.300 billion to $4.600 billion in 2011. We anticipate
directing approximately 75% of the drilling capital expenditure (before drilling carries) during 2010 and
2011 to our Big 6 shale plays.
During 2009, our exploration and development costs were significantly lower than 2008 costs as a
result of a significant decrease in drilling activity and the benefit of approximately $1.2 billion of joint
venture drilling carries in four of our Big 6 shale plays. We expect exploration and development costs
to generally increase in 2010, partially offset by the use of a portion of our remaining $3.4 billion of
drilling carries associated with our joint ventures in the Barnett and Marcellus Shales. These drilling
carries create a significant cost advantage for us that will allow us to continue to drive down finding
costs. The following table provides information about the joint ventures ($ in millions):
ShalePlay
Joint VenturePartner(a)
Joint VentureDate
ProceedsReceivedat Closing
TotalDrillingCarries
DrillingCarries
Remaining
Haynesville and Bossier PXP July 2008 $ 1,650 $ 1,508(b) $ —
Fayetteville BP September 2008 1,100 800 —
Marcellus STO November 2008 1,250 2,125 1,963(c)
Barnett TOT January 2010 800 1,450 1,450(d)
$ 4,800 $ 5,883 $ 3,413
(a) Joint venture partners include Plains Exploration & Production Company (PXP), BP America (BP), Statoil
(STO) and Total S.A. (TOT).
(b) In August 2009, we amended our Haynesville Shale joint venture agreement with Plains Exploration &
Production Company (PXP). As part of the amendment, PXP accelerated the payment of its remaining joint
venture drilling carries as of September 30, 2009 in exchange for an approximate 12% reduction in the total
amount of drilling carry obligations due to Chesapeake. As a result, on September 29, 2009, Chesapeake
received $1.1 billion in cash from PXP and beginning in the 2009 fourth quarter Chesapeake and PXP each
began paying their proportionate working interest costs on drilling.
(c) As of December 31, 2009
(d) As of January 26, 2010
Collectively, in these four joint ventures, we received upfront cash payments of $4.8 billion and
future drilling cost carries of up to $5.9 billion for total consideration of up to $10.7 billion against a cost
basis of approximately $2.7 billion in the property interests we sold. Moreover, Chesapeake retained
an 80% interest in the Haynesville and Bossier Shale properties, a 75% interest in the Fayetteville
Shale properties, a 67.5% interest in the Marcellus Shale properties and a 75% interest in the Barnett
Shale properties.
The joint ventures in our Big 6 shale plays are a complementary part of our business strategy to
maximize the value of our leasehold inventory and minimize our investment risk. There are other new
plays we are identifying and developing which may become additional joint venture opportunities. Our
50/50 joint venture with Global Infrastructure Partners in 2009 is another example of our joining with a
strong partner to develop key assets, in this case, our midstream assets in the Barnett Shale and other
midstream assets in the Mid-Continent. At the closing of this transaction, we received proceeds of
$588 million. During 2009, we sold non-core natural gas and oil assets for proceeds of $418 million.
Over the next two years, we expect to be a net seller of leasehold and producing properties.
42
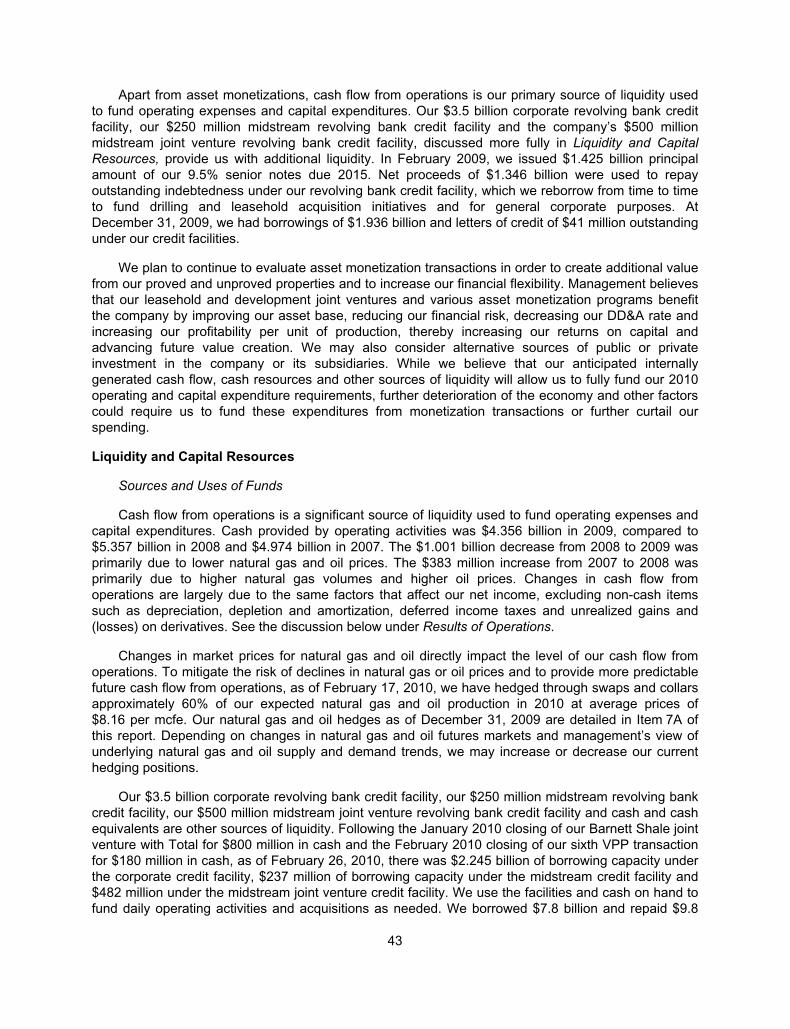
Apart from asset monetizations, cash flow from operations is our primary source of liquidity used
to fund operating expenses and capital expenditures. Our $3.5 billion corporate revolving bank credit
facility, our $250 million midstream revolving bank credit facility and the company’s $500 million
midstream joint venture revolving bank credit facility, discussed more fully in Liquidity and Capital
Resources, provide us with additional liquidity. In February 2009, we issued $1.425 billion principal
amount of our 9.5% senior notes due 2015. Net proceeds of $1.346 billion were used to repay
outstanding indebtedness under our revolving bank credit facility, which we reborrow from time to time
to fund drilling and leasehold acquisition initiatives and for general corporate purposes. At
December 31, 2009, we had borrowings of $1.936 billion and letters of credit of $41 million outstanding
under our credit facilities.
We plan to continue to evaluate asset monetization transactions in order to create additional value
from our proved and unproved properties and to increase our financial flexibility. Management believes
that our leasehold and development joint ventures and various asset monetization programs benefit
the company by improving our asset base, reducing our financial risk, decreasing our DD&A rate and
increasing our profitability per unit of production, thereby increasing our returns on capital and
advancing future value creation. We may also consider alternative sources of public or private
investment in the company or its subsidiaries. While we believe that our anticipated internally
generated cash flow, cash resources and other sources of liquidity will allow us to fully fund our 2010
operating and capital expenditure requirements, further deterioration of the economy and other factors
could require us to fund these expenditures from monetization transactions or further curtail our
spending.
Liquidity and Capital Resources
Sources and Uses of Funds
Cash flow from operations is a significant source of liquidity used to fund operating expenses and
capital expenditures. Cash provided by operating activities was $4.356 billion in 2009, compared to
$5.357 billion in 2008 and $4.974 billion in 2007. The $1.001 billion decrease from 2008 to 2009 was
primarily due to lower natural gas and oil prices. The $383 million increase from 2007 to 2008 was
primarily due to higher natural gas volumes and higher oil prices. Changes in cash flow from
operations are largely due to the same factors that affect our net income, excluding non-cash items
such as depreciation, depletion and amortization, deferred income taxes and unrealized gains and
(losses) on derivatives. See the discussion below under Results of Operations.
Changes in market prices for natural gas and oil directly impact the level of our cash flow from
operations. To mitigate the risk of declines in natural gas or oil prices and to provide more predictable
future cash flow from operations, as of February 17, 2010, we have hedged through swaps and collars
approximately 60% of our expected natural gas and oil production in 2010 at average prices of
$8.16 per mcfe. Our natural gas and oil hedges as of December 31, 2009 are detailed in Item 7A of
this report. Depending on changes in natural gas and oil futures markets and management’s view of
underlying natural gas and oil supply and demand trends, we may increase or decrease our current
hedging positions.
Our $3.5 billion corporate revolving bank credit facility, our $250 million midstream revolving bank
credit facility, our $500 million midstream joint venture revolving bank credit facility and cash and cash
equivalents are other sources of liquidity. Following the January 2010 closing of our Barnett Shale joint
venture with Total for $800 million in cash and the February 2010 closing of our sixth VPP transaction
for $180 million in cash, as of February 26, 2010, there was $2.245 billion of borrowing capacity under
the corporate credit facility, $237 million of borrowing capacity under the midstream credit facility and
$482 million under the midstream joint venture credit facility. We use the facilities and cash on hand to
fund daily operating activities and acquisitions as needed. We borrowed $7.8 billion and repaid $9.8
43
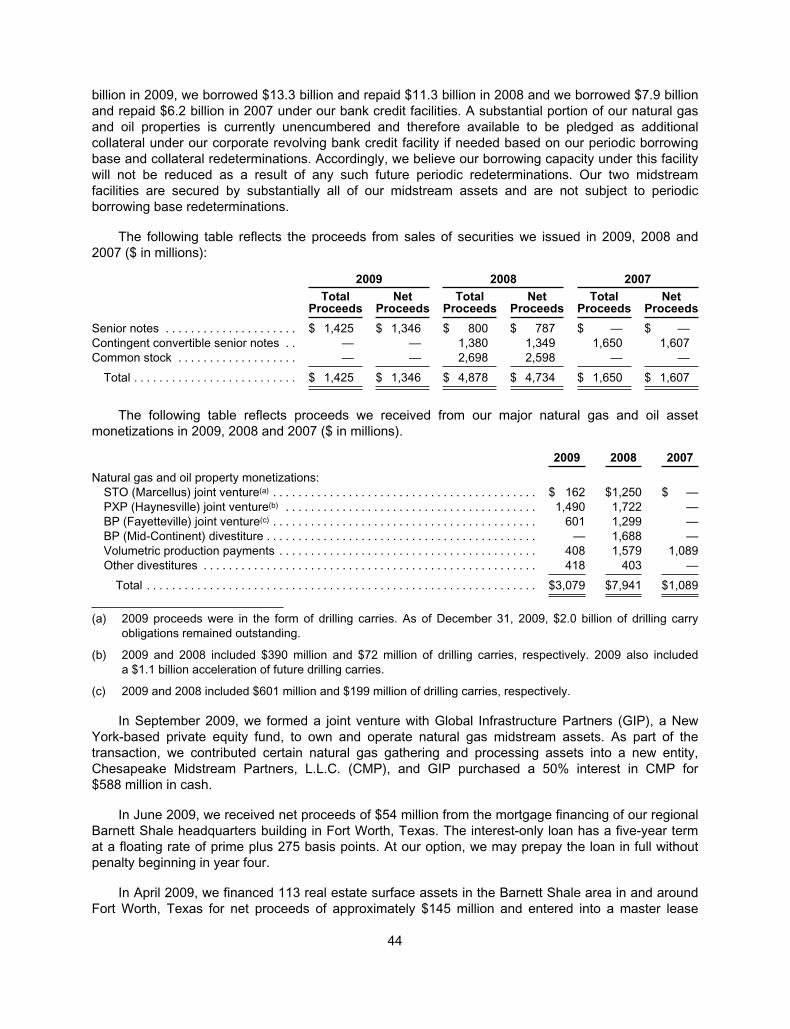
billion in 2009, we borrowed $13.3 billion and repaid $11.3 billion in 2008 and we borrowed $7.9 billion
and repaid $6.2 billion in 2007 under our bank credit facilities. A substantial portion of our natural gas
and oil properties is currently unencumbered and therefore available to be pledged as additional
collateral under our corporate revolving bank credit facility if needed based on our periodic borrowing
base and collateral redeterminations. Accordingly, we believe our borrowing capacity under this facility
will not be reduced as a result of any such future periodic redeterminations. Our two midstream
facilities are secured by substantially all of our midstream assets and are not subject to periodic
borrowing base redeterminations.
The following table reflects the proceeds from sales of securities we issued in 2009, 2008 and
2007 ($ in millions):
2009 2008 2007
TotalProceeds
NetProceeds
TotalProceeds
NetProceeds
TotalProceeds
NetProceeds
Senior notes . . . . . . . . . . . . . . . . . . . . . $ 1,425 $ 1,346 $ 800 $ 787 $ — $ —
Contingent convertible senior notes . . — — 1,380 1,349 1,650 1,607
Common stock . . . . . . . . . . . . . . . . . . . — — 2,698 2,598 — —
Total . . . . . . . . . . . . . . . . . . . . . . . . . . $ 1,425 $ 1,346 $ 4,878 $ 4,734 $ 1,650 $ 1,607
The following table reflects proceeds we received from our major natural gas and oil asset
monetizations in 2009, 2008 and 2007 ($ in millions).
2009 2008 2007
Natural gas and oil property monetizations:
STO (Marcellus) joint venture(a) . . . . . . . . . . . . . . . . . . . . . . . . . . . . . . . . . . . . . . . . . . $ 162 $1,250 $ —
PXP (Haynesville) joint venture(b) . . . . . . . . . . . . . . . . . . . . . . . . . . . . . . . . . . . . . . . . 1,490 1,722 —
BP (Fayetteville) joint venture(c) . . . . . . . . . . . . . . . . . . . . . . . . . . . . . . . . . . . . . . . . . . 601 1,299 —
BP (Mid-Continent) divestiture . . . . . . . . . . . . . . . . . . . . . . . . . . . . . . . . . . . . . . . . . . . — 1,688 —
Volumetric production payments . . . . . . . . . . . . . . . . . . . . . . . . . . . . . . . . . . . . . . . . . 408 1,579 1,089
Other divestitures . . . . . . . . . . . . . . . . . . . . . . . . . . . . . . . . . . . . . . . . . . . . . . . . . . . . . 418 403 —
Total . . . . . . . . . . . . . . . . . . . . . . . . . . . . . . . . . . . . . . . . . . . . . . . . . . . . . . . . . . . . . . $3,079 $7,941 $1,089
(a) 2009 proceeds were in the form of drilling carries. As of December 31, 2009, $2.0 billion of drilling carry
obligations remained outstanding.
(b) 2009 and 2008 included $390 million and $72 million of drilling carries, respectively. 2009 also included
a $1.1 billion acceleration of future drilling carries.
(c) 2009 and 2008 included $601 million and $199 million of drilling carries, respectively.
In September 2009, we formed a joint venture with Global Infrastructure Partners (GIP), a New
York-based private equity fund, to own and operate natural gas midstream assets. As part of the
transaction, we contributed certain natural gas gathering and processing assets into a new entity,
Chesapeake Midstream Partners, L.L.C. (CMP), and GIP purchased a 50% interest in CMP for
$588 million in cash.
In June 2009, we received net proceeds of $54 million from the mortgage financing of our regional
Barnett Shale headquarters building in Fort Worth, Texas. The interest-only loan has a five-year term
at a floating rate of prime plus 275 basis points. At our option, we may prepay the loan in full without
penalty beginning in year four.
In April 2009, we financed 113 real estate surface assets in the Barnett Shale area in and around
Fort Worth, Texas for net proceeds of approximately $145 million and entered into a master lease
44
agreement under which we agreed to lease the assets for 40 years for approximately $15 million to
$27 million annually. This lease transaction was recorded as a financing lease.
Our primary use of funds is for capital expenditures related to exploration, development and
acquisition of natural gas and oil properties. We refer you to the table under Investing Activities below,
which sets forth the components of our natural gas and oil investing activities and other investing
activities for 2009, 2008 and 2007. We retain a significant degree of control over the timing of our
capital expenditures which permits us to defer or accelerate certain capital expenditures if necessary to
address any potential liquidity issues. In addition, higher drilling and field operating costs, drilling
results that alter planned development schedules, acquisitions or other factors could cause us to revise
our drilling program, which is largely discretionary.
We paid dividends on our common stock of $181 million, $148 million and $115 million in 2009,
2008 and 2007, respectively. The Board of Directors increased the quarterly dividend of common stock
from $0.0675 to $0.075 per share beginning with the dividend paid in July 2008. Dividends paid on our
preferred stock decreased to $23 million in 2009 from $35 million in 2008 and $95 million in 2007 as a
result of conversions and exchanges of preferred stock into common stock during 2007, 2008 and
2009.
In 2009, 2008 and 2007, we received $24 million, and paid $167 million and $91 million,
respectively, to settle a portion of the derivative liabilities assumed in our 2005 acquisition of Columbia
Natural Resources, LLC. Additionally in 2009, we received $85 million for settlements of derivatives
which were classified as financing derivatives.
Credit Risk
A significant portion of our liquidity is concentrated in derivative instruments that enable us to
hedge a portion of our exposure to natural gas and oil prices and interest rate volatility. These
arrangements expose us to credit risk from our counterparties. To mitigate this risk, we enter into
derivative contracts only with investment-grade rated counterparties deemed by management to be
competent and competitive market makers, and we attempt to limit our exposure to non-performance
by any single counterparty. During the more than 15 years we have engaged in hedging activities, we
have experienced a counterparty default only once (Lehman Brothers in September 2008), and the
total loss recorded in that instance was immaterial. On December 31, 2009, our commodity and
interest rate derivative instruments were spread among 14 counterparties. Additionally, our multi-
counterparty secured hedging facility requires our counterparties to secure their natural gas and oil
hedging obligations in excess of defined thresholds.
Our accounts receivable are primarily from purchasers of natural gas and oil ($743 million at
December 31, 2009) and exploration and production companies which own interests in properties we
operate ($394 million at December 31, 2009). This industry concentration has the potential to impact
our overall exposure to credit risk, either positively or negatively, in that our customers and joint
working interest owners may be similarly affected by changes in economic, industry or other
conditions. We generally require letters of credit or parent guarantees for receivables from parties
which are judged to have sub-standard credit, unless the credit risk can otherwise be mitigated. During
2009, we recognized $12 million of bad debt expense related to potentially uncollectible receivables.
45
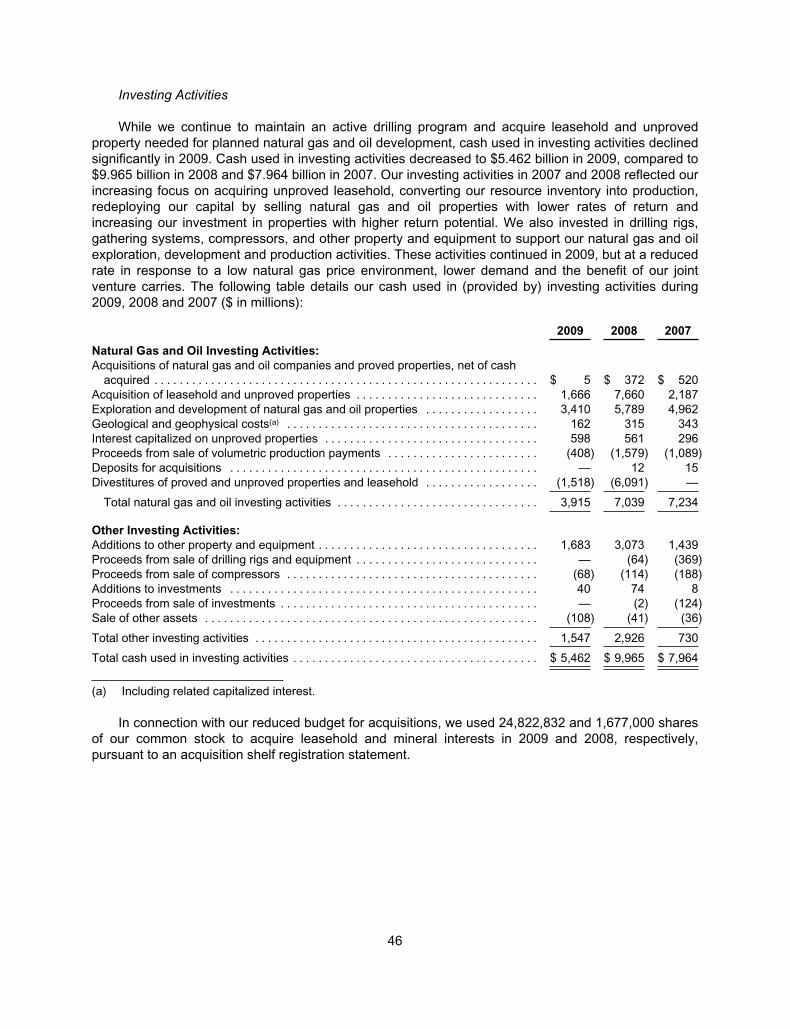
Investing Activities
While we continue to maintain an active drilling program and acquire leasehold and unproved
property needed for planned natural gas and oil development, cash used in investing activities declined
significantly in 2009. Cash used in investing activities decreased to $5.462 billion in 2009, compared to
$9.965 billion in 2008 and $7.964 billion in 2007. Our investing activities in 2007 and 2008 reflected our
increasing focus on acquiring unproved leasehold, converting our resource inventory into production,
redeploying our capital by selling natural gas and oil properties with lower rates of return and
increasing our investment in properties with higher return potential. We also invested in drilling rigs,
gathering systems, compressors, and other property and equipment to support our natural gas and oil
exploration, development and production activities. These activities continued in 2009, but at a reduced
rate in response to a low natural gas price environment, lower demand and the benefit of our joint
venture carries. The following table details our cash used in (provided by) investing activities during
2009, 2008 and 2007 ($ in millions):
2009 2008 2007
Natural Gas and Oil Investing Activities:
Acquisitions of natural gas and oil companies and proved properties, net of cash
acquired . . . . . . . . . . . . . . . . . . . . . . . . . . . . . . . . . . . . . . . . . . . . . . . . . . . . . . . . . . . . . $ 5 $ 372 $ 520
Acquisition of leasehold and unproved properties . . . . . . . . . . . . . . . . . . . . . . . . . . . . . 1,666 7,660 2,187
Exploration and development of natural gas and oil properties . . . . . . . . . . . . . . . . . . 3,410 5,789 4,962
Geological and geophysical costs(a) . . . . . . . . . . . . . . . . . . . . . . . . . . . . . . . . . . . . . . . . 162 315 343
Interest capitalized on unproved properties . . . . . . . . . . . . . . . . . . . . . . . . . . . . . . . . . . 598 561 296
Proceeds from sale of volumetric production payments . . . . . . . . . . . . . . . . . . . . . . . . (408) (1,579) (1,089)
Deposits for acquisitions . . . . . . . . . . . . . . . . . . . . . . . . . . . . . . . . . . . . . . . . . . . . . . . . . — 12 15
Divestitures of proved and unproved properties and leasehold . . . . . . . . . . . . . . . . . . (1,518) (6,091) —
Total natural gas and oil investing activities . . . . . . . . . . . . . . . . . . . . . . . . . . . . . . . . 3,915 7,039 7,234
Other Investing Activities:
Additions to other property and equipment . . . . . . . . . . . . . . . . . . . . . . . . . . . . . . . . . . . 1,683 3,073 1,439
Proceeds from sale of drilling rigs and equipment . . . . . . . . . . . . . . . . . . . . . . . . . . . . . — (64) (369)
Proceeds from sale of compressors . . . . . . . . . . . . . . . . . . . . . . . . . . . . . . . . . . . . . . . . (68) (114) (188)
Additions to investments . . . . . . . . . . . . . . . . . . . . . . . . . . . . . . . . . . . . . . . . . . . . . . . . . 40 74 8
Proceeds from sale of investments . . . . . . . . . . . . . . . . . . . . . . . . . . . . . . . . . . . . . . . . . — (2) (124)
Sale of other assets . . . . . . . . . . . . . . . . . . . . . . . . . . . . . . . . . . . . . . . . . . . . . . . . . . . . . (108) (41) (36)
Total other investing activities . . . . . . . . . . . . . . . . . . . . . . . . . . . . . . . . . . . . . . . . . . . . . 1,547 2,926 730
Total cash used in investing activities . . . . . . . . . . . . . . . . . . . . . . . . . . . . . . . . . . . . . . . $ 5,462 $ 9,965 $ 7,964
(a) Including related capitalized interest.
In connection with our reduced budget for acquisitions, we used 24,822,832 and 1,677,000 shares
of our common stock to acquire leasehold and mineral interests in 2009 and 2008, respectively,
pursuant to an acquisition shelf registration statement.
46
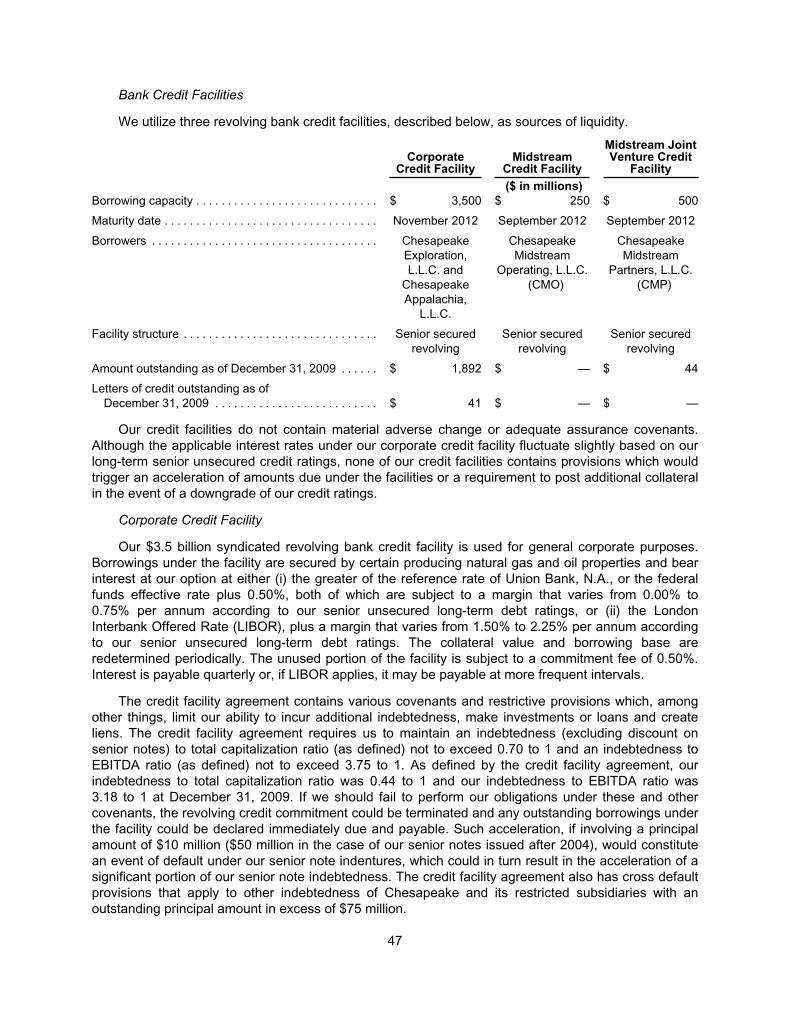
Bank Credit Facilities
We utilize three revolving bank credit facilities, described below, as sources of liquidity.
CorporateCredit Facility
MidstreamCredit Facility
Midstream JointVenture Credit
Facility
($ in millions)
Borrowing capacity . . . . . . . . . . . . . . . . . . . . . . . . . . . . . $ 3,500 $ 250 $ 500
Maturity date . . . . . . . . . . . . . . . . . . . . . . . . . . . . . . . . . . November 2012 September 2012 September 2012
Borrowers . . . . . . . . . . . . . . . . . . . . . . . . . . . . . . . . . . . . Chesapeake
Exploration,
L.L.C. and
Chesapeake
Appalachia,
L.L.C.
Chesapeake
Midstream
Operating, L.L.C.
(CMO)
Chesapeake
Midstream
Partners, L.L.C.
(CMP)
Facility structure . . . . . . . . . . . . . . . . . . . . . . . . . . . . . . . Senior secured
revolving
Senior secured
revolving
Senior secured
revolving
Amount outstanding as of December 31, 2009 . . . . . . $ 1,892 $ — $ 44
Letters of credit outstanding as of
December 31, 2009 . . . . . . . . . . . . . . . . . . . . . . . . . . $ 41 $ — $ —
Our credit facilities do not contain material adverse change or adequate assurance covenants.
Although the applicable interest rates under our corporate credit facility fluctuate slightly based on our
long-term senior unsecured credit ratings, none of our credit facilities contains provisions which would
trigger an acceleration of amounts due under the facilities or a requirement to post additional collateral
in the event of a downgrade of our credit ratings.
Corporate Credit Facility
Our $3.5 billion syndicated revolving bank credit facility is used for general corporate purposes.
Borrowings under the facility are secured by certain producing natural gas and oil properties and bear
interest at our option at either (i) the greater of the reference rate of Union Bank, N.A., or the federal
funds effective rate plus 0.50%, both of which are subject to a margin that varies from 0.00% to
0.75% per annum according to our senior unsecured long-term debt ratings, or (ii) the London
Interbank Offered Rate (LIBOR), plus a margin that varies from 1.50% to 2.25% per annum according
to our senior unsecured long-term debt ratings. The collateral value and borrowing base are
redetermined periodically. The unused portion of the facility is subject to a commitment fee of 0.50%.
Interest is payable quarterly or, if LIBOR applies, it may be payable at more frequent intervals.
The credit facility agreement contains various covenants and restrictive provisions which, among
other things, limit our ability to incur additional indebtedness, make investments or loans and create
liens. The credit facility agreement requires us to maintain an indebtedness (excluding discount on
senior notes) to total capitalization ratio (as defined) not to exceed 0.70 to 1 and an indebtedness to
EBITDA ratio (as defined) not to exceed 3.75 to 1. As defined by the credit facility agreement, our
indebtedness to total capitalization ratio was 0.44 to 1 and our indebtedness to EBITDA ratio was
3.18 to 1 at December 31, 2009. If we should fail to perform our obligations under these and other
covenants, the revolving credit commitment could be terminated and any outstanding borrowings under
the facility could be declared immediately due and payable. Such acceleration, if involving a principal
amount of $10 million ($50 million in the case of our senior notes issued after 2004), would constitute
an event of default under our senior note indentures, which could in turn result in the acceleration of a
significant portion of our senior note indebtedness. The credit facility agreement also has cross default
provisions that apply to other indebtedness of Chesapeake and its restricted subsidiaries with an
outstanding principal amount in excess of $75 million.
47
The facility is fully and unconditionally guaranteed, on a joint and several basis, by Chesapeake
and all of our other wholly-owned restricted subsidiaries other than minor subsidiaries.
Midstream Credit Facility
Our midstream $250 million syndicated revolving bank credit facility is used to fund capital
expenditures to build natural gas gathering and other systems to support our drilling program and for
general corporate purposes associated with our midstream operations. Borrowings under the
midstream credit facility are secured by all of the assets of the wholly-owned subsidiaries (the
restricted subsidiaries) of Chesapeake Midstream Development, L.P. (CMD), itself a wholly-owned
subsidiary of Chesapeake, and bear interest at our option at either (i) the greater of the reference rate
of Wells Fargo Bank, National Association, the federal funds effective rate plus 0.50%, and the
one-month LIBOR plus 1.00%, all of which are subject to a margin that varies from 2.00% to 2.75% per
annum according to the most recent indebtedness to EBITDA ratio (as defined) or (ii) the LIBOR plus a
margin that varies from 3.00% to 3.75% per annum according to the most recent indebtedness to
EBITDA ratio (as defined). The unused portion of the facility is subject to a commitment fee of
0.50% per annum according to the most recent indebtedness to EBITDA ratio (as defined). Interest is
payable quarterly or, if LIBOR applies, it may be paid at more frequent intervals.
The midstream credit facility agreement contains various covenants and restrictive provisions
which, among other things, limit the ability of CMD and its restricted subsidiaries to incur additional
indebtedness, make investments or loans, create liens and pay dividends or distributions to
Chesapeake. The credit facility agreement requires maintenance of an indebtedness to EBITDA ratio
(as defined) not to exceed 3.50 to 1, and an EBITDA (as defined) to interest expense coverage ratio of
not less than 3.00 to 1. As defined by the credit facility agreement, our indebtedness to EBITDA ratio
was 0.01 to 1 and our EBITDA to interest expense coverage ratio was 6.87 to 1 at December 31, 2009.
If CMD or its restricted subsidiaries should fail to perform their obligations under these and other
covenants, the revolving credit commitment could be terminated and any outstanding borrowings under
the midstream facility could be declared immediately due and payable. The midstream credit facility
agreement also has cross default provisions that apply to other indebtedness CMD and its subsidiaries
may have with an outstanding principal amount in excess of $15 million.
Midstream Joint Venture Credit Facility
Our midstream joint venture $500 million syndicated revolving bank credit facility was established
concurrent with the midstream joint venture we formed on September 30, 2009 (see Note 11 for
discussion regarding the midstream joint venture). As a result of that transaction, our existing
midstream credit facility was amended and restated as described above. Borrowings under the
midstream joint venture credit facility are secured by all of the assets of the midstream companies
organized under the joint venture, which is 50% owned by Chesapeake and 50% owned by our joint
venture partner Global Infrastructure Partners, and bear interest at our option at either (i) the greater of
the reference rate of Wells Fargo Bank, National Association, the federal funds effective rate plus
0.50%, and the one-month LIBOR plus 1.00%, all of which are subject to a margin that varies from
2.00% to 2.75% per annum according to the most recent indebtedness to EBITDA ratio (as defined) or
(ii) the LIBOR plus a margin that varies from 3.00% to 3.75% per annum according to the most recent
indebtedness to EBITDA ratio (as defined). The unused portion of the facility is subject to a
commitment fee of 0.50% per annum according to the most recent indebtedness to EBITDA ratio (as
defined). Interest is payable quarterly or, if LIBOR applies, it may be paid at more frequent intervals.
The midstream joint venture credit facility agreement contains various covenants and restrictive
provisions which, among other things, limit the ability of the joint venture and its subsidiaries to incur
additional indebtedness, make investments or loans, create liens and pay dividends or distributions to
48
Chesapeake. The credit facility agreement requires maintenance of an indebtedness to EBITDA ratio
(as defined) not to exceed 3.50 to 1, and an EBITDA (as defined) to interest expense coverage ratio of
not less than 3.00 to 1. As defined by the credit facility agreement, our indebtedness to EBITDA ratio
was 0.19 to 1 and our EBITDA to interest expense coverage ratio was 21.75 to 1 at December 31,
2009. If CMP or its subsidiaries should fail to perform their obligations under these and other
covenants, the revolving credit commitment could be terminated and any outstanding borrowings under
the midstream joint venture facility could be declared immediately due and payable. The midstream
joint venture credit facility agreement also has cross default provisions that apply to other indebtedness
CMP and its subsidiaries may have with an outstanding principal amount in excess of $15 million.
Hedging Facilities
We began 2009 with six secured hedging facilities, each of which permitted us to enter into cash-
settled natural gas and oil commodity transactions, valued by the counterparty, for up to a stated
maximum value. Outstanding transactions under each of the facilities were collateralized by certain of
our natural gas and oil properties that did not secure any of our other obligations. On June 11, 2009,
we entered into a multi-counterparty hedge facility with 13 counterparties that have committed to
provide approximately 3.9 tcfe of trading capacity and an aggregate mark-to-market capacity of $10.4
billion under the terms of the facility. The new multi-counterparty facility has consolidated and replaced
the six secured hedge facilities. All prior trades with these counterparties have been novated and
pledged collateral transferred to the multi-counterparty facility, which had a total of 1.7 tcfe hedged and
collateral value of approximately $5.3 billion as of December 31, 2009. Trades from the original six
secured hedging facilities will continue to be subject to pre-existing exposure fees, but we are not
required to pay an exposure fee for any new trades in the multi-counterparty facility.
The multi-counterparty facility allows us to enter into cash-settled natural gas and oil price and
basis hedges with the counterparties. Our obligations under the multi-counterparty facility are secured
by natural gas and oil proved reserves, the value of which must cover the fair value of the transactions
outstanding under the facility by at least 1.65 times, and guarantees by certain subsidiaries that also
guarantee our corporate revolving bank credit facility and indentures. The counterparties’ obligations
under the facility must be secured by cash or short-term U.S. Treasury instruments to the extent that
any mark-to-market amounts they owe to Chesapeake exceed defined thresholds. The maximum
volume-based trading capacity under the facility is governed by the expected production of the pledged
reserve collateral, and volume-based trading limits are applied separately to price and basis hedges. In
addition, there are volume-based sub-limits for natural gas and oil hedges. Chesapeake has significant
flexibility with regard to releases and/or substitutions of pledged reserves, provided that certain
collateral coverage and other requirements are met. The facility does not have a maturity date.
Counterparties to the agreement have the right to cease trading with the company on a prospective
basis as long as obligations associated with any existing trades in the facility continue to be satisfied in
accordance with the terms of the agreement.
49
Senior Note Obligations
In addition to outstanding revolving bank credit facility borrowings discussed above, as of
December 31, 2009, senior notes represented approximately $10.4 billion of our long-term debt and
consisted of the following ($ in millions):
7.5% senior notes due 2013 . . . . . . . . . . . . . . . . . . . . . . . . . . . . . . . . . . . . . . . . . . . . . . . . . . . . . . . . . . . . $ 364
7.625% senior notes due 2013 . . . . . . . . . . . . . . . . . . . . . . . . . . . . . . . . . . . . . . . . . . . . . . . . . . . . . . . . . . 500
7.0% senior notes due 2014 . . . . . . . . . . . . . . . . . . . . . . . . . . . . . . . . . . . . . . . . . . . . . . . . . . . . . . . . . . . . 300
7.5% senior notes due 2014 . . . . . . . . . . . . . . . . . . . . . . . . . . . . . . . . . . . . . . . . . . . . . . . . . . . . . . . . . . . . 300
6.375% senior notes due 2015 . . . . . . . . . . . . . . . . . . . . . . . . . . . . . . . . . . . . . . . . . . . . . . . . . . . . . . . . . . 600
9.5% senior notes due 2015 . . . . . . . . . . . . . . . . . . . . . . . . . . . . . . . . . . . . . . . . . . . . . . . . . . . . . . . . . . . . 1,425
6.625% senior notes due 2016 . . . . . . . . . . . . . . . . . . . . . . . . . . . . . . . . . . . . . . . . . . . . . . . . . . . . . . . . . . 600
6.875% senior notes due 2016 . . . . . . . . . . . . . . . . . . . . . . . . . . . . . . . . . . . . . . . . . . . . . . . . . . . . . . . . . . 670
6.25% Euro-denominated senior notes due 2017(a) . . . . . . . . . . . . . . . . . . . . . . . . . . . . . . . . . . . . . . . . . . 860
6.5% senior notes due 2017 . . . . . . . . . . . . . . . . . . . . . . . . . . . . . . . . . . . . . . . . . . . . . . . . . . . . . . . . . . . . 1,100
6.25% senior notes due 2018 . . . . . . . . . . . . . . . . . . . . . . . . . . . . . . . . . . . . . . . . . . . . . . . . . . . . . . . . . . . 600
7.25% senior notes due 2018 . . . . . . . . . . . . . . . . . . . . . . . . . . . . . . . . . . . . . . . . . . . . . . . . . . . . . . . . . . . 800
6.875% senior notes due 2020 . . . . . . . . . . . . . . . . . . . . . . . . . . . . . . . . . . . . . . . . . . . . . . . . . . . . . . . . . . 500
2.75% contingent convertible senior notes due 2035(b) . . . . . . . . . . . . . . . . . . . . . . . . . . . . . . . . . . . . . . . 451
2.5% contingent convertible senior notes due 2037(b) . . . . . . . . . . . . . . . . . . . . . . . . . . . . . . . . . . . . . . . . 1,378
2.25% contingent convertible senior notes due 2038(b) . . . . . . . . . . . . . . . . . . . . . . . . . . . . . . . . . . . . . . . 763
Discount on senior notes(c) . . . . . . . . . . . . . . . . . . . . . . . . . . . . . . . . . . . . . . . . . . . . . . . . . . . . . . . . . . . . . . (921)
Interest rate derivatives(d) . . . . . . . . . . . . . . . . . . . . . . . . . . . . . . . . . . . . . . . . . . . . . . . . . . . . . . . . . . . . . . . 69
$ 10,359
(a) The principal amount shown is based on the dollar/euro exchange rate of $1.4332 to €1.00 as of
December 31, 2009. See Note 9 for information on our related cross currency swap.
(b) The holders of our contingent convertible senior notes may require us to repurchase, in cash, all or a portion
of their notes at 100% of the principal amount of the notes on any of four dates that are five, ten, fifteen and
twenty years before the maturity date. The notes are convertible, at the holder’s option, prior to maturity
under certain circumstances into cash and, if applicable, shares of our common stock using a net share
settlement process. One such triggering circumstance is when the price of our common stock exceeds a
threshold amount during a specified period in a fiscal quarter. Convertibility based on common stock price is
measured quarter by quarter. In the fourth quarter of 2009, the price of our common stock was below the
threshold level for each series of the contingent convertible senior notes during the specified period and, as a
result, the holders do not have the option to convert their notes into cash and common stock in the first
quarter of 2010 under this provision. The notes are also convertible, at the holder’s option, during specified
five-day periods if the trading price of the notes is below certain levels determined by reference to the trading
price of our common stock. In general, upon conversion of a contingent convertible senior note, the holder
will receive cash equal to the principal amount of the note and common stock for the note’s conversion value
in excess of such principal amount. We will pay contingent interest on the convertible senior notes after they
have been outstanding at least ten years, under certain conditions. We may redeem the convertible senior
notes once they have been outstanding for ten years at a redemption price of 100% of the principal amount
of the notes, payable in cash. The optional repurchase dates, the common stock price conversion threshold
amounts and the ending date of the first six-month period contingent interest may be payable for the
contingent convertible senior notes are as follows:
ContingentConvertible
Senior Notes Repurchase Dates
Common StockPrice
ConversionThresholds
ContingentInterest
First Payable(if applicable)
2.75% due 2035 November 15, 2015, 2020, 2025, 2030 $ 48.71 May 14, 2016
2.5% due 2037 May 15, 2017, 2022, 2027, 2032 $ 64.36 November 14, 2017
2.25% due 2038 December 15, 2018, 2023, 2028, 2033 $ 107.36 June 14, 2019
50
(c) Included in this discount is $794 million associated with the equity component of our contingent convertible
senior notes. See Note 3 of our consolidated financial statements for a description of the accounting
treatment applied to these notes.
(d) See Note 9 of our consolidated financial statements included in this report for further discussion related to
these instruments.
No scheduled principal payments are required under our senior notes until 2013 when $864 million
is due.
As of December 31, 2009 and currently, debt ratings for the senior notes are Ba3 by Moody’s
Investor Service (stable outlook), BB by Standard & Poor’s Ratings Services (stable outlook) and BB
by Fitch Ratings (negative outlook).
Our senior notes are unsecured senior obligations of Chesapeake and rank equally in right of
payment with all of our other existing and future senior indebtedness and rank senior in right of
payment to all of our future subordinated indebtedness. Chesapeake Energy Corporation is a holding
company and owns no operating assets and has no significant operations independent of its
subsidiaries. Our senior note obligations are guaranteed by certain of our wholly-owned subsidiaries.
See Note 18 of the financial statements included in this report for condensed consolidating financial
information regarding guarantor and non-guarantor subsidiaries. We may redeem the senior notes,
other than the contingent convertible senior notes, at any time at specified redemption or make-whole
prices. Senior notes issued before July 2005 are governed by indentures containing covenants that
limit our ability and our restricted subsidiaries’ ability to incur additional indebtedness; pay dividends on
our capital stock or redeem, repurchase or retire our capital stock or subordinated indebtedness; make
investments and other restricted payments; incur liens; enter into sale/leaseback transactions; create
restrictions on the payment of dividends or other amounts to us from our restricted subsidiaries;
engage in transactions with affiliates; sell assets; and consolidate, merge or transfer assets. Senior
notes issued after June 2005 are governed by indentures containing covenants that limit our ability and
our restricted subsidiaries’ ability to incur certain secured indebtedness; enter into sale/leaseback
transactions; and consolidate, merge or transfer assets. The debt incurrence covenants do not
presently restrict our ability to borrow under or expand our corporate revolving credit facility. As of
December 31, 2009, we estimate that corporate commercial bank indebtedness of approximately
$4.4 billion could have been incurred under the most restrictive indenture covenant.
Conversions and Exchanges of Contingent Convertible Senior Notes and Preferred Stock
In 2009 and 2008, holders of certain of our contingent convertible senior notes exchanged or
converted their senior notes for shares of common stock in privately negotiated exchanges as
summarized below ($ in millions):
YearContingent Convertible
Senior Notes Principal Amount Number of Common Shares
2009 2.25% due 2038 $ 364 10,210,169
2008 2.75% due 2035 $ 239 8,841,526
2008 2.50% due 2037 272 8,416,865
2008 2.25% due 2038 254 6,654,821
$ 765 23,913,212
51
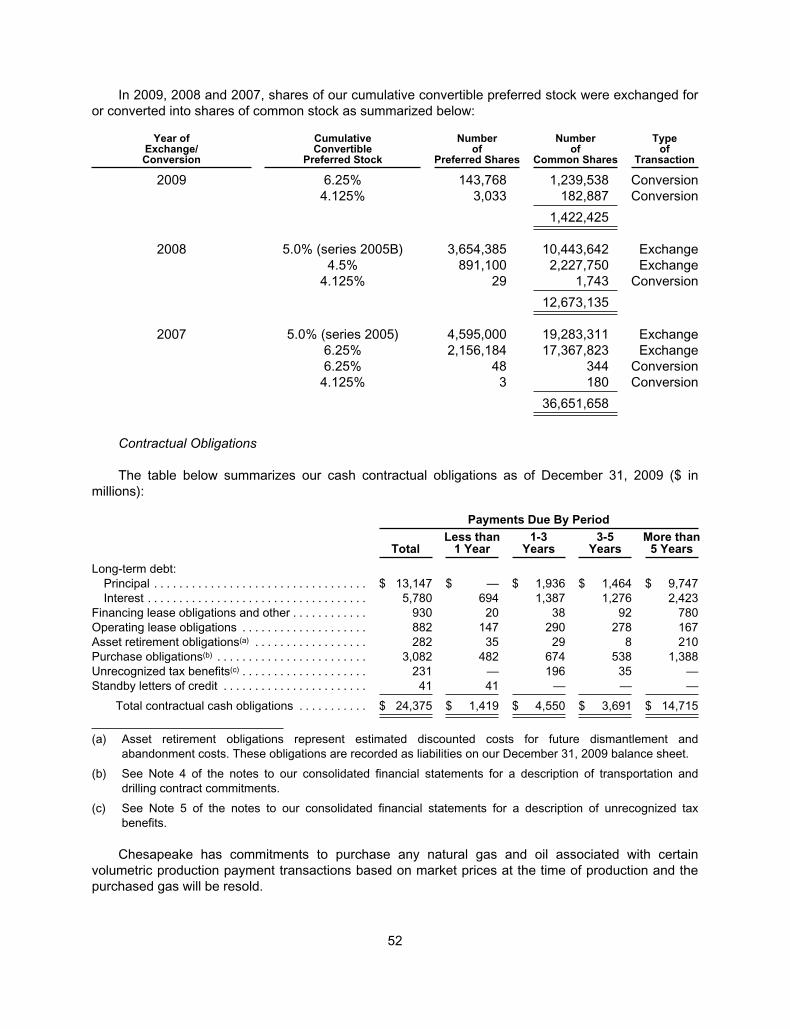
In 2009, 2008 and 2007, shares of our cumulative convertible preferred stock were exchanged for
or converted into shares of common stock as summarized below:
Year ofExchange/Conversion
CumulativeConvertible
Preferred Stock
Numberof
Preferred Shares
Numberof
Common Shares
Typeof
Transaction
2009 6.25% 143,768 1,239,538 Conversion
4.125% 3,033 182,887 Conversion
1,422,425
2008 5.0% (series 2005B) 3,654,385 10,443,642 Exchange
4.5% 891,100 2,227,750 Exchange
4.125% 29 1,743 Conversion
12,673,135
2007 5.0% (series 2005) 4,595,000 19,283,311 Exchange
6.25% 2,156,184 17,367,823 Exchange
6.25% 48 344 Conversion
4.125% 3 180 Conversion
36,651,658
Contractual Obligations
The table below summarizes our cash contractual obligations as of December 31, 2009 ($ in
millions):
Payments Due By Period
TotalLess than
1 Year1-3
Years3-5
YearsMore than
5 Years
Long-term debt:
Principal . . . . . . . . . . . . . . . . . . . . . . . . . . . . . . . . . . $ 13,147 $ — $ 1,936 $ 1,464 $ 9,747
Interest . . . . . . . . . . . . . . . . . . . . . . . . . . . . . . . . . . . 5,780 694 1,387 1,276 2,423
Financing lease obligations and other . . . . . . . . . . . . 930 20 38 92 780
Operating lease obligations . . . . . . . . . . . . . . . . . . . . 882 147 290 278 167
Asset retirement obligations(a) . . . . . . . . . . . . . . . . . . 282 35 29 8 210
Purchase obligations(b) . . . . . . . . . . . . . . . . . . . . . . . . 3,082 482 674 538 1,388
Unrecognized tax benefits(c) . . . . . . . . . . . . . . . . . . . . 231 — 196 35 —
Standby letters of credit . . . . . . . . . . . . . . . . . . . . . . . 41 41 — — —
Total contractual cash obligations . . . . . . . . . . . $ 24,375 $ 1,419 $ 4,550 $ 3,691 $ 14,715
(a) Asset retirement obligations represent estimated discounted costs for future dismantlement and
abandonment costs. These obligations are recorded as liabilities on our December 31, 2009 balance sheet.
(b) See Note 4 of the notes to our consolidated financial statements for a description of transportation and
drilling contract commitments.
(c) See Note 5 of the notes to our consolidated financial statements for a description of unrecognized tax
benefits.
Chesapeake has commitments to purchase any natural gas and oil associated with certain
volumetric production payment transactions based on market prices at the time of production and the
purchased gas will be resold.
52
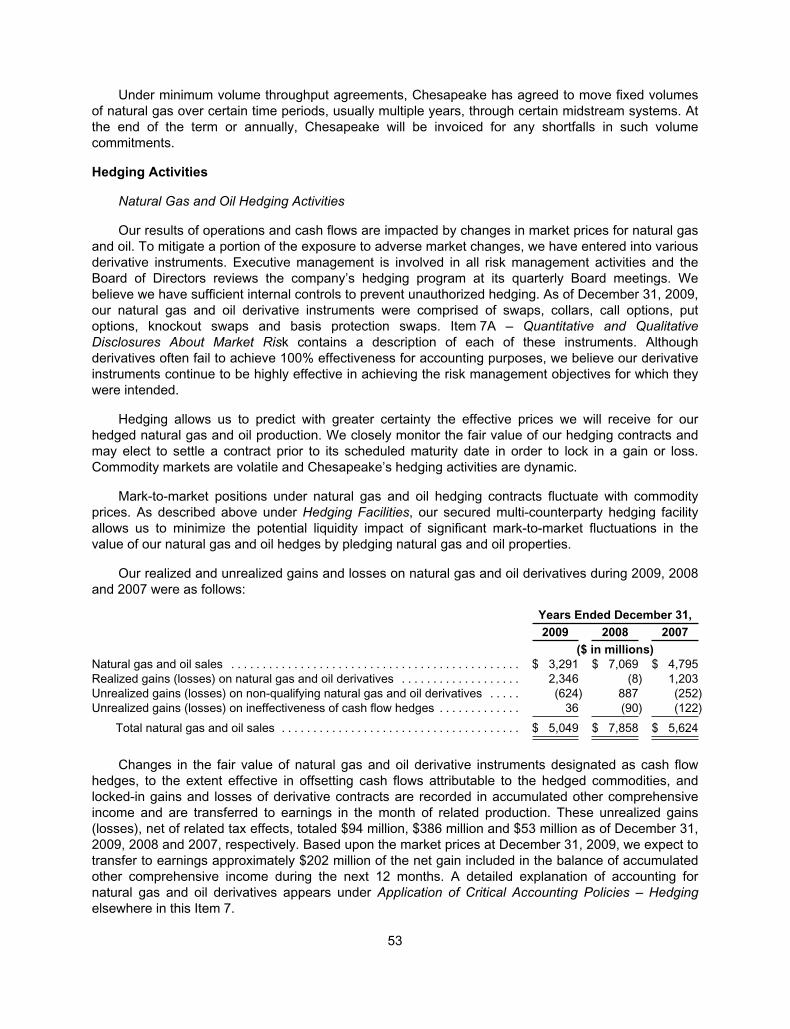
Under minimum volume throughput agreements, Chesapeake has agreed to move fixed volumes
of natural gas over certain time periods, usually multiple years, through certain midstream systems. At
the end of the term or annually, Chesapeake will be invoiced for any shortfalls in such volume
commitments.
Hedging Activities
Natural Gas and Oil Hedging Activities
Our results of operations and cash flows are impacted by changes in market prices for natural gas
and oil. To mitigate a portion of the exposure to adverse market changes, we have entered into various
derivative instruments. Executive management is involved in all risk management activities and the
Board of Directors reviews the company’s hedging program at its quarterly Board meetings. We
believe we have sufficient internal controls to prevent unauthorized hedging. As of December 31, 2009,
our natural gas and oil derivative instruments were comprised of swaps, collars, call options, put
options, knockout swaps and basis protection swaps. Item 7A – Quantitative and Qualitative
Disclosures About Market Risk contains a description of each of these instruments. Although
derivatives often fail to achieve 100% effectiveness for accounting purposes, we believe our derivative
instruments continue to be highly effective in achieving the risk management objectives for which they
were intended.
Hedging allows us to predict with greater certainty the effective prices we will receive for our
hedged natural gas and oil production. We closely monitor the fair value of our hedging contracts and
may elect to settle a contract prior to its scheduled maturity date in order to lock in a gain or loss.
Commodity markets are volatile and Chesapeake’s hedging activities are dynamic.
Mark-to-market positions under natural gas and oil hedging contracts fluctuate with commodity
prices. As described above under Hedging Facilities, our secured multi-counterparty hedging facility
allows us to minimize the potential liquidity impact of significant mark-to-market fluctuations in the
value of our natural gas and oil hedges by pledging natural gas and oil properties.
Our realized and unrealized gains and losses on natural gas and oil derivatives during 2009, 2008
and 2007 were as follows:
Years Ended December 31,
2009 2008 2007
($ in millions)
Natural gas and oil sales . . . . . . . . . . . . . . . . . . . . . . . . . . . . . . . . . . . . . . . . . . . . . . $ 3,291 $ 7,069 $ 4,795
Realized gains (losses) on natural gas and oil derivatives . . . . . . . . . . . . . . . . . . . 2,346 (8) 1,203
Unrealized gains (losses) on non-qualifying natural gas and oil derivatives . . . . . (624) 887 (252)
Unrealized gains (losses) on ineffectiveness of cash flow hedges . . . . . . . . . . . . . 36 (90) (122)
Total natural gas and oil sales . . . . . . . . . . . . . . . . . . . . . . . . . . . . . . . . . . . . . . $ 5,049 $ 7,858 $ 5,624
Changes in the fair value of natural gas and oil derivative instruments designated as cash flow
hedges, to the extent effective in offsetting cash flows attributable to the hedged commodities, and
locked-in gains and losses of derivative contracts are recorded in accumulated other comprehensive
income and are transferred to earnings in the month of related production. These unrealized gains
(losses), net of related tax effects, totaled $94 million, $386 million and $53 million as of December 31,
2009, 2008 and 2007, respectively. Based upon the market prices at December 31, 2009, we expect to
transfer to earnings approximately $202 million of the net gain included in the balance of accumulated
other comprehensive income during the next 12 months. A detailed explanation of accounting for
natural gas and oil derivatives appears under Application of Critical Accounting Policies – Hedging
elsewhere in this Item 7.
53
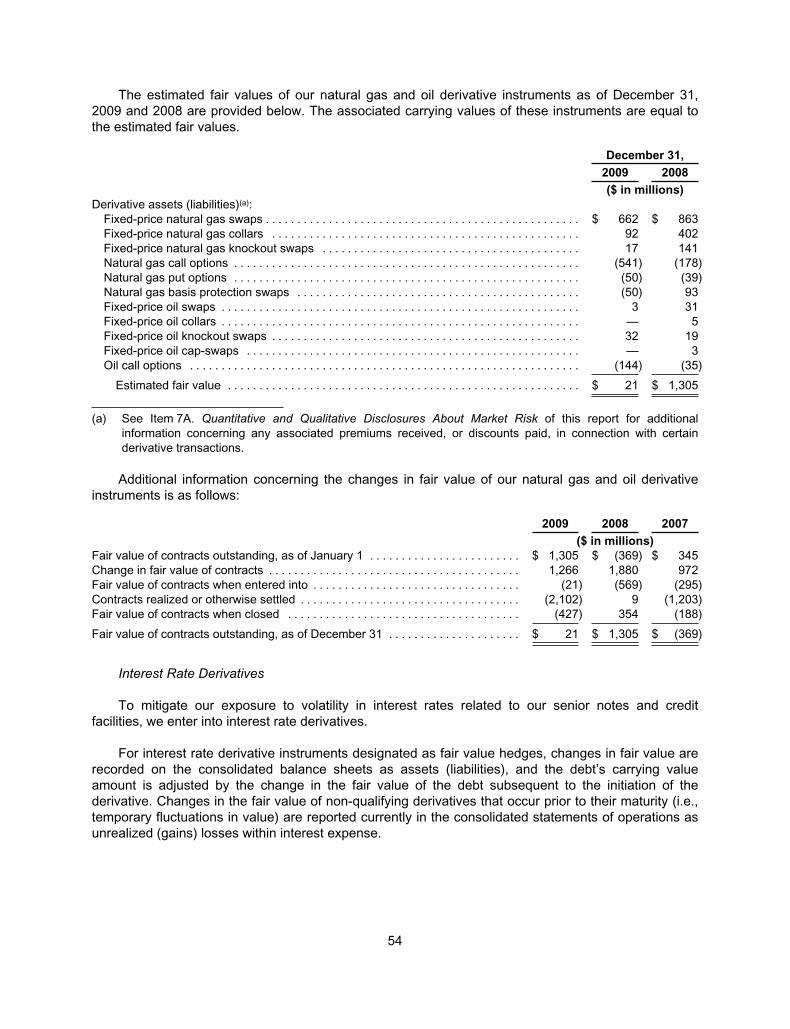
The estimated fair values of our natural gas and oil derivative instruments as of December 31,
2009 and 2008 are provided below. The associated carrying values of these instruments are equal to
the estimated fair values.
December 31,
2009 2008
($ in millions)
Derivative assets (liabilities)(a):
Fixed-price natural gas swaps . . . . . . . . . . . . . . . . . . . . . . . . . . . . . . . . . . . . . . . . . . . . . . . . . . $ 662 $ 863
Fixed-price natural gas collars . . . . . . . . . . . . . . . . . . . . . . . . . . . . . . . . . . . . . . . . . . . . . . . . . 92 402
Fixed-price natural gas knockout swaps . . . . . . . . . . . . . . . . . . . . . . . . . . . . . . . . . . . . . . . . . 17 141
Natural gas call options . . . . . . . . . . . . . . . . . . . . . . . . . . . . . . . . . . . . . . . . . . . . . . . . . . . . . . . (541) (178)
Natural gas put options . . . . . . . . . . . . . . . . . . . . . . . . . . . . . . . . . . . . . . . . . . . . . . . . . . . . . . . (50) (39)
Natural gas basis protection swaps . . . . . . . . . . . . . . . . . . . . . . . . . . . . . . . . . . . . . . . . . . . . . (50) 93
Fixed-price oil swaps . . . . . . . . . . . . . . . . . . . . . . . . . . . . . . . . . . . . . . . . . . . . . . . . . . . . . . . . . 3 31
Fixed-price oil collars . . . . . . . . . . . . . . . . . . . . . . . . . . . . . . . . . . . . . . . . . . . . . . . . . . . . . . . . . — 5
Fixed-price oil knockout swaps . . . . . . . . . . . . . . . . . . . . . . . . . . . . . . . . . . . . . . . . . . . . . . . . . 32 19
Fixed-price oil cap-swaps . . . . . . . . . . . . . . . . . . . . . . . . . . . . . . . . . . . . . . . . . . . . . . . . . . . . . — 3
Oil call options . . . . . . . . . . . . . . . . . . . . . . . . . . . . . . . . . . . . . . . . . . . . . . . . . . . . . . . . . . . . . . (144) (35)
Estimated fair value . . . . . . . . . . . . . . . . . . . . . . . . . . . . . . . . . . . . . . . . . . . . . . . . . . . . . . . . $ 21 $ 1,305
(a) See Item 7A. Quantitative and Qualitative Disclosures About Market Risk of this report for additional
information concerning any associated premiums received, or discounts paid, in connection with certain
derivative transactions.
Additional information concerning the changes in fair value of our natural gas and oil derivative
instruments is as follows:
2009 2008 2007
($ in millions)
Fair value of contracts outstanding, as of January 1 . . . . . . . . . . . . . . . . . . . . . . . . $ 1,305 $ (369) $ 345
Change in fair value of contracts . . . . . . . . . . . . . . . . . . . . . . . . . . . . . . . . . . . . . . . . 1,266 1,880 972
Fair value of contracts when entered into . . . . . . . . . . . . . . . . . . . . . . . . . . . . . . . . . (21) (569) (295)
Contracts realized or otherwise settled . . . . . . . . . . . . . . . . . . . . . . . . . . . . . . . . . . . (2,102) 9 (1,203)
Fair value of contracts when closed . . . . . . . . . . . . . . . . . . . . . . . . . . . . . . . . . . . . . (427) 354 (188)
Fair value of contracts outstanding, as of December 31 . . . . . . . . . . . . . . . . . . . . . $ 21 $ 1,305 $ (369)
Interest Rate Derivatives
To mitigate our exposure to volatility in interest rates related to our senior notes and credit
facilities, we enter into interest rate derivatives.
For interest rate derivative instruments designated as fair value hedges, changes in fair value are
recorded on the consolidated balance sheets as assets (liabilities), and the debt’s carrying value
amount is adjusted by the change in the fair value of the debt subsequent to the initiation of the
derivative. Changes in the fair value of non-qualifying derivatives that occur prior to their maturity (i.e.,
temporary fluctuations in value) are reported currently in the consolidated statements of operations as
unrealized (gains) losses within interest expense.
54
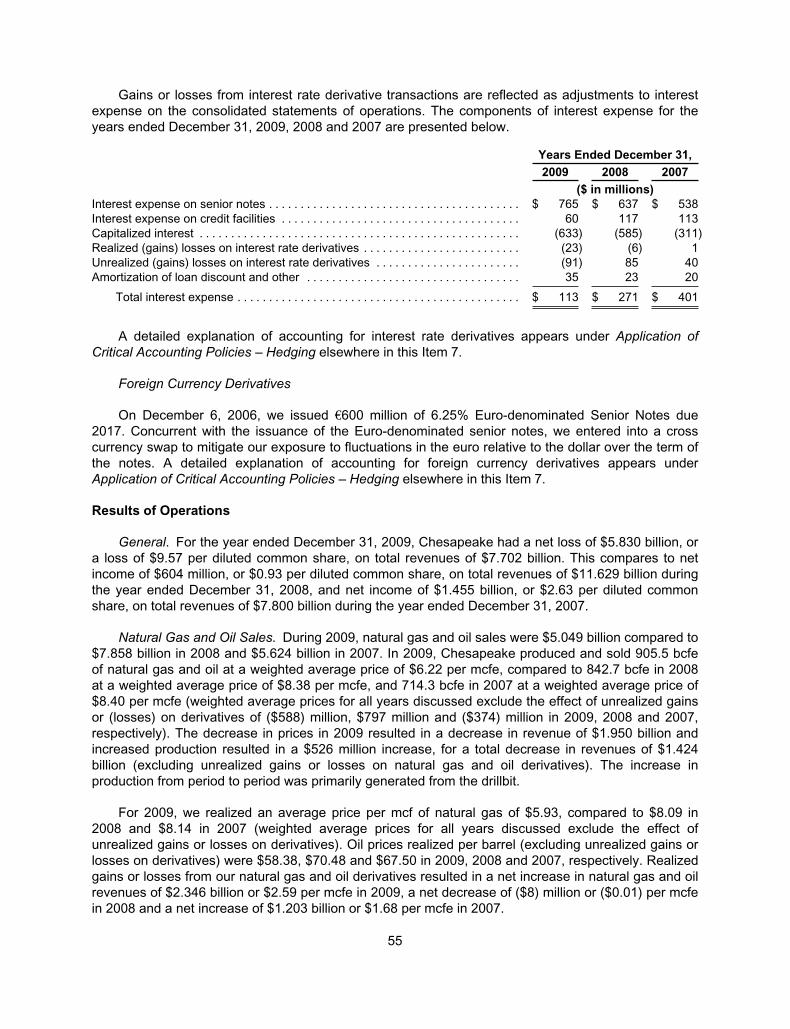
Gains or losses from interest rate derivative transactions are reflected as adjustments to interest
expense on the consolidated statements of operations. The components of interest expense for the
years ended December 31, 2009, 2008 and 2007 are presented below.
Years Ended December 31,
2009 2008 2007
($ in millions)
Interest expense on senior notes . . . . . . . . . . . . . . . . . . . . . . . . . . . . . . . . . . . . . . . . $ 765 $ 637 $ 538
Interest expense on credit facilities . . . . . . . . . . . . . . . . . . . . . . . . . . . . . . . . . . . . . . 60 117 113
Capitalized interest . . . . . . . . . . . . . . . . . . . . . . . . . . . . . . . . . . . . . . . . . . . . . . . . . . . (633) (585) (311)
Realized (gains) losses on interest rate derivatives . . . . . . . . . . . . . . . . . . . . . . . . . (23) (6) 1
Unrealized (gains) losses on interest rate derivatives . . . . . . . . . . . . . . . . . . . . . . . (91) 85 40
Amortization of loan discount and other . . . . . . . . . . . . . . . . . . . . . . . . . . . . . . . . . . 35 23 20
Total interest expense . . . . . . . . . . . . . . . . . . . . . . . . . . . . . . . . . . . . . . . . . . . . . $ 113 $ 271 $ 401
A detailed explanation of accounting for interest rate derivatives appears under Application of
Critical Accounting Policies – Hedging elsewhere in this Item 7.
Foreign Currency Derivatives
On December 6, 2006, we issued €600 million of 6.25% Euro-denominated Senior Notes due
2017. Concurrent with the issuance of the Euro-denominated senior notes, we entered into a cross
currency swap to mitigate our exposure to fluctuations in the euro relative to the dollar over the term of
the notes. A detailed explanation of accounting for foreign currency derivatives appears under
Application of Critical Accounting Policies – Hedging elsewhere in this Item 7.
Results of Operations
General. For the year ended December 31, 2009, Chesapeake had a net loss of $5.830 billion, or
a loss of $9.57 per diluted common share, on total revenues of $7.702 billion. This compares to net
income of $604 million, or $0.93 per diluted common share, on total revenues of $11.629 billion during
the year ended December 31, 2008, and net income of $1.455 billion, or $2.63 per diluted common
share, on total revenues of $7.800 billion during the year ended December 31, 2007.
Natural Gas and Oil Sales. During 2009, natural gas and oil sales were $5.049 billion compared to
$7.858 billion in 2008 and $5.624 billion in 2007. In 2009, Chesapeake produced and sold 905.5 bcfe
of natural gas and oil at a weighted average price of $6.22 per mcfe, compared to 842.7 bcfe in 2008
at a weighted average price of $8.38 per mcfe, and 714.3 bcfe in 2007 at a weighted average price of
$8.40 per mcfe (weighted average prices for all years discussed exclude the effect of unrealized gains
or (losses) on derivatives of ($588) million, $797 million and ($374) million in 2009, 2008 and 2007,
respectively). The decrease in prices in 2009 resulted in a decrease in revenue of $1.950 billion and
increased production resulted in a $526 million increase, for a total decrease in revenues of $1.424
billion (excluding unrealized gains or losses on natural gas and oil derivatives). The increase in
production from period to period was primarily generated from the drillbit.
For 2009, we realized an average price per mcf of natural gas of $5.93, compared to $8.09 in
2008 and $8.14 in 2007 (weighted average prices for all years discussed exclude the effect of
unrealized gains or losses on derivatives). Oil prices realized per barrel (excluding unrealized gains or
losses on derivatives) were $58.38, $70.48 and $67.50 in 2009, 2008 and 2007, respectively. Realized
gains or losses from our natural gas and oil derivatives resulted in a net increase in natural gas and oil
revenues of $2.346 billion or $2.59 per mcfe in 2009, a net decrease of ($8) million or ($0.01) per mcfe
in 2008 and a net increase of $1.203 billion or $1.68 per mcfe in 2007.
55
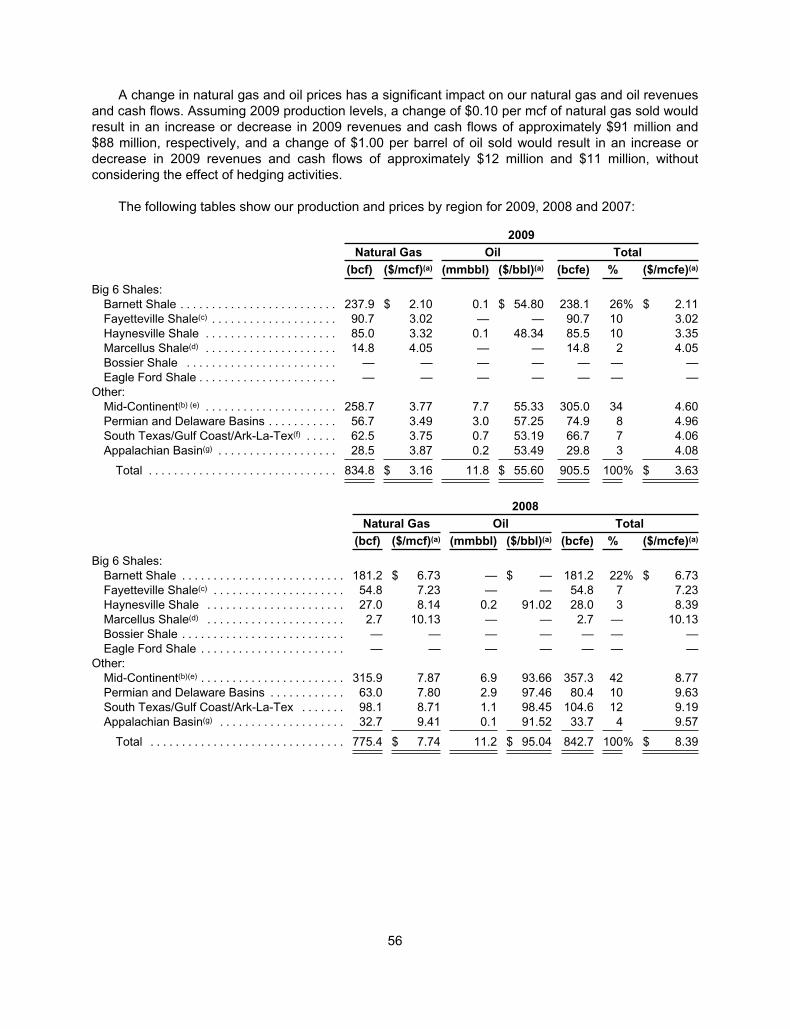
A change in natural gas and oil prices has a significant impact on our natural gas and oil revenues
and cash flows. Assuming 2009 production levels, a change of $0.10 per mcf of natural gas sold would
result in an increase or decrease in 2009 revenues and cash flows of approximately $91 million and
$88 million, respectively, and a change of $1.00 per barrel of oil sold would result in an increase or
decrease in 2009 revenues and cash flows of approximately $12 million and $11 million, without
considering the effect of hedging activities.
The following tables show our production and prices by region for 2009, 2008 and 2007:
2009
Natural Gas Oil Total
(bcf) ($/mcf)(a) (mmbbl) ($/bbl)(a) (bcfe) % ($/mcfe)(a)
Big 6 Shales:
Barnett Shale . . . . . . . . . . . . . . . . . . . . . . . . . 237.9 $ 2.10 0.1 $ 54.80 238.1 26% $ 2.11
Fayetteville Shale(c) . . . . . . . . . . . . . . . . . . . . 90.7 3.02 — — 90.7 10 3.02
Haynesville Shale . . . . . . . . . . . . . . . . . . . . . 85.0 3.32 0.1 48.34 85.5 10 3.35
Marcellus Shale(d) . . . . . . . . . . . . . . . . . . . . . 14.8 4.05 — — 14.8 2 4.05
Bossier Shale . . . . . . . . . . . . . . . . . . . . . . . . — — — — — — —
Eagle Ford Shale . . . . . . . . . . . . . . . . . . . . . . — — — — — — —
Other:
Mid-Continent(b) (e) . . . . . . . . . . . . . . . . . . . . . 258.7 3.77 7.7 55.33 305.0 34 4.60
Permian and Delaware Basins . . . . . . . . . . . 56.7 3.49 3.0 57.25 74.9 8 4.96
South Texas/Gulf Coast/Ark-La-Tex(f) . . . . . 62.5 3.75 0.7 53.19 66.7 7 4.06
Appalachian Basin(g) . . . . . . . . . . . . . . . . . . . 28.5 3.87 0.2 53.49 29.8 3 4.08
Total . . . . . . . . . . . . . . . . . . . . . . . . . . . . . . 834.8 $ 3.16 11.8 $ 55.60 905.5 100% $ 3.63
2008
Natural Gas Oil Total
(bcf) ($/mcf)(a) (mmbbl) ($/bbl)(a) (bcfe) % ($/mcfe)(a)
Big 6 Shales:
Barnett Shale . . . . . . . . . . . . . . . . . . . . . . . . . . 181.2 $ 6.73 — $ — 181.2 22% $ 6.73
Fayetteville Shale(c) . . . . . . . . . . . . . . . . . . . . . 54.8 7.23 — — 54.8 7 7.23
Haynesville Shale . . . . . . . . . . . . . . . . . . . . . . 27.0 8.14 0.2 91.02 28.0 3 8.39
Marcellus Shale(d) . . . . . . . . . . . . . . . . . . . . . . 2.7 10.13 — — 2.7 — 10.13
Bossier Shale . . . . . . . . . . . . . . . . . . . . . . . . . . — — — — — — —
Eagle Ford Shale . . . . . . . . . . . . . . . . . . . . . . . — — — — — — —
Other:
Mid-Continent(b)(e) . . . . . . . . . . . . . . . . . . . . . . . 315.9 7.87 6.9 93.66 357.3 42 8.77
Permian and Delaware Basins . . . . . . . . . . . . 63.0 7.80 2.9 97.46 80.4 10 9.63
South Texas/Gulf Coast/Ark-La-Tex . . . . . . . 98.1 8.71 1.1 98.45 104.6 12 9.19
Appalachian Basin(g) . . . . . . . . . . . . . . . . . . . . 32.7 9.41 0.1 91.52 33.7 4 9.57
Total . . . . . . . . . . . . . . . . . . . . . . . . . . . . . . . 775.4 $ 7.74 11.2 $ 95.04 842.7 100% $ 8.39
56
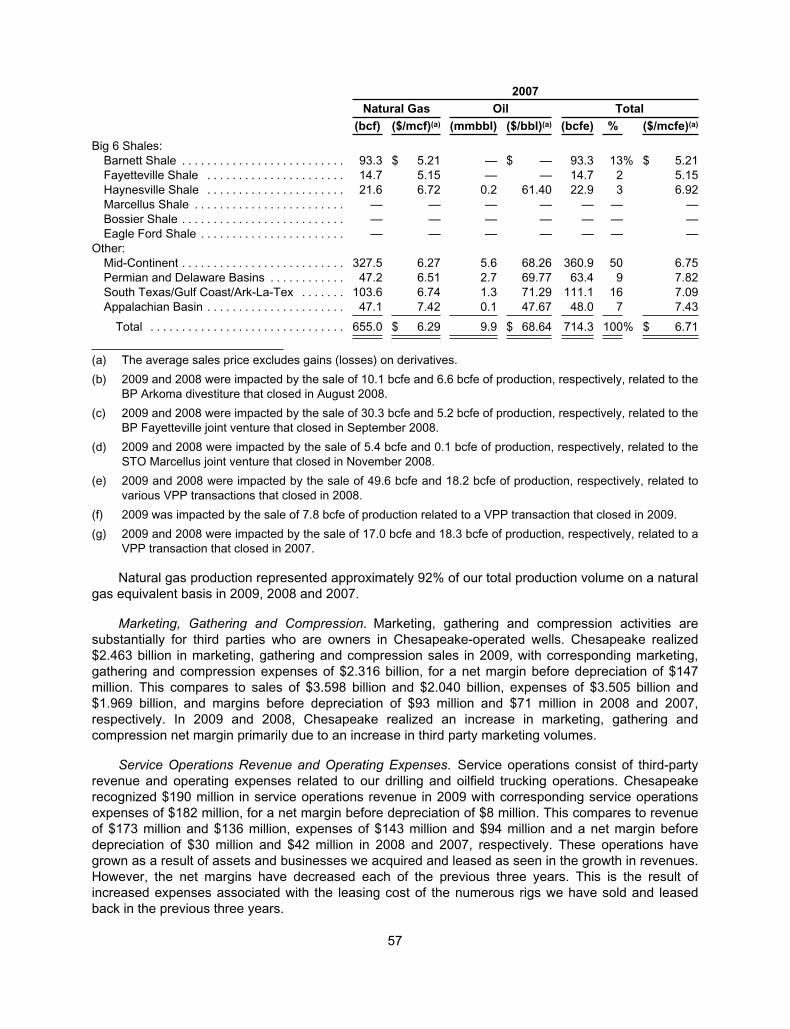
2007
Natural Gas Oil Total
(bcf) ($/mcf)(a) (mmbbl) ($/bbl)(a) (bcfe) % ($/mcfe)(a)
Big 6 Shales:
Barnett Shale . . . . . . . . . . . . . . . . . . . . . . . . . . 93.3 $ 5.21 — $ — 93.3 13% $ 5.21
Fayetteville Shale . . . . . . . . . . . . . . . . . . . . . . 14.7 5.15 — — 14.7 2 5.15
Haynesville Shale . . . . . . . . . . . . . . . . . . . . . . 21.6 6.72 0.2 61.40 22.9 3 6.92
Marcellus Shale . . . . . . . . . . . . . . . . . . . . . . . . — — — — — — —
Bossier Shale . . . . . . . . . . . . . . . . . . . . . . . . . . — — — — — — —
Eagle Ford Shale . . . . . . . . . . . . . . . . . . . . . . . — — — — — — —
Other:
Mid-Continent . . . . . . . . . . . . . . . . . . . . . . . . . . 327.5 6.27 5.6 68.26 360.9 50 6.75
Permian and Delaware Basins . . . . . . . . . . . . 47.2 6.51 2.7 69.77 63.4 9 7.82
South Texas/Gulf Coast/Ark-La-Tex . . . . . . . 103.6 6.74 1.3 71.29 111.1 16 7.09
Appalachian Basin . . . . . . . . . . . . . . . . . . . . . . 47.1 7.42 0.1 47.67 48.0 7 7.43
Total . . . . . . . . . . . . . . . . . . . . . . . . . . . . . . . 655.0 $ 6.29 9.9 $ 68.64 714.3 100% $ 6.71
(a) The average sales price excludes gains (losses) on derivatives.
(b) 2009 and 2008 were impacted by the sale of 10.1 bcfe and 6.6 bcfe of production, respectively, related to the
BP Arkoma divestiture that closed in August 2008.
(c) 2009 and 2008 were impacted by the sale of 30.3 bcfe and 5.2 bcfe of production, respectively, related to the
BP Fayetteville joint venture that closed in September 2008.
(d) 2009 and 2008 were impacted by the sale of 5.4 bcfe and 0.1 bcfe of production, respectively, related to the
STO Marcellus joint venture that closed in November 2008.
(e) 2009 and 2008 were impacted by the sale of 49.6 bcfe and 18.2 bcfe of production, respectively, related to
various VPP transactions that closed in 2008.
(f) 2009 was impacted by the sale of 7.8 bcfe of production related to a VPP transaction that closed in 2009.
(g) 2009 and 2008 were impacted by the sale of 17.0 bcfe and 18.3 bcfe of production, respectively, related to a
VPP transaction that closed in 2007.
Natural gas production represented approximately 92% of our total production volume on a natural
gas equivalent basis in 2009, 2008 and 2007.
Marketing, Gathering and Compression. Marketing, gathering and compression activities are
substantially for third parties who are owners in Chesapeake-operated wells. Chesapeake realized
$2.463 billion in marketing, gathering and compression sales in 2009, with corresponding marketing,
gathering and compression expenses of $2.316 billion, for a net margin before depreciation of $147
million. This compares to sales of $3.598 billion and $2.040 billion, expenses of $3.505 billion and
$1.969 billion, and margins before depreciation of $93 million and $71 million in 2008 and 2007,
respectively. In 2009 and 2008, Chesapeake realized an increase in marketing, gathering and
compression net margin primarily due to an increase in third party marketing volumes.
Service Operations Revenue and Operating Expenses. Service operations consist of third-party
revenue and operating expenses related to our drilling and oilfield trucking operations. Chesapeake
recognized $190 million in service operations revenue in 2009 with corresponding service operations
expenses of $182 million, for a net margin before depreciation of $8 million. This compares to revenue
of $173 million and $136 million, expenses of $143 million and $94 million and a net margin before
depreciation of $30 million and $42 million in 2008 and 2007, respectively. These operations have
grown as a result of assets and businesses we acquired and leased as seen in the growth in revenues.
However, the net margins have decreased each of the previous three years. This is the result of
increased expenses associated with the leasing cost of the numerous rigs we have sold and leased
back in the previous three years.
57
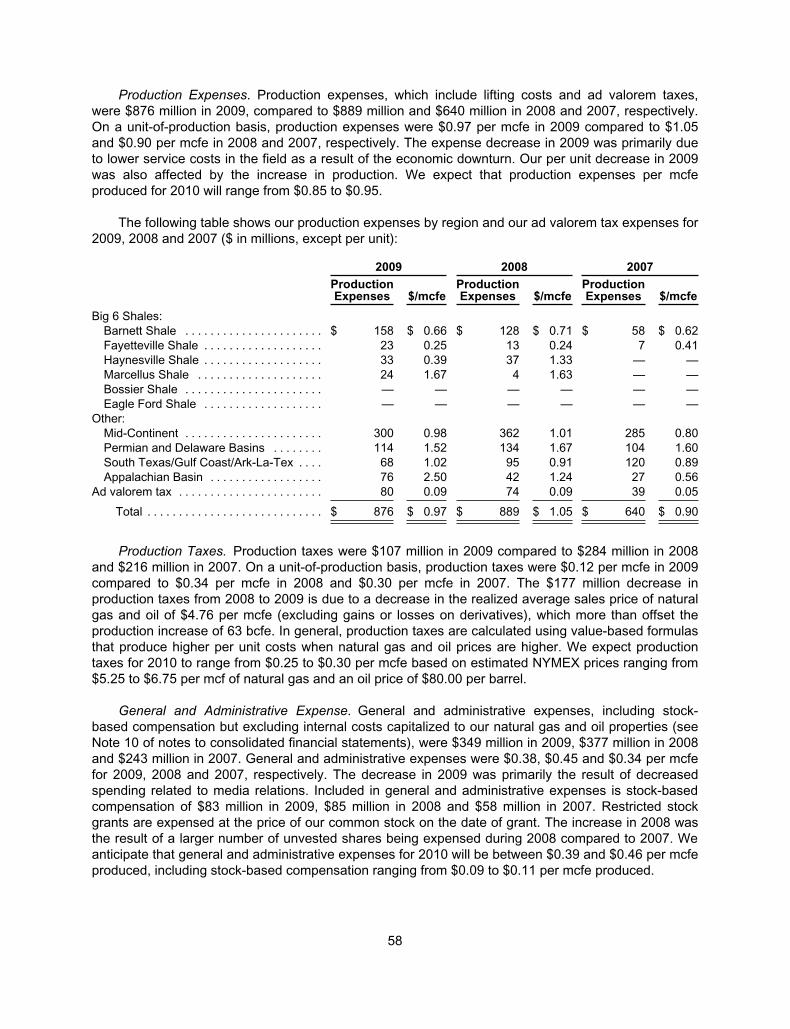
Production Expenses. Production expenses, which include lifting costs and ad valorem taxes,
were $876 million in 2009, compared to $889 million and $640 million in 2008 and 2007, respectively.
On a unit-of-production basis, production expenses were $0.97 per mcfe in 2009 compared to $1.05
and $0.90 per mcfe in 2008 and 2007, respectively. The expense decrease in 2009 was primarily due
to lower service costs in the field as a result of the economic downturn. Our per unit decrease in 2009
was also affected by the increase in production. We expect that production expenses per mcfe
produced for 2010 will range from $0.85 to $0.95.
The following table shows our production expenses by region and our ad valorem tax expenses for
2009, 2008 and 2007 ($ in millions, except per unit):
2009 2008 2007
ProductionExpenses $/mcfe
ProductionExpenses $/mcfe
ProductionExpenses $/mcfe
Big 6 Shales:
Barnett Shale . . . . . . . . . . . . . . . . . . . . . . $ 158 $ 0.66 $ 128 $ 0.71 $ 58 $ 0.62
Fayetteville Shale . . . . . . . . . . . . . . . . . . . 23 0.25 13 0.24 7 0.41
Haynesville Shale . . . . . . . . . . . . . . . . . . . 33 0.39 37 1.33 — —
Marcellus Shale . . . . . . . . . . . . . . . . . . . . 24 1.67 4 1.63 — —
Bossier Shale . . . . . . . . . . . . . . . . . . . . . . — — — — — —
Eagle Ford Shale . . . . . . . . . . . . . . . . . . . — — — — — —
Other:
Mid-Continent . . . . . . . . . . . . . . . . . . . . . . 300 0.98 362 1.01 285 0.80
Permian and Delaware Basins . . . . . . . . 114 1.52 134 1.67 104 1.60
South Texas/Gulf Coast/Ark-La-Tex . . . . 68 1.02 95 0.91 120 0.89
Appalachian Basin . . . . . . . . . . . . . . . . . . 76 2.50 42 1.24 27 0.56
Ad valorem tax . . . . . . . . . . . . . . . . . . . . . . . 80 0.09 74 0.09 39 0.05
Total . . . . . . . . . . . . . . . . . . . . . . . . . . . . $ 876 $ 0.97 $ 889 $ 1.05 $ 640 $ 0.90
Production Taxes. Production taxes were $107 million in 2009 compared to $284 million in 2008
and $216 million in 2007. On a unit-of-production basis, production taxes were $0.12 per mcfe in 2009
compared to $0.34 per mcfe in 2008 and $0.30 per mcfe in 2007. The $177 million decrease in
production taxes from 2008 to 2009 is due to a decrease in the realized average sales price of natural
gas and oil of $4.76 per mcfe (excluding gains or losses on derivatives), which more than offset the
production increase of 63 bcfe. In general, production taxes are calculated using value-based formulas
that produce higher per unit costs when natural gas and oil prices are higher. We expect production
taxes for 2010 to range from $0.25 to $0.30 per mcfe based on estimated NYMEX prices ranging from
$5.25 to $6.75 per mcf of natural gas and an oil price of $80.00 per barrel.
General and Administrative Expense. General and administrative expenses, including stock-
based compensation but excluding internal costs capitalized to our natural gas and oil properties (see
Note 10 of notes to consolidated financial statements), were $349 million in 2009, $377 million in 2008
and $243 million in 2007. General and administrative expenses were $0.38, $0.45 and $0.34 per mcfe
for 2009, 2008 and 2007, respectively. The decrease in 2009 was primarily the result of decreased
spending related to media relations. Included in general and administrative expenses is stock-based
compensation of $83 million in 2009, $85 million in 2008 and $58 million in 2007. Restricted stock
grants are expensed at the price of our common stock on the date of grant. The increase in 2008 was
the result of a larger number of unvested shares being expensed during 2008 compared to 2007. We
anticipate that general and administrative expenses for 2010 will be between $0.39 and $0.46 per mcfe
produced, including stock-based compensation ranging from $0.09 to $0.11 per mcfe produced.
58
Our stock-based compensation for employees and non-employee directors is in the form of
restricted stock. Employee restricted stock awards generally vest over a period of four or five years.
Our non-employee director awards vest over a period of three years. The discussion of stock-based
compensation in Note 1 and Note 8 of notes to the consolidated financial statements included in Item 8
of this report provides additional detail on the accounting for and reporting of our stock-based
compensation.
Chesapeake follows the full-cost method of accounting under which all costs associated with
natural gas and oil property acquisition, exploration and development activities are capitalized. We
capitalize internal costs that can be directly identified with our acquisition, exploration and development
activities and do not include any costs related to production, general corporate overhead or similar
activities. We capitalized $354 million, $352 million and $262 million of internal costs in 2009, 2008 and
2007, respectively, directly related to our natural gas and oil property acquisition, exploration and
development efforts.
Natural Gas and Oil Depreciation, Depletion and Amortization. Depreciation, depletion and
amortization of natural gas and oil properties was $1.371 billion, $1.970 billion and $1.835 billion during
2009, 2008 and 2007, respectively. The average DD&A rate per mcfe, which is a function of capitalized
costs, future development costs, and the related underlying reserves in the periods presented, was
$1.51, $2.34 and $2.57 in 2009, 2008 and 2007, respectively. The decrease in the average rate from
$2.57 in 2007 to $1.51 in 2009 is due primarily to reductions of our natural gas and oil full-cost pool
resulting from our divestitures in 2008 and 2009 and impairments of our full-cost pool in 2008 and 2009
as well as the addition of reserves through our drilling activities. We expect the 2010 DD&A rate to be
between $1.35 and $1.55 per mcfe produced.
Depreciation and Amortization of Other Assets. Depreciation and amortization of other assets was
$244 million in 2009, compared to $174 million in 2008 and $153 million in 2007. The average DD&A
rate per mcfe was $0.27, $0.21 and $0.21 in 2009, 2008 and 2007, respectively. The increase from
2008 to 2009 was mainly due to the significant increase in our investment in gathering systems,
compressors, buildings and drilling rigs. Property and equipment costs are depreciated on a straight-
line basis. Buildings are depreciated over 10 to 39 years, gathering facilities are depreciated over 20
years, drilling rigs are depreciated over 15 years and all other property and equipment are depreciated
over the estimated useful lives of the assets, which range from two to twenty years. To the extent
company-owned drilling rigs are used to drill our wells, a substantial portion of the depreciation is
capitalized in natural gas and oil properties as exploration or development costs. We expect 2010
depreciation and amortization of other assets to be between $0.20 and $0.25 per mcfe produced.
Impairment of Natural Gas and Oil Properties and Other Assets. Due to lower commodity prices in
the second half of 2008 and throughout 2009, we reported a non-cash impairment charge on our
natural gas and oil properties of $11.0 billion in 2009 and $2.8 billion in 2008. We account for our
natural gas and oil properties using the full-cost method of accounting, which limits the amount of costs
we can capitalize and requires us to write off these costs if the carrying value of natural gas and oil
assets in the evaluated portion of our full-cost pool exceeds the sum of the present value of expected
future net cash flows of proved reserves using a 10% pre-tax discount rate based on pricing and cost
assumptions and the present value of certain natural gas and oil hedges. Additionally, in 2009, we
recorded an impairment of $90 million associated with certain of our midstream assets and $27 million
associated with certain of our service operations assets.
Other Income (Expense). Other income (expense) was ($28) million, ($11) million and $15 million
in 2009, 2008 and 2007, respectively. The 2009 loss consisted of $8 million of interest income, a $39
million loss related to our equity in the net losses of certain investments, a $1 million gain on sale of
assets and $2 million of miscellaneous income. The 2008 loss consisted of $22 million of interest
59
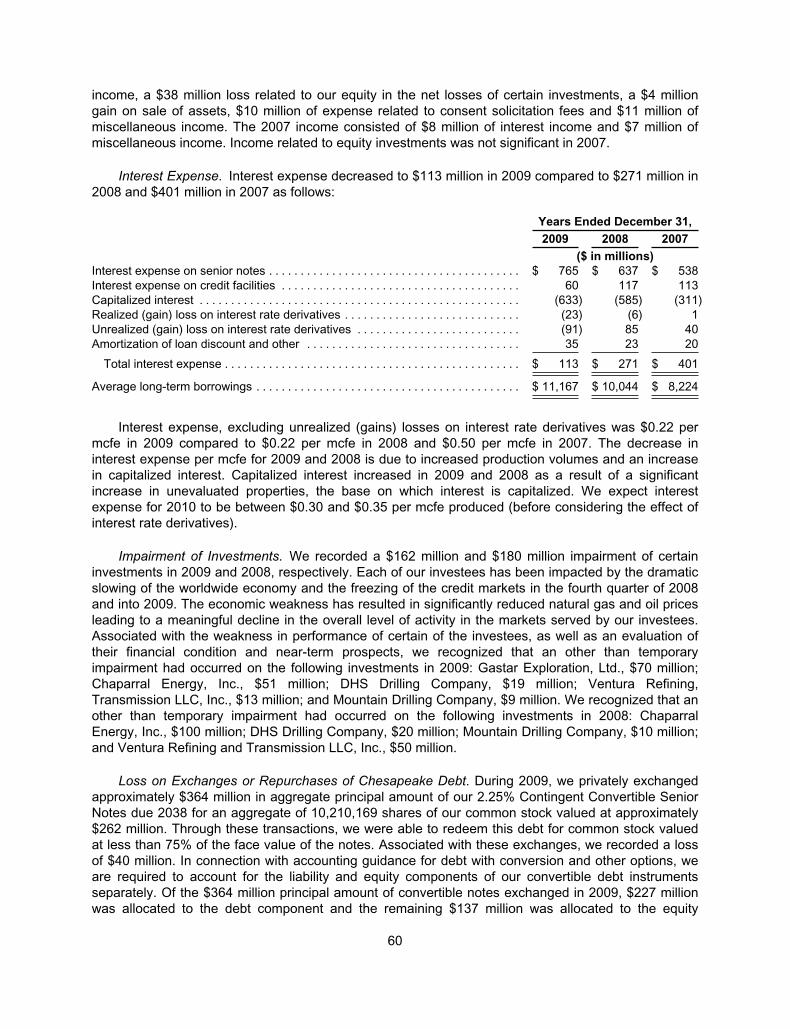
income, a $38 million loss related to our equity in the net losses of certain investments, a $4 million
gain on sale of assets, $10 million of expense related to consent solicitation fees and $11 million of
miscellaneous income. The 2007 income consisted of $8 million of interest income and $7 million of
miscellaneous income. Income related to equity investments was not significant in 2007.
Interest Expense. Interest expense decreased to $113 million in 2009 compared to $271 million in
2008 and $401 million in 2007 as follows:
Years Ended December 31,
2009 2008 2007
($ in millions)
Interest expense on senior notes . . . . . . . . . . . . . . . . . . . . . . . . . . . . . . . . . . . . . . . . $ 765 $ 637 $ 538
Interest expense on credit facilities . . . . . . . . . . . . . . . . . . . . . . . . . . . . . . . . . . . . . . 60 117 113
Capitalized interest . . . . . . . . . . . . . . . . . . . . . . . . . . . . . . . . . . . . . . . . . . . . . . . . . . . (633) (585) (311)
Realized (gain) loss on interest rate derivatives . . . . . . . . . . . . . . . . . . . . . . . . . . . . (23) (6) 1
Unrealized (gain) loss on interest rate derivatives . . . . . . . . . . . . . . . . . . . . . . . . . . (91) 85 40
Amortization of loan discount and other . . . . . . . . . . . . . . . . . . . . . . . . . . . . . . . . . . 35 23 20
Total interest expense . . . . . . . . . . . . . . . . . . . . . . . . . . . . . . . . . . . . . . . . . . . . . . . $ 113 $ 271 $ 401
Average long-term borrowings . . . . . . . . . . . . . . . . . . . . . . . . . . . . . . . . . . . . . . . . . . $ 11,167 $ 10,044 $ 8,224
Interest expense, excluding unrealized (gains) losses on interest rate derivatives was $0.22 per
mcfe in 2009 compared to $0.22 per mcfe in 2008 and $0.50 per mcfe in 2007. The decrease in
interest expense per mcfe for 2009 and 2008 is due to increased production volumes and an increase
in capitalized interest. Capitalized interest increased in 2009 and 2008 as a result of a significant
increase in unevaluated properties, the base on which interest is capitalized. We expect interest
expense for 2010 to be between $0.30 and $0.35 per mcfe produced (before considering the effect of
interest rate derivatives).
Impairment of Investments. We recorded a $162 million and $180 million impairment of certain
investments in 2009 and 2008, respectively. Each of our investees has been impacted by the dramatic
slowing of the worldwide economy and the freezing of the credit markets in the fourth quarter of 2008
and into 2009. The economic weakness has resulted in significantly reduced natural gas and oil prices
leading to a meaningful decline in the overall level of activity in the markets served by our investees.
Associated with the weakness in performance of certain of the investees, as well as an evaluation of
their financial condition and near-term prospects, we recognized that an other than temporary
impairment had occurred on the following investments in 2009: Gastar Exploration, Ltd., $70 million;
Chaparral Energy, Inc., $51 million; DHS Drilling Company, $19 million; Ventura Refining,
Transmission LLC, Inc., $13 million; and Mountain Drilling Company, $9 million. We recognized that an
other than temporary impairment had occurred on the following investments in 2008: Chaparral
Energy, Inc., $100 million; DHS Drilling Company, $20 million; Mountain Drilling Company, $10 million;
and Ventura Refining and Transmission LLC, Inc., $50 million.
Loss on Exchanges or Repurchases of Chesapeake Debt. During 2009, we privately exchanged
approximately $364 million in aggregate principal amount of our 2.25% Contingent Convertible Senior
Notes due 2038 for an aggregate of 10,210,169 shares of our common stock valued at approximately
$262 million. Through these transactions, we were able to redeem this debt for common stock valued
at less than 75% of the face value of the notes. Associated with these exchanges, we recorded a loss
of $40 million. In connection with accounting guidance for debt with conversion and other options, we
are required to account for the liability and equity components of our convertible debt instruments
separately. Of the $364 million principal amount of convertible notes exchanged in 2009, $227 million
was allocated to the debt component and the remaining $137 million was allocated to the equity
60
conversion feature and was recorded as an adjustment to paid-in-capital. The difference between the
debt component and the value of the common stock exchanged in these transactions resulted in a $35
million loss. In addition, we expensed $5 million in deferred charges associated with these exchanges.
During 2008, we exchanged approximately $254 million, $272 million and $239 million in
aggregate principal amount of our 2.25% Contingent Convertible Senior Notes due 2038, 2.50%
Contingent Convertible Senior Notes due 2037, and 2.75% Contingent Convertible Senior Notes due
2035, respectively, for an aggregate of 23,913,212 shares of our common stock valued at
approximately $480 million. Through these transactions, we were able to redeem this debt for common
stock valued at less than 65% of the face value of the notes. Associated with these exchanges, we
recorded a gain of $27 million. Of the combined $765 million principal amount of convertible notes
exchanged in 2008, $515 million was allocated to the debt component and the remaining $250 million
was allocated to the equity conversion feature and was recorded as an adjustment to paid-in-capital.
The difference between the debt component and the value of the common stock exchanged in these
transactions resulted in a $35 million gain. This gain was partially offset by the write-off of $8 million in
deferred charges associated with these exchanges.
Also during 2008, we repurchased $300 million of our 7.75% Senior Notes due 2015 in order to
re-finance a portion of our long-term debt at a lower rate of interest. In connection with the transaction,
we recorded a $31 million loss, which consisted of a $12 million premium and $19 million of discounts,
interest rate derivatives and deferred charges associated with the notes.
Gain on Sale of Investments. In 2007, we sold our 33% limited partnership interest in Eagle
Energy Partners I, L.P., which we first acquired in 2003, for proceeds of $124 million and a gain of $83
million.
Income Tax Expense (Benefit). Chesapeake recorded an income tax benefit of $3.483 billion in
2009 compared to income tax expense of $387 million in 2008 and $892 million in 2007. Of the income
tax benefit recorded in 2009, $4 million is reflected as current income tax expense and $3.487 billion is
reflected as a deferred income tax benefit. Of the $3.870 billion decrease in 2009, $4.009 billion was
the result of the decrease in net income before taxes which was offset by $139 million as the result of a
decrease in the effective tax rate. Our effective income tax rate was 37.5% in 2009 compared to 39%
in 2008 and 38% in 2007. Our effective tax rate fluctuates as a result of the impact of state income
taxes and permanent differences. We expect our effective income tax rate to be 38.5% in 2010.
Loss on Conversion/Exchange of Preferred Stock. Loss on conversion/exchange of preferred
stock was $0, $67 million and $128 million in 2009, 2008 and 2007, respectively. The loss on the
exchanges represented the excess of the fair value of the common stock issued over the fair value of
the securities issuable pursuant to the original conversion terms. See Note 8 of notes to the
consolidated financial statements in Item 8 for further detail regarding these transactions.
Application of Critical Accounting Policies
Readers of this report and users of the information contained in it should be aware of how certain
events may impact our financial results based on the accounting policies in place. The three policies
we consider to be the most significant are discussed below. The company’s management has
discussed each critical accounting policy with the Audit Committee of the company’s Board of
Directors.
The selection and application of accounting policies are an important process that changes as our
business changes and as accounting rules are developed. Accounting rules generally do not involve a
selection among alternatives, but involve an implementation and interpretation of existing rules and the
use of judgment to the specific set of circumstances existing in our business.
61
Hedging. Chesapeake uses commodity price and financial risk management instruments to
mitigate our exposure to price fluctuations in natural gas and oil, changes in interest rates and changes
in foreign exchange rates. Recognized gains and losses on derivative contracts are reported as a
component of the related transaction. Results of natural gas and oil derivative transactions are
reflected in natural gas and oil sales, and results of interest rate and foreign exchange rate hedging
transactions are reflected in interest expense. The changes in the fair value of derivative instruments
not qualifying for designation as either cash flow or fair value hedges that occur prior to maturity are
reported currently in the consolidated statement of operations as unrealized gains (losses) within
natural gas and oil sales or interest expense. Cash flows from derivative instruments are classified in
the same category within the statement of cash flows as the items being hedged, or on a basis
consistent with the nature of the instruments.
Accounting guidance for derivatives and hedging establishes accounting and reporting standards
requiring that derivative instruments (including certain derivative instruments embedded in other
contracts) be recorded at fair value and included in the consolidated balance sheet as assets or
liabilities. The accounting for changes in the fair value of a derivative instrument depends on the
intended use of the derivative and the resulting designation, which is established at the inception of a
derivative. For derivative instruments designated as cash flow hedges, changes in fair value, to the
extent the hedge is effective, are recognized in other comprehensive income until the hedged item is
recognized in earnings. Any change in the fair value resulting from ineffectiveness is recognized
immediately in natural gas and oil sales. For derivative instruments designated as fair value hedges,
changes in fair value, as well as the offsetting changes in the estimated fair value of the hedged item
attributable to the hedged risk, are recognized currently in earnings. Differences between the changes
in the fair values of the hedged item and the derivative instrument, if any, represent gains or losses on
ineffectiveness and are reflected currently in interest expense. Hedge effectiveness is measured at
least quarterly based on the relative changes in fair value between the derivative contract and the
hedged item over time. Changes in fair value of contracts that do not qualify as hedges or are not
designated as hedges are also recognized currently in earnings. See Hedging Activities above and
Item 7A. Quantitative and Qualitative Disclosures About Market Risk for additional information
regarding our hedging activities.
One of the primary factors that can have an impact on our results of operations is the method
used to value our derivatives. We have established the fair value of our derivative instruments utilizing
established index prices, volatility curves and discount factors. These estimates are compared to our
counterparty values for reasonableness. Derivative transactions are also subject to the risk that
counterparties will be unable to meet their obligations. Such non-performance risk is considered in the
valuation of our derivative instruments, but to date has not had a material impact on the values of our
derivatives. The values we report in our financial statements are as of a point in time and subsequently
change as these estimates are revised to reflect actual results, changes in market conditions and other
factors.
Another factor that can impact our results of operations each period is our ability to estimate the
level of correlation between future changes in the fair value of the hedge instruments and the
transactions being hedged, both at inception and on an ongoing basis. This correlation is complicated
since energy commodity prices, the primary risk we hedge, have quality and location differences that
can be difficult to hedge effectively. The factors underlying our estimates of fair value and our
assessment of correlation of our hedging derivatives are impacted by actual results and changes in
conditions that affect these factors, many of which are beyond our control.
Due to the volatility of natural gas and oil prices and, to a lesser extent, interest rates and foreign
exchange rates, the company’s financial condition and results of operations can be significantly
impacted by changes in the market value of our derivative instruments. As of December 31, 2009,
62
2008 and 2007, the fair value of our derivatives was a liability of $63 million, an asset of $1.166 billion
and a liability of $375 million, respectively. The derivatives that we acquired in our CNR acquisition
represented $17 million and $184 million of liability at December 31, 2008 and 2007.
Natural Gas and Oil Properties. The accounting for our business is subject to special accounting
rules that are unique to the natural gas and oil industry. There are two allowable methods of
accounting for natural gas and oil business activities: the successful efforts method and the full-cost
method. Chesapeake follows the full-cost method of accounting under which all costs associated with
property acquisition, exploration and development activities are capitalized. We also capitalize internal
costs that can be directly identified with our acquisition, exploration and development activities and do
not include any costs related to production, general corporate overhead or similar activities.
Under the successful efforts method, geological and geophysical costs and costs of carrying and
retaining undeveloped properties are charged to expense as incurred. Costs of drilling exploratory
wells that do not result in proved reserves are charged to expense. Depreciation, depletion,
amortization and impairment of natural gas and oil properties are generally calculated on a well by well
or lease or field basis versus the aggregated “full-cost” pool basis. Additionally, gain or loss is generally
recognized on all sales of natural gas and oil properties under the successful efforts method. As a
result, our financial statements will differ from companies that apply the successful efforts method
since we will generally reflect a higher level of capitalized costs as well as a higher natural gas and oil
depreciation, depletion and amortization rate, and we will not have exploration expenses that
successful efforts companies frequently have.
Under the full-cost method, capitalized costs are amortized on a composite unit-of-production
method based on proved natural gas and oil reserves. If we maintain the same level of production year
over year, the depreciation, depletion and amortization expense may be significantly different if our
estimate of remaining reserves or future development costs changes significantly. Proceeds from the
sale of properties are accounted for as reductions of capitalized costs unless such sales involve a
significant change in the relationship between costs and proved reserves, in which case a gain or loss
is recognized. The costs of unproved properties are excluded from amortization until the properties are
evaluated. We review all of our unevaluated properties quarterly to determine whether or not and to
what extent proved reserves have been assigned to the properties, and otherwise if impairment has
occurred. Unevaluated properties are grouped by major producing area where individual property costs
are not significant and are assessed individually when individual costs are significant.
We review the carrying value of our natural gas and oil properties under the full-cost accounting
rules of the Securities and Exchange Commission on a quarterly basis. This quarterly review is referred
to as a ceiling test. Under the ceiling test, capitalized costs, less accumulated amortization and related
deferred income taxes, may not exceed an amount equal to the sum of the present value of estimated
future net revenues (adjusted for cash flow hedges) less estimated future expenditures to be incurred in
developing and producing the proved reserves, less any related income tax effects. For 2009, capitalized
costs of natural gas and oil properties exceeded the estimated present value of future net revenues from
our proved reserves, net of related income tax considerations, resulting in a write-down in the carrying
value of natural gas and oil properties of $6.9 billion, net of tax. In calculating future net revenues,
effective December 31, 2009, current prices are calculated as the average natural gas and oil prices
during the preceding 12-month period prior to the end of the current reporting period, determined as the
unweighted arithmetical average of prices on the first day of each month within the 12-month period and
costs used are those as of the end of the appropriate quarterly period. Such prices are utilized except
where different prices are fixed and determinable from applicable contracts for the remaining term of
those contracts, including the effects of derivatives qualifying as cash flow hedges. Based on the average
prices for natural gas and oil during the 12-months of 2009, these cash flow hedges increased the full-
cost ceiling by $1.1 billion, thereby reducing the ceiling test write-down by the same amount.
63
Two primary factors impacting this test are reserve levels and natural gas and oil prices, and their
associated impact on the present value of estimated future net revenues. Revisions to estimates of
natural gas and oil reserves and/or an increase or decrease in prices can have a material impact on
the present value of estimated future net revenues. Any excess of the net book value, less deferred
income taxes, is generally written off as an expense.
In December 2008, the SEC issued its final rule for Modernization of Oil and Gas Reporting.
Pursuant to this rule the SEC adopted revisions to its oil and gas reporting disclosures effective for
annual reports on Form 10-K for fiscal years ending on or after December 31, 2009. The revisions are
intended to provide investors with a more meaningful and comprehensive understanding of oil and gas
reserves, which should help investors evaluate the relative value of oil and gas companies. In the three
decades that have passed since the original adoption of oil and gas disclosure items, there have been
significant changes in the oil and gas industry. These revisions are designed to modernize and update
the oil and gas disclosure requirements to align them with current practices and changes in technology.
The new rules include provisions that permit the use of new technologies to determine proved
reserves. The requirements also require companies to report the independence and qualifications of
the technical person(s) primarily responsible for the preparation or audit of reserve estimations and to
file reports when a third party is relied upon to prepare or audit reserve estimates. In addition, the new
rules require that oil and gas reserves be reported and the full-cost ceiling value calculated using
average first-of-the-month natural gas and oil prices during the 12-month period ending in the reporting
period, compared to prices at period end under prior SEC rules. It is not practicable for Chesapeake to
estimate the effect of adopting the new reserve rules; however, these revisions and requirements affect
the comparability between reporting periods for reserve volume and value estimates, full-cost pool
write-down calculations and the calculation of depreciation, depletion and amortization of oil and gas
assets.
The process of estimating natural gas and oil reserves is complex, requiring significant decisions
in the evaluation of available geological, geophysical, engineering and economic data. The data for a
given property may also change substantially over time as a result of numerous factors, including
additional development activity, evolving production history and a continual reassessment of the
viability of production under changing economic conditions. As a result, material revisions to existing
reserve estimates occur from time to time. Although every reasonable effort is made to ensure that
reserve estimates reported represent the most accurate assessments possible, the subjective
decisions and variances in available data for various properties increase the likelihood of significant
changes in these estimates.
As of December 31, 2008, Chesapeake had proved reserves of 12.051 tcfe at NYMEX spot prices
of $5.71 per mcf and $44.61 per barrel before price differential adjustments. As of December 31, 2009,
we had proved reserves of 14.254 tcfe at 2009 12-month average prices of $3.87 per mcf and $61.14
per barrel before price differential adjustments. The increase in proved reserves is, in part, due to the
new reserve rules in effect for this filing.
Our December 31, 2008 proved undeveloped (PUD) reserve volume was 3.960 tcfe and our
December 31, 2009 PUD reserve volume was 5.923 tcfe. This increase is partially attributable to the
modernized rules, which allow for the reporting of PUD reserves more than one direct spacing area
offsetting producing wells if reasonable certainty can be shown using reliable technology. Chesapeake
has utilized and developed reliable geologic and engineering technology to book PUD reserves more
than one location offsetting production in the Barnett Shale and Fayetteville Shale.
Within the Barnett and Fayetteville Shale plays, we used both public and proprietary geologic data
to establish continuity of the formation and its producing properties. This included seismic data and
interpretations (2-D, 3-D and micro seismic); open hole log information (both vertical and horizontally
collected) and petrophysical analysis of the log data; mud logs; gas sample analysis; drill cutting
samples; measurements of total organic content; thermal maturity; sidewall cores; whole cores and
64
data measured from internal core analysis facility. Once the continuous geologic area was established,
statistical analysis of established producing wells was used to generate reasonable certainty (defined
as 90% probability aggregated to the field level). The analysis required a statistically significant number
of producing wells within the defined geologic area and then tested for confidence by insuring the
variance in results over time, area and distance was evaluated. Proper development spacing was also
statistically analyzed.
Income Taxes. As part of the process of preparing the consolidated financial statements, we are
required to estimate the federal and state income taxes in each of the jurisdictions in which
Chesapeake operates. This process involves estimating the actual current tax exposure together with
assessing temporary differences resulting from differing treatment of items, such as derivative
instruments, depreciation, depletion and amortization, and certain accrued liabilities for tax and
accounting purposes. These differences and our net operating loss carryforwards result in deferred tax
assets and liabilities, which are included in our consolidated balance sheet. We must then assess,
using all available positive and negative evidence, the likelihood that the deferred tax assets will be
recovered from future taxable income. If we believe that recovery is not likely, we must establish a
valuation allowance. Generally, to the extent Chesapeake establishes a valuation allowance or
increases or decreases this allowance in a period, we must include an expense or reduction of
expense within the tax provision in the consolidated statement of operations.
Under accounting guidance for income taxes, an enterprise must use judgment in considering the
relative impact of negative and positive evidence. The weight given to the potential effect of negative
and positive evidence should be commensurate with the extent to which it can be objectively verified.
The more negative evidence that exists (i) the more positive evidence is necessary and (ii) the more
difficult it is to support a conclusion that a valuation allowance is not needed for some portion or all of
the deferred tax asset. Among the more significant types of evidence that we consider are:
• taxable income projections in future years;
• whether the carryforward period is so brief that it would limit realization of tax benefit;
• future sales and operating cost projections that will produce more than enough taxable
income to realize the deferred tax asset based on existing sales prices and cost structures;
and
• our earnings history exclusive of the loss that created the future deductible amount coupled
with evidence indicating that the loss is an aberration rather than a continuing condition.
If (i) natural gas and oil prices were to decrease significantly below present levels (and if such
decreases were considered other than temporary), (ii) exploration, drilling and operating costs were to
increase significantly beyond current levels, or (iii) we were confronted with any other significantly
negative evidence pertaining to our ability to realize our NOL carryforwards prior to their expiration, we
may be required to provide a valuation allowance against our deferred tax assets. As of December 31,
2009, we had deferred tax assets of $934 million.
Accounting guidance for recognizing and measuring uncertain tax positions prescribes a threshold
condition that a tax position must meet for any of the benefit of the uncertain tax position to be
recognized in the financial statements. Guidance is also provided regarding de-recognition,
classification and disclosure of these uncertain tax positions. Based on this guidance, we regularly
analyze tax positions taken or expected to be taken in a tax return based on the threshold condition
prescribed. Tax positions that do not meet or exceed this threshold condition are considered uncertain
tax positions. We accrue interest related to these uncertain tax positions which is recognized in interest
expense. Penalties, if any, related to uncertain tax positions would be recorded in other expenses.
Additional information about uncertain tax positions appears in Note 5 of the notes to our consolidated
financial statements.
65
Disclosures About Effects of Transactions with Related Parties
Since Chesapeake was founded in 1989, our CEO, Aubrey K. McClendon, has acquired working
interests in virtually all of our natural gas and oil properties by participating in our drilling activities
under the terms of the Founder Well Participation Program (FWPP) and predecessor participation
arrangements provided for in Mr. McClendon’s employment agreements. Under the FWPP, approved
by our shareholders in June 2005, Mr. McClendon may elect to participate in all or none of the wells
drilled by or on behalf of Chesapeake during a calendar year, but he is not allowed to participate only
in selected wells. A participation election is required to be received by the Compensation Committee of
Chesapeake’s Board of Directors not less than 30 days prior to the start of each calendar year. His
participation is permitted only under the terms outlined in the FWPP, which, among other things, limits
his individual participation to a maximum working interest of 2.5% in a well and prohibits participation in
situations where Chesapeake’s working interest would be reduced below 12.5% as a result of his
participation. In addition, the company is reimbursed for costs associated with leasehold acquired by
Mr. McClendon as a result of his well participation.
On December 31, 2008, we entered into a new five-year employment agreement with
Mr. McClendon that contained a one-time well cost incentive award to him. The total cost of the award
to Chesapeake was $75 million plus employment taxes in the amount of approximately $1 million. We
will recognize the incentive award as general and administrative expense over the five-year vesting
period for the clawback described below, resulting in an expense of approximately $15 million per year
that began in 2009. In addition to state and federal income tax withholding, similar employment taxes
were imposed on Mr. McClendon and withheld from the award. The net incentive award of
approximately $44 million was fully applied against costs attributable to interests in company wells
acquired by Mr. McClendon or his affiliates under the FWPP in 2009. The incentive award is subject to
a clawback if during the initial five-year term of the employment agreement, Mr. McClendon resigns
from the company or is terminated for cause by the company.
As disclosed in Note 17, in 2007, Chesapeake had revenues of $1.1 billion from natural gas and
oil sales to Eagle Energy Partners I, L.P., a former affiliated entity. We sold our 33% limited partnership
interest in Eagle Energy in June 2007.
Recently Issued Accounting Standards
In June 2009, the FASB issued amendments to the consolidation standard applicable to variable
interest entities in response to concerns about the transparency of involvement with variable interest
entities. The amended standard is effective for calendar year companies beginning on January 1,
2010. Beginning January 1, 2010, we will deconsolidate our joint venture with GIP and account for the
investment in the joint venture under the equity method going forward. Adoption of this guidance will
result in a cumulative effect adjustment for the difference in our equity in the joint venture at January 1,
2010, which was originally recorded at carryover basis, and the fair value of our equity at the formation
of the joint venture based on the then fair value. This cumulative effect adjustment will create a basis
difference between our equity investment balance and the underlying equity in the net assets of the
joint venture. This difference will be accreted through earnings over the expected useful life of the
underlying assets held by the joint venture.
In January 2010, the FASB updated its oil and gas estimation and disclosure requirements to align
its requirements with the SEC’s modernized oil and gas reporting rules, which are described above
under Application of Critical Accounting Policies. The update amends the definition of proved reserves
to use the average of first-day-of-the-month prices during the 12 months preceding the end of the
reporting period, adds definitions used in estimating and disclosing proved oil and natural gas
quantities and expands the disclosures required for equity-method investments. The update must be
66
applied prospectively as a change in accounting principle that is inseparable from a change in
accounting estimate and is effective for entities with annual reporting periods ending on or after
December 31, 2009. See Note 10 of the notes to our consolidated financial statements for disclosures
regarding our natural gas and oil reserves.
Forward-Looking Statements
This report includes “forward-looking statements” within the meaning of Section 27A of the
Securities Act of 1933 and Section 21E of the Securities Exchange Act of 1934. Forward-looking
statements give our current expectations or forecasts of future events. They include estimates of
natural gas and oil reserves, expected natural gas and oil production and future expenses,
assumptions regarding future natural gas and oil prices, planned capital expenditures, and anticipated
asset acquisitions and sales, as well as statements concerning anticipated cash flow and liquidity,
business strategy and other plans and objectives for future operations. Disclosures concerning the fair
values of derivative contracts and their estimated contribution to our future results of operations are
based upon market information as of a specific date. These market prices are subject to significant
volatility.
Although we believe the expectations and forecasts reflected in these and other forward-looking
statements are reasonable, we can give no assurance they will prove to have been correct. They can
be affected by inaccurate assumptions or by known or unknown risks and uncertainties. Factors that
could cause actual results to differ materially from expected results are described under Risk Factors in
Item 1A of this report and include:
• the volatility of natural gas and oil prices;
• the limitations our level of indebtedness may have on our financial flexibility;
• declines in the values of our natural gas and oil properties resulting in ceiling test write-downs;
• the availability of capital on an economic basis, including planned asset monetization
transactions, to fund reserve replacement costs;
• our ability to replace reserves and sustain production;
• uncertainties inherent in estimating quantities of natural gas and oil reserves and projecting
future rates of production and the timing of development expenditures;
• potential differences in our interpretations of new reserve disclosure rules and future SEC
guidance;
• inability to generate profits or achieve targeted results in our development and exploratory
drilling and well operations;
• leasehold terms expiring before production can be established;
• hedging activities resulting in lower prices realized on natural gas and oil sales and the need
to secure hedging liabilities;
• a reduced ability to borrow or raise additional capital as a result of lower natural gas and oil
prices;
• drilling and operating risks, including potential environmental liabilities;
• legislation and regulation adversely affecting our industry and our business;
• general economic conditions negatively impacting us and our business counterparties;
• transportation capacity constraints and interruptions that could adversely affect our cash flow;
and
• losses possible from pending or future litigation.
67
We caution you not to place undue reliance on these forward-looking statements, which speak
only as of the date of this report, and we undertake no obligation to update this information. We urge
you to carefully review and consider the disclosures made in this report and our other filings with the
Securities and Exchange Commission that attempt to advise interested parties of the risks and factors
that may affect our business.
ITEM 7A. Quantitative and Qualitative Disclosures About Market Risk
Natural Gas and Oil Hedging Activities
Our results of operations and cash flows are impacted by changes in market prices for natural gas
and oil. To mitigate a portion of the exposure to adverse market changes, we have entered into various
derivative instruments. These instruments allow us to predict with greater certainty the effective natural
gas and oil prices to be received for our hedged production. Although derivatives often fail to achieve
100% effectiveness for accounting purposes, we believe our derivative instruments continue to be
highly effective in achieving our risk management objectives.
Our general strategy for attempting to mitigate exposure to adverse natural gas and oil price
changes is to hedge into strengthening natural gas and oil futures markets when prices allow us to
generate high cash margins and when we view prices to be in the upper range of our predicted most
likely future price range. Information we consider in forming an opinion about future prices includes
general economic conditions, industrial output levels and expectations, producer breakeven cost
structures, liquefied natural gas import trends, natural gas and oil storage inventory levels, industry
decline rates for base production and weather trends.
Throughout 2008 and 2009, we restructured many of our trades that included knockout features as
commodity prices decreased. The knockouts were typically restructured into straight swaps or collars
based on strip prices at the time of the restructure. Additionally, in the latter half of 2009 we took
advantage of attractive strip prices in 2012 through 2014 and sold natural gas and oil call options to our
counterparties in exchange for 2010 and 2011 natural gas swaps with strike prices above the then
current market price. This effectively allowed us to sell out-year volatility through call options at terms
acceptable to us in exchange for straight natural gas swaps with strike prices well in excess of the then
current market price for natural gas.
We use a wide range of derivative instruments to achieve our risk management objectives,
including swaps, various collar arrangements and options (puts or calls). All of these are described in
more detail below. We typically use swaps or collars for a large portion of the natural gas and oil
volume we hedge. Swaps are used when the price level is acceptable and collars are used when the
downside protection from the bought put is meaningful and the cap on upside from the sold call is at a
satisfactory level. We also sell calls, taking advantage of market volatility for a portion of our projected
production volumes when the strike price levels and the premiums are attractive to us. Typically, we
sell call options when we would be satisfied to sell our production at the price being capped by the call
strike or believe it to be more likely than not that the future natural gas or oil price will stay below the
call strike price plus the premium we will receive.
We determine the volume we may potentially hedge by reviewing the company’s estimated future
production levels, which are derived from extensive examination of existing producing reserve
estimates and estimates of likely production (risked) from new drilling. Production forecasts are
updated at least monthly and adjusted if necessary to actual results and activity levels. We do not
hedge more volumes than we expect to produce, and if production estimates are lowered for future
periods and hedges are already executed for some volume above the new production forecasts, the
hedges are reversed. The actual fixed hedge price on our derivative instruments is derived from
bidding and the reference NYMEX price, as reflected in current NYMEX trading. The pricing dates of
68
our derivative contracts follow NYMEX futures. All of our derivative instruments are net settled based
on the difference between the fixed price payment and the floating-price payment, resulting in a net
amount due to or from the counterparty.
Hedging positions, including swaps and collars, are adjusted in response to changes in prices and
market conditions as part of an ongoing dynamic process. We review our hedging positions
continuously and if future market conditions change and prices have fallen to levels we believe could
jeopardize the effectiveness of a position, we will mitigate such risk by either doing a cash settlement
with our counterparty, restructuring the position, or by entering into a new swap that effectively
reverses the current position (a counter-swap). The factors we consider in closing or restructuring a
position before the settlement date are identical to those we reviewed when deciding to enter into the
original hedge position.
As of December 31, 2009, our natural gas and oil derivative instruments were comprised of the
following:
• Swaps: Chesapeake receives a fixed price and pays a floating market price to the
counterparty for the hedged commodity.
• Collars: These instruments contain a fixed floor price (put) and ceiling price (call). If the
market price exceeds the call strike price or falls below the put strike price, Chesapeake
receives the fixed price and pays the market price. If the market price is between the put and
the call strike price, no payments are due from either party. Three-way collars include an
additional put option in exchange for a more favorable strike price on the collar. This
eliminates the counterparty’s downside exposure below the second put option.
• Call options: Chesapeake sells call options in exchange for a premium from the counterparty.
At the time of settlement, if the market price exceeds the fixed price of the call option,
Chesapeake pays the counterparty such excess and if the market price settles below the fixed
price of the call option, no payment is due from either party.
• Put options: Chesapeake receives a premium from the counterparty in exchange for the sale
of a put option. If the market price falls below the fixed price of the put option, Chesapeake
pays the counterparty such shortfall. If the market price settles above the fixed price of the put
option, no payment is due from either party.
• Knockout swaps: Chesapeake receives a fixed price and pays a floating market price. The
fixed price received by Chesapeake includes a premium in exchange for the possibility to
reduce the counterparty’s exposure to zero, in any given month, if the floating market price is
lower than certain pre-determined knockout prices.
• Basis protection swaps: These instruments are arrangements that guarantee a price
differential to NYMEX for natural gas from a specified delivery point. For non-Appalachian
Basin basis protection swaps, which typically have negative differentials to NYMEX,
Chesapeake receives a payment from the counterparty if the price differential is greater than
the stated terms of the contract and pays the counterparty if the price differential is less than
the stated terms of the contract. For Appalachian Basin basis protection swaps, which
typically have positive differentials to NYMEX, Chesapeake receives a payment from the
counterparty if the price differential is less than the stated terms of the contract and pays the
counterparty if the price differential is greater than the stated terms of the contract.
In accordance with accounting guidance for hedging and derivatives, to the extent that a legal right
of set-off exists, Chesapeake nets the value of its derivative arrangements with the same counterparty
in the accompanying consolidated balance sheets. Cash settlements of our derivative arrangements
are generally classified as operating cash flows unless the derivative contains a significant financing
element at contract inception, in which case, all cash settlements are classified as financing cash flows
in the accompanying consolidated statement of cash flows.
69
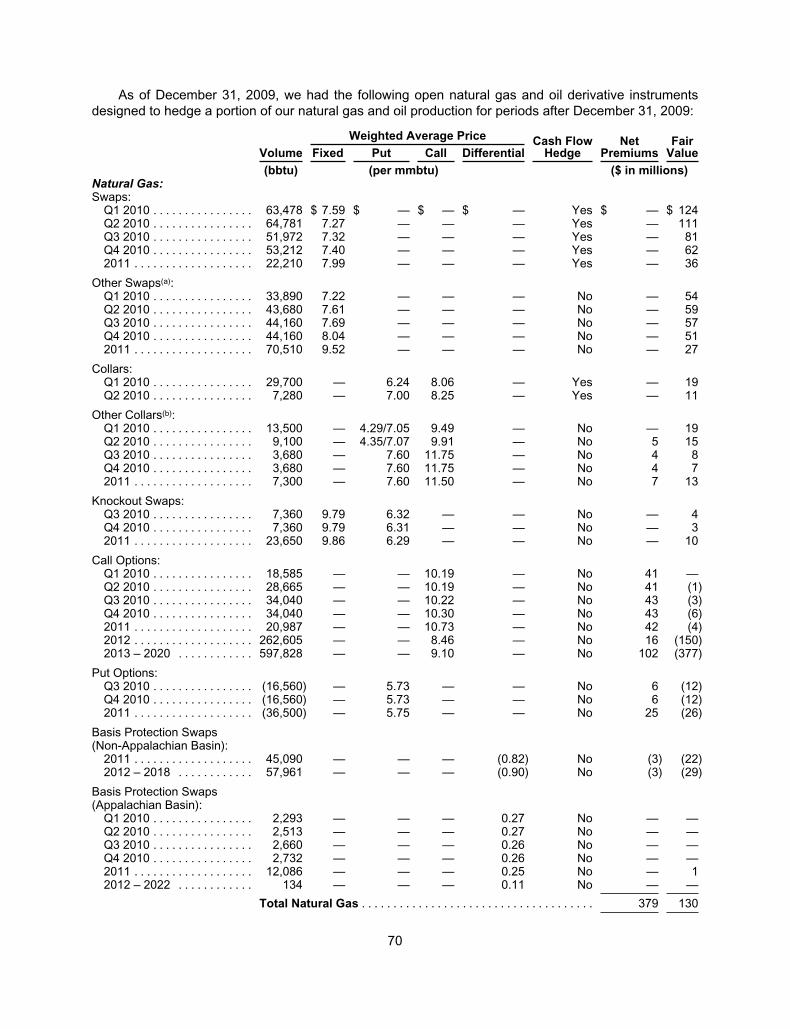
As of December 31, 2009, we had the following open natural gas and oil derivative instruments
designed to hedge a portion of our natural gas and oil production for periods after December 31, 2009:
Volume
Weighted Average Price Cash FlowHedge
NetPremiums
FairValueFixed Put Call Differential
(bbtu) (per mmbtu) ($ in millions)Natural Gas:Swaps:
Q1 2010 . . . . . . . . . . . . . . . . 63,478 $ 7.59 $ — $ — $ — Yes $ — $ 124Q2 2010 . . . . . . . . . . . . . . . . 64,781 7.27 — — — Yes — 111Q3 2010 . . . . . . . . . . . . . . . . 51,972 7.32 — — — Yes — 81Q4 2010 . . . . . . . . . . . . . . . . 53,212 7.40 — — — Yes — 622011 . . . . . . . . . . . . . . . . . . . 22,210 7.99 — — — Yes — 36
Other Swaps(a):Q1 2010 . . . . . . . . . . . . . . . . 33,890 7.22 — — — No — 54Q2 2010 . . . . . . . . . . . . . . . . 43,680 7.61 — — — No — 59Q3 2010 . . . . . . . . . . . . . . . . 44,160 7.69 — — — No — 57Q4 2010 . . . . . . . . . . . . . . . . 44,160 8.04 — — — No — 512011 . . . . . . . . . . . . . . . . . . . 70,510 9.52 — — — No — 27
Collars:Q1 2010 . . . . . . . . . . . . . . . . 29,700 — 6.24 8.06 — Yes — 19Q2 2010 . . . . . . . . . . . . . . . . 7,280 — 7.00 8.25 — Yes — 11
Other Collars(b):Q1 2010 . . . . . . . . . . . . . . . . 13,500 — 4.29/7.05 9.49 — No — 19Q2 2010 . . . . . . . . . . . . . . . . 9,100 — 4.35/7.07 9.91 — No 5 15Q3 2010 . . . . . . . . . . . . . . . . 3,680 — 7.60 11.75 — No 4 8Q4 2010 . . . . . . . . . . . . . . . . 3,680 — 7.60 11.75 — No 4 72011 . . . . . . . . . . . . . . . . . . . 7,300 — 7.60 11.50 — No 7 13
Knockout Swaps:Q3 2010 . . . . . . . . . . . . . . . . 7,360 9.79 6.32 — — No — 4Q4 2010 . . . . . . . . . . . . . . . . 7,360 9.79 6.31 — — No — 32011 . . . . . . . . . . . . . . . . . . . 23,650 9.86 6.29 — — No — 10
Call Options:Q1 2010 . . . . . . . . . . . . . . . . 18,585 — — 10.19 — No 41 —Q2 2010 . . . . . . . . . . . . . . . . 28,665 — — 10.19 — No 41 (1)Q3 2010 . . . . . . . . . . . . . . . . 34,040 — — 10.22 — No 43 (3)Q4 2010 . . . . . . . . . . . . . . . . 34,040 — — 10.30 — No 43 (6)2011 . . . . . . . . . . . . . . . . . . . 20,987 — — 10.73 — No 42 (4)2012 . . . . . . . . . . . . . . . . . . . 262,605 — — 8.46 — No 16 (150)2013 – 2020 . . . . . . . . . . . . 597,828 — — 9.10 — No 102 (377)
Put Options:Q3 2010 . . . . . . . . . . . . . . . . (16,560) — 5.73 — — No 6 (12)Q4 2010 . . . . . . . . . . . . . . . . (16,560) — 5.73 — — No 6 (12)2011 . . . . . . . . . . . . . . . . . . . (36,500) — 5.75 — — No 25 (26)
Basis Protection Swaps(Non-Appalachian Basin):
2011 . . . . . . . . . . . . . . . . . . . 45,090 — — — (0.82) No (3) (22)2012 – 2018 . . . . . . . . . . . . 57,961 — — — (0.90) No (3) (29)
Basis Protection Swaps(Appalachian Basin):
Q1 2010 . . . . . . . . . . . . . . . . 2,293 — — — 0.27 No — —Q2 2010 . . . . . . . . . . . . . . . . 2,513 — — — 0.27 No — —Q3 2010 . . . . . . . . . . . . . . . . 2,660 — — — 0.26 No — —Q4 2010 . . . . . . . . . . . . . . . . 2,732 — — — 0.26 No — —2011 . . . . . . . . . . . . . . . . . . . 12,086 — — — 0.25 No — 12012 – 2022 . . . . . . . . . . . . 134 — — — 0.11 No — —
Total Natural Gas . . . . . . . . . . . . . . . . . . . . . . . . . . . . . . . . . . . . . 379 130
70
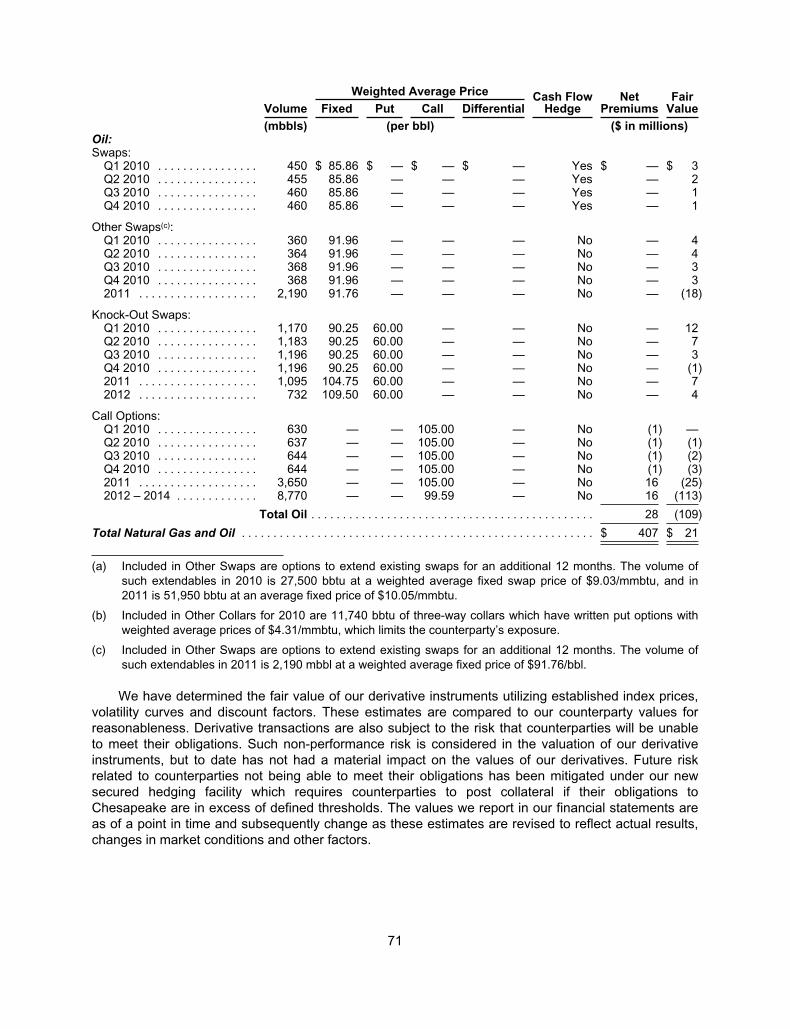
Volume
Weighted Average Price Cash FlowHedge
NetPremiums
FairValueFixed Put Call Differential
(mbbls) (per bbl) ($ in millions)Oil:Swaps:
Q1 2010 . . . . . . . . . . . . . . . . 450 $ 85.86 $ — $ — $ — Yes $ — $ 3Q2 2010 . . . . . . . . . . . . . . . . 455 85.86 — — — Yes — 2Q3 2010 . . . . . . . . . . . . . . . . 460 85.86 — — — Yes — 1Q4 2010 . . . . . . . . . . . . . . . . 460 85.86 — — — Yes — 1
Other Swaps(c):Q1 2010 . . . . . . . . . . . . . . . . 360 91.96 — — — No — 4Q2 2010 . . . . . . . . . . . . . . . . 364 91.96 — — — No — 4Q3 2010 . . . . . . . . . . . . . . . . 368 91.96 — — — No — 3Q4 2010 . . . . . . . . . . . . . . . . 368 91.96 — — — No — 32011 . . . . . . . . . . . . . . . . . . . 2,190 91.76 — — — No — (18)
Knock-Out Swaps:Q1 2010 . . . . . . . . . . . . . . . . 1,170 90.25 60.00 — — No — 12Q2 2010 . . . . . . . . . . . . . . . . 1,183 90.25 60.00 — — No — 7Q3 2010 . . . . . . . . . . . . . . . . 1,196 90.25 60.00 — — No — 3Q4 2010 . . . . . . . . . . . . . . . . 1,196 90.25 60.00 — — No — (1)2011 . . . . . . . . . . . . . . . . . . . 1,095 104.75 60.00 — — No — 72012 . . . . . . . . . . . . . . . . . . . 732 109.50 60.00 — — No — 4
Call Options:Q1 2010 . . . . . . . . . . . . . . . . 630 — — 105.00 — No (1) —Q2 2010 . . . . . . . . . . . . . . . . 637 — — 105.00 — No (1) (1)Q3 2010 . . . . . . . . . . . . . . . . 644 — — 105.00 — No (1) (2)Q4 2010 . . . . . . . . . . . . . . . . 644 — — 105.00 — No (1) (3)2011 . . . . . . . . . . . . . . . . . . . 3,650 — — 105.00 — No 16 (25)2012 – 2014 . . . . . . . . . . . . . 8,770 — — 99.59 — No 16 (113)
Total Oil . . . . . . . . . . . . . . . . . . . . . . . . . . . . . . . . . . . . . . . . . . . . . 28 (109)
Total Natural Gas and Oil . . . . . . . . . . . . . . . . . . . . . . . . . . . . . . . . . . . . . . . . . . . . . . . . . . . . . . . . $ 407 $ 21
(a) Included in Other Swaps are options to extend existing swaps for an additional 12 months. The volume of
such extendables in 2010 is 27,500 bbtu at a weighted average fixed swap price of $9.03/mmbtu, and in
2011 is 51,950 bbtu at an average fixed price of $10.05/mmbtu.
(b) Included in Other Collars for 2010 are 11,740 bbtu of three-way collars which have written put options with
weighted average prices of $4.31/mmbtu, which limits the counterparty’s exposure.
(c) Included in Other Swaps are options to extend existing swaps for an additional 12 months. The volume of
such extendables in 2011 is 2,190 mbbl at a weighted average fixed price of $91.76/bbl.
We have determined the fair value of our derivative instruments utilizing established index prices,
volatility curves and discount factors. These estimates are compared to our counterparty values for
reasonableness. Derivative transactions are also subject to the risk that counterparties will be unable
to meet their obligations. Such non-performance risk is considered in the valuation of our derivative
instruments, but to date has not had a material impact on the values of our derivatives. Future risk
related to counterparties not being able to meet their obligations has been mitigated under our new
secured hedging facility which requires counterparties to post collateral if their obligations to
Chesapeake are in excess of defined thresholds. The values we report in our financial statements are
as of a point in time and subsequently change as these estimates are revised to reflect actual results,
changes in market conditions and other factors.
71
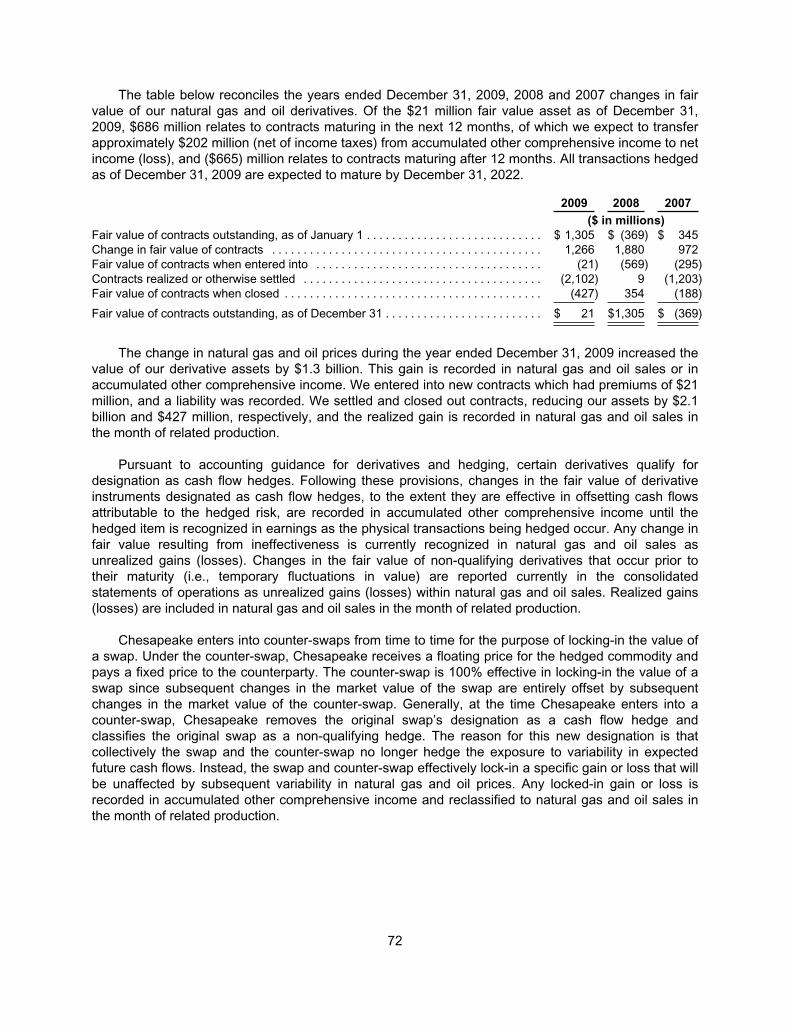
The table below reconciles the years ended December 31, 2009, 2008 and 2007 changes in fair
value of our natural gas and oil derivatives. Of the $21 million fair value asset as of December 31,
2009, $686 million relates to contracts maturing in the next 12 months, of which we expect to transfer
approximately $202 million (net of income taxes) from accumulated other comprehensive income to net
income (loss), and ($665) million relates to contracts maturing after 12 months. All transactions hedged
as of December 31, 2009 are expected to mature by December 31, 2022.
2009 2008 2007
($ in millions)
Fair value of contracts outstanding, as of January 1 . . . . . . . . . . . . . . . . . . . . . . . . . . . . $ 1,305 $ (369) $ 345
Change in fair value of contracts . . . . . . . . . . . . . . . . . . . . . . . . . . . . . . . . . . . . . . . . . . . 1,266 1,880 972
Fair value of contracts when entered into . . . . . . . . . . . . . . . . . . . . . . . . . . . . . . . . . . . . (21) (569) (295)
Contracts realized or otherwise settled . . . . . . . . . . . . . . . . . . . . . . . . . . . . . . . . . . . . . . (2,102) 9 (1,203)
Fair value of contracts when closed . . . . . . . . . . . . . . . . . . . . . . . . . . . . . . . . . . . . . . . . . (427) 354 (188)
Fair value of contracts outstanding, as of December 31 . . . . . . . . . . . . . . . . . . . . . . . . . $ 21 $1,305 $ (369)
The change in natural gas and oil prices during the year ended December 31, 2009 increased the
value of our derivative assets by $1.3 billion. This gain is recorded in natural gas and oil sales or in
accumulated other comprehensive income. We entered into new contracts which had premiums of $21
million, and a liability was recorded. We settled and closed out contracts, reducing our assets by $2.1
billion and $427 million, respectively, and the realized gain is recorded in natural gas and oil sales in
the month of related production.
Pursuant to accounting guidance for derivatives and hedging, certain derivatives qualify for
designation as cash flow hedges. Following these provisions, changes in the fair value of derivative
instruments designated as cash flow hedges, to the extent they are effective in offsetting cash flows
attributable to the hedged risk, are recorded in accumulated other comprehensive income until the
hedged item is recognized in earnings as the physical transactions being hedged occur. Any change in
fair value resulting from ineffectiveness is currently recognized in natural gas and oil sales as
unrealized gains (losses). Changes in the fair value of non-qualifying derivatives that occur prior to
their maturity (i.e., temporary fluctuations in value) are reported currently in the consolidated
statements of operations as unrealized gains (losses) within natural gas and oil sales. Realized gains
(losses) are included in natural gas and oil sales in the month of related production.
Chesapeake enters into counter-swaps from time to time for the purpose of locking-in the value of
a swap. Under the counter-swap, Chesapeake receives a floating price for the hedged commodity and
pays a fixed price to the counterparty. The counter-swap is 100% effective in locking-in the value of a
swap since subsequent changes in the market value of the swap are entirely offset by subsequent
changes in the market value of the counter-swap. Generally, at the time Chesapeake enters into a
counter-swap, Chesapeake removes the original swap’s designation as a cash flow hedge and
classifies the original swap as a non-qualifying hedge. The reason for this new designation is that
collectively the swap and the counter-swap no longer hedge the exposure to variability in expected
future cash flows. Instead, the swap and counter-swap effectively lock-in a specific gain or loss that will
be unaffected by subsequent variability in natural gas and oil prices. Any locked-in gain or loss is
recorded in accumulated other comprehensive income and reclassified to natural gas and oil sales in
the month of related production.
72
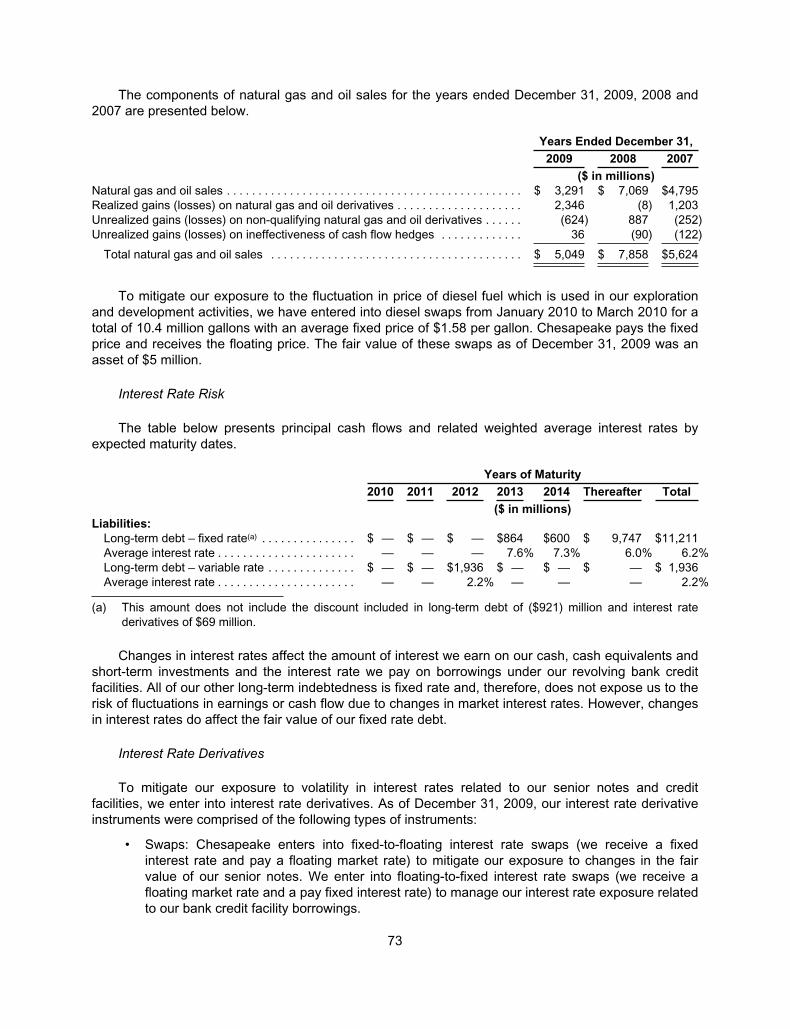
The components of natural gas and oil sales for the years ended December 31, 2009, 2008 and
2007 are presented below.
Years Ended December 31,
2009 2008 2007
($ in millions)
Natural gas and oil sales . . . . . . . . . . . . . . . . . . . . . . . . . . . . . . . . . . . . . . . . . . . . . . . $ 3,291 $ 7,069 $4,795
Realized gains (losses) on natural gas and oil derivatives . . . . . . . . . . . . . . . . . . . . 2,346 (8) 1,203
Unrealized gains (losses) on non-qualifying natural gas and oil derivatives . . . . . . (624) 887 (252)
Unrealized gains (losses) on ineffectiveness of cash flow hedges . . . . . . . . . . . . . 36 (90) (122)
Total natural gas and oil sales . . . . . . . . . . . . . . . . . . . . . . . . . . . . . . . . . . . . . . . . $ 5,049 $ 7,858 $5,624
To mitigate our exposure to the fluctuation in price of diesel fuel which is used in our exploration
and development activities, we have entered into diesel swaps from January 2010 to March 2010 for a
total of 10.4 million gallons with an average fixed price of $1.58 per gallon. Chesapeake pays the fixed
price and receives the floating price. The fair value of these swaps as of December 31, 2009 was an
asset of $5 million.
Interest Rate Risk
The table below presents principal cash flows and related weighted average interest rates by
expected maturity dates.
Years of Maturity
2010 2011 2012 2013 2014 Thereafter Total
($ in millions)
Liabilities:
Long-term debt – fixed rate(a) . . . . . . . . . . . . . . . $ — $ — $ — $864 $600 $ 9,747 $11,211
Average interest rate . . . . . . . . . . . . . . . . . . . . . . — — — 7.6% 7.3% 6.0% 6.2%
Long-term debt – variable rate . . . . . . . . . . . . . . $ — $ — $1,936 $ — $ — $ — $ 1,936
Average interest rate . . . . . . . . . . . . . . . . . . . . . . — — 2.2% — — — 2.2%
(a) This amount does not include the discount included in long-term debt of ($921) million and interest rate
derivatives of $69 million.
Changes in interest rates affect the amount of interest we earn on our cash, cash equivalents and
short-term investments and the interest rate we pay on borrowings under our revolving bank credit
facilities. All of our other long-term indebtedness is fixed rate and, therefore, does not expose us to the
risk of fluctuations in earnings or cash flow due to changes in market interest rates. However, changes
in interest rates do affect the fair value of our fixed rate debt.
Interest Rate Derivatives
To mitigate our exposure to volatility in interest rates related to our senior notes and credit
facilities, we enter into interest rate derivatives. As of December 31, 2009, our interest rate derivative
instruments were comprised of the following types of instruments:
• Swaps: Chesapeake enters into fixed-to-floating interest rate swaps (we receive a fixed
interest rate and pay a floating market rate) to mitigate our exposure to changes in the fair
value of our senior notes. We enter into floating-to-fixed interest rate swaps (we receive a
floating market rate and a pay fixed interest rate) to manage our interest rate exposure related
to our bank credit facility borrowings.
73
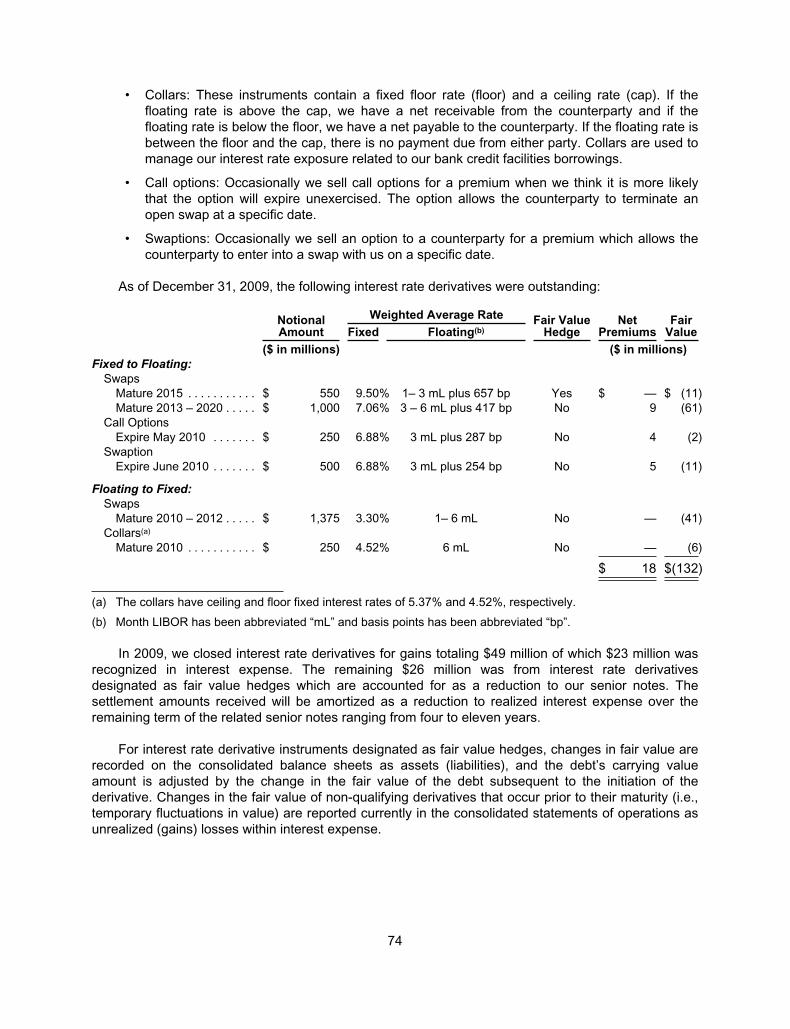
• Collars: These instruments contain a fixed floor rate (floor) and a ceiling rate (cap). If the
floating rate is above the cap, we have a net receivable from the counterparty and if the
floating rate is below the floor, we have a net payable to the counterparty. If the floating rate is
between the floor and the cap, there is no payment due from either party. Collars are used to
manage our interest rate exposure related to our bank credit facilities borrowings.
• Call options: Occasionally we sell call options for a premium when we think it is more likely
that the option will expire unexercised. The option allows the counterparty to terminate an
open swap at a specific date.
• Swaptions: Occasionally we sell an option to a counterparty for a premium which allows the
counterparty to enter into a swap with us on a specific date.
As of December 31, 2009, the following interest rate derivatives were outstanding:
NotionalAmount
Weighted Average Rate Fair ValueHedge
NetPremiums
FairValueFixed Floating(b)
($ in millions) ($ in millions)
Fixed to Floating:
Swaps
Mature 2015 . . . . . . . . . . . $ 550 9.50% 1– 3 mL plus 657 bp Yes $ — $ (11)
Mature 2013 – 2020 . . . . . $ 1,000 7.06% 3 – 6 mL plus 417 bp No 9 (61)
Call Options
Expire May 2010 . . . . . . . $ 250 6.88% 3 mL plus 287 bp No 4 (2)
Swaption
Expire June 2010 . . . . . . . $ 500 6.88% 3 mL plus 254 bp No 5 (11)
Floating to Fixed:
Swaps
Mature 2010 – 2012 . . . . . $ 1,375 3.30% 1– 6 mL No — (41)
Collars(a)
Mature 2010 . . . . . . . . . . . $ 250 4.52% 6 mL No — (6)
$ 18 $(132)
(a) The collars have ceiling and floor fixed interest rates of 5.37% and 4.52%, respectively.
(b) Month LIBOR has been abbreviated “mL” and basis points has been abbreviated “bp”.
In 2009, we closed interest rate derivatives for gains totaling $49 million of which $23 million was
recognized in interest expense. The remaining $26 million was from interest rate derivatives
designated as fair value hedges which are accounted for as a reduction to our senior notes. The
settlement amounts received will be amortized as a reduction to realized interest expense over the
remaining term of the related senior notes ranging from four to eleven years.
For interest rate derivative instruments designated as fair value hedges, changes in fair value are
recorded on the consolidated balance sheets as assets (liabilities), and the debt’s carrying value
amount is adjusted by the change in the fair value of the debt subsequent to the initiation of the
derivative. Changes in the fair value of non-qualifying derivatives that occur prior to their maturity (i.e.,
temporary fluctuations in value) are reported currently in the consolidated statements of operations as
unrealized (gains) losses within interest expense.
74
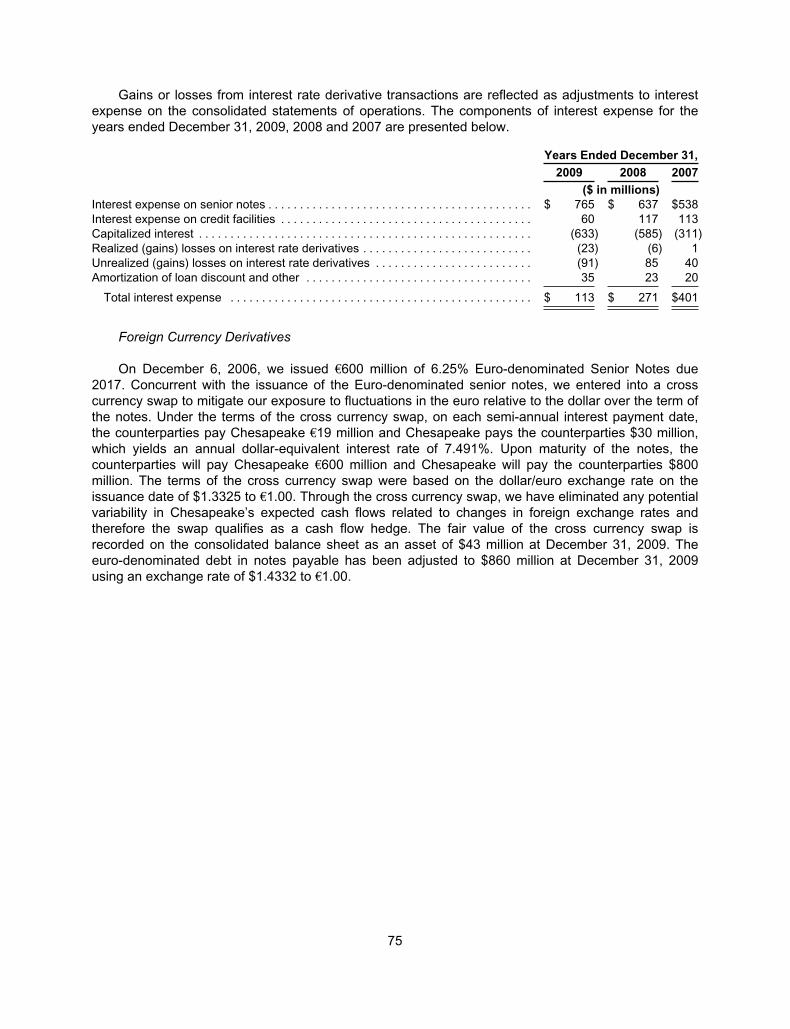
Gains or losses from interest rate derivative transactions are reflected as adjustments to interest
expense on the consolidated statements of operations. The components of interest expense for the
years ended December 31, 2009, 2008 and 2007 are presented below.
Years Ended December 31,
2009 2008 2007
($ in millions)
Interest expense on senior notes . . . . . . . . . . . . . . . . . . . . . . . . . . . . . . . . . . . . . . . . . . $ 765 $ 637 $538
Interest expense on credit facilities . . . . . . . . . . . . . . . . . . . . . . . . . . . . . . . . . . . . . . . . 60 117 113
Capitalized interest . . . . . . . . . . . . . . . . . . . . . . . . . . . . . . . . . . . . . . . . . . . . . . . . . . . . . (633) (585) (311)
Realized (gains) losses on interest rate derivatives . . . . . . . . . . . . . . . . . . . . . . . . . . . (23) (6) 1
Unrealized (gains) losses on interest rate derivatives . . . . . . . . . . . . . . . . . . . . . . . . . (91) 85 40
Amortization of loan discount and other . . . . . . . . . . . . . . . . . . . . . . . . . . . . . . . . . . . . 35 23 20
Total interest expense . . . . . . . . . . . . . . . . . . . . . . . . . . . . . . . . . . . . . . . . . . . . . . . . $ 113 $ 271 $401
Foreign Currency Derivatives
On December 6, 2006, we issued €600 million of 6.25% Euro-denominated Senior Notes due
2017. Concurrent with the issuance of the Euro-denominated senior notes, we entered into a cross
currency swap to mitigate our exposure to fluctuations in the euro relative to the dollar over the term of
the notes. Under the terms of the cross currency swap, on each semi-annual interest payment date,
the counterparties pay Chesapeake €19 million and Chesapeake pays the counterparties $30 million,
which yields an annual dollar-equivalent interest rate of 7.491%. Upon maturity of the notes, the
counterparties will pay Chesapeake €600 million and Chesapeake will pay the counterparties $800
million. The terms of the cross currency swap were based on the dollar/euro exchange rate on the
issuance date of $1.3325 to €1.00. Through the cross currency swap, we have eliminated any potential
variability in Chesapeake’s expected cash flows related to changes in foreign exchange rates and
therefore the swap qualifies as a cash flow hedge. The fair value of the cross currency swap is
recorded on the consolidated balance sheet as an asset of $43 million at December 31, 2009. The
euro-denominated debt in notes payable has been adjusted to $860 million at December 31, 2009
using an exchange rate of $1.4332 to €1.00.
75
ITEM 8. Financial Statements and Supplementary Data
INDEX TO FINANCIAL STATEMENTS
CHESAPEAKE ENERGY CORPORATION
Page
Management’s Report on Internal Control Over Financial Reporting . . . . . . . . . . . . . . . . . . . . . . . . . . . . . . . . 77
Consolidated Financial Statements:
Report of Independent Registered Public Accounting Firm . . . . . . . . . . . . . . . . . . . . . . . . . . . . . . . . . . . . . . . 78
Consolidated Balance Sheets at December 31, 2009 and 2008 . . . . . . . . . . . . . . . . . . . . . . . . . . . . . . . . . . 79
Consolidated Statements of Operations for the Years Ended December 31, 2009, 2008 and 2007 . . . . . . 81
Consolidated Statements of Cash Flows for the Years Ended December 31, 2009, 2008 and 2007 . . . . . 82
Consolidated Statements of Stockholders’ Equity for the Years Ended December 31, 2009, 2008 and
2007 . . . . . . . . . . . . . . . . . . . . . . . . . . . . . . . . . . . . . . . . . . . . . . . . . . . . . . . . . . . . . . . . . . . . . . . . . . . . . . . . . 85
Consolidated Statements of Comprehensive Income for the Years Ended December 31, 2009, 2008 and
2007 . . . . . . . . . . . . . . . . . . . . . . . . . . . . . . . . . . . . . . . . . . . . . . . . . . . . . . . . . . . . . . . . . . . . . . . . . . . . . . . . . 87
Notes to Consolidated Financial Statements . . . . . . . . . . . . . . . . . . . . . . . . . . . . . . . . . . . . . . . . . . . . . . . . . . 88
Financial Statement Schedule:
Schedule II – Valuation and Qualifying Accounts . . . . . . . . . . . . . . . . . . . . . . . . . . . . . . . . . . . . . . . . . . . . . . 149
76
MANAGEMENT’S REPORT ON INTERNAL CONTROL OVER FINANCIAL REPORTING
It is the responsibility of the management of Chesapeake Energy Corporation to establish and
maintain adequate internal control over financial reporting (as defined in Rule 13a-15(f) under the
Securities Exchange Act of 1934). Management utilized the Committee of Sponsoring Organizations of
the Treadway Commission’s Internal Control-Integrated Framework (COSO framework) in conducting
the required assessment of effectiveness of the company’s internal control over financial reporting.
Management has performed an assessment of the effectiveness of the company’s internal control
over financial reporting and has determined the company’s internal control over financial reporting was
effective as of December 31, 2009.
The effectiveness of the company’s internal control over financial reporting as of December 31,
2009 has been audited by PricewaterhouseCoopers LLP, an independent registered public accounting
firm, as stated in its report which appears herein.
/s/ AUBREY K. MCCLENDON
Aubrey K. McClendon
Chairman of the Board and Chief Executive Officer
/s/ MARCUS C. ROWLAND
Marcus C. Rowland
Executive Vice President and Chief Financial Officer
77
REPORT OF INDEPENDENT REGISTERED PUBLIC ACCOUNTING FIRM
To the Board of Directors and Shareholders of Chesapeake Energy Corporation,
In our opinion, the consolidated financial statements listed in the accompanying index present fairly, in all material
respects, the financial position of Chesapeake Energy Corporation and its subsidiaries at December 31, 2009 and
2008, and the results of their operations and their cash flows for each of the three years in the period ended
December 31, 2009 in conformity with accounting principles generally accepted in the United States of America. In
addition, in our opinion, the financial statement schedule listed in the accompanying index presents fairly, in all
material respects, the information set forth therein when read in conjunction with the related consolidated financial
statements. Also in our opinion, the Company maintained, in all material respects, effective internal control over
financial reporting as of December 31, 2009, based on criteria established in Internal Control – Integrated
Framework issued by the Committee of Sponsoring Organizations of the Treadway Commission (COSO). The
Company’s management is responsible for these financial statements and financial statement schedule, for
maintaining effective internal control over financial reporting and for its assessment of the effectiveness of internal
control over financial reporting, included in Management’s Report on Internal Control over Financial Reporting. Our
responsibility is to express opinions on these financial statements, on the financial statement schedule, and on the
Company’s internal control over financial reporting based on our integrated audits. We conducted our audits in
accordance with the standards of the Public Company Accounting Oversight Board (United States). Those standards
require that we plan and perform the audits to obtain reasonable assurance about whether the financial statements
are free of material misstatement and whether effective internal control over financial reporting was maintained in all
material respects. Our audits of the financial statements included examining, on a test basis, evidence supporting the
amounts and disclosures in the financial statements, assessing the accounting principles used and significant
estimates made by management, and evaluating the overall financial statement presentation. Our audit of internal
control over financial reporting included obtaining an understanding of internal control over financial reporting,
assessing the risk that a material weakness exists, and testing and evaluating the design and operating effectiveness
of internal control based on the assessed risk. Our audits also included performing such other procedures as we
considered necessary in the circumstances. We believe that our audits provide a reasonable basis for our opinions.
As discussed in Note 20 to the consolidated financial statements, the Company changed the manner in which it
estimates the quantities of oil and gas reserves in 2009 and the limitation on its capitalized costs as of
December 31, 2009. Also as discussed in Note 3 to the consolidated financial statements, the Company changed
the manner in which it accounts for contingent convertible debt instruments as of January 1, 2009, and
retrospectively applied the impact to prior periods.
A company’s internal control over financial reporting is a process designed to provide reasonable assurance
regarding the reliability of financial reporting and the preparation of financial statements for external purposes in
accordance with generally accepted accounting principles. A company’s internal control over financial reporting
includes those policies and procedures that (i) pertain to the maintenance of records that, in reasonable detail,
accurately and fairly reflect the transactions and dispositions of the assets of the company; (ii) provide reasonable
assurance that transactions are recorded as necessary to permit preparation of financial statements in accordance
with generally accepted accounting principles, and that receipts and expenditures of the company are being made
only in accordance with authorizations of management and directors of the company; and (iii) provide reasonable
assurance regarding prevention or timely detection of unauthorized acquisition, use, or disposition of the
company’s assets that could have a material effect on the financial statements.
Because of its inherent limitations, internal control over financial reporting may not prevent or detect
misstatements. Also, projections of any evaluation of effectiveness to future periods are subject to the risk that
controls may become inadequate because of changes in conditions, or that the degree of compliance with the
policies or procedures may deteriorate.
/s/ PricewaterhouseCoopers LLP
PricewaterhouseCoopers LLP
Tulsa, Oklahoma
March 1, 2010
78
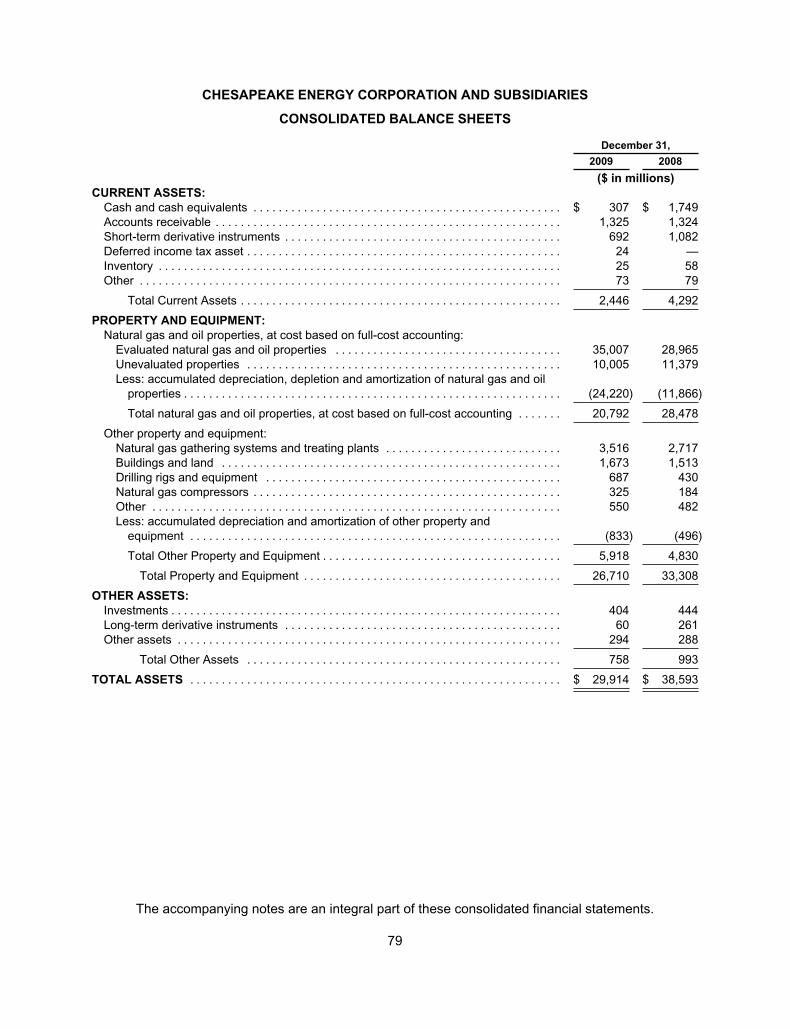
CHESAPEAKE ENERGY CORPORATION AND SUBSIDIARIES
CONSOLIDATED BALANCE SHEETS
December 31,
2009 2008
($ in millions)
CURRENT ASSETS:
Cash and cash equivalents . . . . . . . . . . . . . . . . . . . . . . . . . . . . . . . . . . . . . . . . . . . . . . . . . $ 307 $ 1,749
Accounts receivable . . . . . . . . . . . . . . . . . . . . . . . . . . . . . . . . . . . . . . . . . . . . . . . . . . . . . . . 1,325 1,324
Short-term derivative instruments . . . . . . . . . . . . . . . . . . . . . . . . . . . . . . . . . . . . . . . . . . . . 692 1,082
Deferred income tax asset . . . . . . . . . . . . . . . . . . . . . . . . . . . . . . . . . . . . . . . . . . . . . . . . . . 24 —
Inventory . . . . . . . . . . . . . . . . . . . . . . . . . . . . . . . . . . . . . . . . . . . . . . . . . . . . . . . . . . . . . . . . 25 58
Other . . . . . . . . . . . . . . . . . . . . . . . . . . . . . . . . . . . . . . . . . . . . . . . . . . . . . . . . . . . . . . . . . . . 73 79
Total Current Assets . . . . . . . . . . . . . . . . . . . . . . . . . . . . . . . . . . . . . . . . . . . . . . . . . . . 2,446 4,292
PROPERTY AND EQUIPMENT:
Natural gas and oil properties, at cost based on full-cost accounting:
Evaluated natural gas and oil properties . . . . . . . . . . . . . . . . . . . . . . . . . . . . . . . . . . . . 35,007 28,965
Unevaluated properties . . . . . . . . . . . . . . . . . . . . . . . . . . . . . . . . . . . . . . . . . . . . . . . . . . 10,005 11,379
Less: accumulated depreciation, depletion and amortization of natural gas and oil
properties . . . . . . . . . . . . . . . . . . . . . . . . . . . . . . . . . . . . . . . . . . . . . . . . . . . . . . . . . . . . (24,220) (11,866)
Total natural gas and oil properties, at cost based on full-cost accounting . . . . . . . 20,792 28,478
Other property and equipment:
Natural gas gathering systems and treating plants . . . . . . . . . . . . . . . . . . . . . . . . . . . . 3,516 2,717
Buildings and land . . . . . . . . . . . . . . . . . . . . . . . . . . . . . . . . . . . . . . . . . . . . . . . . . . . . . . 1,673 1,513
Drilling rigs and equipment . . . . . . . . . . . . . . . . . . . . . . . . . . . . . . . . . . . . . . . . . . . . . . . 687 430
Natural gas compressors . . . . . . . . . . . . . . . . . . . . . . . . . . . . . . . . . . . . . . . . . . . . . . . . . 325 184
Other . . . . . . . . . . . . . . . . . . . . . . . . . . . . . . . . . . . . . . . . . . . . . . . . . . . . . . . . . . . . . . . . . 550 482
Less: accumulated depreciation and amortization of other property and
equipment . . . . . . . . . . . . . . . . . . . . . . . . . . . . . . . . . . . . . . . . . . . . . . . . . . . . . . . . . . . (833) (496)
Total Other Property and Equipment . . . . . . . . . . . . . . . . . . . . . . . . . . . . . . . . . . . . . . 5,918 4,830
Total Property and Equipment . . . . . . . . . . . . . . . . . . . . . . . . . . . . . . . . . . . . . . . . . 26,710 33,308
OTHER ASSETS:
Investments . . . . . . . . . . . . . . . . . . . . . . . . . . . . . . . . . . . . . . . . . . . . . . . . . . . . . . . . . . . . . . 404 444
Long-term derivative instruments . . . . . . . . . . . . . . . . . . . . . . . . . . . . . . . . . . . . . . . . . . . . 60 261
Other assets . . . . . . . . . . . . . . . . . . . . . . . . . . . . . . . . . . . . . . . . . . . . . . . . . . . . . . . . . . . . . 294 288
Total Other Assets . . . . . . . . . . . . . . . . . . . . . . . . . . . . . . . . . . . . . . . . . . . . . . . . . . 758 993
TOTAL ASSETS . . . . . . . . . . . . . . . . . . . . . . . . . . . . . . . . . . . . . . . . . . . . . . . . . . . . . . . . . . . $ 29,914 $ 38,593
The accompanying notes are an integral part of these consolidated financial statements.
79
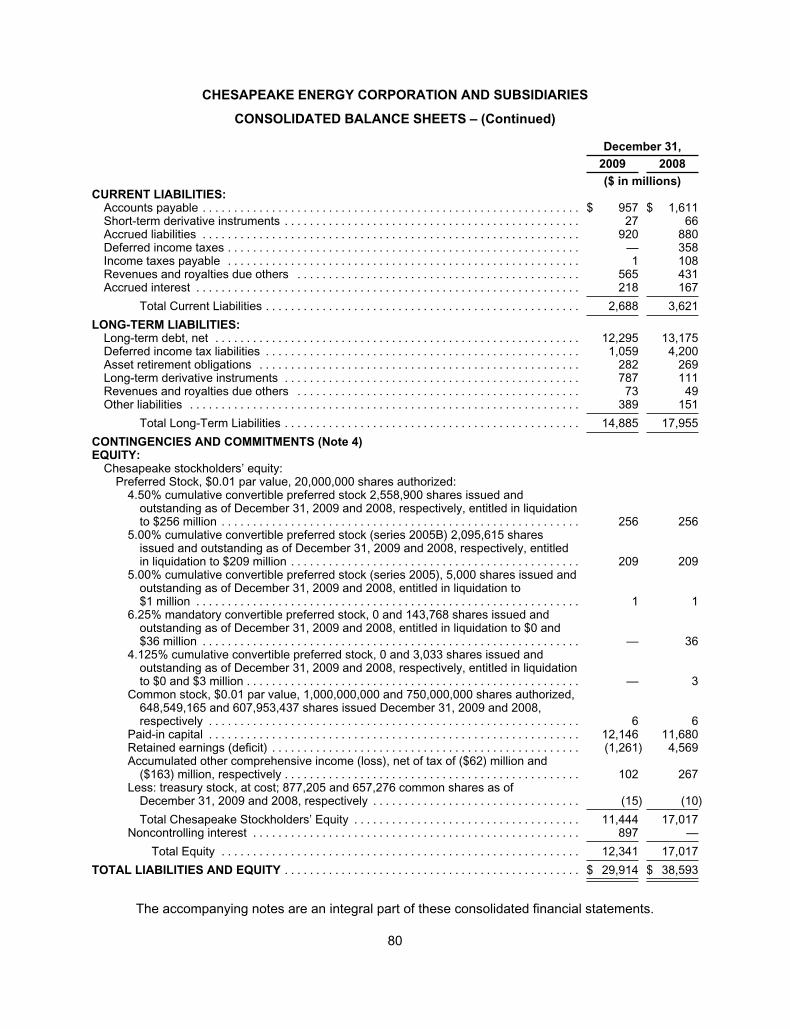
CHESAPEAKE ENERGY CORPORATION AND SUBSIDIARIES
CONSOLIDATED BALANCE SHEETS – (Continued)
December 31,
2009 2008
($ in millions)CURRENT LIABILITIES:
Accounts payable . . . . . . . . . . . . . . . . . . . . . . . . . . . . . . . . . . . . . . . . . . . . . . . . . . . . . . . . . . . . $ 957 $ 1,611Short-term derivative instruments . . . . . . . . . . . . . . . . . . . . . . . . . . . . . . . . . . . . . . . . . . . . . . . 27 66Accrued liabilities . . . . . . . . . . . . . . . . . . . . . . . . . . . . . . . . . . . . . . . . . . . . . . . . . . . . . . . . . . . . 920 880Deferred income taxes . . . . . . . . . . . . . . . . . . . . . . . . . . . . . . . . . . . . . . . . . . . . . . . . . . . . . . . . — 358Income taxes payable . . . . . . . . . . . . . . . . . . . . . . . . . . . . . . . . . . . . . . . . . . . . . . . . . . . . . . . . 1 108Revenues and royalties due others . . . . . . . . . . . . . . . . . . . . . . . . . . . . . . . . . . . . . . . . . . . . . 565 431Accrued interest . . . . . . . . . . . . . . . . . . . . . . . . . . . . . . . . . . . . . . . . . . . . . . . . . . . . . . . . . . . . . 218 167
Total Current Liabilities . . . . . . . . . . . . . . . . . . . . . . . . . . . . . . . . . . . . . . . . . . . . . . . . . . 2,688 3,621
LONG-TERM LIABILITIES:Long-term debt, net . . . . . . . . . . . . . . . . . . . . . . . . . . . . . . . . . . . . . . . . . . . . . . . . . . . . . . . . . . 12,295 13,175Deferred income tax liabilities . . . . . . . . . . . . . . . . . . . . . . . . . . . . . . . . . . . . . . . . . . . . . . . . . . 1,059 4,200Asset retirement obligations . . . . . . . . . . . . . . . . . . . . . . . . . . . . . . . . . . . . . . . . . . . . . . . . . . . 282 269Long-term derivative instruments . . . . . . . . . . . . . . . . . . . . . . . . . . . . . . . . . . . . . . . . . . . . . . . 787 111Revenues and royalties due others . . . . . . . . . . . . . . . . . . . . . . . . . . . . . . . . . . . . . . . . . . . . . 73 49Other liabilities . . . . . . . . . . . . . . . . . . . . . . . . . . . . . . . . . . . . . . . . . . . . . . . . . . . . . . . . . . . . . . 389 151
Total Long-Term Liabilities . . . . . . . . . . . . . . . . . . . . . . . . . . . . . . . . . . . . . . . . . . . . . . . 14,885 17,955
CONTINGENCIES AND COMMITMENTS (Note 4)EQUITY:
Chesapeake stockholders’ equity:Preferred Stock, $0.01 par value, 20,000,000 shares authorized:
4.50% cumulative convertible preferred stock 2,558,900 shares issued andoutstanding as of December 31, 2009 and 2008, respectively, entitled in liquidationto $256 million . . . . . . . . . . . . . . . . . . . . . . . . . . . . . . . . . . . . . . . . . . . . . . . . . . . . . . . . . 256 256
5.00% cumulative convertible preferred stock (series 2005B) 2,095,615 sharesissued and outstanding as of December 31, 2009 and 2008, respectively, entitledin liquidation to $209 million . . . . . . . . . . . . . . . . . . . . . . . . . . . . . . . . . . . . . . . . . . . . . . 209 209
5.00% cumulative convertible preferred stock (series 2005), 5,000 shares issued andoutstanding as of December 31, 2009 and 2008, entitled in liquidation to$1 million . . . . . . . . . . . . . . . . . . . . . . . . . . . . . . . . . . . . . . . . . . . . . . . . . . . . . . . . . . . . . 1 1
6.25% mandatory convertible preferred stock, 0 and 143,768 shares issued andoutstanding as of December 31, 2009 and 2008, entitled in liquidation to $0 and$36 million . . . . . . . . . . . . . . . . . . . . . . . . . . . . . . . . . . . . . . . . . . . . . . . . . . . . . . . . . . . . — 36
4.125% cumulative convertible preferred stock, 0 and 3,033 shares issued andoutstanding as of December 31, 2009 and 2008, respectively, entitled in liquidationto $0 and $3 million . . . . . . . . . . . . . . . . . . . . . . . . . . . . . . . . . . . . . . . . . . . . . . . . . . . . . — 3
Common stock, $0.01 par value, 1,000,000,000 and 750,000,000 shares authorized,648,549,165 and 607,953,437 shares issued December 31, 2009 and 2008,respectively . . . . . . . . . . . . . . . . . . . . . . . . . . . . . . . . . . . . . . . . . . . . . . . . . . . . . . . . . . . 6 6
Paid-in capital . . . . . . . . . . . . . . . . . . . . . . . . . . . . . . . . . . . . . . . . . . . . . . . . . . . . . . . . . . . 12,146 11,680Retained earnings (deficit) . . . . . . . . . . . . . . . . . . . . . . . . . . . . . . . . . . . . . . . . . . . . . . . . . (1,261) 4,569Accumulated other comprehensive income (loss), net of tax of ($62) million and
($163) million, respectively . . . . . . . . . . . . . . . . . . . . . . . . . . . . . . . . . . . . . . . . . . . . . . . 102 267Less: treasury stock, at cost; 877,205 and 657,276 common shares as of
December 31, 2009 and 2008, respectively . . . . . . . . . . . . . . . . . . . . . . . . . . . . . . . . . (15) (10)
Total Chesapeake Stockholders’ Equity . . . . . . . . . . . . . . . . . . . . . . . . . . . . . . . . . . . . 11,444 17,017Noncontrolling interest . . . . . . . . . . . . . . . . . . . . . . . . . . . . . . . . . . . . . . . . . . . . . . . . . . . . 897 —
Total Equity . . . . . . . . . . . . . . . . . . . . . . . . . . . . . . . . . . . . . . . . . . . . . . . . . . . . . . . . . 12,341 17,017
TOTAL LIABILITIES AND EQUITY . . . . . . . . . . . . . . . . . . . . . . . . . . . . . . . . . . . . . . . . . . . . . . . $ 29,914 $ 38,593
The accompanying notes are an integral part of these consolidated financial statements.
80
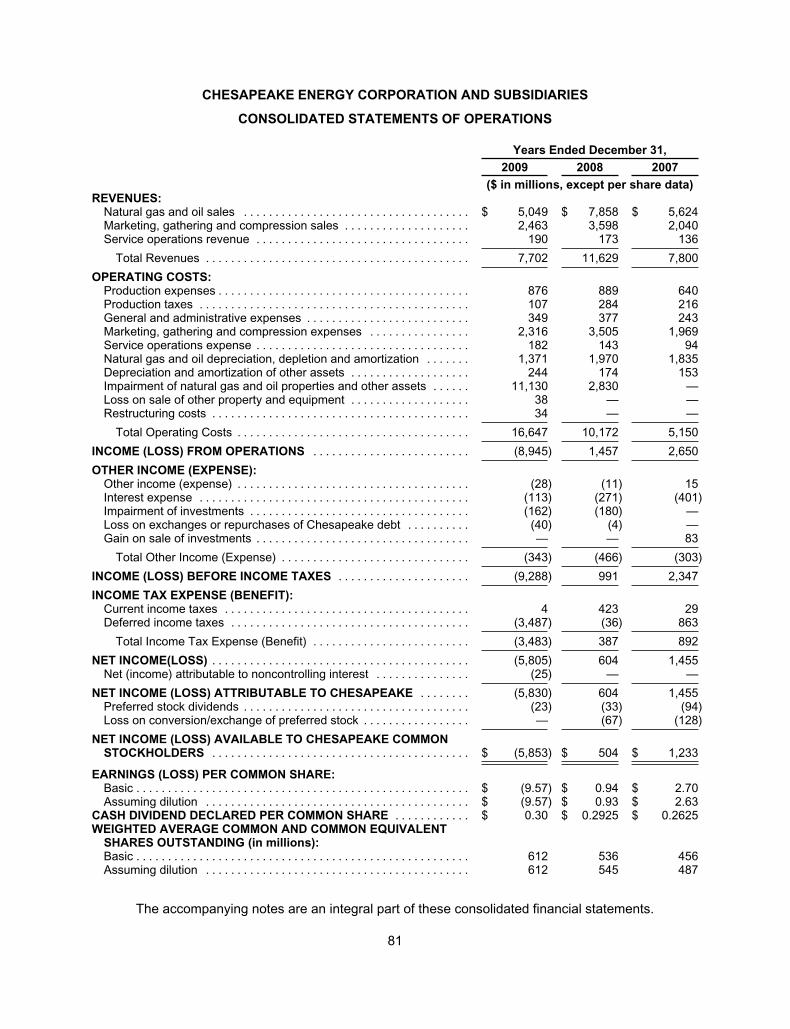
CHESAPEAKE ENERGY CORPORATION AND SUBSIDIARIES
CONSOLIDATED STATEMENTS OF OPERATIONS
Years Ended December 31,
2009 2008 2007
($ in millions, except per share data)REVENUES:
Natural gas and oil sales . . . . . . . . . . . . . . . . . . . . . . . . . . . . . . . . . . . . $ 5,049 $ 7,858 $ 5,624Marketing, gathering and compression sales . . . . . . . . . . . . . . . . . . . . 2,463 3,598 2,040Service operations revenue . . . . . . . . . . . . . . . . . . . . . . . . . . . . . . . . . . 190 173 136
Total Revenues . . . . . . . . . . . . . . . . . . . . . . . . . . . . . . . . . . . . . . . . . . 7,702 11,629 7,800
OPERATING COSTS:Production expenses . . . . . . . . . . . . . . . . . . . . . . . . . . . . . . . . . . . . . . . . 876 889 640Production taxes . . . . . . . . . . . . . . . . . . . . . . . . . . . . . . . . . . . . . . . . . . . 107 284 216General and administrative expenses . . . . . . . . . . . . . . . . . . . . . . . . . . 349 377 243Marketing, gathering and compression expenses . . . . . . . . . . . . . . . . 2,316 3,505 1,969Service operations expense . . . . . . . . . . . . . . . . . . . . . . . . . . . . . . . . . . 182 143 94Natural gas and oil depreciation, depletion and amortization . . . . . . . 1,371 1,970 1,835Depreciation and amortization of other assets . . . . . . . . . . . . . . . . . . . 244 174 153Impairment of natural gas and oil properties and other assets . . . . . . 11,130 2,830 —Loss on sale of other property and equipment . . . . . . . . . . . . . . . . . . . 38 — —Restructuring costs . . . . . . . . . . . . . . . . . . . . . . . . . . . . . . . . . . . . . . . . . 34 — —
Total Operating Costs . . . . . . . . . . . . . . . . . . . . . . . . . . . . . . . . . . . . . 16,647 10,172 5,150
INCOME (LOSS) FROM OPERATIONS . . . . . . . . . . . . . . . . . . . . . . . . . (8,945) 1,457 2,650
OTHER INCOME (EXPENSE):Other income (expense) . . . . . . . . . . . . . . . . . . . . . . . . . . . . . . . . . . . . . (28) (11) 15Interest expense . . . . . . . . . . . . . . . . . . . . . . . . . . . . . . . . . . . . . . . . . . . (113) (271) (401)Impairment of investments . . . . . . . . . . . . . . . . . . . . . . . . . . . . . . . . . . . (162) (180) —Loss on exchanges or repurchases of Chesapeake debt . . . . . . . . . . (40) (4) —Gain on sale of investments . . . . . . . . . . . . . . . . . . . . . . . . . . . . . . . . . . — — 83
Total Other Income (Expense) . . . . . . . . . . . . . . . . . . . . . . . . . . . . . . (343) (466) (303)
INCOME (LOSS) BEFORE INCOME TAXES . . . . . . . . . . . . . . . . . . . . . (9,288) 991 2,347
INCOME TAX EXPENSE (BENEFIT):Current income taxes . . . . . . . . . . . . . . . . . . . . . . . . . . . . . . . . . . . . . . . 4 423 29Deferred income taxes . . . . . . . . . . . . . . . . . . . . . . . . . . . . . . . . . . . . . . (3,487) (36) 863
Total Income Tax Expense (Benefit) . . . . . . . . . . . . . . . . . . . . . . . . . (3,483) 387 892
NET INCOME(LOSS) . . . . . . . . . . . . . . . . . . . . . . . . . . . . . . . . . . . . . . . . . (5,805) 604 1,455Net (income) attributable to noncontrolling interest . . . . . . . . . . . . . . . (25) — —
NET INCOME (LOSS) ATTRIBUTABLE TO CHESAPEAKE . . . . . . . . (5,830) 604 1,455Preferred stock dividends . . . . . . . . . . . . . . . . . . . . . . . . . . . . . . . . . . . . (23) (33) (94)Loss on conversion/exchange of preferred stock . . . . . . . . . . . . . . . . . — (67) (128)
NET INCOME (LOSS) AVAILABLE TO CHESAPEAKE COMMONSTOCKHOLDERS . . . . . . . . . . . . . . . . . . . . . . . . . . . . . . . . . . . . . . . . . $ (5,853) $ 504 $ 1,233
EARNINGS (LOSS) PER COMMON SHARE:Basic . . . . . . . . . . . . . . . . . . . . . . . . . . . . . . . . . . . . . . . . . . . . . . . . . . . . . $ (9.57) $ 0.94 $ 2.70Assuming dilution . . . . . . . . . . . . . . . . . . . . . . . . . . . . . . . . . . . . . . . . . . $ (9.57) $ 0.93 $ 2.63
CASH DIVIDEND DECLARED PER COMMON SHARE . . . . . . . . . . . . $ 0.30 $ 0.2925 $ 0.2625WEIGHTED AVERAGE COMMON AND COMMON EQUIVALENT
SHARES OUTSTANDING (in millions):Basic . . . . . . . . . . . . . . . . . . . . . . . . . . . . . . . . . . . . . . . . . . . . . . . . . . . . . 612 536 456Assuming dilution . . . . . . . . . . . . . . . . . . . . . . . . . . . . . . . . . . . . . . . . . . 612 545 487
The accompanying notes are an integral part of these consolidated financial statements.
81
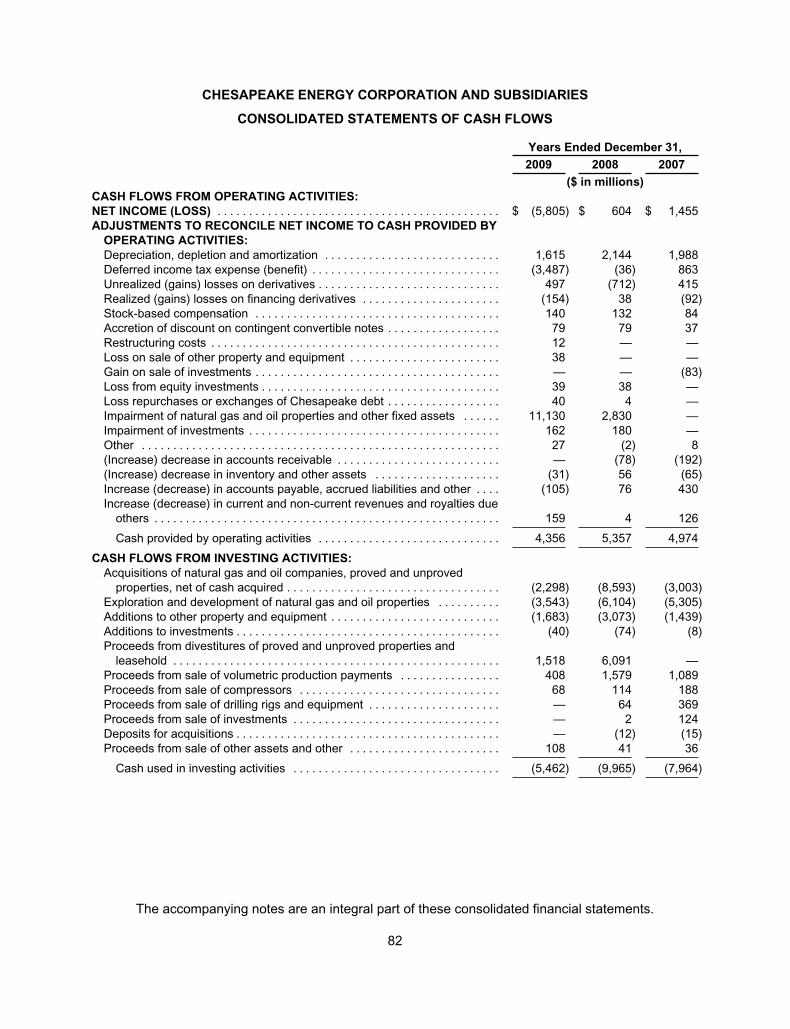
CHESAPEAKE ENERGY CORPORATION AND SUBSIDIARIES
CONSOLIDATED STATEMENTS OF CASH FLOWS
Years Ended December 31,
2009 2008 2007
($ in millions)
CASH FLOWS FROM OPERATING ACTIVITIES:
NET INCOME (LOSS) . . . . . . . . . . . . . . . . . . . . . . . . . . . . . . . . . . . . . . . . . . . . . $ (5,805) $ 604 $ 1,455
ADJUSTMENTS TO RECONCILE NET INCOME TO CASH PROVIDED BY
OPERATING ACTIVITIES:
Depreciation, depletion and amortization . . . . . . . . . . . . . . . . . . . . . . . . . . . . 1,615 2,144 1,988
Deferred income tax expense (benefit) . . . . . . . . . . . . . . . . . . . . . . . . . . . . . . (3,487) (36) 863
Unrealized (gains) losses on derivatives . . . . . . . . . . . . . . . . . . . . . . . . . . . . . 497 (712) 415
Realized (gains) losses on financing derivatives . . . . . . . . . . . . . . . . . . . . . . (154) 38 (92)
Stock-based compensation . . . . . . . . . . . . . . . . . . . . . . . . . . . . . . . . . . . . . . . 140 132 84
Accretion of discount on contingent convertible notes . . . . . . . . . . . . . . . . . . 79 79 37
Restructuring costs . . . . . . . . . . . . . . . . . . . . . . . . . . . . . . . . . . . . . . . . . . . . . . 12 — —
Loss on sale of other property and equipment . . . . . . . . . . . . . . . . . . . . . . . . 38 — —
Gain on sale of investments . . . . . . . . . . . . . . . . . . . . . . . . . . . . . . . . . . . . . . . — — (83)
Loss from equity investments . . . . . . . . . . . . . . . . . . . . . . . . . . . . . . . . . . . . . . 39 38 —
Loss repurchases or exchanges of Chesapeake debt . . . . . . . . . . . . . . . . . . 40 4 —
Impairment of natural gas and oil properties and other fixed assets . . . . . . 11,130 2,830 —
Impairment of investments . . . . . . . . . . . . . . . . . . . . . . . . . . . . . . . . . . . . . . . . 162 180 —
Other . . . . . . . . . . . . . . . . . . . . . . . . . . . . . . . . . . . . . . . . . . . . . . . . . . . . . . . . . 27 (2) 8
(Increase) decrease in accounts receivable . . . . . . . . . . . . . . . . . . . . . . . . . . — (78) (192)
(Increase) decrease in inventory and other assets . . . . . . . . . . . . . . . . . . . . (31) 56 (65)
Increase (decrease) in accounts payable, accrued liabilities and other . . . . (105) 76 430
Increase (decrease) in current and non-current revenues and royalties due
others . . . . . . . . . . . . . . . . . . . . . . . . . . . . . . . . . . . . . . . . . . . . . . . . . . . . . . . 159 4 126
Cash provided by operating activities . . . . . . . . . . . . . . . . . . . . . . . . . . . . . 4,356 5,357 4,974
CASH FLOWS FROM INVESTING ACTIVITIES:
Acquisitions of natural gas and oil companies, proved and unproved
properties, net of cash acquired . . . . . . . . . . . . . . . . . . . . . . . . . . . . . . . . . . (2,298) (8,593) (3,003)
Exploration and development of natural gas and oil properties . . . . . . . . . . (3,543) (6,104) (5,305)
Additions to other property and equipment . . . . . . . . . . . . . . . . . . . . . . . . . . . (1,683) (3,073) (1,439)
Additions to investments . . . . . . . . . . . . . . . . . . . . . . . . . . . . . . . . . . . . . . . . . . (40) (74) (8)
Proceeds from divestitures of proved and unproved properties and
leasehold . . . . . . . . . . . . . . . . . . . . . . . . . . . . . . . . . . . . . . . . . . . . . . . . . . . . 1,518 6,091 —
Proceeds from sale of volumetric production payments . . . . . . . . . . . . . . . . 408 1,579 1,089
Proceeds from sale of compressors . . . . . . . . . . . . . . . . . . . . . . . . . . . . . . . . 68 114 188
Proceeds from sale of drilling rigs and equipment . . . . . . . . . . . . . . . . . . . . . — 64 369
Proceeds from sale of investments . . . . . . . . . . . . . . . . . . . . . . . . . . . . . . . . . — 2 124
Deposits for acquisitions . . . . . . . . . . . . . . . . . . . . . . . . . . . . . . . . . . . . . . . . . . — (12) (15)
Proceeds from sale of other assets and other . . . . . . . . . . . . . . . . . . . . . . . . 108 41 36
Cash used in investing activities . . . . . . . . . . . . . . . . . . . . . . . . . . . . . . . . . (5,462) (9,965) (7,964)
The accompanying notes are an integral part of these consolidated financial statements.
82
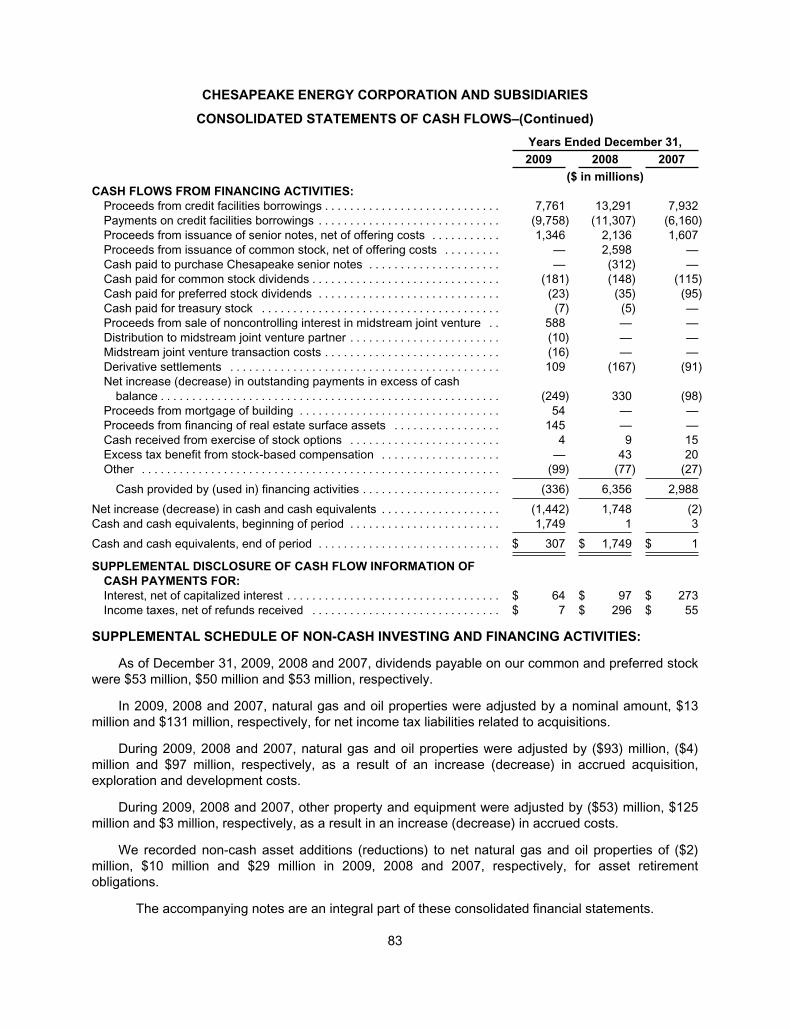
CHESAPEAKE ENERGY CORPORATION AND SUBSIDIARIES
CONSOLIDATED STATEMENTS OF CASH FLOWS–(Continued)
Years Ended December 31,
2009 2008 2007
($ in millions)
CASH FLOWS FROM FINANCING ACTIVITIES:
Proceeds from credit facilities borrowings . . . . . . . . . . . . . . . . . . . . . . . . . . . . 7,761 13,291 7,932
Payments on credit facilities borrowings . . . . . . . . . . . . . . . . . . . . . . . . . . . . . (9,758) (11,307) (6,160)
Proceeds from issuance of senior notes, net of offering costs . . . . . . . . . . . 1,346 2,136 1,607
Proceeds from issuance of common stock, net of offering costs . . . . . . . . . — 2,598 —
Cash paid to purchase Chesapeake senior notes . . . . . . . . . . . . . . . . . . . . . — (312) —
Cash paid for common stock dividends . . . . . . . . . . . . . . . . . . . . . . . . . . . . . . (181) (148) (115)
Cash paid for preferred stock dividends . . . . . . . . . . . . . . . . . . . . . . . . . . . . . (23) (35) (95)
Cash paid for treasury stock . . . . . . . . . . . . . . . . . . . . . . . . . . . . . . . . . . . . . . (7) (5) —
Proceeds from sale of noncontrolling interest in midstream joint venture . . 588 — —
Distribution to midstream joint venture partner . . . . . . . . . . . . . . . . . . . . . . . . (10) — —
Midstream joint venture transaction costs . . . . . . . . . . . . . . . . . . . . . . . . . . . . (16) — —
Derivative settlements . . . . . . . . . . . . . . . . . . . . . . . . . . . . . . . . . . . . . . . . . . . 109 (167) (91)
Net increase (decrease) in outstanding payments in excess of cash
balance . . . . . . . . . . . . . . . . . . . . . . . . . . . . . . . . . . . . . . . . . . . . . . . . . . . . . . (249) 330 (98)
Proceeds from mortgage of building . . . . . . . . . . . . . . . . . . . . . . . . . . . . . . . . 54 — —
Proceeds from financing of real estate surface assets . . . . . . . . . . . . . . . . . 145 — —
Cash received from exercise of stock options . . . . . . . . . . . . . . . . . . . . . . . . 4 9 15
Excess tax benefit from stock-based compensation . . . . . . . . . . . . . . . . . . . — 43 20
Other . . . . . . . . . . . . . . . . . . . . . . . . . . . . . . . . . . . . . . . . . . . . . . . . . . . . . . . . . (99) (77) (27)
Cash provided by (used in) financing activities . . . . . . . . . . . . . . . . . . . . . . (336) 6,356 2,988
Net increase (decrease) in cash and cash equivalents . . . . . . . . . . . . . . . . . . . (1,442) 1,748 (2)
Cash and cash equivalents, beginning of period . . . . . . . . . . . . . . . . . . . . . . . . 1,749 1 3
Cash and cash equivalents, end of period . . . . . . . . . . . . . . . . . . . . . . . . . . . . . $ 307 $ 1,749 $ 1
SUPPLEMENTAL DISCLOSURE OF CASH FLOW INFORMATION OF
CASH PAYMENTS FOR:
Interest, net of capitalized interest . . . . . . . . . . . . . . . . . . . . . . . . . . . . . . . . . . $ 64 $ 97 $ 273
Income taxes, net of refunds received . . . . . . . . . . . . . . . . . . . . . . . . . . . . . . $ 7 $ 296 $ 55
SUPPLEMENTAL SCHEDULE OF NON-CASH INVESTING AND FINANCING ACTIVITIES:
As of December 31, 2009, 2008 and 2007, dividends payable on our common and preferred stock
were $53 million, $50 million and $53 million, respectively.
In 2009, 2008 and 2007, natural gas and oil properties were adjusted by a nominal amount, $13
million and $131 million, respectively, for net income tax liabilities related to acquisitions.
During 2009, 2008 and 2007, natural gas and oil properties were adjusted by ($93) million, ($4)
million and $97 million, respectively, as a result of an increase (decrease) in accrued acquisition,
exploration and development costs.
During 2009, 2008 and 2007, other property and equipment were adjusted by ($53) million, $125
million and $3 million, respectively, as a result in an increase (decrease) in accrued costs.
We recorded non-cash asset additions (reductions) to net natural gas and oil properties of ($2)
million, $10 million and $29 million in 2009, 2008 and 2007, respectively, for asset retirement
obligations.
The accompanying notes are an integral part of these consolidated financial statements.
83
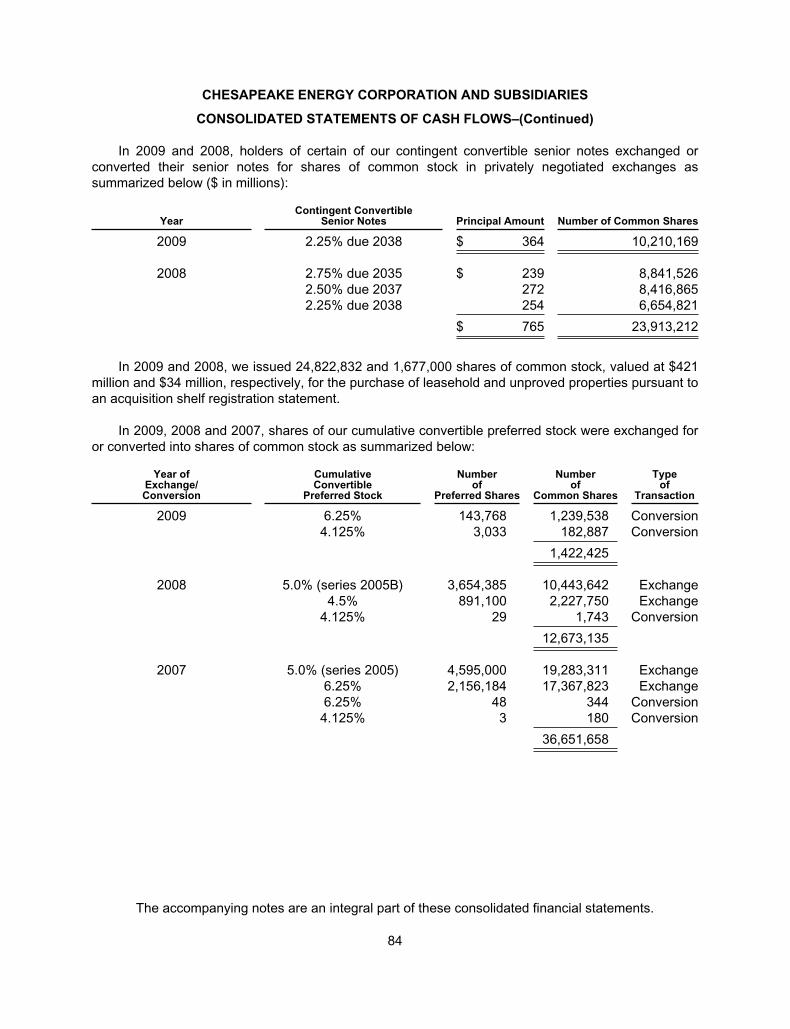
CHESAPEAKE ENERGY CORPORATION AND SUBSIDIARIES
CONSOLIDATED STATEMENTS OF CASH FLOWS–(Continued)
In 2009 and 2008, holders of certain of our contingent convertible senior notes exchanged or
converted their senior notes for shares of common stock in privately negotiated exchanges as
summarized below ($ in millions):
YearContingent Convertible
Senior Notes Principal Amount Number of Common Shares
2009 2.25% due 2038 $ 364 10,210,169
2008 2.75% due 2035 $ 239 8,841,526
2.50% due 2037 272 8,416,865
2.25% due 2038 254 6,654,821
$ 765 23,913,212
In 2009 and 2008, we issued 24,822,832 and 1,677,000 shares of common stock, valued at $421
million and $34 million, respectively, for the purchase of leasehold and unproved properties pursuant to
an acquisition shelf registration statement.
In 2009, 2008 and 2007, shares of our cumulative convertible preferred stock were exchanged for
or converted into shares of common stock as summarized below:
Year ofExchange/Conversion
CumulativeConvertible
Preferred Stock
Numberof
Preferred Shares
Numberof
Common Shares
Typeof
Transaction
2009 6.25% 143,768 1,239,538 Conversion
4.125% 3,033 182,887 Conversion
1,422,425
2008 5.0% (series 2005B) 3,654,385 10,443,642 Exchange
4.5% 891,100 2,227,750 Exchange
4.125% 29 1,743 Conversion
12,673,135
2007 5.0% (series 2005) 4,595,000 19,283,311 Exchange
6.25% 2,156,184 17,367,823 Exchange
6.25% 48 344 Conversion
4.125% 3 180 Conversion
36,651,658
The accompanying notes are an integral part of these consolidated financial statements.
84
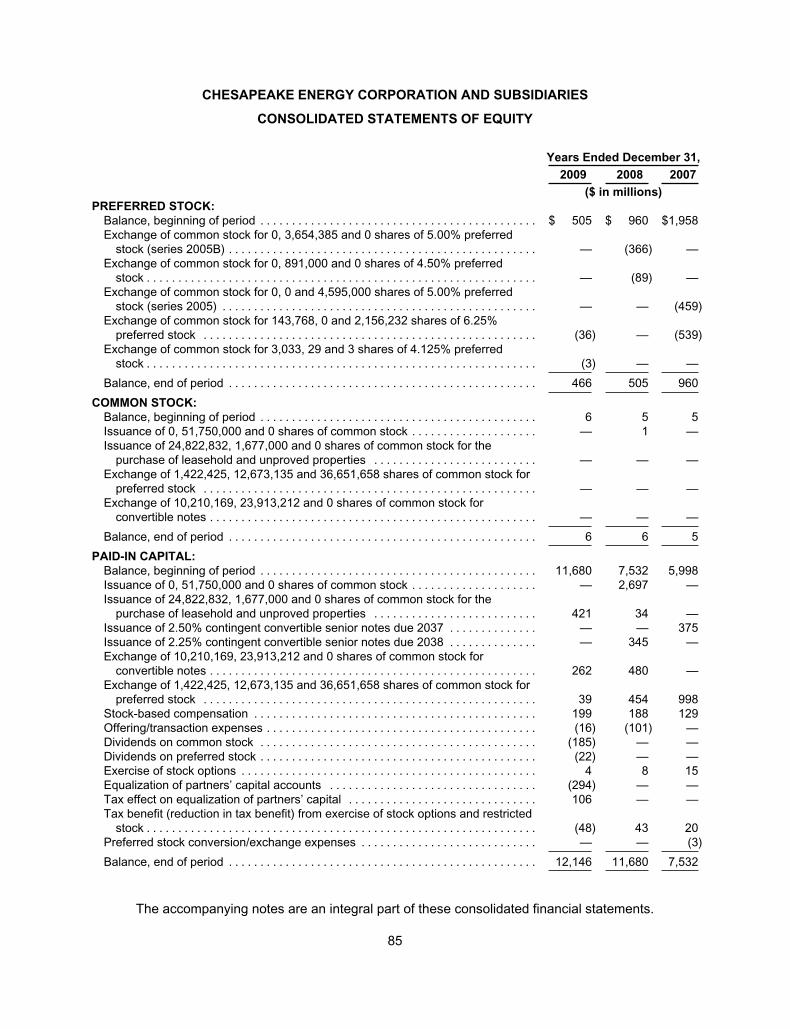
CHESAPEAKE ENERGY CORPORATION AND SUBSIDIARIES
CONSOLIDATED STATEMENTS OF EQUITY
Years Ended December 31,
2009 2008 2007
($ in millions)
PREFERRED STOCK:
Balance, beginning of period . . . . . . . . . . . . . . . . . . . . . . . . . . . . . . . . . . . . . . . . . . . . $ 505 $ 960 $1,958Exchange of common stock for 0, 3,654,385 and 0 shares of 5.00% preferred
stock (series 2005B) . . . . . . . . . . . . . . . . . . . . . . . . . . . . . . . . . . . . . . . . . . . . . . . . . — (366) —Exchange of common stock for 0, 891,000 and 0 shares of 4.50% preferred
stock . . . . . . . . . . . . . . . . . . . . . . . . . . . . . . . . . . . . . . . . . . . . . . . . . . . . . . . . . . . . . . — (89) —Exchange of common stock for 0, 0 and 4,595,000 shares of 5.00% preferred
stock (series 2005) . . . . . . . . . . . . . . . . . . . . . . . . . . . . . . . . . . . . . . . . . . . . . . . . . . — — (459)Exchange of common stock for 143,768, 0 and 2,156,232 shares of 6.25%
preferred stock . . . . . . . . . . . . . . . . . . . . . . . . . . . . . . . . . . . . . . . . . . . . . . . . . . . . . (36) — (539)Exchange of common stock for 3,033, 29 and 3 shares of 4.125% preferred
stock . . . . . . . . . . . . . . . . . . . . . . . . . . . . . . . . . . . . . . . . . . . . . . . . . . . . . . . . . . . . . . (3) — —
Balance, end of period . . . . . . . . . . . . . . . . . . . . . . . . . . . . . . . . . . . . . . . . . . . . . . . . . 466 505 960
COMMON STOCK:
Balance, beginning of period . . . . . . . . . . . . . . . . . . . . . . . . . . . . . . . . . . . . . . . . . . . . 6 5 5Issuance of 0, 51,750,000 and 0 shares of common stock . . . . . . . . . . . . . . . . . . . . — 1 —Issuance of 24,822,832, 1,677,000 and 0 shares of common stock for the
purchase of leasehold and unproved properties . . . . . . . . . . . . . . . . . . . . . . . . . . — — —Exchange of 1,422,425, 12,673,135 and 36,651,658 shares of common stock for
preferred stock . . . . . . . . . . . . . . . . . . . . . . . . . . . . . . . . . . . . . . . . . . . . . . . . . . . . . — — —Exchange of 10,210,169, 23,913,212 and 0 shares of common stock for
convertible notes . . . . . . . . . . . . . . . . . . . . . . . . . . . . . . . . . . . . . . . . . . . . . . . . . . . . — — —
Balance, end of period . . . . . . . . . . . . . . . . . . . . . . . . . . . . . . . . . . . . . . . . . . . . . . . . . 6 6 5
PAID-IN CAPITAL:
Balance, beginning of period . . . . . . . . . . . . . . . . . . . . . . . . . . . . . . . . . . . . . . . . . . . . 11,680 7,532 5,998Issuance of 0, 51,750,000 and 0 shares of common stock . . . . . . . . . . . . . . . . . . . . — 2,697 —Issuance of 24,822,832, 1,677,000 and 0 shares of common stock for the
purchase of leasehold and unproved properties . . . . . . . . . . . . . . . . . . . . . . . . . . 421 34 —Issuance of 2.50% contingent convertible senior notes due 2037 . . . . . . . . . . . . . . — — 375Issuance of 2.25% contingent convertible senior notes due 2038 . . . . . . . . . . . . . . — 345 —Exchange of 10,210,169, 23,913,212 and 0 shares of common stock for
convertible notes . . . . . . . . . . . . . . . . . . . . . . . . . . . . . . . . . . . . . . . . . . . . . . . . . . . . 262 480 —Exchange of 1,422,425, 12,673,135 and 36,651,658 shares of common stock for
preferred stock . . . . . . . . . . . . . . . . . . . . . . . . . . . . . . . . . . . . . . . . . . . . . . . . . . . . . 39 454 998Stock-based compensation . . . . . . . . . . . . . . . . . . . . . . . . . . . . . . . . . . . . . . . . . . . . . 199 188 129Offering/transaction expenses . . . . . . . . . . . . . . . . . . . . . . . . . . . . . . . . . . . . . . . . . . . (16) (101) —Dividends on common stock . . . . . . . . . . . . . . . . . . . . . . . . . . . . . . . . . . . . . . . . . . . . (185) — —Dividends on preferred stock . . . . . . . . . . . . . . . . . . . . . . . . . . . . . . . . . . . . . . . . . . . . (22) — —Exercise of stock options . . . . . . . . . . . . . . . . . . . . . . . . . . . . . . . . . . . . . . . . . . . . . . . 4 8 15Equalization of partners’ capital accounts . . . . . . . . . . . . . . . . . . . . . . . . . . . . . . . . . (294) — —Tax effect on equalization of partners’ capital . . . . . . . . . . . . . . . . . . . . . . . . . . . . . . 106 — —Tax benefit (reduction in tax benefit) from exercise of stock options and restricted
stock . . . . . . . . . . . . . . . . . . . . . . . . . . . . . . . . . . . . . . . . . . . . . . . . . . . . . . . . . . . . . . (48) 43 20Preferred stock conversion/exchange expenses . . . . . . . . . . . . . . . . . . . . . . . . . . . . — — (3)
Balance, end of period . . . . . . . . . . . . . . . . . . . . . . . . . . . . . . . . . . . . . . . . . . . . . . . . . 12,146 11,680 7,532
The accompanying notes are an integral part of these consolidated financial statements.
85
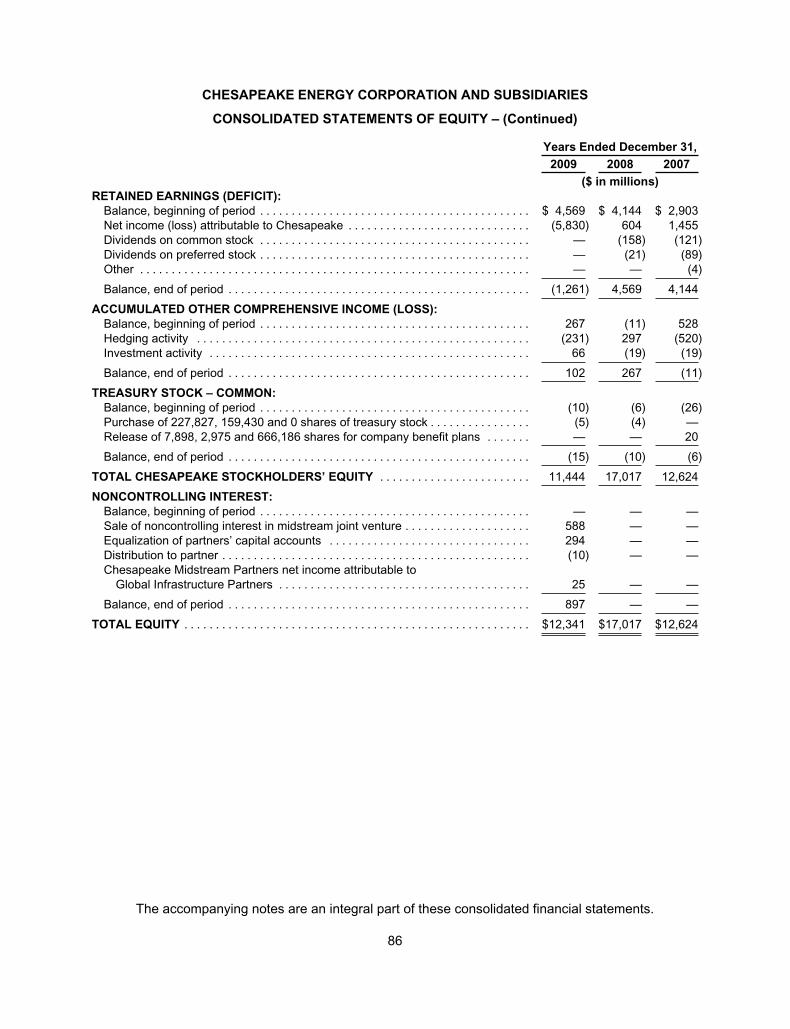
CHESAPEAKE ENERGY CORPORATION AND SUBSIDIARIES
CONSOLIDATED STATEMENTS OF EQUITY – (Continued)
Years Ended December 31,
2009 2008 2007
($ in millions)
RETAINED EARNINGS (DEFICIT):
Balance, beginning of period . . . . . . . . . . . . . . . . . . . . . . . . . . . . . . . . . . . . . . . . . . . $ 4,569 $ 4,144 $ 2,903
Net income (loss) attributable to Chesapeake . . . . . . . . . . . . . . . . . . . . . . . . . . . . . (5,830) 604 1,455
Dividends on common stock . . . . . . . . . . . . . . . . . . . . . . . . . . . . . . . . . . . . . . . . . . . — (158) (121)
Dividends on preferred stock . . . . . . . . . . . . . . . . . . . . . . . . . . . . . . . . . . . . . . . . . . . — (21) (89)
Other . . . . . . . . . . . . . . . . . . . . . . . . . . . . . . . . . . . . . . . . . . . . . . . . . . . . . . . . . . . . . . — — (4)
Balance, end of period . . . . . . . . . . . . . . . . . . . . . . . . . . . . . . . . . . . . . . . . . . . . . . . . (1,261) 4,569 4,144
ACCUMULATED OTHER COMPREHENSIVE INCOME (LOSS):
Balance, beginning of period . . . . . . . . . . . . . . . . . . . . . . . . . . . . . . . . . . . . . . . . . . . 267 (11) 528
Hedging activity . . . . . . . . . . . . . . . . . . . . . . . . . . . . . . . . . . . . . . . . . . . . . . . . . . . . . (231) 297 (520)
Investment activity . . . . . . . . . . . . . . . . . . . . . . . . . . . . . . . . . . . . . . . . . . . . . . . . . . . 66 (19) (19)
Balance, end of period . . . . . . . . . . . . . . . . . . . . . . . . . . . . . . . . . . . . . . . . . . . . . . . . 102 267 (11)
TREASURY STOCK – COMMON:
Balance, beginning of period . . . . . . . . . . . . . . . . . . . . . . . . . . . . . . . . . . . . . . . . . . . (10) (6) (26)
Purchase of 227,827, 159,430 and 0 shares of treasury stock . . . . . . . . . . . . . . . . (5) (4) —
Release of 7,898, 2,975 and 666,186 shares for company benefit plans . . . . . . . — — 20
Balance, end of period . . . . . . . . . . . . . . . . . . . . . . . . . . . . . . . . . . . . . . . . . . . . . . . . (15) (10) (6)
TOTAL CHESAPEAKE STOCKHOLDERS’ EQUITY . . . . . . . . . . . . . . . . . . . . . . . . 11,444 17,017 12,624
NONCONTROLLING INTEREST:
Balance, beginning of period . . . . . . . . . . . . . . . . . . . . . . . . . . . . . . . . . . . . . . . . . . . — — —
Sale of noncontrolling interest in midstream joint venture . . . . . . . . . . . . . . . . . . . . 588 — —
Equalization of partners’ capital accounts . . . . . . . . . . . . . . . . . . . . . . . . . . . . . . . . 294 — —
Distribution to partner . . . . . . . . . . . . . . . . . . . . . . . . . . . . . . . . . . . . . . . . . . . . . . . . . (10) — —
Chesapeake Midstream Partners net income attributable to
Global Infrastructure Partners . . . . . . . . . . . . . . . . . . . . . . . . . . . . . . . . . . . . . . . . 25 — —
Balance, end of period . . . . . . . . . . . . . . . . . . . . . . . . . . . . . . . . . . . . . . . . . . . . . . . . 897 — —
TOTAL EQUITY . . . . . . . . . . . . . . . . . . . . . . . . . . . . . . . . . . . . . . . . . . . . . . . . . . . . . . . $12,341 $17,017 $12,624
The accompanying notes are an integral part of these consolidated financial statements.
86

CHESAPEAKE ENERGY CORPORATION AND SUBSIDIARIES
CONSOLIDATED STATEMENTS OF COMPREHENSIVE INCOME
Years Ended December 31,
2009 2008 2007
($ in millions)
Net income (loss) . . . . . . . . . . . . . . . . . . . . . . . . . . . . . . . . . . . . . . . . . . . . . . . . . . . $ (5,805) $ 604 $ 1,455
Other comprehensive income (loss), net of income tax:
Change in fair value of derivative instruments, net of income taxes of $413
million, $113 million and ($56) million, respectively . . . . . . . . . . . . . . . . . . . . 677 186 (92)
Reclassification of (gain) loss on settled contracts, net of income taxes of
($540) million, $35 million and ($308) million, respectively . . . . . . . . . . . . . . (885) 55 (504)
Ineffective portion of derivatives qualifying for cash flow hedge accounting,
net of income taxes of ($14) million, $34 million and $46 million,
respectively . . . . . . . . . . . . . . . . . . . . . . . . . . . . . . . . . . . . . . . . . . . . . . . . . . . . (23) 56 76
Unrealized (gain) loss on marketable securities, net of income taxes of $14
million, ($12) million and ($11) million, respectively . . . . . . . . . . . . . . . . . . . . 23 (19) (19)
Reclassification of loss on investments, net of income taxes of $26 million,
$0 and $0, respectively . . . . . . . . . . . . . . . . . . . . . . . . . . . . . . . . . . . . . . . . . . . 43 — —
Comprehensive income (loss) . . . . . . . . . . . . . . . . . . . . . . . . . . . . . . . . . . . . . . . . . (5,970) 882 916
(Income) attributable to noncontrolling interest . . . . . . . . . . . . . . . . . . . . . . . . . . . . (25) — —
Comprehensive income (loss) available to Chesapeake . . . . . . . . . . . . . . . . . . . . $ (5,995) $ 882 $ 916
The accompanying notes are an integral part of these consolidated financial statements.
87
CHESAPEAKE ENERGY CORPORATION AND SUBSIDIARIES
NOTES TO CONSOLIDATED FINANCIAL STATEMENTS
1. Basis of Presentation and Summary of Significant Accounting Policies
Description of Company
Chesapeake Energy Corporation (“Chesapeake” or the “company”) is a natural gas and oil
exploration and production company engaged in the exploration, development and acquisition of
properties for the production of natural gas and crude oil from underground reservoirs, and we provide
marketing and other midstream services. Our properties are located in Alabama, Arkansas, Colorado,
Kansas, Kentucky, Louisiana, Maryland, Michigan, Mississippi, Montana, Nebraska, New Mexico, New
York, North Dakota, Ohio, Oklahoma, Pennsylvania, Tennessee, Texas, Utah, Virginia, West Virginia
and Wyoming.
Principles of Consolidation
The accompanying consolidated financial statements of Chesapeake include the accounts of our
direct and indirect wholly-owned subsidiaries, as well as our 50/50 joint venture with Global
Infrastructure Partners (GIP). Because of certain commitments and contractual arrangements with
GIP, the joint venture partnership qualifies as a variable interest entity and must be consolidated by the
company, as the primary beneficiary. All significant intercompany accounts and transactions have been
eliminated.
Change in Accounting Principle
On January 1, 2009, we adopted and applied retrospectively new accounting and reporting
standards for debt with conversion and other options. As a result, our prior year consolidated financial
statements have been retrospectively adjusted. See Note 3 for additional information on the application
of this accounting principle.
Accounting Estimates
The preparation of financial statements in conformity with generally accepted accounting principles
requires management to make estimates and assumptions that affect the reported amounts of assets
and liabilities and disclosure of contingent assets and liabilities at the dates of the financial statements
and the reported amounts of revenues and expenses during the reporting periods. Actual results could
differ from those estimates.
Cash Equivalents
For purposes of the consolidated financial statements, Chesapeake considers investments in all
highly liquid instruments with original maturities of three months or less at date of purchase to be cash
equivalents.
Accounts Receivable
Our accounts receivable are primarily from purchasers of natural gas and oil and exploration and
production companies which own interests in properties we operate. This industry concentration has
the potential to impact our overall exposure to credit risk, either positively or negatively, in that our
customers may be similarly affected by changes in economic, industry or other conditions. We
generally require letters of credit for receivables from customers which are judged to have
sub-standard credit, unless the credit risk can otherwise be mitigated.
88
CHESAPEAKE ENERGY CORPORATION AND SUBSIDIARIES
NOTES TO CONSOLIDATED FINANCIAL STATEMENTS – (Continued)
Accounts receivable consists of the following components:
December 31,
2009 2008
($ in millions)
Natural gas and oil sales . . . . . . . . . . . . . . . . . . . . . . . . . . . . . . . . . . . . . . . . . . . . . . . . . . . . . . . . $ 743 $ 738
Joint interest . . . . . . . . . . . . . . . . . . . . . . . . . . . . . . . . . . . . . . . . . . . . . . . . . . . . . . . . . . . . . . . . . . 394 424
Service operations . . . . . . . . . . . . . . . . . . . . . . . . . . . . . . . . . . . . . . . . . . . . . . . . . . . . . . . . . . . . . 7 20
Related parties(a) . . . . . . . . . . . . . . . . . . . . . . . . . . . . . . . . . . . . . . . . . . . . . . . . . . . . . . . . . . . . . . 15 —
Other . . . . . . . . . . . . . . . . . . . . . . . . . . . . . . . . . . . . . . . . . . . . . . . . . . . . . . . . . . . . . . . . . . . . . . . . 190 154
Allowance for doubtful accounts . . . . . . . . . . . . . . . . . . . . . . . . . . . . . . . . . . . . . . . . . . . . . . . . . . (24) (12)
Total accounts receivable . . . . . . . . . . . . . . . . . . . . . . . . . . . . . . . . . . . . . . . . . . . . . . . . . . . . . $ 1,325 $ 1,324
(a) See Note 6 for discussion of related party transactions.
Natural Gas and Oil Properties
Chesapeake follows the full-cost method of accounting under which all costs associated with
property acquisition, exploration and development activities are capitalized. We capitalize internal costs
that can be directly identified with our acquisition, exploration and development activities and do not
include any costs related to production, general corporate overhead or similar activities (see Note 10).
Capitalized costs are amortized on a composite unit-of-production method based on proved natural
gas and oil reserves. Estimates of our proved reserves as of December 31, 2009 were prepared by
both third party engineering firms and Chesapeake’s internal staff. Approximately 83% of these proved
reserves estimates (by volume) at year-end 2009 were prepared by independent engineering firms. In
addition, our internal engineers review and update our reserves on a quarterly basis. The average
composite rates used for depreciation, depletion and amortization were $1.51 per mcfe in 2009, $2.34
per mcfe in 2008 and $2.57 per mcfe in 2007.
Proceeds from the sale of properties are accounted for as reductions of capitalized costs unless
such sales involve a significant change in the relationship between costs and the value of proved
reserves or the underlying value of unproved properties, in which case a gain or loss is recognized.
The costs of unproved properties are excluded from amortization until the properties are
evaluated. We review all of our unevaluated properties quarterly to determine whether or not and to
what extent proved reserves have been assigned to the properties and otherwise if impairment has
occurred. Unevaluated properties are grouped by major prospect area where individual property costs
are not significant and are assessed individually when individual costs are significant.
We review the carrying value of our natural gas and oil properties under the full-cost accounting
rules of the Securities and Exchange Commission on a quarterly basis. This quarterly review is
referred to as a ceiling test. Under the ceiling test, capitalized costs, less accumulated amortization and
related deferred income taxes, may not exceed an amount equal to the sum of the present value of
estimated future net revenues (adjusted for cash flow hedges) less estimated future expenditures to be
incurred in developing and producing the proved reserves, less any related income tax effects. In 2009,
capitalized costs of natural gas and oil properties exceeded the estimated present value of future net
revenues from our proved reserves, net of related income tax considerations, resulting in a write-down
in the carrying value of natural gas and oil properties of $6.9 billion, net of tax. In calculating future net
revenues, effective December 31, 2009, current prices are calculated as the average natural gas and
oil prices during the preceding 12-month period prior to the end of the current reporting period,
89
CHESAPEAKE ENERGY CORPORATION AND SUBSIDIARIES
NOTES TO CONSOLIDATED FINANCIAL STATEMENTS – (Continued)
determined as the unweighted arithmetical average of prices on the first day of each month within the
12-month period and costs used are those as of the end of the appropriate quarterly period. Such
prices are utilized except where different prices are fixed and determinable from applicable contracts
for the remaining term of those contracts, including the effects of derivatives qualifying as cash flow
hedges. Based on average prices for the prior 12-month period for natural gas and oil as of
December 31, 2009, these cash flow hedges increased the full-cost ceiling by $1.1 billion, thereby
reducing the ceiling test write-down by the same amount. Our qualifying cash flow hedges as of
December 31, 2009, which consisted of swaps and collars, covered 281 bcfe and 22 bcfe in 2010 and
2011, respectively. Our natural gas and oil hedging activities are discussed in Note 9 of these
consolidated financial statements.
Two primary factors impacting the ceiling test are reserve levels and natural gas and oil prices,
and their associated impact on the present value of estimated future net revenues. Revisions to
estimates of natural gas and oil reserves and/or an increase or decrease in prices can have a material
impact on the present value of estimated future net revenues. Any excess of the net book value, less
deferred income taxes, is generally written off as an expense.
We account for seismic costs in accordance with Rule 4-10 of Regulation S-X. Specifically, Rule
4-10 requires that all companies that use the full-cost method capitalize exploration costs as part of
their natural gas and oil properties (i.e., full-cost pool). Exploration costs may be incurred both before
acquiring the related property and after acquiring the property. Further, exploration costs include,
among other things, geological and geophysical studies and salaries and other expenses of geologists,
geophysical crews and others conducting those studies. Such costs are capitalized as incurred.
Seismic costs directly associated with the acquisition and evaluation of unproved properties are
excluded from the amortization computation until it is determined whether or not proved reserves can
be assigned to the properties. The company reviews its unproved properties and associated seismic
costs quarterly in order to ascertain whether impairment has occurred. To the extent that seismic costs
cannot be directly associated with specific unevaluated properties, they are included in the
amortization base as incurred.
Other Property and Equipment
Other property and equipment consists primarily of natural gas gathering and processing facilities,
drilling rigs, land, buildings and improvements, natural gas compressors, vehicles and office
equipment. Major renewals and betterments are capitalized while the costs of repairs and maintenance
are charged to expense as incurred. The costs of assets retired or otherwise disposed of and the
applicable accumulated depreciation are removed from the accounts, and the resulting gain or loss is
reflected in operations. Other property and equipment costs are depreciated on a straight-line basis. A
summary of other property and equipment and the useful lives is as follows:
December 31,
Useful Life2009 2008
($ in millions) (in years)Natural gas gathering systems and treating plants . . . . . . . . . . . . . . . . . . . . . $ 3,516 $ 2,717 20Buildings and improvements . . . . . . . . . . . . . . . . . . . . . . . . . . . . . . . . . . . . . . . 805 681 10 – 39Drilling rigs and equipment . . . . . . . . . . . . . . . . . . . . . . . . . . . . . . . . . . . . . . . . 687 430 3 – 15Natural gas compressors . . . . . . . . . . . . . . . . . . . . . . . . . . . . . . . . . . . . . . . . . . 325 184 20Land . . . . . . . . . . . . . . . . . . . . . . . . . . . . . . . . . . . . . . . . . . . . . . . . . . . . . . . . . . 868 832 —Other . . . . . . . . . . . . . . . . . . . . . . . . . . . . . . . . . . . . . . . . . . . . . . . . . . . . . . . . . . 550 482 2 – 7
Total . . . . . . . . . . . . . . . . . . . . . . . . . . . . . . . . . . . . . . . . . . . . . . . . . . . . . . . $ 6,751 $ 5,326
90
CHESAPEAKE ENERGY CORPORATION AND SUBSIDIARIES
NOTES TO CONSOLIDATED FINANCIAL STATEMENTS – (Continued)
Realization of the carrying value of other property and equipment is reviewed for possible
impairment whenever events or changes in circumstances indicate that the carrying amount may not
be recoverable. Assets are determined to be impaired if a forecast of undiscounted estimated future
net operating cash flows directly related to the asset including disposal value if any, is less than the
carrying amount of the asset. If any asset is determined to be impaired, the loss is measured as the
amount by which the carrying amount of the asset exceeds its fair value. An estimate of fair value is
based on the best information available, including prices for similar assets. For 2009, we recorded an
impairment of $86 million associated with certain of our midstream assets and $27 million associated
with certain of our service operations assets.
Investments
Investments in securities are accounted for under the equity method in circumstances where we
are deemed to exercise significant influence over the operating and investing policies of the investee
but do not have control. Under the equity method, we recognize our share of the investee’s earnings in
our consolidated statements of operations. Investments in securities not accounted for under the equity
method are accounted for under the cost method. Investments in marketable equity securities
accounted for under the cost method have been designated as available for sale and, as such, are
recorded at fair value. We evaluate our investments for impairment in value and recognize a charge to
earnings when any identified impairment is judged to be other than temporary. For 2009, we recorded
an impairment of $162 million associated with certain of our investments. See Note 14 for further
discussion of investments.
Capitalized Interest
During 2009, 2008 and 2007, interest of approximately $627 million, $585 million and $311 million,
respectively, was capitalized on significant investments in unproved properties that were not being
currently depreciated, depleted or amortized and on which exploration activities were in progress. An
additional $6 million was capitalized in 2009 on midstream assets which were under construction.
Interest is capitalized using a weighted average interest rate based on our outstanding borrowings.
Accounts Payable and Accrued Liabilities
Included in accounts payable at December 31, 2009 and 2008, respectively, are liabilities of
approximately $231 million and $480 million representing the amount by which checks issued, but not
yet presented to our banks for collection, exceeded balances in applicable bank accounts. Other
accrued liabilities include $198 million and $258 million of accrued drilling costs as of December 31,
2009 and 2008, respectively.
Debt Issuance Costs
Included in other assets are costs associated with the issuance of our senior notes and costs
associated with our revolving bank credit facilities and hedging facilities. The remaining unamortized
debt issue costs at December 31, 2009 and 2008 totaled $162 million and $142 million, respectively,
and are being amortized over the life of the senior notes, revolving credit facilities or hedging facilities.
Asset Retirement Obligations
We recognize liabilities for retirement obligations associated with the retirement of tangible long-
lived assets that result from the acquisition, construction and development of the assets. We recognize
91
CHESAPEAKE ENERGY CORPORATION AND SUBSIDIARIES
NOTES TO CONSOLIDATED FINANCIAL STATEMENTS – (Continued)
the fair value of a liability for a retirement obligation in the period in which the liability is incurred. For
natural gas and oil properties, this is the period in which a natural gas or oil well is acquired or drilled.
The asset retirement obligation is capitalized as part of the carrying amount of our natural gas and oil
properties at its discounted fair value. The liability is then accreted each period until the liability is
settled or the well is sold, at which time the liability is reversed.
Revenue Recognition
Natural Gas and Oil Sales. Revenue from the sale of natural gas and oil is recognized when title
passes, net of royalties.
Natural Gas Imbalances. We follow the “sales method” of accounting for our natural gas revenue
whereby we recognize sales revenue on all natural gas sold to our purchasers, regardless of whether
the sales are proportionate to our ownership in the property. An asset or a liability is recognized to the
extent that we have an imbalance in excess of the remaining natural gas reserves on the underlying
properties. The natural gas imbalance net position at December 31, 2009 and 2008 was a liability of $7
million and $6 million, respectively.
Marketing Sales. Chesapeake takes title to the natural gas it purchases from other working
interest owners in operated wells, arranges for transportation and delivers the natural gas to third
parties, at which time revenues are recorded. Chesapeake’s results of operations related to its natural
gas and oil marketing activities are presented on a “gross” basis, because we act as a principal rather
than an agent. All significant intercompany accounts and transactions have been eliminated.
Hedging
Chesapeake uses commodity price and financial risk management instruments to mitigate our
exposure to price fluctuations in natural gas and oil and interest rates. Recognized gains and losses on
derivative contracts are reported as a component of the related transaction. Results of natural gas and
oil derivative transactions are reflected in natural gas and oil sales and results of interest rate hedging
transactions are reflected in interest expense. The changes in fair value of derivative instruments not
qualifying for designation as either cash flow or fair value hedges that occur prior to maturity are
reported currently in the consolidated statement of operations as unrealized gains (losses) within
natural gas and oil sales or interest expense.
We have established the fair value of our derivative instruments utilizing established index prices,
volatility curves and discount factors. These estimates are compared to our counterparty values for
reasonableness. Derivative transactions are also subject to the risk that counterparties will be unable
to meet their obligations. Such non-performance risk is considered in the valuation of our derivative
instruments, but to date has not had a material impact on the values of our derivatives. The values we
report in our financial statements are as of a point in time and subsequently change as these estimates
are revised to reflect actual results, changes in market conditions and other factors.
Accounting guidance for derivative instruments and hedging activities, establishes accounting and
reporting standards requiring that derivative instruments (including certain derivative instruments
embedded in other contracts) be recorded at fair value and included in the consolidated balance sheet
as assets or liabilities. The accounting for changes in the fair value of a derivative instrument depends
on the intended use of the derivative and the resulting designation, which is established at the
inception of a derivative. For derivative instruments designated as cash flow hedges, changes in fair
92
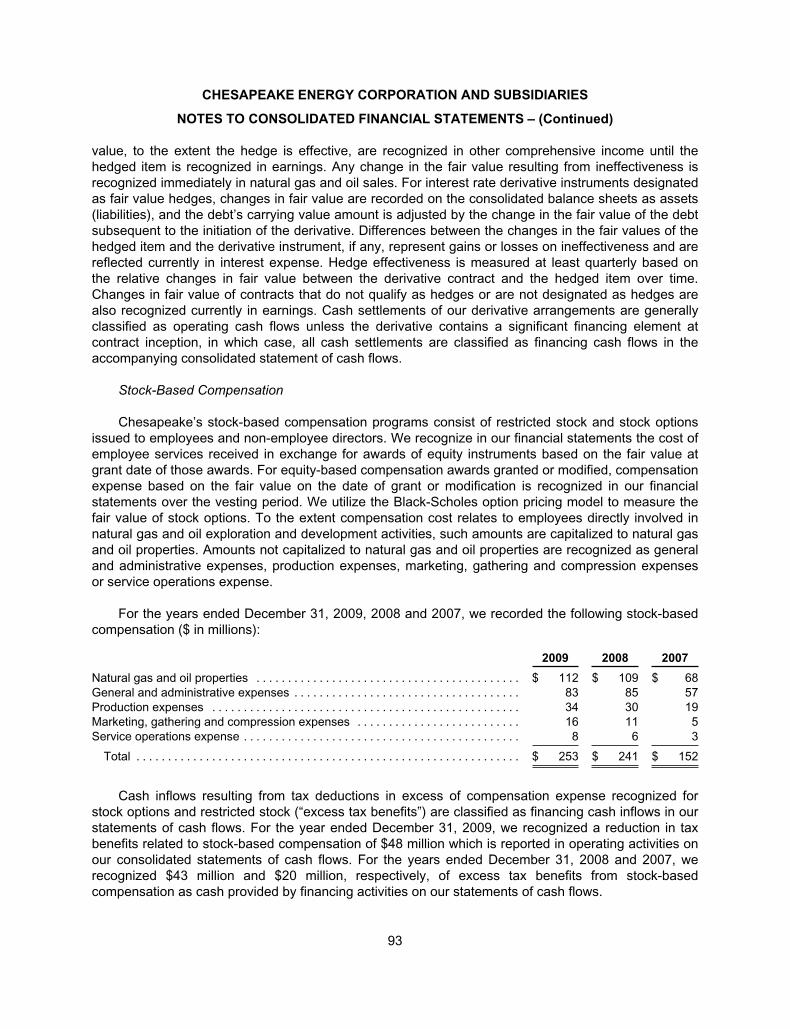
CHESAPEAKE ENERGY CORPORATION AND SUBSIDIARIES
NOTES TO CONSOLIDATED FINANCIAL STATEMENTS – (Continued)
value, to the extent the hedge is effective, are recognized in other comprehensive income until the
hedged item is recognized in earnings. Any change in the fair value resulting from ineffectiveness is
recognized immediately in natural gas and oil sales. For interest rate derivative instruments designated
as fair value hedges, changes in fair value are recorded on the consolidated balance sheets as assets
(liabilities), and the debt’s carrying value amount is adjusted by the change in the fair value of the debt
subsequent to the initiation of the derivative. Differences between the changes in the fair values of the
hedged item and the derivative instrument, if any, represent gains or losses on ineffectiveness and are
reflected currently in interest expense. Hedge effectiveness is measured at least quarterly based on
the relative changes in fair value between the derivative contract and the hedged item over time.
Changes in fair value of contracts that do not qualify as hedges or are not designated as hedges are
also recognized currently in earnings. Cash settlements of our derivative arrangements are generally
classified as operating cash flows unless the derivative contains a significant financing element at
contract inception, in which case, all cash settlements are classified as financing cash flows in the
accompanying consolidated statement of cash flows.
Stock-Based Compensation
Chesapeake’s stock-based compensation programs consist of restricted stock and stock options
issued to employees and non-employee directors. We recognize in our financial statements the cost of
employee services received in exchange for awards of equity instruments based on the fair value at
grant date of those awards. For equity-based compensation awards granted or modified, compensation
expense based on the fair value on the date of grant or modification is recognized in our financial
statements over the vesting period. We utilize the Black-Scholes option pricing model to measure the
fair value of stock options. To the extent compensation cost relates to employees directly involved in
natural gas and oil exploration and development activities, such amounts are capitalized to natural gas
and oil properties. Amounts not capitalized to natural gas and oil properties are recognized as general
and administrative expenses, production expenses, marketing, gathering and compression expenses
or service operations expense.
For the years ended December 31, 2009, 2008 and 2007, we recorded the following stock-based
compensation ($ in millions):
2009 2008 2007
Natural gas and oil properties . . . . . . . . . . . . . . . . . . . . . . . . . . . . . . . . . . . . . . . . . . $ 112 $ 109 $ 68
General and administrative expenses . . . . . . . . . . . . . . . . . . . . . . . . . . . . . . . . . . . . 83 85 57
Production expenses . . . . . . . . . . . . . . . . . . . . . . . . . . . . . . . . . . . . . . . . . . . . . . . . . 34 30 19
Marketing, gathering and compression expenses . . . . . . . . . . . . . . . . . . . . . . . . . . 16 11 5
Service operations expense . . . . . . . . . . . . . . . . . . . . . . . . . . . . . . . . . . . . . . . . . . . . 8 6 3
Total . . . . . . . . . . . . . . . . . . . . . . . . . . . . . . . . . . . . . . . . . . . . . . . . . . . . . . . . . . . . . $ 253 $ 241 $ 152
Cash inflows resulting from tax deductions in excess of compensation expense recognized for
stock options and restricted stock (“excess tax benefits”) are classified as financing cash inflows in our
statements of cash flows. For the year ended December 31, 2009, we recognized a reduction in tax
benefits related to stock-based compensation of $48 million which is reported in operating activities on
our consolidated statements of cash flows. For the years ended December 31, 2008 and 2007, we
recognized $43 million and $20 million, respectively, of excess tax benefits from stock-based
compensation as cash provided by financing activities on our statements of cash flows.
93
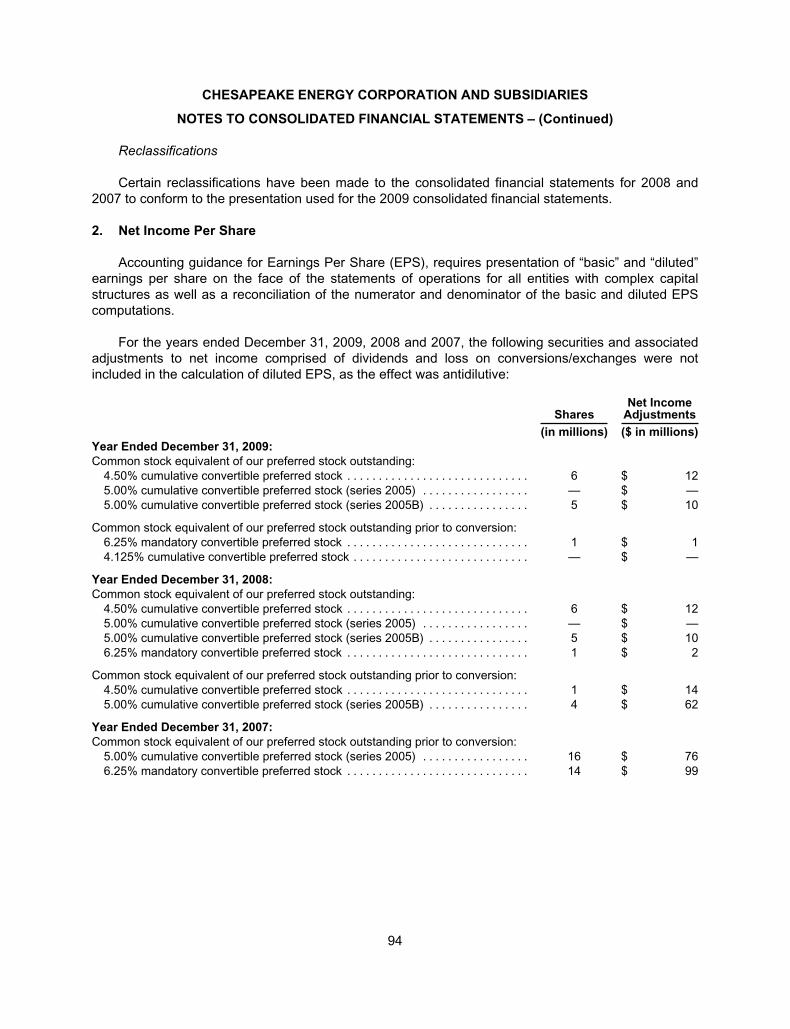
CHESAPEAKE ENERGY CORPORATION AND SUBSIDIARIES
NOTES TO CONSOLIDATED FINANCIAL STATEMENTS – (Continued)
Reclassifications
Certain reclassifications have been made to the consolidated financial statements for 2008 and
2007 to conform to the presentation used for the 2009 consolidated financial statements.
2. Net Income Per Share
Accounting guidance for Earnings Per Share (EPS), requires presentation of “basic” and “diluted”
earnings per share on the face of the statements of operations for all entities with complex capital
structures as well as a reconciliation of the numerator and denominator of the basic and diluted EPS
computations.
For the years ended December 31, 2009, 2008 and 2007, the following securities and associated
adjustments to net income comprised of dividends and loss on conversions/exchanges were not
included in the calculation of diluted EPS, as the effect was antidilutive:
SharesNet Income
Adjustments
(in millions) ($ in millions)
Year Ended December 31, 2009:
Common stock equivalent of our preferred stock outstanding:
4.50% cumulative convertible preferred stock . . . . . . . . . . . . . . . . . . . . . . . . . . . . . 6 $ 12
5.00% cumulative convertible preferred stock (series 2005) . . . . . . . . . . . . . . . . . — $ —
5.00% cumulative convertible preferred stock (series 2005B) . . . . . . . . . . . . . . . . 5 $ 10
Common stock equivalent of our preferred stock outstanding prior to conversion:
6.25% mandatory convertible preferred stock . . . . . . . . . . . . . . . . . . . . . . . . . . . . . 1 $ 1
4.125% cumulative convertible preferred stock . . . . . . . . . . . . . . . . . . . . . . . . . . . . — $ —
Year Ended December 31, 2008:
Common stock equivalent of our preferred stock outstanding:
4.50% cumulative convertible preferred stock . . . . . . . . . . . . . . . . . . . . . . . . . . . . . 6 $ 12
5.00% cumulative convertible preferred stock (series 2005) . . . . . . . . . . . . . . . . . — $ —
5.00% cumulative convertible preferred stock (series 2005B) . . . . . . . . . . . . . . . . 5 $ 10
6.25% mandatory convertible preferred stock . . . . . . . . . . . . . . . . . . . . . . . . . . . . . 1 $ 2
Common stock equivalent of our preferred stock outstanding prior to conversion:
4.50% cumulative convertible preferred stock . . . . . . . . . . . . . . . . . . . . . . . . . . . . . 1 $ 14
5.00% cumulative convertible preferred stock (series 2005B) . . . . . . . . . . . . . . . . 4 $ 62
Year Ended December 31, 2007:
Common stock equivalent of our preferred stock outstanding prior to conversion:
5.00% cumulative convertible preferred stock (series 2005) . . . . . . . . . . . . . . . . . 16 $ 76
6.25% mandatory convertible preferred stock . . . . . . . . . . . . . . . . . . . . . . . . . . . . . 14 $ 99
94
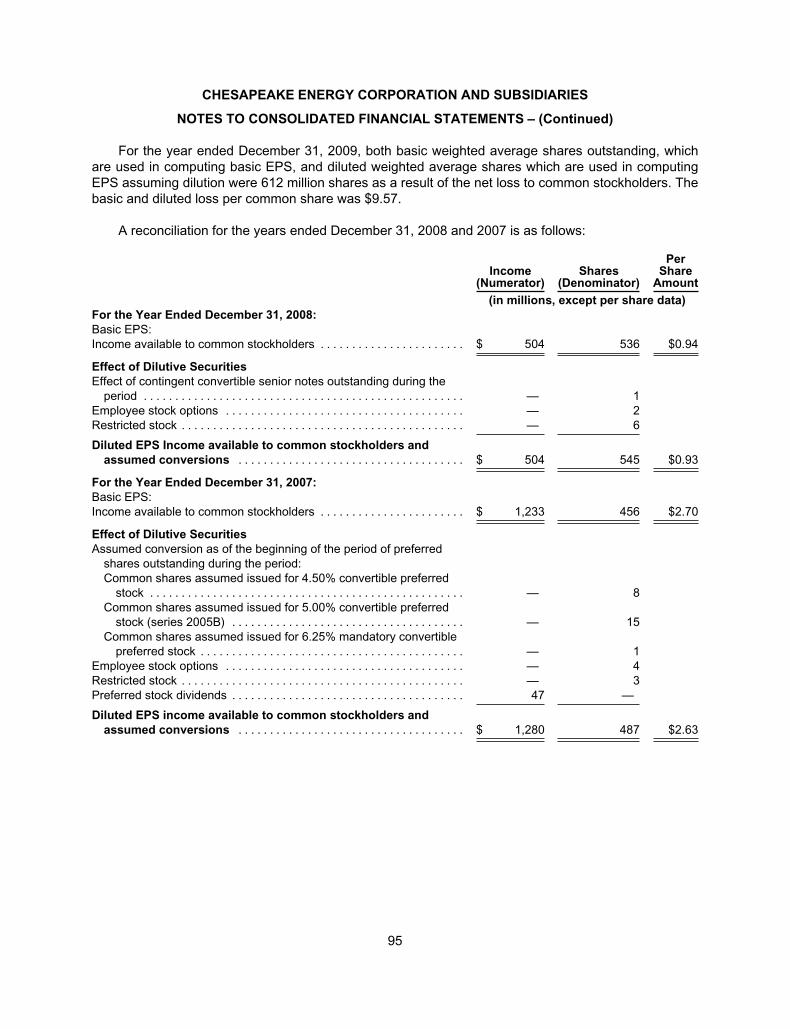
CHESAPEAKE ENERGY CORPORATION AND SUBSIDIARIES
NOTES TO CONSOLIDATED FINANCIAL STATEMENTS – (Continued)
For the year ended December 31, 2009, both basic weighted average shares outstanding, which
are used in computing basic EPS, and diluted weighted average shares which are used in computing
EPS assuming dilution were 612 million shares as a result of the net loss to common stockholders. The
basic and diluted loss per common share was $9.57.
A reconciliation for the years ended December 31, 2008 and 2007 is as follows:
Income(Numerator)
Shares(Denominator)
PerShare
Amount
(in millions, except per share data)
For the Year Ended December 31, 2008:
Basic EPS:
Income available to common stockholders . . . . . . . . . . . . . . . . . . . . . . . $ 504 536 $0.94
Effect of Dilutive Securities
Effect of contingent convertible senior notes outstanding during the
period . . . . . . . . . . . . . . . . . . . . . . . . . . . . . . . . . . . . . . . . . . . . . . . . . . . — 1
Employee stock options . . . . . . . . . . . . . . . . . . . . . . . . . . . . . . . . . . . . . . — 2
Restricted stock . . . . . . . . . . . . . . . . . . . . . . . . . . . . . . . . . . . . . . . . . . . . . — 6
Diluted EPS Income available to common stockholders and
assumed conversions . . . . . . . . . . . . . . . . . . . . . . . . . . . . . . . . . . . . $ 504 545 $0.93
For the Year Ended December 31, 2007:
Basic EPS:
Income available to common stockholders . . . . . . . . . . . . . . . . . . . . . . . $ 1,233 456 $2.70
Effect of Dilutive Securities
Assumed conversion as of the beginning of the period of preferred
shares outstanding during the period:
Common shares assumed issued for 4.50% convertible preferred
stock . . . . . . . . . . . . . . . . . . . . . . . . . . . . . . . . . . . . . . . . . . . . . . . . . . — 8
Common shares assumed issued for 5.00% convertible preferred
stock (series 2005B) . . . . . . . . . . . . . . . . . . . . . . . . . . . . . . . . . . . . . — 15
Common shares assumed issued for 6.25% mandatory convertible
preferred stock . . . . . . . . . . . . . . . . . . . . . . . . . . . . . . . . . . . . . . . . . . — 1
Employee stock options . . . . . . . . . . . . . . . . . . . . . . . . . . . . . . . . . . . . . . — 4
Restricted stock . . . . . . . . . . . . . . . . . . . . . . . . . . . . . . . . . . . . . . . . . . . . . — 3
Preferred stock dividends . . . . . . . . . . . . . . . . . . . . . . . . . . . . . . . . . . . . . 47 —
Diluted EPS income available to common stockholders and
assumed conversions . . . . . . . . . . . . . . . . . . . . . . . . . . . . . . . . . . . . $ 1,280 487 $2.63
95
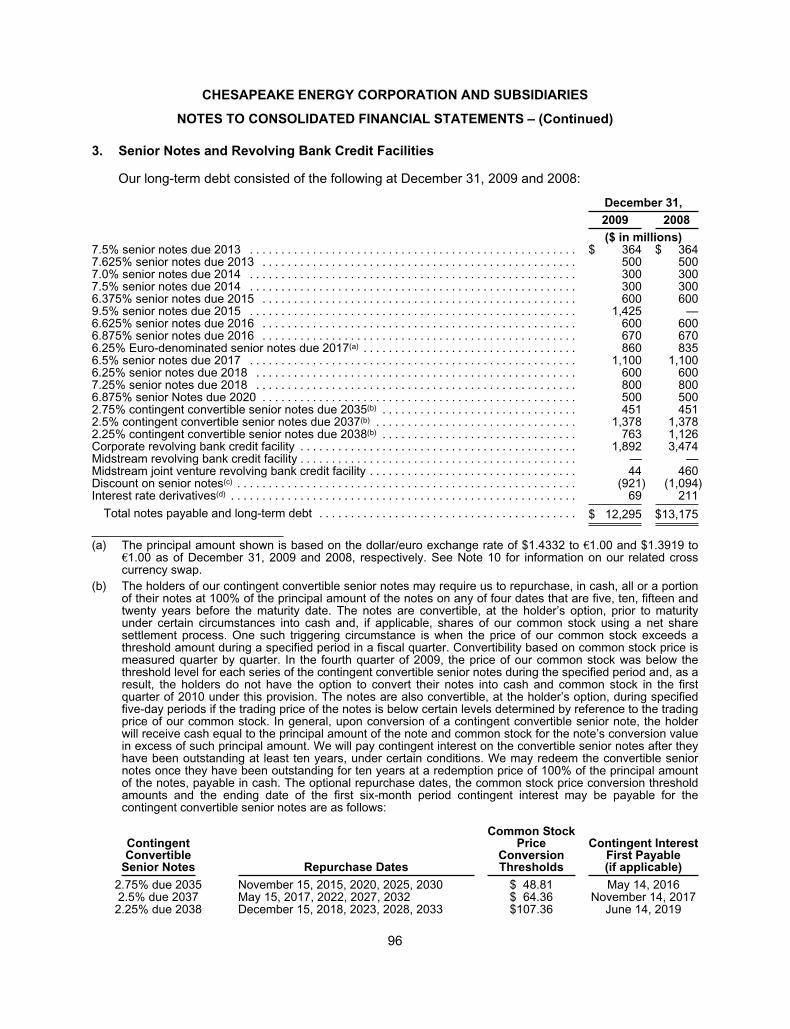
CHESAPEAKE ENERGY CORPORATION AND SUBSIDIARIES
NOTES TO CONSOLIDATED FINANCIAL STATEMENTS – (Continued)
3. Senior Notes and Revolving Bank Credit Facilities
Our long-term debt consisted of the following at December 31, 2009 and 2008:
December 31,
2009 2008
($ in millions)7.5% senior notes due 2013 . . . . . . . . . . . . . . . . . . . . . . . . . . . . . . . . . . . . . . . . . . . . . . . . . . . . $ 364 $ 3647.625% senior notes due 2013 . . . . . . . . . . . . . . . . . . . . . . . . . . . . . . . . . . . . . . . . . . . . . . . . . . 500 5007.0% senior notes due 2014 . . . . . . . . . . . . . . . . . . . . . . . . . . . . . . . . . . . . . . . . . . . . . . . . . . . . 300 3007.5% senior notes due 2014 . . . . . . . . . . . . . . . . . . . . . . . . . . . . . . . . . . . . . . . . . . . . . . . . . . . . 300 3006.375% senior notes due 2015 . . . . . . . . . . . . . . . . . . . . . . . . . . . . . . . . . . . . . . . . . . . . . . . . . . 600 6009.5% senior notes due 2015 . . . . . . . . . . . . . . . . . . . . . . . . . . . . . . . . . . . . . . . . . . . . . . . . . . . . 1,425 —6.625% senior notes due 2016 . . . . . . . . . . . . . . . . . . . . . . . . . . . . . . . . . . . . . . . . . . . . . . . . . . 600 6006.875% senior notes due 2016 . . . . . . . . . . . . . . . . . . . . . . . . . . . . . . . . . . . . . . . . . . . . . . . . . . 670 6706.25% Euro-denominated senior notes due 2017(a) . . . . . . . . . . . . . . . . . . . . . . . . . . . . . . . . . . 860 8356.5% senior notes due 2017 . . . . . . . . . . . . . . . . . . . . . . . . . . . . . . . . . . . . . . . . . . . . . . . . . . . . 1,100 1,1006.25% senior notes due 2018 . . . . . . . . . . . . . . . . . . . . . . . . . . . . . . . . . . . . . . . . . . . . . . . . . . . 600 6007.25% senior notes due 2018 . . . . . . . . . . . . . . . . . . . . . . . . . . . . . . . . . . . . . . . . . . . . . . . . . . . 800 8006.875% senior Notes due 2020 . . . . . . . . . . . . . . . . . . . . . . . . . . . . . . . . . . . . . . . . . . . . . . . . . . 500 5002.75% contingent convertible senior notes due 2035(b) . . . . . . . . . . . . . . . . . . . . . . . . . . . . . . . 451 4512.5% contingent convertible senior notes due 2037(b) . . . . . . . . . . . . . . . . . . . . . . . . . . . . . . . . 1,378 1,3782.25% contingent convertible senior notes due 2038(b) . . . . . . . . . . . . . . . . . . . . . . . . . . . . . . . 763 1,126Corporate revolving bank credit facility . . . . . . . . . . . . . . . . . . . . . . . . . . . . . . . . . . . . . . . . . . . . 1,892 3,474Midstream revolving bank credit facility . . . . . . . . . . . . . . . . . . . . . . . . . . . . . . . . . . . . . . . . . . . . — —Midstream joint venture revolving bank credit facility . . . . . . . . . . . . . . . . . . . . . . . . . . . . . . . . . 44 460Discount on senior notes(c) . . . . . . . . . . . . . . . . . . . . . . . . . . . . . . . . . . . . . . . . . . . . . . . . . . . . . . (921) (1,094)Interest rate derivatives(d) . . . . . . . . . . . . . . . . . . . . . . . . . . . . . . . . . . . . . . . . . . . . . . . . . . . . . . . 69 211
Total notes payable and long-term debt . . . . . . . . . . . . . . . . . . . . . . . . . . . . . . . . . . . . . . . . . $ 12,295 $13,175
(a) The principal amount shown is based on the dollar/euro exchange rate of $1.4332 to €1.00 and $1.3919 to€1.00 as of December 31, 2009 and 2008, respectively. See Note 10 for information on our related crosscurrency swap.
(b) The holders of our contingent convertible senior notes may require us to repurchase, in cash, all or a portionof their notes at 100% of the principal amount of the notes on any of four dates that are five, ten, fifteen andtwenty years before the maturity date. The notes are convertible, at the holder’s option, prior to maturityunder certain circumstances into cash and, if applicable, shares of our common stock using a net sharesettlement process. One such triggering circumstance is when the price of our common stock exceeds athreshold amount during a specified period in a fiscal quarter. Convertibility based on common stock price ismeasured quarter by quarter. In the fourth quarter of 2009, the price of our common stock was below thethreshold level for each series of the contingent convertible senior notes during the specified period and, as aresult, the holders do not have the option to convert their notes into cash and common stock in the firstquarter of 2010 under this provision. The notes are also convertible, at the holder’s option, during specifiedfive-day periods if the trading price of the notes is below certain levels determined by reference to the tradingprice of our common stock. In general, upon conversion of a contingent convertible senior note, the holderwill receive cash equal to the principal amount of the note and common stock for the note’s conversion valuein excess of such principal amount. We will pay contingent interest on the convertible senior notes after theyhave been outstanding at least ten years, under certain conditions. We may redeem the convertible seniornotes once they have been outstanding for ten years at a redemption price of 100% of the principal amountof the notes, payable in cash. The optional repurchase dates, the common stock price conversion thresholdamounts and the ending date of the first six-month period contingent interest may be payable for thecontingent convertible senior notes are as follows:
ContingentConvertible
Senior Notes Repurchase Dates
Common StockPrice
ConversionThresholds
Contingent InterestFirst Payable(if applicable)
2.75% due 2035 November 15, 2015, 2020, 2025, 2030 $ 48.81 May 14, 20162.5% due 2037 May 15, 2017, 2022, 2027, 2032 $ 64.36 November 14, 20172.25% due 2038 December 15, 2018, 2023, 2028, 2033 $107.36 June 14, 2019
96
CHESAPEAKE ENERGY CORPORATION AND SUBSIDIARIES
NOTES TO CONSOLIDATED FINANCIAL STATEMENTS – (Continued)
(c) Discount at December 31, 2008 is adjusted for the retrospective application of accounting guidance for debt
with conversion and other options. Discount at December 31, 2009 and 2008 included $794 million and
$1.009 billion, respectively, associated with the equity component of our contingent convertible senior notes.
(d) See Note 9 for further discussion related to these instruments.
Senior Notes
Our senior notes are unsecured senior obligations of Chesapeake and rank equally in right of
payment with all of our existing and future senior indebtedness and rank senior in right of payment to
all of our future subordinated indebtedness. Our senior note obligations are guaranteed by certain of
our wholly-owned subsidiaries. See Note 18 for condensed consolidating financial information
regarding our guarantor and non-guarantor subsidiaries. We may redeem the senior notes, other than
the contingent convertible senior notes, at any time at specified make-whole or redemption prices.
Senior notes issued before July 2005 are governed by indentures containing covenants that limit our
ability and our restricted subsidiaries’ ability to incur additional indebtedness; pay dividends on our
capital stock or redeem, repurchase or retire our capital stock or subordinated indebtedness; make
investments and other restricted payments; incur liens; enter into sale/leaseback transactions; create
restrictions on the payment of dividends or other amounts to us from our restricted subsidiaries;
engage in transactions with affiliates; sell assets; and consolidate, merge or transfer assets. Senior
notes issued after June 2005 are governed by indentures containing covenants that limit our ability and
our subsidiaries’ ability to incur certain secured indebtedness; enter into sale/leaseback transactions;
and consolidate, merge or transfer assets.
Chesapeake Energy Corporation is a holding company and owns no operating assets and has no
significant operations independent of its subsidiaries. As of September 30, 2008, our obligations under
our outstanding senior notes and contingent convertible notes were fully and unconditionally
guaranteed, jointly and severally, by all of our wholly-owned restricted subsidiaries, other than minor
subsidiaries, on a senior unsecured basis. In October 2008, we restructured our midstream operations.
As a result, beginning in the fourth quarter of 2008, our wholly-owned midstream subsidiaries having
significant assets and operations do not guarantee our outstanding senior notes.
No scheduled principal payments are required under our senior notes until 2013 when $864 million
is due.
On January 1, 2009, we adopted and applied retrospectively new accounting and reporting
standards for debt with conversion and other options. We have three debt issuances affected by this
change: our 2.75% Contingent Convertible Senior Notes due 2035, our 2.5% Contingent Convertible
Senior Notes due 2037 and our 2.25% Contingent Convertible Senior Notes due 2038. These
standards require us to account for the liability and equity components of our convertible debt
instruments separately and to reflect interest expense at the interest rate of similar nonconvertible debt
at the time of issuance (6.86%, 8.0% and 8.0%, respectively). Additionally, debt issuance costs are
required to be allocated in proportion to the liability and equity components and accounted for as debt
issuance costs and equity issuance costs, respectively. The allocation to the equity component of the
convertible notes was $845 million (net of tax) at December 31, 2008. The accretion of the resulting
discount on the debt is recognized as a part of interest expense, thereby increasing the amount of
interest expense required to be recognized with respect to such instruments. Given the increase in our
overall effective interest rate after adoption of these standards, we also capitalized additional interest
which largely offset the increase in interest expense.
97
CHESAPEAKE ENERGY CORPORATION AND SUBSIDIARIES
NOTES TO CONSOLIDATED FINANCIAL STATEMENTS – (Continued)
The following table summarizes the effect of the change in accounting principle related to our
contingent convertible notes on the consolidated balance sheet:
December 31, 2008
PreviouslyReported Adjustment Adjusted
($ in millions)
Unevaluated properties . . . . . . . . . . . . . . . . . . . . . . . . . . . . . . . . . . . . . . . . . . . . $ 11,216 $ 163 $ 11,379
Other long-term assets . . . . . . . . . . . . . . . . . . . . . . . . . . . . . . . . . . . . . . . . . . . . $ 1,007 $ (14) $ 993
Long-term debt, net . . . . . . . . . . . . . . . . . . . . . . . . . . . . . . . . . . . . . . . . . . . . . . . $ 14,184 $ (1,009) $ 13,175
Deferred income tax liability . . . . . . . . . . . . . . . . . . . . . . . . . . . . . . . . . . . . . . . . $ 3,763 $ 437 $ 4,200
Paid-in-capital . . . . . . . . . . . . . . . . . . . . . . . . . . . . . . . . . . . . . . . . . . . . . . . . . . . . $ 10,835 $ 845 $ 11,680
Retained earnings . . . . . . . . . . . . . . . . . . . . . . . . . . . . . . . . . . . . . . . . . . . . . . . . $ 4,694 $ (125) $ 4,569
The following table summarizes the effect of the change in accounting principle related to our
contingent convertible notes on the consolidated statements of operations ($ in millions, except per
share data):
PreviouslyReported Adjustment Adjusted
Year Ended December 31, 2008:
Depreciation and amortization of other assets . . . . . . . . . . . . . . . . . . . . . . . . . . $ 177 $ (3) $ 174
Interest expense . . . . . . . . . . . . . . . . . . . . . . . . . . . . . . . . . . . . . . . . . . . . . . . . . . $ 314 $ (43) $ 271
Gain (loss) on exchanges or repurchases of Chesapeake debt . . . . . . . . . . . . $ 237 $ (241) $ (4)
Income tax expense . . . . . . . . . . . . . . . . . . . . . . . . . . . . . . . . . . . . . . . . . . . . . . . $ 463 $ (76) $ 387
Net income . . . . . . . . . . . . . . . . . . . . . . . . . . . . . . . . . . . . . . . . . . . . . . . . . . . . . . $ 723 $ (119) $ 604
Weighted average common and common equivalent shares outstanding –
assuming dilution (in millions) . . . . . . . . . . . . . . . . . . . . . . . . . . . . . . . . . . . . . 545 — 545
Earnings per common share:
Basic . . . . . . . . . . . . . . . . . . . . . . . . . . . . . . . . . . . . . . . . . . . . . . . . . . . . . . . . . $ 1.16 $ (0.22) $ 0.94
Diluted . . . . . . . . . . . . . . . . . . . . . . . . . . . . . . . . . . . . . . . . . . . . . . . . . . . . . . . . $ 1.14 $ (0.21) $ 0.93
PreviouslyReported Adjustment Adjusted
Year Ended December 31, 2007:
Depreciation and amortization of other assets . . . . . . . . . . . . . . . . . . . . . . . . . . $ 154 $ (1) $ 153
Interest expense . . . . . . . . . . . . . . . . . . . . . . . . . . . . . . . . . . . . . . . . . . . . . . . . . . $ 406 $ (5) $ 401
Income tax expense . . . . . . . . . . . . . . . . . . . . . . . . . . . . . . . . . . . . . . . . . . . . . . . $ 890 $ 2 $ 892
Net income . . . . . . . . . . . . . . . . . . . . . . . . . . . . . . . . . . . . . . . . . . . . . . . . . . . . . . $ 1,451 $ 4 $ 1,455
Weighted average common and common equivalent shares outstanding –
assuming dilution (in millions) . . . . . . . . . . . . . . . . . . . . . . . . . . . . . . . . . . . . . 487 — 487
Earnings per common share:
Basic . . . . . . . . . . . . . . . . . . . . . . . . . . . . . . . . . . . . . . . . . . . . . . . . . . . . . . . . . $ 2.69 $ 0.01 $ 2.70
Diluted . . . . . . . . . . . . . . . . . . . . . . . . . . . . . . . . . . . . . . . . . . . . . . . . . . . . . . . . $ 2.62 $ 0.01 $ 2.63
98
CHESAPEAKE ENERGY CORPORATION AND SUBSIDIARIES
NOTES TO CONSOLIDATED FINANCIAL STATEMENTS – (Continued)
The following table summarizes the effect of the change in accounting principle related to our
contingent convertible notes on the consolidated statement of cash flows for the years ended
December 31, 2008 and 2007, respectively ($ in millions):
PreviouslyReported Adjustment Adjusted
Year Ended December 31, 2008:
Cash flows provided by operating activities . . . . . . . . . . . . . . . . . . . . . . . . . $ 5,236 $ 121 $ 5,357
Cash flows used in investing activities . . . . . . . . . . . . . . . . . . . . . . . . . . . . . $ (9,844) $ (121) $ (9,965)
Cash flows provided by financing activities . . . . . . . . . . . . . . . . . . . . . . . . . . $ 6,356 $ — $ 6,356
Year Ended December 31, 2007:
Cash flows provided by operating activities . . . . . . . . . . . . . . . . . . . . . . . . . $ 4,932 $ 42 $ 4,974
Cash flows used in investing activities . . . . . . . . . . . . . . . . . . . . . . . . . . . . . $ (7,922) $ (42) $ (7,964)
Cash flows provided by financing activities . . . . . . . . . . . . . . . . . . . . . . . . . . $ 2,988 $ — $ 2,988
Bank Credit Facilities
We utilize three revolving bank credit facilities, described below, as sources of liquidity.
CorporateCredit Facility
MidstreamCredit Facility
Midstream JointVenture Credit
Facility
($ in millions)
Borrowing capacity . . . . . . . . . . . . . . . . . . . . . . . . . . . . . $ 3,500 $ 250 $ 500
Maturity date . . . . . . . . . . . . . . . . . . . . . . . . . . . . . . . . . . November 2012 September 2012 September 2012
Borrowers . . . . . . . . . . . . . . . . . . . . . . . . . . . . . . . . . . . . Chesapeake
Exploration,
L.L.C. and
Chesapeake
Appalachia,
L.L.C.
Chesapeake
Midstream
Operating, L.L.C.
(CMO)
Chesapeake
Midstream
Partners, L.L.C.
(CMP)
Facility structure . . . . . . . . . . . . . . . . . . . . . . . . . . . . . . . Senior secured
revolving
Senior secured
revolving
Senior secured
revolving
Amount outstanding as of December 31, 2009 . . . . . . $ 1,892 $ — $ 44
Letters of credit outstanding as of
December 31, 2009 . . . . . . . . . . . . . . . . . . . . . . . . . . $ 41 $ — $ —
Our credit facilities do not contain material adverse change or adequate assurance covenants.
Although the applicable interest rates under our corporate credit facility fluctuate slightly based on our
long-term senior unsecured credit ratings, none of our credit facilities contains provisions which would
trigger an acceleration of amounts due under the facilities or a requirement to post additional collateral
in the event of a downgrade of our credit ratings.
Corporate Credit Facility
Our $3.5 billion syndicated revolving bank credit facility is used for general corporate purposes.
Borrowings under the facility are secured by certain producing natural gas and oil properties and bear
interest at our option at either (i) the greater of the reference rate of Union Bank, N.A. or the federal
funds effective rate plus 0.50%, both of which are subject to a margin that varies from 0.00% to
99
CHESAPEAKE ENERGY CORPORATION AND SUBSIDIARIES
NOTES TO CONSOLIDATED FINANCIAL STATEMENTS – (Continued)
0.75% per annum according to our senior unsecured long-term debt ratings, or (ii) the London
Interbank Offered Rate (LIBOR), plus a margin that varies from 1.50% to 2.25% per annum according
to our senior unsecured long-term debt ratings. The collateral value and borrowing base are
determined periodically. The unused portion of the facility is subject to a commitment fee of 0.50%.
Interest is payable quarterly or, if LIBOR applies, it may be payable at more frequent intervals.
The credit facility agreement contains various covenants and restrictive provisions which, among
other things, limit our ability to incur additional indebtedness, make investments or loans and create
liens. The credit facility agreement requires us to maintain an indebtedness (excluding discount on
senior notes) to total capitalization ratio (as defined) not to exceed 0.70 to 1 and an indebtedness to
EBITDA ratio (as defined) not to exceed 3.75 to 1. As defined by the credit facility agreement, our
indebtedness to total capitalization ratio was 0.44 to 1 and our indebtedness to EBITDA ratio was
3.18 to 1 at December 31, 2009. If we should fail to perform our obligations under these and other
covenants, the revolving credit commitment could be terminated and any outstanding borrowings under
the facility could be declared immediately due and payable. Such acceleration, if involving a principal
amount of $10 million ($50 million in the case of our senior notes issued after 2004), would constitute
an event of default under our senior note indentures, which could in turn result in the acceleration of a
significant portion of our senior note indebtedness. The credit facility agreement also has cross default
provisions that apply to other indebtedness of Chesapeake and its restricted subsidiaries with an
outstanding principal amount in excess of $75 million.
The facility is fully and unconditionally guaranteed, on a joint and several basis, by Chesapeake
and all of our other wholly-owned restricted subsidiaries other than minor subsidiaries.
Midstream Credit Facility
Our midstream $250 million syndicated revolving bank credit facility is used to fund capital
expenditures to build natural gas gathering and other systems to support our drilling program and for
general corporate purposes associated with our midstream operations. Borrowings under the
midstream credit facility are secured by all of the assets of the wholly-owned subsidiaries (the
restricted subsidiaries) of Chesapeake Midstream Development L.P. (CMD), itself a wholly-owned
subsidiary of Chesapeake, and bear interest at our option at either (i) the greater of the reference rate
of Wells Fargo Bank, National Association, the federal funds effective rate plus 0.50%, and the
one-month LIBOR plus 1.00%, all of which are subject to a margin that varies from 2.00% to 2.75% per
annum according to the most recent indebtedness to EBITDA ratio (as defined) or (ii) the LIBOR plus a
margin that varies from 3.00% to 3.75% per annum according to the most recent indebtedness to
EBITDA ratio (as defined). The unused portion of the facility is subject to a commitment fee of
0.50% per annum according to the most recent indebtedness to EBITDA ratio (as defined). Interest is
payable quarterly or, if LIBOR applies, it may be paid at more frequent intervals.
The midstream credit facility agreement contains various covenants and restrictive provisions
which, among other things, limit the ability of CMD and its restricted subsidiaries to incur additional
indebtedness, make investments or loans, create liens and pay dividends or distributions to
Chesapeake. The credit facility agreement requires maintenance of an indebtedness to EBITDA ratio
(as defined) not to exceed 3.50 to 1, and an EBITDA (as defined) to interest expense coverage ratio of
not less than 3.00 to 1. As defined by the credit facility agreement, our indebtedness to EBITDA ratio
was 0.01 to 1 and our EBITDA to interest expense coverage ratio was 6.87 to 1 at December 31, 2009.
If CMD or its restricted subsidiaries should fail to perform their obligations under these and other
covenants, the revolving credit commitment could be terminated and any outstanding borrowings under
100
CHESAPEAKE ENERGY CORPORATION AND SUBSIDIARIES
NOTES TO CONSOLIDATED FINANCIAL STATEMENTS – (Continued)
the midstream facility could be declared immediately due and payable. The midstream credit facility
agreement also has cross default provisions that apply to other indebtedness CMD and its restricted
subsidiaries may have with an outstanding principal amount in excess of $15 million.
Midstream Joint Venture Credit Facility
Our midstream joint venture $500 million syndicated revolving bank credit facility was established
concurrent with the midstream joint venture we formed on September 30, 2009 (see Note 11 for
discussion regarding the midstream joint venture). As a result of that transaction, our existing
midstream credit facility was amended and restated as described above. Borrowings under the
midstream joint venture credit facility are secured by all of the assets of the companies organized
under the joint venture, which is 50% owned by Chesapeake and 50% owned by our joint venture
partner Global Infrastructure Partners, and bear interest at our option at either (i) the greater of the
reference rate of Wells Fargo Bank, National Association, the federal funds effective rate plus 0.50%,
and the one-month LIBOR plus 1.00%, all of which are subject to a margin that varies from 2.00% to
2.75% per annum according to the most recent indebtedness to EBITDA ratio (as defined) or (ii) the
LIBOR plus a margin that varies from 3.00% to 3.75% per annum according to the most recent
indebtedness to EBITDA ratio (as defined). The unused portion of the facility is subject to a
commitment fee of 0.50% per annum according to the most recent indebtedness to EBITDA ratio (as
defined). Interest is payable quarterly or, if LIBOR applies, it may be paid at more frequent intervals.
The midstream joint venture credit facility agreement contains various covenants and restrictive
provisions which, among other things, limit the ability of the joint venture and its subsidiaries to incur
additional indebtedness, make investments or loans, create liens and pay dividends or distributions to
Chesapeake. The credit facility agreement requires maintenance of an indebtedness to EBITDA ratio
(as defined) not to exceed 3.50 to 1, and an EBITDA (as defined) to interest expense coverage ratio of
not less than 3.00 to 1. As defined by the credit facility agreement, our indebtedness to EBITDA ratio
was 0.19 to 1 and our EBITDA to interest expense coverage ratio was 21.75 to 1 at December 31,
2009. If CMP or its subsidiaries should fail to perform their obligations under these and other
covenants, the revolving credit commitment could be terminated and any outstanding borrowings under
the midstream joint venture facility could be declared immediately due and payable. The midstream
joint venture credit facility agreement also has cross default provisions that apply to other indebtedness
CMP and its subsidiaries may have with an outstanding principal amount in excess of $15 million.
4. Contingencies and Commitments
Litigation
On February 25, 2009, a putative class action was filed in the U.S. District Court for the Southern
District of New York against the company and certain of its officers and directors along with certain
underwriters of the company’s July 2008 common stock offering. Following the appointment of a lead
plaintiff and counsel, the plaintiff filed an amended complaint on September 11, 2009 alleging that the
registration statement for the offering contained material misstatements and omissions and seeking
damages under Sections 11, 12 and 15 of the Securities Act of 1933 of an unspecified amount and
rescission. The action was transferred to the U.S. District Court for the Western District of Oklahoma
on October 13, 2009. The company has filed a motion to dismiss which has not been fully briefed. A
derivative action was also filed in the District Court of Oklahoma County, Oklahoma on March 10, 2009
against the company’s directors and certain of its officers alleging breaches of fiduciary duties relating
to the disclosure matters alleged in the securities case.
101
CHESAPEAKE ENERGY CORPORATION AND SUBSIDIARIES
NOTES TO CONSOLIDATED FINANCIAL STATEMENTS – (Continued)
On March 26, 2009, a shareholder filed a petition in the District Court of Oklahoma County,
Oklahoma seeking to compel inspection of company books and records relating to compensation of the
company’s CEO. On August 20, 2009, the court denied the inspection demand, dismissed the petition
and entered judgment in favor of Chesapeake. The shareholder is appealing the court’s ruling.
Three derivative actions were filed in the District Court of Oklahoma County, Oklahoma on
April 28, May 7, and May 20, 2009 against the company’s directors alleging breaches of fiduciary
duties relating to compensation of the company’s CEO and alleged insider trading, among other things,
and seeking unspecified damages, equitable relief and disgorgement. These three derivative actions
were consolidated and a Consolidated Derivative Shareholder Petition was filed on June 23, 2009.
Chesapeake is named as a nominal defendant. Chesapeake has filed a motion to dismiss which was
heard on February 1, 2010. On February 26, 2010, the court ordered that plaintiffs’ claims be
dismissed and granted plaintiffs leave to file an amended petition within 90 days.
It is inherently difficult to predict the outcome of litigation, and we are currently unable to estimate
the amount of any potential liabilities associated with the foregoing cases, which are all in preliminary
stages.
Chesapeake is also involved in various other lawsuits and disputes incidental to its business
operations, including commercial disputes, personal injury claims, claims for underpayment of
royalties, property damage claims and contract actions. With regard to the latter, several mineral or
leasehold owners have filed lawsuits against us seeking specific performance to require us to acquire
their oil and natural gas interests and pay acreage bonus payments, damages based on breach of
contract and/or, in certain cases, punitive damages based on alleged fraud. The company has
satisfactorily resolved several of the suits but some remain pending. The remaining leasehold
acquisition cases are in various stages of discovery. The company believes that it has substantial
defenses to the claims made in all these cases.
The company records an associated liability when a loss is probable and the amount is reasonably
estimable. Although the outcome of litigation cannot be predicted with certainty, management is of the
opinion that no pending or threatened lawsuit or dispute incidental to its business operations is likely to
have a material adverse effect on the company’s consolidated financial position, results of operations
or cash flows. The final resolution of such matters could exceed amounts accrued, however, and actual
results could differ materially from management’s estimates.
Employment Agreements with Officers
Chesapeake has employment agreements with its chief executive officer, chief operating officer,
chief financial officer and other executive officers, which provide for annual base salaries, various
benefits and eligibility for bonus compensation. The agreement with the chief executive officer has an
initial term of five years which is automatically extended for one additional year on each December 31
unless the company provides 30 days notice of non-extension. The agreement contains a cap on cash
salary and bonus compensation for the next five years at 2008 levels. In the event of termination of
employment without cause, the chief executive officer’s base compensation (defined as base salary
plus bonus compensation received during the preceding 12 months) and benefits would continue
during the remaining term of the agreement. The chief executive officer is entitled to receive a payment
in the amount of three times his base compensation upon the happening of certain events following a
change of control. The agreement further provides that any stock-based awards held by the chief
executive officer and deferred compensation will immediately become 100% vested upon termination
102
CHESAPEAKE ENERGY CORPORATION AND SUBSIDIARIES
NOTES TO CONSOLIDATED FINANCIAL STATEMENTS – (Continued)
of employment without cause, or in the event of his incapacity, death or retirement at or after age 55.
The agreement also provides for a one-time $75 million well cost incentive award with a five-year
clawback. The well cost incentive award was fully applied against the CEO’s obligations under the
Founder Well Participation Program in 2009. See Note 6 for a description of the Founder Well
Participation Program and the incentive award. The agreements with the chief operating officer, chief
financial officer and other executive officers expire on September 30, 2012. The agreements with our
COO, CFO and other executive vice presidents contain a cap on cash salary for the three-year term of
the agreement. In addition, annual cash bonuses will not exceed the sum of the individual EVP’s cash
bonus compensation for (a) the last half of 2008 and (b) the first half of 2009. These agreements
provide for the continuation of salary for one year in the event of termination of employment without
cause or death and, in the event of a change of control, a payment in the amount of two times the
executive officer’s base compensation. These executive officers are entitled to receive a lump sum
payment equal to 26 weeks of cash salary following termination of employment as a result of
incapacity. Any stock-based awards held by such executive officers will immediately become 100%
vested upon termination of employment without cause, a change of control, death or retirement at or
after age 55. The agreements also provide for a 2008 incentive award payable in four equal annual
installments, the first of which was paid on September 30, 2009. The payment of each installment of
the award is subject to the individual’s continued employment on the date of payment, except that the
unpaid installments of the award would be accelerated and paid in lump sum in the event of a change
of control or a termination of employment without cause, a voluntary termination by the executive due
to a material breach of contract by the company, or termination due to incapacity or death.
Environmental Risk
Due to the nature of the natural gas and oil business, Chesapeake and its subsidiaries are
exposed to possible environmental risks. Chesapeake has implemented various policies and
procedures to avoid environmental contamination and risks from environmental contamination.
Chesapeake conducts periodic reviews, on a company-wide basis, to identify changes in our
environmental risk profile. These reviews evaluate whether there is a contingent liability, its amount,
and the likelihood that the liability will be incurred. The amount of any potential liability is determined by
considering, among other matters, incremental direct costs of any likely remediation and the
proportionate cost of employees who are expected to devote a significant amount of time directly to
any possible remediation effort. We manage our exposure to environmental liabilities on properties to
be acquired by identifying existing problems and assessing the potential liability. Depending on the
extent of an identified environmental problem, Chesapeake may exclude a property from the
acquisition, require the seller to remediate the property to our satisfaction, or agree to assume liability
for the remediation of the property. Chesapeake has historically not experienced any significant
environmental liability, and is not aware of any potential material environmental issues or claims at
December 31, 2009.
Rig Leases
In a series of transactions in 2006, 2007 and 2008, our drilling subsidiaries sold 83 drilling rigs and
related equipment for $677 million and entered into a master lease agreement under which we agreed
to lease the rigs from the buyer for initial terms of seven to ten years for lease payments of
approximately $93 million annually. The lease obligations are guaranteed by Chesapeake and its other
material restricted subsidiaries. These transactions were recorded as sales and operating leasebacks
and any related gain or loss is amortized to service operations expense over the lease term. Under the
rig leases, we can exercise an early purchase option after six or seven years or on the expiration of the
103
CHESAPEAKE ENERGY CORPORATION AND SUBSIDIARIES
NOTES TO CONSOLIDATED FINANCIAL STATEMENTS – (Continued)
lease term for a purchase price equal to the then fair market value of the rigs. Additionally, we have the
option to renew the rig lease for a negotiated renewal term at a periodic lease equal to the fair market
rental value of the rigs as determined at the time of renewal.
Compressor Leases
In 2007, 2008 and 2009, our compression subsidiary sold a significant portion of its existing
compressor fleet, consisting of 1,685 compressors, for $370 million and entered into a master lease
agreement. The term of the agreement varies by buyer ranging from seven to ten years for aggregate
lease payments of approximately $46 million annually. The lease obligations are guaranteed by
Chesapeake and its other material restricted subsidiaries. These transactions were recorded as sales
and operating leasebacks and any related gain or loss is amortized to natural gas and oil marketing
expenses over the lease term. Under the leases, we can exercise an early purchase option after six to
nine years or we can purchase the compressors at expiration of the lease for the fair market value at
the time. In addition, we have the option to renew the lease for negotiated new terms at the expiration
of the lease. As of December 31, 2009, approximately 324 new compressors were on order for delivery
in 2010 at a cost of approximately $100 million. Our intent is to sell and lease back those compressors
as they are delivered if acceptable leasing arrangements are available to us.
Future operating lease obligations related to rigs, compressors and other equipment or property
are not recorded in the accompanying consolidated balance sheets. As of December 31, 2009,
minimum future lease payments were as follows ($ in millions):
Rigs Compressors Other Total
2010 . . . . . . . . . . . . . . . . . . . . . . . . . . . . . . . . . . . . . . $ 95 $ 45 $ 7 $ 147
2011 . . . . . . . . . . . . . . . . . . . . . . . . . . . . . . . . . . . . . . 95 45 5 145
2012 . . . . . . . . . . . . . . . . . . . . . . . . . . . . . . . . . . . . . . 96 46 3 145
2013 . . . . . . . . . . . . . . . . . . . . . . . . . . . . . . . . . . . . . . 97 49 2 148
2014 . . . . . . . . . . . . . . . . . . . . . . . . . . . . . . . . . . . . . . 82 47 1 130
After 2014 . . . . . . . . . . . . . . . . . . . . . . . . . . . . . . . . . . 60 106 1 167
Total . . . . . . . . . . . . . . . . . . . . . . . . . . . . . . . . . . . . $ 525 $ 338 $ 19 $ 882
Rent expense, including short-term rentals, for the years ended December 31, 2009, 2008 and
2007 was $149 million, $133 million and $81 million, respectively.
Real Estate Surface Asset Leases
In April 2009, we financed 113 real estate surface assets in the Barnett Shale area in and around
Fort Worth, Texas for approximately $145 million and entered into a 40-year master lease agreement
under which we agreed to lease the sites for approximately $15 million to $27 million annually. This
lease transaction was recorded as a financing lease and the cash received was recorded with an
offsetting long-term liability on the consolidated balance sheet. As of December 31, 2009, the minimum
aggregate future lease payments were approximately $859 million. Chesapeake has the option to
repurchase up to a specified number of assets at any time during the term of the lease.
Transportation Contracts
Chesapeake has various “firm” pipeline transportation service agreements with expiration dates
ranging from 2010 to 2099. These commitments are not recorded in the accompanying consolidated
104
CHESAPEAKE ENERGY CORPORATION AND SUBSIDIARIES
NOTES TO CONSOLIDATED FINANCIAL STATEMENTS – (Continued)
balance sheets. Under the terms of these contracts, we are obligated to pay demand charges as set
forth in the transporter’s Federal Energy Regulatory Commission (FERC) gas tariff. In exchange, the
company receives rights to flow natural gas production through pipelines located in highly competitive
markets. Excluded from this summary are demand charges for pipeline projects that are currently
seeking regulatory approval. The aggregate amounts of such required demand payments as of
December 31, 2009 are as follows ($ in millions):
2010 . . . . . . . . . . . . . . . . . . . . . . . . . . . . . . . . . . . . . . . . . . . . . . . . . . . . . . . . . . . . . . . . . . . . . . . . . . . . . . . . . $ 253
2011 . . . . . . . . . . . . . . . . . . . . . . . . . . . . . . . . . . . . . . . . . . . . . . . . . . . . . . . . . . . . . . . . . . . . . . . . . . . . . . . . . 303
2012 . . . . . . . . . . . . . . . . . . . . . . . . . . . . . . . . . . . . . . . . . . . . . . . . . . . . . . . . . . . . . . . . . . . . . . . . . . . . . . . . . 297
2013 . . . . . . . . . . . . . . . . . . . . . . . . . . . . . . . . . . . . . . . . . . . . . . . . . . . . . . . . . . . . . . . . . . . . . . . . . . . . . . . . . 277
2014 . . . . . . . . . . . . . . . . . . . . . . . . . . . . . . . . . . . . . . . . . . . . . . . . . . . . . . . . . . . . . . . . . . . . . . . . . . . . . . . . . 262
After 2014 . . . . . . . . . . . . . . . . . . . . . . . . . . . . . . . . . . . . . . . . . . . . . . . . . . . . . . . . . . . . . . . . . . . . . . . . . . . . 1,388
Total . . . . . . . . . . . . . . . . . . . . . . . . . . . . . . . . . . . . . . . . . . . . . . . . . . . . . . . . . . . . . . . . . . . . . . . . . . . . . . . $ 2,780
Drilling Contracts
We have contracts with various drilling contractors to use 26 drilling rigs with terms of one to three
years. These commitments are not recorded in the accompanying consolidated balance sheets.
Minimum future commitments as of December 31, 2009 are as follows ($ in millions):
2010 . . . . . . . . . . . . . . . . . . . . . . . . . . . . . . . . . . . . . . . . . . . . . . . . . . . . . . . . . . . . . . . . . . . . . . . . . . . . . . . . . . . $ 107
2011 . . . . . . . . . . . . . . . . . . . . . . . . . . . . . . . . . . . . . . . . . . . . . . . . . . . . . . . . . . . . . . . . . . . . . . . . . . . . . . . . . . . 74
After 2011 . . . . . . . . . . . . . . . . . . . . . . . . . . . . . . . . . . . . . . . . . . . . . . . . . . . . . . . . . . . . . . . . . . . . . . . . . . . . . . —
Total . . . . . . . . . . . . . . . . . . . . . . . . . . . . . . . . . . . . . . . . . . . . . . . . . . . . . . . . . . . . . . . . . . . . . . . . . . . . . . . . . $ 181
Natural Gas and Oil Purchase Obligations
Our marketing segment regularly commits to purchase natural gas from other owners in our
properties and such commitments typically are short-term in nature. We have also committed to
purchase any natural gas and oil associated with certain volumetric production payment transactions.
The purchase commitments are based on market prices at the time of production, and the purchased
natural gas and oil will be resold.
Other Commitments
In 2009, we financed our regional Barnett Shale headquarters building in Fort Worth, Texas for
approximately $54 million with a five-year term loan which has a floating rate of prime plus 275 basis
points. At our option, we may prepay in full without penalty beginning in year four. The payment
obligation is guaranteed by Chesapeake.
Under minimum volume throughput agreements, Chesapeake has agreed to move fixed volumes
of natural gas over certain time periods, usually multiple years, through certain midstream systems. At
the end of the term or annually, Chesapeake will be invoiced for any shortfalls in such volume
commitments.
105
CHESAPEAKE ENERGY CORPORATION AND SUBSIDIARIES
NOTES TO CONSOLIDATED FINANCIAL STATEMENTS – (Continued)
5. Income Taxes
The components of the income tax provision (benefit) for each of the periods presented below are
as follows:
Years Ended December 31,
2009 2008 2007
($ in millions)Current . . . . . . . . . . . . . . . . . . . . . . . . . . . . . . . . . . . . . . . . . . . . . . . . . . . . . . . . . . . . . . . . . $ 4 $ 423 $ 29Deferred . . . . . . . . . . . . . . . . . . . . . . . . . . . . . . . . . . . . . . . . . . . . . . . . . . . . . . . . . . . . . . . . (3,487) (36) 863
Total . . . . . . . . . . . . . . . . . . . . . . . . . . . . . . . . . . . . . . . . . . . . . . . . . . . . . . . . . . . . . . . . . $ (3,483) $ 387 $892
The effective income tax expense (benefit) differed from the computed “expected” federal income
tax expense on earnings before income taxes for the following reasons:
Years Ended December 31,
2009 2008 2007
($ in millions)Income tax expense (benefit) at the federal statutory rate (35%) . . . . . . . . . . . . . . . . $ (3,251) $ 347 $ 821State income taxes (net of federal income tax benefit) . . . . . . . . . . . . . . . . . . . . . . . . (275) 24 56Other . . . . . . . . . . . . . . . . . . . . . . . . . . . . . . . . . . . . . . . . . . . . . . . . . . . . . . . . . . . . . . . . 43 16 15
$ (3,483) $ 387 $ 892
Deferred income taxes are provided to reflect temporary differences in the basis of net assets for
income tax and financial reporting purposes. The tax-effected temporary differences and tax loss
carryforwards which comprise deferred taxes are as follows:
Years Ended December 31
2009 2008
($ in millions)Deferred tax liabilities:
Natural gas and oil properties . . . . . . . . . . . . . . . . . . . . . . . . . . . . . . . . . . . . . . . . . . . . . . . . $ (96) $ (2,755)Other property and equipment . . . . . . . . . . . . . . . . . . . . . . . . . . . . . . . . . . . . . . . . . . . . . . . (184) (281)Derivative instruments . . . . . . . . . . . . . . . . . . . . . . . . . . . . . . . . . . . . . . . . . . . . . . . . . . . . . . (265) (550)Volumetric production payments . . . . . . . . . . . . . . . . . . . . . . . . . . . . . . . . . . . . . . . . . . . . . . (937) (943)Contingent convertible debt . . . . . . . . . . . . . . . . . . . . . . . . . . . . . . . . . . . . . . . . . . . . . . . . . . (464) (450)Other . . . . . . . . . . . . . . . . . . . . . . . . . . . . . . . . . . . . . . . . . . . . . . . . . . . . . . . . . . . . . . . . . . . . (23) —
Deferred tax liabilities . . . . . . . . . . . . . . . . . . . . . . . . . . . . . . . . . . . . . . . . . . . . . . . . . . . . . . . (1,969) (4,979)
Deferred tax assets:Net operating loss carryforwards . . . . . . . . . . . . . . . . . . . . . . . . . . . . . . . . . . . . . . . . . . . . . 592 5Asset retirement obligation . . . . . . . . . . . . . . . . . . . . . . . . . . . . . . . . . . . . . . . . . . . . . . . . . . 107 102Investments . . . . . . . . . . . . . . . . . . . . . . . . . . . . . . . . . . . . . . . . . . . . . . . . . . . . . . . . . . . . . . 131 117Deferred stock compensation . . . . . . . . . . . . . . . . . . . . . . . . . . . . . . . . . . . . . . . . . . . . . . . . 57 85Accrued liabilities . . . . . . . . . . . . . . . . . . . . . . . . . . . . . . . . . . . . . . . . . . . . . . . . . . . . . . . . . . 22 22Alternative minimum tax credits . . . . . . . . . . . . . . . . . . . . . . . . . . . . . . . . . . . . . . . . . . . . . . 25 —Other . . . . . . . . . . . . . . . . . . . . . . . . . . . . . . . . . . . . . . . . . . . . . . . . . . . . . . . . . . . . . . . . . . . . — 90
Deferred tax assets . . . . . . . . . . . . . . . . . . . . . . . . . . . . . . . . . . . . . . . . . . . . . . . . . . . . . . . . 934 421
Total deferred tax asset (liability) . . . . . . . . . . . . . . . . . . . . . . . . . . . . . . . . . . . . . . . . . . . . . . . $ (1,035)(a) $ (4,558)
Reflected in accompanying balance sheets as:Current deferred income tax asset . . . . . . . . . . . . . . . . . . . . . . . . . . . . . . . . . . . . . . . . . . . . $ 24 $ —Current deferred income tax liability . . . . . . . . . . . . . . . . . . . . . . . . . . . . . . . . . . . . . . . . . . . — (358)Non-current deferred income tax liability . . . . . . . . . . . . . . . . . . . . . . . . . . . . . . . . . . . . . . . (1,059) (4,200)
$ (1,035) $ (4,558)
106
CHESAPEAKE ENERGY CORPORATION AND SUBSIDIARIES
NOTES TO CONSOLIDATED FINANCIAL STATEMENTS – (Continued)
(a) In addition to the income tax benefit of $3.483 billion, activity during 2009 includes net liabilities of $48 millionrelated to stock-based compensation and $41 million related to investments, deferred tax assets for $141 millionrelated to derivative instruments and $106 million related to the equalization of partners’ capital. These itemswere not recorded as part of the provision for income taxes. In addition, the activity includes an increase todeferred tax liabilities of $157 million related to federal and state income tax refunds and a reduction of $39million related to uncertain tax positions.
As of December 31, 2009, we classified $24 million of deferred tax assets as current that were
attributable to the current portion of net operating losses, which was offset by current temporary
differences associated with derivative assets and other items. As of December 31, 2008, we classified
$358 million of deferred tax liabilities as current that were attributable to the current portion of
derivative assets and other current temporary differences.
At December 31, 2009, Chesapeake had federal income tax net operating loss (NOL)
carryforwards and carrybacks of approximately $889 million and $681 million, respectively.
Additionally, we had $3 million of alternative minimum tax (AMT) NOL carryforwards available as a
deduction against future AMT income and $333 million of AMT NOL carrybacks to be used against
prior year AMT income. The NOL carryforwards expire from 2019 through 2029. The value of these
carryforwards depends on the ability of Chesapeake to generate taxable income.
The ability of Chesapeake to utilize NOL carryforwards to reduce future federal taxable income
and federal income tax of Chesapeake is subject to various limitations under the Internal Revenue
Code of 1986, as amended. The utilization of such carryforwards may be limited upon the occurrence
of certain ownership changes, including the issuance or exercise of rights to acquire stock, the
purchase or sale of stock by 5% stockholders, as defined in the Treasury regulations, and the offering
of stock by us during any three-year period resulting in an aggregate change of more than 50% in the
beneficial ownership of Chesapeake.
In the event of an ownership change (as defined for income tax purposes), Section 382 of the
Code imposes an annual limitation on the amount of a corporation’s taxable income that can be offset
by these carryforwards. The limitation is generally equal to the product of (i) the fair market value of the
equity of the company multiplied by (ii) a percentage approximately equivalent to the yield on long-term
tax exempt bonds during the month in which an ownership change occurs. In addition, the limitation is
increased if there are recognized built-in gains during any post-change year, but only to the extent of
any net unrealized built-in gains (as defined in the Code) inherent in the assets sold. Certain NOLs
acquired through various acquisitions are also subject to limitations.
The following table summarizes our net operating losses as of December 31, 2009 and any
related limitations:
Total LimitedAnnual
Limitation
($ in millions)
Net operating loss . . . . . . . . . . . . . . . . . . . . . . . . . . . . . . . . . . . . . . $1,570 $ 2 $ 1
AMT net operating loss . . . . . . . . . . . . . . . . . . . . . . . . . . . . . . . . . . $336 $ 2 $ 1
As of December 31, 2009, we do not believe that an ownership change has occurred. Future
equity transactions by Chesapeake or by 5% stockholders (including relatively small transactions and
transactions beyond our control) could cause an ownership change and therefore a limitation on the
annual utilization of NOLs.
107
CHESAPEAKE ENERGY CORPORATION AND SUBSIDIARIES
NOTES TO CONSOLIDATED FINANCIAL STATEMENTS – (Continued)
Accounting guidance for recognizing and measuring uncertain tax positions prescribes a threshold
condition that a tax position must meet for any of the benefit of the uncertain tax position to be
recognized in the financial statements. Guidance is also provided regarding de-recognition,
classification and disclosure of these uncertain tax positions.
As of December 31, 2008, the amount of unrecognized tax benefits related to regular tax liabilities
and AMT associated with uncertain tax positions was $60 million. Of this amount, $48 million was
related to regular tax liabilities and $12 million was related to AMT. As of December 31, 2009, the
amount of unrecognized tax benefits related to regular tax liabilities and AMT associated with uncertain
tax positions was $231 million. Of this amount, $87 million is related to regular tax liabilities and $144
million is related to AMT. These unrecognized tax benefits are associated with temporary differences. If
these unrecognized tax benefits are disallowed and we are required to pay additional taxes, the
reversal of the temporary differences associated with the regular tax liabilities will increase our tax
basis which will increase our future tax deductions. Any AMT payments can be utilized as credits
against future regular tax liabilities. The uncertain tax positions identified would not have a material
effect on the effective tax rate. At December 31, 2009, we had an accrued liability of $10 million for
interest related to these uncertain tax positions. Chesapeake recognizes interest related to uncertain
tax positions in interest expense. Penalties, if any, related to uncertain tax positions would be recorded
in other expenses.
A reconciliation of the beginning and ending balances of unrecognized tax benefits is as follows:
2009 2008 2007
($ in millions)
Unrecognized tax benefits at beginning of period . . . . . . . . . . . . . . . . . . . . . . . . . . . . . . $ 60 $ 133 $ 142
Additions based on tax positions related to the current year . . . . . . . . . . . . . . . . . . . . . 171 48 64
Reductions for tax positions of prior years . . . . . . . . . . . . . . . . . . . . . . . . . . . . . . . . . . . — (120) (52)
Settlements . . . . . . . . . . . . . . . . . . . . . . . . . . . . . . . . . . . . . . . . . . . . . . . . . . . . . . . . . . . . — (1) (21)
Unrecognized tax benefits at end of period . . . . . . . . . . . . . . . . . . . . . . . . . . . . . . . . . . . $ 231 $ 60 $ 133
Chesapeake files income tax returns in the U.S. federal jurisdiction and various state and local
jurisdictions. With few exceptions, Chesapeake is no longer subject to U.S. federal, state and local
income tax examinations by tax authorities for years prior to 2006. The Internal Revenue Service (IRS)
commenced an examination of Chesapeake’s 2007 and 2008 U.S. income tax returns in October 2009.
6. Related Party Transactions
As of December 31, 2009, we had accrued accounts receivable from our CEO, Aubrey K.
McClendon, of $14 million representing joint interest billings from December 2009 which were invoiced
and timely paid in January 2010. Since Chesapeake was founded in 1989, Mr. McClendon, has
acquired working interests in virtually all of our natural gas and oil properties by participating in our
drilling activities under the terms of the Founder Well Participation Program (“FWPP”) and predecessor
participation arrangements provided for in Mr. McClendon’s employment agreements. Under the
FWPP, approved by our shareholders in June 2005, Mr. McClendon may elect to participate in all or
none of the wells drilled by or on behalf of Chesapeake during a calendar year, but he is not allowed to
participate only in selected wells. A participation election is required to be received by the
Compensation Committee of Chesapeake’s Board of Directors not less than 30 days prior to the start
of each calendar year. His participation is permitted only under the terms outlined in the FWPP, which,
108
CHESAPEAKE ENERGY CORPORATION AND SUBSIDIARIES
NOTES TO CONSOLIDATED FINANCIAL STATEMENTS – (Continued)
among other things, limits his individual participation to a maximum working interest of 2.5% in a well
and prohibits participation in situations where Chesapeake’s working interest would be reduced below
12.5% as a result of his participation. In addition, the company is reimbursed for costs associated with
leasehold acquired by Mr. McClendon as a result of his well participation.
On December 31, 2008, we entered into a new five-year employment agreement with
Mr. McClendon that contained a one-time well cost incentive award to him. The total cost of the award
to Chesapeake was $75 million plus employment taxes in the amount of approximately $1 million. We
will recognize the incentive award as general and administrative expense over the five-year vesting
period for the clawback described below, resulting in an expense of approximately $15 million per year
that began in 2009. In addition to state and federal income tax withholding, similar employment taxes
were imposed on Mr. McClendon and withheld from the award. The net incentive award of
approximately $44 million was fully applied against costs attributable to interests in company wells
acquired by Mr. McClendon or his affiliates under the FWPP. The incentive award is subject to a
clawback if during the initial five-year term of the employment agreement, Mr. McClendon resigns from
the company or is terminated for cause by the company.
As disclosed in Note 17, in 2007 Chesapeake had revenues of $1.1 billion from natural gas and oil
sales to Eagle Energy Partners I, L.P., a former affiliated entity. We sold our 33% limited partnership
interest in Eagle Energy in June 2007.
7. Employee Benefit Plans
Our qualified 401(k) profit sharing plan is the Chesapeake Energy Corporation Savings and
Incentive Stock Bonus Plan, which is open to employees of Chesapeake and all our subsidiaries
except certain employees of Chesapeake Appalachia, L.L.C. Eligible employees may elect to defer
compensation through voluntary contributions to their 401(k) plan accounts, subject to plan limits and
those set by the Internal Revenue Service. Chesapeake matches employee contributions dollar for
dollar (subject to a maximum contribution of 15% of an employee’s annual salary and bonus
compensation) with Chesapeake common stock purchased in the open market. The company
contributed $48 million, $40 million and $28 million to the Chesapeake plan in 2009, 2008 and 2007,
respectively.
In November 2005, Chesapeake acquired Columbia Natural Resources, LLC (CNR), which
sponsored the Columbia Natural Resources, LLC 401(k) Plan. Chesapeake’s 401(k) plan was
amended effective January 1, 2006 to honor previous service by employees with CNR and
predecessor companies and was open to CNR employees in the Charleston, West Virginia
headquarters office as well as exempt, administrative field employees. The CNR plan was adopted by
the new employer entity, Chesapeake Appalachia, L.L.C., and was open to all non-administrative field
employees, including union employees. Effective January 1, 2007, these employees, other than union
employees, became eligible to participate in the Chesapeake plan.
Prior to 2008, we maintained two nonqualified deferred compensation plans, the 401(k) make-up
plan and the deferred compensation plan. Effective on January 1, 2008, the deferred compensation
plans were merged into the Chesapeake Energy Corporation Amended and Restated Deferred
Compensation Plan (DC Plan). Prior to 2009, to be eligible to participate in the DC Plan, an employee
must have received annual compensation (base salary and bonus combined in the prior 12 months) of
at least $100,000, had a minimum of one year of service as a company employee and have made the
109
CHESAPEAKE ENERGY CORPORATION AND SUBSIDIARIES
NOTES TO CONSOLIDATED FINANCIAL STATEMENTS – (Continued)
maximum contribution allowable under the 401(k) plan. For employees with at least five years of
service as a company employee, the company matched employee contributions to the plan in
Chesapeake common stock. On January 1, 2009, the plan was amended to allow for participation for
any employees who received compensation (base salary only) of at least $150,000 and had an
employment agreement with the company. In addition, the company begins matching employee
contributions with Chesapeake common stock once the employee has at least three years of service
as a company employee.
Chesapeake matches 100% of employee contributions up to 15% of base salary and bonus in the
aggregate for the 401(k) plan and the DC Plan. We contributed $7 million, $6 million and $4 million to
the DC Plan during 2009, 2008 and 2007, respectively, to fund the match. The company’s
non-employee directors are able to defer up to 100% of director fees into the DC Plan. The maximum
compensation that can be deferred by employees under all company deferred compensation plans,
including the Chesapeake 401(k) plan, is a total of 75% of base salary and 100% of performance
bonus.
Any assets placed in trust by Chesapeake to fund future obligations of the company’s nonqualified
deferred compensation plans are subject to the claims of creditors in the event of insolvency or
bankruptcy, and participants are general creditors of the company as to their deferred compensation in
the plans.
Chesapeake maintains no post-employment benefit plans except those sponsored by Chesapeake
Appalachia, L.L.C. Participation in these plans is limited to existing and former employees who were
union members. The Chesapeake Appalachia, L.L.C. benefit plans provide health care and life
insurance benefits to eligible employees upon retirement. We account for these benefits on an accrual
basis. As of December 31, 2009, the company had accrued approximately $2 million in accumulated
post-employment benefit liability.
8. Stockholders’ Equity, Restricted Stock and Stock Options
Common Stock
The following is a summary of the changes in our common shares outstanding for 2009, 2008 and
2007:
2009 2008 2007
(in thousands)
Shares issued at January 1 . . . . . . . . . . . . . . . . . . . . . . . . . . . . . . . . . . . . . . . . . . . . . . 607,953 511,648 458,601
Common stock issuances for cash . . . . . . . . . . . . . . . . . . . . . . . . . . . . . . . . . . . . . . . . — 51,750 —
Convertible note conversions/exchanges . . . . . . . . . . . . . . . . . . . . . . . . . . . . . . . . . . . 10,210 23,913 —
Preferred stock conversions/exchanges . . . . . . . . . . . . . . . . . . . . . . . . . . . . . . . . . . . . 1,423 12,673 36,652
Restricted stock issuances (net of forfeitures) . . . . . . . . . . . . . . . . . . . . . . . . . . . . . . . 3,632 4,708 14,268
Stock option exercises . . . . . . . . . . . . . . . . . . . . . . . . . . . . . . . . . . . . . . . . . . . . . . . . . . 508 1,584 2,127
Common stock issued for the purchase of leasehold and unproved properties . . . . 24,823 1,677 —
Shares issued at December 31 . . . . . . . . . . . . . . . . . . . . . . . . . . . . . . . . . . . . . . . . . . . 648,549 607,953 511,648
110
CHESAPEAKE ENERGY CORPORATION AND SUBSIDIARIES
NOTES TO CONSOLIDATED FINANCIAL STATEMENTS – (Continued)
Contingent Convertible Senior Notes
In 2009 and 2008, holders of certain of our contingent convertible senior notes exchanged or
converted their senior notes for shares of common stock in privately negotiated exchanges as
summarized below ($ in millions):
YearContingent Convertible
Senior Notes Principal Amount Number of Common Shares
2009 2.25% due 2038 $ 364 10,210,169
2008 2.75% due 2035 $ 239 8,841,526
2.50% due 2037 272 8,416,865
2.25% due 2038 254 6,654,821
$ 765 23,913,212
The difference between the allocated debt value of the notes that were exchanged and the fair
value of the common stock issued resulted in a loss of $40 million and $27 million, respectively, on the
cancellation of indebtedness for the years ended December 31, 2009 and 2008. There were no
contingent convertible senior notes exchanged or converted in 2007.
Preferred Stock
The following is a summary of the changes in our preferred shares outstanding for 2009, 2008 and
2007:
4.125%5.00%(2005) 4.50%
5.00%(2005B) 6.25%
(in thousands)
Shares outstanding at January 1, 2009 . . . . . . . . . . . . . . . . . . . . . . . 3 5 2,559 2,096 144
Conversion/exchange of preferred for common stock . . . . . . . . . . 3 — — — 144
Shares outstanding at December 31, 2009 . . . . . . . . . . . . . . . . . . . . — 5 2,559 2,096 —
Shares outstanding at January 1, 2008 . . . . . . . . . . . . . . . . . . . . . . . 3 5 3,450 5,750 144
Conversion/exchange of preferred for common stock . . . . . . . . . . — — (891) (3,654) —
Shares outstanding at December 31, 2008 . . . . . . . . . . . . . . . . . . . . 3 5 2,559 2,096 144
Shares outstanding at January 1, 2007 . . . . . . . . . . . . . . . . . . . . . . . 3 4,600 3,450 5,750 2,300
Conversion/exchange of preferred for common stock . . . . . . . . . . — (4,595) — — (2,156)
Shares outstanding at December 31, 2007 . . . . . . . . . . . . . . . . . . . . 3 5 3,450 5,750 144
Dividends
Dividends declared on our common stock and preferred stock are reflected as adjustments to
retained earnings to the extent a surplus of retained earnings will exist after giving effect to the
dividends. To the extent retained earnings are insufficient to fund the distributions, such payments
constitute a return of contributed capital rather than earnings and are accounted for as a reduction to
paid-in capital.
111
CHESAPEAKE ENERGY CORPORATION AND SUBSIDIARIES
NOTES TO CONSOLIDATED FINANCIAL STATEMENTS – (Continued)
In 2009, 2008 and 2007, shares of our cumulative convertible preferred stock were exchanged for
or converted into shares of common stock as summarized below:
Year ofExchange/Conversion
CumulativeConvertible
Preferred Stock
Numberof
Preferred Shares
Numberof
Common Shares
Typeof
Transaction
2009 6.25% 143,768 1,239,538 Conversion
4.125% 3,033 182,887 Conversion
1,422,425
2008 5.0% (series 2005B) 3,654,385 10,443,642 Exchange
4.5% 891,100 2,227,750 Exchange
4.125% 29 1,743 Conversion
12,673,135
2007 5.0% (series 2005) 4,595,000 19,283,311 Exchange
6.25% 2,156,184 17,367,823 Exchange
6.25% 48 344 Conversion
4.125% 3 180 Conversion
36,651,658
In connection with the exchanges and conversions noted above, we recorded losses of $0, $67
million and $128 million in 2009, 2008 and 2007, respectively. In general, the loss is equal to the
excess of the fair value of all common stock exchanged over the fair value of the common stock
issuable pursuant to the original terms of the preferred stock.
Dividends on our outstanding preferred stock are payable quarterly in cash, common stock or a
combination thereof. Following is a summary of our preferred stock, including the primary conversion
terms as of December 31, 2009:
Preferred StockSeries
IssueDate
LiquidationPreferenceper Share
Holder’sConversion
RightConversion
RateConversion
Price
Company’sConversionRight From
Company’sMarket
ConversionTrigger
5.00% cumulativeconvertible(series2005) . . . . . . . .
April2005 $ 100 Any time 3.8964 $ 25.6647
April 15,2010 $ 33.3641(a)
4.50% cumulativeconvertible . . . .
September2005 $ 100 Any time 2.2692 $ 44.0692
September 15,2010 $ 57.2900(a)
5.00%cumulativeconvertible(series2005B) . . . . . . .
November2005 $ 100 Any time 2.5664 $ 38.9652
November 15,2010 $ 50.6548(a)
(a) Convertible at the company’s option if the company’s common stock equals or exceeds the trigger price for a
specified time period or after the conversion date indicated if there are less than 250,000 shares of preferred
stock outstanding.
112
CHESAPEAKE ENERGY CORPORATION AND SUBSIDIARIES
NOTES TO CONSOLIDATED FINANCIAL STATEMENTS – (Continued)
Stock-Based Compensation Plans
Under Chesapeake’s Long Term Incentive Plan, restricted stock, stock options, stock appreciation
rights, performance shares and other stock awards may be awarded to employees, directors and
consultants of Chesapeake. Subject to any adjustments as provided by the plan, the aggregate
number of shares of common stock available for awards under the plan may not exceed 31,500,000
shares. The maximum period for exercise of an option or stock appreciation right may not be more
than ten years from the date of grant and the exercise price may not be less than the fair market value
of the shares underlying the option or stock appreciation right on the date of grant. Awards granted
under the plan become vested at specified dates or upon the satisfaction of certain performance or
other criteria determined by a committee of the Board of Directors. No awards may be granted under
this plan after September 30, 2014. This plan has been approved by our shareholders. There were
87,500 shares of restricted stock issued to our directors from this plan in each of 2009, 2008 and 2007.
Additionally, there were 4.0 million, 4.5 million and 14.7 million restricted shares issued, net of
forfeitures, to employees and consultants during 2009, 2008 and 2007, respectively, from this plan. As
of December 31, 2009, there were 8.0 million shares remaining available for issuance under the plan.
Under Chesapeake’s 2003 Stock Incentive Plan, restricted stock and incentive and nonqualified
stock options to purchase our common stock may be awarded to employees and consultants of
Chesapeake. Subject to any adjustments as provided by the plan, the aggregate number of shares
available for awards under the plan may not exceed 10,000,000 shares. The maximum period for
exercise of an option may not be more than ten years from the date of grant and the exercise price
may not be less than the fair market value of the shares underlying the option on the date of grant.
Restricted stock and options granted become vested at dates determined by a committee of the Board
of Directors. No awards may be granted under this plan after April 14, 2013. This plan has been
approved by our shareholders. There were (0.4) million, 0.2 million and 0.2 million restricted shares,
net of forfeitures, issued during 2009, 2008 and 2007, respectively, from this plan. As of December 31,
2009, there were 618,282 shares remaining available for issuance under the plan.
Under Chesapeake’s 2003 Stock Award Plan for Non-Employee Directors, 10,000 shares of
Chesapeake’s common stock are awarded to each newly appointed non-employee director on his or
her first day of service. Subject to any adjustments as provided by the plan, the aggregate number of
shares which may be issued may not exceed 100,000 shares. This plan has been approved by our
shareholders. In each of 2008 and 2007, 10,000 shares of common stock were awarded to new
directors from this plan. As of December 31, 2009, there were 50,000 shares remaining available for
issuance under this plan.
113
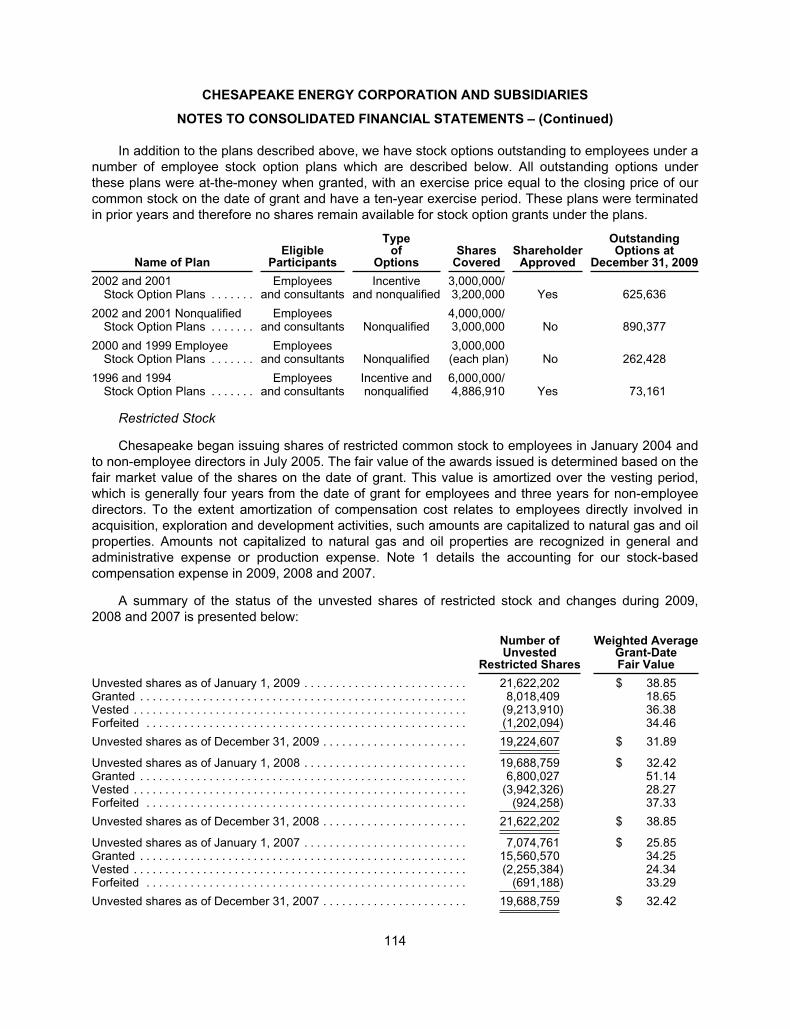
CHESAPEAKE ENERGY CORPORATION AND SUBSIDIARIES
NOTES TO CONSOLIDATED FINANCIAL STATEMENTS – (Continued)
In addition to the plans described above, we have stock options outstanding to employees under a
number of employee stock option plans which are described below. All outstanding options under
these plans were at-the-money when granted, with an exercise price equal to the closing price of our
common stock on the date of grant and have a ten-year exercise period. These plans were terminated
in prior years and therefore no shares remain available for stock option grants under the plans.
Name of PlanEligible
Participants
Typeof
OptionsShares
CoveredShareholder
Approved
OutstandingOptions at
December 31, 2009
2002 and 2001Stock Option Plans . . . . . . .
Employeesand consultants
Incentiveand nonqualified
3,000,000/3,200,000 Yes 625,636
2002 and 2001 NonqualifiedStock Option Plans . . . . . . .
Employeesand consultants Nonqualified
4,000,000/3,000,000 No 890,377
2000 and 1999 EmployeeStock Option Plans . . . . . . .
Employeesand consultants Nonqualified
3,000,000(each plan) No 262,428
1996 and 1994Stock Option Plans . . . . . . .
Employeesand consultants
Incentive andnonqualified
6,000,000/4,886,910 Yes 73,161
Restricted Stock
Chesapeake began issuing shares of restricted common stock to employees in January 2004 and
to non-employee directors in July 2005. The fair value of the awards issued is determined based on the
fair market value of the shares on the date of grant. This value is amortized over the vesting period,
which is generally four years from the date of grant for employees and three years for non-employee
directors. To the extent amortization of compensation cost relates to employees directly involved in
acquisition, exploration and development activities, such amounts are capitalized to natural gas and oil
properties. Amounts not capitalized to natural gas and oil properties are recognized in general and
administrative expense or production expense. Note 1 details the accounting for our stock-based
compensation expense in 2009, 2008 and 2007.
A summary of the status of the unvested shares of restricted stock and changes during 2009,
2008 and 2007 is presented below:
Number ofUnvested
Restricted Shares
Weighted AverageGrant-DateFair Value
Unvested shares as of January 1, 2009 . . . . . . . . . . . . . . . . . . . . . . . . . . 21,622,202 $ 38.85Granted . . . . . . . . . . . . . . . . . . . . . . . . . . . . . . . . . . . . . . . . . . . . . . . . . . . . 8,018,409 18.65Vested . . . . . . . . . . . . . . . . . . . . . . . . . . . . . . . . . . . . . . . . . . . . . . . . . . . . . (9,213,910) 36.38Forfeited . . . . . . . . . . . . . . . . . . . . . . . . . . . . . . . . . . . . . . . . . . . . . . . . . . . (1,202,094) 34.46
Unvested shares as of December 31, 2009 . . . . . . . . . . . . . . . . . . . . . . . 19,224,607 $ 31.89
Unvested shares as of January 1, 2008 . . . . . . . . . . . . . . . . . . . . . . . . . . 19,688,759 $ 32.42Granted . . . . . . . . . . . . . . . . . . . . . . . . . . . . . . . . . . . . . . . . . . . . . . . . . . . . 6,800,027 51.14Vested . . . . . . . . . . . . . . . . . . . . . . . . . . . . . . . . . . . . . . . . . . . . . . . . . . . . . (3,942,326) 28.27Forfeited . . . . . . . . . . . . . . . . . . . . . . . . . . . . . . . . . . . . . . . . . . . . . . . . . . . (924,258) 37.33
Unvested shares as of December 31, 2008 . . . . . . . . . . . . . . . . . . . . . . . 21,622,202 $ 38.85
Unvested shares as of January 1, 2007 . . . . . . . . . . . . . . . . . . . . . . . . . . 7,074,761 $ 25.85Granted . . . . . . . . . . . . . . . . . . . . . . . . . . . . . . . . . . . . . . . . . . . . . . . . . . . . 15,560,570 34.25Vested . . . . . . . . . . . . . . . . . . . . . . . . . . . . . . . . . . . . . . . . . . . . . . . . . . . . . (2,255,384) 24.34Forfeited . . . . . . . . . . . . . . . . . . . . . . . . . . . . . . . . . . . . . . . . . . . . . . . . . . . (691,188) 33.29
Unvested shares as of December 31, 2007 . . . . . . . . . . . . . . . . . . . . . . . 19,688,759 $ 32.42
114
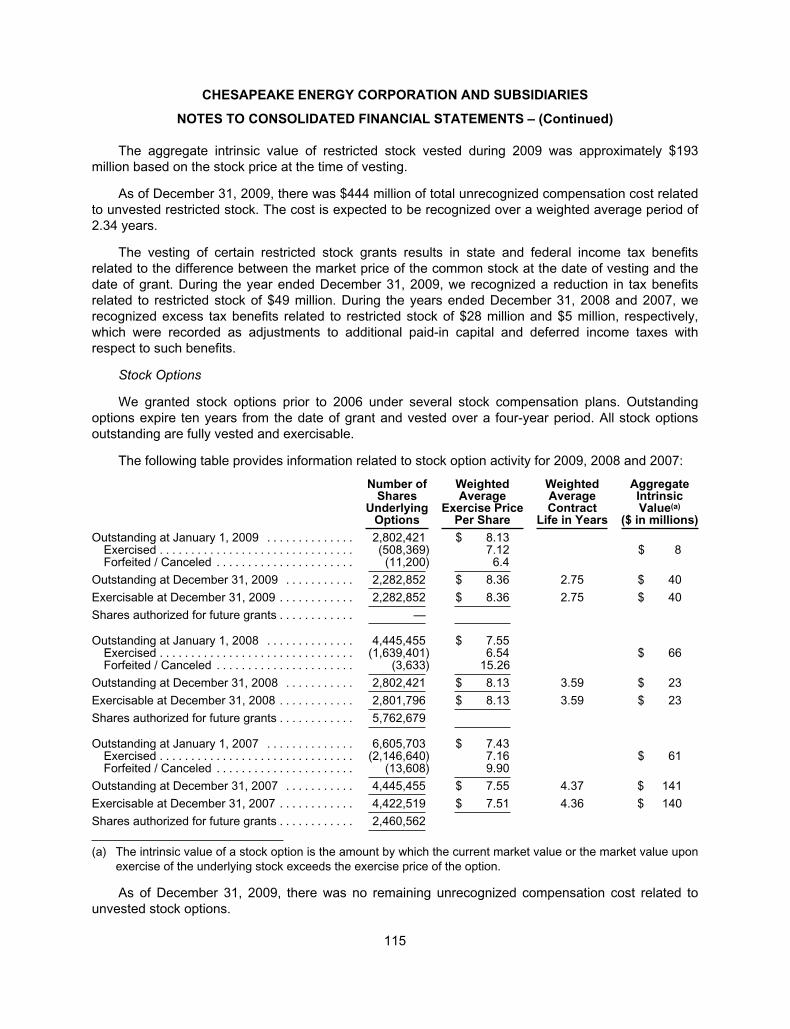
CHESAPEAKE ENERGY CORPORATION AND SUBSIDIARIES
NOTES TO CONSOLIDATED FINANCIAL STATEMENTS – (Continued)
The aggregate intrinsic value of restricted stock vested during 2009 was approximately $193
million based on the stock price at the time of vesting.
As of December 31, 2009, there was $444 million of total unrecognized compensation cost related
to unvested restricted stock. The cost is expected to be recognized over a weighted average period of
2.34 years.
The vesting of certain restricted stock grants results in state and federal income tax benefits
related to the difference between the market price of the common stock at the date of vesting and the
date of grant. During the year ended December 31, 2009, we recognized a reduction in tax benefits
related to restricted stock of $49 million. During the years ended December 31, 2008 and 2007, we
recognized excess tax benefits related to restricted stock of $28 million and $5 million, respectively,
which were recorded as adjustments to additional paid-in capital and deferred income taxes with
respect to such benefits.
Stock Options
We granted stock options prior to 2006 under several stock compensation plans. Outstanding
options expire ten years from the date of grant and vested over a four-year period. All stock options
outstanding are fully vested and exercisable.
The following table provides information related to stock option activity for 2009, 2008 and 2007:
Number ofShares
UnderlyingOptions
WeightedAverage
Exercise PricePer Share
WeightedAverageContract
Life in Years
AggregateIntrinsicValue(a)
($ in millions)
Outstanding at January 1, 2009 . . . . . . . . . . . . . . 2,802,421 $ 8.13Exercised . . . . . . . . . . . . . . . . . . . . . . . . . . . . . . . (508,369) 7.12 $ 8Forfeited / Canceled . . . . . . . . . . . . . . . . . . . . . . (11,200) 6.4
Outstanding at December 31, 2009 . . . . . . . . . . . 2,282,852 $ 8.36 2.75 $ 40
Exercisable at December 31, 2009 . . . . . . . . . . . . 2,282,852 $ 8.36 2.75 $ 40
Shares authorized for future grants . . . . . . . . . . . . —
Outstanding at January 1, 2008 . . . . . . . . . . . . . . 4,445,455 $ 7.55Exercised . . . . . . . . . . . . . . . . . . . . . . . . . . . . . . . (1,639,401) 6.54 $ 66Forfeited / Canceled . . . . . . . . . . . . . . . . . . . . . . (3,633) 15.26
Outstanding at December 31, 2008 . . . . . . . . . . . 2,802,421 $ 8.13 3.59 $ 23
Exercisable at December 31, 2008 . . . . . . . . . . . . 2,801,796 $ 8.13 3.59 $ 23
Shares authorized for future grants . . . . . . . . . . . . 5,762,679
Outstanding at January 1, 2007 . . . . . . . . . . . . . . 6,605,703 $ 7.43Exercised . . . . . . . . . . . . . . . . . . . . . . . . . . . . . . . (2,146,640) 7.16 $ 61Forfeited / Canceled . . . . . . . . . . . . . . . . . . . . . . (13,608) 9.90
Outstanding at December 31, 2007 . . . . . . . . . . . 4,445,455 $ 7.55 4.37 $ 141
Exercisable at December 31, 2007 . . . . . . . . . . . . 4,422,519 $ 7.51 4.36 $ 140
Shares authorized for future grants . . . . . . . . . . . . 2,460,562
(a) The intrinsic value of a stock option is the amount by which the current market value or the market value upon
exercise of the underlying stock exceeds the exercise price of the option.
As of December 31, 2009, there was no remaining unrecognized compensation cost related to
unvested stock options.
115
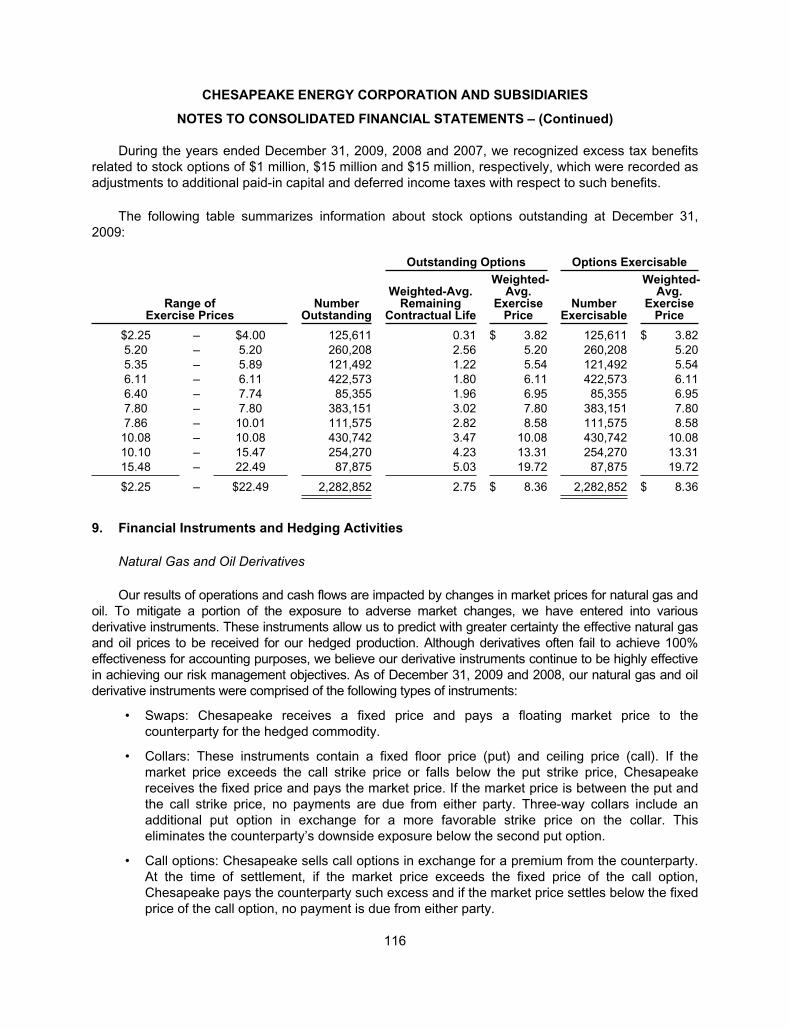
CHESAPEAKE ENERGY CORPORATION AND SUBSIDIARIES
NOTES TO CONSOLIDATED FINANCIAL STATEMENTS – (Continued)
During the years ended December 31, 2009, 2008 and 2007, we recognized excess tax benefits
related to stock options of $1 million, $15 million and $15 million, respectively, which were recorded as
adjustments to additional paid-in capital and deferred income taxes with respect to such benefits.
The following table summarizes information about stock options outstanding at December 31,
2009:
Outstanding Options Options Exercisable
Range ofExercise Prices
NumberOutstanding
Weighted-Avg.Remaining
Contractual Life
Weighted-Avg.
ExercisePrice
NumberExercisable
Weighted-Avg.
ExercisePrice
$2.25 – $4.00 125,611 0.31 $ 3.82 125,611 $ 3.82
5.20 – 5.20 260,208 2.56 5.20 260,208 5.20
5.35 – 5.89 121,492 1.22 5.54 121,492 5.54
6.11 – 6.11 422,573 1.80 6.11 422,573 6.11
6.40 – 7.74 85,355 1.96 6.95 85,355 6.95
7.80 – 7.80 383,151 3.02 7.80 383,151 7.80
7.86 – 10.01 111,575 2.82 8.58 111,575 8.58
10.08 – 10.08 430,742 3.47 10.08 430,742 10.08
10.10 – 15.47 254,270 4.23 13.31 254,270 13.31
15.48 – 22.49 87,875 5.03 19.72 87,875 19.72
$2.25 – $22.49 2,282,852 2.75 $ 8.36 2,282,852 $ 8.36
9. Financial Instruments and Hedging Activities
Natural Gas and Oil Derivatives
Our results of operations and cash flows are impacted by changes in market prices for natural gas and
oil. To mitigate a portion of the exposure to adverse market changes, we have entered into various
derivative instruments. These instruments allow us to predict with greater certainty the effective natural gas
and oil prices to be received for our hedged production. Although derivatives often fail to achieve 100%
effectiveness for accounting purposes, we believe our derivative instruments continue to be highly effective
in achieving our risk management objectives. As of December 31, 2009 and 2008, our natural gas and oil
derivative instruments were comprised of the following types of instruments:
• Swaps: Chesapeake receives a fixed price and pays a floating market price to the
counterparty for the hedged commodity.
• Collars: These instruments contain a fixed floor price (put) and ceiling price (call). If the
market price exceeds the call strike price or falls below the put strike price, Chesapeake
receives the fixed price and pays the market price. If the market price is between the put and
the call strike price, no payments are due from either party. Three-way collars include an
additional put option in exchange for a more favorable strike price on the collar. This
eliminates the counterparty’s downside exposure below the second put option.
• Call options: Chesapeake sells call options in exchange for a premium from the counterparty.
At the time of settlement, if the market price exceeds the fixed price of the call option,
Chesapeake pays the counterparty such excess and if the market price settles below the fixed
price of the call option, no payment is due from either party.
116
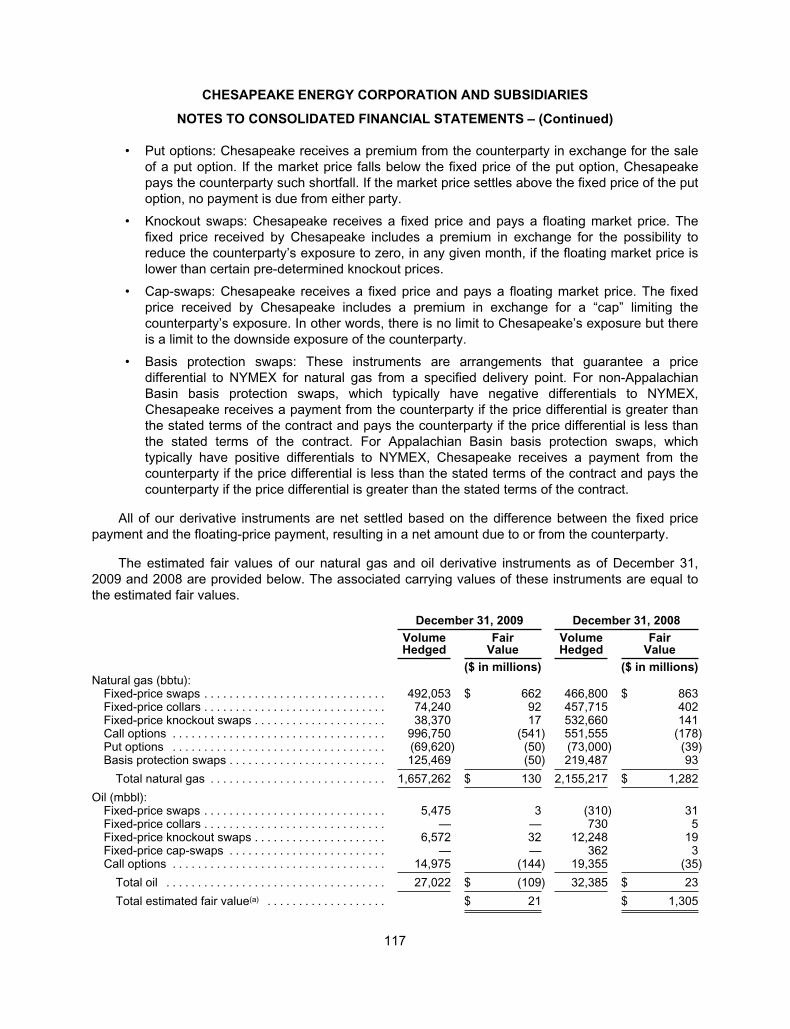
CHESAPEAKE ENERGY CORPORATION AND SUBSIDIARIES
NOTES TO CONSOLIDATED FINANCIAL STATEMENTS – (Continued)
• Put options: Chesapeake receives a premium from the counterparty in exchange for the sale
of a put option. If the market price falls below the fixed price of the put option, Chesapeake
pays the counterparty such shortfall. If the market price settles above the fixed price of the put
option, no payment is due from either party.
• Knockout swaps: Chesapeake receives a fixed price and pays a floating market price. The
fixed price received by Chesapeake includes a premium in exchange for the possibility to
reduce the counterparty’s exposure to zero, in any given month, if the floating market price is
lower than certain pre-determined knockout prices.
• Cap-swaps: Chesapeake receives a fixed price and pays a floating market price. The fixed
price received by Chesapeake includes a premium in exchange for a “cap” limiting the
counterparty’s exposure. In other words, there is no limit to Chesapeake’s exposure but there
is a limit to the downside exposure of the counterparty.
• Basis protection swaps: These instruments are arrangements that guarantee a price
differential to NYMEX for natural gas from a specified delivery point. For non-Appalachian
Basin basis protection swaps, which typically have negative differentials to NYMEX,
Chesapeake receives a payment from the counterparty if the price differential is greater than
the stated terms of the contract and pays the counterparty if the price differential is less than
the stated terms of the contract. For Appalachian Basin basis protection swaps, which
typically have positive differentials to NYMEX, Chesapeake receives a payment from the
counterparty if the price differential is less than the stated terms of the contract and pays the
counterparty if the price differential is greater than the stated terms of the contract.
All of our derivative instruments are net settled based on the difference between the fixed price
payment and the floating-price payment, resulting in a net amount due to or from the counterparty.
The estimated fair values of our natural gas and oil derivative instruments as of December 31,
2009 and 2008 are provided below. The associated carrying values of these instruments are equal to
the estimated fair values.
December 31, 2009 December 31, 2008
VolumeHedged
FairValue
VolumeHedged
FairValue
($ in millions) ($ in millions)Natural gas (bbtu):
Fixed-price swaps . . . . . . . . . . . . . . . . . . . . . . . . . . . . . 492,053 $ 662 466,800 $ 863Fixed-price collars . . . . . . . . . . . . . . . . . . . . . . . . . . . . . 74,240 92 457,715 402Fixed-price knockout swaps . . . . . . . . . . . . . . . . . . . . . 38,370 17 532,660 141Call options . . . . . . . . . . . . . . . . . . . . . . . . . . . . . . . . . . 996,750 (541) 551,555 (178)Put options . . . . . . . . . . . . . . . . . . . . . . . . . . . . . . . . . . (69,620) (50) (73,000) (39)Basis protection swaps . . . . . . . . . . . . . . . . . . . . . . . . . 125,469 (50) 219,487 93
Total natural gas . . . . . . . . . . . . . . . . . . . . . . . . . . . . 1,657,262 $ 130 2,155,217 $ 1,282
Oil (mbbl):Fixed-price swaps . . . . . . . . . . . . . . . . . . . . . . . . . . . . . 5,475 3 (310) 31Fixed-price collars . . . . . . . . . . . . . . . . . . . . . . . . . . . . . — — 730 5Fixed-price knockout swaps . . . . . . . . . . . . . . . . . . . . . 6,572 32 12,248 19Fixed-price cap-swaps . . . . . . . . . . . . . . . . . . . . . . . . . — — 362 3Call options . . . . . . . . . . . . . . . . . . . . . . . . . . . . . . . . . . 14,975 (144) 19,355 (35)
Total oil . . . . . . . . . . . . . . . . . . . . . . . . . . . . . . . . . . . 27,022 $ (109) 32,385 $ 23
Total estimated fair value(a) . . . . . . . . . . . . . . . . . . . $ 21 $ 1,305
117
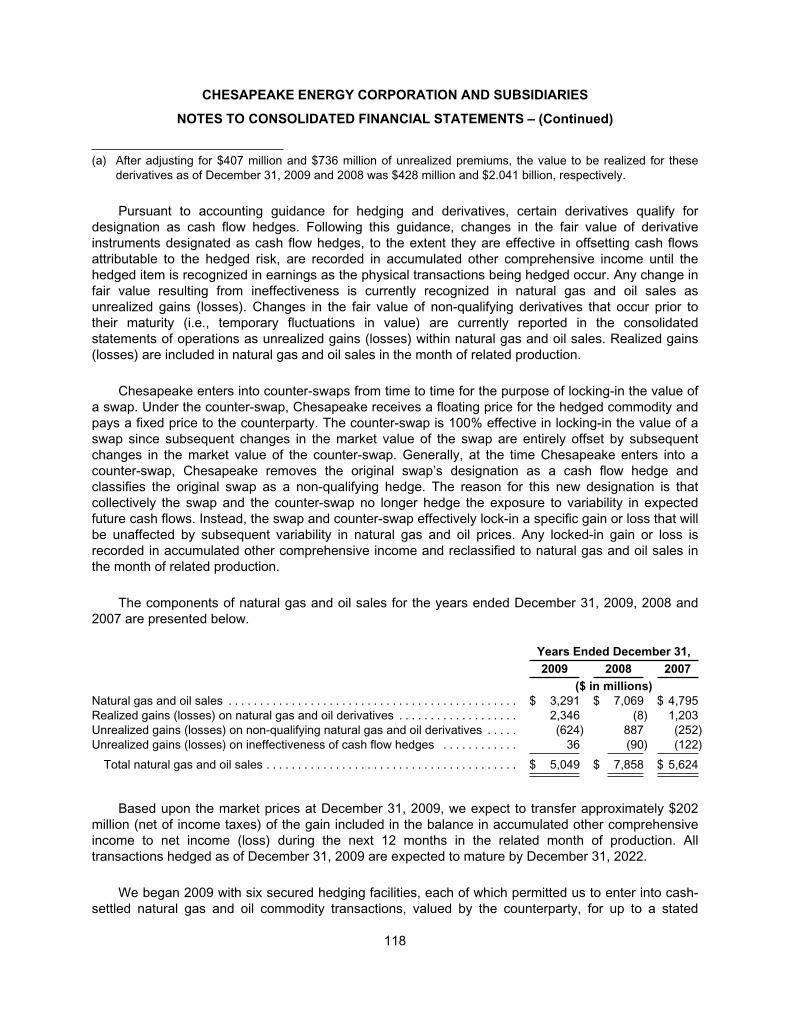
CHESAPEAKE ENERGY CORPORATION AND SUBSIDIARIES
NOTES TO CONSOLIDATED FINANCIAL STATEMENTS – (Continued)
(a) After adjusting for $407 million and $736 million of unrealized premiums, the value to be realized for these
derivatives as of December 31, 2009 and 2008 was $428 million and $2.041 billion, respectively.
Pursuant to accounting guidance for hedging and derivatives, certain derivatives qualify for
designation as cash flow hedges. Following this guidance, changes in the fair value of derivative
instruments designated as cash flow hedges, to the extent they are effective in offsetting cash flows
attributable to the hedged risk, are recorded in accumulated other comprehensive income until the
hedged item is recognized in earnings as the physical transactions being hedged occur. Any change in
fair value resulting from ineffectiveness is currently recognized in natural gas and oil sales as
unrealized gains (losses). Changes in the fair value of non-qualifying derivatives that occur prior to
their maturity (i.e., temporary fluctuations in value) are currently reported in the consolidated
statements of operations as unrealized gains (losses) within natural gas and oil sales. Realized gains
(losses) are included in natural gas and oil sales in the month of related production.
Chesapeake enters into counter-swaps from time to time for the purpose of locking-in the value of
a swap. Under the counter-swap, Chesapeake receives a floating price for the hedged commodity and
pays a fixed price to the counterparty. The counter-swap is 100% effective in locking-in the value of a
swap since subsequent changes in the market value of the swap are entirely offset by subsequent
changes in the market value of the counter-swap. Generally, at the time Chesapeake enters into a
counter-swap, Chesapeake removes the original swap’s designation as a cash flow hedge and
classifies the original swap as a non-qualifying hedge. The reason for this new designation is that
collectively the swap and the counter-swap no longer hedge the exposure to variability in expected
future cash flows. Instead, the swap and counter-swap effectively lock-in a specific gain or loss that will
be unaffected by subsequent variability in natural gas and oil prices. Any locked-in gain or loss is
recorded in accumulated other comprehensive income and reclassified to natural gas and oil sales in
the month of related production.
The components of natural gas and oil sales for the years ended December 31, 2009, 2008 and
2007 are presented below.
Years Ended December 31,
2009 2008 2007
($ in millions)
Natural gas and oil sales . . . . . . . . . . . . . . . . . . . . . . . . . . . . . . . . . . . . . . . . . . . . . . $ 3,291 $ 7,069 $ 4,795
Realized gains (losses) on natural gas and oil derivatives . . . . . . . . . . . . . . . . . . . 2,346 (8) 1,203
Unrealized gains (losses) on non-qualifying natural gas and oil derivatives . . . . . (624) 887 (252)
Unrealized gains (losses) on ineffectiveness of cash flow hedges . . . . . . . . . . . . 36 (90) (122)
Total natural gas and oil sales . . . . . . . . . . . . . . . . . . . . . . . . . . . . . . . . . . . . . . . . $ 5,049 $ 7,858 $ 5,624
Based upon the market prices at December 31, 2009, we expect to transfer approximately $202
million (net of income taxes) of the gain included in the balance in accumulated other comprehensive
income to net income (loss) during the next 12 months in the related month of production. All
transactions hedged as of December 31, 2009 are expected to mature by December 31, 2022.
We began 2009 with six secured hedging facilities, each of which permitted us to enter into cash-
settled natural gas and oil commodity transactions, valued by the counterparty, for up to a stated
118
CHESAPEAKE ENERGY CORPORATION AND SUBSIDIARIES
NOTES TO CONSOLIDATED FINANCIAL STATEMENTS – (Continued)
maximum value. Outstanding transactions under each of the facilities were collateralized by certain of
our natural gas and oil properties that did not secure any of our other obligations. On June 11, 2009,
we entered into a multi-counterparty hedge facility with 13 counterparties that have committed to
provide approximately 3.9 tcfe of trading capacity and an aggregate mark-to-market capacity of $10.4
billion under the terms of the facility. The new multi-counterparty facility has consolidated and replaced
the six secured hedge facilities. All trades have been novated and pledged collateral transferred to the
multi-counterparty facility, which had a total of 1.7 tcfe hedged and collateral value of approximately
$5.3 billion as of December 31, 2009. Trades from the original six secured hedging facilities will
continue to be subject to pre-existing exposure fees, but we are not required to pay an exposure fee for
any new trades in the multi-counterparty facility.
The multi-counterparty facility allows us to enter into cash-settled natural gas and oil price and
basis hedges with the counterparties. Our obligations under the multi-counterparty facility are secured
by natural gas and oil proved reserves, the value of which must cover the fair value of the transactions
outstanding under the facility by at least 1.65 times, and guarantees by certain subsidiaries that also
guarantee our corporate revolving bank credit facility and indentures. The counterparties’ obligations
under the facility must be secured by cash or short-term U.S. Treasury instruments to the extent that
any mark-to-market amounts they owe to Chesapeake exceed defined thresholds. The maximum
volume-based trading capacity under the facility is governed by the expected production of the pledged
reserve collateral, and volume-based trading limits are applied separately to price and basis hedges. In
addition, there are volume-based sub-limits for natural gas and oil hedges. Chesapeake has significant
flexibility with regard to releases and/or substitutions of pledged reserves, provided that certain
collateral coverage and other requirements are met. The facility does not have a maturity date.
Counterparties to the agreement have the right to cease trading with the company on a prospective
basis as long as obligations associated with any existing trades in the facility continue to be satisfied in
accordance with the terms of the agreement.
To mitigate our exposure to the fluctuation in prices of diesel fuel which is used in our exploration
and development activities, we have entered into diesel swaps from January 2010 to March 2010 for a
total of 10.4 million gallons with an average fixed price of $1.58 per gallon. Chesapeake pays the fixed
price and receives a floating price. The fair value of these swaps as of December 31, 2009 was an
asset of $5 million.
Interest Rate Derivatives
To mitigate our exposure to volatility in interest rates related to our senior notes and bank credit
facilities, we enter into interest rate derivatives. As of December 31, 2009 and 2008, our interest rate
derivative instruments were comprised of the following types of instruments:
• Swaps: Chesapeake enters into fixed-to-floating interest rate swaps (we receive a fixed
interest rate and pay a floating market rate) to mitigate our exposure to changes in the fair
value of our senior notes. We enter into floating-to-fixed interest rate swaps (we receive a
floating market rate and pay a fixed interest rate) to manage our interest rate exposure related
to our bank credit facilities borrowings.
• Collars: These instruments contain a fixed floor rate (floor) and a ceiling rate (cap). If the
floating rate is above the cap, we have a net receivable from the counterparty and if the
floating rate is below the floor, we have a net payable to the counterparty. If the floating rate is
between the floor and the cap, there is no payment due from either party. Collars are used to
manage our interest rate exposure related to our bank credit facilities borrowings.
119
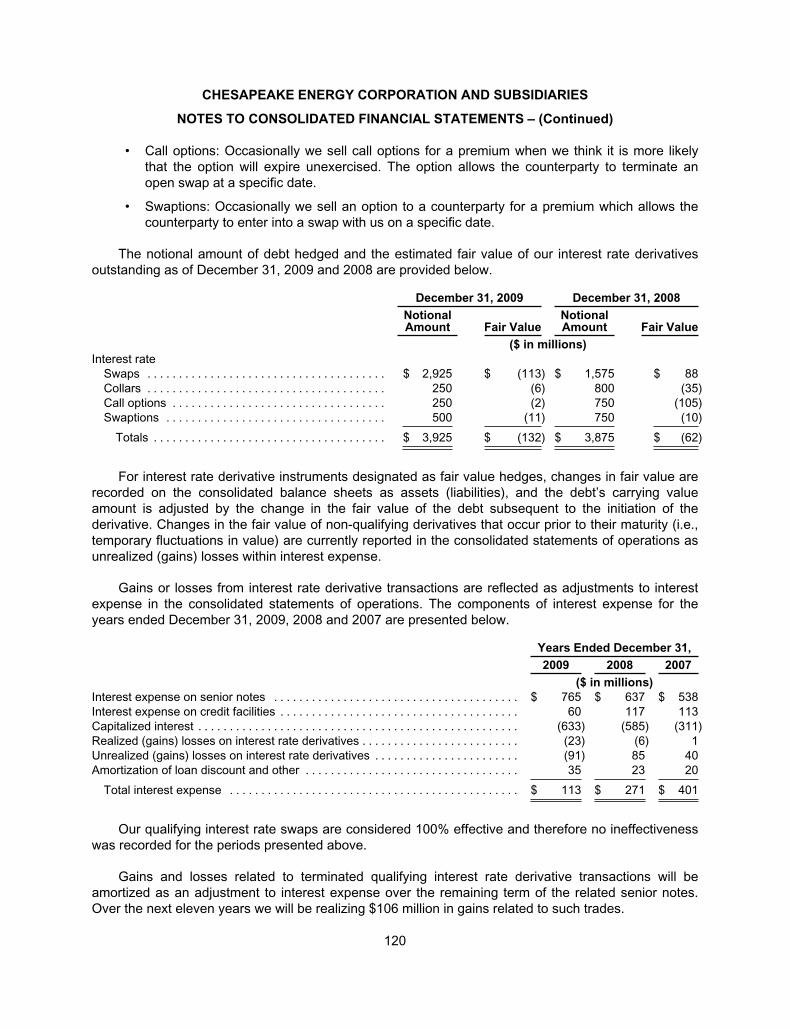
CHESAPEAKE ENERGY CORPORATION AND SUBSIDIARIES
NOTES TO CONSOLIDATED FINANCIAL STATEMENTS – (Continued)
• Call options: Occasionally we sell call options for a premium when we think it is more likely
that the option will expire unexercised. The option allows the counterparty to terminate an
open swap at a specific date.
• Swaptions: Occasionally we sell an option to a counterparty for a premium which allows the
counterparty to enter into a swap with us on a specific date.
The notional amount of debt hedged and the estimated fair value of our interest rate derivatives
outstanding as of December 31, 2009 and 2008 are provided below.
December 31, 2009 December 31, 2008
NotionalAmount Fair Value
NotionalAmount Fair Value
($ in millions)
Interest rate
Swaps . . . . . . . . . . . . . . . . . . . . . . . . . . . . . . . . . . . . . . $ 2,925 $ (113) $ 1,575 $ 88
Collars . . . . . . . . . . . . . . . . . . . . . . . . . . . . . . . . . . . . . . 250 (6) 800 (35)
Call options . . . . . . . . . . . . . . . . . . . . . . . . . . . . . . . . . . 250 (2) 750 (105)
Swaptions . . . . . . . . . . . . . . . . . . . . . . . . . . . . . . . . . . . 500 (11) 750 (10)
Totals . . . . . . . . . . . . . . . . . . . . . . . . . . . . . . . . . . . . . $ 3,925 $ (132) $ 3,875 $ (62)
For interest rate derivative instruments designated as fair value hedges, changes in fair value are
recorded on the consolidated balance sheets as assets (liabilities), and the debt’s carrying value
amount is adjusted by the change in the fair value of the debt subsequent to the initiation of the
derivative. Changes in the fair value of non-qualifying derivatives that occur prior to their maturity (i.e.,
temporary fluctuations in value) are currently reported in the consolidated statements of operations as
unrealized (gains) losses within interest expense.
Gains or losses from interest rate derivative transactions are reflected as adjustments to interest
expense in the consolidated statements of operations. The components of interest expense for the
years ended December 31, 2009, 2008 and 2007 are presented below.
Years Ended December 31,
2009 2008 2007
($ in millions)
Interest expense on senior notes . . . . . . . . . . . . . . . . . . . . . . . . . . . . . . . . . . . . . . . $ 765 $ 637 $ 538
Interest expense on credit facilities . . . . . . . . . . . . . . . . . . . . . . . . . . . . . . . . . . . . . . 60 117 113
Capitalized interest . . . . . . . . . . . . . . . . . . . . . . . . . . . . . . . . . . . . . . . . . . . . . . . . . . . (633) (585) (311)
Realized (gains) losses on interest rate derivatives . . . . . . . . . . . . . . . . . . . . . . . . . (23) (6) 1
Unrealized (gains) losses on interest rate derivatives . . . . . . . . . . . . . . . . . . . . . . . (91) 85 40
Amortization of loan discount and other . . . . . . . . . . . . . . . . . . . . . . . . . . . . . . . . . . 35 23 20
Total interest expense . . . . . . . . . . . . . . . . . . . . . . . . . . . . . . . . . . . . . . . . . . . . . . $ 113 $ 271 $ 401
Our qualifying interest rate swaps are considered 100% effective and therefore no ineffectiveness
was recorded for the periods presented above.
Gains and losses related to terminated qualifying interest rate derivative transactions will be
amortized as an adjustment to interest expense over the remaining term of the related senior notes.
Over the next eleven years we will be realizing $106 million in gains related to such trades.
120
CHESAPEAKE ENERGY CORPORATION AND SUBSIDIARIES
NOTES TO CONSOLIDATED FINANCIAL STATEMENTS – (Continued)
Foreign Currency Derivatives
On December 6, 2006, we issued €600 million of 6.25% Euro-denominated Senior Notes due2017. Concurrent with the issuance of the euro-denominated senior notes, we entered into a crosscurrency swap to mitigate our exposure to fluctuations in the euro relative to the dollar over the term ofthe notes. Under the terms of the cross currency swap, on each semi-annual interest payment date,the counterparties pay Chesapeake €19 million and Chesapeake pays the counterparties $30 million,which yields an annual dollar-equivalent interest rate of 7.491%. Upon maturity of the notes, thecounterparties will pay Chesapeake €600 million and Chesapeake will pay the counterparties $800million. The terms of the cross currency swap were based on the dollar/euro exchange rate on theissuance date of $1.3325 to €1.00. Through the cross currency swap, we have eliminated any potentialvariability in Chesapeake’s expected cash flows related to changes in foreign exchange rates andtherefore the swap qualifies as a cash flow hedge. The fair value of the cross currency swap isrecorded on the consolidated balance sheet as an asset of $43 million at December 31, 2009. Theeuro-denominated debt in notes payable has been adjusted to $860 million at December 31, 2009using an exchange rate of $1.4332 to €1.00.
Additional Disclosures About Derivative Instruments and Hedging Activities
In accordance with accounting guidance for hedging and derivatives, to the extent that a legal rightof set-off exists, Chesapeake nets the value of its derivative arrangements with the same counterparty inthe accompanying consolidated balance sheets. Derivative instruments reflected as current in theconsolidated balance sheet represent the estimated fair value of derivatives scheduled to settle over thenext 12 months based on market prices/rates as of the balance sheet date. The derivative settlementamounts are not due until the month in which the related underlying hedged transaction occurs. Cashsettlements of our derivative arrangements are generally classified as operating cash flows unless thederivative contains a significant financing element at contract inception, in which case, all cashsettlements are classified as financing cash flows in the accompanying consolidated statement of cashflows.
121
CHESAPEAKE ENERGY CORPORATION AND SUBSIDIARIES
NOTES TO CONSOLIDATED FINANCIAL STATEMENTS – (Continued)
The following table sets forth the fair value of each classification of derivative instrument as ofDecember 31, 2009 on a gross basis without regard to same-counterparty netting:
December 31, 2009
Balance Sheet Location Fair Value
($ in millions)
ASSET DERIVATIVES:
Derivatives designated as hedging instruments:
Commodity contracts . . . . . . . . . . . . . . . . . . . . . . . . . . . . . . . . Short-term derivative instruments $ 417
Commodity contracts . . . . . . . . . . . . . . . . . . . . . . . . . . . . . . . . Long-term derivative instruments 36
Foreign exchange contracts . . . . . . . . . . . . . . . . . . . . . . . . . . Long-term derivative instruments 43
Total . . . . . . . . . . . . . . . . . . . . . . . . . . . . . . . . . . . . . . . . . . . . . . . . . . . . . . . . . . . . . . . . . . . . . . . . . . . . . 496
Derivatives not designated as hedging instruments:
Commodity contracts . . . . . . . . . . . . . . . . . . . . . . . . . . . . . . . . Short-term derivative instruments 318
Commodity contracts . . . . . . . . . . . . . . . . . . . . . . . . . . . . . . . . Long-term derivative instruments 66
Total . . . . . . . . . . . . . . . . . . . . . . . . . . . . . . . . . . . . . . . . . . . . . . . . . . . . . . . . . . . . . . . . . . . . . . . . . . . . . 384
LIABILITY DERIVATIVES:
Derivatives designated as hedging instruments:
Commodity contracts . . . . . . . . . . . . . . . . . . . . . . . . . . . . . . . . Short-term derivative instruments (1)
Interest rate contracts . . . . . . . . . . . . . . . . . . . . . . . . . . . . . . . Long-term derivative instruments (11)
Total . . . . . . . . . . . . . . . . . . . . . . . . . . . . . . . . . . . . . . . . . . . . . . . . . . . . . . . . . . . . . . . . . . . . . . . . . . . . . (12)
Derivatives not designated as hedging instruments:
Commodity contracts . . . . . . . . . . . . . . . . . . . . . . . . . . . . . . . . Short-term derivative instruments (42)
Commodity contracts . . . . . . . . . . . . . . . . . . . . . . . . . . . . . . . . Long-term derivative instruments (768)
Interest rate contracts . . . . . . . . . . . . . . . . . . . . . . . . . . . . . . . Short-term derivative instruments (27)
Interest rate contracts . . . . . . . . . . . . . . . . . . . . . . . . . . . . . . . Long-term derivative instruments (94)
Total . . . . . . . . . . . . . . . . . . . . . . . . . . . . . . . . . . . . . . . . . . . . . . . . . . . . . . . . . . . . . . . . . . . . . . . . . . . . . (931)
Total derivative instruments . . . . . . . . . . . . . . . . . . . . . . . . . . . . . . . . . . . . . . . . . . . . . . . . . . . . . . . . $ (63)
A consolidated summary of the effect of derivative instruments on the consolidated statements of
operations for the year ended December 31, 2009 is provided below, separating fair value, cash flow
and non-qualifying derivatives.
The following table presents the gain (loss) recognized in net income (loss) for instruments
designated as fair value derivatives ($ in millions):
Fair Value Derivatives Location of Gain (Loss)Year Ended
December 31, 2009
Interest rate contracts Interest expense(a) . . . . . $ 37
(a) Interest expense on the hedged items for the year ended December 31, 2009 was $71 million, which is
included in interest expense on the consolidated statement of operations.
122
CHESAPEAKE ENERGY CORPORATION AND SUBSIDIARIES
NOTES TO CONSOLIDATED FINANCIAL STATEMENTS – (Continued)
The following table presents the pre-tax gain (loss) recognized in, and reclassified from,
accumulated other comprehensive income (AOCI) and recognized in net income (loss), including any
hedge ineffectiveness, for derivative instruments designated as cash flow derivatives ($ in millions):
Cash Flow Derivatives Location of Gain (Loss)Year Ended
December 31, 2009
Gain (Loss) Recognized in AOCI (Effective Portion)
Commodity contracts AOCI . . . . . . . . . . . . . . . . . . . . $ 958
Foreign exchange contracts AOCI . . . . . . . . . . . . . . . . . . . . 96
$ 1,054
Gain (Loss) Reclassified from AOCI (Effective Portion)
Commodity contracts Natural gas and oil sales . . . . $ 1,425
$ 1,425
Gain (Loss) Recognized (Ineffective Portion and amount
excluded from effectiveness testing)(a)
Commodity contracts Natural gas and oil sales . . . . $ 193
$ 193
(a) The amount of gain (loss) recognized in net income (loss) represents $36 million related to the ineffective
portion of our cash flow derivatives, and $157 million related to the amount excluded from the assessment of
hedge effectiveness.
The following table presents the gain (loss) recognized in net income (loss) for instruments not
qualifying as cash flow or fair value derivatives ($ in millions):
Non-Qualifying Derivatives Location of Gain (Loss)Year Ended
December 31, 2009
Commodity contracts Natural gas and oil sales . . . . $ 139
Interest rate contracts Interest expense . . . . . . . . . . . 77
Total . . . . . . . . . . . . . . . . . . . $ 216
Concentration of Credit Risk
A significant portion of our liquidity is concentrated in derivative instruments that enable us to
hedge a portion of our exposure to natural gas and oil price and interest rate volatility. These
arrangements expose us to credit risk from our counterparties. To mitigate this risk, we enter into
derivative contracts only with investment-grade rated counterparties deemed by management to be
competent and competitive market makers, and we attempt to limit our exposure to non-performance
by any single counterparty. On December 31, 2009, our commodity and interest rate derivative
instruments were spread among 14 counterparties. Additionally, our multi-counterparty secured
hedging facility described previously requires our counterparties to secure their natural gas and oil
hedging obligations in excess of defined thresholds. We now use this facility for substantially all of our
commodity hedging.
Other financial instruments which potentially subject us to concentrations of credit risk consist
principally of investments in equity instruments and accounts receivable. Our accounts receivable are
primarily from purchasers of natural gas and oil and exploration and production companies which own
interests in properties we operate. This industry concentration has the potential to impact our overall
123
CHESAPEAKE ENERGY CORPORATION AND SUBSIDIARIES
NOTES TO CONSOLIDATED FINANCIAL STATEMENTS – (Continued)
exposure to credit risk, either positively or negatively, in that our customers may be similarly affected
by changes in economic, industry or other conditions. We monitor the creditworthiness of all our
counterparties. We generally require letters of credit for receivables from customers which are judged
to have sub-standard credit, unless the credit risk can otherwise be mitigated. In 2009, we recognized
$12 million of bad debt expense related to potentially uncollectible receivables.
10. Supplemental Disclosures About Natural Gas and Oil Producing Activities
Net Capitalized Costs
Evaluated and unevaluated capitalized costs related to Chesapeake’s natural gas and oil
producing activities are summarized as follows:
December 31,
2009 2008
($ in millions)
Natural gas and oil properties:
Proved . . . . . . . . . . . . . . . . . . . . . . . . . . . . . . . . . . . . . . . . . . . . . . . . . . . . . . . . . . . . . . . . $ 35,007 $ 28,965
Unproved . . . . . . . . . . . . . . . . . . . . . . . . . . . . . . . . . . . . . . . . . . . . . . . . . . . . . . . . . . . . . . 10,005 11,379
Total . . . . . . . . . . . . . . . . . . . . . . . . . . . . . . . . . . . . . . . . . . . . . . . . . . . . . . . . . . . . . . . . 45,012 40,344
Less accumulated depreciation, depletion and amortization . . . . . . . . . . . . . . . . . . . . . (24,220) (11,866)
Net capitalized costs . . . . . . . . . . . . . . . . . . . . . . . . . . . . . . . . . . . . . . . . . . . . . . . . . . . . . $ 20,792 $ 28,478
Unproved properties not subject to amortization at December 31, 2009, 2008 and 2007 consisted
mainly of leasehold acquired through corporate and significant natural gas and oil property acquisitions
and through direct purchases of leasehold. We capitalized approximately $627 million, $585 million
and $311 million of interest during 2009, 2008 and 2007, respectively, on significant investments in
unproved properties that were not yet included in the amortization base of the full-cost pool. We will
continue to evaluate our unevaluated properties; however, the timing of the ultimate evaluation and
disposition of the properties has not been determined.
The table below sets forth the cost of unproved properties excluded from the amortization base as
of December 31, 2009 and notes the year in which the associated costs were incurred:
Year of Acquisition
Total2009 2008 2007 Prior
($ in millions)
Leasehold acquisition cost . . . . . . . . . . . . . . . . . . . . . . . . . . . . . . $ 1,803 $ 4,948 $ 1,059 $ 636 $ 8,446
Exploration cost . . . . . . . . . . . . . . . . . . . . . . . . . . . . . . . . . . . . . . . 346 152 120 — 618
Capitalized interest . . . . . . . . . . . . . . . . . . . . . . . . . . . . . . . . . . . . 201 551 118 71 941
Total . . . . . . . . . . . . . . . . . . . . . . . . . . . . . . . . . . . . . . . . . . . . $ 2,350 $ 5,651 $ 1,297 $ 707 $10,005
124
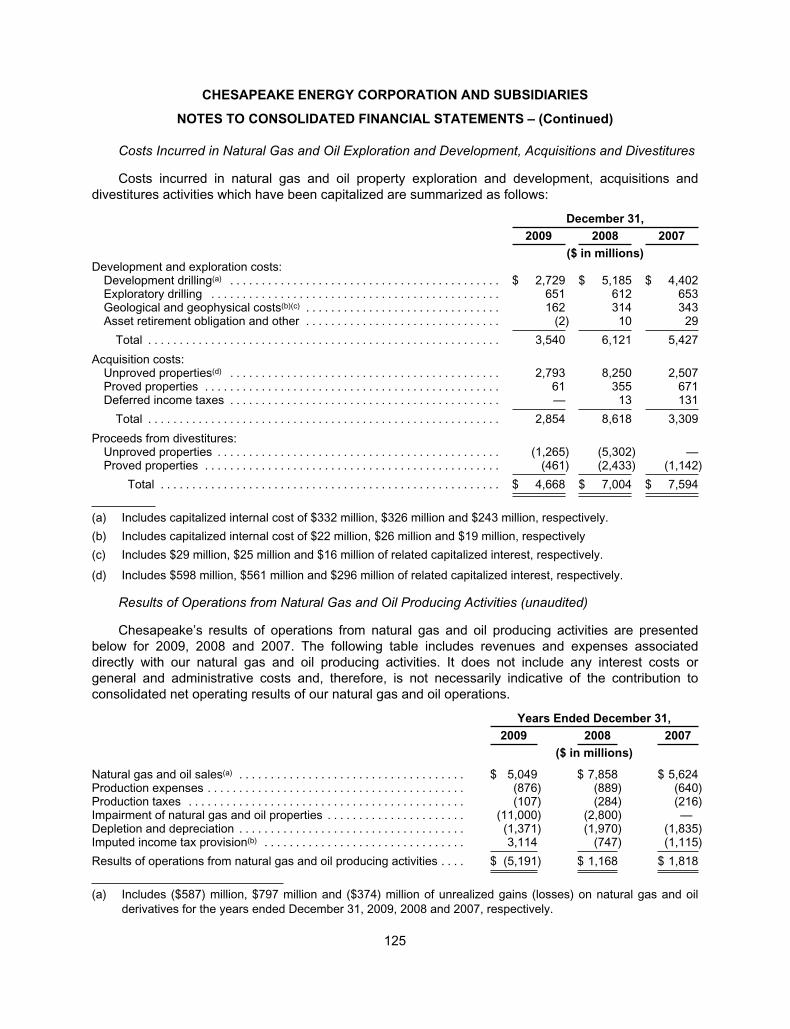
CHESAPEAKE ENERGY CORPORATION AND SUBSIDIARIES
NOTES TO CONSOLIDATED FINANCIAL STATEMENTS – (Continued)
Costs Incurred in Natural Gas and Oil Exploration and Development, Acquisitions and Divestitures
Costs incurred in natural gas and oil property exploration and development, acquisitions and
divestitures activities which have been capitalized are summarized as follows:
December 31,
2009 2008 2007
($ in millions)Development and exploration costs:
Development drilling(a) . . . . . . . . . . . . . . . . . . . . . . . . . . . . . . . . . . . . . . . . . . . $ 2,729 $ 5,185 $ 4,402Exploratory drilling . . . . . . . . . . . . . . . . . . . . . . . . . . . . . . . . . . . . . . . . . . . . . . 651 612 653Geological and geophysical costs(b)(c) . . . . . . . . . . . . . . . . . . . . . . . . . . . . . . . 162 314 343Asset retirement obligation and other . . . . . . . . . . . . . . . . . . . . . . . . . . . . . . . (2) 10 29
Total . . . . . . . . . . . . . . . . . . . . . . . . . . . . . . . . . . . . . . . . . . . . . . . . . . . . . . . . 3,540 6,121 5,427
Acquisition costs:Unproved properties(d) . . . . . . . . . . . . . . . . . . . . . . . . . . . . . . . . . . . . . . . . . . . 2,793 8,250 2,507Proved properties . . . . . . . . . . . . . . . . . . . . . . . . . . . . . . . . . . . . . . . . . . . . . . . 61 355 671Deferred income taxes . . . . . . . . . . . . . . . . . . . . . . . . . . . . . . . . . . . . . . . . . . . — 13 131
Total . . . . . . . . . . . . . . . . . . . . . . . . . . . . . . . . . . . . . . . . . . . . . . . . . . . . . . . . 2,854 8,618 3,309
Proceeds from divestitures:Unproved properties . . . . . . . . . . . . . . . . . . . . . . . . . . . . . . . . . . . . . . . . . . . . . (1,265) (5,302) —Proved properties . . . . . . . . . . . . . . . . . . . . . . . . . . . . . . . . . . . . . . . . . . . . . . . (461) (2,433) (1,142)
Total . . . . . . . . . . . . . . . . . . . . . . . . . . . . . . . . . . . . . . . . . . . . . . . . . . . . . . $ 4,668 $ 7,004 $ 7,594
(a) Includes capitalized internal cost of $332 million, $326 million and $243 million, respectively.
(b) Includes capitalized internal cost of $22 million, $26 million and $19 million, respectively
(c) Includes $29 million, $25 million and $16 million of related capitalized interest, respectively.
(d) Includes $598 million, $561 million and $296 million of related capitalized interest, respectively.
Results of Operations from Natural Gas and Oil Producing Activities (unaudited)
Chesapeake’s results of operations from natural gas and oil producing activities are presented
below for 2009, 2008 and 2007. The following table includes revenues and expenses associated
directly with our natural gas and oil producing activities. It does not include any interest costs or
general and administrative costs and, therefore, is not necessarily indicative of the contribution to
consolidated net operating results of our natural gas and oil operations.
Years Ended December 31,
2009 2008 2007
($ in millions)
Natural gas and oil sales(a) . . . . . . . . . . . . . . . . . . . . . . . . . . . . . . . . . . . . $ 5,049 $ 7,858 $ 5,624Production expenses . . . . . . . . . . . . . . . . . . . . . . . . . . . . . . . . . . . . . . . . . (876) (889) (640)Production taxes . . . . . . . . . . . . . . . . . . . . . . . . . . . . . . . . . . . . . . . . . . . . (107) (284) (216)Impairment of natural gas and oil properties . . . . . . . . . . . . . . . . . . . . . . (11,000) (2,800) —Depletion and depreciation . . . . . . . . . . . . . . . . . . . . . . . . . . . . . . . . . . . . (1,371) (1,970) (1,835)Imputed income tax provision(b) . . . . . . . . . . . . . . . . . . . . . . . . . . . . . . . . 3,114 (747) (1,115)
Results of operations from natural gas and oil producing activities . . . . $ (5,191) $ 1,168 $ 1,818
(a) Includes ($587) million, $797 million and ($374) million of unrealized gains (losses) on natural gas and oil
derivatives for the years ended December 31, 2009, 2008 and 2007, respectively.
125
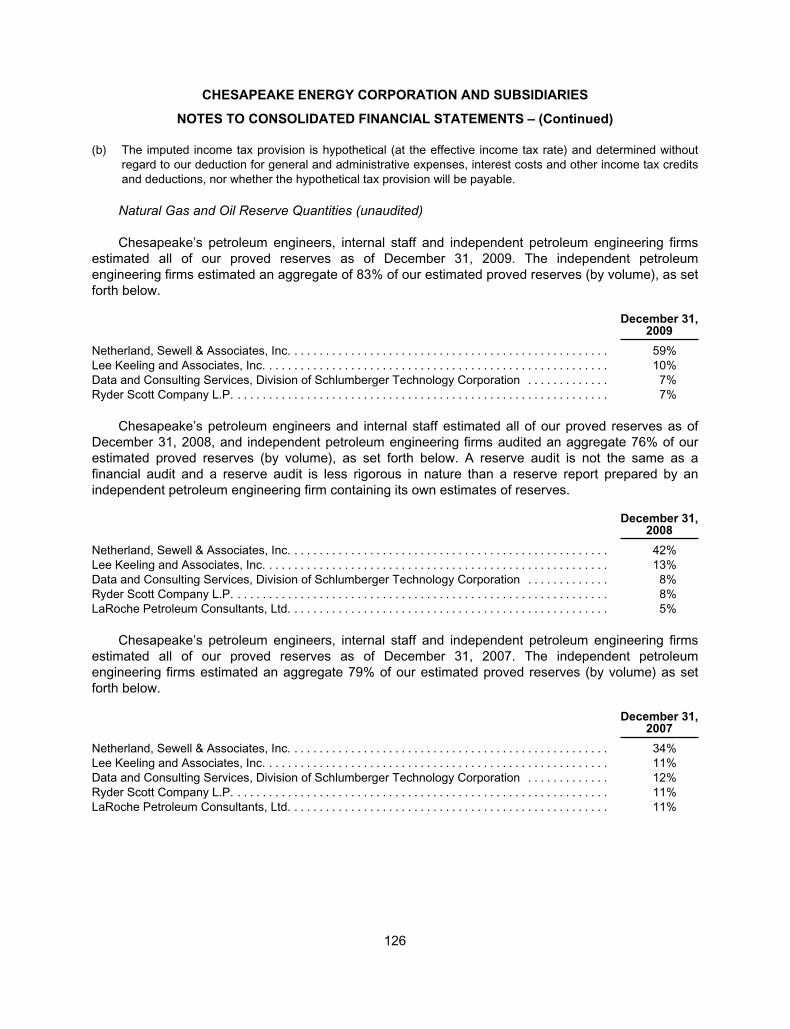
CHESAPEAKE ENERGY CORPORATION AND SUBSIDIARIES
NOTES TO CONSOLIDATED FINANCIAL STATEMENTS – (Continued)
(b) The imputed income tax provision is hypothetical (at the effective income tax rate) and determined without
regard to our deduction for general and administrative expenses, interest costs and other income tax credits
and deductions, nor whether the hypothetical tax provision will be payable.
Natural Gas and Oil Reserve Quantities (unaudited)
Chesapeake’s petroleum engineers, internal staff and independent petroleum engineering firms
estimated all of our proved reserves as of December 31, 2009. The independent petroleum
engineering firms estimated an aggregate of 83% of our estimated proved reserves (by volume), as set
forth below.
December 31,2009
Netherland, Sewell & Associates, Inc. . . . . . . . . . . . . . . . . . . . . . . . . . . . . . . . . . . . . . . . . . . . . . . . . . . 59%
Lee Keeling and Associates, Inc. . . . . . . . . . . . . . . . . . . . . . . . . . . . . . . . . . . . . . . . . . . . . . . . . . . . . . . 10%
Data and Consulting Services, Division of Schlumberger Technology Corporation . . . . . . . . . . . . . 7%
Ryder Scott Company L.P. . . . . . . . . . . . . . . . . . . . . . . . . . . . . . . . . . . . . . . . . . . . . . . . . . . . . . . . . . . . 7%
Chesapeake’s petroleum engineers and internal staff estimated all of our proved reserves as of
December 31, 2008, and independent petroleum engineering firms audited an aggregate 76% of our
estimated proved reserves (by volume), as set forth below. A reserve audit is not the same as a
financial audit and a reserve audit is less rigorous in nature than a reserve report prepared by an
independent petroleum engineering firm containing its own estimates of reserves.
December 31,2008
Netherland, Sewell & Associates, Inc. . . . . . . . . . . . . . . . . . . . . . . . . . . . . . . . . . . . . . . . . . . . . . . . . . . 42%
Lee Keeling and Associates, Inc. . . . . . . . . . . . . . . . . . . . . . . . . . . . . . . . . . . . . . . . . . . . . . . . . . . . . . . 13%
Data and Consulting Services, Division of Schlumberger Technology Corporation . . . . . . . . . . . . . 8%
Ryder Scott Company L.P. . . . . . . . . . . . . . . . . . . . . . . . . . . . . . . . . . . . . . . . . . . . . . . . . . . . . . . . . . . . 8%
LaRoche Petroleum Consultants, Ltd. . . . . . . . . . . . . . . . . . . . . . . . . . . . . . . . . . . . . . . . . . . . . . . . . . . 5%
Chesapeake’s petroleum engineers, internal staff and independent petroleum engineering firms
estimated all of our proved reserves as of December 31, 2007. The independent petroleum
engineering firms estimated an aggregate 79% of our estimated proved reserves (by volume) as set
forth below.
December 31,2007
Netherland, Sewell & Associates, Inc. . . . . . . . . . . . . . . . . . . . . . . . . . . . . . . . . . . . . . . . . . . . . . . . . . . 34%
Lee Keeling and Associates, Inc. . . . . . . . . . . . . . . . . . . . . . . . . . . . . . . . . . . . . . . . . . . . . . . . . . . . . . . 11%
Data and Consulting Services, Division of Schlumberger Technology Corporation . . . . . . . . . . . . . 12%
Ryder Scott Company L.P. . . . . . . . . . . . . . . . . . . . . . . . . . . . . . . . . . . . . . . . . . . . . . . . . . . . . . . . . . . . 11%
LaRoche Petroleum Consultants, Ltd. . . . . . . . . . . . . . . . . . . . . . . . . . . . . . . . . . . . . . . . . . . . . . . . . . . 11%
126
CHESAPEAKE ENERGY CORPORATION AND SUBSIDIARIES
NOTES TO CONSOLIDATED FINANCIAL STATEMENTS – (Continued)
Proved oil and gas reserves are those quantities of oil and gas, which, by analysis of geoscience
and engineering data, can be estimated with reasonable certainty to be economically producible – from
a given date forward, from known reservoirs, and under existing economic conditions, operating
methods, and government regulations – prior to the time at which contracts providing the right to
operate expire, unless evidence indicates that renewal is reasonably certain, regardless of whether
deterministic or probabilistic methods are used for the estimation. Existing economic conditions include
prices and costs at which economic producibility from a reservoir is to be determined. The price shall
be the average price during the 12-month period prior to the ending date of the period covered by the
report, determined as an unweighted arithmetic average of the first-day-of-the-month price for each
month within such period, unless prices are defined by contractual arrangements, excluding
escalations based upon future conditions. The project to extract the hydrocarbons must have
commenced or the operator must be reasonably certain that it will commence the project within a
reasonable time. The area of the reservoir considered as proved includes: (i) the area identified by
drilling and limited by fluid contacts, if any, and (ii) adjacent undrilled portions of the reservoir that can,
with reasonable certainty, be judged to be continuous with it and to contain economically producible oil
or gas on the basis of available geoscience and engineering data. In the absence of data on fluid
contacts, proved quantities in a reservoir are limited by the lowest known hydrocarbons as seen in a
well penetration unless geoscience, engineering or performance data and reliable technology
establishes a lower contact with reasonable certainty. Where direct observation from well penetrations
has defined a highest known oil elevation and the potential exists for an associated gas cap, proved oil
reserves may be assigned in the structurally higher portions of the reservoir only if geoscience,
engineering, or performance data and reliable technology establish the higher contact with reasonable
certainty. Reserves which can be produced economically through application of improved recovery
techniques (including, but not limited to, fluid injection) are included in the proved classification when:
(i) successful testing by a pilot project in an area of the reservoir with properties no more favorable
than in the reservoir as a whole, the operation of an installed program in the reservoir or an analogous
reservoir, or other evidence using reliable technology establishes the reasonable certainty of the
engineering analysis on which the project or program was based; and (ii) the project has been
approved for development by all necessary parties and entities, including governmental entities.
Proved developed oil and gas reserves are reserves of any category that can be expected to be
recovered through existing wells with existing equipment and operating methods or in which the cost of
the required equipment is relatively minor compared to the cost of a new well.
The information below on our natural gas and oil reserves is presented in accordance with
regulations prescribed by the Securities and Exchange Commission as in effect as of the date of such
estimates. Chesapeake emphasizes that reserve estimates are inherently imprecise. Our reserve
estimates were generally based upon extrapolation of historical production trends, analogy to similar
properties and volumetric calculations. Accordingly, these estimates are expected to change, and such
changes could be material and occur in the near term as future information becomes available.
127
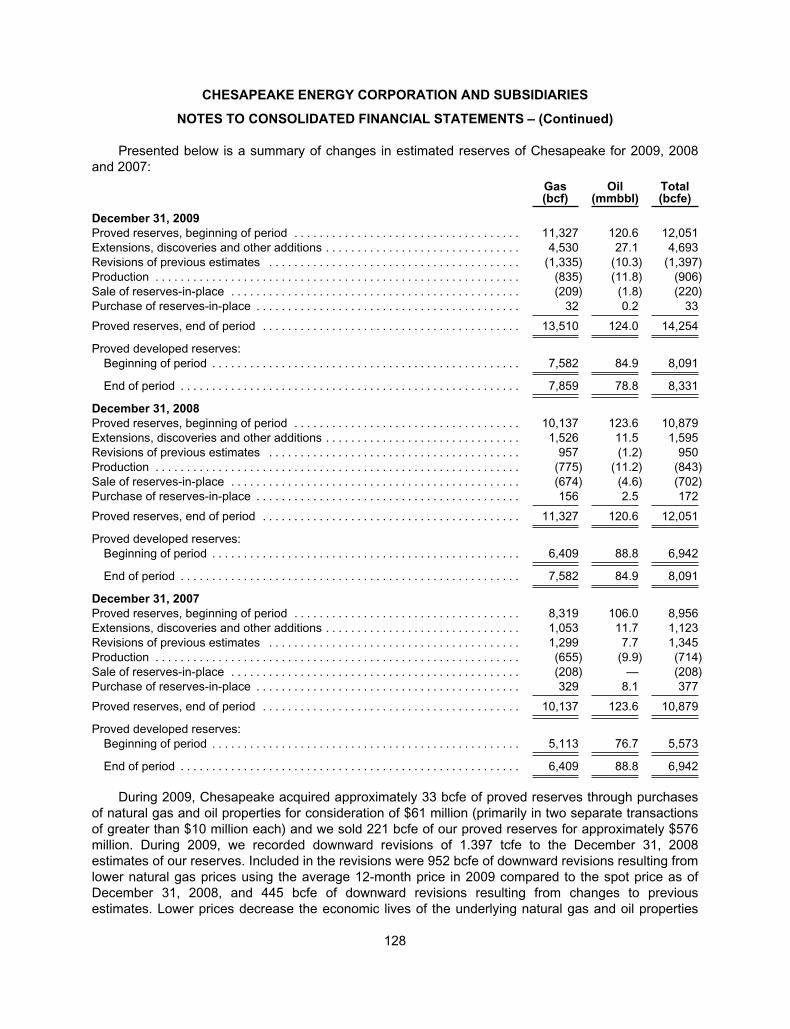
CHESAPEAKE ENERGY CORPORATION AND SUBSIDIARIES
NOTES TO CONSOLIDATED FINANCIAL STATEMENTS – (Continued)
Presented below is a summary of changes in estimated reserves of Chesapeake for 2009, 2008
and 2007:
Gas(bcf)
Oil(mmbbl)
Total(bcfe)
December 31, 2009
Proved reserves, beginning of period . . . . . . . . . . . . . . . . . . . . . . . . . . . . . . . . . . . . 11,327 120.6 12,051
Extensions, discoveries and other additions . . . . . . . . . . . . . . . . . . . . . . . . . . . . . . . 4,530 27.1 4,693
Revisions of previous estimates . . . . . . . . . . . . . . . . . . . . . . . . . . . . . . . . . . . . . . . . (1,335) (10.3) (1,397)
Production . . . . . . . . . . . . . . . . . . . . . . . . . . . . . . . . . . . . . . . . . . . . . . . . . . . . . . . . . . (835) (11.8) (906)
Sale of reserves-in-place . . . . . . . . . . . . . . . . . . . . . . . . . . . . . . . . . . . . . . . . . . . . . . (209) (1.8) (220)
Purchase of reserves-in-place . . . . . . . . . . . . . . . . . . . . . . . . . . . . . . . . . . . . . . . . . . 32 0.2 33
Proved reserves, end of period . . . . . . . . . . . . . . . . . . . . . . . . . . . . . . . . . . . . . . . . . 13,510 124.0 14,254
Proved developed reserves:
Beginning of period . . . . . . . . . . . . . . . . . . . . . . . . . . . . . . . . . . . . . . . . . . . . . . . . . 7,582 84.9 8,091
End of period . . . . . . . . . . . . . . . . . . . . . . . . . . . . . . . . . . . . . . . . . . . . . . . . . . . . . . 7,859 78.8 8,331
December 31, 2008
Proved reserves, beginning of period . . . . . . . . . . . . . . . . . . . . . . . . . . . . . . . . . . . . 10,137 123.6 10,879
Extensions, discoveries and other additions . . . . . . . . . . . . . . . . . . . . . . . . . . . . . . . 1,526 11.5 1,595
Revisions of previous estimates . . . . . . . . . . . . . . . . . . . . . . . . . . . . . . . . . . . . . . . . 957 (1.2) 950
Production . . . . . . . . . . . . . . . . . . . . . . . . . . . . . . . . . . . . . . . . . . . . . . . . . . . . . . . . . . (775) (11.2) (843)
Sale of reserves-in-place . . . . . . . . . . . . . . . . . . . . . . . . . . . . . . . . . . . . . . . . . . . . . . (674) (4.6) (702)
Purchase of reserves-in-place . . . . . . . . . . . . . . . . . . . . . . . . . . . . . . . . . . . . . . . . . . 156 2.5 172
Proved reserves, end of period . . . . . . . . . . . . . . . . . . . . . . . . . . . . . . . . . . . . . . . . . 11,327 120.6 12,051
Proved developed reserves:
Beginning of period . . . . . . . . . . . . . . . . . . . . . . . . . . . . . . . . . . . . . . . . . . . . . . . . . 6,409 88.8 6,942
End of period . . . . . . . . . . . . . . . . . . . . . . . . . . . . . . . . . . . . . . . . . . . . . . . . . . . . . . 7,582 84.9 8,091
December 31, 2007
Proved reserves, beginning of period . . . . . . . . . . . . . . . . . . . . . . . . . . . . . . . . . . . . 8,319 106.0 8,956
Extensions, discoveries and other additions . . . . . . . . . . . . . . . . . . . . . . . . . . . . . . . 1,053 11.7 1,123
Revisions of previous estimates . . . . . . . . . . . . . . . . . . . . . . . . . . . . . . . . . . . . . . . . 1,299 7.7 1,345
Production . . . . . . . . . . . . . . . . . . . . . . . . . . . . . . . . . . . . . . . . . . . . . . . . . . . . . . . . . . (655) (9.9) (714)
Sale of reserves-in-place . . . . . . . . . . . . . . . . . . . . . . . . . . . . . . . . . . . . . . . . . . . . . . (208) — (208)
Purchase of reserves-in-place . . . . . . . . . . . . . . . . . . . . . . . . . . . . . . . . . . . . . . . . . . 329 8.1 377
Proved reserves, end of period . . . . . . . . . . . . . . . . . . . . . . . . . . . . . . . . . . . . . . . . . 10,137 123.6 10,879
Proved developed reserves:
Beginning of period . . . . . . . . . . . . . . . . . . . . . . . . . . . . . . . . . . . . . . . . . . . . . . . . . 5,113 76.7 5,573
End of period . . . . . . . . . . . . . . . . . . . . . . . . . . . . . . . . . . . . . . . . . . . . . . . . . . . . . . 6,409 88.8 6,942
During 2009, Chesapeake acquired approximately 33 bcfe of proved reserves through purchases
of natural gas and oil properties for consideration of $61 million (primarily in two separate transactions
of greater than $10 million each) and we sold 221 bcfe of our proved reserves for approximately $576
million. During 2009, we recorded downward revisions of 1.397 tcfe to the December 31, 2008
estimates of our reserves. Included in the revisions were 952 bcfe of downward revisions resulting from
lower natural gas prices using the average 12-month price in 2009 compared to the spot price as of
December 31, 2008, and 445 bcfe of downward revisions resulting from changes to previous
estimates. Lower prices decrease the economic lives of the underlying natural gas and oil properties
128
CHESAPEAKE ENERGY CORPORATION AND SUBSIDIARIES
NOTES TO CONSOLIDATED FINANCIAL STATEMENTS – (Continued)
and thereby decrease the estimated future reserves. The natural gas and oil prices used in computing
our reserves as of December 31, 2009 were $3.87 per mcf and $61.14 per barrel before price
differentials.
During 2008, Chesapeake acquired approximately 172 bcfe of proved reserves through purchases of
natural gas and oil properties for consideration of $355 million (primarily in five separate transactions of
greater than $10 million each) and we sold 702 bcfe of our proved reserves for approximately $2.433
billion. During 2008, we recorded positive revisions of 950 bcfe to the December 31, 2007 estimates of
our reserves. Included in the revisions were 298 bcfe of negative adjustments caused by lower natural
gas prices at December 31, 2008, and 1.248 tcfe of positive performance related revisions. Lower
prices decrease the economic lives of the underlying natural gas and oil properties and thereby
decrease the estimated future reserves. The natural gas and oil prices used in computing our reserves
as of December 31, 2008 were $5.71 per mcf and $44.61 per barrel before price differentials.
During 2007, Chesapeake acquired approximately 377 bcfe of proved reserves through purchases of
natural gas and oil properties for consideration of $671 million (primarily in 10 separate transactions of
greater than $10 million each). In December 2007, we sold 208 bcfe of our proved reserves in certain
Chesapeake-operated producing assets in Kentucky and West Virginia for approximately $1.142
billion. During 2007, we recorded positive revisions of 1.345 tcfe to the December 31, 2006 estimates
of our reserves. Included in the revisions were 97 bcfe of positive adjustments caused by higher
natural gas prices at December 31, 2007, and 1.248 tcfe of positive performance related revisions of
which 1.207 tcfe relate to infill drilling and increased density locations. Higher prices extend the
economic lives of the underlying natural gas and oil properties and thereby increase the estimated
future reserves. The natural gas and oil prices used in computing our reserves as of December 31,
2007 were $6.80 per mcf and $96.01 per barrel before price differentials.
Standardized Measure of Discounted Future Net Cash Flows (unaudited)
Accounting Standards Topic 932 prescribes guidelines for computing a standardized measure of
future net cash flows and changes therein relating to estimated proved reserves. Chesapeake has
followed these guidelines which are briefly discussed below.
Future cash inflows and future production and development costs as of December 31, 2009 are
determined by applying the trailing average 12-month prices and year-end costs to the estimated
quantities of natural gas and oil to be produced. Actual future prices and costs may be materially
higher or lower than the 12-month average prices and year-end costs used. Amounts as of
December 31, 2007 and 2008 were determined using year-end prices and costs. For each year,
estimates are made of quantities of proved reserves and the future periods during which they are
expected to be produced based on continuation of the economic conditions applied for such year.
Estimated future income taxes are computed using current statutory income tax rates including
consideration for the current tax basis of the properties and related carryforwards, giving effect to
permanent differences and tax credits. The resulting future net cash flows are reduced to present value
amounts by applying a 10% annual discount factor.
The assumptions used to compute the standardized measure are those prescribed by the
Financial Accounting Standards Board and, as such, do not necessarily reflect our expectations of
actual revenue to be derived from those reserves nor their present worth. The limitations inherent in
the reserve quantity estimation process, as discussed previously, are equally applicable to the
standardized measure computations since these estimates reflect the valuation process.
129
CHESAPEAKE ENERGY CORPORATION AND SUBSIDIARIES
NOTES TO CONSOLIDATED FINANCIAL STATEMENTS – (Continued)
The following summary sets forth our future net cash flows relating to proved natural gas and oil
reserves based on the standardized measure:
Years Ended December 31,
2009 2008 2007
($ in millions)
Future cash inflows . . . . . . . . . . . . . . . . . . . . . . . . . . . . . . . . . . . . . . . . . . . . $ 49,322(a) $ 62,995(b) $ 73,955(c)
Future production costs . . . . . . . . . . . . . . . . . . . . . . . . . . . . . . . . . . . . . . . . . (16,620) (18,828) (19,319)
Future development costs . . . . . . . . . . . . . . . . . . . . . . . . . . . . . . . . . . . . . . . (8,881) (7,378) (8,315)
Future income tax provisions . . . . . . . . . . . . . . . . . . . . . . . . . . . . . . . . . . . . . (4,106) (9,813) (14,056)
Future net cash flows . . . . . . . . . . . . . . . . . . . . . . . . . . . . . . . . . . . . . . . . . . . 19,715 26,976 32,265
Less effect of a 10% discount factor . . . . . . . . . . . . . . . . . . . . . . . . . . . . . . . (11,512) (15,143) (17,303)
Standardized measure of discounted future net cash flows . . . . . . . . . . . . $ 8,203 $ 11,833 $ 14,962
(a) Calculated using prices of $61.14 per barrel of oil and $3.87 per mcf of natural gas, before field differentials.
(b) Calculated using prices of $44.61 per barrel of oil and $5.71 per mcf of natural gas, before field differentials.
(c) Calculated using prices of $96.01 per barrel of oil and $6.80 per mcf of natural gas, before field differentials.
The principal sources of change in the standardized measure of discounted future net cash flows
are as follows:
Years Ended December 31,
2009 2008 2007
($ in millions)
Standardized measure, beginning of period(a) . . . . . . . . . . . . . . . . . . . . . . . . . . $ 11,833 $ 14,962 $ 10,007
Sales of natural gas and oil produced, net of production costs(b) . . . . . . . . . . . (2,307) (5,896) (3,939)
Net changes in prices and production costs . . . . . . . . . . . . . . . . . . . . . . . . . . . . (7,297) (5,025) 3,277
Extensions and discoveries, net of production and development costs . . . . . . 2,374 2,752 2,424
Changes in future development costs . . . . . . . . . . . . . . . . . . . . . . . . . . . . . . . . . 1,910 1,043 (639)
Development costs incurred during the period that reduced future
development costs . . . . . . . . . . . . . . . . . . . . . . . . . . . . . . . . . . . . . . . . . . . . . . 650 1,130 1,410
Revisions of previous quantity estimates . . . . . . . . . . . . . . . . . . . . . . . . . . . . . . (1,290) 1,524 2,960
Purchase of reserves-in-place . . . . . . . . . . . . . . . . . . . . . . . . . . . . . . . . . . . . . . . 41 362 1,166
Sales of reserves-in-place . . . . . . . . . . . . . . . . . . . . . . . . . . . . . . . . . . . . . . . . . . (377) (1,696) (708)
Accretion of discount . . . . . . . . . . . . . . . . . . . . . . . . . . . . . . . . . . . . . . . . . . . . . . 1,560 2,057 1,365
Net change in income taxes . . . . . . . . . . . . . . . . . . . . . . . . . . . . . . . . . . . . . . . . . 2,521 1,843 (1,970)
Changes in production rates and other . . . . . . . . . . . . . . . . . . . . . . . . . . . . . . . . (1,415) (1,223) (391)
Standardized measure, end of period(a) . . . . . . . . . . . . . . . . . . . . . . . . . . . . . . . $ 8,203 $ 11,833 $ 14,962
(a) The impact of cash flow hedges has not been included in any of the periods presented.
(b) Excluding gains (losses) on derivatives.
11. Midstream Joint Venture
On September 30, 2009, we formed a joint venture with Global Infrastructure Partners (GIP), a
New York-based private equity fund, to own and operate natural gas midstream assets. As part of the
transaction, Chesapeake contributed certain natural gas gathering and processing assets to a new
entity, Chesapeake Midstream Partners, L.L.C. (CMP), and GIP purchased a 50% interest in CMP.
130
CHESAPEAKE ENERGY CORPORATION AND SUBSIDIARIES
NOTES TO CONSOLIDATED FINANCIAL STATEMENTS – (Continued)
The assets we contributed to the joint venture were substantially all of our midstream assets in the
Barnett Shale and also the majority of our non-shale midstream assets in the Arkoma, Anadarko,
Delaware and Permian Basins. The financial results of CMP are consolidated and GIP’s 50%
ownership interest is reflected as a noncontrolling interest as of December 31, 2009 in our consolidated
financial statements.
CMP focuses on unregulated business activities in service to both Chesapeake and third-party
natural gas producers and its revenues are generated almost entirely from fixed fee-based
arrangements for gathering, compression, dehydration and treating services. CMP has entered into
various agreements with Chesapeake, including a long-term gas gathering agreement at rates
consistent with current market pricing. CMP operates the contributed assets. Certain Chesapeake
employees provide services to CMP through an employee secondment agreement. In return for certain
cost reimbursements, CMP utilizes various support functions within Chesapeake, including accounting,
human resources and information technology.
Subsidiaries of our wholly-owned subsidiary CMD continue to operate our midstream assets
outside of the CMP joint venture. These include natural gas gathering assets in the Fayetteville Shale,
Haynesville Shale, Marcellus Shale and other areas in Appalachia.
Concurrent with GIP’s funding of its interest in the joint venture, CMP closed a new $500 million
secured revolving bank credit facility to partially fund capital expenditures associated with the building
of additional natural gas gathering systems and for general corporate purposes. Additionally, we
amended and restated the existing midstream lending agreement to reduce the total capacity from
$460 million to $250 million, among other changes. This separate secured revolving bank credit facility
supports CMD’s continuing midstream activities. These facilities are described in Note 3.
In 2009, we recorded an $86 million impairment of certain of the gathering systems contributed to
CMP prior to the formation of the joint venture, and we expensed $4 million of debt issuance costs
associated with the portion of our $460 million midstream credit facility that was reduced to $250
million. The combined impairment of $90 million was included in impairment of natural gas and oil
properties and other assets on our consolidated statement of operations. Additionally, an estimated
post-closing adjustment related to the joint venture transaction was recorded at December 31, 2009,
and is expected to be finalized in the first quarter of 2010.
The $897 million noncontrolling interest included in our consolidated equity at December 31, 2009
represents GIP’s 50% interest in the net assets of CMP, which were recorded by CMP at
Chesapeake’s historical cost basis. This noncontrolling interest includes the $588 million GIP
contributed in exchange for a 50% ownership interest in CMP, $294 million of Chesapeake partners’
capital allocated to GIP in order to properly reflect GIP’s 50% interest in the carrying value of CMP’s
net assets, $25 million of pre-tax net income allocated to GIP from CMP’s operations and a $10 million
distribution to GIP for its proportionate share of transaction costs associated with the formation of the
joint venture.
Beginning January 1, 2010, we will deconsolidate our joint venture with GIP and account for the
investment in the joint venture under the equity method going forward. Adoption of this guidance will
result in a cumulative effect adjustment for the difference in our equity in the joint venture at January 1,
2010, which was originally recorded at carryover basis, and the fair value of our equity at the formation
of the joint venture based on the then fair value. This cumulative effect adjustment will create a basis
131
CHESAPEAKE ENERGY CORPORATION AND SUBSIDIARIES
NOTES TO CONSOLIDATED FINANCIAL STATEMENTS – (Continued)
difference between our equity investment balance and the underlying equity in the net assets of the
joint venture. This difference will be accreted through earnings over the expected useful life of the
underlying assets held by the joint venture.
12. Divestitures
Joint Ventures
In 2008, we entered into three joint ventures to sell a portion of our leasehold in the joint venture
areas, which allowed us to recover much or all of our initial leasehold investments in the plays, reduce
our ongoing capital costs and reduce future risks. The transactions are detailed below.
On July 1, 2008, we entered into a joint venture with Plains Exploration & Production Company
(PXP) to develop our Haynesville and Bossier Shale leasehold in Northwest Louisiana and East Texas.
Under the terms of the joint venture, PXP acquired a 20% interest in approximately 550,000 net acres
of our Haynesville and Bossier Shale leasehold for $1.65 billion in cash. PXP also agreed to fund 50%
of our remaining 80% share of the costs associated with drilling and completing future Haynesville and
Bossier Shale joint venture wells over a multi-year period, up to an additional $1.65 billion. In addition,
PXP has the right to a 20% participation in any additional leasehold we acquire in the Haynesville and
Bossier Shales at our cost plus a fee. In August 2009, Chesapeake and PXP amended their joint
venture agreement to accelerate the payment of PXP’s remaining joint venture drilling carries as of
September 30, 2009, in exchange for an approximate 12% reduction in the total amount of drilling carry
obligations due to Chesapeake. As a result, on September 29, 2009, Chesapeake received $1.1 billion
in cash from PXP and beginning in the 2009 fourth quarter Chesapeake and PXP each began paying
their proportionate working interest costs on drilling.
On September 5, 2008, we entered into a joint venture with BP America Inc. to develop our
Fayetteville Shale leasehold in Arkansas. Under the terms of the joint venture, BP acquired a 25%
interest in approximately 540,000 net acres of our Fayetteville Shale leasehold for $1.1 billion in cash.
BP also paid an additional $800 million by funding 100% of Chesapeake’s 75% share of drilling and
completion expenditures during 2008 and 2009. In addition, BP has the right to a 25% participation in
any additional leasehold we acquire in the Fayetteville Shale at our cost plus a fee.
On November 25, 2008, we entered into a joint venture with Statoil to develop our Marcellus Shale
leasehold in Appalachia. Under the terms of the joint venture, Statoil acquired a 32.5% interest in our
Marcellus Shale assets for $3.375 billion. The assets included approximately 1.8 million net acres of
leasehold, of which Statoil now owns approximately 0.6 million net acres and Chesapeake owns
approximately 1.2 million net acres. Chesapeake received $1.25 billion in cash from Statoil and agreed
to fund 75% of Chesapeake’s 67.5% share of drilling and completion expenditures until the $2.125
billion obligation has been funded, subject to certain conditions. In addition, Statoil has the right to a
32.5% participation in any additional leasehold we acquire in the Marcellus Shale. Statoil’s commitment
to fund 75% of our share of future drilling and completion costs (up to $2.125 billion) is expected to
reduce future DD&A expense by reducing the amount of capital we will invest to develop our Marcellus
properties.
For accounting purposes, cash proceeds from these transactions were reflected as a reduction of
natural gas and oil properties with no gain or loss recognized.
132
CHESAPEAKE ENERGY CORPORATION AND SUBSIDIARIES
NOTES TO CONSOLIDATED FINANCIAL STATEMENTS – (Continued)
Volumetric Production Payments
On August 4, 2009, we sold certain Chesapeake-operated long-lived producing assets in South
Texas in our fifth volumetric production payment transaction for proceeds of approximately
$370 million. The assets included proved reserves of approximately 68 bcfe, valued at $5.46 per mcfe,
and had net production (at the time of sale) of approximately 55 mmcfe per day. The VPP had an
original term of approximately seven and half years. As of December 31, 2009, there was
approximately 60 bcfe of production expected to be delivered over the remaining term. Chesapeake
retained drilling rights on the properties below currently producing intervals.
On December 31, 2008, we sold certain long-lived producing assets in the Anadarko and Arkoma
Basins in a volumetric production payment transaction for net proceeds of approximately $412 million.
These assets had estimated proved reserves of approximately 98 bcfe, valued at $4.19 / mcfe and
current net production (at the time of sale) of approximately 60 mmcfe per day. The VPP had an
original term of eight years. As of December 31, 2009, there was approximately 79 bcfe of production
expected to be delivered over the remaining term. Chesapeake retained drilling rights on the properties
below currently producing intervals.
On August 1, 2008, we completed a volumetric production payment transaction for net proceeds of
approximately $594 million with estimated proved reserves of approximately 93 bcfe, valued at
$6.38/mcfe, and current net production (at the time of sale) of approximately 50 mmcfe per day from
wells in the Anadarko Basin of Oklahoma. The VPP had an original term of 11 years. As of
December 31, 2009, we have approximately 72 bcfe of production expected to be delivered over the
remaining term. Chesapeake retained drilling rights on the properties below currently producing
intervals.
On May 1, 2008, we sold certain long-lived producing assets in Texas, Oklahoma and Kansas in a
volumetric production payment transaction for net proceeds of approximately $616 million. These
assets had estimated proved reserves of approximately 94 bcfe, valued at $6.53/mcfe, and current net
production (at the time of sale) of approximately 47 mmcfe per day. The VPP had an original term of
11 years. As of December 31, 2009, we have approximately 68 bcfe of production expected to be
delivered over the remaining term. Chesapeake retained drilling rights on the properties below
currently producing intervals.
On December 31, 2007, we sold a portion of our proved reserves and production in certain
Chesapeake-operated producing assets in Kentucky and West Virginia in a volumetric production
payment for net proceeds of approximately $1.1 billion. These assets had estimated proved reserves
of approximately 208 bcfe, valued at $5.29/mcfe, and current net production (at the time of sale) of
approximately 55 mmcfe per day. The VPP had an original term of 15 years. As of December 31, 2009,
we have approximately 170 bcfe of production expected to be produced over the remaining term.
Chesapeake retained drilling rights on the properties below currently producing intervals.
For accounting purposes, cash proceeds from these transactions were reflected as a reduction of
natural gas and oil properties with no gain or loss recognized and our proved reserves were reduced
accordingly.
Other Divestitures
In 2009, we sold non-core natural gas assets for proceeds of approximately $418 million.
133
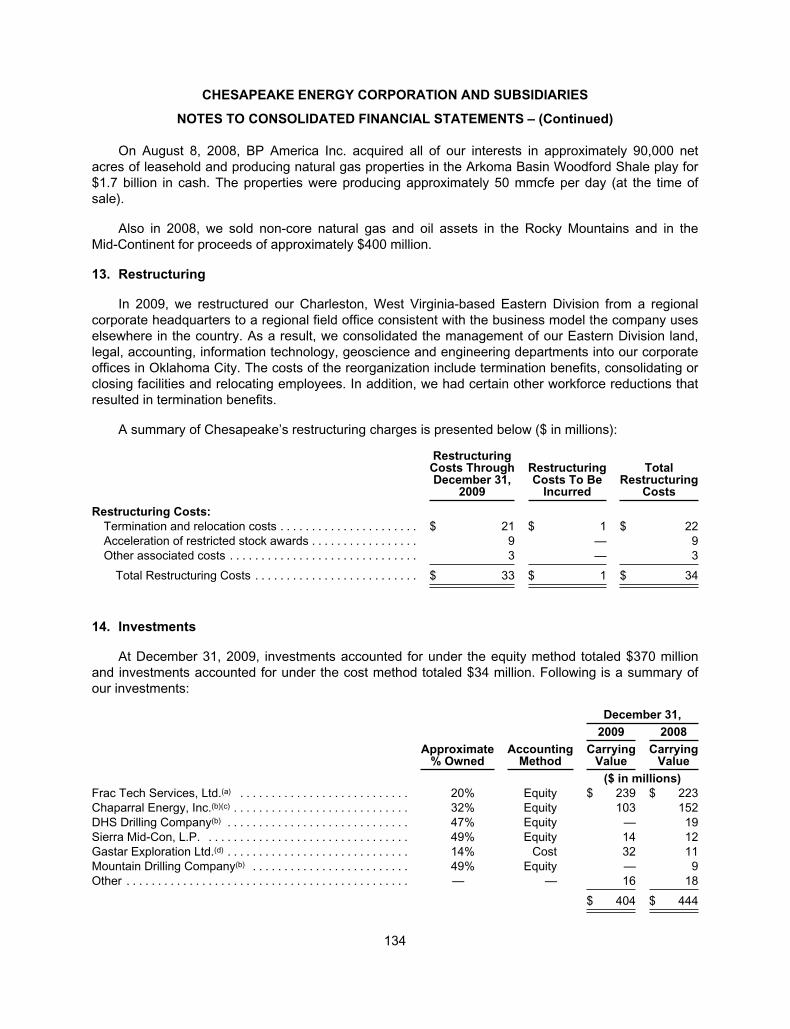
CHESAPEAKE ENERGY CORPORATION AND SUBSIDIARIES
NOTES TO CONSOLIDATED FINANCIAL STATEMENTS – (Continued)
On August 8, 2008, BP America Inc. acquired all of our interests in approximately 90,000 net
acres of leasehold and producing natural gas properties in the Arkoma Basin Woodford Shale play for
$1.7 billion in cash. The properties were producing approximately 50 mmcfe per day (at the time of
sale).
Also in 2008, we sold non-core natural gas and oil assets in the Rocky Mountains and in the
Mid-Continent for proceeds of approximately $400 million.
13. Restructuring
In 2009, we restructured our Charleston, West Virginia-based Eastern Division from a regional
corporate headquarters to a regional field office consistent with the business model the company uses
elsewhere in the country. As a result, we consolidated the management of our Eastern Division land,
legal, accounting, information technology, geoscience and engineering departments into our corporate
offices in Oklahoma City. The costs of the reorganization include termination benefits, consolidating or
closing facilities and relocating employees. In addition, we had certain other workforce reductions that
resulted in termination benefits.
A summary of Chesapeake’s restructuring charges is presented below ($ in millions):
RestructuringCosts ThroughDecember 31,
2009
RestructuringCosts To Be
Incurred
TotalRestructuring
Costs
Restructuring Costs:
Termination and relocation costs . . . . . . . . . . . . . . . . . . . . . . $ 21 $ 1 $ 22
Acceleration of restricted stock awards . . . . . . . . . . . . . . . . . 9 — 9
Other associated costs . . . . . . . . . . . . . . . . . . . . . . . . . . . . . . 3 — 3
Total Restructuring Costs . . . . . . . . . . . . . . . . . . . . . . . . . . $ 33 $ 1 $ 34
14. Investments
At December 31, 2009, investments accounted for under the equity method totaled $370 million
and investments accounted for under the cost method totaled $34 million. Following is a summary of
our investments:
Approximate% Owned
AccountingMethod
December 31,
2009 2008
CarryingValue
CarryingValue
($ in millions)
Frac Tech Services, Ltd.(a) . . . . . . . . . . . . . . . . . . . . . . . . . . . 20% Equity $ 239 $ 223
Chaparral Energy, Inc.(b)(c) . . . . . . . . . . . . . . . . . . . . . . . . . . . . 32% Equity 103 152
DHS Drilling Company(b) . . . . . . . . . . . . . . . . . . . . . . . . . . . . . 47% Equity — 19
Sierra Mid-Con, L.P. . . . . . . . . . . . . . . . . . . . . . . . . . . . . . . . . 49% Equity 14 12
Gastar Exploration Ltd.(d) . . . . . . . . . . . . . . . . . . . . . . . . . . . . . 14% Cost 32 11
Mountain Drilling Company(b) . . . . . . . . . . . . . . . . . . . . . . . . . 49% Equity — 9
Other . . . . . . . . . . . . . . . . . . . . . . . . . . . . . . . . . . . . . . . . . . . . . — — 16 18
$ 404 $ 444
134
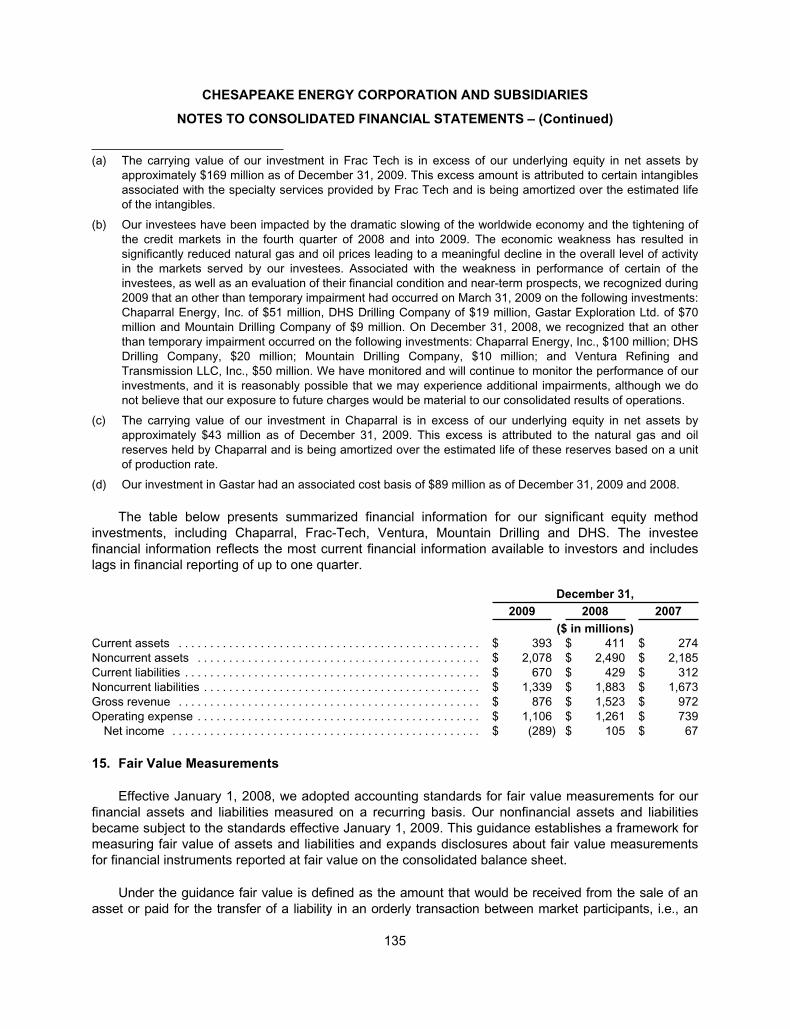
CHESAPEAKE ENERGY CORPORATION AND SUBSIDIARIES
NOTES TO CONSOLIDATED FINANCIAL STATEMENTS – (Continued)
(a) The carrying value of our investment in Frac Tech is in excess of our underlying equity in net assets by
approximately $169 million as of December 31, 2009. This excess amount is attributed to certain intangibles
associated with the specialty services provided by Frac Tech and is being amortized over the estimated life
of the intangibles.
(b) Our investees have been impacted by the dramatic slowing of the worldwide economy and the tightening of
the credit markets in the fourth quarter of 2008 and into 2009. The economic weakness has resulted in
significantly reduced natural gas and oil prices leading to a meaningful decline in the overall level of activity
in the markets served by our investees. Associated with the weakness in performance of certain of the
investees, as well as an evaluation of their financial condition and near-term prospects, we recognized during
2009 that an other than temporary impairment had occurred on March 31, 2009 on the following investments:
Chaparral Energy, Inc. of $51 million, DHS Drilling Company of $19 million, Gastar Exploration Ltd. of $70
million and Mountain Drilling Company of $9 million. On December 31, 2008, we recognized that an other
than temporary impairment occurred on the following investments: Chaparral Energy, Inc., $100 million; DHS
Drilling Company, $20 million; Mountain Drilling Company, $10 million; and Ventura Refining and
Transmission LLC, Inc., $50 million. We have monitored and will continue to monitor the performance of our
investments, and it is reasonably possible that we may experience additional impairments, although we do
not believe that our exposure to future charges would be material to our consolidated results of operations.
(c) The carrying value of our investment in Chaparral is in excess of our underlying equity in net assets by
approximately $43 million as of December 31, 2009. This excess is attributed to the natural gas and oil
reserves held by Chaparral and is being amortized over the estimated life of these reserves based on a unit
of production rate.
(d) Our investment in Gastar had an associated cost basis of $89 million as of December 31, 2009 and 2008.
The table below presents summarized financial information for our significant equity method
investments, including Chaparral, Frac-Tech, Ventura, Mountain Drilling and DHS. The investee
financial information reflects the most current financial information available to investors and includes
lags in financial reporting of up to one quarter.
December 31,
2009 2008 2007
($ in millions)
Current assets . . . . . . . . . . . . . . . . . . . . . . . . . . . . . . . . . . . . . . . . . . . . . . . . $ 393 $ 411 $ 274
Noncurrent assets . . . . . . . . . . . . . . . . . . . . . . . . . . . . . . . . . . . . . . . . . . . . . $ 2,078 $ 2,490 $ 2,185
Current liabilities . . . . . . . . . . . . . . . . . . . . . . . . . . . . . . . . . . . . . . . . . . . . . . . $ 670 $ 429 $ 312
Noncurrent liabilities . . . . . . . . . . . . . . . . . . . . . . . . . . . . . . . . . . . . . . . . . . . . $ 1,339 $ 1,883 $ 1,673
Gross revenue . . . . . . . . . . . . . . . . . . . . . . . . . . . . . . . . . . . . . . . . . . . . . . . . $ 876 $ 1,523 $ 972
Operating expense . . . . . . . . . . . . . . . . . . . . . . . . . . . . . . . . . . . . . . . . . . . . . $ 1,106 $ 1,261 $ 739
Net income . . . . . . . . . . . . . . . . . . . . . . . . . . . . . . . . . . . . . . . . . . . . . . . . . $ (289) $ 105 $ 67
15. Fair Value Measurements
Effective January 1, 2008, we adopted accounting standards for fair value measurements for our
financial assets and liabilities measured on a recurring basis. Our nonfinancial assets and liabilities
became subject to the standards effective January 1, 2009. This guidance establishes a framework for
measuring fair value of assets and liabilities and expands disclosures about fair value measurements
for financial instruments reported at fair value on the consolidated balance sheet.
Under the guidance fair value is defined as the amount that would be received from the sale of an
asset or paid for the transfer of a liability in an orderly transaction between market participants, i.e., an
135
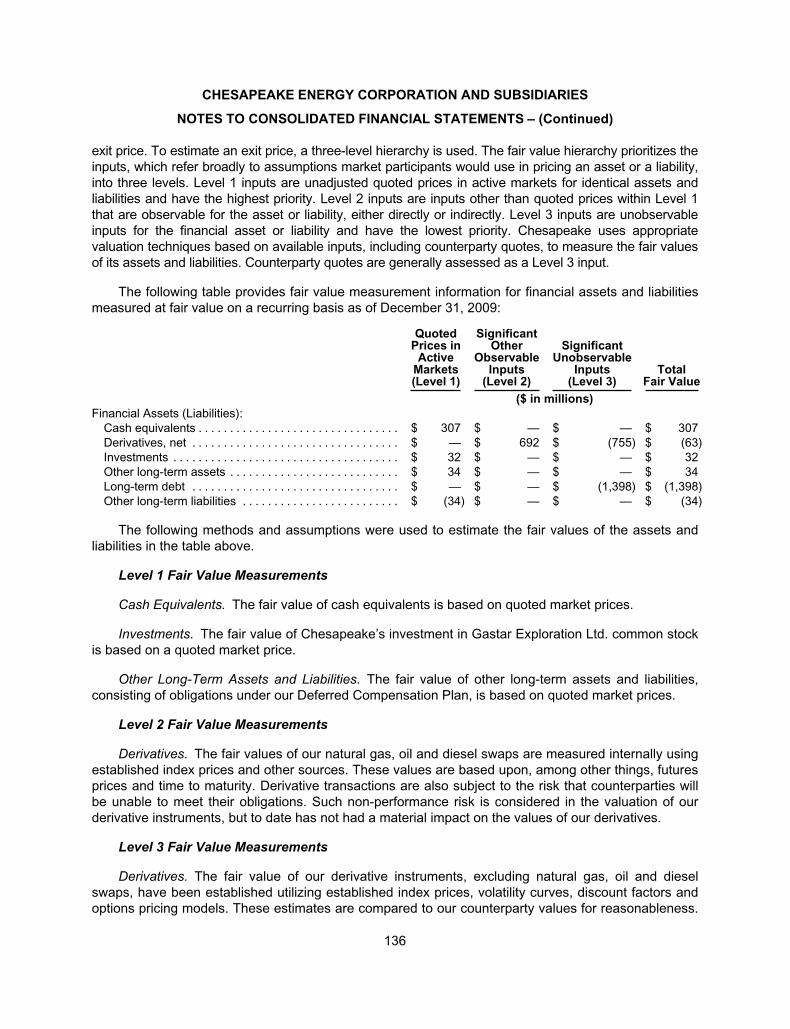
CHESAPEAKE ENERGY CORPORATION AND SUBSIDIARIES
NOTES TO CONSOLIDATED FINANCIAL STATEMENTS – (Continued)
exit price. To estimate an exit price, a three-level hierarchy is used. The fair value hierarchy prioritizes the
inputs, which refer broadly to assumptions market participants would use in pricing an asset or a liability,
into three levels. Level 1 inputs are unadjusted quoted prices in active markets for identical assets and
liabilities and have the highest priority. Level 2 inputs are inputs other than quoted prices within Level 1
that are observable for the asset or liability, either directly or indirectly. Level 3 inputs are unobservable
inputs for the financial asset or liability and have the lowest priority. Chesapeake uses appropriate
valuation techniques based on available inputs, including counterparty quotes, to measure the fair values
of its assets and liabilities. Counterparty quotes are generally assessed as a Level 3 input.
The following table provides fair value measurement information for financial assets and liabilities
measured at fair value on a recurring basis as of December 31, 2009:
QuotedPrices in
ActiveMarkets(Level 1)
SignificantOther
ObservableInputs
(Level 2)
SignificantUnobservable
Inputs(Level 3)
TotalFair Value
($ in millions)
Financial Assets (Liabilities):
Cash equivalents . . . . . . . . . . . . . . . . . . . . . . . . . . . . . . . . $ 307 $ — $ — $ 307
Derivatives, net . . . . . . . . . . . . . . . . . . . . . . . . . . . . . . . . . $ — $ 692 $ (755) $ (63)
Investments . . . . . . . . . . . . . . . . . . . . . . . . . . . . . . . . . . . . $ 32 $ — $ — $ 32
Other long-term assets . . . . . . . . . . . . . . . . . . . . . . . . . . . $ 34 $ — $ — $ 34
Long-term debt . . . . . . . . . . . . . . . . . . . . . . . . . . . . . . . . . $ — $ — $ (1,398) $ (1,398)
Other long-term liabilities . . . . . . . . . . . . . . . . . . . . . . . . . $ (34) $ — $ — $ (34)
The following methods and assumptions were used to estimate the fair values of the assets and
liabilities in the table above.
Level 1 Fair Value Measurements
Cash Equivalents. The fair value of cash equivalents is based on quoted market prices.
Investments. The fair value of Chesapeake’s investment in Gastar Exploration Ltd. common stock
is based on a quoted market price.
Other Long-Term Assets and Liabilities. The fair value of other long-term assets and liabilities,
consisting of obligations under our Deferred Compensation Plan, is based on quoted market prices.
Level 2 Fair Value Measurements
Derivatives. The fair values of our natural gas, oil and diesel swaps are measured internally using
established index prices and other sources. These values are based upon, among other things, futures
prices and time to maturity. Derivative transactions are also subject to the risk that counterparties will
be unable to meet their obligations. Such non-performance risk is considered in the valuation of our
derivative instruments, but to date has not had a material impact on the values of our derivatives.
Level 3 Fair Value Measurements
Derivatives. The fair value of our derivative instruments, excluding natural gas, oil and diesel
swaps, have been established utilizing established index prices, volatility curves, discount factors and
options pricing models. These estimates are compared to our counterparty values for reasonableness.
136
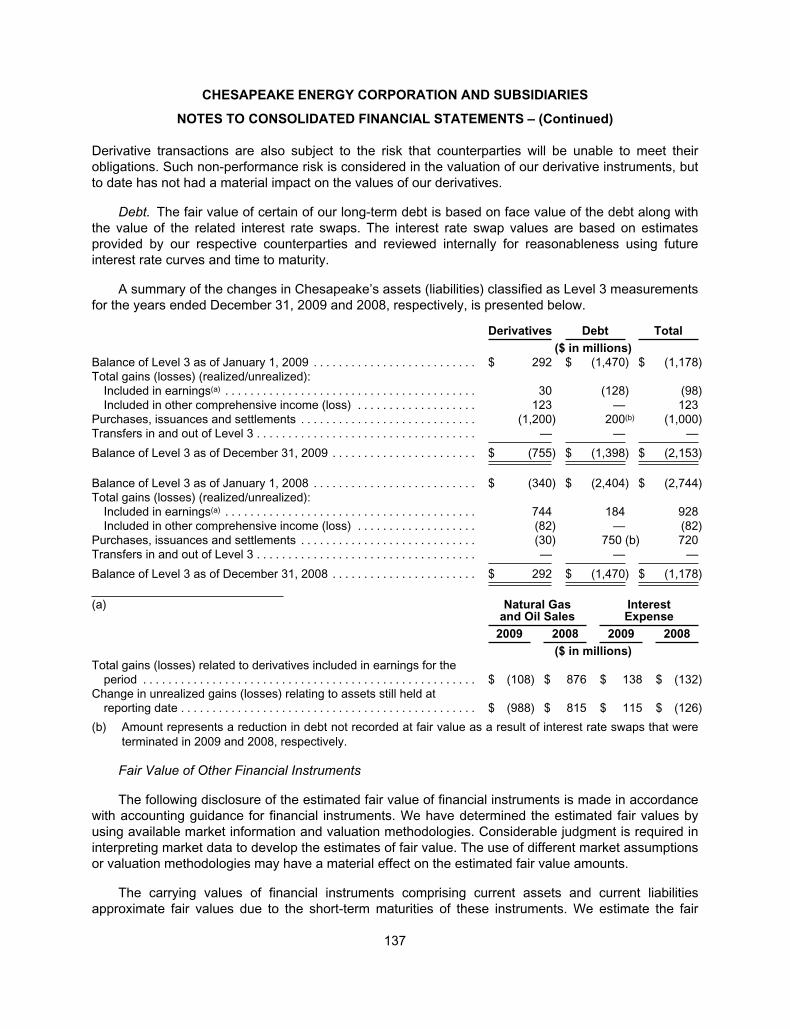
CHESAPEAKE ENERGY CORPORATION AND SUBSIDIARIES
NOTES TO CONSOLIDATED FINANCIAL STATEMENTS – (Continued)
Derivative transactions are also subject to the risk that counterparties will be unable to meet their
obligations. Such non-performance risk is considered in the valuation of our derivative instruments, but
to date has not had a material impact on the values of our derivatives.
Debt. The fair value of certain of our long-term debt is based on face value of the debt along with
the value of the related interest rate swaps. The interest rate swap values are based on estimates
provided by our respective counterparties and reviewed internally for reasonableness using future
interest rate curves and time to maturity.
A summary of the changes in Chesapeake’s assets (liabilities) classified as Level 3 measurements
for the years ended December 31, 2009 and 2008, respectively, is presented below.
Derivatives Debt Total
($ in millions)
Balance of Level 3 as of January 1, 2009 . . . . . . . . . . . . . . . . . . . . . . . . . . $ 292 $ (1,470) $ (1,178)Total gains (losses) (realized/unrealized):
Included in earnings(a) . . . . . . . . . . . . . . . . . . . . . . . . . . . . . . . . . . . . . . . . 30 (128) (98)Included in other comprehensive income (loss) . . . . . . . . . . . . . . . . . . . 123 — 123
Purchases, issuances and settlements . . . . . . . . . . . . . . . . . . . . . . . . . . . . (1,200) 200(b) (1,000)Transfers in and out of Level 3 . . . . . . . . . . . . . . . . . . . . . . . . . . . . . . . . . . . — — —
Balance of Level 3 as of December 31, 2009 . . . . . . . . . . . . . . . . . . . . . . . $ (755) $ (1,398) $ (2,153)
Balance of Level 3 as of January 1, 2008 . . . . . . . . . . . . . . . . . . . . . . . . . . $ (340) $ (2,404) $ (2,744)Total gains (losses) (realized/unrealized):
Included in earnings(a) . . . . . . . . . . . . . . . . . . . . . . . . . . . . . . . . . . . . . . . . 744 184 928Included in other comprehensive income (loss) . . . . . . . . . . . . . . . . . . . (82) — (82)
Purchases, issuances and settlements . . . . . . . . . . . . . . . . . . . . . . . . . . . . (30) 750 (b) 720Transfers in and out of Level 3 . . . . . . . . . . . . . . . . . . . . . . . . . . . . . . . . . . . — — —
Balance of Level 3 as of December 31, 2008 . . . . . . . . . . . . . . . . . . . . . . . $ 292 $ (1,470) $ (1,178)
(a) Natural Gasand Oil Sales
InterestExpense
2009 2008 2009 2008
($ in millions)
Total gains (losses) related to derivatives included in earnings for theperiod . . . . . . . . . . . . . . . . . . . . . . . . . . . . . . . . . . . . . . . . . . . . . . . . . . . . . $ (108) $ 876 $ 138 $ (132)
Change in unrealized gains (losses) relating to assets still held atreporting date . . . . . . . . . . . . . . . . . . . . . . . . . . . . . . . . . . . . . . . . . . . . . . . $ (988) $ 815 $ 115 $ (126)
(b) Amount represents a reduction in debt not recorded at fair value as a result of interest rate swaps that were
terminated in 2009 and 2008, respectively.
Fair Value of Other Financial Instruments
The following disclosure of the estimated fair value of financial instruments is made in accordance
with accounting guidance for financial instruments. We have determined the estimated fair values by
using available market information and valuation methodologies. Considerable judgment is required in
interpreting market data to develop the estimates of fair value. The use of different market assumptions
or valuation methodologies may have a material effect on the estimated fair value amounts.
The carrying values of financial instruments comprising current assets and current liabilities
approximate fair values due to the short-term maturities of these instruments. We estimate the fair
137
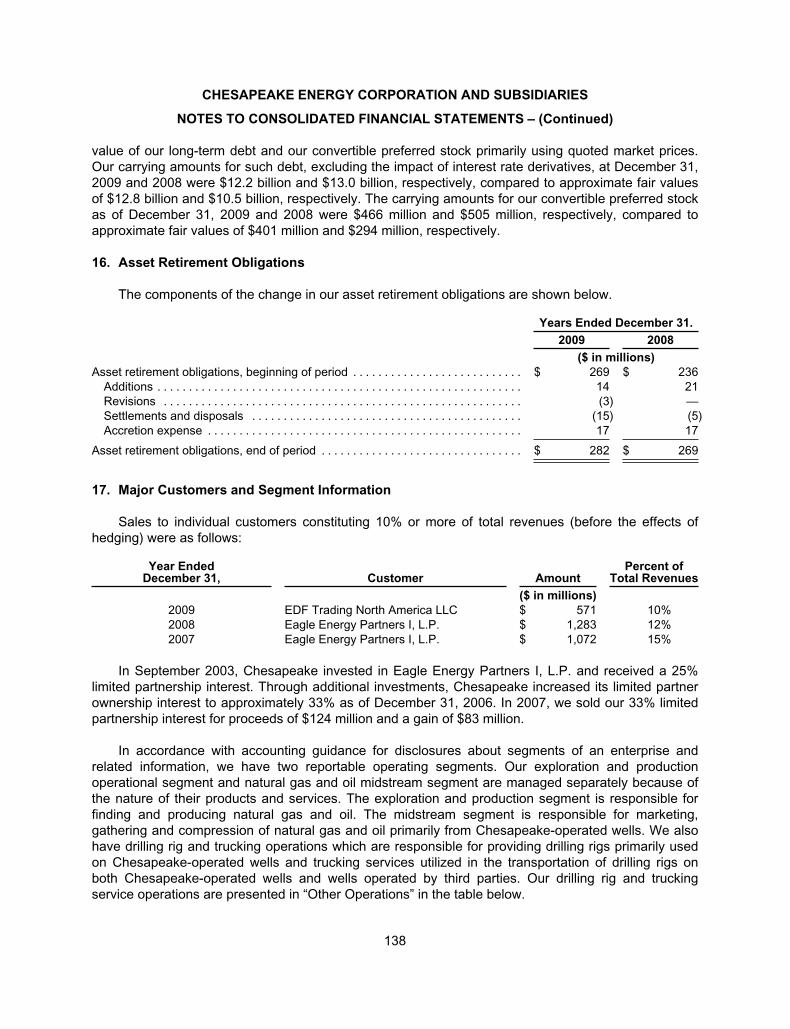
CHESAPEAKE ENERGY CORPORATION AND SUBSIDIARIES
NOTES TO CONSOLIDATED FINANCIAL STATEMENTS – (Continued)
value of our long-term debt and our convertible preferred stock primarily using quoted market prices.
Our carrying amounts for such debt, excluding the impact of interest rate derivatives, at December 31,
2009 and 2008 were $12.2 billion and $13.0 billion, respectively, compared to approximate fair values
of $12.8 billion and $10.5 billion, respectively. The carrying amounts for our convertible preferred stock
as of December 31, 2009 and 2008 were $466 million and $505 million, respectively, compared to
approximate fair values of $401 million and $294 million, respectively.
16. Asset Retirement Obligations
The components of the change in our asset retirement obligations are shown below.
Years Ended December 31.
2009 2008
($ in millions)
Asset retirement obligations, beginning of period . . . . . . . . . . . . . . . . . . . . . . . . . . . $ 269 $ 236
Additions . . . . . . . . . . . . . . . . . . . . . . . . . . . . . . . . . . . . . . . . . . . . . . . . . . . . . . . . . . 14 21
Revisions . . . . . . . . . . . . . . . . . . . . . . . . . . . . . . . . . . . . . . . . . . . . . . . . . . . . . . . . . (3) —
Settlements and disposals . . . . . . . . . . . . . . . . . . . . . . . . . . . . . . . . . . . . . . . . . . . (15) (5)
Accretion expense . . . . . . . . . . . . . . . . . . . . . . . . . . . . . . . . . . . . . . . . . . . . . . . . . . 17 17
Asset retirement obligations, end of period . . . . . . . . . . . . . . . . . . . . . . . . . . . . . . . . $ 282 $ 269
17. Major Customers and Segment Information
Sales to individual customers constituting 10% or more of total revenues (before the effects of
hedging) were as follows:
Year EndedDecember 31, Customer Amount
Percent ofTotal Revenues
($ in millions)
2009 EDF Trading North America LLC $ 571 10%
2008 Eagle Energy Partners I, L.P. $ 1,283 12%
2007 Eagle Energy Partners I, L.P. $ 1,072 15%
In September 2003, Chesapeake invested in Eagle Energy Partners I, L.P. and received a 25%
limited partnership interest. Through additional investments, Chesapeake increased its limited partner
ownership interest to approximately 33% as of December 31, 2006. In 2007, we sold our 33% limited
partnership interest for proceeds of $124 million and a gain of $83 million.
In accordance with accounting guidance for disclosures about segments of an enterprise and
related information, we have two reportable operating segments. Our exploration and production
operational segment and natural gas and oil midstream segment are managed separately because of
the nature of their products and services. The exploration and production segment is responsible for
finding and producing natural gas and oil. The midstream segment is responsible for marketing,
gathering and compression of natural gas and oil primarily from Chesapeake-operated wells. We also
have drilling rig and trucking operations which are responsible for providing drilling rigs primarily used
on Chesapeake-operated wells and trucking services utilized in the transportation of drilling rigs on
both Chesapeake-operated wells and wells operated by third parties. Our drilling rig and trucking
service operations are presented in “Other Operations” in the table below.
138
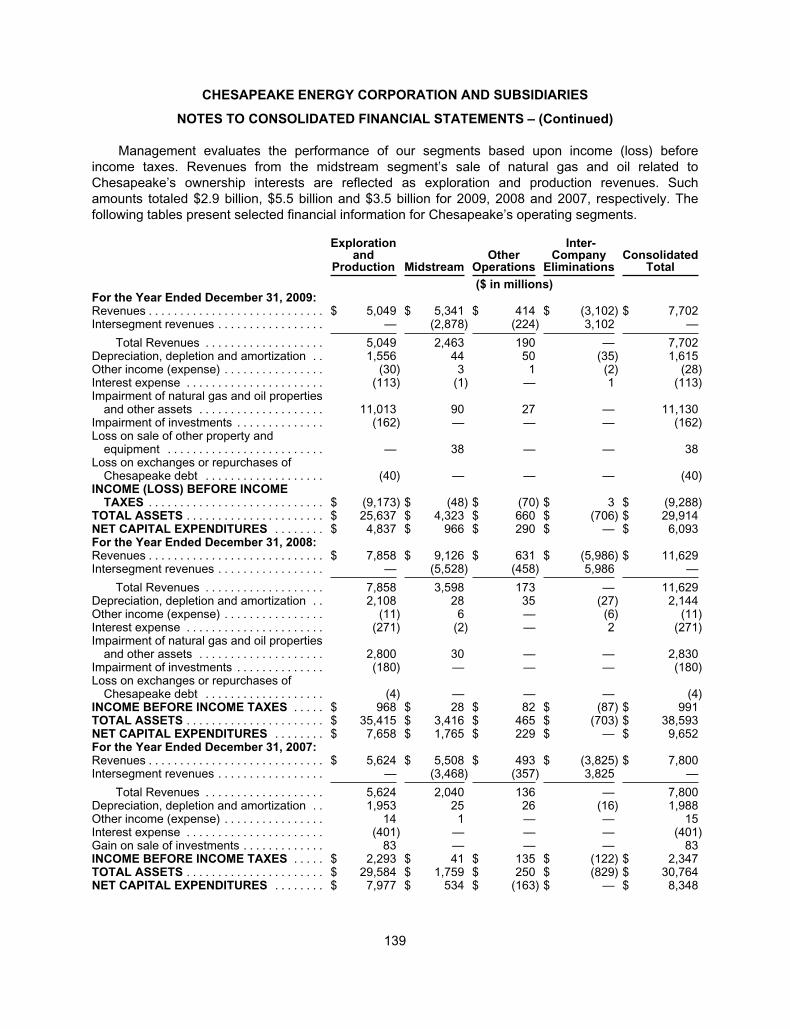
CHESAPEAKE ENERGY CORPORATION AND SUBSIDIARIES
NOTES TO CONSOLIDATED FINANCIAL STATEMENTS – (Continued)
Management evaluates the performance of our segments based upon income (loss) before
income taxes. Revenues from the midstream segment’s sale of natural gas and oil related to
Chesapeake’s ownership interests are reflected as exploration and production revenues. Such
amounts totaled $2.9 billion, $5.5 billion and $3.5 billion for 2009, 2008 and 2007, respectively. The
following tables present selected financial information for Chesapeake’s operating segments.
Explorationand
Production MidstreamOther
Operations
Inter-Company
EliminationsConsolidated
Total
($ in millions)For the Year Ended December 31, 2009:Revenues . . . . . . . . . . . . . . . . . . . . . . . . . . . . $ 5,049 $ 5,341 $ 414 $ (3,102) $ 7,702Intersegment revenues . . . . . . . . . . . . . . . . . — (2,878) (224) 3,102 —
Total Revenues . . . . . . . . . . . . . . . . . . . 5,049 2,463 190 — 7,702Depreciation, depletion and amortization . . 1,556 44 50 (35) 1,615Other income (expense) . . . . . . . . . . . . . . . . (30) 3 1 (2) (28)Interest expense . . . . . . . . . . . . . . . . . . . . . . (113) (1) — 1 (113)Impairment of natural gas and oil properties
and other assets . . . . . . . . . . . . . . . . . . . . 11,013 90 27 — 11,130Impairment of investments . . . . . . . . . . . . . . (162) — — — (162)Loss on sale of other property and
equipment . . . . . . . . . . . . . . . . . . . . . . . . . — 38 — — 38Loss on exchanges or repurchases of
Chesapeake debt . . . . . . . . . . . . . . . . . . . (40) — — — (40)INCOME (LOSS) BEFORE INCOME
TAXES . . . . . . . . . . . . . . . . . . . . . . . . . . . . $ (9,173) $ (48) $ (70) $ 3 $ (9,288)TOTAL ASSETS . . . . . . . . . . . . . . . . . . . . . . $ 25,637 $ 4,323 $ 660 $ (706) $ 29,914NET CAPITAL EXPENDITURES . . . . . . . . $ 4,837 $ 966 $ 290 $ — $ 6,093For the Year Ended December 31, 2008:Revenues . . . . . . . . . . . . . . . . . . . . . . . . . . . . $ 7,858 $ 9,126 $ 631 $ (5,986) $ 11,629Intersegment revenues . . . . . . . . . . . . . . . . . — (5,528) (458) 5,986 —
Total Revenues . . . . . . . . . . . . . . . . . . . 7,858 3,598 173 — 11,629Depreciation, depletion and amortization . . 2,108 28 35 (27) 2,144Other income (expense) . . . . . . . . . . . . . . . . (11) 6 — (6) (11)Interest expense . . . . . . . . . . . . . . . . . . . . . . (271) (2) — 2 (271)Impairment of natural gas and oil properties
and other assets . . . . . . . . . . . . . . . . . . . . 2,800 30 — — 2,830Impairment of investments . . . . . . . . . . . . . . (180) — — — (180)Loss on exchanges or repurchases of
Chesapeake debt . . . . . . . . . . . . . . . . . . . (4) — — — (4)INCOME BEFORE INCOME TAXES . . . . . $ 968 $ 28 $ 82 $ (87) $ 991TOTAL ASSETS . . . . . . . . . . . . . . . . . . . . . . $ 35,415 $ 3,416 $ 465 $ (703) $ 38,593NET CAPITAL EXPENDITURES . . . . . . . . $ 7,658 $ 1,765 $ 229 $ — $ 9,652For the Year Ended December 31, 2007:Revenues . . . . . . . . . . . . . . . . . . . . . . . . . . . . $ 5,624 $ 5,508 $ 493 $ (3,825) $ 7,800Intersegment revenues . . . . . . . . . . . . . . . . . — (3,468) (357) 3,825 —
Total Revenues . . . . . . . . . . . . . . . . . . . 5,624 2,040 136 — 7,800Depreciation, depletion and amortization . . 1,953 25 26 (16) 1,988Other income (expense) . . . . . . . . . . . . . . . . 14 1 — — 15Interest expense . . . . . . . . . . . . . . . . . . . . . . (401) — — — (401)Gain on sale of investments . . . . . . . . . . . . . 83 — — — 83INCOME BEFORE INCOME TAXES . . . . . $ 2,293 $ 41 $ 135 $ (122) $ 2,347TOTAL ASSETS . . . . . . . . . . . . . . . . . . . . . . $ 29,584 $ 1,759 $ 250 $ (829) $ 30,764NET CAPITAL EXPENDITURES . . . . . . . . $ 7,977 $ 534 $ (163) $ — $ 8,348
139
CHESAPEAKE ENERGY CORPORATION AND SUBSIDIARIES
NOTES TO CONSOLIDATED FINANCIAL STATEMENTS – (Continued)
18. Condensed Consolidating Financial Information
Chesapeake Energy Corporation is a holding company and owns no operating assets and has no
significant operations independent of its subsidiaries. As of December 31, 2007, our obligations under
our outstanding senior notes and contingent convertible notes listed in Note 3 were fully and
unconditionally guaranteed, jointly and severally, by all of our wholly-owned subsidiaries, other than
minor subsidiaries, on a senior unsecured basis. Since October 2008, following the restructuring of our
non-Appalachian midstream operations, as described in Note 3, certain of our wholly-owned
subsidiaries having significant assets and operations have not guaranteed our outstanding notes. Our
midstream subsidiaries are subject to covenants in our midstream revolving credit facilities referred to
in Note 3 that restrict them from paying dividends or distributions or making loans to Chesapeake.
140
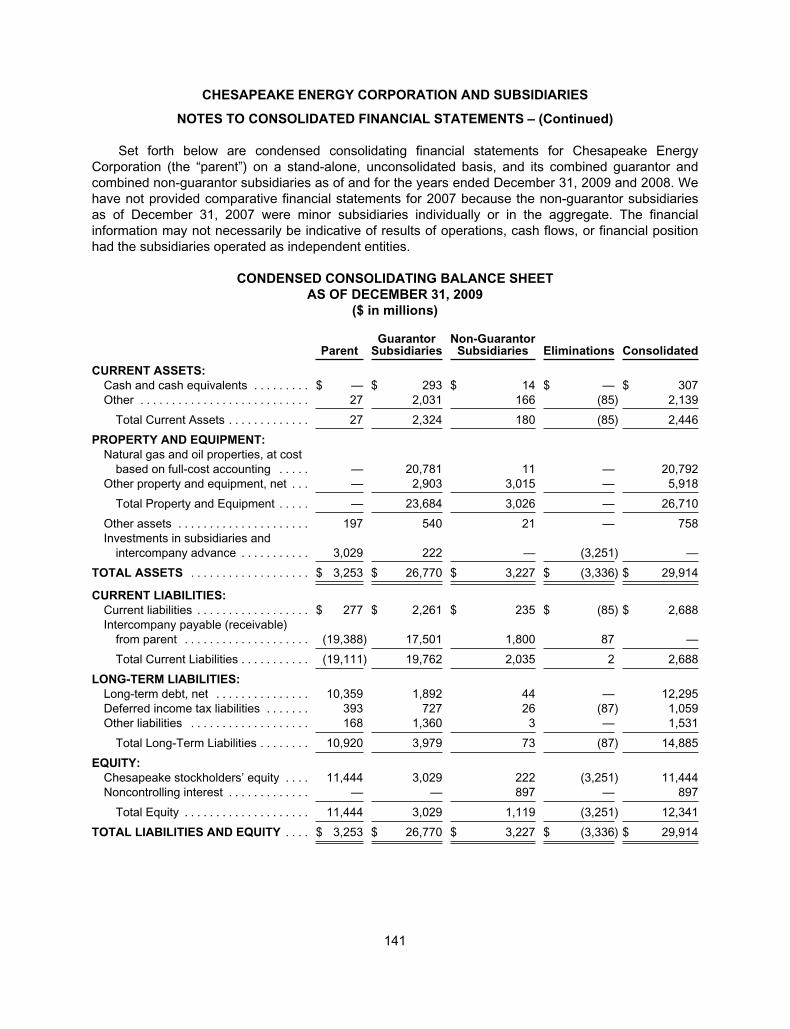
CHESAPEAKE ENERGY CORPORATION AND SUBSIDIARIES
NOTES TO CONSOLIDATED FINANCIAL STATEMENTS – (Continued)
Set forth below are condensed consolidating financial statements for Chesapeake Energy
Corporation (the “parent”) on a stand-alone, unconsolidated basis, and its combined guarantor and
combined non-guarantor subsidiaries as of and for the years ended December 31, 2009 and 2008. We
have not provided comparative financial statements for 2007 because the non-guarantor subsidiaries
as of December 31, 2007 were minor subsidiaries individually or in the aggregate. The financial
information may not necessarily be indicative of results of operations, cash flows, or financial position
had the subsidiaries operated as independent entities.
CONDENSED CONSOLIDATING BALANCE SHEET
AS OF DECEMBER 31, 2009
($ in millions)
ParentGuarantor
SubsidiariesNon-Guarantor
Subsidiaries Eliminations Consolidated
CURRENT ASSETS:
Cash and cash equivalents . . . . . . . . . $ — $ 293 $ 14 $ — $ 307
Other . . . . . . . . . . . . . . . . . . . . . . . . . . . 27 2,031 166 (85) 2,139
Total Current Assets . . . . . . . . . . . . . 27 2,324 180 (85) 2,446
PROPERTY AND EQUIPMENT:
Natural gas and oil properties, at cost
based on full-cost accounting . . . . . — 20,781 11 — 20,792
Other property and equipment, net . . . — 2,903 3,015 — 5,918
Total Property and Equipment . . . . . — 23,684 3,026 — 26,710
Other assets . . . . . . . . . . . . . . . . . . . . . 197 540 21 — 758
Investments in subsidiaries and
intercompany advance . . . . . . . . . . . 3,029 222 — (3,251) —
TOTAL ASSETS . . . . . . . . . . . . . . . . . . . $ 3,253 $ 26,770 $ 3,227 $ (3,336) $ 29,914
CURRENT LIABILITIES:
Current liabilities . . . . . . . . . . . . . . . . . . $ 277 $ 2,261 $ 235 $ (85) $ 2,688
Intercompany payable (receivable)
from parent . . . . . . . . . . . . . . . . . . . . (19,388) 17,501 1,800 87 —
Total Current Liabilities . . . . . . . . . . . (19,111) 19,762 2,035 2 2,688
LONG-TERM LIABILITIES:
Long-term debt, net . . . . . . . . . . . . . . . 10,359 1,892 44 — 12,295
Deferred income tax liabilities . . . . . . . 393 727 26 (87) 1,059
Other liabilities . . . . . . . . . . . . . . . . . . . 168 1,360 3 — 1,531
Total Long-Term Liabilities . . . . . . . . 10,920 3,979 73 (87) 14,885
EQUITY:
Chesapeake stockholders’ equity . . . . 11,444 3,029 222 (3,251) 11,444
Noncontrolling interest . . . . . . . . . . . . . — — 897 — 897
Total Equity . . . . . . . . . . . . . . . . . . . . 11,444 3,029 1,119 (3,251) 12,341
TOTAL LIABILITIES AND EQUITY . . . . $ 3,253 $ 26,770 $ 3,227 $ (3,336) $ 29,914
141
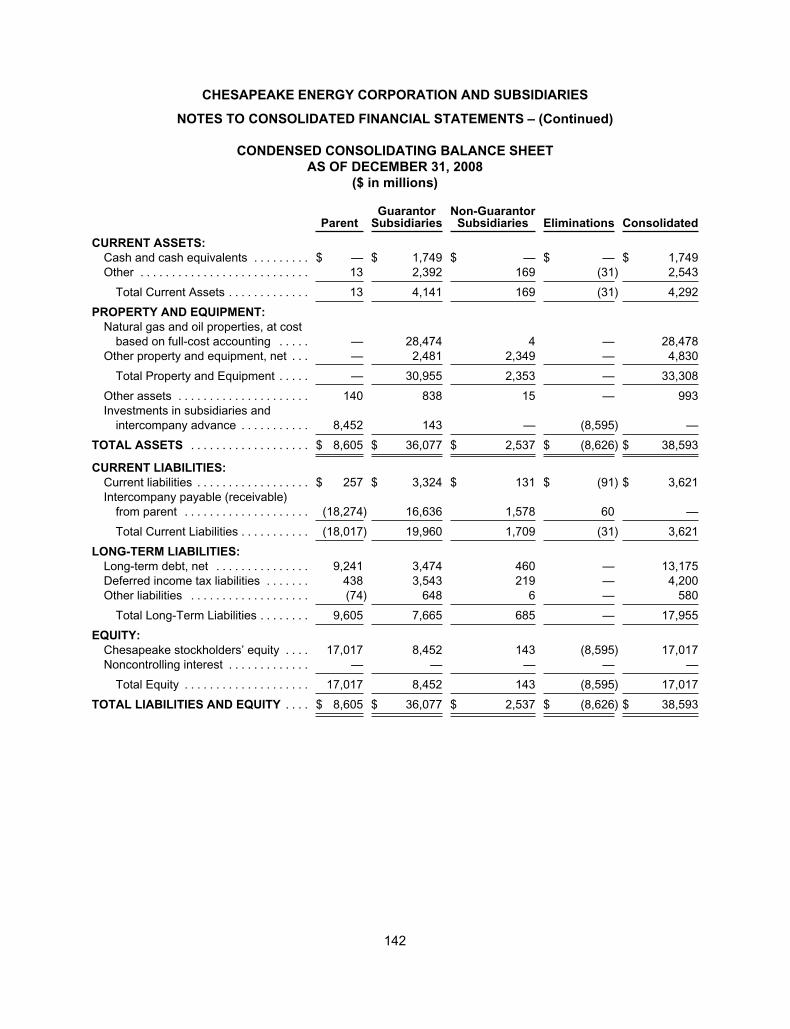
CHESAPEAKE ENERGY CORPORATION AND SUBSIDIARIES
NOTES TO CONSOLIDATED FINANCIAL STATEMENTS – (Continued)
CONDENSED CONSOLIDATING BALANCE SHEET
AS OF DECEMBER 31, 2008
($ in millions)
ParentGuarantor
SubsidiariesNon-Guarantor
Subsidiaries Eliminations Consolidated
CURRENT ASSETS:
Cash and cash equivalents . . . . . . . . . $ — $ 1,749 $ — $ — $ 1,749
Other . . . . . . . . . . . . . . . . . . . . . . . . . . . 13 2,392 169 (31) 2,543
Total Current Assets . . . . . . . . . . . . . 13 4,141 169 (31) 4,292
PROPERTY AND EQUIPMENT:
Natural gas and oil properties, at cost
based on full-cost accounting . . . . . — 28,474 4 — 28,478
Other property and equipment, net . . . — 2,481 2,349 — 4,830
Total Property and Equipment . . . . . — 30,955 2,353 — 33,308
Other assets . . . . . . . . . . . . . . . . . . . . . 140 838 15 — 993
Investments in subsidiaries and
intercompany advance . . . . . . . . . . . 8,452 143 — (8,595) —
TOTAL ASSETS . . . . . . . . . . . . . . . . . . . $ 8,605 $ 36,077 $ 2,537 $ (8,626) $ 38,593
CURRENT LIABILITIES:
Current liabilities . . . . . . . . . . . . . . . . . . $ 257 $ 3,324 $ 131 $ (91) $ 3,621
Intercompany payable (receivable)
from parent . . . . . . . . . . . . . . . . . . . . (18,274) 16,636 1,578 60 —
Total Current Liabilities . . . . . . . . . . . (18,017) 19,960 1,709 (31) 3,621
LONG-TERM LIABILITIES:
Long-term debt, net . . . . . . . . . . . . . . . 9,241 3,474 460 — 13,175
Deferred income tax liabilities . . . . . . . 438 3,543 219 — 4,200
Other liabilities . . . . . . . . . . . . . . . . . . . (74) 648 6 — 580
Total Long-Term Liabilities . . . . . . . . 9,605 7,665 685 — 17,955
EQUITY:
Chesapeake stockholders’ equity . . . . 17,017 8,452 143 (8,595) 17,017
Noncontrolling interest . . . . . . . . . . . . . — — — — —
Total Equity . . . . . . . . . . . . . . . . . . . . 17,017 8,452 143 (8,595) 17,017
TOTAL LIABILITIES AND EQUITY . . . . $ 8,605 $ 36,077 $ 2,537 $ (8,626) $ 38,593
142
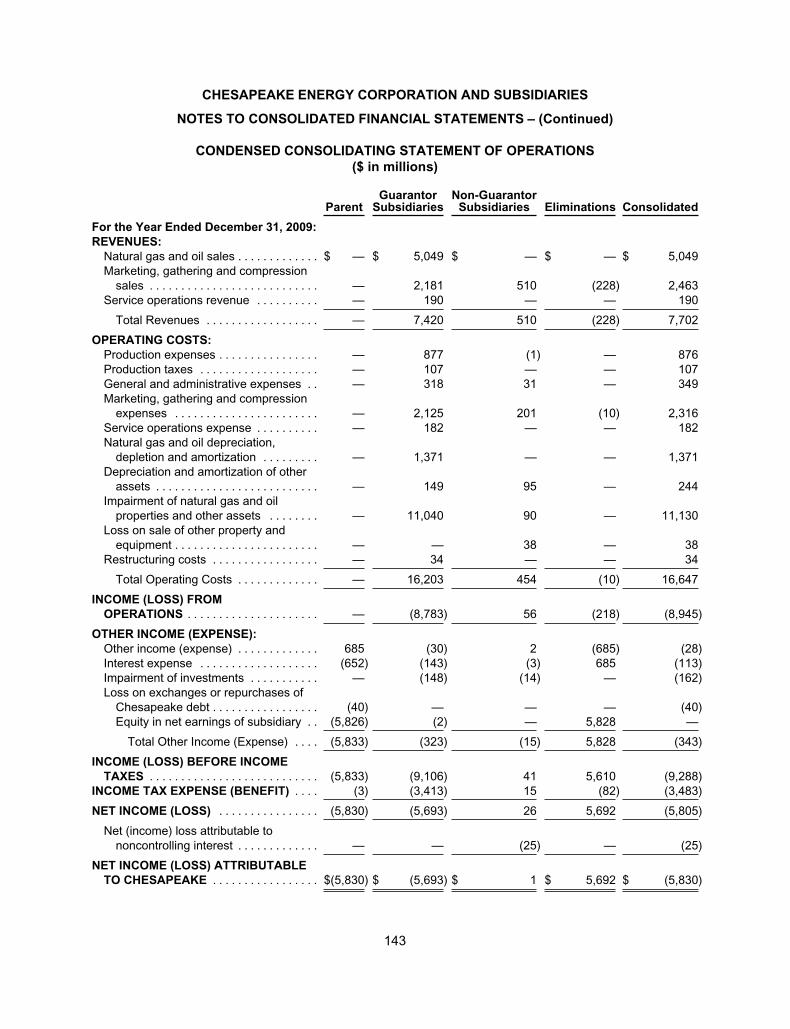
CHESAPEAKE ENERGY CORPORATION AND SUBSIDIARIES
NOTES TO CONSOLIDATED FINANCIAL STATEMENTS – (Continued)
CONDENSED CONSOLIDATING STATEMENT OF OPERATIONS
($ in millions)
ParentGuarantor
SubsidiariesNon-Guarantor
Subsidiaries Eliminations Consolidated
For the Year Ended December 31, 2009:
REVENUES:
Natural gas and oil sales . . . . . . . . . . . . . $ — $ 5,049 $ — $ — $ 5,049
Marketing, gathering and compression
sales . . . . . . . . . . . . . . . . . . . . . . . . . . . — 2,181 510 (228) 2,463
Service operations revenue . . . . . . . . . . — 190 — — 190
Total Revenues . . . . . . . . . . . . . . . . . . — 7,420 510 (228) 7,702
OPERATING COSTS:
Production expenses . . . . . . . . . . . . . . . . — 877 (1) — 876
Production taxes . . . . . . . . . . . . . . . . . . . — 107 — — 107
General and administrative expenses . . — 318 31 — 349
Marketing, gathering and compression
expenses . . . . . . . . . . . . . . . . . . . . . . . — 2,125 201 (10) 2,316
Service operations expense . . . . . . . . . . — 182 — — 182
Natural gas and oil depreciation,
depletion and amortization . . . . . . . . . — 1,371 — — 1,371
Depreciation and amortization of other
assets . . . . . . . . . . . . . . . . . . . . . . . . . . — 149 95 — 244
Impairment of natural gas and oil
properties and other assets . . . . . . . . — 11,040 90 — 11,130
Loss on sale of other property and
equipment . . . . . . . . . . . . . . . . . . . . . . . — — 38 — 38
Restructuring costs . . . . . . . . . . . . . . . . . — 34 — — 34
Total Operating Costs . . . . . . . . . . . . . — 16,203 454 (10) 16,647
INCOME (LOSS) FROM
OPERATIONS . . . . . . . . . . . . . . . . . . . . . — (8,783) 56 (218) (8,945)
OTHER INCOME (EXPENSE):
Other income (expense) . . . . . . . . . . . . . 685 (30) 2 (685) (28)
Interest expense . . . . . . . . . . . . . . . . . . . (652) (143) (3) 685 (113)
Impairment of investments . . . . . . . . . . . — (148) (14) — (162)
Loss on exchanges or repurchases of
Chesapeake debt . . . . . . . . . . . . . . . . . (40) — — — (40)
Equity in net earnings of subsidiary . . (5,826) (2) — 5,828 —
Total Other Income (Expense) . . . . (5,833) (323) (15) 5,828 (343)
INCOME (LOSS) BEFORE INCOME
TAXES . . . . . . . . . . . . . . . . . . . . . . . . . . . (5,833) (9,106) 41 5,610 (9,288)
INCOME TAX EXPENSE (BENEFIT) . . . . (3) (3,413) 15 (82) (3,483)
NET INCOME (LOSS) . . . . . . . . . . . . . . . . (5,830) (5,693) 26 5,692 (5,805)
Net (income) loss attributable to
noncontrolling interest . . . . . . . . . . . . . — — (25) — (25)
NET INCOME (LOSS) ATTRIBUTABLE
TO CHESAPEAKE . . . . . . . . . . . . . . . . . $(5,830) $ (5,693) $ 1 $ 5,692 $ (5,830)
143
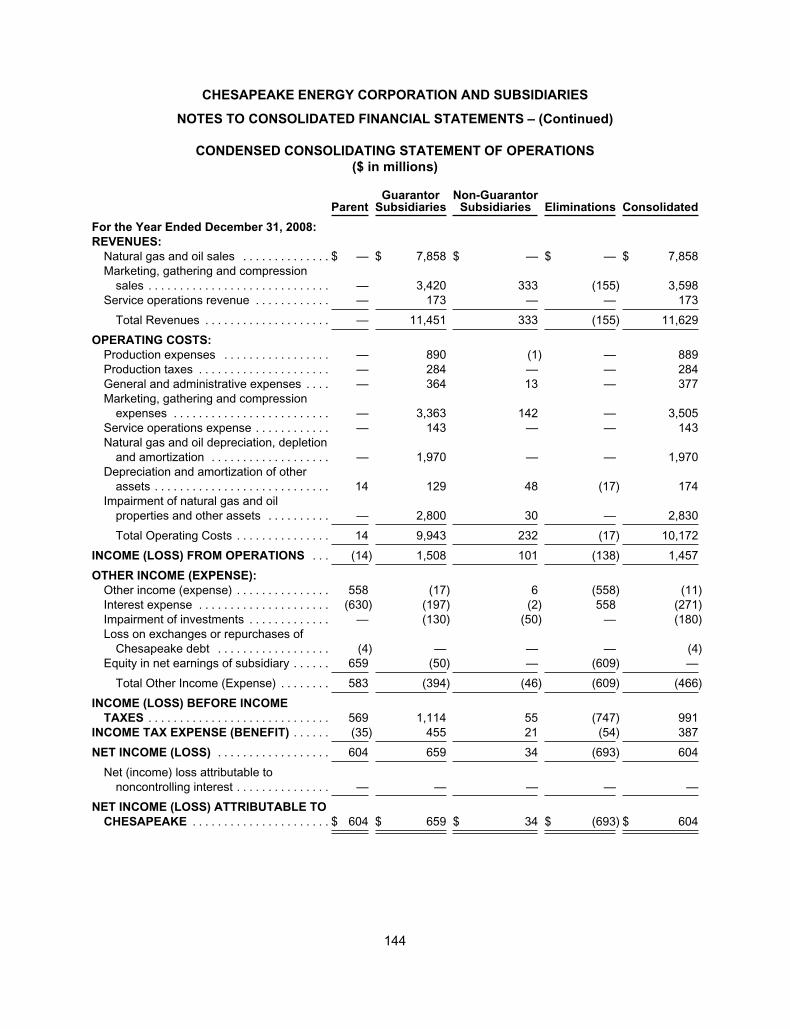
CHESAPEAKE ENERGY CORPORATION AND SUBSIDIARIES
NOTES TO CONSOLIDATED FINANCIAL STATEMENTS – (Continued)
CONDENSED CONSOLIDATING STATEMENT OF OPERATIONS
($ in millions)
ParentGuarantor
SubsidiariesNon-Guarantor
Subsidiaries Eliminations Consolidated
For the Year Ended December 31, 2008:
REVENUES:
Natural gas and oil sales . . . . . . . . . . . . . . $ — $ 7,858 $ — $ — $ 7,858
Marketing, gathering and compression
sales . . . . . . . . . . . . . . . . . . . . . . . . . . . . . — 3,420 333 (155) 3,598
Service operations revenue . . . . . . . . . . . . — 173 — — 173
Total Revenues . . . . . . . . . . . . . . . . . . . . — 11,451 333 (155) 11,629
OPERATING COSTS:
Production expenses . . . . . . . . . . . . . . . . . — 890 (1) — 889
Production taxes . . . . . . . . . . . . . . . . . . . . . — 284 — — 284
General and administrative expenses . . . . — 364 13 — 377
Marketing, gathering and compression
expenses . . . . . . . . . . . . . . . . . . . . . . . . . — 3,363 142 — 3,505
Service operations expense . . . . . . . . . . . . — 143 — — 143
Natural gas and oil depreciation, depletion
and amortization . . . . . . . . . . . . . . . . . . . — 1,970 — — 1,970
Depreciation and amortization of other
assets . . . . . . . . . . . . . . . . . . . . . . . . . . . . 14 129 48 (17) 174
Impairment of natural gas and oil
properties and other assets . . . . . . . . . . — 2,800 30 — 2,830
Total Operating Costs . . . . . . . . . . . . . . . 14 9,943 232 (17) 10,172
INCOME (LOSS) FROM OPERATIONS . . . (14) 1,508 101 (138) 1,457
OTHER INCOME (EXPENSE):
Other income (expense) . . . . . . . . . . . . . . . 558 (17) 6 (558) (11)
Interest expense . . . . . . . . . . . . . . . . . . . . . (630) (197) (2) 558 (271)
Impairment of investments . . . . . . . . . . . . . — (130) (50) — (180)
Loss on exchanges or repurchases of
Chesapeake debt . . . . . . . . . . . . . . . . . . (4) — — — (4)
Equity in net earnings of subsidiary . . . . . . 659 (50) — (609) —
Total Other Income (Expense) . . . . . . . . 583 (394) (46) (609) (466)
INCOME (LOSS) BEFORE INCOME
TAXES . . . . . . . . . . . . . . . . . . . . . . . . . . . . . 569 1,114 55 (747) 991
INCOME TAX EXPENSE (BENEFIT) . . . . . . (35) 455 21 (54) 387
NET INCOME (LOSS) . . . . . . . . . . . . . . . . . . 604 659 34 (693) 604
Net (income) loss attributable to
noncontrolling interest . . . . . . . . . . . . . . . — — — — —
NET INCOME (LOSS) ATTRIBUTABLE TO
CHESAPEAKE . . . . . . . . . . . . . . . . . . . . . . $ 604 $ 659 $ 34 $ (693) $ 604
144
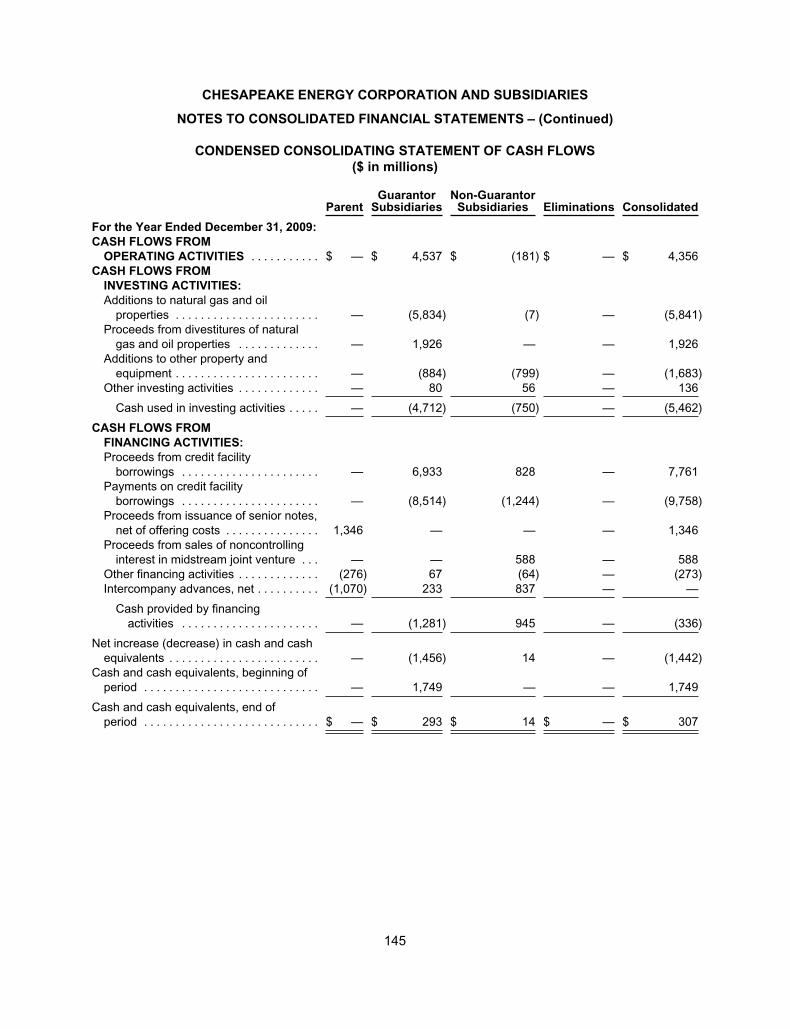
CHESAPEAKE ENERGY CORPORATION AND SUBSIDIARIES
NOTES TO CONSOLIDATED FINANCIAL STATEMENTS – (Continued)
CONDENSED CONSOLIDATING STATEMENT OF CASH FLOWS
($ in millions)
ParentGuarantor
SubsidiariesNon-Guarantor
Subsidiaries Eliminations Consolidated
For the Year Ended December 31, 2009:
CASH FLOWS FROM
OPERATING ACTIVITIES . . . . . . . . . . . $ — $ 4,537 $ (181) $ — $ 4,356
CASH FLOWS FROM
INVESTING ACTIVITIES:
Additions to natural gas and oil
properties . . . . . . . . . . . . . . . . . . . . . . . — (5,834) (7) — (5,841)
Proceeds from divestitures of natural
gas and oil properties . . . . . . . . . . . . . — 1,926 — — 1,926
Additions to other property and
equipment . . . . . . . . . . . . . . . . . . . . . . . — (884) (799) — (1,683)
Other investing activities . . . . . . . . . . . . . — 80 56 — 136
Cash used in investing activities . . . . . — (4,712) (750) — (5,462)
CASH FLOWS FROM
FINANCING ACTIVITIES:
Proceeds from credit facility
borrowings . . . . . . . . . . . . . . . . . . . . . . — 6,933 828 — 7,761
Payments on credit facility
borrowings . . . . . . . . . . . . . . . . . . . . . . — (8,514) (1,244) — (9,758)
Proceeds from issuance of senior notes,
net of offering costs . . . . . . . . . . . . . . . 1,346 — — — 1,346
Proceeds from sales of noncontrolling
interest in midstream joint venture . . . — — 588 — 588
Other financing activities . . . . . . . . . . . . . (276) 67 (64) — (273)
Intercompany advances, net . . . . . . . . . . (1,070) 233 837 — —
Cash provided by financing
activities . . . . . . . . . . . . . . . . . . . . . . — (1,281) 945 — (336)
Net increase (decrease) in cash and cash
equivalents . . . . . . . . . . . . . . . . . . . . . . . . — (1,456) 14 — (1,442)
Cash and cash equivalents, beginning of
period . . . . . . . . . . . . . . . . . . . . . . . . . . . . — 1,749 — — 1,749
Cash and cash equivalents, end of
period . . . . . . . . . . . . . . . . . . . . . . . . . . . . $ — $ 293 $ 14 $ — $ 307
145
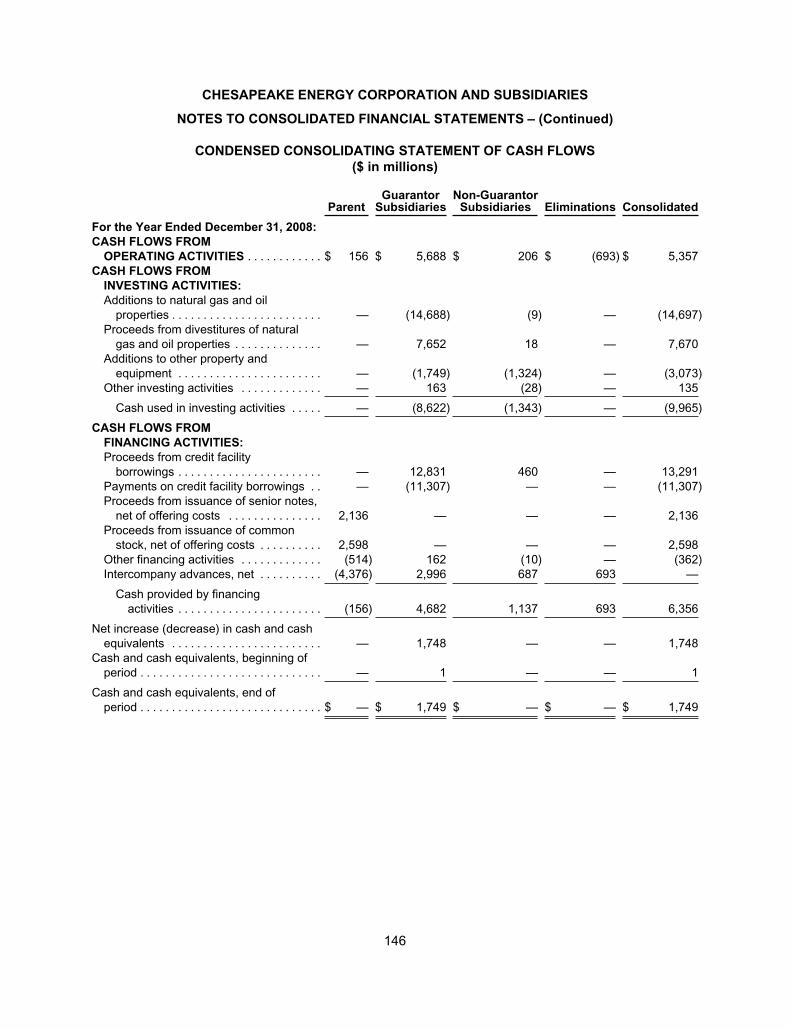
CHESAPEAKE ENERGY CORPORATION AND SUBSIDIARIES
NOTES TO CONSOLIDATED FINANCIAL STATEMENTS – (Continued)
CONDENSED CONSOLIDATING STATEMENT OF CASH FLOWS
($ in millions)
ParentGuarantor
SubsidiariesNon-Guarantor
Subsidiaries Eliminations Consolidated
For the Year Ended December 31, 2008:
CASH FLOWS FROM
OPERATING ACTIVITIES . . . . . . . . . . . . $ 156 $ 5,688 $ 206 $ (693) $ 5,357
CASH FLOWS FROM
INVESTING ACTIVITIES:
Additions to natural gas and oil
properties . . . . . . . . . . . . . . . . . . . . . . . . — (14,688) (9) — (14,697)
Proceeds from divestitures of natural
gas and oil properties . . . . . . . . . . . . . . — 7,652 18 — 7,670
Additions to other property and
equipment . . . . . . . . . . . . . . . . . . . . . . . — (1,749) (1,324) — (3,073)
Other investing activities . . . . . . . . . . . . . — 163 (28) — 135
Cash used in investing activities . . . . . — (8,622) (1,343) — (9,965)
CASH FLOWS FROM
FINANCING ACTIVITIES:
Proceeds from credit facility
borrowings . . . . . . . . . . . . . . . . . . . . . . . — 12,831 460 — 13,291
Payments on credit facility borrowings . . — (11,307) — — (11,307)
Proceeds from issuance of senior notes,
net of offering costs . . . . . . . . . . . . . . . 2,136 — — — 2,136
Proceeds from issuance of common
stock, net of offering costs . . . . . . . . . . 2,598 — — — 2,598
Other financing activities . . . . . . . . . . . . . (514) 162 (10) — (362)
Intercompany advances, net . . . . . . . . . . (4,376) 2,996 687 693 —
Cash provided by financing
activities . . . . . . . . . . . . . . . . . . . . . . . (156) 4,682 1,137 693 6,356
Net increase (decrease) in cash and cash
equivalents . . . . . . . . . . . . . . . . . . . . . . . . — 1,748 — — 1,748
Cash and cash equivalents, beginning of
period . . . . . . . . . . . . . . . . . . . . . . . . . . . . . — 1 — — 1
Cash and cash equivalents, end of
period . . . . . . . . . . . . . . . . . . . . . . . . . . . . . $ — $ 1,749 $ — $ — $ 1,749
146
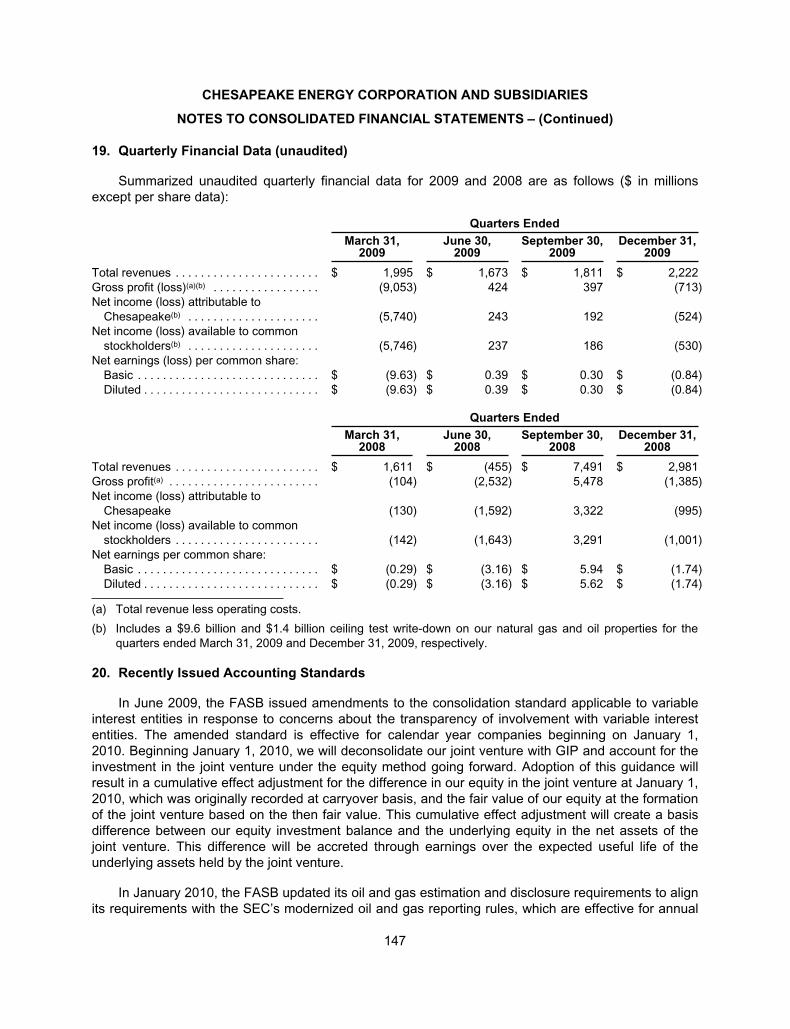
CHESAPEAKE ENERGY CORPORATION AND SUBSIDIARIES
NOTES TO CONSOLIDATED FINANCIAL STATEMENTS – (Continued)
19. Quarterly Financial Data (unaudited)
Summarized unaudited quarterly financial data for 2009 and 2008 are as follows ($ in millions
except per share data):
Quarters Ended
March 31,2009
June 30,2009
September 30,2009
December 31,2009
Total revenues . . . . . . . . . . . . . . . . . . . . . . . $ 1,995 $ 1,673 $ 1,811 $ 2,222
Gross profit (loss)(a)(b) . . . . . . . . . . . . . . . . . (9,053) 424 397 (713)
Net income (loss) attributable to
Chesapeake(b) . . . . . . . . . . . . . . . . . . . . . (5,740) 243 192 (524)
Net income (loss) available to common
stockholders(b) . . . . . . . . . . . . . . . . . . . . . (5,746) 237 186 (530)
Net earnings (loss) per common share:
Basic . . . . . . . . . . . . . . . . . . . . . . . . . . . . . $ (9.63) $ 0.39 $ 0.30 $ (0.84)
Diluted . . . . . . . . . . . . . . . . . . . . . . . . . . . . $ (9.63) $ 0.39 $ 0.30 $ (0.84)
Quarters Ended
March 31,2008
June 30,2008
September 30,2008
December 31,2008
Total revenues . . . . . . . . . . . . . . . . . . . . . . . $ 1,611 $ (455) $ 7,491 $ 2,981
Gross profit(a) . . . . . . . . . . . . . . . . . . . . . . . . (104) (2,532) 5,478 (1,385)
Net income (loss) attributable to
Chesapeake (130) (1,592) 3,322 (995)
Net income (loss) available to common
stockholders . . . . . . . . . . . . . . . . . . . . . . . (142) (1,643) 3,291 (1,001)
Net earnings per common share:
Basic . . . . . . . . . . . . . . . . . . . . . . . . . . . . . $ (0.29) $ (3.16) $ 5.94 $ (1.74)
Diluted . . . . . . . . . . . . . . . . . . . . . . . . . . . . $ (0.29) $ (3.16) $ 5.62 $ (1.74)
(a) Total revenue less operating costs.
(b) Includes a $9.6 billion and $1.4 billion ceiling test write-down on our natural gas and oil properties for the
quarters ended March 31, 2009 and December 31, 2009, respectively.
20. Recently Issued Accounting Standards
In June 2009, the FASB issued amendments to the consolidation standard applicable to variable
interest entities in response to concerns about the transparency of involvement with variable interest
entities. The amended standard is effective for calendar year companies beginning on January 1,
2010. Beginning January 1, 2010, we will deconsolidate our joint venture with GIP and account for the
investment in the joint venture under the equity method going forward. Adoption of this guidance will
result in a cumulative effect adjustment for the difference in our equity in the joint venture at January 1,
2010, which was originally recorded at carryover basis, and the fair value of our equity at the formation
of the joint venture based on the then fair value. This cumulative effect adjustment will create a basis
difference between our equity investment balance and the underlying equity in the net assets of the
joint venture. This difference will be accreted through earnings over the expected useful life of the
underlying assets held by the joint venture.
In January 2010, the FASB updated its oil and gas estimation and disclosure requirements to align
its requirements with the SEC’s modernized oil and gas reporting rules, which are effective for annual
147
CHESAPEAKE ENERGY CORPORATION AND SUBSIDIARIES
NOTES TO CONSOLIDATED FINANCIAL STATEMENTS – (Continued)
reports on Form 10-K for fiscal years ending on or after December 31, 2009. The update amends the
definition of proved reserves to use the average of first-day-of-the-month prices during the 12 months
preceding the end of the reporting period, adds definitions used in estimating and disclosing proved oil
and natural gas quantities and expands the disclosures required for equity-method investments. The
update must be applied prospectively as a change in accounting principle that is inseparable from a
change in accounting estimate and is effective for entities with annual reporting periods ending on or
after December 31, 2009. See Note 10 for disclosures regarding our natural gas and oil reserves. The
company is not able to disclose the effects resulting from the implementation of these changes on the
financial statements or on the amount of proved reserves and disclosed quantities because personnel
and time constraints made it infeasible for the company to perform a second reserve estimation
process under the prior standards.
21. Subsequent Events
On January 26, 2010, Chesapeake and Total E&P USA, Inc., a wholly-owned subsidiary of Total
S.A. (NYSE: TOT, FP: FP) (Total), closed a $2.25 billion Barnett Shale joint venture transaction,
whereby Total acquired a 25% interest in our upstream Barnett Shale assets. Total paid us
approximately $800 million in cash at closing and will pay a further $1.45 billion over time by funding
60% of our share of future drilling and completion expenditures. We expect this drilling carry to be
funded by year-end 2012.
On February 5, 2010, we sold certain Chesapeake-operated long-lived producing assets in East
Texas and the Texas Gulf Coast in our sixth volumetric production payment (VPP) transaction for
proceeds of $180 million, or $3.95 per mcfe of proved reserves. The assets in the VPP included proved
reserves of approximately 45.5 bcfe and current net production of approximately 20 mmcfe per day.
On February 16, 2010, Chesapeake Midstream Partners, L.P. (the Partnership) filed a registration
statement on Form S-1 with the SEC relating to a proposed underwritten initial public offering of
common units, representing limited partnership interests in the Partnership. The Partnership was
formed by Chesapeake and GIP, equal indirect owners of the general partner of the Partnership, to
own, operate, develop and acquire midstream assets. Upon the closing of the offering, Chesapeake
and GIP will contribute CMP’s interests to the Partnership and the Partnership will continue CMP’s
business. It is expected that the Partnership will succeed to CMP’s $500 million revolving credit facility,
with certain amendments, and a portion of the proceeds of the offering will be used to repay the
outstanding borrowings under the midstream joint venture revolving credit facility.
148
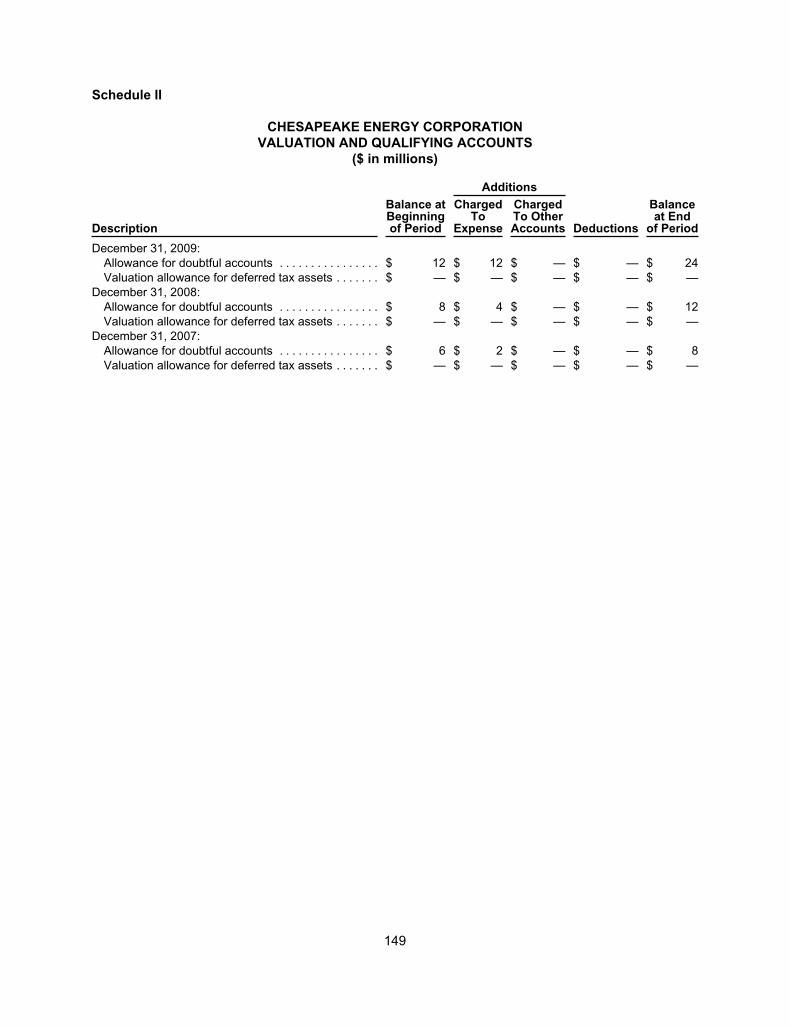
Schedule II
CHESAPEAKE ENERGY CORPORATION
VALUATION AND QUALIFYING ACCOUNTS
($ in millions)
Additions
Description
Balance atBeginningof Period
ChargedTo
Expense
ChargedTo OtherAccounts Deductions
Balanceat End
of Period
December 31, 2009:
Allowance for doubtful accounts . . . . . . . . . . . . . . . . $ 12 $ 12 $ — $ — $ 24
Valuation allowance for deferred tax assets . . . . . . . $ — $ — $ — $ — $ —
December 31, 2008:
Allowance for doubtful accounts . . . . . . . . . . . . . . . . $ 8 $ 4 $ — $ — $ 12
Valuation allowance for deferred tax assets . . . . . . . $ — $ — $ — $ — $ —
December 31, 2007:
Allowance for doubtful accounts . . . . . . . . . . . . . . . . $ 6 $ 2 $ — $ — $ 8
Valuation allowance for deferred tax assets . . . . . . . $ — $ — $ — $ — $ —
149
ITEM 9. Changes in and Disagreements with Accountants on Accounting and Financial
Disclosure
Not applicable.
ITEM 9A. Controls and Procedures
We maintain disclosure controls and procedures designed to ensure that information required to
be disclosed by Chesapeake in reports filed or submitted by it under the Securities Exchange Act of
1934 is recorded, processed, summarized and reported within the time periods specified in the
Securities and Exchange Commission rules and forms. As of December 31, 2009, we carried out an
evaluation, under the supervision and with the participation of Chesapeake management, including
Chesapeake’s Chief Executive Officer and Chief Financial Officer, of the effectiveness of the design
and operation of Chesapeake’s disclosure controls and procedures pursuant to Securities Exchange
Act Rule 13a-15(b). Based upon that evaluation, our Chief Executive Officer and Chief Financial Officer
concluded that our disclosure controls and procedures are effective as of December 31, 2009, to
ensure that information required to be disclosed by Chesapeake is accumulated and communicated to
Chesapeake management, including Chesapeake’s Chief Executive Officer and Chief Financial
Officer, as appropriate to allow timely decisions regarding required disclosure.
Changes in Internal Controls
No changes in the company’s internal control over financial reporting occurred during the quarter
ended December 31, 2009 that have materially affected, or are reasonably likely to materially affect,
the company’s internal control over financial reporting.
Management’s Report on Internal Control Over Financial Reporting
Management’s annual report on internal control over financial reporting and the audit report on our
internal control over financial reporting of our independent registered public accounting firm are
included in Item 8 of this report.
ITEM 9B. Other Information
Not applicable.
150
PART III
ITEM 10. Directors, Executive Officers and Corporate Governance
The information called for by this Item 10 is incorporated herein by reference to the definitive
Proxy Statement to be filed by Chesapeake pursuant to Regulation 14A of the General Rules and
Regulations under the Securities Exchange Act of 1934 not later than April 30, 2010.
ITEM 11. Executive Compensation
The information called for by this Item 11 is incorporated herein by reference to the definitive
Proxy Statement to be filed by Chesapeake pursuant to Regulation 14A of the General Rules and
Regulations under the Securities Exchange Act of 1934 not later than April 30, 2010.
ITEM 12. Security Ownership of Certain Beneficial Owners and Management and Related
Stockholder Matters
The information called for by this Item 12 is incorporated herein by reference to the definitive
Proxy Statement to be filed by Chesapeake pursuant to Regulation 14A of the General Rules and
Regulations under the Securities Exchange Act of 1934 not later than April 30, 2010.
ITEM 13. Certain Relationships and Related Transactions and Director Independence
The information called for by this Item 13 is incorporated herein by reference to the definitive
Proxy Statement to be filed by Chesapeake pursuant to Regulation 14A of the General Rules and
Regulations under the Securities Exchange Act of 1934 not later than April 30, 2010.
ITEM 14. Principal Accountant Fees and Services
The information called for by this Item 14 is incorporated herein by reference to the definitive
Proxy Statement to be filed by Chesapeake pursuant to Regulation 14A of the General Rules and
Regulations under the Securities Exchange Act of 1934 not later than April 30, 2010.
151
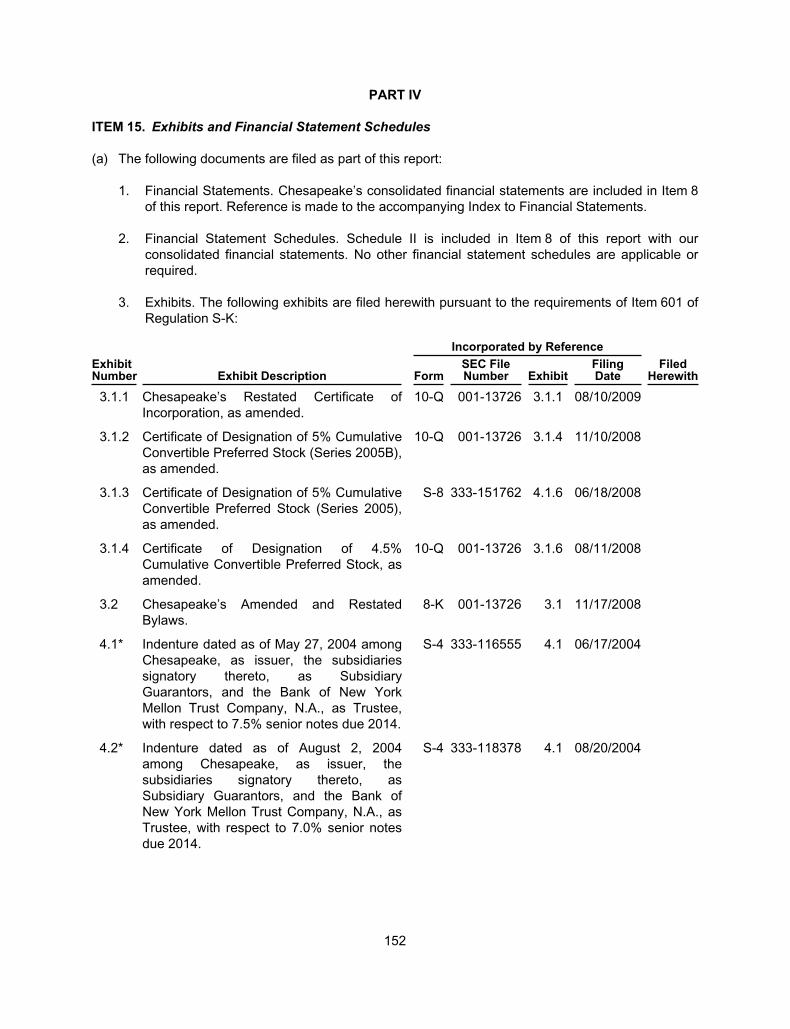
PART IV
ITEM 15. Exhibits and Financial Statement Schedules
(a) The following documents are filed as part of this report:
1. Financial Statements. Chesapeake’s consolidated financial statements are included in Item 8
of this report. Reference is made to the accompanying Index to Financial Statements.
2. Financial Statement Schedules. Schedule II is included in Item 8 of this report with our
consolidated financial statements. No other financial statement schedules are applicable or
required.
3. Exhibits. The following exhibits are filed herewith pursuant to the requirements of Item 601 of
Regulation S-K:
Incorporated by Reference
ExhibitNumber Exhibit Description Form
SEC FileNumber Exhibit
FilingDate
FiledHerewith
3.1.1 Chesapeake’s Restated Certificate of
Incorporation, as amended.
10-Q 001-13726 3.1.1 08/10/2009
3.1.2 Certificate of Designation of 5% Cumulative
Convertible Preferred Stock (Series 2005B),
as amended.
10-Q 001-13726 3.1.4 11/10/2008
3.1.3 Certificate of Designation of 5% Cumulative
Convertible Preferred Stock (Series 2005),
as amended.
S-8 333-151762 4.1.6 06/18/2008
3.1.4 Certificate of Designation of 4.5%
Cumulative Convertible Preferred Stock, as
amended.
10-Q 001-13726 3.1.6 08/11/2008
3.2 Chesapeake’s Amended and Restated
Bylaws.
8-K 001-13726 3.1 11/17/2008
4.1* Indenture dated as of May 27, 2004 among
Chesapeake, as issuer, the subsidiaries
signatory thereto, as Subsidiary
Guarantors, and the Bank of New York
Mellon Trust Company, N.A., as Trustee,
with respect to 7.5% senior notes due 2014.
S-4 333-116555 4.1 06/17/2004
4.2* Indenture dated as of August 2, 2004
among Chesapeake, as issuer, the
subsidiaries signatory thereto, as
Subsidiary Guarantors, and the Bank of
New York Mellon Trust Company, N.A., as
Trustee, with respect to 7.0% senior notes
due 2014.
S-4 333-118378 4.1 08/20/2004
152
Incorporated by Reference
ExhibitNumber Exhibit Description Form
SEC FileNumber Exhibit
FilingDate
FiledHerewith
4.4* Seventh Amended and Restated Credit
Agreement, dated as of November 2, 2007,
among Chesapeake Energy Corporation, as
the Company, Chesapeake Exploration
Limited Partnership and Chesapeake
Appalachia, L.L.C., as Co-Borrowers, Union
Bank of California, N.A., as Administrative
Agent, The Royal Bank of Scotland, as
Syndication Agent, and Bank of America,
N.A., SunTrust Bank and BNP Paribas, as
Co-Documentation Agents, and the several
lenders from time to time parties thereto.
8-K 001-13726 4.1 11/08/2007
4.4.1* Consent & Waiver Letter dated December
12, 2007 with respect to the Seventh
Amended and Restated Credit Agreement,
dated as of November 2, 2007, among
Chesapeake Energy Corporation, as the
Company, Chesapeake Exploration Limited
Partnership and Chesapeake Appalachia,
L.L.C., as Co-Borrowers, Union Bank of
California, N.A., as Administrative Agent,
The Royal Bank of Scotland, as Syndication
Agent, and Bank of America, N.A.,
SunTrust Bank and BNP Paribas, as Co-
Documentation Agents, and the several
lenders from time to time parties thereto.
10-K 001-13726 4.4.1 02/29/2008
4.4.2 Fourth Amendment dated as of March 31,
2009 to Seventh Amended and Restated
Credit Agreement, dated as of November 2,
2007, among Chesapeake Energy
Corporation, as the Company, Chesapeake
Exploration Limited Partnership and
Chesapeake Appalachia, L.L.C., as Co-
Borrowers, Union Bank of California, N.A.,
as Administrative Agent, The Royal Bank of
Scotland, as Syndication Agent, and Bank
of America, N.A., SunTrust Bank and BNP
Paribas, as Co-Documentation Agents, and
the several lenders from time to time parties
thereto.
10-Q 001-13726 4.4.1 05/11/2009
4.5* Indenture dated as of March 5, 2003 among
Chesapeake, as issuer, the subsidiaries
signatory thereto, as Subsidiary Guarantors
and The Bank of New York Mellon Trust
Company, N.A., as Trustee, with respect to
7.5% Senior Notes due 2013.
S-4 333-104396 4.7 04/08/2003
153
Incorporated by Reference
ExhibitNumber Exhibit Description Form
SEC FileNumber Exhibit
FilingDate
FiledHerewith
4.6* Indenture dated as of November 26, 2003
among Chesapeake, as issuer, the
subsidiaries signatory thereto, as
Subsidiary Guarantors and The Bank of
New York Mellon Trust Company, N.A., as
Trustee, with respect to 6.875% senior
notes due 2016.
S-4/A 333-110668 4.2 12/01/2003
4.7* Indenture dated as of December 8, 2004
among Chesapeake, as issuer, the
subsidiaries signatory thereto, as
Subsidiary Guarantors and The Bank of
New York Mellon Trust Company, N.A.
Trust Company, N.A., as Trustee, with
respect to 6.375% senior notes due 2015.
8-K 001-13726 4.1 12/14/2004
4.8* Indenture dated as of April 19, 2005 among
Chesapeake, as issuer, the subsidiaries
signatory thereto, as Subsidiary
Guarantors and The Bank of New York
Mellon Trust Company, N.A., as Trustee,
with respect to 6.625% senior notes due
2016.
10-Q 001-13726 4.12 05/10/2005
4.9* Indenture dated as of June 20, 2005
among Chesapeake, as issuer, the
subsidiaries signatory thereto, as
Subsidiary Guarantors and The Bank of
New York Mellon Trust Company, N.A., as
Trustee, with respect to 6.25% senior notes
due 2018.
10-Q 001-13726 4.1 08/08/2005
4.10* Indenture dated as of August 16, 2005
among Chesapeake, as issuer, the
subsidiaries signatory thereto, as
Subsidiary Guarantors and The Bank of
New York Mellon Trust Company, N.A., as
Trustee, with respect to 6.50% senior notes
due 2017.
8-K 001-13726 4.1 08/16/2005
4.11* Indenture dated as of November 8, 2005
among Chesapeake, as issuer, the
subsidiaries signatory thereto, as
Subsidiary Guarantors and The Bank of
New York Mellon Trust Company, N.A., as
Trustee, with respect to 6.875% senior
notes due 2020.
8-K 001-13726 4.1.1 11/08/2005
154
Incorporated by Reference
ExhibitNumber Exhibit Description Form
SEC FileNumber Exhibit
FilingDate
FiledHerewith
4.12* Indenture dated as of November 8, 2005
among Chesapeake, as issuer, the
subsidiaries signatory thereto, as Subsidiary
Guarantors and The Bank of New York
Mellon Trust Company, N.A., as Trustee,
with respect to 2.75% contingent convertible
senior notes due 2035.
8-K 001-13726 4.1.2 11/08/2005
4.13* Indenture dated as of June 30, 2006 among
Chesapeake, as issuer, the subsidiaries
signatory thereto, as Subsidiary Guarantors
and The Bank of New York Mellon Trust
Company, N.A., as Trustee, with respect to
7.625% senior notes due 2013.
8-K 001-13726 4.1 06/30/2006
4.14* Indenture dated as of December 6, 2006
among Chesapeake, as issuer, the
subsidiaries signatory thereto, as Subsidiary
Guarantors, The Bank of New York Mellon
Trust Company, N.A., as Trustee, AIB/BNY
Fund Management (Ireland) Limited, as Irish
Paying Agent and Transfer Agent, and The
Bank of New York, London Branch, as
Registrar, Transfer Agent and Paying Agent,
with respect to 6.25% senior notes due 2017.
8-K 001-13726 4.1 12/06/2006
4.15* Indenture dated as of May 15, 2007 among
Chesapeake, as issuer, the subsidiaries
signatory thereto, as Subsidiary Guarantors
and The Bank of New York Mellon Trust
Company, N.A., as Trustee, with respect to
2.50% contingent convertible senior notes
due 2037.
8-K 001-13726 4.1 05/15/2007
4.16* Indenture dated as of May 27, 2008 among
Chesapeake, as issuer, the subsidiaries
signatory thereto, as Subsidiary Guarantors
and The Bank of New York Mellon Trust
Company, N.A., as Trustee, with respect to
7.25% senior notes due 2018.
8-K 001-13726 4.1 05/29/2008
4.17* Indenture dated as of May 27, 2008 among
Chesapeake, as issuer, the subsidiaries
signatory thereto, as Subsidiary Guarantors
and The Bank of New York Mellon Trust
Company, N.A., as Trustee, with respect to
2.25% contingent convertible senior notes
due 2038.
8-K 001-13726 4.2 05/29/2008
155
Incorporated by Reference
ExhibitNumber Exhibit Description Form
SEC FileNumber Exhibit
FilingDate
FiledHerewith
4.18 Indenture dated as of February 2,
2009 among Chesapeake, as
issuer, the subsidiaries signatory
thereto, as Subsidiary Guarantors
and The Bank of New York Mellon
Trust Company, N.A., as Trustee,
with respect to 9.50% contingent
convertible senior notes due 2015.
8-K 001-13726 4.1 02/03/2009
4.18.1 First Supplemental Indenture dated
as of February 10, 2009 to Indenture
dated as of February 2, 2009.
8-K 001-13726 4.2 02/17/2009
4.18.2 Second Supplemental Indenture
dated as of March 31, 2009 to
Indenture dated of February 2, 2009.
10-Q 001-13726 4.18.2 05/11/2009
10.1.1† Chesapeake’s 2003 Stock Incentive
Plan, as amended.
10-Q 001-13726 10.1.1 11/09/2009
10.1.2† Chesapeake’s 1992 Nonstatutory
Stock Option Plan, as amended.
10-Q 001-13726 10.1.2 02/14/1997
10.1.3† Chesapeake’s 1994 Stock Option
Plan, as amended.
10-Q 001-13726 10.1.3 11/07/2006
10.1.4† Chesapeake’s 1996 Stock Option
Plan, as amended.
10-Q 001-13726 10.1.4 11/07/2006
10.1.5† Chesapeake’s 1999 Stock Option
Plan, as amended.
10-Q 001-13726 10.1.5 08/11/2008
10.1.6† Chesapeake’s 2000 Employee
Stock Option Plan, as amended.
10-Q 001-13726 10.1.6 08/11/2008
10.1.7† Chesapeake’s 2001 Stock Option
Plan, as amended.
10-Q 001-13726 10.1.8 08/11/2008
10.1.8† Chesapeake’s 2001 Nonqualified
Stock Option Plan, as amended.
10-Q 001-13726 10.1.10 08/11/2008
10.1.9† Chesapeake’s 2002 Stock Option
Plan, as amended.
10-Q 001-13726 10.1.11 08/11/2008
10.1.10† Chesapeake’s 2002 Non-Employee
Director Stock Option Plan.
10-Q 001-13726 10.1.12 08/11/2008
10.1.11† Chesapeake’s 2002 Nonqualified
Stock Option Plan, as amended.
10-Q 001-13726 10.1.13 08/11/2008
10.1.12† Chesapeake’s 2003 Stock Award
Plan for Non-Employee Directors,
as amended.
10-K 001-13726 10.1.14 02/29/2008
10.1.13† Chesapeake Energy Corporation
Amended and Restated Deferred
Compensation Plan.
10-K 001-13726 10.1.16 02/29/2008
156
Incorporated by Reference
ExhibitNumber Exhibit Description Form
SEC FileNumber Exhibit
FilingDate
FiledHerewith
10.1.14† Chesapeake’s Amended and
Restated Long Term Incentive
Plan.
10-Q 001-13726 10.1.14 11/09/2009
10.1.14.1† Form of Restricted Stock Award
Agreement for the Long Term
Incentive Plan.
8-K 001-13726 10.1.18.2 06/16/2005
10.1.14.2† Form of Non-Employee Director
Restricted Stock Award Agreement
for the Long Term `Incentive Plan.
8-K 001-13726 10.1.18.3 06/16/2005
10.1.15† Founder Well Participation
Program.
DEF-14A 001-13726 B 04/29/2005
10.2.1† Employment Agreement dated as
of March 1, 2009, between Aubrey
K. McClendon and Chesapeake
Energy Corporation.
10-Q 001-13726 10.2.1 05/11/2009
10.2.2† Employment Agreement dated as
of October 1, 2009 between
Marcus C. Rowland and
Chesapeake Energy Corporation.
8-K 001-13726 10.2.2 10/01/2009
10.2.3† Employment Agreement dated as
of October 1, 2009 between
Steven C. Dixon and Chesapeake
Energy Corporation.
8-K 001-13726 10.2.3 10/01/2009
10.2.4† Employment Agreement dated as
of October 1, 2009 between J.
Mark Lester and Chesapeake
Energy Corporation.
8-K 001-13726 10.2.4 10/01/2009
10.2.5† Employment Agreement dated as
of October 1, 2009 between
Douglas J. Jacobson and
Chesapeake Energy Corporation.
8-K 001-13726 10.2.5 10/01/2009
10.2.6† Form of Employment Agreement
between Senior Vice President and
Chesapeake Energy Corporation.
10-Q 001-13726 10.2 11/09/2009
10.3† Form of Indemnity Agreement for
officers and directors of
Chesapeake and its subsidiaries.
10-K 001-13726 10.3 02/29/2008
10.4† Consulting Agreement dated as of
February 1, 2010 between J. Mark
Lester and Chesapeake Energy
Corporation.
X
12 Ratios of Earnings to Fixed
Charges and Preferred Dividends.
X
157
Incorporated by Reference
ExhibitNumber Exhibit Description Form
SEC FileNumber Exhibit
FilingDate
FiledHerewith
21 Subsidiaries of Chesapeake. X
23.1 Consent of
PricewaterhouseCoopers, LLP.
X
23.2 Consent of Netherland, Sewell &
Associates, Inc.
X
23.3 Consent of Data & Consulting
Services, Division of Schlumberger
Technology Corporation.
X
23.4 Consent of Lee Keeling and
Associates, Inc.
X
23.5 Consent of Ryder Scott Company,
L.P.
X
31.1 Aubrey K. McClendon, Chairman
and Chief Executive Officer,
Certification pursuant to Section
302 of the Sarbanes-Oxley Act of
2002.
X
31.2 Marcus C. Rowland, Executive
Vice President and Chief Financial
Officer, Certification pursuant to
Section 302 of the Sarbanes-Oxley
Act of 2002.
X
32.1 Aubrey K. McClendon, Chairman
and Chief Executive Officer,
Certification pursuant to Section
906 of the Sarbanes-Oxley Act of
2002.
X
32.2 Marcus C. Rowland, Executive
Vice President and Chief Financial
Officer, Certification pursuant to
Section 906 of the Sarbanes-Oxley
Act of 2002.
X
99.1 Report of Netherland, Sewell &
Associates, Inc.
X
99.2 Report of Data & Consulting
Services, Division of Schlumberger
Technology Corporation.
X
99.3 Report of Lee Keeling and
Associates, Inc.
X
99.4 Report of Ryder Scott Company,
L.P.
X
101.INS# XBRL Instance Document. X
158
Incorporated by Reference
ExhibitNumber Exhibit Description Form
SEC FileNumber Exhibit
FilingDate
FiledHerewith
101.SCH# XBRL Taxonomy Extension
Schema Document.
X
101.CAL# XBRL Taxonomy Extension
Calculation Linkbase Document.
X
101.DEF# XBRL Taxonomy Extension
Definition Linkbase Document.
X
101.LAB# XBRL Taxonomy Extension Labels
Linkbase Document.
X
101.PRE# XBRL Taxonomy Extension
Presentation Linkbase Document.
X
* Chesapeake agrees to furnish a copy of any of its unfiled long-term debt instruments to the
Securities and Exchange Commission upon request.
† Management contract or compensatory plan or arrangement.
# Furnished herewith.
159
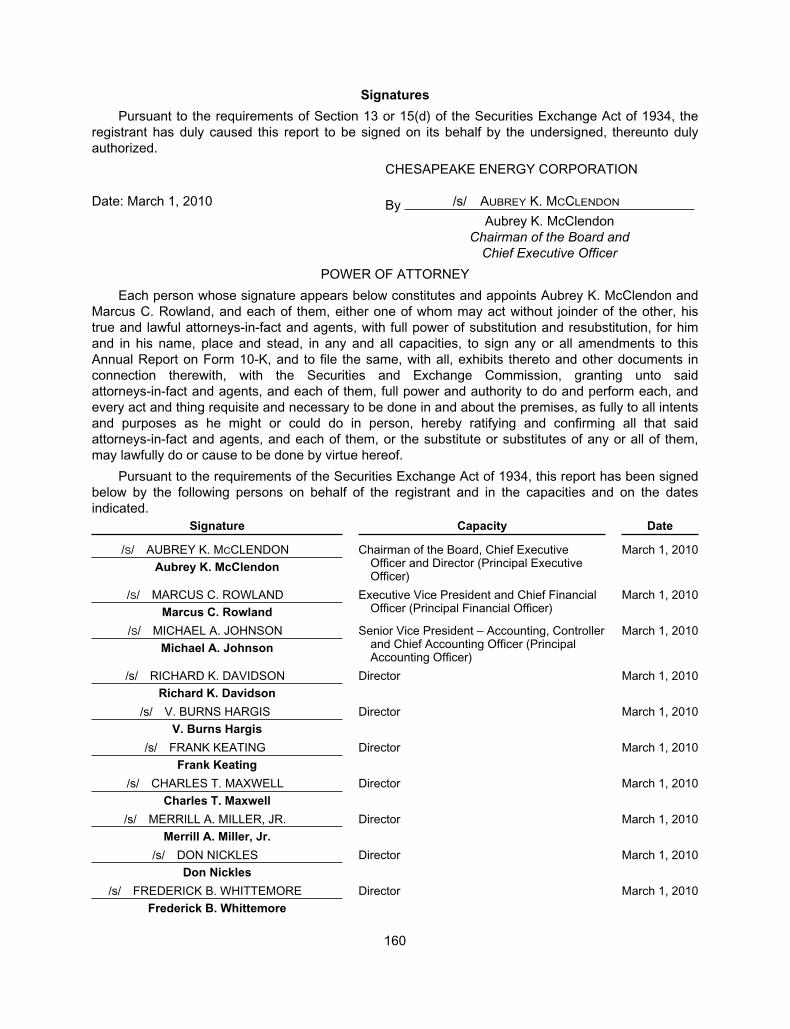
Signatures
Pursuant to the requirements of Section 13 or 15(d) of the Securities Exchange Act of 1934, the
registrant has duly caused this report to be signed on its behalf by the undersigned, thereunto duly
authorized.
CHESAPEAKE ENERGY CORPORATION
Date: March 1, 2010 By /s/ AUBREY K. MCCLENDON
Aubrey K. McClendon
Chairman of the Board and
Chief Executive Officer
POWER OF ATTORNEY
Each person whose signature appears below constitutes and appoints Aubrey K. McClendon and
Marcus C. Rowland, and each of them, either one of whom may act without joinder of the other, his
true and lawful attorneys-in-fact and agents, with full power of substitution and resubstitution, for him
and in his name, place and stead, in any and all capacities, to sign any or all amendments to this
Annual Report on Form 10-K, and to file the same, with all, exhibits thereto and other documents in
connection therewith, with the Securities and Exchange Commission, granting unto said
attorneys-in-fact and agents, and each of them, full power and authority to do and perform each, and
every act and thing requisite and necessary to be done in and about the premises, as fully to all intents
and purposes as he might or could do in person, hereby ratifying and confirming all that said
attorneys-in-fact and agents, and each of them, or the substitute or substitutes of any or all of them,
may lawfully do or cause to be done by virtue hereof.
Pursuant to the requirements of the Securities Exchange Act of 1934, this report has been signed
below by the following persons on behalf of the registrant and in the capacities and on the dates
indicated.
Signature Capacity Date
/S/ AUBREY K. MCCLENDON
Aubrey K. McClendon
Chairman of the Board, Chief ExecutiveOfficer and Director (Principal ExecutiveOfficer)
March 1, 2010
/S/ MARCUS C. ROWLAND
Marcus C. Rowland
Executive Vice President and Chief FinancialOfficer (Principal Financial Officer)
March 1, 2010
/S/ MICHAEL A. JOHNSON
Michael A. Johnson
Senior Vice President – Accounting, Controllerand Chief Accounting Officer (PrincipalAccounting Officer)
March 1, 2010
/s/ RICHARD K. DAVIDSON
Richard K. Davidson
Director March 1, 2010
/s/ V. BURNS HARGIS
V. Burns Hargis
Director March 1, 2010
/s/ FRANK KEATING
Frank Keating
Director March 1, 2010
/s/ CHARLES T. MAXWELL
Charles T. Maxwell
Director March 1, 2010
/s/ MERRILL A. MILLER, JR.
Merrill A. Miller, Jr.
Director March 1, 2010
/s/ DON NICKLES
Don Nickles
Director March 1, 2010
/s/ FREDERICK B. WHITTEMORE
Frederick B. Whittemore
Director March 1, 2010
160
[THIS PAGE INTENTIONALLY LEFT BLANK]
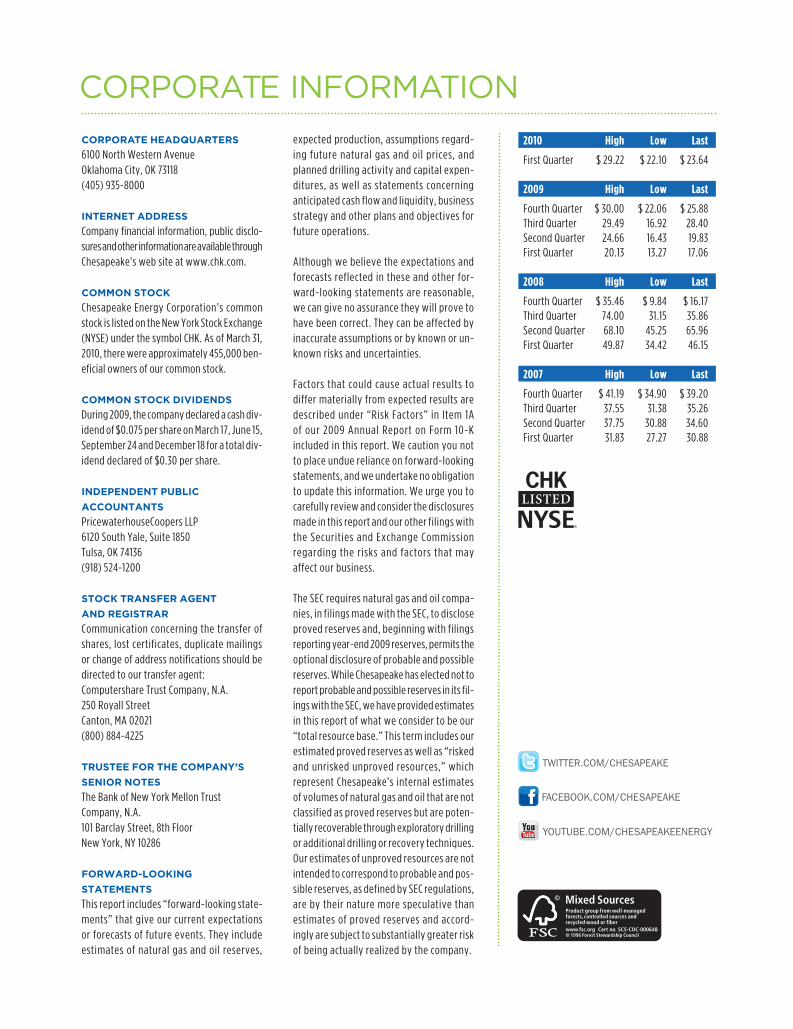
ON THE COVER
Scenes from the field to the natural gas fueling station depict how Chesapeake explores for, produces and advocates the expanded use of natural gas — the clean, affordable, abundant energy resource that is Fueling America’s Future.
CONTENTS
1 FiNaNCial REviEw
4 lETTER TO ShaREhOldERS
14 FuEliNg amERiCa’S FuTuRE
16 OpERaTiNg aREaS
20 iNvESTOR Q&a
22 SOCial RESpONSibiliTy
24 Community Relations
26 enviRonmental, health
& safety
28 bOaRd OF diRECTORS
28 gOvERNaNCE
29 OFFiCERS
30 EmplOyEES
45 FORm 10-K
iNSidE baCK COvER
CORpORaTE iNFORmaTiON
Chesapeake Energy Corporation is the second-largest producer of natural gas and the most active driller of new
wells in the U.S. Headquartered in Oklahoma City, the company’s operations are focused on discovering and
developing unconventional natural gas and oil fields onshore in the U.S. Chesapeake owns leading positions in
the Barnett, Fayetteville, Haynesville, Marcellus and Bossier natural gas shale plays and in the Eagle Ford, Granite
Wash and various other unconventional oil plays. The company has also vertically integrated its operations and
owns substantial midstream, compression, drilling and oilfield service assets. Chesapeake’s stock is listed on the
New York Stock Exchange under the symbol CHK. Further information is available at www.chk.com.
CoRpoRate pRofile CoRpoRate infoRmation
CORpORaTE HEadquaRTERs
6100 North Western AvenueOklahoma City, OK 73118(405) 935-8000
INTERNET addREss
Company financial information, public disclo-sures and other information are available through Chesapeake’s web site at www.chk.com.
COmmON sTOCk
Chesapeake Energy Corporation’s common stock is listed on the New York Stock Exchange (NYSE) under the symbol CHK. As of March 31, 2010, there were approximately 455,000 ben-eficial owners of our common stock.
COmmON sTOCk dIVIdENds
During 2009, the company declared a cash div-idend of $0.075 per share on March 17, June 15, September 24 and December 18 for a total div-idend declared of $0.30 per share.
INdEpENdENT publIC
aCCOuNTaNTs
PricewaterhouseCoopers LLP6120 South Yale, Suite 1850Tulsa, OK 74136(918) 524-1200
sTOCk TRaNsfER agENT
aNd REgIsTRaR
Communication concerning the transfer of shares, lost certificates, duplicate mailings or change of address notifications should be directed to our transfer agent: Computershare Trust Company, N.A.250 Royall StreetCanton, MA 02021(800) 884-4225
TRusTEE fOR THE COmpaNy’s
sENIOR NOTEs
The Bank of New York Mellon Trust Company, N.A.101 Barclay Street, 8th FloorNew York, NY 10286
fORwaRd-lOOkINg
sTaTEmENTs
This report includes “forward-looking state-ments” that give our current expectations or forecasts of future events. They include estimates of natural gas and oil reserves,
expected production, assumptions regard-ing future natural gas and oil prices, and planned drilling activity and capital expen-ditures, as well as statements concerning anticipated cash flow and liquidity, business strategy and other plans and objectives for future operations.
Although we believe the expectations and forecasts reflected in these and other for-ward-looking statements are reasonable, we can give no assurance they will prove to have been correct. They can be affected by inaccurate assumptions or by known or un-known risks and uncertainties.
Factors that could cause actual results to differ materially from expected results are described under “Risk Factors” in Item 1A of our 2009 Annual Report on Form 10-K included in this report. We caution you not to place undue reliance on forward-looking statements, and we undertake no obligation to update this information. We urge you to carefully review and consider the disclosures made in this report and our other filings with the Securities and Exchange Commission regarding the risks and factors that may affect our business.
The SEC requires natural gas and oil compa-nies, in filings made with the SEC, to disclose proved reserves and, beginning with filings reporting year-end 2009 reserves, permits the optional disclosure of probable and possible reserves. While Chesapeake has elected not to report probable and possible reserves in its fil-ings with the SEC, we have provided estimates in this report of what we consider to be our “total resource base.” This term includes our estimated proved reserves as well as “risked and unrisked unproved resources,” which represent Chesapeake’s internal estimates of volumes of natural gas and oil that are not classified as proved reserves but are poten-tially recoverable through exploratory drilling or additional drilling or recovery techniques. Our estimates of unproved resources are not intended to correspond to probable and pos-sible reserves, as defined by SEC regulations, are by their nature more speculative than estimates of proved reserves and accord-ingly are subject to substantially greater risk of being actually realized by the company.
2010 High Low Last
First Quarter $ 29.22 $ 22.10 $ 23.64
2009 High Low Last
Fourth Quarter $ 30.00 $ 22.06 $ 25.88Third Quarter 29.49 16.92 28.40Second Quarter 24.66 16.43 19.83First Quarter 20.13 13.27 17.06
2008 High Low Last
Fourth Quarter $ 35.46 $ 9.84 $ 16.17Third Quarter 74.00 31.15 35.86Second Quarter 68.10 45.25 65.96First Quarter 49.87 34.42 46.15
2007 High Low Last
Fourth Quarter $ 41.19 $ 34.90 $ 39.20Third Quarter 37.55 31.38 35.26Second Quarter 37.75 30.88 34.60 First Quarter 31.83 27.27 30.88
Cert no. SCS-COC-000648
90132rrdD1R1.indd 2 4/26/10 1:05 PM

6100 NORTH WESTERN AVENUE
OKLAHOMA CITY, OK 73118
WWW.CHK.COM
CH
ES
AP
EA
KE
EN
ER
GY
CO
RP
OR
ATIO
N
20
09
AN
NU
AL
RE
PO
RT