america's health care economy
TRANSCRIPT

America’s Health Care Economy
August 2003
Ross C. DeVol Director, Regional Economics, Milken Institute
Rob Koepp Research Fellow, Milken Institute
All rights reserved. Copyright 2003
America’s Health Care Economy August 2003
2
Introduction
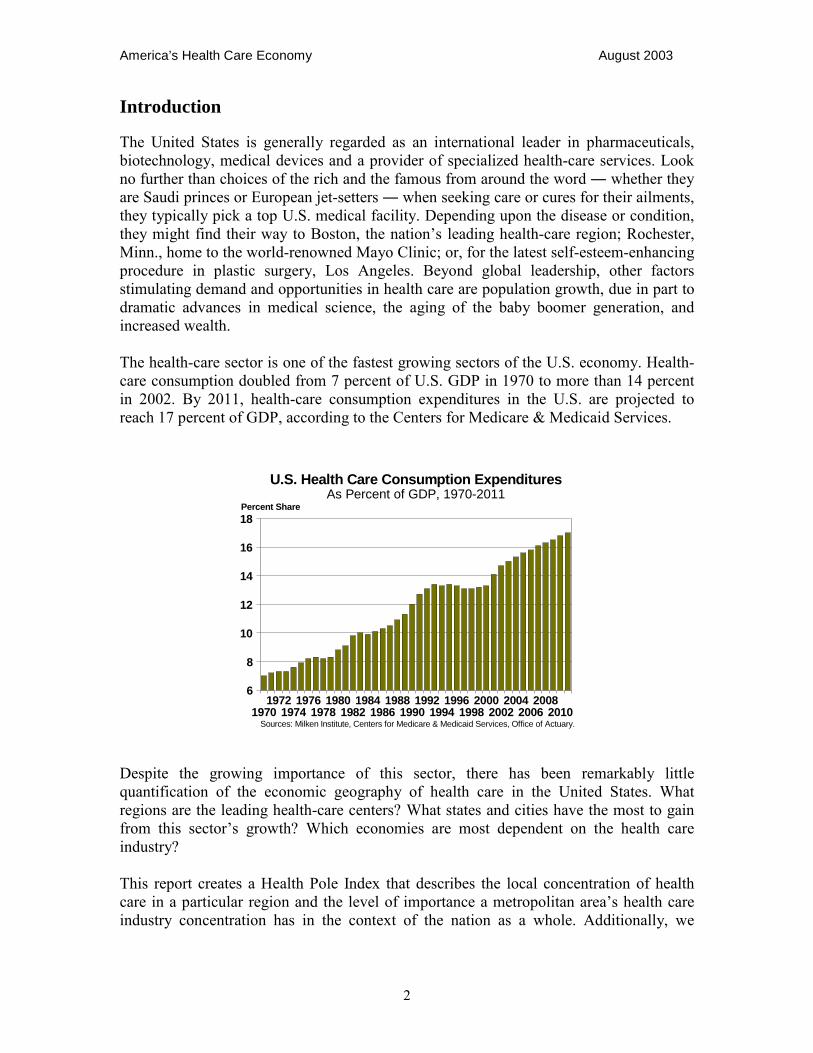
The United States is generally regarded as an international leader in pharmaceuticals, biotechnology, medical devices and a provider of specialized health-care services. Look no further than choices of the rich and the famous from around the word ― whether they are Saudi princes or European jet-setters ― when seeking care or cures for their ailments, they typically pick a top U.S. medical facility. Depending upon the disease or condition, they might find their way to Boston, the nation�s leading health-care region; Rochester, Minn., home to the world-renowned Mayo Clinic; or, for the latest self-esteem-enhancing procedure in plastic surgery, Los Angeles. Beyond global leadership, other factors stimulating demand and opportunities in health care are population growth, due in part to dramatic advances in medical science, the aging of the baby boomer generation, and increased wealth. The health-care sector is one of the fastest growing sectors of the U.S. economy. Health-care consumption doubled from 7 percent of U.S. GDP in 1970 to more than 14 percent in 2002. By 2011, health-care consumption expenditures in the U.S. are projected to reach 17 percent of GDP, according to the Centers for Medicare & Medicaid Services.
20102008
20062004
20022000
19981996
19941992
19901988
19861984
19821980
19781976
19741972
1970
18
16
14
12
10
8
6
Percent Share
Sources: Milken Institute, Centers for Medicare & Medicaid Services, Office of Actuary.
U.S. Health Care Consumption ExpendituresAs Percent of GDP, 1970-2011
Despite the growing importance of this sector, there has been remarkably little quantification of the economic geography of health care in the United States. What regions are the leading health-care centers? What states and cities have the most to gain from this sector�s growth? Which economies are most dependent on the health care industry? This report creates a Health Pole Index that describes the local concentration of health care in a particular region and the level of importance a metropolitan area�s health care industry concentration has in the context of the nation as a whole. Additionally, we
America’s Health Care Economy August 2003
3
measure the level of reliance of each state�s economy on the health care industry, and its impact on the corresponding census regions. Understanding these relationships is important for economic development officials, health-care decision makers and public policy leaders, as nurturing expansion of the health care industry is increasingly vital to global, national and regional economic prosperity.
The Industry
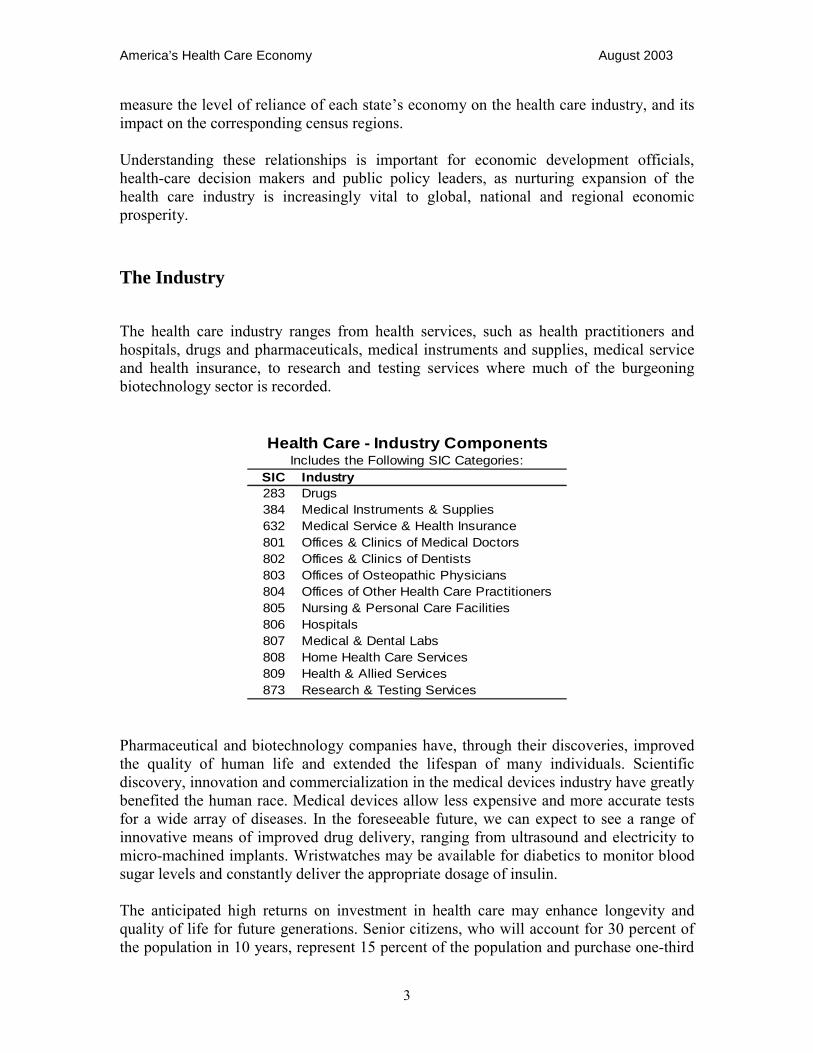
The health care industry ranges from health services, such as health practitioners and hospitals, drugs and pharmaceuticals, medical instruments and supplies, medical service and health insurance, to research and testing services where much of the burgeoning biotechnology sector is recorded.
SIC Industry283 Drugs384 Medical Instruments & Supplies632 Medical Service & Health Insurance801 Offices & Clinics of Medical Doctors802 Offices & Clinics of Dentists803 Offices of Osteopathic Physicians804 Offices of Other Health Care Practitioners805 Nursing & Personal Care Facilities806 Hospitals807 Medical & Dental Labs808 Home Health Care Services809 Health & Allied Services873 Research & Testing Services
Health Care - Industry ComponentsIncludes the Following SIC Categories:
Pharmaceutical and biotechnology companies have, through their discoveries, improved the quality of human life and extended the lifespan of many individuals. Scientific discovery, innovation and commercialization in the medical devices industry have greatly benefited the human race. Medical devices allow less expensive and more accurate tests for a wide array of diseases. In the foreseeable future, we can expect to see a range of innovative means of improved drug delivery, ranging from ultrasound and electricity to micro-machined implants. Wristwatches may be available for diabetics to monitor blood sugar levels and constantly deliver the appropriate dosage of insulin. The anticipated high returns on investment in health care may enhance longevity and quality of life for future generations. Senior citizens, who will account for 30 percent of the population in 10 years, represent 15 percent of the population and purchase one-third
America’s Health Care Economy August 2003
4
of all prescription medications dispensed in the United States. Even more dramatic demographic aging patterns will occur in Japan and Western Europe. On a global basis, the over-65 population is expected to expand from 600 million in 2000 to over one billion by 2020, according to the World Health Organization. The major biotechnology, pharmaceuticals, medical device and health-care service-provider firms and organizations recognize the potential financial returns that these changing demographics imply and are making significant investments in research and development. Biotechnology and biomedicine may mean to the first half of the 21st century what electronics and computers meant to the latter half of the 20th century. We are likely to see a fusing of the information and biotechnology/biomedical industries into a powerful technological and global economic force. Hospitals and clinics are the primary sources of clinical trials and much innovation. However, there is an important race underway � the one to determine where the dominant health care centers will be located. Health-care service providers, such as hospitals, are more service and less technology oriented. While hospitals may be technologically intensive, human beings constitute their chief input and better human health constitutes their chief output. Hospitals succeed based on how well they service an individual�s health needs, not on how well they process technology. Drug companies, research and testing services and medical devices firms are technology-intensive in the research phase and combine their inputs to produce a unique form of knowledge-based compounds and products.
Metropolitan Area Health Poles
The Milken Institute has created this Health Pole Index to depict the health care industry concentration in a given geographic location and the level of importance a metropolitan area�s (MSA) health care industry concentration has in the context of the nation as a whole. The Health Pole concept can be thought of as a measure of the spatial density and diversity of health-care sectors in a metropolitan economy and placed in a national perspective. The Health Pole rankings are based on combining an MSA�s health care industry location quotient (the concentration of health care in an economy) with its share of national health care employment. MSAs then are ranked according to their composite scoring. The metro area with the highest composite score for a given health care industry is assigned a benchmark score of 100. All subsequent ranking metropolitan areas have scores that indicate their placement relative to the benchmark. The principles behind this method for determining and comparing the �gravitational pull� of technology-driven metro areas were introduced in 1999 with the Milken Institute�s nationwide mapping of �Tech Poles,� the first index of its kind. The tech-pole concept is detailed in the study America’s High-Tech Economy: Growth, Development and Risks for
America’s Health Care Economy August 2003
5
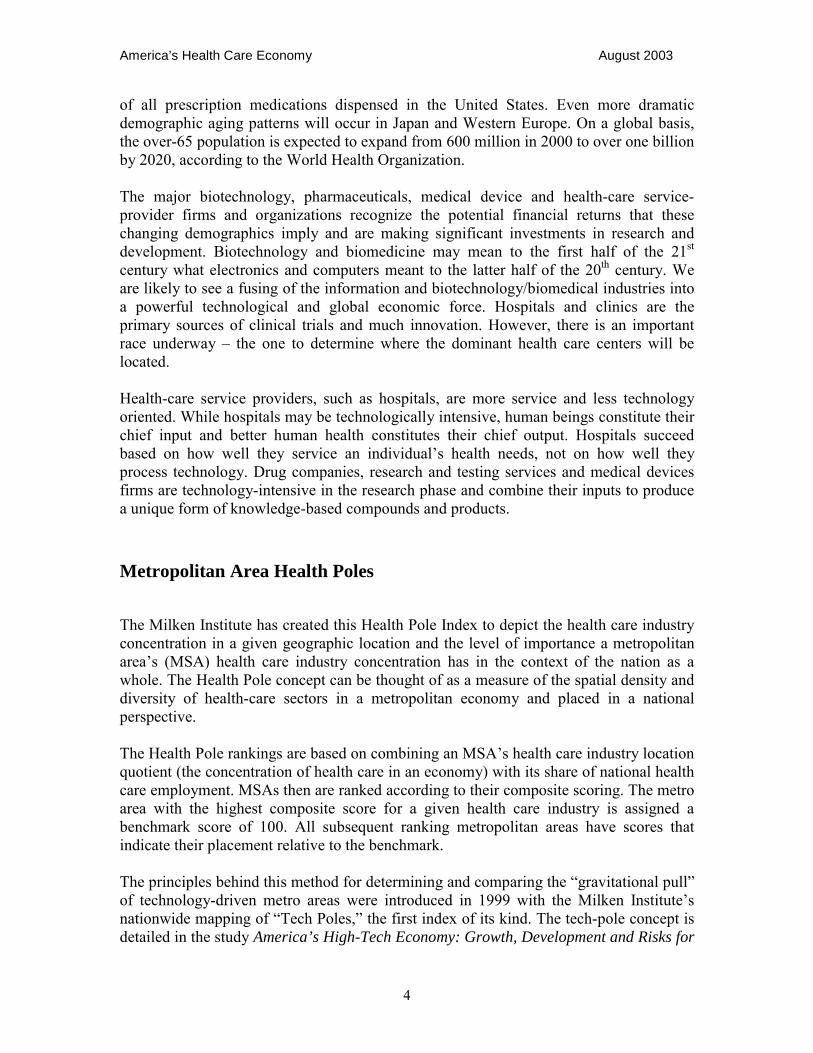
Metropolitan Areas.1 Tech-pole scores capture the spatial intensity of a variety of technology-driven sectors. The health pole index (and the individual industry health pole scores available in the Appendix) referred to in this article relates specifically to areas of concentration of the health care industry. The Health Pole Index reflects the combined scores for all 13 health care industry components. As the map below indicates, the New England region has the distinction of having the top-ranked health pole in the United States, that being Boston whose MSA includes parts of both Massachusetts and New Hampshire that abut the city. Boston earned first place by ranking among the top 10 in most health care sectors. Boston is a center of biotechnology and medical device research and commercialization. Genzyme and Biogen serve as its biotech anchor firms. Among the many health care clusters that dot that metro�s landscape is one of the most outstanding concentrations of resources and expertise comprised of hospitals and affiliated institutions. Boston boasts three top-rated medical schools at Boston University, Tufts and Harvard. Massachusetts General Hospital is the sixth-largest employer in Boston with 11,600 workers.
1 Ross DeVol, America’s High-Tech Economy: Growth, Development, and Risks for Metropolitan Areas (The Milken Institute, 1999): see especially pages 4-6.
America’s Health Care Economy August 2003
6
Rank Metroplitan Area Health Pole Rank Metroplitan Area Health Pole1 Boston MA-NH 100.00 11 Pittsburgh PA 36.262 New York NY 99.85 12 Baltimore MD 33.553 Philadelphia PA-NJ 97.53 13 St. Louis MO-IL 32.124 Chicago IL 92.20 14 Cleveland-Lorain-Elyria OH 31.235 Los Angeles-Long Beach CA 55.15 15 Houston TX 31.036 Washington DC-MD-VA-WV 48.18 16 New Haven-Meriden CT 31.007 Detroit MI 44.09 17 San Diego CA 24.858 Nassau-Suffolk NY 40.66 18 Rochester MN 23.469 Newark NJ 39.49 19 Tampa-St. Petersburg-Clearwater FL 23.46
10 Minneapolis-St.Paul MN-WI 36.29 20 Miami FL 22.74
Total Health Care Employment, 2001Top Twenty Metropolitan Areas by Health Pole
Sources: Milken Institute, Economy.com.
There are aspects of Boston�s top score, however, that temper the metro�s bragging rights. Boston just edges out the New York metro area. The score of second-place New York ranks only 0.15 percent behind that of Boston, a placement that makes it statistically tied with New England�s principal center for health care. New York was 1st in hospitals and in the top 10 in several other categories. New York has some of the top teaching hospitals in the country and is a leader in clinical trials. The New York Presbyterian Healthcare Network is the top employer in the metro area with 30,000 workers. Other leading employers include the North Shore-Long Island Jewish Health System and Saint Vincent Catholic Medical Centers.
Rank Health Care Industry Index12 Drugs 6.0318 Medical Instruments & Supplies 11.8711 Medical Service & Health Insurance 8.263 Offices & Clinics of Medical Doctors 46.185 Offices & Clinics of Dentists 48.78
100 Offices of Osteopathic Physicians 0.097 Offices of Other Health Care Practitioners 58.651 Nursing & Personal Care Facilities 100.005 Hospitals 53.57
10 Medical & Dental Labs 13.627 Home Health Care Services 25.537 Health & Allied Services 29.516 Research & Testing Services 34.531 Total Health Care 100.00
Sources: Milken Institute, Economy.com.
Boston's Health Pole RankingsBy Health Care Industry, 2001
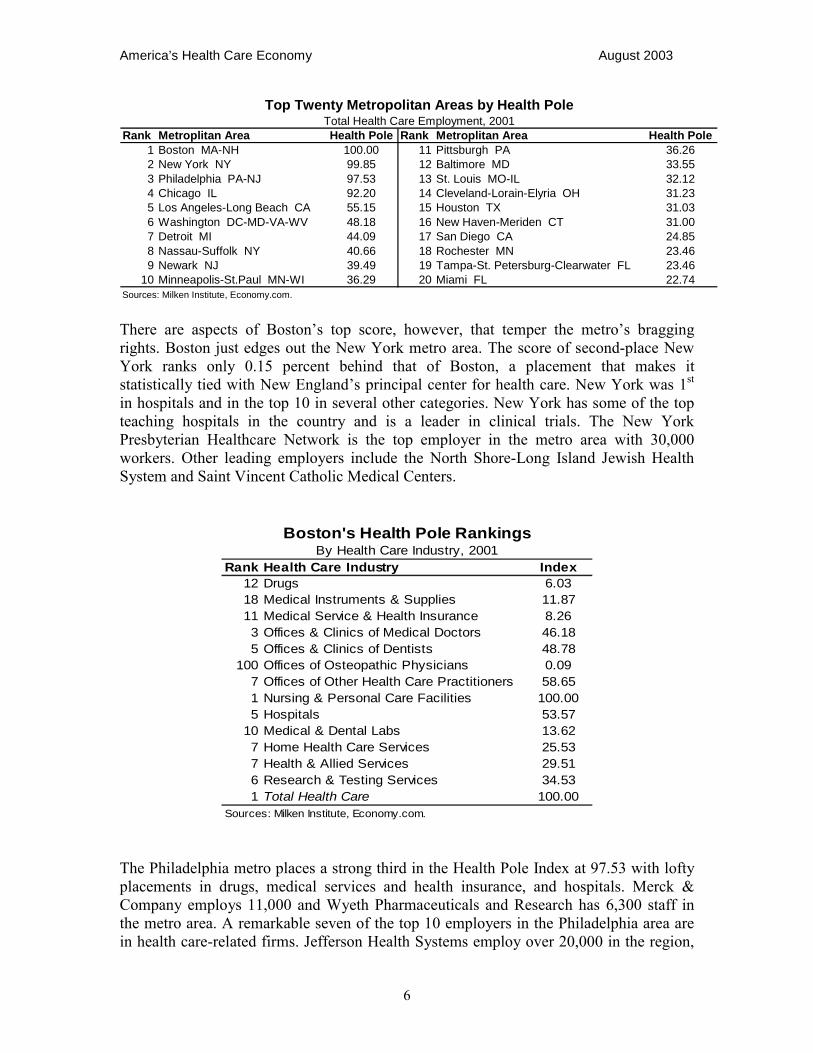
The Philadelphia metro places a strong third in the Health Pole Index at 97.53 with lofty placements in drugs, medical services and health insurance, and hospitals. Merck & Company employs 11,000 and Wyeth Pharmaceuticals and Research has 6,300 staff in the metro area. A remarkable seven of the top 10 employers in the Philadelphia area are in health care-related firms. Jefferson Health Systems employ over 20,000 in the region,
America’s Health Care Economy August 2003
7
making it the second largest employer after the University of Pennsylvania (whose medical school is a path-breaker in gene-based therapies).
20012000
19991998
19971996
19951994
19931992
19911990
19891988
19871986
19851984
19831982
19811980
14
13
12
11
10
9
8
Percent Share
Sources: Milken Institute, Economy.com.
Philadelphia - Health Care EmploymentAs Percent Share of Total Employment, 1980-2001
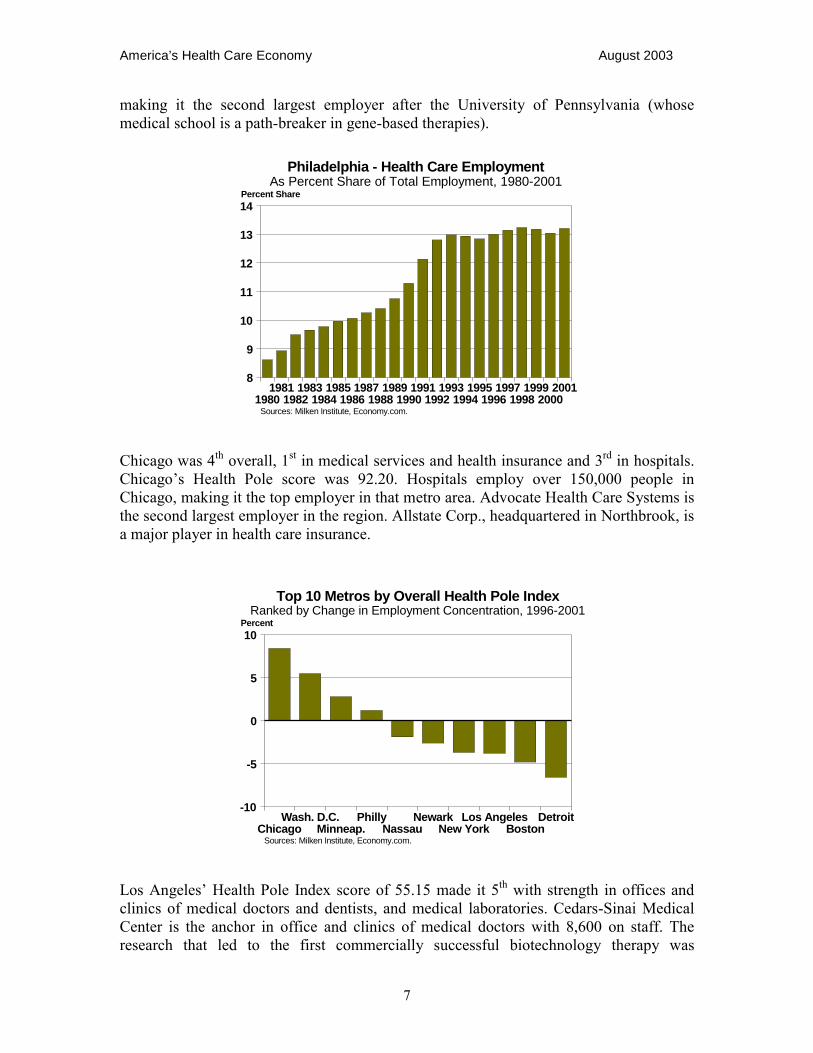
Chicago was 4th overall, 1st in medical services and health insurance and 3rd in hospitals. Chicago�s Health Pole score was 92.20. Hospitals employ over 150,000 people in Chicago, making it the top employer in that metro area. Advocate Health Care Systems is the second largest employer in the region. Allstate Corp., headquartered in Northbrook, is a major player in health care insurance.
DetroitBoston
Los AngelesNew York
NewarkNassau
PhillyMinneap.
Wash. D.C.Chicago
10
5
0
-5
-10
Percent
Sources: Milken Institute, Economy.com.
Top 10 Metros by Overall Health Pole IndexRanked by Change in Employment Concentration, 1996-2001
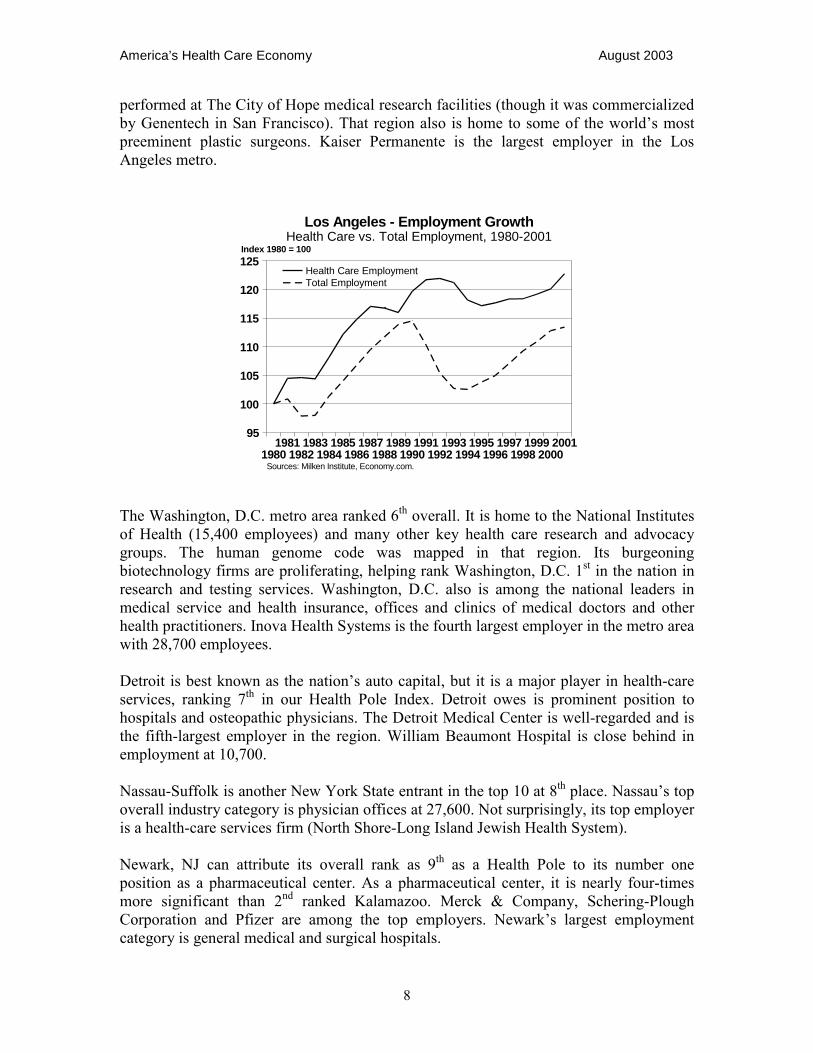
Los Angeles� Health Pole Index score of 55.15 made it 5th with strength in offices and clinics of medical doctors and dentists, and medical laboratories. Cedars-Sinai Medical Center is the anchor in office and clinics of medical doctors with 8,600 on staff. The research that led to the first commercially successful biotechnology therapy was
America’s Health Care Economy August 2003
8
performed at The City of Hope medical research facilities (though it was commercialized by Genentech in San Francisco). That region also is home to some of the world�s most preeminent plastic surgeons. Kaiser Permanente is the largest employer in the Los Angeles metro.
20012000
19991998
19971996
19951994
19931992
19911990
19891988
19871986
19851984
19831982
19811980
125
120
115
110
105
100
95
Index 1980 = 100
Sources: Milken Institute, Economy.com.
Los Angeles - Employment GrowthHealth Care vs. Total Employment, 1980-2001
Health Care Employment Total Employment
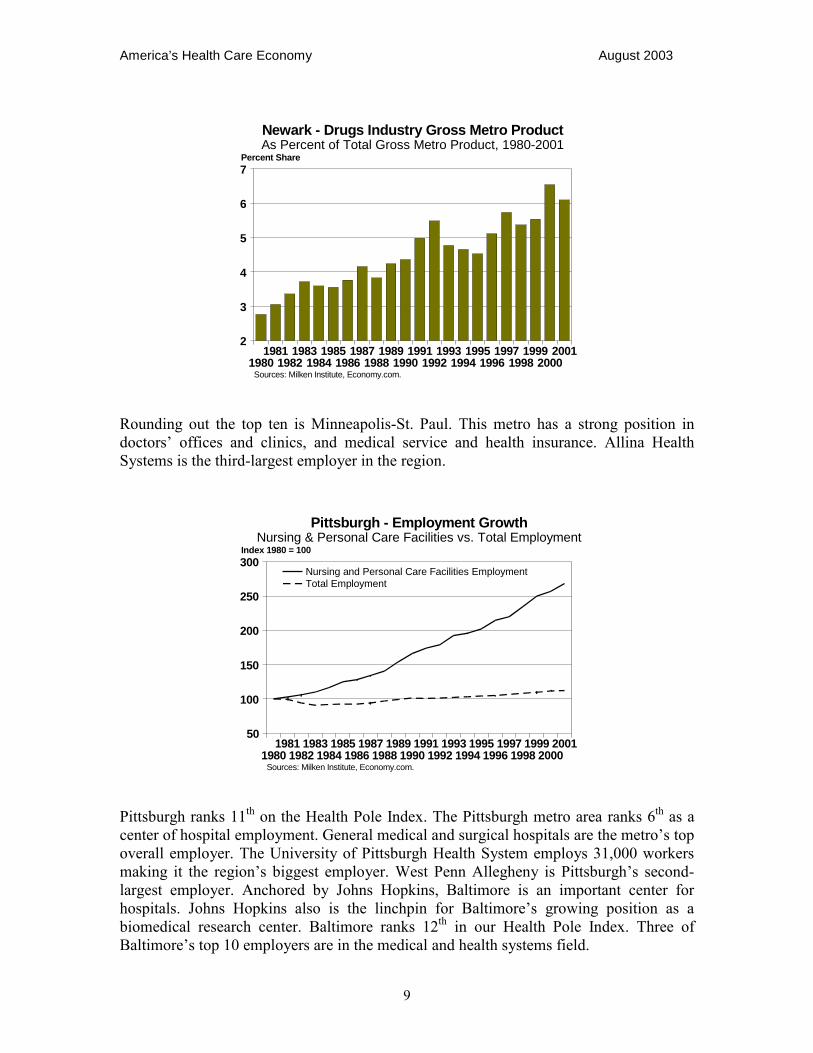
The Washington, D.C. metro area ranked 6th overall. It is home to the National Institutes of Health (15,400 employees) and many other key health care research and advocacy groups. The human genome code was mapped in that region. Its burgeoning biotechnology firms are proliferating, helping rank Washington, D.C. 1st in the nation in research and testing services. Washington, D.C. also is among the national leaders in medical service and health insurance, offices and clinics of medical doctors and other health practitioners. Inova Health Systems is the fourth largest employer in the metro area with 28,700 employees. Detroit is best known as the nation�s auto capital, but it is a major player in health-care services, ranking 7th in our Health Pole Index. Detroit owes is prominent position to hospitals and osteopathic physicians. The Detroit Medical Center is well-regarded and is the fifth-largest employer in the region. William Beaumont Hospital is close behind in employment at 10,700. Nassau-Suffolk is another New York State entrant in the top 10 at 8th place. Nassau�s top overall industry category is physician offices at 27,600. Not surprisingly, its top employer is a health-care services firm (North Shore-Long Island Jewish Health System). Newark, NJ can attribute its overall rank as 9th as a Health Pole to its number one position as a pharmaceutical center. As a pharmaceutical center, it is nearly four-times more significant than 2nd ranked Kalamazoo. Merck & Company, Schering-Plough Corporation and Pfizer are among the top employers. Newark�s largest employment category is general medical and surgical hospitals.
America’s Health Care Economy August 2003
9
20012000
19991998
19971996
19951994
19931992
19911990
19891988
19871986
19851984
19831982
19811980
7
6
5
4
3
2
Percent Share
Sources: Milken Institute, Economy.com.
Newark - Drugs Industry Gross Metro ProductAs Percent of Total Gross Metro Product, 1980-2001
Rounding out the top ten is Minneapolis-St. Paul. This metro has a strong position in doctors� offices and clinics, and medical service and health insurance. Allina Health Systems is the third-largest employer in the region.
20012000
19991998
19971996
19951994
19931992
19911990
19891988
19871986
19851984
19831982
19811980
300
250
200
150
100
50
Index 1980 = 100
Sources: Milken Institute, Economy.com.
Pittsburgh - Employment GrowthNursing & Personal Care Facilities vs. Total Employment
Nursing and Personal Care Facilities Employment Total Employment
Pittsburgh ranks 11th on the Health Pole Index. The Pittsburgh metro area ranks 6th as a center of hospital employment. General medical and surgical hospitals are the metro�s top overall employer. The University of Pittsburgh Health System employs 31,000 workers making it the region�s biggest employer. West Penn Allegheny is Pittsburgh�s second-largest employer. Anchored by Johns Hopkins, Baltimore is an important center for hospitals. Johns Hopkins also is the linchpin for Baltimore�s growing position as a biomedical research center. Baltimore ranks 12th in our Health Pole Index. Three of Baltimore�s top 10 employers are in the medical and health systems field.
America’s Health Care Economy August 2003
10
St. Louis� 13th Health Pole rank is attributable to hospitals, and nursing and personal care facilities. Hospitals are the second biggest employer in the St. Louis metro area with BJC Health System being the largest firm. Cleveland�s world-renowned Cleveland Clinic employs 23,400 (the metro�s largest employer) and serves as the anchor for the region�s health care industry. Cleveland�s second largest firm is University Hospitals Health Systems. Overall, hospitals are the top employer in Cleveland, which ranked 14th.
010099989796959493929190
7000
6000
5000
4000
3000
2000
1000
0
Index 1990 = 100
Sources: Milken Institute, Economy.com.
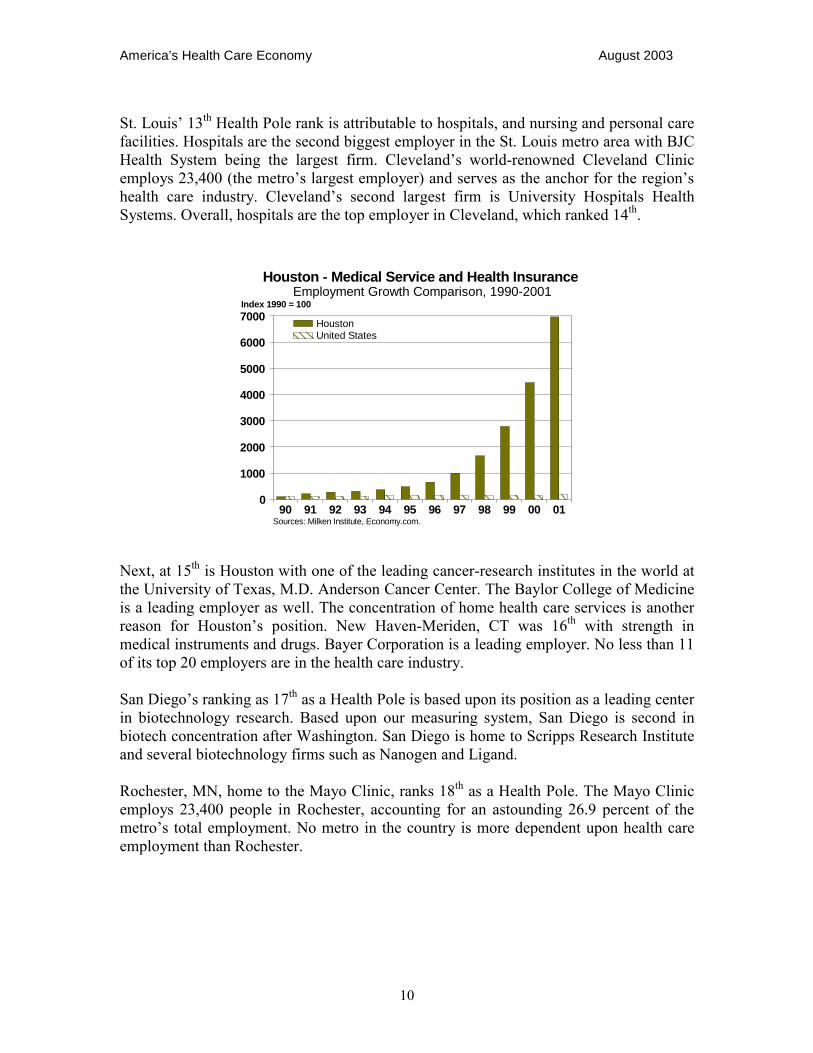
Houston - Medical Service and Health Insurance Employment Growth Comparison, 1990-2001
HoustonUnited States
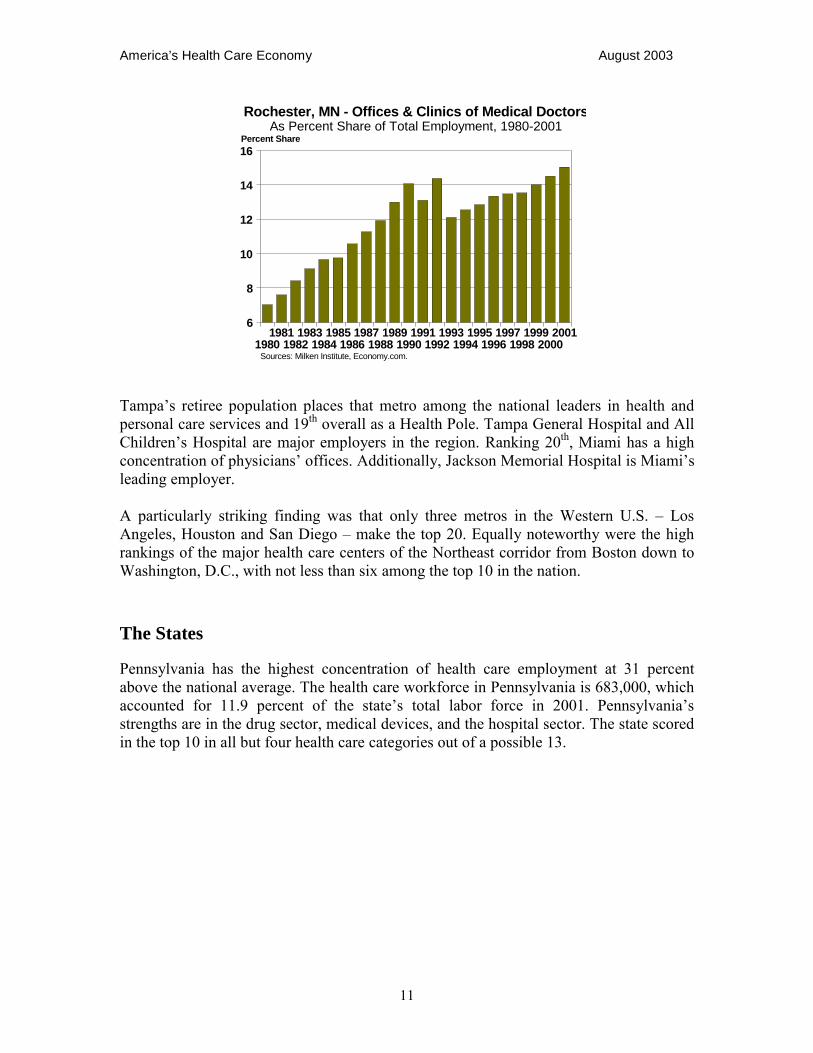
Next, at 15th is Houston with one of the leading cancer-research institutes in the world at the University of Texas, M.D. Anderson Cancer Center. The Baylor College of Medicine is a leading employer as well. The concentration of home health care services is another reason for Houston�s position. New Haven-Meriden, CT was 16th with strength in medical instruments and drugs. Bayer Corporation is a leading employer. No less than 11 of its top 20 employers are in the health care industry. San Diego�s ranking as 17th as a Health Pole is based upon its position as a leading center in biotechnology research. Based upon our measuring system, San Diego is second in biotech concentration after Washington. San Diego is home to Scripps Research Institute and several biotechnology firms such as Nanogen and Ligand. Rochester, MN, home to the Mayo Clinic, ranks 18th as a Health Pole. The Mayo Clinic employs 23,400 people in Rochester, accounting for an astounding 26.9 percent of the metro�s total employment. No metro in the country is more dependent upon health care employment than Rochester.
America’s Health Care Economy August 2003
11
20012000
19991998
19971996
19951994
19931992
19911990
19891988
19871986
19851984
19831982
19811980
16
14
12
10
8
6
Percent Share
Sources: Milken Institute, Economy.com.
Rochester, MN - Offices & Clinics of Medical DoctorsAs Percent Share of Total Employment, 1980-2001
Tampa�s retiree population places that metro among the national leaders in health and personal care services and 19th overall as a Health Pole. Tampa General Hospital and All Children�s Hospital are major employers in the region. Ranking 20th, Miami has a high concentration of physicians� offices. Additionally, Jackson Memorial Hospital is Miami�s leading employer. A particularly striking finding was that only three metros in the Western U.S. � Los Angeles, Houston and San Diego � make the top 20. Equally noteworthy were the high rankings of the major health care centers of the Northeast corridor from Boston down to Washington, D.C., with not less than six among the top 10 in the nation.
The States
Pennsylvania has the highest concentration of health care employment at 31 percent above the national average. The health care workforce in Pennsylvania is 683,000, which accounted for 11.9 percent of the state�s total labor force in 2001. Pennsylvania�s strengths are in the drug sector, medical devices, and the hospital sector. The state scored in the top 10 in all but four health care categories out of a possible 13.
America’s Health Care Economy August 2003
12
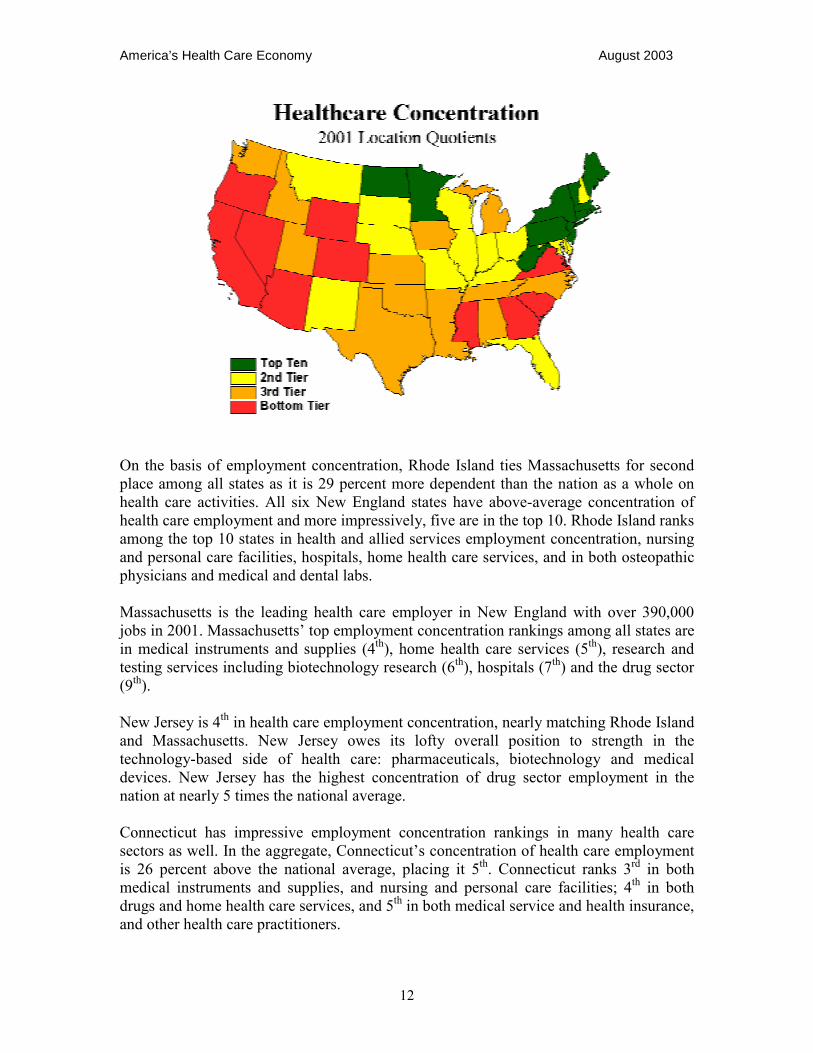
On the basis of employment concentration, Rhode Island ties Massachusetts for second place among all states as it is 29 percent more dependent than the nation as a whole on health care activities. All six New England states have above-average concentration of health care employment and more impressively, five are in the top 10. Rhode Island ranks among the top 10 states in health and allied services employment concentration, nursing and personal care facilities, hospitals, home health care services, and in both osteopathic physicians and medical and dental labs. Massachusetts is the leading health care employer in New England with over 390,000 jobs in 2001. Massachusetts� top employment concentration rankings among all states are in medical instruments and supplies (4th), home health care services (5th), research and testing services including biotechnology research (6th), hospitals (7th) and the drug sector (9th). New Jersey is 4th in health care employment concentration, nearly matching Rhode Island and Massachusetts. New Jersey owes its lofty overall position to strength in the technology-based side of health care: pharmaceuticals, biotechnology and medical devices. New Jersey has the highest concentration of drug sector employment in the nation at nearly 5 times the national average. Connecticut has impressive employment concentration rankings in many health care sectors as well. In the aggregate, Connecticut�s concentration of health care employment is 26 percent above the national average, placing it 5th. Connecticut ranks 3rd in both medical instruments and supplies, and nursing and personal care facilities; 4th in both drugs and home health care services, and 5th in both medical service and health insurance, and other health care practitioners.
America’s Health Care Economy August 2003
13
North Dakota is 6th in health care industry employment concentration mainly due to its top ranking in hospitals, and nursing and personal care facilities. Being a large rural state, its delivery of health care services must be distributed around the state, which limits it ability to capture economies of scale. Maine ranks 4th in medical service and health insurance, 6th in nursing and personal care and among the top 10 in five other health care service categories, placing the state 7th overall. West Virginia ranks 8th in health care employment concentration principally due to its 2nd place rank in the hospitals category. Vermont�s concentration of health care employment is 16 percent above the national average that ranks it 9th overall. Vermont ranks 1st in health and allied services and 6th in home health care services. New York is 10th overall in concentration of health care employment with 900,000 workers, but 1st in absolute employment.
Census Regions
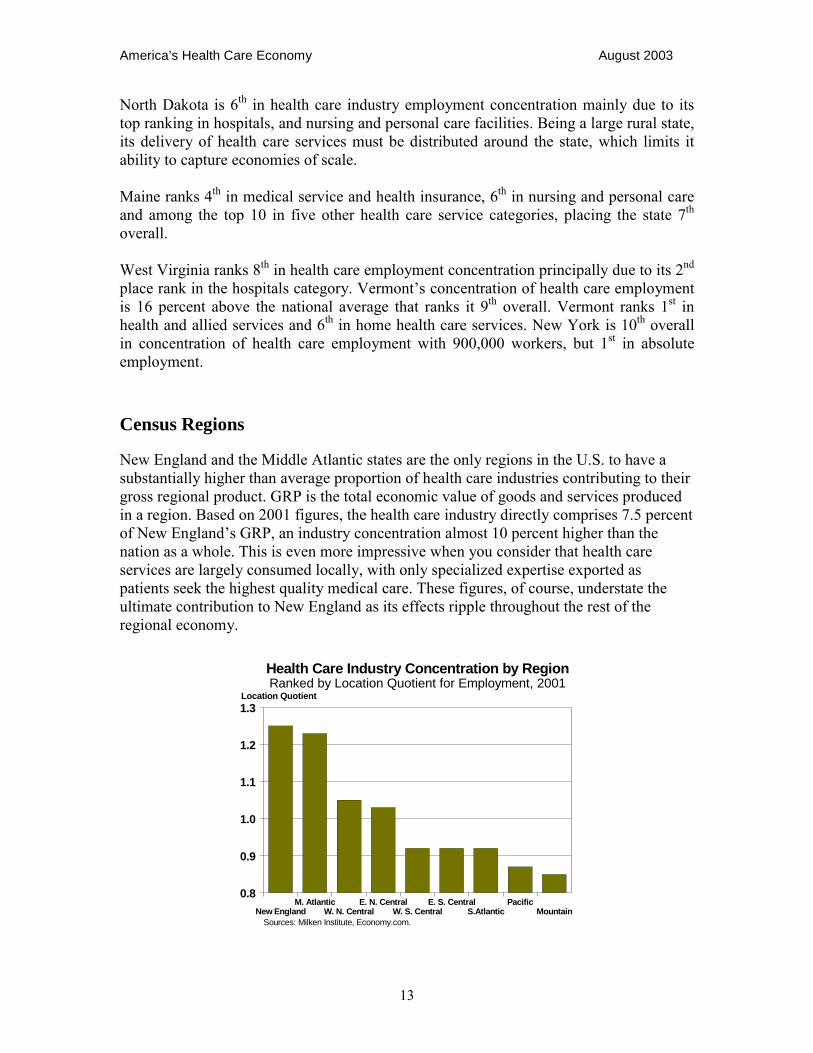
New England and the Middle Atlantic states are the only regions in the U.S. to have a substantially higher than average proportion of health care industries contributing to their gross regional product. GRP is the total economic value of goods and services produced in a region. Based on 2001 figures, the health care industry directly comprises 7.5 percent of New England�s GRP, an industry concentration almost 10 percent higher than the nation as a whole. This is even more impressive when you consider that health care services are largely consumed locally, with only specialized expertise exported as patients seek the highest quality medical care. These figures, of course, understate the ultimate contribution to New England as its effects ripple throughout the rest of the regional economy.
MountainPacific
S.AtlanticE. S. Central
W. S. CentralE. N. Central
W. N. CentralM. Atlantic
New England
1.3
1.2
1.1
1.0
0.9
0.8
Location Quotient
Sources: Milken Institute, Economy.com.
Health Care Industry Concentration by RegionRanked by Location Quotient for Employment, 2001

America’s Health Care Economy August 2003
14
New England is even more closely linked to the health care sector on the basis of employment. In 2001, more than 800,000 New England residents held jobs in the health care sector. This not only makes health care one of the leading employers in New England, but it means the region has the highest concentration of health care employment in the nation. More than 11 percent of New England�s workforce is directly engaged in health care fields. As displayed in the accompanying table, New England�s health care employment is 25 percent higher than the national average. If the concentration of health care employment in a region matched the nation as a whole, its location quotient would be 1.0. A location quotient of 1.25, as is the case for health care employment in New England, means that the concentration of health care employment in New England is 25 percent higher than for the nation as a whole. . The Middle Atlantic is a close second to New England on concentration of health care employment, approximately 23 percent above the national average. On the basis of GRP, the Middle Atlantic region is the most dependent upon the health care sector and employs nearly 2.1 million individuals. The Middle Atlantic States contain several of the leading health care clusters in the world. The West North Central (the plains states) and the East North Central (Great Lakes states) are the only other census regions with a reliance on health care employment that is above the national average, though just barely.
America’s Health Care Economy August 2003
15
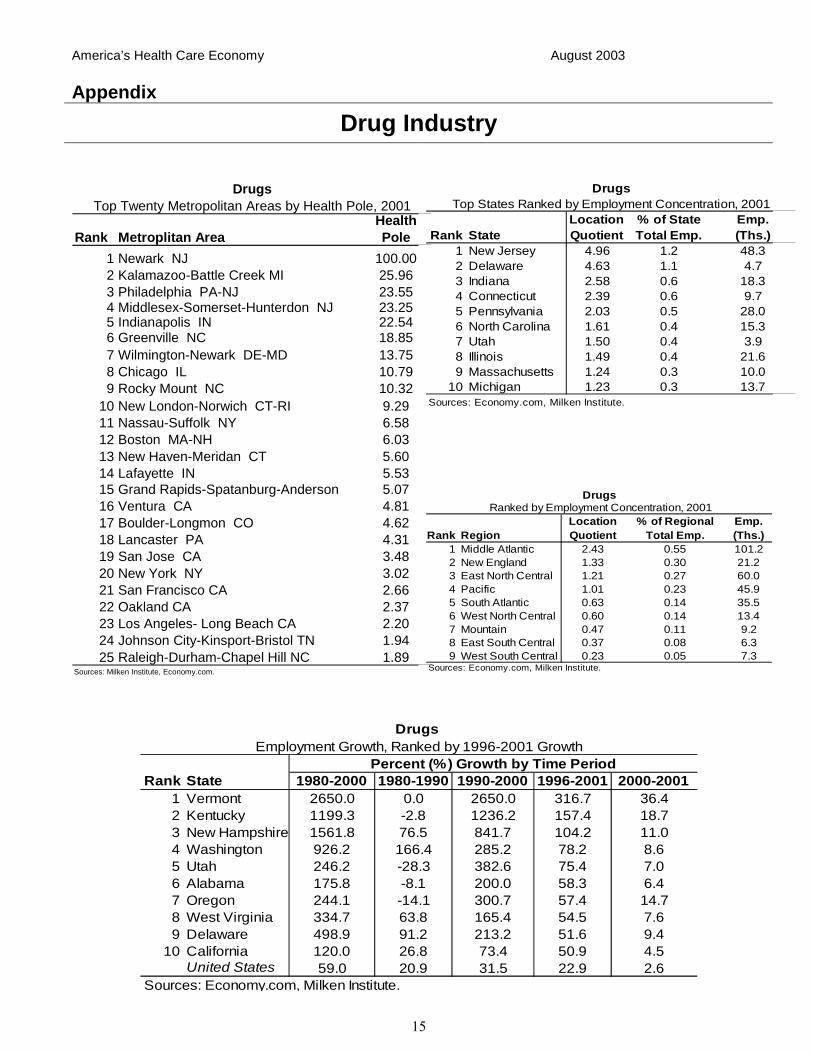
Appendix
Drug Industry
Rank StateLocationQuotient
% of StateTotal Emp.
Emp.(Ths.)
1 New Jersey 4.96 1.2 48.32 Delaware 4.63 1.1 4.73 Indiana 2.58 0.6 18.34 Connecticut 2.39 0.6 9.75 Pennsylvania 2.03 0.5 28.06 North Carolina 1.61 0.4 15.37 Utah 1.50 0.4 3.98 Illinois 1.49 0.4 21.69 Massachusetts 1.24 0.3 10.0
10 Michigan 1.23 0.3 13.7
DrugsTop States Ranked by Employment Concentration, 2001
Sources: Economy.com, Milken Institute.
Rank Metroplitan AreaHealth Pole
1 Newark NJ 100.002 Kalamazoo-Battle Creek MI 25.963 Philadelphia PA-NJ 23.554 Middlesex-Somerset-Hunterdon NJ 23.255 Indianapolis IN 22.546 Greenville NC 18.857 Wilmington-Newark DE-MD 13.758 Chicago IL 10.799 Rocky Mount NC 10.32
10 New London-Norwich CT-RI 9.2911 Nassau-Suffolk NY 6.5812 Boston MA-NH 6.0313 New Haven-Meridan CT 5.6014 Lafayette IN 5.5315 Grand Rapids-Spatanburg-Anderson 5.0716 Ventura CA 4.8117 Boulder-Longmon CO 4.6218 Lancaster PA 4.3119 San Jose CA 3.4820 New York NY 3.0221 San Francisco CA 2.6622 Oakland CA 2.3723 Los Angeles- Long Beach CA 2.2024 Johnson City-Kinsport-Bristol TN 1.9425 Raleigh-Durham-Chapel Hill NC 1.89
DrugsTop Twenty Metropolitan Areas by Health Pole, 2001
Sources: Milken Institute, Economy.com.
Rank RegionLocationQuotient
% of Regional Total Emp.
Emp.(Ths.)
1 Middle Atlantic 2.43 0.55 101.22 New England 1.33 0.30 21.23 East North Central 1.21 0.27 60.04 Pacific 1.01 0.23 45.95 South Atlantic 0.63 0.14 35.56 West North Central 0.60 0.14 13.47 Mountain 0.47 0.11 9.28 East South Central 0.37 0.08 6.39 West South Central 0.23 0.05 7.3
DrugsRanked by Employment Concentration, 2001
Sources: Economy.com, Milken Institute.
Rank State 1980-2000 1980-1990 1990-2000 1996-2001 2000-20011 Vermont 2650.0 0.0 2650.0 316.7 36.42 Kentucky 1199.3 -2.8 1236.2 157.4 18.73 New Hampshire 1561.8 76.5 841.7 104.2 11.04 Washington 926.2 166.4 285.2 78.2 8.65 Utah 246.2 -28.3 382.6 75.4 7.06 Alabama 175.8 -8.1 200.0 58.3 6.47 Oregon 244.1 -14.1 300.7 57.4 14.78 West Virginia 334.7 63.8 165.4 54.5 7.69 Delaware 498.9 91.2 213.2 51.6 9.4
10 California 120.0 26.8 73.4 50.9 4.5United States 59.0 20.9 31.5 22.9 2.6
Employment Growth, Ranked by 1996-2001 GrowthPercent (%) Growth by Time Period
Sources: Economy.com, Milken Institute.
Drugs
America’s Health Care Economy August 2003
16
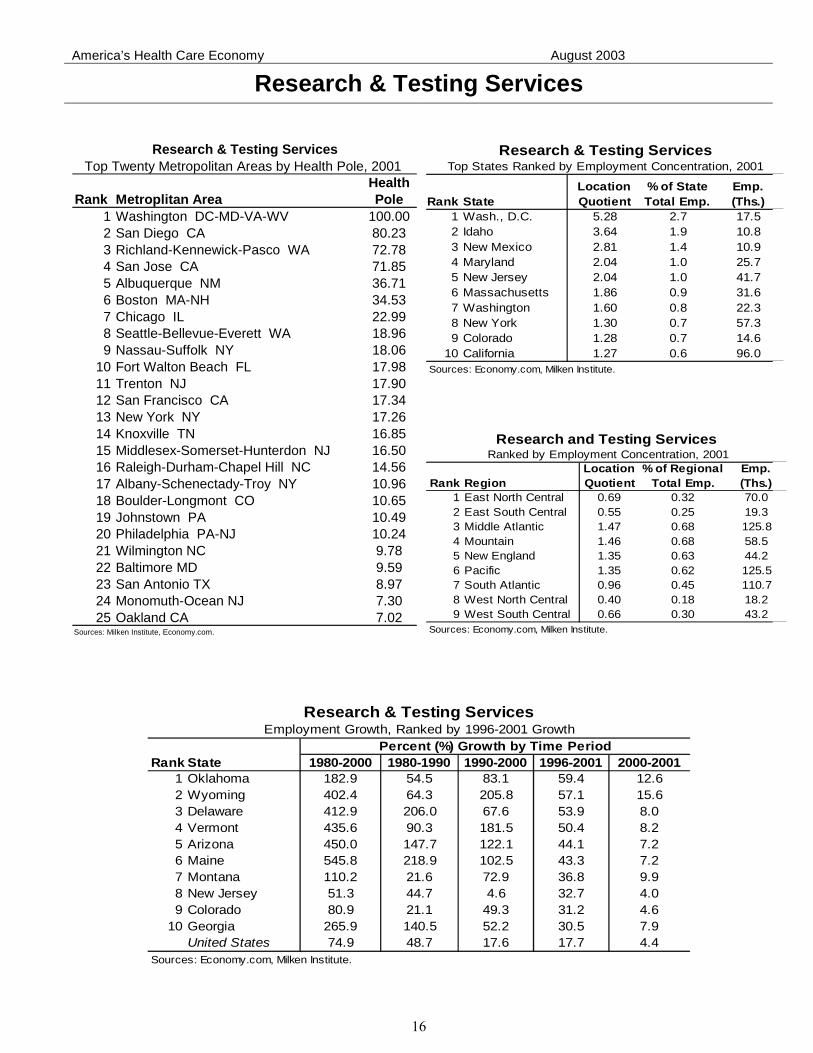
Research & Testing Services
Rank StateLocationQuotient
% of StateTotal Emp.
Emp.(Ths.)
1 Wash., D.C. 5.28 2.7 17.52 Idaho 3.64 1.9 10.83 New Mexico 2.81 1.4 10.94 Maryland 2.04 1.0 25.75 New Jersey 2.04 1.0 41.76 Massachusetts 1.86 0.9 31.67 Washington 1.60 0.8 22.38 New York 1.30 0.7 57.39 Colorado 1.28 0.7 14.6
10 California 1.27 0.6 96.0
Research & Testing ServicesTop States Ranked by Employment Concentration, 2001
Sources: Economy.com, Milken Institute.
Rank Metroplitan AreaHealth Pole
1 Washington DC-MD-VA-WV 100.002 San Diego CA 80.233 Richland-Kennewick-Pasco WA 72.784 San Jose CA 71.855 Albuquerque NM 36.716 Boston MA-NH 34.537 Chicago IL 22.998 Seattle-Bellevue-Everett WA 18.969 Nassau-Suffolk NY 18.06
10 Fort Walton Beach FL 17.9811 Trenton NJ 17.9012 San Francisco CA 17.3413 New York NY 17.2614 Knoxville TN 16.8515 Middlesex-Somerset-Hunterdon NJ 16.5016 Raleigh-Durham-Chapel Hill NC 14.5617 Albany-Schenectady-Troy NY 10.9618 Boulder-Longmont CO 10.6519 Johnstown PA 10.4920 Philadelphia PA-NJ 10.2421 Wilmington NC 9.7822 Baltimore MD 9.5923 San Antonio TX 8.9724 Monomuth-Ocean NJ 7.3025 Oakland CA 7.02
Sources: Milken Institute, Economy.com.
Research & Testing ServicesTop Twenty Metropolitan Areas by Health Pole, 2001
Rank RegionLocationQuotient
% of Regional Total Emp.
Emp.(Ths.)
1 East North Central 0.69 0.32 70.02 East South Central 0.55 0.25 19.33 Middle Atlantic 1.47 0.68 125.84 Mountain 1.46 0.68 58.55 New England 1.35 0.63 44.26 Pacific 1.35 0.62 125.57 South Atlantic 0.96 0.45 110.78 West North Central 0.40 0.18 18.29 West South Central 0.66 0.30 43.2
Research and Testing Services Ranked by Employment Concentration, 2001
Sources: Economy.com, Milken Institute.
Rank State 1980-2000 1980-1990 1990-2000 1996-2001 2000-20011 Oklahoma 182.9 54.5 83.1 59.4 12.62 Wyoming 402.4 64.3 205.8 57.1 15.63 Delaware 412.9 206.0 67.6 53.9 8.04 Vermont 435.6 90.3 181.5 50.4 8.25 Arizona 450.0 147.7 122.1 44.1 7.26 Maine 545.8 218.9 102.5 43.3 7.27 Montana 110.2 21.6 72.9 36.8 9.98 New Jersey 51.3 44.7 4.6 32.7 4.09 Colorado 80.9 21.1 49.3 31.2 4.6
10 Georgia 265.9 140.5 52.2 30.5 7.9United States 74.9 48.7 17.6 17.7 4.4
Sources: Economy.com, Milken Institute.
Research & Testing ServicesEmployment Growth, Ranked by 1996-2001 Growth
Percent (%) Growth by Time Period
America’s Health Care Economy August 2003
17
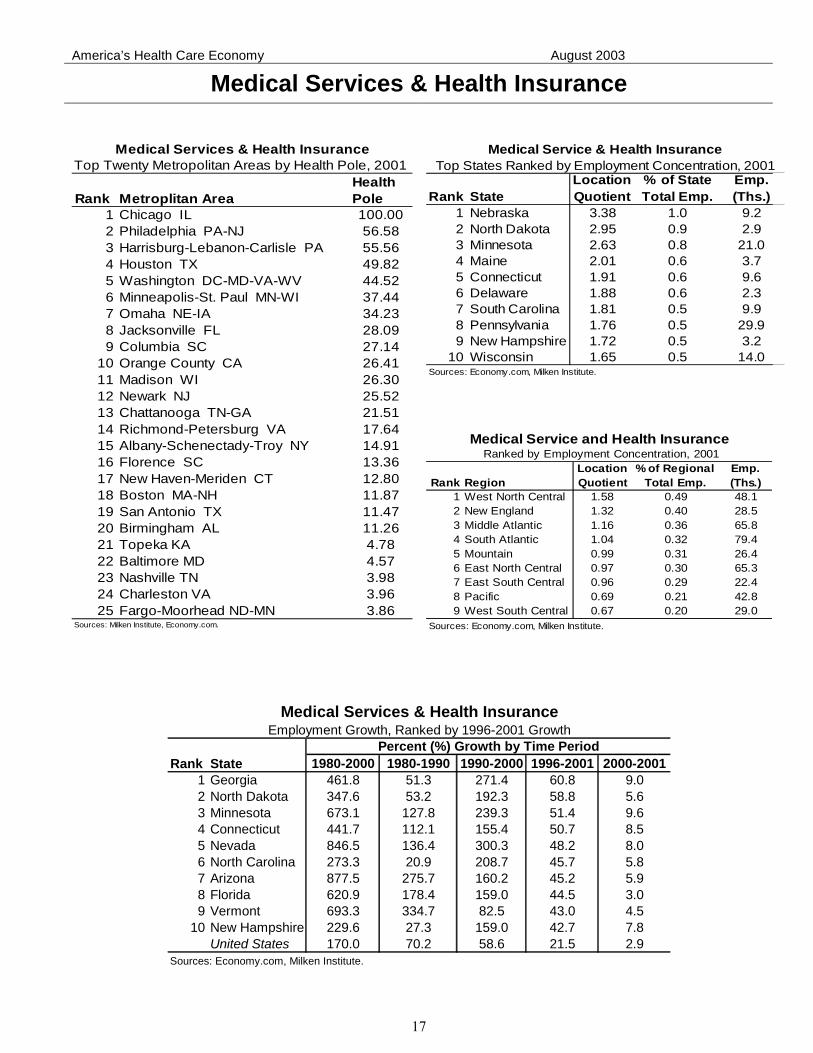
Medical Services & Health Insurance
Rank StateLocationQuotient
% of StateTotal Emp.
Emp.(Ths.)
1 Nebraska 3.38 1.0 9.22 North Dakota 2.95 0.9 2.93 Minnesota 2.63 0.8 21.04 Maine 2.01 0.6 3.75 Connecticut 1.91 0.6 9.66 Delaware 1.88 0.6 2.37 South Carolina 1.81 0.5 9.98 Pennsylvania 1.76 0.5 29.99 New Hampshire 1.72 0.5 3.2
10 Wisconsin 1.65 0.5 14.0
Medical Service & Health InsuranceTop States Ranked by Employment Concentration, 2001
Sources: Economy.com, Milken Institute.
Rank Metroplitan AreaHealth Pole
1 Chicago IL 100.002 Philadelphia PA-NJ 56.583 Harrisburg-Lebanon-Carlisle PA 55.564 Houston TX 49.825 Washington DC-MD-VA-WV 44.526 Minneapolis-St. Paul MN-WI 37.447 Omaha NE-IA 34.238 Jacksonville FL 28.099 Columbia SC 27.14
10 Orange County CA 26.4111 Madison WI 26.3012 Newark NJ 25.5213 Chattanooga TN-GA 21.5114 Richmond-Petersburg VA 17.6415 Albany-Schenectady-Troy NY 14.9116 Florence SC 13.3617 New Haven-Meriden CT 12.8018 Boston MA-NH 11.8719 San Antonio TX 11.4720 Birmingham AL 11.2621 Topeka KA 4.7822 Baltimore MD 4.5723 Nashville TN 3.9824 Charleston VA 3.9625 Fargo-Moorhead ND-MN 3.86
Medical Services & Health InsuranceTop Twenty Metropolitan Areas by Health Pole, 2001
Sources: Milken Institute, Economy.com.
Rank RegionLocationQuotient
% of Regional Total Emp.
Emp.(Ths.)
1 West North Central 1.58 0.49 48.12 New England 1.32 0.40 28.53 Middle Atlantic 1.16 0.36 65.84 South Atlantic 1.04 0.32 79.45 Mountain 0.99 0.31 26.46 East North Central 0.97 0.30 65.37 East South Central 0.96 0.29 22.48 Pacific 0.69 0.21 42.89 West South Central 0.67 0.20 29.0
Medical Service and Health Insurance Ranked by Employment Concentration, 2001
Sources: Economy.com, Milken Institute.
Rank State 1980-2000 1980-1990 1990-2000 1996-2001 2000-20011 Georgia 461.8 51.3 271.4 60.8 9.02 North Dakota 347.6 53.2 192.3 58.8 5.63 Minnesota 673.1 127.8 239.3 51.4 9.64 Connecticut 441.7 112.1 155.4 50.7 8.55 Nevada 846.5 136.4 300.3 48.2 8.06 North Carolina 273.3 20.9 208.7 45.7 5.87 Arizona 877.5 275.7 160.2 45.2 5.98 Florida 620.9 178.4 159.0 44.5 3.09 Vermont 693.3 334.7 82.5 43.0 4.5
10 New Hampshire 229.6 27.3 159.0 42.7 7.8United States 170.0 70.2 58.6 21.5 2.9
Employment Growth, Ranked by 1996-2001 GrowthPercent (%) Growth by Time Period
Sources: Economy.com, Milken Institute.
Medical Services & Health Insurance
America’s Health Care Economy August 2003
18
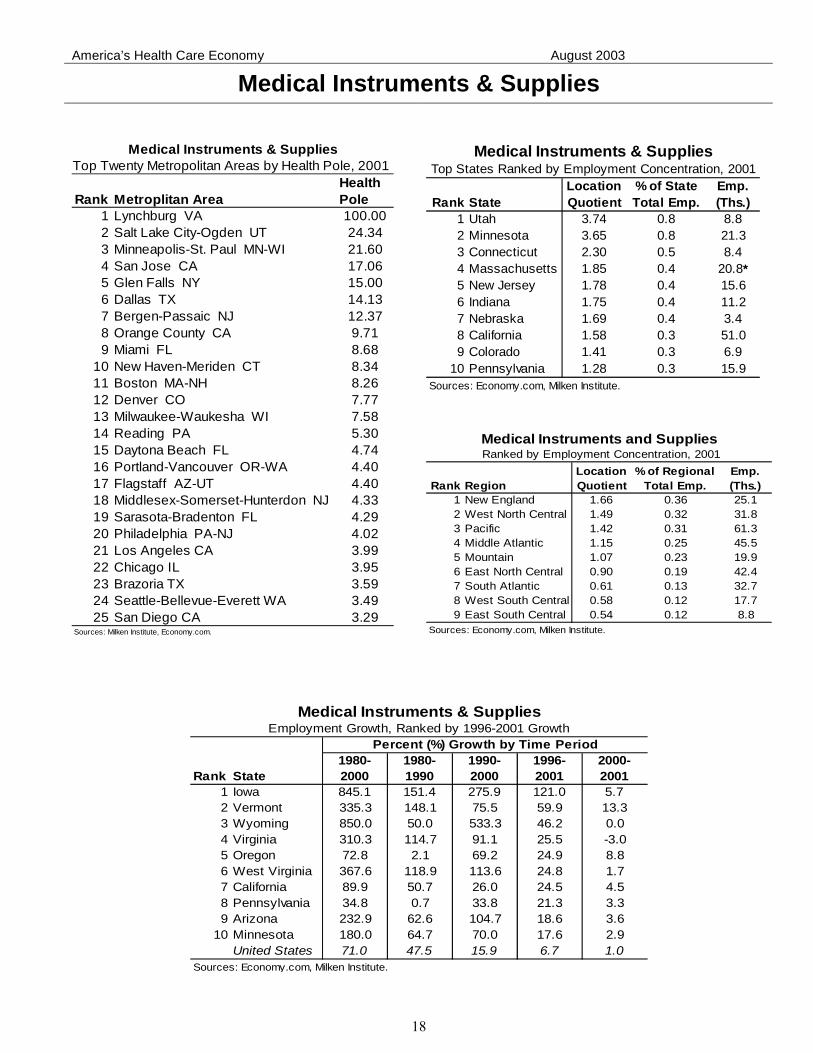
Medical Instruments & Supplies
Rank StateLocationQuotient
% of StateTotal Emp.
Emp.(Ths.)
1 Utah 3.74 0.8 8.82 Minnesota 3.65 0.8 21.33 Connecticut 2.30 0.5 8.44 Massachusetts 1.85 0.4 20.8*5 New Jersey 1.78 0.4 15.66 Indiana 1.75 0.4 11.27 Nebraska 1.69 0.4 3.48 California 1.58 0.3 51.09 Colorado 1.41 0.3 6.9
10 Pennsylvania 1.28 0.3 15.9
Medical Instruments & SuppliesTop States Ranked by Employment Concentration, 2001
Sources: Economy.com, Milken Institute.
Rank Metroplitan AreaHealth Pole
1 Lynchburg VA 100.002 Salt Lake City-Ogden UT 24.343 Minneapolis-St. Paul MN-WI 21.604 San Jose CA 17.065 Glen Falls NY 15.006 Dallas TX 14.137 Bergen-Passaic NJ 12.378 Orange County CA 9.719 Miami FL 8.68
10 New Haven-Meriden CT 8.3411 Boston MA-NH 8.2612 Denver CO 7.7713 Milwaukee-Waukesha WI 7.5814 Reading PA 5.3015 Daytona Beach FL 4.7416 Portland-Vancouver OR-WA 4.4017 Flagstaff AZ-UT 4.4018 Middlesex-Somerset-Hunterdon NJ 4.3319 Sarasota-Bradenton FL 4.2920 Philadelphia PA-NJ 4.0221 Los Angeles CA 3.9922 Chicago IL 3.9523 Brazoria TX 3.5924 Seattle-Bellevue-Everett WA 3.4925 San Diego CA 3.29
Medical Instruments & SuppliesTop Twenty Metropolitan Areas by Health Pole, 2001
Sources: Milken Institute, Economy.com.
Rank RegionLocationQuotient
% of Regional Total Emp.
Emp.(Ths.)
1 New England 1.66 0.36 25.12 West North Central 1.49 0.32 31.83 Pacific 1.42 0.31 61.34 Middle Atlantic 1.15 0.25 45.55 Mountain 1.07 0.23 19.96 East North Central 0.90 0.19 42.47 South Atlantic 0.61 0.13 32.78 West South Central 0.58 0.12 17.79 East South Central 0.54 0.12 8.8
Medical Instruments and Supplies Ranked by Employment Concentration, 2001
Sources: Economy.com, Milken Institute.
Rank State1980-2000
1980-1990
1990-2000
1996-2001
2000-2001
1 Iowa 845.1 151.4 275.9 121.0 5.72 Vermont 335.3 148.1 75.5 59.9 13.33 Wyoming 850.0 50.0 533.3 46.2 0.04 Virginia 310.3 114.7 91.1 25.5 -3.05 Oregon 72.8 2.1 69.2 24.9 8.86 West Virginia 367.6 118.9 113.6 24.8 1.77 California 89.9 50.7 26.0 24.5 4.58 Pennsylvania 34.8 0.7 33.8 21.3 3.39 Arizona 232.9 62.6 104.7 18.6 3.6
10 Minnesota 180.0 64.7 70.0 17.6 2.9United States 71.0 47.5 15.9 6.7 1.0
Employment Growth, Ranked by 1996-2001 GrowthPercent (%) Growth by Time Period
Sources: Economy.com, Milken Institute.
Medical Instruments & Supplies
America’s Health Care Economy August 2003
19
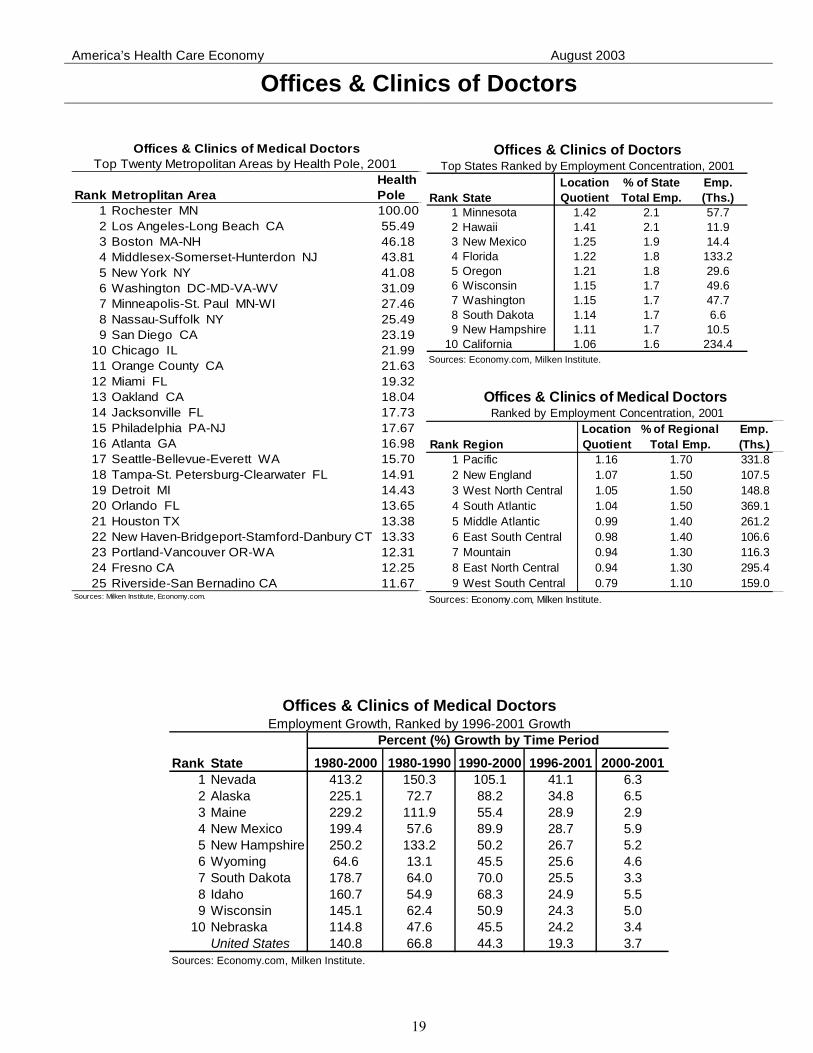
Offices & Clinics of Doctors
Rank StateLocationQuotient
% of StateTotal Emp.
Emp.(Ths.)
1 Minnesota 1.42 2.1 57.72 Hawaii 1.41 2.1 11.93 New Mexico 1.25 1.9 14.44 Florida 1.22 1.8 133.25 Oregon 1.21 1.8 29.66 Wisconsin 1.15 1.7 49.67 Washington 1.15 1.7 47.78 South Dakota 1.14 1.7 6.69 New Hampshire 1.11 1.7 10.5
10 California 1.06 1.6 234.4
Offices & Clinics of DoctorsTop States Ranked by Employment Concentration, 2001
Sources: Economy.com, Milken Institute.
Rank Metroplitan AreaHealth Pole
1 Rochester MN 100.002 Los Angeles-Long Beach CA 55.493 Boston MA-NH 46.184 Middlesex-Somerset-Hunterdon NJ 43.815 New York NY 41.086 Washington DC-MD-VA-WV 31.097 Minneapolis-St. Paul MN-WI 27.468 Nassau-Suffolk NY 25.499 San Diego CA 23.19
10 Chicago IL 21.9911 Orange County CA 21.6312 Miami FL 19.3213 Oakland CA 18.0414 Jacksonville FL 17.7315 Philadelphia PA-NJ 17.6716 Atlanta GA 16.9817 Seattle-Bellevue-Everett WA 15.7018 Tampa-St. Petersburg-Clearwater FL 14.9119 Detroit MI 14.4320 Orlando FL 13.6521 Houston TX 13.3822 New Haven-Bridgeport-Stamford-Danbury CT 13.3323 Portland-Vancouver OR-WA 12.3124 Fresno CA 12.2525 Riverside-San Bernadino CA 11.67
Offices & Clinics of Medical DoctorsTop Twenty Metropolitan Areas by Health Pole, 2001
Sources: Milken Institute, Economy.com.
Rank RegionLocationQuotient
% of Regional Total Emp.
Emp.(Ths.)
1 Pacific 1.16 1.70 331.82 New England 1.07 1.50 107.53 West North Central 1.05 1.50 148.84 South Atlantic 1.04 1.50 369.15 Middle Atlantic 0.99 1.40 261.26 East South Central 0.98 1.40 106.67 Mountain 0.94 1.30 116.38 East North Central 0.94 1.30 295.49 West South Central 0.79 1.10 159.0
Offices & Clinics of Medical Doctors Ranked by Employment Concentration, 2001
Sources: Economy.com, Milken Institute.
Rank State 1980-2000 1980-1990 1990-2000 1996-2001 2000-20011 Nevada 413.2 150.3 105.1 41.1 6.32 Alaska 225.1 72.7 88.2 34.8 6.53 Maine 229.2 111.9 55.4 28.9 2.94 New Mexico 199.4 57.6 89.9 28.7 5.95 New Hampshire 250.2 133.2 50.2 26.7 5.26 Wyoming 64.6 13.1 45.5 25.6 4.67 South Dakota 178.7 64.0 70.0 25.5 3.38 Idaho 160.7 54.9 68.3 24.9 5.59 Wisconsin 145.1 62.4 50.9 24.3 5.0
10 Nebraska 114.8 47.6 45.5 24.2 3.4United States 140.8 66.8 44.3 19.3 3.7
Employment Growth, Ranked by 1996-2001 GrowthPercent (%) Growth by Time Period
Sources: Economy.com, Milken Institute.
Offices & Clinics of Medical Doctors
America’s Health Care Economy August 2003
20
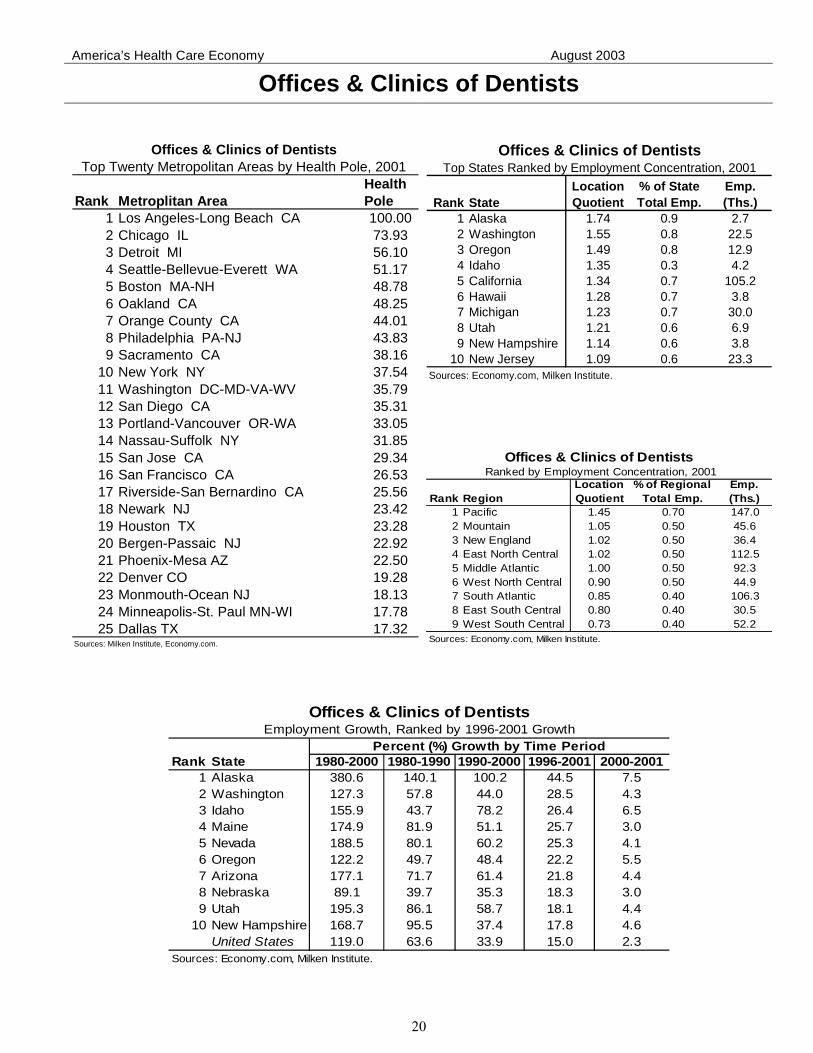
Offices & Clinics of Dentists
Rank StateLocationQuotient
% of StateTotal Emp.
Emp.(Ths.)
1 Alaska 1.74 0.9 2.72 Washington 1.55 0.8 22.53 Oregon 1.49 0.8 12.94 Idaho 1.35 0.3 4.25 California 1.34 0.7 105.26 Hawaii 1.28 0.7 3.87 Michigan 1.23 0.7 30.08 Utah 1.21 0.6 6.99 New Hampshire 1.14 0.6 3.8
10 New Jersey 1.09 0.6 23.3
Offices & Clinics of DentistsTop States Ranked by Employment Concentration, 2001
Sources: Economy.com, Milken Institute.
Rank Metroplitan AreaHealth Pole
1 Los Angeles-Long Beach CA 100.002 Chicago IL 73.933 Detroit MI 56.104 Seattle-Bellevue-Everett WA 51.175 Boston MA-NH 48.786 Oakland CA 48.257 Orange County CA 44.018 Philadelphia PA-NJ 43.839 Sacramento CA 38.16
10 New York NY 37.5411 Washington DC-MD-VA-WV 35.7912 San Diego CA 35.3113 Portland-Vancouver OR-WA 33.0514 Nassau-Suffolk NY 31.8515 San Jose CA 29.3416 San Francisco CA 26.5317 Riverside-San Bernardino CA 25.5618 Newark NJ 23.4219 Houston TX 23.2820 Bergen-Passaic NJ 22.9221 Phoenix-Mesa AZ 22.5022 Denver CO 19.2823 Monmouth-Ocean NJ 18.1324 Minneapolis-St. Paul MN-WI 17.7825 Dallas TX 17.32
Sources: Milken Institute, Economy.com.
Offices & Clinics of Dentists Top Twenty Metropolitan Areas by Health Pole, 2001
Rank RegionLocationQuotient
% of Regional Total Emp.
Emp.(Ths.)
1 Pacific 1.45 0.70 147.02 Mountain 1.05 0.50 45.63 New England 1.02 0.50 36.44 East North Central 1.02 0.50 112.55 Middle Atlantic 1.00 0.50 92.36 West North Central 0.90 0.50 44.97 South Atlantic 0.85 0.40 106.38 East South Central 0.80 0.40 30.59 West South Central 0.73 0.40 52.2
Offices & Clinics of Dentists Ranked by Employment Concentration, 2001
Sources: Economy.com, Milken Institute.
Rank State 1980-2000 1980-1990 1990-2000 1996-2001 2000-20011 Alaska 380.6 140.1 100.2 44.5 7.52 Washington 127.3 57.8 44.0 28.5 4.33 Idaho 155.9 43.7 78.2 26.4 6.54 Maine 174.9 81.9 51.1 25.7 3.05 Nevada 188.5 80.1 60.2 25.3 4.16 Oregon 122.2 49.7 48.4 22.2 5.57 Arizona 177.1 71.7 61.4 21.8 4.48 Nebraska 89.1 39.7 35.3 18.3 3.09 Utah 195.3 86.1 58.7 18.1 4.4
10 New Hampshire 168.7 95.5 37.4 17.8 4.6United States 119.0 63.6 33.9 15.0 2.3
Offices & Clinics of DentistsEmployment Growth, Ranked by 1996-2001 Growth
Percent (%) Growth by Time Period
Sources: Economy.com, Milken Institute.
America’s Health Care Economy August 2003
21
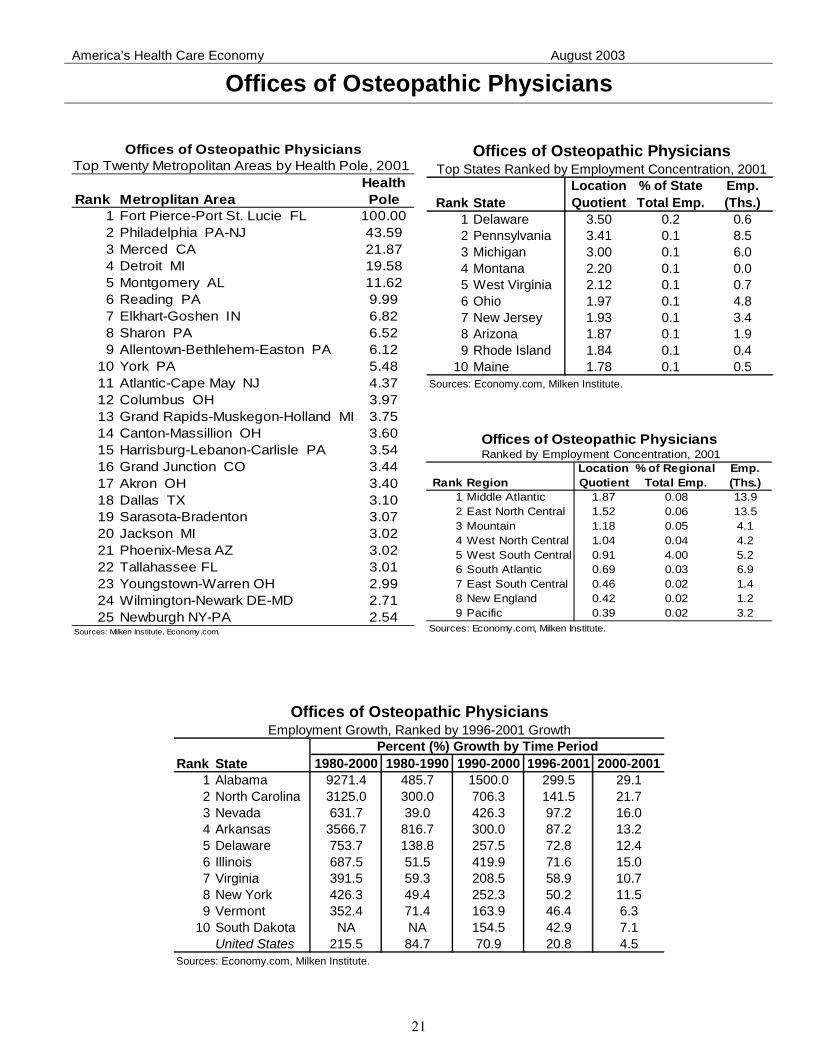
Offices of Osteopathic Physicians
Rank StateLocationQuotient
% of StateTotal Emp.
Emp.(Ths.)
1 Delaware 3.50 0.2 0.62 Pennsylvania 3.41 0.1 8.53 Michigan 3.00 0.1 6.04 Montana 2.20 0.1 0.05 West Virginia 2.12 0.1 0.76 Ohio 1.97 0.1 4.87 New Jersey 1.93 0.1 3.48 Arizona 1.87 0.1 1.99 Rhode Island 1.84 0.1 0.4
10 Maine 1.78 0.1 0.5
Offices of Osteopathic PhysiciansTop States Ranked by Employment Concentration, 2001
Sources: Economy.com, Milken Institute.
Rank Metroplitan AreaHealth Pole
1 Fort Pierce-Port St. Lucie FL 100.002 Philadelphia PA-NJ 43.593 Merced CA 21.874 Detroit MI 19.585 Montgomery AL 11.626 Reading PA 9.997 Elkhart-Goshen IN 6.828 Sharon PA 6.529 Allentown-Bethlehem-Easton PA 6.12
10 York PA 5.4811 Atlantic-Cape May NJ 4.3712 Columbus OH 3.9713 Grand Rapids-Muskegon-Holland MI 3.7514 Canton-Massillion OH 3.6015 Harrisburg-Lebanon-Carlisle PA 3.5416 Grand Junction CO 3.4417 Akron OH 3.4018 Dallas TX 3.1019 Sarasota-Bradenton 3.0720 Jackson MI 3.0221 Phoenix-Mesa AZ 3.0222 Tallahassee FL 3.0123 Youngstown-Warren OH 2.9924 Wilmington-Newark DE-MD 2.7125 Newburgh NY-PA 2.54
Sources: Milken Institute, Economy.com.
Offices of Osteopathic PhysiciansTop Twenty Metropolitan Areas by Health Pole, 2001
Rank RegionLocationQuotient
% of Regional Total Emp.
Emp.(Ths.)
1 Middle Atlantic 1.87 0.08 13.92 East North Central 1.52 0.06 13.53 Mountain 1.18 0.05 4.14 West North Central 1.04 0.04 4.25 West South Central 0.91 4.00 5.26 South Atlantic 0.69 0.03 6.97 East South Central 0.46 0.02 1.48 New England 0.42 0.02 1.29 Pacific 0.39 0.02 3.2
Offices of Osteopathic Physicians Ranked by Employment Concentration, 2001
Sources: Economy.com, Milken Institute.
Rank State 1980-2000 1980-1990 1990-2000 1996-2001 2000-20011 Alabama 9271.4 485.7 1500.0 299.5 29.12 North Carolina 3125.0 300.0 706.3 141.5 21.73 Nevada 631.7 39.0 426.3 97.2 16.04 Arkansas 3566.7 816.7 300.0 87.2 13.25 Delaware 753.7 138.8 257.5 72.8 12.46 Illinois 687.5 51.5 419.9 71.6 15.07 Virginia 391.5 59.3 208.5 58.9 10.78 New York 426.3 49.4 252.3 50.2 11.59 Vermont 352.4 71.4 163.9 46.4 6.3
10 South Dakota NA NA 154.5 42.9 7.1United States 215.5 84.7 70.9 20.8 4.5
Offices of Osteopathic PhysiciansEmployment Growth, Ranked by 1996-2001 Growth
Percent (%) Growth by Time Period
Sources: Economy.com, Milken Institute.
America’s Health Care Economy August 2003
22
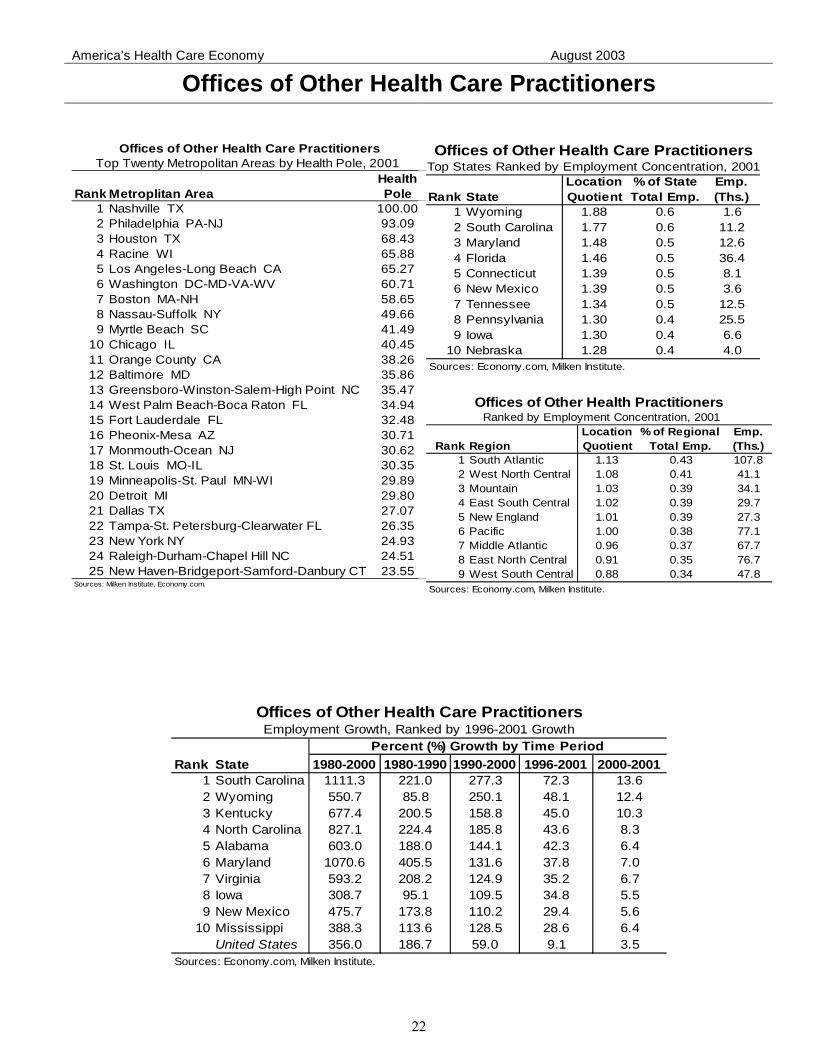
Offices of Other Health Care Practitioners
Rank StateLocationQuotient
% of StateTotal Emp.
Emp.(Ths.)
1 Wyoming 1.88 0.6 1.62 South Carolina 1.77 0.6 11.23 Maryland 1.48 0.5 12.64 Florida 1.46 0.5 36.45 Connecticut 1.39 0.5 8.16 New Mexico 1.39 0.5 3.67 Tennessee 1.34 0.5 12.58 Pennsylvania 1.30 0.4 25.59 Iowa 1.30 0.4 6.6
10 Nebraska 1.28 0.4 4.0
Offices of Other Health Care PractitionersTop States Ranked by Employment Concentration, 2001
Sources: Economy.com, Milken Institute.
Rank Metroplitan AreaHealth Pole
1 Nashville TX 100.002 Philadelphia PA-NJ 93.093 Houston TX 68.434 Racine WI 65.885 Los Angeles-Long Beach CA 65.276 Washington DC-MD-VA-WV 60.717 Boston MA-NH 58.658 Nassau-Suffolk NY 49.669 Myrtle Beach SC 41.49
10 Chicago IL 40.4511 Orange County CA 38.2612 Baltimore MD 35.8613 Greensboro-Winston-Salem-High Point NC 35.4714 West Palm Beach-Boca Raton FL 34.9415 Fort Lauderdale FL 32.4816 Pheonix-Mesa AZ 30.7117 Monmouth-Ocean NJ 30.6218 St. Louis MO-IL 30.3519 Minneapolis-St. Paul MN-WI 29.8920 Detroit MI 29.8021 Dallas TX 27.0722 Tampa-St. Petersburg-Clearwater FL 26.3523 New York NY 24.9324 Raleigh-Durham-Chapel Hill NC 24.5125 New Haven-Bridgeport-Samford-Danbury CT 23.55
Sources: Milken Institute, Economy.com.
Offices of Other Health Care PractitionersTop Twenty Metropolitan Areas by Health Pole, 2001
Rank RegionLocationQuotient
% of Regional Total Emp.
Emp.(Ths.)
1 South Atlantic 1.13 0.43 107.82 West North Central 1.08 0.41 41.13 Mountain 1.03 0.39 34.14 East South Central 1.02 0.39 29.75 New England 1.01 0.39 27.36 Pacific 1.00 0.38 77.17 Middle Atlantic 0.96 0.37 67.78 East North Central 0.91 0.35 76.79 West South Central 0.88 0.34 47.8
Offices of Other Health Practitioners Ranked by Employment Concentration, 2001
Sources: Economy.com, Milken Institute.
Rank State 1980-2000 1980-1990 1990-2000 1996-2001 2000-20011 South Carolina 1111.3 221.0 277.3 72.3 13.62 Wyoming 550.7 85.8 250.1 48.1 12.43 Kentucky 677.4 200.5 158.8 45.0 10.34 North Carolina 827.1 224.4 185.8 43.6 8.35 Alabama 603.0 188.0 144.1 42.3 6.46 Maryland 1070.6 405.5 131.6 37.8 7.07 Virginia 593.2 208.2 124.9 35.2 6.78 Iowa 308.7 95.1 109.5 34.8 5.59 New Mexico 475.7 173.8 110.2 29.4 5.6
10 Mississippi 388.3 113.6 128.5 28.6 6.4United States 356.0 186.7 59.0 9.1 3.5
Offices of Other Health Care PractitionersEmployment Growth, Ranked by 1996-2001 Growth
Percent (%) Growth by Time Period
Sources: Economy.com, Milken Institute.
America’s Health Care Economy August 2003
23
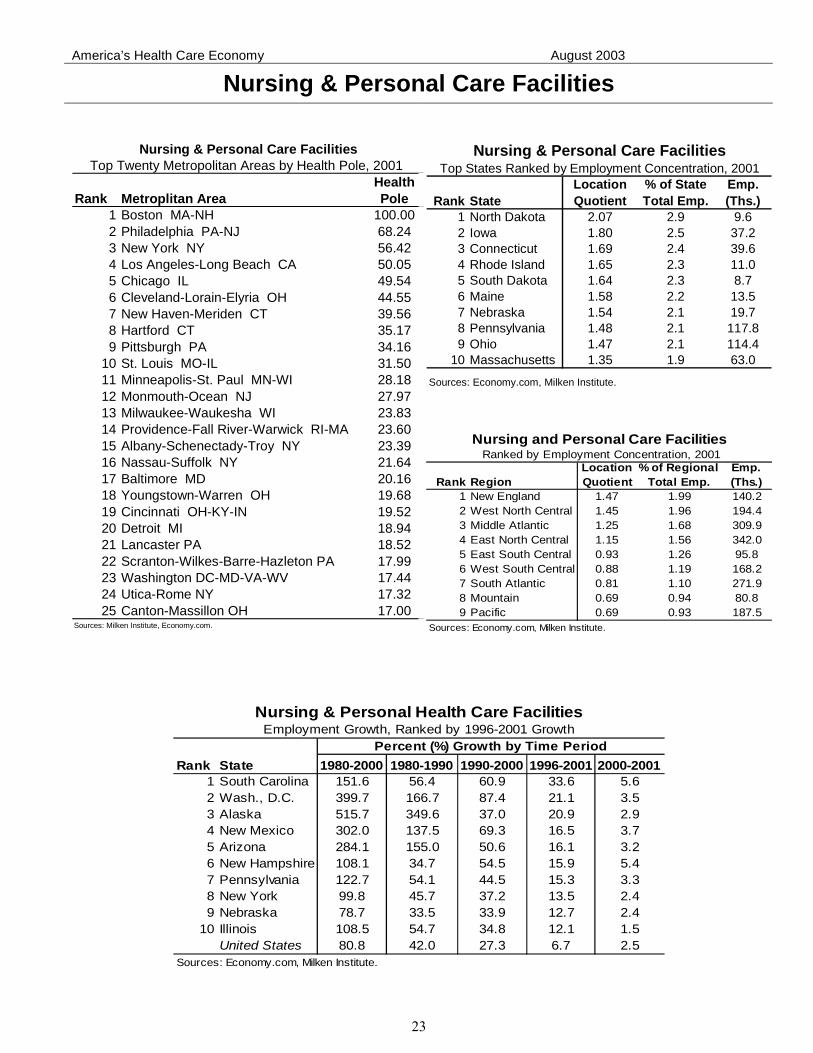
Nursing & Personal Care Facilities
Rank StateLocationQuotient
% of StateTotal Emp.
Emp.(Ths.)
1 North Dakota 2.07 2.9 9.62 Iowa 1.80 2.5 37.23 Connecticut 1.69 2.4 39.64 Rhode Island 1.65 2.3 11.05 South Dakota 1.64 2.3 8.76 Maine 1.58 2.2 13.57 Nebraska 1.54 2.1 19.78 Pennsylvania 1.48 2.1 117.89 Ohio 1.47 2.1 114.4
10 Massachusetts 1.35 1.9 63.0
Nursing & Personal Care FacilitiesTop States Ranked by Employment Concentration, 2001
Sources: Economy.com, Milken Institute.
Rank Metroplitan AreaHealth Pole
1 Boston MA-NH 100.002 Philadelphia PA-NJ 68.243 New York NY 56.424 Los Angeles-Long Beach CA 50.055 Chicago IL 49.546 Cleveland-Lorain-Elyria OH 44.557 New Haven-Meriden CT 39.568 Hartford CT 35.179 Pittsburgh PA 34.16
10 St. Louis MO-IL 31.5011 Minneapolis-St. Paul MN-WI 28.1812 Monmouth-Ocean NJ 27.9713 Milwaukee-Waukesha WI 23.8314 Providence-Fall River-Warwick RI-MA 23.6015 Albany-Schenectady-Troy NY 23.3916 Nassau-Suffolk NY 21.6417 Baltimore MD 20.1618 Youngstown-Warren OH 19.6819 Cincinnati OH-KY-IN 19.5220 Detroit MI 18.9421 Lancaster PA 18.5222 Scranton-Wilkes-Barre-Hazleton PA 17.9923 Washington DC-MD-VA-WV 17.4424 Utica-Rome NY 17.3225 Canton-Massillon OH 17.00
Nursing & Personal Care FacilitiesTop Twenty Metropolitan Areas by Health Pole, 2001
Sources: Milken Institute, Economy.com.
Rank RegionLocationQuotient
% of Regional Total Emp.
Emp.(Ths.)
1 New England 1.47 1.99 140.22 West North Central 1.45 1.96 194.43 Middle Atlantic 1.25 1.68 309.94 East North Central 1.15 1.56 342.05 East South Central 0.93 1.26 95.86 West South Central 0.88 1.19 168.27 South Atlantic 0.81 1.10 271.98 Mountain 0.69 0.94 80.89 Pacific 0.69 0.93 187.5
Nursing and Personal Care Facilities Ranked by Employment Concentration, 2001
Sources: Economy.com, Milken Institute.
Rank State 1980-2000 1980-1990 1990-2000 1996-2001 2000-20011 South Carolina 151.6 56.4 60.9 33.6 5.62 Wash., D.C. 399.7 166.7 87.4 21.1 3.53 Alaska 515.7 349.6 37.0 20.9 2.94 New Mexico 302.0 137.5 69.3 16.5 3.75 Arizona 284.1 155.0 50.6 16.1 3.26 New Hampshire 108.1 34.7 54.5 15.9 5.47 Pennsylvania 122.7 54.1 44.5 15.3 3.38 New York 99.8 45.7 37.2 13.5 2.49 Nebraska 78.7 33.5 33.9 12.7 2.4
10 Illinois 108.5 54.7 34.8 12.1 1.5United States 80.8 42.0 27.3 6.7 2.5
Nursing & Personal Health Care FacilitiesEmployment Growth, Ranked by 1996-2001 Growth
Percent (%) Growth by Time Period
Sources: Economy.com, Milken Institute.
America’s Health Care Economy August 2003
24
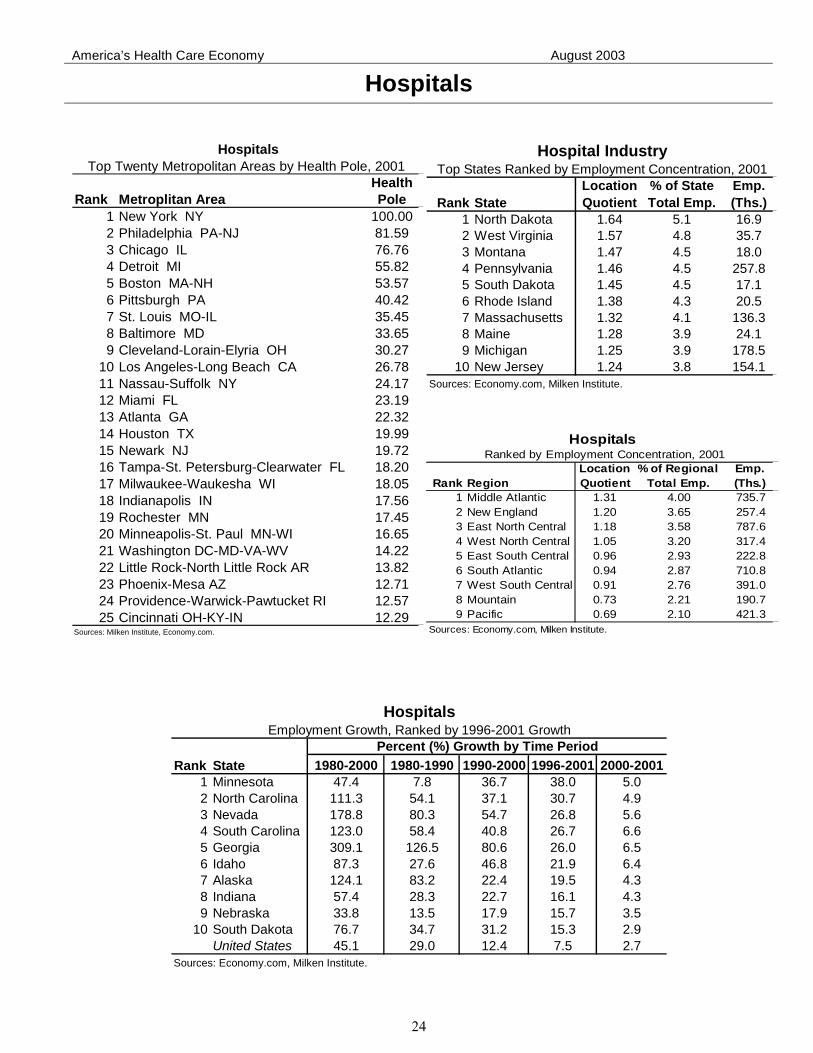
Hospitals
Rank StateLocationQuotient
% of StateTotal Emp.
Emp.(Ths.)
1 North Dakota 1.64 5.1 16.92 West Virginia 1.57 4.8 35.73 Montana 1.47 4.5 18.04 Pennsylvania 1.46 4.5 257.85 South Dakota 1.45 4.5 17.16 Rhode Island 1.38 4.3 20.57 Massachusetts 1.32 4.1 136.38 Maine 1.28 3.9 24.19 Michigan 1.25 3.9 178.5
10 New Jersey 1.24 3.8 154.1
Hospital IndustryTop States Ranked by Employment Concentration, 2001
Sources: Economy.com, Milken Institute.
Rank Metroplitan AreaHealth Pole
1 New York NY 100.002 Philadelphia PA-NJ 81.593 Chicago IL 76.764 Detroit MI 55.825 Boston MA-NH 53.576 Pittsburgh PA 40.427 St. Louis MO-IL 35.458 Baltimore MD 33.659 Cleveland-Lorain-Elyria OH 30.27
10 Los Angeles-Long Beach CA 26.7811 Nassau-Suffolk NY 24.1712 Miami FL 23.1913 Atlanta GA 22.3214 Houston TX 19.9915 Newark NJ 19.7216 Tampa-St. Petersburg-Clearwater FL 18.2017 Milwaukee-Waukesha WI 18.0518 Indianapolis IN 17.5619 Rochester MN 17.4520 Minneapolis-St. Paul MN-WI 16.6521 Washington DC-MD-VA-WV 14.2222 Little Rock-North Little Rock AR 13.8223 Phoenix-Mesa AZ 12.7124 Providence-Warwick-Pawtucket RI 12.5725 Cincinnati OH-KY-IN 12.29
Sources: Milken Institute, Economy.com.
HospitalsTop Twenty Metropolitan Areas by Health Pole, 2001
Rank RegionLocationQuotient
% of Regional Total Emp.
Emp.(Ths.)
1 Middle Atlantic 1.31 4.00 735.72 New England 1.20 3.65 257.43 East North Central 1.18 3.58 787.64 West North Central 1.05 3.20 317.45 East South Central 0.96 2.93 222.86 South Atlantic 0.94 2.87 710.87 West South Central 0.91 2.76 391.08 Mountain 0.73 2.21 190.79 Pacific 0.69 2.10 421.3
Hospitals Ranked by Employment Concentration, 2001
Sources: Economy.com, Milken Institute.
Rank State 1980-2000 1980-1990 1990-2000 1996-2001 2000-20011 Minnesota 47.4 7.8 36.7 38.0 5.02 North Carolina 111.3 54.1 37.1 30.7 4.93 Nevada 178.8 80.3 54.7 26.8 5.64 South Carolina 123.0 58.4 40.8 26.7 6.65 Georgia 309.1 126.5 80.6 26.0 6.56 Idaho 87.3 27.6 46.8 21.9 6.47 Alaska 124.1 83.2 22.4 19.5 4.38 Indiana 57.4 28.3 22.7 16.1 4.39 Nebraska 33.8 13.5 17.9 15.7 3.5
10 South Dakota 76.7 34.7 31.2 15.3 2.9United States 45.1 29.0 12.4 7.5 2.7
HospitalsEmployment Growth, Ranked by 1996-2001 Growth
Percent (%) Growth by Time Period
Sources: Economy.com, Milken Institute.
America’s Health Care Economy August 2003
25
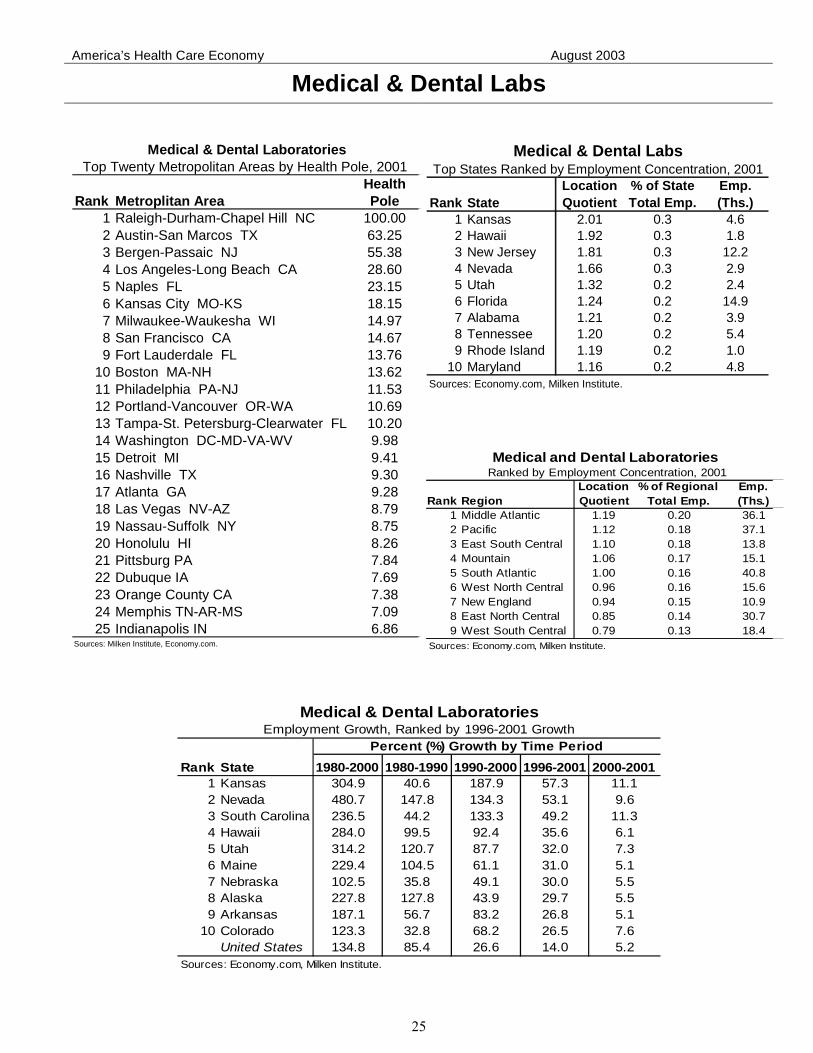
Medical & Dental Labs
Rank StateLocationQuotient
% of StateTotal Emp.
Emp.(Ths.)
1 Kansas 2.01 0.3 4.62 Hawaii 1.92 0.3 1.83 New Jersey 1.81 0.3 12.24 Nevada 1.66 0.3 2.95 Utah 1.32 0.2 2.46 Florida 1.24 0.2 14.97 Alabama 1.21 0.2 3.98 Tennessee 1.20 0.2 5.49 Rhode Island 1.19 0.2 1.0
10 Maryland 1.16 0.2 4.8
Medical & Dental LabsTop States Ranked by Employment Concentration, 2001
Sources: Economy.com, Milken Institute.
Rank Metroplitan AreaHealth Pole
1 Raleigh-Durham-Chapel Hill NC 100.002 Austin-San Marcos TX 63.253 Bergen-Passaic NJ 55.384 Los Angeles-Long Beach CA 28.605 Naples FL 23.156 Kansas City MO-KS 18.157 Milwaukee-Waukesha WI 14.978 San Francisco CA 14.679 Fort Lauderdale FL 13.76
10 Boston MA-NH 13.6211 Philadelphia PA-NJ 11.5312 Portland-Vancouver OR-WA 10.6913 Tampa-St. Petersburg-Clearwater FL 10.2014 Washington DC-MD-VA-WV 9.9815 Detroit MI 9.4116 Nashville TX 9.3017 Atlanta GA 9.2818 Las Vegas NV-AZ 8.7919 Nassau-Suffolk NY 8.7520 Honolulu HI 8.2621 Pittsburg PA 7.8422 Dubuque IA 7.6923 Orange County CA 7.3824 Memphis TN-AR-MS 7.0925 Indianapolis IN 6.86
Top Twenty Metropolitan Areas by Health Pole, 2001
Sources: Milken Institute, Economy.com.
Medical & Dental Laboratories
Rank RegionLocationQuotient
% of Regional Total Emp.
Emp.(Ths.)
1 Middle Atlantic 1.19 0.20 36.12 Pacific 1.12 0.18 37.13 East South Central 1.10 0.18 13.84 Mountain 1.06 0.17 15.15 South Atlantic 1.00 0.16 40.86 West North Central 0.96 0.16 15.67 New England 0.94 0.15 10.98 East North Central 0.85 0.14 30.79 West South Central 0.79 0.13 18.4
Medical and Dental Laboratories Ranked by Employment Concentration, 2001
Sources: Economy.com, Milken Institute.
Rank State 1980-2000 1980-1990 1990-2000 1996-2001 2000-20011 Kansas 304.9 40.6 187.9 57.3 11.12 Nevada 480.7 147.8 134.3 53.1 9.63 South Carolina 236.5 44.2 133.3 49.2 11.34 Hawaii 284.0 99.5 92.4 35.6 6.15 Utah 314.2 120.7 87.7 32.0 7.36 Maine 229.4 104.5 61.1 31.0 5.17 Nebraska 102.5 35.8 49.1 30.0 5.58 Alaska 227.8 127.8 43.9 29.7 5.59 Arkansas 187.1 56.7 83.2 26.8 5.1
10 Colorado 123.3 32.8 68.2 26.5 7.6United States 134.8 85.4 26.6 14.0 5.2
Sources: Economy.com, Milken Institute.
Medical & Dental LaboratoriesEmployment Growth, Ranked by 1996-2001 Growth
Percent (%) Growth by Time Period
America’s Health Care Economy August 2003
26
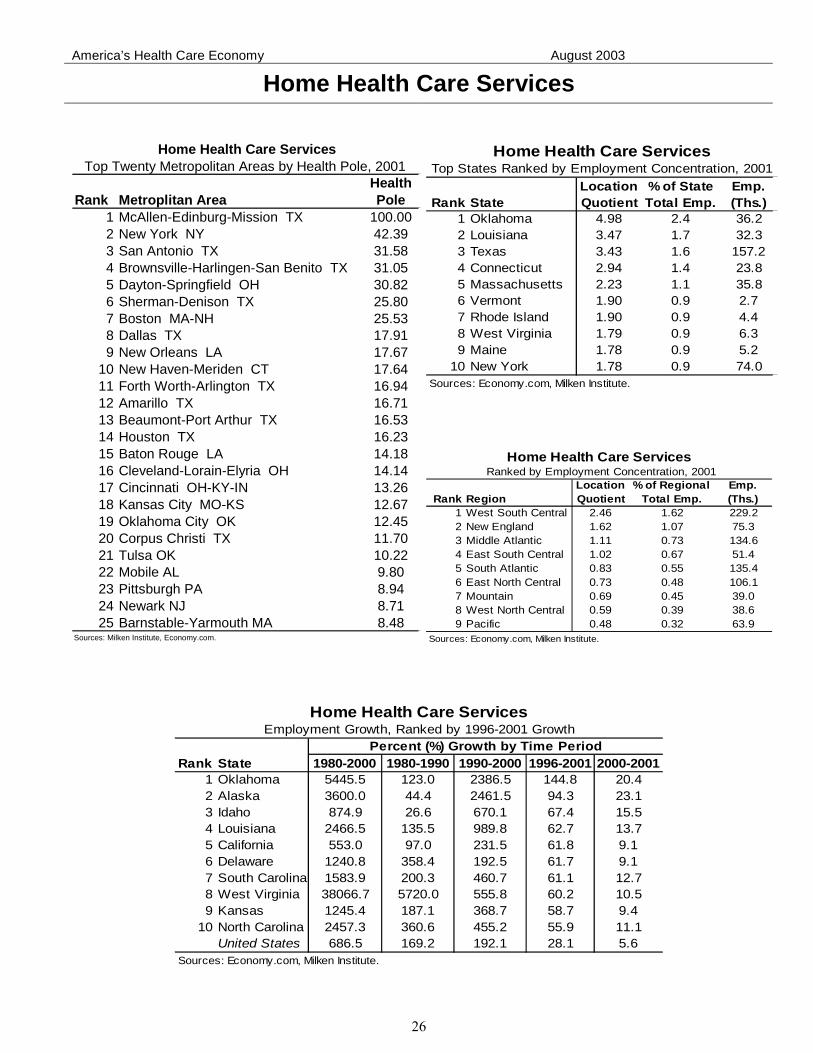
Home Health Care Services
Rank StateLocationQuotient
% of StateTotal Emp.
Emp.(Ths.)
1 Oklahoma 4.98 2.4 36.22 Louisiana 3.47 1.7 32.33 Texas 3.43 1.6 157.24 Connecticut 2.94 1.4 23.85 Massachusetts 2.23 1.1 35.86 Vermont 1.90 0.9 2.77 Rhode Island 1.90 0.9 4.48 West Virginia 1.79 0.9 6.39 Maine 1.78 0.9 5.2
10 New York 1.78 0.9 74.0
Home Health Care ServicesTop States Ranked by Employment Concentration, 2001
Sources: Economy.com, Milken Institute.
Rank Metroplitan AreaHealth Pole
1 McAllen-Edinburg-Mission TX 100.002 New York NY 42.393 San Antonio TX 31.584 Brownsville-Harlingen-San Benito TX 31.055 Dayton-Springfield OH 30.826 Sherman-Denison TX 25.807 Boston MA-NH 25.538 Dallas TX 17.919 New Orleans LA 17.67
10 New Haven-Meriden CT 17.6411 Forth Worth-Arlington TX 16.9412 Amarillo TX 16.7113 Beaumont-Port Arthur TX 16.5314 Houston TX 16.2315 Baton Rouge LA 14.1816 Cleveland-Lorain-Elyria OH 14.1417 Cincinnati OH-KY-IN 13.2618 Kansas City MO-KS 12.6719 Oklahoma City OK 12.4520 Corpus Christi TX 11.7021 Tulsa OK 10.2222 Mobile AL 9.8023 Pittsburgh PA 8.9424 Newark NJ 8.7125 Barnstable-Yarmouth MA 8.48
Sources: Milken Institute, Economy.com.
Home Health Care ServicesTop Twenty Metropolitan Areas by Health Pole, 2001
Rank RegionLocationQuotient
% of Regional Total Emp.
Emp.(Ths.)
1 West South Central 2.46 1.62 229.22 New England 1.62 1.07 75.33 Middle Atlantic 1.11 0.73 134.64 East South Central 1.02 0.67 51.45 South Atlantic 0.83 0.55 135.46 East North Central 0.73 0.48 106.17 Mountain 0.69 0.45 39.08 West North Central 0.59 0.39 38.69 Pacific 0.48 0.32 63.9
Home Health Care Services Ranked by Employment Concentration, 2001
Sources: Economy.com, Milken Institute.
Rank State 1980-2000 1980-1990 1990-2000 1996-2001 2000-20011 Oklahoma 5445.5 123.0 2386.5 144.8 20.42 Alaska 3600.0 44.4 2461.5 94.3 23.13 Idaho 874.9 26.6 670.1 67.4 15.54 Louisiana 2466.5 135.5 989.8 62.7 13.75 California 553.0 97.0 231.5 61.8 9.16 Delaware 1240.8 358.4 192.5 61.7 9.17 South Carolina 1583.9 200.3 460.7 61.1 12.78 West Virginia 38066.7 5720.0 555.8 60.2 10.59 Kansas 1245.4 187.1 368.7 58.7 9.4
10 North Carolina 2457.3 360.6 455.2 55.9 11.1United States 686.5 169.2 192.1 28.1 5.6
Home Health Care ServicesEmployment Growth, Ranked by 1996-2001 Growth
Percent (%) Growth by Time Period
Sources: Economy.com, Milken Institute.
America’s Health Care Economy August 2003
27
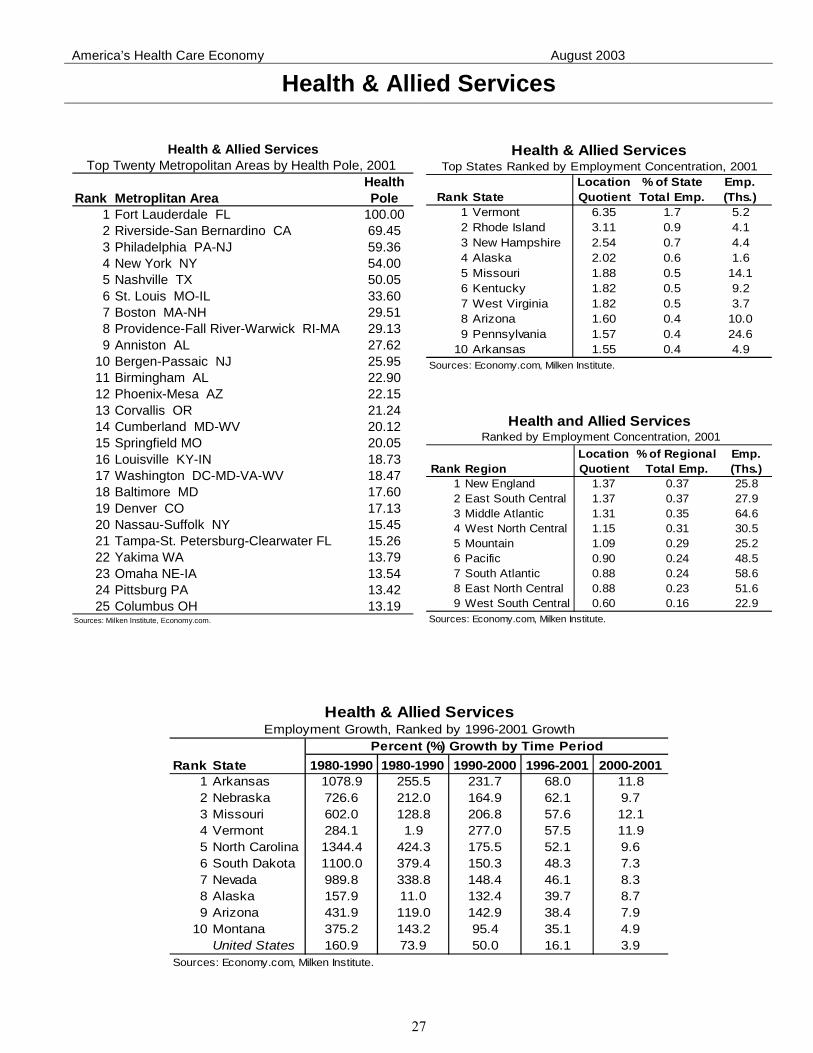
Health & Allied Services
Rank StateLocationQuotient
% of StateTotal Emp.
Emp.(Ths.)
1 Vermont 6.35 1.7 5.22 Rhode Island 3.11 0.9 4.13 New Hampshire 2.54 0.7 4.44 Alaska 2.02 0.6 1.65 Missouri 1.88 0.5 14.16 Kentucky 1.82 0.5 9.27 West Virginia 1.82 0.5 3.78 Arizona 1.60 0.4 10.09 Pennsylvania 1.57 0.4 24.6
10 Arkansas 1.55 0.4 4.9
Health & Allied ServicesTop States Ranked by Employment Concentration, 2001
Sources: Economy.com, Milken Institute.
Rank Metroplitan AreaHealth Pole
1 Fort Lauderdale FL 100.002 Riverside-San Bernardino CA 69.453 Philadelphia PA-NJ 59.364 New York NY 54.005 Nashville TX 50.056 St. Louis MO-IL 33.607 Boston MA-NH 29.518 Providence-Fall River-Warwick RI-MA 29.139 Anniston AL 27.62
10 Bergen-Passaic NJ 25.9511 Birmingham AL 22.9012 Phoenix-Mesa AZ 22.1513 Corvallis OR 21.2414 Cumberland MD-WV 20.1215 Springfield MO 20.0516 Louisville KY-IN 18.7317 Washington DC-MD-VA-WV 18.4718 Baltimore MD 17.6019 Denver CO 17.1320 Nassau-Suffolk NY 15.4521 Tampa-St. Petersburg-Clearwater FL 15.2622 Yakima WA 13.7923 Omaha NE-IA 13.5424 Pittsburg PA 13.4225 Columbus OH 13.19
Sources: Milken Institute, Economy.com.
Health & Allied ServicesTop Twenty Metropolitan Areas by Health Pole, 2001
Rank RegionLocationQuotient
% of Regional Total Emp.
Emp.(Ths.)
1 New England 1.37 0.37 25.82 East South Central 1.37 0.37 27.93 Middle Atlantic 1.31 0.35 64.64 West North Central 1.15 0.31 30.55 Mountain 1.09 0.29 25.26 Pacific 0.90 0.24 48.57 South Atlantic 0.88 0.24 58.68 East North Central 0.88 0.23 51.69 West South Central 0.60 0.16 22.9
Health and Allied Services Ranked by Employment Concentration, 2001
Sources: Economy.com, Milken Institute.
Rank State 1980-1990 1980-1990 1990-2000 1996-2001 2000-20011 Arkansas 1078.9 255.5 231.7 68.0 11.82 Nebraska 726.6 212.0 164.9 62.1 9.73 Missouri 602.0 128.8 206.8 57.6 12.14 Vermont 284.1 1.9 277.0 57.5 11.95 North Carolina 1344.4 424.3 175.5 52.1 9.66 South Dakota 1100.0 379.4 150.3 48.3 7.37 Nevada 989.8 338.8 148.4 46.1 8.38 Alaska 157.9 11.0 132.4 39.7 8.79 Arizona 431.9 119.0 142.9 38.4 7.9
10 Montana 375.2 143.2 95.4 35.1 4.9United States 160.9 73.9 50.0 16.1 3.9
Health & Allied ServicesEmployment Growth, Ranked by 1996-2001 Growth
Percent (%) Growth by Time Period
Sources: Economy.com, Milken Institute.
America’s Health Care Economy August 2003
28
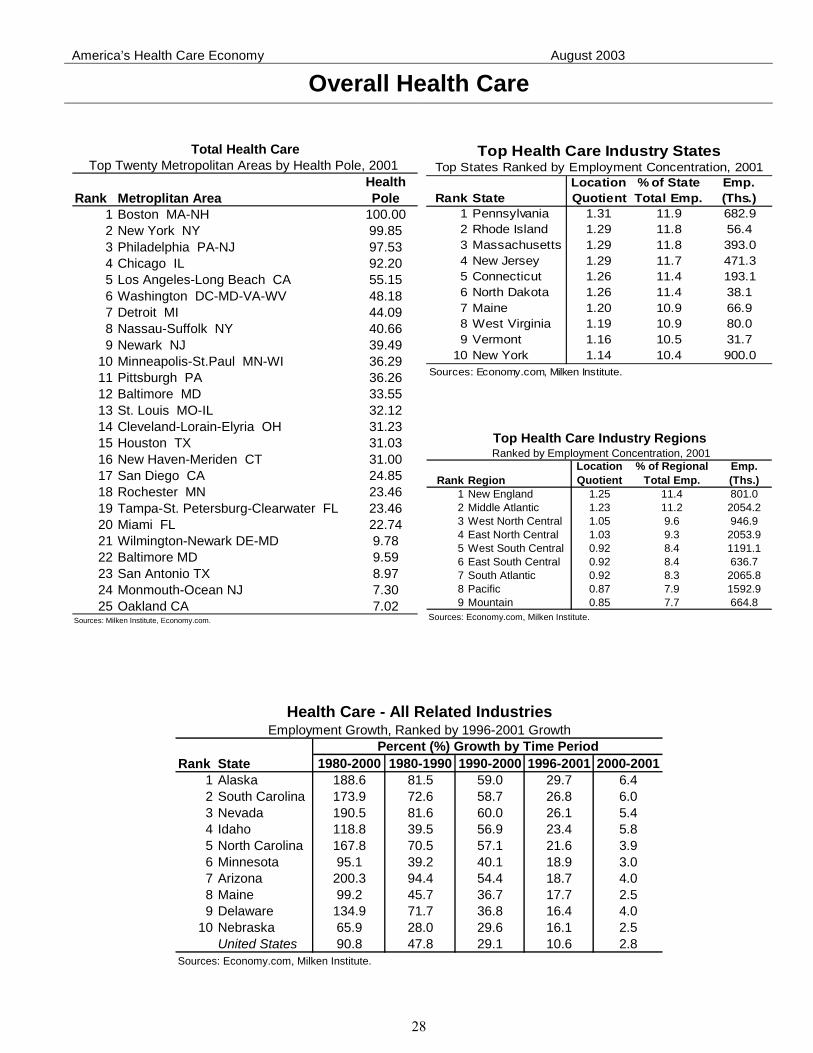
Overall Health Care
Rank StateLocationQuotient
% of StateTotal Emp.
Emp.(Ths.)
1 Pennsylvania 1.31 11.9 682.92 Rhode Island 1.29 11.8 56.43 Massachusetts 1.29 11.8 393.04 New Jersey 1.29 11.7 471.35 Connecticut 1.26 11.4 193.16 North Dakota 1.26 11.4 38.17 Maine 1.20 10.9 66.98 West Virginia 1.19 10.9 80.09 Vermont 1.16 10.5 31.7
10 New York 1.14 10.4 900.0
Top Health Care Industry StatesTop States Ranked by Employment Concentration, 2001
Sources: Economy.com, Milken Institute.
Rank Metroplitan AreaHealth Pole
1 Boston MA-NH 100.002 New York NY 99.853 Philadelphia PA-NJ 97.534 Chicago IL 92.205 Los Angeles-Long Beach CA 55.156 Washington DC-MD-VA-WV 48.187 Detroit MI 44.098 Nassau-Suffolk NY 40.669 Newark NJ 39.49
10 Minneapolis-St.Paul MN-WI 36.2911 Pittsburgh PA 36.2612 Baltimore MD 33.5513 St. Louis MO-IL 32.1214 Cleveland-Lorain-Elyria OH 31.2315 Houston TX 31.0316 New Haven-Meriden CT 31.0017 San Diego CA 24.8518 Rochester MN 23.4619 Tampa-St. Petersburg-Clearwater FL 23.4620 Miami FL 22.7421 Wilmington-Newark DE-MD 9.7822 Baltimore MD 9.5923 San Antonio TX 8.9724 Monmouth-Ocean NJ 7.3025 Oakland CA 7.02
Top Twenty Metropolitan Areas by Health Pole, 2001
Sources: Milken Institute, Economy.com.
Total Health Care
Rank RegionLocationQuotient
% of RegionalTotal Emp.
Emp.(Ths.)
1 New England 1.25 11.4 801.02 Middle Atlantic 1.23 11.2 2054.23 West North Central 1.05 9.6 946.94 East North Central 1.03 9.3 2053.95 West South Central 0.92 8.4 1191.16 East South Central 0.92 8.4 636.77 South Atlantic 0.92 8.3 2065.88 Pacific 0.87 7.9 1592.99 Mountain 0.85 7.7 664.8
Ranked by Employment Concentration, 2001
Sources: Economy.com, Milken Institute.
Top Health Care Industry Regions
Rank State 1980-2000 1980-1990 1990-2000 1996-2001 2000-20011 Alaska 188.6 81.5 59.0 29.7 6.42 South Carolina 173.9 72.6 58.7 26.8 6.03 Nevada 190.5 81.6 60.0 26.1 5.44 Idaho 118.8 39.5 56.9 23.4 5.85 North Carolina 167.8 70.5 57.1 21.6 3.96 Minnesota 95.1 39.2 40.1 18.9 3.07 Arizona 200.3 94.4 54.4 18.7 4.08 Maine 99.2 45.7 36.7 17.7 2.59 Delaware 134.9 71.7 36.8 16.4 4.0
10 Nebraska 65.9 28.0 29.6 16.1 2.5United States 90.8 47.8 29.1 10.6 2.8
Health Care - All Related IndustriesEmployment Growth, Ranked by 1996-2001 Growth
Percent (%) Growth by Time Period
Sources: Economy.com, Milken Institute.

America’s Health Care Economy August 2003
29
About the Authors
Ross DeVol is Director of Regional Economics at the Milken Institute. He oversees the Institute�s research efforts on the dynamics of comparative regional growth performance, technology and its impact on regional and national economies. He is an expert on the new intangible economy and how regions can prepare themselves to compete in it. He authored the ground-breaking study, America’s High-Tech Economy: Growth, Development, and Risks for Metropolitan Areas, an examination of how clusters of high-technology industries across the country affect economic growth in those regions. He also created the Best Performing Cities Index, an annual ranking of U.S. metropolitan areas showing where jobs are being created and economies are growing. Prior to joining the Institute, DeVol was senior vice president of Global Insight, Inc. (formerly Wharton Econometric Forecasting), where he supervised their Regional Economic Services group. DeVol supervised the respecification of Global Insight�s regional econometric models and played an instrumental role on similar work on its U.S. Macro Model originally developed by Nobel Laureate Lawrence Klein. He was the firm�s chief spokesman on international trade. He also served as the head of Global Insight�s U.S. Long-Term Macro Service and authored numerous special reports on behalf of the U.S. Macro Group. DeVol earned his M.A. in economics at Ohio University.
Rob Koepp is a Research Fellow in Regional Economics at the Milken Institute. His research interests center on the topics of innovation, entrepreneurship and regional economic development, especially in the context of global technology businesses. His recent work at the Institute includes contributions to Manufacturing Matters: California's Performance and Prospects and the State Technology and Science Index: Comparing and Contrasting California. Koepp is also author of the book Clusters of Creativity: Enduring Lessons on Innovation and Entrepreneurship from Silicon Valley and Europe's Silicon Fen (John Wiley & Sons, 2002). Fluent in Japanese and Chinese, Koepp served in various senior positions with Western and Japanese technology firms before joining the Institute. Koepp earned his BA in Asian Studies at Pomona College and his MBA with an emphasis in venture capital financing at Cambridge University.