the state of america's children® 2021
TRANSCRIPT

THE STATE OF AMERICA’S CHILDREN®
2021
INCOME AND WEALTH INEQUALITY
ii Children’s Defense Fund
ABOUT THE CHILDREN'S DEFENSE FUND
The Children’s Defense Fund envisions a nation where marginalized children flourish, leaders prioritize their well-being and communities wield the power to assure they thrive. To realize this vision, we pursue a movement-building and institutional growth strategy to build power for child-centered public policy, informed by racial equity and the lived experience of children and youth.
Our Leave No Child Behind® mission is to ensure every child a Healthy Start, a Head Start, a Fair Start, a Safe Start and a Moral Start in life and successful passage to adulthood with the help of caring families and communities.
We serve and advocate for the largest, most diverse generation in America: the 73 million children and youth under the age of 18 and 30 million young adults under the age of 25, with particular attention to those living in poverty and communities of color.
© 2021 Children’s Defense Fund. All rights reserved.Front cover: Biljana B. Milenkovic; Dean Alexander Photography; Alison Wright Photography Inside photos: Dean Alexander Photography; Jess Foami; Steve Liss; Biljana B. Milenkovic; Mark Montemayor; David Rae Morris and Crystal Rucker, CDF staff
Acknowledgments
The CDF team responsible for the work on this report included:
Loy Azalia, Senior Research AssociateSierra Campbell, Special AssistantAnourack Chinyavong, Graphic DesignerBen Dawson, WebmasterMina Dixon Davis, Policy AssociateEmily Gardner, Communications DirectorTeri Hatch, Digital Communications
ManagerKathleen King, Interim Policy Director
Emma Mehrabi, Director of Poverty PolicySteven Olender, Senior Policy Associate
for Child Welfare and Mental HealthBeki San Martin, Communications
AssociateAustin Sowa, Policy AssociateStefanie Sprow, Director of Child
Welfare PolicyZach Tilly, Policy Associate
INCOME AND WEALTH INEQUALITY INCOME AND WEALTH INEQUALITY
The State of America’s Children® 2021 iii
A Note about Using The State of America’s Children® 2021
The Children’s Defense Fund fights for the largest, most diverse generation in America. We know that to succeed, children need stable homes, quality health care, ample nutritious food, good schools, safe neighborhoods, and access to resources and opportunities that enable them to reach their potential. But the fact is that for too many of our children, these basic building blocks for success are out of reach. As we urge policymakers to prioritize child-centered solutions that create equitable conditions in which all young people can thrive, our work must be grounded in data and facts. As our children continue to suffer from the harmful impacts of our country’s health, economic, and racial disparities, which are now magnified by the COVID-19 pandemic, the challenges facing our young people are more daunting in every area.
This year’s State of America’s Children® report is unique in that the majority of the data included in the report reflect realities prior to the pandemic. The report is undergirded by specific data that were vital in reducing child poverty and taking other steps towards improving child well-being before the devastation caused by the COVID-19 pandemic, while also reflecting the deep racial and economic disparities that have long plagued our nation. To bridge the gap between the available data and current realities, each chapter includes a special section highlighting the impact of the COVID-19 public health and economic crisis on children. Taken as a whole, the report underscores the need for government data reporting agencies and other organizations to conduct more real-time data collection, reporting, and information dissemination if we as a nation are to meet the challenges facing our children and families. Throughout the report terms of race, identity, and experience reflect the original data source’s language. This means from chapter to chapter, language usage may vary depending on the source of the data.
The State of America’s Children® 2021 and corresponding state fact sheets provide an overview of how America’s children are faring to inform conversations and improve policies to ensure no child is left behind.
• The State of America’s Children® 2021 summarizes the status of America’s children in 12 areas: child population, child poverty, income and wealth inequality, housing and homelessness, child hunger and nutrition, child health, early childhood, education, child welfare, youth justice, gun violence and immigration. For each area, we compiled the most recent, available national and state-level data. The report includes key findings as well as data tables, which are useful for comparing how children are faring in different states.
• Using data from the tables in The State of America’s Children® 2021, our national and state factsheets each provide a one-page summary of how children are doing in all 50 states, the District of Columbia, and nationwide. Whether you identify as a teacher, child advocate, policymaker, policy wonk, college professor, faith leader, parent or grandparent, a millennial eager to make life better for your younger siblings, or a member of the media, we ask you to use The State of America’s Children® 2021 to inform your conversations and effectively make the case for policies, programs, and strategies to improve the odds for children in your state and nationwide. We must keep moving forward in the fight for America’s children.


1
The State of America’s Children® 2021
TABLE OF CONTENTS
LIST OF TABLES . . . . . . . . . . . . . . . . . . . . . . . . . . . . . . . . . . . . . . . . . . . . . . . . . . . . . . . . . . . . . . . . . . . . . . . . . . .
INTRODUCTION . . . . . . . . . . . . . . . . . . . . . . . . . . . . . . . . . . . . . . . . . . . . . . . . . . . . . . . . . . . . . . . . . . . . . . . . . . .
OVERVIEW . . . . . . . . . . . . . . . . . . . . . . . . . . . . . . . . . . . . . . . . . . . . . . . . . . . . . . . . . . . . . . . . . . . . . . . . . . . . . . . .
MOMENTS IN AMERICA . . . . . . . . . . . . . . . . . . . . . . . . . . . . . . . . . . . . . . . . . . . . . . . . . . . . . . . . . . . . . . . . . . .
KEY FINDINGS BY POLICY AREA . . . . . . . . . . . . . . . . . . . . . . . . . . . . . . . . . . . . . . . . . . . . . . . . . . . . . . . . . .
• Child Population . . . . . . . . . . . . . . . . . . . . . . . . . . . . . . . . . . . . . . . . . . . . . . . . . . . . . . . . . . . . 12
• Child Poverty. . . . . . . . . . . . . . . . . . . . . . . . . . . . . . . . . . . . . . . . . . . . . . . . . . . . . . . . . . . . . . . .14
• Income and Wealth Inequality. . . . . . . . . . . . . . . . . . . . . . . . . . . . . . . . . . . . . . . . . . . . . .16
• Housing and Homelessness . . . . . . . . . . . . . . . . . . . . . . . . . . . . . . . . . . . . . . . . . . . . . . . .18
• Child Hunger and Nutrition. . . . . . . . . . . . . . . . . . . . . . . . . . . . . . . . . . . . . . . . . . . . . . . . 20
• Child Health. . . . . . . . . . . . . . . . . . . . . . . . . . . . . . . . . . . . . . . . . . . . . . . . . . . . . . . . . . . . . . . . 22
• Early Childhood . . . . . . . . . . . . . . . . . . . . . . . . . . . . . . . . . . . . . . . . . . . . . . . . . . . . . . . . . . . . 24
• Education . . . . . . . . . . . . . . . . . . . . . . . . . . . . . . . . . . . . . . . . . . . . . . . . . . . . . . . . . . . . . . . . . . 26
• Child Welfare. . . . . . . . . . . . . . . . . . . . . . . . . . . . . . . . . . . . . . . . . . . . . . . . . . . . . . . . . . . . . . . 28
• Youth Justice. . . . . . . . . . . . . . . . . . . . . . . . . . . . . . . . . . . . . . . . . . . . . . . . . . . . . . . . . . . . . . . 30
• Gun Violence. . . . . . . . . . . . . . . . . . . . . . . . . . . . . . . . . . . . . . . . . . . . . . . . . . . . . . . . . . . . . . . 32
• Immigrant Children. . . . . . . . . . . . . . . . . . . . . . . . . . . . . . . . . . . . . . . . . . . . . . . . . . . . . . . . 34
TABLES. . . . . . . . . . . . . . . . . . . . . . . . . . . . . . . . . . . . . . . . . . . . . . . . . . . . . . . . . . . . . . . . . . . . . . . . . . . . . . . . . . . . .
ENDNOTES . . . . . . . . . . . . . . . . . . . . . . . . . . . . . . . . . . . . . . . . . . . . . . . . . . . . . . . . . . . . . . . . . . . . . . . . . . . . . . . . .
2
4
6
10
12
37
73

INCOME AND WEALTH INEQUALITY
LOST THEIR HEALTH COVERAGE IN 2018
2 Children’s Defense Fund
LIST OF TABLES
CHILD POPULATION. . . . . . . . . . . . . . . . . . . . . . . . . . . . . . . . . . . . . . . . . . . . . . . . . . . . . . . . . . . . . . . . . . . . . . .
Table 1: Child Population by Age and Race/Ethnicity, 2019
CHILD POVERTY . . . . . . . . . . . . . . . . . . . . . . . . . . . . . . . . . . . . . . . . . . . . . . . . . . . . . . . . . . . . . . . . . . . . . . . . . . . Table 2: Poor Children in America in 2019—A Portrait
Table 3: Federal Poverty Thresholds and Guidelines, 2019
Table 4: Number of Poor Children by Race/Ethnicity, 2019
Table 5: Percent of Poor Children by Race/Ethnicity, 2019
Table 6: Poor and Extremely Poor Children by Age, 2019
INCOME AND WEALTH INEQUALITY . . . . . . . . . . . . . . . . . . . . . . . . . . . . . . . . . . . . . . . . . . . . . . . . . . . . . .
Table 7: Median Family Income among Households with Children by Race/Ethnicity, 2019
HOUSING AND HOMELESSNESS . . . . . . . . . . . . . . . . . . . . . . . . . . . . . . . . . . . . . . . . . . . . . . . . . . . . . . . . . .
Table 8: Rental Housing Affordability, Fiscal Year 2020
Table 9: Homeless Children Enrolled in Public Schools, Select School Years
CHILD HUNGER AND NUTRITION . . . . . . . . . . . . . . . . . . . . . . . . . . . . . . . . . . . . . . . . . . . . . . . . . . . . . . . . .
Table 10: Child Hunger, 2018 and 2019
Table 11: School and Summer Feeding Programs, 2018-2019 School Year and Summer 2019
Table 12: Average Monthly Number of Children Participating in SNAP and WIC
CHILD HEALTH . . . . . . . . . . . . . . . . . . . . . . . . . . . . . . . . . . . . . . . . . . . . . . . . . . . . . . . . . . . . . . . . . . . . . . . . . . . .
Table 13a: Uninsured Children—A Portrait
Table 13b: Uninsured Children By Age, Race/Ethnicity, Poverty Level, Citizenship and Region, 2018 and 2019
Table 14: Children Uninsured and Enrolled in Medicaid/CHIP, 2019
Table 15: Selected Characteristics of State Medicaid and CHIP Programs, 2020
Table 16: Births Covered by Medicaid and Infant Mortality, 2018
EARLY CHILDHOOD . . . . . . . . . . . . . . . . . . . . . . . . . . . . . . . . . . . . . . . . . . . . . . . . . . . . . . . . . . . . . . . . . . . . . . . Table 17: Child Care Costs for Infants, 2019
Table 18: Average Monthly Number of Children and Families Served by the Child Care and Development Fund by Race/Ethnicity, Fiscal Year 2018
Table 19: Child Care Worker Wages, 2019
Table 20: Enrollment of 4- and 3-Year-Olds in State-Funded Preschool Programs, 2018-2019
37
38
43
44
46
49
53
LIST OF TABLES

INCOME AND WEALTH INEQUALITY INCOME AND WEALTH INEQUALITY
3
The State of America’s Children® 2021
LIST OF TABLES
EDUCATION . . . . . . . . . . . . . . . . . . . . . . . . . . . . . . . . . . . . . . . . . . . . . . . . . . . . . . . . . . . . . . . . . . . . . . . . . . . . . . .
Table 21: Percent of 4th and 8th Grade Public School Students Performing Below Proficiency in Reading and Math by Income Status, 2019
Table 22: Percent of 4th Grade Public School Students Performing Below Proficiency in Reading or Math by Race/Ethnicity, 2019
Table 23: Percent of 8th Grade Public School Students Performing Below Proficiency in Reading or Math by Race/Ethnicity, 2019
Table 24: On-Time High School Graduation Rates Among Public School Students by Race/Ethnicity, 2017-18 School Year
Table 25: Public Spending on Prisoners vs. Public School Students, 2016-2017
Table 26: Suspensions among Public School Students, 2015-2016 School Year
CHILD WELFARE . . . . . . . . . . . . . . . . . . . . . . . . . . . . . . . . . . . . . . . . . . . . . . . . . . . . . . . . . . . . . . . . . . . . . . . . . .
Table 27: Child Abuse and Neglect, 2019
Table 28: Children Living In, Entering and Exiting Foster Care, Select Fiscal Years
Table 29: Children in Foster Care by Race/Ethnicity, 2018
Table 30: Children in Congregate Care and Care with Relatives, 2008 and 2018
Table 31: Exits from Foster Care and Exits to Emancipation, Fiscal Year 2018
YOUTH JUSTICE . . . . . . . . . . . . . . . . . . . . . . . . . . . . . . . . . . . . . . . . . . . . . . . . . . . . . . . . . . . . . . . . . . . . . . . . . . .
Table 32: Child Arrests, 2019
Table 33: Children in Adult Prisons, 2009-2019
Table 34: Children in Residential Placement by Race/Ethnicity and Sex, 2017
GUN VIOLENCE . . . . . . . . . . . . . . . . . . . . . . . . . . . . . . . . . . . . . . . . . . . . . . . . . . . . . . . . . . . . . . . . . . . . . . . . . . . .
Table 35: Child and Teen Gun Deaths by State, 2010-2019
57
63
68
71
INCOME AND WEALTH INEQUALITY INTRODUCTION
The year since the last publication of the Children’s Defense Fund’s State of America’s Children report
has felt more like a decade. Consequential changes in the nation’s health, wealth, and leadership have
occurred in ways that make the whole world seem different.
Shortly after last year’s release, we were forced to respond to the most significant health pandemic in a
century, which has now taken more than 500,000 American lives. The advent of COVID-19 initiated an
economic crisis and restructuring from Wall Street to each of our homes. Shelter-in-place orders, mask
mandates, and mandatory shifts to telecommuting have altered whole industries and impacted the trajectory
of the future of work.
Meanwhile, last summer brought with it a racial reckoning years in the making. The largest mass mobilization
for social justice in recent memory occurred as a historic presidential campaign took shape. More than 155
million citizens voted in an atmosphere infused with white nationalism and culminating in an attempted siege
of the U.S. Capitol. The protracted struggle for democracy led to a change in partisan control of the federal
government and a first in executive leadership for women, Black, and South Asian Americans.
Every aspect of American life in the social sector has been impacted by these shifts more quickly than data can
track; even the most recent available data sets do not fully encompass how this past year has shaped our lives.
This, of course, includes our 2021 State of America’s Children report. Because, as one element of the report
makes clear “Our Children are Not Immune.”
Young People are Not Immune
Children are being impacted at every level: physically, economically, academically, socially, and psychologically.
As we consider child well-being in this country, this year’s report gives special attention to the various impacts of
the pandemic.
• As of February 25, 2021, 3,168,274 total child COVID-19 cases had been reported, representing
13.1 percent of all cases.
• October 2020 data analysis by the Center on Poverty & Social Policy (CPSP) at Columbia University
showed that an additional 8 million Americans—including 2.5 million children—have fallen into
poverty since May 2020.
• As of February 2021, more than 1 in 7 adults with children (14.5 percent) reported that their children
were not getting enough to eat—more than five times the pre-pandemic rate.
Chief among concerns more difficult to measure and monitor are the impacts on how our children are
processing this dramatic change. But a November 2020 report from the Centers for Disease Control and
Prevention (CDC) paints an important picture. By examining emergency room visits for mental health, the
CDC found increases of between 24 and 31 percent for people under the age of eighteen, compared to the same
period in 2019. Unfortunately, policies regarding reimbursement for services, coverage inequities, and cultural
stigma have contributed to emergency departments being the frontline of support for children’s mental health.
While more than 3 million children and youth have contracted the novel coronavirus in the United States,
all 73 million are impacted by the sense of uncertainty and disruption of routine it has caused. Even the
improvements in the second school year of online learning have not resolved concerns of social isolation and
the loss of important life milestones, like graduation and the high school prom. This loss of certainty, consistent
routine, and connection is leading to increased levels of depression and despair among our children and youth.
INTRODUCTION
Children’s Defense Fund4

INCOME AND WEALTH INEQUALITY INCOME AND WEALTH INEQUALITY
The State of America’s Children® 2021 5
INTRODUCTION
Black youth are especially vulnerable to 2020’s converging crises. COVID-19 and racial uprisings swept into
Black communities wrestling with spiking child suicide rates. In December 2019, the Congressional Black
Caucus’s Emergency Task Force on Black Youth Suicide and Mental Health released Ring the Alarm. The report
found that Black youth under 13 are twice as likely to die by suicide than their white counterparts and the
suicide death rate for Black youth is increasing faster than any other racial or ethnic group.
Time for Healing, Imagination, and Action
A year marked by such dramatic change and drastic negative impact on children’s lives must be followed
by one of healing and restoration. This healing will require disciplined reflection, radical imagination, and
bold action. Throughout the tumult of 2020, two of my most valued thought partners were the late writer
and activist James Baldwin (with whom I share a deep intellectual resonance and a birthday) and Princeton
professor Dr. Eddie Glaude, Jr.
Glaude reflected powerfully on “Jimmy’s” life in his 2020 book, Begin Again: James Baldwin’s America and
Its Urgent Lessons for our Own. A revelation of critical import to me is Glaude’s highlighting Baldwin’s insight
that times of reckoning and crisis call us to “do our first works over.” This is an invitation to re-examine our
foundational commitments, values, and stories to faithfully craft a future.
The Children’s Defense Fund is walking this path of examination. The board and staff entered the year in
discernment about the first leadership transition in our history. After having made the decision, we initiated
a process of organizational, programmatic, and operational planning holding our “first works” and children’s
needs in conversation.
As a result, even in what President Biden has called a “dark winter” considering the pandemic, the Children’s Defense Fund envisions a nation where marginalized children flourish, leaders prioritize their well-being, and communities wield the power to ensure they thrive. From where we currently stand, this is a radical
vision. Yet, we are committed to work – with you – to make it happen.
Join us. Allow this data, compiled by our extraordinary public policy team, to inform your disciplined reflection.
But don’t stop there. Pause and imagine a country where flourishing children smile, sing, and dance. Talk to
young people about what they desire for their lives. Then gather your neighbors, friends, and colleagues to
work together and improve the state of America’s children. We will be with you every step of the way.
For our children,
The Rev. Dr. Starsky Wilson
President & CEO
Children’s Defense Fund

INCOME AND WEALTH INEQUALITY
Children’s Defense Fund6
OVERVIEW
CHILD POPULATION: America’s children are more diverse than ever.
• There were 73 million children in the U.S. in 2019—22 percent of our nation’s population.
• In 2019, children of color made up 49.8 percent of all children and the majority of children under 5.
CHILD POVERTY: Children remain the poorest age group in America, with children of color and young children suffering the highest poverty rates.
• Nearly 1 in 7 children—more than 10.5 million—were poor in 2019. Nearly 71 percent of poor children were children of color. More than 1 in 4 Black children and more than 1 in 5 Hispanic and American Indian/Alaska Native children were poor compared with 1 in 12 white children.
• The youngest children are the poorest. More than 1 in 6 children under 6 were poor and almost half lived in extreme poverty below half the poverty line.
INCOME AND WEALTH INEQUALITY: Income and wealth inequality are growing and harming children in low-income, Black and Brown families.
• The share of all wealth held by the top one percent of Americans grew from 30 to 37 percent and the share held by the bottom 90 percent fell from 33 to 23 percent between 1989 and 2019.
• Today, a member of the top 10 percent of income earners makes about 39 times as much as the average earner in the bottom 90 percent.
• In 2019, the median family income of white households with children ($95,700) was more than double that of Black ($43,900), and Hispanic households with children ($52,300).
HOUSING AND HOMELESSNESS: The lack of affordable housing and federal rental assistance leaves millions of children homeless or at risk of homelessness.
• More than 1 in 3 children live in households burdened by housing costs, meaning more than 30 percent of their family income goes toward housing.
• More than 1.5 million children enrolled in public schools experienced homelessness during the 2017-2018 school year.
• 74 percent of unhoused students during the 2017-2018 school year were living temporarily with family or friends.
CHILD HUNGER AND NUTRITION: Millions of children live in food-insecure households, lacking reliable access to safe, sufficient, and nutritious food.
• More than 1 in 7 children—10.7 million—were food insecure, meaning they lived in households where not everyone had enough to eat. Black and Hispanic children were twice as likely to live in food-insecure households as white children.
• The Supplemental Nutrition Assistance Program (SNAP) helped feed 17 million children in Fiscal Year 2018—nearly a quarter of all children in America.
• Half of all families that received SNAP in 2019 were not able to get enough healthy food, however, because SNAP benefits were too low. Among households with children, monthly SNAP benefits averaged just $118 a person—or less than $4 a day.
The State of America’s Children® 2021
OVERVIEW

INCOME AND WEALTH INEQUALITY INCOME AND WEALTH INEQUALITY
The State of America’s Children® 2021 7
OVERVIEW
CHILD HEALTH: Our children have lost the health coverage they need to survive and thrive at an alarming rate.
• An estimated 4.4 million children under age 19, were uninsured—an increase of 320,000 more children without health insurance since 2018.
• Disparities in health insurance coverage persist. The rates of uninsured children are especially high among Hispanic children, undocumented children, children living in the South, and children in families with lower incomes.
• Medicaid and CHIP are the foundation of the nation's health insurance system for children. In 2019, nearly 36 million children under 19 received comprehensive, pediatric-appropriate and affordable health coverage through Medicaid and CHIP.
EARLY CHILDHOOD: The high cost of child care and lack of early childhood investments leaves many children without quality care during critical years of brain development.
• Center-based child care for an infant cost more than public college tuition in 28 states and the District of Columbia in 2019. More than 80 percent of two-child families were paying more for child care than for rent.
• During the 2018-2019 school year, only 34 percent of 4-year-olds and 6 percent of 3-year-olds were enrolled in a state-funded preschool program.
EDUCATION: America’s schools continue to slip backwards into patterns of deep racial and socioeconomic segregation, perpetuating achievement gaps.
• During the 2017-2018 school year, 19 percent of Black, 21 percent of Hispanic, and more than 26 percent of American Indian/Alaska Native public school students did not graduate on time compared with only 11 percent of white students.
• More than 77 percent of Hispanic and more than 79 percent of Black fourth and eighth grade public school students were not proficient in reading or math in 2019, compared with less than 60 percent of white students.
• In 2017, 60 percent of Black children attended high-poverty schools with a high share of students of color while fewer than 9 percent of white children did.
CHILD WELFARE: For the first time since 2012, the number of children in the child welfare system fell, but too many children wind up in foster care because of poverty.
• Black and American Indian/Alaska Native families are disproportionately impacted by the child welfare system. Nationally, Black and AI/AN children are represented in foster care at a rate 1.66 and 2.84 times their portion of the overall population, respectively.
• After steadily declining since 2008, the number of children aging out of the foster care system jumped by more than 14 percent in 2019, with 20,445 youth reaching adulthood without a permanent family.
YOUTH JUSTICE: A disproportionate number of children of color are incarcerated in the juvenile justice and/or adult criminal justice systems, placing them at risk of physical and psychological harm.
• Despite a 67 percent reduction in child arrests between 2009 and 2019, 530,581 children were arrested in the U.S and a child or teen was arrested every 59 seconds.
• Black children were 2.4 times more likely to be arrested and American Indian children were 1.5 times more likely to be arrested than white children.

OVERVIEW
• Black youth represented less than 15 percent of the total youth population but 52 percent of youth prosecuted in adult criminal court in 2018. Black youth are nine times more likely than white youth to receive an adult prison sentence, American Indian/Alaska Native youth are almost two times more likely, and Hispanic youth are 40 percent more likely.
GUN VIOLENCE: Child and teen gun deaths hit a 19-year high in 2017 and have remained elevated since.
• Gun violence was the leading cause of death for children and teens ages 1-19 in 2018, surpassing motor vehicle accidents for the first time.
• In 2019, 3,371 children and teens were killed with guns—one every 2 hours and 36 minutes.
• Black children and teens had the highest gun death rate, followed by American Indian/Alaska Native children and teens. Black children and teens were 4 times more likely to die from gun violence than their white peers.
• The United States has more guns than people—and nearly 1 in 5 are sold without background checks.
IMMIGRANT CHILDREN: Family separation and anti-immigrant policies are dangerous to children’s health, development, and well-being.
• Nearly 1 in 4, approximately 18 million, U.S. children lived with at least one immigrant parent in 2018.
• More than 1 in 4 immigrant children did not have health coverage in 2019, 25.5 percent compared to 5.1 percent of native-born citizen children.
• An estimated 6.9 million children lived with undocumented parents. Chronic uncertainty and distress about the threat of enforcement activity destroy children’s sense of safety and their mental health.
Children’s Defense Fund8
Each Day in America
2 mothers die from complications of childbirth. 5 children are killed by abuse or neglect. 8 children or teens die by suicide. 9 children or teens are killed with a gun. 20 children or teens die from accidents. 46 children or teens are injured with a gun. 59 babies die before their first birthday. 121 children are arrested for violent crimes. 223 children are arrested for drug crimes. 514 public school students are corporally punished.* 678 babies are born without health insurance. 827 babies are born into extreme poverty. 860 babies are born with low birthweight. 1,541 babies are born into poverty. 1,785 children are confirmed as abused or neglected. 1,909 children are arrested. 2,906 high school students drop out.* 14,206 public school students are suspended.*
* Based on 180 school days a year
The State of America’s Children® 2021 9

INCOME AND WEALTH INEQUALITY
10 Children’s Defense Fund
MOMENTS
*Based on 180 school days a yearNotes: Where possible, racial categories (White, Black, Asian/Pacific Islander, American Indian/Alaska Native) do not include Hispanic children.
MOMENTS
Moments in America for Children by Race/Ethnicity
Asian/ American Indian/ All Children White Hispanic Black Pacific Islander Alaska Native Number of Children 73,039,150 36,682,894 18,687,565 10,007,157 3,831,129 615,950 Percent of the Child Population 100% 50.2% 25.6% 13.7% 5.2% <1%
A public school student is suspended* Every 2 seconds Every 6 sec Every 9 sec Every 4 sec Every 2 min and 19 sec Every 2 min
Conditions lead a high school student to drop out* Every 9 seconds Every 19 sec Every 28 sec Every 53 sec n/a n/a
A child is arrested Every 45 seconds Every min and 12 sec n/a Every 2 min and 15 sec Every 54 min Every 33 min
A child is confirmed abused or neglected Every 48 seconds Every 2 min Every 3 min and 30 sec Every 4 min Every 1 hr and 7 min Every 58 min
A public school student is corporally punished* Every 49 seconds Every 2 min Every 11 min Every 2 min Every 6 hrs and 38 min Every 46 min
A baby is born into poverty Every 1 minute Every 3 min Every 2 min and 15 sec Every 5 min Every 37 minutes Every 9 hrs and 38 min
A baby is born without health insurance Every 2 minutes Every 4 min Every 8 min and 25 sec Every 19 min Every 37 min Every 2 hr and 39 min
A baby is born into extreme poverty Every 2 minutes Every 5 min Every 5 min Every 10 min Every 1 hr and 15 min n/a
A baby is born at low birthweight Every 2 minutes Every 4 min Every 8 min Every 7 min n/a n/a
A child is arrested for a drug offense Every 6.5 minutes Every 9 min n/a Every 30 min Every 7 hrs Every 5 hrs
A child is arrested for a violent offense Every 12 minutes Every 25 min n/a Every 25 min Every 13 hrs Every 11 hrs and 23 min
A baby dies before their first birthday Every 25 minutes Every 59 min Every 2 hrs Every 1 hr and 26 min Every 11 hrs and 15 min Every 1.5 days
A child or teen dies from an accident Every hour and 11 minutes Every 2 hrs and 14 min Every 5 hrs and 30 min Every 5 hrs and 43 min Every 2 days Every 2 days
A child or teen is injured with a gun Every 2 hours and 36 minutes Every 7 hrs and 35 min Every 15 hrs and 24 min Every 6 hrs Every 5.5 days Every 8 days
A child or teen dies by suicide Every 3 hours and 11 minutes Every 5 hrs Every 18 hrs and 13 min Every day and 4 hrs Every 4 days Every 4 days
A child is killed by abuse or neglect Every 5 hours Every 13 hrs and 32 min Every 1.5 days Every 20 hrs and 19 min Every 2.5 weeks Every 5 weeks
A mother dies from complications of childbirth or pregnancy Every 11 hours and 40 minutes Every 25 hrs Every 3.5 days Every 1.5 days Every 1.5 weeks Every 3.5 weeks

INCOME AND WEALTH INEQUALITY INCOME AND WEALTH INEQUALITY
11
The State of America’s Children® 2021
MOMENTS
Moments in America for Children by Race/Ethnicity
Asian/ American Indian/ All Children White Hispanic Black Pacific Islander Alaska Native Number of Children 73,039,150 36,682,894 18,687,565 10,007,157 3,831,129 615,950 Percent of the Child Population 100% 50.2% 25.6% 13.7% 5.2% <1%
A public school student is suspended* Every 2 seconds Every 6 sec Every 9 sec Every 4 sec Every 2 min and 19 sec Every 2 min
Conditions lead a high school student to drop out* Every 9 seconds Every 19 sec Every 28 sec Every 53 sec n/a n/a
A child is arrested Every 45 seconds Every min and 12 sec n/a Every 2 min and 15 sec Every 54 min Every 33 min
A child is confirmed abused or neglected Every 48 seconds Every 2 min Every 3 min and 30 sec Every 4 min Every 1 hr and 7 min Every 58 min
A public school student is corporally punished* Every 49 seconds Every 2 min Every 11 min Every 2 min Every 6 hrs and 38 min Every 46 min
A baby is born into poverty Every 1 minute Every 3 min Every 2 min and 15 sec Every 5 min Every 37 minutes Every 9 hrs and 38 min
A baby is born without health insurance Every 2 minutes Every 4 min Every 8 min and 25 sec Every 19 min Every 37 min Every 2 hr and 39 min
A baby is born into extreme poverty Every 2 minutes Every 5 min Every 5 min Every 10 min Every 1 hr and 15 min n/a
A baby is born at low birthweight Every 2 minutes Every 4 min Every 8 min Every 7 min n/a n/a
A child is arrested for a drug offense Every 6.5 minutes Every 9 min n/a Every 30 min Every 7 hrs Every 5 hrs
A child is arrested for a violent offense Every 12 minutes Every 25 min n/a Every 25 min Every 13 hrs Every 11 hrs and 23 min
A baby dies before their first birthday Every 25 minutes Every 59 min Every 2 hrs Every 1 hr and 26 min Every 11 hrs and 15 min Every 1.5 days
A child or teen dies from an accident Every hour and 11 minutes Every 2 hrs and 14 min Every 5 hrs and 30 min Every 5 hrs and 43 min Every 2 days Every 2 days
A child or teen is injured with a gun Every 2 hours and 36 minutes Every 7 hrs and 35 min Every 15 hrs and 24 min Every 6 hrs Every 5.5 days Every 8 days
A child or teen dies by suicide Every 3 hours and 11 minutes Every 5 hrs Every 18 hrs and 13 min Every day and 4 hrs Every 4 days Every 4 days
A child is killed by abuse or neglect Every 5 hours Every 13 hrs and 32 min Every 1.5 days Every 20 hrs and 19 min Every 2.5 weeks Every 5 weeks
A mother dies from complications of childbirth or pregnancy Every 11 hours and 40 minutes Every 25 hrs Every 3.5 days Every 1.5 days Every 1.5 weeks Every 3.5 weeks

CHILD POPULATION
2020In 2019, there were over 73 million children in the United States—making up 22 percent of our
nation’s population.1
The U.S.—and especially our youngest generation—is reaching a critical moment in racial and ethnic diversity. We need policies and programs that recognize and celebrate this growing diversity.
• In 2019, children of color made up 49.8 percent of all children.• More than half of the 19.6 million children under five in America in 2019 were children of color.2
• The majority of children under 18 were children of color in 14 states—Alaska, Arizona, California, Delaware, Florida, Georgia, Hawaii, Maryland, Mississippi, Nevada, New Jersey, New Mexico, New York and Texas—and the District of Columbia (see Table 1).
• In 2019, 36.7 million children were white (50.2 percent); 18.7 million were Hispanic (25.6 percent); 10 million were Black (13.7 percent); 3.7 million were Asian (5.0 percent); 615,950 were American Indian/Alaska Native (<1 percent); and 147,057 were Native Hawaiian/Other Pacific Islander (<1 percent).3
• Previous estimates suggest the majority of all U.S. children are children of color as of 2020 and the U.S. population will continue to become more racially and ethnically diverse.4
The U.S. is also graying and approaching a tipping point in age, with older adults set to outnumber children.• While the proportion of the population that is younger than 18 has been gradually decreasing
(from 24.0 percent in 2010 and 22.3 percent in 2019), the proportion of the population that is 65 or older continues to steadily increase (from 13.1 percent in 2010 and 16.5 percent in 2019).5
• Given current trends, it is expected that the share of seniors will continue to grow and there will be more seniors than children by 2040.6
• We must prepare our nation to support its aging population, but also plan ahead to ensure our increasingly diverse child population is set from birth on a path to a productive and successful future with the foundation necessary to support future generations.
Our current federal spending reflects our nation’s skewed priorities: Our children are our future but are not getting the investments they need to thrive.
• Despite children making up such a large portion of our population, less than 7.5 percent of federal spending went towards children in FY2020.7
• Although Congress raised statutory caps on discretionary spending in FY2018-FY2020, children didn’t receive their fair share of those increases and children’s share of total federal spending has continued to decline between FY2016 and FY2020.8
THE YEAR CHILDREN OF COLOR BECAME THE MAJORITY OF CHILDREN IN AMERICA.
Children’s Defense Fund12

13
The State of America’s Children® 2021
CHILD POPULATION

Children’s Defense Fund
OF CHILDREN IN POVERTY ARE CHILDREN OF COLOR
71%CHILD POVERTY
The COVID-19 pandemic has not only disrupted the everyday lives of our children, it has also exacerbated our nation’s greatest moral disgrace: child poverty. Even before the pandemic, children, particularly children
of color and very young children, were the poorest Americans. More than 10 million children—nearly 1 in 7 (14.4 percent)—lived in poverty in 2019, the most recent year for which U.S. Census Poverty Data are available.1 The child poverty rate is one-and-a-half times higher than that for adults ages 18-64 (9.4 percent) and adults 65 and older (8.9 percent) (see Table 2). In 2019, a family of four was considered poor if their annual income fell below $26,172, which amounts to $2,181 a month, $503 a week, or less than $72 a day (see Table 3). Almost half of all children living in poverty lived in extreme poverty, which is defined as half the poverty threshold or an annual income of $13,086 for a family of four.
Historical, systemic racism and institutional barriers mean that children of color have been particularly vulnerable to child poverty. Black and Hispanic children experience some of the highest poverty rates in the country, and 71 percent of children in poverty in 2019 were children of color.
• Nearly 1 in 5 children of color in America (20.5 percent) were poor. Children of color were 2.5 times more likely to be poor than their white, non-Hispanic peers.2
• 3.6 million children under six were living in poverty in 2019. Nearly 1 in 6 infants, toddlers, and preschoolers ages 0-5 were poor (15.4 percent).3
• More than 1 in 4 Black children (26.5 percent) and 1 in 5 Hispanic children (20.8 percent) and American Indian/Alaska Native children (20.6 percent) were poor, compared with 1 in 12 white, non-Hispanic children (8.3 percent) and 1 in 14 Asian, Native Hawaiian, and other Pacific Islander children (7.7 percent) (see Tables 4-5).4
Our youngest Americans are being hit hardest during their years of greatest development. • Nearly 1 in 6 children under six were poor in 2019 and almost half of them lived in extreme poverty
(see Table 6).
Children’s chances of being poor are also a result of the lottery of geography—with some states and regions having higher rates of poverty and inequality than others—as well as dramatic differences in services and support for children in families with low-incomes.
• More than 25 percent of Black children were poor in 39 states and the District of Columbia in 2019; Hispanic children, in 22 states; and American Indian/Alaska Native children, in 24 states.
• No states had white child poverty rates 20 percent or higher (see Table 6).• Black children are more likely than white children to live in states where benefits from Temporary
Assistance for Needy Families (TANF), the nation’s core cash assistance program, are lowest.5 State-level decisions about benefit allocation and amounts are too often rooted in historical racism and have disparate impacts on Black families.6
This pandemic has exposed how unequal our pre-COVID economy was: families were working to take care of their children, but the unjust and unequal economy built by our political leaders was not working for them and left millions of children behind. More than two-thirds of poor children (70.1 percent) had at least one family member who worked in 2019, and more than one-third (33.7 percent) had at least one family member who worked full-time year-round.
14

15
The State of America’s Children® 2021
CHILD POVERTY
We know what works when children and families are in financial crisis.7 Mountains of evidence show the benefit of government assistance programs,8 which help curb the negative effects poverty has on children, families, and the economy. Investing in children and their healthy development not only helps our economy, but helps reduce racial disparities and improve opportunities for children in the long run.
• In 2019, more than four million children were lifted out of poverty with the help of the Child Tax Credit (CTC) and Earned Income Tax Credit (EITC); more than 1.4 million with Social Security; nearly 1 million with Supplemental Nutrition Assistance Program (SNAP); 763,000 with housing subsidies; 661,000 with the National School Lunch Program; 536,000 with the Supplemental Social Insurance (SSI); 160,000 with Temporary Assistance for Needy Families (TANF) and general assistance; 133,00 with Unemployment Insurance and 127,000 with the Special Supplemental Nutrition Program for Women, Infants, and Children (WIC).9
Child poverty and racial disparities will worsen if we do not continue to ensure relief for families and expand basic needs programs to help all children learn, grow, and thrive during this pandemic and beyond. Cash assistance, child allowances, rental and housing support, SNAP, and unemployment insurance are all relief measures that must be boosted in the short and long term to help families.
Each September, the U.S. Census Bureau releases income, poverty, and health insurance statistics from the prior year. The official poverty estimates and poverty thresholds released by the Census Bureau inform important policy choices, yet they fail to fully and meaningfully capture who is experiencing poverty and what a family requires to survive and thrive in the 21st century economy. Additionally, as economic conditions have changed dramatically this year, the available data inadequately depicts the challenges that children and families are experiencing due to the impacts of COVID-19. Official Census Bureau measures of poverty are based on a family’s annual resources, which means this data is not only outdated, but creates a lag that makes it hard to spot trends in poverty or measure the impact of policy responses in real time.
However, an October 2020 data analysis by the Center on Poverty & Social Policy (CPSP) at Columbia University monitored monthly poverty estimates, which showed that an additional eight million Americans—including 2.5 million children—have fallen into poverty since May 2020.10 The findings revealed that poverty rose beyond pre-COVID levels after Congress allowed COVID relief to expire. Although the stimulus checks and expanded unemployment benefits included in the CARES Act initially prevented a rise in poverty, keeping as many as 18 million Americans out of poverty in April and May of 2020, CPSP found much of this progress was reversed throughout the summer after cash assistance ended in June and the $600 weekly extra unemployment benefits expired in July.11 By September 2020, the poverty reduction impact of the relief legislation had fallen dramatically and poverty rates had risen among all groups, according to Columbia’s analysis.12 Columbia’s work underscores the importance of frequently updated data to inform wise policy choices, and a forthcoming February 2021 report will update the monthly poverty estimates at a crucial time when a new Congress and administration will be in place.
Advocates and policymakers need consistent, non-partisan, evidence-based, statistically and economically relevant and timely data on child poverty and family income to better respond to this economic crisis and protect children and families from harm.
COVID-19 and the Need for Real-Time Data and Updated Measures of Poverty

INCOME AND WEALTH INEQUALITYINCOME AND WEALTH INEQUALITY
IN 2019 THE MEDIAN WHITE FAMILY HAD ALMOST
EIGHT TIMES MORE WEALTH THAN THE MEDIAN BLACK FAMILY ANDFIVE TIMES MORE THAN THE MEDIAN HISPANIC FAMILY.
A family’s income is critical to ensuring basic needs are met for a child’s life. Income, which is the revenue a family receives, either from work or return on investment, helps a family put food on the table and keep
a roof over their heads. Income inequality is the extent to which income is concentrated among the wealthiest few rather than shared equally among all earners. In the U.S., our economic rules have favored the rich at the expense of our communities’ well-being, especially communities of color. People are working harder than ever, but a powerful and wealthy few CEOs, corporations, and billionaires reap the benefits, raking in record profits off lower-income workers’ production while their families struggle to get by.
On the surface, data tells a rosy story about incomes in America; median household income grew by 4.5 percent between 2018 and 2019 to $65,712, the highest level in history.1 But in recent decades, incomes have grown very quickly for the rich, and relatively slowly for everyone else. Since 1979, incomes for the top 1 percent of earners have grown by 261 percent, compared with only 49 percent for the middle 60 percent of earners.2 These unequal growth rates have produced some astonishing present-day income disparities:
• The top 20 percent of households earn, on average, about 14 times more than households in the bottom 20 percent.3 In 1975, the average household income of the top 20 percent of Americans was 10 times that of the bottom 20 percent.4
• A member of the top 10 percent of income earners makes about 39 times as much as the average earner in the bottom 90 percent; the average member of the richest 0.1 percent of the population earns about 196 times more than an average earner in the bottom 90 percent.5
• In 2019, the share of total income going to the top 10 percent was almost 50 percent and the share going to the top 1 percent was 19 percent (see Figure 1).6
In short, incomes have exploded for the rich, while creeping up slowly for the vast majority of earners, a fact that has corrosive effects on the American Dream. Slow-growing family income means that economic mobility is on the decline and children born into low-income families may grow up to make less money than their parents.7
Income inequality contributes to another runaway economic problem: wealth inequality. Wealth or net worth refers to the total value of a person or family’s money, property, and other assets minus any debt they hold; wealth inequality is the disproportionate concentration of wealth among the richest few. Like income inequality, wealth inequality has increased for decades and reached levels not seen for almost a century. Today, wealth is even more concentrated than income.8
• In 2019, compared to 1989, the share of wealth held by the top one percent of Americans grew from 30 to 37 percent of all wealth and the share held by the bottom 90 percent fell from 33 to 23 percent.9 The top 10 percent of Americans owned more than 75 percent of all wealth in 2019 (see Figure 2).10
• In total, the richest five percent own more than two-thirds of the country’s wealth. The richest one percent own more than half of the stock owned by private Americans, but hold just five percent of the same group’s debt.11
Figure 2: Share of Total U.S. Wealth Held by Income Group, 2019
Top 1 Percent
37%
Next 9 Percent
39%
Bottom 90 Percent
22%
Children’s Defense Fund16
Figure 1: Share of Total U.S. Income Held by Income Group, 2019
Bottom 90 Percent
54%
Top 1 Percent
19%
Next 9 Percent
27%

INCOME AND WEALTH INEQUALITY INCOME AND WEALTH INEQUALITY
17
The State of America’s Children® 2021
• In 2018, the three richest men in the United States—Jeff Bezos, Bill Gates and Warren Buffet—held as much wealth as the entire bottom half of Americans.12
This is not by chance. For centuries, our nation’s policies have been intentionally constructed in a way that has disproportionately denied families with low incomes, especially families of color, the opportunity to build wealth. Racist housing policies, for example, led to differences in homeownership rates that today account for nearly one-third of the racial wealth gap.13 As a result of such policies, racial income and wealth inequality in our nation is staggering. For example:
• In 2019, the median income of Black ($43,900), Hispanic ($52,300), and American Indian ($48,000) families with children was about half the median income of white families with children ($95,700) (see Table 7).
• For every $1 earned by the median white household in 2019, the median Black household only earned 61 cents and the median Hispanic household, 74 cents.14
• In 2019, the median net worth of white families ($188,200) was almost eight times more than Black families ($24,100) and five times more than Hispanic families ($36,100).15
• Today’s median Black family owns $3,600—just 2 percent of the median white family’s wealth. The median Latino family owns $6,600—only 4 percent of that of the median white family.16
• The 400 richest people in the U.S. hold more wealth than every Black household plus a quarter of Hispanic households combined.17
Inequality is a global phenomenon, but the U.S. does not fare well even when compared with other industrialized countries. In 2019, the U.S. held the largest share of the world’s wealth (nearly 30 percent).18 Studies suggest, however, that the U.S. has the highest level of wealth inequality and one of the highest levels of income inequality among developed countries.19
INCOME AND WEALTH INEQUALITY
Figure 3: Share of Total U.S. Wealth Held by Race, 2020
White
86%
Black
4%
Hispanic
2% Other
10%
As the COVID-19 pandemic raged and millions of families lost jobs, a familiar pattern accelerated: the rich got richer, while everyone else suffered.
The pandemic, and the corresponding economic recession, hit low-income workers hardest with lost jobs, wages, and livelihoods. Low-income workers experienced the highest job loss rate during the pandemic, but comparatively few of the highest-income workers lost their jobs.20 In all, more than ten percent of workers between the ages of 25 and 54 lost their jobs during the pandemic.21 Over half of families with children experienced a job loss or loss of income during the pandemic, with those losses concentrated at the lower-end of the income distribution.22
While low-income workers were laid off at staggering rates, the wealthiest few saw their fortunes expand dramatically. According to an Institute for Policy Studies analysis, the combined wealth of all U.S. billionaires increased by more than $1 trillion between March and December 2020, from approximately $3 trillion to about $4 trillion.23 Elon Musk’s net worth increased by about $100 billion during the pandemic.24 Jeff Bezos’s fortune grew by about $70 trillion.25 Although the stock market, took an initial hit in the spring, it has since recovered and remains near an all-time high.
Racial inequality has continued to widen during the pandemic as well. Black, Hispanic, and Indigenous communities were more likely to get sick and die from COVID-19 in addition to having greater chances of becoming unemployed during the pandemic, despite being overrepresented among “essential workers.”26 As the economic recovery progressed, job and income losses for white people bounced back much more quickly than for Black or Hispanic people.27
COVID-19 Made the Rich Even Richer and Widened Inequality

HOUSING AND HOMELESSNESS
CHILDREN ENROLLED IN PUBLIC SCHOOLS EXPERIENCED HOMELESSNESS DURING THE 2017-2018 SCHOOL YEAR.
Having a safe, stable home is a basic need for all children. Homelessness, unstable housing, and the unavailability of affordable housing have dire consequences for children’s health, education, and future
earning potential. Yet, the right to a decent, safe, and affordable home was out of reach even before the COVID-19 crisis for far too many children and families—but particularly for Black, Hispanic, and Indigenous families. Access to housing is a racial justice issue as families of color, especially Black families, are more likely to experience eviction, homelessness, and segregated housing and neighborhoods due to racist policies built deep into our housing system.
The affordable housing crisis has deep and racist roots, but stems largely from policymakers’ intentional divestment from affordable housing and rental assistance programs.
• Federal investment in housing was gutted in the 1970s and 80s and the number of unhoused children and families skyrocketed. The crisis deepened after the 2008 financial crisis as foreclosures forced 9 million new families into the rental market.1
• As more families sought affordable and safe rental housing, construction failed to keep pace with growing demand, and the new units built were mostly luxury units in big cities. Rents rose and working-class wages remained stagnant, leaving many families unable to find suitable housing.2
• By 2020, rents were so high that a person working full-time, year-round at minimum wage could not afford the monthly Fair Market Rent for a two-bedroom rental unit in any state or the District of Columbia and still have enough money for food, utilities, and other necessities.3 To afford this rent, a single person working full-time would have to make almost $24 an hour, more than three times the federal minimum wage (see Table 8).4
These barriers to prosperity and disinvestment in federal housing programs have put decent, affordable housing out of reach for millions of people and disproportionately impacted Black, Hispanic, and Indigenous communities. Families with children are hit especially hard by the affordable housing crisis.
• More than 1 in 3 children live in households burdened by housing costs, meaning more than 30 percent of their family income goes toward housing.5 Sixty-one percent of children in low-income households are rent-burdened.6
• Nearly 2.6 million families with children experience “worst-case housing needs,” meaning they are extremely rent-burdened, their income is at or below the poverty line, they spend half of their income on housing, and receive no housing assistance from the government.7
• Twenty percent of Black households, 17 percent of American Indian or Alaska Native households, 15 percent of Hispanic households, and 10 percent of Asian households (compared to just six percent of white households), are extremely low-income renters and are often locked out of affordable housing due to systemic and structural racism and decades of racist policies.8
The affordable housing crisis is the primary reason so many families are unhoused. Children made up 107,069—nearly 1 in 5—of the nearly 568,000 people who were unhoused on a single night in January 2019.9
• Thirty percent of people who were unhoused were in families with children, and half of all families who are unhoused with children lived in just three states: California, Massachusetts, and New York. Family homelessness declined by 5 percent between 2018 and 2019 and by 27 percent between 2007 and 2019.10
• In 2019, more than half of individuals in families who were unhoused were Black.11 Black youth are 83 percent more likely than youth of other races to be unhoused.12
• More than 1.3 million children under six were unhoused in 2017.13
18 Children’s Defense Fund
MORE THAN
1.5 MILLION

19
The State of America’s Children® 2021
HOUSING AND HOMELESSNESS
More than 1.5 million unhoused children were enrolled in public schools during the 2017-2018 school year, according to the Department of Education, excluding younger children and youth not enrolled in school (see Table 9).14
• The number of unhoused students has increased by 15 percent since the 2015-2016 school year.15
• Seventy-four percent of unhoused students during the 2017-2018 school year were living temporarily with family or friends; 12 percent were in shelters or transitional housing; 7 percent were in hotels or motels; and 7 percent were unsheltered, often living in abandoned buildings or cars.16
• Access to school for unhoused children is complicated by economic mobility and the lack of school supplies and clothes, funds for transportation, and necessary records to enroll in a new school. The trauma, poor physical and mental health, hunger, and fatigue many experience continue to challenge these children when they get to school.
• In addition to school-aged public school students, 4.2 million teens and young adults experienced homelessness during 2016 and 2017.17 Black and Hispanic youth, youth living in poverty, and young adults; youth with less than a high school diploma or GED; young parents; youth aging out of foster care; and LGBTQ youth were all at especially high risk of homelessness.
Housing insecurity and homelessness are exacerbated by a lack of accessible federal assistance. This assistance is extremely effective, but these programs do not come close to meeting families’ needs because they are woefully underfunded.
• Families with children make up 60 percent of those helped by federal rental assistance.• Although federal rental assistance can help reduce homelessness, housing instability, and overcrowding,
only 1 in 4 eligible households receive it.18
• Housing vouchers can help families move from areas of concentrated poverty to lower-poverty neighborhoods. Children who moved from concentrated poverty neighborhoods before age 13 have been shown to have higher earnings as 26-year-old adults when compared with those who did not leave the neighborhoods.19
• Vouchers for unhoused families with children reduce foster care placements by more than half and also reduce school moves and other hardships.20
The pandemic has accelerated the nationwide affordable housing crisis and the racial inequities in housing. By February 2021, the hardship facing renter families with children was staggering. More than a quarter of renter families with children were behind on their rent.21 In February, nearly 4 in 10 of those families reported little or no confidence in their ability to pay the next month’s rent.22 Most shocking of all, almost half of renter families with children said it was either somewhat or very likely that they would lose their home within the next two months due to eviction.23
Though evictions were banned in many states and localities for much of 2020 and banned nationwide beginning in September by the Centers for Disease Control and Prevention (CDC), many evictions slipped through the patchwork of legal protections and became a major driver of the spread of COVID-19. Evictions that took place between the beginning of the pandemic and the CDC’s national eviction moratorium in September led to 433,700 excess COVID-19 cases and 10,700 additional deaths.24
If the CDC's eviction moratorium is allowed to expire before renters receive adequate assistance from Congress, 30 to 40 million renters are at risk of losing their home due to eviction.25 The fallout from such a wave of evictions would be devastating, a crisis primed by the nation's failure to address its underlying affordable housing crisis.
COVID-19 Has Pushed Millions of Children and Families to the Brink of Eviction

Children need healthy food to grow, learn, and thrive. Even before the COVID-19 pandemic, however, children in America went hungry at alarming rates. Institutional racism, low wages, and other inequities
made it impossible for many families—especially Black, Hispanic, and Indigenous families—to put food on the table. At the same time, policymakers have refused to adequately fund nutrition programs to reach and feed all children in need. Millions of children entered this crisis without consistent access to nutritious food, leaving them especially vulnerable to hunger and harm.
In 2019, more than 1 in 7 children—10.7 million—were food insecure, meaning they lived in households where not everyone had enough to eat (see Table 10). These households struggled to afford and access healthy meals, forcing them to rely on low-cost food to feed their children, skip meals, or even go hungry.
• Black and Hispanic children were twice as likely to live in food-insecure households as white children. Nearly 1 in 4 Black children (24.1 percent) and 1 in 5 Hispanic children (19.2 percent) lived in households that didn’t get enough food to eat in 2019, compared with 1 in 9 white children (11.0 percent).1
• Younger children also faced a greater risk of hunger. Households with children under 6 were more likely to lack access to healthy food than households with children under 18.2
• The majority of households experiencing hunger struggle to put food on the table even with full- or part-time employment. In 2019, 61 percent of households experiencing hunger were in the labor force; 51 percent had at least one full-time worker.3 With living expenses rising, wages stagnating, and systemic racism, food and other basic necessities are becoming increasingly out of reach for working families.
• Lack of nutritious and healthy food is linked to low birth weight and birth defects, physical and mental health problems, oral health problems, and poor educational outcomes.4
School meal programs like the National School Lunch Program (NLSP) and the National School Breakfast Program (SBP) are a critical source of nutritious food for children experiencing hunger and poverty. Many children typically consume up to two full meals a day at school and too often, these are the only meals they can count on.
• Nearly half of all public school students rely on free or reduced-price school meals to meet their daily nutritional needs.5 During the 2018-2019 school year, more than 21.6 million children received free or reduced-price school lunch, and 12.4 million received free or reduced-price breakfast (see Table 11).
• While most schools are now serving free meals to all children regardless of income in response to COVID-19, a growing number offered universal meals through the Community Eligibility Provision (CEP) prior to the pandemic. During the 2019-2020 school year, nearly 30,700 schools serving 14.9 million children participated in community eligibility,6 allowing them to offer free meals to every student without processing applications or collecting meal fees. This is up from nearly 28,800 schools that participated during the previous school year. Serving meals to all students at no charge reduces administrative burdens and costs, enabling schools to invest time and resources in building stronger nutrition programs that reach more children.
Even during traditional school years, however, most children who receive free or reduced-price school meals cannot access them when schools are closed after school, on weekends, and over the summer. Prolonged school closures due to COVID-19 are now exacerbating the systemic gaps in federal nutrition support, leaving children without reliable access to healthy meals year round.
CHILD HUNGER AND NUTRITION
Children’s Defense Fund20
CHILDREN LIVED IN FOOD-INSECURE HOUSEHOLDS BEFORE THE COVID-19 PANDEMIC.
MORE THAN
1 in 7

21
The State of America’s Children® 2021
CHILD HUNGER AND NUTRITION
• Only 1 in 15 eligible children received after school suppers through the At-Risk Afterschool Meals component of the Child and Adult Care Food Program (CACFP) on an average weekday in October 2019.7
• In summer 2019, the Summer Food Service Program (SFSP) and the Seamless Summer Option (SSO) through the NSLP reached only 1 in 7 children (13 percent) who received free or reduced-price lunch during the 2018-2019 school year (see Table 11). This marks the fourth year in a row that participation in summer nutrition programs declined.
The Supplemental Nutrition Assistance Program (SNAP)—our nation’s largest federal nutrition program— helps connect children to healthy meals to supplement food budgets, improve health, and reduce poverty. Due to limited funding, however, SNAP benefits fall far short of meeting the need—and that need has only grown since the pandemic began.
• The Supplemental Nutrition Assistance Program (SNAP) helped feed 17 million children in Fiscal Year 2018—nearly a quarter of all children in America (see Table 12). SNAP participation is linked to improved health and educational outcomes .8
• SNAP lifted nearly one million children out of poverty in 2019 and helps more children escape deep poverty than any other government program.9
• In FY2018, 3.8 million households had no income except SNAP benefits, including 1.2 million households with children.10
• Half of all families that received SNAP in 2019 were not able to get enough healthy food,11 however, because SNAP benefits were too low. Among households with children, monthly SNAP benefits averaged just $118 a person—or less than $4 a day.12
Federal nutrition programs like SNAP must be strengthened and expanded to support children’s well-being and success.
• Calculating SNAP benefits using the Low Cost Food Plan rather than the current Thrifty Food Plan would increase SNAP benefits by 31 percent, improve SNAP’s anti-hunger impact, and lift 1.5 million children out of poverty.13
• Boosting SNAP is smart economic policy, especially during recessions. Every $1 invested in SNAP generates $1.50 to $1.80 in economic activity and creates jobs.14
Child hunger was a crisis long before the COVID-19 pandemic—and it has only worsened since. Widespread school and child care closures have left millions of children without reliable access to affordable meals, while record job losses have made it even harder for families to keep food on the table at home. Now, child hunger is reaching dangerous new heights. As of February 2021, more than 1 in 7 adults with children (14.5 percent) reported that their children were not getting enough to eat15—more than five times the pre-pandemic rate (3 percent).16
Due to historic and systemic racism, children of color are going hungry at even higher rates. As of February 2021, more than 1 in 5 Black and Hispanic adults with children (22.8 percent and 20.6 percent, respectively) said their households were not getting enough to eat compared with 1 in 10 white adults with children (10.4 percent).17 If unemployment and poverty rates remain elevated, as many as 1 in 4 children—18 million in total—could be at risk of going hungry as a result of COVID-19.18 Without continued and expanded nutrition assistance during the pandemic and beyond, rising child hunger will devastate our children’s development and community success for years to come.
COVID-19 is Deepening America’s Longstanding Hunger Crisis

CHILDREN LOST HEALTH INSURANCE BETWEEN 2016 AND 2019.
726,000 A ll children need access to comprehensive, affordable health coverage that is easy to get and to keep.
Yet, even before our country began facing a devastating pandemic that has left more than 28 million Americans infected with the coronavirus, including more than 3 million children, our children were losing access to the health coverage they need to survive and thrive at an alarming rate.1
Decades of hard-fought progress to expand access to comprehensive, affordable health and mental health coverage through expansions of Medicaid, the Children’s Health Insurance Program (CHIP), and the Affordable Care Act brought the rate of uninsured children in America to an historic low. However, over the course of the last three years, our nation has shamefully reversed course and the number of uninsured children in America continues to steadily increase.2
• In 2019, an estimated 5.7 percent of children under age 19 (nearly 4.4 million) were uninsured—an increase of 320,000 more children without health insurance since 2018 (see Table 13). This is the third year in a row the number of uninsured children has grown and it is the largest annual increase in more than a decade.3
• This data also highlights continued and worsening disparities in health insurance coverage. The rates of uninsured children were especially high among Hispanic children, undocumented children, children living in the South, and children in families with lower incomes; and these children were among those that experienced some of the greatest increases in uninsured rates between 2018 and 2019.4
• This means millions of children and families lacked health insurance even before the rapid spread of the COVID-19 pandemic and the beginning of the economic crisis where many parents became unemployed and lost access to job-based health insurance. While fortunately, some of these children may be eligible for Medicaid and CHIP, it is but certain that many of them are going uninsured.5 In 2018, more than half (57.4 percent) of uninsured children were eligible for Medicaid or CHIP, demonstrating the critical need for outreach and enrollment efforts.6
Unfortunately, this is far from surprising given sustained efforts over the last four years by the Trump administration to undermine the public health insurance system, including Medicaid and CHIP, which form the backbone of the health insurance system for children in low- to middle-income families, as well as the administration’s anti-immigrant rhetoric and policies which have led many families to remove their eligible children—many of them U.S. citizens—from the health coverage they need out of fear of repercussions.7
• In 2019, Medicaid and CHIP provided comprehensive, pediatric-appropriate and affordable health coverage to more than 36 million children under 19 (see Table 14).
• More than half of American Indian/Alaska Native, Black, multi-racial, and Hispanic children rely on Medicaid and CHIP as their source of health coverage.8
• Following steady increases in child enrollment in Medicaid and CHIP since 2007, 2017 was the first year to not see an increase despite a strong economy—and those numbers have only gotten worse in subsequent years. Child enrollment in Medicaid and CHIP decreased by 821,000 between 2017 and 2018 and decreased by 224,000 between 2018 and 2019.9
• Children in low-income families are far more likely to be covered by Medicaid and CHIP than private insurance. In 2019, 72 percent of children in low-income families had public health insurance coverage, including Medicaid, CHIP, Medicare, and TRI-CARE.10
• These health insurance programs provide lifelong benefits that far outweigh the short-term costs. The National Bureau of Economic Research compared children eligible for Medicaid during childhood with those not eligible and found Medicaid-eligible children were more likely to attend college and make greater contributions as adult taxpayers.11
Children’s Defense Fund22
CHILD HEALTH

INCOME AND WEALTH INEQUALITY
23
The State of America’s Children® 2021
We know that children with health coverage are more likely to receive the preventive services they need, including immunizations; miss fewer days of school and have better educational outcomes; and grow up to be more economically secure and more likely to contribute to their communities.12 As children are losing coverage at staggering rates, there will be long-term consequences for their health and well-being.
When parents have health coverage, their children are more likely to have health coverage. • A child is eight times more likely to have public health insurance if their parent has it.13
• States that have expanded Medicaid coverage to parents have higher Medicaid participation among children. For example, Massachusetts’ coverage expansion for parents cut the rate of uninsured children in half.14
• While 33 states and the District of Columbia have expanded Medicaid to very low-income parents and adults under the ACA’s expansion option, 12 states have not done so as of October 2020 (see Table 15).
• States that have not expanded Medicaid to parents and other adults under the Affordable Care Act have seen increases in their rate of uninsured children nearly three times as large as states that have.15
• Lack of health coverage—as well as inequities in our healthcare system and disparities in social determinants of health—have devastating impacts on our nation’s infants and mothers.16 The maternal mortality rate is higher now than it was decades ago, and Black women are bearing the brunt of this crisis.17 What’s more, for every 1,000 infants born in 2018, six died before their first birthday (see Table 16). Continuing to expand coverage to low-income parents through the ACA’s Medicaid expansion would help decrease the number of uninsured children as well as ensure more women access to essential prenatal care to help reduce both maternal and infant mortality.18
CHILD HEALTH
Although COVID-19 infection and death rates may be lower for children when compared to adults, our children are certainly not immune—to the virus itself or the racial inequities it is magnifying.
• As of February 25, 2021, 3,168,274 total child COVID-19 cases have been reported, representing 13.1 percent of all cases. Children were 0 to 0.19 percent of all COVID-19 deaths in the states that provided data (Note: only 43 states provided data on the age distribution of COVID-19 deaths).19
• CDC reports show that between February and July 2020, 78 percent of children who died from COVID-19 were Hispanic, Black, and American Indian children, though they represent only 41 percent of the population.20
These disparities mirror the disparities we see among adults and reflect decades of structural racism and injustice that have created a long history of social and economic inequities.21 Long before COVID-19, children of color were more likely to experience harmful environmental factors and toxic stress, grow up with underlying health conditions, and experience inequitable health care into adulthood including racial bias, discrimination, and inadequate treatment.22 Amid the pandemic, children of color are more likely to live with essential workers; experience crowded housing conditions, food insecurity, and wealth gaps; and face additional barriers to accessing high-quality, non-discriminatory health care—inequities that put the health and well-being of Black, Hispanic, and American Indian children at risk during a public health crisis.23
In addition to COVID-19 cases, the pandemic has created further child health concerns as well. Children are missing routine well-child visits that include important developmental screenings and vaccinations: compared to March through May 2019, there have been 3.2 million fewer child screening services, 6.9 million fewer outpatient mental health services, and 1.7 million fewer vaccinations for children ages zero to two through Medicaid and CHIP.24 Even with the need to continue to social distance and limit potential exposure, ensuring children have access to preventative services is critical in order to prevent further health concerns. Vaccines save lives and are critical in order to keep children safe from preventable diseases and ensure against the added crisis of a preventable outbreak amid the ongoing pandemic.
Children Are Not Immune

24
IN 2019, CENTER-BASED CHILD CARE FOR AN INFANT COST MORE THAN PUBLIC COLLEGE TUITION IN
28 STATES AND DC.The first five years of a child’s life are a time of both great opportunity and risk as their brain develops
more rapidly than at any other point. Children who grow up in supportive environments are more likely to develop self-confidence, an increased desire to learn, and better impulse control as well as improved achievement in school and throughout their life.1 Unfortunately, COVID-19 has upended a system that was already not adequately serving children and families: even before the pandemic, children—especially the 3.6 million children under six living in poverty—lacked access to a meaningful continuum of care and supports during this critical period of development.2
A full continuum of high-quality early childhood development and learning opportunities from birth to age five have been proven to buffer the negative impacts of poverty and other stressors, improve outcomes throughout a child’s life, and yield great societal returns on investment.
• Head Start and Early Head Start are federally-funded, high-quality early childhood programs that provide comprehensive services including child care, mental health, nutritional, and other developmental services and connect poor children and families with other community resources when needed. Children who participate in the Head Start program are able to pay better attention in school and engage in learning; perform better in cognitive and language development; and have better pre-reading, pre-writing, and vocabulary skills making them more prepared for kindergarten and school.3 The Maternal, Infant, and Early Childhood Home Visiting (MIECHV) Program similarly promotes child development and school readiness.4 Gaps in opportunity and outcomes based on race and income exist from the start of school, but access to high-quality early childhood programs can give children the skills they need to thrive in school and close these gaps.5
• Studies show children who attend high-quality early childhood programs are more likely to graduate from high school and hold a job, make more money, and are less likely to have contact with the criminal justice system than peers who do not. Programs that directly target children’s health outcomes, like Head Start, have been shown to increase child health insurance, child immunization, and receipt of primary care.6
• Research estimates the lifelong return on investment for quality early childhood programs is more than 13 percent a year for every dollar invested.7
High-quality, affordable child care that meets children’s developmental needs is a critical part of the early childhood continuum and essential for working families, but the cost of high-quality child care is a barrier for many.
• Center-based child care for an infant cost more than public college tuition in 28 states and the District of Columbia in 2019 (see Table 17). In one study, more than 80 percent of two-child families were paying more for child care than for rent.8
• The Child Care and Development Fund, which provides subsidies to help families with child care costs, served just 15 percent of all federally-eligible children in 2016.9
• The number of children receiving publicly-funded child care subsidies has decreased by more than 430,000 since 2006 (see Table 18). Access to high-quality child care is not guaranteed even for families who do receive subsidies as care costs increase.10
• A well-trained, competitively-compensated workforce is necessary to ensure the child care provided is high-quality and our children are supported during their most critical years of development. However, in 2019, child care workers in 42 states were paid less than half of a living wage for a single parent with one child (see Table 19).
While many existing early childhood development and education programs are effective, they often fall far short of serving and supporting all children in need.
EARLY CHILDHOOD
Children’s Defense Fund

25
The State of America’s Children® 2021
EARLY CHILDHOOD
• Voluntary, evidence-based home visiting programs provide impressive short- and long-term gains for children and families who participate. However, in FY2019, the MIECHV Program served only a small portion of parents and children across the country.11
• Due to underfunding, Head Start served less than 57 percent of eligible three and four-year-olds and Early Head Start served less than 8 percent of eligible infants and toddlers in 2019.12
• Other quality preschool programs for three and four-year-olds are also a key part of the continuum. Yet, according to the National Institute for Early Education Research (NIEER), during the 2018-2019 school year, only 34 percent of four-year-olds and 6 percent of three-year-olds were enrolled in a state-funded preschool program. Only four states operated a program that met all ten of NIEER’s evidence-based quality standards (see Table 20).
• While total state funding for preschool increased by 3.6 percent during the 2018-2019 school year, the increase was small compared to high growth years and spending per child was essentially flat after adjusting for inflation.13
• Full-day kindergarten boosts students’ academic achievement as well as their social and emotional skills. Studies show full-day kindergarten can produce long-term educational gains, especially for children of color and children from families with low incomes.14 The majority of five-year-olds (82.7 percent) in kindergarten are enrolled in a full-day program; however, access to full-day kindergarten is only guaranteed in 17 states and the District of Columbia.15
The high cost of child care and lack of early childhood investments leave many children without quality care during critical years of brain development. We must ensure every child has the head start they need through access to a continuum of high-quality, comprehensive early childhood opportunities starting at birth. To do this, Congress must ensure child care providers have the immediate support needed to keep from permanently closing during the pandemic and states have the long-term funding needed to reconstruct a child care infrastructure that better serves all children and families.
In May 2020, Cristina Guajardo of Austin, TX, was let go from her job and unable to start a new job until her two-year-old’s subsidized daycare was able to reopen. Cristina turned down job opportunities as bills continued to pile up and was forced into the impossible decision between caring for her child and beginning a much-needed new job.16
The COVID-19 pandemic has made it clear that child care providers are not only essential for the development and education of our next generation, but for parents like Cristina who have been forced to choose between working to keep food on the table and provide for their families and staying home to care for their children as many child care providers don’t have the resources they need to safely stay open. Child care is also essential for our healthcare workers, United States Postal Service (USPS) workers, and other workers providing essential services we all depend on to keep our economy running. This burden has fallen especially hard on our nation’s mothers as 2.2 million women have left the workforce since the pandemic began, largely due to caregiving responsibilities;17 mothers could face $64.5 billion in lost wages and economic activity with continued inaction.18
With months-long child care closures and little federal relief to date, as many as 4.5 million child care slots could be permanently lost due to the pandemic—a loss that is estimated to impact at least 2.25 million families.19 Many child care providers—including those that have contributed their own funds and faced growing debt to ensure they have the resources they need to stay safe while caring for our children—continue to face economic destabilization and permanent closures.20 Our child care system was struggling long before the pandemic and we must ensure the system is strengthened and has the necessary funding and support that recognizes it as the as the necessity it is for families, businesses, and our economy.
The Child Care Crisis Creates Impossible Decisions for Families
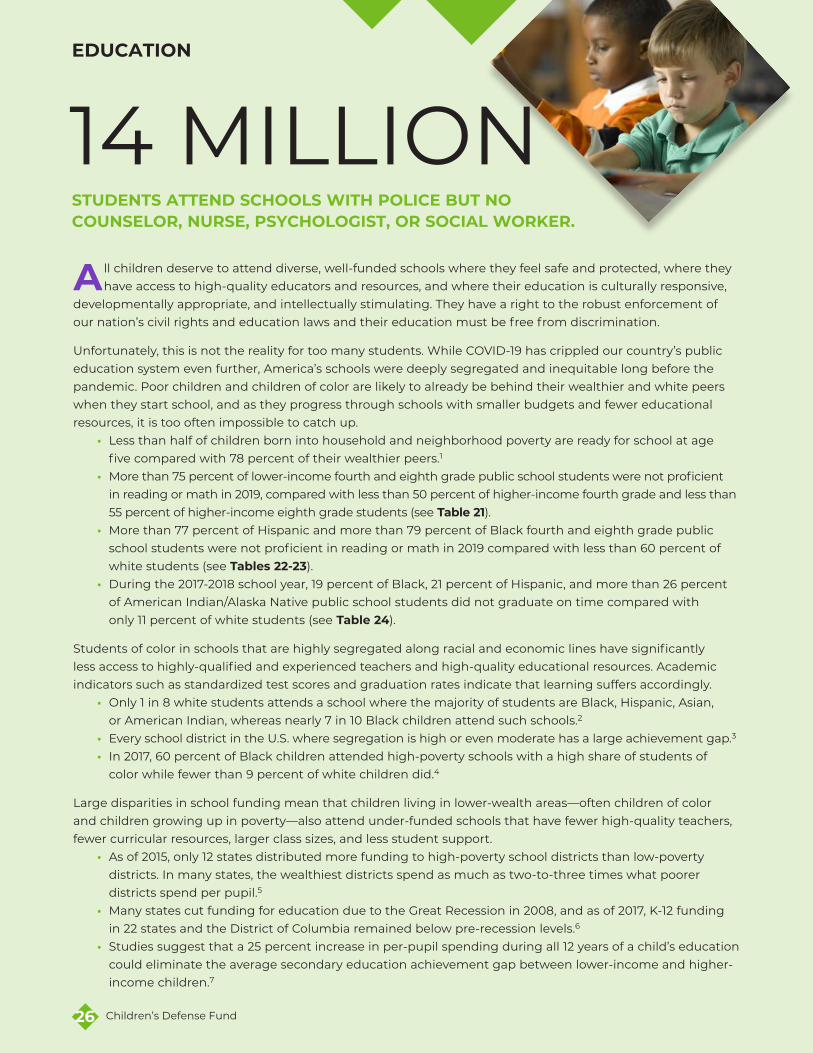
Children’s Defense Fund26
EDUCATION
STUDENTS ATTEND SCHOOLS WITH POLICE BUT NO COUNSELOR, NURSE, PSYCHOLOGIST, OR SOCIAL WORKER.
14 MILLION A ll children deserve to attend diverse, well-funded schools where they feel safe and protected, where they
have access to high-quality educators and resources, and where their education is culturally responsive, developmentally appropriate, and intellectually stimulating. They have a right to the robust enforcement of our nation’s civil rights and education laws and their education must be free from discrimination.
Unfortunately, this is not the reality for too many students. While COVID-19 has crippled our country’s public education system even further, America’s schools were deeply segregated and inequitable long before the pandemic. Poor children and children of color are likely to already be behind their wealthier and white peers when they start school, and as they progress through schools with smaller budgets and fewer educational resources, it is too often impossible to catch up.
• Less than half of children born into household and neighborhood poverty are ready for school at age five compared with 78 percent of their wealthier peers.1
• More than 75 percent of lower-income fourth and eighth grade public school students were not proficient in reading or math in 2019, compared with less than 50 percent of higher-income fourth grade and less than 55 percent of higher-income eighth grade students (see Table 21).
• More than 77 percent of Hispanic and more than 79 percent of Black fourth and eighth grade public school students were not proficient in reading or math in 2019 compared with less than 60 percent of white students (see Tables 22-23).
• During the 2017-2018 school year, 19 percent of Black, 21 percent of Hispanic, and more than 26 percent of American Indian/Alaska Native public school students did not graduate on time compared with only 11 percent of white students (see Table 24).
Students of color in schools that are highly segregated along racial and economic lines have significantly less access to highly-qualified and experienced teachers and high-quality educational resources. Academic indicators such as standardized test scores and graduation rates indicate that learning suffers accordingly.
• Only 1 in 8 white students attends a school where the majority of students are Black, Hispanic, Asian, or American Indian, whereas nearly 7 in 10 Black children attend such schools.2
• Every school district in the U.S. where segregation is high or even moderate has a large achievement gap.3
• In 2017, 60 percent of Black children attended high-poverty schools with a high share of students of color while fewer than 9 percent of white children did.4
Large disparities in school funding mean that children living in lower-wealth areas—often children of color and children growing up in poverty—also attend under-funded schools that have fewer high-quality teachers, fewer curricular resources, larger class sizes, and less student support.
• As of 2015, only 12 states distributed more funding to high-poverty school districts than low-poverty districts. In many states, the wealthiest districts spend as much as two-to-three times what poorer districts spend per pupil.5
• Many states cut funding for education due to the Great Recession in 2008, and as of 2017, K-12 funding in 22 states and the District of Columbia remained below pre-recession levels.6
• Studies suggest that a 25 percent increase in per-pupil spending during all 12 years of a child’s education could eliminate the average secondary education achievement gap between lower-income and higher-income children.7

INCOME AND WEALTH INEQUALITY
27
The State of America’s Children® 2021
EDUCATION
Too many students, especially students of color, face exclusionary discipline policies that threaten to derail their education or over-policed schools that put their very safety at risk.8 Over the last decade, schools have increased investment in school policing under the guise of making them safer for students. However, police in schools do not necessarily make children safer, but rather contribute to the school-to-prison pipeline and continue to disproportionately deny Black children, Latino children, and children with disabilities the opportunity to succeed.9
• During the 2015-2016 school year, the suspension rate for Black students in public school was more than four times that for white students (see Table 26).
• Fourteen million students attend schools with police but no counselor, nurse, psychologist, or social worker. This is despite evidence that schools with these types of supports “see improved attendance rates, better academic achievement, and higher graduation rates, as well as lower rates of suspension, expulsion, and other disciplinary incidents.”10
• While students with disabilities made up only 12 percent of students during the 2015-2016 school year, they comprised 26 percent of students who received out-of-school suspensions.11
Children who are experiencing homelessness, in foster care, or returning from juvenile detention are especially likely to be educationally disadvantaged and are less likely to graduate from high school.
• The estimated national graduation rate for students experiencing homelessness is only 67.5 percent, as compared to the overall national average for all students which is 85.3 percent.12
• Because of the lack of adequate supports, students in foster care are more likely to be suspended or expelled, to score lower on standardized tests in reading and math, to be involved in special education, and to have higher rates of grade retention and drop out, and are less likely to attend and graduate from college.13
• Without adequate educational resources, young people in juvenile justice facilities are chronically behind in school and make no meaningful progress in academic achievement while incarcerated. Approximately 2 in 3 drop out of school after exiting the juvenile justice system.14
When we deny our children the education to which they have every right, we deny them the chance they deserve to have a bright future. We must continue to work to equitably distribute educational resources, eliminate segregation and gross inequities in school funding, and eliminate discriminatory education policies that undermine equal opportunities for all students.
The COVID-19 pandemic has caused an education crisis that will impact this generation of students for the rest of their lives. While many school districts provided some distance learning opportunities during the 2019-2020 school year, children with disabilities, children from low-income and unemployed families, children living in rural communities, and children of color faced many barriers to accessing this modified education—including insufficient internet access, lack of support for online learning due to parent work schedules, and inability to effectively learn via modified formats, among others.
Too many students could not access modified education or lived in districts where no instruction was offered after schools closed for the last several months of the 2019-2020 school year.15 A survey of close to 1,600 families found that parents with low incomes were “10 times more likely to say their kids are doing little or no remote learning,” and children with Individualized Educational Program accommodations (which includes many students with disabilities) are “twice as likely as their peers to be doing little or no remote learning.”16 This untenable situation has carried into the 2020-2021 school year in districts across the country.
COVID-19 Leaves Marginalized Students Disconnected and Behind

Children’s Defense Fund28
CHILD WELFARE
A CHILD IS REMOVED FROM THEIR HOME AND PLACED INTO FOSTER CARE
EVERY TWO MINUTES.
The child welfare system is in the midst of a paradigm shift that recognizes the critical importance of supporting families so children can remain safely at home and foster
care is used only as a last resort. With the historic passage of the Family First Prevention Services Act (Family First) in 2018, states and tribes can now utilize guaranteed child welfare funds to provide certain evidence-based services and programs to stabilize families and prevent the need for foster care.1 However, Family First, which is still in early stages of implementation, is just the first step to ensure children can thrive with their families.
The U.S. has deeply underinvested in the upstream services that support families and keep them strong, services that extend well beyond the bounds of the formal child welfare system and into housing, economic support, and other critical services, and this was exacerbated in 2020 by the COVID-19 pandemic. By investing in keeping families strong, we can prevent child maltreatment and give all children the opportunity to thrive.
In 2019, 651,505 children were victims of abuse or neglect, a decrease of 21,643 compared to the previous year (see Table 27). That means, on average, a child is abused or neglected every 48 seconds in America, 1,785 each day.2 More than half of all child maltreatment cases in 2019 involved children who were six years old or younger, with 14.9 percent of cases involving infants under one.3 Of these children, 251,359 entered foster care.4
• Neglect, often a proxy for the consequences of poverty, was the most common reason for children entering the child welfare system. Neglect was associated with a child’s removal in 63 percent of cases. Issues related to unsafe or substandard housing were associated with 10 percent of child removals.5
• After steadily rising every year since 2008, the proportion of child removals in which parental drug abuse played a role declined in 2019. Parental drug abuse is partly responsible for 34 percent of child removals, while alcohol abuse played a role in 5 percent of child removals.6
• A common misconception is that physical and sexual abuse are the primary drivers of child welfare involvement, though these serious forms of abuse factor into a smaller portion of cases. Physical abuse was associated with 13 percent of removals and sexual abuse four percent.7
Children in foster care are among the most vulnerable children in America. There were 423,997 children in care in 2019 (see Table 28), 41 percent of whom were under the age of six.8 These children spend an average of 19.6 months in foster care, with 14 percent spending more than three years in the system.9 Children of color, particularly Black and American Indian/Alaska Native children, are dramatically overrepresented in the child welfare system. Of every 1,000 white children in the United States, 5.2 are in foster care, compared with 9.9 of every 1,000 Black children and 16.9 of every 1,000 American Indian/Alaska Native children.10
• Nationally, Black children, are represented in foster care at a rate that is 1.66 times their portion of the overall population, and in 18 states at a rate that is more than double (see Table 29).
• American Indian/Alaska Native children are represented in foster care at a rate that is 2.84 times their portion of the population nationally. This disproportionality varies by state, with 11 states where the percent of the foster care population that is American Indian/Alaska Native is more than double the percent of the overall child population that is American Indian/Alaska Native, including one state where it is more than 15 times as high (see Table 29).
Children do best when placed with families, preferably their own relatives, but some require a level of mental or behavioral health treatment that can only be provided in a congregate (non-family) setting, such as a group home or child care institution. Congregate care is meant to be temporary treatment, but children are often inappropriately placed in these settings without a clinical need or are held long after their clinical needs are met.

29
The State of America’s Children® 2021
CHILD WELFARE CHILD WELFARE
• Nationally, 11 percent of children in foster care are placed in congregate care settings, with up to 27 percent of children in congregate care in certain states (see Table 30). While this number has been steadily decreasing, the number of children in congregate care increased in 19 states between 2017 and 2018.11
• More than 2.6 million children live in households headed by grandparents or other relatives without their parents present.12 Approximately 133,000 children in foster care are placed with relatives, and the remainder of these kinship placements occur outside of the child welfare system with little or no government support.13
Foster care is intended to be temporary, with the ultimate goal of returning children safely home to their families. When this is not possible, children must be placed into permanent homes, either through adoption, guardianship, or other arrangements with relatives. In 2019, 248,669 children left foster care after an average of 20 months in care.14
• In 2019, only 47 percent of children exiting foster care were reunified with their families, the lowest percentage ever recorded (see Table 31).
• In 2019, 64,415 (26 percent) children were adopted out of the child welfare system, the highest number recorded,15 and 122,216 children were waiting to be adopted.16
• After steadily declining since 2008, the number of children aging out of foster care jumped by more than 14 percent in 2019, with 20,445 youth reaching adulthood without a permanent family.17 When the system fails to find permanent homes for youth, they are significantly more likely to experience homelessness, unemployment, and incarceration.
More resources are needed to ensure that every child can grow up in a safe, stable, and loving family. By dramatically increasing investments in family support, we can keep families strong and prevent the need for foster care. Making this early investment will free up necessary resources to improve the child welfare system for the families that do need it, including specialized treatment services to help children heal from the trauma they have experienced and robust supports to help families reunify safely.
Stressors caused by the COVID-19 pandemic that are detailed throughout this report —economic, housing, and food insecurity, school and child care closures, and decreased access to services and supports—are testing the resilience of families. Stress directly impacts the ability of parents to safely care for their children and an overload of stressors without sufficient support contributes to child maltreatment.18 As the pandemic places unprecedented stress on families, it also made it more difficult for them to access the services that help them to remain strong. In response, the child welfare system has had to rapidly adapt to help children remain safe with their families.
The pandemic weighed especially heavily on older youth in extended foster care and on youth who have recently aged out as they often lack the resources and connections that other young people have relied on to weather this crisis and face staggering levels of job loss and food insecurity.19 Additionally, kin caregivers, especially the approximately 2.5 million kin caregivers raising children outside the formal child welfare system, have been made particularly vulnerable as they are disproportionately older and at high risk from the virus.20
The pandemic has laid bare the fact that too many families were in a precarious position before the pandemic began. It has made clear that we must invest in the strong families and communities that keep children safe.
COVID-19 Places Unprecedented Stresses on Children, Families, and the Child Welfare System

YOUTH JUSTICE
CHILDREN ARE ARRESTED EACH DAY IN THE U.S.
1,453 The number of children arrested and incarcerated has declined over the past decade, largely due to positive
changes in policy and practice. However, America’s children continue to be criminalized at alarming rates and disparities have persisted. Many children—particularly children in poverty; children of color; children with disabilities; children with mental health and substance abuse challenges; children subjected to neglect, abuse, and/or other violence; children in foster care; and LGBTQ children—are pushed out of their schools and homes into the juvenile justice or adult criminal justice systems.
• In 2019, 530,581 children were arrested in the U.S. (see Table 32). A child or teen was arrested every 59 seconds despite a 67 percent reduction in child arrests between 2009 and 2019.1
• During the 2015-2016 school year alone, there were over 61,000 school arrests and 230,000 referrals to law enforcement, largely overrepresented by students with disabilities, Black students, and Indigenous students. The prioritization of police over mental health professionals in schools often leads to the criminalization of typical adolescent behavior and fuels the school-to-prison pipeline. Today, 14 million students attend schools with police but no counselor, nurse, psychologist, or social worker.2
• Although the number of children in the juvenile justice system has been cut in half since 2007, 43,580 children and youth were held in residential placement on a given night in 2017. Nearly 2 in 3 were placed in the most restrictive facilities.3
• Another 653 children were incarcerated in adult prisons on any given night in 2019—down from 2,743 in 2009 (see Table 33).
• Despite research showing that young people’s brains continue to develop and mature through their late teens and into their mid-twenties,4 young adults do not often have access to the age- and developmentally- appropriate policies and resources they need. Adolescents and young adults often “age out” of offending; however, as of 2021, 46 states and the District of Columbia automatically prosecute 18-year-olds as adults and 3 states automatically prosecute 17-year-olds as adults (Vermont is the first and only state to expand juvenile court jurisdiction to 18). All states also allow or require younger children charged with certain offenses to be prosecuted in adult court.5
Even as child arrests and detentions have fallen, extreme racial disparities have persisted across the juvenile and adult criminal justice systems. Children of color, particularly Black children, continue to be overcriminalized and overrepresented at every point—from school discipline and arrest to sentencing and post-adjudication placements.
• Although 63 percent of children arrested in the U.S. were white, American Indian children were 1.5 times more likely to be arrested and Black children were 2.4 times more likely to be arrested than white children.6
• In 2017, the residential placement rate for children of color was two times higher than that of white children nationwide: Hispanic children were 1.4 times more likely, American Indian children were 2.8 times more likely, and Black children were 4.6 times more likely to be committed or detained than white children. In 18 states and the District of Columbia, the residential placement rate for children of color was four times higher than that of white children.7
• Two-thirds (67 percent) of children in the juvenile justice system were children of color: 41 percent were Black and 21 percent were Hispanic (see Table 34).
• Children of color are also disproportionately transferred to the adult criminal justice system, where they are tried and prosecuted as adults. In 2018, Black youth represented less than 15 percent of the total youth population but 52 percent of youth prosecuted in adult criminal court.8 Black youth are nine times more likely than white youth to receive an adult prison sentence, American Indian/Alaska Native youth are almost two times more likely, and Hispanic youth are 40 percent more likely.9
30 Children’s Defense Fund

INCOME AND WEALTH INEQUALITY
31
The State of America’s Children® 2021
YOUTH JUSTICE
Boys, youth with disabilities, and LGBTQ youth also come into disproportionate contact with the juvenile and adult criminal justice systems.
• In 2017, the residential placement rate for boys was more than five times that for girls. Eighty-five percent of children in residential placement were male.10
• At least 1 in 3 youth in the juvenile justice system has a disability qualifying them for special education services under the Individuals with Disabilities Education Act (IDEA)—nearly four times the rate of youth in public schools. However, less than half receive special education services while in custody.11
• The percent of LGBTQ children in the juvenile justice system (20 percent) is more than two times that of LGBTQ youth in the general population (7-9 percent); 85 percent are LGBTQ children of color.12
Children do not belong in prisons. Incarceration does not support the growth and development of our children; it places them at risk and limits their access to resources.
• While incarcerated, children are often provided with inadequate education instruction, health care, and counseling services and they are at greater risk of maltreatment, physical and psychological abuse, sexual assault, and suicide.13
• The use of solitary confinement further deprives them of social interaction, mental stimulation, and key services during a critical time of adolescent brain development. Youth of color and LGBTQ youth are at heightened risk of being placed in solitary confinement and youth with disabilities are often placed in isolation due to lack of available services or accommodations—when no child should be placed in solitary confinement regardless of identity.14
• Risks are heightened for children in the adult criminal justice system, which is even more focused on punishment rather than rehabilitation and treatment. Children in adult jails are more likely to suffer permanent trauma and are five times more likely to die by suicide than children held in juvenile detention centers.15
As youth crime and arrest rates continue to decline, now is the time to re-imagine youth justice. We have better choices than incarceration: diversion, treatment, after school programs, and family support programs support children, keep communities safe, and save taxpayer dollars. It is time to end the criminalization of children and provide every child time and space for learning, mistakes, and restorative support from caring adults.
With continued reliance on criminalization and incarceration, our nation’s children—especially Black children—are being put at risk of lasting harm to their health, development, and well-being instead of receiving the resources and supports they need. This is especially true amid the ongoing pandemic.
Latoyia Porter of Louisiana is filing early release papers for her son, Treyjon. “We can do more for him on this side of the facility. He’s already served five years for vehicular theft, a non-violent crime,” she said. “With no rehabilitation services, what’s the point of having him in there?” Treyjon and other young people detained in Louisiana have had their rehabilitation services suspended; have been pepper sprayed by untrained temps; and have been denied COVID-19 tests despite having symptoms. “It’s really hard for a mother not to be in control of her child’s healthcare,” Latoyia explains.16
Living in congregate care settings with inadequate resources puts children like Treyjon at great risk of COVID-19. As of late February 2021, more than 3,750 young people in juvenile facilities and even more staff have been diagnosed with coronavirus across 41 states, the District of Columbia, and Puerto Rico.17 The roughly 44,000 incarcerated children across the country are living in fear of COVID-19 and are facing solitary confinement as a form of social distancing, limited access to PPE, limited or no visitations or contact with loved ones, and limited educational and recreational activities. To date, their needs have largely been ignored by federal lawmakers as they have crafted legislation to respond to the crisis.
COVID-19 Magnifies the Harms of Incarceration

GUN VIOLENCE
IN 2019, A CHILD OR TEEN WAS KILLED WITH A GUN EVERY
2 HOURS AND 36 MINUTES.
Even before COVID-19, another epidemic was killing our children at higher rates: gun violence. Gun violence was the leading cause of death for all children and teens ages 1-19 in 2018, surpassing
motor vehicle accidents for the first time in history.1 Children and teens are far more likely to die from gunfire than COVID-19,2 yet our leaders continue to allow gun violence to go uncurbed and gun laws to go unchanged.
After years of congressional inaction, a growing number of children are paying with their lives. In 2019, 3,371 American children and teens were killed with guns—enough to fill more than 168 classrooms of 20 (see Table 35).
• Child and teen gun deaths hit a 19-year high in 2017 and have remained elevated since.3 • In 2019, nine children and teens were killed with guns each day in America—one every 2 hours
and 36 minutes.4
• Guns killed more children and teens than cancer, pneumonia, influenza, asthma, HIV/AIDs, and opioids combined.5
• While mass shootings grabbed fleeting public and policymaker attention, routine gunfire took the lives of more children and teens every week than the Parkland, Sandy Hook, and Columbine massacres combined.
• Since 1963, nearly 193,000 children and teens have been killed with guns on American soil—more than four times the number of U.S. soldiers killed in action in the Vietnam, Persian Gulf, Afghanistan, and Iraq wars combined.6
Shamefully, gun deaths reflect only part of the devastating toll of America’s growing gun violence epidemic. Many more children and teens are injured than killed with guns each day in our nation.
• For every child or teen fatally shot, another 5 suffered non-fatal gunshot wounds.7
• An estimated 16,644 children and teens were injured with guns in 2018—one every 32 minutes.8
Gun violence affects all children, but children of color, boys, and older youth are at greatest risk. • Black children and teens had the highest gun death rate in 2019 (11.9 per 100,000) followed by
American Indian/Alaska Native children and teens (6.4 per 100,000).9
• Although Black children and teens made up only 14 percent of all children and teens in 2019, they accounted for 43 percent of child and teen gun deaths.10
• Black children and teens were four times more likely to be killed with guns than their white peers.11
• Eighty-six percent of children and teens who died from gunfire in 2019 were boys. Boys were six times more likely than girls to die in gun homicides. Black boys were 18 times more likely to be killed in gun homicides than white boys.12
• Eighty-five percent of child and teen gun deaths occurred among 15- to 19-year-olds, but infants and toddlers were far from immune. Guns killed more preschoolers than law enforcement officers in the line of duty. In 2019, 86 children under 5 were killed with guns compared with 51 law enforcement officers in the line of duty.13
No child is safe in a nation with easy access to deadly weapons. Even before the pandemic drove up fear and gun sales, there were too many firearms in our homes and streets—and a shocking number were sold without background checks.
• As of 2017, American civilians owned 393 million firearms—more than one gun per person. In contrast, U.S. military and law enforcement agencies possessed 5.5 million.14
Children’s Defense Fund32

INCOME AND WEALTH INEQUALITY
33
The State of America’s Children® 2021
GUN VIOLENCE
• Americans accounted for less than five percent of the global population, but owned nearly half (46 percent) of all civilian guns in the world.15
• Nearly 1 in 5 guns are sold without a background check due to a loophole in federal law exempting sales at gun shows, online, or between private individuals.16
Children are learning there are no safe spaces in our gun-saturated nation. Many children even live in homes with loaded, unlocked guns and know where they are kept. Too often, this leads to tragic accidents and preventable deaths. With a growing number of children learning and playing at home during COVID-related closures, the risk of gun accidents and suicides has only increased.
• A third of households with children have a gun and nearly half of gun-owning households with children do not store all of their firearms safely.17
• An estimated 4.6 million children live in homes with at least one unlocked and loaded gun—and most children know where these guns are kept.18 About 3 in 4 children ages 5-14 with gun-owning parents know where firearms are stored and more than 1 in 5 have handled a gun in the home without their parents’ knowledge.19
• Guns in the home are more likely to endanger than protect loved ones. The presence of a gun in the home makes the likelihood of homicide three times higher, suicide three to five times higher, and accidental death four times higher.20
• Eight children and teens are killed or injured in accidental shootings involving an improperly stored gun each day in America.21
It is long past time for leaders to end America’s gun violence epidemic. Congress must urgently pass common-sense gun safety measures like universal background checks and child access prevention laws to protect children from firearms in their homes, schools, and communities. All children deserve the chance to live, learn, and play safely—free from violence and fear.
The pandemic has created and exacerbated so many crises for children and families and gun violence is no exception. Unprecedented increases in gun sales—coupled with financial insecurity, social isolation, and other stressors—are magnifying America’s gun violence crisis.
• Nearly two million guns were sold in March 2020 alone—the second highest number of guns ever sold in a single month—and this disturbing trend continued in the months that followed.22
• Even with much of the country on lockdown, mass shootings hit a record high in 2020. Children witnessed, suffered, or died in 611 mass shootings in 2020—up from 417 in 2019.23
• Gun accidents in the home have also surged during the pandemic. School and child care closures have exacerbated children’s risk of dying in gun accidents at home. Between March and May 2020, accidental gun deaths by children increased by 30 percent relative to rates over the past three years.24
• The pandemic has also intensified factors that contribute to gun-related domestic violence and community violence: job losses and financial insecurities have left victims of domestic violence more vulnerable to harm as well as fueling community gun violence.25
The COVID-19 crisis has exposed the consequences of our nation’s longstanding failure to pass policies to keep children safe where they live and learn. Our leaders must not only advance meaningful solutions to address the COVID-19 crisis but also the ongoing gun violence crisis in America. We cannot allow children to die at the hands of these crises.
COVID-19 is Magnifying Our Gun Violence Epidemic and Highlighting the Need for Immediate Reform

IMMIGRANT CHILDREN
1 in 4CHILDREN IN THE U.S.— APPROXIMATELY 18 MILLION—ARE CHILDREN OF IMMIGRANTS.
34 Children’s Defense Fund
Immigrants are a part of our families, workplaces, and houses of worship. They are friends and neighbors woven into the fabric of our communities. Critically, they are parents tucking children into bed each night.1
More than 1 in 4 (26 percent), or approximately 18 million, U.S. children lived with at least one immigrant parent in 2018.2 For America to flourish and prosper, we must commit to policies that promote all children’s well-being and center children of immigrants in these policies.
In direct opposition to children’s well-being, the Trump administration's four-year legacy of dangerous, reckless policy choices has created a climate of confusion, fear, and impossible choices. The administration continuously attacked family unity, a foundational principle of child welfare protected by the U.S. Constitution.3
• Family separation is dangerous to children’s health, development, and well-being.4 Yet during the enforcement of the administration’s Zero Tolerance policy between April and June 2018, the government took 4,500 children from their parents.5 Although a court order forced the administration to end the policy in June 2018, 1,100 more children were taken from their parents between June 2018 and November 2019.6 As of October 2020, the parents of 545 children taken from their families cannot be found.7
• Family separation is still happening. Today, there are fresh threats of separations due to the Remain in Mexico program, which has trapped nearly 60,000 people in terrible conditions at the U.S. border as they are forced to wait for their immigration proceedings in Mexico.8 Parents are faced with the impossible choice between an indefinite wait in dangerous tent camps and sending their children alone across the border.9
• Parents detained together with their children in the U.S. have also faced family separation. In May 2020, families told their lawyers that ICE officers asked them to make the unconscionable choice of either separating from their children or staying in indefinite detention during a global pandemic.10
Family separation as well as the battle over the border wall and who will pay for it have been highly visible horrors, but the Trump administration’s less visible shifts in regulatory and executive action also erected barriers to critical, life-saving benefits and services, affecting the lives of millions in the U.S.11 What does that “invisible wall” look like?
A hungry child. • Fear and confusion—known as the chilling effect—over intentionally complex Trump administration
“public charge” regulations are causing families to disenroll or forgo health care, nutrition, public service, and other economic support programs.12 For example, between 2016-2019, Texas experienced a precipitous drop in enrollment in benefit programs,13 including a 13.5 percent drop in SNAP enrollment between December 2017 and April 2019.14 A qualitative study of 32 geographically diverse organizations in Texas by CDF-Texas found that anti-immigrant policies such as public charge caused many mixed-status families to fear enrolling even their citizen children.15
• A nationally representative survey found that 11.4 percent of adults in immigrant families with children reported they or a family member avoided a nutrition program (SNAP or WIC) in 2019.16

35
The State of America’s Children® 2021
IMMIGRANT CHILDREN
A child without access to health care. • More than 1 in 4 immigrant children did not have health coverage in 2019 (25.5 percent compared to
5.1 percent of native-born citizen children).17 • As of January 2020, 35 states and the District of Columbia provided health coverage to lawfully residing
immigrant children without a five-year wait,18 and as of July 2019, six states and the District of Columbia use state-only funds to provide Medicaid coverage to income-eligible children regardless of immigration status.19
A scared child. • Children’s feelings of personal safety are linked to the perceived safety of those who care for them.20
Chronic uncertainty and distress about the threat of enforcement activity destroy children’s sense of safety and their mental health.21 The Trump administration’s aggressive enforcement choices, including continuous threats to DACA, heightened fears of deportation.
• More than 250,000 children in the U.S. have at least one parent who is a DACA recipient.22 • An estimated 6.9 million children lived with undocumented parents.23
Beyond tearing down the harmful policies that separate families and chill access to critical services, we must lean forward and build a permanent solution to this nation’s immigration crisis so that every child has the opportunity to grow up in a safe, stable, and loving family and community.
Right now, immigrant workers are at the frontlines of the COVID-19 crisis, keeping all of us healthy, fed, and cared for in health care, retail, manufacturing, and other essential industries.24 In recognition of the critical role immigrant families play in our communities, Congress must ensure that COVID relief packages are inclusive of our immigrant children and families.25
For example, our leaders have the opportunity to make economic stimulus payments inclusive and fair. Immigrants and their families must be included in any new COVID stimulus payments and receive retroactive stimulus from when they were cut out of relief last year—regardless of the kind of taxpayer identification they use.
COVID relief, including economic stimulus payments, help families make ends meet during this crisis, and it is well established that cash assistance also supports children’s well-being and healthy development.26 Our leaders must act swiftly to ensure the next COVID relief package is the most robust and inclusive yet.
Immigrant Families are Essential Members of Our Communities and Must Be Prioritized in COVID-19 Relief

INCOME AND WEALTH INEQUALITY
LOST THEIR HEALTH COVERAGE IN 2018
425KTABLES
Children’s Defense Fund36

37
The State of America’s Children® 2021
INCOME AND WEALTH INEQUALITY
CHILD POPULATION
Notes: Racial categories (White, Black, Asian, American Indian/Alaska Native) exclude children of Hispanic ethnicity. Hispanic children can be of any race. Children of color include all racial categories except white. Racial/ethnic categories are presented in the order of their share in the child population.Source: U.S. Census Bureau, Population Division. 2020. “Annual State Resident Population Estimates for 6 Race Groups (5 Race Alone Groups and Two or More Races) by Age, Sex, and Hispanic Origin: April 1, 2010 to July 1, 2019,” “2019 Population Estimates. https://www.census.gov/data/tables/time-series/demo/popest/2010s-state-detail.html.”
In 2019, children of color made up nearly 50 percent of the total U.S. child population and more than half the child population in 11 states and the District of Columbia.
Table 1: Child Population by Age and Race/Ethnicity, 2019
Percent of Children Who Are:
Children of Color White Hispanic Black Asian
Two or More Races
American Indian/ Alaska Native
Native Hawaiian/
Other Pacific Islander Under 5 Under 18
Alabama 294,357 1,088,306 42.4 57.6 8.2 28.8 1.5 <1 0.5% 0.1%Alaska 51,080 179,983 51.2 48.8 9.9 3.0 7.3 19.0 18.2 1.7Arizona 429,788 1,640,236 61.4 38.6 44.5 5.0 3.0 5.0 4.9 0.2Arkansas 188,464 700,155 37.2 62.8 12.7 17.7 2.1 <1 0.7 0.5California 2,383,716 8,894,641 74.4 25.6 52.0 5.1 12.0 <1 0.4 0.4Colorado 332,201 1,259,519 44.1 55.9 31.5 4.4 3.3 <1 0.6 0.1Connecticut 181,710 727,440 46.1 53.9 25.3 11.5 5.2 <1 0.3 0.0Delaware 54,719 203,572 51.6 48.4 16.5 25.4 4.0 <1 0.3 0.0District of Columbia 45,368 128,168 76.3 23.7 17.1 52.5 2.5 <1 0.1 0.1Florida 1,139,742 4,229,929 58.7 41.3 32.1 19.9 2.7 <1 0.2 0.1Georgia 656,566 2,503,881 56.6 43.4 15.0 33.6 4.0 <1 0.2 0.1Hawaii 85,219 299,868 85.6 14.4 18.5 1.9 34.2 <1 0.1 11.0Idaho 116,200 448,201 25.3 74.7 18.4 0.9 1.3 1.0 1.1 0.2Illinois 746,934 2,817,875 48.8 51.2 24.9 15.1 5.2 <1 0.1 0.0Indiana 418,340 1,567,974 29.6 70.4 11.4 11.2 2.6 <1 0.2 0.0Iowa 195,636 726,841 23.0 77.0 10.4 5.4 2.8 <1 0.4 0.2Kansas 185,331 700,250 33.7 66.3 18.7 6.2 2.9 <1 0.7 0.1Kentucky 272,610 1,002,871 22.0 78.0 6.5 9.3 1.8 <1 0.2 0.1Louisiana 301,469 1,087,630 49.1 50.9 7.3 36.2 1.6 <1 0.6 0.0Maine 63,537 248,842 12.0 88.0 2.9 2.9 1.4 <1 0.8 0.0Maryland 361,937 1,334,687 58.7 41.3 16.5 30.6 6.1 <1 0.2 0.0Massachusetts 357,362 1,352,800 39.6 60.4 19.2 8.9 7.2 <1 0.2 0.0Michigan 566,442 2,143,933 33.2 66.8 8.5 16.0 3.4 <1 0.6 0.0Minnesota 351,622 1,303,157 31.7 68.3 9.0 10.1 6.1 1.0 1.4 0.1Mississippi 183,478 698,583 50.7 49.3 5.0 41.5 1.0 <1 0.6 0.0Missouri 368,080 1,370,585 27.6 72.4 7.0 13.4 2.2 <1 0.4 0.2Montana 61,156 228,588 22.4 77.6 6.7 0.7 <1 10.0 9.6 0.1Nebraska 130,880 476,074 32.0 68.0 18.1 6.0 2.8 1.0 1.1 0.1Nevada 185,575 692,639 65.4 34.6 41.2 10.5 6.2 <1 0.8 0.7New Hampshire 63,621 255,253 15.7 84.3 6.6 2.0 3.3 <1 0.2 0.0New Jersey 514,690 1,938,578 54.1 45.9 27.8 13.4 9.6 <1 0.1 0.0New Mexico 120,986 475,838 76.2 23.8 60.4 1.7 1.2 10.0 10.3 0.1New York 1,127,001 4,028,299 52.1 47.9 25.0 15.0 8.1 <1 0.3 0.0North Carolina 609,770 2,300,715 48.3 51.7 16.9 22.5 3.4 1.0 1.2 0.1North Dakota 54,101 180,171 24.7 75.3 6.8 4.3 1.6 8.0 7.7 0.1Ohio 690,828 2,578,019 29.1 70.9 6.5 15.1 2.5 <1 0.2 0.1Oklahoma 255,533 952,238 47.0 53.0 17.7 7.8 2.3 10.0 9.7 0.2Oregon 227,811 866,562 36.6 63.4 22.3 2.4 4.6 1.0 1.2 0.5Pennsylvania 697,924 2,634,613 33.9 66.1 12.8 13.1 3.9 <1 0.1 0.0Rhode Island 54,521 204,495 43.1 56.9 26.5 7.6 3.7 <1 0.6 0.1South Carolina 292,464 1,111,183 45.3 54.7 9.8 29.3 1.8 <1 0.3 0.1South Dakota 61,167 217,101 29.0 71.0 7.1 2.9 1.6 13.0 12.7 0.1Tennessee 408,605 1,510,051 35.2 64.8 10.2 18.9 1.9 <1 0.2 0.1Texas 1,990,891 7,399,810 68.7 31.3 49.5 11.8 4.4 <1 0.2 0.1Utah 247,803 931,184 26.6 73.4 18.0 1.3 2.8 <1 0.9 1.1Vermont 29,043 114,005 11.0 89.0 2.9 1.9 2.1 <1 0.3 0.0Virginia 505,477 1,860,848 46.9 53.1 14.5 19.8 6.5 <1 0.2 0.1Washington 456,476 1,663,061 44.2 55.8 21.5 4.5 8.8 1.0 1.4 0.9West Virginia 93,025 359,567 11.4 88.6 2.8 3.6 <1 <1 0.2 0.0Wisconsin 330,496 1,266,597 29.8 70.2 12.1 8.8 3.7 1.0 1.1 0.0Wyoming 34,931 133,734 23.3 76.7 15.0 1.1 <1 3.0 2.9 0.1United States 19,576,683 73,039,150 49.8 50.2 25.6 13.7 5.2 <1 0.8% 0.2%
Number of Children

38 Children’s Defense Fund
CHILD POVERTY
Table 2: Poor Children in America in 2019—A Portrait
Number Percent Percent of Who Are Poor Who Are Poor Poor Children
Among All Children 10,466,000 14.4% 100% Extremely Poor 4,501,000 6.2 43.0 Under 6 3,612,000 15.4 34.5 Under 6 and Extremely Poor 1,679,000 7.2 16.0 By Race/Ethnicity White 3,030,000 8.3 29.0 Hispanic 3,888,000 20.8 37.1 Black 2,668,000 26.5 25.5 American Indian/Alaska Native 127,000 20.6 1.2 Asian 271,000 7.0 2.6 Native Hawaiian/Other Pacific Islander 30,000 18.1 0.3 Two or More Races 452,000 14.0 4.3 By Geography In Cities > 50,000 4,218,000 18.3 40.3 In Suburbs 4,458,000 11.0 42.6 Outside Cities and Suburbs 1,790,000 19.6 17.1 By Region Northeast 1,439,000 12.6 13.7 Midwest 2,132,000 13.9 20.4 South 4,615,000 16.3 44.1 West 2,280,000 13.0 21.8
By Family Structure In Single-Parent Family 6,958,000 31.7 68.4a In Married-Couple Family 3,220,000 6.4 31.6a
By Family Working Status Any Family Member Works 7,128,000 10.5 70.1b Works Full-Time, Year-Round 3,430,000 5.8 33.7b
Head of Family Works 5,565,000 9.5 54.8b Works Full-Time, Year-Round 2,341,000 5.2 23.0b
Adults 18-64 18,660,000 9.4% _ Seniors 65+ 4,858,000 8.9% _
a Percentages calculated relative to the number of poor children related to the head of household (10,177,000) rather than the total number of poor children (10,466,000).
b Percentages calculated relative to the number of poor children in related families (10,165,000) rather than the total number of poor children (10,466,000).
Notes: A family of four was considered poor in 2019 with an annual income below $26,370 and extremely poor with an income below half that amount ($13,185). Poverty estimates differ based on the source of the Census data. Census data on poverty is collected through both the American Community Survey (ACS) and the Current Population Survey (CPS). The CPS provides the most accurate national data on poverty and is therefore the official source of national poverty estimates. The ACS uses a larger sample size and is therefore preferred for state-level poverty data. All racial categories exclude children of Hispanic ethnicity. Hispanic children can be of any race.
Sources: U.S. Census Bureau, Current Population Survey. 2020. "2019 Annual Social and Economic Supplement," Tables POV01, POV03, POV07, POV13, POV21, POV40. https://www.census.gov/topics/income-poverty/data/tables.html. Additional customized tables generated using MDAT. https://data.census/gov/mdat/#/.
Nearly 1 in 7 children were poor in 2019. 71 percent were children of color and more than 2 in 3 lived in working families.

39
The State of America’s Children® 2021
CHILD POVERTY
The federal government uses different guidelines for determining who is considered poor and who is eligible for public benefits. In 2019, a family
of four was considered poor if their annual income fell below $26,172 and extremely poor if their income fell below half that amount.
A family of four was considered eligible for public benefits if their annual income fell below $25,750.
Table 3: Federal Poverty Thresholds and Guidelines, 2019
Federal Poverty Thresholdsa
Poverty (100 Percent) Extreme Poverty (50 Percent)
Family Size Per Year Per Month Per Week Per Year Per Month Per Week1 $13,011 $1,084 $250 $6,506 $542 $1252 16,521 1,377 318 8,261 688 1593 20,335 1,695 391 10,168 847 1964 26,172 2,181 503 13,086 1,091 2525 31,021 2,585 597 15,511 1,293 2986 35,129 2,927 676 17,565 1,464 3387 40,016 3,335 770 20,008 1,667 3858 44,461 3,705 855 22,231 1,853 428
9 or More 52,875 4,406 1,017 26,438 2,203 508
Federal Poverty Guideinesb
Family Size Poverty1 $12,4902 16,9103 21,3304 25,7505 30,1706 34,5907 39,0108 43,430
Each Additional Person beyond 8
4,420
a The federal poverty thresholds are used to calculate those who are considered poor and extremely poor. The poverty threshold numbers in the table are weighted averages of the actual thresholds. The actual poverty thresholds vary slightly based on the number of children and, for households of size one and two, whether the houshold includes someone over 64. Except for Alaska and Hawaii, which have slightly higher thresholds, no adjustments are made for differences in living costs from state to state. Extreme poverty is defined as half of the poverty thresholds.
b The federal poverty guidelines (also called the Federal Poverty Level) are a simplification of the poverty thresholds used to determine eligibility for public benefits and are adjusted annually to account for inflation.
Sources: U.S. Census Bureau. 2020. ""Poverty Thresholds for 2019 by Size of Family and Number of Related Children Under 18 Years."" https://www.census.gov/data/tables/time-series/demo/income-poverty/historical-poverty-thresholds.html; U.S Department of Health and Human Services. 2019. ""Annual Update of the HHS Poverty Guidelines."" Federal Register 84 (22). https://www.govinfo.gov/content/pkg/FR-2019-02-01/pdf/2019-00621.pdf.

40 Children’s Defense Fund
CHILD POVERTY
Hispanic children were the largest group of poor children in 2019 followed by white and Black children.
Table 4: Number of Poor Children by Race/Ethnicity, 2019
Asian/Native American Hawaiian/Other Indian/Alaska Two or More White Hispanic Black Pacific Islander Native Races Alabama 81,673 28,725 110,120 1,087 917 8,099 Alaska 5,641 2,044 1,524 108 10,318 2,775 Arizona 58,188 180,638 25,491 5,225 33,257 22,203 Arkansas 70,713 22,639 45,681 1,763 151 11,952 California 164,357 952,382 117,166 82,954 16,576 87,281 Colorado 42,168 68,837 14,606 2,896 3,337 12,859 Connecticut 18,889 53,102 24,198 2,917 1,487 9,127 Delaware 9,502 9,974 10,742 659 n/a 1,920 District of Columbia n/a 2,572 21,496 35 n/a n/a Florida 184,081 279,388 245,708 10,716 2,661 43,612 Georgia 100,492 97,131 234,667 7,915 3,633 25,697 Hawaii 2,777 8,580 140 17,050 n/a 14,559 Idaho 36,474 17,444 n/a 798 2,423 3,530 Illinois 126,380 139,568 139,887 13,162 1,188 25,651 Indiana 118,839 34,409 55,671 5,400 806 19,517 Iowa 55,417 16,071 15,096 1,211 1,167 4,478 Kansas 42,761 34,128 13,404 2,977 1,572 9,807 Kentucky 147,561 18,574 28,132 2,868 n/a 17,691 Louisiana 81,557 25,662 167,298 2,065 1,141 11,571 Maine 27,734 566 2,644 340 327 1,268 Maryland 30,246 31,572 76,384 7,095 489 12,641 Massachusetts 45,461 60,187 34,702 6,221 896 19,110 Michigan 167,315 54,851 117,363 6,230 4,487 29,021 Minnesota 51,850 19,137 45,414 9,162 5,792 15,636 Mississippi 47,465 13,385 123,582 846 1,499 7,256 Missouri 133,568 26,443 49,827 2,217 1,755 17,954 Montana 19,852 3,258 n/a n/a 8,308 3,095 Nebraska 22,300 15,192 9,173 802 1,713 3,394 Nevada 24,783 59,649 18,944 5,165 2,542 10,002 New Hampshire 14,391 1,600 659 110 n/a 1,070 New Jersey 50,737 108,232 56,704 9,675 760 13,224 New Mexico 15,643 77,345 2,875 387 21,269 7,279 New York 230,083 240,382 184,354 46,690 3,799 52,205 North Carolina 122,241 112,212 167,122 5,283 11,394 30,463 North Dakota 7,918 1,920 n/a n/a 4,523 1,870 Ohio 227,321 48,080 144,047 5,596 1,742 48,038 Oklahoma 69,468 45,613 27,622 2,915 20,465 28,855 Oregon 54,380 37,994 5,598 2,566 2,902 10,798 Pennsylvania 180,925 109,057 123,326 11,384 1,719 33,074 Rhode Island 5,740 14,886 4,060 332 n/a 6,726 South Carolina 61,613 33,881 106,983 1,397 110 12,160 South Dakota 11,424 1,840 1,916 n/a 13,626 2,671 Tennessee 133,986 48,128 84,585 2,195 1,947 22,614 Texas 189,524 930,760 233,275 31,610 4,744 57,191 Utah 41,999 36,451 4,456 1,692 1,712 7,764 Vermont 8,789 n/a 1,104 n/a n/a 542 Virginia 81,285 44,913 96,897 6,627 163 21,048 Washington 79,927 74,509 14,697 8,583 6,370 20,195 West Virginia 56,494 1,922 4,864 n/a n/a 5,732 Wisconsin 69,290 37,718 38,228 7,150 5,827 13,653 Wyoming 9,041 3,869 n/a n/a 922 1,205
United States 3,029,608 3,888,278 2,667,773 301,093 126,543 452,478 Notes: Poverty estimates differ based on the source of Census data. Census data on poverty is collected through both the American Community Survey
(ACS) and Current Population Survey (CPS). The CPS provides the most accurate national data on poverty and is therefore the official source of national poverty estimates. The ACS uses a larger sample size and is preferred for state-level poverty data. For national estimates, all racial categories exclude children of Hispanic ethnicity. For state estimates, only the "White" racial category excludes children of Hispanic ethnicity. Hispanic children can be of any race. The racial categories Asian, Native Hawaiian, and Other Pacific Islander are combined because disaggregated data were not available for most states. "N/A" means data were not available.
Sources: U.S. Census Bureau. 2019. “2018 American Community Survey 1-Year Estimates,” Tables B17020B-I. https://data.census.gov/cedsci/; U.S. Census Bureau, Current Population Survey. 2019. “2018 Annual Social and Economic Supplement.” Accessed using Data Ferrett. https://dataferrett.census.gov/.

41
The State of America’s Children® 2021
CHILD POVERTY
In 2019, more than 1 in 4 Black children were poor in 39 states and the District of Columbia; Hispanic children, in 22 states; and
American Indian/Alaska Native children, in 24 states.
Table 5: Percent of Poor Children by Race/Ethnicity, 2019
Asian/Native American Hawaiian/Other Indian/Alaska Two or More White Hispanic Black Pacific Islander Native Races Alabama 13.20% 33.3% 35.2% 7.9% 20.5% 20.9% Alaska 6.7 11.9 40.2 1.3 28.0 10.8 Arizona 9.4 25.1 29.4 11.2 36.4 18.5 Arkansas 16.4 26.9 38.9 15.8 5.8 29.8 California 7.4 21.0 25.7 8.0 23.6 10.8 Colorado 6.1 17.7 25.5 8.4 26.8 13.1 Connecticut 4.9 29.3 26.8 8.7 52.2 15.8 Delaware 10.2 30.0 21.2 8.6 n/a 13.0 District of Columbia n/a 12.0 31.0 1.5 n/a n/a Florida 10.9 20.9 29.2 10.5 22.2 15.8 Georgia 9.5 26.6 28.4 8.4 34.2 18.2 Hawaii 6.6 15.8 3.0 14.7 n/a 12.3 Idaho 11.1 21.4 n/a 15.5 42.7 13.3 Illinois 8.9 20.3 34.0 9.6 13.7 15.8 Indiana 11.1 19.9 32.7 13.4 22.7 23.2 Iowa 10.1 21.9 37.6 7.3 44.3 13.9 Kansas 9.4 26.6 32.3 15.9 37.6 19.5 Kentucky 19.3 30.3 32.2 15.1 n/a 33.4 Louisiana 15.0 32.8 43.2 10.9 14.3 29.0 Maine 13.2 9.2 40.2 16.7 17.1 12.9 Maryland 5.6 14.9 18.7 9.5 13.6 14.0 Massachusetts 5.7 23.8 26.8 7.0 28.9 18.2 Michigan 11.9 30.6 35.6 9.3 35.6 21.2 Minnesota 6.0 16.5 37.2 12.2 37.1 16.8 Mississippi 14.1 43.4 42.9 11.3 40.5 32.5 Missouri 13.8 28.7 28.4 9.3 34.8 22.1 Montana 11.5 27.4 n/a n/a 37.2 22.1 Nebraska 7.0 18.7 32.2 7.5 26.9 12.4 Nevada 10.7 21.2 25.8 10.5 24.3 16.3 New Hampshire 6.9 9.5 12.8 1.7 n/a 8.3 New Jersey 5.8 20.4 21.4 5.5 18.4 10.8 New Mexico 14.2 27.4 26.9 5.7 40.1 24.8 New York 12.2 24.8 27.7 15.2 28.7 21.5 North Carolina 10.5 29.8 32.5 8.1 37.3 22.0 North Dakota 5.9 19.6 n/a n/a 33.0 15.5 Ohio 12.7 29.8 38.8 9.9 32.2 28.7 Oklahoma 14.1 27.5 38.2 15.4 22.8 24.0 Oregon 10.2 20.2 33.8 7.8 25.2 14.2 Pennsylvania 10.6 33.4 34.5 12.6 24.3 21.1 Rhode Island 5.1 32.7 23.3 5.3 n/a 34.2 South Carolina 10.4 14.7 34.5 7.3 3.3 19.0 South Dakota 7.5 31.9 31.2 n/a 50.9 22.7 Tennessee 14.0 25.7 30.9 8.4 49.2 29.8 Texas 8.3 21.9 26.5 9.8 16.8 15.3 Utah 6.2 17.8 37.0 8.1 17.8 15.4 Vermont 8.8 n/a 52.3 n/a n/a 10.0 Virginia 8.4 17.7 25.9 5.9 3.5 14.7 Washington 8.8 21.2 20.1 6.6 24.5 10.7 West Virginia 18.3 21.4 44.5 n/a n/a 35.8 Wisconsin 7.9 25.4 35.5 17.2 39.7 19.2 Wyoming 9.1 20.2 n/a n/a 24.0 14.5
United States 8.3% 20.8% 26.5% 7.7% 20.6% 14.0%
Notes: Poverty estimates differ based on the source of Census data. Census data on poverty is collected through both the American Community Survey (ACS) and Current Population Survey (CPS). The CPS provides the most accurate national data on poverty and is therefore the official source of national poverty estimates. The ACS uses a larger sample size and is preferred for state-level poverty data. For national estimates, all racial categories exclude children of Hispanic ethnicity. For state estimates, only the "White" racial category excludes children of Hispanic ethnicity. Hispanic children can be of any race. The racial categories Asian, Native Hawaiian, and Other Pacific Islander are combined because disaggregated data were not available for most states. "N/A" means data were not available.
Sources: U.S. Census Bureau. 2020. "2019 American Community Survey 1-Year Estimates," Tables B17020B-I. https://data.census.gov/cedsci/; U.S. Census Bureau, Current Population Survey. 2020. "2019 Annual Social and Economic Supplement." Accessed using MDAT. https://data.census.gov/mdat/#/.
42 Children’s Defense Fund
CHILD POVERTY
In 2019, more than 1 in 6 children were poor in 21 states and the District of Columbia.
Table 6: Poor and Extremely Poor Children by Age, 2019
Poor Children Extremely Poor ChildrenUnder 18 Under 6 Under 18 Under 6
Number Percent Rank* Number Percent Rank* Number Percent Rank* Number Percent Rank* Alabama 228,412 21.4% 45 81,998 24.1% 45 108,936 10.2% 46 42,231 12.4% 46Alaska 22,921 13.0 14 9,618 15.9 22 7,589 4.3 3 2,661 4.4 2Arizona 308,459 19.1 38 104,663 20.8 37 137,419 8.5 39 48,268 9.6 38Arkansas 151,448 22.1 47 54,838 25.5 46 59,582 8.7 41 22,709 10.6 44California 1,363,574 15.6 27 431,358 15.5 20 556,820 6.4 26 180,820 6.5 19Colorado 135,405 10.9 5 42,516 10.9 3 59,438 4.8 7 18,794 4.8 4Connecticut 101,233 14.1 22 31,236 14.5 15 43,899 6.1 22 14,707 6.8 21Delaware 32,277 16.4 29 10,351 16.8 24 11,345 5.8 18 4,838 7.9 27District of Columbia 23,931 18.9 — 9,654 18.2 — 12,737 10.1 — 5,775 10.9 —Florida 737,415 17.7 34 259,512 19.7 35 324,966 7.8 33 120,199 9.1 36Georgia 461,456 18.7 37 152,237 20.0 36 187,231 7.6 31 64,691 8.5 32Hawaii 36,461 12.4 13 11,362 11.3 7 18,333 6.2 24 5,250 5.2 5Idaho 58,188 13.2 17 23,581 16.7 23 23,293 5.3 11 9,111 6.5 19Illinois 436,327 15.7 28 153,921 17.6 29 175,016 6.3 25 63,144 7.2 24Indiana 230,725 15.2 26 82,393 17.1 26 109,776 7.2 30 40,542 8.4 31Iowa 92,018 13.0 14 34,616 15.1 18 36,995 5.2 9 12,767 5.6 7Kansas 101,094 14.7 23 36,243 16.8 24 39,681 5.8 18 15,854 7.3 25Kentucky 212,130 21.7 46 81,402 25.5 46 102,771 10.5 47 42,737 13.4 47Louisiana 288,732 27.0 49 97,332 28.1 49 140,522 13.2 50 48,949 14.1 49Maine 32,746 13.8 20 12,782 17.6 29 12,622 5.3 11 5,084 7.0 22Maryland 156,992 12.0 10 50,697 12.1 8 78,016 6.0 20 26,543 6.4 16Massachusetts 154,457 11.6 8 50,244 12.1 8 79,599 6.0 20 25,986 6.3 14Michigan 371,020 17.6 33 129,434 19.3 34 162,436 7.7 32 56,934 8.5 32Minnesota 143,006 11.2 7 46,414 11.2 6 61,995 4.9 8 21,542 5.2 5Mississippi 192,413 28.1 50 65,621 30.9 50 85,187 12.4 49 30,911 14.6 50Missouri 229,336 17.1 32 78,375 18.3 31 108,887 8.1 35 35,806 8.3 30Montana 32,888 14.9 24 10,313 15.3 19 12,338 5.6 15 5,395 8.0 28Nebraska 51,085 11.0 6 19,924 13.1 12 21,827 4.7 6 9,401 6.2 13Nevada 114,886 16.9 30 40,248 18.5 32 43,469 6.4 26 15,381 7.1 23New Hampshire 17,609 7.1 1 5,537 7.3 1 6,853 2.7 1 2,434 3.2 1New Jersey 235,470 12.3 12 81,031 13.4 13 102,571 5.4 13 36,043 6.0 9New Mexico 115,997 24.9 48 38,572 27.7 48 52,678 11.3 48 18,771 13.5 48New York 711,686 18.1 35 244,630 18.8 33 331,669 8.4 37 115,945 8.9 35North Carolina 440,230 19.5 40 153,623 21.9 41 198,004 8.8 42 70,274 10.0 40North Dakota 17,823 10.2 3 6,237 10.5 2 9,062 5.2 9 3,442 5.8 8Ohio 466,168 18.4 36 169,765 21.0 38 208,477 8.2 36 82,067 10.2 42Oklahoma 186,392 19.9 43 65,187 21.9 41 81,827 8.8 42 30,333 10.2 42Oregon 110,323 13.1 16 33,675 12.7 10 47,412 5.6 15 16,925 6.4 16Pennsylvania 434,904 16.9 30 143,024 17.4 27 203,907 7.9 34 72,027 8.8 34Rhode Island 28,009 14.0 21 9,718 15.5 20 13,154 6.6 28 4,737 7.6 26South Carolina 214,772 19.7 41 72,672 21.7 40 95,259 8.8 42 33,107 9.9 39South Dakota 31,425 15.0 25 12,177 17.4 27 14,899 7.1 29 5,637 8.1 29Tennessee 290,815 19.7 41 104,712 22.1 44 124,188 8.4 37 44,158 9.3 37Texas 1,400,918 19.2 39 502,052 21.5 39 624,266 8.6 40 233,897 10.0 40Utah 91,433 9.9 2 32,755 11.1 5 35,505 3.9 2 13,238 4.5 3Vermont 11,320 10.2 3 3,627 11.0 4 5,101 4.6 4 1,961 6.0 9Virginia 244,953 13.4 18 83,381 14.3 14 110,938 6.1 22 36,825 6.3 14Washington 196,520 12.0 10 69,443 13.0 11 89,933 5.5 14 32,634 6.1 12West Virginia 69,975 20.1 44 23,611 22.0 43 35,117 10.1 45 12,859 12.0 45Wisconsin 167,605 13.5 19 56,225 14.5 15 71,008 5.7 17 23,023 6.0 9Wyoming 15,088 11.6 8 5,910 15.0 17 6,060 4.6 4 2,526 6.4 16United States 10,465,773 14.4% 3,612,490 15.4% 4,500,840 6.2% 1,678,050 7.2%
*States are ranked 1 to 50 with 1 meaning the lowest child poverty rate and 50 meaning the highest child poverty rate.
Notes: Poverty estimates differ based on the sources of Census data. Census data on poverty is collected through both the American Community Survey (ACS) and Current Population Survey (CPS). The CPS provides the most accurate national data on poverty and is therefore the official source of national poverty estimates. The ACS uses a larger sample size and is preferred for state-level poverty data.
Sources: U.S. Census Bureau. 2020. “2019 American Community Survey 1-Year Estimates,” Tables B17020 and B17024. https://data.census.gov/cedsci/; U.S. Census Bureau, Current Population Survey. 2020. "2019 Annual Social and Economic Supplement." Accessed using MDAT. https://data.census.gov/mdat/#/.

43
The State of America’s Children® 2021
INCOME AND WEALTH INEQUALITY
In 2019, the median income of Black (43,900), Hispanic (52,300) and American Indian (48,000) families with children was about half the median income of
white families with children (95,700).
Table 7: Median Family Income among Households with Children by Race/Ethnicity, 2019
Total White Hispanic BlackAsian/Pacific
IslanderTwo or More
RacesAmerican
IndianAlabama 62,400 78,900 35,400 35,300 87,100 69,500 SAlaska 83,700 99,200 76,300 S 64,200 76,000 53,300Arizona 70,200 92,400 50,200 52,900 115,200 75,500 42,300Arkansas 57,300 69,600 42,200 28,800 93,200 49,700 SCalifornia 85,300 123,500 57,600 58,800 132,600 88,300 64,700Colorado 92,500 110,200 59,100 45,400 111,700 76,000 56,600Connecticut 98,300 130,500 46,000 47,800 140,200 75,200 SDelaware 77,200 101,200 47,300 49,100 117,800 S SDistrict of Columbia 106,700 247,900 92,800 47,400 S S SFlorida 65,800 85,800 52,300 45,000 90,700 65,100 49,400Georgia 70,800 93,100 50,700 47,400 100,600 73,200 SHawaii 93,300 105,700 71,800 86,900 92,300 81,800 SIdaho 72,500 79,300 52,200 S S 62,100 SIllinois 86,600 107,400 55,800 39,700 118,700 74,800 63,600Indiana 71,100 80,400 47,100 34,200 64,700 57,400 SIowa 77,900 86,400 48,600 36,900 82,100 53,300 SKansas 75,700 86,300 46,300 40,800 76,300 47,800 SKentucky 65,100 69,300 45,600 39,600 76,100 41,200 SLouisiana 61,300 84,500 40,500 33,900 69,000 65,800 53,100Maine 75,600 76,500 S S S S SMaryland 103,600 130,500 68,700 71,700 134,100 97,000 SMassachusetts 111,800 135,600 48,100 63,100 142,000 71,600 SMichigan 73,700 83,800 45,800 34,700 105,000 45,200 45,400Minnesota 97,200 108,600 52,900 41,600 90,000 52,000 34,000Mississippi 53,100 75,700 39,300 31,400 60,700 S SMissouri 72,100 80,000 45,100 40,700 95,100 54,300 SMontana 71,600 76,500 49,700 S S S 33,300Nebraska 80,300 90,000 53,100 42,400 69,400 52,300 34,400Nevada 69,300 89,100 50,900 47,400 77,900 69,400 61,100New Hampshire 102,400 104,400 57,800 S 137,400 S SNew Jersey 108,400 141,000 58,000 57,900 157,700 86,900 SNew Mexico 53,400 78,400 46,400 38,100 77,100 58,500 32,500New York 83,600 110,100 54,100 51,300 87,400 64,400 55,500North Carolina 68,900 88,400 40,400 41,000 106,100 53,200 39,600North Dakota 87,600 97,700 56,800 S S S 33,600Ohio 72,100 81,700 45,800 33,300 105,100 45,600 SOklahoma 62,200 76,000 43,000 40,000 69,400 51,100 54,000Oregon 81,200 89,100 56,900 48,000 121,200 64,100 60,500Pennsylvania 80,700 93,100 40,800 37,900 99,900 45,900 SRhode Island 82,300 100,600 39,800 45,700 S S SSouth Carolina 66,700 85,600 45,400 36,800 111,100 70,800 SSouth Dakota 75,100 83,300 48,700 S S S 27,300Tennessee 66,400 77,500 41,600 40,500 91,000 47,000 STexas 72,100 106,400 51,200 49,200 112,400 69,700 61,900Utah 87,300 94,700 56,100 S 81,100 66,500 51,300Vermont 82,200 84,800 S S S S SVirginia 94,500 110,200 63,500 57,100 140,100 77,700 SWashington 91,500 101,900 52,800 57,800 130,100 78,100 41,600West Virginia 58,500 61,000 S 26,800 S S SWisconsin 82,000 92,600 43,100 30,900 93,700 55,500 31,700Wyoming 80,000 85,100 68,200 S S S SUnited States 78,000 95,700 52,300 43,900 114,900 67,800 48,000
Notes: “S” means estimates were suppressed when confidence interval around the percent was greater than or equal to 10 percentage points. Racial/ethnic categories are presented in the order of their share in the child population. The racial category, “White,” excludes children of Hispanic ethnicity while the racial categories, “Black,” “Asian/Pacific Islander,” “Two or More Races” and “American Indian” include children of Hispanic ethnicity.
Source: The Annie E. Casey Foundation, KIDS COUNT Data Center. 2020. “Median Family Income among Households with Children by Race and Ethnicity, 2019.” https://datacenter.kidscount.org/data/tables/8782-median-family-income-among-households-with-children-by-race-and-ethnicity#detailed/.

44 Children’s Defense Fund
HOUSING AND HOMELESSNESS
a In these states federal minimum wage law supersedes state minimum wage laws because the federal minimum wage is greater than the state minimum wage or there is no state minimum wage.
b As of July 1, 2020, Nevada raised the minimum wage to $8.00 for employees with health insurance and $9.00 for employees without health insurance.
Notes: Affordability is defined as rent not being more than 30 percent of monthly income. Fair Market Rent (FMR) is the 40th percentile of gross rents for typical, non-substandard rental units. It is calculated annually by the Department of Housing and Urban Development.
Sources: National Low Income Housing Coalition. 2020. “Out of Reach 2020.” https://reports.nlihc.org/sites/default/files/oor/OOR_2020.pdf; U.S. Department of Labor. "Consolidated Minimum Wage Table." Updated as of September 1, 2020. https://www.dol.gov/agencies/whd/mw-consolidated.
In 2020, a person working full-time, year-round at minimum wage could not afford the monthly Fair Market Rent (FMR) for a two-bedroom
rental unit in any state or the District of Columbia.
Table 8: Rental Housing Affordability, FY2020
Monthly Fair Market Rent (FMR) for a Two-Bedroom
Rental UnitMinimum Wage
($/hr)
Number of Full-Time Jobs at Minimum Wage Needed to
Afford Two- Bedroom FMR
Hourly Wage Necessary
to Afford FMR with One Full-Time Job
Alabama $803 $7.25a 2.1 $15.44Alaska 1,304 10.19 2.5 25.07Arizona 1,097 12.00 1.8 21.10Arkansas 738 10.00 1.4 14.19California 1,922 12.00 2.8 36.96Colorado 1,375 12.00 2.2 26.45Connecticut 1,374 12.00 2.4 26.42Delaware 1,142 9.25 2.4 21.96District of Columbia 1,707 15.00 2.2 32.83Florida 1,270 8.56 2.9 24.43Georgia 994 7.25 2.6 19.11Hawaii 2,015 10.10 3.8 38.76Idaho 863 7.25 2.3 16.59Illinois 1,108 10.00 2.1 21.30Indiana 848 7.25 2.3 16.32Iowa 804 7.25 2.1 15.46Kansas 855 7.25 2.3 16.43Kentucky 780 7.25 2.1 14.99Louisiana 909 7.257.25a 2.4 17.48Maine 1,029 12.00 1.6 19.79Maryland 1,459 11.00 2.6 28.06Massachusetts 1,847 12.75 2.8 35.52Michigan 906 9.65 1.8 17.42Minnesota 1,068 10.00 2.1 20.53Mississippi 774 7.257.25a 2.1 14.89Missouri 836 9.45 1.7 16.07Montana 878 8.65 2.0 16.88Nebraska 846 9.00 1.8 16.27Nevada 1,065 9.00/8.00b 2.3 20.48New Hampshire 1,218 7.25 3.2 23.43New Jersey 1,544 11.00 2.7 29.69New Mexico 851 9.00 1.8 16.37New York 1,691 11.80 2.8 32.53North Carolina 919 7.25 2.4 17.67North Dakota 841 7.25 2.2 16.18Ohio 832 8.70 1.8 15.99Oklahoma 828 7.25 2.2 15.93Oregon 1,267 12.00 2.0 24.37Pennsylvania 1,000 7.25 2.7 19.23Rhode Island 1,101 10.50 2.0 21.16South Carolina 900 7.257.25a 2.4 17.30South Dakota 793 9.30 1.6 15.24Tennessee 889 7.257.25a 2.4 17.09Texas 1,087 7.25 2.9 20.90Utah 1,031 7.25 2.7 19.83Vermont 1,215 10.96 2.1 23.36Virginia 1,229 7.25 3.3 23.64Washington 1,584 13.50 2.3 30.46West Virginia 778 8.75 1.7 14.97Wisconsin 898 7.25 2.4 17.27Wyoming 892 7.25 2.4 17.15United States $1,246 $7.25 2.4 $23.96
45
The State of America’s Children® 2021
HOUSING AND HOMELESSNESS
a U.S. totals exclude data from Puerto Rico and the Bureau of Indian Education.
Sources: National Center for Homeless Education. 2009. "Education for Homesless Children and Youths Program: Analysis of Data." https://nche.ed.gov/wp-content/uploads/2018/12/data_comp_04-07.pdf; National Center for Homeless Education. 2019. "Federal Data Summary School Years 2014-15 to 2016-17: Education for Homeless Children and Youth," Table 4. https://nche.ed.gov/wp-content/uploads/2019/02/Federal-Data-Summary-SY-14.15-to-16.17-Final-Published-2.12.19.pdf; National Center for Homeless Education. 2020. "Federal Data Summary School Years 2015-16 to 2017-18: Education For Homeless Children and Youth," Table 5. https://nche.ed.gov/wp-content/uploads/2020/01/Federal-Data-Summary-SY-15.16-to-17.18-Published-1.30.2020.pdf.
The number of homeless children and youth in public schools has more than doubled since the start of the Great Recession. Only 19 states saw decreases
between the 2016-2017 and 2017-2018 school years.
Table 9: Homeless Children Enrolled in Public Schools, Select School Years
School Year:
Percent Change between
2006-2007 and 2017-2018
Percent Change between
2016-2017 and 2017-20182006-2007 2014-2015 2015-2016 2016-2017 2017-2018
Alabama 10,907 19,373 14,112 15,931 15,023 37.7% -5.7%Alaska 3,216 4,018 3,784 4,041 3,769 17.2 -6.7Arizona 19,628 28,393 24,770 25,454 24,399 24.3 -4.1Arkansas 7,080 10,756 11,984 13,104 14,052 98.5 7.2California 178,014 235,983 246,296 262,935 263,058 47.8 0.0Colorado 11,978 24,146 23,014 21,062 22,369 86.8 6.2Connecticut 1,980 3,192 3,759 4,293 5,015 153.3 16.8Delaware 1,842 3,098 3,227 3,018 3,484 89.1 15.4District of Columbia 824 3,551 6,260 6,415 7,445 803.5 16.1Florida 30,554 73,117 72,042 75,106 95,167 211.5 26.7Georgia 14,017 37,791 38,474 38,336 39,571 182.3 3.2Hawaii 1,132 3,526 3,790 2,958 3,101 173.9 4.8Idaho 1,875 7,162 7,143 7,512 8,080 330.9 7.6Illinois 19,821 52,333 50,949 51,617 52,978 167.3 2.6Indiana 8,249 19,205 17,863 18,431 18,625 125.8 1.1Iowa 2,886 6,936 6,774 6,789 7,124 146.8 4.9Kansas 3,569 9,715 9,265 9,297 8,471 137.3 -8.9Kentucky 18,337 27,836 27,603 26,826 23,964 30.7 -10.7Louisiana 34,102 20,277 20,254 30,481 18,320 -46.3 -39.9Maine 1,055 1,934 2,271 2,515 2,443 131.6 -2.9Maryland 8,456 16,096 16,267 17,122 17,601 108.1 2.8Massachusetts 11,863 19,353 20,929 20,872 23,601 98.9 13.1Michigan 24,066 40,861 39,092 36,811 35,193 46.2 -4.4Minnesota 6,008 15,196 16,550 17,750 16,698 177.9 -5.9Mississippi 12,856 10,309 9,284 9,979 9,815 -23.7 -1.6Missouri 13,620 30,650 32,133 33,857 36,006 164.4 6.3Montana 2,202 3,075 3,003 3,606 3,977 80.6 10.3Nebraska 1,633 3,317 3,422 3,592 3,723 128.0 3.6Nevada 5,374 17,178 20,696 16,765 20,685 284.9 23.4New Hampshire 1,983 3,335 3,349 3,913 3,982 100.8 1.8New Jersey 4,279 10,150 10,391 10,994 13,234 209.3 20.4New Mexico 4,383 10,279 10,071 11,625 10,683 143.7 -8.1New York 44,018 118,435 139,959 148,418 153,209 248.1 3.2North Carolina 12,659 26,613 26,339 29,297 28,877 128.1 -1.4North Dakota 1,209 2,715 2,230 2,153 2,156 78.3 0.1Ohio 13,578 27,939 29,403 30,385 34,180 151.7 12.5Oklahoma 8,284 26,979 26,268 27,096 25,623 209.3 -5.4Oregon 15,517 22,637 22,958 24,322 23,141 49.1 -4.9Pennsylvania 12,935 22,014 23,164 25,109 30,624 136.8 22.0Rhode Island 667 1,004 1,049 1,231 1,523 128.3 23.7South Carolina 6,033 13,353 14,140 11,767 12,426 106.0 5.6South Dakota 1,038 2,156 1,958 2,018 2,037 96.2 0.9Tennessee 6,567 13,259 15,404 16,851 17,766 170.5 5.4Texas 33,896 113,063 115,676 111,177 231,305 582.4 108.1Utah 9,991 14,999 15,094 15,438 13,838 38.5 -10.4Vermont 764 1,124 1,098 1,097 N/A N/A N/AVirginia 9,898 17,876 18,577 20,593 20,393 106.0 -1.0Washington 16,853 35,511 39,127 40,930 40,112 138.0 -2.0West Virginia 2,984 7,955 9,320 9,024 9,716 225.6 7.7Wisconsin 8,103 18,366 18,592 19,264 18,853 132.7 -2.1Wyoming 675 1,556 1,625 1,908 1,703 152.3 -10.7United States 673,458 1,259,695 1,300,802 1,351,085 1,499,138 122.6% 11.0%

46 Children’s Defense Fund
CHILD HUNGER AND NUTRITION
a Food-insecure households are households with children that had difficulty meeting basic food needs for adults, children or both. b States are ranked 1-50 with 1 meaning the lowest percent of children living in food-insecure households and 50 meaning the highest percent of children
living in food-insecure households.
Source: “Map the Meal Gap 2020: A Report on County and Congressional District Food Insecurity and County Food Cost in the United States in 2018." Feeding America. https://www.feedingamerica.org/sites/default/files/2020-06/MaptheMealGap2020CombinedModules.pdf; Coleman-Jensen, Alisa et al. 2020. “Household Food Security in the United States in 2019 Statistical Supplement,” Table S-3. Washington, DC: United States Department of Agriculture. https://www.ers.usda.gov/webdocs/publications/99289/ap-084.pdf?v=7883.8.
In 2018, at least 1 in 6 children living in food-insecure households in 24 states and District of Columbia.
Table 10: Child Hunger, 2018 and 2019
Children Living in Food-Insecure Householdsa
2018 Number 2018 Percent State Rankb
Alabama 251,800 23.1% 47Alaska 33,200 18.1 32Arizona 311,390 19.0 37Arkansas 162,270 23.1 47California 1,362,340 15.2 16Colorado 155,120 12.2 5Connecticut 117,660 16.0 21Delaware 38,680 19.0 37District of Columbia 24,280 19.1 n/aFlorida 819,370 19.4 41Georgia 405,380 16.2 24Hawaii 55,710 18.4 33Idaho 56,120 12.6 8Illinois 363,900 12.7 9Indiana 274,080 17.5 29Iowa 102,190 13.9 11Kansas 129,780 18.4 33Kentucky 190,600 18.9 35Louisiana 269,650 24.6 50Maine 47,460 19.1 39Maryland 216,070 16.1 23Massachusetts 138,760 10.1 2Michigan 318,960 14.7 13Minnesota 161,880 12.4 6Mississippi 162,150 23.0 46Missouri 209,870 15.2 16Montana 36,560 15.9 19Nebraska 79,310 16.7 27Nevada 134,350 19.5 42New Hampshire 34,280 13.3 10New Jersey 219,760 11.3 3New Mexico 114,180 23.8 49New York 685,500 16.9 28North Carolina 443,040 19.3 40North Dakota 16,700 9.6 1Ohio 489,160 18.9 35Oklahoma 208,110 21.8 45Oregon 139,220 16.0 21Pennsylvania 399,270 15.1 15Rhode Island 36,270 17.8 31South Carolina 178,710 16.2 24South Dakota 35,330 16.5 26Tennessee 267,110 17.7 30Texas 1,598,940 21.6 44Utah 113,190 12.1 4Vermont 17,550 15.2 16Virginia 233,530 12.5 7Washington 244,480 14.7 13West Virginia 73,770 20.3 43Wisconsin 179,180 14.1 12Wyoming 21,160 15.9 19United States 2018 United States 2019
11,174,000 10,732,000
15.2%14.7%

47
The State of America’s Children® 2021
CHILD HUNGER AND NUTRITION
a States are ranked 1-50 with 1 meaning the highest percent of children who receive free or reduced-price lunch also participated in Summer Nutrition Programs and 50 meaning the lowest number of children who receive free or reduced-price lunch also participate in Summer Nutrition Programs.
b In these states, 50 percent or more of eligible school districts adopted the Community Eligiblity Provision for the 2018-2019 school year. These high poverty school districts offered breakfast and lunch at no charge to all students without having to collect and process individual meal applications.
Note: Participation data are based on average daily meals served from September through May for the School Lunch and Breakfast Programs and in July for the Summer Food Service Program.Sources: Philbin, Etienne Melcher, Crystal FitzSimons, and Randy Rosso. 2020. “School Breakfast Scorecard: School Year 2018-2019.” Food Research and Action Center (FRAC). https://frac.org/wp-content/uploads/Breakfast-Scorecard-2018-2019_FNL.pdf; Hayes, Clarissa and Crystal FitzSimons. 2020. “Hunger Doesn’t Take a Vacation: Summer Nutrition Status Report.” FRAC. https://frac.org/wp-content/uploads/FRAC-Summer-Nutrition-Report-2020.pdf; Maurice, Alison, Randy Rosso, Crystal FitzSimons, and Kathryn Furtado. 2019. “Community Eligibility: The Key to Hunger-Free Schools: School Year 2018-2019.” FRAC. https://www.frac.org/wp-content/uploads/community-eligibility-key-to-hunger-free-schools-sy-2018-2019.pdf.
More than 21.6 million children received free or reduced-price lunch during the 2018-2019 school year, but less than 3 million of them received meals in summer 2019. In 44 states, more than 4 in 5 children who received free or reduced-price lunch did not participate in Summer Nutrition Programs.
Table 11: School and Summer Feeding Programs, 2018-2019 School Year and Summer 2019
Free and Reduced-Price
Lunch
Free and Reduced-Price
BreakfastSummer Food
Service Programs
Summer Food Service Particiation as a Percent of Free and Reduced-Price Lunch Participation
State Rank Based on Summer Food Service
Participation as a Percent of Free and Reduced-Price
Lunch ParticipationaAlabama 381,690 229,960 35,691 9.4% 38Alaska 40,101 22,196 4,160 10.4 31Arizona 475,335 265,387 69,099 14.5 20Arkansas 239,627 159,276 24,577 10.3 32California 2,609,162 1,488,463 398,577 15.3 15Colorado 225,045 129,448 19,773 8.8 40Connecticut 197,440 101,576 34,736 17.6 8Delaware 65,426 40,942 10,673 16.3 13District of Columbia 42,908 29,575 14,983 34.9 —Florida 1,478,971 762,038 189,431 12.8 26Georgia 894,473 548,478 112,495 12.6 27Hawaii 64,810 25,476 5,230 8.1 43Idaho 92,404 50,813 16,154 17.5 9Illinois 797,483 409,682 86,772 10.9 30Indiana 453,523 231,077 63,377 14.0 23Iowa 192,364 82,205 18,466 9.6 36Kansas 190,002 99,046 16,744 8.8 40Kentucky 434,270 292,773 41,449 9.5 37Louisiana 456,192 271,145 21,419 4.7 49Maine 57,900 37,173 14,216 24.6 4Maryland 305,040 188,504 65,366 21.4 5Massachusetts 342,327 187,236 52,392 15.3 15Michigan 591,565 349,149 60,720 10.3 32Minnesota 282,314 155,679 48,114 17.0 11Mississippi 298,367 180,493 20,316 6.8 45Missouri 358,404 224,681 30,036 8.4 42Montana 48,606 29,793 8,955 18.4 7Nebraska 129,648 57,946 8,761 6.8 45Nevada 185,342 111,943 13,731 7.4 44New Hampshire 34,385 15,393 4,848 14.1 22New Jersey 442,019 262,957 91,698 20.7 6New Mexico 175,458 121,777 44,973 25.6 2New York 1,389,734 728,280 354,712 25.5 3North Carolina 661,170 383,888 85,055 12.9 25North Dakota 33,735 17,497 3,172 9.4 38Ohio 636,939 365,425 61,575 9.7 35Oklahoma 319,031 185,781 14,501 4.5 50Oregon 201,935 111,462 30,030 14.9 17Pennsylvania 688,965 362,368 83,734 12.2 28Rhode Island 51,860 27,927 8,047 15.5 14South Carolina 364,049 227,651 53,772 14.8 18South Dakota 48,720 22,403 7,131 14.6 19Tennessee 487,223 316,379 55,011 11.3 29Texas 2,694,377 1,706,449 182,871 6.8 45Utah 159,295 63,497 26,870 16.9 12Vermont 25,567 17,796 7,928 31.0 1Virginia 457,001 282,822 60,598 13.3 24Washington 353,105 166,310 35,688 10.1 34West Virginia 145,420 120,683 8,923 6.1 48Wisconsin 294,868 153,752 42,470 14.4 21Wyoming 24,029 11,825 4,161 17.3 10United States 21,619,624 12,434,975 2,774,183 12.8%
Number of Children Participating in:

48 Children’s Defense Fund
CHILD HUNGER AND NUTRITION
In FY2018, nearly 1 in 4 children benefited from SNAP. In FY2020, nearly 1 in 6 children under age 5 relied on WIC during years of critical development.
Table 12: Average Monthly Number of Children Participating in SNAP and WICSupplemental Nutrition Assistance
Program (SNAP), FY2018Special Supplemental Nutrition Program for Women, Infants,
and Children (WIC), FY2020a
As a Percent of: Number of:
Number All Childrenb
All SNAP Participants
All Participants Infants Children Under 5
As a Percent of Children Under 5c
Alabama 347,000 31.8% 46.3% 114,893 31,689 55,554 18.9%Alaska 37,000 20.1 41.0 15,519 3,534 8,478 16.6Arizona 389,000 23.7 47.3 125,911 32,207 65,909 15.3Arkansas 172,000 24.5 47.2 62,255 19,038 27,196 14.4California 1,901,000 21.1 49.5 843,766 179,619 479,421 20.1Colorado 203,000 16.0 45.7 80,026 18,687 42,564 12.8Connecticut 136,000 18.5 35.8 43,684 11,716 22,177 12.2Delaware 59,000 29.0 43.8 16,183 4,476 7,964 14.6District of Columbia 37,000 29.0 33.5 12,742 3,637 5,734 12.6Florida 1,228,000 29.0 40.4 414,933 105,055 211,193 18.5Georgia 721,000 28.8 47.8 196,856 56,647 90,293 13.8Hawaii 62,000 20.4 38.7 24,934 5,820 13,322 15.6Idaho 74,000 16.6 47.4 30,214 7,376 15,770 13.6Illinois 775,000 27.1 43.3 171,877 49,486 81,380 10.9Indiana 288,000 18.4 47.5 140,161 35,337 72,301 17.3Iowa 144,000 19.7 43.4 57,717 13,833 30,816 15.8Kansas 95,000 13.5 45.0 46,835 11,518 24,648 13.3Kentucky 239,000 23.7 39.9 93,615 25,812 45,916 16.8Louisiana 401,000 36.6 46.8 95,544 30,719 39,183 13.0Maine 55,000 22.0 35.3 16,671 3,872 9,353 14.7Maryland 252,000 18.8 39.6 121,457 29,419 63,340 17.5Massachusetts 265,000 19.4 34.9 102,489 22,761 57,455 16.1Michigan 470,000 21.7 37.6 209,010 51,506 113,076 20.0Minnesota 186,000 14.3 44.7 100,264 22,417 56,143 16.0Mississippi 244,000 34.6 48.6 77,092 22,594 36,402 19.8Missouri 319,000 23.2 45.3 101,934 29,256 46,729 12.7Montana 44,000 19.2 39.3 15,212 3,630 8,308 13.6Nebraska 81,000 17.0 48.9 33,069 7,818 17,854 13.6Nevada 184,000 26.7 42.5 58,543 14,090 31,385 16.9New Hampshire 35,000 13.6 41.1 12,330 2,620 7,169 11.3New Jersey 331,000 16.9 44.1 131,252 31,302 68,721 13.4New Mexico 190,000 39.4 42.7 37,978 9,557 19,091 15.8New York 1,006,000 24.7 37.0 363,461 87,059 192,509 17.1North Carolina 441,000 19.2 41.1 217,681 55,655 109,694 18.0North Dakota 22,000 12.3 43.0 10,187 2,395 5,598 10.3Ohio 579,000 22.3 41.6 186,666 62,615 79,431 11.5Oklahoma 262,000 27.4 46.4 66,316 17,551 32,409 12.7Oregon 198,000 22.7 32.4 78,514 16,282 45,224 19.9Pennsylvania 629,000 23.7 35.2 191,978 47,671 101,737 14.6Rhode Island 50,000 24.4 32.8 17,471 4,339 9,374 17.2South Carolina 302,000 27.3 46.9 77,005 23,586 33,457 11.4South Dakota 43,000 19.8 49.1 14,087 3,476 7,692 12.6Tennessee 414,000 27.5 43.6 110,420 33,110 47,668 11.7Texas 2,035,000 27.5 54.2 678,056 177,773 311,186 15.6Utah 95,000 10.2 51.6 41,348 9,985 21,583 8.7Vermont 23,000 19.8 32.4 11,052 2,050 6,718 23.1Virginia 323,000 17.3 45.4 111,168 29,891 54,796 10.8Washington 296,000 17.8 34.3 122,401 26,605 68,438 15.0West Virginia 112,000 30.8 35.7 33,548 9,037 16,754 18.0Wisconsin 260,000 20.4 41.2 86,936 20,753 47,998 14.5Wyoming 13,000 9.6 46.1 7,338 1,758 3,848 11.0United States 17,067,000 23.3% 43.6% 6,030,599 1,528,639 3,070,959 15.7%
a Average monthly participation data from October 2019 to April 2020 as of July 2020. All data are preliminary and subject to revision. Data excludes participation from American Indian tribal organizations.b Calculations made by the Children’s Defense Fund based on the annual estimates of the resident population on July 1, 2017.c Calculations made by the Children’s Defense Fund based on the annual estimates of the resident population on July 1, 2019.Sources: Supplemental Nutrition Assistance Program. 2019. “Characteristics of Supplemental Nutrition Assistance Program Households: Fiscal Year 2018,” Table B.14. https://fns-prod.azureedge.net/sites/default/files/resource-files/Characteristics2018.pdf; U.S. Department of Agriculture. 2020. WIC Program Data. “Monthly Data-State Level Participation by Category and Program Costs – FY 2020 (Preliminary).” https://www.fns.usda.gov/pd/wic-program; U.S. Census Bureau, Population Division. 2020. “Annual State Resident Population Estimates for 6 Race Groups (5 Race Alone Groups and Two or More Races) by Age, Sex, and Hispanic Origin: April 1, 2010 to July 1, 2019,” 2019 Population Estimates. https://www.census.gov/data/tables/time-series/demo/popest/2010s-state-detail.html.

49
The State of America’s Children® 2021
CHILD HEALTH
1 in 18 children in the U.S. were uninsured in 2019 – nearly than 4.4 million children. Hispanic children were much more likely to be uninsured than white, Black, and Asian children. Children in families living below 100% of the poverty
line were more likely to be uninsured than their counterparts.
Table 13A: Uninsured Children—A Portrait
Number and Percent of People Uninsured by Age, 2018 and 2019
2018 2019 Change 2018-2019 Number Percent Number Percent Number Percent
Total, All Ages 28,565,542 8.9% 29,638,672 9.2% 1,073,130 3.8%Under 19 4,055,370 5.2 4,375,102 5.7 319,732 9.4
Under 6 1,019,380 4.3 1,082,653 4.7 63,273 8.36-18 Years 3,035,990 5.6 3,292,449 6.1 256,459 9.119-64 Years 24,109,214 12.5% 24,851,900 12.9% 742,686 3.4%
Table 13B: Uninsured Children By Age, Race/Ethnicity, Poverty Level, Citizenship and Region, 2018 and 2019
Percent Uninsured
in 2018
Percent Uninsured
in 2019
Percent Change
2018-2019
One out of Every____ Is Uninsured
All Children Under 19 5.2% 5.7% 9.6% 18
By AgeUnder 6 4.3 4.7 9.3 216 to 18 Years 5.6 6.1 8.9 16
By Race/EthnicityWhite 4.1 4.3 4.9 23Hispanic 8.2 9.2 12.2 11Black 4.4 4.6 4.5 22Asian 3.9 4.1 5.1 24
By Poverty LevelBelow 100% of poverty 6.6 7.4 12.1 13100%-399% of poverty 6.4 6.9 7.8 15400%+ of poverty 2.3 2.6 13.0 38
By CitizenshipNative-born Citizen 4.7 5.1 8.5 20Naturalized Citizen 6.2 7.7 24.2 13Non-Citizen 24.0 25.5 6.3 4
By RegionNortheast 3.1 3.3 6.5 30Midwest 4.3 4.7 9.3 21South 7.1 7.7 8.5 13West 4.4% 4.9% 11.4% 20
Notes: Uninsured is defined as not covered by any type of insurance (private or public) for the entire year. The white racial category does not include children of Hispanic ethnicity.
Sources: Keisler-Starkey, Katherine and Lisa Bunch. 2020. "Health Insurance Coverage in the United States: 2019 Current Population Reports," Figure 5. U.S. Census Bureau. https://www.census.gov/library/publications/2020/demo/p60-271.html; U.S. Census Bureau. 2020. 2019 American Community Survey 1-Year Estimates, Table B27001 - Health Insurance Coverage Status by Sex by Age. https://data.census.gov/cedsci/.
50 Children’s Defense Fund
CHILD HEALTH
In 2019, Medicaid and the Children's Health Insurance Program (CHIP) provided comprehensive and affordable health and mental health coverage to more than
36 million children but more than 4 million children remained uninsured.
Table 14: Children Uninsured and Enrolled in Medicaid/CHIP, 2019a
Uninsured, Ages 0-18 Child Enrollment in Medicaid and CHIP
Uninsured, Under Age 6
Uninsured, Ages 6-18
Uninsured, Ages 0-18,
Change in Coverage 2018-2019b
State Rank by Percent Uninsuredc Dec 2018 Dec 2019
Change in Enrollment 2018-2019
State Expandedd
Number % Number % Number % Number Number Number Number % Y/NAlabama 10,113 2.9% 30,047 3.7% 40,160 3.5% 558 11 650,406 664,904 14,498 2.2% NoAlaska 6,199 10.0 11,660 9.1 17,859 9.4 316 48 94,469 97,434 2,965 3.1 YesArizona 40,853 8.0 120,477 9.8 161,330 9.2 -15,046 47 759,466 763,023 3,557 0.5 YesArkansas 10,119 4.6 33,276 6.4 43,395 5.9 -9,680 35 426,599 433,540 6,941 1.5 YesCalifornia 75,758 2.7 258,276 3.9 334,034 3.6 -35,335 14 4,971,516 4,874,521 -96,995 -2.0 YesColorado 15,408 3.9 57,148 6.1 72,556 5.5 -10,324 28 588,054 569,132 -18,922 -3.2 YesConnecticut 6,712 3.1 20,189 3.6 26,901 3.5 -6,529 12 330,253 333,764 3,511 1.1 YesDelaware 2,537 3.9 7,845 5.2 10,382 4.8 -2,544 24 105,732 105,591 -141 -0.1 YesDistrict of Columbia 829 1.6 1,995 2.3 2,824 2.0 -395 - 92,575 92,773 198 0.2 YesFlorida 71,821 5.3 270,858 8.6 342,679 7.6 -3,635 41 2,483,564 2,435,574 -47,990 -1.9 NoGeorgia 44,938 5.8 152,198 8.1 197,136 7.4 20,154 40 1,245,555 1,273,274 27,719 2.2 NoHawaii 1,869 1.8 6,954 3.3 8,823 2.8 -513 5 140,392 139,530 -862 -0.6 YesIdaho 5,181 3.6 18,388 5.6 23,569 5.0 5,229 26 202,303 197,533 -4,770 -7.3 No*Illinois 28,665 3.2 91,374 4.4 120,039 4.0 -17,573 17 1,356,850 1,350,045 -6,805 -0.5 YesIndiana 34,289 6.9 84,494 7.2 118,783 7.1 -9,789 39 800,565 803,575 3,010 0.4 YesIowa 7,340 3.1 15,011 2.8 22,351 2.9 -1,329 6 334,623 338,908 4,285 1.3 YesKansas 9,301 4.2 33,735 6.5 43,036 5.8 -4,899 33 270,256 260,439 -9,817 -3.6 NoKentucky 13,984 4.2 31,107 4.3 45,091 4.3 -5,067 19 564,123 551,738 -12,385 -2.2 YesLouisiana 13,313 3.8 36,725 4.6 50,038 4.4 -10,834 21 749,077 731,669 -17,408 -2.3 YesMaine 4,325 5.7 10,338 5.6 14,663 5.6 -151 29 104,796 103,538 -1,258 -1.2 YesMaryland 10,740 2.5 37,042 3.8 47,782 3.4 -1,012 9 618,583 622,786 4,203 0.7 YesMassachusetts 6,636 1.6 15,387 1.5 22,023 1.5 -4,067 1 685,233 679,394 -5,839 -0.9 YesMichigan 21,215 3.1 56,749 3.6 77,964 3.4 -105 10 948,635 939,546 -9,089 -1.0 YesMinnesota 11,060 2.6 31,327 3.3 42,387 3.1 2,807 7 536,246 530,404 -5,842 -1.1 YesMississippi 10,318 4.8 35,395 6.7 45,713 6.1 -10,284 36 420,209 419,061 -1,148 -0.3 NoMissouri 29,402 6.7 65,284 6.5 94,686 6.5 -12,153 38 564,476 524,374 -40,102 -7.1 NoMontana 3,887 5.6 11,147 6.5 15,034 6.2 -117 37 127,863 122,324 -5,539 -4.3 YesNebraska 8,560 5.4 19,834 5.8 28,394 5.7 -2,166 30 164,913 164,247 -666 -0.4 No*Nevada 13,947 6.2 44,039 8.8 57,986 8.0 -446 44 330,343 298,087 -32,256 -1.7 YesNew Hampshire 2,245 2.9 7,931 4.0 10,176 3.7 -2,920 15 91,337 89,163 -2,174 -2.4 YesNew Jersey 21,597 3.5 66,524 4.7 88,121 4.3 -8,360 20 826,133 815,411 -10,722 -1.3 YesNew Mexico 5,513 3.9 23,324 6.5 28,837 5.7 -2,028 31 330,359 329,876 -483 -0.1 YesNew York 27,296 2.0 73,499 2.5 100,795 2.4 6,586 4 2,504,152 2,496,514 -7,638 0.3 YesNorth Carolina 33,516 4.7 108,012 6.2 141,528 5.8 -11,466 32 1,186,195 1,194,836 8,641 0.7 NoNorth Dakota 4,951 8.2 9,583 7.6 14,534 7.8 -3,359 42 43,094 42,921 -173 -0.4 YesOhio 36,574 4.4 94,455 4.9 131,029 4.8 1,538 23 1,143,206 1,174,978 31,772 2.8 YesOklahoma 22,945 7.6 63,334 9.0 86,279 8.6 -2,863 46 511,168 512,444 1,276 0.2 NoOregon 10,141 3.7 27,374 4.3 37,515 4.1 -4,624 18 414,548 416,723 2,175 0.5 YesPennsylvania 40,007 4.8 87,900 4.5 127,907 4.6 -4,126 22 1,390,084 1,389,372 -712 -0.1 YesRhode Island 1,322 2.1 2,859 1.8 4,181 1.9 604 2 122,710 118,303 -4,407 -3.6 YesSouth Carolina 16,736 4.9 52,094 6.2 68,830 5.8 -13,154 34 653,431 652,750 -681 -0.1 NoSouth Dakota 5,342 7.5 12,295 7.9 17,637 7.8 -4,326 43 78,791 78,019 -772 -1.0 NoTennessee 20,206 4.2 60,266 5.4 80,472 5.0 2,452 27 788,680 830,091 41,411 5.3 NoTexas 236,724 10.0 758,600 14.0 995,324 12.7 -122,530 50 3,406,298 3,313,891 -92,407 -2.7 NoUtah 20,481 6.9 61,136 8.9 81,617 8.3 -9,359 45 195,061 186,758 -8,303 -4.3 No*Vermont 647 1.9 1,958 2.2 2,605 2.1 -142 3 63,270 61,192 -2,078 -3.3 YesVirginia 20,515 3.4 76,054 5.5 96,569 4.9 4,999 25 702,460 740,192 37,732 5.4 YesWashington 14,602 2.7 39,543 3.3 54,145 3.1 -6,663 8 829,464 822,109 -7,355 -0.9 YesWest Virginia 3,054 2.7 10,371 3.9 13,425 3.5 -325 13 217,920 215,198 -2,722 -1.2 YesWisconsin 15,067 3.8 35,646 3.8 50,713 3.8 384 16 480,642 506,598 25,956 5.4 NoWyoming 3,853 9.4 11,392 11.1 15,245 10.6 -5,121 49 38,918 36,990 -1,928 -5.0 NoUnited States 1,082,653 4.7% 3,292,449 6.1% 4,375,102 5.7% -319,732 36,658,946 36,435,057 -223,889 -0.6%a Uninsured at the time of the survey, not necessarily for the entire year. These numbers are among children ages 0-18.b Calculations were based on a comparison with data from 2018 American Community Survey 1-Year Estimates, Table B27001- Health Insurance Coverage Status by Sex by Agec States are ranked 1-50 with 1 meaning the highest percent of children who are uninsured and 50 meaning the lowest percent of children who are uninsured.d These states had expanded Medicaid to 138 percent of the FPL for all eligible adults in the state as of January 2020. When parents are covered, their children are more likely to also be covered. An asterisk (*) denotes the state has expanded Medicaid between January 2020 and January 2021.
Sources: U.S. Census Bureau. 2020. 2019 American Community Survey 1-Year Estimates, Table B27001 - Health Insurance Coverage Status by Sex by Age. https://data.census.gov/cedsci/; Brooks, Tricia. 2020 "Child Enrollment in Medicaid and CHIP Remains Down in 2019." Georgetown University Health Policy Institute Center for Children and Families. https://ccf.georgetown.edu/2020/02/18/child-enrollment-in-medicaid-and-chip-remains-down-in-2019/; Kaiser Family Foundation. 2020. “Status of State Action on the Medicaid Expansion" as of October 21, 2020. https://www.kff.org/health-reform/state-indicator/state-activity-around-expanding-medicaid-under-the-affordable-care-act/.

51
The State of America’s Children® 2021
CHILD HEALTH
Children's access to health coverage and services across the United States remains a lottery of geography.
Table 15: Selected Characteristics of State Medicaid and CHIP Programs, 2020Upper-Income Eligibility for
Medicaid and CHIP
(Percent of FPL)a CHIP Waiting
Periodb
12-month Continuous Eligibilityc
Lawfully- Residing Immigrant
Children Covered without
5-Year WaitdACA Medicaid
Expansion Statee
Alabama 317% M, C No NoAlaska 208 M, n/a No YesArizona 205 90 days No YesArkansas 216 90 days C Yes YesCalifornia 266 M, n/a Yes YesColorado 265 M, C Yes YesConnecticut 323 Yes YesDelaware 217 C Yes YesDistrict of Columbia 324 n/a Yes YesFlorida 215 2 months C Yes NoGeorgia 252 No NoHawaii 313 n/a Yes YesIdaho 190 M, C No YesIllinois 318 90 days M,C Yes YesIndiana 262 90 days No YesIowa 380 1 month M, C Yes YesKansas 240 M, C No NoKentucky 218 Yes YesLouisiana 255 90 days M, C Yes YesMaine 213 90 days M, C Yes YesMaryland 322 n/a Yes YesMassachusetts 305 Yes YesMichigan 217 M, n/a No YesMinnesota 288 n/a Yes YesMississippi 214 M, C No NoMissouri 305 No Yes*Montana 266 M, C Yes YesNebraska 218 n/a Yes YesNevada 205 C Yes YesNew Hampshire 323 n/a No YesNew Jersey 355 90 days M, C Yes YesNew Mexico 305 M, n/a Yes YesNew York 405 M, C Yes YesNorth Carolina 216 M, C Yes NoNorth Dakota 175 M, n/a No YesOhio 211 M, n/a Yes YesOklahoma 210 n/a No Yes*Oregon 305 M, C Yes YesPennsylvania 319 C Yes YesRhode Island 266 n/a Yes YesSouth Carolina 213 n/r Yes NoSouth Dakota 209 90 days No NoTennessee 255 C No NoTexas 206 90 days C Yes NoUtah 205 90 days C Yes YesVermont 317 n/a Yes YesVirginia 205 Yes YesWashington 317 M, C Yes YesWest Virginia 305 M, C Yes YesWisconsin 306 Yes NoWyoming 205% 1 month M, C No No
a Highest level of income eligibility for Medicaid or CHIP as a percent of the federal poverty level (FPL). b “ Waiting period” refers to the length of time a state requires a child to be uninsured prior to enrolling in CHIP, although every state has exceptions. The ACA prohibited
waiting periods longer than 90 days starting in 2014. c “M” denotes 12-month continuous eligibility for Medicaid. "C" denotes 12-month continuous eligibility for CHIP. "n/a" denotes the state does not provide a separate CHIP
program for uninsured children. “n/r” denotes the state did not report.d These states cover immigrant children who have been lawfully residing in the U.S. for less than five years under the Immigrant Children's Health Improvement Act
(ICHIA) option with state funds.e These states have expanded Medicaid to 138 percent of the FPL for all eligible adults in the state as of January 2020. When parents are covered, their children are more
likely to also be covered. An asterisk (*) denotes the state has expanded Medicaid but enrollment for the expansion population will not begin until 2021.
Sources: Brooks, Tricia, Lauren Roygardner, Samantha Artiga, Olivia Pham, and Rachel Dolan. 2020. “Medicaid and CHIP Eligibility, Enrollment, Renewal, and Cost-Sharing Practices as of January 2020: Findings from a 50-State Survey,” Updated as of November 2, 2020. Georgetown University Center for Children and Families and Kaiser Family Foundation. https://www.kff.org/report-section/medicaid-and-chip-eligibility-enrollment-and-cost-sharing-policies-as-of-january-2020-findings-from-a-50-state-survey-executive-summary/; Kaiser Family Foundation. 2020. "Status of State Action on the Medicaid Expansion Decision, as of October 16, 2020. https://www.kff.org/health-reform/state-indicator/state-activity-around-expanding-medicaid-under-the-affordable-care-act/.
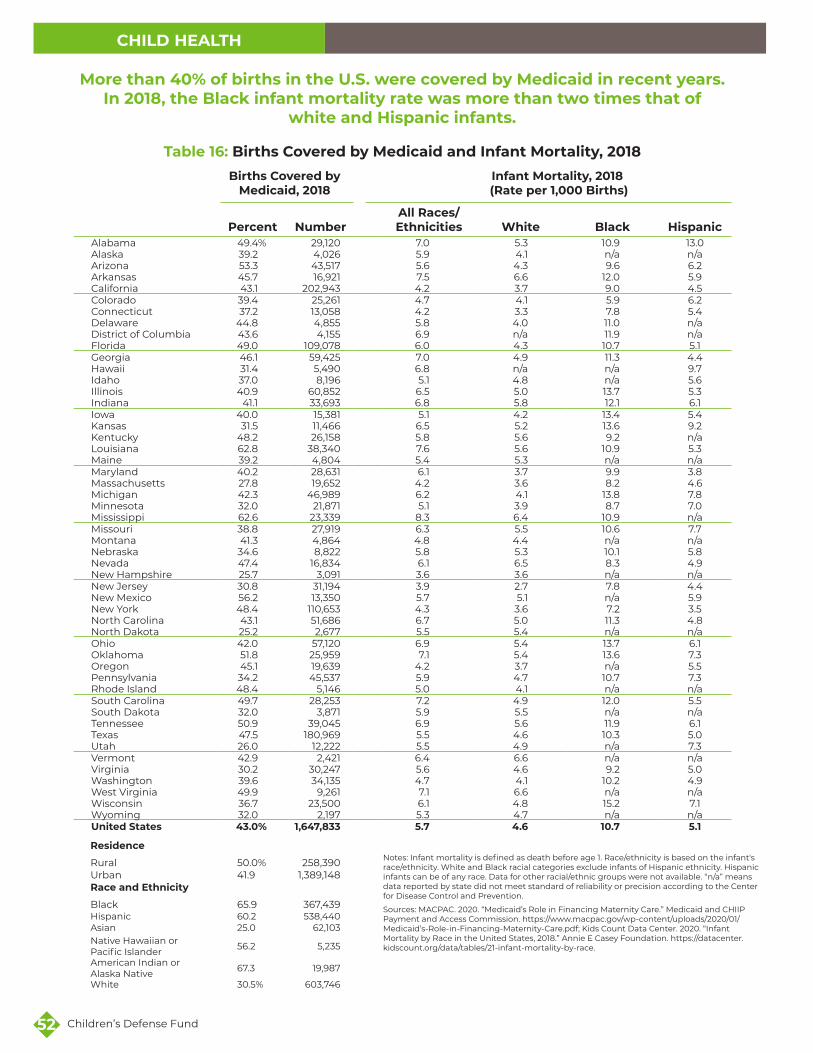
52 Children’s Defense Fund
CHILD HEALTH
More than 40% of births in the U.S. were covered by Medicaid in recent years. In 2018, the Black infant mortality rate was more than two times that of
white and Hispanic infants.
Table 16: Births Covered by Medicaid and Infant Mortality, 2018Births Covered by
Medicaid, 2018Infant Mortality, 2018
(Rate per 1,000 Births)
Percent NumberAll Races/ Ethnicities White Black Hispanic
Alabama 49.4% 29,120 7.0 5.3 10.9 13.0Alaska 39.2 4,026 5.9 4.1 n/a n/aArizona 53.3 43,517 5.6 4.3 9.6 6.2Arkansas 45.7 16,921 7.5 6.6 12.0 5.9California 43.1 202,943 4.2 3.7 9.0 4.5Colorado 39.4 25,261 4.7 4.1 5.9 6.2Connecticut 37.2 13,058 4.2 3.3 7.8 5.4Delaware 44.8 4,855 5.8 4.0 11.0 n/aDistrict of Columbia 43.6 4,155 6.9 n/a 11.9 n/aFlorida 49.0 109,078 6.0 4.3 10.7 5.1Georgia 46.1 59,425 7.0 4.9 11.3 4.4Hawaii 31.4 5,490 6.8 n/a n/a 9.7Idaho 37.0 8,196 5.1 4.8 n/a 5.6Illinois 40.9 60,852 6.5 5.0 13.7 5.3Indiana 41.1 33,693 6.8 5.8 12.1 6.1Iowa 40.0 15,381 5.1 4.2 13.4 5.4Kansas 31.5 11,466 6.5 5.2 13.6 9.2Kentucky 48.2 26,158 5.8 5.6 9.2 n/aLouisiana 62.8 38,340 7.6 5.6 10.9 5.3Maine 39.2 4,804 5.4 5.3 n/a n/aMaryland 40.2 28,631 6.1 3.7 9.9 3.8Massachusetts 27.8 19,652 4.2 3.6 8.2 4.6Michigan 42.3 46,989 6.2 4.1 13.8 7.8Minnesota 32.0 21,871 5.1 3.9 8.7 7.0Mississippi 62.6 23,339 8.3 6.4 10.9 n/aMissouri 38.8 27,919 6.3 5.5 10.6 7.7Montana 41.3 4,864 4.8 4.4 n/a n/aNebraska 34.6 8,822 5.8 5.3 10.1 5.8Nevada 47.4 16,834 6.1 6.5 8.3 4.9New Hampshire 25.7 3,091 3.6 3.6 n/a n/aNew Jersey 30.8 31,194 3.9 2.7 7.8 4.4New Mexico 56.2 13,350 5.7 5.1 n/a 5.9New York 48.4 110,653 4.3 3.6 7.2 3.5North Carolina 43.1 51,686 6.7 5.0 11.3 4.8North Dakota 25.2 2,677 5.5 5.4 n/a n/aOhio 42.0 57,120 6.9 5.4 13.7 6.1Oklahoma 51.8 25,959 7.1 5.4 13.6 7.3Oregon 45.1 19,639 4.2 3.7 n/a 5.5Pennsylvania 34.2 45,537 5.9 4.7 10.7 7.3Rhode Island 48.4 5,146 5.0 4.1 n/a n/aSouth Carolina 49.7 28,253 7.2 4.9 12.0 5.5South Dakota 32.0 3,871 5.9 5.5 n/a n/aTennessee 50.9 39,045 6.9 5.6 11.9 6.1Texas 47.5 180,969 5.5 4.6 10.3 5.0Utah 26.0 12,222 5.5 4.9 n/a 7.3Vermont 42.9 2,421 6.4 6.6 n/a n/aVirginia 30.2 30,247 5.6 4.6 9.2 5.0Washington 39.6 34,135 4.7 4.1 10.2 4.9West Virginia 49.9 9,261 7.1 6.6 n/a n/aWisconsin 36.7 23,500 6.1 4.8 15.2 7.1Wyoming 32.0 2,197 5.3 4.7 n/a n/aUnited States 43.0% 1,647,833 5.7 4.6 10.7 5.1
Notes: Infant mortality is defined as death before age 1. Race/ethnicity is based on the infant's race/ethnicity. White and Black racial categories exclude infants of Hispanic ethnicity. Hispanic infants can be of any race. Data for other racial/ethnic groups were not available. “n/a” means data reported by state did not meet standard of reliability or precision according to the Center for Disease Control and Prevention.
Sources: MACPAC. 2020. “Medicaid’s Role in Financing Maternity Care.” Medicaid and CHIIP Payment and Access Commission. https://www.macpac.gov/wp-content/uploads/2020/01/Medicaid’s-Role-in-Financing-Maternity-Care.pdf; Kids Count Data Center. 2020. “Infant Mortality by Race in the United States, 2018.” Annie E Casey Foundation. https://datacenter.kidscount.org/data/tables/21-infant-mortality-by-race.
Residence
Rural 50.0% 258,390Urban 41.9 1,389,148Race and Ethnicity
Black 65.9 367,439Hispanic 60.2 538,440Asian 25.0 62,103Native Hawaiian or Pacific Islander 56.2 5,235
American Indian or Alaska Native 67.3 19,987
White 30.5% 603,746

53
The State of America’s Children® 2021
EARLY CHILDHOOD
In 2019, center-based child care for infants was more expensive than public college in at least 28 states and the District of Columbia.
Table 17: Child Care Costs for Infants, 2019
Average Annual Cost for an
Infant in Center-Based
Care
Percent Difference between Cost of
Center-Based Infant Care and Public
Collegea
Cost of Center-Based Infant Care as a Percent of:
Income for a Poor Family
State Median Income for
a Single-Parent Family
Median Annual Rent
Alabama $7,592 -30.5%* 35.6%* 35.8% 82.0%Alaska 11,832 43.7 44.4 32.8 80.4Arizona 11,017 -7.6* 51.7* 38.4 91.0Arkansas 7,540 -16.5* 35.3* 33.6 86.2California 17,384 74.4 81.5 56.7 101.4Colorado* 15,881 39.6 74.5 48.3 110.7Connecticut 16,224 18.7 76.1 50.1 117.0Delaware 11,473 -13.7 53.8 37.4 86.1District of Columbia 24,081 185.2 112.9 86.9 135.0Florida 9,617 51.4 45.1 34.7 71.0Georgia 8,112 -7 38.0 30.7 69.8Hawaii 14,354 30.7 58.5 35.8 76.4Idaho 8,791 9.9* 41.2* 36.3 88.8Illinois 9,876 -30.3 46.3 35.8 83.6Indiana 11,094 14.7 52.0 43.9 114.6Iowa 11,185 19.4 52.4 41.0 121.7Kansas 12,881 39.3* 60.1* 46.9 129.2Kentucky 7,574 -30.5* 35.5* 34.8 85.2Louisiana 8,734 -9.2 40.9 41.1 85.6Maine 10,734 2.4 50.3 39.5 107.6Maryland 15,680 55 73.5 39.2 96.3Massachusetts 21,256 55.8 99.7 67.4 144.6Michigan 10,870 -21.1 51.0 43.4 106.6Minnesota 16,164 36.6 75.8 50.4 142.7Mississippi 5,864 -31.8* 27.5* 28.4 64.1Missouri 9,782 8.4 45.9 37.7 100.8Montana n/a n/a n/a n/a n/aNebraska 11,960 36.8 56.1 42.9 123.8Nevada 11,107 39.7 52.1 35.8 87.3New Hampshire 13,355 -21 62.6 40.3 103.3New Jersey 16,268 11.9* 76.3* 50.4 104.7New Mexico 9,299 25.1* 43.6* 40.8 93.6New York 13,390 58.8 62.8 46.0 90.0North Carolina 9,650 32.5 45.2 38.1 91.7North Dakota 9,248 -0.4 43.4 31.7 95.6Ohio 9,919 -12.5 46.5 41.2 104.9Oklahoma 9,041 1.4 42.4 37.8 95.0Oregon 10,092 -10.1 47.3 37.5 80.1Pennsylvania 12,308 -17.6* 57.7* 44.8 112.1Rhode Island 11,152 -14.6* 52.3* 39.0 94.7South Carolina 9,490 -27.3 44.5 39.1 91.1South Dakota 7,426 -17.3 34.8 28.1 85.7Tennessee 10,780 5.1 50.5 45.4 106.8Texas 10,306 -1.6* 48.3* 37.9 86.1Utah 9,120 27.3 42.8 29.4 76.9Vermont 13,915 -20.4 65.2 47.6 119.3Virginia 14,778 8.4 69.3 47.1 102.5Washington 15,420 53 72.3 50.0 107.6West Virginia 9,360 10.3 43.9 47.6 109.7Wisconsin 10,332 13.5 48.4 36.8 102.9Wyoming 9,490 70* 44.5* 32.4 93.8a A positive percent (higher than 0) means infant center-based care cost more than public college tuition. A negative percent (lower than 0) means infant center-based care
cost less than public college tuition.
Notes: “*” means state did not report on the 2020 survey; data reported from state's most recent Market Rate Survey. “n/a” means data was not reported or not available.
Source: Child Care Aware of America. 2020. “Picking Up the Pieces: Building a Better Child Care System Post COVID-19,” Appendices III, XI, XII, XV. https://www.childcareaware.org/picking-up-the-pieces/.

54 Children’s Defense Fund
EARLY CHILDHOOD
a Counts for the United States exclude U.S. territories and protectorates. Percents include data from territories and protectorates. Note: Data are preliminary and subject to change. Racial categories (White, Black, Asian, American Indian/Alaska Native, Native Hawaiian/Pacific Islander, Multi-Racial) include children of Hispanic ethnicity. Percents for racial groups do not add up to 100 percent because of missing data.
Source: U.S. Department of Health and Human Services. 2019. “FY 2018 CCDF Data Tables (Preliminary),” Tables 1, 4, 11, and 12. https://www.acf.hhs.gov/occ/resource/fy-2018-ccdf-data-tables-preliminary; U.S. Department of Health and Human Services. 2008. “FY 2006 CCDF Data Tables (Final),” Table 1. https://www.acf.hhs.gov/occ/resource/ccdf-data-06acf800-final.
Although over 812,000 families and 1.3 million children were served each month by the Child Care and Development Fund in FY2018, more than 430,000 subsidies
have been lost since 2006—the year before the recession began.
Table 18: Average Monthly Number of Children and Families Served by the Child Care and Development Fund by Race/Ethnicity, FY2018
Number of
Families, FY2018
Number of Children,FY2018
Change in Children Served
2006-2018 White Hispanic Black Asian
Native American/
Alaska Native
Native Hawaiian/
Pacific Islander
Two or More Races
In Unregulated
CareAlabama 15,800 27,900 -100 18.9% 1.0% 79.3% 0.2% 0.1% 0.0% 1.5% 42.5%Alaska 2,100 3,000 -1,900 48.5 10.9 8.6 2.6 8.4 2.0 24.2 1.3Arizona 18,100 27,100 -3,100 59.3 34.3 19.9 0.4 4.7 0.4 15.3 5.1Arkansas 3,800 4,900 -700 46.6 10.3 40.3 0.3 0.2 0.3 3.5 0.1California 73,100 107,800 -67,700 69.9 57.5 20.9 5.0 1.6 0.7 1.9 19.9Colorado 11,800 20,400 4,100 35.5 27.1 10.9 0.6 1.1 0.2 5.8 0.7Connecticut 10,800 16,200 6,100 30.8 43.7 34.1 1.2 0.3 1.1 8.0 30.8Delaware 4,600 7,300 -200 34.1 12.7 64.9 0.7 0.1 0.1 0.0 5.6District of Columbia 800 1,100 -2,600 11.4 14.4 85.8 0.3 0.8 0.7 0.3 0.0Florida 70,500 99,100 -9,500 43.0 34.6 48.2 0.3 0.2 0.2 3.9 7.3Georgia 21,700 24,600 -40,000 21.5 4.9 75.2 0.1 0.3 0.2 1.9 0.3Hawaii 2,200 3,900 -4,700 8.8 9.6 0.9 17.9 0.1 33.9 38.5 71.6Idaho 4,100 7,100 -2,800 83.9 22.3 6.6 0.2 0.0 0.2 1.4 4.8Illinois 23,100 41,200 -41,000 17.9 21.0 43.9 1.3 0.2 0.2 3.8 25.6Indiana 14,500 26,200 -6,600 38.8 10.5 52.1 0.3 0.2 0.1 8.5 21.4Iowa 10,100 18,100 -1,300 67.6 12.9 19.0 0.6 0.4 0.2 7.7 3.0Kansas 5,700 10,000 -12,400 57.6 12.1 24.4 0.1 0.6 0.1 14.8 6.7Kentucky 10,000 18,000 -10,900 58.3 6.4 31.8 0.1 0.0 0.1 3.8 0.7Louisiana 11,000 17,400 -21,700 21.1 3.0 71.5 0.2 0.6 0.1 6.3 3.5Maine 2,600 4,100 -1,300 73.2 2.8 11.2 0.4 0.4 0.0 3.6 14.6Maryland 8,000 13,700 -9,200 12.2 4.6 81.6 0.6 0.4 0.2 5.0 4.7Massachusetts 18,400 26,700 -5,400 26.8 12.7 16.7 2.3 0.4 0.1 1.9 1.1Michigan 22,300 39,700 -48,100 41.7 5.3 53.9 0.1 0.7 0.0 1.9 21.4Minnesota 10,100 20,400 -6,900 31.7 5.1 53.7 1.7 1.3 0.0 7.0 10.8Mississippia 9,300 16,400 -22,700 15.0 0.9 83.9 0.1 0.1 0.0 0.9 1.2Missouri 23,800 35,900 2,300 36.4 9.5 46.5 0.2 0.2 0.1 1.8 22.5Montana 2,500 3,700 -1,100 72.2 6.0 2.4 0.2 14.3 0.5 3.6 5.9Nebraska 5,200 9,500 -3,600 50.4 17.4 27.2 0.5 2.4 0.1 10.0 7.3Nevada 5,100 8,800 2,800 45.3 29.9 42.6 1.3 0.9 1.3 2.5 32.6New Hampshire 3,700 5,000 -2,500 69.0 7.6 3.7 0.3 0.3 0.1 2.5 3.9New Jersey 29,200 43,500 5,600 41.2 41.4 45.0 1.1 0.2 1.0 1.2 1.1New Mexico 12,000 19,500 -2,100 77.5 73.1 5.0 0.5 6.7 0.4 2.6 8.4New York 61,100 102,200 -21,500 38.1 29.9 38.2 2.6 0.8 2.2 6.2 27.1North Carolina 20,000 38,000 -41,900 30.3 4.0 64.5 0.3 3.4 0.0 1.3 0.3North Dakota 1,800 2,700 -1,300 63.5 6.1 16.5 0.3 12.0 0.6 7.1 14.3Ohio 26,700 50,300 10,400 30.6 5.7 55.7 0.3 0.1 0.1 5.9 0.0Oklahoma 16,700 27,700 2,700 56.0 13.9 28.3 0.4 5.3 0.2 9.8 0.0Oregon 7,400 13,400 -6,800 80.5 26.7 12.0 1.0 2.1 0.6 3.7 26.4Pennsylvania 58,000 99,700 16,900 31.2 16.9 49.1 1.4 0.1 0.1 2.7 6.1Rhode Island 4,300 6,500 -600 22.6 13.7 10.3 0.3 0.5 0.1 0.5 2.9South Carolina 7,300 11,600 -8,100 26.1 3.8 63.2 0.1 0.2 0.1 6.3 7.7South Dakota 2,300 3,600 -1,300 56.9 4.7 4.8 0.4 24.8 0.3 12.7 11.1Tennessee 14,400 22,400 -20,100 31.0 2.0 68.7 0.3 0.1 0.0 0.0 1.0Texas 68,600 115,000 -11,200 43.9 41.0 25.9 0.3 0.2 0.1 1.9 0.4Utah 6,200 11,400 -1,600 21.8 10.1 3.3 0.2 1.3 0.3 0.3 3.5Vermont 2,400 3,100 -3,700 90.4 2.5 4.0 1.2 0.3 0.1 3.9 0.1Virginia 10,300 18,000 -9,900 33.9 6.7 63.2 2.0 0.5 0.4 0.0 0.6Washington 22,300 38,200 -15,000 45.3 29.6 18.8 2.1 3.0 0.9 0.0 0.0West Virginia 4,900 8,300 -1,000 71.5 2.5 11.7 0.1 0.1 0.1 14.1 0.1Wisconsin 9,900 16,500 -13,000 22.5 11.7 34.2 0.9 0.8 0.0 5.7 0.0Wyoming 1,900 3,000 -1,700 80.8 11.8 4.1 0.4 2.3 0.1 0.0 9.2
United Statesb 812,500 1,319,800 -437,900 41.4% 23.7% 39.7% 1.2% 1.1% 0.6% 4.0% 10.3%
Percent of Children Who Are:
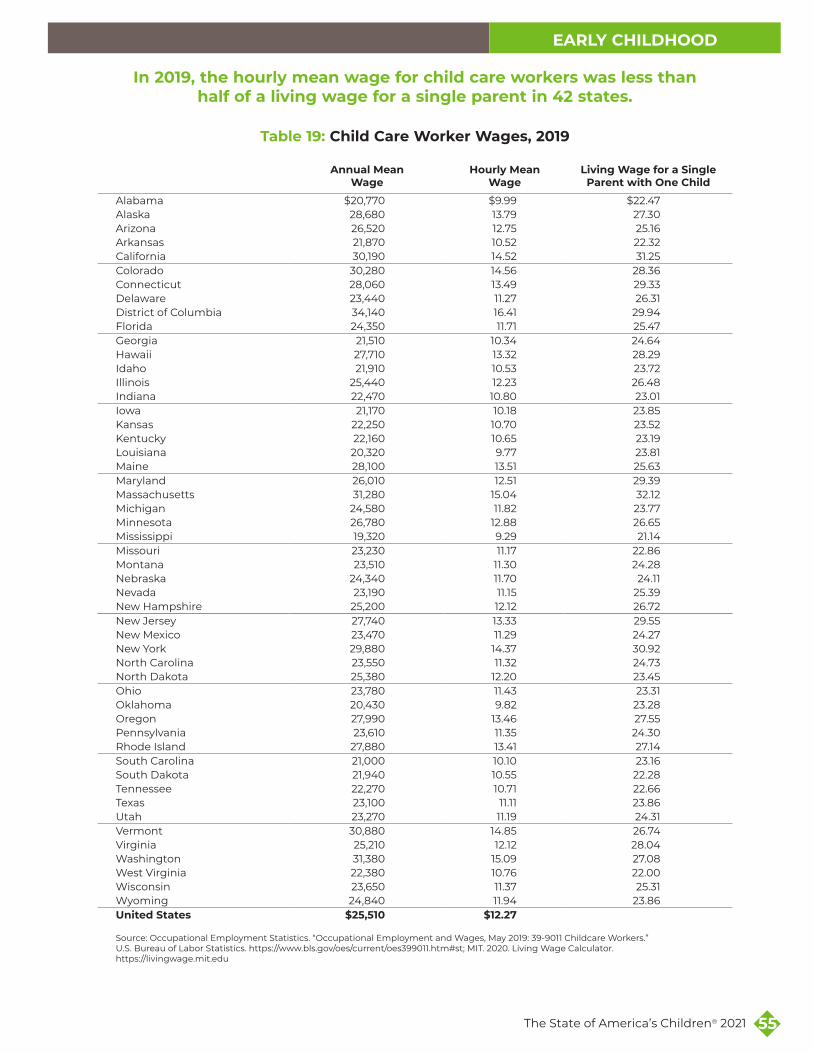
55
The State of America’s Children® 2021
EARLY CHILDHOOD
In 2019, the hourly mean wage for child care workers was less than half of a living wage for a single parent in 42 states.
Table 19: Child Care Worker Wages, 2019
Annual Mean Wage
Hourly Mean Wage
Living Wage for a Single Parent with One Child
Alabama $20,770 $9.99 $22.47Alaska 28,680 13.79 27.30Arizona 26,520 12.75 25.16Arkansas 21,870 10.52 22.32California 30,190 14.52 31.25Colorado 30,280 14.56 28.36Connecticut 28,060 13.49 29.33Delaware 23,440 11.27 26.31District of Columbia 34,140 16.41 29.94Florida 24,350 11.71 25.47Georgia 21,510 10.34 24.64Hawaii 27,710 13.32 28.29Idaho 21,910 10.53 23.72Illinois 25,440 12.23 26.48Indiana 22,470 10.80 23.01Iowa 21,170 10.18 23.85Kansas 22,250 10.70 23.52Kentucky 22,160 10.65 23.19Louisiana 20,320 9.77 23.81Maine 28,100 13.51 25.63Maryland 26,010 12.51 29.39Massachusetts 31,280 15.04 32.12Michigan 24,580 11.82 23.77Minnesota 26,780 12.88 26.65Mississippi 19,320 9.29 21.14Missouri 23,230 11.17 22.86Montana 23,510 11.30 24.28Nebraska 24,340 11.70 24.11Nevada 23,190 11.15 25.39New Hampshire 25,200 12.12 26.72New Jersey 27,740 13.33 29.55New Mexico 23,470 11.29 24.27New York 29,880 14.37 30.92North Carolina 23,550 11.32 24.73North Dakota 25,380 12.20 23.45Ohio 23,780 11.43 23.31Oklahoma 20,430 9.82 23.28Oregon 27,990 13.46 27.55Pennsylvania 23,610 11.35 24.30Rhode Island 27,880 13.41 27.14South Carolina 21,000 10.10 23.16South Dakota 21,940 10.55 22.28Tennessee 22,270 10.71 22.66Texas 23,100 11.11 23.86Utah 23,270 11.19 24.31Vermont 30,880 14.85 26.74Virginia 25,210 12.12 28.04Washington 31,380 15.09 27.08West Virginia 22,380 10.76 22.00Wisconsin 23,650 11.37 25.31Wyoming 24,840 11.94 23.86United States $25,510 $12.27
Source: Occupational Employment Statistics. “Occupational Employment and Wages, May 2019: 39-9011 Childcare Workers.” U.S. Bureau of Labor Statistics. https://www.bls.gov/oes/current/oes399011.htm#st; MIT. 2020. Living Wage Calculator. https://livingwage.mit.edu

56 Children’s Defense Fund
EARLY CHILDHOOD
Only 34 percent of 4-year-olds and 6 percent of 3-year-olds were enrolled in a state-funded preschool program during 2018-2019 and quality
varied widely from state to state.
Table 20: Enrollment of 4- and 3-Year-Olds in State-Funded Preschool Programs, 2018-2019
Number Percent NIEER Quality Benchmarks Met
(Out of 10)4-Year-Olds 3-Year-Olds 4-Year-Olds 3-Year-OldsAlabama 18,756 0 32% 0% 10Alaska 1,043 261 10% 2% 1Arizona 3,424 1,986 4% 2% 3Arkansas 12,256 7,071 32% 18% 8California 187,565 57,447 38% 12% 4.7Colorado 15,616 5,877 23% 9% 4Connecticut 11,528 3,330 31% 9% 5Delaware 581 264 5% 2% 9District of Columbia 7,237 6,360 87% 71% 4Florida 173,633 0 75% 0% 2Georgia 80,493 0 60% 0% 8Hawaii 415 0 2% 0% 8Idaho 0 0 0% 0% n/aIllinois 47,360 33,598 31% 22% 8Indiana 0 0 0% 0% n/aIowa 26,528 1,244 66% 3% 7.9Kansas 10,147 913 26% 2% 4Kentucky 16,497 4,854 29% 9% 8Louisiana 18,841 0 30% 0% 7.9Maine 5,805 0 44% 0% 9Maryland 27,780 4,000 38% 5% 7Massachusetts 21,642 11,791 30% 16% 5.2Michigan 37,140 0 32% 0% 10Minnesota 7,613 624 10% 1% 5.4Mississippi 1,954 0 5% 0% 10Missouri 4,626 1,097 6% 1% 5.9Montana 269 2 2% .02% 6Nebraska 9,057 4,021 34% 15% 8Nevada 2,139 0 6% 0% 7New Hampshire 0 0 0% 0% n/aNew Jersey 31,221 21,332 30% 20% 8New Mexico 9,987 1,264 38% 5% 9New York 121,610 4,692 54% 2% 7North Carolina 29,509 0 24% 0% 8North Dakota 1,062 0 10% 0% 2Ohio 16,091 1,779 11% 1% 5Oklahoma 40,625 1,567 76% 3% 9Oregon 5,767 3,593 12% 8% 7.5Pennsylvania 29,141 13,726 20% 10% 6.6Rhode Island 1,080 0 10% 0% 10South Carolina 28,137 284 47% .05% 7South Dakota 0 0 0% 0% n/aTennessee 17,812 67 22% .01% 8Texas 203,650 35,271 49% 9% 3Utah 0 0 0% 0% n/aVermont 4,818 3,830 78% 65% 7Virginia 17,657 0 17% 0% 6Washington 8,432 5,059 9% 5% 8West Virginia 11,913 1,150 59% 6% 9Wisconsin 48,943 504 72% 1% 3Wyoming 0 0 0% 0% n/aUnited States 1,377,484 239,104 34% 6%
a The National Institute for Early Education Research (NIEER) defines a state preschool program as one serving 3- and 4- year olds that is funded, controlled, and directed by the state. Its primary focus must be early childhood education and it must offer a group learning experience to children at least two days each a week. It may serve children with disabilities but cannot be primarily designed to serve these children. State-funded preschool may be coordinated and integrated with the child care subsidy system in the state. State supplements for Head Start constitute state preschool if they substantially increase the number of children served and involve some state administrative responsibility. NIEER uses 10 benchmarks to measure the quality of state preschool programs: 1) comprehensive early learning and development standards that are horizontally and vertically aligned, supported, and culturally sensitive; 2) supports for curriculum implementation; 3) teachers with bachelor's degrees and 4) specialization in early childhood; 5) assistant teachers with child development associate's or equivalent degrees; 6) at least 15 hours/year of professional development, individualized plans and professional development plans, and coaching for lead and assistant teachers; 7) a maximum class size of 20; 8) child-staff ratios of no more than 10:1; 9) comprehensive vision, hearing, and health screenings; and 10) continuous quality improvement system.
Note: “n/a” means no program.
Source: Friedman-Krauss, Allison et al. 2020. “The State of Preschool 2019 Yearbook,” Tables 1 and 2. National Institute for Early Education Research. http://nieer.org/wp-content/uploads/2020/07/YB2019_Full_Report.pdf.

57
The State of America’s Children® 2021
EDUCATION
In 2019, the percent of lower-income 4th and 8th grade public school students who were not proficient in reading and math was 1.5 times that
of higher-income students.
Table 21: Percent of 4th and 8th Grade Public School Students Performing Below Proficiency in Reading and Math by Income Status, 2019
Lower-Income Students Higher-Income Students
4th Grade 8th Grade 4th Grade 8th Grade
Reading Math Reading Math Reading Math Reading MathAlabama 84.4% 84.3% 86.0% 91.2% 55.1% 55.6% 66.8% 65.9%Alaska 86.2 80.3 87.0 83.6 63.2 53.3 67.1 58.6Arizona 82.3 77.8 83.5 79.0 53.6 45.2 58.4 59.2Arkansas 76.3 76.0 79.3 83.3 52.4 47.8 56.2 55.4California 79.6 81.2 81.6 84.1 48.2 43.9 53.0 50.3Colorado 78.1 77.0 80.7 81.7 45.8 39.3 51.3 51.3Connecticut 80.3 77.1 76.8 81.7 43.2 37.4 47.7 47.7Delaware 82.8 76.8 83.8 87.1 60.0 53.6 63.7 64.4District of Columbia 81.2 77.0 88.8 88.4 38.6 35.6 50.3 48.8Florida 72.1 62.2 75.4 81.1 47.8 37.7 53.0 53.6Georgia 80.0 78.0 79.4 83.4 43.8 37.4 50.3 47.3Hawaii 78.2 76.4 83.3 84.9 55.6 47.1 62.0 63.0Idaho 74.5 69.2 75.2 78.1 51.0 44.4 53.2 51.0Illinois 79.3 75.6 78.8 79.6 50.5 46.0 50.3 53.7Indiana 76.1 67.2 75.4 76.9 47.6 36.9 51.9 50.0Iowa 77.9 74.9 82.9 82.3 54.2 43.3 56.7 56.2Kansas 79.8 75.2 80.5 80.3 51.8 43.2 55.5 54.2Kentucky 74.5 71.3 76.7 82.1 49.8 42.8 52.5 56.8Louisiana 81.6 80.0 81.5 85.7 55.6 47.9 56.5 60.3Maine 76.8 73.0 75.9 81.0 53.5 45.2 55.9 56.0Maryland 81.1 78.5 81.7 85.9 49.2 44.0 51.6 54.1Massachusetts 74.4 71.7 76.1 74.6 44.8 37.5 47.4 43.8Michigan 80.2 79.5 81.2 83.7 55.2 48.4 56.9 57.1Minnesota 79.4 68.9 82.5 77.7 51.1 34.2 56.7 43.9Mississippi 74.1 68.6 81.3 83.1 46.3 33.1 54.8 53.8Missouri 77.4 72.0 78.7 82.1 49.3 43.9 54.8 54.7Montana 77.6 71.2 76.2 78.4 51.2 45.2 57.8 54.7Nebraska 78.0 70.0 81.6 79.4 50.3 40.0 54.8 51.6Nevada 76.4 74.9 79.6 84.2 54.3 46.0 59.8 60.1New Hampshire 78.7 71.7 80.3 80.9 52.6 45.0 55.4 53.4New Jersey 77.5 73.7 77.5 78.3 43.7 35.6 45.8 43.2New Mexico 82.9 77.1 84.0 85.9 52.2 48.8 56.9 60.3New York 79.9 76.4 78.2 79.2 47.4 45.7 57.5 54.0North Carolina 79.0 74.1 79.6 79.6 49.9 44.5 57.6 51.1North Dakota 78.0 73.2 80.7 80.2 58.8 47.1 62.8 54.1Ohio 77.7 74.5 80.5 83.2 46.6 41.3 47.4 46.0Oklahoma 79.7 76.2 83.0 84.0 57.7 47.0 61.4 61.2Oregon 77.1 73.8 76.6 80.1 48.3 42.8 52.7 53.8Pennsylvania 77.1 73.7 78.7 80.2 44.6 35.2 53.5 47.3Rhode Island 79.2 74.0 81.8 88.1 50.4 44.2 50.4 55.0South Carolina 80.3 77.0 80.8 83.7 48.0 41.3 56.8 53.8South Dakota 77.0 75.0 82.7 77.9 57.8 47.9 62.1 53.6Tennessee 82.4 78.4 82.6 84.9 57.2 51.3 62.7 61.7Texas 81.1 68.5 85.2 81.3 51.7 37.6 60.0 55.3Utah 77.6 67.8 75.2 80.6 50.5 45.9 55.3 53.2Vermont 78.6 72.7 72.1 77.0 52.7 52.8 52.8 53.7Virginia 79.9 70.0 81.7 80.5 48.3 38.7 57.8 51.1Washington 78.3 75.7 79.1 76.9 49.8 43.8 45.6 44.0West Virginia 77.9 81.2 81.3 85.3 59.9 57.4 69.1 68.0Wisconsin 79.9 73.7 76.9 78.2 52.2 40.9 50.4 45.8Wyoming 72.7 66.5 79.0 76.3 51.1 43.6 59.2 55.7United States 78.9% 74.3% 80.5% 81.8% 49.6% 42.1% 54.5% 52.2%
Notes: Lower-income students are students who qualify for free and reduced-price school lunch, which means their families’ incomes are at or below 185 percent of the Federal Poverty Level (FPL). Higher-income students are students who do not qualify, or whose families’ incomes are higher than 185 percent of FPL.
Source: U.S. Department of Education and NAEP. 2019. “2019 Mathematics Grades 4 and 8 Assessment Report Cards: Summary Data Tables for National and State Average Scores and Achievement Level Results” https://www.nationsreportcard.gov/; U.S. Department of Education and NAEP. 2019. “2019 Reading Grades 4 and 8 Assessment Report Cards: Summary Data Tables for National and State Average Scores and Achievement Level Results.” https://www.nationsreportcard.gov/.

58 Children’s Defense Fund
EDUCATION
In 2019, around 60 percent of public school 4th graders were not proficient in reading and math.
Table 22: Percent of 4th Grade Public School Students Performing Below Proficiency in Reading or Math by Race/Ethnicity, 2019
Reading Math
All Students White Hispanic Black Asian
Native Hawaiian/
Other Pacific
Islander
Two or More Races
State Rank
Based on Readinga
All Students White
Hispanic Black Asian
Native Hawaiian/
Other Pacific
Islander
Two or More Races
State Rank Based
on Matha
Alabama 71.8% 61.9% 79.8% 87.1% n/a n/a n/a 47 71.9% 61.6% 83.8% 88.3% n/a n/a n/a 50Alaska 74.9 64.5 78.6 n/a 72.5% 90.5% 73.3% 49 66.8 51.3 73.3 77.8 74.1% 86.7% 68.7% 46Arizona 68.6 56.0 80.2 78.6 n/a n/a 58.8 41 62.7 46.4 76.4 80.4 24.2 n/a 50.2 36Arkansas 68.8 62.5 73.3 84.8 n/a n/a n/a 42 66.8 58.8 74.3 86.8 n/a n/a n/a 45California 67.9 50.7 78.3 82.2 42.8 n/a 54.0 37 66.4 46.0 79.5 80.8 34.2 n/a 45.8 44Colorado 60.3 49.7 77.0 75.2 52.2 n/a 51.0 7 55.5 42.9 74.8 75.4 38.8 n/a 53.7 14Connecticut 59.9 47.2 80.0 83.1 35.4 n/a 52.2 4 55.0 43.5 74.1 79.2 26.9 n/a 45.2 12Delaware 67.5 53.7 77.6 84.2 30.1 n/a 72.1 35 60.9 47.1 71.7 79.7 19.7 n/a 53.0 31District of Columbia 69.9 20.8 73.1 80.7 n/a n/a 31.6 — 65.8 16.1 67.3 77.8 n/a n/a n/a —Florida 62.3 53.6 66.1 77.0 30.7 n/a 66.7 11 52.5 41.0 57.3 72.4 24.2 n/a 51.0 6Georgia 67.8 51.7 77.4 83.1 37.5 n/a 62.7 36 63.5 47.6 75.3 81.0 17.2 n/a 53.2 39Hawaii 66.2 44.3 72.8 n/a 58.8 82.4 61.5 33 60.2 42.3 66.4 n/a 46.1 81.9 54.5 28Idaho 62.6 57.2 82.0 n/a n/a n/a 62.7 12 57.0 51.1 75.7 n/a n/a n/a 66.5 18Illinois 65.6 55.1 77.3 82.7 43.3 n/a 57.0 28 61.5 49.0 71.6 85.5 35.1 n/a 60.4 35Indiana 63.0 57.1 75.6 83.0 52.8 n/a 66.8 14 52.9 45.9 66.2 80.5 36.7 n/a 53.8 8Iowa 64.9 60.4 79.6 89.3 57.5 n/a 64.9 23 58.0 51.3 79.4 87.0 n/a n/a 68.4 20Kansas 66.2 60.4 79.0 85.3 n/a n/a 66.0 32 59.7 50.9 77.7 86.3 41.3 n/a 62.3 25Kentucky 64.9 61.2 75.5 85.8 46.9 n/a 66.6 26 60.1 56.3 73.3 79.6 35.0 n/a 62.1 26Louisiana 74.3 63.1 76.2 87.2 n/a n/a 63.0 48 71.2 56.6 79.7 86.6 n/a n/a 62.7 48Maine 64.0 63.3 n/a 81.1 n/a n/a 66.3 18 58.2 56.6 n/a 80.3 n/a n/a 64.7 21Maryland 64.9 51.7 77.9 77.6 36.5 n/a 54.9 24 60.9 46.1 72.6 77.3 19.7 n/a 57.9 32Massachusetts 54.6 45.9 75.2 75.6 38.3 n/a 32.7 1 49.8 40.7 69.8 72.0 21.9 n/a 51.4 2Michigan 68.4 62.8 81.8 85.0 55.8 n/a 65.2 39 64.4 56.1 78.7 89.7 40.4 n/a 71.4 41Minnesota 61.9 54.5 80.6 80.7 61.0 n/a 60.9 10 47.1 35.3 78.8 74.5 43.9 n/a 50.6 1Mississippi 68.5 57.1 66.4 80.6 n/a n/a n/a 40 61.2 44.7 57.7 78.4 n/a n/a 51.1 33Missouri 65.8 62.4 72.4 82.2 n/a n/a 64.6 31 60.7 55.2 65.3 85.1 n/a n/a 61.8 29Montana 63.6 59.6 73.6 n/a n/a n/a 66.1 16 57.4 52.8 67.3 n/a n/a n/a 63.0 19Nebraska 63.2 55.1 77.4 85.0 n/a n/a 72.8 15 54.5 45.2 71.8 83.9 56.8 n/a 55.3 11Nevada 69.1 57.0 76.0 84.2 52.5 n/a 64.7 43 65.7 50.8 74.7 85.1 43.3 n/a 60.8 43New Hampshire 61.8 61.1 74.0 n/a 51.9 n/a n/a 9 54.2 53.2 73.6 71.1 29.1 n/a n/a 10New Jersey 58.1 46.6 73.9 76.5 35.5 n/a n/a 2 51.8 39.0 70.3 75.6 19.5 n/a n/a 3New Mexico 76.3 59.2 81.3 n/a n/a n/a n/a 50 71.3 56.4 76.4 n/a n/a n/a n/a 49New York 65.7 56.0 77.7 84.0 48.6 n/a 46.7 30 63.1 53.2 78.8 83.1 31.0 n/a 56.5 38North Carolina 64.0 50.7 77.0 79.9 41.3 n/a 60.1 19 58.6 43.5 68.2 78.2 21.0 n/a 76.4 22North Dakota 65.7 61.8 75.8 76.4 n/a n/a n/a 29 55.7 50.5 72.0 76.0 n/a n/a n/a 15Ohio 63.9 57.5 77.9 85.2 38.0 n/a 72.7 17 58.9 51.5 75.8 85.6 30.0 n/a 60.8 23Oklahoma 71.5 65.3 81.4 86.7 n/a n/a 68.5 46 65.5 57.7 78.5 81.6 n/a n/a 67.9 42Oregon 66.2 61.8 82.6 n/a 54.1 n/a 52.8 34 62.8 55.3 80.8 n/a 38.8 n/a 73.1 37Pennsylvania 60.3 51.7 81.6 83.4 34.6 n/a 65.4 6 52.7 42.4 77.5 79.0 32.7 n/a 52.4 7Rhode Island 64.6 54.5 79.6 85.3 60.7 n/a 67.3 22 59.5 49.2 76.1 76.3 48.4 n/a 70.5 24South Carolina 68.2 55.4 73.1 85.4 n/a n/a 69.9 38 63.7 47.3 72.9 85.3 n/a n/a 66.7 40South Dakota 64.0 58.6 80.4 78.6 n/a n/a 67.8 20 57.0 48.8 76.2 80.2 n/a n/a 67.7 17Tennessee 65.4 57.3 79.0 82.4 n/a n/a 59.7 27 60.1 51.1 80.1 77.4 n/a n/a 54.8 27Texas 69.7 51.8 78.9 84.3 34.9 n/a 62.3 45 56.3 41.1 65.1 68.5 18.2 n/a 48.9 16Utah 60.0 54.2 80.2 n/a n/a n/a 56.9 5 53.7 47.7 75.0 n/a n/a n/a 52.2 9Vermont 62.9 62.8 n/a n/a n/a n/a 57.0 13 61.2 60.3 n/a n/a n/a n/a 66.9 34Virginia 61.7 53.8 74.5 80.6 37.0 n/a 56.0 8 52.1 42.6 64.2 74.0 23.6 n/a 49.2 4Washington 64.9 56.9 80.6 79.0 51.0 n/a 58.5 25 60.7 52.8 76.3 78.7 33.4 n/a 60.0 30West Virginia 69.7 68.9 n/a 84.0 n/a n/a 79.0 44 70.4 69.3 n/a 83.6 n/a n/a 73.5 47Wisconsin 64.5 58.3 77.3 89.3 64.8 n/a 64.4 21 55.2 46.7 72.8 85.9 59.0 n/a 60.3 13Wyoming 59.4 56.2 69.7 n/a n/a n/a n/a 3 52.2 48.1 63.5 n/a n/a n/a n/a 5United States 65.7% 55.6% 77.4% 82.4% 43.4% 75.9% 60.3% 59.6% 48.1% 72.4% 79.9% 30.3% 70.8% 56.5%
a States are ranked 1-50 with 1 meaning the lowest percent of students performing below proficiency and 50 meaning the highest percent of students performing below proficiency. States with different ranks may have same percents due to rounding.
Note: “n/a” means reporting standards were not met and sample size was insufficient to generate a reliable estimate. Racial categories (White, Black, Asian, Native Hawaiian/Other Pacific Islander, two or more races) exclude children of Hispanic ethnicity. Hispanic children can be of any race.
Sources: U.S. Department of Education and NAEP. 2019. “2019 Mathematics Grades 4 and 8 Assessment Report Cards: Summary Data Tables for National and State Average Scores and Achievement Level Results.” https://www.nationsreportcard.gov/; U.S. Department of Education and NAEP. 2019. “2019 Reading Grades 4 and 8 Assessment Report Cards: Summary Data Tables for National and State Average Scores and Achievement Level Results.” https://www.nationsreportcard.gov/.

59
The State of America’s Children® 2021
EDUCATION
In 2019, more than 67 percent of public school 8th graders were not proficient in reading and math.
Table 23: Percent of 8th Grade Public School Students Performing Below Proficiency in Reading or Math by Race/Ethnicity, 2019
Reading Math
All Students White Hispanic Black Asian
Native Hawai-
ian/Other Pacific
Islander
Two or More Races
State Rank
Based on Readinga
All Students White Hispanic Black Asian
Native Hawai-
ian/Other Pacific
Islander
Two or More Races
State Rank Based
on Matha
Alabama 76.4% 69.9% 83.1% 88.5% n/a n/a n/a 48 78.7% 70.5% 89.2% 92.9% n/a n/a n/a 49Alaska 76.7 67.1 81.6 88.3 74.9 90.4 74.8 50 71.0 59.0 73.6 91.0 69.1 88.8 68.7 38Arizona 71.6 58.9 81.0 85.2 n/a n/a n/a 42 69.0 54.6 80.1 80.0 32.5 n/a n/a 32Arkansas 70.5 65.1 71.1 89.0 n/a n/a n/a 38 72.7 65.3 77.3 92.5 n/a n/a n/a 43California 70.2 55.1 80.6 90.2 42.7 n/a 60.3 37 71.5 53.2 85.3 89.7 37.4 n/a 56.6 41Colorado 62.3 51.9 79.8 82.1 44.9 n/a 51.4 10 63.1 52.4 80.6 82.2 34.0 n/a 62.7 18Connecticut 59.0 48.9 76.9 78.3 40.1 n/a n/a 3 60.8 49.6 82.5 85.9 20.6 n/a 68.3 7Delaware 69.0 58.2 79.8 83.6 33.5 n/a 62.5 36 70.8 58.8 81.5 87.1 30.8 n/a 65.9 37District of Columbia 77.0 26.6 75.9 86.6 n/a n/a n/a — 77.0 23.2 82.4 85.3 n/a n/a n/a —Florida 66.1 55.4 70.0 83.4 43.7 n/a 54.0 22 69.4 58.1 74.1 87.0 32.0 n/a 67.8 34Georgia 67.9 56.8 74.7 82.3 41.1 n/a 51.4 31 68.9 56.7 74.8 85.7 22.6 n/a 66.0 31Hawaii 70.8 58.0 72.8 n/a 63.0 84.2 64.8 40 72.3 61.3 74.7 n/a 61.5 87.8 69.0 42Idaho 62.9 58.8 79.4 n/a n/a n/a n/a 11 62.7 56.5 85.6 n/a n/a n/a 61.6 15Illinois 64.6 54.8 74.9 85.4 34.2 n/a 68.2 15 66.2 58.4 76.2 85.8 26.7 n/a 62.3 22Indiana 63.0 57.9 72.6 83.5 n/a n/a 69.6 12 62.6 57.1 75.6 84.6 n/a n/a 66.8 13Iowa 67.4 64.2 80.6 87.1 n/a n/a 69.7 28 67.5 63.2 82.7 91.4 n/a n/a 78.2 27Kansas 67.7 63.1 76.3 86.6 n/a n/a 72.9 30 67.1 61.2 80.7 86.4 n/a n/a 64.4 25Kentucky 66.6 63.8 73.2 85.6 61.0 n/a 63.7 24 71.0 68.1 80.0 89.5 45.8 n/a 82.9 39Louisiana 72.8 63.7 68.8 86.5 n/a n/a n/a 43 76.9 65.9 77.8 90.8 n/a n/a n/a 48Maine 64.4 63.3 n/a 86.5 n/a n/a n/a 14 66.4 65.6 n/a 87.4 n/a n/a n/a 23Maryland 64.0 49.9 79.0 80.1 32.0 n/a 54.4 13 67.4 49.6 82.5 86.0 37.6 n/a 60.6 26Massachusetts 55.4 48.9 78.4 73.8 32.8 n/a 48.9 1 52.6 45.3 76.1 79.3 22.0 n/a 49.5 1Michigan 68.5 64.8 77.5 87.9 44.4 n/a 59.7 35 69.0 63.2 84.0 90.6 48.0 n/a 75.8 33Minnesota 65.8 59.1 81.7 89.1 63.4 n/a 69.9 19 55.8 46.9 79.1 86.3 53.0 n/a 57.6 2Mississippi 75.0 62.8 69.8 87.9 n/a n/a n/a 46 75.7 61.9 76.7 89.5 n/a n/a n/a 46Missouri 66.7 62.8 72.3 87.6 n/a n/a 66.3 25 68.4 64.2 78.3 88.8 n/a n/a 69.2 28Montana 65.7 62.3 75.1 n/a n/a n/a 67.4 18 64.3 60.4 71.2 n/a n/a n/a 72.0 21Nebraska 66.2 60.0 82.1 87.8 48.6 n/a 67.4 23 63.1 54.6 83.0 90.7 53.8 n/a 71.1 19Nevada 71.4 61.2 78.2 85.3 56.9 n/a 68.0 41 74.3 62.8 82.8 89.1 49.0 n/a 71.6 44New Hampshire 62.3 61.2 79.6 n/a 49.9 n/a n/a 9 61.5 61.0 78.0 79.6 38.6 n/a n/a 9New Jersey 57.1 46.9 75.0 78.6 30.0 n/a n/a 2 55.9 44.3 77.4 81.0 22.3 n/a n/a 3New Mexico 76.7 62.8 80.9 n/a n/a n/a n/a 49 79.3 63.2 84.3 n/a n/a n/a n/a 50New York 67.5 58.8 79.0 81.5 53.6 n/a n/a 29 66.5 55.8 83.3 85.3 39.7 n/a n/a 24North Carolina 67.1 57.7 71.6 85.6 40.0 n/a 72.2 27 63.5 53.0 73.9 81.5 29.0 n/a 61.8 20North Dakota 68.4 64.4 83.6 83.4 n/a n/a n/a 33 62.6 56.7 74.0 91.2 n/a n/a n/a 14Ohio 61.9 54.8 69.7 88.4 n/a n/a 73.4 7 62.5 55.4 74.4 87.5 43.0 n/a 77.5 12Oklahoma 74.4 68.3 83.8 86.7 n/a n/a 71.3 44 74.5 69.3 80.6 92.7 n/a n/a 70.8 45Oregon 66.0 61.1 79.8 n/a 46.6 n/a 58.4 20 68.6 62.5 86.8 n/a 43.2 n/a 59.4 29Pennsylvania 64.8 58.2 82.3 86.7 38.1 n/a 78.3 16 61.4 52.8 83.4 89.4 34.4 n/a 66.0 8Rhode Island 65.0 54.1 83.0 79.6 64.4 n/a 67.4 17 70.5 61.3 87.3 84.7 n/a n/a 75.6 36South Carolina 70.7 60.4 75.9 87.1 n/a n/a 72.0 39 71.1 59.4 77.9 90.0 n/a n/a 71.3 40South Dakota 68.1 63.0 78.5 n/a n/a n/a 71.1 32 60.6 52.8 79.7 n/a n/a n/a 64.9 6Tennessee 68.4 62.7 78.4 84.8 42.4 n/a 62.8 34 68.8 62.2 80.8 88.2 27.2 n/a 64.3 30Texas 75.0 64.7 80.7 89.4 40.8 n/a 74.7 47 70.4 56.4 79.0 84.0 29.2 n/a 58.6 35Utah 62.2 57.4 78.7 n/a n/a n/a n/a 8 62.7 56.8 84.8 n/a n/a n/a 52.2 16Vermont 59.8 59.2 n/a n/a n/a n/a 57.2 4 61.7 60.8 n/a n/a n/a n/a 68.8 10Virginia 66.8 59.0 78.3 85.0 41.0 n/a 62.7 26 62.2 54.4 70.0 83.6 34.9 n/a 59.4 11Washington 61.5 53.9 78.2 86.2 40.0 n/a 70.9 6 60.0 54.5 79.3 79.0 29.0 n/a 55.2 5West Virginia 74.7 74.1 n/a 88.0 n/a n/a 80.7 45 75.9 75.3 n/a 85.6 n/a n/a n/a 47Wisconsin 61.5 55.3 79.4 89.8 50.2 n/a 59.7 5 58.7 51.4 73.6 87.9 56.7 n/a 73.0 4Wyoming 66.1 62.5 78.5 n/a n/a n/a n/a 21 62.9 58.5 74.8 n/a n/a n/a 71.7 17United States 67.6% 58.7% 78.6% 85.3% 43.5% 75.6% 64.5% 67.1% 57.0% 80.5% 86.7% 36.0% 81.7% 63.8%a States are ranked 1-50 with 1 meaning the lowest percent of students performing below proficiency and 50 meaning the highest percent of students performing below proficiency.
States with different ranks may have same percents due to rounding.
Note: “n/a” means reporting standards were not met and sample size was insufficient to generate a reliable estimate. Racial categories (White, Black, Asian, Native Hawaiian/Other Pacific Islander, two or more races) exclude children of Hispanic ethnicity. Hispanic children can be of any race.
Sources: U.S. Department of Education and NAEP. 2019. “2019 Mathematics Grades 4 and 8 Assessment Report Cards: Summary Data Tables for National and State Average Scores and Achievement Level Results.” https://www.nationsreportcard.gov/; U.S. Department of Education and NAEP. 2019. “2019 Reading Grades 4 and 8 Assessment Report Cards: Summary Data Tables for National and State Average Scores and Achievement Level Results.” https://www.nationsreportcard.gov/.

60 Children’s Defense Fund
EDUCATION
During the 2017-18 school year, more than 20 percent of Black high school students did not graduate on time in 28 states and the District of Columbia; Hispanic
students, in 27 states and the District of Columbia; American Indian and Alaska Native students, in 27 states.
Table 24: On-Time High School Graduation Rates Among Public School Students by Race/Ethnicity, 2017-18 School Year
Adjusted Cohort Graduation Rate (ACGR)
Rank by ACGR for
All StudentsaAll Students White Hispanic BlackAsian/Pacific
Islander
American Indian/Alaska
NativeTwo or More
RacesAlabama 90.0 91.5 87.6 87.7 94.0 90.0 91.0 5Alaska 78.5 83.7 76.0 73.0 84.0 69.0 74.0 11Arizona 78.7 83.4 75.7 73.7 89.0 67.8 75.0 29Arkansas 89.2 91.2 85.8 85.6 88.0 84.0 90.0 4California 83.0 87 80.6 73.3 93.0 70.5 73.2 3Colorado 80.8 85.3 73.4 74.4 89.0 68.0 83.0 21Connecticut 88.4 93.4 78.6 80.6 96.0 85.0 88.0 3Delaware 86.9 89.9 82.0 83.2 95.0 76.0 91.0 20District of Columbia 68.5 89 65.0 67.0 88.0 S ≥90 —Florida 86.3 89.3 85.4 81.2 95.5 80.0 87.3 24Georgia 81.6 84.9 74.6 79.4 90.3 77.0 82.0 37Hawaii 84.5 86 80.0 82.0 84.6 n/a n/a 18Idaho 80.7 82.3 75.9 71.0 83.0 61.0 74.0 35Illinois 86.5 91.1 82.0 77.6 93.9 80.0 85.5 15Indiana 88.1 90 84.3 79.4 95.0 84.0 84.9 11Iowa 91.4 93.2 83.9 81.0 91.0 76.0 88.0 1Kansas 87.2 89.7 81.3 79.0 93.0 79.0 86.0 13Kentucky 90.3 91.9 83.0 82.0 95.0 89.0 88.0 3Louisiana 81.4 85.5 68.0 78.1 92.0 89.0 81.0 25Maine 86.7 87.3 83.0 78.0 92.0 71.0 79.0 15Maryland 87.1 93.2 72.2 84.8 96.2 90.0 90.0 15Massachusetts 87.8 92.2 73.8 80.1 94.3 83.0 87.0 9Michigan 80.6 83.9 74.4 70.0 91.0 70.0 74.9 39Minnesota 83.2 88.4 66.8 67.4 86.5 51.0 72.0 25Mississippi 84.0 87.7 79.0 80.7 93.0 86.0 82.0 27Missouri 89.2 91.6 84.7 80.0 92.0 87.0 88.0 5Montana 86.4 89.4 79.0 80.0 90.0 68.0 82.0 18Nebraska 88.7 92.5 80.9 78.0 82.0 71.0 85.0 10Nevada 83.2 86 82.3 71.5 92.0 80.0 83.0 23New Hampshire 88.8 89.5 76.0 81.0 93.0 85.0 92.0 7New Jersey 90.9 95 84.8 84.2 97.0 87.0 92.0 2New Mexico 73.9 79.3 73.1 69.0 86.0 66.0 n/a 28New York 82.3 90.1 71.6 72.9 88.9 69.0 84.0 32North Carolina 86.3 89.6 80.0 83.2 93.4 84.0 84.1 24North Dakota 88.1 91.4 75.0 76.0 89.0 72.0 n/a 9Ohio 82.1 85.6 72.8 68.6 90.0 70.0 77.1 25Oklahoma 81.8 83.3 78.9 77.2 86.0 81.1 83.9 27Oregon 78.7 80.1 74.6 68.0 88.0 65.0 78.0 33Pennsylvania 85.9 90.5 73.7 72.1 92.4 79.0 78.6 27Rhode Island 84.0 87.3 77.0 83.0 91.0 69.0 78.0 18South Carolina 81.0 83.6 80.5 76.9 93.0 73.0 n/a 37South Dakota 84.1 89.9 71.0 75.0 87.0 50.0 80.0 21Tennessee 90.0 93 83.1 83.7 95.0 90.0 n/a 5Texas 90.0 93.6 88.2 86.5 96.1 85.0 91.4 3Utah 87.0 89.3 78.1 76.0 89.0 77.0 87.0 19Vermont 85.1 86.2 79.0 70.0 72.0 S 80.0 8Virginia 87.5 91.8 73.5 83.8 94.6 84.0 90.8 4Washington 86.7 88 83.2 80.1 91.6 71.0 86.7 20West Virginia 90.2 90.4 92.0 86.0 ≥95% 87.0 86.0 2Wisconsin 89.7 93.6 82.4 69.5 91.0 78.0 85.0 7Wyoming 81.7 83.8 75.0 77.0 86.0 59.0 78.0 37United States 85.3 89.1 81.0 79.0 92.2 73.5 n/a
Notes: The ACGR is an estimate of the percent of public school students who receive a regular diploma within four years of entering ninth grade. Racial categories exclude children of Hispanic ethnicity. Hispanic children can be of any race. "S" means data were suppressed to protect the confidentiality of individual student data. The greater than or equal to sign "≥" means the estimate has been top-coded to protect the confidentiality of individual student data. "n/a" means data were not available.a a States are ranked 1 to 50 with 1 meaning highest ACGR and 50 meaning lowest ACGR.
Source: National Center for Education Statistics. 2019. "Table 1. Public High School 4-Year Adjusted Cohort Graduation Rate (ACGR), by Race/Ethnicity and Selected Demographic Characteristics for the United States, the 50 States, and the District of Columbia: School Year 2017-18." https://nces.ed.gov/ccd/tables/ACGR_RE_and_characteristics_2017-18.asp.

61
The State of America’s Children® 2021
EDUCATION
The U.S. spends far more on incarceration than education. On average, the U.S. spent 2.5 times as much per prisoner as per public school student during 2016-2017.
Table 25: Public Spending on Prisoners vs. Public School Students, 2016-2017Spending Per
Prisoner, FY2016
Spending Per Public School Student,
2016-2017
Ratio of Spending Per Prisoner vs. Public
School Student Rank by Ratioa
Alabama $14,300 $9,528 1.5 3Alaska 54,405 17,838 3.1 34Arizona 22,828 8,053 2.8 31Arkansas 20,216 10,004 2.0 11California 59,029 12,151 4.9 49Colorado 35,015 9,849 3.6 42Connecticut 41,891 19,929 2.1 15Delaware 38,094 14,892 2.6 28District of Columbiab n/a 22,561 n/a n/aFlorida 17,622 9,374 1.9 10Georgia 17,264 10,274 1.7 5Hawaii 36,158 14,322 2.5 26Idaho 30,728 7,554 4.1 46Illinois 21,763 15,517 1.4 2Indiana 23,593 9,823 2.4 22Iowa 30,819 11,456 2.7 30Kansas 26,999 10,428 2.6 29Kentucky 25,697 10,083 2.5 27Louisiana 10,385 11,379 0.9 1Maine 64,012 14,633 4.4 47Maryland 54,675 14,933 3.7 43Massachusetts 96,569 17,718 5.5 50Michigan 36,984 11,256 3.3 40Minnesota 31,406 12,635 2.5 25Mississippi 15,350 8,755 1.8 7Missouri 19,121 10,684 1.8 9Montana 34,913 11,538 3.0 33Nebraska 19,839 12,662 1.6 4Nevada 16,020 9,120 1.8 8New Hampshire 36,964 15,958 2.3 18New Jersey 47,945 19,585 2.4 24New Mexico 45,246 9,949 4.5 48New York 53,811 22,861 2.4 21North Carolina 29,536 8,995 3.3 39North Dakota 55,300 13,767 4.0 44Ohio 21,618 12,569 1.7 6Oklahoma 18,523 7,921 2.3 20Oregon 35,175 11,252 3.1 36Pennsylvania 38,152 15,782 2.4 23Rhode Island 52,554 16,620 3.2 37South Carolina 21,785 10,419 2.1 13South Dakota 32,759 10,117 3.2 38Tennessee 21,498 9,246 2.3 19Texas 20,615 9,520 2.2 16Utah 29,040 7,206 4.0 45Vermont 39,633 19,480 2.0 12Virginia 24,976 11,885 2.1 14Washington 35,354 11,971 3.0 32West Virginia 38,963 11,745 3.3 41Wisconsin 36,489 11,962 3.1 35Wyoming 37,957 16,513 2.3 17United States $30,361 $12,258 2.5
a States are ranked 1-50 with 1 meaning the lowest ratio of spending per prisoner vs. public school student and 50 meaning the highest ratio of spending per prisoner vs. public school student.Notes: “n/a” means data were not available because the District of Columbia does not have a prison system. Spending per prisoner based on prisoner count on December 31, 2015, the latest count within FY2016.
Sources: U.S. Department of Justice, Bureau of Justice Statistics, Justice Expenditure and Employment Extracts. 2019. “Table 10. Detail of Direct Expenditure for Correctional Activities of State Governments by Character and Object, Fiscal Year 2016 (Preliminary)."" https://www.bjs.gov/index.cfm?ty=pbdetail&iid=6728; U.S. Department of Justice, Bureau of Justice Statistics. 2018. “Inmates in Custody of State or Federal Correctional Facilities, Including Private Prison Facilities, December 31, 1999-2016,” http://www.bjs.gov/index.cfm?ty=nps; U.S. Department of Education, National Center for Education Statistics. 2019. ""Digest of Education Statistics,"" Table 236.65. Current Expenditure per Pupil in Fall Enrollment in Public Elementary and Secondary Schools, by State or Jurisdiction: Selected Years, 1969-70 through 2016-17. https://nces.ed.gov/programs/digest/d19/tables/dt19_236.65.asp.

62 Children’s Defense Fund
EDUCATION
During the 2015-2016 school year, the suspension rate for Black students in public elementary school was more than four times that for white students.
Table 26: Suspensions among Public School Students, 2015-2016 School Year
Percent of Elementary and Secondary Students Receiving at Least One Out-of-School Suspension by Race/Ethnicity
All Students White Hispanic Black Asian
American Indian/Alaska Native
Native Hawaiian
and Pacific Islander
Two or More Races
Alabama 7.9% 4.1% 2.6% 15.8% 1.3% 3.8% 3.7% 4.5%Alaska 5.2 3.3 4.7 10.4 1.3 8.7 7.9 5.3Arizona 5.1 3.7 5.2 12.0 1.5 8.9 4.0 5.3Arkansas 6.8 4.3 3.7 15.9 1.0 4.4 4.0 6.7California 3.5 2.9 3.4 10.0 1.0 6.9 3.9 3.3Colorado 4.5 3.3 5.6 10.3 1.4 8.0 4.4 4.7Connecticut 3.8 1.5 5.9 9.9 0.6 4.2 1.6 3.3Delaware 8.8 4.5 6.5 16.4 1.4 8.2 2.2 7.8District of Columbia 8.9 0.7 3.1 11.4 1.7 3.4 5.4 2.0Florida 5.6 4.1 3.6 10.1 0.9 5.0 3.2 6.2Georgia 7.1 3.4 4.1 12.9 1.2 4.7 6.6 6.4Hawaii 3.6 2.5 2.8 3.9 1.9 4.7 5.9 2.3Idaho 2.1 1.9 2.4 3.8 0.5 4.0 2.7 2.8Illinois 4.1 2.3 3.1 11.3 0.6 3.4 2.7 5.0Indiana 6.0 3.9 5.2 18.1 1.3 4.8 2.3 7.9Iowa 2.8 2.0 2.9 11.2 0.8 3.3 2.7 5.0Kansas 4.3 2.9 4.5 15.1 1.5 5.5 2.5 5.9Kentucky 4.9 3.9 3.4 13.3 1.0 4.5 2.9 5.9Louisiana 9.0 4.7 4.4 12.5 1.8 7.5 3.5 6.2Maine 3.5 3.3 3.4 6.8 1.1 5.0 1.1 3.4Maryland 4.0 2.1 2.3 6.9 0.5 4.1 2.5 3.6Massachusets 3.3 1.9 6.1 7.6 0.7 3.6 1.9 3.5Michigan 7.2 4.4 6.3 18.7 1.4 8.0 3.5 7.6Minnesota 3.6 2.0 4.3 13.3 1.1 9.4 1.1 5.2Mississippi 9.7 4.5 3.9 15.0 2.0 7.1 3.0 6.3Missouri 5.5 3.4 4.0 15.7 1.1 5.1 3.1 5.6Montana 3.8 2.5 3.7 6.3 0.5 12.3 1.1 2.9Nebraska 4.1 2.7 4.3 15.2 1.4 8.7 3.3 7.5Nevada 7.3 4.7 6.8 19.1 2.4 6.7 5.9 7.1New Hampshire 4.4 3.8 9.3 11.4 1.3 6.7 2.9 3.3New Jersey 4.2 2.0 5.0 11.4 0.8 3.1 1.8 3.4New Mexico 4.5 3.3 4.7 8.4 1.2 6.0 2.3 4.3New York 3.2 2.6 2.3 6.7 0.5 3.3 0.6 4.2North Carolina 7.1 4.0 4.9 14.1 1.2 11.3 4.4 7.9North Dakota 2.1 1.5 2.1 4.2 0.5 6.6 2.2 0.9Ohio 6.8 3.9 6.6 19.3 1.4 6.0 2.9 9.1Oklahoma 5.6 4.4 5.1 16.0 1.1 4.7 4.4 4.7Oregon 3.6 3.4 3.8 7.7 1.1 7.2 4.1 3.7Pennsylvania 5.6 2.9 8.4 16.6 1.2 5.8 2.1 6.9Rhode Island 4.7 3.1 6.7 8.7 1.6 10.8 1.0 6.7South Carolina 10.2 5.9 5.4 17.7 1.7 9.8 5.4 8.6South Dakota 2.9 1.8 3.5 7.3 1.1 8.7 5.0 3.8Tennessee 7.2 3.6 4.4 18.6 1.6 6.0 3.8 5.7Texas 4.7 2.2 4.2 11.7 0.7 3.5 3.1 3.8Utah 1.5 1.2 2.5 4.5 0.8 2.6 2.1 1.3Vermont 3.4 3.1 2.8 7.4 1.4 11.6 1.1 1.9Virginia 5.7 3.4 3.6 13.1 0.7 5.8 3.7 4.8Washington 4.0 3.3 4.5 9.0 1.2 7.7 5.8 4.7West Virginia 8.0 7.4 5.3 16.7 1.7 5.2 3.5 8.2Wisconsin 4.1 2.2 4.4 18.0 1.2 7.7 2.6 6.2Wyoming 3.3 2.8 4.1 5.6 2.2 8.7 2.9 3.8United States 5.1% 3.2% 4.1% 12.9% 1.0% 6.7% 4.4% 5.2%
Notes: Data by race/ethnicity exclude students with disabilities served only under Section 504 (not receiving services under IDEA). Racial categories (White, Black, Asian, American Indian/Alaska Native, and Pacific Islander) exclude students of Hispanic ethnicity. Hispanic students can be of any race.
Source: U.S. Department of Education, Office for Civil Rights, Civil Rights Data Collection. 2020. “2015-16 State and National Estimations,” One or More Out-of-School Suspensions and Enrollment. https://ocrdata.ed.gov/estimations/2015-2016. Calculations made by the Children’s Defense Fund.

63
The State of America’s Children® 2021
CHILD WELFARE
More than 651,000 children were victims of abuse and neglect in 2019. Nearly 3 in 4 were victims of neglect.
Table 27: Child Abuse and Neglect, 2019Victims of
Maltreatment Percent of Maltreatment Cases that Involved:
Number
Rate per 1,000
Children Neglect
Only
Physical Abuse Only
Sexual Abuse Only
Sex Trafficking
Only
Emotional Abuse Only
Medical Neglect
OnlyOther or
UnknownAlabama 11,677 10.7 39.1 53.8 17.5 0.0 0.2 0.7 n/aAlaska 3,059 17.0 75.1 16.0 9.1 0.1 32.6 2.9 n/aArizona 12,847 7.8 91.6 7.9 3.8 n/a 0.1 n/a n/aArkansas 8,422 12.0 51.1 24.2 19.2 0.1 1.1 17.2 0.0California 64,115 7.2 88.9 7.1 5.3 0.1 9.1 0.1 0.5Colorado 12,246 9.7 82.8 10.0 9.6 n/a 2.1 1.3 0.2Connecticut 8,042 11.1 86.0 5.4 4.7 n/a 32.0 3.0 n/aDelaware 1,248 6.1 30.9 17.7 10.6 n/a 38.5 n/a 13.1District of Columbia 1,857 14.5 87.1 15.0 3.5 1.5 n/a n/a 0.2Florida 32,915 7.8 58.8 8.5 8.8 n/a 1.3 3.2 42.0Georgia 10,102 4.0 67.6 11.8 8.4 0.4 19.4 2.6 n/aHawaii 1,342 4.5 16.3 10.5 5.7 1.2 1.0 0.8 90.7Idaho 1,869 4.2 77.4 20.2 6.8 0.1 n/a 0.6 0.4Illinois 33,331 11.8 75.0 18.2 13.8 n/a 0.2 2.1 0.1Indiana 23,029 14.7 87.2 6.9 10.7 0.1 n/a n/a n/aIowa 11,648 16.0 71.6 10.2 6.1 n/a 0.6 0.9 31.3Kansas 2,945 4.2 45.8 24.6 19.8 0.3 15.8 2.9 0.0Kentucky 20,130 20.1 95.5 6.7 3.9 n/a 0.2 1.8 n/aLouisiana 8,441 7.8 87.5 12.5 5.2 0.1 0.2 n/a 0.1Maine 4,413 17.7 62.2 29.6 8.1 n/a 33.4 n/a n/aMaryland 7,661 5.7 61.2 20.3 25.0 n/a 0.2 n/a n/aMassachusetts 25,029 18.5 94.0 8.0 3.2 1.1 n/a n/a 0.0Michigan 33,043 15.4 87.4 15.4 4.0 0.1 0.6 2.3 0.0Minnesota 6,780 5.2 69.1 14.7 23.3 0.4 2.0 n/a n/aMississippi 9,377 13.4 71.9 15.9 13.6 0.1 16.6 5.0 0.1Missouri 4,762 3.5 53.0 30.0 32.9 0.2 12.2 3.0 0.1Montana 3,736 16.3 97.6 4.6 2.5 n/a 0.6 0.3 0.1Nebraska 2,822 5.9 83.5 12.8 9.3 0.1 0.4 0.1 n/aNevada 4,999 7.2 84.0 19.3 5.9 n/a 0.1 1.7 n/aNew Hampshire 1,217 4.8 86.7 8.8 8.2 n/a 1.6 4.1 n/aNew Jersey 5,132 2.6 74.4 12.9 15.1 0.1 1.4 2.3 0.0New Mexico 8,025 16.9 82.3 12.1 2.7 n/a 27.2 3.2 n/aNew York 67,269 16.7 95.5 9.1 3.4 n/a 0.8 6.4 27.1North Carolina 5,601 2.4 45.0 28.8 21.7 n/a 1.9 1.0 2.8North Dakota 1,797 10.0 77.6 7.4 3.7 n/a 27.9 2.8 n/aOhio 25,470 9.9 45.8 45.3 17.7 0.1 6.4 1.9 n/aOklahoma 15,148 15.9 74.8 12.5 4.7 0.0 32.9 1.8 n/aOregon 13,543 15.6 50.1 12.2 8.0 0.3 2.0 1.4 49.2Pennsylvania 4,817 1.8 9.9 44.6 43.6 0.7 1.2 4.5 0.5Rhode Island 3,183 15.6 58.8 13.6 4.4 0.0 35.2 1.8 2.0South Carolina 18,717 16.8 55.4 56.0 5.0 n/a 0.6 2.0 0.1South Dakota 1,537 7.1 92.3 9.4 3.8 n/a 1.2 n/a n/aTennessee 9,859 6.5 24.9 60.6 24.9 1.1 4.0 1.5 n/aTexas 64,093 8.7 83.4 12.2 10.8 0.0 0.6 1.8 0.0Utah 10,579 11.4 28.0 43.1 17.4 0.1 30.6 0.4 1.3Vermont 851 7.5 2.9 57.7 40.2 n/a 1.6 2.1 n/aVirginia 6,159 3.3 65.2 28.9 12.6 n/a 1.1 2.4 n/aWashington 4,222 2.5 77.8 22.0 11.5 0.4 n/a n/a n/aWest Virginia 6,727 18.7 39.5 79.7 3.6 n/a 62.6 5.5 n/aWisconsin 4,576 3.6 68.0 16.0 21.2 1.1 0.7 2.0 0.0Wyoming 1,096 8.2 75.6 1.9 6.6 n/a 31.8 0.6 n/aUnited States 651,505 8.9 74.9% 17.5% 9.3% 0.1% 6.1% 2.3% 6.8%
Notes: “n/a” means the category is not reported by state. Percents add up to over 100 percent as some cases involved multiple types of maltreatment. Due to differences in definitions of child maltreatment, data should not be compared between states. Categorization of child maltreatment was analyzed differently for 2019, and data should not be compared to that of previous reports. U.S. total excludes data from Puerto Rico and U.S. territories.
Source: U.S. Department of Health and Human Services. 2021. “Child Maltreatment 2019,” Tables 3-4 and 3-9. https://www.acf.hhs.gov/cb/report/child-maltreatment-2019.

64 Children’s Defense Fund
CHILD WELFARE
Source: U.S. Department of Health and Human Services. 2019. “Trends in Foster Care and Adoption.” Adoption Foster Care Analysis Reporting System (AFCARS), FY 2008 - 2018. https://www.acf.hhs.gov/cb/resource/trends-in-foster-care-and-adoption; U.S. Department of Health and Human Services. 2020. “Trends in Foster Care and Adoption.” AFCARS, FY 2010 - 2019. https://www.acf.hhs.gov/cb/resource/trends-in-foster-care-and-adoption.
After increasing every year since FY2012, the number of children living in foster care decreased for the first time in FY2018.
In FY2019, that trend continued, decreasing to 423,997.Table 28: Children Living In, Entering and Exiting Foster Care, Select Fiscal Years
FY2012 FY2019
Percent Change FY2012-FY2019 FY2019 FY2019
Alabama 4,561 5,783 26.8% 3,985 3,958Alaska 1,854 2,879 55.3 1,496 1,337Arizona 13,461 13,330 -1.0 9,607 9,359Arkansas 3,711 4,127 11.2 3,071 3,107California 54,553 51,268 -6.0 28,138 26,622Colorado 6,003 5,340 -11.0 4,420 4,402Connecticut 4,563 4,333 -5.0 2,046 1,647Delaware 799 576 -27.9 299 354District of Columbia 1,216 672 -44.7 360 389Florida 19,536 24,563 25.7 15,597 14,572Georgia 7,671 12,867 67.7 6,468 7,309Hawaii 1,079 1,706 58.1 1,272 1,169Idaho 1,234 1,752 42.0 1,322 1,289Illinois 16,772 18,317 9.2 6,709 4,716Indiana 11,190 16,307 45.7 9,180 10,904Iowa 6,262 5,955 -4.9 3,769 3,819Kansas 6,002 8,066 34.4 4,212 3,998Kentucky 6,979 9,148 31.1 6,629 6,635Louisiana 4,044 3,919 -3.1 2,769 3,317Maine 1,512 2,096 38.6 1,246 901Marlyand 4,884 3,840 -21.4 1,917 1,949Massachusetts 8,522 9,871 15.8 5,419 5,930Michigan 14,522 11,671 -19.6 5,758 6,169Minnesota 5,330 8,400 57.6 6,045 6,614Mississippi 3,699 4,161 12.5 2,396 2,898Missouri 9,985 12,685 27.0 6,889 6,642Montana 1,937 3,697 90.9 2,178 2,353Nebraska 5,116 3,506 -31.5 2,209 2,137Nevada 4,745 4,541 -4.3 3,231 3,181New Hampshire 768 1,225 59.5 846 886New Jersey 6,848 4,430 -35.3 2,679 3,700New Mexico 1,914 2,326 21.5 1,447 1,609New York 23,924 16,086 -32.8 8,337 7,968North Carolina 8,461 11,223 32.6 5,564 4,454North Dakota 1,109 1,502 35.4 987 1,020Ohio 11,877 16,387 38.0 12,410 11,053Oklahoma 9,120 8,306 -8.9 4,524 4,802Oregon 8,686 6,994 -19.5 3,329 3,348Pennsylvania 14,515 15,526 7.0 9,528 10,058Rhode Island 1,707 2,200 28.9 1,111 860South Carolina 3,113 4,521 45.2 3,958 3,779South Dakota 1,399 1,706 21.9 1,215 1,027Tennessee 7,440 9,290 24.9 6,719 5,081Texas 29,613 31,427 6.1 18,455 19,673Utah 2,813 2,488 -11.6 2,020 2,084Vermont 975 1,245 27.7 736 743Virginia 4,579 4,925 7.6 2,800 2,701Washington 9,606 10,909 13.6 5,336 5,673West Virginia 4,562 7,269 59.3 5,048 4,757Wisconsin 6,384 7,642 19.7 4,631 4,635Wyoming 949 994 4.7 1,042 1,081United States 392,104 423,997 8.1% 251,359 248,669
Entering Care Existing Care

65
The State of America’s Children® 2021
CHILD WELFARE
Black children and American Indian children were overrepresented in foster care in 2018. In 18 states, the percent of Black children in foster care was at least two
times the percent of Black children in the overall child population; and in 11 states for American Indian and Alaska Native children.
Table 29: Children in Foster Care by Race/Ethnicity, 2018
Percent of Children in Foster Care Who Are: Ratio of Black
Children in Foster Care to Black
Children in the Overall Population
Ratio of AI/AN Children in Foster Care
to AI/AN Children in the Overall PopulationWhite Hispanic Black
Asian/Native Hawaiian/
Other Pacific Islander
American Indian/Alaska Native
Two or More Races
Alabama 55.09% 4.57% 34.89% 0.15% 0.17% 4.65% 1.21 0.38Alaska 24.03 5.01 1.87 3.62 45.38 19.99 0.58 2.47Arizona 34.04 38.35 11.28 0.46 4.79 4.79 2.31 0.97Arkansas 64.95 6.33 16.37 0.40 0.09 11.55 0.92 0.13California 19.88 53.29 19.05 1.48 0.72 4.84 3.73 1.89Colorado 43.45 37.96 10.83 0.47 0.72 5.49 2.48 1.21Connecticut 32.66 35.50 23.27 0.21 0.17 6.49 2.05 0.61Delaware 31.99 12.10 47.98 0.14 n/a 7.79 1.89 n/aDistrict of Columbia 0.15 12.56 82.18 0.59 n/a 0.74 1.52 n/aFlorida 47.04 15.63 29.86 0.20 0.06 6.60 1.49 0.29Georgia 47.48 5.96 39.41 0.31 0.04 6.47 1.18 0.24Hawaii 12.33 2.37 1.36 30.35 0.12 51.33 0.72 0.83Idaho 75.36 15.33 1.27 0.66 1.82 2.09 1.36 1.61Illinois 42.43 8.86 44.15 0.25 0.10 4.05 2.90 0.72Indiana 65.84 8.07 16.96 0.21 0.03 8.83 1.51 0.18Iowa 68.36 8.35 11.92 0.70 1.35 4.73 2.21 3.60Kansas 64.55 12.72 13.87 0.30 0.94 7.61 2.24 1.33Kentucky 75.10 4.77 10.39 0.19 0.04 6.30 1.12 0.27Louisiana 54.08 1.89 38.65 0.26 0.13 3.92 1.06 0.21Maine 71.82 4.64 2.77 0.40 1.36 7.19 0.95 1.58Maryland 27.45 7.20 53.08 0.54 n/a 4.63 1.73 n/aMassachusetts 42.39 29.82 13.92 0.59 0.23 9.69 1.58 1.22Michigan 49.13 7.80 29.10 0.26 0.40 13.27 1.82 0.67Minnesota 34.81 10.02 15.28 1.81 22.71 13.76 1.54 15.50Mississippi 54.79 1.87 37.78 0.26 0.06 3.32 0.91 0.10Missouri 64.80 9.13 18.17 0.18 0.41 1.82 1.35 1.02Montana 50.23 7.75 1.19 0.05 30.74 9.68 1.80 3.16Nebraska 50.09 18.08 17.59 1.05 4.63 7.56 2.94 4.06Nevada 39.83 24.27 25.53 1.63 0.75 7.57 2.47 0.91New Hampshire 73.74 8.30 4.88 0.52 0.07 4.77 2.50 0.43New Jersey 30.26 24.14 40.39 0.65 0.05 4.27 3.02 0.39New Mexico 23.41 61.21 5.26 n/a 6.19 2.64 3.10 0.60New York 25.04 25.42 40.21 1.03 0.27 6.71 2.68 0.92North Carolina 50.89 7.98 25.80 0.28 2.18 11.14 1.14 1.83North Dakota 42.58 6.41 5.52 0.70 33.63 9.01 1.30 4.29Ohio 52.70 5.30 30.13 0.19 0.01 11.33 2.00 0.08Oklahoma 37.32 17.93 8.53 0.06 9.05 27.11 1.08 0.92Oregon 62.95 16.34 4.08 0.97 4.37 7.62 1.71 3.56Pennsylvania 42.24 13.09 36.32 0.43 0.02 7.13 2.77 0.16Rhode Island 46.33 28.36 13.08 0.45 0.25 10.43 1.74 0.44South Carolina 49.60 5.97 35.79 0.16 0.22 4.76 1.21 0.67South Dakota 22.56 5.32 2.95 0.19 55.00 13.97 1.01 4.25Tennessee 64.58 5.51 22.34 0.20 0.16 6.35 1.18 0.73Texas 29.66 41.26 22.35 0.32 0.08 4.78 1.90 0.33Utah 65.80 23.40 2.60 1.23 2.68 4.06 2.07 2.93Vermont 93.50 1.38 2.68 0.23 0.15 1.15 1.39 0.54Virginia 51.88 9.60 27.96 0.57 0.06 8.77 1.41 0.29Washington 48.89 19.76 7.96 1.97 4.90 16.41 1.80 3.42West Virginia 88.51 0.91 3.18 0.11 0.03 6.92 0.88 0.18Wisconsin 46.99 9.70 27.71 1.05 7.21 5.90 3.12 6.46Wyoming 74.61 16.50 3.39 0.27 1.47 2.20 3.00 0.49United States 44.37% 20.84% 22.76% 0.73% 2.40% 7.56% 1.66 2.84
Notes: Data are for children in foster care on September 30, 2018. Racial categories exclude children of Hispanic ethnicity. “n/a” means data were not available.Sources: The Annie E. Casey Foundation, KIDS Count Data Center. 2020. “Children in Foster Care by Race and Hispanic Origin in the United States, 2018.” https://datacenter.kidscount.org/data/tables/6246-children-in-foster-care-by-race-and-hispanic-origin; The Annie E. Casey Foundation, KIDS Count Data Center. 2020. “Child Population by Race in the United States, 2018” https://datacenter.kidscount.org/data/tables/103-child-population-by-race.

66 Children’s Defense Fund
CHILD WELFARE
Between 2008 and 2018, 26 states and the District of Columbia decreased their use of congregate care by at least 33.3 percent. In 14 of these states children
in congregate care declined by at least 50 percent. Only two states— Delaware and New Mexico—increased their use of congregate care.
Table 30: Children in Congregate Care and Care with Relatives, 2008 and 2018
Percent Change in Percent of Children in Congregate
Care 2008-2018
Percent Change in Percent of
Children in Foster Care with Relatives,
2008-2018
Children in Congregate Care, 2008
Children in Congregate Care, 2018
Children in Foster Care
with Relatives, 2008
Children in Foster Care with Relatives, 2018
Number Percent Number Percent Number Percent Number PercentAlabama 1,314 19% 1,046 18% -5.3 801 12% 759 13% 8.3%Alaska 201 9 109 4 -55.6 460 21 763 27 28.6Arizona 1,537 15 1,893 14 -6.7 3,386 33 5,823 44 33.3Arkansas 704 20 748 18 -10.0 313 9 920 22 144.4California 8,242 12 4,282 8 -33.3 19,021 28 17,234 33 17.9Colorado 2,578 33 1,465 27 -18.2 1,080 14 1,331 25 78.6Connecticut 1,356 26 332 8 -69.2 822 16 1,613 38 137.5Delaware 126 13 119 17 30.8 111 12 63 9 -25.0District of Columbia 333 15 62 9 -40.0 358 17 153 22 29.4Florida 3,219 15 2,560 10 -33.3 9,256 42 10,539 43 2.4Georgia 1,964 20 1,620 12 -40.0 1,716 17 3,798 28 64.7Hawaii 122 8 74 4 -50.0 662 41 755 45 9.8Idaho 189 11 160 9 -18.2 332 19 554 31 63.2Illinois 1,835 10 1,220 7 -30.0 6,252 35 7,679 46 31.4Indiana 2,125 17 1,074 6 -64.7 2,152 17 6,705 36 111.8Iowa 1,548 23 636 10 -56.5 1,241 18 2,280 36 100.0Kansas 521 8 613 8 0.0 1351 21 2,357 29 38.1Kentucky 1,281 18 1,230 13 -27.8 766 11 932 10 -9.1Louisiana 687 14 401 9 -35.7 1,083 21 1,535 34 61.9Maine 252 14 88 5 -64.3 414 24 631 36 50.0Maryland 1,489 20 557 14 -30.0 2,210 29 1,602 40 37.9Massachusetts 1,978 19 1,686 16 -15.8 1,891 18 2,762 26 44.4Michigan 3,270 16 1,128 9 -43.8 7,429 37 4,675 39 5.4Minnesota 1,586 26 1,141 12 -53.8 961 16 3,796 41 156.3Mississippi 698 21 308 7 -66.7 635 19 1,690 36 89.5Missouri 1,705 17 1,059 8 -52.9 1,857 18 4,591 36 100.0Montana 206 13 278 7 -46.2 450 28 1,768 45 60.7Nebraska 1,227 22 176 5 -77.3 1,039 19 1,096 31 63.2Nevada 440 9 239 5 -44.4 1,462 29 1,799 40 37.9New Hampshire 239 23 310 20 -13.0 159 15 410 27 80.0New Jersey 970 11 328 6 -45.5 3,229 38 1,834 33 -13.2New Mexico 113 5 212 8 60.0 458 21 554 22 4.8New York 5,760 20 2,216 14 -30.0 5,825 20 3,742 24 20.0North Carolina 1,273 13 1,114 11 -15.4 2,214 23 2,431 24 4.3North Dakota 316 26 170 11 -57.7 187 15 298 19 26.7Ohio 1,870 14 1,960 12 -14.3 1,970 14 3,353 21 50.0Oklahoma 895 8 506 6 -25.0 2,995 28 2,678 31 10.7Oregon 659 7 402 5 -28.6 1,720 19 2,462 32 68.4Pennsylvania 4,738 25 2,333 14 -44.0 4,268 22 6,242 38 72.7Rhode Island 829 34 307 15 -55.9 539 22 853 43 95.5South Carolina 1,215 24 897 20 -16.7 340 7 223 5 -28.6South Dakota 328 22 235 15 -31.8 266 18 336 22 22.2Tennessee 1,455 20 1,543 17 -15.0 544 8 1,052 12 50.0Texas 4,943 18 3864 12 -33.3 7,436 27 11,303 34 25.9Utah 524 19 245 9 -52.6 390 14 758 29 107.1Vermont 251 21 173 13 -38.1 134 11 373 29 163.6Virginia 1,478 22 735 15 -31.8 386 6 340 7 16.7Washington 585 5 535 5 0.0 4,019 36 3,879 34 -5.6West Virginia 1,142 26 1,193 17 -34.6 671 15 1,497 21 40.0Wisconsin 1,073 14 752 10 -28.6 2,290 31 3,165 40 29.0Wyoming 472 41 176 16 -61.0 167 14 353 32 128.6United States 73,861 16.2% 46,510 10.7% -34.0 109,718 24.2% 138,339 31.8% 31.4%
Source: The Annie E. Casey Foundation, KIDS COUNT Data Center. 2020. “Children in Foster Care by Placement Type.” https://datacenter.kidscount.org/data/tables/6247-children-in-foster-care-by-placement-type.

67
The State of America’s Children® 2021
CHILD WELFARE
Four out of five children exiting foster care were placed in a permanent family in 2018; the majority of children reunited with their families. However, 11 percent of children—nearly 18,000—"aged out" of foster care without a permanent family.
Table 31: Exits from Foster Care and Exits to Emancipation, FY2018
Number of Children
Who Exited
Foster Care
Median Length of Stay
(Months) Reunification Adoption Guardianship
Number of Children
Who “Aged Out” of the
System
Percent Who Aged Out Who Entered
Foster Care at Age 13 and Older
Alabama 3,582 11.9 68.0% 19.9% 1.5% 317 82.0Alaska 1,251 21.2 54.5 28.0 6.7 81 86.4Arizona 10,549 15.8 44.9 37.3 7.5 881 92.6Arkansas 3,578 12.0 63.1 27.3 2.0 219 82.6California 25,879 16.2 53.8 25.8 10.9 1,988 80.3Colorado 4,741 8.0 61.4 15.3 7.1 225 85.8Connecticut 1,560 19.1 45.1 38.5 2.9 120 55.0Delaware 370 13.8 17.0 30.8 22.7 30 90.0District of Columbia 361 22.0 44.3 27.4 14.1 49 81.6Florida 15,505 13.5 46.0 27.1 19.5 1,026 87.8Georgia 7,257 14.5 63.8 17.8 7.2 640 91.4Hawaii 1,043 10.8 59.0 17.3 13.7 71 87.3Idaho 1,143 11.1 65.6 20.5 4.8 83 94.0Illinois 4,278 33.9 38.3 41.1 10.1 398 72.4Indiana 12,132 14.1 69.0 16.4 10.4 392 87.2Iowa 3,617 15.5 53.8 29.4 10.4 223 83.0Kansas 3,696 17.0 56.6 25.1 5.3 391 84.1Kentucky 5,993 8.0 69.2 18.7 0.3 667 89.5Louisiana 3,458 11.5 55.7 26.3 8.6 150 81.3Maine 883 19.9 41.6 44.6 6.2 63 71.4Maryland 2,237 15.2 62.7 15.5 2.8 389 71.5Massachusetts 5,850 14.5 62.0 14.2 9.6 813 82.2Michigan 5,984 19.2 46.6 33.4 6.1 706 86.7Minnesota 6,771 11.6 61.6 19.0 10.9 427 85.7Mississippi 3,181 16.3 64.2 20.4 11.2 68 76.5Missouri 6,559 18.2 45.3 25.4 19.6 538 79.2Montana 2,154 15.3 64.1 18.5 8.9 89 80.9Nebraska 2,438 16.8 60.2 22.9 9.3 115 87.8Nevada 2,965 11.9 60.4 25.6 7.0 136 78.7New Hampshire 828 17.2 56.4 29.1 2.2 85 89.4New Jersey 3,863 13.9 61.2 27.1 3.7 265 84.2New Mexico 1,793 10.5 65.1 23.0 4.5 98 78.6New York 8,400 16.3 65.9 24.4 5.9 112 88.4North Carolina 4,698 16.9 41.6 29.8 21.6 184 84.8North Dakota 1,043 10.0 57.0 15.0 10.9 68 83.8Ohio 11,014 10.8 71.6 13.8 4.5 902 87.3Oklahoma 5,320 18.9 45.7 40.2 6.3 203 77.3Oregon 3,335 18.8 56.4 19.4 13.7 295 72.2Pennsylvania 9,931 14.2 52.1 26.7 8.2 836 92.0Rhode Island 1,107 13.6 50.5 23.1 11.4 134 86.6South Carolina 3,591 5.1 77.7 12.3 2.2 257 82.9South Dakota 1,145 11.5 56.9 16.1 10.0 57 84.2Tennessee 5,241 10.0 57.8 20.6 5.5 388 94.8Texas 19,403 15.6 38.4 29.6 25.5 1,148 75.6Utah 2,263 13.3 47.0 34.3 7.6 170 87.6Vermont 740 15.8 57.3 31.1 4.1 46 89.1Virginia 2,849 17.8 41.0 31.0 0.1 642 88.8Washington 5,422 18.8 63.7 24.4 7.1 191 76.4West Virginia 4,429 13.4 56.7 31.8 8.8 61 96.7Wisconsin 4,724 13.8 56.7 16.1 17.7 395 87.8Wyoming 1,007 8.0 76.6 7.4 8.2 11 81.8United States FY2018 251,161 13.2 49% 25% 11% 17,843 United States FY2019 248,669 13.3 47% 26% 11% 20,445
Note: National data is presented for both FY2018 and FY2019 but state data is presented for FY2018 alone as state data for FY2019 was not available at the time of publication.
Source: U.S. Department of Health and Human Services. 2020. “Child Welfare Outcomes Report Data.” https://cwoutcomes.acf.hhs.gov/cwodatasite/threeOne/index; U.S. Department of Health and Human Services. 2019. “The Adoption Foster Care Analysis Reporting System (AFCARS) Report, Preliminary FY 2018 Estimates as of August 22, 2019 - No. 26. https://www.acf.hhs.gov/sites/default/files/cb/afcarsreport26.pdf; U.S. Department of Health and Human Services. 2020. The Adoption Foster Care Analysis Reporting System (AFCARS) Report, Preliminary FY 2019 Estimates as of June 23, 2020 - No. 27.” https://www.acf.hhs.gov/sites/default/files/cb/afcarsreport27.pdf;U.S. Department of Health and Human Services. 2020. “Trends in Foster Care and Adoption.” AFCARS, FY 2010 - 2019. https://www.acf.hhs.gov/cb/resource/trends-in-foster-care-and-adoption.
Percent by Type of Exit:

68 Children’s Defense Fund
YOUTH JUSTICE
In 2019, more than 500,000 children were arrested in the U.S. In 45 states, less than 10 percent of child arrests were for violent crimes.
Table 32: Child Arrests, 2019
Total Number of Child Arrests
Arrests per 100,000 Childrena
Percent of Arrests for Violent Crimes
Alabama 103 9 2.9Alaska 1,433 796 12.4Arizona 18,502 1,128 5.9Arkansas 7,809 1,115 5.7California 38,617 434 17.5Colorado 16,885 1,341 4.8Connecticut 6,942 954 4.4Delaware 2,924 1,436 10.8District of Columbia 807 630 23.3Florida 44,634 1,055 7.3Georgia 5,176 207 5.2Hawaii 1,849 617 5.8Idaho 6,235 1,391 3.4Illinois 696 25 7.2Indiana 5,211 332 5.4Iowa 8,901 1,225 5.7Kansas 3,632 519 5.7Kentucky 4,798 478 6.9Louisiana 12,267 1,128 7.8Maine 2,470 993 1.7Maryland 18,857 1,413 10.9Massachusetts 4,141 306 11.7Michigan 11,172 521 9.2Minnesota 18,594 1,427 5.1Mississippi 2,719 389 4.0Missouri 10,435 761 6.9Montana 4,355 1,905 4.1Nebraska 8,282 1,740 2.9Nevada 10,818 1,562 8.8New Hampshire 3,243 1,271 1.8New Jersey 13,360 689 7.8New Mexico 2,852 599 6.9New York 11,606 288 9.8North Carolina 12,088 525 6.6North Dakota 4,152 2,304 1.6Ohio 20,149 782 5.1Oklahoma 7,195 756 5.6Oregon 8,031 927 5.5Pennsylvania 8,153 309 8.0Rhode Island 2,176 1,064 4.6South Carolina 9,403 846 6.2South Dakota 4,791 2,207 2.3Tennessee 19,687 1,304 7.0Texas 49,409 668 8.9Utah 11,334 1,217 3.0Vermont 803 704 5.9Virginia 15,992 859 4.7Washington 10,101 607 9.3West Virginia 292 81 7.5Wisconsin 33,383 2,636 2.9Wyoming 3,117 2,331 1.3United States 530,581 726 7.3%
a Juvenile arrest rates are based on the number of arrests of children ages 0-17 per 100,000 children ages 0-17 in the resident population.
Notes: “Violent crimes” include the offenses of robbery, aggravated assault, rape, and homicide.
Source: U.S. Department of Justice, Federal Bureau of Investigation. 2019. “Crime in the United States, 2019,” Table 69. https://ucr.fbi.gov/crime-in-the-u.s/2019/crime-in-the-u.s.-2019/topic-pages/tables/table-69; Puzzanchera, C., A. Sladky, and W. Kang. 2020. “Easy Access to Juvenile Populations: 1990-2019 State Comparisons.” https://www.ojjdp.gov/ojstatbb/ezapop/asp/comparison_display.asp.
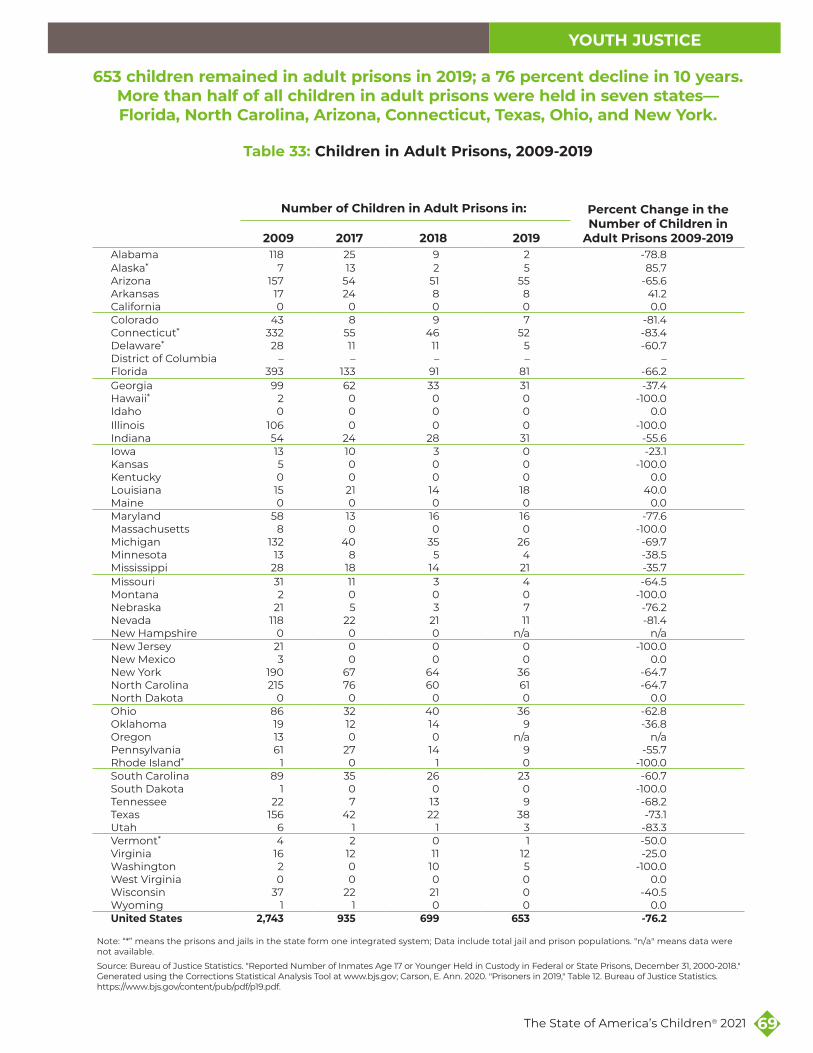
69
The State of America’s Children® 2021
YOUTH JUSTICE
Note: “*” means the prisons and jails in the state form one integrated system; Data include total jail and prison populations. "n/a" means data were not available.
Source: Bureau of Justice Statistics. "Reported Number of Inmates Age 17 or Younger Held in Custody in Federal or State Prisons, December 31, 2000-2018." Generated using the Corrections Statistical Analysis Tool at www.bjs.gov; Carson, E. Ann. 2020. "Prisoners in 2019," Table 12. Bureau of Justice Statistics. https://www.bjs.gov/content/pub/pdf/p19.pdf.
2009 2017 2018 2019
Percent Change in the Number of Children in
Adult Prisons 2009-2019Alabama 118 25 9 2 -78.8Alaska* 7 13 2 5 85.7Arizona 157 54 51 55 -65.6Arkansas 17 24 8 8 41.2California 0 0 0 0 0.0Colorado 43 8 9 7 -81.4Connecticut* 332 55 46 52 -83.4Delaware* 28 11 11 5 -60.7District of Columbia – – – – –Florida 393 133 91 81 -66.2Georgia 99 62 33 31 -37.4Hawaii* 2 0 0 0 -100.0Idaho 0 0 0 0 0.0Illinois 106 0 0 0 -100.0Indiana 54 24 28 31 -55.6Iowa 13 10 3 0 -23.1Kansas 5 0 0 0 -100.0Kentucky 0 0 0 0 0.0Louisiana 15 21 14 18 40.0Maine 0 0 0 0 0.0Maryland 58 13 16 16 -77.6Massachusetts 8 0 0 0 -100.0Michigan 132 40 35 26 -69.7Minnesota 13 8 5 4 -38.5Mississippi 28 18 14 21 -35.7Missouri 31 11 3 4 -64.5Montana 2 0 0 0 -100.0Nebraska 21 5 3 7 -76.2Nevada 118 22 21 11 -81.4New Hampshire 0 0 0 n/a n/aNew Jersey 21 0 0 0 -100.0New Mexico 3 0 0 0 0.0New York 190 67 64 36 -64.7North Carolina 215 76 60 61 -64.7North Dakota 0 0 0 0 0.0Ohio 86 32 40 36 -62.8Oklahoma 19 12 14 9 -36.8Oregon 13 0 0 n/a n/aPennsylvania 61 27 14 9 -55.7Rhode Island* 1 0 1 0 -100.0South Carolina 89 35 26 23 -60.7South Dakota 1 0 0 0 -100.0Tennessee 22 7 13 9 -68.2Texas 156 42 22 38 -73.1Utah 6 1 1 3 -83.3Vermont* 4 2 0 1 -50.0Virginia 16 12 11 12 -25.0Washington 2 0 10 5 -100.0West Virginia 0 0 0 0 0.0Wisconsin 37 22 21 0 -40.5Wyoming 1 1 0 0 0.0United States 2,743 935 699 653 -76.2
653 children remained in adult prisons in 2019; a 76 percent decline in 10 years. More than half of all children in adult prisons were held in seven states—Florida, North Carolina, Arizona, Connecticut, Texas, Ohio, and New York.
Table 33: Children in Adult Prisons, 2009-2019
Number of Children in Adult Prisons in:

70 Children’s Defense Fund
Nearly 44,000 children were held in residential placement on an average night in 2017. In 14 states and the District of Columbia, Black children made up more than
half of all children in residential placements.Table 35: Children in Residential Placement by Race/Ethnicity and Sex, 2017
Percent of Children in Residential Placement Who Are:
Percent of Children in Residential
Placement Who Are:
Number White Hispanic Black Asian
American Indian/
Alaska Native Malea Femalea
Alabama 804 44% 3% 52% <1% 0% 81% 19%Alaska 207 35 1 14 4 36 81 19Arizona 531 31 42 16 <1 5 86 14Arkansas 585 40b 14b 42b 1 0b 82b 19b
California 5,463 14 56 26 2 <1 85 15Colorado 993 39 37 22 <1b <1 88 12Connecticut 99 18b 27b 49b 3b 0b 88b 12b
Delaware 129 14 5 81 0 0 93 7District of Columbia 93 3 3 94 0 0 84 16Florida 2,712 29 10 61 0 <1b 85 15Georgia 1,068 17 7 73 <1b 0 89 11Hawaii 60 0 20 5 40 0 70 30Idaho 408 71 16 5 <1 3 80 20Illinois 1,071 21 11 66 <1 <1 91 9Indiana 1,335 61 6 26 <1b <1 81 19Iowa 585 46 10 35 1 2 85 15Kansas 423 49 15 34 <1 1 89 11Kentucky 555 55 4 33 1 0 87 13Louisiana 762 22 <1b 76 0 <1 88 12Maine 93 84 3 10 0 0 81 19Maryland 549 15 8 77 0 0 90 10Massachusetts 309 25 41 32 0 0 91 9Michigan 1,260 42 4 45 0 <1 76 24Minnesota 675 35 7 42 2 10 85 15Mississippi 273 30b 11b 57b 0 1b 76b 24b
Missouri 780 54 4 39 <1 0 86 14Montana 183 62 7 3 2 25 82 18Nebraska 486 35 20 32 1 6 65 35b
Nevada 588 27 28 40 3 2 80 20New Hampshire 69 61 22 9 0 4 82 18b
New Jersey 585 11 23 65 0 0 92 8b
New Mexico 318 15 71 7 0 8 83 17New York 870 29 16 53 <1 1 81 19North Carolina 366 16 7 73 0 2 89 11North Dakota 108 36 8 17 0 36 76 24Ohio 2,079 41 3 49 <1 <1 86 14Oklahoma 426 36 11 39 <1 10 87 13Oregon 909 55 21 14 1 7 89 11b
Pennsylvania 1,791 34 12 49 0 <1 86 14Rhode Island 123 46 15 27 0 0 95 5South Carolina 546 44b 14b 37b <1b 1b 88 12South Dakota 150 44 2b 12 0 40 84 16Tennessee 537 36 8 53 0b 0b 89b 11b
Texas 3,963 20 40 38 <1 <1 85 15Utah 222 49 39 7 3 3 87 13Vermont 18 83 0 17 0 0 100 0Virginia 1,062 25 10 62 <1 0 87 13Washington 834 39 24 21 4 4 87 13West Virginia 474 80 <1 13 0 0 83 17Wisconsin 630 33 8 53 1 3 87 13Wyoming 183 64 20 12b 0 5 77 23United States 43,580 33% 21% 41% <1% 2% 85% 15%
a Relative to the combined number of children in residential placement who identified as male or female, which may differ from total counts due to rounding.b Interpret data with caution. In these states, 30% or more of the information for age, sex, and/or race/ethnicity was imputed.
Notes: Residential placements range from non-secure community-based group homes to long-term secure facilities. Racial categories (White, Black, Asian, and American Indian/Alaska Native) exclude children of Hispanic ethnicity. Hispanic children can be of any race. U.S. totals exclude youth in tribal facilities.
Source: Sickmund, Melissa et al. 2019. “Easy Access to the Census of Juveniles in Residential Placement: 1997-2017.” http://www.ojjdp.gov/ojstatbb/ezacjrp/.
YOUTH JUSTICE

71
The State of America’s Children® 2021
GUN VIOLENCE
aStates are ranked 1-50 from lowest to highest gun death rate.
Notes: Gun deaths include homicides, suicides, accidents and deaths of unknown intent, but exclude deaths from legal intervention. Rates are not age adjusted. "S" denotes cases where the number of deaths was below 10 and the exact number was not released to protect the anonymity of the victims. "U" means the rate is unreliable because it is based on fewer than 20 deaths.
Source: Centers for Disease Control and Prevention. 2020. “Underlying Cause of Death, 1999-2019,” Detailed Mortality Files. Accessed using CDC WONDER Online Database. https://wonder.cdc.gov/Deaths-by-Underlying-Cause.html.
Table 36: Child and Teen Gun Deaths by State, 2010-2019Number of Deaths Rate per 100,000 Children and Teens
2019 2010-2019 20192010-2019Average
2010-2019 State Ranka
Alabama 98 729 8.1 5.9 47Alaska 24 183 12.2 8.9 50Arizona 79 614 4.3 3.4 21Arkansas 50 392 6.4 5.0 39California 232 2,610 2.3 2.6 11Colorado 73 500 5.2 3.6 23Connecticut <10 136 S 1.6 5Delaware 10 96 U 4.2 34District of Columbia 20 132 13.4 9.6 —Florida 187 1,705 4.0 3.7 25Georgia 163 1,207 5.8 4.3 35Hawaii <10 20 S 0.6 1Idaho 16 181 U 3.8 29Illinois 179 1,692 5.7 5.1 40Indiana 100 804 5.7 4.5 37Iowa 26 212 3.2 2.6 11Kansas 42 296 5.4 3.7 25Kentucky 58 489 5.2 4.3 35Louisiana 107 959 8.9 7.8 49Maine <10 72 S 2.5 9Maryland 58 514 3.9 3.4 21Massachusetts 17 181 U 1.1 3Michigan 83 949 3.4 3.8 29Minnesota 37 354 2.6 2.5 9Mississippi 64 475 8.2 5.8 45Missouri 122 907 8.0 5.8 45Montana 17 141 U 5.6 44Nebraska 13 143 U 2.7 13Nevada 33 304 4.3 4.1 33New Hampshire <10 53 S 1.7 6New Jersey 38 411 1.8 1.8 7New Mexico 39 264 7.3 4.7 38New York 50 711 1.1 1.5 4North Carolina 116 938 4.5 3.7 25North Dakota 10 68 U 3.6 23Ohio 142 1,135 4.9 3.8 29Oklahoma 70 537 6.6 5.1 40Oregon 25 260 2.6 2.7 13Pennsylvania 100 1,165 3.4 3.8 29Rhode Island <10 21 S 0.8 2South Carolina 95 634 7.6 5.2 42South Dakota 10 86 U 3.7 25Tennessee 102 899 6.1 5.4 43Texas 384 2,621 4.7 3.3 18Utah 32 320 3.1 3.2 17Vermont <10 33 S 2.3 8Virginia 87 698 4.2 3.3 18Washington 54 501 2.9 2.8 15West Virginia 20 141 5.0 3.3 18Wisconsin 48 436 3.4 3.0 16Wyoming 13 90 U 5.9 47United States 3,371 29,019 4.1 3.5 —
In 2019, 3,371 children and teens were killed with guns in America. More than half of all child and teen gun deaths occurred in just 10 states: Texas, California,
Florida, Illinois, Georgia, Ohio, Missouri, North Carolina, Louisiana and Tennessee.

SECTION HEAD
72 Children’s Defense Fund

SECTION HEAD
73
The State of America’s Children® 2021
ENDNOTES
Child Population1 U.S. Census Bureau. 2020. “Annual State Resident Population Estimates for 6 Race Groups (5 Race Alone Groups and Two or More Races) by Age, Sex, and Hispanic Origin: April 1, 2010 to July 1, 2019," 2019 Population Estimates. https://www.census.gov/newsroom/press-kits/2020/population-estimates-detailed.html.
2 Ibid.
3 Ibid. Note: Racial categories (White, Black, Asian/Native Hawaiian/Other Pacific Islander, American Indian/Alaska Native) exclude children of Hispanic ethnicity. Hispanic children include children of any racial category. Children of color include all racial categories except white. We use these categories to reflect those of the U.S. Census Bureau though we recognize other terms of race, ethnicity, and identity are often more reflective of communities.”
4 Vespa, Jonathan, Lauren Medina, and David Armstrong. 2020. “Demographic Turning Points for the United States: Population Projections for 2020 to 2060,” p. 4. U.S. Census Bureau Current Population Reports. https://www.census.gov/content/dam/Census/library/publications/2020/demo/p25-1144.pdf.
5 U.S. Census Bureau. 2020. “Annual State Resident Population Estimates,” 2019 Population Estimates.
6 Vespa, Jonathan, et al. 2020. “Demographic Turning Points,” p. 4.
7 First Focus on Children. 2020. “Children’s Budget 2020,” p. 2. https://firstfocus.org/resources/report/childrensbudget2020.
8 Ibid at p. 1-2.
Child Poverty1 Children’s Defense Fund (CDF). 2020. “Child Poverty in America 2019: National Analysis,” p. 1. Washington, DC: CDF. https://www.childrensdefense.org/wp-content/uploads/2020/12/Child-Poverty-in-America-2019-National-Factsheet.pdf.
2 Ibid at p. 2.
3 Ibid at p. 2.
4 “Black” and “Asian” racial categories, as reported in CPS Detailed Tables for Poverty, include children of Hispanic ethnicity. “Hispanic” children can be of any race.
5 Safawi, Ali and Ife Floyd. 2020. “TANF Benefits Still Too Low to Help Families, Especially Black Families, Avoid Increased Hardship,” Appendix Table 6B. Washington, DC: Center on Budget and Policy Priorities (CBPP). https://www.cbpp.org/research/family-income-support/tanf-benefits-still-too-low-to-help-families-especially-black.
6 Ibid at p. 9-11.
7 CDF. 2019. “Ending Child Poverty Now,” p. 17. Washington, DC: CDF. https://www.childrensdefense.org/endingchild-poverty-now/.
8 For a review of the structure and role of current federal assistance programs that affect child poverty, see Duncan, Greg and Suzanne Le Menestrel. 2019. A Roadmap to Reducing Child Poverty, p. 106 -120. Washington, DC: National Academy Press. https://www.nap.edu/catalog/25246/a-roadmap-to-reducing-child-poverty.
9 Fox, Liana. 2020. “The Supplemental Poverty Measure: 2019,” Appendix Table 7. Suitland, MD: U.S. Census Bureau. https://www.census.gov/content/dam/Census/library/publications/2020/demo/p60-272.pdf.
10 Parolin, Zachary, Megan Curran, Jordan Matsudaira, Jane Waldfogel, and Christopher Wimer. 2020. “Monthly Poverty Rates in the United States during the COVID-19 Pandemic,” p. 9. NY: Center on Poverty & Social Policy at Columbia https://static1.squarespace.com/static/5743308460b5e922a25a6dc7/t/5f87c59e4cd0011fabd38973/1602733471158/COVID-Projecting-Poverty-Monthly-CPSP-2020.pdf; Additional commentary and calculations by DeParle, Jason. 2020. “8 Million Have Slipped into Poverty Since May as Federal Aid Has Dried Up.” New York Times, October 15. https://www.nytimes.com/2020/10/15/us/politics/federal-aid-poverty-levels.html.
11 Ibid at p. 1.
12 Ibid.
Income and Wealth Inequality1 U.S. Census Bureau. “2019 American Community Survey Statistics for Income, Poverty and Health Insurance Available for States and Local Areas.” News release, September 17, 2020. U.S. Census Bureau. Accessed September 17, 2020. https://www.census.gov/newsroom/press-releases/2020/acs-1year.html#:~:text=The%202019%20U.S.%20median%20household,the%202018%20and%202019%20ACS.
2 Congressional Budget Office (CBO). 2020. “The Distribution of Household Income, 2017,” p. 4. Washington, DC: CBO. https://www.cbo.gov/publication/56575.
3 Ibid at p. 1.
4 Donovan, Sarah A., Marc Labonte, and Joseph Dalaker. 2016. “The U.S. Income Distribution: Trends and Issues,” p.1. Washington, DC: Congressional Research Service. https://fas.org/sgp/crs/misc/R44705.pdf.
5 Inequality.org. 2020. “Income Inequality in the United States.” https://inequality.org/facts/income-inequality/.
6 Bricker, Jesse, and Sarena Goodman, Kevin B. Moore, Alice Henriques Volz, and Dalton Ruh. 2020. “Wealth and Income Concentration in the SCF: 1989–2019, Accessible Data.” Washington, DC: Federal Reserve. https://www.federalreserve.gov/econres/notes/feds-notes/wealth-and-income-concentration-in-the-scf-20200928.htm.
7 Chetty, Raj, David Grusky, Maximilian Hell, Nathaniel Hendren, Robert Manduca, and Jimmy Narang. 2017. “The Fading American Dream: Trends in Absolute Income Mobility since 1940,” p. 398. Science 356(6336): 398-406. https://science.sciencemag.org/content/356/6336/398/tab-pdf.
8 Stone, Chad, Danilo Trisi, Arloc Sherman, and Roderick Taylor. 2020. “A Guide to Statistics on Historical Trends in Income Inequality,” p.1. Washington, DC: Center on Budget and Policy Priorities. https://www.cbpp.org/sites/default/files/atoms/files/11-28-11pov_0.pdf.
9 Bricker, Jesse, and Sarena Goodman, Kevin B. Moore, Alice Henriques Volz, and Dalton Ruh. 2020. “Wealth and Income Concentration in the SCF: 1989–2019, Accessible Data.” Federal Reserve. https://www.federalreserve.gov/econres/notes/feds-notes/wealth-and-income-concentration-in-the-scf-20200928.htm.
10 Ibid.
11 Inequality.org. 2020. “Wealth Inequality in the United States.” https://inequality.org/facts/wealth-inequality/.
12 Ibid.
13 Traub, Amy, Catherine Ruetschlin, Laura Sullivan, Tatjana Meschede, Lars Dietrich, and Thomas Shapiro. 2016. “The Racial Wealth Gap: Why Policy Matters,” p.9-11. Demos. https://www.demos.org/sites/default/files/publications/RacialWealthGap_2.pdf.
14 Wilson, Valerie. 2020. “Racial Disparities in Income and Poverty Remain Largely Unchanged Amid Strong Income Growth in 2019.” Economic Policy Institute. https://www.epi.org/blog/racial-disparities-in-income-and-poverty-remain-largely-unchanged-amid-strong-income-growth-in-2019/.
15 Bhutta, Neil, Andrew C. Chang, Lisa J. Dettling, and Joanne W. Hsu. 2020. “Disparities in Wealth by Race and Ethnicity in the 2019 Survey of Consumer Finances.” Federal Reserve. https://www.federalreserve.gov/econres/notes/feds-notes/disparities-in-wealth-by-race-and-ethnicity-in-the-2019-survey-of-consumer-finances-20200928.htm.
16 Collins, Chuck, Darrick Hamilton, Dedrick Asante-Muhammad, and Josh Hoxie. 2019. “Ten Solutions to Bridge the Racial Wealth Divide,” p. 7. Washington, DC: Institute for Policy Studies. https://ips-dc.org/wp-content/uploads/2019/04/Ten-Solutions-to-Bridge-the-Racial-Wealth-Divide-FINAL-.pdf.
17 Ibid at p. 4.

SECTION HEAD SECTION HEAD
74 Children’s Defense Fund
ENDNOTES
18 Credit Suisse. 2019. “Global Wealth Data Book 2019,” Table 2-4. https://www.credit-suisse.com/about-us/en/reports-research/global-wealth-report.html.
19 Allianz. 2019. “Global Wealth Report 2019,” p. 51. https://www.allianz.com/content/dam/onemarketing/azcom/Allianz_com/economic-research/publications/specials/en/2019/AGWR_2019.pdf; Alvaredo, Facundo, Lucas Chancel, Thomas Piketty, Emmanuel Saez, and Gabriel Zucman. 2018. “World Inequality Report,” p. 78. Paris: World Inequality Lab at the Paris School of Economics. https://wir2018.wid.world/files/download/wir2018-full-report-english.pdf.
20 Cajner, Tomas, Leland D. Crane, Ryan A. Decker, John Grigsby, Adrian Hamins-Puertolaset et al. 2020. “The U.S. Labor Market During the Beginning of the Pandemic Recession,” p. 2. Chicago: Becker Friedman Institute. https://bfi.uchicago.edu/wp-content/uploads/HurstBFI_WP_202058_Revision.pdf.
21 Long, Heather, Andrew Van Dam, Alyssa Fowers, and Leslie Shapiro. 2020. “The Covid-19 Recession is the Most Unequal in Modern U.S. History.” Washington Post, September 30. https://www.washingtonpost.com/graphics/2020/business/coronavirus-recession-equality/
22 Georgetown University Center on Education and the Workforce. 2020. “Tracking COVID-19 Unemployment and Job Losses.” https://cew.georgetown.edu/cew-reports/jobtracker/#unemployment-tracking
23 Collins, Chuck. 2020. “Updates: Billionaire Wealth, U.S. Job Losses and Pandemic Profiteers.” Institute for Policy Studies.” Blogging Our Great Divide, December 9. https://inequality.org/great-divide/updates-billionaire-pandemic/.
24 Ibid.
25 Ibid.
26 Institute for Policy Studies. 2020. “Covid-19 and Inequality.” https://inequality.org/facts/inequality-and-covid-19/.
27 Long, Heather, Andrew Van Dam, Alyssa Fowers, and Leslie Shapiro. 2020. “The COVID-19 Recession.” https://www.washingtonpost.com/graphics/2020/business/coronavirus-recession-equality/.
Housing and Homelessness1 Gowan, Peter and Ryan Cooper. 2017. “Social Housing in the United States,” p.1. Washington, DC: People’s Policy Project. https://www.peoplespolicyproject.org/wp-content/uploads/2018/04/SocialHousing.pdf,
2 Ibid at p. 5.
3 Aurand, Andrew, Dan Emmanuel, Dan Threet, Ikra Rafi, and Diane Yentel. 2020. “Out of Reach 2020,” p. 4. Washington, DC: National Low Income Housing Coalition. https://reports.nlihc.org/sites/default/files/oor/OOR_2020.pdf.
4 Ibid at p. 2.
5 KIDS COUNT Data Center. 2020. “Children Living in Households with a High Housing Cost Burden in the United States.” Baltimore: Annie E. Casey Foundation. Updated December 2020. https://datacenter.kidscount.org/data/tables/7244-children-living-in-households-with-a-high-housing-cost-burden?loc=1&loct=1#detailed/1/any/false/871,870,573,869,36,868,867,133,38,35/any/14287,14288.
6 KIDS COUNT Data Center. 2020. “Children in Low-Income Households with a High Housing Cost Burden in the United States.” Baltimore: Annie E. Casey Foundation. Updated December 2020. https://datacenter.kidscount.org/data/tables/71-children-in-low-income-households-with-a-high-housing-cost-burden?loc=1&loct=1#detailed/1/any/false/871,870,573,869,36,868,867,133,38,35/any/376,377. A family is considered rent-burdened when at least 30 percent of its income is spent on rent.
7 U.S. Department of Housing and Urban Development. 2020. “Worst Case Housing Needs: 2019 Report to Congress,” p. 8. Washington, DC: U.S. Department of Housing and Urban Development, Office of Community Planning and Development. https://www.huduser.gov/portal/sites/default/files/pdf/worst-case-housing-needs-2020.pdf.
8 Aurand, Andrew, Dan Emmanuel, Dan Threet, Ikra Rafi, and Diane Yentel. 2020. “The Gap: A Shortage of Affordable Homes,” p.13. Washington, DC: National Low Income Housing Coalition. https://reports.nlihc.org/sites/default/files/gap/Gap-Report_2020.pdf.
9 Henry, Meghan, Rian Watt, Anna Mahathey, Jillian Ouellette, and Aubrey Sitler, Abt Associates. 2020. “The 2019 Annual Homeless Assessment Report (AHAR) to Congress,” p. 9. Washington, DC: U.S. Department of Housing and Urban Development, Office of Community Planning and Development. https://www.huduser.gov/portal/sites/default/files/pdf/2019-AHAR-Part-1.pdf. This annual report considers both sheltered and unsheltered, meaning these numbers represent people living in shelters, transitional housing and on the streets.
10 Ibid at p. 33-36.
11 Ibid at p. 34.
12 Morton, Matthew H., Amy Dworsky, and Gina M. Samuels. 2017. “Missed Opportunities: Youth Homelessness in America. National Estimates,” p.12. Chicago: Voices of Youth Count and University of Chicago, Chapin Hall. http://voicesofyouthcount.org/wp-content/uploads/2017/11/ChapinHall_VoYC_NationalReport_Final.pdf.
13 Yamashiro, Amy and John McLaughlin. 2019. “Early Childhood Homelessness State Profiles 2019,” p.1. Washington, DC: U.S. Department of Education, Office of Planning, Evaluation and Policy Development. https://www2.ed.gov/rschstat/eval/disadv/homeless/early-childhood-homelessness-state-profiles-2019.pdf.
14 National Center for Homeless Education. 2020. “Federal Data Summary School Years 2015-16 to 2017-18,” p.iii. Brown’s Summit, NC: National Center for Homeless Education. https://nche.ed.gov/wp-content/uploads/2020/01/Federal-Data-Summary-SY-15.16-to-17.18-Published-1.30.2020.pdf.
15 Ibid.
16 Ibid.
17 Morton, Matthew H., Amy Dworsky, and Gina M. Samuels. 2017. “Missed Opportunities: Youth Homelessness in America. National Estimates,” p. 6. Chicago: Voices of Youth Count and University of Chicago, Chapin Hall. http://voicesofyouthcount.org/wp-content/uploads/2017/11/ChapinHall_VoYC_NationalReport_Final.pdf. Note: Homelessness is defined here as lack of consistent and safe housing. This study captures homelessness broadly including sleeping on the streets, in shelters, running away, being kicked out, and coach surfing.
18 Center on Budget and Policy Priorities (CBPP). 2017. “Policy Basics: Federal Rental Assistance,” p. 2. Washington, DC: CBPP. http://www.cbpp.org/sites/default/files/atoms/files/PolicyBasics-housing-1-25-13RA.pdf.
19 Chetty, Raj, Nathaniel Hendren, and Lawrence Katz. 2016. “The Effects of Exposure to Better Neighborhoods on Children: New Evidence from the Moving to Opportunity Project.” American Economic Review 106 (4). https://scholar.harvard.edu/hendren/publications/effects-exposure-better-neighborhoods-children-new-evidence-moving-opportunity.
20 Fischer, Will. 2015. “Research Shows Housing Vouchers Reduce Hardship and Provide Platform for Long-Term Gains among Children,” p. 2. Washington, DC: Center on Budget and Policy Priorities. http://www.cbpp.org/sites/default/files/atoms/files/3-10-14hous.pdf.
21 United States Census Bureau. 2021. “Week 24 Household Pulse Survey: February 3 – February 15,” Housing Table 1b. https://www.census.gov/data/tables/2021/demo/hhp/hhp24.html.
ENDNOTES

SECTION HEAD
75
The State of America’s Children® 2021
ENDNOTES
22 Ibid at Housing Table 2b.
23 Ibid at Housing Table 3b.
24 Leifheit, Kathryn, Sabriya Linton, Julia Raifman, Gabriel Schwartz, Emily Benfer, Frederick J. Zimmerman, and Craig Evan Pollack. 2020. “Expiring Eviction Moratoriums and COVID-19 Incidence and Mortality,” p. 5. https://papers.ssrn.com/sol3/papers.cfm?abstract_id=3739576.
25 Benfer, Emily, David Bloom Robinson, Stacy Butler, Lavar Edmonds, Sam Gilman, Katherine Lucas McKay, Zach Neumann, Lisa Owens, Neil Steinkamp, and Diane Yentel. 2020. “The COVID-19 Eviction Crisis: An Estimated 30-40 Million People in America Are at Risk.” Aspen Institute: Family Finance Blog, August 7. https://www.aspeninstitute.org/blog-posts/the-covid-19-eviction-crisis-an-estimated-30-40-million-people-in-america-are-at-risk/.
Child Hunger and Nutrition1 Coleman-Jensen, Alisa et al. 2020. “Household Food Security in the United States in 2019 Statistical Supplement,” Table S-3. Washington, DC: United States Department of Agriculture. https://www.ers.usda.gov/webdocs/publications/99289/ap-084.pdf?v=1116.5.
2 Ibid at Table S-2.
3 Economic Research Service. 2020. “Interactive Charts and Highlights: Food Insecurity and Very Low Food Security by Education, Employment, Disability Status, and SNAP Participation.” Washington, D.C: U.S. Department of Agriculture. https://www.ers.usda.gov/topics/food-nutrition-assistance/food-security-in-the-u-s/interactive-charts-and-highlights/#disability.
4 Food Research & Action Center (FRAC). 2017. “The Impact of Poverty, Food Insecurity, and Poor Nutrition on Health and Well-Being,” Figure 1. Washington, DC: FRAC. https://frac.org/wp-content/uploads/hunger-health-impact-poverty-food-insecurity-health-well-being.pdf.
5 Department of Education, National Center for Education Statistics. 2020. “Number and percentage of public school students eligible for free or reduced-price lunch, by state: Selected years, 2000-01 through 2016-17,” Table 204.10. https://nces.ed.gov/programs/digest/d18/tables/dt18_204.10.asp.
6 Maurice, Alison et al. 2020. "Community Eligibility: The Key to Hunger-Free Schools: School Year 2019-2020," p. 3. Washington, DC: FRAC. https://frac.org/wp-content/uploads/CEP-Report-2020.pdf.
7 Hayes, Clarissa, Crystal Fitzsimmons, and Alyson Perez. 2020. “Afterschool Suppers: A Snapshot of Participation 2020,” p. 5. Washington, DC: FRAC. https://frac.org/wp-content/uploads/FRAC-Afterschool-Report-2020.pdf.
8 Food Research & Action Center. 2017. “The Role of the Supplemental Nutrition Assistance Program in Improving Health and Well-Being,” p. 5. Washington, DC: FRAC. https://frac.org/wp-content/uploads/hunger-health-role-snap-improving-health-well-being.pdf.
9 Fox, Liana. 2020. “The Supplemental Poverty Measure: 2019,” Appendix Table 7. Suitland, MD: U.S. Census Bureau. https://www.census.gov/content/dam/Census/library/publications/2020/demo/p60-272.pdf; Trisi, Danilo and Matt Saenz. 2020. “Deep Poverty Among Children Rose in TANF’s First Decade, Then Fell as Other Programs Strengthened,” p. 2. Washington, DC: Center on Budget and Policy Priorities. https://www.cbpp.org/sites/default/files/atoms/files/2-27-20pov.pdf.
10 Cronquist, Kathryn. 2020. “Characteristics of Supplemental Nutrition Assistance Program Households: Fiscal Year 2018,” Table A.3. Washington, DC: United States Department of Agriculture. https://fns-prod.azureedge.net/sites/default/files/resource-files/Characteristics2018.pdf.
11 Coleman-Jensen, Alisa et al. 2020. “Household Food Security in the United States in 2019,” Table 8. Washington, DC: United States Department of Agriculture. https://www.ers.usda.gov/webdocs/publications/99282/err-275.pdf?v=9000.7.
12 Cronquist, Kathryn. 2020. "Characteristics of Supplemental Nutrition Assistance Program,” Table 3.4. Calculations of per meal average based on average monthly SNAP benefit made by Children’s Defense Fund.
13 CDF. 2019. “Ending Child Poverty Now,” Table 2.1. Washington, DC: CDF. https://www.childrensdefense.org/wp-content/uploads/2019/04/Ending-Child-Poverty-2019.pdf.
14 Rosenbaum, Dorothy, Stacy Dean, and Zoë Neuberger. 2020. “The Case for Boosting SNAP Benefits in Next Major Economic Response Package,” p. 1-3. Washington, DC: CBPP. https://www.cbpp.org/sites/default/files/atoms/files/4-22-20fa.pdf.
15 Center on Budget and Policy Priorities. 2020. “Tracking the COVID-19 Recession’s Effects on Food, Housing, and Employment Hardships,” p. 2. https://www.cbpp.org/sites/default/files/atoms/files/8-13-20pov.pdf.
16 Coleman-Jensen, Alisa et al. 2020. “Household Food Security in the United States in 2019 Statistical Supplement,” Table S-7. United States Department of Agriculture. https://www.ers.usda.gov/webdocs/publications/99289/ap-084.pdf.
17 United States Census Bureau. 2021. “Week 24 Household Pulse Survey: February 3 – February 15,” Food Security and Sufficiency Table 3b. https://www.census.gov/data/tables/2021/demo/hhp/hhp24.html. Calculations made by the Children’s Defense Fund.
18 Feeding America. 2020. “The Impact of the Coronavirus on Child Food Insecurity,” Table 2. https://www.feedingamerica.org/sites/default/files/2020-04/Brief_Impact%20of%20Covid%20on%20Child%20Food%20Insecurity%204.22.20.pdf.
Child Health1 Centers for Disease Control and Prevention (CDC). 2020. “United States COVID-19 Cases and Deaths by State,” updated March 1, 2021. https://covid.cdc.gov/covid-data-tracker/.
2 Keisler-Starkey, Katherine and Lisa Bunch. 2020. “Health Insurance Coverage in the United States: 2019 Current Population Reports,” p. 8-9. Suitland, MD: U.S. Census Bureau, Current Population Survey. https://www.census.gov/content/dam/Census/library/publications/2020/demo/p60-271.pdf.
3 Alker, Joan and Alexandra Corcoran. 2020. “Children’s Uninsured Rate Rises by Largest Annual Jump in More Than a Decade,” p. 2 Washington, DC: Georgetown University Center for Children and Families (CCF). https://ccf.georgetown.edu/wp-content/uploads/2020/10/ACS-Uninsured-Kids-2020_10-06-edit-3.pdf.
4 Keisler-Starkey, Katherine and Lisa Bunch. 2020. “Health Insurance Coverage,” p. 12; Alker, Joan and Alexandra Corcoran. 2020. “Children’s Uninsured Rate,” p. 7-10.
5 Garfield, Rachel, Gary Claxton, Anthony Damico, and Larry Levitt. 2020. “Eligibility for ACA Health Coverage Following Job Loss,” Figure 1. Washington, DC: Kaiser Family Foundation. https://www.kff.org/coronavirus-covid-19/issue-brief/eligibility-for-aca-health-coverage-following-job-loss.
6 Haley, Jennifer, Genevieve Kenney, Clare Wang Pan, Robin Wang, et al. 2020. “Progress in Children’s Coverage Continued to Stall Out in 2018,” p. 2. Washington, DC: Urban Institute. https://www.urban.org/research/publication/progress-childrens-coverage-continued-stall-out-2018.
7 Center on Budget and Policy Priorities (CBPP). 2020. “Trump administration’s Harmful Changes to Medicaid.” Washington, DC: CBPP. https://www.cbpp.org/sites/default/files/atoms/files/6-12-19health.pdf; Alonso-Zaldivar, Ricardo. 2019. “Rise in Health Uninsured May Be Linked to Immigrants’ Fears.” AP News, September 15. https://apnews.com/article/4f2a8639b841406880f4d61cd253a77d.

SECTION HEAD SECTION HEAD
76 Children’s Defense Fund
ENDNOTES
8 Brooks, Tricia. 2020. “Medicaid and CHIP Provide Health Coverage to More than Half of Children of Color.” Washington, DC: CCF. https://ccf.georgetown.edu/2020/07/27/medicaid-and-chip-provide-health-coverage-to-more-than-half-of-children-of-color/.
9 Brooks, Tricia. 2020. “Child Enrollment in Medicaid and CHIP Remains Down in 2019.” Washington, DC: CCF. https://ccf.georgetown.edu/2020/02/18/child-enrollment-in-medicaid-and-chip-remains-down-in-2019/.
10 Kaiser Family Foundation. 2020. “Health Insurance Coverage of Low Income Children 0-18 (under 200% FPL), 2019.” https://www.kff.org/other/state-indicator/health-insurance-coverage-of-low-income-children-0-18-under-200-fpl/.
11 Brown, David, Amanda Kowalski, and Ithai Lurie. 2015. “Medicaid as an Investment in Children: What is the Long-Term Impact on Tax Receipts?” p. 31-32. Cambridge, MA: National Bureau of Economic Research. http://www.nber.org/papers/w20835.pdf.
12 Lu, Peng-jun, Alissa O’Halloran, and Walter Williams. 2015. “Impact of Health Insurance Status on Vaccination Coverage Among Adult Populations.” American Journal of Preventive Medicine 48(6): 647-661. https://www.ncbi.nlm.nih.gov/pmc/articles/PMC5826635/; Zhang, Shishu. 2012. “Do Our Children Become Healthier and Wiser? A Study of the Effect of Medicaid Coverage on School Absenteeism.” International Journal of Health Services 42(4): 627-646. https://www.ncbi.nlm.nih.gov/pubmed/23367797; Murphey, David. 2017. “Health Insurance Coverage Improves Child Well-Being,” p. 3. Bethesda, MD: Child Trends. https://www.childtrends.org/publications/health-insurance-coverage-improves-child-well.
13 CCF. 2014. “Medicaid Expansion: Good for Parents and Children,” p. 1. Washington, DC: CCF. http://ccf.georgetown.edu/wp-content/uploads/2013/12/Expanding-Coverage-for-Parents-Helps-Children-2013.pdf.
14 CCF. 2014. “Medicaid Expansion: Good for Parents and Children,” p. 1.
15 Clark, Maggie. 2020. “In Medicaid Expansion States, Fewer Young Children Go Uninsured.” Washington, DC: CFF. https://ccf.georgetown.edu/2020/01/15/in-medicaid-expansion-states-fewer-young-children-go-uninsured/.
16 Taylor, Jamila, Cristina Novoa, Katie Hamm, and Shilpa Phadke. 2019. “Eliminating Racial Disparities in Maternal and Infant Mortality.” Washington, DC: Center for American Progress. https://www.americanprogress.org/issues/women/reports/2019/05/02/469186/eliminating-racial-disparities-maternal-infant-mortality/.
17 Villarosa, Linda. 2018. “Why America’s Black Mothers and Babies are in a Life-or-Death Crisis.” New York Times, April 11. https://www.nytimes.com/2018/04/11/magazine/black-mothers-babies-death-maternal-mortality.html.
18 Clark, Maggie. 2020. “In Medicaid Expansion States”; Searing, Adam and Donna Cohen Ross. 2019. “Medicaid Expansion Fills Gaps in Maternal Health Coverage Leading to Healthier Mothers and Babies,” p. 7. Washington, DC: CCF. https://ccf.georgetown.edu/wp-content/uploads/2019/05/Maternal-Health_FINAL-1.pdf.
19 American Academy of Pediatrics. 2021. “Children and COVID-19: State-Level Data Report, Version 02/25/2021,” p. 4. https://services.aap.org/en/pages/2019-novel-coronavirus-covid-19-infections/children-and-covid-19-state-level-data-report/.
20 Bixler, Danae, Allison Miller, Clair Mattison, et al. 2020. “SARS-CoV-2-Associated Deaths Among Persons Aged <21 Years – United States, February 12-July 31, 2020.” Morbidity and Mortality Weekly Report, 69(37): 1325. https://www.cdc.gov/mmwr/volumes/69/wr/mm6937e4.htm.
21 CDC. 2020. “Coronavirus Disease: Hospitalization and Death by Race/Ethnicity,” updated February 18, 2021. https://www.cdc.gov/coronavirus/2019-ncov/covid-data/investigations-discovery/hospitalization-death-by-race-ethnicity.html.
22 Bell, Jasmine. 2016. “5 Things to Know About Communities of Color and Environmental Justice.” Washington, DC: Center for American Progress. https://www.americanprogress.org/issues/race/news/2016/04/25/136361/5-things-to-know-about-communities-of-color-and-environmental-justice/; Morsy, Leila and Richard Rothstein. 2019. “Toxic Stress and Children’s Outcomes.” Washington, DC: Economic Policy Institute. https://www.epi.org/publication/toxic-stress-and-childrens-outcomes-african-american-children-growing-up-poor-are-at-greater-risk-of-disrupted-physiological-functioning-and-depressed-academic-achievement/; Mehta, Neil, Hedwig Lee, and Kelly Ylitalo. 2013. “Child Health in the United States: Recent Trends in Racial/Ethnic Disparities.” Social Science & Medicine 95: 6-15. https://www.ncbi.nlm.nih.gov/pmc/articles/PMC4374424/.
23 CDC. 2020. “Health Equity Considerations & Racial & Ethnic Minority Groups,” updated. https://www.cdc.gov/coronavirus/2019-ncov/community/health-equity/race-ethnicity.html.
24 U.S. Centers for Medicare and Medicaid Services. 2020. “Fact Sheet: Service Use Among Medicaid & CHIP Beneficiaries Age 18 and Under During COVID-19.” Baltimore, MD: HHS. https://www.cms.gov/newsroom/fact-sheets/fact-sheet-service-use-among-medicaid-chip-beneficiaries-age-18-and-under-during-covid-19.
Early Childhood1 Shonkoff, Jack and Deborah P. Phillips. 2000. From Neurons to Neighborhoods: The Science of Early Childhood Development, p. 56. Washington, D.C.: National Academy Press. http://www.nap.edu/read/9824/chapter/1#ii.
2 U.S. Census Bureau. 2020. “Current Population Survey, 2019 Annual Social and Economic Supplement,” Table POV-34, Single Year of Age- Poverty Status. https://www.census.gov/data/tables/time-series/demo/income-poverty/cps-pov/pov-34.html.
3 National Head Start Association. “The Head Start Advantage: Success in School Readiness,” p. 1. https://www.nhsa.org/files/resources/hsa_-_school_readiness.pdf.
4 Health Resources and Services Administration (HRSA), Maternal and Child Health Bureau. 2020. “The Maternal, Infant, and Early Childhood Home Visiting Program,” p. 1. Washington, DC: U.S. Department of Health and Human Services. https://mchb.hrsa.gov/sites/default/files/mchb/MaternalChildHealthInitiatives/HomeVisiting/pdf/programbrief.pdf.
5 Garcia, Emma and Elaine Weiss. 2017. “Education Inequalities at the School Starting Gate,” p. 21. Economic Policy Institute. https://www.epi.org/publication/education-inequalities-at-the-school-starting-gate/.
6 Yoshikawa, Hirokazu et al. 2013. “Investing in Our Future: The Evidence Base on Preschool Education,” p. 5. Society for Research in Child Development and Foundation for Child Development. https://www.fcd-us.org/assets/2013/10/Evidence20Base20on20Preschool20Education20FINAL.pdf.
7 García, Jorge Luis, James Heckman, Duncan Ermini Leaf, and Maria Jose Prado. 2019. “Quantifying the Life-Cycle Benefits of an Influential Early Childhood Program,” p. 1. Chicago: Human Capital and Economic Opportunity Global Working Group. http://humcap.uchicago.edu/RePEc/hka/wpaper/Garcia_Heckman_Leaf_etal_2016_life-cycle-benefits-ecp_r2.pdf.
8 Gould, Elise and Tanyell Cooke. 2015. “High Quality Child Care is Out of Reach for Working Families,” p. 2. Economic Policy Institute. http://www.epi.org/publication/child-care-affordability/.
9 U.S. Department of Health and Human Services. 2019. “Estimates of Child Care Eligibility and Receipt for Fiscal Year 2016,” p. 2. https://aspe.hhs.gov/system/files/pdf/262926/CY2016-Child-Care-Subsidy-Eligibility.pdf.

SECTION HEAD
77
The State of America’s Children® 2021
ENDNOTES
10 U.S. Department of Health and Human Services. 2019. “Preliminary FY 2018 CCDF Data Tables,” Tables 1, 4, 11, and 12. https://www.acf.hhs.gov/occ/resource/fy-2018-ccdf-data-tables-preliminary.
11 HRSA, Maternal and Child Health Bureau. 2020. “The Maternal, Infant, and Early Childhood Home Visiting Program.”
12 U.S. Department of Health and Human Services. 2020. “Administration for Children and Families FY2020 Justification of Estimates for Appropriations Committees,” p. 119. https://www.acf.hhs.gov/sites/default/files/documents/olab/acf_congressional_budget_justification_2020.pdf; U.S. Census Bureau. 2020. “Current Population Survey, 2019 Annual Social and Economic Supplement,” Table POV-34, Single Year of Age- Poverty Status. https://www.census.gov/data/tables/time-series/demo/ income-poverty/cps-pov/pov-34.html. Calculations made by the Children’s Defense Fund by comparing funded slots for children in Head Start programs in FY2019 to total children of the appropriate age ranges below 100 of poverty.
13 Friedman-Krauss, Allison et al. 2020. “The State of Preschool 2019: State Preschool Yearbook,” p. 10. National Institute for Early Education Research. http://nieer.org/state-preschool-yearbooks/2019-2.
14 National Education Association. 2020. “Full-Day Kindergarten Helps Close the Achievement Gaps,” p. 1. https://www.nea.org/sites/default/files/2020-07/18001_Full-Day_Kindergarten_Policy_Brief-final.pdf.
15 U.S. Census Bureau, Current Population Survey. 2020. “School Enrollment in the United States: 2018,” Table 3. https://www.census.gov/data/tables/2018/demo/school-enrollment/2018-cps.html; Education Commission of the States. 2020. “50-State Comparison: State K-3 Policies.” https://www.ecs.org/kindergarten-policies/.
16 Vesoulis, Abby. 2020. “How COVID-19 Has Created a Childcare Catch-22 for Working Families.” TIME, May 13. https://time.com/5836309/coronavirus-childcare-working-families/.
17 Ewing-Nelson, Claire. 2020. “Nearly 2.2 Million Women Have Left the Labor Force Since February.” Washington, DC: National Women’s Law Center. https://nwlc.org/wp-content/uploads/2020/11/October-Jobs-Day.pdf.
18 Kashen, Julie, Sarah Jane Glynn, and Amanda Novello. 2020. “How COVID-19 Sent Women’s Workforce Progress Backward: Congress’ $64.5 Billion Mistake,” p. 1. The Century Foundation and the Center for American Progress. https://tcf.org/content/report/how-covid-19-sent-womens-workforce-progress-backward-congress-64-5-billion-mistake/.
19 Ibid at p. 2.
20 U.S. House of Representatives, Committee on Education and Labor. Member Briefing: Child Care in Peril: How COVID-19 is Pushing this Essential Sector to the Brink of Collapse. Testimony by Hannah Matthews of CLASP. 116th Cong., 2nd sess., May 26, 2020. https://www.clasp.org/publications/testimony/comments/child-care-peril-how-covid-19-pushing-essential-sector-brink; Stavely, Zaidee. 2020. “California Child Care Providers Losing Money, Risking Health During Pandemic.” EdSource, August 3. https://edsource.org/2020/california-child-care-providers-losing-money-risking-health-during-pandemic/637458.
Education1 Roos, Leslie, Elizabeth Wall-Wieler, and Janelle Boram Lee. 2019. “Poverty and Early Childhood Outcomes.” Pediatrics, 143(6): 5. https://pediatrics.aappublications.org/content/143/6/e20183426/tab-article-info.
2 García, Emma. 2020. “Schools are Still Segregated, and Children Are Paying a Price,” p. 1. Washington, DC: Economic Policy Institute. https://www.epi.org/publication/schools-are-still-segregated-and-black-children-are-paying-a-price/.
3 Reardon, Sean, Ericka Weathers, Erin Fahle, Heewon Jang, and Demetra Kalogrides. 2019. “Is Separate Still Unequal? New Evidence on School Segregation and Racial Academic Achievement Gaps,” p. 33. Stanford, CA: Stanford Center for Education Policy Analysis. https://edopportunity.org/papers/wp19-06-v092019.pdf.
4 García, Emma. 2020. “Schools are Still Segregated,” p. 3.
5 Darling-Hammond, Linda. 2019. “Investing for Student Success: Lessons from State School Finance Reforms,” p. v. Palo Alto, CA: Learning Policy Institute. https://learningpolicyinstitute.org/product/investing-student-success-school-finance-reforms-report.
6 Leachman, Michael. 2019. “K-12 Funding Still Lagging in Many States.” Washington, DC: Center on Budget and Policy Priorities. https://www.cbpp.org/blog/k-12-funding-still-lagging-in-many-states.
7 Jackson, C. Kirabo, Rucker Johnson, Claudia Persico. 2016. “The Effects of School Spending on Educational and Economic Outcomes: Evidence from School Finance Reforms.” The Quarterly Journal of Economics,131(1): 160. https://gsppi.berkeley.edu/~ruckerj/QJE_resubmit_final_version.pdf.
8 Jimenez, Laura and Antoinette Flores. 2019. “3 Ways DeVos Has Put Students At Risk by Deregulating Education.” Washington, DC: Center for American Progress. https://www.americanprogress.org/issues/education-k-12/reports/2019/05/30/470509/3-ways-devos-put-students-risk-deregulating-education/.
9 American Civil Liberties Union (ACLU). 2019. “Cops and No Counselors: How the Lack of School Mental Health Staff is Harming Students,” p. 7. New York, NY: ACLU. https://www.aclu.org/report/cops-and-no-counselors.
10 Ibid at p. 4.
11 Office for Civil Rights. 2019. “School Climate and Safety,” p. 1. Washington, DC: U.S. Department of Education. https://www2.ed.gov/about/offices/list/ocr/docs/school-climate-and-safety.pdf.
12 Civic and Everyone Graduates Center at the School of Education at Johns Hopkins University. 2020. “Building a Grad Nation: Progress and Challenge in Raising High School Graduation Rates. Annual Update 2020,” p. 22-23. https://www.americaspromise.org/report/2020-building-grad-nation-report.
13 National Working Group on Foster Care and Education. 2018. “Fostering Success in Education: National Factsheet on the Educational Outcomes of Children in Foster Care,” p. 5, 7, and 19. Washington, DC: American Bar Association Legal Center for Foster Care and Education. https://foster-ed.org/fostering-success-in-education-national-factsheet-on-the-educational-outcomes-of-children-in-foster-care/.
14 De Nike, Moira, Randall Shelden, Daniel Macallair, and Renee Menart. 2019. “Collaborating for Successful Reentry: A Practical Guide to Support Justice-Involved Young People Returning to the Community.” San Francisco, CA: Center on Juvenile and Criminal Justice. http://www.cjcj.org/uploads/cjcj/documents/collaborating_for_successful_reentry_juvenile_justice_practical_guide.pdf.
15 ParentsTogether Action. 2020. “ParentsTogether Survey Reveals Remote Learning is Failing Our Most Vulnerable Students.” New York, NY: ParentsTogether Action. https://parentstogetheraction.org/2020/05/27/parentstogether-survey-reveals-remote-learning-is-failing-our-most-vulnerable-students-2/.
16 Gross, Betheny and Alice Opalka. 2020. “Too Many Schools Leave Learning to Chance during the Pandemic,” p. 8. Seattle, WA: Center on Reinventing Public Education. https://www.crpe.org/publications/too-many-schools-leave-learning-chance-during-pandemic.

SECTION HEAD SECTION HEAD
78 Children’s Defense Fund
ENDNOTES
Child Welfare1 Children’s Defense Fund. 2018. “Family First Prevention Services Act.” https://www.childrensdefense.org/wp-content/uploads/2018/02/ffpsa-short-summary.pdf.
2 Administration on Children, Youth, and Families, Children’s Bureau. 2021. “Child Maltreatment 2019,” Table 3-4 Child Victims, 2015-2019. Washington, DC: U.S. Department of Health and Human Services (HHS). https://www.acf.hhs.gov/cb/report/child-maltreatment-2019.
3 Ibid at Table 3-6 Victims by Age, 2018.
4 Administration on Children, Youth, and Families, Children’s Bureau. 2020. “The AFCARS Report, Preliminary FY2019 Estimates as of June 23, 2020 - No. 27,” p. 3. Washington, DC: HHS. https://www.acf.hhs.gov/cb/report/afcars-report-27.
5 Ibid at p. 2.
6 Ibid at p. 2.
7 Ibid at p. 1.
8 Ibid at p. 2.
9 Ibid at p. 2-4.
10 The Annie E. Casey Foundation, KIDS Count Data Center. 2020. “Children in Foster Care by Race and Hispanic Origin in the United States, 2018.” https://datacenter.kidscount.org/data/tables/6246-children-in-foster-care-by-race-and-hispanic-origin; The Annie E. Casey Foundation, KIDS Count Data Center. 2020. “Child Population by Race in the United States, 2018.” https://datacenter.kidscount.org/data/tables/103-child-population-by-race. Calculations by the Children’s Defense Fund.
11 KIDS COUNT Data Center. 2020. “Children in Foster Care by Placement Type in the United States.” Baltimore, MD: Annie E. Casey Foundation. https://datacenter.kidscount.org/data/tables/6247-children-in-foster-care-by-placement-type.
12 KIDS COUNT Data Center. 2020. “Children in Kinship Care in the United States, 2018-2020.” Baltimore, MD: Annie E. Casey Foundation. https://datacenter.kidscount.org/data/tables/10455-children-in-kinship-care.
13 Administration on Children, Youth, and Families, Children’s Bureau. 2020. “The AFCARS Report - No. 27,” p. 1.
14 Ibid at p. 1-2.
15 Ibid at p. 3.
16 Ibid at p. 4.
17 Administration on Children, Youth, and Families, Children’s Bureau. 2020. “The AFCARS Report - No. 27,” p. 3; Administration on Children, Youth, and Families, Children's Bureau. 2019. "The AFCARS Report, Preliminary FY2018 Estimates as of August 22, 2019 - No. 26," p. 3. Washington, DC: HHS. https://www.acf.hhs.gov/sites/default/files/documents/cb/afcarsreport26.pdf.
18 Child Welfare Information Gateway. 2004. “Risk and Protective Factors for Child Abuse and Neglect,” p. 3-4. Washington, DC: HHS. https://www.childwelfare.gov/pubPDFs/riskprotectivefactors.pdf.
19 FosterClub. 2020. “The Impact of COVID-19 on Youth from Foster Care: A National Poll,” p. 2-4. https://www.fosterclub.com/sites/default/files/docs/blogs/COVID%20Poll%20Results%20May%2010%202020.pdf.
20 Generations United. 2020 “Facing a Pandemic: Grandfamilies Living Together During COVID-19 and Thriving Beyond,” p. 7. https://www.gu.org/app/uploads/2020/10/2020-Grandfamilies-Report-Web.pdf.
Youth Justice1 U.S. Department of Justice, Federal Bureau of Investigation. 2019. “Crime in the United States, 2019,” Table 69. https://ucr.fbi.gov/crime-in-the-u.s/2019/crime-in-the-u.s.-2019/topic-pages/tables/table-69; U.S. Department of Justice, Federal Bureau of Investigation. 2010. “Crime in the United States, 2009,” Table 69. https://ucr.fbi.gov/crime-in-the-u.s/2009. Calculations by the Children’s Defense Fund.
2 ACLU. 2019. “Cops and No Counselors: How the Lack of School Mental Health Staff is Harming Students,” p. 4, 23-24. New York, NY: ACLU. https://www.aclu.org/report/cops-and-no-counselors.
3 Sickmund, Melissa, T.J. Sladky, Wei Kang, and Charles Puzzanchera. 2019. “Easy Access to the Census of Juveniles in Residential Placement.” Office of Juvenile Justice and Delinquency Prevention. https://www.ojjdp.gov/ojstatbb/ezacjrp/. Note: National Crosstabs selection criteria included Year of Census (2017) and Facility Self-Classification (Detention Center and Long-term Secure). Additional calculations by the Children’s Defense Fund.
4 State Adolescent Health Resource Center. “Developmental Tasks and Attributes of Late Adolescence/Young Adulthood,” p. 1. http://www.amchp.org/programsandtopics/AdolescentHealth/projects/Documents/SAHRC%20AYADevelopment%20LateAdolescentYoungAdulthood.pdf.
5 National Conference of State Legislatures. 2020. “Juvenile Age of Jurisdiction and Transfer to Adult Court Laws.” https://www.ncsl.org/research/civil-and-criminal-justice/juvenile-age-of-jurisdiction-and-transfer-to-adult-court-laws.aspx.
6 U.S. Department of Justice, Office of Justice Programs. 2020. “OJJDP Statistical Briefing Book,” Demographic Characteristics of Juvenile Arrests, 2019. https://www.ojjdp.gov/ojstatbb/crime/qa05104.asp?qaDate=2019; U.S. Department of Justice, Office of Justice Programs. 2020. “OJJDP Statistical Briefing Book,” Juvenile Arrest Rates by Offense and Race, 2019 (Rates per 100,000 in Age Group). https://www.ojjdp.gov/ojstatbb/crime/ucr.asp?table_in=2&selYrs=2019&rdoGroups=2&rdoData=r.
7 U.S. Department of Justice, Office of Justice Programs. 2019. “OJJDP Statistical Briefing Book,” State Residential Placement Rates by Race/Ethnicity, 2017. https://www.ojjdp.gov/ojstatbb/corrections/qa08203.asp?qaDate=2017.
8 Sickmund, Melissa, Anthony Sladky, and Wei Kang. 2020. “Easy Access to Juvenile Court Statistics: 1985-2018.” Office of Juvenile Justice and Delinquency Prevention. https://www.ojjdp.gov/ojstatbb/ezajcs/. Note: Delinquency Cases were Filtered by race and selection criteria included Disposition (Waived). Youth population estimates derived from Methods: “Population at risk of juvenile court handling in 2018.” Additional calculations by the Children’s Defense Fund.
9 Campaign for Youth Justice. 2016. “Key Facts: Youth in the Justice System,” p. 7. Washington, DC: Campaign for Youth Justice. http://cfyj.org/images/factsheets/KeyYouthCrimeFactsJune72016final.pdf.
10 Sickmund, Melissa, T.J. Sladky, Wei Kang, and Charles Puzzanchera. 2019. “Easy Access to the Census of Juveniles in Residential Placement.” Office of Juvenile Justice and Delinquency Prevention. https://www.ojjdp.gov/ojstatbb/ezacjrp/. Note: National Crosstabs selection criteria included Year of Census (2017) and Sex. Additional calculations by the Children’s Defense Fund.
11 Office of Special Education Programs. 2020. “Improving Outcomes for Youth with Disabilities in Juvenile Corrections: Educational Practices,” p. 1. Washington, DC: U.S. Department of Education. https://osepideasthatwork.org/sites/default/files/JJ-TIB-EducationalPractices-508.pdf; Council of State Governments Justice Center. 2015. “Locked Out: Improving Educational and Vocational Outcomes for Incarcerated Youth,” p. 1. New York: Council of State Governments Justice Center. https://csgjusticecenter.org/publications/locked-out-improving-educational-and-vocational-outcomes-for-incarcerated-youth/.

SECTION HEAD
79
The State of America’s Children® 2021
ENDNOTES
12 Center for American Progress, Movement Advancement Project, and Youth First. 2017. “Unjust: LGBTQ Youth Incarcerated in the Juvenile Justice System,” p. 2. https://www.lgbtmap.org/file/lgbtq-incarcerated-youth.pdf.
13 Mendel, Richard. 2015. “Maltreatment of Youth in U.S. Juvenile Corrections Facilities: An Update,” p. 2. Annie E. Casey Foundation. https://www.aecf.org/resources/maltreatment-of-youth-in-us-juvenile-corrections-facilities/.
14 Feierman, Jessica, Karen Kindell, and Natane Eaddy. 2017. “Unlocking Youth: Legal Strategies to End Solitary Confinement in Juvenile Facilities,” p. 4. Juvenile Law Center. https://jlc.org/resources/unlocking-youth-legal-strategies-end-solitary-confinement-juvenile-facilities.
15 Campaign for Youth Justice. 2018. “Let’s Get Children Out of Adult Courts, Jails, and Prisons.” Washington, DC: Campaign for Youth Justice. http://www.campaignforyouthjustice.org/images/factsheets/Basic_Facts_FINAL.pdf.
16 Madeson, Frances. 2020. “Amidst COVID-19 Pandemic, Parents and Advocates Push for a Release of Juvenile Inmates.” Louisiana Illuminator, July 22. https://lailluminator.com/2020/07/22/amidst-covid-19-pandemic-parents-and-advocates-push-for-a-release-of-juvenile-inmates/.
17 Rovner, Josh. 2021. “COVID-19 in Juvenile Facilities,” updated February 22, 2021. The Sentencing Project. https://www.sentencingproject.org/publications/covid-19-in-juvenile-facilities/.
Gun Violence Prevention1 Centers for Disease Control and Prevention (CDC). 2020. “Causes of Injury-Related Death.” Accessed using the Web-based Injury Statis-tics Query and Reporting System (WISQARS). https://wisqars-viz.cdc.gov:8006/explore-data/explore/selected-years?ex=eyJ0YmkiOlsiMCJdLCJpbnRlbnRzIjpbIjAiXSwibWVjaHMiOlsiMjA4MTAiXSwic3RhdGUi-OlsiMDEiLCIwMiIsIjA0IiwiMDUiLCIwNiIsIjA4IiwiMDkiLCIxMCIsIjExI-iwiMTIiLCIxMyIsIjE1IiwiMTYiLCIxNyIsIjE4IiwiMTkiLCIyMCIsIjIxIiwiMjI-iLCIyMyIsIjI0IiwiMjUiLCIyNiIsIjI3IiwiMjgiLCIyOSIsIjMwIiwiMzEiLCIzMi-IsIjMzIiwiMzQiLCIzNSIsIjM2IiwiMzciLCIzOCIsIjM5IiwiNDAiLCI0MSIsI-jQyIiwiNDQiLCI0NSIsIjQ2IiwiNDciLCI0OCIsIjQ5IiwiNTAiLCI1MSIsI-jUzIiwiNTQiLCI1NSIsIjU2Il0sInJhY2UiOlsiMSIsIjIiLCIzIiwiNCJdLCJld-GhuaWN0eSI6WyIxIiwiMiIsIjMiXSwic2V4IjpbIjEiLCIyIl0sImFnZUdy-b3Vwc01pbiI6WyIwMC0wNCJdLCJhZ2VHcm91cHNNYXgiOlsiMTUt-MTkiXSwiY3VzdG9tQWdlc01pbiI6WyIxIl0sImN1c3RvbUFnZXNNYXgi-OlsiMTkiXSwiZnJvbVllYXIiOlsiMjAxOCJdLCJ0b1llYXIiOlsiMjAxOCJdL-CJ5cGxsQWdlcyI6WyI2NSJdLCJtZXRybyI6WyIxIiwiMiJdLCJhZ2VidXR-0biI6ImN1c3RvbSIsImdyb3VwYnkxIjoiTk9ORSJ9. Note: Data grouped by mechanism for children and teens ages 1-19.
2 CDC. 2020. “Underlying Cause of Death, 1999-2019,” Detailed Mortality Tables. Accessed using CDC WONDER Online Database. https://wonder.cdc.gov/ucd-icd10.html. Note: All data are for children and teens ages 0-19 and exclude deaths for interactions with law enforcement; American Academy of Pediatrics. 2021. “Children and COVID-19: State-Level Data Report, Version 02/25/2021,” p. 4. https://services.aap.org/en/pages/2019-novel-coronavirus-covid-19-infections/children-and-covid-19-state-level-data-report/. Note: Gun violence and COVID-19 mortality rates for children are not directly comparable, as age ranges reported for children vary state by state in COVID-19 death counts. While the majority of states reported COVID-19 deaths for children ages 0-19, some states reported COVID-19 deaths for children ages 0-14, 0-17, or 0-20. Based on available data, the Children's Defense Fund compared the gun death rate in 2019 for children ages 0-19 (4.1 per 100,000 children) to the approximate COVID-19 death rate for children within the age range reported by each state as of February 25, 2021 (0.35 per 100,000 children).
3 CDC. 2020. “Underlying Cause of Death, 1999-2019,” Detailed Mortality Tables. Accessed using CDC WONDER Online Database. https://wonder.cdc.gov/ucd-icd10.html. Note: All data are for children and teens ages 0-19 and exclude deaths for interactions with law enforcement.
4 Ibid.
5 Ibid. Note: ICD-10 codes included C00-D49 (Neoplasms); J09-J18 (Influenza and Pneumonia); J45 (Asthma); B20-B24 and R75 (HIV/AIDS). Opioid overdose deaths were represented by the presence of any of the following MCOD codes: Opium (T40.0); heroin (T40.1); natural opioid analgesics (T40.2); methadone (T40.3); synthetic opioid analgesics other than methadone (T40.4); or other and unspecified narcotics (T40.6).
6 CDC. 2015. “Vital Statistics in the United States,” 1963-1967. http://www.cdc.gov/nchs/products/vsus.htm; CDC. 2019. “Underlying Cause of Death,” Compressed Mortality File, Mortality for 1968-1978 and Mortality for 1979-1998. https://wonder.cdc.gov/mortsql.html; CDC. 2020. “Underlying Cause of Death, 1999-2019,” Detailed Mortality Tables. Accessed using CDC WONDER Online Database. https://wonder.cdc.gov/ucd-icd10.html; U.S. Department of Defense. 2021. “Conflict Casualties.” Accessed using Defense Casualty Analysis System. https://dcas.dmdc.osd.mil/dcas/pages/casualties.xhtml.
Note: Data represents soldiers killed in action on the battlefield as of January 27, 2021. Estimates do not include soldiers who died of wounds or suffered non-hostile deaths.
7 CDC. 2020. “Nonfatal Injury Reports 2000-2018.” Accessed using WISQARS. http://www.cdc.gov/injury/wisqars/nonfatal.html. Calculations by Children’s Defense Fund.
8 Ibid. Note: Data includes a small number of injuries resulting from legal intervention.
9 Ibid.
10 Ibid.
11 Ibid.
12 Ibid.
13 Federal Bureau of Investigation. 2020. “2019 Law Enforcement Officers Killed and Assaulted,” Table 28: Law Enforcement Officers Feloniously Killed by Type of Weapon, 2010–2019 and Table 65: Law Enforcement Officers Accidentally Killed by Type of Accident and Activity of Victim Officer at Time of Incident, 2013–2017. http://www.fbi.gov/about-us/cjis/ucr/leoka. Note: Law enforcement deaths include felonious and accidental deaths by firearms.
14 Karp, Aaron. 2018. “Estimating Global Civilian-Held Firearms Numbers,” p. 4. Small Arms Survey, Graduate Institute of International and Development Studies. http://www.smallarmssurvey.org/fileadmin/docs/T-Briefing-Papers/SAS-BP-Civilian-Firearms-Numbers.pdf; Small Arms Survey. 2018. “Global Firearms Holding Dynamic Map.” Small Arms Survey, Graduate Institute of International and Development Studies. http://www.smallarmssurvey.org/weapons-and-markets/tools/global-firearms-holdings.html.
15 Karp, Aaron. 2018. “Estimating Global,” p. 4.
16 Miller, Matthew, Lisa Hepburn, and Deborah Azrael. 2017. “Firearm Acquisition Without Background Checks.” Annals of Internal Medicine 166(4): 233-239. https://annals.org/aim/fullarticle/2595892/firearm-acquisition-without-background-checks-results-national-survey.
17 Crifasi, Cassandra, Mitchell Doucette, Emma McGinty, Daniel Webster, and Colleen Barry. 2018. “Storage Practices of US Gun Owners in 2016.” American Journal of Public Health 108(4): 532-537. https://ajph.aphapublications.org/doi/pdf/10.2105/AJPH.2017.304262; Johns Hopkins Bloomberg School of Public Health (JHBSPH). 2018. “Survey: More Than Half of U.S. Gun Owners Do Not Safely Store Their Guns.” Baltimore, MD: JHBSPH. https://www.jhsph.edu/news/news-releases/2018/survey-more-than-half-of-u-s-gun-owners-do-not-safely-store-their-guns.html.

SECTION HEAD
80 Children’s Defense Fund
ENDNOTES ENDNOTES
18 Azrael, Deborah, Joanna Cohen, Carmel Salhi, and Matthew Miller. 2018. “Firearm Storage in Gun-Owning Households with Children: Results of a 2015 National Survey.” Journal of Urban Health 95(3): 295-304. https://link.springer.com/article/10.1007%2Fs11524-018-0261-7.
19 Baxley, Frances and Matthew Miller. 2006. “Parental Misperceptions about Children and Firearms.” Archives of Pediatric Adolescent Medicine 160(5): 542-457. https://jamanetwork.com/journals/jamapediatrics/fullarticle/204929.
20 Kellermann, Arthur, Frederick Rivara, Norman Rushforth, Joyce Banton, et all. 1993. “Gun Ownership as a Risk Factor for Homicide in the Home.” New England Journal of Medicine 329: 1084-1119. https://www.nejm.org/doi/full/10.1056/NEJM199310073291506; Wiebe, Douglas. 2003. “Homicide and Suicide Risks Associated with Guns in the Home: A National Case-Control Study.” Annals of Emergency Medicine 41(6): 771-782. https://pubmed.ncbi.nlm.nih.gov/12764330/; Kellermann, Arthur, Frederick Rivara, Grant Somes, Donald Reay, et al. 1992. “Suicide in the Home in Relation to Gun Ownership.” New England Journal of Medicine 327: 467-472. https://www.nejm.org/doi/full/10.1056/NEJM199208133270705; Wiebe, Douglas. 2003. “Firearms in US Homes as a Risk Factor for Unintentional Gunshot Fatality.” Accident Analysis and Prevention 35(5): 711-716. https://www.ncbi.nlm.nih.gov/pubmed/12850071.
21 End Family Fire. 2020. “What is Family Fire?” Washington, DC: Brady. https://brady-static.s3.amazonaws.com/resources/EFF-InformationalBrochure.pdf.
22 Parsons, Chelsea and Rukmani Bhatia. 2020. “Dangerous Gaps in Gun Laws Exposed by the Coronavirus Gun Sale Surge.” Washington, DC: Center for American Progress. https://www.americanprogress.org/issues/guns-crime/reports/2020/07/08/486292/dangerous-gaps-gun-laws-exposed-coronavirus-gun-sale-surge/.
23 Gun Violence Archive (GVA). 2021. “Mass Shootings in 2020” and “Mass Shootings in 2019.” Washington, DC: GVA. https://www.gunviolencearchive.org/past-tolls. Note: GVA defines mass shootings as events in which four or more people (excluding the shooter) were shot but not necessarily killed at the same general time and location. Data reflect the number of incidents reported and verified.
24 Everytown for Gun Safety. 2020. “Gun Violence and COVID-19: Colliding Public Health Crises.” New York, NY: Everytown for Gun Safety. https://everytownresearch.org/report/gun-violence-and-covid-19-colliding-public-health-crises/. Note: Accidental gun deaths by children increased by 30 percent between March and May 2020, compared to the March-May average of the past three years.
25 Ibid.
Immigration1 For example, more than 250,000 Dreamers, or immigrants who arrived in the U.S. as children, have grown up and started their own families in the U.S. Svajlenka, Nicole Prchal. 2019. “What We Know About DACA Recipients in the United States.” Washington, DC: Center for American Progress. https://www.americanprogress.org/issues/immigration/news/2019/09/05/474177/know-daca-recipients-united-states/.
2 Batalova, Jeanne, Brittany Blizzard, and Jessica Bolter. 2020. “Frequently Requested Statistics on Immigrants and Immigration in the United States,” Migration Policy Institute: Spotlight, February 14. https://www.migrationpolicy.org/article/frequently-requested-statistics-immigrants-and-immigration-united-states#Children%20of%20Immigrants. Children of immigrants or children in immigrant families is defined here and throughout the chapter as children with at least one immigrant parent, including children who were born in the United States.
3 The case Santosky v. Kramer, 455 U.S. 745, 753 (1982), discusses a parent’s right to the care and custody of her child is a fundamental liberty interest.
4 Zayas, Luis, Sergio Aguilar-Gaxiola, Hyunwoo Yoon, and Guillermina Natera Rey. 2015. “The Distress of Citizen-Children with Detained and Deported Parents,” Journal of Child and Family Studies 24(11): 3213-3223. https://www.ncbi.nlm.nih.gov/pmc/articles/PMC4667551/.
5 Young Center for Immigrant Children’s Rights. 2020. “Family Separation is Not Over: How the Trump Administration Continues to Separate Children from Their Parents to Serve its Political Ends,” p. 6. Washington, DC: Young Center for Immigrant Children’s Rights. https://static1.squarespace.com/static/597ab5f3bebafb0a625aaf45/t/5f032e87ff32c80f99c7fee5/1594044%20048699/Young+Center-Family+Separation+Report-Final+PDF.pdf.
6 Ibid at p. 7.
7 Dickerson, Caitlin. 2020. “Parents of 545 Children Separated at the Border Cannot Be Found.” New York Times, October 21. https://www.nytimes.com/2020/10/21/us/migrant-children-separated.html.
8 Young Center for Immigrant Children’s Rights. 2020. “Family Separation is Not Over,” p.13-14.
9 Ibid.
10 Amnesty International USA. 2020. “Family Separation 2.0: ‘You Aren’t Going to Separate Me from My Only Child.’” New York, NY: Amnesty International USA. https://www.amnestyusa.org/wp-content/uploads/2020/04/Amnesty-International-USA-Family-Separation-2.0_May-21-2020-.pdf.
11 Morris, Rachel. 2019. “Trump Got His Wall After All.” Huffington Post, November 24. https://www.huffpost.com/highline/article/invisible-wall/.
12 Anderson, Cheasty. 2020. “Public Charge and Private Dilemmas: Key Challenges and Best Practices for Fighting the Chilling Effect in Texas, 2017-2019,” p. 1. Bellaire, TX: Children’s Defense Fund-Texas. https://cdftexas.org/protecting-immigrant-communities/public-charge-and-private-dilemmas/.
13 Ibid.
14 Ibid at p. 6.
15 Ibid at p. 1. Note: Mixed-status families is defined here as families whose members include people with different citizenship or immigrant statuses. For example, a mixed status family might include one or two parents are undocumented and the children are U.S-born citizens.
16 Haley, Jennifer, Genevieve M. Kenney, Hamutal Bernstein, and Dulce Gonzalez. 2020. “One in Five Adults in Immigrant Families with Children Reported Chilling Effects on Public Benefit Receipt in 2019,” p. 6. Washington, DC: Urban Institute. https://www.urban.org/sites/default/files/publication/102406/one-in-five-adults-in-immigrant-families-with-children-reported-chilling-effects-on-public-benefit-receipt-in-2019_1.pdf.
17 Keisler-Starkey, Katherine, Lisa N Bunch. 2020. “Health Insurance Coverage in the United States: 2019,” p. 12. Suitland, MD: U.S. Census Bureau. https://www.census.gov/library/publications/2020/demo/p60-271.html. Note: Immigrant children is defined here as foreign-born children who emigrated to the United States and are not yet U.S. citizens.
18 Brooks, Tricia, and Lauren Roygardner. 2020. Medicaid and CHIP Eligibility, Enrollment, and Cost Sharing Policies as of January 2020,” p. 13. Washington, DC: Kaiser Family Foundation. http://files.kff.org/attachment/Report-Medicaid-and-CHIP-Eligibility,-Enrollment-and-Cost-Sharing-Policies-as-of-January-2020.pdf. Note: Lawfully residing immigrant children is defined here as children who have “qualified non-citizen” immigration status, humanitarian statuses or circumstances, valid non-immigrant visas, or legal status conferred by other laws.
19 Artiga, Samantha and Maria Diaz. 2019. “Health Coverage and Care of Undocumented Immigrants.” Washington, DC: Kaiser Family Foundation. https://www.kff.org/racial-equity-and-health-policy/issue-brief/health-coverage-and-care-of-undocumented-immigrants/.

SECTION HEAD
81
The State of America’s Children® 2021
ENDNOTES
20 Cervantes, Wendy, Rebecca Ullrich, and Hannah Matthews. 2018. “Our Children’s Fear: Immigration Policy’s Effects on Young Children,” p. 8. Washington, DC: CLASP. https://www.clasp.org/publications/report/brief/our-childrens-fear-immigration-policys-effects-young-children.
21 Ibid at p. 11.
22 Svajlenka, Nicole Prchal. 2019.“What We Know About DACA Recipients in the United States.” Washington, DC: Center for American Progress.
23 KIDS COUNT Data Center. 2020. “Children in Immigrant Families in Which Resident Parents Are Not U.S. Citizens for the Nation (Number & Percent).” Baltimore, MD: Annie E. Casey Foundation. https://datacenter.kidscount.org/data/tables/133-children-in-immigrant-families-in-which-resident-parents-are-not-us-citizens#detailed/1/any/false/37,871,870,573,869,36,868,867,133,38/any/480,481.
24 Gelatt, Julia. 2020. “Immigrant Workers: Vital to the U.S. COVID-19 Response, Disproportionately Vulnerable.” Washington, DC: Migration Policy Institute. https://www.migrationpolicy.org/research/immigrant-workers-us-covid-19-response.
25 King, Kathleen. 2020. “Here’s What the $2 Trillion Stimulus Package Means for Children and Families.” Children’s Defense Fund: In Defense of Children, March 26. https://www.childrensdefense.org/blog/2-trillion-stimulus-package/.
26 Sherman, Arloc and Tazra Mitchell. 2017. “Economic Security Programs Help Low-Income Children Succeed Over Long Term, Many Studies Find,” p.1-2. Washington, DC: CBPP. https://www.cbpp.org/sites/default/files/atoms/files/7-17-17pov.pdf.

82 Children’s Defense Fund
840 First Street NESuite 300Washington, DC 20002(202) 628-8787 www.childrensdefense.org
The Children’s Defense Fund envisions
a nation where marginalized children
flourish, leaders prioritize their well-
being, and communities wield the
power to ensure they thrive.
“ ”