leaders in snack - hostess brands
TRANSCRIPT
LEADERS IN SNACKINNOVATION
2017ANNUAL REPORT
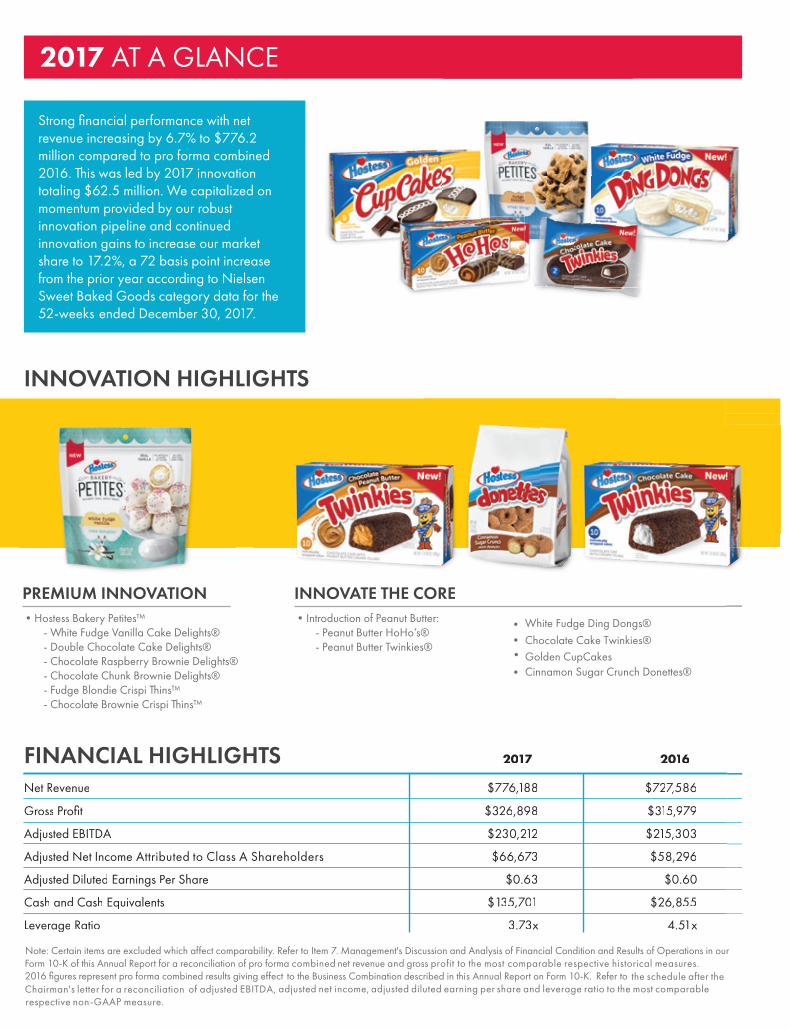
2017 AT A GLANCE
INNOVATION HIGHLIGHTS
FINANCIAL HIGHLIGHTS
PREMIUM INNOVATION•Hostess Bakery Petites™
- White Fudge Vanilla Cake Delights®- Double Chocolate Cake Delights®- Chocolate Raspberry Brownie Delights®- Chocolate Chunk Brownie Delights®- Fudge Blondie Crispi Thins™- Chocolate Brownie Crispi Thins™
INNOVATE THE CORE•Introduction of Peanut Butter:
- Peanut Butter HoHo’s®- Peanut Butter Twinkies®
•• Chocolate Cake Twinkies®•
• Cinnamon Sugar Crunch Donettes®
Note: Certain items are excluded which affect comparability. Refer to Item 7. Management's Discussion and Analysis of Financial Condition and Results of Operations in ouForm 10-K of this Annual Report for a reconciliation of pro forma combined net revenue and gross profit to the most comparable respective historical measures.
Net Revenue
Gross Profit
Adjusted EBITDA
Adjusted Net Income Attributed to Class A Shareholders
Adjusted Diluted Earnings Per Share
Cash and Cash Equivalents
2017
$776,77 188
$326,898
$230,212
$66,673
$0.63
$135,701
2016
$727,58677
$315,979
$215,303
$58,296
$0.60
$26,855
Leverage Ratio 3.73x 4.51x
Strong financial performance with netrevenue increasing by 6.7% to $776.2million compared to pro forma combined2016. This was led by 2017 innovationtotaling $62.5 million. We capitalized onmomentum provided by our robustinnovation pipeline and continuedinnovation gains to increase our marketshare to 17.2%, a 72 basis point increasefrom the prior year according to NielsenSweet Baked Goods category data for the52-weeks ended December 30, 2017.
r
White Fudge Ding Dongs®
Golden CupCakes
Chairman's letter for a reconciliation of adjusted EBITDA, respective non-GAAP measure.
2016 figures represent pro forma combined results giving effect the schedule after the Refer toto the Business Combination adjusted net income, adjusted diluted earning per share and leverage ratio to the most comparable
compared to prior year driven by2017 product innovation and
whitespace growth.
of net revenue, increasing 7%compared to prior year driven by
$776 MILLI N
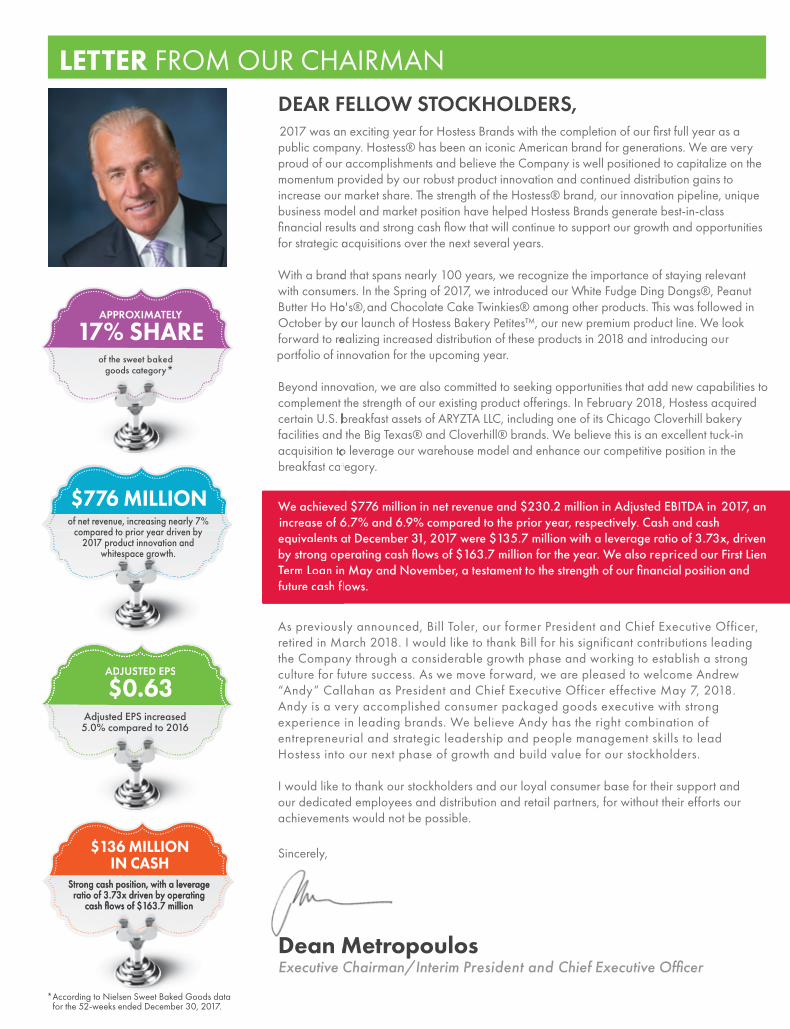
LETTER FROM OUR CHAIRMAN
Chairman/Interim President and Chief Executive Officer
2017 was an exciting year for Hostess Brands with the completion of our first full year as a public company. Hostess® has been an iconic American brand for generations. We are veryproud of our accomplishments and believe the Company is well positioned to capitalize on themomentum provided by our robust product innovation and continued distribution gains toincrease our market share. The strength of the Hostess® brand, our innovation pipeline, uniquebusiness model and market position have helped Hostess Brands generate best-in-classfinancial results and strong cash flow that will continue to support our growth and opportunities
acquisitions over the next several years.
d that spans nearly 100 years, we recognize the importance of staying relevanters. In the Spring of 2017, we introduced our White Fudge Ding Dongs®, Peanuto's®,and Chocolate Cake Twinkies® among other products. This was followed inour launch of Hostess Bakery Petites™, our new premium product line. We lookealizing increased distribution of these products in 2018 and introducing our
portfolio for the upcoming year.
vation, we are also committed to seeking opportunities that add new capabilities tothe strength of our existing product offerings. In February 2018, Hostess acquiredbreakfast assets of ARYZTA LLC, including one of its Chicago Cloverhill bakerythe Big Texas® and Cloverhill® brands. We believe this is an excellent tuck-in
o leverage our warehouse model and enhance our competitive position in theegory.
d $776 million in net revenue and $230.2 million in Adjusted EBITDA in
at December 31, 2017 were $135.7 million with a leverage ratio of 3.73x, drivenperating cash flows of $163.7 million for the year. We also repriced
DEAR FELLOW STOCKHOLDERS,
for strategic a
With a brandwith consumeButter Ho HoOctober by oforward to re
of innovation
Beyond innovcomplement t
b
ot
d
of the sweet baked goods category
APPROXIMATELY
17% SHARE
equivalents aby strong op our First L
position and
certain U.S. bfacilities andacquisition tobreakfast cat
We achieved 2017, an
Adjusted EPS increased5.0% compared to 2016
ADJUSTED EPS
$0.63
Executive
p
Strong cash position, with a leverageratio of 3.73x driven by operating
cash flows of $163.7 million
$136 MILLIONIN CASH
rease of 6.7% and 6.9% compared to the prior year, respectively. Cash and cashinc
ienTerm Loan in May and November, a testament to the strength of our financialfuture cash flows.
bb
oo
ap
ppbbbb
oooott
d
equivalents aby strong oppp
certain U.S. bbbbfacilities andacquisition toobreakfast cat
We achieved
ADJUSDD TED EPS
$0.63
rease of 66inc
Term Loan innfuture cash flfl
compared to prior year driven by2017 product innovation and
whw itespap ce grgrg owth.
of net revenue, increasing 7%compared to prior year driven by
$$7777667777 MMIILLLLII NNof net revenue, increasing nearly 7%
compared to prior year driven by 2017 product innovation and
whitespace growth.
$776 MILLION
Strong cash position, with a leverageratio of 3.73x driven by operating
cash flows of $163.7 million
$136 MILLIONIN CASH
As previously announced, Bill Toler, our former President and Chief Executive Officer, retired in March 2018. I would like to thank Bill for his significant contributions leading the Company through a considerable growth phase and working to establish a strong culture for future success. As we move forward, we are pleased to welcome Andrew “Andy” Callahan as President and Chief Executive Officer effective May 7, 2018. Andy is a very accomplished consumer packaged goods executive with strong experience in leading brands. We believe Andy has the right combination of entrepreneurial and strategic leadership and people management skills to lead Hostess into our next phase of growth and build value for our stockholders.
I would like to thank our stockholders and our loyal consumer base for their support and our dedicated employees and distribution and retail partners, for without their efforts our achievements would not be possible.
*
*According to Nielsen Sweet Baked Goods data
for the 52-weeks ended December 30, 2017.
Sincerely,
MetropoulosDean M
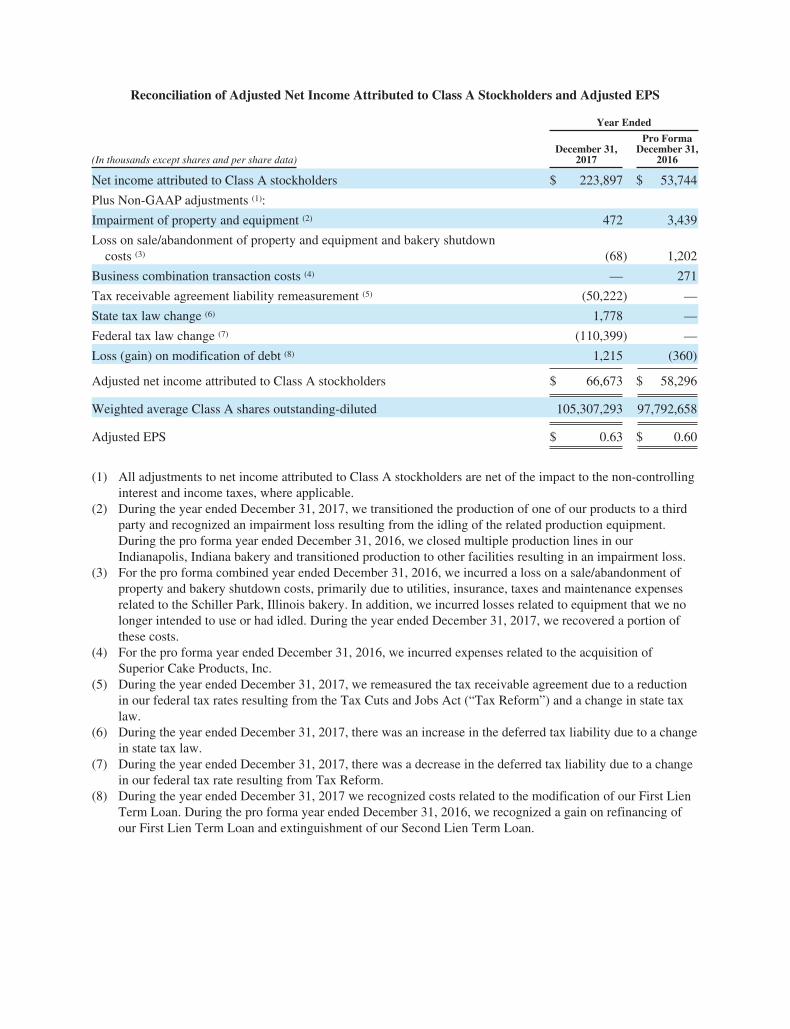
Reconciliation of Adjusted Net Income Attributed to Class A Stockholders and Adjusted EPS
Year Ended
(In thousands except shares and per share data)December 31,
2017
Pro FormaDecember 31,
2016
Net income attributed to Class A stockholders $ 223,897 $ 53,744
Plus Non-GAAP adjustments (1):
Impairment of property and equipment (2) 472 3,439
Loss on sale/abandonment of property and equipment and bakery shutdowncosts (3) (68) 1,202
Business combination transaction costs (4) — 271
Tax receivable agreement liability remeasurement (5) (50,222) —
State tax law change (6) 1,778 —
Federal tax law change (7) (110,399) —
Loss (gain) on modification of debt (8) 1,215 (360)
Adjusted net income attributed to Class A stockholders $ 66,673 $ 58,296
Weighted average Class A shares outstanding-diluted 105,307,293 97,792,658
Adjusted EPS $ 0.63 $ 0.60
(1) All adjustments to net income attributed to Class A stockholders are net of the impact to the non-controllinginterest and income taxes, where applicable.
(2) During the year ended December 31, 2017, we transitioned the production of one of our products to a thirdparty and recognized an impairment loss resulting from the idling of the related production equipment.During the pro forma year ended December 31, 2016, we closed multiple production lines in ourIndianapolis, Indiana bakery and transitioned production to other facilities resulting in an impairment loss.
(3) For the pro forma combined year ended December 31, 2016, we incurred a loss on a sale/abandonment ofproperty and bakery shutdown costs, primarily due to utilities, insurance, taxes and maintenance expensesrelated to the Schiller Park, Illinois bakery. In addition, we incurred losses related to equipment that we nolonger intended to use or had idled. During the year ended December 31, 2017, we recovered a portion ofthese costs.
(4) For the pro forma year ended December 31, 2016, we incurred expenses related to the acquisition ofSuperior Cake Products, Inc.
(5) During the year ended December 31, 2017, we remeasured the tax receivable agreement due to a reductionin our federal tax rates resulting from the Tax Cuts and Jobs Act (“Tax Reform”) and a change in state taxlaw.
(6) During the year ended December 31, 2017, there was an increase in the deferred tax liability due to a changein state tax law.
(7) During the year ended December 31, 2017, there was a decrease in the deferred tax liability due to a changein our federal tax rate resulting from Tax Reform.
(8) During the year ended December 31, 2017 we recognized costs related to the modification of our First LienTerm Loan. During the pro forma year ended December 31, 2016, we recognized a gain on refinancing ofour First Lien Term Loan and extinguishment of our Second Lien Term Loan.
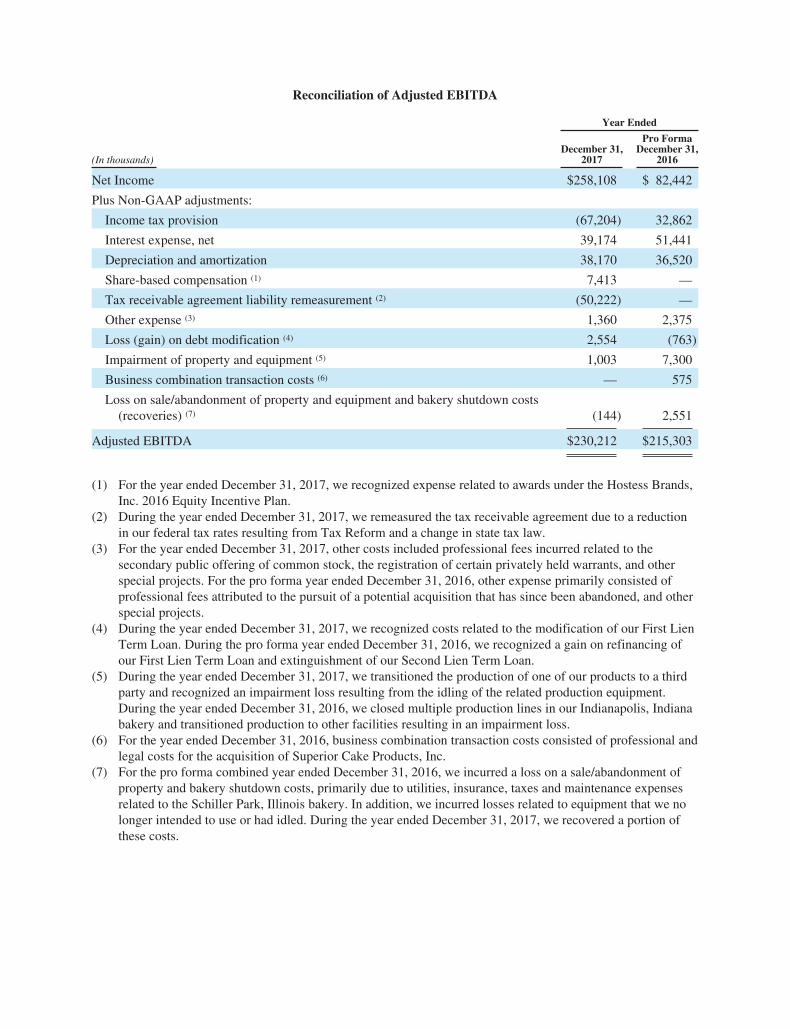
Reconciliation of Adjusted EBITDA
Year Ended
(In thousands)December 31,
2017
Pro FormaDecember 31,
2016
Net Income $258,108 $ 82,442
Plus Non-GAAP adjustments:
Income tax provision (67,204) 32,862
Interest expense, net 39,174 51,441
Depreciation and amortization 38,170 36,520
Share-based compensation (1) 7,413 —
Tax receivable agreement liability remeasurement (2) (50,222) —
Other expense (3) 1,360 2,375
Loss (gain) on debt modification (4) 2,554 (763)
Impairment of property and equipment (5) 1,003 7,300
Business combination transaction costs (6) — 575
Loss on sale/abandonment of property and equipment and bakery shutdown costs(recoveries) (7) (144) 2,551
Adjusted EBITDA $230,212 $215,303
(1) For the year ended December 31, 2017, we recognized expense related to awards under the Hostess Brands,Inc. 2016 Equity Incentive Plan.
(2) During the year ended December 31, 2017, we remeasured the tax receivable agreement due to a reductionin our federal tax rates resulting from Tax Reform and a change in state tax law.
(3) For the year ended December 31, 2017, other costs included professional fees incurred related to thesecondary public offering of common stock, the registration of certain privately held warrants, and otherspecial projects. For the pro forma year ended December 31, 2016, other expense primarily consisted ofprofessional fees attributed to the pursuit of a potential acquisition that has since been abandoned, and otherspecial projects.
(4) During the year ended December 31, 2017, we recognized costs related to the modification of our First LienTerm Loan. During the pro forma year ended December 31, 2016, we recognized a gain on refinancing ofour First Lien Term Loan and extinguishment of our Second Lien Term Loan.
(5) During the year ended December 31, 2017, we transitioned the production of one of our products to a thirdparty and recognized an impairment loss resulting from the idling of the related production equipment.During the year ended December 31, 2016, we closed multiple production lines in our Indianapolis, Indianabakery and transitioned production to other facilities resulting in an impairment loss.
(6) For the year ended December 31, 2016, business combination transaction costs consisted of professional andlegal costs for the acquisition of Superior Cake Products, Inc.
(7) For the pro forma combined year ended December 31, 2016, we incurred a loss on a sale/abandonment ofproperty and bakery shutdown costs, primarily due to utilities, insurance, taxes and maintenance expensesrelated to the Schiller Park, Illinois bakery. In addition, we incurred losses related to equipment that we nolonger intended to use or had idled. During the year ended December 31, 2017, we recovered a portion ofthese costs.
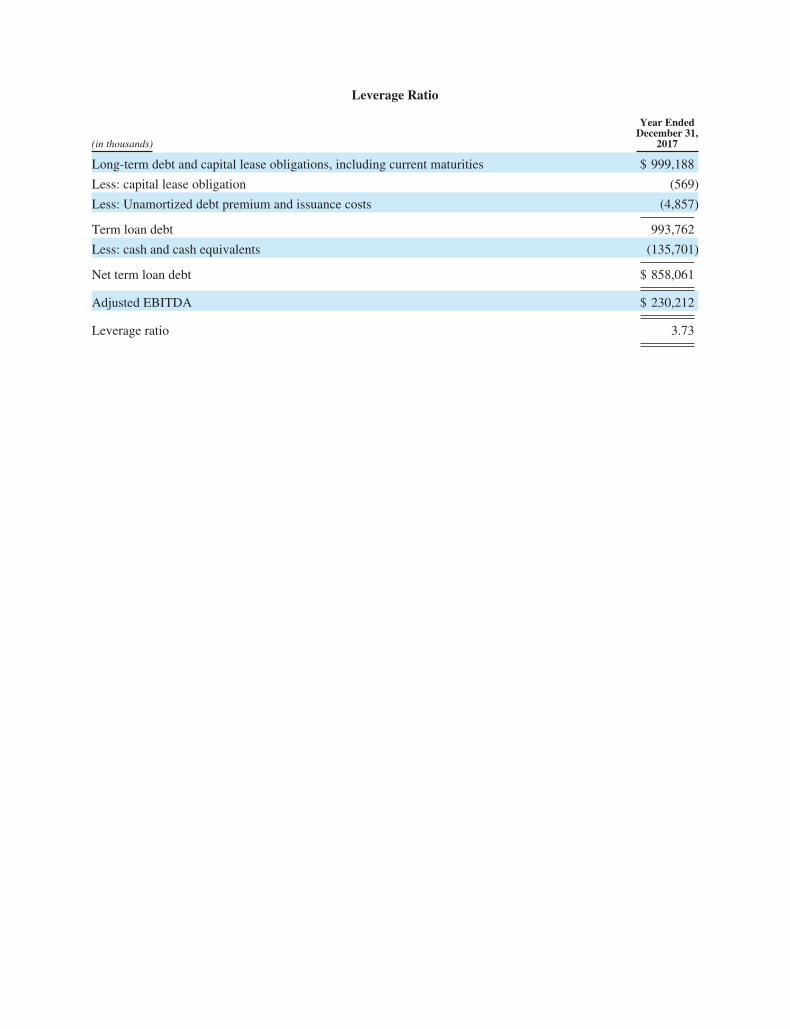
Leverage Ratio
(in thousands)
Year EndedDecember 31,
2017
Long-term debt and capital lease obligations, including current maturities $ 999,188
Less: capital lease obligation (569)
Less: Unamortized debt premium and issuance costs (4,857)
Term loan debt 993,762
Less: cash and cash equivalents (135,701)
Net term loan debt $ 858,061
Adjusted EBITDA $ 230,212
Leverage ratio 3.73
UNITED STATESSECURITIES AND EXCHANGE COMMISSION
Washington, D.C. 20549
FORM 10-KÈ ANNUAL REPORT PURSUANT TO SECTION 13 OR 15(d) OF THE SECURITIES EXCHANGE
ACT OF 1934For the fiscal year ended December 31, 2017
‘ TRANSITION REPORT PURSUANT TO SECTION 13 OR 15(d) OF THE SECURITIES EXCHANGEACT OF 1934
For the transition period from toCommission file number 001-37540
HOSTESS BRANDS, INC.(f/k/a GORES HOLDINGS, INC.)
(Exact name of registrant as specified in its charter)Delaware 47-4168492
(State or other jurisdiction ofincorporation or organization)
(I.R.S. EmployerIdentification No.)
1 East Armour BoulevardKansas City, MO
(Address of principal executive offices)64111
(Zip Code)
(816) 701-4600Registrant’s telephone number, including area code
Securities registered pursuant to Section 12(b) of the Act:Title of Each Class Name of Each Exchange on Which Registered
Class A Common Stock, par value of $0.0001 per share NASDAQ Capital Market56,499,890 Warrants, each exercisable for half share of Class A Common Stock NASDAQ Capital Market
Securities registered pursuant to Section 12(g) of the Act: None.Indicate by check mark if the Registrant is a well-known seasoned issuer, as defined in Rule 405 of the Securities Act. Yes È No ‘
Indicate by check mark if the Registrant is not required to file reports pursuant to Section 13 or Section 15(d) of the Act. Yes ‘ No È
Indicate by check mark whether the registrant (1) has filed all reports required to be filed by Section 13 or 15(d) of the Securities ExchangeAct of 1934 during the preceding 12 months (or for such shorter period that the registrant was required to file such reports), and (2) has been subjectto such filing requirements for the past 90 days. Yes È No ‘
Indicate by check mark whether the registrant has submitted electronically and posted on its corporate Website, if any, every Interactive DataFile required to be submitted and posted pursuant to Rule 405 of Regulation S-T (§229.405 of this chapter) during the preceding 12 months (or forsuch shorter period that the registrant was required to submit such files). Yes È No ‘
Indicate by check mark if disclosure of delinquent filers pursuant to Item 405 of Regulation S-K (§229.405 of this chapter) is not containedherein, and will not be contained, to the best of the Registrant’s knowledge, in definitive proxy or information statements incorporated by referencein Part III of this Form 10-K or any amendment to this Form 10-K ‘
Indicate by check mark whether the registrant is a large accelerated filer, an accelerated filer, a non-accelerated filer, a smaller reportingcompany, or an emerging growth company. See definitions of “large accelerated filer,” “accelerated filer,” “smaller reporting company,” and“emerging growth company” in Rule 12b-2 of the Exchange Act.:
Large accelerated filer È Accelerated filer ‘ Non-accelerated filer ‘(Do not check if a
smaller reporting company)
Smaller reportingcompany ‘
Emerging growthcompany ‘
If an emerging growth company, indicate by check mark if the registrant has elected not to use the extended transition period for complyingwith any new or revised financial accounting standards provided pursuant to Section 13(a) of the Exchange Act. ‘
Indicate by check mark whether the registrant is a shell company (as defined in Rule 12b-2 of the Act). Yes ‘ No È
The aggregate market value of the voting and non-voting common equity held by non-affiliates of the registrant on June 30, 2017, computedby reference to the closing price reported on the NASDAQ Capital Market on such date was $1,460,103,929 (90,689,685 shares at a closing price pershare of $16.10).
Shares of Class A common stock outstanding—99,855,625 shares at February 23, 2018Shares of Class B common stock outstanding—30,255,184 shares at February 23, 2018
DOCUMENTS INCORPORATED BY REFERENCEPortions of the Registrant’s definitive proxy statement relating to its 2018 annual meeting of shareholders (the “2018 Proxy Statement”) are
incorporated by reference into Part III of this Annual Report on Form 10-K where indicated. The 2018 Proxy Statement will be filed with the U.S.Securities and Exchange Commission within 120 days after the end of the fiscal year to which this report relates.
Indicate by check mark whether the registrant (1) has filed all reports required to be filed by Section 13 or 15(d) of the Securities Exchange Act of 1934 during the preceding12 months (or for such shorter period that the registrant was required to file such reports), and (2) has been subject to such filing requirements for the past 90 days.
Yes x No o
Indicate by check mark whether the registrant has submitted electronically and posted on its corporate Website, if any, every Interactive Data File required to be submitted andposted pursuant to Rule 405 of Regulation S‑T (§229.405 of this chapter) during the preceding 12 months (or for such shorter period that the registrant was required to submit such
files).
Yes x No o
Indicate by check mark if disclosure of delinquent filers pursuant to Item 405 of Regulation S-K (§229.405 of this chapter) is not contained herein, and will not be contained, to thebest of the Registrant’s knowledge, in definitive proxy or information statements incorporated by reference in Part III of this Form 10-K or any amendment to this Form 10-K o
Indicate by check mark whether the registrant is a large accelerated filer, an accelerated filer, a non‑accelerated filer, a smaller reporting company, or an emerging growth company.See definitions of “large accelerated filer,” “accelerated filer,” “smaller reporting company,” and “emerging growth company” in Rule 12b‑2 of the Exchange Act.:
Large accelerated filer xAccelerated
filer o
Non‑accelerated filer o (Do not check if a
smaller reporting company)
Smaller reporting company o Emerging growth company o
If an emerging growth company, indicate by check mark if the registrant has elected not to use the extended transition period for complying with any new or revised financialaccounting standards provided pursuant to Section 13(a) of the Exchange Act. o
Indicate by check mark whether the registrant is a shell company (as defined in Rule 12b‑2 of the Act). Yes o No x
The aggregate market value of the voting and non-voting common equity held by non-affiliates of the registrant on June 30, 2017, computed by reference to the closing pricereported on the NASDAQ Capital Market on such date was $1,460,103,929 (90,689,685 shares at a closing price per share of $16.10).
Shares of Class A common stock outstanding - 99,855,625 shares at February 23, 2018
Shares of Class B common stock outstanding - 30,255,184 shares at February 23, 2018
DOCUMENTS INCORPORATED BY REFERENCE
Portions of the Registrant’s definitive proxy statement relating to its 2018 annual meeting of shareholders (the “2018 Proxy Statement”) are incorporated byreference into Part III of this Annual Report on Form 10-K where indicated. The 2018 Proxy Statement will be filed with the U.S. Securities and ExchangeCommission within 120 days after the end of the fiscal year to which this report relates.
HOSTESS BRANDS, INC.
FORM 10-K
FOR THE YEAR ENDED DECEMBER 31, 2017
INDEX
Page
Part I
Item 1. Business 5
Item 1A. Risk Factors 13
Item 1B. Unresolved Staff Comments 26
Item 2. Properties 27
Item 3. Legal Proceedings 27
Item 4. Mine Safety Disclosures 27
Part II
Item 5. Market for Registrant’s Common Equity, Related Stockholder Matters and Issuer Purchases of Equity Securities 28
Item 6. Selected Financial Data 30
Item 7. Management’s Discussion and Analysis of Financial Condition and Results of Operations 34
Item 7A. Quantitative and Qualitative Disclosures about Market Risk 59
Item 8. Financial Statements and Supplementary Data 59
Item 9. Changes in and Disagreements with Accountants on Accounting and Financial Disclosure 98
Item 9A. Controls and Procedures 98
Item 9B. Other Information 98
Part III
Item 10. Directors, Executive Officers and Corporate Governance 98
Item 11. Executive Compensation 98
Item 12. Security Ownership of Certain Beneficial Owners and Management and Related Stockholder Matters 99
Item 13. Certain Relationships and Related Transactions, and Director Independence 99
Item 14. Principal Accounting Fees and Services 99
Part IV
Item 15. Exhibits, Financial Statement Schedules 99
Cautionary Note Regarding Forward Looking Statements
This Annual Report on Form 10-K (“Annual Report”) contains statements reflecting our views about our future performance that constitute “forward-
looking statements” within the meaning of Section 27A of the Securities Act of 1933, as amended (the “Securities Act”) and Section 21E of the Securities
Exchange Act of 1934, as amended (the “Exchange Act”), that involve substantial risks and uncertainties. All statements contained in this Annual Report
other than statements of historical fact, including statements regarding our future results of operations and financial position, our business strategy and
plans, and our objectives for future operations, are forward-looking statements. Statements that constitute forward-looking statements are generally
identified through the inclusion of words such as “believes,” “expects,” “intends,” “estimates,” “projects,” “anticipates,” “will,” “plan,” “may,”
“should,” or similar language. Statements addressing our future operating performance and statements addressing events and developments that we expect
or anticipate will occur are also considered as forward-looking statements. All forward‑looking statements included herein are made only as of the date
hereof. It is routine for our internal projections and expectations to change throughout the year, and any forward-looking statements based upon these
projections or expectations may change prior to the end of the next quarter or year. Readers of this Annual Report are cautioned not to place undue
reliance on any such forward-looking statements. As a result of a number of known and unknown risks and uncertainties, our actual results or performance
may be materially different from those expressed or implied by these forward-looking statements. Risks and uncertainties are identified and discussed in
Item 1A-Risk Factors in this Annual Report on Form 10-K. All subsequent written or oral forward-looking statements attributable to us or persons acting on
our behalf are expressly qualified in their entirety by these risk factors. We undertake no obligation to update any forward-looking statement, whether as a
result of new information, future events, or otherwise. The discussion and analysis of our financial condition and results of operations included in Item 7-
Management’s Discussion and Analysis of Financial Condition and Results of Operations should be read in conjunction with our Consolidated Financial
Statements and related notes included in Item 8 of this Annual Report on Form 10-K.
Explanatory Note
Hostess Brands, Inc. (f/k/a Gores Holdings, Inc.) was originally incorporated in Delaware on June 1, 2015 as a special purpose acquisition company (SPAC),formed for the purpose of effecting a merger, capital stock exchange, asset acquisition, stock purchase, reorganization, or other similar business combinationwith one or more target businesses. On August 19, 2015, Gores Holdings, Inc. consummated its initial public offering (the “IPO”), following which its sharesbegan trading on the Nasdaq Capital Market (“NASDAQ”).
On November 4, 2016 (the “Closing Date”), in a transaction referred to as the “Business Combination,” Gores Holdings, Inc. acquired a controlling interest inHostess Holdings, L.P. (“Hostess Holdings”), an entity owned indirectly by C. Dean Metropoulos (the “Metropoulos Entities”) and certain equity fundsmanaged by affiliates of Apollo Global Management, LLC (the “Apollo Funds” and, together with the Metropoulos Entities, the “Legacy HostessEquityholders”). Hostess Holdings had acquired the Hostess brand and certain strategic assets out of the bankruptcy liquidation proceedings of its priorowner (“Old Hostess”), free and clear of all past liabilities, in April 2013, and relaunched the Hostess brand later that year.
In connection with the closing of the Business Combination, Gores Holdings, Inc. changed its name to “Hostess Brands, Inc.” and its trading symbols onNASDAQ from “GRSH” and “GRSHW,” to “TWNK” and “TWNKW”.
As a result of the Business Combination, for accounting purposes, Hostess Brands, Inc. (“we”, “us” or the “Company”) is the acquirer and Hostess Holdings isthe acquired party and accounting predecessor. Our financial statement presentation includes the financial statements of Hostess Holdings and its subsidiariesas “Predecessor” for periods prior to the completion of the Business Combination and of Hostess Brands, Inc., including the consolidation of HostessHoldings and its subsidiaries, for periods from and after the Closing Date.
4
PART I
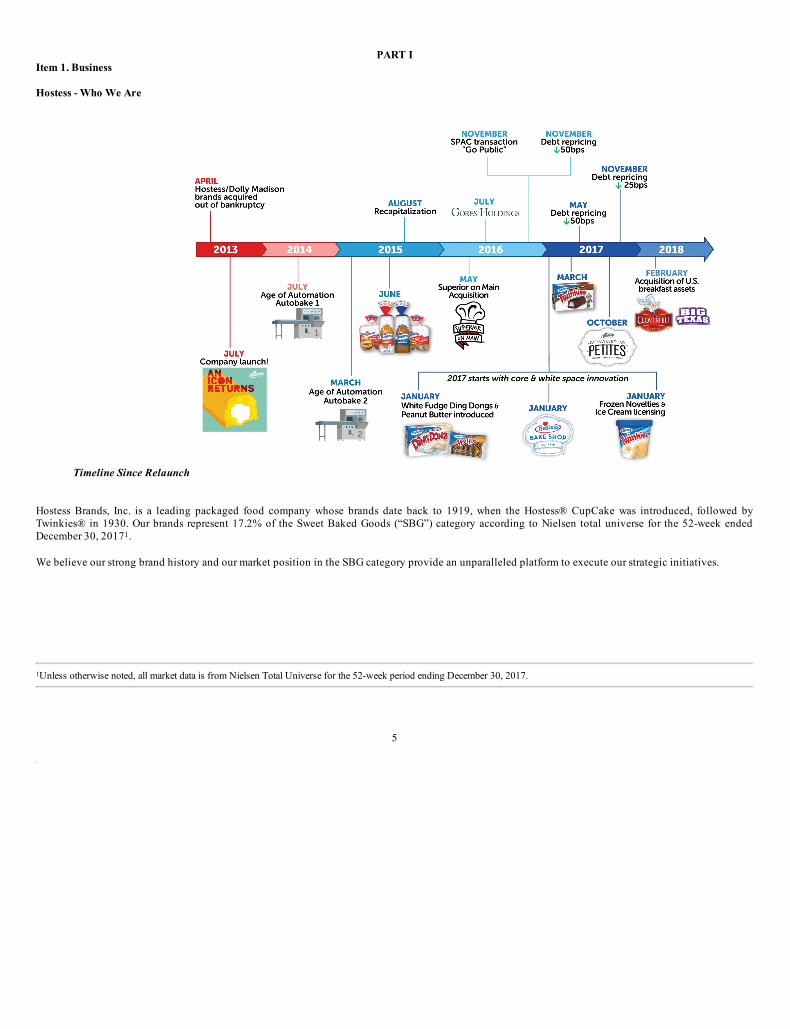
Item 1. Business
Hostess - Who We Are
Timeline Since Relaunch
Hostess Brands, Inc. is a leading packaged food company whose brands date back to 1919, when the Hostess® CupCake was introduced, followed byTwinkies® in 1930. Our brands represent 17.2% of the Sweet Baked Goods (“SBG”) category according to Nielsen total universe for the 52-week endedDecember 30, 20171.
We believe our strong brand history and our market position in the SBG category provide an unparalleled platform to execute our strategic initiatives.
1Unless otherwise noted, all market data is from Nielsen Total Universe for the 52-week period ending December 30, 2017.
5
The Brand
Hostess® has been an iconic American brand for generations. In April 2013, we acquired the Hostess® and Dolly Madison® brands out of the bankruptcyliquidation proceedings of its prior owners, free and clear of all prior liabilities, contracts, deferred taxes and other “legacy” issues. After a brief hiatus inproduction, we began providing Hostess products to retailer partners and consumers nationwide in July 2013. We offer a variety of new and classic treatsunder the Hostess® brand including Twinkies®, Cupcakes, Ding Dongs®, Ho Hos®, Donettes®, and Zingers® among others. By combining Hostess’ strongreputation with innovative technology and a Direct-To-Warehouse (“DTW”) business model, we rapidly recaptured market share.
In nearly five years we have invested approximately $200 million to upgrade our manufacturing footprint, implement new IT systems and enhanceproduction efficiency through the installation of automated baking and packaging lines. These investments, combined with our DTW distribution model,have reestablished Hostess’ leading, premium brand position in the $6.6 billion U.S. SBG category and have increased our distribution channels and pavednew growth opportunities for the Company.
Our DTW distribution model uses centralized distribution centers and common carriers to fill orders, with products generally delivered to our customers’warehouses. This model has eliminated the need for Direct-Store-Delivery (“DSD”) routes and drivers which has allowed us to expand our core distributionwhile gaining access to new channels (e.g., further penetration into convenience, drug store, dollar, foodservice, and cash & carry). We have both renewedand added relationships with retailers and distributors around the country.
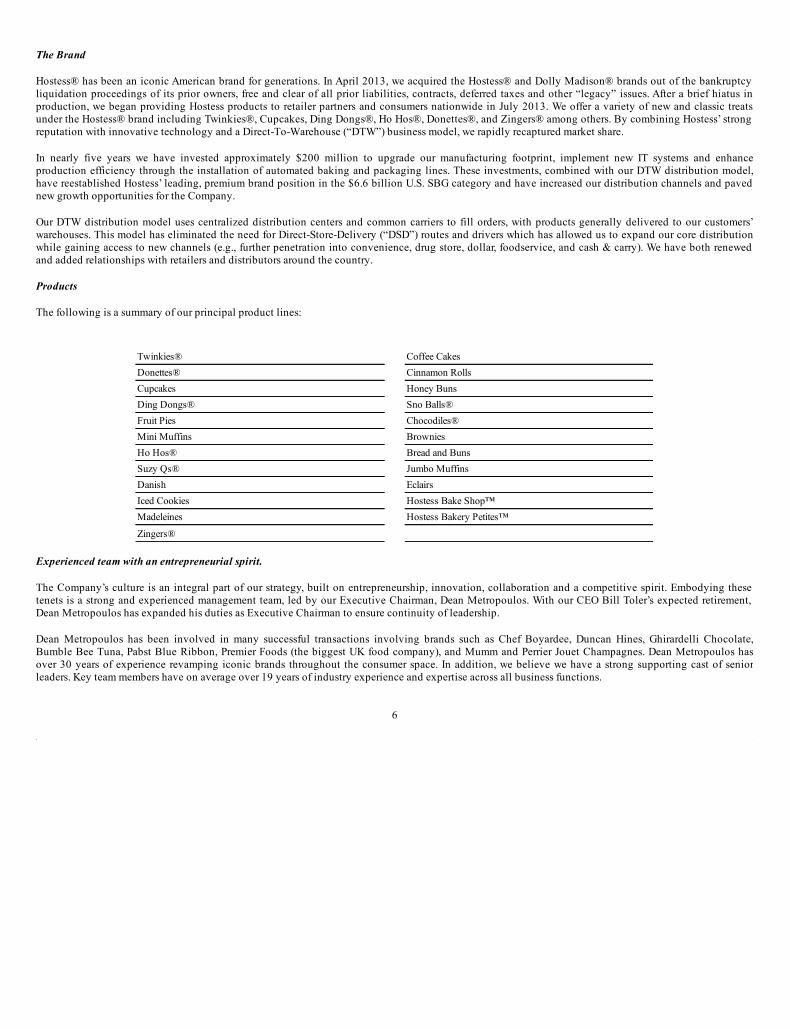
Products
The following is a summary of our principal product lines:
Twinkies® Coffee Cakes
Donettes® Cinnamon Rolls
Cupcakes Honey Buns
Ding Dongs® Sno Balls®
Fruit Pies Chocodiles®
Mini Muffins Brownies
Ho Hos® Bread and Buns
Suzy Qs® Jumbo Muffins
Danish Eclairs
Iced Cookies Hostess Bake Shop™
Madeleines Hostess Bakery Petites™
Zingers®
Experienced team with an entrepreneurial spirit.
The Company’s culture is an integral part of our strategy, built on entrepreneurship, innovation, collaboration and a competitive spirit. Embodying thesetenets is a strong and experienced management team, led by our Executive Chairman, Dean Metropoulos. With our CEO Bill Toler’s expected retirement,Dean Metropoulos has expanded his duties as Executive Chairman to ensure continuity of leadership.
Dean Metropoulos has been involved in many successful transactions involving brands such as Chef Boyardee, Duncan Hines, Ghirardelli Chocolate,Bumble Bee Tuna, Pabst Blue Ribbon, Premier Foods (the biggest UK food company), and Mumm and Perrier Jouet Champagnes. Dean Metropoulos hasover 30 years of experience revamping iconic brands throughout the consumer space. In addition, we believe we have a strong supporting cast of seniorleaders. Key team members have on average over 19 years of industry experience and expertise across all business functions.
6
Our management team is complemented by an experienced Board of Directors, all of which have senior executive leadership and bring with them extensiveconsumer products knowledge. Our board members include:
• Dean Metropolous• Bill Toler• Mark R. Stone• Laurence Bodner• Neil P. DeFeo• Jerry D. Kaminski• Craig D. Steeneck
A detailed biography of each of our board members and key management team members can be found at www.hostessbrands.com. Unless expressly statedotherwise, the information contained on or accessible through our website is not incorporated by reference into this Annual Report on Form 10-K.
Our Growth Strategy
Our strategy is to be the premium sweet baked goods market leader in the United States by producing innovative products which enable us to grow faster thanthe SBG category. This growth will be driven by our strategic initiatives:
Strategic initiatives
– Core distribution expansion– Innovation– Expansion of white space– Platform for future acquisitions
Our strategic initiatives have been a key part of our success since our launch in 2013. We continue to execute on these as we launch items that expand on ourcore distribution and whitespace opportunities. With our recent acquisition of the Cloverhill® bakery in February 2018, we continue to leverage our positionand deliver on our strategic initiatives.
Core Distribution Expansion
We plan to capitalize on the strength of the Hostess® brand and our attractive retailer economics in order to drive growth by generating new customers andincreasing the number of stores carrying our products. With the potential afforded by the extended reach of the warehouse model, distribution and marketshare gains are expected to come from traditional channels (“core expansion”) through our investment in quality, targeted marketing, product renovation anda focus on our top brands and SKUs that continue to deliver. Our top 7 brands in 2017 represented 74.0% of our net revenue for the fiscal year and 82.9% ofour market share for the 52-weeks ending December 30, 2017. The Company grew total distribution points by 11% in 2017.
Our brand strategy, combined with investments in highly effective marketing and brand-building, has resulted in what we believe to be one of the strongestbrand equities in snacking. While we have re-established and grown our presence throughout the traditional channels in which Old Hostess previouslyoperated, there remains further opportunity to close the gap in market share relative to Old Hostess’ penetration. By expanding points of distribution,increasing SKU assortments and recapturing shelf space in existing retailers, we plan to continue our top line growth. Our top three products (Donettes®,Twinkies® and Cupcakes) have All Commodity Volume (“ACV”) distribution rates in core channels that are significantly higher than the average rateachieved by other products in our portfolio (based on Nielsen 52 weeks ending December 30, 2017) . These high levels are directly correlated to our focusedapproach on our strategic initiatives. By applying this tailored and focused approach to our other existing product lines, we will work with retailers to expandthe average number of SKUs offered and attempt to reduce distribution gaps. The average number of products selling at core retailers today is approximately23 items.
Innovation
7
Our innovation is key to fueling our growth. We extend the Hotess® brand in segments to meet consumer demand. In doing this, we are devoted tomaintaining our iconic brands while contemporizing in order to stay relevant with consumers into the future. Supporting our premium position requires us toevolve with changing consumer preferences and trends.
The success of our product innovation is in part driven by understanding consumer preferences, providing awareness and trials by partnering with ourcustomers, all while maintaining our iconic brands and product quality. With strong innovation from previous years, we continued in 2017 with a robustpipeline of innovation including peanut butter products, Hostess Bake Shop™, and Hostess Bakery Petites™. This, combined with flavor innovation in 2017with the Golden Cup Cake, Chocolate Cake Twinkies®, and White Fudge Ding Dongs®, led to a contribution of approximately $62.5 million of net revenuefrom products launched in 2017. We will continue this innovation and expect to introduce a number of new items in early 2018.
During 2017 we launched Hostess Bakery Petites™, a premium snacking platform made with no artificial flavors or colors or high fructose corn syrup. Webelieve there is growth potential in providing an on-the-go snacking option for ingredient conscious consumers. We continue to develop new flavors andplatforms, and have a robust innovation pipeline that expands the Hostess brand across categories.
The in-store bakery (“ISB”) sections of grocery and club retailers are increasingly utilized to provide a differentiated shopping experience and to showcaseproduct offerings. Our Superior on Main® and Hostess Bake Shop™ brands include eclairs, madeleines, brownies, and iced cookies, as well as preservative-free and gluten-free products offered in the ISB section.
The breakfast sub-category is a significant opportunity for the Company where our share is 15%, nearly a 5.0% share gap compared to All Day Snacking. Thissub-category represents approximately 51.3% of the $6.6 billion SBG category according to Nielsen U.S. total universe for the 52 weeks ended December 30,2017. According to a July 2016 study by Mintel, convenience and brand preference continue to influence snack selection, as over half of U.S. consumers rateportability as a key attribute in breakfast items. These consumption trends play to our strengths as our products conveniently come packaged in both single-serve and multipack varieties. In addition, we have launched a line of Hostess jumbo muffins, danishes, and glazed donuts, which have been well-received asnew breakfast offerings. Further to this, we expect our recent acquisition of the Cloverhill® bakery in Chicago to enable us to leverage our current platformand to expand our breakfast capabilities in this core product category.
We also understand the need to continually evolve while maintaining the tradition and offerings our loyal consumer base has come to know and love. Wehave been actively investing in new product development and building our long-term pipeline, leveraging our innovation pipeline and commercializationprocess to bring new products to market in a timely fashion. Our product innovation strategy is organized around four key objectives:
• Complementing our existing product offering by launching classic products not yet launched or entirely new products in SBG sub-segments wherewe currently do not compete;
• Launching line extensions to drive sub-brand reach;
• Unlocking new consumer segments with new benefits and / or occasions; and
• Expanding into new categories and markets to drive highly incremental growth.
Whitespace opportunity
We continue to penetrate ISB in the grocery and club channels. Our ISB focus is on core product support and seasonality-relevant core extensions byleveraging the Superior on Main® market presence and product offerings. We have had early success with our licensing in frozen retail and continue toexpand into food service through our relationship with a national distributor. We have products that are now packaged for sale in Mexico, the UnitedKingdom and Canada through third parties. Our products are also sold on various e-commerce platforms.
8
Platform for future acquisitions
We believe we serve as a platform for growth. Within the fragmented consumer packaged goods market, there exists the opportunity to drive value creationthrough acquisitions by leveraging our brand, platform, infrastructure and performance driven management culture. We are committed to seeking-outopportunities that add new capabilities to our already broad offerings.
The acquisition of the Cloverhill® bakery in Chicago, IL, announced in February 2018, is an example where we can leverage our warehouse model andexpand our existing breakfast capabilities1. As we explore other opportunities, we will consider our ability to leverage the brand in indulgent Snacking,expand into ISB, and integrate existing SBG business to be produced on our existing assets or integrate a broader market to leverage our warehouse model.
Our experienced management team includes several individuals who have successfully managed and acquired consumer businesses. We believe our scale,access to capital and management experience will allow us to consider both small and large acquisitions in the future and to integrate them in a seamlessfashion.
1 For the 52-week period ended December 30, 2017, Breakfast represented 51% of the SBG category and we had a 15% share compared to All Day Snacking, which represents49% of the SBG category, where we had a 20% share
The Category: Large and Attractive
Nearly all U.S. consumers eat snacks at least once per day. The U.S. SBG category is one of the largest categories within the broader $97 billion U.S. TotalSnack category, with estimated retail sales of $6.6 billion in 2017 according to Nielsen U.S. total universe for the 52 weeks ended December 30, 2017. TheSBG category includes breakfast items (e.g., donuts, breakfast danishes, and muffins) and all-day snacking items (e.g., snack cakes, pies, bars, brownies,blondies, and cookies). According to The Nielsen Company, the Sweet Snacks category (Candy, Cookies, Desserts, Fruit Snacks, SBG) accounted for 59.2%of the Total Snacks category dollars.
Since its reintroduction to the market in 2013, the Hostess® brand has contributed significantly to the total growth of the SBG category. During the Hostess®brand’s hiatus from 2012 to 2013 the category declined by 8%. From the reintroduction of Hostess® through December 31, 2017, the category has grown14%.
During 2017, the Hostess® brands contributed $38 million or 3.5% to the category’s growth. All other brands on a combined basis declined $95 million. TheHostess® brand’s 17.2% share of the category represents an opportunity for continued growth in comparison to its pre-hiatus share of 22.8%. Hostess® is thenumber one brand in the two largest SBG category segments: snack cakes and doughnuts. These two segments accounted for 49% of total category salesvolume. The brand’s average price point is at an 80% premium over the category leader.
Competitive landscape
9
Hostess® is #2 in the U.S. SBG category. The top three brands account for 60% of the SBG retail sales according to Nielsen, while the rest of the categoryremains fairly fragmented. With limited private label penetration within the category (3.5% market share vs. 19.5% for overall packaged food), consumershave shown a strong preference for trusted brands within the SBG category. The leading positions are solidified through extensive product portfolios, strongbrand awareness, established distribution capabilities and long-standing relationships with critical high-volume retailers. Furthermore, high levels of capitalinvestment are required to establish manufacturing and distribution capabilities of meaningful scale, providing additional barriers to entry.
Seasonality
Sweet baked goods revenues tend to be moderately seasonal, with declines during the early winter period, which we believe are attributable to alteredconsumption patterns during the holiday season. We expect this trend to continue and continue to be applicable to our business. We strive to mitigate theseasonality by running certain targeted promotional campaigns.
Strategy Execution
Our Competitive Strengths
Leading brands synonymous with American snacking
We believe that we have maintained our brand power and category awareness for nearly a century by satisfying consumers’ need for fun, light-hearted treats.We believe our portfolio of highly recognized products is synonymous with American snacking, and there is perhaps no better indicator of this than our90%+ brand awareness, according to a Harman Atchison study in 2014. We believe that we have established our leadership position in the SBG segmentthrough the strength and quality of our products, developing and promoting a brand that unites our loyal consumer base and by pricing our products at areasonable premium to other snacking alternatives.
The New Hostess is an innovation engine
When we relaunched Hostess®, we set out to challenge the status quo business model of our competitors. We established our innovative DTW distributionmodel and heavily invested in our bakeries, which has resulted in energy, labor and time savings, along with the ability to achieve efficiently made qualityproducts. These investments paved the way for new product innovation. Unlike Old Hostess, whose DSD model required new products to be manufactured onvarious lines in multiple facilities in order to facilitate distribution across the country, we can now leverage our existing infrastructure and produce newproducts on one line in one facility. Centralized production allows us to continually innovate and bring new products to market while not disrupting theproduction of our existing product portfolio.
We are devoted to maintaining our iconic brands while contemporizing in order to stay relevant with consumers into the future. We believe that to supportour premium position, we must continually evolve with changing consumer preferences and trends. As such, we have created an infrastructure that allows usto remain flexible. We continue to develop new flavors and platforms, and have a robust innovation pipeline that expands the Hostess® brand acrosscategories. Recent launches include White Fudge Ding Dongs®, Hostess Bake Shop™ , Hostess Bakery Petites™ and Peanut Butter Ho Hos®. Collectively,we believe our product launches have been successful and augmented our top line growth. Product launches in 2017 have resulted in net revenue of $62.5million for the year ended December 31, 2017.
DTW Distribution Model
We believe our DTW distribution model has created a substantial whitespace opportunity, which is one of the key drivers that we expect to fuel our futuregrowth. We have greater access to convenience, drug and dollar stores. Distributing to these channels under a DSD model can be inefficient due to smallaverage drop size. Similarly, we have an opportunity to continue building distribution in the drug store channel after having successfully established a strongpresence. Historically, DSD snack cake companies have competed with candy and tobacco distributors; however, our
10
DTW model has enabled us to partner with these third-party distributors who can profitably penetrate both the convenience store and drug store channels andwho are looking for opportunities to gain share in the SBG category. For 2017, convenience and drug stores accounted for 32.6% of net revenues. We haveestablished a strong presence and market share in the drug store channel and are focused on continuously expanding coverage of convenience stores. Thesepartnerships further expand our distribution reach in a highly efficient manner, and we believe they will add to our growth potential going forward.
We utilize a DTW distribution system, using centralized distribution centers and common carriers. From our five baking facilities, products are shipped tothree distribution centers located in Shorewood, Illinois, Carthage, Missouri and Worcester, Massachusetts. Each distribution center is owned and operatedby third parties. The distribution centers are able to fill customer orders and reduce inventory on hand as a result of this centralized consolidation ofinventory. Products are delivered to customers’ warehouses from the distribution centers using common carriers. A small number of our customers pick uptheir orders directly from our distribution centers.
The DTW model is enabled by our extended shelf life (“ESL”) technology. Some of our products are shipped frozen at the request of certain retailers. As aresult of our DTW model, we do not keep a significant backlog of finished goods inventory, as our fresh bakery products are promptly shipped to ourdistribution centers after being produced.
Highly efficient and profitable business model.
We continue to invest heavily in automation, which allows for improved product quality, consistency and efficiency. However, the benefits of our industryredefining model are felt even after our products leave the bakery. By shipping products using prebuilt, shippable display cases through our DTW network,we believe we now offer retailers an enhanced merchandising asset and the ability to execute nationwide marketing campaigns with retail-ready displaysplaced in stores across the country all on the same day. Given the impulse driven nature of the category, in-store displays are a key differentiator in drivingsales velocities.
Our business model is supported by cost-advantaged manufacturing and distribution, expanded channel/retail store reach and enhanced in-storemerchandising capabilities, and offers retailers attractive margins that incentivize further distribution of our products.
We believe that impulse purchase decisions are another fundamental driver of retail sales in the SBG category, which makes prominent in-store placement anessential growth lever. The DTW model provides us with a competitive advantage through the ability to utilize retail-ready corrugated displays. These pre-built displays are visually impactful, produced economically, and require minimal in-store labor to assemble or load, thus providing cost-efficient displayvehicles that benefit both the retailer and us alike. Preloaded displays also allow us full control over our brand marketing, which allows us to execute retailer-wide campaigns regionally or nationally in a consistent manner, providing a unique competitive advantage across the entire SBG category, which ispredominantly DSD-served.
Investment of Capital
With nearly $200 million invested in the business since the re-launch in 2013, combined with our growth strategy, we anticipate continued investment in thebusiness under our strategic initiatives. Our capital investment focus will be on operational capabilities that directly support or expand our growth andinnovation. Further, we anticipate continued investment in automation and productivity gains.
Production
We produce Hostess® and/or Dolly Madison® products at three baking facilities located in Emporia, Kansas; Columbus, Georgia; and Indianapolis, Indiana.In-Store bakery products are produced at two baking facilities located in Southbridge, Massachusetts. We have invested heavily in baking and packagingtechnology to improve productivity and efficiency, including installing two Autobake systems and a fully-automated packaging system. A portion of ourproducts are co-manufactured and packaged under our brands and sold through our distribution facilities.
11

Our state of the art Autobake technologies have resulted in significant energy, labor and time savings. The technology provides fully-automated industrialbaking ovens and systems, combining cost efficient, compact and continuous baking solutions that can be custom configured. The first Autobake, whichexclusively produces Twinkies®, was installed in Emporia, Kansas in July 2014. Its capabilities include equipment that fully-automates the packagingprocess (from wrapping to palletizing). We installed the second Autobake in Emporia in March 2015, which exclusively produces cupcakes.
Raw Materials
Our principal raw materials are flour, sweeteners, edible oils and compound coating, as well as corrugate and films used to package our products. We utilizevarious buying strategies to lock in prices for various raw materials and packaging to reduce the impact of commodity price fluctuations. In addition, we aredependent on natural gas as fuel for firing our ovens. Our third-party common carriers use gasoline and diesel as fuel for their trucks.
We have strategic, long-term relationships with our key suppliers for our raw materials and packaging that help leverage our buying power. While the cost ofsome raw materials has, and may continue to, increase or decrease over time, we believe that we will be able to purchase an adequate supply of raw materialsas needed. We also sole source certain raw materials. We have multiple vendors that me et the Company’s supply requirements for the sole sourced materials,except in the case of the enzymes used in our ESL technology. With respect to the enzymes, we continue to evaluate other sources in order to maintainbusiness continuity and flexibility.
Customers
Our top 10 customers in 2017 accounted for 59.9% of total net revenue. During 2017, our largest customer, Wal-Mart and affiliates, represented 20.4% of ournet revenue. No other customer accounted for more than 10% of 2017 net revenue. The loss of, or a material negative change in, our relationship with Wal-Mart or any of our other top 10 customers could have a material adverse effect on our business. Our customers include mass merchandisers, supermarkets andother retailers, distributors, convenience, drug and dollar stores.
Competition
We face competition from other brands, large national bakeries, smaller regional operators, supermarket chains with their own private label brands, andgrocery stores with their own in-store bakery departments. The key competitive factors in the industry include product quality, price, customer service, brandrecognition and loyalty, promotional activities, access to retail outlets, sufficient shelf-space and ability to identify and satisfy consumer preferences. Someof our largest national competitors include Flowers Foods, Inc., Group Bimbo, S.A. and McKee Foods Corporation. In addition, we also compete withregional sweet goods branded manufacturers and other companies, including in the ISB space, that produce cookies, candies and other sweet snacks. At times,we experience pricing pressure in certain of our markets from competitor promotions and other pricing practices. However, we believe our brand recognition,product quality and innovation have generated consumer loyalty to many of our products help mitigate this impact.
Trademarks and Other Intellectual Property
We believe that our intellectual property has substantial value and has contributed to the success of our business. In particular, our trademarks, including ourregistered Hostess® and Dolly Madison® brand trademarks and our sub-brand trademarks, including Twinkies®, Ding Dongs®, Ho Hos®, Zingers®, Sno Balls®,and Donettes®, are valuable assets that we believe reinforces our consumers’ favorable perception of our products.
From time to time, third parties have used names similar to ours, have applied to register trademarks similar to ours and, we believe, have infringed ormisappropriated our intellectual property rights. Third parties have also, from time to time, opposed our trademarks and challenged our intellectual propertyrights. We respond to these actions on a case-by-case basis.
12
We rely on laws and regulations, as well as contractual restrictions, to protect our intellectual property and proprietary rights.
Research and Development
The majority of our research and development spend is dedicated to enhancing and expanding our product lines, responding to changing consumerpreferences and trends and continuing to enhance the taste of our products. In addition, our research and development organization provides technicalsupport to ensure that our core products are consistently produced in accordance with our high standards of quality and specifications. Finally, thisdepartment is charged with developing processes to reduce our costs without adversely affecting the quality of our products.
Government Regulation
Our operations, including the manufacturing, processing, formulating, packaging, labeling and advertising of products, are subject to regulation by variousfederal agencies, including the Food and Drug Administration (the “FDA”), the Federal Trade Commission (the “FTC”), and the Environmental ProtectionAgency (the “EPA”). Our products are subject to various local, state, and federal laws, regulations and administrative practices affecting our business. Wemust comply with provisions regulating registrations and licensing, health and sanitation standards, current Good Manufacturing Practices and traceability,food labeling, equal employment, wage and hour requirements, and environmental protection, among others. We take compliance and the safety of ourproducts seriously and take all steps that we consider necessary or appropriate to comply with all applicable laws, rules and regulations.
Employees
As of December 31, 2017, we employed approximately 1,340 people. Of our total workforce, approximately 1,170 were located at our bakery facilities. Theremaining workers comprised functions including operations management, sales and supply chain, among others. In early 2015, we entered into collectivebargaining agreements with the local unions of the Bakery, Confectionary, Tobacco Workers and Grain Millers Union in Indianapolis, Indiana andColumbus, Georgia. Approximately 360 employees are covered by these collective bargaining agreements.
We consider our relations with employees to be good and have not experienced a strike or significant work stoppage.
Employee Safety and Environmental Sustainability
We are committed to keeping our employees safe, protecting the environment and providing developmental opportunities for our employees. We endeavorto be a company of energized people and to be a good corporate citizen.
Our goal is to create a higher standard of living and quality of life for our employees and our communities. New automation, safety investments andbehavioral safety training have resulted in higher employee engagement and lower workers’ compensation costs. We meet periodically with local and stateleaders to discuss business planning and ways to become a better community partner with educational, municipal and regulatory agencies. We promoteparticipation in charitable organizations and make philanthropic donations in some of the communities where we operate.
We also routinely donate a portion of our excess production to food banks in areas where we operate.
Available Information
The Company’s Internet website address is www.hostessbrands.com. The Company makes available free of charge (other than an investor’s own Internetaccess charges) through its Internet website its Annual Report on Form 10-K, Quarterly Reports on Form 10-Q, Current Reports on Form 8-K, and amendmentsto those reports, on the same day they are electronically filed with, or furnished to, the Securities and Exchange Commission. The Company is not includingthe information contained on or available through its website as a part of, or incorporating such information by reference into, this Annual Report on Form10-K.
Item 1A. Risk Factors
You should carefully consider the following risk factors, together with all of the other information included in this Annual Report on Form 10-K. The risks
described below are those which we believe are the material risks that we face. Additional risks not presently known to us or which we currently consider
immaterial may also have an adverse effect on us. Any risk described below may have a material adverse impact on our business or financial condition.
Under these circumstances, the trading price of our common stock could decline, and you may lose all or part of your investment.
Risks Related to Our Business
Maintaining, extending and expanding our reputation and brand image are essential to our business success.
We have many iconic brands with long-standing consumer recognition. Our success depends on our ability to maintain our brand image for our existingproducts, extend our brands to new platforms, and expand our brand image with new product offerings.
13
We seek to maintain, extend, and expand our brand image through marketing investments, including advertising and consumer promotions, and productinnovation. Increasing attention on the role of food marketing could adversely affect our brand image. It could also lead to stricter regulations and greaterscrutiny of marketing practices. Existing or increased legal or regulatory restrictions on our advertising, consumer promotions and marketing, or our responseto those restrictions, could limit our efforts to maintain, extend and expand our brands. Moreover, adverse publicity about regulatory or legal action againstus could damage our reputation and brand image, undermine our customers’ confidence and reduce long-term demand for our products, even if the regulatoryor legal action is unfounded or not material to our operations.
In addition, our success in maintaining, extending, and expanding our brand image depends on our ability to adapt to a rapidly changing mediaenvironment. We increasingly rely on social media and online dissemination of advertising campaigns. The growing use of social and digital media increasesthe speed and extent that information or misinformation and opinions can be shared. Negative posts or comments about us, our brands or our products onsocial or digital media, whether or not valid, could seriously damage our brands and reputation. If we do not maintain, extend, and expand our brand image,then our product sales, financial condition and operating results could be materially and adversely affected.
Our intellectual property rights are valuable, and our failure to protect them could reduce the value of our products and brands.
We consider our intellectual property rights, including our trademarks, trade names, copyrights, trade secrets and trade dress, to be a significant and valuablepart of our business. We attempt to protect our intellectual property rights by taking advantage of a combination of applicable laws, copyright registrations,trademark registrations and/or applications for our trademarks, third-party agreements (including non-disclosures, assignments, distribution and/ormanufacturing, licenses, consents and co-existence) and policing and enforcement of third-party misuse or infringement of our intellectual property. Ourfailure to obtain or adequately protect our intellectual property rights, or any change in law or other changes that serve to lessen or remove the current legalprotections of our intellectual property, may diminish our competitiveness and could materially harm our business. In addition, third-party claims ofintellectual property infringement might require us to pay monetary damages or enter into costly license agreements. We also may be subject to injunctionsagainst development and sale of certain of our products.
Any litigation regarding intellectual property (including third-party infringement claims or litigation initiated by us to protect our intellectual propertyrights) could be costly and time-consuming and could divert management’s and other key personnel’s attention from our business operations. Any of theoccurrences outlined above could materially and adversely affect our reputation, product sales, financial condition and operating results.
We may be unable to leverage our brand value to compete against lower-priced alternative brands.
In nearly all of our product categories, we compete with lower-priced alternative products. Our products must provide higher value and/or quality to ourconsumers than alternatives, particularly during periods of economic uncertainty. Consumers may not buy our products if relative differences in value and/orquality between our products and retailer or other economy brands change in favor of competitors’ products or if consumers perceive this type of change. Ifconsumers choose the lower-priced brands, then we could lose market share or sales volumes, which could materially and adversely affect our product sales,financial condition, and operating results.
We may be unable to correctly predict, identify and interpret changes in consumer preferences and demand and offer new products or methods of
distribution to meet those changes.
Consumer preferences for food and snacking products change continually. Our success will depend on our ability to predict, identify and interpret the tastes,dietary habits, purchasing behavior and other preferences of consumers and to offer products that appeal to these preferences. Moreover, weak economicconditions, recession or other factors could affect consumer preferences and demand. If we do not offer products that appeal to consumers or if we misjudgeconsumer demand for our products, our sales and market share will decrease and our profitability could suffer.
14
We continually introduce new products or product extensions and our operating results and growth will depend upon the market reception of such newproducts. There can be no assurance that new products will find widespread acceptance among consumers, and unsuccessful product launches may decreaseour profitability and damage our brands’ reputation.
The continued prevalence of e-commerce and other methods of distribution outside of traditional retail shopping could also impact our sales and profitabilityif we are unable to adequately modify the marketing and distribution of our product in response.
In addition, prolonged negative perceptions concerning the health implications of certain food products could influence consumer preferences andacceptance of some of our products and marketing programs. For example, consumers are increasingly focused on health and wellness, and aware of productingredients such as added sugar and artificial flavors or colors. We might be unsuccessful in our efforts to effectively respond to changing consumerpreferences and social expectations. Continued negative perceptions and failure to satisfy consumer preferences could materially and adversely affect ourreputation, product sales, financial condition and operating results.
We operate in a highly competitive industry.
The sweet baked goods (“SBG”) industry is highly competitive. Numerous brands and products compete for shelf space and sales, with competition basedprimarily on product quality, brand recognition and loyalty, price, trade promotion, consumer promotion, customer service, and the ability to identify andsatisfy emerging consumer preferences. We face competition from other large national bakeries, smaller regional operators, supermarket chains with their ownprivate labeled brands, grocery stores with their own in-store bakery departments and diversified food companies. Our competitors include a significantnumber of companies of varying sizes, including divisions, subdivisions, or subsidiaries of larger companies. Many of these competitors have multipleproduct lines, substantially greater financial and other resources available to them, and may be substantially less leveraged than us. We may not be able tocompete successfully with these companies. Competitive pressures or other factors could cause us to lose market share, which may require us to lower prices,increase marketing and advertising expenditures, or increase the use of discounting or promotional campaigns, each of which could materially and adverselyaffect our margins and could result in a decrease in our operating results and profitability.
Our growth may be limited by our inability to maintain or add additional shelf or retail space for our products.
Our results will depend on our ability to drive revenue growth, in part, by expanding the distribution channels for our products. However, our ability to do somay be limited by our inability to secure additional shelf, display, or other retail space for our products. Retail space for sweet baked goods is limited andsubject to competitive and other pressures, and there can be no assurance that retail operators will provide us sufficient space for our products to enable us tomeet our growth objectives. If we are unable to maintain or increase our retail space, we could experience an adverse impact on our financial condition andoperating results.
Our success will depend on our continued ability to produce and successfully market products with extended shelf life.
We have invested to extend our product shelf life, while maintaining our products’ taste, texture and quality. Extended shelf life, or ESL, is an importantcomponent of our DTW model. Our ability to produce and successfully market existing and new products with this extended shelf life, while maintainingtaste, texture and quality, is essential to our success. If we are unable to continue to produce products with extended shelf life or if the products are notaccepted by consumers, we could be forced to make changes to our distribution model and that could have an adverse effect on our product sales, financialcondition and operating results.
15
If we do not successfully integrate and manage our acquired businesses or brands, our operating results may adversely be affected.
From time to time, we acquire businesses or brands to expand our product portfolio and distribution. We may incur unforeseen liabilities and obligations inconnection with the acquisition, integration, or management of the acquired businesses or brands and may encounter unexpected difficulties and costs inintegrating them into our operating and internal control structures. We may also experience delays in extending our internal control over financial reportingto a newly acquired business, which may increase the risk of failure to prevent misstatements in their financial records and in our consolidated financialstatements. Our financial performance depends in large part on how well we can manage and improve the performance of acquired businesses or brands. Wecannot assure you; however, that we will be able to achieve our strategic and financial objectives for such acquisitions. If we are unable to achieve suchobjectives, our operating results could be negatively affected.
We may be unable to drive revenue growth in our key products or add products that are faster-growing and more profitable.
The SBG industry’s overall growth is linked to population growth. Our future results will depend on our ability to drive revenue growth in our key products.Because our operations are concentrated in the United States where growth in the SBG industry has been moderate, our success also depends in part on ourability to enhance our portfolio by adding innovative new products. There can be no assurance that new products will find widespread acceptance amongconsumers. Our failure to drive revenue growth in our key products or develop innovative new products could materially and adversely affect ourprofitability, financial condition and operating results.
The cost to manufacture our products is subject to pricing volatility.
We purchase and use large quantities of commodities, including flour, sweeteners, edible oils and compound coating to manufacture our products. Inaddition, we purchase and use significant quantities of corrugate and films to package our products.
Prices for commodities, energy, transportation and other inputs are volatile and can fluctuate due to conditions that are difficult to predict, including globalcompetition for resources, currency fluctuations, severe weather or global climate change, consumer, industrial or investment demand and changes ingovernmental regulation and trade, alternative energy, and agricultural programs. Rising commodity, energy, transportation and other input costs couldmaterially and adversely affect our cost of operations, which could materially and adversely affect our financial condition and operating results.
Although we monitor our exposure to commodity prices as an integral part of our overall risk management program, and seek to utilize forward buyingstrategies through short-term and long-term advance purchase contracts, to lock in prices for certain high-volume raw materials, packaging components andfuel inputs, these strategies may not protect us from increases in specific raw materials costs.
Continued volatility or sustained increases in the prices of commodities, transportation and other supplies we purchase could increase the costs of ourproducts, and our profitability could suffer. Moreover, increases in the prices of our products to cover these increased costs may result in lower sales volumes.If we are not successful in our buying strategies, or if we are unable to price our products to cover increased costs, then commodity and other input pricevolatility or increases could materially and adversely affect our financial condition and operating results.
The ability to distribute our products is subject to significant changes in the availability and pricing of transportation.
We utilize third-party carriers to ship our product to customers. The availability of timely and reliable transportation and the associated costs are subject tomarket demand, carrier capacity, fuel prices and regulatory oversight. Our procurement of transportation services from a diversified group of carriers andcontinuous monitoring of carrier usage and pricing could be insufficient to protect us from changes in market demand or carrier capacity.
16
If we lose one or more of our major customers, or if any of our major customers experience significant business interruption, our operating results could be
adversely affected.
We have several large customers that account for a significant portion of our sales. Wal-Mart and its affiliates is our largest customer and representedapproximately 20.4% of our net revenue for the year ended December 31, 2017. Cumulatively, including Wal-Mart, our top ten customers accounted for59.9% of net revenue for the year ended December 31, 2017.
We do not have long-term supply contracts with any of our major customers. The loss of one or more major customers, a material reduction in sales to thesecustomers for any reason, or the occurrence of a significant business interruption of our customers’ operations would result in a decrease in our revenue,operating results, and earnings.
Our geographic focus makes us particularly vulnerable to economic and other events and trends in North America.
We operate in the United States and, therefore, are particularly susceptible to adverse United States regulations, economic climate, consumer trends, marketfluctuations, including commodity price fluctuations or supply shortages of our key ingredients, and other adverse events. The concentration of ourbusinesses in United States could present challenges and may increase the likelihood that an adverse event in United States would materially and adverselyaffect our product sales, financial condition and operating results.
The consolidation of retail customers could adversely affect us.
Retail customers may continue to consolidate, resulting in fewer customers for our business. Consolidation also produces larger retail customers that mayseek to leverage their position to improve their profitability by demanding improved efficiency, lower pricing, increased promotional programs, orspecifically tailored products. In addition, larger retailers have the scale to develop supply chains that permit them to operate with reduced inventories or todevelop and market their own retailer brands. Retail consolidation and increasing retailer power could materially and adversely affect our product sales,financial condition, and operating results.
Retail consolidation also increases the risk that adverse changes in our customers’ business operations or financial performance will have a correspondingmaterial and adverse effect on us. For example, if our customers cannot access sufficient funds or financing, then they may delay, decrease, or cancelpurchases of our products, or delay or fail to pay us for previous purchases, which could materially and adversely affect our product sales, financial condition,and operating results.
Our results could be adversely impacted as a result of increased labor and employee-related expenses.
Inflationary pressures and any shortages in the labor market could increase labor costs, which could have a material adverse effect on our consolidatedoperating results or financial condition. Our labor costs include the cost of providing employee benefits, including health and welfare, and severancebenefits. The annual costs of benefits vary with increased costs of health care and the outcome of collectively-bargained wage and benefit agreements.
Various federal and state labor laws govern our relationships with our employees and affect operating costs. These laws include employee classifications asexempt or non-exempt, minimum wage requirements, unemployment tax rates, workers’ compensation rates, overtime, family leave, safety standards, payrolltaxes, citizenship requirements and other wage and benefit requirements for employees classified as non-exempt. As our employees are paid at rates set above,but related to, the applicable minimum wage, further increases in the minimum wage could increase our labor costs. Significant additional governmentregulations could materially adversely affect our business, financial condition and operating results.
Higher health care costs and labor costs due to statutory and regulatory changes could adversely affect our business.
Under the United States Patient Protection and Affordable Care Act (the “ACA”), we are required to provide affordable coverage, as defined in the ACA, to allemployees, or otherwise be subject to a payment per employee based on the affordability criteria in the ACA. Additionally, some states and localities havepassed state and local laws mandating the provision of certain levels of health benefits by some employers. Increased health care and insurance costs couldhave a material adverse effect on our business, financial condition and operating results. In addition, changes in federal or state workplace regulations couldadversely affect our business, financial condition and operating results.
17
A portion of our workforce belongs to unions. Failure to successfully negotiate collective bargaining agreements, or strikes or work stoppages could cause
our business to suffer.
Approximately 26.9% of our employees, as of December 31, 2017, are covered by collective bargaining agreements and other employees may seek to becovered by collective bargaining agreements. Strikes or work stoppages or other business interruptions could occur if we are unable to renew theseagreements on satisfactory terms or enter into new agreements on satisfactory terms, which could impair manufacturing and distribution of our products orresult in a loss of sales, which could adversely impact our business, financial condition or operating results. The terms and conditions of existing,renegotiated or new collective bargaining agreements could also increase our costs or otherwise affect our ability to fully implement future operationalchanges to enhance our efficiency or to adapt to changing business needs or strategy.
We may be subject to product liability claims should the consumption of any of our products cause injury, illness or death.
We sell food products for human consumption, which involves risks such as product contamination or spoilage, mislabeling, product tampering and otheradulteration of food products. Consumption of a mislabeled, adulterated, contaminated or spoiled product may result in personal illness or injury. We couldbe subject to claims or law suits relating to an actual or alleged illness or injury, and we could incur liabilities that are not insured or exceed our insurancecoverage. Even if product liability claims against us are not successful or fully pursued, these claims could be costly and time consuming and may require ourmanagement to spend time defending the claims rather than operating the business. In addition, publicity regarding these claims could adversely affect ourreputation and brands.
Product recalls may increase our costs, negatively impact our brands’ reputation, and adversely affect our business.
A product that has been actually or allegedly misbranded or becomes adulterated could result in product withdrawals or recalls, destruction of productinventory, negative publicity, temporary plant closings, substantial cost of compliance or remediation, and potentially significant product liabilityjudgments against us. Any of these events could result in a loss of demand for our products, which would have a material adverse effect on our financialcondition, operating results or cash flows. We could also be adversely affected if consumers lose confidence in our product quality, safety and integritygenerally.
Unanticipated business disruptions could adversely affect our ability to provide our products to our customers.
Factors that are hard to predict or beyond our control, like weather, natural disasters, fire, explosions, terrorism, political unrest, generalized labor unrest orhealth pandemics could damage or disrupt our operations. In addition, our operations could be disrupted by a material equipment failure. We do not havesignificant redundant operating equipment to allow for such disruptions. Accordingly, if we do not effectively respond to disruptions in our operations, forexample, by replacing capacity at our manufacturing locations, or cannot quickly repair damage to our information, production or supply systems, we may belate in delivering or unable to deliver products to our customers. If that occurs, we may lose our customers’ confidence, and long-term consumer demand forour products could decline. These events could materially and adversely affect our product sales, financial condition and operating results.
We rely on third parties for significant services that are important to our business, and their failure to perform could adversely affect our business,
financial condition and operating results.
We operate a DTW distribution system that utilizes third-party centralized distribution centers and common carriers to transport a substantial majority of ourproducts. While this has expanded our distribution reach and reduced delivery costs, we are dependent upon third parties to effectively distribute ourproducts. Any failure by us to deliver our products in a timely manner would have an adverse impact on our sales and our reputation. In addition, we rely onthird parties for sales and marketing services. We do not have long-term contracts with any of these third-party service providers. Accordingly, anytermination by a third party provider of their services to us, or any failure by these third parties to perform their obligations to us, would have a materialadverse impact on our business and operating results.
18
We may not successfully identify or complete strategic acquisitions, alliances, divestitures or joint ventures.
From time to time, we may evaluate acquisition candidates, alliances or joint ventures that may strategically fit our business objectives, or we may considerdivesting businesses that do not meet our strategic objectives or growth or profitability targets. These activities may present financial, managerial, andoperational risks, including, but not limited to, diversion of management’s attention from existing core businesses. In addition, to the extent we undertakeacquisitions, alliances or joint ventures or other developments outside our core geography or in new categories, we may face additional risks related to suchdevelopments. Any of these factors could materially and adversely affect our product sales, financial condition, and operating results.
Legal claims or other regulatory enforcement actions could subject us to civil and criminal penalties.
As a large food company, we operate in a highly regulated environment with constantly evolving legal and regulatory frameworks. Various laws andregulations govern food production, storage, distribution, sales, advertising and marketing, as well as licensing, trade, labor, tax and environmental matters,and health and safety practices. Government authorities regularly change laws and regulations and their interpretations. Consequently, we are subject toheightened risk of legal claims or other regulatory enforcement actions. Although we have implemented policies and procedures designed to ensurecompliance with existing laws and regulations, there can be no assurance that our employees, contractors, or agents will not violate our policies andprocedures. Moreover, a failure to maintain effective control processes could lead to violations, unintentional or otherwise, of laws and regulations. Legalclaims or regulatory enforcement actions arising out of our failure or alleged failure to comply with applicable laws and regulations could subject us to civiland criminal penalties that could materially and adversely affect our product sales, reputation, financial condition, and operating results.
Our insurance may not provide adequate levels of coverage against claims.
We believe that we maintain insurance customary for businesses of our size and type. However, there are types of losses we may incur that cannot be insuredagainst or that we believe are not economically reasonable to insure. Such losses could have a material adverse effect on our business and operating results.
We are subject to laws and regulations relating to protection of the environment, worker health, and workplace safety. Costs to comply with these laws and
regulations, or claims with respect to environmental, health and safety matters, could have a significant negative impact on our business.
Our operations are subject to various federal, state and local laws and regulations relating to the protection of the environment, including those governing thedischarge of pollutants into the air and water, the management and disposal of solid and hazardous materials and wastes, employee exposure to hazards in theworkplace and the cleanup of contaminated sites. We are required to obtain and comply with environmental permits for many of our operations, andsometimes we are required to install pollution control equipment or to implement operational changes to limit air emissions or wastewater discharges and/ordecrease the likelihood of accidental releases of hazardous materials. We could incur substantial costs, including cleanup costs, civil or criminal fines orpenalties, and third-party claims for property damage or personal injury as a result of any violations of environmental laws and regulations, noncompliancewith environmental permit conditions or contamination for which we may be responsible that is identified or that may occur in the future. Such costs may bematerial.
Under federal and state environmental laws, we may be liable for the costs of investigation, removal or remediation of certain hazardous or toxic substances,as well as related costs of investigation and damage to natural resources, at various properties, including our current and former properties and the formerproperties of our predecessors, as well as off-site waste handling or disposal sites that we or our predecessors have used. Liability may be imposed upon uswithout regard to whether we knew of or caused the presence of such hazardous or toxic substances. Any such locations, or locations that we may acquire inthe future, may result in liability to us under such laws or expose us to third-party actions such as tort suits based on alleged conduct or environmentalconditions. In addition, we may be liable if hazardous or toxic substances migrate from properties for which we may be responsible to other properties.
19
In addition to regulations applicable to our operations, failure by any of our suppliers to comply with regulations, or allegations of compliance failure, maydisrupt their operations and could result in potential liability. Even if we were able to obtain insurance coverage or compensation for any losses or damagesresulting from the noncompliance of a supplier with applicable regulations, our brands and reputation may be adversely affected by negative perceptions ofour brands stemming from such compliance failures.
We cannot predict what environmental or health and safety legislation or regulations will be enacted in the future or how existing or future laws orregulations will be enforced, administered or interpreted. We also cannot predict the amount of future expenditures that may be required in order to complywith such environmental or health and safety laws or regulations or to respond to environmental claims.
Our operations are subject to regulation by the FDA, FTC and other governmental entities, and such regulations are subject to change from time to time
which could impact how we manage our production and sale of products.
Our operations are subject to extensive regulation by the FDA, the FTC and other national, state, and local authorities. For example, we are subject to theFDCA and regulations promulgated thereunder by the FDA. This comprehensive regulatory program governs, among other things, the manufacturing,composition and ingredients, packaging, and safety of food. Under this program, the FDA regulates manufacturing practices for foods through, among otherthings, its current “good manufacturing practices” regulations, or CGMPs, and specifies the recipes for certain foods. Our processing facilities and productsare subject to periodic inspection by federal, state, and local authorities. In January 2011, the FSMA was signed into law. The law increased the number ofinspections at food facilities in the United States in an effort to enhance the detection of food-borne illness outbreaks and order recalls of tainted foodproducts. It also imposes greater responsibility upon factors throughout the food chain to design and implement effective preventive food safety programs.The FTC and other authorities regulate how we market and advertise our products, and we could be the target of claims relating to alleged false or deceptiveadvertising under federal, state, and foreign laws and regulations. Changes in these laws or regulations or the introduction of new laws or regulations couldincrease the costs of doing business for us or our customers or suppliers or restrict our actions, causing our operating results to be adversely affected.
We seek to comply with applicable regulations through a combination of employing internal personnel to ensure quality-assurance compliance andcontracting with third-party laboratories that conduct analysis of products for the nutritional-labeling requirements. Compliance with regulations is costlyand time-consuming. Failure to comply with applicable laws and regulations or maintain permits and licenses relating to our operations could subject us tocivil remedies, including fines, injunctions, recalls or seizures, as well as potential criminal sanctions, which could result in increased operating costsresulting in a material adverse effect on our business and operating results.
Significant additional labeling or warning requirements or limitations on the marketing or sale of our products may reduce demand for such products and
could adversely affect our business or operating results.
Certain jurisdictions in which our products are made, manufactured, distributed or sold have either imposed, or are considering imposing, product labeling orwarning requirements or limitations on the marketing or sale of certain of our products as a result of ingredients or substances contained in such products.These types of provisions have required that we provide a label that highlights perceived concerns about a product or warns consumers to avoid consumptionof certain ingredients or substances present in our products. For example, in California, Proposition 65 requires a specific warning on any product thatcontains a substance listed by the State of California as having been found to cause cancer or birth defects, unless the level of such substance in the product isbelow a safe harbor level.
In addition, the United States has imposed new nutrition labeling regulations that require food manufacturers to declare the quantity of added sugar, as wellas update serving sizes and labeling requirements for certain package sizes. As we transition our packaging to comply with the proposed January 1, 2020compliance deadline, our new product labeling may impact the consumption and public perception of our products.
The imposition or proposed imposition of additional product labeling or warning requirements could reduce overall consumption of our products, lead tonegative publicity (whether based in scientific fact or not) or leave consumers with the perception (whether or not valid) that our products do not meet theirhealth and wellness needs. Such factors could adversely affect our business and operating results.
20
Changes in laws, regulations or rules, or a failure to comply with any laws, regulations or rules, may adversely affect our business, investments and results
of operations.
We are subject to laws, regulations and rules enacted by national, regional and local governments and NASDAQ. In particular, we are required to comply withcertain SEC, NASDAQ and other legal or regulatory requirements. Compliance with, and monitoring of, applicable laws, regulations and rules may bedifficult, time consuming and costly. Those laws, regulations or rules and their interpretation and application may also change from time to time and thosechanges could have a material adverse effect on our business and operating results. In particular, the new presidential administration has indicated its intentto pursue comprehensive regulatory reform. In addition, a failure to comply with applicable laws, regulations or rules, as interpreted and applied, could havea material adverse effect on our business and operating results.
Unanticipated changes in effective tax rates or adverse outcomes resulting from examination of our income or other tax returns could adversely affect our
financial condition and results of operations.
We are subject to income taxes in the United States, and our domestic tax liabilities will be subject to the allocation of expenses in differing jurisdictions.Our future effective tax rates could be subject to volatility or adversely affected by a number of factors, including:
• changes in the valuation of our deferred tax assets and liabilities;• expected timing and amount of the release of any tax valuation allowances;• tax effects of stock-based compensation;• costs related to intercompany restructurings;• changes in tax laws, regulations or interpretations thereof; and• lower than anticipated future earnings in jurisdictions where we have lower statutory tax rates and higher than anticipated future earnings in
jurisdictions where we have higher statutory tax rates.
In addition, we may be subject to audits of our income, sales and other transaction taxes by United States federal and state authorities. Outcomes from theseaudits could have an adverse effect on our financial condition and results of operations.
Our business operations could be disrupted if our information technology systems fail to perform adequately.
The efficient operation of our business depends on our information technology systems, some of which are managed by third-party service providers. We relyon our information technology systems to effectively manage our business data, communications, supply chain, order entry and fulfillment, and otherbusiness processes. The failure of our information technology systems to perform as we anticipate could disrupt our business and could result in transactionerrors, processing inefficiencies, and the loss of sales and customers, causing our business and operating results to suffer. In addition, our informationtechnology systems may be vulnerable to damage or interruption from circumstances beyond our control, including fire, natural disasters, power outages,systems failures, security breaches, cyber-attacks and viruses. Any such damage or interruption could have a material adverse effect on our business.
We may be unable to hire or retain and develop key personnel or a highly skilled and diverse workforce or manage changes in our workforce.
We must hire, retain and develop a highly skilled and diverse workforce. We compete to hire new personnel in the many regions in which we manufactureand market our products and then to develop and retain their skills and competencies. Unplanned turnover or failure to develop adequate succession plans forleadership positions or hire and retain a diverse workforce with the skills and in the locations we need to operate and grow our business could deplete ourinstitutional knowledge base and erode our competitiveness. With our CEO Bill Toler’s expected retirement, Dean Metropoulos has expanded his duties asExecutive Chairman to ensure continuity of leadership.
Our inability to find a permanent CEO or the loss of our other senior managers or other key personnel, or our inability to identify, recruit and retain highlyskilled personnel, could materially and adversely affect our business, operating results and financial condition.
21

We also face increased personnel-related risks. These risks could lead to operational challenges, including increased competition for employees with theskills we require to achieve our business goals, and higher employee turnover, including employees with key capabilities. Furthermore, we might be unableto manage changes in, or that affect, our workforce appropriately or satisfy the legal requirements associated with how we manage and compensate ouremployees.
These risks could materially and adversely affect our reputation, ability to meet the needs of our customers, product sales, financial condition and operatingresults.
Risks Related to Our Capital Structure
Our substantial leverage could adversely affect our ability to raise additional capital to fund our operations, limit our ability to react to changes in the
economy or our industry, expose us to interest rate risk to the extent of our variable rate debt, and prevent us from meeting our obligations under our
indebtedness.
We are highly leveraged. As of December 31, 2017, our total balance on long term debt, excluding deferred financing charges, discount, premium, and capitallease obligations, was approximately $993 million. Our high degree of leverage could have important consequences, including:
• requiring a substantial portion of cash flow from operations to be dedicated to the payment of principal and interest on our indebtedness,thereby reducing our ability to use our cash flow to fund our operations, capital expenditures, and future business opportunities or to paydividends;
• exposing us to the risk of increased interest rates because all of our borrowings, including our borrowings under our credit facilities, are atvariable rates;
• making it more difficult for us to make payments on our indebtedness;• increasing our vulnerability to general economic and industry conditions;• restricting us from making strategic acquisitions or causing us to make non-strategic divestitures;• subjecting us to restrictive covenants that may limit our flexibility in operating our business;• limiting our ability to obtain additional financing for working capital, capital expenditures, product development, debt service requirements,
acquisitions, and general corporate or other purposes; and• placing us at a competitive disadvantage compared to our competitors who are less highly leveraged.
Despite our significant leverage, we may be able to incur significant additional amounts of debt, which could further exacerbate the risks associated with oursignificant leverage.
We may be unable to obtain additional financing to fund our operations and growth.
We may require additional financing to fund our operations or growth. The failure to secure additional financing could have a material adverse effect on ourcontinued development or growth. None of our officers, directors or stockholders is required to provide any financing to us.
The Metropoulos Entities and The Gores Group have significant influence over us.
As of February 23, 2018, The Gores Group (and related entities) and the Metropoulos Entities beneficially own approximately 28% of our common stock,including approximately 6% of our Class A common stock and 100% of our Class B common stock. Holders of our Class B stock are entitled to vote on allmatters presented to the Company’s stockholders, but do not have any economic rights to the distributions of the Company. As long as the MetropoulosEntities and The Gores Group own or control a significant percentage of our outstanding voting power, they will have the ability to significantly influenceall corporate actions requiring stockholder approval, including the election and removal of directors and the size of our board, any amendment to ourcertificate of incorporation or bylaws, or the approval of any merger or other significant corporate transaction, including a sale of substantially all of ourassets.
Pursuant to the Executive Chairman Director Agreement entered into with Mr. Metropoulos, Mr. Metropoulos serves as the Executive Chairman of ourboard. The Executive Chairman Director Agreement provides that, for so long as the Metropoulos Entities in the aggregate hold at least 7.5% of the capitalstock of the Company on a fully-diluted basis, Mr. Metropoulos will have the right to designate one member for election to the board, which designee will beMr. Metropoulos himself so long as he is employed as Executive Chairman.
22
The Metropoulos Entities’ and The Gores Group’s interests may not align with the interests of our other stockholders. The Metropoulos Entities and TheGores Group are in the business of making investments in companies and may acquire and hold interests in businesses that compete directly or indirectlywith us. The Metropoulos Entities and The Gores Group may also pursue acquisition opportunities that may be complementary to our business.
We are required to pay the Metropoulos Entities for a significant portion of the tax benefit relating to any additional tax depreciation or amortization
deductions we claim as a result of any step up in the tax basis of the assets of our operating subsidiaries resulting from the Metropoulos Entities’ exchange
of shares of Class B common stock and Class B units of Hostess Holdings for shares of our Class A common stock.
Class B units in Hostess Holdings may be exchanged (together with the cancellation of shares of our Class B common stock) by the holders thereof for, at theCompany’s election, shares of Class A common stock, on a one-for-one basis (subject to customary anti-dilution adjustments), or the cash equivalent of suchshares. The exchanges may result in increases to our share of the tax basis of the tangible and intangible assets of our operating subsidiaries that otherwisewould not have been available, although the United States Internal Revenue Service may challenge all or part of that tax basis increase, and a court couldsustain such a challenge by the United States Internal Revenue Service. These increases in tax basis, if sustained, may reduce the amount of tax that we wouldotherwise be required to pay in the future.
We are party to a Tax Receivable Agreement that provides for the payment by us of approximately 85% of the net cash savings, if any, in United Statesfederal, state and local income tax that the Company actually realizes (or is deemed to realize in certain circumstances) as a result of: (i) certain increases intax basis resulting from the Business Combination; (ii) certain tax attributes of Hostess Holdings and its subsidiaries existing prior to the BusinessCombination and prior to subsequent exchanges of Class B units; (iii) certain increases in tax basis resulting from exchanges of Class B units; (iv) imputedinterest deemed to be paid by the Company as a result of payments that it makes under the Tax Receivable Agreement; and (v) certain increases in tax basisresulting from payments that the Company makes under the Tax Receivable Agreement.
In addition, in January 2018, we entered into an agreement with the Apollo Funds terminating all future payment obligations to the Apollo Funds inexchange for a payment of $34.0 million. However, if the Company enters into a definitive agreement on or before January 26, 2019 and that agreementresults in a change in control (as defined in the Tax Receivable Agreement), the Company would be required to make an additional payment of $10.0 millionto the Apollo Funds.
If our dividend policy is materially different than the distribution policy of Hostess Holdings, upon the exchange of any Class B units, the limited partners
of Hostess Holdings could receive a disproportionate interest in the aggregate distributions by our operating subsidiaries that have not been distributed by
us.
We and the Metropoulos Entities are limited partners of Hostess Holdings. To the extent Hostess Holdings distributes to its limited partners a greater share ofincome received from our operating subsidiaries than we distribute to our stockholders, then any of the Metropoulos Entities who participate in suchdistribution by Hostess Holdings and subsequently exercise their rights to exchange limited partnership units in Hostess Holdings for Class A common stockmay receive a disproportionate interest in the aggregate distributions by our operating subsidiaries that have not been distributed by us. The reason is thatsuch Metropoulos Entity could receive both (i) the benefit of a distribution by Hostess Holdings to its limited partners, including such Metropoulos Entity,and (ii) the benefit of a distribution by the Company to the holders of Class A common stock, including such Metropoulos Entity. Consequently, if ourdividend policy does not match the distribution policy of Hostess Holdings, other holders of Class A common stock as of the date of an exchange couldexperience a reduction in their interest in the profits previously distributed by our operating subsidiaries that have not been distributed by us. Our currentdividend policy could result in distributions to our common stockholders that are different from the distributions made by Hostess Holdings to its limitedpartners.
23
Our only significant asset is our ownership interest in our operating subsidiaries and such ownership may not be sufficient to pay dividends or make
distributions or loans to enable us to pay any dividends on our common stock or satisfy our other financial obligations, including our obligations under
the Tax Receivable Agreement.
We have no direct operations and no significant assets other than our ownership interest in our operating subsidiaries. We depend on our operatingsubsidiaries for distributions, loans and other payments to generate the funds necessary to meet our financial obligations, including our expenses as apublicly traded company, to pay any dividends with respect to our common stock, and to satisfy our obligations under the Tax Receivable Agreement. Thefinancial condition and operating requirements of our operating subsidiaries may limit our ability to obtain cash from our operating subsidiaries. Theearnings from, or other available assets of, our operating subsidiaries may not be sufficient to pay dividends or make distributions or loans to enable us to payany dividends on our common stock or satisfy our other financial obligations, including our obligations under the Tax Receivable Agreement.
The ability of our operating subsidiaries (other than subsidiaries which have been designated as unrestricted pursuant to our ability to do so in certain limitedcircumstances) to make distributions, loans and other payments to us for the purposes described above and for any other purpose are governed by the terms ofour credit facilities, and will be subject to the negative covenants set forth therein. Any loans or other extensions of credit will be subject to the investmentcovenants contained therein, which provide for several exceptions including, among others (i) a general investment basket equal to the greater of a fixeddollar amount and a percentage of EBITDA and (ii) an unlimited investment basket based on satisfying a total net leverage ratio on a pro formabasis. Similarly, any dividends, distributions or similar payments will be subject to the dividends and distributions covenant under such credit facilities,which also provide for several exceptions including, among others (i) for payment of overhead and certain fees and expenses of parent companies, (ii) for taxdistributions, subject to certain limitations, (iii) a general dividend and distribution basket equal to the greater of a fixed dollar amount and a percentage ofEBITDA and (iv) an unlimited dividend and distribution basket based on satisfying a total net leverage ratio on a pro forma basis.
Risks Related to Our Class A Common Stock
Resales of the shares of Class A common stock issued in the Business Combination could depress the market price of our Class A common stock.
There may be a large number of shares of Class A common stock sold in the market in the near future. These sales, or the perception in the market that theholders of a large number of shares intend to sell shares, could reduce the market price of our Class A common stock. As of February 27, 2018, theMetropoulos Entities held approximately 23% of our Common Stock, including 100% of our Class B common stock, and The Gores Group heldapproximately 5% of our Common Stock. All such shares of Class A common stock held by or obtainable in exchange for Class B common stock and Class Bunits held by the Metropoulos Entities have been registered for resale under the Securities Act pursuant to a shelf registration statement filed in November2016.
We have approximately 99,855,625 shares of Class A common stock outstanding as of February 23, 2018. There are also remaining registered shares of ClassA common stock that we may issue under the Hostess Brands, Inc. 2016 Equity Incentive Plan, which shares may be freely sold in the public market uponissuance, subject to compliance with stock ownership guidelines and volume limitations applicable to affiliates.
In addition, as of December 31, 2017, there were 44,182,889 public warrants and 12,317,001 private warrants outstanding. Each warrant entitles its holder topurchase one half of one share of our Class A common stock at an exercise price of $5.75 per half share, to be exercised only for a whole number of shares ofour Class A common stock.
Such sales of shares of Class A common stock or the perception of such sales may depress the market price of our Class A common stock.
24
A market for our securities may not continue, which would adversely affect the liquidity and price of our securities.
The price of our securities may fluctuate significantly due to general market and economic conditions. An active trading market for our securities may not besustained. In addition, the price of our securities can vary due to general economic conditions and forecasts, our general business condition and the release ofour financial reports. Additionally, if our securities become delisted from NASDAQ for any reason, and are quoted on the OTC Bulletin Board, an inter-dealerautomated quotation system for equity securities that is not a national securities exchange, the liquidity and price of our securities may be more limited thanif we were quoted or listed on NASDAQ or another national securities exchange. You may be unable to sell your securities unless a market can be establishedor sustained.
If securities or industry analysts cease publishing research or reports about us, our business, or our market, or if they change their recommendations
regarding our Class A common stock adversely, then the price and trading volume of our Class A common stock could decline.
The trading market for our Class A common stock will be influenced by the research and reports that industry or securities analysts may publish about us, ourbusiness, our market, or our competitors. Securities and industry analysts may cease to publish research on us. If any of the analysts who may cover us changetheir recommendation regarding our stock adversely, or provide more favorable relative recommendations about our competitors, the price of our Class Acommon stock would likely decline. If any analyst who may cover us were to cease coverage of us or fail to regularly publish reports on it, we could losevisibility in the financial markets, which could cause our stock price or trading volume to decline.
If we fail to maintain an effective system of internal controls, we may not be able to accurately report our financial results.
We are required to comply with Section 404 of the Sarbanes Oxley Act, which requires, among other things, that companies maintain disclosure controls andprocedures to ensure timely disclosure of material information, and that management review the effectiveness of those controls on a quarterly basis. Effectiveinternal controls are necessary for us to provide reliable financial reports and to help prevent fraud, and our management and other personnel devote asubstantial amount of time to these compliance requirements. Moreover, these rules and regulations increased our legal and financial compliance costs andmake some activities more time-consuming and costly. We cannot be certain that we will be able to maintain adequate controls over our financial processesand reporting in the future or that we will be able to comply with our obligations under Section 404 of the Sarbanes Oxley Act. Section 404 of the Sarbanes-Oxley Act also requires us to evaluate annually the effectiveness of our internal controls over financial reporting as of the end of each fiscal year and toinclude a management report assessing the effectiveness of our internal control over financial reporting in our Annual Report on Form 10-K. If we fail tomaintain the adequacy of our internal controls, we cannot assure you that we will be able to conclude in the future that we have effective internal control overfinancial reporting and/or we may encounter difficulties in implementing or improving our internal controls, which could harm our operating results or causeus to fail to meet our reporting obligations. If we fail to maintain effective internal controls, we might be subject to sanctions or investigation by regulatoryauthorities, such as the SEC. Any such action could adversely affect our financial results and may also result in delayed filings with the SEC.
25
Our quarterly operating results may fluctuate significantly and could fall below the expectations of securities analysts and investors due to seasonality and
other factors, some of which are beyond our control, resulting in a decline in our stock price.
Our quarterly operating results may fluctuate significantly because of seasonality and several other factors, including:
• labor availability and costs for hourly and management personnel;• profitability of our products, especially in new markets and due to seasonal fluctuations;• changes in interest rates;• impairment of long-lived assets;• macroeconomic conditions, both nationally and locally;• disruption in production by us or a co-manufacturer;• negative publicity relating to products we sell;• changes in consumer preferences and competitive conditions;• expansion to new markets;• fluctuations in commodity prices; and• actions by our competitors (e.g., pricing promotions).
Fluctuations in our operating results due to the foregoing or other factors could cause our results to fall below the expectations of securities analysts andinvestors, resulting in a decline in our stock price.
Anti-takeover provisions contained in our certificate of incorporation and bylaws, as well as provisions of Delaware law, could impair a takeover attempt.
Our certificate of incorporation contains provisions that may discourage unsolicited takeover proposals that stockholders may consider to be in their bestinterests. We are also subject to anti-takeover provisions under Delaware law, which could delay or prevent a change of control. Together, these provisionsmay make more difficult the removal of management and may discourage transactions that otherwise could involve payment of a premium over prevailingmarket prices for our securities. These provisions include:
• a staggered board providing for three classes of directors, which limits the ability of a stockholder or group to gain control of our board;• no cumulative voting in the election of directors, which limits the ability of minority stockholders to elect director candidates;• the right of our board to elect a director to fill a vacancy created by the expansion of our board or the resignation, death or removal of a director
in certain circumstances, which prevents stockholders from being able to fill vacancies on our board;• a prohibition on stockholder action by written consent, which forces stockholder action to be taken at an annual or special meeting of our
stockholders;• a prohibition on stockholders calling a special meeting and the requirement that a meeting of stockholders may only be called by members of
our board, which may delay the ability of our stockholders to force consideration of a proposal or to take action, including the removal ofdirectors;
• the requirement that changes or amendments to certain provisions of our certificate of incorporation or bylaws must be approved by holders ofat least two-thirds of our common stock; and
• advance notice procedures that stockholders must comply with in order to nominate candidates to our board or to propose matters to be actedupon at a meeting of stockholders, which may discourage or deter a potential acquirer from conducting a solicitation of proxies to elect theacquirer’s own slate of directors or otherwise attempting to obtain control of us.
Item 1B. Unresolved Staff Comments
None.
26
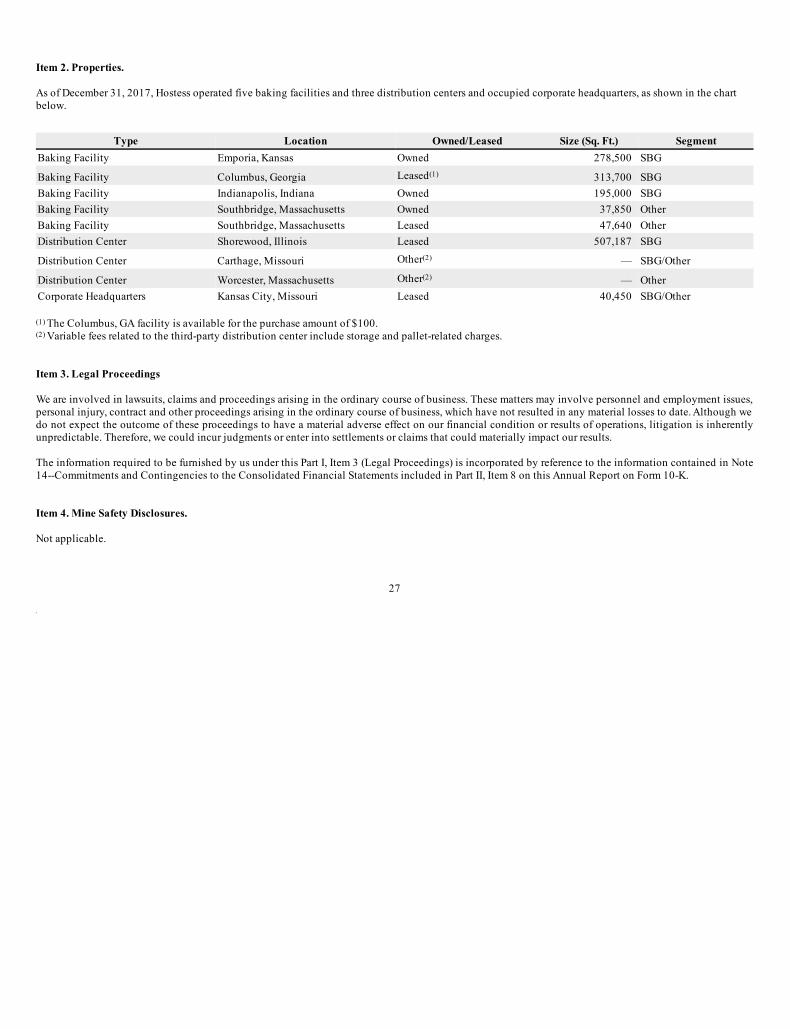
Item 2. Properties.
As of December 31, 2017, Hostess operated five baking facilities and three distribution centers and occupied corporate headquarters, as shown in the chartbelow.
Type Location Owned/Leased Size (Sq. Ft.) Segment
Baking Facility Emporia, Kansas Owned 278,500 SBG
Baking Facility Columbus, Georgia Leased(1) 313,700 SBG
Baking Facility Indianapolis, Indiana Owned 195,000 SBG
Baking Facility Southbridge, Massachusetts Owned 37,850 Other
Baking Facility Southbridge, Massachusetts Leased 47,640 Other
Distribution Center Shorewood, Illinois Leased 507,187 SBG
Distribution Center Carthage, Missouri Other(2) — SBG/Other
Distribution Center Worcester, Massachusetts Other(2) — Other
Corporate Headquarters Kansas City, Missouri Leased 40,450 SBG/Other
(1) The Columbus, GA facility is available for the purchase amount of $100.(2) Variable fees related to the third-party distribution center include storage and pallet-related charges.
Item 3. Legal Proceedings
We are involved in lawsuits, claims and proceedings arising in the ordinary course of business. These matters may involve personnel and employment issues,personal injury, contract and other proceedings arising in the ordinary course of business, which have not resulted in any material losses to date. Although wedo not expect the outcome of these proceedings to have a material adverse effect on our financial condition or results of operations, litigation is inherentlyunpredictable. Therefore, we could incur judgments or enter into settlements or claims that could materially impact our results.
The information required to be furnished by us under this Part I, Item 3 (Legal Proceedings) is incorporated by reference to the information contained in Note14--Commitments and Contingencies to the Consolidated Financial Statements included in Part II, Item 8 on this Annual Report on Form 10-K.
Item 4. Mine Safety Disclosures.
Not applicable.
27
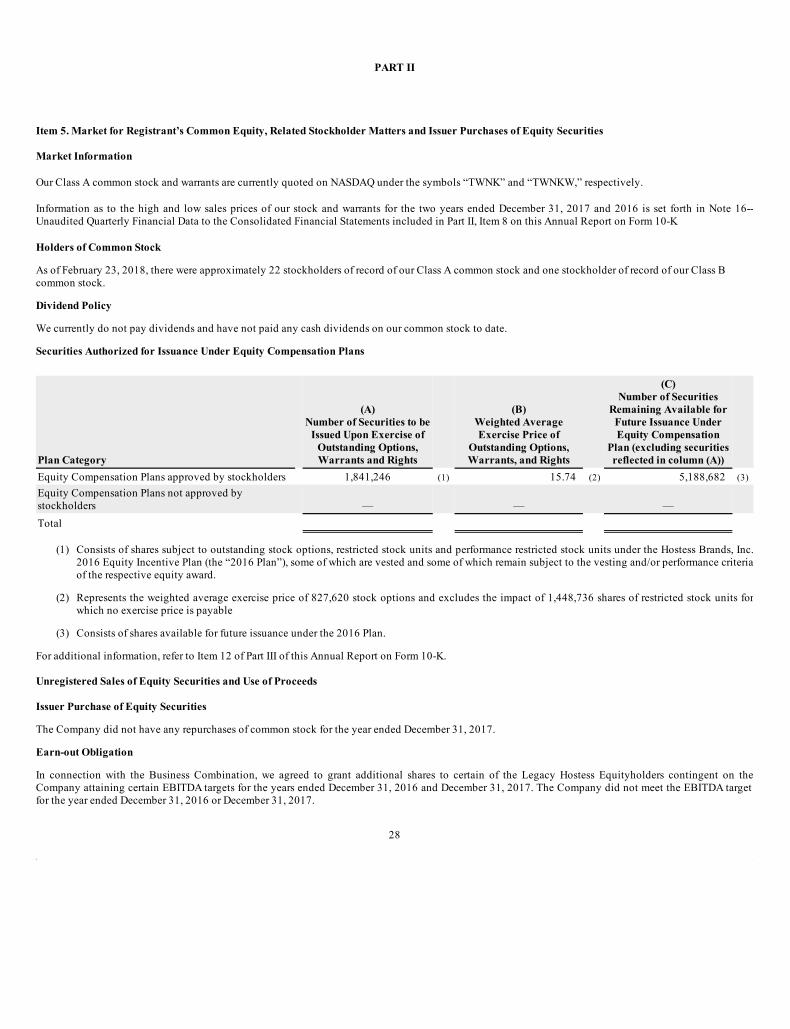
PART II
Item 5. Market for Registrant’s Common Equity, Related Stockholder Matters and Issuer Purchases of Equity Securities
Market Information
Our Class A common stock and warrants are currently quoted on NASDAQ under the symbols “TWNK” and “TWNKW,” respectively.
Information as to the high and low sales prices of our stock and warrants for the two years ended December 31, 2017 and 2016 is set forth in Note 16--Unaudited Quarterly Financial Data to the Consolidated Financial Statements included in Part II, Item 8 on this Annual Report on Form 10-K
Holders of Common Stock
As of February 23, 2018, there were approximately 22 stockholders of record of our Class A common stock and one stockholder of record of our Class Bcommon stock.
Dividend Policy
We currently do not pay dividends and have not paid any cash dividends on our common stock to date.
Securities Authorized for Issuance Under Equity Compensation Plans
Plan Category
(A)
Number of Securities to be
Issued Upon Exercise of
Outstanding Options,
Warrants and Rights
(B)
Weighted Average
Exercise Price of
Outstanding Options,
Warrants, and Rights
(C)
Number of Securities
Remaining Available for
Future Issuance Under
Equity Compensation
Plan (excluding securities
reflected in column (A))
Equity Compensation Plans approved by stockholders 1,841,246 (1) 15.74 (2) 5,188,682 (3)
Equity Compensation Plans not approved bystockholders — — —
Total
(1) Consists of shares subject to outstanding stock options, restricted stock units and performance restricted stock units under the Hostess Brands, Inc.2016 Equity Incentive Plan (the “2016 Plan”), some of which are vested and some of which remain subject to the vesting and/or performance criteriaof the respective equity award.
(2) Represents the weighted average exercise price of 827,620 stock options and excludes the impact of 1,448,736 shares of restricted stock units forwhich no exercise price is payable
(3) Consists of shares available for future issuance under the 2016 Plan.
For additional information, refer to Item 12 of Part III of this Annual Report on Form 10-K.
Unregistered Sales of Equity Securities and Use of Proceeds
Issuer Purchase of Equity Securities
The Company did not have any repurchases of common stock for the year ended December 31, 2017.
Earn-out Obligation
In connection with the Business Combination, we agreed to grant additional shares to certain of the Legacy Hostess Equityholders contingent on theCompany attaining certain EBITDA targets for the years ended December 31, 2016 and December 31, 2017. The Company did not meet the EBITDA targetfor the year ended December 31, 2016 or December 31, 2017.
28

In addition, we agreed to grant additional shares to Mr. Metropoulos as part of the Executive Chairman Agreement if certain EBITDA targets are met for theyear ending December 31, 2018. The potential grants range from zero to 2.7 million shares. No amounts were accrued for this earn-out as of December 31,2017, as management determined that it was not probable these thresholds would be met.
Warrants
As of December 31, 2017, there were 44,182,889 public warrants and 12,317,001 private warrants outstanding. Each warrant entitles its holder to purchaseone half of one share of our Class A common stock at an exercise price of $5.75 per half share, to be exercised only for a whole number of shares of our ClassA common stock. The warrants became exercisable on December 4, 2016 and expire five years after that date or earlier upon redemption or liquidation. TheCompany may redeem the outstanding warrants at a price $0.01 per warrant, if the last sale price of the Company’s common stock equals or exceeds $24.00per share for any 20 trading days within a 30 trading day period ending on the third business day before the Company sends the notice of redemption to thewarrant holders. The private placement warrants, however, are nonredeemable so long as they are held by Gores Sponsor, LLC or its permitted transferees.During the the year ended December 31, 2017, the private warrants were registered with the SEC for future potential sales to the public. When sold to thepublic, the private placement warrants will become public warrants.
29
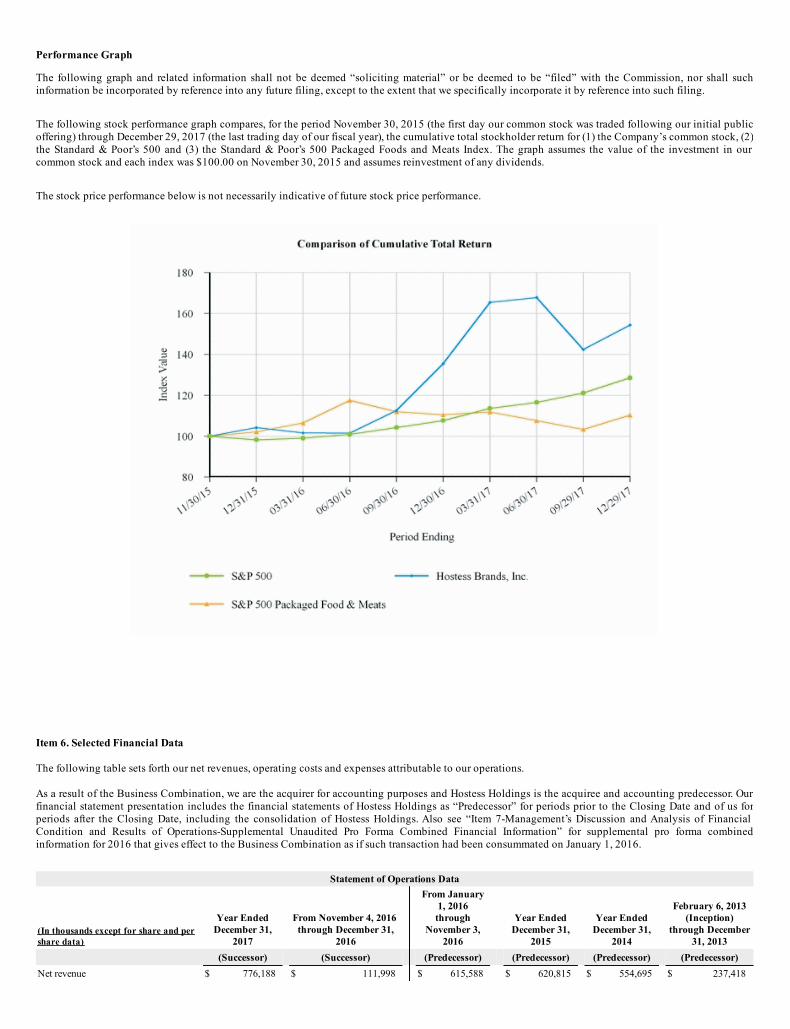
Performance Graph
The following graph and related information shall not be deemed “soliciting material” or be deemed to be “filed” with the Commission, nor shall suchinformation be incorporated by reference into any future filing, except to the extent that we specifically incorporate it by reference into such filing.
The following stock performance graph compares, for the period November 30, 2015 (the first day our common stock was traded following our initial publicoffering) through December 29, 2017 (the last trading day of our fiscal year), the cumulative total stockholder return for (1) the Company’s common stock, (2)the Standard & Poor’s 500 and (3) the Standard & Poor’s 500 Packaged Foods and Meats Index. The graph assumes the value of the investment in ourcommon stock and each index was $100.00 on November 30, 2015 and assumes reinvestment of any dividends.
The stock price performance below is not necessarily indicative of future stock price performance.
Item 6. Selected Financial Data
The following table sets forth our net revenues, operating costs and expenses attributable to our operations.
As a result of the Business Combination, we are the acquirer for accounting purposes and Hostess Holdings is the acquiree and accounting predecessor. Ourfinancial statement presentation includes the financial statements of Hostess Holdings as “Predecessor” for periods prior to the Closing Date and of us forperiods after the Closing Date, including the consolidation of Hostess Holdings. Also see “Item 7-Management’s Discussion and Analysis of FinancialCondition and Results of Operations-Supplemental Unaudited Pro Forma Combined Financial Information” for supplemental pro forma combinedinformation for 2016 that gives effect to the Business Combination as if such transaction had been consummated on January 1, 2016.
Statement of Operations Data
(In thousands except for share and per
share data)
Year Ended
December 31,
2017
From November 4, 2016
through December 31,
2016
From January
1, 2016
through
November 3,
2016
Year Ended
December 31,
2015
Year Ended
December 31,
2014
February 6, 2013
(Inception)
through December
31, 2013
(Successor) (Successor) (Predecessor) (Predecessor) (Predecessor) (Predecessor)
Net revenue $ 776,188 $ 111,998 $ 615,588 $ 620,815 $ 554,695 $ 237,418
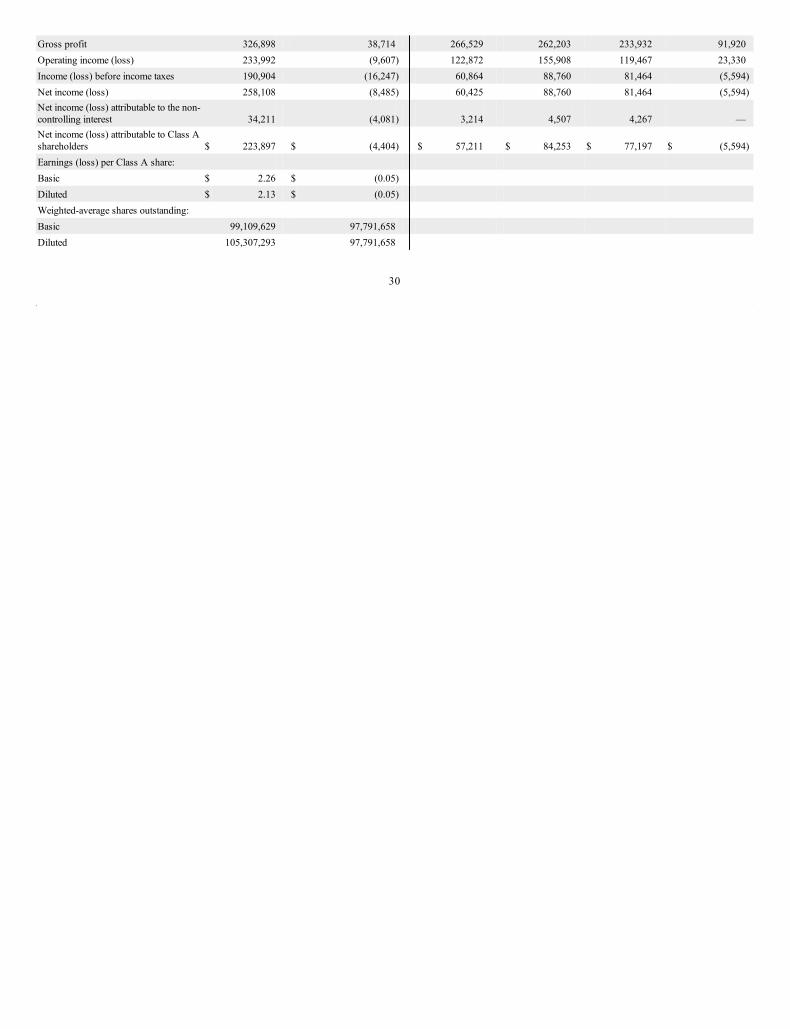
Gross profit 326,898 38,714 266,529 262,203 233,932 91,920
Operating income (loss) 233,992 (9,607) 122,872 155,908 119,467 23,330
Income (loss) before income taxes 190,904 (16,247) 60,864 88,760 81,464 (5,594)
Net income (loss) 258,108 (8,485) 60,425 88,760 81,464 (5,594)
Net income (loss) attributable to the non-controlling interest 34,211 (4,081) 3,214 4,507 4,267 —
Net income (loss) attributable to Class Ashareholders $ 223,897 $ (4,404) $ 57,211 $ 84,253 $ 77,197 $ (5,594)
Earnings (loss) per Class A share:
Basic $ 2.26 $ (0.05)
Diluted $ 2.13 $ (0.05)
Weighted-average shares outstanding:
Basic 99,109,629 97,791,658
Diluted 105,307,293 97,791,658
30
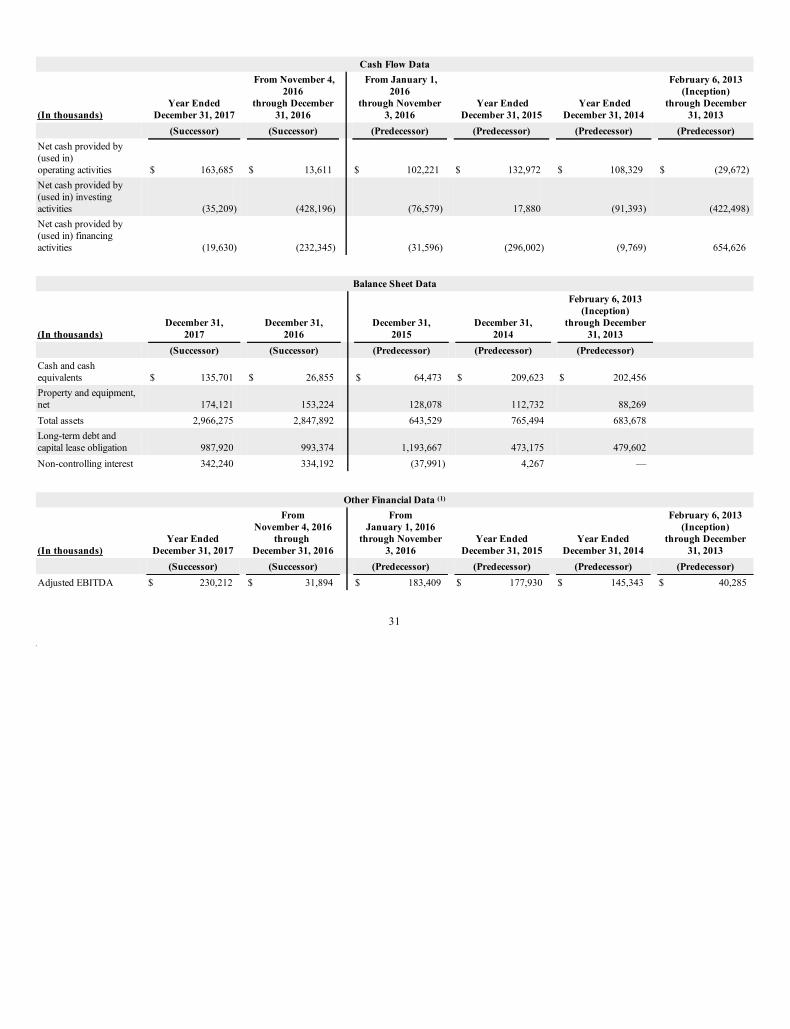
Cash Flow Data
(In thousands) Year Ended
December 31, 2017
From November 4,
2016
through December
31, 2016
From January 1,
2016
through November
3, 2016 Year Ended
December 31, 2015 Year Ended
December 31, 2014
February 6, 2013
(Inception)
through December
31, 2013
(Successor) (Successor) (Predecessor) (Predecessor) (Predecessor) (Predecessor)
Net cash provided by(used in)operating activities $ 163,685 $ 13,611 $ 102,221 $ 132,972 $ 108,329 $ (29,672)
Net cash provided by(used in) investingactivities (35,209) (428,196) (76,579) 17,880 (91,393) (422,498)
Net cash provided by(used in) financingactivities (19,630) (232,345) (31,596) (296,002) (9,769) 654,626
Balance Sheet Data
(In thousands) December 31,
2017 December 31,
2016 December 31,
2015 December 31,
2014
February 6, 2013
(Inception)
through December
31, 2013
(Successor) (Successor) (Predecessor) (Predecessor) (Predecessor)
Cash and cashequivalents $ 135,701 $ 26,855 $ 64,473 $ 209,623 $ 202,456
Property and equipment,net 174,121 153,224 128,078 112,732 88,269
Total assets 2,966,275 2,847,892 643,529 765,494 683,678
Long-term debt andcapital lease obligation 987,920 993,374 1,193,667 473,175 479,602
Non-controlling interest 342,240 334,192 (37,991) 4,267 —
Other Financial Data (1)
(In thousands) Year Ended
December 31, 2017
From
November 4, 2016
through
December 31, 2016
From
January 1, 2016
through November
3, 2016 Year Ended
December 31, 2015 Year Ended
December 31, 2014
February 6, 2013
(Inception)
through December
31, 2013
(Successor) (Successor) (Predecessor) (Predecessor) (Predecessor) (Predecessor)
Adjusted EBITDA $ 230,212 $ 31,894 $ 183,409 $ 177,930 $ 145,343 $ 40,285
31
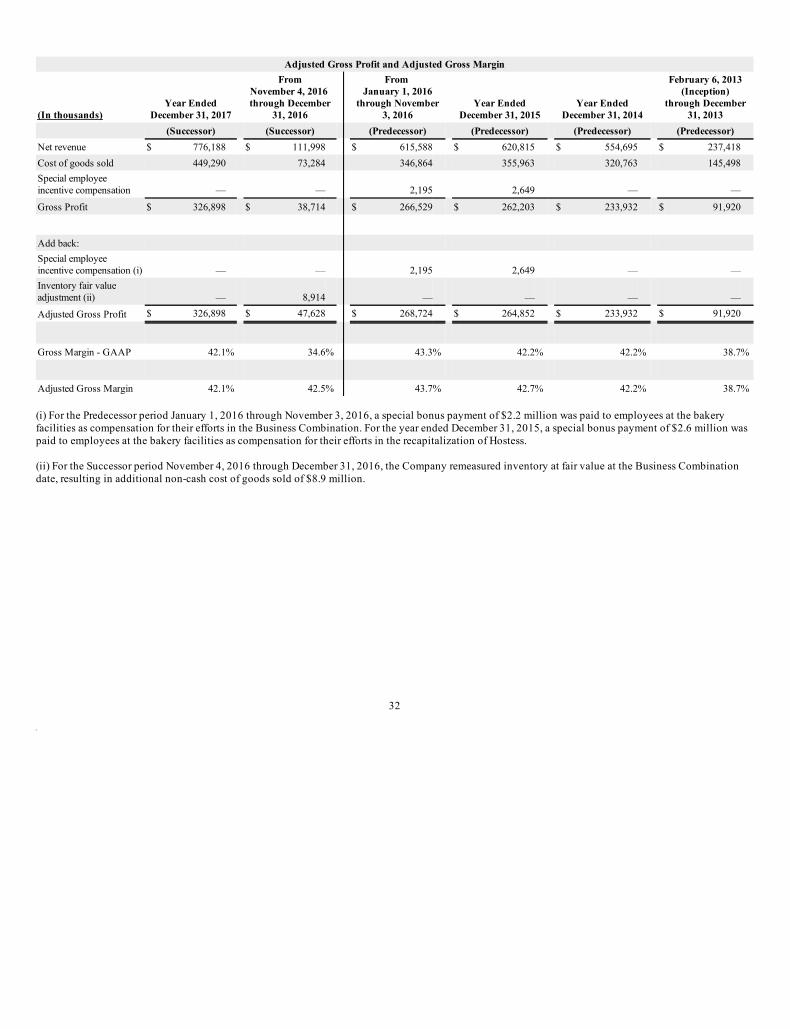
Adjusted Gross Profit and Adjusted Gross Margin
(In thousands)
Year Ended
December 31, 2017
From
November 4, 2016
through December
31, 2016
From
January 1, 2016
through November
3, 2016 Year Ended
December 31, 2015 Year Ended
December 31, 2014
February 6, 2013
(Inception)
through December
31, 2013
(Successor) (Successor) (Predecessor) (Predecessor) (Predecessor) (Predecessor)
Net revenue $ 776,188 $ 111,998 $ 615,588 $ 620,815 $ 554,695 $ 237,418
Cost of goods sold 449,290 73,284 346,864 355,963 320,763 145,498
Special employeeincentive compensation — — 2,195 2,649 — —
Gross Profit $ 326,898 $ 38,714 $ 266,529 $ 262,203 $ 233,932 $ 91,920
Add back:
Special employeeincentive compensation (i) — — 2,195 2,649 — —
Inventory fair valueadjustment (ii) — 8,914 — — — —
Adjusted Gross Profit $ 326,898 $ 47,628 $ 268,724 $ 264,852 $ 233,932 $ 91,920
Gross Margin - GAAP 42.1% 34.6% 43.3% 42.2% 42.2% 38.7%
Adjusted Gross Margin 42.1% 42.5% 43.7% 42.7% 42.2% 38.7%
(i) For the Predecessor period January 1, 2016 through November 3, 2016, a special bonus payment of $2.2 million was paid to employees at the bakeryfacilities as compensation for their efforts in the Business Combination. For the year ended December 31, 2015, a special bonus payment of $2.6 million waspaid to employees at the bakery facilities as compensation for their efforts in the recapitalization of Hostess.
(ii) For the Successor period November 4, 2016 through December 31, 2016, the Company remeasured inventory at fair value at the Business Combinationdate, resulting in additional non-cash cost of goods sold of $8.9 million.
32
(1) Adjusted EBITDA is defined and explained in more detail in Item 7. Management’s Discussion and Analysis of Financial Condition and Results ofOperations, which contains a reconciliation to the most comparable GAAP measure. Adjusted EBITDA is a non-GAAP financial measures commonly used bysecurities analysts, investors and other interested parties in their evaluation of the operating performance of companies in industries similar to ours. However,Adjusted EBITDA should not be construed as an alternative to net income as an indicator of operating performance or as an alternative to cash flow providedby operating activities as a measure of liquidity (each as determined in accordance with GAAP). Adjusted EBITDA may not be comparable to similarly titledmeasures reported by other companies. We have included Adjusted EBITDA because we believe it provides management and investors with additionalinformation to measure our performance.
Adjusted Gross Profit and Adjusted Gross Margin are non-GAAP financial measures commonly used in our industry, however they should not be construed asan alternative to gross profit and gross margin as an indicator of operating performance. Adjusted Gross Profit and Adjusted Gross Margin may not becomparable to similarly titled measures reported by other companies. We have included Adjusted Gross Profit and Adjusted Gross Margin because we believethey provide management and investors with additional information to measure our performance. We believe the presentation of Adjusted Gross Profit andAdjusted Gross Margin is useful to investors because it is consistent with our definition of Adjusted EBITDA.
See Item 7-Management’s Discussion and Analysis of financial Condition and Results of Operations-Adjusted EBITDA Reconciliation.
33
Item 7. Management’s Discussion and Analysis of Financial Condition and Results of Operations
The following discussion and analysis of our financial condition and results of operations should be read in conjunction with our Consolidated Financial
Statements and related notes included in Item 8 of this Annual Report on Form 10-K. This discussion contains forward-looking statements that involve risks
and uncertainties. Our actual results could differ materially from those discussed below. Factors that could cause or contribute to such differences include,
but are not limited to, those identified below and those discussed in Item 1A “Risk Factors” of this Annual Report on Form 10-K.
Overview
We are a leading United States packaged food company focused on developing, manufacturing, marketing, selling and distributing fresh sweet baked goodscoast-to-coast, providing a wide range of snack cakes, donuts, sweet rolls, snack pies and related products. We acquired the Hostess® brand and certainstrategic assets out of the bankruptcy liquidation proceedings of Old HB Inc., its prior owner, free and clear of all past liabilities, in April 2013, andrelaunched the brand later that year.
As of December 31, 2017, we operate five bakeries and three centralized distribution centers. Our direct-to-warehouse (“DTW”) product distribution systemallows us to deliver to our customers’ warehouses. Our customers in turn distribute to their retail stores and/or distributors.
We have two reportable segments: “Sweet Baked Goods” and “In-Store Bakery”. A change in the Company’s internal reporting structure during the lastquarter of 2017 caused the Company to reassess its reportable segments. Sweet Baked Goods consists of fresh and frozen sweet baked goods and breadproducts sold under the Hostess® and Dolly Madison® brands. In-Store Bakery consists of certain Superior and Hostess® branded eclairs, madeleines,brownies, and iced cookies sold in the bakery section of grocery and club stores.
Hostess® is the second leading brand by market share within the Sweet Baked Goods (“SBG”) category, according to Nielsen U.S. total universe. For the 52-week period ended December 30, 2017 our market share was 17.2% per Nielsen’s U.S. SBG category data. We hav e a #1 leading market position within thetwo largest SBG Segments; Donut Segment and Snack Cake Segment, The Donut and Snack Cake Segments together account for 49% of the Sweet BakedGoods category’s total dollar sales.
Principal Components of Operating Results
Net Revenue
We generate revenue primarily through selling sweet baked goods and other products under the Hostess® group of brands, which includes iconic productssuch as Twinkies®, CupCakes, Ding Dongs®, Zingers®, HoHos® and Donettes®, the Dolly Madison® brand and the Superior on Main® brand (e.g., eclairs,madeleines, brownies and iced cookies). Our product assortment is sold to customers’ warehouses and distribution centers by the case or in display readycorrugate units. Retailers display and sell our products to the end consumer in single-serve, multi-pack or club-pack formats. We sell our products primarilyto supermarket chains, national mass merchandisers and convenience stores, along with a smaller portion of our product sales going to dollar stores, vending,club, and other retail outlets.
Our revenues are driven by average net price and total volume of products sold. Factors that impact unit pricing and sales volume include product mix, thecost of ingredients, the promotional activities implemented by the Company and its competitors, industry capacity, new product initiatives and quality andconsumer preferences. We do not keep a significant backlog of finished goods inventory, as our fresh baked products are promptly shipped to our distributioncenters after being produced and then distributed to customers.
34
Cost of Goods Sold
Cost of goods sold consists of ingredients, packaging, labor, energy, other production costs, warehousing and transportation costs for the distribution of ourproducts to our customers. The cost of ingredients and packaging represent the majority of our total costs of goods sold. All costs that are incurred at thebakeries are included in cost of goods sold. We do not allocate any corporate functions into cost of goods sold.
Our cost of ingredients consists principally of flour, sweeteners, edible oils and cocoa, which are subject to substantial price fluctuations, as is the cost ofpaper, corrugate, films and plastics used to package our products. The prices for raw materials are influenced by a number of factors, including the weather,crop production, transportation and processing costs, government regulation and policies and worldwide market supply and demand. We also rely on fuelproducts, such as natural gas, diesel, propane and electricity, to operate our bakeries and produce our products. Fluctuations in the prices of the raw materialsor fuel products used in the production, packaging or transportation of our products affect the cost of products sold and our product pricing strategy. Weutilize forward buying strategies through short-term and long-term advance purchase contracts to lock in prices for certain high-volume raw materials,packaged components and certain fuel inputs. Through these initiatives, we believe we are able to obtain competitive pricing.
Advertising and Marketing
Our advertising and marketing expenses relate to our advertising campaigns, which include social media, print, online advertising, local promotional eventsand monthly agency fees. We also invest in wire and corrugate displays delivered to customers to display our products off shelf, field marketing andmerchandising to reset and check the store inventory on a regular basis and marketing employment costs.
Selling Expense
Selling expenses primarily include sales management, employment, travel, and related expenses, as well as broker fees. We utilize brokers for sales support,including managing promotional activities and order processing.
General and Administrative
General and administrative expenses primarily include employee and related expenses for the accounting, planning, customer service, legal, humanresources, corporate operations, research and development, purchasing, logistics and executive functions. Also included are professional service fees relatedto audit and tax, legal, outsourced information technology functions, transportation planning, and corporate site and insurance costs.
Related Party Expenses
Related party expenses consisted of the normal annual cash payments associated with our employment arrangements with Mr. Metropoulos as ChiefExecutive Officer and/or Executive Chairman.
Non-Controlling Interest
Mr. Metropoulos and the Metropoulos Entities hold their equity investment in us primarily through Class B limited partnership units in the Company’ssubsidiary, Hostess Holdings (“Class B Units”), and an equal number of shares of the Company’s Class B common stock (“Class B Stock”). Our Class B Stockhas voting, but no economic rights, while Hostess Holdings’ Class B Units have economic, but no voting rights. Each Class B Unit, together with a share ofClass B Stock held by the Metropoulos Entities, is exchangeable for a share of the Company’s Class A common stock (or at the option of the Company, thecash equivalent thereof). The Company holds 100% of the general partnership interest in Hostess Holdings and a majority of the limited partnership interestsand consolidates Hostess Holdings in the Company’s consolidated financial statements. The interest of the Metropoulos Entities in Hostess Holdings’ ClassB Units is reflected in our consolidated financial statements as a non-controlling interest.
For periods prior to the Business Combination, Hostess Holdings consolidated the financial position and results of operations of New Hostess Holdco, LLC.The portion of New Hostess Holdco, LLC not owned by Hostess Holdings (which constituted a profits interest plan for management) was recognized as a non-controlling interest in its consolidated financial statements.
35
Factors Impacting Recent Results
Long-term Debt Refinancing and Interest Rate Risk Management
To manage the risk related to our variable rate debt, during the year ended December 31, 2017, we entered into an interest rate swap contract with a counterparty to make a series of payments based on a fixed interest rate of 1.78% and receive a series of payments based on the greater of LIBOR or 0.75%. Both thefixed and floating payment streams are based on a notional amount of $500 million at the inception of the contract and will be reduced by $100 million eachyear of the five year contract.
On November 20, 2017 and May 19, 2017, our first lien term loan was amended resulting in a decrease of 0.25% and 0.50%, respectively, to the marginapplied to our variable rate. The maturity date of August 3, 2022 remained unchanged.
Seasonality
Sweet baked goods revenues tend to be moderately seasonal, with declines during the early winter period, which we believe are attributable to alteredconsumption patterns during the holiday season. We expect this trend to continue and continue to be applicable to our business. We strive to mitigate theseasonality by running certain targeted promotional campaigns.
Note on Financial Presentation
As a result of the completion of the Business Combination on November 4, 2016, our Consolidated Financial Statements included elsewhere in the AnnualReport are presented: (i) as of December 31, 2017 and for the year ended December 31, 2017 (Successor); (ii) as of December 31, 2016 and for the periodNovember 4, 2016 to December 31, 2016 (Successor); (iii) for the period January 1, 2016 to November 3, 2016 (Predecessor); and (iv) for the year endedDecember 31, 2015 (Predecessor). For comparative purposes, we also present supplemental unaudited pro forma combined Statements of Operations for theyear ended December 31, 2016 in the table below and the discussion that follows. See “-Supplemental Unaudited Pro Forma Combined FinancialInformation.”
36
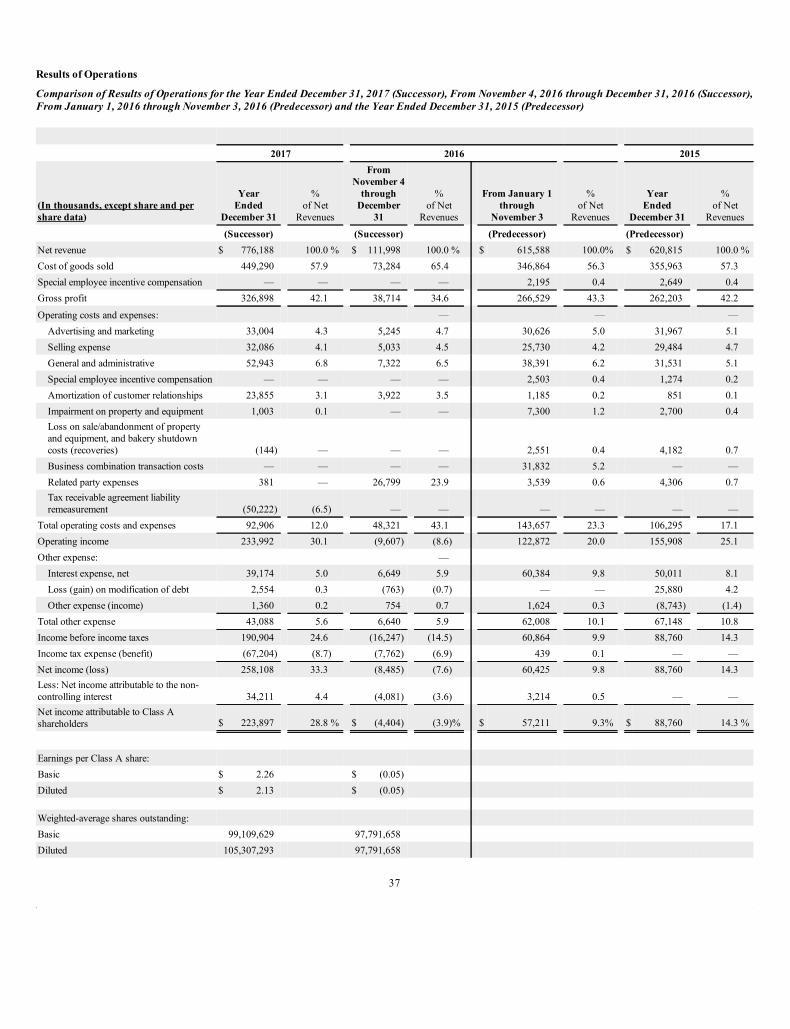
Results of Operations
Comparison of Results of Operations for the Year Ended December 31, 2017 (Successor), From November 4, 2016 through December 31, 2016 (Successor),
From January 1, 2016 through November 3, 2016 (Predecessor) and the Year Ended December 31, 2015 (Predecessor)
2017 2016 2015
(In thousands, except share and per
share data)
Year
Ended
December 31
%of Net
Revenues
From
November 4
through
December
31
%of Net
Revenues
From January 1
through
November 3
%of Net
Revenues
Year
Ended
December 31
%of Net
Revenues
(Successor) (Successor) (Predecessor) (Predecessor)
Net revenue $ 776,188 100.0 % $ 111,998 100.0 % $ 615,588 100.0% $ 620,815 100.0 %
Cost of goods sold 449,290 57.9 73,284 65.4 346,864 56.3 355,963 57.3
Special employee incentive compensation — — — — 2,195 0.4 2,649 0.4
Gross profit 326,898 42.1 38,714 34.6 266,529 43.3 262,203 42.2
Operating costs and expenses: — — —
Advertising and marketing 33,004 4.3 5,245 4.7 30,626 5.0 31,967 5.1
Selling expense 32,086 4.1 5,033 4.5 25,730 4.2 29,484 4.7
General and administrative 52,943 6.8 7,322 6.5 38,391 6.2 31,531 5.1
Special employee incentive compensation — — — — 2,503 0.4 1,274 0.2
Amortization of customer relationships 23,855 3.1 3,922 3.5 1,185 0.2 851 0.1
Impairment on property and equipment 1,003 0.1 — — 7,300 1.2 2,700 0.4
Loss on sale/abandonment of propertyand equipment, and bakery shutdowncosts (recoveries) (144) — — — 2,551 0.4 4,182 0.7
Business combination transaction costs — — — — 31,832 5.2 — —
Related party expenses 381 — 26,799 23.9 3,539 0.6 4,306 0.7
Tax receivable agreement liabilityremeasurement (50,222) (6.5) — — — — — —
Total operating costs and expenses 92,906 12.0 48,321 43.1 143,657 23.3 106,295 17.1
Operating income 233,992 30.1 (9,607) (8.6) 122,872 20.0 155,908 25.1
Other expense: —
Interest expense, net 39,174 5.0 6,649 5.9 60,384 9.8 50,011 8.1
Loss (gain) on modification of debt 2,554 0.3 (763) (0.7) — — 25,880 4.2
Other expense (income) 1,360 0.2 754 0.7 1,624 0.3 (8,743) (1.4)
Total other expense 43,088 5.6 6,640 5.9 62,008 10.1 67,148 10.8
Income before income taxes 190,904 24.6 (16,247) (14.5) 60,864 9.9 88,760 14.3
Income tax expense (benefit) (67,204) (8.7) (7,762) (6.9) 439 0.1 — —
Net income (loss) 258,108 33.3 (8,485) (7.6) 60,425 9.8 88,760 14.3
Less: Net income attributable to the non-controlling interest 34,211 4.4 (4,081) (3.6) 3,214 0.5 — —
Net income attributable to Class Ashareholders $ 223,897 28.8 % $ (4,404) (3.9)% $ 57,211 9.3% $ 88,760 14.3 %
Earnings per Class A share:
Basic $ 2.26 $ (0.05)
Diluted $ 2.13 $ (0.05)
Weighted-average shares outstanding:
Basic 99,109,629 97,791,658
Diluted 105,307,293 97,791,658
37
As discussed above, the financial information presented herein for periods prior to the completion of the Business Combination is of our accountingPredecessor, Hostess Holdings, and, for periods from and after the Business Combination, is of Hostess Brands, Inc.
The financial information for the year ended December 31, 2016 is divided into Predecessor and Successor periods and is not comparable to the full yearended December 31, 2017 (Successor) and the full year ended December 31, 2015 (Predecessor). Accordingly, such periods are presented on a historicalstand-alone basis without comparison. In addition, we have presented comparative results of operations for the year ended December 31, 2017 (Successor)compared to the pro forma combined year ended December 31, 2016 and of such pro forma combined year ended December 31, 2016 compared to the yearended December 31, 2015 (Predecessor).
Results for the Year Ended December 31, 2017 (Successor)
Net Revenue, Cost of Goods Sold and Gross Profit
Net revenue was $776.2 million for the year ended December 31, 2017 (Successor), with cost of goods sold of $449.3 million and gross profit of $326.9million, or 42.1% as a percentage of net revenue.
Net revenue for the Sweet Baked Goods segment was $733.8 million for the year ended December 31, 2017 (Successor), with gross profit of $316.9 million, or43.2% of net revenue, while net revenue for the In-Store Bakery segment was $42.4 million for the year ended December 31, 2017, with gross profit of $10.0million, or 23.6% of net revenue.
Operating Costs and Expenses
Advertising and Marketing, Selling Expense, and General and Administrative
For the year ended December 31, 2017, advertising and marketing expenses were $33.0 million, selling expenses were $32.1 million, while general andadministrative expenses were $52.9 million.
Amortization of Customer Relationships
Amortization of customer relationships was $23.9 million for the year ended December 31, 2017.
Impairment, Loss on Sale/Abandonment of Property and Equipment, and Bakery Shutdown Costs
During the year ended December 31, 2017, we idled a production line in our Columbus, Georgia facility and transitioned the production to a third party. Werecognized an impairment loss of $1.0 million.
Related Party Expenses
Related party expenses were $0.4 million for the year ended December 31, 2017. These expenses represent payments made to Mr. Metropoulos under theterms of his employment arrangements.
Tax Receivable Agreement Liability Remeasurement
For the year ended December 31, 2017, we adjusted the value of the Tax Receivable Agreement due to a lower projected future cash tax savings rate as aresult of the Tax Cuts and Jobs Act. This adjustment resulted in a gain of $51.8 million. A similar adjustment was made due to a change in a state tax law andresulted in a loss of $1.6 million.
Operating Income
Operating income for the year ended December 31, 2017 was $234.0 million.
Interest Expense, net
Our interest expense was $39.2 million for the year ended December 31, 2017.
38

Loss on Modification of debt
During the year ended December 31, 2017, we expensed $1.6 million of previously capitalized debt financing charges for a total loss of $2.6 million. Theremaining loss of $1.0 million was related to the May and November 2017 repricing transactions. See Note 1- “Summary of Significant Accounting Policies”to the consolidated financial statements included in Part II, Item 8 of this Annual Report on Form 10-K.
Income Taxes
The income tax benefit of $67.2 million for the year ended December 31, 2017 includes a benefit of approximately $111.3 million due to a revaluation of ourdeferred tax liability to reflect lower future U.S. corporate income tax rates caused by the Tax Cuts and Jobs Act. The tax provision also includes a $1.7million expense caused by a change in state tax rates. The remaining tax expense of $42.4 million represents an effective tax rate of 30.1%, giving effect tothe non-controlling interest, a partnership for income tax purposes and excluding the impact of the remeasurement of the tax receivable agreement.
Net Income
For the year ended December 31, 2017, the Company had net income of $258.1 million.
Earnings Per Share
For the year ended December 31, 2017, earnings per class A share was $2.26 (basic) and $2.13 (dilutive).
39
Results for the Successor period November 4, 2016 through December 31, 2016 and Predecessor period January 1, 2016 through November 3, 2016
Net Revenue
Net revenues in the Successor period from November 4, 2016 through December 31, 2016 were $112.0 million, compared to $615.6 million for thePredecessor period from January 1, 2016 through November 3, 2016. During the Predecessor period, we acquired Superior on May 10, 2016 and reported netrevenues of $19.9 million from Superior from the date of acquisition through November 3, 2016. During the Successor period, the net revenues for Superiorwere $6.8 million.
Cost of Goods Sold
In the Successor period, as a result of the Business Combination, we recorded a one-time inventory fair value step-up of $8.9 million that was charged to costof goods sold. Excluding the impact of the inventory fair value step-up, cost of goods sold in the Successor period would have been 57.5% of net revenues.
Special Employee Incentive Compensation
For the Predecessor period January 1, 2016 through November 3, 2016, we made a special bonus payment to certain employees at our bakery facilities ascompensation for their efforts in connection with the Business Combination. Payment of $2.2 million of this special bonus was recorded as a separate lineitem reducing gross profit.
Gross Profit
For the Predecessor period January 1, 2016 through November 3, 2016, gross profit, including the effect of the special employee incentive compensationdiscussed above, was $266.5 million, or 43.3% of net revenue. Excluding this item, gross profit would have been $268.7 million, or 43.7% of net revenue.
For the Successor period November 4, 2016 through December 31, 2016, gross profit was $38.7 million, or 34.6% of net revenue. Excluding the impact of theinventory fair value step up discussed above, adjusted gross margin for the Successor period was 42.5% of net revenue. Adjusted gross margin for theSuccessor period compared to the gross margin for the Predecessor period declined slightly due to overall changes in mix of products sold.
Operating Costs and Expenses
Advertising and Marketing
For the Predecessor period January 1, 2016 through November 4, 2016, advertising and marketing expenses were $30.6 million, or 5.0% of net revenue.
For the Successor period November 4, 2016 through December 31, 2016, advertising and marketing expenses were $5.2 million, or 4.7% in netrevenue.
Advertising and marketing expenses as a percentage of net revenue were lower in the Successor period primarily due to higher field marketing costs in thePredecessor Period.
Selling Expense
For the Predecessor period January 1, 2016 through November 4, 2016, selling expenses were $25.7 million, or 4.2% of net revenue.For the Successor period November 4, 2016 through December 31, 2016, selling expenses were $5.0 million, or 4.5% in net revenue.
General and Administrative
For the Predecessor period January 1, 2016 through November 4, 2016, general and administrative expenses were $38.4 million, or 6.2%, of net revenue.
40
For the Successor period November 4, 2016 through December 31, 2016, general and administrative expenses were $7.3 million, or 6.5% of net revenue.
Special Employee Incentive Compensation
For the Predecessor period January 1, 2016 through November 3, 2016, we paid a special bonus payment of $2.5 million to certain corporateemployees as compensation for their efforts in connection with the Business Combination. This payment to corporate employees was recorded underoperating costs and expenses.
Amortization of Customer Relationships
For the Predecessor period January 1, 2016 through November 3, 2016, amortization of customer relationships was $1.2 million, or 0.2% of net revenue.
For the Successor period November 4, 2016 through December 31, 2016, amortization of customer relationships was $3.9 million, or 3.5% of net revenue.
Amortization of customer relationships in the Successor period was significantly higher than in the Predecessor period primarily due to the higher fair valuemeasurement at November 4, 2016 as a result of the Business Combination compared to the overall fair value of the customer relationships in the Predecessorperiod. There were no significant changes in the nature of the customer relationships, including overall useful lives in the comparative periods.
Impairment of Property and Equipment
For the Predecessor period January 1, 2016 through November 3, 2016, impairment of property and equipment was $7.3 million, or 1.2% of net revenue.During the Predecessor period, we closed multiple production lines at our Indianapolis, Indiana bakery, and transitioned production to other facilities.
There were no such impairments in the Successor period November 4, 2016 through December 31, 2016.
Loss on Sale/Abandonment of Property and Equipment and Bakery Shutdown Costs
For the Predecessor period January 1, 2016 through November 3, 2016, we recorded a charge for loss on sale/abandonment of property and bakery shutdowncosts of $2.6 million, or 0.4% of net revenue, primarily due to utilities, insurance, taxes and maintenance expenses related to the Schiller Park, Illinois bakery.
For the Successor period November 4, 2016 through December 31, 2016, there were no such charges.
Business Combination Transaction Costs
For the Predecessor period January 1, 2016 through November 3, 2016, business combination transaction costs were $31.8 million, or 5.2% of net revenue.This consisted of professional and legal costs associated with the Business Combination, and transactional costs attributable to the acquisition of Superior inMay 2016.
For the Successor period November 4, 2016 through December 31, 2016, there were no such charges.
Related Party Expenses
For the Predecessor period January 1, 2016 through November 3, 2016, related party expenses were $3.5 million, or 0.6% of net revenue. These amountsrepresent the normal annual cash payments associated with our employment arrangements with Mr. Metropoulos as Chief Executive Officer and/or ExecutiveChairman.
For the Successor period November 4, 2016 through December 31, 2016, the Company expensed $26.8 million, or 23.9% of net revenue, as a result of a grantof stock awarded to Mr. Metropoulos as required under his new employment arrangements.
Operating Income (Loss)
For the Predecessor period January 1, 2016 through November 3, 2016, total operating costs and expenses were $143.7 million, or 23.3% of net revenue, andoperating income was $122.9 million, or 20.0% of net revenue.
41
For the Successor period November 4, 2016 through December 31, 2016, total operating costs and expenses were $48.3 million, or 43.1% of net revenue, andoperating loss was $9.6 million or 8.6% of net revenue.
Operating loss for the Successor period was significantly impacted by the related party expense discussed above.
Interest Expense, net
For the Predecessor period January 1, 2016 through November 3, 2016, interest expense, net was $60.4 million, or 9.8% of net revenue. For the Successorperiod November 4, 2016 through December 31, 2016, interest expense, net was $6.6 million, or 5.9% of net revenue.
The lower interest expense in the Successor period is a result of the reduced applicable interest rates following the debt refinancing discussed below.
Gain on Debt Extinguishment
For the Successor period November 4, 2016 through December 31, 2016, in connection with the refinancing of existing debt with the new first lien term loanwe recorded a net gain on a partial extinguishment of debt in the amount of $0.8 million. The gain consisted of the write-off of approximately $4.0 million ofdebt premium and deferred financing costs, partially offset by prepayment penalties of $3.0 million and the write-off of deferred financing costs of $0.2million.
Other Expense
For the Predecessor period January 1, 2016 through November 3, 2016, other expense was $1.6 million, or 0.3% of net revenue. This consisted of professionaland transactional costs for acquisition activity which has since been abandoned, partially offset by a gain from the settlement in connection with productrecall matter with one of our suppliers of approximately $0.8 million.
For the Successor period November 4, 2016 through December 31, 2016, other expense was $0.8 million, or 0.7% of net revenue.
Income (Loss) Before Income Taxes
For the Predecessor period January 1, 2016 through November 3, 2016, income before income taxes was $60.9 million, or 9.9% of net revenue.
For the Successor period November 4, 2016 through December 31, 2016, loss before income taxes was $16.2 million or 14.5% of net revenue.
Income Tax Expense
For the Predecessor period January 1, 2016 through November 3, 2016, the Company was a series of limited liability companies and, therefore, had no taxexpense or benefit, except insignificant amounts for Superior, a C corporation.
For the Successor period November 4, 2016 through December 31, 2016, income tax benefit was $7.8 million or 6.9% of net revenue. This represented aneffective tax rate of 47.8% which exceeds the statutory rates primarily due to the reversal of a previously recorded valuation allowance.
42
Results for the Year Ended December 31, 2015 (Predecessor)
Net Revenue, Gross Profit and Cost of Goods Sold
Net revenue was $620.8 million for the year ended December 31, 2015, with cost of goods sold of $356.0 million, and gross profit of $264.9 million,excluding the impact of a $2.6 million special employee incentive compensation payment. Cost of goods sold was impacted by higher ingredient costs dueto an outbreak of avian influenza which led to reduced availability of eggs, which increased egg ingredient prices to record high levels.
Special Employee Incentive Compensation
For the year ended December 31, 2015, a special bonus payment was paid to employees at our bakery facilities as compensation for their efforts in therecapitalization of our Company of which $2.6 million was recorded on a separate line in our Consolidated Statements of Operations as a deduction fromgross profit.
Operating Costs and Expenses
Advertising and Marketing
Advertising and marketing expenses were $32.0 million, selling expenses were $29.5 million, and general and administrative expenses were $31.5 million forthe year ended December 31, 2015.
Special Employee Incentive Compensation
For the year ended December 31, 2015, a special bonus payment of $1.3 million was paid to corporate employees as compensation for their efforts in therecapitalization of the Company.
Amortization of Customer Relationships
Amortization of customer relationships was $0.9 million for the year ended December 31, 2015.
Loss on Sale/Abandonment of Property and Equipment and Bakery Shutdown Costs
For the year ended December 31, 2015, we incurred a loss on sale/abandonment of property and equipment and bakery shutdown costs of $4.2 million.
Related Party Expenses
Related party expenses were $4.3 million for the year ended December 31, 2015. Mr. Metropoulos serves as our Executive Chairman and expenses associatedwith his employment agreements are recorded in related party expenses.
Operating Income (Loss)
For the year ended December 31, 2015, total operating costs and expenses were $106.3 million. Operating income was $155.9 million for the year endedDecember 31, 2015.
Interest Expense, net
Interest expense for the year ended December 31, 2015 was 50.0 million.
Loss on Debt Extinguishment
We extinguished the Term Loan dated April 9, 2013 (the “2013 Term Loan”) through early principal payments of $343.8 million and $150.0 million onAugust 3, 2015 and June 4, 2015, respectively. As part of this debt extinguishment and in accordance with its contractual terms, we expensed 2% prepaymentpenalties of $9.9 million, as well as $16.0 million of amortization to write-off the remaining deferred financing costs. For the year ended December 31, 2015,the total loss on debt extinguishment was $25.9 million.
43

Other Income
For the year ended December 31, 2015, other income consisted of $12.0 million of proceeds from the sale of foreign trademark rights and certain “know how”in certain countries in the Middle East, partially offset by $3.3 million for professional service fees related to the pursuit of potential sale transactions.
Income Taxes
For the year ended December 31, 2015, the Company was a series of limited partnerships and, therefore, had no income tax expense or benefit.
44
Supplemental Unaudited Pro Forma Combined Financial Information
For comparative purposes, we are presenting a supplemental unaudited pro forma combined statement of operations for the year ended December 31, 2016,and we discuss such pro forma combined results compared to the Successor’s full year 2017, and the Predecessor’s full year 2015 results below.
The unaudited pro forma combined statements of operations for the year ended December 31, 2016 presents our consolidated results of operations giving proforma effect to the Business Combination as if it had occurred as of January 1, 2016. The pro forma combined adjustments are based on available informationand upon assumptions that our management believes are reasonable in order to reflect, on a pro forma combined basis, the impact of these transactions on thehistorical financial information of our Predecessor and Successor entities, as applicable.
The Business Combination was accounted for using the acquisition method of accounting. The final fair values of the acquired assets and assumed liabilitiesas of the Closing Date, which are based on the consideration paid and our estimates and assumptions, are reflected herein. As explained in more detail in Note2 in the accompanying Notes to the Consolidated Financial Statements, the total purchase price to acquire Hostess Holdings has been allocated to the assetsacquired and assumed liabilities of Hostess Holdings, based upon the fair values at the Closing Date. We utilized third-party valuation specialists to assist ourmanagement in determining the fair values of the acquired assets and liabilities assumed. As of November 3, 2017, management determined that theallocation of the purchase price for the Business Combination is final.
The unaudited pro forma combined financial information contains a variety of adjustments, assumptions and estimates, is subject to numerous otheruncertainties and the assumptions and adjustments as described in the accompanying notes hereto and should not be relied upon as being indicative of ourresults of operations had the Business Combination occurred on January 1, 2016. The unaudited pro forma combined financial information also does notproject our results of operations for any future period or date. The unaudited pro forma combined financial information for the year ended December 31, 2016includes results of the Superior acquisition and its related operations from May 10, 2016, the date of acquisition, through December 31, 2016. We evaluatedthe impact of the Superior acquisition on the Company’s financial statements and concluded that the impact was not significant and did not require norseparately warrant the inclusion of pro forma combined financial results assuming the acquisition of Superior at January 1, 2016 under applicable SEC rulesand regulations or under GAAP. In addition, we evaluated the impact of the refinancing of existing debt pursuant to the New First Lien Term Loan, completedon November 18, 2016, and concluded that the impact was not significant and did not require nor separately warrant the inclusion of pro forma combinedfinancial results assuming the completion of the refinancing on January 1, 2016. The pro forma combined adjustments give effect to the items identified inthe pro forma combined table below in connection with the Business Combination.
45
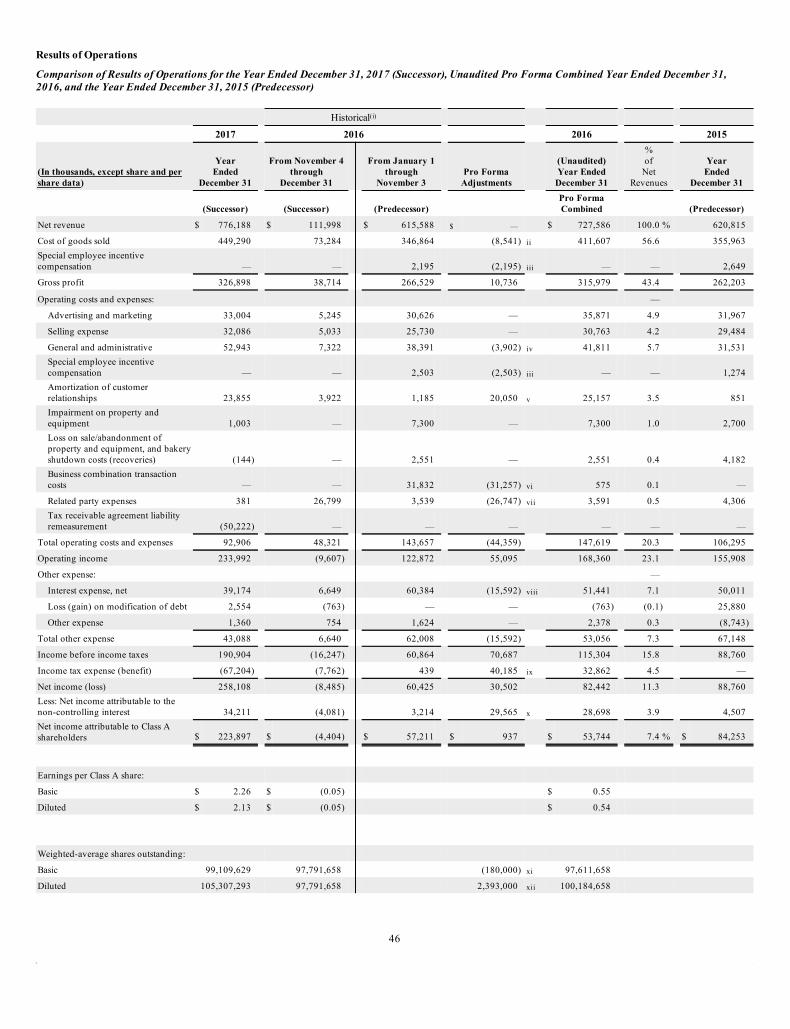
Results of Operations
Comparison of Results of Operations for the Year Ended December 31, 2017 (Successor), Unaudited Pro Forma Combined Year Ended December 31,
2016, and the Year Ended December 31, 2015 (Predecessor)
Historical(i)
2017 2016 2016 2015
(In thousands, except share and per
share data)
Year
Ended
December 31
From November 4
through
December 31
From January 1
through
November 3 Pro Forma
Adjustments
(Unaudited)
Year Ended
December 31
%
of
Net
Revenues
Year
Ended
December 31
(Successor) (Successor) (Predecessor) Pro Forma
Combined (Predecessor)
Net revenue $ 776,188 $ 111,998 $ 615,588 $ — $ 727,586 100.0 % 620,815
Cost of goods sold 449,290 73,284 346,864 (8,541) ii 411,607 56.6 355,963
Special employee incentive
compensation — — 2,195 (2,195) iii — — 2,649
Gross profit 326,898 38,714 266,529 10,736 315,979 43.4 262,203
Operating costs and expenses: —
Advertising and marketing 33,004 5,245 30,626 — 35,871 4.9 31,967
Selling expense 32,086 5,033 25,730 — 30,763 4.2 29,484
General and administrative 52,943 7,322 38,391 (3,902) iv 41,811 5.7 31,531
Special employee incentive
compensation — — 2,503 (2,503) iii — — 1,274
Amortization of customer
relationships 23,855 3,922 1,185 20,050 v 25,157 3.5 851
Impairment on property and
equipment 1,003 — 7,300 — 7,300 1.0 2,700
Loss on sale/abandonment of
property and equipment, and bakery
shutdown costs (recoveries) (144) — 2,551 — 2,551 0.4 4,182
Business combination transaction
costs — — 31,832 (31,257) vi 575 0.1 —
Related party expenses 381 26,799 3,539 (26,747) vii 3,591 0.5 4,306
Tax receivable agreement liability
remeasurement (50,222) — — — — — —
Total operating costs and expenses 92,906 48,321 143,657 (44,359) 147,619 20.3 106,295
Operating income 233,992 (9,607) 122,872 55,095 168,360 23.1 155,908
Other expense: —
Interest expense, net 39,174 6,649 60,384 (15,592) viii 51,441 7.1 50,011
Loss (gain) on modification of debt 2,554 (763) — — (763) (0.1) 25,880
Other expense 1,360 754 1,624 — 2,378 0.3 (8,743)
Total other expense 43,088 6,640 62,008 (15,592) 53,056 7.3 67,148
Income before income taxes 190,904 (16,247) 60,864 70,687 115,304 15.8 88,760
Income tax expense (benefit) (67,204) (7,762) 439 40,185 ix 32,862 4.5 —
Net income (loss) 258,108 (8,485) 60,425 30,502 82,442 11.3 88,760
Less: Net income attributable to the
non-controlling interest 34,211 (4,081) 3,214 29,565 x 28,698 3.9 4,507
Net income attributable to Class A
shareholders $ 223,897 $ (4,404) $ 57,211 $ 937 $ 53,744 7.4 % $ 84,253
Earnings per Class A share:
Basic $ 2.26 $ (0.05) $ 0.55
Diluted $ 2.13 $ (0.05) $ 0.54
Weighted-average shares outstanding:
Basic 99,109,629 97,791,658 (180,000) xi 97,611,658
Diluted 105,307,293 97,791,658 2,393,000 xii 100,184,658
46
i. The amounts in these columns represent the Successor’s and Predecessor’s historical results of operations for the periods reflected.ii. Approximately $8.9 million of this adjustment reflects the non-cash impact of the remeasurement of inventory at fair value as a result of the Business
Combination. In addition, the adjustment reflects the incremental depreciation expense associated with the allocation of purchase price to propertyand equipment and is recorded in cost of goods sold.
iii. For cost of goods sold, this adjustment represents special payments we made to certain employees at our bakery facilities of $2.2 million and for theoperating costs this adjustment represents special payments to corporate employees of $2.5 million as compensation for their efforts in connectionwith the Business Combination.
iv. Represents compensation for management profits interest plan of approximately $3.9 million that was recognized as part of the BusinessCombination. See Note 3 to the Consolidated Financial Statements for additional information.
v. Represents additional amortization expense associated with the fair value recognized for customer relationships in connection with the BusinessCombination.
vi. This adjustment consists primarily of legal and professional fees, and other costs associated with the Business Combination.vii. Represents non-cash expenses incurred by Successor for stock awarded to Mr. Metropoulos as required under his new employment arrangements.viii. Represents the reduction in interest expense due to the repayment of a portion of Hostess Holdings debt as part of the Business Combination.ix. Represents the effective income tax rate of 28.5% for the Successor, giving effect to the non-controlling interest, and not giving effect to the
adjustment made to the valuation allowance on the Company’s historical deferred tax assets.x. Represents the elimination of historical income attributable to the non-controlling interest and attributes a portion of the pro forma income to the
non-controlling interest created in the Business Combination. Income is allocated to the non-controlling interest based on its pro rata share of thetotal equity of Hostess Holdings.
xi. This adjustment annualized the basic weighted average number of Class A shares outstanding.xii. This adjustment includes the dilutive impact of the outstanding warrants that are considered anti-dilutive on a historical basis.
47
Results for the Year Ended December 31, 2017 compared to the Pro Forma Combined Year Ended December 31, 2016
Net Revenue
Net revenue was $776.2 million for the year ended December 31, 2017, compared to $727.6 million for the pro forma combined year ended December 31,2016, an increase of 6.7%, or $48.6 million. Growth in net revenue for the year ended December 31, 2017 from current year new product initiatives was $62.5million, led by Chocolate Cake Twinkies®, Golden Cupcakes, White Fudge Ding Dongs®, and Peanut Butter HoHo’s®. Additionally, there was an $11.9million increase in net sales attributed to the acquisition of Superior in May 2016. These increases were offset primarily by a decrease in net revenue from2016 product innovations and discontinued items.
Cost of Goods Sold and Gross Profit
Cost of goods sold for the year ended December 31, 2017 of $449.3 million represents an increase of $37.7 million, or 9.2%, from the pro forma combinedcost of goods sold of $411.6 million for the year ended December 31, 2016. The increase for the year ended December 31, 2017 from the pro forma combinedyear ended December 31, 2016 is primarily attributed to higher shipping costs and increased sales volume.
Gross profit was $326.9 million for the year ended December 31, 2017, an increase of $10.9 million, or 3.5%, compared to pro forma gross profit of $316.0million for the year ended December 31, 2016. The increase for the year ended December 31, 2017 from pro forma combined year ended December 31, 2016was primarily attributed to an increase in sales.
Gross margin was 42.1% for the year ended December 31, 2017, compared to gross margin of 43.4% for the pro forma combined year ended December 31,2016 . The decrease in margin for the year ended December 31, 2017 from pro forma combined gross margin for the year ended December 31, 2016 wasprimarily due to higher shipping costs which caused a 70 basis point decrease in gross margin. The decrease in margin was also attributed to a shift in ourproduct mix due to higher growth in multi-pack, club-pack than other pack types, and additional In-Store Bakery sales.
Gross profit for the Sweet Baked Goods segment for the year ended December 31, 2017 was $316.9 million or 43.2% of net revenue, compared to gross profito f $309.8 million, or 44.2% of net revenue, for the pro forma combined year ended December 31, 2016. Gross margin decreased 120 basis points due tohigher shipping costs. Gross margin was also affected by a shift in product mix due to higher growth in multi-pack sales than other pack types.
Gross profit for the In-Store Bakery segment for the year ended December 31, 2017 was $10.0 million, or 23.6% of net revenue, compared to pro formacombined gross profit of $6.1 million, or 23.0% of net revenue, for the year ended December 31, 2016. Gross profit increased primarily due to increasedrevenue.
Operating Costs and Expenses
Advertising and Marketing
Advertising and marketing expenses for the year ended December 31, 2017 of $33.0 million represent a decrease from pro forma combined advertising andmarketing expenses of $35.9 million, or 8.0% for the year ended December 31, 2016 as a result of reduced permanent wire display deployment.
Selling Expense
Selling expense was $32.1 million, or 4.1% of revenue for the year ended December 31, 2017, compared to $30.8 million, or 4.2% of revenue on a pro formacombined basis for the year ended December 31, 2016. The increase in selling expense is reflective of the increase in sales volume during the year.
General and Administrative
General and administrative expenses for the year ended December 31, 2017 of $52.9 million represent an increase of $11.1 million, or 26.6%, over the proforma combined general and administrative expenses of $41.8 million for the year ended December 31, 2016. The increase is attributed to increased non-cashshare-based compensation of $7.4 million, additional professional and administrative costs of $3.5 million due to public company compliance, and a $2.0million litigation settlement.
48
Amortization of Customer Relationships
Amortization of customer relationships was $23.9 million for the year ended December 31, 2017, compared to pro forma combined customer relationshipsamortization of $25.2 million for the year ended December 31, 2016. For the year ended December 31, 2016 on a historical basis, amortization expense wasbased on the valuation of customer relationships acquired from Old HB Inc. in 2013. The amortization expense for the year ended December 31, 2017 and theyear ended December 31, 2016 on a pro forma combined basis reflects the new valuation of the customer relationships acquired through the BusinessCombination.
Impairment, Loss on Sale/Abandonment of Property and Equipment, and Bakery Shutdown Costs
During the year ended December 31, 2017, an impairment loss of $1.0 million was recognized when we idled a production line in our Columbus, Georgiafacility and transitioned the production to a third party. During the pro forma combined year ended December 31, 2016, we recorded an impairment of $7.3million when we closed multiple production lines at the Indianapolis, Indiana bakery and transitioned production to other facilities in preparation to convertthe bakery to a nut facility. In addition, we incurred a loss on sale/abandonment of property and equipment, and bakery shutdown costs of $2.6 millionprimarily due to utilities, insurance, taxes and maintenance expenses related to the Schiller Park, Illinois bakery.
Related Party Expenses
Related party expenses were $0.4 million for the year ended December 31, 2017 compared to pro forma combined expenses of $3.6 million for the year endedDecember 31, 2016. These expenses represent payments made to Mr. Metropoulos under the terms of his employment arrangements, which changed as part ofthe Business Combination.
Tax Receivable Agreement Liability Remeasurement
For the year ended December 31, 2017, we adjusted the value of the Tax Receivable Agreement due to a lower projected future cash tax savings rate as aresult of the Tax Cuts and Jobs Act. This adjustment resulted in a gain of $51.8 million. A similar adjustment was made due to a change in a state tax law andresulted in a loss of $1.6 million.
Operating Income
The $65.6 million increase in operating income from pro forma combined operating income of $168.4 million for the year ended December 31, 2016 to$234.0 million for the year ended December 31, 2017 is primarily attributed to the gain on the remeasurement of the tax receivable agreement, higher salesvolume, and lower impairment/abandonment costs.
Interest Expense, net
Our interest expense decreased $12.3 million from $51.4 million for the pro forma combined year ended December 31, 2016 to $39.2 million for the yearended December 31, 2017 primarily due to the pay down of our Second Lien Term Loan in November 2016, and three repricing transactions betweenNovember of 2016 and November of 2017 which collectively reduced the effective interest rate on our first lien term loan by 1.25%.
Loss on Modification of debt
During the year ended December 31, 2017, we recognized $2.6 million of losses related to the repricing transactions on our first lien term loan, of which $1.6million was attributed to previously capitalized charges. See Note 1- “Summary of Significant Accounting Policies” to the consolidated financial statementsincluded in Part II, Item 8 of this Annual Report on Form 10-K.
Income Taxes
The income tax benefit of $67.2 million for the year ended December 31, 2017 includes a benefit of approximately $126.4 million due to a revaluation of ourdeferred tax liability to reflect lower future U.S. corporate income tax rates caused by the Tax Cuts and Jobs Act (“Tax Reform”). This benefit was partiallyoffset by a tax expense of $15.1 million due to the remeasurement of the tax receivable agreement also due to Tax Reform. The tax provision also includes a$1.7 million expense caused by a change in state tax rates. The remaining tax expense of $42.4 million represents an effective tax rate of 30.1%, giving effectto the non-controlling interest, a partnership for income tax purposes and excluding the impact of the remeasurement of the tax receivable agreement. Incometax expense for the pro forma combined year ended December 31, 2016 was $32.9 million, representing an effective tax rate of 28.5%. After accounting fortax law changes, our effective tax rate for 2017 was higher than the pro forma combined 2016 due to a higher statutory rate for one of the states in which weoperate.
49
Results of Operations for the Pro Forma Combined Year Ended December 31, 2016 compared to the Year Ended December 31, 2015 (Predecessor)
Net Revenue
Net revenue increased $106.8 million, or 17.2%, to $727.6 million, for the pro forma combined year ended December 31, 2016, compared to $620.8 millionfor the year ended December 31, 2015, primarily due to new product launches in 2016 of $44.0 million and contribution of Superior net revenue of $26.7million from the date of its acquisition. New products in 2016 included Deep Fried Twinkies®, Hostess Sweet Shop™ brownies, plus the relaunch of SuzyQs®
Cost of Goods Sold and Gross Profit
Cost of goods sold increased $55.6 million, to $411.6 million, for the pro forma combined year ended December 31, 2016, compared to $356.0 million, forthe year ended December 31, 2015, primarily due to the increase in volume.
As a percentage of net revenue, pro forma combined cost of goods sold was 56.6%, compared to 57.3% of net revenue for the year ended December 31, 2015.The decrease in cost of goods sold from the year ended December 31, 2015 to the pro forma combined for the year ended December 31, 2016, is primarily dueto higher ingredient costs in 2015. An outbreak of avian influenza in 2015 led to reduced availability of eggs, which increased egg ingredient prices torecord high levels.
Pro Forma combined gross profit was $316.0 million for the year ended December 31, 2016, compared to $262.2 million for the year ended December 31,2015.
Gross margin was 43.4% for the pro forma combined year ended December 31, 2016, compared to historical gross margin of 42.2% for the year endedDecember 31, 2015. The increase in gross profit was driven primarily by commodity cost decreases and improved bakery costs.
Operating Costs and Expenses
Advertising and Marketing
Advertising and marketing expenses for the year increased 12.2% on a pro forma combined basis for the year ended December 31, 2016, to $35.9 million,compared to $32.0 million for the year ended December 31, 2015. The increase was primarily attributable to planned expansion of field marketing activities.
Selling Expense
Selling expense increased $1.3 million, or 4.3%, to $30.8 million, during the pro forma combined year ended December 31, 2016, compared to $29.5 millionfor the year ended December 31, 2015, primarily due to increases in sales management expense and broker fees.
General and Administrative
General and administrative expenses increased 32.6%, to $41.8 million, on a pro forma combined basis for the year ended December 31, 2016, compared to$31.5 million for the year ended December 31, 2015. The increase is primarily due to increased incentive compensation related to improved operatingperformance and the addition of Superior’s operations.
Special Employee Incentive Compensation
A special bonus payment of $1.3 million was paid during the year ended December 31, 2015 to corporate employees as compensation for their efforts in therecapitalization of the Company. There was no special employee incentive compensation for the pro forma combined year ended December 31, 2016.
Amortization of Customer Relationships
Amortization of customer relationships was $25.2 million for the pro forma combined year ended December 31, 2016, compared to $0.9 million, for the yearended December 31, 2015. The increase is primarily due to an increase in intangible assets with definite lives as a result of the Business Combination, as wellas the acquisition of Superior during 2016.
Impairment, Loss on Sale/Abandonment of Property and Equipment, and Bakery Shutdown Costs
For the pro forma combined year ended December 31, 2016, we recorded an impairment of $7.3 million. We closed multiple production lines at Indianapolis,Indiana bakery and transitioned production to other facilities resulting in a loss of $7.3 million, compared to a similar loss of $2.7 million for the year endedDecember 31, 2015.
50
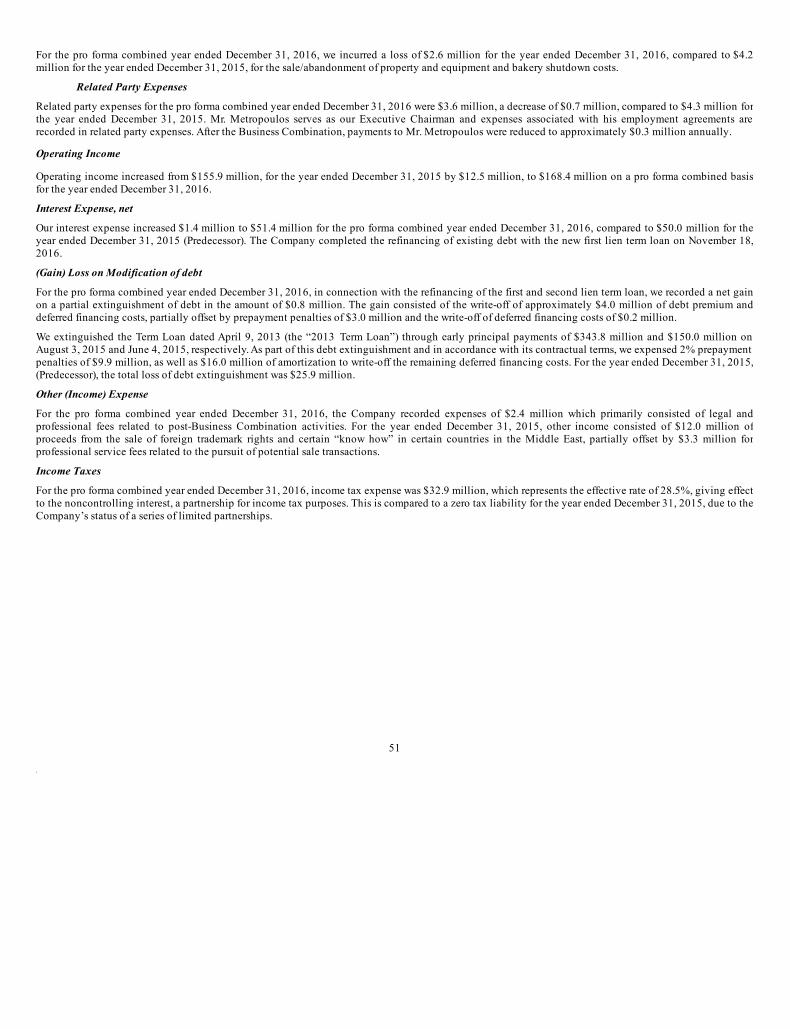
For the pro forma combined year ended December 31, 2016, we incurred a loss of $2.6 million for the year ended December 31, 2016, compared to $4.2million for the year ended December 31, 2015, for the sale/abandonment of property and equipment and bakery shutdown costs.
Related Party Expenses
Related party expenses for the pro forma combined year ended December 31, 2016 were $3.6 million, a decrease of $0.7 million, compared to $4.3 million forthe year ended December 31, 2015. Mr. Metropoulos serves as our Executive Chairman and expenses associated with his employment agreements arerecorded in related party expenses. After the Business Combination, payments to Mr. Metropoulos were reduced to approximately $0.3 million annually.
Operating Income
Operating income increased from $155.9 million, for the year ended December 31, 2015 by $12.5 million, to $168.4 million on a pro forma combined basisfor the year ended December 31, 2016.
Interest Expense, net
Our interest expense increased $1.4 million to $51.4 million for the pro forma combined year ended December 31, 2016, compared to $50.0 million for theyear ended December 31, 2015 (Predecessor). The Company completed the refinancing of existing debt with the new first lien term loan on November 18,2016.
(Gain) Loss on Modification of debt
For the pro forma combined year ended December 31, 2016, in connection with the refinancing of the first and second lien term loan, we recorded a net gainon a partial extinguishment of debt in the amount of $0.8 million. The gain consisted of the write-off of approximately $4.0 million of debt premium anddeferred financing costs, partially offset by prepayment penalties of $3.0 million and the write-off of deferred financing costs of $0.2 million.
We extinguished the Term Loan dated April 9, 2013 (the “2013 Term Loan”) through early principal payments of $343.8 million and $150.0 million onAugust 3, 2015 and June 4, 2015, respectively. As part of this debt extinguishment and in accordance with its contractual terms, we expensed 2% prepaymentpenalties of $9.9 million, as well as $16.0 million of amortization to write-off the remaining deferred financing costs. For the year ended December 31, 2015,(Predecessor), the total loss of debt extinguishment was $25.9 million.
Other (Income) Expense
For the pro forma combined year ended December 31, 2016, the Company recorded expenses of $2.4 million which primarily consisted of legal andprofessional fees related to post-Business Combination activities. For the year ended December 31, 2015, other income consisted of $12.0 million ofproceeds from the sale of foreign trademark rights and certain “know how” in certain countries in the Middle East, partially offset by $3.3 million forprofessional service fees related to the pursuit of potential sale transactions.
Income Taxes
For the pro forma combined year ended December 31, 2016, income tax expense was $32.9 million, which represents the effective rate of 28.5%, giving effectto the noncontrolling interest, a partnership for income tax purposes. This is compared to a zero tax liability for the year ended December 31, 2015, due to theCompany’s status of a series of limited partnerships.
51

Adjusted EBITDA Reconciliation
Adjusted EBITDA was $230.2 million for the year ended December 31, 2017, an increase of $14.9 million, or 6.9%, compared to pro forma combinedadjusted EBITDA of $215.3 million for the year ended December 31, 2016, and an increase of $52.3 million, or 29.4% compared to adjusted EBITDA of$177.9 million for the year ended December 31, 2015. As a percentage of net revenue, adjusted EBITDA was 29.7% for the year ended December 31, 2017,which was comparable to pro forma combined adjusted EBITDA of 29.6% of net revenues for the year ended December 31, 2016, and 28.7% for the yearended December 31, 2015.
Adjusted EBITDA is a non-GAAP financial measure commonly used in our industry and should not be construed as an alternative to net income as anindicator of operating performance or as an alternative to cash flow provided by operating activities as a measure of liquidity (each as determined inaccordance with GAAP). This measure may not be comparable to similarly titled measures reported by other companies. We have included these measuresbecause we believe they provide management and investors with additional information to measure our performance and liquidity, estimate our value andevaluate our ability to service debt.
We define adjusted EBITDA as net income adjusted to exclude (i)income taxes, (ii) interest expense, net (iii) depreciation and amortization and (iv) as furtheradjusted to eliminate the impact of certain items that we do not consider indicative of our ongoing operating performance. These further adjustments areitemized below. You are encouraged to evaluate these adjustments and the reasons we consider them appropriate for supplemental analysis. In evaluatingadjusted EBITDA, you should be aware that in the future we may incur expenses that are the same as or similar to some of the adjustments set forth below. Ourpresentation of adjusted EBITDA should not be construed as an inference that our future results will be unaffected by unusual or non-recurring items.
Adjusted EBITDA has important limitations as an analytical tool, and you should not consider it in isolation, or as a substitute for analysis of our results asreported under GAAP. For example, adjusted EBITDA:
• does not reflect our capital expenditures, future requirements for capital expenditures or contractual commitments;• does not reflect changes in, or cash requirements for, our working capital needs;• does not reflect the significant interest expenses, or the cash requirements necessary to service interest or principal payments, on our debt;• does not reflect any cash requirements for the assets being depreciated and amortized that may have to be replaced in the future; and• does not reflect payments related to income taxes, the tax receivable agreement or distributions to the non-controlling interest to reimburse its tax
liability.
52
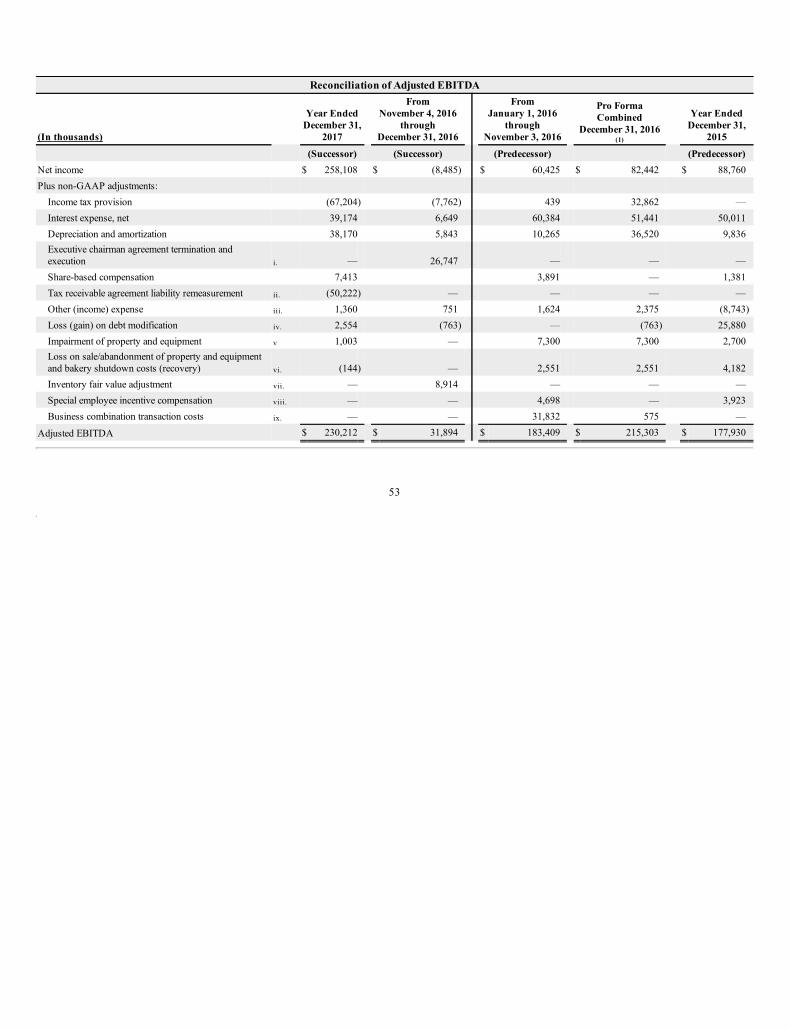
Reconciliation of Adjusted EBITDA
(In thousands)
Year Ended
December 31,
2017
From
November 4, 2016
through
December 31, 2016
From
January 1, 2016
through
November 3, 2016
Pro Forma
Combined
December 31, 2016(1)
Year Ended
December 31,
2015
(Successor) (Successor) (Predecessor) (Predecessor)
Net income $ 258,108 $ (8,485) $ 60,425 $ 82,442 $ 88,760
Plus non-GAAP adjustments:
Income tax provision (67,204) (7,762) 439 32,862 —
Interest expense, net 39,174 6,649 60,384 51,441 50,011
Depreciation and amortization 38,170 5,843 10,265 36,520 9,836
Executive chairman agreement termination andexecution i. — 26,747 — — —
Share-based compensation 7,413 3,891 — 1,381
Tax receivable agreement liability remeasurement ii. (50,222) — — — —
Other (income) expense iii. 1,360 751 1,624 2,375 (8,743)
Loss (gain) on debt modification iv. 2,554 (763) — (763) 25,880
Impairment of property and equipment v 1,003 — 7,300 7,300 2,700
Loss on sale/abandonment of property and equipmentand bakery shutdown costs (recovery) vi. (144) — 2,551 2,551 4,182
Inventory fair value adjustment vii. — 8,914 — — —
Special employee incentive compensation viii. — — 4,698 — 3,923
Business combination transaction costs ix. — — 31,832 575 —
Adjusted EBITDA $ 230,212 $ 31,894 $ 183,409 $ 215,303 $ 177,930
53
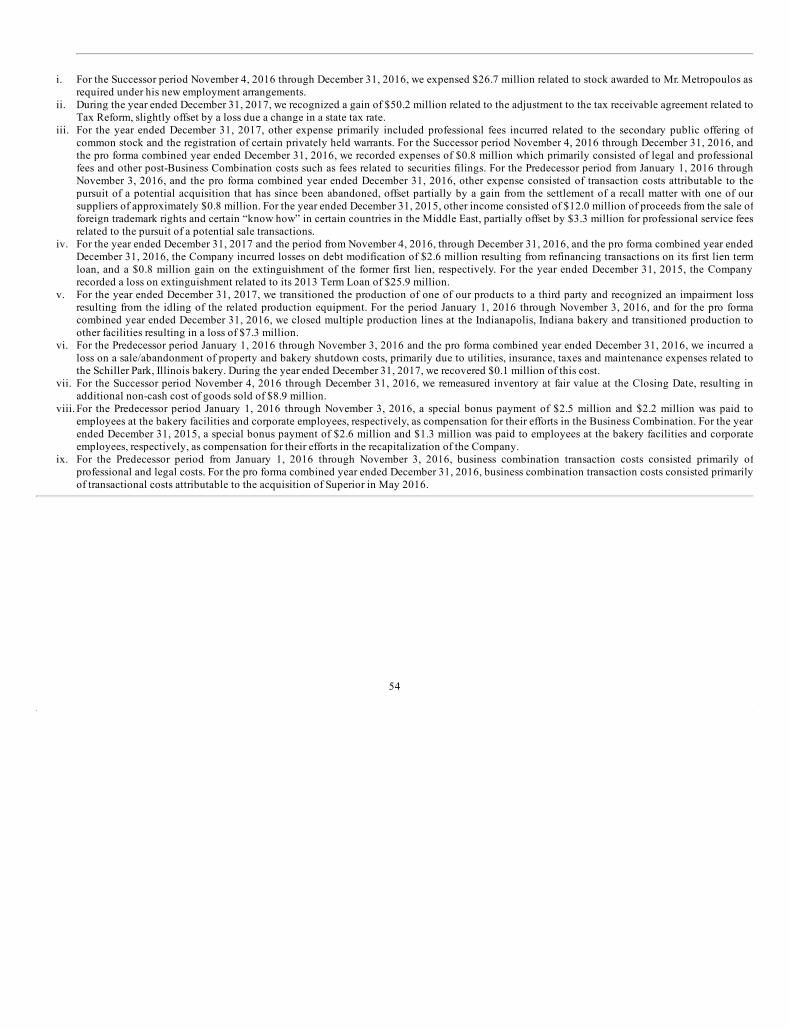
i. For the Successor period November 4, 2016 through December 31, 2016, we expensed $26.7 million related to stock awarded to Mr. Metropoulos asrequired under his new employment arrangements.
ii. During the year ended December 31, 2017, we recognized a gain of $50.2 million related to the adjustment to the tax receivable agreement related toTax Reform, slightly offset by a loss due a change in a state tax rate.
iii. For the year ended December 31, 2017, other expense primarily included professional fees incurred related to the secondary public offering ofcommon stock and the registration of certain privately held warrants. For the Successor period November 4, 2016 through December 31, 2016, andthe pro forma combined year ended December 31, 2016, we recorded expenses of $0.8 million which primarily consisted of legal and professionalfees and other post-Business Combination costs such as fees related to securities filings. For the Predecessor period from January 1, 2016 throughNovember 3, 2016, and the pro forma combined year ended December 31, 2016, other expense consisted of transaction costs attributable to thepursuit of a potential acquisition that has since been abandoned, offset partially by a gain from the settlement of a recall matter with one of oursuppliers of approximately $0.8 million. For the year ended December 31, 2015, other income consisted of $12.0 million of proceeds from the sale offoreign trademark rights and certain “know how” in certain countries in the Middle East, partially offset by $3.3 million for professional service feesrelated to the pursuit of a potential sale transactions.
iv. For the year ended December 31, 2017 and the period from November 4, 2016, through December 31, 2016, and the pro forma combined year endedDecember 31, 2016, the Company incurred losses on debt modification of $2.6 million resulting from refinancing transactions on its first lien termloan, and a $0.8 million gain on the extinguishment of the former first lien, respectively. For the year ended December 31, 2015, the Companyrecorded a loss on extinguishment related to its 2013 Term Loan of $25.9 million.
v. For the year ended December 31, 2017, we transitioned the production of one of our products to a third party and recognized an impairment lossresulting from the idling of the related production equipment. For the period January 1, 2016 through November 3, 2016, and for the pro formacombined year ended December 31, 2016, we closed multiple production lines at the Indianapolis, Indiana bakery and transitioned production toother facilities resulting in a loss of $7.3 million.
vi. For the Predecessor period January 1, 2016 through November 3, 2016 and the pro forma combined year ended December 31, 2016, we incurred aloss on a sale/abandonment of property and bakery shutdown costs, primarily due to utilities, insurance, taxes and maintenance expenses related tothe Schiller Park, Illinois bakery. During the year ended December 31, 2017, we recovered $0.1 million of this cost.
vii. For the Successor period November 4, 2016 through December 31, 2016, we remeasured inventory at fair value at the Closing Date, resulting inadditional non-cash cost of goods sold of $8.9 million.
viii. For the Predecessor period January 1, 2016 through November 3, 2016, a special bonus payment of $2.5 million and $2.2 million was paid toemployees at the bakery facilities and corporate employees, respectively, as compensation for their efforts in the Business Combination. For the yearended December 31, 2015, a special bonus payment of $2.6 million and $1.3 million was paid to employees at the bakery facilities and corporateemployees, respectively, as compensation for their efforts in the recapitalization of the Company.
ix. For the Predecessor period from January 1, 2016 through November 3, 2016, business combination transaction costs consisted primarily ofprofessional and legal costs. For the pro forma combined year ended December 31, 2016, business combination transaction costs consisted primarilyof transactional costs attributable to the acquisition of Superior in May 2016.
54
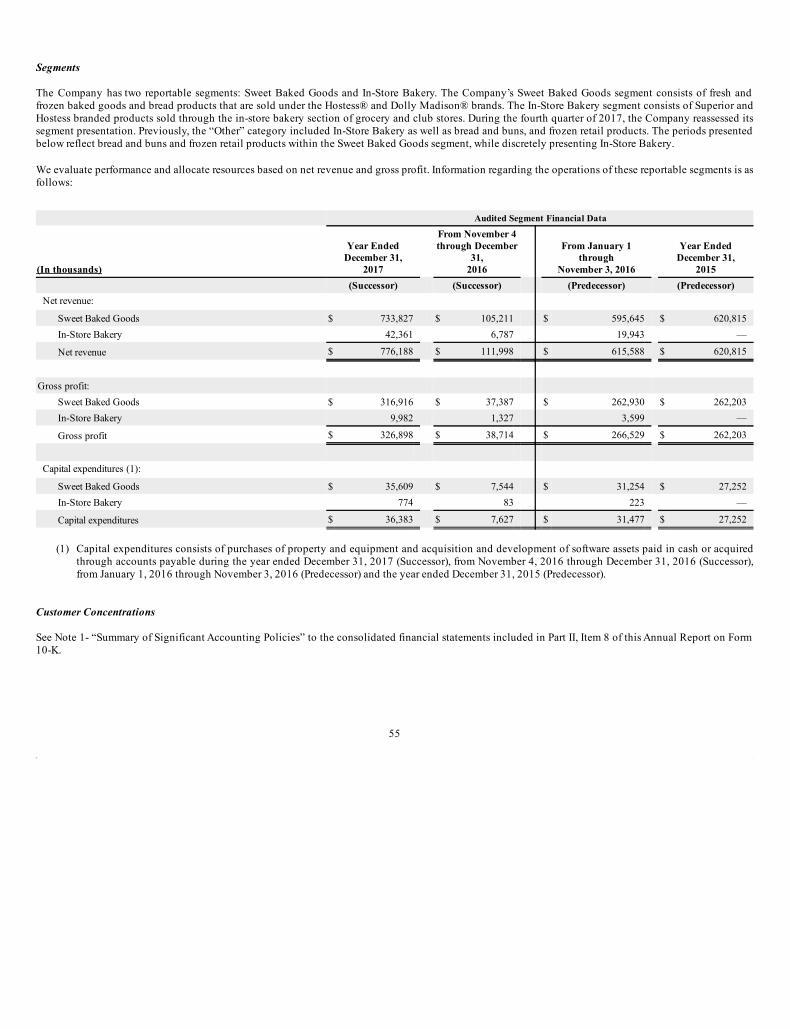
Segments
The Company has two reportable segments: Sweet Baked Goods and In-Store Bakery. The Company’s Sweet Baked Goods segment consists of fresh andfrozen baked goods and bread products that are sold under the Hostess® and Dolly Madison® brands. The In-Store Bakery segment consists of Superior andHostess branded products sold through the in-store bakery section of grocery and club stores. During the fourth quarter of 2017, the Company reassessed itssegment presentation. Previously, the “Other” category included In-Store Bakery as well as bread and buns, and frozen retail products. The periods presentedbelow reflect bread and buns and frozen retail products within the Sweet Baked Goods segment, while discretely presenting In-Store Bakery.
We evaluate performance and allocate resources based on net revenue and gross profit. Information regarding the operations of these reportable segments is asfollows:
Audited Segment Financial Data
(In thousands)
Year Ended
December 31,
2017
From November 4
through December
31,
2016
From January 1
through
November 3, 2016
Year Ended
December 31,
2015
(Successor) (Successor) (Predecessor) (Predecessor)
Net revenue:
Sweet Baked Goods $ 733,827 $ 105,211 $ 595,645 $ 620,815
In-Store Bakery 42,361 6,787 19,943 —
Net revenue $ 776,188 $ 111,998 $ 615,588 $ 620,815
Gross profit:
Sweet Baked Goods $ 316,916 $ 37,387 $ 262,930 $ 262,203
In-Store Bakery 9,982 1,327 3,599 —
Gross profit $ 326,898 $ 38,714 $ 266,529 $ 262,203
Capital expenditures (1):
Sweet Baked Goods $ 35,609 $ 7,544 $ 31,254 $ 27,252
In-Store Bakery 774 83 223 —
Capital expenditures $ 36,383 $ 7,627 $ 31,477 $ 27,252
(1) Capital expenditures consists of purchases of property and equipment and acquisition and development of software assets paid in cash or acquiredthrough accounts payable during the year ended December 31, 2017 (Successor), from November 4, 2016 through December 31, 2016 (Successor),from January 1, 2016 through November 3, 2016 (Predecessor) and the year ended December 31, 2015 (Predecessor).
Customer Concentrations
See Note 1- “Summary of Significant Accounting Policies” to the consolidated financial statements included in Part II, Item 8 of this Annual Report on Form10-K.
55
Liquidity and Capital Resources
Our primary sources of liquidity are from the cash and cash equivalents on the balance sheet, future cash flow generated from operations, and availabilityunder our revolving credit agreement (“Revolver”). We believe that cash flows from operations and the current cash and cash equivalents on the balancesheet will be sufficient to satisfy the anticipated cash requirements associated with our existing operations for at least the next 12 months. Our ability togenerate sufficient cash from our operating activities depends on our future performance, which is subject to general economic, political, financial,competitive and other factors beyond our control. In addition, our future capital expenditures and other cash requirements could be higher than we currentlyexpect as a result of various factors, including any expansion of our business that we undertake, including acquisitions. We consider all highly liquidinvestments purchased with an original maturity of three months or less to be cash equivalents.
We had working capital, excluding cash, as of December 31, 2017 and December 31, 2016 of $15.5 million and $20.6 million, respectively. We have theability to borrow under our Revolver to meet obligations as they come due. As of December 31, 2017, we had approximately $96.1 million available forborrowing, net of letters of credit, under our Revolver.
Cash Flows from Operating Activities
Cash flows provided by operating activities for the year ended December 31, 2017 were $163.7 million compared to cash flows for the Successor periodNovember 4, 2016 through December 31, 2016 of $13.6 million and for the Predecessor period January 1, 2016 through November 3, 2016 of $102.2 million,and $133.0 million for the year ended December 31, 2015. Cash flows provided by operating activities during 2017 was driven by an increase in incomebefore taxes and benefits from accounts payable and customer trade allowances, offset by higher inventory, accounts receivable, and prepaid expensebalances. Cash flow provided by operating activities for the 2016 periods was driven by the payment of transaction costs related to the BusinessCombination.
Cash Flows from Investing Activities
Cash flows used in investing activities for the year ended December 31, 2017 were $35.2 million. Cash flows used in investing activities for the periodNovember 4, 2016 through December 31, 2016 were $428.2 million (Successor) and $76.6 million for the period January 1, 2016 through November 3, 2016(Predecessor) and cash flows of $17.9 million were provided by investing activities for the year ended December 31, 2015. The acquisition of Superior andHostess during the Predecessor and Successor 2016 periods, respectively, represented a significant investing use of cash. Our property and equipment capitalexpenditures primarily consisted of strategic growth initiatives, maintenance and productivity improvements.
Cash Flows from Financing Activities
Cash flows used in financing activities were $19.6 million for the year ended December 31, 2017, $232.3 million for the Successor period November 4, 2016through December 31, 2016, $31.6 million for the Predecessor period January 1, 2016 through November 3, 2016, and $296.0 million for the year endedDecember 31, 2015. For the year ended December 31, 2017 (Successor), financing activities were primarily attributed to scheduled principal payments onlong term debt and distributions to partners/non-controlling interest in respect of their tax liability. For the Successor period of 2016, we had $13.1 million ofdeferred underwriting costs related to the Business Combination.
In November 2016, we extinguished the former second lien term loan through early principal payments and refinanced our first lien term loan whichaccounted for the primary use of cash used in financing activities for the Successor period. In June 2015 and August 2015 the Predecessor extinguished the2013 Term Loan through early principal payments. In the period January 1, 2016 through November 3, 2016, and in the year ended December 31, 2015, thePredecessor paid distributions of $23.6 million, and $952.9 million, respectively, to partners, and $1.0 million, $46.8 million to non-controlling interest,respectively.
Long-Term Debt
As of December 31, 2017, $993.8 million aggregate principal amount of the Third Amended First Lien Term Loan and $3.9 million aggregate principalamount of letters of credit, reducing the amount available under the Revolver, were outstanding. See Note 14 - “Commitments and Contingencies” to theconsolidated financial statements in Part II, Item 8 of this Annual Report on Form 10-K for information regarding the letters of credits. We had no outstandingborrowings under our Revolver as of December 31, 2017.
As of December 31, 2017, we were in compliance with the covenants under the Third Amended First Lien Term Loan and the Revolver.
56
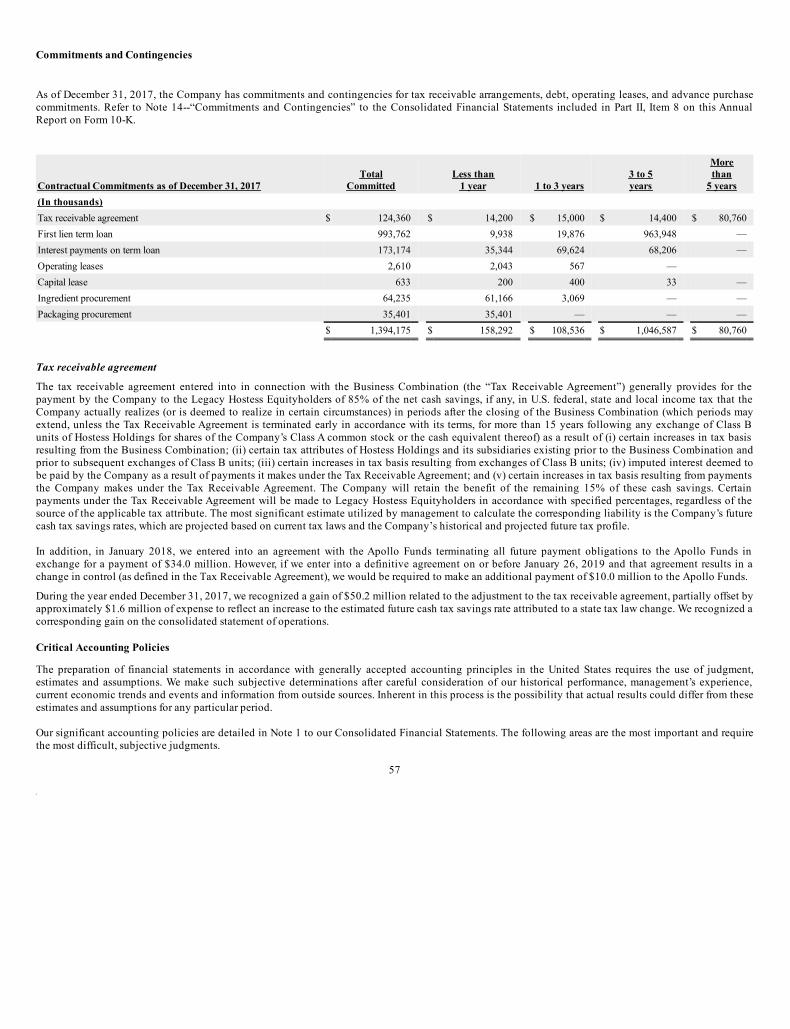
Commitments and Contingencies
As of December 31, 2017, the Company has commitments and contingencies for tax receivable arrangements, debt, operating leases, and advance purchasecommitments. Refer to Note 14--“Commitments and Contingencies” to the Consolidated Financial Statements included in Part II, Item 8 on this AnnualReport on Form 10-K.
Contractual Commitments as of December 31, 2017
Total
Committed Less than
1 year 1 to 3 years 3 to 5
years
More
than
5 years
(In thousands)
Tax receivable agreement $ 124,360 $ 14,200 $ 15,000 $ 14,400 $ 80,760
First lien term loan 993,762 9,938 19,876 963,948 —
Interest payments on term loan 173,174 35,344 69,624 68,206 —
Operating leases 2,610 2,043 567 —
Capital lease 633 200 400 33 —
Ingredient procurement 64,235 61,166 3,069 — —
Packaging procurement 35,401 35,401 — — —
$ 1,394,175 $ 158,292 $ 108,536 $ 1,046,587 $ 80,760
Tax receivable agreement
The tax receivable agreement entered into in connection with the Business Combination (the “Tax Receivable Agreement”) generally provides for thepayment by the Company to the Legacy Hostess Equityholders of 85% of the net cash savings, if any, in U.S. federal, state and local income tax that theCompany actually realizes (or is deemed to realize in certain circumstances) in periods after the closing of the Business Combination (which periods mayextend, unless the Tax Receivable Agreement is terminated early in accordance with its terms, for more than 15 years following any exchange of Class Bunits of Hostess Holdings for shares of the Company’s Class A common stock or the cash equivalent thereof) as a result of (i) certain increases in tax basisresulting from the Business Combination; (ii) certain tax attributes of Hostess Holdings and its subsidiaries existing prior to the Business Combination andprior to subsequent exchanges of Class B units; (iii) certain increases in tax basis resulting from exchanges of Class B units; (iv) imputed interest deemed tobe paid by the Company as a result of payments it makes under the Tax Receivable Agreement; and (v) certain increases in tax basis resulting from paymentsthe Company makes under the Tax Receivable Agreement. The Company will retain the benefit of the remaining 15% of these cash savings. Certainpayments under the Tax Receivable Agreement will be made to Legacy Hostess Equityholders in accordance with specified percentages, regardless of thesource of the applicable tax attribute. The most significant estimate utilized by management to calculate the corresponding liability is the Company’s futurecash tax savings rates, which are projected based on current tax laws and the Company’s historical and projected future tax profile.
In addition, in January 2018, we entered into an agreement with the Apollo Funds terminating all future payment obligations to the Apollo Funds inexchange for a payment of $34.0 million. However, if we enter into a definitive agreement on or before January 26, 2019 and that agreement results in achange in control (as defined in the Tax Receivable Agreement), we would be required to make an additional payment of $10.0 million to the Apollo Funds.
During the year ended December 31, 2017, we recognized a gain of $50.2 million related to the adjustment to the tax receivable agreement, partially offset byapproximately $1.6 million of expense to reflect an increase to the estimated future cash tax savings rate attributed to a state tax law change. We recognized acorresponding gain on the consolidated statement of operations.
Critical Accounting Policies
The preparation of financial statements in accordance with generally accepted accounting principles in the United States requires the use of judgment,estimates and assumptions. We make such subjective determinations after careful consideration of our historical performance, management’s experience,current economic trends and events and information from outside sources. Inherent in this process is the possibility that actual results could differ from theseestimates and assumptions for any particular period.
Our significant accounting policies are detailed in Note 1 to our Consolidated Financial Statements. The following areas are the most important and requirethe most difficult, subjective judgments.
57
Trade and consumer promotion programs
We offer various sales incentive programs to customers and consumers, such as feature price discounts, in-store display incentives, cooperative advertisingprograms, new product introduction fees, and coupons. The mix between promotional programs, which are classified as reductions in revenue in theStatement of Operations, and advertising or other marketing activities, which are classified as marketing and selling expenses in the Statement of Operations,fluctuates between periods based on our overall marketing plans, and such fluctuations have an impact on revenues. These trade programs also requiremanagement to make estimates about the expected total cost of the programs and related allocations amongst participants (who might have different levels ofincentives based on various program requirements). These estimates are inherently uncertain and are generally based on historical experience, adjusted forany new facts or circumstances that might impact the ultimate cost estimate for a particular program or programs.
Goodwill and Indefinite-lived trade names
When evaluating goodwill and indefinite-lived intangible assets for impairment, under U.S. GAAP we may first perform an assessment of qualitative factorsto determine if the fair value of the reporting unit or the intangible asset is more-likely-than-not greater than the carrying amount. Such qualitative factorsinclude, but are not limited to, macro-economic conditions, market and industry conditions, cost considerations, competitive environment, share pricefluctuations, overall financial performance and results of past impairment tests. If, based on a review of the qualitative factors, we determine it is not more-likely-than-not that the fair value is less than the carrying value, we may bypass the two-step quantitative impairment test. The first step (“Step 1”) of thequantitative impairment test calculates the estimated fair value of each of the reporting units and compares it to the carrying value. If the fair value is inexcess of the carrying value, no impairment exists. If Step 1 does indicate impairment, a second step (“Step 2”) must take place. Under Step 2, the fair value ofthe assets and liabilities of the reporting unit are estimated as if the reporting unit were acquired in a business combination. The excess of the fair value of thereporting unit over the amounts assigned to its assets and liabilities is the implied fair value of the goodwill, to which the carrying value of the goodwill mustbe adjusted.
In performing the quantitative test of goodwill, we primarily use the income approach method of valuation that included the discounted cash flow method aswell as other generally accepted valuation methodologies to determine the fair value of goodwill and intangible assets. Significant assumptions used todetermine fair value under the discounted cash flow model included future trends in sales, operating expenses, overhead expenses, capital expenditures andchanges in working capital, along with an appropriate discount rate based on our estimated cost of equity capital and after-tax cost of debt.
In the process of our annual impairment review of the trade names, we primarily use the relief of royalty method under the income approach method ofvaluation. Significant assumptions used to determine fair value under the relief of royalty method included future trends in sales, a royalty rate and a discountrate to be applied to the forecast revenue stream.
Business Combinations
We account for acquisitions using the purchase method of accounting. Assets acquired, liabilities assumed, and non-controlling interests are recorded at theirestimated fair values at the acquisition date. The excess of purchase price over fair value of the net assets acquired, including the amount assigned toidentifiable intangible assets, is recorded as goodwill. Given the time it takes to obtain pertinent information to finalize the acquired company’s balancesheet, it may be multiple quarters before we are able to finalize those initial fair value estimates. Accordingly, it is not uncommon for the initial estimates tobe subsequently revised.
Tax receivable agreement
See “-Commitments and Contingencies- Tax receivable agreement” above.
New Accounting Pronouncements
Refer to Note 1. Significant Accounting Policies of the Notes to our Consolidated Financial Statements elsewhere in this filing for further informationregarding recently issued accounting standards.
58
Item 7A. Quantitative and Qualitative Disclosures about Market Risk
We are exposed to interest rate market risk.
Market risk on variable-rate financial instruments
Our Third Amended First Lien Term Loan and Revolver each bear interest on outstanding borrowings thereunder at variable interest rates. The rate in effect atDecember 31, 2017 for the outstanding Third Amended First Lien Term Loan was a LIBOR-based rate of 3.60% per annum. At December 31, 2017, thesubsidiary borrower had an aggregate principal balance of $993.8 million outstanding under the Third Amended First Lien Term Loan. At December 31,2017, the subsidiary borrower had $96.1 million available for borrowing, net of letters of credit of $3.9 million, under its Revolver. Increases in marketinterest rates would cause interest expense to increase and earnings before income taxes to decrease.
To manage the risk related to our variable rate debt, we have entered into an interest rate swap contract with a counter party to make a series of paymentsbased on a fixed interest rate of 1.78% and receive a series of payments based on the greater of LIBOR or 0.75%. Both the fixed and floating payment streamsare based on a notional amount of $500 million at the inception of the contract and will be reduced by $100 million each year of the five year contract.
The change in interest expense and earnings before income taxes resulting from a change in market interest rates would be dependent upon the weightedaverage outstanding borrowings and the portion of those borrowings that are hedged by our swap contract during the reporting period following an increasein market interest rates. An increase or decrease in applicable interest rates of 1% would result in an increase or decrease in interest payable of approximately$4.9 million for the year ended December 31, 2017, after accounting for the impact of our swap contract.
Item 8. Financial Statements and Supplementary Data
INDEX TO CONSOLIDATED FINANCIAL STATEMENTS
Audited Consolidated Financial Statements
Report of Independent Registered Public Accounting Firm 60
Consolidated Balance Sheets as of December 31, 2017 and December 31, 2016 62
Consolidated Statements of Operations for the year ended December 31, 2017 (Successor), from November 4, 2016 through December 31,2016 (Successor), and from January 1, 2016 through November 3, 2016 (Predecessor), and the year ended December 31, 2015 (Predecessor) 63
Consolidated Statements of Comprehensive Income (Loss) for the year ended December 31, 2017 (Successor), from November 4, 2016 throughDecember 31, 2016 (Successor), and from January 1, 2016 through November 3, 2016 (Predecessor), and the year ended December 31, 2015(Predecessor) 64
Consolidated Statements of Stockholders’ Equity for the year ended December 31, 2017 (Successor), from November 4, 2016 throughDecember 31, 2016 (Successor), and Partners’ Equity (Deficit) from January 1, 2016 through November 3, 2016 (Predecessor) and the yearended December 31, 2015 (Predecessor) 65
Consolidated Statements of Cash Flows for the year ended December 31, 2017, November 4, 2016 through December 31, 2016 (Successor),and from January 1, 2016 through November 3, 2016 (Predecessor), and the year ended December 31, 2015 (Predecessor) 66
Notes to Consolidated Financial Statements 67
59
Report of Independent Registered Public Accounting Firm
To the Shareholders and Board of DirectorsHostess Brands, Inc.:
Opinions on the Consolidated Financial Statements and Internal Control Over Financial Reporting
We have audited the accompanying consolidated balance sheets of Hostess Brands, Inc. and subsidiaries (the “Company”) as of December 31, 2017 and2016, and the related consolidated statements of operations, comprehensive income (loss), equity, and cash flows for the year ended December 31, 2017 andfor the period November 4, 2016 through December 31, 2016, and the related notes. We have also audited the accompanying consolidated statements ofoperations, equity, and cash flows for the period January 1, 2016 through November 3, 2016 and the year ended December 31, 2015 of Hostess Holdings, L.P.and subsidiaries, and the related notes (collectively with the consolidated financial statements of Hostess Brands, Inc., the “consolidated financialstatements”). We also have audited the Company’s internal control over financial reporting as of December 31, 2017, based on criteria established in Internal
Control - Integrated Framework (2013) issued by the Committee of Sponsoring Organizations of the Treadway Commission.
In our opinion, the consolidated financial statements referred to above present fairly, in all material respects, the financial position of Hostess Brands, Inc. andsubsidiaries as of December 31, 2017 and 2016, and the results of their operations and their cash flows for the year ended December 31, 2017 and for theperiod November 4, 2016 through December 31, 2016, in conformity with U.S. generally accepted accounting principles. It is also our opinion that thefinancial statements referred to above present fairly, in all material respects, the results of Hostess Holdings, L.P. and subsidiaries’ operations and cash flowsfor the period January 1, 2016 through November 3, 2016 and the year ended December 31, 2015, in conformity with U.S. generally accepted accountingprinciples. Also in our opinion, the Company maintained, in all material respects, effective internal control over financial reporting as of December 31, 2017,based on criteria established in Internal Control - Integrated Framework (2013) issued by the Committee of Sponsoring Organizations of the TreadwayCommission.
Basis for Opinions
The Company’s management is responsible for these consolidated financial statements, for maintaining effective internal control over financial reporting,and for its assessment of the effectiveness of internal control over financial reporting, included in the accompanying Management’s Report on InternalControl Over Financial Reporting. Our responsibility is to express an opinion on the Company’s consolidated financial statements and an opinion on theCompany’s internal control over financial reporting based on our audits. We are a public accounting firm registered with the Public Company AccountingOversight Board (United States) (“PCAOB”) and are required to be independent with respect to the Company in accordance with the U.S. federal securitieslaws and the applicable rules and regulations of the Securities and Exchange Commission and the PCAOB.
We conducted our audits in accordance with the standards of the PCAOB. Those standards require that we plan and perform the audits to obtain reasonableassurance about whether the consolidated financial statements are free of material misstatement, whether due to error or fraud, and whether effective internalcontrol over financial reporting was maintained in all material respects.
60
Our audits of the consolidated financial statements included performing procedures to assess the risks of material misstatement of the consolidated financialstatements, whether due to error or fraud, and performing procedures that respond to those risks. Such procedures included examining, on a test basis,evidence regarding the amounts and disclosures in the consolidated financial statements. Our audits also included evaluating the accounting principles usedand significant estimates made by management, as well as evaluating the overall presentation of the consolidated financial statements. Our audit of internalcontrol over financial reporting included obtaining an understanding of internal control over financial reporting, assessing the risk that a material weaknessexists, and testing and evaluating the design and operating effectiveness of internal control based on the assessed risk. Our audits also included performingsuch other procedures as we considered necessary in the circumstances. We believe that our audits provide a reasonable basis for our opinions.
Definition and Limitations of Internal Control Over Financial Reporting
A company’s internal control over financial reporting is a process designed to provide reasonable assurance regarding the reliability of financial reportingand the preparation of financial statements for external purposes in accordance with generally accepted accounting principles. A company’s internal controlover financial reporting includes those policies and procedures that (1) pertain to the maintenance of records that, in reasonable detail, accurately and fairlyreflect the transactions and dispositions of the assets of the company; (2) provide reasonable assurance that transactions are recorded as necessary to permitpreparation of financial statements in accordance with generally accepted accounting principles, and that receipts and expenditures of the company are beingmade only in accordance with authorizations of management and directors of the company; and (3) provide reasonable assurance regarding prevention ortimely detection of unauthorized acquisition, use, or disposition of the company’s assets that could have a material effect on the financial statements.
Because of its inherent limitations, internal control over financial reporting may not prevent or detect misstatements. Also, projections of any evaluation ofeffectiveness to future periods are subject to the risk that controls may become inadequate because of changes in conditions, or that the degree of compliancewith the policies or procedures may deteriorate.
(signed) KPMG LLP
We have served as the Company’s auditor since 2013.
Kansas City, MissouriFebruary 28, 2018
61
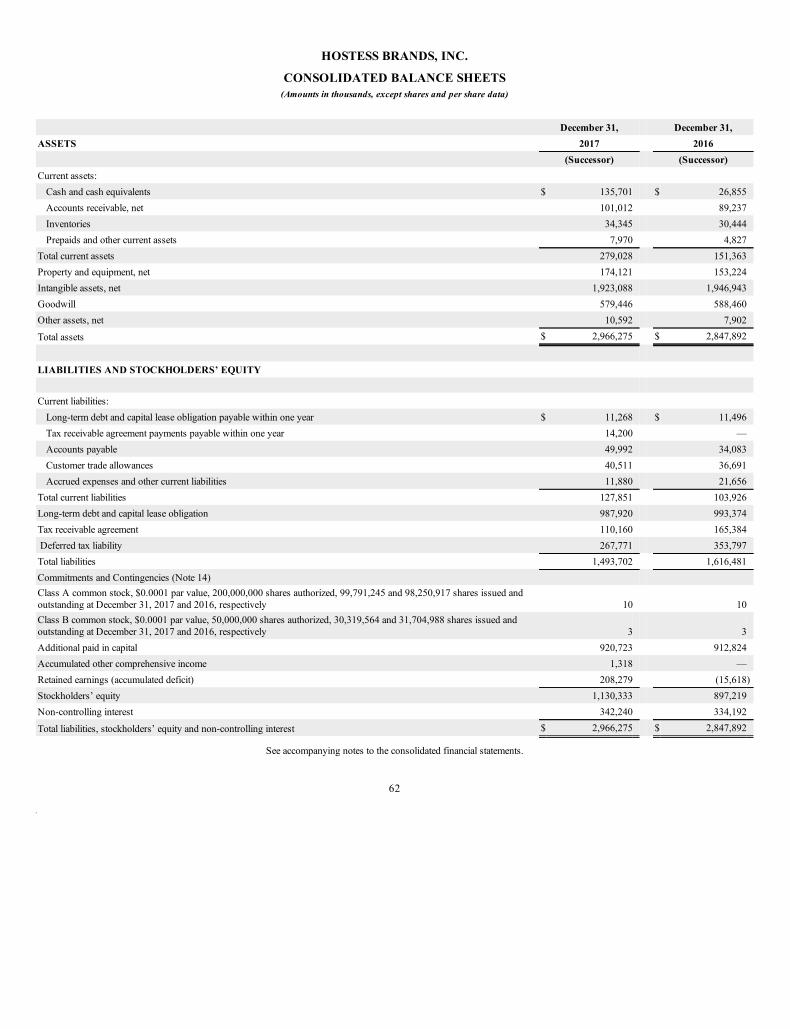
HOSTESS BRANDS, INC.
CONSOLIDATED BALANCE SHEETS
(Amounts in thousands, except shares and per share data)
December 31, December 31,
ASSETS 2017 2016
(Successor) (Successor)
Current assets:
Cash and cash equivalents $ 135,701 $ 26,855
Accounts receivable, net 101,012 89,237
Inventories 34,345 30,444
Prepaids and other current assets 7,970 4,827
Total current assets 279,028 151,363
Property and equipment, net 174,121 153,224
Intangible assets, net 1,923,088 1,946,943
Goodwill 579,446 588,460
Other assets, net 10,592 7,902
Total assets $ 2,966,275 $ 2,847,892
LIABILITIES AND STOCKHOLDERS’ EQUITY
Current liabilities:
Long-term debt and capital lease obligation payable within one year $ 11,268 $ 11,496
Tax receivable agreement payments payable within one year 14,200 —
Accounts payable 49,992 34,083
Customer trade allowances 40,511 36,691
Accrued expenses and other current liabilities 11,880 21,656
Total current liabilities 127,851 103,926
Long-term debt and capital lease obligation 987,920 993,374
Tax receivable agreement 110,160 165,384
Deferred tax liability 267,771 353,797
Total liabilities 1,493,702 1,616,481
Commitments and Contingencies (Note 14)
Class A common stock, $0.0001 par value, 200,000,000 shares authorized, 99,791,245 and 98,250,917 shares issued andoutstanding at December 31, 2017 and 2016, respectively 10 10
Class B common stock, $0.0001 par value, 50,000,000 shares authorized, 30,319,564 and 31,704,988 shares issued andoutstanding at December 31, 2017 and 2016, respectively 3 3
Additional paid in capital 920,723 912,824
Accumulated other comprehensive income 1,318 —
Retained earnings (accumulated deficit) 208,279 (15,618)
Stockholders’ equity 1,130,333 897,219
Non-controlling interest 342,240 334,192
Total liabilities, stockholders’ equity and non-controlling interest $ 2,966,275 $ 2,847,892
See accompanying notes to the consolidated financial statements.
62
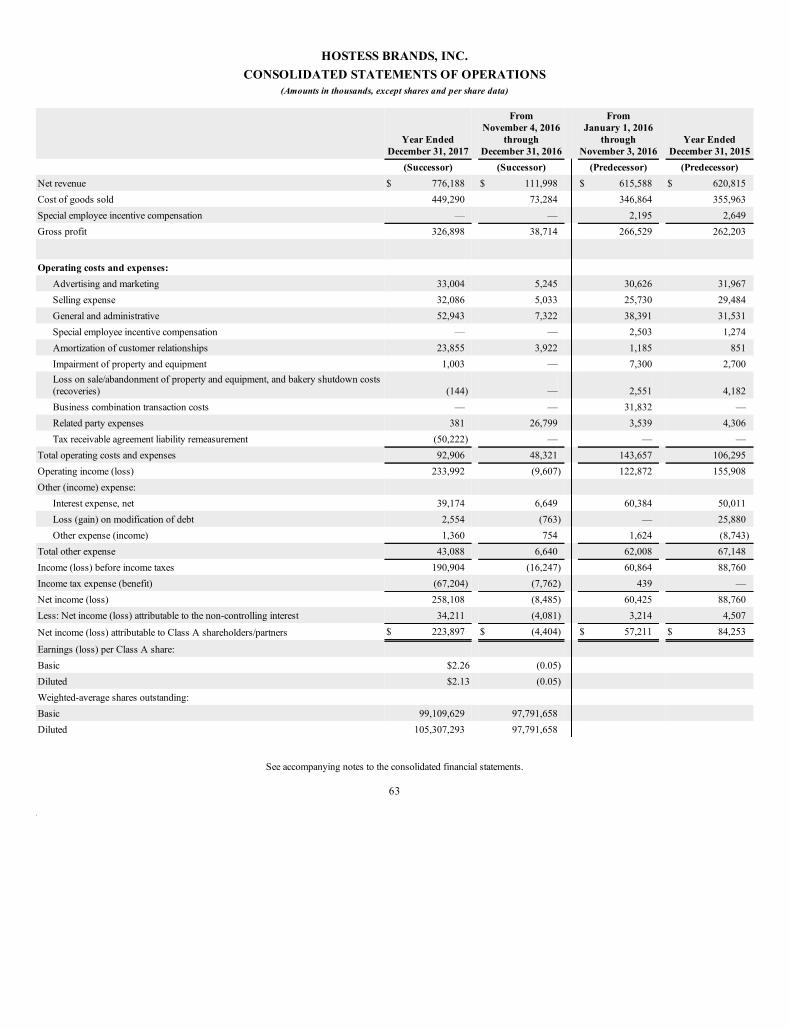
HOSTESS BRANDS, INC.
CONSOLIDATED STATEMENTS OF OPERATIONS
(Amounts in thousands, except shares and per share data)
Year Ended
December 31, 2017
From
November 4, 2016
through
December 31, 2016
From
January 1, 2016
through
November 3, 2016 Year Ended
December 31, 2015
(Successor) (Successor) (Predecessor) (Predecessor)
Net revenue $ 776,188 $ 111,998 $ 615,588 $ 620,815
Cost of goods sold 449,290 73,284 346,864 355,963
Special employee incentive compensation — — 2,195 2,649
Gross profit 326,898 38,714 266,529 262,203
Operating costs and expenses:
Advertising and marketing 33,004 5,245 30,626 31,967
Selling expense 32,086 5,033 25,730 29,484
General and administrative 52,943 7,322 38,391 31,531
Special employee incentive compensation — — 2,503 1,274
Amortization of customer relationships 23,855 3,922 1,185 851
Impairment of property and equipment 1,003 — 7,300 2,700
Loss on sale/abandonment of property and equipment, and bakery shutdown costs(recoveries) (144) — 2,551 4,182
Business combination transaction costs — — 31,832 —
Related party expenses 381 26,799 3,539 4,306
Tax receivable agreement liability remeasurement (50,222) — — —
Total operating costs and expenses 92,906 48,321 143,657 106,295
Operating income (loss) 233,992 (9,607) 122,872 155,908
Other (income) expense:
Interest expense, net 39,174 6,649 60,384 50,011
Loss (gain) on modification of debt 2,554 (763) — 25,880
Other expense (income) 1,360 754 1,624 (8,743)
Total other expense 43,088 6,640 62,008 67,148
Income (loss) before income taxes 190,904 (16,247) 60,864 88,760
Income tax expense (benefit) (67,204) (7,762) 439 —
Net income (loss) 258,108 (8,485) 60,425 88,760
Less: Net income (loss) attributable to the non-controlling interest 34,211 (4,081) 3,214 4,507
Net income (loss) attributable to Class A shareholders/partners $ 223,897 $ (4,404) $ 57,211 $ 84,253
Earnings (loss) per Class A share:
Basic $2.26 (0.05)
Diluted $2.13 (0.05)
Weighted-average shares outstanding:
Basic 99,109,629 97,791,658
Diluted 105,307,293 97,791,658
See accompanying notes to the consolidated financial statements.
63
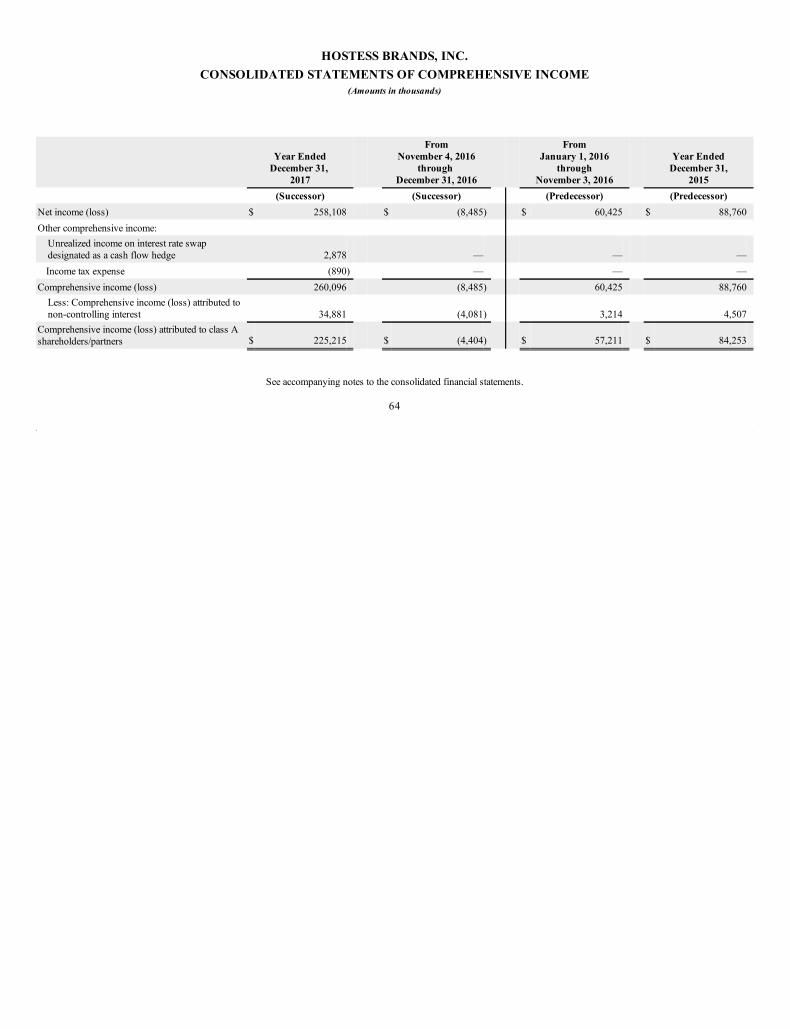
HOSTESS BRANDS, INC.
CONSOLIDATED STATEMENTS OF COMPREHENSIVE INCOME
(Amounts in thousands)
Year Ended
December 31,
2017
From
November 4, 2016
through
December 31, 2016
From
January 1, 2016
through
November 3, 2016
Year Ended
December 31,
2015
(Successor) (Successor) (Predecessor) (Predecessor)
Net income (loss) $ 258,108 $ (8,485) $ 60,425 $ 88,760
Other comprehensive income:
Unrealized income on interest rate swapdesignated as a cash flow hedge 2,878 — — —
Income tax expense (890) — — —
Comprehensive income (loss) 260,096 (8,485) 60,425 88,760
Less: Comprehensive income (loss) attributed tonon-controlling interest 34,881 (4,081) 3,214 4,507
Comprehensive income (loss) attributed to class Ashareholders/partners $ 225,215 $ (4,404) $ 57,211 $ 84,253
See accompanying notes to the consolidated financial statements.
64
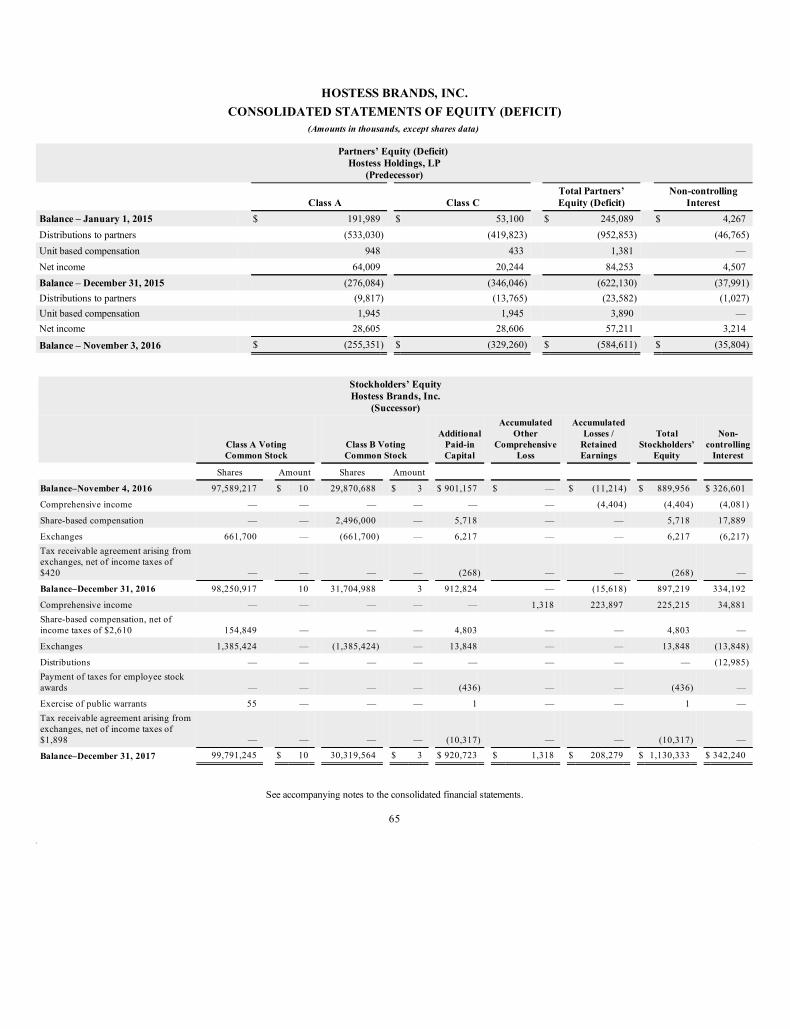
HOSTESS BRANDS, INC.
CONSOLIDATED STATEMENTS OF EQUITY (DEFICIT)
(Amounts in thousands, except shares data)
Partners’ Equity (Deficit)
Hostess Holdings, LP
(Predecessor)
Class A Class C
Total Partners’
Equity (Deficit)
Non-controlling
Interest
Balance – January 1, 2015 $ 191,989 $ 53,100 $ 245,089 $ 4,267
Distributions to partners (533,030) (419,823) (952,853) (46,765)
Unit based compensation 948 433 1,381 —
Net income 64,009 20,244 84,253 4,507
Balance – December 31, 2015 (276,084) (346,046) (622,130) (37,991)
Distributions to partners (9,817) (13,765) (23,582) (1,027)
Unit based compensation 1,945 1,945 3,890 —
Net income 28,605 28,606 57,211 3,214
Balance – November 3, 2016 $ (255,351) $ (329,260) $ (584,611) $ (35,804)
Stockholders’ Equity
Hostess Brands, Inc.
(Successor)
Class A Voting
Common Stock Class B Voting
Common Stock
Additional
Paid-in
Capital
Accumulated
Other
Comprehensive
Loss
Accumulated
Losses /
Retained
Earnings
Total
Stockholders’
Equity
Non-
controlling
Interest
Shares Amount Shares Amount
Balance–November 4, 2016 97,589,217 $ 10 29,870,688 $ 3 $ 901,157 $ — $ (11,214) $ 889,956 $ 326,601
Comprehensive income — — — — — — (4,404) (4,404) (4,081)
Share-based compensation — — 2,496,000 — 5,718 — — 5,718 17,889
Exchanges 661,700 — (661,700) — 6,217 — — 6,217 (6,217)
Tax receivable agreement arising from
exchanges, net of income taxes of
$420 — — — — (268) — — (268) —
Balance–December 31, 2016 98,250,917 10 31,704,988 3 912,824 — (15,618) 897,219 334,192
Comprehensive income — — — — — 1,318 223,897 225,215 34,881
Share-based compensation, net of
income taxes of $2,610 154,849 — — — 4,803 — — 4,803 —
Exchanges 1,385,424 — (1,385,424) — 13,848 — — 13,848 (13,848)
Distributions — — — — — — — — (12,985)
Payment of taxes for employee stock
awards — — — — (436) — — (436) —
Exercise of public warrants 55 — — — 1 — — 1 —
Tax receivable agreement arising from
exchanges, net of income taxes of
$1,898 — — — — (10,317) — — (10,317) —
Balance–December 31, 2017 99,791,245 $ 10 30,319,564 $ 3 $ 920,723 $ 1,318 $ 208,279 $ 1,130,333 $ 342,240
See accompanying notes to the consolidated financial statements.
65
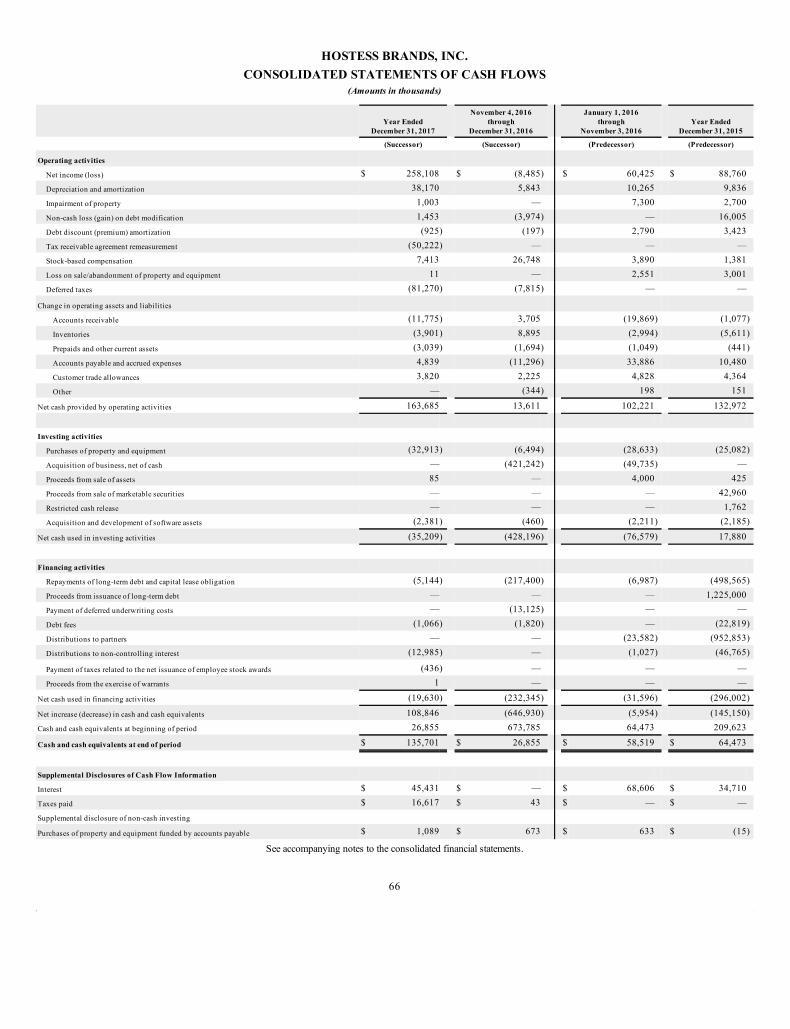
HOSTESS BRANDS, INC.
CONSOLIDATED STATEMENTS OF CASH FLOWS
(Amounts in thousands)
Year Ended
December 31, 2017
November 4, 2016
through
December 31, 2016
January 1, 2016
through
November 3, 2016
Year Ended
December 31, 2015
(Successor) (Successor) (Predecessor) (Predecessor)
Operating activities
Net income (loss) $ 258,108 $ (8,485) $ 60,425 $ 88,760
Depreciation and amortization 38,170 5,843 10,265 9,836
Impairment of property 1,003 — 7,300 2,700
Non-cash loss (gain) on debt modification 1,453 (3,974) — 16,005
Debt discount (premium) amortization (925) (197) 2,790 3,423
Tax receivable agreement remeasurement (50,222) — — —
Stock-based compensation 7,413 26,748 3,890 1,381
Loss on sale/abandonment of property and equipment 11 — 2,551 3,001
Deferred taxes (81,270) (7,815) — —
Change in operating assets and liabilities
Accounts receivable (11,775) 3,705 (19,869) (1,077)
Inventories (3,901) 8,895 (2,994) (5,611)
Prepaids and other current assets (3,039) (1,694) (1,049) (441)
Accounts payable and accrued expenses 4,839 (11,296) 33,886 10,480
Customer trade allowances 3,820 2,225 4,828 4,364
Other — (344) 198 151
Net cash provided by operating activities 163,685 13,611 102,221 132,972
Investing activities
Purchases of property and equipment (32,913) (6,494) (28,633) (25,082)
Acquisition of business, net of cash — (421,242) (49,735) —
Proceeds from sale of assets 85 — 4,000 425
Proceeds from sale of marketable securities — — — 42,960
Restricted cash release — — — 1,762
Acquisition and development of software assets (2,381) (460) (2,211) (2,185)
Net cash used in investing activities (35,209) (428,196) (76,579) 17,880
Financing activities
Repayments of long-term debt and capital lease obligation (5,144) (217,400) (6,987) (498,565)
Proceeds from issuance of long-term debt — — — 1,225,000
Payment of deferred underwriting costs — (13,125) — —
Debt fees (1,066) (1,820) — (22,819)
Distributions to partners — — (23,582) (952,853)
Distributions to non-controlling interest (12,985) — (1,027) (46,765)
Payment of taxes related to the net issuance of employee stock awards (436) — — —
Proceeds from the exercise of warrants 1 — — —
Net cash used in financing activities (19,630) (232,345) (31,596) (296,002)
Net increase (decrease) in cash and cash equivalents 108,846 (646,930) (5,954) (145,150)
Cash and cash equivalents at beginning of period 26,855 673,785 64,473 209,623
Cash and cash equivalents at end of period $ 135,701 $ 26,855 $ 58,519 $ 64,473
Supplemental Disclosures of Cash Flow Information
Interest $ 45,431 $ — $ 68,606 $ 34,710
Taxes paid $ 16,617 $ 43 $ — $ —
Supplemental disclosure of non-cash investing
Purchases of property and equipment funded by accounts payable $ 1,089 $ 673 $ 633 $ (15)
See accompanying notes to the consolidated financial statements.
66
HOSTESS BRANDS, INC.
NOTES TO CONSOLIDATED FINANCIAL STATEMENTS
1. Summary of Significant Accounting Policies
Description of Business
Hostess Brands, Inc. is a Delaware corporation headquartered in Kansas City, Missouri. The consolidated financial statements include the accounts of Hostess
Brands, Inc. and its wholly owned subsidiaries (collectively, the “Company”). The Company is a leading packaged food company focused on developing,
manufacturing, marketing, selling and distributing fresh sweet baked goods in the United States. The Hostess brand dates to 1919 when the Hostess CupCake
was introduced to the public, followed by Twinkies® in 1930. In 2013, the Legacy Hostess Equityholders (as defined below) acquired the Hostess brand out
of the bankruptcy liquidation proceedings of its prior owners, free and clear of all past liabilities. After a brief hiatus in production, the Company began
providing Hostess products to consumers and retailers across the nation in July 2013. Today, the Company produces a variety of new and classic treats
primarily under the Hostess® and Dolly Madison® group of brands, including Twinkies®, CupCakes, Ding Dongs®, HoHos®, Donettes® and Fruit Pies.
On November 4, 2016 (the “Closing Date”), in a transaction referred to as the “Business Combination,” the Company, then known as Gores Holdings, Inc.(“Gores Holdings”), acquired a controlling interest in Hostess Holdings, L.P. (“Hostess Holdings”), an entity owned indirectly by C. Dean Metropoulos andcertain equity funds managed by affiliates of Apollo Global Management, LLC (the “Apollo Funds”, and together with entities controlled by Mr.Metropoulos, the “Legacy Hostess Equityholders”). Our “Sponsor” refers to Gores Sponsor, LLC, a Delaware limited liability company and the principalstockholder of Gores Holdings, Inc. prior to the Business Combination, and the “The Gores Group” refers to The Gores Group LLC, an affiliate of ourSponsor. In connection with the closing of the Business Combination, Gores Holdings, Inc. changed its name to “Hostess Brands, Inc.” and its tradingsymbols on NASDAQ from “GRSH” and “GRSHW,” to “TWNK” and “TWNKW”.
As a result of the Business Combination, for accounting purposes, Hostess Brands, Inc. is the acquirer and Hostess Holdings is the acquired party andaccounting predecessor. The Company’s financial statement presentation includes the financial statements of Hostess Holdings and its subsidiaries as“Predecessor” for periods prior to the completion of the Business Combination and of Hostess Brands, Inc., including the consolidation of Hostess Holdingsand its subsidiaries, for periods from and after the Closing Date (referred to as the “Successor”). Unless the context requires otherwise, the “Company” refersto the Predecessor for periods prior to the Business Combination and to the Successor for periods after the Business Combination.
On May 10, 2016, the Company purchased the stock of Superior Cake Products, Inc. (“Superior”) located in Southbridge, Massachusetts. Superiormanufactures and distributes eclairs, madeleines, brownies, and iced cookies sold in the “In-Store Bakery” section of retailers.
Basis of Presentation
The consolidated financial statements included herein have been prepared in accordance with generally accepted accounting principles in the United Statesof America (“U.S. GAAP”) and the rules and regulations of Securities and Exchange Commission (“SEC”). The accompanying consolidated financialstatements include the accounts of the Company and its majority-owned or controlled subsidiaries, collectively referred to as either Hostess or the Company.All intercompany balances and transactions have been eliminated in consolidation.
67
The Company has determined that Hostess Holdings, a limited partnership, is a variable interest entity (“VIE”) and that the Company is the primarybeneficiary of the VIE. The Company determined that, through Hostess GP, it has the power to direct all of the activities of Hostess Holdings, with nosubstantive kick-out rights or participating rights by the limited partners individually or as a group. Hostess Holdings constitutes the majority of the assets ofthe Company.
Mr. Metropoulos and the Metropoulos Entities hold their equity investment in the company primarily through Class B limited partnership units in theCompany’s subsidiary, Hostess Holdings (“Class B Units”) and an equal number of shares of the Company’s Class B common stock (“Class B Stock”). TheCompany’s Class B Stock has voting, but no economic, rights, while Hostess Holdings’ Class B Units have economic, but no voting, rights. Each Class BUnit, together with a share of Class B Stock held by the Metropoulos Entities, is exchangeable for a share of the Company’s Class A common stock (or at theoption of the Company, the cash equivalent thereof). The interest of the Metropoulos Entities in Hostess Holdings’ Class B Units is reflected in ourConsolidated Financial Statements as a non-controlling interest. The non-controlling interest was recorded at fair value at November 4, 2016 as a result of theBusiness Combination.
For the Predecessor periods, Hostess Holdings consolidated the financial position and results of operations of New Hostess Holdco LLC. The portion of theNew Hostess Holdco, LLC not owned by Hostess Holdings was recognized as a non-controlling interest in the Consolidated Financial Statements. The non-controlling interest presented in the accompanying consolidated balance sheet represents the amount of cash that would be payable to the non-controllinginterest holders if the Company were liquidated at book value as of the balance sheet date. The difference between the calculated liquidation distributionamounts at the beginning and the end of the reporting period, is the share of the earnings or losses allocated to non-controlling interest for the period.
For the year ended December 31, 2017, the Company recorded adjustments to previously reported gains on debt modifications, resulting in a pre-tax chargeof $1.6 million. The Company has determined that this correction of an error is immaterial to the current and prior reported periods.
The Company has two reportable segments: Sweet Baked Goods and In-Store Bakery. Previously, the Company’s reportable segments were Sweet BakedGoods and Other. A change in the Company’s internal reporting structure during the last quarter of 2017 caused the Company to reassess its reportablesegments. Prior period segment disclosures have been reclassified to conform with current period presentation.
Use of Estimates
The preparation of consolidated financial statements in conformity with U.S. GAAP requires management to make estimates and judgments that affect thereported amounts of assets and liabilities at the date of the financial statements and for the reported amounts of revenues and expenses during the reportingperiod. Management utilizes estimates, including, but not limited to, valuation and useful lives of tangible and intangible assets, valuation of expectedfuture payments under the tax receivable agreement, and reserves for trade and promotional allowances. Actual results could differ from these estimates.
Cash and Cash Equivalents
The Company considers all highly liquid investments purchased with original maturities of three months or less when purchased as cash equivalents and arerecorded at cost. Under the Company’s cash management system, checks that have been issued and are out of the control of the Company, but which have notcleared the bank by the balance sheet date, are reported as a reduction of cash.
Accounts Receivable
Accounts receivable represents amounts invoiced to customers for goods that have been received by the customer. As of December 31, 2017 and December31, 2016, the Company’s accounts receivable were $101.0 million and $89.2 million, respectively, which have been reduced by allowances for damagesoccurring during shipment, quality claims and doubtful accounts in the amount of $2.1 million and $1.9 million, respectively.
68
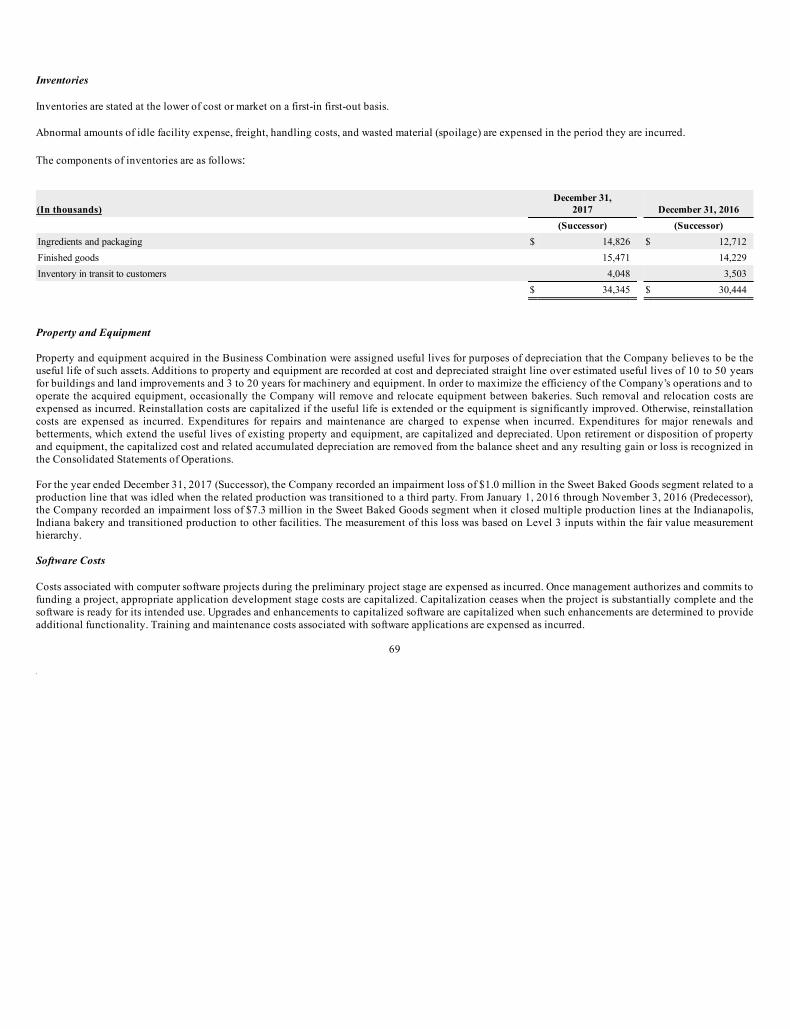
Inventories
Inventories are stated at the lower of cost or market on a first-in first-out basis.
Abnormal amounts of idle facility expense, freight, handling costs, and wasted material (spoilage) are expensed in the period they are incurred.
The components of inventories are as follows:
(In thousands)
December 31,
2017 December 31, 2016
(Successor) (Successor)
Ingredients and packaging $ 14,826 $ 12,712
Finished goods 15,471 14,229
Inventory in transit to customers 4,048 3,503
$ 34,345 $ 30,444
Property and Equipment
Property and equipment acquired in the Business Combination were assigned useful lives for purposes of depreciation that the Company believes to be theuseful life of such assets. Additions to property and equipment are recorded at cost and depreciated straight line over estimated useful lives of 10 to 50 yearsfor buildings and land improvements and 3 to 20 years for machinery and equipment. In order to maximize the efficiency of the Company’s operations and tooperate the acquired equipment, occasionally the Company will remove and relocate equipment between bakeries. Such removal and relocation costs areexpensed as incurred. Reinstallation costs are capitalized if the useful life is extended or the equipment is significantly improved. Otherwise, reinstallationcosts are expensed as incurred. Expenditures for repairs and maintenance are charged to expense when incurred. Expenditures for major renewals andbetterments, which extend the useful lives of existing property and equipment, are capitalized and depreciated. Upon retirement or disposition of propertyand equipment, the capitalized cost and related accumulated depreciation are removed from the balance sheet and any resulting gain or loss is recognized inthe Consolidated Statements of Operations.
For the year ended December 31, 2017 (Successor), the Company recorded an impairment loss of $1.0 million in the Sweet Baked Goods segment related to aproduction line that was idled when the related production was transitioned to a third party. From January 1, 2016 through November 3, 2016 (Predecessor),the Company recorded an impairment loss of $7.3 million in the Sweet Baked Goods segment when it closed multiple production lines at the Indianapolis,Indiana bakery and transitioned production to other facilities. The measurement of this loss was based on Level 3 inputs within the fair value measurementhierarchy.
Software Costs
Costs associated with computer software projects during the preliminary project stage are expensed as incurred. Once management authorizes and commits tofunding a project, appropriate application development stage costs are capitalized. Capitalization ceases when the project is substantially complete and thesoftware is ready for its intended use. Upgrades and enhancements to capitalized software are capitalized when such enhancements are determined to provideadditional functionality. Training and maintenance costs associated with software applications are expensed as incurred.
69
Included in the caption “Other assets” in the Consolidated Balance Sheets is capitalized software in the amount of approximately $7.3 million and $7.4million at December 31, 2017 and December 31, 2016, respectively. Capitalized software costs are amortized over their estimated useful life of five yearscommencing when such assets are ready for their intended use. Software amortization expense included in general and administrative was $2.5 million for theyear ended December 31, 2017, $1.5 million from January 1, 2016 through November 3, 2016 (Predecessor), $0.3 million from November 4, 2016 throughDecember 31, 2016 (Successor), and $1.4 million (Predecessor), for the year ended December 31, 2015.
Goodwill and Intangible Assets
At December 31, 2017 and 2016, the goodwill balances of $579.4 million and $588.5 million, respectively, represent the excess of the amount the Successorpaid for the Business Combination over the fair value of the assets acquired and liabilities assumed. Goodwill that resulted from the Business Combinationwas allocated to the Sweet Baked Goods segment and the In-Store Bakery segment.
The Company’s indefinite-lived intangible assets consist of trademarks and trade names. The $1,408.8 million balance at December 31, 2017 and 2016, wasrecognized as part of the Business Combination. The trademarks and trade names are integral to the Company’s identity and are expected to contributeindefinitely to its corporate cash flows. Fair value for trademarks and tradenames was determined using the income approach, which is considered to be Level3 within the fair value hierarchy. The application of the income approach was premised on a royalty savings method, whereby the trademark and tradenamesare valued by reference to the amount of royalty income it could generate if it was licensed, in an arm’s‑length transaction, to a third party. These assets havebeen assigned an indefinite life and therefore are not amortized but rather evaluated for impairment annually.
Also, the Company has finite-lived intangible assets that consist of customer relationships. The $514.2 million and $538.1 million balances on December 31,2017 and 2016 respectively, were recognized as part of the Business Combination. For customer relationships, the application of the income approach (Level3) was premised on an excess earnings method, whereby the customer relationships are valued by the earnings expected to be generated from those customersafter other capital charges. Definite-lived intangible assets are being amortized on a straight‑line basis over the estimated remaining useful lives of the assets.
During the year ended December 31, 2017, the Company changed its policy and will perform an impairment assessment each year as of October 1 (previouslySeptember 30).
Reserves for Self-Insurance Benefits
The Company’s employee health plan is self-insured by the Company up to a stop-loss amount of $0.3 million for each participant per plan year. In addition,the Company maintains insurance programs covering its exposure to workers’ compensation. Such programs include the retention of certain levels of risksand costs through high deductibles and other risk retention strategies. Included in the accrued expenses in the Consolidated Balance Sheets is a reserve forhealthcare claims in the amount of approximately $1.1 million and $1.7 million at December 31, 2017 and December 31, 2016, respectively, and a reserve forworkers’ compensation claims of $1.7 million and $1.3 million at December 31, 2017 and December 31, 2016, respectively.
Revenue Recognition
The Company invoices at the time of shipment of its product, but only recognizes revenue upon delivery to retail customers and distributors as the Companyarranges freight and is generally responsible, along with the Company’s common carriers, for any damage that occurs during transportation. The Companyallows retail customers and distributors to return product that is damaged or defective at the time of delivery. A provision for payment discounts and productreturn allowances, which is estimated based upon the Company’s historical performance, management’s experience and current economic trends, is recordedas a reduction of sales in the same period that the revenue is recognized.
70
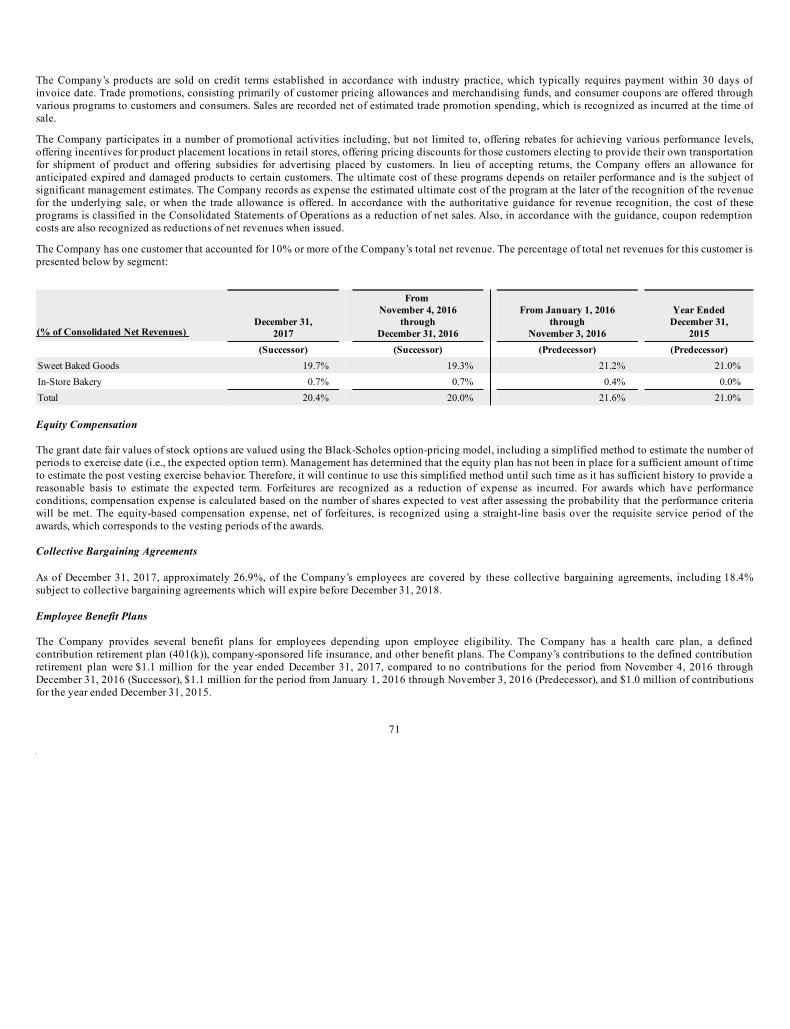
The Company’s products are sold on credit terms established in accordance with industry practice, which typically requires payment within 30 days ofinvoice date. Trade promotions, consisting primarily of customer pricing allowances and merchandising funds, and consumer coupons are offered throughvarious programs to customers and consumers. Sales are recorded net of estimated trade promotion spending, which is recognized as incurred at the time ofsale.
The Company participates in a number of promotional activities including, but not limited to, offering rebates for achieving various performance levels,offering incentives for product placement locations in retail stores, offering pricing discounts for those customers electing to provide their own transportationfor shipment of product and offering subsidies for advertising placed by customers. In lieu of accepting returns, the Company offers an allowance foranticipated expired and damaged products to certain customers. The ultimate cost of these programs depends on retailer performance and is the subject ofsignificant management estimates. The Company records as expense the estimated ultimate cost of the program at the later of the recognition of the revenuefor the underlying sale, or when the trade allowance is offered. In accordance with the authoritative guidance for revenue recognition, the cost of theseprograms is classified in the Consolidated Statements of Operations as a reduction of net sales. Also, in accordance with the guidance, coupon redemptioncosts are also recognized as reductions of net revenues when issued.
The Company has one customer that accounted for 10% or more of the Company’s total net revenue. The percentage of total net revenues for this customer ispresented below by segment:
(% of Consolidated Net Revenues) December 31,
2017
From
November 4, 2016
through
December 31, 2016
From January 1, 2016
through
November 3, 2016
Year Ended
December 31,
2015
(Successor) (Successor) (Predecessor) (Predecessor)
Sweet Baked Goods 19.7% 19.3% 21.2% 21.0%
In-Store Bakery 0.7% 0.7% 0.4% 0.0%
Total 20.4% 20.0% 21.6% 21.0%
Equity Compensation
The grant date fair values of stock options are valued using the Black-Scholes option-pricing model, including a simplified method to estimate the number ofperiods to exercise date (i.e., the expected option term). Management has determined that the equity plan has not been in place for a sufficient amount of timeto estimate the post vesting exercise behavior. Therefore, it will continue to use this simplified method until such time as it has sufficient history to provide areasonable basis to estimate the expected term. Forfeitures are recognized as a reduction of expense as incurred. For awards which have performanceconditions, compensation expense is calculated based on the number of shares expected to vest after assessing the probability that the performance criteriawill be met. The equity-based compensation expense, net of forfeitures, is recognized using a straight-line basis over the requisite service period of theawards, which corresponds to the vesting periods of the awards.
Collective Bargaining Agreements
As of December 31, 2017, approximately 26.9%, of the Company’s employees are covered by these collective bargaining agreements, including 18.4%subject to collective bargaining agreements which will expire before December 31, 2018.
Employee Benefit Plans
The Company provides several benefit plans for employees depending upon employee eligibility. The Company has a health care plan, a definedcontribution retirement plan (401(k)), company-sponsored life insurance, and other benefit plans. The Company’s contributions to the defined contributionretirement plan were $1.1 million for the year ended December 31, 2017, compared to no contributions for the period from November 4, 2016 throughDecember 31, 2016 (Successor), $1.1 million for the period from January 1, 2016 through November 3, 2016 (Predecessor), and $1.0 million of contributionsfor the year ended December 31, 2015.
71
The Company offers an annual incentive plan based upon operating targets. Final payout is approved by the board of directors. The Company has accrued$4.3 million and $6.0 million at December 31, 2017 (Successor) and December 31, 2016 (Successor), respectively.
The Company has also has a long-term incentive plan for certain director-level employees, payment under which is contingent on changes in certainownership levels. Amounts paid in the Predecessor period from January 1, 2016 through November 3, 2016 and the year ended December 31, 2015 arereported as special employee incentive compensation in the consolidated statement of operations. The total that could be payable due to any futurequalifying changes in ownership levels under the plan is $0.6 million as of December 31, 2017. In accordance with U.S. GAAP, the Company does not carryan accrual for the long-term incentive plan.
Income Taxes
As a result of the Business Combination, Hostess Brands, Inc. acquired a controlling interest in Hostess Holdings, which is treated as a partnership for U.S.federal and most applicable state and local income tax purposes. As a partnership, Hostess Holdings is not directly subject to U.S. federal and certain state andlocal income taxes. Any taxable income or loss generated by Hostess Holdings is passed through to and included in the taxable income or loss of its partners,including the Company following the Business Combination. The Company is subject to U.S. federal income taxes, in addition to state and local incometaxes with respect to its allocable share of any taxable income of Hostess Holdings following the Business Combination.
On December 22, 2017, the President of the United States signed into law the Tax Cuts and Jobs Act (“Tax Reform”). The SEC staff issued Staff AccountingBulletin No. 119 (“SAB 118”) to address the application of U.S. GAAP in situations when a registrant does not have the necessary information available tocomplete the accounting for Tax Reform. The Company has recognized the provisional tax impacts related to the revaluation of deferred tax assets andliabilities. Further information on the tax impacts of Tax Reform is included in Note 13 of the Company’s consolidated financial statements.
Derivatives
In April 2017, the Company entered into an interest rate swap contract to mitigate its exposure to changes in the variable interest rate on its long-term debt.This contract was designated as a cash flow hedge. Changes in the fair value of this instrument are recognized in accumulated other comprehensive income inthe consolidated balance sheets and reclassified into earnings in the period in which the hedged transaction affects earnings. Hedging ineffectiveness, if any,is recognized as a component of interest expense in the consolidated statements of operations. Payments made under this contract are included in thesupplemental disclosure of interest in the consolidated statement of cash flows.
Fair Value Measurements
The Company utilizes valuation techniques that maximize the use of observable inputs and minimize the use of unobservable inputs to the best extentpossible. The Company determines fair value based on assumptions that market participants would use in pricing an asset or liability in the principal or mostadvantageous market. When considering market participant assumptions in fair value measurements, the following fair value hierarchy distinguishes betweenobservable and unobservable inputs, which are categorized in one of the following levels:
• Level 1 inputs: Unadjusted quoted prices in active markets for identical assets or liabilities accessible to the reporting entity at themeasurement date• Level 2 inputs: Other than quoted prices included in Level 1 inputs that are observable for the asset or liability, either directly orindirectly, for substantially the full term of the asset or liability• Level 3 inputs: Unobservable inputs for the asset or liability used to measure fair value to the extent that observable inputs are notavailable, thereby allowing for situations in which there is little, if any, market activity for the asset or liability at measurement date
72
Fair Value of Financial Instruments
The Company estimates that the carrying amount of its long-term debt reasonably approximates fair value. At December 31, 2017 and December 31, 2016,the approximate fair value of the Company’s debt was $998.7 million and $1,005.5 million, respectively. The fair value is calculated using current interestrates and pricing from financial institutions (Level 2 inputs).
New Accounting Pronouncements
In August 2017, the FASB issued Accounting Standards Update No. 2017-12 (“ASU 2017-12”), Derivatives and Hedging: Targeted Improvements to
Accounting for Hedging Activities, which improves the financial reporting of hedging relationships to better portray the economic results of an entity's riskmanagement activities in its financial statements and make certain targeted improvements to simplify the application of the hedge accounting guidance incurrent U.S. GAAP. The amendments in this update better align an entity's risk management activities and financial reporting for hedging relationshipsthrough changes to both the designation and measurement guidance for qualifying hedging relationships and presentation of hedge results. The effectivedate for the standard is for fiscal years beginning after December 15, 2018. The Company plans to early adopt this standard in the first quarter of 2018 anddoes not expect the adoption of this standard to have a material impact on its consolidated financial position, results of operations or cash flows.
In May 2017, the FASB issued Accounting Standards Update No. 2017-9 (“ASU 2017-9”), Compensation - Stock Compensation (Topic 718): Scope of
Modification Accounting, which provides guidance about what changes to the terms or conditions of a share-based payment award require an entity to applymodification accounting in Topic 718. Per ASU 2017-9, an entity should account for the effects of a modification unless all the following are met: (1) the fairvalue (or calculated value or intrinsic value, if such an alternative measurement method is used) of the modified award is the same as the fair value (orcalculated value or intrinsic value, if such an alternative measurement method is used) of the original award immediately before the original award ismodified. If the modification does not affect any of the inputs to the valuation technique that the entity uses to value the award, the entity is not required toestimate the value immediately before and after the modification, (2) the vesting conditions of the modified award are the same as the vesting conditions ofthe original award immediately before the original award is modified, and (3) the classification of the modified award as an equity instrument or a liabilityinstrument is the same as the classification of the original award immediately before the original award is modified. The current disclosure requirements inTopic 718 apply regardless of whether an entity is required to apply modification accounting under the amendments in ASU 2017-9. The Company earlyadopted ASU 2017-9 during the year ended December 31, 2017. The adoption of this standard did not have a material impact on the Company’s consolidatedfinancial position, results of operations, or cash flows.
In January 2017, the FASB issued Accounting Standards Update No. 2017-4 (“ASU 2017-4”), Intangibles—Goodwill and Other (Topic 350): Simplifying the
Test for Goodwill Impairment . ASU 2017-4 eliminates Step 2 from the goodwill impairment test. Step 2 required an entity to determine the fair value at theimpairment testing date of its assets and liabilities following the procedure that would be required in a business combination. Instead, an entity shouldperform its goodwill impairment test and recognize an impairment charge by comparing the fair value of a reporting unit with its carrying amount. ASU 2017-4 will become effective for fiscal years beginning after December 15, 2019, including interim periods within those fiscal years. Early adoption is permitted.The Company early adopted ASU 2017-4 during the year ended December 31, 2017, the adoption did not have a material impact on the company’sconsolidated financial position, results of operations or cash flows. The company’s goodwill impairment tests have not proceeded to Step 2 at any testingdate.
In February 2016, the FASB issued ASU No. 2016-02, Leases (“ASU 2016-02”), which is intended to improve financial reporting about leasing transactions.This standard requires a lessee to record on the balance sheet the assets and liabilities for the rights and obligations created by lease terms of more than12 months. This standard will be effective for fiscal years beginning after December 15, 2018, including interim periods within those fiscal years, and earlyadoption is permitted. The Company is currently evaluating the impact the adoption of ASU 2016-02 will have on its consolidated financial position, resultsof operations or cash flows.
73
In May 2014, the FASB issued ASU No. 2014-09, Revenue from Contracts with Customers (Topic 606), (“ASU 2014-09”), which requires an entity torecognize the amount of revenue to which it expects to be entitled for the transfer of promised goods or services to customers. The ASU will replace mostexisting revenue recognition guidance in U.S. GAAP when it becomes effective. The new standard is effective for the Company on January 1, 2018.
The Company plans to adopt the standard in the first quarter of 2018 retrospectively with the cumulative effect of initial application reported as of January 1,2018. The Company is utilizing a comprehensive approach when reviewing its current accounting policies to identify potential differences that would resultfrom applying the new requirements to its customer contracts. The approach includes the evaluation of sales terms, performance obligations, variableconsideration, and costs to obtain and fulfill contracts. The Company has made significant progress on its process review. Based on the Company’s review,management does not currently expect the initial application of this guidance to have a material impact on its consolidated financial statements.
2. Business Combination
The following summarizes the fair value of the Business Combination:
(In thousands)
Cash paid $ 479,761
Equity consideration paid (1) 239,323
Tax receivable arrangement payable 161,681
Total consideration 880,765
Hostess Holdings debt assumed by Gores Holdings, Inc 1,228,254
Noncontrolling interest (2) 326,601
Fair value of the Business Combination $ 2,435,620
(1) Equity consideration paid to the Legacy Hostess Equityholders is summarized below:
(In thousands, except share data)
Class A common shares of the Company subject to six month sales restriction 22,098,139
Fair value per share $ 10.83
$ 239,323
(2) The class B units in Hostess Holdings, LP, which are not owned by the Company, represent the noncontrolling interest as provided below:
(In thousands except share data)
Class B units of Hostess Holdings, LP subject to six month sales restriction 24,424,259
Fair value per unit $ 10.83
$ 264,515
(In thousands except share data)
Class B units of Hostess Holdings, LP not subject to sales restrictions 5,446,429
Fair value per unit $ 11.40
$ 62,086
74

The fair value of these units was determined as follows:
Per share price based on average market price on the day of the Business Combination $ 11.40
Discount for lack of marketability 5.0%
$ 10.83
The 5% discount for lack of marketability was determined by using an option pricing method (Finnerty Protective Put Model) to reflect a six month salesrestriction.
The Company recorded an allocation of the purchase price to Predecessor’s tangible and identified intangible assets acquired and liabilities assumed,excluding long-term debt, based on their fair values as of the closing date. The purchase price allocation is as follows:
(In thousands)
Cash $ 58,519
Accounts receivable 58,474
Inventories 39,338
Prepaids and other assets 2,998
Property and equipment 155,076
Accounts payable and accrued expenses (56,559)
Deferred tax liabilities (352,531)
Trade name and trademarks 1,408,848
Customer relationships 542,011
Goodwill 579,446
Total assets acquired and liabilities assumed $ 2,435,620
Goodwill is attributed to intangible assets which do not qualify for separate recognition, and is partially deductible for income tax purposes.
From January 1, 2016 through November 3, 2016 (the Predecessor) approximately $31.3 million of expenses were incurred directly related to the BusinessCombination. From January 1, 2016 through the date of its last filing for the nine month period ending September 30, 2016, Gores Holdings incurred $4.0million of transaction related expenses. From October 1, 2016 through the Closing Date, Gores Holdings incurred $6.7 million of expenses related to theBusiness Combination. On the Closing Date, the Company paid $13.1 million of deferred underwriting costs related to Gores Holdings’ initial publicoffering and repaid a working capital loan of $0.2 million.
During the measurement period which started on the Closing Date and ended on November 3, 2017, the Company revised its preliminary estimate of thefuture cash tax savings under the tax receivable agreement. This resulted in an $8.1 million decrease in goodwill, a decrease to the tax receivable agreementliability of $3.0 million, a $5.5 million decrease to deferred tax liabilities, and an increase to accrued expenses and other liabilities of $0.4 million. TheCompany also revised its estimate of deferred tax liabilities which decreased both deferred tax liabilities and goodwill by $0.9 million. As of November 3,2017, the allocation of the purchase price for the Business Combination is final.
75
The following unaudited pro forma combined financial information presents the Company’s results as though the Business Combination had occurred atJanuary 1, 2016. The unaudited pro forma consolidated financial information has been prepared using the acquisition method of accounting in accordancewith U.S. GAAP:
Year Ended
December 31, 2016
(In thousands) (Pro Forma)
(Unaudited)
Net Revenue $ 727,586
Net Income 82,442
On May 10, 2016, the Predecessor purchased the stock of Superior for $51.1 million, $49.7 million net of cash acquired. Superior is located in Southbridge,Massachusetts and manufactures eclairs, madeleines, brownies, and iced cookies. The Predecessor acquired Superior to expand its market and productofferings in the In-Store Bakery section of grocery and club retailers. The Company expects to realize synergies and cost savings related to this acquisition asa result of purchasing and procurement economies of scale and general and administrative expense savings, particularly with respect to the consolidation ofcorporate related functions and elimination of redundancies.
The acquisition of Superior was treated as a purchase in accordance with ASC 805, Business Combinations, which requires allocation of the purchase price tothe estimated fair values of assets and liabilities acquired in the transaction. The allocation of purchase price is considered final. The following is a summaryof the allocation of the purchase price:
(In thousands)
Cash $ 1,009
Accounts receivable 2,122
Inventories 2,300
Prepaids and other current assets 112
Property and equipment (1) 7,075
Intangible assets (2) 29,370
Goodwill (3) 24,227
Accounts payable (2,920)
Accrued expenses (552)
Capital lease obligation (799)
Deferred tax liability (10,844)
Total assets acquired and liabilities assumed $ 51,100
(1) Amounts recorded for property and equipment includes land, building, plant machinery and equipment.
(2) Amounts recorded for intangible assets includes customer relationships, trade names and trademarks.
(3) Amounts recorded for goodwill are generally not expected to be deductible for tax purposes.
The fair value measurement of tangible and intangible assets and liabilities was based on significant inputs not observable in the market and thus representLevel 3 measurements within the fair value measurement hierarchy. Level 3 fair market values were determined using a variety of information, includingestimated future cash flows, appraisals, and market comparables.
76
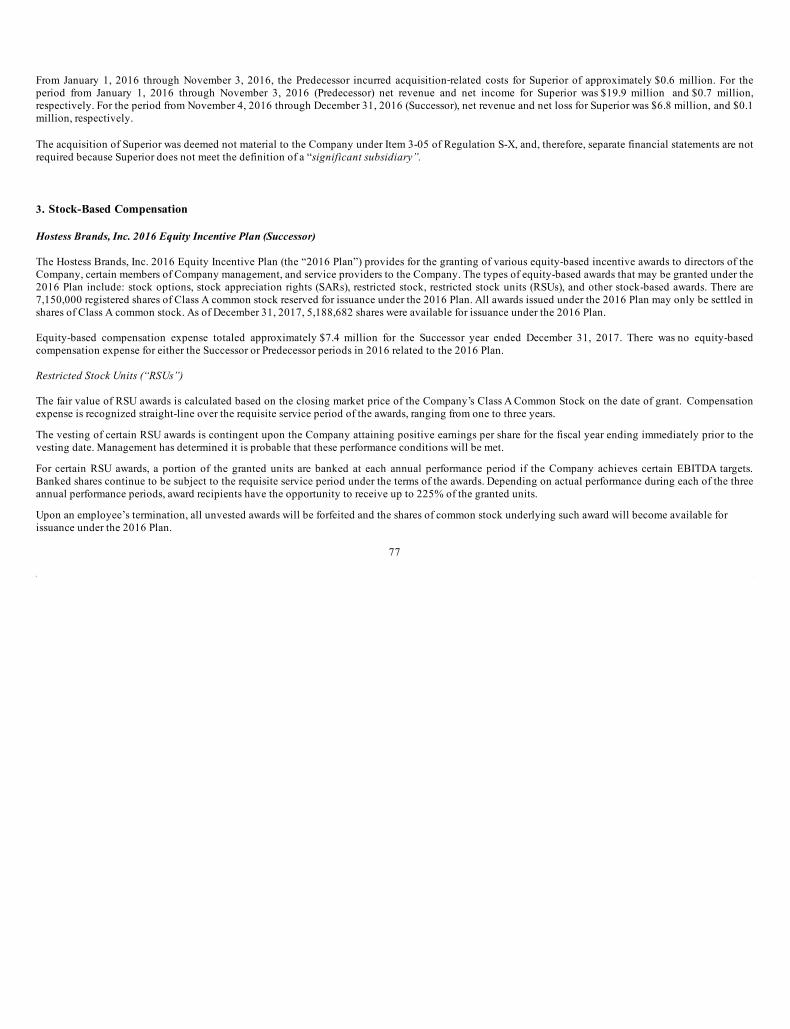
From January 1, 2016 through November 3, 2016, the Predecessor incurred acquisition‑related costs for Superior of approximately $0.6 million. For theperiod from January 1, 2016 through November 3, 2016 (Predecessor) net revenue and net income for Superior was $19.9 million and $0.7 million,respectively. For the period from November 4, 2016 through December 31, 2016 (Successor), net revenue and net loss for Superior was $6.8 million, and $0.1million, respectively.
The acquisition of Superior was deemed not material to the Company under Item 3-05 of Regulation S-X, and, therefore, separate financial statements are notrequired because Superior does not meet the definition of a “significant subsidiary”.
3. Stock-Based Compensation
Hostess Brands, Inc. 2016 Equity Incentive Plan (Successor)
The Hostess Brands, Inc. 2016 Equity Incentive Plan (the “2016 Plan”) provides for the granting of various equity-based incentive awards to directors of theCompany, certain members of Company management, and service providers to the Company. The types of equity-based awards that may be granted under the2016 Plan include: stock options, stock appreciation rights (SARs), restricted stock, restricted stock units (RSUs), and other stock-based awards. There are7,150,000 registered shares of Class A common stock reserved for issuance under the 2016 Plan. All awards issued under the 2016 Plan may only be settled inshares of Class A common stock. As of December 31, 2017, 5,188,682 shares were available for issuance under the 2016 Plan.
Equity-based compensation expense totaled approximately $7.4 million for the Successor year ended December 31, 2017. There was no equity-basedcompensation expense for either the Successor or Predecessor periods in 2016 related to the 2016 Plan.
Restricted Stock Units (“RSUs”)
The fair value of RSU awards is calculated based on the closing market price of the Company’s Class A Common Stock on the date of grant. Compensationexpense is recognized straight-line over the requisite service period of the awards, ranging from one to three years.
The vesting of certain RSU awards is contingent upon the Company attaining positive earnings per share for the fiscal year ending immediately prior to thevesting date. Management has determined it is probable that these performance conditions will be met.
For certain RSU awards, a portion of the granted units are banked at each annual performance period if the Company achieves certain EBITDA targets.Banked shares continue to be subject to the requisite service period under the terms of the awards. Depending on actual performance during each of the threeannual performance periods, award recipients have the opportunity to receive up to 225% of the granted units.
Upon an employee’s termination, all unvested awards will be forfeited and the shares of common stock underlying such award will become available forissuance under the 2016 Plan.
77
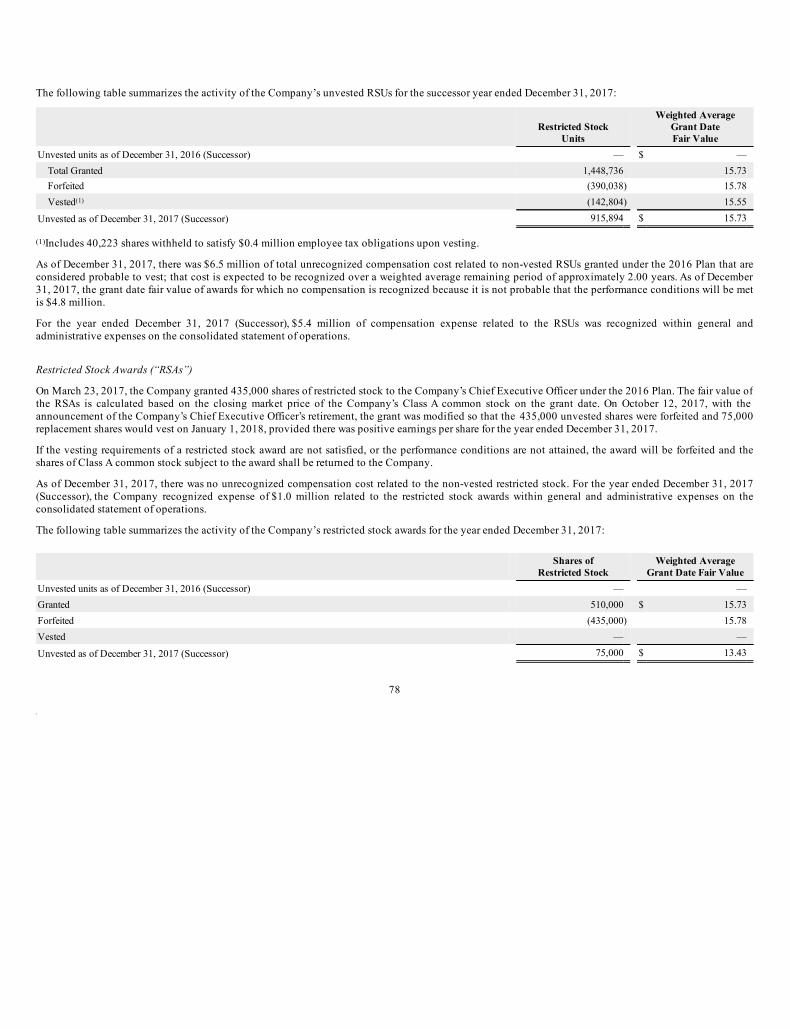
The following table summarizes the activity of the Company’s unvested RSUs for the successor year ended December 31, 2017:
Restricted Stock
Units
Weighted Average
Grant Date
Fair Value
Unvested units as of December 31, 2016 (Successor) — $ —
Total Granted 1,448,736 15.73
Forfeited (390,038) 15.78
Vested(1) (142,804) 15.55
Unvested as of December 31, 2017 (Successor) 915,894 $ 15.73
(1)Includes 40,223 shares withheld to satisfy $0.4 million employee tax obligations upon vesting.
As of December 31, 2017, there was $6.5 million of total unrecognized compensation cost related to non-vested RSUs granted under the 2016 Plan that areconsidered probable to vest; that cost is expected to be recognized over a weighted average remaining period of approximately 2.00 years. As of December31, 2017, the grant date fair value of awards for which no compensation is recognized because it is not probable that the performance conditions will be metis $4.8 million.
For the year ended December 31, 2017 (Successor), $5.4 million of compensation expense related to the RSUs was recognized within general andadministrative expenses on the consolidated statement of operations.
Restricted Stock Awards (“RSAs”)
On March 23, 2017, the Company granted 435,000 shares of restricted stock to the Company’s Chief Executive Officer under the 2016 Plan. The fair value ofthe RSAs is calculated based on the closing market price of the Company’s Class A common stock on the grant date. On October 12, 2017, with theannouncement of the Company’s Chief Executive Officer’s retirement, the grant was modified so that the 435,000 unvested shares were forfeited and 75,000replacement shares would vest on January 1, 2018, provided there was positive earnings per share for the year ended December 31, 2017.
If the vesting requirements of a restricted stock award are not satisfied, or the performance conditions are not attained, the award will be forfeited and theshares of Class A common stock subject to the award shall be returned to the Company.
As of December 31, 2017, there was no unrecognized compensation cost related to the non-vested restricted stock. For the year ended December 31, 2017(Successor), the Company recognized expense of $1.0 million related to the restricted stock awards within general and administrative expenses on theconsolidated statement of operations.
The following table summarizes the activity of the Company’s restricted stock awards for the year ended December 31, 2017:
Shares of
Restricted Stock Weighted Average
Grant Date Fair Value
Unvested units as of December 31, 2016 (Successor) — —
Granted 510,000 $ 15.73
Forfeited (435,000) 15.78
Vested — —
Unvested as of December 31, 2017 (Successor) 75,000 $ 13.43
78
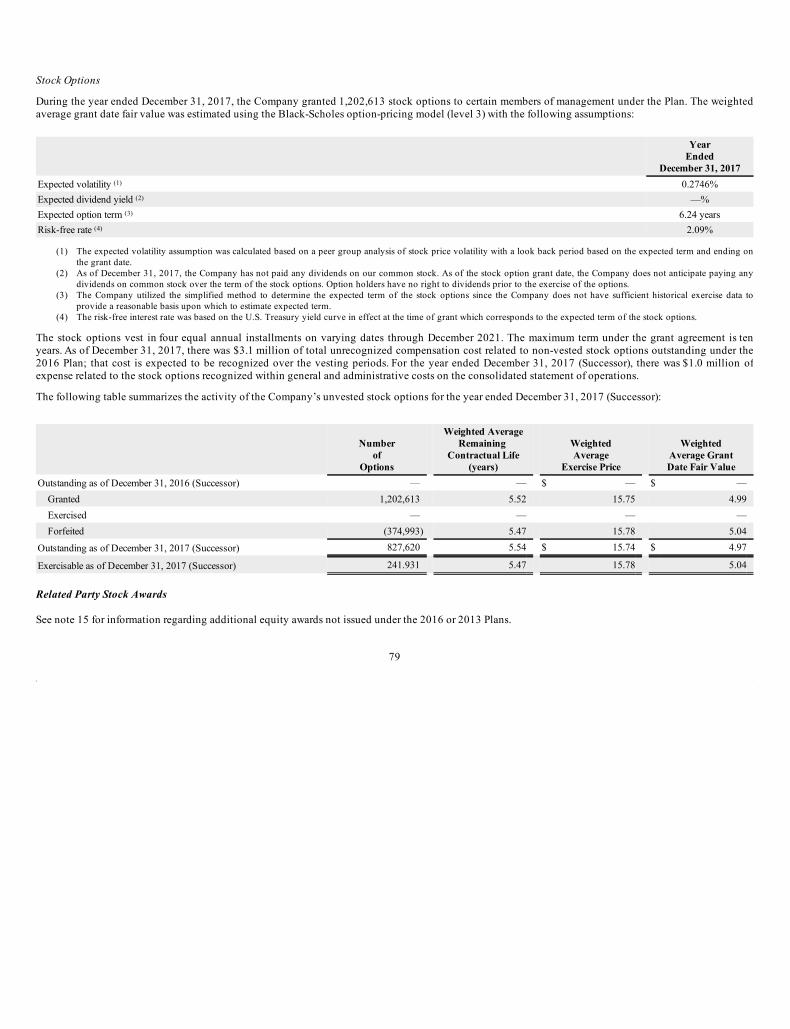
Stock Options
During the year ended December 31, 2017, the Company granted 1,202,613 stock options to certain members of management under the Plan. The weightedaverage grant date fair value was estimated using the Black-Scholes option-pricing model (level 3) with the following assumptions:
Year
Ended
December 31, 2017
Expected volatility (1) 0.2746%
Expected dividend yield (2) —%
Expected option term (3) 6.24 years
Risk-free rate (4) 2.09%
(1) The expected volatility assumption was calculated based on a peer group analysis of stock price volatility with a look back period based on the expected term and ending on
the grant date.
(2) As of December 31, 2017, the Company has not paid any dividends on our common stock. As of the stock option grant date, the Company does not anticipate paying any
dividends on common stock over the term of the stock options. Option holders have no right to dividends prior to the exercise of the options.
(3) The Company utilized the simplified method to determine the expected term of the stock options since the Company does not have sufficient historical exercise data to
provide a reasonable basis upon which to estimate expected term.
(4) The risk-free interest rate was based on the U.S. Treasury yield curve in effect at the time of grant which corresponds to the expected term of the stock options.
The stock options vest in four equal annual installments on varying dates through December 2021. The maximum term under the grant agreement is tenyears. As of December 31, 2017, there was $3.1 million of total unrecognized compensation cost related to non-vested stock options outstanding under the2016 Plan; that cost is expected to be recognized over the vesting periods. For the year ended December 31, 2017 (Successor), there was $1.0 million ofexpense related to the stock options recognized within general and administrative costs on the consolidated statement of operations.
The following table summarizes the activity of the Company’s unvested stock options for the year ended December 31, 2017 (Successor):
Number
of
Options
Weighted Average
Remaining
Contractual Life
(years)
Weighted
Average
Exercise Price
Weighted
Average Grant
Date Fair Value
Outstanding as of December 31, 2016 (Successor) — — $ — $ —
Granted 1,202,613 5.52 15.75 4.99
Exercised — — — —
Forfeited (374,993) 5.47 15.78 5.04
Outstanding as of December 31, 2017 (Successor) 827,620 5.54 $ 15.74 $ 4.97
Exercisable as of December 31, 2017 (Successor) 241.931 5.47 15.78 5.04
Related Party Stock Awards
See note 15 for information regarding additional equity awards not issued under the 2016 or 2013 Plans.
79
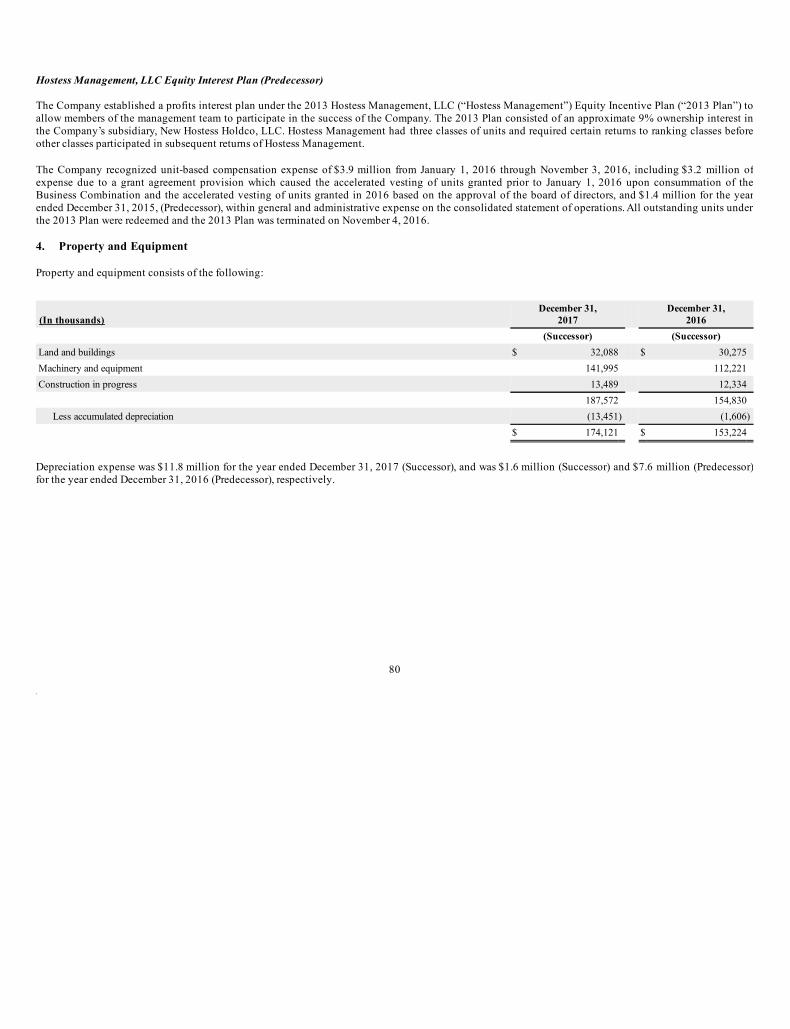
Hostess Management, LLC Equity Interest Plan (Predecessor)
The Company established a profits interest plan under the 2013 Hostess Management, LLC (“Hostess Management”) Equity Incentive Plan (“2013 Plan”) toallow members of the management team to participate in the success of the Company. The 2013 Plan consisted of an approximate 9% ownership interest inthe Company’s subsidiary, New Hostess Holdco, LLC. Hostess Management had three classes of units and required certain returns to ranking classes beforeother classes participated in subsequent returns of Hostess Management.
The Company recognized unit-based compensation expense of $3.9 million from January 1, 2016 through November 3, 2016, including $3.2 million ofexpense due to a grant agreement provision which caused the accelerated vesting of units granted prior to January 1, 2016 upon consummation of theBusiness Combination and the accelerated vesting of units granted in 2016 based on the approval of the board of directors, and $1.4 million for the yearended December 31, 2015, (Predecessor), within general and administrative expense on the consolidated statement of operations. All outstanding units underthe 2013 Plan were redeemed and the 2013 Plan was terminated on November 4, 2016.
4. Property and Equipment
Property and equipment consists of the following:
(In thousands)
December 31,
2017 December 31,
2016
(Successor) (Successor)
Land and buildings $ 32,088 $ 30,275
Machinery and equipment 141,995 112,221
Construction in progress 13,489 12,334
187,572 154,830
Less accumulated depreciation (13,451) (1,606)
$ 174,121 $ 153,224
Depreciation expense was $11.8 million for the year ended December 31, 2017 (Successor), and was $1.6 million (Successor) and $7.6 million (Predecessor)for the year ended December 31, 2016 (Predecessor), respectively.
80
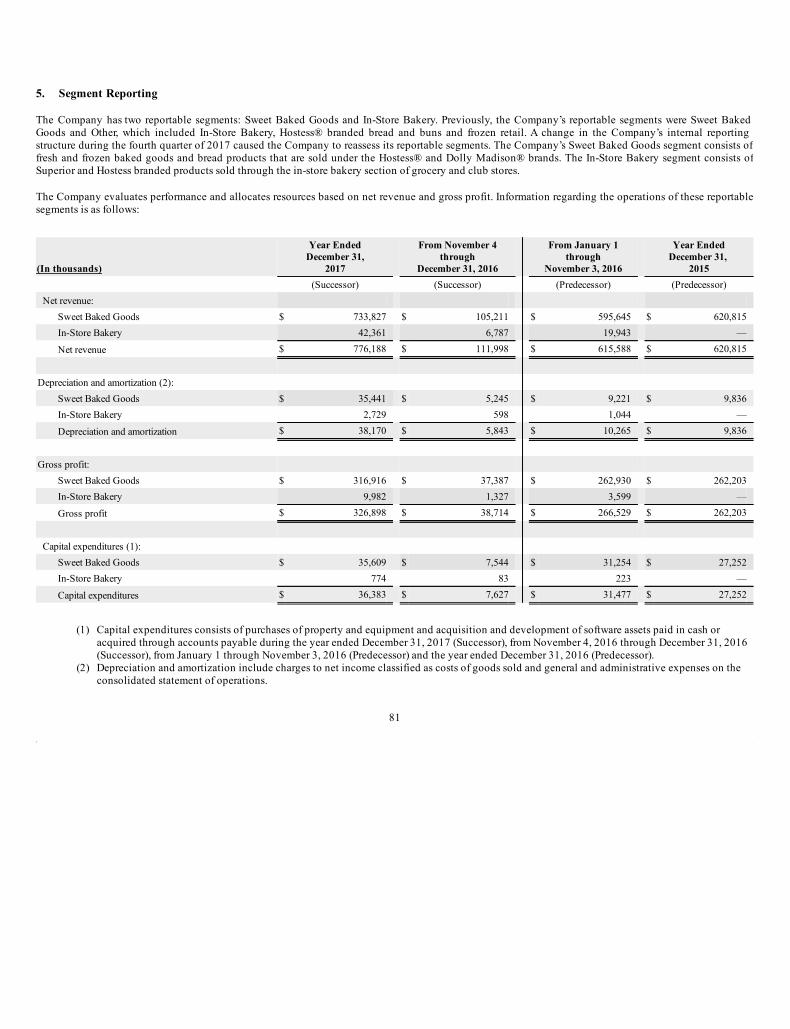
5. Segment Reporting
The Company has two reportable segments: Sweet Baked Goods and In-Store Bakery. Previously, the Company’s reportable segments were Sweet BakedGoods and Other, which included In-Store Bakery, Hostess® branded bread and buns and frozen retail. A change in the Company’s internal reportingstructure during the fourth quarter of 2017 caused the Company to reassess its reportable segments. The Company’s Sweet Baked Goods segment consists offresh and frozen baked goods and bread products that are sold under the Hostess® and Dolly Madison® brands. The In-Store Bakery segment consists ofSuperior and Hostess branded products sold through the in-store bakery section of grocery and club stores.
The Company evaluates performance and allocates resources based on net revenue and gross profit. Information regarding the operations of these reportablesegments is as follows:
(In thousands)
Year Ended
December 31,
2017
From November 4
through
December 31, 2016
From January 1
through
November 3, 2016
Year Ended
December 31,
2015
(Successor) (Successor) (Predecessor) (Predecessor)
Net revenue:
Sweet Baked Goods $ 733,827 $ 105,211 $ 595,645 $ 620,815
In-Store Bakery 42,361 6,787 19,943 —
Net revenue $ 776,188 $ 111,998 $ 615,588 $ 620,815
Depreciation and amortization (2):
Sweet Baked Goods $ 35,441 $ 5,245 $ 9,221 $ 9,836
In-Store Bakery 2,729 598 1,044 —
Depreciation and amortization $ 38,170 $ 5,843 $ 10,265 $ 9,836
Gross profit:
Sweet Baked Goods $ 316,916 $ 37,387 $ 262,930 $ 262,203
In-Store Bakery 9,982 1,327 3,599 —
Gross profit $ 326,898 $ 38,714 $ 266,529 $ 262,203
Capital expenditures (1):
Sweet Baked Goods $ 35,609 $ 7,544 $ 31,254 $ 27,252
In-Store Bakery 774 83 223 —
Capital expenditures $ 36,383 $ 7,627 $ 31,477 $ 27,252
(1) Capital expenditures consists of purchases of property and equipment and acquisition and development of software assets paid in cash oracquired through accounts payable during the year ended December 31, 2017 (Successor), from November 4, 2016 through December 31, 2016(Successor), from January 1 through November 3, 2016 (Predecessor) and the year ended December 31, 2016 (Predecessor).
(2) Depreciation and amortization include charges to net income classified as costs of goods sold and general and administrative expenses on theconsolidated statement of operations.
81
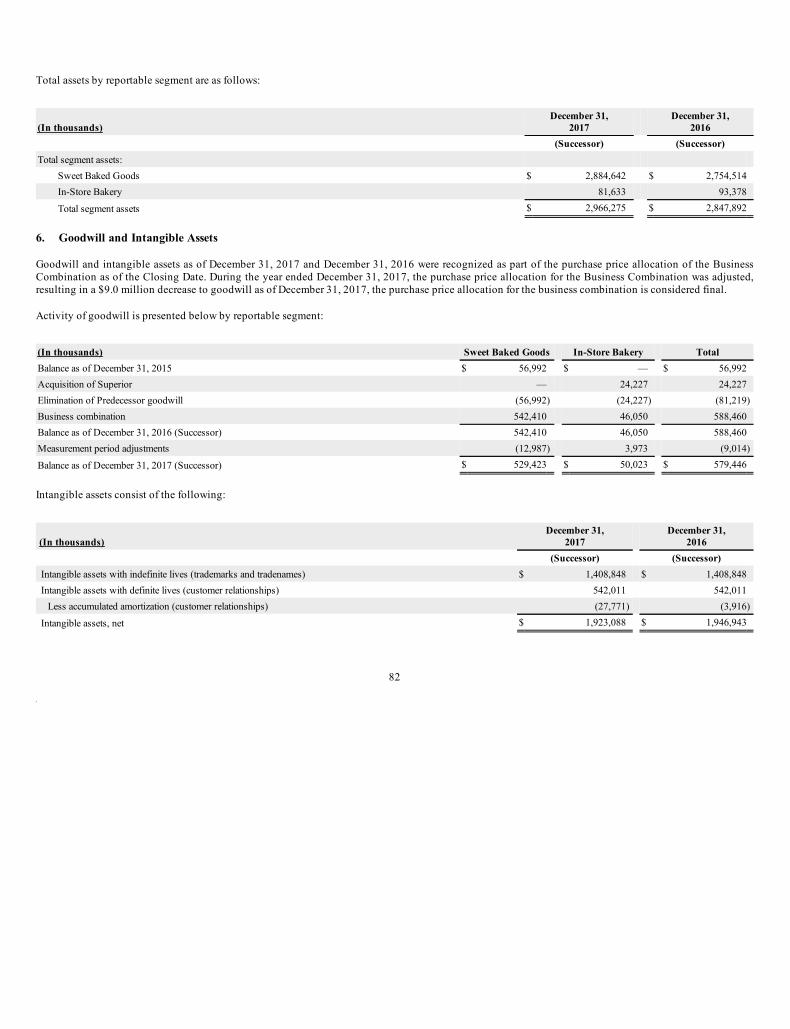
Total assets by reportable segment are as follows:
(In thousands)
December 31,
2017 December 31,
2016
(Successor) (Successor)
Total segment assets:
Sweet Baked Goods $ 2,884,642 $ 2,754,514
In-Store Bakery 81,633 93,378
Total segment assets $ 2,966,275 $ 2,847,892
6. Goodwill and Intangible Assets
Goodwill and intangible assets as of December 31, 2017 and December 31, 2016 were recognized as part of the purchase price allocation of the BusinessCombination as of the Closing Date. During the year ended December 31, 2017, the purchase price allocation for the Business Combination was adjusted,resulting in a $9.0 million decrease to goodwill as of December 31, 2017, the purchase price allocation for the business combination is considered final.
Activity of goodwill is presented below by reportable segment:
(In thousands) Sweet Baked Goods In-Store Bakery Total
Balance as of December 31, 2015 $ 56,992 $ — $ 56,992
Acquisition of Superior — 24,227 24,227
Elimination of Predecessor goodwill (56,992) (24,227) (81,219)
Business combination 542,410 46,050 588,460
Balance as of December 31, 2016 (Successor) 542,410 46,050 588,460
Measurement period adjustments (12,987) 3,973 (9,014)
Balance as of December 31, 2017 (Successor) $ 529,423 $ 50,023 $ 579,446
Intangible assets consist of the following:
(In thousands)
December 31,
2017 December 31,
2016
(Successor) (Successor)
Intangible assets with indefinite lives (trademarks and tradenames) $ 1,408,848 $ 1,408,848
Intangible assets with definite lives (customer relationships) 542,011 542,011
Less accumulated amortization (customer relationships) (27,771) (3,916)
Intangible assets, net $ 1,923,088 $ 1,946,943
82

Amortization expense was $23.9 million for the year ended December 31, 2017, and $3.9 million (Successor) and $1.2 million (Predecessor) for the periodsfrom November 4, 2016 through December 31, 2016 and from January 1, 2016 through November 3, 2016, respectively, and $0.9 million (Predecessor) forthe year ended December 31, 2015. The unamortized portion of customer relationships will be expensed over their remaining useful life, from 18 to 23 years.The weighted-average amortization period as of December 31, 2017 for customer relationships was 21.5 years. Future expected amortization expense is asfollows:
(In thousands)
2018 $ 23,977
2019 23,977
2020 23,977
2021 23,977
2022 23,977
2023 and thereafter 394,355
7. Accrued Expenses
Included in accrued expenses are the following:
(In thousands) December 31, 2017 December 31, 2016
(Successor) (Successor)
Annual incentive compensation $ 4,259 $ 5,997
Payroll, vacation and other compensation 4,342 5,121
Self-insurance reserves 1,192 2,091
Accrued interest 338 4,885
Current income taxes payable 99 2
Workers compensation reserve 1,650 1,321
Litigation — 1,100
Other — 1,139
$ 11,880 $ 21,656
83
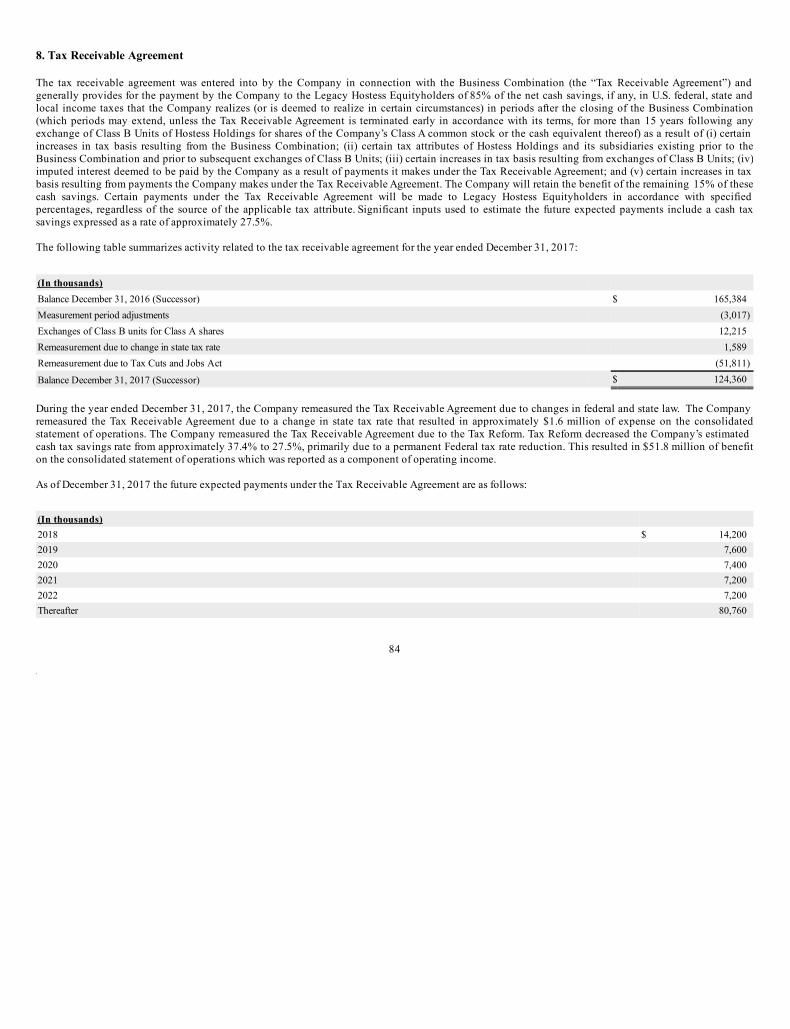
8. Tax Receivable Agreement
The tax receivable agreement was entered into by the Company in connection with the Business Combination (the “Tax Receivable Agreement”) andgenerally provides for the payment by the Company to the Legacy Hostess Equityholders of 85% of the net cash savings, if any, in U.S. federal, state andlocal income taxes that the Company realizes (or is deemed to realize in certain circumstances) in periods after the closing of the Business Combination(which periods may extend, unless the Tax Receivable Agreement is terminated early in accordance with its terms, for more than 15 years following anyexchange of Class B Units of Hostess Holdings for shares of the Company’s Class A common stock or the cash equivalent thereof) as a result of (i) certainincreases in tax basis resulting from the Business Combination; (ii) certain tax attributes of Hostess Holdings and its subsidiaries existing prior to theBusiness Combination and prior to subsequent exchanges of Class B Units; (iii) certain increases in tax basis resulting from exchanges of Class B Units; (iv)imputed interest deemed to be paid by the Company as a result of payments it makes under the Tax Receivable Agreement; and (v) certain increases in taxbasis resulting from payments the Company makes under the Tax Receivable Agreement. The Company will retain the benefit of the remaining 15% of thesecash savings. Certain payments under the Tax Receivable Agreement will be made to Legacy Hostess Equityholders in accordance with specifiedpercentages, regardless of the source of the applicable tax attribute. Significant inputs used to estimate the future expected payments include a cash taxsavings expressed as a rate of approximately 27.5%.
The following table summarizes activity related to the tax receivable agreement for the year ended December 31, 2017:
(In thousands)
Balance December 31, 2016 (Successor) $ 165,384
Measurement period adjustments (3,017)
Exchanges of Class B units for Class A shares 12,215
Remeasurement due to change in state tax rate 1,589
Remeasurement due to Tax Cuts and Jobs Act (51,811)
Balance December 31, 2017 (Successor) $ 124,360
During the year ended December 31, 2017, the Company remeasured the Tax Receivable Agreement due to changes in federal and state law. The Companyremeasured the Tax Receivable Agreement due to a change in state tax rate that resulted in approximately $1.6 million of expense on the consolidatedstatement of operations. The Company remeasured the Tax Receivable Agreement due to the Tax Reform. Tax Reform decreased the Company’s estimatedcash tax savings rate from approximately 37.4% to 27.5%, primarily due to a permanent Federal tax rate reduction. This resulted in $51.8 million of benefiton the consolidated statement of operations which was reported as a component of operating income.
As of December 31, 2017 the future expected payments under the Tax Receivable Agreement are as follows:
(In thousands)
2018 $ 14,200
2019 7,600
2020 7,400
2021 7,200
2022 7,200
Thereafter 80,760
84
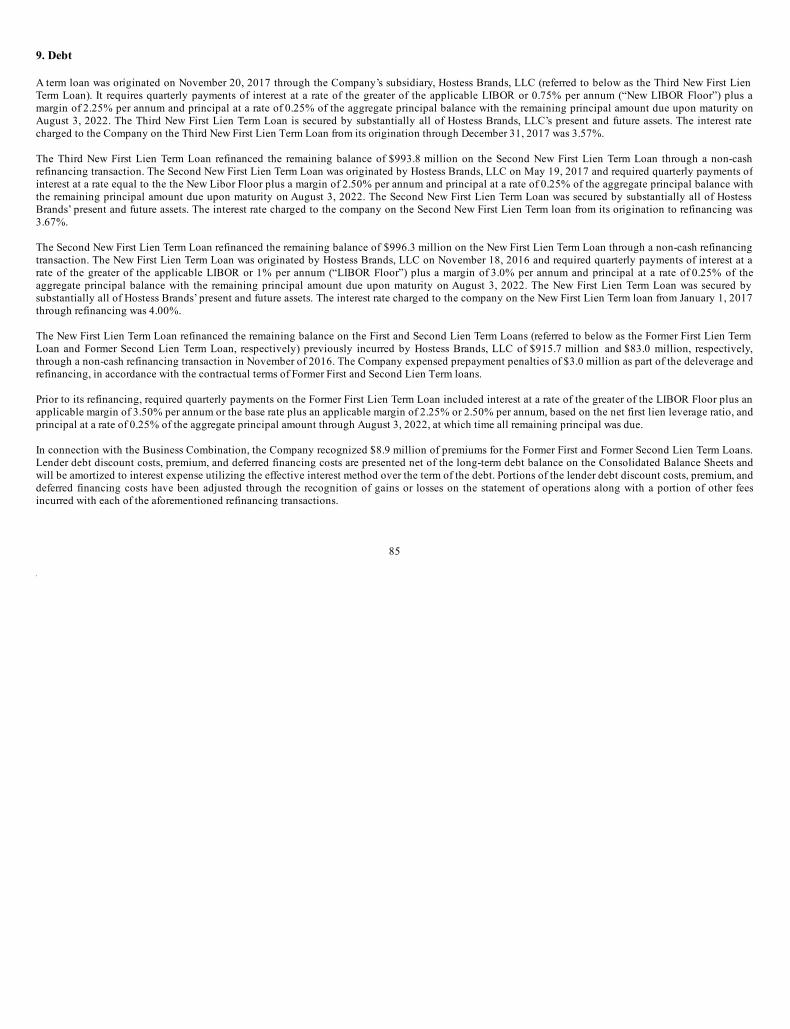
9. Debt
A term loan was originated on November 20, 2017 through the Company’s subsidiary, Hostess Brands, LLC (referred to below as the Third New First LienTerm Loan). It requires quarterly payments of interest at a rate of the greater of the applicable LIBOR or 0.75% per annum (“New LIBOR Floor”) plus amargin of 2.25% per annum and principal at a rate of 0.25% of the aggregate principal balance with the remaining principal amount due upon maturity onAugust 3, 2022. The Third New First Lien Term Loan is secured by substantially all of Hostess Brands, LLC’s present and future assets. The interest ratecharged to the Company on the Third New First Lien Term Loan from its origination through December 31, 2017 was 3.57%.
The Third New First Lien Term Loan refinanced the remaining balance of $993.8 million on the Second New First Lien Term Loan through a non-cashrefinancing transaction. The Second New First Lien Term Loan was originated by Hostess Brands, LLC on May 19, 2017 and required quarterly payments ofinterest at a rate equal to the the New Libor Floor plus a margin of 2.50% per annum and principal at a rate of 0.25% of the aggregate principal balance withthe remaining principal amount due upon maturity on August 3, 2022. The Second New First Lien Term Loan was secured by substantially all of HostessBrands’ present and future assets. The interest rate charged to the company on the Second New First Lien Term loan from its origination to refinancing was3.67%.
The Second New First Lien Term Loan refinanced the remaining balance of $996.3 million on the New First Lien Term Loan through a non-cash refinancingtransaction. The New First Lien Term Loan was originated by Hostess Brands, LLC on November 18, 2016 and required quarterly payments of interest at arate of the greater of the applicable LIBOR or 1% per annum (“LIBOR Floor”) plus a margin of 3.0% per annum and principal at a rate of 0.25% of theaggregate principal balance with the remaining principal amount due upon maturity on August 3, 2022. The New First Lien Term Loan was secured bysubstantially all of Hostess Brands’ present and future assets. The interest rate charged to the company on the New First Lien Term loan from January 1, 2017through refinancing was 4.00%.
The New First Lien Term Loan refinanced the remaining balance on the First and Second Lien Term Loans (referred to below as the Former First Lien TermLoan and Former Second Lien Term Loan, respectively) previously incurred by Hostess Brands, LLC of $915.7 million and $83.0 million, respectively,through a non-cash refinancing transaction in November of 2016. The Company expensed prepayment penalties of $3.0 million as part of the deleverage andrefinancing, in accordance with the contractual terms of Former First and Second Lien Term loans.
Prior to its refinancing, required quarterly payments on the Former First Lien Term Loan included interest at a rate of the greater of the LIBOR Floor plus anapplicable margin of 3.50% per annum or the base rate plus an applicable margin of 2.25% or 2.50% per annum, based on the net first lien leverage ratio, andprincipal at a rate of 0.25% of the aggregate principal amount through August 3, 2022, at which time all remaining principal was due.
In connection with the Business Combination, the Company recognized $8.9 million of premiums for the Former First and Former Second Lien Term Loans.Lender debt discount costs, premium, and deferred financing costs are presented net of the long-term debt balance on the Consolidated Balance Sheets andwill be amortized to interest expense utilizing the effective interest method over the term of the debt. Portions of the lender debt discount costs, premium, anddeferred financing costs have been adjusted through the recognition of gains or losses on the statement of operations along with a portion of other feesincurred with each of the aforementioned refinancing transactions.
85
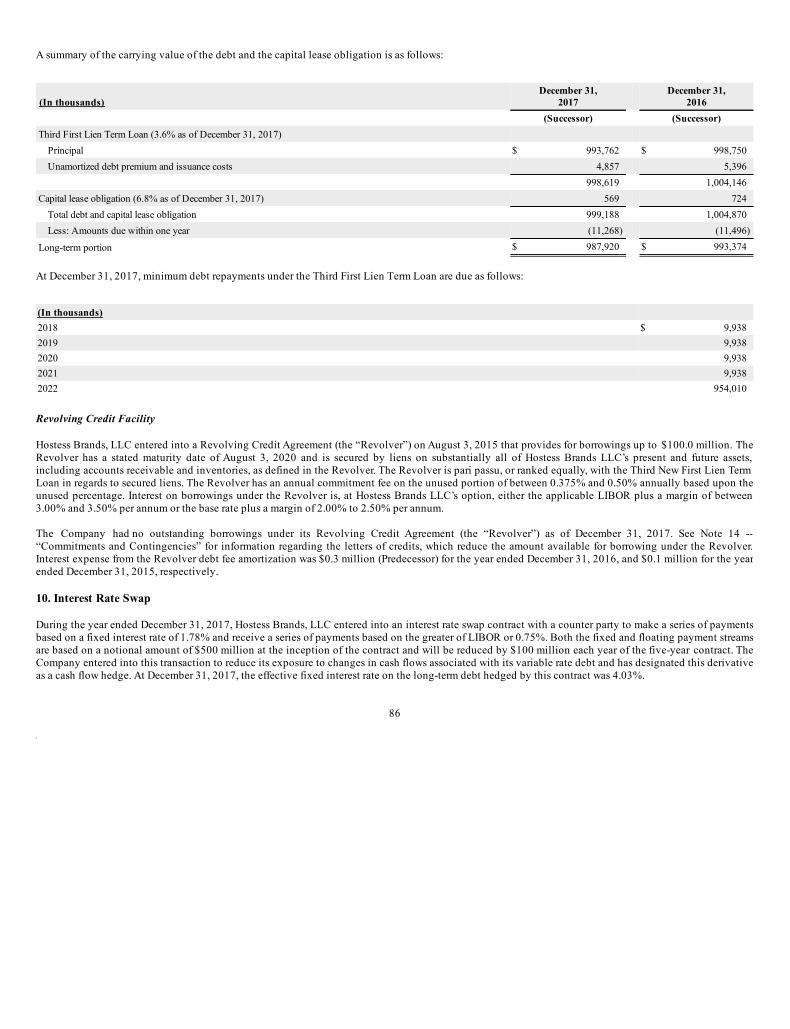
A summary of the carrying value of the debt and the capital lease obligation is as follows:
(In thousands)
December 31,
2017 December 31,
2016
(Successor) (Successor)
Third First Lien Term Loan (3.6% as of December 31, 2017)
Principal $ 993,762 $ 998,750
Unamortized debt premium and issuance costs 4,857 5,396
998,619 1,004,146
Capital lease obligation (6.8% as of December 31, 2017) 569 724
Total debt and capital lease obligation 999,188 1,004,870
Less: Amounts due within one year (11,268) (11,496)
Long-term portion $ 987,920 $ 993,374
At December 31, 2017, minimum debt repayments under the Third First Lien Term Loan are due as follows:
(In thousands)
2018 $ 9,938
2019 9,938
2020 9,938
2021 9,938
2022 954,010
Revolving Credit Facility
Hostess Brands, LLC entered into a Revolving Credit Agreement (the “Revolver”) on August 3, 2015 that provides for borrowings up to $100.0 million. TheRevolver has a stated maturity date of August 3, 2020 and is secured by liens on substantially all of Hostess Brands LLC’s present and future assets,including accounts receivable and inventories, as defined in the Revolver. The Revolver is pari passu, or ranked equally, with the Third New First Lien TermLoan in regards to secured liens. The Revolver has an annual commitment fee on the unused portion of between 0.375% and 0.50% annually based upon theunused percentage. Interest on borrowings under the Revolver is, at Hostess Brands LLC’s option, either the applicable LIBOR plus a margin of between3.00% and 3.50% per annum or the base rate plus a margin of 2.00% to 2.50% per annum.
The Company had no outstanding borrowings under its Revolving Credit Agreement (the “Revolver”) as of December 31, 2017. See Note 14 --“Commitments and Contingencies” for information regarding the letters of credits, which reduce the amount available for borrowing under the Revolver.Interest expense from the Revolver debt fee amortization was $0.3 million (Predecessor) for the year ended December 31, 2016, and $0.1 million for the yearended December 31, 2015, respectively.
10. Interest Rate Swap
During the year ended December 31, 2017, Hostess Brands, LLC entered into an interest rate swap contract with a counter party to make a series of paymentsbased on a fixed interest rate of 1.78% and receive a series of payments based on the greater of LIBOR or 0.75%. Both the fixed and floating payment streamsare based on a notional amount of $500 million at the inception of the contract and will be reduced by $100 million each year of the five-year contract. TheCompany entered into this transaction to reduce its exposure to changes in cash flows associated with its variable rate debt and has designated this derivativeas a cash flow hedge. At December 31, 2017, the effective fixed interest rate on the long-term debt hedged by this contract was 4.03%.
86
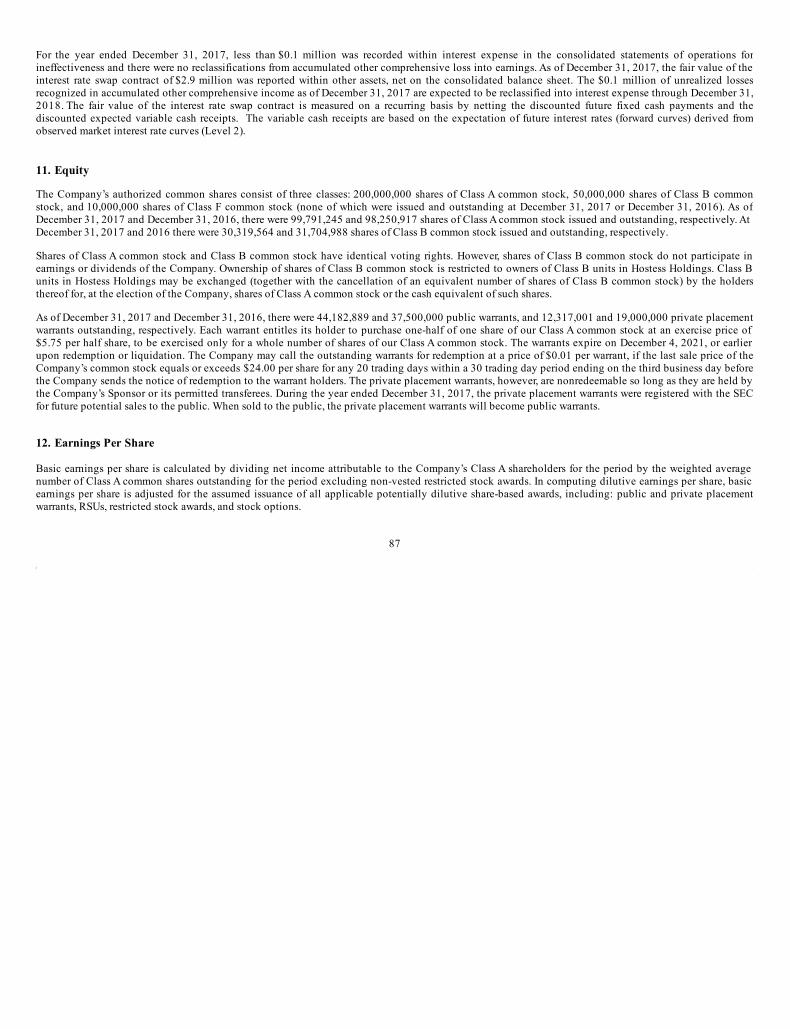
For the year ended December 31, 2017, less than $0.1 million was recorded within interest expense in the consolidated statements of operations forineffectiveness and there were no reclassifications from accumulated other comprehensive loss into earnings. As of December 31, 2017, the fair value of theinterest rate swap contract of $2.9 million was reported within other assets, net on the consolidated balance sheet. The $0.1 million of unrealized lossesrecognized in accumulated other comprehensive income as of December 31, 2017 are expected to be reclassified into interest expense through December 31,2018. The fair value of the interest rate swap contract is measured on a recurring basis by netting the discounted future fixed cash payments and thediscounted expected variable cash receipts. The variable cash receipts are based on the expectation of future interest rates (forward curves) derived fromobserved market interest rate curves (Level 2).
11. Equity
The Company’s authorized common shares consist of three classes: 200,000,000 shares of Class A common stock, 50,000,000 shares of Class B commonstock, and 10,000,000 shares of Class F common stock (none of which were issued and outstanding at December 31, 2017 or December 31, 2016). As ofDecember 31, 2017 and December 31, 2016, there were 99,791,245 and 98,250,917 shares of Class A common stock issued and outstanding, respectively. AtDecember 31, 2017 and 2016 there were 30,319,564 and 31,704,988 shares of Class B common stock issued and outstanding, respectively.
Shares of Class A common stock and Class B common stock have identical voting rights. However, shares of Class B common stock do not participate inearnings or dividends of the Company. Ownership of shares of Class B common stock is restricted to owners of Class B units in Hostess Holdings. Class Bunits in Hostess Holdings may be exchanged (together with the cancellation of an equivalent number of shares of Class B common stock) by the holdersthereof for, at the election of the Company, shares of Class A common stock or the cash equivalent of such shares.
As of December 31, 2017 and December 31, 2016, there were 44,182,889 and 37,500,000 public warrants, and 12,317,001 and 19,000,000 private placementwarrants outstanding, respectively. Each warrant entitles its holder to purchase one-half of one share of our Class A common stock at an exercise price of$5.75 per half share, to be exercised only for a whole number of shares of our Class A common stock. The warrants expire on December 4, 2021, or earlierupon redemption or liquidation. The Company may call the outstanding warrants for redemption at a price of $0.01 per warrant, if the last sale price of theCompany’s common stock equals or exceeds $24.00 per share for any 20 trading days within a 30 trading day period ending on the third business day beforethe Company sends the notice of redemption to the warrant holders. The private placement warrants, however, are nonredeemable so long as they are held bythe Company’s Sponsor or its permitted transferees. During the year ended December 31, 2017, the private placement warrants were registered with the SECfor future potential sales to the public. When sold to the public, the private placement warrants will become public warrants.
12. Earnings Per Share
Basic earnings per share is calculated by dividing net income attributable to the Company’s Class A shareholders for the period by the weighted averagenumber of Class A common shares outstanding for the period excluding non-vested restricted stock awards. In computing dilutive earnings per share, basicearnings per share is adjusted for the assumed issuance of all applicable potentially dilutive share-based awards, including: public and private placementwarrants, RSUs, restricted stock awards, and stock options.
87
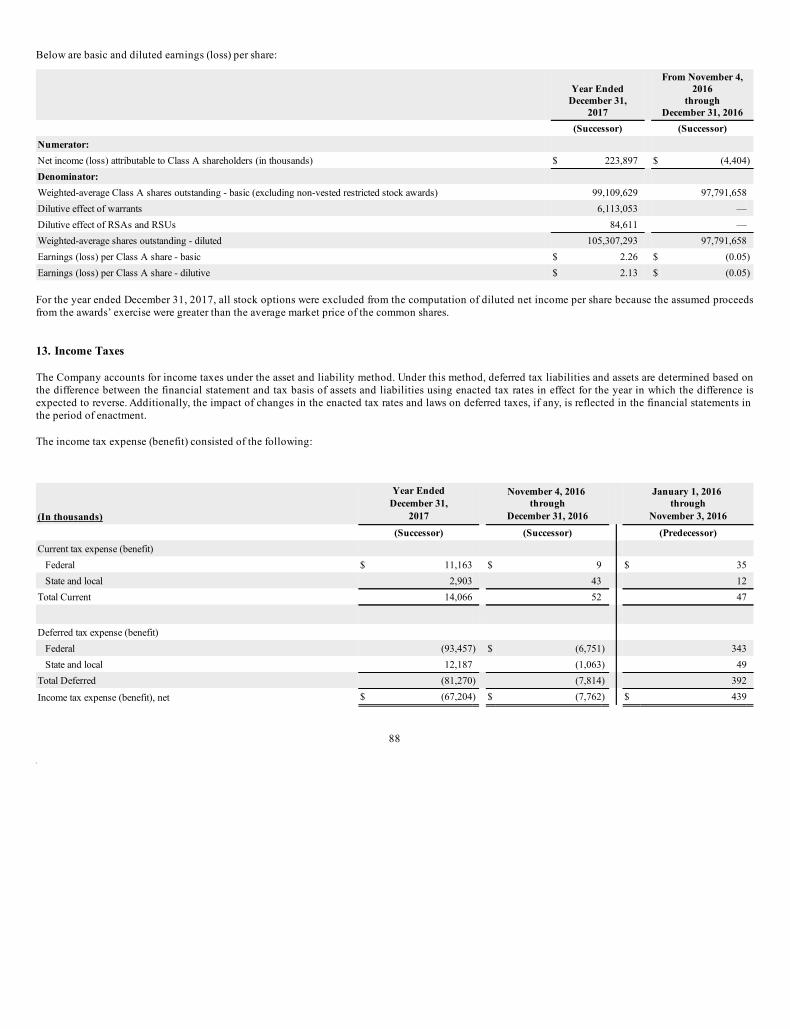
Below are basic and diluted earnings (loss) per share:
Year Ended
December 31,
2017
From November 4,
2016
through
December 31, 2016
(Successor) (Successor)
Numerator:
Net income (loss) attributable to Class A shareholders (in thousands) $ 223,897 $ (4,404)
Denominator:
Weighted-average Class A shares outstanding - basic (excluding non-vested restricted stock awards) 99,109,629 97,791,658
Dilutive effect of warrants 6,113,053 —
Dilutive effect of RSAs and RSUs 84,611 —
Weighted-average shares outstanding - diluted 105,307,293 97,791,658
Earnings (loss) per Class A share - basic $ 2.26 $ (0.05)
Earnings (loss) per Class A share - dilutive $ 2.13 $ (0.05)
For the year ended December 31, 2017, all stock options were excluded from the computation of diluted net income per share because the assumed proceedsfrom the awards’ exercise were greater than the average market price of the common shares.
13. Income Taxes
The Company accounts for income taxes under the asset and liability method. Under this method, deferred tax liabilities and assets are determined based onthe difference between the financial statement and tax basis of assets and liabilities using enacted tax rates in effect for the year in which the difference isexpected to reverse. Additionally, the impact of changes in the enacted tax rates and laws on deferred taxes, if any, is reflected in the financial statements inthe period of enactment.
The income tax expense (benefit) consisted of the following:
(In thousands)
Year Ended
December 31,
2017
November 4, 2016
through
December 31, 2016
January 1, 2016
through
November 3, 2016
(Successor) (Successor) (Predecessor)
Current tax expense (benefit)
Federal $ 11,163 $ 9 $ 35
State and local 2,903 43 12
Total Current 14,066 52 47
Deferred tax expense (benefit)
Federal (93,457) $ (6,751) 343
State and local 12,187 (1,063) 49
Total Deferred (81,270) (7,814) 392
Income tax expense (benefit), net $ (67,204) $ (7,762) $ 439
88
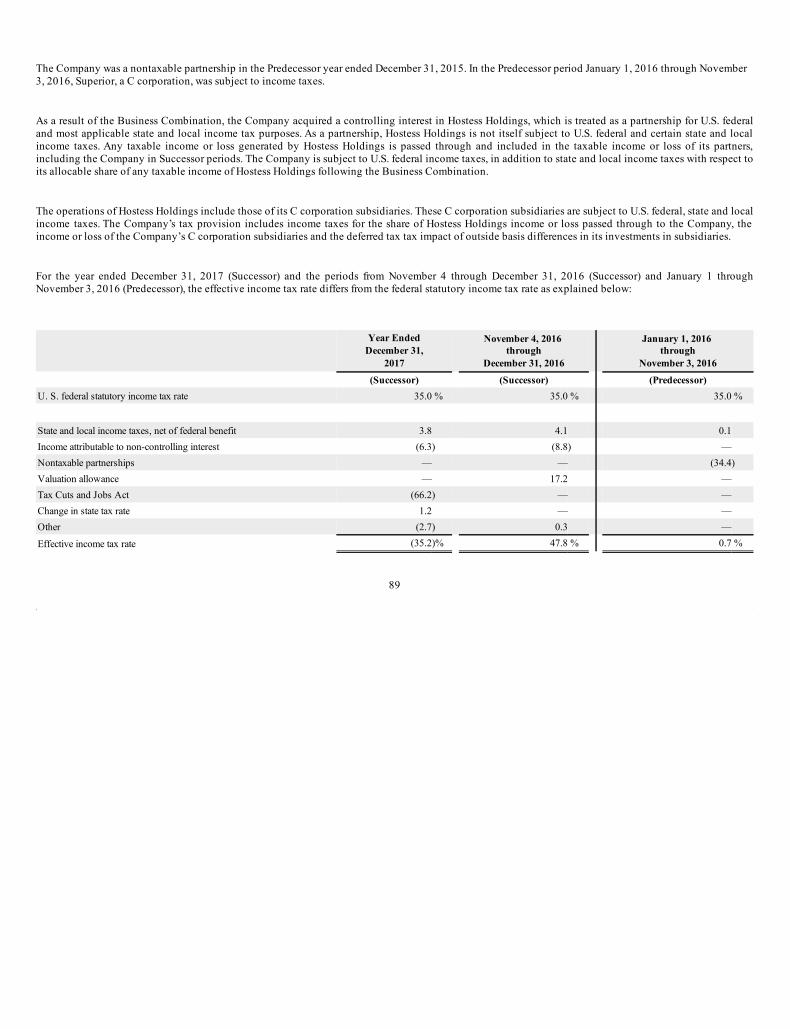
The Company was a nontaxable partnership in the Predecessor year ended December 31, 2015. In the Predecessor period January 1, 2016 through November3, 2016, Superior, a C corporation, was subject to income taxes.
As a result of the Business Combination, the Company acquired a controlling interest in Hostess Holdings, which is treated as a partnership for U.S. federaland most applicable state and local income tax purposes. As a partnership, Hostess Holdings is not itself subject to U.S. federal and certain state and localincome taxes. Any taxable income or loss generated by Hostess Holdings is passed through and included in the taxable income or loss of its partners,including the Company in Successor periods. The Company is subject to U.S. federal income taxes, in addition to state and local income taxes with respect toits allocable share of any taxable income of Hostess Holdings following the Business Combination.
The operations of Hostess Holdings include those of its C corporation subsidiaries. These C corporation subsidiaries are subject to U.S. federal, state and localincome taxes. The Company’s tax provision includes income taxes for the share of Hostess Holdings income or loss passed through to the Company, theincome or loss of the Company’s C corporation subsidiaries and the deferred tax tax impact of outside basis differences in its investments in subsidiaries.
For the year ended December 31, 2017 (Successor) and the periods from November 4 through December 31, 2016 (Successor) and January 1 throughNovember 3, 2016 (Predecessor), the effective income tax rate differs from the federal statutory income tax rate as explained below:
Year Ended
December 31,
2017
November 4, 2016
through
December 31, 2016
January 1, 2016
through
November 3, 2016
(Successor) (Successor) (Predecessor)
U. S. federal statutory income tax rate 35.0 % 35.0 % 35.0 %
State and local income taxes, net of federal benefit 3.8 4.1 0.1
Income attributable to non-controlling interest (6.3) (8.8) —
Nontaxable partnerships — — (34.4)
Valuation allowance — 17.2 —
Tax Cuts and Jobs Act (66.2) — —
Change in state tax rate 1.2 — —
Other (2.7) 0.3 —
Effective income tax rate (35.2)% 47.8 % 0.7 %
89
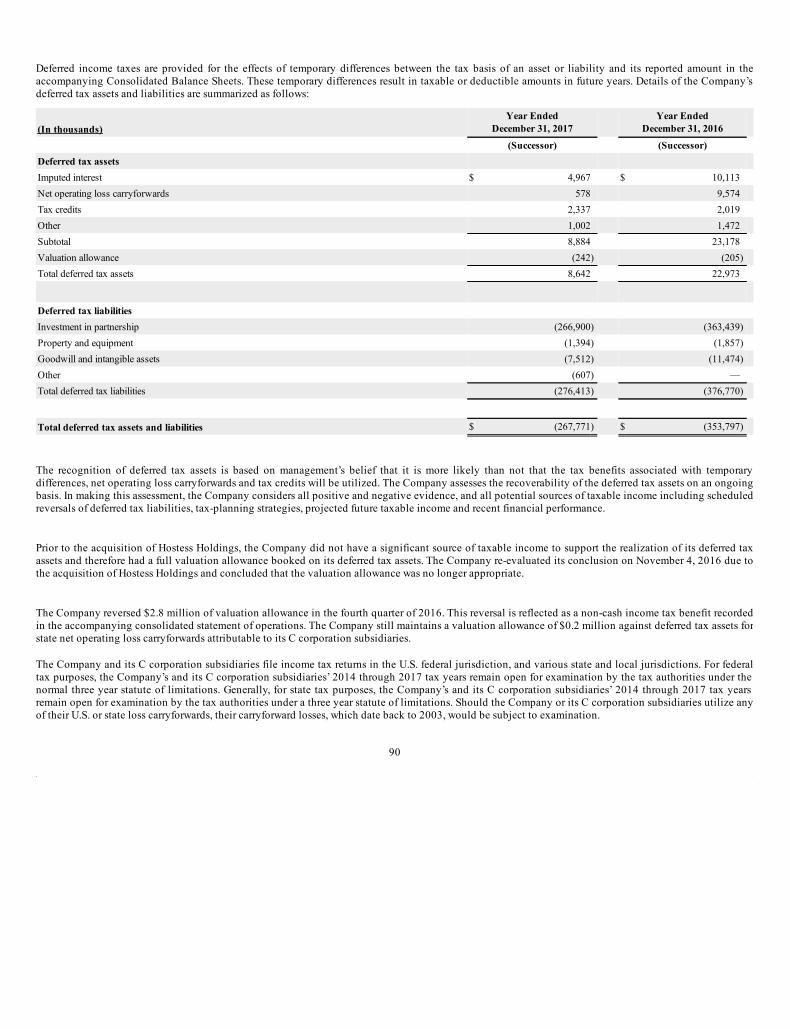
Deferred income taxes are provided for the effects of temporary differences between the tax basis of an asset or liability and its reported amount in theaccompanying Consolidated Balance Sheets. These temporary differences result in taxable or deductible amounts in future years. Details of the Company’sdeferred tax assets and liabilities are summarized as follows:
(In thousands)
Year Ended
December 31, 2017
Year Ended
December 31, 2016
(Successor) (Successor)
Deferred tax assets
Imputed interest $ 4,967 $ 10,113
Net operating loss carryforwards 578 9,574
Tax credits 2,337 2,019
Other 1,002 1,472
Subtotal 8,884 23,178
Valuation allowance (242) (205)
Total deferred tax assets 8,642 22,973
Deferred tax liabilities
Investment in partnership (266,900) (363,439)
Property and equipment (1,394) (1,857)
Goodwill and intangible assets (7,512) (11,474)
Other (607) —
Total deferred tax liabilities (276,413) (376,770)
Total deferred tax assets and liabilities $ (267,771) $ (353,797)
The recognition of deferred tax assets is based on management’s belief that it is more likely than not that the tax benefits associated with temporarydifferences, net operating loss carryforwards and tax credits will be utilized. The Company assesses the recoverability of the deferred tax assets on an ongoingbasis. In making this assessment, the Company considers all positive and negative evidence, and all potential sources of taxable income including scheduledreversals of deferred tax liabilities, tax-planning strategies, projected future taxable income and recent financial performance.
Prior to the acquisition of Hostess Holdings, the Company did not have a significant source of taxable income to support the realization of its deferred taxassets and therefore had a full valuation allowance booked on its deferred tax assets. The Company re-evaluated its conclusion on November 4, 2016 due tothe acquisition of Hostess Holdings and concluded that the valuation allowance was no longer appropriate.
The Company reversed $2.8 million of valuation allowance in the fourth quarter of 2016. This reversal is reflected as a non-cash income tax benefit recordedin the accompanying consolidated statement of operations. The Company still maintains a valuation allowance of $0.2 million against deferred tax assets forstate net operating loss carryforwards attributable to its C corporation subsidiaries.
The Company and its C corporation subsidiaries file income tax returns in the U.S. federal jurisdiction, and various state and local jurisdictions. For federaltax purposes, the Company’s and its C corporation subsidiaries’ 2014 through 2017 tax years remain open for examination by the tax authorities under thenormal three year statute of limitations. Generally, for state tax purposes, the Company’s and its C corporation subsidiaries’ 2014 through 2017 tax yearsremain open for examination by the tax authorities under a three year statute of limitations. Should the Company or its C corporation subsidiaries utilize anyof their U.S. or state loss carryforwards, their carryforward losses, which date back to 2003, would be subject to examination.
90
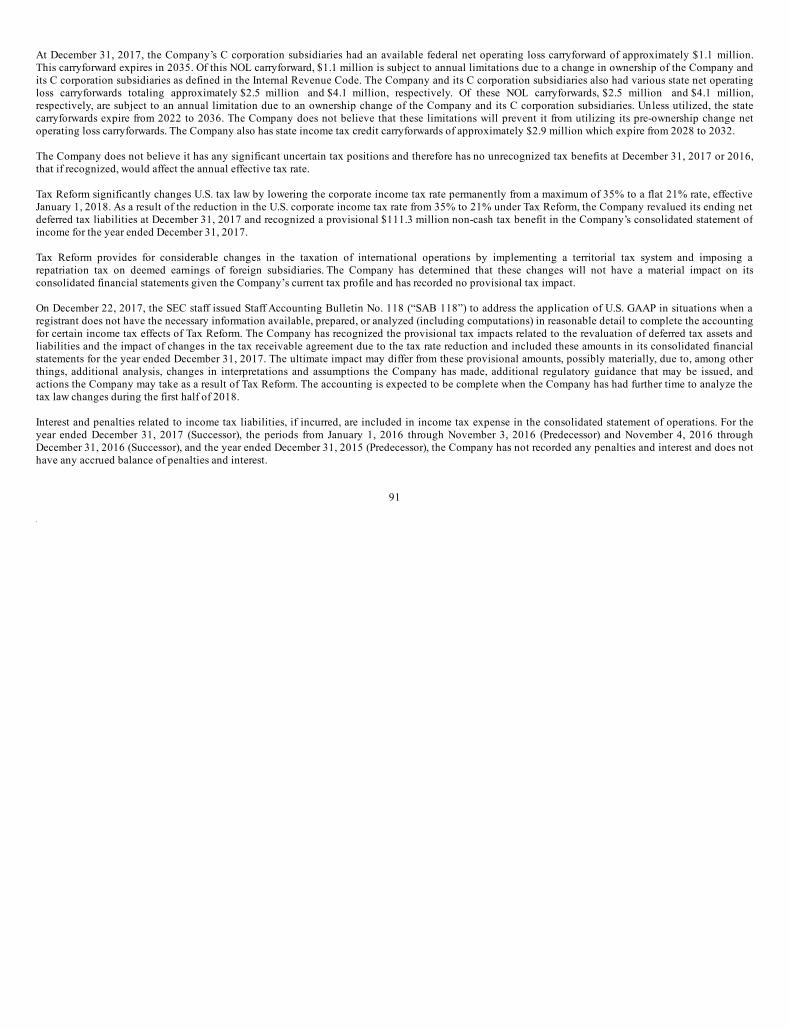
At December 31, 2017, the Company’s C corporation subsidiaries had an available federal net operating loss carryforward of approximately $1.1 million.This carryforward expires in 2035. Of this NOL carryforward, $1.1 million is subject to annual limitations due to a change in ownership of the Company andits C corporation subsidiaries as defined in the Internal Revenue Code. The Company and its C corporation subsidiaries also had various state net operatingloss carryforwards totaling approximately $2.5 million and $4.1 million, respectively. Of these NOL carryforwards, $2.5 million and $4.1 million,respectively, are subject to an annual limitation due to an ownership change of the Company and its C corporation subsidiaries. Unless utilized, the statecarryforwards expire from 2022 to 2036. The Company does not believe that these limitations will prevent it from utilizing its pre-ownership change netoperating loss carryforwards. The Company also has state income tax credit carryforwards of approximately $2.9 million which expire from 2028 to 2032.
The Company does not believe it has any significant uncertain tax positions and therefore has no unrecognized tax benefits at December 31, 2017 or 2016,that if recognized, would affect the annual effective tax rate.
Tax Reform significantly changes U.S. tax law by lowering the corporate income tax rate permanently from a maximum of 35% to a flat 21% rate, effectiveJanuary 1, 2018. As a result of the reduction in the U.S. corporate income tax rate from 35% to 21% under Tax Reform, the Company revalued its ending netdeferred tax liabilities at December 31, 2017 and recognized a provisional $111.3 million non-cash tax benefit in the Company’s consolidated statement ofincome for the year ended December 31, 2017.
Tax Reform provides for considerable changes in the taxation of international operations by implementing a territorial tax system and imposing arepatriation tax on deemed earnings of foreign subsidiaries. The Company has determined that these changes will not have a material impact on itsconsolidated financial statements given the Company’s current tax profile and has recorded no provisional tax impact.
On December 22, 2017, the SEC staff issued Staff Accounting Bulletin No. 118 (“SAB 118”) to address the application of U.S. GAAP in situations when aregistrant does not have the necessary information available, prepared, or analyzed (including computations) in reasonable detail to complete the accountingfor certain income tax effects of Tax Reform. The Company has recognized the provisional tax impacts related to the revaluation of deferred tax assets andliabilities and the impact of changes in the tax receivable agreement due to the tax rate reduction and included these amounts in its consolidated financialstatements for the year ended December 31, 2017. The ultimate impact may differ from these provisional amounts, possibly materially, due to, among otherthings, additional analysis, changes in interpretations and assumptions the Company has made, additional regulatory guidance that may be issued, andactions the Company may take as a result of Tax Reform. The accounting is expected to be complete when the Company has had further time to analyze thetax law changes during the first half of 2018.
Interest and penalties related to income tax liabilities, if incurred, are included in income tax expense in the consolidated statement of operations. For theyear ended December 31, 2017 (Successor), the periods from January 1, 2016 through November 3, 2016 (Predecessor) and November 4, 2016 throughDecember 31, 2016 (Successor), and the year ended December 31, 2015 (Predecessor), the Company has not recorded any penalties and interest and does nothave any accrued balance of penalties and interest.
91
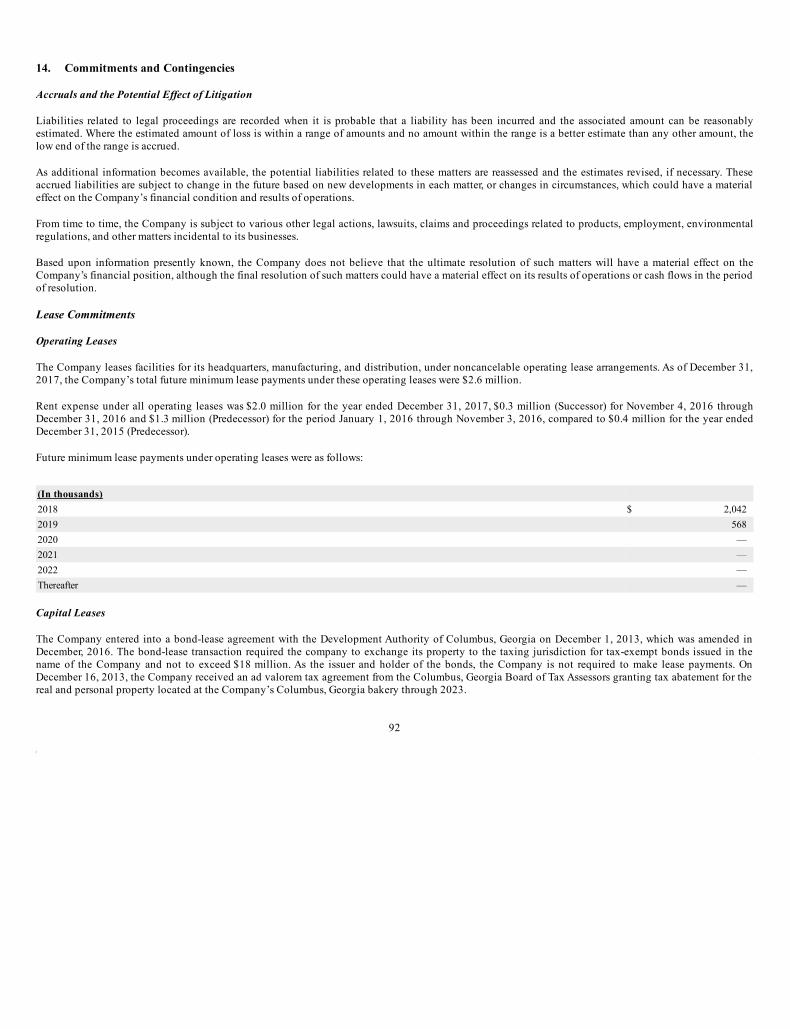
14. Commitments and Contingencies
Accruals and the Potential Effect of Litigation
Liabilities related to legal proceedings are recorded when it is probable that a liability has been incurred and the associated amount can be reasonablyestimated. Where the estimated amount of loss is within a range of amounts and no amount within the range is a better estimate than any other amount, thelow end of the range is accrued.
As additional information becomes available, the potential liabilities related to these matters are reassessed and the estimates revised, if necessary. Theseaccrued liabilities are subject to change in the future based on new developments in each matter, or changes in circumstances, which could have a materialeffect on the Company’s financial condition and results of operations.
From time to time, the Company is subject to various other legal actions, lawsuits, claims and proceedings related to products, employment, environmentalregulations, and other matters incidental to its businesses.
Based upon information presently known, the Company does not believe that the ultimate resolution of such matters will have a material effect on theCompany’s financial position, although the final resolution of such matters could have a material effect on its results of operations or cash flows in the periodof resolution.
Lease Commitments
Operating Leases
The Company leases facilities for its headquarters, manufacturing, and distribution, under noncancelable operating lease arrangements. As of December 31,2017, the Company’s total future minimum lease payments under these operating leases were $2.6 million.
Rent expense under all operating leases was $2.0 million for the year ended December 31, 2017, $0.3 million (Successor) for November 4, 2016 throughDecember 31, 2016 and $1.3 million (Predecessor) for the period January 1, 2016 through November 3, 2016, compared to $0.4 million for the year endedDecember 31, 2015 (Predecessor).
Future minimum lease payments under operating leases were as follows:
(In thousands)
2018 $ 2,042
2019 568
2020 —
2021 —
2022 —
Thereafter —
Capital Leases
The Company entered into a bond-lease agreement with the Development Authority of Columbus, Georgia on December 1, 2013, which was amended inDecember, 2016. The bond-lease transaction required the company to exchange its property to the taxing jurisdiction for tax-exempt bonds issued in thename of the Company and not to exceed $18 million. As the issuer and holder of the bonds, the Company is not required to make lease payments. OnDecember 16, 2013, the Company received an ad valorem tax agreement from the Columbus, Georgia Board of Tax Assessors granting tax abatement for thereal and personal property located at the Company’s Columbus, Georgia bakery through 2023.
92
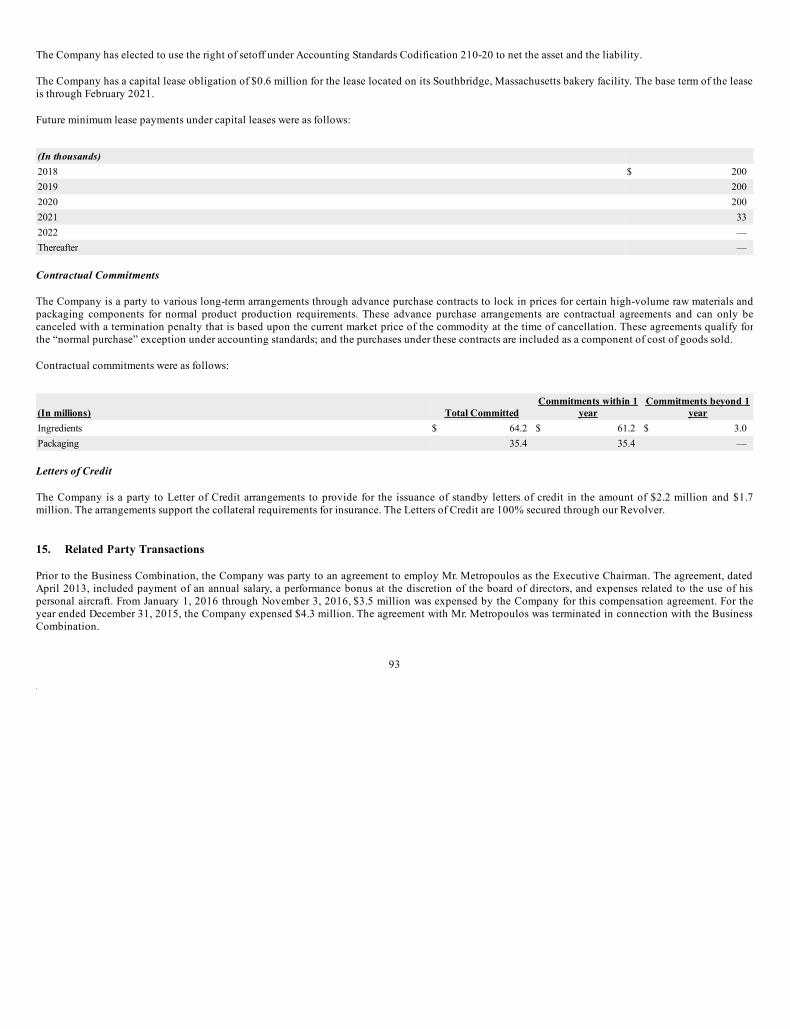
The Company has elected to use the right of setoff under Accounting Standards Codification 210-20 to net the asset and the liability.
The Company has a capital lease obligation of $0.6 million for the lease located on its Southbridge, Massachusetts bakery facility. The base term of the leaseis through February 2021.
Future minimum lease payments under capital leases were as follows:
(In thousands)
2018 $ 200
2019 200
2020 200
2021 33
2022 —
Thereafter —
Contractual Commitments
The Company is a party to various long-term arrangements through advance purchase contracts to lock in prices for certain high-volume raw materials andpackaging components for normal product production requirements. These advance purchase arrangements are contractual agreements and can only becanceled with a termination penalty that is based upon the current market price of the commodity at the time of cancellation. These agreements qualify forthe “normal purchase” exception under accounting standards; and the purchases under these contracts are included as a component of cost of goods sold.
Contractual commitments were as follows:
(In millions) Total Committed
Commitments within 1
year
Commitments beyond 1
year
Ingredients $ 64.2 $ 61.2 $ 3.0
Packaging 35.4 35.4 —
Letters of Credit
The Company is a party to Letter of Credit arrangements to provide for the issuance of standby letters of credit in the amount of $2.2 million and $1.7million. The arrangements support the collateral requirements for insurance. The Letters of Credit are 100% secured through our Revolver.
15. Related Party Transactions
Prior to the Business Combination, the Company was party to an agreement to employ Mr. Metropoulos as the Executive Chairman. The agreement, datedApril 2013, included payment of an annual salary, a performance bonus at the discretion of the board of directors, and expenses related to the use of hispersonal aircraft. From January 1, 2016 through November 3, 2016, $3.5 million was expensed by the Company for this compensation agreement. For theyear ended December 31, 2015, the Company expensed $4.3 million. The agreement with Mr. Metropoulos was terminated in connection with the BusinessCombination.
93
In connection with the Business Combination, the Company entered into an Executive Chairman Employment Agreement with Mr. Metropoulos. Under theterms of this agreement, on November 4, 2016, Mr. Metropoulos was granted 2,496,000 fully vested units of Hostess Holdings and an equivalent number ofshares of Class B common stock in the Company as compensation for his continuing service as Executive Chairman.
The Company determined the fair value of this compensation as follows:
(In thousands, except share data)
Number of Class B units granted 2,496
Closing price of equivalent shares of Class A common stock on date of grant $ 11.40
28,454
Discount for lack of marketability 6%
$ 26,747
As these units are subject to certain sales restrictions, a discount for lack of marketability was determined by using an option pricing method (FinnertyProtective Put Model). The $26.7 million of compensation expense related to these awards is recognized as related party expenses on the consolidatedstatements of operations for the year ended December 31, 2016 along with less than $0.1 million of other payments under this employment agreement.
Also in connection to the Business Combination, the Company agreed to grant shares of Class A common stock or Class B units of Hostess Holdings andequivalent shares of Class B common stock of the Company to an entity owned by Mr. Metropoulos if certain EBITDA thresholds are met for the year endedDecember 31, 2017. The potential grants under this arrangement are between zero and 5.5 million shares. Based on the nature of the arrangement, for U.S.GAAP purposes the potential grants are considered to be compensation for future services to be provided by Mr. Metropoulos. In order to receive 2.75 millionshares under this agreement, adjusted EBITDA, as calculated pursuant to the terms of the Master Transaction Agreement entered into in connection with theBusiness Combination, (“MTA EBITDA”), for the year ended December 31, 2017 must be greater than $240.5 million. The minimum EBITDA threshold forthe year ended December 31, 2017 was not met and no Class A common shares or Class B units were issued.
Under the terms of Mr. Metropoulos’ employment agreement, the Company is obligated to grant additional equity (in the form of either shares of Class Acommon stock of the Company, or Class B units of Hostess Holdings and equivalent shares of Class B common stock of the Company) to Mr. Metropoulos ifMTA EBITDA thresholds are met for the year ended December 31, 2018. The potential grants range from zero to 2.75 million shares. In order to receive 1.375million shares under this agreement, MTA EBITDA for the year ended December 31, 2018 must be greater than $257.8 million. If MTA EBITDA is greaterthan $262.8 million, an additional 1.375 million shares will be awarded. As of December 31, 2017, management determined it was not probable that theCompany would meet the 2018 MTA EBITDA thresholds.
94
16. Unaudited Quarterly Financial Data
Summarized quarterly financial data:
Three Months Ended
(In thousands) December 31,
2017 September 30,
2017 June 30,
2017 March 31,
2017
(Successor) (Successor) (Successor) (Successor)
Net revenue $ 196,221 $ 192,250 $ 203,178 $ 184,538
Operating income 100,762 38,716 49,792 44,723
Net income 189,574 16,130 28,207 24,199
Net income (loss) attributable to Class Ashareholders/partners 179,686 9,549 18,830 15,832
Earnings (loss) per Class A share:
Basic $ 1.80 .10 .19 .16
Diluted $ 1.74 .09 .18 .15
As a result of Tax Reform, the Company remeasured its net deferred tax liabilities and recognized a $111.3 million non-cash tax benefit and also recognizeda gain on the remeasurement of the tax receivable arrangement of $51.8 million during the three months ended December 31, 2017.
(In thousands)
From
November 4, 2016
through
December 31, 2016
From
October 1, 2016
through
November 3, 2016
Three Months
Ended
September 30,
2016
Three Months
Ended
June 30,
2016
Three Months
Ended
March 31,
2016
(Successor) (Predecessor) (Predecessor) (Predecessor) (Predecessor)
Net revenue $ 111,998 $ 66,831 $ 196,197 $ 192,343 $ 160,217
Operating income (9,607) (15,022) 51,667 48,600 37,640
Net income (loss) (8,485) (21,084) 33,513 29,472 18,537
Income (Loss) per Class Ashare:
Basic $ (0.05)
Diluted $ (0.05)
95
The following table sets forth the high and low sales prices for shares of our Class A common stock and warrants for the quarterly periods indicated, asreported on NASDAQ:
Class A Common Stock Warrants
Year Ended December 31, 2017 High Low High Low
First Quarter $ 16.48 $ 12.75 $ 3.00 $ 1.73
Second Quarter 17.18 14.93 3.57 2.43
Third Quarter 16.55 13.00 3.04 1.69
Fourth Quarter 15.40 11.00 2.49 1.23
Year Ended December 31, 2016
First Quarter $ 10.00 $ 9.50 $ 0.40 $ 0.21
Second Quarter 9.80 9.50 0.36 0.16
Third Quarter 11.16 9.72 1.38 0.25
Fourth Quarter 13.50 10.67 1.98 1.13
17. Subsequent Events
Tax Receivable Agreement
On January 26, 2018, the Company entered into an agreement to terminate all future payments payable under the Tax Receivable Agreement to the ApolloFunds in exchange for a payment of $34.0 million. The agreement did not affect the portion of the rights under the Tax Receivable Agreement for theremaining Legacy Hostess Equity Holders. However, if the Company enters into a definitive agreement on or before January 26, 2019 and that agreementresults in a change of control (as defined in the Tax Receivable Agreement), the Company would be required to make an additional payment of $10.0 millionto the Apollo Funds. Prior to the buyout, the Company anticipated making its first payment under the Tax Receivable Agreement between $14.0 and $15.0million in 2018. As a result of the buyout, the first estimated payment to be made in 2018 will be reduced to between $8 million and $9 million.
The summary of expected cash payments under the Tax Receivable Agreement after the buyout and reflecting the impact of Tax Reform is as follows:
(In millions)
Estimated Cash
Payments
2018 $8.0 - $9.0
2019 4.0 - 5.0
2020 4.0 - 5.0
2021 4.0 - 5.0
Thereafter 57.0 - 58.0
Total estimated payments $77.0 - $82.0
96

Acquisition
On February 1, 2018, the Company acquired certain U.S. breakfast assets of Aryzta, LLC, primarily including a bakery facility, inventory and the Big Texas® and Cloverhill ® tradenames for a purchase price of approximately $25 million. A preliminary allocation of the purchase price to the net assets acquired forthis business combination is expected to be made during the first quarter of 2018.
97
Item 9. Changes in and Disagreements with Accountants on Accounting and Financial Disclosure
None.
Item 9A. Controls and Procedures
Evaluation Of Disclosure Controls And Procedures
We have established disclosure controls and procedures (as defined in Rules 13a-15(e) and 15d-15(e) of the Securities Exchange Act of 1934, as amended(the “Exchange Act”), that are designed to provide reasonable assurance that information required to be disclosed in our reports filed or submitted under theExchange Act is recorded, processed, summarized and reported within the time periods specified in the rules and forms of the Securities and ExchangeCommission, and that information relating to the Company is accumulated and communicated to management, including our Chief Executive Officer andChief Financial Officer, as appropriate, to allow timely decisions regarding required disclosure. Based on that evaluation, the Chief Executive Officer andChief Financial Officer have concluded that our current disclosure controls and procedures are effective at a level of reasonable assurance. Management’s Report On Internal Control Over Financial Reporting
Our management is responsible for establishing and maintaining adequate internal control over financial reporting, as defined in Exchange Act Rule 13a-15(f). Under the supervision and with the participation of our management, including our Chief Executive Officer and Chief Financial Officer, we conductedan evaluation of the effectiveness of our internal control over financial reporting based on criteria established in Internal Control - Integrated Framework
(2013) by the Committee of Sponsoring Organization of the Treadway Commission. Based on that evaluation, our management concluded that our internalcontrol over financial reporting was effective as of December 31, 2017.
Attestation Report Of The Registered Public Accounting Firm
The effectiveness of the Company’s internal control of financial reporting as of December 31, 2017 has been audited by KPMG LLP, an independentregistered public accounting firm, as stated in their report which appears herein.
Changes In Internal Controls
During 2017, the Company completed its implementation of internal control over financial reporting in a manner commensurate with the scale of ouroperations subsequent to the November 4, 2016 Business Combination.
Except as disclosed above, there has been no change in the Company’s internal control over financial reporting during 2017 that has materially affected, or isreasonably likely to affect, the Company’s internal control over financial reporting.
Item 9B. Other Information
None.
Item 10. Directors, Executive Officers and Corporate Governance
The information required by this item will be contained in our definitive proxy statement to be filed with the SEC in connection with our 2018 AnnualMeeting of Stockholders, which is expected to be filed not later than 120 days after the end of our fiscal year, and is incorporated herein by reference.
Item 11. Executive Compensation
The information required by this item will be contained in our definitive proxy statement to be filed with the SEC in connection with our 2018 AnnualMeeting of Stockholders, which is expected to be filed not later than 120 days after the end of our fiscal year, and is incorporated herein by reference.
98
Item 12. Security Ownership of Certain Beneficial Owners and Management and Related Stockholder Matters
The information required by this item will be contained in our definitive proxy statement to be filed with the SEC in connection with our 2018 AnnualMeeting of Stockholders, which is expected to be filed not later than 120 days after the end of our fiscal year, and is incorporated herein by reference.
Item 13. Certain Relationships and Related Transactions, and Director Independence
The information required by this item will be contained in our definitive proxy statement to be filed with the SEC in connection with our 2018 AnnualMeeting of Stockholders, which is expected to be filed not later than 120 days after the end of our fiscal year, and is incorporated herein by reference.
Item 14. Principal Accounting Fees and Services
The information required by this item will be contained in our definitive proxy statement to be filed with the SEC in connection with our 2018 AnnualMeeting of Stockholders, which is expected to be filed not later than 120 days after the end of our fiscal year, and is incorporated herein by reference.
Part IV.
Item 15. Exhibits, Financial Statement Schedules
Financial Statements and Financial Statement Schedules
See “Index to Consolidated Financial Statements” in Part II, Item 8 of this Annual Report on Form 10-K. Financial statement schedules have been omittedbecause they are not required or are not applicable or because the information required in those schedules either is not material or is included in theconsolidated financial statements or the accompanying notes.
99
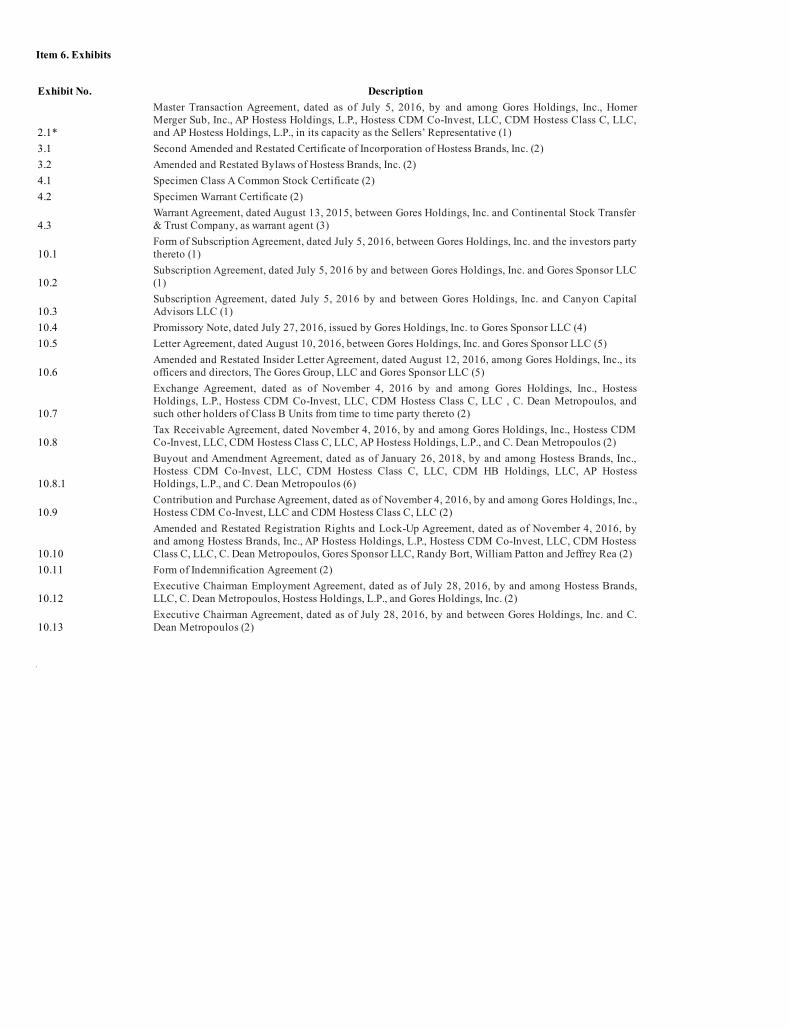
Item 6. Exhibits
Exhibit No. Description
2.1*
Master Transaction Agreement, dated as of July 5, 2016, by and among Gores Holdings, Inc., HomerMerger Sub, Inc., AP Hostess Holdings, L.P., Hostess CDM Co-Invest, LLC, CDM Hostess Class C, LLC,and AP Hostess Holdings, L.P., in its capacity as the Sellers’ Representative (1)
3.1 Second Amended and Restated Certificate of Incorporation of Hostess Brands, Inc. (2)
3.2 Amended and Restated Bylaws of Hostess Brands, Inc. (2)
4.1 Specimen Class A Common Stock Certificate (2)
4.2 Specimen Warrant Certificate (2)
4.3 Warrant Agreement, dated August 13, 2015, between Gores Holdings, Inc. and Continental Stock Transfer& Trust Company, as warrant agent (3)
10.1 Form of Subscription Agreement, dated July 5, 2016, between Gores Holdings, Inc. and the investors partythereto (1)
10.2 Subscription Agreement, dated July 5, 2016 by and between Gores Holdings, Inc. and Gores Sponsor LLC(1)
10.3 Subscription Agreement, dated July 5, 2016 by and between Gores Holdings, Inc. and Canyon CapitalAdvisors LLC (1)
10.4 Promissory Note, dated July 27, 2016, issued by Gores Holdings, Inc. to Gores Sponsor LLC (4)
10.5 Letter Agreement, dated August 10, 2016, between Gores Holdings, Inc. and Gores Sponsor LLC (5)
10.6 Amended and Restated Insider Letter Agreement, dated August 12, 2016, among Gores Holdings, Inc., itsofficers and directors, The Gores Group, LLC and Gores Sponsor LLC (5)
10.7
Exchange Agreement, dated as of November 4, 2016 by and among Gores Holdings, Inc., HostessHoldings, L.P., Hostess CDM Co-Invest, LLC, CDM Hostess Class C, LLC , C. Dean Metropoulos, andsuch other holders of Class B Units from time to time party thereto (2)
10.8 Tax Receivable Agreement, dated November 4, 2016, by and among Gores Holdings, Inc., Hostess CDMCo-Invest, LLC, CDM Hostess Class C, LLC, AP Hostess Holdings, L.P., and C. Dean Metropoulos (2)
10.8.1
Buyout and Amendment Agreement, dated as of January 26, 2018, by and among Hostess Brands, Inc.,Hostess CDM Co-Invest, LLC, CDM Hostess Class C, LLC, CDM HB Holdings, LLC, AP HostessHoldings, L.P., and C. Dean Metropoulos (6)
10.9 Contribution and Purchase Agreement, dated as of November 4, 2016, by and among Gores Holdings, Inc.,Hostess CDM Co-Invest, LLC and CDM Hostess Class C, LLC (2)
10.10
Amended and Restated Registration Rights and Lock-Up Agreement, dated as of November 4, 2016, byand among Hostess Brands, Inc., AP Hostess Holdings, L.P., Hostess CDM Co-Invest, LLC, CDM HostessClass C, LLC, C. Dean Metropoulos, Gores Sponsor LLC, Randy Bort, William Patton and Jeffrey Rea (2)
10.11 Form of Indemnification Agreement (2)
10.12 Executive Chairman Employment Agreement, dated as of July 28, 2016, by and among Hostess Brands,LLC, C. Dean Metropoulos, Hostess Holdings, L.P., and Gores Holdings, Inc. (2)
10.13 Executive Chairman Agreement, dated as of July 28, 2016, by and between Gores Holdings, Inc. and C.Dean Metropoulos (2)
10.14 Letter Agreement, dated as of July 22, 2014, by and between Hostess Brands, LLC and William Toler (2)
10.15 Letter Agreement, dated as of March 1, 2016, by and between Hostess Brands, LLC and Tom Peterson (2)
10.16 Hostess Brands, Inc. 2016 Equity Incentive Plan (2)
10.17 Third Amended and Restated First Lien Credit Agreement, dated as of November 20, 2017 (7)
10.18 Letter Agreement, dated as of October 12, 2017, by and between Hostess Brands, LLC and William Toler
10.19 Letter Agreement, dated as of December 6, 2017, by and between Hostess Brands, LLC and Andrew Jacobs
21.1 Subsidiaries of the Company
23.1 Consent of KPMG LLP
31.1 Certification of Chief Executive Officer Pursuant to Section 302 of the Sarbanes-Oxley Act of 2002
31.2 Certification of Chief Financial Officer Pursuant to Section 302 of the Sarbanes-Oxley Act of 2002
32.1 Certification of Chief Executive Officer Pursuant to 18 U.S.C. Section 1350 as adopted pursuant toSection 906 of the Sarbanes-Oxley Act of 2002
32.2 Certification of Chief Financial Officer Pursuant to 18 U.S.C. Section 1350 as adopted pursuant to Section906 of the Sarbanes-Oxley Act of 2002
101.INS XBRL Instance Document
101.SCH XBRL Taxonomy Extension Schema Document
101.CAL XBRL Taxonomy Extension Calculation Linkbase Document
101.DEF XBRL Taxonomy Extension Definition Linkbase Document
101.LAB XBRL Taxonomy Extension Label Linkbase Document
101.PRE XBRL Taxonomy Extension Presentation Linkbase Document
*Schedules and exhibits to this Exhibit omitted pursuant to Regulation S-K Item 601(b)(2). The Company agrees to furnish supplementally a copy of anyomitted schedules or exhibits to the SEC upon request.
(1) Filed as an exhibit to the Company’s Current Report on Form 8-K filed with the SEC on July 5, 2016 and incorporated herein by reference.(2) Filed as an exhibit to the Company’s Current Report on Form 8-K filed with the SEC on November 9, 2016 and incorporated herein by reference.(3) Filed as an exhibit of the Company’s Current Report on Form 8-K filed with the SEC on August 19, 2015 and incorporated herein by reference.(4) Filed as an exhibit to the Company’s Current Report on Form 8-K filed with the SEC on July 27, 2016 and incorporated herein by reference.(5) Filed as an exhibit to the Company’s Current Report on Form 8-K filed with the SEC on August 15, 2016 and incorporated herein by reference.(6) Filed as an exhibit to the Company’s Current Report on Form 8-K filed with the SEC on January 29, 2018 and incorporated herein by reference.(7) Filed as an exhibit to the Company’s Current Report on Form 8-K filed with the SEC on November 20, 2017 and incorporated herein by reference.

[THIS PAGE INTENTIONALLY LEFT BLANK]
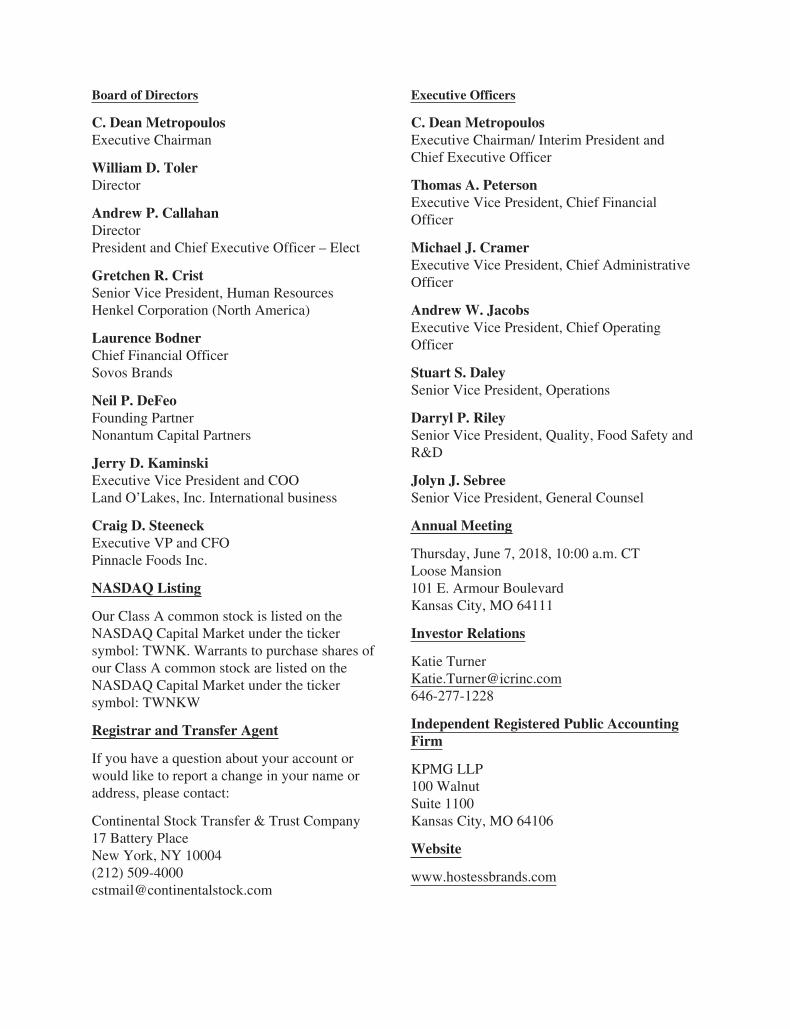
Board of Directors Executive Officers
C. Dean MetropoulosExecutive Chairman
William D. TolerDirector
Andrew P. CallahanDirectorPresident and Chief Executive Officer – Elect
Gretchen R. CristSenior Vice President, Human ResourcesHenkel Corporation (North America)
Laurence BodnerChief Financial OfficerSovos Brands
Neil P. DeFeoFounding PartnerNonantum Capital Partners
Jerry D. KaminskiExecutive Vice President and COOLand O’Lakes, Inc. International business
Craig D. SteeneckExecutive VP and CFOPinnacle Foods Inc.
NASDAQ Listing
Our Class A common stock is listed on theNASDAQ Capital Market under the tickersymbol: TWNK. Warrants to purchase shares ofour Class A common stock are listed on theNASDAQ Capital Market under the tickersymbol: TWNKW
Registrar and Transfer Agent
If you have a question about your account orwould like to report a change in your name oraddress, please contact:
Continental Stock Transfer & Trust Company17 Battery PlaceNew York, NY 10004(212) [email protected]
C. Dean MetropoulosExecutive Chairman/ Interim President andChief Executive Officer
Thomas A. PetersonExecutive Vice President, Chief FinancialOfficer
Michael J. CramerExecutive Vice President, Chief AdministrativeOfficer
Andrew W. JacobsExecutive Vice President, Chief OperatingOfficer
Stuart S. DaleySenior Vice President, Operations
Darryl P. RileySenior Vice President, Quality, Food Safety andR&D
Jolyn J. SebreeSenior Vice President, General Counsel
Annual Meeting
Thursday, June 7, 2018, 10:00 a.m. CTLoose Mansion101 E. Armour BoulevardKansas City, MO 64111
Investor Relations
Katie [email protected]
Independent Registered Public AccountingFirm
KPMG LLP100 WalnutSuite 1100Kansas City, MO 64106
Website
www.hostessbrands.com
Forward-Looking Statements
This Annual Report contains statements reflecting our views about our future performance thatconstitute “forward-looking statements” that involve substantial risks and uncertainties. All forward-looking statements included herein are made only as of the date hereof. These statements inherentlyinvolve risks and uncertainties that could cause actual results to differ materially from those anticipatedin such forward-looking statements. It is routine for our internal projections and expectations to changethroughout the year, and any forward-looking statements based upon these projections or expectationsmay change prior to the end of the next quarter or year. Readers are cautioned not to place unduereliance on any such forward-looking statements. We undertake no obligation to update any forward-looking statement, whether as a result of new information, future events, or otherwise.