bloomin' brands, inc. - annualreports.com
TRANSCRIPT
BLOOMIN' BRANDS, INC.
FORM 10-K(Annual Report)
Filed 02/22/17 for the Period Ending 12/25/16
Address 2202 NORTH WEST SHORE BOULEVARDSUITE 500TAMPA, FL 33607
Telephone 813-282-1225CIK 0001546417
Symbol BLMNSIC Code 5812 - Eating Places
Industry Restaurants & BarsSector Consumer Cyclicals
Fiscal Year 12/28
http://www.edgar-online.com© Copyright 2017, EDGAR Online, Inc. All Rights Reserved.
Distribution and use of this document restricted under EDGAR Online, Inc. Terms of Use.
UNITED STATES
SECURITIES AND EXCHANGE COMMISSIONWashington, D.C. 20549
FORM 10-K(Mark One)
[X] Annual Report Pursuant to Section 13 or 15(d) of the Securities Exchange Act of 1934 For the fiscal year ended: December 25, 2016 Or
[ ] Transition Report Pursuant to Section 13 or 15(d) of the Securities Exchange Act of 1934 For the transition period from ______ to ______
Commission File Number: 001-35625
BLOOMIN’ BRANDS, INC.(Exact name of registrant as specified in its charter)
Delaware 20-8023465(State or other jurisdiction of incorporation or organization)
(I.R.S. Employer
Identification No.)2202 North West Shore Boulevard, Suite 500, Tampa, Florida 33607
(Address of principal executive offices) (Zip Code)
(813) 282-1225(Registrant’s telephone number, including area code)
Securities registered pursuant to Section 12(b) of the Act:
Title of each class Name of each exchange on which registered
Common Stock, $0.01 par value
The Nasdaq Stock Market LLC(Nasdaq Global Select Market)
Securities registered pursuant to Section 12(g) of the Act: None
Indicate by check mark if the registrant is a well-known seasoned issuer, as defined in Rule 405 of the Securities Act. YES ý NO o
Indicate by check mark if the registrant is not required to file reports pursuant to Section 13 or Section 15(d) of the Act. YES o NO ý
Indicate by check mark whether the registrant (1) has filed all reports required to be filed by Section 13 or 15(d) of the Securities Exchange Act of 1934 during thepreceding 12 months (or for such shorter period that the registrant was required to file such reports), and (2) has been subject to such filing requirements for thepast 90 days. YES ý NO o
Indicate by check mark whether the registrant has submitted electronically and posted on its corporate Web site, if any, every Interactive Data File required to besubmitted and posted pursuant to Rule 405 of Regulation S-T (§232.405 of this chapter) during the preceding 12 months (or for such shorter period that theregistrant was required to submit and post such files). YES ý NO o
Indicate by check mark if disclosure of delinquent filers pursuant to Item 405 of Regulation S-K (§229.405 of this chapter) is not contained herein, and will not becontained, to the best of registrant’s knowledge, in definitive proxy or information statements incorporated by reference in Part III of this Form 10-K or anyamendment to this Form 10-K. ý
Indicate by check mark whether the registrant is a large accelerated filer, an accelerated filer, a non-accelerated filer, or a smaller reporting company. See thedefinitions of “large accelerated filer,” “accelerated filer” and “smaller reporting company” in Rule 12b-2 of the Exchange Act.
Large accelerated filer ýAccelerated filer o

Non-accelerated filer o(Do not check if smaller reporting company) Smaller reporting company o
Indicate by check mark whether the registrant is a shell company (as defined in Rule 12b-2 of the Act). YES o NO ý
The aggregate market value of common stock held by non-affiliates (based on the closing price on the last business day of the registrant’s most recently completedsecond fiscal quarter as reported on the Nasdaq Global Select Market) was $1.6 billion .
As of February 17, 2017 , 102,843,651 shares of common stock of the registrant were outstanding.
DOCUMENTS INCORPORATED BY REFERENCEPortions of the registrant’s definitive Proxy Statement for its 2017 Annual Meeting of Stockholders, expected to be held on April 21, 2017 , are incorporated byreference into Part III, Items 10-14 of this Annual Report on Form 10-K.
Table of ContentsBLOOMIN’ BRANDS, INC.
INDEX TO ANNUAL REPORT ON FORM 10-KFor Fiscal Year 2016
TABLE OF CONTENTS
PAGE NO.
PART I Item 1. Business 5
Item 1A. Risk Factors 15Item 1B. Unresolved Staff Comments 25
Item 2. Properties 26Item 3. Legal Proceedings 26Item 4. Mine Safety Disclosures 27
PART II Item 5. Market for Registrant’s Common Equity, Related Stockholder Matters and Issuer Purchases of Equity Securities 27Item 6. Selected Financial Data 30Item 7. Management’s Discussion and Analysis of Financial Condition and Results of Operations 31
Item 7A. Quantitative and Qualitative Disclosures About Market Risk 61Item 8. Financial Statements and Supplementary Data 63Item 9. Changes in and Disagreements With Accountants on Accounting and Financial Disclosure 109
Item 9A. Controls and Procedures 109Item 9B. Other Information 109
PART III Item 10. Directors, Executive Officers and Corporate Governance 110Item 11. Executive Compensation 110Item 12. Security Ownership of Certain Beneficial Owners and Management and Related Stockholder Matters 110Item 13. Certain Relationships and Related Transactions, and Director Independence 110Item 14. Principal Accounting Fees and Services 111
PART IV Item 15. Exhibits, Financial Statement Schedules 112Item 16. Form 10-K Summary 116Signatures 117
2
Table of ContentsBLOOMIN’ BRANDS, INC.
PART I
Cautionary Statement
This Annual Report on Form 10-K (the “Report”) includes statements that express our opinions, expectations, beliefs, plans, objectives,assumptions or projections regarding future events or future results and therefore are, or may be deemed to be, “forward-looking statements”within the meaning of Section 27A of the Securities Act of 1933, as amended, and Section 21E of the Securities Exchange Act of 1934, asamended (the “Exchange Act”). These forward-looking statements can generally be identified by the use of forward-looking terminology,including the terms “believes,” “estimates,” “anticipates,” “expects,” “feels,” “seeks,” “forecasts,” “projects,” “intends,” “plans,” “may,”“will,” “should,” “could” or “would” or, in each case, their negative or other variations or comparable terminology, although not all forward-looking statements are accompanied by such terms. These forward-looking statements include all matters that are not historical facts. Theyappear in a number of places throughout this Report and include statements regarding our intentions, beliefs or current expectationsconcerning, among other things, our results of operations, financial condition, liquidity, prospects, growth, strategies and the industry inwhich we operate.
By their nature, forward-looking statements involve risks and uncertainties because they relate to events and depend on circumstances thatmay or may not occur in the future. Although we base these forward-looking statements on assumptions that we believe are reasonable whenmade, we caution you that forward-looking statements are not guarantees of future performance and that our actual results of operations,financial condition and liquidity, and industry developments may differ materially from statements made in or suggested by the forward-looking statements contained in this Report. In addition, even if our results of operations, financial condition and liquidity, and industrydevelopments are consistent with the forward-looking statements contained in this Report, those results or developments may not beindicative of results or developments in subsequent periods. Important factors that could cause actual results to differ materially fromstatements made or suggested by forward-looking statements include, but are not limited to, those described in the “Risk Factors” section ofthis Report and the following:
(i) Consumer reactions to public health and food safety issues;
(ii) Our ability to compete in the highly competitive restaurant industry with many well-established competitors and new market entrants;
(iii) Minimum wage increases and additional mandated employee benefits;
(iv) Our ability to comply with governmental laws and regulations, the costs of compliance with such laws and regulations and the effectsof changes to applicable laws and regulations, including tax laws and unanticipated liabilities;
(v) Economic conditions and their effects on consumer confidence and discretionary spending, consumer traffic, the cost and availabilityof credit and interest rates;
(vi) Fluctuations in the price and availability of commodities;
(vii) Our ability to implement our expansion, remodeling and relocation plans due to uncertainty in locating and acquiring attractive siteson acceptable terms, obtaining required permits and approvals, recruiting and training necessary personnel, obtaining adequatefinancing and estimating the performance of newly opened, remodeled or relocated restaurants;
(viii) Our ability to protect our information technology systems from interruption or security breach and to protect consumer data andpersonal employee information;
(ix) The effects of international economic, political and social conditions and legal systems on our foreign operations and on foreigncurrency exchange rates;
3
Table of ContentsBLOOMIN’ BRANDS, INC.
(x) Our ability to preserve and grow the reputation and value of our brands;
(xi) Seasonal and periodic fluctuations in our results and the effects of significant adverse weather conditions and other disasters orunforeseen events;
(xii) Our ability to effectively respond to changes in patterns of consumer traffic, consumer tastes and dietary habits;
(xiii) Strategic actions, including acquisitions and dispositions, and our success in integrating any acquired or newly created businesses.
(xiv) The effects of our substantial leverage and restrictive covenants in our various credit facilities on our ability to raise additional capitalto fund our operations, to make capital expenditures to invest in new or renovate restaurants and to react to changes in the economy orour industry, and our exposure to interest rate risk in connection with our variable-rate debt; and
(xv) The adequacy of our cash flow and earnings and other conditions which may affect our ability to pay dividends and repurchase sharesof our common stock.
In light of these risks and uncertainties, we caution you not to place undue reliance on these forward-looking statements. Any forward-looking statement that we make in this Report speaks only as of the date of such statement, and we undertake no obligation to update anyforward-looking statement or to publicly announce the results of any revision to any of those statements to reflect future events ordevelopments. Comparisons of results for current and any prior periods are not intended to express any future trends or indications of futureperformance, unless specifically expressed as such, and should only be viewed as historical data.
4
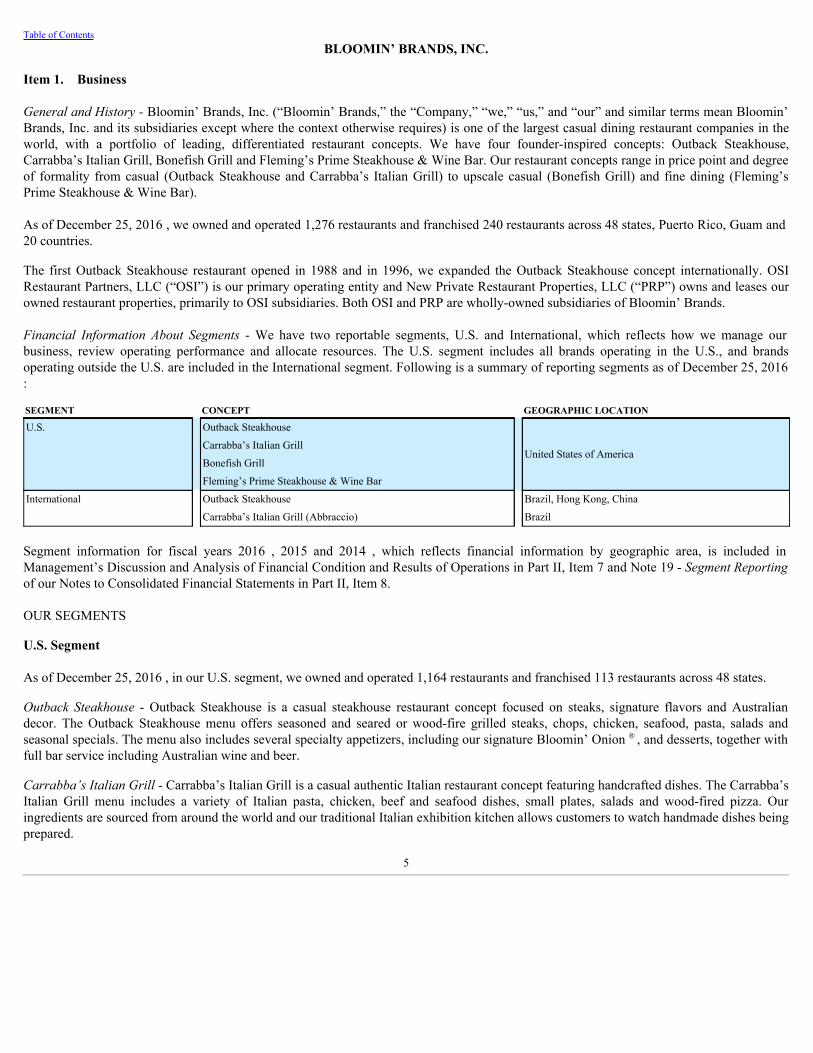
Table of ContentsBLOOMIN’ BRANDS, INC.
Item 1. Business
GeneralandHistory- Bloomin’ Brands, Inc. (“Bloomin’ Brands,” the “Company,” “we,” “us,” and “our” and similar terms mean Bloomin’Brands, Inc. and its subsidiaries except where the context otherwise requires) is one of the largest casual dining restaurant companies in theworld, with a portfolio of leading, differentiated restaurant concepts. We have four founder-inspired concepts: Outback Steakhouse,Carrabba’s Italian Grill, Bonefish Grill and Fleming’s Prime Steakhouse & Wine Bar. Our restaurant concepts range in price point and degreeof formality from casual (Outback Steakhouse and Carrabba’s Italian Grill) to upscale casual (Bonefish Grill) and fine dining (Fleming’sPrime Steakhouse & Wine Bar).
As of December 25, 2016 , we owned and operated 1,276 restaurants and franchised 240 restaurants across 48 states, Puerto Rico, Guam and20 countries.
The first Outback Steakhouse restaurant opened in 1988 and in 1996, we expanded the Outback Steakhouse concept internationally. OSIRestaurant Partners, LLC (“OSI”) is our primary operating entity and New Private Restaurant Properties, LLC (“PRP”) owns and leases ourowned restaurant properties, primarily to OSI subsidiaries. Both OSI and PRP are wholly-owned subsidiaries of Bloomin’ Brands.
Financial Information About Segments - We have two reportable segments, U.S. and International, which reflects how we manage ourbusiness, review operating performance and allocate resources. The U.S. segment includes all brands operating in the U.S., and brandsoperating outside the U.S. are included in the International segment. Following is a summary of reporting segments as of December 25, 2016:
SEGMENT CONCEPT GEOGRAPHIC LOCATION
U.S. Outback Steakhouse
United States of America Carrabba’s Italian Grill Bonefish Grill Fleming’s Prime Steakhouse & Wine Bar
International Outback Steakhouse Brazil, Hong Kong, China
Carrabba’s Italian Grill (Abbraccio) Brazil
Segment information for fiscal years 2016 , 2015 and 2014 , which reflects financial information by geographic area, is included inManagement’s Discussion and Analysis of Financial Condition and Results of Operations in Part II, Item 7 and Note 19 - SegmentReportingof our Notes to Consolidated Financial Statements in Part II, Item 8.
OUR SEGMENTS
U.S. Segment
As of December 25, 2016 , in our U.S. segment, we owned and operated 1,164 restaurants and franchised 113 restaurants across 48 states.
Outback Steakhouse - Outback Steakhouse is a casual steakhouse restaurant concept focused on steaks, signature flavors and Australiandecor. The Outback Steakhouse menu offers seasoned and seared or wood-fire grilled steaks, chops, chicken, seafood, pasta, salads andseasonal specials. The menu also includes several specialty appetizers, including our signature Bloomin’ Onion ® , and desserts, together withfull bar service including Australian wine and beer.
Carrabba’sItalianGrill-Carrabba’s Italian Grill is a casual authentic Italian restaurant concept featuring handcrafted dishes. The Carrabba’sItalian Grill menu includes a variety of Italian pasta, chicken, beef and seafood dishes, small plates, salads and wood-fired pizza. Ouringredients are sourced from around the world and our traditional Italian exhibition kitchen allows customers to watch handmade dishes beingprepared.
5
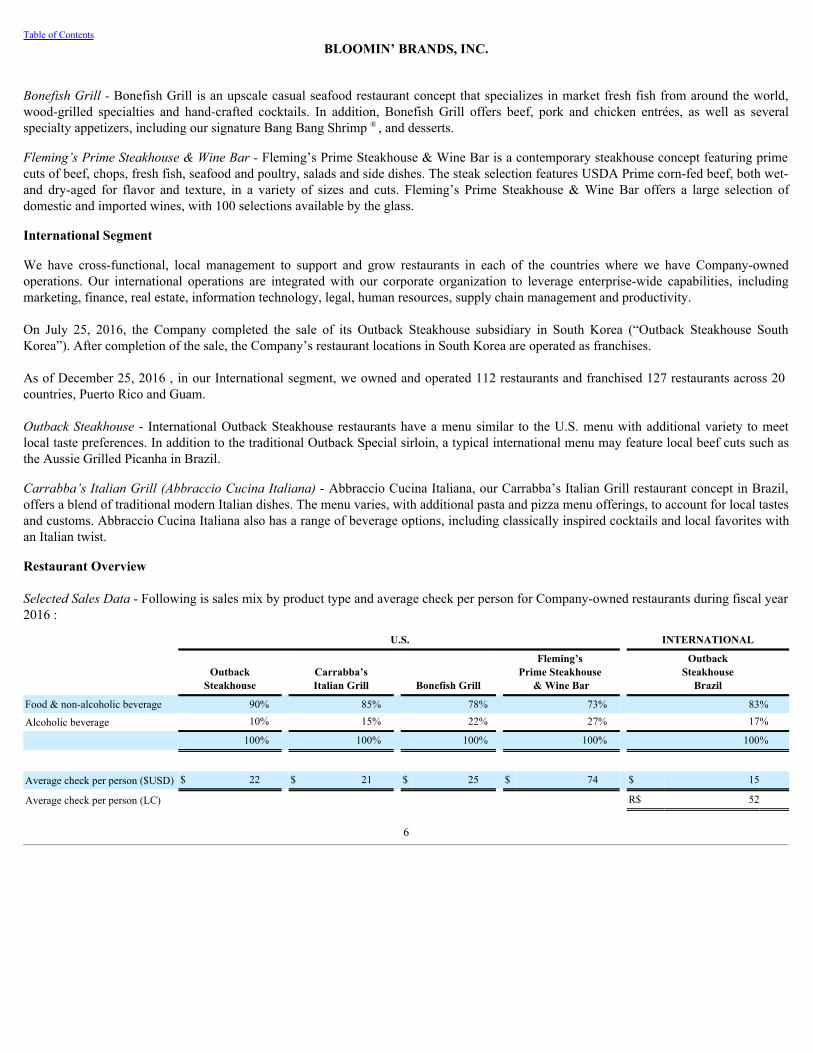
Table of ContentsBLOOMIN’ BRANDS, INC.
BonefishGrill-Bonefish Grill is an upscale casual seafood restaurant concept that specializes in market fresh fish from around the world,wood-grilled specialties and hand-crafted cocktails. In addition, Bonefish Grill offers beef, pork and chicken entrées, as well as severalspecialty appetizers, including our signature Bang Bang Shrimp ® , and desserts.
Fleming’sPrimeSteakhouse&WineBar-Fleming’s Prime Steakhouse & Wine Bar is a contemporary steakhouse concept featuring primecuts of beef, chops, fresh fish, seafood and poultry, salads and side dishes. The steak selection features USDA Prime corn-fed beef, both wet-and dry-aged for flavor and texture, in a variety of sizes and cuts. Fleming’s Prime Steakhouse & Wine Bar offers a large selection ofdomestic and imported wines, with 100 selections available by the glass.
International Segment
We have cross-functional, local management to support and grow restaurants in each of the countries where we have Company-ownedoperations. Our international operations are integrated with our corporate organization to leverage enterprise-wide capabilities, includingmarketing, finance, real estate, information technology, legal, human resources, supply chain management and productivity.
On July 25, 2016, the Company completed the sale of its Outback Steakhouse subsidiary in South Korea (“Outback Steakhouse SouthKorea”). After completion of the sale, the Company’s restaurant locations in South Korea are operated as franchises.
As of December 25, 2016 , in our International segment, we owned and operated 112 restaurants and franchised 127 restaurants across 20countries, Puerto Rico and Guam.
OutbackSteakhouse- International Outback Steakhouse restaurants have a menu similar to the U.S. menu with additional variety to meetlocal taste preferences. In addition to the traditional Outback Special sirloin, a typical international menu may feature local beef cuts such asthe Aussie Grilled Picanha in Brazil.
Carrabba’sItalianGrill(AbbraccioCucinaItaliana)- Abbraccio Cucina Italiana, our Carrabba’s Italian Grill restaurant concept in Brazil,offers a blend of traditional modern Italian dishes. The menu varies, with additional pasta and pizza menu offerings, to account for local tastesand customs. Abbraccio Cucina Italiana also has a range of beverage options, including classically inspired cocktails and local favorites withan Italian twist.
Restaurant Overview
SelectedSalesData- Following is sales mix by product type and average check per person for Company-owned restaurants during fiscal year2016 :
U.S. INTERNATIONAL
Outback
Steakhouse Carrabba’sItalian Grill Bonefish Grill
Fleming’s Prime Steakhouse
& Wine Bar
OutbackSteakhouse
Brazil
Food & non-alcoholic beverage 90% 85% 78% 73% 83%
Alcoholic beverage 10% 15% 22% 27% 17%
100% 100% 100% 100% 100%
Average check per person ($USD) $ 22 $ 21 $ 25 $ 74 $ 15
Average check per person (LC) R$ 52
6
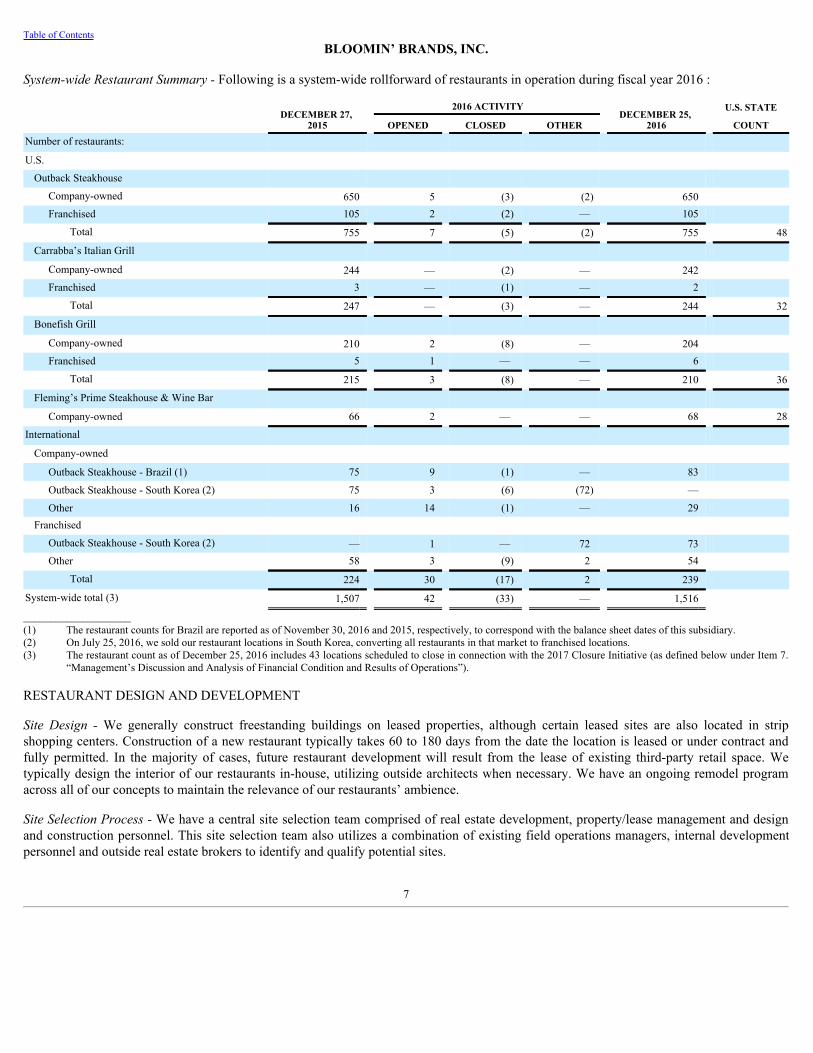
Table of ContentsBLOOMIN’ BRANDS, INC.
System-wideRestaurantSummary-Following is a system-wide rollforward of restaurants in operation during fiscal year 2016 :
DECEMBER 27,
2015
2016 ACTIVITY DECEMBER 25,
2016
U.S. STATE
OPENED CLOSED OTHER COUNTNumber of restaurants: U.S.
Outback Steakhouse Company-owned 650 5 (3) (2) 650 Franchised 105 2 (2) — 105
Total 755 7 (5) (2) 755 48
Carrabba’s Italian Grill Company-owned 244 — (2) — 242 Franchised 3 — (1) — 2
Total 247 — (3) — 244 32
Bonefish Grill Company-owned 210 2 (8) — 204 Franchised 5 1 — — 6
Total 215 3 (8) — 210 36
Fleming’s Prime Steakhouse & Wine Bar Company-owned 66 2 — — 68 28
International Company-owned
Outback Steakhouse - Brazil (1) 75 9 (1) — 83 Outback Steakhouse - South Korea (2) 75 3 (6) (72) — Other 16 14 (1) — 29
Franchised Outback Steakhouse - South Korea (2) — 1 — 72 73 Other 58 3 (9) 2 54
Total 224 30 (17) 2 239 System-wide total (3) 1,507 42 (33) — 1,516 ____________________(1) The restaurant counts for Brazil are reported as of November 30, 2016 and 2015, respectively, to correspond with the balance sheet dates of this subsidiary.(2) On July 25, 2016, we sold our restaurant locations in South Korea, converting all restaurants in that market to franchised locations.(3) The restaurant count as of December 25, 2016 includes 43 locations scheduled to close in connection with the 2017 Closure Initiative (as defined below under Item 7.
“Management’s Discussion and Analysis of Financial Condition and Results of Operations”).
RESTAURANT DESIGN AND DEVELOPMENT
Site Design -We generally construct freestanding buildings on leased properties, although certain leased sites are also located in stripshopping centers. Construction of a new restaurant typically takes 60 to 180 days from the date the location is leased or under contract andfully permitted. In the majority of cases, future restaurant development will result from the lease of existing third-party retail space. Wetypically design the interior of our restaurants in-house, utilizing outside architects when necessary. We have an ongoing remodel programacross all of our concepts to maintain the relevance of our restaurants’ ambience.
SiteSelectionProcess-We have a central site selection team comprised of real estate development, property/lease management and designand construction personnel. This site selection team also utilizes a combination of existing field operations managers, internal developmentpersonnel and outside real estate brokers to identify and qualify potential sites.
7
Table of ContentsBLOOMIN’ BRANDS, INC.
We have a relocation initiative in process, primarily related to the Outback Steakhouse brand. This multi-year relocation plan is focused ondriving additional traffic to our restaurants by moving legacy restaurants from non-prime to prime locations within the same trade area.
Restaurant Development
We utilize the ownership structure and market entry strategy that best fits the needs for a particular market, including Company-owned units,joint ventures and franchises. For each market, we determine whether we will focus on Company-owned units, joint ventures or franchisesbased on demand, cost structure and economic conditions.
InternationalDevelopment-We continue to expand internationally, leveraging established equity and franchise markets in South Americaand Asia, and in strategically selected emerging and high-growth developed markets, focusing on Brazil and China. As we continue to expandinternationally, we complement our ownership positions in high growth markets with franchisee partnerships. During 2016, we entered into amulti-country franchise agreement for the development of up to 26 Outback Steakhouse and Abbraccio Cucina Italiana restaurants in theMiddle East over the next five years. We also entered into a development agreement in 2016 with an existing franchisee in Australia to open20 Outback Steakhouse restaurants over the next three years.
See Item 2 - Propertiesfor disclosure of our international restaurant count by country.
U.S. Development -We plan to opportunistically pursue unit growth across our concepts through existing geography fill-in and marketexpansion opportunities based on their current location mix.
RESEARCH & DEVELOPMENT / INNOVATION
We utilize a global core menu policy to ensure consistency and quality in our menu offerings. Before we add an item to the core menu, ourresearch and development (“R&D”) team performs a thorough review of the item, including conducting consumer research, in order to assistin determining the viability of adding the item. Internationally, we have teams in our developed markets that tailor our menus to address thepreferences of local consumers.
We continuously evolve our product offerings to improve efficiency based on consumer trends and feedback. We have a 12-month pipeline ofnew menu and promotional items across all concepts that allows us to quickly make adjustments in response to market demands, whennecessary. In addition, we continue to focus on productivity across the portfolio. For new menu items and significant product changes, wehave a testing process that includes direct consumer feedback on the product and its pricing.
Menu innovation and enhancement remains a high priority across all concepts. During 2016, we introduced a new center-cut sirloin, increasedcertain portion sizes and simplified the menu at Outback Steakhouse. We reduced menu complexity to refocus efforts on fresh seafood atBonefish Grill and launched a new core menu at Carrabba’s in 2016.
INFORMATION SYSTEMS
The Company leverages technology to support customer engagement, labor and food productivity initiatives and restaurant operations.
To drive customer engagement, the Company continues to invest in technology infrastructure, including brand websites, online ordering andmobile apps. To increase customer convenience, we are leveraging our existing online ordering infrastructure to facilitate expanded off-premise dining. Additionally, we have developed systems to support our new customer loyalty program with a focus to increase traffic to ourrestaurants. Investments are also being made in a global supply chain management system to provide better inventory forecasting andreplenishment to our restaurants, which will help manage food quality and specifications. We also continue to invest in a range of tools andinfrastructure to support risk management and cyber security.
8
Table of ContentsBLOOMIN’ BRANDS, INC.
Our integrated point-of-sale (“POS”) system allows us to transact business in our restaurants, communicate sales data through a securecorporate network to our enterprise resource planning system and data warehouse and automate financial and accounting controls. OurCompany-owned restaurants, and most of our franchised restaurants, are connected through a portal that provides our Company employeesand franchise partners with access to business information and tools that allow them to collaborate, communicate, train and share information.
ADVERTISING AND MARKETING
We generally advertise through national and spot television and radio media. Our concepts have an active public relations program and alsorely on national promotions, site visibility, local marketing, digital marketing, direct mail, billboards and point-of-sale materials to promoteour restaurants. In recent years, we have increased the use of digital advertising which has allowed us to be more efficient with ouradvertising expenditures. Internationally, we have teams in our developed markets that engage local agencies to tailor advertising to eachmarket and develop relevant and timely promotions based on local consumer demand.
In July 2016, we launched our first multi-brand loyalty program called Dine Rewards. Additionally, to help maintain consumer interest andrelevance, each concept leverages limited-time offers featuring seasonal specials. We promote limited-time offers through integratedmarketing programs that utilize all of our advertising resources.
RESTAURANT OPERATIONS
Management and Employees - The management staff of our restaurants varies by concept and restaurant size. Our restaurants employprimarily hourly employees, many of whom work part-time. The Restaurant Managing Partner has primary responsibility for the day-to-dayoperation of the restaurant and is required to follow Company-established operating standards. Area Operating Partners are responsible foroverseeing the operations of typically six to 13 restaurants and Restaurant Managing Partners in a specific region.
Area Operating Partners, Restaurant Managing Partner and Chef Partner Programs - In addition to salary, Area Operating Partners,Restaurant Managing Partners and Chef Partners generally receive performance-based bonuses for providing management and supervisoryservices to their restaurants, certain of which may be based on a percentage of their restaurants’ monthly operating results or distributablecash flow (“Monthly Payments”).
Restaurant Managing Partners and Chef Partners in the U.S. are eligible to participate in deferred compensation programs. Under thesedeferred compensation programs, the Restaurant Managing Partners and Chef Partners are eligible to receive payments beginning uponcompletion of their five-year employment agreement. We invest in various corporate-owned life insurance policies, which are held within anirrevocable grantor or “rabbi” trust account for settlement of our obligations under the deferred compensation plans. Also, on the fifthanniversary of the opening of each new U.S. Company-owned restaurant, the Area Operating Partner supervising the restaurant during thefirst five years of operation receives an additional performance-based bonus.
Many of our International Restaurant Managing Partners are given the option to purchase participation interests in the cash distributions fromthe restaurants they manage. The amount, terms and availability vary by country. This interest gives the partners the right to receive apercentage of the restaurant’s annual cash flows for the duration of the agreement.
SupervisionandTraining- We require our Area Operating Partners and Restaurant Managing Partners to have significant experience in thefull-service restaurant industry. All Area Operating Partners and Restaurant Managing Partners are required to complete a comprehensivetraining program that emphasizes our operating strategy, procedures and standards. The Restaurant Managing Partners and Area OperatingPartners, together with our Presidents, Regional Vice Presidents, Vice Presidents of Training and Directors of Training, are responsible forselecting and training the employees for each new restaurant.
9
Table of ContentsBLOOMIN’ BRANDS, INC.
Service - In order to better assess and improve our performance, we use a third-party research firm to conduct an ongoing satisfactionmeasurement program that provides us with industry benchmarking information for our Company-owned and franchise locations in the U.S.We have a similar consumer satisfaction measurement program for our international Company-owned and certain franchise locations and weobtain industry benchmarking information for the international markets in which we operate, when available. These programs measuresatisfaction across a wide range of experience elements.
SOURCING AND SUPPLY
SourcingandSupply-We take a global approach to procurement and supply chain management, with our corporate team serving all U.S. andinternational concepts. In addition, we have dedicated supply chain management personnel for our international operations in South Americaand Asia. The supply chain management organization is responsible for all food and operating supply purchases as well as a large percentageof purchases of field and corporate services.
We address the end-to-end costs associated with the products and goods we purchase by utilizing a combination of global, regional and localsuppliers to capture efficiencies and economies of scale. This “total cost of ownership” (“TCO”) approach focuses on the initial purchaseprice, coupled with the cost structure underlying the procurement and order fulfillment process. The TCO approach includes monitoringcommodity markets and trends to execute product purchases at the most advantageous times.
We have a distribution program that includes food, beverage, smallwares and packaging goods in all major markets. This program is managedby a custom distribution company that only provides products approved for our system. This customized relationship also enables our staff toeffectively manage and prioritize our supply chain.
Proteins represent 62% of our global commodity procurement composition, with beef representing 56% of purchased proteins. In 2016 , wepurchased: (i) more than 85% of our U.S. beef raw materials from four beef suppliers that represent approximately 83% of the total U.S. beefmarketplace and (ii) more than 95% of our Brazil beef raw materials from one beef supplier that represents approximately eight percent of thetotal Brazil beef marketplace. Due to the nature of our industry, we expect to continue purchasing a substantial amount of our beef from asmall number of suppliers. Other major commodity categories purchased include produce, dairy, bread and pasta, and energy sources tooperate our restaurants, such as natural gas and electricity.
QualityControl-Our R&D facility is located in Tampa, Florida and serves as a global test kitchen and vendor product qualification site. Ourquality assurance team manages internal auditors responsible for supplier evaluations and external third parties who inspect supplieradherence to quality, food safety and product specification. Our suppliers also utilize third-party labs for food safety and quality verification.We have a program that ensures suppliers comply with quality, food safety and other specifications. We develop sourcing strategies for allcommodity categories based on the dynamics of each category. In addition, we require our supplier partners to meet or exceed our qualityassurance standards.
Our operational teams have multiple touch points in the restaurants ensuring food safety, quality and freshness throughout all phases of thepreparation process. In addition, we employ third-party auditors to verify our standards of food safety, training and sanitation.
RESTAURANT OWNERSHIP STRUCTURES
Our restaurants are Company-owned or operated under franchise arrangements. We generate our revenues from our Company-ownedrestaurants and through ongoing royalties from our franchised restaurants and sales of franchise rights.
10
Table of ContentsBLOOMIN’ BRANDS, INC.
Company-OwnedRestaurants-Company-owned restaurants are wholly-owned by us or in which we have a majority ownership. Our cashflows from entities in which we have a majority ownership are limited to the portion of our ownership. The results of operations of Company-owned restaurants are included in our consolidated operating results and the portion of income or loss attributable to the noncontrollinginterests is eliminated in our Consolidated Statements of Operations and Comprehensive Income .
We pay royalties that range from 1.0% to 1.5% of U.S. sales on the majority of our Carrabba’s Italian Grill restaurants, pursuant toagreements we entered into with the Carrabba’s Italian Grill founders (“Carrabba’s Founders”). Certain Carrabba’s Italian Grill restaurantsthat opened or started serving weekday lunch on or after June 1, 2014, pay royalties of 0.5% on lunch sales.
Each Carrabba’s restaurant located outside the United States pays a one-time lump sum fee to the Carrabba’s Founders, which variesdepending on the size of the restaurant. No continuing royalty fee is paid to the Carrabba’s Founders for Carrabba’s restaurants locatedoutside the United States.
UnaffiliatedFranchiseProgram- Our unaffiliated franchise agreements grant third parties rights to establish and operate a restaurant usingone of our concepts. Franchised restaurants are required to be operated in accordance with the franchise agreement and in compliance withtheir respective concept’s standards and specifications.
Under our franchise agreements, each of our franchisees is required to pay an initial franchise fee and pay monthly royalties based on apercentage of gross restaurant sales. Initial franchise fees are $40,000 for U.S. franchisees and range between $40,000 and $75,000 forinternational franchisees, depending on the market. Some franchisees may also pay administration fees based on a percentage of grossrestaurant sales. Following is a summary of franchise fee percentages based on our current existing unaffiliated franchise agreements:
(as a % of gross Restaurant sales)MONTHLY FRANCHISE FEE
PERCENTAGE (1)
U.S. franchisees (1) 3.50% - 5.75%International franchisees 3.00% - 6.00%_________________(1) In addition, under U.S. franchise agreements, a U.S. franchisee must contribute a percentage of gross sales for national marketing programs and must also spend a
certain amount of gross sales on local advertising, up to a maximum of 8.0% of gross restaurant sales for combined national marketing and local advertising.
On July 25, 2016, the Company completed the sale of Outback Steakhouse South Korea. After completion of the sale, the Company’srestaurant locations in South Korea are operated under an international franchise agreement.
T-Bird Restaurant Group, Inc. (“T-Bird”) is party to an Outback Steakhouse Master Franchise Agreement. T-Bird, through its affiliates, ownsand operates 55 Outback Steakhouse restaurants in California. T-Bird is also party to a separate Outback Steakhouse development agreement,which gives T-Bird the exclusive right to open additional Outback Steakhouse restaurants in California through 2031 and commits T-Bird toopening seven new Outback Steakhouse restaurants in California by January 2022. Each new Outback Steakhouse restaurant that T-Birdopens in California is governed by the Master Franchise Agreement. As of December 25, 2016 , no new Outback Steakhouse restaurants haveopened under T-Bird’s development agreement.
COMPETITION
The restaurant industry is highly competitive with a substantial number of restaurant operators that compete directly and indirectly with us inrespect to price, service, location and food quality, and there are other well-established competitors with significant financial and otherresources. There is also active competition for management personnel, attractive suitable real estate sites, supplies and restaurant employees.In addition, competition is also influenced strongly by marketing and brand reputation. At an aggregate level, all major U.S. casual diningrestaurants and casual dining restaurants in the international markets in which we operate would be considered competitors of our concepts.Further, we face growing competition from the supermarket industry and home delivery services and applications,
11
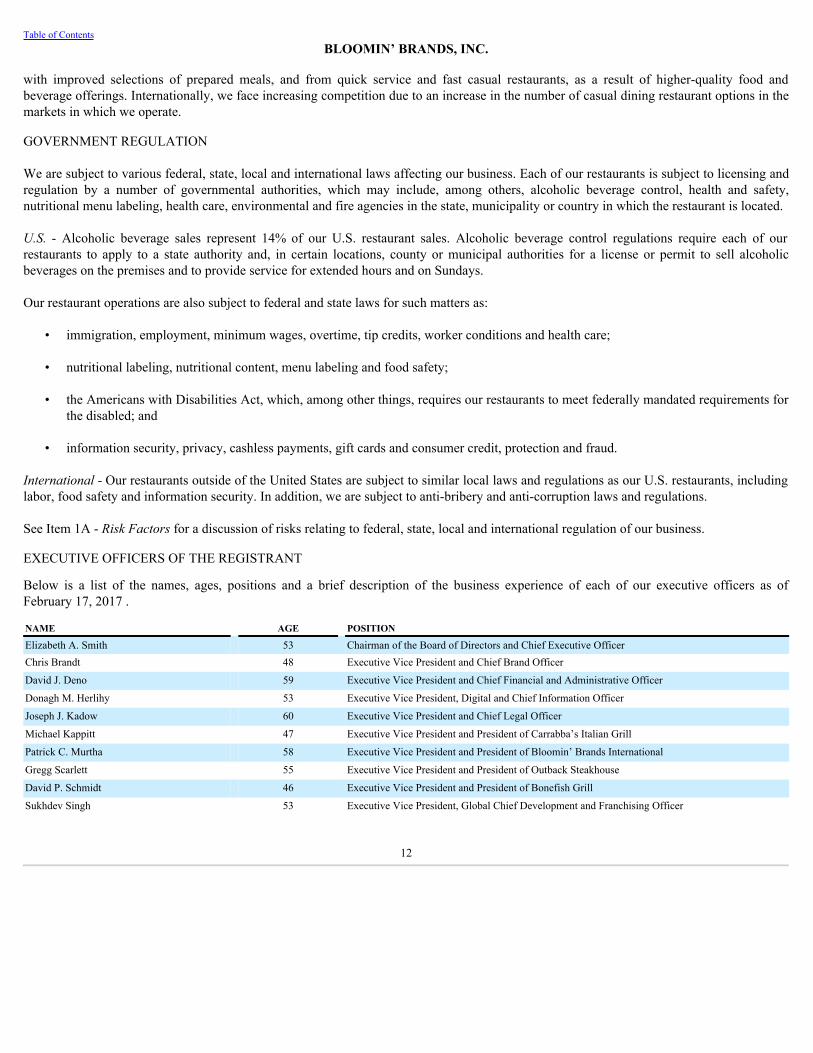
Table of ContentsBLOOMIN’ BRANDS, INC.
with improved selections of prepared meals, and from quick service and fast casual restaurants, as a result of higher-quality food andbeverage offerings. Internationally, we face increasing competition due to an increase in the number of casual dining restaurant options in themarkets in which we operate.
GOVERNMENT REGULATION
We are subject to various federal, state, local and international laws affecting our business. Each of our restaurants is subject to licensing andregulation by a number of governmental authorities, which may include, among others, alcoholic beverage control, health and safety,nutritional menu labeling, health care, environmental and fire agencies in the state, municipality or country in which the restaurant is located.
U.S. - Alcoholic beverage sales represent 14% of our U.S. restaurant sales. Alcoholic beverage control regulations require each of ourrestaurants to apply to a state authority and, in certain locations, county or municipal authorities for a license or permit to sell alcoholicbeverages on the premises and to provide service for extended hours and on Sundays.
Our restaurant operations are also subject to federal and state laws for such matters as:
• immigration, employment, minimum wages, overtime, tip credits, worker conditions and health care;
• nutritional labeling, nutritional content, menu labeling and food safety;
• the Americans with Disabilities Act, which, among other things, requires our restaurants to meet federally mandated requirements forthe disabled; and
• information security, privacy, cashless payments, gift cards and consumer credit, protection and fraud.
International-Our restaurants outside of the United States are subject to similar local laws and regulations as our U.S. restaurants, includinglabor, food safety and information security. In addition, we are subject to anti-bribery and anti-corruption laws and regulations.
See Item 1A - RiskFactorsfor a discussion of risks relating to federal, state, local and international regulation of our business.
EXECUTIVE OFFICERS OF THE REGISTRANT
Below is a list of the names, ages, positions and a brief description of the business experience of each of our executive officers as ofFebruary 17, 2017 .
NAME AGE POSITION
Elizabeth A. Smith 53 Chairman of the Board of Directors and Chief Executive OfficerChris Brandt 48 Executive Vice President and Chief Brand Officer
David J. Deno 59 Executive Vice President and Chief Financial and Administrative Officer
Donagh M. Herlihy 53 Executive Vice President, Digital and Chief Information Officer
Joseph J. Kadow 60 Executive Vice President and Chief Legal Officer
Michael Kappitt 47 Executive Vice President and President of Carrabba’s Italian Grill
Patrick C. Murtha 58 Executive Vice President and President of Bloomin’ Brands International
Gregg Scarlett 55 Executive Vice President and President of Outback Steakhouse
David P. Schmidt 46 Executive Vice President and President of Bonefish Grill
Sukhdev Singh 53 Executive Vice President, Global Chief Development and Franchising Officer
12
Table of ContentsBLOOMIN’ BRANDS, INC.
Elizabeth A. Smith was appointed Chairman in January 2012. Since November 2009, Ms. Smith has served as Chief Executive Officer andas a member of our Board of Directors. Ms. Smith is a member of the Board of Directors of Hilton Worldwide Holdings, Inc. and waspreviously a member of the Board of Directors of Staples, Inc. from September 2008 to June 2014.
Chris Brandt joined Bloomin’ Brands as Executive Vice President and Chief Brand Officer in May 2016. Prior to joining Bloomin’ Brands,Mr. Brandt was the Chief Brand Officer/Chief Marketing Officer for Taco Bell, a subsidiary of Yum! Brands Inc., from May 2013 to May2016. Mr. Brandt was also a Senior Director and Vice President of Marketing for Taco Bell from November 2010 to May 2013.
David J. Deno has served as Executive Vice President and Chief Financial and Administrative Officer since May 2012. From December2009 to May 2012, Mr. Deno served as Chief Financial Officer of the international division of Best Buy Co. Inc. Mr. Deno previously servedas President and later Chief Executive Officer of Quiznos and Chief Financial Officer and later Chief Operating Officer of YUM! Brands,Inc.
Donagh M. Herlihy has served as Executive Vice President, Digital and Chief Information Officer since September 2014. Prior to joiningBloomin’ Brands, Mr. Herlihy was Senior Vice President, Chief Information Officer and eCommerce of Avon Products, Inc. from March2008 to August 2014.
Joseph J. Kadow has served as Executive Vice President and Chief Legal Officer since April 2005. Mr. Kadow has served as AssistantSecretary since February 2016 and previously served as Secretary from April 1994 to February 2016.
Michael Kappitt has served as Executive Vice President and President of Carrabba’s Italian Grill since February 2016. Mr. Kappitt served asSenior Vice President and Chief Marketing Officer from January 2014 to February 2016 and Chief Marketing Officer of Outback Steakhousefrom March 2011 to December 2013.
Patrick C. Murtha has served as Executive Vice President and President of Bloomin’ Brands International since November 2013. FromJanuary 2006 to March 2013, Mr. Murtha was the Chief Operating Officer of Pizza Hut, Inc.
Gregg Scarlett has served as Executive Vice President and President of Outback Steakhouse since July 2016. Mr. Scarlett previously servedas Executive Vice President and President of Bonefish Grill from March 2015 to July 2016; Senior Vice President, Casual Dining RestaurantOperations from January 2013 to March 2015; and Senior Vice President of Operations for Outback Steakhouse from March 2010 to January2013.
David P. Schmidt has served as Executive Vice President and President of Bonefish Grill since July 2016. Mr. Schmidt previously served asGroup Vice President of Finance from April 2016 to July 2016; Vice President of Finance for Bonefish Grill from August 2015 to April2016; Vice President of Productivity from November 2011 to August 2015 and Vice President of Corporate Finance from April 2010 toNovember 2011 for Bloomin’ Brands.
Sukhdev Singh has served as Executive Vice President, Global Chief Development and Franchising Officer since May 2015. Mr. Singhpreviously served as Senior Vice President, Chief Development Officer from January 2014 to May 2015. Prior to joining Bloomin’ Brands,Mr. Singh was Chief Development Officer for Darden Restaurants, Inc. from July 2006 to January 2014.
EMPLOYEES
As of December 25, 2016 , we employed approximately 97,000 persons, of which approximately 950 are corporate personnel. None of ourU.S. employees are covered by a collective bargaining agreement. Various national industry-wide labor agreements apply to certain of ouremployees in Brazil. We consider our employee relations to be in good standing.
13
Table of ContentsBLOOMIN’ BRANDS, INC.
TRADEMARKS
We regard our Outback ® , Outback Steakhouse ® , Carrabba’s Italian Grill ® , Bonefish Grill ® , and Fleming’s Prime Steakhouse & Wine Bar® service marks and our Bloomin’ Onion ® trademark as having significant value and as being important factors in the marketing of ourrestaurants. We have also obtained trademarks for several of our other menu items and for various advertising slogans. We are aware ofnames and marks similar to the service marks of ours used by other persons in certain geographic areas in which we have restaurants.However, we believe such uses will not adversely affect us. Our policy is to pursue registration of our marks whenever possible and to opposevigorously any infringement of our marks.
We license the use of our registered trademarks to franchisees and third parties through franchise arrangements and licenses. The franchiseand license arrangements restrict franchisees’ and licensees’ activities with respect to the use of our trademarks, and impose quality controlstandards in connection with goods and services offered in connection with the trademarks.
SEASONALITY AND QUARTERLY RESULTS
Our business is subject to seasonal fluctuations. Historically, customer traffic patterns for our established U.S. restaurants are generallyhighest in the first quarter of the year and lowest in the third quarter of the year. International customer traffic patterns vary by market. Forexample, Brazil historically experiences minimal seasonal traffic fluctuations. Additionally, holidays and severe weather may affect salesvolumes seasonally in some of our markets.
Quarterly results have been and will continue to be significantly affected by general economic conditions, the timing of new restaurantopenings and their associated pre-opening costs, restaurant closures and exit-related costs and impairments of goodwill, definite andindefinite-lived intangible assets and property, fixtures and equipment. As a result of these and other factors, our financial results for anygiven quarter may not be indicative of the results that may be achieved for a full fiscal year.
ADDITIONAL INFORMATION
We make available, free of charge, through our internet website www.bloominbrands.com, our Annual Report on Form 10-K, QuarterlyReports on Form 10-Q, Current Reports on Form 8-K, Proxy Statements and amendments to those reports filed or furnished pursuant toSection 13(a) or 15(d) of the Securities Exchange Act of 1934, as amended, as soon as reasonably practicable after electronically filing suchmaterial with the Securities and Exchange Commission (“SEC”). You may read and copy any materials filed with the SEC at the Securitiesand Exchange Commission’s Public Reference Room at 100 F Street, NE, Washington, DC 20549. You may obtain information on theoperation of the Public Reference Room by calling the SEC at 1-800-SEC-0330. Our reports and other materials filed with the SEC are alsoavailable at www.sec.gov. The reference to these website addresses does not constitute incorporation by reference of the informationcontained on the websites and should not be considered part of this Report.
14
Table of ContentsBLOOMIN’ BRANDS, INC.
Item 1A. Risk Factors
Therisk factors set forth belowshould be carefully considered. Therisks describedbeloware those that webelieve could materially andadverselyaffectourbusiness,financialconditionorresultsofoperations,however,theyarenottheonlyrisksfacingus.Additionalrisksanduncertaintiesnotcurrentlyknowntousorthosewecurrentlyviewtobeimmaterialmayalsomateriallyandadverselyaffectourbusiness,financialconditionorresultsofoperations.
Risks Related to Our Business and Industry
Food safety and food-borne illness concerns in our restaurants or throughout the industry or supply chain may have an adverse effect onour business by reducing demand and increasing costs.
Regardless of the source or cause, any report of food-borne illnesses and other food safety issues, whether at one of our restaurants or in theindustry or supply chain generally, could have a negative impact on our traffic and sales and adversely affect the reputation of our brands.Food safety issues could be caused by suppliers or distributors and, as a result, be out of our control. Health concerns or outbreaks of diseasein a food product could also reduce demand for particular menu offerings. Even instances of food-borne illness, food tampering or foodcontamination occurring solely at restaurants of other companies could result in negative publicity about the food service industry generallyand adversely impact our sales. The occurrence of food-borne illnesses or food safety issues could also adversely affect the price andavailability of affected ingredients, resulting in higher costs and lower margins.
The restaurant industry is highly competitive. Our inability to compete effectively could adversely affect our business, financial conditionand results of operations.
A substantial number of restaurant operators compete directly and indirectly with us with respect to price, service, location and food quality,some of which are well-established with significant resources. There is also active competition for management and other personnel, andattractive suitable real estate sites. Consumer tastes, nutritional and dietary trends, traffic patterns and the type, number and location ofcompeting restaurants often affect the restaurant business, and our competitors may react more efficiently, creatively and effectively to thoseconditions. In addition, our competitors may generate or better implement business strategies that improve the value and relevance of theirbrands and reputation, relative to ours. For example, our competitors may more successfully implement menu or technology initiatives, suchas remote ordering, social media or mobile technology platforms that expedite or enhance the customer experience. Further, we face growingcompetition from the supermarket industry and home delivery services and applications, with the improvement of their prepared foodofferings, and from quick service and fast casual restaurants. We believe all of the above factors have increased competitive pressures in thecasual dining sector in recent periods and we believe they will continue to present a challenging competitive environment in future periods. Ifwe are unable to continue to compete effectively, our traffic, sales and margins could decline and our business, financial condition and resultsof operations would be adversely affected.
We are subject to various federal and state employment and labor laws and regulations.
Various federal and state employment and labor laws and regulations govern our relationships with our employees and affect operating costs,and similar laws and regulations apply to our operations outside of the U.S. These laws and regulations relate to matters includingemployment discrimination, minimum wage requirements, overtime, tip credits, unemployment tax rates, workers’ compensation rates,working conditions, immigration status, tax reporting and other wage and benefit requirements. Any significant additional governmentregulations and new laws governing our relationships with employees, including minimum wage increases, mandated benefits or otherrequirements that impose additional obligations on us, could increase our costs and adversely affect our business and results of operations.
As a significant number of our food service and preparation personnel are paid at rates related to the applicable minimum wage, federal, stateand local proposals related to minimum wage requirements or similar matters could, to the extent implemented, materially increase our laborand other costs. Several states in which we operate have recently approved minimum wage increases. As minimum wage increases areimplemented in these states or any other states in which
15
Table of ContentsBLOOMIN’ BRANDS, INC.
we operate in the future, we expect our labor costs will increase. Our ability to respond to minimum wage increases by increasing menuprices would depend on the responses of our competitors and consumers. Our distributors and suppliers could also be affected by higherminimum wage, benefit standards and compliance costs, which could result in higher costs for goods and services supplied to us.
We rely on our employees to accurately disclose the full amount of their tip income, and we base our FICA tax reporting on the disclosuresprovided to us by such tipped employees. Inaccurate employee FICA tax reporting could subject us to monetary liabilities, which could harmour business, results of operations and financial condition. In 2015, the IRS issued audit adjustments in aggregate of $6.4 million , for theemployer’s share of FICA taxes related to cash tips allegedly received and unreported by our employees during calendar years 2011 and2012.
We are also subject, in the ordinary course of business, to employee claims against us based, among other things, on discrimination,harassment, wrongful termination, or violation of wage and labor laws. These claims may divert our financial and management resources thatwould otherwise be used to benefit our operations. The ongoing expense of any resulting lawsuits, and any substantial settlement payment ordamage award against us, could adversely affect our business and results of operations.
Challenging economic conditions may have a negative effect on our business and financial results.
Challenging economic conditions may negatively impact consumer spending and thus cause a decline in our financial results. For example,international, domestic and regional economic conditions, consumer income levels, financial market volatility, social unrest, governmental,political and budget matters and a slow or stagnant pace of economic growth generally may have a negative effect on consumer confidenceand discretionary spending. In recent years, we believe these factors and conditions have affected consumer traffic and comparable restaurantsales for us and throughout our industry and may continue to result in a challenging sales environment in the casual dining sector. A declinein economic conditions or negative developments with respect to any of the other factors mentioned above, generally or in particular marketsin which we operate, and our consumers’ reactions to these trends could result in increased pressure with respect to our pricing, traffic levels,commodity and other costs and the continuation of our innovation and productivity initiatives, which could negatively impact our businessand results of operations. These factors could also cause us to, among other things, reduce the number and frequency of new restaurantopenings, close restaurants or delay remodeling of our existing restaurant locations. Further, poor economic conditions may force nearbybusinesses to shut down, which could cause our restaurant locations to be less attractive.
Increased commodity, energy and other costs could decrease our profit margins or cause us to limit or otherwise modify our menus orincrease prices, which could adversely affect our business.
The performance of our restaurants depends on our ability to anticipate and react to changes in the price and availability of food commodities.Our business also incurs significant costs for energy, insurance, labor, marketing and real estate. Prices may be affected due to supply, marketchanges, increased competition, the general risk of inflation, changes in laws, shortages or interruptions in supply due to weather, disease orother conditions beyond our control, or other reasons. Increased prices or shortages could affect the cost and quality of the items we buy orrequire us to raise prices, limit our menu options or implement alternative processes or products. For example, in 2016 , average commoditycosts increased by 0.3% . As result, these events, combined with other more general economic and demographic conditions, could impact ourpricing and negatively affect our sales and profit margins.
Our failure to comply with government regulation related to our restaurant operations, and the costs of compliance or non-compliance,could adversely affect our business.
We are subject to various federal, state, local and foreign laws affecting our business. Each of our restaurants is subject to licensing andregulation by a number of governmental authorities, which may include, among others, alcoholic beverage control, food safety, nutritionalmenu labeling, health care, environmental and fire agencies in the state, municipality or country in which the restaurant is located. Oursuppliers are also subject to regulation in some of these areas. Any difficulties or inabilities to retain or renew licenses, or increasedcompliance costs due to changed regulations,
16
Table of ContentsBLOOMIN’ BRANDS, INC.
could adversely affect operations at existing restaurants. Additionally, difficulties in obtaining or failing to obtain the required licenses orapprovals could delay or prevent the development of new restaurants.
Alcoholic beverage sales represent 14% of our consolidated restaurant sales and are subject to extensive state and local licensing and otherregulations. The failure of a restaurant to obtain or retain a liquor license would adversely affect that restaurant’s operations. In addition, weare subject to “dram shop” statutes in certain states. These statutes generally provide a person injured by an intoxicated person the right torecover damages from an establishment that wrongfully served alcoholic beverages to the intoxicated person.
The FDA adopted final regulations to implement federal nutritional disclosure requirements in 2014, and, although implementation has beendelayed, we expect we will be required to comply with these regulations during 2017. The regulations will require us to include calorieinformation on our menus, and provide additional nutritional information upon request. If the costs of implementing or complying with thesenew requirements exceed our expectations, our results of operations could be adversely affected. Furthermore, the effect of such labelingrequirements on consumer choices, if any, is unclear. It is possible that we may also become subject to other regulation in the future seekingto tax or regulate high fat and high sodium foods in certain of our markets. Compliance with these regulations could be costly.
The food service industry is affected by consumer preferences and perceptions. Changes in these preferences and perceptions may lessenthe demand for our products, which would reduce sales and harm our business.
Food service businesses are affected by changes in consumer tastes and demographic trends. For instance, if prevailing health or dietarypreferences cause consumers to avoid steak and other products we offer in any of our concepts in favor of foods or ingredients that areperceived as healthier or otherwise reflect popular demand, our business and operating results would be harmed. If we are unable to anticipateor successfully respond to changes in consumer preferences, our results of operations could be adversely affected, generally or in particularconcepts or markets.
Changes in tax laws and unanticipated tax liabilities could adversely affect the taxes we pay and our profitability.
We are subject to income and other taxes in the United States and numerous foreign jurisdictions. Our effective income tax rate in the futurecould be adversely affected by a number of factors, including changes in the mix of earnings in countries with different statutory tax rates,changes in the valuation of deferred tax assets and liabilities, changes in tax laws or other legislative changes, including those that may resultfrom the Base Erosion Profit Shifting initiative being conducted by the Organization for Economic Co-operation and Development, theoutcome of income tax audits, and any repatriation of non-U.S. earnings for which we have not previously provided for U.S. taxes. Althoughwe believe our tax estimates are reasonable, the final determination of tax audits could be materially different from our historical income taxprovisions and accruals. The results of a tax audit could have a material effect on our results of operations or cash flows in the period orperiods for which that determination is made. In addition, our effective income tax rate and our results may be impacted by our ability torealize deferred tax benefits and by any increases or decreases of our valuation allowances applied to our existing deferred tax assets.
Risks associated with our expansion, remodeling and relocation plans may have adverse effects on our operating results.
As part of our business strategy, we intend to continue to expand our current portfolio of restaurants. Our current development schedule callsfor the construction of between 40 and 50 new system-wide locations in 2017. A variety of factors could cause the actual results and outcomeof those expansion plans to differ from the anticipated results, including among other things:
• the availability of attractive sites for new restaurants;• acquiring or leasing those sites at acceptable prices and other terms;• funding or financing our development;• obtaining all required permits, approvals and licenses on a timely basis;
17
Table of ContentsBLOOMIN’ BRANDS, INC.
• recruiting and training skilled management and restaurant employees and retaining those employees on acceptable terms;• weather, natural disasters and other events or factors beyond our control resulting in construction or other delays; and• consumer tastes in new geographic regions and acceptance of our restaurant concepts and awareness of our brands in those regions.
It is difficult to estimate the performance of newly opened restaurants. Earnings achieved to date by restaurants open for less than two yearsmay not be indicative of future operating results. If new restaurants do not meet targeted performance, it could have a material adverse effecton our operating results, including as a result of any impairment losses that we may be required to recognize. There is also the possibility thatnew restaurants may attract consumers away from other restaurants we own, thereby reducing the revenues of those existing restaurants, orthat we will incur unrecoverable costs in the event a development project is abandoned prior to completion.
International expansion is an important part of our strategy, and some of the challenges described above could be more significant ininternational markets in which we have more limited experience, either generally or with a particular brand. Those markets are likely to havedifferent competitive conditions, consumer tastes, discretionary spending patterns and brand awareness, which may cause our new restaurantsto be less successful than restaurants in our existing markets or make it more difficult to estimate the performance of new restaurants.
In addition, in an effort to increase same-store sales and improve our operating performance, we continue to make improvements to ourfacilities through our remodeling and relocation programs. We also close underperforming restaurants from time to time in order to improvethe performance of our brands. As demographic and economic patterns change or there are declines in neighborhoods where our restaurantsare located or adverse economic conditions in local areas, current locations may not continue to be attractive or profitable. Because we lease asignificant majority of our restaurants, we incur significant lease termination expenses when we close or relocate a restaurant. We also incursignificant asset impairment and other charges in connection with closures and relocations. If the expenses associated with remodels,relocations or closures are higher than anticipated, we cannot find suitable locations or remodeled or relocated restaurants do not perform asexpected, these programs may not yield the desired return on investment, which could have a negative effect on our operating results.
Security breaches of confidential consumer, personal employee and other material information may adversely affect our business.
The majority of our restaurant sales are by credit or debit cards. We also maintain certain personal information regarding our employees.Despite our security measures, our technology systems may be vulnerable to damage, disability or failures due to physical theft, fire, powerloss, telecommunications failure or other catastrophic events, as well as from internal and external security breaches, employee error ormalfeasance, denial of service attacks, viruses, worms and other disruptive problems caused by hackers and cyber criminals. A breach in oursystems that compromises the information of our consumers or employees could result in widespread negative publicity, damage to thereputation of our brands, a loss of consumers and legal liabilities.
We may in the future become subject to lawsuits or other proceedings for purportedly fraudulent transactions arising out of the actual oralleged theft of our consumers’ credit or debit card information or if consumer or employee information is obtained by unauthorized personsor used inappropriately. Any such claim or proceeding, or any adverse publicity resulting from such an event, may have a material adverseeffect on our business.
We rely heavily on information technology in our operations and any material failure, weakness, interruption or breach of security couldprevent us from effectively operating our business.
Our operations and corporate functions rely heavily on information systems, including point-of-sale processing in our restaurants,management of our supply chain, payment of obligations, collection of cash, data warehousing to support analytics, finance and accountingsystems, mobile technologies to enhance the customer experience and other various
18
Table of ContentsBLOOMIN’ BRANDS, INC.
processes and procedures, some of which are handled by third parties. Our ability to efficiently and effectively manage our business dependssignificantly on the reliability and capacity of these systems. The failure of these systems to operate effectively, maintenance problems,upgrading or transitioning to new platforms, or a breach in security relating to these systems could result in delays in consumer service,reduce efficiency in our operations or result in negative publicity. These problems could adversely affect our results of operations, andremediation could result in significant, unplanned capital investments.
We face a variety of risks associated with doing business in foreign markets that could have a negative impact on our financialperformance.
We have a significant number of restaurants outside the United States, and we intend to continue our efforts to grow internationally. Althoughwe believe we have developed an appropriate support structure for international operations and growth, there is no assurance thatinternational operations will be profitable or international growth will continue. In addition, if we have a significant concentration ofrestaurants in a foreign market the impact of any negative local conditions can have a sizable impact on our results.
Our foreign operations are subject to all of the same risks as our U.S. restaurants, as well as additional risks including, among others,international economic, political, social and legal conditions and the possibility of instability and unrest, differing cultures and consumerpreferences, diverse government regulations and tax systems, corruption, anti-American sentiment, the ability to source high qualityingredients and other commodities in a cost-effective manner, uncertain or differing interpretations of rights and obligations in connectionwith international franchise agreements and the collection of ongoing royalties from international franchisees, the availability and costs ofland, construction and financing, and the availability of experienced management, appropriate franchisees and area operating partners.
Currency regulations and fluctuations in exchange rates could also affect our performance. We have operations in a total of 20 foreigncountries, including direct investments in restaurants in Brazil, Hong Kong and China, as well as international franchises. Brazil is our largestinternational market and will continue to be our top international development priority. As a result, we may experience losses fromfluctuations in foreign currency exchange rates or any hedging arrangements we enter into to offset such fluctuations, and such losses couldadversely affect our overall sales and earnings.
We are subject to governmental regulation of our foreign operations, including antitrust and tax requirements, anti-boycott regulations,import/export/customs regulations and other international trade regulations, the USA Patriot Act and the Foreign Corrupt Practices Act. Anynew regulatory or trade initiatives could impact our operations in certain countries. Failure to comply with any such legal requirements couldsubject us to monetary liabilities and other sanctions, which could harm our business, results of operations and financial condition.
Loss of key management personnel could hurt our business and inhibit our ability to operate and grow successfully.
Our success will continue to depend, to a significant extent, on our leadership team and other key management personnel. If we are unable toattract and retain sufficiently experienced and capable management personnel, our business and financial results may suffer.
Our success depends substantially on the value of our brands.
Our success depends on our ability to preserve and grow our brands. Our brand value and reputation are especially important to differentiateour concepts in the highly competitive casual dining sector. Brand value and reputation is based in large part on consumer perceptions, whichare driven by both our actions and actions beyond our control, such as new brand strategies or their implementation, business incidents,ineffective advertising or marketing efforts, or unfavorable mainstream or social media publicity involving us, our industry, our franchisees,or our suppliers.
The risks of negative publicity could be amplified by the increased prevalence and influence of social media. The availability of informationon social media platforms is virtually immediate as is its impact, and users can post
19
Table of ContentsBLOOMIN’ BRANDS, INC.
information often without filters or checks on the accuracy of the content posted. Adverse or inaccurate information concerning our companyor concepts may be posted on such platforms at any time, and such information can quickly reach a wide audience. The harm may beimmediate without affording us an opportunity for redress or correction, and it is challenging to monitor and anticipate developments onsocial media in order to respond in an effective and timely manner. We could also be exposed to these risks if we fail to use social mediaresponsibly in our marketing efforts. These factors could have a material adverse effect on our business.
Regardless of its basis or validity, any unfavorable publicity could adversely affect public perception of our brands. If customers perceive thatwe and our franchisees fail to deliver a consistently positive and relevant experience, our brands could suffer and this could have an adverseeffect on our business.
We have limited control with respect to the operations of our franchisees, which could have a negative impact on our business.
In the past year, we have increased the number of our franchisees through the sale of our South Korea operations. As of December 25, 2016 ,we franchised 240 restaurants across 13 states, Puerto Rico, Guam and 18 countries. Our franchisees are contractually obligated to operatetheir restaurants in accordance with our standards and we provide training and support to franchisees. However, franchisees are independentthird parties that we do not control, and these franchisees own, operate and oversee the daily operations of their restaurants. As a result, theultimate success and quality of any franchise restaurant rests with the franchisee. If franchisees do not successfully operate restaurants in amanner consistent with our product and service quality standards and contractual requirements, our image and reputation could be harmed,which in turn could adversely affect our business and operating results.
We have a limited number of suppliers for our major products and rely on one custom distribution company for our national distributionprogram in the U.S. and Brazil. If our suppliers or custom distributor are unable to fulfill their obligations under their contracts or we areunable to develop or maintain relationships with these or new suppliers or distributors, if needed, we could encounter supply shortagesand incur higher costs.
We depend on frequent deliveries of fresh food products that meet our specifications, and we have a limited number of suppliers for ourmajor products, such as beef. In 2016 , we purchased: (i) more than 85% of our U.S. beef raw materials from four beef suppliers thatrepresent approximately 83% of the total beef marketplace in the U.S and (ii) more than 95% of our Brazil beef raw materials from one beefsupplier that represents approximately eight percent of the total Brazil beef marketplace. Due to the nature of our industry, we expect tocontinue to purchase a substantial amount of our beef from a small number of suppliers. We also use one supplier in the U.S. and Brazil,respectively, to process beef raw materials to our specifications and we use one distribution company to provide distribution services in theU.S and Brazil, respectively. Although we have not experienced significant problems with our suppliers or distributors, if our suppliers ordistributors are unable to fulfill their obligations under their contracts, we could encounter supply shortages and incur higher costs.
In addition, if we are unable to maintain current purchasing terms or ensure service availability with our suppliers and distributor, we maylose consumers and experience an increase in costs in seeking alternative supplier or distribution services. The failure to develop and maintainsupplier and distributor relationships and any resulting disruptions to the provision of food and other supplies to our restaurant locations couldadversely affect our operating results.
Failure to achieve our projected cost savings from our efficiency initiatives could adversely affect our results of operations and eliminatepotential funding for growth opportunities.
In recent years, we have identified strategies and taken steps to reduce operating costs and free up resources to reinvest in our business. Thesestrategies include improved supply chain management, implementing labor scheduling tools and integrating restaurant information systemsacross our brands. We continue to evaluate and implement further cost-saving initiatives. However, the ability to reduce our operating coststhrough these initiatives is subject to risks and uncertainties, such as our ability to obtain improved supply pricing and the reliability of anynew suppliers or technology, and we cannot assure that these activities, or any other activities that we may undertake in the future, willachieve the
20
Table of ContentsBLOOMIN’ BRANDS, INC.
desired cost savings and efficiencies. Failure to achieve such desired savings could adversely affect our results of operations and financialcondition and curtail investment in growth opportunities.
There are risks and uncertainties associated with strategic actions and initiatives that we may implement.
From time to time, we consider various strategic actions and initiatives in order to grow and evolve our business and brands and improve ouroperating results. These actions and initiatives could include, among other things, acquisitions or dispositions of restaurants or brands, newjoint ventures, new franchise arrangements, restaurant closures and changes to our operating model. For example, in fiscal year 2016, we sold72 South Korea restaurants and engaged in sale-leaseback transactions with respect to 159 restaurant properties. There can be no assurancethat any such actions or initiatives will be successful or deliver their anticipated benefits. We may be exposed to new and unforeseen risks andchallenges, particularly if we enter into markets or engage in activities with which we have no or limited prior experience, and it may bedifficult to predict the success of such endeavors. If we incur significant expenses or divert management, financial and other resources to astrategic initiative that is unsuccessful or does not meet our expectations, our results of operations and financial condition would be adverselyaffected. We may also incur significant asset impairment and other charges in connection with any such initiative. Regardless of the ultimatesuccess of a strategic initiative, the implementation and integration of new business or operational processes could be disruptive to our currentoperations. Even if we test and evaluate an initiative on a limited basis, the diversion of management time and resources could have anadverse effect on our business.
Our business is subject to seasonal and periodic fluctuations and past results are not indicative of future results.
Historically, consumer traffic patterns for our established restaurants are generally highest in the first quarter of the year and lowest in thethird quarter of the year. Holidays may also affect sales volumes seasonally in some of the markets in which we operate. In addition, ourquarterly results have been and will continue to be affected by the timing of new restaurant openings and their associated preopening costs, aswell as restaurant closures and exit-related costs, debt extinguishment and modification costs and impairments of goodwill, intangible assetsand property, fixtures and equipment. As a result of these and other factors, our financial results for any quarter may not be indicative of theresults that may be achieved for a full fiscal year.
Significant adverse weather conditions and other disasters or unforeseen events could negatively impact our results of operations.
Adverse weather conditions and natural disasters and other unforeseen events, such as winter storms, severe temperatures, thunderstorms,floods, hurricanes and earthquakes, terror attacks, war and widespread/pandemic illness, and the effects of such events on economicconditions and consumer spending patterns, could negatively impact our results of operations. Temporary and prolonged restaurant closuresmay occur and consumer traffic may decline due to the actual or perceived effects from these events. For example, severe winter weatherconditions have impacted our traffic and results of operations in the past.
Our failure or inability to enforce our trademarks or other proprietary rights could adversely affect our competitive position or the valueof our brand.
Our trademarks, including Outback Steakhouse, Carrabba’s Italian Grill, Bonefish Grill, Fleming’s Prime Steakhouse & Wine Bar andBloomin’ Onion, and other proprietary rights are important to our success and our competitive position. The protective actions that we takemay not be sufficient to prevent unauthorized usage or imitation by others, which could harm our image, brand or competitive position.Furthermore, our ability to protect trademarks and other proprietary rights may be more limited in certain international markets where weoperate.
Litigation could have a material adverse impact on our business and our financial performance.
We are subject to lawsuits, administrative proceedings and claims that arise in the regular course of business. These matters typically involveclaims by consumers, employees and others regarding issues such as food borne illness, food
21
Table of ContentsBLOOMIN’ BRANDS, INC.
safety, premises liability, “dram shop” statute liability, compliance with wage and hour requirements, work-related injuries, promotionaladvertising, discrimination, harassment, disability and other operational issues common to the foodservice industry, as well as contractdisputes and intellectual property infringement matters. Significant legal fees and costs in complex class action litigation or an adversejudgment or settlement that is not insured or is in excess of insurance coverage could have a material adverse effect on our financial positionand results of operations.
Our insurance policies may not provide adequate levels of coverage against all claims, and fluctuating insurance requirements and costscould negatively impact our profitability.
We carry insurance programs with specific retention levels or high per-claim deductibles, for a significant portion of our risks and associatedliabilities with respect to workers’ compensation, general liability, liquor liability, employment practices liability, property, health benefits,cyber security and other insurable risks. However, there are types of losses we may incur that cannot be insured against or that we believe arenot commercially reasonable to insure, including wage and hour claims. These losses, if they occur, could have a material and adverse effecton our business and results of operations. Additionally, if our insurance costs increase, there can be no assurance that we will be able tosuccessfully offset the effect of such increases and our results of operations may be adversely affected.
Failure to maintain effective systems of internal control over financial reporting and disclosure controls and procedures could adverselyaffect the trading price of our common stock.
Effective internal control over financial reporting is necessary for us to provide accurate financial information. If we are unable to adequatelymaintain effective internal control over financial reporting, we may not be able to accurately report our financial results, which could causeinvestors to lose confidence in our reported financial information and negatively affect the trading price of our common stock. Furthermore,we cannot be certain that our internal control over financial reporting and disclosure controls and procedures will prevent all possible errorand fraud. Because of inherent limitations in all control systems, no evaluation of controls can provide absolute assurance that all controlissues and instances of error or fraud, if any, in our company have been detected. These inherent limitations include the realities thatjudgments in decision-making can be faulty and that breakdowns can occur because of simple error or mistake, which could have an adverseimpact on our business.
Risks Related to Our Indebtedness
Our substantial leverage and our ability to refinance our indebtedness in the future could adversely affect our ability to raise additionalcapital to fund our operations, limit our ability to react to changes in the economy or our industry and expose us to interest rate risk inconnection with our variable-rate debt.
We are highly leveraged. As of December 25, 2016 , our total indebtedness was $1.1 billion and we had $175.2 million in available unusedborrowing capacity under our revolving credit facility, net of undrawn letters of credit of $27.8 million .
Our high degree of leverage could have important consequences, including:
• making it more difficult for us to make payments on indebtedness;• increasing our vulnerability to general economic, industry and competitive conditions and the various risks we face in our business;• increasing our cost of borrowing;• requiring a substantial portion of cash flow from operations to be dedicated to the payment of principal and interest on our
indebtedness, thereby reducing our ability to use our cash flow to fund our operations, capital expenditures, dividend payments, sharerepurchases and future business opportunities;
• exposing us to the risk of increased interest rates because certain of our borrowings are at variable rates of interest;• restricting us from making strategic acquisitions or causing us to make non-strategic divestitures;
22
Table of ContentsBLOOMIN’ BRANDS, INC.
• limiting our ability to obtain additional financing for working capital, capital expenditures, restaurant development, debt servicerequirements, acquisitions and general corporate or other purposes; and
• limiting our ability to adjust to changing market conditions and placing us at a competitive disadvantage compared to our competitorswho may not be as highly leveraged.
We may incur substantial additional indebtedness in the future, subject to the restrictions contained in our senior secured credit facilities (the“Senior Secured Credit Facility”). If new indebtedness is added to our current debt levels, the related risks that we now face could increase.
We had $1.0 billion of variable-rate debt outstanding under our Senior Secured Credit Facility as of December 25, 2016 . In September 2014,we entered into variable-to-fixed interest rate swap agreements with eight counterparties to hedge a portion of the cash flows of our variablerate debt that had a start date of June 30, 2015 . The swap agreements have an aggregate notional amount of $400.0 million and mature onMay 16, 2019 . While these agreements limit our exposure to higher interest rates, an increase in the floating rate could nonetheless cause amaterial increase in our interest expense due to the total amount of our outstanding variable rate indebtedness.
We cannot be certain that our financial condition or credit and other market conditions will be favorable when our Senior Secured CreditFacility matures in 2019, or at any earlier time we may seek to refinance our debt. If we are unable to refinance our indebtedness on favorableterms, our financial condition and results of operations would be adversely affected.
Our debt agreements contain restrictions that limit our flexibility in operating our business.
We are a holding company and conduct our operations through our subsidiaries, certain of which have incurred their own indebtedness. Oursubsidiaries’ debt agreements contain various covenants that limit our ability to obtain funds from our subsidiaries through dividends, loans oradvances. In addition, certain of our debt agreements limit our and our subsidiaries’ ability to, among other things, incur or guaranteeadditional indebtedness, pay dividends on, redeem or repurchase our capital stock, make certain acquisitions or investments, incur or permitto exist certain liens, enter into transactions with affiliates or sell our assets to, merge or consolidate with or into, another company. Our debtagreements require us to satisfy certain financial tests and ratios. Our ability to satisfy such tests and ratios may be affected by events outsideof our control.
If we breach the covenants under our debt agreements, the lenders could elect to declare all amounts outstanding under the agreements to beimmediately due and payable and terminate all commitments to extend further credit. If we are unable to repay those amounts, the lenderscould proceed against the collateral granted to them to secure that indebtedness. We have pledged substantially all of our assets as collateralunder our debt agreement. If our lenders accelerate the repayment of borrowings, we cannot be certain that we will have sufficient assets torepay them.
We may not be able to generate sufficient cash to service all of our indebtedness and operating lease obligations, and we may be forced totake other actions to satisfy our obligations under our indebtedness and operating lease obligations, which may not be successful. If wefail to meet these obligations, we would be in default under our debt agreements and the lenders could elect to declare all amountsoutstanding under them to be immediately due and payable and terminate all commitments to extend further credit.
Our ability to make scheduled payments on our debt obligations and to satisfy our operating lease obligations depends on our financialcondition and operating performance, which is subject to prevailing economic and competitive conditions and to financial, business and otherfactors, many of which are beyond our control. We cannot be certain that we will maintain a level of cash flow from operating activitiessufficient to permit us to pay the principal, premium, if any, and interest on our indebtedness, or to pay our operating lease obligations. If ourcash flow and capital resources are insufficient to fund our debt service obligations and operating lease obligations, we may be forced toreduce or delay capital expenditures, sell assets, seek additional capital or restructure or refinance our indebtedness. These alternativemeasures may not be successful and may not permit us to meet our scheduled debt service obligations. In the absence of sufficient operatingresults and resources, we could face substantial liquidity problems and might be
23

Table of ContentsBLOOMIN’ BRANDS, INC.
required to dispose of material assets or operations or take other actions to meet our debt service and other obligations. Our debt agreementsrestrict our ability to dispose of assets and how we may use the proceeds from the disposition. We may not be able to consummate thosedispositions or to obtain the proceeds that we could otherwise realize from such dispositions and any such proceeds that are realized may notbe adequate to meet any debt service obligations then due. The failure to meet our debt service obligations or the failure to remain incompliance with the financial covenants under our debt agreements would constitute an event of default under those agreements and thelenders could elect to declare all amounts outstanding under them to be immediately due and payable and terminate all commitments toextend further credit.
Risks Related to Our Common Stock
Our stock price is subject to volatility.
The stock market in general is highly volatile. As a result, the market price of our common stock is similarly volatile. The price of ourcommon stock could be subject to wide fluctuations in response to a number of factors, some of which may be beyond our control. Thesefactors include actual or anticipated fluctuations in our operating results, changes in, or our ability to achieve, estimates of our operatingresults by analysts, investors or management, analysts’ recommendations regarding our stock or our competitors’ stock, sales of substantialamounts of our common stock by our stockholders, actions or announcements by us or our competitors, the maintenance and growth of thevalue of our brands, litigation, legislation or other regulatory developments affecting us or our industry, natural disasters, terrorist acts, war orother calamities and changes in general market and economic conditions.
If we are unable to continue to pay dividends or repurchase our stock, your investment in our common stock may decline in value.
In 2015, we initiated a quarterly dividend program. Our Board of Directors has also authorized several stock repurchase programscommencing in late 2014 and we have repurchased a significant amount of our stock since that time. The continuation of these programs, atall or consistent with past levels, will require the generation of sufficient cash flows and the existence of surplus. Any decisions to declare andpay dividends and continue stock repurchase programs in the future will be made at the discretion of our Board of Directors and will dependon, among other things, our results of operations, financial condition, cash requirements, borrowing capacity, contractual restrictions andother factors that our Board of Directors may deem relevant at the time.
Our ability to pay dividends is dependent on our ability to obtain funds from our subsidiaries and to have access to our revolving creditfacility. Based on our credit agreement, restricted dividend payments from OSI to Bloomin’ Brands can be made on an unlimited basisprovided we are compliant with our debt covenants.
If we discontinue our dividend or stock repurchase programs, or reduce the amount of the dividends we pay or stock that we repurchase, theprice of our common stock may fall. As a result, you may not be able to resell your shares at or above the price you paid for them.
Provisions in our certificate of incorporation and bylaws, our Senior Secured Credit Facility and Delaware law may discourage, delay orprevent a change of control of our company or changes in our management and, therefore, may depress the trading price of our stock.
Our certificate of incorporation and bylaws include certain provisions that could have the effect of discouraging, delaying or preventing achange of control of our company or changes in our management.
In addition, our Senior Secured Credit Facility includes change of control provisions that require that no stockholder or “group” within themeaning of Section 13(d) of the Exchange Act (other than our former private equity sponsors, our founders and our management stockholdersor other permitted holders) has obtained more than 40% of our voting power.
24
Table of ContentsBLOOMIN’ BRANDS, INC.
These provisions in our certificate of incorporation, bylaws, and Senior Secured Credit Facility may discourage, delay or prevent a transactioninvolving a change in control of the Company that is in the best interests of our stockholders. Even in the absence of a takeover attempt, theexistence of these provisions may adversely affect the prevailing market price of our common stock if they are viewed as discouraging futuretakeover attempts.
Section 203 of the Delaware General Corporation Law may affect the ability of an “interested stockholder” to engage in certain businesscombinations, including mergers, consolidations or acquisitions of additional shares, for a period of three years following the time that thestockholder becomes an “interested stockholder.” An “interested stockholder” is defined to include persons owning directly or indirectly 15%or more of the outstanding voting stock of a corporation. Although we have elected in our certificate of incorporation not to be subject toSection 203 of the Delaware General Corporation Law our certificate of incorporation contains provisions that have the same effect asSection 203, except that they provide that our former private equity sponsors will not be deemed to be “interested stockholders,” regardless ofthe percentage of our voting stock owned by them, and accordingly will not be subject to such restrictions.
Our ability to raise capital in the future may be limited, which could make us unable to fund our capital requirements.
Our business and operations may consume resources faster than we anticipate. In the future, we may need to raise additional funds throughthe issuance of new equity securities, debt or a combination of both. Additional financing may not be available on favorable terms or at all. Ifadequate funds are not available on acceptable terms, we may be unable to fund our capital requirements. If we issue new debt securities, thedebt holders would have rights senior to common stockholders to make claims on our assets, and the terms of any debt could restrict ouroperations, including our ability to pay dividends on our common stock. If we issue additional equity securities, existing stockholders mayexperience dilution, and the new equity securities could have rights senior to those of our common stock. Because our decision to issuesecurities in any future offering will depend on market conditions and other factors beyond our control, we cannot predict or estimate theamount, timing or nature of our future offerings. Thus, our stockholders bear the risk of our future securities offerings reducing the marketprice of our common stock and diluting their interest.
Item 1B. Unresolved Staff Comments
Not applicable.
25

Table of ContentsBLOOMIN’ BRANDS, INC.
Item 2. Properties
During 2016, we entered into sale-leaseback transactions with third-parties in which we sold 159 restaurant properties. As of December 25,2016 , we owned 7% of our restaurant sites and leased the remaining 93% of our restaurant sites from third parties. We had 1,516 system-wide restaurants located across the following states, territories or countries as of December 25, 2016 :
U.S.
COMPANY-OWNED FRANCHISE
Alabama 20 Louisiana 22 Ohio 49 Alabama 1
Arizona 28 Maryland 41 Oklahoma 11 Alaska 1
Arkansas 11 Massachusetts 22 Pennsylvania 46 California 62
California 15 Michigan 37 Rhode Island 3 Florida 1
Colorado 30 Minnesota 9 South Carolina 39 Georgia 1
Connecticut 15 Mississippi 1 South Dakota 2 Idaho 6
Delaware 4 Missouri 16 Tennessee 37 Mississippi 7
Florida 220 Montana 1 Texas 74 Montana 2
Georgia 48 Nebraska 7 Utah 6 Ohio 1
Hawaii 6 Nevada 16 Vermont 1 Oregon 7
Illinois 26 New Hampshire 3 Virginia 60 Tennessee 3
Indiana 23 New Jersey 44 West Virginia 8 Virginia 1
Iowa 7 New Mexico 6 Wisconsin 12 Washington 20
Kansas 7 New York 45 Wyoming 2 Kentucky 17 North Carolina 67
Total U.S. company-owned 1,164 Total U.S. franchise 113INTERNATIONAL
COMPANY-OWNED FRANCHISE
Brazil (1) 97 Australia 7 Ecuador 1 Puerto Rico 3
China (Mainland) 6 Bahamas 1 Guam 1 Qatar 1
Hong Kong 9 Brazil 1 Indonesia 4 Saudi Arabia 5
Canada 2 Japan 10 Singapore 2
Chile 1 Malaysia 2 South Korea 73
Costa Rica 1 Mexico 5 Thailand 1
Dominican Republic 2 Philippines 4
Total International company-owned 112 Total International franchise 127
____________________(1) The restaurant count for Brazil is reported as of November 2016 to correspond with the balance sheet date of this subsidiary.
Following is a summary of the location and leased square footage for our corporate offices as of December 25, 2016 :
LOCATION USE SQUARE FEET LEASE EXPIRATION
Tampa, Florida Corporate Headquarters 168,000 1/31/2025
São Paulo, Brazil Brazil Operations Center 22,000 7/31/2021
We also have other smaller office locations regionally in China (mainland) and Hong Kong.
Item 3. Legal Proceedings
For a description of our legal proceedings, see Note 18 - Commitments and Contingencies , of the Notes to the Consolidated FinancialStatements of this Report.
26
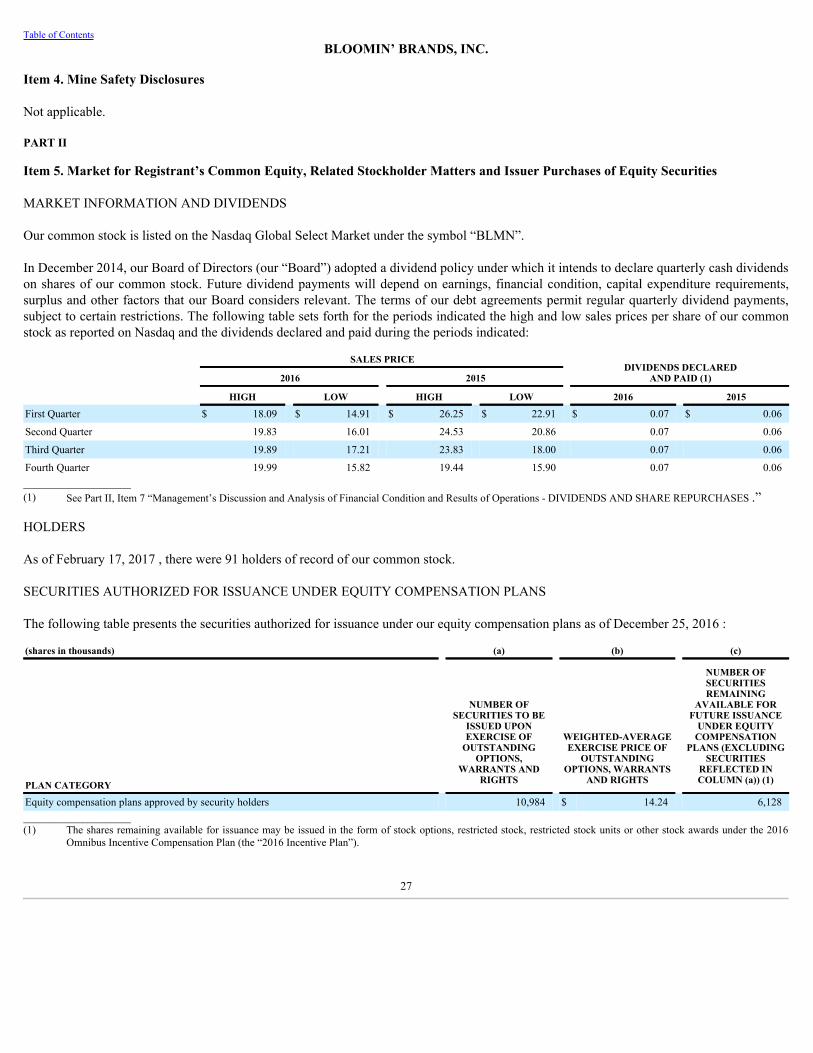
Table of ContentsBLOOMIN’ BRANDS, INC.
Item 4. Mine Safety Disclosures
Not applicable.
PART II
Item 5. Market for Registrant’s Common Equity, Related Stockholder Matters and Issuer Purchases of Equity Securities
MARKET INFORMATION AND DIVIDENDS
Our common stock is listed on the Nasdaq Global Select Market under the symbol “BLMN”.
In December 2014, our Board of Directors (our “Board”) adopted a dividend policy under which it intends to declare quarterly cash dividendson shares of our common stock. Future dividend payments will depend on earnings, financial condition, capital expenditure requirements,surplus and other factors that our Board considers relevant. The terms of our debt agreements permit regular quarterly dividend payments,subject to certain restrictions. The following table sets forth for the periods indicated the high and low sales prices per share of our commonstock as reported on Nasdaq and the dividends declared and paid during the periods indicated:
SALES PRICE DIVIDENDS DECLARED
AND PAID (1) 2016 2015 HIGH LOW HIGH LOW 2016 2015
First Quarter $ 18.09 $ 14.91 $ 26.25 $ 22.91 $ 0.07 $ 0.06
Second Quarter 19.83 16.01 24.53 20.86 0.07 0.06
Third Quarter 19.89 17.21 23.83 18.00 0.07 0.06
Fourth Quarter 19.99 15.82 19.44 15.90 0.07 0.06____________________(1) See Part II, Item 7 “Management’s Discussion and Analysis of Financial Condition and Results of Operations - DIVIDENDS AND SHARE REPURCHASES .”
HOLDERS
As of February 17, 2017 , there were 91 holders of record of our common stock.
SECURITIES AUTHORIZED FOR ISSUANCE UNDER EQUITY COMPENSATION PLANS
The following table presents the securities authorized for issuance under our equity compensation plans as of December 25, 2016 :
(shares in thousands) (a) (b) (c)
PLAN CATEGORY
NUMBER OFSECURITIES TO BE
ISSUED UPONEXERCISE OF
OUTSTANDINGOPTIONS,
WARRANTS ANDRIGHTS
WEIGHTED-AVERAGEEXERCISE PRICE OF
OUTSTANDINGOPTIONS, WARRANTS
AND RIGHTS
NUMBER OFSECURITIESREMAINING
AVAILABLE FORFUTURE ISSUANCE
UNDER EQUITYCOMPENSATION
PLANS (EXCLUDINGSECURITIES
REFLECTED INCOLUMN (a)) (1)
Equity compensation plans approved by security holders 10,984 $ 14.24 6,128____________________(1) The shares remaining available for issuance may be issued in the form of stock options, restricted stock, restricted stock units or other stock awards under the 2016
Omnibus Incentive Compensation Plan (the “2016 Incentive Plan”).
27
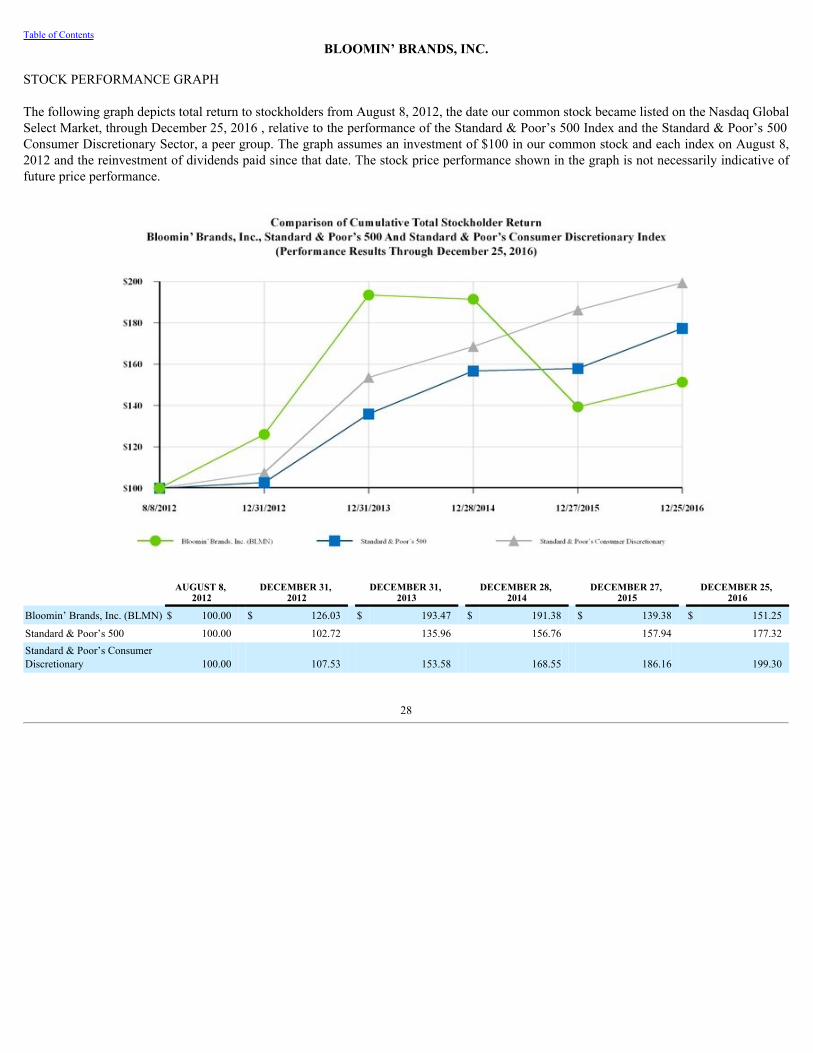
Table of ContentsBLOOMIN’ BRANDS, INC.
STOCK PERFORMANCE GRAPH
The following graph depicts total return to stockholders from August 8, 2012, the date our common stock became listed on the Nasdaq GlobalSelect Market, through December 25, 2016 , relative to the performance of the Standard & Poor’s 500 Index and the Standard & Poor’s 500Consumer Discretionary Sector, a peer group. The graph assumes an investment of $100 in our common stock and each index on August 8,2012 and the reinvestment of dividends paid since that date. The stock price performance shown in the graph is not necessarily indicative offuture price performance.
AUGUST 8, 2012
DECEMBER 31, 2012
DECEMBER 31, 2013
DECEMBER 28, 2014
DECEMBER 27, 2015
DECEMBER 25, 2016
Bloomin’ Brands, Inc. (BLMN) $ 100.00 $ 126.03 $ 193.47 $ 191.38 $ 139.38 $ 151.25
Standard & Poor’s 500 100.00 102.72 135.96 156.76 157.94 177.32Standard & Poor’s ConsumerDiscretionary 100.00 107.53 153.58 168.55 186.16 199.30
28
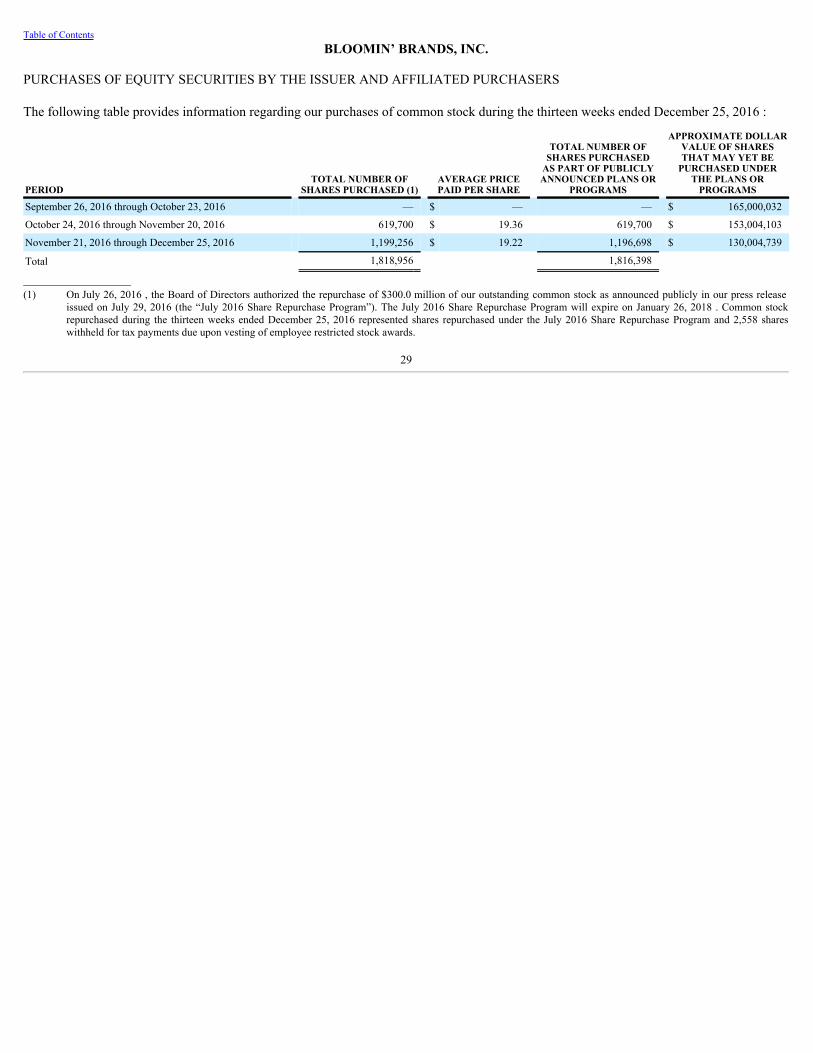
Table of ContentsBLOOMIN’ BRANDS, INC.
PURCHASES OF EQUITY SECURITIES BY THE ISSUER AND AFFILIATED PURCHASERS
The following table provides information regarding our purchases of common stock during the thirteen weeks ended December 25, 2016 :
PERIOD TOTAL NUMBER OF
SHARES PURCHASED (1) AVERAGE PRICEPAID PER SHARE
TOTAL NUMBER OFSHARES PURCHASED
AS PART OF PUBLICLYANNOUNCED PLANS OR
PROGRAMS
APPROXIMATE DOLLARVALUE OF SHARESTHAT MAY YET BE
PURCHASED UNDERTHE PLANS OR
PROGRAMS
September 26, 2016 through October 23, 2016 — $ — — $ 165,000,032
October 24, 2016 through November 20, 2016 619,700 $ 19.36 619,700 $ 153,004,103
November 21, 2016 through December 25, 2016 1,199,256 $ 19.22 1,196,698 $ 130,004,739
Total 1,818,956 1,816,398 ____________________(1) On July 26, 2016 , the Board of Directors authorized the repurchase of $300.0 million of our outstanding common stock as announced publicly in our press release
issued on July 29, 2016 (the “July 2016 Share Repurchase Program”). The July 2016 Share Repurchase Program will expire on January 26, 2018 . Common stockrepurchased during the thirteen weeks ended December 25, 2016 represented shares repurchased under the July 2016 Share Repurchase Program and 2,558 shareswithheld for tax payments due upon vesting of employee restricted stock awards.
29
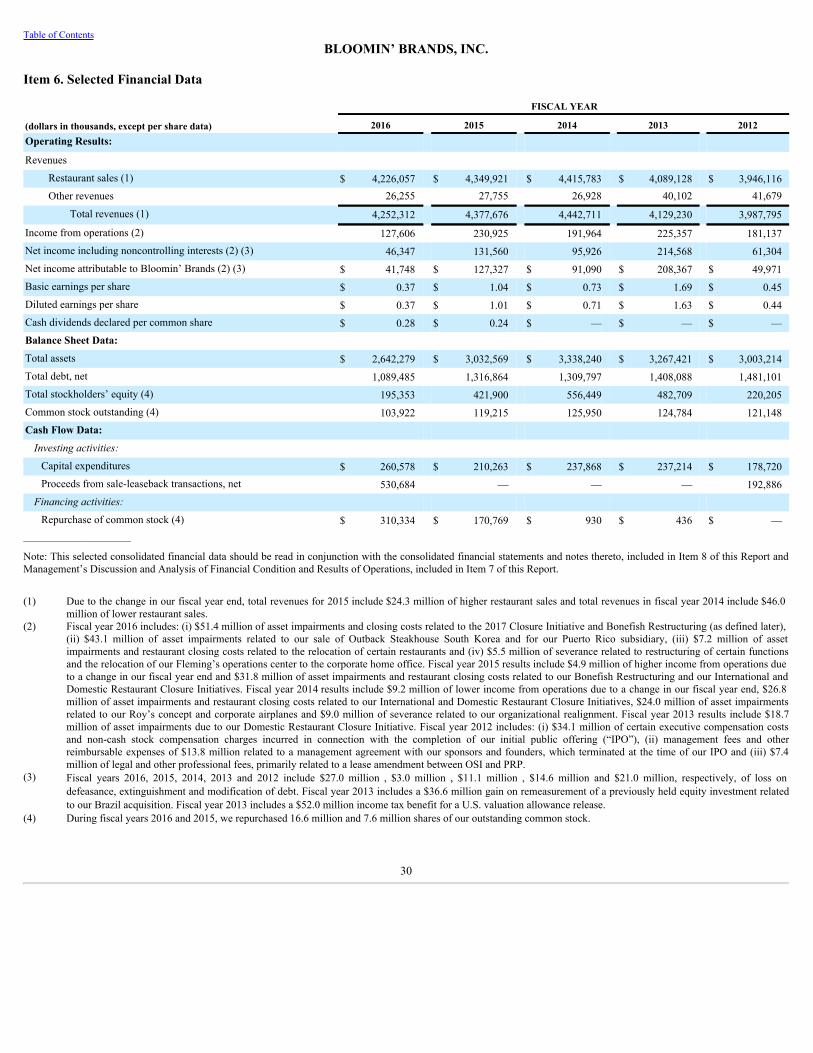
Table of ContentsBLOOMIN’ BRANDS, INC.
Item 6. Selected Financial Data
FISCAL YEAR
(dollars in thousands, except per share data) 2016 2015 2014 2013 2012Operating Results: Revenues
Restaurant sales (1) $ 4,226,057 $ 4,349,921 $ 4,415,783 $ 4,089,128 $ 3,946,116Other revenues 26,255 27,755 26,928 40,102 41,679
Total revenues (1) 4,252,312 4,377,676 4,442,711 4,129,230 3,987,795
Income from operations (2) 127,606 230,925 191,964 225,357 181,137Net income including noncontrolling interests (2) (3) 46,347 131,560 95,926 214,568 61,304Net income attributable to Bloomin’ Brands (2) (3) $ 41,748 $ 127,327 $ 91,090 $ 208,367 $ 49,971Basic earnings per share $ 0.37 $ 1.04 $ 0.73 $ 1.69 $ 0.45Diluted earnings per share $ 0.37 $ 1.01 $ 0.71 $ 1.63 $ 0.44Cash dividends declared per common share $ 0.28 $ 0.24 $ — $ — $ —Balance Sheet Data: Total assets $ 2,642,279 $ 3,032,569 $ 3,338,240 $ 3,267,421 $ 3,003,214Total debt, net 1,089,485 1,316,864 1,309,797 1,408,088 1,481,101Total stockholders’ equity (4) 195,353 421,900 556,449 482,709 220,205Common stock outstanding (4) 103,922 119,215 125,950 124,784 121,148Cash Flow Data: Investingactivities:
Capital expenditures $ 260,578 $ 210,263 $ 237,868 $ 237,214 $ 178,720Proceeds from sale-leaseback transactions, net 530,684 — — — 192,886Financingactivities:
Repurchase of common stock (4) $ 310,334 $ 170,769 $ 930 $ 436 $ —____________________
Note: This selected consolidated financial data should be read in conjunction with the consolidated financial statements and notes thereto, included in Item 8 of this Report andManagement’s Discussion and Analysis of Financial Condition and Results of Operations, included in Item 7 of this Report.
(1) Due to the change in our fiscal year end, total revenues for 2015 include $24.3 million of higher restaurant sales and total revenues in fiscal year 2014 include $46.0million of lower restaurant sales.
(2) Fiscal year 2016 includes: (i) $51.4 million of asset impairments and closing costs related to the 2017 Closure Initiative and Bonefish Restructuring (as defined later),(ii) $43.1 million of asset impairments related to our sale of Outback Steakhouse South Korea and for our Puerto Rico subsidiary, (iii) $7.2 million of assetimpairments and restaurant closing costs related to the relocation of certain restaurants and (iv) $5.5 million of severance related to restructuring of certain functionsand the relocation of our Fleming’s operations center to the corporate home office. Fiscal year 2015 results include $4.9 million of higher income from operations dueto a change in our fiscal year end and $31.8 million of asset impairments and restaurant closing costs related to our Bonefish Restructuring and our International andDomestic Restaurant Closure Initiatives. Fiscal year 2014 results include $9.2 million of lower income from operations due to a change in our fiscal year end, $26.8million of asset impairments and restaurant closing costs related to our International and Domestic Restaurant Closure Initiatives, $24.0 million of asset impairmentsrelated to our Roy’s concept and corporate airplanes and $9.0 million of severance related to our organizational realignment. Fiscal year 2013 results include $18.7million of asset impairments due to our Domestic Restaurant Closure Initiative. Fiscal year 2012 includes: (i) $34.1 million of certain executive compensation costsand non-cash stock compensation charges incurred in connection with the completion of our initial public offering (“IPO”), (ii) management fees and otherreimbursable expenses of $13.8 million related to a management agreement with our sponsors and founders, which terminated at the time of our IPO and (iii) $7.4million of legal and other professional fees, primarily related to a lease amendment between OSI and PRP.
(3) Fiscal years 2016, 2015, 2014, 2013 and 2012 include $27.0 million , $3.0 million , $11.1 million , $14.6 million and $21.0 million, respectively, of loss ondefeasance, extinguishment and modification of debt. Fiscal year 2013 includes a $36.6 million gain on remeasurement of a previously held equity investment relatedto our Brazil acquisition. Fiscal year 2013 includes a $52.0 million income tax benefit for a U.S. valuation allowance release.
(4) During fiscal years 2016 and 2015, we repurchased 16.6 million and 7.6 million shares of our outstanding common stock.
30
Table of ContentsBLOOMIN’ BRANDS, INC.
MANAGEMENT’S DISCUSSION AND ANALYSIS OFFINANCIAL CONDITION AND RESULTS OF OPERATIONS
Item 7. Management’s Discussion and Analysis of Financial Condition and Results of Operations
Management’s discussion and analysis of financial condition and results of operations should be read in conjunction with our consolidatedfinancial statements and the related notes.
Overview
We are one of the largest casual dining restaurant companies in the world with a portfolio of leading, differentiated restaurant concepts. As ofDecember 25, 2016 , we owned and operated 1,276 restaurants and franchised 240 restaurants across 48 states, Puerto Rico, Guam and 20countries. We have four founder-inspired concepts: Outback Steakhouse, Carrabba’s Italian Grill, Bonefish Grill and Fleming’s PrimeSteakhouse & Wine Bar.
Executive Summary
Our 2016 financial results include:
• A decrease in total revenues of 2.9% to $4.3 billion in 2016 as compared to 2015 , driven primarily by the sale of OutbackSteakhouse South Korea, lower U.S. comparable restaurant sales and the effect of foreign currency translation, partially offset bythe net benefit of restaurant openings and closings.
• Operating margin at the restaurant level declined (0.7)% in fiscal year 2016 as compared to fiscal year 2015 , primarily due tohigher labor costs and commodity and operating expense inflation, partially offset by the impact of certain cost saving initiativesand increases in average check per person.
• Income from operations decreased to $127.6 million in 2016 as compared to $230.9 million in 2015 , primarily due to impairmentcharges incurred in connection with the 2017 Closure Initiative and the sale of Outback South Korea and a decrease in operatingmargin at the restaurant-level, partially offset by lower general and administrative expense.
• During fiscal year 2016, we repurchased $309.9 million of our common stock and declared and paid $31.4 million of dividends.
Following is a summary of factors that impacted our operating results and liquidity in 2016 and significant actions we have taken during theyear:
PRPMortgageLoan- In February 2016 , New Private Restaurant Partners, LLC, our indirect wholly-owned subsidiary (“PRP”), entered intoa loan agreement (the “PRP Mortgage Loan”), pursuant to which PRP borrowed $300.0 million. The proceeds of the PRP Mortgage Loanwere used, together with borrowings under our revolving credit facility, to prepay a portion, and fully defease the remainder, of the 2012CMBS loan. In connection with the defeasance, we recognized a loss of $26.6 million during 2016. In July 2016, PRP entered into anAmendment to the PRP Mortgage Loan to provide for additional borrowings of $69.5 million . See Note 11 - Long-termDebt, Netof theNotes to Consolidated Financial Statements for further information.
Sale-leasebackTransactions- During fiscal year 2016, we entered into sale-leaseback transactions with third-parties in which we sold 159restaurant properties at fair market value for gross proceeds of $560.4 million . With the proceeds from these transactions, we made paymentsof $322.3 million on our PRP Mortgage Loan.
Subsequent to December 25, 2016 , we entered into sale-leaseback transactions with third parties in which we sold six restaurant properties atfair market value for gross proceeds of $21.6 million and made payments of $19.2 million on our PRP Mortgage Loan. As of the date of thisfiling, the PRP Mortgage Loan had a remaining balance of $28.0 million .
31
Table of ContentsBLOOMIN’ BRANDS, INC.
MANAGEMENT’S DISCUSSION AND ANALYSIS OFFINANCIAL CONDITION AND RESULTS OF OPERATIONS - Continued
OutbackSouthKorea- On July 25, 2016, we sold Outback Steakhouse South Korea for $50.0 million in cash. In connection with the decisionto sell Outback Steakhouse South Korea, we recognized an impairment charge of $39.6 million during fiscal year 2016. After completion ofthe sale, our restaurant locations in South Korea are operated as franchises.
Casual Dining Industry and Macroeconomic Conditions
The combination of casual dining industry conditions and other macroeconomic factors has put considerable pressure on restaurant sales.Competitive pressures, including discounting and marketing strategies, excess capacity in the industry, the relative affordability and quality ofprepared meals from supermarkets and an increase in home delivery services and applications have impacted our traffic levels. We expectcomparable restaurant sales to continue to be impacted in fiscal 2017 by current and anticipated market conditions.
2017 Closure Initiative
On February 15, 2017 , we decided to close 43 underperforming restaurants (the “2017 Closure Initiative”). Most of these restaurants willclose in 2017, with the balance closing as leases and certain operating covenants expire or are amended or waived. In connection with the2017 Closure Initiative, we reassessed the future undiscounted cash flows of the impacted restaurants, and as a result, we recognized pre-taxasset impairments of $46.5 million during fiscal year 2016. See Note 3 - Impairments,DisposalsandExitCostsof our Notes to ConsolidatedFinancial Statements in Part II, Item 8 for additional details regarding the 2017 Closure Initiative.
Business Strategies
In 2017 , our key business strategies include:
• ContinuedFocusonU.S.SalesandProfitability.We plan to continue to remodel and relocate restaurants, make investments toenhance our core guest experience, increase off-premise dining occasions, introduce innovative menu items that match evolvingconsumer preferences and use limited-time offers and multimedia marketing campaigns to drive traffic.
• AccelerateInternationalGrowth.We continue to focus on existing geographic regions in South America and Asia, with strategicexpansion in selected emerging and high growth developed markets. Specifically, we are focusing our existing market growth inBrazil and new market growth in China. We expect to open between 40 and 50 system-wide locations in 2017 , with most expectedto be international locations.
• DriveLong-TermShareholderValue.We plan to drive long-term shareholder value by reinvesting operational cash flow in ourbusiness, improving our credit profile and returning excess cash to shareholders through share repurchases and dividends.
We intend to fund our business strategies, in part, by utilizing productivity initiatives across our business. Productivity savings will bereinvested in the business to drive revenue growth and margin improvement.
Key Performance Indicators
Key measures that we use in evaluating our restaurants and assessing our business include the following:
• Averagerestaurantunitvolumes—average sales per restaurant to measure changes in consumer traffic, pricing and developmentof the brand;
32
Table of ContentsBLOOMIN’ BRANDS, INC.
MANAGEMENT’S DISCUSSION AND ANALYSIS OFFINANCIAL CONDITION AND RESULTS OF OPERATIONS - Continued
• Comparable restaurant sales—year-over-year comparison of sales volumes for Company-owned restaurants that are open 18months or more in order to remove the impact of new restaurant openings in comparing the operations of existing restaurants;
• System-widesales—total restaurant sales volume for all Company-owned, franchise and unconsolidated joint venture restaurants,regardless of ownership, to interpret the overall health of our brands;
• Adjustedrestaurant-leveloperatingmargin,Adjustedincomefromoperations,Adjustednetincome,Adjusteddilutedearningspershare —non-GAAP financial measures utilized to evaluate our operating performance, which definitions, usefulness andreconciliations are described in more detail in the “Non-GAAP Financial Measures” section below; and
• Consumersatisfactionscores—measurement of our consumers’ experiences in a variety of key areas.
33
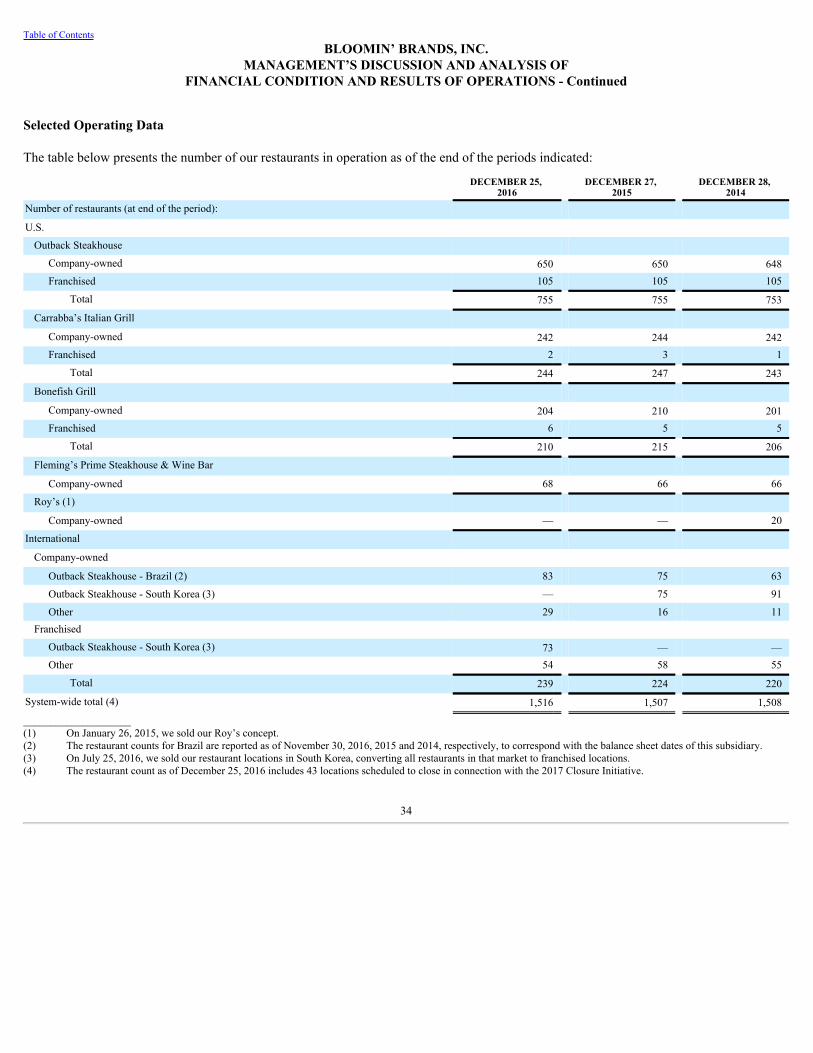
Table of ContentsBLOOMIN’ BRANDS, INC.
MANAGEMENT’S DISCUSSION AND ANALYSIS OFFINANCIAL CONDITION AND RESULTS OF OPERATIONS - Continued
Selected Operating Data
The table below presents the number of our restaurants in operation as of the end of the periods indicated:
DECEMBER 25,
2016 DECEMBER 27,
2015 DECEMBER 28,
2014Number of restaurants (at end of the period): U.S.
Outback Steakhouse Company-owned 650 650 648Franchised 105 105 105
Total 755 755 753
Carrabba’s Italian Grill Company-owned 242 244 242Franchised 2 3 1
Total 244 247 243
Bonefish Grill Company-owned 204 210 201Franchised 6 5 5
Total 210 215 206
Fleming’s Prime Steakhouse & Wine Bar Company-owned 68 66 66
Roy’s (1) Company-owned — — 20
International Company-owned
Outback Steakhouse - Brazil (2) 83 75 63
Outback Steakhouse - South Korea (3) — 75 91
Other 29 16 11Franchised
Outback Steakhouse - South Korea (3) 73 — —Other 54 58 55
Total 239 224 220
System-wide total (4) 1,516 1,507 1,508
____________________(1) On January 26, 2015, we sold our Roy’s concept.(2) The restaurant counts for Brazil are reported as of November 30, 2016, 2015 and 2014, respectively, to correspond with the balance sheet dates of this subsidiary.(3) On July 25, 2016, we sold our restaurant locations in South Korea, converting all restaurants in that market to franchised locations.(4) The restaurant count as of December 25, 2016 includes 43 locations scheduled to close in connection with the 2017 Closure Initiative.
34
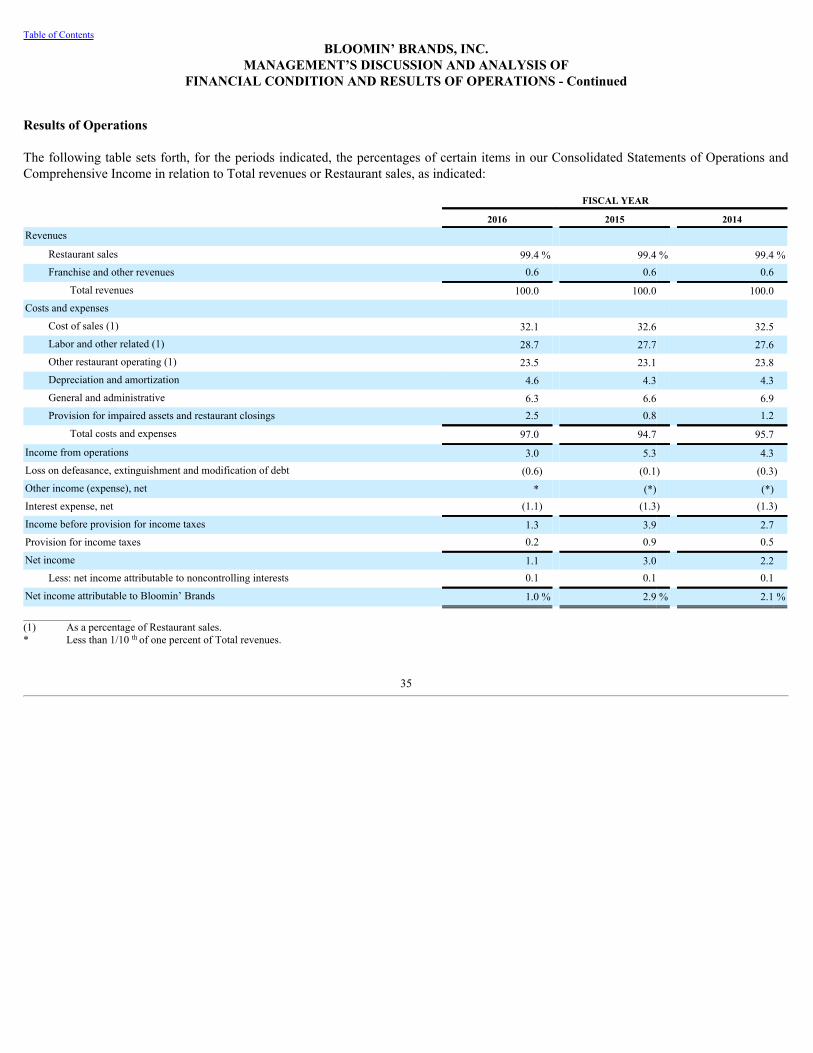
Table of ContentsBLOOMIN’ BRANDS, INC.
MANAGEMENT’S DISCUSSION AND ANALYSIS OFFINANCIAL CONDITION AND RESULTS OF OPERATIONS - Continued
Results of Operations
The following table sets forth, for the periods indicated, the percentages of certain items in our Consolidated Statements of Operations andComprehensive Income in relation to Total revenues or Restaurant sales, as indicated:
FISCAL YEAR
2016 2015 2014Revenues
Restaurant sales 99.4 % 99.4 % 99.4 %Franchise and other revenues 0.6 0.6 0.6
Total revenues 100.0 100.0 100.0Costs and expenses
Cost of sales (1) 32.1 32.6 32.5Labor and other related (1) 28.7 27.7 27.6Other restaurant operating (1) 23.5 23.1 23.8Depreciation and amortization 4.6 4.3 4.3General and administrative 6.3 6.6 6.9Provision for impaired assets and restaurant closings 2.5 0.8 1.2
Total costs and expenses 97.0 94.7 95.7
Income from operations 3.0 5.3 4.3Loss on defeasance, extinguishment and modification of debt (0.6) (0.1) (0.3)Other income (expense), net * (*) (*)Interest expense, net (1.1) (1.3) (1.3)
Income before provision for income taxes 1.3 3.9 2.7Provision for income taxes 0.2 0.9 0.5
Net income 1.1 3.0 2.2Less: net income attributable to noncontrolling interests 0.1 0.1 0.1
Net income attributable to Bloomin’ Brands 1.0 % 2.9 % 2.1 %
____________________(1) As a percentage of Restaurant sales.* Less than 1/10 th of one percent of Total revenues.
35
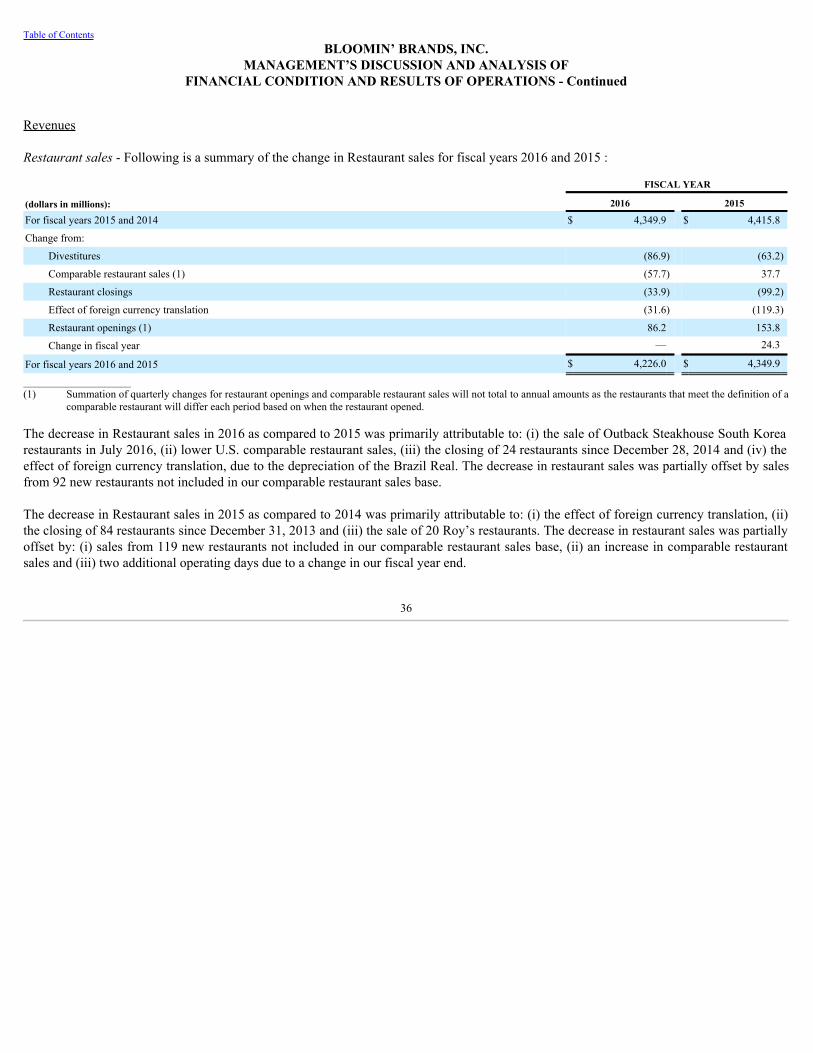
Table of ContentsBLOOMIN’ BRANDS, INC.
MANAGEMENT’S DISCUSSION AND ANALYSIS OFFINANCIAL CONDITION AND RESULTS OF OPERATIONS - Continued
Revenues
Restaurantsales- Following is a summary of the change in Restaurant sales for fiscal years 2016 and 2015 :
FISCAL YEAR
(dollars in millions): 2016 2015
For fiscal years 2015 and 2014 $ 4,349.9 $ 4,415.8
Change from: Divestitures (86.9) (63.2)
Comparable restaurant sales (1) (57.7) 37.7
Restaurant closings (33.9) (99.2)
Effect of foreign currency translation (31.6) (119.3)
Restaurant openings (1) 86.2 153.8
Change in fiscal year — 24.3
For fiscal years 2016 and 2015 $ 4,226.0 $ 4,349.9
____________________(1) Summation of quarterly changes for restaurant openings and comparable restaurant sales will not total to annual amounts as the restaurants that meet the definition of a
comparable restaurant will differ each period based on when the restaurant opened.
The decrease in Restaurant sales in 2016 as compared to 2015 was primarily attributable to: (i) the sale of Outback Steakhouse South Korearestaurants in July 2016, (ii) lower U.S. comparable restaurant sales, (iii) the closing of 24 restaurants since December 28, 2014 and (iv) theeffect of foreign currency translation, due to the depreciation of the Brazil Real. The decrease in restaurant sales was partially offset by salesfrom 92 new restaurants not included in our comparable restaurant sales base.
The decrease in Restaurant sales in 2015 as compared to 2014 was primarily attributable to: (i) the effect of foreign currency translation, (ii)the closing of 84 restaurants since December 31, 2013 and (iii) the sale of 20 Roy’s restaurants. The decrease in restaurant sales was partiallyoffset by: (i) sales from 119 new restaurants not included in our comparable restaurant sales base, (ii) an increase in comparable restaurantsales and (iii) two additional operating days due to a change in our fiscal year end.
36
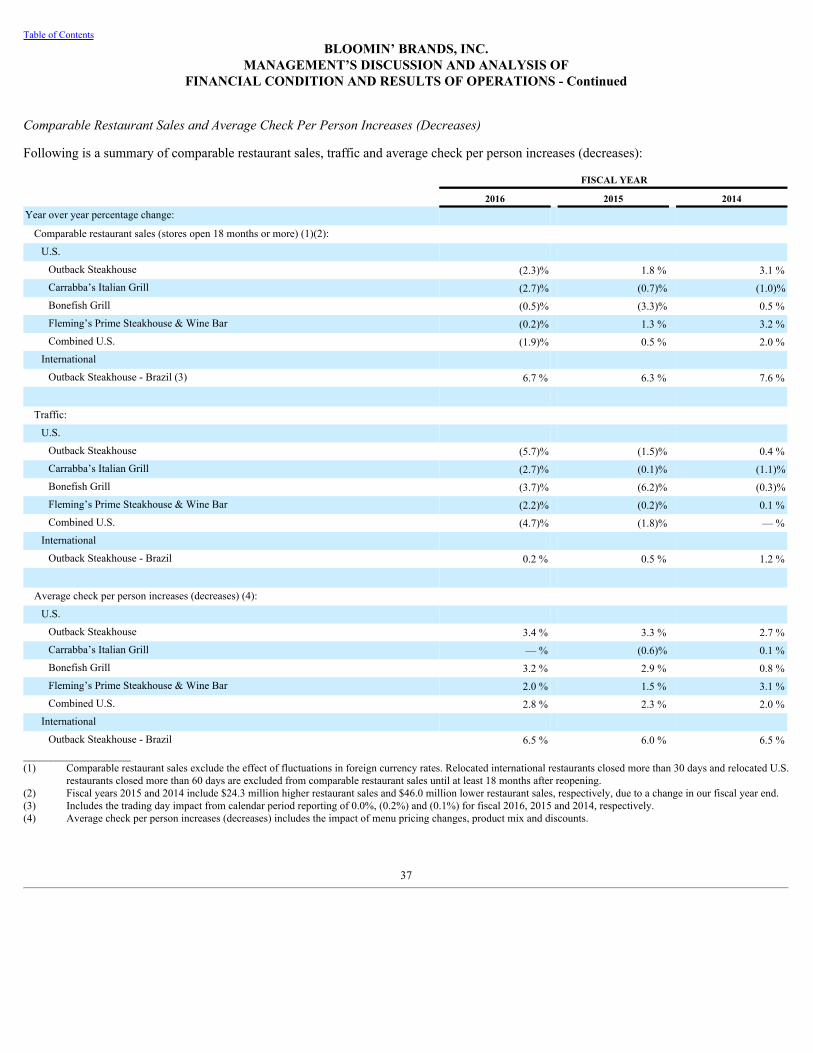
Table of ContentsBLOOMIN’ BRANDS, INC.
MANAGEMENT’S DISCUSSION AND ANALYSIS OFFINANCIAL CONDITION AND RESULTS OF OPERATIONS - Continued
ComparableRestaurantSalesandAverageCheckPerPersonIncreases(Decreases)
Following is a summary of comparable restaurant sales, traffic and average check per person increases (decreases):
FISCAL YEAR
2016 2015 2014Year over year percentage change:
Comparable restaurant sales (stores open 18 months or more) (1)(2): U.S.
Outback Steakhouse (2.3)% 1.8 % 3.1 %Carrabba’s Italian Grill (2.7)% (0.7)% (1.0)%Bonefish Grill (0.5)% (3.3)% 0.5 %Fleming’s Prime Steakhouse & Wine Bar (0.2)% 1.3 % 3.2 %Combined U.S. (1.9)% 0.5 % 2.0 %
International Outback Steakhouse - Brazil (3) 6.7 % 6.3 % 7.6 %
Traffic:
U.S. Outback Steakhouse (5.7)% (1.5)% 0.4 %Carrabba’s Italian Grill (2.7)% (0.1)% (1.1)%Bonefish Grill (3.7)% (6.2)% (0.3)%Fleming’s Prime Steakhouse & Wine Bar (2.2)% (0.2)% 0.1 %Combined U.S. (4.7)% (1.8)% — %
International Outback Steakhouse - Brazil 0.2 % 0.5 % 1.2 %
Average check per person increases (decreases) (4):
U.S. Outback Steakhouse 3.4 % 3.3 % 2.7 %Carrabba’s Italian Grill — % (0.6)% 0.1 %Bonefish Grill 3.2 % 2.9 % 0.8 %Fleming’s Prime Steakhouse & Wine Bar 2.0 % 1.5 % 3.1 %Combined U.S. 2.8 % 2.3 % 2.0 %
International Outback Steakhouse - Brazil 6.5 % 6.0 % 6.5 %
____________________(1) Comparable restaurant sales exclude the effect of fluctuations in foreign currency rates. Relocated international restaurants closed more than 30 days and relocated U.S.
restaurants closed more than 60 days are excluded from comparable restaurant sales until at least 18 months after reopening.(2) Fiscal years 2015 and 2014 include $24.3 million higher restaurant sales and $46.0 million lower restaurant sales, respectively, due to a change in our fiscal year end.(3) Includes the trading day impact from calendar period reporting of 0.0%, (0.2%) and (0.1%) for fiscal 2016, 2015 and 2014, respectively.(4) Average check per person increases (decreases) includes the impact of menu pricing changes, product mix and discounts.
37
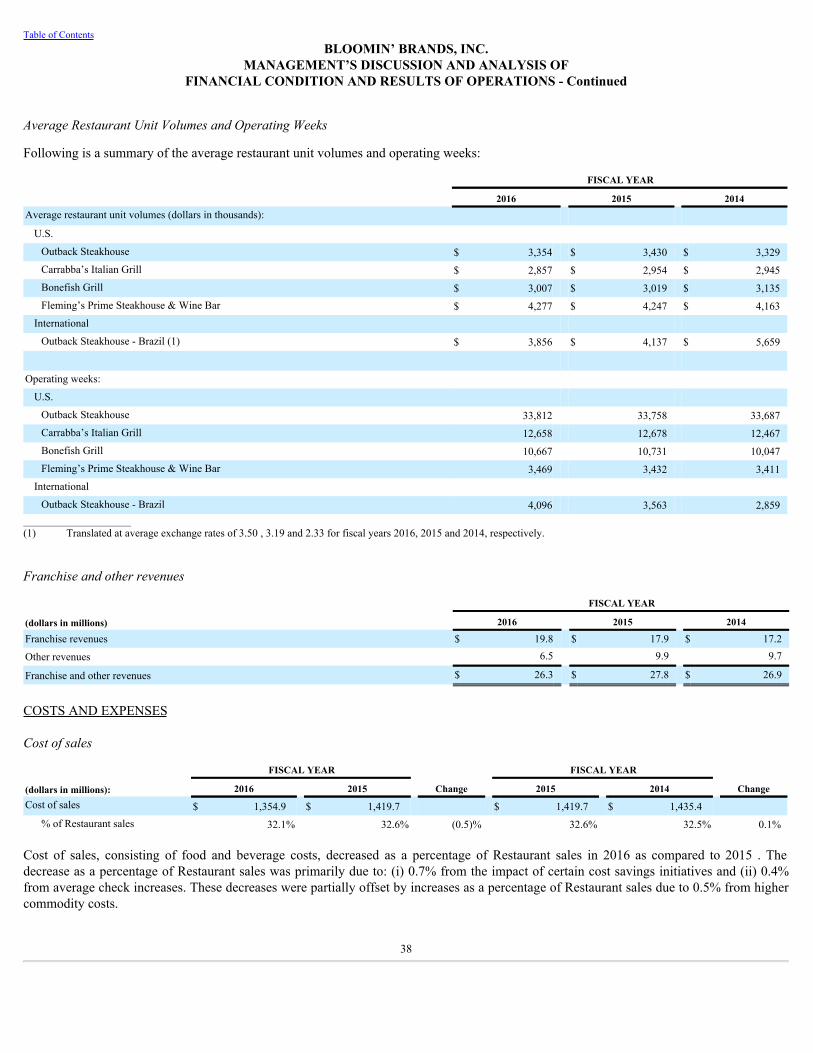
Table of ContentsBLOOMIN’ BRANDS, INC.
MANAGEMENT’S DISCUSSION AND ANALYSIS OFFINANCIAL CONDITION AND RESULTS OF OPERATIONS - Continued
AverageRestaurantUnitVolumesandOperatingWeeks
Following is a summary of the average restaurant unit volumes and operating weeks:
FISCAL YEAR
2016 2015 2014Average restaurant unit volumes (dollars in thousands):
U.S. Outback Steakhouse $ 3,354 $ 3,430 $ 3,329Carrabba’s Italian Grill $ 2,857 $ 2,954 $ 2,945Bonefish Grill $ 3,007 $ 3,019 $ 3,135Fleming’s Prime Steakhouse & Wine Bar $ 4,277 $ 4,247 $ 4,163
International Outback Steakhouse - Brazil (1) $ 3,856 $ 4,137 $ 5,659
Operating weeks:
U.S. Outback Steakhouse 33,812 33,758 33,687Carrabba’s Italian Grill 12,658 12,678 12,467Bonefish Grill 10,667 10,731 10,047Fleming’s Prime Steakhouse & Wine Bar 3,469 3,432 3,411
International Outback Steakhouse - Brazil 4,096 3,563 2,859
____________________(1) Translated at average exchange rates of 3.50 , 3.19 and 2.33 for fiscal years 2016, 2015 and 2014, respectively.
Franchiseandotherrevenues
FISCAL YEAR
(dollars in millions) 2016 2015 2014
Franchise revenues $ 19.8 $ 17.9 $ 17.2
Other revenues 6.5 9.9 9.7
Franchise and other revenues $ 26.3 $ 27.8 $ 26.9
COSTS AND EXPENSES
Costofsales
FISCAL YEAR FISCAL YEAR
(dollars in millions): 2016 2015 Change 2015 2014 ChangeCost of sales $ 1,354.9 $ 1,419.7 $ 1,419.7 $ 1,435.4
% of Restaurant sales 32.1% 32.6% (0.5)% 32.6% 32.5% 0.1%
Cost of sales, consisting of food and beverage costs, decreased as a percentage of Restaurant sales in 2016 as compared to 2015 . Thedecrease as a percentage of Restaurant sales was primarily due to: (i) 0.7% from the impact of certain cost savings initiatives and (ii) 0.4%from average check increases. These decreases were partially offset by increases as a percentage of Restaurant sales due to 0.5% from highercommodity costs.
38
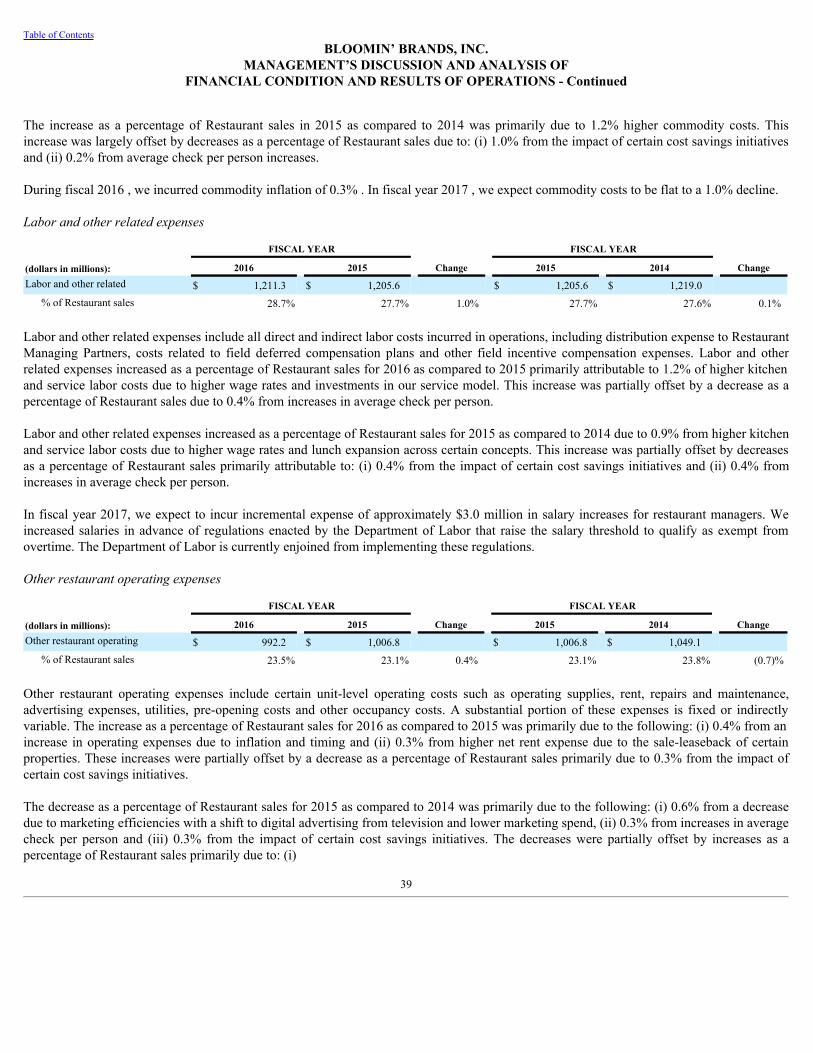
Table of ContentsBLOOMIN’ BRANDS, INC.
MANAGEMENT’S DISCUSSION AND ANALYSIS OFFINANCIAL CONDITION AND RESULTS OF OPERATIONS - Continued
The increase as a percentage of Restaurant sales in 2015 as compared to 2014 was primarily due to 1.2% higher commodity costs. Thisincrease was largely offset by decreases as a percentage of Restaurant sales due to: (i) 1.0% from the impact of certain cost savings initiativesand (ii) 0.2% from average check per person increases.
During fiscal 2016 , we incurred commodity inflation of 0.3% . In fiscal year 2017 , we expect commodity costs to be flat to a 1.0% decline.
Laborandotherrelatedexpenses
FISCAL YEAR FISCAL YEAR
(dollars in millions): 2016 2015 Change 2015 2014 ChangeLabor and other related $ 1,211.3 $ 1,205.6 $ 1,205.6 $ 1,219.0
% of Restaurant sales 28.7% 27.7% 1.0% 27.7% 27.6% 0.1%
Labor and other related expenses include all direct and indirect labor costs incurred in operations, including distribution expense to RestaurantManaging Partners, costs related to field deferred compensation plans and other field incentive compensation expenses. Labor and otherrelated expenses increased as a percentage of Restaurant sales for 2016 as compared to 2015 primarily attributable to 1.2% of higher kitchenand service labor costs due to higher wage rates and investments in our service model. This increase was partially offset by a decrease as apercentage of Restaurant sales due to 0.4% from increases in average check per person.
Labor and other related expenses increased as a percentage of Restaurant sales for 2015 as compared to 2014 due to 0.9% from higher kitchenand service labor costs due to higher wage rates and lunch expansion across certain concepts. This increase was partially offset by decreasesas a percentage of Restaurant sales primarily attributable to: (i) 0.4% from the impact of certain cost savings initiatives and (ii) 0.4% fromincreases in average check per person.
In fiscal year 2017, we expect to incur incremental expense of approximately $3.0 million in salary increases for restaurant managers. Weincreased salaries in advance of regulations enacted by the Department of Labor that raise the salary threshold to qualify as exempt fromovertime. The Department of Labor is currently enjoined from implementing these regulations.
Otherrestaurantoperatingexpenses
FISCAL YEAR FISCAL YEAR
(dollars in millions): 2016 2015 Change 2015 2014 ChangeOther restaurant operating $ 992.2 $ 1,006.8 $ 1,006.8 $ 1,049.1
% of Restaurant sales 23.5% 23.1% 0.4% 23.1% 23.8% (0.7)%
Other restaurant operating expenses include certain unit-level operating costs such as operating supplies, rent, repairs and maintenance,advertising expenses, utilities, pre-opening costs and other occupancy costs. A substantial portion of these expenses is fixed or indirectlyvariable. The increase as a percentage of Restaurant sales for 2016 as compared to 2015 was primarily due to the following: (i) 0.4% from anincrease in operating expenses due to inflation and timing and (ii) 0.3% from higher net rent expense due to the sale-leaseback of certainproperties. These increases were partially offset by a decrease as a percentage of Restaurant sales primarily due to 0.3% from the impact ofcertain cost savings initiatives.
The decrease as a percentage of Restaurant sales for 2015 as compared to 2014 was primarily due to the following: (i) 0.6% from a decreasedue to marketing efficiencies with a shift to digital advertising from television and lower marketing spend, (ii) 0.3% from increases in averagecheck per person and (iii) 0.3% from the impact of certain cost savings initiatives. The decreases were partially offset by increases as apercentage of Restaurant sales primarily due to: (i)
39
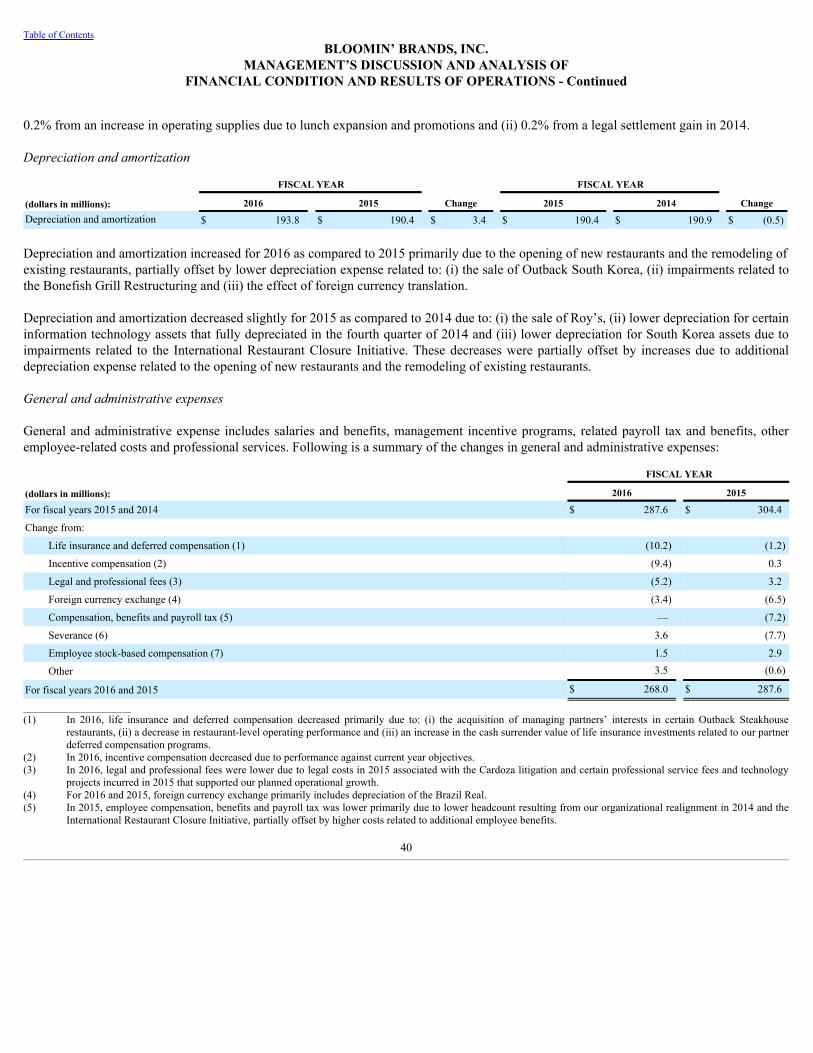
Table of ContentsBLOOMIN’ BRANDS, INC.
MANAGEMENT’S DISCUSSION AND ANALYSIS OFFINANCIAL CONDITION AND RESULTS OF OPERATIONS - Continued
0.2% from an increase in operating supplies due to lunch expansion and promotions and (ii) 0.2% from a legal settlement gain in 2014.
Depreciationandamortization
FISCAL YEAR FISCAL YEAR
(dollars in millions): 2016 2015 Change 2015 2014 ChangeDepreciation and amortization $ 193.8 $ 190.4 $ 3.4 $ 190.4 $ 190.9 $ (0.5)
Depreciation and amortization increased for 2016 as compared to 2015 primarily due to the opening of new restaurants and the remodeling ofexisting restaurants, partially offset by lower depreciation expense related to: (i) the sale of Outback South Korea, (ii) impairments related tothe Bonefish Grill Restructuring and (iii) the effect of foreign currency translation.
Depreciation and amortization decreased slightly for 2015 as compared to 2014 due to: (i) the sale of Roy’s, (ii) lower depreciation for certaininformation technology assets that fully depreciated in the fourth quarter of 2014 and (iii) lower depreciation for South Korea assets due toimpairments related to the International Restaurant Closure Initiative. These decreases were partially offset by increases due to additionaldepreciation expense related to the opening of new restaurants and the remodeling of existing restaurants.
Generalandadministrativeexpenses
General and administrative expense includes salaries and benefits, management incentive programs, related payroll tax and benefits, otheremployee-related costs and professional services. Following is a summary of the changes in general and administrative expenses:
FISCAL YEAR
(dollars in millions): 2016 2015
For fiscal years 2015 and 2014 $ 287.6 $ 304.4
Change from: Life insurance and deferred compensation (1) (10.2) (1.2)
Incentive compensation (2) (9.4) 0.3
Legal and professional fees (3) (5.2) 3.2
Foreign currency exchange (4) (3.4) (6.5)
Compensation, benefits and payroll tax (5) — (7.2)
Severance (6) 3.6 (7.7)
Employee stock-based compensation (7) 1.5 2.9
Other 3.5 (0.6)
For fiscal years 2016 and 2015 $ 268.0 $ 287.6
____________________(1) In 2016, life insurance and deferred compensation decreased primarily due to: (i) the acquisition of managing partners’ interests in certain Outback Steakhouse
restaurants, (ii) a decrease in restaurant-level operating performance and (iii) an increase in the cash surrender value of life insurance investments related to our partnerdeferred compensation programs.
(2) In 2016, incentive compensation decreased due to performance against current year objectives.(3) In 2016, legal and professional fees were lower due to legal costs in 2015 associated with the Cardoza litigation and certain professional service fees and technology
projects incurred in 2015 that supported our planned operational growth.(4) For 2016 and 2015, foreign currency exchange primarily includes depreciation of the Brazil Real.(5) In 2015, employee compensation, benefits and payroll tax was lower primarily due to lower headcount resulting from our organizational realignment in 2014 and the
International Restaurant Closure Initiative, partially offset by higher costs related to additional employee benefits.
40
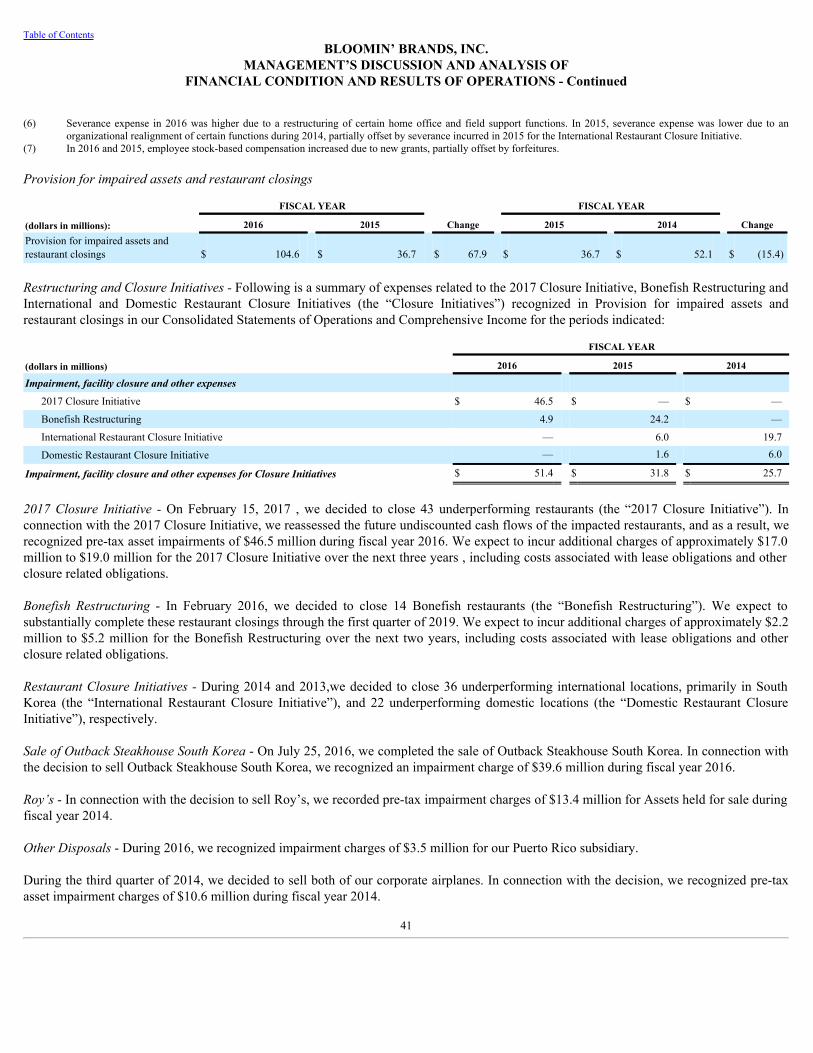
Table of ContentsBLOOMIN’ BRANDS, INC.
MANAGEMENT’S DISCUSSION AND ANALYSIS OFFINANCIAL CONDITION AND RESULTS OF OPERATIONS - Continued
(6) Severance expense in 2016 was higher due to a restructuring of certain home office and field support functions. In 2015, severance expense was lower due to anorganizational realignment of certain functions during 2014, partially offset by severance incurred in 2015 for the International Restaurant Closure Initiative.
(7) In 2016 and 2015, employee stock-based compensation increased due to new grants, partially offset by forfeitures.
Provisionforimpairedassetsandrestaurantclosings
FISCAL YEAR FISCAL YEAR
(dollars in millions): 2016 2015 Change 2015 2014 ChangeProvision for impaired assets andrestaurant closings $ 104.6 $ 36.7 $ 67.9 $ 36.7 $ 52.1 $ (15.4)
RestructuringandClosureInitiatives-Following is a summary of expenses related to the 2017 Closure Initiative, Bonefish Restructuring andInternational and Domestic Restaurant Closure Initiatives (the “Closure Initiatives”) recognized in Provision for impaired assets andrestaurant closings in our Consolidated Statements of Operations and Comprehensive Income for the periods indicated:
FISCAL YEAR
(dollars in millions) 2016 2015 2014
Impairment, facility closure and other expenses 2017 Closure Initiative $ 46.5 $ — $ —
Bonefish Restructuring 4.9 24.2 —
International Restaurant Closure Initiative — 6.0 19.7
Domestic Restaurant Closure Initiative — 1.6 6.0
Impairment, facility closure and other expenses for Closure Initiatives $ 51.4 $ 31.8 $ 25.7
2017 Closure Initiative -On February 15, 2017 , we decided to close 43 underperforming restaurants (the “2017 Closure Initiative”). Inconnection with the 2017 Closure Initiative, we reassessed the future undiscounted cash flows of the impacted restaurants, and as a result, werecognized pre-tax asset impairments of $46.5 million during fiscal year 2016. We expect to incur additional charges of approximately $17.0million to $19.0 million for the 2017 Closure Initiative over the next three years , including costs associated with lease obligations and otherclosure related obligations.
Bonefish Restructuring - In February 2016, we decided to close 14 Bonefish restaurants (the “Bonefish Restructuring”). We expect tosubstantially complete these restaurant closings through the first quarter of 2019. We expect to incur additional charges of approximately $2.2million to $5.2 million for the Bonefish Restructuring over the next two years, including costs associated with lease obligations and otherclosure related obligations.
RestaurantClosureInitiatives-During 2014 and 2013,we decided to close 36 underperforming international locations, primarily in SouthKorea (the “International Restaurant Closure Initiative”), and 22 underperforming domestic locations (the “Domestic Restaurant ClosureInitiative”), respectively.
SaleofOutbackSteakhouseSouthKorea- On July 25, 2016, we completed the sale of Outback Steakhouse South Korea. In connection withthe decision to sell Outback Steakhouse South Korea, we recognized an impairment charge of $39.6 million during fiscal year 2016.
Roy’s- In connection with the decision to sell Roy’s, we recorded pre-tax impairment charges of $13.4 million for Assets held for sale duringfiscal year 2014.
OtherDisposals- During 2016, we recognized impairment charges of $3.5 million for our Puerto Rico subsidiary.
During the third quarter of 2014, we decided to sell both of our corporate airplanes. In connection with the decision, we recognized pre-taxasset impairment charges of $10.6 million during fiscal year 2014.
41
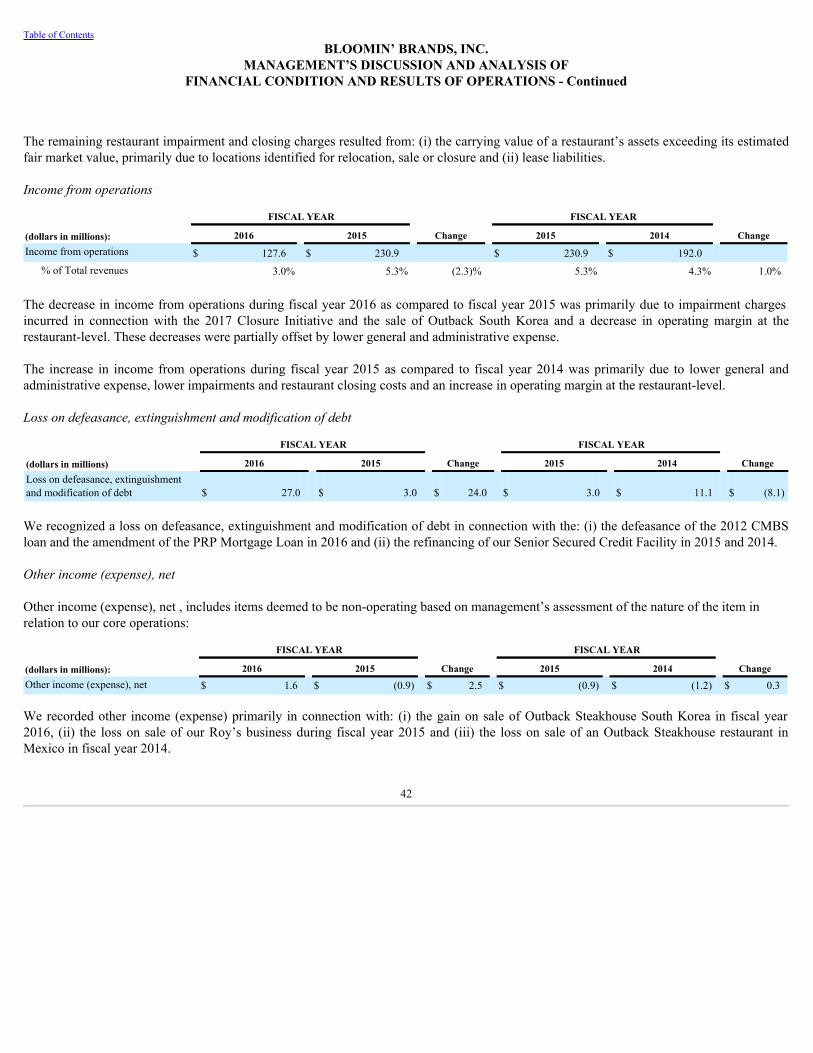
Table of ContentsBLOOMIN’ BRANDS, INC.
MANAGEMENT’S DISCUSSION AND ANALYSIS OFFINANCIAL CONDITION AND RESULTS OF OPERATIONS - Continued
The remaining restaurant impairment and closing charges resulted from: (i) the carrying value of a restaurant’s assets exceeding its estimatedfair market value, primarily due to locations identified for relocation, sale or closure and (ii) lease liabilities. Incomefromoperations
FISCAL YEAR FISCAL YEAR
(dollars in millions): 2016 2015 Change 2015 2014 ChangeIncome from operations $ 127.6 $ 230.9 $ 230.9 $ 192.0
% of Total revenues 3.0% 5.3% (2.3)% 5.3% 4.3% 1.0%
The decrease in income from operations during fiscal year 2016 as compared to fiscal year 2015 was primarily due to impairment chargesincurred in connection with the 2017 Closure Initiative and the sale of Outback South Korea and a decrease in operating margin at therestaurant-level. These decreases were partially offset by lower general and administrative expense.
The increase in income from operations during fiscal year 2015 as compared to fiscal year 2014 was primarily due to lower general andadministrative expense, lower impairments and restaurant closing costs and an increase in operating margin at the restaurant-level.
Lossondefeasance,extinguishmentandmodificationofdebt
FISCAL YEAR FISCAL YEAR
(dollars in millions) 2016 2015 Change 2015 2014 ChangeLoss on defeasance, extinguishmentand modification of debt $ 27.0 $ 3.0 $ 24.0 $ 3.0 $ 11.1 $ (8.1)
We recognized a loss on defeasance, extinguishment and modification of debt in connection with the: (i) the defeasance of the 2012 CMBSloan and the amendment of the PRP Mortgage Loan in 2016 and (ii) the refinancing of our Senior Secured Credit Facility in 2015 and 2014. Otherincome(expense),net
Other income (expense), net , includes items deemed to be non-operating based on management’s assessment of the nature of the item inrelation to our core operations:
FISCAL YEAR FISCAL YEAR
(dollars in millions): 2016 2015 Change 2015 2014 ChangeOther income (expense), net $ 1.6 $ (0.9) $ 2.5 $ (0.9) $ (1.2) $ 0.3
We recorded other income (expense) primarily in connection with: (i) the gain on sale of Outback Steakhouse South Korea in fiscal year2016, (ii) the loss on sale of our Roy’s business during fiscal year 2015 and (iii) the loss on sale of an Outback Steakhouse restaurant inMexico in fiscal year 2014.
42
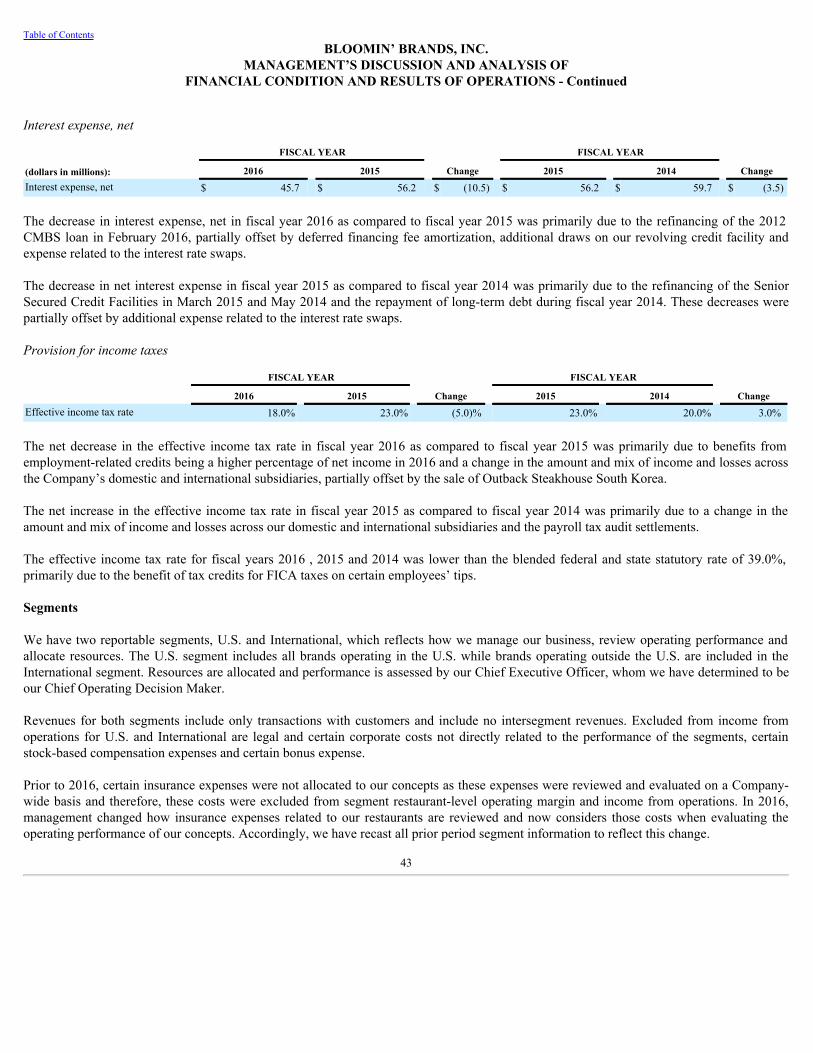
Table of ContentsBLOOMIN’ BRANDS, INC.
MANAGEMENT’S DISCUSSION AND ANALYSIS OFFINANCIAL CONDITION AND RESULTS OF OPERATIONS - Continued
Interestexpense,net
FISCAL YEAR FISCAL YEAR
(dollars in millions): 2016 2015 Change 2015 2014 ChangeInterest expense, net $ 45.7 $ 56.2 $ (10.5) $ 56.2 $ 59.7 $ (3.5)
The decrease in interest expense, net in fiscal year 2016 as compared to fiscal year 2015 was primarily due to the refinancing of the 2012CMBS loan in February 2016, partially offset by deferred financing fee amortization, additional draws on our revolving credit facility andexpense related to the interest rate swaps.
The decrease in net interest expense in fiscal year 2015 as compared to fiscal year 2014 was primarily due to the refinancing of the SeniorSecured Credit Facilities in March 2015 and May 2014 and the repayment of long-term debt during fiscal year 2014. These decreases werepartially offset by additional expense related to the interest rate swaps.
Provisionforincometaxes
FISCAL YEAR FISCAL YEAR 2016 2015 Change 2015 2014 ChangeEffective income tax rate 18.0% 23.0% (5.0)% 23.0% 20.0% 3.0%
The net decrease in the effective income tax rate in fiscal year 2016 as compared to fiscal year 2015 was primarily due to benefits fromemployment-related credits being a higher percentage of net income in 2016 and a change in the amount and mix of income and losses acrossthe Company’s domestic and international subsidiaries, partially offset by the sale of Outback Steakhouse South Korea.
The net increase in the effective income tax rate in fiscal year 2015 as compared to fiscal year 2014 was primarily due to a change in theamount and mix of income and losses across our domestic and international subsidiaries and the payroll tax audit settlements.
The effective income tax rate for fiscal years 2016 , 2015 and 2014 was lower than the blended federal and state statutory rate of 39.0%,primarily due to the benefit of tax credits for FICA taxes on certain employees’ tips.
Segments
We have two reportable segments, U.S. and International, which reflects how we manage our business, review operating performance andallocate resources. The U.S. segment includes all brands operating in the U.S. while brands operating outside the U.S. are included in theInternational segment. Resources are allocated and performance is assessed by our Chief Executive Officer, whom we have determined to beour Chief Operating Decision Maker.
Revenues for both segments include only transactions with customers and include no intersegment revenues. Excluded from income fromoperations for U.S. and International are legal and certain corporate costs not directly related to the performance of the segments, certainstock-based compensation expenses and certain bonus expense.
Prior to 2016, certain insurance expenses were not allocated to our concepts as these expenses were reviewed and evaluated on a Company-wide basis and therefore, these costs were excluded from segment restaurant-level operating margin and income from operations. In 2016,management changed how insurance expenses related to our restaurants are reviewed and now considers those costs when evaluating theoperating performance of our concepts. Accordingly, we have recast all prior period segment information to reflect this change.
43
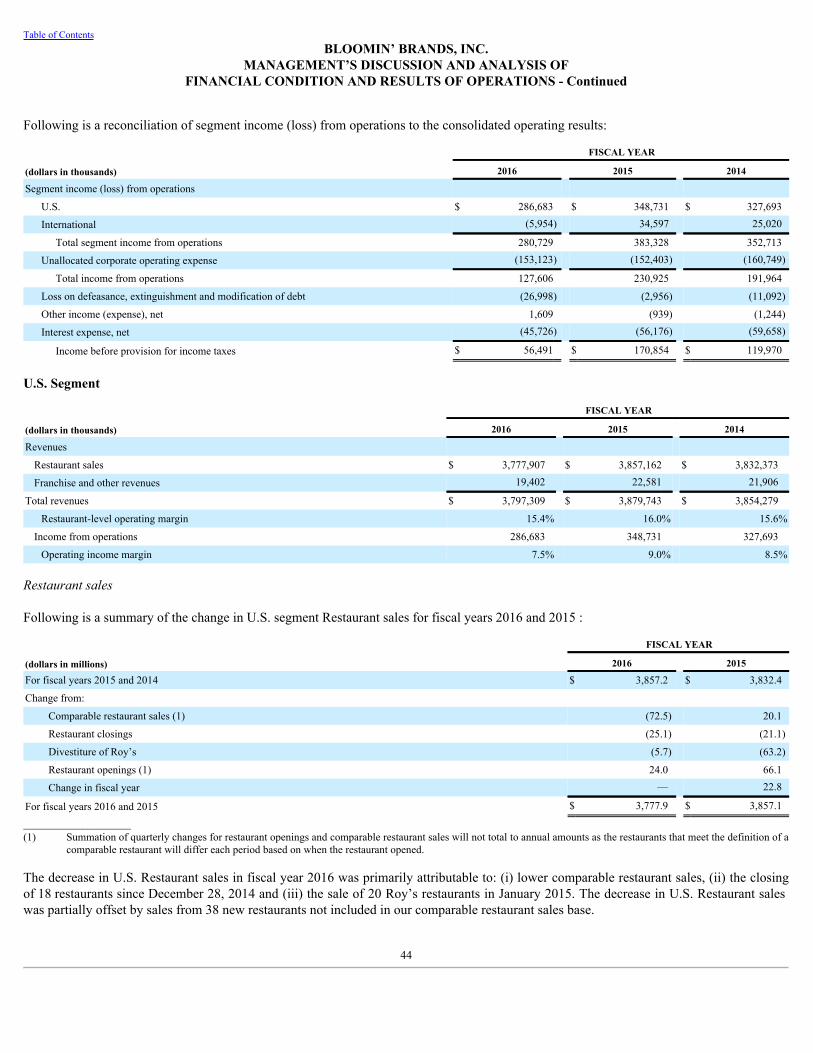
Table of ContentsBLOOMIN’ BRANDS, INC.
MANAGEMENT’S DISCUSSION AND ANALYSIS OFFINANCIAL CONDITION AND RESULTS OF OPERATIONS - Continued
Following is a reconciliation of segment income (loss) from operations to the consolidated operating results:
FISCAL YEAR
(dollars in thousands) 2016 2015 2014
Segment income (loss) from operations U.S. $ 286,683 $ 348,731 $ 327,693
International (5,954) 34,597 25,020
Total segment income from operations 280,729 383,328 352,713
Unallocated corporate operating expense (153,123) (152,403) (160,749)
Total income from operations 127,606 230,925 191,964
Loss on defeasance, extinguishment and modification of debt (26,998) (2,956) (11,092)
Other income (expense), net 1,609 (939) (1,244)
Interest expense, net (45,726) (56,176) (59,658)
Income before provision for income taxes $ 56,491 $ 170,854 $ 119,970
U.S. Segment
FISCAL YEAR
(dollars in thousands) 2016 2015 2014
Revenues Restaurant sales $ 3,777,907 $ 3,857,162 $ 3,832,373
Franchise and other revenues 19,402 22,581 21,906
Total revenues $ 3,797,309 $ 3,879,743 $ 3,854,279
Restaurant-level operating margin 15.4% 16.0% 15.6%
Income from operations 286,683 348,731 327,693
Operating income margin 7.5% 9.0% 8.5%
Restaurantsales
Following is a summary of the change in U.S. segment Restaurant sales for fiscal years 2016 and 2015 :
FISCAL YEAR
(dollars in millions) 2016 2015
For fiscal years 2015 and 2014 $ 3,857.2 $ 3,832.4
Change from: Comparable restaurant sales (1) (72.5) 20.1
Restaurant closings (25.1) (21.1)
Divestiture of Roy’s (5.7) (63.2)
Restaurant openings (1) 24.0 66.1
Change in fiscal year — 22.8
For fiscal years 2016 and 2015 $ 3,777.9 $ 3,857.1
____________________(1) Summation of quarterly changes for restaurant openings and comparable restaurant sales will not total to annual amounts as the restaurants that meet the definition of a
comparable restaurant will differ each period based on when the restaurant opened.
The decrease in U.S. Restaurant sales in fiscal year 2016 was primarily attributable to: (i) lower comparable restaurant sales, (ii) the closingof 18 restaurants since December 28, 2014 and (iii) the sale of 20 Roy’s restaurants in January 2015. The decrease in U.S. Restaurant saleswas partially offset by sales from 38 new restaurants not included in our comparable restaurant sales base.
44
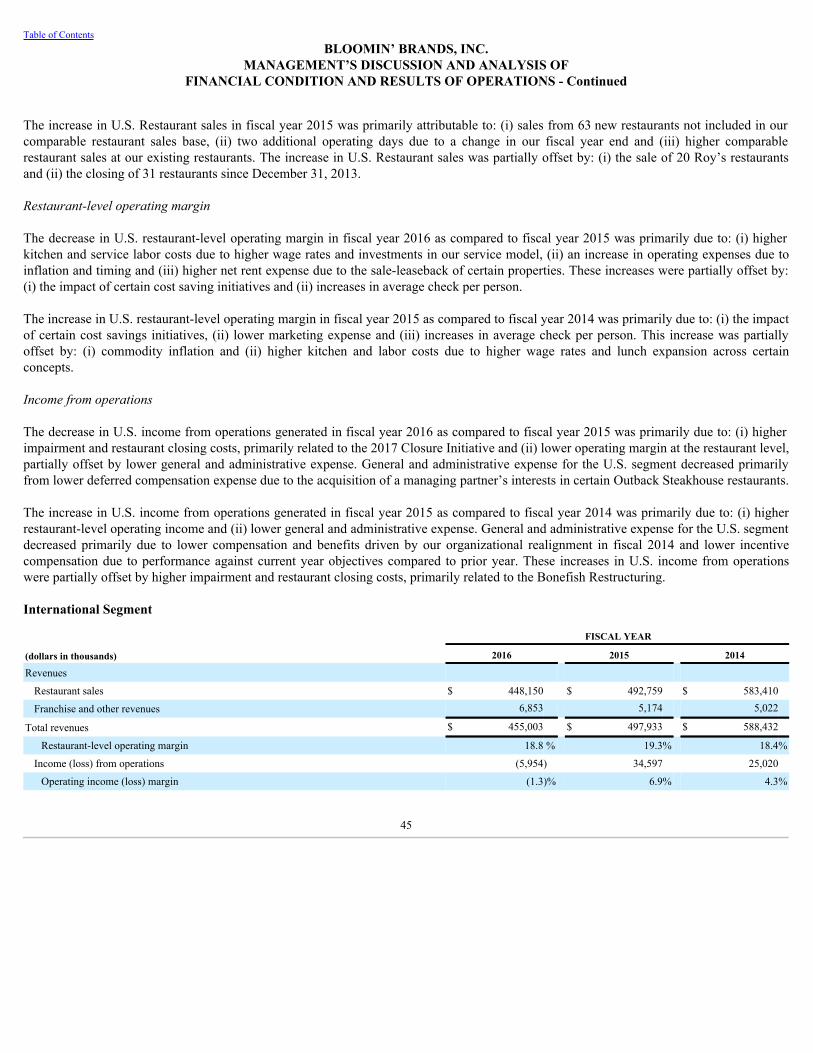
Table of ContentsBLOOMIN’ BRANDS, INC.
MANAGEMENT’S DISCUSSION AND ANALYSIS OFFINANCIAL CONDITION AND RESULTS OF OPERATIONS - Continued
The increase in U.S. Restaurant sales in fiscal year 2015 was primarily attributable to: (i) sales from 63 new restaurants not included in ourcomparable restaurant sales base, (ii) two additional operating days due to a change in our fiscal year end and (iii) higher comparablerestaurant sales at our existing restaurants. The increase in U.S. Restaurant sales was partially offset by: (i) the sale of 20 Roy’s restaurantsand (ii) the closing of 31 restaurants since December 31, 2013.
Restaurant-leveloperatingmargin
The decrease in U.S. restaurant-level operating margin in fiscal year 2016 as compared to fiscal year 2015 was primarily due to: (i) higherkitchen and service labor costs due to higher wage rates and investments in our service model, (ii) an increase in operating expenses due toinflation and timing and (iii) higher net rent expense due to the sale-leaseback of certain properties. These increases were partially offset by:(i) the impact of certain cost saving initiatives and (ii) increases in average check per person.
The increase in U.S. restaurant-level operating margin in fiscal year 2015 as compared to fiscal year 2014 was primarily due to: (i) the impactof certain cost savings initiatives, (ii) lower marketing expense and (iii) increases in average check per person. This increase was partiallyoffset by: (i) commodity inflation and (ii) higher kitchen and labor costs due to higher wage rates and lunch expansion across certainconcepts.
Incomefromoperations
The decrease in U.S. income from operations generated in fiscal year 2016 as compared to fiscal year 2015 was primarily due to: (i) higherimpairment and restaurant closing costs, primarily related to the 2017 Closure Initiative and (ii) lower operating margin at the restaurant level,partially offset by lower general and administrative expense. General and administrative expense for the U.S. segment decreased primarilyfrom lower deferred compensation expense due to the acquisition of a managing partner’s interests in certain Outback Steakhouse restaurants.
The increase in U.S. income from operations generated in fiscal year 2015 as compared to fiscal year 2014 was primarily due to: (i) higherrestaurant-level operating income and (ii) lower general and administrative expense. General and administrative expense for the U.S. segmentdecreased primarily due to lower compensation and benefits driven by our organizational realignment in fiscal 2014 and lower incentivecompensation due to performance against current year objectives compared to prior year. These increases in U.S. income from operationswere partially offset by higher impairment and restaurant closing costs, primarily related to the Bonefish Restructuring.
International Segment
FISCAL YEAR
(dollars in thousands) 2016 2015 2014
Revenues Restaurant sales $ 448,150 $ 492,759 $ 583,410
Franchise and other revenues 6,853 5,174 5,022
Total revenues $ 455,003 $ 497,933 $ 588,432
Restaurant-level operating margin 18.8 % 19.3% 18.4%
Income (loss) from operations (5,954) 34,597 25,020
Operating income (loss) margin (1.3)% 6.9% 4.3%
45
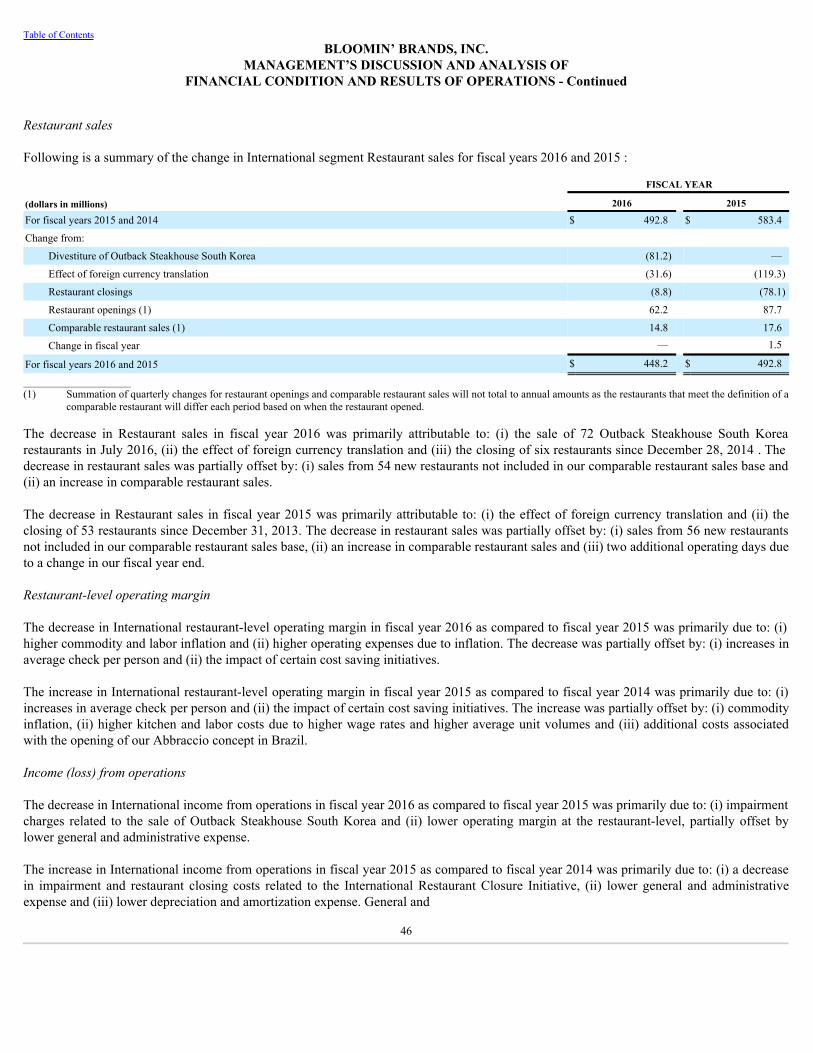
Table of ContentsBLOOMIN’ BRANDS, INC.
MANAGEMENT’S DISCUSSION AND ANALYSIS OFFINANCIAL CONDITION AND RESULTS OF OPERATIONS - Continued
Restaurantsales
Following is a summary of the change in International segment Restaurant sales for fiscal years 2016 and 2015 :
FISCAL YEAR
(dollars in millions) 2016 2015
For fiscal years 2015 and 2014 $ 492.8 $ 583.4
Change from: Divestiture of Outback Steakhouse South Korea (81.2) —
Effect of foreign currency translation (31.6) (119.3)
Restaurant closings (8.8) (78.1)
Restaurant openings (1) 62.2 87.7
Comparable restaurant sales (1) 14.8 17.6
Change in fiscal year — 1.5
For fiscal years 2016 and 2015 $ 448.2 $ 492.8
____________________(1) Summation of quarterly changes for restaurant openings and comparable restaurant sales will not total to annual amounts as the restaurants that meet the definition of a
comparable restaurant will differ each period based on when the restaurant opened.
The decrease in Restaurant sales in fiscal year 2016 was primarily attributable to: (i) the sale of 72 Outback Steakhouse South Korearestaurants in July 2016, (ii) the effect of foreign currency translation and (iii) the closing of six restaurants since December 28, 2014 . Thedecrease in restaurant sales was partially offset by: (i) sales from 54 new restaurants not included in our comparable restaurant sales base and(ii) an increase in comparable restaurant sales.
The decrease in Restaurant sales in fiscal year 2015 was primarily attributable to: (i) the effect of foreign currency translation and (ii) theclosing of 53 restaurants since December 31, 2013. The decrease in restaurant sales was partially offset by: (i) sales from 56 new restaurantsnot included in our comparable restaurant sales base, (ii) an increase in comparable restaurant sales and (iii) two additional operating days dueto a change in our fiscal year end.
Restaurant-leveloperatingmargin
The decrease in International restaurant-level operating margin in fiscal year 2016 as compared to fiscal year 2015 was primarily due to: (i)higher commodity and labor inflation and (ii) higher operating expenses due to inflation. The decrease was partially offset by: (i) increases inaverage check per person and (ii) the impact of certain cost saving initiatives.
The increase in International restaurant-level operating margin in fiscal year 2015 as compared to fiscal year 2014 was primarily due to: (i)increases in average check per person and (ii) the impact of certain cost saving initiatives. The increase was partially offset by: (i) commodityinflation, (ii) higher kitchen and labor costs due to higher wage rates and higher average unit volumes and (iii) additional costs associatedwith the opening of our Abbraccio concept in Brazil.
Income(loss)fromoperations
The decrease in International income from operations in fiscal year 2016 as compared to fiscal year 2015 was primarily due to: (i) impairmentcharges related to the sale of Outback Steakhouse South Korea and (ii) lower operating margin at the restaurant-level, partially offset bylower general and administrative expense.
The increase in International income from operations in fiscal year 2015 as compared to fiscal year 2014 was primarily due to: (i) a decreasein impairment and restaurant closing costs related to the International Restaurant Closure Initiative, (ii) lower general and administrativeexpense and (iii) lower depreciation and amortization expense. General and
46

Table of ContentsBLOOMIN’ BRANDS, INC.
MANAGEMENT’S DISCUSSION AND ANALYSIS OFFINANCIAL CONDITION AND RESULTS OF OPERATIONS - Continued
administrative expense for the International segment decreased primarily due to the impact of foreign currency translation, partially offset byincreased compensation and benefits.
Non-GAAP Financial Measures
In addition to the results provided in accordance with U.S. GAAP, we provide certain non-GAAP measures, which present operating resultson an adjusted basis. These are supplemental measures of performance that are not required by or presented in accordance with U.S. GAAPand include the following: (i) system-wide sales, (ii) Adjusted restaurant-level operating margins, (iii) Adjusted income from operations andthe corresponding margins, (iv) Adjusted net income and (v) Adjusted diluted earnings per share.
We believe that our use of non-GAAP financial measures permits investors to assess the operating performance of our business relative to ourperformance based on U.S. GAAP results and relative to other companies within the restaurant industry by isolating the effects of certainitems that may vary from period to period without correlation to core operating performance or that vary widely among similar companies.However, our inclusion of these adjusted measures should not be construed as an indication that our future results will be unaffected byunusual or infrequent items or that the items for which we have made adjustments are unusual or infrequent or will not recur. We believe thatthe disclosure of these non-GAAP measures is useful to investors as they form part of the basis for how our management team and Board ofDirectors evaluate our operating performance, allocate resources and establish employee incentive plans.
These non-GAAP financial measures are not intended to replace U.S. GAAP financial measures, and they are not necessarily standardized orcomparable to similarly titled measures used by other companies. We maintain internal guidelines with respect to the types of adjustments weinclude in our non-GAAP measures. These guidelines endeavor to differentiate between types of gains and expenses that are reflective of ourcore operations in a period, and those that may vary from period to period without correlation to our core performance in that period.However, implementation of these guidelines necessarily involves the application of judgment, and the treatment of any items not directlyaddressed by, or changes to, our guidelines will be considered by our disclosure committee. Refer to the reconciliations of non-GAAPmeasures for descriptions of the actual adjustments made in the current period and the corresponding prior period.
Based on a review of our non-GAAP presentations, we have determined that, commencing with our results for the first fiscal quarter of 2017,when presenting the non-GAAP measures Adjusted income from operations and the corresponding margins, Adjusted net income andAdjusted diluted earnings per share, we will no longer adjust for expenses incurred in connection with our remodel program or intangibleamortization recorded as a result of the acquisition of our Brazil operations. We intend to recast the historical comparable periods presented inour future filings to conform to the revised presentation.
System-WideSales
System-wide sales is a non-GAAP financial measure that includes sales of all restaurants operating under our brand names, whether we ownthem or not. Management uses this information to make decisions about future plans for the development of additional restaurants and newconcepts, as well as evaluation of current operations. System-wide sales comprise sales of Company-owned and franchised restaurants and, inhistorical periods, sales of unconsolidated joint venture restaurants.
47
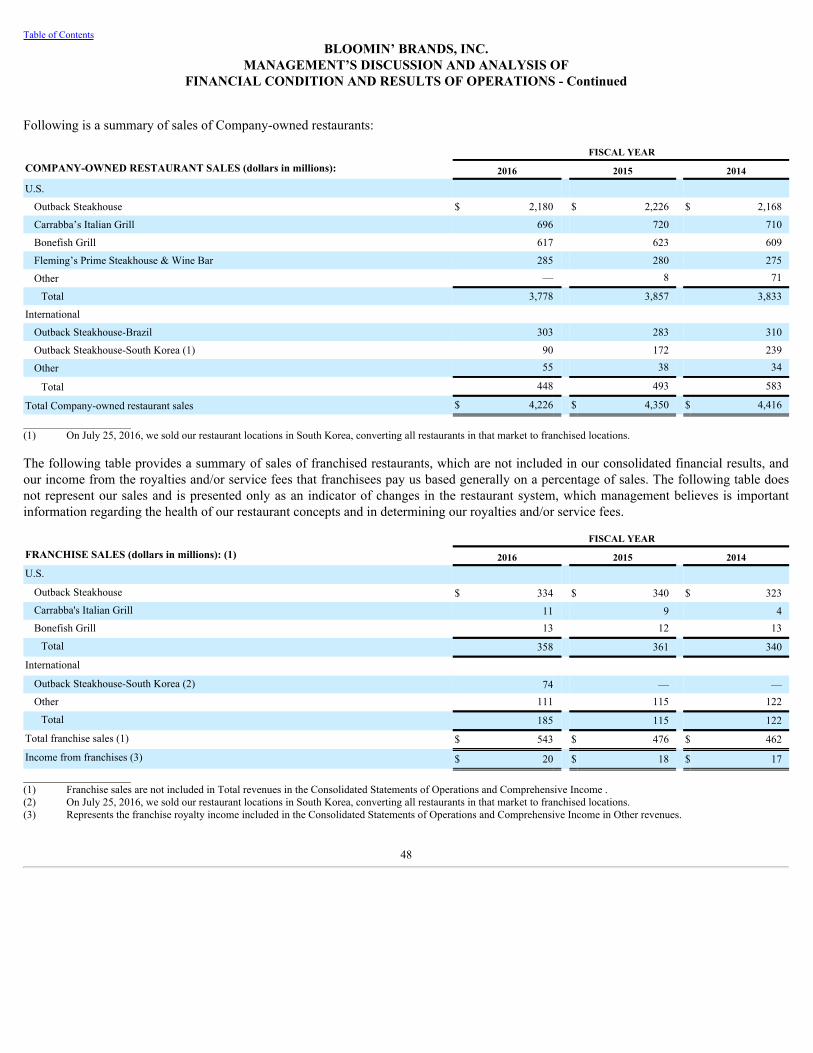
Table of ContentsBLOOMIN’ BRANDS, INC.
MANAGEMENT’S DISCUSSION AND ANALYSIS OFFINANCIAL CONDITION AND RESULTS OF OPERATIONS - Continued
Following is a summary of sales of Company-owned restaurants:
FISCAL YEARCOMPANY-OWNED RESTAURANT SALES (dollars in millions): 2016 2015 2014
U.S. Outback Steakhouse $ 2,180 $ 2,226 $ 2,168
Carrabba’s Italian Grill 696 720 710
Bonefish Grill 617 623 609
Fleming’s Prime Steakhouse & Wine Bar 285 280 275
Other — 8 71
Total 3,778 3,857 3,833
International Outback Steakhouse-Brazil 303 283 310
Outback Steakhouse-South Korea (1) 90 172 239
Other 55 38 34
Total 448 493 583
Total Company-owned restaurant sales $ 4,226 $ 4,350 $ 4,416
____________________(1) On July 25, 2016, we sold our restaurant locations in South Korea, converting all restaurants in that market to franchised locations.
The following table provides a summary of sales of franchised restaurants, which are not included in our consolidated financial results, andour income from the royalties and/or service fees that franchisees pay us based generally on a percentage of sales. The following table doesnot represent our sales and is presented only as an indicator of changes in the restaurant system, which management believes is importantinformation regarding the health of our restaurant concepts and in determining our royalties and/or service fees.
FISCAL YEARFRANCHISE SALES (dollars in millions): (1) 2016 2015 2014U.S.
Outback Steakhouse $ 334 $ 340 $ 323Carrabba's Italian Grill 11 9 4Bonefish Grill 13 12 13
Total 358 361 340
International Outback Steakhouse-South Korea (2) 74 — —Other 111 115 122
Total 185 115 122
Total franchise sales (1) $ 543 $ 476 $ 462
Income from franchises (3) $ 20 $ 18 $ 17
____________________(1) Franchise sales are not included in Total revenues in the Consolidated Statements of Operations and Comprehensive Income .(2) On July 25, 2016, we sold our restaurant locations in South Korea, converting all restaurants in that market to franchised locations.(3) Represents the franchise royalty income included in the Consolidated Statements of Operations and Comprehensive Income in Other revenues.
48
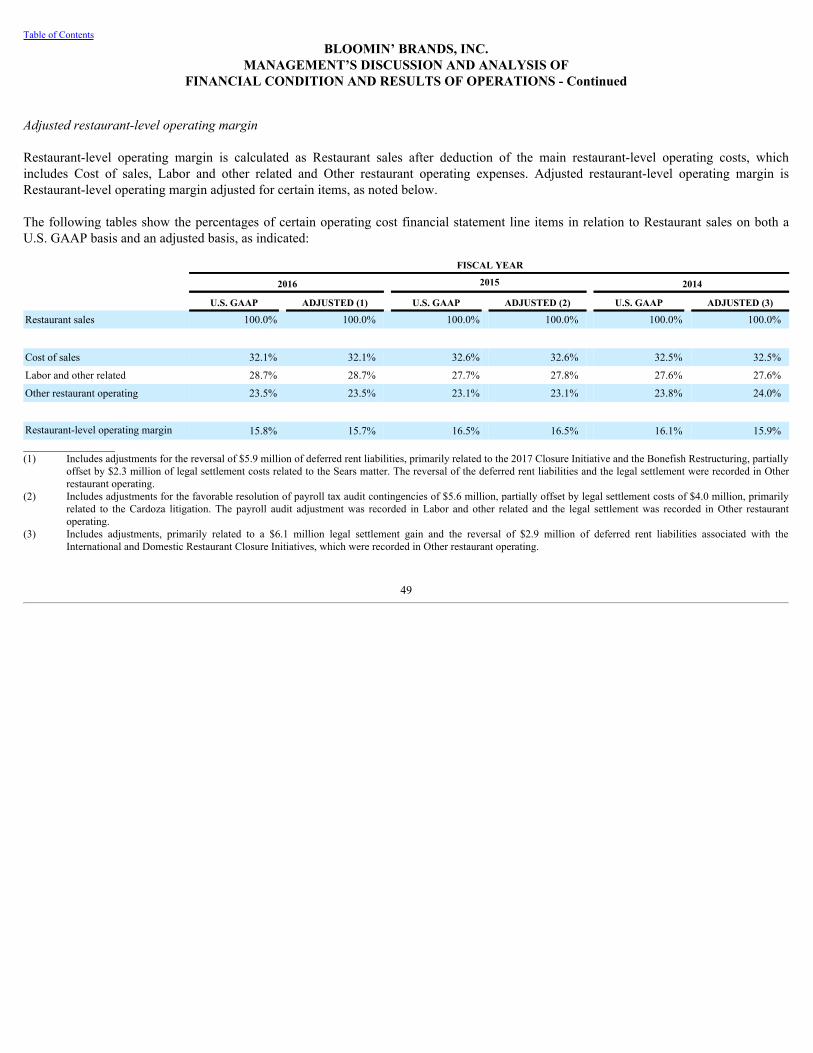
Table of ContentsBLOOMIN’ BRANDS, INC.
MANAGEMENT’S DISCUSSION AND ANALYSIS OFFINANCIAL CONDITION AND RESULTS OF OPERATIONS - Continued
Adjustedrestaurant-leveloperatingmargin
Restaurant-level operating margin is calculated as Restaurant sales after deduction of the main restaurant-level operating costs, whichincludes Cost of sales, Labor and other related and Other restaurant operating expenses. Adjusted restaurant-level operating margin isRestaurant-level operating margin adjusted for certain items, as noted below.
The following tables show the percentages of certain operating cost financial statement line items in relation to Restaurant sales on both aU.S. GAAP basis and an adjusted basis, as indicated:
FISCAL YEAR
2016 2015 2014
U.S. GAAP ADJUSTED (1) U.S. GAAP ADJUSTED (2) U.S. GAAP ADJUSTED (3)
Restaurant sales 100.0% 100.0% 100.0% 100.0% 100.0% 100.0%
Cost of sales 32.1% 32.1% 32.6% 32.6% 32.5% 32.5%
Labor and other related 28.7% 28.7% 27.7% 27.8% 27.6% 27.6%
Other restaurant operating 23.5% 23.5% 23.1% 23.1% 23.8% 24.0%
Restaurant-level operating margin 15.8% 15.7% 16.5% 16.5% 16.1% 15.9%_________________(1) Includes adjustments for the reversal of $5.9 million of deferred rent liabilities, primarily related to the 2017 Closure Initiative and the Bonefish Restructuring, partially
offset by $2.3 million of legal settlement costs related to the Sears matter. The reversal of the deferred rent liabilities and the legal settlement were recorded in Otherrestaurant operating.
(2) Includes adjustments for the favorable resolution of payroll tax audit contingencies of $5.6 million, partially offset by legal settlement costs of $4.0 million, primarilyrelated to the Cardoza litigation. The payroll audit adjustment was recorded in Labor and other related and the legal settlement was recorded in Other restaurantoperating.
(3) Includes adjustments, primarily related to a $6.1 million legal settlement gain and the reversal of $2.9 million of deferred rent liabilities associated with theInternational and Domestic Restaurant Closure Initiatives, which were recorded in Other restaurant operating.
49
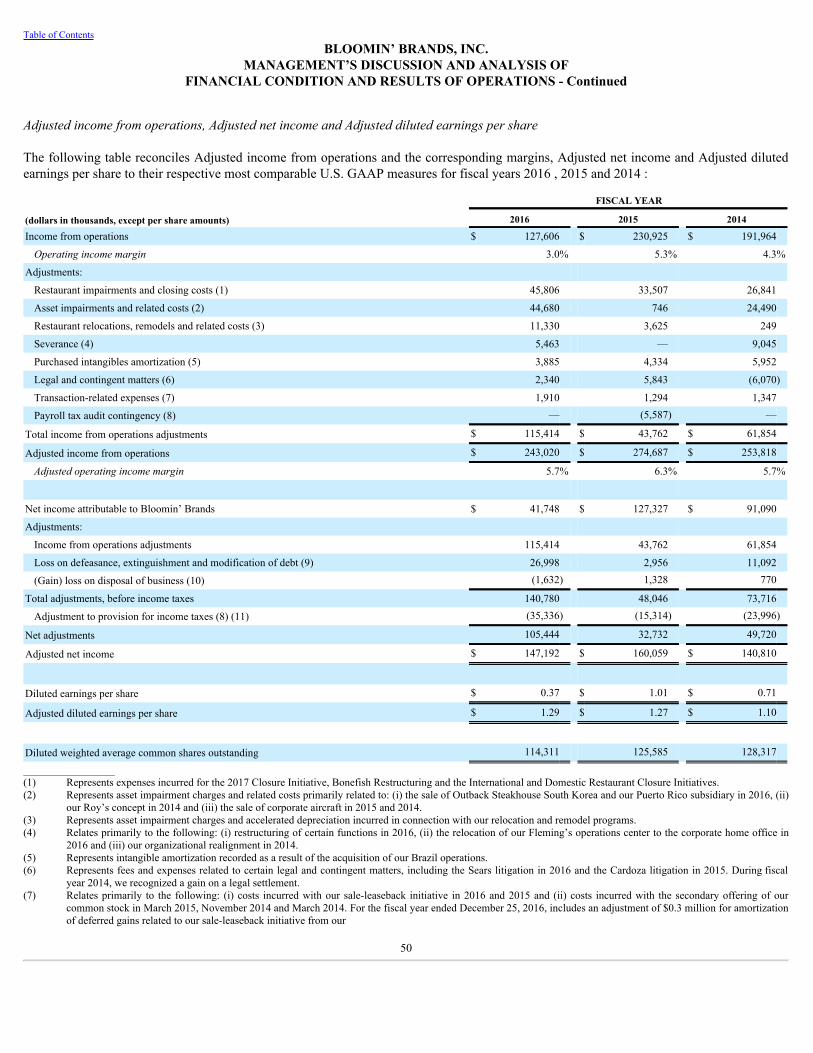
Table of ContentsBLOOMIN’ BRANDS, INC.
MANAGEMENT’S DISCUSSION AND ANALYSIS OFFINANCIAL CONDITION AND RESULTS OF OPERATIONS - Continued
Adjustedincomefromoperations,AdjustednetincomeandAdjusteddilutedearningspershare
The following table reconciles Adjusted income from operations and the corresponding margins, Adjusted net income and Adjusted dilutedearnings per share to their respective most comparable U.S. GAAP measures for fiscal years 2016 , 2015 and 2014 :
FISCAL YEAR
(dollars in thousands, except per share amounts) 2016 2015 2014
Income from operations $ 127,606 $ 230,925 $ 191,964
Operatingincomemargin 3.0% 5.3% 4.3%
Adjustments: Restaurant impairments and closing costs (1) 45,806 33,507 26,841
Asset impairments and related costs (2) 44,680 746 24,490
Restaurant relocations, remodels and related costs (3) 11,330 3,625 249
Severance (4) 5,463 — 9,045
Purchased intangibles amortization (5) 3,885 4,334 5,952
Legal and contingent matters (6) 2,340 5,843 (6,070)
Transaction-related expenses (7) 1,910 1,294 1,347
Payroll tax audit contingency (8) — (5,587) —
Total income from operations adjustments $ 115,414 $ 43,762 $ 61,854
Adjusted income from operations $ 243,020 $ 274,687 $ 253,818
Adjustedoperatingincomemargin 5.7% 6.3% 5.7%
Net income attributable to Bloomin’ Brands $ 41,748 $ 127,327 $ 91,090
Adjustments: Income from operations adjustments 115,414 43,762 61,854
Loss on defeasance, extinguishment and modification of debt (9) 26,998 2,956 11,092
(Gain) loss on disposal of business (10) (1,632) 1,328 770
Total adjustments, before income taxes 140,780 48,046 73,716
Adjustment to provision for income taxes (8) (11) (35,336) (15,314) (23,996)
Net adjustments 105,444 32,732 49,720
Adjusted net income $ 147,192 $ 160,059 $ 140,810
Diluted earnings per share $ 0.37 $ 1.01 $ 0.71
Adjusted diluted earnings per share $ 1.29 $ 1.27 $ 1.10
Diluted weighted average common shares outstanding 114,311 125,585 128,317
_________________(1) Represents expenses incurred for the 2017 Closure Initiative, Bonefish Restructuring and the International and Domestic Restaurant Closure Initiatives.(2) Represents asset impairment charges and related costs primarily related to: (i) the sale of Outback Steakhouse South Korea and our Puerto Rico subsidiary in 2016, (ii)
our Roy’s concept in 2014 and (iii) the sale of corporate aircraft in 2015 and 2014.(3) Represents asset impairment charges and accelerated depreciation incurred in connection with our relocation and remodel programs.(4) Relates primarily to the following: (i) restructuring of certain functions in 2016, (ii) the relocation of our Fleming’s operations center to the corporate home office in
2016 and (iii) our organizational realignment in 2014.(5) Represents intangible amortization recorded as a result of the acquisition of our Brazil operations.(6) Represents fees and expenses related to certain legal and contingent matters, including the Sears litigation in 2016 and the Cardoza litigation in 2015. During fiscal
year 2014, we recognized a gain on a legal settlement.(7) Relates primarily to the following: (i) costs incurred with our sale-leaseback initiative in 2016 and 2015 and (ii) costs incurred with the secondary offering of our
common stock in March 2015, November 2014 and March 2014. For the fiscal year ended December 25, 2016, includes an adjustment of $0.3 million for amortizationof deferred gains related to our sale-leaseback initiative from our
50
Table of ContentsBLOOMIN’ BRANDS, INC.
MANAGEMENT’S DISCUSSION AND ANALYSIS OFFINANCIAL CONDITION AND RESULTS OF OPERATIONS - Continued
second fiscal quarter. Subsequent to the second quarter, based on an ongoing review of our non-GAAP presentations, we determined not to adjust for this item. We donot consider this change material to the historical periods presented.
(8) Relates to a payroll tax audit contingency adjustment for the employer’s share of FICA taxes related to cash tips allegedly received and unreported by our employeesduring calendar year 2011, which is recorded in Labor and other related expenses. In addition, a deferred income tax adjustment has been recorded for the allowableincome tax credits for the employer’s share of FICA taxes expected to be paid, which is included in Provision for income taxes and offsets the adjustment to Labor andother related expenses. As a result, there is no impact to Net income from this adjustment.
(9) Relates to: (i) the amendment of the PRP Mortgage Loan and defeasance of the 2012 CMBS loan in 2016 and (ii) the refinancing of our Senior Secured Credit Facilityin 2015 and 2014.
(10) Primarily relates to the sale of Outback Steakhouse South Korea in 2016 and Roy’s in 2015.(11) Represents income tax effect of the adjustments, on a jurisdiction basis. Included in the adjustment for fiscal year 2016 is $2.4 million for a tax obligation related to the
Outback Steakhouse South Korea sale. Additionally, for fiscal year 2015, a deferred income tax adjustment has been recorded for the allowable income tax credits forthe employer’s share of FICA taxes expected to be paid. See footnote 8 to this table.
51
Table of ContentsBLOOMIN’ BRANDS, INC.
MANAGEMENT’S DISCUSSION AND ANALYSIS OFFINANCIAL CONDITION AND RESULTS OF OPERATIONS - Continued
Liquidity and Capital Resources
LIQUIDITY
Our liquidity sources consist of cash flow from our operations, cash and cash equivalents and credit capacity under our credit facilities. Weexpect to use cash primarily for general operating expenses, share repurchases and dividend payments, remodeling or relocating olderrestaurants, development of new restaurants and new markets, principal and interest payments on our debt, obligations related to our deferredcompensation plans and investments in technology.
We believe that our expected liquidity sources are adequate to fund debt service requirements, lease obligations, capital expenditures andworking capital obligations for the next 12 months. However, our ability to continue to meet these requirements and obligations will dependon, among other things, our ability to achieve anticipated levels of revenue and cash flow and our ability to manage costs and working capitalsuccessfully.
CashandCashEquivalents- As of December 25, 2016 , we had $127.2 million in cash and cash equivalents, of which $33.6 million washeld by foreign affiliates, a portion of which would be subject to additional taxes if repatriated to the United States. The internationaljurisdictions in which we have significant cash do not have any known restrictions that would prohibit the repatriation of cash and cashequivalents.
We had aggregate undistributed earnings of $60.6 million for foreign subsidiaries as of December 25, 2016 , which we consider to bepermanently reinvested and are expected to continue to be permanently reinvested. It is not practical to determine the amount of unrecognizeddeferred income tax liabilities on the undistributed earnings we consider to be permanently reinvested.
SaleofOutbackSteakhouseSouthKorea- On July 25, 2016, we completed the sale of Outback Steakhouse South Korea for a purchase priceof $50.0 million .
Sale-LeasebackTransactions-During fiscal year 2016, we entered into sale-leaseback transactions with third-parties in which we sold 159restaurant properties at fair market value for gross proceeds of $560.4 million . With the proceeds from these transactions, we made paymentsof $322.3 million on our PRP Mortgage Loan.
Subsequent to December 25, 2016 , we entered into sale-leaseback transactions with third-parties in which we sold six restaurant properties atfair market value for gross proceeds of $21.6 million .
Restructuring- Total aggregate future undiscounted cash expenditures of $41.6 million to $49.5 million for the 2017 Closure Initiative andBonefish Restructuring, primarily related to lease liabilities, are expected to occur over the remaining lease terms with the final term ending inJanuary 2029 .
CapitalExpenditures- We estimate that our capital expenditures will total between $260.0 million and $280.0 million in 2017 . The amountof actual capital expenditures may be affected by general economic, financial, competitive, legislative and regulatory factors, among otherthings, including restrictions imposed by our borrowing arrangements.
52
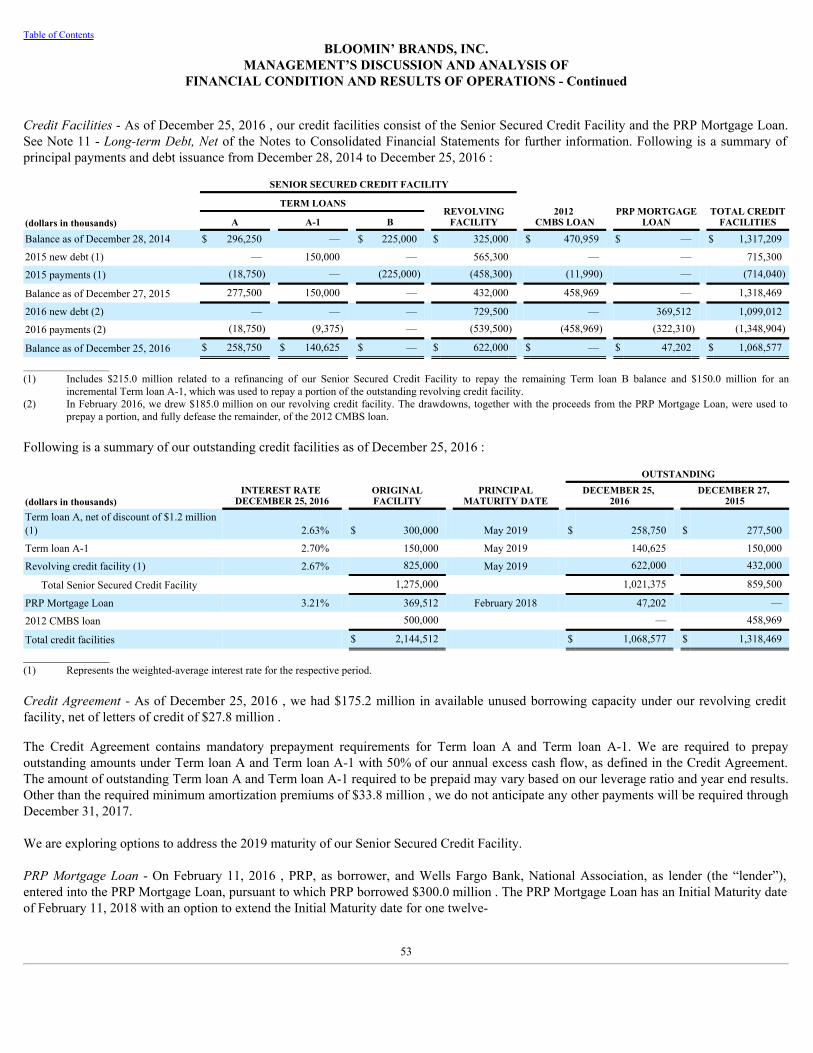
Table of ContentsBLOOMIN’ BRANDS, INC.
MANAGEMENT’S DISCUSSION AND ANALYSIS OFFINANCIAL CONDITION AND RESULTS OF OPERATIONS - Continued
CreditFacilities- As of December 25, 2016 , our credit facilities consist of the Senior Secured Credit Facility and the PRP Mortgage Loan.See Note 11 - Long-termDebt, Netof the Notes to Consolidated Financial Statements for further information. Following is a summary ofprincipal payments and debt issuance from December 28, 2014 to December 25, 2016 :
SENIOR SECURED CREDIT FACILITY
2012 CMBS LOAN
PRP MORTGAGELOAN
TOTAL CREDITFACILITIES
TERM LOANS REVOLVING
FACILITY
(dollars in thousands) A A-1 B Balance as of December 28, 2014 $ 296,250 — $ 225,000 $ 325,000 $ 470,959 $ — $ 1,317,209
2015 new debt (1) — 150,000 — 565,300 — — 715,300
2015 payments (1) (18,750) — (225,000) (458,300) (11,990) — (714,040)
Balance as of December 27, 2015 277,500 150,000 — 432,000 458,969 — 1,318,469
2016 new debt (2) — — — 729,500 — 369,512 1,099,012
2016 payments (2) (18,750) (9,375) — (539,500) (458,969) (322,310) (1,348,904)
Balance as of December 25, 2016 $ 258,750 $ 140,625 $ — $ 622,000 $ — $ 47,202 $ 1,068,577
________________(1) Includes $215.0 million related to a refinancing of our Senior Secured Credit Facility to repay the remaining Term loan B balance and $150.0 million for an
incremental Term loan A-1, which was used to repay a portion of the outstanding revolving credit facility.(2) In February 2016, we drew $185.0 million on our revolving credit facility. The drawdowns, together with the proceeds from the PRP Mortgage Loan, were used to
prepay a portion, and fully defease the remainder, of the 2012 CMBS loan.
Following is a summary of our outstanding credit facilities as of December 25, 2016 :
INTEREST RATE
DECEMBER 25, 2016
ORIGINALFACILITY
PRINCIPAL
MATURITY DATE
OUTSTANDING
(dollars in thousands) DECEMBER 25,
2016 DECEMBER 27,
2015Term loan A, net of discount of $1.2 million(1) 2.63% $ 300,000 May 2019 $ 258,750 $ 277,500
Term loan A-1 2.70% 150,000 May 2019 140,625 150,000
Revolving credit facility (1) 2.67% 825,000 May 2019 622,000 432,000
Total Senior Secured Credit Facility 1,275,000 1,021,375 859,500
PRP Mortgage Loan 3.21% 369,512 February 2018 47,202 —
2012 CMBS loan 500,000 — 458,969
Total credit facilities $ 2,144,512 $ 1,068,577 $ 1,318,469
________________(1) Represents the weighted-average interest rate for the respective period.
Credit Agreement- As of December 25, 2016 , we had $175.2 million in available unused borrowing capacity under our revolving creditfacility, net of letters of credit of $27.8 million .
The Credit Agreement contains mandatory prepayment requirements for Term loan A and Term loan A-1. We are required to prepayoutstanding amounts under Term loan A and Term loan A-1 with 50% of our annual excess cash flow, as defined in the Credit Agreement.The amount of outstanding Term loan A and Term loan A-1 required to be prepaid may vary based on our leverage ratio and year end results.Other than the required minimum amortization premiums of $33.8 million , we do not anticipate any other payments will be required throughDecember 31, 2017.
We are exploring options to address the 2019 maturity of our Senior Secured Credit Facility.
PRPMortgage Loan - On February 11, 2016 , PRP, as borrower, and Wells Fargo Bank, National Association, as lender (the “lender”),entered into the PRP Mortgage Loan, pursuant to which PRP borrowed $300.0 million . The PRP Mortgage Loan has an Initial Maturity dateof February 11, 2018 with an option to extend the Initial Maturity date for one twelve-
53
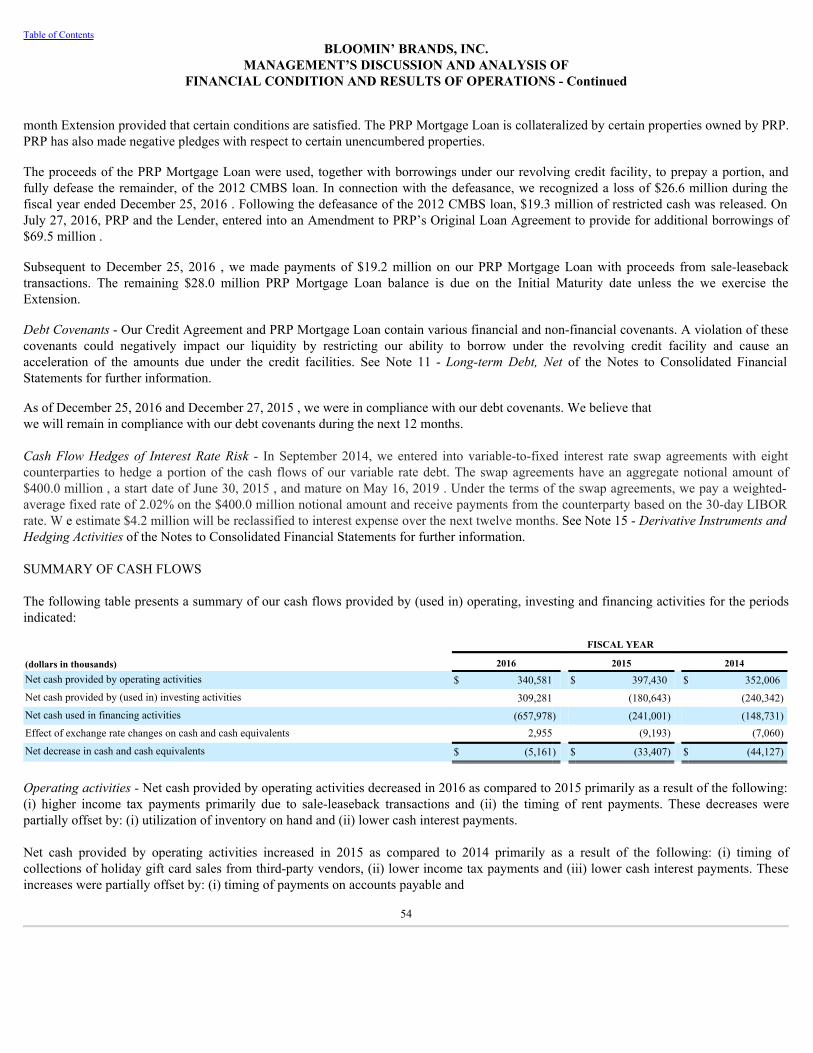
Table of ContentsBLOOMIN’ BRANDS, INC.
MANAGEMENT’S DISCUSSION AND ANALYSIS OFFINANCIAL CONDITION AND RESULTS OF OPERATIONS - Continued
month Extension provided that certain conditions are satisfied. The PRP Mortgage Loan is collateralized by certain properties owned by PRP.PRP has also made negative pledges with respect to certain unencumbered properties.
The proceeds of the PRP Mortgage Loan were used, together with borrowings under our revolving credit facility, to prepay a portion, andfully defease the remainder, of the 2012 CMBS loan. In connection with the defeasance, we recognized a loss of $26.6 million during thefiscal year ended December 25, 2016 . Following the defeasance of the 2012 CMBS loan, $19.3 million of restricted cash was released. OnJuly 27, 2016, PRP and the Lender, entered into an Amendment to PRP’s Original Loan Agreement to provide for additional borrowings of$69.5 million .
Subsequent to December 25, 2016 , we made payments of $19.2 million on our PRP Mortgage Loan with proceeds from sale-leasebacktransactions. The remaining $28.0 million PRP Mortgage Loan balance is due on the Initial Maturity date unless the we exercise theExtension.
DebtCovenants- Our Credit Agreement and PRP Mortgage Loan contain various financial and non-financial covenants. A violation of thesecovenants could negatively impact our liquidity by restricting our ability to borrow under the revolving credit facility and cause anacceleration of the amounts due under the credit facilities. See Note 11 - Long-term Debt, Net of the Notes to Consolidated FinancialStatements for further information.
As of December 25, 2016 and December 27, 2015 , we were in compliance with our debt covenants. We believe thatwe will remain in compliance with our debt covenants during the next 12 months.
Cash Flow Hedges of Interest Rate Risk - In September 2014, we entered into variable-to-fixed interest rate swap agreements with eightcounterparties to hedge a portion of the cash flows of our variable rate debt. The swap agreements have an aggregate notional amount of$400.0 million , a start date of June 30, 2015 , and mature on May 16, 2019 . Under the terms of the swap agreements, we pay a weighted-average fixed rate of 2.02% on the $400.0 million notional amount and receive payments from the counterparty based on the 30-day LIBORrate. W e estimate $4.2 million will be reclassified to interest expense over the next twelve months. See Note 15 - DerivativeInstrumentsandHedgingActivitiesof the Notes to Consolidated Financial Statements for further information.
SUMMARY OF CASH FLOWS
The following table presents a summary of our cash flows provided by (used in) operating, investing and financing activities for the periodsindicated:
FISCAL YEAR
(dollars in thousands) 2016 2015 2014Net cash provided by operating activities $ 340,581 $ 397,430 $ 352,006Net cash provided by (used in) investing activities 309,281 (180,643) (240,342)Net cash used in financing activities (657,978) (241,001) (148,731)Effect of exchange rate changes on cash and cash equivalents 2,955 (9,193) (7,060)
Net decrease in cash and cash equivalents $ (5,161) $ (33,407) $ (44,127)
Operatingactivities-Net cash provided by operating activities decreased in 2016 as compared to 2015 primarily as a result of the following:(i) higher income tax payments primarily due to sale-leaseback transactions and (ii) the timing of rent payments. These decreases werepartially offset by: (i) utilization of inventory on hand and (ii) lower cash interest payments.
Net cash provided by operating activities increased in 2015 as compared to 2014 primarily as a result of the following: (i) timing ofcollections of holiday gift card sales from third-party vendors, (ii) lower income tax payments and (iii) lower cash interest payments. Theseincreases were partially offset by: (i) timing of payments on accounts payable and
54
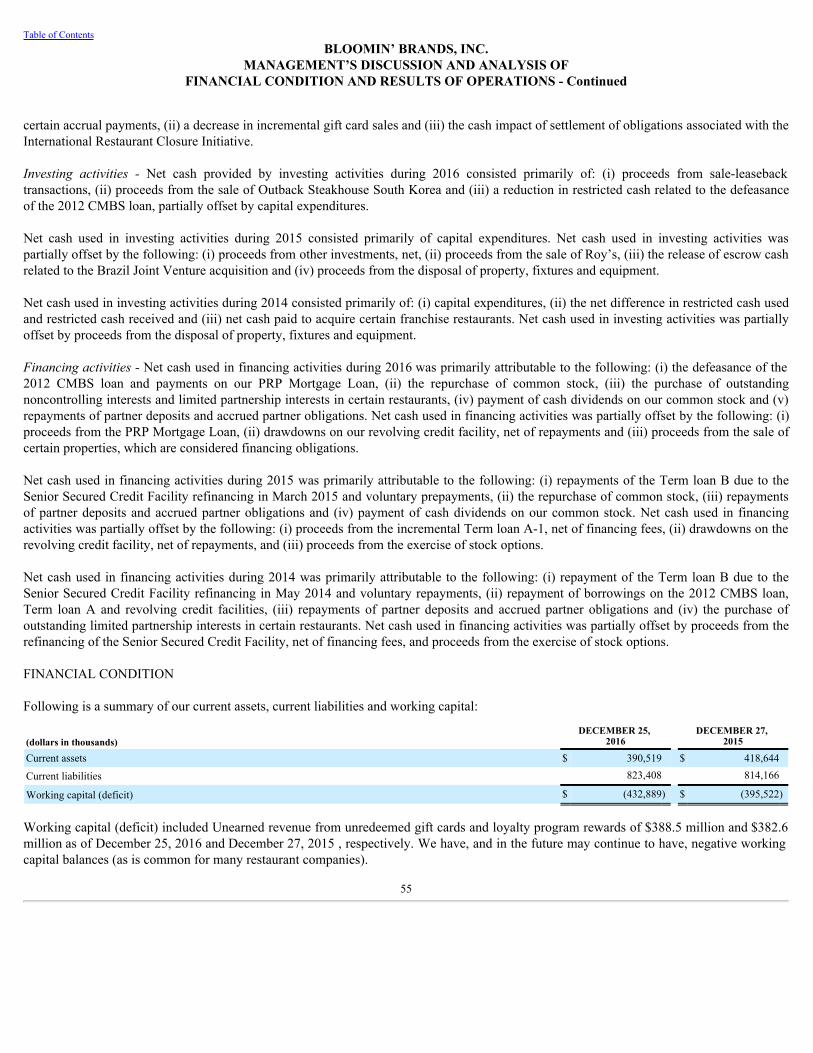
Table of ContentsBLOOMIN’ BRANDS, INC.
MANAGEMENT’S DISCUSSION AND ANALYSIS OFFINANCIAL CONDITION AND RESULTS OF OPERATIONS - Continued
certain accrual payments, (ii) a decrease in incremental gift card sales and (iii) the cash impact of settlement of obligations associated with theInternational Restaurant Closure Initiative.
Investing activities - Net cash provided by investing activities during 2016 consisted primarily of: (i) proceeds from sale-leasebacktransactions, (ii) proceeds from the sale of Outback Steakhouse South Korea and (iii) a reduction in restricted cash related to the defeasanceof the 2012 CMBS loan, partially offset by capital expenditures.
Net cash used in investing activities during 2015 consisted primarily of capital expenditures. Net cash used in investing activities waspartially offset by the following: (i) proceeds from other investments, net, (ii) proceeds from the sale of Roy’s, (iii) the release of escrow cashrelated to the Brazil Joint Venture acquisition and (iv) proceeds from the disposal of property, fixtures and equipment.
Net cash used in investing activities during 2014 consisted primarily of: (i) capital expenditures, (ii) the net difference in restricted cash usedand restricted cash received and (iii) net cash paid to acquire certain franchise restaurants. Net cash used in investing activities was partiallyoffset by proceeds from the disposal of property, fixtures and equipment.
Financingactivities-Net cash used in financing activities during 2016 was primarily attributable to the following: (i) the defeasance of the2012 CMBS loan and payments on our PRP Mortgage Loan, (ii) the repurchase of common stock, (iii) the purchase of outstandingnoncontrolling interests and limited partnership interests in certain restaurants, (iv) payment of cash dividends on our common stock and (v)repayments of partner deposits and accrued partner obligations. Net cash used in financing activities was partially offset by the following: (i)proceeds from the PRP Mortgage Loan, (ii) drawdowns on our revolving credit facility, net of repayments and (iii) proceeds from the sale ofcertain properties, which are considered financing obligations.
Net cash used in financing activities during 2015 was primarily attributable to the following: (i) repayments of the Term loan B due to theSenior Secured Credit Facility refinancing in March 2015 and voluntary prepayments, (ii) the repurchase of common stock, (iii) repaymentsof partner deposits and accrued partner obligations and (iv) payment of cash dividends on our common stock. Net cash used in financingactivities was partially offset by the following: (i) proceeds from the incremental Term loan A-1, net of financing fees, (ii) drawdowns on therevolving credit facility, net of repayments, and (iii) proceeds from the exercise of stock options.
Net cash used in financing activities during 2014 was primarily attributable to the following: (i) repayment of the Term loan B due to theSenior Secured Credit Facility refinancing in May 2014 and voluntary repayments, (ii) repayment of borrowings on the 2012 CMBS loan,Term loan A and revolving credit facilities, (iii) repayments of partner deposits and accrued partner obligations and (iv) the purchase ofoutstanding limited partnership interests in certain restaurants. Net cash used in financing activities was partially offset by proceeds from therefinancing of the Senior Secured Credit Facility, net of financing fees, and proceeds from the exercise of stock options.
FINANCIAL CONDITION
Following is a summary of our current assets, current liabilities and working capital:
(dollars in thousands)DECEMBER 25,
2016 DECEMBER 27,
2015
Current assets $ 390,519 $ 418,644
Current liabilities 823,408 814,166
Working capital (deficit) $ (432,889) $ (395,522)
Working capital (deficit) included Unearned revenue from unredeemed gift cards and loyalty program rewards of $388.5 million and $382.6million as of December 25, 2016 and December 27, 2015 , respectively. We have, and in the future may continue to have, negative workingcapital balances (as is common for many restaurant companies).
55
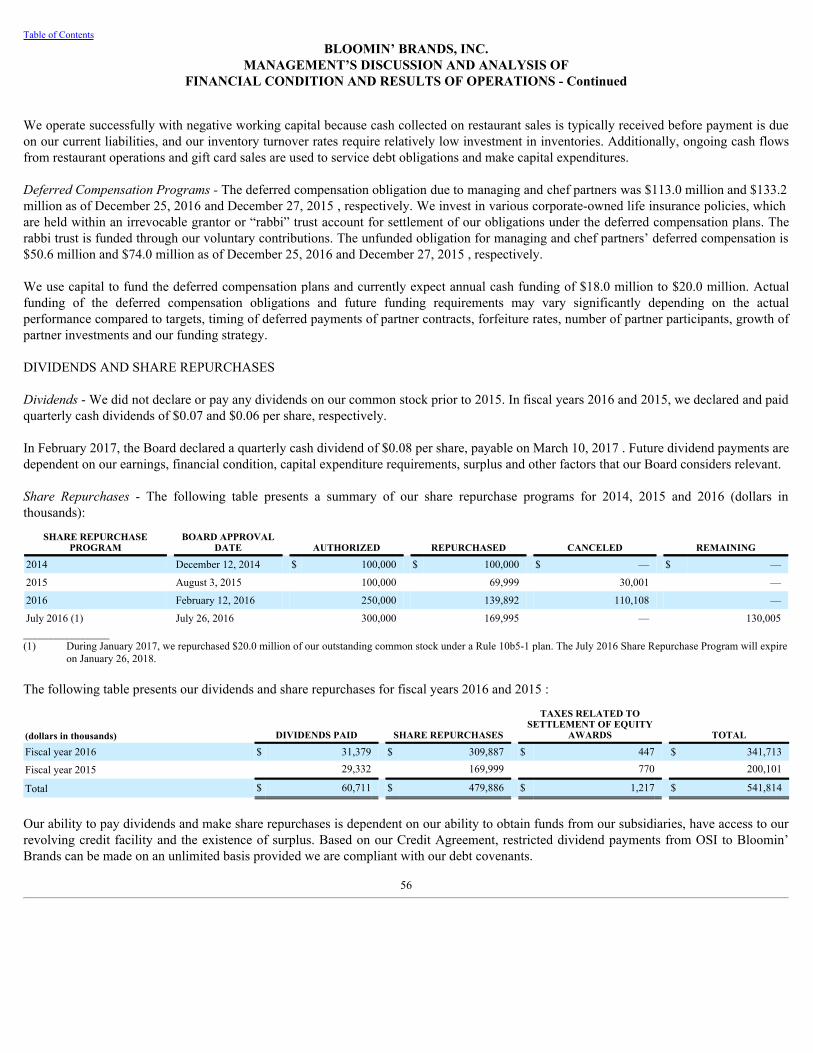
Table of ContentsBLOOMIN’ BRANDS, INC.
MANAGEMENT’S DISCUSSION AND ANALYSIS OFFINANCIAL CONDITION AND RESULTS OF OPERATIONS - Continued
We operate successfully with negative working capital because cash collected on restaurant sales is typically received before payment is dueon our current liabilities, and our inventory turnover rates require relatively low investment in inventories. Additionally, ongoing cash flowsfrom restaurant operations and gift card sales are used to service debt obligations and make capital expenditures.
DeferredCompensationPrograms-The deferred compensation obligation due to managing and chef partners was $113.0 million and $133.2million as of December 25, 2016 and December 27, 2015 , respectively. We invest in various corporate-owned life insurance policies, whichare held within an irrevocable grantor or “rabbi” trust account for settlement of our obligations under the deferred compensation plans. Therabbi trust is funded through our voluntary contributions. The unfunded obligation for managing and chef partners’ deferred compensation is$50.6 million and $74.0 million as of December 25, 2016 and December 27, 2015 , respectively.
We use capital to fund the deferred compensation plans and currently expect annual cash funding of $18.0 million to $20.0 million. Actualfunding of the deferred compensation obligations and future funding requirements may vary significantly depending on the actualperformance compared to targets, timing of deferred payments of partner contracts, forfeiture rates, number of partner participants, growth ofpartner investments and our funding strategy.
DIVIDENDS AND SHARE REPURCHASES
Dividends- We did not declare or pay any dividends on our common stock prior to 2015. In fiscal years 2016 and 2015, we declared and paidquarterly cash dividends of $0.07 and $0.06 per share, respectively.
In February 2017, the Board declared a quarterly cash dividend of $0.08 per share, payable on March 10, 2017 . Future dividend payments aredependent on our earnings, financial condition, capital expenditure requirements, surplus and other factors that our Board considers relevant.
Share Repurchases - The following table presents a summary of our share repurchase programs for 2014, 2015 and 2016 (dollars inthousands):
SHARE REPURCHASEPROGRAM
BOARD APPROVALDATE AUTHORIZED REPURCHASED CANCELED REMAINING
2014 December 12, 2014 $ 100,000 $ 100,000 $ — $ —
2015 August 3, 2015 100,000 69,999 30,001 —
2016 February 12, 2016 250,000 139,892 110,108 —
July 2016 (1) July 26, 2016 300,000 169,995 — 130,005________________(1) During January 2017, we repurchased $20.0 million of our outstanding common stock under a Rule 10b5-1 plan. The July 2016 Share Repurchase Program will expire
on January 26, 2018.
The following table presents our dividends and share repurchases for fiscal years 2016 and 2015 :
(dollars in thousands) DIVIDENDS PAID SHARE REPURCHASES
TAXES RELATED TOSETTLEMENT OF EQUITY
AWARDS TOTAL
Fiscal year 2016 $ 31,379 $ 309,887 $ 447 $ 341,713
Fiscal year 2015 29,332 169,999 770 200,101
Total $ 60,711 $ 479,886 $ 1,217 $ 541,814
Our ability to pay dividends and make share repurchases is dependent on our ability to obtain funds from our subsidiaries, have access to ourrevolving credit facility and the existence of surplus. Based on our Credit Agreement, restricted dividend payments from OSI to Bloomin’Brands can be made on an unlimited basis provided we are compliant with our debt covenants.
56
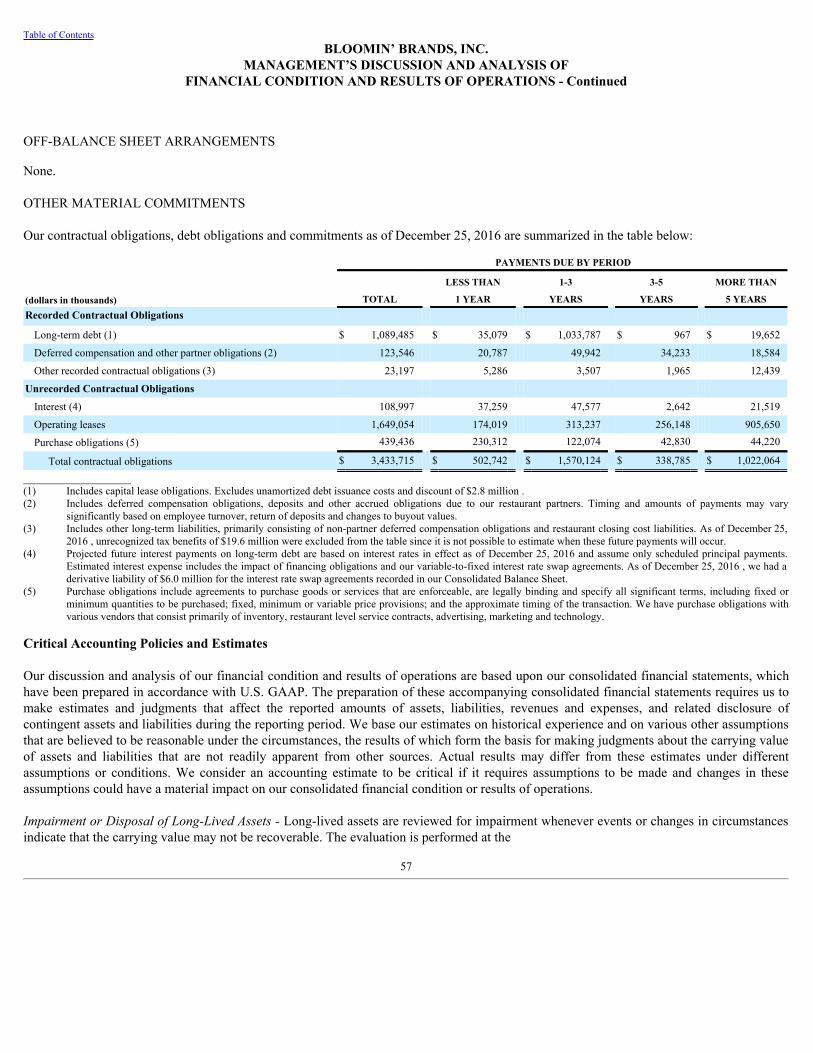
Table of ContentsBLOOMIN’ BRANDS, INC.
MANAGEMENT’S DISCUSSION AND ANALYSIS OFFINANCIAL CONDITION AND RESULTS OF OPERATIONS - Continued
OFF-BALANCE SHEET ARRANGEMENTS
None.
OTHER MATERIAL COMMITMENTS
Our contractual obligations, debt obligations and commitments as of December 25, 2016 are summarized in the table below:
PAYMENTS DUE BY PERIOD
LESS THAN 1-3 3-5 MORE THAN
(dollars in thousands) TOTAL 1 YEAR YEARS YEARS 5 YEARSRecorded Contractual Obligations
Long-term debt (1) $ 1,089,485 $ 35,079 $ 1,033,787 $ 967 $ 19,652
Deferred compensation and other partner obligations (2) 123,546 20,787 49,942 34,233 18,584
Other recorded contractual obligations (3) 23,197 5,286 3,507 1,965 12,439
Unrecorded Contractual Obligations Interest (4) 108,997 37,259 47,577 2,642 21,519
Operating leases 1,649,054 174,019 313,237 256,148 905,650
Purchase obligations (5) 439,436 230,312 122,074 42,830 44,220
Total contractual obligations $ 3,433,715 $ 502,742 $ 1,570,124 $ 338,785 $ 1,022,064
____________________(1) Includes capital lease obligations. Excludes unamortized debt issuance costs and discount of $2.8 million .(2) Includes deferred compensation obligations, deposits and other accrued obligations due to our restaurant partners. Timing and amounts of payments may vary
significantly based on employee turnover, return of deposits and changes to buyout values.(3) Includes other long-term liabilities, primarily consisting of non-partner deferred compensation obligations and restaurant closing cost liabilities. As of December 25,
2016 , unrecognized tax benefits of $19.6 million were excluded from the table since it is not possible to estimate when these future payments will occur.(4) Projected future interest payments on long-term debt are based on interest rates in effect as of December 25, 2016 and assume only scheduled principal payments.
Estimated interest expense includes the impact of financing obligations and our variable-to-fixed interest rate swap agreements. As of December 25, 2016 , we had aderivative liability of $6.0 million for the interest rate swap agreements recorded in our Consolidated Balance Sheet.
(5) Purchase obligations include agreements to purchase goods or services that are enforceable, are legally binding and specify all significant terms, including fixed orminimum quantities to be purchased; fixed, minimum or variable price provisions; and the approximate timing of the transaction. We have purchase obligations withvarious vendors that consist primarily of inventory, restaurant level service contracts, advertising, marketing and technology.
Critical Accounting Policies and Estimates
Our discussion and analysis of our financial condition and results of operations are based upon our consolidated financial statements, whichhave been prepared in accordance with U.S. GAAP. The preparation of these accompanying consolidated financial statements requires us tomake estimates and judgments that affect the reported amounts of assets, liabilities, revenues and expenses, and related disclosure ofcontingent assets and liabilities during the reporting period. We base our estimates on historical experience and on various other assumptionsthat are believed to be reasonable under the circumstances, the results of which form the basis for making judgments about the carrying valueof assets and liabilities that are not readily apparent from other sources. Actual results may differ from these estimates under differentassumptions or conditions. We consider an accounting estimate to be critical if it requires assumptions to be made and changes in theseassumptions could have a material impact on our consolidated financial condition or results of operations.
ImpairmentorDisposalofLong-LivedAssets-Long-lived assets are reviewed for impairment whenever events or changes in circumstancesindicate that the carrying value may not be recoverable. The evaluation is performed at the
57
Table of ContentsBLOOMIN’ BRANDS, INC.
MANAGEMENT’S DISCUSSION AND ANALYSIS OFFINANCIAL CONDITION AND RESULTS OF OPERATIONS - Continued
lowest level of identifiable cash flows independent of other assets. For long-lived assets deployed at our restaurants, we review forimpairment at the individual restaurant level.
When evaluating for impairment, the total future undiscounted cash flows expected to be generated by the assets are compared to the carryingamount. If the total future undiscounted cash flows expected to be generated by the assets are less than the carrying amount, this may be anindicator of impairment. An impairment loss is recognized in earnings when the asset’s carrying value exceeds its estimated fair value. Fairvalue is generally estimated using a discounted cash flow model. The key estimates and assumptions used in this model are future cash flowestimates, with material changes generally driven by changes in expected use, and the discount rate.
Goodwill andIndefinite-LivedIntangibleAssets-Goodwill and indefinite-lived intangible assets are tested for impairment annually in thesecond fiscal quarter, or whenever events or changes in circumstances indicate that the carrying amount may not be recoverable.
We may elect to perform a qualitative assessment to determine whether it is more likely than not that a reporting unit is impaired. Inconsidering the qualitative approach, we evaluate factors including, but not limited to, macro-economic conditions, market and industryconditions, commodity cost fluctuations, competitive environment, share price performance, results of prior impairment tests, operationalstability and the overall financial performance of the reporting units.
If the qualitative assessment is not performed or if we determine that it is not more likely than not that the fair value of the reporting unitexceeds the carrying value, the fair value of the reporting unit is calculated. Fair value of a reporting unit is the price a willing buyer wouldpay for the reporting unit and is estimated using a discounted cash flow model. The key estimates and assumptions used in this model arefuture cash flow estimates, which are heavily influenced by growth rates, and the discount rate. The fair value of the trade name is determinedthrough a relief from royalty method.
The carrying value of the reporting unit is compared to its estimated fair value, with any excess of carrying value over fair value deemed to bean indicator of potential impairment, in which case a second step is performed comparing the recorded amount of goodwill or indefinite-livedintangible assets to the implied fair value.
The carrying value of goodwill as of December 25, 2016 was $310.1 million , which related to our U.S. and International reporting units. Weperformed our annual impairment test in the second quarter of 2016 utilizing the qualitative assessment and determined that none of ourreporting units with remaining goodwill were at risk for impairment. Sales declines at our restaurants, unplanned increases in commodity or labor costs, deterioration in overall economic conditions andchallenges in the restaurant industry may result in future impairment charges. It is possible that changes in circumstances or changes in ourjudgments, assumptions and estimates could result in an impairment charge of a portion or all of our goodwill or other intangible assets.
InsuranceReserves-We carry insurance programs with specific retention levels or high per-claim deductibles for a significant portion ofexpected losses under our workers’ compensation, general liability/liquor liability, health, property and management liability insuranceprograms. For some programs, we maintain stop-loss coverage to limit the exposure relating to certain risks.
We record a liability for all unresolved claims and for an estimate of incurred but not reported claims at the anticipated cost that falls belowour specified retention levels or per-claim deductible amounts. Our liability for insurance claims was $62.8 million and $61.5 million as ofDecember 25, 2016 and December 27, 2015 , respectively. In establishing our reserves, we consider certain actuarial assumptions andjudgments regarding economic conditions, the frequency and severity of claims and claim development history and settlement practices.Reserves recorded for workers’ compensation and general liability/liquor liability claims are discounted using the average of the one-year andfive-year risk free rate of monetary assets that have comparable maturities.
58
Table of ContentsBLOOMIN’ BRANDS, INC.
MANAGEMENT’S DISCUSSION AND ANALYSIS OFFINANCIAL CONDITION AND RESULTS OF OPERATIONS - Continued
We do not believe there is a reasonable likelihood that there will be a material change in the estimates or assumptions used to calculate ourinsurance claim liabilities. However, if actual results are not consistent with our estimates or assumptions, we may be exposed to losses orgains that could be material. A 50 basis point change in the discount rate in our insurance claim liabilities as of December 25, 2016 , wouldhave affected net earnings by $1.0 million in fiscal year 2016 .
Stock-Based Compensation -We have a stock-based compensation plan that permits the grant of stock options, stock appreciation rights,restricted stock, restricted stock units, performance awards and other stock-based awards to our management and other key employees. Weaccount for our stock-based employee compensation using a fair value-based method of accounting.
We use the Black-Scholes option pricing model to estimate the weighted-average grant date fair value of stock options granted. Expectedvolatilities are based on historical volatilities of our stock and the stock of comparable peer companies. The expected term of options grantedrepresents the period of time that options granted are expected to be outstanding. The simplified method of estimating expected term is usedsince we do not have significant historical exercise experience for our stock options. Dividend yield is the level of dividends expected to bepaid on our common stock over the expected term of our options. The risk-free rate for periods within the expected life of the option is basedon the U.S. Treasury yield curve in effect as of the grant date.
Our performance-based share units (“PSUs”) require assumptions regarding the likelihood of achieving certain Company performance criteriaset forth in the award agreements. Assumptions used in our assessment are consistent with our internal forecasts and operating plans .
Estimates and assumptions are based upon information currently available, including historical experience and current business and economicconditions. A simultaneous 10% change in our volatility, forfeiture rate, weighted-average risk-free interest rate, dividend rate and term ofgrant in our stock option pricing model for fiscal year 2016 would have affected net income by $0.5 million .
If we assumed that the PSU performance conditions for stock-based awards were not met, stock-based compensation expense would havedecreased by $1.4 million for fiscal year 2016 . If we assumed that PSU share awards met their maximum threshold, expense would haveincreased by $3.4 million for fiscal year 2016 .
IncomeTaxes-Deferred tax assets and liabilities are recognized based on the differences between the financial statement carrying amounts ofassets and liabilities and their respective tax basis. Deferred tax assets and liabilities are measured using the tax rates, based on certainjudgments regarding enacted tax laws and published guidance, in effect in the years in which we expect those temporary differences toreverse. As of December 25, 2016, tax loss carryforwards and credit carryforwards that do not have a valuation allowance are expected to berecoverable within the applicable statutory expiration periods. A valuation allowance is established against the deferred tax assets when it ismore likely than not that some portion or all of the deferred taxes may not be realized. Changes in assumptions regarding our level andcomposition of earnings, tax laws or the deferred tax valuation allowance and the results of tax audits, may materially impact the effectiveincome tax rate.
Our income tax returns, like those of most companies, are periodically audited by U.S. and foreign tax authorities. In determining taxableincome, income or loss before taxes is adjusted for differences between local tax laws and generally accepted accounting principles. A taxbenefit from an uncertain position is recognized only if it is more likely than not that the position is sustainable based on its technical merits.For uncertain tax positions that do not meet this threshold, we recognize a liability. The liability for unrecognized tax benefits requiressignificant management judgment regarding exposures about our various tax positions. These assumptions and probabilities are periodicallyreviewed and updated based upon new information. An unfavorable tax settlement generally requires the use of cash and an increase in theamount of income tax expense we recognize.
59
Table of ContentsBLOOMIN’ BRANDS, INC.
MANAGEMENT’S DISCUSSION AND ANALYSIS OFFINANCIAL CONDITION AND RESULTS OF OPERATIONS - Continued
Revenue Recognition - The following accounting estimates relating to revenue recognition contain uncertainty because they requiremanagement to make assumptions and to apply judgment regarding the effects of future events:
Gift Card Breakage – We sell gift cards to customers in our restaurants, through our websites and through select third parties. A liability isinitially established for the value of the gift card when sold. We recognize revenue from gift cards when the card is redeemed by thecustomer. We recognize gift card breakage revenue for gift cards when the likelihood of redemption by the customer is remote, which wehave determined are those gift cards issued on or before three years prior to the balance sheet date. For fiscal year 2017, we do not believethere is a reasonable likelihood that there will be a material change in the future estimates or assumptions we use to record breakage.
Upon the adoption of ASU No. 2014-09 “Revenue Recognition (Topic 606), Revenue from Contracts with Customers”, the Company expectsto recognize breakage proportional to actual gift card redemptions. See Note 2 - SummaryofSignificantAccountingPoliciesof our Notes toConsolidated Financial Statements in Part II, Item 8 for further information.
Recently Issued Financial Accounting Standards
For a description of recently issued Financial Accounting Standards that we adopted in 2016 and that are applicable to us but have not yetbeen adopted, see Note 2 - SummaryofSignificantAccountingPoliciesof the Notes to the Consolidated Financial Statements of this Report.
60
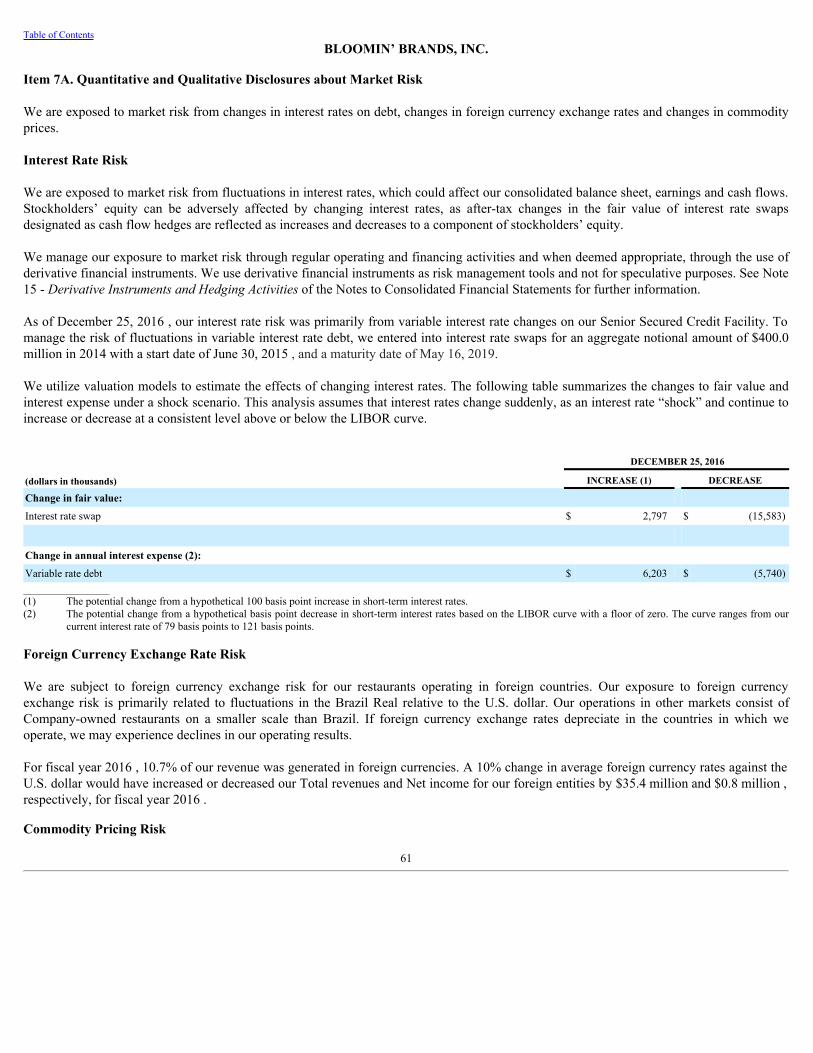
Table of ContentsBLOOMIN’ BRANDS, INC.
Item 7A. Quantitative and Qualitative Disclosures about Market Risk
We are exposed to market risk from changes in interest rates on debt, changes in foreign currency exchange rates and changes in commodityprices.
Interest Rate Risk
We are exposed to market risk from fluctuations in interest rates, which could affect our consolidated balance sheet, earnings and cash flows.Stockholders’ equity can be adversely affected by changing interest rates, as after-tax changes in the fair value of interest rate swapsdesignated as cash flow hedges are reflected as increases and decreases to a component of stockholders’ equity.
We manage our exposure to market risk through regular operating and financing activities and when deemed appropriate, through the use ofderivative financial instruments. We use derivative financial instruments as risk management tools and not for speculative purposes. See Note15 - DerivativeInstrumentsandHedgingActivitiesof the Notes to Consolidated Financial Statements for further information.
As of December 25, 2016 , our interest rate risk was primarily from variable interest rate changes on our Senior Secured Credit Facility. Tomanage the risk of fluctuations in variable interest rate debt, we entered into interest rate swaps for an aggregate notional amount of $400.0million in 2014 with a start date of June 30, 2015 , and a maturity date of May 16, 2019.
We utilize valuation models to estimate the effects of changing interest rates. The following table summarizes the changes to fair value andinterest expense under a shock scenario. This analysis assumes that interest rates change suddenly, as an interest rate “shock” and continue toincrease or decrease at a consistent level above or below the LIBOR curve.
DECEMBER 25, 2016
(dollars in thousands) INCREASE (1) DECREASE
Change in fair value: Interest rate swap $ 2,797 $ (15,583)
Change in annual interest expense (2): Variable rate debt $ 6,203 $ (5,740)________________(1) The potential change from a hypothetical 100 basis point increase in short-term interest rates.(2) The potential change from a hypothetical basis point decrease in short-term interest rates based on the LIBOR curve with a floor of zero. The curve ranges from our
current interest rate of 79 basis points to 121 basis points.
Foreign Currency Exchange Rate Risk
We are subject to foreign currency exchange risk for our restaurants operating in foreign countries. Our exposure to foreign currencyexchange risk is primarily related to fluctuations in the Brazil Real relative to the U.S. dollar. Our operations in other markets consist ofCompany-owned restaurants on a smaller scale than Brazil. If foreign currency exchange rates depreciate in the countries in which weoperate, we may experience declines in our operating results.
For fiscal year 2016 , 10.7% of our revenue was generated in foreign currencies. A 10% change in average foreign currency rates against theU.S. dollar would have increased or decreased our Total revenues and Net income for our foreign entities by $35.4 million and $0.8 million ,respectively, for fiscal year 2016 .
Commodity Pricing Risk
61
Table of ContentsBLOOMIN’ BRANDS, INC.
Many of the ingredients used in the products sold in our restaurants are commodities that are subject to unpredictable price volatility.Although we attempt to minimize the effect of price volatility by negotiating fixed price contracts for the supply of key ingredients, there areno established fixed price markets for certain commodities such as produce and wild fish, and we are subject to prevailing market conditionswhen purchasing those types of commodities. Other commodities are purchased based upon negotiated price ranges established with vendorswith reference to the fluctuating market prices. The related agreements may contain contractual features that limit the price paid byestablishing certain price floors and caps. Extreme changes in commodity prices or long-term changes could affect our financial resultsadversely. We expect that in most cases increased commodity prices could be passed through to our customers through increases in menuprices. However, if there is a time lag between the increasing commodity prices and our ability to increase menu prices, or if we believe thecommodity price increase to be short in duration and we choose not to pass on the cost increases, our short-term financial results could benegatively affected. Additionally, from time to time, competitive circumstances could limit menu price flexibility, and in those cases marginswould be negatively impacted by increased commodity prices.
Our restaurants are dependent upon energy to operate and are impacted by changes in energy prices, including natural gas. We utilizederivative instruments to mitigate some of our overall exposure to material increases in natural gas prices. We record mark-to-market changesin the fair value of our natural gas derivative instruments in earnings in the period of change. We incurred gains of $0.1 million and losses of$0.5 million and $0.6 million as a result of changes in the fair value of the commodity derivative instruments during fiscal years 2016 , 2015 ,and 2014 , respectively. As of December 25, 2016 and December 27, 2015 , the fair value of the derivative instruments was $0.2 million and$0.6 million , respectively, in a liability position.
In addition to the market risks identified above, we are subject to business risk as our U.S. beef supply is highly dependent upon a limitednumber of vendors. If these vendors were unable to fulfill their obligations under their contracts, we could encounter supply shortages andincur higher costs to secure adequate supplies. See Note 18 - Commitments and Contingencies of the Notes to Consolidated FinancialStatements for further details.
This market risk discussion contains forward-looking statements. Actual results may differ materially from the discussion based upon generalmarket conditions and changes in U.S. and global financial markets.
62
Table of ContentsBLOOMIN’ BRANDS, INC.
Item 8. Financial Statements and Supplementary Data
INDEX TO FINANCIAL INFORMATION
PAGE NO.
Management’s Annual Report on Internal Control over Financial Reporting 64
Report of Independent Registered Certified Public Accounting Firm 65
Consolidated Balance Sheets — December 25, 2016 and December 27, 2015 66
Consolidated Statements of Operations and Comprehensive Income — For Fiscal Years 2016, 2015 and 2014 67
Consolidated Statements of Changes in Stockholders’ Equity — For Fiscal Years 2016, 2015 and 2014 68
Consolidated Statements of Cash Flows — For Fiscal Years 2016, 2015 and 2014 70 Notes to Consolidated Financial Statements 72
63
Table of ContentsBLOOMIN’ BRANDS, INC.
Management’s Annual Report on Internal Control over Financial Reporting
Management is responsible for establishing and maintaining adequate internal control over financial reporting, as such term is defined inExchange Act Rule 13a-15(f). The Company’s internal control over financial reporting includes those policies and procedures that (i) pertainto the maintenance of records that in reasonable detail accurately and fairly reflect the transactions and dispositions of the assets of theCompany; (ii) provide reasonable assurance that transactions are recorded as necessary to permit preparation of financial statements inaccordance with generally accepted accounting principles, and that receipts and expenditures of the Company are being made only inaccordance with authorizations of management and directors of the Company; and (iii) provide reasonable assurance regarding prevention ortimely detection of unauthorized acquisition, use or disposition of the Company’s assets that could have a material effect on the financialstatements.
Internal control over financial reporting is designed to provide reasonable assurance regarding the reliability of financial reporting and thepreparation of financial statements prepared for external purposes in accordance with generally accepted accounting principles. Because of itsinherent limitations, internal control over financial reporting may not prevent or detect misstatements. Also, projections of any evaluation ofeffectiveness to future periods are subject to the risk that controls may become inadequate because of changes in conditions, or that the degreeof compliance with the policies or procedures may deteriorate.
On May 14, 2013, the Committee of Sponsoring Organizations of the Treadway Commission (“COSO”) issued an updated version of itsInternalControl—IntegratedFramework(“2013 Framework”). Under the supervision and with the participation of management, includingour Chief Executive Officer and Chief Financial and Administrative Officer, we carried out an evaluation of the effectiveness of our internalcontrol over financial reporting as of December 25, 2016 using the 2013 Framework. Based upon our evaluation, management concluded thatour internal control over financial reporting was effective as of December 25, 2016 .
The effectiveness of our internal control over financial reporting as of December 25, 2016 has been audited by PricewaterhouseCoopers LLP,an independent registered certified public accounting firm, as stated in their report which is included herein.
64
Table of ContentsBLOOMIN’ BRANDS, INC.
Report of Independent Registered Certified Public Accounting Firm
To the Board of Directors and Stockholders of Bloomin’ Brands, Inc.
In our opinion, the accompanying consolidated balance sheets and the related consolidated statements of operations and comprehensiveincome, of changes in stockholders’ equity and cash flows present fairly, in all material respects, the financial position of Bloomin’ Brands,Inc. and its subsidiaries at December 25, 2016 and December 27, 2015, and the results of their operations and their cash flows for each of thethree years in the period ended December 25, 2016 in conformity with accounting principles generally accepted in the United States ofAmerica. Also in our opinion, the Company maintained, in all material respects, effective internal control over financial reporting as ofDecember 25, 2016, based on criteria established in InternalControl-IntegratedFramework(2013)issued by the Committee of SponsoringOrganizations of the Treadway Commission (COSO). The Company's management is responsible for these financial statements, formaintaining effective internal control over financial reporting and for its assessment of the effectiveness of internal control over financialreporting, included in the accompanying Management's Annual Report on Internal Control over Financial Reporting. Our responsibility is toexpress opinions on these financial statements and on the Company's internal control over financial reporting based on our integrated audits.We conducted our audits in accordance with the standards of the Public Company Accounting Oversight Board (United States). Thosestandards require that we plan and perform the audits to obtain reasonable assurance about whether the financial statements are free ofmaterial misstatement and whether effective internal control over financial reporting was maintained in all material respects. Our audits of thefinancial statements included examining, on a test basis, evidence supporting the amounts and disclosures in the financial statements,assessing the accounting principles used and significant estimates made by management, and evaluating the overall financial statementpresentation. Our audit of internal control over financial reporting included obtaining an understanding of internal control over financialreporting, assessing the risk that a material weakness exists, and testing and evaluating the design and operating effectiveness of internalcontrol based on the assessed risk. Our audits also included performing such other procedures as we considered necessary in thecircumstances. We believe that our audits provide a reasonable basis for our opinions.
A company’s internal control over financial reporting is a process designed to provide reasonable assurance regarding the reliability offinancial reporting and the preparation of financial statements for external purposes in accordance with generally accepted accountingprinciples. A company’s internal control over financial reporting includes those policies and procedures that (i) pertain to the maintenance ofrecords that, in reasonable detail, accurately and fairly reflect the transactions and dispositions of the assets of the company; (ii) providereasonable assurance that transactions are recorded as necessary to permit preparation of financial statements in accordance with generallyaccepted accounting principles, and that receipts and expenditures of the company are being made only in accordance with authorizations ofmanagement and directors of the company; and (iii) provide reasonable assurance regarding prevention or timely detection of unauthorizedacquisition, use, or disposition of the company’s assets that could have a material effect on the financial statements.
Because of its inherent limitations, internal control over financial reporting may not prevent or detect misstatements. Also, projections of anyevaluation of effectiveness to future periods are subject to the risk that controls may become inadequate because of changes in conditions, orthat the degree of compliance with the policies or procedures may deteriorate.
/s/ PricewaterhouseCoopers LLPTampa, FloridaFebruary 22, 2017
65
Table of ContentsBLOOMIN’ BRANDS, INC.
CONSOLIDATED BALANCE SHEETS(IN THOUSANDS, EXCEPT SHARE AND PER SHARE DATA)
DECEMBER 25,
2016 DECEMBER 27,
2015
ASSETS Current Assets
Cash and cash equivalents $ 127,176 $ 132,337
Current portion of restricted cash and cash equivalents 7,886 6,772
Inventories 65,231 80,704
Other current assets, net 190,226 198,831
Total current assets 390,519 418,644
Restricted cash 1,124 16,265
Property, fixtures and equipment, net 1,237,148 1,594,460
Goodwill 310,055 300,861
Intangible assets, net 535,523 546,837
Deferred income tax assets 38,764 7,631
Other assets, net 129,146 147,871
Total assets $ 2,642,279 $ 3,032,569
LIABILITIES, MEZZANINE EQUITY AND STOCKHOLDERS’ EQUITY Current Liabilities
Accounts payable $ 195,371 $ 193,116
Accrued and other current liabilities 204,415 206,611
Unearned revenue 388,543 382,586
Current portion of long-term debt, net 35,079 31,853
Total current liabilities 823,408 814,166
Deferred rent 151,130 139,758
Deferred income tax liabilities 16,709 53,546
Long-term debt, net 1,054,406 1,285,011
Deferred gain on sale-leaseback transactions, net 181,696 33,154
Other long-term liabilities, net 219,030 261,508
Total liabilities 2,446,379 2,587,143
Commitments and contingencies (Note 18) Mezzanine Equity
Redeemable noncontrolling interests 547 23,526
Stockholders’ Equity Bloomin’ Brands Stockholders’ Equity
Preferred stock, $0.01 par value, 25,000,000 shares authorized; no shares issued and outstanding as of December 25,2016 and December 27, 2015 — —Common stock, $0.01 par value, 475,000,000 shares authorized; 103,922,110 and 119,214,522 shares issued andoutstanding as of December 25, 2016 and December 27, 2015, respectively 1,039 1,192
Additional paid-in capital 1,079,583 1,072,861
Accumulated deficit (786,780) (518,360)
Accumulated other comprehensive loss (111,143) (147,367)
Total Bloomin’ Brands stockholders’ equity 182,699 408,326
Noncontrolling interests 12,654 13,574
Total stockholders’ equity 195,353 421,900
Total liabilities, mezzanine equity and stockholders’ equity $ 2,642,279 $ 3,032,569
The accompanying notes are an integral part of these consolidated financial statements.
66

Table of ContentsBLOOMIN’ BRANDS, INC.
CONSOLIDATED STATEMENTS OF OPERATIONS AND COMPREHENSIVE INCOME(IN THOUSANDS, EXCEPT PER SHARE DATA)
FISCAL YEAR
2016 2015 2014
Revenues Restaurant sales $ 4,226,057 $ 4,349,921 $ 4,415,783
Franchise and other revenues 26,255 27,755 26,928
Total revenues 4,252,312 4,377,676 4,442,711
Costs and expenses Cost of sales 1,354,853 1,419,689 1,435,359
Labor and other related 1,211,250 1,205,610 1,218,961
Other restaurant operating 992,157 1,006,772 1,049,053
Depreciation and amortization 193,838 190,399 190,911
General and administrative 267,981 287,614 304,382
Provision for impaired assets and restaurant closings 104,627 36,667 52,081
Total costs and expenses 4,124,706 4,146,751 4,250,747
Income from operations 127,606 230,925 191,964
Loss on defeasance, extinguishment and modification of debt (26,998) (2,956) (11,092)
Other income (expense), net 1,609 (939) (1,244)
Interest expense, net (45,726) (56,176) (59,658)
Income before provision for income taxes 56,491 170,854 119,970
Provision for income taxes 10,144 39,294 24,044
Net income 46,347 131,560 95,926
Less: net income attributable to noncontrolling interests 4,599 4,233 4,836
Net income attributable to Bloomin’ Brands $ 41,748 $ 127,327 $ 91,090
Net income $ 46,347 $ 131,560 $ 95,926
Other comprehensive income: Foreign currency translation adjustment 37,075 (96,194) (31,731)
Unrealized loss on derivatives, net of tax (1,250) (6,033) (2,393)
Reclassification of adjustment for loss on derivatives included in Net income, net of tax 3,807 2,235 —
Comprehensive income 85,979 31,568 61,802
Less: comprehensive income (loss) attributable to noncontrolling interests 8,008 (8,934) 4,836
Comprehensive income attributable to Bloomin’ Brands $ 77,971 $ 40,502 $ 56,966
Earnings per share:
Basic $ 0.37 $ 1.04 $ 0.73
Diluted $ 0.37 $ 1.01 $ 0.71
Weighted average common shares outstanding: Basic 111,381 122,352 125,139
Diluted 114,311 125,585 128,317
Cash dividends declared per common share $ 0.28 $ 0.24 $ —
The accompanying notes are an integral part of these consolidated financial statements.
67
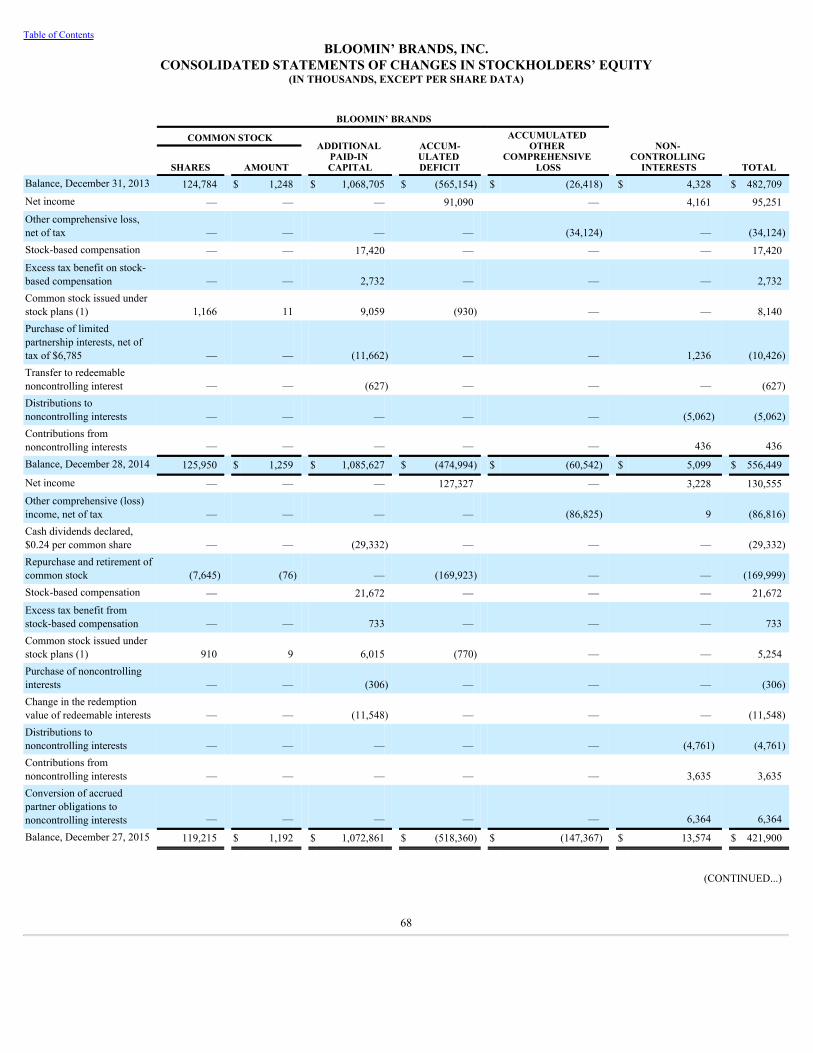
Table of ContentsBLOOMIN’ BRANDS, INC.
CONSOLIDATED STATEMENTS OF CHANGES IN STOCKHOLDERS’ EQUITY(IN THOUSANDS, EXCEPT PER SHARE DATA)
BLOOMIN’ BRANDS
COMMON STOCK ADDITIONAL
PAID-IN CAPITAL
ACCUM-ULATED DEFICIT
ACCUMULATED OTHER
COMPREHENSIVE LOSS
NON-
CONTROLLING INTERESTS
TOTAL SHARES AMOUNT Balance, December 31, 2013 124,784 $ 1,248 $ 1,068,705 $ (565,154) $ (26,418) $ 4,328 $ 482,709Net income — — — 91,090 — 4,161 95,251Other comprehensive loss,net of tax — — — — (34,124) — (34,124)Stock-based compensation — — 17,420 — — — 17,420Excess tax benefit on stock-based compensation — — 2,732 — — — 2,732Common stock issued understock plans (1) 1,166 11 9,059 (930) — — 8,140Purchase of limitedpartnership interests, net oftax of $6,785 — — (11,662) — — 1,236 (10,426)Transfer to redeemablenoncontrolling interest — — (627) — — — (627)Distributions tononcontrolling interests — — — — — (5,062) (5,062)Contributions fromnoncontrolling interests — — — — — 436 436
Balance, December 28, 2014 125,950 $ 1,259 $ 1,085,627 $ (474,994) $ (60,542) $ 5,099 $ 556,449
Net income — — — 127,327 — 3,228 130,555Other comprehensive (loss)income, net of tax — — — — (86,825) 9 (86,816)Cash dividends declared,$0.24 per common share — — (29,332) — — — (29,332)Repurchase and retirement ofcommon stock (7,645) (76) — (169,923) — — (169,999)Stock-based compensation — 21,672 — — — 21,672Excess tax benefit fromstock-based compensation — — 733 — — — 733Common stock issued understock plans (1) 910 9 6,015 (770) — — 5,254Purchase of noncontrollinginterests — — (306) — — — (306)Change in the redemptionvalue of redeemable interests — — (11,548) — — — (11,548)Distributions tononcontrolling interests — — — — — (4,761) (4,761)Contributions fromnoncontrolling interests — — — — — 3,635 3,635Conversion of accruedpartner obligations tononcontrolling interests — — — — — 6,364 6,364
Balance, December 27, 2015 119,215 $ 1,192 $ 1,072,861 $ (518,360) $ (147,367) $ 13,574 $ 421,900
(CONTINUED...)
68
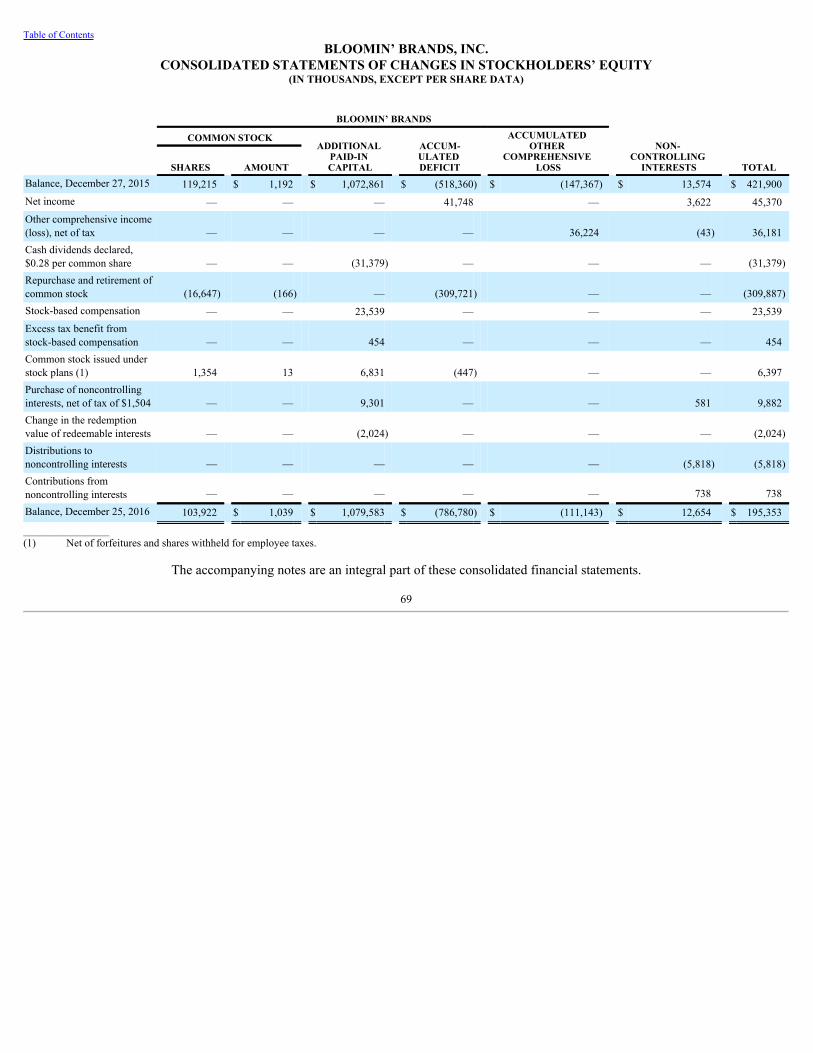
Table of ContentsBLOOMIN’ BRANDS, INC.
CONSOLIDATED STATEMENTS OF CHANGES IN STOCKHOLDERS’ EQUITY(IN THOUSANDS, EXCEPT PER SHARE DATA)
BLOOMIN’ BRANDS
COMMON STOCK ADDITIONAL
PAID-IN CAPITAL
ACCUM-ULATED DEFICIT
ACCUMULATED OTHER
COMPREHENSIVE LOSS
NON-
CONTROLLING INTERESTS
TOTAL SHARES AMOUNT Balance, December 27, 2015 119,215 $ 1,192 $ 1,072,861 $ (518,360) $ (147,367) $ 13,574 $ 421,900Net income — — — 41,748 — 3,622 45,370Other comprehensive income(loss), net of tax — — — — 36,224 (43) 36,181Cash dividends declared,$0.28 per common share — — (31,379) — — — (31,379)Repurchase and retirement ofcommon stock (16,647) (166) — (309,721) — — (309,887)Stock-based compensation — — 23,539 — — — 23,539Excess tax benefit fromstock-based compensation — — 454 — — — 454Common stock issued understock plans (1) 1,354 13 6,831 (447) — — 6,397Purchase of noncontrollinginterests, net of tax of $1,504 — — 9,301 — — 581 9,882Change in the redemptionvalue of redeemable interests — — (2,024) — — — (2,024)Distributions tononcontrolling interests — — — — — (5,818) (5,818)Contributions fromnoncontrolling interests — — — — — 738 738
Balance, December 25, 2016 103,922 $ 1,039 $ 1,079,583 $ (786,780) $ (111,143) $ 12,654 $ 195,353
________________(1) Net of forfeitures and shares withheld for employee taxes.
The accompanying notes are an integral part of these consolidated financial statements.
69
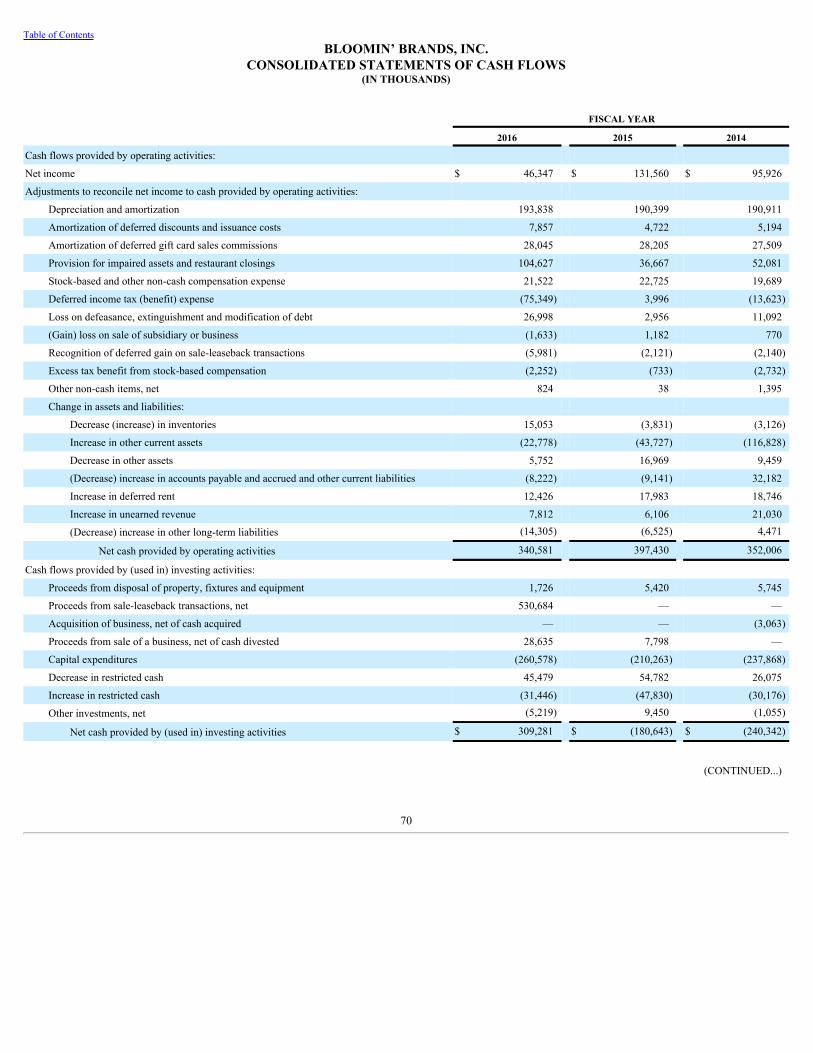
Table of ContentsBLOOMIN’ BRANDS, INC.
CONSOLIDATED STATEMENTS OF CASH FLOWS(IN THOUSANDS)
FISCAL YEAR
2016 2015 2014
Cash flows provided by operating activities: Net income $ 46,347 $ 131,560 $ 95,926
Adjustments to reconcile net income to cash provided by operating activities: Depreciation and amortization 193,838 190,399 190,911
Amortization of deferred discounts and issuance costs 7,857 4,722 5,194
Amortization of deferred gift card sales commissions 28,045 28,205 27,509
Provision for impaired assets and restaurant closings 104,627 36,667 52,081
Stock-based and other non-cash compensation expense 21,522 22,725 19,689
Deferred income tax (benefit) expense (75,349) 3,996 (13,623)
Loss on defeasance, extinguishment and modification of debt 26,998 2,956 11,092
(Gain) loss on sale of subsidiary or business (1,633) 1,182 770
Recognition of deferred gain on sale-leaseback transactions (5,981) (2,121) (2,140)
Excess tax benefit from stock-based compensation (2,252) (733) (2,732)
Other non-cash items, net 824 38 1,395
Change in assets and liabilities: Decrease (increase) in inventories 15,053 (3,831) (3,126)
Increase in other current assets (22,778) (43,727) (116,828)
Decrease in other assets 5,752 16,969 9,459
(Decrease) increase in accounts payable and accrued and other current liabilities (8,222) (9,141) 32,182
Increase in deferred rent 12,426 17,983 18,746
Increase in unearned revenue 7,812 6,106 21,030
(Decrease) increase in other long-term liabilities (14,305) (6,525) 4,471
Net cash provided by operating activities 340,581 397,430 352,006
Cash flows provided by (used in) investing activities: Proceeds from disposal of property, fixtures and equipment 1,726 5,420 5,745
Proceeds from sale-leaseback transactions, net 530,684 — —
Acquisition of business, net of cash acquired — — (3,063)
Proceeds from sale of a business, net of cash divested 28,635 7,798 —
Capital expenditures (260,578) (210,263) (237,868)
Decrease in restricted cash 45,479 54,782 26,075
Increase in restricted cash (31,446) (47,830) (30,176)
Other investments, net (5,219) 9,450 (1,055)
Net cash provided by (used in) investing activities $ 309,281 $ (180,643) $ (240,342)
(CONTINUED...)
70
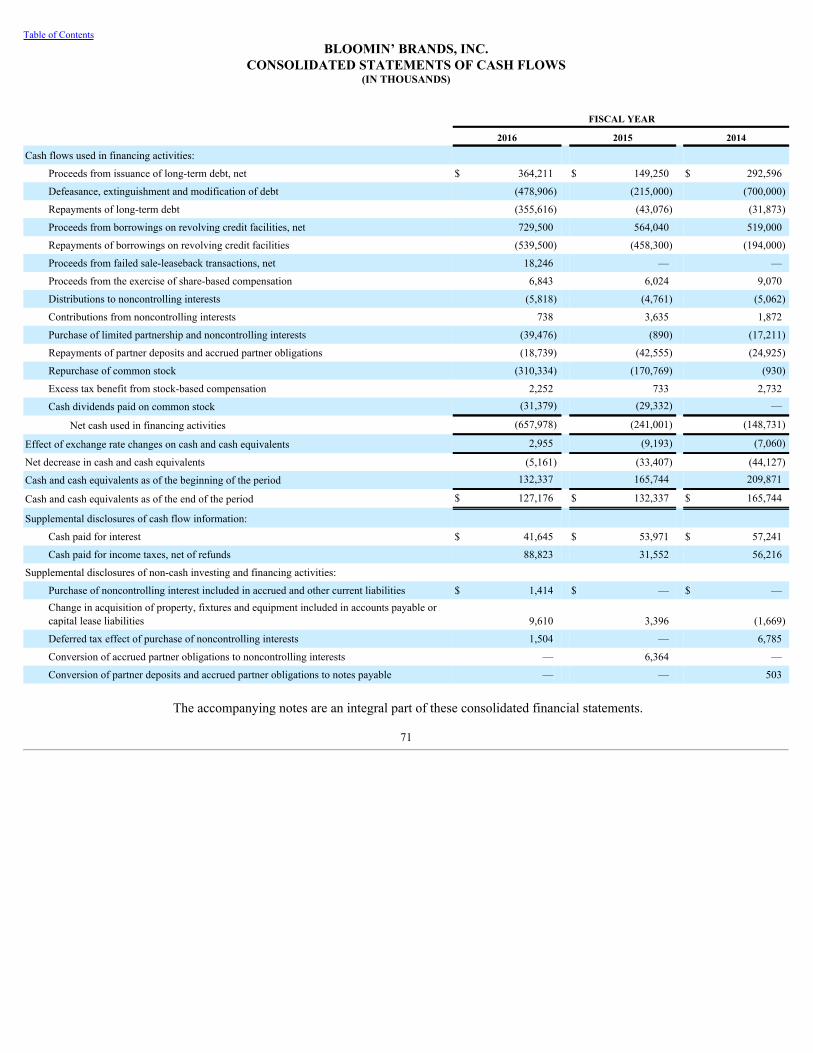
Table of ContentsBLOOMIN’ BRANDS, INC.
CONSOLIDATED STATEMENTS OF CASH FLOWS(IN THOUSANDS)
FISCAL YEAR
2016 2015 2014
Cash flows used in financing activities: Proceeds from issuance of long-term debt, net $ 364,211 $ 149,250 $ 292,596
Defeasance, extinguishment and modification of debt (478,906) (215,000) (700,000)
Repayments of long-term debt (355,616) (43,076) (31,873)
Proceeds from borrowings on revolving credit facilities, net 729,500 564,040 519,000
Repayments of borrowings on revolving credit facilities (539,500) (458,300) (194,000)
Proceeds from failed sale-leaseback transactions, net 18,246 — —
Proceeds from the exercise of share-based compensation 6,843 6,024 9,070
Distributions to noncontrolling interests (5,818) (4,761) (5,062)
Contributions from noncontrolling interests 738 3,635 1,872
Purchase of limited partnership and noncontrolling interests (39,476) (890) (17,211)
Repayments of partner deposits and accrued partner obligations (18,739) (42,555) (24,925)
Repurchase of common stock (310,334) (170,769) (930)
Excess tax benefit from stock-based compensation 2,252 733 2,732
Cash dividends paid on common stock (31,379) (29,332) —
Net cash used in financing activities (657,978) (241,001) (148,731)
Effect of exchange rate changes on cash and cash equivalents 2,955 (9,193) (7,060)
Net decrease in cash and cash equivalents (5,161) (33,407) (44,127)
Cash and cash equivalents as of the beginning of the period 132,337 165,744 209,871
Cash and cash equivalents as of the end of the period $ 127,176 $ 132,337 $ 165,744
Supplemental disclosures of cash flow information: Cash paid for interest $ 41,645 $ 53,971 $ 57,241
Cash paid for income taxes, net of refunds 88,823 31,552 56,216
Supplemental disclosures of non-cash investing and financing activities: Purchase of noncontrolling interest included in accrued and other current liabilities $ 1,414 $ — $ —Change in acquisition of property, fixtures and equipment included in accounts payable orcapital lease liabilities 9,610 3,396 (1,669)
Deferred tax effect of purchase of noncontrolling interests 1,504 — 6,785
Conversion of accrued partner obligations to noncontrolling interests — 6,364 —
Conversion of partner deposits and accrued partner obligations to notes payable — — 503
The accompanying notes are an integral part of these consolidated financial statements.
71
Table of ContentsBLOOMIN’ BRANDS, INC.
NOTES TO CONSOLIDATED FINANCIAL STATEMENTS
1. Description of Business
Bloomin’ Brands, Inc. (“Bloomin’ Brands” or the “Company”) is one of the largest casual dining restaurant companies in the world, with aportfolio of leading, differentiated restaurant concepts. OSI Restaurant Partners, LLC (“OSI”) is the Company’s primary operating entity andNew Private Restaurant Properties, LLC (“PRP”), another indirect wholly-owned subsidiary of the Company, leases certain of the Company-owned restaurant properties to OSI’s subsidiaries.
The Company owns and operates casual, upscale casual and fine dining restaurants. The Company’s restaurant portfolio has four concepts:Outback Steakhouse, Carrabba’s Italian Grill, Bonefish Grill and Fleming’s Prime Steakhouse & Wine Bar. Additional Outback Steakhouse,Carrabba’s Italian Grill and Bonefish Grill restaurants in which the Company has no direct investment are operated under franchiseagreements.
2 . Summary of Significant Accounting Policies
Basis of Presentation-The Company’s consolidated financial statements include the accounts and operations of Bloomin’ Brands and itssubsidiaries.
To ensure timely reporting, the Company consolidates the results of its Brazil operations on a one -month calendar lag. In December 2016,the Company made payments of $24.8 million to purchase the remaining interests in its Outback Steakhouse operations in Brazil. As thesepayments were material to the Company’s Consolidated Balance Sheet and Consolidated Statement of Cash Flows, the cash payments andacquisition of the redeemable noncontrolling interest were recognized as of December 25, 2016. See Note 13 - RedeemableNoncontrollingInterestsfor further information.
As of November 30, 2016 and December 25, 2016, the Brazil Real to U.S. dollar foreign exchange rate was 3.39 and 3.27 , respectively.There were no other intervening events that would materially affect the Company’s consolidated financial position, results of operations orcash flows as of and for the fiscal year ended December 25, 2016 .
PrinciplesofConsolidation-All intercompany accounts and transactions have been eliminated in consolidation.
The Company consolidates variable interest entities where it has been determined the Company is the primary beneficiary of those entities’operations. The Company is a franchisor of 240 restaurants as of December 25, 2016 , but does not possess any ownership interests in itsfranchisees and does not provide financial support to its franchisees. These franchise relationships are not deemed variable interest entitiesand are not consolidated.
Investments in entities the Company does not control, but where the Company’s interest is generally between 20% and 50% and the Companyhas the ability to exercise significant influence over the entity are accounted for under the equity method.
UseofEstimates-The preparation of the accompanying consolidated financial statements in conformity with generally accepted accountingprinciples requires management to make estimates and assumptions that affect the reported amounts of assets and liabilities and disclosure ofcontingent assets and liabilities at the date of the financial statements and the reported amounts of revenues and expenses during the reportingperiod. Actual results could differ from those estimated.
CashandCashEquivalents-Cash equivalents consist of investments that are readily convertible to cash with an original maturity date ofthree months or less. Cash and cash equivalents include $50.0 million and $60.7 million , as of December 25, 2016 and December 27, 2015 ,respectively, for amounts in transit from credit card companies since settlement is reasonably assured.
ConcentrationsofCreditandCounterpartyRisk-Financial instruments that potentially subject the Company to a concentration of credit riskare vendor and other receivables. Vendor and other receivables consist primarily of amounts
72

Table of ContentsBLOOMIN’ BRANDS, INC.
NOTES TO CONSOLIDATED FINANCIAL STATEMENTS - Continued
due from vendor rebates and gift card resellers, respectively. The Company considers the concentration of credit risk for vendor and otherreceivables to be minimal due to the payment histories and general financial condition of its vendors and gift card resellers.
Financial instruments that potentially subject the Company to concentrations of counterparty risk are cash and cash equivalents, restrictedcash and derivatives. The Company attempts to limit its counterparty risk by investing in certificates of deposit, money market funds,noninterest-bearing accounts and other highly rated investments. Whenever possible, the Company selects investment grade counterpartiesand rated money market funds in order mitigate its counterparty risk. At times, cash balances may be in excess of FDIC insurance limits. SeeNote 15 - DerivativeInstrumentsandHedgingActivitiesfor a discussion of the Company’s use of derivative instruments and management ofcredit risk inherent in derivative instruments.
FairValue-Fair value is the price that would be received for an asset or paid to transfer a liability, or the exit price, in an orderly transactionbetween market participants on the measurement date. Fair value is categorized into one of the following three levels based on the lowestlevel of significant input:
Level 1 Unadjusted quoted market prices in active markets for identical assets or liabilitiesLevel 2 Observable inputs available at measurement date other than quoted prices included in Level 1Level 3 Unobservable inputs that cannot be corroborated by observable market data
Inventories-Inventories consist of food and beverages and are stated at the lower of cost (first-in, first-out) or market.
RestrictedCash- The Company has both current and long-term restricted cash balances consisting of amounts: (i) pledged for payment of thePRP Mortgage loan, (ii) pledged for settlement of deferred compensation plan obligations and (iii) held in escrow for certain indemnificationsassociated with the sale of Roy’s.
Property, Fixtures and Equipment -Property, fixtures and equipment are stated at cost, net of accumulated depreciation. Depreciation iscomputed on the straight-line method over the estimated useful life of the assets. Improvements to leased properties are depreciated over theshorter of their useful life or the lease term, which includes renewal periods that are reasonably assured. Estimated useful lives by major assetcategory are generally as follows:
Buildings and building improvements 20 to 30 yearsFurniture and fixtures 5 to 7 yearsEquipment 2 to 7 yearsLeasehold improvements 5 to 20 yearsCapitalized software 3 to 7 years
Repair and maintenance costs that maintain the appearance and functionality of the restaurant, but do not extend the useful life of anyrestaurant asset are expensed as incurred. The Company suspends depreciation and amortization for assets held for sale. The cost and relatedaccumulated depreciation of assets sold or disposed are removed from the Company’s Consolidated Balance Sheets, and any resulting gain orloss is generally recognized in Other restaurant operating expenses in the Company’s Consolidated Statements of Operations andComprehensive Income .
The Company capitalizes direct and indirect internal costs associated with the acquisition, development, design and construction ofCompany-owned restaurant locations as these costs have a future benefit to the Company. Upon restaurant opening, these costs aredepreciated and charged to depreciation and amortization expense. Internal costs of $7.6 million , $8.0 million and $8.7 million werecapitalized during fiscal years 2016 , 2015 and 2014 , respectively.
For fiscal years 2016 and 2015 , software development costs of $7.1 million and $4.8 million , respectively, were capitalized. As ofDecember 25, 2016 and December 27, 2015 , there was $24.4 million and $27.9 million , respectively, of unamortized software included inProperty, fixtures and equipment in the Company’s Consolidated Balance Sheets .
73
Table of ContentsBLOOMIN’ BRANDS, INC.
NOTES TO CONSOLIDATED FINANCIAL STATEMENTS - Continued
GoodwillandIntangibleAssets-Goodwill represents the excess of the purchase price over the fair value of net assets acquired in businesscombinations and is assigned to the reporting unit in which the acquired business will operate. The Company’s indefinite-lived intangibleassets consist of trade names. Goodwill and indefinite-lived intangible assets are tested for impairment annually, as of the first day of thesecond fiscal quarter, or whenever events or changes in circumstances indicate that the carrying amount may not be recoverable.
The Company may elect to perform a qualitative assessment to determine whether it is more likely than not that a reporting unit is impaired.If the qualitative assessment is not performed or if the Company determines that it is not more likely than not that the fair value of thereporting unit exceeds the carrying value, the fair value of the reporting unit is calculated. The carrying value of the reporting unit iscompared to its estimated fair value, with any excess of carrying value over fair value deemed to be an indicator of potential impairment, inwhich case a second step is performed comparing the recorded amount of goodwill or indefinite-lived intangible assets to the implied fairvalue.
Definite-lived intangible assets, which consist primarily of trademarks, franchise agreements, reacquired franchise rights, favorable leases,and other long-lived assets, are amortized over their estimated useful lives and are tested for impairment, using the discounted cash flowmethod, whenever events or changes in circumstances indicate that the carrying value may not be recoverable.
Derivatives -The Company records all derivatives on the balance sheet at fair value. The accounting for changes in the fair value ofderivatives depends on the intended use of the derivative, whether the Company has elected to designate a derivative in a hedging relationshipand apply hedge accounting and whether the hedging relationship has satisfied the criteria necessary to apply hedge accounting.
Derivatives designated and qualifying as a hedge of the exposure to variability in expected future cash flows, or other types of forecastedtransactions, are considered cash flow hedges. If the derivative qualifies for hedge accounting treatment, then the effective portion of the gainor loss on the derivative instrument is recognized in equity as a change to Accumulated other comprehensive loss and reclassified intoearnings in the same period or periods during which the hedged transaction affects earnings. Any ineffective portion of the gain or loss on thederivative instrument is immediately recognized in the Company’s Consolidated Statements of Operations and Comprehensive Income .
The Company may enter into derivative contracts that are intended to economically hedge certain of its risk, even though hedge accountingdoes not apply or the Company elects not to apply hedge accounting. Derivatives not designated as hedges are not speculative and are used tomanage the Company’s exposure to interest rate movements, foreign currency exchange rate movements and other identified risks. Changesin the fair value of derivatives not designated in hedging relationships are recorded directly in earnings. The Company has elected not tooffset derivative positions in the balance sheet with the same counterparty under the same agreement.
DeferredFinancingFees- For fees associated with its revolving credit facility, the Company records deferred financing fees related to theissuance of debt obligations in Other assets, net. For fees associated with all other debt obligations, the Company records deferred financingfees in Long-term debt, net.
The Company amortizes deferred financing fees to interest expense over the term of the respective financing arrangement, primarily using theeffective interest method. The Company amortized deferred financing fees of $7.1 million , $2.9 million and $3.1 million to interest expensefor fiscal years 2016 , 2015 and 2014 , respectively.
LiquorLicenses-The costs of obtaining non-transferable liquor licenses directly issued by local government agencies for nominal fees areexpensed as incurred. The costs of purchasing transferable liquor licenses through open markets in jurisdictions with a limited number ofauthorized liquor licenses are capitalized as indefinite-lived intangible assets and included in Other assets, net. Annual liquor license renewalfees are expensed over the renewal term.
InsuranceReserves-The Company carries insurance programs with specific retention levels or high per-claim deductibles for a significantportion of expected losses under its workers’ compensation, general liability/liquor liability,
74
Table of ContentsBLOOMIN’ BRANDS, INC.
NOTES TO CONSOLIDATED FINANCIAL STATEMENTS - Continued
health, property and management liability insurance programs. The Company records a liability for all unresolved claims and for an estimateof incurred but not reported claims at the anticipated cost that falls below its specified retention levels or per-claim deductible amounts. Inestablishing reserves, the Company considers certain actuarial assumptions and judgments regarding economic conditions, the frequency andseverity of claims, claim development history and settlement practices. Reserves recorded for workers’ compensation and general liabilityclaims are discounted using the average of the one -year and five -year risk free rate of monetary assets that have comparable maturities.
RedeemableNoncontrollingInterests-The Company consolidates its Outback Steakhouse subsidiary in China, which has a noncontrollinginterest that is permitted to deliver subsidiary shares in exchange for cash at a future date. The Company believes that it is probable that thenoncontrolling interest will become redeemable.
The Redeemable noncontrolling interest is reported at its estimated redemption value measured as the greater of estimated fair value at theend of each reporting period or the historical cost basis of the redeemable noncontrolling interest adjusted for cumulative earnings or lossallocations. The resulting increases or decreases to fair value, if applicable, are recognized as adjustments to Retained earnings, or in theabsence of Retained earnings, Additional paid-in capital. The redeemable noncontrolling interest is classified in Mezzanine equity in theCompany’s Consolidated Balance Sheets.
ShareRepurchase-Shares repurchased are retired. The par value of the repurchased shares is deducted from common stock and the excess ofthe purchase price over the par value of the shares is recorded to Accumulated deficit.
RevenueRecognition-The Company records food and beverage revenues, net of discounts, upon sale. Initial and developmental franchisefees are recognized as income once the Company has substantially performed all of its material obligations under the franchise agreement,which is generally upon the opening of the franchised restaurant. Continuing royalties, which are a percentage of net sales of the franchisee,are recognized as income when earned. Franchise-related revenues are included in Other revenues in the Company’s Consolidated Statementsof Operations and Comprehensive Income , except for amounts received for national marketing, which are recorded as a reduction of Otherrestaurant operating expenses.
The Company defers revenue for gift cards, which do not have expiration dates, until redemption by the customer. Gift cards sold at adiscount are recorded as revenue upon redemption of the associated gift cards at an amount net of the related discount. The Company alsorecognizes gift card breakage revenue for gift cards when the likelihood of redemption by the customer is remote, which the Companydetermined are those gift cards issued on or before three years prior to the balance sheet date. The Company recorded breakage revenue of$26.0 million , $22.9 million and $18.8 million for fiscal years 2016 , 2015 and 2014 , respectively. Breakage revenue is recorded as acomponent of Restaurant sales in the Company’s Consolidated Statements of Operations and Comprehensive Income .
Gift card sales commissions paid to third-party providers are initially capitalized and subsequently recognized as Other restaurant operatingexpenses upon redemption of the associated gift card. Deferred expenses of $15.6 million and $16.1 million as of December 25, 2016 andDecember 27, 2015 , respectively, were reflected in Other current assets, net in the Company’s Consolidated Balance Sheets. Gift card salesthat are accompanied by a bonus gift card to be used by the customer at a future visit result in a separate deferral of a portion of the originalgift card sale. Revenue is recorded when the bonus card is redeemed at the estimated fair market value of the bonus card.
The Company maintains a customer loyalty program, Dine Rewards, in the U.S., where customers have the ability to earn a reward after anumber of qualified visits. The Company has developed an estimated value of the partial reward earned from each qualified visit based onhistorical data. The estimated value of the partial reward is recorded as deferred revenue. Each reward has a maximum value and must beredeemed within three months of earning such reward. The revenue associated with the fair value of the qualified visit is recognized upon theearlier of redemption or expiration of the reward. Deferred revenue related to the loyalty program was $4.2 million and $0.8 million as ofDecember 25, 2016 and December 27, 2015 , respectively.
75
Table of ContentsBLOOMIN’ BRANDS, INC.
NOTES TO CONSOLIDATED FINANCIAL STATEMENTS - Continued
The Company collects and remits sales, food and beverage, alcoholic beverage and hospitality taxes on transactions with customers andreports revenue net of taxes in its Consolidated Statements of Operations and Comprehensive Income .
OperatingLeases-Rent expense for the Company’s operating leases, which generally have escalating rentals over the term of the lease andmay include rent holidays, is recorded on a straight-line basis over the initial lease term and those renewal periods that are reasonably assured.The difference between rent expense and rent paid is recorded as deferred rent and is included in the Company’s Consolidated BalanceSheets. Payments received from landlords as incentives for leasehold improvements are recorded as deferred rent and are amortized on astraight-line basis over the term of the lease as a reduction of rent expense. Favorable and unfavorable lease assets and liabilities areamortized on a straight-line basis to rent expense over the remaining lease term.
Pre-Opening Expenses -Non-capital expenditures associated with opening new restaurants are expensed as incurred and are included inOther restaurant operating expenses in the Company’s Consolidated Statements of Operations and Comprehensive Income .
ConsiderationReceivedfromVendors-The Company receives consideration for a variety of vendor-sponsored programs, such as volumerebates, promotions and advertising allowances. Advertising allowances are intended to offset the Company’s costs of promoting and sellingmenu items in its restaurants. Vendor consideration is recorded as a reduction of Cost of sales or Other restaurant operating expenses whenrecognized in the Company’s Consolidated Statements of Operations and Comprehensive Income .
ImpairmentofLong-LivedAssetsandCostsAssociatedwithExitActivities-Long-lived assets are reviewed for impairment whenever eventsor changes in circumstances indicate that the carrying value may not be recoverable. The evaluation is performed at the lowest level ofidentifiable cash flows independent of other assets. For long-lived assets deployed at its restaurants, the Company reviews for impairment atthe individual restaurant level. When evaluating for impairment, the total future undiscounted cash flows expected to be generated by theasset are compared to the carrying amount. If the total future undiscounted cash flows of the asset are less than its carrying amount,recoverability is measured by comparing the fair value of the assets to the carrying amount. An impairment loss is recognized in earningswhen the asset’s carrying value exceeds its estimated fair value. Fair value is generally estimated using a discounted cash flow model.
Generally, restaurant closure costs, including lease termination fees, are expensed as incurred. When the Company ceases using the propertyrights under a non-cancelable operating lease, it records a liability for the net present value of any remaining lease obligations as a result oflease termination, less the estimated sublease income that can reasonably be obtained for the property. Any subsequent adjustments to thatliability as a result of lease termination or changes in estimates of sublease income are recorded in the period incurred. The associatedexpense is recorded in Provision for impaired assets and restaurant closings in the Company’s Consolidated Statements of Operations andComprehensive Income .
Restaurant sites and certain other assets to be sold are included in assets held for sale when certain criteria are met, including the requirementthat the likelihood of selling the assets within one year is probable.
AdvertisingCosts-Advertising production costs are expensed in the period when the advertising first occurs. All other advertising costs areexpensed in the period in which the costs are incurred. Advertising expense of $160.8 million , $161.6 million and $191.1 million for fiscalyears 2016 , 2015 and 2014 , respectively, was recorded in Other restaurant operating expenses in the Company’s Consolidated Statements ofOperations and Comprehensive Income .
LegalCosts-Settlement costs are accrued when they are deemed probable and reasonably estimable. Legal fees are recognized as incurredand are reported in General and administrative expense in the Company’s Consolidated Statements of Operations and Comprehensive Income.
76
Table of ContentsBLOOMIN’ BRANDS, INC.
NOTES TO CONSOLIDATED FINANCIAL STATEMENTS - Continued
Research and Development Expenses (“R&D”) -R&D is expensed as incurred in General and administrative expense in the Company’sConsolidated Statements of Operations and Comprehensive Income . R&D primarily consists of payroll and benefit costs. R&D was $5.2million , $6.5 million and $5.8 million for fiscal years 2016 , 2015 and 2014 , respectively.
Partner Compensation - In additional to salary, the Restaurant Managing Partner of each Company-owned U.S. restaurant and the ChefPartner of each Fleming’s Prime Steakhouse & Wine Bar, as well as Area Operating Partners, generally receive performance-based bonusesfor providing management and supervisory services to their restaurants, certain of which may be based on a percentage of their associatedrestaurants’ monthly operating results or distributable cash flows (“Monthly Payments”). The expense associated with the Monthly Paymentsfor Restaurant Managing Partners and Chef Partners is included in Labor and other related expenses, and the expense associated with theMonthly Payments for Area Operating Partners is included in General and administrative expenses in the Company’s ConsolidatedStatements of Operations and Comprehensive Income .
Restaurant Managing Partners and Chef Partners in the U.S. that are eligible to participate in a deferred compensation program receive anunsecured promise of a cash contribution to their account (see Note 5 - Stock-basedandDeferredCompensationPlans). Also, on the fifthanniversary of the opening of each new U.S. Company-owned restaurant, the Area Operating Partner supervising the restaurant during thefirst five years of operation receives an additional performance-based bonus.
The Company estimates future bonuses and deferred compensation obligations to Restaurant Managing, Chef Partners and Area OperatingPartners, using current and historical information on restaurant performance and records the long-term portion of partner obligations in Otherlong-term liabilities, net in its Consolidated Balance Sheets. Deferred compensation expenses for Restaurant Managing and Chef partners areincluded in Labor and other related expenses and bonus expense for Area Operating Partners is included in General and administrativeexpenses in the Company’s Consolidated Statements of Operations and Comprehensive Income .
Stock-basedCompensation-Stock-based compensation awards are measured at fair value at the date of grant and expensed over their vestingor service periods. Stock-based compensation expense is recognized only for those awards expected to vest. The expense, net of forfeitures, isrecognized using the straight-line method.
ForeignCurrencyTranslationandTransactions-For non-U.S. operations, the functional currency is the local currency. Foreign currencydenominated assets and liabilities are translated into U.S. dollars using the exchange rates in effect at the balance sheet date with thetranslation adjustments recorded in Accumulated other comprehensive loss in the Company’s Consolidated Statements of Changes inStockholders’ Equity. Results of operations are translated using the average exchange rates for the reporting period.
The Company recorded foreign currency exchange transaction losses of $1.3 million , $1.2 million and $0.7 million for fiscal years 2016 ,2015 and 2014 , respectively. Foreign currency exchange transaction losses are recorded in General and administrative in the Company’sConsolidated Statements of Operations and Comprehensive Income .
IncomeTaxes-Deferred income tax assets and liabilities are recognized for the future tax consequences attributable to differences betweenthe financial statement carrying amounts of existing assets and liabilities and their respective tax basis. Deferred income tax assets andliabilities are measured using enacted tax rates expected to apply to taxable income in the years in which those temporary differences areexpected to be recovered or settled. The effect on deferred income tax assets and liabilities of a change in the tax rate is recognized in incomein the period that includes the enactment date of the rate change. A valuation allowance may reduce deferred income tax assets to the amountthat is more likely than not to be realized.
The Company records a tax benefit for an uncertain tax position using the highest cumulative tax benefit that is more likely than not to berealized. The Company adjusts its liability for unrecognized tax benefits in the period in which it determines the issue is effectively settled,the statute of limitations expires or when more information becomes available.
77
Table of ContentsBLOOMIN’ BRANDS, INC.
NOTES TO CONSOLIDATED FINANCIAL STATEMENTS - Continued
Liabilities for unrecognized tax benefits, including penalties and interest, are recorded in Accrued and other current liabilities and Other long-term liabilities on the Company’s Consolidated Balance Sheets.
Recently Adopted Financial Accounting Standards - In August 2014, the Financial Accounting Standards Board (“the FASB”) issuedAccounting Standards Update (“ASU”) 2014-15: “Presentation of Financial Statements-Going Concern (Subtopic 205-40): Disclosure ofUncertainties about an Entity’s Ability to Continue as a Going Concern” (“ASU No. 2014-15”). ASU No. 2014-15 requires management toevaluate whether there is substantial doubt about an entity’s ability to continue as a going concern, and to provide related footnote disclosuresin certain circumstances. The adoption of ASU No. 2014-15 on December 25, 2016 did not have an impact on the Company’s financialposition, results of operations or cash flows.
Recently Issued Financial Accounting Standards Not Yet Adopted - In January 2017, the FASB issued ASU No. 2017-04, “ Intangibles -Goodwill and Other (Topic 350): Simplifying the Test for Goodwill Impairment,” (“ASU No. 2017-04”).ASU No. 2017-04 eliminates the second step of goodwill impairment, which requires a hypothetical purchase price allocation. Under ASUNo. 2017-14, goodwill impairment will be calculated as the amount a reporting unit’s carrying value exceeds its calculated fair value. ASUNo. 2017-04 will be applied prospectively and is effective for the Company in fiscal year 2020, with early adoption permitted. The Companydoes not expect the adoption of ASU No. 2017-04 to have a material impact on its Consolidated Financial Statements.
In January 2017, the FASB issued ASU No. 2017-01, “Business Combinations - Clarifying the Definition of a Business,” (“ASU No. 2017-01”). ASU No. 2017-01 clarifies the definition of a business when evaluating whether transactions should be accounted for as acquisitions (ordisposals) of assets or businesses. The definition of a business affects various areas of accounting including acquisitions, disposals, goodwill,and consolidation. ASU No. 2017-01 is effective for the Company in fiscal year 2018 and is not expected to have an impact on theCompany’s Consolidated Financial Statements.
In November 2016, the FASB issued ASU No. 2016-18, “Statement of Cash Flows (Topic 230), Restricted Cash” (“ASU No. 2016-18”).ASU No. 2016-18 provides guidance on the presentation of restricted cash and restricted cash equivalents, which should now be includedwith cash and cash equivalents when reconciling the beginning and ending cash amounts shown on the Statements of Cash Flows. ASU No.2016-18 will be effective for the Company in fiscal year 2018, with early adoption permitted. Other than the change in presentation ofrestricted cash within the Statement of Cash Flows, the adoption of ASU No. 2016-18 is not expected to have an impact on the Company’sConsolidated Financial Statements.
In August 2016, the FASB issued ASU No. 2016-15, Statement of Cash Flows (Topic 230): Classification of Certain Cash Receipts and CashPayments (“ASU No. 2016-15”), which provides guidance on the statement of cash flows presentation of certain transactions where diversityin practice exists. ASU No. 2016-15 will be effect ive for the Company in fiscal year 2018 , and early adoption is permitted. The Companydoes not expect ASU No. 2016-15 to have a material impact on its Consolidated Financial Statements.
In March 2016, the FASB issued ASU 2016-09: “Compensation - Stock Compensation (Topic 718): Improvements to Employee Share-BasedPayment Accounting” (“ASU No. 2016-09”). ASU No. 2016-09 simplifies several aspects related to the accounting for share-based paymenttransactions, including the accounting for income taxes, statutory tax withholding requirements and classification on the statement of cashflows. ASU No. 2016-09 will be effective for the Company in fiscal year 2017.
Currently, the Company recognizes excess tax benefits for stock compensation in the Statement of Stockholder’s Equity when the benefits arerealized (on a with and without basis). Upon adoption of ASU No. 2016-09, excess tax benefits related to stock compensation will berecorded through the Statement of Operations and Comprehensive Income. Excess tax benefits of approximately $14.0 million to $15.0million will be recorded as a cumulative effect adjustment to equity in fiscal year 2017.
78
Table of ContentsBLOOMIN’ BRANDS, INC.
NOTES TO CONSOLIDATED FINANCIAL STATEMENTS - Continued
The impact of adopting ASU No. 2016-09 will depend on the difference between the market price of the Company’s stock between the grantdates and subsequent vesting dates of share-based awards, and this impact could be positive or negative depending on how the Company’sstock price fluctuates.
In February 2016, the FASB issued ASU No. 2016-02: “Leases (Topic 842)” (“ASU No. 2016-02”). ASU No. 2016-02 requires the leaserights and obligations arising from lease contracts, including existing and new arrangements, to be recognized as assets and liabilities on thebalance sheet. ASU No. 2016-02 is effective for the Company in fiscal year 2019 and must be adopted using a modified retrospectiveapproach. The Company is currently evaluating the impact the adoption of ASU No. 2016-02 will have on its Consolidated FinancialStatements.
In May 2014, the FASB issued ASU No. 2014-09 “Revenue Recognition (Topic 606), Revenue from Contracts with Customers” (“ASU No.2014-09”). ASU No. 2014-09 provides a single source of guidance for revenue arising from contracts with customers and supersedes currentrevenue recognition standards. Under ASU No. 2014-09, revenue is recognized in an amount that reflects the consideration an entity expectsto receive for the transfer of goods and services. ASU No. 2014-09, as amended, will be effective for the Company in fiscal year 2018 and isapplied retrospectively to each period presented or as a cumulative effect adjustment at the date of adoption.
While the Company continues to assess all potential impacts of the standard, it currently believes the most significant impact relates toaccounting for breakage and advertising fees charged to franchisees. Under the new standard, the Company expects to recognize breakageproportional to actual gift card redemptions. Advertising fees charged to franchisees, which are currently recorded as a reduction to Otherrestaurant operating expenses, will be recognized as Other revenue. In addition, initial franchise fees will be recognized over the term of thefranchise agreement, which is not expected to have a material impact on the Consolidated Financial Statements.
Recent accounting guidance not discussed above is not applicable, did not have, or is not expected to have a material impact to the Company.
79
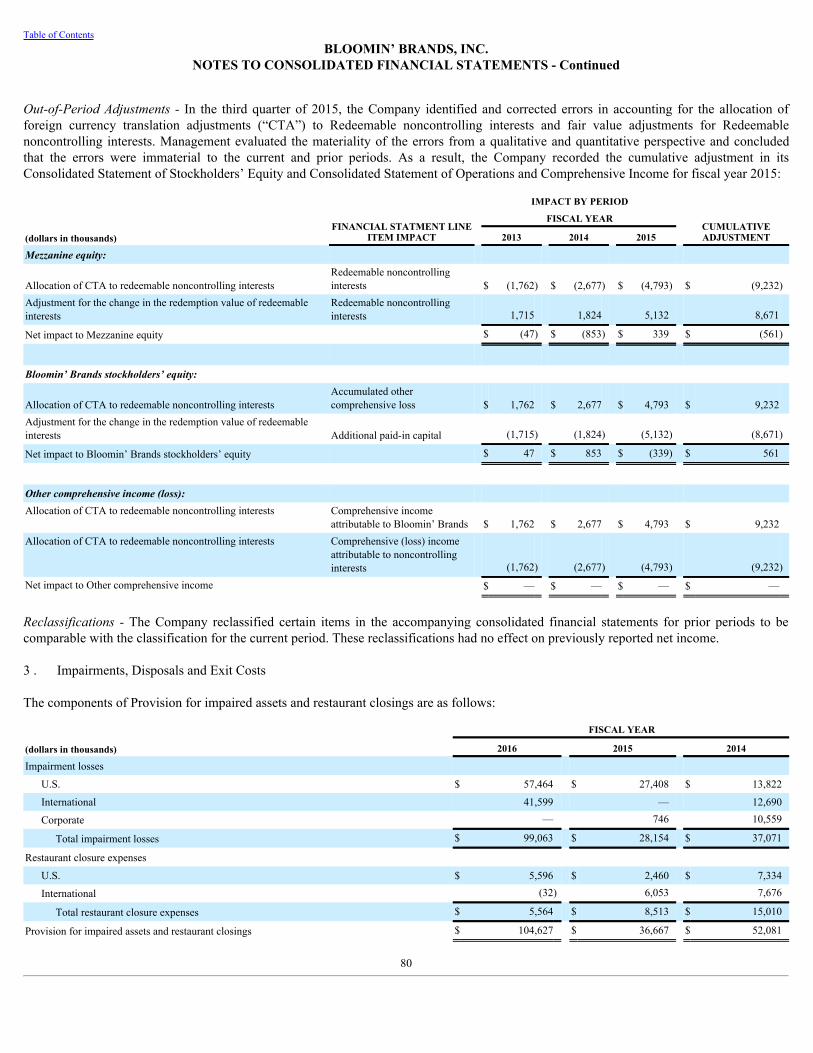
Table of ContentsBLOOMIN’ BRANDS, INC.
NOTES TO CONSOLIDATED FINANCIAL STATEMENTS - Continued
Out-of-Period Adjustments - In the third quarter of 2015, the Company identified and corrected errors in accounting for the allocation offoreign currency translation adjustments (“CTA”) to Redeemable noncontrolling interests and fair value adjustments for Redeemablenoncontrolling interests. Management evaluated the materiality of the errors from a qualitative and quantitative perspective and concludedthat the errors were immaterial to the current and prior periods. As a result, the Company recorded the cumulative adjustment in itsConsolidated Statement of Stockholders’ Equity and Consolidated Statement of Operations and Comprehensive Income for fiscal year 2015:
FINANCIAL STATMENT LINEITEM IMPACT
IMPACT BY PERIOD
CUMULATIVEADJUSTMENT
FISCAL YEAR
(dollars in thousands) 2013 2014 2015 Mezzanine equity:
Allocation of CTA to redeemable noncontrolling interests Redeemable noncontrollinginterests $ (1,762) $ (2,677) $ (4,793) $ (9,232)
Adjustment for the change in the redemption value of redeemableinterests
Redeemable noncontrollinginterests 1,715 1,824 5,132 8,671
Net impact to Mezzanine equity $ (47) $ (853) $ 339 $ (561)
Bloomin’ Brands stockholders’ equity:
Allocation of CTA to redeemable noncontrolling interests Accumulated othercomprehensive loss $ 1,762 $ 2,677 $ 4,793 $ 9,232
Adjustment for the change in the redemption value of redeemableinterests Additional paid-in capital (1,715) (1,824) (5,132) (8,671)
Net impact to Bloomin’ Brands stockholders’ equity $ 47 $ 853 $ (339) $ 561
Other comprehensive income (loss): Allocation of CTA to redeemable noncontrolling interests
Comprehensive incomeattributable to Bloomin’ Brands $ 1,762 $ 2,677 $ 4,793 $ 9,232
Allocation of CTA to redeemable noncontrolling interests
Comprehensive (loss) incomeattributable to noncontrollinginterests (1,762) (2,677) (4,793) (9,232)
Net impact to Other comprehensive income $ — $ — $ — $ —
Reclassifications -The Company reclassified certain items in the accompanying consolidated financial statements for prior periods to becomparable with the classification for the current period. These reclassifications had no effect on previously reported net income.
3 . Impairments, Disposals and Exit Costs
The components of Provision for impaired assets and restaurant closings are as follows:
FISCAL YEAR
(dollars in thousands) 2016 2015 2014
Impairment losses U.S. $ 57,464 $ 27,408 $ 13,822
International 41,599 — 12,690
Corporate — 746 10,559
Total impairment losses $ 99,063 $ 28,154 $ 37,071
Restaurant closure expenses U.S. $ 5,596 $ 2,460 $ 7,334
International (32) 6,053 7,676
Total restaurant closure expenses $ 5,564 $ 8,513 $ 15,010
Provision for impaired assets and restaurant closings $ 104,627 $ 36,667 $ 52,081
80
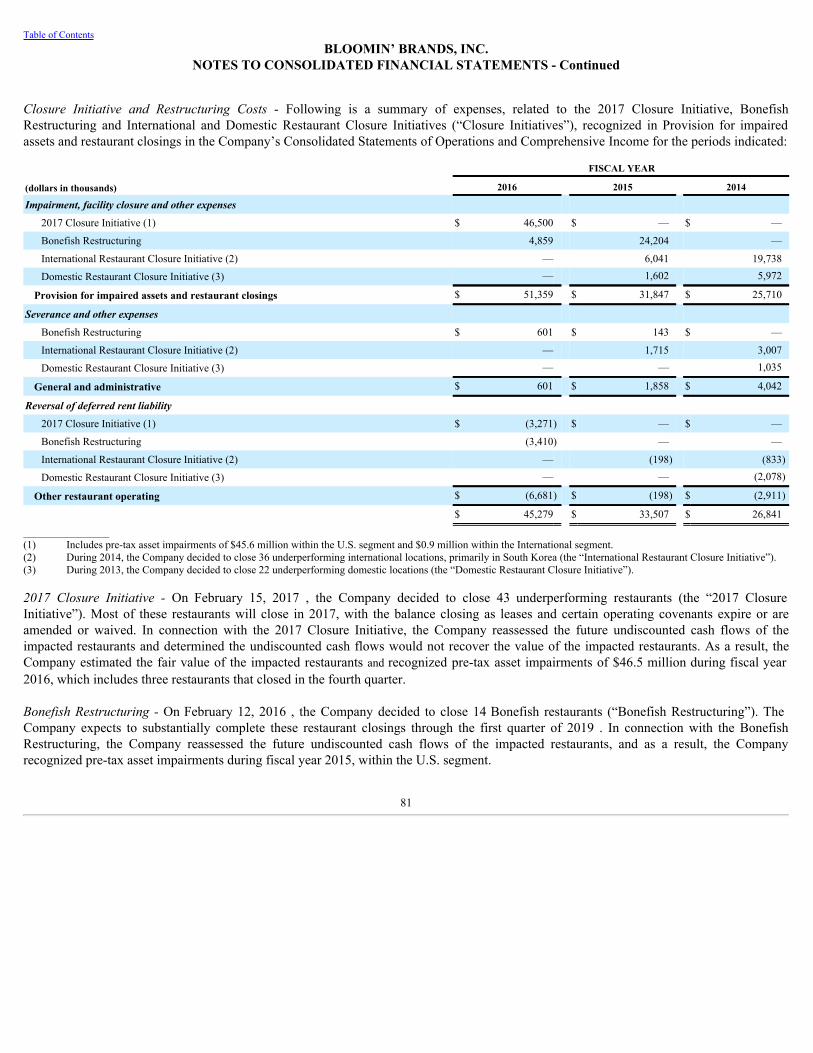
Table of ContentsBLOOMIN’ BRANDS, INC.
NOTES TO CONSOLIDATED FINANCIAL STATEMENTS - Continued
Closure Initiative and Restructuring Costs - Following is a summary of expenses, related to the 2017 Closure Initiative, BonefishRestructuring and International and Domestic Restaurant Closure Initiatives (“Closure Initiatives”), recognized in Provision for impairedassets and restaurant closings in the Company’s Consolidated Statements of Operations and Comprehensive Income for the periods indicated:
FISCAL YEAR
(dollars in thousands) 2016 2015 2014
Impairment, facility closure and other expenses 2017 Closure Initiative (1) $ 46,500 $ — $ —
Bonefish Restructuring 4,859 24,204 —
International Restaurant Closure Initiative (2) — 6,041 19,738
Domestic Restaurant Closure Initiative (3) — 1,602 5,972
Provision for impaired assets and restaurant closings $ 51,359 $ 31,847 $ 25,710
Severance and other expenses Bonefish Restructuring $ 601 $ 143 $ —
International Restaurant Closure Initiative (2) — 1,715 3,007
Domestic Restaurant Closure Initiative (3) — — 1,035
General and administrative $ 601 $ 1,858 $ 4,042
Reversal of deferred rent liability 2017 Closure Initiative (1) $ (3,271) $ — $ —
Bonefish Restructuring (3,410) — —
International Restaurant Closure Initiative (2) — (198) (833)
Domestic Restaurant Closure Initiative (3) — — (2,078)
Other restaurant operating $ (6,681) $ (198) $ (2,911)
$ 45,279 $ 33,507 $ 26,841
________________(1) Includes pre-tax asset impairments of $45.6 million within the U.S. segment and $0.9 million within the International segment.(2) During 2014, the Company decided to close 36 underperforming international locations, primarily in South Korea (the “International Restaurant Closure Initiative”).(3) During 2013, the Company decided to close 22 underperforming domestic locations (the “Domestic Restaurant Closure Initiative”).
2017 Closure Initiative - On February 15, 2017 , the Company decided to close 43 underperforming restaurants (the “2017 ClosureInitiative”). Most of these restaurants will close in 2017, with the balance closing as leases and certain operating covenants expire or areamended or waived. In connection with the 2017 Closure Initiative, the Company reassessed the future undiscounted cash flows of theimpacted restaurants and determined the undiscounted cash flows would not recover the value of the impacted restaurants. As a result, theCompany estimated the fair value of the impacted restaurants and recognized pre-tax asset impairments of $46.5 million during fiscal year2016, which includes three restaurants that closed in the fourth quarter.
Bonefish Restructuring -On February 12, 2016 , the Company decided to close 14 Bonefish restaurants (“Bonefish Restructuring”). TheCompany expects to substantially complete these restaurant closings through the first quarter of 2019 . In connection with the BonefishRestructuring, the Company reassessed the future undiscounted cash flows of the impacted restaurants, and as a result, the Companyrecognized pre-tax asset impairments during fiscal year 2015, within the U.S. segment.
81
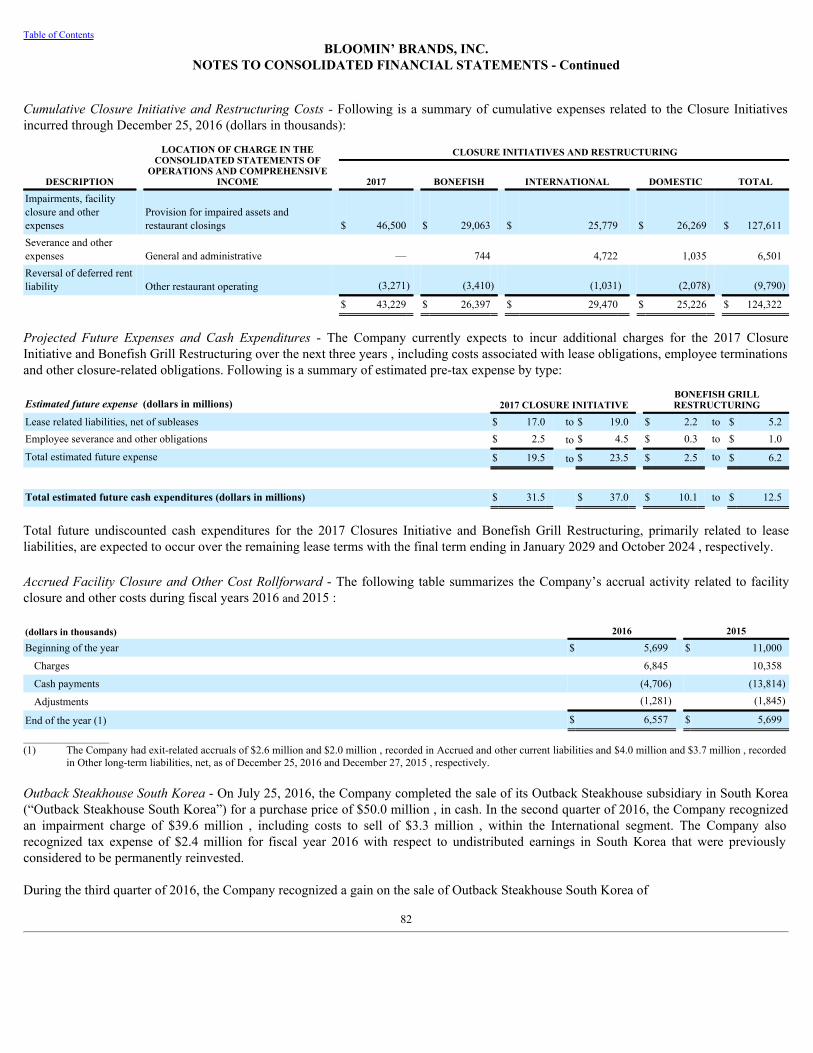
Table of ContentsBLOOMIN’ BRANDS, INC.
NOTES TO CONSOLIDATED FINANCIAL STATEMENTS - Continued
CumulativeClosureInitiativeandRestructuringCosts-Following is a summary of cumulative expenses related to the Closure Initiativesincurred through December 25, 2016 (dollars in thousands):
DESCRIPTION
LOCATION OF CHARGE IN THECONSOLIDATED STATEMENTS OF
OPERATIONS AND COMPREHENSIVEINCOME
CLOSURE INITIATIVES AND RESTRUCTURING
2017 BONEFISH INTERNATIONAL DOMESTIC TOTAL
Impairments, facilityclosure and otherexpenses
Provision for impaired assets andrestaurant closings $ 46,500 $ 29,063 $ 25,779 $ 26,269 $ 127,611
Severance and otherexpenses General and administrative — 744 4,722 1,035 6,501Reversal of deferred rentliability Other restaurant operating (3,271) (3,410) (1,031) (2,078) (9,790)
$ 43,229 $ 26,397 $ 29,470 $ 25,226 $ 124,322
Projected Future Expenses and Cash Expenditures - The Company currently expects to incur additional charges for the 2017 ClosureInitiative and Bonefish Grill Restructuring over the next three years , including costs associated with lease obligations, employee terminationsand other closure-related obligations. Following is a summary of estimated pre-tax expense by type:
Estimated future expense (dollars in millions) 2017 CLOSURE INITIATIVE BONEFISH GRILLRESTRUCTURING
Lease related liabilities, net of subleases $ 17.0 to $ 19.0 $ 2.2 to $ 5.2Employee severance and other obligations $ 2.5 to $ 4.5 $ 0.3 to $ 1.0
Total estimated future expense $ 19.5 to $ 23.5 $ 2.5 to $ 6.2
Total estimated future cash expenditures (dollars in millions) $ 31.5 $ 37.0 $ 10.1 to $ 12.5
Total future undiscounted cash expenditures for the 2017 Closures Initiative and Bonefish Grill Restructuring, primarily related to leaseliabilities, are expected to occur over the remaining lease terms with the final term ending in January 2029 and October 2024 , respectively.
AccruedFacility ClosureandOtherCost Rollforward- The following table summarizes the Company’s accrual activity related to facilityclosure and other costs during fiscal years 2016 and 2015 :
(dollars in thousands) 2016 2015
Beginning of the year $ 5,699 $ 11,000
Charges 6,845 10,358
Cash payments (4,706) (13,814)
Adjustments (1,281) (1,845)
End of the year (1) $ 6,557 $ 5,699
________________(1) The Company had exit-related accruals of $2.6 million and $2.0 million , recorded in Accrued and other current liabilities and $4.0 million and $3.7 million , recorded
in Other long-term liabilities, net, as of December 25, 2016 and December 27, 2015 , respectively.
OutbackSteakhouseSouthKorea- On July 25, 2016, the Company completed the sale of its Outback Steakhouse subsidiary in South Korea(“Outback Steakhouse South Korea”) for a purchase price of $50.0 million , in cash. In the second quarter of 2016, the Company recognizedan impairment charge of $39.6 million , including costs to sell of $3.3 million , within the International segment. The Company alsorecognized tax expense of $2.4 million for fiscal year 2016 with respect to undistributed earnings in South Korea that were previouslyconsidered to be permanently reinvested.
During the third quarter of 2016, the Company recognized a gain on the sale of Outback Steakhouse South Korea of
82

Table of ContentsBLOOMIN’ BRANDS, INC.
NOTES TO CONSOLIDATED FINANCIAL STATEMENTS - Continued
$2.1 million within Other income (expense), net in the Consolidated Statements of Operations and Comprehensive Income , primarily due toa change in foreign currency exchange rates subsequent to the Company’s second fiscal quarter. After completion of the sale, the Company’srestaurant locations in South Korea are operated as franchises.
Following are the components of Outback Steakhouse South Korea included in the Consolidated Statements of Operations andComprehensive Income for the following periods:
FISCAL YEAR
(dollars in thousands) 2016 2015 2014
Restaurant sales $ 90,455 $ 171,649 $ 238,802
(Loss) income before income taxes (1) $ (32,348) $ 3,284 $ (12,955)________________(1) Includes impairment charges of $39.6 million for Assets held for sale and a gain of $2.1 million on the sale of Outback Steakhouse South Korea for fiscal year 2016 .
Roy’s- On January 26, 2015, the Company sold its Roy’s business to United Ohana, LLC (the “Buyer”), for a purchase price of $10.0 million, less certain liabilities, and recognized a loss on sale of $0.9 million , which was recorded in Other expense, net, during fiscal year 2015.
In connection with the sale of Roy’s, the Company continues to provide lease guarantees for certain of the Roy’s locations. Under theguarantees, the Company will pay the rental expense over the remaining lease term in the event of default by the Buyer. The fair value andmaximum value of the lease guarantees is nominal. The maximum amount is calculated as the fair value of the lease payments, net ofsublease assumptions, over the remaining lease term.
Following are the components of Roy’s included in the Company’s Consolidated Statements of Operations and Comprehensive Income forthe following periods:
FISCAL YEAR
(dollars in thousands) 2015 2014
Restaurant sales $ 5,729 $ 68,575
Loss before income taxes (1)(2) $ (831) $ (13,612)________________(1) Loss before income taxes includes loss on sale of $0.9 million in fiscal year 2015.(2) Loss before income taxes includes impairment charges of $13.4 million in fiscal year 2014, which was recorded within the U.S. segment.
OtherDisposals-During 2016, the Company recognized impairment charges of $3.5 million for its Puerto Rico subsidiary, within the U.S.segment.
During 2014, the Company decided to sell both of its corporate airplanes. In connection with this decision, the Company recognized pre-taxasset impairment charges of $0.7 million and $10.6 million in fiscal years 2015 and 2014, respectively.
The remaining restaurant impairment and closing charges resulted from the carrying value of a restaurant’s assets exceeding its estimated fairmarket value, primarily due to locations identified for relocation or closure.
4. Earnings Per Share
The Company computes basic earnings per share based on the weighted average number of common shares that were outstanding during theperiod. Diluted earnings per share includes the dilutive effect of common stock equivalents consisting of restricted stock, restricted stockunits, performance-based share units and stock options, using the treasury stock method. Performance-based share units are considereddilutive when the related performance criterion has been met.
83

Table of ContentsBLOOMIN’ BRANDS, INC.
NOTES TO CONSOLIDATED FINANCIAL STATEMENTS - Continued
The following table presents the computation of basic and diluted earnings per share:
FISCAL YEAR
(in thousands, except per share amounts) 2016 2015 2014Net income attributable to Bloomin’ Brands $ 41,748 $ 127,327 $ 91,090
Basic weighted average common shares outstanding 111,381 122,352 125,139
Effect of diluted securities:
Stock options 2,659 2,992 3,079Nonvested restricted stock and restricted stock units 260 216 91Nonvested performance-based share units 11 25 8
Diluted weighted average common shares outstanding 114,311 125,585 128,317
Basic earnings per share $ 0.37 $ 1.04 $ 0.73Diluted earnings per share $ 0.37 $ 1.01 $ 0.71
Dilutive securities outstanding not included in the computation of earnings per share because their effect was antidilutive were as follows:
FISCAL YEAR
(shares in thousands) 2016 2015 2014
Stock options 5,151 2,670 3,090
Nonvested restricted stock and restricted stock units 219 27 206
Nonvested performance-based share units 92 — —
5 . Stock-based and Deferred Compensation Plans
Stock-based Compensation Plans
EquityCompensationPlans-On April 22, 2016, the Company’s shareholders approved the Bloomin’ Brands, Inc. 2016 Omnibus IncentiveCompensation Plan (the “2016 Incentive Plan”). Following approval of the 2016 Incentive Plan, no further awards have been granted underthe Company’s previous equity compensation plans. Existing awards under previous plans continue to vest in accordance with the originalvesting schedule and will expire at the end of their original term. The 2016 Incentive Plan permits the grant of stock options, stockappreciation rights, restricted stock, restricted stock units, performance awards and other cash-based or stock-based awards to Companymanagement, other key employees, consultants and directors.
As of December 25, 2016 , the maximum number of shares of common stock available for issuance pursuant to the 2016 Incentive Plan was6,127,810 .
The Company recognized stock-based compensation expense as follows:
FISCAL YEAR
(dollars in thousands) 2016 2015 2014
Stock options $ 11,926 $ 10,041 $ 11,946
Restricted stock and restricted stock units 9,275 6,758 3,857
Performance-based share units 1,393 3,596 1,190
$ 22,594 $ 20,395 $ 16,993
84
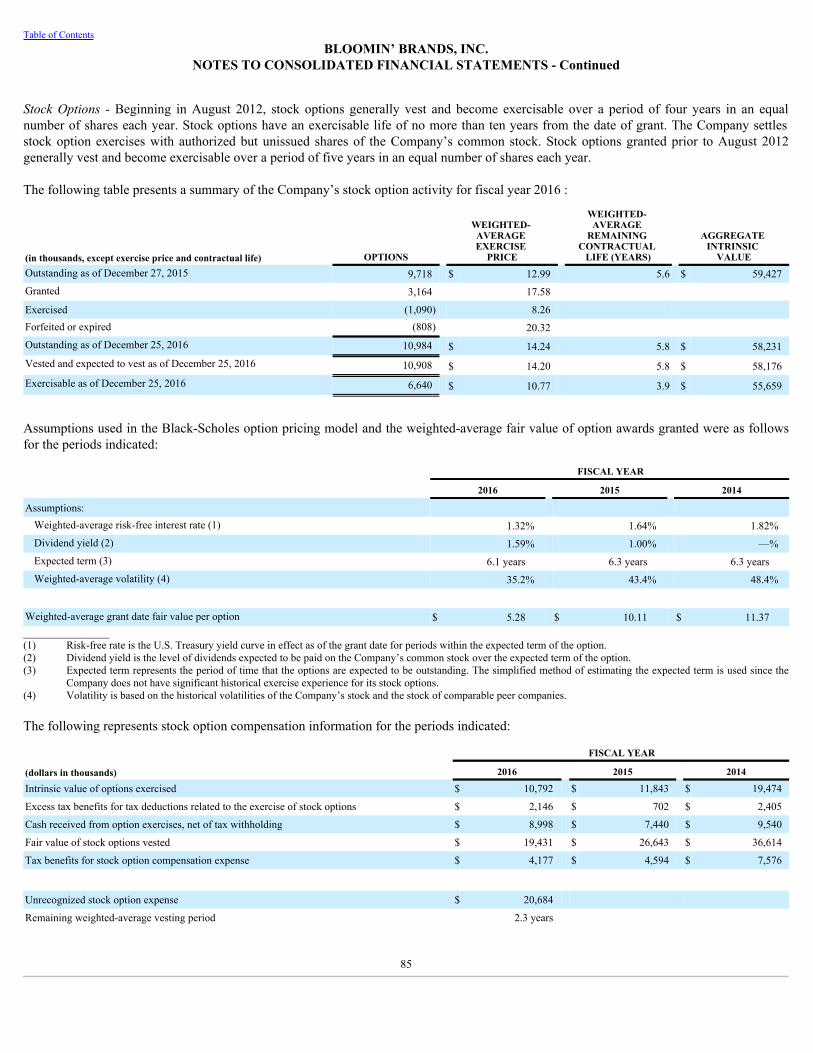
Table of ContentsBLOOMIN’ BRANDS, INC.
NOTES TO CONSOLIDATED FINANCIAL STATEMENTS - Continued
Stock Options -Beginning in August 2012, stock options generally vest and become exercisable over a period of four years in an equalnumber of shares each year. Stock options have an exercisable life of no more than ten years from the date of grant. The Company settlesstock option exercises with authorized but unissued shares of the Company’s common stock. Stock options granted prior to August 2012generally vest and become exercisable over a period of five years in an equal number of shares each year.
The following table presents a summary of the Company’s stock option activity for fiscal year 2016 :
(in thousands, except exercise price and contractual life) OPTIONS
WEIGHTED- AVERAGE EXERCISE
PRICE
WEIGHTED- AVERAGE
REMAINING CONTRACTUAL
LIFE (YEARS)
AGGREGATE INTRINSIC
VALUEOutstanding as of December 27, 2015 9,718 $ 12.99 5.6 $ 59,427Granted 3,164 17.58
Exercised (1,090) 8.26 Forfeited or expired (808) 20.32 Outstanding as of December 25, 2016 10,984 $ 14.24 5.8 $ 58,231Vested and expected to vest as of December 25, 2016 10,908 $ 14.20 5.8 $ 58,176Exercisable as of December 25, 2016 6,640 $ 10.77 3.9 $ 55,659
Assumptions used in the Black-Scholes option pricing model and the weighted-average fair value of option awards granted were as followsfor the periods indicated:
FISCAL YEAR
2016 2015 2014
Assumptions: Weighted-average risk-free interest rate (1) 1.32% 1.64% 1.82%Dividend yield (2) 1.59% 1.00% —%Expected term (3) 6.1 years 6.3 years 6.3 yearsWeighted-average volatility (4) 35.2% 43.4% 48.4%
Weighted-average grant date fair value per option $ 5.28 $ 10.11 $ 11.37________________(1) Risk-free rate is the U.S. Treasury yield curve in effect as of the grant date for periods within the expected term of the option.(2) Dividend yield is the level of dividends expected to be paid on the Company’s common stock over the expected term of the option.(3) Expected term represents the period of time that the options are expected to be outstanding. The simplified method of estimating the expected term is used since the
Company does not have significant historical exercise experience for its stock options.(4) Volatility is based on the historical volatilities of the Company’s stock and the stock of comparable peer companies.
The following represents stock option compensation information for the periods indicated:
FISCAL YEAR
(dollars in thousands) 2016 2015 2014
Intrinsic value of options exercised $ 10,792 $ 11,843 $ 19,474
Excess tax benefits for tax deductions related to the exercise of stock options $ 2,146 $ 702 $ 2,405
Cash received from option exercises, net of tax withholding $ 8,998 $ 7,440 $ 9,540
Fair value of stock options vested $ 19,431 $ 26,643 $ 36,614
Tax benefits for stock option compensation expense $ 4,177 $ 4,594 $ 7,576
Unrecognized stock option expense $ 20,684 Remaining weighted-average vesting period 2.3 years
85
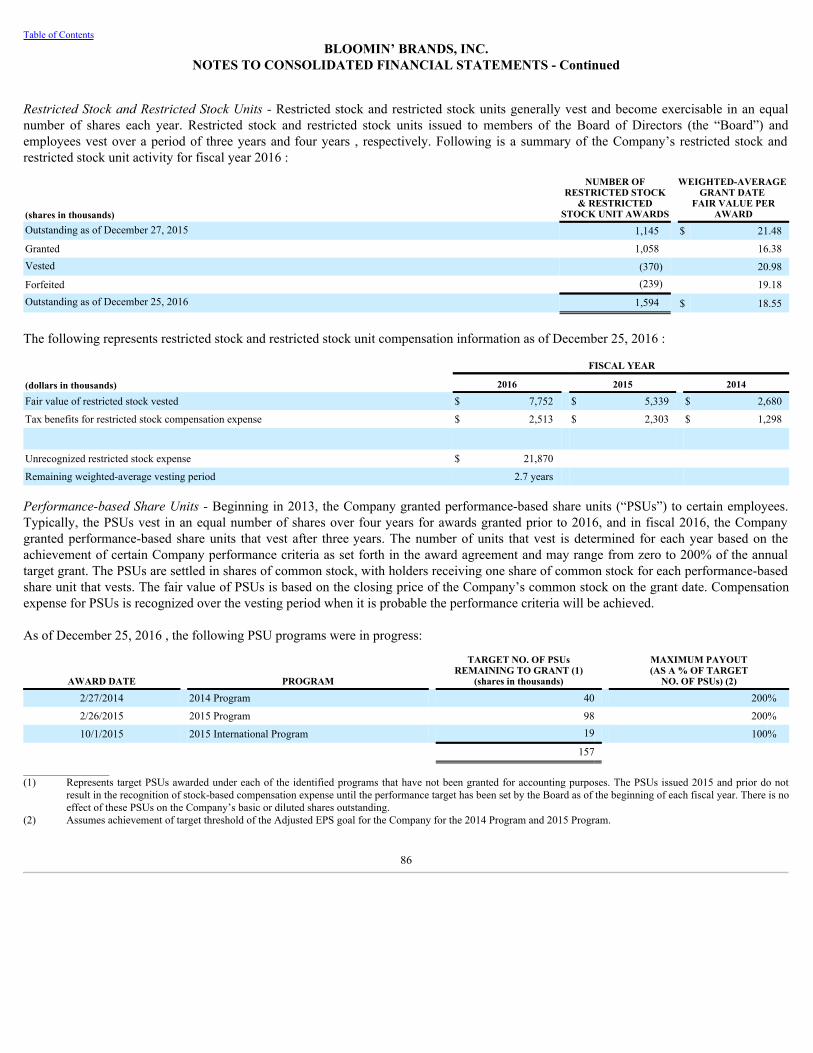
Table of ContentsBLOOMIN’ BRANDS, INC.
NOTES TO CONSOLIDATED FINANCIAL STATEMENTS - Continued
RestrictedStockandRestrictedStockUnits-Restricted stock and restricted stock units generally vest and become exercisable in an equalnumber of shares each year. Restricted stock and restricted stock units issued to members of the Board of Directors (the “Board”) andemployees vest over a period of three years and four years , respectively. Following is a summary of the Company’s restricted stock andrestricted stock unit activity for fiscal year 2016 :
(shares in thousands)
NUMBER OFRESTRICTED STOCK
& RESTRICTEDSTOCK UNIT AWARDS
WEIGHTED-AVERAGE GRANT DATE
FAIR VALUE PERAWARD
Outstanding as of December 27, 2015 1,145 $ 21.48
Granted 1,058 16.38Vested (370) 20.98
Forfeited (239) 19.18Outstanding as of December 25, 2016 1,594 $ 18.55
The following represents restricted stock and restricted stock unit compensation information as of December 25, 2016 :
FISCAL YEAR
(dollars in thousands) 2016 2015 2014
Fair value of restricted stock vested $ 7,752 $ 5,339 $ 2,680
Tax benefits for restricted stock compensation expense $ 2,513 $ 2,303 $ 1,298
Unrecognized restricted stock expense $ 21,870 Remaining weighted-average vesting period 2.7 years
Performance-basedShareUnits-Beginning in 2013, the Company granted performance-based share units (“PSUs”) to certain employees.Typically, the PSUs vest in an equal number of shares over four years for awards granted prior to 2016, and in fiscal 2016, the Companygranted performance-based share units that vest after three years. The number of units that vest is determined for each year based on theachievement of certain Company performance criteria as set forth in the award agreement and may range from zero to 200% of the annualtarget grant. The PSUs are settled in shares of common stock, with holders receiving one share of common stock for each performance-basedshare unit that vests. The fair value of PSUs is based on the closing price of the Company’s common stock on the grant date. Compensationexpense for PSUs is recognized over the vesting period when it is probable the performance criteria will be achieved.
As of December 25, 2016 , the following PSU programs were in progress:
TARGET NO. OF PSUsREMAINING TO GRANT (1)
(shares in thousands)
MAXIMUM PAYOUT(AS A % OF TARGET
NO. OF PSUs) (2)AWARD DATE PROGRAM 2/27/2014 2014 Program 40 200%
2/26/2015 2015 Program 98 200%
10/1/2015 2015 International Program 19 100%
157 ________________(1) Represents target PSUs awarded under each of the identified programs that have not been granted for accounting purposes. The PSUs issued 2015 and prior do not
result in the recognition of stock-based compensation expense until the performance target has been set by the Board as of the beginning of each fiscal year. There is noeffect of these PSUs on the Company’s basic or diluted shares outstanding.
(2) Assumes achievement of target threshold of the Adjusted EPS goal for the Company for the 2014 Program and 2015 Program.
86
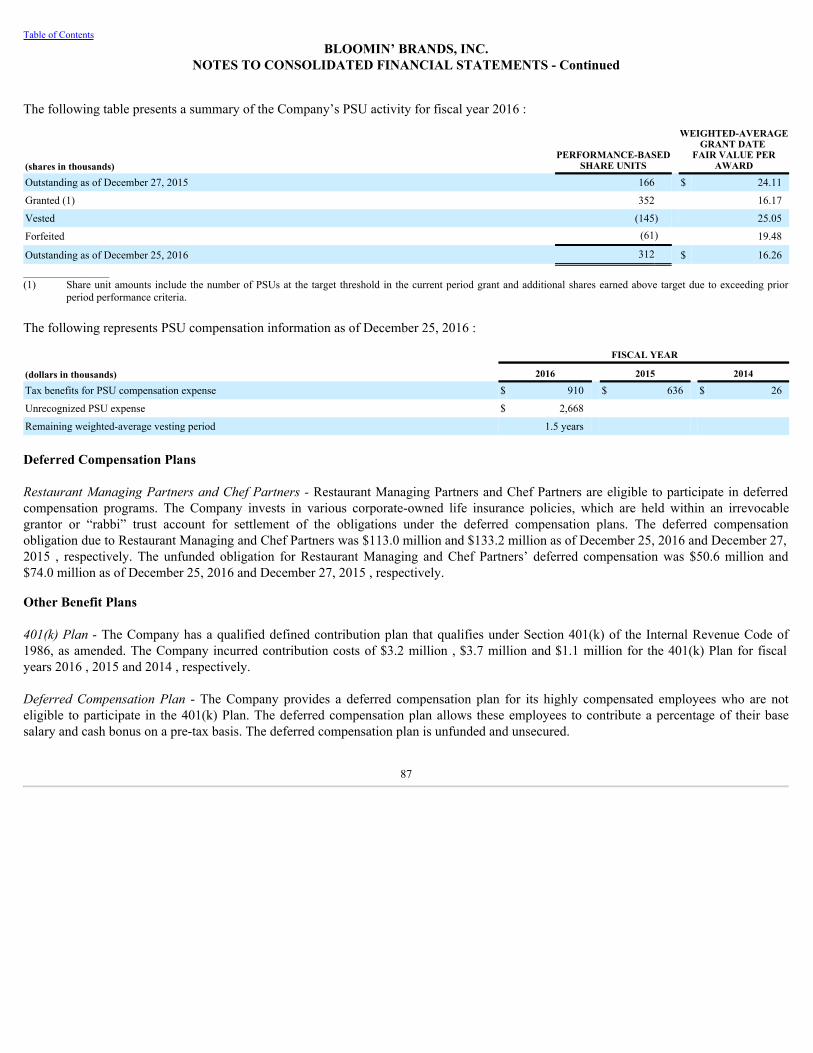
Table of ContentsBLOOMIN’ BRANDS, INC.
NOTES TO CONSOLIDATED FINANCIAL STATEMENTS - Continued
The following table presents a summary of the Company’s PSU activity for fiscal year 2016 :
(shares in thousands)PERFORMANCE-BASED
SHARE UNITS
WEIGHTED-AVERAGEGRANT DATE
FAIR VALUE PERAWARD
Outstanding as of December 27, 2015 166 $ 24.11
Granted (1) 352 16.17
Vested (145) 25.05
Forfeited (61) 19.48
Outstanding as of December 25, 2016 312 $ 16.26________________(1) Share unit amounts include the number of PSUs at the target threshold in the current period grant and additional shares earned above target due to exceeding prior
period performance criteria.
The following represents PSU compensation information as of December 25, 2016 :
FISCAL YEAR
(dollars in thousands) 2016 2015 2014
Tax benefits for PSU compensation expense $ 910 $ 636 $ 26
Unrecognized PSU expense $ 2,668 Remaining weighted-average vesting period 1.5 years
Deferred Compensation Plans
RestaurantManagingPartnersandChefPartners-Restaurant Managing Partners and Chef Partners are eligible to participate in deferredcompensation programs. The Company invests in various corporate-owned life insurance policies, which are held within an irrevocablegrantor or “rabbi” trust account for settlement of the obligations under the deferred compensation plans. The deferred compensationobligation due to Restaurant Managing and Chef Partners was $113.0 million and $133.2 million as of December 25, 2016 and December 27,2015 , respectively. The unfunded obligation for Restaurant Managing and Chef Partners’ deferred compensation was $50.6 million and$74.0 million as of December 25, 2016 and December 27, 2015 , respectively.
Other Benefit Plans
401(k)Plan- The Company has a qualified defined contribution plan that qualifies under Section 401(k) of the Internal Revenue Code of1986, as amended. The Company incurred contribution costs of $3.2 million , $3.7 million and $1.1 million for the 401(k) Plan for fiscalyears 2016 , 2015 and 2014 , respectively.
Deferred Compensation Plan - The Company provides a deferred compensation plan for its highly compensated employees who are noteligible to participate in the 401(k) Plan. The deferred compensation plan allows these employees to contribute a percentage of their basesalary and cash bonus on a pre-tax basis. The deferred compensation plan is unfunded and unsecured.
87
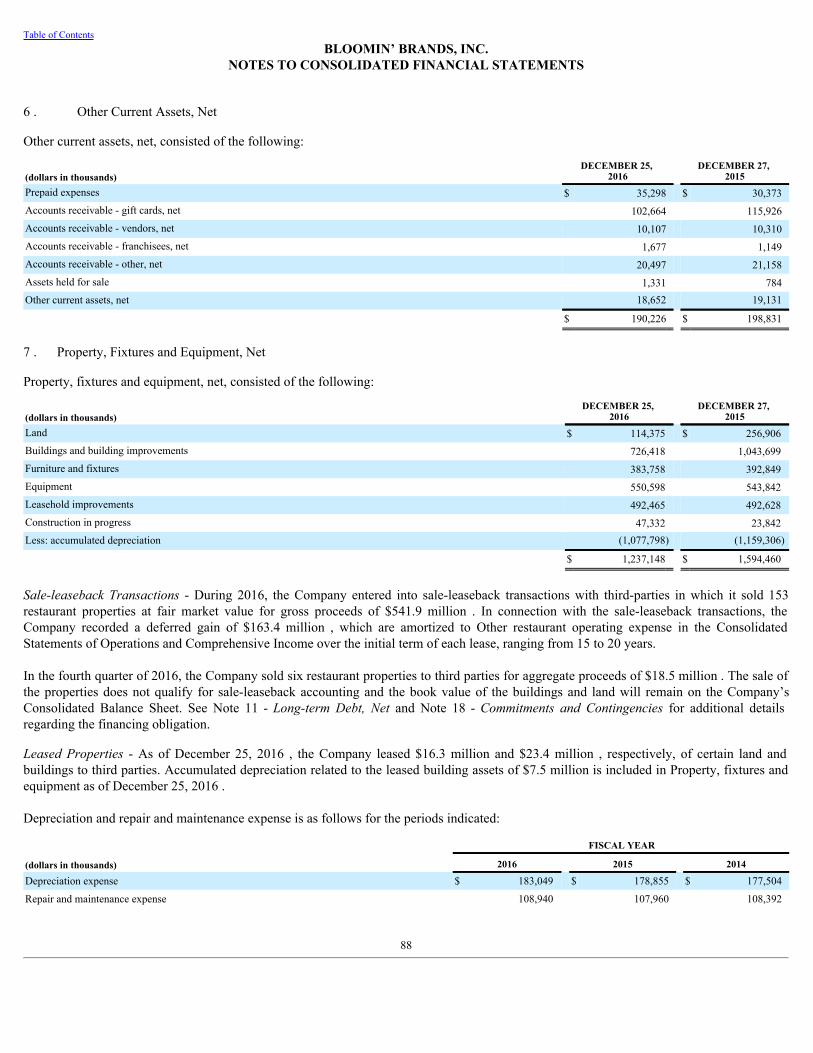
Table of ContentsBLOOMIN’ BRANDS, INC.
NOTES TO CONSOLIDATED FINANCIAL STATEMENTS
6 . Other Current Assets, Net
Other current assets, net, consisted of the following:
(dollars in thousands)DECEMBER 25,
2016 DECEMBER 27,
2015Prepaid expenses $ 35,298 $ 30,373Accounts receivable - gift cards, net 102,664 115,926Accounts receivable - vendors, net 10,107 10,310Accounts receivable - franchisees, net 1,677 1,149Accounts receivable - other, net 20,497 21,158Assets held for sale 1,331 784Other current assets, net 18,652 19,131
$ 190,226 $ 198,831
7 . Property, Fixtures and Equipment, Net
Property, fixtures and equipment, net, consisted of the following:
(dollars in thousands)DECEMBER 25,
2016 DECEMBER 27,
2015Land $ 114,375 $ 256,906Buildings and building improvements 726,418 1,043,699Furniture and fixtures 383,758 392,849Equipment 550,598 543,842Leasehold improvements 492,465 492,628Construction in progress 47,332 23,842Less: accumulated depreciation (1,077,798) (1,159,306)
$ 1,237,148 $ 1,594,460
Sale-leaseback Transactions - During 2016, the Company entered into sale-leaseback transactions with third-parties in which it sold 153restaurant properties at fair market value for gross proceeds of $541.9 million . In connection with the sale-leaseback transactions, theCompany recorded a deferred gain of $163.4 million , which are amortized to Other restaurant operating expense in the ConsolidatedStatements of Operations and Comprehensive Income over the initial term of each lease, ranging from 15 to 20 years.
In the fourth quarter of 2016, the Company sold six restaurant properties to third parties for aggregate proceeds of $18.5 million . The sale ofthe properties does not qualify for sale-leaseback accounting and the book value of the buildings and land will remain on the Company’sConsolidated Balance Sheet. See Note 11 - Long-term Debt, Net and Note 18 - Commitments and Contingencies for additional detailsregarding the financing obligation.
Leased Properties - As of December 25, 2016 , the Company leased $16.3 million and $23.4 million , respectively, of certain land andbuildings to third parties. Accumulated depreciation related to the leased building assets of $7.5 million is included in Property, fixtures andequipment as of December 25, 2016 .
Depreciation and repair and maintenance expense is as follows for the periods indicated:
FISCAL YEAR
(dollars in thousands) 2016 2015 2014
Depreciation expense $ 183,049 $ 178,855 $ 177,504
Repair and maintenance expense 108,940 107,960 108,392
88
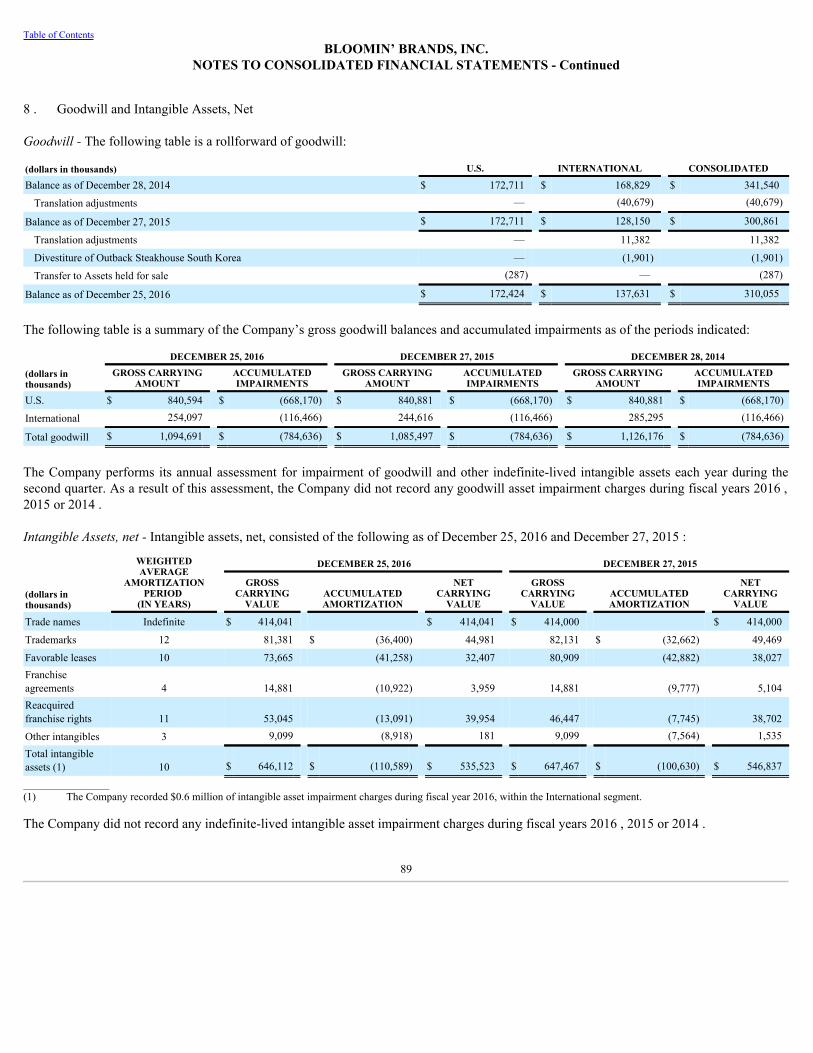
Table of ContentsBLOOMIN’ BRANDS, INC.
NOTES TO CONSOLIDATED FINANCIAL STATEMENTS - Continued
8 . Goodwill and Intangible Assets, Net
Goodwill-The following table is a rollforward of goodwill:
(dollars in thousands) U.S. INTERNATIONAL CONSOLIDATED
Balance as of December 28, 2014 $ 172,711 $ 168,829 $ 341,540
Translation adjustments — (40,679) (40,679)
Balance as of December 27, 2015 $ 172,711 $ 128,150 $ 300,861
Translation adjustments — 11,382 11,382
Divestiture of Outback Steakhouse South Korea — (1,901) (1,901)
Transfer to Assets held for sale (287) — (287)
Balance as of December 25, 2016 $ 172,424 $ 137,631 $ 310,055
The following table is a summary of the Company’s gross goodwill balances and accumulated impairments as of the periods indicated:
DECEMBER 25, 2016 DECEMBER 27, 2015 DECEMBER 28, 2014
(dollars inthousands)
GROSS CARRYINGAMOUNT
ACCUMULATEDIMPAIRMENTS
GROSS CARRYINGAMOUNT
ACCUMULATEDIMPAIRMENTS
GROSS CARRYINGAMOUNT
ACCUMULATEDIMPAIRMENTS
U.S. $ 840,594 $ (668,170) $ 840,881 $ (668,170) $ 840,881 $ (668,170)
International 254,097 (116,466) 244,616 (116,466) 285,295 (116,466)
Total goodwill $ 1,094,691 $ (784,636) $ 1,085,497 $ (784,636) $ 1,126,176 $ (784,636)
The Company performs its annual assessment for impairment of goodwill and other indefinite-lived intangible assets each year during thesecond quarter. As a result of this assessment, the Company did not record any goodwill asset impairment charges during fiscal years 2016 ,2015 or 2014 .
IntangibleAssets,net-Intangible assets, net, consisted of the following as of December 25, 2016 and December 27, 2015 :
WEIGHTEDAVERAGE
AMORTIZATIONPERIOD
(IN YEARS)
DECEMBER 25, 2016 DECEMBER 27, 2015
(dollars inthousands)
GROSSCARRYING
VALUE ACCUMULATEDAMORTIZATION
NETCARRYING
VALUE
GROSSCARRYING
VALUE ACCUMULATEDAMORTIZATION
NETCARRYING
VALUE
Trade names Indefinite $ 414,041 $ 414,041 $ 414,000 $ 414,000
Trademarks 12 81,381 $ (36,400) 44,981 82,131 $ (32,662) 49,469
Favorable leases 10 73,665 (41,258) 32,407 80,909 (42,882) 38,027Franchiseagreements 4 14,881 (10,922) 3,959 14,881 (9,777) 5,104Reacquiredfranchise rights 11 53,045 (13,091) 39,954 46,447 (7,745) 38,702
Other intangibles 3 9,099 (8,918) 181 9,099 (7,564) 1,535
Total intangibleassets (1) 10 $ 646,112 $ (110,589) $ 535,523 $ 647,467 $ (100,630) $ 546,837
________________(1) The Company recorded $0.6 million of intangible asset impairment charges during fiscal year 2016, within the International segment.
The Company did not record any indefinite-lived intangible asset impairment charges during fiscal years 2016 , 2015 or 2014 .
89
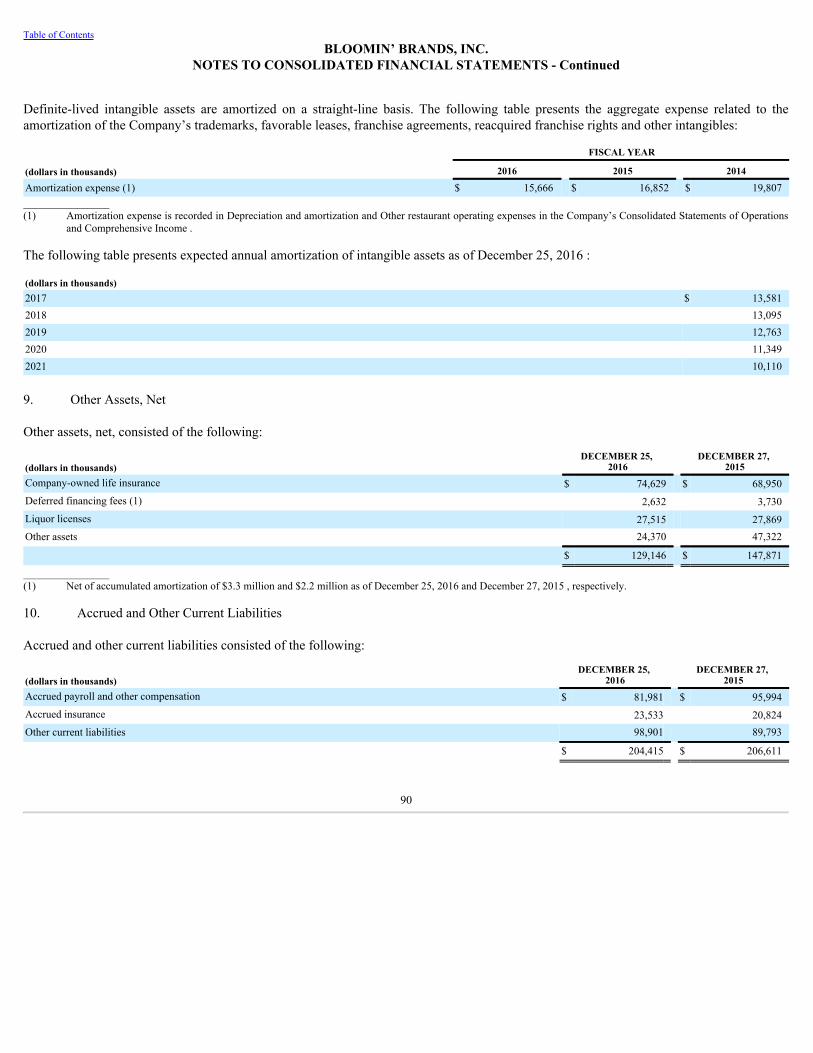
Table of ContentsBLOOMIN’ BRANDS, INC.
NOTES TO CONSOLIDATED FINANCIAL STATEMENTS - Continued
Definite-lived intangible assets are amortized on a straight-line basis. The following table presents the aggregate expense related to theamortization of the Company’s trademarks, favorable leases, franchise agreements, reacquired franchise rights and other intangibles:
FISCAL YEAR
(dollars in thousands) 2016 2015 2014
Amortization expense (1) $ 15,666 $ 16,852 $ 19,807________________(1) Amortization expense is recorded in Depreciation and amortization and Other restaurant operating expenses in the Company’s Consolidated Statements of Operations
and Comprehensive Income .
The following table presents expected annual amortization of intangible assets as of December 25, 2016 :
(dollars in thousands) 2017 $ 13,5812018 13,0952019 12,7632020 11,3492021 10,110
9. Other Assets, Net
Other assets, net, consisted of the following:
(dollars in thousands)DECEMBER 25,
2016 DECEMBER 27,
2015Company-owned life insurance $ 74,629 $ 68,950Deferred financing fees (1) 2,632 3,730Liquor licenses 27,515 27,869Other assets 24,370 47,322
$ 129,146 $ 147,871
________________(1) Net of accumulated amortization of $3.3 million and $2.2 million as of December 25, 2016 and December 27, 2015 , respectively.
10. Accrued and Other Current Liabilities
Accrued and other current liabilities consisted of the following:
(dollars in thousands)DECEMBER 25,
2016 DECEMBER 27,
2015Accrued payroll and other compensation $ 81,981 $ 95,994Accrued insurance 23,533 20,824Other current liabilities 98,901 89,793
$ 204,415 $ 206,611
90
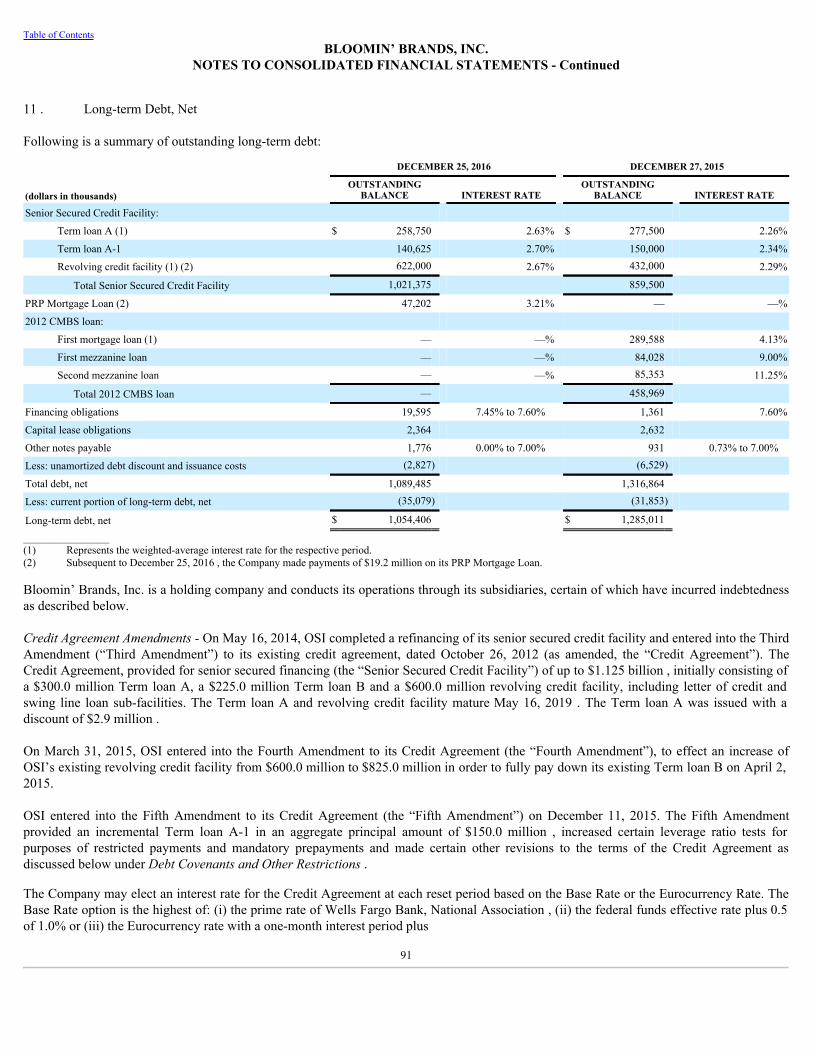
Table of ContentsBLOOMIN’ BRANDS, INC.
NOTES TO CONSOLIDATED FINANCIAL STATEMENTS - Continued
11 . Long-term Debt, Net
Following is a summary of outstanding long-term debt:
DECEMBER 25, 2016 DECEMBER 27, 2015
(dollars in thousands)OUTSTANDING
BALANCE INTEREST RATE OUTSTANDING
BALANCE INTEREST RATE
Senior Secured Credit Facility: Term loan A (1) $ 258,750 2.63% $ 277,500 2.26%
Term loan A-1 140,625 2.70% 150,000 2.34%
Revolving credit facility (1) (2) 622,000 2.67% 432,000 2.29%
Total Senior Secured Credit Facility 1,021,375 859,500 PRP Mortgage Loan (2) 47,202 3.21% — —%
2012 CMBS loan: First mortgage loan (1) — —% 289,588 4.13%
First mezzanine loan — —% 84,028 9.00%
Second mezzanine loan — —% 85,353 11.25%
Total 2012 CMBS loan — 458,969 Financing obligations 19,595 7.45% to 7.60% 1,361 7.60%
Capital lease obligations 2,364 2,632 Other notes payable 1,776 0.00% to 7.00% 931 0.73% to 7.00%
Less: unamortized debt discount and issuance costs (2,827) (6,529) Total debt, net 1,089,485 1,316,864 Less: current portion of long-term debt, net (35,079) (31,853) Long-term debt, net $ 1,054,406 $ 1,285,011 ________________(1) Represents the weighted-average interest rate for the respective period.(2) Subsequent to December 25, 2016 , the Company made payments of $19.2 million on its PRP Mortgage Loan.
Bloomin’ Brands, Inc. is a holding company and conducts its operations through its subsidiaries, certain of which have incurred indebtednessas described below.
CreditAgreementAmendments-On May 16, 2014, OSI completed a refinancing of its senior secured credit facility and entered into the ThirdAmendment (“Third Amendment”) to its existing credit agreement, dated October 26, 2012 (as amended, the “Credit Agreement”). TheCredit Agreement, provided for senior secured financing (the “Senior Secured Credit Facility”) of up to $1.125 billion , initially consisting ofa $300.0 million Term loan A, a $225.0 million Term loan B and a $600.0 million revolving credit facility, including letter of credit andswing line loan sub-facilities. The Term loan A and revolving credit facility mature May 16, 2019 . The Term loan A was issued with adiscount of $2.9 million .
On March 31, 2015, OSI entered into the Fourth Amendment to its Credit Agreement (the “Fourth Amendment”), to effect an increase ofOSI’s existing revolving credit facility from $600.0 million to $825.0 million in order to fully pay down its existing Term loan B on April 2,2015.
OSI entered into the Fifth Amendment to its Credit Agreement (the “Fifth Amendment”) on December 11, 2015. The Fifth Amendmentprovided an incremental Term loan A-1 in an aggregate principal amount of $150.0 million , increased certain leverage ratio tests forpurposes of restricted payments and mandatory prepayments and made certain other revisions to the terms of the Credit Agreement asdiscussed below under DebtCovenantsandOtherRestrictions.
The Company may elect an interest rate for the Credit Agreement at each reset period based on the Base Rate or the Eurocurrency Rate. TheBase Rate option is the highest of: (i) the prime rate of Wells Fargo Bank, National Association , (ii) the federal funds effective rate plus 0.5of 1.0% or (iii) the Eurocurrency rate with a one-month interest period plus
91
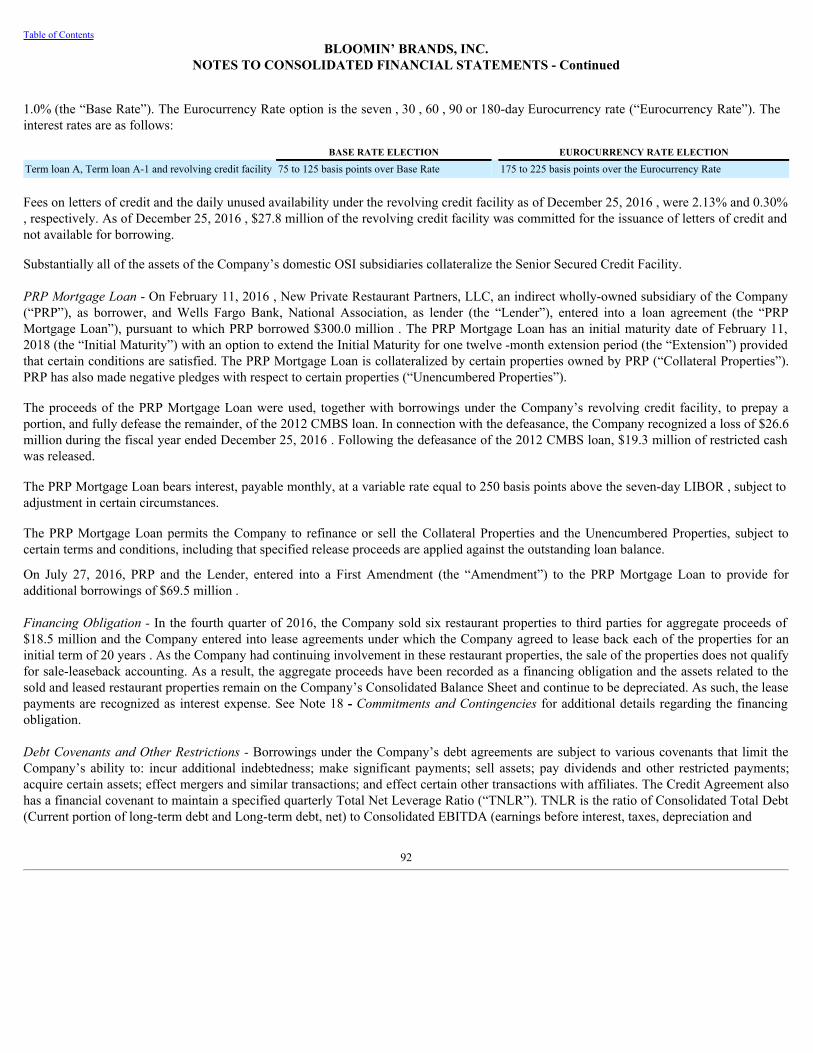
Table of ContentsBLOOMIN’ BRANDS, INC.
NOTES TO CONSOLIDATED FINANCIAL STATEMENTS - Continued
1.0% (the “Base Rate”). The Eurocurrency Rate option is the seven , 30 , 60 , 90 or 180-day Eurocurrency rate (“Eurocurrency Rate”). Theinterest rates are as follows:
BASE RATE ELECTION EUROCURRENCY RATE ELECTION
Term loan A, Term loan A-1 and revolving credit facility 75 to 125 basis points over Base Rate 175 to 225 basis points over the Eurocurrency Rate
Fees on letters of credit and the daily unused availability under the revolving credit facility as of December 25, 2016 , were 2.13% and 0.30%, respectively. As of December 25, 2016 , $27.8 million of the revolving credit facility was committed for the issuance of letters of credit andnot available for borrowing.
Substantially all of the assets of the Company’s domestic OSI subsidiaries collateralize the Senior Secured Credit Facility.
PRPMortgageLoan- On February 11, 2016 , New Private Restaurant Partners, LLC, an indirect wholly-owned subsidiary of the Company(“PRP”), as borrower, and Wells Fargo Bank, National Association, as lender (the “Lender”), entered into a loan agreement (the “PRPMortgage Loan”), pursuant to which PRP borrowed $300.0 million . The PRP Mortgage Loan has an initial maturity date of February 11,2018 (the “Initial Maturity”) with an option to extend the Initial Maturity for one twelve -month extension period (the “Extension”) providedthat certain conditions are satisfied. The PRP Mortgage Loan is collateralized by certain properties owned by PRP (“Collateral Properties”).PRP has also made negative pledges with respect to certain properties (“Unencumbered Properties”).
The proceeds of the PRP Mortgage Loan were used, together with borrowings under the Company’s revolving credit facility, to prepay aportion, and fully defease the remainder, of the 2012 CMBS loan. In connection with the defeasance, the Company recognized a loss of $26.6million during the fiscal year ended December 25, 2016 . Following the defeasance of the 2012 CMBS loan, $19.3 million of restricted cashwas released.
The PRP Mortgage Loan bears interest, payable monthly, at a variable rate equal to 250 basis points above the seven-day LIBOR , subject toadjustment in certain circumstances.
The PRP Mortgage Loan permits the Company to refinance or sell the Collateral Properties and the Unencumbered Properties, subject tocertain terms and conditions, including that specified release proceeds are applied against the outstanding loan balance.
On July 27, 2016, PRP and the Lender, entered into a First Amendment (the “Amendment”) to the PRP Mortgage Loan to provide foradditional borrowings of $69.5 million .
FinancingObligation-In the fourth quarter of 2016, the Company sold six restaurant properties to third parties for aggregate proceeds of$18.5 million and the Company entered into lease agreements under which the Company agreed to lease back each of the properties for aninitial term of 20 years . As the Company had continuing involvement in these restaurant properties, the sale of the properties does not qualifyfor sale-leaseback accounting. As a result, the aggregate proceeds have been recorded as a financing obligation and the assets related to thesold and leased restaurant properties remain on the Company’s Consolidated Balance Sheet and continue to be depreciated. As such, the leasepayments are recognized as interest expense. See Note 18 - CommitmentsandContingenciesfor additional details regarding the financingobligation.
DebtCovenantsandOtherRestrictions-Borrowings under the Company’s debt agreements are subject to various covenants that limit theCompany’s ability to: incur additional indebtedness; make significant payments; sell assets; pay dividends and other restricted payments;acquire certain assets; effect mergers and similar transactions; and effect certain other transactions with affiliates. The Credit Agreement alsohas a financial covenant to maintain a specified quarterly Total Net Leverage Ratio (“TNLR”). TNLR is the ratio of Consolidated Total Debt(Current portion of long-term debt and Long-term debt, net) to Consolidated EBITDA (earnings before interest, taxes, depreciation and
92
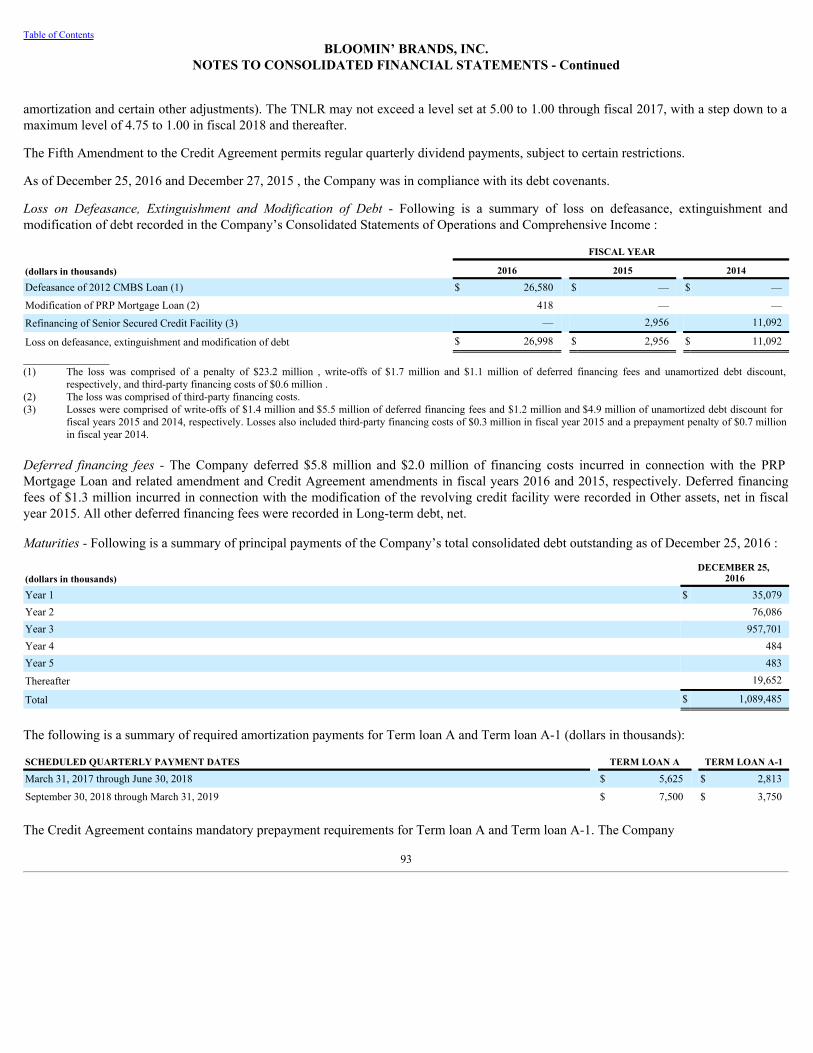
Table of ContentsBLOOMIN’ BRANDS, INC.
NOTES TO CONSOLIDATED FINANCIAL STATEMENTS - Continued
amortization and certain other adjustments). The TNLR may not exceed a level set at 5.00 to 1.00 through fiscal 2017, with a step down to amaximum level of 4.75 to 1.00 in fiscal 2018 and thereafter.
The Fifth Amendment to the Credit Agreement permits regular quarterly dividend payments, subject to certain restrictions.
As of December 25, 2016 and December 27, 2015 , the Company was in compliance with its debt covenants.
Loss on Defeasance, Extinguishment and Modification of Debt - Following is a summary of loss on defeasance, extinguishment andmodification of debt recorded in the Company’s Consolidated Statements of Operations and Comprehensive Income :
FISCAL YEAR
(dollars in thousands) 2016 2015 2014
Defeasance of 2012 CMBS Loan (1) $ 26,580 $ — $ —
Modification of PRP Mortgage Loan (2) 418 — —
Refinancing of Senior Secured Credit Facility (3) — 2,956 11,092
Loss on defeasance, extinguishment and modification of debt $ 26,998 $ 2,956 $ 11,092
________________(1) The loss was comprised of a penalty of $23.2 million , write-offs of $1.7 million and $1.1 million of deferred financing fees and unamortized debt discount,
respectively, and third-party financing costs of $0.6 million .(2) The loss was comprised of third-party financing costs.(3) Losses were comprised of write-offs of $1.4 million and $5.5 million of deferred financing fees and $1.2 million and $4.9 million of unamortized debt discount for
fiscal years 2015 and 2014, respectively. Losses also included third-party financing costs of $0.3 million in fiscal year 2015 and a prepayment penalty of $0.7 millionin fiscal year 2014.
Deferred financing fees -The Company deferred $5.8 million and $2.0 million of financing costs incurred in connection with the PRPMortgage Loan and related amendment and Credit Agreement amendments in fiscal years 2016 and 2015, respectively. Deferred financingfees of $1.3 million incurred in connection with the modification of the revolving credit facility were recorded in Other assets, net in fiscalyear 2015. All other deferred financing fees were recorded in Long-term debt, net.
Maturities-Following is a summary of principal payments of the Company’s total consolidated debt outstanding as of December 25, 2016 :
(dollars in thousands)DECEMBER 25,
2016
Year 1 $ 35,079Year 2 76,086Year 3 957,701Year 4 484Year 5 483
Thereafter 19,652
Total $ 1,089,485
The following is a summary of required amortization payments for Term loan A and Term loan A-1 (dollars in thousands):
SCHEDULED QUARTERLY PAYMENT DATES TERM LOAN A TERM LOAN A-1
March 31, 2017 through June 30, 2018 $ 5,625 $ 2,813
September 30, 2018 through March 31, 2019 $ 7,500 $ 3,750
The Credit Agreement contains mandatory prepayment requirements for Term loan A and Term loan A-1. The Company
93
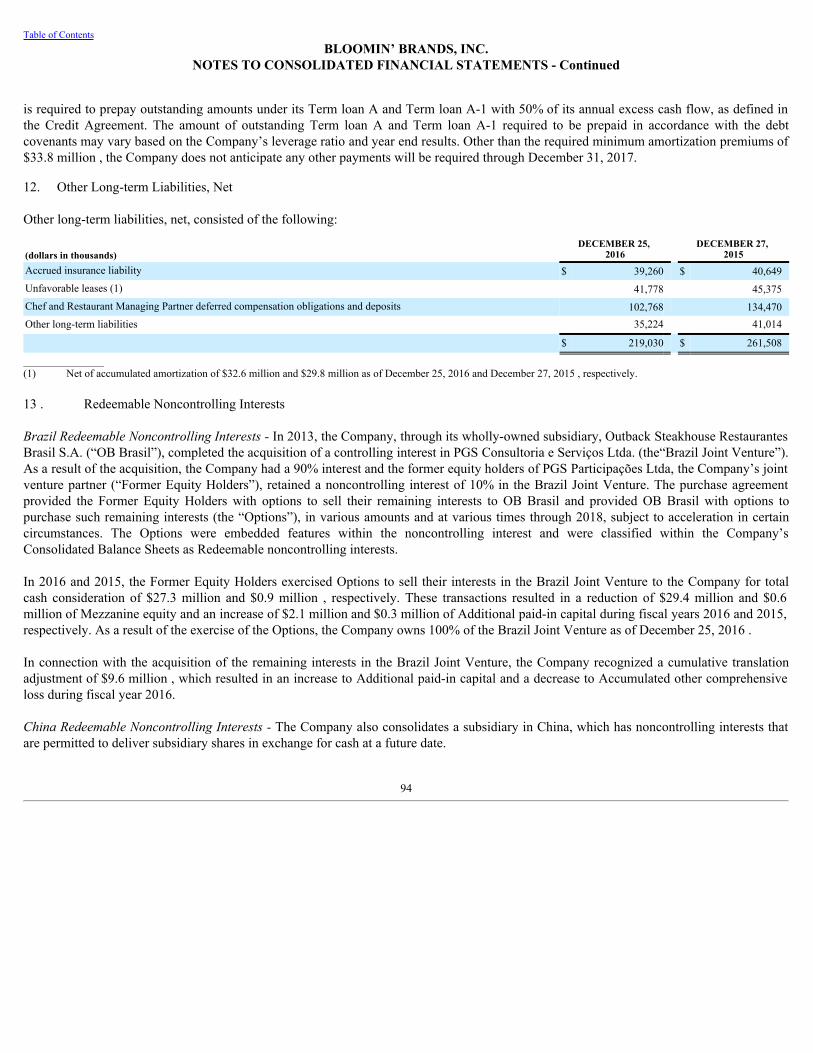
Table of ContentsBLOOMIN’ BRANDS, INC.
NOTES TO CONSOLIDATED FINANCIAL STATEMENTS - Continued
is required to prepay outstanding amounts under its Term loan A and Term loan A-1 with 50% of its annual excess cash flow, as defined inthe Credit Agreement. The amount of outstanding Term loan A and Term loan A-1 required to be prepaid in accordance with the debtcovenants may vary based on the Company’s leverage ratio and year end results. Other than the required minimum amortization premiums of$33.8 million , the Company does not anticipate any other payments will be required through December 31, 2017.
12. Other Long-term Liabilities, Net
Other long-term liabilities, net, consisted of the following:
(dollars in thousands)DECEMBER 25,
2016 DECEMBER 27,
2015Accrued insurance liability $ 39,260 $ 40,649Unfavorable leases (1) 41,778 45,375Chef and Restaurant Managing Partner deferred compensation obligations and deposits 102,768 134,470Other long-term liabilities 35,224 41,014
$ 219,030 $ 261,508
_______________(1) Net of accumulated amortization of $32.6 million and $29.8 million as of December 25, 2016 and December 27, 2015 , respectively.
13 . Redeemable Noncontrolling Interests
BrazilRedeemableNoncontrollingInterests-In 2013, the Company, through its wholly-owned subsidiary, Outback Steakhouse RestaurantesBrasil S.A. (“OB Brasil”), completed the acquisition of a controlling interest in PGS Consultoria e Serviços Ltda. (the“Brazil Joint Venture”).As a result of the acquisition, the Company had a 90% interest and the former equity holders of PGS Participações Ltda, the Company’s jointventure partner (“Former Equity Holders”), retained a noncontrolling interest of 10% in the Brazil Joint Venture. The purchase agreementprovided the Former Equity Holders with options to sell their remaining interests to OB Brasil and provided OB Brasil with options topurchase such remaining interests (the “Options”), in various amounts and at various times through 2018, subject to acceleration in certaincircumstances. The Options were embedded features within the noncontrolling interest and were classified within the Company’sConsolidated Balance Sheets as Redeemable noncontrolling interests.
In 2016 and 2015, the Former Equity Holders exercised Options to sell their interests in the Brazil Joint Venture to the Company for totalcash consideration of $27.3 million and $0.9 million , respectively. These transactions resulted in a reduction of $29.4 million and $0.6million of Mezzanine equity and an increase of $2.1 million and $0.3 million of Additional paid-in capital during fiscal years 2016 and 2015,respectively. As a result of the exercise of the Options, the Company owns 100% of the Brazil Joint Venture as of December 25, 2016 .
In connection with the acquisition of the remaining interests in the Brazil Joint Venture, the Company recognized a cumulative translationadjustment of $9.6 million , which resulted in an increase to Additional paid-in capital and a decrease to Accumulated other comprehensiveloss during fiscal year 2016.
ChinaRedeemableNoncontrollingInterests-The Company also consolidates a subsidiary in China, which has noncontrolling interests thatare permitted to deliver subsidiary shares in exchange for cash at a future date.
94
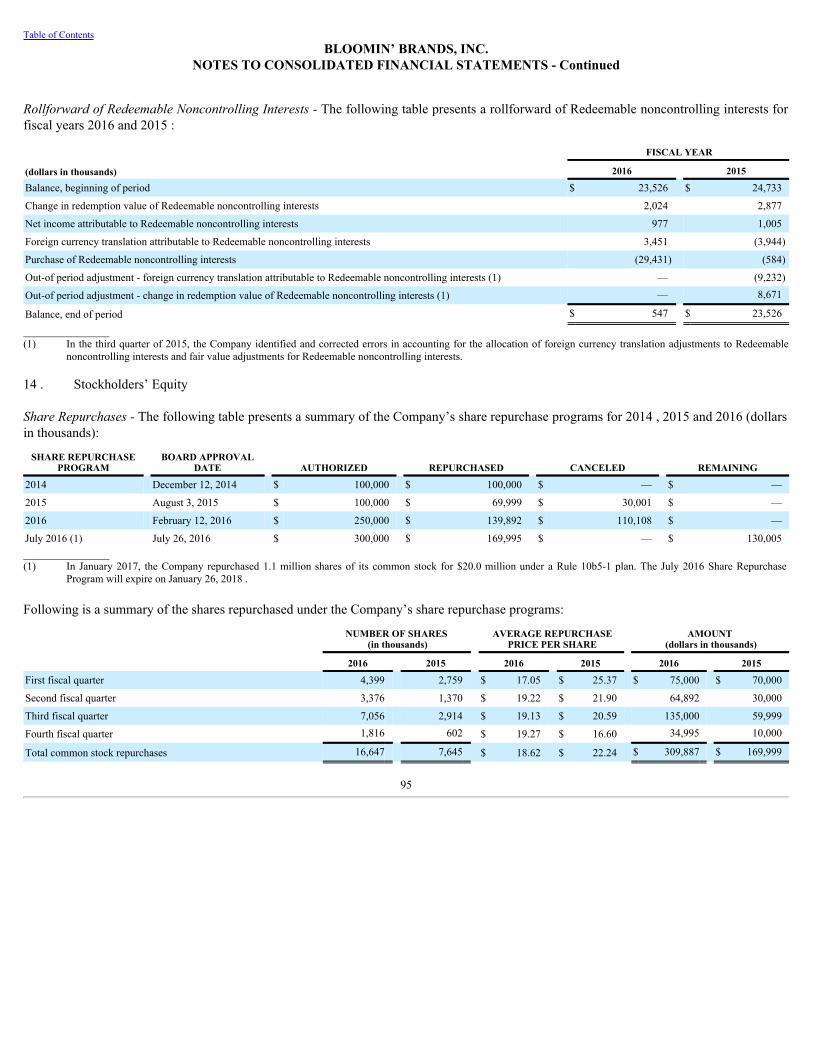
Table of ContentsBLOOMIN’ BRANDS, INC.
NOTES TO CONSOLIDATED FINANCIAL STATEMENTS - Continued
RollforwardofRedeemableNoncontrollingInterests-The following table presents a rollforward of Redeemable noncontrolling interests forfiscal years 2016 and 2015 :
FISCAL YEAR
(dollars in thousands) 2016 2015
Balance, beginning of period $ 23,526 $ 24,733
Change in redemption value of Redeemable noncontrolling interests 2,024 2,877
Net income attributable to Redeemable noncontrolling interests 977 1,005
Foreign currency translation attributable to Redeemable noncontrolling interests 3,451 (3,944)
Purchase of Redeemable noncontrolling interests (29,431) (584)
Out-of period adjustment - foreign currency translation attributable to Redeemable noncontrolling interests (1) — (9,232)
Out-of period adjustment - change in redemption value of Redeemable noncontrolling interests (1) — 8,671
Balance, end of period $ 547 $ 23,526
________________(1) In the third quarter of 2015, the Company identified and corrected errors in accounting for the allocation of foreign currency translation adjustments to Redeemable
noncontrolling interests and fair value adjustments for Redeemable noncontrolling interests.
14 . Stockholders’ Equity ShareRepurchases- The following table presents a summary of the Company’s share repurchase programs for 2014 , 2015 and 2016 (dollarsin thousands):
SHARE REPURCHASEPROGRAM
BOARD APPROVALDATE AUTHORIZED REPURCHASED CANCELED REMAINING
2014 December 12, 2014 $ 100,000 $ 100,000 $ — $ —
2015 August 3, 2015 $ 100,000 $ 69,999 $ 30,001 $ —
2016 February 12, 2016 $ 250,000 $ 139,892 $ 110,108 $ —
July 2016 (1) July 26, 2016 $ 300,000 $ 169,995 $ — $ 130,005________________(1) In January 2017, the Company repurchased 1.1 million shares of its common stock for $20.0 million under a Rule 10b5-1 plan. The July 2016 Share Repurchase
Program will expire on January 26, 2018 .
Following is a summary of the shares repurchased under the Company’s share repurchase programs:
NUMBER OF SHARES
(in thousands) AVERAGE REPURCHASE
PRICE PER SHARE AMOUNT
(dollars in thousands)
2016 2015 2016 2015 2016 2015
First fiscal quarter 4,399 2,759 $ 17.05 $ 25.37 $ 75,000 $ 70,000
Second fiscal quarter 3,376 1,370 $ 19.22 $ 21.90 64,892 30,000
Third fiscal quarter 7,056 2,914 $ 19.13 $ 20.59 135,000 59,999
Fourth fiscal quarter 1,816 602 $ 19.27 $ 16.60 34,995 10,000
Total common stock repurchases 16,647 7,645 $ 18.62 $ 22.24 $ 309,887 $ 169,999
95
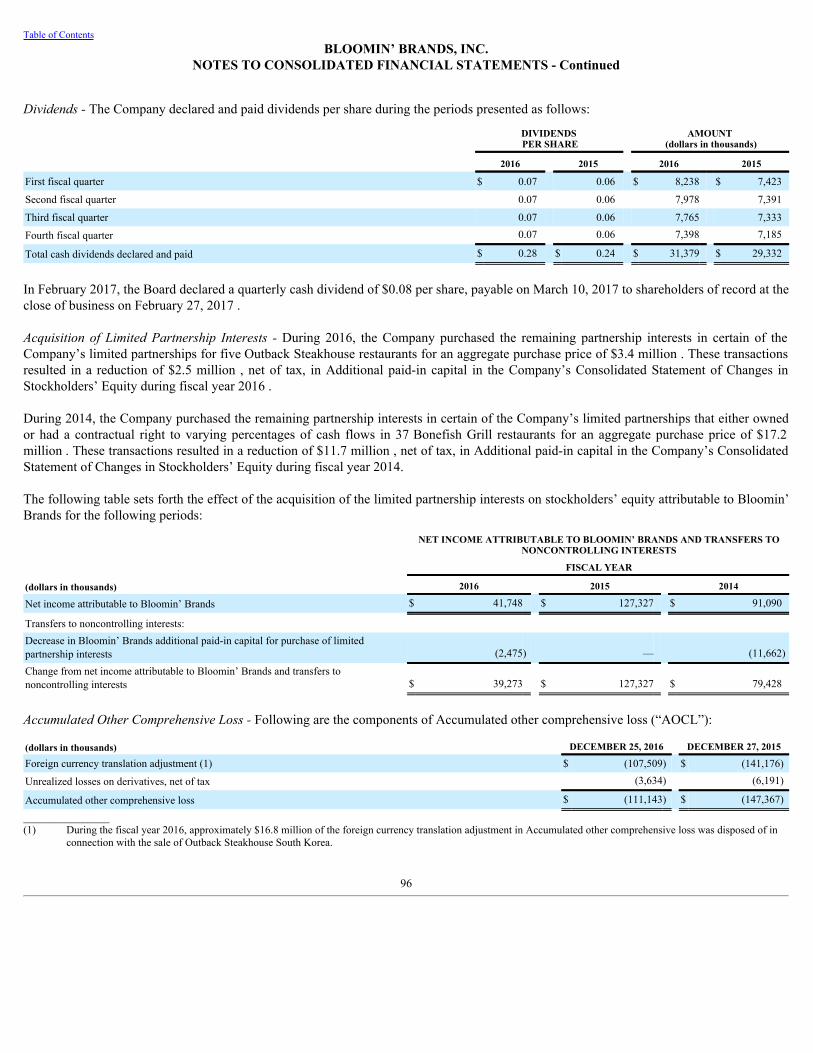
Table of ContentsBLOOMIN’ BRANDS, INC.
NOTES TO CONSOLIDATED FINANCIAL STATEMENTS - Continued
Dividends-The Company declared and paid dividends per share during the periods presented as follows:
DIVIDENDS PER SHARE
AMOUNT (dollars in thousands)
2016 2015 2016 2015
First fiscal quarter $ 0.07 0.06 $ 8,238 $ 7,423
Second fiscal quarter 0.07 0.06 7,978 7,391
Third fiscal quarter 0.07 0.06 7,765 7,333
Fourth fiscal quarter 0.07 0.06 7,398 7,185
Total cash dividends declared and paid $ 0.28 $ 0.24 $ 31,379 $ 29,332
In February 2017, the Board declared a quarterly cash dividend of $0.08 per share, payable on March 10, 2017 to shareholders of record at theclose of business on February 27, 2017 .
Acquisition of Limited Partnership Interests -During 2016, the Company purchased the remaining partnership interests in certain of theCompany’s limited partnerships for five Outback Steakhouse restaurants for an aggregate purchase price of $3.4 million . These transactionsresulted in a reduction of $2.5 million , net of tax, in Additional paid-in capital in the Company’s Consolidated Statement of Changes inStockholders’ Equity during fiscal year 2016 .
During 2014, the Company purchased the remaining partnership interests in certain of the Company’s limited partnerships that either ownedor had a contractual right to varying percentages of cash flows in 37 Bonefish Grill restaurants for an aggregate purchase price of $17.2million . These transactions resulted in a reduction of $11.7 million , net of tax, in Additional paid-in capital in the Company’s ConsolidatedStatement of Changes in Stockholders’ Equity during fiscal year 2014.
The following table sets forth the effect of the acquisition of the limited partnership interests on stockholders’ equity attributable to Bloomin’Brands for the following periods:
NET INCOME ATTRIBUTABLE TO BLOOMIN’ BRANDS AND TRANSFERS TO
NONCONTROLLING INTERESTS FISCAL YEAR
(dollars in thousands) 2016 2015 2014
Net income attributable to Bloomin’ Brands $ 41,748 $ 127,327 $ 91,090
Transfers to noncontrolling interests: Decrease in Bloomin’ Brands additional paid-in capital for purchase of limitedpartnership interests (2,475) — (11,662)
Change from net income attributable to Bloomin’ Brands and transfers tononcontrolling interests $ 39,273 $ 127,327 $ 79,428
AccumulatedOtherComprehensiveLoss-Following are the components of Accumulated other comprehensive loss (“AOCL”):
(dollars in thousands) DECEMBER 25, 2016 DECEMBER 27, 2015
Foreign currency translation adjustment (1) $ (107,509) $ (141,176)
Unrealized losses on derivatives, net of tax (3,634) (6,191)
Accumulated other comprehensive loss $ (111,143) $ (147,367)
________________(1) During the fiscal year 2016, approximately $16.8 million of the foreign currency translation adjustment in Accumulated other comprehensive loss was disposed of in
connection with the sale of Outback Steakhouse South Korea.
96
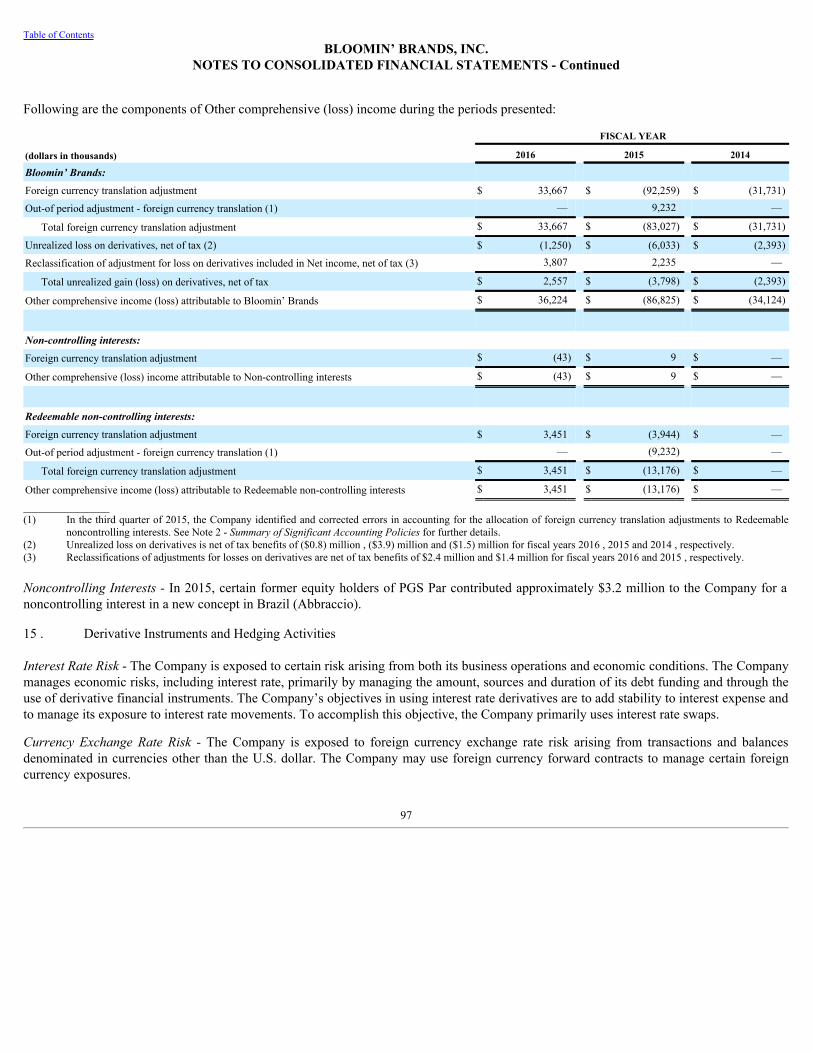
Table of ContentsBLOOMIN’ BRANDS, INC.
NOTES TO CONSOLIDATED FINANCIAL STATEMENTS - Continued
Following are the components of Other comprehensive (loss) income during the periods presented:
FISCAL YEAR
(dollars in thousands) 2016 2015 2014
Bloomin’ Brands: Foreign currency translation adjustment $ 33,667 $ (92,259) $ (31,731)
Out-of period adjustment - foreign currency translation (1) — 9,232 —
Total foreign currency translation adjustment $ 33,667 $ (83,027) $ (31,731)
Unrealized loss on derivatives, net of tax (2) $ (1,250) $ (6,033) $ (2,393)
Reclassification of adjustment for loss on derivatives included in Net income, net of tax (3) 3,807 2,235 —
Total unrealized gain (loss) on derivatives, net of tax $ 2,557 $ (3,798) $ (2,393)
Other comprehensive income (loss) attributable to Bloomin’ Brands $ 36,224 $ (86,825) $ (34,124)
Non-controlling interests: Foreign currency translation adjustment $ (43) $ 9 $ —
Other comprehensive (loss) income attributable to Non-controlling interests $ (43) $ 9 $ —
Redeemable non-controlling interests: Foreign currency translation adjustment $ 3,451 $ (3,944) $ —
Out-of period adjustment - foreign currency translation (1) — (9,232) —
Total foreign currency translation adjustment $ 3,451 $ (13,176) $ —
Other comprehensive income (loss) attributable to Redeemable non-controlling interests $ 3,451 $ (13,176) $ —
________________(1) In the third quarter of 2015, the Company identified and corrected errors in accounting for the allocation of foreign currency translation adjustments to Redeemable
noncontrolling interests. See Note 2 - SummaryofSignificantAccountingPoliciesfor further details.(2) Unrealized loss on derivatives is net of tax benefits of ($0.8) million , ($3.9) million and ($1.5) million for fiscal years 2016 , 2015 and 2014 , respectively.(3) Reclassifications of adjustments for losses on derivatives are net of tax benefits of $2.4 million and $1.4 million for fiscal years 2016 and 2015 , respectively.
NoncontrollingInterests-In 2015, certain former equity holders of PGS Par contributed approximately $3.2 million to the Company for anoncontrolling interest in a new concept in Brazil (Abbraccio).
15 . Derivative Instruments and Hedging Activities
InterestRateRisk- The Company is exposed to certain risk arising from both its business operations and economic conditions. The Companymanages economic risks, including interest rate, primarily by managing the amount, sources and duration of its debt funding and through theuse of derivative financial instruments. The Company’s objectives in using interest rate derivatives are to add stability to interest expense andto manage its exposure to interest rate movements. To accomplish this objective, the Company primarily uses interest rate swaps.
Currency Exchange Rate Risk - The Company is exposed to foreign currency exchange rate risk arising from transactions and balancesdenominated in currencies other than the U.S. dollar. The Company may use foreign currency forward contracts to manage certain foreigncurrency exposures.
97
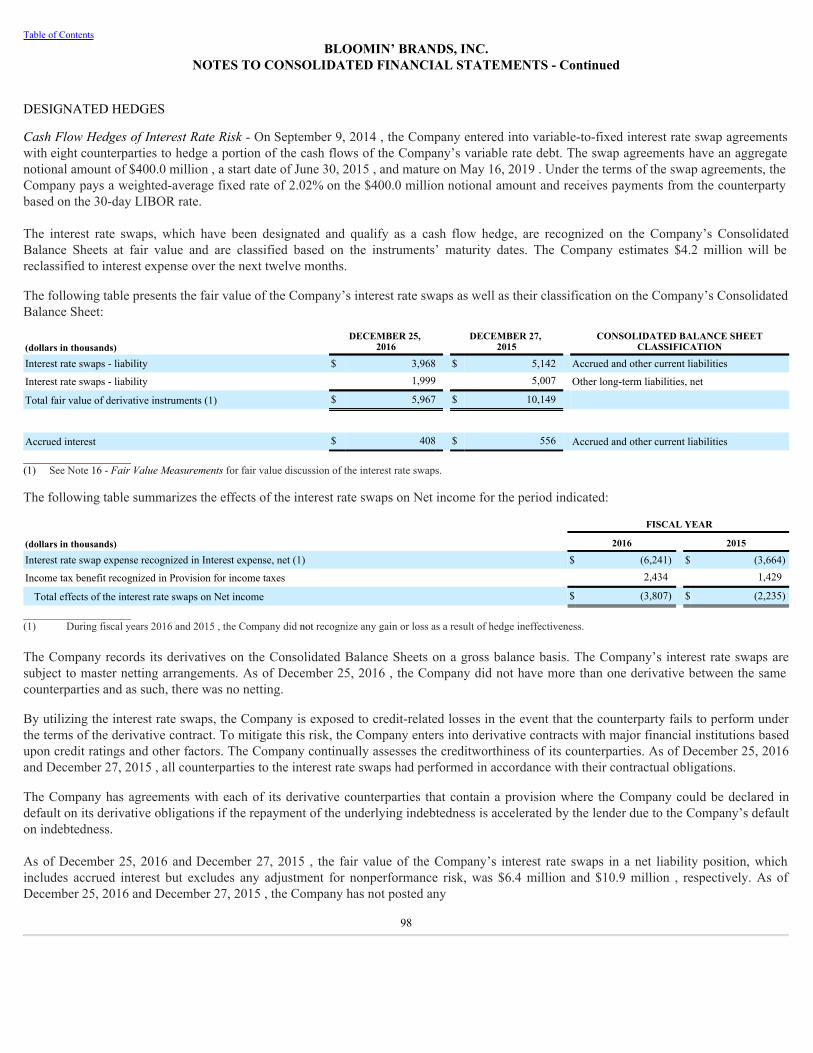
Table of ContentsBLOOMIN’ BRANDS, INC.
NOTES TO CONSOLIDATED FINANCIAL STATEMENTS - Continued
DESIGNATED HEDGES
CashFlowHedgesofInterestRateRisk-On September 9, 2014 , the Company entered into variable-to-fixed interest rate swap agreementswith eight counterparties to hedge a portion of the cash flows of the Company’s variable rate debt. The swap agreements have an aggregatenotional amount of $400.0 million , a start date of June 30, 2015 , and mature on May 16, 2019 . Under the terms of the swap agreements, theCompany pays a weighted-average fixed rate of 2.02% on the $400.0 million notional amount and receives payments from the counterpartybased on the 30-day LIBOR rate.
The interest rate swaps, which have been designated and qualify as a cash flow hedge, are recognized on the Company’s ConsolidatedBalance Sheets at fair value and are classified based on the instruments’ maturity dates. The Company estimates $4.2 million will bereclassified to interest expense over the next twelve months.
The following table presents the fair value of the Company’s interest rate swaps as well as their classification on the Company’s ConsolidatedBalance Sheet:
(dollars in thousands)DECEMBER 25,
2016 DECEMBER 27,
2015 CONSOLIDATED BALANCE SHEET
CLASSIFICATION
Interest rate swaps - liability $ 3,968 $ 5,142 Accrued and other current liabilities
Interest rate swaps - liability 1,999 5,007 Other long-term liabilities, net
Total fair value of derivative instruments (1) $ 5,967 $ 10,149
Accrued interest $ 408 $ 556 Accrued and other current liabilities____________________(1) See Note 16 - FairValueMeasurementsfor fair value discussion of the interest rate swaps.
The following table summarizes the effects of the interest rate swaps on Net income for the period indicated:
FISCAL YEAR
(dollars in thousands) 2016 2015
Interest rate swap expense recognized in Interest expense, net (1) $ (6,241) $ (3,664)
Income tax benefit recognized in Provision for income taxes 2,434 1,429
Total effects of the interest rate swaps on Net income $ (3,807) $ (2,235)
____________________(1) During fiscal years 2016 and 2015 , the Company did not recognize any gain or loss as a result of hedge ineffectiveness.
The Company records its derivatives on the Consolidated Balance Sheets on a gross balance basis. The Company’s interest rate swaps aresubject to master netting arrangements. As of December 25, 2016 , the Company did not have more than one derivative between the samecounterparties and as such, there was no netting.
By utilizing the interest rate swaps, the Company is exposed to credit-related losses in the event that the counterparty fails to perform underthe terms of the derivative contract. To mitigate this risk, the Company enters into derivative contracts with major financial institutions basedupon credit ratings and other factors. The Company continually assesses the creditworthiness of its counterparties. As of December 25, 2016and December 27, 2015 , all counterparties to the interest rate swaps had performed in accordance with their contractual obligations.
The Company has agreements with each of its derivative counterparties that contain a provision where the Company could be declared indefault on its derivative obligations if the repayment of the underlying indebtedness is accelerated by the lender due to the Company’s defaulton indebtedness.
As of December 25, 2016 and December 27, 2015 , the fair value of the Company’s interest rate swaps in a net liability position, whichincludes accrued interest but excludes any adjustment for nonperformance risk, was $6.4 million and $10.9 million , respectively. As ofDecember 25, 2016 and December 27, 2015 , the Company has not posted any
98
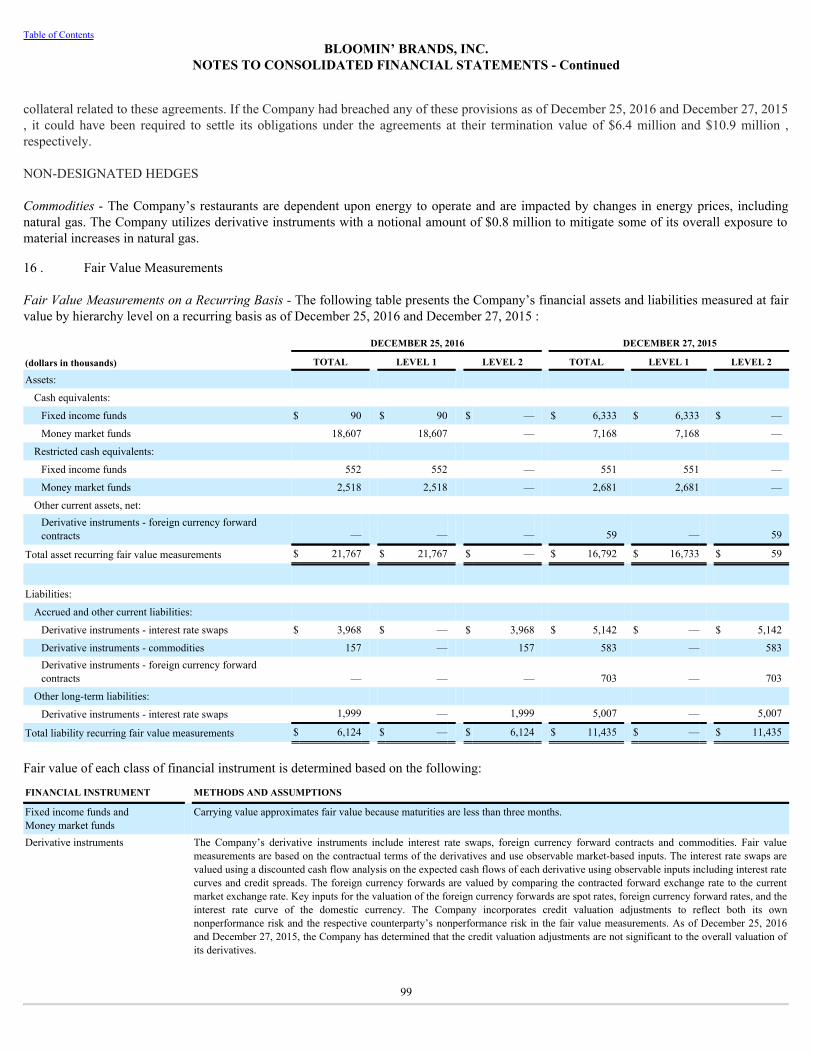
Table of ContentsBLOOMIN’ BRANDS, INC.
NOTES TO CONSOLIDATED FINANCIAL STATEMENTS - Continued
collateral related to these agreements. If the Company had breached any of these provisions as of December 25, 2016 and December 27, 2015, it could have been required to settle its obligations under the agreements at their termination value of $6.4 million and $10.9 million ,respectively.
NON-DESIGNATED HEDGES Commodities- The Company’s restaurants are dependent upon energy to operate and are impacted by changes in energy prices, includingnatural gas. The Company utilizes derivative instruments with a notional amount of $0.8 million to mitigate some of its overall exposure tomaterial increases in natural gas.
16 . Fair Value Measurements
FairValueMeasurementsonaRecurringBasis-The following table presents the Company’s financial assets and liabilities measured at fairvalue by hierarchy level on a recurring basis as of December 25, 2016 and December 27, 2015 :
DECEMBER 25, 2016 DECEMBER 27, 2015
(dollars in thousands) TOTAL LEVEL 1 LEVEL 2 TOTAL LEVEL 1 LEVEL 2
Assets: Cash equivalents:
Fixed income funds $ 90 $ 90 $ — $ 6,333 $ 6,333 $ —
Money market funds 18,607 18,607 — 7,168 7,168 —
Restricted cash equivalents: Fixed income funds 552 552 — 551 551 —
Money market funds 2,518 2,518 — 2,681 2,681 —
Other current assets, net: Derivative instruments - foreign currency forwardcontracts — — — 59 — 59
Total asset recurring fair value measurements $ 21,767 $ 21,767 $ — $ 16,792 $ 16,733 $ 59
Liabilities: Accrued and other current liabilities:
Derivative instruments - interest rate swaps $ 3,968 $ — $ 3,968 $ 5,142 $ — $ 5,142
Derivative instruments - commodities 157 — 157 583 — 583Derivative instruments - foreign currency forwardcontracts — — — 703 — 703
Other long-term liabilities: Derivative instruments - interest rate swaps 1,999 — 1,999 5,007 — 5,007
Total liability recurring fair value measurements $ 6,124 $ — $ 6,124 $ 11,435 $ — $ 11,435
Fair value of each class of financial instrument is determined based on the following:
FINANCIAL INSTRUMENT METHODS AND ASSUMPTIONS
Fixed income funds andMoney market funds
Carrying value approximates fair value because maturities are less than three months.
Derivative instruments
The Company’s derivative instruments include interest rate swaps, foreign currency forward contracts and commodities. Fair valuemeasurements are based on the contractual terms of the derivatives and use observable market-based inputs. The interest rate swaps arevalued using a discounted cash flow analysis on the expected cash flows of each derivative using observable inputs including interest ratecurves and credit spreads. The foreign currency forwards are valued by comparing the contracted forward exchange rate to the currentmarket exchange rate. Key inputs for the valuation of the foreign currency forwards are spot rates, foreign currency forward rates, and theinterest rate curve of the domestic currency. The Company incorporates credit valuation adjustments to reflect both its ownnonperformance risk and the respective counterparty’s nonperformance risk in the fair value measurements. As of December 25, 2016and December 27, 2015, the Company has determined that the credit valuation adjustments are not significant to the overall valuation ofits derivatives.
99
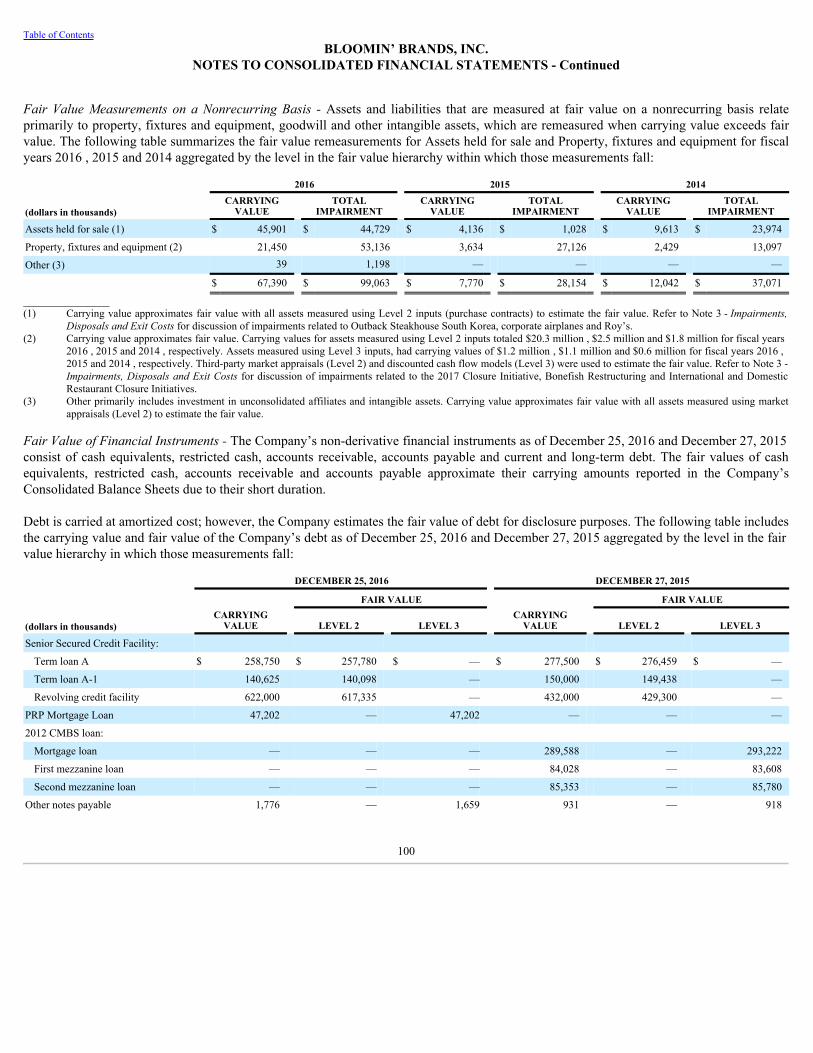
Table of ContentsBLOOMIN’ BRANDS, INC.
NOTES TO CONSOLIDATED FINANCIAL STATEMENTS - Continued
Fair Value Measurements on a Nonrecurring Basis -Assets and liabilities that are measured at fair value on a nonrecurring basis relateprimarily to property, fixtures and equipment, goodwill and other intangible assets, which are remeasured when carrying value exceeds fairvalue. The following table summarizes the fair value remeasurements for Assets held for sale and Property, fixtures and equipment for fiscalyears 2016 , 2015 and 2014 aggregated by the level in the fair value hierarchy within which those measurements fall:
2016 2015 2014
(dollars in thousands)CARRYING
VALUE TOTAL
IMPAIRMENT CARRYING
VALUE TOTAL
IMPAIRMENT CARRYING
VALUE TOTAL
IMPAIRMENT
Assets held for sale (1) $ 45,901 $ 44,729 $ 4,136 $ 1,028 $ 9,613 $ 23,974
Property, fixtures and equipment (2) 21,450 53,136 3,634 27,126 2,429 13,097
Other (3) 39 1,198 — — — —
$ 67,390 $ 99,063 $ 7,770 $ 28,154 $ 12,042 $ 37,071
________________(1) Carrying value approximates fair value with all assets measured using Level 2 inputs (purchase contracts) to estimate the fair value. Refer to Note 3 - Impairments,
DisposalsandExitCostsfor discussion of impairments related to Outback Steakhouse South Korea, corporate airplanes and Roy’s.(2) Carrying value approximates fair value. Carrying values for assets measured using Level 2 inputs totaled $20.3 million , $2.5 million and $1.8 million for fiscal years
2016 , 2015 and 2014 , respectively. Assets measured using Level 3 inputs, had carrying values of $1.2 million , $1.1 million and $0.6 million for fiscal years 2016 ,2015 and 2014 , respectively. Third-party market appraisals (Level 2) and discounted cash flow models (Level 3) were used to estimate the fair value. Refer to Note 3 -Impairments, DisposalsandExit Costsfor discussion of impairments related to the 2017 Closure Initiative, Bonefish Restructuring and International and DomesticRestaurant Closure Initiatives.
(3) Other primarily includes investment in unconsolidated affiliates and intangible assets. Carrying value approximates fair value with all assets measured using marketappraisals (Level 2) to estimate the fair value.
FairValueofFinancialInstruments-The Company’s non-derivative financial instruments as of December 25, 2016 and December 27, 2015consist of cash equivalents, restricted cash, accounts receivable, accounts payable and current and long-term debt. The fair values of cashequivalents, restricted cash, accounts receivable and accounts payable approximate their carrying amounts reported in the Company’sConsolidated Balance Sheets due to their short duration.
Debt is carried at amortized cost; however, the Company estimates the fair value of debt for disclosure purposes. The following table includesthe carrying value and fair value of the Company’s debt as of December 25, 2016 and December 27, 2015 aggregated by the level in the fairvalue hierarchy in which those measurements fall:
DECEMBER 25, 2016 DECEMBER 27, 2015
FAIR VALUE FAIR VALUE
(dollars in thousands)CARRYING
VALUE LEVEL 2 LEVEL 3 CARRYING
VALUE LEVEL 2 LEVEL 3
Senior Secured Credit Facility: Term loan A $ 258,750 $ 257,780 $ — $ 277,500 $ 276,459 $ —
Term loan A-1 140,625 140,098 — 150,000 149,438 —
Revolving credit facility 622,000 617,335 — 432,000 429,300 —
PRP Mortgage Loan 47,202 — 47,202 — — —
2012 CMBS loan: Mortgage loan — — — 289,588 — 293,222
First mezzanine loan — — — 84,028 — 83,608
Second mezzanine loan — — — 85,353 — 85,780
Other notes payable 1,776 — 1,659 931 — 918
100
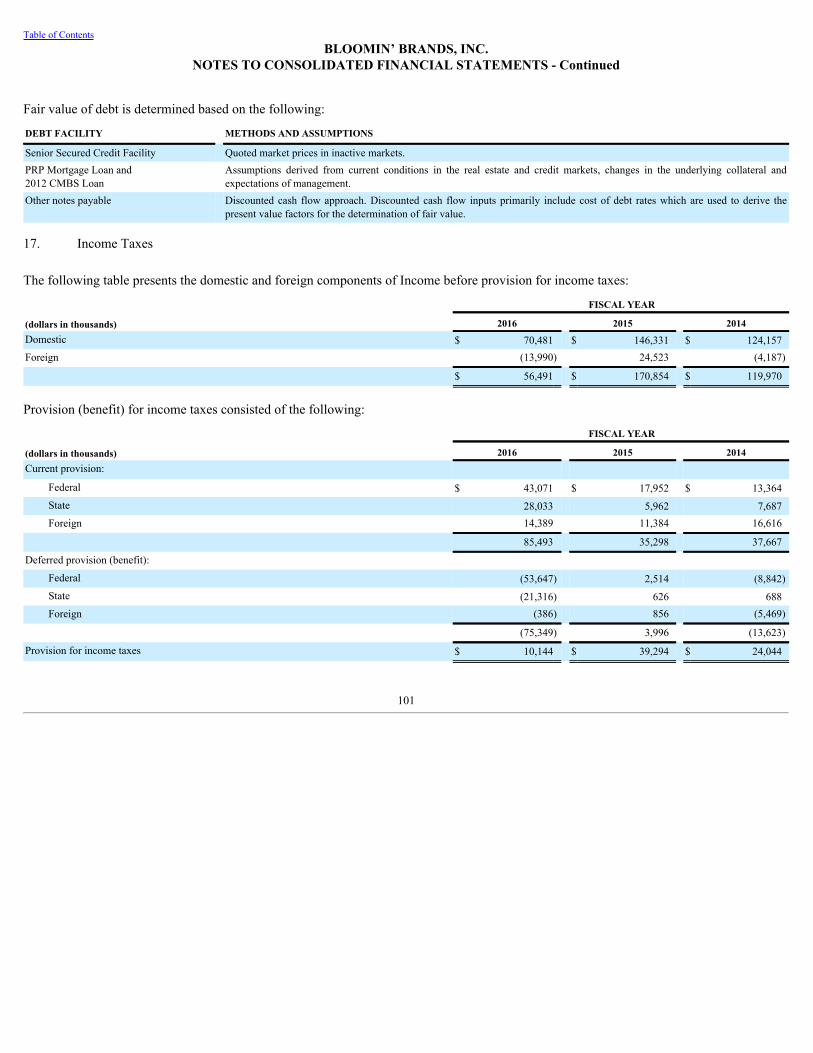
Table of ContentsBLOOMIN’ BRANDS, INC.
NOTES TO CONSOLIDATED FINANCIAL STATEMENTS - Continued
Fair value of debt is determined based on the following:
DEBT FACILITY METHODS AND ASSUMPTIONS
Senior Secured Credit Facility Quoted market prices in inactive markets.PRP Mortgage Loan and 2012 CMBS Loan
Assumptions derived from current conditions in the real estate and credit markets, changes in the underlying collateral andexpectations of management.
Other notes payable
Discounted cash flow approach. Discounted cash flow inputs primarily include cost of debt rates which are used to derive thepresent value factors for the determination of fair value.
17. Income Taxes
The following table presents the domestic and foreign components of Income before provision for income taxes:
FISCAL YEAR
(dollars in thousands) 2016 2015 2014Domestic $ 70,481 $ 146,331 $ 124,157Foreign (13,990) 24,523 (4,187)
$ 56,491 $ 170,854 $ 119,970
Provision (benefit) for income taxes consisted of the following:
FISCAL YEAR
(dollars in thousands) 2016 2015 2014Current provision:
Federal $ 43,071 $ 17,952 $ 13,364State 28,033 5,962 7,687Foreign 14,389 11,384 16,616
85,493 35,298 37,667
Deferred provision (benefit): Federal (53,647) 2,514 (8,842)State (21,316) 626 688Foreign (386) 856 (5,469)
(75,349) 3,996 (13,623)
Provision for income taxes $ 10,144 $ 39,294 $ 24,044
101
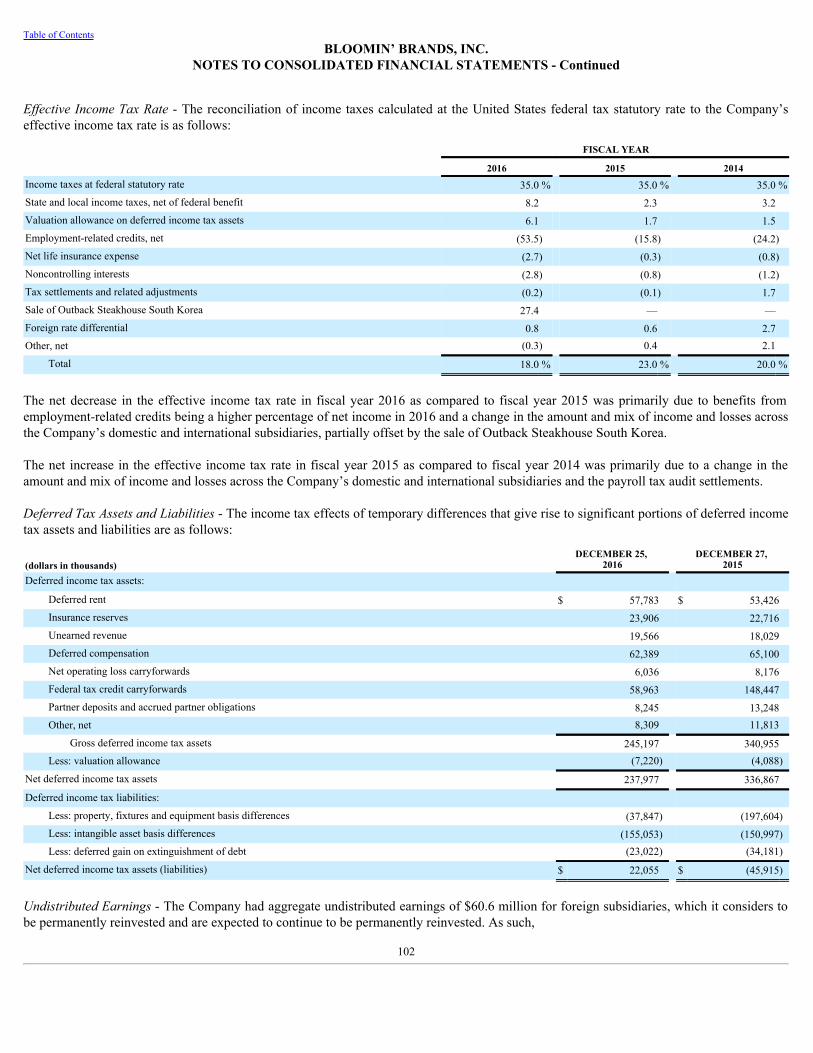
Table of ContentsBLOOMIN’ BRANDS, INC.
NOTES TO CONSOLIDATED FINANCIAL STATEMENTS - Continued
EffectiveIncomeTaxRate- The reconciliation of income taxes calculated at the United States federal tax statutory rate to the Company’seffective income tax rate is as follows:
FISCAL YEAR
2016 2015 2014Income taxes at federal statutory rate 35.0 % 35.0 % 35.0 %State and local income taxes, net of federal benefit 8.2 2.3 3.2Valuation allowance on deferred income tax assets 6.1 1.7 1.5Employment-related credits, net (53.5) (15.8) (24.2)Net life insurance expense (2.7) (0.3) (0.8)Noncontrolling interests (2.8) (0.8) (1.2)Tax settlements and related adjustments (0.2) (0.1) 1.7Sale of Outback Steakhouse South Korea 27.4 — —Foreign rate differential 0.8 0.6 2.7Other, net (0.3) 0.4 2.1
Total 18.0 % 23.0 % 20.0 %
The net decrease in the effective income tax rate in fiscal year 2016 as compared to fiscal year 2015 was primarily due to benefits fromemployment-related credits being a higher percentage of net income in 2016 and a change in the amount and mix of income and losses acrossthe Company’s domestic and international subsidiaries, partially offset by the sale of Outback Steakhouse South Korea.
The net increase in the effective income tax rate in fiscal year 2015 as compared to fiscal year 2014 was primarily due to a change in theamount and mix of income and losses across the Company’s domestic and international subsidiaries and the payroll tax audit settlements.
DeferredTaxAssetsandLiabilities- The income tax effects of temporary differences that give rise to significant portions of deferred incometax assets and liabilities are as follows:
(dollars in thousands)DECEMBER 25,
2016 DECEMBER 27,
2015Deferred income tax assets:
Deferred rent $ 57,783 $ 53,426Insurance reserves 23,906 22,716Unearned revenue 19,566 18,029Deferred compensation 62,389 65,100Net operating loss carryforwards 6,036 8,176Federal tax credit carryforwards 58,963 148,447Partner deposits and accrued partner obligations 8,245 13,248Other, net 8,309 11,813
Gross deferred income tax assets 245,197 340,955Less: valuation allowance (7,220) (4,088)
Net deferred income tax assets 237,977 336,867
Deferred income tax liabilities: Less: property, fixtures and equipment basis differences (37,847) (197,604)Less: intangible asset basis differences (155,053) (150,997)Less: deferred gain on extinguishment of debt (23,022) (34,181)
Net deferred income tax assets (liabilities) $ 22,055 $ (45,915)
UndistributedEarnings- The Company had aggregate undistributed earnings of $60.6 million for foreign subsidiaries, which it considers tobe permanently reinvested and are expected to continue to be permanently reinvested. As such,
102
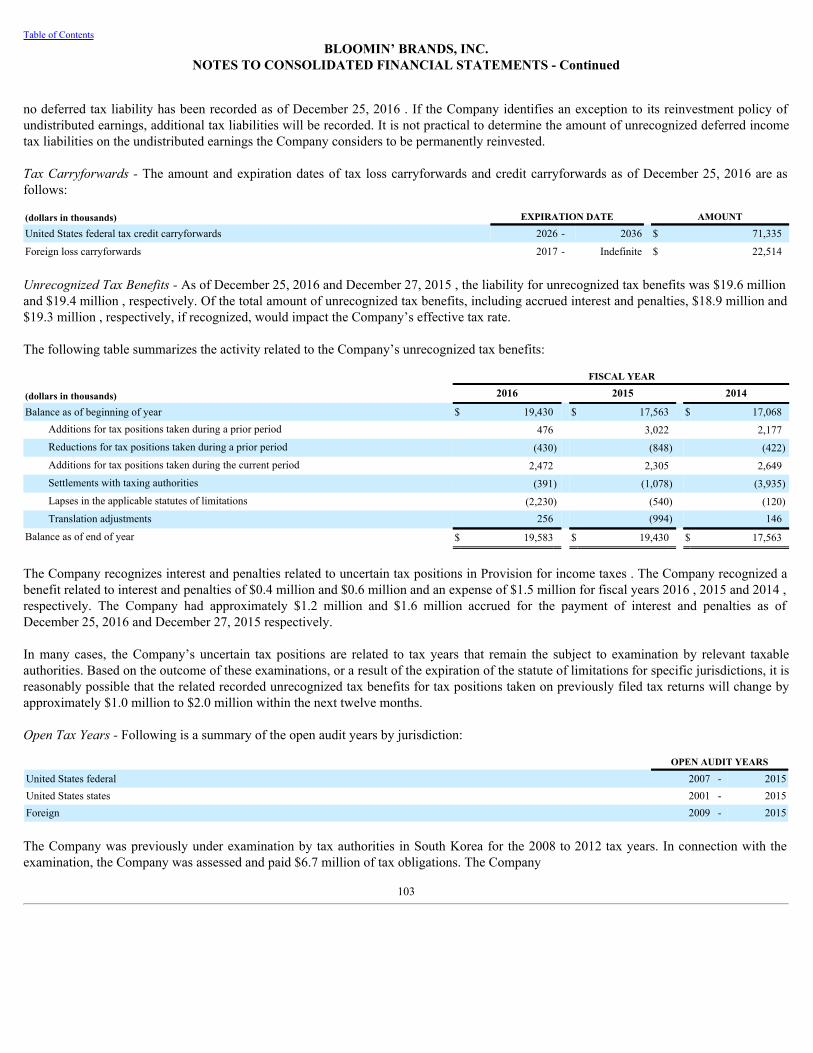
Table of ContentsBLOOMIN’ BRANDS, INC.
NOTES TO CONSOLIDATED FINANCIAL STATEMENTS - Continued
no deferred tax liability has been recorded as of December 25, 2016 . If the Company identifies an exception to its reinvestment policy ofundistributed earnings, additional tax liabilities will be recorded. It is not practical to determine the amount of unrecognized deferred incometax liabilities on the undistributed earnings the Company considers to be permanently reinvested.
TaxCarryforwards-The amount and expiration dates of tax loss carryforwards and credit carryforwards as of December 25, 2016 are asfollows:
(dollars in thousands) EXPIRATION DATE AMOUNT
United States federal tax credit carryforwards 2026 - 2036 $ 71,335
Foreign loss carryforwards 2017 - Indefinite $ 22,514
UnrecognizedTaxBenefits-As of December 25, 2016 and December 27, 2015 , the liability for unrecognized tax benefits was $19.6 millionand $19.4 million , respectively. Of the total amount of unrecognized tax benefits, including accrued interest and penalties, $18.9 million and$19.3 million , respectively, if recognized, would impact the Company’s effective tax rate.
The following table summarizes the activity related to the Company’s unrecognized tax benefits:
FISCAL YEAR
(dollars in thousands) 2016 2015 2014
Balance as of beginning of year $ 19,430 $ 17,563 $ 17,068Additions for tax positions taken during a prior period 476 3,022 2,177Reductions for tax positions taken during a prior period (430) (848) (422)Additions for tax positions taken during the current period 2,472 2,305 2,649Settlements with taxing authorities (391) (1,078) (3,935)Lapses in the applicable statutes of limitations (2,230) (540) (120)Translation adjustments 256 (994) 146
Balance as of end of year $ 19,583 $ 19,430 $ 17,563
The Company recognizes interest and penalties related to uncertain tax positions in Provision for income taxes . The Company recognized abenefit related to interest and penalties of $0.4 million and $0.6 million and an expense of $1.5 million for fiscal years 2016 , 2015 and 2014 ,respectively. The Company had approximately $1.2 million and $1.6 million accrued for the payment of interest and penalties as ofDecember 25, 2016 and December 27, 2015 respectively.
In many cases, the Company’s uncertain tax positions are related to tax years that remain the subject to examination by relevant taxableauthorities. Based on the outcome of these examinations, or a result of the expiration of the statute of limitations for specific jurisdictions, it isreasonably possible that the related recorded unrecognized tax benefits for tax positions taken on previously filed tax returns will change byapproximately $1.0 million to $2.0 million within the next twelve months.
OpenTaxYears-Following is a summary of the open audit years by jurisdiction:
OPEN AUDIT YEARS
United States federal 2007 - 2015United States states 2001 - 2015Foreign 2009 - 2015
The Company was previously under examination by tax authorities in South Korea for the 2008 to 2012 tax years. In connection with theexamination, the Company was assessed and paid $6.7 million of tax obligations. The Company
103
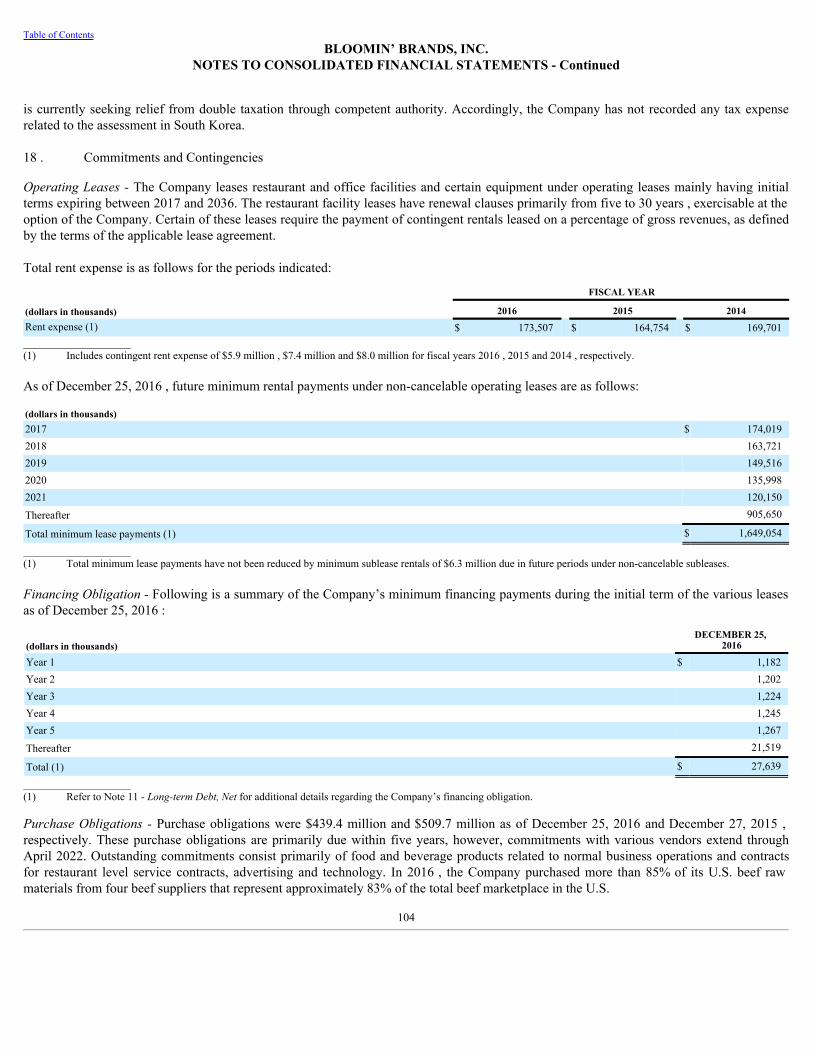
Table of ContentsBLOOMIN’ BRANDS, INC.
NOTES TO CONSOLIDATED FINANCIAL STATEMENTS - Continued
is currently seeking relief from double taxation through competent authority. Accordingly, the Company has not recorded any tax expenserelated to the assessment in South Korea.
18 . Commitments and Contingencies
OperatingLeases-The Company leases restaurant and office facilities and certain equipment under operating leases mainly having initialterms expiring between 2017 and 2036. The restaurant facility leases have renewal clauses primarily from five to 30 years , exercisable at theoption of the Company. Certain of these leases require the payment of contingent rentals leased on a percentage of gross revenues, as definedby the terms of the applicable lease agreement.
Total rent expense is as follows for the periods indicated:
FISCAL YEAR
(dollars in thousands) 2016 2015 2014Rent expense (1) $ 173,507 $ 164,754 $ 169,701____________________(1) Includes contingent rent expense of $5.9 million , $7.4 million and $8.0 million for fiscal years 2016 , 2015 and 2014 , respectively.
As of December 25, 2016 , future minimum rental payments under non-cancelable operating leases are as follows:
(dollars in thousands) 2017 $ 174,0192018 163,7212019 149,5162020 135,9982021 120,150
Thereafter 905,650
Total minimum lease payments (1) $ 1,649,054
____________________(1) Total minimum lease payments have not been reduced by minimum sublease rentals of $6.3 million due in future periods under non-cancelable subleases.
FinancingObligation-Following is a summary of the Company’s minimum financing payments during the initial term of the various leasesas of December 25, 2016 :
(dollars in thousands)DECEMBER 25,
2016
Year 1 $ 1,182Year 2 1,202Year 3 1,224Year 4 1,245Year 5 1,267
Thereafter 21,519
Total (1) $ 27,639
____________________(1) Refer to Note 11 - Long-termDebt,Netfor additional details regarding the Company’s financing obligation.
Purchase Obligations -Purchase obligations were $439.4 million and $509.7 million as of December 25, 2016 and December 27, 2015 ,respectively. These purchase obligations are primarily due within five years, however, commitments with various vendors extend throughApril 2022. Outstanding commitments consist primarily of food and beverage products related to normal business operations and contractsfor restaurant level service contracts, advertising and technology. In 2016 , the Company purchased more than 85% of its U.S. beef rawmaterials from four beef suppliers that represent approximately 83% of the total beef marketplace in the U.S.
104
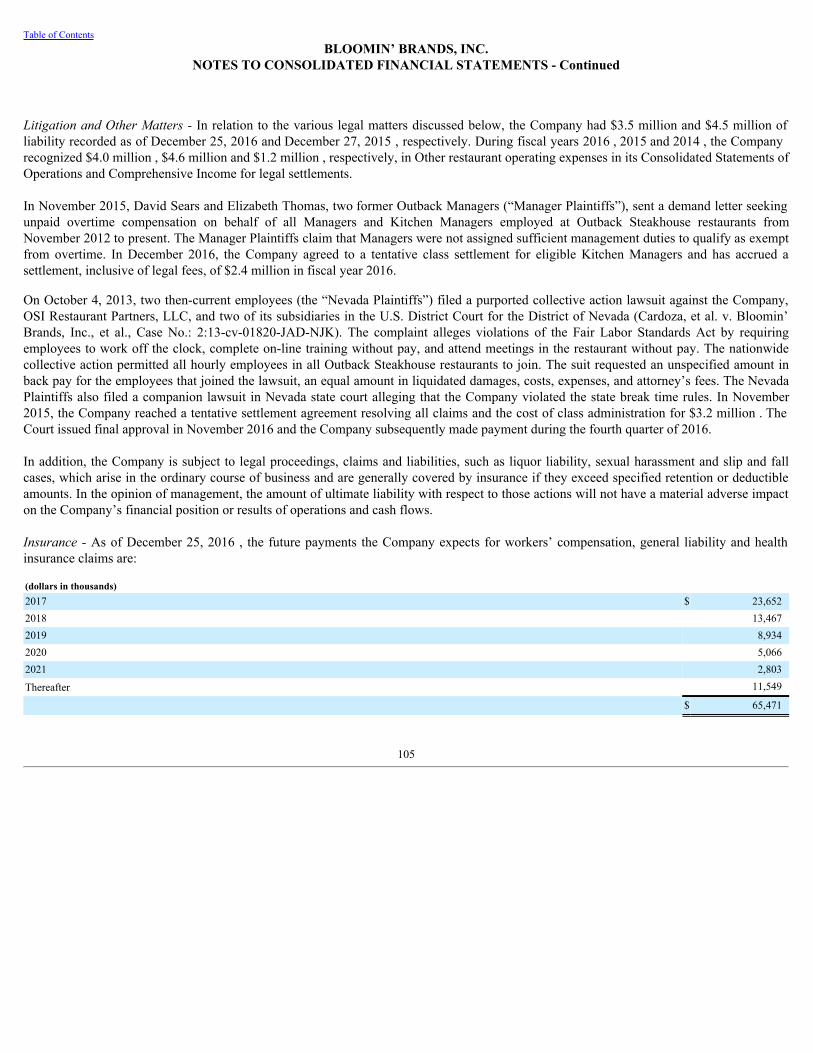
Table of ContentsBLOOMIN’ BRANDS, INC.
NOTES TO CONSOLIDATED FINANCIAL STATEMENTS - Continued
LitigationandOtherMatters-In relation to the various legal matters discussed below, the Company had $3.5 million and $4.5 million ofliability recorded as of December 25, 2016 and December 27, 2015 , respectively. During fiscal years 2016 , 2015 and 2014 , the Companyrecognized $4.0 million , $4.6 million and $1.2 million , respectively, in Other restaurant operating expenses in its Consolidated Statements ofOperations and Comprehensive Income for legal settlements.
In November 2015, David Sears and Elizabeth Thomas, two former Outback Managers (“Manager Plaintiffs”), sent a demand letter seekingunpaid overtime compensation on behalf of all Managers and Kitchen Managers employed at Outback Steakhouse restaurants fromNovember 2012 to present. The Manager Plaintiffs claim that Managers were not assigned sufficient management duties to qualify as exemptfrom overtime. In December 2016, the Company agreed to a tentative class settlement for eligible Kitchen Managers and has accrued asettlement, inclusive of legal fees, of $2.4 million in fiscal year 2016.
On October 4, 2013, two then-current employees (the “Nevada Plaintiffs”) filed a purported collective action lawsuit against the Company,OSI Restaurant Partners, LLC, and two of its subsidiaries in the U.S. District Court for the District of Nevada (Cardoza, et al. v. Bloomin’Brands, Inc., et al., Case No.: 2:13-cv-01820-JAD-NJK). The complaint alleges violations of the Fair Labor Standards Act by requiringemployees to work off the clock, complete on-line training without pay, and attend meetings in the restaurant without pay. The nationwidecollective action permitted all hourly employees in all Outback Steakhouse restaurants to join. The suit requested an unspecified amount inback pay for the employees that joined the lawsuit, an equal amount in liquidated damages, costs, expenses, and attorney’s fees. The NevadaPlaintiffs also filed a companion lawsuit in Nevada state court alleging that the Company violated the state break time rules. In November2015, the Company reached a tentative settlement agreement resolving all claims and the cost of class administration for $3.2 million . TheCourt issued final approval in November 2016 and the Company subsequently made payment during the fourth quarter of 2016.
In addition, the Company is subject to legal proceedings, claims and liabilities, such as liquor liability, sexual harassment and slip and fallcases, which arise in the ordinary course of business and are generally covered by insurance if they exceed specified retention or deductibleamounts. In the opinion of management, the amount of ultimate liability with respect to those actions will not have a material adverse impacton the Company’s financial position or results of operations and cash flows.
Insurance-As of December 25, 2016 , the future payments the Company expects for workers’ compensation, general liability and healthinsurance claims are:
(dollars in thousands) 2017 $ 23,6522018 13,4672019 8,9342020 5,0662021 2,803
Thereafter 11,549
$ 65,471
105

Table of ContentsBLOOMIN’ BRANDS, INC.
NOTES TO CONSOLIDATED FINANCIAL STATEMENTS - Continued
Discount rates of 1.32% and 1.08% were used for December 25, 2016 and December 27, 2015 , respectively. A reconciliation of the expectedaggregate undiscounted reserves to the discounted reserves for insurance claims recognized in the Company’s Consolidated Balance Sheets isas follows:
(dollars in thousands)DECEMBER 25,
2016 DECEMBER 27,
2015
Undiscounted reserves $ 65,471 $ 63,791Discount (2,678) (2,318)
Discounted reserves $ 62,793 $ 61,473
Discounted reserves recognized in the Company ’ s Consolidated Balance Sheets:
Accrued and other current liabilities $ 23,533 $ 20,824Other long-term liabilities, net 39,260 40,649
$ 62,793 $ 61,473
19 . Segment Reporting
The Company has two reportable segments, U.S. and International, which reflects how the Company manages its business, reviews operatingperformance and allocates resources. The U.S. segment includes all brands operating in the U.S. while brands operating outside the U.S. areincluded in the International segment. Resources are allocated and performance is assessed by the Company’s Chief Executive Officer, whomthe Company has determined to be its Chief Operating Decision Maker. Following is a summary of reporting segments as of December 25,2016 :
SEGMENT CONCEPT GEOGRAPHIC LOCATION
U.S. Outback Steakhouse
United States of America Carrabba’s Italian Grill Bonefish Grill Fleming’s Prime Steakhouse & Wine Bar
International Outback Steakhouse Brazil, Hong Kong, China
Carrabba’s Italian Grill (Abbraccio) Brazil
Segment accounting policies are the same as those described in Note 2 - Summary of Significant Accounting Policies . Revenues for allsegments include only transactions with customers and include no intersegment revenues. Excluded from income from operations for U.S.and International are certain legal and corporate costs not directly related to the performance of the segments, certain stock-basedcompensation expenses and certain bonus expense.
Prior to 2016, certain insurance expenses were not allocated to the Company’s concepts as these expenses were reviewed and evaluated on aCompany-wide basis and therefore, these costs were excluded from segment restaurant-level operating margin and income fromoperations. In 2016, the Company’s management changed how insurance expenses related to its restaurants are reviewed and now considersthose costs when evaluating the operating performance of the Company’s concepts. Accordingly, the Company has recast all prior periodsegment information to reflect this change.
106
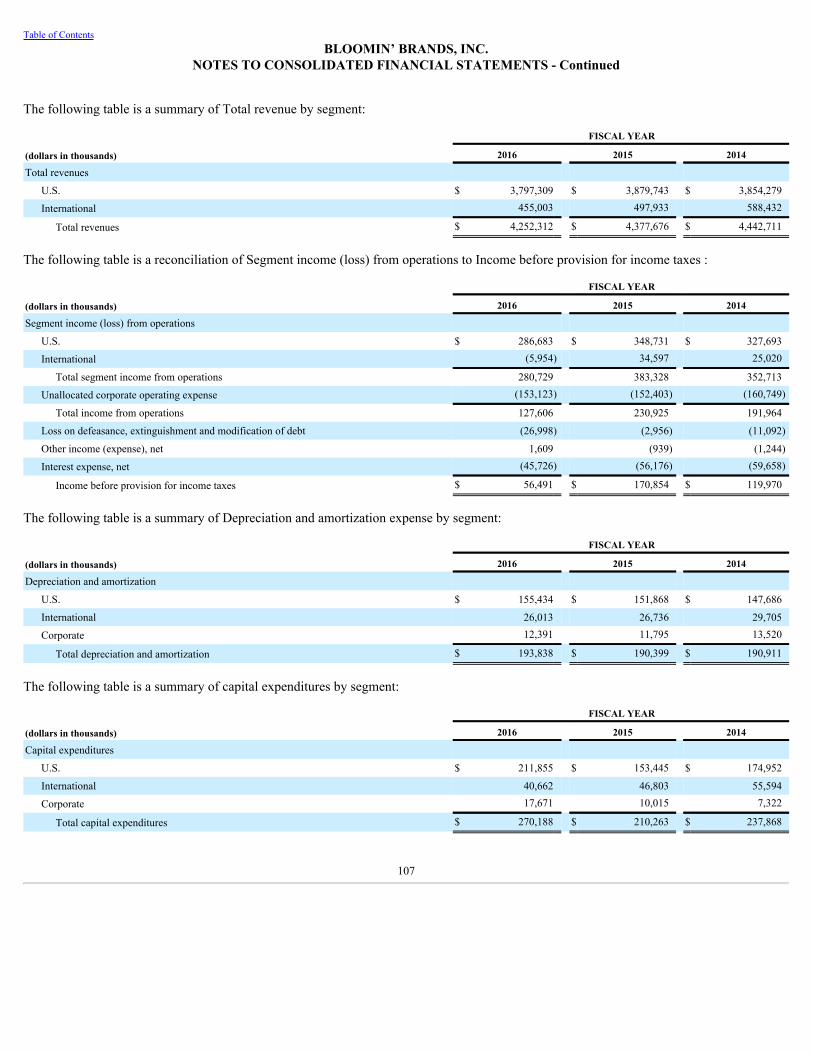
Table of ContentsBLOOMIN’ BRANDS, INC.
NOTES TO CONSOLIDATED FINANCIAL STATEMENTS - Continued
The following table is a summary of Total revenue by segment:
FISCAL YEAR
(dollars in thousands) 2016 2015 2014
Total revenues U.S. $ 3,797,309 $ 3,879,743 $ 3,854,279
International 455,003 497,933 588,432
Total revenues $ 4,252,312 $ 4,377,676 $ 4,442,711
The following table is a reconciliation of Segment income (loss) from operations to Income before provision for income taxes :
FISCAL YEAR
(dollars in thousands) 2016 2015 2014
Segment income (loss) from operations U.S. $ 286,683 $ 348,731 $ 327,693
International (5,954) 34,597 25,020
Total segment income from operations 280,729 383,328 352,713
Unallocated corporate operating expense (153,123) (152,403) (160,749)
Total income from operations 127,606 230,925 191,964
Loss on defeasance, extinguishment and modification of debt (26,998) (2,956) (11,092)
Other income (expense), net 1,609 (939) (1,244)
Interest expense, net (45,726) (56,176) (59,658)
Income before provision for income taxes $ 56,491 $ 170,854 $ 119,970
The following table is a summary of Depreciation and amortization expense by segment:
FISCAL YEAR
(dollars in thousands) 2016 2015 2014
Depreciation and amortization U.S. $ 155,434 $ 151,868 $ 147,686
International 26,013 26,736 29,705
Corporate 12,391 11,795 13,520
Total depreciation and amortization $ 193,838 $ 190,399 $ 190,911
The following table is a summary of capital expenditures by segment:
FISCAL YEAR
(dollars in thousands) 2016 2015 2014
Capital expenditures U.S. $ 211,855 $ 153,445 $ 174,952
International 40,662 46,803 55,594
Corporate 17,671 10,015 7,322
Total capital expenditures $ 270,188 $ 210,263 $ 237,868
107
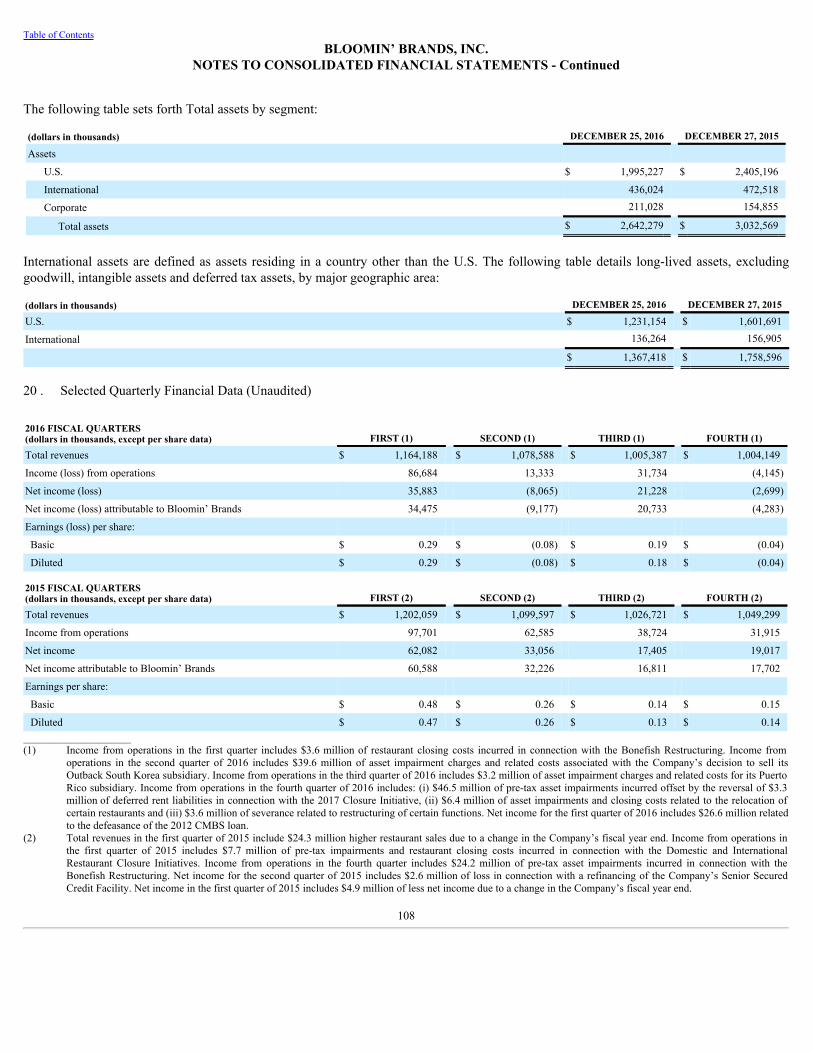
Table of ContentsBLOOMIN’ BRANDS, INC.
NOTES TO CONSOLIDATED FINANCIAL STATEMENTS - Continued
The following table sets forth Total assets by segment:
(dollars in thousands) DECEMBER 25, 2016 DECEMBER 27, 2015
Assets U.S. $ 1,995,227 $ 2,405,196
International 436,024 472,518
Corporate 211,028 154,855
Total assets $ 2,642,279 $ 3,032,569
International assets are defined as assets residing in a country other than the U.S. The following table details long-lived assets, excludinggoodwill, intangible assets and deferred tax assets, by major geographic area:
(dollars in thousands) DECEMBER 25, 2016 DECEMBER 27, 2015
U.S. $ 1,231,154 $ 1,601,691
International 136,264 156,905
$ 1,367,418 $ 1,758,596
20 . Selected Quarterly Financial Data (Unaudited)
2016 FISCAL QUARTERS (dollars in thousands, except per share data) FIRST (1) SECOND (1) THIRD (1) FOURTH (1)
Total revenues $ 1,164,188 $ 1,078,588 $ 1,005,387 $ 1,004,149
Income (loss) from operations 86,684 13,333 31,734 (4,145)
Net income (loss) 35,883 (8,065) 21,228 (2,699)
Net income (loss) attributable to Bloomin’ Brands 34,475 (9,177) 20,733 (4,283)
Earnings (loss) per share: Basic $ 0.29 $ (0.08) $ 0.19 $ (0.04)
Diluted $ 0.29 $ (0.08) $ 0.18 $ (0.04)
2015 FISCAL QUARTERS (dollars in thousands, except per share data) FIRST (2) SECOND (2) THIRD (2) FOURTH (2)
Total revenues $ 1,202,059 $ 1,099,597 $ 1,026,721 $ 1,049,299
Income from operations 97,701 62,585 38,724 31,915
Net income 62,082 33,056 17,405 19,017
Net income attributable to Bloomin’ Brands 60,588 32,226 16,811 17,702
Earnings per share: Basic $ 0.48 $ 0.26 $ 0.14 $ 0.15
Diluted $ 0.47 $ 0.26 $ 0.13 $ 0.14____________________(1) Income from operations in the first quarter includes $3.6 million of restaurant closing costs incurred in connection with the Bonefish Restructuring. Income from
operations in the second quarter of 2016 includes $39.6 million of asset impairment charges and related costs associated with the Company’s decision to sell itsOutback South Korea subsidiary. Income from operations in the third quarter of 2016 includes $3.2 million of asset impairment charges and related costs for its PuertoRico subsidiary. Income from operations in the fourth quarter of 2016 includes: (i) $46.5 million of pre-tax asset impairments incurred offset by the reversal of $3.3million of deferred rent liabilities in connection with the 2017 Closure Initiative, (ii) $6.4 million of asset impairments and closing costs related to the relocation ofcertain restaurants and (iii) $3.6 million of severance related to restructuring of certain functions. Net income for the first quarter of 2016 includes $26.6 million relatedto the defeasance of the 2012 CMBS loan.
(2) Total revenues in the first quarter of 2015 include $24.3 million higher restaurant sales due to a change in the Company’s fiscal year end. Income from operations inthe first quarter of 2015 includes $7.7 million of pre-tax impairments and restaurant closing costs incurred in connection with the Domestic and InternationalRestaurant Closure Initiatives. Income from operations in the fourth quarter includes $24.2 million of pre-tax asset impairments incurred in connection with theBonefish Restructuring. Net income for the second quarter of 2015 includes $2.6 million of loss in connection with a refinancing of the Company’s Senior SecuredCredit Facility. Net income in the first quarter of 2015 includes $4.9 million of less net income due to a change in the Company’s fiscal year end.
108
Table of ContentsBLOOMIN’ BRANDS, INC.
Item 9. Changes in and Disagreements with Accountants on Accounting and Financial Disclosure
None.
Item 9A. Controls and Procedures
Evaluation of Disclosure Controls and Procedures
We have established and maintain disclosure controls and procedures that are designed to ensure that information required to be disclosed byus in the reports that we file or submit under the Securities Exchange Act of 1934, as amended, is recorded, processed, summarized, andreported within the time periods specified in the Securities and Exchange Commission’s rules and forms, and that such information isaccumulated and communicated to our management, including our Chief Executive Officer and Chief Financial and Administrative Officer,as appropriate to allow timely decisions regarding required disclosure. We carried out an evaluation, under the supervision and with theparticipation of our management, including our Chief Executive Officer and Chief Financial and Administrative Officer, of the effectivenessof our disclosure controls and procedures as of the end of the period covered by this report. Based on that evaluation, the Chief ExecutiveOfficer and Chief Financial and Administrative Officer concluded that our disclosure controls and procedures were effective as ofDecember 25, 2016 .
Management’s Annual Report on Internal Control over Financial Reporting
Management’s report on our internal control over financial reporting and the attestation report of PricewaterhouseCoopers LLP, ourindependent registered certified public accounting firm, on our internal control over financial reporting are included in Item 8, FinancialStatements and Supplementary Data, of this Annual Report on Form 10-K.
Changes in Internal Control over Financial Reporting
There have been no changes in our internal control over financial reporting during our most recent quarter ended December 25, 2016 thathave materially affected, or are reasonably likely to materially affect, our internal control over financial reporting.
Item 9B. Other Information
None.
109
Table of ContentsBLOOMIN’ BRANDS, INC.
PART III
Item 10. Directors, Executive Officers and Corporate Governance
The information required by this item relating to our directors and nominees will be included under the captions “Proposal No. 1-Election ofDirectors: Nominees for Election at this Annual Meeting” and “—Directors Continuing in Office” in our definitive Proxy Statement for the2017 Annual Meeting of Stockholders (“Definitive Proxy Statement”) and is incorporated herein by reference.
The information required by this item relating to our executive officers is included under the caption “Executive Officers of the Registrant” inPart I of this Report on Form 10-K.
The information required by this item regarding compliance with Section 16(a) of the Securities Act of 1934 will be included under thecaption “Ownership of Securities—Section 16(a) Beneficial Ownership Reporting Compliance” in our Definitive Proxy Statement and isincorporated herein by reference.
We have adopted a Business Conduct and Code of Ethics that applies to all employees. A copy of our Business Conduct and Code of Ethics isavailable on our website, free of charge. The Internet address for our website is www.bloominbrands.com, and the Business Conduct andCode of Ethics may be found on our main webpage by clicking first on “Investors” and then on “Corporate Governance” and next on “Codeof Business Conduct and Ethics.”
We intend to satisfy any disclosure requirement under Item 5.05 of Form 8-K regarding an amendment to, or waiver from, a provision of thiscode of ethics by posting such information on our website, on the webpage found by clicking through to “Code of Business Conduct andEthics” as specified above.
The information required by this item regarding our Audit Committee will be included under the caption “Proposal No. 1: Election ofDirectors—Board Committees and Meetings” in our Definitive Proxy Statement and is incorporated herein by reference.
Item 11. Executive Compensation
The information required by this item will be included under the captions “Proposal No. 1: Election of Directors—Director Compensation”and “Executive Compensation and Related Information” in our Definitive Proxy Statement and is incorporated herein by reference.
Item 12. Security Ownership of Certain Beneficial Owners and Management and Related Stockholder Matters
The information required by this item will be included under the caption “Ownership of Securities” in our Definitive Proxy Statement and isincorporated herein by reference.
The information relating to securities authorized for issuance under equity compensation plans is included under the caption “SecuritiesAuthorized for Issuance Under Equity Compensation Plans” in Item 5 of this Report on Form 10-K.
Item 13. Certain Relationships and Related Transactions, and Director Independence
The information required by this item relating to transactions with related persons will be included under the caption “Certain Relationshipsand Related Party Transactions,” and the information required by this item relating to director independence will be included under thecaption “Proposal No. 1: Election of Directors—Independent Directors,” in each case in our Definitive Proxy Statement, and is incorporatedherein by reference.
110

Table of ContentsBLOOMIN’ BRANDS, INC.
Item 14. Principal Accounting Fees and Services
The information required by this item will be included under the captions “Proposal No. 2: Ratification of Independent Registered CertifiedPublic Accounting Firm—Principal Accountant Fees and Services” and “—Policy on Audit Committee Pre-Approval of Audit andPermissible Non-Audit Services of Independent Registered Certified Public Accounting Firm” in our Definitive Proxy Statement and isincorporated herein by reference.
111
Table of ContentsBLOOMIN’ BRANDS, INC.
PART IV
Item 15. Exhibits and Financial Statement Schedules.
(a)(1) LISTING OF FINANCIAL STATEMENTS
The following consolidated financial statements of the Company and subsidiaries are included in Item 8 of this Report:
• Consolidated Balance Sheets - December 25, 2016 and December 27, 2015• Consolidated Statements of Operations and Comprehensive Income – Fiscal years 2016 , 2015 , and 2014• Consolidated Statements of Changes in Stockholders’ Equity – Fiscal years 2016 , 2015 , and 2014• Consolidated Statements of Cash Flows – Fiscal years 2016 , 2015 , and 2014• Notes to Consolidated Financial Statements
(a)(2) FINANCIAL STATEMENT SCHEDULES
All financial statement schedules have been omitted, since the required information is not applicable or is not present in amounts sufficient torequire submission of the schedule, or because the information required is included in the consolidated financial statements and notes theretoincluded in this Report.
(a)(3) EXHIBITS
EXHIBITNUMBER DESCRIPTION OF EXHIBITS
FILINGS REFERENCED FOR INCORPORATION BY REFERENCE
2.1
Quota Purchase and Sale Agreement dated October 31, 2013 and effectiveNovember 1, 2013, by and between Bloomin’ Brands, Inc., OutbackSteakhouse Restaurantes Brasil S.A. (formerly known as Bloom HoldcoParticipações Ltda.), PGS Participações Ltda., the equity holders of PGSParticipações Ltda., PGS Consultoria e Serviços Ltda., and BloomParticipações Ltda. 1
December 31, 2013 Form 10-K, Exhibit 2.1
3.1
Second Amended and Restated Certificate of Incorporation of Bloomin’Brands, Inc.
Registration Statement on Form S-8, File No.333-183270, filed on August 13, 2012,Exhibit 4.1
3.2
Second Amended and Restated Bylaws of Bloomin’ Brands, Inc.
Registration Statement on Form S-8, File No.333-183270, filed on August 13, 2012,Exhibit 4.2
4.1
Form of Common Stock Certificate
Amendment No. 4 to Registration Statementon Form S-1, File No. 333-180615, filed onJuly 18, 2012, Exhibit 4.1
10.1
Credit Agreement dated October 26, 2012 among OSI Restaurant Partners,LLC, OSI HoldCo, Inc., the Lenders and Deutsche Bank Trust CompanyAmericas, as administrative agent for the Lenders 1
September 30, 2012 Form 10-Q, Exhibit 10.1
10.2
First Amendment to Credit Agreement, Guaranty and Security Agreementdated as of April 10, 2013 among OSI Restaurant Partners, LLC, OSIHoldCo, Inc., the Subsidiary Guarantors, the Lenders and Deutsche BankTrust Company Americas, as administrative agent for the Lenders
March 31, 2013 Form 10-Q, Exhibit 10.1
10.3
Second Amendment to Credit Agreement dated as of January 3, 2014 amongOSI Restaurant Partners, LLC, OSI HoldCo, Inc., the Subsidiary Guarantorsand Deutsche Bank Trust Company Americas, as administrative agent
December 31, 2013 Form 10-K, Exhibit 10.3
112
Table of ContentsBLOOMIN’ BRANDS, INC.
EXHIBITNUMBER DESCRIPTION OF EXHIBITS
FILINGS REFERENCED FOR INCORPORATION BY REFERENCE
10.4
Third Amendment to Credit Agreement dated as of May 16, 2014 amongOSI Restaurant Partners, LLC, OSI HoldCo, Inc., the Subsidiary Guarantors,Deutsche Bank Trust Company Americas, as administrative agent, collateralagent, L/C issuer, swing line lender and assigning Lender, Deutsche BangAG New York Branch, as assignee and Wells Fargo Bank, NationalAssociation, as successor administrative agent
June 29, 2014 Form 10-Q, Exhibit 10.5
10.5
Fourth Amendment to Credit Agreement and Incremental Amendment datedas of March 31, 2015, among OSI Restaurant Partners, LLC, OSI Holdco,Inc., the Subsidiary Guarantors party thereto, the lenders party thereto, andWells Fargo Bank, National Association, as administrative agent
March 29, 2015 Form 10-Q, Exhibit 10.1
10.6
Fifth Amendment to Credit Agreement and Incremental Amendment dated asof December 11, 2015, among OSI Restaurant Partners, LLC, OSI Holdco,Inc., the Subsidiary Guarantors party thereto, the lenders party thereto, andWells Fargo Bank, National Association, as administrative agent
December 27, 2015 Form 10-K, Exhibit 10.6
10.7
Loan Agreement, dated February 11, 2016, between New Private RestaurantProperties, LLC, as borrower, and Wells Fargo Bank, National Association,as lender 1
March 27, 2016 Form 10-Q, Exhibit 10.1
10.8
First Amendment to Loan Agreement, dated July 27, 2016, between NewPrivate Restaurant Properties, LLC as borrower, and Wells Fargo Bank,National Association, as lender. 1
September 25, 2016 Form 10-Q, Exhibit 10.1
10.9
Secured Promissory Note, dated February 11, 2016, between New PrivateRestaurant Properties, LLC, as borrower, and Wells Fargo Bank, NationalAssociation, as lender
March 27, 2016 Form 10-Q, Exhibit 10.2
10.10
Royalty Agreement dated April 1995 among Carrabba’s Italian Grill, Inc.,Outback Steakhouse, Inc., Mangia Beve, Inc., Carrabba, Inc., CarrabbaWoodway, Inc., John C. Carrabba, III, Damian C. Mandola, and John C.Carrabba, Jr., as amended by First Amendment to Royalty Agreement datedJanuary 1997 and Second Amendment to Royalty Agreement made andentered into effective April 7, 2010 by and among Carrabba’s Italian Grill,LLC, OSI Restaurant Partners, LLC, Mangia Beve, Inc., Mangia Beve II,Inc., Original, Inc., Voss, Inc., John C. Carrabba, III, Damian C. Mandola,and John C. Carrabba, Jr.
Registration Statement on Form S-1, File No.333-180615, filed on April 6, 2012, Exhibit10.6
10.11
Third Amendment to Royalty Agreement made and entered into effectiveJune 1, 2014, by and among Carrabba’s Italian Grill, LLC, OSI RestaurantPartners, LLC, Mangia Beve, Inc., Mangia Beve II, Inc., Original, Inc., Voss,Inc., John C. Carrabba, III, Damian C. Mandola, and John C. Carrabba, Jr.
June 29, 2014 Form 10-Q, Exhibit 10.6
10.12
Amended and Restated Operating Agreement for OSI/Fleming’s, LLC madeas of June 4, 2010 by and among OS Prime, LLC, a wholly-owned subsidiaryof OSI Restaurant Partners, LLC, FPSH Limited Partnership and AWA IIISteakhouses, Inc.
Registration Statement on Form S-1, File No.333-180615, filed on April 6, 2012, Exhibit10.8
10.13
Amended and Restated Master Lease Agreement, dated March 27, 2012,between New Private Restaurant Properties, LLC, as landlord, and PrivateRestaurant Master Lessee, LLC, as tenant 1
Amendment No. 1 to Registration Statementon Form S-1, File No. 333-180615, filed onMay 17, 2012, Exhibit 10.26
113
Table of ContentsBLOOMIN’ BRANDS, INC.
EXHIBITNUMBER DESCRIPTION OF EXHIBITS
FILINGS REFERENCED FOR INCORPORATION BY REFERENCE
10.14
Lease, dated June 14, 2007, between OS Southern, LLC andSelmon’s/Florida-I, Limited Partnership (predecessor to MVP LRS, LLC), asamended May 27, 2010
Amendment No. 1 to Registration Statementon Form S-1, File No. 333-180615, filed onMay 17, 2012, Exhibit 10.52
10.15
Lease, dated January 21, 2014, between OS Southern, LLC and MVP LRS,LLC
December 31, 2013 Form 10-K, Exhibit10.28
10.16*
Employee Rollover Agreement for conversion of OSI Restaurant Partners,Inc. restricted stock to Kangaroo Holdings, Inc. restricted stock entered intoby the individuals listed on Schedule 1 thereto
Registration Statement on Form S-1, File No.333-180615, filed on April 6, 2012, Exhibit10.4
10.17*
OSI Restaurant Partners, LLC HCE Deferred Compensation Plan effectiveOctober 1, 2007
Registration Statement on Form S-1, File No.333-180615, filed on April 6, 2012, Exhibit10.46
10.18*
Kangaroo Holdings, Inc. 2007 Equity Incentive Plan, as amended
Registration Statement on Form S-1, File No.333-180615, filed on April 6, 2012, Exhibit10.1
10.19*
Form of Option Agreement for Options under the Kangaroo Holdings, Inc.2007 Equity Incentive Plan
Registration Statement on Form S-1, File No.333-180615, filed on April 6, 2012, Exhibit10.42
10.20*
Bloomin’ Brands, Inc. 2012 Incentive Award Plan
Amendment No. 4 to Registration Statementon Form S-1, File No. 333-180615, filed onJuly 18, 2012, Exhibit 10.2
10.21*
Form of Nonqualified Stock Option Award Agreement for options grantedunder the Bloomin’ Brands, Inc. 2012 Incentive Award Plan
December 7, 2012 Form 8-K, Exhibit 10.2
10.22*
Form of Restricted Stock Award Agreement for restricted stock granted todirectors under the Bloomin’ Brands, Inc. 2012 Incentive Award Plan
December 7, 2012 Form 8-K, Exhibit 10.3
10.23*
Form of Restricted Stock Award Agreement for restricted stock granted toemployees and consultants under the Bloomin’ Brands, Inc. 2012 IncentiveAward Plan
December 7, 2012 Form 8-K, Exhibit 10.4
10.24*
Form of Restricted Stock Unit Award Agreement for restricted stock grantedto directors under the Bloomin’ Brands, Inc. 2012 Incentive Award Plan
September 30, 2013 Form 10-Q, Exhibit 10.1
10.25*
Form of Restricted Stock Unit Award Agreement for restricted stock grantedto employees and consultants under the Bloomin’ Brands, Inc. 2012Incentive Award Plan
September 30, 2013 Form 10-Q, Exhibit 10.2
10.26*
Form of Performance Unit Award Agreement for performance units grantedunder the Bloomin’ Brands, Inc. 2012 Incentive Award Plan
December 7, 2012 Form 8-K, Exhibit 10.5
10.27*
Form of Bloomin’ Brands, Inc. Indemnification Agreement by and betweenBloomin’ Brands, Inc. and each member of its Board of Directors and eachof its executive officers
Amendment No. 4 to Registration Statementon Form S-1, File No. 333-180615, filed onJuly 18, 2012, Exhibit 10.39
10.28* Bloomin’ Brands, Inc. 2016 Omnibus Incentive Compensation Plan June 26, 2016 Form 10-Q, Exhibit 10.1
114
Table of ContentsBLOOMIN’ BRANDS, INC.
EXHIBITNUMBER DESCRIPTION OF EXHIBITS
FILINGS REFERENCED FOR INCORPORATION BY REFERENCE
10.29*
Form of Nonqualified Stock Option Award Agreement for options granted toexecutive management under the Bloomin’ Brands, Inc. 2016 OmnibusIncentive Compensation Plan
June 26, 2016 Form 10-Q, Exhibit 10.2
10.30*
Form of Restricted Stock Unit Award Agreement for restricted stock grantedto directors under the Bloomin’ Brands, Inc. 2016 Omnibus IncentiveCompensation Plan
June 26, 2016 Form 10-Q, Exhibit 10.3
10.31*
Form of Restricted Stock Unit Award Agreement for restricted stock grantedto executive management under the Bloomin’ Brands, Inc. 2016 OmnibusIncentive Compensation Plan
June 26, 2016 Form 10-Q, Exhibit 10.4
10.32*
Form of Performance Award Agreement for performance units granted underthe Bloomin’ Brands, Inc. 2016 Omnibus Incentive Compensation Plan
June 26, 2016 Form 10-Q, Exhibit 10.5
10.33*
Bloomin’ Brands, Inc. Executive Change in Control Plan, effectiveDecember 6, 2012
December 7, 2012 Form 8-K, Exhibit 10.1
10.34*
Amended and Restated Employment Agreement made and entered intoSeptember 4, 2012 by and between Elizabeth A. Smith and Bloomin’ Brands,Inc.
June 30, 2012 Form 10-Q, Exhibit 10.1
10.35*
Option Agreement, dated November 16, 2009, by and between KangarooHoldings, Inc. and Elizabeth A. Smith, as amended December 31, 2009
Registration Statement on Form S-1, File No.333-180615, filed on April 6, 2012, Exhibit10.40
10.36*
Option Agreement, dated July 1, 2011, by and between Kangaroo Holdings,Inc. and Elizabeth A. Smith
Registration Statement on Form S-1, File No.333-180615, filed on April 6, 2012, Exhibit10.41
10.37*
Officer Employment Agreement, made and entered into effective May 7,2012, by and among David Deno and OSI Restaurant Partners, LLC
Amendment No. 1 to Registration Statementon Form S-1, File No. 333-180615, filed onMay 17, 2012, Exhibit 10.53
10.38*
Amendment, dated July 16, 2014, to the Officer Employment Agreement,made and entered into effective May 7, 2012, by and among David Deno andOSI Restaurant Partners, LLC
June 29, 2014 Form 10-Q, Exhibit 10.7
10.39*
Amended and Restated Employment Agreement dated June 14, 2007,between Joseph J. Kadow and OSI Restaurant Partners, LLC, as amended onJanuary 1, 2009, June 12, 2009, December 30, 2010 and December 16, 2011
Registration Statement on Form S-1, File No.333-180615, filed on April 6, 2012, Exhibit10.29
10.40*
Split-Dollar Agreement dated August 12, 2008 and effective March 30,2006, by and between OSI Restaurant Partners, LLC (formerly known asOutback Steakhouse, Inc.) and Joseph J. Kadow
Registration Statement on Form S-1, File No.333-180615, filed on April 6, 2012, Exhibit10.48
10.41*
Employment Offer Letter Agreement, dated as of November 1, 2013,between Bloomin’ Brands, Inc. and Patrick Murtha
December 31, 2013 Form 10-K, Exhibit10.55
10.42*
Employment Offer Letter Agreement, dated as of July 30, 2014, betweenBloomin’ Brands, Inc. and Donagh Herlihy
December 28, 2014 Form 10-K, Exhibit10.58
10.43*
Employment Offer Letter Agreement, dated as of May 4, 2015, betweenBloomin’ Brands, Inc. and Sukhdev Singh
December 27, 2015 Form 10-K, Exhibit10.57
10.44*
Employment Offer Letter Agreement, dated as of February 12, 2016,between Bloomin’ Brands, Inc. and Michael Kappitt
March 27, 2016 Form 10-Q, Exhibit 10.3
115

Table of ContentsBLOOMIN’ BRANDS, INC.
EXHIBITNUMBER DESCRIPTION OF EXHIBITS
FILINGS REFERENCED FOR INCORPORATION BY REFERENCE
10.45*
Employment Offer Letter Agreement, dated as of April 15, 2016, betweenBloomin’ Brands, Inc. and Christopher Brandt
June 26, 2016 Form 10-Q, Exhibit 10.6
10.46*
Employment Offer Letter Agreement, dated as of July 29, 2016, betweenBloomin’ Brands, Inc. and Gregg Scarlett
September 25, 2016 Form 10-Q, Exhibit 10.2
10.47*
Employment Offer Letter Agreement, dated as of July 29, 2016, betweenBloomin’ Brands, Inc. and David Schmidt
September 25, 2016 Form 10-Q, Exhibit 10.3
10.48
Registration Rights Agreement among Bloomin’ Brands, Inc. and certainstockholders of Bloomin’ Brands, Inc. made as of April 29, 2014
May 1, 2014 Form 8-K, Exhibit 10.3
21.1 List of Subsidiaries Filed herewith
23.1 Consent of PricewaterhouseCoopers LLP Filed herewith
31.1
Certification of Chief Executive Officer pursuant to Section 302 of theSarbanes-Oxley Act of 2002
Filed herewith
31.2
Certification of Chief Financial and Administrative Officer pursuant toSection 302 of the Sarbanes-Oxley Act of 2002
Filed herewith
32.1
Certification of Chief Executive Officer pursuant to 18 U.S.C. Section 1350,as adopted pursuant to Section 906 of the Sarbanes-Oxley Act of 2002 2
Filed herewith
32.2
Certification of Chief Financial and Administrative Officer pursuant to 18U.S.C. Section 1350, as adopted pursuant to Section 906 of the Sarbanes-Oxley Act of 2002 2
Filed herewith
101.INS XBRL Instance Document Filed herewith
101.SCH XBRL Taxonomy Extension Schema Document Filed herewith
101.CAL XBRL Taxonomy Extension Calculation Linkbase Document Filed herewith
101.DEF XBRL Taxonomy Extension Definition Linkbase Document Filed herewith
101.LAB XBRL Taxonomy Extension Label Linkbase Document Filed herewith
101.PRE XBRL Taxonomy Extension Presentation Linkbase Document Filed herewith
* Management contract or compensatory plan or arrangement required to be filed as an exhibit
1 Confidential treatment has been granted with respect to portions of Exhibits 2.1 , 10.1 , 10.7 , 10.8 and 10.13 and such portions have beenfiled separately with the Securities and Exchange Commission.
2 These certifications are not deemed to be “filed” for purposes of Section 18 of the Exchange Act, or otherwise subject to the liability of thatsection. These certifications will not be deemed to be incorporated by reference into any filing under the Securities Act or the Exchange Act,except to the extent that the registrant specifically incorporates them by reference.
Item 16. Form 10-K Summary
None.
116
Table of ContentsBLOOMIN’ BRANDS, INC.
SIGNATURES
Pursuant to the requirements of Section 13 or 15(d) of the Securities Exchange Act of 1934, the registrant has duly caused this report to besigned on its behalf by the undersigned, thereunto duly authorized.
Date: February 22, 2017 Bloomin’ Brands, Inc.
By: /s/ Elizabeth A. Smith
Elizabeth A. SmithChief Executive Officer(Principal Executive Officer)
Pursuant to the requirements of the Securities Exchange Act of 1934, this report has been signed below by the following persons on behalf ofthe registrant and in the capacities and on the dates indicated.
Signature Title Date /s/ Elizabeth A. Smith Chief Executive Officer and Director
(Principal Executive Officer)
Elizabeth A. Smith February 22, 2017 /s/ David J. Deno Executive Vice President and Chief Financial and Administrative
Officer(Principal Financial and Accounting Officer)
David J. Deno February 22, 2017
/s/ James R. Craigie
James R. Craigie Director February 22, 2017
/s/ David R. Fitzjohn
David R. Fitzjohn Director February 22, 2017 /s/ Mindy Grossman
Mindy Grossman Director February 22, 2017 /s/ Tara Walpert Levy
Tara Walpert Levy Director February 22, 2017 /s/ John J. Mahoney
John J. Mahoney Director February 22, 2017 /s/ Chris T. Sullivan
Chris T. Sullivan Director February 22, 2017

Exhibit 21.1
SUBSIDIARY NAME STATE OR OTHER JURISDICTION OF INCORPORATION OR ORGANIZATION
Annapolis Outback, LLC MD
BBI International Holdings, Inc. FL
BBI Ristorante Italiano, LLC FL
Bel Air Outback, Inc. MD
BFG Florida Services, Ltd FL
BFG Georgia Services, Ltd FL
BFG Indiana Services, Limited Partnership FL
BFG Nebraska, Inc. FL
BFG New Jersey Services, Limited Partnership FL
BFG North Carolina Services, Ltd FL
BFG Oklahoma, Inc. FL
BFG Pennsylvania Services, Ltd FL
BFG South Carolina Services, Ltd FL
BFG/FPS of Marlton Partnership FL
Bloom Brands Holdings I C.V. NL
Bloom Brands Holdings II C.V. NL
Bloom Group Holdings B.V. NL
Bloom Group Holdings II, B.V. NL
Bloom Group Restaurants, B.V. NL
Bloom Group Restaurants, LLC FL
Bloom No.1 Limited HK
Bloom No.2 Limited HK
Bloom Participações, Ltda. BR
Bloom Restaurantes Brasil S.A. BR
Bloomin’ Brands Gift Card Services, LLC FL
Bloomin’ Brands International, LLC FL
Bloomin Canada Inc. ON
Bloomin Hong Kong Limited HK
Bloomin Korea Holding CI
Bloomin Puerto Rico L.P. CI
Bonefish Baltimore County, LLC MD
Bonefish Beverages, LLC TX
Bonefish Brandywine, LLC MD
Bonefish Designated Partner, LLC DE
Bonefish Grill International, LLC FL
Bonefish Grill of Florida Designated Partner, LLC DE
Bonefish Grill of Florida, LLC DE
Bonefish Grill of Rogers, Inc. AR
Bonefish Grill, LLC FL
Bonefish Holdings, LLC TX
Bonefish Kansas Designated Partner, LLC DE
Bonefish Kansas LLC KS
Bonefish of Bel Air, LLC MD
Bonefish of Gaithersburg, Inc. MD
Bonefish/Anne Arundel, LLC MD
Bonefish/Asheville, Limited Partnership FL
Bonefish/Carolinas, Limited Partnership FL
Bonefish/Centreville, Limited Partnership FL
Bonefish/Columbus-I, Limited Partnership FL
Bonefish/Crescent Springs, Limited Partnership FL
Bonefish/Fredericksburg, Limited Partnership FL
Bonefish/Glen Burnie, LLC MD

Bonefish/Greensboro, Limited Partnership FL
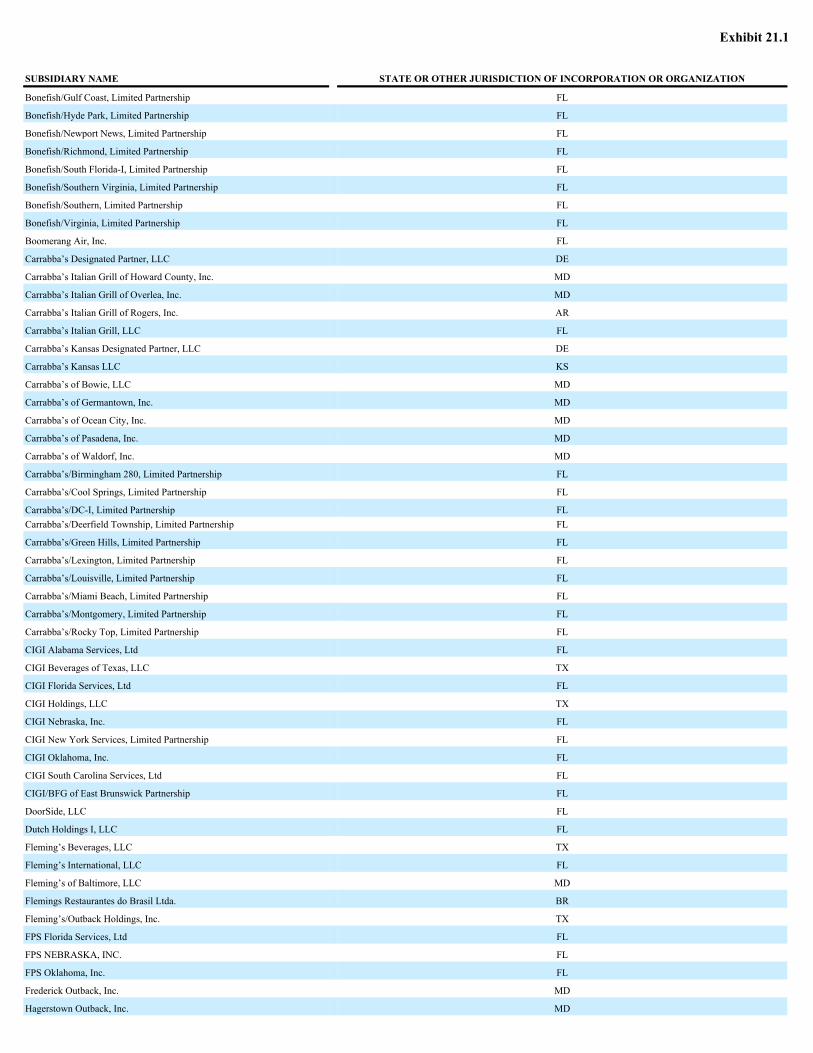
Exhibit 21.1
SUBSIDIARY NAME STATE OR OTHER JURISDICTION OF INCORPORATION OR ORGANIZATION
Bonefish/Gulf Coast, Limited Partnership FL
Bonefish/Hyde Park, Limited Partnership FL
Bonefish/Newport News, Limited Partnership FL
Bonefish/Richmond, Limited Partnership FL
Bonefish/South Florida-I, Limited Partnership FL
Bonefish/Southern Virginia, Limited Partnership FL
Bonefish/Southern, Limited Partnership FL
Bonefish/Virginia, Limited Partnership FL
Boomerang Air, Inc. FL
Carrabba’s Designated Partner, LLC DE
Carrabba’s Italian Grill of Howard County, Inc. MD
Carrabba’s Italian Grill of Overlea, Inc. MD
Carrabba’s Italian Grill of Rogers, Inc. AR
Carrabba’s Italian Grill, LLC FL
Carrabba’s Kansas Designated Partner, LLC DE
Carrabba’s Kansas LLC KS
Carrabba’s of Bowie, LLC MD
Carrabba’s of Germantown, Inc. MD
Carrabba’s of Ocean City, Inc. MD
Carrabba’s of Pasadena, Inc. MD
Carrabba’s of Waldorf, Inc. MD
Carrabba’s/Birmingham 280, Limited Partnership FL
Carrabba’s/Cool Springs, Limited Partnership FL
Carrabba’s/DC-I, Limited Partnership FLCarrabba’s/Deerfield Township, Limited Partnership FL
Carrabba’s/Green Hills, Limited Partnership FL
Carrabba’s/Lexington, Limited Partnership FL
Carrabba’s/Louisville, Limited Partnership FL
Carrabba’s/Miami Beach, Limited Partnership FL
Carrabba’s/Montgomery, Limited Partnership FL
Carrabba’s/Rocky Top, Limited Partnership FL
CIGI Alabama Services, Ltd FL
CIGI Beverages of Texas, LLC TX
CIGI Florida Services, Ltd FL
CIGI Holdings, LLC TX
CIGI Nebraska, Inc. FL
CIGI New York Services, Limited Partnership FL
CIGI Oklahoma, Inc. FL
CIGI South Carolina Services, Ltd FL
CIGI/BFG of East Brunswick Partnership FL
DoorSide, LLC FL
Dutch Holdings I, LLC FL
Fleming’s Beverages, LLC TX
Fleming’s International, LLC FL
Fleming’s of Baltimore, LLC MD
Flemings Restaurantes do Brasil Ltda. BR
Fleming’s/Outback Holdings, Inc. TX
FPS Florida Services, Ltd FL
FPS NEBRASKA, INC. FL
FPS Oklahoma, Inc. FL
Frederick Outback, Inc. MD
Hagerstown Outback, Inc. MD

New Private Restaurant Properties, LLC DE
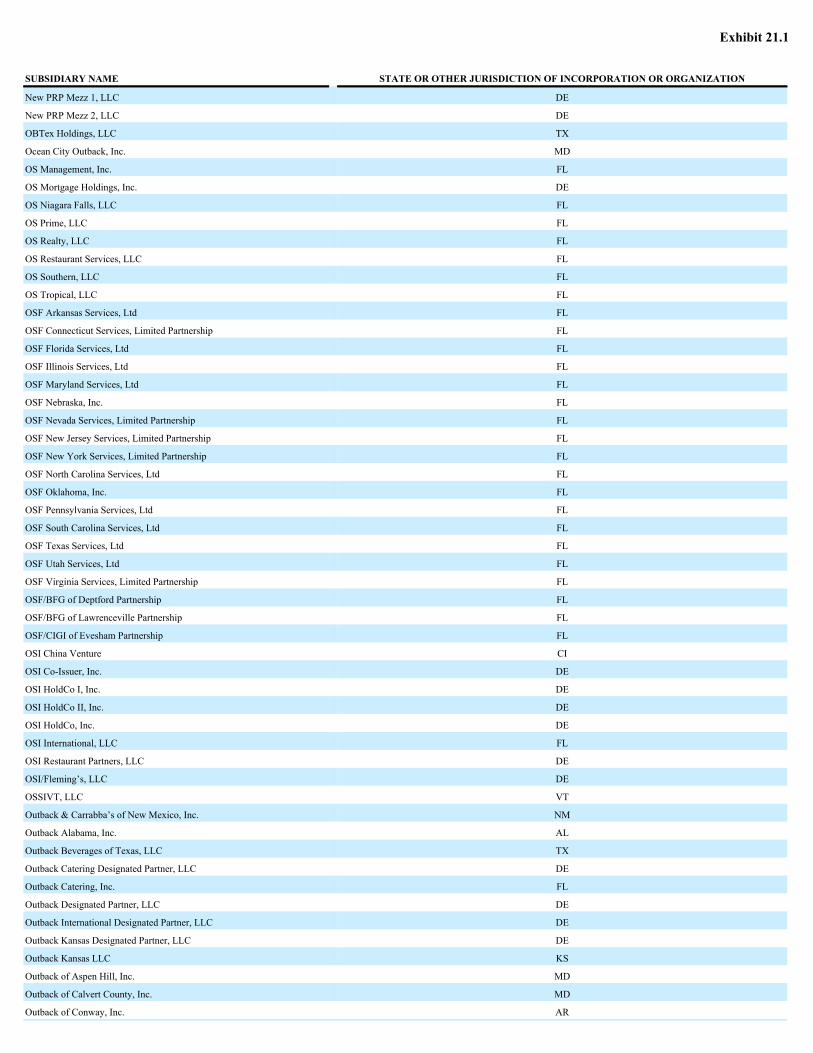
Exhibit 21.1
SUBSIDIARY NAME STATE OR OTHER JURISDICTION OF INCORPORATION OR ORGANIZATION
New PRP Mezz 1, LLC DE
New PRP Mezz 2, LLC DE
OBTex Holdings, LLC TX
Ocean City Outback, Inc. MD
OS Management, Inc. FL
OS Mortgage Holdings, Inc. DE
OS Niagara Falls, LLC FL
OS Prime, LLC FL
OS Realty, LLC FL
OS Restaurant Services, LLC FL
OS Southern, LLC FL
OS Tropical, LLC FL
OSF Arkansas Services, Ltd FL
OSF Connecticut Services, Limited Partnership FL
OSF Florida Services, Ltd FL
OSF Illinois Services, Ltd FL
OSF Maryland Services, Ltd FL
OSF Nebraska, Inc. FL
OSF Nevada Services, Limited Partnership FL
OSF New Jersey Services, Limited Partnership FL
OSF New York Services, Limited Partnership FL
OSF North Carolina Services, Ltd FL
OSF Oklahoma, Inc. FL
OSF Pennsylvania Services, Ltd FL
OSF South Carolina Services, Ltd FL
OSF Texas Services, Ltd FL
OSF Utah Services, Ltd FL
OSF Virginia Services, Limited Partnership FL
OSF/BFG of Deptford Partnership FL
OSF/BFG of Lawrenceville Partnership FL
OSF/CIGI of Evesham Partnership FL
OSI China Venture CI
OSI Co-Issuer, Inc. DE
OSI HoldCo I, Inc. DE
OSI HoldCo II, Inc. DE
OSI HoldCo, Inc. DE
OSI International, LLC FL
OSI Restaurant Partners, LLC DE
OSI/Fleming’s, LLC DE
OSSIVT, LLC VT
Outback & Carrabba’s of New Mexico, Inc. NM
Outback Alabama, Inc. AL
Outback Beverages of Texas, LLC TX
Outback Catering Designated Partner, LLC DE
Outback Catering, Inc. FL
Outback Designated Partner, LLC DE
Outback International Designated Partner, LLC DE
Outback Kansas Designated Partner, LLC DE
Outback Kansas LLC KS
Outback of Aspen Hill, Inc. MD
Outback of Calvert County, Inc. MD
Outback of Conway, Inc. AR

Outback of Germantown, Inc. MD
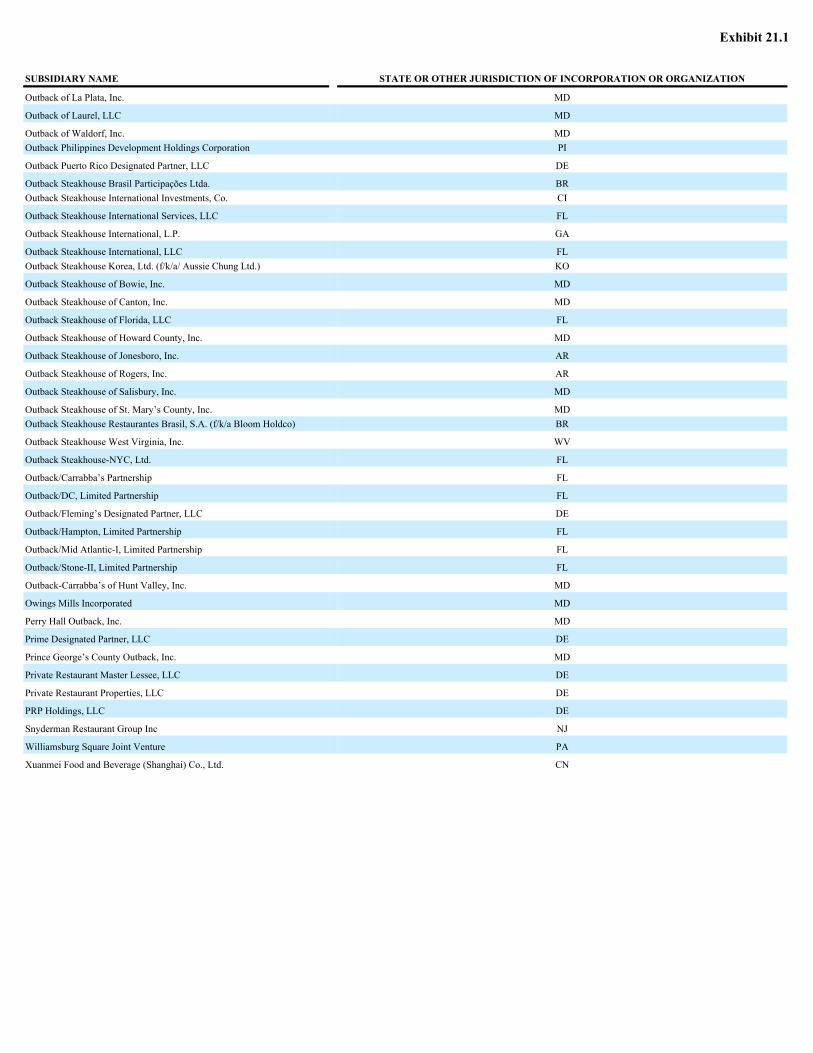
Exhibit 21.1
SUBSIDIARY NAME STATE OR OTHER JURISDICTION OF INCORPORATION OR ORGANIZATION
Outback of La Plata, Inc. MD
Outback of Laurel, LLC MD
Outback of Waldorf, Inc. MDOutback Philippines Development Holdings Corporation PI
Outback Puerto Rico Designated Partner, LLC DE
Outback Steakhouse Brasil Participações Ltda. BROutback Steakhouse International Investments, Co. CI
Outback Steakhouse International Services, LLC FL
Outback Steakhouse International, L.P. GA
Outback Steakhouse International, LLC FLOutback Steakhouse Korea, Ltd. (f/k/a/ Aussie Chung Ltd.) KO
Outback Steakhouse of Bowie, Inc. MD
Outback Steakhouse of Canton, Inc. MD
Outback Steakhouse of Florida, LLC FL
Outback Steakhouse of Howard County, Inc. MD
Outback Steakhouse of Jonesboro, Inc. AR
Outback Steakhouse of Rogers, Inc. AR
Outback Steakhouse of Salisbury, Inc. MD
Outback Steakhouse of St. Mary’s County, Inc. MDOutback Steakhouse Restaurantes Brasil, S.A. (f/k/a Bloom Holdco) BR
Outback Steakhouse West Virginia, Inc. WV
Outback Steakhouse-NYC, Ltd. FL
Outback/Carrabba’s Partnership FL
Outback/DC, Limited Partnership FL
Outback/Fleming’s Designated Partner, LLC DE
Outback/Hampton, Limited Partnership FL
Outback/Mid Atlantic-I, Limited Partnership FL
Outback/Stone-II, Limited Partnership FL
Outback-Carrabba’s of Hunt Valley, Inc. MD
Owings Mills Incorporated MD
Perry Hall Outback, Inc. MD
Prime Designated Partner, LLC DE
Prince George’s County Outback, Inc. MD
Private Restaurant Master Lessee, LLC DE
Private Restaurant Properties, LLC DE
PRP Holdings, LLC DE
Snyderman Restaurant Group Inc NJ
Williamsburg Square Joint Venture PA
Xuanmei Food and Beverage (Shanghai) Co., Ltd. CN
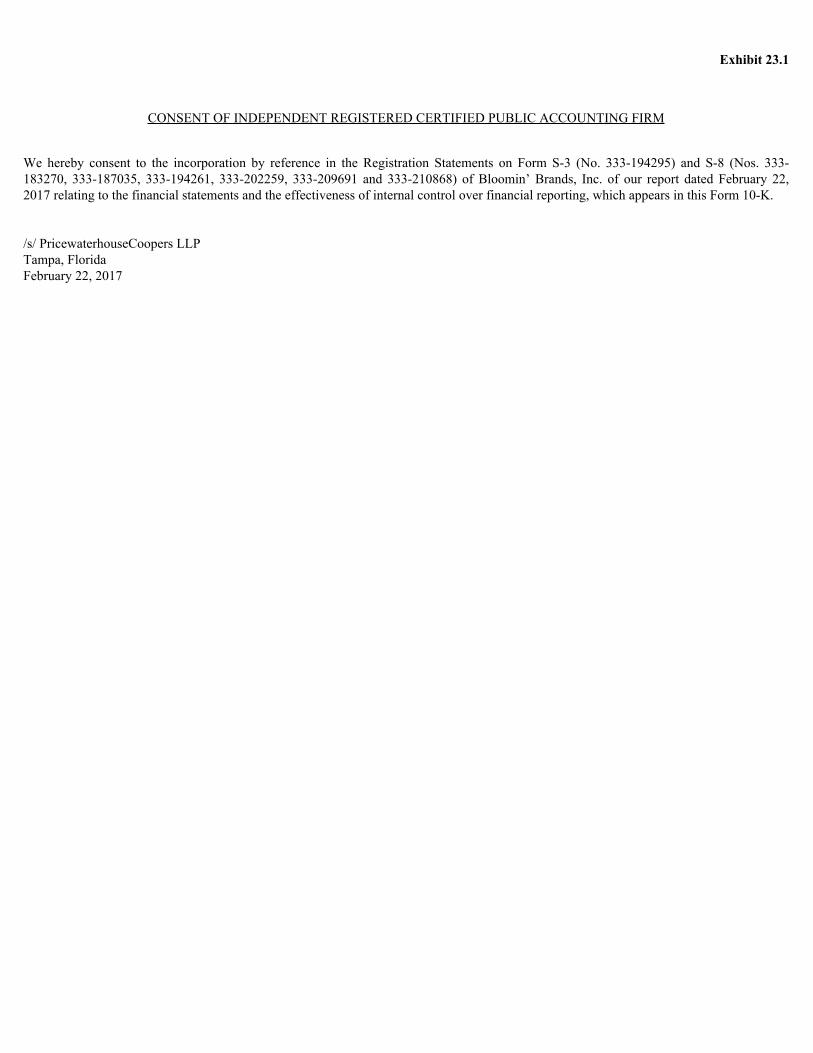
Exhibit 23.1
CONSENT OF INDEPENDENT REGISTERED CERTIFIED PUBLIC ACCOUNTING FIRM
We hereby consent to the incorporation by reference in the Registration Statements on Form S-3 (No. 333-194295) and S-8 (Nos. 333-183270, 333-187035, 333-194261, 333-202259, 333-209691 and 333-210868) of Bloomin’ Brands, Inc. of our report dated February 22,2017 relating to the financial statements and the effectiveness of internal control over financial reporting, which appears in this Form 10-K.
/s/ PricewaterhouseCoopers LLPTampa, FloridaFebruary 22, 2017
Exhibit 31.1
CERTIFICATION
I, Elizabeth A. Smith, certify that:
1. I have reviewed this Annual Report on Form 10-K of Bloomin’ Brands, Inc.;
2. Based on my knowledge, this report does not contain any untrue statement of a material fact or omit to state a material fact necessaryto make the statements made, in light of the circumstances under which such statements were made, not misleading with respect to theperiod covered by this report;
3. Based on my knowledge, the financial statements, and other financial information included in this report, fairly present in all materialrespects the financial condition, results of operations and cash flows of the registrant as of, and for, the periods presented in this report;
4. The registrant’s other certifying officer(s) and I are responsible for establishing and maintaining disclosure controls and procedures (asdefined in Exchange Act Rules 13a-15(e) and 15d-15(e)) and internal control over financial reporting (as defined in Exchange ActRules 13a-15(f) and 15d-15(f)) for the registrant and have:
(a) Designed such disclosure controls and procedures, or caused such disclosure controls and procedures to be designed underour supervision, to ensure that material information relating to the registrant, including its consolidated subsidiaries, is madeknown to us by others within those entities, particularly during the period in which this report is being prepared;
(b) Designed such internal control over financial reporting, or caused such internal control over financial reporting to be designedunder our supervision, to provide reasonable assurance regarding the reliability of financial reporting and the preparation offinancial statements for external purposes in accordance with generally accepted accounting principles;
(c) Evaluated the effectiveness of the registrant’s disclosure controls and procedures and presented in this report our conclusionsabout the effectiveness of the disclosure controls and procedures, as of the end of the period covered by this report based onsuch evaluation; and
(d) Disclosed in this report any change in the registrant’s internal control over financial reporting that occurred during theregistrant’s most recent fiscal quarter (the registrant’s fourth fiscal quarter in the case of an annual report) that has materiallyaffected, or is reasonably likely to materially affect, the registrant’s internal control over financial reporting; and
5. The registrant’s other certifying officer(s) and I have disclosed, based on our most recent evaluation of internal control over financialreporting, to the registrant’s auditors and the audit committee of the registrant’s board of directors (or persons performing theequivalent functions):
(a) All significant deficiencies and material weaknesses in the design or operation of internal control over financial reportingwhich are reasonably likely to adversely affect the registrant’s ability to record, process, summarize and report financialinformation; and
(b) Any fraud, whether or not material, that involves management or other employees who have a significant role in theregistrant’s internal control over financial reporting.
Date: February 22, 2017 /s/ Elizabeth A. Smith Elizabeth A. Smith
Chief Executive Officer(Principal Executive Officer)
Exhibit 31.2
CERTIFICATION
I, David J. Deno, certify that:
1. I have reviewed this Annual Report on Form 10-K of Bloomin’ Brands, Inc.;
2. Based on my knowledge, this report does not contain any untrue statement of a material fact or omit to state a material fact necessaryto make the statements made, in light of the circumstances under which such statements were made, not misleading with respect to theperiod covered by this report;
3. Based on my knowledge, the financial statements, and other financial information included in this report, fairly present in all materialrespects the financial condition, results of operations and cash flows of the registrant as of, and for, the periods presented in this report;
4. The registrant’s other certifying officer(s) and I are responsible for establishing and maintaining disclosure controls and procedures (asdefined in Exchange Act Rules 13a-15(e) and 15d-15(e)) and internal control over financial reporting (as defined in Exchange ActRules 13a-15(f) and 15d-15(f)) for the registrant and have:
(a) Designed such disclosure controls and procedures, or caused such disclosure controls and procedures to be designed underour supervision, to ensure that material information relating to the registrant, including its consolidated subsidiaries, is madeknown to us by others within those entities, particularly during the period in which this report is being prepared;
(b) Designed such internal control over financial reporting, or caused such internal control over financial reporting to be designedunder our supervision, to provide reasonable assurance regarding the reliability of financial reporting and the preparation offinancial statements for external purposes in accordance with generally accepted accounting principles;
(c) Evaluated the effectiveness of the registrant’s disclosure controls and procedures and presented in this report our conclusionsabout the effectiveness of the disclosure controls and procedures, as of the end of the period covered by this report based onsuch evaluation; and
(d) Disclosed in this report any change in the registrant’s internal control over financial reporting that occurred during theregistrant’s most recent fiscal quarter (the registrant’s fourth fiscal quarter in the case of an annual report) that has materiallyaffected, or is reasonably likely to materially affect, the registrant’s internal control over financial reporting; and
5. The registrant’s other certifying officer(s) and I have disclosed, based on our most recent evaluation of internal control over financialreporting, to the registrant’s auditors and the audit committee of the registrant’s board of directors (or persons performing theequivalent functions):
(a) All significant deficiencies and material weaknesses in the design or operation of internal control over financial reportingwhich are reasonably likely to adversely affect the registrant’s ability to record, process, summarize and report financialinformation; and
(b) Any fraud, whether or not material, that involves management or other employees who have a significant role in theregistrant’s internal control over financial reporting.
Date: February 22, 2017 /s/ David J. Deno David J. Deno
Executive Vice President and Chief Financial and Administrative Officer(Principal Financial Officer)
Exhibit 32.1
CERTIFICATION PURSUANT TO 18 U.S.C. SECTION 1350, AS ADOPTED PURSUANT TO SECTION 906 OF THESARBANES-OXLEY ACT OF 2002
In connection with the Annual Report of Bloomin’ Brands, Inc. (the “Company”) on Form 10-K for the fiscal year ended December 25, 2016as filed with the Securities and Exchange Commission on the date hereof (the “Report”), I, Elizabeth A. Smith, Chief Executive Officer of theCompany, hereby certify, pursuant to 18 U.S.C. Section 1350, as adopted pursuant to Section 906 of the Sarbanes-Oxley Act of 2002, to thebest of my knowledge, that:
(1) The Report fully complies with the requirements of Section 13(a) or 15(d) of the Securities Exchange Act of 1934; and
(2) The information contained in the Report fairly presents, in all material respects, the financial condition and results of operations of theCompany for the dates and periods covered by the Report.
Date: February 22, 2017 /s/ Elizabeth A. Smith Elizabeth A. Smith
Chief Executive Officer(Principal Executive Officer)
A signed original of this written statement required by Section 906 has been provided to, and will be retained by, Bloomin’ Brands, Inc. andfurnished to the Securities and Exchange Commission or its staff upon request.
Exhibit 32.2
CERTIFICATION PURSUANT TO 18 U.S.C. SECTION 1350, AS ADOPTED PURSUANT TO SECTION 906 OF THESARBANES-OXLEY ACT OF 2002
In connection with the Annual Report of Bloomin’ Brands, Inc. (the “Company”) on Form 10-K for the fiscal year ended December 25, 2016as filed with the Securities and Exchange Commission on the date hereof (the “Report”), I, David J. Deno, Executive Vice President andChief Financial and Administrative Officer of the Company, hereby certify, pursuant to 18 U.S.C. Section 1350, as adopted pursuant toSection 906 of the Sarbanes-Oxley Act of 2002, to the best of my knowledge, that:
(1) The Report fully complies with the requirements of Section 13(a) or 15(d) of the Securities Exchange Act of 1934; and
(2) The information contained in the Report fairly presents, in all material respects, the financial condition and results of operations of theCompany for the dates and periods covered by the Report.
Date: February 22, 2017 /s/ David J. Deno David J. Deno
Executive Vice President and Chief Financial and Administrative Officer(Principal Financial Officer)
A signed original of this written statement required by Section 906 has been provided to, and will be retained by, Bloomin’ Brands, Inc. andfurnished to the Securities and Exchange Commission or its staff upon request.