simulation study of process latitude for liquid immersion lithography
TRANSCRIPT
Simulation Study of Process Latitude for Liquid ImmersionLithography
So-Yeon Baeka, Daniel C. Colea, Mordechai Rothschildb, Michael Switkesb, Michael S.Yeunga,and Eytan Baroucha
aDept. Manufacturing Engineering, 15 St. Mary’s Street, Boston University,Brookline, MA 02446, USA
bLincoln Laboratory, Massachusetts Institute of Technology, 244 Wood Street,Lexington, MA 02420, USA
ABSTRACT
A simulation package has been developed for predicting the influence of immersion, i.e. the presence of a uniformliquid layer between the last objective lens and the photoresist, on optical projection lithography. This technologyhas engendered considerable interest in the microlithography community during the past year, as it enables thereal part of the index of refraction in the image space, and thus the numerical aperture of the projection system,to be greater than unity. The simulation program described here involves a Maxwell vector solution approach,including polarization effects and arbitrary thin film multilayers. We examine here the improvement in processwindow afforded by immersion under a variety of conditions, including λ = 193 nm and 157 nm, annularillumination, and the use of alternating phase shift mask technology. Immersion allows printing of dense linesand spaces as small as 45 nm with acceptable process window. We also examine the effect of variations in liquidindex on the process window and conclude that the index of the liquid must be known to and maintained withina few parts-per-million. This has important implications for the temperature control required in future liquidimmersion projection systems.
1. INTRODUCTION
Liquid immersion lithography has risen to a promising candidate position for the micro/nanolithography tech-nology roadmap for critical dimensions (CDs) down to perhaps 45 nm. In the last few years, several articles1,2,3
have been written on various aspects of liquid immersion lithography. Clearly, numerous factors need to beinvestigated to evaluate the viability of this potentially lower cost lithography technology, including optical,fluid dynamic, and fluid property variability concerns. A simulation package, as described here, has been de-veloped to address many of the optical issues. The package accounts for high NA imaging, via a full Maxwellvector solution approach, including polarization effects, as well as accounting for multilayers of thin film mediaof arbitrary complex index of refraction. This simulation capability was used to examine the process windowfor line and space structures, based on depth of focus (DOF), for a wide range of conditions: namely, 193 and157 nm wavelength projection systems, numerical apertures (NA) ranging between 0.9 and 1.3, and for circularand annular illumination schemes, as well as for alternating phase shift mask structures. Liquid immersion ispredicted to significantly improve printability between 45 nm and 90 nm CDs, with changes in NA required atspecific CD junctions to remain on the optimal operating curve. Also examined here are the lithographic effectsof changes in the index of refraction of the liquid and the constraints these impose on liquid temperature control.
The outline of our article is as follows. Section 2 describes the physical and mathematical model we imple-mented to predict the effects of including a uniform liquid between the last objective lens and the photoresist onthe wafer. Section 3 turns to using this simulation package to ascertain the effects on printability of dense linesand spaces of various dimensions, when liquid immersion is taken into account. Section 4 considers the impactof uniform changes in real part of the index of the liquid, such as those arising from a change in temperature.Finally, we end this article in section 5 with a few concluding remarks.
l0
Hemispherical lens (nlens)
Immersion liquid (nliquid)
Thin-film stack (optional)
Resist
Substrate (infinitely thick)
q
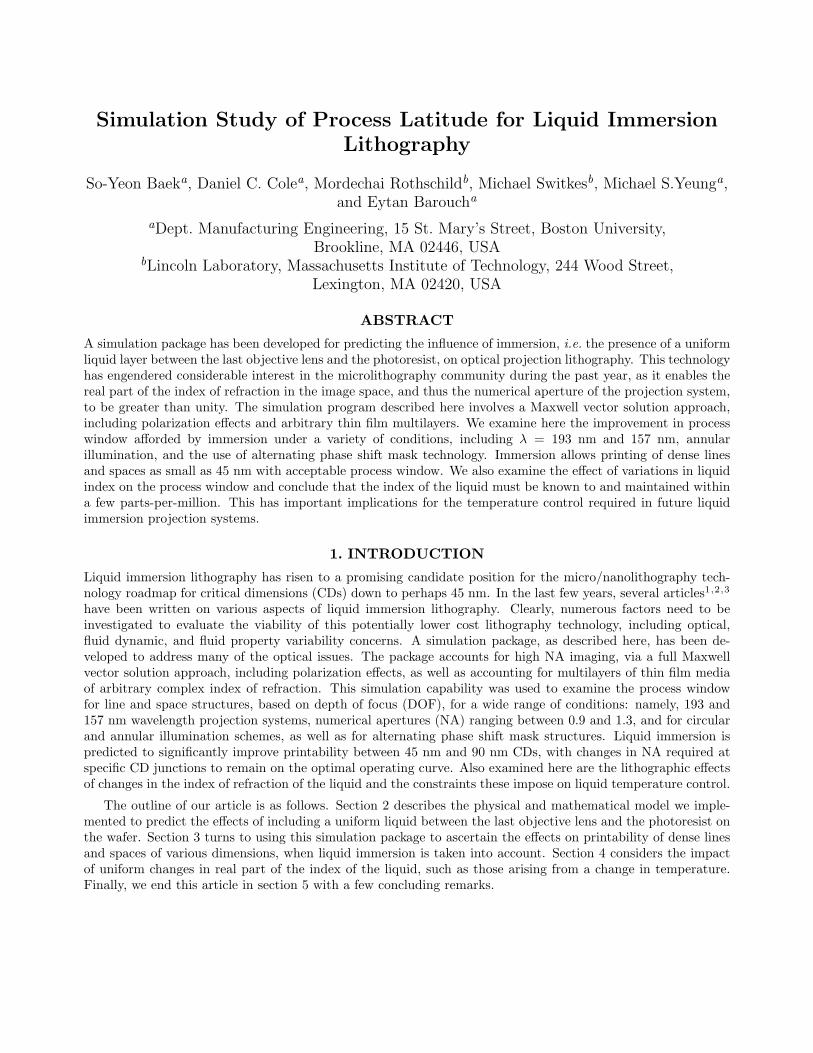
Figure 1. The physical picture of liquid immersion microlithography. The software that has been developed to simulatethis arrangement can handle an arbitrary number of layers of films in the “thin-film stack”, with each film described bya single complex index of refraction.
2. MODEL OF LIQUID IMMERSION LITHOGRAPHY
The model of liquid immersion lithography we made use of is shown in Fig. 1. The space between the finaloptical element of the projection lens (represented in Fig. 1 by a hemispherical lens) and the resist coated waferis assumed to be filled with a high-index liquid. This effect permits exposure with incident light of large obliquitythat would otherwise be totally internally reflected at the optic-air interface of a dry exposure system.1 A lightray of wavelength λ in air entering the hemispherical lens of refractive index nlens at an angle θlens contributesto an image spatial frequency f = nlens sin θlens/λ. For a ray passing next to the rim of the lens pupil, thiscorresponds to a numerical aperture NA = nlens sin θlens = nliquid sin θliquid, where nliquid is the liquid refractiveindex (assumed to be real for the present discussion) and θliquid is the propagation angle of the ray in the liquid.In order for the ray to propagate through the liquid, the numerical aperture must satisfy NA < nlens or nliquid,whichever is less.
Suppose the Gaussian focal plane is at a distance D below the optic-liquid interface. The projection lensmust provide a ray propagating in the liquid at an angle θliquid (corresponding to image spatial frequency f)with a phase shift Φ(f),
Φ(f) = −2πD
λnliquid
√1− sin2 θliquid
= −2πD
λnliquid
√1−
(λf
nliquid
)2
, (1)
up to an additive constant, in order for the ray to arrive at the focal plane with the correct phase. If during theexposure the liquid refractive index is actually nliquid (as a result of density fluctuation), the phase delay of theray due to propagation from the optic-liquid interface to a plane a distance D below the interface is φ(f),
φ(f) =2πD
λnliquid
√1−
(λf
nliquid
)2
. (2)
This results in a phase error on the focal plane (where D = D) equal to φ(f) + Φ(f),
φ(f) + Φ(f) =2πD
λnliquid
√1−
(λf
nliquid
)2
− 2πD
λnliquid
√1−
(λf
nliquid
)2
=2πD
λ(nliquid − nliquid)− πλD
(1
nliquid− 1
nliquid
)f2
−πλ3D
4
(1
n3liquid
− 1n3
liquid
)f4 + . . . . (3)
Thus, fluctuation in the liquid refractive index during exposure will give rise to defocus and spherical aberrationsof various orders.
The above model has been implemented in an aerial-image software for liquid immersion lithography. Vectorand thin-film interference effects are taken into account4 to allow simulation of the image intensity distributioninside the resist layer. High numerical aperture effects are also taken into account by the use of a suitablehigh-NA factor.5,6
3. DOF CALCULATIONS
Our software can calculate the light intensity throughout the entire thickness of the photoresist. However, sincemany resist chemistries are still under consideration for immersion lithography,7 we concentrate on the opticaleffects expected by including a liquid between the last lens surface and the photoresist. Thus, the results reportedhere are for the light intensity just below the surface of the resist, taking into account the influence of the liquid–resist interface but not the absorbance or other properties of the bulk of the resist itself. We use the conventionalaerial image threshold model procedure8,9 to estimate the printability of such structures. We anticipate thatdespite the simplicity of this model, the general trends should still hold even when more realistic resist propertiesare later taken into account,
For the rest of the article, all results will be based on the light intensity calculated in the top part of thephotoresist which is taken to be sufficiently thick so as to prevent reflection from the Si substrate. The variouslayers have the following indices: n = 0.6644+2.04i for the underlying silicon, n = 1.52+0.03i for the photoresistat λ = 193 nm, and n = 1.4+0.03i for the photoresist at λ = 157 nm, and n = 1.47 (water) and n = 1.38+10−5i(perfluoropolyether) for the immersion liquids at λ = 193 nm and 157 nm, respectively. The immersion liquidthickness is taken to be 1 mm at 193 nm and 0.1 mm for 157 nm. These values reflect our best estimates forthe appropriate parameters given the current state of immersion lithography7 at 193 and 157 nm; they willundoubtedly need to be refined as the technologies develop. Still, we anticipate that the general conclusionsdrawn from the present simulations will remain valid.
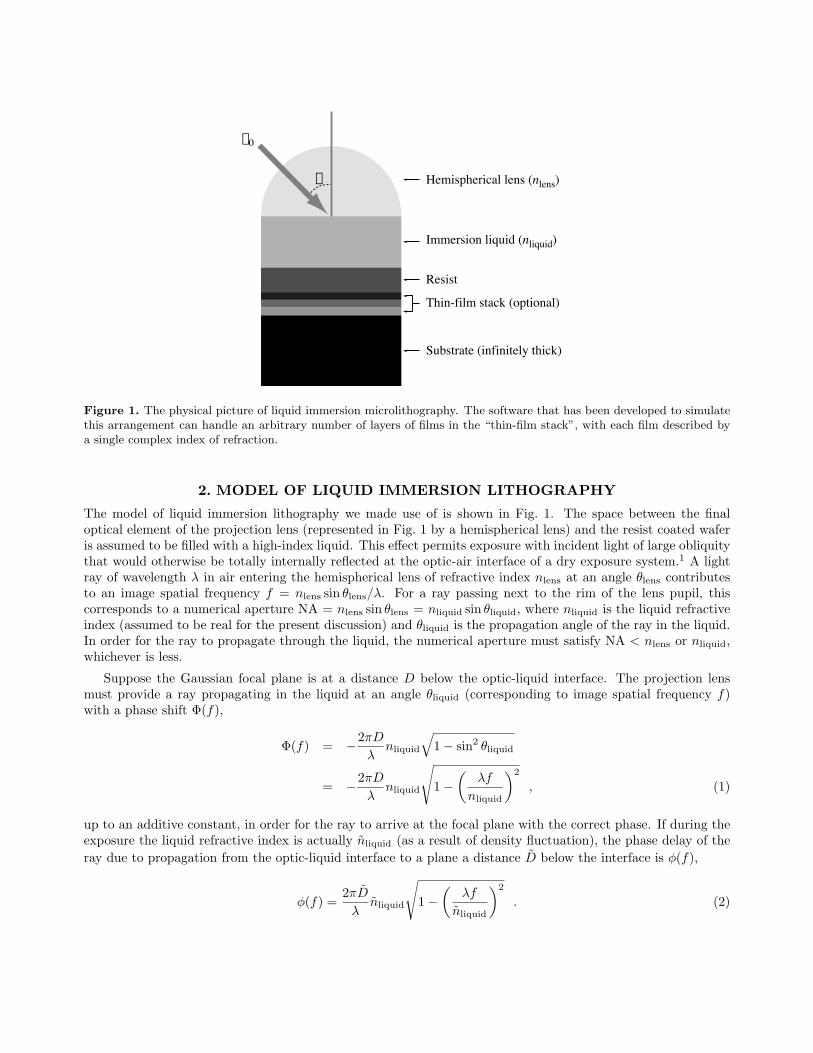
Our initial results use contrast calculations to estimate the printability of a given aerial image. Later, we turnto exposure-defocus (ED) calculations, following conventions often discussed in B. Lin’s works.10 The contrast,
C =Imax − Imin
Imax + Imin,
was calculated just below the surface of the photoresist. Figure 2 shows curves of contrast versus focus for foursets of equal lines and spaces with dimensions of 75, 65, 55, and 45 nm exposed with a binary mask under circularillumination with σ = 0.6. In each case, curves for NA = 1.1 and 1.3 at 193 nm and NA = 0.9 and 1.3 at 157 nmare shown. All exposures except the NA = 0.9 case are made in liquid immersion. If we take a contrast of 0.3as an acceptable level of printability, then a reasonable estimate of the depth of focus (DOF) can be calculatedfrom these and other similar plots, as indicated in Fig. 2(c). In Fig. 2(a), all four wavelength/NA combinationscan print 75 nm L/S, with the largest DOF occurring for the NA = 1.1, λ = 193 nm case. As expected, for agiven wavelength, as NA increases, one can obtain a higher level of contrast when in best focus; however, DOFis typically negatively affected.
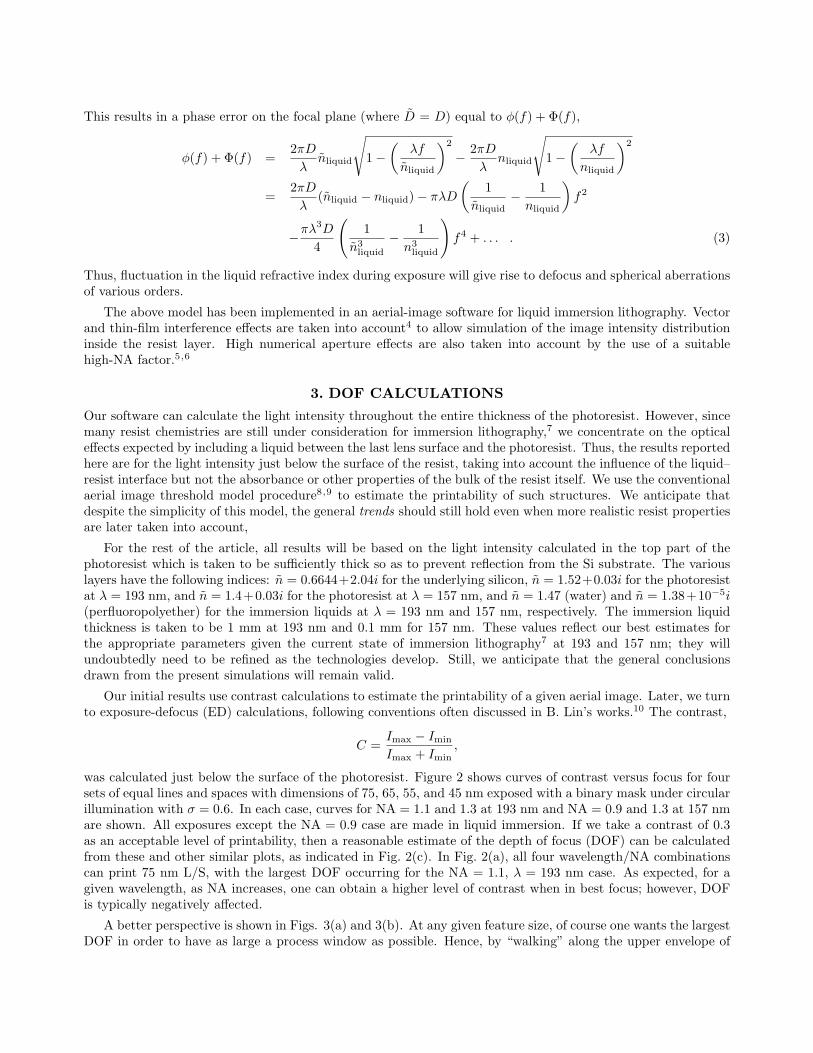
A better perspective is shown in Figs. 3(a) and 3(b). At any given feature size, of course one wants the largestDOF in order to have as large a process window as possible. Hence, by “walking” along the upper envelope of
1.0
0.8
0.6
0.4
0.2
0.0
Con
trast
-200 -100 0 100 200Defocus (nm)
55 nm L/S
1.0
0.8
0.6
0.4
0.2
0.0
Con
trast
-200 -100 0 100 200Defocus (nm)
65 nm L/S
1.0
0.8
0.6
0.4
0.2
0.0
Con
trast
-200 -100 0 100 200Defocus (nm)
157 nm NA=0.9 (dry) 157 nm NA=1.3 193 nm NA=1.1 193 nm NA=1.3
45 nm L/S
1.0
0.8
0.6
0.4
0.2
0.0
Con
trast
-200 -100 0 100 200Defocus (nm)
75 nm L/SA
C
B
D
Figure 2. Contrast vs. focus for 1:1 L/S structures exposed with a binary mask and circular illumination (σ = 0.6).
400
300
200
100
0
DO
F (n
m)
9080706050Feature Size (nm)
l = 157 nm NA = 0.9 (dry) NA = 0.9 (liquid) NA = 1.1 NA = 1.3
400
300
200
100
0
DO
F (n
m)
9080706050Feature Size (nm)
l = 193� nm NA = 0.9 (dry) NA = 0.9 (liquid) NA = 1.1 NA = 1.3
A B
Figure 3. DOF vs. feature size with a binary mask and circular illumination for (a) λ = 193 nm; (b) λ = 157 nm, ascalculated from the information in Fig. 2.
each of the curves in Figs. 3(a) and 3(b), we see roughly the desired point at each stage to best take advantageof liquid immersion capability.
Thus, liquid immersion technology offers the ability of increasing the maximum range of NA beyond unity,as well as providing a vehicle to select the most appropriate NA value for printing the features of interest, withthe maximum DOF allowable. In addition, liquid immersion technology can be readily combined with other wellknown resolution enhancement techniques,11 such as off-axis illumination, optical proximity corrections (OPC),
1.0
0.8
0.6
0.4
0.2
0.0
Con
trast
-200 -100 0 100 200Defocus (nm)
157 nm 1.3 NA annular circular
45 nm L/S1.0
0.8
0.6
0.4
0.2
0.0
Con
trast
-200 -100 0 100 200Defocus (nm)
65 nm L/S 193 nm 1.1 NA 1.3 NAannular circular
A B
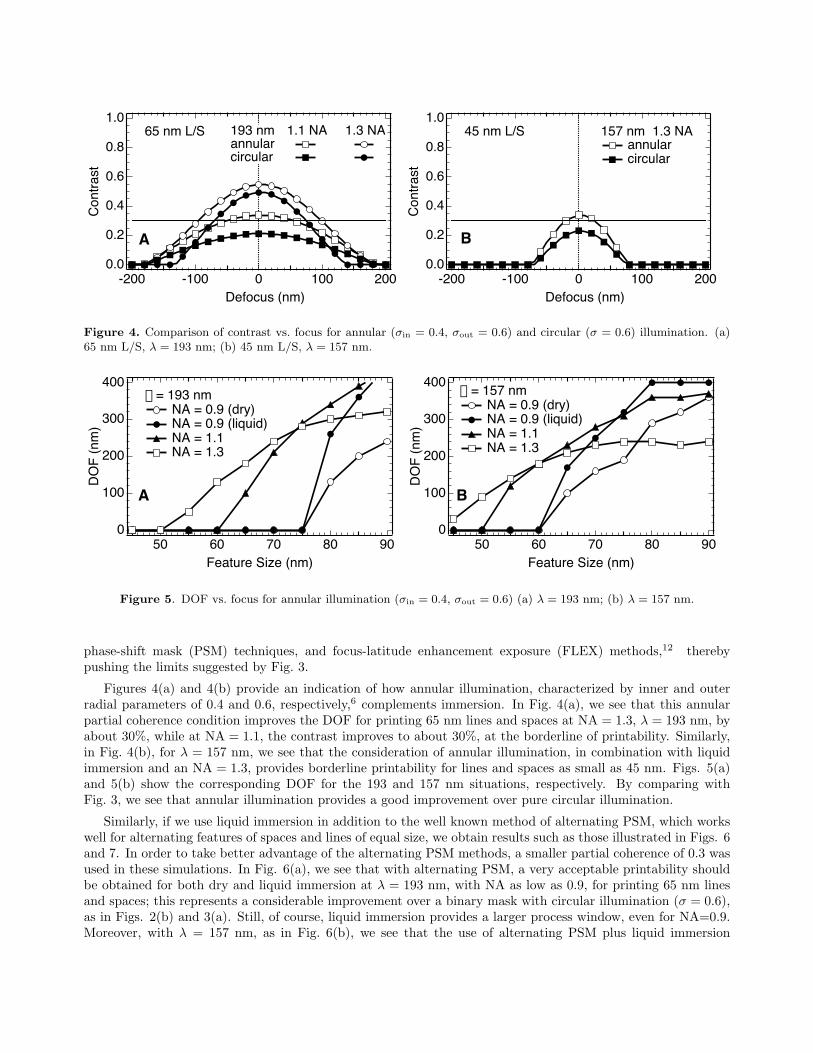
Figure 4. Comparison of contrast vs. focus for annular (σin = 0.4, σout = 0.6) and circular (σ = 0.6) illumination. (a)65 nm L/S, λ = 193 nm; (b) 45 nm L/S, λ = 157 nm.
400
300
200
100
0
DO
F (n
m)
9080706050Feature Size (nm)
l = 157 nm NA = 0.9 (dry) NA = 0.9 (liquid) NA = 1.1 NA = 1.3
400
300
200
100
0
DO
F (n
m)
9080706050Feature Size (nm)
l = 193 nm NA = 0.9 (dry) NA = 0.9 (liquid) NA = 1.1 NA = 1.3
A B
Figure 5. DOF vs. focus for annular illumination (σin = 0.4, σout = 0.6) (a) λ = 193 nm; (b) λ = 157 nm.
phase-shift mask (PSM) techniques, and focus-latitude enhancement exposure (FLEX) methods,12 therebypushing the limits suggested by Fig. 3.
Figures 4(a) and 4(b) provide an indication of how annular illumination, characterized by inner and outerradial parameters of 0.4 and 0.6, respectively,6 complements immersion. In Fig. 4(a), we see that this annularpartial coherence condition improves the DOF for printing 65 nm lines and spaces at NA = 1.3, λ = 193 nm, byabout 30%, while at NA = 1.1, the contrast improves to about 30%, at the borderline of printability. Similarly,in Fig. 4(b), for λ = 157 nm, we see that the consideration of annular illumination, in combination with liquidimmersion and an NA = 1.3, provides borderline printability for lines and spaces as small as 45 nm. Figs. 5(a)and 5(b) show the corresponding DOF for the 193 and 157 nm situations, respectively. By comparing withFig. 3, we see that annular illumination provides a good improvement over pure circular illumination.
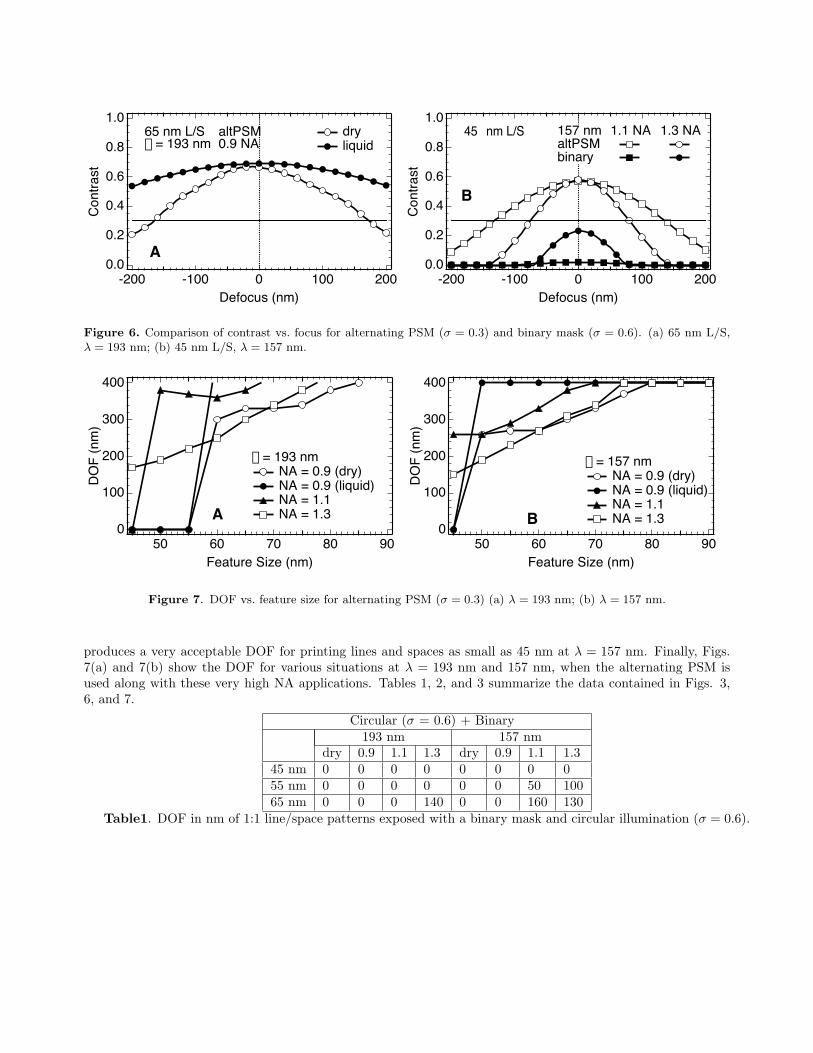
Similarly, if we use liquid immersion in addition to the well known method of alternating PSM, which workswell for alternating features of spaces and lines of equal size, we obtain results such as those illustrated in Figs. 6and 7. In order to take better advantage of the alternating PSM methods, a smaller partial coherence of 0.3 wasused in these simulations. In Fig. 6(a), we see that with alternating PSM, a very acceptable printability shouldbe obtained for both dry and liquid immersion at λ = 193 nm, with NA as low as 0.9, for printing 65 nm linesand spaces; this represents a considerable improvement over a binary mask with circular illumination (σ = 0.6),as in Figs. 2(b) and 3(a). Still, of course, liquid immersion provides a larger process window, even for NA=0.9.Moreover, with λ = 157 nm, as in Fig. 6(b), we see that the use of alternating PSM plus liquid immersion
1.0
0.8
0.6
0.4
0.2
0.0
Con
trast
-200 -100 0 100 200Defocus (nm)
dry liquid
65 nm L/S altPSM l = 193 nm 0.9 NA
1.0
0.8
0.6
0.4
0.2
0.0
Con
trast
-200 -100 0 100 200Defocus (nm)
157 nm 1.1 NA 1.3 NAaltPSM binary
45� nm L/S
A
B
Figure 6. Comparison of contrast vs. focus for alternating PSM (σ = 0.3) and binary mask (σ = 0.6). (a) 65 nm L/S,λ = 193 nm; (b) 45 nm L/S, λ = 157 nm.
400
300
200
100
0
DO
F (n
m)
9080706050Feature Size (nm)
l = 157 nm NA = 0.9 (dry) NA = 0.9 (liquid) NA = 1.1 NA = 1.3
400
300
200
100
0
DO
F (n
m)
9080706050Feature Size (nm)
l = 193 nm NA = 0.9 (dry) NA = 0.9 (liquid) NA = 1.1 NA = 1.3A B
Figure 7. DOF vs. feature size for alternating PSM (σ = 0.3) (a) λ = 193 nm; (b) λ = 157 nm.
produces a very acceptable DOF for printing lines and spaces as small as 45 nm at λ = 157 nm. Finally, Figs.7(a) and 7(b) show the DOF for various situations at λ = 193 nm and 157 nm, when the alternating PSM isused along with these very high NA applications. Tables 1, 2, and 3 summarize the data contained in Figs. 3,6, and 7.
Circular (σ = 0.6) + Binary193 nm 157 nm
dry 0.9 1.1 1.3 dry 0.9 1.1 1.345 nm 0 0 0 0 0 0 0 055 nm 0 0 0 0 0 0 50 10065 nm 0 0 0 140 0 0 160 130
Table1. DOF in nm of 1:1 line/space patterns exposed with a binary mask and circular illumination (σ = 0.6).
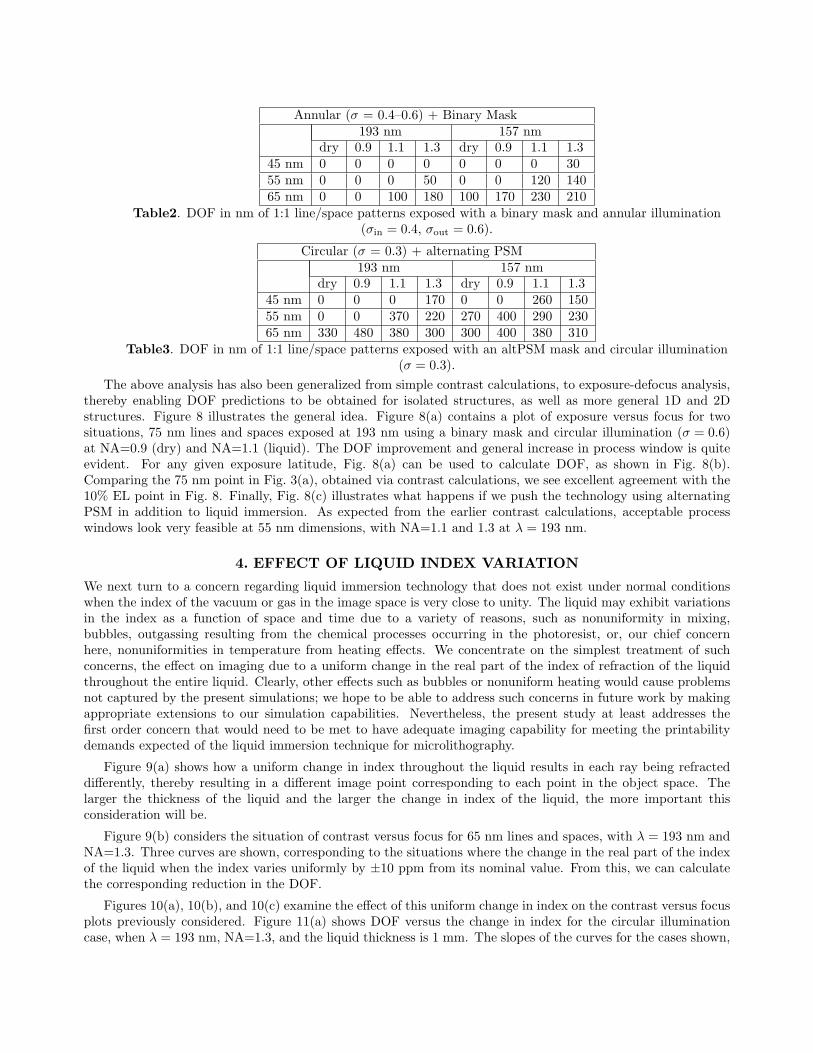
Annular (σ = 0.4–0.6) + Binary Mask193 nm 157 nm
dry 0.9 1.1 1.3 dry 0.9 1.1 1.345 nm 0 0 0 0 0 0 0 3055 nm 0 0 0 50 0 0 120 14065 nm 0 0 100 180 100 170 230 210
Table2. DOF in nm of 1:1 line/space patterns exposed with a binary mask and annular illumination(σin = 0.4, σout = 0.6).
Circular (σ = 0.3) + alternating PSM193 nm 157 nm
dry 0.9 1.1 1.3 dry 0.9 1.1 1.345 nm 0 0 0 170 0 0 260 15055 nm 0 0 370 220 270 400 290 23065 nm 330 480 380 300 300 400 380 310
Table3. DOF in nm of 1:1 line/space patterns exposed with an altPSM mask and circular illumination(σ = 0.3).
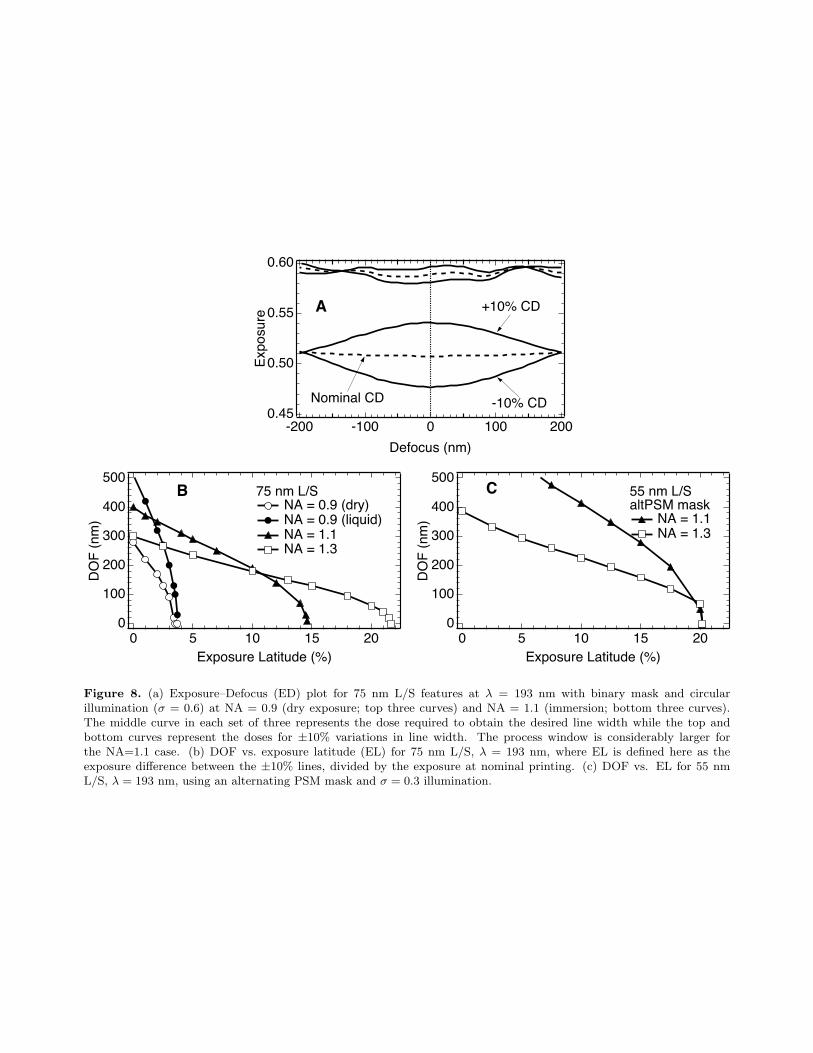
The above analysis has also been generalized from simple contrast calculations, to exposure-defocus analysis,thereby enabling DOF predictions to be obtained for isolated structures, as well as more general 1D and 2Dstructures. Figure 8 illustrates the general idea. Figure 8(a) contains a plot of exposure versus focus for twosituations, 75 nm lines and spaces exposed at 193 nm using a binary mask and circular illumination (σ = 0.6)at NA=0.9 (dry) and NA=1.1 (liquid). The DOF improvement and general increase in process window is quiteevident. For any given exposure latitude, Fig. 8(a) can be used to calculate DOF, as shown in Fig. 8(b).Comparing the 75 nm point in Fig. 3(a), obtained via contrast calculations, we see excellent agreement with the10% EL point in Fig. 8. Finally, Fig. 8(c) illustrates what happens if we push the technology using alternatingPSM in addition to liquid immersion. As expected from the earlier contrast calculations, acceptable processwindows look very feasible at 55 nm dimensions, with NA=1.1 and 1.3 at λ = 193 nm.
4. EFFECT OF LIQUID INDEX VARIATION
We next turn to a concern regarding liquid immersion technology that does not exist under normal conditionswhen the index of the vacuum or gas in the image space is very close to unity. The liquid may exhibit variationsin the index as a function of space and time due to a variety of reasons, such as nonuniformity in mixing,bubbles, outgassing resulting from the chemical processes occurring in the photoresist, or, our chief concernhere, nonuniformities in temperature from heating effects. We concentrate on the simplest treatment of suchconcerns, the effect on imaging due to a uniform change in the real part of the index of refraction of the liquidthroughout the entire liquid. Clearly, other effects such as bubbles or nonuniform heating would cause problemsnot captured by the present simulations; we hope to be able to address such concerns in future work by makingappropriate extensions to our simulation capabilities. Nevertheless, the present study at least addresses thefirst order concern that would need to be met to have adequate imaging capability for meeting the printabilitydemands expected of the liquid immersion technique for microlithography.
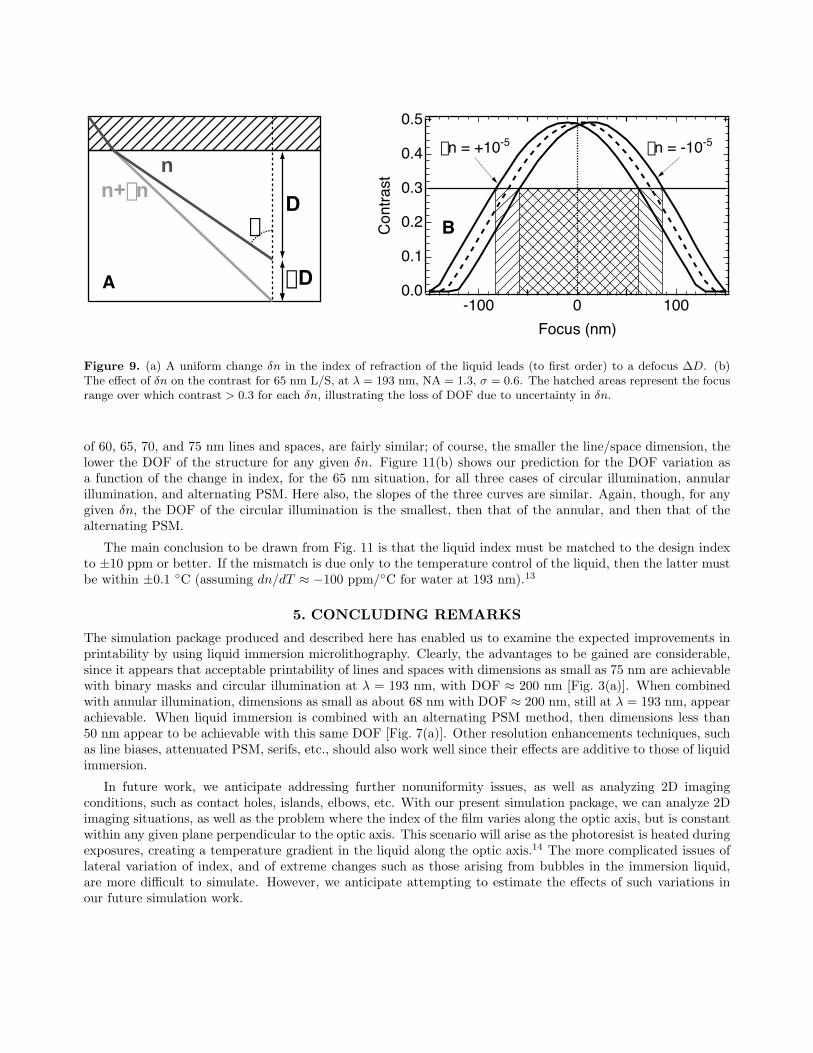
Figure 9(a) shows how a uniform change in index throughout the liquid results in each ray being refracteddifferently, thereby resulting in a different image point corresponding to each point in the object space. Thelarger the thickness of the liquid and the larger the change in index of the liquid, the more important thisconsideration will be.
Figure 9(b) considers the situation of contrast versus focus for 65 nm lines and spaces, with λ = 193 nm andNA=1.3. Three curves are shown, corresponding to the situations where the change in the real part of the indexof the liquid when the index varies uniformly by ±10 ppm from its nominal value. From this, we can calculatethe corresponding reduction in the DOF.
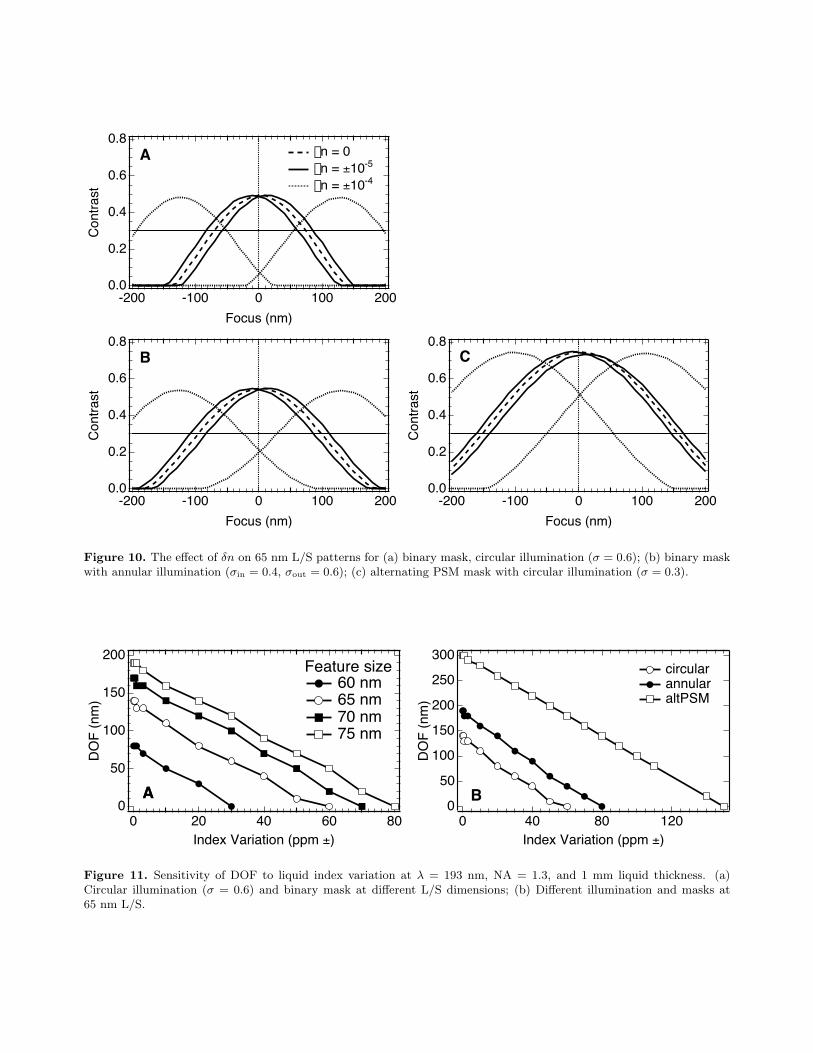
Figures 10(a), 10(b), and 10(c) examine the effect of this uniform change in index on the contrast versus focusplots previously considered. Figure 11(a) shows DOF versus the change in index for the circular illuminationcase, when λ = 193 nm, NA=1.3, and the liquid thickness is 1 mm. The slopes of the curves for the cases shown,
0.60
0.55
0.50
0.45
Expo
sure
-200 -100 0 100 200Defocus (nm)
+10% CD
-10% CDNominal CD
500
400
300
200
100
0
DO
F (n
m)
20151050Exposure Latitude (%)
75 nm L/S NA = 0.9 (dry) NA = 0.9 (liquid) NA = 1.1 NA = 1.3
500
400
300
200
100
0
DO
F (n
m)
20151050Exposure Latitude (%)
55 nm L/SaltPSM mask
NA = 1.1 NA = 1.3
A
B C
Figure 8. (a) Exposure–Defocus (ED) plot for 75 nm L/S features at λ = 193 nm with binary mask and circularillumination (σ = 0.6) at NA = 0.9 (dry exposure; top three curves) and NA = 1.1 (immersion; bottom three curves).The middle curve in each set of three represents the dose required to obtain the desired line width while the top andbottom curves represent the doses for ±10% variations in line width. The process window is considerably larger forthe NA=1.1 case. (b) DOF vs. exposure latitude (EL) for 75 nm L/S, λ = 193 nm, where EL is defined here as theexposure difference between the ±10% lines, divided by the exposure at nominal printing. (c) DOF vs. EL for 55 nmL/S, λ = 193 nm, using an alternating PSM mask and σ = 0.3 illumination.
0.5
0.4
0.3
0.2
0.1
0.0
Con
trast
-100 0 100Focus (nm)
dn = +10-5 dn = -10-5
D
DD
q
nn+dn
A
B
Figure 9. (a) A uniform change δn in the index of refraction of the liquid leads (to first order) to a defocus ∆D. (b)The effect of δn on the contrast for 65 nm L/S, at λ = 193 nm, NA = 1.3, σ = 0.6. The hatched areas represent the focusrange over which contrast > 0.3 for each δn, illustrating the loss of DOF due to uncertainty in δn.
of 60, 65, 70, and 75 nm lines and spaces, are fairly similar; of course, the smaller the line/space dimension, thelower the DOF of the structure for any given δn. Figure 11(b) shows our prediction for the DOF variation asa function of the change in index, for the 65 nm situation, for all three cases of circular illumination, annularillumination, and alternating PSM. Here also, the slopes of the three curves are similar. Again, though, for anygiven δn, the DOF of the circular illumination is the smallest, then that of the annular, and then that of thealternating PSM.
The main conclusion to be drawn from Fig. 11 is that the liquid index must be matched to the design indexto ±10 ppm or better. If the mismatch is due only to the temperature control of the liquid, then the latter mustbe within ±0.1 ◦C (assuming dn/dT ≈ −100 ppm/◦C for water at 193 nm).13
5. CONCLUDING REMARKS
The simulation package produced and described here has enabled us to examine the expected improvements inprintability by using liquid immersion microlithography. Clearly, the advantages to be gained are considerable,since it appears that acceptable printability of lines and spaces with dimensions as small as 75 nm are achievablewith binary masks and circular illumination at λ = 193 nm, with DOF ≈ 200 nm [Fig. 3(a)]. When combinedwith annular illumination, dimensions as small as about 68 nm with DOF ≈ 200 nm, still at λ = 193 nm, appearachievable. When liquid immersion is combined with an alternating PSM method, then dimensions less than50 nm appear to be achievable with this same DOF [Fig. 7(a)]. Other resolution enhancements techniques, suchas line biases, attenuated PSM, serifs, etc., should also work well since their effects are additive to those of liquidimmersion.
In future work, we anticipate addressing further nonuniformity issues, as well as analyzing 2D imagingconditions, such as contact holes, islands, elbows, etc. With our present simulation package, we can analyze 2Dimaging situations, as well as the problem where the index of the film varies along the optic axis, but is constantwithin any given plane perpendicular to the optic axis. This scenario will arise as the photoresist is heated duringexposures, creating a temperature gradient in the liquid along the optic axis.14 The more complicated issues oflateral variation of index, and of extreme changes such as those arising from bubbles in the immersion liquid,are more difficult to simulate. However, we anticipate attempting to estimate the effects of such variations inour future simulation work.
0.8
0.6
0.4
0.2
0.0
Con
trast
-200 -100 0 100 200Focus (nm)
dn = 0 dn = ±10-5
dn = ±10-4
0.8
0.6
0.4
0.2
0.0
Con
trast
-200 -100 0 100 200Focus (nm)
0.8
0.6
0.4
0.2
0.0
Con
trast
-200 -100 0 100 200Focus (nm)
A
B C
Figure 10. The effect of δn on 65 nm L/S patterns for (a) binary mask, circular illumination (σ = 0.6); (b) binary maskwith annular illumination (σin = 0.4, σout = 0.6); (c) alternating PSM mask with circular illumination (σ = 0.3).
300
250
200
150
100
50
0
DO
F (n
m)
12080400Index Variation (ppm ±)
circular annular altPSM
200
150
100
50
0
DO
F (n
m)
806040200Index Variation (ppm ±)
Feature size 60 nm 65 nm 70 nm 75 nm
AA B
Figure 11. Sensitivity of DOF to liquid index variation at λ = 193 nm, NA = 1.3, and 1 mm liquid thickness. (a)Circular illumination (σ = 0.6) and binary mask at different L/S dimensions; (b) Different illumination and masks at65 nm L/S.
ACKNOWLEDGMENTS
This work was performed under the Advanced Lithography Program of the Defense Advanced Research ProjectsAgency, under Air Force Contract F19628-00-C-0002. Opinions, interpretations, conclusions, and recommenda-tions are those of the authors, and do not necessarily represent the view of the Department of Defense.
REFERENCES1. M. Switkes and M. Rothschild, “Resolution enhancement of 157 nm lithography by liquid immersion,” J.
Microlith., Microfab., Microsyst. 1, pp. 225–228, 2002.2. J. A. Hoffnagle, W. D. Hinsberg, M. Sanchez, and F. A.Houle, “Liquid immersion deep-ultraviolet interfer-
ometric lithography”, J. Vac. Sci. Technol. B 17, pp. 3306–3309, 1999.3. M. Switkes and M. Rothschild, “Immersion lithography at 157 nm”, J. Vac. Sci. Technol. B 19, pp. 2353–
2356, 2001.4. M. Yeung, “Modeling aerial images in two and three dimensions,” Proc. Kodak Microelectronics Seminar,
Interface ’85 , pp. 115–126, 1986.5. M. S. Yeung, “Modeling high numerical aperture optical lithography,” Proc. SPIE 922, pp. 149–167, 1988.6. D. C. Cole, E. Barouch, U. Hollerbach, and S. A. Orszag, “Derivation and simulation of higher numerical
aperture scalar aerial images,” Jpn. J. Appl. Phys. 31, pp. 4110–4119, 1992.7. M. Switkes, M. Rothschild, R. R. Kunz, R. F. Sinta, P. M. Gallagher-Wetmore, V. J. Krukonis, and
K. Williams, “Immersion liquids for lithography in the deep ultraviolet,” Proc. SPIE 5040, 2003 (in press).8. T. A. Brunner and R. A. Ferguson, “Approximate models for resist processing effects,” Proc. SPIE 2726,
pp. 198–207, 1996.9. D. C. Cole, E. Barouch, E. W. Conrad, and M. Yeung, “Using advanced simulation to aid microlithography
development,” Proc. IEEE 89, pp. 1194–1213, 2001.10. B. Lin and P. Young, “Full-depth optical proximity correction (FD-OPC) based on E-D forest,” Proc. SPIE
3679, pp. 600–606, 1999.11. A. K.-K. Wong, Resolution Enhancement Techniques in Optical Lithography, vol. 47 of Tutorial Texts in
Optical Engineering, SPIE Press, Bellingham. WA, 2001.12. C. Spence, D. C. Cole, and B. Peck, “Using multiple focal planes to enhance depth of focus,” Proc. SPIE
1674, pp. 285–295, 1992.13. P. Schiebner, J. Straub, J. M. H. Levelt Sengers, and J. S. Gallagher, “Refractive index of water and steam
as function of wavelength, temperature, and density”, J. Phys. Chem. Ref. Data 19, pp. 677–717, 1990.14. A. C. Wei, G. F. Nellis, A. Y. Abdo, C. Chen, R. L. Engelstad, W. A. Beckman, E. G. Lovell, M. Switkes,
and M. Rothschild, “Preliminary microfluidic simulations for immersion lithography”, Proc. SPIE 5040,2003 (in press).