tip desensitization of an axial turbine rotor using tip platform extensions
TRANSCRIPT
CC-42
TIP DESENSITIZATION OF AN AXIAL TURBINE ROTOR
USING TIP PLATFORM EXTENSIONS
Debashis Dey1 & Cengiz Camci2
Department of Aerospace Engineering Turbomachinery Heat Transfer Laboratory
The Pennsylvania State University University Park, PA 16802
[email protected] http://www.personal.psu.edu/cxc11/
Abstract
Aerodynamic losses due to the formation of a leakage vortex near the tip section of rotor blades form a significant part of viscous losses in axial flow turbines. The leakage flow, mainly induced by the pressure differential between the pressure side and suction side of a rotor tip section, usually rolls into a streamwise vortical structure near the suction side part of the blade tip. The current study uses the concept of a tip platform extension that is a very short “winglet” obtained by slightly extending the tip platform in the tangential direction. The use of a pressure side tip extension can significantly affect the local aerodynamic field by weakening the leakage vortex structure. Phase averaged, time accurate total pressure measurements downstream of a single stage turbine facility are provided from a total pressure probe that has a time response of 150 kHz. Complete total pressure maps in all of the 29 rotor exit planes are measured accurately. Various pressure and suction side extension configurations are compared against a baseline case. The current investigation performed in the Axial Flow Turbine Research Facility (AFTRF) of the Pennsylvania State University shows that significant total-to-total efficiency gain is possible by the use of tip platform extensions.
INTRODUCTION
The pressure difference between the pressure and the suction sides of a turbine rotor blade causes a leakage flow to accelerate through the tip gap. The leakage flow mixing with the rotor passage flow causes total pressure loss and reduces turbine stage efficiency. Tip leakage related losses might account for as much as a third of the total losses in a stage (Booth [1]). The losses originate during the formation of a leakage vortex and its interaction with the passage vortex. In addition, the leakage flow has the ability to transport hot mainstream fluid into the tip gap region eventually leading to tip damage.
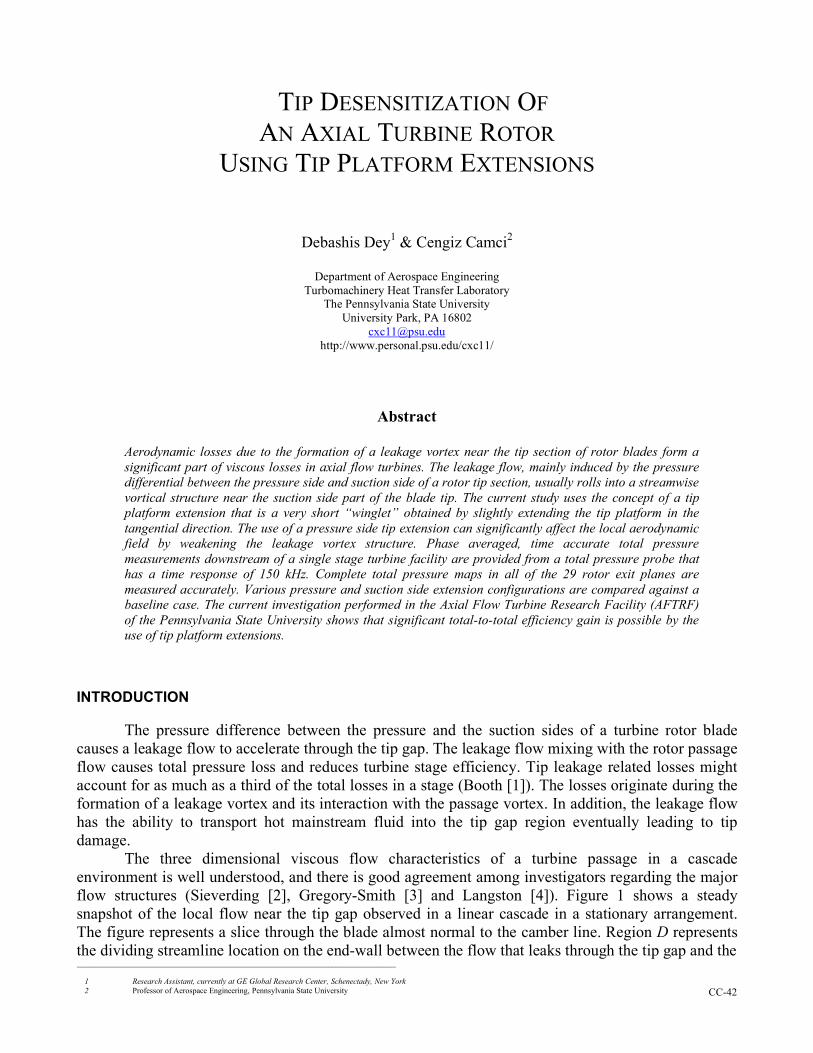
The three dimensional viscous flow characteristics of a turbine passage in a cascade environment is well understood, and there is good agreement among investigators regarding the major flow structures (Sieverding [2], Gregory-Smith [3] and Langston [4]). Figure 1 shows a steady snapshot of the local flow near the tip gap observed in a linear cascade in a stationary arrangement. The figure represents a slice through the blade almost normal to the camber line. Region D represents the dividing streamline location on the end-wall between the flow that leaks through the tip gap and the
________________________________________________________________________________ 1 Research Assistant, currently at GE Global Research Center, Schenectady, New York 2 Professor of Aerospace Engineering, Pennsylvania State University
CC-43
flow from the pressure side towards the suction side that forms the passage vortex. The separation bubble b1 usually forms on tips with sharp corners. Often there is a second re-circulation zone b2 near the outer casing, formed as the leakage flow progresses towards the suction side. A leakage jet core could be observed between the outer casing and the blade tip in this stationary cascade arrangement. The separation bubbles located at b1 and b2 modifies the leakage jet orientation between the outer casing and the tip surface.
This scenario is typical of blades with maximum thickness of 4t or more (Denton [5]) which is the case with the present study. The bubble b1 never reattaches for thinner blades (Hayes and Hodson [6]). Either way, the mean kinetic energy trapped in the leakage vortex dissipates as loss. The scenario is more complicated in an actual turbine rotor when the shearing effect of the outer casing and Coriolis forces due to the relative motion contribute to flow physics.
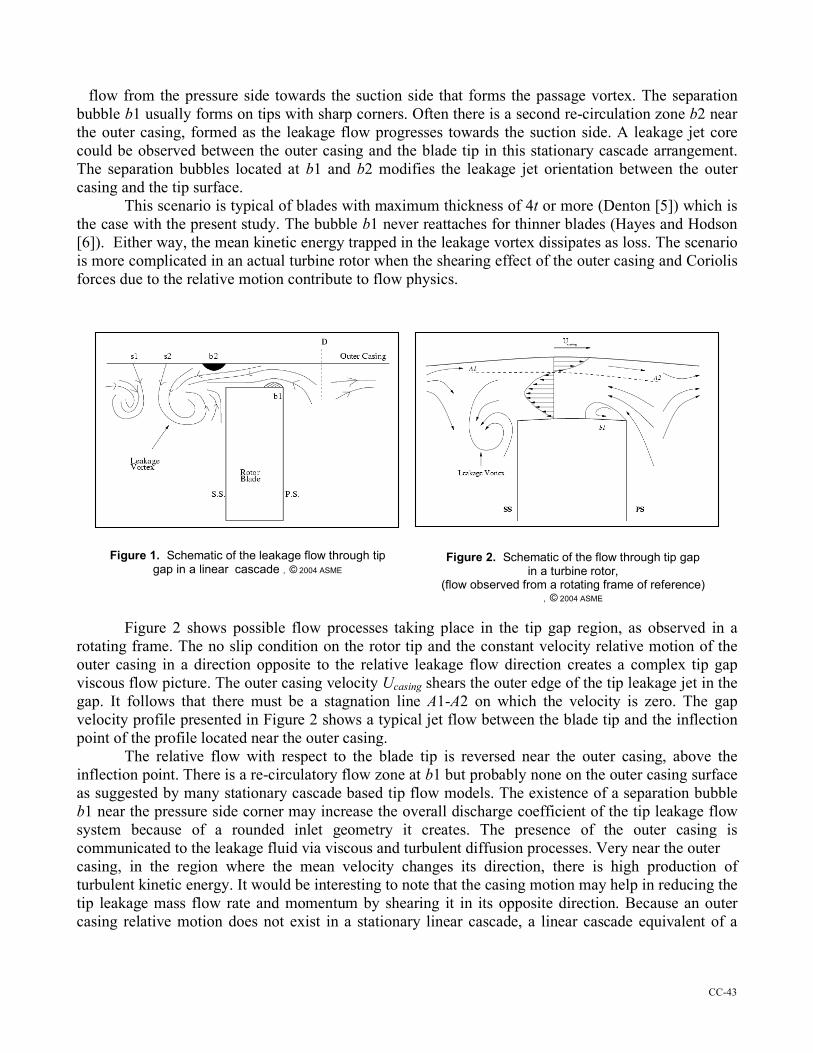
Figure 2 shows possible flow processes taking place in the tip gap region, as observed in a
rotating frame. The no slip condition on the rotor tip and the constant velocity relative motion of the outer casing in a direction opposite to the relative leakage flow direction creates a complex tip gap viscous flow picture. The outer casing velocity Ucasing shears the outer edge of the tip leakage jet in the gap. It follows that there must be a stagnation line A1-A2 on which the velocity is zero. The gap velocity profile presented in Figure 2 shows a typical jet flow between the blade tip and the inflection point of the profile located near the outer casing.
The relative flow with respect to the blade tip is reversed near the outer casing, above the inflection point. There is a re-circulatory flow zone at b1 but probably none on the outer casing surface as suggested by many stationary cascade based tip flow models. The existence of a separation bubble b1 near the pressure side corner may increase the overall discharge coefficient of the tip leakage flow system because of a rounded inlet geometry it creates. The presence of the outer casing is communicated to the leakage fluid via viscous and turbulent diffusion processes. Very near the outer casing, in the region where the mean velocity changes its direction, there is high production of turbulent kinetic energy. It would be interesting to note that the casing motion may help in reducing the tip leakage mass flow rate and momentum by shearing it in its opposite direction. Because an outer casing relative motion does not exist in a stationary linear cascade, a linear cascade equivalent of a
Figure 1. Schematic of the leakage flow through tip gap in a linear cascade , © 2004 ASME
Figure 2. Schematic of the flow through tip gap in a turbine rotor,
(flow observed from a rotating frame of reference) , © 2004 ASME
CC-44
rotating tip clearance flow is supposed to have a stronger leakage flow. Yaras and Sjolander [7] took measurements inside the tip gap in a cascade with a moving wall. They observed that a large gap would lead to pressure driven flow with an inviscid jet while the flow would be highly sheared for smaller gap sizes.
There are two parts of tip related losses: losses that occur inside the gap passage and the losses that occur in the mixing process as the leakage vortex mixes with the passage flow. The second part usually predominates (Morphis and Bindon [8]). The loss generating mechanism appears to have several stages (Moore et. al.[9]). The gap mean flow works against turbulent stresses to generate turbulent kinetic energy. The turbulent kinetic energy is subsequently dissipated into heat by viscous action. Mean kinetic energy of the flow is reduced by the turbulent and viscous dissipation. Once the leakage fluid leaves the tip gap region some of its mean kinetic energy is transferred into velocity components that increase the secondary kinetic energy of the rolling tip vortex structure.
Over the years, researchers have found a number of ways to limit the tip leakage related loss. There has been successful attempts to eliminate the tip separation bubble by contouring the pressure side edge (Morphis and Bindon [8]). Off loading the blade tip by modifying the exit angle is another solution. A short and systematic survey of all these attempts could be found in Harvey and Ramsden [10].
“Tip extensions”, also called “winglets”, are routinely employed in airplane wings to reduce the adverse aerodynamic effects from wingtip vortices. The concept of reduction of the strength of the tip vortex using winglets could be applied to turbine blades as well. Presently, only a handful of studies targeted winglets as a desensitization method in turbomachinery aerodynamics. Among these are computational investigations (Harvey and Ramsden [10]; Willinger and Haselbacher [11] and an extensive cascade study (Booth, Dodge and Hepworth [12]). All three studies reported positive results from the use of winglet type modifications near the tip. The winglets in the computational study (Harvey and Ramsden [10]) extended to both the suction side and pressure side and the overhang was large enough for the authors to term it “partial shroud”. Their calculations showed that the winglets increase the stage efficiency by 1.2-1.8 % for a t/h of 2%. The cascade studies by Booth et. al. [12] were performed for various tip treatments including winglets.
Several winglet designs were tried, with extensions or overhangs either towards the pressure side or the suction side. The amount of overhang of the winglet was a test parameter, and two different sizes were tested with the pressure side extension. However, the largest overhang was less than 5% of the axial chord, and about 6% of the passage width near the tip.
The present experiments were performed at the Penn State Axial Flow Turbine Research Facility. Phase averaged total pressure measurements were obtained at 30% axial chord downstream of the rotor trailing edge. A fast response (150 kHz) pressure probe is used to obtain time accurate total pressure maps in the stationary frame of reference. The study was performed in two phases.
1. The tip gap was varied, without any tip treatment. Four different tip gap sizes were tested to see the variation of stage exit total pressure with gap height in the measurement plane. These set of measurements formed the baseline data set against which the desensitization treatments were compared.
2. Tip platform extensions were tested as a possible desensitization scheme. Comparisons against the baseline set were made for the change in exit total pressure.
APPARATUS
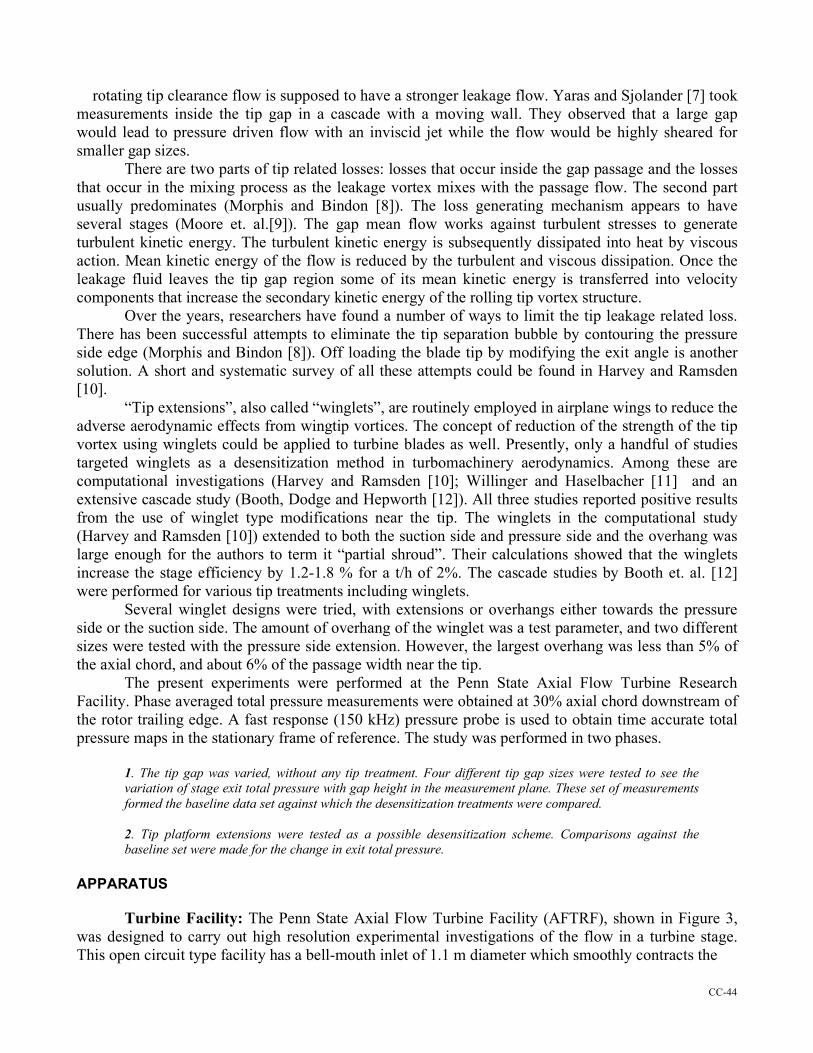
Turbine Facility: The Penn State Axial Flow Turbine Facility (AFTRF), shown in Figure 3, was designed to carry out high resolution experimental investigations of the flow in a turbine stage. This open circuit type facility has a bell-mouth inlet of 1.1 m diameter which smoothly contracts the
CC-45
flow to a test section of 0.916 m (36 inch) diameter. The test section consists of a constant diameter outer casing, housing a single turbine stage with 23 nozzle guide vanes and 29 rotor blades. The flow passage height between the cylindrical hub surface and the outer casing is 0.123 m. The rotor has an axial chord c of 0.129 m at the tip. The flow exiting the rotor passes through an annular row of exit
Figure 3. Schematic of the Penn State Axial Flow Turbine Research Facility (AFTRF) , © 2004 ASME
Figure 4. Velocity triangles at the tip section , © 2004 ASME
Figure 6. Fast response (150 kHz) total pressure probe , © 2004 ASME
Figure 5. A View of the rotor blade row, flow from right to left , © 2004 ASME
Figure 7. Instrumentation chain for the fast response probe , © 2004 ASME
CC-46
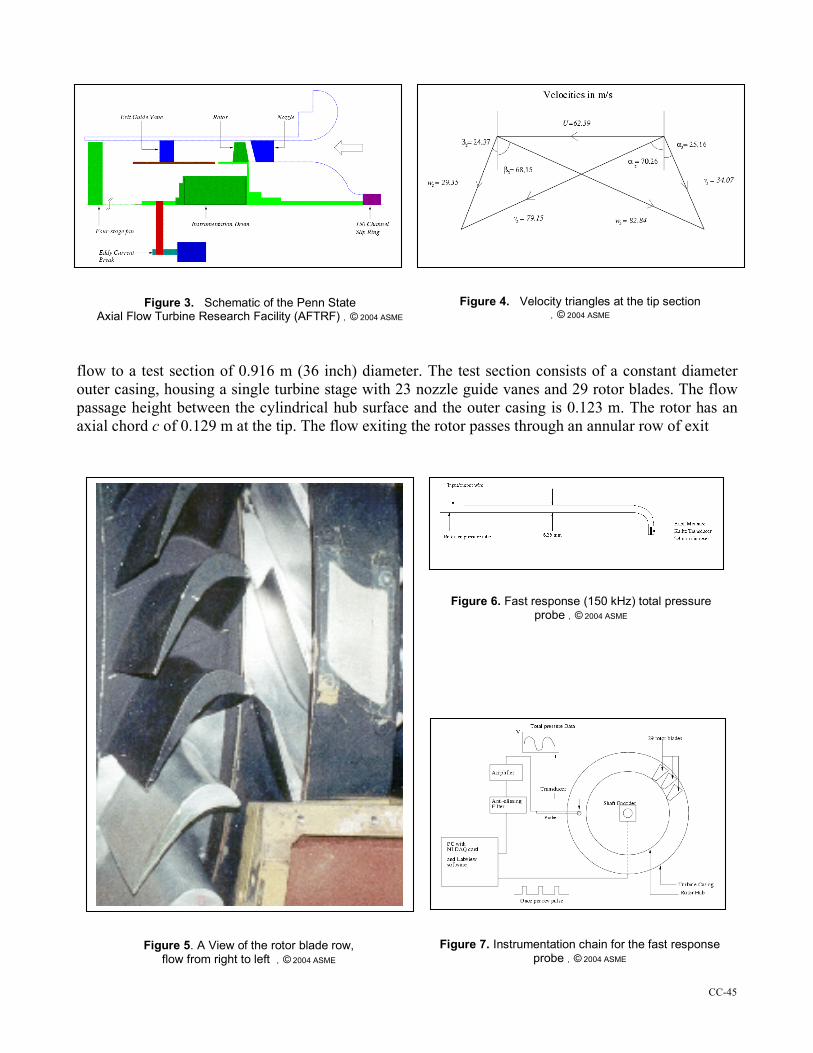
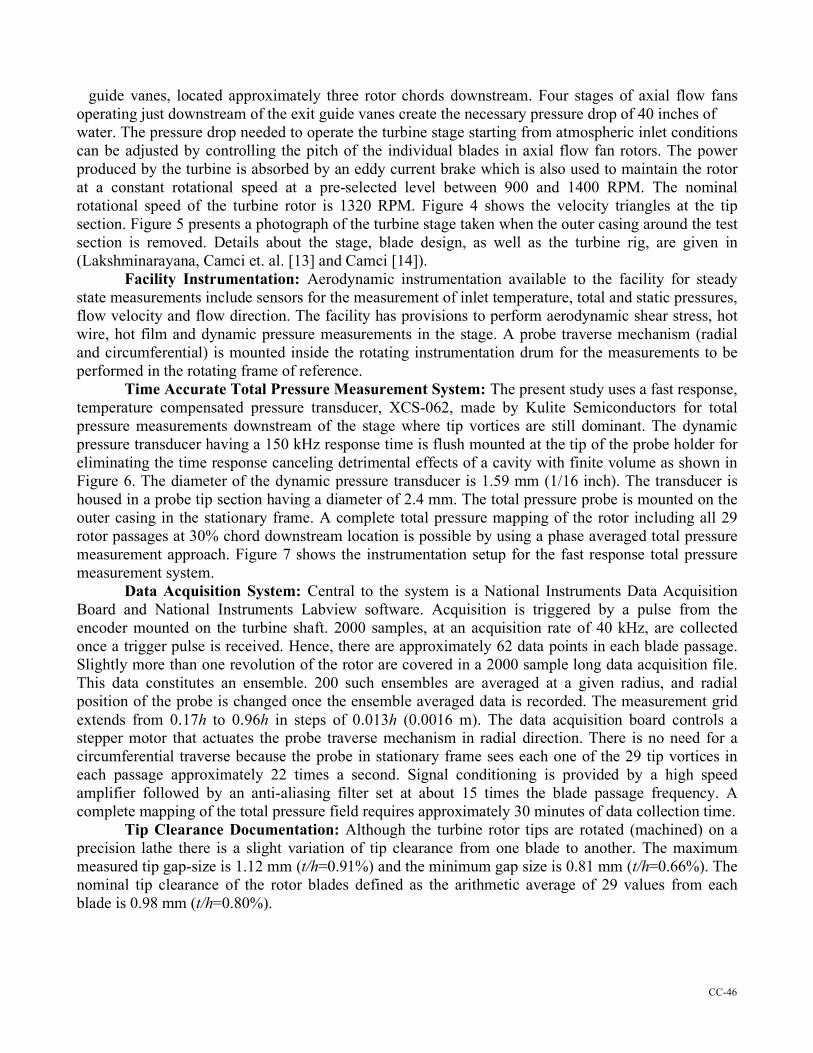
guide vanes, located approximately three rotor chords downstream. Four stages of axial flow fans operating just downstream of the exit guide vanes create the necessary pressure drop of 40 inches of water. The pressure drop needed to operate the turbine stage starting from atmospheric inlet conditions can be adjusted by controlling the pitch of the individual blades in axial flow fan rotors. The power produced by the turbine is absorbed by an eddy current brake which is also used to maintain the rotor at a constant rotational speed at a pre-selected level between 900 and 1400 RPM. The nominal rotational speed of the turbine rotor is 1320 RPM. Figure 4 shows the velocity triangles at the tip section. Figure 5 presents a photograph of the turbine stage taken when the outer casing around the test section is removed. Details about the stage, blade design, as well as the turbine rig, are given in (Lakshminarayana, Camci et. al. [13] and Camci [14]).
Facility Instrumentation: Aerodynamic instrumentation available to the facility for steady state measurements include sensors for the measurement of inlet temperature, total and static pressures, flow velocity and flow direction. The facility has provisions to perform aerodynamic shear stress, hot wire, hot film and dynamic pressure measurements in the stage. A probe traverse mechanism (radial and circumferential) is mounted inside the rotating instrumentation drum for the measurements to be performed in the rotating frame of reference.
Time Accurate Total Pressure Measurement System: The present study uses a fast response, temperature compensated pressure transducer, XCS-062, made by Kulite Semiconductors for total pressure measurements downstream of the stage where tip vortices are still dominant. The dynamic pressure transducer having a 150 kHz response time is flush mounted at the tip of the probe holder for eliminating the time response canceling detrimental effects of a cavity with finite volume as shown in Figure 6. The diameter of the dynamic pressure transducer is 1.59 mm (1/16 inch). The transducer is housed in a probe tip section having a diameter of 2.4 mm. The total pressure probe is mounted on the outer casing in the stationary frame. A complete total pressure mapping of the rotor including all 29 rotor passages at 30% chord downstream location is possible by using a phase averaged total pressure measurement approach. Figure 7 shows the instrumentation setup for the fast response total pressure measurement system.
Data Acquisition System: Central to the system is a National Instruments Data Acquisition Board and National Instruments Labview software. Acquisition is triggered by a pulse from the encoder mounted on the turbine shaft. 2000 samples, at an acquisition rate of 40 kHz, are collected once a trigger pulse is received. Hence, there are approximately 62 data points in each blade passage. Slightly more than one revolution of the rotor are covered in a 2000 sample long data acquisition file. This data constitutes an ensemble. 200 such ensembles are averaged at a given radius, and radial position of the probe is changed once the ensemble averaged data is recorded. The measurement grid extends from 0.17h to 0.96h in steps of 0.013h (0.0016 m). The data acquisition board controls a stepper motor that actuates the probe traverse mechanism in radial direction. There is no need for a circumferential traverse because the probe in stationary frame sees each one of the 29 tip vortices in each passage approximately 22 times a second. Signal conditioning is provided by a high speed amplifier followed by an anti-aliasing filter set at about 15 times the blade passage frequency. A complete mapping of the total pressure field requires approximately 30 minutes of data collection time.
Tip Clearance Documentation: Although the turbine rotor tips are rotated (machined) on a precision lathe there is a slight variation of tip clearance from one blade to another. The maximum measured tip gap-size is 1.12 mm (t/h=0.91%) and the minimum gap size is 0.81 mm (t/h=0.66%). The nominal tip clearance of the rotor blades defined as the arithmetic average of 29 values from each blade is 0.98 mm (t/h=0.80%).
CC-47
Differentiation of Desensitized Tip Data from the Baseline Data: Since the current tip desensitization study requires continuous tip region modifications with prescribed tip gap, a special “test blade” was machined down to a large tip gap of 1.651 mm (t/h = 1.34%). In this approach it is possible to restore this large gap back to the nominal clearance value of t/h = 0.8% by using precision thermoplastic strips machined to the profile of the tip section. This type of operation allows the researcher to control the tip gap distance of the special “test blade” to any value that may be imposed for research purposes. This operation is particularly useful in implementing a desensitization scheme that has the same tip gap distance as the normal turbine blades that has no desensitization. Since the aerodynamic probe has a time response of about 150 kHz, the present method can easily differentiate the quantified aerodynamic field of the special “test blade” from the neighboring blade that has a “normal” tip clearance with no tip treatment. This method results in an excellent comparison of the desensitization approach introduced with respect to the normal tip vortices originating from the normal blades in the same data set obtained from a single run at a given radius.
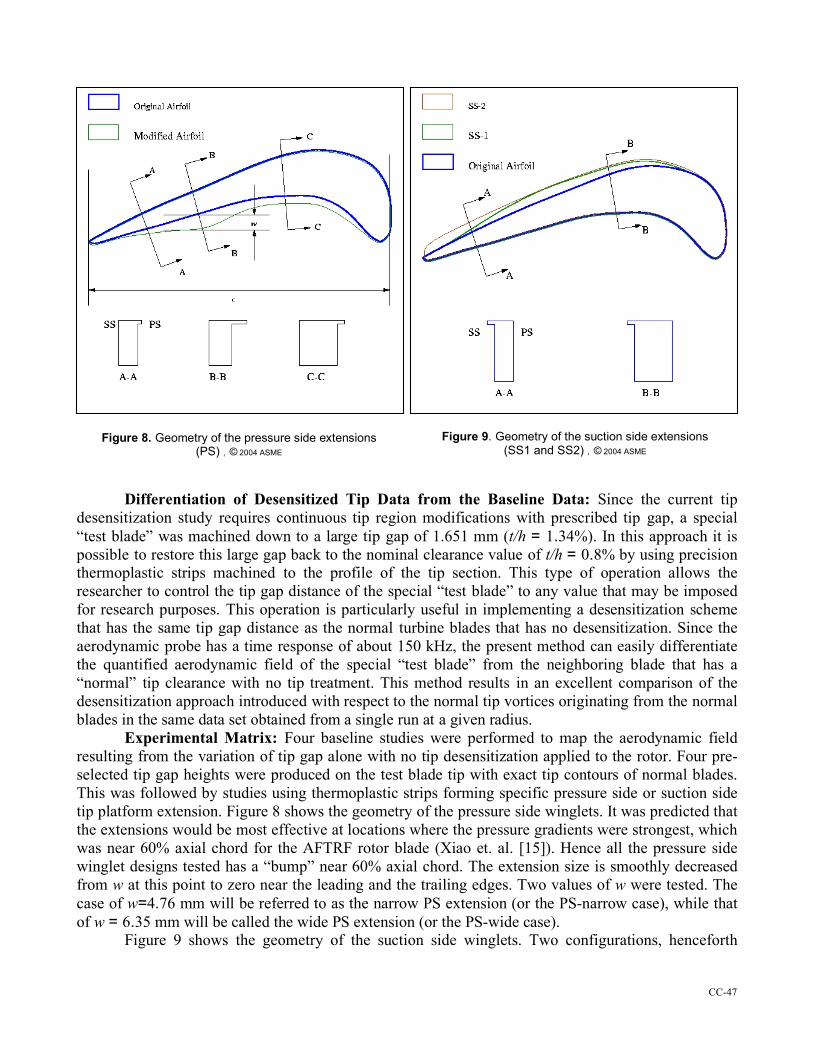
Experimental Matrix: Four baseline studies were performed to map the aerodynamic field resulting from the variation of tip gap alone with no tip desensitization applied to the rotor. Four pre-selected tip gap heights were produced on the test blade tip with exact tip contours of normal blades. This was followed by studies using thermoplastic strips forming specific pressure side or suction side tip platform extension. Figure 8 shows the geometry of the pressure side winglets. It was predicted that the extensions would be most effective at locations where the pressure gradients were strongest, which was near 60% axial chord for the AFTRF rotor blade (Xiao et. al. [15]). Hence all the pressure side winglet designs tested has a “bump” near 60% axial chord. The extension size is smoothly decreased from w at this point to zero near the leading and the trailing edges. Two values of w were tested. The case of w=4.76 mm will be referred to as the narrow PS extension (or the PS-narrow case), while that of w = 6.35 mm will be called the wide PS extension (or the PS-wide case).
Figure 9 shows the geometry of the suction side winglets. Two configurations, henceforth
Figure 8. Geometry of the pressure side extensions (PS) , © 2004 ASME
Figure 9. Geometry of the suction side extensions (SS1 and SS2) , © 2004 ASME
CC-48
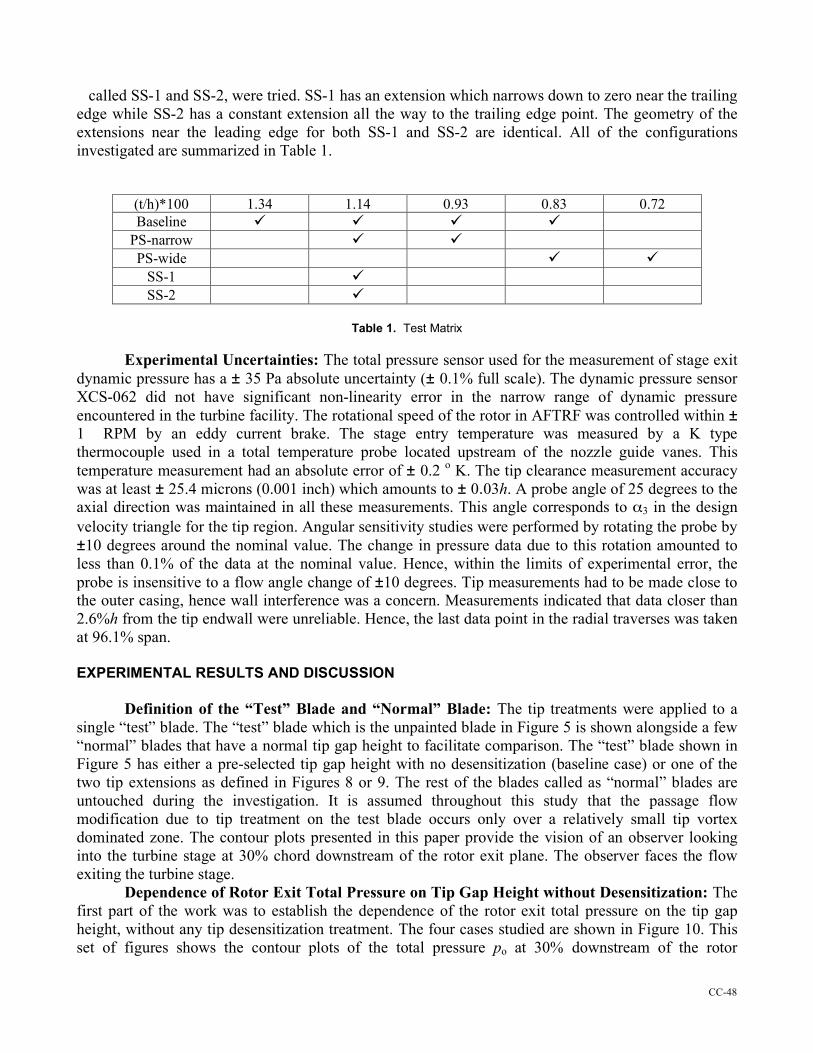
called SS-1 and SS-2, were tried. SS-1 has an extension which narrows down to zero near the trailing edge while SS-2 has a constant extension all the way to the trailing edge point. The geometry of the extensions near the leading edge for both SS-1 and SS-2 are identical. All of the configurations investigated are summarized in Table 1.
(t/h)*100 1.34 1.14 0.93 0.83 0.72 Baseline
PS-narrow PS-wide
SS-1 SS-2
Table 1. Test Matrix
Experimental Uncertainties: The total pressure sensor used for the measurement of stage exit
dynamic pressure has a ± 35 Pa absolute uncertainty (± 0.1% full scale). The dynamic pressure sensor XCS-062 did not have significant non-linearity error in the narrow range of dynamic pressure encountered in the turbine facility. The rotational speed of the rotor in AFTRF was controlled within ± 1 RPM by an eddy current brake. The stage entry temperature was measured by a K type thermocouple used in a total temperature probe located upstream of the nozzle guide vanes. This temperature measurement had an absolute error of ± 0.2 o K. The tip clearance measurement accuracy was at least ± 25.4 microns (0.001 inch) which amounts to ± 0.03h. A probe angle of 25 degrees to the axial direction was maintained in all these measurements. This angle corresponds to α3 in the design velocity triangle for the tip region. Angular sensitivity studies were performed by rotating the probe by ±10 degrees around the nominal value. The change in pressure data due to this rotation amounted to less than 0.1% of the data at the nominal value. Hence, within the limits of experimental error, the probe is insensitive to a flow angle change of ±10 degrees. Tip measurements had to be made close to the outer casing, hence wall interference was a concern. Measurements indicated that data closer than 2.6%h from the tip endwall were unreliable. Hence, the last data point in the radial traverses was taken at 96.1% span. EXPERIMENTAL RESULTS AND DISCUSSION
Definition of the “Test” Blade and “Normal” Blade: The tip treatments were applied to a single “test” blade. The “test” blade which is the unpainted blade in Figure 5 is shown alongside a few “normal” blades that have a normal tip gap height to facilitate comparison. The “test” blade shown in Figure 5 has either a pre-selected tip gap height with no desensitization (baseline case) or one of the two tip extensions as defined in Figures 8 or 9. The rest of the blades called as “normal” blades are untouched during the investigation. It is assumed throughout this study that the passage flow modification due to tip treatment on the test blade occurs only over a relatively small tip vortex dominated zone. The contour plots presented in this paper provide the vision of an observer looking into the turbine stage at 30% chord downstream of the rotor exit plane. The observer faces the flow exiting the turbine stage.
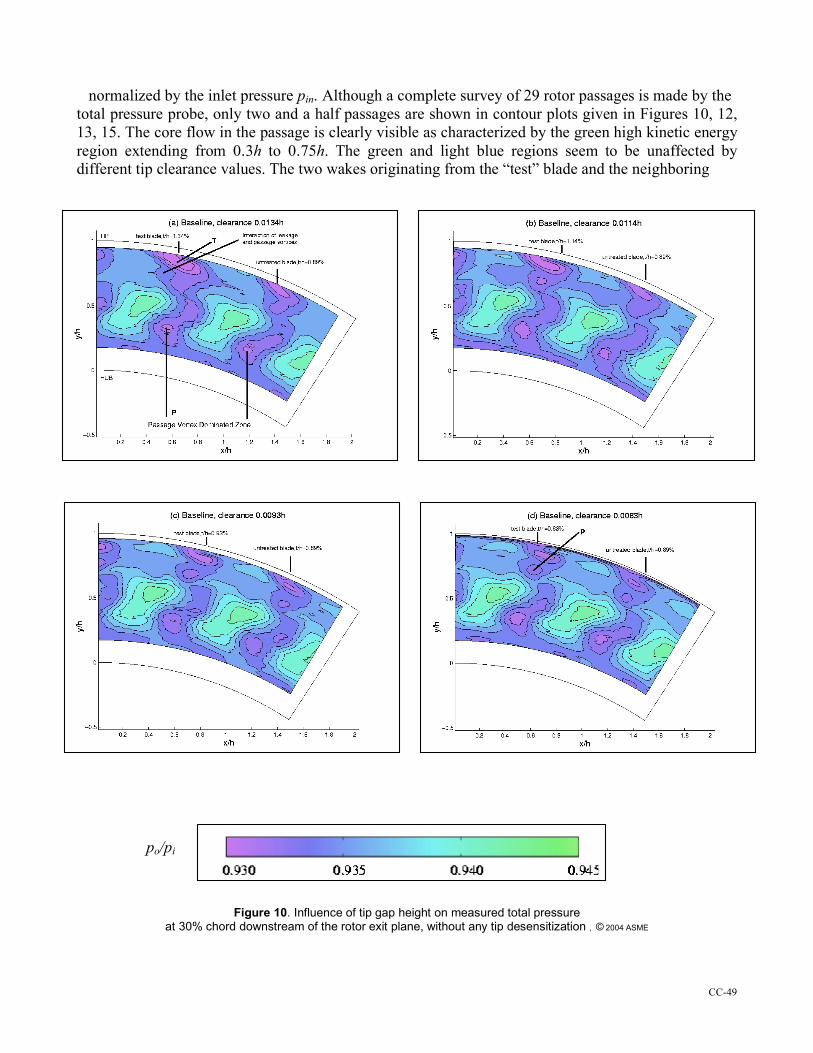
Dependence of Rotor Exit Total Pressure on Tip Gap Height without Desensitization: The first part of the work was to establish the dependence of the rotor exit total pressure on the tip gap height, without any tip desensitization treatment. The four cases studied are shown in Figure 10. This set of figures shows the contour plots of the total pressure po at 30% downstream of the rotor
CC-49
normalized by the inlet pressure pin. Although a complete survey of 29 rotor passages is made by the total pressure probe, only two and a half passages are shown in contour plots given in Figures 10, 12, 13, 15. The core flow in the passage is clearly visible as characterized by the green high kinetic energy region extending from 0.3h to 0.75h. The green and light blue regions seem to be unaffected by different tip clearance values. The two wakes originating from the “test” blade and the neighboring
Figure 10. Influence of tip gap height on measured total pressure at 30% chord downstream of the rotor exit plane, without any tip desensitization , © 2004 ASME
po/pi
n
CC-50
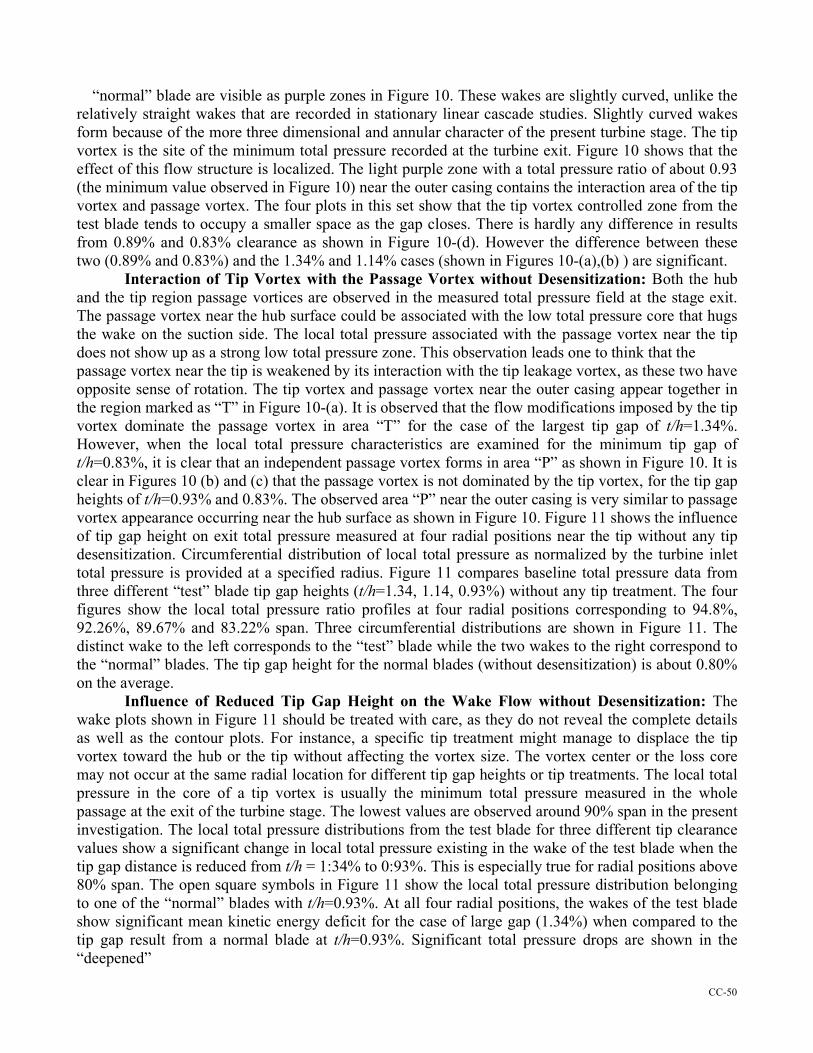
“normal” blade are visible as purple zones in Figure 10. These wakes are slightly curved, unlike the relatively straight wakes that are recorded in stationary linear cascade studies. Slightly curved wakes form because of the more three dimensional and annular character of the present turbine stage. The tip vortex is the site of the minimum total pressure recorded at the turbine exit. Figure 10 shows that the effect of this flow structure is localized. The light purple zone with a total pressure ratio of about 0.93 (the minimum value observed in Figure 10) near the outer casing contains the interaction area of the tip vortex and passage vortex. The four plots in this set show that the tip vortex controlled zone from the test blade tends to occupy a smaller space as the gap closes. There is hardly any difference in results from 0.89% and 0.83% clearance as shown in Figure 10-(d). However the difference between these two (0.89% and 0.83%) and the 1.34% and 1.14% cases (shown in Figures 10-(a),(b) ) are significant.
Interaction of Tip Vortex with the Passage Vortex without Desensitization: Both the hub and the tip region passage vortices are observed in the measured total pressure field at the stage exit. The passage vortex near the hub surface could be associated with the low total pressure core that hugs the wake on the suction side. The local total pressure associated with the passage vortex near the tip does not show up as a strong low total pressure zone. This observation leads one to think that the passage vortex near the tip is weakened by its interaction with the tip leakage vortex, as these two have opposite sense of rotation. The tip vortex and passage vortex near the outer casing appear together in the region marked as “T” in Figure 10-(a). It is observed that the flow modifications imposed by the tip vortex dominate the passage vortex in area “T” for the case of the largest tip gap of t/h=1.34%. However, when the local total pressure characteristics are examined for the minimum tip gap of t/h=0.83%, it is clear that an independent passage vortex forms in area “P” as shown in Figure 10. It is clear in Figures 10 (b) and (c) that the passage vortex is not dominated by the tip vortex, for the tip gap heights of t/h=0.93% and 0.83%. The observed area “P” near the outer casing is very similar to passage vortex appearance occurring near the hub surface as shown in Figure 10. Figure 11 shows the influence of tip gap height on exit total pressure measured at four radial positions near the tip without any tip desensitization. Circumferential distribution of local total pressure as normalized by the turbine inlet total pressure is provided at a specified radius. Figure 11 compares baseline total pressure data from three different “test” blade tip gap heights (t/h=1.34, 1.14, 0.93%) without any tip treatment. The four figures show the local total pressure ratio profiles at four radial positions corresponding to 94.8%, 92.26%, 89.67% and 83.22% span. Three circumferential distributions are shown in Figure 11. The distinct wake to the left corresponds to the “test” blade while the two wakes to the right correspond to the “normal” blades. The tip gap height for the normal blades (without desensitization) is about 0.80% on the average.
Influence of Reduced Tip Gap Height on the Wake Flow without Desensitization: The wake plots shown in Figure 11 should be treated with care, as they do not reveal the complete details as well as the contour plots. For instance, a specific tip treatment might manage to displace the tip vortex toward the hub or the tip without affecting the vortex size. The vortex center or the loss core may not occur at the same radial location for different tip gap heights or tip treatments. The local total pressure in the core of a tip vortex is usually the minimum total pressure measured in the whole passage at the exit of the turbine stage. The lowest values are observed around 90% span in the present investigation. The local total pressure distributions from the test blade for three different tip clearance values show a significant change in local total pressure existing in the wake of the test blade when the tip gap distance is reduced from t/h = 1:34% to 0:93%. This is especially true for radial positions above 80% span. The open square symbols in Figure 11 show the local total pressure distribution belonging to one of the “normal” blades with t/h=0.93%. At all four radial positions, the wakes of the test blade show significant mean kinetic energy deficit for the case of large gap (1.34%) when compared to the tip gap result from a normal blade at t/h=0.93%. Significant total pressure drops are shown in the “deepened”
CC-51
Figure 11. Influence of tip gap height on measured stage exit total pressure measured at five radial positions, without any tip desensitization , © 2004 ASME
po/pi
n
CC-52
and “widened” wake formations as defined by open circular symbols for the case where t/h=1.34%. The wake originating from the test blade with large tip gap is also shifted in the circumferential direction. This shift occurs because of the severe local aerodynamic passage flow modification imposed by the tip vortex resulting from the largest tip gap, t/h=1.34%. It is interesting to note in Figure 11 that the normal blades to the right of the “test” blade produce very similar total pressure distributions when the tip gap of the “test” blade is altered. This observation suggests that the tip gap modification from the test blade (baseline case with no desensitization) does not appear to affect the aerodynamic field in neighboring passages (normal blades) in a significant manner, within the experimental uncertainty range.
The Mid-span Influence of Tip Vortex Structure: The measured aerodynamic modifications due to tip gap height variations in the present experiments are limited to locations within the last one fifth of the blade height near the tip region. Figure 11-(e) shows the stage exit total pressure profiles obtained at an approximate mid-span position (57.41%span) for three different tip clearance values imposed only on the test blade. The wake of the test blade and normal blades show very similar aerodynamic character for all three tip gap heights considered. This figure clearly shows that tip vortex flow modifications are local aerodynamic effects near blade tips. Passage flow at the mid span location is not influenced from the tip vortex flow structure at a significant rate.
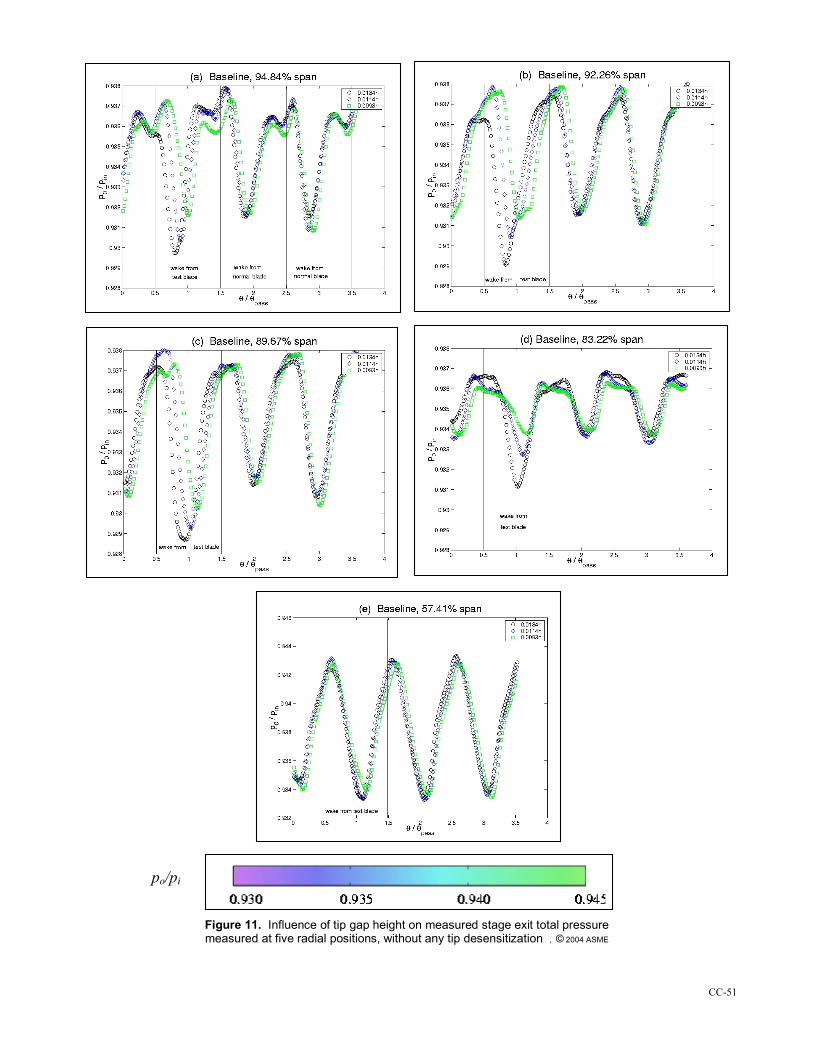
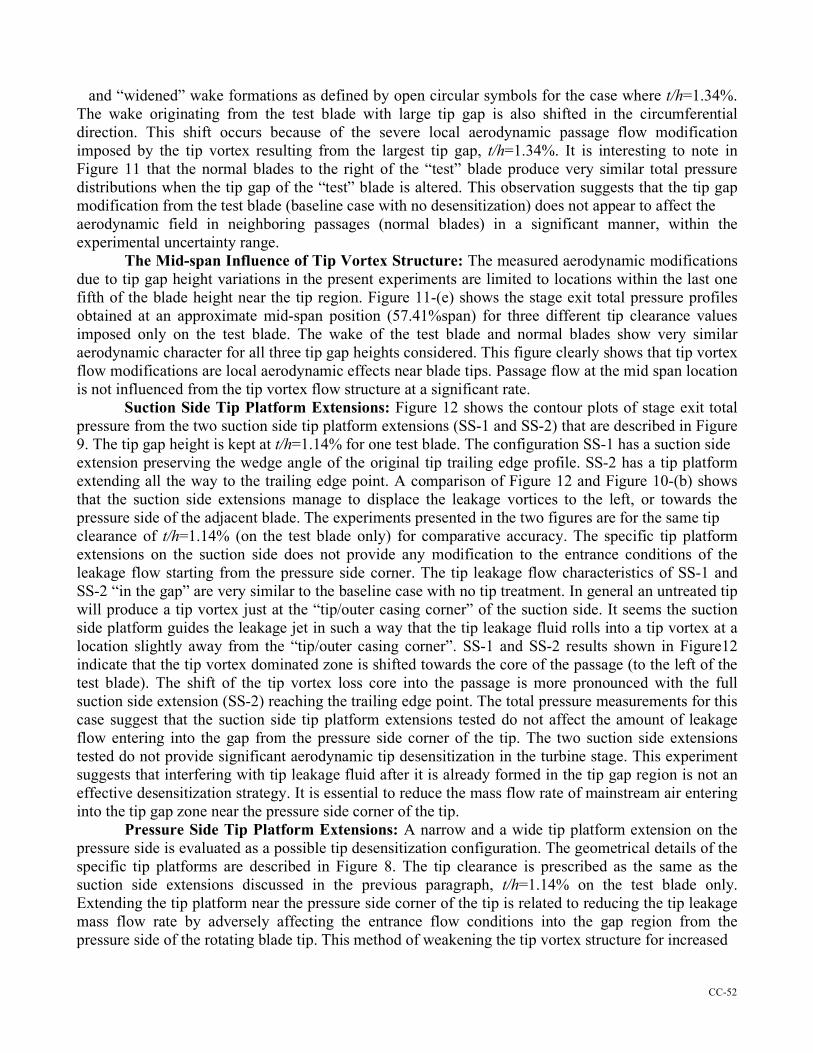
Suction Side Tip Platform Extensions: Figure 12 shows the contour plots of stage exit total pressure from the two suction side tip platform extensions (SS-1 and SS-2) that are described in Figure 9. The tip gap height is kept at t/h=1.14% for one test blade. The configuration SS-1 has a suction side extension preserving the wedge angle of the original tip trailing edge profile. SS-2 has a tip platform extending all the way to the trailing edge point. A comparison of Figure 12 and Figure 10-(b) shows that the suction side extensions manage to displace the leakage vortices to the left, or towards the pressure side of the adjacent blade. The experiments presented in the two figures are for the same tip clearance of t/h=1.14% (on the test blade only) for comparative accuracy. The specific tip platform extensions on the suction side does not provide any modification to the entrance conditions of the leakage flow starting from the pressure side corner. The tip leakage flow characteristics of SS-1 and SS-2 “in the gap” are very similar to the baseline case with no tip treatment. In general an untreated tip will produce a tip vortex just at the “tip/outer casing corner” of the suction side. It seems the suction side platform guides the leakage jet in such a way that the tip leakage fluid rolls into a tip vortex at a location slightly away from the “tip/outer casing corner”. SS-1 and SS-2 results shown in Figure12 indicate that the tip vortex dominated zone is shifted towards the core of the passage (to the left of the test blade). The shift of the tip vortex loss core into the passage is more pronounced with the full suction side extension (SS-2) reaching the trailing edge point. The total pressure measurements for this case suggest that the suction side tip platform extensions tested do not affect the amount of leakage flow entering into the gap from the pressure side corner of the tip. The two suction side extensions tested do not provide significant aerodynamic tip desensitization in the turbine stage. This experiment suggests that interfering with tip leakage fluid after it is already formed in the tip gap region is not an effective desensitization strategy. It is essential to reduce the mass flow rate of mainstream air entering into the tip gap zone near the pressure side corner of the tip.
Pressure Side Tip Platform Extensions: A narrow and a wide tip platform extension on the pressure side is evaluated as a possible tip desensitization configuration. The geometrical details of the specific tip platforms are described in Figure 8. The tip clearance is prescribed as the same as the suction side extensions discussed in the previous paragraph, t/h=1.14% on the test blade only. Extending the tip platform near the pressure side corner of the tip is related to reducing the tip leakage mass flow rate by adversely affecting the entrance flow conditions into the gap region from the pressure side of the rotating blade tip. This method of weakening the tip vortex structure for increased
CC-53
Figure 12. Contours of po/=pin for the suction-side tip platform extensions (SS-1 and SS-2), t=//h = 1.14% , © 2004 ASME
Figure 13. Contours of po/=pin for the pressure-side-narrow extension cases, t/h = 1.14% and 0.93% , © 2004 ASME
po/pi
n
CC-54
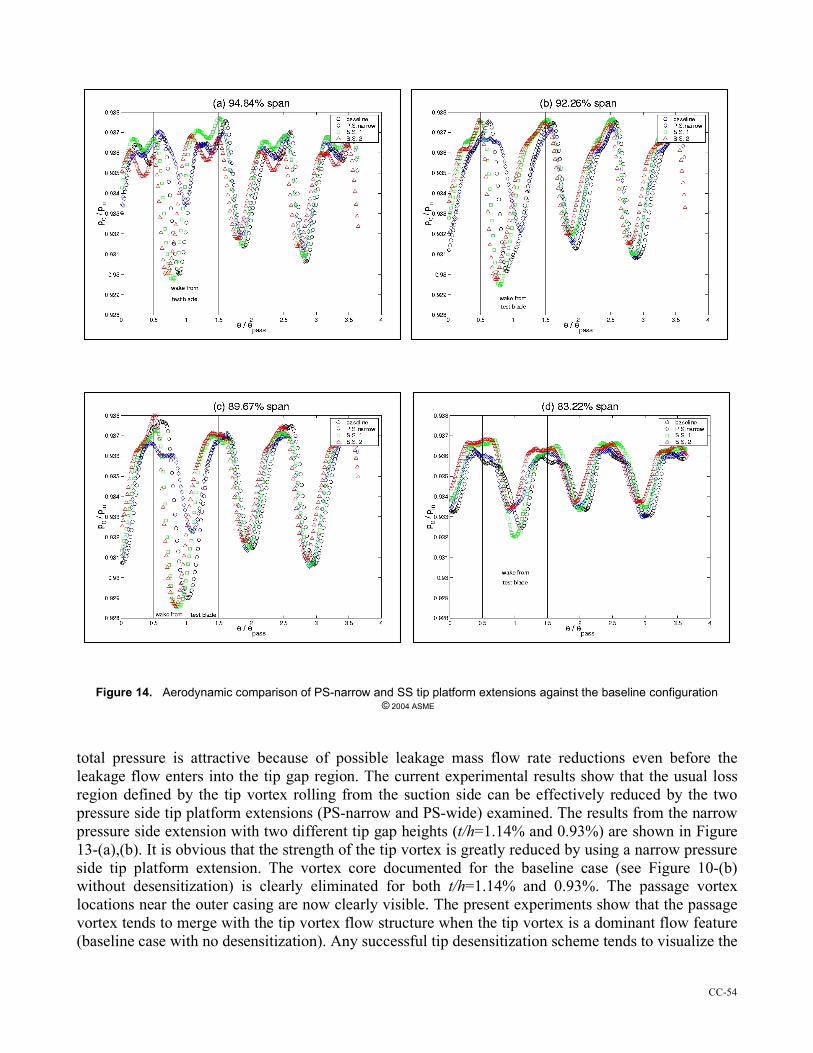
Figure 14. Aerodynamic comparison of PS-narrow and SS tip platform extensions against the baseline configuration © 2004 ASME
total pressure is attractive because of possible leakage mass flow rate reductions even before the leakage flow enters into the tip gap region. The current experimental results show that the usual loss region defined by the tip vortex rolling from the suction side can be effectively reduced by the two pressure side tip platform extensions (PS-narrow and PS-wide) examined. The results from the narrow pressure side extension with two different tip gap heights (t/h=1.14% and 0.93%) are shown in Figure 13-(a),(b). It is obvious that the strength of the tip vortex is greatly reduced by using a narrow pressure side tip platform extension. The vortex core documented for the baseline case (see Figure 10-(b) without desensitization) is clearly eliminated for both t/h=1.14% and 0.93%. The passage vortex locations near the outer casing are now clearly visible. The present experiments show that the passage vortex tends to merge with the tip vortex flow structure when the tip vortex is a dominant flow feature (baseline case with no desensitization). Any successful tip desensitization scheme tends to visualize the

CC-55
individual passage vortex structure as a distinct region in total pressure maps obtained downstream of the rotor. The region marked as P in Figure 13 (a) and (b) show the individual passage vortex zones near the outer casing. The passage vortex features near the hub are also visualized as pink regions in Figure 13. The desensitization achieved by using the narrow pressure side tip platform extension is more apparent when the tip clearance is reduced from =1.14% to 0.93%. The specific desensitization scheme using pressure side extensions tend to reduce the high loss region of the standard tip vortex structure. This region is indicated by a pink color in baseline data sets (see Figure 10 (b) and (c)).
Comparison of Pressure Side and Suction Side Tip Platform Extensions: Figure 14 shows the stage exit total pressure distributions for three different desensitization schemes in addition to the baseline case without any tip desensitization. The tip clearance value of =1.14% is the same for all four tip configurations. The total pressure distributions in the wake of the test blade and two neighboring blades at four radial positions near the tip are presented (r=h=94.84%, 92.26%, 89.67% and 83.22%). The baseline case shown in Figure 14 by open circular symbols serves as reference in deciding the most effective tip desensitization scheme. With any successful tip desensitization effort, the recovered local total pressure at the exit of the stage needs to be elevated in the region containing the fluid coming from near the suction side corner of the blade tip. A desensitization scheme that is not providing an aerodynamic gain is supposed to result in local total pressure values that are less than the baseline measurement defined by open circular symbols in Figure 14. The flow originating from the “test” blade that provided the desensitization data in Figure 14 is shown between the two vertical lines marking one complete rotor passage. The flow modifications achieved by the two suction side desensitizations (SS-1 and SS-2) are shown by green square and red triangular symbols, respectively. It is clear that the suction side extensions do not provide any aerodynamic gain in Figure 14 (a), (b) and
Figure 15. Contours of po/pin for the PS-wide extension cases, t/h = 0.83% and 0.72% , © 2004 ASME
po/pi
n
CC-56
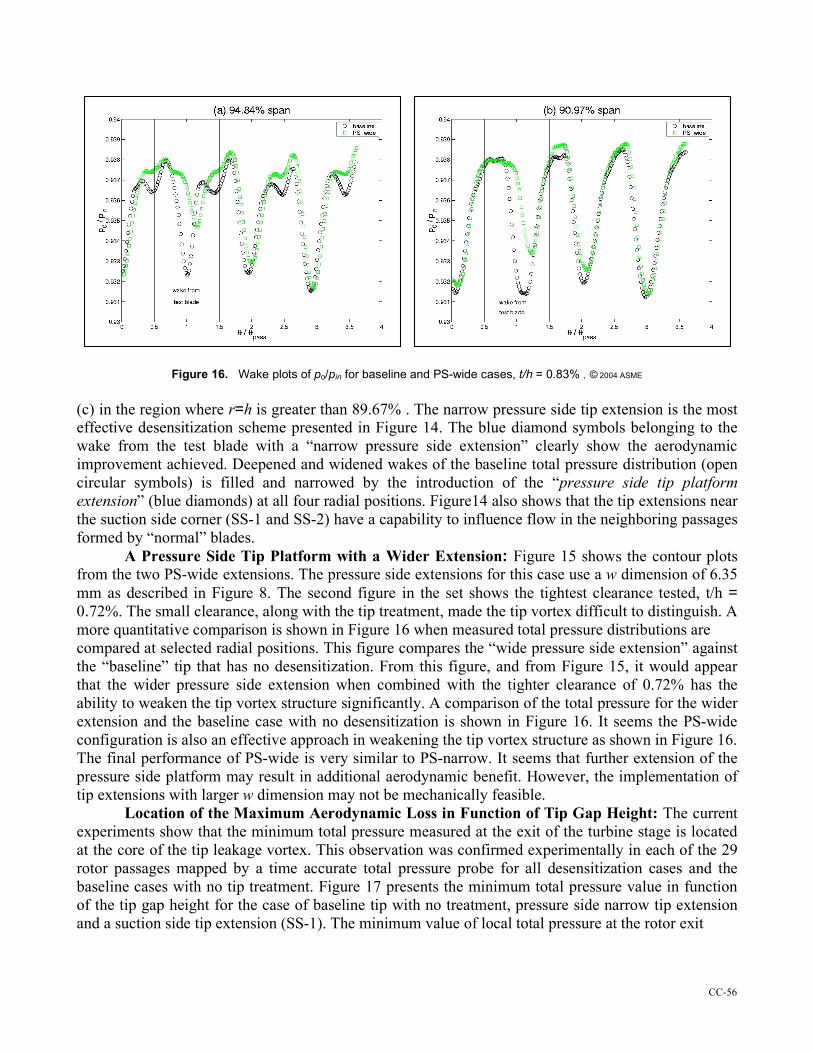
Figure 16. Wake plots of po/pin for baseline and PS-wide cases, t/h = 0.83% , © 2004 ASME
(c) in the region where r=h is greater than 89.67% . The narrow pressure side tip extension is the most effective desensitization scheme presented in Figure 14. The blue diamond symbols belonging to the wake from the test blade with a “narrow pressure side extension” clearly show the aerodynamic improvement achieved. Deepened and widened wakes of the baseline total pressure distribution (open circular symbols) is filled and narrowed by the introduction of the “pressure side tip platform extension” (blue diamonds) at all four radial positions. Figure14 also shows that the tip extensions near the suction side corner (SS-1 and SS-2) have a capability to influence flow in the neighboring passages formed by “normal” blades.
A Pressure Side Tip Platform with a Wider Extension: Figure 15 shows the contour plots from the two PS-wide extensions. The pressure side extensions for this case use a w dimension of 6.35 mm as described in Figure 8. The second figure in the set shows the tightest clearance tested, t/h = 0.72%. The small clearance, along with the tip treatment, made the tip vortex difficult to distinguish. A more quantitative comparison is shown in Figure 16 when measured total pressure distributions are compared at selected radial positions. This figure compares the “wide pressure side extension” against the “baseline” tip that has no desensitization. From this figure, and from Figure 15, it would appear that the wider pressure side extension when combined with the tighter clearance of 0.72% has the ability to weaken the tip vortex structure significantly. A comparison of the total pressure for the wider extension and the baseline case with no desensitization is shown in Figure 16. It seems the PS-wide configuration is also an effective approach in weakening the tip vortex structure as shown in Figure 16. The final performance of PS-wide is very similar to PS-narrow. It seems that further extension of the pressure side platform may result in additional aerodynamic benefit. However, the implementation of tip extensions with larger w dimension may not be mechanically feasible.
Location of the Maximum Aerodynamic Loss in Function of Tip Gap Height: The current experiments show that the minimum total pressure measured at the exit of the turbine stage is located at the core of the tip leakage vortex. This observation was confirmed experimentally in each of the 29 rotor passages mapped by a time accurate total pressure probe for all desensitization cases and the baseline cases with no tip treatment. Figure 17 presents the minimum total pressure value in function of the tip gap height for the case of baseline tip with no treatment, pressure side narrow tip extension and a suction side tip extension (SS-1). The minimum value of local total pressure at the rotor exit

CC-57
Figure 17. Minimum total pressure versus tip gap height (PS-narrow, Baseline and SS-1) , © 2004 ASME varies linearly with tip gap height with no tip desensitization (open squares). The curve defining the minimum total pressure value with a narrow pressure side extension (diamond symbols) shows a significant improvement in terms of exit local pressure. The minimum total pressure generated by the suction side tip extension SS-1 at a tip gap of =1.14% shows slightly less exit total pressure compared to the baseline tip with no treatment.
Possible Flow Mechanisms near Tip Platforms: Figure 18 attempts to present possible flow mechanism that makes the pressure side extension an effective tip desensitization scheme. The extended platform interacts with the passage flow structure in the rotor tip region where the driving pressure differential is significant. The central location of this region is around 60% axial chord location as defined in Figure 8. The entrance pressure losses for this viscous flow case are certainly elevated by the extended tip platform. The free stream fluid will have more resistance during its entry motion into the tip gap zone. The recirculatory flow zone b1 observed even without desensitization is
Figure 18. Possible flow mechanisms for pressure side extensions , © 2004 ASME
CC-58
now located on the entrance section of the tip platform. It is also likely that some of the passage flow moving in a radially outward direction at the pressure side corner meets the fluid particles that are trying to enter into the tip gap zone. This flow when combined with the shearing effect of the outer casing may create unfavorable viscous flow conditions in terms of the mass flow rate of the leakage flow entering into the tip gap channel. The existence of a pressure side extension tends to lower the discharge coefficient of the leakage flow system near the tip of the blade. Due to a significant reduction in the tip leakage mass flow rate, the tip vortex formation occurring on the suction side of the blade is weakened. The weakened tip vortex core can now attain a higher mean kinetic energy level with the use of a pressure side extension. The dissipation of mean kinetic energy into heat is reduced and the mean secondary kinetic energy is at a level much less than that of the tip vortex from a comparable baseline case. This type of desensitization scheme works by eliminating the cause of the loss generation mechanism that is the leakage mass flow rate and momentum allowed at the entrance section near the pressure side. The physical processes described in this paragraph are likely to create a new loading distribution for the tip region with tip platform extensions. The suction side winglets used in this study do not perform as effectively as the pressure side extensions as shown in Figures 12, 13 and 17. Since there is no treatment near the entrance section of the tip gap, the mass flow rate and momentum of the relative flow is comparable to that of the baseline case with no tip treatment. The suction side extension only delays the delivery of a tip leakage jet near the suction side corner of the blade tip. A leakage jet existing on the suction side extended platform can now roll into a tip vortex at a location slightly away from the suction side corner. The loss generating tip vortex core is pushed more into the core flow. It is only natural to generate more pressure loss in a mainstream region where passage flow is highly accelerated in the aft portion of the suction side. The suction side extension tries to modify the tip vortex flow after a strong leakage flow is already formed in the tip gap region. It seems the schemes dealing with the cause of the tip leakage flow even before it fully forms a leakage jet in the gap have a better chance to reduce the pressure losses in this problem. Reducing the relative leakage mass flow rate may also have a favorable impact on the amount of convective heat transfer that will occur in the tip gap zone.
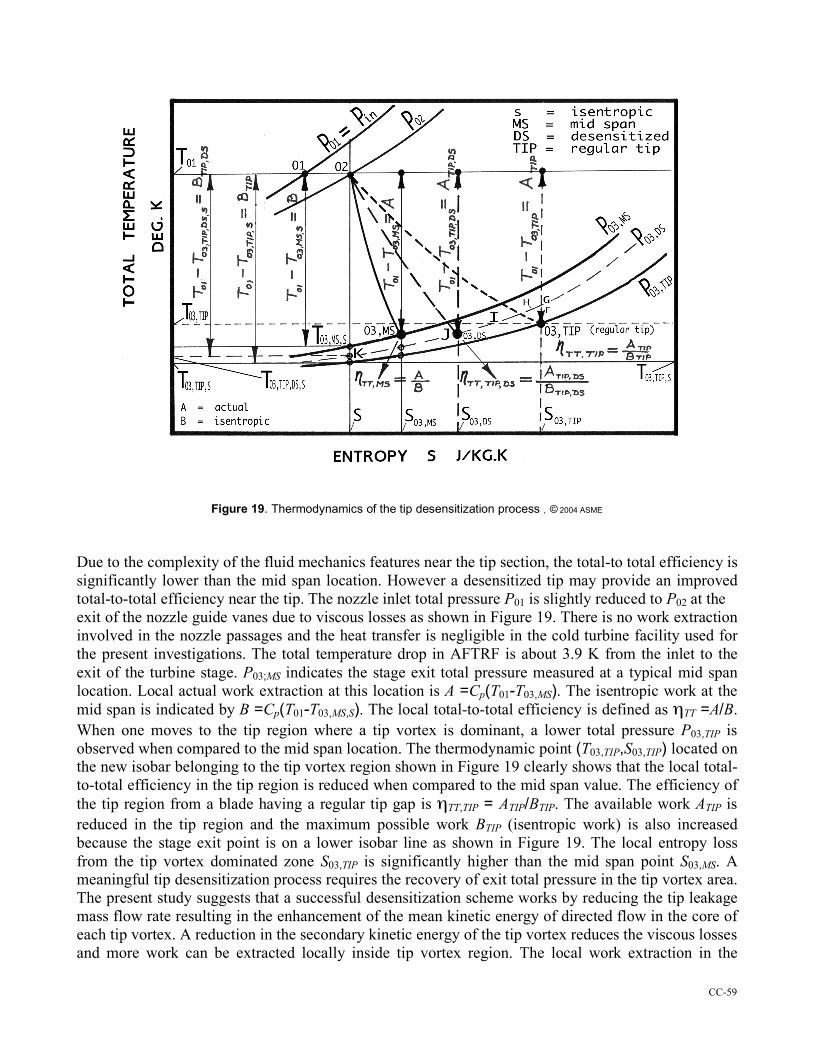
Total-to-total stage efficiency and tip desensitization: Aerodynamic influence of specific tip treatments in the current study are explained by measuring the total pressure field at the exit of the stage. The high resolution measurements of the phase averaged total pressure measured in the stationary frame provide an excellent description of the rotor exit flow field. The measured data presented in Figures 10 to 17 indicate if a tip vortex dominated zone is “weakened” by the suggested treatment. A good example of a “weakened” tip vortex system is the one obtained by the pressure side-side-narrow tip extension case as discussed in Figure 13. There are also cases in which the area of the tip vortex controlled flow is enlarged such as the suction side tip platforms termed as SS-1 and SS-2. A “weakened” tip vortex structure is obtained when the total pressure defect inside the tip vortex area is recovered significantly. Of course the area coverage of the tip vortex after the treatment needs to be reduced as shown in Figure 14. It is possible to improve the total-to-total efficiency of a turbine stage by recovering the local total pressure in the tip vortices originating from individual blades. The relationship between the change in stage exit total pressure due to desensitization and stage total to total efficiency can be described on an enthalpy entropy diagram. Figure 19 explains the aerothermal processes occurring:
1. at the mid span location in a measurement plane located downstream of the turbine rotor (03,MS) 2. inside a typical tip vortex originating from a standard blade with the nominal tip gap height (03,TIP) 3. inside the tip vortex of a desensitized blade tip (03,DS)
CC-59
Figure 19. Thermodynamics of the tip desensitization process , © 2004 ASME Due to the complexity of the fluid mechanics features near the tip section, the total-to total efficiency is significantly lower than the mid span location. However a desensitized tip may provide an improved total-to-total efficiency near the tip. The nozzle inlet total pressure P01 is slightly reduced to P02 at the exit of the nozzle guide vanes due to viscous losses as shown in Figure 19. There is no work extraction involved in the nozzle passages and the heat transfer is negligible in the cold turbine facility used for the present investigations. The total temperature drop in AFTRF is about 3.9 K from the inlet to the exit of the turbine stage. P03;MS indicates the stage exit total pressure measured at a typical mid span location. Local actual work extraction at this location is A =Cp(T01-T03,MS). The isentropic work at the mid span is indicated by B =Cp(T01-T03,MS,S). The local total-to-total efficiency is defined as ηTT =A/B. When one moves to the tip region where a tip vortex is dominant, a lower total pressure P03,TIP is observed when compared to the mid span location. The thermodynamic point (T03,TIP,S03,TIP) located on the new isobar belonging to the tip vortex region shown in Figure 19 clearly shows that the local total-to-total efficiency in the tip region is reduced when compared to the mid span value. The efficiency of the tip region from a blade having a regular tip gap is ηTT,TIP = ATIP/BTIP. The available work ATIP is reduced in the tip region and the maximum possible work BTIP (isentropic work) is also increased because the stage exit point is on a lower isobar line as shown in Figure 19. The local entropy loss from the tip vortex dominated zone S03,TIP is significantly higher than the mid span point S03,MS. A meaningful tip desensitization process requires the recovery of exit total pressure in the tip vortex area. The present study suggests that a successful desensitization scheme works by reducing the tip leakage mass flow rate resulting in the enhancement of the mean kinetic energy of directed flow in the core of each tip vortex. A reduction in the secondary kinetic energy of the tip vortex reduces the viscous losses and more work can be extracted locally inside tip vortex region. The local work extraction in the
CC-60
vortex core of a desensitized blade is shown as ATIP,DS = Cp(T01-T03,TIP,DS). Point J corresponding to this desensitization point is located on the dashed isobar line P03,DS in Figure 19. As the available work level Cp(ATIP,DS) is elevated by desensitization, the maximum possible work Cp(BTIP;DS) that can be extracted on the isobar line is also reduced. The local total-to total efficiency of the desensitized tip vortex zone is ηTT,TIP,DS = ATIP,DS/BTIP,DS. Significant local improvement inefficiency from the tip treatment is obvious. Each thermodynamic point on the dashed isobar line belongs to a possible desensitization scheme. The best desensitization points are the ones obtained by moving to the left of the entropy axis on the dashed isobar line. Point K is the isentropic point. However, it is not likely that a desensitized tip will reach the entropy value assigned to the mid span location, S03,MS. Starting from point I, if one moves to the left on the dashed isobar line the local efficiency of treatment becomes higher and higher. This region corresponds to desensitized tip vortex total temperatures that are smaller than that of the regular tip (T03,TIP). There are also a few desensitization points to the right of point I that result in slightly improved efficiency and reduced entropy loss. The specific points result from the fact that isobar lines slightly diverge in the increasing entropy direction. Points to the right of H result in lower total-to total efficiencies even though the entropy losses are less than that of the regular tip related entropy level S03,TIP at point G. All of the points to the right of point G result in a lower efficiency than that of the regular tip with elevated aerodynamic losses as shown in Figure 19. In an axial flow turbine, the desensitization related isobar line will always be between the P03,TIP and P03,MS. More successful desensitization schemes are the ones that result in a more elevated total pressure level P03,DS as shown by the dashed-line.
When the total pressure recovery (P03,DS > P03,TIP) in a tip vortex dominated zone is observed, there are two possible scenarios. In one case the aerodynamic losses are so high, the actual work output is severely reduced and the total-to-total efficiency is reduced further. The thermodynamic points to the right of point H on the dashed line P03,DS belong to this undesirable category. The effective tip desensitization with improved work output and reduced entropy loss occur at locations to the left of point H. An effective way of finding out the success of the desensitization is the measurement of the local temperature in the tip vortex area. However, a reduced vortex area coverage and a significant recovery of the total pressure when compared to an untreated tip measurement are the first signs of effective tip desensitization. CONCLUSIONS
The present paper describes a method of quantifying total pressure change generated by the tip vortices in an axial flow turbine stage. Time accurate total pressure measurements at 30% downstream of the rotor exit plane are recorded from a stationary probe that has a 150 kHz response time. The high spatial resolution data allows the researcher to distinguish the tip vortices, passage vortices, wake and high kinetic energy core flow.
A series of baseline tips without desensitization were first studied by varying the tip gap height of a selected blade defined as a “test blade”. This set of data formed a reference data set for the experiments performed with a desensitized tip. The influence of the tip gap height on the total pressure downstream of the test blade without desensitization was clearly documented.
Tip desensitization schemes using pressure side and suction side tip extensions were compared to baseline experiments with untreated blades at similar tip gap heights. Tip platform extensions, as scaled down forms of winglets used in aircraft wings, were implemented in one rotor blade defined as a “test blade”.
The aerodynamic data from the desensitized “test blade” were compared to an untreated baseline case at a similar tip clearance value. Comparisons were also made between the “test blade”

CC-61
and the “untreated” blade of the subsequent passage from the same experiment. The current experiments show that the suction side extensions are not effective tip
desensitization schemes. The tip extension near the suction side pushes the core of tip vortex further away from the suction side. Although the position of the tip vortex zone is altered, the stage exit total pressure field from this configuration is not different compared to the baseline case.
The experiments show that the pressure side extensions tested are highly effective tip desensitization schemes. The entry flow conditions into the tip gap are altered in such a way that the mass flow rate and momentum of the jet leaking into the suction side is reduced.
A thermodynamic description of the tip desensitization process is presented. The total to total efficiency of a turbine stage is influenced by work (or total temperature drop) and total pressure at the stage exit. A clear distinction between the contribution of work and entropy loss is made by using an enthalpy entropy diagram.
An effective way of finding out the success of the desensitization is the measurement of the local temperature in the tip vortex area. However, a reduced vortex area coverage and a significant recovery of the total pressure when compared to an untreated tip measurement are the first signs of effective tip desensitization. Current measurements suggest that the local efficiency gains from a pressure side tip platform extension case can be significant. Acknowledgments The authors are indebted to Dr. B. Glezer of Solar Turbines Inc., and Dr. R. Bunker of General Electric Corporate Research and Development Center for their support and help in the design of the tip desensitization experiments in the AFTRF of the Pennsylvania State University. The authors also acknowledge The Advanced Gas Turbine Systems Research Consortium (AGTSR) of the U.S. Department of Energy for providing a research grant on turbine tip desensitization. The program monitors were Drs. R. Wenglarz and L. Golan of SCIES/AGTSR at Clemson University. Nomenclature c Rotor axial chord-length at tip = 0.129 m h Rotor blade height = 0.123 m p0 Total pressure patm Ambient pressure pin Inlet total pressure ps Static pressure r,θ, ; z Radial, tangential and axial coordinates t Rotor tip clearance height v Absolute velocity w Relative velocity x;y Coordinates Cp Specific heat at constant pressure N Rotor speed (RPM) Re Reynolds number S Entropy T Total temperature Um Mean wheel speed, i.e. midspan rotor speed Greek symbols α Absolute flow angle measured from axial direction β Relative flow angle or yaw angle measured from axial direction ηTT Turbine stage total to total efficiency
CC-62
References
[1] Booth, T.C., 1985, “Importance of Tip Leakage Flow in Turbine Design”, VKI Lecture Series 1985-05. [2] Sieverding, C.H., 1985, “Recent Progress in the Understanding of Basic Aspects of Secondary Flows in Turbine Blade Passages”, ASME J. Turbomachinery, Vol. 114, pp. 248-257. [3] Gregory-Smith, D.G., 1997, “Physics of Secondary Flows”, VKI Lecture Series 1997-01. [4] Langston, L. S., “Secondary Flow in Axial Turbines- A Review”, Presented at ICHMT Turbine Symposium 2000, Cesme, Turkey, 13-18 August, 2000. [5] Denton, J.D., 1993, “Loss Mechanisms in Turbomachines”, ASME 93-GT-435. [6] Heyes, F.J.G. and Hodson, H.P., 1993, “Measurement and Prediction of Tip Clearance Flow in Linear Turbine Cascades”, ASME J. Turbomachinery, Vol. 115, pp. 376-382. [7] Yaras, M.I., Sjolander, S.A., 1991, “Effects of Simulated Rotation on Tip Leakage Flow in a Plane cascade of Turbine Blades-I and II”, ASME J. Turbomachinery, Vol. 114, pp. 652-667. [8] Morphis, G. and Bindon, J.P., 1994, “The Performance of a Low Speed One and Half Stage Axial Turbine with Varying Rotor Tip Clearance and Tip Gap Geometry”, ASME Paper 94-GT-481. [9] Moore, J. and Moore, J.G., 1995, “Tip Clearance Losses in Linear Turbine Cascade”, ASME J. Turbomachinery, Vol.117, pp. 142-153. [10] Harvey, N.W., Ramsden, K., 2000, “A Computational Study of a Novel Turbine Partial Shroud”, ASME Paper 2000-GT-668. [11] Willinger, R. and Haselbacher, H., 2000, “On the Modeling of Tip Leakage Flow in Axial Turbine Blade Rows”, ASME Paper 2000-GT-633. [12] Booth, T.C., Dodge, P.R. and Hepworth, H.K., 1981, “Rotor Tip Leakage, Part-I - Basic Methodology”, ASME Paper 81-GT-71. [13] Lakshminarayana, B., Camci, C., Halliwell, I., Zaccaria, M., 1996, “Design and Development of a Turbine Research Facility to Study Rotor-Stator Interaction”, International Journal of Turbo and Jet Engines, Vol. 13, pp. 155-172. [14] Camci, C., 2004, “A Turbine Research Facility to Study Tip De-sensitization Including Cooling Flows,” VKI Lecture Series on “ Turbine Blade Tip Design and Tip Clearance Treatment” 19-23 January 2004, pp. 1-26.
[15] Xiao, X., McCarter, A.A. and Lakshminarayana, B., 2000, “Tip Clearance Effects in a Turbine Rotor, Part I: Pressure Field and Loss”, ASME Paper 2000-GT-0476.