evolution of the tip leakage vortex in an axial compressor rotor
TRANSCRIPT
Proceedings of ASME TURBO EXPO 2004 Power for Land, Sea, and Air
Vienna, Austria
2004-GT-53703
EVOLUTION OF THE TIP LEAKAGE VORTEX IN AN AXIAL COMPRESSOR ROTOR
Baojie Liu, Xianjun Yu, Hongwei Wang, Huoxing Liu Haokang Jiang, Maozhang Chen
School of Jet Propulsion
Beijing University of Aeronautics and Astronautics Beijing, China
Proceedings of ASME Turbo Expo 2004 Power for Land, Sea, and Air
June 14-17, 2004, Vienna, Austria
GT2004-53703
ABSTRACT The evolution of tip leakage vortex is analyzed at both
design and near stall conditions based on instantaneous and averaged velocity and vorticity distributions in cross flow sections measured with Stereoscopic Particle Image Velocimetry (SPIV) in a large-scale low-speed compressor facility. Formation, becoming unstable, and interaction of small-scale vortices and mainstream characterize the evolution of the tip leakage vortex in the compressor rotor. These processes influence the mainstream in very different ways. The process of leakage vortex becoming unstable is relatively smooth at design condition and vortex breakdown occurs at near stall condition for the case in the experiment. The main reason is that the critical condition occurs only in the core of tip leakage vortex at near stall condition. The effect of Coriolis force and centrifugal force on the stability of tip leakage vortex is analyzed theoretically with hypothesis of incompressible, inviscid and quasi-cylindrical swirling flow.
INTRODUCTION
Tip leakage flow characterized by the evolution of the tip leakage vortex and its interaction with mainstream and other flow structures influences compressor’s rotor performance remarkably. Study on the tip leakage flow has attracted mass researchers since fifty years ago.
Lots of efforts have been made on the tip leakage flow by theoretical analysis (Rains 1954, Lakshminaragana 1970, Chen 1991), experimental investigation on cascade (Storer & Cumpsty 1991, Kang & Hirsch 1994) and compressor facility (Hunter & Cumpsty 1982, Inoue & Kuroumaru 1986, 1989, Goto 1992, Stauter 1993, Lakshminarayana 1982,1995, Ma & Jiang 2000, etc.), and lots of numerical simulations. Steady characteristics of rotor tip leakage flow have been well understood based on mean flow, turbulence characteristics, and pressure distribution on the blade and casing after a half-century study. Study now begins to deal with its unsteady nature based on unsteady CFD simulation (Schlechtriem &
Lotzerich 1997, Furukawa 1999,2000) and SPIV technique (Wernet 2002, Baojie 2003), especially on the breakdown of the tip leakage vortex. It’s far more enough, however, to give the pictures of vortex instability. The mechanism under the complex phenomenon is rarely mentioned.
Vortex breakdown of leading edge vortices over highly swept wings is a well-known phenomenon of flow instability based on the intensive studies in aircraft aerodynamics; some reviews refers to Hall 1972, Leibovich 1984, Stuart 1987, Escudier 1988, Lucca-Negro 2001 etc. Vortex breakdown is a complex flow phenomenon that characterized by significant change of flow structure, occurrence of stagnation point and limited region of reverse flow in the core, large amplitude fluctuation of the turbulence downstream at high Reynolds number. The leading-edge vortices can be treated as axisymmetric ones, especially well fitted by “Q-vortex” (Leibovich 1984). It is necessary to point out here that vortices can be unstable without breakdown (Leibovich 1984).
Similar to the leading edge vortex, the tip leakage vortex is also a streamwise vortex (swirling flow) and may break down at certain conditions. Nevertheless, the tip leakage vortex has many distinctive characteristics, such as wake-like distribution of streamwise velocity in the core, nonaxisymmetirc distribution of the streamwise, rotational velocity, and highly three-dimensional surrounding flow with adverse pressure gradient and complex downstream condition. Therefore, the analysis of the evolution of the tip leakage vortex is mainly based on the instantaneous velocity distributions measured with SPIV and their average results in this paper. Preliminary analysis of the instability of tip leakage vortex follows the way of M. G. Hall (1966) and S. Leibovich (1984). Another purpose of the paper is to show a relatively complete figure of the evolution of the tip leakage vortex at both design and near stall conditions. As will be shown, many differences exist in the two cases.
1 Copyright © 2004 by ASME

NOMENCLATURE −+ cc , Phase speed for upstream propagating and
downstream propagating waves of extreme length
ql ,,δ Constants of Q-vortex model wvu ,, Velocity with respect to Cartesian
coordinates X, Y, and Z respectively
zr www ,, θ Relative velocity with respect to cylindrical
coordinates r , θ , and z respectively N Characteristic parameter for critical regions
of a flow R Radius of vortex core OR Rossby number ρ Density p Pressure Ω Angular rotation speed of compressor Γ Vortex circulation defined as rwθ≡Γ
Table 1 Parameters of the test compressor Outer Diameter (m) 1.0
Aspect Ratio 0.6
Design Speed 1200 RPM
Design Mass Flow Rate 22.4 kg/s
Flow Coefficient 0.58
Pressure Rise Coefficient 0.4
Vortex Design Free Vortex
Configuration IGV+Rotor+Stator
Number of Blades 36+17+20
Airfoil Type C4
Blade Camber Angle 17.4+26.5+49.1
Blade Chord (mm) 100+180+180
Reynolds Number 7.5×10⁵
Rotor Tip Clearance (As percentage of blade height) 0.5%
COMPRESSOR FACILITY Data were acquired in the Low-Speed Large-Scale
Compressor Facility in Beijing University of Aeronautics & Astronautics in October of 2003. Compared to the first measurement in 2001, the spatial resolution was improved, more effective velocity fields were obtained, and the flow field near the pressure side of the rotor was also measured. A full list of the geometric and aerodynamic characteristics for the experiment facility is given here for the consideration of further comparison and analysis. The key parameters of the compressor facility are as Table 1. The facility is a typical single stage low-speed test compressor and the flow in the tip region should be
able to represent most low-speed compressors. A curved glass window with length of 420mm, width of 280mm and thickness of 5mm is embedded on the casing for optical measurement. Performance of the compressor is shown as Figure 1.
0.35 0.40 0.45 0.50 0.55 0.60 0.65 0.70 0.75
0.20
0.25
0.30
0.35
0.40
0.45
0.50 Measurement Point
Design Point
Pres
sure
Ris
e C
oeffi
cien
t
Flow Coefficient Figure 1 Compressor characteristic
The layout of the measurement cross-sections is shown as Figure 2. To achieve high spatial resolution with the limited pixels CCD, two sizes of field of view were contrived, the width of the larger one is more than half of the rotor passage (about 75 mm), and the width of the smaller one is about one third of the rotor passage. The larger field of view was used to scan the structure of tip leakage flow ranging from near the leading edge to the trailing edge along the suction side and the pressure side respectively. The smaller field of view was used to measure the leakage vortex upstream of 40% chord length in detail. Ten cross-sections were arranged near the suction side from 20% to 110% chord length with interval of 10% and eleven cross-sections were arranged near the pressure side from the leading edge to the trailing edge. The measured effective area of the cross-sections, however, is subject to intensive light reflection from the hub and random movement of the seeding. The coordinates are based on the measurement cross-sections that are perpendicular to the tip chord of the blade. The velocity axis X, Y, and Z for velocity u, v, and w with Z represents streamwise direction are shown on the Figure 2.
1
2
9
Figure 2 SPIV measurement cross-sections
SPIV SYSTEM Particle Image Velocimetry (PIV) and Stereoscopic
Particle Image Velocimetry (SPIV) break through the limit of single-point measurement techniques based on their capability of measuring instantaneous velocity distribution of unsteady complex flow. They have more advantages such as non-intrusive, high spatial resolution, mass data acquisition capacity, and fast testing operation (Adrian 1991,Grant 1997,Raffel 1998). The accuracy of PIV is high and enough for most
Y
X Z
2 Copyright © 2004 by ASME

quantitative analysis. It has been widely used in the studies of unsteady flows. While PIV can only measure the velocity component projected on the measuring plane, SPIV can obtain all of the three velocity components. For compressor facility, only SPIV is competent for measuring velocity distribution of tip leakage flow. As shown in Figure 3, the two CCD cameras and the light sheet forming optics can all be placed outside the casing window and make the measurement truly non-intrusive.
Table 2 Parameters of the SPIV system Light Resource Dual-Cavity YAG Laser,
150 mJ/Pulse, 30Hz
CCD 1280×1024 Pixels, 3.7Hz, Minimum Time Interval 0.5µs
Synchronizer TSI Model 6300 Acquisition and
Analysis Software TSI INSIGHT3
Figure 3 Measurement Scheme of SPIV
SPIV with two CCD cameras placed at each side of the light sheet was applied to the measurement of rotor tip leakage flow in the low-speed large-scale research compressor facility in this paper. Instantaneous velocity and vorticity distribution were successfully documented at design and near stall condition. The whole SPIV system is manufactured by TSI incorporation as described in table 2, which is applicable for common cases. Phase locking was used to ensure that the measurement was in the same position relative to the same blade. Nevertheless, the instantaneous flow field in the same cross-section do not relate with each other directly since the acquisition frequency of the SPIV is far lower than the blade passing frequency, which should be noticed in the analysis later.
SEEDING Seeding is the key for the optical techniques such as LDV
or SPIV applying on compressor facilities. An effective method is to seed only around the measurement region to escape the difficulty of large flow rate and complicated flow in such facilities. In the first SPIV measurement two years ago, the seeding scattered in the measuring passage was unstable and non-uniform due to inlet disturbance, which makes most of the results wasted. To deal with the problem, a pipe grid was used to scatter the smoke this time, which made the smoke fairly uniform in the measured passage, one third of the results measured are good. The size of the particles is around 1~2 µm which are generated by evaporation and condensation of mixed glycerol oil. They should be small enough to follow the flow in the rotor passage.
The used interrogation size is 32× 16 pixels and the overlap is 50% in the image processing. The size is half of that used last time. Influence of the curve window is eliminated in a preliminary SPIV calibration. Accuracies of measured three velocity components are nearly equal because the angle between two CCD is 60 degrees. Accuracy of instantaneous velocity components should be around 2% in the tip region. More details of the measurement and data processing refer to a previous paper (Baojie 2002). International system of units is used in the paper except those specified in the paper.
RESULTS AND DISCUSSION Vortex mentioned in the paper means a concentrated
vortex with definite size that rotates around a core with pure vorticity, such as the leakage vortex. It is unreliable to recognize a vortex from velocity distribution in a complex flow with multiple vortices since the result will depend on the location of an observer. Vortex identification is thereby based on both vorticity and velocity distributions. The average results of 10 instantaneous ones are also shown besides the instantaneous results in comparison to help to identify the flow structures.
All the analysis is in the rotor frame since the vorticity distribution was calculated based on relative velocity. The achieved spatial resolution is around 0.5~1.0 mm, which is more than adequate to recognize small-scale structure of turbulence flow. All resulted measurement areas are 2mm away from the blade surface and the casing due to light reflection,, which means that no data is obtained in the boundary layer. The vectors in the figures represent the velocity component projected on the observing plane, and the component perpendicular to the plane (w velocity) is represented by color contour.
Color contour is also used to show vorticity distribution that is superimposed with the streamlines near the cores of vortices. The streamlines are helpful to identify the leakage vortex structures at different sections. Absolute values of vorticity smaller than one-fifth the maximum vorticity level are cut off in all the vorticity contour figures, so any vorticity spots represented by the color different with green (low vorticity) should be considered as high vorticity ones.
EVOLUTION OF TIP LEAKAGE FLOW Figure 4 is the measurement results at 20% chord at near
stall condition. The tip leakage vortex is very clear at 20% chord at near stall condition and can be detected even at 10% chord. No results at this section are shown at design condition since the tip leakage vortex is not formed here yet.
Figure 5 is the measurement results at 30% chord at design condition and Figure 6 is the results at near stall condition. A leakage vortex is clearly detected here at design condition whose size is similar to the one at 10% chord at near stall condition, which means that the tip leakage vortex forms 20% chord earlier at near stall condition over design condition.
The vortex is stable or not at a certain position can easily be judged by studying instantaneous velocity and vorticity distribution measured at different instants, or by comparing the instantaneous results with the average one. The vortex is stable if the instantaneous results are similar to each other or they are similar to the average one and a concentrated vortex form; otherwise it is unstable. As shown in Figure 4 and Figure 5 etc,
3 Copyright © 2004 by ASME

the tip leakage vortex is stable after its formation at both design and near stall conditions. If a vortex is stable, its instantaneous vorticity concentrates in the core; when it breaks down, several vorticity spots would exist in the low-speed core region and the maximum vorticity in average result is much lower than that in the instantaneous ones, which suggests that instantaneous vorticity distribution is also useful to judge the vortex states.
Instantaneous Results
Average Results
Figure 4 SPIV results at 20% chord at near stall condition (Left: Velocity w; Right: Corresponding vorticity)
As shown in Figure 4 and Figure 5, the streamwise velocity (w velocity) of the leakage vortex core is lower than the mainstream velocity, which is a remarkable difference to the leading edge vortices over highly swept wings. This has a important influence on the vortex stability as will be shown in the next paragraph. It is noticeable that the streamwise velocity in the core of tip leakage vortex at near stall condition is much lower than the mainstream velocity comparing to the one at design condition.
At near stall condition, the minimal streamwise velocity in the core is about 35 m/s at 20% chord in Figure 4 and drops to 18 m/s at 30% chord in Figure 6, while the streamwise velocity in the mainstream decreases only 10 m/s. The minimal instantaneous streamwise velocity in the core at 30% is only 4 m/s, close to stagnation comparing to the streamwise velocity 53 m/s at the vortex edge, which strongly suggests that the leakage vortex would break down soon. At design condition, the minimal streamwise velocity in the core keeps 45 m/s above even at 60% chord when the leakage vortex becomes unstable, which also suggests vortex breakdown could not happen during the process of leakage vortex becoming unstable at design condition.
The mainstream flow should achieve the maximum speed at 30% chord where the blade maximum thickness is located for this rotor. Comparing Figure 5 and Figure 6, some low speed high vorticity bearing regions exist near the rotor’s suction surface at near stall condition, which indicates that the boundary layer becomes unstable and presents a 3-D
characteristic (Baojie 2003), while the flow is fairly even there at design condition.
Instantaneous Results
Average Results
Figure 5 SPIV results at 30% chord at design condition (Left: Velocity w; Right: Corresponding vorticity)
Instantaneous Results
Average Results
Figure 6 SPIV results at 30% chord at near stall condition (Left: Velocity w; Right: Corresponding vorticity)
Figure 7, Figure 9, and Figure 11 are the measurement results at 40%, 50%, and 60% chords at design condition respectively. As shown in Figure 9, the leakage vortex is still stable at 50% chord and keeps the form of a concentrated vortex such as large single vorticity spots in the vortex core, circular streamlines. The form of the instantaneous vortex is similar to that of the average one. These are lost at 60% chord in Figure 11, especially the streamlines are spirally spread out, which indicates that the leakage vortex is becoming unstable.
4 Copyright © 2004 by ASME

Instantaneous Results
Average Results
Figure 7 SPIV results at 40% chord at design condition (Left: Velocity w; Right: Corresponding vorticity)
Instantaneous Results
Instantaneous Results
Average Results
Figure 8 SPIV results at 40% chord at near stall condition (Left: Velocity w; Right: Corresponding vorticity)
Instantaneous Results
Average Results
Figure 9 SPIV results at 50% chord at design condition (Left: Velocity w; Right: Corresponding vorticity)
Instantaneous Results
Instantaneous Results
Average Results
Figure 10 SPIV results at 50% chord at near stall condition (Left: Velocity w; Right: Corresponding vorticity)
5 Copyright © 2004 by ASME

Figure 8 is the measurement results at 40% chord at near stall condition. No stable leakage vortex exists here even in the average fields, single large vorticity spots breaks into several smaller ones, and both the velocities and the streamlines distributions do not have feature of a concentrated vortex, and the size of vortex core doubles. Comparing the continuously evolution from stable to unstable at design condition, the stable leakage vortex suddenly disappears from 30% chord to 40% chord at near stall condition, since the streamwise flow almost stops at 30% chord, it is reasonable to conclude that vortex breakdown occurs at near stall condition. Comparing Figure 6 and Figure 8, the vortex structure changes dramatically, the size of low-speed region in the core increases a lot, and the downstream broken vortices interacts violently with mainstream, which are all the typical features of the breakdown of a concentrated vortex (Leibovich 1984). Analytical results in the next section also support the conclusion. Figure 10 and Figure 12 are the measurement results at 50% and 60% chords results at near stall condition, these results confirm that the single large leakage vortex breaks down into smaller vortices. The high vorticity of the broken vortices and the high radial gradient of streamwise velocity at the edge of low-speed core cause the broken vortices interact strongly with the mainstream, which results in the low speed region expanding rapidly.
Instantaneous Results
Average Results
Figure 11 SPIV results at 60% chord at design condition (Left: Velocity w; Right: Corresponding vorticity)
Besides the characteristics of having much lower velocity, the low-speed region in the core at near stall condition is larger than the one at even 20% chord downstream at design condition. The rotation speed of the tip leakage vortex is distributed almost axisymmetricly, while the streamwise velocity distribution is nonaxisymmetirc, especially at design condition. Such features will influence the vortex stability and make the stability analysis of the tip leakage vortex more difficult.
The measurement results at 70% and 80% chords at design condition are shown in Figure 13 and Figure 14. Comparing with Figure 11, the vorticity core split into smaller ones, the vortex likes a long ellipse in the average result, and the
instantaneous results apparently differ with the average ones. Comparing with the vortex breakdown at near stall condition, the process of the leakage vortex becoming unstable is smooth. Since the streamwise velocity keeps relatively high right before and after the tip leakage vortex becoming unstable, the size of low-speed region in the core does not increase much and the downstream small-scale vortices does not interact strongly with the mainstream.
Instantaneous Results
Instantaneous Results
Average Results
Figure 12 SPIV results at 60% chord at near stall condition (Left: Velocity w; Right: Corresponding vorticity)
No matter breakdown occurs or not, the vortex core will split into small-scale spots with high vorticity once a vortex becomes unstable, and the spots with high vorticity forms the small-scale vortices downstream. There is a large low-speed region with high vorticity spots preserving in the mainstream after the breakdown of tip leakage vortex at near stall condition, but no such structure exists at design condition. Instead, the spots with high vorticity spread out along the casing. This is caused mainly by the different distributions of the streamwise velocity in the core of the tip leakage vortex at design condition and near stall condition as will be stated in the next paragraph.
There are two types of vortex breakdown of streamwise vortex at high Reynolds number: the “bubble” breakdown and the “spiral” breakdown, the former is axisymmetric phenomena and the latter is nonaxisymmetric, which can be easily seen from the instantaneous velocity distribution (Brüker, 1992, 1993). Unlike the leading edge vortices over highly swept
6 Copyright © 2004 by ASME

wings, the tip leakage vortex exists in strong sheared mainstream and it is difficult to judge the type of vortex breakdown even with the measured instantaneous velocity and vorticity distributions. Breakdown of the tip leakage vortex at near stall condition is the “bubble” type or the “spiral” type or a new type still needs further study.
Instantaneous Results
Average Results
Figure 13 SPIV results at 70% chord at design condition (Left: Velocity w; Right: Corresponding vorticity)
Instantaneous Results
Average Results
Figure 14 SPIV results at 80% chord at design condition (Left: Velocity w; Right: Corresponding vorticity)
The measurement results at 70% chord cross-section at near stall condition are shown in Figure 15, the velocity distributions measured in the half passage near the pressure side are also shown because the broken vortices already extend to the middle passage. The broken vortices interact violently with the mainstream when moving downstream, which results in a
large low-speed region. The low-speed region blocks the mainstream and the interaction causes much loss. At the design condition, the small-scale vortices do not block the mainstream much since the low-speed region is limited and the speed inside which is not quite low.
The measurement results at 100% chord cross-sections at design condition are shown in Figure 16 and the corresponding ones at near stall condition are shown in Figure 17. At near stall condition, the broken vortices have moved to the side near the pressure surface and a newly formed corner vortex dominates the flow near the suction surface (Baojie 2003). In contrary, no corner vortex is formed at design condition and the small-scale vortices spread out along the casing centered at the middle of the passage. Comparing Figure 16 and Figure 17, the blockage is more severe at near stall condition, which is caused by both the broken vortices and the corner vortex. At design condition, the small-scale vortices only block the mainstream near the casing, especially 5% blade height at the tip.
Figure 18 and Figure 19 are the integration of the measurement results in several cross-sections for the instantaneous and the average streamwise velocity w at design condition and near stall condition. The instantaneous results at each cross-section in the figures do not relate to each other directly since they were not measured at the same time. From the integration results, the evolution of tip leakage vortex can be defined into three phases. The first is the formation stage, 10% ~30% chord at near stall condition and 30%~50% chord at design condition. During the formation, the leakage flow continues to roll up into the vortex and the vortex remains near the suction surface. The second is the unstable stage, the tip leakage vortex becomes unstable at 50%~60% chord at design condition and breaks down at 30%~40% chord at near stall condition. The last is the interaction stage. The interaction between the small-scale vortices and mainstream is much stronger at near stall condition than that at design condition.
MECHANISM OF LEAKAGE VORTEX BREAKDOWN The mechanism of streamwise vortex breakdown was
intensively analyzed in the past several decades. All of them were in stationary coordinates and the streamwise velocity distribution cannot represent that of the tip leakage vortex. The following analysis will focus on the Coriolis force effect, centrifugal force effect, and the instability of tip leakage vortex. As shown in the measurement results, the tip leakage vortex is three-dimensional viscous unsteady flow. It is reasonable, however, to treat it as incompressible inviscid steady columnar vortex in order to investigate its preliminary mechanism.
A notable characteristic of a concentrated vortex is that the pressure gradient imposed at the edge can be amplified on the centerline under the effect of vortex rotation, which was successfully analyzed by M. G. Hall (1966). Following the way of M. G. Hall, the control equations are deduced in rotation coordinates and used to analyze the Coriolis force effect and the centrifugal force effect. The reason that the core always becomes unstable first when a vortex becomes unstable is also analyzed.
The equations of motion for an incompressible inviscid quasi-cylindrical steady vortex in cylindrical coordinates are as follow
0)(1
=∂∂
+∂
∂zw
rrw
rzr (1)
7 Copyright © 2004 by ASME
rprw
rw
∂∂
=Ω+Ω+ρθ
θ 12 22
(2)
02 =Ω++∂∂
+∂∂
rr
zr wrww
zww
rww θθθ (3)
zp
zww
rww z
zz
r ∂∂
−=∂∂
+∂∂
ρ1 (4)
Where r , θ and z are radial, circumferential and axial coordinates, rw , θw and zw are the corresponding components in rotation coordinates. Ω is the rotating speed of the coordinates.
Equation 2 can be deduced as:
200
12R
r r R
dp dp drdz dz r zr
ρ= =
Γ ∂Γ= + + Ω ∂∫ (5)
Where rwθ≡Γ , R is the radius of the edge of vortex core. The following equation can be obtained from Equation 1 and Equation 3:
Ω+∂Γ∂
−=∂Γ∂ r
rww
z z
r 2 (6)
From Equation 5 and Equation 6, we have
drrw
rw
rrww
dzdp
dzdp R
z
r
Rrr
Ω+
∂Ω∂
+Ω
+
∂Γ∂Γ
+= ∫==
2
300
2)(3
2
θθ
ρ (7)
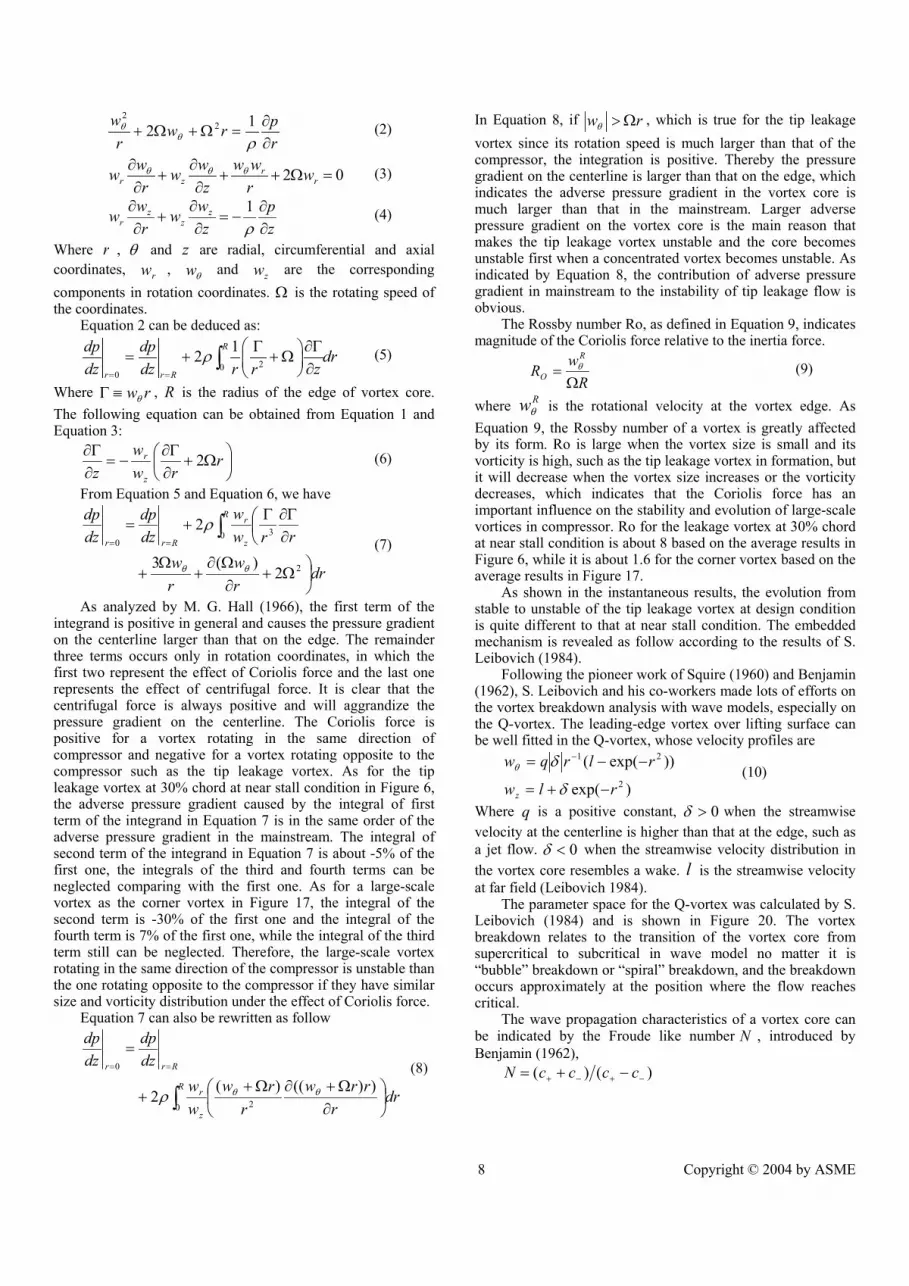
As analyzed by M. G. Hall (1966), the first term of the integrand is positive in general and causes the pressure gradient on the centerline larger than that on the edge. The remainder three terms occurs only in rotation coordinates, in which the first two represent the effect of Coriolis force and the last one represents the effect of centrifugal force. It is clear that the centrifugal force is always positive and will aggrandize the pressure gradient on the centerline. The Coriolis force is positive for a vortex rotating in the same direction of compressor and negative for a vortex rotating opposite to the compressor such as the tip leakage vortex. As for the tip leakage vortex at 30% chord at near stall condition in Figure 6, the adverse pressure gradient caused by the integral of first term of the integrand in Equation 7 is in the same order of the adverse pressure gradient in the mainstream. The integral of second term of the integrand in Equation 7 is about -5% of the first one, the integrals of the third and fourth terms can be neglected comparing with the first one. As for a large-scale vortex as the corner vortex in Figure 17, the integral of the second term is -30% of the first one and the integral of the fourth term is 7% of the first one, while the integral of the third term still can be neglected. Therefore, the large-scale vortex rotating in the same direction of the compressor is unstable than the one rotating opposite to the compressor if they have similar size and vorticity distribution under the effect of Coriolis force.
Equation 7 can also be rewritten as follow
drr
rrwr
rwww
dzdp
dzdp
R
z
r
Rrr
∂Ω+∂Ω+
+
=
∫
==
))(()(2 20
0
θθρ
(8)
In Equation 8, if rw Ω>θ , which is true for the tip leakage vortex since its rotation speed is much larger than that of the compressor, the integration is positive. Thereby the pressure gradient on the centerline is larger than that on the edge, which indicates the adverse pressure gradient in the vortex core is much larger than that in the mainstream. Larger adverse pressure gradient on the vortex core is the main reason that makes the tip leakage vortex unstable and the core becomes unstable first when a concentrated vortex becomes unstable. As indicated by Equation 8, the contribution of adverse pressure gradient in mainstream to the instability of tip leakage flow is obvious.
The Rossby number Ro, as defined in Equation 9, indicates magnitude of the Coriolis force relative to the inertia force.
Rw
RR
O Ω= θ (9)
where Rwθ is the rotational velocity at the vortex edge. As Equation 9, the Rossby number of a vortex is greatly affected by its form. Ro is large when the vortex size is small and its vorticity is high, such as the tip leakage vortex in formation, but it will decrease when the vortex size increases or the vorticity decreases, which indicates that the Coriolis force has an important influence on the stability and evolution of large-scale vortices in compressor. Ro for the leakage vortex at 30% chord at near stall condition is about 8 based on the average results in Figure 6, while it is about 1.6 for the corner vortex based on the average results in Figure 17.
As shown in the instantaneous results, the evolution from stable to unstable of the tip leakage vortex at design condition is quite different to that at near stall condition. The embedded mechanism is revealed as follow according to the results of S. Leibovich (1984).
Following the pioneer work of Squire (1960) and Benjamin (1962), S. Leibovich and his co-workers made lots of efforts on the vortex breakdown analysis with wave models, especially on the Q-vortex. The leading-edge vortex over lifting surface can be well fitted in the Q-vortex, whose velocity profiles are
)exp(
))exp((2
21
rlw
rlrqw
z −+=
−−= −
δ
δθ (10)
Where q is a positive constant, 0>δ when the streamwise velocity at the centerline is higher than that at the edge, such as a jet flow. 0<δ when the streamwise velocity distribution in the vortex core resembles a wake. l is the streamwise velocity at far field (Leibovich 1984).
The parameter space for the Q-vortex was calculated by S. Leibovich (1984) and is shown in Figure 20. The vortex breakdown relates to the transition of the vortex core from supercritical to subcritical in wave model no matter it is “bubble” breakdown or “spiral” breakdown, and the breakdown occurs approximately at the position where the flow reaches critical.
The wave propagation characteristics of a vortex core can be indicated by the Froude like number N , introduced by Benjamin (1962),
)()( −+−+ −+= ccccN
8 Copyright © 2004 by ASME

where +c and −c are the greater and lesser values of the phase speed for waves of extreme length. The flow is supercritical when 1>N , subcritical when 1<N and critical when 1=N . In Figure 20, the hatched regions are supercritical, the inclined lines, a to f, indicate the breakdown of several Q-vortex with 0>δ .
The approaching flow in a leading edge vortex over highly swept wings is supercritical and with 0>δ . As shown by the measurement results, the streamwise velocity distribution at the core of tip leakage vortex is wake-like both at design and near stall conditions, which means that 0<δ .
According to the measurement results, blue line A and red line B in Figure 20 are the analyzed results for the tip leakage vortex at design condition and near stall condition, respectively. It is clear that critical condition occurs in the tip leakage vortex at near stall condition, the approaching flow is supercritical and the wake flow is subcritical. No critical condition occurs at design condition, the approaching flow and the wake flow are all supercritical. Thereby, vortex breakdown is only observed at near stall condition in the experiment, while the evolution of the tip leakage vortex is smooth at design condition.
As shown in the measurement results, the distribution of streamwise and circumferential velocities in the tip leakage vortex is nonaxisymmetric, the mainstream is also highly three-dimensional with high turbulence and adverse pressure gradient, and the downstream disturbance is periodic and complicated under rotor-stator interaction. More works need to be done on the stability of the tip leakage vortex.
CONCLUSIONS Based on the instantaneous velocity and vorticity fields
measured in the low-speed large-scale compressor rotor, the evolution of the tip leakage vortex is analyzed at design and near stall conditions. The conclusions below might be mainly suitable to low-speed compressors.
1). The evolution of tip leakage vortex is a process from stable to unstable, from large-scale to turbulence, which is characterized by formation, becoming unstable and interaction with mainstream.
2). The effect of the tip leakage vortex on mainstream varies during its evolution downstream. When the tip leakage vortex is stable, low-energy leakage flow is rolling up into the vortex continuously, which is almost harmless to the mainstream. After it becomes unstable, the blockage and loss occurs mainly by the strong interaction of small-scale vortices and mainstream.
3). The processes of tip leakage vortex becoming unstable at design and nears stall conditions are quite different. It is smooth at design condition but breakdown occurs at near stall condition in the experiment. The main reason is that critical condition only occurs in the tip leakage vortex at near stall condition.
4). Coriolis force and centrifugal force could result in the large-scale concentrated vortex rotating opposite to the rotor more stable than the one rotating in the same direction of the rotor. The centrifugal force could always destabilize the vortex.
ACKNOWLEDGMENTS The authors would like to acknowledge the support of
National Natural Science Foundation of China, Grant No.
50006001, Grant No. 50206002, and the support of National Foundation Research Project, Grant No. 1999022305. The authors also would like to thank the help and contributions of Mr. Huijing Yuan and Pro. Yueting Xu.
REFERENCES Baojie, L., Huoxing, L., Huijing, Yuen, Hongjun, Y. etc,
2002, “SPIV Application in the Measurement Leakage Flow of Compressor Rotor”, Proceedings of SPIE, 5058: 146-154.
Baojie, L., Hongwei, W., Huoxing, L., Hongjun, Y. etc, 2003, “Experimental Investigation of Unsteady Flow Field in The Tip Region of An Axial Compressor Rotor Passage at Near Stall Condition with SPIV”, ASME-2003-38185.
Benjamin T. B., 1962, “Theory of the vortex breakdown phenomenon,” J. Fluid Mech., 14: 593-629.
Brücker, Ch., Althaus, W., 1992, “Study of vortex breakdown by particle tracking velocimetry. Part 1: bubble-type vortex breakdown”. Exp. Fluids, 13:339-349.
Brücker, Ch., 1993, “Study of vortex breakdown by particle tracking velocimetry. Part 2: spiral-type vortex breakdown”. Exp. Fluids, 14:133-139.
Chen, G. T., Greitzer, E. M., Tan, C. S., and Marble, F. E., 1991, “Similarity analysis of compressor tip clearance flow structure,” ASME J. Turbomachinery, 113, pp. 260-271.
Escudier, M., 1988, “Vortex breakdown: observations and explanations,” Progress in Aerospace Science, 25(2): 189-229.
Furukawa, M., Inoue, M., Saiki, K., and Yamada, K., 1999, “The Role of Tip Leakage Vortex Breakdown in Compressor Rotor Aerodynamics”, ASME J. Turbomachinery, 121, pp. 469-480.
Furukawa, M., Saiki, K., Yamada, K., and Inoue, M., 2000, “Unsteady Flow Behavior Due to Breakdown of Tip Leakage Vortex in an Axial Compressor Rotor at Near-Stall Condition,” ASME Paper 2000-GT-666.
Goto, A., 1992, “Three-Dimensional Flow and Mixing in an Axial Flow Compressor With Different Rotor Tip Clearances,” ASME J. Turbomachinery, 114, pp. 675-685.
Hall, M. G., 1966, “The Structure of Concentrated Vortex Cores,” Progress in Aeronautical Science, 7: 53-110.
Hall, M. G., 1972, “Vortex Breakdown,” Annual Review of Fluid Mechanics, 4: 195-218.
Hongwei, Ma, and Haokang, Jiang, 2000, “Three-dimensional Turbulent Flow of the Tip Leakage Vortex in an Axial Compressor Rotor Passage,” ASME Paper, 2000-GT-503.
Hunter, I. H. and Cumpsty, N. A., 1982, “Casing Wall Boundary Layer Development Through an Isolated Compressor Rotor,” ASME J. Engineering for Power, 104, pp. 805-818.
Inoue, M., Kurou, M., and Fukuhara, M., 1986, “Behavior of Tip Leakage Flow behind an Axial Compressor Rotor,” ASME J. Engineering for Gas Turbines and Power, 108, pp. 7-14.
Inoue, M., and Kurou, M., 1989, “Structure of tip clearance flow in an isolated axial compressor rotor,” ASME J. Turbomachinery, 111, pp. 250-256.
Kang, S., and Hirsch, C., 1993, “Experiment Study on the Three-Dimension Flow within a Compressor Cascade with Tip Clearance: Part one - Velocity and Pressure Fields,” J. Turbomachinery, 115, pp. 444-452.
Lakshminarayana, B. et al, 1982, “Three-Dimensional Flow Field in the Tip Region of a Compressor Rotor Passage,
9 Copyright © 2004 by ASME

Parts I and II, ” ASME Journal of Engineering for Power, 104, pp. 760-781.
Lakshminarayana, B., 1970, “Methods of Predicting the Tip Clearance Effects in Axial Flow Turbomachinery,” ASME J. Basic Engineering, 112, pp. 609-617.
Lakshmirayana, B., Zaccaria, M., and Marathe, B., 1995, “The structure of tip clearance flow in an axial flow compressor,” ASME J. Turbomachinery, 117, pp. 336-347.
Leibovich, S., 1984, “Vortex Stability and Breakdown: Survey and Extension,” AIAA Journal, 22: 1192-1206.
Lucca-Negro, O., O'Doherty, T., 2001, “Vortex breakdown: a review,” Progress in Energy and Combustion Science, 27: 431-481.
Miller, G. R., and Bailey, E. E., 1971, “Static-Pressure Contours in the Blade Passage at the Tip of Several High Mach Number Rotors,” NASA TM X-2170.
Rains, D. A., 1954, “Tip clearance flows in axial flow compressors and pumps,” California Institute of Technology, hydrodynamics and Mechanical Engineering Laboratories, Report No.5.
Schlechtriem, S., and Lotzerich M., 1997, “Breakdown of Tip Leakage Vortices in Compressors at Flow Conditions Close to Stall,” ASME Paper No. 97-GT-41.
Squire, H. B., 1960, “Analysis of the vortex breakdown Phenomenon,” Miszellaneen der Angewwandten Mechanik, Berlin, Akademie-Verlag, pp. 306-312.
Stauter, R. C., 1993, “Measurement of the Three-dimensional Tip Region Flow in an Axial Compressor,” ASME J. Turbomachinery, 115, pp. 468-476.
Storer, J. A., and Cumpsty, N. A., 1991, “Tip Leakage Flow in Axial Compressor,” J. Turbomachinery, 113, pp. 252-259
Stuart, J. T., 1987, “A critical review of vortex breakdown theory, Vortex control and breakdown behaviour,” Second International Colloquium on Vortical Flows, BBC, pp. 131±54.
Suder K. L., and Celestina, M. L., 1994, “Experimental and Computational Investigation of the Tip Clearance Flow in a Transonic Axial Compressor Rotor,” ASME Paper No. 94-GT-365.
Wennerstrom, A. J., 1984, “Experimental Study of a High Through-Flow Transonic Axial Compressor Stage,” ASME J. Engineering for Gas Turbines and Power, 106, pp. 552-560.
Wernet, M. P., Zante, D. V., Strazisar, T. J., John, W. T., etc, 2002, “3-D Digital PIV Measurements of the Tip Clearance Flow in an Axial Compressor,”ASME-2002-30643
Left: Velocity w; Right: Corresponding vorticity Left: Velocity w; Right: Corresponding vorticity
Half passage near suction surface Half passage near pressure surface
Left: Velocity w; Right: Corresponding vorticity Left: Velocity w; Right: Corresponding vorticity
Half passage near suction surface Half passage near pressure surface
Figure 15 SPIV results at 70% chord at near stall condition (Up: Instantaneous Results, Down: Average Results)
10 Copyright © 2004 by ASME

Left: Velocity w; Right: Corresponding vorticity Left: Velocity w; Right: Corresponding vorticity
Half passage near suction surface Half passage near pressure surface
Left: Velocity w; Right: Corresponding vorticity Left: Velocity w; Right: Corresponding vorticity
Half passage near suction surface Half passage near pressure surface
Figure 16 SPIV results at 100% chord at design condition (Up: Instantaneous Results, Down: Average Results)
Left: Velocity w; Right: Corresponding vorticity Left: Velocity w; Right: Corresponding vorticity
Half passage near suction surface Half passage near pressure surface
Left: Velocity w; Right: Corresponding vorticity Left: Velocity w; Right: Corresponding vorticity
Half passage near suction surface Half passage near pressure surface
Figure 17 SPIV results at 100% chord at near stall condition (Up: Instantaneous Results, Down: Average Results)
11 Copyright © 2004 by ASME

(Left: design condition; Right: near stall condition)
Figure 18 Composite figure of velocity instantaneous w distribution
(Left: design condition; Right: near stall condition)
Figure 19 Composite figure of average velocity w distribution
Figure 20 Parameter space for the Q-vortex (Leibovich 1984)
12 Copyright © 2004 by ASME