three-dimensional event visualization for the atlas calorimeter
TRANSCRIPT
ATL
-TIL
ECA
L-PU
B-20
10-0
0110
Aug
ust2
010
Three-dimensional Event Visualization for the
ATLAS Calorimeter
Luciano M. de Andrade Filho a Jose Manoel de Seixas b
Roberto Agostino Vitillo c Brian Thomas Martin d
aFederal Univertity of Juiz de Fora - Department of Electrical CircuitsbFederal University of Rio de Janeiro - Signal Processing Laboratory
cNational Institute of Nuclear Physics - PisadMichigan State University
Abstract
The ATLAS detector has been commissioned with cosmic rays. For this commission-ing phase, a number of software tools has been developed to support data analysis.Among ATLAS subdetectors, commissioning the calorimeter system demanded aconsiderable effort due to its segmentation into seven detection layers, which pro-duces more than a hundred thousand readout channels. Tasks like performanceevaluation of the calorimeter, calibration and noisy or dead channel detection bene-fit a lot from cosmic muon track visualization, which facilitates the identification ofthe activated cells in the calorimeter. The coherence of the reconstructed data canbe visually checked and potential problems can be detected in a easier way. Thiswork presents a 3D visualization tool for the ATLAS calorimeter system, the Calo-GeoView, which provides a smooth integration with analyses currently performedby the ATLAS community. The tool structure and some applications with recon-structed data are presented. Due to its 3D graphical interface, the CaloGeoView hasbeen providing a simple and intuitive way to analyze results of event reconstruction.As a consequence, the ATLAS hadronic calorimeter collaboration is now using thisvisualization tool online in the control room.
Key words: Event display, Cosmic rays, Calorimetry, Triggering Systems, ATLASdetector
Email address: [email protected] (Luciano M. deAndrade Filho).
Preprint submitted to Elsevier 4 August 2010

Fig. 1. The ATLAS detector
1 Introduction
LHC [1] will collide protons with 14 TeV in the center of mass at a 25 nanosec-ond period. As one of the main LHC detectors, ATLAS [2] will explore thefundamental nature of matter and the basic forces that shape our universe.The detector has a total length of 42 m and a radius of 11 m (see Figure 1).
The Inner Detector [3] extends to a radius of 1.2 m, and is 7 m in lengthalong the beam pipe. Its basic function is to track charged particles, reveal-ing detailed information about the type of particle and its momentum. Thecalorimeter [4] is situated outside the solenoidal magnet that surrounds theinner detector and comprises two sections: electromagnetic and hadronic part.Their purpose is to measure the energy of incoming particles by total ab-sorption [5]. The muon spectrometer is an extremely large detection system,extending from a radius of 4.25 m around the calorimeters out to the fullradius of the detector (11 m) [6]. Its tremendous size is required to accuratelymeasure the momentum of muons.
Due to the extremely high interaction rate and the huge background noise gen-erated by LHC, ATLAS requires the design of a sophisticated on-line triggeringsystem, for which calorimeters provide an essential information. In ATLAS,the triggering system operation is split into three cascaded levels and shouldreduce dramatically the background noise rate, providing an output frequencyof the order of 100 Hz [7].
Synchronization of all the ATLAS subdetectors with the trigger system can
2

be considered as a real challenge, when complexity of the detector system,the huge number of channels and the variety of the technologies used in thedifferent parts are taken into account. In order to achieve this goal, severalcommissioning procedures have been put into place. For commissioning thewhole system with physical events, before the LHC start, an exhaustive testswith cosmic rays have been performed since 2006 [8], [9], [10], [11]. Thesetests have allowed to check the integrity of each sub-detector, identifying localproblems, and testing the intercommunication of the sub-systems as well.
Different algorithms are executed to analyze cosmic runs. One of the mostefficient way to identify local problems is the visual inspection of the recon-structed data, using an event display tool. While standard event displays inATLAS - like Atlantis [12], Persint [13] and VP1 [14] - were developed to vi-sualize as much information as possible in LHC proton-proton collisions, theCaloGeoView provides specific calorimeter cell level information that can bevery usefull during comissioning phase with cosmic rays, like actual 3D cell ge-ometry, energy-to-color palette and track visualization of cosmic muons basedon calorimeter information only.
This work presents a software tool for 3D visualization of the calorimeter cells,the CaloGeoView [15]. This tool allows to check the coherency of the recon-struction algorithms and supports the commissioning phase with cosmic rays.The CaloGeoView has been developed using ROOT framework [16] and its em-bedded geometry package [17]. Since the framework for data reconstructionin ATLAS, Athena [18], generates specific files to be loaded in ROOT envi-ronment, the integration between reconstructed data and the CaloGeoViewcan be done smoothly. Due to its easy and intuitive way to analyze and iden-tify problems, this tool has become part of the Online Hadronic CalorimeterMonitoring System [19] and should be operational during LHC collisions aswell.
This paper is organized as it follows. For the ATLAS calorimeter system,both the geometry and segmentation profile are presented in Section 2. InSection 3, the online triggering system is described. Section 4 addresses thecalorimeter commissioning with cosmic rays. Then, Section 5 presents the 3Devent display tool, their features and some practical examples. Details aboutimplementation are given in Section 6. Finally, conclusions are derived in theSection 7.
2 Calorimeter System
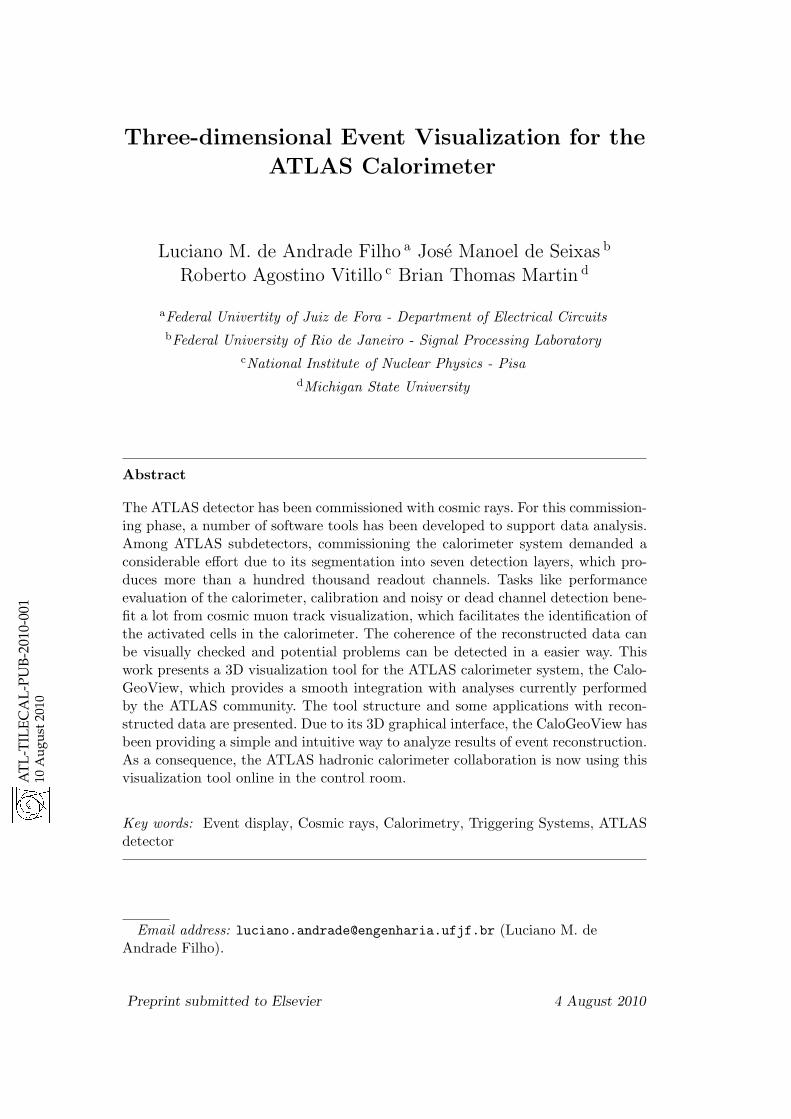
The calorimeter system comprises two sections: an inner electromagnetic calorime-ter and an outer hadronic calorimeter (Figure 2). Both are sampling calorime-
3
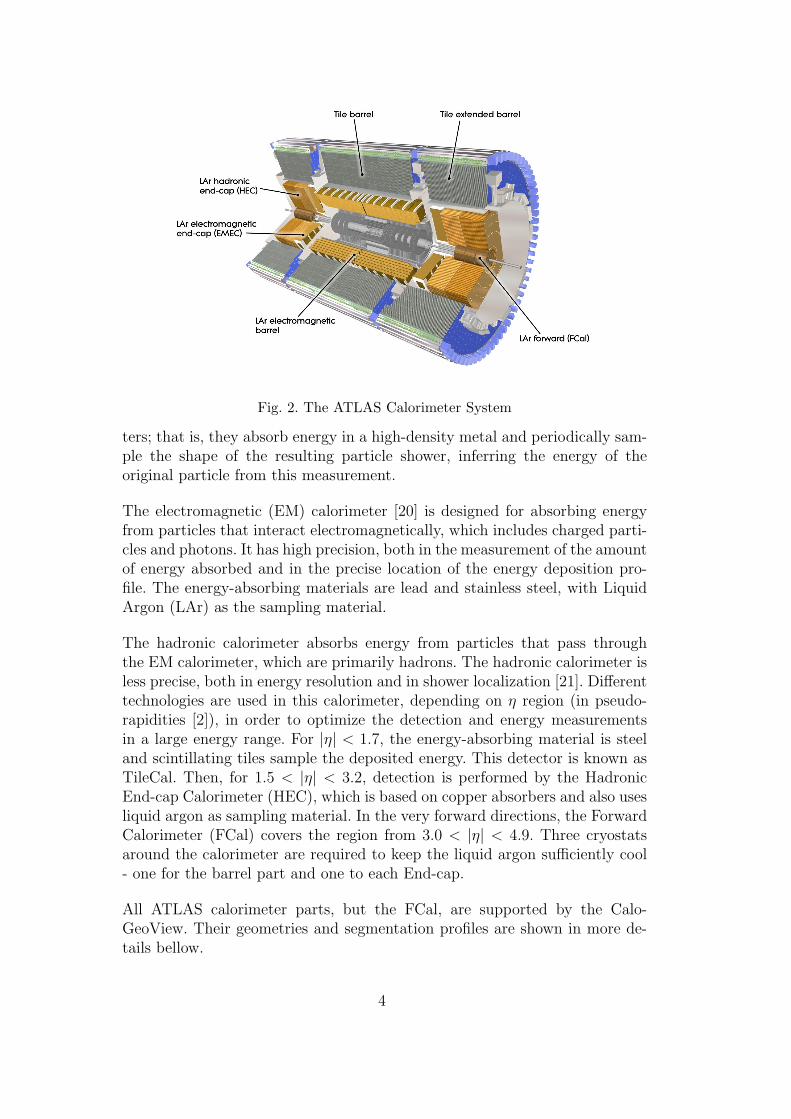
Fig. 2. The ATLAS Calorimeter System
ters; that is, they absorb energy in a high-density metal and periodically sam-ple the shape of the resulting particle shower, inferring the energy of theoriginal particle from this measurement.
The electromagnetic (EM) calorimeter [20] is designed for absorbing energyfrom particles that interact electromagnetically, which includes charged parti-cles and photons. It has high precision, both in the measurement of the amountof energy absorbed and in the precise location of the energy deposition pro-file. The energy-absorbing materials are lead and stainless steel, with LiquidArgon (LAr) as the sampling material.
The hadronic calorimeter absorbs energy from particles that pass throughthe EM calorimeter, which are primarily hadrons. The hadronic calorimeter isless precise, both in energy resolution and in shower localization [21]. Differenttechnologies are used in this calorimeter, depending on η region (in pseudo-rapidities [2]), in order to optimize the detection and energy measurementsin a large energy range. For |η| < 1.7, the energy-absorbing material is steeland scintillating tiles sample the deposited energy. This detector is known asTileCal. Then, for 1.5 < |η| < 3.2, detection is performed by the HadronicEnd-cap Calorimeter (HEC), which is based on copper absorbers and also usesliquid argon as sampling material. In the very forward directions, the ForwardCalorimeter (FCal) covers the region from 3.0 < |η| < 4.9. Three cryostatsaround the calorimeter are required to keep the liquid argon sufficiently cool- one for the barrel part and one to each End-cap.
All ATLAS calorimeter parts, but the FCal, are supported by the Calo-GeoView. Their geometries and segmentation profiles are shown in more de-tails bellow.
4
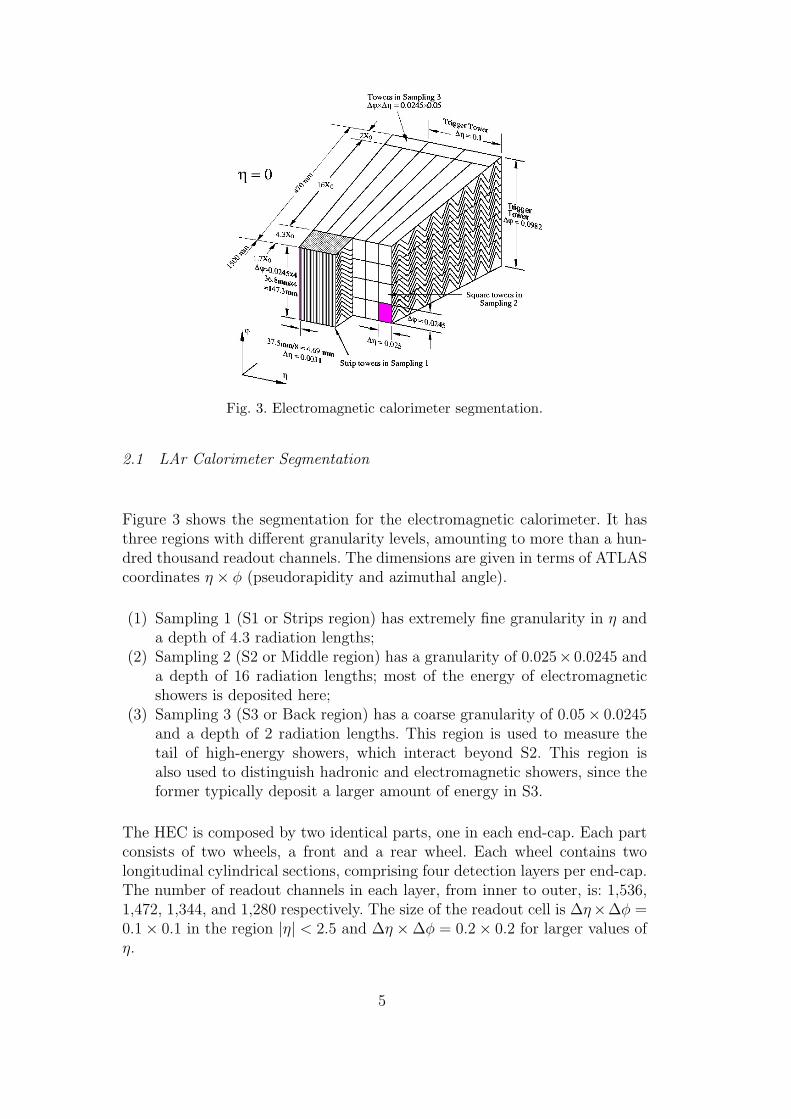
Fig. 3. Electromagnetic calorimeter segmentation.
2.1 LAr Calorimeter Segmentation
Figure 3 shows the segmentation for the electromagnetic calorimeter. It hasthree regions with different granularity levels, amounting to more than a hun-dred thousand readout channels. The dimensions are given in terms of ATLAScoordinates η × φ (pseudorapidity and azimuthal angle).
(1) Sampling 1 (S1 or Strips region) has extremely fine granularity in η anda depth of 4.3 radiation lengths;
(2) Sampling 2 (S2 or Middle region) has a granularity of 0.025× 0.0245 anda depth of 16 radiation lengths; most of the energy of electromagneticshowers is deposited here;
(3) Sampling 3 (S3 or Back region) has a coarse granularity of 0.05× 0.0245and a depth of 2 radiation lengths. This region is used to measure thetail of high-energy showers, which interact beyond S2. This region isalso used to distinguish hadronic and electromagnetic showers, since theformer typically deposit a larger amount of energy in S3.
The HEC is composed by two identical parts, one in each end-cap. Each partconsists of two wheels, a front and a rear wheel. Each wheel contains twolongitudinal cylindrical sections, comprising four detection layers per end-cap.The number of readout channels in each layer, from inner to outer, is: 1,536,1,472, 1,344, and 1,280 respectively. The size of the readout cell is ∆η×∆φ =0.1 × 0.1 in the region |η| < 2.5 and ∆η × ∆φ = 0.2 × 0.2 for larger values ofη.
5
Fig. 4. TileCal longitudinal segmentation.
2.2 TileCal Segmentation
The TileCal comprises three cylindrical parts: one barrel, which covers therapidity range |η| < 1.0, and two extended barrel wheels, covering the rapidityrange 0.8 < |η| < 1.7 on either side of the barrel [21]. The barrel and the twoextended barrels are separated by a gap of 600 mm to provide space for LiquidArgon distribution pipes, LAr Calorimeter front-end crates and Inner Detectorservices. Each of the sub-detectors is composed of 64 azimuthal wedge-shapedmodules. Figure 4 shows the TileCal segmentation. Each calorimeter cell iscoupled to two PMTs for readout redundancy.
3 Trigger System
In order to identify interesting and rare physics phenomena in the bulk ofthe data, the ATLAS detector implements a three-level trigger (Figure 5).The last two levels form the ATLAS High-level trigger [22]. The task of thetrigger system [23] is to classify events according to landmark properties andto store those that comply with a list of given descriptions (the trigger menu).The three cascaded trigger levels have different requirements and differentimplementation strategies:
(1) Level1 The first level (L1) trigger is optimized for maximum processingspeed [7]. It processes a subset of the available data: calorimeters areread out only with coarse granularity, while fast Muon Trigger detectorsare read out with full granularity. To further reduce processing time, thetrigger is implemented with dedicated electronics, located as close to thedetector as possible. The designed output rate from L1 is 100 kHz
(2) Level2 The second-level (L2) trigger receives input from L1 for acceptedevents [22]. This input consists of Regions of Interest (RoIs), which rep-
6

Fig. 5. The ATLAS three-level online trigger.
resent signal areas in the sub-detectors that are recognized by the firstlevel trigger as containing a trigger item. The average processing time forL2 algorithms - running on multiple PCs - is 40 ms.
(3) Event Filter The Event Filter receives L2 decisions with an input rateof 1 kHz, then proceeds to read out the full event data from all thesub-detectors. The processing time is expected to be on average 4 secondper event, and the result is stored in a permanent repository. The EventFilter is implemented on a large farm of PCs, and the output rate forreconstructed data is 100-200 Hz.
4 Commissioning with cosmic rays
The goal of the calorimeter commissioning with cosmic rays [24] was the per-formance validation of the calibrated detector, ensuring the readiness for LHCturn-on. The detector commissioning started before the triggering system wasready for full integration. Therefore, in order to acquire cosmic data, the AT-LAS trigger system was bypassed and a coincidence board was assembled forperforming trigger based on TileCal information [25]. Figure 6 shows how wasthe Tile Cosmic Trigger setup. The straight-line represents a cosmic muoncrossing the center of the detector. For triggering, coincidence from both topand bottom parts of the TileCal was required. When a trigger signal was gener-ated, data from both hadronic and electromagnetic calorimeters were recordedwith full granularity. The coincidence board was fed from TileCal compactedinformation, which was obtained from its trigger towers. These towers corre-
7

Fig. 6. Triggering cosmic rays with TileCal.
spond to the analog sum of all PMTs inside ∆η < 0.1, for each module [26].In Figure 4, one can identify, for instance, that the first tower corresponds tothe sum of signals from A1, BC1 and D0 cells.
Cosmic ray muons can be used to check various detector parameters. Whilethe cell by cell statistics might not be sufficient, it will be possible to sumsimilar cells (along the φ direction) and perform physics signal shape studies,as well as amplitude and time inter-calibrations. The problematic channels,such as having HV different from nominal voltage, dead readout channels etc,can be identified, and proper treatment of these channels can be investigated.To help in these tasks, the 3D visualization for the excited calorimeters cellshas been an easy and intuitive way to identify problems.
5 The Visualization Tool
The presented visualization tool provides two different modules: a TileCalspecific module and a combined TileCal and LAr Calorimeters module.
The first module is used to load specific TileCal reconstructed data, providingdetailed information from this subdetector. The second module accesses cellenergy for both electromagnetic and hadronic calorimeters. However, bothpulse-shape and TileCal individual PMT information, like fitting parameters,are not available (energy information only at the cell level). Also, cosmic muontracks computed using information from TileCal [27] are shown as well for bothmodules.
5.1 The TileCal Specific Module
Figure 7 shows the Graphical User Interface (GUI) for this module. Threewindows can be observed. The left-back window is the standard viewer for 3Dobjects in ROOT (ROOTs GL viewer). A cosmic ray event is displayed in the
8
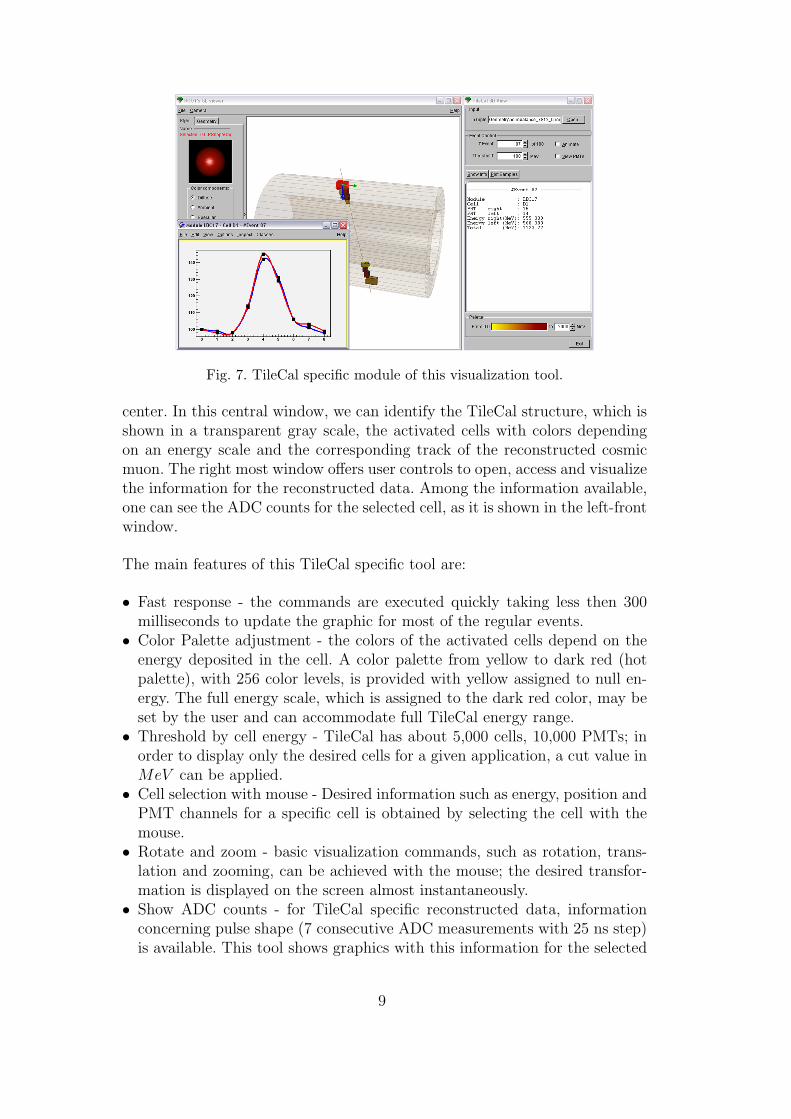
Fig. 7. TileCal specific module of this visualization tool.
center. In this central window, we can identify the TileCal structure, which isshown in a transparent gray scale, the activated cells with colors dependingon an energy scale and the corresponding track of the reconstructed cosmicmuon. The right most window offers user controls to open, access and visualizethe information for the reconstructed data. Among the information available,one can see the ADC counts for the selected cell, as it is shown in the left-frontwindow.
The main features of this TileCal specific tool are:
• Fast response - the commands are executed quickly taking less then 300milliseconds to update the graphic for most of the regular events.
• Color Palette adjustment - the colors of the activated cells depend on theenergy deposited in the cell. A color palette from yellow to dark red (hotpalette), with 256 color levels, is provided with yellow assigned to null en-ergy. The full energy scale, which is assigned to the dark red color, may beset by the user and can accommodate full TileCal energy range.
• Threshold by cell energy - TileCal has about 5,000 cells, 10,000 PMTs; inorder to display only the desired cells for a given application, a cut value inMeV can be applied.
• Cell selection with mouse - Desired information such as energy, position andPMT channels for a specific cell is obtained by selecting the cell with themouse.
• Rotate and zoom - basic visualization commands, such as rotation, trans-lation and zooming, can be achieved with the mouse; the desired transfor-mation is displayed on the screen almost instantaneously.
• Show ADC counts - for TileCal specific reconstructed data, informationconcerning pulse shape (7 consecutive ADC measurements with 25 ns step)is available. This tool shows graphics with this information for the selected
9

cell.• Show individual PMTs - the TileCal cells can be drawn in two parts, each
part representing one of the two PMTs of the cell. In this mode, each PMTreceives a different color depending on its energy. With this approach onecan visually inspect for problems like energy imbalance of the cell.
5.2 The General Calorimeter Module
This is the visualization tool for the combined hadronic and electromagneticATLAS calorimeter. The controls are pretty much the same as the ones pro-vided by TileCal specific tool. The threshold and the color palette can be setindependently for the two calorimeters, with a bright to dark green paletteassigned to EM calorimeter and yellow to dark red palette assigned to thehadronic calorimeter. The combined visualization tool has been mainly usedto test algorithms for the High-Level Trigger and visualize online event recon-struction in the ATLAS control room.
5.3 Application Examples
This section presents some applications of this visualization tool. Several com-missioning aspects, like simulation validation, online monitoring and offlinereconstruction were tested using the visualization facilities provided by thistool.
5.3.1 HLT RoI Visualization
Figure 8 shows the CaloGeoView graphical interface where one can identifya level-two trigger Region of Interest (RoI) simulation. This figure representsa typical LHC collision simulation resulting in two electrons. Thanks to thiskind of visualization, a reconstruction problem (Figure 9) related to the RoIborder cells, in some events with a higher pseudorapidity angle, where outercalorimeter cells are used, has been found. One can see a smooth cell energydecay from the center cell (most energetic cell) after fixing the problem. Thiskind of problem is hard to be detected without 3D visualization.
5.3.2 L2 feature extraction algorithm
The job of the L2’s calorimeter baseline algorithm, named T2Calo [22], consistsof evaluating a more precise interaction point using the available calorimetergranularity and, based on that, extract features of the cluster that may lead
10
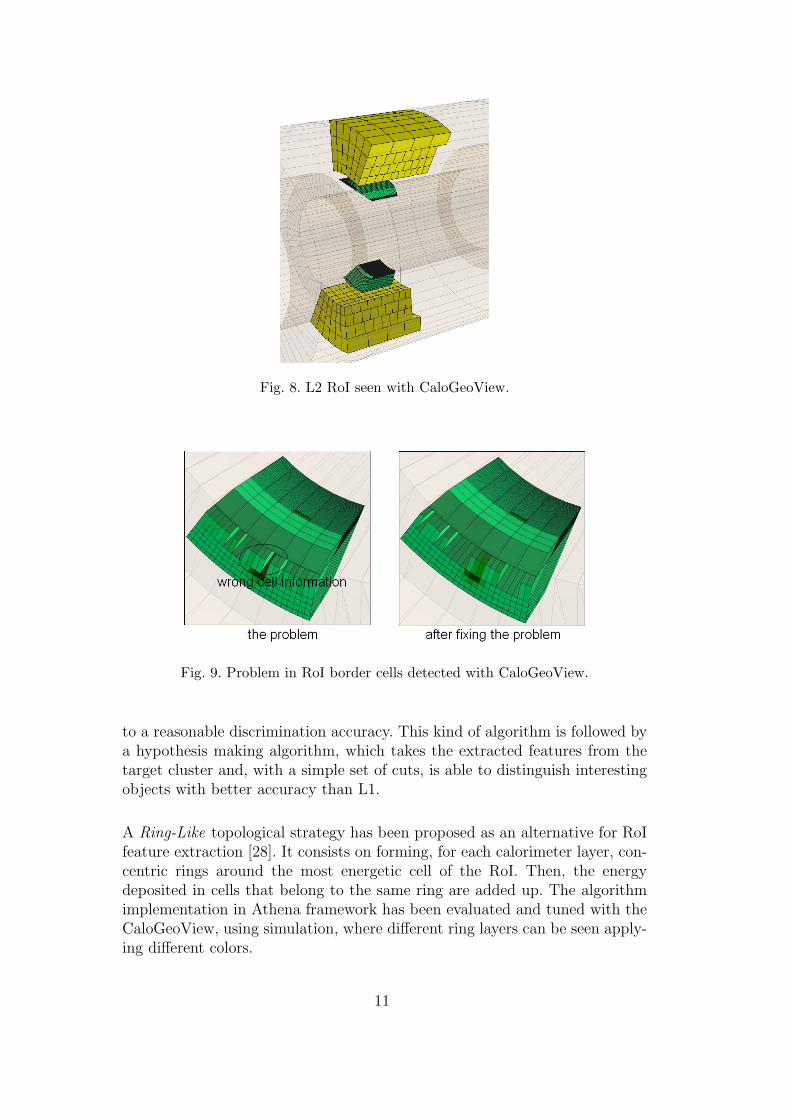
Fig. 8. L2 RoI seen with CaloGeoView.
Fig. 9. Problem in RoI border cells detected with CaloGeoView.
to a reasonable discrimination accuracy. This kind of algorithm is followed bya hypothesis making algorithm, which takes the extracted features from thetarget cluster and, with a simple set of cuts, is able to distinguish interestingobjects with better accuracy than L1.
A Ring-Like topological strategy has been proposed as an alternative for RoIfeature extraction [28]. It consists on forming, for each calorimeter layer, con-centric rings around the most energetic cell of the RoI. Then, the energydeposited in cells that belong to the same ring are added up. The algorithmimplementation in Athena framework has been evaluated and tuned with theCaloGeoView, using simulation, where different ring layers can be seen apply-ing different colors.
11

Fig. 10. Cosmic simulation seen with CaloGeoView.
5.3.3 Cosmic Ray Simulation in ATLAS
Figure 10 shows an example of cosmic ray simulation event without noise. Onecan see the perfect match between the truth track, generated by the MonteCarlo simulation, and the activated cells for both hadronic and electromagneticcalorimeters. Both track truth and activated cell list are read from the samereconstruction file. This kind of visualization has become important to attestand to get confidence with the simulation of cosmic rays in ATLAS.
5.3.4 Commissioning with Cosmic Rays
This 3D visualization tool has been shown to be very important for commis-sioning with cosmic rays. In fact, several kind of problems has been detected,including dead and hot cell identification, wrong calibration constants for cer-tain cells in the calorimeter and problems in the reconstruction algorithms.The visualization of a large number of real events with such tool, provided agood understanding of the whole ATLAS calorimeter acquisition process.
As an example of a detected problem in TileCal, it was noticed that for acosmic run acquired during one day, besides the display of cells activated bythe cosmic ray, a bunch of cells at the same TileCal module (LBA45, in thiscase) has been detected in several events. That indicates a noise problem inthe module, forcing the replacement of its power-supply.
12
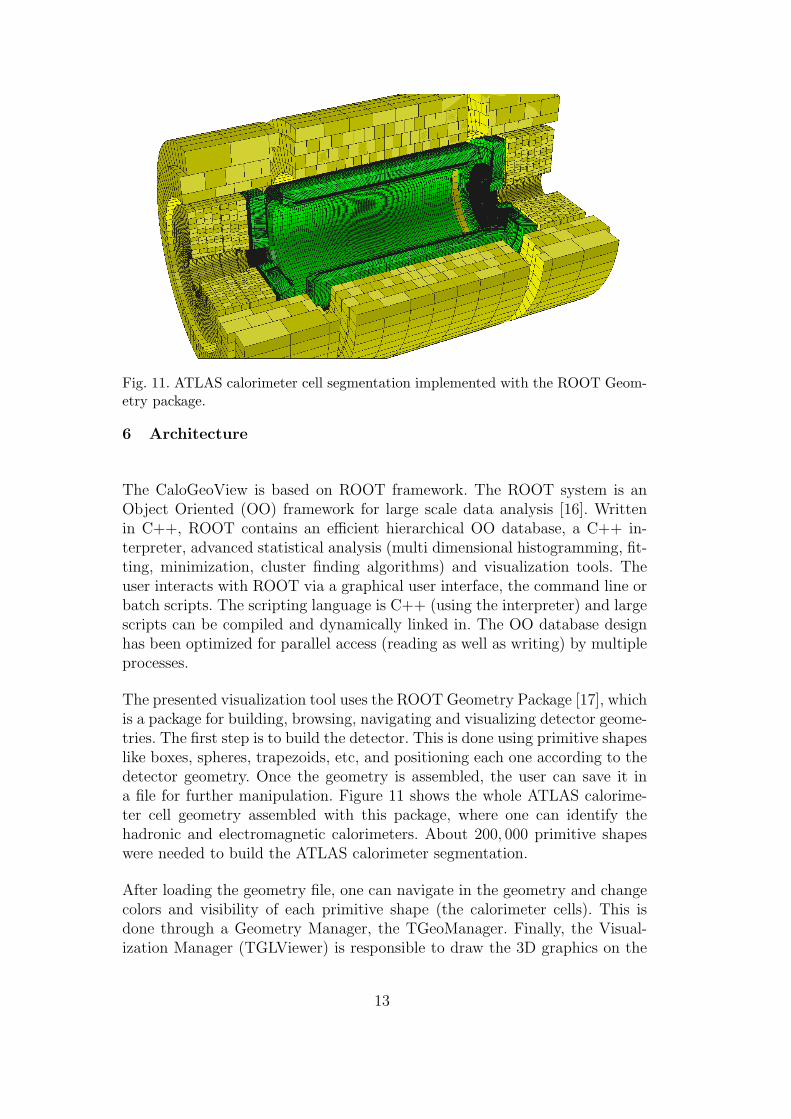
Fig. 11. ATLAS calorimeter cell segmentation implemented with the ROOT Geom-etry package.
6 Architecture
The CaloGeoView is based on ROOT framework. The ROOT system is anObject Oriented (OO) framework for large scale data analysis [16]. Writtenin C++, ROOT contains an efficient hierarchical OO database, a C++ in-terpreter, advanced statistical analysis (multi dimensional histogramming, fit-ting, minimization, cluster finding algorithms) and visualization tools. Theuser interacts with ROOT via a graphical user interface, the command line orbatch scripts. The scripting language is C++ (using the interpreter) and largescripts can be compiled and dynamically linked in. The OO database designhas been optimized for parallel access (reading as well as writing) by multipleprocesses.
The presented visualization tool uses the ROOT Geometry Package [17], whichis a package for building, browsing, navigating and visualizing detector geome-tries. The first step is to build the detector. This is done using primitive shapeslike boxes, spheres, trapezoids, etc, and positioning each one according to thedetector geometry. Once the geometry is assembled, the user can save it ina file for further manipulation. Figure 11 shows the whole ATLAS calorime-ter cell geometry assembled with this package, where one can identify thehadronic and electromagnetic calorimeters. About 200, 000 primitive shapeswere needed to build the ATLAS calorimeter segmentation.
After loading the geometry file, one can navigate in the geometry and changecolors and visibility of each primitive shape (the calorimeter cells). This isdone through a Geometry Manager, the TGeoManager. Finally, the Visual-ization Manager (TGLViewer) is responsible to draw the 3D graphics on the
13

screen. The TGLViewer uses a standard and powerful library for 3D graphicalvisualization, the OpenGL package [29].
Besides the Geometry Package, this event display uses other important graph-ical featuring in ROOT: the Graphical User Interface (GUI) Builder [30]. Withthis package, one can build custom windows, with buttons and text box toinput user information and to control the operation of the program. Throughthe GUI, the user can choose the reconstructed event files, energy threshold,navigate through the events, etc.
Figure 12 shows the visualization tool architecture, where one can identify twosoftware layers. The same architecture is used in both TileCal specific and gen-eral calorimeter tool, where the only difference is that the Pulse Shape Drawerblock is not present in the last module. The outer layer, the GUI, is responsiblefor receiving commands and send status to the user, providing an user-friendlyinterface. An inner layer, the Interface, translates the user commands to TGe-oManager commands. The geometry file is loaded by the TGeoManager assoon as the program starts. Information from a specific event is stored in alocal Buffer for further accesses, increasing the tool speed response. A Primi-tive Filter block decides if a specific calorimeter cell (a primitive shape in thegeometry) will be shown on the screen, depending on the threshold. The colorof the primitives is controlled by the Energy to Color component, accordingto the cell energy and the color palette used. The communication betweenthe TGeoManager and the TGLViewer is straightforward and the primitiveshapes are drawn on the screen.
In terms of performance, the computational cost is strongly depends on thechosen energy threshold, since this value defines how many cells should beplotted. In other words, the time to read an entire event, assign the correctprimitive colors and draw the desired cells grows with the number of plot-ted cells. Figure 13 shows the relation between the processing time and thenumber of drawn cells, performed on a regular Personal Computer (ProcessorIntel Centrino - 1.7 GHz). One can notice that up to a thousand of cells, theprocessing time is lower than 300 milliseconds. Most of the interesting eventsin the commissioning phase was under this limit. In fact, event visualizationbecomes useless for a big amount of drawn cells.
7 Conclusions
In the whole chain of an ATLAS event data processing, one of the final analysesis the reconstructed event visualization. With a simple visual inspection, onecan check the agreement of all subsequent data processing steps, starting fromtrigger acceptance, passing trough the readout of all detector channels, up to
14

Fig. 12. Visualization tool architecture.
Number of cells210 310 410
Pro
cess
ing
tim
e (s
eco
nd
s)
0
0.5
1
1.5
2
2.5
Performance test
Fig. 13. Processing time versus number of drawn cells (Processor Intel Centrino -1.7 GHz).
decodification and reconstruction of the event in a readable way.
The presented 3D visualization tool has been extensively used in the commis-sioning phase of the ATLAS calorimeter system. Different kind of problems,either detected from real data acquisition with cosmic or simulated cosmic
15
rays and L2 RoI, have been discovered thanks to the CaloGeoView. The im-plementation of the remaining ATLAS sub-detectors, besides the calorimeters,is on the way, in order to have a more complete online 3D event display forATLAS.
Acknowledgements
The authors would like to thank CAPES, CNPq, FINEP and FAPERJ (Brazil),CERN (Switzerland) and European Union for their support to this work. Wewould also like to thank our colleagues from the ATLAS TileCal, LAr andTrigger collaborations for providing the data and for fruitful discussions con-cerning this work.
References
[1] L. Evans and P. Bryant (editors), LHC Machine, JINST 3 S08001, 2008.
[2] The ATLAS Collaboration, G Aad et al, The ATLAS Experiment at the CERNLarge Hadron Collider, JINST 3 S08003, 2008.
[3] Eduardo Ros, ATLAS Inner Detector, Nuclear Physics B (Proc. Suppl.) 120,235-238, 2003.
[4] P. Puzo, ATLAS Calorimetry, Nuclear Instruments and Methods in PhysicsResearch A 494, 340-345 (2002)
[5] R. Wigmans, Calorimetry. Energy Measurement in Particle Physics, OxfordUniversity Press, 2000.
[6] S. Palestini, The Muon Spectrometer of the ATLAS Experiment, NuclearPhysics B (Proc. Suppl.) 125, 337-345, 2003.
[7] S. Falciano, The ATLAS Level-l and Level-2 trigger, Nuclear Instruments andMethods in Physics Research A 384, 136-142, 1996.
[8] J. Boyd, The ATLAS Trigger - Commissioning with cosmic rays, Journal ofPhysics: Conference Series, 119, 2008.
[9] T. Pauly, Commissioning of the ATLAS Level-1 Trigger with Cosmic Rays,Journal of Physics: Conference Series, 110, 2008.
[10] H. Hadavand, Commissioning of the ATLAS Offline Software with CosmicRays, Journal of Physics: Conference Series, 119, 2008.
[11] G. Schlager, The status and performance of the ATLAS hadronic tilecalorimeter, Nuclear Instruments and Methods in Physics Research A, 581,393-396, 2007.
[12] http://www.hep.ucl.ac.uk/atlas/atlantis. Accessed on December 21th, 2009.
16

[13] D. Pomarede, M. Virchaux, The Persint visualization program for the ATLASexperiment, Computing in High Energy and Nuclear Physics, 24-28 March 2003,La Jolla, California.
[14] http://cern.ch/atlas-vp1. Accessed on June 15th, 2010.
[15] https://twiki.cern.ch/twiki/bin/view/Atlas/TileStandaloneReconstruction.Accessed on December 21th, 2009.
[16] R. Brun and F. Rademakers, ROOT - An Object Oriented Data AnalysisFramework, Proceedings AIHENP’96 Workshop, Lausanne, Sep. 1996, NuclearInstruments and Methods in Physics Research A 389, 81-86, 1997.
[17] R. Brun, A. Gheata, M. Gheata, The ROOT geometry package, NuclearInstruments and Methods in Physics Research A 502, 676-680, 2003
[18] K. S. Cranmer, The ATLAS Analysis Architecture, Nuclear Physics B (Proc.Suppl.), 126-130, 2008.
[19] J. M. Abdallah, U. Blumenschein, T. Davidek, A. Dotti, L. Fiorini, C.Maidantchik, C. S. Sanchez, A. Solodkov, ATLAS Tile Calorimeter DataQuality Assessment with Commissioning Data, International Conference onComputing in High Energy and Nuclear Physics (CHEP07), Conference Series119 (2008) 032001, doi:10.1088/1742-6596/119/3/032001.
[20] P. Perrodo, The ATLAS liquid argon calorimetry system, Proceedings of ICHEP,pp. 909-912, 2002.
[21] E. Mazzoni, The hadronic calorimeter of the ATLAS experiment at the LHC,Nuclear Instruments and Methods in Physics Research A 461, 351-354, 2001.
[22] A. Trigger, D. A. Collaboration, ATLAS high-level trigger, DAQ and DCSTechnical Design Report, 2003.
[23] J. Richard Hubbard, The ATLAS trigger/DAQ system, Nuclear Instrumentsand Methods in Physics Research A 360, 331-333, 1995.
[24] https://twiki.cern.ch/twiki/bin/view/Atlas/LArCosmicMuonAnalysis.Accessed on December 21th, 2009.
[25] K. Anderson, J.Pilcher, H.Sanders, F.Tang and R.Teuscher. Stand-alone CosmicRay Trigger Electronics for the ATLAS Tile Calorimeter. 10th Workshop onElectronics for LHC and future Experiments, 2004.
[26] A. S. Cerqueira, J. M. de Seixas, L. P. Caloba. Analog system for buildingthe rst-level triggering signal provided by the ATLAS hadronic calorimeter ofATLAS detector, Nuclear Instruments and Methods in Physics Research A 570,117-125, 2007.
[27] https://twiki.cern.ch/twiki/bin/view/Atlas/TileMuonFitter. accessed on June15th, 2010.
17
[28] A. dos Anjos, R.C. Torres, J.M. Seixas, B.C. Ferreira, T.C. Xavier, Neuraltriggering system operating on high resolution calorimetry information, NuclearInstruments and Methods in Physics Research A 559, 134-138, 2006.
[29] http://www.opengl.org, accessed on November 2009.
[30] I. Antcheva, R. Brun, C. Hof, F. Rademakers, The graphics editor in ROOT,Nuclear Instruments and Methods in Physics Research A 559, 17-21, 2006.
18