thesis - mountain scholar
TRANSCRIPT

THESIS
INVESTIGATION OF SUPERTURBOCHARGER PERFORMANCE
IMPROVEMENTS THROUGH STEADY STATE ENGINE SIMULATION
Submitted by
Kevin Whitley
Department of Mechanical Engineering
In partial fulfillment of the requirements
For the Degree of Master of Science
Colorado State University
Fort Collins, Colorado
Fall 2010
Master’s Committee:
Department Chair: Susan James
Advisor: Daniel Olsen
Thomas Bradley Daniel Zimmerle John Labadie

ii
ABSTRACT
INVESTIGATION OF SUPERTURBOCHARGER PERFORMANCE
IMPROVEMENTS THROUGH STEADY STATE ENGINE SIMULATION
An integrated supercharger/turbocharger (SuperTurbo) is a device that combines
the advantages of a supercharging, turbocharging and turbocompounding while
eliminating some of their individual disadvantages. High boost, turbocompounding, and
advanced controls are important strategies in meeting impending fuel economy
requirements. High boost increases engine power output while many losses remain
constant, producing an overall efficiency gain. Turbocompounding increases engine
efficiency by capturing excess exhaust turbine power at high speed and torque.
Supercharging increases low speed high torque operating performance.
Steady state performance gains of a Superturbocharger equipped engine are
investigated using engine simulation software. The engine simulation software uses a 1-D
wave flow assumption to model the engine’s unsteady flow behavior through one
dimensional pipes. With these pipes connected to other engine components the overall
performance of the engine can be modeled. GT-Power was chosen to run the simulations
due to an already correlated engine model being available. This software is used to ‘tune’
an existing stock engine model to approximate stock engine data over the full speed and

iii
torque range. The SuperTurbo is added to the model and simulations are performed over
the full engine speed and torque range for direct comparison with the stock engine.
The model results show turbocompounding to be most effective at high speeds
and torques in the area above 10 bar BMEP in the 3000 – 4000 RPM range and above 5
bar BMEP in the 500 – 6000 RPM range. In addition to turbocompounding there are fuel
savings due to the reduced use of the compressor when it is not needed. With the stock
configuration there is boost pressure created by compressor power that is then restricted
by the throttle in the 2500 RPM range in the 8-12 bar BMEP range on up to 6000 RPM in
the 2-10 bar BMEP range. The control of compressor speed to produce no boost at these
locations improves efficiency by not wasting energy creating boost that is not needed.

iv
TABLE OF CONTENTS
ABSTRACT ......................................................................................................................................... ii
TABLE OF CONTENTS....................................................................................................................... iv
List of Tables ................................................................................................................................... vi
List of Figures ................................................................................................................................. vii
CHAPTER 1: INTRODUCTION ............................................................................................................ 1
1.1 Scope and Focus of Thesis ............................................................................................... 1
1.2 Literature Review ............................................................................................................. 1
1.2.1 Transient and Steady State Performance ................................................................ 2
1.2.2 Forced Induction ...................................................................................................... 4
1.2.3 Waste Heat Recovery ............................................................................................... 9
1.2.4 Control Strategies .................................................................................................. 11
1.3 SuperTurbo .................................................................................................................... 19
CHAPTER 2: ENGINE MODEL .......................................................................................................... 26
2.1 GT‐Power ....................................................................................................................... 26
2.2 Stock model from Volkswagen ...................................................................................... 29
2.3 SuperTurbo added by SwRI ............................................................................................ 31
2.4 Stock Engine Model Tuning ............................................................................................ 33
CHAPTER 3: ENGINE SIMULATIONS ............................................................................................... 42
3.1 Simulation of Stock Engine Configuration ..................................................................... 42
3.2 Comparison of SuperTurbo Model to SuperTurbo Test Data ........................................ 46
3.3 Simulation of SuperTurbo Engine Configuration ........................................................... 47
3.4 Results ............................................................................................................................ 49
CHAPTER 4: SUMMARY AND CONCLUSION ................................................................................... 59
4.1 Summary ........................................................................................................................ 59
4.2 Conclusion and Future Work ......................................................................................... 60

v
References ..................................................................................................................................... 62
Appendix A: Volkswagen Test Data ............................................................................................... 64
Appendix B: Volkswagen Stock Modeling Data ............................................................................. 72
Appendix C: Volkswagen SuperTurbo Modeling Data ................................................................... 82
Appendix D: Comparison of SuperTurbo test data to modeling data ........................................... 92

vi
List of Tables
Table 1.1: Level road acceleration tests (2) ..................................................................................... 18

vii
List of Figures
Figure 1.1: 1980 Scirocco fuel economy and 0‐60 mph times (1) ..................................................... 5
Figure 1.2: 1979 Omni fuel economy and 0‐60 mph times (1) .......................................................... 6
Figure 1.3: Comparison of turbocharged/supercharged 2.3l EFI spark‐ignited engine
performance of WOT transient at 2000 rpm (left) and 3000 rpm (right) (4) .................................... 9
Figure 1.4: Steady state WOT performance tests (4) ...................................................................... 10
Figure 1.5: Comparison of load acceptance response between (15) turbocharged and series
turbocompounded engine ............................................................................................................. 11
Figure 1.6: Acceleration speeds and types (7)................................................................................. 12
Figure 1.7: MAP responses according to the throttle valve opening speed (left) and acceleration
type (right) (7).................................................................................................................................. 12
Figure 1.8: Air excess ratio responses according to the valve opening speed and acceleration
type (7) ............................................................................................................................................ 13
Figure 1.9: Transient response specifications of RPM (7) ............................................................... 13
Figure 1.10: Comparison of fuel consumptions for three types of supercharger regulation (5) .... 15
Figure 1.11: Turbocharger speed for conventional system (TA) and for zero airflow (FR) for two
sub‐ambient pressures (2) ............................................................................................................... 16
Figure 1.12: Control of zero flow compressor speed for fast response system (2) ........................ 16
Figure 1.13: Transient response of conventional (‐ ‐) and fast response (‐) system (2).................. 17
Figure 1.14: Ratio of efficiency of strategy V‐I to strategy V‐II for different values of F (left) and
ratio of peak pressure of strategy V‐I to strategy V‐II for different values of F (right) (19) ............. 19
Figure 1.15: Ratio of efficiency of strategy V‐I to strategy I for different values of F (left) and ratio
of peak pressure of strategy V‐I to strategy I for different values of F (right) (19) .......................... 19
Figure 1.16: SuperTurbo power flow diagram ............................................................................... 19
Figure 1.17: The SuperTurbocharger combines the advantages of a supercharger and a
turbocharger as well as eliminating some of their individual disadvantages ................................ 20
Figure 1.18: Simulated improvement in BSFC of Hyundai natural gas engine with
mechanical/hydraulic transmission to transfer power between crankshaft and turbine shaft (17)
....................................................................................................................................................... 21
Figure 1.19: Improvement in BSFC for Mack E7G engine with SuperTurbocharger compared to
stock turbocharger (17) .................................................................................................................... 21
Figure 1.20: WOT curve for MACK E7G with SuperTurbocharger and stock turbocharger (17) ...... 22
Figure 1.21: Step change response of a SuperTurbocharger compared to stock turbo (17) ........... 23
Figure 1.22: SuperTurbo transient response for a pedal snap from 2‐bar BMEP to WOT at 2000
RPM. The engine reaches 90% of the peak in 0.36 seconds (17) ..................................................... 24

viii
Figure 1.23: Torque curve of the SuperTurbocharged 2.0 Liter versus a N/A 3.2 Liter V6 (17) ....... 24
Figure 1.24: Full load efficiency curve of the SuperTurbocharged 2.0 Liter versus a N/A 3.2 Liter
V6 (17) .............................................................................................................................................. 25
Figure 2.1: Volumetric efficiency correlation (20) ........................................................................... 28
Figure 2.2: Airflow correlation (20) .................................................................................................. 28
Figure 2.3: Performance Correlation (20) ........................................................................................ 28
Figure 2.4: Compressor Outlet Conditions (20) ............................................................................... 28
Figure 2.5: Turbine Inlet Conditions (20) ......................................................................................... 28
Figure 2.6: Main View of GT‐Power Model in original form from Volkswagen ............................. 29
Figure 2.7: View of the controls page dealing with temperature corrections, wastegate control,
and lambda control. ....................................................................................................................... 30
Figure 2.8: SuperTurbo Model added by SwRI .............................................................................. 32
Figure 2.9: In‐Cylinder Timing Events ............................................................................................ 33
Figure 2.10: Error in BMEP values for modeling data compared to test data ............................... 35
Figure 2.11: FMEP Model Output from GT‐Power ........................................................................ 36
Figure 2.12: Error in BMEP values for modeling data compared to test data ............................... 37
Figure 2.13: Turbine Map Data Analysis Plots for Turbine Map 1 (above) and Turbine Map 2
(below) ........................................................................................................................................... 40
Figure 2.14: Turbine Map Data Analysis Plots for Turbine Map 1 (left) and Turbine Map 2 (right);
the Blade Speed Ratio (BSR) is used for normalization and extrapolation calculations in GT‐
Power ............................................................................................................................................. 40
Figure 3.1: Wastegate flow versus engine speed (RPM/1000) and load (bar) .............................. 44
Figure 3.2: Boost pressure created by the compressor that is unneeded ..................................... 45
Figure 3.3: The new turbine design has a wider inlet area to allow less back pressure as well as
longer blades to improve efficiency .............................................................................................. 48
Figure 3.4: Brake specific fuel consumption improvement over stock engine.............................. 49
Figure 3.5: At this higher load point the contribution from turbocompounding dominates the
contribution from throttle/gear ratio control ............................................................................... 50
Figure 3.6: Brake specific fuel consumption improvement over stock engine.............................. 50
Figure 3.7: Power transferred from SuperTurbo to Crankshaft .................................................... 51
Figure 3.8: BMEP contribution from Turbocompounding ............................................................. 51
Figure 3.9: Pressure at different locations through the engine for 3000 RPM 8 bar BMEP .......... 52
Figure 3.10: Power transferred from SuperTurbo to Crankshaft .................................................. 53
Figure 3.11: Wasted boost pressure and compressor power as a function of SuperTurbo gear
ratio ................................................................................................................................................ 54
Figure 3.12: While the pressure drop across the throttle reduces with gear ratio, the pumping
losses increase slightly ................................................................................................................... 54
Figure 3.13: The reduced backpressure more than compensates for the increased pumping
losses from the reduced intake manifold pressure ....................................................................... 55
Figure 3.14: Log P‐V plot comparing pumping losses at 3500 RPM 4 bar BMEP ........................... 55
Figure 3.15: Log P‐V plot comparing pumping losses at 3500 RPM 15 bar BMEP ......................... 56

ix
Figure 3.16: Difference in intake manifold pressure calculated as stock pressure minus
SuperTurbo pressure so (+) indicates stock pressure is greater .................................................... 56
Figure 3.17: Difference in pre‐turbine pressure calculated as stock pressure minus SuperTurbo
pressure so (+) indicates stock pressure is greater ........................................................................ 56
Figure 3.18: Stock PMEP minus SuperTurbo PMEP ....................................................................... 57
Figure 3.19: Overall gear ratio from turbine shaft to crankshaft .................................................. 57

1
CHAPTER 1: INTRODUCTION
1.1 Scope and Focus of Thesis
In this work, an already calibrated engine model is modified by adding a model of a
device called a superturbocharger (SuperTurbo). This device incorporates a transmission
between the turbocharger shaft and the engine’s crankshaft. The transmission consists of a high
speed traction drive section and a continuously variable section that will allow control of
turbocharger speed, independent of crankshaft speed. This allows for more options for load
control as the load can now be adjusted with both the SuperTurbo gear ratio and the throttle
valve.
Chapter one discusses work leading up to this investigation as well as the current status
of the SuperTurbo development. Chapter two describes the modeling software and the available
calibrated stock engine model, as well as the SuperTurbo addition. Chapter three describes the
simulations of the two independent load control mechanisms consisting of the throttle and the
SuperTurbo. Chapter four summarizes the results, presents a conclusion and possibilities for
future work.
1.2 Literature Review
There are several aspects of engines that relate to current efforts to make them more
fuel efficient, while keeping emissions low and maintaining drivability. Both steady state and
transient modes are considered. Forced induction as a means of downsizing the engine is

2
investigated. Waste heat recovery methods can be used to increase fuel efficiency. Control
efforts are also an important consideration.
1.2.1 Transient and Steady State Performance
It has become increasingly common for smaller, better performing engines to replace
larger engines in automobiles. In the past, engine manufacturers were able to accommodate
increased performance requirements with increased displacement. However, since the advent
of political uncertainty surrounding emissions and fuel prices, it has become necessary for
engine and automobile manufacturers to continually improve fuel economy and lower
emissions without sacrificing drivability. A common goal has been to produce equivalent power,
through means such as boosting, from a smaller engine leading to potential fuel and emissions
savings (1), (2), (3), (4). This technique has often been referred to as engine downsizing (1), (5), (6).
Through the study of previous and current efforts along with modern engine modeling software,
further engine downsizing can be realized.
Engine performance relating to fuel economy, emissions, and power can be divided into
two operating modes: transient and steady state. Steady state behavior has usually been
characterized by low load constant speed driving, such as on the highway. In stationary
applications where engines run at near constant speed and load, the engines can be designed
around a single operating point, making them among the most efficient of all reciprocating
engines available. The problem arises with trying to obtain improved fuel economy while at the
same time having satisfactory transient performance.
A vehicle can experience several different types of transients. One type of transient
response is when the speed remains relatively constant while the load is changed, which occurs
as the clutch is being let out on an automobile with a manual transmission. Another type of

3
transient situation is where the load is kept relatively constant while the speed undergoes
transient behavior. In urban settings automobiles most often undergo a combination of the two
where load and speed are both experiencing transient behavior (7), (8). This is where drivability of
the downsized engine comes into play. The automobile will intermittently need extra power for
the quick accelerations necessary in daily driving. If the downsized engine is not able to
adequately accept its given load at a given speed, the engine speed will drop and in the extreme
case, eventually stall if corrective measures such as downshifting are not implemented (8).
When a torque (or horsepower) curve vs. engine speed is given for a specific engine, it
indicates the steady state torque at a given engine speed. Loading (increased torque) the engine
above this line results in a decrease in engine speed. Steady state loads are associated with
friction in the system as well as air drag forces. The transient situation must also take into
account the energy used to accelerate the inertial loads (8), (9), (10). As a car is accelerating through
its gear range, it is continually going through the speed range of the engine. This requires the
engine to overcome inertia from the engine, the drive train, and from the automobile itself, in
addition to the friction and air resistance that is also experienced at steady state operation. This
plays an important role in the drivability of an automobile.
Another disadvantage during transient performance is the rapidly changing intake air. In
contrast with steady state operation, where there is ample time for the ECU to optimize the air
fuel ratio accurately, transient response is susceptible to transient response characteristics in all
control systems, such as overshoot and settling time, resulting in poorer fuel and emissions
ratings (7). When an automobile engine operates at steady state mode, it has the advantage of
being able to accurately keep the air to fuel (A/F) ratio at the desired level with an O2 sensor due
to the near constant rate of air being delivered. Along with the use of a 3‐way catalyst,
satisfactory power, fuel consumption, and emissions can be realized.

4
Automobile engines require a large range of operating conditions that need to be
considered for overall performance. Engines must have satisfactory steady state fuel and
emissions performance and maintain this performance during transient operation, which
require dramatic increases in load. These considerations must also take into account the overall
economic value with respect to the additional complexity. Boosted engines are becoming
increasingly more complex, but the cost benefit ratio of such systems has been realized through
their ever‐increasing use.
1.2.2 Forced Induction
As the saying goes, “There is no replacement for displacement.” A forced induction
engine is simply not capable of meeting the transient performance of a naturally aspirated
engine of the same power output (3), (4), (8), (9). This has been the main challenge confronting the
use of forced induction engines with regards to both superchargers and turbochargers.
Forced induction refers to the concept of forcing more air into the intake manifold
stream than a naturally aspirated engine is capable of. This compressed air is referred to as
boost. The two most common types of forced induction are supercharging and turbocharging.
While turbocharging is sometimes referred to as a type of supercharging (1), they will be referred
to as two separate concepts herein. Supercharging uses energy from the crankshaft to drive a
compressor; turbochargers use exhaust gas energy to drive a compressor. Another type of
forced induction is the Comprex pressure wave charger (9), (10), (11). This system uses the exhaust
gas pulses as a means for compressing the intake air. There are also studies on injecting a stored
source of compressed air into the intake stream (8).
Supercharging is historically associated with high performance and racing applications
without regard for fuel economy. Compared to other pressure charging methods, supercharging

5
is not very desirable for steady state performance as it requires crankshaft power. Additionally,
at steady state operation this extra power is not needed. Through the technique of downsizing,
a supercharged engine can replace a larger naturally aspirated engine for transient needs while
still having adequate low load capability for steady state operation. A supercharger needs to be
selected that can quickly develop boost with minimal losses at low loads when not in use.
In one study, a positive displacement backflow vane type supercharger was selected for
its capability of developing the necessary boost at speeds close to engine speed due to its
closely matched volumetric efficiency (1). This eliminated the complexity of high speed operation.
It was also chosen since it was compact and lightweight compared to compressors with similar
outputs. With the proper selection of a supercharger, the engine acts as a smaller naturally
aspirated engine at steady state speeds while still being able to develop the torque needed at
higher loads with the assistance of the supercharger. While good results were obtained, this
design was not widely implemented. Figure 1.1 shows fuel economy and 0‐60 mph time
Figure 1.1: 1980 Scirocco fuel economy and 0‐60 mph times (1)

6
comparisons for a 1980 Volkswagen Scirocco with a 1.6 liter inline 4 cylinder engine with a 5
speed manual transmission. The axle ratio was kept constant at 3.89:1 and the continuous fuel
injection system left unchanged. The graph shows almost identical city fuel economy with
slightly worse highway fuel economy, but a 0‐60 mph time decrease from 11.5 to 8.9 seconds
(23% decrease). Figure 1.2 shows the same comparison for a 1979 Dodge Omni with a 1.7 liter
inline 4 cylinder engine with a 4 speed manual transmission. The axel ratio was 3.47:1 as
received and reduced to 3.08:1 for the supercharged testing. The fuel system was switched from
a Holley 2v to a Pierburg 1v most likely in order to be able to operate under boost pressure. The
Figure 1.2: 1979 Omni fuel economy and 0‐60 mph times (1)

7
results show improved fuel economy for both city and highway (about 17% and 9%
respectively), as well as improved 0‐60 mph time response (13% faster).
Turbochargers are becoming increasingly used for improved efficiency. Unlike the
supercharger, a turbine in the exhaust system powers the compressor instead of the crankshaft.
The losses due to the increased back pressure in the exhaust are overcome, by the advantages
of the forced induction. This makes it ideal for improved load acceptance during steady state
applications where the engine performance can be designed around a smaller range of
operating points. However, turbochargers have inherent disadvantages with transient
performance.
In a turbocharger, the compressor and turbine must be matched for a required pressure
ratio and mass flow. Perfect matching can only be accomplished for one particular operating
point (12). Due to this, compromises in efficiency are often made in order to enable operation
over a wider range of conditions.
When a turbocharged engine increases its speed, the excess turbine power needed to
accelerate the turbo machinery inertia can result in what is known as turbo lag, a temporary
mismatch of the turbocharger‐engine system. This causes reduced fuel efficiency and higher
emissions during this period. A turbocharger that is optimized for steady state performance will
have a considerable amount of turbo lag. To address this issue it is common practice to sacrifice
efficiency even further in order to reduce the inertia and thus the turbo lag (12).
Boosted engines also have the disadvantage of an increased likelihood of self ignition,
commonly known as knock. This is often dealt with by a retarded spark advance. Turbocharged
engines have yet another disadvantage involving exhaust gas temperatures. The maximum
turbine inlet temperature can easily be exceeded during full load operation, requiring the
engine to run rich in order to reduce turbine inlet temperature to an acceptable level, as well to

8
decrease the tendency for knock by reducing in‐cylinder temperature. Periods of transient
response, where the engine is required to run rich, leads to higher fuel consumption and
emissions (5).
Testing was done to compare the differences between a turbocharger and a
supercharger on a 2.3 liter spark ignition engine (4). The first objective was to optimize the
turbocharger operation in two areas. First, tests were conducted to evaluate the effect of
turbine inlet temperature on turbocharger performance. The stock manifold used was
excessively long resulting in a temperature loss of about 56 C compared to the rerouted
crossover pipe, which was 60% shorter. The shortened pipe had a significant impact in
turbocharger speed change with an improvement of about 31%, while steady state tests showed
only a slight improvement. Next, the effect of intake volume between the compressor discharge
and the ends of the intake manifold were investigated. Through calculations it was predicted
that a 25‐fold increase in volume (from 40 to 1000 cu. In.) would affect the response time by 0.1
seconds. These surprising results were then verified experimentally where an increase from 50.6
cu. in. to 1174 cu. in. resulted in a delay in the range of 0.1 to 0.125 seconds. Following the
turbocharger optimization tests were a series of tests to compare the supercharger setup with
the turbocharger setup. The supercharger used was the Bendix clutched, positive displacement
type referenced earlier. The transient tests conducted consist of transient load only, from an
idle condition at a set speed to wide‐open throttle at that same speed. The results are shown in
Figure 1.3. The supercharger shows a quick response in the
time it takes to develop boost, where the turbocharger comes up to ambient pressure quickly as
the throttle is opened, but then develops boost at a much slower rate taking up to a second
longer at 3000 RPM and never reaching full boost at the 2000 RPM condition. The slow
turbocharger boost rise in the 2000 RPM condition triggered the ignition timing switch, which

9
resulted in 6 degrees of spark retard and added to the torque difference as shown. The steady
state performance tests are shown in Figure 1.4.
The major differences between supercharging and turbocharging appear to be the
higher temperature difference across the supercharger compressor indicating more parasitic
losses, whereas the turbine in the turbocharger has a much higher level of backpressure in the
exhaust, which also leads to pumping inefficiencies. Another tradeoff between these two setups
was that the supercharger was capable of accepting load more quickly while the turbocharger
was able to accept more load overall.
1.2.3 Waste Heat Recovery
For reciprocating engines there is a rule of thirds which approximately states that only
one third of the combustion energy is used as mechanical energy with another third of the
Figure 1.3: Comparison of turbocharged/supercharged 2.3l EFI spark‐ignited engine performance of WOT transient at 2000 rpm (left) and 3000 rpm (right) (4)

10
Figure 1.4: Steady state WOT performance tests (4)
energy transferred to the
cooling system and the
final third wasted in
exhaust heat. While
modern engines are more
efficient thermal energy in
the exhaust still accounts
for a significant amount of
the total thermal energy
released during
combustion. A
turbocharger is capable of
converting some of this
energy into compressed
air, but there is
considerably more energy available to a turbine than a compressor is capable of using at steady
state. This leads to the method of turbocompounding where extra energy available in the
exhaust that is not used for turbocharging is converted to mechanical energy with a power
turbine and then transferred to the crankshaft of the reciprocating engine.
Mechanical turbocompounding has an extensive history dating back to WWII with a
wide range in application and arrangement (13), (14). While turbocompounding might commonly
be thought of as a solution to improved steady state operation, it has been shown that if the
turbines are placed in series, the compressor turbine is able to maintain higher speeds during
transient load tests, which in turn improves the transient response of the system (15) as shown in

11
Figure 1.5: Comparison of load acceptance response between (15)
Figure 1.5. This figure shows the turbocompounded engine reaching 85% of maximum load from
one half to over a second
faster across the engine
speed range shown.
Both electrical
and mechanical
turbocompounding have
been studied (12), (16).
Mechanical
turbocompounding
seems to be the
preferred method due to
the electrical system’s increased inertia and its sensitivity to the high temperatures inherent in
the turbocharger system (17).
Other methods studied for recovering waste heat energy include Rankine bottoming
cycles (16) and charge air cooling (18). Rankine bottoming cycles use exhaust heat to create a steam
cycle that goes through a power turbine. Charge air cooling uses exhaust gas energy in
combination with heat exchangers, suction compressors, and expanders to cool the intake air.
1.2.4 Control Strategies
With the increased complexity of modern engines due to downsizing techniques, it is
becoming necessary for controls to play a larger role in engine performance. Modern fuel
systems are able to deliver fuel at a very controllable rate. The more difficult part of air fuel ratio
control deals with precise control of the intake air.

12
Figure 1.7: Acceleration speeds and types (7)
Although there has been much research going on in the area of transient engine system
control, it helps to first have an accurate and quantified analysis and evaluation of the transient
behavior. This has led to the development of transient response specifications as well as the
classification and evaluation of different acceleration types as shown in Figure 1.6. These
correspond to throttle changes
from 10‐17% assuming 0% is
fully closed and 100% is fully
open. The speeds were changed
at a constant load setting. It
was shown that the driving
behavior of an individual can
also have an effect on
performance.
Figure 1.7 shows the
Figure 1.6: MAP responses according to the throttle valve opening speed (left) and acceleration type ( i ht) (7)

13
Figure 1.9: Transient response specifications of RPM (7)
difference in manifold absolute pressure (MAP) vs. time for the different acceleration types. The
air excess ratio of an automobile (7) was also affected as shown in Figure 1.8, which in turn leads
to poorer emissions. The engine speed response for all acceleration types except for the two
slowest linear types were shown to be fairly similar indicating that there is a limit to acceleration
performance as shown in Figure 1.9, and anything beyond that limit only leads to poorer fuel
economy and
emissions. This
lead to the
idea that
control of
throttle
position,
independent
from pedal position, could be a desired control strategy for improved fuel and emissions
performance.
Figure 1.8: Air excess ratio responses according to the valve opening speed and acceleration type (7)

14
Integration of throttle and wastegate control for turbocharged engines has been studied
(3). Due to the increased need for accurate throttle control with turbine engines, control
strategies have been developed for electronically actuated intake throttles for improved
response. The airflow can then be controlled independently of the foot pedal position. With this
setup, the driver still requests a speed or load increase, but the control of the intake throttle
valve are performed by the computer controlling the overall system.
Decoupling the throttle response from the foot pedal has led the way to additional
improvements in air flow control. Modeling performed on an engine using GT‐Power engine
simulation software shows the effect of different throttle arrangements for a supercharger and
compares them to the effects of different fueling and wastegate management for a
turbocharger (5). The engine simulations were first calibrated according to experiments involving
spark advance, combustion, max combustion pressure, full‐load curves, etc. Once the engine
model was validated, changes to the model involving the location of the throttle were
implemented. Intake air can be controlled by many different throttle arrangements for a
supercharged engine. The throttle can be placed either before or after the compressor. There
was also the option of having a bypass/recirculating valve for the compressor on both of the
previous conditions for a total of 4 different arrangements. Modeling on 3 of the 4
configurations, leaving out throttle after the compressor with bypass, showed that throttle
before the compressor, with bypass, has the best low load fuel consumption with the same
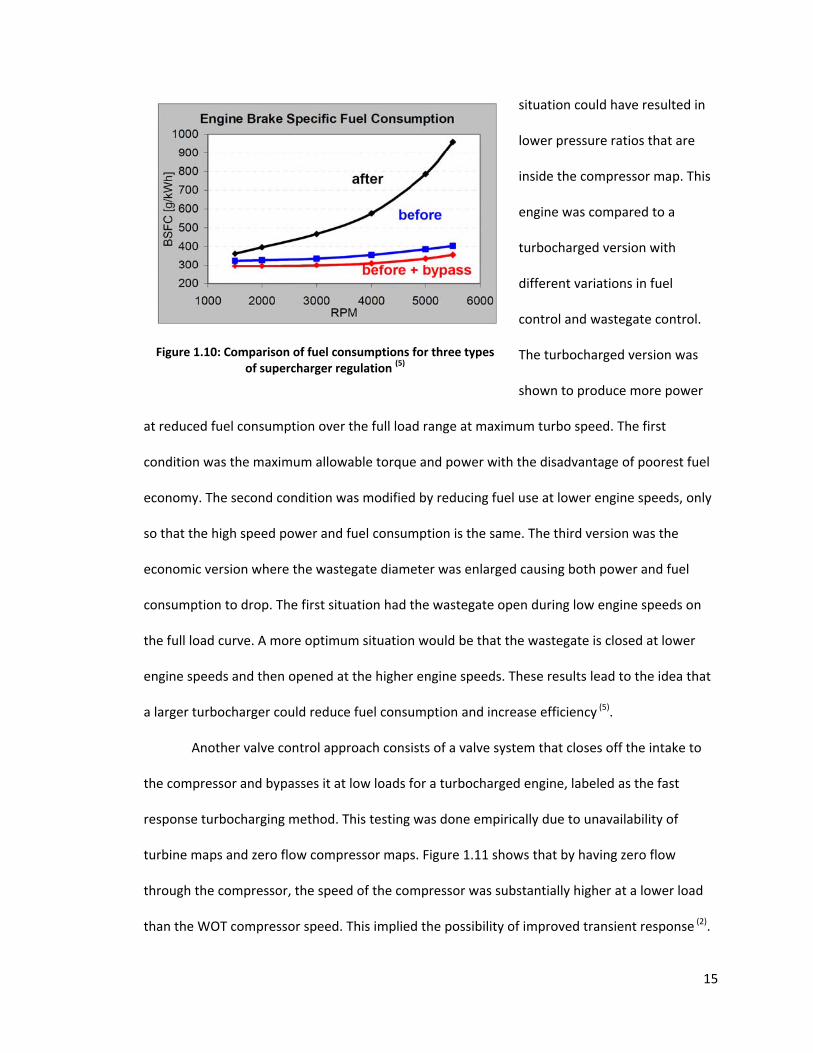
version without the bypass slightly higher as shown in Figure 1.10. The condition with the
throttle after the compressor with no bypass was shown to be much less efficient at these
operating points, largely due to the operating points being at high compression ratios lying
outside the original compressor map which only went up to a pressure ratio of 3. The effect of
having a bypass with the throttle after the compressor was not shown. The use of bypass in this
15
Figure 1.10: Comparison of fuel consumptions for three types of supercharger regulation (5)
situation could have resulted in
lower pressure ratios that are
inside the compressor map. This
engine was compared to a
turbocharged version with
different variations in fuel
control and wastegate control.
The turbocharged version was
shown to produce more power
at reduced fuel consumption over the full load range at maximum turbo speed. The first
condition was the maximum allowable torque and power with the disadvantage of poorest fuel
economy. The second condition was modified by reducing fuel use at lower engine speeds, only
so that the high speed power and fuel consumption is the same. The third version was the
economic version where the wastegate diameter was enlarged causing both power and fuel
consumption to drop. The first situation had the wastegate open during low engine speeds on
the full load curve. A more optimum situation would be that the wastegate is closed at lower
engine speeds and then opened at the higher engine speeds. These results lead to the idea that
a larger turbocharger could reduce fuel consumption and increase efficiency (5).
Another valve control approach consists of a valve system that closes off the intake to
the compressor and bypasses it at low loads for a turbocharged engine, labeled as the fast
response turbocharging method. This testing was done empirically due to unavailability of
turbine maps and zero flow compressor maps. Figure 1.11 shows that by having zero flow
through the compressor, the speed of the compressor was substantially higher at a lower load
than the WOT compressor speed. This implied the possibility of improved transient response (2).

16
Figure 1.12: Turbocharger speed for conventional system (TA) and for zero airflow (FR) for two sub‐ambient pressures (2)
Figure 1.11: Control of zero flow compressor speed for fast response system (2)
After this finding,
the turbo shaft speed was
limited by the use of a
throttle that choked the
bypassing airflow through
the engine to a level low
enough that the turbine had
only enough power to keep
the compressor speed at an
acceptable level, as shown
in Figure 1.12. It was also
determined that bearing
losses in the
compressor
dominated at low
speeds while
turbulent losses
dominated at
higher speeds,
which helps to
keep the
compressor from
spinning too fast.
Other methods

17
such as use of a wastegate control to maintain shaft speed were also found to be effective, but
not essential.
After the effective valve areas were chosen in a manner to ensure smooth airflow
transfer, transient tests were implemented. Tests were carried out where the engine speed was
held constant at a low load and then the throttle was opened suddenly as shown in Figure 1.13.
It was found that when initial low load turbo speed was below steady state full load speed,
manifold pressure immediately following fast throttle opening was above ambient pressure but
less than full load. If the initial low load turbo speed was above steady state full load speed, the
manifold pressure would temporarily exceed steady state full load pressure while the turbo
speed decelerated. When installed in the same automobile, the fast response system showed
significant improvement over the traditional system as shown in Table 1.1. The fast response
system also allowed the turbine shaft to maintain its speed during gear changes. Some
drawbacks to this system were the complexity of the mechanical valve linkages and the
possibility of surge instability, although in the experiments carried out, no evidence of surge was
found. There were additional measures suggested that could help suppress surge oscillations if
Figure 1.13: Transient response of conventional (‐ ‐) and fast response (‐) system (2)

18
Table 1.1: Level road acceleration tests (2) present. Overall, the fast response
system was shown to improve
performance over a conventional
turbocharging system (2).
Air cycle calculations were
carried out to investigate several
load control strategies as
alternatives to throttling for an Otto
cycle engine (19). This study was
motivated by the fact that Otto cycle
engines are not capable of the part
load efficiencies of a diesel engine
due primarily to throttling losses. After presenting the base case of a throttled engine (strategy
I), several alternatives were presented consisting of variable fueling, variable compression ratio,
and early intake valve closing. After studying the tradeoffs between these strategies, the final
two strategies for comparison consisted of versions of variable valve timing with boost. The first
strategy met load demand first with boost, and if no boost was available, would utilize delayed
intake valve closing (strategy V‐I). The second concept delayed valve timing first, then used
turbocharger boost to meet the high load demands (strategy V‐II). The results indicated that the
first method had increased thermal efficiency and reduced peak pressure over the second
method as shown in Figure 1.14. Then when compared to the naturally aspirated throttled
engine, it was shown that there are efficiency gains over the full range of loads, as well as peak
pressure reductions over much of the range as shown in Figure 1.15.

19
Figure 1.16: SuperTurbo power flow diagram
1.3 SuperTurbo
The SuperTurbocharger is a concept
currently being developed by VanDyne
SuperTurbo. As shown in Figure 1.16, it allows
power to flow from the crankshaft to the turbine
shaft to supplement turbine power when
substantial boost is needed and it also allows
turbocompounding where excess turbine power
flows back to the crankshaft. As Figure 1.17
illustrates it combines the advantages of a
Figure 1.15: Ratio of efficiency of strategy V‐I to strategy I for different values of F (left) and ratio of peak pressure of strategy V‐I to strategy I for different values of F (right) (19)
Figure 1.14: Ratio of efficiency of strategy V‐I to strategy V‐II for different values of F (left) and ratio of peak pressure of strategy V‐I to strategy V‐II for different values of F (right) (19)

20
Figure 1.17: The SuperTurbocharger combines the advantages of a supercharger and a turbocharger as well as eliminating some of their individual disadvantages
supercharger and a turbocharger while eliminating some of their individual disadvantages.
The rationale for design consisted of a comparison of double stage turbocompound,
single stage turbocompounding, and electrical turbocompounding to the already established
single stage conventional turbocharger setup. It was decided that the thermal sensitivity and
added inertia of the electrical system were larger drawbacks than the mechanical and packaging
constraints inherent with the single stage mechanical SuperTurbocharger concept.
Initial modeling work was done with GT‐Power on an 11 liter Hyundai natural gas engine
(17). The modeling showed an improvement in brake specific fuel consumption (BSFC) of as much
as 10% for high speed and load as shown in Figure 1.18. This was due in part to the extra 22kW
of power available from the turbine shaft, which was estimated to make up approximately 6% of
the total power output.

21
Figure 1.18: Improvement in BSFC for Mack E7G engine with SuperTurbocharger compared to stock turbocharger (17)
Figure 1.19: Simulated improvement in BSFC of Hyundai natural gas engine with mechanical/hydraulic transmission to transfer
power between crankshaft and turbine shaft (17)
The Hyundai engine
was not available for testing, so
a Mack E7G engine with similar
geometry and performance
was selected. The turbocharger
selected was not ideal for this
engine, but was considered
over others due to the variable
nozzle turbine feature that increased the controllable parameters. The turbocharger was left
unmodified except for the turbo shaft, which was modified for a planetary gear arrangement.
Once the speed was reduced significantly from the planetary gear arrangement, it was
connected to the crankshaft through a continuously variable hydraulic transmission.
Testing showed an almost 6% gain in BSFC at high engine speed and load as shown in
Figure 1.19, while also showing reduced efficiency at other operating points. These results were
consistent with the
belief that the current
turbocompounding
setup was not as
optimized as it would
need to be to fully
realize these benefits
due to turbocharger
miss‐match and the
use of off the shelf

22
hydraulic transmission components. Wide open throttle (WOT) results shown in Figure 1.20
indicate a slight improvement in torque at lower speeds. These results were thought to be less
than optimal due to the pressure limits on the hydraulic system as well as the overall limits of
the speed ratio between the turbine and crank shaft. During a load acceptance test from 50 ft‐lb
to 400 ft‐lb at 1600 RPM, the two methods were almost identical in load acceptance up to 300
ft‐lb. The major difference was once boosting was required to get from 300 to 400 ft‐lb, the
SuperTurbo application was able to accept the load in less than 1.5 seconds due to the
supercharging effect of using crankshaft power to supplement turbine power, while the regular
turbocharger application took almost 13 seconds to reach full load as shown in Figure 1.21.
Some challenges realized were the turbocharger mismatch due to unavailability of turbo
maps from the manufacturer, as well as the inefficiencies of the hydraulic transmission chosen
for this application due to non‐optimized operating points (17). Since its first prototype
demonstration, VanDyne SuperTurbo has spun out of its parent company Woodward Governor
to focus more on automobile applications.
Figure 1.20: WOT curve for MACK E7G with SuperTurbocharger and stock turbocharger (17)

23
Current work has focused on development of a SuperTurbo application for a 2L
Volkswagen inline 4 cylinder engine as a downsized candidate for replacing a larger 3.2L V6
engine. Using engine data to compare the SuperTurbo L4 with a naturally aspirated 3.2L V6, it
was estimated that the EPA city fuel efficiency would increase by as much as 17% (6). Transient
load simulation tests showed a time of 0.3 seconds to reach production Brake Mean Effective
Pressure (BMEP) limit and 0.36 seconds to reach 90% of the peak BMEP for this configuration as
shown in Figure 1.22. As shown in Figure 1.23, the WOT torque curve of the SuperTurbo L4
engine exceeds the naturally aspirated V6 except for the 1000 RPM operating point which is
likely not to be experienced by the engine due to the stall speed limit on the torque converter
and the fact that the vehicle’s acceleration will be accompanied by an increase in engine speed.
At wide open throttle the BSFC was higher on the SuperTurbo version as expected due to the
need for retarded timing to prevent knock, which led to higher temperatures than the turbine
could stand, which in turn led to fuel enrichment and higher BSFC numbers as shown in Figure
1.24. Although the BSFC numbers were higher than the naturally aspirated configuration, they
Figure 1.21: Step change response of a SuperTurbocharger compared to stock turbo (17)

24
Figure 1.23: SuperTurbo transient response for a pedal snap from 2‐bar BMEP to WOT at 2000 RPM. The engine reaches 90% of the peak in 0.36 seconds (17)
Figure 1.22: Torque curve of the SuperTurbocharged 2.0 Liter versus a N/A 3.2 Liter V6 (17)
were still lower than expected stock engine values due to the added advantage of
turbocompounding.
The current development of the SuperTurbo consists of a new design for the high‐speed
section of the transmission as well as new concepts for the continuously variable transmission
(CVT) part of the SuperTurbo.
The high speed section of the
transmission makes use of
traction fluid instead of gears
for the planetary set‐up which
is supposed to be more efficient
at the high rotational speeds
associated with a turbocharger.
The focus of this

25
Figure 1.24: Full load efficiency curve of the SuperTurbocharged 2.0 Liter versus a N/A 3.2 Liter V6 (17)
project will be the calibration and
use of an already developed engine
model with a SuperTurbo model
added in to see what efficiency gains
are possible with this technology.

26
CHAPTER 2: ENGINE MODEL
2.1 GT‐Power
Engine simulation software is becoming increasingly common as evidenced by its use in
the above examples. Its iterative use during the phases of engine concept, design, and
development for a turbocharged engine has been thoroughly investigated (20). Most engine
simulation software makes use of 1D flow simulation to approximate the flow behavior due to
the highly reduced computational demand. With simulation software, the performance of new
concepts can be investigated during the design process. These models are often based on
previously developed models from existing engines. Although this is an approximation, it can
still provide valuable insight into concept performance at a low cost. The major computations
involve the gas conditions in the pipes. This leads to a calculation of the trapped air mass used in
the combustion calculation to determine the indicated mean effective pressure (IMEP). Friction
and pumping losses (FMEP and PMEP) are subtracted from IMEP to give predicted performance.
This dependency makes the later calculations involving performance less accurate than the
initial calculations about gas conditions.
A fully developed model relies on test data, which is typically not available during the
initial concept stage of the engine. This requires assumptions to be made or data to be taken
from elsewhere. The combustion model requires in‐cylinder pressure data that must be
estimated from similar engine data in the absence of test data. Until data is available for
correlation, the accuracy will be affected according to how close the assumed data matches test
data. Application to the design process includes optimization of the intake and exhaust

27
manifold, variable valve timing if available and turbocharger match. While going through
the iterative process of choosing a proper turbocharger, it is important to work closely with the
design engineers to realize all of the constraints in the design.
GT‐Power can be a valuable tool for selecting a particular turbocharger based on the
tradeoffs between minimizing the turbo lag for low speed torque and higher power output. The
modeling of the compressor and turbocharger is accomplished with the use of compressor and
turbine maps, which relate pressure ratios to mass flow for constant speed lines and efficiency
contours. The simulation software assumes quasi‐steady flow, meaning that it assumes steady
flow relationships at instantaneous conditions. However, the unsteady flow that a turbine
experiences is most likely outside the turbine map provided by the manufacturer. An
extrapolation method is suggested by the software manufacture to account for this. When
modeling the effect of a turbocharger, it is suggested that the inlet conditions be set to the
compressor outlet conditions and a nozzle added to the exhaust to simulate the backpressure
from a turbine. This gives a good estimate, but does not take into account the link between
intake and exhaust.
Once a prototype engine is available, it is likely that test data is available to validate and
update the current model to provide greater accuracy. For turbocharged engines correlation
data is very important because the model is especially dependent on turbocharger performance,
particularly at low speeds where the wastegate is shut (20). As shown in Figures 2.1‐2.5, a close
match to test data can be modeled to within about 5% accuracy for most of the speed range of
this WOT test.
Discrepancies in volumetric efficiency are attributed to the combustion model as shown
in Figure 2.1. The difference between compressor pressure outputs in Figure 2.4 is due to the
difference in tested and manufacturer supplied compressor efficiency. The heat transfer model

28
Figure 25: Turbine Inlet Conditions (20)
used for the exhaust is cited as the cause for turbine inlet temperature discrepancies in Figure
2.5. These discrepancies are thought to cause the air flow and torque discrepancies of Figure 2.2
and Figure 2.3. With the proper correlation data, an engine’s performance can be modeled with
validated accuracy. With the proper test
data to validate a model, it is still possible
to investigate different design strategies
that deviate from the original model, but at
a reduced level of accuracy.
Figure 29: Volumetric efficiency correlation (20)
Figure 28: Airflow correlation (20)
Figure 27: Performance Correlation (20) Figure 26: Compressor Outlet Conditions (20)

29
2.2 Stock model from Volkswagen
GT‐Power is chosen as the modeling software due to the availability of a previously
developed stock engine model from Volkswagen. The original model Southwest Research
Institute (SwRI) received of a 2.0L L4 turbocharged GDI engine is validated against test data (6).
Although it is cited as being validated, it is unknown to what extent the original model is
validated. Additional validation is carried out for this project using a more extensive data set
provided by Volkswagen that covers the entire speed and load range. The original model did not
have a throttle so it is likely only validated against WOT data with the timing parameters set for
WOT operation only. The data provided by Volkswagen is contained in Appendix A. A map view
of the simulation layout along with a map view of the controls layout is shown in Figures 2.6 and
Figure 30: Main View of GT‐Power Model in original form from Volkswagen

30
2.7, respectively. The map view of the engine model has several of the major components
labeled. On the left side of the map view, the tree view shows all of the parts currently set up to
use in the model. The majority of the components used are pipe objects as they represent the
flow boundaries throughout the system.
For this original model the wastegate is set up to control desired engine brake mean
effective pressure (BMEP) since there is no throttle. For this project a throttle is added and the
wastegate is used to control boost pressure rather than BMEP so that the throttle is able to
independently control BMEP. The original model contains two sets of maps for both the turbine
and compressor.
The GT‐Power model is set up to run until it converges based on several requirements
specified in the Run Setup menu. There are a maximum number of periods or engine cycles the
Figure 31: View of the controls page dealing with temperature corrections, wastegate control, and lambda control.

31
user must specify that the simulation will not go over, but it will not necessarily converge by this
point. The output file provides information on the number of cycles run for each case and
convergence. There are also a minimum number of cycles the user can set that the simulation
must run before being allowed to stop even if all the convergence parameters are met. In the
flow convergence tab a mass flow steady state auto shut off limit is set. There is another tab
that lets the user select which result (RLT) variable should converge before the simulation ends.
RLT variables are the single valued results such as averages, maximums, and minimums during a
cycle as opposed to instantaneous values which are usually plotted versus crank angle or time.
The RLT variables that are listed to define convergence are the turbine shaft speed, the shaft
torque imbalance between the compressor and the turbine, BMEP, and the orifice diameter of
the wastegate. With the exception of the shaft torque imbalance being set to target zero, the
parameters are set to converge on a cycle‐to‐cycle basis all within a certain user defined
tolerance.
2.3 SuperTurbo added by SwRI
The main addition to the model by SwRI is the transmission between the turbocharger
and the engine crankshaft. In some of SwRI models the wastegate is removed while it remains in
other versions of the model from SwRI. The most used version has a gear ratio controller that
would adjust the gear ratio according to a desired air mass flow rate through the compressor.
The addition of the CVT to the SuperTurbo transmission presents challenges with torque
oscillations due to the cyclic behavior of the engine and the pressure pulses on the turbine. It is
assumed during the initial modeling done by SwRI that the final version of the transmission will
have some way of dampening these oscillations (6). This method is not yet finalized so the SwRI
model without the gear ratio control and with wastegate control is used for this project. To deal

32
with the torque oscillations the SwRI model senses a torque value from the SuperTurbo shaft.
These sensed instantaneous torque value are then averaged over two cycles at an interval of
twelve times per cycle. This averaged value is multiplied by the efficiency if it is positive and
divided by the efficiency if it is negative. This final value is imposed on the shaft labeled
ST_TQeff_shaft_01 with a torque object which is in turn connected to the CVT transmission as
shown in Figure 2.8. In addition to the assumption that the final version of the CVT will include
damping, it is also
assumed that the
mechanical
efficiency will be
80%. GT‐Power
defines the
efficiency based
on torque so that
torque out will be
80% of the torque
in value. This
efficiency is an
estimation and
will need to be modified once data is available on efficiency versus speed, load, gear ratio and
parasitic losses.
Figure 32: SuperTurbo Model added by SwRI

33
2.4 Stock Engine Model Tuning
In addition to the modification to the SuperTurbo model, there are several changes that
need to be made in order to compare the stock simulation against the stock test data. The
original model is set to operate at wide open throttle, so it has no information or controls to
allow operation at part load or throttled operation. In addition, the engine has several
parameters that change depending on both load and engine speed such as ignition timing,
camshaft timing, and injection timing. An example of these timing events relative to crank angle
and piston location is shown in Figure 2.9. This extended validation concentrates on getting a
close match for BMEP and BSFC while also checking that other parameters do not have
excessive discrepancies.
In order to isolate different tuning effects the original model is stripped down to start at
the intake manifold and end at the exhaust manifold. This version of the model is labeled m1.
Figure 33: In‐Cylinder Timing Events

34
Intake and exhaust manifold pressures and temperatures are available from test data to set as
ambient intake and exhaust conditions for this configuration. This configuration allows for
isolated tuning of parameters within this flow path of the engine.
Another advantage model m1 has over the full engine model is the elimination of the
turbocharger and associated wastegate control. The wastegate control and turbo lag associated
with the turbocharger’s large inertia take a considerable amount of computational time to
converge to steady state values. The elimination of this part of the model allows for much faster
tuning of the parameters that are independent of the turbocharger operation except for minor
pressure pulse effects.
To get the most accurate comparison several parameters from the test data are
specified for the engine in the design of experiment (DOE) setup folder. The parameters
imposed on the model from test data include compressor outlet temperature, compressor
outlet pressure, turbine inlet temperature, turbine inlet pressure, ignition timing, fuel injection
timing, fuel injection duration, lambda, camshaft timing, and engine speed. Since the original
model is set up for WOT operation only, it has no information or controls for these parameters
during part load operation.
The lambda values available from test data are imposed on the model as targets. In the
controls page of the model there is a group of objects used to control the amount of fuel
injected based on the desired lambda value and the air flow through the engine. For
turbocharged engines this is an especially important aspect since fuel is often used to cool down
the turbine at high engine speeds and loads. If the temperature limit is exceeded the turbine can
expand and cause catastrophic failure. Extra fueling is also sometimes used to prevent pre‐
detonation. The injected fuel mass is an important parameter for characterizing the
improvements in BSFC.

35
The first parameter to tune in model version m1 is the camshaft timing data. While all of
the other timing parameters are referenced relative to the crank shaft top dead center (TDC)
position the crankshaft timing data is not referenced to anything. The timing has to be
referenced to before or after TDC and can be referenced to the crankshaft angle or the camshaft
angle. All of these possibilities are run and the case with the closest BMEP match to the test
data is chosen.
While this initial tuning is able to show an overall BMEP trend match to test data for the
camshaft timing reference chosen, the model is not able to reach as high of values for BMEP as
the test engine is able to at lower loads as depicted in Figure 2.10. The error is larger as the
reference BMEP is
reduced. Analysis of IMEP,
trapped air mass and
other parameters indicate
that the FMEP model is
inaccurate. At higher loads
this difference is not as
significant since FMEP is a
smaller fraction of IMEP.
GT‐Power uses the Chen‐
Flynn engine friction model to calculate FMEP values as shown below
FMEP (bar) = C + PCPF + MPSF + MPSSF
where,
C = Constant Term
PCPF = Peak Cylinder Pressure Factor
Figure 34: Error in BMEP values for modeling data compared to test data

36
MPSF = Mean Piston Speed Factor
MPSSF = Mean Piston Speed Squared Factor
The C value for the original model is set at 0.8443 bar when the recommended value for
this is suggested by the GT‐Power Help Navigator to be between 0.3 and 0.5 bar. Several
different versions of FMEP were modeled by varying the different coefficients to be mostly
within the range suggested by GT‐Power in an effort to lower the error in the low BMEP range of
the map. The old and new output of the FMEP model is shown in Figure 2.11. Ideally there
would be test data for
FMEP values so that the
FMEP model could be
evaluated directly, but
unfortunately this data is
not available. After this
change the BMEP error
comes down to more
acceptable levels as shown in Figure 2.12.
The next step in tuning the stock model consists of adding a throttle component to the
model and extending the inlet conditions back to the outlet of the compressor. The addition of
the throttle makes this model m2. The new inlet conditions are then set to the outlet conditions
of the compressor based on the available test data. The flow through the throttle is based on an
array of discharge coefficients versus throttle angles. The discharge coefficients are defined by
the ratio of effective flow area to the reference flow area which originates from the isentropic
velocity equation for flow through orifices. The flow coefficients were determined as follows:
First, an initial guess is used and a simulation ran over the BMEP range for an engine speed of
Figure 35: FMEP Model Output from GT‐Power

37
1000 RPM at the
throttle angles listed in
the test data. The
model predicted
pressure drop values
were compared with
test data and then the
flow coefficients were
adjusted iteratively
until a close match is
achieved. This is done
for 1500 RPM as well and then the results were applied to the whole speed range to verify that
they are a good match for the entire speed range. GT‐Power has an Excel spreadsheet that
calculates coefficients automatically if the specified test data is available.
The final step of validating the model against test data requires the addition of the
turbocharger into the model (model m3 and m4). As previously mentioned the wastegate in the
original model is used to control BMEP instead of the more typical configuration of controlling
boost pressure. Since the throttle is controlling BMEP, the wastegate controller is altered to
control the desired boost pressure sensed after the intercooler. The reference boost pressure is
based on post intercooler pressure measurements from the test data.
The final comparison will consist of two configurations. In the first round of this final
comparison the throttle angle will continue to be specified based on the test data (model m3)
while the second round will use a throttle controller object that will adjust to give the desired
BMEP (model m4). This will allow for the comparison of matching parameters based on the
Figure 36: Error in BMEP values for modeling data compared to test data

38
exact throttle angle, and a slightly different version where the throttle angle can vary to give the
referenced BMEP values.
The test data imposed on this simulation configuration include ignition timing, injection
timing, injection duration, camshaft timing, lambda values, and engine speed as well as the
throttle angle added for the previous configuration. In addition to these, reference boost
pressure sensed after the intercooler is added as a target for the wastegate controller.
Depending on the simulation type mentioned above, reference BMEP will also be used in place
of the imposed throttle angles and the throttle will be controlled to try to match this reference
BMEP value.
The results from these simulations show a close overall match to the test data for both
configuration setups. While the first version has larger BMEP difference, the second one has
throttle angle differences as expected. The for the configuration where throttle angle was
adjusted to match BMEP values the average BSFC error is about 3.2% with a standard deviation
of 4.3%.
Even though most of the parameters of importance match well with test data, the
exhaust temperatures are much higher than those reported in the test data. This would have
been apparent with the earlier models, except this parameter is not directly compared
upstream of the boundary conditions that are specified to match the test data in model m1. It
appears that there are heat transfer discrepancies between the model and the test data that
have not been accounted for since the individual exhaust runners were all indicating higher
exhaust temperature directly out of the cylinder model. This difference is likely due to several
issues unrelated to the heat transfer model of the cylinder. The precise location of the
measurement is unknown. The measurements themselves are difficult to interpret due to
radiation and conduction losses that need to be accounted for. Additionally, the temperature at

39
this location is undergoing rapid oscillations. The errors in the GT‐Power model as they correlate
to the given test data are also dependant on the inherent error in the actual measuring of the
test data. GT‐Power’s manual indicates that this is to be expected and correlations are given to
how much these exhaust temperatures are likely to be off depending on different wall and
ambient air temperatures.
Another noticeable difference is the modeling output of the turbine pressure and
temperature drops across the turbine. More research into the details of the GT‐Power turbine
model reveals some possible reasons for these differences. The turbine map data entered into
GT‐Power goes through pre‐processing which extrapolates the data over a wider range and fits
it to a curve for use in the actual simulation. In post‐processing there are plots which indicate
how well the turbine data is suited for this processing. Analysis of the plots reveals that both
sets of turbine data provided in the original model are for a very narrow range compared to the
range that the turbine data will be extrapolated out to as shown in Figure 2.13. Data for the first
turbine map does not fit the normalized curve as well as the second turbine map and the
pressure ratio curve for the second turbine map also gives a better fit as shown in Figure 2.14.
The efficiency curve of the second map is less smooth and shows two local maximums when it is
desirable to have only one maximum.
This leads to an experiment comparing two simulation runs with the two different
turbine maps. The results from the second turbine map are very similar to the results of the first
map with a few exceptions. The second turbine map is unable to produce results for a few of the
low load, low speed cases. This is presumably due to the fact that the data seems to be slightly
more towards the higher end of the blade speed ratio (BSR) line causing the low speed, low load
operating points to use data extrapolated out to a distance that is unreliable. The second map
does not match the temperature

40
and pressure drops across the turbine as well as the first turbine map, although the difference
between the two are much smaller than the overall difference from the test data. Since the
second map does not match as well the best option is to continue using the first map. Despite
Figure 38: Turbine Map Data Analysis Plots for Turbine Map 1 (left) and Turbine Map 2 (right); the Blade Speed Ratio (BSR) is used for normalization and extrapolation calculations in GT‐Power
Figure 37: Turbine Map Data Analysis Plots for Turbine Map 1 (above) and Turbine Map 2 (below)

41
these obvious faults of the model, they will still serve as a useful tool for evaluating a
comparison between the original stock engine model and a SuperTurbo version of the model.
While it is preferable to have a more extensive set of data that will allow for more
precise correlation, as well as more information about the iterative build‐up of the model, the
current model will still be adequate in serving its purpose of showing improvements to the
SuperTurbo model over the stock engine model.

42
CHAPTER 3: ENGINE SIMULATIONS
With a stock simulation model ready for use simulations are run to see where efficiency
improvements can be made and then the SuperTurbo version is ran for comparison. The stock
model is modified to be able to run at engine speed and load points not listed in the test data.
Stock model runs at these new data points are analyzed to see what areas of the BSFC map may
offer the most improvement. The SuperTurbo is added to the model to evaluate the
improvements.
3.1 Simulation of Stock Engine Configuration
For the remaining simulations the engine model is modified to be able to run at
operating points other than those listed in the test data. This allows operation between test
data points where the exact load and speed dependant parameters are not provided. The new
data points are at BMEP intervals of one bar and engine speed intervals of 500 RPM. The results
from this simulation are analyzed to see areas of potential BSFC improvements.
Modifying the model to be able to run at points other than those listed in the test data
is accomplished through the use of the neural network tool in GT‐Power. Neural networks
consist of interconnected processing elements called neurons which work together in parallel to
compute an output based off one or more inputs. Neural networks are trained to interpolate
the nonlinear behavior of important engine parameters that vary based on engine load and
speed. The neural network tool consists of a training tool and a neural network control
component for use in the simulation model. The neural network training tool teaches a neural

43
network the desired output based on a given set of inputs. The use of neural networks instead
of a simple look‐up table has several advantages such as being able to determine the output in a
shorter amount of time, being able to handle data where linear interpolation is insufficient, and
being able to handle more inputs.
The different training methods are briefly explained in the Train Neural Network
document provided with the software (21). Once the neural network is trained, a file is created
that can be accessed by the neural network control component for use in any model. To train
the neural network, the user specifies input data such as BMEP and engine speed values. The
desired output values are entered, such as camshaft timing, ignition timing, etc. The user selects
one of the various training methods or lets the software automatically choose one. If automatic
is chosen the software runs several training methods and output the results of the method that
provided the lowest root mean square (RMS) training and testing error. As a built in default, the
training methods set aside 10% of the data to validate the training once the training is complete.
Parameter modeling using this method consists of ignition timing, injection timing, injection
duration, camshaft timing, lambda values, reference boost pressure, and reference BMEP.
With a more general model capable of running at any point within the range of engine
speeds and BMEPs, the model is run for comparison against a SuperTurbo configuration. Since
wastegate data is not included in the test data, the modeling is split into two sections with
overlap in the transition area. One section contains data points where the wastegate is closed.
The second set uses the wastegate to control desired boost.
Based on results from the stock engine modeling there are several areas of possible
BSFC improvement. The first case occurs when the wastegate is open. With typical turbocharger
configurations the wastegate is open when the exhaust gas supplies the turbine with more
energy than the compressor is able to effectively use. This area of the map covers the higher

44
Figure 39: Wastegate flow versus engine speed (RPM/1000) and load (bar)
02
46
0
10
200
20
40
60
Engine Speed (RPM/1000)
Wastegate Flow
BMEP(bar)
Ma
ss F
low
(g
/s)
0
10
20
30
40
50
engine speed and load regions of the engines operating range as shown in Figure 3.1. The
wasted exhaust gas flow corresponds to the additional energy available that can be used for
turbocompounding with the red highest flow area able to show the most improvement. The
wastegate diameter is evaluated using the model by controlling the diameter based on desired
boost pressure input from the test data available. With the SuperTurbo configuration the
wastegate is closed and the gear ratio is controlled to act as a brake on the turbine so that it
does not over‐speed. This braking energy is fed back to the crankshaft through the transmission.
The second case occurs when the compressor is creating boost pressure that is not
needed. The compressor uses energy from the turbine to create boost and the throttle is
actuated to control engine load so that much of the energy spent on creating boost is lost
through the pressure drop across the throttle. This is done with the stock configuration to keep
turbine speeds high. Even though boost is not needed the stock configuration creates the boost
in anticipation that boost will be needed soon. The turbo speed is kept high and a recirculation
valve is used when the boost is not needed. Once boost is needed the turbo is already at or near

45
Figure 40: Boost pressure created by the compressor that is unneeded
0
2
4
6
05
10
15200
0.5
Engine Speed(RPM/1000)
Wasted Boost Pressure
BMEP(bar)
Pre
ssu
re (
ba
r)
0
0.1
0.2
0.3
0.4
a speed where it is able to adequately provide boost so that turbo lag is less of an issue. The
area of the map with boost pressure higher than atmospheric pressure and manifold pressure
less than atmospheric pressure covers a large area of the map except for high load cases where
the throttle is at or near wide open position and low load and speed cases where the boost
pressure is already near atmospheric as shown in Figure 3.2. The wasted boost pressure is
calculated by subtracting manifold pressure from boost pressure if manifold pressure is greater
than atmospheric pressure and by subtracting atmospheric pressure from boost pressure when
manifold pressure is lower than atmospheric pressure. The compressor is wasting the most
power in the red higher pressure difference area so it should show the most improvement.
When boost pressure is not needed the compressor can be controlled to provide almost
no boost with the braking energy going to the crankshaft instead of being wasted. Reduced low
load compressor use also has the advantage of supplying the cylinder with cooler air. Since the
air is not being compressed as much before passing through the throttle restriction the intake
air temperature is denser due to its lower temperature.

46
Another source of improvement is the substitution of the stock turbine design for a new
turbine design that is optimized for this type of application. Turbochargers have a tradeoff
between turbine efficiency and turbo lag. The turbine must be larger in order to be more
efficient causing the turbo lag to increase. With the SuperTurbo design the turbine inertia is less
of an issue since engine power is available to accelerate the turbine so the size can be increased
to make it more efficient.
3.2 Comparison of SuperTurbo Model to SuperTurbo Test Data
While development of the SuperTurbo is in the early stages some test data is available
which demonstrates turbocompounding ability. The configuration consists of the high speed
section of the SuperTurbo and a fixed gear ratio pulley between the high‐speed section and the
crankshaft. In addition it utilizes the lower efficiency stock turbine. The test data currently
available uses a pulley from a 4000 RPM max load test at 2707 RPM part load conditions.
Unfortunately, the engine speed and load tested do not deviate much in ratio from the 4000
RPM full load condition so the improvement is not as much as it could be for this operating
point. While there is some turbocompounding benefit due to the wastegate being closed the
gear ratio is not optimal for this condition since the boost pressure is higher than the required
manifold pressure and the throttle is not wide open. The more optimal comparison for this
operating point would be at a condition where the throttle is wide open or a gear ratio where
wasted boost is not created.
The model is run with the parameters available from test data imposed into the model.
These include lambda, ignition timing, gear ratio, and atmospheric conditions. While not all of
the results match the test data parameters that are available they are close enough of a match
to provide validation in terms of turbocompounding ability. While the ignition timing is imposed

47
on the model from the test data, there seems to be some discrepancy with regards to the
combustion model with the 50% burned crank angle location being a couple of degrees off. The
BMEP and IMEP(360) data points show less than one percent difference and the IMEP(720) data
shows about two and a half percent difference. However, the FMEP data show a difference of
sixty percent. This is due to the way it is calculated. The BMEP value is calculated based on the
brake torque measured. This gives an unrealistic number for the actual in‐cylinder BMEP value
since it now incorporates turbocompounding power. Since the BMEP now incorporates
turbocompounding power, the calculation of FMEP based on BMEP, IMEP(360) and PMEP is off.
The modeling data is available for comparison in Appendix D. The BSFC values are
between one and two percent off but it is still possible to determine the benefits of the
turbocompounding by comparing the SuperTurbo model to the stock model at these same
conditions. The BSFC improvement of the SuperTurbo model over stock model is about 1.2%.
The amount of torque added to the crankshaft in the test data is 4.31 Newton meters (N‐m)
which is close to the modeling prediction of 4.51 N‐m. This close match of transferred torque
provides validation that the model is capable of predicting the improvements due to
turbocompounding.
3.3 Simulation of SuperTurbo Engine Configuration
The SuperTurbo configuration incorporates a new turbine wheel in production form so a
different model is used for the SuperTurbo turbine. Since the design is not fully developed and
tested a simplified version of a turbine is modeled. GT‐Power has a simplified turbine model that
predicts output power, mass flow rate and outlet temperature using an orifice flow model and
imposed efficiency. The new turbine design is capable of much higher efficiencies than a normal
turbocharger turbine since there is no longer a tradeoff between turbine inertia and turbo lag.

48
Figure 41: The new turbine design has a wider inlet area to allow less back pressure as well as longer
blades to improve efficiency
The differences in the two designs are illustrated in Figure 3.3. The figure shows that the new
turbine design has noticeably longer blades and a larger inlet area. The orifice diameter in the
model is determined based on matching the pre‐turbine pressure of the stock configuration at
5000 RPM full load with the SuperTurbo
version at the same load, but with the
wastegate closed.
The final configuration is split into
a high load section where boost is needed,
and a low load section where boost is not
needed. The high load cases will have a
wide open throttle and will use the
SuperTurbo gear ratio to control engine
load. The limit on how low of a load can
be achieved with this method is dependent on the compressor pressure ratio. Modeling of
pressure ratios below one without test data is not recommended by GT‐Power due to the need
to extrapolate the available data out to these points. The second section uses the throttle to
control load while the SuperTurbo gear ratio is used to control the speed of the compressor
such that its pressure ratio remains slightly above one.
Initial modeling with the simple turbine reveals that flow convergence parameters are
not converging for some cases. The flow convergence is specified in terms of change in mass and
pressure flow from one period to the next at any flow path location. The location of the
changing flow is further down the exhaust stream in the muffler section of the model. The
source of this is thought to be due to the simple turbine having less of a pressure drop across
the turbine part of the system. While the pressure drop across the turbine is the same, the stock

49
Figure 42: Brake specific fuel consumption improvement over stock engine
02
46
0
10
200
2
4
6
Engine Speed(RPM/1000)
BSFC Improvement
BMEP(bar)
% Im
pro
vem
en
t
2
3
4
5
6
model’s wastegate is open allowing for more of an overall pressure drop which dampens the
pressure oscillations coming from the engine. Due to this the flow convergence parameters
were slightly relaxed from a fractional value of .002 to .02.
3.4 Results
The primary parameter of interest for this modeling is brake specific fuel consumption
(BSFC). The results show improvement in BSFC over the entire range of the map as shown in
Figure 3.4. The improvements correspond to the predicted areas of improvement in the range of
2 – 6 % over stock conditions. The high load and speed areas are affected more by
turbocompounding from the wastegate being closed as shown in Figure 3.5. The middle to lower
region is affected most by the reduced losses associated with using energy to compress air that
is later restricted by the throttle as Figure 3.6 illustrates.
The power transfer from the turbine to the crankshaft is higher with increasing speed
and load as shown in Figure 3.7 maxing out at 6000 RPM 14 bar BMEP. This correlates well with

50
BMEP contribution from the turbocompounding as shown in Figure 3.8. This contribution means
the in‐cylinder power requirement is reduced resulting in overall fuel savings. BMEP
contribution is obtained by calculating in‐cylinder BMEP values as listed below and subtracting
that number from the overall BMEP for the entire engine system reported by GT‐Power.
Figure 43: Brake specific fuel consumption improvement over stock engine as low load case where
Figure 44: At this higher load point the contribution from turbocompounding dominates the

51
Figure 46: Power transferred from SuperTurbo to Crankshaft
02
46
0
10
200
5
10
15
Engine Speed(RPM/1000)
Turbocompounding Power
BMEP(bar)
Po
we
r (k
W)
2
4
6
8
10
12
Figure 45: BMEP contribution from Turbocompounding
02
46
0
10
200
1
2
Engine Speed(RPM/1000)
Turbocompounding BMEP Contribution
BMEP(bar)
Pre
ssu
re (
ba
r)
0.2
0.4
0.6
0.8
1
1.2
1.4

52
BMEP = IMEP(360) + PMEP – FMEP
where,
BMEP = Brake Mean Effective Pressure
IMEP(360) = Indicated Mean Effective Pressure (during compression/combustion stroke)
PMEP = Pumping Mean Effective Pressure
FMEP = Friction Mean Effective Pressure
The mid to lower load region of the map is improved by the reduced use of the
compressor when it is not needed as illustrated in Figure 3.9. The mid region of the map saves
up to three or four kilowatts that are typically wasted by the compressor due to the SuperTurbo
control of the gear ratio as illustrated in Figure 3.10. The difference is due to the ability of the
superturbo to control the pressure ratio of the compressor. At low loads where the intake
manifold pressure is below atmospheric the pressure ratio is controlled to be just above one
where at higher loads the throttle is wide open and the gear ratio is controlled to give the
required manifold pressure. This power difference correlates well with Figure 3.2 above showing
areas where boost pressure is not needed. This reduction in power also corresponds to a
reduction in in‐cylinder power requirement for the same brake power.
Figure 47: Pressure at different locations through the engine for 3000 RPM 8 bar BMEP
0.7
0.8
0.9
1
1.1
1.2
1.3
1.4
1.5
0 1 2 3 4 5 6 7
Pressure (bar)
Location Through Engine
Comparison of Average Pressure Through Engineat 3000 RPM 8 bar BMEP
Stock
SuperTurbo
1 ‐ Compressor In
2 ‐ Compressor Out
3 ‐ Intercooler Out
4 ‐ Intake Manifold
5 ‐ Pre‐Turbine

53
While the wasted compressor boost pressure and power goes down with lower gear
ratio as shown in Figure 3.11, the PMEP rises slightly with decreasing gear ratio even though
pressure drop across the throttle is decreasing as shown in Figure 3.12. From the stock
configuration to the superturbo configuration there is a reduction in pumping losses, but as the
gear ratio is reduced the pumping losses gradually creep higher. The reduction in pumping
losses at this location comes from the reduced backpressure of the improved turbine design as
illustrated in Figure 3.13. With the stock gear ratio imposed there are additional pumping losses
on the intake side due to the slightly lower manifold pressure. These losses are made up for by
the higher reduction in pumping losses on the exhaust side. As the gear ratio is reduced the
exhaust pressure drops, but not as much as the intake pressure drops which causes a very slight
increase in pumping losses. These pumping losses are insignificant compared to the reduced
compressor power losses shown above leading to overall BSFC improvement.
Figure 48: Power transferred from SuperTurbo to Crankshaft
02
46
0
10
200
2
4
6
Engine Speed(RPM/1000)
Compressor Power Difference
BMEP(bar)
Pow
er (k
W)
1
2
3
4

54
A comparison of the log pressure vs. volume (P‐V) plots shows the difference in intake
and exhaust pressures in Figure 3.14. For the 3500 RPM 4 bar BMEP case the savings from lower
exhaust back pressure clearly makes up for the lower intake manifold pressure. For the higher
load case of 15 bar BMEP the pumping losses are higher than stock as illustrated in Figure 3.15.
For this case the backpressure is close to stock, but the intake pressure is reduced enough to
Figure 50: Wasted boost pressure and compressor power as a function of SuperTurbo gear ratio
Figure 49: While the pressure drop across the throttle reduces with gear ratio, the pumping losses increase slightly

55
Figure 52: Log P‐V plot comparing pumping losses at 3500 RPM 4
cause an overall increase in pumping losses. Although the pumping losses are higher compared
to stock, they are insignificant compared to the turbocompounding benefit.
The intake manifold pressure is lower for the SuperTurbo configuration over the entire
operating range as shown in Figure 3.16. The entire area has a reduction in pressure of about 2‐
7%. This is to be expected
since the cylinder does not
need as much air to create the
same overall power in the
system. While the new turbine
design allows reduced
backpressure for much of the
operating range as shown in
Figure 3.17 the higher speed
Figure 51: The reduced backpressure more than compensates for the increased pumping losses from the reduced intake manifold pressure

56
Figure 53: Log P‐V plot comparing pumping losses at 3500 RPM 15
Figure 54: Difference in intake manifold pressure calculated as stock pressure minus SuperTurbo pressure so (+) indicates stock
pressure is greater
02
46
0
10
200
5
10
Engine Speed(RPM/1000)
Intake Manifold Pressure Difference
BMEP(bar)
% D
iffe
ren
ce
2
4
6
8
Figure 55: Difference in pre‐turbine pressure calculated as stock pressure minus SuperTurbo
pressure so (+) indicates stock pressure is greater
0 2 4 6010
20-40
-20
0
20
Engine Speed(RPM/1000)
Pre-Turbine Pressure Difference
BMEP(bar)
% D
iffe
ren
ce
-30
-20
-10
0
10
and load area has higher
backpressure due to the
wastegate being closed for
turbocompounding. These
pressure differences
correlate to lower pumping
losses in the mid range of
the engine while the high
load and high engine speed
area of the engine
experiences higher pumping losses compared to stock as illustrated in Figure 3.18. The low load
and speed area shows almost no difference. The overall gear ratio used stays under 30 for most
of the map except for the low speed high load region as Figure 3.19 shows.
Another source of improvement not realized with the modeling relates to the intake air
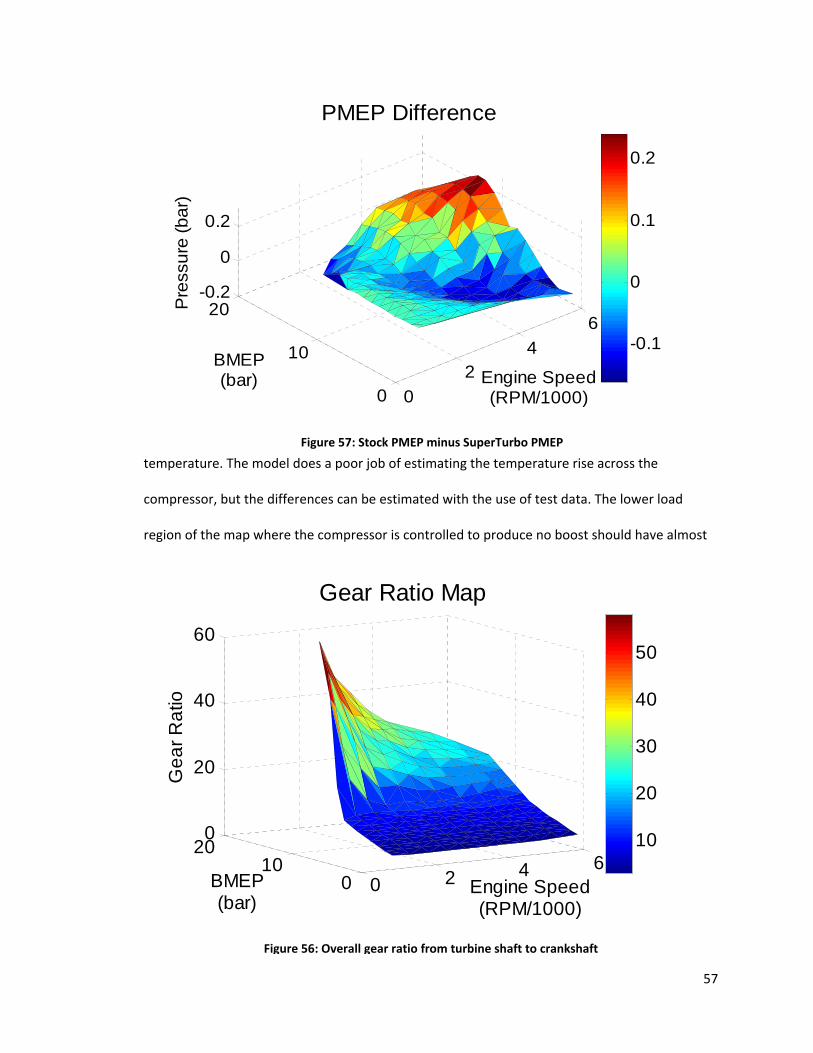
57
temperature. The model does a poor job of estimating the temperature rise across the
compressor, but the differences can be estimated with the use of test data. The lower load
region of the map where the compressor is controlled to produce no boost should have almost
Figure 56: Overall gear ratio from turbine shaft to crankshaft
0 2 4 60
1020
0
20
40
60
Engine Speed(RPM/1000)
Gear Ratio Map
BMEP(bar)
Ge
ar
Ra
tio
10
20
30
40
50
Figure 57: Stock PMEP minus SuperTurbo PMEP
0
24
6
0
10
20-0.2
0
0.2
Engine Speed(RPM/1000)
PMEP Difference
BMEP(bar)
Pre
ssu
re (
bar)
-0.1
0
0.1
0.2

58
no temperature rise compared to the stock configuration. This results in lower intake manifold
temperatures which provide denser in‐cylinder air meaning less pressure is required.
The model results help solidify the understanding of how the SuperTurbo is able to
benefit a reciprocating engine over the entire steady state operating range. The
turbocompounding advantage goes up with higher load and engine speed since that is the area
where most of the additional exhaust energy is passed through the wastegate. The mid to lower
load range of the engine is able to realize more benefit due to the control of the compressor
speed. Instead of creating boost that is not needed to prevent turbo lag boost is able to be
created on demand at any given operating point with the use of the SuperTurbo. The mid range
also benefits from reduced pumping losses. Even though the higher load and speed range has
higher pumping losses compared to stock, the benefits from turbocompounding more than
make up for the pumping losses and is able to supplement some of the in‐cylinder BMEP
requirement.

59
CHAPTER 4: SUMMARY AND CONCLUSION
4.1 Summary
A modeling project was carried out on a Volkswagen engine model using GT‐Power. The
addition of a SuperTurbo to the model was used to predict potential BSFC improvements. The
SuperTurbo acts as a supercharger for the engine giving the intake manifold boost when it is
needed and provides turbocompounding when excess boost is available. The stock engine
model was used that Volkswagen had already correlated with test data for a wide open throttle
configuration. Additional test data was used to correlate the data over the entire range of
operating points. The SuperTurbo model developed by SwRI was added to the model and the
original turbine model was replaced by a simplified version of a turbine model to represent
characteristics of a new turbine design for use in the superturbo configuration.
It was predicted that the improvements would come from two sources. One source of
improvement is where the turbine wastegate is open. This wasted energy was available to offset
in‐cylinder power with the use of turbocompounding. The second source of improvement comes
from the reduced use of the compressor at low loads where boost is not needed. The modeling
results confirmed the areas of improvement. The actual magnitude of improvements will
depend on transmission efficiencies yet to be determined.

60
4.2 Conclusion and Future Work
The original model required modification for accurate part load simulations.
The improved model is able to match stock data with acceptable accuracy due
to imposing engine timing parameters from the test data as well as modifying
the FMEP model and throttle model.
The SuperTurbo simulations resulted in significant BSFC benefits.
The area of operation where the stock engine wastegate is normally open
shows improvement due to utilization of excess exhaust energy through
turbocompounding with a maximum of 6.7% improvement at 5000 RPM; 17 bar
BMEP although the maximum amount of turbocompounding is 12.95 kW at
6000 RPM; 14 bar BMEP.
The area of operation where boost pressure is limited when it is not needed
also shows improvement due to the minimization of wasted compressor power
with the largest power savings being 4.3 kW at 5500 RPM; 8 bar BMEP which
coincides with the highest point for wasted boost pressure.
The simulations showed approximate magnitudes of possible improvements
with an assumed transmission mechanical efficiency of 80%.
The actual magnitudes of improvements will depend heavily on the final
efficiency of the turbocompounding action of the transmission between the
turbine shaft and the crankshaft.
Possibilities of future work consist of further improvements to the current configuration
by optimizing the timing parameters. This will require knowledge about the limitations affecting
the current timing parameters. Once more information is known about the parasitic losses and

61
mechanical efficiency of the final transmission it can be included into the model to show more
realistic improvements.
Now that steady state results have been modeled these can be incorporated into
transient models that are able to benefit more from the supercharging function of the
SuperTurbo. The combination of transient and steady state modeling can then be used to
determine fuel saving benefits over prescribed drive cycles. With a working model capable of
both transient and steady state operation, control strategies can be developed and tested
before being implemented on hardware.

62
References
1. Supercharging for Fuel Economy. J. Buike, J. Davis, J. Marsh, and L. Ryder. s.l. : SAE, 1981.
2. A Fast Response Turbocharging System. A. Nekut, R. Callaway, and C. Kuenhl. s.l. : SAE, 1983.
3. Electronic Throttle and Wastegate Control for Turbocharged Gasonline Engines. A. Y. Karnik, J.
H. Buckland and J. S. Freudenberg. Portland : American Control Conference, 2005.
4. Comparison of a turbocharger to a supercharger on a spark ignited engine. Adams, T. G. s.l. :
SAE, 1984.
5. Simulation of Supercharged and Turbocharged Small Spark‐Ignition Engine. J.i Navratil, M.s
Polasek, O.h Vitek, J. Macek, P.l Baumruk. Prague : Journal of Middle European Construction
and Design of Cars, 2003.
6. Analysis of a SuperTurbocharged Downsized Engine Using 1‐D CFD Simulation. C.J. Chadwell,
M. Walls. s.l. : SAE, 2010.
7. Transient performance of an SI engine by transient response specifications. J. ‐H. Kwark, C. ‐H.
Jeon and Y. ‐J. Chang. 3, Busan : International Journal of Automotive Technology, 2003, Vol. 4.
8. Janota, N. Watson and M.S. Turbocharging the Internal Combustion Engine. New York : John
Wiley & Sons, 1982.
9. A Comparitive Study of The Acceleration Performance of a Truck Diesel Engine With Exhaust‐
Gas Turbocharger and with Pressure‐Wave Supercharger Comprex. I. Summerauer, F. Spinnler,
A. Mayer and A. Hafner. London : Turbocharging and Turbochargers Conference, 1978.
10. Testing Methods for the Transient Behavior of Charged Vehicle Engines. Hiereth, H. s.l. : SAE,
1986.
11. Investigation on performance of a compression‐ignition engine with pressure‐wave
supercharger. Y. Lei, D. S. Zhou, H. G. Zhang. s.l. : Elsevier, 2009.
12. Turbocharger motor‐generator for improvement of transient performance in an internal
combustion engine. J. Panting, K. R. Pullen, and R. F. Martinez‐Botas. 3, London : Professional

63
Engineering Publishing, 2001, Proceedings of the Institution of Mechanical Engineers, Part D:
Journal of Automobile Engineering, Vol. 215. 09544070.
13. The Turbocompound Diesel Engine. D. W. H. Tennant, B. E. Walsham. Huddersfield : SAE
Technical Paper Series, 1989.
14. Compound piston and turbine engines. London, A. L. s.l. : Gas and Oil Power, 1959.
15. Testing of a Low Specific Fuel Consumption Turbocompound Engine. Holtman, R. H. s.l. : SAE,
1987.
16. Study of available exhaust gas heat recovery technologies for HD diesel engine applications.
D.T. Hountalas, C.O. Katsanos, D.A. Kouremenos, E.D. Rogdakis. 2, s.l. : International Journal of
Alternative Propulsion, 2007, Vol. 1.
17. An Advanced Turbocharging System for Improved Fuel Efficiency. E. A. Vandyne, M. B. Riley.
s.l. : ASME, 2007.
18. Turbo‐Cool turbocharging system for spark ignition engines. L. S. Wang, S. Yang. s.l. :
Professional Engineering Publishing, 2006, Vol. 220.
19. An Air Cycle Analysis of Alternatives to Throttling in the Otto Cycle Engine. Y. Yacoub, C.
Atkinson. s.l. : American Society of Mechanical Engineers, Internal Combustion Engine Division.
20. The Design of Turbocharged Engines Using 1D Simulation. Gurney, D. s.l. : SAE, 2001.
21. GT‐Power Help Navigator. s.l. : Gamma Technologies. Vol. V 7.0.

64
Appendix A: Volkswagen Test Data

65

66

67

68

69

70

71

72
Appendix B: Volkswagen Stock Modeling Data

73

74

75

76

77

78

79

80

81

82
Appendix C: Volkswagen SuperTurbo Modeling Data

83

84

85

86

87

88

89

90

91

92
Appendix D: Comparison of SuperTurbo test data to modeling data