the use of stim and pesa to measure profiles of aerosol mass and hydrogen content, respectively,...
TRANSCRIPT

Aerosol Science and Technology 36 642ndash651 (2002)cdeg 2002 American Association for Aerosol ResearchPublished by Taylor and Francis0278-6826=02=$1200 C 00
The Use of STIM and PESA to Measure Proles ofAerosol Mass and Hydrogen Content Respectivelyacross Mylar Rotating Drums Impactor Samples
Graham Bench1 Patrick G Grant1 Dawn Ueda1 Steve S Cliff2 Kevin D Perry3
and Thomas A Cahill21Center for Accelerator Mass Spectrometry Lawrence Livermore National LaboratoryLivermore California2Department of Land Air and Water Resources (LAWR) University of California Davis California3Department of Meteorology San Jose State University San Jose California
A method has been developed for measuring pro les of aerosolmass on thin (480 sup1gcm2) Apiezon-L coated Mylar lms employedin rotating drum aerosol impactor samplers using the ion beamanalysis technique scanning transmission ion microscopy (STIM)The greased Mylar lms are excellent impaction substrates andpossess excellent uniformity in projected density making them anideal substrate for STIM analysis The uniformity in projected den-sity of a lm enables STIM with a 3 MeV proton beam to pro-duce pro les of aerosol mass with an accuracy of better than 90and a mass sensitivity approaching 10 sup1gcm2 Further we haveextended proton elastic scattering analysis (PESA) to the same lms achieving measurement of an organic surrogate Althoughthe lms contain raquo 20 sup1gcm2 hydrogen the spatial uniformity in lm hydrogen content enables PESA with a 3 MeV proton beamto produce pro les of hydrogen arising solely from the aerosolswith an accuracy to within sect 1 sup1gcm2 and a mass sensitivity ofraquo 1 sup1gcm2 These measurements when combined with synchro-tron-x-ray uorescence (S-XRF) measurements on the same lmallow mass closure sum of species versus measured mass a keyquality assurance protocol to be approached All 3 techniques wereapplied to very ne and ultra- ne particles collected in Fresno CANovember 2000 by slotted DRUM samplers Temporal resolutionin the resulting pro les was middot 6 h The dramatic changes in com-position versus size and time and new types of elemental corre-lations unseen in PM25 lters will be major assets in correlating
Received 27 June 2001 accepted 13 August 2001This work was partially supported by a NSF grant ATM-0080225
and was partially performed under the auspices of the US Departmentof Energy by Lawrence Livermore National Laboratory under contractW-7405-ENG-48
We would like to acknowledge Dr Nehzat Motellabi and theCalifornia Air Resources Board for their invaluable assistance and sup-port in the FACES study and our efforts to advance size and time re-solved sampling for health studies
Address correspondence to Graham Bench Center for AcceleratorMass Spectrometry L-397 Lawrence Livermore National LaboratoryLivermore CA 94550 E-mail bench1llnlgov
aerosols and health impacts visibility degradation and the effectsof aerosols on climate
INTRODUCTIONCompositional analysis of aerosols is greatly aided by re-
moving the particles from the overwhelming volume of carriergases Separation of aerosols from the ambient atmosphere byimpaction offers many advantages over standard ltration tech-niques Some of the most important advantages are the abilityof impactors to segregate by particle size to better preservechemical integrity since the air stream does not pass through thedeposit to collect samples as a function of time and to have awide variety of impaction surfaces available to match analyti-cal needs Disadvantages include the increased analytical costsassociated with size-segregated samples the very small amountof mass available for compositional analysis and the dif cultyin measuring the mass of the deposit (Cahill and Wakabayashi(1993) and references therein) For impactor strips that havesampled aerosols as a function of time spatially small areas (assmall as 02 pound 02 mm) have to be studied on the strip that hastypical dimensions of raquo1 pound 15 cm The collected aerosol massin a given area is suf ciently small (on the order of 100 sup1gcm2)and covers a suf ciently small area that measurement of totalmass in such an area has rarely been achieved (Malm et al 1994)While impaction has been used since the 1970s the lack of masshas become a major handicap for integration of impaction-basedstudies into standard EPA lter based mass standards As an ex-ample data from 14400 days of 3 size cut impaction based airmonitoring in California 1973ndash1977 (Flocchini et al 1976) wasuseful for many purposes (Barone et al 1978) but was not ableto account for more than about 20 of the aerosol mass seen onside by side samples It was also not possible to measure total
642
STIM AND PESA IN AEROSOL MEASUREMENTS 643
mass directly from the impaction strips Furthermore this studyhad no capability for organic and nitrate mass determinationThis was primarily due to the inability of x-ray based methodsto measure organic matter and nitrates (Cahill et al 1989)
In this paper we report on developing andor extending meth-ods that measure both total mass and organic matter mass sur-rogates thus allowing us to approach mass closure which is soimportant to quality assurance protocols in speciated aerosolsMeasurement of total mass involves the use of the well-established method of scanning transmission ion microscopy(STIM) (Lefevre et al 1987 Bench et al 1993) on aerosolstrip samples from impactors The strip sample substrate usedwas Apiezon-L coated Mylar This substrate has excellent par-ticle collection and antibounce capabilities and we show that ithas excellent uniformity in projected density making it a suit-able substrate for STIM analysis Further the well-establishedproton elastic scattering analysis (PESA) method (Cahill et al1987 Malm et al 1994 Cohen et al 1996) has been extendedto the same substrates PESA has routinely been used to mea-sure aerosol hydrogen content on Te on substrates (which arehydrogen free) to deliver a surrogate organic composition Herewe show that although the Mylar substrate has a large hydrogenblank value the hydrogen content of this substrate is relativelyuniform This uniformity allows reliable subtraction of the sub-strate hydrogen yield from the sample hydrogen yield to giveaerosol hydrogen content for determination of an organic sur-rogate Finally we show how STIM and PESA measurementswhen combined with synchrotron-x-ray uorescence (S-XRF)measurements on the same foil allow us to employ the concept ofintegral redundancy to approach mass closure sum of speciesversus measured mass All 3 techniques were applied to very ne and ultra- ne particles collected in Fresno CA November2000 with slotted DRUM samplers (Raabe et al 1988) It is notthe purpose of this paper to present a detailed analysis of ambi-ent aerosols of Fresno However the STIM PESA and S-XRFanalyses of the impaction strips revealed dramatic changes incomposition versus size and time and new types of elementalcorrelations unseen in PM25 lters The wealth of informationobtained suggests that data acquired from the STIM PESA andS-XRF analyses of impaction strips could be a major asset incorrelating aerosols and health impacts visibility degradationand the effects of aerosols on climate
METHODS
SamplesThe rotating drum impactor substrates were raquo1 pound 17 cm2
strips of Apiezon-L (M amp I Materials Limited ManchesterUK) coated Mylar (C10H8O4) with an areal density of raquo480 sect10 sup1gcm2 The 480 sup1gcm2 Mylar strips were coated withraquo5 sup1gcm2 Apiezon-L in the laboratory after purchase by uni-formly exposing the Mylar strips to a 2 by weight solutionof Apiezon-L in toluene Coating thickness was determined by
weighing the strip before and after coating Apiezon-L greaseis a clean high poise vacuum grease shown to have excellentantiparticle bounce capabilities (Wesolowski et al 1978 Cahill1979) For the work reported here aerosol samples were col-lected at the Fresno CA EPA Superfund site from November 8through 29 2000 for the California Air Resources Board as partof the preliminary quality assurance tests for the Fresno Asth-matic Children Environment Study (FACES) This paper reportson STIM PESA and S-XRF analysis of 6 sub PM25 (particleswith aerodynamic diameter middot25 sup1m) mode stages from therotating drum aerosol impactor studies in Fresnomdashstages 3ndash8These 6 stages represent particulate aerodynamic diameters (Dp)in the following size ranges 25 sup1m gt D p cedil 115 sup1m (stage 3)115 sup1m gt D p cedil 075 sup1m (stage 4) 075 sup1m gt Dp cedil 056 sup1m(stage 5) 056 sup1m gt Dp cedil 034 sup1m (stage 6) 034 sup1m gt D p cedil024 sup1m (stage 7) and 024 sup1m gt Dp cedil 007 sup1m (stage 8)These cut points differ from the original cut points of the jettedDRUM sampler (Raabe et al 1988) since they were modi edwhen the unit was changed from single jets to 6 mm long slots(Raabe 1997) The rotating DRUM impactor strips had a rotationrate of 4 mmday sampling a ow of 10 Lmin through a 6 mmlength slot Four blank Apiezon-L coated Mylar strips were alsoexamined via STIM and PESA to determine the contribution ofthe lm to the energy lost by the proton beam and the hydrogenyield
Nuclear Microprobe Sample Orientation and ScanningSamples were analyzed at the nuclear microprobe facility
at the Lawrence Livermore National Laboratory (Roberts et al1999) using PESA and STIM to determine the pro les of aerosolhydrogen content and projected density respectively along eachsample Because STIM utilizes a millionfold lower beam cur-rents than PESA all samples were initially analyzed by STIMFor all analyses an incident 3 MeV proton beam was focusedonto the specimen in a square spot of size 125 pound 125 sup1m2 Sam-ples were mounted within the microprobe target chamber withthe largest dimension in the vertical direction The sample sur-face was normal to the incident beam direction and oriented sothat any deposited aerosol was facing downstream from the in-cident beam With this orientation the beam passes through thesubstrate before the aerosol and always loses the same amountof energy in passing through a uniform substrate independentof variations in the amount of aerosol on the substrate
To obtain spatial information the beam was scanned overthe sample and data recorded as a function of beam positionOwing to the spatial extent of the samples sample scanningwas achieved by a combination of electrostatic and mechani-cal scanning Electrostatic scanning of the incident beam wasutilized to scan areas of 1 pound 1 mm2 using a point by pointraster mode with a pixel (or step) size of 125 sup1m The beamdwelt at a particular sample location until a preset amount ofintegrated charge was recorded before stepping onto the nextbeam location Following completion of an electrostatic scan the
644 G BENCH ET AL
sample was mechanically translated vertically 1 mm and anotherelectrostatic scan started This process was repeated until the de-sired length of the sample to be analyzed had been achieved Thewhole process is automated and with this approach samples aslong as 20 cm can be analyzed However the 6 FACES sub PM25
mode drum impactor samples had only been exposed to aerosolmaterial along raquo9 cm of the sample length (corresponding tothe time period of November 8 to 29 2000) Consequently scansizes of 1 pound 90 mm were utilized to scan all samples These scansconsisted of 8 pound 720 pixels with a pixel size of 125 pound 125 sup1m2The vertical step size of 125 sup1m in the STIM and PESA pro- les corresponds to an impactor drum collection time periodof 075 h for the FACES samples In addition to determinethe reproducibility of the STIM and PESA data collection andanalysis protocols the FACES stage 8 sample was analyzed in2 separate 1 mm pound 90 mm areas laterally separated by 2 mmAs the length of the impactor slot was raquo6 mm raquo16 of theaerosols collected on a strip were measured in an individualpro le
STIM Data Collection and ReductionTo determine pro les of aerosol mass or areal density on a
sample a method that can resolve lt50 sup1gcm2 aerosol areal den-sity differences within localized areas on a sample is requiredSTIM can supply such data by measuring the energy lost by theincident beam as it traverses the sample (Lefevre et al 1987)Protons with energies above 1 MeV primarily lose energy inpassing through a specimen by interactions with specimen atomelectrons Because of the simple physics involved in this ion en-ergy loss mechanism and the accurate data bases available ionenergy losses can be readily converted into specimen projecteddensities which in turn can be used to determine specimen mass(Lefevre et al 1987 1991 Bench et al 1993) STIM has previ-ously been used to determine the areal densities of thin material lms of known areal density and composition (Bench 1991)Conversion of energy losses to areal densities using the knownmaterial composition revealed the technique to have a quanti-tative accuracy of better than 95 in determining sample arealdensities (Bench 1991)
Residual proton energies after traversing the sample weremeasured with a 300 mm2 retractable charged particle siliconsurface barrier detector located raquo5 cm directly behind thesample To avoid catastrophic damage to the detector with thenanoampere beam currents used with most other microprobeanalysis techniques beam currents of 2000 protons per second(raquo3 pound 10iexcl16 A) were used for STIM analysis by reducing thesize of an aperture just after the ion source Restricting this aper-ture affords ne control of the amount of beam current incidenton target over a range of nanoamperes down to a few ions persecond and has no noticeable effect on the nal beam spot sizeWith STIM as virtually every incident ion produces useful in-formation in traversing the sample the technique is nearly 100ef cient (Lefevre et al 1991) consequently even with low beam
currents data acquisition is rapid The STIM data sets reportedhere took raquo20 min to acquire
Residual ion energies were recorded in list mode along withcoincident beam spatial coordinates arising from scanning thebeam over the sample The residual energy of 199 ions was mea-sured at each beam location The median value of these 199 ionenergies was selected to represent the average residual energyof the ion beam at each beam location (Lefevre et al 1987) Theproduct of STIM data collection was a two-dimensional data set(8 pound 720 pixels) of the median residual ion energy at each beamlocation on the sample Inspection of each data set showed thatfor a given vertical position the resulting median residual ion en-ergies for each horizontal position were similar Consequentlybefore further analysis the median STIM data values in a dataset were averaged over the horizontal direction and the resultingenergies converted to energy losses This process resulted in alinescan of ion energy loss versus position across the sampleconsisting of 720 data points with a spacing of 125 sup1m betweensequential points Each data point represented an interrogatedarea of 125 sup1m by 1 mm
STIM energy loss data from the 6 FACES sub PM25 modesamples were corrected for the Mylar lm contribution to theenergy loss by subtracting the measured energy thickness ofthe blank lms to produce pro les of energy loss arising solelyfrom the aerosols Aerosol energy losses were converted to arealdensities using the annual average lt25 sup1m diameter aerosolcomposition for Sequoia National Park CA (Malm et al 1994)shown in Table 1 and a beam energy that had been corrected for
Table 1Fractional weights for the 18 most common elements
found in the lt25 micron diameter annual averageaerosol composition at Sequoia National Park
Element Fractional weight (gg)
H 00340C 02131N 00822O 04737Na 00180Si 00881S 00337Cl 00013K 00133Ca 00113Ti 00027V 00002Mn 00005Fe 00270Cu 00001Zn 00003Br 00002Pb 00001
STIM AND PESA IN AEROSOL MEASUREMENTS 645
energy loss after passing through the Mylar lm The aerosolcomposition from Sequoia National Park strongly re ects theSan Joaquin Valley within which Fresno is located
PESA Data Collection and ReductionWith PESA protons with energies above 1 MeV that elasti-
cally scatter from target atoms into forward angles can be de-tected by a particle detector (Cahill et al 1987) The energy ofthe scattered projectiles depends on the atomic number of tar-get atoms By measuring the energy of the scattered ions it ispossible to discriminate ions scattered from hydrogen from ionsscattered by other elements Integrating the number of ions scat-tered from hydrogen gives a quantitative measure of the samplehydrogen content Forward scattered protons were detected witha silicon surface barrier charged particle detector that subtendeda solid angle of raquo75 pound 10iexcl3 steradian to the specimen The de-tector was located at an angle of 45plusmn with respect to the incidentbeam Total incident beam charge was collected in a Faradaycup located 15 cm behind the sample
As the beam was scanned across the sample PESA data wererecorded in list mode along with coincident beam spatial coor-dinates arising from scanning the beam over the sample Beamcurrents were in the range of 15 to 25 nA and1 nC was depositedto each beam location PESA data sets typically took raquo55 minto acquire The data were then sorted off-line into a data cubewith axes energy horizontal position and vertical position In-spection of each cube showed that for a given vertical positionthe resulting PESA spectra for each horizontal position werevirtually identical Consequently before further analysis PESAspectra were summed across the horizontal direction to improvecounting statistics The result of this compression produced atwo-dimensional data set with axes of energy and position astep size of 125 sup1m and an interrogated area in each step of125 sup1m by 1 mm The number of ions scattered from hydrogenat each position ordinate in this data set was computationallycalculated by setting a window around the hydrogen peak inte-grating the number of counts within this window and subtract-ing any contribution from the background continuum Becausebackgrounds underneath the hydrogen peak were low and dis-played a roughly linear increase with increasing ion energy alinear t to the background on either side of the hydrogen peakwas used to determine the background contribution Thin plastic lms with known hydrogen contents of 10 50 and 100 sup1gcm2
were analyzed via PESA to generate a linear calibration curveof hydrogen yield versus hydrogen areal density This calibra-tion curve was used to convert strip sample hydrogen yields intohydrogen areal densities After subtraction of the substrate con-tribution to the hydrogen yield organic mass surrogates wereobtained from the aerosol hydrogen areal densities using thesame protocols employed by Malm et al (1994)
S-XRF Analysis of SamplesS-XRF of lters and impaction strips has been used for the
past decade (Cahill et al 1992 Reid et al 1994) for high
sensitivity elemental analysis of aerosol samples S-XRF datawere collected on Line 1031 of the Advanced Light Source(ALS) at Lawrence Berkeley National Laboratory using a whitebeam of energy 4ndash18 keV S-XRF was utilized because of itstime ef ciency in generating elemental pro les across the ex-tended impactor strip samples and because the incident x-ray ux causes minimal sample alteration (Reid et al 1994) S-XRFanalysis of strip samples has been described elsewhere (Reidet al 1994) and is summarized here Brie y strip samples werescanned with a beam spot size of 1 pound 1 mm2 and x-rays weredetected with an energy dispersive Si(Li) x-ray detector located5 cm from the sample The beam dwelt at each point on a sam-ple for 30 s before the sample was moved to the next locationWith these parameters a sensitivity of raquo01 ngm3 for transitionmetals is achieved for the rotating drum sampler strips Datareduction was performed offline using the well-accepted inter-national XRF code AXIL and pro les of elements with atomicnumber gt10 were generated The 1 pound 1 mm2 beam spot usedto generate the S-XRF elemental pro les corresponds to an im-pactor drum collection time period of 6 h Mass surrogates fromthe S-XRF element signatures were obtained using the sameprotocols employed by Malm et al (1994)
Conversion from Areal Densities (sup1gm2) to AerosolConcentration (sup1gm3)
To convert from areal density in sup1gm2 to aerosol concen-tration in sup1gm3 one has to multiply the areal density by aconversion constant in cm2m3 the area of the surface impactedby the volume of air In a lter it is just the area of the lter di-vided by the volume of air samples In a rotating drum impactorthe area is set by the rotation rate times the slit length In thispaper aerosol concentrations were calculated for a collectiontime period of 6 h corresponding to a 1 pound 6 mm area on a stripSix hours of sampling at a ow of 10 Lmin gives a volume of36 m3 (Cahill 1978) The resulting conversion constant is00167 cm2m3 about 4 times smaller than Interagency Moni-toring of Protected Visual Environments Program (IMPROVE)(Malm et al 1994)
Statistical AnalysisRelevant data sets were compared using linear regression
analysis with the statistics software package GBSTAT A coef -cient of correlation (R2)gt 07was considered to show signi cantcorrelation between data sets
RESULTS AND DISCUSSION
Accuracy and Sensitivity of STIM in Determining Prolesof Aerosol Mass
STIM measurements shown in Table 2 from the 4 blankApiezon-L coated Mylar strips reveal that incident 3 MeV pro-tons lose raquo50 keV in traversing the 480 sup1gcm2 lms and thatthe energy loss over each of the 4 lms is uniform to within4 keV Furthermore during STIM and PESA analysis the in-cident beam passes through the substrate before the deposited
646 G BENCH ET AL
Table 2Average (mean sect standard deviation) minimum
and maximum STIM energy losses from each of 4 blankApiezon-L coated Mylar lms data obtained from analysis
of 90 contiguous 1 mm pound 0125 sup1m areas in a vertical linescanacross each lm
Film Average energy Minimum energy Maximum energyloss (keV) loss (keV) loss (keV)
1 497 sect 05 484 5172 494 sect 06 481 5123 503 sect 05 488 5154 507 sect 06 487 517
aerosol This orientation ensures that the beam always loses thesame amount of energy in passing through a uniform substrateindependent of variations in the amount of aerosol on the sam-ple Consequently the relative uniformity in energy thicknessof the substrate enables the 50 keV energy loss arising from thesubstrate to be reliably subtracted from the energy losses arisingfrom aerosol laden samples to produce pro les of energy losssolely arising from the deposited aerosols The data in Table 2suggest that the resulting energy loss arising solely from theaerosol should be accurate to within sect2 keV for each point in apro le Con rmation of this inference was provided by lookingat blank regions of each FACES sample After applying the sub-strate energy loss correction of 50 keV blank regions on eachFACES sample had energy losses between ndash2 and 2 keV
Figure 1 shows curves of areal density versus calculatedproton energy loss for a 295 MeV proton beam passing throughthe aerosol composition shown in Table 1 and a C5H9O2N ma-trix (295 MeV corresponds to the proton beam energy aftertraversing the Apiezon-L coated Mylar lm) The C5H9O2Nmatrix has been previously determined to be an accurate model(Lefevre et al 1987 1991 Bench et al 1993) for proton energylosses in organic material and changes of sect1 atom in C H
Figure 1 Curves of areal density versus proton energy lossfor a 295 MeV proton beam passing through the aerosol com-position shown in Table 1 and a C5H9O2N matrix
Figure 2 Two separate linescans (solid line and dashed line)of areal density versus position across the FACES rotating drumimpactor stage 8 sample The 2 linescans were separated by ahorizontal distance of 2 mm
N and O content typically produce changes in areal density oflt3 (Lefevre et al 1987) The two curves in Figure 1 differby lt15 illustrating the relative insensitivity of the stoppingpower curves to chemical composition Consequently in mostinstances the aerosol composition shown in Table 1 should yieldan accuracy of better than 90 when used to convert energylosses to projected densities
Figure 2 shows the 2 separate STIM linescans of aerosolmass along the FACES stage 8 sample Linear regression ofthe 2 data sets yields an R2 D 094 and only minor differencesin areal density for a given position are observed The repro-ducibility in the data determined visuallygraphically togetherwith signal to noise values in the 2 linescans indicate an aerosolmass sensitivity approaching 10 sup1gcm2 Such a sensitivity com-pares favorably with theoretical calculations of areal densitysensitivity of 10ndash30 sup1gcm2 for 3 MeV protons in low atomicnumber dominated matrices (Bench 1991) The mass sensitiv-ity obtained with STIM could be improved by utilizing heavierions or a lower proton beam energy (Bench et al 1993) Forexample use of a 2 MeV alpha particle beam could improveareal density sensitivity and resolution by an order of magnitudecompared to 3 MeV protons (Bench et al 1993) In principleSTIM would also lend itself well to making measurements ofaerosol mass on Te on or other thin lms providing the lmshave good areal density uniformity However in preliminarySTIM scans of Te on strips we have found that the areal den-sity typically varies by 40 over the strip length Such variationwould presently preclude an accurate aerosol mass analysis bySTIM
Accuracy and Sensitivity of PESA in Determining AerosolHydrogen Proles
The nominal hydrogen content in the Apiezon-L coatedMylar lm determined from its thickness and composition is20 sup1gcm2 PESA measurements of the blank Apiezon-L coated
STIM AND PESA IN AEROSOL MEASUREMENTS 647
Table 3Average (mean sect standard deviation) minimum
and maximum PESA hydrogen masses from each of 4 blankApiezon-L coated Mylar lms data obtained from analysis
of 90 contiguous 1 mm pound 0125 sup1m areas in a vertical linescanacross each lm
Average Minimum Maximumhydrogen content hydrogen content hydrogen content
Film (sup1gcm2) (sup1gcm2) (sup1gcm2)
1 200 sect 02 194 sect 05 207 sect 052 202 sect 03 195 sect 05 208 sect 053 201 sect 02 191 sect 05 209 sect 054 198 sect 02 193 sect 05 205 sect 05
Mylar strips (Table 3) revealed the maximum variation in the hy-drogen content across the analyzed region of each sample to belt10 of the average sample hydrogen content of raquo20 mgcm2This relative uniformity in hydrogen content of the lm enablesthe hydrogen yields arising from the lm to be reliably subtractedfrom the hydrogen yields arising from aerosol-laden samples toproduce pro les of hydrogen yield solely arising from the de-posited aerosols The data in Table 3 further suggest that theresulting hydrogen yields arising solely from the aerosol shouldbe accurate to within sect1 sup1gcm2 for each point in the pro leCon rmation of this inference was provided by looking at blankregions of each FACES sample After subtracting the substratecontribution to the hydrogen yield blank regions on each FACESsample had hydrogen contents betweenndash1 and 1 sup1gcm2 Con-sequently the remaining data derived from PESA in this paperhave been corrected for the substrate hydrogen contribution of20 sup1gcm2
Figure 3 shows the 2 separate PESA linescans of aerosol hy-drogen mass along the FACES stage 8 rotating drum impactorsample Linear regression of the 2 data sets yields an R2 D 092and only minor differences in hydrogen mass for a given po-sition are observed The reproducibility in the data determinedvisuallygraphically together with signal to noise values in the2 linescans indicates an aerosol hydrogen mass sensitivity ofraquo1 sup1gcm2 Such a sensitivity compares favorably with the sen-sitivity that can be calculated using the hydrogen yield data fromthe 4 blank Apiezon-L coated nylon strips The hydrogen yieldat each position ordinate in the resulting PESA pro les of thesubstrates was raquo2000 counts or 100 counts(sup1gcm2) Using theformulation that the minimum detectable hydrogen signal fromthe aerosols that can be resolved over the background contri-bution arising from the substrate is 329 times the square rootof the substrate contribution (Currie 1968) yields 150 counts or15 sup1gcm2 as the minimum detectable limit
One other point worth noting is that since the hydrogen con-tent within the Mylar substrate is 20 sup1gcm2 regions on the lm that have not been exposed to aerosols could serve as an
Figure 3 Two separate linescans (solid line and dashed line)of hydrogen mass versus position across the FACES rotatingdrum impactor stage 8 sample The 2 linescans were separatedby a horizontal distance of 2 mm
integral standard to convert aerosol hydrogen yields to hydrogenmasses
STIM and PESA Proles from the 6 FACES Sub PM25Mode Stages
Figure 4 shows STIM derived linescans of aerosol mass alongthe 6 FACES sub PM25 mode stages Similarly Figure 5 showsPESA derived linescans of aerosol hydrogen mass along thesame 6 FACES stages It is not the purpose of this paper topresent a detailed analysis of the aerosol science in these pro- les however the STIM and PESA data from the 6 sub PM25
modes show that dramatic changes in both total and hydrogenmass occur as a function of size and time in the various sizefractions The data also indicate that a surprisingly high frac-tion of the local PM25 mass and organic matter is in very ne(stages 5 and 6) to ultra- ne (stages 7 and 8) modes with theultra- nes representing a large fraction of the total ne mass(EPA 1995)
Integration of STIM and PESA with S-XRF DataAgain it is not the purpose of this paper to present a detailed
analysis of ambient aerosols of Fresno but for completenessFigure 6 shows a comparison of some of the S-XRF data fromthe FACES stage 8 sample with the corresponding STIM andPESA data The horizontal axis has been recalibrated so thatit represents time and day of collection over the time periodNovember 8 to 27 2000 In the top graph the STIM and PESAresults from Figures 2 and 3 have been rebinned (data averagedover every block of 8 pixels) tohave the same temporal resolutionof 6 h as the S-XRF data In addition the STIM and PESAmass per unit area data have respectively been converted to totalaerosol mass and surrogate organic aerosol mass per cubic meterof air sampled using the protocols used by Malm et al (1994)
648 G BENCH ET AL
Figure 4 Linescans of aerosol mass versus position across the 6 FACES sub PM25 mode rotating drum impactor stages (stages3ndash8) analyzed by STIM The average aerosol mass on each impactor stage was 190 sup1gcm2 for stage 3 272 sup1gcm2 for stage 4277 sup1gcm2 for stage 5 451 sup1gcm2 for stage 6 193 sup1gcm2 for stage 7 and 262 sup1gcm2 for stage 8
The middle graph displays S-XRF pro les of the trace elementscopper iron and zinc while the bottom graph presents S-XRFpro les of sulfur chlorine and potassism
The top graph in Figure 6 indicates a high degree of cor-relation between the total aerosol mass and surrogate organicaerosol mass in the stage 8 sample Figure 7 shows a graph ofthe regression of surrogate organic aerosol mass measured byPESA versus total aerosol mass measured by STIM The co-ef cient of correlation between the mass measured by STIMand the organic matter measured by PESA is 081 Consideringall the uncertainties in sampling and analysis and the dramaticchanges in these parameters versus time the agreement must beconsidered excellent Integrating under the 2 curves in the topgraph in Figure 6 indicates that raquo45 of the total aerosol mass iscomprised of organic matter Closer inspection of the top graphin Figure 6 also suggests that the ratio of organic matter to totalaerosol mass appears to be higher during the daytime than the
nighttime The fact that nonbiomass organic matter contributes asigni cant fraction to the ultra- ne particles in stage 8 in Fresnowas previously unsuspected and raises important questions asto the nature of what low volatility organic species can surviveKelvin effect evaporation associated with such small diameterparticles
As with the STIM and PESA data the elements with atomicnumber cedil11 in Figure 6 also change dramatically as a functionof time While iron is usually found in soils the iron in thissize mode has essentially no silicon (and little calcium) asso-ciated with it This plus its very ne size indicates that it hasan anthropogenic origin Note the almost total lack of iron onthe nights of November 22 and 23 when copper and zinc trackthe mass and organic species Potassium can be associated withsoil (D p gt 1 sup1m) and bio-mass smoke (03 lt D p lt 1 sup1m) Thepotassium seen here is of neither source but is highly correlatedwith anthropogenic trace metals such as copper and zinc The
STIM AND PESA IN AEROSOL MEASUREMENTS 649
Figure 5 Linescans of aerosol hydrogen content versus position across the 6 FACES sub PM25 mode rotating drum impactorstages (stages 3ndash8) analyzed by PESA The average aerosol hydrogen mass on each stage was 68 sup1gcm2 for stage 3 70 sup1gcm2
for stage 4 77 sup1gcm2 for stage 5 108 sup1gcm2 for stage 6 83 sup1gcm2 for stage 7 and 116 sup1gcm2 for stage 8
S-XRF data combined with the high correlation between theSTIM and PESA results and the fact that when converted intoaerosol composition roughly45 of the aerosolmass in the stage8 FACES sample was organic point to an unexpected ultra- neorganic aerosol in Fresno These data when combined with XRFdata for trace elements suggest a possible high temperature an-thropogenic source such as diesel exhaust
The data in Figures 4 5 and 6 reveal a wealth of informationunseen in analyses of PM25 lters Such data have the potentialto be major assets in correlating aerosols and health impactsvisibility degradation and the effects of aerosols on climateFurthermore owing to the dramatic changes in time for the el-ements sodium and heavier the STIM mass and PESA organicsurrogate mass provide crucial data in approaching mass clo-sure Reconstructed masses using the protocols of Malm et al(1994) and the elemental signatures from the PESA and S-XRFanalyses were compared to the total aerosol masses obtained bySTIM for each of the 6 FACES sub PM25 mode stages The com-
parison suggests that mass closure for the coarse stages (stages3 and 4) dominated by soils is typically around 80 similarto that reported in dry western sites by the Interagency Moni-toring of Protected Visual Environments (IMPROVE) program(Malm et al 1994) This supports the absolute accuracy of massby STIM since a mass closure of around 80 is the typical re-sult IMPROVE obtains using gravimetric mass Mass closure inthe ner stages (stages 5ndash8) is not possible presently because ofthe lack of data on nitrates a major component in atmospheric ne mass in the San Joaquin Valley of California Howeverthe nuclear microprobe facility at Lawrence Livermore NationalLaboratory (LLNL) can measure nitrogen content in thin lmsvia Rutherford back-scattering analysis and Mylar is nitrogen-free This opens the possibility of greatly increasing the fractionof mass observed Initial measurements at the LLNL facility sug-gest that nitrogen contents in aerosol masses up to 500 sup1gcm2
collected on Mylar strips can be accurately measured via Ruther-ford back-scattering analysis
650 G BENCH ET AL
Figure 6 STIM PESA and S-XRF results from the FACES stage 8 rotating drum impactor sample In the top graph total aerosolmass (from STIM) and organic mass (from PESA) are presented The middle graph presents 3 trace elements copper iron andzinc The bottom graph presents sulfur chlorine and potassium
Figure 7 Graph of the regression of surrogate organic aerosolmass measured by PESA versus total aerosol mass measured bySTIM from the FACES stage 8 rotating drum impactor sample
CONCLUSIONSIn this study we have established the ability of both STIM
and PESA to provide hitherto unavailable information from theincreasingly popular greased Mylar impaction stages The STIMand PESA data from the Apiezon-L coated Mylar strips demon-strate that such samples possess excellent uniformity in thick-ness and hydrogen content thus making them an ideal sub-strate for STIM analysis The joining of such data with othertechniques affords the ability to approach mass closure on sizeand time resolved aerosol samples
REFERENCESBarone J B Cahill T A Eldred R A Flocchini R G Shadoan D J and
Dietz T M (1978) A Multivariate Statistical Analysis of Visibility Degra-dation at Four California Cities Atmos Environ 122213ndash2221
Bench G (1991) Scanning Transmission Ion Microscopy PhD thesisUniversity of Melbourne Melbourne Australia
Bench G S Saint A Legge G J F and Cholewa M (1993) Applicationsof Energy Loss Contrast STIM Nuclear Instruments and Methods in PhysicsResearch B Beam Interactions with Materials and Atoms 77175ndash183
STIM AND PESA IN AEROSOL MEASUREMENTS 651
Cahill T A (1978) Sensitivity Quality Assurance and Cost in AutomatedAnalysis via Ion-Induced X-Rays Nuclear Instruments and Methods inPhysics Research 149431ndash433
Cahill T A (1979) Comments on Surface Coatings for Lundgren-TypeImpactors In Aerosol Measurement edited by D A Lundgren UniversityPresses of Florida FL pp 131ndash134
Cahill T A (1996) Compositional Analysis of Atmospheric Aerosols InParticle-Induced X-Ray Emission Spectrometry edited by S A E JohanssonJ L Campbell and K G Malmqvist Chemical Analysis Series John Wileyamp Sons Inc New York Vol 133 237ndash311
Cahill T A Eldred R A Motallebi N and Malm W C (1989) IndirectMeasurement of Hydrocarbon Aerosols Across the United States by Non-sulfate Hydrogen-Remaining Gravimetric Mass Correlations Aerosol SciTechnol 10421ndash429
Cahill T A Eldred R A Wallace D andKusko B H (1987) The Hydrogen-Sulfur Correlation by PIXE Plus PESA and Aerosol Source Identi cationFourth International PIXE Conference Tallahassee FL June 9ndash13 1986Nuclear Instruments and Methods in Physics Research B Beam Interactionswith Materials and Atoms 22296ndash300
Cahill T A and Wakabayashi P (1993) Compositional Analysis of Size-Segregated Aerosol Samples In Measurement Challenges in AtmosphericChemistry edited by L Newman American Chemical Society New YorkChapter 7 pp 211ndash228
Cahill T A Wilkinson K and Schnell R (1992) Composition Analyses ofSize-Resolved Aerosol Samples taken from Aircraft Downwind of KuwaitSpring 1991 J Geophys Res 97(D13)145139 ndash145150
Cohen D D Bailey G M and Kondepudi R (1996) Elemental Analy-sis by PIXE and Other IBA Techniques and their Application to SourceFingerprinting of Fine Particle Pollution Nuclear Instruments and Methodsin Physics Research B Beam Interactions with Materials and Atoms 109110218ndash226
Currie L A (1968) Limits for Qualitative Detection and Quantitative Deter-mination Application to Radiochemistry Anal Chem 40586ndash593
EPA (1995) Criterion Document for Fine Particulate Matter EPA 600 Vol 1Section 6
Flocchini R G Cahill T A Shadoan D J Lange S J Eldred R A FeeneyP J Wolfe G W Simmeroth D C and Suder J K (1976) MonitoringCaliforniarsquos Aerosols by Size and Elemental Composition Environ Sci Tech-nol 1076ndash82
Lefevre H W Scho eld R M S Bench G and Legge G J F (1991)STIM with Energy Loss Contrast An Imaging Modality Unique to MeV IonsNuclear Instruments and Methods in Physics Research B Beam Interactionswith Materials and Atoms 54363ndash370
Lefevre H W Scho eld R M S Overley J C and McDonald J C(1987) Scanning Transmission Ion Microscopy as it Complements Par-ticle Induced X-Ray Emission microscopy Scanning Microscopy 1879ndash
889Malm W C Sisler J F Huffman D Eldred R A and Cahill T A (1994)
Spatial and Seasonal Trends in Particle Concentration and Optical Extinctionin the United States J Geophys Res 99(D1)1347ndash1370
Raabe O (1997) Personal communication Department for Health and theEnvironment University of California Davis
Raabe O G Braaten D A Axelbaum R L Teague S V and Cahill T A(1988) Calibration Studies of the DRUM Impactor J Aerosol Sci 19(2)183ndash
195Reid J S Cahill T A and Dunlap M R (1994) GeometricAerodynamic
Equivalent Diameter Ratios of Ash Aggregate Aerosols Collected in BurningKuwaiti Well Fields Atmos Environ 28(13)2227ndash2234
Roberts M L Grant P G Bench G S Brown T A Frantz B R MorseD H and Antolak A J (1999) The Stand-Alone Microprobe at LivermoreNuclear Instruments and Methods in Physics Research B Beam Interactionswith Materials and Atoms 15824ndash30
Wesolowski J J John W Devor W Cahill T A Feeney P J Wolfe Gand Flocchini R (1978) Collection Surfaces of Cascade Impactors In X-RayFluorescence Analysis of Environmental Samples edited by T Dzubay AnnArbor Science Ann Arbor MI pp 121ndash130
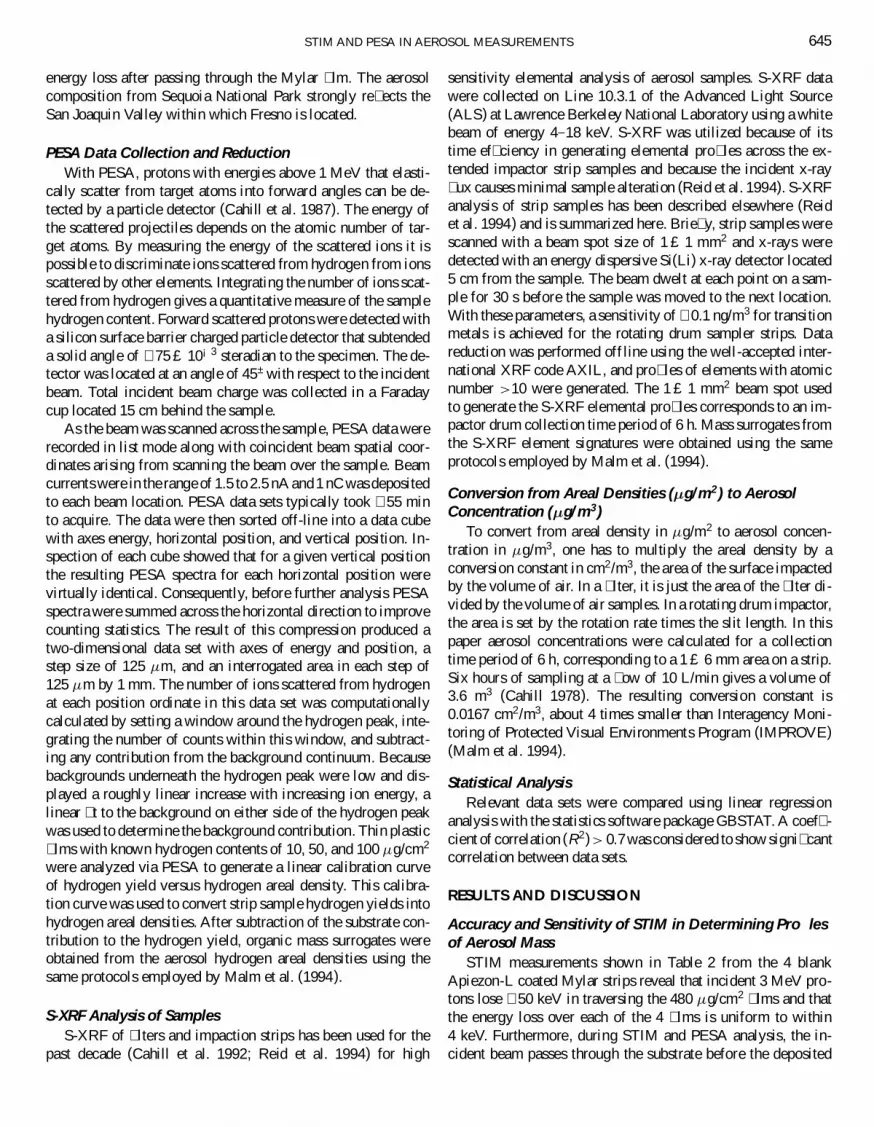
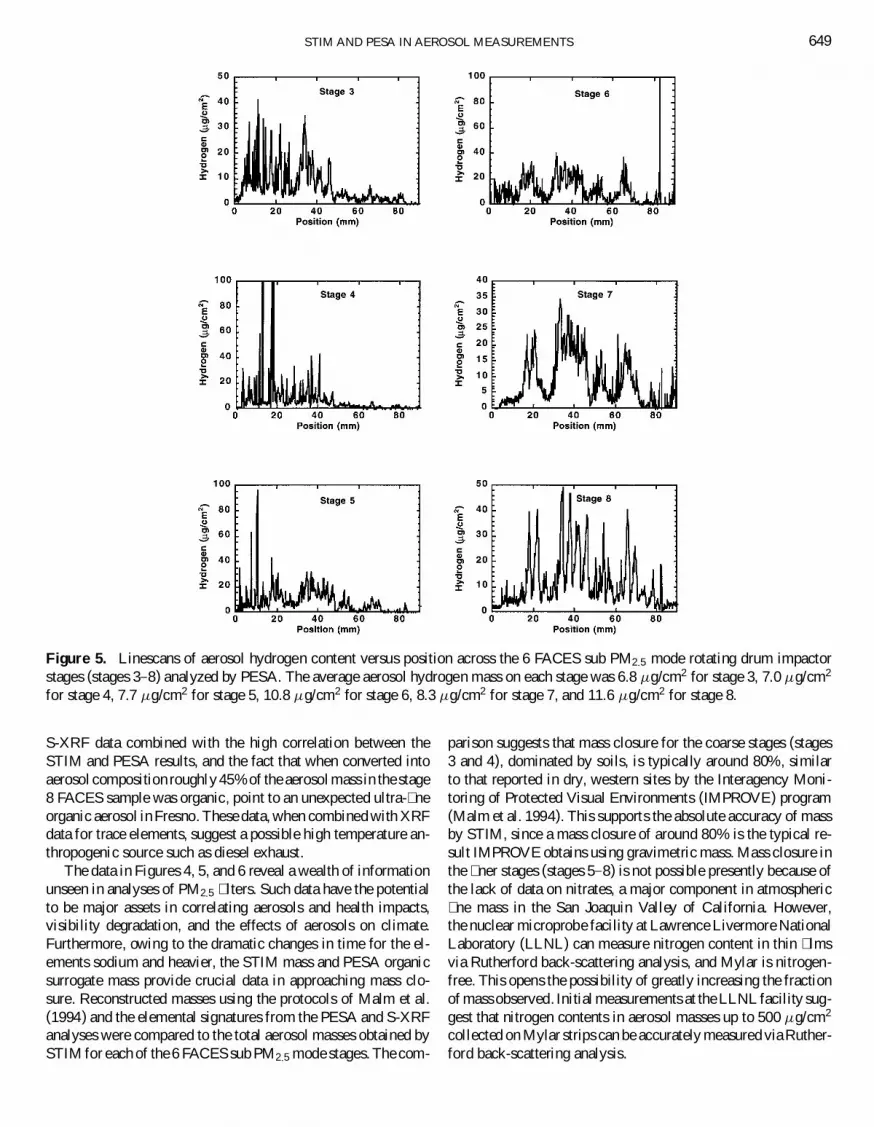
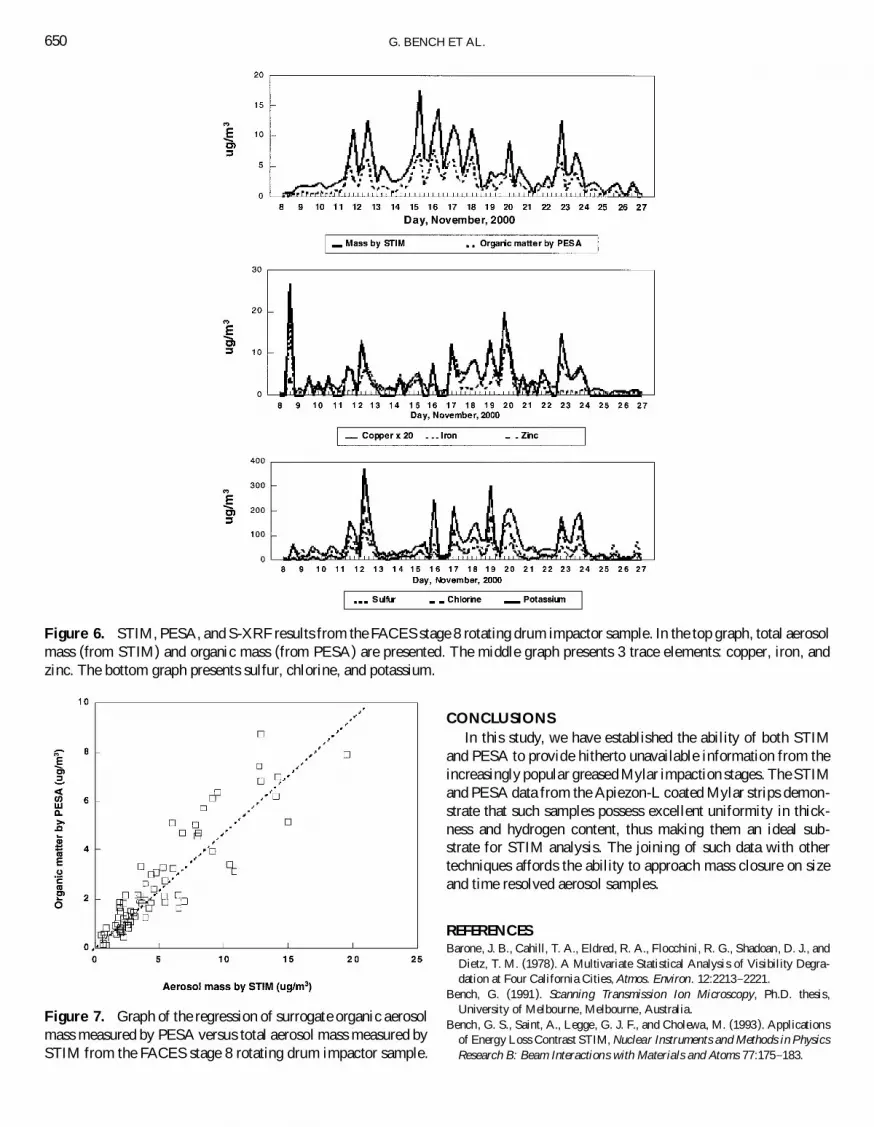