size distribution measurement of carbonaceous particulate matter using a low pressure impactor with...
TRANSCRIPT
This article was downloaded by: [Ingenta Content Distribution (Publishing Technology)]On: 14 October 2014, At: 06:26Publisher: Taylor & FrancisInforma Ltd Registered in England and Wales Registered Number: 1072954 Registered office: Mortimer House,37-41 Mortimer Street, London W1T 3JH, UK
Aerosol Science and TechnologyPublication details, including instructions for authors and subscription information:http://www.tandfonline.com/loi/uast20
Size Distribution Measurement of CarbonaceousParticulate Matter Using a Low Pressure Impactor withQuartz Fiber SubstratesSanna Saarikoski a , Anna Frey a , Timo Mäkelä a & Risto Hillamo aa Finnish Meteorological Institute, Air Quality , Helsinki, FinlandPublished online: 10 Jul 2008.
To cite this article: Sanna Saarikoski , Anna Frey , Timo Mäkelä & Risto Hillamo (2008) Size Distribution Measurement ofCarbonaceous Particulate Matter Using a Low Pressure Impactor with Quartz Fiber Substrates, Aerosol Science and Technology,42:8, 603-612, DOI: 10.1080/02786820802227329
To link to this article: http://dx.doi.org/10.1080/02786820802227329
PLEASE SCROLL DOWN FOR ARTICLE
Taylor & Francis makes every effort to ensure the accuracy of all the information (the “Content”) containedin the publications on our platform. However, Taylor & Francis, our agents, and our licensors make norepresentations or warranties whatsoever as to the accuracy, completeness, or suitability for any purpose of theContent. Any opinions and views expressed in this publication are the opinions and views of the authors, andare not the views of or endorsed by Taylor & Francis. The accuracy of the Content should not be relied upon andshould be independently verified with primary sources of information. Taylor and Francis shall not be liable forany losses, actions, claims, proceedings, demands, costs, expenses, damages, and other liabilities whatsoeveror howsoever caused arising directly or indirectly in connection with, in relation to or arising out of the use ofthe Content.
This article may be used for research, teaching, and private study purposes. Any substantial or systematicreproduction, redistribution, reselling, loan, sub-licensing, systematic supply, or distribution in anyform to anyone is expressly forbidden. Terms & Conditions of access and use can be found at http://www.tandfonline.com/page/terms-and-conditions
Aerosol Science and Technology, 42:603–612, 2008Copyright c© American Association for Aerosol ResearchISSN: 0278-6826 print / 1521-7388 onlineDOI: 10.1080/02786820802227329
Size Distribution Measurement of Carbonaceous ParticulateMatter Using a Low Pressure Impactor with Quartz FiberSubstrates
Sanna Saarikoski, Anna Frey, Timo Makela, and Risto HillamoFinnish Meteorological Institute, Air Quality, Helsinki, Finland
The collection characteristics of a small deposit area low pres-sure impactor (SDI) were studied in order to employ the impactorfor size distribution measurements of carbonaceous matter. In thiswork, the SDI was calibrated for soft and porous quartz substratematerial in a series of laboratory experiments. The collection effi-ciency curves were measured by using monodisperse dioctyl seba-cate particles and by applying two different detection methods. Onemethod was based on the detection of current carried by chargedtest particles, and the other measured number concentrations ofparticles in bipolar charge equilibrium by two condensation parti-cle counters. Concerning the particle size corresponding to a 50%collection efficiency (D50), significant shifts toward smaller parti-cle sizes were found for the quartz fiber substrates compared withthe flat plates. Also the shapes of the collection efficiency curvesdiffered considerably: quartz substrate gave less steep curves thanplain impaction plates. The new calibration was applied to fielddata from urban and rural sites. Compared with the original cali-bration of the SDI, the new calibration changed the measured sizedistributions of organic and elemental carbon. In addition, a rea-sonable size-segregated mass closure was achieved by combiningdata from thermal-optical analysis and ion-chromatography.
INTRODUCTIONVarious types of impactors are widely used for the collec-
tion of size-segregated particulate matter. In the atmosphere,a multi-stage impactor can typically collect samples over therange 30 nm–10 µm of particle aerodynamic diameter. Impactorstages operating in the range of 0.5–10 µm are easy to designand manufacture, since the diameters of impactor orifices arelarge and easy to drill. In order to extend the size range belowapproximately 0.5 µm, a special design is needed. Two basicapproaches have been used for this purpose. In the design of
Received 12 June 2007; accepted 23 May 2008.Financial support from the Finnish Funding Agency for Technol-
ogy and Innovation (Grant no. 40531/04, and the LIPIKA project),the Academy of Finland (Contract no. 201131), and the Maj and TorNessling Foundation is gratefully acknowledged.
Address correspondence to Sanna Saarikoski, Finnish Meteorolog-ical Institute, Air Quality, P.O. Box 503, FI-00101 Helsinki, Finland.E-mail: [email protected]
Hering et al. (1978), there is a critical non-collecting orifice re-ducing the pressure of the lowest stages enabling collection ofsub-0.5 µm particles. In the design of the Berner low-pressureimpactor (BLPI; Berner and Lurzer 1980), every stage is collect-ing but the pressure is reduced gradually using different com-binations of the number of the nozzles and their diameters foreach stage. A low pressure and high jet velocities (close to sonicfor lowest stages) allow the collection of particles down to 30nm. In the micro-orifice uniform deposit impactor (MOUDI),designed by Marple et al. (1991), the extension of the particlesize range is made using micro-orifices. Using a stage pressureof 55 kPa for the lowest stage and 50 µm orifices, particles assmall as 0.056 µm can be collected. In a more recent designcalled nano-MOUDI, the size range is extended down to 10 nmusing a combination of micro-orifices and low pressure (Marpleand Olson 1999).
Provided that there is a single nozzle or that nozzles are notvery close to each other, and that the collection surface is a planarand smooth foil or film perpendicular to the nozzles, the theorypredicts the collection properties of an impactor stage quite well(Rader and Marple 1985; Hillamo and Kauppinen 1991). Formultiple nozzles and non-ideal collection surfaces, such as aporous surface, the situation is more complicated (Huang et al.2001; Marjamaki and Keskinen 2004). The use of a non-idealcollection surface may be necessary because of required highmass loads (Kavouras and Koutrakis 2001; Sillanpaa et al. 2003)or because of special analytical purposes (Viidanoja et al. 2002;Carvalho et al. 2003; Hasegava et al. 2004; Jaffrezo et al. 2005;Yttri et al. 2005). Porous substrates have also been found toreduce particle bouncing from impactor stages (Fujitani et al.2006).
A special analytical method that needs the use of a porous ma-terial in particle collection is the thermal-optical analysis (TOA;Chow et al. 1993; Birch and Cary 1996). In that method thesampling media have to resist temperatures of up to 700–900◦C,as a result of which quartz fiber filters are commonly used asimpactor substrates for subsequent thermal analyses. The majordisadvantage of using quartz filters is that the filter substrate isthick and porous. It can therefore be expected that the air jets car-rying particles penetrate the filter surface and particle collection
603
Dow
nloa
ded
by [
Inge
nta
Con
tent
Dis
trib
utio
n (P
ublis
hing
Tec
hnol
ogy)
] at
06:
26 1
4 O
ctob
er 2
014
604 S. SAARIKOSKI ET AL.
characteristics will be altered compared with dense films or foilsas a collection medium.
In this study, the collection characteristics of the small de-posit area low pressure impactor (SDI; Maenhaut et al. 1996)were studied in order to employ the impactor for size distribu-tion measurements of carbonaceous matter. Because of the smalldeposit area of the SDI, the whole impactor substrate of the SDIcan be analyzed using the thermal-optical transmission method.The SDI was calibrated for quartz fiber substrates and the newcollection efficiency curves were used to extract the size distri-butions of carbonaceous matter at two different environments:rural and urban. By combining OC and EC size distributions withthe size distributions measured for the mass and inorganic ionsusing another SDI, a size-segregated mass closure was obtained.
IMPACTOR DESIGN, CALIBRATION,AND DATA REDUCTION
Most often the practical impactor design is based on the the-ory of Marple and Liu (1974). For a certain nozzle design thereis a dimensionless parameter, called the Stokes number (Stk),which is defined as the ratio of the particle stopping distance (S= τV) to the nozzle radius (W/2) at the average jet velocity V0
(Hinds 1999):
Stk = τV
W/2= ρpD2
pV0CC
9µW. [1]
Here ρp is the particle density, Dp is the particle diameter, CC isthe slip correction factor and µ is the air viscosity. The averagejet velocity is usually calculated assuming an adiabatic flow(Hering 1987). The Stokes number is constant as long as thedesign and flow parameters are within certain limits. Those arefor the nozzle (jet) to collection plate ratio 1–5 and for the flowReynolds number 500–3000.
Although the impactor theory predicts the collection effi-ciency of impactor stages quite well also for designs differentthan an ideal single round (or slit) nozzle, most impactors arecalibrated experimentally. Calibration data can be used in twodifferent ways. In a simple approach, only one particle size (di-ameter) corresponding to the 50% collection efficiency of a stage(often called cut-off diameter D50) is used to represent the stagecollection. If the collection efficiency curve is steep and the im-pactor has 4–5 stages per decade, this approach may give reason-able size distributions for different mass concentration modes ofatmospheric aerosols. However, for more detailed analysis of im-pactor data or less steep collection efficiency curves, data inver-sion procedures (Wolfenbarger and Seinfeld 1990; Winklmayeret al. 1990) are useful. For data inversion one usually needs thewhole collection efficiency curve as input data. In most casescollection efficiency curves are obtained experimentally.
EXPERIMENTAL
Small Deposit Area ImpactorThe details of the design of the SDI have been presented in
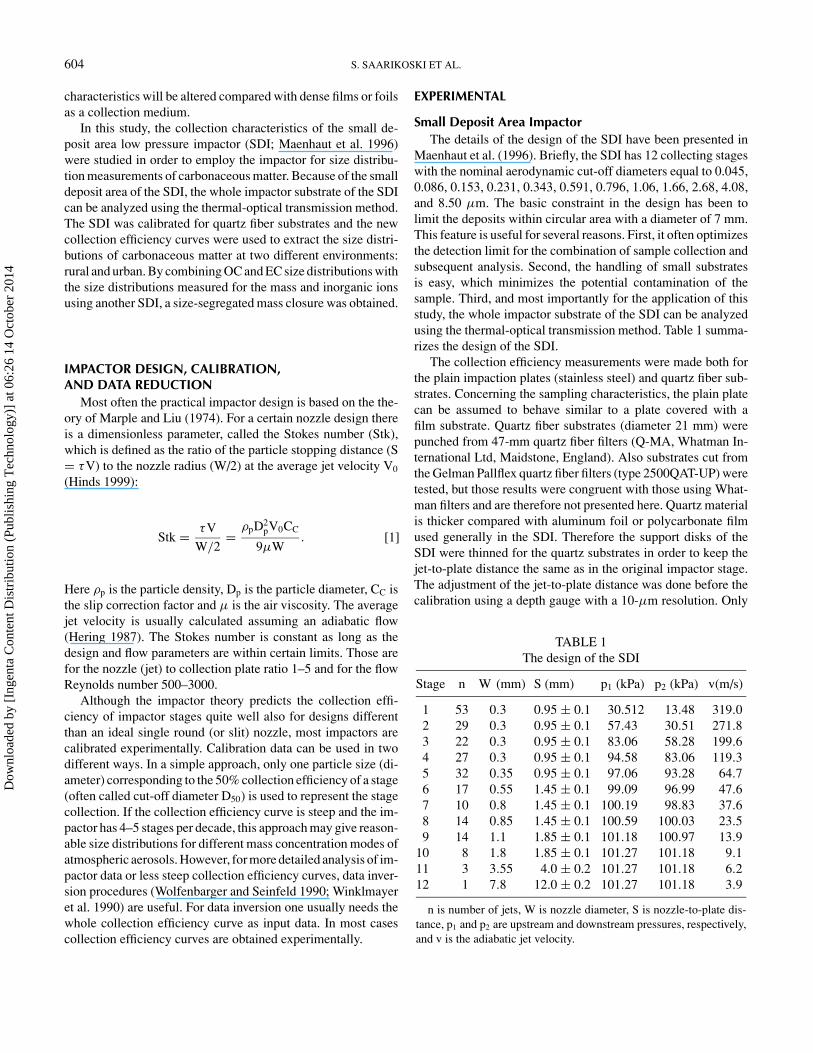
Maenhaut et al. (1996). Briefly, the SDI has 12 collecting stageswith the nominal aerodynamic cut-off diameters equal to 0.045,0.086, 0.153, 0.231, 0.343, 0.591, 0.796, 1.06, 1.66, 2.68, 4.08,and 8.50 µm. The basic constraint in the design has been tolimit the deposits within circular area with a diameter of 7 mm.This feature is useful for several reasons. First, it often optimizesthe detection limit for the combination of sample collection andsubsequent analysis. Second, the handling of small substratesis easy, which minimizes the potential contamination of thesample. Third, and most importantly for the application of thisstudy, the whole impactor substrate of the SDI can be analyzedusing the thermal-optical transmission method. Table 1 summa-rizes the design of the SDI.
The collection efficiency measurements were made both forthe plain impaction plates (stainless steel) and quartz fiber sub-strates. Concerning the sampling characteristics, the plain platecan be assumed to behave similar to a plate covered with afilm substrate. Quartz fiber substrates (diameter 21 mm) werepunched from 47-mm quartz fiber filters (Q-MA, Whatman In-ternational Ltd, Maidstone, England). Also substrates cut fromthe Gelman Pallflex quartz fiber filters (type 2500QAT-UP) weretested, but those results were congruent with those using What-man filters and are therefore not presented here. Quartz materialis thicker compared with aluminum foil or polycarbonate filmused generally in the SDI. Therefore the support disks of theSDI were thinned for the quartz substrates in order to keep thejet-to-plate distance the same as in the original impactor stage.The adjustment of the jet-to-plate distance was done before thecalibration using a depth gauge with a 10-µm resolution. Only
TABLE 1The design of the SDI
Stage n W (mm) S (mm) p1 (kPa) p2 (kPa) v(m/s)
1 53 0.3 0.95 ± 0.1 30.512 13.48 319.02 29 0.3 0.95 ± 0.1 57.43 30.51 271.83 22 0.3 0.95 ± 0.1 83.06 58.28 199.64 27 0.3 0.95 ± 0.1 94.58 83.06 119.35 32 0.35 0.95 ± 0.1 97.06 93.28 64.76 17 0.55 1.45 ± 0.1 99.09 96.99 47.67 10 0.8 1.45 ± 0.1 100.19 98.83 37.68 14 0.85 1.45 ± 0.1 100.59 100.03 23.59 14 1.1 1.85 ± 0.1 101.18 100.97 13.9
10 8 1.8 1.85 ± 0.1 101.27 101.18 9.111 3 3.55 4.0 ± 0.2 101.27 101.18 6.212 1 7.8 12.0 ± 0.2 101.27 101.18 3.9
n is number of jets, W is nozzle diameter, S is nozzle-to-plate dis-tance, p1 and p2 are upstream and downstream pressures, respectively,and v is the adiabatic jet velocity.
Dow
nloa
ded
by [
Inge
nta
Con
tent
Dis
trib
utio
n (P
ublis
hing
Tec
hnol
ogy)
] at
06:
26 1
4 O
ctob
er 2
014
SIZE DISTRIBUTION OF CARBONACEOUS MATTER 605
the eight lowest impactor stages (stages 1–8) were calibrated,since the main interest of this study was in submicron carbona-ceous matter, and since the used particle generation system waslimited to produce particles smaller than 1 µm.
Collection Efficiency Curve MeasurementsParticle Generation
Calibrations were performed using monodisperse dioctylsebacate particles (DOS, density 0.914 g/cm3). The primaryaerosol consisting of submicrometer particles (0.01–1 µm) wasgenerated with a Constant Output Atomizer (TSI Model 3068,St. Paul, Minnesota, USA) from 0.002% to 2% solutions of DOSin 2-propanol. The aerosol obtained from the atomizer was trans-ported into an evaporation-condensation aerosol generator in or-der to get a narrow particle number size distribution (Liu andLee 1975). After this procedure a desired monodisperse particlesize fraction was selected using a Differential Mobility Analyzer(DMA, TSI Model 3080, St. Paul, Minnesota, USA). The nar-row size distribution minimized the number of multiple-chargedparticles and kept the aerosol highly monodisperse.
Electric DetectionThe collection efficiency curves were measured in two ways,
using either electric detection or two condensation particle coun-ters (CPCs). The electric measurement method has been de-scribed in detail by Hillamo and Kauppinen (1991) and Maen-haut et al. (1996). Briefly, charged monodisperse test particlesfrom the DMA were fed into the impactor stage and the cur-rent carried by these particles was measured simultaneouslyfrom the impaction plate and back-up filter using electrome-ters (Keithley 617 Programmable Electrometer, Cleveland, OH,USA). The quartz filter was attached to the metal impaction platewith a conductive tape. The collection efficiency was calculatedas the ratio of impacted portion to the sum of impacted andpenetrated portions. Since the impaction plate was electricallyisolated from the rest of the impactor body by a plate made ofpolytetrafluoroethylene (PTFE), this method measured the realimpaction efficiency and neglected the collection due to inter-stage losses.
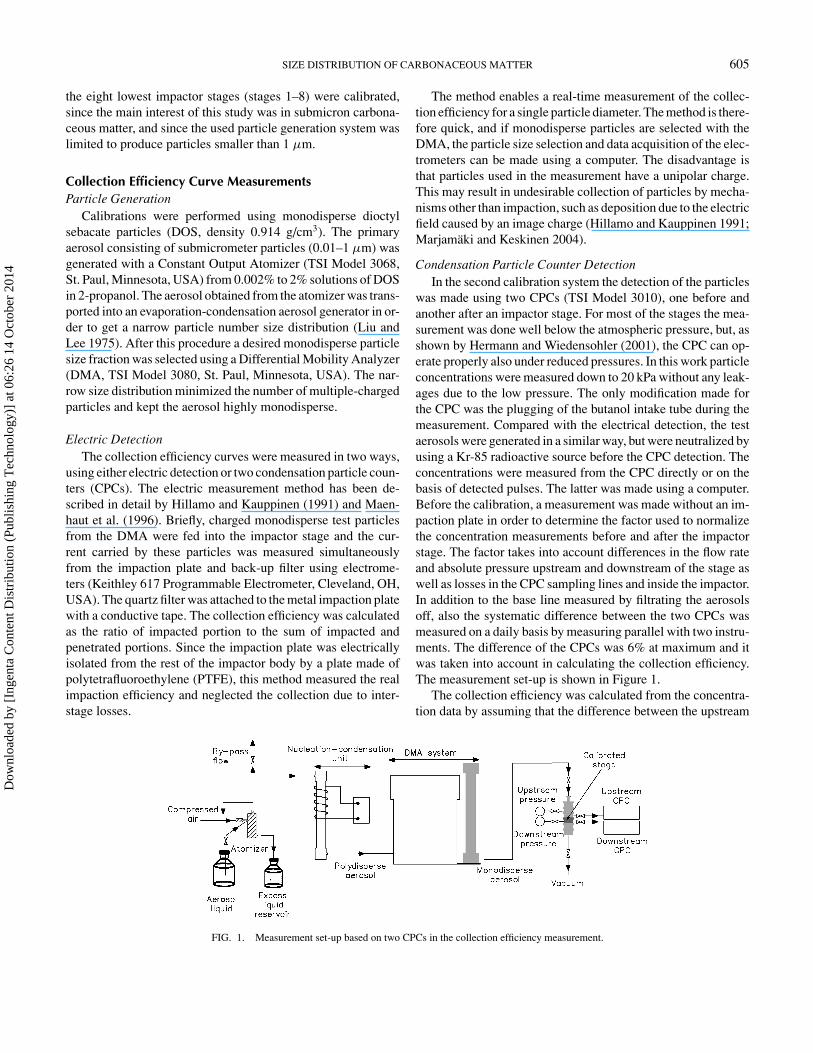
FIG. 1. Measurement set-up based on two CPCs in the collection efficiency measurement.
The method enables a real-time measurement of the collec-tion efficiency for a single particle diameter. The method is there-fore quick, and if monodisperse particles are selected with theDMA, the particle size selection and data acquisition of the elec-trometers can be made using a computer. The disadvantage isthat particles used in the measurement have a unipolar charge.This may result in undesirable collection of particles by mecha-nisms other than impaction, such as deposition due to the electricfield caused by an image charge (Hillamo and Kauppinen 1991;Marjamaki and Keskinen 2004).
Condensation Particle Counter DetectionIn the second calibration system the detection of the particles
was made using two CPCs (TSI Model 3010), one before andanother after an impactor stage. For most of the stages the mea-surement was done well below the atmospheric pressure, but, asshown by Hermann and Wiedensohler (2001), the CPC can op-erate properly also under reduced pressures. In this work particleconcentrations were measured down to 20 kPa without any leak-ages due to the low pressure. The only modification made forthe CPC was the plugging of the butanol intake tube during themeasurement. Compared with the electrical detection, the testaerosols were generated in a similar way, but were neutralized byusing a Kr-85 radioactive source before the CPC detection. Theconcentrations were measured from the CPC directly or on thebasis of detected pulses. The latter was made using a computer.Before the calibration, a measurement was made without an im-paction plate in order to determine the factor used to normalizethe concentration measurements before and after the impactorstage. The factor takes into account differences in the flow rateand absolute pressure upstream and downstream of the stage aswell as losses in the CPC sampling lines and inside the impactor.In addition to the base line measured by filtrating the aerosolsoff, also the systematic difference between the two CPCs wasmeasured on a daily basis by measuring parallel with two instru-ments. The difference of the CPCs was 6% at maximum and itwas taken into account in calculating the collection efficiency.The measurement set-up is shown in Figure 1.
The collection efficiency was calculated from the concentra-tion data by assuming that the difference between the upstream
Dow
nloa
ded
by [
Inge
nta
Con
tent
Dis
trib
utio
n (P
ublis
hing
Tec
hnol
ogy)
] at
06:
26 1
4 O
ctob
er 2
014
606 S. SAARIKOSKI ET AL.
and downstream concentrations (after applying the correctionsexplained before) was due to particle impaction. As a result,the collection efficiency was equal to the ratio of this differenceto the upstream concentration. The measurement was made forboth plain impaction plate and quartz fiber substrate. The formerdata are not shown because they were used only for checking outthat the impactor configuration equaled that used in the electricaldetection.
Field MeasurementsSites
Field measurements were carried out at an urban and ruralsite in Finland. The urban site was located in Helsinki, 65 me-ters from a busy road. Sampling at this site was carried outbetween January and March 2004. The sampling duration wasabout 17 hours. The rural site was located in a boreal forest inHyytiala (SMEAR II), representing a background area of south-ern Finland (Kulmala et al. 2001). In Hyytiala the samples werecollected during May 2004. Since particle mass concentrationsare typically very low in Hyytiala, the sampling duration rangedfrom two days to five days.
Sampling System and Analytical MethodsInstruments and analytical methods used for the field mea-
surements have been described in detail by Saarikoski et al.(2005). Briefly, the sampling system consisted of three annulardenuders (URG-2000, 30 × 242 mm, Chapel Hill, NC) followedby the SDI and virtual impactor (VI; Loo and Cork 1988) witha cut-off diameter of 1.3 µm. The denuders were coated withXAD-4 material according to Gundel et al. (1995) and no singledenuder was used longer than 24 hours. In the VI two quartzfilters (Whatman Q-MA, 47 mm) were used back-to-back andcorrespondingly, the substrates used in the SDI were cut fromthe same filter material. Prior to the sampling, the quartz filtersand substrates were cleaned at 550◦C for six hours. The VI sam-ples collected by using quartz filters (VI-Q), as well as the SDIquartz filter substrates (SDI-Q), were analyzed for organic andelemental carbon (OC and EC) with a thermal-optical transmit-tance method by using a carbon analyzer developed by SunsetLaboratory Inc., Oregon. The thermal method had four temper-ature steps in a helium-phase (310, 480, 615, and 800◦C) andfour steps in a helium-oxygen phase (675, 750, 825, and 920◦C).For the SDI, the charring of OC was corrected by the method ofViidanoja et al. (2002) with the help of parallel VI samples.
In Hyytiala, a second set of SDI and VI was used for the aclosure study. In this system the SDI was loaded with greasedaluminum substrates (SDI-Al), whereas the VI had PTFE filters(VI-PTFE; Millipore Fluoropore, 3.0 µm, 47 mm). No denuderswere used prior to the SDI-Al and VI-PTFE. The SDI-Al andVI-PTFE samples were weighed before and after the samplingusing a microbalance (MT5, Mettler-Toledo Inc. Hightstown,NJ) and analyzed for ions (methanesulfonate (MSA), chloride,nitrate, sulfate, oxalate, sodium, ammonium (NH4), potassium,
TABLE 2List of sample types used in text. Same sampling set-up wasused in the field measurements conducted in Helsinki (urban)
and in Hyytiala (rural)
AnalysesSample Impactor Filter/Substrate for massID type Denuders material closure study
SDI-Q SDI Yes Quartz OC, ECSDI-Al SDI No Aluminum Mass, ionsVI-Q VI Yes Quartz OC, ECVI-PTFE VI No PTFE Mass, ions
magnesium, and calcium) by ion chromatography (Teinila et al.2000). The sample types and performed analyses for the samplesare listed in Table 2.
RESULTS AND DISCUSSION
Calibration of SDI for QuartzCollection Efficiency Curves
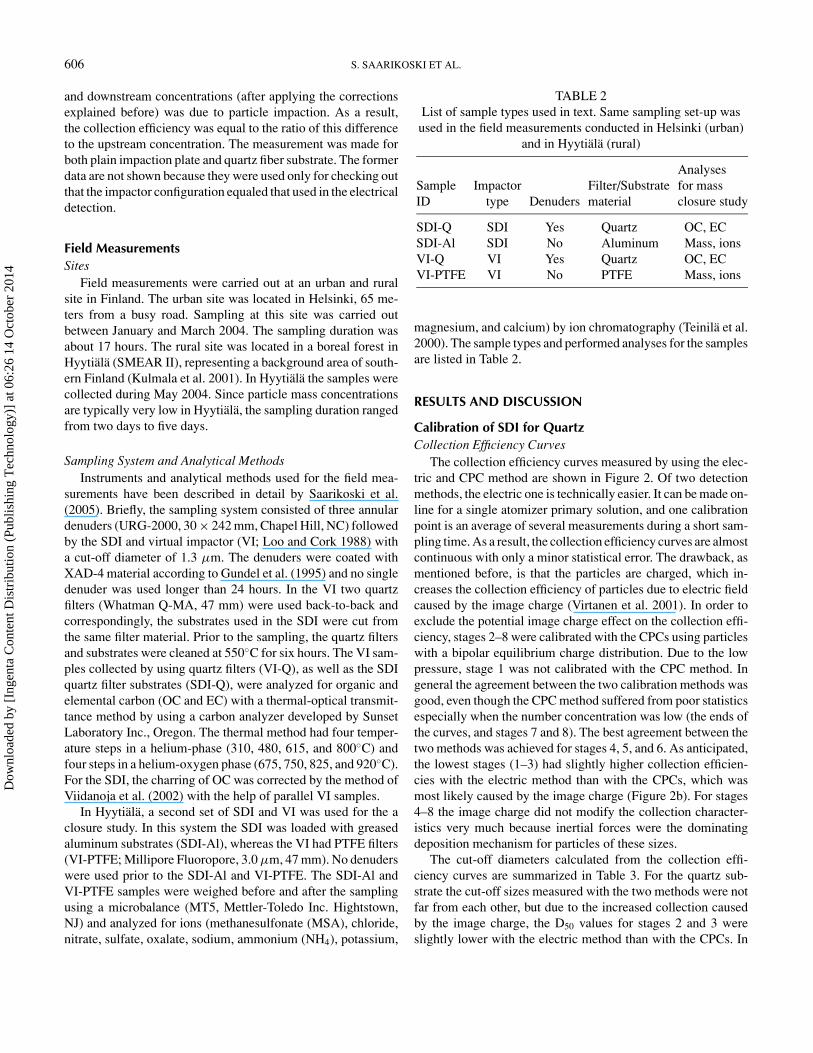
The collection efficiency curves measured by using the elec-tric and CPC method are shown in Figure 2. Of two detectionmethods, the electric one is technically easier. It can be made on-line for a single atomizer primary solution, and one calibrationpoint is an average of several measurements during a short sam-pling time. As a result, the collection efficiency curves are almostcontinuous with only a minor statistical error. The drawback, asmentioned before, is that the particles are charged, which in-creases the collection efficiency of particles due to electric fieldcaused by the image charge (Virtanen et al. 2001). In order toexclude the potential image charge effect on the collection effi-ciency, stages 2–8 were calibrated with the CPCs using particleswith a bipolar equilibrium charge distribution. Due to the lowpressure, stage 1 was not calibrated with the CPC method. Ingeneral the agreement between the two calibration methods wasgood, even though the CPC method suffered from poor statisticsespecially when the number concentration was low (the ends ofthe curves, and stages 7 and 8). The best agreement between thetwo methods was achieved for stages 4, 5, and 6. As anticipated,the lowest stages (1–3) had slightly higher collection efficien-cies with the electric method than with the CPCs, which wasmost likely caused by the image charge (Figure 2b). For stages4–8 the image charge did not modify the collection character-istics very much because inertial forces were the dominatingdeposition mechanism for particles of these sizes.
The cut-off diameters calculated from the collection effi-ciency curves are summarized in Table 3. For the quartz sub-strate the cut-off sizes measured with the two methods were notfar from each other, but due to the increased collection causedby the image charge, the D50 values for stages 2 and 3 wereslightly lower with the electric method than with the CPCs. In
Dow
nloa
ded
by [
Inge
nta
Con
tent
Dis
trib
utio
n (P
ublis
hing
Tec
hnol
ogy)
] at
06:
26 1
4 O
ctob
er 2
014
SIZE DISTRIBUTION OF CARBONACEOUS MATTER 607
FIG. 2. Collection efficiency curves for plain impaction plate (a) and for quartzsubstrates (b–c). Quartz substrates were calibrated using two detection methods,the electric detection (b) and the CPC detection (c).
contrast, the difference between the quartz substrate and platewas significant (Figure 3a).
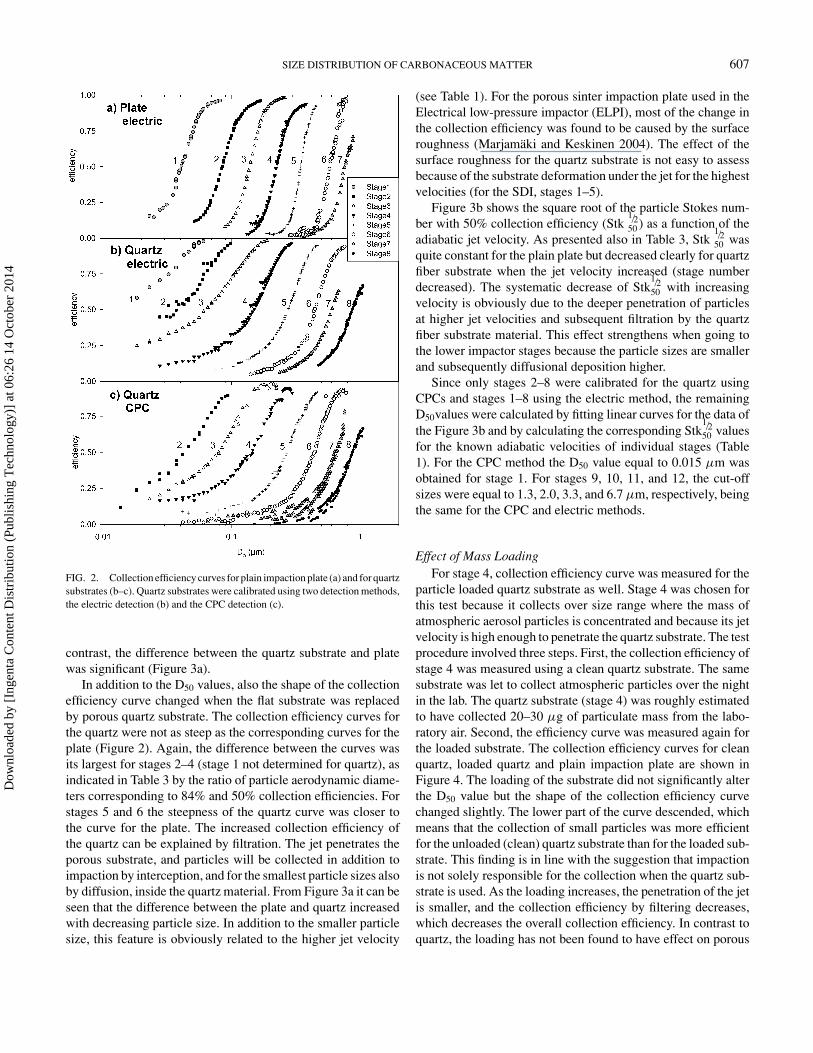
In addition to the D50 values, also the shape of the collectionefficiency curve changed when the flat substrate was replacedby porous quartz substrate. The collection efficiency curves forthe quartz were not as steep as the corresponding curves for theplate (Figure 2). Again, the difference between the curves wasits largest for stages 2–4 (stage 1 not determined for quartz), asindicated in Table 3 by the ratio of particle aerodynamic diame-ters corresponding to 84% and 50% collection efficiencies. Forstages 5 and 6 the steepness of the quartz curve was closer tothe curve for the plate. The increased collection efficiency ofthe quartz can be explained by filtration. The jet penetrates theporous substrate, and particles will be collected in addition toimpaction by interception, and for the smallest particle sizes alsoby diffusion, inside the quartz material. From Figure 3a it can beseen that the difference between the plate and quartz increasedwith decreasing particle size. In addition to the smaller particlesize, this feature is obviously related to the higher jet velocity
(see Table 1). For the porous sinter impaction plate used in theElectrical low-pressure impactor (ELPI), most of the change inthe collection efficiency was found to be caused by the surfaceroughness (Marjamaki and Keskinen 2004). The effect of thesurface roughness for the quartz substrate is not easy to assessbecause of the substrate deformation under the jet for the highestvelocities (for the SDI, stages 1–5).
Figure 3b shows the square root of the particle Stokes num-ber with 50% collection efficiency (Stk
1/250 ) as a function of the
adiabatic jet velocity. As presented also in Table 3, Stk1/250 was
quite constant for the plain plate but decreased clearly for quartzfiber substrate when the jet velocity increased (stage numberdecreased). The systematic decrease of Stk
1/250 with increasing
velocity is obviously due to the deeper penetration of particlesat higher jet velocities and subsequent filtration by the quartzfiber substrate material. This effect strengthens when going tothe lower impactor stages because the particle sizes are smallerand subsequently diffusional deposition higher.
Since only stages 2–8 were calibrated for the quartz usingCPCs and stages 1–8 using the electric method, the remainingD50values were calculated by fitting linear curves for the data ofthe Figure 3b and by calculating the corresponding Stk
1/250 values
for the known adiabatic velocities of individual stages (Table1). For the CPC method the D50 value equal to 0.015 µm wasobtained for stage 1. For stages 9, 10, 11, and 12, the cut-offsizes were equal to 1.3, 2.0, 3.3, and 6.7 µm, respectively, beingthe same for the CPC and electric methods.
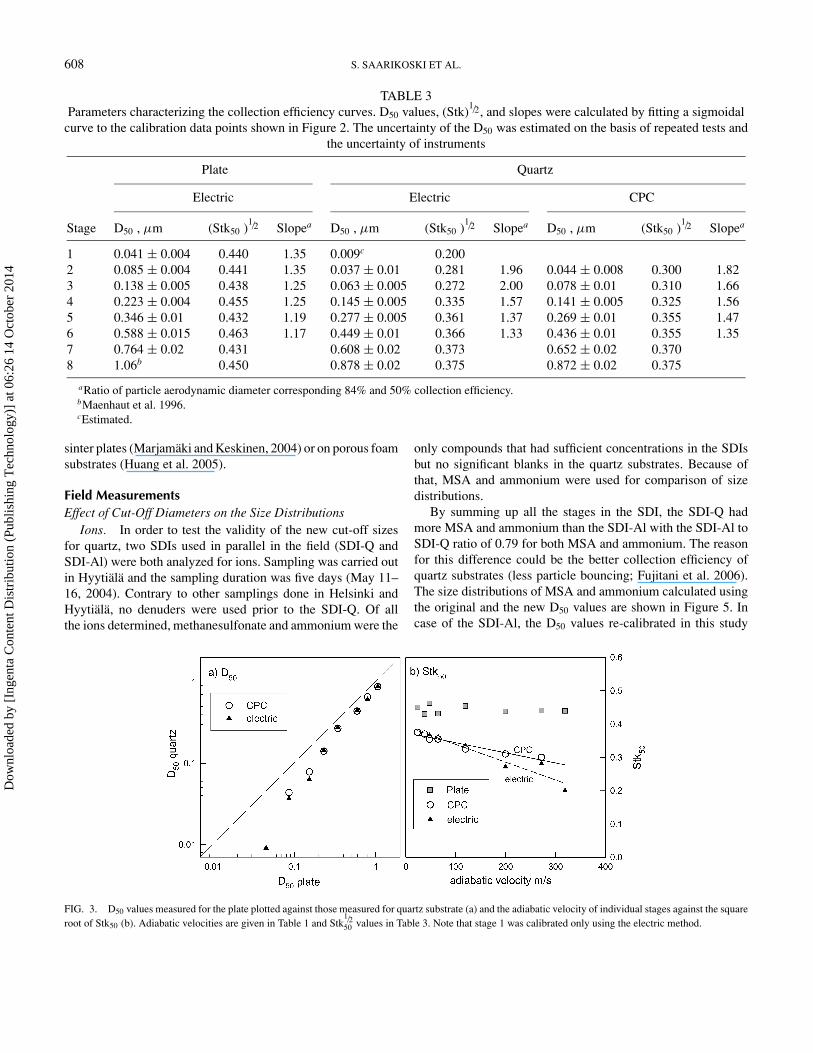
Effect of Mass LoadingFor stage 4, collection efficiency curve was measured for the
particle loaded quartz substrate as well. Stage 4 was chosen forthis test because it collects over size range where the mass ofatmospheric aerosol particles is concentrated and because its jetvelocity is high enough to penetrate the quartz substrate. The testprocedure involved three steps. First, the collection efficiency ofstage 4 was measured using a clean quartz substrate. The samesubstrate was let to collect atmospheric particles over the nightin the lab. The quartz substrate (stage 4) was roughly estimatedto have collected 20–30 µg of particulate mass from the labo-ratory air. Second, the efficiency curve was measured again forthe loaded substrate. The collection efficiency curves for cleanquartz, loaded quartz and plain impaction plate are shown inFigure 4. The loading of the substrate did not significantly alterthe D50 value but the shape of the collection efficiency curvechanged slightly. The lower part of the curve descended, whichmeans that the collection of small particles was more efficientfor the unloaded (clean) quartz substrate than for the loaded sub-strate. This finding is in line with the suggestion that impactionis not solely responsible for the collection when the quartz sub-strate is used. As the loading increases, the penetration of the jetis smaller, and the collection efficiency by filtering decreases,which decreases the overall collection efficiency. In contrast toquartz, the loading has not been found to have effect on porous
Dow
nloa
ded
by [
Inge
nta
Con
tent
Dis
trib
utio
n (P
ublis
hing
Tec
hnol
ogy)
] at
06:
26 1
4 O
ctob
er 2
014
608 S. SAARIKOSKI ET AL.
TABLE 3Parameters characterizing the collection efficiency curves. D50 values, (Stk)
1/2, and slopes were calculated by fitting a sigmoidalcurve to the calibration data points shown in Figure 2. The uncertainty of the D50 was estimated on the basis of repeated tests and
the uncertainty of instruments
Plate Quartz
Electric Electric CPC
Stage D50 , µm (Stk50 )1/2 Slopea D50 , µm (Stk50 )
1/2 Slopea D50 , µm (Stk50 )1/2 Slopea
1 0.041 ± 0.004 0.440 1.35 0.009c 0.2002 0.085 ± 0.004 0.441 1.35 0.037 ± 0.01 0.281 1.96 0.044 ± 0.008 0.300 1.823 0.138 ± 0.005 0.438 1.25 0.063 ± 0.005 0.272 2.00 0.078 ± 0.01 0.310 1.664 0.223 ± 0.004 0.455 1.25 0.145 ± 0.005 0.335 1.57 0.141 ± 0.005 0.325 1.565 0.346 ± 0.01 0.432 1.19 0.277 ± 0.005 0.361 1.37 0.269 ± 0.01 0.355 1.476 0.588 ± 0.015 0.463 1.17 0.449 ± 0.01 0.366 1.33 0.436 ± 0.01 0.355 1.357 0.764 ± 0.02 0.431 0.608 ± 0.02 0.373 0.652 ± 0.02 0.3708 1.06b 0.450 0.878 ± 0.02 0.375 0.872 ± 0.02 0.375
aRatio of particle aerodynamic diameter corresponding 84% and 50% collection efficiency.bMaenhaut et al. 1996.cEstimated.
sinter plates (Marjamaki and Keskinen, 2004) or on porous foamsubstrates (Huang et al. 2005).
Field MeasurementsEffect of Cut-Off Diameters on the Size Distributions
Ions. In order to test the validity of the new cut-off sizesfor quartz, two SDIs used in parallel in the field (SDI-Q andSDI-Al) were both analyzed for ions. Sampling was carried outin Hyytiala and the sampling duration was five days (May 11–16, 2004). Contrary to other samplings done in Helsinki andHyytiala, no denuders were used prior to the SDI-Q. Of allthe ions determined, methanesulfonate and ammonium were the
FIG. 3. D50 values measured for the plate plotted against those measured for quartz substrate (a) and the adiabatic velocity of individual stages against the squareroot of Stk50 (b). Adiabatic velocities are given in Table 1 and Stk
1/250 values in Table 3. Note that stage 1 was calibrated only using the electric method.
only compounds that had sufficient concentrations in the SDIsbut no significant blanks in the quartz substrates. Because ofthat, MSA and ammonium were used for comparison of sizedistributions.
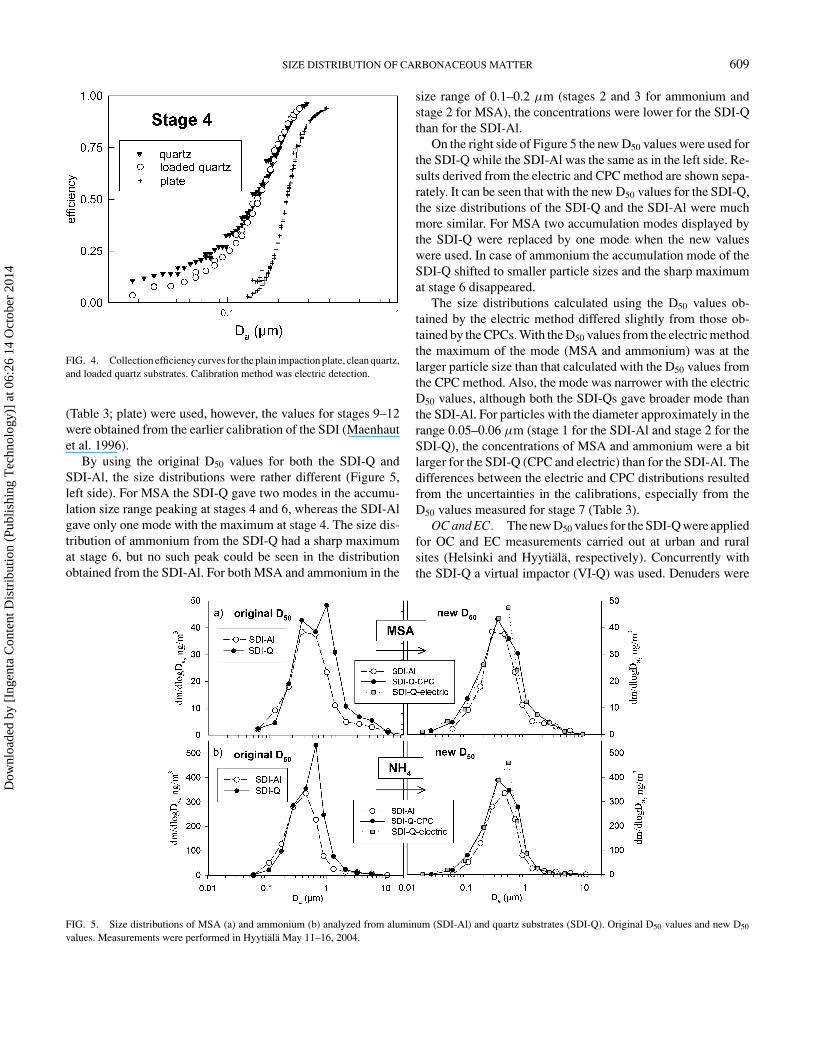
By summing up all the stages in the SDI, the SDI-Q hadmore MSA and ammonium than the SDI-Al with the SDI-Al toSDI-Q ratio of 0.79 for both MSA and ammonium. The reasonfor this difference could be the better collection efficiency ofquartz substrates (less particle bouncing; Fujitani et al. 2006).The size distributions of MSA and ammonium calculated usingthe original and the new D50 values are shown in Figure 5. Incase of the SDI-Al, the D50 values re-calibrated in this study
Dow
nloa
ded
by [
Inge
nta
Con
tent
Dis
trib
utio
n (P
ublis
hing
Tec
hnol
ogy)
] at
06:
26 1
4 O
ctob
er 2
014
SIZE DISTRIBUTION OF CARBONACEOUS MATTER 609
FIG. 4. Collection efficiency curves for the plain impaction plate, clean quartz,and loaded quartz substrates. Calibration method was electric detection.
(Table 3; plate) were used, however, the values for stages 9–12were obtained from the earlier calibration of the SDI (Maenhautet al. 1996).
By using the original D50 values for both the SDI-Q andSDI-Al, the size distributions were rather different (Figure 5,left side). For MSA the SDI-Q gave two modes in the accumu-lation size range peaking at stages 4 and 6, whereas the SDI-Algave only one mode with the maximum at stage 4. The size dis-tribution of ammonium from the SDI-Q had a sharp maximumat stage 6, but no such peak could be seen in the distributionobtained from the SDI-Al. For both MSA and ammonium in the
FIG. 5. Size distributions of MSA (a) and ammonium (b) analyzed from aluminum (SDI-Al) and quartz substrates (SDI-Q). Original D50 values and new D50
values. Measurements were performed in Hyytiala May 11–16, 2004.
size range of 0.1–0.2 µm (stages 2 and 3 for ammonium andstage 2 for MSA), the concentrations were lower for the SDI-Qthan for the SDI-Al.
On the right side of Figure 5 the new D50 values were used forthe SDI-Q while the SDI-Al was the same as in the left side. Re-sults derived from the electric and CPC method are shown sepa-rately. It can be seen that with the new D50 values for the SDI-Q,the size distributions of the SDI-Q and the SDI-Al were muchmore similar. For MSA two accumulation modes displayed bythe SDI-Q were replaced by one mode when the new valueswere used. In case of ammonium the accumulation mode of theSDI-Q shifted to smaller particle sizes and the sharp maximumat stage 6 disappeared.
The size distributions calculated using the D50 values ob-tained by the electric method differed slightly from those ob-tained by the CPCs. With the D50 values from the electric methodthe maximum of the mode (MSA and ammonium) was at thelarger particle size than that calculated with the D50 values fromthe CPC method. Also, the mode was narrower with the electricD50 values, although both the SDI-Qs gave broader mode thanthe SDI-Al. For particles with the diameter approximately in therange 0.05–0.06 µm (stage 1 for the SDI-Al and stage 2 for theSDI-Q), the concentrations of MSA and ammonium were a bitlarger for the SDI-Q (CPC and electric) than for the SDI-Al. Thedifferences between the electric and CPC distributions resultedfrom the uncertainties in the calibrations, especially from theD50 values measured for stage 7 (Table 3).
OC and EC. The new D50 values for the SDI-Q were appliedfor OC and EC measurements carried out at urban and ruralsites (Helsinki and Hyytiala, respectively). Concurrently withthe SDI-Q a virtual impactor (VI-Q) was used. Denuders were
Dow
nloa
ded
by [
Inge
nta
Con
tent
Dis
trib
utio
n (P
ublis
hing
Tec
hnol
ogy)
] at
06:
26 1
4 O
ctob
er 2
014
610 S. SAARIKOSKI ET AL.
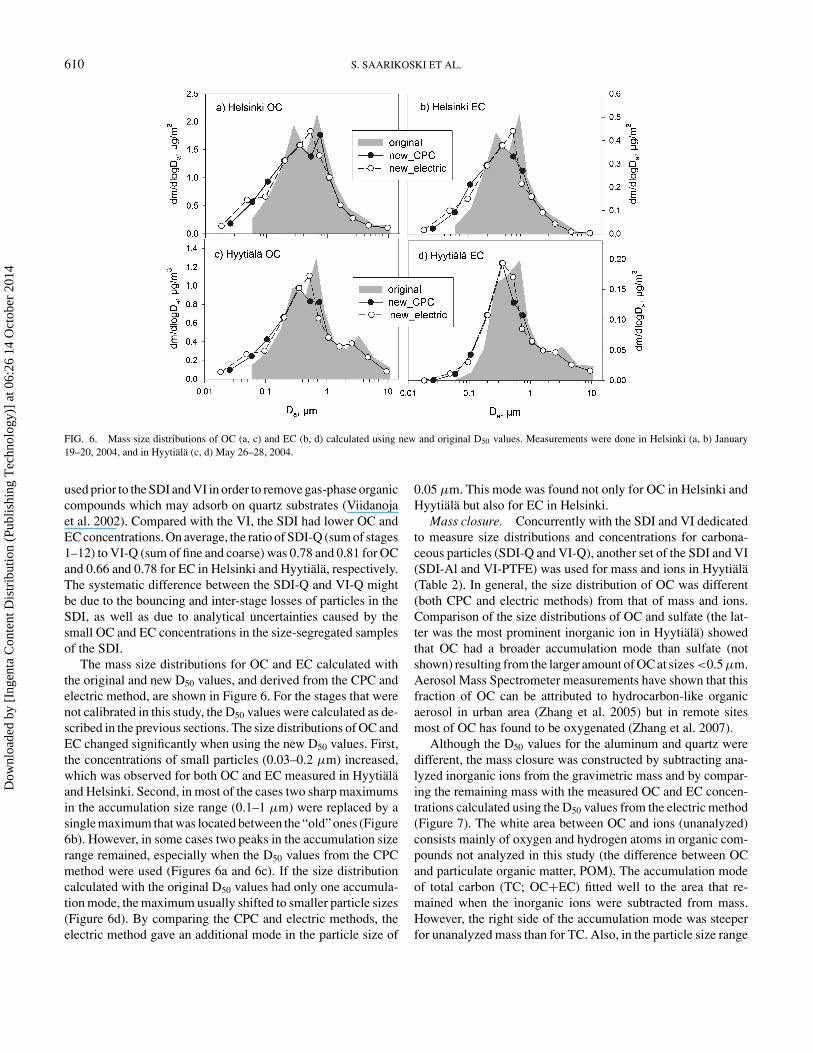
FIG. 6. Mass size distributions of OC (a, c) and EC (b, d) calculated using new and original D50 values. Measurements were done in Helsinki (a, b) January19–20, 2004, and in Hyytiala (c, d) May 26–28, 2004.
used prior to the SDI and VI in order to remove gas-phase organiccompounds which may adsorb on quartz substrates (Viidanojaet al. 2002). Compared with the VI, the SDI had lower OC andEC concentrations. On average, the ratio of SDI-Q (sum of stages1–12) to VI-Q (sum of fine and coarse) was 0.78 and 0.81 for OCand 0.66 and 0.78 for EC in Helsinki and Hyytiala, respectively.The systematic difference between the SDI-Q and VI-Q mightbe due to the bouncing and inter-stage losses of particles in theSDI, as well as due to analytical uncertainties caused by thesmall OC and EC concentrations in the size-segregated samplesof the SDI.
The mass size distributions for OC and EC calculated withthe original and new D50 values, and derived from the CPC andelectric method, are shown in Figure 6. For the stages that werenot calibrated in this study, the D50 values were calculated as de-scribed in the previous sections. The size distributions of OC andEC changed significantly when using the new D50 values. First,the concentrations of small particles (0.03–0.2 µm) increased,which was observed for both OC and EC measured in Hyytialaand Helsinki. Second, in most of the cases two sharp maximumsin the accumulation size range (0.1–1 µm) were replaced by asingle maximum that was located between the “old” ones (Figure6b). However, in some cases two peaks in the accumulation sizerange remained, especially when the D50 values from the CPCmethod were used (Figures 6a and 6c). If the size distributioncalculated with the original D50 values had only one accumula-tion mode, the maximum usually shifted to smaller particle sizes(Figure 6d). By comparing the CPC and electric methods, theelectric method gave an additional mode in the particle size of
0.05 µm. This mode was found not only for OC in Helsinki andHyytiala but also for EC in Helsinki.
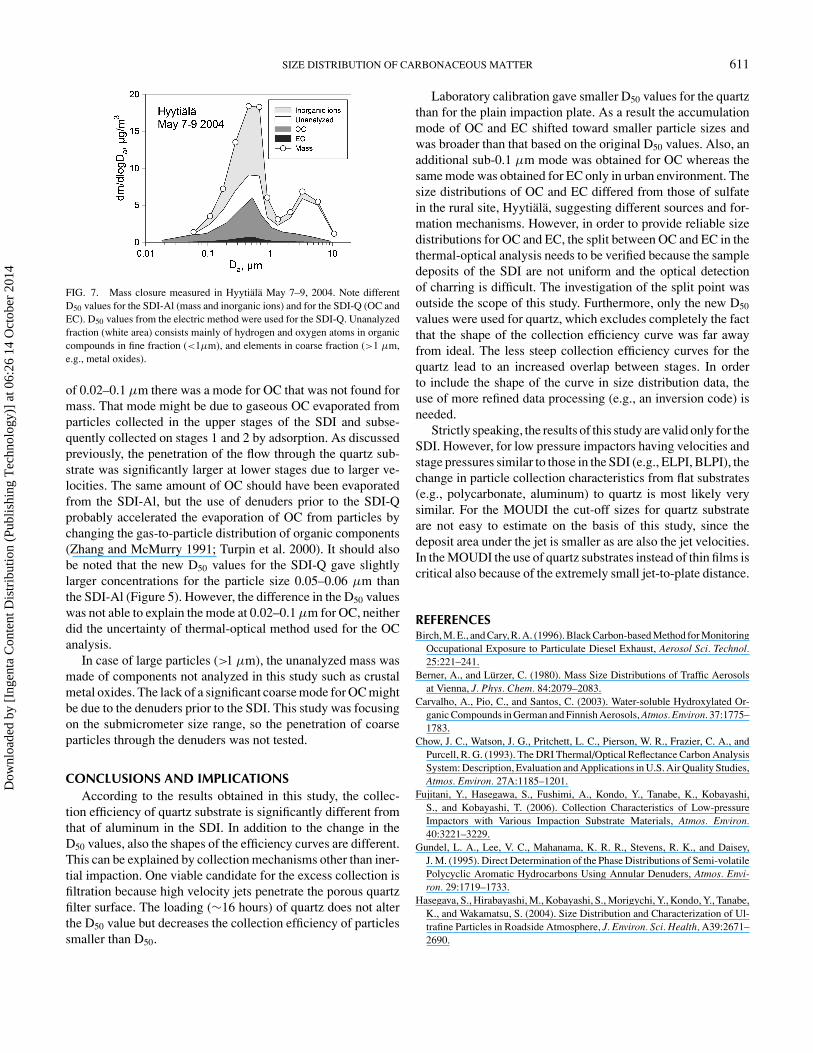
Mass closure. Concurrently with the SDI and VI dedicatedto measure size distributions and concentrations for carbona-ceous particles (SDI-Q and VI-Q), another set of the SDI and VI(SDI-Al and VI-PTFE) was used for mass and ions in Hyytiala(Table 2). In general, the size distribution of OC was different(both CPC and electric methods) from that of mass and ions.Comparison of the size distributions of OC and sulfate (the lat-ter was the most prominent inorganic ion in Hyytiala) showedthat OC had a broader accumulation mode than sulfate (notshown) resulting from the larger amount of OC at sizes <0.5 µm.Aerosol Mass Spectrometer measurements have shown that thisfraction of OC can be attributed to hydrocarbon-like organicaerosol in urban area (Zhang et al. 2005) but in remote sitesmost of OC has found to be oxygenated (Zhang et al. 2007).
Although the D50 values for the aluminum and quartz weredifferent, the mass closure was constructed by subtracting ana-lyzed inorganic ions from the gravimetric mass and by compar-ing the remaining mass with the measured OC and EC concen-trations calculated using the D50 values from the electric method(Figure 7). The white area between OC and ions (unanalyzed)consists mainly of oxygen and hydrogen atoms in organic com-pounds not analyzed in this study (the difference between OCand particulate organic matter, POM). The accumulation modeof total carbon (TC; OC+EC) fitted well to the area that re-mained when the inorganic ions were subtracted from mass.However, the right side of the accumulation mode was steeperfor unanalyzed mass than for TC. Also, in the particle size range
Dow
nloa
ded
by [
Inge
nta
Con
tent
Dis
trib
utio
n (P
ublis
hing
Tec
hnol
ogy)
] at
06:
26 1
4 O
ctob
er 2
014
SIZE DISTRIBUTION OF CARBONACEOUS MATTER 611
FIG. 7. Mass closure measured in Hyytiala May 7–9, 2004. Note differentD50 values for the SDI-Al (mass and inorganic ions) and for the SDI-Q (OC andEC). D50 values from the electric method were used for the SDI-Q. Unanalyzedfraction (white area) consists mainly of hydrogen and oxygen atoms in organiccompounds in fine fraction (<1µm), and elements in coarse fraction (>1 µm,e.g., metal oxides).
of 0.02–0.1 µm there was a mode for OC that was not found formass. That mode might be due to gaseous OC evaporated fromparticles collected in the upper stages of the SDI and subse-quently collected on stages 1 and 2 by adsorption. As discussedpreviously, the penetration of the flow through the quartz sub-strate was significantly larger at lower stages due to larger ve-locities. The same amount of OC should have been evaporatedfrom the SDI-Al, but the use of denuders prior to the SDI-Qprobably accelerated the evaporation of OC from particles bychanging the gas-to-particle distribution of organic components(Zhang and McMurry 1991; Turpin et al. 2000). It should alsobe noted that the new D50 values for the SDI-Q gave slightlylarger concentrations for the particle size 0.05–0.06 µm thanthe SDI-Al (Figure 5). However, the difference in the D50 valueswas not able to explain the mode at 0.02–0.1 µm for OC, neitherdid the uncertainty of thermal-optical method used for the OCanalysis.
In case of large particles (>1 µm), the unanalyzed mass wasmade of components not analyzed in this study such as crustalmetal oxides. The lack of a significant coarse mode for OC mightbe due to the denuders prior to the SDI. This study was focusingon the submicrometer size range, so the penetration of coarseparticles through the denuders was not tested.
CONCLUSIONS AND IMPLICATIONSAccording to the results obtained in this study, the collec-
tion efficiency of quartz substrate is significantly different fromthat of aluminum in the SDI. In addition to the change in theD50 values, also the shapes of the efficiency curves are different.This can be explained by collection mechanisms other than iner-tial impaction. One viable candidate for the excess collection isfiltration because high velocity jets penetrate the porous quartzfilter surface. The loading (∼16 hours) of quartz does not alterthe D50 value but decreases the collection efficiency of particlessmaller than D50.
Laboratory calibration gave smaller D50 values for the quartzthan for the plain impaction plate. As a result the accumulationmode of OC and EC shifted toward smaller particle sizes andwas broader than that based on the original D50 values. Also, anadditional sub-0.1 µm mode was obtained for OC whereas thesame mode was obtained for EC only in urban environment. Thesize distributions of OC and EC differed from those of sulfatein the rural site, Hyytiala, suggesting different sources and for-mation mechanisms. However, in order to provide reliable sizedistributions for OC and EC, the split between OC and EC in thethermal-optical analysis needs to be verified because the sampledeposits of the SDI are not uniform and the optical detectionof charring is difficult. The investigation of the split point wasoutside the scope of this study. Furthermore, only the new D50
values were used for quartz, which excludes completely the factthat the shape of the collection efficiency curve was far awayfrom ideal. The less steep collection efficiency curves for thequartz lead to an increased overlap between stages. In orderto include the shape of the curve in size distribution data, theuse of more refined data processing (e.g., an inversion code) isneeded.
Strictly speaking, the results of this study are valid only for theSDI. However, for low pressure impactors having velocities andstage pressures similar to those in the SDI (e.g., ELPI, BLPI), thechange in particle collection characteristics from flat substrates(e.g., polycarbonate, aluminum) to quartz is most likely verysimilar. For the MOUDI the cut-off sizes for quartz substrateare not easy to estimate on the basis of this study, since thedeposit area under the jet is smaller as are also the jet velocities.In the MOUDI the use of quartz substrates instead of thin films iscritical also because of the extremely small jet-to-plate distance.
REFERENCESBirch, M. E., and Cary, R. A. (1996). Black Carbon-based Method for Monitoring
Occupational Exposure to Particulate Diesel Exhaust, Aerosol Sci. Technol.25:221–241.
Berner, A., and Lurzer, C. (1980). Mass Size Distributions of Traffic Aerosolsat Vienna, J. Phys. Chem. 84:2079–2083.
Carvalho, A., Pio, C., and Santos, C. (2003). Water-soluble Hydroxylated Or-ganic Compounds in German and Finnish Aerosols, Atmos. Environ. 37:1775–1783.
Chow, J. C., Watson, J. G., Pritchett, L. C., Pierson, W. R., Frazier, C. A., andPurcell, R. G. (1993). The DRI Thermal/Optical Reflectance Carbon AnalysisSystem: Description, Evaluation and Applications in U.S. Air Quality Studies,Atmos. Environ. 27A:1185–1201.
Fujitani, Y., Hasegawa, S., Fushimi, A., Kondo, Y., Tanabe, K., Kobayashi,S., and Kobayashi, T. (2006). Collection Characteristics of Low-pressureImpactors with Various Impaction Substrate Materials, Atmos. Environ.40:3221–3229.
Gundel, L. A., Lee, V. C., Mahanama, K. R. R., Stevens, R. K., and Daisey,J. M. (1995). Direct Determination of the Phase Distributions of Semi-volatilePolycyclic Aromatic Hydrocarbons Using Annular Denuders, Atmos. Envi-ron. 29:1719–1733.
Hasegava, S., Hirabayashi, M., Kobayashi, S., Morigychi, Y., Kondo, Y., Tanabe,K., and Wakamatsu, S. (2004). Size Distribution and Characterization of Ul-trafine Particles in Roadside Atmosphere, J. Environ. Sci. Health, A39:2671–2690.
Dow
nloa
ded
by [
Inge
nta
Con
tent
Dis
trib
utio
n (P
ublis
hing
Tec
hnol
ogy)
] at
06:
26 1
4 O
ctob
er 2
014
612 S. SAARIKOSKI ET AL.
Hermann, M., and Wiedensohler, A. (2001). Counting Efficiency of Condensa-tion Particle Counters at Low-pressures with Illustrative Data from the UpperTroposphere, J. Aerosol Sci. 32:975–991.
Hering, S. V., Flagan, R. C., and Friedlander, S. K. (1978). Design and Evaluationof New Low-pressure Impactor. I, Environ. Sci. Technol. 12:667–673.
Hering, S. V. (1987). Calibration of QCM Impactor for Stratospheric Sampling,Aerosol Sci. Technol. 7:257–274.
Hillamo, R. E., and Kauppinen, E. I. (1991). On the Performance of the BernerLow Pressure Impactor, Aerosol Sci. Technol. 14:33–47.
Hinds, W. C. (1999). Aerosol Technology; Properties, Behaviour and Measure-ment of Airborne Particles. John Wiley & Johns, New York, p. 124.
Huang, C.-H., Tsai, C.-J., and Shih, T.-S. (2001). Particle Collection Efficiencyof an Inertial Impactor with Porous Metal Substrates, J. Aerosol Sci. 32:1035–1044.
Huang, C.-H., Chang, C.-S., Chang, S.-H., Tsai, C.-J., Shih, T.-S., and Tang,D.-T. (2005). Use of Porous Foam as the Substrate of an Impactor for Res-pirable Aerosol Sampling, J. Aerosol Sci. 36:1373–1386.
Jaffrezo, J.-L., Aymoz, G., and Cozic, J. (2005). Size Distribution of EC and OCin the Aerosol of Alpine Valleys during Summer and Winter, Atmos. Chem.Phys. 5:2915–2925.
Kavouras, I. G., and Koutrakis, P. (2001). Use of Polyurethane Foam as theImpaction Substrate/Collection Medium in Conventional Inertial Impactors,Aerosol Sci. Technol. 34:46–56.
Kulmala, M., Hameri, K., Aalto, P. P., Makela, J. M., Pirjola, L., Nilsson,E. D., Buzorius, G., Rannik, U., Dal Maso, M., Seidl, W., Hoffmann, T.,Janson, R., Hansson, H.-C., Viisanen, Y., Laaksonen, A., and O’Dowd, C. D.(2001). Overview of the International Project on Biogenic Aerosol Formationin the Boreal Forest (BIOFOR), Tellus 53B:324–343.
Liu, B. Y. H., and Lee, K. W. (1975). An Aerosol Generator of High Stability,Am. Indus. Hyg. Assoc. J. 36:861–865.
Loo, B. W., and Cork, C. P. (1988). Development of High Efficiency VirtualImpactor, Aerosol Sci. Technol. 9:167–170.
Maenhaut, W., Hillamo, R., Makela, T., Jaffrezo, J.-L., Bergin, M. H., andDavidson, C. I. (1996). A New Cascade Impactor for Aerosol Sampling withSubsequent PIXE Analysis, Nucl. Inst. Meth. Phys. Res. B. 109/110:482–487.
Marjamaki., M., and Keskinen, J. (2004). Effect of Impaction Plate Roughnessand Porosity on Collection Efficiency, J. Aerosol Sci. 35:301–308.
Marple, V. A., and Liu, B. Y. H. (1974). Characteristics of Laminar Jet Impactors,Environ. Sci. Technol. 8: 648–654.
Marple, V. A., Rubow, K. L., and Behm, S. M. (1991). A Microorifice UniformDeposit Impactor (MOUDI): Description, Calibration and Use, Aerosol Sci.Technol. 14: 434–446.
Marple, V. A., and Olson, B. A. (1999). A Micro-Orifice Impactor with Cut-Sizes Down to 10 Nanometers for Diesel Exhaust Sampling. Final Report for
Grant Number G1145242, G1155242/#2783 Generic Technology Center forRespirable Dust.
Rader, D. J., and Marple, V. A. (1985). Effect of Ultra-Stokesian Drag and Par-ticle Interception on Impaction Characteristics, Aerosol Sci. Technol. 4:141–156.
Saarikoski, S., Makela, T., Hillamo, R., Aalto, P. P., Kerminen, V.-M., and Kul-mala, M. (2005). Physico-chemical Characterization and Mass Closure ofSize-segregated Atmospheric Aerosols in Hyytiala, Finland, Boreal Env. Res.10:385–400.
Sillanpaa, M., Hillamo, R., Makela, T., Pennanen, A. S., and Salonen, R. O.(2003). Field and Laboratory Tests of a High Volume Cascade Impactor, J.Aerosol Sci. 34:485–500.
Teinila, K., Kerminen, V.-M., and Hillamo, R. (2000). A Study of Size-Segregated Aerosol Chemistry in the Antarctic Atmosphere, J. Geophys. Res.105:3893–3904.
Turpin, B. J., Saxena, P., and Andrews, E. (2000). Measuring and Simulating Par-iculate Organics in the Atmosphere: Problems and Prospects, Atmos. Environ.34:2983–3013.
Viidanoja, J., Kerminen, V.-M., and Hillamo, R. (2002). Measuring the Size Dis-tribution of Atmospheric Organic and Black Carbon Using Impactor SamplingCoupled with Thermal Carbon Analysis: Method Development and Uncer-tainties, Aerosol Sci. Technol. 36:1–10.
Virtanen, A., Marjamaki, M., Ristimaki, J., and Keskinen, J. (2001). Fine ParticleLosses in Electrical Low-pressure Impactor, J. Aerosol Sci. 32:389–401.
Winklmayer, W., Wang, H.-C., and John, W. (1990). Adaptation of the TwomeyAlgorithm to the Inversion of Cascade Impactor data, Aerosol Sci. Technol.13:322–331.
Wolfenbarger, J. K., and Seinfeld, J. H. (1990). Inversion of Aerosol Size Dis-tribution Data, J. Aerosol Sci. 21:227–247.
Yttri, K. E., Dye, C., Siørdal, L. H., and Braathen, O.-A. (2005). Quantifica-tion of Monosaccharide Anhydrides by Liquid Chromatography Combinedwith Mass Spectrometry: Application to Aerosol Samples from an Urban anda Suburban Site Influenced by Small-scale Wood Burning, J. Air & WasteManage. Assoc. 55:1169–1177.
Zhang, X., and McMurry, P. H. (1991). Theoretical Analysis of EvaporativeLosses of Adsorbed and Absorbed Species during Atmospheric Aerosol Sam-pling. Environ. Sci. Technol. 25:456–459.
Zhang, Q., Worsnop, D. R., Canagaratna, M. R., and Jimenez J. L. (2005).Hydrocarbon-like and Oxygenated Organic Aerosols in Pittsburgh: Insightsinto Sources and Processes of Organic Aerosol, Atmos. Chem. Phys. 5:3289–3311.
Zhang, Q., Jimenez, J. L., Canagaratna, M. R., Allan, J. D., Coe, H. et al.(2007). Ubiquity and Dominance of Oxygenated Species in Organic Aerosolin Anthropogenically-influenced Northern Hemisphere Midlatitudes. Geo-phys. Res. Lett. 34:L13801.
Dow
nloa
ded
by [
Inge
nta
Con
tent
Dis
trib
utio
n (P
ublis
hing
Tec
hnol
ogy)
] at
06:
26 1
4 O
ctob
er 2
014