corrosion resistance of m100 grade concrete using quartz sand and quartz fillers in hybrid fiber...
TRANSCRIPT

CORROSION RESISTANCE OF M100 GRADE CONCRETE USING QUARTZ SAND AND QUARTZ FILLERS IN HYBRID FIBER
REINFORCED SELF COMPACTING CONCRETE
INTRODUCTION
Performance of concrete is generally judged by strength
and durability properties. Probably the most important
durability issue with reinforced concrete is deterioration due
to reinforcement corrosion (Wallbank, 1989). A detailed
description of the corrosion process can be found in the
study of Rosenberg A, Hanson CM, Andrade C (1989). In the
alkaline cementitious environment, a stable oxide film is
formed on the steel surface which protects the interior steel
from corroding. However, corrosion starts due to the
carbonation of concrete leading to a reduction in the
alkalinity, or the presence of chloride ions causing pitting
damage of the protective film on the steel bar. The
corrosion product absorbs water and increases in volume.
By
Once the expansion becomes excessive, concrete
cracking will occur. Following the approach proposed by
Tuutti k (1982), the corrosion process can be divided into
two parts: an initiation (depassivation) stage and a
propagation (corrosion) stage. During the initiation stage,
corrosion agents such as chloride ions and carbon dioxide
penetrate into the concrete cover, but their concentration
around the steel reinforcement is not high enough to cause
corrosion yet. The end of the initiation stage or the
beginning of the propagation stage is the moment when
corrosion starts at threshold concentration of aggressive
species. Within the propagation stage, steel corrosion is
accompanied by the growth of radial cracks from the steel
bar, which will eventually lead to spalling of the concrete
cover.
ABSTRACT
Cement concrete is porous in its basic structure as a result of which permeation of air, moisture and other deleterious
agents occur, causing corrosion of reinforcement. Corrosion is defined as the deterioration of a material through a
chemical or electrochemical reaction with its environment. The phenomenon of corrosion of reinforcement bar in
concrete is a time dependent process. Under severe environmental conditions also, it takes years for the steel
reinforcement to be corroded and to cause deterioration of Reinforced Concrete (RC) structures. However when it
becomes imperative to evaluate the relative performance of different types of steel and binder in a short time, the
accelerated corrosion test can be adopted. Effort has been made to present the corrosion resistance of M100 High
Strength Self Compacting Concrete (HSSCC) with and without adding Hybrid fibers (Steel Fibers with aspect ratio 60:1
and Glass Fibers with aspect ratio 857:1). The specimens are tested after 28 days of curing. The corrosion process is
initiated by applying a constant voltage of 6 volts to the system in which concrete specimens of 100x200mm cylinders
with concentrically embedded rebar of 10mm are placed in NaCl solution of 1.2 molarity. The specimens are visually
inspected at regular intervals of time for the onset of cracks. The accelerated corrosion test is terminated after cracking
of the specimen is observed i.e., when there is onset of a large current increase corresponding to time and the results are
interpreted in a current-time graph.
Keywords: Corrosion Resistance, HSSCC (High Strength Self Composting Concrete) Hybrid Fiber, Electrochemical
Reaction, Cracking.
B. NARENDRA KUMAR * P. SRINIVASA RAO ** K.RAJESH *** R. KRISHNESWAR ****
* Associate Professor, Department of Civil Engineering, Hyderabad, India. ** Professor, Department of Civil Engineering, Jawaharl Nehru Technology University College of Engineering, Hyderabad, India.
*** M.Tech, Department of Civil Engineering, VNR Vignana Institute of Engineering and Technology, Hyderabad, India. **** B.Tech, Department of Civil Engineering, VNR Vignana Institute of Engineering and Technology, Hyderabad, India.
VNR Vignana Institute of Engineering and Technology,
RESEARCH PAPERS
10 li-manager’s Journal on Structural Engineering Vol. No. 3 14l, 3 September - November 20

RESEARCH PAPERS
Performance measurements of reinforced concrete
related to the corrosion of embedded steel may be based
on the type and condition of steel bar and thickness and
quality of concrete cover, properties of cement paste,
mortar, and concrete, and electrochemical conditions of
the reinforcement in contact with the solution, paste,
mortar, or concrete. Issues relating to reinforcement type
have been extensively discussed in the study by Haynes G,
Fasullo EJ and McCuen RH et al (1992), and the use of
galvanized steel, stainless steel, or coated reinforcement in
preventing chloride-induced steel corrosion in concrete
have been investigated by Rober H (1982) and
Rasheeduzzafar (1992). Cracking has been noted to
increase the likelihood of damage to reinforced concrete
Suzuki K (1990) and Beeby AW (1981). Cover to
reinforcement is considered of prime importance by some
researchers (Gu P, Beaudoin JJ, Zhang MH, Malhotra VM,
2000) while others believe that concrete type/quality is
more critical than the cover thickness. Further information
on concrete cover, its modification, cracking, and de-
lamination can also be found in the study by Babaei,
Hawkins and Rasheeduzzafar (1992).
1. Objectives
1. To investigate the corrosion resistance of M100 grade
self-compacting concrete.
2. To compare the resistance to corrosion b\w HSSCC and
high strength hybrid fibre self-compacting concrete
(HSHFSCC).
3. To observe the difference in cracking due to corrosion in
HSSCC and HSHFSCC.
2. SCC Materials
An ordinary Portland cement of 53 grades is being used in the
mix. Quartz sand is used as fine aggregate replacing river
sand by 100%. Aggregate of size ranging from 4.75mm to
20mm is used as coarse aggregate. MasterGlenium ACE 30
and Glenium stream 2 are used as Super plasticizer and VMA
respectively. Hooked end steel fibers of aspect ratio 60:1 and
CEM-FIL anti crack alkali resistant glass fibers of aspect ratio
857:1 are used in the mix.
3. Mix Proportion
Self-compacting concrete mix is made using 640kg/m3 of
cement, 64kg/m3 of micro silica and 160 kg/m3 of quartz
powder. 1.5% of cementations material is used as super
plasticizer and 0.25% of cementations material is used as
viscosity modifying agent has been taken from previous
study done by B. Narendra Kumar, P. Srinivasa Rao, K.Rajesh
(2013). Fibers are tuned to 1.5% of cementations material
P. Srinivasa Rao, Seshadri Sekhar.T and P.Sravana (2009). The
Quantities in the mix are as shown in Table1.
4. Batching, Mixing and Placing of HSHFSCC
The proportioning of the quantity of cementations material
(Cement, Quartz powder and micro silica), fine aggregate
(Quartz Sand), coarse aggregate, superplasticizer, VMA
steel and glass fibers were done using weight batching as
per the mix design. Water was measured in volume. All the
measuring equipment are maintained in a clean
serviceable condition with their accuracy periodically
checked.
The concrete used in the study is laboratory produced with
an electrically operated pan mixer 80 litre in capacity.
Buttering of the mixer (disposal of the first mix) was always
firstly conducted before the first intended batch. This is to
eliminate the effect of the mixer dryness/wetness condition.
The same mixing procedure was followed for all HSHFSCC
mixtures. Firstly, the total content of course aggregate and
fine aggregate were mixed in dry condition in the mixer
until uniform distribution was observed. Then cementations
materials (cement + quartz powder + micro silica) are
added and mixed until uniformity. Secondly, water and
chemical admixtures like SP and VMA are premixed in a
beaker and stirred lightly. The premixed solution (Water + SP
+ VMA) was added to the running mixer in about 3 - 4
intervals limiting the running time to 3 minutes. The mixer is
kept still for 30 seconds and at last the fibres were sprinkled
while mixing thoroughly for 2min until uniform mix is
Table 1. Mix Proportions Used
Materials
HSSCC
HSHFSCC
3Cement (kg/m ) 640 640
Micro Silica (kg/m3) 64 64
Quartz Powder (kg/m3) 160 160Quartz Sand (kg/m3) 887 887
Coarse aggregate (kg/m3) 797.53 797.53SP (% of P.C) 1.5 1.5
VMA (% of P.C) 0.5 0.5W/P ratio 0.20 0.21
Steel Fibers (% of P.C) - 0.75 Glass Fibers (% of P.C) - 0.75
11li-manager’s Journal on Structural Engineering Vol. No. 3 14l, 3 September - November 20
RESEARCH PAPERS
obtained (this 2min mixing is done even though fibres were
not 3 added). Once the mixing time was completed,
concrete is placed and the rheological tests (slump flow
test, V-funnel test, L-box test and U-box test) were performed
in quick succession.
5. Testing of the Specimen
5.1 Properties of fresh concrete:
In order to determine the self-compatibility the following
test were conducted on fresh concrete
(I) Flow Table
(ii) V Funnel
(iii) L-box
In Flow Table test the diameter and T500 represent flowing
ability, where V Funnel and L Box represent the passing and
filling ability, which are presented in Table 2 and Table 3. The
flow properties in both the concretes are within limits in
accordance to EFNARC (2005) guidelines.
5.2 Properties of hardened concrete
The hardened properties like compressive strength, split
tensile strength and flexural strength of HSSCC and
HSHFSCC are presented in Table 4 and Table 5 respectively.
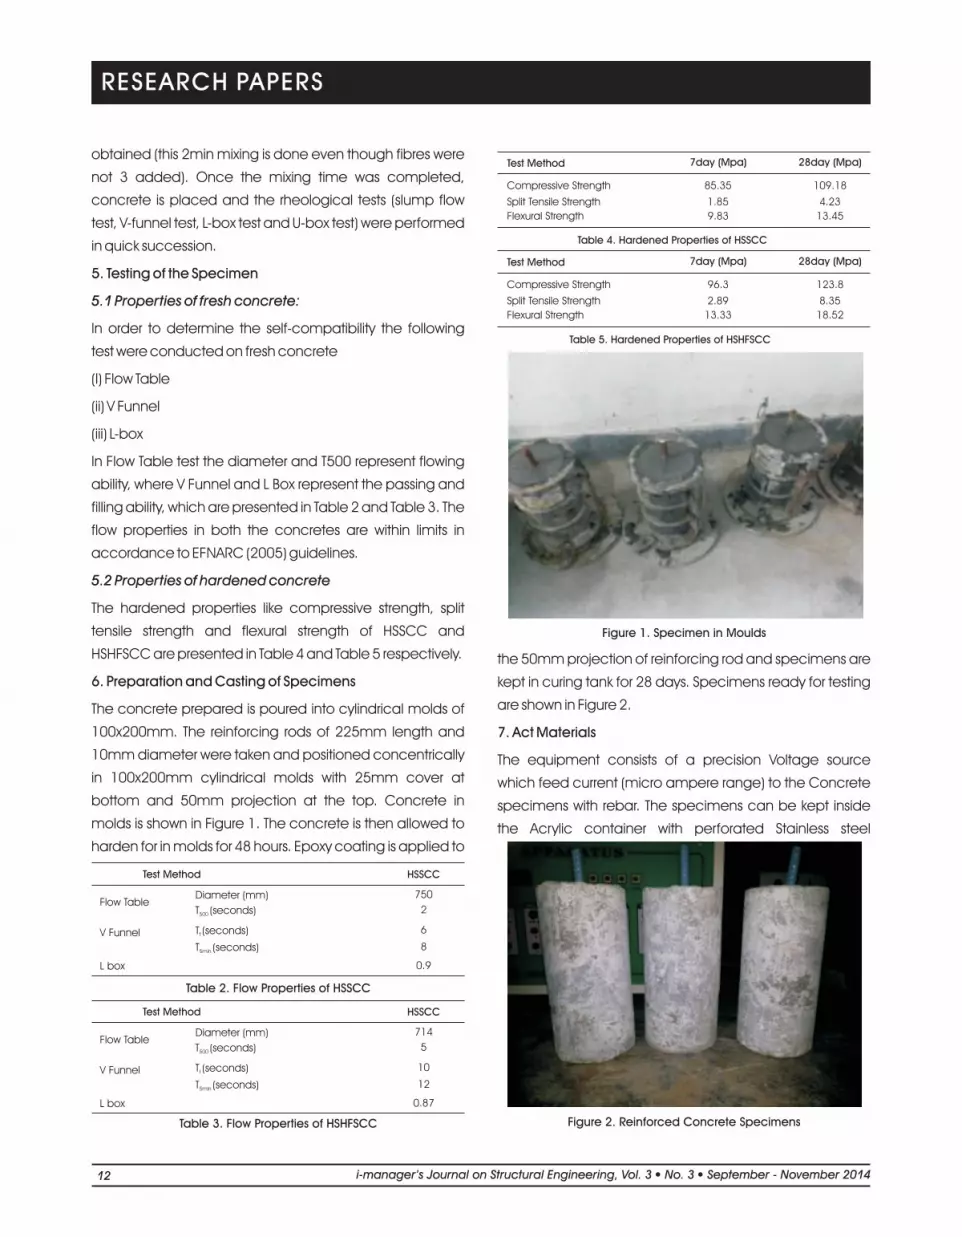
6. Preparation and Casting of Specimens
The concrete prepared is poured into cylindrical molds of
100x200mm. The reinforcing rods of 225mm length and
10mm diameter were taken and positioned concentrically
in 100x200mm cylindrical molds with 25mm cover at
bottom and 50mm projection at the top. Concrete in
molds is shown in Figure 1. The concrete is then allowed to
harden for in molds for 48 hours. Epoxy coating is applied to
the 50mm projection of reinforcing rod and specimens are
kept in curing tank for 28 days. Specimens ready for testing
are shown in Figure 2.
7. Act Materials
The equipment consists of a precision Voltage source
which feed current (micro ampere range) to the Concrete
specimens with rebar. The specimens can be kept inside
the Acrylic container with perforated Stainless steel
Table 2. Flow Properties of HSSCC
Table 3. Flow Properties of HSHFSCC
Table 4. Hardened Properties of HSSCC
Table 5. Hardened Properties of HSHFSCC
Figure 1. Specimen in Moulds
Test Method HSSCC
Flow TableDiameter (mm) 750
T (seconds)500 2
V Funnel T (seconds)f 6
T (seconds)5min 8
L box 0.9
Test Method HSSCC
Flow TableDiameter (mm) 714
T (seconds)500 5
V Funnel T (seconds)f 10
T (seconds)5min 12
L box 0.87
Test Method 7day (Mpa) 28day (Mpa)
Compressive Strength 85.35 109.18
Split Tensile Strength 1.85 4.23
Flexural Strength 9.83 13.45
Test Method 7day (Mpa) 28day (Mpa)
Compressive Strength 96.3 123.8
Split Tensile Strength 2.89 8.35
Flexural Strength 13.33 18.52
Figure 2. Reinforced Concrete Specimens
12 li-manager’s Journal on Structural Engineering Vol. No. 3 14l, 3 September - November 20
cathode of suitable diameter. NaCl solution is poured
inside the container for penetration into the concrete
specimen. Stable DC voltage is applied between the SS
cathode and the steel rod. The data acquisition monitors
the voltage and current of each concrete specimen. The
readings are acquired 4 for an interval of say 1 min (can be
settable by the user). The period of test can be set upto a
week. At the end of test the data can be transferred to a PC
which will provide all the readings. Graphical plot can be
done current with respect to time.
7.1 Assembly of ACT Equipment
·Power source- Eight channel Data Acquisition System
with PC interface (Figure 3).
·The time at which sudden raise of current will be noted
down for each cell
·LED display indicates the voltage applied to cells.
·Four line LCD display will indicate the current in each
cell.
·Logging period and the total test period can be set by
the user using the key switches
·The data are stored in the equipment.
·At the end of test a buzzer is activated. The data can
be transferred to the PC.
·Any time the stored data in the equipment can be
transferred to PC by pressing the INC continuously for
10 seconds.
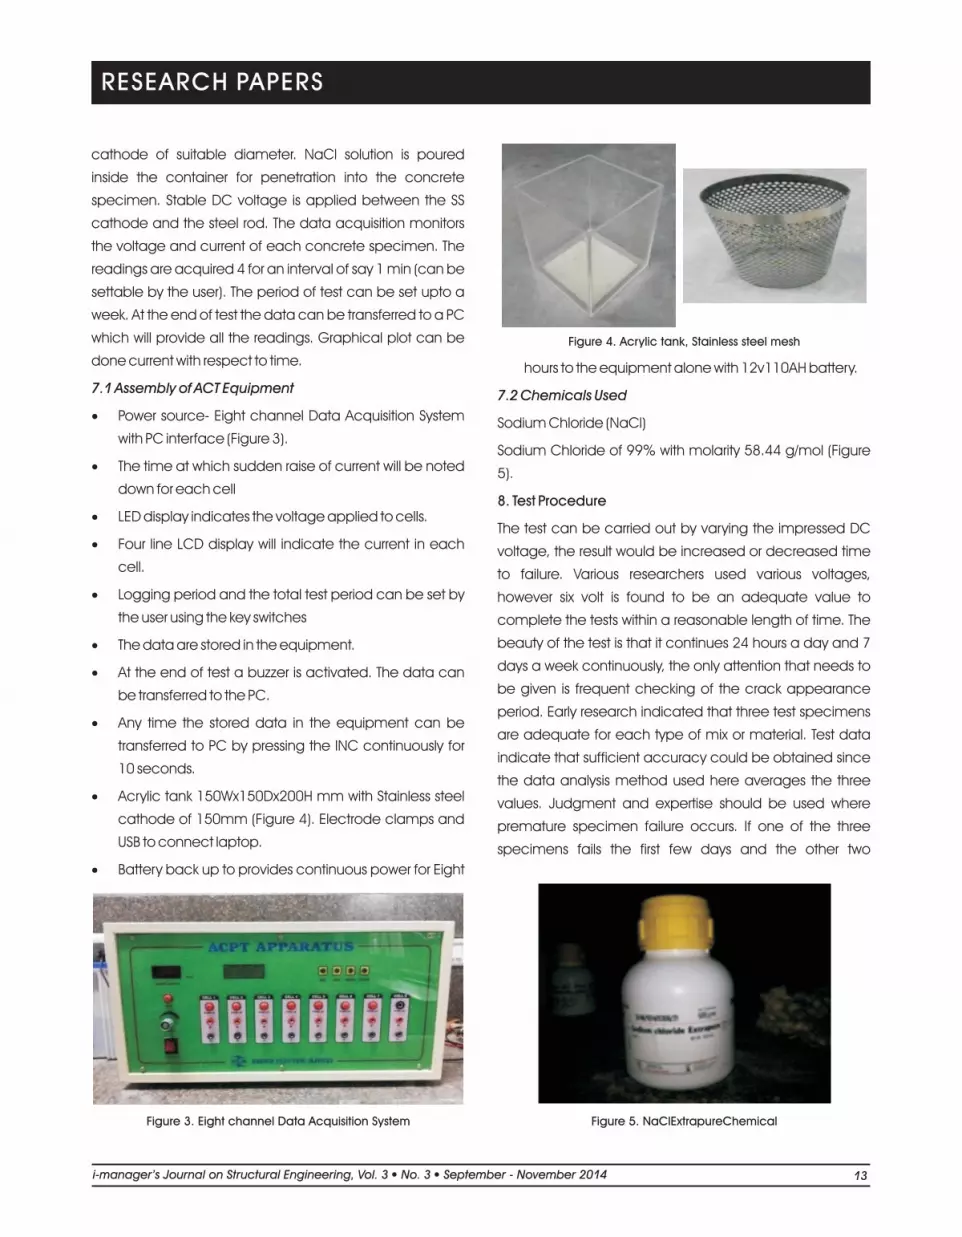
·Acrylic tank 150Wx150Dx200H mm with Stainless steel
cathode of 150mm (Figure 4). Electrode clamps and
USB to connect laptop.
·Battery back up to provides continuous power for Eight
hours to the equipment alone with 12v110AH battery.
7.2 Chemicals Used
Sodium Chloride (NaCl)
Sodium Chloride of 99% with molarity 58.44 g/mol (Figure
5).
8. Test Procedure
The test can be carried out by varying the impressed DC
voltage, the result would be increased or decreased time
to failure. Various researchers used various voltages,
however six volt is found to be an adequate value to
complete the tests within a reasonable length of time. The
beauty of the test is that it continues 24 hours a day and 7
days a week continuously, the only attention that needs to
be given is frequent checking of the crack appearance
period. Early research indicated that three test specimens
are adequate for each type of mix or material. Test data
indicate that sufficient accuracy could be obtained since
the data analysis method used here averages the three
values. Judgment and expertise should be used where
premature specimen failure occurs. If one of the three
specimens fails the first few days and the other two
RESEARCH PAPERS
Figure 3. Eight channel Data Acquisition System
Figure 4. Acrylic tank, Stainless steel mesh
Figure 5. NaClExtrapureChemical
13li-manager’s Journal on Structural Engineering Vol. No. 3 14l, 3 September - November 20

continue for a long period, the data from the prematurely
failed specimen should not be used. Visual inspection of
this one specimen will probably show improper preparation
of the specimen. Longer time-to-failure and higher
resistance are indicative of improvement over the
standard mix and the ability to better deter the intrusion of
chloride to the reinforcing steel. Preliminary research results
established that a continuation of testing to a point where
cracks became 0.79mm and larger caused pollution from
seepage of corrosion products into the water. For the
purpose of these tests various researchers used various
chloride concentrations, based on the exposure level the
concrete structure will be exposed when put on use.
8.1 Accelerated Corrosion Test Setup
A rapid corrosion testing technique was used to compare
the corrosion performance of plain and blended cement
concretes. Similar cells with some differences 5 were
reported by other researchers (Al-Tayyib AJ, Al-Zahrani MM,
1990). The setup for accelerated corrosion test (also known
as impressed voltage test) is as show below. It consists of a
DC power supply, two stainless steel plates, a data logger,
test specimen and the container containing 1.2 molarity of
NaCl solution. Concrete Cylinder specimens 100x200 mm
with a centrally embedded steel bar are used for the
accelerated corrosion test. The specimens are tested at
the required age after preparation. The steel bar (anode/
working electrode) of the cylinder specimen is connected
to the positive terminal and the stainless steel plates
(cathode/ counter electrode) are connected to the
negative terminal of the DC power source.
The corrosion process is initiated by applying a constant
voltage to the system. The current response is continuously
monitored and recorded by the data logger. In addition
the specimens are daily inspected visually for the onset of
cracks.
The data logger is set at a sampling frequency of 24 hours
for recording the corrosion current of the circuit. The
accelerated corrosion test is terminated after cracking of
the specimen when the rate of increase of corrosion
current with time was negligible.
8.2 Data Analysis
An important fact of this test is definition of specimen failure.
In all cases test is considered to commence at the time of
application of the impressed current. Specimen failure is
defined as that time corresponding to onset of a large
current increase. The example in Figure 6 and Figure 7
illustrates schematically the generalized nature of current
variations in the constant voltage test method. Initially it can
be seen that some relatively small amplitude variations are
encountered; but after that at later stage a large increase
in current occurs. It is considered that this corresponds to
growth of a crack within the concrete and to a
corresponding decrease in electrical resistance. Crack
growth is sub sequent incremental and is comprised of
RESEARCH PAPERS
Figure 6. Schematic Test Setup for Accelerated Corrosion Test
Figure 7. Test Setup for Accelerated Corrosion Test with 6-concrete specimens
14 li-manager’s Journal on Structural Engineering Vol. No. 3 14l, 3 September - November 20
successive stages of propagation, which relieves tensile
stresses, and arrestment, which gives rise to additional solid
corrosion products accumulation.
9. Precaution
In this test, the specimen is accompanied in some
instances by development of an aqueous solution on top
of the specimen surface as shown in Figure 8. The pH of the
top liquid has been found to be approximately 1.9,
presumably due to hydrolysis of initial corrosion products.
Because of this and also because of the relatively low
electrical resistance of the top liquid, corrosion can occur
pre-ferentially at this location. Occurrence of this can lead
to erroneous conclusions. In order to permit this liquid to
drain away from the reinforcing steel, the specimen
preparation procedure specifies a 100 slope to the top
surface.
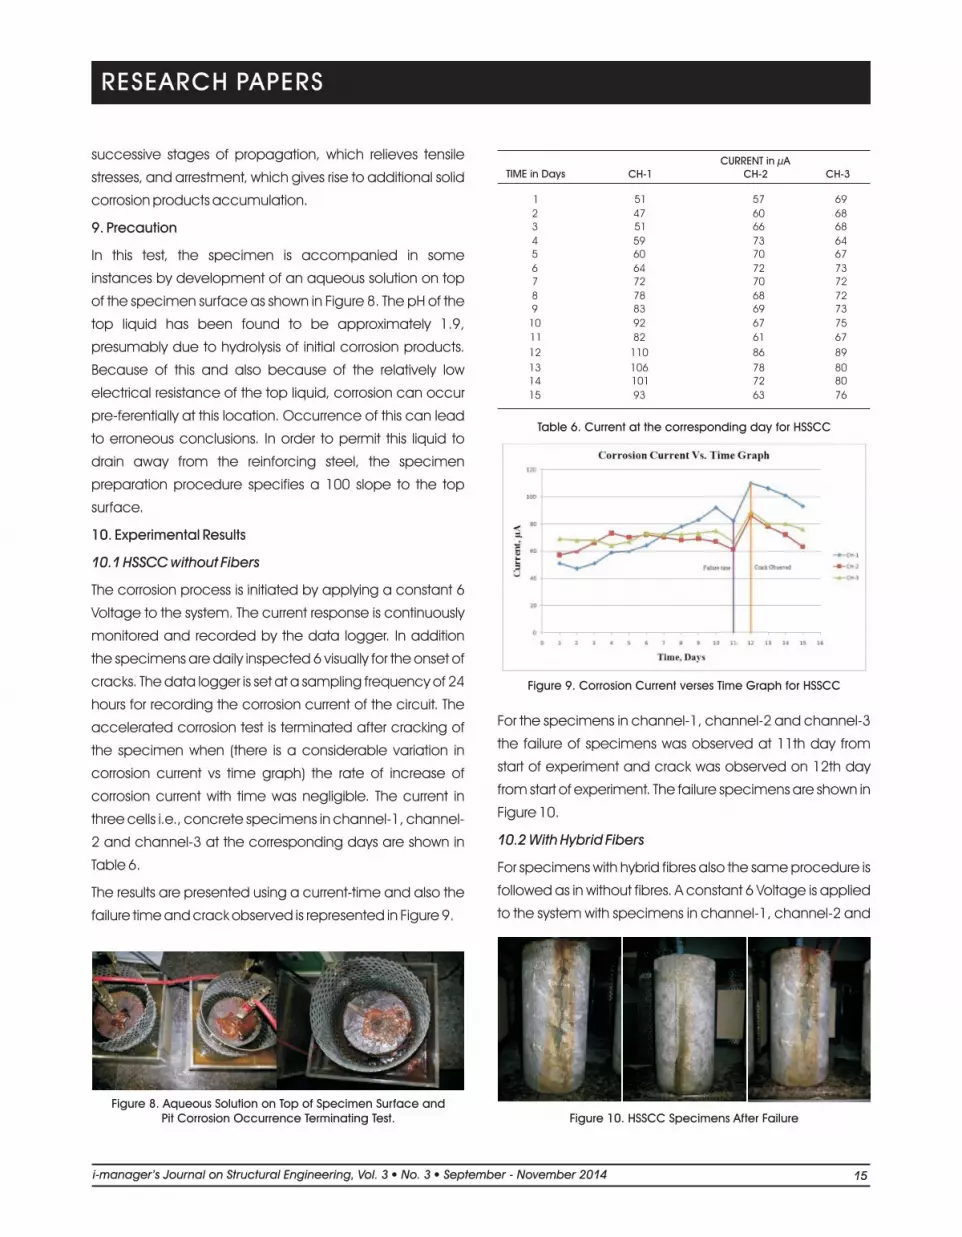
10. Experimental Results
10.1 HSSCC without Fibers
The corrosion process is initiated by applying a constant 6
Voltage to the system. The current response is continuously
monitored and recorded by the data logger. In addition
the specimens are daily inspected 6 visually for the onset of
cracks. The data logger is set at a sampling frequency of 24
hours for recording the corrosion current of the circuit. The
accelerated corrosion test is terminated after cracking of
the specimen when (there is a considerable variation in
corrosion current vs time graph) the rate of increase of
corrosion current with time was negligible. The current in
three cells i.e., concrete specimens in channel-1, channel-
2 and channel-3 at the corresponding days are shown in
Table 6.
The results are presented using a current-time and also the
failure time and crack observed is represented in Figure 9.
For the specimens in channel-1, channel-2 and channel-3
the failure of specimens was observed at 11th day from
start of experiment and crack was observed on 12th day
from start of experiment. The failure specimens are shown in
Figure 10.
10.2 With Hybrid Fibers
For specimens with hybrid fibres also the same procedure is
followed as in without fibres. A constant 6 Voltage is applied
to the system with specimens in channel-1, channel-2 and
RESEARCH PAPERS
Figure 8. Aqueous Solution on Top of Specimen Surface and Pit Corrosion Occurrence Terminating Test.
Table 6. Current at the corresponding day for HSSCC
Figure 9. Corrosion Current verses Time Graph for HSSCC
TIME in DaysCURRENT in µA
CH-1 CH-2 CH-3
1 51 57 69
2 47 60 68 3 51 66 68
4 59 73 64 5 60 70 67
6 64 72 73 7 72 70 72
8 78 68 72 9 83 69 73
10 92 67 75
11 82 61 67
12 110 86 89
13 106 78 80 14 101 72 80
15 93 63 76
Figure 10. HSSCC Specimens After Failure
15li-manager’s Journal on Structural Engineering Vol. No. 3 14l, 3 September - November 20
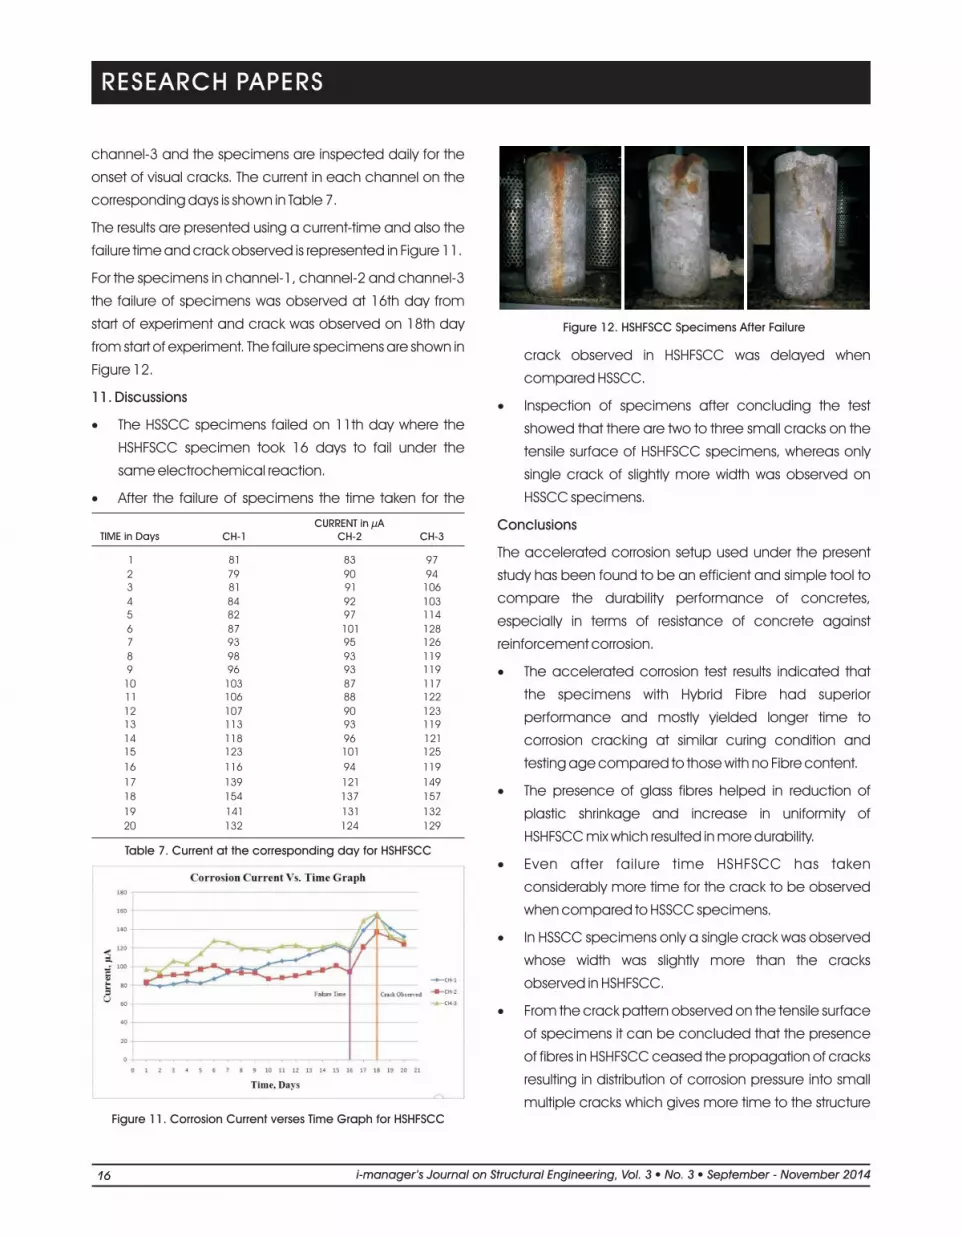
channel-3 and the specimens are inspected daily for the
onset of visual cracks. The current in each channel on the
corresponding days is shown in Table 7.
The results are presented using a current-time and also the
failure time and crack observed is represented in Figure 11.
For the specimens in channel-1, channel-2 and channel-3
the failure of specimens was observed at 16th day from
start of experiment and crack was observed on 18th day
from start of experiment. The failure specimens are shown in
Figure 12.
11. Discussions
·The HSSCC specimens failed on 11th day where the
HSHFSCC specimen took 16 days to fail under the
same electrochemical reaction.
·After the failure of specimens the time taken for the
crack observed in HSHFSCC was delayed when
compared HSSCC.
·Inspection of specimens after concluding the test
showed that there are two to three small cracks on the
tensile surface of HSHFSCC specimens, whereas only
single crack of slightly more width was observed on
HSSCC specimens.
Conclusions
The accelerated corrosion setup used under the present
study has been found to be an efficient and simple tool to
compare the durability performance of concretes,
especially in terms of resistance of concrete against
reinforcement corrosion.
·The accelerated corrosion test results indicated that
the specimens with Hybrid Fibre had superior
performance and mostly yielded longer time to
corrosion cracking at similar curing condition and
testing age compared to those with no Fibre content.
·The presence of glass fibres helped in reduction of
plastic shrinkage and increase in uniformity of
HSHFSCC mix which resulted in more durability.
·Even after failure time HSHFSCC has taken
considerably more time for the crack to be observed
when compared to HSSCC specimens.
·In HSSCC specimens only a single crack was observed
whose width was slightly more than the cracks
observed in HSHFSCC.
·From the crack pattern observed on the tensile surface
of specimens it can be concluded that the presence
of fibres in HSHFSCC ceased the propagation of cracks
resulting in distribution of corrosion pressure into small
multiple cracks which gives more time to the structure
RESEARCH PAPERS
Table 7. Current at the corresponding day for HSHFSCC
Figure 11. Corrosion Current verses Time Graph for HSHFSCC
Figure 12. HSHFSCC Specimens After Failure
TIME in DaysCURRENT in µA
CH-1 CH-2 CH-3
1 81 83 97
2 79 90 94 3 81 91 106
4 84 92 103 5 82 97 114
6 87 101 128 7 93 95 126
8 98 93 119 9 96 93 119
10 103 87 117 11 106 88 122
12 107 90 123 13 113 93 119
14 118 96 121 15 123 101 125
16 116 94 119
17 139 121 149
18 154 137 157
19 141 131 132
20 132 124 129
16 li-manager’s Journal on Structural Engineering Vol. No. 3 14l, 3 September - November 20
before failure.
Recommendation
In view of the assured self-compatibility property and
improved corrosion resistance capacity of HSHFSCC this
concrete can be adopted for structural applications,
especially where there is heavy congestion of
reinforcement in RC structures and for prestressed
structures.
References
[1]. Wallbank EJ. (1989). "The performance of concrete in
bridges: a survey of 200 highway bridges". London: HMSO.
[2]. Rosenberg A, Hanson CM, Andrade C. (1989).
"Mechanisms of corrosion of steel in concrete". In: Skalny J,
editor. Material Science of Concrete. Westerville, Ohio:
American Ceramic Society, pp. 285–313.
[3]. Tuutti K. (1982). "Corrosion of Steel in Concrete".
Stochholm: Swedish Cement and Concrete Research
Institute.
[4]. Haynes G. et.al (1992). "Review of laboratory corrosion
tests and standards". In: Baobian R, Dean SW, editors.
Corrosion Testing and Evaluation: Silver Anniversary Volume,
ASTM STP 1000. Philadelphia: American Society for Testing
and Materials, pp.281–8.
[5]. Fasullo EJ. (1992). "Infrastructure: the battlefield of
corrosion". In: Chaker V, editor. Corrosion forms and control
for infrastructure. ASTM STP 1137. Philadelphia: American
Society for Testing and Materials, pp. 1–16.
[6]. McCuen RH, Albrecht P, Cheng J. (1992). "New
approach to powermodel regression of corrosion
penetration data". In: ChakerV, editor. Corrosion forms and
control for infrastructure. ASTM STP 1137. Philadelphia:
American Society for Testing and Materials, pp. 46–76.
[7]. Rasheeduzzafar, Bader AM, Khan MM. (1992).
"Performance of corrosion resisting steel in chloride-bearing
concrete". ACI Mater J, Vol.89, No.5, pp.439–48.
[8]. Rober H. (1982). "Reinforcement for concrete structures
subject to fatigue". In: Proceedings of Symposium on
Fatigue of Steel and Concrete Structures, LABSE, AIPC, IVBH,
Lausanne, Switzerland, pp. 239–45.
[9]. Suzuki K, Ohno Y, Praparntanatorn S, Tamura H. (1990).
"Mechanism of steel corrosion in cracked concrete". In:
Proceedings of Third International Symposium on Corrosion
of Reinforcement in Concrete Construction, The Chemical
Industry Society, UK, pp. 19–28.
[10]. Beeby AW. (1981). "Cracking, cover and corrosion of
reinforcement". In: ACI Spring Convention, American
Concrete Institute, Dallas, Texas.
[11]. Gu P, Beaudoin JJ, Zhang MH, Malhotra VM.
"Performance of reinforcing steel in concrete containing
silica fume and blastfurnace slag ponded with sodium
chloride solution". ACI Mater J, Vol.97, No.3, pp.254–62.
[12]. Babaei K, Hawkins NM. (1992). "Performance of
rehabilitated/protected concrete bridge decks". In: Chaker
V, editor. Corrosion Forms and Concrete for Infrastructure.
ASTM STM 1137. 154: American Society for Testing and
Materials, pp. 140–54.
[13]. Rasheeduzzafar, Al-Saadoun SS, Al-Gahtani AS.
(1992). "Corrosion cracking in relation to bar diameter,
cover, and concrete quality". ASCE J Mater Civil Eng; Vol.4,
No.4, pp.327–42.
[14]. EFNARC, (2005). "Specifications and guidelines for self
compacting concrete", www.efnarc.org.
[15]. B.Narendra Kumar, Dr.P.Sinivasa Rao (2013).
"Development of Ultra High Strength Self Compacting Fiber
Reinforced Concrete with Quartz sand & Quartz powder"
NUiCONE- pp. 53.
[16]. B. Narendra Kumar, P. Srinivasa Rao, K.Rajesh (2013).
"Study On The Effect Of Quartz Sand And Hybrid Fibers On
The Properties Of Fresh And Hardened High Strength Self
Compacting Fiber Reinforced Concrete" i-manager's
Journal on Civil Engineering, Vol. 3, No. 4. pp. 22
[17]. P. Srinivasa Rao, Seshadri Sekhar.T and P.Sravana
(2009). "study the Effect of glass Fibres on the Durability
parameter of self compacting concrete" .
[18]. Al-Tayyib AJ, Al-Zahrani MM. "Corrosion of steel
reinforcement in polypropylene fiber reinforced concrete
structure". ACI Mater J, Vol.87, No.2, pp.108–13.
RESEARCH PAPERS
17li-manager’s Journal on Structural Engineering Vol. No. 3 14l, 3 September - November 20

RESEARCH PAPERS
ABOUT THE AUTHORS
Singh
Professor, Department of Civil Engineering, Jawaharl Nehru Technology University College of Engineering, Hyderabad, India. He
B.Narendra Kumar is currently working as an Associate Professor in Department of Civil Engineering, VNR Vignana Jyothi Institute of Engineering & Technology, Hyderabad. He received his B.Tech in Civil Engineering, M.Tech in Structural Engineering and is pursuing his PhD at JNTU, Hyderabad.His research interests are SCC, special concretes and concrete mix designs.
Dr.P.Srinivasa Rao is currently working as an specialized in Structural Engineering .Research interests are Concrete
Technology, Structural Design, High performance Concrete, Prefabricating Structures, Special Concretes and use of Micro Silica, Fly ash in Building Materials. He has been associates with a number of Designs projects, for Number of Organizations and involved as a key person in Quality Control and Mix Designs.He has guided three Ph.D s and 100 M.Tech projects .Guiding 15 Ph.D students and delivered invited lectures in other organizations and institutions.Member of ISTE, Member of ICI and Member of Institute of Engineers.
K. Rajesh is currently pursuing his M. Tech. degree (Structural Engineering) in the Department of Civil Engineering, VNR Vignana Jyothi Institute of Engineering & Technology, Hyderabad.
R.Krishneswar currently pursuing his B. Tech. degree in the department of Civil Engineering, VNR Vignana Jyothi Institute of Engineering & Technology, Hyderabad.
18 li-manager’s Journal on Structural Engineering Vol. No. 3 14l, 3 September - November 20