the relative importance of cattle grazing in subtropical grasslands: does it reduce or enhance plant...
TRANSCRIPT

Journal of Applied Ecology
2003
40
, 445–457
© 2003 British Ecological Society
Blackwell Publishing Ltd.
The relative importance of cattle grazing in subtropical grasslands: does it reduce or enhance plant biodiversity?
S. MCINTYRE, K. M. HEARD and T. G. MARTIN
CSIRO Sustainable Ecosystems, 120 Meiers Road, Indooroopilly, Queensland 4068, Australia
Summary
1.
Livestock grazing enterprises have potentially threatening effects on the conserva-tion of plants in grassy subtropical eucalypt woodlands. Commercial levels of grazingcould cause local extinctions of sensitive native species and/or reductions in abundanceand species richness in native pastures.
2.
We studied the nature of grazing impacts on the diversity and composition ofherbaceous plants and used a natural experiment to analyse the effects of disturbances(cattle grazing, soil disturbance, water enrichment) and environment (lithology, slopeposition, presence of trees) on plant community composition in eastern Australia. Wesampled pastures and reserves at 191 sites over an area of 3000 ha.
3.
Canonical correspondence analysis (CCA) was used to explore the relative import-ance of disturbance and environment in accounting for floristic variation and to examineindividual species responses. From individual responses, we identified seven responsegroups relating to grazing. The factors analysed explained small but significant amountsof floristic variation, and there were interactions between soil disturbance, water enrich-ment and grazing.
4.
We explored the hypothesis that grazing increased species density at small scales butdecreased it at landscape scales, due to the elimination of grazing-sensitive species. Ourdata did not support the hypothesis, as there were similar numbers of species thatincrease with grazing (increasers) and species that decline with increasing grazing(decreasers) in the assemblage. However, there were more native decreasers and moreexotic increasers in the assemblage.
5.
Synthesis and applications.
For land managers to retain plant diversity on grazedlandscapes, it would be desirable to provide all levels of grazing pressure across thelandscape, including areas protected from livestock grazing. This would apply to allplant communities where both grazing increasers and decreasers are present. Extensiveareas supporting grassland with a tall tussock structure that is selectively grazed are mostimportant, as all plant response groups have some representation and ecosystemfunction is retained under moderate grazing. In terms of regional conservation planning,the protection and enlargement of areas protected from livestock grazing is important inthe study area, as these occur on only about 4% of the landscape and are threatened byon-going disturbances and land-use intensification.
Key-words
:
canonical correspondence analysis, conservation, disturbance, grassland,lithology, slope position, woodland.
Journal of Applied Ecology
(2003)
40
, 445–457
Introduction
The way in which grazing affects the diversity of grass-lands is a question encompassing the full complexity of
ecosystem dynamics. As Olff & Ritchie (1998) suggest,the question for researchers is no longer ‘do herbivoreshave an effect?’ but ‘why do effects differ?’. The effectsof herbivory on grassland diversity is influenced bythe type of herbivore, the intensity of defoliationand the environment. Compared with insects and smallmammals, large grazers such as livestock are cons-idered to have relatively consistent effects (Olff & Ritchie
Correspondence: S. McIntyre, CSIRO Sustainable Ecosystems,GPO Box 284, Canberra City, ACT 2911, Australia (fax +61262421555; e-mail [email protected]).

446
S. McIntyre, K. M. Heard & T. G. Martin
© 2003 British Ecological Society,
Journal of Applied Ecology
,
40
,445–457
1998), with diversity increasing at moderate levelsof grazing and decreasing under heavy non-selectivedefoliation. This pattern was hypothesized by Milchunas,Sala & Lauenroth (1988) only for subhumid environ-ments, while semi-arid grasslands were predicted toshow little or no diversity increase under intermediategrazing by large generalist herbivores. A subsequentreview of the (predominantly) North American litera-ture broadly supported the idea that floristic change inresponse to grazing is least in low productivity grass-lands (Milchunas & Lauenroth 1993). However, theAustralian and African data available do not comfort-ably conform to this model (Landsberg, O’Connor &Freudenberger 1999).
Relative to some other parts of the world, Australiahas an evolutionary history of light grazing (Landsberg,O’Connor & Freudenberger 1999) and, according toMilchunas, Sala & Lauenroth (1988), with this history,diversity in subhumid grasslands (625–1000 mmrainfall) should increase sharply from no grazing tovery light grazing, and decline progressively as grazingmoves from very light to intense. There are two sourcesof confusion in interpreting data in relation to thishypothesis. First, there are no standardized measuresof grazing that are comparable across all studies and,given that most studies only observe a segment of apotential grazing gradient, it can be difficult to aligndifferent results. Secondly, there is the issue of histor-ical filtering of the regional or local species assemblage.Management of a study area in the previous decades orcenturies may have eliminated certain response groups,affecting the potential floristic changes. For example, ifa stocking rate experiment is conducted in an area witha history of heavy grazing, the grazing-sensitive speciesmay have been eliminated from the plant assemblage,thus affecting the floristic response to grazing. Althoughthis issue has been recognized elsewhere (Denslow 1980;Armesto & Pickett 1985; Chaneton & Facelli 1991) ithas not been well integrated into generalizations aboutgrazing and diversity response.
In Australia, one way to ensure that the fullest pos-sible species assemblage is present in natural experi-ments is to include sites that are known to have hadlittle or no livestock grazing since European coloniza-tion. Studies in which non-grazed subhumid grass-lands have been compared with similar vegetation thathas been moderately stocked with sheep or cattle havegenerally shown native species density to be similar(Stuwe & Parsons 1977; McIntyre & Lavorel 1994a;Fensham 1998; Fensham & Skull 1999; Fensham,Holman & Cox 1999; McIntyre & Martin 2001), anexception being Prober & Thiele (1995).
There are fewer observations of non-selective live-stock grazing and responses that are reported includeno change (Fensham 1998; McIntyre & Martin 2001),declines (McIntyre & Lavorel 1994a; Fensham 1998;McIntyre & Martin 2001) and increases (McIvor 1998;McIntyre & Lavorel 2001) in species density withincreasing grazing. Some of the inconsistency may
result from scale effects. Olff & Ritchie (1998) predictedungrazed grasslands to have greater species density atlarge spatial scales and grazed grasslands to havegreater species density at smaller scales, due to the lossof grazing-sensitive species from the species pool in thegrazed grasslands. Data from Flooding Pampa grass-land support this (Chaneton & Facelli 1991).
This paper presents the results of a regional surveyanalysing the effects of grazing on the floristic compo-sition of the grassland layer in subhumid, subtropicalwoodlands. Specifically we asked the following. (i)How important is livestock grazing compared with theinfluence of local biophysical variables on grasslandcomposition? (ii) Is the effect of livestock grazing onplant diversity at the patch scale different to the effectof grazing at the landscape scale? (iii) How do the grazingresponses of grassland plants determine the distributionof the regional species pool across the landscape? (iv) Islivestock grazing a threatening process for the sub-tropical grassland flora in Australia?
Methods
The survey occurred within the south-east QueenslandBioregion (Sattler & Williams 1999), Australia, within27–28
°
S and 151–153
°
E, over an elevation range of400–500 m a.s.l. The climate is subtropical, with 850mm rainfall (subhumid using the Milchunas, Sala &Lauenroth 1988 criterion) and most plant growth inthe summer months. Grassy eucalypt woodland is thedominant vegetation type with the most abundanteucalypts being
Eucalyptus crebra
,
E. melanophloia
and
E. tereticornis
. Plant names and information on speciesorigin used in this study followed Henderson (1997)but, where necessary, names were updated using infor-mation from the Queensland Herbarium (BRI). Thelandscape is undulating and dissected with intermit-tent and permanent streams. The alteration state of thelandscape is variegated (
sensu
McIntyre & Hobbs1999), with cattle grazing of the natural grasslands themajor land use. The density of trees has been modifiedthrough ringbarking and stem injection with herbicides.Intensive uses (crops and sown pastures) are limited tofertile soils.
The survey was conducted between December 1997and March 1999 during the active growing season.Sampling was focused on three grazing properties andadjacent habitats covering 3000 ha in area, with aspatial distribution of 152 km
2
. The habitats sampledincluded native pastures, road verges and travellingstock routes (linear reserves created for the movementof livestock before the availability of road transport).The physical condition of the sward and knowledge ofland use and history were used to assess three categories

447
Plant diversity and cattle grazing
© 2003 British Ecological Society,
Journal of Applied Ecology
,
40
,445–457
of grazing intensity, described in Table 1. The medium(Gm) and high (Gh) grazing categories represent theextremes of low and high defoliation that occurredwithin the pastures. The sward structure of the graz-ing treatments was quantified using a vertical pointquadrat, the design based on Kent & Coker (1992).The swards associated with the highest level of grazing(Gh) were structurally distinct from the others. Thesegrazing ‘lawns’ could be dominated by stoloniferousor tussock grasses, but were not structurally differ-entiated on this basis (Fig. 1). Short patches had less totalbiomass, and that biomass was largely within 5 cm ofthe ground. Tall patches had more biomass close to theground than short patches, but substantial biomassalso extended to around 30 cm above the ground. Themedium (Gm) grazed and low (Gl) (lightly) grazed siteswere structurally similar and land-use information wasused to differentiate them.
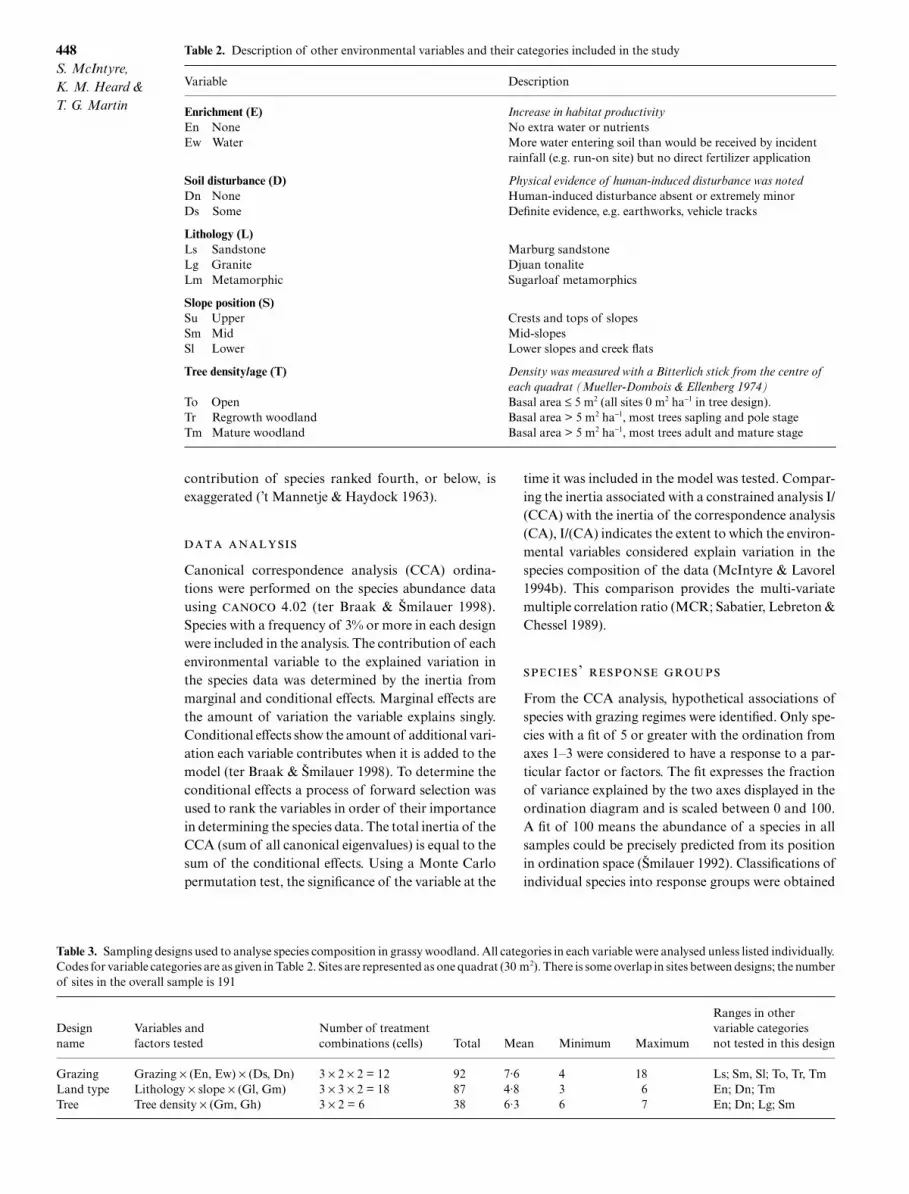
In addition to grazing, soil disturbance, soil enrich-ment, lithology, slope position and tree density wereincluded as variables in the study (Table 2). Threebalanced designs were used to explore the effects of
grazing, although two of them (‘land type’ and ‘tree’)covered only two of the three levels of grazing, beingprimarily designed to explore the effects of lithology,slope position and tree density (Table 3). The fact thatdata were not sampled as one fully factorial design ispartly because not all combinations of categories werepresent on the landscape. The restriction for thesevariables was that Gl sites were generally not clearedof trees.
At each site, data were obtained from one 5
×
6-mquadrat, placed in locations representative of thedisturbance level and environment being sampled atthat particular site. In each quadrat, all ground layerspecies were recorded as present, including shrubs (witha potential growth height less than 1 m). In addition,the three most abundant plant species occurring in thetransect were ranked in order of dominance in terms ofbiomass. Abundance was scored as 1 = present (but notdominant), 2 = third most abundant, 3 = second mostabundant, and 4 = most abundant species. This scoringmethod is the equivalent of an arc sine, square-roottransformation of relative biomass, although the
Table 1. Description of the three categories representing levels of cattle grazing reported in the study. There was a limited amountof herbivory by insects and native macropods common to all treatments. Structural attributes of typical swards sampled aredescribed in Fig. 1
Grazing category (code) Description
Low (Gl) Roadsides and linear reserves used for moving livestock before road transport. This land use is indicative of a history of infrequent livestock grazing since European colonization. Characterized by bouts of potentially heavy utilization during droughts but mostly ungrazed.
Gm and Gh were sampled from within fenced pastures. These areas are generally set stocked and have been commercially grazed over a period of at least 100 years.
Medium (Gm) Large tussock structure present, indicating selective grazing by cattle. Some closely grazed patches within these swards but limited to < 1 m in diameter.
High (Gh) Closely cropped areas, indicating non-selective grazing by cattle. Only areas that were uniformlygrazed were sampled.
Fig. 1. Vertical stratification of biomass in the three cattle grazing treatments sampled in native grasslands. Bars (± SE) representaverage number of interceptions with vegetation and litter (36 pin hits × 25 quadrats × 2 sites) for each height category. See Table 1for definitions of Gh, Gm and Gl.
448
S. McIntyre, K. M. Heard & T. G. Martin
© 2003 British Ecological Society,
Journal of Applied Ecology
,
40
,445–457
contribution of species ranked fourth, or below, isexaggerated (’t Mannetje & Haydock 1963).
Canonical correspondence analysis (CCA) ordina-tions were performed on the species abundance datausing
4.02 (ter Braak &
S
milauer 1998).Species with a frequency of 3% or more in each designwere included in the analysis. The contribution of eachenvironmental variable to the explained variation inthe species data was determined by the inertia frommarginal and conditional effects. Marginal effects arethe amount of variation the variable explains singly.Conditional effects show the amount of additional vari-ation each variable contributes when it is added to themodel (ter Braak &
S
milauer 1998). To determine theconditional effects a process of forward selection wasused to rank the variables in order of their importancein determining the species data. The total inertia of theCCA (sum of all canonical eigenvalues) is equal to thesum of the conditional effects. Using a Monte Carlopermutation test, the significance of the variable at the
time it was included in the model was tested. Compar-ing the inertia associated with a constrained analysis I/(CCA) with the inertia of the correspondence analysis(CA), I/(CA) indicates the extent to which the environ-mental variables considered explain variation in thespecies composition of the data (McIntyre & Lavorel1994b). This comparison provides the multi-variatemultiple correlation ratio (MCR; Sabatier, Lebreton &Chessel 1989).
’
From the CCA analysis, hypothetical associations ofspecies with grazing regimes were identified. Only spe-cies with a fit of 5 or greater with the ordination fromaxes 1–3 were considered to have a response to a par-ticular factor or factors. The fit expresses the fractionof variance explained by the two axes displayed in theordination diagram and is scaled between 0 and 100.A fit of 100 means the abundance of a species in allsamples could be precisely predicted from its positionin ordination space (
S
milauer 1992). Classifications ofindividual species into response groups were obtained
Table 2. Description of other environmental variables and their categories included in the study
Variable Description
Enrichment (E) Increase in habitat productivityEn None No extra water or nutrientsEw Water More water entering soil than would be received by incident
rainfall (e.g. run-on site) but no direct fertilizer application
Soil disturbance (D) Physical evidence of human-induced disturbance was notedDn None Human-induced disturbance absent or extremely minorDs Some Definite evidence, e.g. earthworks, vehicle tracks
Lithology (L)Ls Sandstone Marburg sandstoneLg Granite Djuan tonaliteLm Metamorphic Sugarloaf metamorphics
Slope position (S)Su Upper Crests and tops of slopesSm Mid Mid-slopesSl Lower Lower slopes and creek flats
Tree density/age (T) Density was measured with a Bitterlich stick from the centre of each quadrat (Mueller-Dombois & Ellenberg 1974)
To Open Basal area ≤ 5 m2 (all sites 0 m2 ha−1 in tree design).Tr Regrowth woodland Basal area > 5 m2 ha−1, most trees sapling and pole stageTm Mature woodland Basal area > 5 m2 ha−1, most trees adult and mature stage
Table 3.
Sampling designs used to analyse species composition in grassy woodland. All categories in each variable were analysed unless listed individually.Codes for variable categories are as given in Table 2. Sites are represented as one quadrat (30 m
2
). There is some overlap in sites between designs; the numberof sites in the overall sample is 191
Design name
Variables and factors tested
Number of treatmentcombinations (cells) Total Mean Minimum Maximum
Ranges in other variable categories not tested in this design
Grazing Grazing
×
(En, Ew)
×
(Ds, Dn) 3
×
2
×
2 = 12 92 7·6 4 18 Ls; Sm, Sl; To, Tr, TmLand type Lithology
×
slope
×
(Gl, Gm) 3
×
3
×
2 = 18 87 4·8 3 6 En; Dn; TmTree Tree density
×
(Gm, Gh) 3
×
2 = 6 38 6·3 6 7 En; Dn; Lg; Sm

449
Plant diversity and cattle grazing
© 2003 British Ecological Society,
Journal of Applied Ecology
,
40
,445–457
by synthesizing the results of each of the three designssubjectively, with examination of species abundancesto confirm the classifications and taking interactionswith other variables into account. Each species re-corded in the overall sample was allocated to one ofseven response groups defined (see Table 1 for codes).(i) Grazing increasers: species increasing in abundancebetween both Gl and Gm, and between Gm and Gh,i.e. a continuous positive response to higher grazing.(ii) Low grazing intolerants: species with no differencebetween Gh and Gm but decreasing in abundancebetween Gm and Gl. (iii) Grazing decreasers: speciesdecreasing in abundance between both Gl and Gm,and between Gm and Gh, i.e. the higher the grazing,the lower the abundance of the species. (iv) Highgrazing intolerants: species with no difference betweenGl and Gm but decreasing in abundance betweenGm and Gh. (v) Intermediates: species with maximumabundance at Gm. (vi) Grazing generalists: no grazingpreference detected (fit < 5 in all ordinations). (vii)Unclassifiable: unable to determine grazing preferencedue, in most cases, to species being too low frequency tobe included in the analyses. There were also cases wherethe results were not interpretable due to conflicting
responses, or the response could be determined for onlypart of the grazing gradient.
Results
’
The cumulative number of species encountered inthe three grazing categories in the ‘grazing’ designsites is shown in Fig. 2. Low grazing (27 sites) andhigh grazing (30 sites) had similar total numbers ofspecies recorded, while medium grazing (35 sites)had the highest number of species at around 30 sites.Although all samples had exceeded the phase of rapidspecies accumulation, new species were still beingencountered.
:
‘
’
The ‘grazing’ design tested all three levels of grazing (Gl,Gm, Gh) with two levels of soil disturbance (Dn, Ds)and enrichment (En, Ew) (Table 3). Overall thesevariables accounted for 16·8% of the variance in thedata (Table 4). An additional 5·4% was accounted
Table 4. Canonical correspondence analysis of the grazing design. The relative contribution of significant (P ≤ 0·05) factors inexplaining intersite variability is proportional to the inertia values. The inertia from the conditional effects is used to derive themulti-variate correlation ratio (MCR), which represents the proportion of variation explained by the individual disturbancefactors. The sum of all unconstrained eigenvalues = 5·147
Factors (see Tables 1 & 2 for codes) Inertia marginal effects Inertia conditional effects P-value MCR (%) per factor
Gl × Dn 0·23 0·23 0·005 4·5Dn × En 0·20 0·16 0·005 3·1Grazing, low (Gl) 0·22 0·14 0·005 2·7Gm × Dn 0·12 0·11 0·005 2·1Disturbance, none (Dn) 0·18 0·08 0·025 1·6Gh × Ds × En 0·12 0·08 0·045 1·6Gl × En 0·21 0·06 0·05 1·2Disturbance, some (Ds) 0·18 – – –Enrichment, none (En) 0·14 – – –Enrichment, water (Ew) 0·14 – – –Grazing, medium (Gm) 0·09 – – –Grazing, high (Gh) 0·07 – – –Total 16·8%
Fig. 2. Species accumulation curves for three categories of grazing (from the ‘grazing’ design). Each quadrat of 30 m2 represents a site.

450
S. McIntyre, K. M. Heard & T. G. Martin
© 2003 British Ecological Society,
Journal of Applied Ecology
,
40
,445–457
for by variables that were not significant under theMonte Carlo permutation test (
P
> 0·05). Individuallythe interaction term Gl
×
Dn explained the most vari-ation (inertia = 0·23; MCR = 4·5%,
P
= 0·005). Fourother interactions accounted for the majority of theexplained variation (Table 4). Monte Carlo permuta-tion analyses using 199 permutations showed thatoverall the analysis, and the first two axes, were signi-ficant (CCA,
P
= 0·005; axis 1,
P
= 0·005; axis 2,
P
=0·01; axis 3,
P
= 0·06).In the ordination, the major split on the first axis was
between the non-disturbed (Dn), non-enriched sites(En), low/medium grazed (Gl/Gm) sites at one end andthe disturbed (Ds), high grazed sites (Gh) at the oppos-ing end (Fig. 3). The second axis separated the mediumgrazed from the low grazed sites within the group thatwas undisturbed and unenriched.
In order to determine the effect of grazing, takinginto account the effects of soil disturbance and enrich-ment, we performed an additional partial analysis notincluding the interaction terms, with soil disturbanceand enrichment as covariables. In the full analysis(Table 4), low grazing accounted for more of thevariation than either high or medium grazing. But oncethe effects of soil disturbance and enrichment were ac-counted for (partial analysis), medium grazing becamethe most important explanatory variable (inertia = 0·08;MCR = 1·6%). Grazing alone explained the least amountof variation (MCR = 2·4). Most of the variation ex-plained (5·7%) by the partial model was shared by bothgrazing and soil disturbance. This was not surprisinggiven that interaction terms between grazing and soildisturbance were significant contributors to the model.
:
‘
’
Within the ‘land type’ design the two lower levels ofgrazing (Gl, Gm) were investigated across three land
types (Ls, Lg, Lm) and three slope positions (Sl, Sm,Su) under conditions of no soil disturbance or enrich-ment (Dn, En) (Table 3). The variables in this designexplained 13·4% of the variation in the species data. Afurther 9·6% was explained by variables that were notsignificant under the Monte Carlo permutation test(
P
> 0·05).In the ordination, the first axis separated the low
grazed sites (Gl) from medium grazed sites (Gm), andthe second axis showed a clear separation of sandstoneland types from both metamorphic and granite (Fig. 4).On the third axis metamorphic and granite sites weresegregated (data not presented). Slope position onlyseparated on the fourth axis, with lower slope positionssplitting from mid and upper slope positions; however,this axis was not significant (CCA,
P
= 0·005; axis 1,
P
= 0·005; axis 2,
P
= 0·005; axis 3,
P
= 0·005; axis 4,
P
=0·18). Upper slope did make a significant contributionto the model (Table 5).
Both low grazing and sandstone accounted for mostof the variation explained by the model, with a significantinteraction between the two (Table 5). We partitionedthe variance between the variables (not including theinteraction terms) to determine the relative contributionof each variable. Of the total 12·6% variation explainedby the CCA, lithology (L) accounted for 6·1%, grazing(G) 4·1% and slope position (S) 2·3%. The remainingvariation (0·1%) was shared between the variables witha residual (unexplained variation) of 86·5%.
:
‘
’
The ‘tree’ design tested the two higher levels of grazing(Gm, Gh) with three levels of tree density/age (Tm, Tr,To) (Table 3) in the context of no soil disturbance or
Fig. 3. Ordination for the ‘grazing’ design showing the first twoaxes of the CCA. Length of the vectors indicate the strength ofthe correlation between categories of factors and the CCAaxes. Factors are G = grazing (l = low, m = medium, h = high),D = soil disturbance and E = water enrichment (n = none, s =some). Details of these variables are in Table 2.
Fig. 4. Ordination for the ‘land type’ design showing the firsttwo axes of the CCA. Length of the vectors indicate thestrength of the correlation between categories of factors andthe CCA axes. Factors are G = grazing (l = low, m = medium),L = lithology (s = sandstone, g = granite, m = metamorphic)and S = slope position (u = upper slope, m = mid slope, l =lower slope). Details of these variables are in Table 2.

451
Plant diversity and cattle grazing
© 2003 British Ecological Society,
Journal of Applied Ecology
,
40
,445–457
enrichment (i.e. all sites were Dn, En). Overall 8·6% ofthe variation in the species was explained by this model(Table 6). An additional 8·2% was explained by vari-ables that were not significant in the Monte Carlopermutation test (
P
< 0·05). There were no significantinteractions between grazing and tree factors. Parti-tioning the variance revealed that trees accounted for6·9% of the explained variance and grazing 4·7%, withno variance shared between them.
In the ordination (Fig. 5) the first axis indicatedthat the greatest difference in composition was between
medium grazing under mature woodland and highgrazing in areas cleared of trees. The second axis separ-ated mature woodland from regrowth areas; however,this axis was not significant (CCA,
P
= 0·005; axis 1,
P
= 0·005; axis 2,
P
= 0·25).
The 324 species recorded in the 191 sites were classifiedinto seven response groups (Table 7) by collectivelyinterpreting the results of the three individual designs.Grazing generalists were the largest group, followed bygrazing decreasers and grazing increasers. Taxa com-prising the response groups are identified in Table 8.The generalist group contains many high frequencyspecies. Exotic species tend to be more frequent amongstthe increasers and low grazing intolerants, while thegreatest proportion of native species is found in thegrazing decreaser, intermediate and high grazingintolerant groups (Tables 7 and 8).
The relative importance of low grazing in account-ing for floristic variation (Table 4) is reflected in the factthat the largest non-generalist response group com-prises the grazing decreasers, which have the highestabundances in low grazed habitats.
Figure 6 illustrates the average relative contributionof the different response groups to average plot floristicspecies density over the three grazing levels. In the graz-ing design, an intermediate species density maximum isindicated (Fig. 6), which is mostly reflected in a declinein species density from Gm to Gh. The high density atGm is due to the large contribution of intermediate andgeneralist species but also the fact that all the specialistgroups are contributing to total density.
Fig. 5. Ordination for the ‘tree’ design showing the first twoaxes of the CCA. Length of the vectors indicate the strength ofthe correlation between categories of factors and the CCAaxes. Factors are G = grazing (m = medium, h = high) and T= tree density (o = open, r = regrowth woodland, m = maturewoodland). Details of these variables are in Table 2.
Table 5. Canonical correspondence analysis of the land type design. The sum of all unconstrained eigenvalues = 3·35
Table 6. Canonical correspondence analysis of the tree design. The sum of all unconstrained eigenvalues = 2·09
Factors (see Tables 1 & 2 for codes) Inertia marginal effects Inertia conditional effects P-value MCR (%) per factor
Grazing, low (Gl) 0·14 0·14 0·005 4·2Lithology, sandstone (Ls) 0·14 0·13 0·005 3·9Lithology, metamorphic (Lm) 0·09 0·08 0·005 2·4Gl × Ls 0·11 0·05 0·005 1·5Slope, upper (Su) 0·05 0·05 0·03 1·5Grazing, medium (Gm) 0·14 – – –Lithology, granite (Lg) 0·09 – – –Slope, mid (Sm) 0·03 – – –Slope, lower (Sl) 0·02 – – –Total 13·5%
Factors (see Tables 1 & 2 for codes) Inertia marginal effects Inertia conditional effects P-value MCR (%) per factor
Grazing, medium (Gm) 0·1 0·1 0·01 4·8Trees, mature (Tm) 0·08 0·08 0·01 3·8Trees, open (To) 0·07 – – –Grazing, high (Gh) 0·1 – – –Trees, regrowth (Tr) 0·06 – – –Total 8·6%

452S. McIntyre, K. M. Heard & T. G. Martin
© 2003 British Ecological Society, Journal of Applied Ecology, 40,445–457
Table 7. Number of species classified into each of eight response groups after synthesizing the results from the three analyses
Table 8. Plant taxa for which a grazing response was identified. Frequencies (%Freq.) are derived from the entire sample of 191sites. * = exotic species; (*) = uncertain origin. Names follow McIntyre, Heard & Martin (2002). Grazing responses are thoseobserved at sites that were undisturbed (Dn) and unenriched (En), except species in bold which only occurred on disturbed andenriched sites. Arrows indicate interactions between grazing and disturbance in which the tolerance of grazing increases (↑) ordecreases (↓) in the presence of soil disturbance and/or water enrichment
Response group Number of species Number native species % exotic species
Grazing increaser 36 20 44Low grazing intolerant 13 7 46Grazing decreaser 47 41 13High grazing intolerant 12 9 20Intermediate 21 19 10Grazing generalist 65 49 25Unclassifiable 130 86 34Total 324 231 28
Grazing decreasers (47 spp.) %Freq. Grazing generalists (65 spp.) %Freq. Grazing increasers (36 spp.) %Freq.
Cyperus gracilis ↑58 Glycine spp.† 89 *Conyza bonariensis 76Cyanthillium cinereum 48 Sporobolus creber ↓74 *Centaurium erythraea ↓56Galactia tenuiflora 45 Fimbristylis dichotoma 63 Phyllanthus virgatus ↓50Themeda triandra 39 Desmodium varians ↓63 Oxalis thompsoniae 49Lobelia purpurascens ↑32 *Paspalum dilatatum ↑61 *Gamochaeta americana 46Eustrephus latifolius 26 *Ciclospermum leptophyllum 60 Bothriochloa macra ↓44Lomandra multiflora 24 Euchiton sphaericus 59 Glossocardia bidens ↓40Eremophila debilis 24 Panicum effusum var. effusum 58 Eragrostis cumingii 38Asperula conferta 22 Chrysocephalum apiculatum ↓54 Heteropogon contortus 29Indigofera baileyi 19 Rostellularia adscendens 50 Chloris divaricata ↓26*Bidens pilosa 18 Dichondra repens 50 *Hypochaeris microcephala 26Scleria mackaviensis 17 *Conyza sumatrensis ↑48 Dichanthium sericeum ↓25Brunoniella australis 16 *Cirsium vulgare ↑45 Hypericum gramineum 25Capillipedium spicigerum ↓16 Mentha satureioides 45 Cullen tenax ↓18*Chloris gayana 16 Wahlenbergia gracilis ↓44 (*)Cynodon spp. 17Lespedeza juncea 16 Zornia dyctiocarpa 43 Poranthera microphylla 17Sorghum leiocladum 16 *Sida rhombifolia 39 Polygala linariifolia 15Dianella brevipedunculata 14 *Verbena rigida ↓39 *Gomphrena celosioides 13Dianella longifolia 14 Cheilanthes sieberi 38 *Anagallis arvensis 12*Gomphocarpus physocarpus 12 Cyperus fulvus 36 Eragrostis sororia ↓12Calotis cuneifolia 11 *Conyza canadensis 33 Eremochloa bimaculata 12Jasminum simplicifolium hybrid 11 Wahlenbergia communis 33 *Trifolium repens 12*Melinis repens 11 Microlaena stipoides ↓26 *Lepidium bonariense 11Oxalis chnoodes 11 Hyparrhenia filipendula 20 Neptunia gracilis ↓11Maireana microphylla ↑10 Velleia paradoxa ↓20 *Medicago lupulina ↓9·4*Sonchus oleraceus 10 Eriochloa pseudoacrotricha ↑18 *Modiola caroliniana 9·4Centaurium spicatum ↓9·4 *Verbena officinalis 17 Solenogyne bellioides 8·9Commelina diffusa 8·9 Dichelachne micrantha 16 Crassula sieberiana 7·3Paspalidium criniforme 8·4 Haloragis heterophylla 14 *Pennisetum clandestinum 6·3Laxmannia gracilis 6·8 Einadia hastata/E. trigonos ↑14 Vittadinia pustulata 6·3Elymus multiflorus 6·3 Digitaria diffusa ↓13 *Richardia brasiliensis 5·8Chamaecrista mimosoides 5·8 Lomandra filiformis 13 *Sisyrinchium sp. 5·8Panicum effusum var. simile 5·8 Digitaria longiflora 13 Eragrostis parviflora 4·7Plectranthus parviflorus 5·8 Malvastrum coromandelianum 12 *Heliotropium amplexicaule 3·7Desmodium rhytidophyllum 5·2 Calotis lappulacea 11 *Polygonum aviculare 3·7Digitaria brownii 5·2 Lomandra confertifolia 9·4 Juncus usitatus 2·1Lomandra longifolia 5·2 Veronica plebeia 9·4
Low grazing intolerant (13 spp.)Senecio tenuiflorus 5·2 Imperata cylindrica 8·4Desmodium brachypodum 4·7 Rhynchosia minimaPicris angustifolia 3·1 Thesium australe 8·4 *Cyperus sesquiflorus 20·9Desmodium gunnii 2·6 (*)Solanum americanum 8·4 *Hypochaeris glabra/radicata ↓15·7Dianella revoluta 2·6 Viola betonicifolia 7·9 Rumex brownii 12·6Hardenbergia violacea 2·6 Chamaesyce dallachyana 6·8 *Cyperus aggregatus 12·0Panicum decompositum 2·6 Crotalaria montana 6·3 *Richardia stellaris 11·5*Verbena aristigera 2·6 Hypoxis hygrometrica 6·3 *Verbena litoralis ↓10·5Pandorea spp. 2·1 Oxalis radicosa 6·3 *Paronychia brasiliana 9·4Swainsona brachycarpa 2·1 Alternanthera nana 6·3 Chloris truncata 8·4
Panicum queenslandicum 5·8 Pterocaulon redolens 5·85·8 Austrostipa verticillata 4·7

453Plant diversity and cattle grazing
© 2003 British Ecological Society, Journal of Applied Ecology, 40,445–457
Intermediate response (21 spp.) %Freq. Grazing generalists (cont.) %Freq. Low grazing intolerant (cont.) %Freq.
Aristida ramosa 74 Digitaria divaricatissima 5·2 Brachyscome microcarpa 4·7Cymbopogon refractus ↓61 *Plantago lanceolata 5·2 Cyperus subulatus 2·1Hydrocotyle laxiflora ↓56 Poa sieberiana 5·2 Ophioglossum reticulatum 2·1Plantago debilis 54 Stackhousia spp. 5·2
High grazing intolerant (12 spp.)Carex inversa ↑48 Cymbonotus lawsonianus 4·7Bothriochloa decipiens ↑45 *Polycarpon tetraphyllum 4·7Eragrostis leptostachya 39 Polygala japonica 4·7 Echinopogon nutans ↑47·6Sida subspicata 37 *Tagetes minuta 4·7 Aristida queenslandica 39·3Paspalidium distans ↑36 *Trifolium glomeratum 4·7 Chloris ventricosa 32·5Geranium solanderi 33 Alloteropsis semialata 4·2 Hybanthus stellaroides 29·8Glycine clandestina 31 Bothriochloa bladhii 4·2 *Verbena bonariensis ↑21·5Einadia polygonoides 26 *Lactuca saligna 4·2 *Urochloa panicoides ↑15·7*Lepidium africanum 23 Sauropus hirtellus 4·2 *Sigesbeckia orientalis 15·2Vittadinia sulcata 20 Chamaesyce drummondii 3·7 Dichanthium setosum 14·7Cynoglossum suaveolens 19 *Medicago polymorpha 3·7 Dichanthium tenue 13·1Centella asiatica 14 Austrodanthonia racemosa 2·6 Goodenia hederacea 4·7Dichondra sp. 12 *Chloris virgata 2·1 Teucrium argutum 3·7Dichelachne crinita/D. rara 9·4 Eriochloa crebra 2·1Tricoryne elatior 9·4Goodenia glabra 8·4*Aster subulatus 2·6
†Glycine cracens ms Tindale and B. Pfeil, G. microphylla (Benth) Tindale, G. pacifica ms B. Pfeil and Tindale, G. stenophyta ms B. Pfeil and Tindale, G. tabacina (Labill.) Benth, G. tomentella Hayata s.l.
Grazing decreasers (47 spp.) %Freq. Grazing generalists (65 spp.) %Freq. Grazing increasers (36 spp.) %Freq.
The grazing responses described in Table 8 were thoseobserved on sites that were not soil disturbed or waterenriched. However, interactions between these twofactors were important. Some interactions were due tospecies that were disturbance intolerant (McIntyre &Martin 2002) that were not able to respond to grazingdue to their absence at these sites. Of more interestwere species whose grazing responses changed whendisturbance or enrichment status changed. There weretwo main responses observed: (i) the tolerance of grazing
increased in the presence of soil disturbance and/or waterenrichment and (ii) the tolerance of grazing decreasedin the presence of soil disturbance and/or water enrich-ment. These species are identified in Table 8. Both nativeand exotic species had interactions in similar proportions.However, of the species whose tolerance of grazingdecreased in the presence of soil disturbance and/orwater enrichment, a greater proportion (80%) werenatives and fewer (20%) exotics. Also noteworthy wasthe fact that all the grazing increasers that had inter-actions had their grazing tolerance weakened in thepresence of soil disturbance and/or water enrichment.
Fig. 6. Contribution of grazing response groups to species density for three categories of grazing (Gl, Gm, Gh). Data are fromthe grazing design. Response groups are defined in the Methods. Grazing has a significant effect on species density in this design(McIntyre & Martin 2001).
Table 8. Continued

454S. McIntyre, K. M. Heard & T. G. Martin
© 2003 British Ecological Society, Journal of Applied Ecology, 40,445–457
In the land type design there was a significant inter-action between sandstone sites and low grazing. Thiswas attributed to the more distinctive nature of thevegetation on sandstone (there were 88 species with anaffinity for sandstone compared with 36 for metamor-phic and 24 for granite). Of the 88 species, 35% weregrazing decreasers. This interaction was also reflectedin species density, with low grazed sandstone siteshaving the greatest species density (McIntyre & Martin2001).
Discussion
This study used land-use history (reserve vs. pasture) todifferentiate between the lowest level of grazing (Gl)and the other levels. Within pastures, sward height wasused to differentiate selectively grazed grassland (Gm)from heavily utilized, non-selective grazing (Gh). Thisnatural experimental approach (sensu Diamond 1986)has considerable advantages in being able to observedifferences in regimes that have occurred over manydecades, a time scale that it is not possible to include inexperiments. A second advantage is that the spatialextent of our observations was far larger than the gen-erally limited extent of grazing trials.
The use of sward structure to indicate extremesof high and low grazing within pastures results fromthe variable and heterogeneous nature of livestockdefoliation. The existence of persistent grazing lawns ingrasslands is widely acknowledged in the literature(Coughenour 1991). These are closely cropped areasthat are repeatedly grazed and are thus subjected tohigher grazing pressure than other parts of the pasture.However, the actual location of these areas is the resultof complex interactions between the behaviour of thegrazers and small-scale variations in the pasture. Onepossibility is that the lawns are grazed-down areas thatare randomly distributed over space and time and graz-ing has not impacted on floristics. However, the detec-tion of floristic differences between the Gm and Ghsites indicates that this is not the case. The source ofthese floristic differences could be (i) existing vegeta-tion patchiness, elements of which the cattle persist-ently seek out to selectively graze; this patchiness couldresult from the effect of fire in changing forage quality,concentrations of palatable species or variations in soil;and (ii) floristic change resulting from prolonged heavygrazing. Our understanding of the system is that even ifthe initiation of a grazing patch is influenced by com-position, the main driver determining composition isultimately grazing. Observations of grazed and fencedgrazing lawns in the survey area show that compositionof grazed lawns remains stable over 3–4 years whileexclosed patches tend to gain species typical of select-ively grazed, large tussock swards (J.G. McIvor, unpub-lished data). Regular mowing of large tussock patches
has also been found to change composition in direc-tions that are consistent with the results reported here(J.G. McIvor unpublished data). We suggest that thegrazing categories used in this paper have some value inproviding two extremes (little or no grazing vs. non-selective grazing) and an intermediate point (selectivegrazing) along a grazing gradient.
Another way to consider the validity of our assump-tions about grazing pressure is to compare our resultswith independent observations of grazing responseunder experimental conditions. A cattle stocking-rateexperiment conducted in similar subtropical vegetationhad 27 taxa whose response could be compared withthe current study (McIntyre & Lavorel 2001). None ofthese 27 had responses that were contradictory (i.e. haddefinite responses in an inconsistent direction), 40%were confirmatory (they had definite responses in aconsistent direction) and 60% were consistent (one orboth species were generalist).
Stohlgren, Schell & Vanden Heuvel (1999) arguedthat inconsistent responses of plants to grazing under-mined the concept of ‘increaser’ and ‘decreaser’ species.Inconsistent responses do occur in Australia, at a rateof about 40% of observations at the continental scale(Vesk & Westoby 2001). At the regional scale, a higherlevel of consistency might occur. Three natural exper-iments examining grazing in tropical and subtropicalQueensland grasslands reported 31 grazing responsesof species that were in common with our own study. Ofthese, 20% were contradictory, 40% consistent and 40%confirmatory (Fensham 1998; Fensham & Skull 1999;Fensham, Holman & Cox 1999). However, we do not seediscarding ‘increaser’ and ‘decreaser’ concepts as a prac-tical approach to the issues of generalization in ecology.It is only through meta-analysis of repeated observationsof response under different conditions that a generaloverview of a particular species can be obtained.
Together, the three analyses examined the influence ofsoil disturbance, soil enrichment, lithology, trees, graz-ing and slope position on the herbaceous community.However, our interpretation of the relative importanceof these factors is complicated by interactions. Thesewere negligible in the land type and tree designs and itwas possible to see that trees were a major influence,accounting for 6·9% of floristic variation, followed bylithology (6·1%) and grazing (4·1% and 4·7% in the twodesigns, respectively). Slope position appeared to bethe weakest of these four factors (2·3%). The role ofsoil disturbance and water enrichment is more difficultto interpret because of interactions. Both Fairfax& Fensham (2000) and McIvor (1998) found thatestablishment of sown pasture was more importantto herbaceous floristic composition than tree removal intropical grassy woodlands. This is consistent with the

455Plant diversity and cattle grazing
© 2003 British Ecological Society, Journal of Applied Ecology, 40,445–457
results of an analysis of disturbance and enrichmentonly (both moderate and severe), which accounted for8·7% of floristic variation (McIntyre & Martin 2002),more than that of trees (6·9%, this study). In Argen-tinean subhumid grasslands (Díaz, Acosta & Cabido1994) cultivation was also found to be important, andaffected composition much more than grazing.
A previous analysis of temperate woodland ratedlithology, altitude and soil disturbance as the mostimportant variables explaining floristic variation whenranked on the basis of inertia per factor, while slopeposition, grazing and water enrichment were of lesserimportance in determining floristic composition(McIntyre & Lavorel 1994b). Soil cultivation andfertilizer use were not assessed in the temperate study.Excluding these latter two factors, we conclude fromthe temperate and subtropical observations that theenvironmental variables and disturbance factors allcontribute a small but significant amount of floristicvariation.
Previous authors have emphasized the importance ofinteractions among disturbances and environmentalvariables on plant community structure (Collins 1987;Silvertown & Tremlett 1989). Published analyses ofspecies density from our data set (McIntyre & Martin2001) have shown that there were no significant inter-actions between variables in the three designs reportedin this paper. In terms of composition, the interactionsof importance in these three analyses were between soildisturbance, grazing and enrichment. In other words,the interactions were most importantly between thedisturbances, not between disturbances and the en-vironment. The interactions between soil disturbanceand enrichment (analysed in McIntyre & Martin 2002)resulted from a large group of predominantly nativespecies that were highly sensitive to the presence ofdisturbances. The community composition changed ina similar way, whether the disturbances were presentsingly or in combination. In the case of soil disturbanceand grazing, a similar situation appears to exist where-by there is a group of species that are associated withungrazed, undisturbed habitats and that are sensitive toeven minor soil disturbance or commercial cattle grazing.
Is the effect of livestock grazing on plant diversity at thepatch scale different to the effect of grazing at the land-scape scale? Olff & Ritchie (1998) hypothesized that atsmall scales (< 100 m2) density is increased by grazingdue to reduced plant competition and enhanced regen-eration. Over larger areas, they postulate that grazinginhibits diversity due to the pool of potential speciesbeing restricted to grazing-tolerant plants. This ques-tion can be explored by examining Figs 2 and 6, andTable 7 and by comparing the grazing treatments Gland Gm, where medium grazing should result in anincrease in species density compared with infrequent
grazing (Gl). At small scales (30 m2) this is supported inthe grazing design (Fig. 6), although the pattern is notconsistent in other data sets at the 30-m2 scale (Table 6in McIntyre & Martin 2001).
Figure 2 indicates that, as samples accumulate, thesize of the pool of species associated with the differentgrazing levels does not differ between Gl and Gh and ishigher, rather than lower, in Gm. Thus, our data do notsupport the hypothesis. We suggest this is because Olff& Ritchie (1998) have failed to recognize that there canalso be a pool of grazing increasers that can be of sim-ilar size to grazing decreasers (Table 7). The increasersoffset the loss of decreasers as grazing intensityincreases. The presence of intermediate, low grazingintolerant and high grazing intolerant response groupsin our assemblage also contributes to the high speciesdensity with medium grazing (Fig. 6). Stohlgren,Schell & Vanden Heuvel (1999) observed results thatwere similar to ours. They compared species density ingrazed and ungrazed areas and found that grazingincreased density at 1-m2 scales but at the 1000-m2 scaleungrazed plots were not richer. However, in arid range-lands Landsberg et al. (2002) found Olff & Ritchie’s(1998) hypothesis to be supported, although the largernumber of increaser over decreaser species identified inthe assemblage made interpretation difficult.
Our observations are partially consistent with theprediction of Milchunas, Sala & Lauenroth (1988) thatdiversity in subhumid grasslands with a history of lightgrazing should increase sharply from no grazing tovery light grazing, and decline progressively as grazingmoves from very light to intense. However, the problemremains that generalizations about grazing cannot bemade easily without the definition of more universalgrazing gradients. Our lightest grazing treatment wouldhave included sites that were intermittently grazed inthe past and which are burned, possibly maintain-ing species density at higher levels than predicted byMilchunas, Sala & Lauenroth (1988) under no grazing. Inrelation to the Milchunas, Sala & Lauenroth (1988)prediction, Landsberg, O’Connor & Freudenberger(1999) suggested that tropical grasslands from sub-humid regions with a short grazing history are morerobust to grazing than comparable temperate ones.In diversity terms, our results seem to support this,with many native species tolerant of livestock grazing(Table 7). Perhaps there has been a greater level ofpre-adaptation to grazing over evolutionary time scales.However, the difference could also be explained bythe high levels of landscape intensification and dis-turbance affecting grazing response in the temperateregions, rather than inherent differences between thesystems.
In the region studied, uncultivated and unfertilizedpastures form the landscape matrix and ungrazed areas

456S. McIntyre, K. M. Heard & T. G. Martin
© 2003 British Ecological Society, Journal of Applied Ecology, 40,445–457
are poorly represented. They are largely restricted tothe area of road reserves that is not actually occupiedby roads and drains, and represent around 4% of theland area. This habitat is preferred by the 47 grazingdecreaser species but is threatened by road works andongoing development. Thus the careful managementof road reserves will be an important component of agrassland conservation strategy.
The fact that there are native species that prefer oneor more of each of the three grazing levels (Table 7)supports a case to maintain a range of grazing intens-ities at the landscape scale, to optimize the conservationof herbaceous plants. Economic conditions mean thatthere is strong pressure to graze all legally accessibleland at Gm or Gh levels. Despite the fact that someplants prefer sites that are grazed non-selectively (Gh),it is important that these grazing lawns be restricted inorder to maintain grassland structure and function(Thurow 1991; McIvor, Ash & Cook 1995; Derner,Briske & Boutton 1997). With non-selective grazing,larger tussock grasses tend to be replaced by shorttussocks and stoloniferous species. The grazing lawnsrepresent a lesser habitat for vertebrates (Ford &Barrett 1995; Recher & Davis 1998; Barrett & Davidson1999) and many invertebrates (Uetz 1991; Bromhamet al. 1999). As all plant response groups are repres-ented to some extent under medium levels of grazing(Fig. 6), this is a desirable state for large areas, enablingthe maintenance of diversity and ecosystem function.
An important consideration is that the apparentcompatibility of grazing and high diversity in our studyis highly contextual. Where there is heavy grazing andbroadcast fertilizers, and exotic species are sown,native grassland diversity is heavily impacted (Whalley,Robinson & Taylor 1978; Prober & Thiele 1995). Thisis supported in our results by the tendency for nativegrazing increasers to become less grazing tolerant inthe presence of water enrichment or soil disturbance.
Land use can rapidly change conservation scenarios.If significant tracts of land are reassigned from grazingenterprise to conservation reserve, there will be a tend-ency for managers to permanently remove livestock,which may in turn disadvantage intermediate andincreaser species. However, alternative disturbanceregimes are possible, e.g. fire and marsupial grazing.Although cattle grazing on part of the landscapeappears to be compatible with the maintenance ofnative grassland plants, it would not be correct toassume it is a necessary part of the disturbance regimefor grasslands, which have evolved in the absence ofdomestic livestock.
Acknowledgements
The work was supported by Land & Water Australia,Environment Australia and Meat and Livestock AustraliaLtd (North Australia Program NAP3.222). We thankthe staff of the Queensland Herbarium (BRI) forassistance with plant identifications. Thanks to Chris
Stokes and John Ive who reviewed earlier drafts of themanuscript.
ReferencesArmesto, J.J. & Pickett, S.T.A. (1985) Experiments on dis-
turbance in old-field plant communities: impact on speciesrichness and abundance. Ecology, 66, 230–240.
Barrett, G. & Davidson, I. (1999) Community monitoring ofwoodland habitats – the Birds on Farms Survey. TemperateEucalypt Woodlands in Australia: Biology, Conservation,Management and Restoration (eds R.J. Hobbs & C.J. Yates),pp. 382–399. Surrey Beatty & Sons, Chipping Norton,Australia.
ter Braak, C.J.F. & Smilauer, P. (1998) CANOCO 4. Centre forBiometry, Wageningen, the Netherlands.
Bromham, L.M., Cardillo, M., Bennett, A.F. & Elgar, M.A.(1999) Effects of stock grazing on the ground invertebratefauna of woodland remnants. Australian Journal of Ecology,24, 199–207.
Chaneton, E.J. & Facelli, J.M. (1991) Disturbance effects onplant community diversity: spatial scales and dominancehierarchies. Vegetatio, 93, 143–155.
Collins, S.C. (1987) Interaction of disturbances in a tallgrassprairie: a field experiment. Ecology, 68, 1243–1250.
Coughenour, M.B. (1991) Spatial components of plant–herbivore interactions in pastoral, ranching, and native un-gulate systems. Journal of Range Management, 44, 530–541.
Denslow, J.S. (1980) Patterns of plant species diversity duringsuccession under different disturbance regimes. Oecologia,46, 18–21.
Derner, J.D., Briske, D.D. & Boutton, T.W. (1997) Does graz-ing mediate soil carbon and nitrogen accumulation beneathC4, perennial grasses along an environmental gradient?Plant and Soil, 191, 147–156.
Diamond, J. (1986) Overview: laboratory experiments, fieldexperiments, and natural experiments. Community Ecology(eds J. Diamond & T.J. Case), pp. 3–22. Harper & Row,New York, NY.
Díaz, S., Acosta, A. & Cabido, M. (1994) Community struc-ture in montane grasslands of central Argentina in relationto land use. Journal of Vegetation Science, 5, 483–488.
Fairfax, R.J. & Fensham, R.J. (2000) The effect of exoticpasture development on floristic diversity in central Queens-land, Australia. Biological Conservation, 94, 11–21.
Fensham, R.J. (1998) The grassy vegetation of the DarlingDowns, south-eastern Queensland, Australia. Floristicsand grazing effects. Biological Conservation, 84, 301–310.
Fensham, R.J. & Skull, S.D. (1999) Before cattle: a com-parative floristic study of eucalyptus savanna grazed bymacropods and cattle in north Queensland, Australia.Biotropica, 31, 37–47.
Fensham, R.J., Holman, J.E. & Cox, M.J. (1999) Plant speciesresponses along a grazing disturbance gradient in Australiangrassland. Journal of Vegetation Science, 10, 77–86.
Ford, H.A. & Barrett, G. (1995) The role of birds and theirconservation in agricultural systems. Wildlife Conservationand Management on Private Land (eds A.F. Bennett, G.N.Backhouse & T.W. Clark), Surrey Beatty & Sons, ChippingNorton, Australia.
Henderson, R.J.F. (1997) Queensland Plants: Names andDistribution. Queensland Herbarium, Indooroopilly,Australia.
Kent, M. & Coker, P. (1992) Vegetation Description and Ana-lysis: A Practical Approach. CRC Press, Boca Raton, FL.
Landsberg, J., James, C.D., Maconochie, J., Nicholls, A.O.,Stol, J. & Tynan, R. (2002) Scale-related effects of grazingon native plant communities in an arid rangeland regionof South Australia. Journal of Applied Ecology, 39, 427–444.

457Plant diversity and cattle grazing
© 2003 British Ecological Society, Journal of Applied Ecology, 40,445–457
Landsberg, J., O’Connor, T. & Freudenberger, D. (1999) Theimpacts of livestock grazing on biodiversity in naturalecosystems. Nutritional Ecology of Herbivores: Proceedingsof the Vth International Symposium on the Nutrition ofHerbivores (eds H.-J.G. Jung & G.C. Fahey), pp. 752–777.American Society of Animal Science, Savoy, IL.
McIntyre, S. & Hobbs, R.J. (1999) A framework for con-ceptualizing human impacts on landscapes and its relevanceto management and research models. Conservation Biology,13, 1282–1292.
McIntyre, S. & Lavorel, S. (1994a) Predicting richness ofnative, rare and exotic plants in response to habitat anddisturbance variables across a variegated landscape. Con-servation Biology, 8, 521–531.
McIntyre, S. & Lavorel, S. (1994b) How environmental anddisturbance factors influence species composition in tem-perate Australian grasslands. Journal of Vegetation Science,5, 373–384.
McIntyre, S. & Lavorel, S. (2001) Livestock grazing in sub-tropical pastures: steps in the analysis of attribute responseand plant functional types. Journal of Ecology, 89, 209–226.
McIntyre, S. & Martin, T.G. (2001) Biophysical and humaninfluences on plant species richness in grasslands – comparingvariegated landscapes in sub-tropical and temperate regions.Austral Ecology, 26, 233–245.
McIntyre, S. & Martin, T.G. (2002) Managing intensive andextensive land uses to conserve grassland plants in eucalyptwoodlands. Biological Conservation, 107, 241–251.
McIntyre, S., Heard, K.M. & Martin, T.G. (2002) How grass-land plants are distributed over five human-created habitatstypical of eucalypt woodlands in a variegated landscape.Pacific Conservation Biology, 7, 274–285.
McIvor, J.G. (1998) Pasture management in semi-arid tro-pical woodlands: effects on species diversity. AustralianJournal of Ecology, 23, 349–364.
McIvor, J.G., Ash, A.J. & Cook, G.D. (1995) Land conditionin the tropical tallgrass pasture lands. I. Effects on herbageproduction. Rangeland Journal, 17, 69–85.
’t Mannetje, L. & Haydock, K.P. (1963) The dry-weight-rankmethod for the botanical analysis of pasture. Journal of theBritish Grassland Society, 18, 268–275.
Milchunas, D.G. & Lauenroth, W.K. (1993) A quantitativeassessment of the effects of grazing on vegetation and soilsover a global range of environments. Ecological Mono-graphs, 63, 327–366.
Milchunas, D.G., Sala, O.E. & Lauenroth, W.K. (1988) A gen-eralized model of the effects of grazing by large herbivoreson grassland community structure. American Naturalist,132, 87–106.
Mueller-Dombois, D. & Ellenberg, H. (1974) Aims and Methodsof Vegetation Ecology. Wiley, Toronto, Canada.
Olff, H. & Ritchie, M.E. (1998) Effects of herbivores on grass-land plant diversity. Trends in Ecology and Evolution, 13,261–265.
Prober, S.M. & Thiele, K.R. (1995) Conservation of thegrassy white box woodlands: relative contributions of sizeand disturbance to floristic composition and diversity ofremnants. Australian Journal of Botany, 43, 349–366.
Recher, H.F. & Davis, W. (1998) The foraging profile of awandoo woodland avifauna in early spring. Australian Journalof Ecology, 23, 514–527.
Sabatier, R., Lebreton, J.D. & Chessel, D. (1989) Principalcomponents analysis with instrumental variables as a toolfor modelling composition data. Multiway Data Analysis(eds R. Coppi & S. Bolasco), pp. 341–335. North-HollandPublishing Co., Amsterdam, the Netherlands.
Sattler, P.S. & Williams, R.D. (1999) The Conservation Statusof Queensland’s Bioregional Ecosystems. Queensland Environ-mental Protection Agency, Brisbane, Australia.
Silvertown, J. & Tremlett, M. (1989) Interactive effects ofdisturbance and shade upon colonization of grassland:an experiment with Anthriscus sylvestris (L.) Hoffm.,Conium maculatum L., Daucus carota L. and Heracleumsphondylium L. Functional Ecology, 3, 229–235.
Smilauer, P. (1992) CanoDraw. Microcomputer Power, Ithaca,NY.
Stohlgren, T., Schell, L.D. & Vanden Heuvel, B. (1999) Howgrazing and soil quality affect native and exotic plant diver-sity in rocky mountain grasslands. Ecological Applications,9, 45–64.
Stuwe, J. & Parsons, R.F. (1977) Themeda australis grasslandson the Basalt Plains, Victoria: floristics and managementeffects. Australian Journal of Ecology, 2, 467–476.
Thurow, T.L. (1991) Hydrology and erosion. Grazing Man-agement: An Ecological Perspective (eds R.K. Heitschmidt& J.W. Stuth), pp. 141–159. Timber Press, Portland, OR.
Uetz, G.W. (1991) Habitat structure and spider foraging.Habitat Structure: The Physical Arrangement of Objects inSpace (eds S.S. Bell, E.D. McCoy & H.R. Mushinsky),pp. 325–348. Chapman & Hall, London, UK.
Vesk, P.A. & Westoby, M. (2001) Predicting plant species’responses to grazing. Journal of Applied Ecology, 38, 897–909.
Whalley, R.D.B., Robinson, G.G. & Taylor, J.A. (1978)General effects of management and grazing by domesticlivestock on the rangelands of the Northern Tablelands ofNew South Wales. Australian Rangeland Journal, 1, 174–190.
Received 4 July 2002; final copy received 28 February 2003