the relationship between impaired glucose tolerance, type 2 diabetes, and cognitive function
TRANSCRIPT
Journal of Clinical and Experimental Neuropsychology2004, Vol. 26, No. 8, pp. 1044–1080
1380–3395/04/2608-1044$16.00 © Taylor & Francis Ltd.
Journal of Clinical and Experimental Neuropsychology
The Relationship between Impaired Glucose Tolerance, Type 2 Diabetes, and Cognitive Function
Nesrine Awad1, Michèle Gagnon2, and Claude Messier1
1School of Psychology, University of Ottawa, Ottawa, Ontario, Canada and 2Institute of Mental Health Research, Ottawa, Ontario, Canada
ABSTRACT
The present review integrates findings of published studies that have evaluated the cognitive function oftreated and untreated type 2 diabetic patients and provides a detailed overview of the neuropsychologicalassessments conducted. Cognitive deficits are observed in older people with glucose intolerance or untreateddiabetes but these deficits appear to be attenuated by treatments that improve glycemic control. Cognitivedecrements in treated type 2 diabetic patients are most consistently observed on measures of verbal memory(35% of the measures) and processing speed (45% of the measures) while preserved function is observed onmeasures of visuospatial, attention, semantic and language function. Some studies suggest that deficits incognitive functions are associated with poorer glycemic control. A number of other factors, such as depression,cardiovascular and cerebrovascular disease, increase these deficits. We conclude that, in diabetic patientswho achieve and maintain good glycemic control, type 2 diabetes only has a small impact on cognitive functionsbefore the age of 70 years. However, early onset of type 2 diabetes, poor glycemic control and the presenceof micro- and macrovascular disease may interact to produce early cognitive deficits. In older adults (70 yearsand over), diabetes likely interacts with other dementing processes such as vascular disease and Alzheimer’sdisease to hasten cognitive decline.
INTRODUCTION
There have been a number of excellent reviewsdescribing and analyzing the impact of type 2diabetes on cognitive functions (Biessels, van derHeide, Kamal, Bleys, & Gispen, 2002; Ryan, 1997;Stewart & Liolitsa, 1999; Strachan, Deary, Ewing, &Frier, 1997). We revisited the studies included inthese reviews and those more recently publishedand examined the effects of impaired glucose regu-lation, untreated and treated diabetes on cognitivefunctions. The findings are summarized accordingto specific neuropsychological tests and functions
using effect sizes and statistical significance. Thesewere presented and interpreted according to thevarious study designs (e.g., cross-sectional, longi-tudinal, or population), while taking into accountmeasures of methodological control employed byeach study for potentially confounding factors suchas age, cardio- and cerebrovascular effects, anddepression. This was done in order to reach generalconclusions about the impact of type 2 diabeteson brain function and give a more neuropsycho-logical perspective on this issue. In reviewing thestudies, it became apparent that an examination ofthe cognitive changes on a continuum of disease
Address correspondence to Dr. Claude Messier, School of Psychology, University of Ottawa, 145 Jean-JacquesLussier, Room 352, Ottawa, Ontario Canada, K1N 6N5. Tel: (613) 562-5800 ext 4562, FAX: (613) 562-5147. E mail:[email protected] for publication: December 11, 2003.
TYPE 2 DIABETES AND COGNITIVE FUNCTION 1045
severity, from mild glucose intolerance to insulin-treated diabetes that took into account the inter-action with age, would be helpful in resolvingsome of the contradictions in the literature.
This review also emphasizes a number of issuesthat have not been consistently addressed in pre-vious articles examining the impact of diabetes oncognitive functions. The first issue is that moststudies have evaluated cognitive function inpeople with diabetes currently under treatment.Very few studies have examined cognitive func-tion in diabetic people before and after treatmentsto improve glucose tolerance (Gradman, Laws,Thompson, & Reaven, 1993; Meneilly, Cheung,Tessier, Yakura, & Tuokko, 1993; Naor, Steingru-ber, Westhoff, Schottenfeld-Naor, & Gries, 1997).Taken together, these studies suggest the possibil-ity that some of the cognitive deficits observed intype 2 diabetes may be directly attributed to theimpact of either high glucose levels or insulinresistance and are attenuated by improvement ofglucose tolerance.
The second issue concerns studies that haveexamined cognitive functions of people whoseglucose levels would be considered in the highnormal range for glucose tolerance or who werediagnosed with impaired glucose tolerance (Craft,Murphy, & Wemstrom, 1994; Kaplan, Greenwood,Winocur, & Wolever, 2000; Kaplan, Greenwood,Winocur, & Wolever, 2001; Kaplan, Winocur,Wolever, & Greenwood, 1999; Manning, Parsons,Cotter, & Gold, 1997; Manning, Stone, Korol, &Gold, 1998; Messier, Tsiakas, Gagnon,Desrochers, & Awad, 2003). These studies werenot originally designed to evaluate the impact ofglucoregulation but rather to examine the memory-improving effect of drinking glucose solutions.Only later did it become evident that this effectwas mainly found in people with impaired glu-cose tolerance. These studies have not been previ-ously included in the discussion of the impact ofdiabetes on cognitive function, as these individu-als did not reach the criteria for type 2 diabetes.However, they tend to show that when evaluatedfor cognitive function while fasting, these individ-uals show deficits compared to age-matched con-trols. Surprisingly, when they are tested afterdrinking a 50g glucose solution (or equivalentcarbohydrate), these deficits are reduced. Collec-
tively, these studies show that people withimpaired glucose tolerance do not perform wellwhen fasting and that cognitive deficits arealleviated by increasing blood glucose (and indi-rectly insulin) levels. The deficits were not due toan effect of fasting on cognition because the pat-tern of cognitive deficits was not typical ofhypoglycemia and the effect of glucose was dose-dependent. There are some recent indications thatthis reversal by glucose ingestion does not takeplace in patients with type 2 diabetes (Greenwood,2003) suggesting that deficits may becomeirreversible in patients with diabetes. Finally, theexamination of the studies presented here suggestthat, in people with treated diabetes, cognitivedeficits increase with advancing age and thelargest deficits are observed in people older than70 years.
Overall, we think that the cognitive deficitsobserved in people with impaired glucose toler-ance and possibly also in people in the earlystages of type 2 diabetes are caused by changes inbrain function that appear reversible. As they age,people with diabetes develop other related pathol-ogies such as hypertension, atherosclerosis, macro-and microvascular disease that produce furthercognitive deficits, which become most apparent inlater life. These cognitive deficits appear to beirreversible and, as several recent populationstudies show, diabetes compounds the deficitsproduced by vascular dementia and Alzheimer’sdisease. With this broad plan in mind, we nowturn to a brief description of diabetes.
Diabetes is clinically defined by high bloodglucose levels and by the general inability of thebody to control these levels. There are a numberof etiological classifications of diabetes mellitusthat will not be covered here such as gestationaldiabetes or iatrogenic diabetes (for example, dia-betes secondary to atypical antipsychotic drugtreatment). Here, we are concerned by the twomain types of diabetes mellitus: juvenile-onsetinsulin-dependent diabetes mellitus (type 1 diabe-tes) and maturity-onset non-insulin-dependentdiabetes (type 2 diabetes).
Normal glucose tolerance is defined as fastingglucose concentrations below 6.1 mmol/L andglucose concentrations below 7.8 mmol/L, 2 hoursafter drinking a glucose solution containing the
1046 NESRINE AWAD ET AL.
equivalent of 75g anhydrous glucose dissolved inwater (called a load). Impaired fasting glucose(IFG) is defined as fasting glucose concentrationbetween 6.1 and 7.0 mmol/L. Impaired glucosetolerance is defined as fasting glucose concentra-tion below 7.0 mmol/L and 2-hour post-load glucoseconcentrations between 7.8 and 11.1 mmol/L.Diabetes is defined as fasting glucose concen-tration above 7.0 mmol/L, casual glucose concen-trations above 11.1 with diabetes symptoms (forexample, increased urine output, unusual thirst,fatigue), or 2-hour post-load concentration above11.1 mmol/L (American Diabetes Association,2002).
In both types of diabetes, the aim of treatmentis to maintain normal glucose levels and utiliza-tion in order to prevent vascular and neurologicalcomplications such as retinopathy, nephropathy,microvascular changes and neuropathy (changesin peripheral nervous system decreasing painsensitivity and control of autonomic functions)that result from chronic hyperglycemia (Gregg &Brown, 2003). Glycemic control (i.e. the ability tokeep glucose levels in the normal range) of dia-betic patients over the past 2–3 months is esti-mated using percent of glycosylated hemoglobinof hemoglobin A1 (total glycosylated hemo-globin) or hemoglobin A1c (glycosylation of theN-terminal valine of the B-chain of hemoglobin).This percentage reflects the proportion of hemo-globin that has become glycosylated because glu-cose is attached to it. Because blood cells live forabout 2–3 months, HbA1c levels reveal the aver-age levels of glucose during that period. Normallevels of HbA1 and HbA1c are between 5.5–9%and at 5%, respectively, whereas HbA1 andHbA1c levels suggesting poor metabolic/glycemiccontrol are between 10.9–15.5% and 8–11.9%,respectively (American Diabetes Association, 2002).
Type 1 diabetes, formally known as insulin-dependent diabetes mellitus, is the more seriousform and is usually manifested in childhood or inyoung adulthood. Individuals with type 1 diabetesare eventually unable to secrete insulin because ofprogressive damage from cellular-mediated auto-immune destruction of the insulin-producing betacells of the pancreas (Atkinson & Maclaren, 1994).The autoimmune destruction of beta cells hasbeen linked to multiple genetic predispositions as
well as to environmental factors (American Dia-betes Association, 2002). Although not incompat-ible, obesity is rare in this form of diabetes. TypeI diabetic patients depend on insulin injections forsurvival and this results in substantial fluctuationof glucose concentrations in response to foodingestion, exercise and the insulin injectionsthemselves. Cognitive deficits in young peoplewith type 1 diabetes appear to be related to thenumber of hypoglycemic events that the personhas experienced (Deary et al., 1993; Hershey,Bhargava, Sadler, White, & Craft, 1999; Hershey,Craft, Bhargava, & White, 1997) although somestudies have failed to find this relationship(Ferguson et al., 2003). It must be noted thatbrains of people with diabetes adapt to hypo-glycemia and therefore, the cognitive effects ofhypoglycemia for these individuals occur at lowerlevels of blood glucose than for people with nor-mal glucoregulation.
Type 2 diabetes, formally known as noninsulin-dependent diabetes mellitus differs from type 1diabetes in that type 2 diabetes is not character-ized by auto-immune destruction of the insulin-producing beta cells. People with type 2 diabetesare able to produce insulin, however, the diseaseis characterized by slower glucose absorption andhigher fasting glucose levels that result fromfactors such as reduced hepatic insulin sensitivity,relative reduction of insulin secretion andincreased glucagons secretion (Kahn, 1994). As aresult, the metabolic disturbances observed intype 2 diabetes are less pronounced than in type 1diabetes. Initially, compensatory increases ininsulin secretion (hyperinsulinemia) maintain nor-mal glucose concentrations by counteracting thereduced sensitivity of tissues to insulin. Glucoselevels rise and hyperglycemia develops whenindividuals are no longer able to sustain hyperin-sulinemia and when high levels of insulin are nolonger able to maintain normal glucose levels(Reaven, 1993). From that point, overt type 2 dia-betes is observed and is characterized by a relativedecrease in insulin secretion (Kumari, Brunner, &Fuhrer, 2000).
Patients with type 2 diabetes are initiallytreated with dietary restrictions and exercise tocontrol hyperglycemia. Increased muscle mass anddecreased fat tissue both lead to better glucose
TYPE 2 DIABETES AND COGNITIVE FUNCTION 1047
absorption. Many people are unable to changetheir lifestyle patterns to reduce weight or increaseexercise sufficiently to achieve better glucosecontrol. Patients are then prescribed oral hypogly-cemic drugs to further control hyperglycemia.These drugs either increase insulin secretion orreduce glucose output from the liver. A final treat-ment for type 2 diabetes consists of daily insulininjections when hypoglycemiant drugs are no longereffective in maintaining normal blood glucose.
The risk of developing type 2 diabetes increaseswith age, obesity or increased percentage of bodyfat distributed predominantly in the abdominalregion, and lack of physical activity (AmericanDiabetes Association, 2002). Type 2 diabetes ischaracterized by a strong but complex geneticpredisposition (Diamond, 2003). This form ofdiabetes often remains undiagnosed for manyyears because patients do not notice initial symp-toms of hyperglycemia: this puts them at higherrisk of developing macrovascular and micro-vascular complications (Kuusisto, Mykkanen,Pyorala, & Laakso, 1994; Uusitupaa, Niskanen,Siitonen, Voutilainen, & Pyorala, 1993). Recentstudies are showing that the prevalence of type 2diabetes and glucose intolerance in young adultsis rising dramatically (Hoffman & Armstrong,1996; McCance et al., 1994; Pinhas-Hamiel et al.,1996).
Type 2 diabetes is a disease of slow onset char-acterized by a rather long period during whichblood glucose and often insulin levels remain ele-vated. In a longitudinal study evaluating thedevelopment of type 2 diabetes, the diagnosis oftype 2 diabetes was preceded by 5 years of ele-vated 2-hour insulin levels and approximately 2.5years of elevated 2-hour glucose levels (Hara,Egusa, & Yamakido, 1996). During this period oftime, now referred to as pre-diabetes, impairedglucose tolerance or impaired fasting glucose istypically observed. With these facts in mind, wenow turn to the examination of the cognitivechanges observed in diabetes and impaired glu-cose tolerance.
Cognitive Function of Treated Type 2 Diabetes PatientsNumerous studies have been conducted to evalu-ate the neuropsychological functioning of individ-
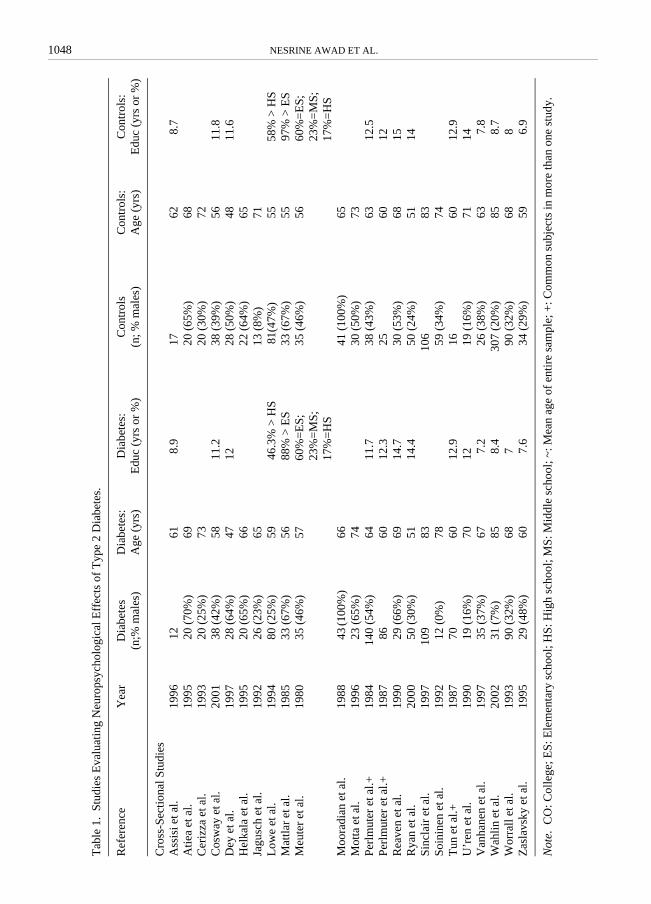
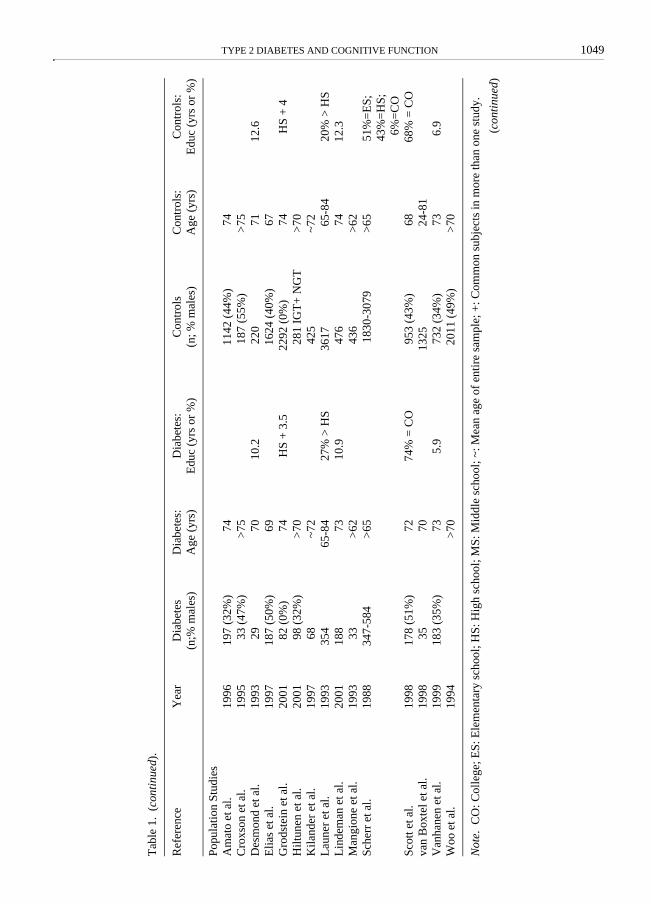
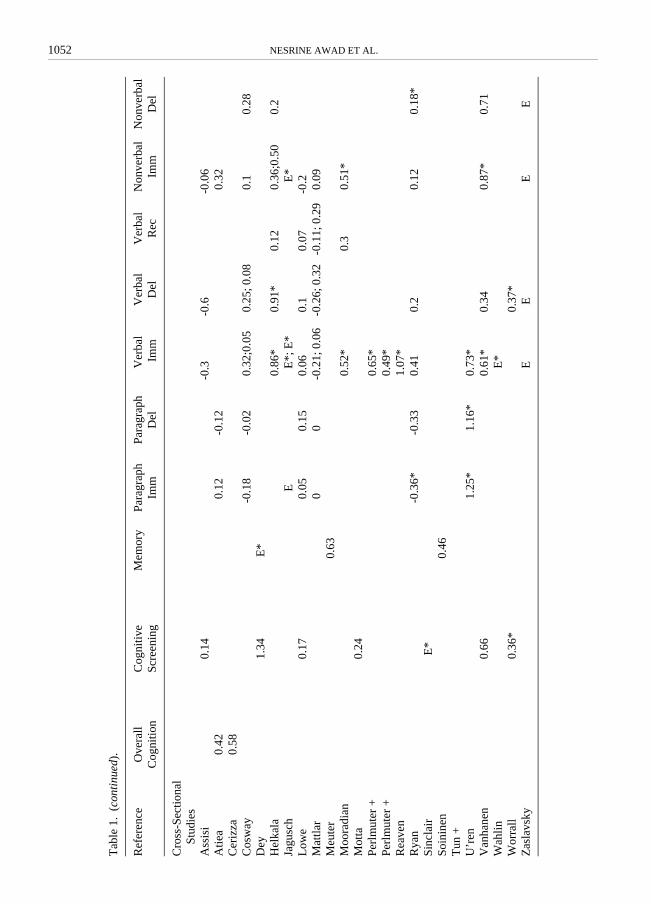
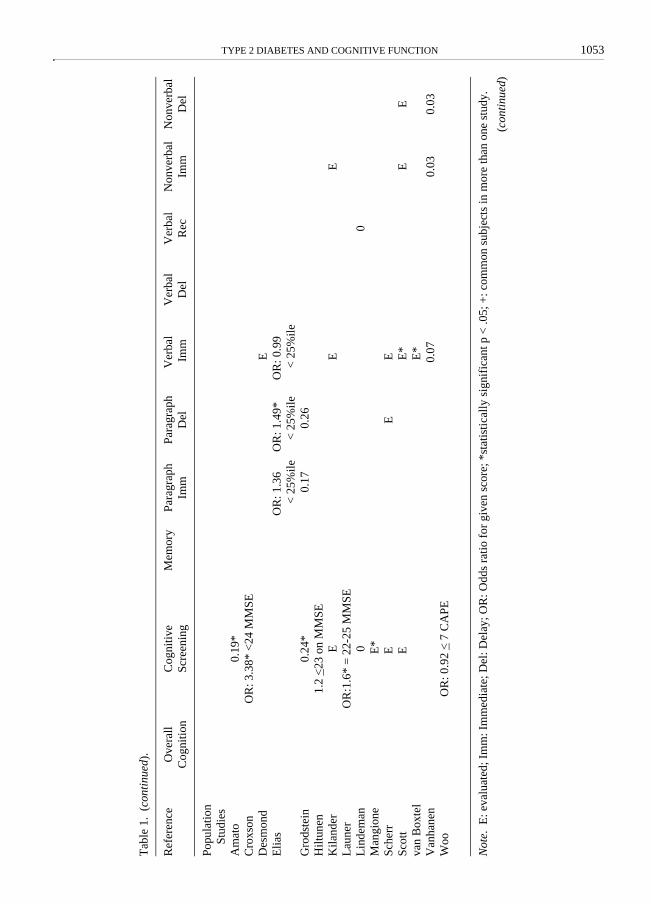
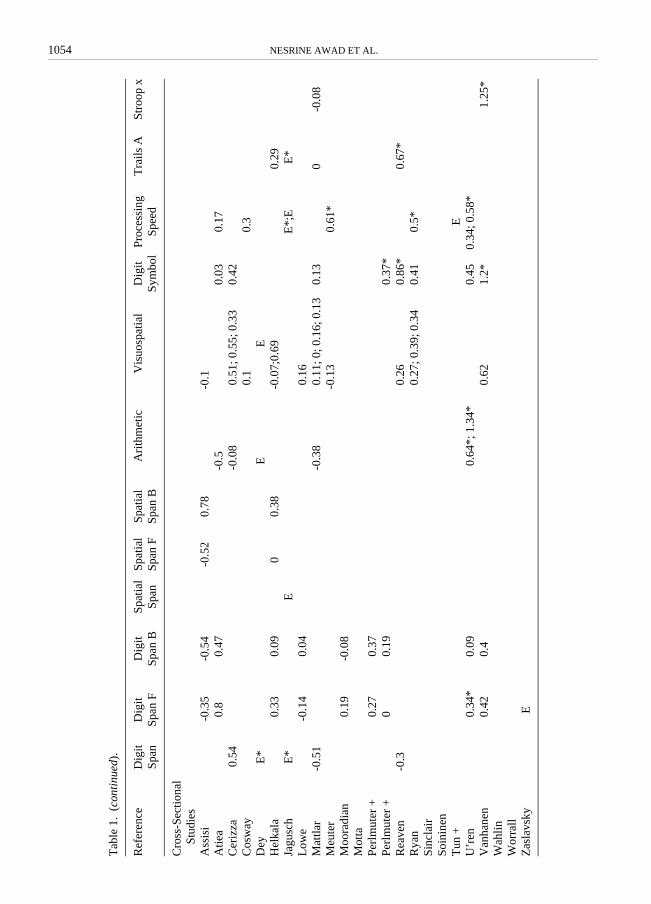
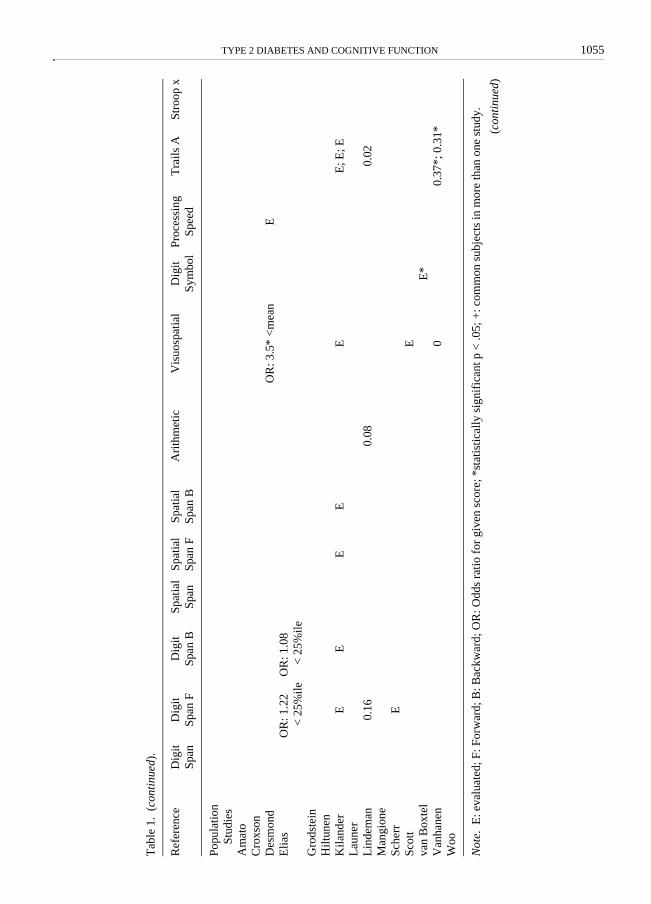
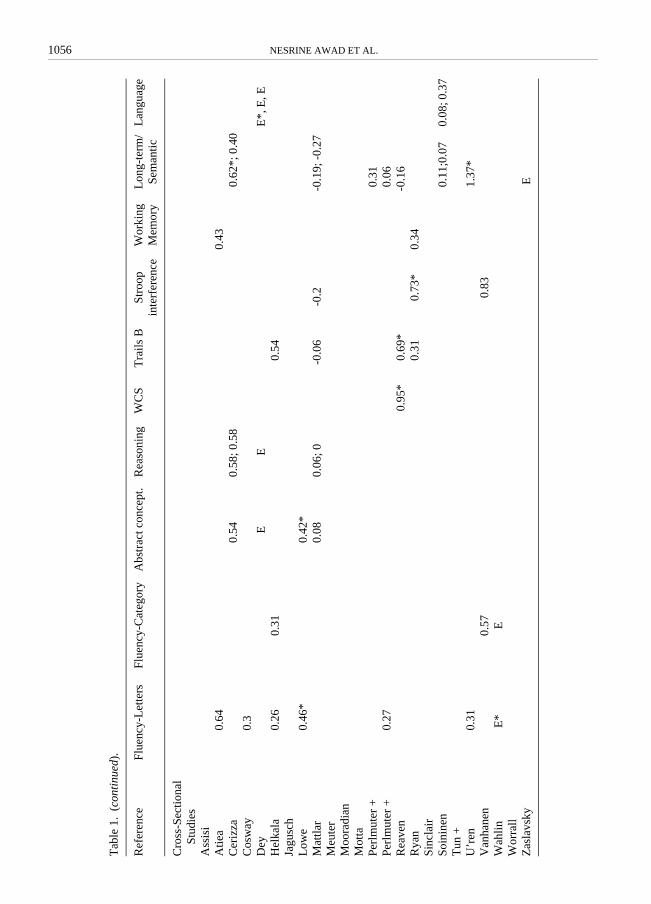
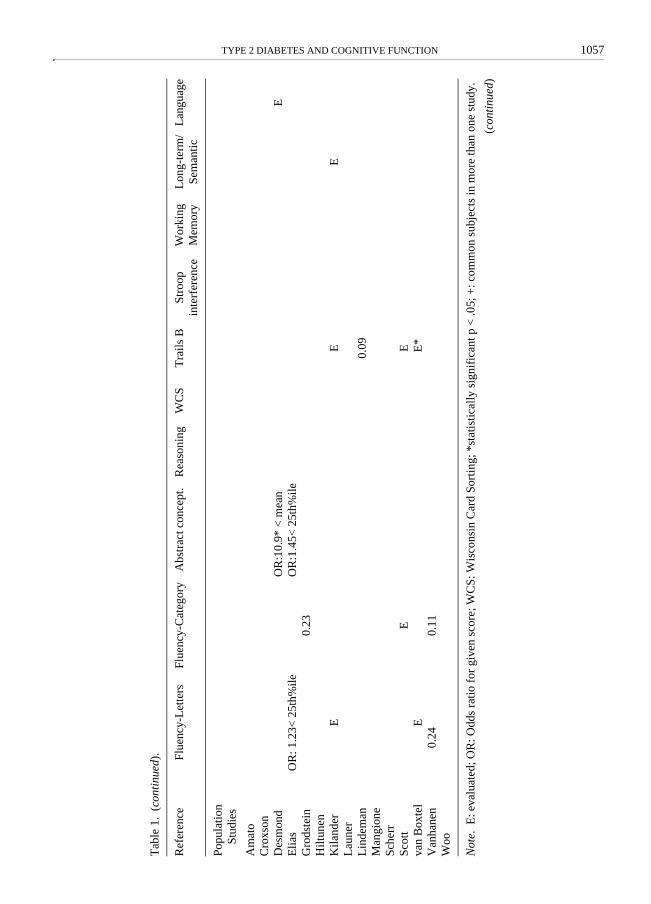
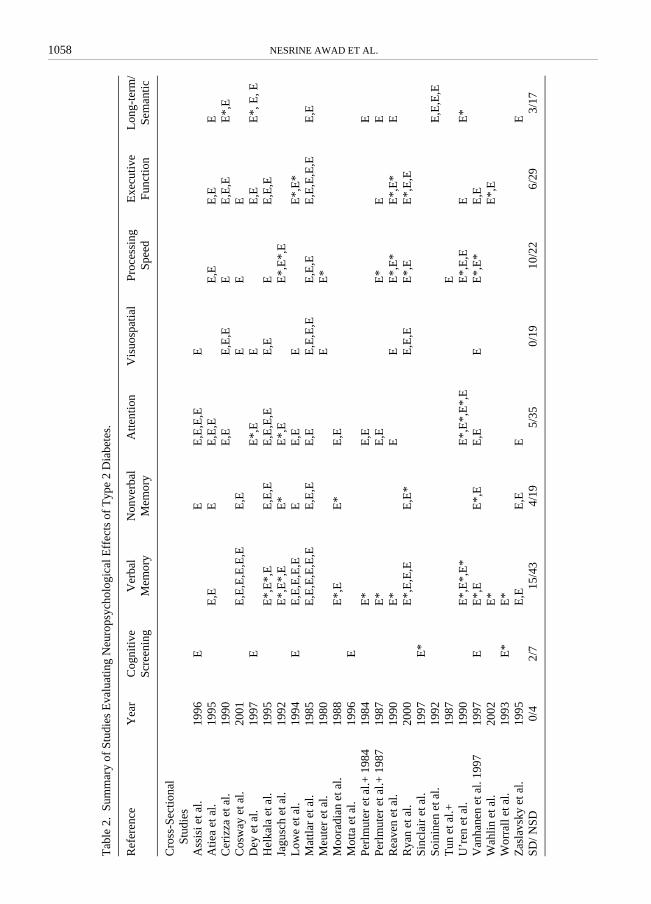
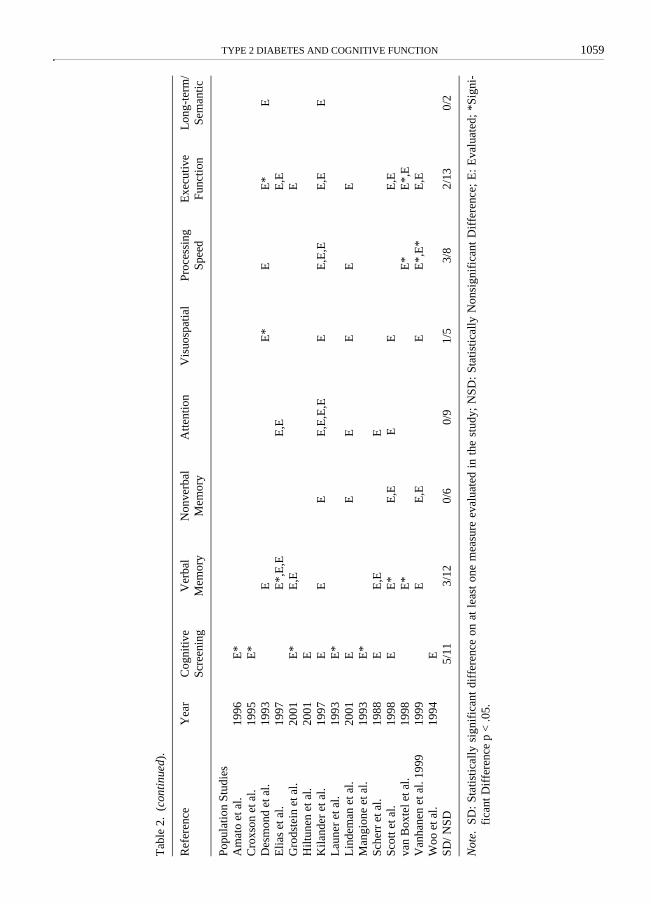
uals diagnosed with type 2 diabetes and undertreatment. These investigations differ in the demo-graphics of samples employed (age, gender, andduration of diabetes), in methodological controlas well as in the neuropsychological test per-formances evaluated rendering cross-study com-parisons difficult. Studies evaluating the cognitiveeffects of type 2 diabetes have included cross-sectional, population, and longitudinal designs.Given the heterogeneity among studies, twotables summarizing the methodology and resultsof cross-sectional and population studies will beused to integrate findings and draw commonal-ities. Table 1 provides a detailed description of thestudies and Table 2 provides an overall summaryof the results presented in Table 1 in which thefindings of specific measures were collapsed intobroader categories of neuropsychological function.
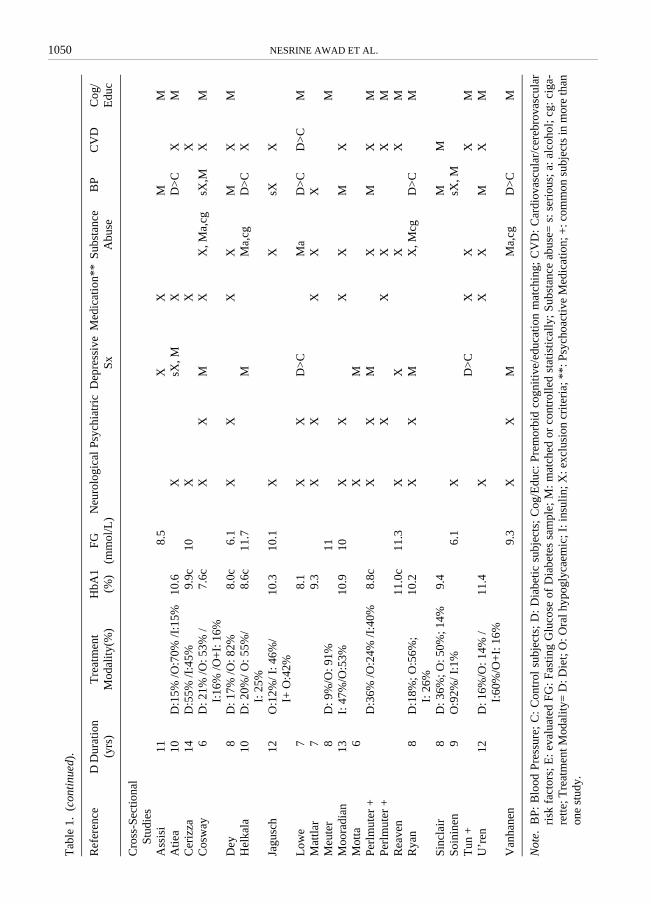
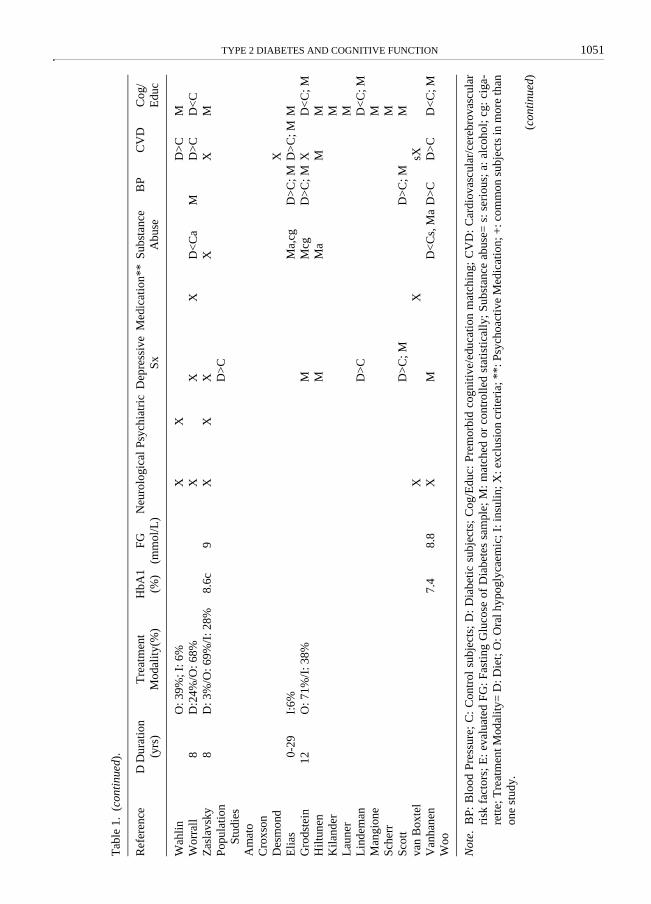
The studies included in Tables 1 and 2 havebeen obtained using PsycInfo and Medline data-bases as well as references included within pub-lications. An attempt was made to include allarticles in English evaluating cognitive effects ofType 2 diabetes. The tables include informationon demographics (number of participants andgender distribution, age, and education), diabetes(duration of diabetes, treatment modality, glyco-sylated hemoglobin (HbA1c), and fasting glucoselevels), exclusion criteria (neurological conditions,psychiatric conditions, depressive symptomat-ology, the use of psychoactive medication, sub-stance use, blood pressure, and cardiovascular andcerebrovascular disease risk factors) as well asinformation on statistical/methodological controlof premorbid cognitive function or education.Information presented on exclusion criteria andstatistical/methodological control indicate whethervariables were matched or statistically adjusted orwhether a given factor was used as an exclusioncriterion for the study (X), as well as whether dif-ferences between groups were observed using “>”or “<” signs to indicate statistically significantdifferences (p < .05).
To facilitate the integration of findings, the fol-lowing rules guided the table construction andsubsequent sections will include discussions ofrelevant data that were not included in the tables.Data for groups other than type 2 diabetes andcontrol groups were not included in the tables.
1048 NESRINE AWAD ET AL.
Tab
le 1
.St
udie
s E
valu
atin
g N
euro
psyc
holo
gica
l Eff
ects
of
Typ
e 2
Dia
bete
s.
Ref
eren
ceY
ear
Dia
bete
s (n
;% m
ales
)D
iabe
tes:
A
ge (
yrs)
Dia
bete
s:
Edu
c (y
rs o
r %
)C
ontr
ols
(n; %
mal
es)
Con
trol
s:
Age
(yr
s)C
ontr
ols:
E
duc
(yrs
or
%)
Cro
ss-S
ectio
nal S
tudi
esA
ssis
i et a
l.19
9612
618.
917
628.
7A
tiea
et a
l.19
9520
(70
%)
6920
(65
%)
68C
eriz
za e
t al.
1993
20 (
25%
)73
20 (
30%
)72
Cos
way
et a
l.20
0138
(42
%)
5811
.238
(39
%)
5611
.8D
ey e
t al.
1997
28 (
64%
)47
1228
(50
%)
4811
.6H
elka
la e
t al.
1995
20 (
65%
)66
22 (
64%
)65
Jagu
sch
et a
l.19
9226
(23
%)
6513
(8%
)71
Low
e et
al.
1994
80 (
25%
)59
46.3
% >
HS
81(4
7%)
5558
% >
HS
Mat
tlar
et a
l.19
8533
(67
%)
5688
% >
ES
33 (
67%
)55
97%
> E
SM
eute
r et
al.
1980
35 (
46%
)57
60%
=E
S;
23%
=M
S;
17%
=H
S
35 (
46%
)56
60%
=E
S;
23%
=M
S;
17%
=H
SM
oora
dian
et a
l.19
8843
(100
%)
6641
(10
0%)
65M
otta
et a
l.19
9623
(65
%)
7430
(50
%)
73Pe
rlm
uter
et a
l.+19
8414
0 (5
4%)
6411
.738
(43
%)
6312
.5Pe
rlm
uter
et a
l.+19
8786
6012
.325
6012
Rea
ven
et a
l.19
9029
(66
%)
6914
.730
(53
%)
6815
Rya
n et
al.
2000
50 (
30%
)51
14.4
50 (
24%
)51
14Si
ncla
ir e
t al.
1997
109
8310
683
Soin
inen
et a
l.19
9212
(0%
)78
59 (
34%
)74
Tun
et a
l.+19
8770
6012
.916
6012
.9U
’ren
et a
l.19
9019
(16
%)
7012
19 (
16%
)71
14V
anha
nen
et a
l.19
9735
(37
%)
677.
226
(38
%)
637.
8W
ahlin
et a
l.20
0231
(7%
)85
8.4
307
(20%
)85
8.7
Wor
rall
et a
l.19
9390
(32
%)
687
90 (
32%
)68
8Z
asla
vsky
et a
l.19
9529
(48
%)
607.
634
(29
%)
596.
9
Not
e.C
O: C
olle
ge; E
S: E
lem
enta
ry s
choo
l; H
S: H
igh
scho
ol; M
S: M
iddl
e sc
hool
; ~: M
ean
age
of e
ntir
e sa
mpl
e; +
: Com
mon
sub
ject
s in
mor
e th
an o
ne s
tudy
.
TYPE 2 DIABETES AND COGNITIVE FUNCTION 1049
Tab
le 1
.(c
onti
nued
).
Ref
eren
ceY
ear
Dia
bete
s (n
;% m
ales
)D
iabe
tes:
A
ge (
yrs)
Dia
bete
s:
Edu
c (y
rs o
r %
)C
ontr
ols
(n; %
mal
es)
Con
trol
s:
Age
(yr
s)C
ontr
ols:
E
duc
(yrs
or
%)
Popu
latio
n St
udie
sA
mat
o et
al.
1996
197
(32%
)74
1142
(44
%)
74C
roxs
on e
t al.
1995
33 (
47%
)>
7518
7 (5
5%)
>75
Des
mon
d et
al.
1993
2970
10.2
220
7112
.6E
lias
et a
l.19
9718
7 (5
0%)
6916
24 (
40%
)67
Gro
dste
in e
t al.
2001
82 (
0%)
74H
S +
3.5
2292
(0%
)74
HS
+ 4
Hilt
unen
et a
l.20
0198
(32
%)
>70
281
IGT
+ N
GT
>70
Kila
nder
et a
l.19
9768
~72
425
~72
Lau
ner
et a
l.19
9335
465
-84
27%
> H
S36
1765
-84
20%
> H
SL
inde
man
et a
l.20
0118
873
10.9
476
7412
.3M
angi
one
et a
l.19
9333
>62
436
>62
Sche
rr e
t al.
1988
347-
584
>65
1830
-307
9>
6551
%=
ES;
43
%=
HS;
6%
=C
OSc
ott e
t al.
1998
178
(51%
)72
74%
= C
O95
3 (4
3%)
6868
% =
CO
van
Box
tel e
t al.
1998
3570
1325
24-8
1V
anha
nen
et a
l.19
9918
3 (3
5%)
735.
973
2 (3
4%)
736.
9W
oo e
t al.
1994
>70
2011
(49
%)
>70
Not
e.C
O: C
olle
ge; E
S: E
lem
enta
ry s
choo
l; H
S: H
igh
scho
ol; M
S: M
iddl
e sc
hool
; ~: M
ean
age
of e
ntir
e sa
mpl
e; +
: Com
mon
sub
ject
s in
mor
e th
an o
ne s
tudy
.
(con
tinu
ed)
1050 NESRINE AWAD ET AL.
Tab
le 1
.(c
onti
nued
).
Ref
eren
ceD
Dur
atio
n (y
rs)
Tre
atm
ent
Mod
ality
(%)
HbA
1(%
)FG
(m
mol
/L)
Neu
rolo
gica
lPs
ychi
atri
cD
epre
ssiv
e S
xM
edic
atio
n**
Subs
tanc
e A
buse
BP
CV
DC
og/
Edu
c
Cro
ss-S
ectio
nal
Stud
ies
Ass
isi
118.
5X
XM
MA
tiea
10D
:15%
/O:7
0% /I
:15%
10.6
XsX
, MX
D>
CX
MC
eriz
za14
D:5
5% /I
:45%
9.9c
10X
XX
Cos
way
6D
: 21%
/O: 5
3% /
I:16
% /O
+I:
16%
7.6c
XX
MX
X, M
a,cg
sX,M
XM
Dey
8D
: 17%
/O: 8
2%8.
0c6.
1X
XX
XM
XM
Hel
kala
10D
: 20%
/ O: 5
5%/
I: 2
5%8.
6c11
.7M
Ma,
cgD
>C
X
Jagu
sch
12O
:12%
/ I: 4
6%/
I+ O
:42%
10.3
10.1
XX
sXX
Low
e7
8.1
XX
D>
CM
aD
>C
D>
CM
Mat
tlar
79.
3X
XX
XX
Meu
ter
8D
: 9%
/O: 9
1%11
MM
oora
dian
13I:
47%
/O:5
3%10
.910
XX
XX
MX
Mot
ta6
XM
Perl
mut
er +
D:3
6% /O
:24%
/I:4
0%8.
8cX
XM
XM
XM
Perl
mut
er +
XX
XX
MR
eave
n11
.0c
11.3
XX
XX
MR
yan
8D
:18%
; O:5
6%;
I: 2
6%10
.2X
XM
X, M
cgD
>C
M
Sinc
lair
8D
: 36%
; O: 5
0%; 1
4%9.
4M
MSo
inin
en9
O:9
2%/ I
:1%
6.1
XsX
, MT
un +
D>
CX
XX
MU
’ren
12D
: 16%
/O: 1
4% /
I:60
%/O
+I:
16%
11.4
XX
XM
XM
Van
hane
n9.
3X
XM
Ma,
cgD
>C
M
Not
e.B
P: B
lood
Pre
ssur
e; C
: C
ontr
ol s
ubje
cts;
D:
Dia
betic
sub
ject
s; C
og/E
duc:
Pre
mor
bid
cogn
itive
/edu
catio
n m
atch
ing;
CV
D:
Car
diov
ascu
lar/
cere
brov
ascu
lar
risk
fac
tors
; E: e
valu
ated
FG
: Fas
ting
Glu
cose
of
Dia
bete
s sa
mpl
e; M
: m
atch
ed o
r co
ntro
lled
stat
isti
cally
; Su
bsta
nce
abus
e= s
: ser
ious
; a: a
lcoh
ol; c
g: c
iga-
rette
; Tre
atm
ent M
odal
ity=
D: D
iet;
O: O
ral h
ypog
lyca
emic
; I: i
nsul
in; X
: exc
lusi
on c
rite
ria;
**:
Psy
choa
ctiv
e M
edic
atio
n; +
: com
mon
sub
ject
s in
mor
e th
anon
e st
udy.
TYPE 2 DIABETES AND COGNITIVE FUNCTION 1051
Tab
le 1
.(c
onti
nued
).
Ref
eren
ceD
Dur
atio
n (y
rs)
Tre
atm
ent
Mod
ality
(%)
HbA
1 (%
)FG
(m
mol
/L)
Neu
rolo
gica
lPs
ychi
atri
cD
epre
ssiv
e S
xM
edic
atio
n**
Subs
tanc
e A
buse
BP
CV
DC
og/
Edu
c
Wah
linO
: 39%
; I: 6
%X
XD
>C
MW
orra
ll8
D:2
4%/O
: 68%
XX
XD
<C
aM
D>
CD
<C
Zas
lavs
ky8
D: 3
%/O
: 69%
/I: 2
8%8.
6c9
XX
XX
XM
Popu
latio
n St
udie
sD
>C
Am
ato
Cro
xson
Des
mon
dX
Elia
s0-
29I:
6%M
a,cg
D>
C; M
D>
C; M
MG
rods
tein
12O
: 71%
/I: 3
8%M
Mcg
D>
C; M
XD
<C
; MH
iltun
enM
Ma
MM
Kila
nder
ML
aune
rM
Lin
dem
anD
>C
D<
C; M
Man
gion
eM
Sch
err
MSc
ott
D>
C; M
D>
C; M
Mva
n B
oxte
lX
XsX
Van
hane
n7.
48.
8X
MD
<C
s, M
aD
>C
D>
CD
<C
; MW
oo
Not
e.B
P: B
lood
Pre
ssur
e; C
: C
ontr
ol s
ubje
cts;
D:
Dia
betic
sub
ject
s; C
og/E
duc:
Pre
mor
bid
cogn
itive
/edu
catio
n m
atch
ing;
CV
D:
Car
diov
ascu
lar/
cere
brov
ascu
lar
risk
fac
tors
; E: e
valu
ated
FG
: Fas
ting
Glu
cose
of
Dia
bete
s sa
mpl
e; M
: m
atch
ed o
r co
ntro
lled
stat
isti
cally
; Su
bsta
nce
abus
e= s
: ser
ious
; a: a
lcoh
ol; c
g: c
iga-
rette
; Tre
atm
ent M
odal
ity=
D: D
iet;
O: O
ral h
ypog
lyca
emic
; I: i
nsul
in; X
: exc
lusi
on c
rite
ria;
**:
Psy
choa
ctiv
e M
edic
atio
n; +
: com
mon
sub
ject
s in
mor
e th
anon
e st
udy.
(con
tinu
ed)
1052 NESRINE AWAD ET AL.
Tab
le 1
.(c
onti
nued
).
Ref
eren
ceO
vera
ll C
ogni
tion
Cog
nitiv
e Sc
reen
ing
Mem
ory
Para
grap
h
Imm
Para
grap
h D
elV
erba
l I
mm
Ver
bal
Del
Ver
bal
Rec
Non
verb
al
Imm
Non
verb
al
Del
Cro
ss-S
ectio
nal
Stud
ies
Ass
isi
0.14
-0.3
-0.6
-0.0
6A
tiea
0.42
0.12
-0.1
20.
32C
eriz
za0.
58C
osw
ay-0
.18
-0.0
20.
32;0
.05
0.25
; 0.0
80.
10.
28D
ey1.
34E
*H
elka
la0.
86*
0.91
*0.
120.
36;0
.50
0.2
Jagu
sch
EE
*; E
*E
*L
owe
0.17
0.05
0.15
0.06
0.1
0.07
-0.2
Mat
tlar
00
-0.2
1; 0
.06
-0.2
6; 0
.32
-0.1
1; 0
.29
0.09
Meu
ter
0.63
Moo
radi
an0.
52*
0.3
0.51
*M
otta
0.24
Perl
mut
er +
0.65
*Pe
rlm
uter
+0.
49*
Rea
ven
1.07
*R
yan
-0.3
6*-0
.33
0.41
0.2
0.12
0.18
*S
incl
air
E*
Soin
inen
0.46
Tun
+U
’ren
1.25
*1.
16*
0.73
*V
anha
nen
0.66
0.61
*0.
340.
87*
0.71
Wah
lin
E*
Wor
rall
0.36
*0.
37*
Zas
lavs
kyE
EE
E
TYPE 2 DIABETES AND COGNITIVE FUNCTION 1053
Tab
le 1
.(c
onti
nued
).
Ref
eren
ceO
vera
ll C
ogni
tion
Cog
nitiv
e Sc
reen
ing
Mem
ory
Para
grap
h
Imm
Para
grap
h D
elV
erba
l I
mm
Ver
bal
Del
Ver
bal
Rec
Non
verb
al
Imm
Non
verb
al
Del
Popu
latio
n St
udie
sA
mat
o0.
19*
Cro
xson
OR
: 3.3
8* <
24 M
MSE
Des
mon
dE
Elia
sO
R: 1
.36
< 2
5%ile
OR
: 1.4
9*<
25%
ileO
R: 0
.99
< 2
5%ile
Gro
dste
in0.
24*
0.17
0.26
Hilt
unen
1.2
<23
on M
MSE
Kila
nder
EE
EL
aune
rO
R:1
.6*
= 2
2-25
MM
SEL
inde
man
00
Man
gion
eE
*Sc
herr
EE
ES
cott
EE
*E
Eva
n B
oxte
lE
*V
anha
nen
0.07
0.03
0.03
Woo
OR
: 0.9
2 <
7 C
APE
Not
e.E
: eva
luat
ed; I
mm
: Im
med
iate
; Del
: Del
ay; O
R: O
dds
ratio
for
giv
en s
core
; *st
atis
tica
lly s
igni
fica
nt p
< .0
5; +
: com
mon
sub
ject
s in
mor
e th
an o
ne s
tudy
.
(con
tinu
ed)
1054 NESRINE AWAD ET AL.
Tab
le 1
.(c
onti
nued
).
Ref
eren
ceD
igit
Spa
nD
igit
Span
FD
igit
Span
BS
patia
l Sp
anSp
atia
l Sp
an F
Spat
ial
Span
BA
rith
met
icV
isuo
spat
ial
Dig
it Sy
mbo
lPr
oces
sing
Sp
eed
Tra
ils A
Stro
op x
Cro
ss-S
ectio
nal
Stud
ies
Ass
isi
-0.3
5-0
.54
-0.5
20.
78-0
.1A
tiea
0.8
0.47
-0.5
0.03
0.17
Cer
izza
0.54
-0.0
80.
51; 0
.55;
0.3
30.
42C
osw
ay0.
10.
3D
eyE
*E
EH
elka
la0.
330.
090
0.38
-0.0
7;0.
690.
29Ja
gusc
hE
*E
E*;
EE
*L
owe
-0.1
40.
040.
16M
attla
r-0
.51
-0.3
80.
11; 0
; 0.1
6; 0
.13
0.13
0-0
.08
Meu
ter
-0.1
30.
61*
Moo
radi
an0.
19-0
.08
Mot
taPe
rlm
uter
+0.
270.
37Pe
rlm
uter
+0
0.19
0.37
*R
eave
n-0
.30.
260.
86*
0.67
*R
yan
0.27
; 0.3
9; 0
.34
0.41
0.5*
Sin
clai
rSo
inin
enT
un +
EU
’ren
0.34
*0.
090.
64*;
1.3
4*0.
450.
34; 0
.58*
Van
hane
n0.
420.
40.
621.
2*1.
25*
Wah
lin
Wor
rall
Zas
lavs
kyE
TYPE 2 DIABETES AND COGNITIVE FUNCTION 1055
Tab
le 1
.(c
onti
nued
).
Ref
eren
ceD
igit
Spa
nD
igit
Span
FD
igit
Span
BS
patia
l Sp
anSp
atia
l Sp
an F
Spat
ial
Span
BA
rith
met
icV
isuo
spat
ial
Dig
it Sy
mbo
lPr
oces
sing
Sp
eed
Tra
ils A
Stro
op x
Popu
latio
n St
udie
sA
mat
oC
roxs
onD
esm
ond
OR
: 3.5
* <
mea
nE
Elia
sO
R: 1
.22
< 2
5%ile
OR
: 1.0
8<
25%
ileG
rods
tein
Hilt
unen
Kila
nder
EE
EE
EE
; E; E
Lau
ner
Lin
dem
an0.
160.
080.
02M
angi
one
Sche
rrE
Scot
tE
van
Box
tel
E*
Van
hane
n0
0.37
*; 0
.31*
Woo
Not
e.E
: eva
luat
ed; F
: For
war
d; B
: Bac
kwar
d; O
R: O
dds
ratio
for
giv
en s
core
; *st
atis
tical
ly s
igni
fica
nt p
< .0
5; +
: com
mon
sub
ject
s in
mor
e th
an o
ne s
tudy
.
(con
tinu
ed)
1056 NESRINE AWAD ET AL.
Tab
le 1
.(c
onti
nued
).
Ref
eren
ceF
luen
cy-L
ette
rsFl
uenc
y-C
ateg
ory
Abs
trac
t con
cept
.R
easo
ning
WC
ST
rails
BSt
roop
in
terf
eren
ceW
orki
ng
Mem
ory
Lon
g-te
rm/
Sem
antic
Lan
guag
e
Cro
ss-S
ectio
nal
Stud
ies
Ass
isi
Atie
a0.
640.
43C
eriz
za0.
540.
58; 0
.58
0.62
*; 0
.40
Cos
way
0.3
Dey
EE
E*,
E, E
Hel
kala
0.26
0.31
0.54
Jagu
sch
Low
e0.
46*
0.42
*M
attla
r0.
080.
06; 0
-0.0
6-0
.2-0
.19;
-0.
27M
eute
rM
oora
dian
Mot
taPe
rlm
uter
+0.
31Pe
rlm
uter
+0.
270.
06R
eave
n0.
95*
0.69
*-0
.16
Rya
n0.
310.
73*
0.34
Sin
clai
rSo
inin
en0.
11;0
.07
0.08
; 0.3
7T
un +
U’r
en0.
311.
37*
Van
hane
n0.
570.
83W
ahli
nE
*E
Wor
rall
Zas
lavs
kyE
TYPE 2 DIABETES AND COGNITIVE FUNCTION 1057
Tab
le 1
.(c
onti
nued
).
Ref
eren
ceF
luen
cy-L
ette
rsFl
uenc
y-C
ateg
ory
Abs
trac
t con
cept
.R
easo
ning
WC
ST
rails
BSt
roop
in
terf
eren
ceW
orki
ng
Mem
ory
Lon
g-te
rm/
Sem
antic
Lan
guag
e
Popu
latio
n St
udie
s
Am
ato
Cro
xson
Des
mon
dO
R:1
0.9*
< m
ean
EE
lias
OR
: 1.2
3< 2
5th%
ileO
R:1
.45<
25t
h%ile
Gro
dste
in0.
23H
iltun
enK
iland
erE
EE
Lau
ner
Lin
dem
an0.
09M
angi
one
Sch
err
Scot
tE
Eva
n B
oxte
lE
E*
Van
hane
n0.
240.
11W
oo
Not
e.E
: eva
luat
ed; O
R: O
dds
ratio
for
giv
en s
core
; WC
S: W
isco
nsin
Car
d So
rtin
g; *
stat
istic
ally
sig
nifi
cant
p <
.05;
+: c
omm
on s
ubje
cts
in m
ore
than
one
stu
dy.
(con
tinu
ed)
1058 NESRINE AWAD ET AL.
Tab
le 2
.Su
mm
ary
of S
tudi
es E
valu
atin
g N
euro
psyc
holo
gica
l Eff
ects
of
Typ
e 2
Dia
bete
s.
Ref
eren
ceY
ear
Cog
nitiv
e Sc
reen
ing
Ver
bal
Mem
ory
Non
verb
al
Mem
ory
Atte
ntio
nV
isuo
spat
ial
Proc
essi
ng
Spee
dE
xecu
tive
Func
tion
Lon
g-te
rm/
Sem
antic
Cro
ss-S
ectio
nal
Stud
ies
Ass
isi e
t al.
1996
EE
E,E
,E,E
EA
tiea
et a
l.19
95E
,EE
E,E
,EE
,EE
,EE
Cer
izza
et a
l.19
90E
,EE
,E,E
EE
,E,E
E*,
EC
osw
ay e
t al.
2001
E,E
,E,E
,E,E
E,E
EE
ED
ey e
t al.
1997
EE
*,E
EE
,EE
*, E
, EH
elka
la e
t al.
1995
E*,
E*,
EE
,E,E
E,E
,E,E
E,E
EE
,E,E
Jagu
sch
et a
l.19
92E
*,E
*,E
E*
E*,
EE
*,E
*,E
Low
e et
al.
1994
EE
,E,E
,E,E
EE
,EE
E*,
E*
Mat
tlar
et a
l.19
85E
,E,E
,E,E
,EE
,E,E
E,E
E,E
,E,E
E,E
,EE
,E,E
,E,E
E,E
Meu
ter
et a
l.19
80E
E*
Moo
radi
an e
t al.
1988
E*,
EE
*E
,EM
otta
et a
l.19
96E
Perl
mut
er e
t al.+
198
419
84E
*E
,EE
Perl
mut
er e
t al.+
198
719
87E
*E
,EE
*E
ER
eave
n et
al.
1990
E*
EE
E*,
E*
E*,
E*
ER
yan
et a
l.20
00E
*,E
,E,E
E,E
*E
,E,E
E*,
EE
*,E
,ESi
ncla
ir e
t al.
1997
E*
Soin
inen
et a
l.19
92E
,E,E
,ET
un e
t al.+
1987
EU
’ren
et a
l.19
90E
*,E
*,E
*E
*,E
*,E
*,E
E*,
E,E
EE
*V
anha
nen
et a
l. 19
9719
97E
E*,
EE
*,E
E,E
EE
*,E
*E
,EW
ahlin
et a
l.20
02E
*E
*,E
Wor
rall
et a
l.19
93E
*E
*Z
asla
vsky
et a
l.19
95E
,EE
,EE
ESD
/ NSD
0/4
2/7
15/4
34/
195/
350/
1910
/22
6/29
3/17
TYPE 2 DIABETES AND COGNITIVE FUNCTION 1059
Tab
le 2
.(c
onti
nued
).
Ref
eren
ceY
ear
Cog
nitiv
e Sc
reen
ing
Ver
bal
Mem
ory
Non
verb
al
Mem
ory
Atte
ntio
nV
isuo
spat
ial
Proc
essi
ng
Spee
dE
xecu
tive
Func
tion
Lon
g-te
rm/
Sem
antic
Popu
latio
n St
udie
sA
mat
o et
al.
1996
E*
Cro
xson
et a
l.19
95E
*D
esm
ond
et a
l.19
93E
E*
EE
*E
Elia
s et
al.
1997
E*,
E,E
E,E
E,E
Gro
dste
in e
t al.
2001
E*
E,E
EH
iltun
en e
t al.
2001
EK
iland
er e
t al.
1997
EE
EE
,E,E
,EE
E,E
,EE
,EE
Lau
ner
et a
l.19
93E
*L
inde
man
et a
l.20
01E
EE
EE
EM
angi
one
et a
l.19
93E
*Sc
herr
et a
l.19
88E
E,E
ESc
ott e
t al.
1998
EE
*E
,EE
EE
,Eva
n B
oxte
l et a
l.19
98E
*E
*E
*,E
Van
hane
n et
al.
1999
1999
EE
,EE
E*,
E*
E,E
Woo
et a
l.19
94E
SD
/ NSD
5/11
3/12
0/6
0/9
1/5
3/8
2/13
0/2
Not
e.SD
: St
atis
tica
lly s
igni
fica
nt d
iffe
renc
e on
at
leas
t on
e m
easu
re e
valu
ated
in
the
stud
y; N
SD:
Stat
istic
ally
Non
sign
ific
ant
Dif
fere
nce;
E:
Eva
luat
ed;
*Sig
ni-
fica
nt D
iffe
renc
e p
< .0
5.
1060 NESRINE AWAD ET AL.
Data from multiple studies using the same samplewere only presented once to prevent overrepre-sentation of the same data. In addition, for studiesevaluating subtypes of type 2 diabetes groups,only data from one type 2 diabetes group werepresented. The choice of the type 2 diabetes groupincluded was dependent on its comparability withthe type 2 diabetes groups in the other studies. Assuch, the table included the following type 2diabetes groups: patients with recognized type 2diabetes (Vanhanen et al., 1997); type 2 diabeticpatients without hypertension (Atiea, Moses, &Sinclair, 1995); type 2 diabetic patients with noevidence of dementia (Motta et al., 1996); drug-treated diabetic patients (Soininen, Puranen,Helkala, Laakso, & Riekkinen, 1992); type 2 dia-betic patients without autonomic polyneuropathy(Zaslavsky, Gross, Chaves, & Machado, 1995).Finally, younger type 2 diabetes group (mean age:60 years) were included because of the larger con-trol group (Perlmuter, Tun, Sizer, McGlinchey, &Nathan, 1987; Tun, Perlmuter, Russo, & Nathan,1987) and the reduced incidence of other patholo-gies in the younger groups.
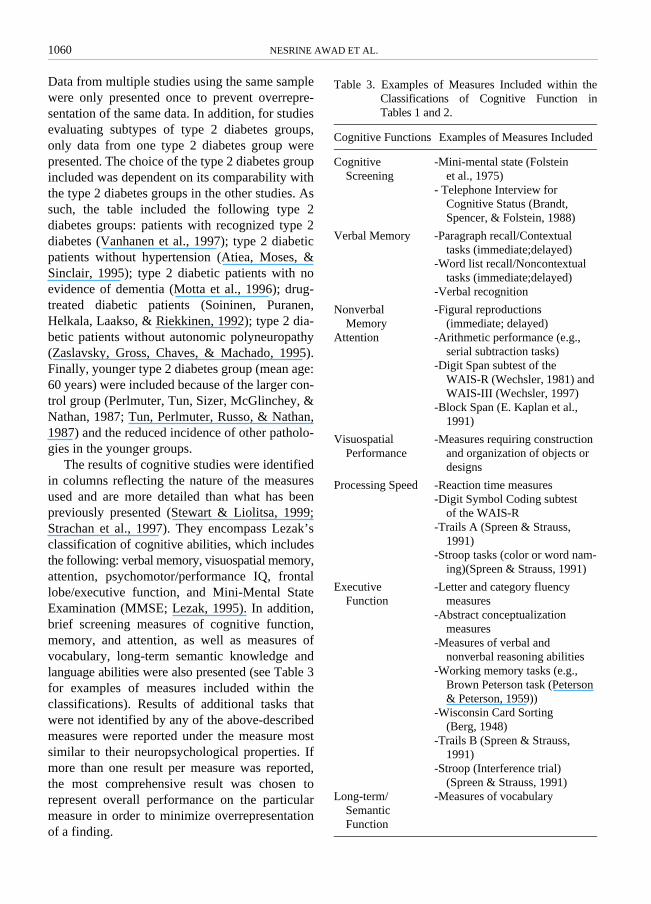
The results of cognitive studies were identifiedin columns reflecting the nature of the measuresused and are more detailed than what has beenpreviously presented (Stewart & Liolitsa, 1999;Strachan et al., 1997). They encompass Lezak’sclassification of cognitive abilities, which includesthe following: verbal memory, visuospatial memory,attention, psychomotor/performance IQ, frontallobe/executive function, and Mini-Mental StateExamination (MMSE; Lezak, 1995). In addition,brief screening measures of cognitive function,memory, and attention, as well as measures ofvocabulary, long-term semantic knowledge andlanguage abilities were also presented (see Table 3for examples of measures included within theclassifications). Results of additional tasks thatwere not identified by any of the above-describedmeasures were reported under the measure mostsimilar to their neuropsychological properties. Ifmore than one result per measure was reported,the most comprehensive result was chosen torepresent overall performance on the particularmeasure in order to minimize overrepresentationof a finding.
Table 3. Examples of Measures Included within theClassifications of Cognitive Function inTables 1 and 2.
Cognitive Functions Examples of Measures Included
Cognitive Screening
-Mini-mental state (Folstein et al., 1975)
- Telephone Interview for Cognitive Status (Brandt, Spencer, & Folstein, 1988)
Verbal Memory -Paragraph recall/Contextual tasks (immediate;delayed)
-Word list recall/Noncontextual tasks (immediate;delayed)
-Verbal recognition
Nonverbal Memory
-Figural reproductions (immediate; delayed)
Attention -Arithmetic performance (e.g., serial subtraction tasks)
-Digit Span subtest of the WAIS-R (Wechsler, 1981) and WAIS-III (Wechsler, 1997)
-Block Span (E. Kaplan et al., 1991)
Visuospatial Performance
-Measures requiring construction and organization of objects or designs
Processing Speed -Reaction time measures-Digit Symbol Coding subtest
of the WAIS-R-Trails A (Spreen & Strauss,
1991)-Stroop tasks (color or word nam-
ing)(Spreen & Strauss, 1991)
Executive Function
-Letter and category fluency measures
-Abstract conceptualization measures
-Measures of verbal and nonverbal reasoning abilities
-Working memory tasks (e.g., Brown Peterson task (Peterson & Peterson, 1959))
-Wisconsin Card Sorting (Berg, 1948)
-Trails B (Spreen & Strauss, 1991)
-Stroop (Interference trial) (Spreen & Strauss, 1991)
Long-term/Semantic Function
-Measures of vocabulary
TYPE 2 DIABETES AND COGNITIVE FUNCTION 1061
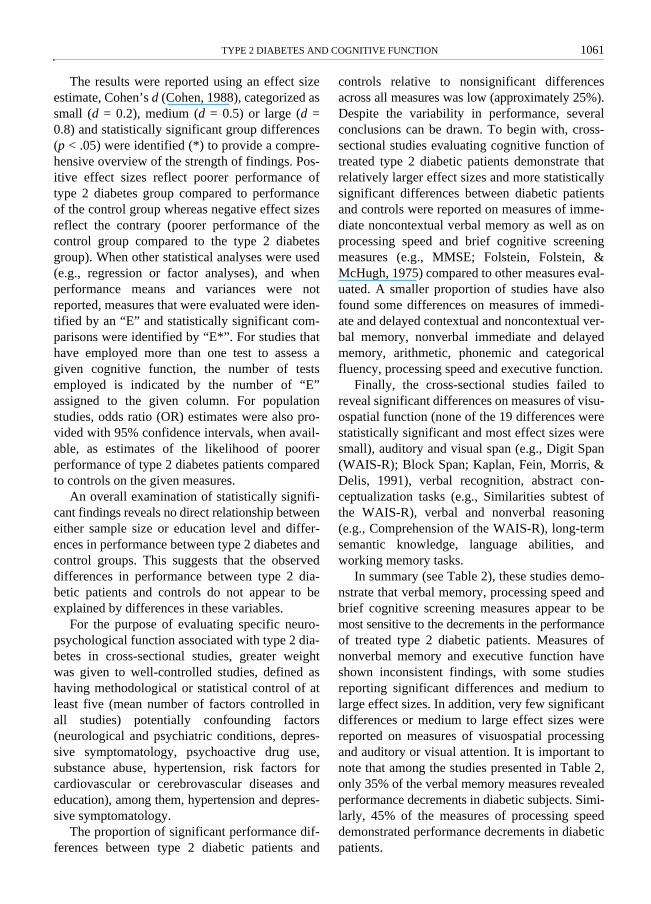
The results were reported using an effect sizeestimate, Cohen’s d (Cohen, 1988), categorized assmall (d = 0.2), medium (d = 0.5) or large (d =0.8) and statistically significant group differences(p < .05) were identified (*) to provide a compre-hensive overview of the strength of findings. Pos-itive effect sizes reflect poorer performance oftype 2 diabetes group compared to performanceof the control group whereas negative effect sizesreflect the contrary (poorer performance of thecontrol group compared to the type 2 diabetesgroup). When other statistical analyses were used(e.g., regression or factor analyses), and whenperformance means and variances were notreported, measures that were evaluated were iden-tified by an “E” and statistically significant com-parisons were identified by “E*”. For studies thathave employed more than one test to assess agiven cognitive function, the number of testsemployed is indicated by the number of “E”assigned to the given column. For populationstudies, odds ratio (OR) estimates were also pro-vided with 95% confidence intervals, when avail-able, as estimates of the likelihood of poorerperformance of type 2 diabetes patients comparedto controls on the given measures.
An overall examination of statistically signifi-cant findings reveals no direct relationship betweeneither sample size or education level and differ-ences in performance between type 2 diabetes andcontrol groups. This suggests that the observeddifferences in performance between type 2 dia-betic patients and controls do not appear to beexplained by differences in these variables.
For the purpose of evaluating specific neuro-psychological function associated with type 2 dia-betes in cross-sectional studies, greater weightwas given to well-controlled studies, defined ashaving methodological or statistical control of atleast five (mean number of factors controlled inall studies) potentially confounding factors(neurological and psychiatric conditions, depres-sive symptomatology, psychoactive drug use,substance abuse, hypertension, risk factors forcardiovascular or cerebrovascular diseases andeducation), among them, hypertension and depres-sive symptomatology.
The proportion of significant performance dif-ferences between type 2 diabetic patients and
controls relative to nonsignificant differencesacross all measures was low (approximately 25%).Despite the variability in performance, severalconclusions can be drawn. To begin with, cross-sectional studies evaluating cognitive function oftreated type 2 diabetic patients demonstrate thatrelatively larger effect sizes and more statisticallysignificant differences between diabetic patientsand controls were reported on measures of imme-diate noncontextual verbal memory as well as onprocessing speed and brief cognitive screeningmeasures (e.g., MMSE; Folstein, Folstein, &McHugh, 1975) compared to other measures eval-uated. A smaller proportion of studies have alsofound some differences on measures of immedi-ate and delayed contextual and noncontextual ver-bal memory, nonverbal immediate and delayedmemory, arithmetic, phonemic and categoricalfluency, processing speed and executive function.
Finally, the cross-sectional studies failed toreveal significant differences on measures of visu-ospatial function (none of the 19 differences werestatistically significant and most effect sizes weresmall), auditory and visual span (e.g., Digit Span(WAIS-R); Block Span; Kaplan, Fein, Morris, &Delis, 1991), verbal recognition, abstract con-ceptualization tasks (e.g., Similarities subtest ofthe WAIS-R), verbal and nonverbal reasoning(e.g., Comprehension of the WAIS-R), long-termsemantic knowledge, language abilities, andworking memory tasks.
In summary (see Table 2), these studies demo-nstrate that verbal memory, processing speed andbrief cognitive screening measures appear to bemost sensitive to the decrements in the performanceof treated type 2 diabetic patients. Measures ofnonverbal memory and executive function haveshown inconsistent findings, with some studiesreporting significant differences and medium tolarge effect sizes. In addition, very few significantdifferences or medium to large effect sizes werereported on measures of visuospatial processingand auditory or visual attention. It is important tonote that among the studies presented in Table 2,only 35% of the verbal memory measures revealedperformance decrements in diabetic subjects. Simi-larly, 45% of the measures of processing speeddemonstrated performance decrements in diabeticpatients.
1062 NESRINE AWAD ET AL.
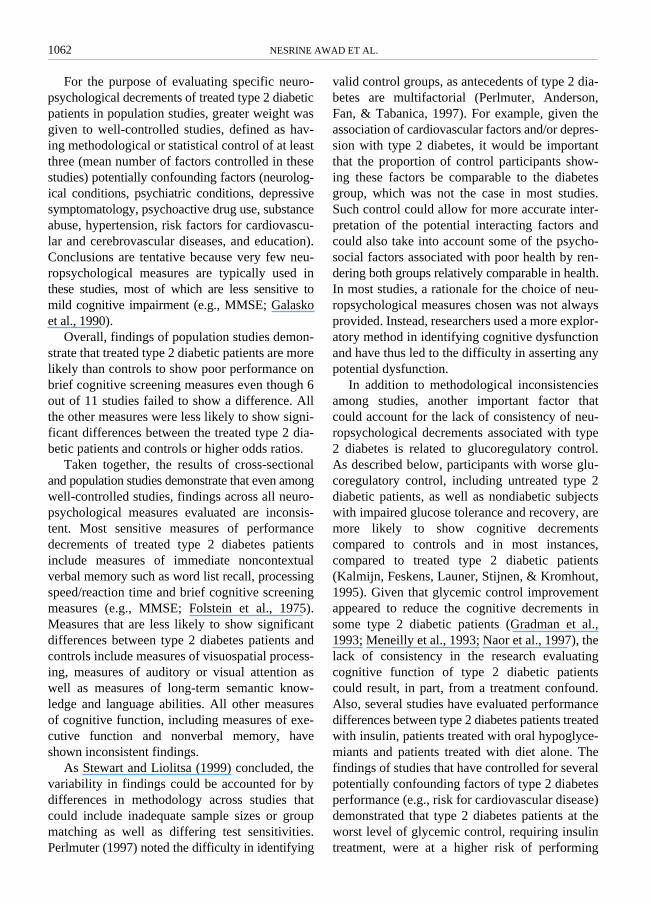
For the purpose of evaluating specific neuro-psychological decrements of treated type 2 diabeticpatients in population studies, greater weight wasgiven to well-controlled studies, defined as hav-ing methodological or statistical control of at leastthree (mean number of factors controlled in thesestudies) potentially confounding factors (neurolog-ical conditions, psychiatric conditions, depressivesymptomatology, psychoactive drug use, substanceabuse, hypertension, risk factors for cardiovascu-lar and cerebrovascular diseases, and education).Conclusions are tentative because very few neu-ropsychological measures are typically used inthese studies, most of which are less sensitive tomild cognitive impairment (e.g., MMSE; Galaskoet al., 1990).
Overall, findings of population studies demon-strate that treated type 2 diabetic patients are morelikely than controls to show poor performance onbrief cognitive screening measures even though 6out of 11 studies failed to show a difference. Allthe other measures were less likely to show signi-ficant differences between the treated type 2 dia-betic patients and controls or higher odds ratios.
Taken together, the results of cross-sectionaland population studies demonstrate that even amongwell-controlled studies, findings across all neuro-psychological measures evaluated are inconsis-tent. Most sensitive measures of performancedecrements of treated type 2 diabetes patientsinclude measures of immediate noncontextualverbal memory such as word list recall, processingspeed/reaction time and brief cognitive screeningmeasures (e.g., MMSE; Folstein et al., 1975).Measures that are less likely to show significantdifferences between type 2 diabetes patients andcontrols include measures of visuospatial process-ing, measures of auditory or visual attention aswell as measures of long-term semantic know-ledge and language abilities. All other measuresof cognitive function, including measures of exe-cutive function and nonverbal memory, haveshown inconsistent findings.
As Stewart and Liolitsa (1999) concluded, thevariability in findings could be accounted for bydifferences in methodology across studies thatcould include inadequate sample sizes or groupmatching as well as differing test sensitivities.Perlmuter (1997) noted the difficulty in identifying
valid control groups, as antecedents of type 2 dia-betes are multifactorial (Perlmuter, Anderson,Fan, & Tabanica, 1997). For example, given theassociation of cardiovascular factors and/or depres-sion with type 2 diabetes, it would be importantthat the proportion of control participants show-ing these factors be comparable to the diabetesgroup, which was not the case in most studies.Such control could allow for more accurate inter-pretation of the potential interacting factors andcould also take into account some of the psycho-social factors associated with poor health by ren-dering both groups relatively comparable in health.In most studies, a rationale for the choice of neu-ropsychological measures chosen was not alwaysprovided. Instead, researchers used a more explor-atory method in identifying cognitive dysfunctionand have thus led to the difficulty in asserting anypotential dysfunction.
In addition to methodological inconsistenciesamong studies, another important factor thatcould account for the lack of consistency of neu-ropsychological decrements associated with type2 diabetes is related to glucoregulatory control.As described below, participants with worse glu-coregulatory control, including untreated type 2diabetic patients, as well as nondiabetic subjectswith impaired glucose tolerance and recovery, aremore likely to show cognitive decrementscompared to controls and in most instances,compared to treated type 2 diabetic patients(Kalmijn, Feskens, Launer, Stijnen, & Kromhout,1995). Given that glycemic control improvementappeared to reduce the cognitive decrements insome type 2 diabetic patients (Gradman et al.,1993; Meneilly et al., 1993; Naor et al., 1997), thelack of consistency in the research evaluatingcognitive function of type 2 diabetic patientscould result, in part, from a treatment confound.Also, several studies have evaluated performancedifferences between type 2 diabetes patients treatedwith insulin, patients treated with oral hypoglyce-miants and patients treated with diet alone. Thefindings of studies that have controlled for severalpotentially confounding factors of type 2 diabetesperformance (e.g., risk for cardiovascular disease)demonstrated that type 2 diabetes patients at theworst level of glycemic control, requiring insulintreatment, were at a higher risk of performing
TYPE 2 DIABETES AND COGNITIVE FUNCTION 1063
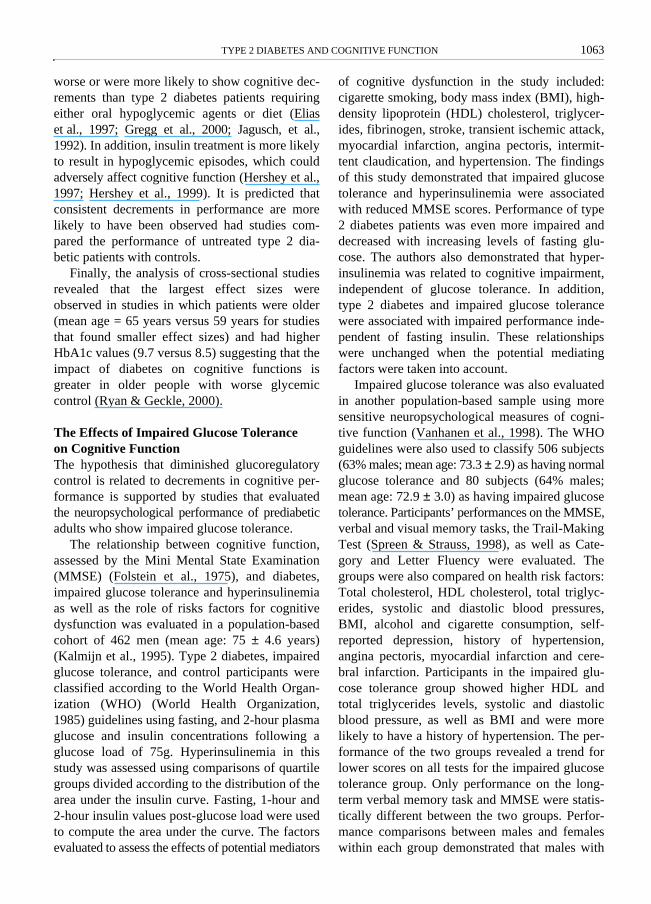
worse or were more likely to show cognitive dec-rements than type 2 diabetes patients requiringeither oral hypoglycemic agents or diet (Eliaset al., 1997; Gregg et al., 2000; Jagusch, et al.,1992). In addition, insulin treatment is more likelyto result in hypoglycemic episodes, which couldadversely affect cognitive function (Hershey et al.,1997; Hershey et al., 1999). It is predicted thatconsistent decrements in performance are morelikely to have been observed had studies com-pared the performance of untreated type 2 dia-betic patients with controls.
Finally, the analysis of cross-sectional studiesrevealed that the largest effect sizes wereobserved in studies in which patients were older(mean age = 65 years versus 59 years for studiesthat found smaller effect sizes) and had higherHbA1c values (9.7 versus 8.5) suggesting that theimpact of diabetes on cognitive functions isgreater in older people with worse glycemiccontrol (Ryan & Geckle, 2000).
The Effects of Impaired Glucose Tolerance on Cognitive FunctionThe hypothesis that diminished glucoregulatorycontrol is related to decrements in cognitive per-formance is supported by studies that evaluatedthe neuropsychological performance of prediabeticadults who show impaired glucose tolerance.
The relationship between cognitive function,assessed by the Mini Mental State Examination(MMSE) (Folstein et al., 1975), and diabetes,impaired glucose tolerance and hyperinsulinemiaas well as the role of risks factors for cognitivedysfunction was evaluated in a population-basedcohort of 462 men (mean age: 75 ± 4.6 years)(Kalmijn et al., 1995). Type 2 diabetes, impairedglucose tolerance, and control participants wereclassified according to the World Health Organ-ization (WHO) (World Health Organization,1985) guidelines using fasting, and 2-hour plasmaglucose and insulin concentrations following aglucose load of 75g. Hyperinsulinemia in thisstudy was assessed using comparisons of quartilegroups divided according to the distribution of thearea under the insulin curve. Fasting, 1-hour and2-hour insulin values post-glucose load were usedto compute the area under the curve. The factorsevaluated to assess the effects of potential mediators
of cognitive dysfunction in the study included:cigarette smoking, body mass index (BMI), high-density lipoprotein (HDL) cholesterol, triglycer-ides, fibrinogen, stroke, transient ischemic attack,myocardial infarction, angina pectoris, intermit-tent claudication, and hypertension. The findingsof this study demonstrated that impaired glucosetolerance and hyperinsulinemia were associatedwith reduced MMSE scores. Performance of type2 diabetes patients was even more impaired anddecreased with increasing levels of fasting glu-cose. The authors also demonstrated that hyper-insulinemia was related to cognitive impairment,independent of glucose tolerance. In addition,type 2 diabetes and impaired glucose tolerancewere associated with impaired performance inde-pendent of fasting insulin. These relationshipswere unchanged when the potential mediatingfactors were taken into account.
Impaired glucose tolerance was also evaluatedin another population-based sample using moresensitive neuropsychological measures of cogni-tive function (Vanhanen et al., 1998). The WHOguidelines were also used to classify 506 subjects(63% males; mean age: 73.3 ± 2.9) as having normalglucose tolerance and 80 subjects (64% males;mean age: 72.9 ± 3.0) as having impaired glucosetolerance. Participants’ performances on the MMSE,verbal and visual memory tasks, the Trail-MakingTest (Spreen & Strauss, 1998), as well as Cate-gory and Letter Fluency were evaluated. Thegroups were also compared on health risk factors:Total cholesterol, HDL cholesterol, total triglyc-erides, systolic and diastolic blood pressures,BMI, alcohol and cigarette consumption, self-reported depression, history of hypertension,angina pectoris, myocardial infarction and cere-bral infarction. Participants in the impaired glu-cose tolerance group showed higher HDL andtotal triglycerides levels, systolic and diastolicblood pressure, as well as BMI and were morelikely to have a history of hypertension. The per-formance of the two groups revealed a trend forlower scores on all tests for the impaired glucosetolerance group. Only performance on the long-term verbal memory task and MMSE were statis-tically different between the two groups. Perfor-mance comparisons between males and femaleswithin each group demonstrated that males with
1064 NESRINE AWAD ET AL.
impaired glucose tolerance were significantly worsethan males with normal glucose tolerance and allfemales. The authors also ran a multiple stepwiselinear regression using age, education, sex, hyper-tension, 2-hour glucose and insulin to predict per-formance on the MMSE. Results of these analysesrevealed that whereas age and education wereassociated with MMSE scores in the normal glu-cose tolerance group, age, education and 2-hourinsulin levels were associated with MMSE scoresin the impaired glucose tolerance group.
In a third study, cognitive performance of type2 diabetes patients (n = 26) was compared to theperformance of normoglycemic older adults withincreased risk for developing type 2 diabetes (n =22) and to the performance normoglycemic olderadults with low risk for developing type 2 diabe-tes (n = 26; Vanhanen et al., 1997). The riskgroups were classified using median 2-hour glu-cose and insulin plasma levels following a 75g.glucose load: Low risk participants showed glu-cose and insulin levels below 5.9 mmol/l and279.6 pmol/l, respectively, and high risk parti-cipants showed levels above these medians. Usingage, education, and sex as covariates, type 2 dia-betes patients were impaired on a verbal andvisual memory task, a response inhibition test (theStroop color test; Spreen & Strauss, 1998), and aprocessing speed task (the Digit Symbol test;Wechsler, 1987) compared to the low risk group.The high-risk participants also showed decre-ments on these tasks as well as on a verbal flu-ency task compared to the low-risk group. Type 2diabetes and high-risk participants were compar-able on all measures evaluated. The authors attrib-uted the performance decrements of the high-riskgroup to hyperinsulinemia as reflected by parti-cipants’ elevated insulin levels and BMI.
However, in a recent study, decrements in cog-nitive function were not associated with impairedglucose tolerance (Lindeman et al., 2001).Lindemann et al. (2001) compared 188 type 2diabetes patients to 175 impaired glucose toler-ance patients and 476 normal glucose toleranceparticipants on measures of attention, memory,visuospatial functioning and cognitive flexibility.They observed that the type 2 diabetes and impairedglucose tolerance patients were comparable to thenormal glucose tolerance participants on all
measures except for the visuospatial measure (penta-gon drawing) on which the impaired glucose tole-rance group demonstrated superior performancecompared to the other two groups.
The findings of this study are difficult to inter-pret because the three groups were differentiallytreated: The impaired glucose tolerance and nor-mal glucose tolerance groups and only half of thetype 2 diabetic patients (who had been previouslydiagnosed with diabetes) ingested 75g of glucoseprior to cognitive assessment. This creates a con-found because a number of studies have nowestablished that ingestion of glucose (50–75g) candifferentially affect cognitive performance inyoung and older people, depending on their glu-coregulatory status (Awad, Gagnon, Desrochers,Tsiakas, & Messier, 2002; Craft et al., 1994;Donohoe & Benton, 2000; Kaplan et al., 1999;Kaplan et al., 2000; Kaplan et al., 2001; Manning,Hall, & Gold, 1990; Manning, Parsons, & Gold,1992; Messier, Desrochers, & Gagnon, 1999;Messier, Gagnon, & Knott, 1997; Messier, Pierre,Desrochers, & Gravel, 1998; Messier et al.,2003). In some of these studies, older or youngerpeople were separated into two groups based onthe results of a glucose tolerance test: Those withbetter glucoregulation and those with poorer glu-coregulation. Participants were tested twice, onceafter drinking a saccharin solution and once afterdrinking a glucose solution. In general, thesestudies show that glucose ingestion improves thecognitive performance (particularly verbal mem-ory) of people with poor glucoregulation (i.e. whotend to have impaired glucose tolerance).
It is important to note that the effect of glucoseon cognitive performance was not due to the factthat people do not perform well when fasted sincethe effect of glucose follows an inverted U-shapeddose-response curve consistent with a pharmaco-logical effect and that performance on measureslikely affected by fasting/hypoglycemia such asprocessing speed, do not show any effect ofglucose ingestion (Manning et al., 1992; Manninget al., 1998). In these experiments, the effect ofglucose on memory also occurred when glucosewas given after the initial learning suggesting thatglucose retroactively enhanced memory.
Therefore, it is possible that in studies thathave tested cognitive performance during an oral
TYPE 2 DIABETES AND COGNITIVE FUNCTION 1065
glucose tolerance test, glucose improved thecognitive performance in the impaired glucosetolerance group rendering the comparisons con-founded with the impact of ingesting glucose, par-ticularly in older people where the impact ofglucose and impaired glucose regulation are thegreatest (Messier et al., 2003). We recently foundthat poor glucoregulation was associated withpoorer attentional processes, verbal memory andexecutive functions only in individuals over theage of 72 years with poor glucose tolerance andthat these deficits were partially alleviated by a 50g oral glucose load (Messier et al., 2003).
These results are important in two ways. First,they underscore the necessity of separating theneuropsychological testing from the assessmentof glucose tolerance to prevent this confound, par-ticularly in people with impaired glucose toler-ance. Secondly, they provide indirect evidencethat poor glucose tolerance, particularly in olderadults, is associated with similar cognitive deficitsthat have been described in diabetic patients.
In this section, we have described the few stud-ies that have examined the impact of impairedglucose tolerance on cognitive functions. Collec-tively, these studies demonstrate the presence ofmild cognitive deficits in people with impairedglucose tolerance. The results of studies that havecompared performance of these subjects afterdrinking a glucose solution suggest that the defi-cits can be attenuated. A number of possiblemechanisms have been studied in animals to try toexplain this phenomenon. We will now relatethose briefly.
Underlying Mechanisms Associated with Cognitive Dysfunction in Impaired Glucose Tolerance/Recovery
Glucose and Brain Function. Glucose is the pri-mary energy substrate of the brain. The humanbrain, which constitutes only 2% of the bodyweight, utilizes approximately 25% of total bodyglucose (Magistretti & Pellerin, 1996). The break-down of glucose also provides necessary com-pounds for normal structure and function ofneurons including neurotransmitters such asacetylcholine, and glutamate and GABA(Schulingkamp, Pagano, Hung, & Raffa, 2000).
Brain glucose utilization is regionally hetero-genous (Sokoloff et al., 1977) and is dependent onthe functional activation of specific neuronal sys-tems (Ingvar & Petersson, 2000).
Recently, it has been shown in rats that hippoc-ampal neuronal activation produced by trainingon a memory task resulted in a decrease of extra-cellular glucose levels in the hippocampus(McNay, Fries, & Gold, 2000). This decrease ofextracellular glucose levels in the hippocampuswas much more pronounced in aged rats than inyounger rats but could be reversed by peripheralglucose injections (McNay & Gold, 2001; McNay,McCarty, & Gold, 2001). Given that glucose isregionally heterogenous and that its levels fluctu-ate with neuronal activity, these results suggestthat its supply may not be optimal under condi-tions of increased neuronal demand in certainbrain regions. This situation may be particularlytrue of neurons that use acetylcholine as a neu-rotransmitter because the synthesis of acetylcho-line is directly dependent on glucose influx foracetylcoenzyme A, one of its building blocks. Inaddition, the metabolic pool of glucose that isused to produce acetylcholine appears to be segre-gated from the main metabolic pool that cells use(Blass & Gibson, 1979; Gibson, Blass, & Jenden,1978). Peripheral glucose injections in rats havebeen shown to increase acetylcholine availabilityin the hippocampus at the same time that glucosealso improved memory (Blass & Gibson, 1979;Durkin, Messier, de Boer, & Westerink, 1992;Messier, Durkin, Mrabet, & Destrade, 1990;Ragozzino, Pal, Unick, Stefani, & Gold, 1998;Ragozzino, Unick, & Gold, 1996). Because defi-cits in acetylcholine are usually associated withcognitive alterations in animals and humans (Rush,1988; Rusted & Warburton, 1989), this mechanismmay explain the influence of glucose on memory.
A more recent study demonstrated a relation-ship between peripheral glucose regulation, hip-pocampal volume and contextual verbal memoryperformance in humans (Convit, Wolf, Tarshish, &De Leon, 2003). In this study, hippocampal vol-umes and memory performance of nondiabeticmiddle-aged and older individuals were correlatedwith a measure of peripheral glucose regulation. Itwas reported that poor peripheral glucose regu-lation was associated with smaller hippocampal
1066 NESRINE AWAD ET AL.
volumes and poorer memory performance. Glu-cose regulation and memory performance were notassociated with the volumes of other brain regions(superior temporal gyrus or parahippocampalgyrus), nor were they associated with overallbrain atrophy, suggesting that the circumscribedmemory decrements in individuals with impairedglucose regulation appear to be specifically linkedto hippocampal function. Convit et al. (2003)attributed the decrements in cognitive perfor-mance to an inability of the hippocampus tocompensate for the decreases in glucose levelsthat result from the neuronal activation caused bymemory function. It was concluded that hippo-campal atrophy is likely to result from repeatedexposure to such localized metabolic deficiencies.Taken together, these findings suggest that thedecrements in memory function observed in indi-viduals with impaired glucose regulation appearsto be associated with hippocampal function andcould be attributed to decreases in extracellularglucose levels in the hippocampus.
Insulin and Brain Function. The findings of thestudies evaluating the cognitive function associ-ated with impaired glucose regulation also demon-strated however, that insulin levels, independentof glucose levels and risk factors associated withhyperinsulinemia, also appear to be associated withdecrements in performance of nondiabetic adults(Kalmijn et al., 1995; Vanhanen et al., 1997).
Insulin is produced in the brain but it alsocrosses the blood brain barrier and enters neu-ronal tissue via receptor-mediated active transport(Banks, Jaspan, & Kastin, 1997a, 1997b). Insulinreceptors are widely distributed in the brain, par-ticularly in the hypothalamus and hippocampus,where they appear to be involved in cholinergictransmission (Raizada et al., 1988). Several animalstudies have demonstrated that insulin appears toplay a direct role in learning and memory. Forexample, Messier and Destrade (1994) demon-strated that peripheral insulin administrationattenuated the scopolamine-induced performancedecrements on a learning task presumably throughits role on the cholinergic system (Messier &Destrade, 1994). It has also been shown that block-ing neuronal insulin receptor function usingintracerebroventricular streptozotocin injections
results in impoverished learning and memory(Lannert & Hoyer, 1998). Insulin could play arole in glucose transport in certain brain cellpopulations because there are insulin-sensitiveglucose transporters (GLUT4 and GLUT8) in vari-ous brain regions, including the hippocampus(Choeiri, Staines, & Messier, 2002; El Messariet al., 1998; Leloup et al., 1996; McCall et al.,1997; Reagan et al., 2002).
Thus, given the presence of insulin in the brainand its possible link with learning and memory, itis likely that increased brain insulin or insulinresistance in the brain could mediate some of thecognitive deficits observed in type 2 diabeticpatients. However, the contribution of braininsulin, their receptors and associated glucosetransporters to diabetic brain pathology remainsspeculative because we know very little about theroles of insulin in the brain apart from its role infeeding (Gerozissis, 2003). We now turn to areview of the effects of untreated type 2 diabeteson cognitive function and describe three studiesthat examined the impact of glycemic controlimprovement on cognition.
The Effects of Untreated Type 2 Diabetes and Glycemic Improvement on Cognitive FunctionThe relationship between poor glycemic controland decrements in cognitive function has beensubstantiated by findings of well-controlled popu-lation studies that have evaluated performance ofparticipants who, at the time of assessment, showedevidence of type 2 diabetes but had not yetreceived treatment (Grodstein, Chen, Wilson, &Manson, 2001; Hiltunen, Keinanen-Kiukaanniemi, &Laara, 2001; U’Ren, Riddle, Lezak, & Bennington-Davis, 1990). Hiltunen et al. examined the resultsof the Mini-Mental Status Examination in 379older people (mean age: 75years) of which 21were previously diagnosed with diabetes and 12with undiagnosed diabetes. The odds ratio ofscoring less than 23 on the MMSE was 1.2 in pre-viously diagnosed diabetic patients and 1.6 forundiagnosed patients suggesting that undiagnoseddiabetes was associated with worse cognitiveperformance. In the Grodstein et al. study, 82 dia-betic nurses were compared to over 2,000 nurseswithout diabetes. The average age was 74 years.Neuropsychological tests consisted of a short
TYPE 2 DIABETES AND COGNITIVE FUNCTION 1067
mental status examination obtained by a tele-phone interview, a verbal fluency and a paragraphrecall test. Within the diabetes patients, those whoreported being treated performed as well as non-diabetic controls whereas diabetic patients report-ing no treatment performed significantly worse onthe short mental status examination. These studiessuggest that that type 2 diabetic patients who hadnot yet received treatment for their condition per-formed worse or had higher odds ratio of impairedcognitive function, as assessed by global meas-ures of cognitive function, compared to type 2diabetes patients receiving treatment and controls.The specific nature of these decrements are diffi-cult to ascertain at this point given that only a fewstudies have actually evaluated the cognitivefunction of untreated diabetic patients.
Three studies investigating the effects of gly-cemic improvement evaluated cognitive functionof type 2 diabetes participants before and follow-ing antidiabetic treatment to determine the effectsof improved glycemic control (Gradman et al.,1993; Meneilly et al., 1993; Naor et al., 1997).Meneilly et al. (1993) evaluated the performanceof 16 participants (mean age: 71 years) at threetime points: At baseline, at 1 month followingtreatment with a stable dose of an oral hypolgyce-mic agent (glipizide) and at 6 months followingcontinued treatment with the oral hypoglycemicagent. At each time point, the average of twoassessments was used to determine the effects ofglycemic improvement on cognition. The assess-ment included measures of mental status, visualreaction time, mental dexterity (the GroovedPegboard (Matthews & Klove, 1964)), processingspeed (Digit Symbol Substitution of the WAIS-R(Wechsler, 1987); Digit Symbol of the WAIS-R;Trail-Making test A; Stroop color and word(Spreen & Strauss, 1998)), executive function(Trail-Making test B (Spreen & Strauss, 1998)); amodified cued recall task to evaluate new learning,and nonverbal reasoning (Picture Arrangement ofthe WAIS-R, (Wechsler, 1987)). When comparingperformance means of the baseline assessmentand the 6-month assessment, the authors reportedsignificant improvements on measures of mentaldexterity, processing speed (Trail-Making part A;Stroop word), modified cued recall and nonverbalreasoning. These results demonstrate that some
cognitive improvement appears to be associatedwith improvement in glycemic control. AlthoughMeneilly et al.’s (1993) study did not control forpractice effects (alternative tasks were not usedacross the six assessments and a control group nottested to eliminate alternative interpretations ofthe results), another study by Gradman, et al.(1993) substantiated their findings.
Gradman et al. (1993) compared 13 previouslytreated type 2 diabetes participants (mean age: 67years) and 10 untreated type 2 diabetes parti-cipants (mean age : 69 years) to 13 controls (meanage : 67 years). In total, all participants wereassessed at four time points : Time 1 : baseline;time 2 : after one month wash-out period of pre-viously treated type 2 diabetic patients; time 3 :following two months of treatment with glipizide;time 4 : following 6 months of treatment withglipizide. They were assessed on several measuresto measure verbal and visual memory, attention,processing speed/perceptual-motor function, andexecutive function. It was reported that improve-ments in glycemic control were associated withimprovement on a verbal memory task, theBuschke Selective Reminding Test, which evalu-ates the total number of words in long-term stor-age (Buschke, 1973). More specifically, at time 2,the previously treated type 2 diabetes participantshad declined in their performance and the twogroups of type 2 diabetes participants werecomparable. At time 3, the previously treated type2 diabetic patients recalled significantly morewords than at time 2 and the previously untreatedtype 2 diabetic patients also improved althoughthe findings were not statistically different. Whencompared at time 4, the previously untreateddiabetic patients recalled significantly more wordsthan at all previous assessments. The control groupdid not improve throughout the assessments.
This study demonstrated that decrements inperformance appear to be dependent on transientglycemic control in type 2 diabetes and not on thecomplications associated with type 2 diabetes.These findings also provide support for the rela-tionship between impaired glucoregulatory con-trol and neuropsychological decrements. Theperformance of the previously treated type 2 dia-betes group deteriorated during the wash-outperiod and later improved when treatment was
1068 NESRINE AWAD ET AL.
reinstated. The changes in glycemic control appearto be associated specifically with changes on theBuschke Selective Reminding Test, a verbalnoncontextual memory task (Buschke, 1973). Incomparison to recognition tasks, the authorsdescribed the verbal noncontextual memory taskas the more sensitive tool in the evaluation ofglycemic control.
More recently, Naor et al. (1997) compared theperformance of two groups of 20 type 2 diabetespatients who showed initial poor metabolic con-trol (HbA1> 10%; mean age for both groups: 64years) before and after differential diabetes treat-ment (Naor et al., 1997). Patients assigned to theintensified inpatient treatment group (IT) under-went diabetes assessment and treatment to nor-malize glucose levels and were provided with anindividually adapted diet, daily monitoring ofblood glucose and a standardized educational pro-gram for type 2 diabetes to optimize their diabetescondition. Patients assigned to the regular treat-ment group (RT) continued with their unchangedprevious treatment. All patients were assessed atbaseline (T0), following two weeks of IT treat-ment (T1), and 6 weeks after the discharge of ITgroup from the hospital (T2). Blood glucose andHbA1levels as well as measures of simple reac-tion time, attention and processing speed wereassessed at each time point.
The findings of this study revealed improvedperformance on most cognitive measures, acrossthe assessments, in the IT group only. In the RTgroup, performance on these measures eitherremained unchanged or even decreased across theassessments. The cognitive improvements observedin the IT group followed the observed improve-ment in glycemic control. However, the authorsalso discussed one unexpected finding: glycemiccontrol also improved in the RT group. They con-cluded that it was likely that the RT group hadimproved their treatment compliance as a result ofparticipating in the study, which amelioratedglycemic control. Given that no cognitiveimprovement accompanied the observed glycemicimprovement in the RT group, they attributed theobserved cognitive improvements in the IT groupto an improved sense of well-being resulting fromthe care and social contact provided. Whilemotivational or psychosocial factors likely play
an important role in glycemic control and treat-ment adherence (Perlmuter, 1999; see followingsection on the role of depressive symptoms oncognitive function of type 2 diabetes), it is diffi-cult to conclude, based on the findings of thisstudy, that the improved cognitive performancewas only due to such factors as these were notdirectly assessed. If psychosocial factors were theonly factors accounting for the improvement incognitive function, then a general improvementacross other measures would also be expected(which was not the case in Gradman et al.’sstudy). It is also to be noted that 5 patients fromthe RT group did not complete the final assess-ment because of hospital admittance compared to2 patients from the IT group (one of which wasfor a medical reason), which suggests that thosewith the worst health status in the RT group didnot participate in the final assessment. It is pos-sible that those individuals also showed worseglycemic control and their exclusion resulted inan apparent improved mean glycemic function forthe group. As no data were provided on the glyce-mic control of the remaining subjects in the RTgroup at baseline, it is difficult to ascertain actualchanges in glycemic function. In addition, theauthors reported a significant correlation betweenperformance on one attentional and processingspeed task and HbA1levels using data from bothgroups. This finding provides further support forthe relationship between glycemic control andcognitive function.
The studies evaluating the effect of glycemicimprovement on cognitive function also suggestthat at least some of the cognitive decrements intype 2 diabetes can be attenuated and may beassociated with glycemic control as measured byHbA1c. This is a very positive finding and mayserve to further motivate patients to comply withtreatment. These results also point to a factor thatcould increase variability across studies that exam-ine the impact of treated diabetes on cognition.Studies that included more participants with goodcontrol may observe little cognitive deficits whilestudies including more participants with poorcontrol may observe a higher incidence of cog-nitive deficits. Because the 3 studies we describedhere involved a small number of patients and somemay have lacked proper control, we suggest that
TYPE 2 DIABETES AND COGNITIVE FUNCTION 1069
new studies be conducted to examine the impactof diabetic treatment in newly diagnosed patientsas well as to determine whether improvements inglycemic control are accompanied by cognitiveimprovements. The following sections provide anoverview of the effects of other potentially con-founding factors on cognitive functioning of type2 diabetic patients that have been studied, includ-ing the effects of cardio- and cerebrovascular riskfactors, and depression.
The Effects of Cardiovascular Factors on Cognitive Function of Type 2 DiabetesType 2 diabetes has been associated with cardio-vascular and cerebrovascular disease risk factors(Mooradian, 1997; Stolar, 1990). Hyperinsuline-mia, typically preceding type 2 diabetes, is part ofwhat is known as the metabolic syndrome, whichalso encompasses hyperglycemia, dyslipidemiaand hypertension (Kumari et al., 2000). Hyperin-sulinemia, dyslipidemia (high serum triglycer-ides), and hypertension have all been associatedwith atherosclerosis, which is associated withcerebrovascular disease. Kumari et al., also notedthat hypertension has been independently asso-ciated with brain white matter lesions and lacunarinfarcts. Cardiovascular factors have been shownto be independently associated with decrements incognitive performance (Desmond, Tatemichi,Paik, & Stern, 1993; Elias, Wolf, D’Agostino,Cobb, & White, 1993; Kilander, Nyman, Boberg, &Lithell, 1997; Kumari et al., 2000; Vanhanen et al.,1999; Zaslavsky et al., 1995). Given the relation-ship of type 2 diabetes and cardiovascular andcerebrovascular factors, it is important to deter-mine the roles of such factors on the cognitivefunction of type 2 diabetic patients.
In one well-controlled population study, Eliaset al. (1997) evaluated the effects of hypertensionas a risk factor for cardiovascular and cerebro-vascular disease on the performance of type 2 dia-betes participants. They reported an interactionbetween type 2 diabetes and hypertension oncognitive performance, which was associated withgreater risk of poor performance on a test ofvisual memory and of lower composite scores(reflecting performance on measures of simpleauditory attention, abstract reasoning, verbalfluency, and verbal and visual memory). This
finding, however, was not replicated in two longi-tudinal studies that also examined the effects ofhypertension on the performance of type 2 dia-betic patients (Fontbonne, Berr, Ducimetiere, &Alperovitch, 2001; Gregg et al., 2000). The dif-ference between the conclusions of these studiescould not be attributed to differences in the severityof hypertension, or other potentially interactingfactor (e.g., age). Given that few studies evaluatedthe effects of hypertension on the performance oftype 2 diabetic patients, the inconsistent findingscould be attributed to the differences in the neu-ropsychological measures used. It is also possiblethat hypertension does interact with performanceof type 2 diabetic patients.
Other studies have evaluated the interactingeffects of risk factors for cerebrovascular diseasesuch as history of stroke or heart disease. Resultssuggest that these risk factors, as assessed usingclinical interview and/or electrocardiogram data,do not appear to play a significant role in furtherincreasing the cognitive dysfunction associated withtype 2 diabetes (Reaven, Thompson, Nahum, &Haskins, 1990; Worrall, Moulton, & Briffett, 1993;Zaslavsky et al., 1995). A small cross-sectionalstudy which included a comprehensive neuropsy-chological assessment as well as other measuresof risk factors for cardiovascular and cerebrovas-cular disease (serum total and very-low-densitylipoprotein triglycerides, systolic blood pressureand body mass index) demonstrated that serumtotal and very-low-density lipoprotein triglycer-ides were negatively related to verbal fluency intype 2 diabetes patients (Helkala, Niskanen,Viinamaki, Partanen, & Uusitupa, 1995). Therewas no relationship between these factors andperformance of control participants.
Another study compared the performance oftype 2 diabetic patients with high triglyceridelevels to type 2 diabetic patients with low tri-glyceride levels and noted that type 2 diabeticpatients with high triglycerides levels showedreduced memory and attention and were signi-ficantly slowed on a simple reaction time measurecompared to type 2 diabetic patients with lowtriglyceride levels (Perlmuter et al., 1988). Thisfinding was also replicated by another cross-sectional study (Jagusch et al., 1992), which reporteda negative correlation between fasting triglycerides
1070 NESRINE AWAD ET AL.
and reaction time measures as well as betweenfasting cholesterol and auditory and visual atten-tion in type 2 diabetic patients.
These studies used different procedures toassess for the various risk factors of cardiovas-cular and cerebrovascular diseases renderingcomparisons and conclusions difficult. It is to benoted, however, that there appears to be someevidence that hypertension and high levels of tri-glycerides are associated with decrements in thecognitive performance of type 2 diabetic patients.None of the studies evaluated the interactingeffects of cerebrovascular disease on the cognitivefunction of type 2 diabetic patients using imagingdata to confirm cerebrovascular dysfunction. Thereviewed studies therefore, may have under-estimated the potential confounding effects of cere-brovascular disease.
The Role of Depressive Symptoms in the Cognitive Function of Type 2 DiabetesGeneral health status, particularly in older popu-lations has been linked to depressive symptoma-tology (Borson et al., 1986). Several studies haveshown increased prevalence of depression amongtype 2 diabetes patients compared to controls(Amato et al., 1996; Gregg et al., 2000; Lindemanet al., 2001; Lowe, Tranel, Wallace, & Welty,1994; Scott, Kritz-Silverstein, Barrett-Connor, &Wiederholt, 1998; Tun et al., 1987; for review ofcomorbid depression in adults with diabetes, seeAnderson, Freedland, Clouse, & Lustman, 2001).In their review, Anderson et al. (2001) concludedthat the odds of depression were doubled in bothtypes of diabetes (type 1 and type 2) compared tothe nondiabetic controls. They also noted thatmajor depressive disorder (assessed usingdiagnostic interviews) was observed in 11% ofdiabetic patients whereas elevated depressivesymptoms (obtained from self-report measures)was observed in 31% of diabetic patients.Although these percentages were not available bytype of diabetes, this finding suggests that depres-sive symptomatology is likely present in a third ofthe diabetes cases and major depression in over10% of diabetic patients and this could lead tocognitive deficits.
It has been suggested that diabetes could causedepressive symptoms because of associated
psychological factors (Anderson et al., 2001) suchas its chronicity/impeding health and the requiredlifestyle change or because of biological changesunderlying type 2 diabetes or causing both, diabe-tes and depression (Amato et al., 1996). Theseinclude changes in noradrenergic and serotoniner-gic neurotransmitter systems in the brain as wellas changes in plasma cortisol levels and in theactivity of the hypothalamic-pituitary axis. Evi-dence from recent prospective studies suggeststhat depression doubled the odds of incident type2 diabetes (Eaton, Armenian, Gallo, Pratt, &Ford, 1996; Kawakami, Takatsuka, Shimizu, &Ishibashi, 1999). It has also been shown thatsuccessful treatment of depression, either pharma-cologically or behaviorally, is associated withimprovements in glycemic control presumably byincreasing compliance with treatment (Andersonet al., 2001). Taken together, these findings sug-gest that depression may play an important role inthe maintenance of optimal glycemic control, assupported by studies linking depression to poortreatment adherence.
Depression is a predictor of decreased cogni-tive functions in the elderly (Wang, Van Belle,Kukull, & Larson, 2002) and has been indepen-dently associated with hippocampal atrophy causedby elevated glucocorticoid secretions, resulting inmemory deficits and dementia in later life (seeLupien et al., 1998; Lupien et al., 1999 for areview on effects of elevated glucocorticoidsecretion). It is important to determine the poten-tial interactive effects of depression on cognitiveperformance in type 2 diabetic patients. However,an overall evaluation of the studies evaluating thisinteraction reveals that depression does notappear to account for all the cognitive deficitsobserved in diabetes.
Lowe et al. (1994) reported that diabeticpatients showed poorer performance on a verbalfluency task compared to controls even followingstatistical adjustments for depressive symptoms(Lowe et al., 1994). In a population study evaluat-ing cognitive impairment and decline in olderwomen, no significant interactions were observedbetween depressive symptoms and performanceon the MMS, or measures of psychomotor speedand executive function (Gregg et al., 2000). Thesestudies suggest that cognitive decrements in
TYPE 2 DIABETES AND COGNITIVE FUNCTION 1071
performance of type 2 diabetes patients appearindependent of depressive symptoms. Given thatonly few studies have evaluated the interactiveeffects of depression on cognitive performance,these findings are to be interpreted with caution.
In summary, research has shown that althoughsome decrements in cognitive performance oftype 2 diabetic patients appear to be attributed totransient glucoregulatory control, complicationsassociated with impaired glucose regulation suchas cardiovascular or cerebrovascular diseasecould further impede cognitive performance oftype 2 diabetes patients.
Interpretation of Neuropsychological Findings of Type 2 Diabetes PatientsAn overall evaluation of the cognitive function oftype 2 diabetic patients indicates, as others have(Bent, Rabbitt, & Metcalfe, 2000; Cosway,Strachan, Dougall, Frier, & Deary, 2001;Perlmuter et al., 1984; Wahlin, Nilsson, & Fastbom,2002), that their neuropsychological performanceis suggestive of accelerated aging. Despite theconsiderable variability in findings and the multi-ple interacting factors, type 2 diabetic patientsshow a general cognitive decline, which is moreobservable in the areas of verbal memory andprocessing speed. Such decrements have beenreported to be the normal intellectual changesassociated with age (Keefover, 1998). The under-lying pathologies or central nervous systemchanges associated with type 2 diabetes have alsobeen described as ones similar to the changesassociated with aging. These include oxidativestress, an accumulation of advanced glycationend-products, nonenzymatic protein glycosyla-tion, vascular dysfunction, alterations in bloodbrain barrier transport processes, accumulation oflipid peroxidation byproduct and changes in betaadrenergic receptor activity of cerebral microves-sels (Gipsen & Biessels, 2000; Mooradian, 1997).
The pattern of neuropsychological performanceobserved in type 2 diabetic patients appears to bethe result of multiple interacting processes devel-oping over time. Data from the studies evaluatingimpaired glucose tolerance demonstrate that thereis an initial change in central nervous system func-tion that is independent of type 2 diabetes compli-cations and is associated with transient glucose and
insulin levels. Cognitive decrements in impairedglucose regulation and hyperinsulinemia may bemediated by transient glucose and insulin action onbrain areas, particularly in the hippocampus.
In addition to the detrimental effects of pro-tracted impaired glucose regulation on the centralnervous system, type 2 diabetes pathology alsoencompasses the detrimental effects of associatedcomplications such as cerebrovascular disease,which is likely the main cause of the observedprocessing speed/reaction time decrements. Theidea of multiple underlying factors causing type 2diabetes brain pathology has also been high-lighted by Stewart and Liolitsa (1999) who indi-cated that imaging studies of type 2 diabeticpatients reflect parallel pathological processes,including subclinical infarctions and temporallobe atrophy more typical of Alzheimer’s disease.This resulting CNS pathology may be the cause ofbrain aging and associated neurological changesin type 2 diabetic patients.
It is also interesting to note that the underlyingpathology and associated neuropsychologicalprofile of individuals with impaired glucose toler-ance appears to mimic what is typically observedin individuals with age associated memoryimpairment (AAMI; Dal Forno & Kawas, 1995).More specifically, the National Institute of MentalHealth defined AAMI as impairment on memorytests with sparing of intellectual function andabsence of dementia (Crook et al., 1986). Indi-viduals with AAMI demonstrate an overall reduc-tion in hippocampal volume, particularly of theright hippocampus (Soininen et al., 1994). They arealso at higher risk of developing dementia com-pared to those with no memory difficulties (DalForno & Kawas, 1995), a pattern also observed inindividuals with impaired glucose regulation whodevelop type 2 diabetes (see discussion below fora summary of the longitudinal studies linking type2 diabetes and dementia; Messier, 2003). Takentogether, the neuropsychological performance andunderlying pathology of AAMI as well as theassociation of AAMI with dementia suggests thatprotracted impaired glucose regulation is one con-dition that could result in AAMI. The transitionfrom AAMI to dementia is a gradual one that canonly be observed using longitudinal studies. Thelong-term impact of treated diabetes is also best
1072 NESRINE AWAD ET AL.
evaluated using longitudinal studies examining theassociation between type 2 diabetes and dementia.
Longitudinal Studies: The Link Between Type 2 Diabetes and DementiaAnother way to determine whether type 2 diabe-tes is associated with cognitive decrements is toevaluate the long-term effects of diabetes on cog-nitive function and whether changes over time areobservable in repeated-measures designs. Longi-tudinal studies allow for this assessment and limitthe between-subjects variability observed in cross-sectional studies.
Two recent longitudinal studies have been con-ducted to evaluate the relationship between cogni-tive decline and type 2 diabetes. Gregg et al. (2000)compared the performance of 682 diabetic women(mean duration of type 2 diabetes = 10.2 years; SD= 9.5 years) to the performance of 8,997 age-matched women (mean age = 72 years) who wereassessed on two occasions: at baseline and 3 to 6years following baseline assessment (Gregg et al.,2000). Variables such as age, education, depres-sion, hypertension, and cardiovascular diseasewere methodologically controlled. The neuropsy-chological assessment included a modified versionof the MMSE as a brief cognitive screening mea-sure, a psychomotor speed test and a measure offrontal lobe/executive function. The results of thisstudy reveal increased odds of major cognitivedecline in type 2 diabetic patients (defined as thegreatest 10th percentile reduction in performancefrom initial to follow-up score) on the psychomotorspeed test and measure of frontal lobe/executivefunction (Digit Symbol test (Wechsler, 1981) andon the Trails B test (Spreen & Strauss, 1991)).
A second longitudinal study compared the per-formance of 55 type 2 diabetes participants to theperformance of 103 participants with impairedfasting glucose and 768 age-matched controls(mean age = 65 years) on several neuropsycho-logical tests including the MMSE as well asmeasures of verbal and visual memory, facial rec-ognition, executive function, motor function,arithmetic ability, processing speed and logicalreasoning (Fontbonne et al., 2001). The authorscontrolled for age, gender, education, depression,hypertension and body mass index; however theyreported that diabetic participants had higher
levels of triglycerides, and lower levels of totalcholesterol and HDL cholesterol compared tocontrols. They concluded that the odds ratio forserious worsening (defined as a change in scoresinto the worst 15% of the distribution of theobserved changes for the whole sample) weregreater than 2 for measures of verbal memory,facial recognition, processing speed and motorfunction when controlling for age, gender, educa-tion and systolic blood pressure. Taken together,the longitudinal studies suggest that the type 2diabetes participants are at higher risk of cogni-tive decline compared to age-matched controls.
The findings of these longitudinal studies arefurther substantiated by studies evaluating risk ofco-existence of diabetes and dementia (reviewedin Messier, 2003). Some studies evaluating theco-existence of these two diseases reported a mod-erate association between diabetes and Alzheimer’sdisease with odds ratios ranging from 1.3 to 1.9(Brayne et al., 1998; Ott et al., 1996; Ott et al.,1999; Peila, Rodriguez, & Launer, 2002). Thisfinding has not been consistently observed asother studies did not report an association (Oddsratios ranging from 1.0 to 1.3; (Curb et al., 1999;Leibson et al., 1997; Luchsinger, Tang, Stern,Shea, & Mayeux, 2001). More recently, it hasbeen demonstrated that the odds ratio for the co-existence of diabetes and Alzheimer’s diseasesignificantly increased only for subjects with theApoE4 allele. Post-mortem examination of thesesubjects revealed that Alzheimer’s patients whowere diabetic had increased number of infarctsand that the ApoE4 allele was associated withincreased neurofibrillary tangles in the hippocam-pus and cortex and increased cerebral amyloidangiopathy (Peila et al., 2002). Although somereports found that Alzheimer’s disease is asso-ciated with hyperinsulinemia (Bucht, Adolfsson,Lithner, & Winblad, 1983; Craft et al., 1993; Craft etal., 1996; Craft et al., 1998a) some did not(Fujisawa, Sasaki, & Akiyama, 1991; Kilander,Boberg, & Lithell, 1993). Two studies have foundthat bearers of the ApoE4 allele tended to havelower insulin levels compared to ApoE2 bearers(Craft et al., 1998b; Gonzalez et al., 1999). The rela-tionship between diabetes and Alzheimer’s disease isunclear but could be mediated by insulin-degradingenzyme, which also degrades beta-amyloid protein.
TYPE 2 DIABETES AND COGNITIVE FUNCTION 1073
Given that insulin competes with beta-amyloid forthe insulin-degrading enzyme, it has been proposedthat in some cases, Alzheimer’s disease amyloiddeposition may be increased by excessive levels ofinsulin (Cook et al., 2003; Craft et al., 2000; Ling,Martins, Racchi, Craft, & Helmerhorst, 2002). How-ever, there is no indication that high levels of insulinor diabetes as such, independently produces amyloiddeposition of neurofibrillary tangles (Heitner &Dickson, 1997; Peila et al., 2002) suggesting thatdiabetes is not a cause of Alzheimer’s pathology butrather further aggravates the pathologies alreadypresent in Alzheimer’s patients.
As discussed elsewhere (Messier, 2003),hypotheses linking impaired insulin sensitivity ordiabetes to Alzheimer’s disease will have to takeinto account the observations that: (1) diabetes isa greater risk for AD patients with ApoE4 geno-type but as a group, they have a lower incidenceof impaired insulin sensitivity; (2) non-ApoE4subjects are those demonstrating the highest insu-lin insensitivity, but they also have lower rates ofAlzheimer’s disease; (3) diabetes as such, is notassociated with an increase in neurofibrillary tan-gles amyloid plaques but that in AD patients withthe ApoE4 genotype, diabetes further increasesthe occurrence of tangles and plaques.
One study evaluating the co-existence ofAlzheimer’s disease and diabetes reported astrong association between Alzheimer’s diseasepatients with cerebrovascular disease and diabetes(odds ratio 3.0; Ott et al., 1999). More specifi-cally, the odds ratios of Alzheimer’s disease withcerebrovascular disease and diabetes increasedwith the need for diabetes treatment: odds ratiosof 1.3, 2.4, and 4.3 were observed for diabeticpatients treated with diet, hypoglycemiant agentsand insulin, respectively. This finding is consis-tent with the strong association observed betweenvascular dementia and diabetes (Brayne et al.,1998; Leibson et al., 1997; Mortel, Wood, Pavol,Meyer, & Rexer, 1993; Ott et al., 1999).
CONCLUSIONS
In summary, studies demonstrate that verbal mem-ory, processing speed and brief cognitive screen-ing measures appear to be most sensitive to the
decrements in the performance of treated type 2diabetic patients. Measures of nonverbal memoryand executive function have shown inconsistentfindings, with some studies reporting significantdifferences and medium to large effect sizes. Inaddition, very few significant differences or mediumto large effect sizes were reported on measures ofvisuospatial processing, auditory or visual atten-tion, semantic and language functions.
Overall, findings of population studies dem-onstrate that treated type 2 diabetic patients aremore likely than controls to show poor perfor-mance on brief cognitive screening measureseven though 6 out of 11 studies failed to show adifference. All the other measures were lesslikely to show significant differences betweenthe treated type 2 diabetic patients and controlsor higher odds ratios.
Finally, the analysis of cross-sectional studiesrevealed that the largest effect sizes were observedin studies in which patients were older (mean age =65 years versus 59 years for studies that foundsmaller effect sizes) and had higher HbA1c values(9.7 versus 8.5) suggesting that the impact ofdiabetes on cognitive functions is greater in olderpeople with worse glycemic control (Ryan &Geckle, 2000).
The studies that have examined the impact ofimpaired glucose tolerance on cognitive functionsdemonstrate the presence of mild cognitivedeficits in people with impaired glucose toler-ance. The results of studies that have comparedperformance of these subjects after drinking aglucose solution suggest that the deficits can beattenuated. The mechanisms by which impairedglucose tolerance impairs cognitive functions areunknown. Animal studies suggest that impairedglucose tolerance and insulin sensitivity couldselectively affect brain regions such as the hip-pocampus where glucose uptake or utilizationmay be compromised by abnormal peripheralglucose or insulin levels. A more thorough dis-cussion of these mechanisms is presented in aforthcoming special issue of the European Journalof Pharmacology (Messier, in press). We havedescribed three studies that suggest that improve-ment in glucose tolerance may lead to improvedcognitive functions. More studies are needed toconfirm these observations.
1074 NESRINE AWAD ET AL.
In conclusion, research evaluating the cog-nitive function of type 2 diabetes suggests thatinitial decrements in performance appear to beattributed to transient impaired glucoregulatorycontrol and can be attenuated by diabetic treat-ment. Studies evaluating the effects of confound-ing factors associated with type 2 diabetes (i.e.,cardiovascular disease) as well as studies assess-ing risk of cognitive decline and dementia in type2 diabetic patients suggest that over time, cog-nitive decrements may become irreversible, parti-cularly if associated with the ApoE4 allele, andare likely attributed to prolonged hyperinsuline-mia, and/or vascular disease. Future studies shouldexamine the contribution of glycemic control tocognitive function because of the possible impli-cation for treatment as well as to provide add-itional incentive for patients to comply withtreatment. Also, older diabetic patients (more than70 years old), in particular, should be studied asthey are more likely to show cognitive decrementsand because diabetes may interact with otherpathological processes such as cerebrovasculardisease and Alzheimer’s disease, which are moreprominent at that age.
ACKNOWLEDGEMENTS
This research was supported by a grant from theCanadian Institutes for Health Research of Canada toC.M. Nesrine Awad was supported by fellowships fromthe Fonds FCAR (Québec), the Canadian Institutes forHealth Research of Canada and from the OntarioGraduate Scholarship Program.
REFERENCES
Amato, L., Paolisso, G., Cacciatore, F., Ferrara, N.,Canonico, S., Rengo, F., et al. (1996). Non-insulin-dependent diabetes mellitus is associated with agreater prevalence of depression in the elderly. TheOsservatorio Geriatrico of Campania Region Group.Diabetes & Metabolism, 22(5), 314–318.
American Diabetes Association. (2002). Report of theexpert committee on the diagnosis and classification ofdiabetes mellitus. Diabetes Care, 25 (Suppl. 1), S5–S20.
Anderson, R. J., Freedland, K. E., Clouse, R. E., &Lustman, P. J. (2001). The prevalence of comorbid
depression in adults with diabetes: A meta-analysis.Diabetes Care, 24(6), 1069–1078.
Assisi, A., Alimenti, M., Maceli, F., Di Pietro, S.,Lalloni, G., & Montera, P. (1996). Diabetes andcognitive function: Preliminary studies. Archives ofGerontology and Geriatry, suppl., 5, 229–232.
Atiea, J. A., Moses, J. L., & Sinclair, A. J. (1995).Neuropsychological function in older subjects withnon-insulin- dependent diabetes mellitus. DiabeticMedecine, 12(8), 679–685.
Atkinson, M. A., & Maclaren, N. K. (1994). The patho-genesis of insulin dependent diabetes. New EnglandJournal of Medicine, 331, 1428–1436.
Awad, N., Gagnon, M., Desrochers, A., Tsiakas, M., &Messier, C. (2002). Impact of peripheral gluco-regulation on memory. Behavioral Neuroscience,116(4), 691–702.
Banks, W. A., Jaspan, J. B., & Kastin, A. J. (1997a). Effectof diabetes mellitus on the permeability of the blood-brain barrier to insulin. Peptides, 18(10), 1577–1584.
Banks, W. A., Jaspan, J. B., & Kastin, A. J. (1997b).Selective, physiological transport of insulin acrossthe blood-brain barrier: novel demonstration byspecies-specific radioimmunoassays. Peptides, 18(8),1257–1262.
Bent, N., Rabbitt, P., & Metcalfe, D. (2000). Diabetesmellitus and the rate of cognitive ageing. BritishJournal of Clinical Psychology, 39, 349–362.
Berg, E. A. (1948). A simple objective treatment formeasuring flexibility in thinking. Journal of Gen-eral Psychology, 39, 15–22.
Biessels, G. J., van der Heide, L. P., Kamal, A., Bleys,R. L., & Gispen, W. H. (2002). Ageing and dia-betes: implications for brain function. EuropeanJournal of Pharmacology, 441(1–2), 1–14.
Blass, J. P., & Gibson, G. E. (1979). Carbohydrates andacetylcholine synthesis: Implications for cognitivedisorders. In K. L. Davis & P. A. Berger (Eds.),Brain Acetylcholine and Neuropsychiatric Disease(pp. 215–236). New York, NY: Plenum Press.
Borson, S., Barnes, R. A., Kukull, W. A., Okimoto, J. T.,Veith, R. C., Inui, T. S., et al. (1986). Symptomaticdepression in elderly medical outpatients. I. Preva-lence, demography, and health service utilization.Journal of the American Geriatrics Society, 34(5),341–347.
Brandt, J., Spencer, M., & Folstein, M. (1988). Thetelephone interview for cognitive status. Neurpsy-chiatry, Neuropsychology, and Behavioral Neuro-logy, 1, 111–117.
Brayne, C., Gill, C., Huppert, F. A., Barkley, C.,Gehlhaar, E., Girling, D. M., et al. (1998). Vascularrisks and incident dementia: results from a cohortstudy of the very old. Dementia & Geriatric Cogni-tive Disorders, 9(3), 175–180.
TYPE 2 DIABETES AND COGNITIVE FUNCTION 1075
Bucht, G., Adolfsson, R., Lithner, F., & Winblad, B.(1983). Changes in blood glucose and insulin secre-tion in patients with senile dementia of alzheimertype. Acta Medicalis Scandinavica, 213, 387–392.
Buschke, H. (1973). Selective reminding for analysis ofmemory and learning. Journal of Verbal Learningand Verbal Behavior, 9, 176–189.
Cerizza, M., Minciotti, G., Meregalli, S., Garosi, V.,Crosti, P. F., & Frattola, L. (1990). Central nervoussystem involvement in elderly patients with non-insulin-dependent diabetes mellitus. Acta Diabeto-logica Latina, 27(4), 343–348.
Choeiri, C., Staines, W., & Messier, C. (2002). Immu-nohistochemical localization and quantification ofglucose transporters in the mouse brain. Neuro-science, 111(1), 19–34.
Cohen, J. (1988). Statistical power analysis for thebehavioral sciences (2nd ed.). New Jersey: Lau-rence Erlbaum.
Convit, A., Wolf, O. T., Tarshish, C., & De Leon, M. J.(2003). Reduced glucose tolerance is associatedwith poor memory performance and hippocampalatrophy among normal elderly. Proceedings of theNational Academy of Sciences of the United Statesof America, 100(4), 2019–2022.
Cook, D. G., Leverenz, J. B., McMillan, P. J., Kulstad, J. J.,Ericksen, S., Roth, R. A., et al. (2003). Reducedhippocampal insulin-degrading enzyme in late-onsetAlzheimer's disease is associated with the apolipo-protein E-epsilon4 allele. American Journal ofPathology, 162(1), 313–319.
Cosway, R., Strachan, M. W., Dougall, A., Frier, B. M.,& Deary, I. J. (2001). Cognitive function and infor-mation processing in type 2 diabetes. Diabetic Medi-cine, 18(10), 803–810.
Craft, S., Asthana, S., Schellenberg, G., Baker, L.,Cherrier, M., Boyt, A. A., et al. (2000). Insulin effectson glucose metabolism, memory, and plasma amy-loid precursor protein in Alzheimer's disease differaccording to apolipoprotein-E genotype. Annals ofthe New York Academy of Sciences, 903, 222–228.
Craft, S., Dagogo-Jack, S. E., Wiethop, B. V., Murphy, C.,Nevins, R. T., Fleischman, S., et al. (1993). Effectsof hyperglycemia on memory and hormone levels indementia of the Alzheimer type: A longitudinalstudy. Behavioral Neuroscience, 107(6), 926–940.
Craft, S., Murphy, C., & Wemstrom, J. (1994). Glucoseeffects on complex memory and nonmemory tasks:The influence of age, sex, and glucoregulatoryresponse. Psychobiology, 22(2), 95–105.
Craft, S., Newcomer, J., Kanne, S., Dagogo-Jack, S.,Cryer, P., Sheline, Y., et al. (1996). Memory Improve-ment following induced hyperinsulinemia inAlzheimer’s Disease. Neurobiology of Aging, 17(1),123–130.
Craft, S., Peskind, E., Schwartz, M. W.,Schellenberg, G. D., Raskind, M., & Porte, D.(1998a). Cerebrospinal fluid and plasma insulinlevels in Alzheimer's disease: Relationship toseverity of dementia and apolipoprotein Egenotype. Neurology, 50(1), 164–168.
Crook, T. H., Bartus, R. T., Ferris, S. H., Whitehouse, P.,Cohen, G. D., & Gershon, S. (1986). Age-associatedmemory impairment: proposed diagnostic criteria andmeasures of clinical change—Report of a Nationalinstitute of Mental Health work group. Developmen-tal Neuropsychology,2, 261–276.
Croxson, S. C., & Jagger, C. (1995). Diabetes and cog-nitive impairment: A community-based study ofelderly subjects. Age & Ageing, 24(5), 421–424.
Curb, J. D., Rodriguez, B. L., Abbott, R. D., Petrovitch, H.,Ross, G. W., Masaki, K. H., et al. (1999). Longitudi-nal association of vascular and Alzheimer's demen-tias, diabetes, and glucose tolerance. Neurology,52(5), 971–975.
Dal Forno, G., & Kawas, C. H. (1995). Cognitive prob-lems in the elderly. Curr Opin Neurol, 8(4), 256–261.
Deary, I. J., Crawford, J. R., Hepburn, D. A., Langan, S. J.,Blackmore, L. M., & Frier, B. M. (1993). Severehypoglycemia and intelligence in adult patients withinsulin-treated diabetes. Diabetes, 42(2), 341–344.
Desmond, D. W., Tatemichi, T. K., Paik, M., & Stern, Y.(1993). Risk factors for cerebrovascular disease ascorrelates of cognitive function in a stroke-freecohort. Archives of Neurology, 50(2), 162–166.
Dey, J., Misra, A., Desai, N. G., Mahapatra, A. K., &Padma, M. V. (1997). Cognitive function in youngertype II diabetes. Diabetes Care, 20(1), 32–35.
Diamond, J. (2003). The double puzzle of diabetes.Nature, 423(6940), 599–602.
Donohoe, R. T., & Benton, D. (2000). Glucose toler-ance predicts memory and cognition. Physiologyand Behavior, 71, 395–401.
Durkin, T. P., Messier, C., de Boer, P., & Westerink,B. H. C. (1992). Raised glucose levels enhance sco-polamine-induced acetylcholine outflow from thehippocampus: An in vivo microdialysis study in therat. Behavioural Brain Research, 49, 181–188.
Eaton, W. W., Armenian, H., Gallo, J., Pratt, L., &Ford, D. E. (1996). Depression and risk for onset oftype II diabetes. A prospective population-basedstudy. Diabetes Care, 19(10), 1097–1102.
El Messari, S., Leloup, C., Quignon, M., Brisorgueil,M. J., Penicaud, L., & Arluison, M. (1998).Immunocytochemical localization of the insulin-responsive glucose transporter 4 (Glut4) in the ratcentral nervous system. J Comp Neurol, 399(4),492–512.
Elias, M. F., Wolf, P. A., D’Agostino, R. B., Cobb, J., &White, L. R. (1993). Untreated blood pressure level
1076 NESRINE AWAD ET AL.
is inversely related to cognitive functioning: theFramingham Study. American Journal of Epidemi-ology, 138(6), 353–364.
Elias, P. K., Elias, M. F., D’Agostino, R. B., Cupples,L. A., Wilson, P. W., Silbershatz, H., (1997).NIDDM and blood pressure as risk factors for poorcognitive performance. The Framingham Study.Diabetes Care, 20(9), 1388–1395.
Ferguson, S. C., Blane, A., Perros, P., McCrimmon, R. J.,Best, J. J., Wardlaw, J., et al. (2003). Cognitiveability and brain structure in type 1 diabetes: Relationto microangiopathy and preceding severe hypoglyce-mia. Diabetes, 52(1), 149–156.
Folstein, M. F., Folstein, S. E., & McHugh, P. R.(1975). 'Mini Mental State’: A practical method forgrading the cognitive state of patients for the clini-cian. Journal of Psychiatric Research, 12, 189–198.
Fontbonne, A., Berr, C., Ducimetiere, P., &Alperovitch, A. (2001). Changes in cognitive abili-ties over a 4-year period are unfavorably affected inelderly diabetic subjects: Results of the Epidemiol-ogy of Vascular Aging Study. Diabetes Care, 24(2),366–370.
Fujisawa, Y., Sasaki, K., & Akiyama, K. (1991).Increased insulin levels after OGTT load in periph-eral blood and cerebrospinal fluid of patients withdementia of Alzheimer type. Biological Psychiatry,30(12), 1219–1228.
Galasko, D., Klauber, M. R., Hofstetter, C. R., Salmon,D. P., Lasker, B., & Thal, L. J. (1990). The Mini-Mental State Examination in the early diagnosis ofAlzheimer's disease. Archives of Neurology, 47(1),49–52.
Gerozissis, K. (2003). Brain insulin: Regulation, mech-anisms of action and functions. Cell Mol Neurobiol,23(1), 1–25.
Gibson, G. E., Blass, J. P., & Jenden, D. J. (1978). Meas-urement of acetylcholine turnover with glucose usedas precursor: Evidence for compartmentation ofglucose metabolism in brain. Journal of Neuro-chemistry, 30, 71–76.
Gipsen, W. H., & Biessels, G. J. (2000). Cognition andsynaptic plasticity in diabetes mellitus. Trends inNeurosciences, 23(1), 542–549.
Gonzalez, C., Martin, T., Cacho, J., Brenas, M. T.,Arroyo, T., Garcia-Berrocal, B., et al. (1999). Serumzinc, copper, insulin and lipids in Alzheimer’s diseaseepsilon 4 apolipoprotein E allele carriers. EuropeanJournal of Clinical Investigation, 29(7), 637–642.
Gradman, T. J., Laws, A., Thompson, L. W., & Reaven,G. M. (1993). Verbal learning and/or memoryimproves with glycemic control in older subjectswith non-insulin-dependent diabetes mellitus. Jour-nal of the American Geriatrics Society, 41(12),1305–1312.
Greenwood, C. E. (2003). Dietary carbohydrate,glucose regulation, and cognitive performance inelderly persons. Nutrition Reviews, 61(5 Pt 2),S68–74.
Gregg, E. W., & Brown, A. (2003). Cognitive andPhysical Disabilities and Aging-Related Complica-tions of Diabetes. Clinical Diabetes, 21, 113–118.
Gregg, E. W., Yaffe, K., Cauley, J. A., Rolka, D. B.,Blackwell, T. L., Narayan, K. M., et al. (2000). Isdiabetes associated with cognitive impairment andcognitive decline among older women? Study ofOsteoporotic Fractures Research Group. Archives ofInternal Medecine, 160(2), 174–180.
Grodstein, F., Chen, J., Wilson, R. S., & Manson, J. E.(2001). Type 2 diabetes and cognitive function incommunity-dwelling elderly women. Diabetes Care,24(6), 1060–1065.
Hara, H., Egusa, G., & Yamakido, M. (1996). Inci-dence of non-insulin-dependent diabetes mellitusand its risk factors in Japanese-Americans livingin Hawaii and Los Angeles. Diabetic Medicine,13(9 Suppl 6), S133–142.
Heitner, J., & Dickson, D. (1997). Diabetics do nothave increased Alzheimer-type pathology comparedwith age-matched control subjects. A retrospectivepostmortem immunocytochemical and histofluores-cent study. Neurology, 49(5), 1306–1311.
Helkala, E. L., Niskanen, L., Viinamaki, H., Partanen, J.,& Uusitupa, M. (1995). Short-term and long-termmemory in elderly patients with NIDDM. DiabetesCare, 18(5), 681–685.
Hershey, T., Bhargava, N., Sadler, M., White, N. H., &Craft, S. (1999). Conventional versus intensive dia-betes therapy in children with type 1 diabetes: Effectson memory and motor speed [see comments]. Dia-betes Care, 22(8), 1318–1324.
Hershey, T., Craft, S., Bhargava, N., & White, N. H.(1997). Memory and insulin dependent diabetesmellitus (IDDM): Effects of childhood onset andsevere hypoglycemia. Journal of the InternationalNeuropsychological Society, 3(6), 509–520.
Hiltunen, L. A., Keinanen-Kiukaanniemi, S. M., &Laara, E. M. (2001). Glucose tolerance and cogni-tive impairment in an elderly population. PublicHealth, 115(3), 197–200.
Hoffman, R. P., & Armstrong, P. T. (1996). Glucoseeffectiveness, peripheral and hepatic insulin sensi-tivity, in obese and lean prepubertal children. Inter-national Journal of Obesity, 20(6), 521–525.
Ingvar, M., & Petersson, K. M. (2000). FunctionalMaps and Brain Networks. In A. W. Toga &J. C. Mazziotta (Eds.), Brain mapping: The sys-tems (pp. 111–139). San Diego: Academic Press.
Jagusch, W., v. Cramon, R. R., & Hepp, K. D. (1992).Cognitive function and metabolic state in elderly
TYPE 2 DIABETES AND COGNITIVE FUNCTION 1077
diabetic patients. Diabetes Nutrition & Metabolism,5, 265–274.
Kahn, C. R. (1994). Insulin action, diabetogenes, and thecause of type II diabetes. Diabetes, 43, 1066–1084.
Kalmijn, S., Feskens, E. J., Launer, L. J., Stijnen, T., &Kromhout, D. (1995). Glucose intolerance, hyper-insulinaemia and cognitive function in a generalpopulation of elderly men. Diabetologia, 38(9),1096–1102.
Kaplan, E., Fein, D., Morris, R., & Delis, D. C. (1991).WAIS-R NI. Manual. San Antonio: The Psycholo-gical Corporation.
Kaplan, R. J., Greenwood, C. E., Winocur, G., &Wolever, T. M. (2001). Dietary protein, carbohy-drate, and fat enhance memory performance in thehealthy elderly. Am J Clin Nutr, 74(5), 687–693.
Kaplan, R. J., Greenwood, C. E., Winocur, G., &Wolever, T. M. S. (2000). Cognitive performance isassociated with glucose regulation in healthy elderlypersons and can be enhanced with glucose anddietary carbohydrates. American Journal of ClinicalNutrition, 72, 825–836.
Kaplan, R. J., Winocur, G., Wolever, T. M. S., &Greenwood, C. E. (1999). Influence of glucose anddietary carbohydrates on memory in healthy elderlyhumans. Society for Neuroscience Abstracts, 25, 896.
Kawakami, N., Takatsuka, N., Shimizu, H., & Ishibashi, H.(1999). Depressive symptoms and occurrence of type2 diabetes among Japanese men. Diabetes Care,22(7), 1071–1076.
Keefover, R. W. (1998). Aging and cognition. NeurolClin, 16(3), 635–648.
Kilander, L., Boberg, M., & Lithell, H. (1993). Peri-pheral glucose metabolism and insulin sensitivity inAlzheimer’s disease. Acta Neurol Scand, 87(4),294–298.
Kilander, L., Nyman, H., Boberg, M., & Lithell, H.(1997). Cognitive function, vascular risk factors andeducation. A cross- sectional study based on acohort of 70-year-old men. Journal of Internal Med-icine, 242(4), 313–321.
Kumari, M., Brunner, E., & Fuhrer, R. (2000). Minire-view: Mechanisms by which the metabolic syndromeand diabetes impair memory. Journals of Geront-ology. Series A, Biological Sciences & Medical Sci-ences, 55(5), B228–232.
Kuusisto, J., Mykkanen, L., Pyorala, K., & Laakso, M.(1994). NIDDM and its metabolic control predictcoronary heart disease in elderly subjects. Diabetes,43(8), 960–967.
Lannert, H., & Hoyer, S. (1998). Intracerebroventricularadmission of streptozotocin causes long-term diamu-nitions in learning and memory abilities and incerebral energy metabolism in rats. Behavioral Neu-roscience, 112(5), 1119—1208.
Launer, L. J., Dinkgreve, M. A., Jonker, C., Hooijer, C.,& Lindeboom, J. (1993). Are age and educationindependent correlates of the Mini-Mental StateExam performance of community-dwelling elderly?Journal of Gerontology, 48(6), P271–277.
Leibson, C. L., Rocca, W. A., Hanson, V. A., Cha, R.,Kokmen, E., Obrien, P. C., et al. (1997). Risk ofdementia among persons with diabetes mellitus: Apopulation-based cohort study. American Journal ofEpidemiology, 145(4), 301–308.
Leloup, C., Arluison, M., Kassis, N., Lepetit, N.,Cartier, N., Ferre, P., et al. (1996). Discrete brainareas express the insulin-responsive glucose trans-porter GLUT4. Molecular Brain Research, 38(1),45–53.
Lezak, M. D. (1995). Neuropsychological assessment3rd edition. New York: Oxford University Press.
Lindeman, R. D., Romero, L. J., LaRue, A., Yau, C. L.,Schade, D. S., Koehler, K. M., et al. (2001). Abiethnic community survey of cognition in participantswith type 2 diabetes, impaired glucose tolerance, andnormal glucose tolerance: The New Mexico ElderHealth Survey. Diabetes Care, 24(9), 1567–1572.
Ling, X., Martins, R. N., Racchi, M., Craft, S., &Helmerhorst, E. (2002). Amyloid beta antagonizes insu-lin promoted secretion of the amyloid beta protein pre-cursor. Journal of Alzheimer’s Disease, 4(5), 369–374.
Lowe, L. P., Tranel, D., Wallace, R. B., & Welty, T. K.(1994). Type II diabetes and cognitive function. Apopulation-based study of Native Americans.Diabetes Care, 17(8), 891–896.
Luchsinger, J. A., Tang, M. X., Stern, Y., Shea, S., &Mayeux, R. (2001). Diabetes mellitus and risk ofAlzheimer’s disease and dementia with stroke in amultiethnic cohort. American Journal of Epidemio-logy, 154(7), 635–641.
Lupien, S. J., de Leon, M., de Santi, S., Convit, A.,Tarshish, C., Nair, N. P., et al. (1998). Cortisol levelsduring human aging predict hippocampal atrophy andmemory deficits. Nature Neuroscience, 1(1), 69–73.
Lupien, S. J., Nair, N. P., Briere, S., Maheu, F., Tu, M. T.,Lemay, M., et al. (1999). Increased cortisol levelsand impaired cognition in human aging: implicationfor depression and dementia in later life. Reviews inthe Neurosciences, 10(2), 117–139.
Magistretti, P. J., & Pellerin, L. (1996). Cellular mecha-nisms of brain energy metabolism. Relevance tofunctional brain imaging and to neurodegenerativedisorders. Annals of the New York Academy of Sci-ences, 777, 380–387.
Mangione, C. M., Seddon, J. M., Cook, E. F., Krug,J. H., Jr., Sahagian, C. R., Campion, E. W., et al.(1993). Correlates of cognitive function scores in eld-erly outpatients. Journal of the American GeriatricsSociety, 41(5), 491–497.
1078 NESRINE AWAD ET AL.
Manning, C. A., Hall, J. L., & Gold, P. E. (1990). Glu-cose effects on memory and other neuropsychologi-cal tests in elderly humans. Psychological Science,5, 307–311.
Manning, C. A., Parsons, M. W., Cotter, E. M., & Gold,P. E. (1997). Glucose effects on declarative andnondeclarative memory in healthy elderly and youngadults. Psychobiology, 25(2), 103–108.
Manning, C. A., Parsons, M. W., & Gold, P. E. (1992).Anterograde and retrograde enhancement of 24-hmemory by glucose in elderly humans. Behavioraland Neural Biology, 58(2), 125–130.
Manning, C. A., Stone, W. S., Korol, D. L., & Gold,P. E. (1998). Glucose enhancement of 24-h memoryretrieval in healthy elderly humans. BehaviouralBrain Research, 93(1–2), 71–76.
Matthews, C. G., & Klove, H. (1964). Instruction manualfor the adult neuropsychology test battery. Madison,WI: University of Wisconsin Medical School.
Mattlar, C.-E., Falk, B., Rönnemaa, T., & Hyyppä, M. T.(1985). Neuropsychological cognitive performanceof patients with Type-2 diabetes. ScandinavianJournal of Rehabilitation Medecine, 17, 101–105.
McCall, A. L., van Bueren, A. M., Huang, L., Stenbit, A.,Celnik, E., & Charron, M. J. (1997). Forebrain endo-thelium expresses GLUT4, the insulin-responsive glu-cose transporter. Brain Research, 744(2), 318–326.
McCance, D. R., Pettitt, D. J., Hanson, R. L.,Jacobsson, L., Bennett, P. H., & Knowler, W. C.(1994). Glucose, insulin concentrations and obesityin childhood and adolescence as predictors ofNIDDM. Diabetologia, 37(6), 617–623.
McNay, E. C., Fries, T. M., & Gold, P. E. (2000).Decreases in rat extracellular hippocampal glucoseconcentration associated with cognitive demandduring a spatial task. Proceedings of the NationalAcademy of Sciences of the United States of America,97(6), 2881–2885.
McNay, E. C., & Gold, P. E. (2001). Age-related differ-ences in hippocampal extracellular fluid glucoseconcentration during behavioral testing and follow-ing systemic glucose administration. Journal ofGerontology. Series A, Biological Sciences, 56A(2),B66–B71.
McNay, E. C., McCarty, R. C., & Gold, P. E. (2001).Fluctuations in brain glucose concentration duringbehavioral testing: dissociations between brain areasand between brain and blood. Neurobiology ofLearning and Memory, 75, 325–337.
Meneilly, G. S., Cheung, E., Tessier, D., Yakura, C., &Tuokko, H. (1993). The effect of improved glycemiccontrol on cognitive functions in the elderly patientwith diabetes. Journal of Gerontology, 48(4),M117–M121.
Messier, C. (2003). Diabetes, Alzheimer’s disease andapolipoprotein genotype. Experimental Geronto-logy, 38(9), 941–946.
Messier, C. (in press). Glucose improvement ofmemory: A review. European Journal of Phar-macology.
Messier, C., Desrochers, A., & Gagnon, M. (1999).Effect of glucose, glucose regulation and wordimagery value on human memory. Behavioral Neu-roscience, 113(3), 431–438.
Messier, C., & Destrade, C. (1994). Insulin attenuatesscopolamine-induced memory deficits. Psychobio-logy, 22(1), 16–21.
Messier, C., Durkin, T., Mrabet, O., & Destrade, C.(1990). Memory-improving action of glucose: Indi-rect evidence for a facilitation of hippocampal ace-tylcholine synthesis. Behavioural Brain Research,39, 135–143.
Messier, C., Gagnon, M., & Knott, V. (1997). Effect ofglucose and peripheral glucose regulation on memoryin the elderly. Neurobiology of Aging, 18(3), 297–304.
Messier, C., Pierre, J., Desrochers, A., & Gravel, M.(1998). Dose-dependent action of glucose on mem-ory processes in women: Effect on serial positionand recall priority. Cognitive Brain Research, 7(2),221–233.
Messier, C., Tsiakas, M., Gagnon, M., Desrochers, A.,& Awad, N. (2003). Effect of age and glucoregula-tion on cognitive performance. Neurobiology ofAging, 24(7), 985–1003.
Meuter, F., Thomas, W., Gruneklee, D., Gries, F. A., &Lohman, R. (1980). Psychometric evaluation of per-formance in diabetes mellitus.Hormones and Meta-bolic Research, 9 (suppl), 9–17.
Mooradian, A. D. (1997). Pathophysiology of centralnervous system complications in diabetes mellitus.Clinical Neuroscience, 4(6), 322–326.
Mooradian, A. D., Perryman, K., Fitten, J., Kavonian,G. D., & Morley, J. E. (1988). Cortical function inelderly non-insulin dependent diabetic patients.Behavioral and electrophysiological studies. Archivesof Internal Medecine, 148, 2369–2372.
Mortel, K. F., Wood, S., Pavol, M. A., Meyer, J. S., &Rexer, J. L. (1993). Analysis of familial and individ-ual risk factors among patients with ischemic vascu-lar dementia and Alzheimer's disease. Angiology,44(8), 599–605.
Motta, M., Sorace, S., Restuccia, S., Carnazzo, G.,Corrao, G., Seminara, G., et al. (1996). Cognitiveimpairment in the elderly diabetics. Archives ofGerontology and Geriatry, 23 (Suppl. 5), 43–46.
Naor, M., Steingruber, H. J., Westhoff, K., Schottenfeld-Naor, Y., & Gries, A. F. (1997). Cognitive function inelderly non-insulin-dependent diabetic patients before
TYPE 2 DIABETES AND COGNITIVE FUNCTION 1079
and after inpatient treatment for metabolic control.Journal of Diabetes & Its Complications, 11(1), 40–46.
Ott, A., Stolk, R. P., Hofman, A., van Harskamp, F.,Grobbee, D. E., & Breteler, M. M. (1996). Associa-tion of diabetes mellitus and dementia: The RotterdamStudy. Diabetologia, 39(11), 1392–1397.
Ott, A., Stolk, R. P., van Harskamp, F., Pols, H. A.,Hofman, A., & Breteler, M. M. (1999). Diabetesmellitus and the risk of dementia: The RotterdamStudy. Neurology, 53(9), 1937–1942.
Peila, R., Rodriguez, B. L., & Launer, L. J. (2002).Type 2 diabetes, APOE gene, and the risk fordementia and related pathologies - the Honolulu-Asia aging study. Diabetes, 51(4), 1256–1262.
Perlmuter, L. C. (1999). Considering psychosocial vari-ables in evaluating assessments of glycemic control.Diabetes Care, 22(11), 1918–1919.
Perlmuter, L. C., Anderson, K. S., Fan, X., & Tabanica, F.(1997). Does Cognitive function decline in Type IIdiabetes? Diabetes Spectrum, 10(1), 57–62.
Perlmuter, L. C., Hakami, M. K., Hodgson-Harrington, C.,Ginsberg, J., Katz, J., Singer, D. E., et al. (1984).Decreased cognitive function in aging non-insulin-dependent diabetic patients. American Journal ofMedecine, 77, 1043–1048.
Perlmuter, L. C., Nathan, D. M., Goldfinger, S. H.,Russo, P. A., Yates, J., & Larkin, M. (1988). Tri-glyceride levels affect cognitive function in non-insulin-dependent diabetics. Journal of DiabetesComplications, 2(4), 210–213.
Perlmuter, L. C., Tun, P., Sizer, N., McGlinchey, R. E.,& Nathan, D. M. (1987). Age and diabetes relatedchanges in verbal fluency. Experimental AgingResearch.
Peterson, L. R., & Peterson, M. J. (1959). Short-termretention of individual verbal items. Journal ofExperimental Psychology, 58, 193–198.
Pinhas-Hamiel, O., Dolan, L. M., Daniels, S. R.,Standiford, D., Khoury, P. R., & Zeitler, P. (1996).Increased incidence of non-insulin-dependent diabe-tes mellitus among adolescents. Journal of Pedia-trics, 128(5 PT 1), 608–615.
Ragozzino, M. E., Pal, S. N., Unick, K., Stefani, M. R.,& Gold, P. E. (1998). Modulation of hippocampalacetylcholine release and spontaneous alternationscores by intrahippocampal glucose injections.Journal of Neuroscience, 18(4), 1595–1601.
Ragozzino, M. E., Unick, K. E., & Gold, P. E. (1996).Hippocampal acetylcholine release during memorytesting in rats: augmentation by glucose. Proceed-ings of the National Academy of Sciences of theUnited States of America, 93(10), 4693–4698.
Raizada, M. K., Shemer, J., Judkins, J. H., Clarke, D. W.,Masters, B. A., & LeRoith, D. (1988). Insulin receptors
in the brain: Structural and physiological characteriza-tion. Neurochemical Research, 13(4), 297–303.
Reagan, L. P., Rosell, D. R., Alves, S. E., Hoskin,E. K., McCall, A. L., Charron, M. J., et al. (2002).GLUT8 glucose transporter is localized to excita-tory and inhibitory neurons in the rat hippocampus.Brain Research, 932(1–2), 129–134.
Reaven, G. M. (1993). Role of insulin resistance inhuman disease (syndrome X): An expanded defini-tion. Annual Review of Medecine, 44, 121–131.
Reaven, G. M., Thompson, L. W., Nahum, D., &Haskins, E. (1990). Relationship between hypergly-cemia and cognitive function in older NIDDMpatients. Diabetes Care, 13, 16–21.
Rush, D. K. (1988). Scopolamine amnesia of passiveavoidance: A deficit of information acquisition.Behavioral and Neural Biology, 50, 255–274.
Rusted, J. M., & Warburton, D. M. (1989). Effects ofScopolamine on Verbal Memory - A Retrieval orAcquisition Deficit. Neuropsychobiology, 21(2),76–83.
Ryan, C. M. (1997). Effects of Diabetes Mellitus onNeuropsychological Functioning: A Lifespan Pers-pective. Seminars in Clinical Neuropsychiatry, 2(1),4–14.
Ryan, C. M., & Geckle, M. (2000). Why is learning andmemory dysfunction in Type 2 diabetes limited toolder adults? Diabetes Metabolic Research andReviews, 16(5), 308–315.
Ryan, C. M., & Geckle, M. O. (2000). Circumscribedcognitive dysfunction in middle-aged adults withtype 2 diabetes. Diabetes Care, 23(10), 1486–1493.
Scherr, P. A., Albert, M. S., Funkenstein, H. H., Cook,N. R., Hennekens, C. H., Branch, L. G., et al. (1988).Correlates of cognitive function in an elderly com-munity population. American Journal of Epidemiol-ogy, 128(5), 1084–1101.
Schulingkamp, R. J., Pagano, T. C., Hung, D., & Raffa,R. B. (2000). Insulin receptors and insulin action inthe brain: Review and clinical implications.Neuroscience and Biobehavioral Reviews, 24(8),855–872.
Scott, R. D., Kritz-Silverstein, D., Barrett-Connor, E., &Wiederholt, W. C. (1998). The association of non-insulin-dependent diabetes mellitus and cognitivefunction in an older cohort. Journal of the AmericanGeriatric Society, 46(10), 1217–1222.
Sinclair, A. J., Allard, I., & Bayer, A. (1997). Obser-vations of diabetes care in long-term institutionalsettings with measures of cognitive function anddependency. Diabetes Care, 20(5), 778–784.
Soininen, H., Puranen, M., Helkala, E. L., Laakso, M., &Riekkinen, P. J. (1992). Diabetes mellitus andbrain atrophy: a computed tomography study in an
1080 NESRINE AWAD ET AL.
elderly population. Neurobiology of Aging, 13(6),717–721.
Soininen, H. S., Partanen, K., Pitkanen, A., Vainio, P.,Hanninen, T., Hallikainen, M., et al. (1994). Volu-metric MRI analysis of the amygdala and thehippocampus in subjects with age-associated memoryimpairment: correlation to visual and verbal memory.Neurology, 44(9), 1660–1668.
Sokoloff, L., Reivich, M., Kennedy, C., DesRosiers,M. H., Patlak, C. S., Pettigrew, K. D., et al. (1977).The 14C-deoxyglucose method for measurement oflocal cerebral glucose utilization: Theory, procedureand normal values in the conscious and anesthetizedalbino rat. Journal of Neurochemistry, 28, 897–916.
Spreen, O., & Strauss, E. (1991). A Compendium ofNeuropsychological Tests. New York: Oxford Uni-versity Press.
Spreen, O., & Strauss, E. (1998). A Compendium ofNeuropsychological Tests. New York: Oxford Uni-versity Press.
Stewart, R., & Liolitsa, D. (1999). Type 2 diabetes mel-litus, cognitive impairment and dementia. DiabeticMedecine, 16(2), 93–112.
Stolar, M. (1990). Diabetic complications - atheroscle-rotic, cardiovascular and cerebrovascular disease.Diabetes Mellitus in the Elderly, 151–164.
Strachan, M. W., Deary, I. J., Ewing, F. M., & Frier, B. M.(1997). Is type II diabetes associated with an increasedrisk of cognitive dysfunction? A critical review of pub-lished studies. Diabetes Care, 20(3), 438–445.
Tun, P. A., Perlmuter, L. C., Russo, P., & Nathan, D. M.(1987). Memory self-assessment and performancein aged diabetics and non-diabetics. ExperimentalAging Research, 13, 151–157.
U’Ren, R. C., Riddle, M. C., Lezak, M. D., & Benning-ton-Davis, M. (1990). The mental efficiency of theelderly person with Type II diabetes mellitus. Journalof the American Geriatrics Society, 38, 505–510.
Uusitupaa, M. I. J., Niskanen, L. K., Siitonen, O.,Voutilainen, E., & Pyorala, K. (1993). Ten year car-diovascular mortality in relation to risk factors andabnormalities in lipoprotein composition in type 2(non-insulin-dependent) diabetic and non-diabeticsubjects. Diabetologia, 11, 1175–1184.
van Boxtel, M. P., Buntinx, F., Houx, P. J.,Metsemakers, J. F., Knottnerus, A., & Jolles, J.(1998). The relation between morbidity and cogni-tive performance in a normal aging population.
Journal of Gerontology. Series A, Biological Sci-ences & Medical Sciences, 53(2), M147–154.
Vanhanen, M., Koivisto, K., Karjalainen, L., Helkala,E. L., Laakso, M., Soininen, H., et al. (1997). Riskfor non-insulin-dependent diabetes in the normogly-caemic elderly is associated with impaired cognitivefunction. Neuroreport, 8(6), 1527–1530.
Vanhanen, M., Koivisto, K., Kuusisto, J., Mykkanen, L.,Helkala, E. L., Hanninen, T., et al. (1998). Cognitivefunction in an elderly population with persistentimpaired glucose tolerance. Diabetes Care, 21(3),398–402.
Vanhanen, M., Kuusisto, J., Koivisto, K., Mykkanen, L.,Helkala, E. L., Hanninen, T., et al. (1999). Type-2diabetes and cognitive function in a non-dementedpopulation. Acta Neurologica Scandinavica, 100(2),97–101.
Wahlin, A., Nilsson, E., & Fastbom, J. (2002). Cogni-tive performance in very old diabetic persons: theimpact of semantic structure, preclinical dementia,and impending death. Neuropsychology, 16(2),208–216.
Wang, L., Van Belle, G., Kukull, W. B., & Larson, E. B.(2002). Predictors of functional change: a longitudi-nal study of nondemented people aged 65 and older.J Am Geriatr Soc, 50(9), 1525–1534.
Wechsler, D. (1981). Wechsler Adult IntelligenceScale-Revised. New York: Harcourt BraceJovanovich.
Wechsler, D. (1987). Wechsler Memory Scale-Revised.New York: Psychological Corporation.
Wechsler, D. (1997). Wechsler Adult IntelligenceScale-III. New York: Psychological Corporation.
Woo, J., Ho, S. C., Lau, S., Lau, J., & Yuen, Y. K.(1994). Prevalence of cognitive impairment andassociated factors among elderly Hong KongChinese aged 70 years and over. Neuroepidemi-ology, 13(1–2), 50–58.
World Health Organization. (1985). Diabetes mellitus.Report of a WHO Study Group.
Worrall, G., Moulton, N., & Briffett, E. (1993). Effectof type II diabetes mellitus on cognitive function.Journal of Family Practice, 36(6), 639–643.
Zaslavsky, L., Gross, J. L., Chaves, M. L., & Machado, R.(1995). Memory dysfunction and autonomic neur-opathy in non-insulin-dependent (type 2) diabeticpatients. Diabetes Research & Clinical Practice,30(2), 101–110.