glucose and insulin measurements from the oral glucose tolerance test and mortality prediction
TRANSCRIPT
Glucose and Insulin Measurements from the Glucose ToleranceTest and Mortality Prediction
E. Jeffrey Metter, M.D.1, B. Gwen Windham, M.D., M.H.S.1, Marcello Maggio, M.D., Ph.D.2,Eleanor M. Simonsick, Ph.D.1, Shari M. Ling, M.D.1, Josephine M. Egan, M.D.3, and LuigiFerrucci, M.D., Ph.D.11 Longitudinal Studies Section, Clinical Research Branch, National Institute on Aging Intramural ResearchProgram (NIA-IRP), National Institutes of Health (NIH), Baltimore, MD, USA
2 Department of Internal Medicine and Biomedical Sciences, Section of Geriatrics, University of Parma, Italy
3 Laboratory of Clinical Investigation, National Institute on Aging Intramural Research Program (NIA-IRP),National Institutes of Health (NIH), Baltimore, MD, USA
AbstractObjective—To verify what information from oral glucose tolerance testing (OGTT) independentlypredicts mortality.
Research Design and Methods—1401 initially non-diabetic participants from the BaltimoreLongitudinal Study of Aging, aged 17–95 years, with one or more OGTT (median=2, range 1–8)with insulin and glucose measurements measured every 20 minutes over 2 hours. Proportional hazardusing the longitudinally collected data and Bayesian model averaging were used to examine theassociation of OGTT measurements individually and grouped with mortality adjusting for covariates.
Results—Participants were followed for a median 20.3 years (range 0.5 – 40 years). The first hourOGTT glucose and insulin levels increased only modestly with age; whereas levels during the secondhour increased more than 4% per decade. Individually, the 100-and 120-minute glucose measuresand the fasting and 100-minute insulin levels were all independent predictors of mortality. When allmeasures were considered together, only higher 120-minute glucose was a significant independentrisk factor for mortality.
Conclusion—The steeper rise with age of the OGTT 2-hour glucose values and the prognosticprimacy of the 120 minute glucose value for mortality is consistent with previous reports and suggeststhe value of using the OGTT in clinical practice.
Many but not all studies have found a near-linear association between fasting plasma glucoselevels above 100 mg/dl and mortality (1). Plasma glucose two hours after an oral glucose loadis also a strong predictor of mortality regardless of fasting plasma glucose level (2,3), and mayactually be a better predictor of mortality than the fasting level (4).
It has been proposed that in early stages of glucose metabolism dysregulation, fasting and 2hour plasma glucose measures during an oral glucose tolerance test (OGTT) may be normalor slightly elevated, but the amount of insulin necessary to maintain this equilibrium is supra-physiological (5). This state of “insulin resistance” may have detrimental consequences onhealth. However, little evidence exists that hyperinsulinemia either fasting, or with a glucosechallenge, is a risk factor for mortality (6). Thus the clinical usefulness of measuring insulinremains uncertain.
Corresponding Author: E. Jeffrey Metter M.D, National Institute on Aging, Harbor Hospital 5th Floor, 3001 S. Hanover Street, Baltimore,MD 21225. Email: [email protected], telephone: 410-350-3980, fax: 410-350-7304.
NIH Public AccessAuthor ManuscriptDiabetes Care. Author manuscript; available in PMC 2009 May 1.
Published in final edited form as:Diabetes Care. 2008 May ; 31(5): 1026–1030.
NIH
-PA Author Manuscript
NIH
-PA Author Manuscript
NIH
-PA Author Manuscript

Using data from the Baltimore Longitudinal Study of Aging (BLSA), we examinedlongitudinal change in glucose and insulin in response to OGTT, and the association of differentglucose and insulin measurements on mortality.
Research Design and MethodsStudy population
BLSA participants are community-dwelling volunteers with above-average education, incomeand access to medical care (7). Participants underwent extensive evaluations bi-annually.Participants who were non-diabetic at the initial OGTT evaluation and with at least one OGTTwith both glucose and insulin measurements were included in this study. The research protocolwas approved by the Institutional Review Board at the Johns Hopkins Bayview Medical Centerand all participants provided written informed consent.
Analysis was restricted to OGTT performed prior to 1995 (when laboratory procedures weremodified). Overall, 1510 BLSA participants (age 17 to 95 years) were eligible, of whom 109had diabetes at the time of their initial OGTT, defined as a fasting glucose >= 7.0 mm/l (126mg/dl), 2 hour OGTT glucose measurement >= 11.1 mm/l (200 mg/dl), history of diabetes orcurrent use of oral hypoglycemic agents or insulin, leaving 1401 participants with 3727observations (424 subjects with 1 observation, 343 with 2 observations, 262 with 3observations, and 372 with 4 or more observations).
OGTTOGTT assessments began in 1959 using 1.75 g glucose/kg body weight glucose challenge,which was changed to 40 g/m2 body surface area in 1977, following recommended guidelines.Consistent with previous research (2,3), to convert OGTT results across methods we regressedglucose and insulin levels at each OGTT time point on a fourth order polynomial of the glucoseload which was centered at 75 grams. Adjusted measurements no longer depended on glucoseload.
Participants were observed overnight on the research ward, beginning fasting at 8 pm andreceived the OGTT between 7 and 8 am. Blood samples were drawn at 0, 20, 40, 60, 80, 100and 120 minutes. Glucose levels were measured using the ferricyanide reduction method(Technico-Auto- Analyzer) before 1977 and the glucose oxidase method from 1977 to present,with the Beckman glucose analyzer (1977–1983), Abbott Laboratories ABA 200 ATC SeriesII Biochromatic Analyzer (1983–1992), Abbott Spectrum CCX (1992 to present). Plasmainsulin was measured using radio-immunoassay (8). The lower limit of detection for this assayis 15 pmol/ml, interassay coefficient of variation is 11.5 with intra-assay coefficient of variationof 6% (9).
CovariatesHeight, weight, and seated blood pressure were measured by standard methods. Body massindex (BMI) was calculated as weight (kilograms) divided by height (meters) squared. Waistcircumference (cm) was measured as the smallest circumference between the umbilicus andlower ribs. Smoking history was assessed using a standard questionnaire.
MortalityDeaths were ascertained by telephone follow-up of inactive participants, correspondence fromrelatives, and search of the National Death Index. Cause of death was determined by theconsensus of three physicians reviewing available information.
Metter et al. Page 2
Diabetes Care. Author manuscript; available in PMC 2009 May 1.
NIH
-PA Author Manuscript
NIH
-PA Author Manuscript
NIH
-PA Author Manuscript
Statistical AnalysisData are summarized as mean ±SD unless otherwise stated. Differences in baselinecharacteristics (Table 1) between survivors and decedents were tested by age and sex adjustedancova or logistic regressions as appropriate.
From the 3727 observations, 2.0% of the OGTT glucose and insulin measurements and 0.6%of covariate data were missing. Missing data were imputed using the MICE program (10) withfive replicated datasets. Survival models were based on the first imputation while all otheranalyses use the average of the five imputations. The remaining four imputed datasets producedthe same conclusions.
Basal insulin resistance was estimated by the homeostatic assessment model (HOMA) wascalculated using fasting glucose and insulin levels as an assessment of basal insulin resistance(11). Integration of the glucose and insulin OGTT curves was calculated by the standardtrapezoid method.
Proportional hazard models using all longitudinally collected OGTT data were used to examinethe relationship between glucose and insulin levels at each OGTT time point and time to deathwith three hierarchical models that 1) adjusted for date and sex, 2) added age, and 3) addedother covariates. The survival model used all longitudinally collected OGTT data though atime-dependent approach based on the Anderson-Gill formulation of a counting process usingthe survival functions developed by Therneau. (12).
To examine which OGTT measurements independently predicted mortality, we used a standardbackward elimination to obtain a parsimonious model with all variables showing p<0.10.Additionally, we fitted a Bayesian model averaging (BMA; 13) to identify the best set ofpredictors for mortality across all feasible models. Because BMA used the initial evaluation,the effects of diabetes on mortality would be underestimated because of the exclusion of thosewho were diabetic at initial evaluation. Therefore, we repeated the BMA analysis includingdiabetic participants.
A two-tailed p value < 0.05 was used to indicate statistical significance. All analyses and graphswere completed using R version 2.4.1 (R Project for Statistical Computing,http://www.r-project.org).
ResultsThere were 470 deaths and 931 surviving participants as of January 2006. Baselinecharacteristics are presented in Table 1. Those who died were older initially, had shorter follow-up time, tended to have higher BMI, systolic and diastolic blood pressures, and were less likelyto smoke than those who survived.
At the initial evaluation, average glucose values during the OGTT were higher in those whodied than those who survived (Table 1). After adjusting for age and sex, glucose at 40, 100 and120 minutes were higher in those who died compared to survivors, while insulin levels did notdiffer at any time point. In adjusted analyses, HOMA, integrated glucose and integrated insulinwere not statistically different according to survivorship (Table 1).
In analyses that considered longitudinal trends, all OGTT glucose levels increased with follow-up time (p<0.0001), but the rate of change was lowest for the fasting state ( 0.07 mmol/l/10yr) and increased progressively for subsequent OGTT time points (e.g. rate at 60 minutes =0.37 mmol/l/10 yr, and rate at 120 minutes= 0.42 mmol/l/10yr). Corresponding rates for insulin
Metter et al. Page 3
Diabetes Care. Author manuscript; available in PMC 2009 May 1.
NIH
-PA Author Manuscript
NIH
-PA Author Manuscript
NIH
-PA Author Manuscript

were 1.32 pmol/l/10 yr for fasting, 12.90 pmol/l/10 yr for 60 minutes, and for 128.92 pmol/l/10 yr for 120 minutes.
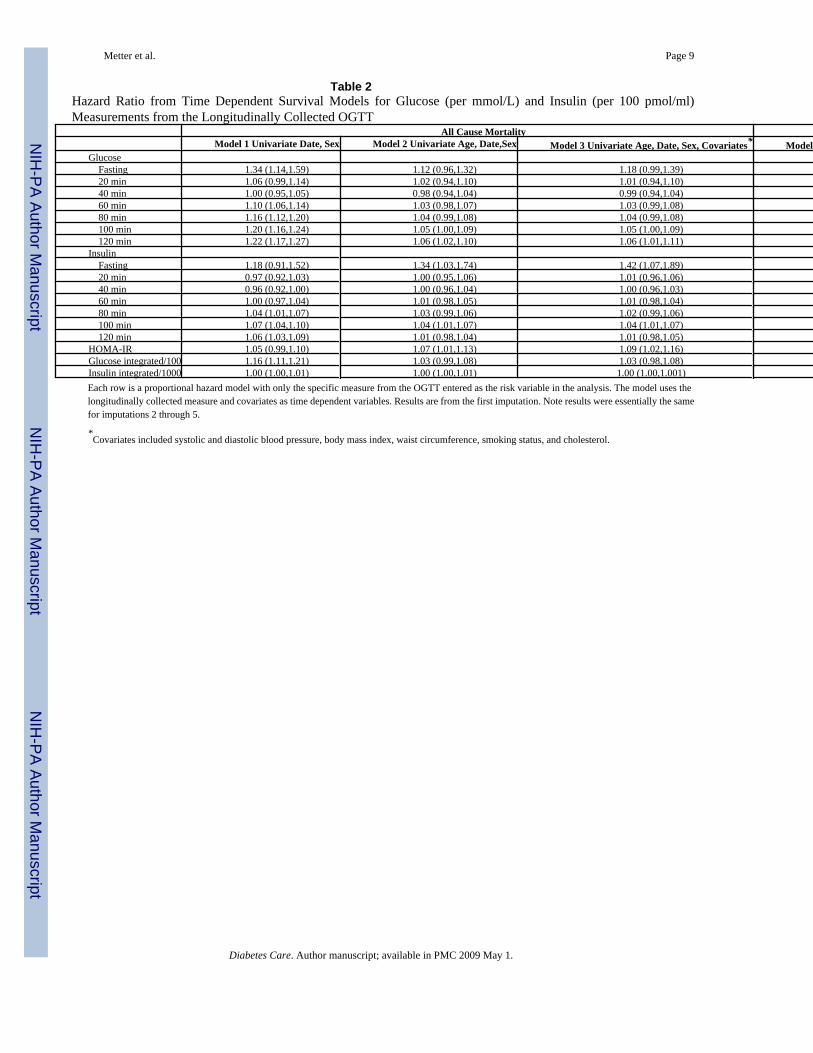
Proportional hazard models using all longitudinally collected data evaluated the individualrelative risk of mortality for each OGTT measure (Table 2). Adjusting for age, date and sex,100- and 120-minute glucose, fasting insulin, 100-minute insulin, and HOMA were associatedwith all cause mortality. These associations persisted after further adjustments for BMI, waistcircumference, diastolic and systolic blood pressure, lipids and smoking. Of the 326 deaths,134 were considered cardiovascular deaths. In adjusted analyses, only 120 min glucose andintegrated glucose were significant predictors of mortality (Table 2, Model 4).
For each OGTT measure, Figure 1a presents risk ratios with 95% confidence intervals (CI)comparing risk of mortality associated with being at the 75th percentile versus the 25th
percentile adjusted for age, date and sex. The greatest discernable risk was found with the 100-and 120-minute glucose measurements. Figure 1b shows a similar result for cardiovascularmortality.
From the longitudinal survival model including all glucose and insulin measures, we removedvariables not independently associated with mortality. In the final parsimonious model, 100-minute insulin (RR = 1.11, 95% CI: 1.05–1.17 per 100 pmol/ml increase), 120-minute insulin(RR=0.90, CI: 0.85–0.92), 40-minute glucose (RR=0.92, CI: 0.87–0.97 per mmol/L increase),120-minute glucose (RR=1.10, CI: 1.05–1.16), and HOMA (RR=1.07, CI:1.00–1.13) wereindependently associated with greater mortality. Since the selection of variables with thismethod may be strongly influenced by collinearity, we performed a confirmatory analysis usingBMA, which assesses uncertainty by exploring multiple models and providing weightedprobabilities that coefficients are not equal to zero. Using data from the first evaluation, 120-minute glucose was the only variable in the BMA model with a probability greater than 10%(16.4%) that the regression coefficient was not zero (i.e. no association with mortality). Whenthe 109 participants classified as diabetic at baseline were included in the BMA, the probabilitythat the 120-minute glucose regression coefficient was not zero was 93.4%, while fastinginsulin was only 15.5%. Fasting glucose was not an independent predictor of mortality in thesemodels.
DiscussionIn a large population of men and women aged 17 to 95 years at initial OGTT, higher 120-minute glucose level was the single OGTT measure consistently and independently associatedwith mortality.
Independent of age and sex, fasting glucose, 120-minute glucose, fasting insulin and 100-minute insulin were associated with higher mortality. When considering all glucose and insulinmeasurements together, only the 120-minute glucose remained prognostic for mortality,independent of age, date and sex. Although the 100- and 120-minute insulin, 40-minuteglucose, and HOMA were statistically independent predictors of mortality in the parsimoniousmodel, the prognostic information contributed by the other four variables was almostnegligible. This observation is consistent with Sorkin et al (3) who found that the 120-minuteglucose measurement improved mortality prediction over using fasting glucose alone.However, these authors did not consider the predictive value of the 120-minute measure alone.
Why might 120-minute glucose be the most robust predictor of mortality? It is possible thatas long as beta cells secrete enough insulin to maintain euglycemia, consequences of elevatedblood glucose are avoided, regardless of the amount of insulin necessary to maintain glucosehomeostasis (14). Although this interpretation contrasts, at least in part, with the report bySorkin et al (3) which focused on categorical characterizations, e.g. normal, impaired and
Metter et al. Page 4
Diabetes Care. Author manuscript; available in PMC 2009 May 1.
NIH
-PA Author Manuscript
NIH
-PA Author Manuscript
NIH
-PA Author Manuscript
diabetic, we suggest that a more refined risk assessment can be obtained by examining thecontinuous range 120-minute glucose values. Alternatively, the 120-minute glucose could bea marker of poor health. Deteriorating health may cause a progressive inability to respond toa glucose challenge, possibly due to a loss of resiliency in the hypothalamic-pituitary-adrenalaxis resulting in prolonged secretion of glucocorticoids following challenge (15).
Our findings do not imply that insulin resistance is not critical in the development of glucoseimpairment and diabetes. HOMA-IR was associated with mortality independent of thecovariates, although its predictive value substantially diminished after adjusting for 120-minuteglucose. Since calculating HOMA-IR does not require an OGTT, its clinical usefulness remainshigh. Interestingly, in preliminary analyses, fasting insulin was a significant, independentpredictor of mortality. The ratio between fasting insulin and glucose during the OGTT is amarker of prompt homeostatic response, while fasting insulin depends on long term responsewhich has 8–10 hours to reach a steady state and is also influenced by change in hormonallevel characteristic of the morning awakening (e.g. cortisol, catecholamines). The insulin levelrequired to reach steady state over a long time period may be a better indicator of the overallhomeostatic capability. In addition, the insulin assay used in this study detects the proinsulindes (64–65) and proinsulin split (65–66) which may partially mask the effect of insulin onmortality.
The BLSA population is well-educated and tends to be health seeking, which may limitgeneralizability of these findings to similar populations. However, previous reports from theBLSA involving glucose (2,3,16) and other systems (e.g., 17,18,6) have been consistent withobservations from more general populations. In conclusion, consistent with Sorkin et al (3) wefind that the OGTT is an important tool for assessing glucose homeostasis. Informationprovided by fasting glucose can be usefully complemented by evaluating the 120 minuteglucose. Although investigators have proposed that the shape of the OGTT response curve(19), as well as OGTT indices of insulin release and sensitivity may be informative (20,21,22), we found no evidence to support of these hypotheses.
Acknowledgements
This research was supported by the Intramural Research Program of the NIH, National Institute on Aging.
References1. Balkau B, Bertrais S, Ducimetiere P, Eschwege E. Is there a glycemic threshold for mortality risk?
Diabetes Care 1999;22:696–699.2. Meigs JB, Muller DC, Nathan DM, Blake DR, Andres R. The natural history of progression from
normal glucose tolerance to type 2 diabetes in the Baltimore Longitudinal Study of Aging. Diabetes2003;52:1475–1484. [PubMed: 12765960]
3. Sorkin JD, Muller DC, Fleg JL, Andres R. The relation of fasting and 2-h postchallenge plasma glucoseconcentrations to mortality: Data from the Baltimore Longitudinal Study of Aging with a criticalreview of the literature. Diabetes Care 2005;28:2626–2632. [PubMed: 16249530]
4. DECODE Study Group. Glucose tolerance and mortality: comparison of WHO and American DiabeticAssociation diagnostic criteria. Lancet 1999;354:617–621. [PubMed: 10466661]
5. DeFronzo RA, Bonadonna RC, Ferrannini E. Pathogenesis of NIDDM. A balanced overview. DiabetesCare 1992;15:318–368. [PubMed: 1532777]
6. Lenzen M, Ryden L, Ohrvik J, Bartnik M, Malmberg K, Scholte OP, Reimer W, Simoons ML. Diabetesknown or newly detected, but not impaired glucose regulation, has a negative influence on 1-yearoutcome in patients with coronary artery disease: a report from the Euro Heart Survey on diabetes andthe heart. Eur Heart J 2006;27:2969–2974. [PubMed: 17090612]
Metter et al. Page 5
Diabetes Care. Author manuscript; available in PMC 2009 May 1.
NIH
-PA Author Manuscript
NIH
-PA Author Manuscript
NIH
-PA Author Manuscript

7. Shock, NW.; Greulich, RC.; Andres, R.; Arenberg, D.; Costa, PT., Jr; Lakatta, EG.; Tobin, JD. NormalHuman Aging: The Baltimore Longitudinal Study of Aging. (NIH Publication 84–2450). Washington,DC: U.S. Govt. Printing Office, 1984;
8. Soeldner JS, Slone D. Critical variables in the radioimmunoassay of serum insulin using the doubleantibody technic. Diabetes 1965;14:771–779. [PubMed: 5850216]
9. Muller DC, Elahi D, Tobin JD, Andres R. Insulin response during the oral glucose tolerance test: therole of age, sex, body fat and the pattern of fat distribution. Aging (Milano) 1996;8:13–21. [PubMed:8695671]
10. Van Buuren, S.; Oudshoorn, CGM. Multivariate imputation by chained equations: MICE V1.0 User’sManual. Report PG/VGZ/00.038. Leiden: TNO Preventie en Gezondheid; 2000.
11. Wallace TM, Matthews DR. The assessment of insulin resistance in man. Diabet Med 2002;19:527–534. [PubMed: 12099954]
12. Therneau, TM.; Grambsch, PM. Modeling survival data extending the Cox model. New York:Springer; 2000.
13. Hoeting JA, Madigan D, Raftery AE, Volinsky CT. Bayesian model averaging: a tutorial. Stat Sci1999;14:382–417.
14. Wild SH, Smith FB, Lee AJ, Fowkes FG. Criteria for previously undiagnosed diabetes and risk ofmortality: 15-year follow-up of the Edinburgh Artery Study cohort. Diabet Med 2005;22:490–496.[PubMed: 15787678]
15. Seeman TE, Robbins RJ. Aging and hypothalamic-pituitary-adrenal response to challenge in humans.Endocr Rev 1994;15:233–60. [PubMed: 8026389]
16. Blake DR, Meigs JB, Muller DC, Najjar SS, Andres R, Nathan DM. Impaired glucose tolerance, butnot impaired fasting glucose, is associated with increased levels of coronary heart disease risk factors:results from the Baltimore Longitudinal Study of Aging. Diabetes 2004;53:2095–2100. [PubMed:15277391]
17. Harman SM, Metter EJ, Tobin JD, Pearson J, Blackman MR. Longitudinal effects of aging on serumtotal and free testosterone levels in healthy men. J Clin Endocrinol Metabol 2001;86:724–731.
18. Rowe JW, Andres R, Tobin JD, Norris AH, Shock NW. The effect of age on creatinine clearance inmen: a cross-sectional and longitudinal study. J Gerontol 1976;31:155–163. [PubMed: 1249404]
19. Tschritter O, Fritsche A, Shirkavand F, Machicao F, Häring H, Stumvoll M. Assessing the shape ofthe glucose curve during an oral glucose tolerance test. Diabetes Care 2003;26:1026–1033. [PubMed:12663568]
20. Stumvoll M, Mitrakou A, Pimenta W, Jenssen T, Yki-Järvinen, Van Haeften T, Renn W, Gerich J.Use of the oral glucose tolerance test to assess insulin release and insulin sensitivity. Diabetes Care2000;23:295–301. [PubMed: 10868854]
21. Matsuda M, DeFronzo RA. Insulin sensitivity indices obtained from oral glucose tolerance testing:comparison with the euglycemic insulin clamp. Diabetes Care 1999;22:1462–1470. [PubMed:10480510]
22. Mari A, Pacini G, Murphy E, Ludvik B, Nolan JJ. A model-based method for assessing insulinsensitivity from the oral glucose tolerance test. Diabetes Care 2001;24:539–548. [PubMed:11289482]
Metter et al. Page 6
Diabetes Care. Author manuscript; available in PMC 2009 May 1.
NIH
-PA Author Manuscript
NIH
-PA Author Manuscript
NIH
-PA Author Manuscript
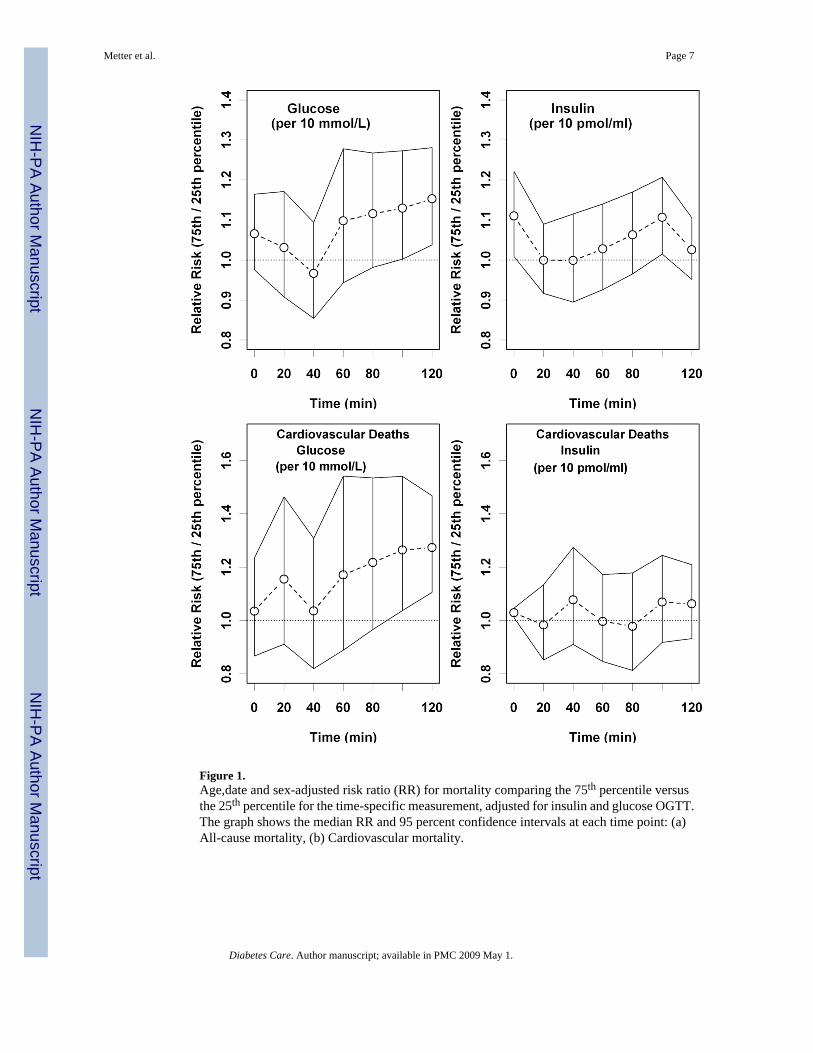
Figure 1.Age,date and sex-adjusted risk ratio (RR) for mortality comparing the 75th percentile versusthe 25th percentile for the time-specific measurement, adjusted for insulin and glucose OGTT.The graph shows the median RR and 95 percent confidence intervals at each time point: (a)All-cause mortality, (b) Cardiovascular mortality.
Metter et al. Page 7
Diabetes Care. Author manuscript; available in PMC 2009 May 1.
NIH
-PA Author Manuscript
NIH
-PA Author Manuscript
NIH
-PA Author Manuscript

NIH
-PA Author Manuscript
NIH
-PA Author Manuscript
NIH
-PA Author Manuscript
Metter et al. Page 8
Table 1Characteristics of Participants at First Evaluation
Survivors Decedents P*Number Subjects 931 470Percent Female 42.6 24.9Age 45.2 (15.5) 69.3 (11.7) <0.0001Age (Censor,Death) 68.3 (15.9) 83.0 (10.8) <0.0001Time Follow-up 23.2 (5.2) 13.7 (6.7) <0.0001OGTTGlucose (mmol/l)Fasting 5.3 (0.4) 5.5 (0.4) 0.48 20 minutes 7.4 (1.2) 7.6 (1.1) 0.06 40 minutes 9.0 (1.7) 9.2 (1.6) 0.03 60 minutes 8.5 (2.1) 9.4 (2.0) 0.71 80 minutes 7.7 (2.1) 8.9 (2.0) 0.11 100 minutes 7.1 (1.8) 8.3 (1.9) 0.002 120 minutes 6.5 (1.5) 7.6 (1.7) 0.0001Insulin (pmol/l) Fasting 53 (34) 53 (35) 0.42 20 minutes 224 (153) 209 (153) 0.27 40 minutes 373 (250) 348 (239) 0.50 60 minutes 376 (249) 400 (282) 0.87 80 minutes 349 (242) 403 (278) 0.67 100 minutes 317 (239) 385 (286) 0.28 120 minutes 272 (207) 341 (256) 0.12HOMA-IR units 2.13 (1.43) 2.37 (1.84) 0.38Glucose Area+ (mmol* min/L) 917 (172) 1005 (165) 0.46Insulin Area+ (pmol* min/L) 36468 (21462) 39270 (23772) 0.92Covariates Weight (kg) 72.8 (12.3) 72.8 (14.2) 0.68 Height (cm) 172.1 (9.8) 170.8 (9.0) 0.02 BMI (kg/m2) 24.4 (3.5) 24.8 (3.4) 0.08 Waist (cm) 82.6 (11.5) 87.8 (10.0) <0.0001 Systolic BP (mm/Hg) 119.5 (15.9) 136.2 (20.5) <0.0001 Diastolic BP (mm/Hg) 77.2 (10.2) 81.2 (10.8) <0.0001 Current Smokers (%) 17.7 14.1 0.0003*adjusted for age and sex
+Glucose and Insulin area are the integrated areas under the curve.
Diabetes Care. Author manuscript; available in PMC 2009 May 1.
NIH
-PA Author Manuscript
NIH
-PA Author Manuscript
NIH
-PA Author Manuscript
Metter et al. Page 9
Table 2Hazard Ratio from Time Dependent Survival Models for Glucose (per mmol/L) and Insulin (per 100 pmol/ml)Measurements from the Longitudinally Collected OGTT
All Cause Mortality Cardiovascular MortalityModel 1 Univariate Date, Sex Model 2 Univariate Age, Date,Sex Model 3 Univariate Age, Date, Sex, Covariates* Model 4 Univariate Age, Date, Sex, Covariates*
Glucose Fasting 1.34 (1.14,1.59) 1.12 (0.96,1.32) 1.18 (0.99,1.39) 1.11 (0.80,1.55) 20 min 1.06 (0.99,1.14) 1.02 (0.94,1.10) 1.01 (0.94,1.10) 1.06 (0.91,1.23) 40 min 1.00 (0.95,1.05) 0.98 (0.94,1.04) 0.99 (0.94,1.04) 0.99 (0.89,1.10) 60 min 1.10 (1.06,1.14) 1.03 (0.98,1.07) 1.03 (0.99,1.08) 1.02 (0.94,1.11) 80 min 1.16 (1.12,1.20) 1.04 (0.99,1.08) 1.04 (0.99,1.08) 1.04 (0.96,1.12) 100 min 1.20 (1.16,1.24) 1.05 (1.00,1.09) 1.05 (1.00,1.09) 1.06 (0.98,1.14) 120 min 1.22 (1.17,1.27) 1.06 (1.02,1.10) 1.06 (1.01,1.11) 1.08 (1.00,1.18)Insulin Fasting 1.18 (0.91,1.52) 1.34 (1.03,1.74) 1.42 (1.07,1.89) 1.03 (0.60,1.76) 20 min 0.97 (0.92,1.03) 1.00 (0.95,1.06) 1.01 (0.96,1.06) 0.99 (0.90,1.08) 40 min 0.96 (0.92,1.00) 1.00 (0.96,1.04) 1.00 (0.96,1.03) 1.02 (0.96,1.09) 60 min 1.00 (0.97,1.04) 1.01 (0.98,1.05) 1.01 (0.98,1.04) 1.00 (0.94,1.06) 80 min 1.04 (1.01,1.07) 1.03 (0.99,1.06) 1.02 (0.99,1.06) 0.98 (0.92,1.04) 100 min 1.07 (1.04,1.10) 1.04 (1.01,1.07) 1.04 (1.01,1.07) 1.01 (0.95,1.07) 120 min 1.06 (1.03,1.09) 1.01 (0.98,1.04) 1.01 (0.98,1.05) 1.02 (0.96,1.08)HOMA-IR 1.05 (0.99,1.10) 1.07 (1.01,1.13) 1.09 (1.02,1.16) 1.02 (0.90,1.16)Glucose integrated/100 1.16 (1.11,1.21) 1.03 (0.99,1.08) 1.03 (0.98,1.08) 1.00 (1.00,1.01)Insulin integrated/1000 1.00 (1.00,1.01) 1.00 (1.00,1.01) 1.00 (1.00,1.001) 1.01 (0.97,1.06)Each row is a proportional hazard model with only the specific measure from the OGTT entered as the risk variable in the analysis. The model uses thelongitudinally collected measure and covariates as time dependent variables. Results are from the first imputation. Note results were essentially the samefor imputations 2 through 5.
*Covariates included systolic and diastolic blood pressure, body mass index, waist circumference, smoking status, and cholesterol.
Diabetes Care. Author manuscript; available in PMC 2009 May 1.