the recent survey and monitoring techniques of the shoreline erosion
TRANSCRIPT
THE RECENT SURVEY AND MONITORING
TECHNIQUES OF THE SHORELINE EROSION
Associate Prof. Mahmoud El-Mewafi, Associate Prof. Z. Zeidan and Dr. A. Awad Public Works Dept., Faculty of Engineering, Mansoura University, Egypt
:ملخص البحث
فقد حدث تطور سريع للعديد من . يف السنوات القليلة املاضية حدث تطور سريع يف صناعة اإللكرتونيات وأنظمة الرصد املساحية
ويقدم هذا البحث بعض من احدث الطرق املساحية ملراقبة . هذه األنظمة وخاصة يف استخدام األقمار الصناعية واملوجات الصوتية
. النحر وحركة الرواسب على الشواطئ باستخدام املوجات الصوتية واملوجات الكهرومغناطيسية واألقمار الصناعية
وجد أن معدل . (2000-1986)و بتطبيق بعض طرق املراقبة السابقة على شواطئ راس الرب و عزبة الربج و اجلميل ملدة طويلة
سنة وذلك بسبب النشاط الزائد لألمواج واملد واجلذر يف / م 10النحر يف الشواطئ الشمالية الشرقية جلمهورية مصر العربية هو
وقد أوضح نظام . حلماية هذه الشواطئ من خطر التآكلجمما جعل من الضرورة استخدام احلواجز الصناعية لألموا. هذه املنطقة
. املراقبة املقرتح لكل شاطئ أن حتسن واضح فد حدث على هذه الشواطئ
Abstract
During the past five years, both Electronics and survey technology have developed
rapidly. Many techniques - especially positioning and echo survey systems - are
improving very quickly. The present paper reviews some of the most recent survey
and monitoring techniques commonly used today, such as Echo sounder, multibeam
echo sounding, total stations, Trisponder , and positioning systems. The rapid erosion
rate in the some of Egyptian coasts has created a need for monitoring methods to
design adequate and efficient protection technique for the shorelines. Three sites
along the Egyptian coasts named Ras El-Bar, El-Gameel and Ezbet El-Borg coasts
were studied for along time since 1986 to 1997. The erosion rate for the Egyptian
coasts is estimated at 10.00 m/yr because of increased wave action and tidal effects. It
makes the utilization of breakwaters, as a wave dampening technique, very favourable
for the project sites. Monitoring of shoreline and bed topography after breakwaters
construction showed that sediment was accumulating in nearly all the shoreline.

1. INTRODUCTION
Recently the increasing numbers of coastal communities, the governments, as well as
forward-looking politicians, are recognizing that sandy beaches are good for the
economy, as well as being beautiful. The beaches are the essence of Egypt, and the
basis for much of the tourism income and jobs. The aim of this study is to discusses
solutions of the coastal erosion and protection on retreating coastlines. The position of
the shoreline along Coasts and around inland waters (lakes) varies over a broad
spectrum of time scales in response to shoreline erosion (retreat) or accretion
(advance). Shoreline position reflects the coastal sediment budget, and changes may
indicate natural or human-induced effects alongshore or in nearby river catchments.
The detailed shape and sedimentary character of a beach are highly sensitive to deep-
water wave-energy, shallow water wave transformation, wave setup, storm surge,
tides, and near shore circulation. Changes in the position of the shoreline affect
transportation routes, coastal installations, communities, and ecosystems [Reid, 1984 -
Fox & Davis, 1978].
The effects of shoreline erosion on coastal communities and structures can be drastic
and costly. It is of paramount importance for coastal settlements to know if local
shorelines are advancing, retreating or stable. Using survey techniques the following
parameters are commonly monitored:
1- Width of the dry beach, position of the mean water line, the high water
line, or the base of the beach where well defined. However,
measurements are subject to local variations in water level and sand
storage.
2- Beach profiles along sequential transects normal to the shoreline. Best
for evaluating seasonal or other short- term shoreline movements, and
beach morphology. To help in understanding why shoreline change is
occurring, it can be helpful to measure; Water levels, wind speed and
direction, storm waves, and coastal currents; these can be related to
shoreline change.
3- Losses or gains of sediment (sediment budget) in specific coastal
compartments or cells. A sediment surplus is typically associated with
an advancing shoreline, whereas a deficit may lead to shoreline retreat.
2. SURVEYING AND MONITORING TECHNIQUES OF THE
SHORELINE EROSION
To document annual shoreline movement, total stations, Trisponder & Echosouner
and differential GPS approaches were used at specific points along the shoreline
(Coastal profiles) and unspecific points under water to identify changes in coastal
and seabed land elevation. The procedure of these methods, the difficulties
encountered, and investigations of the reliability of the measurements will be
discussed and explained.
2.1 TOTAL STATIONS METHOD
Field mapping is the basic requirement for studying monitoring of shoreline and bed
topography. Topographic mapping can be accomplished using total stations. Points
can be collected offshore to depths of approximately 1 m to provide overlapping
coverage with the bathymetry survey. The bathymetric survey points (data of water
depths and coordinates of all points under water to depth of approximately -7 m) were
also collected using a total stations. The measuring process consists of a shore-based
total station, a boat-mounted transducer, a receiving unit, and a computer that controls
the digital data collection process. The shore station data is radio-telemetered to the
boat computer where depth-position data is calculated and automatically stored. The
location of the boat is determined by targeting a reflective prism mounted directly
above the transducer. Digital depth records are checked by comparison with the
analogy sonar recording [Craenenbroeck & et al, 1998].
2.2 TRISPONDER & SINGLE BEAM ECHO SOUNDER METHOD
The measuring process of trisponder & single beam echo sounder method consists of
shore- reflectors (receivers), a boat-mounted echo sounder, transducer, a digital
remounting unit of trisponder, and a computer that controls the digital data collection

process. The depth-position data is calculated using echo sounder and automatically
stored. The location of the boat is determined using resection technique directly by
targeting a reflective prisms mounted above the fixed points on the shoreline [Reid,
1984].
2.3 MULTIBEAM ECHO SOUNDING METHOD
As is the case with the commonly used single-beam echo sounders, multibeam echo
sounders also use short acoustic transmission pulses to scan the seabed. Each seabed
element produces its own echo, which is received at the receiving part of the acoustic
transducers. These echoes, together with sound travelling time and other system
parameters, are processed into calculations of angle between the element on the
seabed and the transducer normal. In this way, the horizontal distance and depth to
each seabed element can be calculated. With multi-beam echo sounding, where the
transducers are mounted in the bow of the boat lines were surveyed parallel to the axis
of the boat. Moreover, with the multi-beam echo sounder, the progress of the
shoreline could be observed clearly, which enabled the daily re-definition of the
sedimentation areas. When a multi-beam system is built into the bow of the vessel, or
mounted in the bottom, the wide coverage of the multi-beam makes it possible to
"view" the seabed accurately on both sides. Making use of dedicated software, the
cross-profiles of the seabed, can be shown on the computer three-dimensionally. Early
results with multibeam echo sounding however identified a very small systematic
error in the system, which resulted in areas of seabed, which were known to be flat
taking on a very slight convex shape across the width of the multi-beam swath. The
error was corrected by applying a very small adjustment in software of approximately
seven thousandths of a degree (0.007°) [Jorgen, 1999].
2.4 DIFFERENTIAL GPS METHOD
With the important increase of the accuracy of positioning systems for many civilian
applications, the accuracy of the positioning of the shoreline monitoring increased
drastically and was even more improved by the development of systems to monitor
online the position of the shoreline monitoring with regard to the sediment (Figure 1).

Figure (1): Differential GPS rover receiver, combined single-beam echo sounders transducer.
Global Positioning Systems (GPS), based on satellite transmission of microwave
signals to surface receivers, whose positions can be determined with accuracies as
great as 3-5 mm for short baselines (100 km) and 10-15 mm over longer distances
(1000 km). To document annual shoreline movement, differential GPS approaches
were used at specific points along the shoreline and unspecific points under water.
Intervals between points will be determined based on shoreline configuration. It is
recommended that at least 25 points be used, when possible, within a land type. The
measuring process consists of a shore-based fixed receiver, a Zodiac (Surveying
vassal) - mounted rover receiver unit, combined single-beam echo sounder transducer,
and a computer that controls the data collection process. A particular positioning
system was developed, where a high frequency echo-sounding system was mounted in
an acoustic mirror mode at both sides of the Zodiac [Wu, 1993]
During the monitoring operations, the positioning of the specific points along the
shoreline and unspecific points under water DGPS systems, combined single-beam
echo sounders are used. Datum conversion enables us to combine GPS measurements
with the existing conventional measurements. It has advantages in establishing minor
control points and finding outlier points in local datum since they can be done with
efforts much less than when the conventional method is used. This has led us to
establish converting processes from a global datum to local ones[Wu, 1993].

3. OBSERVATIONS AND SITES
The Shore Protection Egyptian Authority (SPEA) is responsible for the protection of
Egyptian 's North coasts against beach erosion. One of the main tasks of the Coastal
Authority is to closely monitor the coastal erosion using a hydro graphic surveys or
modern geodetic techniques. To achieve the task of surveying over 75 kilometres of
coastlines are surveyed by using two survey Boats, the Trisponder & ECHO and the
DGPS & ECHO. The first boat used a conventional echo sounder and Trisponder to
survey the coastline and seabed by running lines perpendicular to the coast at 200 ms
intervals. Each line extended out from the coast to a distance of 2 kilometres with
some additional longer lines run at less frequent intervals. In the second boat DGPS
systems, combined with echo sounder (single-beam) was used to determine the
positioning of the specific points along the shoreline and unspecific points under
water. Three sites along the Egyptian coasts named Ras El-Bar, El-Gameel and Ezbet
El-Borg coasts were studied for along time since 1983 to 2000.
3.1 RAS EL-BAR COAST
Ras El-Bar project is located in the northeast iterance of the Egyptian cost, and
approximately lies on the east of Domietta branch of river Nile. Extensive field
observations have been carried out at Ras El-Bar, from the autumn of 1986 to the
spring of 1997. Since 1986 survey works was started by taking 22 sections offshore
every 100 m perpendicular to the cost using two surveying techniques (total stations
and Trisponder & Echo sounder) to defined which zones are greatly affected by
erosion. Long-term survey analysis found that this area experiences had three main
problems as follows:
1- Erosion along the 3Kms reaches fronting Ras EL-Bar summer resort
2- Erosion to the East Side of the Damietta branch of the Nile, and
3- Shoaling along the navigation channel at Damietta estuary.
In 1993, Shore Protection Egyptian Authority (SPEA) was decided to construct four
breakwaters at the break zone parallel to the cost. It made waves break across the
Detached Breakwater and passed in a slow motion to the coast were sediment
particles fill at the beach. Monitoring of Ras El-Bar shoreline and bed topography
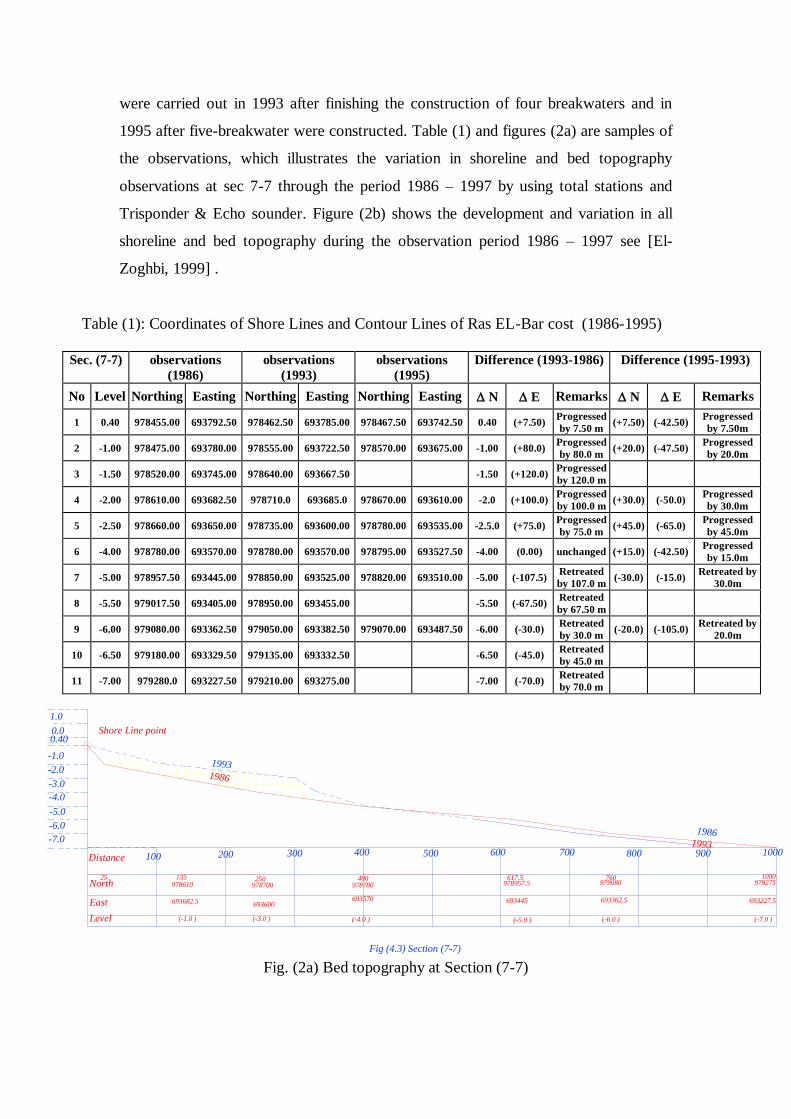
were carried out in 1993 after finishing the construction of four breakwaters and in
1995 after five-breakwater were constructed. Table (1) and figures (2a) are samples of
the observations, which illustrates the variation in shoreline and bed topography
observations at sec 7-7 through the period 1986 – 1997 by using total stations and
Trisponder & Echo sounder. Figure (2b) shows the development and variation in all
shoreline and bed topography during the observation period 1986 – 1997 see [El-
Zoghbi, 1999] .
Table (1): Coordinates of Shore Lines and Contour Lines of Ras EL-Bar cost (1986-1995)
Sec. (7-7)
observations
(1986)
observations
(1993)
observations
(1995)
Difference (1993-1986) Difference (1995-1993)
No Level Northing Easting Northing Easting Northing Easting N E Remarks N E Remarks
1 0.40 978455.00 693792.50 978462.50 693785.00 978467.50 693742.50 0.40 (+7.50) Progressed
by 7.50 m (+7.50) (-42.50)
Progressed
by 7.50m
2 -1.00 978475.00 693780.00 978555.00 693722.50 978570.00 693675.00 -1.00 (+80.0) Progressed
by 80.0 m (+20.0) (-47.50)
Progressed
by 20.0m
3 -1.50 978520.00 693745.00 978640.00 693667.50 -1.50 (+120.0) Progressed
by 120.0 m
4 -2.00 978610.00 693682.50 978710.0 693685.0 978670.00 693610.00 -2.0 (+100.0) Progressed
by 100.0 m (+30.0) (-50.0)
Progressed
by 30.0m
5 -2.50 978660.00 693650.00 978735.00 693600.00 978780.00 693535.00 -2.5.0 (+75.0) Progressed
by 75.0 m (+45.0) (-65.0)
Progressed
by 45.0m
6 -4.00 978780.00 693570.00 978780.00 693570.00 978795.00 693527.50 -4.00 (0.00) unchanged (+15.0) (-42.50) Progressed
by 15.0m
7 -5.00 978957.50 693445.00 978850.00 693525.00 978820.00 693510.00 -5.00 (-107.5) Retreated
by 107.0 m (-30.0) (-15.0)
Retreated by
30.0m
8 -5.50 979017.50 693405.00 978950.00 693455.00 -5.50 (-67.50) Retreated
by 67.50 m
9 -6.00 979080.00 693362.50 979050.00 693382.50 979070.00 693487.50 -6.00 (-30.0) Retreated
by 30.0 m (-20.0) (-105.0)
Retreated by
20.0m
10 -6.50 979180.00 693329.50 979135.00 693332.50 -6.50 (-45.0) Retreated
by 45.0 m
11 -7.00 979280.0 693227.50 979210.00 693275.00 -7.00 (-70.0) Retreated
by 70.0 m
Fig. (2a) Bed topography at Section (7-7)
Fig (4.3) Section (7-7)
500
-5.0
East
Level
North25
-6.0
-7.0
Distance
693682.5
(-1.0 )
978610135
693600
(-3.0 )
978700250
100 200
978780
693570
(-4.0 )
400
400300
Shore Line point
-1.0
-2.0
-3.0
-4.0
0.400.0
1.0
1986
1993
693445
(-5.0 )
978957.5617.5
600 700
693362.5
(-6.0 )
760979080
8001993900
1986
1000
693227.5
(-7.0 )
979275
1000

3.2 EL-GAMEEL COAST
Shoreline retreat had destroyed the Port Said Damietta road in many areas along the
coastline; particularly along the stretch of shoreline immediately to the south of the
Damietta spit formation. Also, shoreline retreat causing damage to improvement at the
new resort Town near EL-Gameil; and further damage to the old coastal road, which
provides access to the north-eastern side of the Damietta promontory. EL-Gameil
coast between two entrance, dredging of any inlet effect on the coast where
decreasing level by dredging deform trap for transport sediment at inlet causing
shoaling of transport sediment about east direction, so erosion happen in the zone of
the east direction as result of decreasing sediment transport.
EL-Gameil shoreline has observed using DGPS & ECHO at 1994, where shoreline
suffered from retreat towards building in the zone between old and new inlet. At
1995, start constructions four detached breakwaters, at distance 500.0 ms from the
shoreline, breakwater length 250.0 ms, the distance between every two breakwater
was 150.0 ms. The shoreline began to progress at sea direction tell the sediment reach
to breakwaters it’s called Tomoblo and gulf at position between every two
breakwaters see fig. (3). After finished from constructed six breakwaters in July 1997,
long-term survey analysis found that the beach became more development, so the
sedimentation increase much more than 1995, area that won from sea 150,000.0 m2.
A full set of the monitoring observations using DGPS & ECHO is illustrated in [El-
Zoghbi, 1999], the sample of the shoreline observations in 1994 and 2000 are
illustrated in fig. (3).
3.3 EZBET EL-BORG COAST
Long-term survey monitoring of shoreline at eastern side of River Nile from 1983 to
1992, it was remarked that the shore line retreat every year 50.0 m. The observations
at 1983 for the first ten points and first ten points at 1996 the retreat range from 172.5
m to 345.0 m. Coastal Engineers normally consider shoreline change of a 0.5 m per
year significant. It means that the area of EZBET EL-BORG has critical current
erosion. These currents flow perpendicular to the beach in the seaward direction. They
are very strong and narrow. These currents can sometimes wash away great quantities
of sand when the conditions are right. In this case, an appropriate solution is the use of
concrete. Therefore, in 1994 the Revetment structure began constructing to stop
Eroasion, it constructed from (-6.0) at bed to (+6.0) at crest.
Survey analysis and monitoring which carried after construction from 1996 to 1997
showed that the retreat value was controlled and sediment was accumulating at the
bed topography. A full set of the monitoring observations using DGPS & ECHO is
illustrated in [El- Zoghbi, 1999], the sample of the variation in shoreline, bed
topography observations and topographic maps in 1994 to 1997 are summarized in
fig. (4) respectively.

4. RESULTS AND DISSECTIONS
We completed three costalline survey trips that will allow us to test the monitoring
methods listed above. The shorelines and beds topography were measured before and
after protection constructions the topographic measurements were made for along
time. Profiles, volumes and areas are generated from the surface model within
predetermined boundaries. The volumes of sediment and plan area of sand bars were
calculated from a subset of the survey area and changes of sediment height before and
after shoreline protection projects in each site.
A sample of observations and results, which were obtained using the monitoring
methods listed above is illustrated in tables (1), (2), and (3). They are samples from
mor than 134 tables show the variation of the shoreline and sea bed topography for
three different sites. These sites along the EGPTIAN coasts named Ras El-Bar, El-
Gameel and Ezbet El-Borg coasts were studied for along time since 1986 to 2000.
Graphical presentation are illustrated by figures (2), (3) and (4) which they are a
sample of 34 figures given in El- Zogbai, (1999). From these figures and tables we
can see that:
1. A long-term monitoring program include volumetric measurements to assess the
impacts of future erosion on the sediment resources of the Egyptian Coasts.
Changes shoreline profiles were a sensitive indicator of the depositional/erosional
effects.
2. From survey data analyses for all sites measured before and after protection
constructions, Rates of erosion as high as 5- 10 m/yr have been measured in many
places around the northern- east entrance of the Egyptian coasts, and much higher
rates (50 m/yr) have been recorded locally in Domietta promontory (Ezbet El-Borg
-Ras El- bar) and in Port Said (El-Gameil) coasts see El- Zoghbi, (1999).
3. At the 3 study sites during seven Manths after finishing of the protection
constructions , sediment was successfully redistributed at the sea bed and
redeposited as higher elevation sand sediment. Sand sediment volume increased by
an average of 49% of the final values, while beachs area change increased by 50
ms belong all shore line. After one year shore line became stable and progress
value was 115.0 m at this zone as a resulted of detached breakwater construction.

5. CONCLUSIONS AND RECOMMENDATIONS
Depending on the results of the Long-term survey monitoring of beach erosion can be
done by a whole range of survey techniques, on both beach and board survey vessels,
including total station with a single beam echo sounder; trisponder & single beam
echo sounder, multibeam echo sounding, as well as, positioning systems (GPS). The
following points summarize the conclusions of the research:
1. In a study at three coasts in Egypt data collected over eleven years
confirmed that wave action was the dominant erosion process causing 77%
of the erosion during the 1986-1997 study years [El- Zoghbi, 1999]. The
amount of wave erosion is dependent upon water level, wind direction,
velocity and duration.
2. The DGPS and sounding devices systems have already proved invaluable in
both reducing survey time and improving survey accuracy. One particular
benefit the system brings is that it enables the survey vessels to run survey
lines in both directions and towards the beach in anything other than calm
conditions.
3. Trisponder and total station with single beam echo sounder systems gave
also reasonable results. Results showed that survey accuracy using the
mentioned total station survey and single beam echo sounder procedures
were less than DGPS by eight percent due to the vessel surfing on the
waves. Therefore, sand bar volume changes greater than eight percent are
considered significant.
4. Beach erosion is reduced or stopped by the use of a combination of
breakwaters and beach nourishment. From the above analysis, it can be
concluded that; breakwaters and beach nourishment were the most logical
choice for protecting our eroding shorelines areas. It gave good protection
to Ras EL-Bar and El-Gamil coasts and they are suitable for resorts where
the zone between the shoreline and the breakwaters can be used safely.
5. Revetment structures are considered an appropriate solution to reduced or
stopped the critical current beach erosion. When these currents are very
strong and narrow because of these currents can sometimes wash away
great quantities of sand. It can be concluded that Revetment gave good
protection to Ezbet EL-Borg coast. It is suitable for resorts where the zone
between the shoreline and the revetments can’t be used safely [ Abd El-Aal,
1992].
6. Sediment transport by water is a complex phenomenon that is little
understood despite more than 200 years of intense study by engineers.
REFERANCES
1- Abd El-Aal, F.M. (1992)” Groin Field for Beach protection.”
Journal of Engineering and Applied Science, Vol. 39-3, Cairo
University, June.
2- Craenenbroeck, K., Dutho, J., Vandecasteele, M., and
Eygenraam, J.A. and Van Oostveen, J. (1998) " Application of
Modern Survey Techniques in Today's Dredging Practice.”
Terra et Aqua - International Journal on public works, Ports &
waterways Developments. Issue #72 September 1998.
3- El-Zogbi, M. (1999) “ New Surveying Techniques for
Monitoring the Shore’s Lines in Egyptian Coasts.” Msc.thesis,
Mansoura University, Public works Department.
4- Fox, W.T., and Davis, R.A., (1978) "Seasonal variation in
beach erosion and sedimentation in the Oregon coast."
Geological Society of America Bulletin, v.89, pp. 1541-1549.
5- Jorgen, N. and Steenstrup, P. (1999) “ New multibeam system
helps plan and evaluate beach nourishment projects.” RESON
SeaBat Multibeam Echo Sounders: www.reson.com, EIVA
Survey Systems: www.eiva.dk. - Copyright RESON
November 99.

6- Reid, John R. (1984) "Shoreline Erosion Processes: Orwell
Lake, Minnesota." U.S. Army Corp. of Engineers. Grand
Forks. North Dakota. December 1984.
7- Wu, S and W Melbourne, (1993) “An optimal GPS data-
processing technique for precise positioning.” IEEE Trans
Geosci & Remote Sensing, 31(1), 146-152.