the project for the study on togo logistics corridor
TRANSCRIPT
E I
J R
1 3 - 2 1 8
MINISTRY OF PUBLIC WORKS AND TRANSPORTS (MPWT)REPUBLIC OF TOGO
MINISTRY OF PUBLIC WORKS AND TRANSPORTS (MPWT)REPUBLIC OF TOGO
The Project for The Studyon
Togo Logistics Corridor Developmentin
The Republic of Togo
The Project for The Studyon
Togo Logistics Corridor Developmentin
The Republic of Togo
OCTOBER 2013OCTOBER 2013
JAPAN INTERNATIONAL COOPERATION AGENCY (JICA)CENTRAL CONSULTANT INC.
YACHIYO ENGINEERING CO., LTD.
FINAL REPORT
OCTOBER 2013
JAPAN INTERNATIONAL COOPERATION AGENCY (JICA)CENTRAL CONSULTANT INC.
YACHIYO ENGINEERING CO., LTD.
FINAL REPORT
The Project for The Study onTogo Logistics Corridor Developm
ent in The Republic of TogoFINAL REPORT
MINISTRY OF PUBLIC WORKS AND TRANSPORTS (MPWT)REPUBLIC OF TOGO
MINISTRY OF PUBLIC WORKS AND TRANSPORTS (MPWT)REPUBLIC OF TOGO
The Project for The Studyon
Togo Logistics Corridor Developmentin
The Republic of Togo
The Project for The Studyon
Togo Logistics Corridor Developmentin
The Republic of Togo
OCTOBER 2013
OCTOBER 2013
JAPAN INTERNATIONAL COOPERATION AGENCY (JICA)CENTRAL CONSULTANT INC.
YACHIYO ENGINEERING CO., LTD.
FINAL REPORT
OCTOBER 2013
JAPAN INTERNATIONAL COOPERATION AGENCY (JICA)CENTRAL CONSULTANT INC.
YACHIYO ENGINEERING CO., LTD.
FINAL REPORT
The Project for The Study onTogo Logistics Corridor Developm
ent in The Republic of TogoFINAL REPORT

Exchange Rate
EUR 1.00 = FCFA 655.957 = USD 1.30 = JPY 130.00
August 2013
PREFACE
Japan International Cooperation Agency (JICA) decided to conduct the Project for the Study
on Togo Logistics Corridor Development in the Republic of Togo and entrusted the study to Central
Consultant Inc. and Yachiyo Engineering Co., Ltd.
The team held discussions with officials of the Government of the Republic of Togo and
conducted a master plan study and feasibility study on the development of the Togo Logistics Corridor
from August 2012 to August 2013. After returning to Japan, the team conducted further studies and
prepared this final report.
I hope that this report will promote the project and enhance friendly relationship between our
two countries.
Finally, I wish to express my sincere appreciation to the officials concerned of the
Government of the Republic of Togo for their tremendous cooperation with the study.
October 2013
Kazunori MIURA
Director General
Economic Infrastructure Department
Japan International Cooperation Agency
LETTER OF TRANSMITTAL
October 2013
Mr. Kazunori MIURA
Director General
Economic Infrastructure Department
Japan International Cooperation Agency
Dear Sir,
We are pleased to submit herewith the final report on the Project for the Study on Togo
Logistics Corridor Development in the Republic of Togo. This study was conducted by Central
Consultant Inc. in association with Yachiyo Engineering Co. Ltd. between August 2012 and August
2013 in Togo.
During the course of the study, we examined the present conditions of the transport network
in Togo, prepared the Togo Logistics Corridor Development Plan and conducted feasibility studies of
higher priority projects. These are the construction of a bypass on the steep gradient section and two
bridges on the Katchamba–Sadori road, which are both on RN17 as an alternative to the RN1 route.
We wish to take this opportunity to express our sincere gratitude to the officials concerned of
the Japan International Cooperation Agency and the Embassy of Japan in the Republic of Côte
d’Ivoire. We would also like to thank the officials concerned of the Ministry of Public Works and
Transports and other relevant authorities in the Government of the Republic of Togo.
We hope this study will assist the development of the Togo Logistics Corridor in the
Republic of Togo.
Yours faithfully,
Hikaru NISHIMURA
Team Leader
Project for the Study on Togo Logistics Corridor
Development in the Republic of Togo
The Project for the Study on Togo Logistics Corridor Development Final Report Abstract
- 1 -
ABSTRACT
1. Outline of the Study
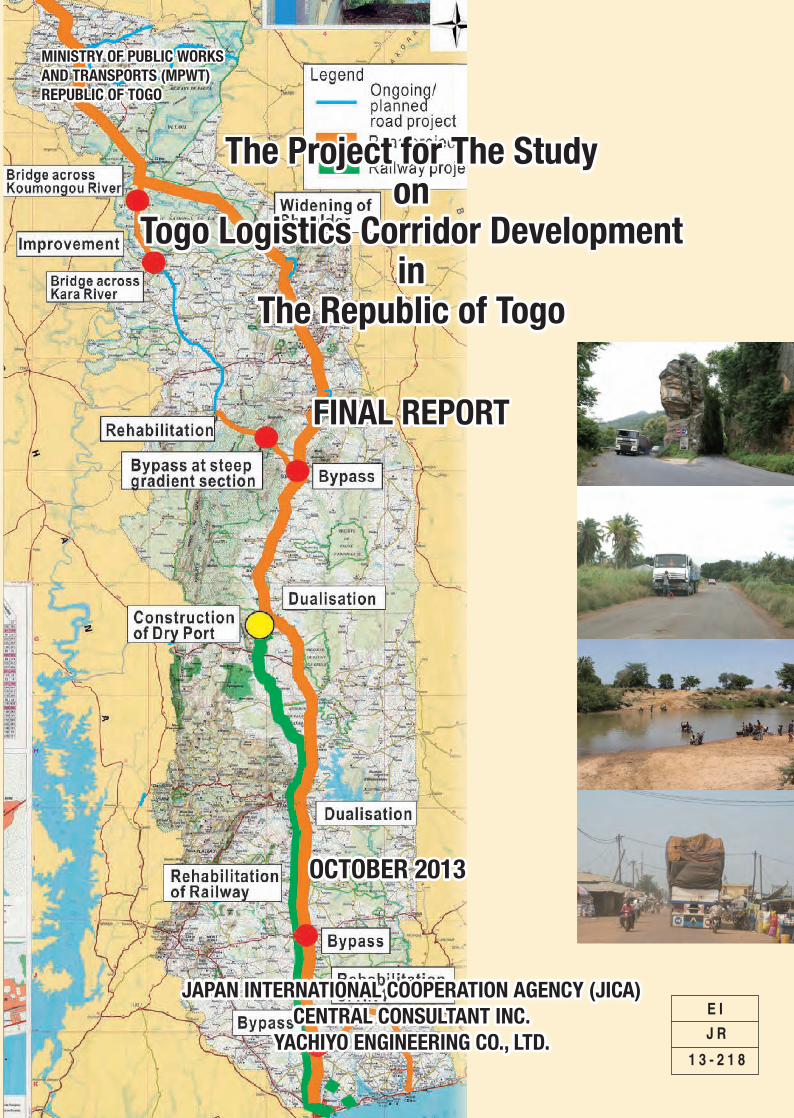
The Togo Logistics Corridor (TLC) has significant potential for the economic and social
development of Togo and the region. The 667-km corridor, stretching from Lomé Port, a gateway to
Togo, to the one stop border post (OSBP) at Cinkassé, to the border with Burkina Faso, includes roads,
bridges, and railway, and is a mainstay of the country.
The objectives of the study are: 1) to prepare the TLC Development Master Plan with a target year
of 2030, 2) to carry out the Feasibility Study (F/S) for the selected priority project in order to confirm
the viability of the projects, 3) to share the results of the Study with development partners, and 4) to
develop the capacity of personnel in the Ministry of Transport (MT) and the Ministry of Public Works
(MPW) of the Government of Togo (GoT).
2. Major Findings and Problems of the Transport Sector in Togo
The major findings and problems of the transport sectors are as follows:
• A number of challenges confront the road sub-sector: 1) inadequate funds for investment and
maintenance, 2) the non-control of axle loads, 3) inadequate attention to road safety, and 4) the
lack of viable alternative routes to the main north-south corridor.
• There are many problems concerning the railway development policy, regulations, facilities, train
operation and maintenance.
• The major problems of the port and maritime sub-sector are: 1) shortage of capacity of the
mineral quay, 2) insufficient capacity of on-land facilities, and 3) traffic congestion at Sahel
Terminal.
• The major issues of transit transport on the TLC are: 1) the low level of maintenance at Lomé
Port and deteriorated condition on RN1, 2) aged freight vehicles, and overloaded and oversized
vehicles, 3) complicated and inefficient customs clearance processes, customs clearance
document forms that are not interchangeable between Togo and Burkina Faso, and 4) requests for
bribes at the port, border and checkpoints.
3. TLC Development Plan and Programme
The TLC Development Plan provides a comprehensive plan for the development of transport
infrastructure including both hardware and software in order to achieve general economic growth. One
aim is to cope with increasing traffic demand in the future, and another is to support development
potential in developing local areas.
Based on the concepts for development of the TLC as well as directions to achieve the targets of the
TLC development, various alternatives are prepared for the evaluation. These alternatives mainly
consist of improvement of roads and rehabilitation/construction of the railway.
Based on the overview for the development of the TLC, alternative transport networks for
The Project for the Study on Togo Logistics Corridor Development Final Report Abstract
- 2 -
evaluation, including traffic assignment and the essential factors of the network, are proposed. The
Economic Internal Rate of Return (EIRR) of respective projects suggested in the TLC Development
Plan and those projects with an EIRR of more than 12% are considered to be economically feasible.
Based on the results of evaluating each item of the alternative transport networks, the alternative of
“Combination of Intermodal and Multi Modal Development Plus Alternative Road Network” is
selected as the most desirable transport network for the development of the TLC, and the projects
included in this alternative are selected for the development of the TLC by 2030.
4. Results of Feasibility Studies
The Study Team selected two projects for the feasibility study: 1) construction of a bypass at the
steep gradient section between Bouzalo and Binako (Malfakassa Bypass), and 2) construction of two
bridges across the Kara and Koumongou Rivers on RN17, after consultations with the Steering
Committee and JICA.
The Study Team conducted natural condition surveys, preliminary design, preliminary cost
estimation, environmental and social study, and analyses of the feasibility of these two projects in
terms of technical, economic, regional development, environmental, and social considerations.
• From the results of the economic analysis, construction of the Malfakassa Bypass project is
recommended for implementation, together with upgrading of the Katchamba–Sadori road.
• Construction of the two bridges across the Kara and Koumongou Rivers is also recommended for
implementation, together with upgrading of the Katchamba–Sadori road regardless of
construction of the Malfakassa Bypass.
• As a result of overall evaluation, both projects are considered feasible for implementation at an
early stage.
5. Recommendations
(1) Recommendations in the Master Plan
• The newly established Ministry of Public Works and Transports (MPWT) can inform the
outcomes of the Study to development partners for possible assistance with project
implementation, and coordinate with them for effective and efficient cooperation on the projects
proposed in the TLC development programme.
• The GoT should start implementing controls on axle load and oversized vehicles, together with
legal initiatives.
• The GoT should review the contents of the Master Plan in 2018.
• The GoT should prepare a F/S for construction of a new railway line between Lomé and the
border of Burkina Faso by standard gauge as a long-term plan.
• The GoT should prepare a F/S for the expansion of the mineral berth at Lomé Port.
• The MPWT needs to secure sufficient budget for the operation and maintenance of the roads.
• The MPWT needs to strengthen its organisation and develop the capacity of personnel.
The Project for the Study on Togo Logistics Corridor Development Final Report Abstract
- 3 -
• The GoT should legislate the Railway Business Act.
• In order to strengthen the competitiveness of the TLC and to attract transit cargo, it is essential to
shorten the transport time on the TLC and to reduce costs by efficiently operating OSBP,
reducing check points, improving roads, enhancing port security, and improving the custom
clearance procedures at Lomé Port.
• As other corridors are also making efforts to attract transit cargo, it is important to make the TLC
more competitive than the other corridors.
(2) Recommendations in the F/S
• The DGPW should carry out the environmental impact assessment to start land acquisition to
secure the right-of-way.

SUMMARY
The Project for the Study on Togo Logistics Corridor Development Final Report Summary
S - 1
SUMMARY
1. Introduction
The TLC has significant potential for the economic and social development of Togo and the region.
The 667 km corridor, stretching from Lomé Port, an entrance to Togo to the OSBP at Cinkassé, to the
border with Burkina Faso, includes roads, bridges, and railway, and is mainstay of the country.
The objectives of the study are as follows:
• To prepare the TLC Development Master Plan with a target year of 2030.
• To carry out the F/S for the selected priority project in order to confirm the viability of the
projects.
• To share the results of the Study with development partners.
• To develop the capacity of personnel in the MT and MPW1.
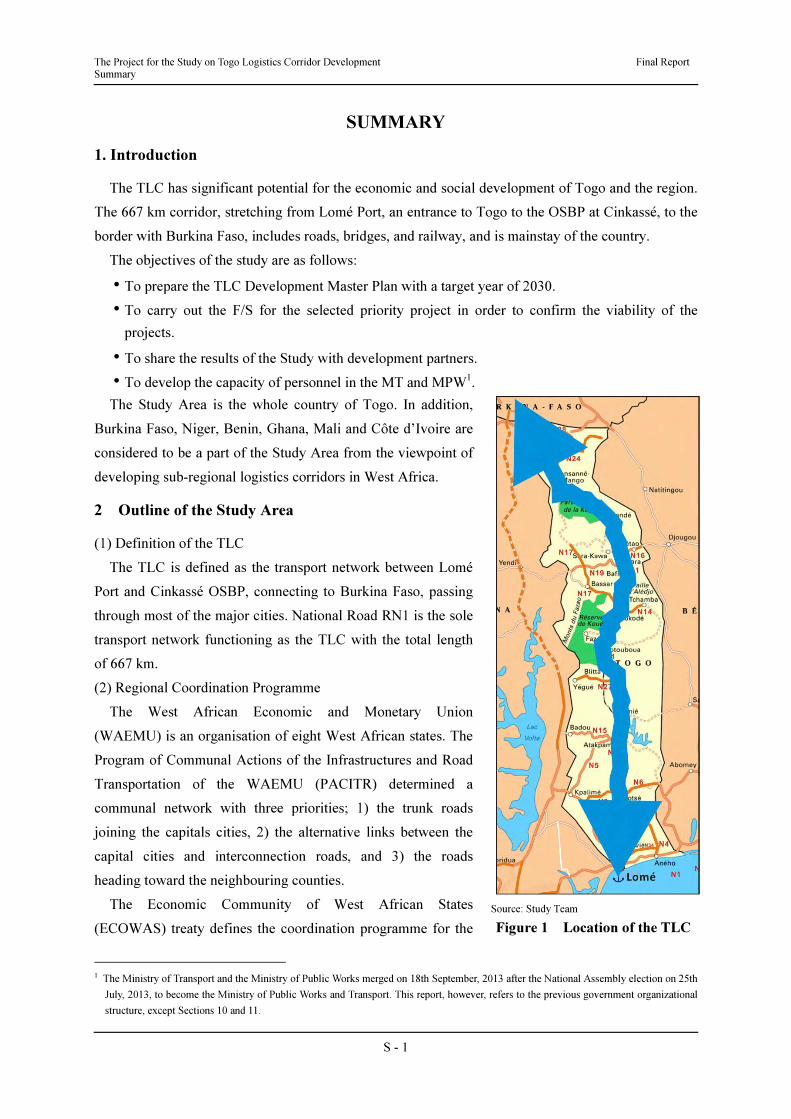
The Study Area is the whole country of Togo. In addition,
Burkina Faso, Niger, Benin, Ghana, Mali and Côte d’Ivoire are
considered to be a part of the Study Area from the viewpoint of
developing sub-regional logistics corridors in West Africa.
2 Outline of the Study Area
(1) Definition of the TLC
The TLC is defined as the transport network between Lomé
Port and Cinkassé OSBP, connecting to Burkina Faso, passing
through most of the major cities. National Road RN1 is the sole
transport network functioning as the TLC with the total length
of 667 km.
(2) Regional Coordination Programme
The West African Economic and Monetary Union
(WAEMU) is an organisation of eight West African states. The
Program of Communal Actions of the Infrastructures and Road
Transportation of the WAEMU (PACITR) determined a
communal network with three priorities; 1) the trunk roads
joining the capitals cities, 2) the alternative links between the
capital cities and interconnection roads, and 3) the roads
heading toward the neighbouring counties.
The Economic Community of West African States
(ECOWAS) treaty defines the coordination programme for the
1 The Ministry of Transport and the Ministry of Public Works merged on 18th September, 2013 after the National Assembly election on 25th
July, 2013, to become the Ministry of Public Works and Transport. This report, however, refers to the previous government organizational
structure, except Sections 10 and 11.
Source: Study Team
Figure 1 Location of the TLC
The Project for the Study on Togo Logistics Corridor Development Final Report Summary
S - 2
transport, communications and tourism sectors.
(3) Social Conditions in Togo
• About 42% of the population is concentrated in the Maritime Region where the capital city Lomé
and major industrial and mining activities are located. The population concentration in Lomé is
about 13.5%. The average annual population growth rate in the whole country between 1981 and
2010 was 2.9%.
• Land use in Togo is mainly agricultural, consisting of 44.2% arable land (2005). Mainly food
crops are cultivated throughout the country.
• Even though the poverty headcount ratio for the whole country fell 3% from 2006 to 2011, the
poverty headcount ratios increased in the Plateux, Centrale and Savanes Regions. The poverty
headcount ratio of the Savanes Region in particular was quite high at 90.8% in 2011.
(4) Economic Conditions in Togo and Neighbouring Countries
The agricultural sector had a share of 43.2% in 2011, followed by the service sector (40.9%) and
industry sector (15.9%). The share of the agriculture sector has gradually increased, while both the
industry and service sectors have slightly lost share.
(5) Existing Development Programmes
The Second Poverty Reduction Strategy Paper (PRSP-II) is the prior national development plan and
it would be appropriate to understand the contents of the plan for analysing the current and the future
development direction of Togo.
3. Current Transport System in Togo
(1) Transport Policy, Planning and Coordination
The transport development policy falls within the country’s broader economic strategic objectives
in support of the Government’s Vision 2030 and the current PRSP-II. The development strategy for
the sector therefore demonstrates the Government’s recognition of its importance.
(2) Major Findings and Problems of the Road Sub-Sector
A number of observations have been made on the road sub-sector. Despite some strides made in
recent years a number of challenges confront the sub-sector. The challenges include: 1) inadequate
funds for investment and maintenance, 2) the lack of a Road Management System, 3) the non-control
of axle loads, 4) inadequate attention given to road safety, and 5) the lack of viable alternative routes
to the main north- south corridor.
(3) Major Findings and Problems of the Railway Sub-Sector
There are many problems on the railway development policy, regulations, facilities, train operation
and maintenance; 1) non-materialised railway development policy, 2) non-established railway acts and
regulations, 3) supervision of the railway concessioners by the MT is not functioning, 4) Improper
maintenance of railway facilities and tracks, 5) no signaling and telecommunication system, 6) many
level crossings, and 7) deteriorated rolling stock.
The Project for the Study on Togo Logistics Corridor Development Final Report Summary
S - 3
(4) Major Findings and Problems of the Port and Maritime Sub-sector
The major problems of the port and maritime sub-sector are: 1) shortage of the quay capacity
accompanied with increasing volume of trade, particularly the mineral berth, 2) insufficient capacity
of on land facility in the port, and 3) traffic congestion in and around Sahel Terminal.
(5) Major Findings and Problems of Transit Transport on the TLC
The major issues of transit transport on the TLC are: 1) the low level of maintenance at Lomé Port
and deteriorated condition on RN1, 2) aged freight vehicles, many broken-down, overloaded and
oversized vehicles, and 3) complicated and inefficient customs clearance processes, inappropriate and
inexperienced customs brokerages, customs clearance document forms and data that are not
interchangeable between Togo and Burkina Faso, and requests to pay bribes at the port, border and
checkpoints.
Therefore, the transit cargo transport systems in Togo and Burkina Faso are still not efficient and
must be improved to the standard of international logistics.
4. Outline of Existing Development Projects/Plan
(1) Road Rehabilitation and Transport Facilitation on the TLC
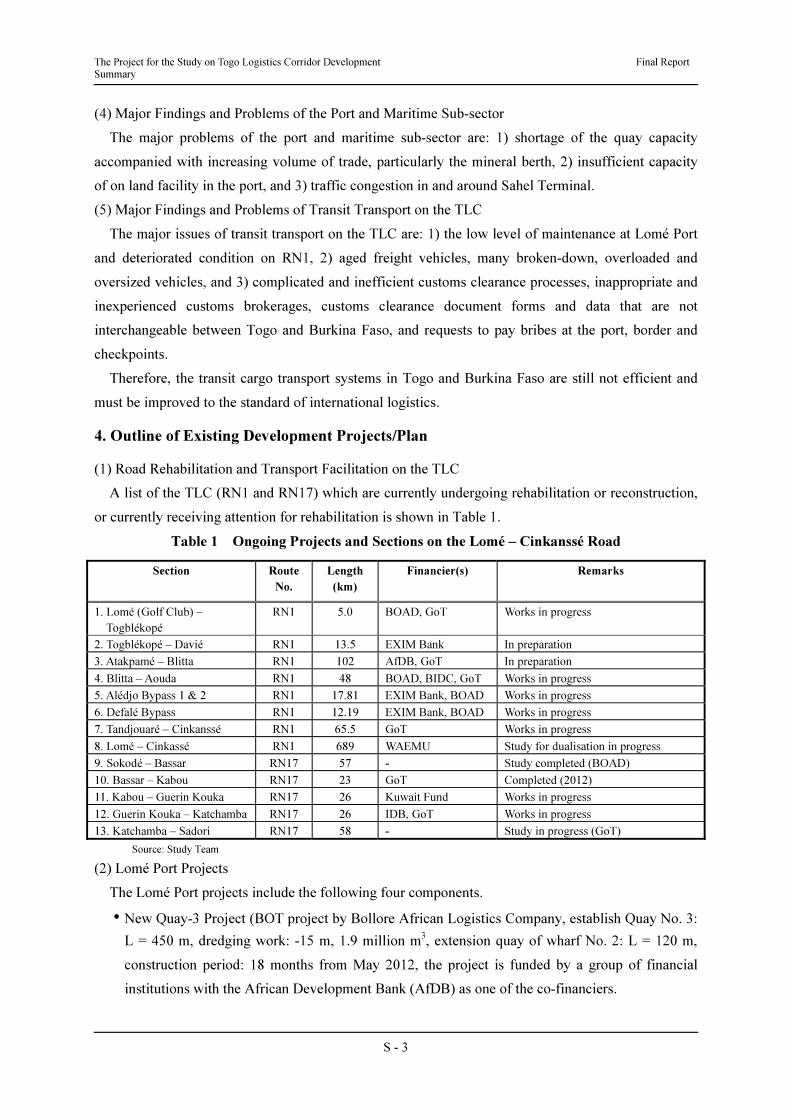
A list of the TLC (RN1 and RN17) which are currently undergoing rehabilitation or reconstruction,
or currently receiving attention for rehabilitation is shown in Table 1.
Table 1 Ongoing Projects and Sections on the Lomé – Cinkanssé Road
Section
Route
No.
Length
(km)
Financier(s) Remarks
1. Lomé (Golf Club) –
Togblékopé
RN1 5.0 BOAD, GoT Works in progress
2. Togblékopé – Davié RN1 13.5 EXIM Bank In preparation
3. Atakpamé – Blitta RN1 102 AfDB, GoT In preparation
4. Blitta – Aouda RN1 48 BOAD, BIDC, GoT Works in progress
5. Alédjo Bypass 1 & 2 RN1 17.81 EXIM Bank, BOAD Works in progress
6. Defalé Bypass RN1 12.19 EXIM Bank, BOAD Works in progress
7. Tandjouaré – Cinkanssé RN1 65.5 GoT Works in progress
8. Lomé – Cinkassé RN1 689 WAEMU Study for dualisation in progress
9. Sokodé – Bassar RN17 57 - Study completed (BOAD)
10. Bassar – Kabou RN17 23 GoT Completed (2012)
11. Kabou – Guerin Kouka RN17 26 Kuwait Fund Works in progress
12. Guerin Kouka – Katchamba RN17 26 IDB, GoT Works in progress
13. Katchamba – Sadori RN17 58 - Study in progress (GoT)
Source: Study Team
(2) Lomé Port Projects
The Lomé Port projects include the following four components.
• New Quay-3 Project (BOT project by Bollore African Logistics Company, establish Quay No. 3:
L = 450 m, dredging work: -15 m, 1.9 million m3, extension quay of wharf No. 2: L = 120 m,
construction period: 18 months from May 2012, the project is funded by a group of financial
institutions with the African Development Bank (AfDB) as one of the co-financiers.
The Project for the Study on Togo Logistics Corridor Development Final Report Summary
S - 4
• Lomé Container Terminal Project (Private project by Lomé Container Terminal with a 35-year
concession agreement, with initial capacity is 0.9 million Twenty-foot Equivalent Unit (TEU)
and final capacity of 1.5 million TEU, length of north quay: 750 m, length of south quay:1,015
m, basin area: (750 + 1,015) × 250 / 2=220,625 m2, depth: -16.6 m, -16.6 m over-Panamax size
container cargo ships will be able to moor at this terminal; main co-financiers: IFC, AfDB, CDB,
FMO and DGE).
• Extension of Ore Berth (Extend the existing mineral berth to a handling capacity of about 3.5
million tonnes per year to the north side, however, even under this plan, the total capacity of the
mineral berths will be insufficient after 2015, yet the Port Master Plan contains no
countermeasure).
• Introduction of “The Single Window System” to speed up the work flow of port and customs
procedures
5. Future Traffic Demand Forecast
(1) Analysis of Present Traffic Condition
a) Traffic Survey
The Study Team carried out the following traffic surveys:
• Traffic volume count survey: 17 points
• Roadside Origin-Destination (O/D) survey: 16 points
• Broken-down freight vehicle survey: RN1 between Tsévié and Kara
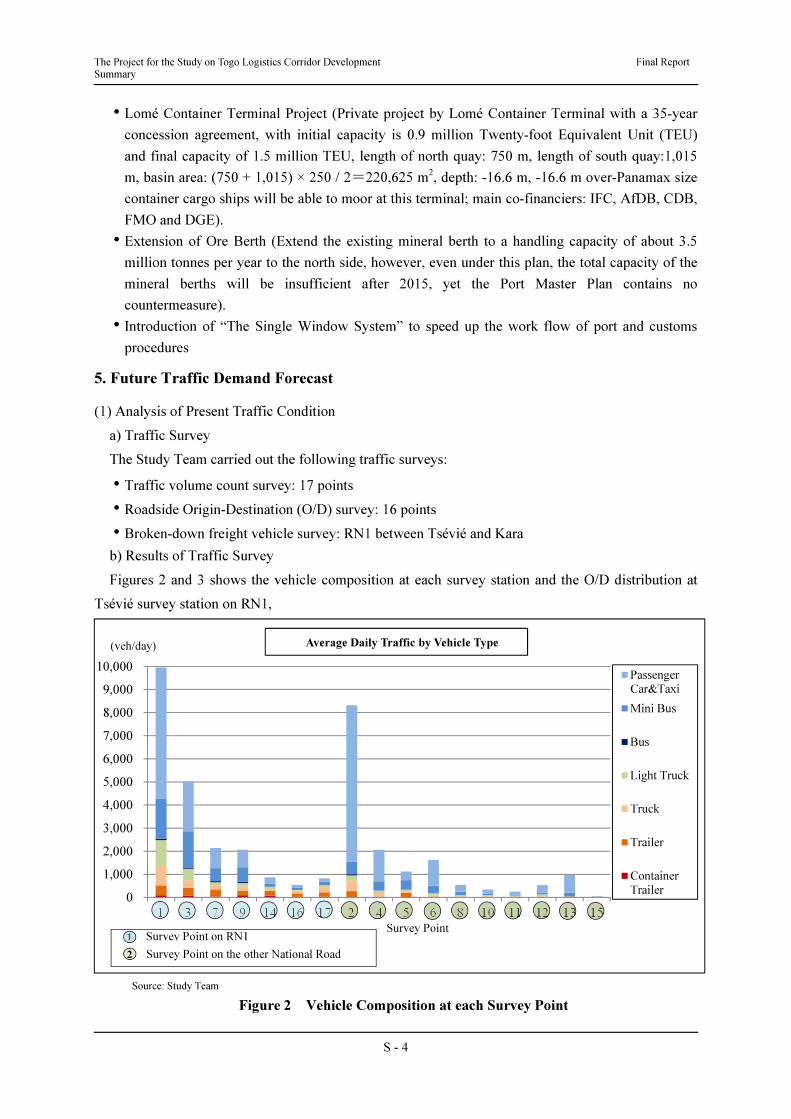
b) Results of Traffic Survey
Figures 2 and 3 shows the vehicle composition at each survey station and the O/D distribution at
Tsévié survey station on RN1,
Source: Study Team
Figure 2 Vehicle Composition at each Survey Point
0
1,000
2,000
3,000
4,000
5,000
6,000
7,000
8,000
9,000
10,000
1 3 7 9 14 16 17 2 4 5 6 8 10 11 12 13 15
Passenger
Car&Taxi
Mini Bus
Bus
Light Truck
Truck
Trailer
Container
Trailer
Average Daily Traffic by Vehicle Type
1 Survey Point on RN1
Survey Point on the other National Road2
Survey Point
(veh/day)
The Project for the Study on Togo Logistics Corridor Development Final Report Summary
S - 5
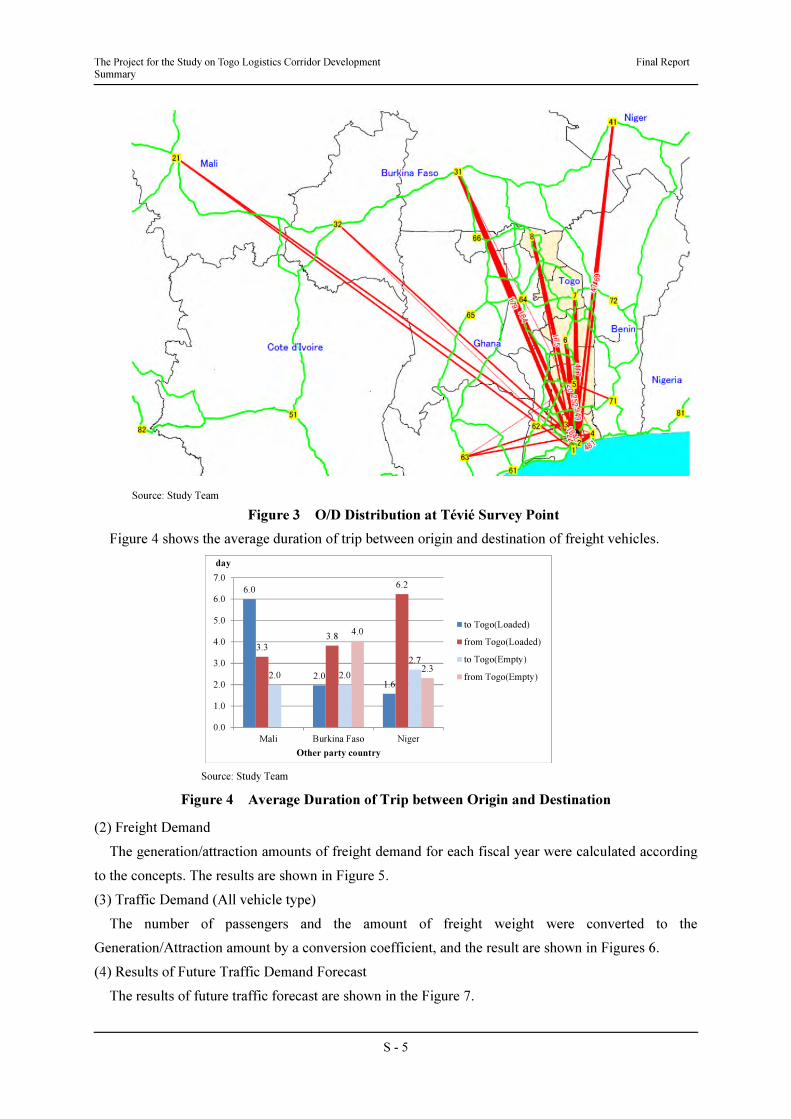
Source: Study Team
Figure 3 O/D Distribution at Tévié Survey Point
Figure 4 shows the average duration of trip between origin and destination of freight vehicles.
Source: Study Team
Figure 4 Average Duration of Trip between Origin and Destination
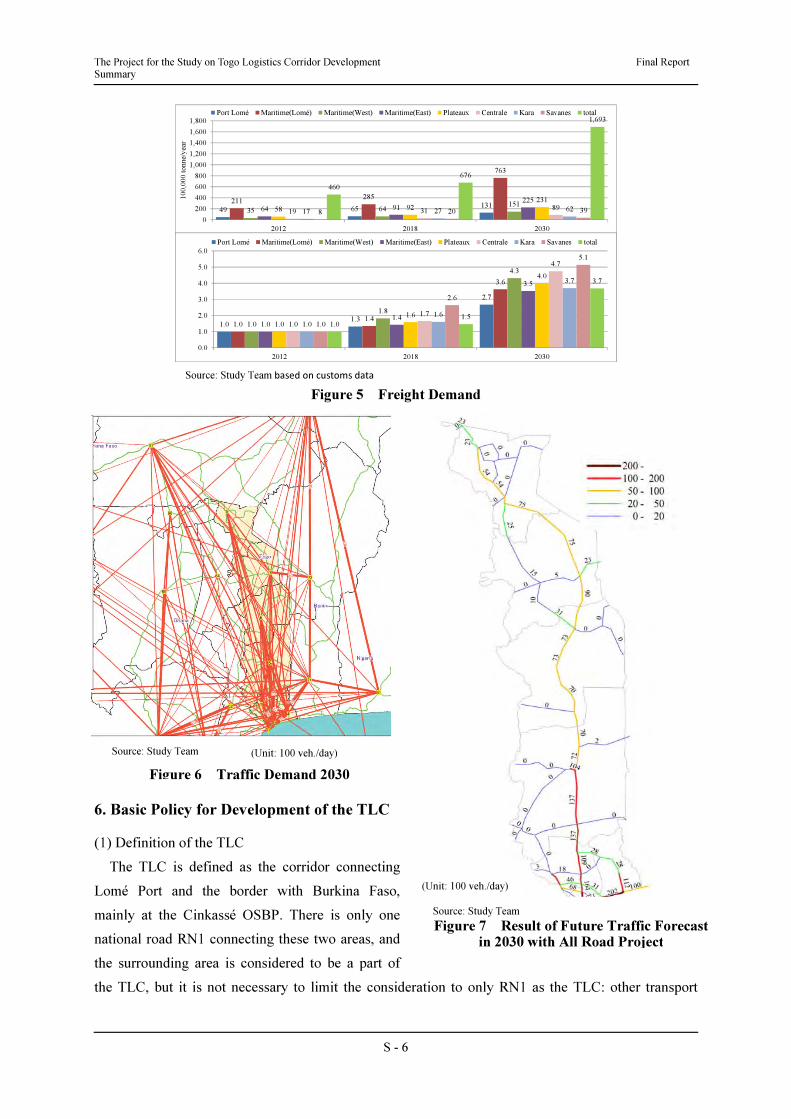
(2) Freight Demand
The generation/attraction amounts of freight demand for each fiscal year were calculated according
to the concepts. The results are shown in Figure 5.
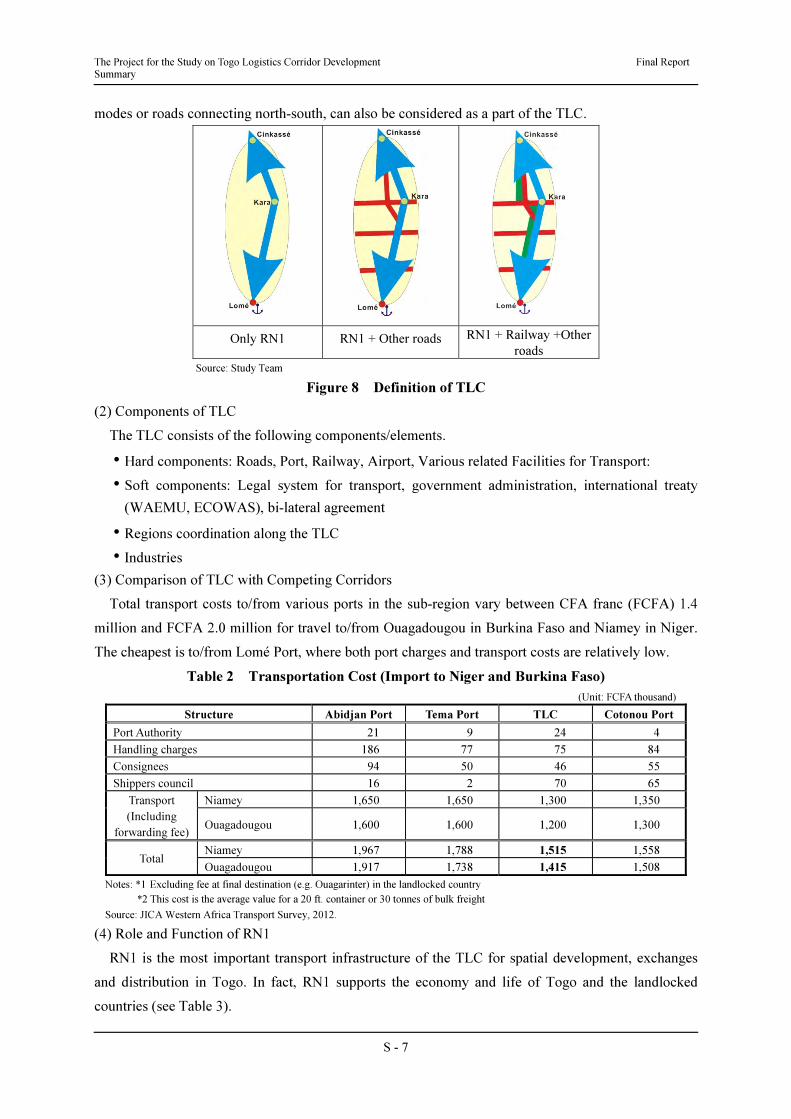
(3) Traffic Demand (All vehicle type)
The number of passengers and the amount of freight weight were converted to the
Generation/Attraction amount by a conversion coefficient, and the result are shown in Figures 6.
(4) Results of Future Traffic Demand Forecast
The results of future traffic forecast are shown in the Figure 7.
6.0
2.01.6
3.3
3.8
6.2
2.0 2.0
2.7
4.0
2.3
0.0
1.0
2.0
3.0
4.0
5.0
6.0
7.0
Mali Burkina Faso Niger
day
Other party country
to Togo(Loaded)
from Togo(Loaded)
to Togo(Empty)
from Togo(Empty)
The Project for the Study on Togo Logistics Corridor Development Final Report Summary
S - 6
Source: Study Team based on customs data
Figure 5 Freight Demand
6. Basic Policy for Development of the TLC
(1) Definition of the TLC
The TLC is defined as the corridor connecting
Lomé Port and the border with Burkina Faso,
mainly at the Cinkassé OSBP. There is only one
national road RN1 connecting these two areas, and
the surrounding area is considered to be a part of
the TLC, but it is not necessary to limit the consideration to only RN1 as the TLC: other transport
49 65131
211285
763
35 64151
64 91225
58 92231
19 31 8917 27 628 20 39
460
676
1,693
0
200
400
600
800
1,000
1,200
1,400
1,600
1,800
2012 2018 2030
100,0
00 tonne/
yea
r
Port Lomé Maritime(Lomé) Maritime(West) Maritime(East) Plateaux Centrale Kara Savanes total
1.0 1.3
2.7
1.0 1.4
3.6
1.0
1.8
4.3
1.0 1.4
3.5
1.0
1.6
4.0
1.0
1.7
4.7
1.0
1.6
3.7
1.0
2.6
5.1
1.0 1.5
3.7
0.0
1.0
2.0
3.0
4.0
5.0
6.0
2012 2018 2030
Port Lomé Maritime(Lomé) Maritime(West) Maritime(East) Plateaux Centrale Kara Savanes total
Source: Study Team
Figure 6 Traffic Demand 2030
(Unit: 100 veh./day)
(Unit: 100 veh./day)
Source: Study Team
Figure 7 Result of Future Traffic Forecast in 2030 with All Road Project
The Project for the Study on Togo Logistics Corridor Development Final Report Summary
S - 7
modes or roads connecting north-south, can also be considered as a part of the TLC.
Only RN1 RN1 + Other roads RN1 + Railway +Other
roads
Source: Study Team
Figure 8 Definition of TLC
(2) Components of TLC
The TLC consists of the following components/elements.
• Hard components: Roads, Port, Railway, Airport, Various related Facilities for Transport:
• Soft components: Legal system for transport, government administration, international treaty
(WAEMU, ECOWAS), bi-lateral agreement
• Regions coordination along the TLC
• Industries
(3) Comparison of TLC with Competing Corridors
Total transport costs to/from various ports in the sub-region vary between CFA franc (FCFA) 1.4
million and FCFA 2.0 million for travel to/from Ouagadougou in Burkina Faso and Niamey in Niger.
The cheapest is to/from Lomé Port, where both port charges and transport costs are relatively low.
Table 2 Transportation Cost (Import to Niger and Burkina Faso)
(Unit: FCFA thousand)
Structure Abidjan Port Tema Port TLC Cotonou Port
Port Authority 21 9 24 4
Handling charges 186 77 75 84
Consignees 94 50 46 55
Shippers council 16 2 70 65
Transport
(Including
forwarding fee)
Niamey 1,650 1,650 1,300 1,350
Ouagadougou 1,600 1,600 1,200 1,300
Total Niamey 1,967 1,788 1,515 1,558
Ouagadougou 1,917 1,738 1,415 1,508
Notes: *1 Excluding fee at final destination (e.g. Ouagarinter) in the landlocked country
*2 This cost is the average value for a 20 ft. container or 30 tonnes of bulk freight
Source: JICA Western Africa Transport Survey, 2012.
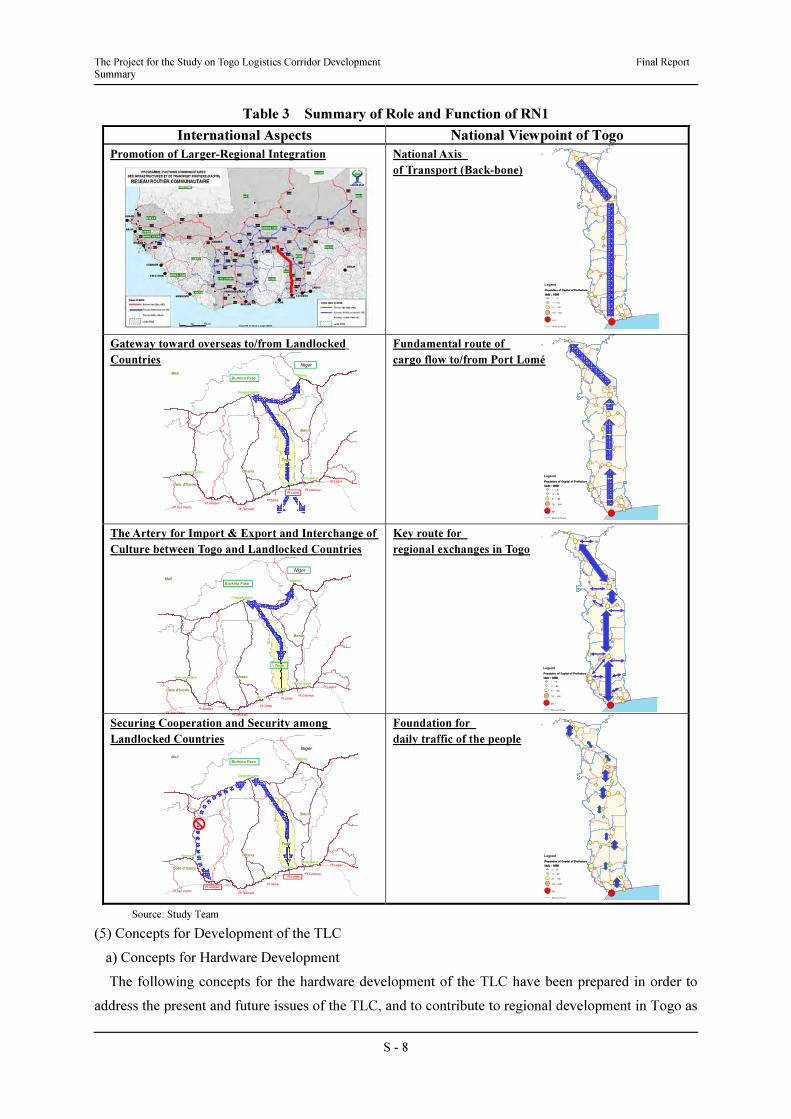
(4) Role and Function of RN1
RN1 is the most important transport infrastructure of the TLC for spatial development, exchanges
and distribution in Togo. In fact, RN1 supports the economy and life of Togo and the landlocked
countries (see Table 3).
The Project for the Study on Togo Logistics Corridor Development Final Report Summary
S - 8
")
")")
")
")
")")
!.
!.
!.
!.
!.
!.
Pt.Lome
Pt.Tema
Pt.Lagos
Pt.Abidjan
Pt.Cotonou
Pt.TakoradiPt.San Pedro
Lome
Accra
Niamey
Porto-Novo
Ouagadougou
Yamoussoukro
Togo
Mali
Ghana
Benin
Burkina Faso
Cote d'Ivoire
Niger
")
")")
")
")
")")
!.
!.
!.
!.
!.
!.
Pt.Lome
Pt.Tema
Pt.Lagos
Pt.Abidjan
Pt.Cotonou
Pt.TakoradiPt.San Pedro
Lome
Accra
Niamey
Porto-Novo
Ouagadougou
Yamoussoukro
Togo
Mali
Ghana
Benin
Burkina Faso
Cote d'Ivoire
Niger
µ
Legend
Unit : 1000
Population of Capital of Prefecture
1 - 10
11 - 50
51 - 100
101 - 500
National Route
501 -
Table 3 Summary of Role and Function of RN1
International Aspects National Viewpoint of Togo
Promotion of Larger-Regional Integration National Axis
of Transport (Back-bone)
Gateway toward overseas to/from Landlocked
Countries
Fundamental route of
cargo flow to/from Port Lomé
The Artery for Import & Export and Interchange of
Culture between Togo and Landlocked Countries
Key route for
regional exchanges in Togo
Securing Cooperation and Security among
Landlocked Countries
Foundation for
daily traffic of the people
Source: Study Team
(5) Concepts for Development of the TLC
a) Concepts for Hardware Development
The following concepts for the hardware development of the TLC have been prepared in order to
address the present and future issues of the TLC, and to contribute to regional development in Togo as
")
")")
")
")
")")
!.
!.
!.
!.
!.
!.
Pt.Lome
Pt.Tema
Pt.Lagos
Pt.Abidjan
Pt.Cotonou
Pt.TakoradiPt.San Pedro
Lome
Accra
Niamey
Porto-Novo
Ouagadougou
Yamoussoukro
Togo
Mali
Ghana
Benin
Burkina Faso
Cote d'Ivoire
Niger
µ
Legend
Unit : 1000
Population of Capital of Prefecture
1 - 10
11 - 50
51 - 100
101 - 500
National Route
501 -
µ
Legend
Unit : 1000
Population of Capital of Prefecture
1 - 10
11 - 50
51 - 100
101 - 500
National Route
501 -
µ
Legend
Unit : 1000
Population of Capital of Prefecture
1 - 10
11 - 50
51 - 100
101 - 500
National Route
501 -
The Project for the Study on Togo Logistics Corridor Development Final Report Summary
S - 9
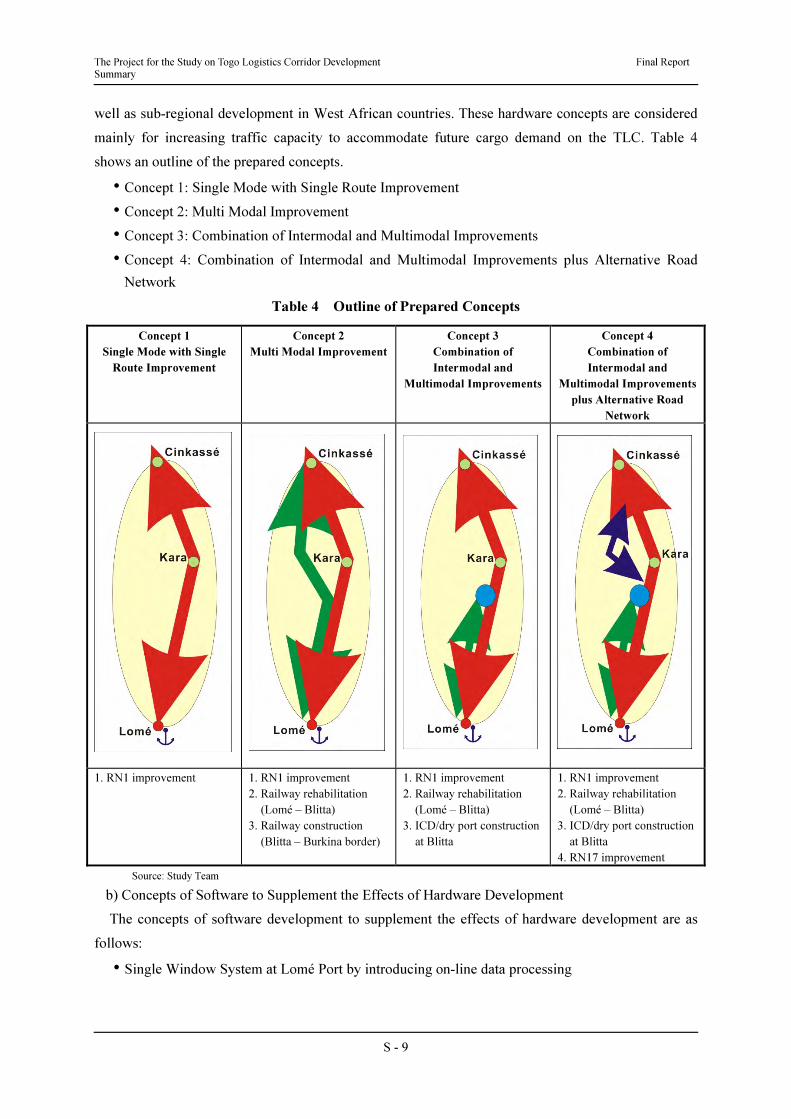
well as sub-regional development in West African countries. These hardware concepts are considered
mainly for increasing traffic capacity to accommodate future cargo demand on the TLC. Table 4
shows an outline of the prepared concepts.
• Concept 1: Single Mode with Single Route Improvement
• Concept 2: Multi Modal Improvement
• Concept 3: Combination of Intermodal and Multimodal Improvements
• Concept 4: Combination of Intermodal and Multimodal Improvements plus Alternative Road
Network
Table 4 Outline of Prepared Concepts
Concept 1
Single Mode with Single
Route Improvement
Concept 2
Multi Modal Improvement
Concept 3
Combination of
Intermodal and
Multimodal Improvements
Concept 4
Combination of
Intermodal and
Multimodal Improvements
plus Alternative Road
Network
1. RN1 improvement
1. RN1 improvement
2. Railway rehabilitation
(Lomé – Blitta)
3. Railway construction
(Blitta – Burkina border)
1. RN1 improvement
2. Railway rehabilitation
(Lomé – Blitta)
3. ICD/dry port construction
at Blitta
1. RN1 improvement
2. Railway rehabilitation
(Lomé – Blitta)
3. ICD/dry port construction
at Blitta
4. RN17 improvement
Source: Study Team
b) Concepts of Software to Supplement the Effects of Hardware Development
The concepts of software development to supplement the effects of hardware development are as
follows:
• Single Window System at Lomé Port by introducing on-line data processing
The Project for the Study on Togo Logistics Corridor Development Final Report Summary
S - 10
• Improvement of Sahel Terminal for 1) expansion of area for the short term, and 2) conversion of
area into an inland container depot (ICD) for domestic freight for the medium term by
completion of a dry port at Blitta.
• Installation of weigh bridges and enacting regulations to control overloading.
• Modification of traffic law to restrict oversized vehicles.
• Prohibition on majority of freight vehicles registered other than Togo operating south-bound
from Blitta, after completion of the dry port.
• Provision of appropriate and cheaper rest stops for freight vehicles. This measure will also create
more job opportunities in areas where rest stops will be constructed.
• Development of the capacity of personnel related to documentation at the port, OSBP, a dry port
and an ICD.
• Development of the capacity of personnel for operating weigh bridges.
• Development of the capacity of personnel in the MT and MPW.
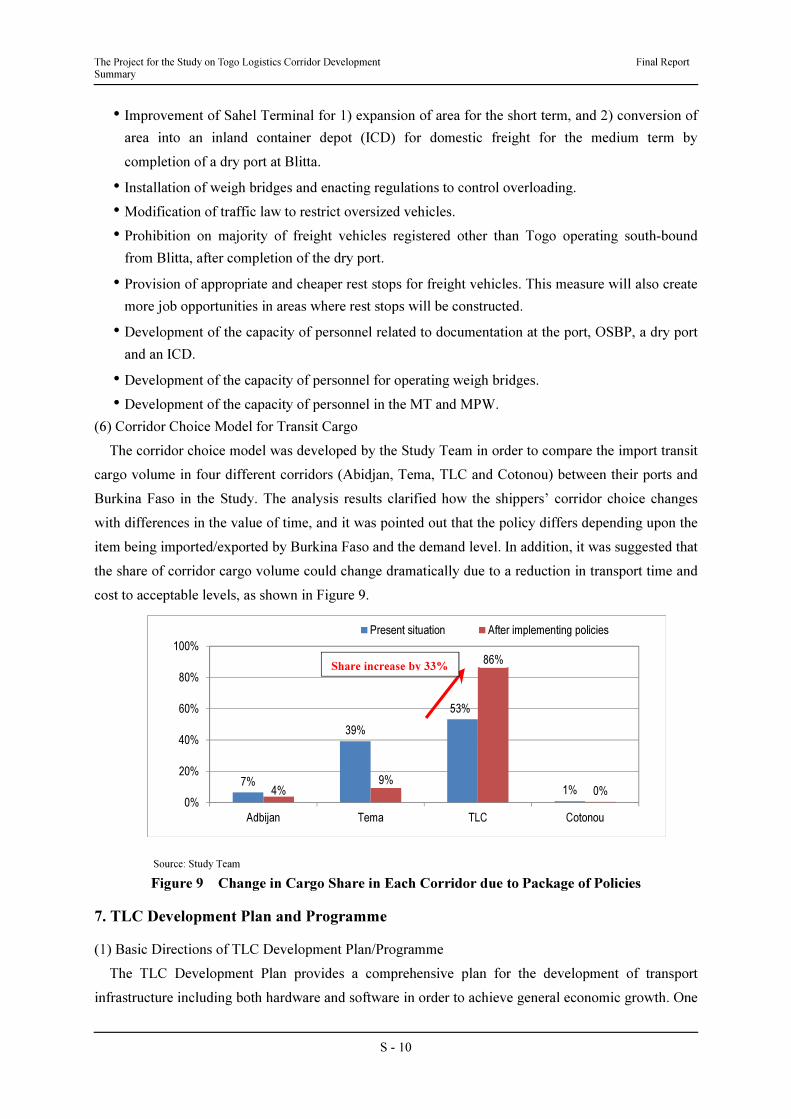
(6) Corridor Choice Model for Transit Cargo
The corridor choice model was developed by the Study Team in order to compare the import transit
cargo volume in four different corridors (Abidjan, Tema, TLC and Cotonou) between their ports and
Burkina Faso in the Study. The analysis results clarified how the shippers’ corridor choice changes
with differences in the value of time, and it was pointed out that the policy differs depending upon the
item being imported/exported by Burkina Faso and the demand level. In addition, it was suggested that
the share of corridor cargo volume could change dramatically due to a reduction in transport time and
cost to acceptable levels, as shown in Figure 9.
Source: Study Team
Figure 9 Change in Cargo Share in Each Corridor due to Package of Policies
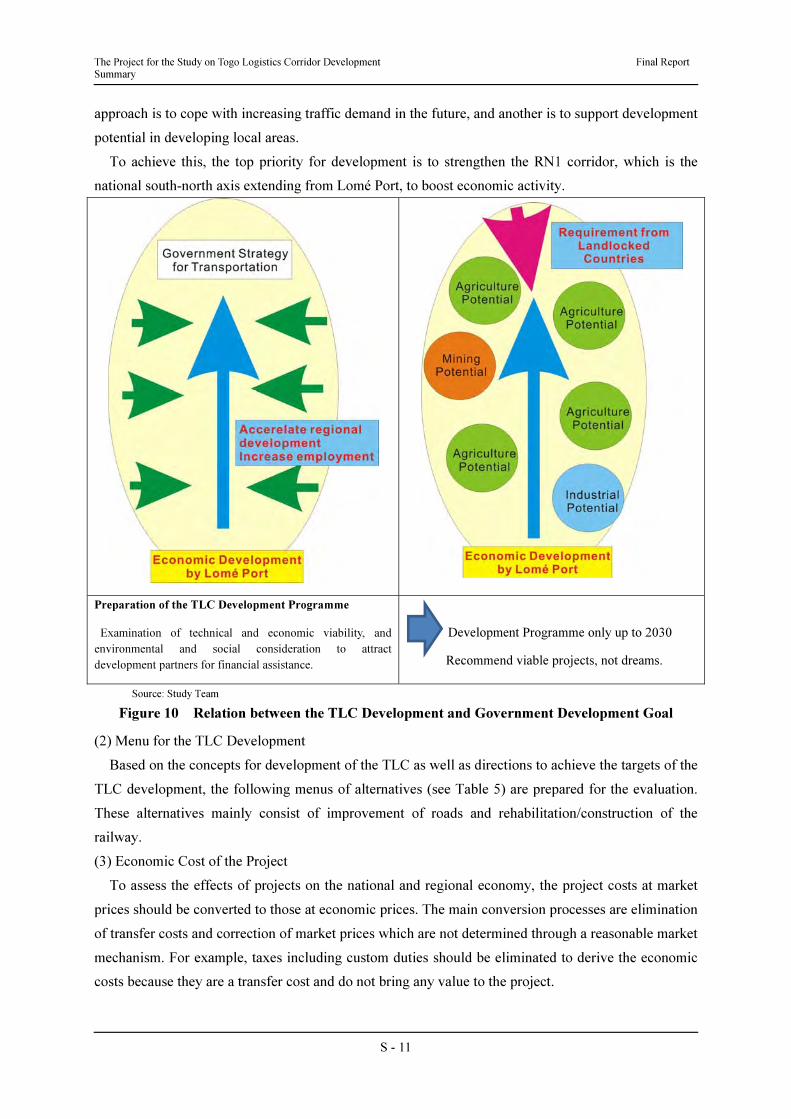
7. TLC Development Plan and Programme
(1) Basic Directions of TLC Development Plan/Programme
The TLC Development Plan provides a comprehensive plan for the development of transport
infrastructure including both hardware and software in order to achieve general economic growth. One
7%
39%
53%
1%4%9%
86%
0%0%
20%
40%
60%
80%
100%
Adbijan Tema TLC Cotonou
Present situation After implementing policies
Share increase by 33%
The Project for the Study on Togo Logistics Corridor Development Final Report Summary
S - 11
approach is to cope with increasing traffic demand in the future, and another is to support development
potential in developing local areas.
To achieve this, the top priority for development is to strengthen the RN1 corridor, which is the
national south-north axis extending from Lomé Port, to boost economic activity.
Preparation of the TLC Development Programme
Examination of technical and economic viability, and
environmental and social consideration to attract
development partners for financial assistance.
Development Programme only up to 2030
Recommend viable projects, not dreams.
Source: Study Team
Figure 10 Relation between the TLC Development and Government Development Goal
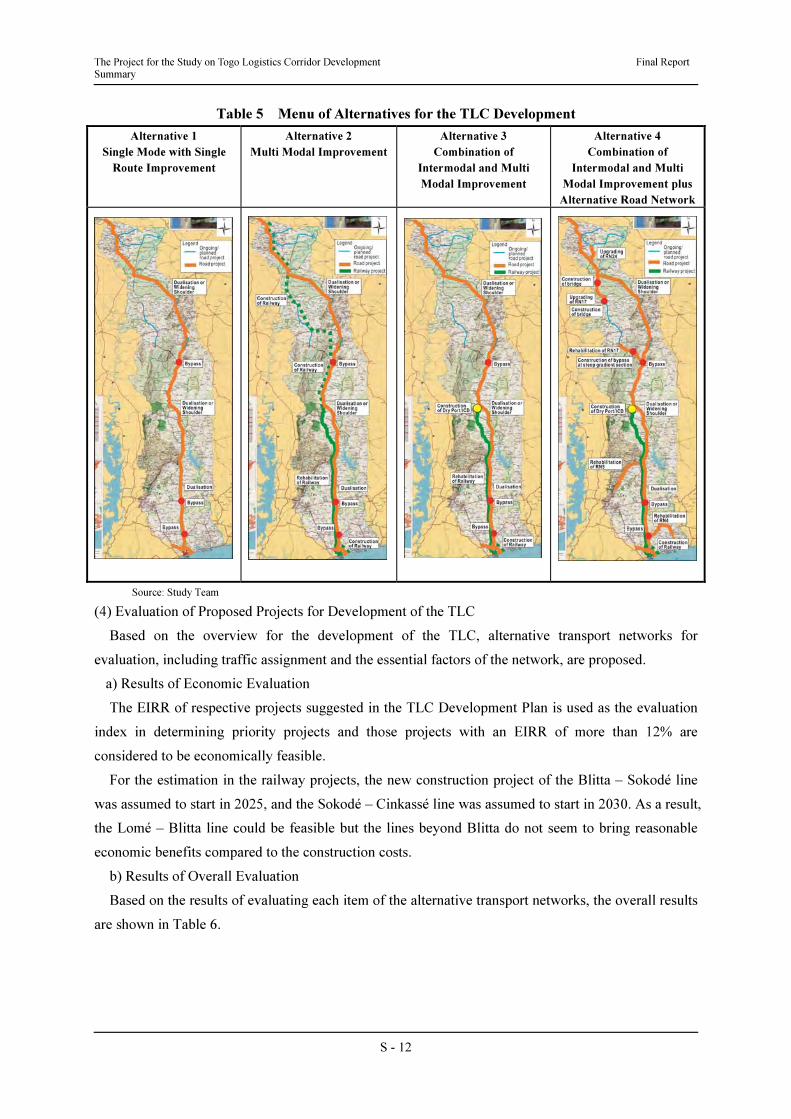
(2) Menu for the TLC Development
Based on the concepts for development of the TLC as well as directions to achieve the targets of the
TLC development, the following menus of alternatives (see Table 5) are prepared for the evaluation.
These alternatives mainly consist of improvement of roads and rehabilitation/construction of the
railway.
(3) Economic Cost of the Project
To assess the effects of projects on the national and regional economy, the project costs at market
prices should be converted to those at economic prices. The main conversion processes are elimination
of transfer costs and correction of market prices which are not determined through a reasonable market
mechanism. For example, taxes including custom duties should be eliminated to derive the economic
costs because they are a transfer cost and do not bring any value to the project.
The Project for the Study on Togo Logistics Corridor Development Final Report Summary
S - 12
Table 5 Menu of Alternatives for the TLC Development
Alternative 1
Single Mode with Single
Route Improvement
Alternative 2
Multi Modal Improvement
Alternative 3
Combination of
Intermodal and Multi
Modal Improvement
Alternative 4
Combination of
Intermodal and Multi
Modal Improvement plus
Alternative Road Network
Source: Study Team
(4) Evaluation of Proposed Projects for Development of the TLC
Based on the overview for the development of the TLC, alternative transport networks for
evaluation, including traffic assignment and the essential factors of the network, are proposed.
a) Results of Economic Evaluation
The EIRR of respective projects suggested in the TLC Development Plan is used as the evaluation
index in determining priority projects and those projects with an EIRR of more than 12% are
considered to be economically feasible.
For the estimation in the railway projects, the new construction project of the Blitta – Sokodé line
was assumed to start in 2025, and the Sokodé – Cinkassé line was assumed to start in 2030. As a result,
the Lomé – Blitta line could be feasible but the lines beyond Blitta do not seem to bring reasonable
economic benefits compared to the construction costs.
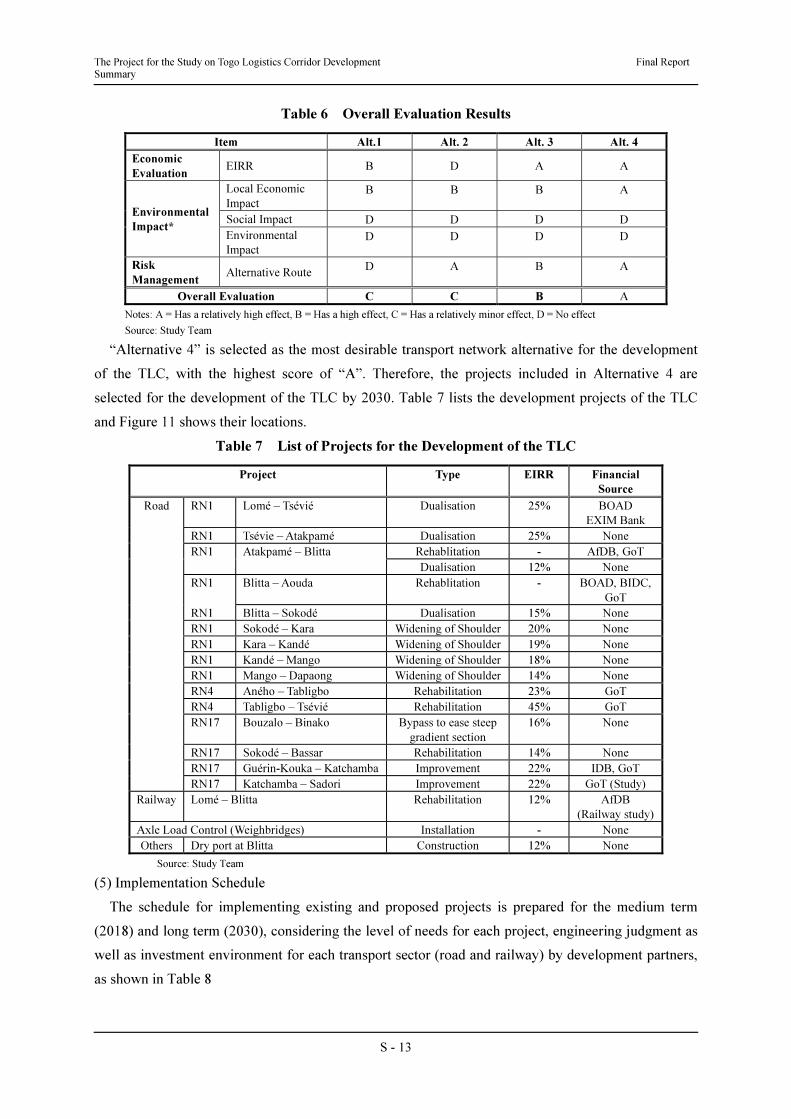
b) Results of Overall Evaluation
Based on the results of evaluating each item of the alternative transport networks, the overall results
are shown in Table 6.
The Project for the Study on Togo Logistics Corridor Development Final Report Summary
S - 13
Table 6 Overall Evaluation Results
Item Alt.1 Alt. 2 Alt. 3 Alt. 4
Economic
Evaluation EIRR B D A A
Environmental
Impact*
Local Economic
Impact
B B B A
Social Impact D D D D
Environmental
Impact D D D D
Risk
Management Alternative Route
D A B A
Overall Evaluation C C B A
Notes: A = Has a relatively high effect, B = Has a high effect, C = Has a relatively minor effect, D = No effect
Source: Study Team
“Alternative 4” is selected as the most desirable transport network alternative for the development
of the TLC, with the highest score of “A”. Therefore, the projects included in Alternative 4 are
selected for the development of the TLC by 2030. Table 7 lists the development projects of the TLC
and Figure 11 shows their locations.
Table 7 List of Projects for the Development of the TLC
Project Type EIRR Financial
Source
Road RN1 Lomé – Tsévié Dualisation 25% BOAD
EXIM Bank
RN1 Tsévie – Atakpamé Dualisation 25% None
RN1 Atakpamé – Blitta Rehablitation - AfDB, GoT
Dualisation 12% None
RN1 Blitta – Aouda Rehablitation - BOAD, BIDC,
GoT
RN1 Blitta – Sokodé Dualisation 15% None
RN1 Sokodé – Kara Widening of Shoulder 20% None
RN1 Kara – Kandé Widening of Shoulder 19% None
RN1 Kandé – Mango Widening of Shoulder 18% None
RN1 Mango – Dapaong Widening of Shoulder 14% None
RN4 Aného – Tabligbo Rehabilitation 23% GoT
RN4 Tabligbo – Tsévié Rehabilitation 45% GoT
RN17 Bouzalo – Binako Bypass to ease steep
gradient section
16% None
RN17 Sokodé – Bassar Rehabilitation 14% None
RN17 Guérin-Kouka – Katchamba Improvement 22% IDB, GoT
RN17 Katchamba – Sadori Improvement 22% GoT (Study)
Railway Lomé – Blitta Rehabilitation 12% AfDB
(Railway study)
Axle Load Control (Weighbridges) Installation - None
Others Dry port at Blitta Construction 12% None
Source: Study Team
(5) Implementation Schedule
The schedule for implementing existing and proposed projects is prepared for the medium term
(2018) and long term (2030), considering the level of needs for each project, engineering judgment as
well as investment environment for each transport sector (road and railway) by development partners,
as shown in Table 8
The Project for the Study on Togo Logistics Corridor Development Final Report Summary
S - 14
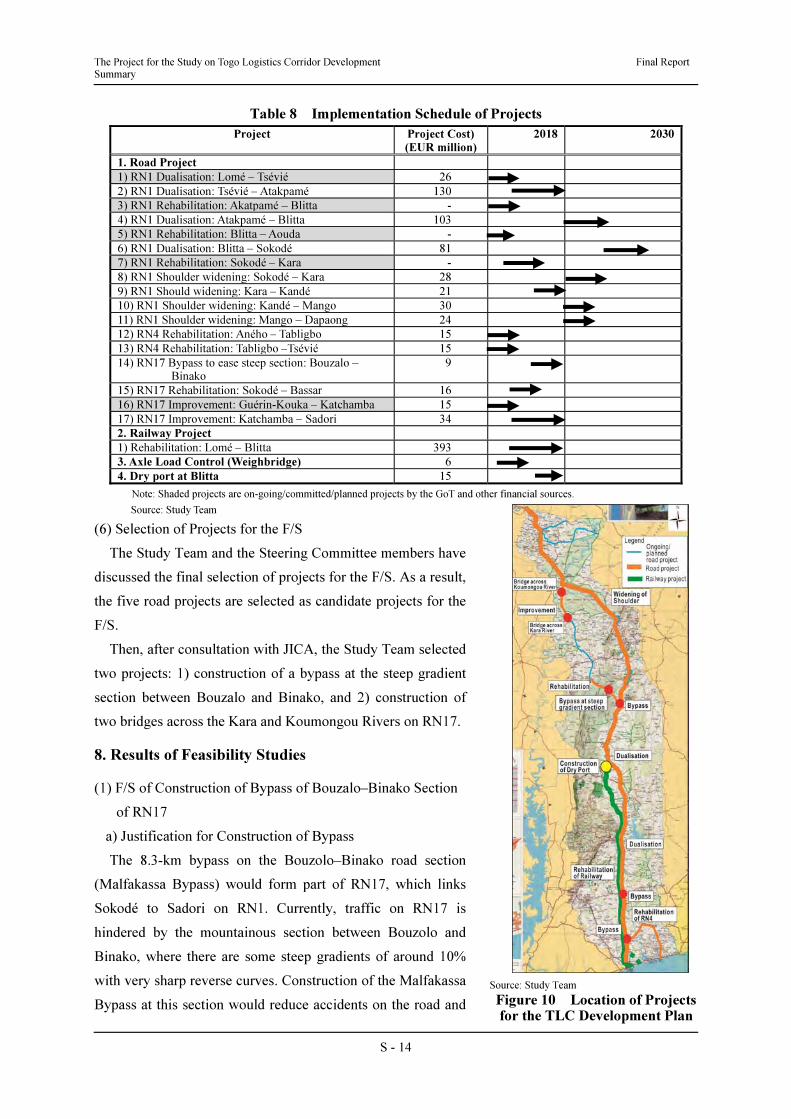
Table 8 Implementation Schedule of Projects
Project Project Cost)
(EUR million)
2018 2030
1. Road Project
1) RN1 Dualisation: Lomé – Tsévié 26
2) RN1 Dualisation: Tsévié – Atakpamé 130
3) RN1 Rehabilitation: Akatpamé – Blitta -
4) RN1 Dualisation: Atakpamé – Blitta 103
5) RN1 Rehabilitation: Blitta – Aouda -
6) RN1 Dualisation: Blitta – Sokodé 81
7) RN1 Rehabilitation: Sokodé – Kara -
8) RN1 Shoulder widening: Sokodé – Kara 28
9) RN1 Should widening: Kara – Kandé 21
10) RN1 Shoulder widening: Kandé – Mango 30
11) RN1 Shoulder widening: Mango – Dapaong 24
12) RN4 Rehabilitation: Aného – Tabligbo 15
13) RN4 Rehabilitation: Tabligbo –Tsévié 15
14) RN17 Bypass to ease steep section: Bouzalo – Binako
9
15) RN17 Rehabilitation: Sokodé – Bassar 16
16) RN17 Improvement: Guérin-Kouka – Katchamba 15
17) RN17 Improvement: Katchamba – Sadori 34
2. Railway Project
1) Rehabilitation: Lomé – Blitta 393
3. Axle Load Control (Weighbridge) 6
4. Dry port at Blitta 15
Note: Shaded projects are on-going/committed/planned projects by the GoT and other financial sources.
Source: Study Team
(6) Selection of Projects for the F/S
The Study Team and the Steering Committee members have
discussed the final selection of projects for the F/S. As a result,
the five road projects are selected as candidate projects for the
F/S.
Then, after consultation with JICA, the Study Team selected
two projects: 1) construction of a bypass at the steep gradient
section between Bouzalo and Binako, and 2) construction of
two bridges across the Kara and Koumongou Rivers on RN17.
8. Results of Feasibility Studies
(1) F/S of Construction of Bypass of Bouzalo–Binako Section
of RN17
a) Justification for Construction of Bypass
The 8.3-km bypass on the Bouzolo–Binako road section
(Malfakassa Bypass) would form part of RN17, which links
Sokodé to Sadori on RN1. Currently, traffic on RN17 is
hindered by the mountainous section between Bouzolo and
Binako, where there are some steep gradients of around 10%
with very sharp reverse curves. Construction of the Malfakassa
Bypass at this section would reduce accidents on the road and
Source: Study Team
Figure 10 Location of Projects for the TLC Development Plan
The Project for the Study on Togo Logistics Corridor Development Final Report Summary
S - 15
reduce travel time.
Construction of the Malfakassa Bypass and the Katchamba–Sadori road would have the synergistic
effect of reducing the distance between Lomé and Cincassé by approximately 15 km, thus improving
the efficiency of the TLC with remarkable knock-on effects on national and regional trade,
socio-economic development and poverty alleviation in Togo.
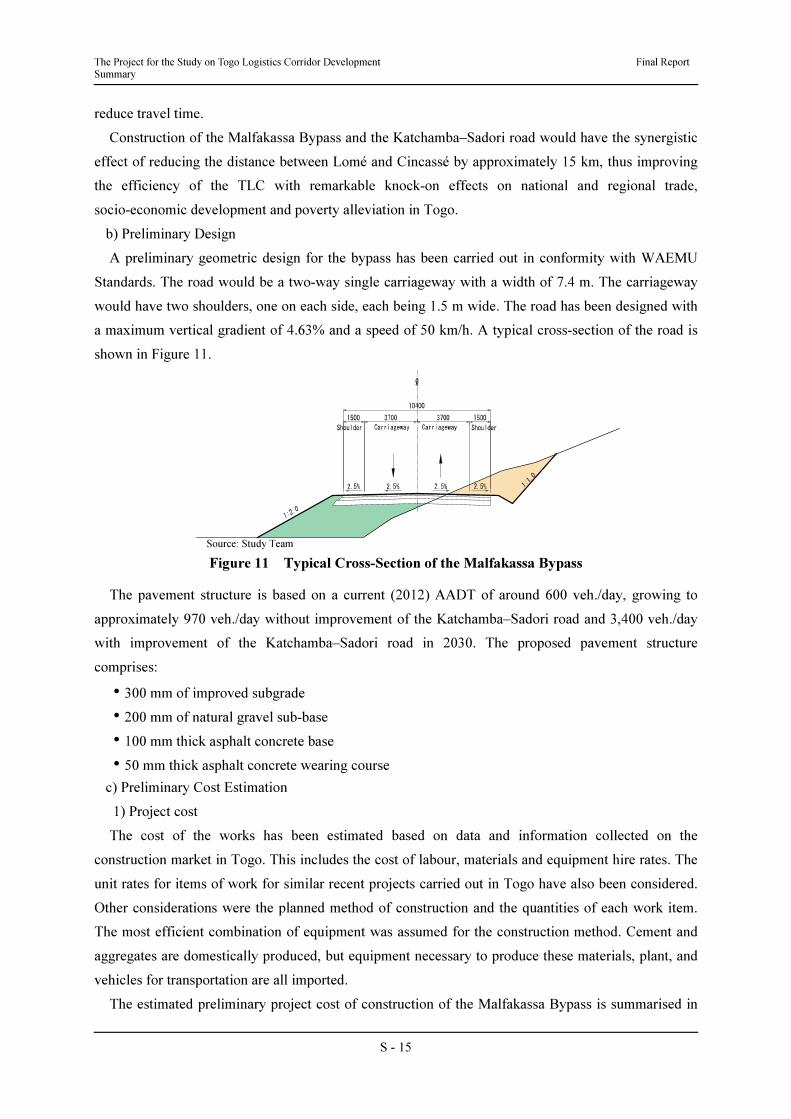
b) Preliminary Design
A preliminary geometric design for the bypass has been carried out in conformity with WAEMU
Standards. The road would be a two-way single carriageway with a width of 7.4 m. The carriageway
would have two shoulders, one on each side, each being 1.5 m wide. The road has been designed with
a maximum vertical gradient of 4.63% and a speed of 50 km/h. A typical cross-section of the road is
shown in Figure 11.
Source: Study Team
Figure 11 Typical Cross-Section of the Malfakassa Bypass
The pavement structure is based on a current (2012) AADT of around 600 veh./day, growing to
approximately 970 veh./day without improvement of the Katchamba–Sadori road and 3,400 veh./day
with improvement of the Katchamba–Sadori road in 2030. The proposed pavement structure
comprises:
• 300 mm of improved subgrade
• 200 mm of natural gravel sub-base
• 100 mm thick asphalt concrete base
• 50 mm thick asphalt concrete wearing course
c) Preliminary Cost Estimation
1) Project cost
The cost of the works has been estimated based on data and information collected on the
construction market in Togo. This includes the cost of labour, materials and equipment hire rates. The
unit rates for items of work for similar recent projects carried out in Togo have also been considered.
Other considerations were the planned method of construction and the quantities of each work item.
The most efficient combination of equipment was assumed for the construction method. Cement and
aggregates are domestically produced, but equipment necessary to produce these materials, plant, and
vehicles for transportation are all imported.
The estimated preliminary project cost of construction of the Malfakassa Bypass is summarised in
The Project for the Study on Togo Logistics Corridor Development Final Report Summary
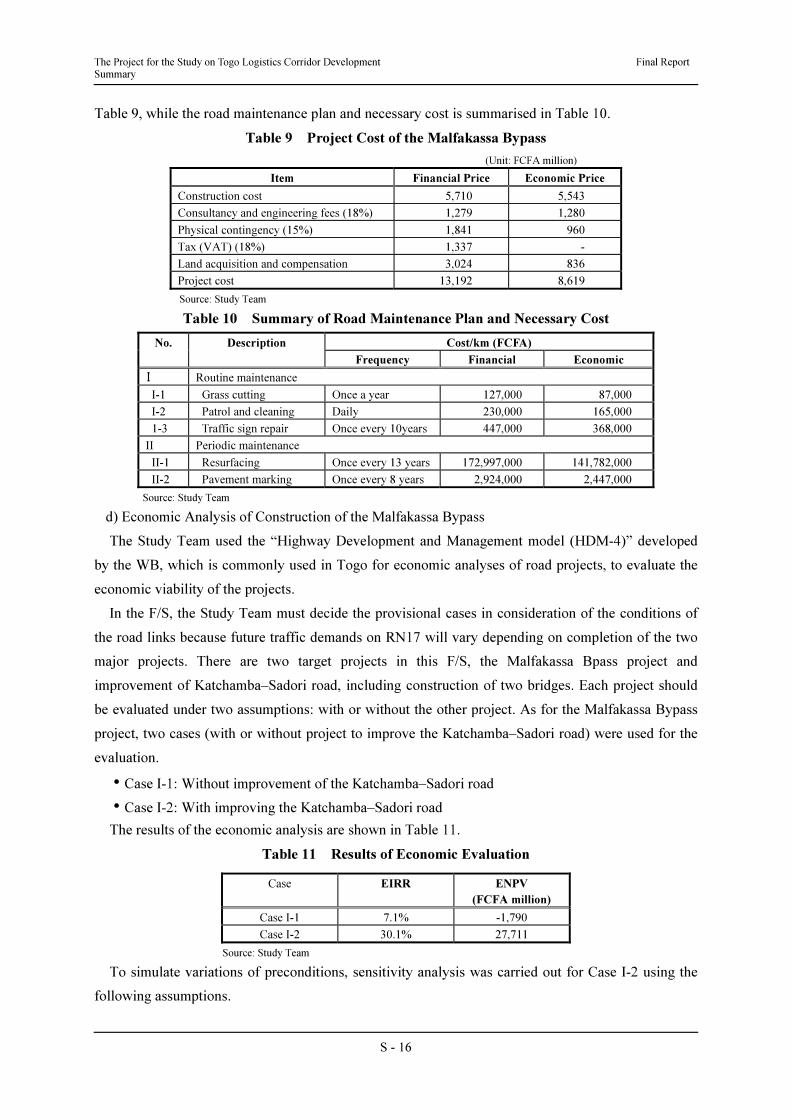
S - 16
Table 9, while the road maintenance plan and necessary cost is summarised in Table 10.
Table 9 Project Cost of the Malfakassa Bypass
(Unit: FCFA million)
Item Financial Price Economic Price
Construction cost 5,710 5,543
Consultancy and engineering fees (18%) 1,279 1,280
Physical contingency (15%) 1,841 960
Tax (VAT) (18%) 1,337 -
Land acquisition and compensation 3,024 836
Project cost 13,192 8,619
Source: Study Team
Table 10 Summary of Road Maintenance Plan and Necessary Cost
No. Description Cost/km (FCFA)
Frequency Financial Economic
I Routine maintenance
I-1 Grass cutting Once a year 127,000 87,000
I-2 Patrol and cleaning Daily 230,000 165,000
1-3 Traffic sign repair Once every 10years 447,000 368,000
II Periodic maintenance
II-1 Resurfacing Once every 13 years 172,997,000 141,782,000
II-2 Pavement marking Once every 8 years 2,924,000 2,447,000
Source: Study Team
d) Economic Analysis of Construction of the Malfakassa Bypass
The Study Team used the “Highway Development and Management model (HDM-4)” developed
by the WB, which is commonly used in Togo for economic analyses of road projects, to evaluate the
economic viability of the projects.
In the F/S, the Study Team must decide the provisional cases in consideration of the conditions of
the road links because future traffic demands on RN17 will vary depending on completion of the two
major projects. There are two target projects in this F/S, the Malfakassa Bpass project and
improvement of Katchamba–Sadori road, including construction of two bridges. Each project should
be evaluated under two assumptions: with or without the other project. As for the Malfakassa Bypass
project, two cases (with or without project to improve the Katchamba–Sadori road) were used for the
evaluation.
• Case I-1: Without improvement of the Katchamba–Sadori road
• Case I-2: With improving the Katchamba–Sadori road
The results of the economic analysis are shown in Table 11.
Table 11 Results of Economic Evaluation
Case EIRR ENPV
(FCFA million)
Case I-1 7.1% -1,790
Case I-2 30.1% 27,711
Source: Study Team
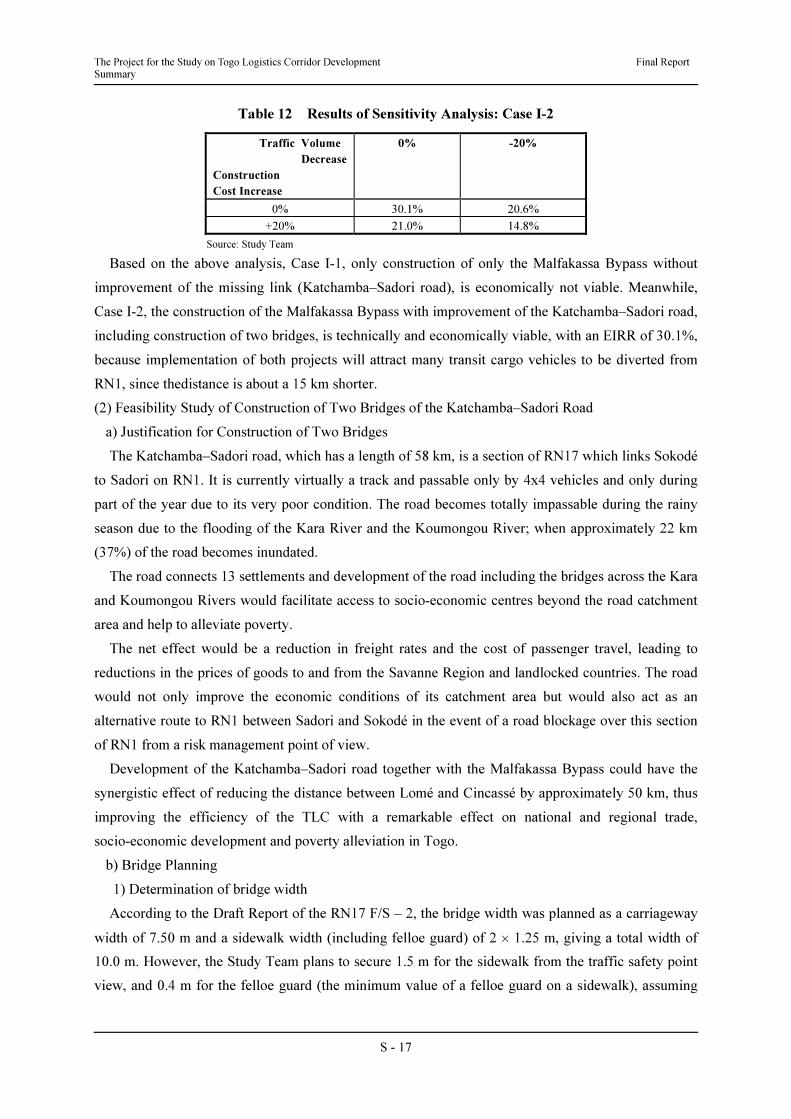
To simulate variations of preconditions, sensitivity analysis was carried out for Case I-2 using the
following assumptions.
The Project for the Study on Togo Logistics Corridor Development Final Report Summary
S - 17
Table 12 Results of Sensitivity Analysis: Case I-2
Traffic Volume
Decrease
Construction
Cost Increase
0% -20%
0% 30.1% 20.6%
+20% 21.0% 14.8%
Source: Study Team
Based on the above analysis, Case I-1, only construction of only the Malfakassa Bypass without
improvement of the missing link (Katchamba–Sadori road), is economically not viable. Meanwhile,
Case I-2, the construction of the Malfakassa Bypass with improvement of the Katchamba–Sadori road,
including construction of two bridges, is technically and economically viable, with an EIRR of 30.1%,
because implementation of both projects will attract many transit cargo vehicles to be diverted from
RN1, since thedistance is about a 15 km shorter.
(2) Feasibility Study of Construction of Two Bridges of the Katchamba–Sadori Road
a) Justification for Construction of Two Bridges
The Katchamba–Sadori road, which has a length of 58 km, is a section of RN17 which links Sokodé
to Sadori on RN1. It is currently virtually a track and passable only by 4x4 vehicles and only during
part of the year due to its very poor condition. The road becomes totally impassable during the rainy
season due to the flooding of the Kara River and the Koumongou River; when approximately 22 km
(37%) of the road becomes inundated.
The road connects 13 settlements and development of the road including the bridges across the Kara
and Koumongou Rivers would facilitate access to socio-economic centres beyond the road catchment
area and help to alleviate poverty.
The net effect would be a reduction in freight rates and the cost of passenger travel, leading to
reductions in the prices of goods to and from the Savanne Region and landlocked countries. The road
would not only improve the economic conditions of its catchment area but would also act as an
alternative route to RN1 between Sadori and Sokodé in the event of a road blockage over this section
of RN1 from a risk management point of view.
Development of the Katchamba–Sadori road together with the Malfakassa Bypass could have the
synergistic effect of reducing the distance between Lomé and Cincassé by approximately 50 km, thus
improving the efficiency of the TLC with a remarkable effect on national and regional trade,
socio-economic development and poverty alleviation in Togo.
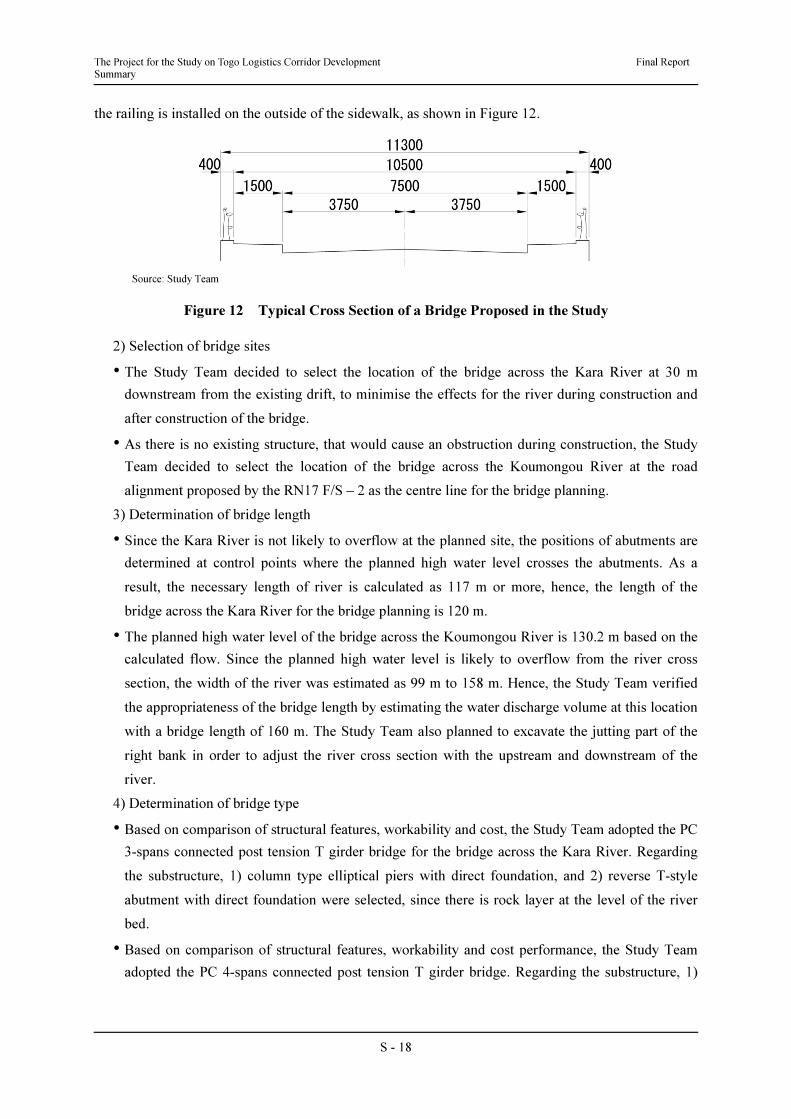
b) Bridge Planning
1) Determination of bridge width
According to the Draft Report of the RN17 F/S – 2, the bridge width was planned as a carriageway
width of 7.50 m and a sidewalk width (including felloe guard) of 2 × 1.25 m, giving a total width of
10.0 m. However, the Study Team plans to secure 1.5 m for the sidewalk from the traffic safety point
view, and 0.4 m for the felloe guard (the minimum value of a felloe guard on a sidewalk), assuming
The Project for the Study on Togo Logistics Corridor Development Final Report Summary
S - 18
the railing is installed on the outside of the sidewalk, as shown in Figure 12.
Source: Study Team
Figure 12 Typical Cross Section of a Bridge Proposed in the Study
2) Selection of bridge sites
• The Study Team decided to select the location of the bridge across the Kara River at 30 m
downstream from the existing drift, to minimise the effects for the river during construction and
after construction of the bridge.
• As there is no existing structure, that would cause an obstruction during construction, the Study
Team decided to select the location of the bridge across the Koumongou River at the road
alignment proposed by the RN17 F/S – 2 as the centre line for the bridge planning.
3) Determination of bridge length
• Since the Kara River is not likely to overflow at the planned site, the positions of abutments are
determined at control points where the planned high water level crosses the abutments. As a
result, the necessary length of river is calculated as 117 m or more, hence, the length of the
bridge across the Kara River for the bridge planning is 120 m.
• The planned high water level of the bridge across the Koumongou River is 130.2 m based on the
calculated flow. Since the planned high water level is likely to overflow from the river cross
section, the width of the river was estimated as 99 m to 158 m. Hence, the Study Team verified
the appropriateness of the bridge length by estimating the water discharge volume at this location
with a bridge length of 160 m. The Study Team also planned to excavate the jutting part of the
right bank in order to adjust the river cross section with the upstream and downstream of the
river.
4) Determination of bridge type
• Based on comparison of structural features, workability and cost, the Study Team adopted the PC
3-spans connected post tension T girder bridge for the bridge across the Kara River. Regarding
the substructure, 1) column type elliptical piers with direct foundation, and 2) reverse T-style
abutment with direct foundation were selected, since there is rock layer at the level of the river
bed.
• Based on comparison of structural features, workability and cost performance, the Study Team
adopted the PC 4-spans connected post tension T girder bridge. Regarding the substructure, 1)
The Project for the Study on Togo Logistics Corridor Development Final Report Summary
S - 19
column type elliptical piers with direct foundation, and 2) reverse T-style abutment with piling
foundation were selected, since there is a rock layer at the level of the river bed.
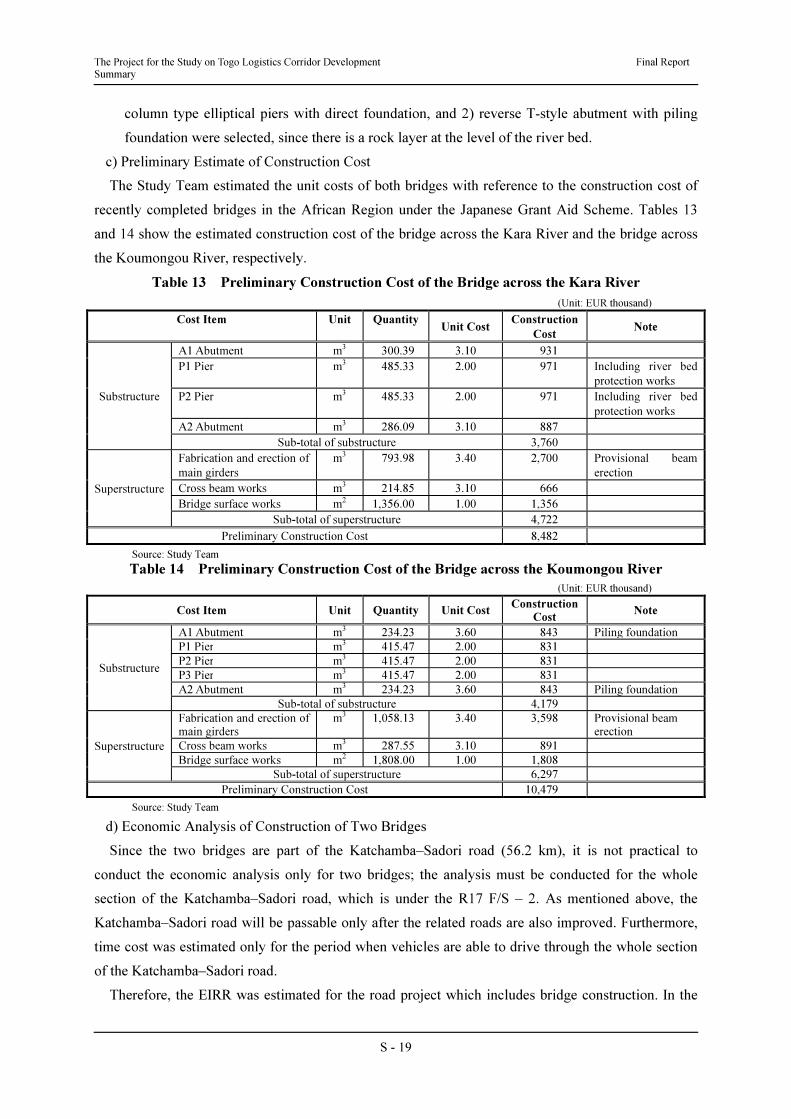
c) Preliminary Estimate of Construction Cost
The Study Team estimated the unit costs of both bridges with reference to the construction cost of
recently completed bridges in the African Region under the Japanese Grant Aid Scheme. Tables 13
and 14 show the estimated construction cost of the bridge across the Kara River and the bridge across
the Koumongou River, respectively.
Table 13 Preliminary Construction Cost of the Bridge across the Kara River
(Unit: EUR thousand)
Cost Item Unit QuantityUnit Cost
Construction
Cost Note
Substructure
A1 Abutment m3 300.39 3.10 931
P1 Pier m3 485.33 2.00 971 Including river bed
protection works
P2 Pier m3 485.33 2.00 971 Including river bed
protection works
A2 Abutment m3 286.09 3.10 887
Sub-total of substructure 3,760
Superstructure
Fabrication and erection of
main girders
m3 793.98 3.40 2,700 Provisional beam
erection
Cross beam works m3 214.85 3.10 666
Bridge surface works m2 1,356.00 1.00 1,356
Sub-total of superstructure 4,722
Preliminary Construction Cost 8,482
Source: Study Team
Table 14 Preliminary Construction Cost of the Bridge across the Koumongou River
(Unit: EUR thousand)
Cost Item Unit Quantity Unit CostConstruction
Cost Note
Substructure
A1 Abutment m3 234.23 3.60 843 Piling foundation
P1 Pier m3 415.47 2.00 831
P2 Pier m3 415.47 2.00 831
P3 Pier m3 415.47 2.00 831
A2 Abutment m3 234.23 3.60 843 Piling foundation
Sub-total of substructure 4,179
Superstructure
Fabrication and erection of main girders
m3 1,058.13 3.40 3,598 Provisional beam erection
Cross beam works m3 287.55 3.10 891
Bridge surface works m2 1,808.00 1.00 1,808
Sub-total of superstructure 6,297
Preliminary Construction Cost 10,479
Source: Study Team
d) Economic Analysis of Construction of Two Bridges
Since the two bridges are part of the Katchamba–Sadori road (56.2 km), it is not practical to
conduct the economic analysis only for two bridges; the analysis must be conducted for the whole
section of the Katchamba–Sadori road, which is under the R17 F/S – 2. As mentioned above, the
Katchamba–Sadori road will be passable only after the related roads are also improved. Furthermore,
time cost was estimated only for the period when vehicles are able to drive through the whole section
of the Katchamba–Sadori road.
Therefore, the EIRR was estimated for the road project which includes bridge construction. In the
The Project for the Study on Togo Logistics Corridor Development Final Report Summary
S - 20
Study, all sections of the Katchamba–Sadori road, including construction of two bridges across the
Kara and Koumongou Rivers, are assumed to be completed.
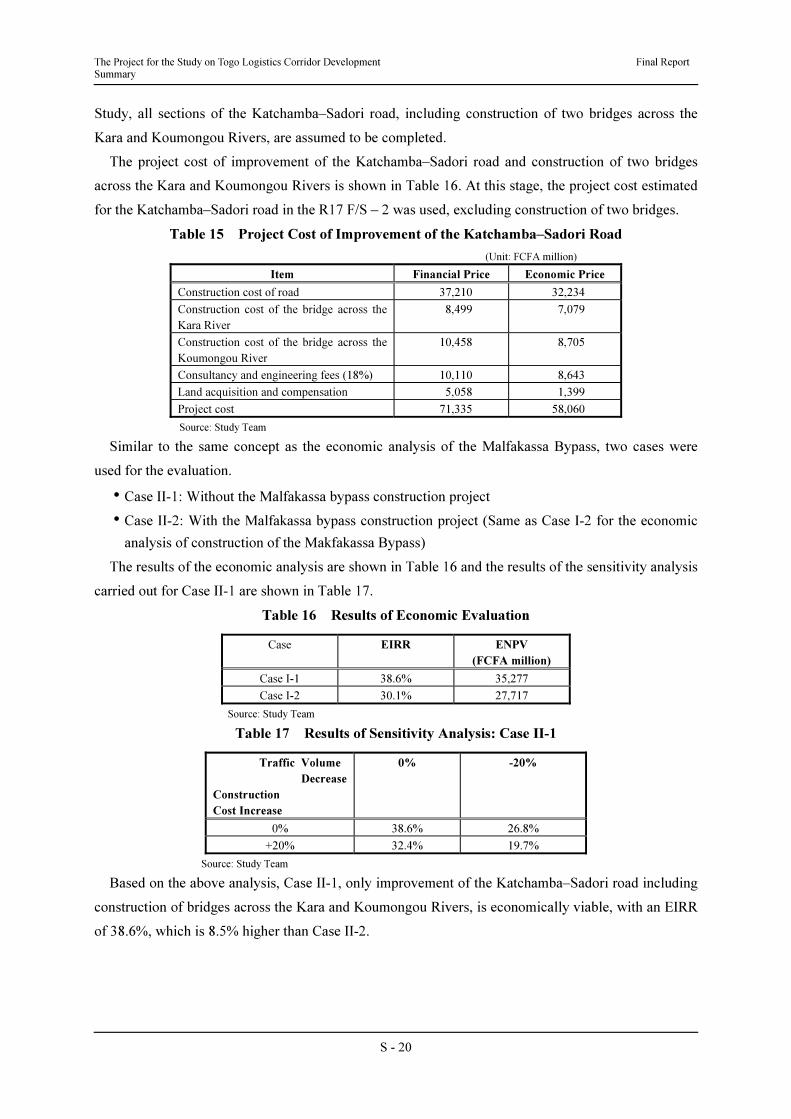
The project cost of improvement of the Katchamba–Sadori road and construction of two bridges
across the Kara and Koumongou Rivers is shown in Table 16. At this stage, the project cost estimated
for the Katchamba–Sadori road in the R17 F/S – 2 was used, excluding construction of two bridges.
Table 15 Project Cost of Improvement of the Katchamba–Sadori Road
(Unit: FCFA million)
Item Financial Price Economic Price
Construction cost of road 37,210 32,234
Construction cost of the bridge across the
Kara River
8,499 7,079
Construction cost of the bridge across the
Koumongou River
10,458 8,705
Consultancy and engineering fees (18%) 10,110 8,643
Land acquisition and compensation 5,058 1,399
Project cost 71,335 58,060
Source: Study Team
Similar to the same concept as the economic analysis of the Malfakassa Bypass, two cases were
used for the evaluation.
• Case II-1: Without the Malfakassa bypass construction project
• Case II-2: With the Malfakassa bypass construction project (Same as Case I-2 for the economic
analysis of construction of the Makfakassa Bypass)
The results of the economic analysis are shown in Table 16 and the results of the sensitivity analysis
carried out for Case II-1 are shown in Table 17.
Table 16 Results of Economic Evaluation
Case EIRR ENPV
(FCFA million)
Case I-1 38.6% 35,277
Case I-2 30.1% 27,717
Source: Study Team
Table 17 Results of Sensitivity Analysis: Case II-1
Traffic Volume
Decrease
Construction
Cost Increase
0% -20%
0% 38.6% 26.8%
+20% 32.4% 19.7%
Source: Study Team
Based on the above analysis, Case II-1, only improvement of the Katchamba–Sadori road including
construction of bridges across the Kara and Koumongou Rivers, is economically viable, with an EIRR
of 38.6%, which is 8.5% higher than Case II-2.
The Project for the Study on Togo Logistics Corridor Development Final Report Summary
S - 21
(3) Overall Evaluation of Projects
a) Results of Economic Evaluation
• From the results of the economic analysis, construction of the Malfakassa Bypass project is
recommended for implementation, together with improvement of the Katchamba–Sadori road.
• Construction of two bridges across the Kara and Koumongou Rivers is also recommended for
implementation, together with improvement of Katchamba–Sadori road regardless of
construction of the Malfakassa Bypass.
b) Environmental and Social Considerations
• The new Malfakassa Bypass to be constructed between Bouzolo–Binako of RN17 will not pass
through populated areas and will thus require no resettlement and cause few impacts on noise, air
quality and vibration for local residents. In addition, at the public consultation meeting, none of
the stake-holders raised any objections to the construction of this bypass. Thus, construction of
the Malfakassa Bypass will not cause major negative impacts on the environment or lives along
the road.
• Construction of two bridges across the Kara and Koumongou Rivers, will not require any
resettlement and will cause few impacts on noise, air quality and vibration for local residents.
Also, construction of two bridges will generate positive impacts for people along the road by
providing better access to farm lands and easy transportation of agricultural products. Thus,
construction of two bridges across the Kara and Koumongou Rivers will not cause major
negative impacts provided that the affected people are appropriately compensated.
c) Overall Evaluation
The Study Team has analysed the feasibility of two projects: 1) construction of the Malfakassa
Bypass and 2) Construction of two bridges across the Kara and Koumongou Rivers, in terms of
technical, economic, regional development, environmental and social considerations. As a result, both
projects are considered feasible for implementation at an early stage.
9. Environmental and Social Considerations
(1) Legal Framework for Environmental and Social Considerations
The legal framework for environmental and social considerations in Togo is fairly developed.
However, due to active customary laws, special care is needed to understand the “enforcement of
common laws” and customary practices, especially concerning land management. Chieftaincy and its
associated land management are still common in Togo, especially in rural areas. Because this
customary land management is based on trust among a community and surrounding communities,
there are no official titles in many cases. In the case of land acquisition, buyers must pay attention to
not only legal ownership and rights of use but also customary owners (mostly chiefs) and customary
users. In many cases, no official land titles are available, so it is highly recommended for outsiders or
foreigners to have a local expert handle such customary matters.
Considering the environmental and social policy frameworks for the proposed construction of the
The Project for the Study on Togo Logistics Corridor Development Final Report Summary
S - 22
Malfakassa Bypass and two bridges across the Kara and Koumongou Rives, the Directorate General
of Public Works (DGPW) is likely to apply the national political and legal frameworks for
environmental management and resettlement. Both the frameworks are principal environmental and
social consideration policies for any agency under the MPW. Since both frameworks were
developed based on the WB’s operational policies in addition to legislation of Togo, the principal
policies are identical to the JICA Guidelines for Environmental and Social Considerations. Thus, it
is reasonable to apply the frameworks for the proposed road projects.
(2) Major Findings of the Environmental Impact Assessment of the Proposed Project
A pre-EIA environmental impact assessment was conducted to clarify the environmental and social
baseline of the proposed project sites and assess the potential impacts of the projects. Though the
proposed projects are located adjacent to two natural reserve areas, the environmental conditions of
the proposed projects are commonly used farm-land, cattle fields, or degraded bush or wood-land.
Based on the references and field surveys, no sensitive area would be affected by the proposed
projects.
Regarding the negative impacts on the natural environment, no significant impacts are expected for
any of the environmental and social consideration items. Major negative impacts of the proposed
projects would be temporary air pollution, soil contamination, and water contamination from the
construction activities. As the geology along the proposed alignment is moderate, no significant
earthwork is expected. The extent of all impacts would be minimal or limited in extent.
Regarding the negative impacts on the social environment, no significant impacts are expected from
the proposed projects. The major negative impacts would be acquisition of mainly open land. None of
the farmland owners would be required to relocate.
Regarding the positive impacts on the social environment, namely improvement of the social
infrastructure and services during the operation phase, the proposed projects are likely to attract
agricultural investment into the region. Though not only resulting from the proposed road and bridge
construction projects, the regional demand for skilled/unskilled labours is likely to support new
agribusinesses through the new transport network.
As a part of the EIA process, the DGPW hosted one public consultation at the project-affected area.
There were no objections to the projects: rather, there was great interest in participating in the projects.
(3) Overall Recommendation from the Environmental and Social Considerations
The Pre-EIA level assessment found that the proposed projects are reasonable. However, it is highly
recommended to address the following points during the next detailed design stage.
a) Assurance and Enforcement of Budget for Land Acquisition
Throughout the hearing at the land commission and public consultations, many stakeholders
repeatedly mentioned incomplete compensation by the DGPW or other public agencies due to the lack
of funding at the beginning of a project and continuous shortage of funding. Though legal frameworks
and safeguard policies are well implemented in the DGPW, sufficient budget is the key to
accomplishing such duties. Thus, it is highly recommended to monitor the enforcement of the budget
The Project for the Study on Togo Logistics Corridor Development Final Report Summary
S - 23
regarding environmental and social consideration matters.
b) Assurance for Environmental Services
The DGPW has an in-house environmental division with several officers and all of whom are
unlikely to be able to concentrate on one project. Those officers need to cover all environmental
related duties under the DGPW throughout the nation. In order to ensure tightly-controlled EIA
processes, it is highly recommended to continuously assist the DGPW’s environmental officers by
team of foreign environmental experts and local environmental experts in the following stage.
10. Institutional Arrangements for the TLC Development Programme
(1) Institutional Arrangements for the Road Sub-sector
• Togo may have to consider setting up an autonomous Road Authority (RA) to improve road
management. If this is done, it should be accompanied by a restructuring of the DGPW under the
newly established Ministry of Public Works and Transports (MPWT)2 to enable it to concentrate
on policy formulation, evaluation and monitoring.
• Improvement of most of the trunk roads in the Study Area is expected to be completed in the long
term (2030), and so operation and maintenance works to maintain the functions of road assets
will become more important in the near future.
• Considerable resources are required both for investment and for maintenance. Strategies need to
be developed for bridging existing investment gaps, such as the use of public-private partnerships
(PPP). With CAPER revenues only accounting for about a third of the network maintenance
needs, new and innovative ways need to be found to increase CAPER’s revenues.
• In parallel with the axle control measures proposed in the TLC Development Plan, it would be
necessary to provide a legal frame work within which axle loads can be effectively controlled.
The Act should define clearly the vehicles that are allowed to use the public roads to ensure
uniform interpretation by all parties. To comply with the WAEMU regulation (Reglement No.
14/2005/ CM/UEMOA), which was ratified by member countries, and actually apply it in Togo
prior to other member countries, it is necessary to set up a legal initiative for axle load and
oversized vehicle control in Togo.
• In order to secure efficient freight transport as well as safety of road transportation, it is desirable
to reduce the number of broken-down freight vehicles. One measure is strict vehicle inspections
for freight vehicles, and another is to require transport operators to renew their aged freight
vehicles more that are over 20 years old, for example. In addition, in order to control aged freight
vehicles entering Togo from landlocked countries, it is necessary to discuss with counterparts an
agreement to control the operation of aged freight vehicles entering each other’s countries.
2 Even though the Ministry of Public Works and Transports was established on 18th September, 2013 and the Study Team has no
information regarding the organisation of the new ministry, the Study Team refer to the new ministry name in Sections 10 and 11 in this
summary, since contents of these chapters are proposed future institutional arrangements and recommendations.
The Project for the Study on Togo Logistics Corridor Development Final Report Summary
S - 24
(2) Institutional Arrangements for the Railway Sub-sector
• The legal instruments for the institutional arrangements should define the objectives of the
implementing authorities and the roles and responsibilities of the various parties. Legal
instruments for international railway transport should also be established.
• There are problems and issues in the current concessions between the MPWT and Togo Rail and
M.M. Mining. The most urgent matter is who will be responsible for container transport to
Burkina Faso in future. This matter should be considered when establishing the policy for
developing the railway, including revision work for the current concessionaires.
• The Railway Business Act should be established at an early stage. The purpose of this Act is to
secure the safety of railway transportation and protect the benefit of railway users as well as to
ensure the sound development of the railway business.
(3) Institutional Arrangements for the Port and Maritime Sub-Sector
• The PAL is preparing to set-up a Single Window System. This system will unify into a single
window all the various complicated procedures at the port, import and export procedures, and
customs clearance procedures, to speed up the flow of cargoes. In order to improve the efficiency
of the port, early implementation and proper operation of this system are necessary.
• The GoT and governments of landlocked countries, together with WAEMU or other international
organisations, should support shippers the shippers’ council for negotiating with shipping
companies to reduce the deposit charge of containers. If the majority of containers are transported
to destinations in landlocked countries without devanning in Lomé Port, the operational
efficiency of Lomé Port will be drastically improved.
• For the development of the TLC, strengthening the competitiveness of Lomé Port will be the
major issue in the near future, so the GoT needs to encourage improving operational efficiency
and strengthening the competitiveness of Lomé Port.
(4) Institutional Frameworks for Environmental Management
• Environmental and social management will be implemented by the developer through the
company responsible for the execution of works. Monitoring and supervision will be the
responsibility of the promoter through its consultant’s study of the environmental and social
impacts. For the implementation of measures other than those relating to compensation of
property and persons affected by the project, an institutional framework encompassing the
following four activities is recommended: office control, enforcement measures, control and
mediation.
11. Conclusions and Recommendations
The conclusions and recommendations for the development of the TLC are as follows.
The Project for the Study on Togo Logistics Corridor Development Final Report Summary
S - 25
(1) Conclusions and Recommendations in the Master Plan
a) Conclusions in the Master Plan
• The proposed projects for the development of the TLC in the Study were selected as the most
desirable transport network in terms of economic evaluation, SEA and risk management. In
addition, axle load control measures involving installing weighbridges at six locations as a first
stage are also judged necessary.
• The corridor choice model was developed by the Study Team in order to compare the import
transit cargo volume in four different corridors (Abidjan, Tema, TLC and Cotonou) between their
ports and Burkina Faso in the Study. It was suggested that the share of corridor cargo volume
could change dramatically due to a reduction in transport time and cost to acceptable levels.
• Among the proposed projects in the TLC development programme, two projects, both on RN17,
were selected as the highest priority projects for the F/S.
b) Recommendations in the Master Plan
• The MPWT can inform outcomes of the Study to development partners for possible assistance
with project implementation. Also, it is important for the GoT to coordinate with development
partners for effective and efficient cooperation on the projects proposed in the TLC development
programme.
• The GoT should start implementing axle load and oversized vehicle controls, by setting up
weighbridges as recommended in the TLC development programme. At the same time, legal
initiatives for controlling axle load and oversized vehicles should be enacted in order to legally
control vehicle weight and dimensions.
• The GoT should review the contents of the master plan in 2018 by when the medium-term
projects will have been implemented based on the latest economic situation in the West African
sub-region, trends of transit cargoes through landlocked countries to/from competing ports, and
development plans to strengthen the competitive power of competing ports.
• The GoT should, at an early stage, prepare a F/S for the construction of a new railway line
between Lomé Port and the border of Burkina Faso by standard gauge as a long-term plan.
• The GoT should prepare a F/S for the expansion of the mineral berth in Lomé Port to meet the
future demand for mineral cargo with a new generation dry bulk carrier, such as the 100,000
DWT class vessel, as the capacity of the planned mineral berth will be insufficient after 2015.
• The MPW needs to secure sufficient budget for the operation and maintenance of the roads to
maximise the use of existing road assets, including RN1 between Lomé and Cinkassé, and other
national road networks.
• Togo may have to consider setting up an autonomous Road Authority (RA) to improve road
management. If this is done, it should be accompanied by a restructuring of the MPWT to enable
it to concentrate on policy formulation, evaluation and monitoring.
The Project for the Study on Togo Logistics Corridor Development Final Report Summary
S - 26
• It is necessary to strengthen its function and manpower of DGT of the MPWT for executing
railway projects. It is also recommended to strengthen the authority of the DGT to supervise the
operation and maintenance of the concessionaires.
• The GoT should legislate the railway business act to secure the safety of railway transportation
and protect railway users as well as to ensure the sound development of the railway business.
• In order to strengthen the competitiveness of the TLC and to attract transit cargo, it is essential to
shorten the transport time in the TLC and reduce cost by the efficient operation of OSBP,
reducing check points, improving roads, enhancing port security, and improving the custom
clearance procedures at Lomé Port.
• As other corridors are also making efforts to attract transit cargo, it is important that the TLC be
made more competitive than other corridors.
• In order to carry out effective and adequate maintenance of the Project roads, the Study Team
recommends that the MPWT outsource maintenance works to private enterprises using resources
from the Road Fund.
(2) Conclusions and Recommendations in the F/S
a) Conclusions in the F/S
• The Study Team carried out an economic analysis of the above two projects and the results of
this analysis indicated that construction of both projects is technically and economically feasible.
However, construction of the Malfakassa Bypass is economically feasible only if the
Katchamba–Sadori road is improved at the same time. These projects, however, will generate the
greatest benefits, if both projects are implemented at the same time, in order to attract more
diverted freight vehicles from RN1.
• The Study Team also supported the DGPW in holding one public consultation meeting at Bassar,
and no objections to the project plan were raised.
• These two projects will greatly contribute to sustainable economic growth, poverty alleviation
and improvement of living conditions in the influence area by improving access to rural growth
centres from local communities.
b) Recommendations in the F/S
When the financial source is determined, the DGPW should carry out an EIA to obtain an
environmental permit and start land acquisition to secure ROW.
The Project for the Study on Togo Logistics Corridor Development Final Report Table of Contents
i
TABLE OF CONTENTS
PREFACE
LETTER OF TRANSMITTAL
ABSTRUCT
SUMMARY
LIST OF ABBREVIATIONS
CHAPTER 1 INTRODUCTION
1.1 Background of the Study ....................................................................................................................... 1- 1
1.2 Objectives of the Study ......................................................................................................................... 1- 1
1.3 Study Area ............................................................................................................................................. 1- 2
1.4 Scope of the Study ................................................................................................................................ 1- 2
1.4.1 Work Items Completed .............................................................................................................. 1- 2
1.4.2 Work Items to be Carried Out in the Next Stage of the Study ................................................... 1- 4
1.5 Study Organisation ................................................................................................................................ 1- 5
1.5.1 Study Team Members ................................................................................................................ 1- 5
1.5.2 List of Officials and Counterpart Personnel of Togo related to the Study ................................. 1- 6
CHAPTER 2 OUTLINE OF THE STUDY AREA
2.1 Definition of the Togo Logistics Corridor ............................................................................................. 2- 1
2.2 Regional Coordination Programme ....................................................................................................... 2- 1
2.3 Social Conditions in Togo ..................................................................................................................... 2- 5
2.3.1 Demography .............................................................................................................................. 2- 5
2.3.2 Land Use in Togo ....................................................................................................................... 2- 7
2.3.3 Poverty Ratio ............................................................................................................................. 2- 7
2.4 Economic Conditions in Togo and Neighbouring Countries ................................................................. 2- 7
2.4.1 GDP ........................................................................................................................................... 2- 7
2.4.2 Foreign Direct Investment ......................................................................................................... 2- 8
2.4.3 External Trade ............................................................................................................................ 2-10
2.4.4 Agriculture ................................................................................................................................. 2-10
2.4.5 Mining ....................................................................................................................................... 2-11
2.5 Natural Conditions in Togo ................................................................................................................... 2-12
2.5.1 Topographical Conditions .......................................................................................................... 2-12
2.5.2 Geological Conditions ............................................................................................................... 2-13
2.5.3 Hydrological Conditions ............................................................................................................ 2-13
2.5.4 Meteorological Conditions ........................................................................................................ 2-15
2.6 Existing Development Programmes ...................................................................................................... 2-18
2.6.1 National Development Plan ....................................................................................................... 2-18
2.6.2 Regional Development Plan ...................................................................................................... 2-25
2.6.3 Potential Growth Sector ............................................................................................................. 2-30
2.6.4 Major Development Project ....................................................................................................... 2-57
CHAPTER 3 CURRENT TRANSPORT SYSTEM IN TOGO
3.1 Overview of the Transport Sector ......................................................................................................... 3- 1
3.2 Transport Policy, Planning and Coordination........................................................................................ 3- 1
3.3 Present Situation of Road Sub-sector .................................................................................................... 3- 2
3.3.1 Administration ........................................................................................................................... 3- 2
3.3.2 Policy and Programmes of the Road Sub-Sector ....................................................................... 3- 3
The Project for the Study on Togo Logistics Corridor Development Final Report Table of Contents
ii
3.3.3 The Road Network ..................................................................................................................... 3- 3
3.3.4 Network Condition .................................................................................................................... 3- 4
3.3.5 Road Networks in Neighbouring Countries ............................................................................... 3- 5
3.3.6 Road and Bridge Inventories and Condition Survey .................................................................. 3- 7
3.3.7 Traffic Accidents ........................................................................................................................ 3-10
3.3.8 Road Financing in Togo ............................................................................................................. 3-11
3.3.9 The Road Fund in Togo ............................................................................................................. 3-12
3.3.10 Major Findings and Problems of the Road Sub-Sector ............................................................ 3-15
3.3.11 Present Situation of Road Transportation................................................................................. 3-17
3.4 Present Situation of Railway Sub-sector ............................................................................................... 3-18
3.4.1 Policy and Programmes of the Railway Sub-sector ................................................................... 3-18
3.4.2 Present Status of the Railway Network in Togo ........................................................................ 3-19
3.4.3 Railway Operation in Togo ........................................................................................................ 3-25
3.4.4 Results of Railway Inventory Survey ........................................................................................ 3-31
3.2.5 Major Findings and Problems of the Railway Sub-sector.......................................................... 3-41
3.5 Present Situation of Port and Maritime Sub-sector ............................................................................... 3-43
3.5.1 Policy and Programmes of the Port and Maritime Sub-sector ................................................... 3-43
3.5.2 Present Status of Lomé Port Facilities ....................................................................................... 3-44
3.5.3 Present Status of Lomé Port Operation ...................................................................................... 3-48
3.5.4 Present Status of Kpémé Jetty.................................................................................................... 3-51
3.5.5 Sahel Terminal ........................................................................................................................... 3-54
3.5.6 Major Findings and Problems of the Port and Maritime Sub-sector .......................................... 3-55
3.6 Present Situation of Air Transport Sub-sector ....................................................................................... 3-57
3.6.1 Airport ....................................................................................................................................... 3-57
3.6.2 Air Traffic .................................................................................................................................. 3-58
3.7 Summary of Transit Transport on the TLC ........................................................................................... 3-58
3.7.1 Transit Transport System ........................................................................................................... 3-58
3.7.2 Current Situation of Transit Cargo Transport on the TLC ......................................................... 3-59
CHAPTER 4 OUTLINE OF EXISTING DEVELOPMENT PROJECTS/PLANS
4.1 Road Rehabilitation and Transport Facilitation on the Lomé – Ouagadogou CU9 Corridor ................ 4- 1
4.2 Master Plan for Development of the Autonomous Port of Lomé .......................................................... 4- 2
4.2.1 The New Quay-3 Project in Lomé Port ..................................................................................... 4- 2
4.2.2 Lomé Container Terminal Project .............................................................................................. 4- 4
4.2.3 Extension of Ore Berth .............................................................................................................. 4- 6
CHAPTER 5 FUTURE TRAFFIC DEMAND FORECAST
5.1 Analysis of Present Traffic Condition ................................................................................................... 5- 1
5.1.1 Contents of Traffic Surveys ....................................................................................................... 5- 1
5.1.2 Zoning ........................................................................................................................................ 5- 5
5.1.3 Results of Traffic Surveys .......................................................................................................... 5- 7
5.1.4 Results of Broken-down Freight Vehicle Survey ....................................................................... 5-21
5.1.5 Results of Axle Load Survey ..................................................................................................... 5-24
5.1.6 Present Characteristics of Traffic and Logistics ......................................................................... 5-27
5.2 Forecast of Future Traffic Demand ....................................................................................................... 5-27
5.2.1 Methodology Used for Traffic Demand Forecast ...................................................................... 5-27
5.2.2 Future Socioeconomic Framework ............................................................................................ 5-30
5.2.3 Traffic Demand Forecast for the Master Plan ............................................................................ 5-41
5.2.4 Transport Network to Meet Future Traffic Demand .................................................................. 5-47
5.2.5 Forecast of Future Freight Flow ................................................................................................ 5-49
5.2.6 Traffic Assignments on Alternative Transport Networks ........................................................... 5-50
5.2.7 Traffic Demand Forecast for the Feasibility Study .................................................................... 5-62
The Project for the Study on Togo Logistics Corridor Development Final Report Table of Contents
iii
CHAPTER 6 BASIC POLICY FOR DEVELOPMENT OF THE TLC
6.1 Components of the TLC ........................................................................................................................ 6- 1
6.1.1 Definition of the TLC ................................................................................................................ 6- 1
6.1.2 Components of TLC .................................................................................................................. 6- 1
6.1.3 TLC from the Viewpoint of Landlocked Countries ................................................................... 6- 2
6.2 Significances of TLC ............................................................................................................................ 6- 3
6.2.1 Roles and Functions of RN1 ...................................................................................................... 6- 3
6.2.2 Comparison of TLC with Competing Corridors ........................................................................ 6- 7
6.3 Development Potential and Necessity for Development of the TLC .................................................... 6-11
6.3.1 National Development Visions related to the TLC .................................................................... 6-11
6.3.2 Development Potential of the TLC Region ................................................................................ 6-13
6.4 Concepts for Development of the TLC ......................................................................................... 6-13
6.4.1 Preparation of Development Concepts ...................................................................................... 6-13
6.4.2 Preparation of TLC Development Plans .................................................................................... 6-15
6.5 Corridor Choice Model for Transit Cargo ............................................................................................. 6-16
6.5.1 Outline of Model ........................................................................................................................ 6-16
6.5.2 Stated Preference Survey and Parameter Estimation ................................................................. 6-17
6.5.3 Estimation of Scale Parameter θ ................................................................................................ 6-18
6.5.4 Policy Simulation ....................................................................................................................... 6-20
6.5.5 Conclusions and Recommendations .......................................................................................... 6-22
CHAPTER 7 TLC DEVELOPMENT PLAN AND PROGRAMME
7.1 General .................................................................................................................................................. 7- 1
7.1.1 Preconditions of the TLC Development Plan ............................................................................ 7- 1
7.2 Basic Directions of TLC Development Plan/Programme ..................................................................... 7- 1
7.2.1 Targets of TLC Development Plan ............................................................................................ 7- 1
7.2.3 Menu for TLC Development ..................................................................................................... 7- 4
7.3 Preparation of Development Plan for the Road Sub-sector ................................................................... 7- 6
7.3.1 Ongoing/Planned Road Improvement Projects and Major Issues .............................................. 7- 6
7.3.2 Basic Concepts for Improving RN1 and Relevant Roads .......................................................... 7- 7
7.3.3 Proposed Road Projects ............................................................................................................. 7- 7
7.3.4 Axle Load Control ..................................................................................................................... 7-10
7.4 Preparation of Development Plan for the Railway Sub-sector .............................................................. 7-14
7.4.1 Railway Master Plan by ECOWAS and WAEMU ..................................................................... 7-14
7.4.2 Consideration on Gauge Conversion ......................................................................................... 7-17
7.4.3 Basic Policy for the Rehabilitation and Construction of the Railway ........................................ 7-19
7.4.4 Proposed Railway Projects ........................................................................................................ 7-22
7.4.5 Signalling and Telecommunication ............................................................................................ 7-28
7.4.6 Depot and Workshop .................................................................................................................. 7-28
7.4.7 Train Operation Plan .................................................................................................................. 7-29
7.4.8 Comparison between Gauge Conversion and New Line Construction ...................................... 7-32
7.4.9 Consideration of Construction of New Line between Lomé and Blitta with Standard Gauge ... 7-33
7.5 Port and Maritime Sub-Sectors ............................................................................................................. 7-38
7.5.1 Review of the Lomé Port Master Plan for the Mineral Jetty ..................................................... 7-38
7.5.2 Consideration for Further Expansion of Mineral Berth ............................................................. 7-38
7.5.3 Comparison of Vessel Size for the New Mineral Berth ............................................................. 7-43
7.6 Corridor Town and Logistics Facilities Plan ......................................................................................... 7-45
7.6.1 Development of Corridor Towns ............................................................................................... 7-45
7.6.2 Development of Sub-Corridor Town in North Togo .................................................................. 7-58
7.6.3 Improvement of Sahel Terminal ................................................................................................ 7-62
7.6.4 Implementation Schedule for Logistics Facilities ...................................................................... 7-63
7.7 Preliminary Cost Estimation ................................................................................................................. 7-64
7.7.1 Preliminary Estimation of Construction Cost ............................................................................ 7-64
7.7.2 Project Costs .............................................................................................................................. 7-65
7.7.3 Unit Costs .................................................................................................................................. 7-65
The Project for the Study on Togo Logistics Corridor Development Final Report Table of Contents
iv
7.7.4 Cost Estimation Results ............................................................................................................. 7-67
7.7.5 Economic Cost of the Project .................................................................................................... 7-68
7.8 Evaluation of Proposed Projects for Development of the TLC ............................................................. 7-69
7.8.1 Alternative Transport Networks for Evaluation ......................................................................... 7-69
7.8.2 Evaluation Items ........................................................................................................................ 7-69
7.9 Economic Evaluation ............................................................................................................................ 7-70
7.9.1 Method of Economic Analysis ................................................................................................... 7-70
7.9.2 Target Projects and Scenarios .................................................................................................... 7-72
7.9.3 Conditions .................................................................................................................................. 7-72
7-9.4 Vehicle Operating Cost .............................................................................................................. 7-72
7.9.5 Travel Time Cost ....................................................................................................................... 7-73
7.9.6 Results of Economic Evaluation ................................................................................................ 7-73
7.10 Other Impacts ...................................................................................................................................... 7-74
7.11 Overall Evaluation Results .................................................................................................................. 7-77
7.12 The TLC Development Programme .................................................................................................... 7-77
7.12.1 List of Projects for the TLC Development Programme ........................................................... 7-77
7.12.2 Implementation Schedule......................................................................................................... 7-77
7.12.3 Selection of Projects for the F/S .............................................................................................. 7-80
CHAPTER 8 RESULTS OF FEASIBILITY STUDIES
8.1 Feasibility Study of Construction of Bypass of Bouzalo – Binako Section of RN17 ........................... 8- 1
8.1.1 Justification for Construction of Bypass .................................................................................... 8- 1
8.1.2 Review of Preliminary Design of Road Sections Prepared by DGPW ...................................... 8- 1
8.1.3 Preliminary Design .................................................................................................................... 8- 3
8.1.4 Preliminary Cost Estimation ...................................................................................................... 8- 4
8.1.5 Establishment of a Road Maintenance Plan ............................................................................... 8- 6
8.1.6 Economic Analysis of Construction of the Malfakassa Bypass on RN17 ................................. 8- 9
8.1.7 Implementation Programme for Construction of Malfakassa Bypass ........................................ 8-15
8.2 Feasibility Study of Construction of Two Bridges of the Katchamba – Sadori Road ........................... 8-16
8.2.1 Justification for Construction of Two Bridges ........................................................................... 8-16
8.2.2 Review of Preliminary Design of Road Sections Prepared by MPW ........................................ 8-17
8.2.3 Present Condition of Planned Bridge Sites ................................................................................ 8-19
8.2.4 Results of Natural Condition Survey ......................................................................................... 8-21
8.2.5 Condition of Rivers .................................................................................................................... 8-26
8.2.6 Bridge Planning ......................................................................................................................... 8-27
8.2.7 Construction Schedule ............................................................................................................... 8-46
8.2.8 Preliminary Cost Estimation ...................................................................................................... 8-50
8.2.9 Economic Analysis of the Construction of Two Bridges ........................................................... 8-54
8.3 Overall Evaluation of Projects .............................................................................................................. 8-57
8.3.1 Results of Economic Evaluation ................................................................................................ 8-57
8.3.2 Environmental and Social Considerations ................................................................................. 8-58
8.3.3 Overall Evaluation ..................................................................................................................... 8-58
CHAPTER 9 ENVIRONMENTAL AND SOCIAL CONSIDERATIONS
9.1 National Environmental Framework and Legal Requirements ............................................................. 9- 1
9.1.1 Legal Framework ....................................................................................................................... 9- 1
9.1.2 Political Framework ................................................................................................................... 9-13
9.1.3 Institutional Framework ............................................................................................................. 9-20
9.2 Strategic Environment Assessment for the Master Plan ........................................................................ 9-23
9.2.1 Basic Approach of the SEA ....................................................................................................... 9-23
9.2.2 Methodology of the SEA ........................................................................................................... 9-24
9.2.3 Description of Proposed Projects ............................................................................................... 9-24
9.2.4 Baseline Condition of Natural and Social Environment ............................................................ 9-25
9.2.5 Public Consultation .................................................................................................................... 9-33
9.2.6 Screening of Proposed Projects ................................................................................................. 9-34
The Project for the Study on Togo Logistics Corridor Development Final Report Table of Contents
v
9.2.7 Issues Related to Proposed Project ............................................................................................ 9-35
9.2.8 Scoping of Proposed Projects .................................................................................................... 9-36
9.2.9 Results of the SEA ..................................................................................................................... 9-36
9.3 Pre-EIA of the Feasibility Study Projects.............................................................................................. 9-42
9.3.1 Methodology of the Study ......................................................................................................... 9-42
9.3.2 Feasibility Study Projects .......................................................................................................... 9-42
9.3.3 Environment and Social Survey ................................................................................................. 9-44
9.3.4 Stakeholder Meeting .................................................................................................................. 9-49
9.3.5 Environmental and Social Impact Analysis of the F/S Projects ................................................. 9-50
9.3.6 Scoping of the F/S Projects ........................................................................................................ 9-52
9.3.7 Environment Assessment ........................................................................................................... 9-57
9.3.8 Mitigation Measures and Cost Estimation ................................................................................. 9-60
9.3.9 Environment and Social Management and Monitoring Plan ..................................................... 9-63
9.4 Abbreviated Resettlement Action Plan for the F/S Projects .................................................................. 9-64
9.4.1 Necessity of Resettlement and Land Acquisition ....................................................................... 9-64
9.4.2 Legal Framework for Resettlement and Land Acquisition ........................................................ 9-65
9.4.3 Institutional Framework for Resettlement Plan ......................................................................... 9-68
9.4.4 Scope of Resettlement Impact ................................................................................................... 9-69
9.4.5 Specific Measures of Compensation and Support for the Project .............................................. 9-71
9.4.6 Complaint Management System ................................................................................................ 9-73
9.4.7 Monitoring Programme for the RAP ......................................................................................... 9-73
9.4.8 Schedule for Resettlement ......................................................................................................... 9-74
9.4.9 Cost Estimation and Finance ..................................................................................................... 9-74
CHAPTER 10 INSTITUTIONAL ARRANGEMENTS FOR TLC DEVELOPMENT
PROGRAMME
10.1 Institutional Arrangements for the Road Sub-sector ........................................................................... 10- 1
10.1.1 Proposed Reform of DGPW .................................................................................................... 10- 1
10.1.2 Operation and Maintenance of Road ....................................................................................... 10- 1
10.1.3 Road Fund ................................................................................................................................ 10- 2
10.1.4 Effective Use of Containers for Transit Transport ................................................................... 10- 2
10.1.5 Legal Initiative for the Axle Load and Oversized Vehicle Control .......................................... 10- 3
10.1.6 Renewal of Aged Freight Vehicles ........................................................................................... 10- 8
10.2 Institutional Arrangements for the Railway Sub-sector ...................................................................... 10- 8
10.2.1 Outline ..................................................................................................................................... 10- 8
10.2.2 Revision of Concession Scheme .............................................................................................. 10-11
10.2.3 Outline of the Railway Business Act ....................................................................................... 10-13
10.3 Institutional Arrangements for the Port and Maritime Sub-Sector ...................................................... 10-15
10.3.1 Single Window System ............................................................................................................ 10-16
10.4 Institutional Frameworks for the Environmental Management ........................................................... 10-16
CHAPTER 11 CAPACITY DEVELOPMENT IN THE STUDY
11.1 Capacity Development in the Study .................................................................................................... 11- 1
CHAPTER 12 CONCLUSIONS AND RECOMMENDATIONS
12.1 Major Findings in the Study Area ....................................................................................................... 12- 1
12.2 Seminars .............................................................................................................................................. 12- 2
12.3 Conclusions and Recommendations in the Master Plan ...................................................................... 12- 2
12.3.1 Conclusions in the Master Plan ................................................................................................ 12- 2
12.3.2 Recommendations in the Master Plan ...................................................................................... 12- 3
12.4 Conclusions and Recommendations in the F/S ................................................................................... 12- 4
12.4.1 Conclusions in the F/S ............................................................................................................. 12- 4
12.4.2 Recommendations in the F/S ................................................................................................... 12- 5
The Project for the Study on Togo Logistics Corridor Development Final Report Table of Contents
vi
CHAPTER 12 CONCLUSIONS AND RECOMMENDATIONS
12.1 Conclusions ......................................................................................................................................... 12- 1
12.1.1 Major Findings in the Study Area ............................................................................................ 12- 1
12.1.2 Seminars .................................................................................................................................. 12- 2
12.1.3 Conclusions.............................................................................................................................. 12- 2
12.2 Execution, Operation and Maintenance of the Project ........................................................................ 12- 3
12.2.1 Project Executing Agency ........................................................................................................ 12- 3
12.2.2 Operation and Maintenance of the Projects ............................................................................. 12- 3
12.3 Recommendations ............................................................................................................................... 12- 4
APPENDICES
Appendix 1 Regional Development Strategy .............................................................................................. A- 1
Appendix 2 Results of Road and Bridge Inventory Survey ........................................................................ A-16
Appendix 2-1 Results of Road Inventory Survey ............................................................................... A-16
Appendix 2-2 Results of Bridge Inventory Survey ............................................................................. A-21
Appendix 3 Classification of Vehicles for the Traffic Survey ..................................................................... A-26
Appendix 4 Results of O/D Interview Surveys ........................................................................................... A-27
Appendix 5 Forecast of Future Freight Flow .............................................................................................. A-35
Appendix 6 O/D Matrices ........................................................................................................................... A-44
Appendix 6-1 Present O/D Matrices ................................................................................................... A-44
Appendix 6-2 Future O/D Matrices in 2018 ....................................................................................... A-54
Appendix 6-3 Future O/D Matrices in 2030 ....................................................................................... A-64
Appendix 7 Proposed Alignment of Railway .............................................................................................. A-74
Appendix 8 Plans and Profile of the Malfakassa Bypass ............................................................................ A-78
Appendix 9 Superstructure and Substructure Designs of Bridges .............................................................. A-113
Appendix 9-1 Superstructure and Substructure Designs of Bridge Across the Kara River ................ A-113
Appendix 9-2 Superstructure and Substructure Designs of Bridge Across the Koumongou River .... A-118
Appendix 10 Results of Economic Evaluation by HDM-4 ......................................................................... A-122
Appendix 10-1 Results of Economic Evaluation for Case I-1 ............................................................ A-122
Appendix 10-2 Results of Economic Evaluation for Case I-2 and Case II-2 ...................................... A-124
Appendix 10-3 Results of Economic Evaluation for Case II-1 ........................................................... A-126
Appendix 11 Environmental Check List ..................................................................................................... A-128
Appendix 12 Sample of Monitoring Forms ................................................................................................ A-130
Appendix 13 Road Transport Regulation of WAEMU ................................................................................ A-133
The Project for the Study on Togo Logistics Corridor Development Final Report List of Tables
vii
LIST OF TABLES
Table 1-1 Study Team Members ................................................................................................................. 1- 5
Table 1-2 List of Officials and Counterpart Personnel of Togolese related to the Study ............................ 1- 6
Table 2-1 Road Development Plans under the PACITR ............................................................................. 2- 3
Table 2-2 PACITR Programme and Its Target Roads .................................................................................. 2- 3
Table 2-3 Progress of road development under PACITR (as of 2010) ........................................................ 2- 4
Table 2-4 Population and Population Density by Region............................................................................ 2- 6
Table 2-5 Comparison of Poverty Headcount Ratio between 2006 and 2011 ............................................. 2- 7
Table 2-6 GDP by Sector ............................................................................................................................ 2- 8
Table 2-7 Total Imports and Exports ........................................................................................................... 2-10
Table 2-8 Major Export Commodities ........................................................................................................ 2-10
Table 2-9 Major Import Commodities ........................................................................................................ 2-11
Table 2-10 Cultivated Land and Yield of Major Agricultural Products ...................................................... 2-12
Table 2-11 Monthly Precipitation at Four Observatories between 2000 and 2011 ...................................... 2-17
Table 2-12 Current and Future Amount of Mining Products ....................................................................... 2-22
Table 2-13 Strategy Plan for Economic Infrastructure ................................................................................ 2-23
Table 2-14 National Agricultural Strategy .................................................................................................. 2-36
Table 2-15 Approved Mining Deposit (1996) ............................................................................................. 2-47
Table 2-16 Priorities of Tourism Strategy ................................................................................................... 2-51
Table 2-17 Present Tourism Sites and Elements ......................................................................................... 2-53
Table 2-18 Ongoing or Future Agricultural Development .......................................................................... 2-58
Table 3-1 Regional Distribution of Roads in Togo ...................................................................................... 3- 4
Table 3-2 Road Network Condition (2011) ................................................................................................. 3- 5
Table 3-3 Condition of Transit Corridors .................................................................................................... 3- 5
Table 3-4 Network Statistics for Togo and its Neighbouring Countries ...................................................... 3- 8
Table 3-5 Number of Traffic Accidents and Casualties ............................................................................... 3-10
Table 3-6 External Contributions to Road Sub-Sector Budget (2007 – 2011) ............................................ 3-12
Table 3-7 Government of Togo Contributions to Road Sub-Sector Budget (2007 – 2011) ......................... 3-12
Table 3-8 Road Maintenance Funding (2007 – 2011) ................................................................................. 3-12
Table 3-9 Current Performance of Railway Concessions in SSA ............................................................... 3-22
Table 3-10 Summary of Railway Lines in Togo.......................................................................................... 3-23
Table 3-11 Types of Rolling Stock .............................................................................................................. 3-28
Table 3-12 Summary of Tracks ................................................................................................................... 3-30
Table 3-13 Summary of Structures .............................................................................................................. 3-33
Table 3-14 Major Findings and Problems of the Railway Sub-sector on General Matters ......................... 3-41
Table 3-15 Summary of Major Physical Problems of Railway for Container Transportation ..................... 3-42
Table 3-16 Summary of Major Physical Problems of Railway for Iron Ore Transportation ....................... 3-43
Table 3-17 The Trading Volumes Handled at Lomé Port ............................................................................ 3-44
Table 3-18 Number and Types of Vessels at Lomé Port (1990 to 2010) ..................................................... 3-45
Table 3-19 Occupation Percentage of Ships at Each Quay ......................................................................... 3-46
Table 3-20 Port Handling Efficiency ........................................................................................................... 3-50
Table 3-21 Stevedore List in Lomé Port ..................................................................................................... 3-50
Table 3-22 Outline of Airports and Aerodromes in Togo ............................................................................ 3-57
Table 3-23 Air Traffic at Lomé International Airport.................................................................................. 3-58
Table 3-24 Breakdown of Transport Costs .................................................................................................. 3-60
Table 4-1 Ongoing Projects and Sections on the Lomé – Cinkanssé Road with Secured Funding ............. 4- 1
Table 4-2 Sections of Road Expected to Impact Efficiency of Lomé – Cinkanssé Road and Receiving
Attention Section ........................................................................................................................ 4- 2
Table 4-3 Standard Principal Dimensions of Container Cargo Ships .......................................................... 4- 4
The Project for the Study on Togo Logistics Corridor Development Final Report List of Tables
viii
Table 5-1 Dates of Traffic Survey ............................................................................................................... 5- 1
Table 5-2 O/D Zone .................................................................................................................................... 5- 5
Table 5-3 Preconditions of Future Traffic Demand Forecast ...................................................................... 5-27
Table 5-4 GDP Forecast Scenarios and GDP at Constant Prices in 2018 and 2030 .................................... 5-31
Table 5-5 Estimated Population in 2018 and 2030 ...................................................................................... 5-32
Table 5-6 Estimated Poverty Ratios by Regions in 2018 and 2030 ............................................................ 5-32
Table 5-7 Cement Factory and Mining Product Transport Volume ............................................................. 5-36
Table 5-8 Growth Rate of Passenger Traffic ............................................................................................... 5-39
Table 5-9 Growth Rate of Freight Traffic ................................................................................................... 5-39
Table 5-10 Forecast of Numbers of Registered Vehicles ............................................................................ 5-39
Table 5-11 Growth Rate of Passenger and Freight Traffic .......................................................................... 5-40
Table 5-12 Outline of Trip Production and Generation/Attraction .............................................................. 5-40
Table 5-13 Results of the Monthly Fluctuation Factor Computation .......................................................... 5-42
Table 5-14 Correlation Coefficient between AADT and forecast ............................................................... 5-50
Table 5-15 Modal split of freight transportation ......................................................................................... 5-52
Table 5-16 Future Traffic Volume by Vehicle Type at Project Sites in 2030 ............................................... 5-64
Table 6-1 Share of Transit Freight Volume by Port ..................................................................................... 6- 4
Table 6-2 Summary of Roles and Functions of RN1 .................................................................................. 6- 8
Table 6-3 Comparison of Road Conditions between the TLC and the Central Corridor in Ghana ............. 6- 7
Table 6-4 Transportation Cost (Import to Niger and Burkina Faso) ........................................................... 6- 9
Table 6-5 Transportation Time (Import from Port to Ouagadougou) .......................................................... 6- 9
Table 6-6 Truck Transport Costs (Ouagadougou-Ports) .............................................................................. 6- 9
Table 6-7 Bribery per Trip by Corridor ....................................................................................................... 6-10
Table 6-8 Quality of Service at Port ............................................................................................................ 6-10
Table 6-9 Comparison of Transport Conditions by Corridor (Import to Ouagadougou) ............................. 6-11
Table 6-10 Outline of Prepared Concepts ................................................................................................... 6-14
Table 6-11 Parameter Estimation Results .................................................................................................... 6-18
Table 6-12 Results of Estimated Value of Time .......................................................................................... 6-18
Table 6-13 List of Extraversion Values ....................................................................................................... 6-19
Table 6-14 Scale Parameter θ ...................................................................................................................... 6-20
Table 6-15 Change in Cargo Volume in Each Corridor due to OSBP Operation ........................................ 6-20
Table 6-16 Change in Cargo Volume in the TLC due to OSBP Operation .................................................. 6-21
Table 6-17 Contribution to Increase in Cargo in the TLC ........................................................................... 6-22
Table 7-1 Comparison of Characteristics and Advantages of Road and Railway Transport ....................... 7- 5
Table 7-2 Menu of Alternatives for the TLC Development ........................................................................ 7- 5
Table 7-3 List of Proposed Road Projects ................................................................................................... 7- 7
Table 7-4 Railway Master Plan Routes ....................................................................................................... 7-15
Table 7-5 Railway Networks in ECOWAS ................................................................................................. 7-18
Table 7-6 Gauge System in the World ......................................................................................................... 7-19
Table 7-7 Comparison between Standard Gauge and Narrow Gauge ......................................................... 7-20
Table 7-8 Summary of Proposed Railway Projects ..................................................................................... 7-22
Table 7-9 Phases of Construction Project.................................................................................................... 7-22
Table 7-10 Potential Demand for Railway Freight (2012) .......................................................................... 7-30
Table 7-11 Potential Demand for Railway Freight (2018) .......................................................................... 7-30
Table 7-12 Potential Demand for Railway Freight (2030) .......................................................................... 7-30
Table 7-13 Train Operation Plan and Transport Capacity ........................................................................... 7-31
Table 7-14 Required Number of Rolling Stock ........................................................................................... 7-31
Table 7-15 Pros and Cons of Gauge Conversion and New Line Construction............................................ 7-33
Table 7-16 Construction Standards ............................................................................................................. 7-34
Table 7-18 Projected Dry Bulk Handling Volumes at Lomé Port ............................................................... 7-38
Table 7-19 Comparison of Major Specifications of Large Dry Bulk Vessels .............................................. 7-40
Table 7-20 Comparison of Vessel Size for the New Mineral Berth ............................................................ 7-45
Table 7-21 Function of Dry Port ................................................................................................................. 7-48
Table 7-22 Elements Required for Dry Ports .............................................................................................. 7-48
The Project for the Study on Togo Logistics Corridor Development Final Report List of Tables
ix
Table 7-23 Estimation of Apron Area.......................................................................................................... 7-51
Table 7-24 Estimation of Container Yard Area ........................................................................................... 7-51
Table 7-25 Estimation of Back Yard Area ................................................................................................... 7-51
Table 7-26 Required Area for Inland Container Depot ............................................................................... 7-51
Table 7-27 Dry Port Gross Area by Zone .................................................................................................... 7-52
Table 7-28 Free Zones in Togo and their Specific Features ........................................................................ 7-53
Table 7-29 Fiscal and Custom Arrangements in Free Zones in Togo .......................................................... 7-53
Table 7-30 Service profile for Loaded Import Container ............................................................................ 7-56
Table 7-31 Service profile for Loaded Export Container ............................................................................ 7-56
Table 7-32 Service profile for Empty Container ......................................................................................... 7-56
Table 7-33 Service profile for Cargo ........................................................................................................... 7-56
Table 7-34 Service profile for Customs clearance ...................................................................................... 7-57
Table 7-35 Utilisation Characteristics of RN1 ............................................................................................ 7-58
Table 7-36 Number of Parked Trucks/Trailers at Truck Stations ................................................................ 7-59
Table 7-37 Layout of Parking and Rest Facilities on RN1 .......................................................................... 7-60
Table 7-38 Specifications of Truck Station of Sansame-Mango ................................................................. 7-61
Table 7-39 Assumptions for Estimating the Project Costs .......................................................................... 7-65
Table 7-40 Product Costs ............................................................................................................................ 7-66
Table 7-41 Unit Cost of Road Construction ................................................................................................ 7-67
Table 7-42 Phased Construction Costs ........................................................................................................ 7-67
Table 7-43 Unit Construction Cost of Truck Yard and Dry Port ................................................................. 7-67
Table 7-44 Economic Cost of Projects ........................................................................................................ 7-68
Table 7-45 Alternative Transport Networks for the Evaluation .................................................................. 7-69
Table 7-46 Types of Social Benefits of Transportation Projects ................................................................. 7-70
Table 7-47 Details of Balance Items ........................................................................................................... 7-71
Table 7-48 Conditions of Economic Evaluation ......................................................................................... 7-72
Table 7-49 Estimated VOC (Area: Level, Road Condition: Good) ............................................................. 7-72
Table 7-50 Estimated VOC (Area: Level, Road Condition: Bad) ............................................................... 7-73
Table 7-51 Estimated VOC (Area: Rolling, Road Condition: Good) .......................................................... 7-73
Table 7-52 Estimated VOC (Area: Rolling, Road Condition: Bad) ............................................................ 7-73
Table 7-53 Travel Time Values.................................................................................................................... 7-74
Table 7-54 Cargo Opportunity Values ......................................................................................................... 7-74
Table 7-55 EIRR of Individual Projects ...................................................................................................... 7-75
Table 7-56 Overall Results of SEA ............................................................................................................. 7-76
Table 7-57 Evaluation of Alternatives in terms of Risk Management ......................................................... 7-76
Table 7-58 Overall Evaluation Results ........................................................................................................ 7-77
Table 7-59 List of Projects for the Development of the TLC ...................................................................... 7-78
Table 7-60 Implementation Schedule of Projects ........................................................................................ 7-78
Table 7-61 List of Candidate Projects for the F/S ....................................................................................... 7-80
Table 8-1 Design Features for Malfakassa Bypass ...................................................................................... 8- 3
Table 8-2 Labour Costs ............................................................................................................................... 8- 6
Table 8-3 Personnel Expenses ..................................................................................................................... 8- 6
Table 8-4 Rates for Leasing Equipment ...................................................................................................... 8- 7
Table 8-5 Material Costs ............................................................................................................................. 8- 7
Table 8-6 Custom Duties and Road Fund Tax ............................................................................................. 8- 7
Table 8-7 Construction Cost of the Malfakassa Bypass .............................................................................. 8- 8
Table 8-8 Summary of Road Maintenance Plan and Necessary Cost ......................................................... 8- 9
Table 8-9 Indexes Used in the Economic Analysis of the F/S ..................................................................... 8-10
Table 8-10 Project Cost of the Malfakassa Bypass ..................................................................................... 8-12
Table 8-11 Future Traffic Volume at the Malfakassa Bypass Section in 2018 and 2030 ............................ 8-12
Table 8-12 Gross Weight of Vehicles .......................................................................................................... 8-13
Table 8-13 Maintenance Labour Cost ......................................................................................................... 8-13
Table 8-14 Summary of Vehicle Fleet Unit Costs (Economic) ................................................................... 8-14
Table 8-15 Results of Economic Evaluation ............................................................................................... 8-14
Table 8-16 Results of Sensitivity Analysis: Case I-2 .................................................................................. 8-15
The Project for the Study on Togo Logistics Corridor Development Final Report List of Tables
x
Table 8-17 Construction Schedule of the Malfakassa Bypass ..................................................................... 8-15
Table 8-18 Design Features for Katchamba – Sadori Road ........................................................................ 8-18
Table 8-19 Outline of Boring Works at the Kara River ............................................................................... 8-23
Table 8-20 Outlines of Boring Works at the Koumongou River ................................................................. 8-24
Table 8-21 Estimated Water Discharge Volume at Planned Bridge Sites .................................................... 8-26
Table 8-22 Clearance and Standard Span Length based on the Water Discharge Volume .......................... 8-26
Table 8-23 Relation between Planned Water Discharge Volume and Clearance ......................................... 8-26
Table 8-24 Estimation of Flow Quantity at Planned Bridge Locations ....................................................... 8-27
Table 8-25 Comparison of Number of Spans for the Bridge across the Kara River ................................... 8-34
Table 8-26 Comparison of Applicable Superstructures for the Bridge across the Kara River .................... 8-35
Table 8-27 Comparison of Bridge Types for the Bridge across the Kara River .......................................... 8-36
Table 8-28 Comparison of Number of Spans for the Bridge across the Koumongou River ....................... 8-38
Table 8-29 Comparison of Applicable Superstructure for the Bridge across the Koumongou River .......... 8-38
Table 8-30 Comparison of Bridge Types for the Bridge across the Koumongou River .............................. 8-40
Table 8-31 Comparison of Abutment Types ................................................................................................ 8-42
Table 8-32 Construction Schedule for the Bridge across the Kara River .................................................... 8-49
Table 8-33 Construction Schedule for the Bridge across the Koumongou River ........................................ 8-49
Table 8-34 List of Rough Quantities of Concrete and Steel Materials for the Bridge across the
Kara River ................................................................................................................................ 8-50
Table 8-35 List of Rough Quantities of Concrete and Steel Materials for the Bridge across the
Koumongou River .................................................................................................................... 8-51
Table 8-36 Basic Data of Bridge Used for Estimating Unit Costs .............................................................. 8-52
Table 8-37 Estimated Unit Costs of the Reference Bridge .......................................................................... 8-52
Table 8-38 Determination of Unit Costs Used in the Study ........................................................................ 8-53
Table 8-39 Estimation of Preliminary Construction Cost of the Bridge across the Kara River .................. 8-53
Table 8-40 Estimation of Preliminary Construction Cost of the Bridge across the Koumongou River ...... 8-54
Table 8-41 Project Cost of Improvement of the Katchamba–Sadori Road ................................................. 8-56
Table 8-42 Future Traffic Volume of Katchamba–Sadori Road in 2030 ..................................................... 8-56
Table 8-43 Results of Economic Evaluation ............................................................................................... 8-57
Table 8-44 Results of Sensitivity Analysis: Case II-1 ................................................................................. 8-57
Table 9-1 Profiles of Protected Natural Reserves........................................................................................ 9- 4
Table 9-2 Criteria for whether EIA is required ............................................................................................ 9- 9
Table 9-3 Protection of the Environment .................................................................................................... 9-12
Table 9-4 Profiles of Proposed Projects ...................................................................................................... 9-25
Table 9-5 Results of Public Consultations .................................................................................................. 9-33
Table 9-6 Screening of Proposed Projects ................................................................................................... 9-35
Table 9-7 Dualisation including Construction of Bypass Route, RN1 ........................................................ 9-37
Table 9-8 Widening of Shoulder, RN1 ........................................................................................................ 9-37
Table 9-9 Rehabilitation of Existing RN4 and RN5 .................................................................................... 9-38
Table 9-10 Construction of Diversion Road for Steep Gradient Section, RN17 ......................................... 9-38
Table 9-11 Improvement of Road and Construction of Bridges, RN17 ...................................................... 9-39
Table 9-12 Construction of Railway, Blitta – Border of Burkina Faso ....................................................... 9-39
Table 9-13 Rehabilitation of Railway, Lomé Port – Blitta .......................................................................... 9-40
Table 9-14 Construction of Dry Port at Blitta ............................................................................................. 9-40
Table 9-15 Results of the SEA for Selected Proposed Projects ................................................................... 9-41
Table 9-16 Outline of F/S Projects for the Pre-EIA .................................................................................... 9-42
Table 9-17 Key Points of Stakeholder Meeting at Bassar ........................................................................... 9-50
Table 9-18 Summary of Environmental and Social Impacts of All Projects ............................................... 9-51
Table 9-19 Results of Scoping for Construction of the Malfakassa Bypass ................................................ 9-53
Table 9-20 Result of Scoping for Construction of Bridges across the Kara and Koumongou
Rivers ....................................................................................................................................... 9-55
Table 9-21 Environment Assessment (Construction of the Malfakassa Bypass) ........................................ 9-57
Table 9-22 Environment Assessment (Construction of Bridges across the Kara and Koumongou
Rivers) ...................................................................................................................................... 9-59
Table 9-23 Mitigation Measures for the F/S Projects .................................................................................. 9-61
The Project for the Study on Togo Logistics Corridor Development Final Report List of Tables
xi
Table 9-24 Proposed Management Activities for the F/S Projects .............................................................. 9-64
Table 9-25 Proposed Monitoring Activities for the F/S Projects ................................................................. 9-64
Table 9-26 JICA’s Involuntary Resettlement Policy ................................................................................... 9-66
Table 9-27 Comparison between JICA’s Guideline and Togo’s Policy of Resettlement ............................. 9-67
Table 9-28 Relevant Ministries for RAP ..................................................................................................... 9-69
Table 9-29 Affected Land and Number of Trees along Malfakassa Bypass................................................ 9-70
Table 9-30 Inventory of Land Acquisition for the Construction of Bridges ................................................ 9-71
Table 9-31 Entitlement Matrix for the Feasibility Project ........................................................................... 9-72
Table 9-32 Schedule of Resettlement .......................................................................................................... 9-74
Table 9-33 Compensation Amount for Malfakassa Bypass Construction ................................................... 9-74
Table 9-34 Compensation for Bridge Construction..................................................................................... 9-75
Table 10-1 Forms of Private-Sector Participation ....................................................................................... 10-12
Table 10-2 Risks and Responsibility by Type of Contract .......................................................................... 10-13
Table 10-3 Problems and Issues in the Current Concessions ...................................................................... 10-13
Table 11-1 Counterpart Training Programme in the Study ......................................................................... 11- 2
The Project for the Study on Togo Logistics Corridor Development Final Report List of Figures
xii
LIST OF FIGURES
Figure 1-1 Study Area in Togo .................................................................................................................... 1- 2
Figure 1-2 Study Area Covering Neighbouring Countries .......................................................................... 1- 2
Figure 1-3 Work Flowchart ......................................................................................................................... 1- 3
Figure 2-1 Location of the TLC .................................................................................................................. 2- 1
Figure 2-2 Target Roads of the PACTIR ..................................................................................................... 2- 2
Figure 2-3 GDP Per Capita in Ghana and Neighbouring Countries ............................................................ 2- 8
Figure 2-4 GDP Growth Rate in Togo and Neighbouring Countries .......................................................... 2- 9
Figure 2-5 Foreign Direct Investment (Net Flow) ...................................................................................... 2- 9
Figure 2-6 Foreign Direct Investment (% of GDP) ..................................................................................... 2- 9
Figure 2-7 Topography of Togo .................................................................................................................. 2-13
Figure 2-8 Geological Map of Togo ............................................................................................................ 2-14
Figure 2-9 Major River Basins of Togo ...................................................................................................... 2-15
Figure 2-10 Maximum Temperature in Togo (2000–2011) ......................................................................... 2-16
Figure 2-11 Monthly Precipitation at Major Cities between 2007 and 2011 ............................................... 2-16
Figure 2-12 Location of Maritime Region .................................................................................................. 2-25
Figure 2-13 Location of Plateaux Region ................................................................................................... 2-26
Figure 2-14 Location of Centrale Region ................................................................................................... 2-27
Figure 2-15 Location of Kara Region ......................................................................................................... 2-28
Figure 2-16 Location of Savanes Region .................................................................................................... 2-29
Figure 2-17 Total Amount of Yields and Cultivated Land .......................................................................... 2-31
Figure 2-18 Yield Amount of Major Crops ................................................................................................. 2-33
Figure 2-19 Surplus of Agricultural Production by Region 2010 ............................................................... 2-38
Figure 2-20 Scenario of Agricultural Production by Prefecture 2010-2015-2020 ...................................... 2-39
Figure 2-21 Location of Industrial Development Project Sites ................................................................... 2-40
Figure 2-22 Production and Deposit of Minerals ........................................................................................ 2-48
Figure 2-23 Tourism Map of Togo (North) ................................................................................................. 2-56
Figure 2-24 Tourism Map of Togo (South) ................................................................................................. 2-57
Figure 2-25 Project Site for Agricultural Development .............................................................................. 2-59
Figure 3-1 Organisation Chart of Directorate General of Public Works ..................................................... 3- 3
Figure 3-2 National Road Network ............................................................................................................. 3- 4
Figure 3-3 Road Network in Bénin ............................................................................................................. 3- 5
Figure 3-4 Road Network in Burkina Faso ................................................................................................. 3- 6
Figure 3-5 Road Network in Ghana ............................................................................................................ 3- 6
Figure 3-6 Road Network in Niger ............................................................................................................. 3- 7
Figure 3-7 Road Network in Côte d’Ivoire ................................................................................................. 3- 7
Figure 3-8 Comparison of Road Development Index for Togo and Neighbouring Countries .................... 3- 8
Figure 3-9 Comparison of Road Density for Togo and Neighbouring Countries........................................ 3- 8
Figure 3-10 Conditions of Transit Corridors in West Africa ....................................................................... 3- 9
Figure 3-11 Current Conditions of Major National Roads .......................................................................... 3-10
Figure 3-12 Major Location of Traffic Accident ......................................................................................... 3-11
Figure 3-13 Organisation Chart of the MT ................................................................................................. 3-17
Figure 3-14 Railway Concessions in Sub-Saharan Africa .......................................................................... 3-21
Figure 3-15 Railway Route Map of Togo.................................................................................................... 3-24
Figure 3-16 Route Map of Common Line ................................................................................................... 3-24
Figure 3-17 Route Map of SNPT Line ........................................................................................................ 3-25
Figure 3-18 Longitudinal Section of Railway in Togo (Lomé–Blitta) ........................................................ 3-25
Figure 3-19 Railway Freight Transport ....................................................................................................... 3-27
Figure 3-20 Route Map of Passenger Train Operation in the Past .............................................................. 3-27
Figure 3-21 Track Type by Line .................................................................................................................. 3-30
Figure 3-22 Kpalimé Line Extension Plan .................................................................................................. 3-31
The Project for the Study on Togo Logistics Corridor Development Final Report List of Figures
xiii
Figure 3-23 Four Factors Aspects of Track Maintenance ........................................................................... 3-32
Figure 3-24 Track Layout at Tsévié Station ................................................................................................ 3-35
Figure 3-25 Track Layout at Notsé Station ................................................................................................. 3-36
Figure 3-26 Track Layout at Wahala Station ............................................................................................... 3-36
Figure 3-27 Track Layout at Agbonou Station ............................................................................................ 3-37
Figure 3-28 Track Layout at Anié Station ................................................................................................... 3-38
Figure 3-29 Track Layout at Pagala Station ................................................................................................ 3-38
Figure 3-30 Track Layout at Blitta Station.................................................................................................. 3-39
Figure 3-31 Location of Major Problems of Railway Sub-sector ............................................................... 3-42
Figure 3-32 Organisation Chart of the Autonomous Port of Lomé ............................................................. 3-43
Figure 3-33 The Plan of Lomé Port ............................................................................................................ 3-45
Figure 3-34 Berthing Facilities at Lomé Port .............................................................................................. 3-46
Figure 3-35 Location of Kpémé Jetty ......................................................................................................... 3-52
Figure 3-36 Process Flow (Mining to Shipping) ......................................................................................... 3-52
Figure 3-37 Mooring Dolphin ..................................................................................................................... 3-53
Figure 3-38 Terminal du Sahel .................................................................................................................... 3-54
Figure 3-39 Plan of the Wharf No. 1 ........................................................................................................... 3-56
Figure 3-40 System of Transit Cargo Transport on International Corridor ................................................. 3-59
Figure 4-1 Locations of Projects by Work Status ........................................................................................ 4- 3
Figure 4-2 Locations of Projects by Financier(s) ........................................................................................ 4- 3
Figure 4-3 Plan of the Quay 3 Project ......................................................................................................... 4- 4
Figure 4-4 Image of Quay 3 Sections .......................................................................................................... 4- 4
Figure 4-5 Present Circumstances of the Project Site ................................................................................. 4- 5
Figure 4-6 The First Stage (Capacity: 900,000 TEU/year) ......................................................................... 4- 5
Figure 4-7 Final Stage (Capacity: 1,500,000 TEU/year)............................................................................. 4- 6
Figure 4-8 Projected Demand and Capacity of Mineral Berths .................................................................. 4- 7
Figure 4-9 General Mineral Berth Extension Plan ...................................................................................... 4- 7
Figure 4-10 Details of Mineral Berth Extension Plan ................................................................................. 4- 8
Figure 5-1 Traffic Count Survey Point ........................................................................................................ 5- 2
Figure 5-2 O/D Zone Map........................................................................................................................... 5- 6
Figure 5-3 Average Daily Traffic ................................................................................................................ 5- 8
Figure 5-4 Traffic Ratio by Vehicle Type .................................................................................................... 5- 9
Figure 5-5 Steps for preparing the Daily O/D Matrix ................................................................................. 5-10
Figure 5-6 O/D Distribution at Point No. 3 Tsévié (RN1) .......................................................................... 5-12
Figure 5-7 Number of Passengers ............................................................................................................... 5-12
Figure 5-8 Average Number of Passengers per Vehicle .............................................................................. 5-13
Figure 5-9 Trip Purpose of Passengers on Cars & Taxis and Buses ............................................................ 5-14
Figure 5-10 Transportation Freight Weight by Vehicle Type ...................................................................... 5-15
Figure 5-11 Transportation Freight Weight by Commodity ........................................................................ 5-16
Figure 5-12 Empty Vehicle Ratio of Freight Vehicles ................................................................................. 5-17
Figure 5-13 Average Freight Load per Loaded Freight Vehicle .................................................................. 5-18
Figure 5-14 Year of Manufacture of Heavy Freight Vehicles ..................................................................... 5-19
Figure 5-15 Heavy Freight Vehicle Registration Country Ratio with Landlocked Countries ..................... 5-20
Figure 5-16 Average Trip Days of Heavy Freight Vehicles with Landlocked Countries ............................ 5-20
Figure 5-17 Number of Broken-down Freight Vehicle ............................................................................... 5-21
Figure 5-18 Vehicle Registration Country of Broken-down Freight Vehicles ............................................. 5-21
Figure 5-19 Vehicle Types of Broken-down Freight Vehicles ..................................................................... 5-22
Figure 5-20 O/D Pairs of Broken-down Freight Vehicles ........................................................................... 5-22
Figure 5-21 Types of Goods Loaded on Broken-down Freight Vehicles .................................................... 5-23
Figure 5-22 Loading Ratio of Broken-down Freight Vehicle ...................................................................... 5-23
Figure 5-23 Year of Vehicle Manufacture of Broken-down Freight Vehicles ............................................. 5-24
Figure 5-24 Broken-down Parts of Interviewed Vehicles ........................................................................... 5-24
Figure 5-25 Cause of Break Down of Interviewed Vehicles ....................................................................... 5-24
Figure 5-26 Ratio of Vehicles by Type ........................................................................................................ 5-25
The Project for the Study on Togo Logistics Corridor Development Final Report List of Figures
xiv
Figure 5-27 Ratio of Vehicles by Country................................................................................................... 5-25
Figure 5-28 Gross Weight of Surveyed Vehicles ......................................................................................... 5-26
Figure 5-29 Ratio of Overloaded Vehicles by Gross Weight....................................................................... 5-26
Figure 5-30 Ratio of Overloaded Vehicles by Single or Multiple Axle Load ............................................. 5-27
Figure 5-31 Basic Concepts Applied in Traffic Demand Forecast .............................................................. 5-28
Figure 5-32 Details considered in passenger demand forecast.................................................................... 5-29
Figure 5-33 Details on Concepts Applied in Freight Demand Forecast ...................................................... 5-30
Figure 5-34 GDP Forecast at Constant Prices ............................................................................................. 5-31
Figure 5-35 Estimated Population by Region in 2018 and 2030 ................................................................. 5-32
Figure 5-36 Estimated Production in 2018 and 2030 (Cereals) .................................................................. 5-33
Figure 5-37 Estimated Production in 2018 and 2030 (Tubers) ................................................................... 5-34
Figure 5-38 Estimated Production in 2018 and 2030 (Legumes) ................................................................ 5-34
Figure 5-39 Estimated Production in 2018 and 2030 (Cotton) ................................................................... 5-35
Figure 5-40 Estimated Production in 2018 and 2030 (Coffee) ................................................................... 5-35
Figure 5-41 Estimated Production in 2018 and 2030 (Cacao) .................................................................... 5-35
Figure 5-42 O/D Volume of Cement Related Materials .............................................................................. 5-37
Figure 5-43 O/D Volume of Other Mineral Products .................................................................................. 5-38
Figure 5-44 Ranking by Commodity .......................................................................................................... 5-41
Figure 5-45 Results of Weekly Fluctuation Factor Computation ................................................................ 5-41
Figure 5-46 Results of Computation of Monthly Fluctuation Factors ........................................................ 5-42
Figure 5-47 Monthly Variation of Export/Import/Transit Volume in Togo ................................................. 5-42
Figure 5-48 Percentage Accounted for by Container Freight Passing through the Port .............................. 5-43
Figure 5-49 Percentage Accounted for by Container Freight not Passing through the Port ........................ 5-43
Figure 5-50 Passenger Demand .................................................................................................................. 5-44
Figure 5-51 Passenger Demand in 2030 ..................................................................................................... 5-44
Figure 5-52 Freight Demand ....................................................................................................................... 5-45
Figure 5-53 Freight Demand in 2030 .......................................................................................................... 5-45
Figure 5-54 Traffic Demand of All Vehicle Types (except motorcycles) .................................................... 5-46
Figure 5-55 Traffic Demand of All Vehicle Types (except motorcycles) in 2030 ....................................... 5-47
Figure 5-56 Road Network in 2012............................................................................................................. 5-47
Figure 5-57 Road Network in 2018............................................................................................................. 5-48
Figure 5-58 Road Network in 2030............................................................................................................. 5-49
Figure 5-59 Results of Route Assignment of Present Traffic in 2012 ......................................................... 5-51
Figure 5-60 Correlation Coefficient between AADT and Forecast ............................................................. 5-52
Figure 5-61 Air Passenger Demand in 2030 ............................................................................................... 5-53
Figure 5-62 Results of Route Assignment on Full Road Network in 2030 ................................................. 5-54
Figure 5-63 Results of Traffic Assignment on Road Network without New Project (2030) ....................... 5-55
Figure 5-64 Results of Route Assignment on Road Network in 2018 ........................................................ 5-56
Figure 5-65 Level of Service ....................................................................................................................... 5-57
Figure 5-66 Level of Service of Present Traffic Forecast in 2012 .............................................................. 5-58
Figure 5-67 Level of Service of Future Traffic Forecast in 2018 ................................................................ 5-59
Figure 5-68 Level of Service of Future Traffic Demand in 2030 with Full Road Network ........................ 5-60
Figure 5-69 Level of Service of Future Traffic Volume in 2030 without New Project ............................... 5-61
Figure 5-70 Zoning Map for the F/S ........................................................................................................... 5-62
Figure 5-71 Results of Route Assignments of Future Traffic Demand for the F/S ..................................... 5-63
Figure 6-1 Definition of TLC ...................................................................................................................... 6- 1
Figure 6-2 Trunk Road Network, WAEMU ................................................................................................ 6- 3
Figure 6-3 Share of Import/Export Volume (2010) ..................................................................................... 6- 4
Figure 6-4 Share of Transit Freight Volume ................................................................................................ 6- 5
Figure 6-5 O/D Distribution at the Burkina Faso – Togo Border ................................................................ 6- 5
Figure 6-6 RN1 and Population Distribution in Togo ................................................................................. 6- 6
Figure 6-7 Road Governance Initiative Data Map ...................................................................................... 6-10
Figure 6-8 Freight Demand in 2030 ............................................................................................................ 6-13
Figure 6-9 Corridor Network ...................................................................................................................... 6-16
Figure 6-10 Change in Cargo Share in Each Corridor due to Package of Policies ..................................... 6-22
The Project for the Study on Togo Logistics Corridor Development Final Report List of Figures
xv
Figure 7-1 Relation between the TLC Development and Government Development Goal ........................ 7- 2
Figure 7-2 TLC Development to Attract Sub-regional Development ......................................................... 7- 2
Figure 7-3 TLC Development to Attract Regional Development ............................................................... 7- 3
Figure 7-4 Ongoing/Planned Road Project Sites and Major Issues on Road Network ............................... 7- 6
Figure 7-5 Proposed Road Project .............................................................................................................. 7- 8
Figure 7-6 Proposed Typical Cross Section of Dualisation of RN1 ............................................................ 7- 8
Figure 7-7 Proposed Typical Cross Section for Widening of Shoulder on RN1 ......................................... 7- 9
Figure 7-8 Proposed Alignment of Bypasses at Tsévié, Notsé and Sokodé ................................................ 7- 9
Figure 7-9 Steep Gradient Section on RN17 ............................................................................................... 7-10
Figure 7-10 Location of Koumongou River Require a Bridge .................................................................... 7-10
Figure 7-11 Proposed Location of Weighbridges ........................................................................................ 7-13
Figure 7-12 Railway Master Plan in ECOWAS .......................................................................................... 7-15
Figure 7-13 Routes related to Togo ............................................................................................................. 7-16
Figure 7-14 Loading Capacity .................................................................................................................... 7-21
Figure 7-15 Existing Bridge ........................................................................................................................ 7-21
Figure 7-16 Location of Proposed Railway Projects ................................................................................... 7-23
Figure 7-17 Proposed Track Layout in the Shunting Yard and Container Yard .......................................... 7-24
Figure 7-18 Proposed Double Tracking Section ......................................................................................... 7-24
Figure 7-19 Proposed New Line ................................................................................................................. 7-27
Figure 7-20 Communication Based Train Control System ......................................................................... 7-29
Figure 7-21 Draft Layout of the Depot ....................................................................................................... 7-29
Figure 7-22 3-rail Dual-Gauge Track .......................................................................................................... 7-32
Figure 7-23 Widening of Formation at Embankment Section ..................................................................... 7-32
Figure 7-24 Widening of Formation at Cutting Section .............................................................................. 7-32
Figure 7-25 UIC Loading Gauges ............................................................................................................... 7-33
Figure 7-26 Typical Embankment ............................................................................................................... 7-35
Figure 7-27 Typical Cutting Section ........................................................................................................... 7-35
Figure 7-28 RC Beam-type Bridge ............................................................................................................. 7-36
Figure 7-29 PC Beam-type Bridge .............................................................................................................. 7-36
Figure 7-30 Typical Interchange Station ..................................................................................................... 7-36
Figure 7-31 Estimation of Water Depth at the Eastern Side of Mineral Jetty ............................................. 7-39
Figure 7-32 Function of the Existing Breakwater ....................................................................................... 7-41
Figure 7-33 Breakwater Extension Plan (Alternative 1: Plan for 70,000 DWT Vessel ) ............................ 7-42
Figure 7-34 Breakwater Extension Plan (Alternative 2: Straight Plan for 100,000 DWT Vessels) ............ 7-42
Figure 7-35 Effects for the Approach Channel by Extension of Breakwater .............................................. 7-43
Figure 7-36 General Layout Plan of New Mineral Berth for 70,000 DWT Class Vessel ............................ 7-44
Figure 7-37 General Layout Plan of New Mineral Beth for 100,000 DWT Class Vessel ........................... 7-44
Figure 7-38 Concept of Dry Port ................................................................................................................ 7-49
Figure 7-39 Projected Container Volume to be Handled at Dry Port (TEU/day) ........................................ 7-50
Figure 7-40 Layout Plan of Dry Port .......................................................................................................... 7-52
Figure 7-41 System of Inland Container Depot in Blitta Dry Port .............................................................. 7-57
Figure 7-42 Existing Truck Station in Togo ................................................................................................ 7-59
Figure 7-43 Location of New Truck Station ............................................................................................... 7-61
Figure 7-44 Layout Plan of Truck Station ................................................................................................... 7-62
Figure 7-45 Expansion Plan of Sahel Terminal ........................................................................................... 7-63
Figure 7-46 Implementation Schedule of Logistics Facilities ..................................................................... 7-64
Figure 7-47 Process of Cost Estimation ...................................................................................................... 7-65
Figure 7-48 Definition of Project Benefits .................................................................................................. 7-71
Figure 7-49 Elements of Transportation Cost ............................................................................................. 7-71
Figure 7-50 Location of Projects for the Development of the TLC ............................................................ 7-79
Figure 8-1 Typical Cross-Section of the Malfakassa Bypass ...................................................................... 8- 4
Figure 8-2 Proposed Pavement Structure of the Malfakassa Bypass .......................................................... 8- 4
Figure 8-3 Horizontal Alignment of the Malfakassa Bypass ...................................................................... 8- 5
Figure 8-4 Concept of Economic Benefit in the F/S ................................................................................... 8- 9
Figure 8-5 Case I-1: Without the Katchamba–Sadori Road Improvement Project ..................................... 8-11
The Project for the Study on Togo Logistics Corridor Development Final Report List of Figures
xvi
Figure 8-6 Case I-2: With the the Katchamba–Sadori Road Improvement Project ..................................... 8-11
Figure 8-7 Locations of Boreholes at the Kara River.................................................................................. 8-21
Figure 8-8 Boring Logs at Boreholes P1 and P2 at the Kara River ............................................................. 8-23
Figure 8-9 Assumed Line of Bearing Layer at the Kara River ................................................................... 8-24
Figure 8-10 Locations of Boreholes at the Koumongou River ................................................................... 8-24
Figure 8-11 Boring Logs at Boreholes P1 and P2 at the Koumongou River ............................................... 8-25
Figure 8-12 Assumed Line of Bearing Layer at the Koumongou River ..................................................... 8-25
Figure 8-13 Clearance and Span Length of a Bridge .................................................................................. 8-26
Figure 8-14 Obstruction Ratio for the Flow Area ....................................................................................... 8-27
Figure 8-15 Bridge Width Planned by the RN17 F/S – 2 for Bridges on RN17 ......................................... 8-28
Figure 8-16 Typical Cross Section of a Bridge Proposed in the Study ....................................................... 8-28
Figure 8-17 Proposed Location of the Bridge in the RN17 F/S – 2 ............................................................ 8-29
Figure 8-18 Location of Road Centre Line by Changing the Alignment to the Upstream Side .................. 8-29
Figure 8-19 River Cross Section at Location 30 m Upstream from the Drift ............................................. 8-30
Figure 8-20 River Cross Section at Same Location as Excavation of Left Bank ........................................ 8-30
Figure 8-21 Location of Road Centre Line by Changing Alignment to Downstream Side ......................... 8-30
Figure 8-22 River Cross Section at Location 30 m Downstream from the Drift ........................................ 8-30
Figure 8-23 Location of Road Centre Line for the Bridge across the Kara River ....................................... 8-31
Figure 8-24 Location of Road Centre Line for the Bridge across the Koumongou River ........................... 8-31
Figure 8-25 Position of Abutment for a River of more than 50 m Width .................................................... 8-32
Figure 8-26 Position of Control Points at the Proposed Location of the Bridge across the Kara River ...... 8-32
Figure 8-27 Length of Bridge across the Kara River .................................................................................. 8-32
Figure 8-28 Relation between the River Cross Section and Planned High Water Level at the Proposed
Location of the Bridge across the Koumongou River ............................................................ 8-33
Figure 8-29 River Improvement Works at the Proposed Location of the Bridge across the
Koumongou River .................................................................................................................. 8-33
Figure 8-30 Length of Bridge across the Koumongou River ...................................................................... 8-34
Figure 8-31 Position of Piers for Uniform Distribution of Spans ............................................................... 8-39
Figure 8-32 Embedment Depth for the Bridge across the Kara River ........................................................ 8-39
Figure 8-33 Embedment Depth for the Bridge across the Koumongou River ............................................ 8-42
Figure 8-34 Comparison of Foundation of Abutments of the Bridge Across the Koumongou River ......... 8-43
Figure 8-35 General Plan of the Bridge across the Kara River ................................................................... 8-44
Figure 8-36 General Plan of the Bridge across the Koumongou River ....................................................... 8-45
Figure 8-37 Flowchart of Construction Works ............................................................................................ 8-46
Figure 8-38 Proposed Location of Temporary Yard for the Bridge across the Kara River ......................... 8-47
Figure 8-39 Proposed Location of Temporary Yard for the Bridge across the Koumongou River ............. 8-47
Figure 8-40 Main Girder Erection by Provisional Beam Erection Method ................................................. 8-48
Figure 8-41 Case II-1: Without the Malfakassa Bypass Construction Project ............................................ 8-55
Figure 8-42 Case II-2: With the Malfakassa Bypass Construction Project ................................................. 8-55
Figure 9-1 Locations of Protected Natural Reserves in Togo ..................................................................... 9- 6
Figure 9-2 EIA Scheme of Togo.................................................................................................................. 9-10
Figure 9-3 Locations of Proposed Projects ................................................................................................. 9-26
Figure 9-4 Biological Environment of Togo ............................................................................................... 9-28
Figure 9-5 Outline of the Project (Malfakassa Bypass) .............................................................................. 9-43
Figure 9-6 Outline of the Project (Construction of Bridges) ....................................................................... 9-45
Figure 9-7 Possible Affected Area (Malfakassa Bypass) ............................................................................ 9-46
Figure 9-8 Possible Affected Area (Bridge across the Kara River) ............................................................. 9-46
Figure 9-9 Possible Affected Area (Bridge across the Koumongou River) ................................................. 9-47
Figure 10-1 Indicative Project Implementation Structure ........................................................................... 10-11
Figure 10-2 Example of Single Window System in Japan .......................................................................... 10-16
The Project for the Study on Togo Logistics Corridor Development Final Report List of Photographs
xvii
LIST OF PHOTOGRAPHS
Photo 2-1 Agricultural Field (Beans) in Maritime Region .......................................................................... 2-33
Photo 2-2 Agricultural Field (Rice) in Maritime Region ............................................................................ 2-33
Photo 2-3 Agricultural Field (Maize) in Maritime Region ......................................................................... 2-34
Photo 2-4 Agricultural Field (Sorghum) in Maritime Region ..................................................................... 2-34
Photo 2-5 Agricultural Field (Cotton) in Plateaux Region .......................................................................... 2-34
Photo 2-6 Cassava Venders in Plateaux Region .......................................................................................... 2-34
Photo 2-7 Agricultural Field (Cocoa) in Plateaux Region .......................................................................... 2-34
Photo 2-8 Agricultural Field (Sugar cane) in Plateaux Region ................................................................... 2-34
Photo 2-9 Agricultural Field (Beans) in Centre Region .............................................................................. 2-34
Photo 2-10 Agricultural Field (Cotton) in Centre Region ........................................................................... 2-34
Photo 2-11 Agricultural Field (Maize) in Centre Region ............................................................................ 2-35
Photo 2-12 Agricultural Field (Yam) in Centre Region .............................................................................. 2-35
Photo 2-13 Agricultural Field (Millet) in Kara Region ............................................................................... 2-35
Photo 2-14 Agricultural Field (Sorghum) in Kara Region .......................................................................... 2-35
Photo 2-15 Agricultural Field (Maize) in Kara Region ............................................................................... 2-35
Photo 2-16 Agricultural Field in Kara Region ............................................................................................ 2-35
Photo 2-17 Agricultural Field (Rice) in Savanes Region ............................................................................ 2-35
Photo 2-18 Agricultural Field (Cotton) in Savanes Region ........................................................................ 2-35
Photo 2-19 Agricultural Field (Millet) in Savanes Region ......................................................................... 2-36
Photo 2-20 Agricultural Field (Soy Beans) in Savanes Region .................................................................. 2-36
Photos 3-1 Workshop (M.M. Mining) ......................................................................................................... 3-29
Photos 3-2 Workshop (SNPT) ..................................................................................................................... 3-29
Photos 3-3 Track Condition ........................................................................................................................ 3-31
Photo 3-4 Hao River Bridge ........................................................................................................................ 3-33
Photo 3-5 Wahara River Bridge .................................................................................................................. 3-34
Photos 3-6 Anié River Bridge ..................................................................................................................... 3-34
Photos 3-7 Embankment and Cutting Slope Sections ................................................................................. 3-35
Photo 3-8 Tsévié Station ............................................................................................................................. 3-35
Photos 3-9 Notsé Station ............................................................................................................................. 3-36
Photo 3-10 Wahala Station .......................................................................................................................... 3-37
Photo 3-11 Agbonou Station ....................................................................................................................... 3-37
Photo 3-12 Anié Station .............................................................................................................................. 3-38
Photo 3-13 Pagala Station ........................................................................................................................... 3-39
Photos 3-14 Blitta Station ........................................................................................................................... 3-40
Photos 3-15 Level Crossings ....................................................................................................................... 3-40
Photos 3-16 Illegal Occupation ................................................................................................................... 3-41
Photo 3-17 Overview of the Jetty ................................................................................................................ 3-53
Photo 3-18 Loading Jetty ............................................................................................................................ 3-53
Photo 3-19 Maintenance Station ................................................................................................................. 3-54
Photos 3-20 Current Situation at Lomé Port ............................................................................................... 3-61
Photos 3-21 Devanning at Lomé Port ......................................................................................................... 3-61
Photos 3-22 Selection of Transport Operator by the National Road Transporter Union of Togo
at Lomé Port ........................................................................................................................... 3-61
Photos 3-23 Tracking GPS Receiver Provided at the Sahel Terminal ......................................................... 3-61
Photo 3-24 Parking at Bittou Customs Office ............................................................................................. 3-62
Photo 3-25 Bittou Customs Office .............................................................................................................. 3-62
Photos 3-26 Long Queue of Cargo Vehicles neat the Bittou Customs Office ............................................. 3-62
Photo 3-27 Administration Office ............................................................................................................... 3-63
Photo 3-28 Freight Vehicle Scanner ............................................................................................................ 3-63
The Project for the Study on Togo Logistics Corridor Development Final Report List of Photographs
xviii
Photo 5-1 Condition of Traffic Count Survey ............................................................................................. 5- 1
Photos 5-2 Condition of Roadside O/D Interview Survey .......................................................................... 5- 3
Photos 5-3 Condition of Broken-down Freight Vehicle Survey .................................................................. 5- 4
Photo 7-1 Switching of 3-rail Dual-Gauge Track ....................................................................................... 7-32
Photos 7-2 Container Handling Equipment ................................................................................................ 7-50
Photo 8-1 A Cargo Truck in Accident on RN17 .......................................................................................... 8- 1
Photo 8-2 Malfakassa Village Seen from Proposed Bypass ........................................................................ 8- 1
Photo 8-3 Koumongou River ...................................................................................................................... 8-16
Photo 8-4 Katchamba–Sadori Road ............................................................................................................ 8-16
Photos 8-5 Aerial View of Planned Bridge Site across the Kara River with a Drift ................................... 8-20
Photos 8-6 River Condition at Planned Bridge Site across the Kara River ................................................. 8-20
Photos 8-7 Drift Installed at Planned Bridge Location across the Kara River ............................................ 8-20
Photos 8-8 Natural Embankment and River Bed Condition at the Kara River ........................................... 8-20
Photos 8-9 Aerial View of Planned Bridge Site across the Koumongou River ........................................... 8-22
Photos 8-10 River Condition at Planned River Site across the Koumongou River ..................................... 8-22
Photos 8-11 River Crossing Situation by Local Residents during the Dry Season at Koumongou River ... 8-22
Photos 8-12 Small Embankment far from the Right Side River Bank of the Koumongou River ............... 8-22
Photos 9-1 Photos of Public Consultation ................................................................................................... 9-34
Photo 9-2 Malfakassa Villate ...................................................................................................................... 9-48
Photo 9-3 Logging along Existing RN17 .................................................................................................... 9-48
Photo 9-4 Typical Landscape around the projected site at Kara River ........................................................ 9-48
Photo 9-5 Typical Landscape around the Project Site at the Koumongou River ........................................ 9-49
Photos 9-6 Stakeholder meeting at Bassar, Kara Region ............................................................................ 9-50
The Project for the Study on Togo Logistics Corridor Development Final Report List of Abbreviations
xix
LIST OF ABBREVIATIONS
Abbreviation Full Name
English French
AADT Annual Average Daily Traffic Débit Journalier Moyen Annuel (DJMA)
ADF African Development Fund Fonds Africain de Développement (FAD)
ADT Average Daily Traffic Trafic moyen journalier (TMJ)
AEP Water Supply Approvisionnement en Eau Potable
AfDB African Development Bank Banque Africaine de Développement (BAD)
AFNOR French Standard Association Association française de normalisation
AGAIB Agency Initiatives Support Base Agence d’ appui aux Initiatives à la Base
AGB General Budget Support Appui Budgétaire Général
AGR Income Generating Activity Activité Génératricede Revenus
AICD Africa Infrastructure Country Diagnostic Afrique du Diagnostic des infrastructures nationales
AIDS Acquired Immunodeficiency Syndrome Syndrome de l'immunodéficience Acquise
ANAC Agence Nationale de l'Aviation Civile Agence Nationale de l'Aviation Civile
ANGE National Agency of Environmental Management Agence Nationale de Gestion de l’Environnement
ANPAT National Association of Agricultural Occupations in Togo
Association Nationale des Professions Avicoles du Togo
ANSAT National Agency for Food Security in Togo Agence Nationale de Sécurité Alimentaire du Togo
ANT National Tourism Administration Administration nationale du tourisme
ARVs Antiviral Drugs Antiviraux
ASATO National Agency for Food Security in Togo Agence Nationale de Sécurité Alimentaire du Togo
AU African Union Union africaine (UA)
B/C Benefit-Cost Ratio -
BCEAO Central Bank of the States of West Africa Banque centrale des Etats de l' Afrique de l'Ouest
BIA International Bank for Africa Banque Internationale pour l’Afrique
BIDC Bank for Investment and Development of ECOWAS Banque d'Investissement et de Développement de la CEDEAO
BINTO Bakery Industrial in Togo Boulangerie Industrielle du Togo
BOAD West African Development Bank (WADB) Banque Ouest Africaine de Développement
BOD Biochemical oxygen demand demande biochimique en oxygène (DBO)
BOT Built Operate Transfer Built Operate Transfer
BP Border Post Poste de Contrôle Juxtaposé (PCJ)
CAPER Autonomous Company for Tolls and Road Maintenance
Compagnie Autonome des Péages et de l'Entretien Routier
CBC Burkina Shipper’s Council Conseil Burkinabe des Chargeurs
CBTC Communication Based Train Control -
CCI-BF Burkina Faso Chamber of Commerce La chambre de Commerce et d’Industrie du Burkina Faso
CCIT Chamber of Commerce and Industry of Togo Chambre de Commerce et d’Industrie du Togo
CDB China Development Bank China Development Bank
CENATIS National Weaving Centre Centre Nationalde Tissage
CGES Environmental and Social Management Framework Cadre de Gestion Environnementale et Sociale
CFS Container Freight Station -
CFT Togo Railway Chemin de fer du Togo
CH4 Methane Méthane
CILSS Permanent Inter-State Fight against Drought in the Sahel
Comité permanent Inter-Etats de Lutte contre la Sécheresse dans le Sahel
CIMAO Cement of West Africa Cimenteries de l’Afrique de l’Ouest
CIMC Coronation International Mining Corporation -
CNACET National Accreditation and Ranking Tourist Establishments
Commission Nationale d’Agrément et de Classement des Établissements Touristiques
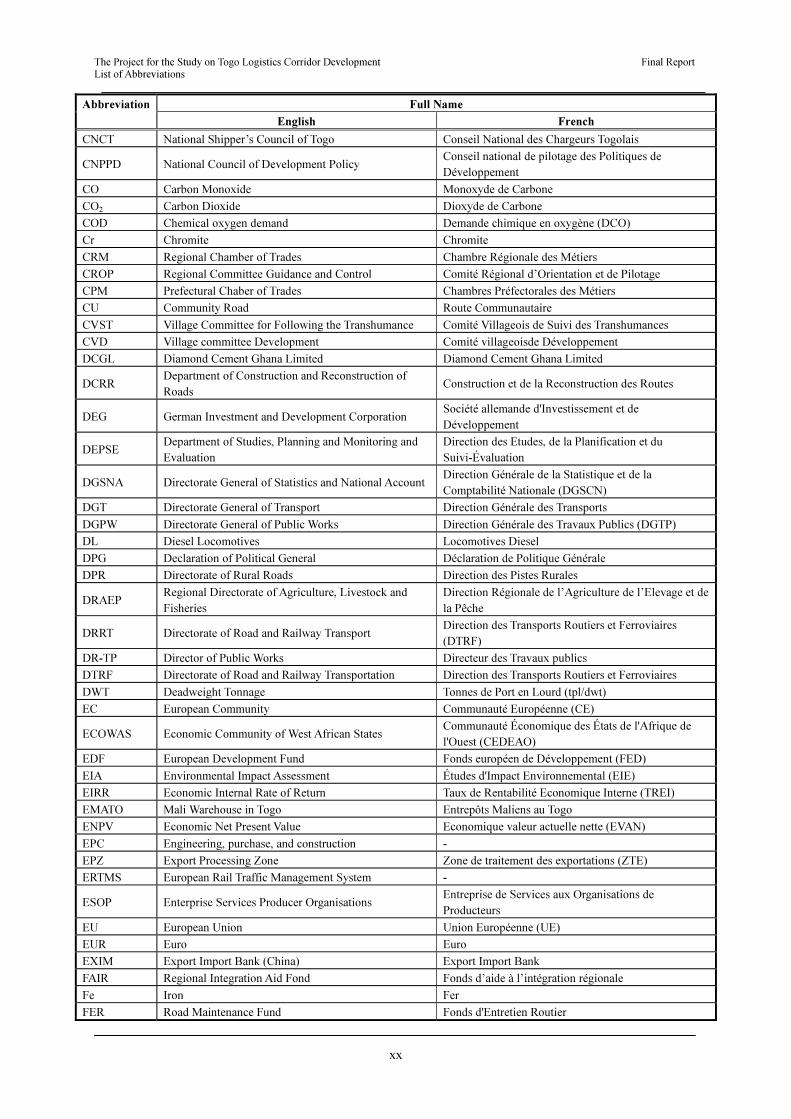
The Project for the Study on Togo Logistics Corridor Development Final Report List of Abbreviations
xx
Abbreviation Full Name
English French
CNCT National Shipper’s Council of Togo Conseil National des Chargeurs Togolais
CNPPD National Council of Development Policy Conseil national de pilotage des Politiques de Développement
CO Carbon Monoxide Monoxyde de Carbone
CO2 Carbon Dioxide Dioxyde de Carbone
COD Chemical oxygen demand Demande chimique en oxygène (DCO)
Cr Chromite Chromite
CRM Regional Chamber of Trades Chambre Régionale des Métiers
CROP Regional Committee Guidance and Control Comité Régional d’Orientation et de Pilotage
CPM Prefectural Chaber of Trades Chambres Préfectorales des Métiers
CU Community Road Route Communautaire
CVST Village Committee for Following the Transhumance Comité Villageois de Suivi des Transhumances
CVD Village committee Development Comité villageoisde Développement
DCGL Diamond Cement Ghana Limited Diamond Cement Ghana Limited
DCRR Department of Construction and Reconstruction of Roads
Construction et de la Reconstruction des Routes
DEG German Investment and Development Corporation Société allemande d'Investissement et de Développement
DEPSE Department of Studies, Planning and Monitoring and Evaluation
Direction des Etudes, de la Planification et du Suivi-Évaluation
DGSNA Directorate General of Statistics and National AccountDirection Générale de la Statistique et de la Comptabilité Nationale (DGSCN)
DGT Directorate General of Transport Direction Générale des Transports
DGPW Directorate General of Public Works Direction Générale des Travaux Publics (DGTP)
DL Diesel Locomotives Locomotives Diesel
DPG Declaration of Political General Déclaration de Politique Générale
DPR Directorate of Rural Roads Direction des Pistes Rurales
DRAEP Regional Directorate of Agriculture, Livestock and Fisheries
Direction Régionale de l’Agriculture de l’Elevage et de la Pêche
DRRT Directorate of Road and Railway Transport Direction des Transports Routiers et Ferroviaires (DTRF)
DR-TP Director of Public Works Directeur des Travaux publics
DTRF Directorate of Road and Railway Transportation Direction des Transports Routiers et Ferroviaires
DWT Deadweight Tonnage Tonnes de Port en Lourd (tpl/dwt)
EC European Community Communauté Européenne (CE)
ECOWAS Economic Community of West African States Communauté Économique des États de l'Afrique de l'Ouest (CEDEAO)
EDF European Development Fund Fonds européen de Développement (FED)
EIA Environmental Impact Assessment Études d'Impact Environnemental (EIE)
EIRR Economic Internal Rate of Return Taux de Rentabilité Economique Interne (TREI)
EMATO Mali Warehouse in Togo Entrepôts Maliens au Togo
ENPV Economic Net Present Value Economique valeur actuelle nette (EVAN)
EPC Engineering, purchase, and construction -
EPZ Export Processing Zone Zone de traitement des exportations (ZTE)
ERTMS European Rail Traffic Management System -
ESOP Enterprise Services Producer Organisations Entreprise de Services aux Organisations de Producteurs
EU European Union Union Européenne (UE)
EUR Euro Euro
EXIM Export Import Bank (China) Export Import Bank
FAIR Regional Integration Aid Fond Fonds d’aide à l’intégration régionale
Fe Iron Fer
FER Road Maintenance Fund Fonds d'Entretien Routier
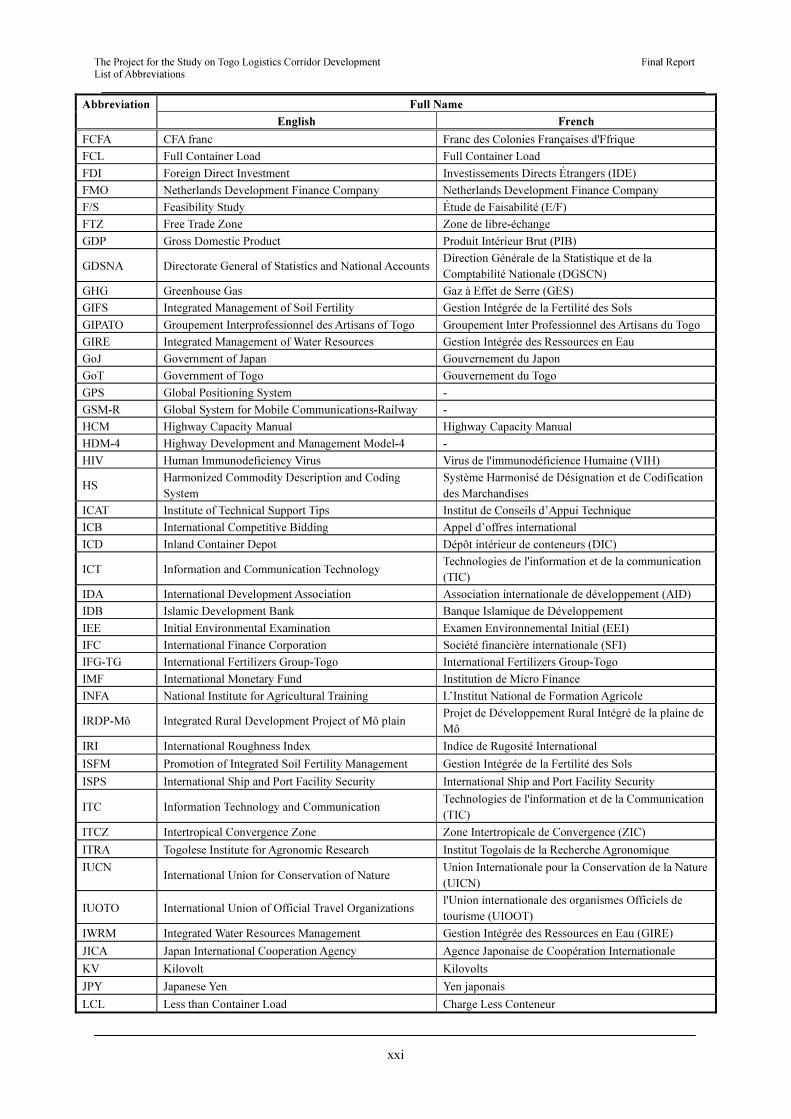
The Project for the Study on Togo Logistics Corridor Development Final Report List of Abbreviations
xxi
Abbreviation Full Name
English French
FCFA CFA franc Franc des Colonies Françaises d'Ffrique
FCL Full Container Load Full Container Load
FDI Foreign Direct Investment Investissements Directs Étrangers (IDE)
FMO Netherlands Development Finance Company Netherlands Development Finance Company
F/S Feasibility Study Étude de Faisabilité (E/F)
FTZ Free Trade Zone Zone de libre-échange
GDP Gross Domestic Product Produit Intérieur Brut (PIB)
GDSNA Directorate General of Statistics and National AccountsDirection Générale de la Statistique et de la Comptabilité Nationale (DGSCN)
GHG Greenhouse Gas Gaz à Effet de Serre (GES)
GIFS Integrated Management of Soil Fertility Gestion Intégrée de la Fertilité des Sols
GIPATO Groupement Interprofessionnel des Artisans of Togo Groupement Inter Professionnel des Artisans du Togo
GIRE Integrated Management of Water Resources Gestion Intégrée des Ressources en Eau
GoJ Government of Japan Gouvernement du Japon
GoT Government of Togo Gouvernement du Togo
GPS Global Positioning System -
GSM-R Global System for Mobile Communications-Railway -
HCM Highway Capacity Manual Highway Capacity Manual
HDM-4 Highway Development and Management Model-4 -
HIV Human Immunodeficiency Virus Virus de l'immunodéficience Humaine (VIH)
HS Harmonized Commodity Description and Coding System
Système Harmonisé de Désignation et de Codification des Marchandises
ICAT Institute of Technical Support Tips Institut de Conseils d’Appui Technique
ICB International Competitive Bidding Appel d’offres international
ICD Inland Container Depot Dépôt intérieur de conteneurs (DIC)
ICT Information and Communication Technology Technologies de l'information et de la communication (TIC)
IDA International Development Association Association internationale de développement (AID)
IDB Islamic Development Bank Banque Islamique de Développement
IEE Initial Environmental Examination Examen Environnemental Initial (EEI)
IFC International Finance Corporation Société financière internationale (SFI)
IFG-TG International Fertilizers Group-Togo International Fertilizers Group-Togo
IMF International Monetary Fund Institution de Micro Finance
INFA National Institute for Agricultural Training L’Institut National de Formation Agricole
IRDP-Mô Integrated Rural Development Project of Mô plain Projet de Développement Rural Intégré de la plaine de Mô
IRI International Roughness Index Indice de Rugosité International
ISFM Promotion of Integrated Soil Fertility Management Gestion Intégrée de la Fertilité des Sols
ISPS International Ship and Port Facility Security International Ship and Port Facility Security
ITC Information Technology and Communication Technologies de l'information et de la Communication (TIC)
ITCZ Intertropical Convergence Zone Zone Intertropicale de Convergence (ZIC)
ITRA Togolese Institute for Agronomic Research Institut Togolais de la Recherche Agronomique
IUCN International Union for Conservation of Nature
Union Internationale pour la Conservation de la Nature (UICN)
IUOTO International Union of Official Travel Organizations l'Union internationale des organismes Officiels de tourisme (UIOOT)
IWRM Integrated Water Resources Management Gestion Intégrée des Ressources en Eau (GIRE)
JICA Japan International Cooperation Agency Agence Japonaise de Coopération Internationale
KV Kilovolt Kilovolts
JPY Japanese Yen Yen japonais
LCL Less than Container Load Charge Less Conteneur
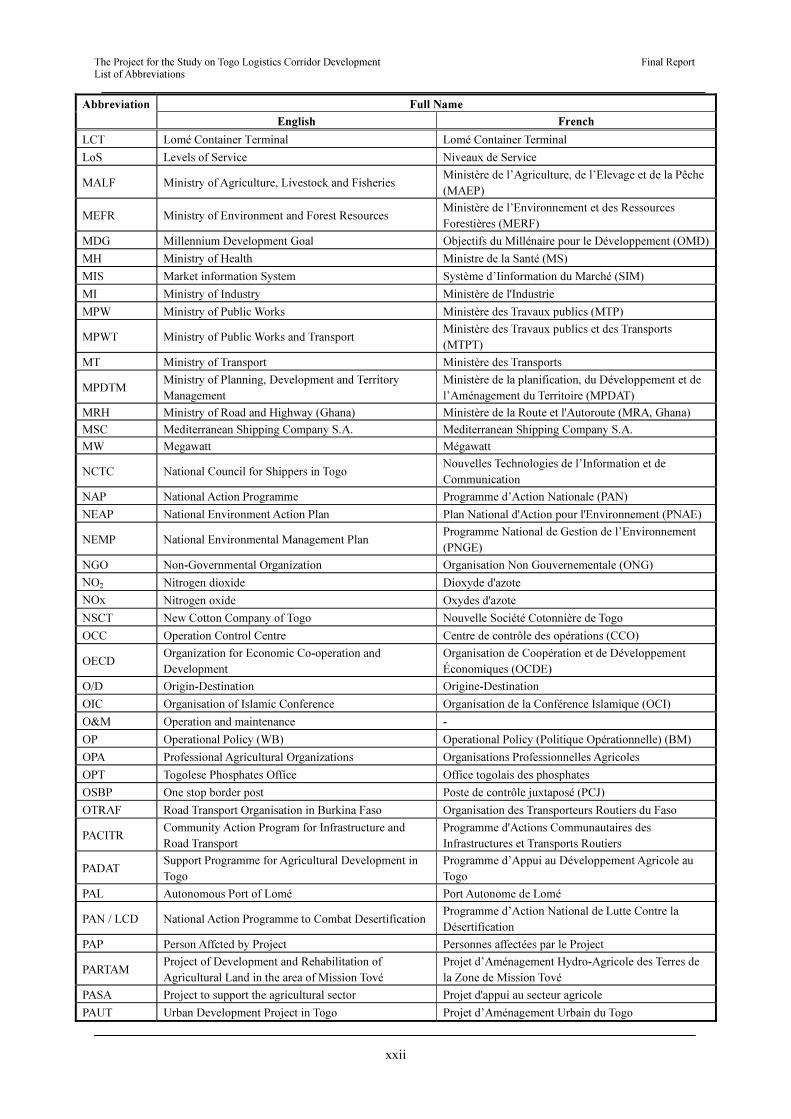
The Project for the Study on Togo Logistics Corridor Development Final Report List of Abbreviations
xxii
Abbreviation Full Name
English French
LCT Lomé Container Terminal Lomé Container Terminal
LoS Levels of Service Niveaux de Service
MALF Ministry of Agriculture, Livestock and Fisheries Ministère de l’Agriculture, de l’Elevage et de la Pêche (MAEP)
MEFR Ministry of Environment and Forest Resources Ministère de l’Environnement et des Ressources Forestières (MERF)
MDG Millennium Development Goal Objectifs du Millénaire pour le Développement (OMD)
MH Ministry of Health Ministre de la Santé (MS)
MIS Market information System Système d’Iinformation du Marché (SIM)
MI Ministry of Industry Ministère de l'Industrie
MPW Ministry of Public Works Ministère des Travaux publics (MTP)
MPWT Ministry of Public Works and Transport Ministère des Travaux publics et des Transports (MTPT)
MT Ministry of Transport Ministère des Transports
MPDTM Ministry of Planning, Development and Territory Management
Ministère de la planification, du Développement et de l’Aménagement du Territoire (MPDAT)
MRH Ministry of Road and Highway (Ghana) Ministère de la Route et l'Autoroute (MRA, Ghana)
MSC Mediterranean Shipping Company S.A. Mediterranean Shipping Company S.A.
MW Megawatt Mégawatt
NCTC National Council for Shippers in Togo Nouvelles Technologies de l’Information et de Communication
NAP National Action Programme Programme d’Action Nationale (PAN)
NEAP National Environment Action Plan Plan National d'Action pour l'Environnement (PNAE)
NEMP National Environmental Management Plan Programme National de Gestion de l’Environnement (PNGE)
NGO Non-Governmental Organization Organisation Non Gouvernementale (ONG)
NO2 Nitrogen dioxide Dioxyde d'azote
NOx Nitrogen oxide Oxydes d'azote
NSCT New Cotton Company of Togo Nouvelle Société Cotonnière de Togo
OCC Operation Control Centre Centre de contrôle des opérations (CCO)
OECD Organization for Economic Co-operation and Development
Organisation de Coopération et de Développement Économiques (OCDE)
O/D Origin-Destination Origine-Destination
OIC Organisation of Islamic Conference Organisation de la Conférence Islamique (OCI)
O&M Operation and maintenance -
OP Operational Policy (WB) Operational Policy (Politique Opérationnelle) (BM)
OPA Professional Agricultural Organizations Organisations Professionnelles Agricoles
OPT Togolese Phosphates Office Office togolais des phosphates
OSBP One stop border post Poste de contrôle juxtaposé (PCJ)
OTRAF Road Transport Organisation in Burkina Faso Organisation des Transporteurs Routiers du Faso
PACITR Community Action Program for Infrastructure and Road Transport
Programme d'Actions Communautaires des Infrastructures et Transports Routiers
PADAT Support Programme for Agricultural Development in Togo
Programme d’Appui au Développement Agricole au Togo
PAL Autonomous Port of Lomé Port Autonome de Lomé
PAN / LCD National Action Programme to Combat DesertificationProgramme d’Action National de Lutte Contre la Désertification
PAP Person Affcted by Project Personnes affectées par le Project
PARTAM Project of Development and Rehabilitation of Agricultural Land in the area of Mission Tové
Projet d’Aménagement Hydro-Agricole des Terres de la Zone de Mission Tové
PASA Project to support the agricultural sector Projet d'appui au secteur agricole
PAUT Urban Development Project in Togo Projet d’Aménagement Urbain du Togo
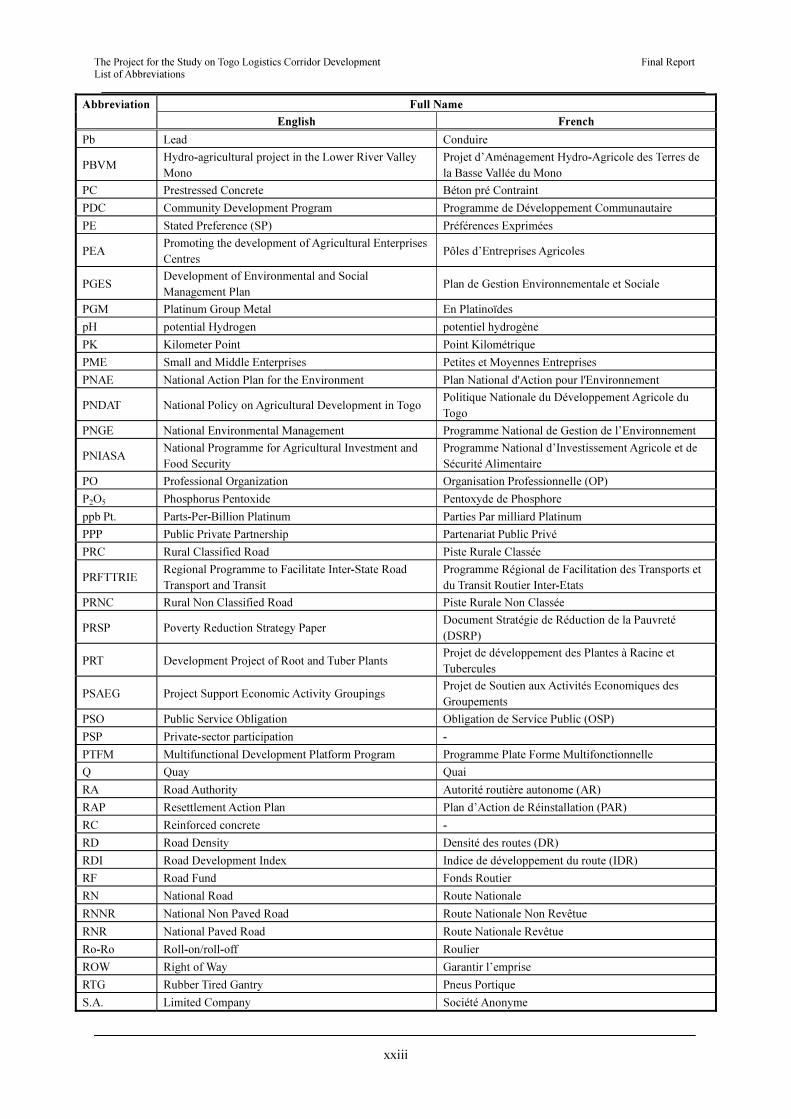
The Project for the Study on Togo Logistics Corridor Development Final Report List of Abbreviations
xxiii
Abbreviation Full Name
English French
Pb Lead Conduire
PBVM Hydro-agricultural project in the Lower River Valley Mono
Projet d’Aménagement Hydro-Agricole des Terres de la Basse Vallée du Mono
PC Prestressed Concrete Béton pré Contraint
PDC Community Development Program Programme de Développement Communautaire
PE Stated Preference (SP) Préférences Exprimées
PEA Promoting the development of Agricultural Enterprises Centres
Pôles d’Entreprises Agricoles
PGES Development of Environmental and Social Management Plan
Plan de Gestion Environnementale et Sociale
PGM Platinum Group Metal En Platinoïdes
pH potential Hydrogen potentiel hydrogène
PK Kilometer Point Point Kilométrique
PME Small and Middle Enterprises Petites et Moyennes Entreprises
PNAE National Action Plan for the Environment Plan National d'Action pour l'Environnement
PNDAT National Policy on Agricultural Development in Togo Politique Nationale du Développement Agricole du Togo
PNGE National Environmental Management Programme National de Gestion de l’Environnement
PNIASA National Programme for Agricultural Investment and Food Security
Programme National d’Investissement Agricole et de Sécurité Alimentaire
PO Professional Organization Organisation Professionnelle (OP)
P2O5 Phosphorus Pentoxide Pentoxyde de Phosphore
ppb Pt. Parts-Per-Billion Platinum Parties Par milliard Platinum
PPP Public Private Partnership Partenariat Public Privé
PRC Rural Classified Road Piste Rurale Classée
PRFTTRIE Regional Programme to Facilitate Inter-State Road Transport and Transit
Programme Régional de Facilitation des Transports et du Transit Routier Inter-Etats
PRNC Rural Non Classified Road Piste Rurale Non Classée
PRSP Poverty Reduction Strategy Paper Document Stratégie de Réduction de la Pauvreté (DSRP)
PRT Development Project of Root and Tuber Plants Projet de développement des Plantes à Racine et Tubercules
PSAEG Project Support Economic Activity Groupings Projet de Soutien aux Activités Economiques des Groupements
PSO Public Service Obligation Obligation de Service Public (OSP)
PSP Private-sector participation -
PTFM Multifunctional Development Platform Program Programme Plate Forme Multifonctionnelle
Q Quay Quai
RA Road Authority Autorité routière autonome (AR)
RAP Resettlement Action Plan Plan d’Action de Réinstallation (PAR)
RC Reinforced concrete -
RD Road Density Densité des routes (DR)
RDI Road Development Index Indice de développement du route (IDR)
RF Road Fund Fonds Routier
RN National Road Route Nationale
RNNR National Non Paved Road Route Nationale Non Revêtue
RNR National Paved Road Route Nationale Revêtue
Ro-Ro Roll-on/roll-off Roulier
ROW Right of Way Garantir l’emprise
RTG Rubber Tired Gantry Pneus Portique
S.A. Limited Company Société Anonyme
The Project for the Study on Togo Logistics Corridor Development Final Report List of Abbreviations
xxiv
Abbreviation Full Name
English French
SAFER Autonomous Company in charge of Road Financing Société Autonome de Financement de l'Entretien Routier
SAM Furniture and Joinery Company Société d’Ameublement de Menuiseries
SAP Structural Adjustment Programs Programmes d’Ajustement Structurels (PAS)
SAZOF Society of Directors of the Zone Société d’Administration de la Zone Franche
SCAPE Strategy of Accelerated Growth and Employment Stratégie de Croissance Accélérée et de Promotion de l’Emploi
SEA Strategic Environmental Assessment Évaluation Environnementale Stratégique (EES)
SEDEX Sedimentary Exhalative Exhalatif Sédimentaire
SETRA Technical Guidelines for Design of Roads for the Construction of Major Roads
d'Etudes Techniques des Routes et Autoroutes
SiO2 Silicon Dioxide Dioxyde de silicium
SME Small and medium enterprise Petites et Moyennes Entreprises (PME)
SMS Short Message Service Short Message Service
SNCT National Society of the Railways of Togo Nouvelle Société Cotonnière du Togo
SNDD National Strategy on Sustainable Development Stratégie Nationale de Développement Durable
SNPR National Feeder Road Department Service National des Pistes Rurales
SNPT New Phosphates Society of Togo Société Nouvelle des Phosphates de Togo
SO2 Sulphur Dioxide Dioxyde de Soufre
SiO2 Silicon Dioxide Dioxyde de silicium
SOTOMA Togolese Marble Society Société Togolaise de Marbrerie
SOTRAL Transport Society in Lomé Sociétéde Transportde Lomé
SP Stated Preference Préférences Exprimées (PE)
SPT Standard Penetration Test -
SS Suspended solids Matière en suspension (MES)
SSA Sub-Sahara Africa Afrique subsaharienne (ASS)
STD Sexually Transmitted Diseases Maladie Sexuellement Transmissible (MST)
STI Sexually Transmitted Infection Infections Sexuellement Transmissibles (IST)
SWOT Strengths, Weaknesses, Opportunities, and Threats Forces Faiblesses Opportunités Menaces (FFOM)
TEU Twenty-foot Equivalent Unit Équivalent Vingt Pieds (EVP)
TEX Togo Textile Factory Usine Textile Togo
TLC Togo Logistic Corridor Togo Corridor Logistique
TVT Togo Television Télévision officielle du Togo
UDPT Urban Development Project in Togo Projet d’Aménagement Urbain du Togo (PAUT)
UIC International Union of Railways Union Internationalle des Chemins de fer
UN United Nations Organisation des Nations unies (OUN)
UNCCD United Nations Convention to Combat Desertification -
UNCTAD United Nations Conference on Trade and DevelopmentConférence des Nations Unies sur le Commerce et le Développement (CNUCED)
UNECA United Nations Economic Commission for Africa Nations Unies Commision économique pour l’Afrique (NUCEA)
UNUT Niger Public Transport Utilisation Concil Conseil Nigerien des Utilisateurs des Transport Publics
UNWTO United Nations World Tourism Organization Organisation mondiale du tourisme (OMT)
USA United States of America États-Unis d'Amérique
USAID United States Agency for International Development L’Agence des États-Unis pour le développement International
USD United States Dollar Dollar US
UTB Union Bank of Togo Union Togolaise de Banque
VAT Value Added Tax Taxe sur la Valeur Ajoutée (TVA)
v/c Volume by Capacity Ratio Volume de ratio de capacité
veh./day vehicle per day véhicules par jour (véh./jour)
The Project for the Study on Togo Logistics Corridor Development Final Report List of Abbreviations
xxv
Abbreviation Full Name
English French
VOC Vehicle Operating Cost Coût d’opération des véhicules (COV)
VTCC Vehicle Technical Control Centre Centre de Contrôle Technique Automobile (CCTV)
WAAPP West Africa Agricultural Productivity Program Programme de Productivité Agricole en Afrique de l’Ouest (PPAAO)
WACEM West African Cement S.A. West African Cement
WADB West African Development Bank Banque Ouest-Africaine de Développement (BOAD)
WAEMU West African Economic and Monetary Union Union Économique et Monétaire Ouest-Africaine (UEMOA)
WB World Bank Banque Mondiale (BM)
WFP World Food Program Programme Alimentaire Mondial (PAM)
ZAAP Priority Action Area Zone d'Action Prioritaire

CHAPTER 1
INTRODUCTION
The Project for the Study on Togo Logistics Corridor Development Final Report Chapter 1 Introduction
1 - 1
Chapter 1 Introduction
1.1 Background of the Study
The TLC has significant potential for the economic and social development of Togo and the
region. The 667 km corridor, stretching from the Lomé Port, an entrance to Togo to Cinkassé, to
the border with Burkina Faso, includes roads, bridges, and railway, and is mainstay of the
country. Restarting full-scale economic development in 2007, Togo declared its policy of
becoming a “port-oriented nation” by stimulating both transhipment and transit, supported by
increasing the capacity of the Lomé Port.
The sub-region also has the same goals. The WAEMU and ECOWAS are taking the initiative
for promoting smooth regional logistics. As benchmarks, WAEMU and ECOWAS instituted the
Community Infrastructure and Road Transport Action Programme (PACITR: Le Programme
d’Actions Communautaire des Infrastructures et Transports Routiers) and Regional Programme
to Facilitate Inter-State Road Transport and Transit (PRFTTRIE: Programme Régional de
Facilitation des Transports et du Transit Routier Inter-Etats) to coordinate and harmonise the
strategies for development of the transport sector in all member nations, then designated 11
corridors, which include the TLC, as priority for development.
These intrinsic potentials drove the GoT to request the Government of Japan (GoJ) for
technical cooperation for development planning through the “Project for Modernisation and
Development of the Transport Sector” to harmonise all development projects and plans under
one umbrella to achieve the effective and efficient modernisation and development of the
country.
Based on the request from the GoT, the MT and MPW1 of the GoT, and Japan International
Cooperation Agency (JICA) have discussed and initiated the project by dispatching a JICA
mission to conduct a preparatory survey for the project. As a result of the series of discussions,
the Togo side and JICA’s mission agreed to carry out the “Project for the Study on Togo
Logistics Corridor Development” (Study).
1.2 Objectives of the Study
The objectives of the Study are as follows:
(1) To prepare the TLC Development Master Plan with a target year of 2030, including all
medium- and long-term priority projects.
(2) To share the results of the Study to prepare the TLC Development Master Plan, including
priority projects, with development partners.
1 The Ministry of Transport and the Ministry of Public Works merged on 18th September, 2013 after the National Assembly election on
25th July, 2013, to become the Ministry of Public Works and Transports. This report, however, refers to the previous government organizational structure, except Chapters 10 and 12.
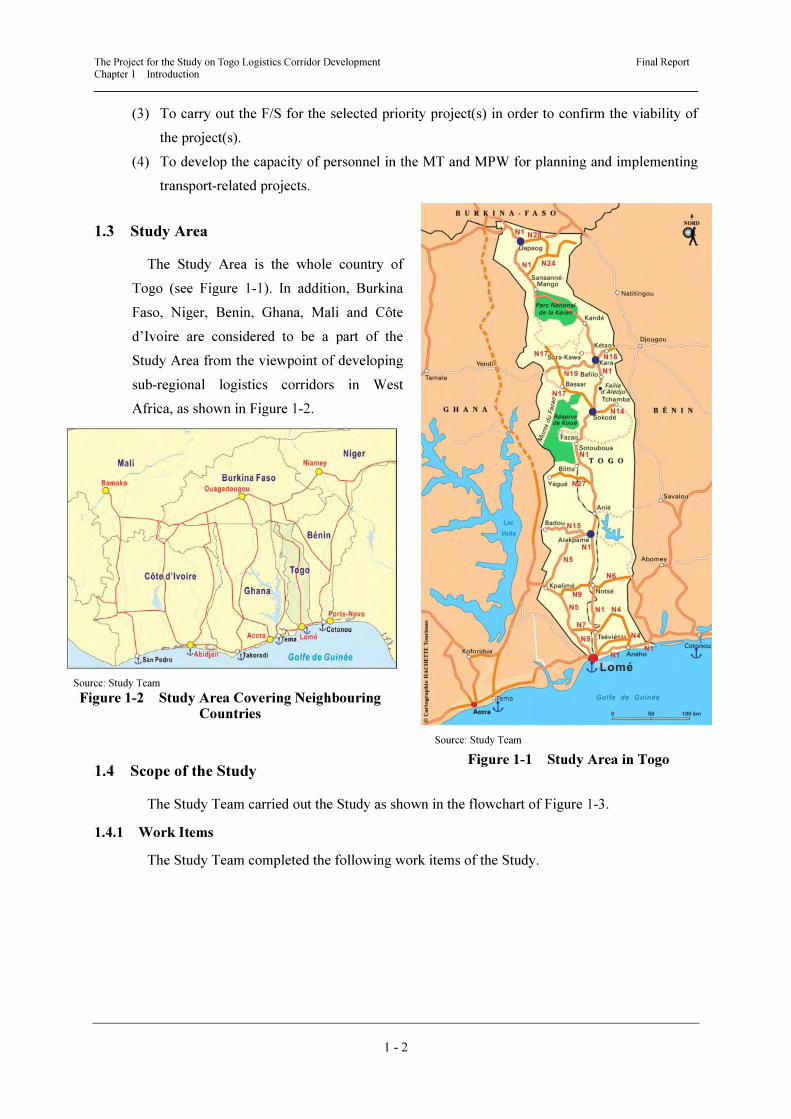
The Project for the Study on Togo Logistics Corridor Development Final Report Chapter 1 Introduction
1 - 2
(3) To carry out the F/S for the selected priority project(s) in order to confirm the viability of
the project(s).
(4) To develop the capacity of personnel in the MT and MPW for planning and implementing
transport-related projects.
1.3 Study Area
The Study Area is the whole country of
Togo (see Figure 1-1). In addition, Burkina
Faso, Niger, Benin, Ghana, Mali and Côte
d’Ivoire are considered to be a part of the
Study Area from the viewpoint of developing
sub-regional logistics corridors in West
Africa, as shown in Figure 1-2.
1.4 Scope of the Study
The Study Team carried out the Study as shown in the flowchart of Figure 1-3.
1.4.1 Work Items
The Study Team completed the following work items of the Study.
Source: Study Team
Figure 1-1 Study Area in Togo
Source: Study Team
Figure 1-2 Study Area Covering Neighbouring Countries
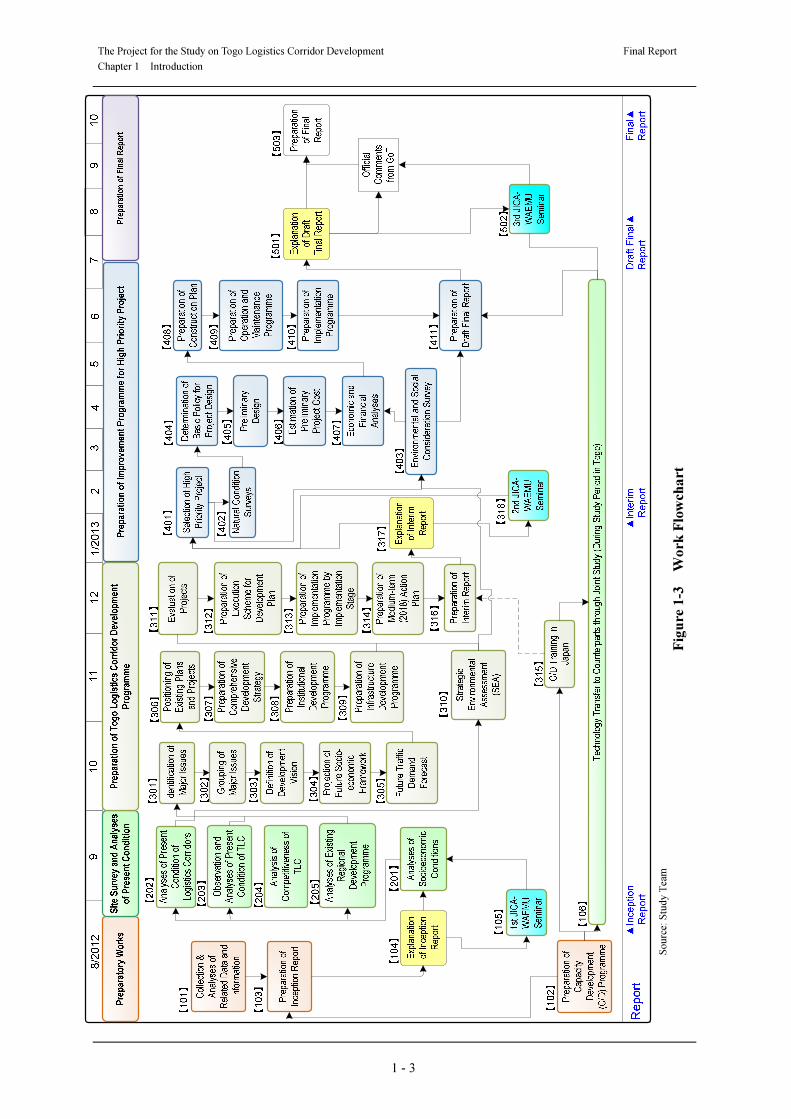
The Project for the Study on Togo Logistics Corridor Development Final Report
Chapter 1 Introduction
1 - 3
Sourc
e: S
tudy T
eam
Fig
ure 1
-3
W
ork
Flo
wch
art
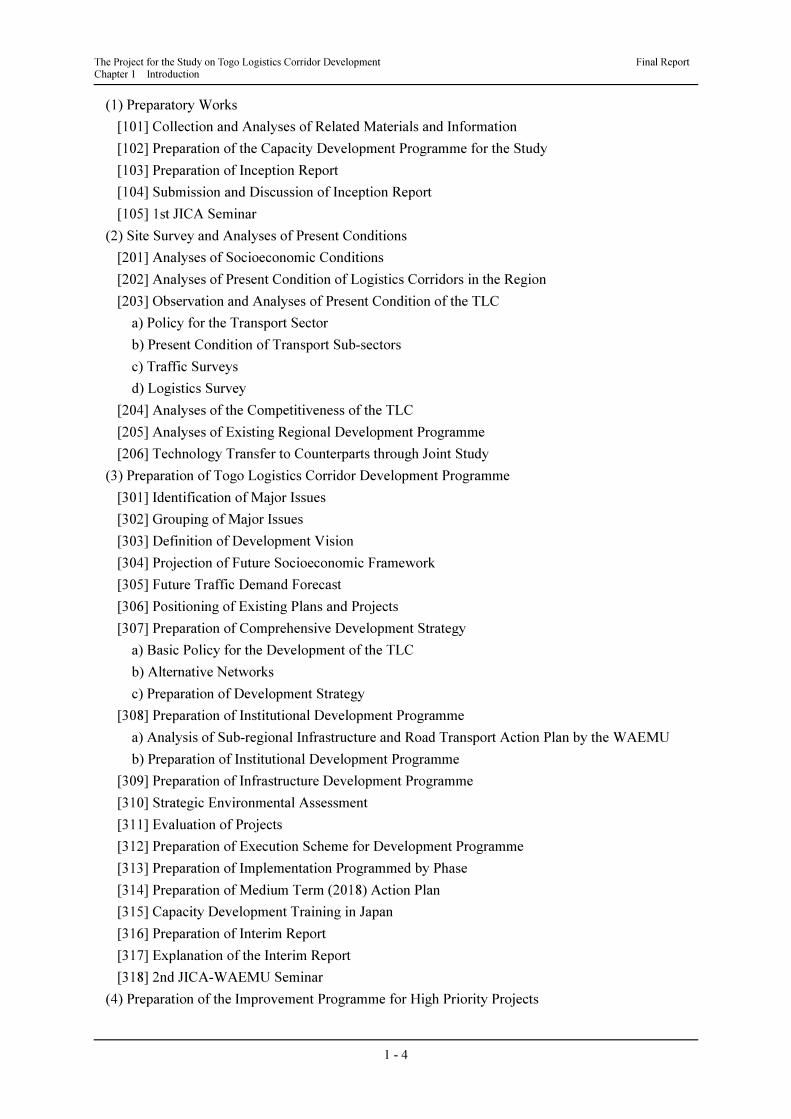
The Project for the Study on Togo Logistics Corridor Development Final Report Chapter 1 Introduction
1 - 4
(1) Preparatory Works
[101] Collection and Analyses of Related Materials and Information
[102] Preparation of the Capacity Development Programme for the Study
[103] Preparation of Inception Report
[104] Submission and Discussion of Inception Report
[105] 1st JICA Seminar
(2) Site Survey and Analyses of Present Conditions
[201] Analyses of Socioeconomic Conditions
[202] Analyses of Present Condition of Logistics Corridors in the Region
[203] Observation and Analyses of Present Condition of the TLC
a) Policy for the Transport Sector
b) Present Condition of Transport Sub-sectors
c) Traffic Surveys
d) Logistics Survey
[204] Analyses of the Competitiveness of the TLC
[205] Analyses of Existing Regional Development Programme
[206] Technology Transfer to Counterparts through Joint Study
(3) Preparation of Togo Logistics Corridor Development Programme
[301] Identification of Major Issues
[302] Grouping of Major Issues
[303] Definition of Development Vision
[304] Projection of Future Socioeconomic Framework
[305] Future Traffic Demand Forecast
[306] Positioning of Existing Plans and Projects
[307] Preparation of Comprehensive Development Strategy
a) Basic Policy for the Development of the TLC
b) Alternative Networks
c) Preparation of Development Strategy
[308] Preparation of Institutional Development Programme
a) Analysis of Sub-regional Infrastructure and Road Transport Action Plan by the WAEMU
b) Preparation of Institutional Development Programme
[309] Preparation of Infrastructure Development Programme
[310] Strategic Environmental Assessment
[311] Evaluation of Projects
[312] Preparation of Execution Scheme for Development Programme
[313] Preparation of Implementation Programmed by Phase
[314] Preparation of Medium Term (2018) Action Plan
[315] Capacity Development Training in Japan
[316] Preparation of Interim Report
[317] Explanation of the Interim Report
[318] 2nd JICA-WAEMU Seminar
(4) Preparation of the Improvement Programme for High Priority Projects
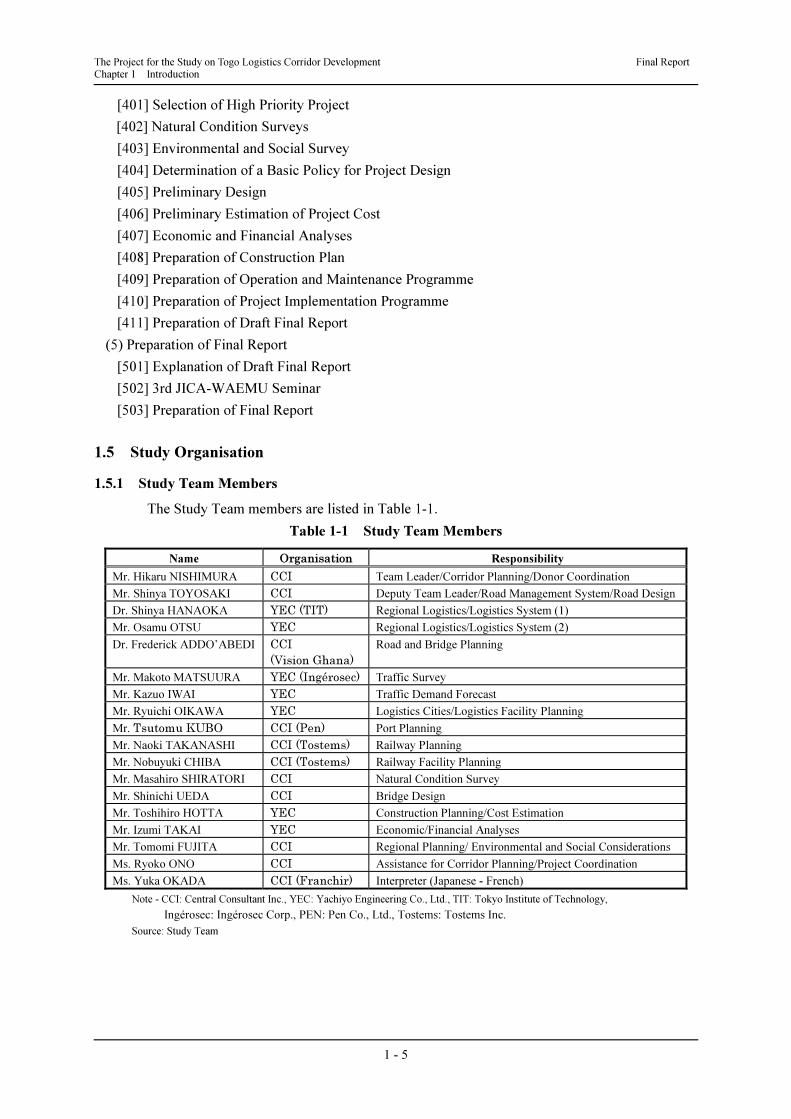
The Project for the Study on Togo Logistics Corridor Development Final Report Chapter 1 Introduction
1 - 5
[401] Selection of High Priority Project
[402] Natural Condition Surveys
[403] Environmental and Social Survey
[404] Determination of a Basic Policy for Project Design
[405] Preliminary Design
[406] Preliminary Estimation of Project Cost
[407] Economic and Financial Analyses
[408] Preparation of Construction Plan
[409] Preparation of Operation and Maintenance Programme
[410] Preparation of Project Implementation Programme
[411] Preparation of Draft Final Report
(5) Preparation of Final Report
[501] Explanation of Draft Final Report
[502] 3rd JICA-WAEMU Seminar
[503] Preparation of Final Report
1.5 Study Organisation
1.5.1 Study Team Members
The Study Team members are listed in Table 1-1.
Table 1-1 Study Team Members
Name Organisation Responsibility
Mr. Hikaru NISHIMURA CCI Team Leader/Corridor Planning/Donor Coordination
Mr. Shinya TOYOSAKI CCI Deputy Team Leader/Road Management System/Road Design
Dr. Shinya HANAOKA YEC (TIT) Regional Logistics/Logistics System (1)
Mr. Osamu OTSU YEC Regional Logistics/Logistics System (2)
Dr. Frederick ADDO’ABEDI CCI
(Vision Ghana)
Road and Bridge Planning
Mr. Makoto MATSUURA YEC (Ingérosec) Traffic Survey
Mr. Kazuo IWAI YEC Traffic Demand Forecast
Mr. Ryuichi OIKAWA YEC Logistics Cities/Logistics Facility Planning
Mr. Tsutomu KUBO CCI (Pen) Port Planning
Mr. Naoki TAKANASHI CCI (Tostems) Railway Planning
Mr. Nobuyuki CHIBA CCI (Tostems) Railway Facility Planning
Mr. Masahiro SHIRATORI CCI Natural Condition Survey
Mr. Shinichi UEDA CCI Bridge Design
Mr. Toshihiro HOTTA YEC Construction Planning/Cost Estimation
Mr. Izumi TAKAI YEC Economic/Financial Analyses
Mr. Tomomi FUJITA CCI Regional Planning/ Environmental and Social Considerations
Ms. Ryoko ONO CCI Assistance for Corridor Planning/Project Coordination
Ms. Yuka OKADA CCI (Franchir) Interpreter (Japanese - French)
Note - CCI: Central Consultant Inc., YEC: Yachiyo Engineering Co., Ltd., TIT: Tokyo Institute of Technology,
Ingérosec: Ingérosec Corp., PEN: Pen Co., Ltd., Tostems: Tostems Inc.
Source: Study Team
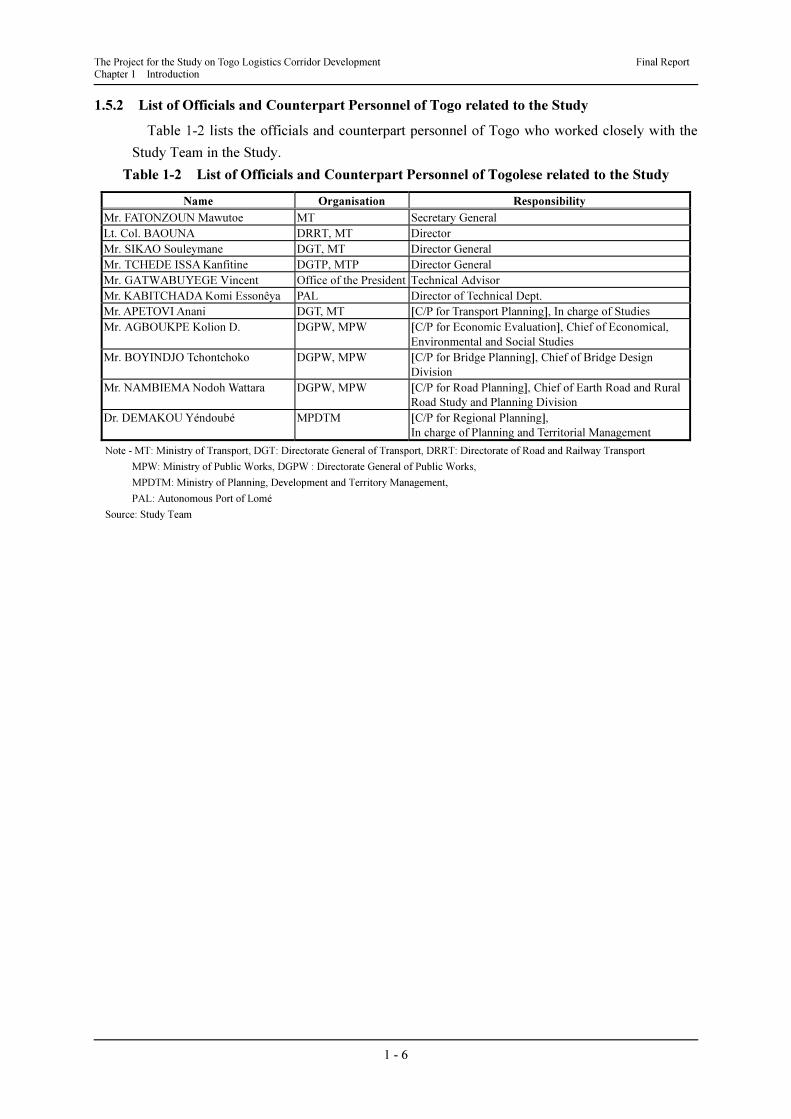
The Project for the Study on Togo Logistics Corridor Development Final Report Chapter 1 Introduction
1 - 6
1.5.2 List of Officials and Counterpart Personnel of Togo related to the Study
Table 1-2 lists the officials and counterpart personnel of Togo who worked closely with the
Study Team in the Study.
Table 1-2 List of Officials and Counterpart Personnel of Togolese related to the Study
Name Organisation Responsibility
Mr. FATONZOUN Mawutoe MT Secretary General
Lt. Col. BAOUNA DRRT, MT Director
Mr. SIKAO Souleymane DGT, MT Director General
Mr. TCHEDE ISSA Kanfitine DGTP, MTP Director General
Mr. GATWABUYEGE Vincent Office of the President Technical Advisor
Mr. KABITCHADA Komi Essonêya PAL Director of Technical Dept.
Mr. APETOVI Anani DGT, MT [C/P for Transport Planning], In charge of Studies
Mr. AGBOUKPE Kolion D. DGPW, MPW [C/P for Economic Evaluation], Chief of Economical,
Environmental and Social Studies
Mr. BOYINDJO Tchontchoko DGPW, MPW [C/P for Bridge Planning], Chief of Bridge Design
Division
Mr. NAMBIEMA Nodoh Wattara DGPW, MPW [C/P for Road Planning], Chief of Earth Road and Rural
Road Study and Planning Division
Dr. DEMAKOU Yéndoubé MPDTM [C/P for Regional Planning],
In charge of Planning and Territorial Management
Note - MT: Ministry of Transport, DGT: Directorate General of Transport, DRRT: Directorate of Road and Railway Transport
MPW: Ministry of Public Works, DGPW : Directorate General of Public Works,
MPDTM: Ministry of Planning, Development and Territory Management,
PAL: Autonomous Port of Lomé
Source: Study Team

CHAPTER 2
OUTLINE OF
THE STUDY AREA
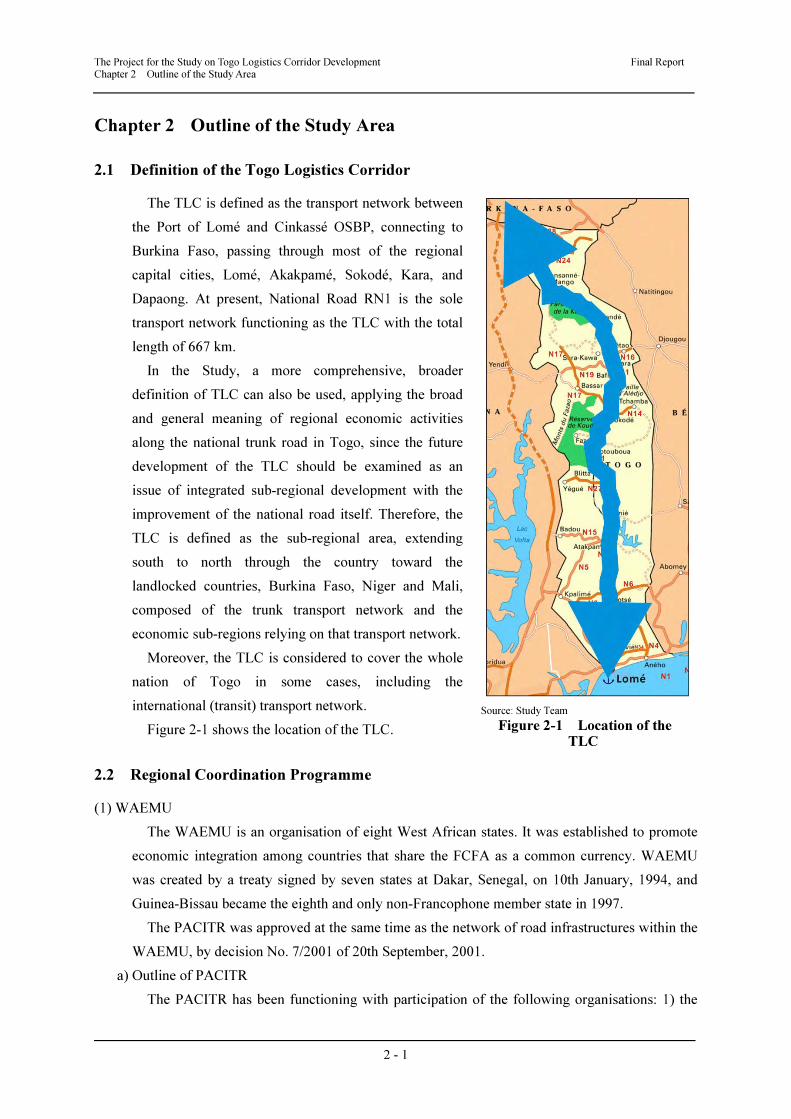
The Project for the Study on Togo Logistics Corridor Development Final Report Chapter 2 Outline of the Study Area
2 - 1
Chapter 2 Outline of the Study Area
2.1 Definition of the Togo Logistics Corridor
The TLC is defined as the transport network between
the Port of Lomé and Cinkassé OSBP, connecting to
Burkina Faso, passing through most of the regional
capital cities, Lomé, Akakpamé, Sokodé, Kara, and
Dapaong. At present, National Road RN1 is the sole
transport network functioning as the TLC with the total
length of 667 km.
In the Study, a more comprehensive, broader
definition of TLC can also be used, applying the broad
and general meaning of regional economic activities
along the national trunk road in Togo, since the future
development of the TLC should be examined as an
issue of integrated sub-regional development with the
improvement of the national road itself. Therefore, the
TLC is defined as the sub-regional area, extending
south to north through the country toward the
landlocked countries, Burkina Faso, Niger and Mali,
composed of the trunk transport network and the
economic sub-regions relying on that transport network.
Moreover, the TLC is considered to cover the whole
nation of Togo in some cases, including the
international (transit) transport network.
Figure 2-1 shows the location of the TLC.
2.2 Regional Coordination Programme
(1) WAEMU
The WAEMU is an organisation of eight West African states. It was established to promote
economic integration among countries that share the FCFA as a common currency. WAEMU
was created by a treaty signed by seven states at Dakar, Senegal, on 10th January, 1994, and
Guinea-Bissau became the eighth and only non-Francophone member state in 1997.
The PACITR was approved at the same time as the network of road infrastructures within the
WAEMU, by decision No. 7/2001 of 20th September, 2001.
a) Outline of PACITR
The PACITR has been functioning with participation of the following organisations: 1) the
Source: Study Team
Figure 2-1 Location of the TLC

The Project for the Study on Togo Logistics Corridor Development Final Report Chapter 2 Outline of the Study Area
2 - 2
States of the union, 2) the three institutions of the union (the Commission, the West African
Development Bank (BOAD: Banque Ouest Africaine de Développement) and the West African
State Central Bank (BCEAO: La Banque Centrale des Etats de l'Afrique de l'Ouest), 3) the
operators of the transport sector, 4) the regional organisation of West Africa (ECOWAS), and
the Permanent Interstate Committee of Struggle against Drought in the Sahel (CILSS: Comité
permanent Inter-Etats de Lutte contre la Sécheresse dans le Sahel) and 5) development
partners.
As described in the structural chapter on the strategy, a communal network has been
determined and three priorities have been designated:
• 1st priority:
� The trunk roads joining the capitals cities of the Member States of the WAEMU.
• 2nd priority:
� The alternative links between the capital cities
� The interconnection roads
• 3rd priority
� The roads heading toward the neighbouring countries that are not members of the
union and extension roads of the communal network.
Table 2-1 shows the road development plans under the PACITR, and Table 2-2 shows the
programme for improvement under the PACITR and its target road network is shown in Figure
2-2.
Source : Programme d’Actions Communautaire, September 2001, WAEMU
Figure 2-2 Target Roads of the PACTIR
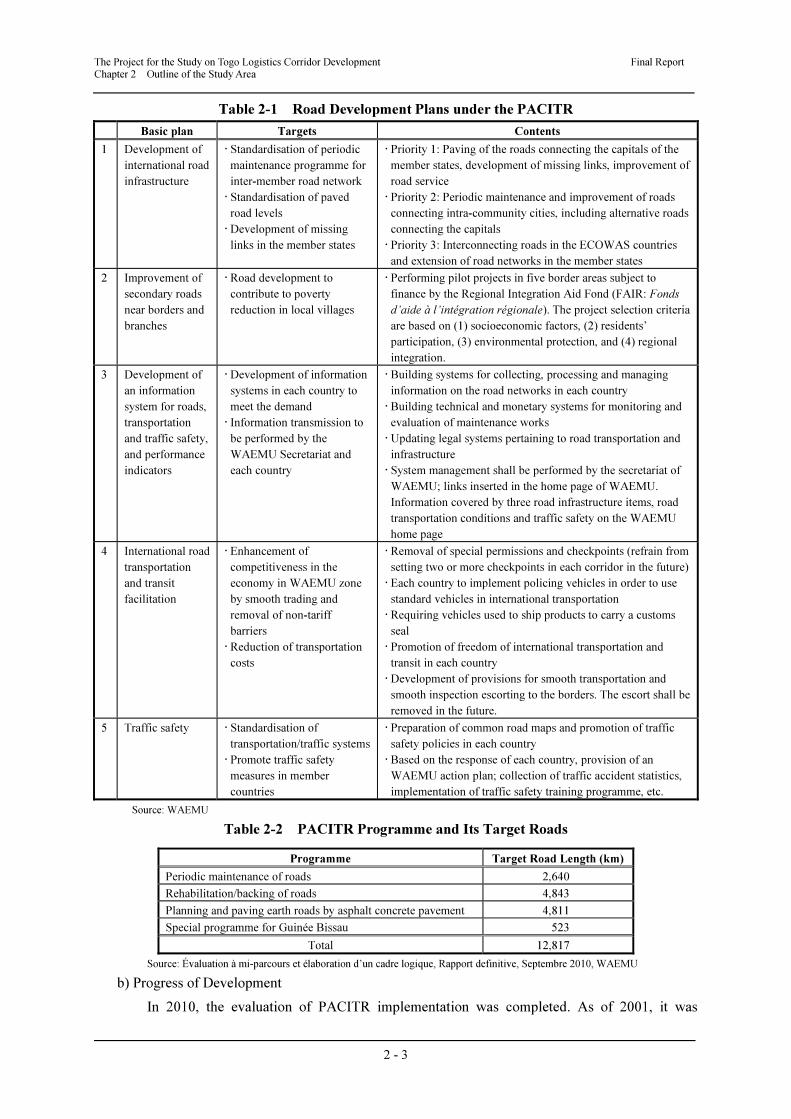
The Project for the Study on Togo Logistics Corridor Development Final Report Chapter 2 Outline of the Study Area
2 - 3
Table 2-1 Road Development Plans under the PACITR
Basic plan Targets Contents
1 Development of
international road
infrastructure
� Standardisation of periodic
maintenance programme for
inter-member road network
� Standardisation of paved
road levels
� Development of missing
links in the member states
� Priority 1: Paving of the roads connecting the capitals of the
member states, development of missing links, improvement of
road service
� Priority 2: Periodic maintenance and improvement of roads
connecting intra-community cities, including alternative roads
connecting the capitals
� Priority 3: Interconnecting roads in the ECOWAS countries
and extension of road networks in the member states
2 Improvement of
secondary roads
near borders and
branches
� Road development to
contribute to poverty
reduction in local villages
� Performing pilot projects in five border areas subject to
finance by the Regional Integration Aid Fond (FAIR: Fonds
d’aide à l’intégration régionale). The project selection criteria
are based on (1) socioeconomic factors, (2) residents’
participation, (3) environmental protection, and (4) regional
integration.
3 Development of
an information
system for roads,
transportation
and traffic safety,
and performance
indicators
� Development of information
systems in each country to
meet the demand
� Information transmission to
be performed by the
WAEMU Secretariat and
each country
� Building systems for collecting, processing and managing
information on the road networks in each country
� Building technical and monetary systems for monitoring and
evaluation of maintenance works
� Updating legal systems pertaining to road transportation and
infrastructure
� System management shall be performed by the secretariat of
WAEMU; links inserted in the home page of WAEMU.
Information covered by three road infrastructure items, road
transportation conditions and traffic safety on the WAEMU
home page
4 International road
transportation
and transit
facilitation
� Enhancement of
competitiveness in the
economy in WAEMU zone
by smooth trading and
removal of non-tariff
barriers
� Reduction of transportation
costs
� Removal of special permissions and checkpoints (refrain from
setting two or more checkpoints in each corridor in the future)
� Each country to implement policing vehicles in order to use
standard vehicles in international transportation
� Requiring vehicles used to ship products to carry a customs
seal
� Promotion of freedom of international transportation and
transit in each country
� Development of provisions for smooth transportation and
smooth inspection escorting to the borders. The escort shall be
removed in the future.
5 Traffic safety � Standardisation of
transportation/traffic systems
� Promote traffic safety
measures in member
countries
� Preparation of common road maps and promotion of traffic
safety policies in each country
� Based on the response of each country, provision of an
WAEMU action plan; collection of traffic accident statistics,
implementation of traffic safety training programme, etc.
Source: WAEMU
Table 2-2 PACITR Programme and Its Target Roads
Programme Target Road Length (km)
Periodic maintenance of roads 2,640
Rehabilitation/backing of roads 4,843
Planning and paving earth roads by asphalt concrete pavement 4,811
Special programme for Guinée Bissau 523
Total 12,817
Source: Évaluation à mi-parcours et élaboration d’un cadre logique, Rapport definitive, Septembre 2010, WAEMU
b) Progress of Development
In 2010, the evaluation of PACITR implementation was completed. As of 2001, it was
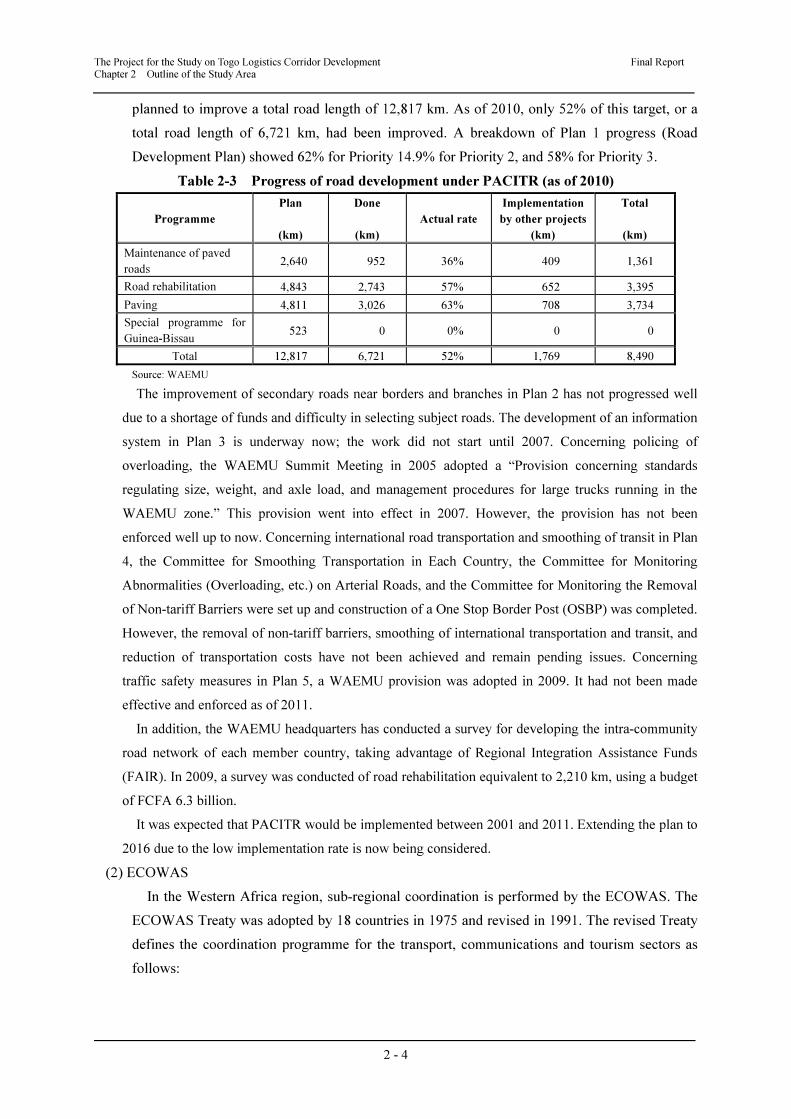
The Project for the Study on Togo Logistics Corridor Development Final Report Chapter 2 Outline of the Study Area
2 - 4
planned to improve a total road length of 12,817 km. As of 2010, only 52% of this target, or a
total road length of 6,721 km, had been improved. A breakdown of Plan 1 progress (Road
Development Plan) showed 62% for Priority 14.9% for Priority 2, and 58% for Priority 3.
Table 2-3 Progress of road development under PACITR (as of 2010)
Programme
Plan
(km)
Done
(km)
Actual rate
Implementation
by other projects
(km)
Total
(km)
Maintenance of paved
roads 2,640 952 36% 409 1,361
Road rehabilitation 4,843 2,743 57% 652 3,395
Paving 4,811 3,026 63% 708 3,734
Special programme for
Guinea-Bissau 523 0 0% 0 0
Total 12,817 6,721 52% 1,769 8,490
Source: WAEMU
The improvement of secondary roads near borders and branches in Plan 2 has not progressed well
due to a shortage of funds and difficulty in selecting subject roads. The development of an information
system in Plan 3 is underway now; the work did not start until 2007. Concerning policing of
overloading, the WAEMU Summit Meeting in 2005 adopted a “Provision concerning standards
regulating size, weight, and axle load, and management procedures for large trucks running in the
WAEMU zone.” This provision went into effect in 2007. However, the provision has not been
enforced well up to now. Concerning international road transportation and smoothing of transit in Plan
4, the Committee for Smoothing Transportation in Each Country, the Committee for Monitoring
Abnormalities (Overloading, etc.) on Arterial Roads, and the Committee for Monitoring the Removal
of Non-tariff Barriers were set up and construction of a One Stop Border Post (OSBP) was completed.
However, the removal of non-tariff barriers, smoothing of international transportation and transit, and
reduction of transportation costs have not been achieved and remain pending issues. Concerning
traffic safety measures in Plan 5, a WAEMU provision was adopted in 2009. It had not been made
effective and enforced as of 2011.
In addition, the WAEMU headquarters has conducted a survey for developing the intra-community
road network of each member country, taking advantage of Regional Integration Assistance Funds
(FAIR). In 2009, a survey was conducted of road rehabilitation equivalent to 2,210 km, using a budget
of FCFA 6.3 billion.
It was expected that PACITR would be implemented between 2001 and 2011. Extending the plan to
2016 due to the low implementation rate is now being considered.
(2) ECOWAS
In the Western Africa region, sub-regional coordination is performed by the ECOWAS. The
ECOWAS Treaty was adopted by 18 countries in 1975 and revised in 1991. The revised Treaty
defines the coordination programme for the transport, communications and tourism sectors as
follows:
The Project for the Study on Togo Logistics Corridor Development Final Report Chapter 2 Outline of the Study Area
2 - 5
Article 32 Transport and Communications
1. For the purpose of ensuring the harmonious integration of the physical infrastructures of
Member States and the promotion and facilitation of the movement of persons, goods and
services within the Community, Member States undertake to:
a) evolve common transport and communications policies, laws and regulations;
b) develop an extensive network of all-weather highways within the Community, priority
being given to the inter-State highways;
c) formulate plans for the improvement and integration of railway and road networks in
the region;
d) formulate programmes for the improvement of coastal shipping services and inter-state
inland waterways and the harmonisation of policies on maritime transport and services;
e) co-ordinate their positions in international negotiations in the area of maritime
transport;
f) encourage co-operation in flight-scheduling, leasing of aircraft and granting and joint
use of fifth freedom rights to airlines of the region;
g) promote the development of regional air transportation services and endeavour to bring
about the merger of national airlines in order to promote their efficiency and
profitability;
h) facilitate the development of human resources through the harmonisation and
coordination of their national training programmes and policies in the area of
transportation in general and air transport in particular;
i) endeavour to standardise equipment used in transport and communications and establish
common facilities for production, maintenance and repair.
2. Member States also undertake to encourage the establishment and promotion of joint
ventures and Community enterprises and the participation of the private sector in the
areas of transport and communications.
Source: ECOWAS website - http://www.comm.ecowas.int/sec/index.php?id=treaty&lang=en, April 2012
2.3 Social Conditions in Togo
2.3.1 Demography
(1) Population and Population Density in Togo
The latest population census was conducted by the Directorate General of Statistics and
National Accounts (DGSNA) of the Ministry of Planning, Development and Territory
Management (MPDTM) in 2010 after a long absence following the previous census in 1981.
Table 2-4 shows the population and population density by region in 1981 and 2010.
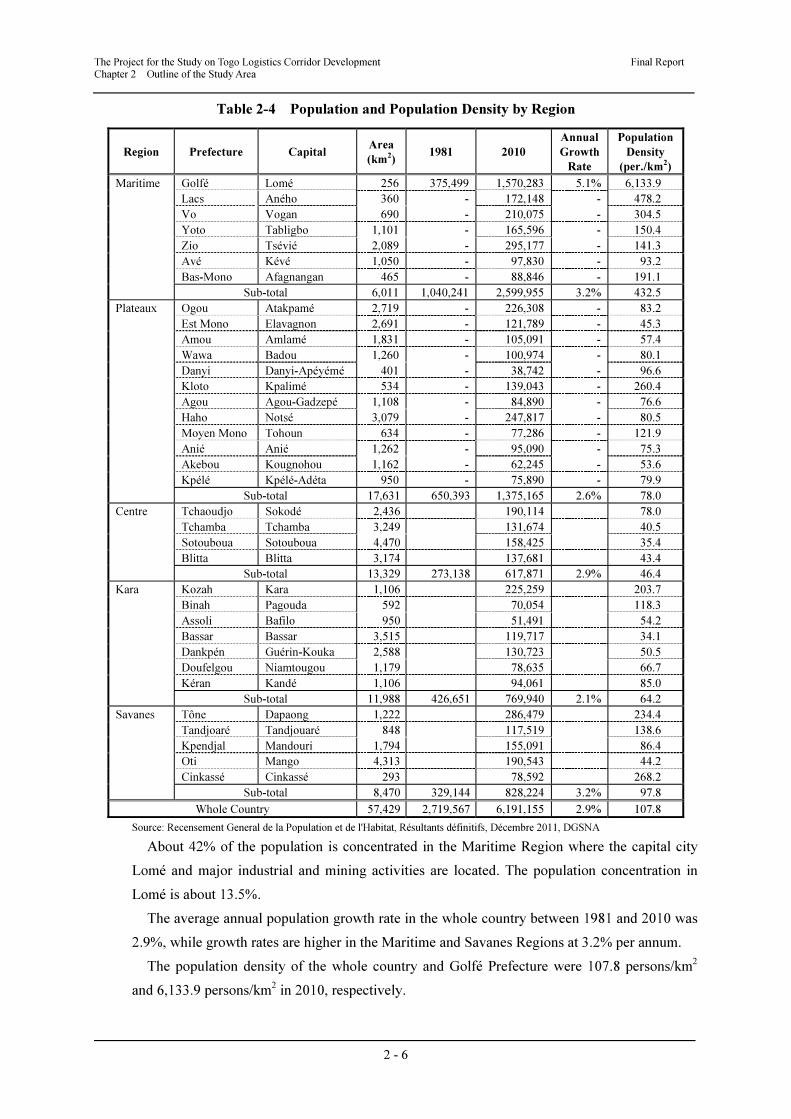
The Project for the Study on Togo Logistics Corridor Development Final Report Chapter 2 Outline of the Study Area
2 - 6
Table 2-4 Population and Population Density by Region
Region Prefecture Capital Area
(km2)1981 2010
Annual
Growth
Rate
Population
Density
(per./km2)
Maritime Golfé Lomé 256 375,499 1,570,283 5.1% 6,133.9
Lacs Aného 360 - 172,148 - 478.2
Vo Vogan 690 - 210,075 - 304.5
Yoto Tabligbo 1,101 - 165,596 - 150.4
Zio Tsévié 2,089 - 295,177 - 141.3
Avé Kévé 1,050 - 97,830 - 93.2
Bas-Mono Afagnangan 465 - 88,846 - 191.1
Sub-total 6,011 1,040,241 2,599,955 3.2% 432.5
Plateaux Ogou Atakpamé 2,719 - 226,308 - 83.2
Est Mono Elavagnon 2,691 - 121,789 - 45.3
Amou Amlamé 1,831 - 105,091 - 57.4
Wawa Badou 1,260 - 100,974 - 80.1
Danyi Danyi-Apéyémé 401 - 38,742 - 96.6
Kloto Kpalimé 534 - 139,043 - 260.4
Agou Agou-Gadzepé 1,108 - 84,890 - 76.6
Haho Notsé 3,079 - 247,817 - 80.5
Moyen Mono Tohoun 634 - 77,286 - 121.9
Anié Anié 1,262 - 95,090 - 75.3
Akebou Kougnohou 1,162 - 62,245 - 53.6
Kpélé Kpélé-Adéta 950 - 75,890 - 79.9
Sub-total 17,631 650,393 1,375,165 2.6% 78.0
Centre Tchaoudjo Sokodé 2,436 190,114 78.0
Tchamba Tchamba 3,249 131,674 40.5
Sotouboua Sotouboua 4,470 158,425 35.4
Blitta Blitta 3,174 137,681 43.4
Sub-total 13,329 273,138 617,871 2.9% 46.4
Kara Kozah Kara 1,106 225,259 203.7
Binah Pagouda 592 70,054 118.3
Assoli Bafilo 950 51,491 54.2
Bassar Bassar 3,515 119,717 34.1
Dankpén Guérin-Kouka 2,588 130,723 50.5
Doufelgou Niamtougou 1,179 78,635 66.7
Kéran Kandé 1,106 94,061 85.0
Sub-total 11,988 426,651 769,940 2.1% 64.2
Savanes Tône Dapaong 1,222 286,479 234.4
Tandjoaré Tandjouaré 848 117,519 138.6
Kpendjal Mandouri 1,794 155,091 86.4
Oti Mango 4,313 190,543 44.2
Cinkassé Cinkassé 293 78,592 268.2
Sub-total 8,470 329,144 828,224 3.2% 97.8
Whole Country 57,429 2,719,567 6,191,155 2.9% 107.8
Source: Recensement General de la Population et de l'Habitat, Résultants définitifs, Décembre 2011, DGSNA
About 42% of the population is concentrated in the Maritime Region where the capital city
Lomé and major industrial and mining activities are located. The population concentration in
Lomé is about 13.5%.
The average annual population growth rate in the whole country between 1981 and 2010 was
2.9%, while growth rates are higher in the Maritime and Savanes Regions at 3.2% per annum.
The population density of the whole country and Golfé Prefecture were 107.8 persons/km2
and 6,133.9 persons/km2 in 2010, respectively.
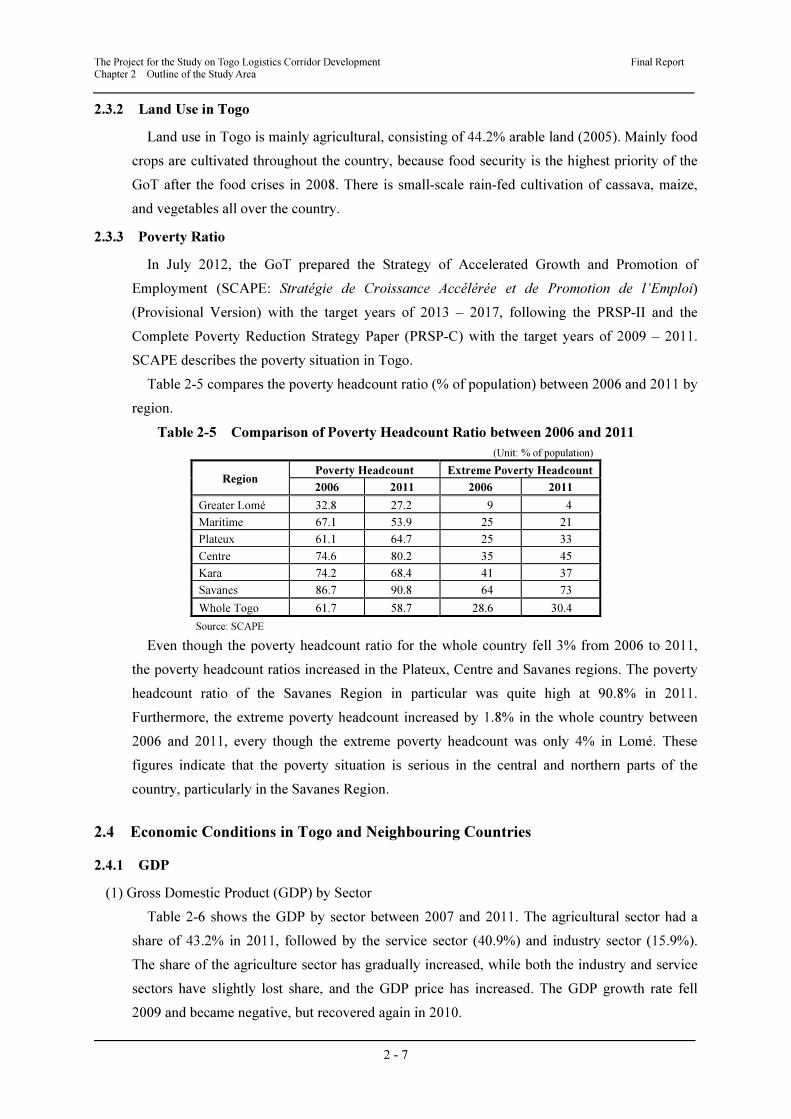
The Project for the Study on Togo Logistics Corridor Development Final Report Chapter 2 Outline of the Study Area
2 - 7
2.3.2 Land Use in Togo
Land use in Togo is mainly agricultural, consisting of 44.2% arable land (2005). Mainly food
crops are cultivated throughout the country, because food security is the highest priority of the
GoT after the food crises in 2008. There is small-scale rain-fed cultivation of cassava, maize,
and vegetables all over the country.
2.3.3 Poverty Ratio
In July 2012, the GoT prepared the Strategy of Accelerated Growth and Promotion of
Employment (SCAPE: Stratégie de Croissance Accélérée et de Promotion de l’Emploi)
(Provisional Version) with the target years of 2013 – 2017, following the PRSP-II and the
Complete Poverty Reduction Strategy Paper (PRSP-C) with the target years of 2009 – 2011.
SCAPE describes the poverty situation in Togo.
Table 2-5 compares the poverty headcount ratio (% of population) between 2006 and 2011 by
region.
Table 2-5 Comparison of Poverty Headcount Ratio between 2006 and 2011
(Unit: % of population)
Region Poverty Headcount Extreme Poverty Headcount
2006 2011 2006 2011
Greater Lomé 32.8 27.2 9 4
Maritime 67.1 53.9 25 21
Plateux 61.1 64.7 25 33
Centre 74.6 80.2 35 45
Kara 74.2 68.4 41 37
Savanes 86.7 90.8 64 73
Whole Togo 61.7 58.7 28.6 30.4
Source: SCAPE
Even though the poverty headcount ratio for the whole country fell 3% from 2006 to 2011,
the poverty headcount ratios increased in the Plateux, Centre and Savanes regions. The poverty
headcount ratio of the Savanes Region in particular was quite high at 90.8% in 2011.
Furthermore, the extreme poverty headcount increased by 1.8% in the whole country between
2006 and 2011, every though the extreme poverty headcount was only 4% in Lomé. These
figures indicate that the poverty situation is serious in the central and northern parts of the
country, particularly in the Savanes Region.
2.4 Economic Conditions in Togo and Neighbouring Countries
2.4.1 GDP
(1) Gross Domestic Product (GDP) by Sector
Table 2-6 shows the GDP by sector between 2007 and 2011. The agricultural sector had a
share of 43.2% in 2011, followed by the service sector (40.9%) and industry sector (15.9%).
The share of the agriculture sector has gradually increased, while both the industry and service
sectors have slightly lost share, and the GDP price has increased. The GDP growth rate fell
2009 and became negative, but recovered again in 2010.
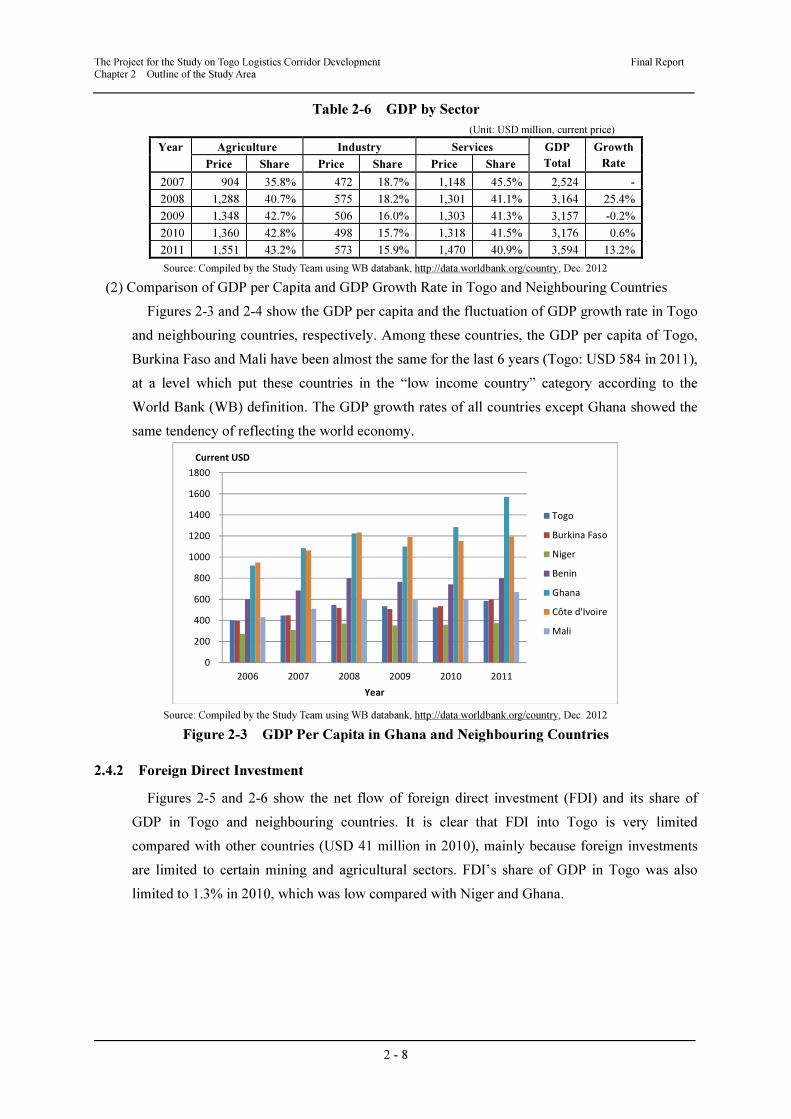
The Project for the Study on Togo Logistics Corridor Development Final Report Chapter 2 Outline of the Study Area
2 - 8
Table 2-6 GDP by Sector
(Unit: USD million, current price)
Year Agriculture Industry Services GDP
Total
Growth
Rate Price Share Price Share Price Share
2007 904 35.8% 472 18.7% 1,148 45.5% 2,524 -
2008 1,288 40.7% 575 18.2% 1,301 41.1% 3,164 25.4%
2009 1,348 42.7% 506 16.0% 1,303 41.3% 3,157 -0.2%
2010 1,360 42.8% 498 15.7% 1,318 41.5% 3,176 0.6%
2011 1,551 43.2% 573 15.9% 1,470 40.9% 3,594 13.2%
Source: Compiled by the Study Team using WB databank, http://data.worldbank.org/country, Dec. 2012
(2) Comparison of GDP per Capita and GDP Growth Rate in Togo and Neighbouring Countries
Figures 2-3 and 2-4 show the GDP per capita and the fluctuation of GDP growth rate in Togo
and neighbouring countries, respectively. Among these countries, the GDP per capita of Togo,
Burkina Faso and Mali have been almost the same for the last 6 years (Togo: USD 584 in 2011),
at a level which put these countries in the “low income country” category according to the
World Bank (WB) definition. The GDP growth rates of all countries except Ghana showed the
same tendency of reflecting the world economy.
Source: Compiled by the Study Team using WB databank, http://data.worldbank.org/country, Dec. 2012
Figure 2-3 GDP Per Capita in Ghana and Neighbouring Countries
2.4.2 Foreign Direct Investment
Figures 2-5 and 2-6 show the net flow of foreign direct investment (FDI) and its share of
GDP in Togo and neighbouring countries. It is clear that FDI into Togo is very limited
compared with other countries (USD 41 million in 2010), mainly because foreign investments
are limited to certain mining and agricultural sectors. FDI’s share of GDP in Togo was also
limited to 1.3% in 2010, which was low compared with Niger and Ghana.
0
200
400
600
800
1000
1200
1400
1600
1800
2006 2007 2008 2009 2010 2011
Current USD
Year
Togo
Burkina Faso
Niger
Benin
Ghana
Côte d'Ivoire
Mali
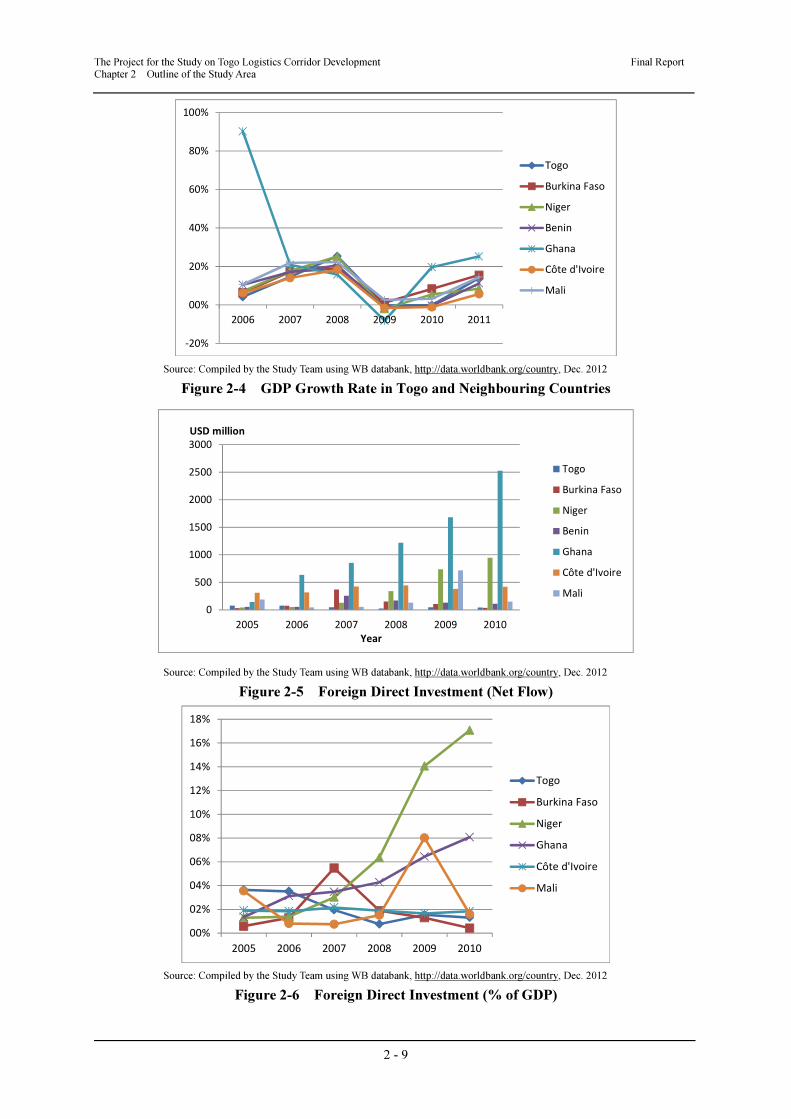
The Project for the Study on Togo Logistics Corridor Development Final Report Chapter 2 Outline of the Study Area
2 - 9
Source: Compiled by the Study Team using WB databank, http://data.worldbank.org/country, Dec. 2012
Figure 2-4 GDP Growth Rate in Togo and Neighbouring Countries
Source: Compiled by the Study Team using WB databank, http://data.worldbank.org/country, Dec. 2012
Figure 2-5 Foreign Direct Investment (Net Flow)
Source: Compiled by the Study Team using WB databank, http://data.worldbank.org/country, Dec. 2012
Figure 2-6 Foreign Direct Investment (% of GDP)
-20%
00%
20%
40%
60%
80%
100%
2006 2007 2008 2009 2010 2011
Togo
Burkina Faso
Niger
Benin
Ghana
Côte d'Ivoire
Mali
0
500
1000
1500
2000
2500
3000
2005 2006 2007 2008 2009 2010
USD million
Year
Togo
Burkina Faso
Niger
Benin
Ghana
Côte d'Ivoire
Mali
00%
02%
04%
06%
08%
10%
12%
14%
16%
18%
2005 2006 2007 2008 2009 2010
Togo
Burkina Faso
Niger
Ghana
Côte d'Ivoire
Mali
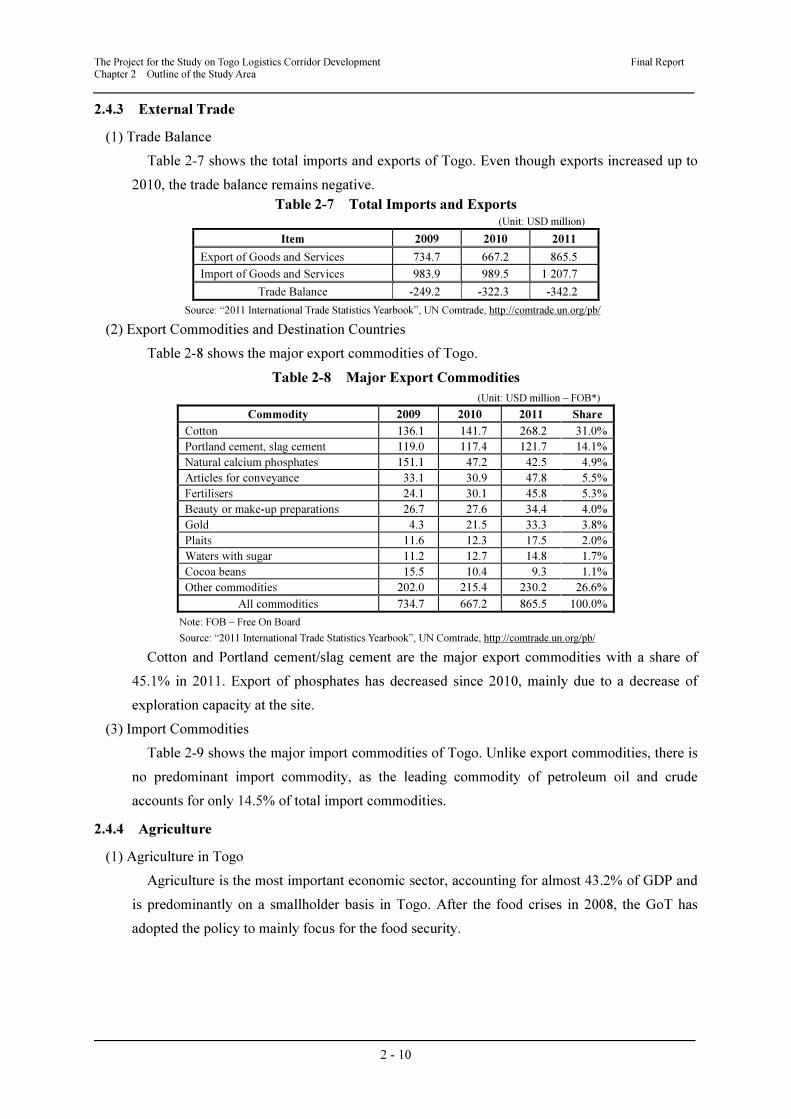
The Project for the Study on Togo Logistics Corridor Development Final Report Chapter 2 Outline of the Study Area
2 - 10
2.4.3 External Trade
(1) Trade Balance
Table 2-7 shows the total imports and exports of Togo. Even though exports increased up to
2010, the trade balance remains negative.
Table 2-7 Total Imports and Exports (Unit: USD million)
Item 2009 2010 2011
Export of Goods and Services 734.7 667.2 865.5
Import of Goods and Services 983.9 989.5 1 207.7
Trade Balance -249.2 -322.3 -342.2
Source: “2011 International Trade Statistics Yearbook”, UN Comtrade, http://comtrade.un.org/pb/
(2) Export Commodities and Destination Countries
Table 2-8 shows the major export commodities of Togo.
Table 2-8 Major Export Commodities
(Unit: USD million – FOB*)
Commodity 2009 2010 2011 Share
Cotton 136.1 141.7 268.2 31.0%
Portland cement, slag cement 119.0 117.4 121.7 14.1%
Natural calcium phosphates 151.1 47.2 42.5 4.9%
Articles for conveyance 33.1 30.9 47.8 5.5%
Fertilisers 24.1 30.1 45.8 5.3%
Beauty or make-up preparations 26.7 27.6 34.4 4.0%
Gold 4.3 21.5 33.3 3.8%
Plaits 11.6 12.3 17.5 2.0%
Waters with sugar 11.2 12.7 14.8 1.7%
Cocoa beans 15.5 10.4 9.3 1.1%
Other commodities 202.0 215.4 230.2 26.6%
All commodities 734.7 667.2 865.5 100.0%
Note: FOB – Free On Board
Source: “2011 International Trade Statistics Yearbook”, UN Comtrade, http://comtrade.un.org/pb/
Cotton and Portland cement/slag cement are the major export commodities with a share of
45.1% in 2011. Export of phosphates has decreased since 2010, mainly due to a decrease of
exploration capacity at the site.
(3) Import Commodities
Table 2-9 shows the major import commodities of Togo. Unlike export commodities, there is
no predominant import commodity, as the leading commodity of petroleum oil and crude
accounts for only 14.5% of total import commodities.
2.4.4 Agriculture
(1) Agriculture in Togo
Agriculture is the most important economic sector, accounting for almost 43.2% of GDP and
is predominantly on a smallholder basis in Togo. After the food crises in 2008, the GoT has
adopted the policy to mainly focus for the food security.
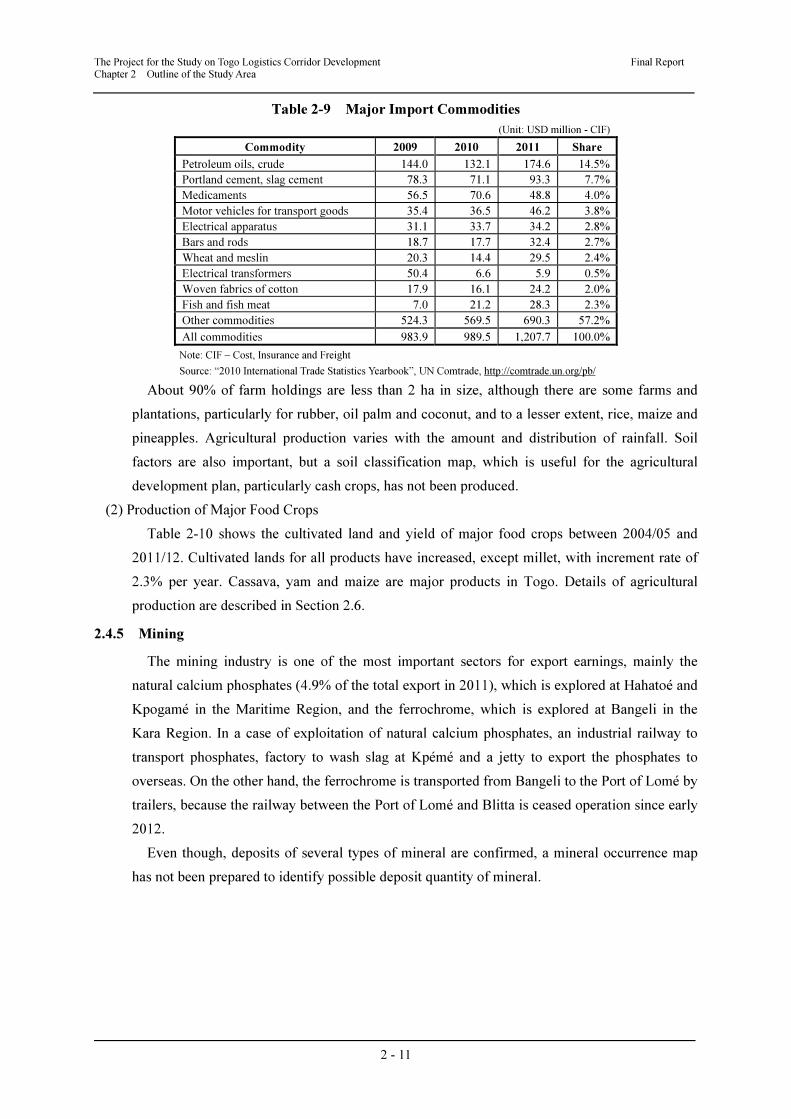
The Project for the Study on Togo Logistics Corridor Development Final Report Chapter 2 Outline of the Study Area
2 - 11
Table 2-9 Major Import Commodities
(Unit: USD million - CIF)
Commodity 2009 2010 2011 Share
Petroleum oils, crude 144.0 132.1 174.6 14.5%
Portland cement, slag cement 78.3 71.1 93.3 7.7%
Medicaments 56.5 70.6 48.8 4.0%
Motor vehicles for transport goods 35.4 36.5 46.2 3.8%
Electrical apparatus 31.1 33.7 34.2 2.8%
Bars and rods 18.7 17.7 32.4 2.7%
Wheat and meslin 20.3 14.4 29.5 2.4%
Electrical transformers 50.4 6.6 5.9 0.5%
Woven fabrics of cotton 17.9 16.1 24.2 2.0%
Fish and fish meat 7.0 21.2 28.3 2.3%
Other commodities 524.3 569.5 690.3 57.2%
All commodities 983.9 989.5 1,207.7 100.0%
Note: CIF – Cost, Insurance and Freight
Source: “2010 International Trade Statistics Yearbook”, UN Comtrade, http://comtrade.un.org/pb/
About 90% of farm holdings are less than 2 ha in size, although there are some farms and
plantations, particularly for rubber, oil palm and coconut, and to a lesser extent, rice, maize and
pineapples. Agricultural production varies with the amount and distribution of rainfall. Soil
factors are also important, but a soil classification map, which is useful for the agricultural
development plan, particularly cash crops, has not been produced.
(2) Production of Major Food Crops
Table 2-10 shows the cultivated land and yield of major food crops between 2004/05 and
2011/12. Cultivated lands for all products have increased, except millet, with increment rate of
2.3% per year. Cassava, yam and maize are major products in Togo. Details of agricultural
production are described in Section 2.6.
2.4.5 Mining
The mining industry is one of the most important sectors for export earnings, mainly the
natural calcium phosphates (4.9% of the total export in 2011), which is explored at Hahatoé and
Kpogamé in the Maritime Region, and the ferrochrome, which is explored at Bangeli in the
Kara Region. In a case of exploitation of natural calcium phosphates, an industrial railway to
transport phosphates, factory to wash slag at Kpémé and a jetty to export the phosphates to
overseas. On the other hand, the ferrochrome is transported from Bangeli to the Port of Lomé by
trailers, because the railway between the Port of Lomé and Blitta is ceased operation since early
2012.
Even though, deposits of several types of mineral are confirmed, a mineral occurrence map
has not been prepared to identify possible deposit quantity of mineral.
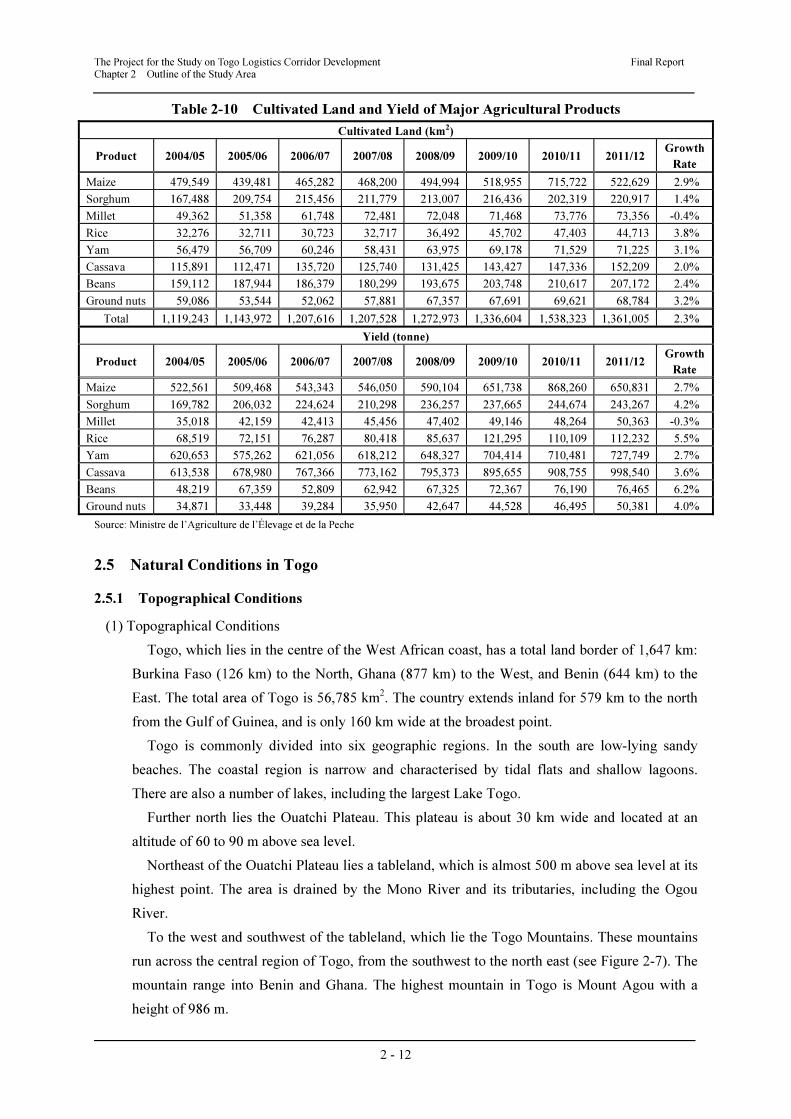
The Project for the Study on Togo Logistics Corridor Development Final Report Chapter 2 Outline of the Study Area
2 - 12
Table 2-10 Cultivated Land and Yield of Major Agricultural Products
Cultivated Land (km2)
Product 2004/05 2005/06 2006/07 2007/08 2008/09 2009/10 2010/11 2011/12 Growth
Rate
Maize 479,549 439,481 465,282 468,200 494,994 518,955 715,722 522,629 2.9%
Sorghum 167,488 209,754 215,456 211,779 213,007 216,436 202,319 220,917 1.4%
Millet 49,362 51,358 61,748 72,481 72,048 71,468 73,776 73,356 -0.4%
Rice 32,276 32,711 30,723 32,717 36,492 45,702 47,403 44,713 3.8%
Yam 56,479 56,709 60,246 58,431 63,975 69,178 71,529 71,225 3.1%
Cassava 115,891 112,471 135,720 125,740 131,425 143,427 147,336 152,209 2.0%
Beans 159,112 187,944 186,379 180,299 193,675 203,748 210,617 207,172 2.4%
Ground nuts 59,086 53,544 52,062 57,881 67,357 67,691 69,621 68,784 3.2%
Total 1,119,243 1,143,972 1,207,616 1,207,528 1,272,973 1,336,604 1,538,323 1,361,005 2.3%
Yield (tonne)
Product 2004/05 2005/06 2006/07 2007/08 2008/09 2009/10 2010/11 2011/12 Growth
Rate
Maize 522,561 509,468 543,343 546,050 590,104 651,738 868,260 650,831 2.7%
Sorghum 169,782 206,032 224,624 210,298 236,257 237,665 244,674 243,267 4.2%
Millet 35,018 42,159 42,413 45,456 47,402 49,146 48,264 50,363 -0.3%
Rice 68,519 72,151 76,287 80,418 85,637 121,295 110,109 112,232 5.5%
Yam 620,653 575,262 621,056 618,212 648,327 704,414 710,481 727,749 2.7%
Cassava 613,538 678,980 767,366 773,162 795,373 895,655 908,755 998,540 3.6%
Beans 48,219 67,359 52,809 62,942 67,325 72,367 76,190 76,465 6.2%
Ground nuts 34,871 33,448 39,284 35,950 42,647 44,528 46,495 50,381 4.0%
Source: Ministre de l’Agriculture de l’Élevage et de la Peche
2.5 Natural Conditions in Togo
2.5.1 Topographical Conditions
(1) Topographical Conditions
Togo, which lies in the centre of the West African coast, has a total land border of 1,647 km:
Burkina Faso (126 km) to the North, Ghana (877 km) to the West, and Benin (644 km) to the
East. The total area of Togo is 56,785 km2. The country extends inland for 579 km to the north
from the Gulf of Guinea, and is only 160 km wide at the broadest point.
Togo is commonly divided into six geographic regions. In the south are low-lying sandy
beaches. The coastal region is narrow and characterised by tidal flats and shallow lagoons.
There are also a number of lakes, including the largest Lake Togo.
Further north lies the Ouatchi Plateau. This plateau is about 30 km wide and located at an
altitude of 60 to 90 m above sea level.
Northeast of the Ouatchi Plateau lies a tableland, which is almost 500 m above sea level at its
highest point. The area is drained by the Mono River and its tributaries, including the Ogou
River.
To the west and southwest of the tableland, which lie the Togo Mountains. These mountains
run across the central region of Togo, from the southwest to the north east (see Figure 2-7). The
mountain range into Benin and Ghana. The highest mountain in Togo is Mount Agou with a
height of 986 m.
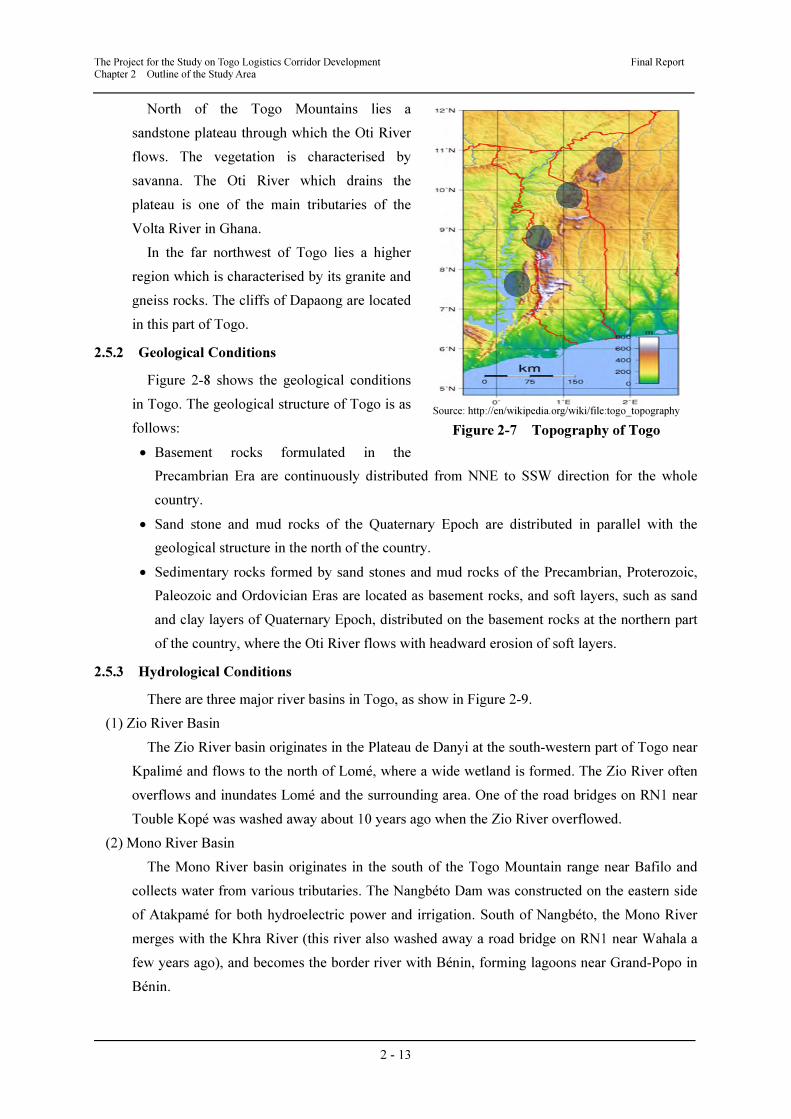
The Project for the Study on Togo Logistics Corridor Development Final Report Chapter 2 Outline of the Study Area
2 - 13
North of the Togo Mountains lies a
sandstone plateau through which the Oti River
flows. The vegetation is characterised by
savanna. The Oti River which drains the
plateau is one of the main tributaries of the
Volta River in Ghana.
In the far northwest of Togo lies a higher
region which is characterised by its granite and
gneiss rocks. The cliffs of Dapaong are located
in this part of Togo.
2.5.2 Geological Conditions
Figure 2-8 shows the geological conditions
in Togo. The geological structure of Togo is as
follows:
• Basement rocks formulated in the
Precambrian Era are continuously distributed from NNE to SSW direction for the whole
country.
• Sand stone and mud rocks of the Quaternary Epoch are distributed in parallel with the
geological structure in the north of the country.
• Sedimentary rocks formed by sand stones and mud rocks of the Precambrian, Proterozoic,
Paleozoic and Ordovician Eras are located as basement rocks, and soft layers, such as sand
and clay layers of Quaternary Epoch, distributed on the basement rocks at the northern part
of the country, where the Oti River flows with headward erosion of soft layers.
2.5.3 Hydrological Conditions
There are three major river basins in Togo, as show in Figure 2-9.
(1) Zio River Basin
The Zio River basin originates in the Plateau de Danyi at the south-western part of Togo near
Kpalimé and flows to the north of Lomé, where a wide wetland is formed. The Zio River often
overflows and inundates Lomé and the surrounding area. One of the road bridges on RN1 near
Touble Kopé was washed away about 10 years ago when the Zio River overflowed.
(2) Mono River Basin
The Mono River basin originates in the south of the Togo Mountain range near Bafilo and
collects water from various tributaries. The Nangbéto Dam was constructed on the eastern side
of Atakpamé for both hydroelectric power and irrigation. South of Nangbéto, the Mono River
merges with the Khra River (this river also washed away a road bridge on RN1 near Wahala a
few years ago), and becomes the border river with Bénin, forming lagoons near Grand-Popo in
Bénin.
Source: http://en/wikipedia.org/wiki/file:togo_topography
Figure 2-7 Topography of Togo
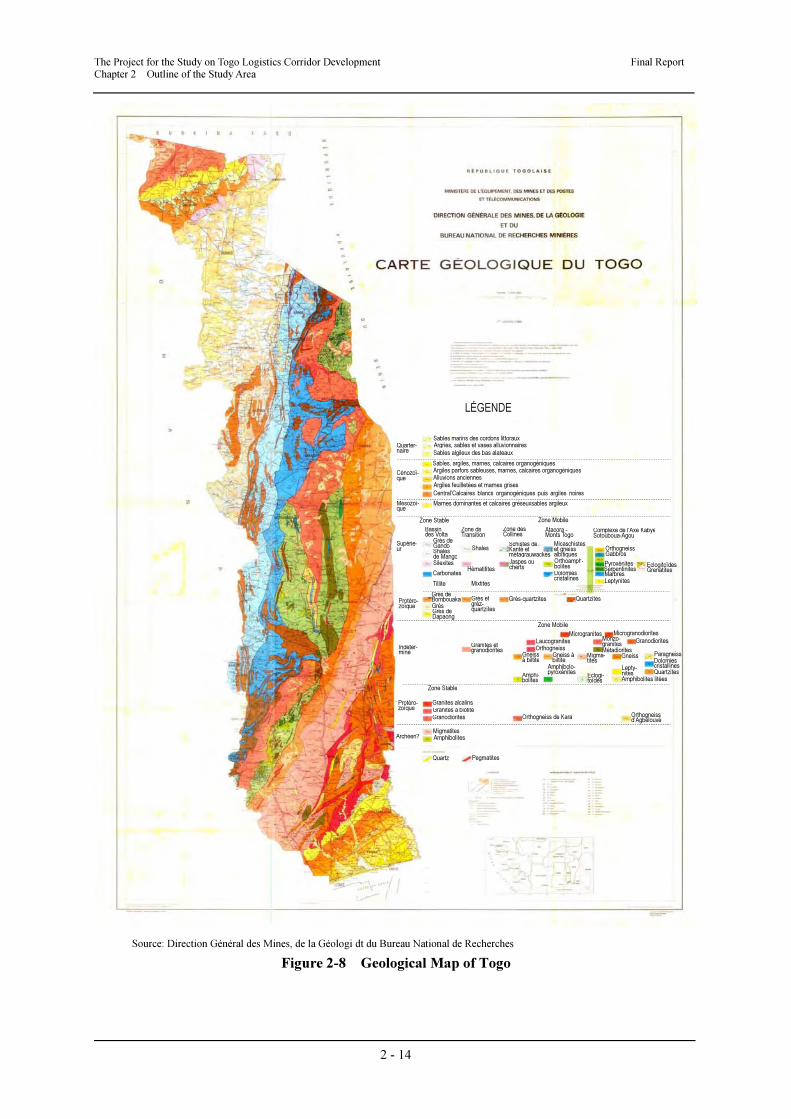
The Project for the Study on Togo Logistics Corridor Development Final Report Chapter 2 Outline of the Study Area
2 - 14
Source: Direction Général des Mines, de la Géologi dt du Bureau National de Recherches
Figure 2-8 Geological Map of Togo
Sables marins des cordons littorauxArgries, sables et vases alluvionnairesSables algileux des bas alateaux
Sables, argiles, marnes, calcaires organogéniquesArgiles parfors sableuses, marnes, calcaires organogéniques Alluvions anciennesArgiles feuilletées et marnes grises
Central’Calcaires blancs organogéniques puis argiles noires
LÉGENDE
Marnes dominantes et calcaires gréseuxsables argileux
Quarter-naire
Cénozoï-que
Mésozoï-que
Supérie-ur
Indéter-miné
Protéro-zoïque
Zone Stable Zone Mobile
Bassin des Volta
Zone deTransition
Zone desCollines
Atacora - Monts Togo
Complexe de l’Axe KabyéSotouboua-Agou
Protéro-zoïque
Archéen?
Grés de Gando Shalesde MangoSilexites
Carbonates
Tillite
Shales
Hématitites
Mixtites
Schistes deKanté et métagrauwackesC lliJaspes oucherts
Micaschistes et gneiss albitiques Orthoamph- bolites Dolomies cristalines
GabbrosOrthogneiss
Pyroxénites Serpentinites Marbres Leptynites
EclogitoïdesGrenatites
Quartzites Grés-quartzitesGrés etgréz- quartzites
Grés deBombouaka GrésGrés deDapaong
Zone Mobile
Granites etgranodiorites
Microgranites MicrogranodioritesGranodioritesMonzo-
granites Métadiorites
Paragneiss Dolomiescristallines Quartzites
Gneiss
Lepty- nites Amphibolites litées
Eclogi- toïdes
Migma- tites
Laucogranites Orthogneiss
Gneiss á biltite
Gneiss á biltite
Amphi-bolites
Amphibolo- pyroxénites
Zone Stable
Granites alcalinsGranites á biotiteGranodiorites Orthogneiss de Kara Orthogneiss
d’Agbélouvé
MigmatitesAmphibolites
Quartz Pegmatites
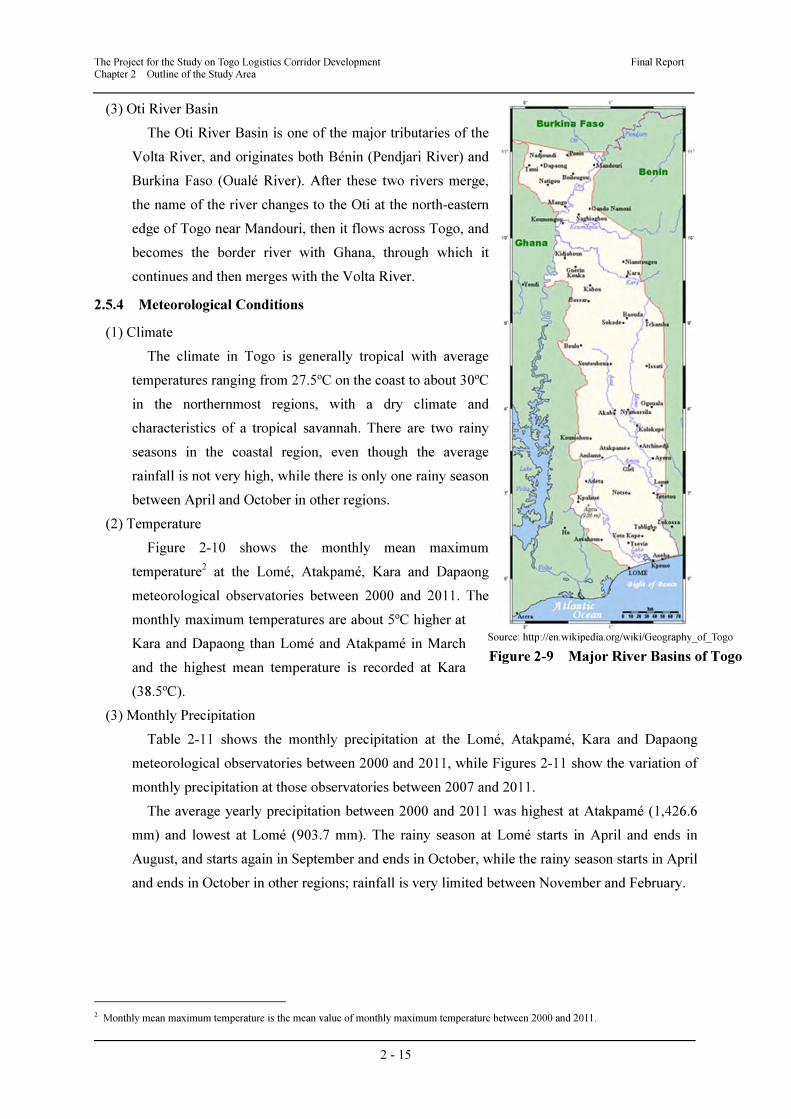
The Project for the Study on Togo Logistics Corridor Development Final Report Chapter 2 Outline of the Study Area
2 - 15
(3) Oti River Basin
The Oti River Basin is one of the major tributaries of the
Volta River, and originates both Bénin (Pendjari River) and
Burkina Faso (Oualé River). After these two rivers merge,
the name of the river changes to the Oti at the north-eastern
edge of Togo near Mandouri, then it flows across Togo, and
becomes the border river with Ghana, through which it
continues and then merges with the Volta River.
2.5.4 Meteorological Conditions
(1) Climate
The climate in Togo is generally tropical with average
temperatures ranging from 27.5ºC on the coast to about 30ºC
in the northernmost regions, with a dry climate and
characteristics of a tropical savannah. There are two rainy
seasons in the coastal region, even though the average
rainfall is not very high, while there is only one rainy season
between April and October in other regions.
(2) Temperature
Figure 2-10 shows the monthly mean maximum
temperature2 at the Lomé, Atakpamé, Kara and Dapaong
meteorological observatories between 2000 and 2011. The
monthly maximum temperatures are about 5ºC higher at
Kara and Dapaong than Lomé and Atakpamé in March
and the highest mean temperature is recorded at Kara
(38.5ºC).
(3) Monthly Precipitation
Table 2-11 shows the monthly precipitation at the Lomé, Atakpamé, Kara and Dapaong
meteorological observatories between 2000 and 2011, while Figures 2-11 show the variation of
monthly precipitation at those observatories between 2007 and 2011.
The average yearly precipitation between 2000 and 2011 was highest at Atakpamé (1,426.6
mm) and lowest at Lomé (903.7 mm). The rainy season at Lomé starts in April and ends in
August, and starts again in September and ends in October, while the rainy season starts in April
and ends in October in other regions; rainfall is very limited between November and February.
2 Monthly mean maximum temperature is the mean value of monthly maximum temperature between 2000 and 2011.
Source: http://en.wikipedia.org/wiki/Geography_of_Togo
Figure 2-9 Major River Basins of Togo
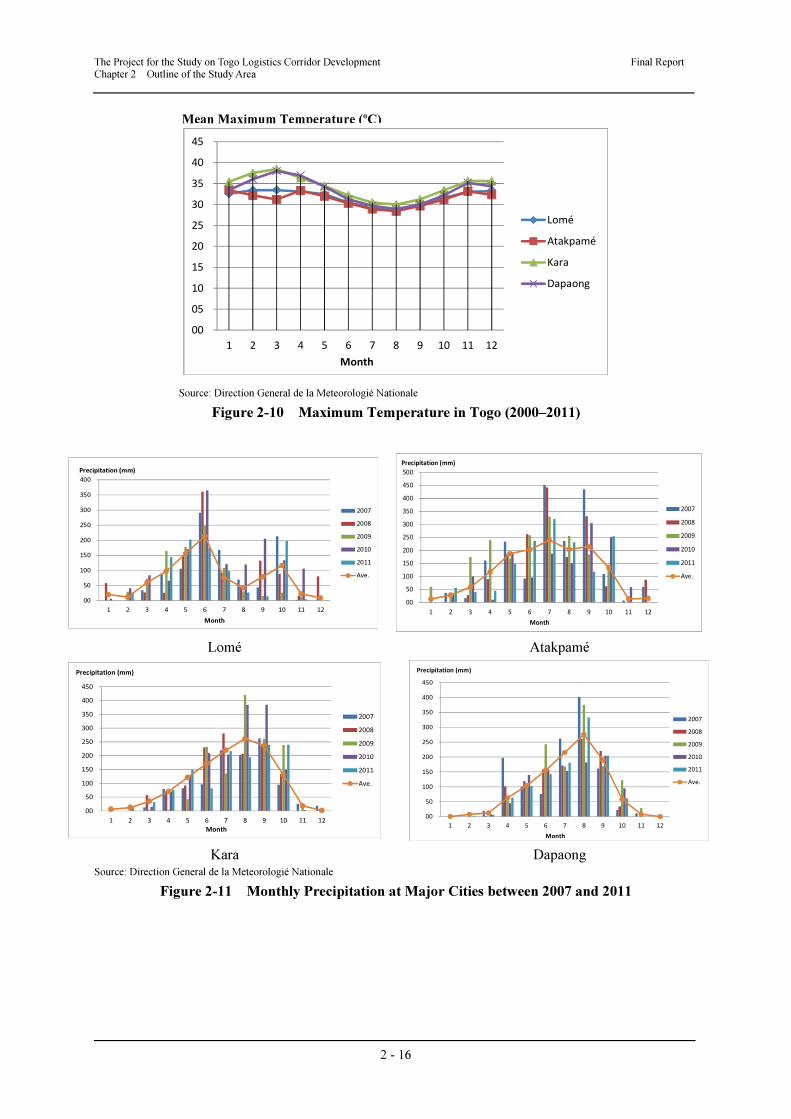
The Project for the Study on Togo Logistics Corridor Development Final Report Chapter 2 Outline of the Study Area
2 - 16
Source: Direction General de la Meteorologié Nationale
Figure 2-10 Maximum Temperature in Togo (2000–2011)
Lomé Atakpamé
Kara Dapaong Source: Direction General de la Meteorologié Nationale
Figure 2-11 Monthly Precipitation at Major Cities between 2007 and 2011
00
05
10
15
20
25
30
35
40
45
1 2 3 4 5 6 7 8 9 10 11 12
Month
Lomé
Atakpamé
Kara
Dapaong
00
50
100
150
200
250
300
350
400
1 2 3 4 5 6 7 8 9 10 11 12
Precipitation (mm)
Month
2007
2008
2009
2010
2011
Ave.
00
50
100
150
200
250
300
350
400
450
500
1 2 3 4 5 6 7 8 9 10 11 12
Precipitation (mm)
Month
2007
2008
2009
2010
2011
Ave.
00
50
100
150
200
250
300
350
400
450
1 2 3 4 5 6 7 8 9 10 11 12
Precipitation (mm)
Month
2007
2008
2009
2010
2011
Ave.
00
50
100
150
200
250
300
350
400
450
1 2 3 4 5 6 7 8 9 10 11 12
Precipitation (mm)
Month
2007
2008
2009
2010
2011
Ave.
Mean Maximum Temperature (ºC)
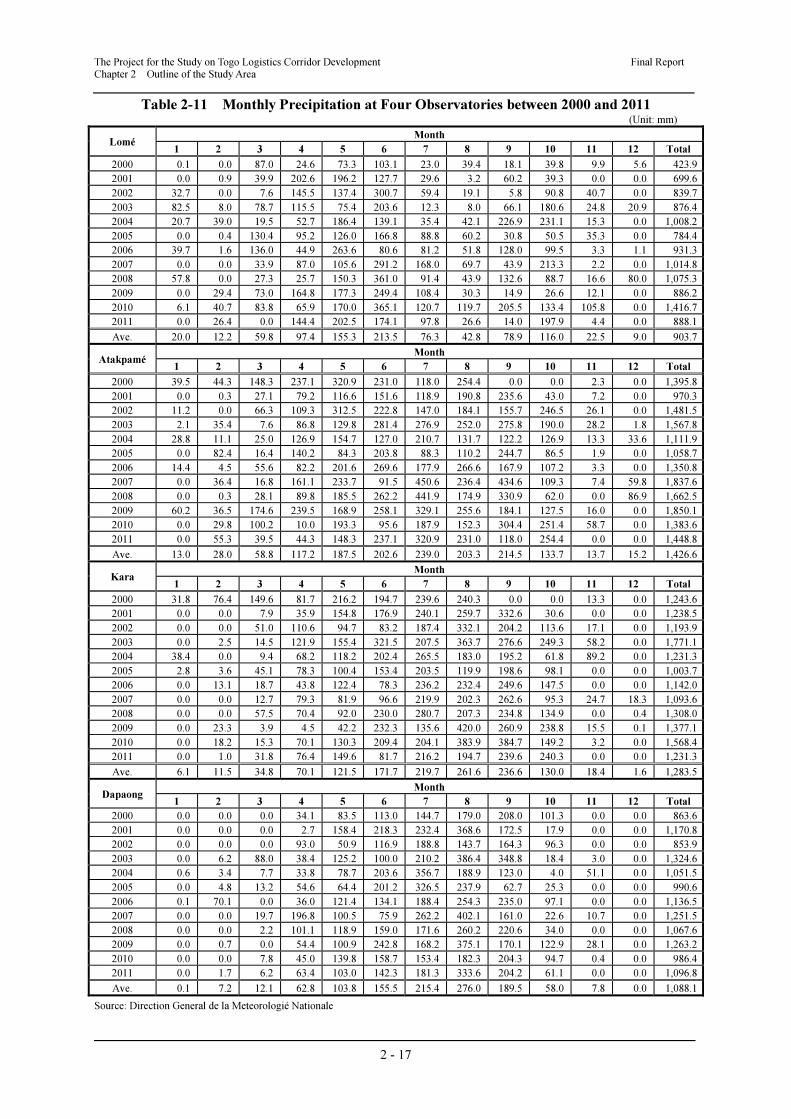
The Project for the Study on Togo Logistics Corridor Development Final Report Chapter 2 Outline of the Study Area
2 - 17
Table 2-11 Monthly Precipitation at Four Observatories between 2000 and 2011 (Unit: mm)
Lomé Month
1 2 3 4 5 6 7 8 9 10 11 12 Total
2000 0.1 0.0 87.0 24.6 73.3 103.1 23.0 39.4 18.1 39.8 9.9 5.6 423.9 2001 0.0 0.9 39.9 202.6 196.2 127.7 29.6 3.2 60.2 39.3 0.0 0.0 699.6 2002 32.7 0.0 7.6 145.5 137.4 300.7 59.4 19.1 5.8 90.8 40.7 0.0 839.7 2003 82.5 8.0 78.7 115.5 75.4 203.6 12.3 8.0 66.1 180.6 24.8 20.9 876.4 2004 20.7 39.0 19.5 52.7 186.4 139.1 35.4 42.1 226.9 231.1 15.3 0.0 1,008.2 2005 0.0 0.4 130.4 95.2 126.0 166.8 88.8 60.2 30.8 50.5 35.3 0.0 784.4 2006 39.7 1.6 136.0 44.9 263.6 80.6 81.2 51.8 128.0 99.5 3.3 1.1 931.3 2007 0.0 0.0 33.9 87.0 105.6 291.2 168.0 69.7 43.9 213.3 2.2 0.0 1,014.8 2008 57.8 0.0 27.3 25.7 150.3 361.0 91.4 43.9 132.6 88.7 16.6 80.0 1,075.3 2009 0.0 29.4 73.0 164.8 177.3 249.4 108.4 30.3 14.9 26.6 12.1 0.0 886.2 2010 6.1 40.7 83.8 65.9 170.0 365.1 120.7 119.7 205.5 133.4 105.8 0.0 1,416.7 2011 0.0 26.4 0.0 144.4 202.5 174.1 97.8 26.6 14.0 197.9 4.4 0.0 888.1
Ave. 20.0 12.2 59.8 97.4 155.3 213.5 76.3 42.8 78.9 116.0 22.5 9.0 903.7
Atakpamé Month
1 2 3 4 5 6 7 8 9 10 11 12 Total
2000 39.5 44.3 148.3 237.1 320.9 231.0 118.0 254.4 0.0 0.0 2.3 0.0 1,395.8 2001 0.0 0.3 27.1 79.2 116.6 151.6 118.9 190.8 235.6 43.0 7.2 0.0 970.3 2002 11.2 0.0 66.3 109.3 312.5 222.8 147.0 184.1 155.7 246.5 26.1 0.0 1,481.5 2003 2.1 35.4 7.6 86.8 129.8 281.4 276.9 252.0 275.8 190.0 28.2 1.8 1,567.8 2004 28.8 11.1 25.0 126.9 154.7 127.0 210.7 131.7 122.2 126.9 13.3 33.6 1,111.9 2005 0.0 82.4 16.4 140.2 84.3 203.8 88.3 110.2 244.7 86.5 1.9 0.0 1,058.7 2006 14.4 4.5 55.6 82.2 201.6 269.6 177.9 266.6 167.9 107.2 3.3 0.0 1,350.8 2007 0.0 36.4 16.8 161.1 233.7 91.5 450.6 236.4 434.6 109.3 7.4 59.8 1,837.6 2008 0.0 0.3 28.1 89.8 185.5 262.2 441.9 174.9 330.9 62.0 0.0 86.9 1,662.5 2009 60.2 36.5 174.6 239.5 168.9 258.1 329.1 255.6 184.1 127.5 16.0 0.0 1,850.1 2010 0.0 29.8 100.2 10.0 193.3 95.6 187.9 152.3 304.4 251.4 58.7 0.0 1,383.6 2011 0.0 55.3 39.5 44.3 148.3 237.1 320.9 231.0 118.0 254.4 0.0 0.0 1,448.8
Ave. 13.0 28.0 58.8 117.2 187.5 202.6 239.0 203.3 214.5 133.7 13.7 15.2 1,426.6
Kara Month
1 2 3 4 5 6 7 8 9 10 11 12 Total
2000 31.8 76.4 149.6 81.7 216.2 194.7 239.6 240.3 0.0 0.0 13.3 0.0 1,243.6 2001 0.0 0.0 7.9 35.9 154.8 176.9 240.1 259.7 332.6 30.6 0.0 0.0 1,238.5 2002 0.0 0.0 51.0 110.6 94.7 83.2 187.4 332.1 204.2 113.6 17.1 0.0 1,193.9 2003 0.0 2.5 14.5 121.9 155.4 321.5 207.5 363.7 276.6 249.3 58.2 0.0 1,771.1 2004 38.4 0.0 9.4 68.2 118.2 202.4 265.5 183.0 195.2 61.8 89.2 0.0 1,231.3 2005 2.8 3.6 45.1 78.3 100.4 153.4 203.5 119.9 198.6 98.1 0.0 0.0 1,003.7 2006 0.0 13.1 18.7 43.8 122.4 78.3 236.2 232.4 249.6 147.5 0.0 0.0 1,142.0 2007 0.0 0.0 12.7 79.3 81.9 96.6 219.9 202.3 262.6 95.3 24.7 18.3 1,093.6 2008 0.0 0.0 57.5 70.4 92.0 230.0 280.7 207.3 234.8 134.9 0.0 0.4 1,308.0 2009 0.0 23.3 3.9 4.5 42.2 232.3 135.6 420.0 260.9 238.8 15.5 0.1 1,377.1 2010 0.0 18.2 15.3 70.1 130.3 209.4 204.1 383.9 384.7 149.2 3.2 0.0 1,568.4 2011 0.0 1.0 31.8 76.4 149.6 81.7 216.2 194.7 239.6 240.3 0.0 0.0 1,231.3
Ave. 6.1 11.5 34.8 70.1 121.5 171.7 219.7 261.6 236.6 130.0 18.4 1.6 1,283.5
Dapaong Month
1 2 3 4 5 6 7 8 9 10 11 12 Total
2000 0.0 0.0 0.0 34.1 83.5 113.0 144.7 179.0 208.0 101.3 0.0 0.0 863.6 2001 0.0 0.0 0.0 2.7 158.4 218.3 232.4 368.6 172.5 17.9 0.0 0.0 1,170.8 2002 0.0 0.0 0.0 93.0 50.9 116.9 188.8 143.7 164.3 96.3 0.0 0.0 853.9 2003 0.0 6.2 88.0 38.4 125.2 100.0 210.2 386.4 348.8 18.4 3.0 0.0 1,324.6 2004 0.6 3.4 7.7 33.8 78.7 203.6 356.7 188.9 123.0 4.0 51.1 0.0 1,051.5 2005 0.0 4.8 13.2 54.6 64.4 201.2 326.5 237.9 62.7 25.3 0.0 0.0 990.6 2006 0.1 70.1 0.0 36.0 121.4 134.1 188.4 254.3 235.0 97.1 0.0 0.0 1,136.5 2007 0.0 0.0 19.7 196.8 100.5 75.9 262.2 402.1 161.0 22.6 10.7 0.0 1,251.5 2008 0.0 0.0 2.2 101.1 118.9 159.0 171.6 260.2 220.6 34.0 0.0 0.0 1,067.6 2009 0.0 0.7 0.0 54.4 100.9 242.8 168.2 375.1 170.1 122.9 28.1 0.0 1,263.2 2010 0.0 0.0 7.8 45.0 139.8 158.7 153.4 182.3 204.3 94.7 0.4 0.0 986.4 2011 0.0 1.7 6.2 63.4 103.0 142.3 181.3 333.6 204.2 61.1 0.0 0.0 1,096.8
Ave. 0.1 7.2 12.1 62.8 103.8 155.5 215.4 276.0 189.5 58.0 7.8 0.0 1,088.1
Source: Direction General de la Meteorologié Nationale
The Project for the Study on Togo Logistics Corridor Development Final Report Chapter 2 Outline of the Study Area
2 - 18
2.6 Existing Development Programmes
Three kinds of the development plans; national, regional and sectorial level, are summarized
with a list of major development programmes designated in the existing development plan.
2.6.1 National Development Plan
The National Development Plan explains a broad idea of national strategy for economic
growth in Togo, which should be correlated to prepared the development of the TLG. The
DSRP II is the prior national development plan and it would be appropriate to understand the
contents of the plan for analysing the current and the future development direction of Togo.
(1) Condition of the National Development Plan
The first national development plan was adopted by the GoT in the early 1980s, known as the
Structural Adjustment Programmes (SAP), to overcome a financial stabilization and
improvement of microeconomic framework, however the plan unfortunately brought
imbalances between economic and social development.
With the intentions of next challenges, the Millennium Development Goals (MDG) was
issued in 2007 covering the period of 2009 to 2015. The MDG was kept followed up and
validated in 2010. The general descriptions of the MDG are listed below.
• MDG 1: Elimination of extreme poverty
• MDG 2: Assure of primary education
• MDG 3: Promotion of gender equality
• MDG 4, 5, 6: Improvement of environment for health in terms of death of infancy and
pregnancy
• MDG 7: Conservation and restoration of natural environment
• MDG 8: Establishment of international partnership for the development
The GoT, then, published the Interim Poverty Reduction Strategy Paper (I-PRSP) in 2008 to
consolidate public finances and urge private development. One of the significant effects of the
analysis of the paper was the strong recognition of crisis in the field of the national economy,
which leads to the development of the PRSP-C in 2009, serving as a unifying framework of
various development activities on period of 2009 to 2011. The development plan was
successfully organized with priority action programs, and the progress indicated its achievement
in the political, economic and social fields.
Concerning the continuing achievement of MGD, the GoT began to prepare the further
national development plan to keep the successful efforts of the previous development plan, and
it was featured by the development of the SCAPE in July 2012, which is currently known as the
PRSP-II.
DSRP II was launched in order not only to collect political, economic and social data which
illustrate current situation of Togo in the various levels, but also to ensure the economic growth
covering the period of 2013 to 2017. It has two important functions, document and process. As a
document, it provides a roadmap of national development, directed by the strategies in the plan,
The Project for the Study on Togo Logistics Corridor Development Final Report Chapter 2 Outline of the Study Area
2 - 19
initiated with the government, development partners, private sectors and public society. As a
process, it is prepared according to a sequential approach defined by participatory manner of
five (5) major steps as followed: i) Developing Roadmap, ii) Survey and Study, iii) Developing
Strategic Plan, iv) Developing draft Strategy, v) Going through schematic procedure for
validation and adaptation. In terms of the last step, levels of dialogue include a public
consultation, regional and national workshop and reviewed by National Council of
Development Policy (CNPPD).
(2) General Strategy
In the Stage of the development of strategy, the strategies are prioritised by four (4) principal
directions as followed: i) Acceleration of economic growth, ii) Increasing employment, iii)
Strengthening governance, iv) Reduction of regional disparity.
a) Acceleration of Economic Growth
For the acceleration of economic growth, there is the fact that the average growth rate is 3.8%
per year over the period of 2008 to 2011, which can be estimated that demographic growth rate
of 2.84% could be double within the 25 years. And this acceleration of economic growth
reflects to increasing employment and reducing poverty. One of the key for the continuing
growth over the next five years is an investment. A private investment is expected in the field of
mining and agricultural industry to ensure sustainability of economic growth of Togo.
The goal and objectives of the strategy for the acceleration of economic growth is stated as
listed below:
• Rehabilitate, in partnership with industry deprives the main network infrastructure along the
corridor, including road and rail links between Togo and its neighbouring countries.,
• Optimize the investment in the area of the corridor taking advantage of new opportunities
created by rehabilitation of infrastructure,
• Optimize the opportunities of social development and market outlets while encouraging the
participation of traditionally underprivileged communities and
• Reduce the regional disparities and promote the development at regional level.
b) Increasing of Employment
Employment is one of the main subjects that the government intends to develop to improve
incomes. Employment policy will aim to respond to improving the unemployment rate of 29.15
in 2011.
c) Strengthening of Governance
The good governance will be deployed during next five years in the political, administrative,
institutional and economic level, including public finance and corporate governance. Continuity
of the relative activities provides strengthening the region, a section of security and justice,
durability against corruption, capacity building of human resources, decentralization economic
development. Regional office is supposed to create the right conditions for participation and
ownership of the development vision. The challenge is to build the rules, behaviour and ethics
The Project for the Study on Togo Logistics Corridor Development Final Report Chapter 2 Outline of the Study Area
2 - 20
conducive to the economic development and social progress of Togo.
d) Reduction of Regional Disparity
Reducing the regional disparity promotes the smooth development procedure and creates
definite base of the economic decentralization. For the maximum support for the reduction of
regional disparity, the government plan to have items followed as: (i) ensure the gradual transfer
of skills and resources in favour of territorial communities, (ii) support the capacity building of
communities to manage local affairs, and (iii) ensure the coherence of local action with State
policies.
(3) High Potential Areas of Growth
In the last stage of organizing the PRSP-II, it was finalized by sectorial committees in
eleven(11) areas of activity groups as followed: i) Agriculture, ii) Political and administrative
governance, iii) Justice, human rights and society, iv) National defence, v) Infrastructure, vi)
Competitiveness of private sector, vii) Health, viii) Social protection and employment,
ix)Capability of governance, x)Water, sanitation and quality of life, xi) Education.
In this study, among the areas of activity mentioned above, relevant elements to the TLC are
to be selected as the outline of the regional development, such as agriculture and Infrastructure.
a) Agriculture
Togo has significant agricultural potential due to an adequate arable land estimated as
approximately 3.4 million hectares of which only 45% is currently cultivated. Togo’s varied
climate and soil provide the variety of agricultural production. Moreover, it is the fact that land
suitable for irrigation development is estimated to 86,000 ha and the area of exploitable low
land is 175,000 ha in total.
The report defines constrains against the acceleration of agricultural growth in Togo as
follows: i) Size of the farms is too small, ii) Most of the farmers have only rudiment knowledge
level for agriculture and agricultural machinery, iii) Consequence aging of farmers and lack of
succeeding young due to their leaving, iv) Small number of agricultural organization, v)
Increasing impoverished agricultural fields especially cocoa, coffee, sugar cane fields, vi) Only
exporting operation is well functioned to traders and farmers, vii) Isolation of agricultural field,
viii) Lack of accessibility to the cultivated land, ix) Increasing pressure on arable land, x) Low
transformation rate of agricultural products, and xi) Difficulties of accessing to finance for
agricultural development.
In the medium term of the agricultural growth (2013 to 2017), the report states that the Togo
government will devote at least 10% of the national budget to the agricultural measurements.
And the long term, implementation of logistic corridor from south to north will affect to
acceleration of agricultural development of the country and regions. Addition to the budgetary
support, the government will encourage activities of granting credit to farmers to help reducing
an impact of substantial poverty. Some other implementations are to be carried out as the
national policy of agricultural sector, and with these implementation mentioned above the report
The Project for the Study on Togo Logistics Corridor Development Final Report Chapter 2 Outline of the Study Area
2 - 21
ensuring the agricultural growth rate at least from 4.0 % to 6.0% by 2017.
b) Industrial Productivity
Growth of industrial sector in Togo is characterised as one of the immature and it is
mentioned that the sector is poorly integrated to other sectors. The report analyses major
difficulties for the growth of industrial sector as followed: i) no favourable business opportunity
conducive to attracting investment, ii) too small domestic market size, iii) difficulties of access
to financing, iv) tough competition of foreign products, v) high production cost, vi) and a lack
of designated industrial parks.
The updated main concept of the industrial policy is stated as “It is to develop and sustain a
domestic industry integrated, internationally competitive, environmentally friendly, and can
significantly improve living standard”. With the main concept, the main priorities is developed
as followed: i) upgrading of existing enterprises more competitive and sustainable, ii) creating
diverse opportunities of the national industrial production and increasing processing rate of raw
materials and local products to an average of 20% in 2030, iii) and promoting small and
medium sized enterprises.
As a part of development programs based on the main concept and priorities mentioned
above, the report stated that the GoT could develop following implementations for examples.
• Togolese phosphate could be transformed locally into fertilizer and exports
• Accelerate growth of cotton yarn for knitting and the manufacture of traditional fabrics
• Cocoa could be transformed into local made chocolate
• Establish food processing industry from local agricultural products
c) Mining Industry
Mining industry has played an important role for Togo’s economy since the exploitation and
exportation of phosphate started in1996. Although there were more than 20 licensed private
company for operation of exploitation for gold, diamond, manganese, nickel, zinc and
phosphate, the government has not evolve the appropriate legal and institutional framework to
attract either domestic or international private investment. For this reason, it can be said that the
existing regulation of the mining does not allow appropriate benefits to the mining industry. In
the PRSP-II, significance of creating a strong strategic vision is stated for the development of
mining industry, and some of the actions to be beneficial to the sector is implied as followed: i)
construction of north to south corridor including rail and port services, ii) and promoting
institutional reforms. Strategic targets of major mining products are summarized in the Table
2-12.
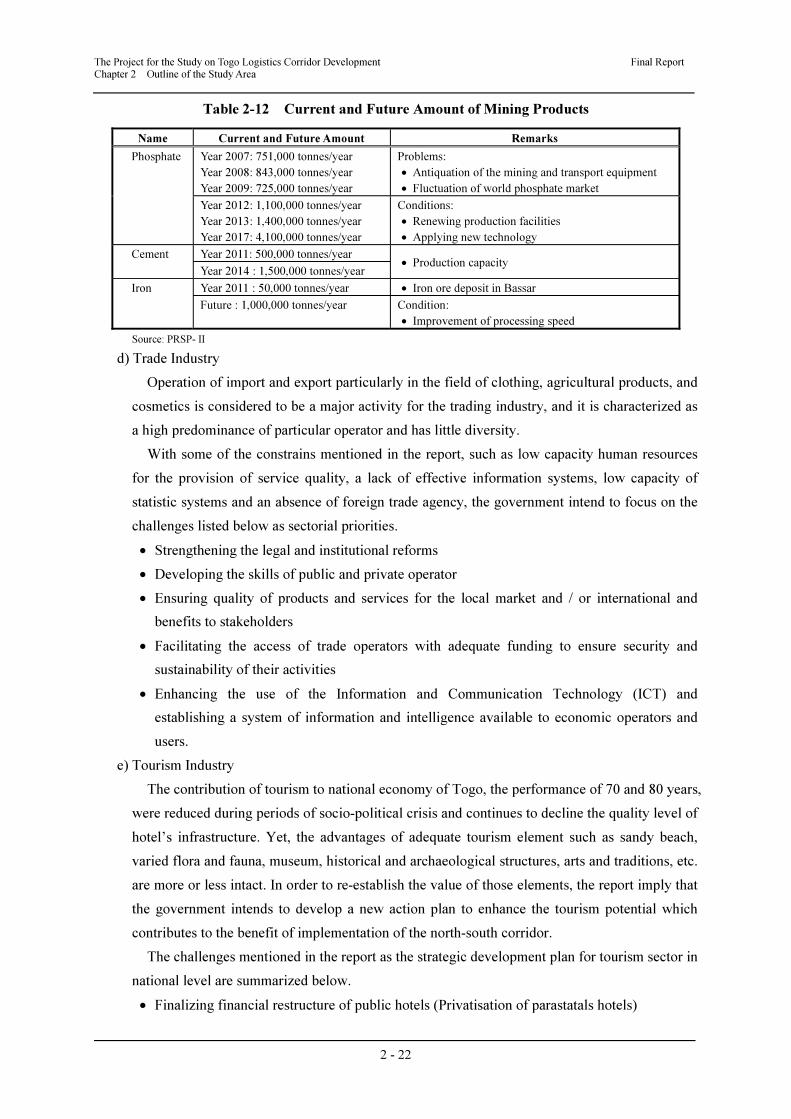
The Project for the Study on Togo Logistics Corridor Development Final Report Chapter 2 Outline of the Study Area
2 - 22
Table 2-12 Current and Future Amount of Mining Products
Name Current and Future Amount Remarks
Phosphate Year 2007: 751,000 tonnes/year
Year 2008: 843,000 tonnes/year
Year 2009: 725,000 tonnes/year
Problems:
• Antiquation of the mining and transport equipment
• Fluctuation of world phosphate market
Year 2012: 1,100,000 tonnes/year
Year 2013: 1,400,000 tonnes/year
Year 2017: 4,100,000 tonnes/year
Conditions:
• Renewing production facilities
• Applying new technology
Cement Year 2011: 500,000 tonnes/year • Production capacity
Year 2014 : 1,500,000 tonnes/year
Iron Year 2011 : 50,000 tonnes/year • Iron ore deposit in Bassar
Future : 1,000,000 tonnes/year Condition:
• Improvement of processing speed
Source: PRSP- II
d) Trade Industry
Operation of import and export particularly in the field of clothing, agricultural products, and
cosmetics is considered to be a major activity for the trading industry, and it is characterized as
a high predominance of particular operator and has little diversity.
With some of the constrains mentioned in the report, such as low capacity human resources
for the provision of service quality, a lack of effective information systems, low capacity of
statistic systems and an absence of foreign trade agency, the government intend to focus on the
challenges listed below as sectorial priorities.
• Strengthening the legal and institutional reforms
• Developing the skills of public and private operator
• Ensuring quality of products and services for the local market and / or international and
benefits to stakeholders
• Facilitating the access of trade operators with adequate funding to ensure security and
sustainability of their activities
• Enhancing the use of the Information and Communication Technology (ICT) and
establishing a system of information and intelligence available to economic operators and
users.
e) Tourism Industry
The contribution of tourism to national economy of Togo, the performance of 70 and 80 years,
were reduced during periods of socio-political crisis and continues to decline the quality level of
hotel’s infrastructure. Yet, the advantages of adequate tourism element such as sandy beach,
varied flora and fauna, museum, historical and archaeological structures, arts and traditions, etc.
are more or less intact. In order to re-establish the value of those elements, the report imply that
the government intends to develop a new action plan to enhance the tourism potential which
contributes to the benefit of implementation of the north-south corridor.
The challenges mentioned in the report as the strategic development plan for tourism sector in
national level are summarized below.
• Finalizing financial restructure of public hotels (Privatisation of parastatals hotels)
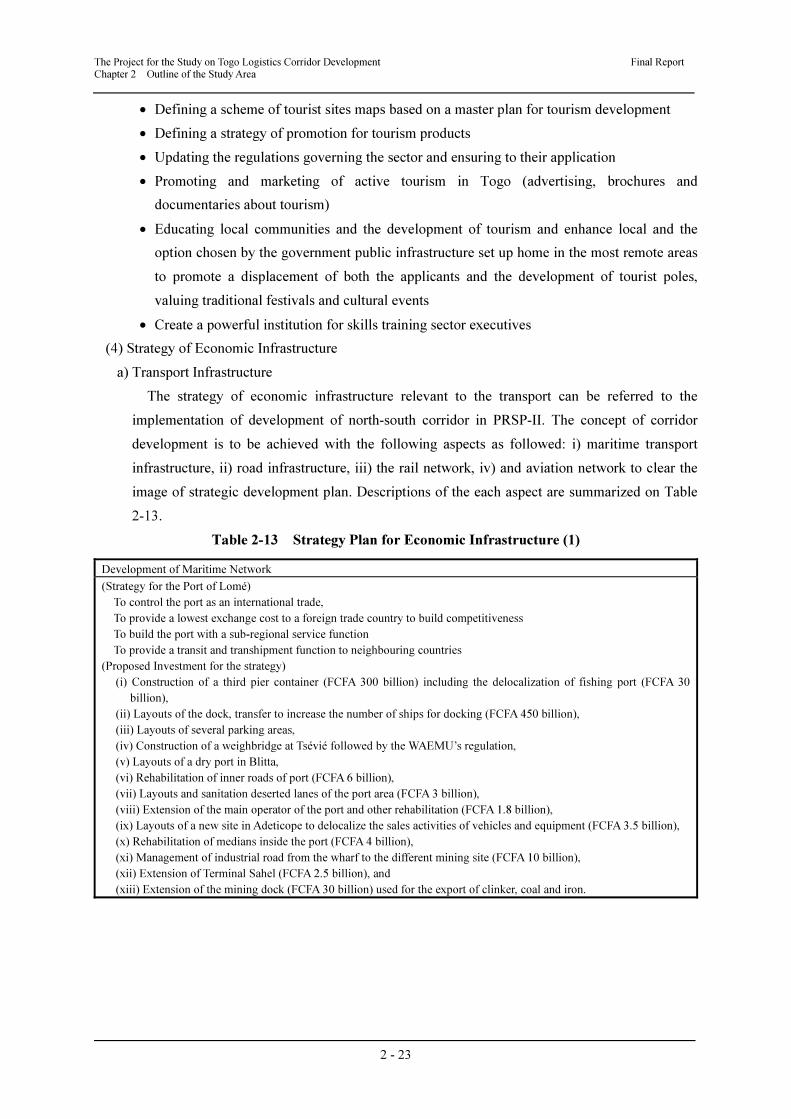
The Project for the Study on Togo Logistics Corridor Development Final Report Chapter 2 Outline of the Study Area
2 - 23
• Defining a scheme of tourist sites maps based on a master plan for tourism development
• Defining a strategy of promotion for tourism products
• Updating the regulations governing the sector and ensuring to their application
• Promoting and marketing of active tourism in Togo (advertising, brochures and
documentaries about tourism)
• Educating local communities and the development of tourism and enhance local and the
option chosen by the government public infrastructure set up home in the most remote areas
to promote a displacement of both the applicants and the development of tourist poles,
valuing traditional festivals and cultural events
• Create a powerful institution for skills training sector executives
(4) Strategy of Economic Infrastructure
a) Transport Infrastructure
The strategy of economic infrastructure relevant to the transport can be referred to the
implementation of development of north-south corridor in PRSP-II. The concept of corridor
development is to be achieved with the following aspects as followed: i) maritime transport
infrastructure, ii) road infrastructure, iii) the rail network, iv) and aviation network to clear the
image of strategic development plan. Descriptions of the each aspect are summarized on Table
2-13.
Table 2-13 Strategy Plan for Economic Infrastructure (1)
Development of Maritime Network
(Strategy for the Port of Lomé)
To control the port as an international trade,
To provide a lowest exchange cost to a foreign trade country to build competitiveness
To build the port with a sub-regional service function
To provide a transit and transhipment function to neighbouring countries
(Proposed Investment for the strategy)
(i) Construction of a third pier container (FCFA 300 billion) including the delocalization of fishing port (FCFA 30
billion),
(ii) Layouts of the dock, transfer to increase the number of ships for docking (FCFA 450 billion),
(iii) Layouts of several parking areas,
(iv) Construction of a weighbridge at Tsévié followed by the WAEMU’s regulation,
(v) Layouts of a dry port in Blitta,
(vi) Rehabilitation of inner roads of port (FCFA 6 billion),
(vii) Layouts and sanitation deserted lanes of the port area (FCFA 3 billion),
(viii) Extension of the main operator of the port and other rehabilitation (FCFA 1.8 billion),
(ix) Layouts of a new site in Adeticope to delocalize the sales activities of vehicles and equipment (FCFA 3.5 billion),
(x) Rehabilitation of medians inside the port (FCFA 4 billion),
(xi) Management of industrial road from the wharf to the different mining site (FCFA 10 billion),
(xii) Extension of Terminal Sahel (FCFA 2.5 billion), and
(xiii) Extension of the mining dock (FCFA 30 billion) used for the export of clinker, coal and iron.
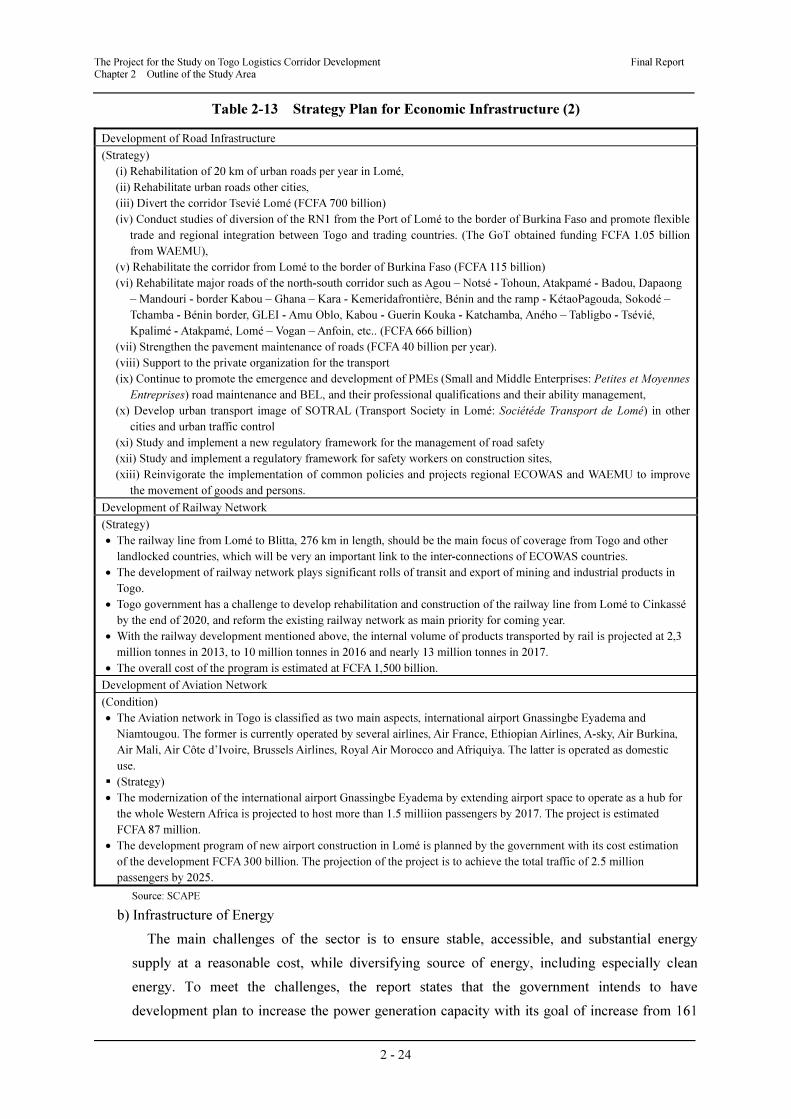
The Project for the Study on Togo Logistics Corridor Development Final Report Chapter 2 Outline of the Study Area
2 - 24
Table 2-13 Strategy Plan for Economic Infrastructure (2)
Development of Road Infrastructure
(Strategy)
(i) Rehabilitation of 20 km of urban roads per year in Lomé,
(ii) Rehabilitate urban roads other cities,
(iii) Divert the corridor Tsevié Lomé (FCFA 700 billion)
(iv) Conduct studies of diversion of the RN1 from the Port of Lomé to the border of Burkina Faso and promote flexible
trade and regional integration between Togo and trading countries. (The GoT obtained funding FCFA 1.05 billion
from WAEMU),
(v) Rehabilitate the corridor from Lomé to the border of Burkina Faso (FCFA 115 billion)
(vi) Rehabilitate major roads of the north-south corridor such as Agou – Notsé - Tohoun, Atakpamé - Badou, Dapaong
– Mandouri - border Kabou – Ghana – Kara - Kemeridafrontière, Bénin and the ramp - KétaoPagouda, Sokodé –
Tchamba - Bénin border, GLEI - Amu Oblo, Kabou - Guerin Kouka - Katchamba, Aného – Tabligbo - Tsévié,
Kpalimé - Atakpamé, Lomé – Vogan – Anfoin, etc.. (FCFA 666 billion)
(vii) Strengthen the pavement maintenance of roads (FCFA 40 billion per year).
(viii) Support to the private organization for the transport
(ix) Continue to promote the emergence and development of PMEs (Small and Middle Enterprises: Petites et Moyennes
Entreprises) road maintenance and BEL, and their professional qualifications and their ability management,
(x) Develop urban transport image of SOTRAL (Transport Society in Lomé: Sociétéde Transport de Lomé) in other
cities and urban traffic control
(xi) Study and implement a new regulatory framework for the management of road safety
(xii) Study and implement a regulatory framework for safety workers on construction sites,
(xiii) Reinvigorate the implementation of common policies and projects regional ECOWAS and WAEMU to improve
the movement of goods and persons.
Development of Railway Network
(Strategy)
• The railway line from Lomé to Blitta, 276 km in length, should be the main focus of coverage from Togo and other
landlocked countries, which will be very an important link to the inter-connections of ECOWAS countries.
• The development of railway network plays significant rolls of transit and export of mining and industrial products in
Togo.
• Togo government has a challenge to develop rehabilitation and construction of the railway line from Lomé to Cinkassé
by the end of 2020, and reform the existing railway network as main priority for coming year.
• With the railway development mentioned above, the internal volume of products transported by rail is projected at 2,3
million tonnes in 2013, to 10 million tonnes in 2016 and nearly 13 million tonnes in 2017.
• The overall cost of the program is estimated at FCFA 1,500 billion.
Development of Aviation Network
(Condition)
• The Aviation network in Togo is classified as two main aspects, international airport Gnassingbe Eyadema and
Niamtougou. The former is currently operated by several airlines, Air France, Ethiopian Airlines, A-sky, Air Burkina,
Air Mali, Air Côte d’Ivoire, Brussels Airlines, Royal Air Morocco and Afriquiya. The latter is operated as domestic
use.
� (Strategy)
• The modernization of the international airport Gnassingbe Eyadema by extending airport space to operate as a hub for
the whole Western Africa is projected to host more than 1.5 milliion passengers by 2017. The project is estimated
FCFA 87 million.
• The development program of new airport construction in Lomé is planned by the government with its cost estimation
of the development FCFA 300 billion. The projection of the project is to achieve the total traffic of 2.5 million
passengers by 2025.
Source: SCAPE
b) Infrastructure of Energy
The main challenges of the sector is to ensure stable, accessible, and substantial energy
supply at a reasonable cost, while diversifying source of energy, including especially clean
energy. To meet the challenges, the report states that the government intends to have
development plan to increase the power generation capacity with its goal of increase from 161
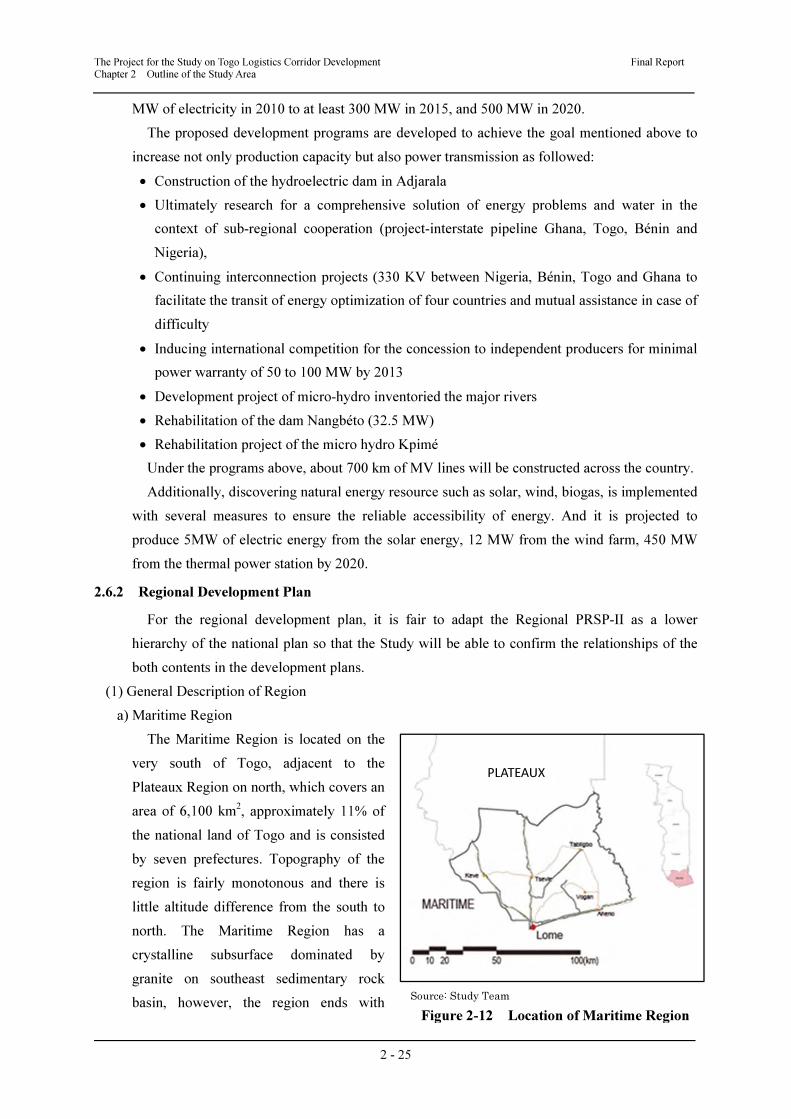
The Project for the Study on Togo Logistics Corridor Development Final Report Chapter 2 Outline of the Study Area
2 - 25
MW of electricity in 2010 to at least 300 MW in 2015, and 500 MW in 2020.
The proposed development programs are developed to achieve the goal mentioned above to
increase not only production capacity but also power transmission as followed:
• Construction of the hydroelectric dam in Adjarala
• Ultimately research for a comprehensive solution of energy problems and water in the
context of sub-regional cooperation (project-interstate pipeline Ghana, Togo, Bénin and
Nigeria),
• Continuing interconnection projects (330 KV between Nigeria, Bénin, Togo and Ghana to
facilitate the transit of energy optimization of four countries and mutual assistance in case of
difficulty
• Inducing international competition for the concession to independent producers for minimal
power warranty of 50 to 100 MW by 2013
• Development project of micro-hydro inventoried the major rivers
• Rehabilitation of the dam Nangbéto (32.5 MW)
• Rehabilitation project of the micro hydro Kpimé
Under the programs above, about 700 km of MV lines will be constructed across the country.
Additionally, discovering natural energy resource such as solar, wind, biogas, is implemented
with several measures to ensure the reliable accessibility of energy. And it is projected to
produce 5MW of electric energy from the solar energy, 12 MW from the wind farm, 450 MW
from the thermal power station by 2020.
2.6.2 Regional Development Plan
For the regional development plan, it is fair to adapt the Regional PRSP-II as a lower
hierarchy of the national plan so that the Study will be able to confirm the relationships of the
both contents in the development plans.
(1) General Description of Region
a) Maritime Region
The Maritime Region is located on the
very south of Togo, adjacent to the
Plateaux Region on north, which covers an
area of 6,100 km2, approximately 11% of
the national land of Togo and is consisted
by seven prefectures. Topography of the
region is fairly monotonous and there is
little altitude difference from the south to
north. The Maritime Region has a
crystalline subsurface dominated by
granite on southeast sedimentary rock
basin, however, the region ends with Source: Study Team
Figure 2-12 Location of Maritime Region
PLATEAUX
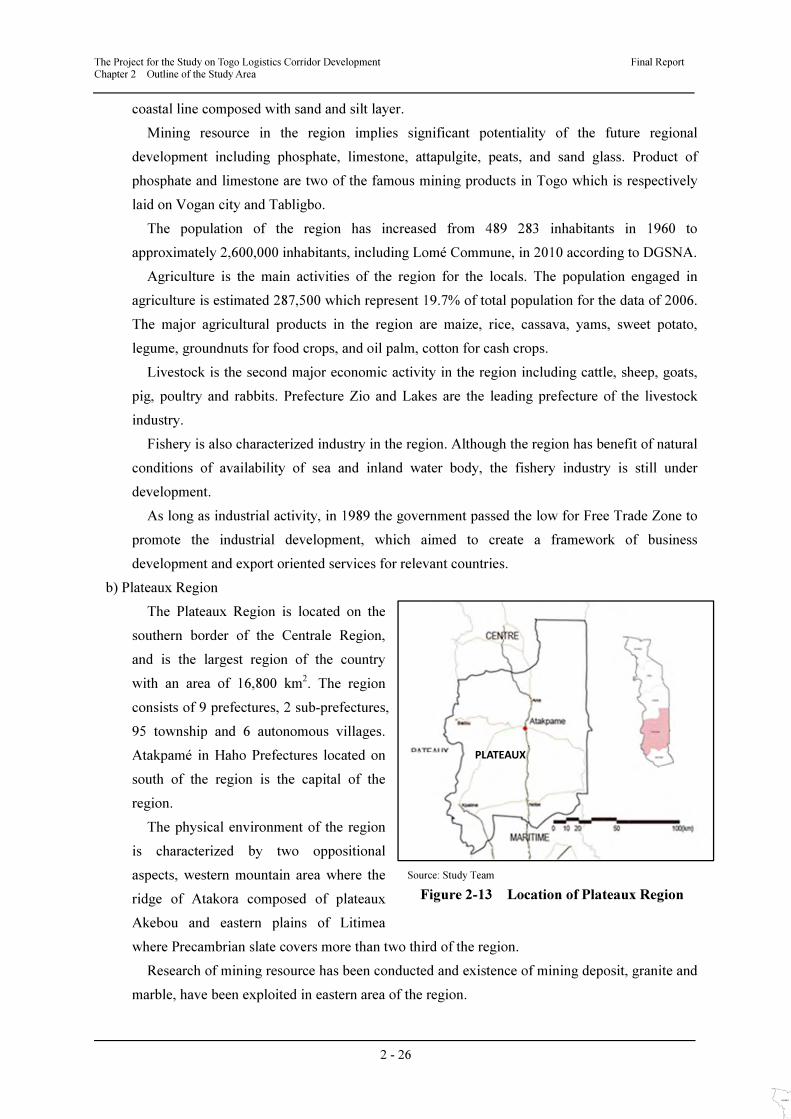
The Project for the Study on Togo Logistics Corridor Development Final Report Chapter 2 Outline of the Study Area
2 - 26
coastal line composed with sand and silt layer.
Mining resource in the region implies significant potentiality of the future regional
development including phosphate, limestone, attapulgite, peats, and sand glass. Product of
phosphate and limestone are two of the famous mining products in Togo which is respectively
laid on Vogan city and Tabligbo.
The population of the region has increased from 489 283 inhabitants in 1960 to
approximately 2,600,000 inhabitants, including Lomé Commune, in 2010 according to DGSNA.
Agriculture is the main activities of the region for the locals. The population engaged in
agriculture is estimated 287,500 which represent 19.7% of total population for the data of 2006.
The major agricultural products in the region are maize, rice, cassava, yams, sweet potato,
legume, groundnuts for food crops, and oil palm, cotton for cash crops.
Livestock is the second major economic activity in the region including cattle, sheep, goats,
pig, poultry and rabbits. Prefecture Zio and Lakes are the leading prefecture of the livestock
industry.
Fishery is also characterized industry in the region. Although the region has benefit of natural
conditions of availability of sea and inland water body, the fishery industry is still under
development.
As long as industrial activity, in 1989 the government passed the low for Free Trade Zone to
promote the industrial development, which aimed to create a framework of business
development and export oriented services for relevant countries.
b) Plateaux Region
The Plateaux Region is located on the
southern border of the Centrale Region,
and is the largest region of the country
with an area of 16,800 km2. The region
consists of 9 prefectures, 2 sub-prefectures,
95 township and 6 autonomous villages.
Atakpamé in Haho Prefectures located on
south of the region is the capital of the
region.
The physical environment of the region
is characterized by two oppositional
aspects, western mountain area where the
ridge of Atakora composed of plateaux
Akebou and eastern plains of Litimea
where Precambrian slate covers more than two third of the region.
Research of mining resource has been conducted and existence of mining deposit, granite and
marble, have been exploited in eastern area of the region.
Source: Study Team
Figure 2-13 Location of Plateaux Region
PLATEAUX
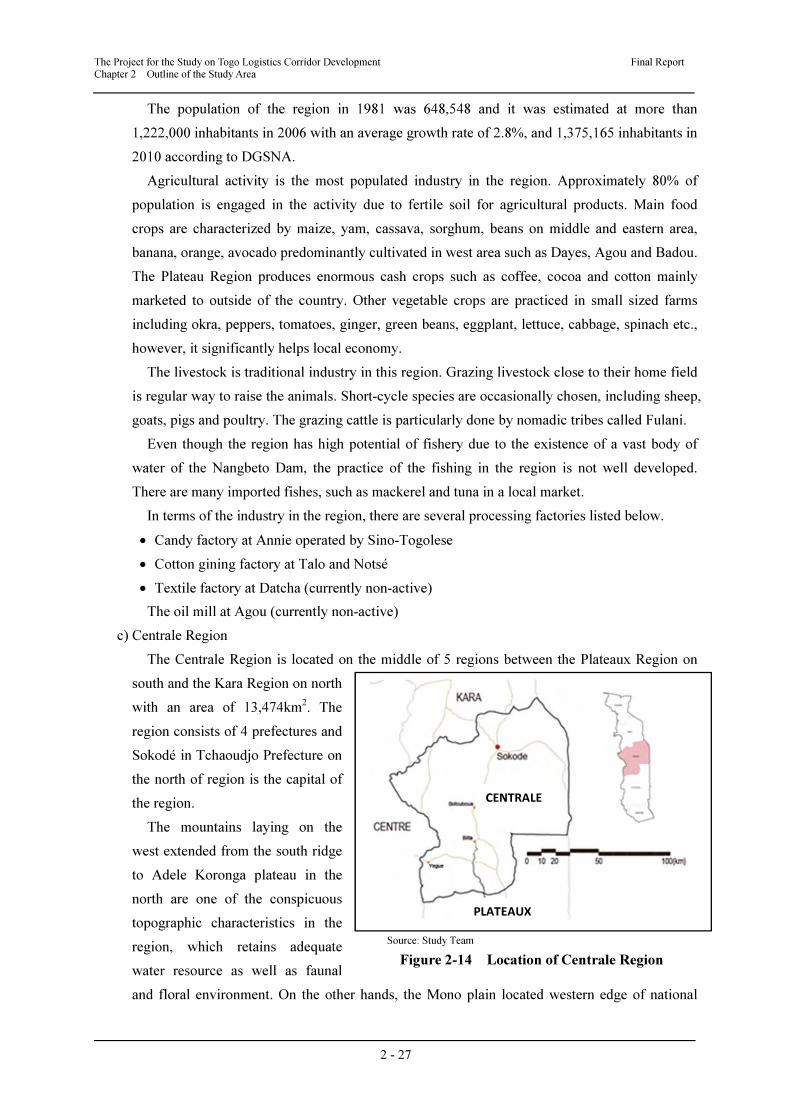
The Project for the Study on Togo Logistics Corridor Development Final Report Chapter 2 Outline of the Study Area
2 - 27
The population of the region in 1981 was 648,548 and it was estimated at more than
1,222,000 inhabitants in 2006 with an average growth rate of 2.8%, and 1,375,165 inhabitants in
2010 according to DGSNA.
Agricultural activity is the most populated industry in the region. Approximately 80% of
population is engaged in the activity due to fertile soil for agricultural products. Main food
crops are characterized by maize, yam, cassava, sorghum, beans on middle and eastern area,
banana, orange, avocado predominantly cultivated in west area such as Dayes, Agou and Badou.
The Plateau Region produces enormous cash crops such as coffee, cocoa and cotton mainly
marketed to outside of the country. Other vegetable crops are practiced in small sized farms
including okra, peppers, tomatoes, ginger, green beans, eggplant, lettuce, cabbage, spinach etc.,
however, it significantly helps local economy.
The livestock is traditional industry in this region. Grazing livestock close to their home field
is regular way to raise the animals. Short-cycle species are occasionally chosen, including sheep,
goats, pigs and poultry. The grazing cattle is particularly done by nomadic tribes called Fulani.
Even though the region has high potential of fishery due to the existence of a vast body of
water of the Nangbeto Dam, the practice of the fishing in the region is not well developed.
There are many imported fishes, such as mackerel and tuna in a local market.
In terms of the industry in the region, there are several processing factories listed below.
• Candy factory at Annie operated by Sino-Togolese
• Cotton gining factory at Talo and Notsé
• Textile factory at Datcha (currently non-active)
The oil mill at Agou (currently non-active)
c) Centrale Region
The Centrale Region is located on the middle of 5 regions between the Plateaux Region on
south and the Kara Region on north
with an area of 13,474km2. The
region consists of 4 prefectures and
Sokodé in Tchaoudjo Prefecture on
the north of region is the capital of
the region.
The mountains laying on the
west extended from the south ridge
to Adele Koronga plateau in the
north are one of the conspicuous
topographic characteristics in the
region, which retains adequate
water resource as well as faunal
and floral environment. On the other hands, the Mono plain located western edge of national
Source: Study Team
Figure 2-14 Location of Centrale Region
CENTRALE
PLATEAUX
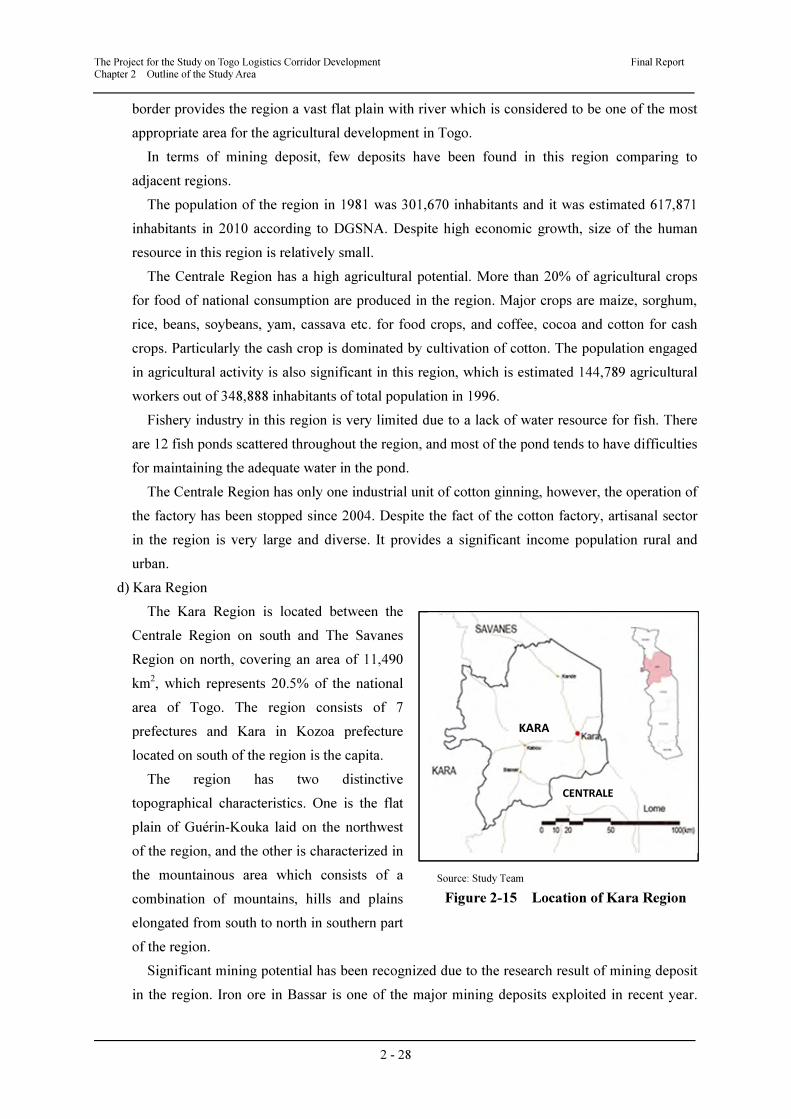
The Project for the Study on Togo Logistics Corridor Development Final Report Chapter 2 Outline of the Study Area
2 - 28
border provides the region a vast flat plain with river which is considered to be one of the most
appropriate area for the agricultural development in Togo.
In terms of mining deposit, few deposits have been found in this region comparing to
adjacent regions.
The population of the region in 1981 was 301,670 inhabitants and it was estimated 617,871
inhabitants in 2010 according to DGSNA. Despite high economic growth, size of the human
resource in this region is relatively small.
The Centrale Region has a high agricultural potential. More than 20% of agricultural crops
for food of national consumption are produced in the region. Major crops are maize, sorghum,
rice, beans, soybeans, yam, cassava etc. for food crops, and coffee, cocoa and cotton for cash
crops. Particularly the cash crop is dominated by cultivation of cotton. The population engaged
in agricultural activity is also significant in this region, which is estimated 144,789 agricultural
workers out of 348,888 inhabitants of total population in 1996.
Fishery industry in this region is very limited due to a lack of water resource for fish. There
are 12 fish ponds scattered throughout the region, and most of the pond tends to have difficulties
for maintaining the adequate water in the pond.
The Centrale Region has only one industrial unit of cotton ginning, however, the operation of
the factory has been stopped since 2004. Despite the fact of the cotton factory, artisanal sector
in the region is very large and diverse. It provides a significant income population rural and
urban.
d) Kara Region
The Kara Region is located between the
Centrale Region on south and The Savanes
Region on north, covering an area of 11,490
km2, which represents 20.5% of the national
area of Togo. The region consists of 7
prefectures and Kara in Kozoa prefecture
located on south of the region is the capita.
The region has two distinctive
topographical characteristics. One is the flat
plain of Guérin-Kouka laid on the northwest
of the region, and the other is characterized in
the mountainous area which consists of a
combination of mountains, hills and plains
elongated from south to north in southern part
of the region.
Significant mining potential has been recognized due to the research result of mining deposit
in the region. Iron ore in Bassar is one of the major mining deposits exploited in recent year.
Source: Study Team
Figure 2-15 Location of Kara Region
KARA
CENTRALE
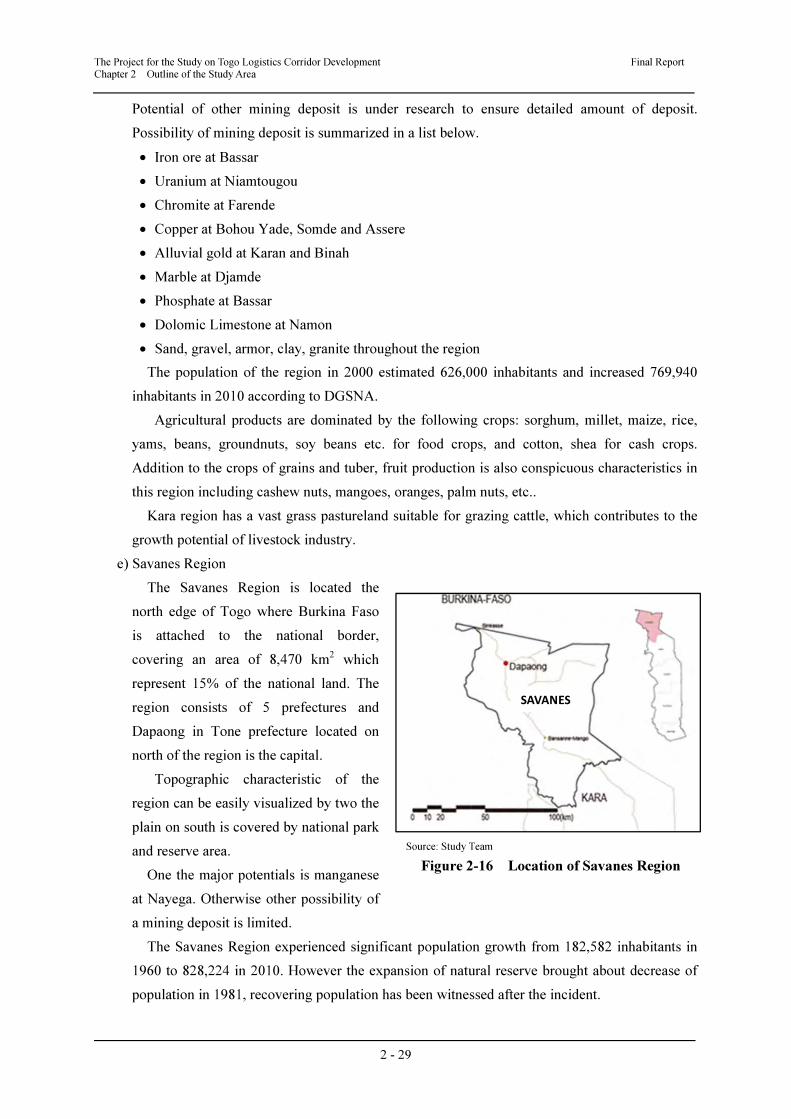
The Project for the Study on Togo Logistics Corridor Development Final Report Chapter 2 Outline of the Study Area
2 - 29
Potential of other mining deposit is under research to ensure detailed amount of deposit.
Possibility of mining deposit is summarized in a list below.
• Iron ore at Bassar
• Uranium at Niamtougou
• Chromite at Farende
• Copper at Bohou Yade, Somde and Assere
• Alluvial gold at Karan and Binah
• Marble at Djamde
• Phosphate at Bassar
• Dolomic Limestone at Namon
• Sand, gravel, armor, clay, granite throughout the region
The population of the region in 2000 estimated 626,000 inhabitants and increased 769,940
inhabitants in 2010 according to DGSNA.
Agricultural products are dominated by the following crops: sorghum, millet, maize, rice,
yams, beans, groundnuts, soy beans etc. for food crops, and cotton, shea for cash crops.
Addition to the crops of grains and tuber, fruit production is also conspicuous characteristics in
this region including cashew nuts, mangoes, oranges, palm nuts, etc..
Kara region has a vast grass pastureland suitable for grazing cattle, which contributes to the
growth potential of livestock industry.
e) Savanes Region
The Savanes Region is located the
north edge of Togo where Burkina Faso
is attached to the national border,
covering an area of 8,470 km2 which
represent 15% of the national land. The
region consists of 5 prefectures and
Dapaong in Tone prefecture located on
north of the region is the capital.
Topographic characteristic of the
region can be easily visualized by two the
plain on south is covered by national park
and reserve area.
One the major potentials is manganese
at Nayega. Otherwise other possibility of
a mining deposit is limited.
The Savanes Region experienced significant population growth from 182,582 inhabitants in
1960 to 828,224 in 2010. However the expansion of natural reserve brought about decrease of
population in 1981, recovering population has been witnessed after the incident.
Source: Study Team
Figure 2-16 Location of Savanes Region
SAVANES
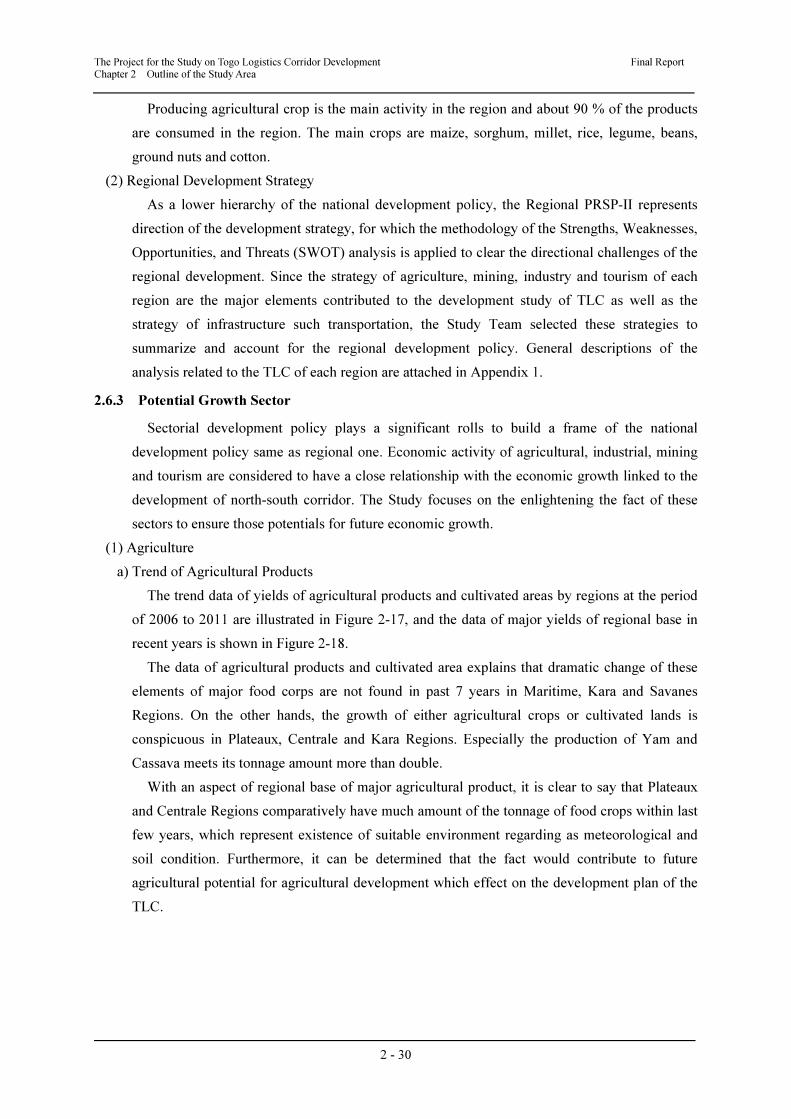
The Project for the Study on Togo Logistics Corridor Development Final Report Chapter 2 Outline of the Study Area
2 - 30
Producing agricultural crop is the main activity in the region and about 90 % of the products
are consumed in the region. The main crops are maize, sorghum, millet, rice, legume, beans,
ground nuts and cotton.
(2) Regional Development Strategy
As a lower hierarchy of the national development policy, the Regional PRSP-II represents
direction of the development strategy, for which the methodology of the Strengths, Weaknesses,
Opportunities, and Threats (SWOT) analysis is applied to clear the directional challenges of the
regional development. Since the strategy of agriculture, mining, industry and tourism of each
region are the major elements contributed to the development study of TLC as well as the
strategy of infrastructure such transportation, the Study Team selected these strategies to
summarize and account for the regional development policy. General descriptions of the
analysis related to the TLC of each region are attached in Appendix 1.
2.6.3 Potential Growth Sector
Sectorial development policy plays a significant rolls to build a frame of the national
development policy same as regional one. Economic activity of agricultural, industrial, mining
and tourism are considered to have a close relationship with the economic growth linked to the
development of north-south corridor. The Study focuses on the enlightening the fact of these
sectors to ensure those potentials for future economic growth.
(1) Agriculture
a) Trend of Agricultural Products
The trend data of yields of agricultural products and cultivated areas by regions at the period
of 2006 to 2011 are illustrated in Figure 2-17, and the data of major yields of regional base in
recent years is shown in Figure 2-18.
The data of agricultural products and cultivated area explains that dramatic change of these
elements of major food corps are not found in past 7 years in Maritime, Kara and Savanes
Regions. On the other hands, the growth of either agricultural crops or cultivated lands is
conspicuous in Plateaux, Centrale and Kara Regions. Especially the production of Yam and
Cassava meets its tonnage amount more than double.
With an aspect of regional base of major agricultural product, it is clear to say that Plateaux
and Centrale Regions comparatively have much amount of the tonnage of food crops within last
few years, which represent existence of suitable environment regarding as meteorological and
soil condition. Furthermore, it can be determined that the fact would contribute to future
agricultural potential for agricultural development which effect on the development plan of the
TLC.

The Project for the Study on Togo Logistics Corridor Development Final Report Chapter 2 Outline of the Study Area
2 - 31
Figure 2-17 Total Amount of Yields and Cultivated Land (1)
0
5,000
10,000
15,000
20,000
25,000
30,000
0
500
1,000
1,500
2,000
2,500
3,000
2005 2006 2007 2008 2009 2010 2011
(tonne)
(ha)
Yam (Maritime Rregion)
0
50,000
100,000
150,000
200,000
250,000
300,000
350,000
40,000
42,000
44,000
46,000
48,000
50,000
52,000
54,000
56,000
2005 2006 2007 2008 2009 2010 2011
(tonne)
(ha)
Cassava (Maritime Region)
0
50,000
100,000
150,000
200,000
250,000
300,000
0
5,000
10,000
15,000
20,000
25,000
30,000
35,000
2005 2006 2007 2008 2009 2010 2011
(tonne)
(ha)
Yam (Plateaux Region)
0
50,000
100,000
150,000
200,000
250,000
300,000
350,000
400,000
0
10,000
20,000
30,000
40,000
50,000
60,000
2005 2006 2007 2008 2009 2010 2011
(tonne)
(ha)
Cassava (Plateaux Region)
290,000
300,000
310,000
320,000
330,000
340,000
350,000
23,500
24,000
24,500
25,000
25,500
26,000
26,500
27,000
2005 2006 2007 2008 2009 2010 2011
(tonne)
(ha)
Yam (Centre Region)
0
50,000
100,000
150,000
200,000
250,000
300,000
0
5,000
10,000
15,000
20,000
25,000
30,000
35,000
40,000
2005 2006 2007 2008 2009 2010 2011
(tonne)
(ha)
Cassava (Centre Region)
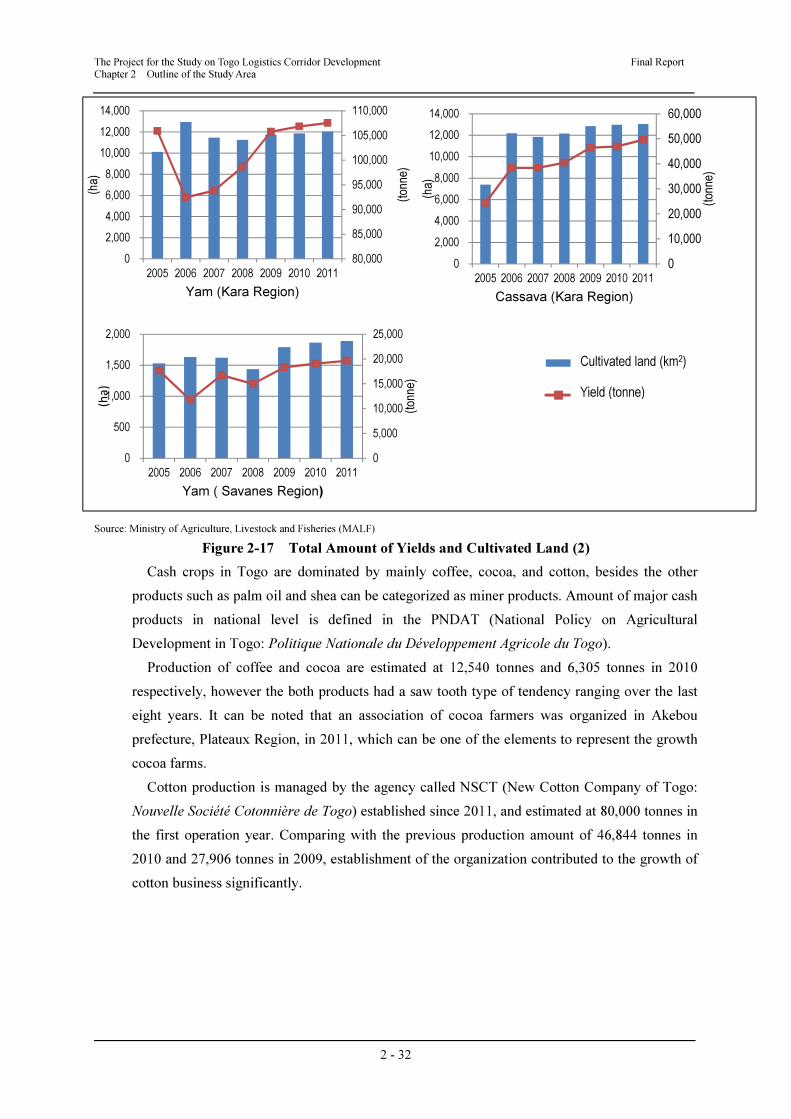
The Project for the Study on Togo Logistics Corridor Development Final Report Chapter 2 Outline of the Study Area
2 - 32
0
10,000
20,000
30,000
40,000
50,000
60,000
0
2,000
4,000
6,000
8,000
10,000
12,000
14,000
2005 2006 2007 2008 2009 2010 2011
(tonne)
(ha)
Cassava (Kara Region)
0
50000
100000
2005
Cultivate Land
(km2)
Yield (ton)
Source: Ministry of Agriculture, Livestock and Fisheries (MALF)
Figure 2-17 Total Amount of Yields and Cultivated Land (2)
Cash crops in Togo are dominated by mainly coffee, cocoa, and cotton, besides the other
products such as palm oil and shea can be categorized as miner products. Amount of major cash
products in national level is defined in the PNDAT (National Policy on Agricultural
Development in Togo: Politique Nationale du Développement Agricole du Togo).
Production of coffee and cocoa are estimated at 12,540 tonnes and 6,305 tonnes in 2010
respectively, however the both products had a saw tooth type of tendency ranging over the last
eight years. It can be noted that an association of cocoa farmers was organized in Akebou
prefecture, Plateaux Region, in 2011, which can be one of the elements to represent the growth
cocoa farms.
Cotton production is managed by the agency called NSCT (New Cotton Company of Togo:
Nouvelle Société Cotonnière de Togo) established since 2011, and estimated at 80,000 tonnes in
the first operation year. Comparing with the previous production amount of 46,844 tonnes in
2010 and 27,906 tonnes in 2009, establishment of the organization contributed to the growth of
cotton business significantly.
80,000
85,000
90,000
95,000
100,000
105,000
110,000
0
2,000
4,000
6,000
8,000
10,000
12,000
14,000
2005 2006 2007 2008 2009 2010 2011
(tonne)
(ha)
Yam (Kara Region)
0
5,000
10,000
15,000
20,000
25,000
0
500
1,000
1,500
2,000
2005 2006 2007 2008 2009 2010 2011
(tonne)
(ha)
Yam ( Savanes Region)
Cultivated land (km2)
Yield (tonne)
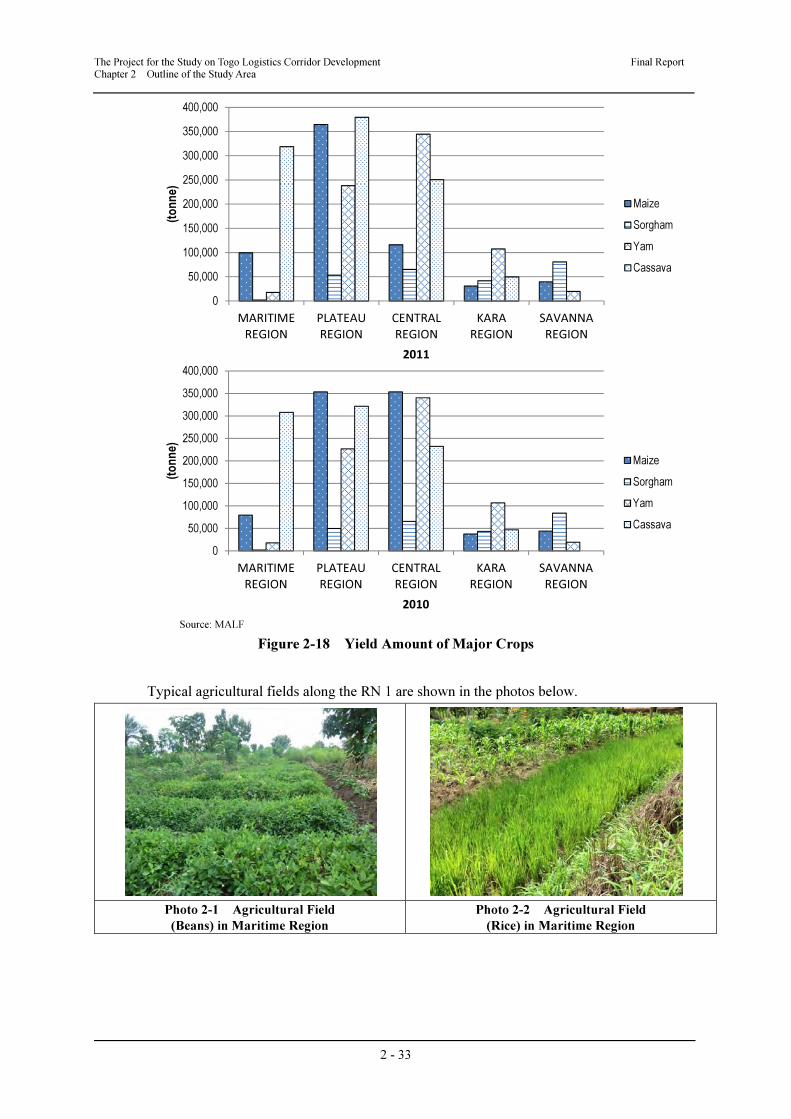
The Project for the Study on Togo Logistics Corridor Development Final Report Chapter 2 Outline of the Study Area
2 - 33
0
50,000
100,000
150,000
200,000
250,000
300,000
350,000
400,000
MARITIME
REGION
PLATEAU
REGION
CENTRAL
REGION
KARA
REGION
SAVANNA
REGION
(tonne)
2011
Maize
Sorgham
Yam
Cassava
Source: MALF
Figure 2-18 Yield Amount of Major Crops
Typical agricultural fields along the RN 1 are shown in the photos below.
Photo 2-1 Agricultural Field
(Beans) in Maritime Region
Photo 2-2 Agricultural Field
(Rice) in Maritime Region
0
50,000
100,000
150,000
200,000
250,000
300,000
350,000
400,000
MARITIME
REGION
PLATEAU
REGION
CENTRAL
REGION
KARA
REGION
SAVANNA
REGION
(tonne)
2010
Maize
Sorgham
Yam
Cassava
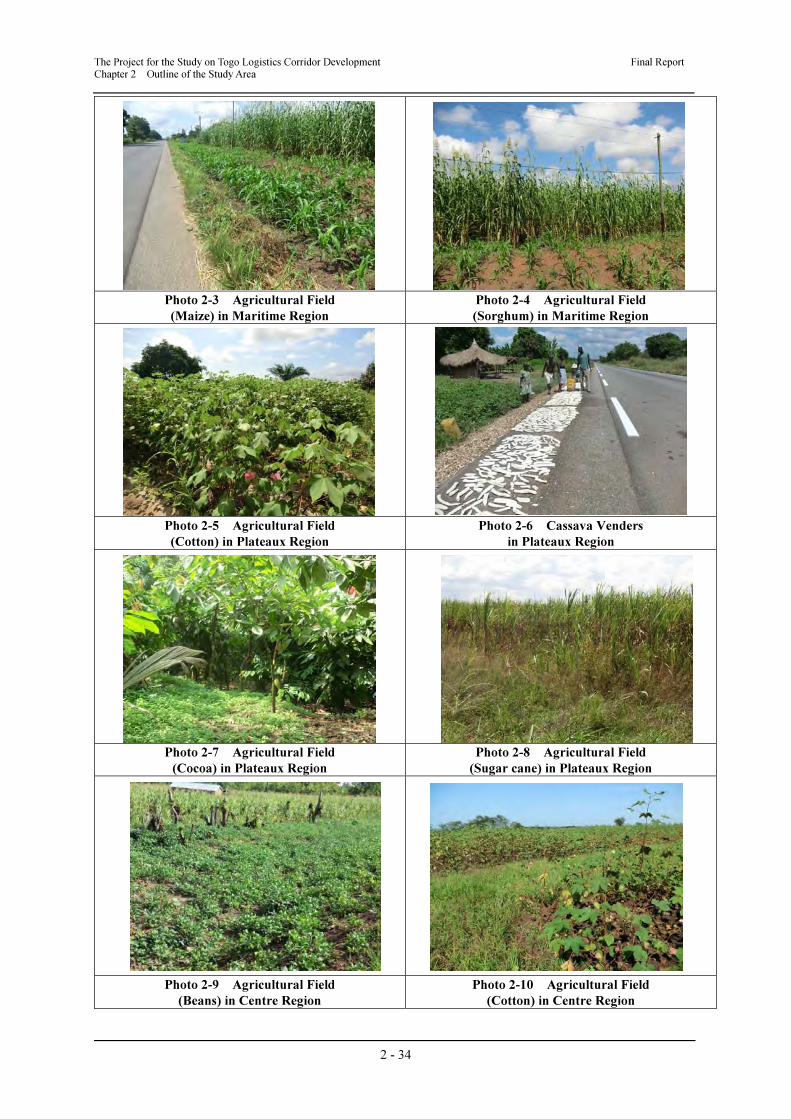
The Project for the Study on Togo Logistics Corridor Development Final Report Chapter 2 Outline of the Study Area
2 - 34
Photo 2-3 Agricultural Field
(Maize) in Maritime Region
Photo 2-4 Agricultural Field
(Sorghum) in Maritime Region
Photo 2-5 Agricultural Field
(Cotton) in Plateaux Region
Photo 2-6 Cassava Venders
in Plateaux Region
Photo 2-7 Agricultural Field
(Cocoa) in Plateaux Region
Photo 2-8 Agricultural Field
(Sugar cane) in Plateaux Region
Photo 2-9 Agricultural Field
(Beans) in Centre Region
Photo 2-10 Agricultural Field
(Cotton) in Centre Region
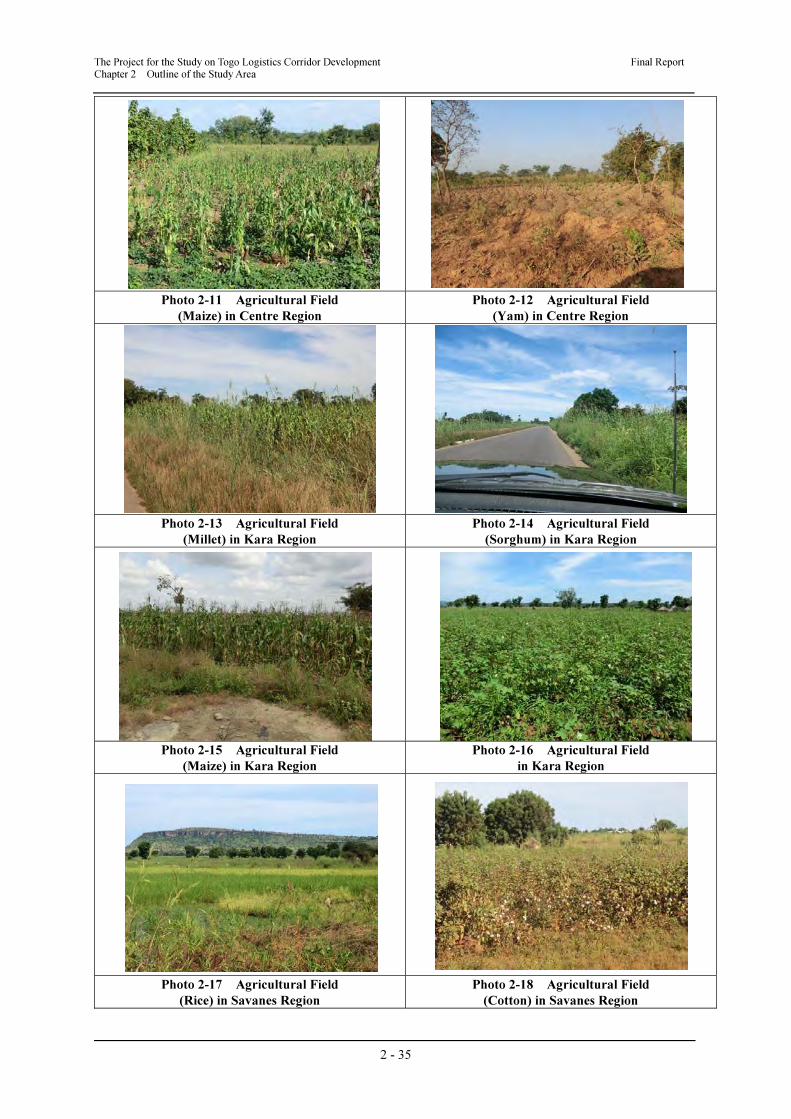
The Project for the Study on Togo Logistics Corridor Development Final Report Chapter 2 Outline of the Study Area
2 - 35
Photo 2-11 Agricultural Field
(Maize) in Centre Region
Photo 2-12 Agricultural Field
(Yam) in Centre Region
Photo 2-13 Agricultural Field
(Millet) in Kara Region
Photo 2-14 Agricultural Field
(Sorghum) in Kara Region
Photo 2-15 Agricultural Field
(Maize) in Kara Region
Photo 2-16 Agricultural Field
in Kara Region
Photo 2-17 Agricultural Field
(Rice) in Savanes Region
Photo 2-18 Agricultural Field
(Cotton) in Savanes Region
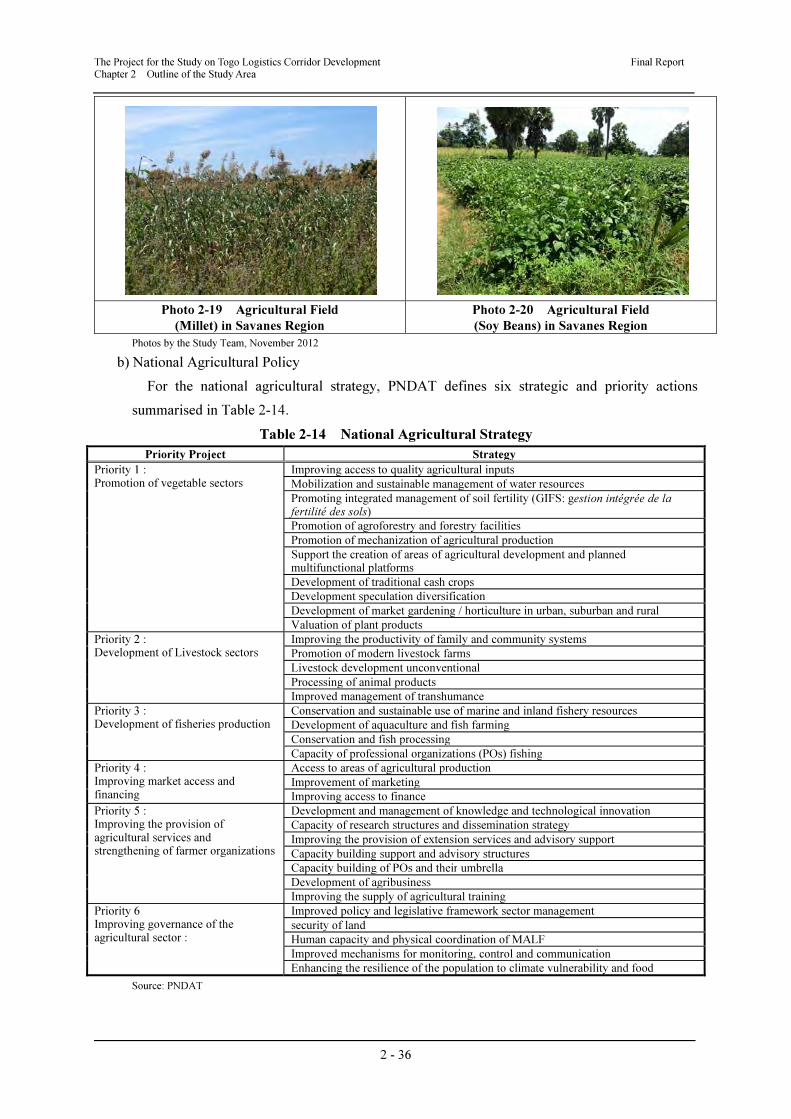
The Project for the Study on Togo Logistics Corridor Development Final Report Chapter 2 Outline of the Study Area
2 - 36
Photo 2-19 Agricultural Field
(Millet) in Savanes Region
Photo 2-20 Agricultural Field
(Soy Beans) in Savanes Region
Photos by the Study Team, November 2012
b) National Agricultural Policy
For the national agricultural strategy, PNDAT defines six strategic and priority actions
summarised in Table 2-14.
Table 2-14 National Agricultural Strategy
Priority Project Strategy
Priority 1 : Promotion of vegetable sectors
Improving access to quality agricultural inputs
Mobilization and sustainable management of water resources
Promoting integrated management of soil fertility (GIFS: gestion intégrée de la fertilité des sols)
Promotion of agroforestry and forestry facilities
Promotion of mechanization of agricultural production
Support the creation of areas of agricultural development and planned multifunctional platforms
Development of traditional cash crops
Development speculation diversification
Development of market gardening / horticulture in urban, suburban and rural
Valuation of plant products
Priority 2 : Development of Livestock sectors
Improving the productivity of family and community systems
Promotion of modern livestock farms
Livestock development unconventional
Processing of animal products
Improved management of transhumance
Priority 3 : Development of fisheries production
Conservation and sustainable use of marine and inland fishery resources
Development of aquaculture and fish farming
Conservation and fish processing
Capacity of professional organizations (POs) fishing
Priority 4 : Improving market access and financing
Access to areas of agricultural production
Improvement of marketing
Improving access to finance
Priority 5 : Improving the provision of agricultural services and strengthening of farmer organizations
Development and management of knowledge and technological innovation
Capacity of research structures and dissemination strategy
Improving the provision of extension services and advisory support
Capacity building support and advisory structures
Capacity building of POs and their umbrella
Development of agribusiness
Improving the supply of agricultural training
Priority 6 Improving governance of the agricultural sector :
Improved policy and legislative framework sector management
security of land
Human capacity and physical coordination of MALF
Improved mechanisms for monitoring, control and communication
Enhancing the resilience of the population to climate vulnerability and food
Source: PNDAT
The Project for the Study on Togo Logistics Corridor Development Final Report Chapter 2 Outline of the Study Area
2 - 37
c) Potential of Agricultural Sector
To search the potential of agricultural sector in Togo, the government developed
comprehensive analysis of future conditions of agriculture to direct and drive the appropriate
agricultural investments which would significantly contribute to Togo’s economy. The analysis
was established based on the effects of implementation of PNIASA (National Programme for
Agricultural Investment and Food Security: Programme National d’Investissement Agricole et
de Sécurité Alimentaire) which stated that it is expected to meet substantial increase in yield and
cultivated areas accompanied with relatively large productions which enable to provide
adequate amount of food and cash crops.
Current condition of distribution of agricultural products from region to region is defined in
the Figure 2-19. According to the figure, surplus of the products can be found in Plateaux and
Centrale Regions, which has definite correlated to the total amount of food crops mentioned
previous section.
Figure 2-20 illustrates minimum scenario of total agricultural food productions by prefecture
in the period of 2010, 2015 and 2020.
(2) Industry
a) National Development Policy
The national policy of industrial sector has been developed by the Ministry of Industry (MI).
The policy consists of five components to frame the direction of industrial growth of Togo with
its strategies of the components described below.
• Component 1: Processing, Production and Distribution
- Raw materials, supplies, equipment, plant and machinery
- Development and training workforce
- Promotion of products manufactured in Togo
- Financing industrial development
- Plots and infrastructure development industry
• Component 2: Technology and Innovation
-Supporting the emergence of a system of innovation and industrial technology;
-Awareness-industrial environments on technological innovation and industrial property;
-Capacity building support structures;
-The industrial development of ICT.
• Component 3: Promotion of standardization, metrology, certification, accreditation, quality
and environmental protection
-Organisation, functioning structures quality management
-Norma/standards metrology
-Accreditation/certification
-Promotion of quality
-Promotion and protection of the environment awareness
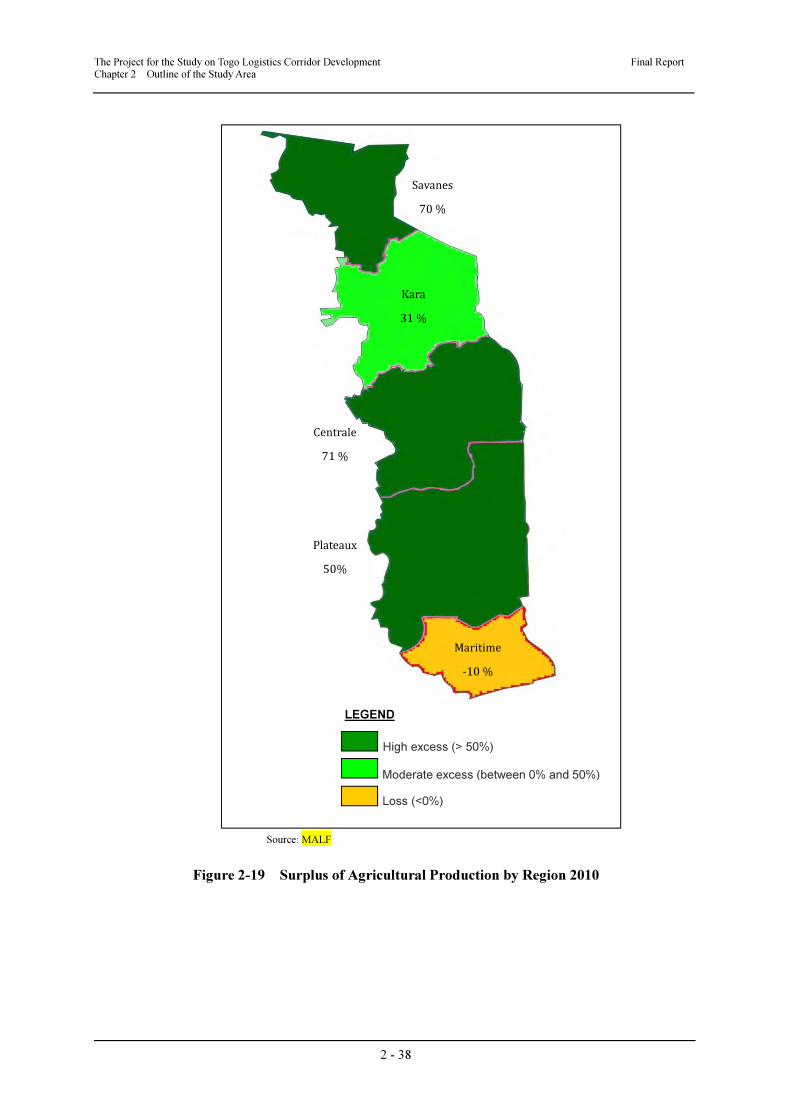
The Project for the Study on Togo Logistics Corridor Development Final Report Chapter 2 Outline of the Study Area
2 - 38
Figure 2-19 Surplus of Agricultural Production by Region 2010
Kara
31 %
Centrale
71 %
Plateaux
50%
Maritime
-10 %
Savanes
70 %
LEGEND
High excess (> 50%)
Moderate excess (between 0% and 50%)
Loss (<0%)
Source: MALF
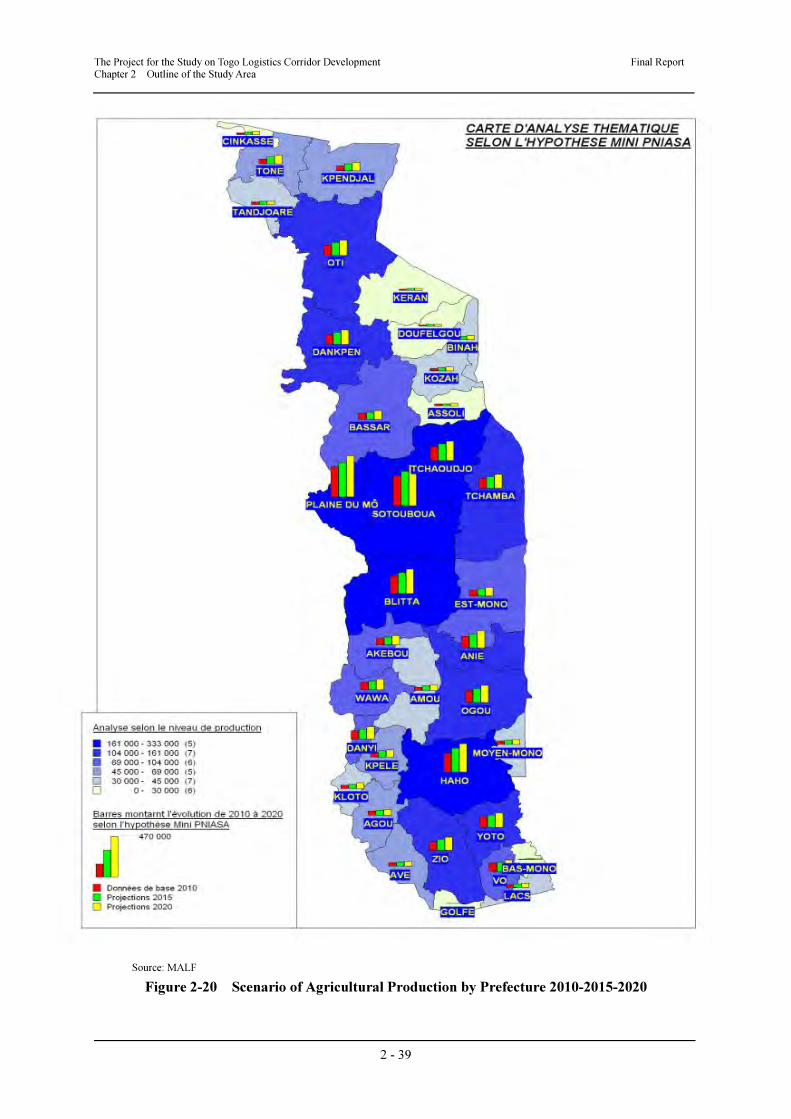
The Project for the Study on Togo Logistics Corridor Development Final Report Chapter 2 Outline of the Study Area
2 - 39
Source: MALF
Figure 2-20 Scenario of Agricultural Production by Prefecture 2010-2015-2020
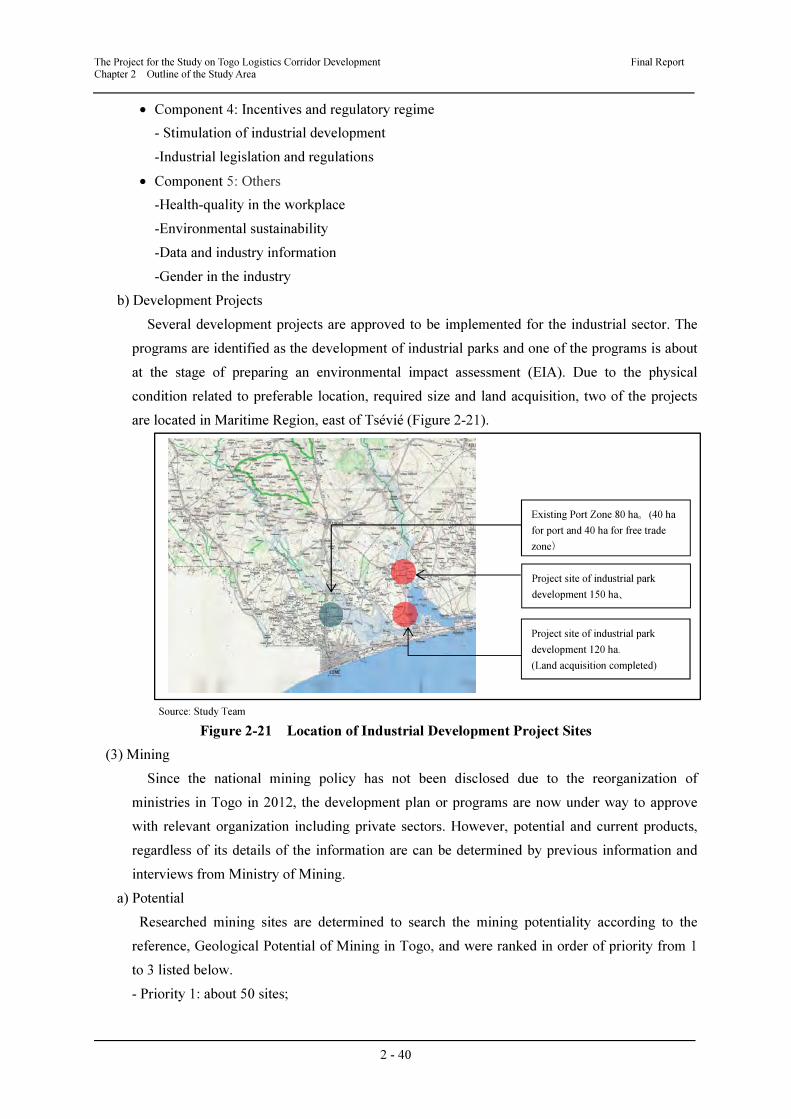
The Project for the Study on Togo Logistics Corridor Development Final Report Chapter 2 Outline of the Study Area
2 - 40
• Component 4: Incentives and regulatory regime
- Stimulation of industrial development
-Industrial legislation and regulations
• Component 5: Others
-Health-quality in the workplace
-Environmental sustainability
-Data and industry information
-Gender in the industry
b) Development Projects
Several development projects are approved to be implemented for the industrial sector. The
programs are identified as the development of industrial parks and one of the programs is about
at the stage of preparing an environmental impact assessment (EIA). Due to the physical
condition related to preferable location, required size and land acquisition, two of the projects
are located in Maritime Region, east of Tsévié (Figure 2-21).
Source: Study Team
Figure 2-21 Location of Industrial Development Project Sites
(3) Mining
Since the national mining policy has not been disclosed due to the reorganization of
ministries in Togo in 2012, the development plan or programs are now under way to approve
with relevant organization including private sectors. However, potential and current products,
regardless of its details of the information are can be determined by previous information and
interviews from Ministry of Mining.
a) Potential
Researched mining sites are determined to search the mining potentiality according to the
reference, Geological Potential of Mining in Togo, and were ranked in order of priority from 1
to 3 listed below.
- Priority 1: about 50 sites;
Project site of industrial park
development 150 ha、
Existing Port Zone 80 ha。(40 ha
for port and 40 ha for free trade
zone)
Project site of industrial park
development 120 ha.
(Land acquisition completed)
The Project for the Study on Togo Logistics Corridor Development Final Report Chapter 2 Outline of the Study Area
2 - 41
- Priority 2: 70 sites;
- Priority 3: about 120 sites;
Only thirty sites in the priority 1 and 2 have taken for geological research until the year of
2004. For the adopting a classification element, following situations have been analysed:
• 150 Sites for gold
• 70 sites for polymetallic (zinc, lead, copper, tin, tungsten, molybdenum)
• 5 Sites for phosphates
• 2 Sites for rutile
• 2 Sites for chromite
• 2 Sites for platinum
• 1 Site for the diamond
• 1 Sites for rare earth
• Dapaong-sheet (north of 10th parallel): 18 sites
• Kara-sheet (between 9 and 10th parallel): 68 sites
• Sokodé-sheet (between 8th and 9th parallel): 78 sites
• Atakpamé-sheet (between 7th and 8th parallel): 44 sites
• Lomé-sheet (below the 7th parallel): 25 sites;
Although the information is relatively old, it would be helpful to understand overall image of
the mining possibility. Followings are description of potentiality of certain minerals.
1) Diamond
In Plateau Akébou in the structural unit of Atacora is estimated to more than 5,000 the
number of stones found by local diamineurs. These stones are often 1 carat or less, however,
individuals from several carats have been identified, the maximum being 37 carats a stone found
in the early 1990s. No studies have been carried out to this day, dedicated to the search for
primary source of diamonds. If have known that microscopic diamonds were isolated from
alluvial concentrated in the north of Benin, in similar geological formations, the entire chain of
Atacora and its eastern edge (suture zone) which must be the subject of investigations, an area
of more than 25,000 km2. The host rocks are the subject of speculation, namely:
• Rock-type ophiolite furrow basic-ultrabasic;
• Metavolcanic-found in the structural unit of Atacora;
• Old volcanic breccias revised by the Pan-African orogeny.
2) Zinc
By studying the Gossan in Pagala area hat zinc has been highlighted. The local geology
includes, from west to east and vertically from bottom to top:
Unit-1: Metavolcanics (basalt, ferro-basalts) and nodular carbonates;
Unit-2: Muscovite quartzites and feldspathic quartzite;
Unit-3: All sandstone-pelitic schist alternations, including quartzite, graphitic schists and
dolomites;
The Project for the Study on Togo Logistics Corridor Development Final Report Chapter 2 Outline of the Study Area
2 - 42
Unit-4: All albitic schist including shale and séricitoschistes alternating with quartzite;
Unit5: Carbonate series including the sericitoschistes brechoides dolomites and black shale.
Gossans in signing Zn-Pb-As-Ba-Cu are present in all units. Mineralization intersected in the
survey in 1991 conducted by BRGM works is hosted in schist unit 4.
Simple Paragenesis, pyrite-sphalerite-galena-barite-siderite, is characteristic of sedimentary
exhalative (SEDEX) of sulphide mineralization type. The ore grades were intersected 4.5 to
14.50/0 Zn.
Between 1995 and 2002, two companies of international standing (Coronation International
Mining Corporation (CIMC)-AMBASE and Exploration, Anglo American branch) successively
obtained permits research area, for work including geochemistry, soil, airborne geophysics
(electromagnetism) and surveys. Other levels of zinc mineralization were intersected including
a 300/0 Zn. However, these studies did not permit the identification of an economic whimper.
3) Nickel
During surveys in recent years, nickel saprolite containing interesting was highlighted on
Mount Kpote. Mount Kpote part of the basic-groove ultabasique, about 150 km north of Lomé.
It consists of serpentinites occurring in silicified facies schistoses, sometimes with the presence
of pimelite. The investigations have consist in sinking 15 wells to a maximum depth of 12 m, no
wells met the bedrock. Six wells have given nickel values between 10/0 and 2 080/0 of several
meters. These wells delimit an area favourable 1,600 m x about 400 m.
4) Platinum
In the massive Kabyè (basic-ultrabasic furrow), 10 km NE of the town of Kara, two
anomalous areas of Platinum Group Metal (PGM) were discovered during the geochemical
strategic in 1990. These areas are associated with blades pryroxenites hosted in amphibole
gneiss.
The first anomaly Stream sediment (Mount Soto) has values of around 60 ppb Pt and 40 ppb
Pt.
The second area (Mount Toldja) is characterized by values of the order of 20 ppb Pt and 17
ppb Pt. During the years 2000 to 2002, the area of Mt Soto is the subject of a tactic by sampling
soil profiles with a distance of 500 m x 50 m sampling all the profits. Significant results (forty
platinum values between 40 and 620 ppb. Out of a total sample equal to about 600) are grouped
together in an area of approximately 2,000 m x 500 m.
5) Iron
The iron ore is geographically located in the centre of the country, in the prefecture of Bassar.
School textbooks talk about the iron Togo Bandjéli but Bandjéli is only localities where there
prefecture iron ore, along with other places like Tchodokou, Manka, Bitjabé, Ditankpayabouri,
Dimouri the list is not closed.
• The list of places proves that it is a scattered field which in fact extends to Ghana, where it
forms the deposit Shieni.
The Project for the Study on Togo Logistics Corridor Development Final Report Chapter 2 Outline of the Study Area
2 - 43
• The iron ore reserves were estimated at 500 million tonnes with an average grade of 45%
iron.
• The ore consists of hematite iron very fine crystallization with a silica content up to 50%.
• World reserves of iron ore are estimated at 750 billion tonnes, of which more than half is
held by only four countries: Brazil, Australia, Canada, and Russian Federation.
• In Africa, the largest reserves are found in Liberia, Guinea, Mauritania and Côte d'Ivoire.
• World production (50 producing countries), about 700 million tonnes, is provided to more
than 50% by Brazil, Australia, India, China, the USA and the countries of the former
Communist bloc (Russia, Ukraine).
• Back in Togo, Bassar, to say that currently, iron ore Togo does not show very favourable for
operation at industrial scale:
• Because of its quality, low content: minerals headlined sold 60 to 70% iron metal.
Theoretically, it is possible, with appropriate treatment, raising the level of content, but for
that you need to have cheap energy, which is not the case in Togo;
• To cause as reserves, rather average if we consider the global level. Also because of the
distance from the coast: 450 km and 150 km of the port railway terminus. However, the use
of iron ore may be considered by Bassar locally. It should be noted in this connection that
the time when the steel plant operating in Lomé, ore blocks were incorporated into the scrap
iron for the production of concrete.
6) Manganese
A Nayéga, 30km east of the city of Dapaong was discovered a small deposit of manganese
(in the series of sandstones and shale Voltairian) whose reserves were estimated at 13 million
tonnes, with content ranging 10 to 35% Mn metal.
Manganese is used in 90% in the production of ferro-alloys used in industry, alongside steel.
Its other uses include: the manufacture of dry cell batteries, disinfectants, deodorants, chemicals
and pharmaceuticals.
7) Chromite
Two small chromite deposits were discovered at Mount Ahito Farendè and 30 km north-east
of the city of Kara, in the series of basic-ultrabasic furrow.
Proved reserves are:
• Ahito -10,000 tonnes with a grade of 25% Cr metal and a ratio of Cr / Fe ratio of 2.46.
• 30,000 tonnes Farende with a content of 15% Cr and a metal ratio of Cr / Fe less than 1.
Chromium is used for a large proportion (60-70%) in the metallurgical industry for the
manufacture of chrome steel and various alloys. Its other uses include: the manufacture of paints
and pigments, corrosion products and other chemicals. Ore (chromite) can be used in the
manufacture of refractory products.
8) Bauxite
Bauxite is the ore from which aluminium is extracted. Considering global distribution the
The Project for the Study on Togo Logistics Corridor Development Final Report Chapter 2 Outline of the Study Area
2 - 44
mineral, the bearing of Mount Agou (1 million tonnes) seems rather modest. However, it could
be used locally for the manufacture of refractory bricks in addition to kaolin clays, this part of
local pottery production.
9) Phosphate
Phosphates are found in the Eocene formations of the coastal sedimentary basin and in the
meta-sedimentary formations proterozique upper Bassar region.
Phosphates coastal sedimentary basin were discovered in 1952. The exploitation of the
deposit was started in 1962 with extends over 35 km. Layer industrial thickness of 2 to 6 m, is
topped by a layer of clay and sandstone-ironstone from 7 to 30 m.
The ore is a phospharenite furniture. Concentrates merchants have an average grade of
between 36.1 and 36.4%. According to the feedback of the operating company, the deposit
would still have more than 50 million tonnes of reserves concentrated merchant.
Phosphates are indurated upper Proterozoic and occur in the landscape as the hills 10 to 20 m
high, aligned discontinuous in the meridional direction over a distance of more than 100 km.
Sites studied (trenches and holes) are named Bassar I, II, III and IV. The mineral is fluorapatite
grading 35-42% P2O5 (Phosphorus Pentoxide), SiO2 (Silicon Dioxide) and Feral with generally
lower, respectively, 11% and 3%, and absence of cadmium and arsenic.
Reservations are not precisely known, they are estimated in the tens (or even hundreds) of
millions of tons.
Semi-industrial tests carried out on samples of Bassar I have shown that these phosphates are
well suited to the manufacture of phosphoric acid.
10) Dolomite and limestone
The Togo has many deposits of dolomite and limestone, which have been recognized to
varying degrees. For dolomite, the sites are spread over the whole territory are: Is Mono
Gnaoulou, Pagala, Kamin-Akébou, Djamdè, Namon. Some of these deposits have been
exploited as pirres marbrieres (Gnaoulou, Pagala). Dolomite reserves are estimated at several
hundred million tons.
Regarding the limestone deposits are found in the coastal basin: outside Tabligbo operation
include Avéta, Animabio, and Kpogamé Gladjoé. Avéta of the work has highlighted a deposit of
200 million tonnes.
Many sectors of industry use dolomite and limestone: iron and steel foundry, chemical
industry, glass industry, the paper industry, plastics and rubber, paint industry, ceramics,
refractories, the agriculture and agri-food. But the main uses are related to the manufacture of
cement and lime.
World reserves are virtually limitless, dolomites and lime stones are very widespread in
geological formations many countries of the world.
11) Industrial clays
Togo, industrial clays include: -Kaolin clays; - Illite clays; -Attapulgite clays and bentonite.
The Project for the Study on Togo Logistics Corridor Development Final Report Chapter 2 Outline of the Study Area
2 - 45
The kaolin clays have been identified in many parts of the coastal basin, particularly in the
south-east, but the reserves have not been quantified. A Kpodji near Kpalimé to nyitoé-Zoukpé
SW Kpalimé well as Houloum north of Kara, kaolinite clays were recognized, with reserves of
3 million, 1.5 million and 125 million tonnes respectively. Kaolinite clays uses depend on their
composition and purity. Tests on these clays in Togo showed that suitable for the manufacture
of ceramic products such as tiles and tile flooring.
When the illite clays, they appear as indurated and cover a large area in the prefecture of
Bassar between Bandjéli Kabou and north of the river Katcha south. Reserves are virtually
limitless. These clays are also suitable for the manufacture of ceramic products, as demonstrated
by tests performed by the company installed zone Stilart Noépé.
Regarding the attapulgite and bentonite clays, are found in the coastal basin, including Avéta
and Watchidomé or prospecting took place. Reserves are quantified 20 and 300 million tonnes
respectively. Attapulgite and bentonite clays are used primarily for their industrial absorbent
properties and bleaching. They are also used in the manufacture of drilling muds and oil in the
manufacture of pesticides and pharmaceuticals.
12) Peat
Peat is a fossil mineral that forms in the basement by the decomposition of plant debris.
Peat is used as an energy source in the industrial and domestic use. It is also used in agriculture
for soil amendment.
In Togo, small groan were highlighted in the coastal basin in fluvial systems Mono, Zio and
Haho and lake systems in Togo and Boko. Reserves were estimated at 5 million m3.
The use of peat as an energy source Togo is possible for some sites-especially Kondji Logo
and Esse Ana as indicated by initial tests, but these tests need to be refined.
Regarding the chain soil amendment, tests were conducted at the University of Lomé, the
results of these tests show that, under certain conditions, the peat can be used as agro mineral of
Togo.
13) Ornamental stones
Ornamental stones are stones used for decoration because of their aesthetic and technical
qualities. The main uses are for flooring, interior finishes and exterior stairways, doorways and
windows, the monuments, the knickknacks, sculpture. The aesthetic quality is assessed
according to the colour, grain size, the presence of polished surfaces such as drawings or shapes
rubanements mosaic.
Togo, two sites were dolomitic marble Gnaoulou and operated by Pagala SOTOMA
(Togolese Marble Society: Société Togolaise de Marbrerie) between 1970 and 92. Before its
closure, the production was SOTOMA 6,000-11,000 m2 350 m
3 slices and blocks a year with a
plant capacity of 60,000m2. To date, the SOTOMA still looking for a buyer. Marbles and
Gnaoulou Pagala were used in the construction of banks (BCEAO, BIA, UTB (Union Bank of
Togo: Union Togolaise de Banque) to luxury hotels (Sarakawa, Bénin, Peace), public buildings
The Project for the Study on Togo Logistics Corridor Development Final Report Chapter 2 Outline of the Study Area
2 - 46
(Congress, the Presidency Palace).
Sites outside of masons and Gnaoulou Pagala, other sites ornamental stones have been
extensively studied up to the French standards AFNOR (French Standard Association:
Association française de normalisation) tests and, for some, to the polls. Studies have shown
that these sites are usable. They can include:
• Them dolomitic marbles Eastern Mono
• Dolomitic marbles Kamina-Akébou
• Dolomitic marbles and Djamdè Namon (Kara region)
• It cipolin Djéti Green Mountain, which was carved in the stele Nangbéto inauguration of the
dam
• Granite-green Ezime
• Granites, grey, yellow and pink Glito in eastern Mono
• Migmatites Alokoegbé them in Zio
• Porphyritic granite-Tovégan in Hail
• Amphibole gneisses and garnet solid Kabyè
• Quartzites of Akata and Bafilo
• Pink granites Dapaong
• Sotouboua-gabbros.
b) Current Production and Deposit of Mining Resources
Table 2-15 and Figure 2-22 show approved deposit of mining resources researched in 1996.
Since exploitation of the mining deposit has not been developed so far apart from the minerals
which have been licensed for exploitation such as phosphate, it would be informative to analyse
the possibility of future development of mining.
(4) Tourism
a) Conceptual Framework
Tourism is undoubtedly one of the human activities that experienced a significant change in
practice in the aftermath of the Second World War. The institution which regulates tourism
globally is the United Nations World Tourism Organization (UNWTO) was created in 1975. It
has replaced the International Union of Official Travel Organizations (IUOTO), and continues
so bold, develop management mechanisms for control tourism development.
Many countries in the world have opted for the expansion of tourism have focused primarily
on economic considerations without any real attention to the sometimes contradictory
interactions of its uncontrolled development in relation to environmental and socio-cultural
exchanges. To ensure the sustainability of its growth and its contribution to sustainable human
development, the WTO adopted legal instruments, including the Global Code of Ethics for
Tourism and Sustainable Tourism Charter. It also encourages Member States to observe the
relevant provisions for the protection of tourism resources and interests of stakeholders, visitors
and host communities. As a member state of the WTO, Togo fully adheres to all its provisions.
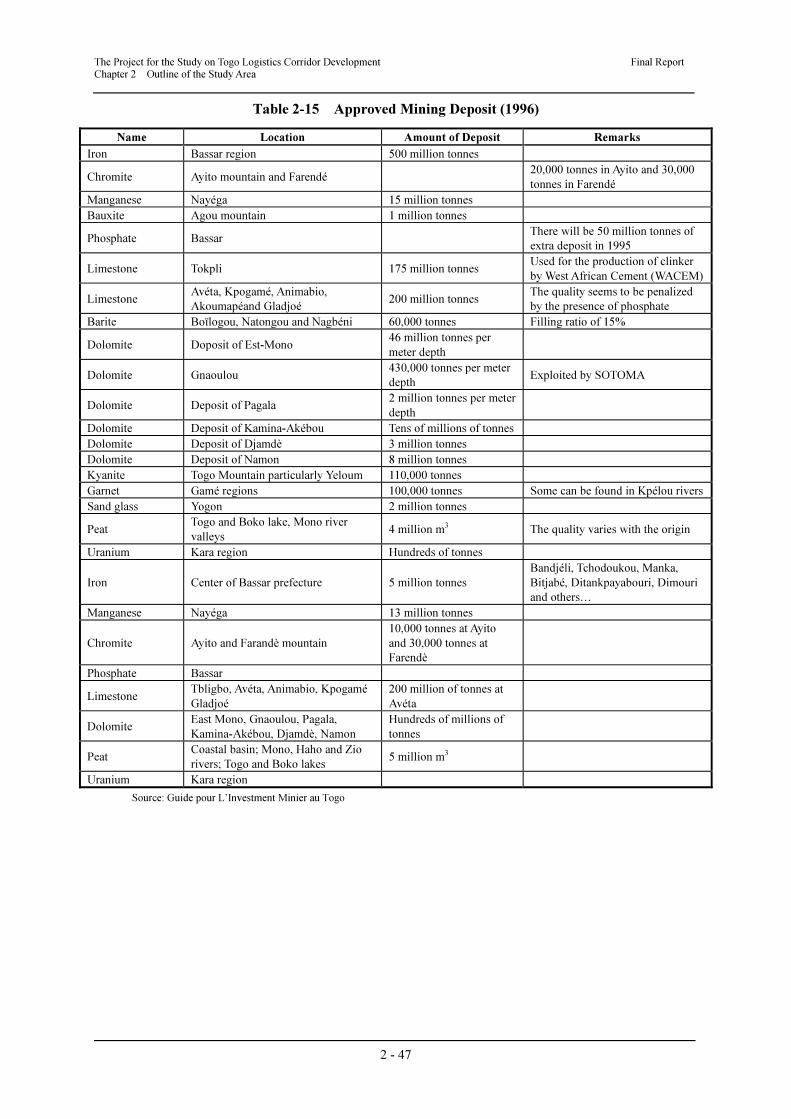
The Project for the Study on Togo Logistics Corridor Development Final Report Chapter 2 Outline of the Study Area
2 - 47
Table 2-15 Approved Mining Deposit (1996)
Name Location Amount of Deposit Remarks
Iron Bassar region 500 million tonnes
Chromite Ayito mountain and Farendé 20,000 tonnes in Ayito and 30,000
tonnes in Farendé
Manganese Nayéga 15 million tonnes
Bauxite Agou mountain 1 million tonnes
Phosphate Bassar There will be 50 million tonnes of
extra deposit in 1995
Limestone Tokpli 175 million tonnes Used for the production of clinker
by West African Cement (WACEM)
Limestone Avéta, Kpogamé, Animabio,
Akoumapéand Gladjoé 200 million tonnes
The quality seems to be penalized
by the presence of phosphate
Barite Boïlogou, Natongou and Nagbéni 60,000 tonnes Filling ratio of 15%
Dolomite Doposit of Est-Mono 46 million tonnes per
meter depth
Dolomite Gnaoulou 430,000 tonnes per meter
depth Exploited by SOTOMA
Dolomite Deposit of Pagala 2 million tonnes per meter
depth
Dolomite Deposit of Kamina-Akébou Tens of millions of tonnes
Dolomite Deposit of Djamdè 3 million tonnes
Dolomite Deposit of Namon 8 million tonnes
Kyanite Togo Mountain particularly Yeloum 110,000 tonnes
Garnet Gamé regions 100,000 tonnes Some can be found in Kpélou rivers
Sand glass Yogon 2 million tonnes
Peat Togo and Boko lake, Mono river
valleys 4 million m3 The quality varies with the origin
Uranium Kara region Hundreds of tonnes
Iron Center of Bassar prefecture 5 million tonnes
Bandjéli, Tchodoukou, Manka,
Bitjabé, Ditankpayabouri, Dimouri
and others…
Manganese Nayéga 13 million tonnes
Chromite Ayito and Farandè mountain
10,000 tonnes at Ayito
and 30,000 tonnes at
Farendè
Phosphate Bassar
Limestone Tbligbo, Avéta, Animabio, Kpogamé
Gladjoé
200 million of tonnes at
Avéta
Dolomite East Mono, Gnaoulou, Pagala,
Kamina-Akébou, Djamdè, Namon
Hundreds of millions of
tonnes
Peat Coastal basin; Mono, Haho and Zio
rivers; Togo and Boko lakes 5 million m3
Uranium Kara region
Source: Guide pour L’Investment Minier au Togo
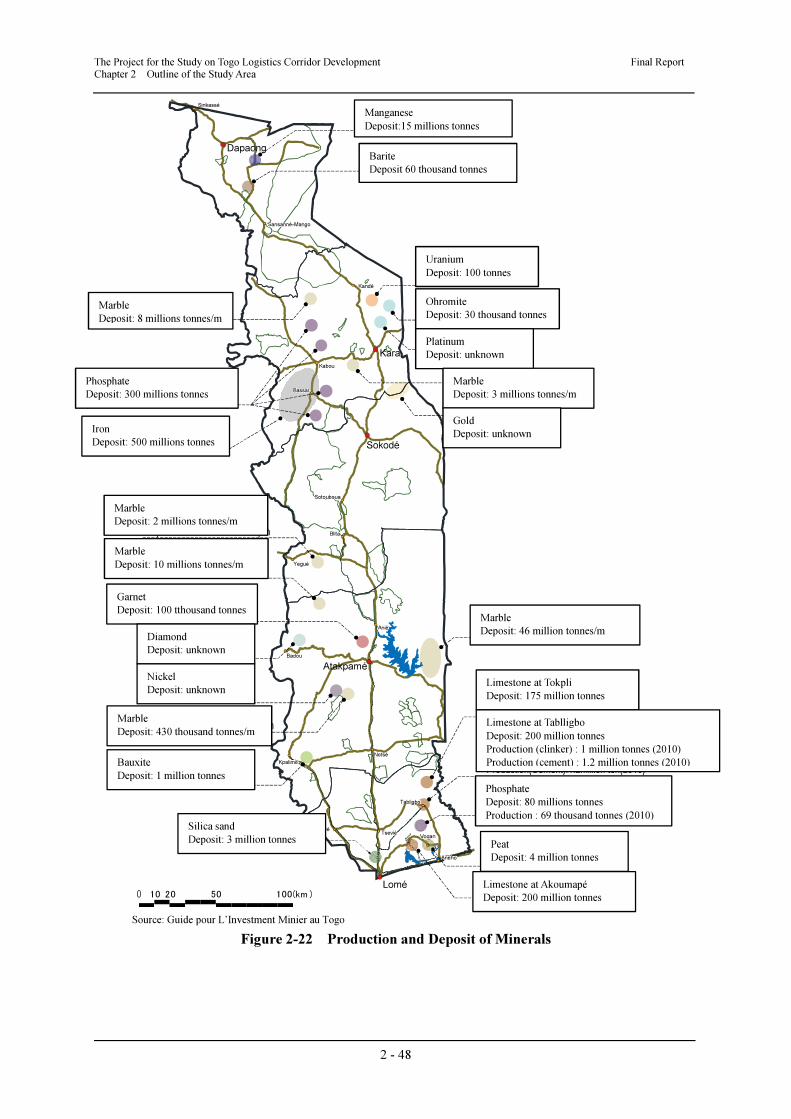
The Project for the Study on Togo Logistics Corridor Development Final Report Chapter 2 Outline of the Study Area
2 - 48
Source: Guide pour L’Investment Minier au Togo
Figure 2-22 Production and Deposit of Minerals
0 10 20 50 100(km )
IronDeposit:500million ton
ManganeseDeposit:15million ton
BariteDeposit:60,000 ton
PhosphateDeposit:80million tonProduction:0.69million ton(2010)
PhosphateDeposit:300million ton
Silica sandDeposit:3.0million ton
Limestone @ TabligboDeposit:200million tonProduction(Clinker):1.0million ton(2010)Production(Cement):1.2million ton(2010)
Limestone @ TokpliDeposit:175million ton
MarbleDeposit:46million ton/m in depth
MarbleDeposit:0.43million ton/m indepth
NickelDeposit:unknown
MarbleDeposit:2.0million ton/m indepth
MarbleDeposit:8.0million ton/m indepth
MarbleDeposit:3.0million ton/m indepth
GoldDeposit:unkown
UraniumDeposit:100 ton
ChromiteDeposit:30,000 ton
PlutinumDeposit:unknown
MarbleDeposit:10million ton/m indepth
GarnetDeposit:0.1million ton
DiamondDeposit:unknown
BauxiteDeposit:1.0million ton
Limestone @ AkoumapéDeposit:200million ton
PeatDeposit:4.0million
Lomé
TseviéTseviéKévéKévé
TabligboTabligbo
VoganVogan
AnéhoAného
Atakpamé
NotséNotsé
BadouBadou
AniéAnié
KpaliméKpalimé
Sokodé
BlitaBlita
YeguéYegué
SotoubouaSotouboua
Kara
BassarBassar
KabouKabou
KandéKandé
Dapaong
Sansanné-MangoSansanné-Mango
SinkasséSinkassé
Manganese Deposit:15 millions tonnes
Barite Deposit 60 thousand tonnes
Uranium Deposit: 100 tonnes
Ohromite Deposit: 30 thousand tonnes
Platinum Deposit: unknown
Marble Deposit: 3 millions tonnes/m
Gold Deposit: unknown
Marble Deposit: 8 millions tonnes/m
Phosphate Deposit: 300 millions tonnes
Iron Deposit: 500 millions tonnes
Marble Deposit: 2 millions tonnes/m
Marble Deposit: 10 millions tonnes/m
Garnet Deposit: 100 tthousand tonnes
Diamond Deposit: unknown
Nickel Deposit: unknown
Marble Deposit: 430 thousand tonnes/m
Bauxite Deposit: 1 million tonnes
Phosphate Deposit: 80 millions tonnes Production : 69 thousand tonnes (2010)
Limestone at Tokpli Deposit: 175 million tonnes
Limestone at Tablligbo Deposit: 200 million tonnes Production (clinker) : 1 million tonnes (2010) Production (cement) : 1,2 million tonnes (2010)
Marble Deposit: 46 million tonnes/m
Silica sand Deposit: 3 million tonnes Peat
Deposit: 4 million tonnes
Limestone at Akoumapé Deposit: 200 million tonnes
The Project for the Study on Togo Logistics Corridor Development Final Report Chapter 2 Outline of the Study Area
2 - 49
The United Nations Conference on Trade and Development (UNCTAD), for its part, is
committed to the establishment of trade relations more balanced in the tourism operation
between sending countries and receiving countries tourists. Thus, it strengthens the capacity of
these negotiations and in control at the base exchange of goods and services in the field.
Faced with the challenges of globalization and environmental challenges including climate
change, the WTO supports the promotion of the green economy and invites Member States to
better exploitation of the tourism sector in favour of the integrity of destinations and satisfaction
of visitors and host populations.
Initiatives organization, operation and joint promotion of tourism economy are also involved
at the African sub-region. They operate in particular the African Union (AU), the ECOWAS
and especially the WAEMU in the context of the integration of this space.
It is in this dynamic sector developments at global, continental and sub-regional development
that is part of the national tourism policy. It is based on the realities necessarily Togo. Therefore,
it is guided by the provisions of the operating sector, the national environmental concerns, the
need to protect cultural heritage and promotion of diversity and the obligations of economic
growth for an integrated development of countries. It refers to various legal and regulatory
frameworks in these various areas.
The ultimate goal of the development and implementation of national tourism policy is to
define a guideline and conduct of government action for the harmonious development of the
tourism sector in Togo.
b) Strength
As one of the reports which defines the potentiality of tourism economy, analysis of strength
listed below is developed and these can be a key to know outline of the tourism situation in
Togo for the Study.
• Political will to develop the tourism sector.
• Diversity existing potential, whether related to nature (landscape, flora and fauna, coastal)
or related to the history and culture (monuments, museums, crafts, music, folklore).
• Stakeholder engagement to address the sector.
• Existence of state and private institutions in tourism.
• Associative grouping of private operators
• Existence of a certain practice of consultation between government officials and tourism
private operators.
• Experience in development and management of tourism in the 1980s.
• Existence of a diverse clientele and faithful.
• Qualities of welcome and hospitality of the Togolese people.
Existence of two international airports and a deep-sea port.
These advantages are significant for Togo tourism development opportunities if they are
highlighted optimally both the planning as well as marketing. The cultural and natural riches
The Project for the Study on Togo Logistics Corridor Development Final Report Chapter 2 Outline of the Study Area
2 - 50
must constitute elements of choice in the country's tourism development.
The combination of increasingly visible in the local implementation of a sustainable
development, protection and enhancement of cultural heritage sites and is also an asset for the
area.
c) Challenges and Opportunity
In a context of global financial crisis and general economic and competitive tourism Togo
faces new challenges:
• Insufficient development of quality tourism products, very competitive among competitors
and recovery under a policy of promoting and aggressive with large budgets.
• Security concerns due to the rise of terrorism (11th September, London and Sharm
El-Sheikh, the socio-political crises). Tourism of Togo has great opportunities to seize.
• Maintaining traditional customers and new markets such as the Nordic countries (Sweden,
Norway, Denmark, Finland), China, South America, Centre Asia.
• Contribution to the achievement of the MDG through the reduction of unemployment and
poverty.
In the context of globalization with many implications economic, environmental, cultural and
social, the state is seen as the guarantor of a controlled tourism development, coherent and
sustainable.
d) Strategy
To direct economy of tourism sector to the confident growth corresponding to the TLC, the
strategy of national tourism policy was developed by the Ministry of Tourism recently. The
policy has eight priorities in Table 2-16 to concrete following action plans and implementations.
e) Measures and Action Programs
Expected actions of the state are intended to catalyse and guide the energy sector. Thus, the
government's efforts will focus on the elements described below:
• Organizing, enhancing and strengthening management actions, monitoring, training and
facilitation.
• Stabilisation of the institution concerned what the National Tourism Administration (NTA).
• Identification, delineation and servicing centres of tourism development.
• Redefinition of the tourism product, taking into account the originality of the tender and the
requirement of the application.
• Updating and implementation of legislation regulating the sector.
• Revitalization of frameworks with different departments related to tourism.
• Promoting tourism through a strategy of information and communication for the
consolidation of existing markets and new markets.
• Strengthening the promotion of domestic tourism.
• Training and the provision of training courses for upgrading the design staff and current
framework.
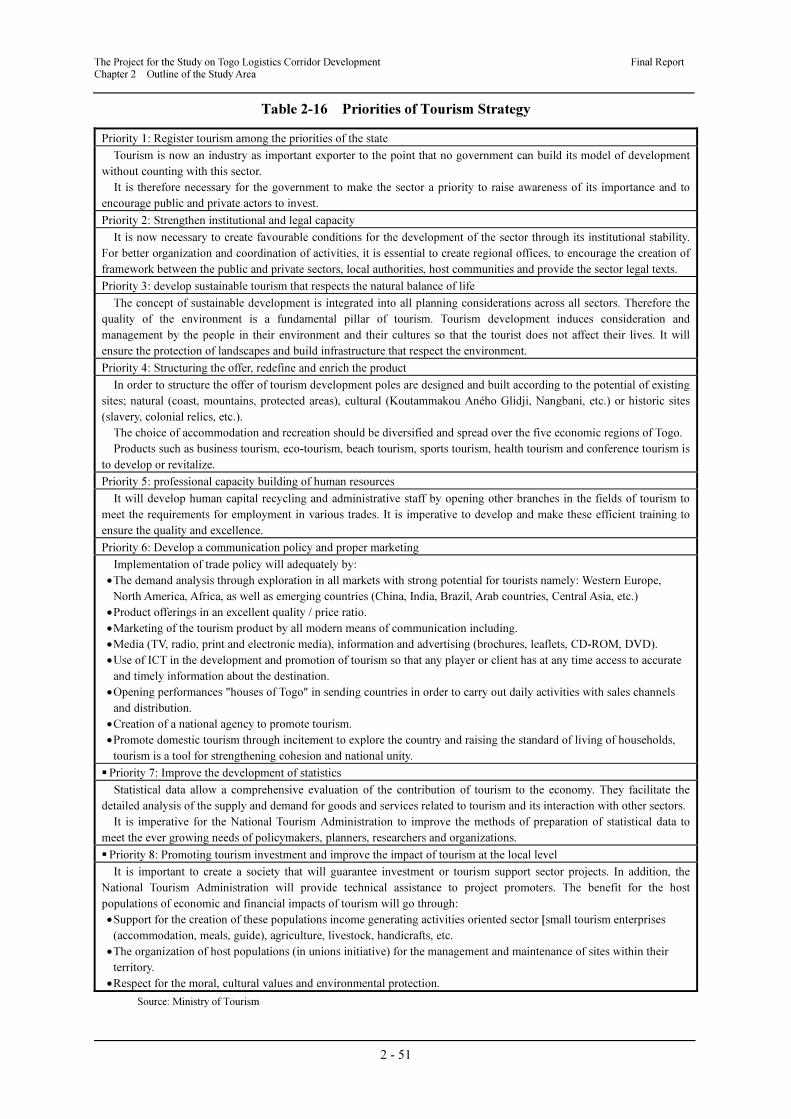
The Project for the Study on Togo Logistics Corridor Development Final Report Chapter 2 Outline of the Study Area
2 - 51
Table 2-16 Priorities of Tourism Strategy
Priority 1: Register tourism among the priorities of the state
Tourism is now an industry as important exporter to the point that no government can build its model of development
without counting with this sector.
It is therefore necessary for the government to make the sector a priority to raise awareness of its importance and to
encourage public and private actors to invest.
Priority 2: Strengthen institutional and legal capacity
It is now necessary to create favourable conditions for the development of the sector through its institutional stability.
For better organization and coordination of activities, it is essential to create regional offices, to encourage the creation of
framework between the public and private sectors, local authorities, host communities and provide the sector legal texts.
Priority 3: develop sustainable tourism that respects the natural balance of life
The concept of sustainable development is integrated into all planning considerations across all sectors. Therefore the
quality of the environment is a fundamental pillar of tourism. Tourism development induces consideration and
management by the people in their environment and their cultures so that the tourist does not affect their lives. It will
ensure the protection of landscapes and build infrastructure that respect the environment.
Priority 4: Structuring the offer, redefine and enrich the product
In order to structure the offer of tourism development poles are designed and built according to the potential of existing
sites; natural (coast, mountains, protected areas), cultural (Koutammakou Aného Glidji, Nangbani, etc.) or historic sites
(slavery, colonial relics, etc.).
The choice of accommodation and recreation should be diversified and spread over the five economic regions of Togo.
Products such as business tourism, eco-tourism, beach tourism, sports tourism, health tourism and conference tourism is
to develop or revitalize.
Priority 5: professional capacity building of human resources
It will develop human capital recycling and administrative staff by opening other branches in the fields of tourism to
meet the requirements for employment in various trades. It is imperative to develop and make these efficient training to
ensure the quality and excellence.
Priority 6: Develop a communication policy and proper marketing
Implementation of trade policy will adequately by:
• The demand analysis through exploration in all markets with strong potential for tourists namely: Western Europe,
North America, Africa, as well as emerging countries (China, India, Brazil, Arab countries, Central Asia, etc.)
• Product offerings in an excellent quality / price ratio.
• Marketing of the tourism product by all modern means of communication including.
• Media (TV, radio, print and electronic media), information and advertising (brochures, leaflets, CD-ROM, DVD).
• Use of ICT in the development and promotion of tourism so that any player or client has at any time access to accurate
and timely information about the destination.
• Opening performances "houses of Togo" in sending countries in order to carry out daily activities with sales channels
and distribution.
• Creation of a national agency to promote tourism.
• Promote domestic tourism through incitement to explore the country and raising the standard of living of households,
tourism is a tool for strengthening cohesion and national unity.
� Priority 7: Improve the development of statistics
Statistical data allow a comprehensive evaluation of the contribution of tourism to the economy. They facilitate the
detailed analysis of the supply and demand for goods and services related to tourism and its interaction with other sectors.
It is imperative for the National Tourism Administration to improve the methods of preparation of statistical data to
meet the ever growing needs of policymakers, planners, researchers and organizations.
� Priority 8: Promoting tourism investment and improve the impact of tourism at the local level
It is important to create a society that will guarantee investment or tourism support sector projects. In addition, the
National Tourism Administration will provide technical assistance to project promoters. The benefit for the host
populations of economic and financial impacts of tourism will go through:
• Support for the creation of these populations income generating activities oriented sector [small tourism enterprises
(accommodation, meals, guide), agriculture, livestock, handicrafts, etc.
• The organization of host populations (in unions initiative) for the management and maintenance of sites within their
territory.
• Respect for the moral, cultural values and environmental protection.
Source: Ministry of Tourism
The Project for the Study on Togo Logistics Corridor Development Final Report Chapter 2 Outline of the Study Area
2 - 52
• Integration options or specializations in tourism in university curricula and/or training
courses in tourism and hospitality and enrichment training programs in existing private
schools.
• The development and implementation of a system of incentives for investment in the sector
(Tourism Investment Code).
• Strengthening the capacity of Gnassingbe Eyadema International Airport for wide body,
encouraging companies to serve Niamtougou airport, the rehabilitation of secondary airports
and also the strengthening of road, rail and river to Togo.
• encouraging competition through the implementation of the Yamoussoukro agreements and
the open sky policy for both scheduled for charters.
• Looking for quality equipment and services for tourism businesses through the revitalization
of the National Accreditation and Ranking Tourist Establishments (CNACET: Commission
Nationale d’Agrément et de Classement des Établissements Touristiques).
• Strengthening international and regional cooperation (framework agreement, ratification by
Togo texts in the field).
• Measures of facilitation of travel (visa, vaccination, etc.).
• The requirement for environmental impact study for projects to be implemented.
• Taking measures to protect and conserve the natural coastline, lakes and rivers.
• Capacity building of local participatory management of natural resources and conservation
of cultural heritage.
• Strengthening the public-private partnership.
• Regulation of associations and Non-Government Organizations (NGOs) working in the
sector.
• Creating a font tourist.
• The development of the special status of NTA staff.
f) Present Tourism Site
Table 2-17 describes present tourism sites and elements by regions and the major tourism
sites illustrate in Figures 2-23 and 2-24.
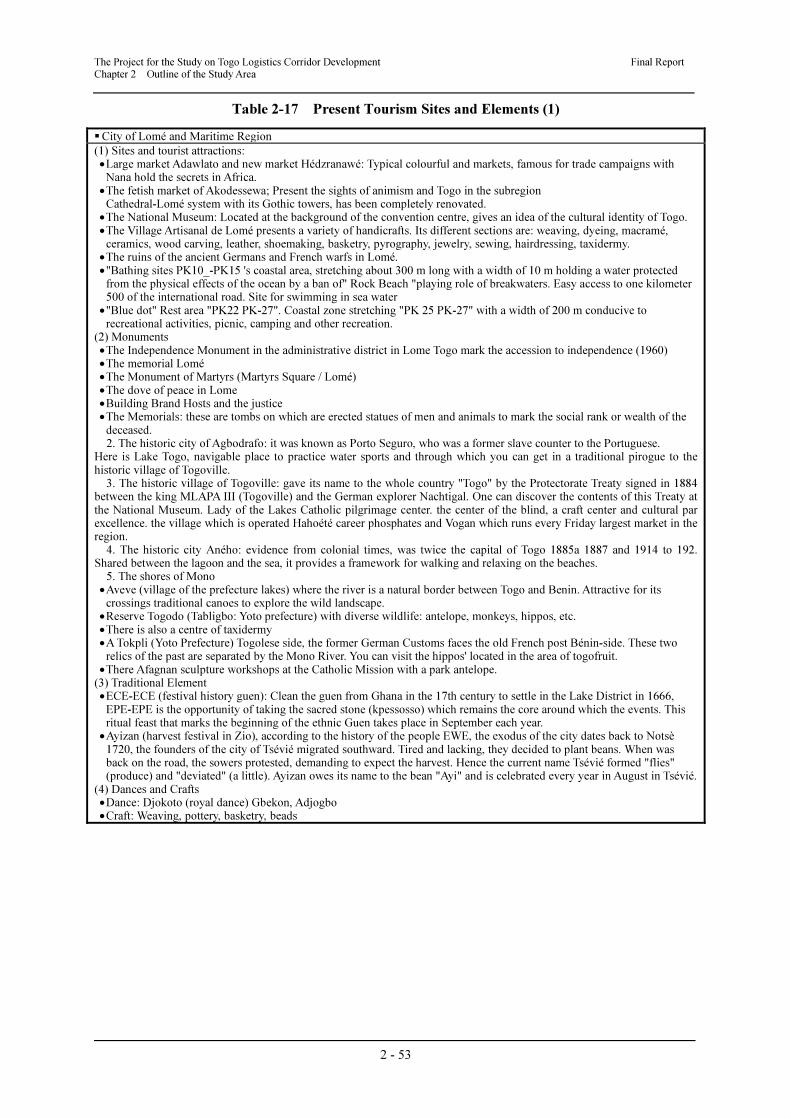
The Project for the Study on Togo Logistics Corridor Development Final Report Chapter 2 Outline of the Study Area
2 - 53
Table 2-17 Present Tourism Sites and Elements (1)
� City of Lomé and Maritime Region
(1) Sites and tourist attractions: • Large market Adawlato and new market Hédzranawé: Typical colourful and markets, famous for trade campaigns with
Nana hold the secrets in Africa. • The fetish market of Akodessewa; Present the sights of animism and Togo in the subregion
Cathedral-Lomé system with its Gothic towers, has been completely renovated. • The National Museum: Located at the background of the convention centre, gives an idea of the cultural identity of Togo. • The Village Artisanal de Lomé presents a variety of handicrafts. Its different sections are: weaving, dyeing, macramé,
ceramics, wood carving, leather, shoemaking, basketry, pyrography, jewelry, sewing, hairdressing, taxidermy. • The ruins of the ancient Germans and French warfs in Lomé. • "Bathing sites PK10_-PK15 's coastal area, stretching about 300 m long with a width of 10 m holding a water protected
from the physical effects of the ocean by a ban of" Rock Beach "playing role of breakwaters. Easy access to one kilometer 500 of the international road. Site for swimming in sea water
• "Blue dot" Rest area "PK22 PK-27". Coastal zone stretching "PK 25 PK-27" with a width of 200 m conducive to recreational activities, picnic, camping and other recreation.
(2) Monuments • The Independence Monument in the administrative district in Lome Togo mark the accession to independence (1960) • The memorial Lomé • The Monument of Martyrs (Martyrs Square / Lomé) • The dove of peace in Lome • Building Brand Hosts and the justice • The Memorials: these are tombs on which are erected statues of men and animals to mark the social rank or wealth of the
deceased. 2. The historic city of Agbodrafo: it was known as Porto Seguro, who was a former slave counter to the Portuguese.
Here is Lake Togo, navigable place to practice water sports and through which you can get in a traditional pirogue to the historic village of Togoville.
3. The historic village of Togoville: gave its name to the whole country "Togo" by the Protectorate Treaty signed in 1884 between the king MLAPA III (Togoville) and the German explorer Nachtigal. One can discover the contents of this Treaty at the National Museum. Lady of the Lakes Catholic pilgrimage center. the center of the blind, a craft center and cultural par excellence. the village which is operated Hahoété career phosphates and Vogan which runs every Friday largest market in the region.
4. The historic city Aného: evidence from colonial times, was twice the capital of Togo 1885a 1887 and 1914 to 192. Shared between the lagoon and the sea, it provides a framework for walking and relaxing on the beaches.
5. The shores of Mono • Aveve (village of the prefecture lakes) where the river is a natural border between Togo and Benin. Attractive for its
crossings traditional canoes to explore the wild landscape. • Reserve Togodo (Tabligbo: Yoto prefecture) with diverse wildlife: antelope, monkeys, hippos, etc. • There is also a centre of taxidermy • A Tokpli (Yoto Prefecture) Togolese side, the former German Customs faces the old French post Bénin-side. These two
relics of the past are separated by the Mono River. You can visit the hippos' located in the area of togofruit. • There Afagnan sculpture workshops at the Catholic Mission with a park antelope.
(3) Traditional Element • ECE-ECE (festival history guen): Clean the guen from Ghana in the 17th century to settle in the Lake District in 1666,
EPE-EPE is the opportunity of taking the sacred stone (kpessosso) which remains the core around which the events. This ritual feast that marks the beginning of the ethnic Guen takes place in September each year.
• Ayizan (harvest festival in Zio), according to the history of the people EWE, the exodus of the city dates back to Notsè 1720, the founders of the city of Tsévié migrated southward. Tired and lacking, they decided to plant beans. When was back on the road, the sowers protested, demanding to expect the harvest. Hence the current name Tsévié formed "flies" (produce) and "deviated" (a little). Ayizan owes its name to the bean "Ayi" and is celebrated every year in August in Tsévié.
(4) Dances and Crafts • Dance: Djokoto (royal dance) Gbekon, Adjogbo • Craft: Weaving, pottery, basketry, beads
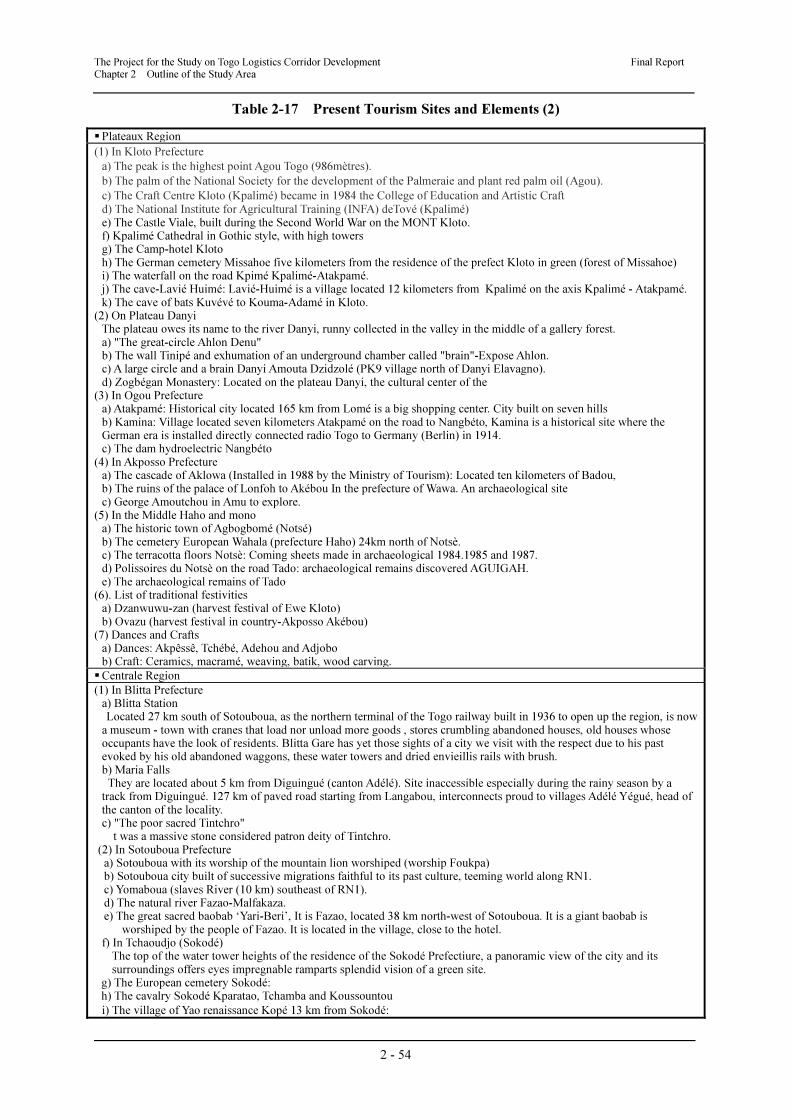
The Project for the Study on Togo Logistics Corridor Development Final Report Chapter 2 Outline of the Study Area
2 - 54
Table 2-17 Present Tourism Sites and Elements (2)
� Plateaux Region
(1) In Kloto Prefecture
a) The peak is the highest point Agou Togo (986mètres).
b) The palm of the National Society for the development of the Palmeraie and plant red palm oil (Agou).
c) The Craft Centre Kloto (Kpalimé) became in 1984 the College of Education and Artistic Craft
d) The National Institute for Agricultural Training (INFA) deTové (Kpalimé) e) The Castle Viale, built during the Second World War on the MONT Kloto. f) Kpalimé Cathedral in Gothic style, with high towers g) The Camp-hotel Kloto h) The German cemetery Missahoe five kilometers from the residence of the prefect Kloto in green (forest of Missahoe) i) The waterfall on the road Kpimé Kpalimé-Atakpamé. j) The cave-Lavié Huimé: Lavié-Huimé is a village located 12 kilometers from Kpalimé on the axis Kpalimé - Atakpamé. k) The cave of bats Kuvévé to Kouma-Adamé in Kloto.
(2) On Plateau Danyi The plateau owes its name to the river Danyi, runny collected in the valley in the middle of a gallery forest. a) "The great-circle Ahlon Denu" b) The wall Tinipé and exhumation of an underground chamber called "brain"-Expose Ahlon. c) A large circle and a brain Danyi Amouta Dzidzolé (PK9 village north of Danyi Elavagno). d) Zogbégan Monastery: Located on the plateau Danyi, the cultural center of the
(3) In Ogou Prefecture a) Atakpamé: Historical city located 165 km from Lomé is a big shopping center. City built on seven hills b) Kamina: Village located seven kilometers Atakpamé on the road to Nangbéto, Kamina is a historical site where the German era is installed directly connected radio Togo to Germany (Berlin) in 1914. c) The dam hydroelectric Nangbéto
(4) In Akposso Prefecture a) The cascade of Aklowa (Installed in 1988 by the Ministry of Tourism): Located ten kilometers of Badou, b) The ruins of the palace of Lonfoh to Akébou In the prefecture of Wawa. An archaeological site c) George Amoutchou in Amu to explore.
(5) In the Middle Haho and mono a) The historic town of Agbogbomé (Notsé) b) The cemetery European Wahala (prefecture Haho) 24km north of Notsè. c) The terracotta floors Notsè: Coming sheets made in archaeological 1984.1985 and 1987. d) Polissoires du Notsè on the road Tado: archaeological remains discovered AGUIGAH. e) The archaeological remains of Tado
(6). List of traditional festivities a) Dzanwuwu-zan (harvest festival of Ewe Kloto) b) Ovazu (harvest festival in country-Akposso Akébou)
(7) Dances and Crafts a) Dances: Akpêssê, Tchébé, Adehou and Adjobo b) Craft: Ceramics, macramé, weaving, batik, wood carving.
� Centrale Region
(1) In Blitta Prefecture a) Blitta Station
Located 27 km south of Sotouboua, as the northern terminal of the Togo railway built in 1936 to open up the region, is now a museum - town with cranes that load nor unload more goods , stores crumbling abandoned houses, old houses whose occupants have the look of residents. Blitta Gare has yet those sights of a city we visit with the respect due to his past evoked by his old abandoned waggons, these water towers and dried envieillis rails with brush. b) Maria Falls They are located about 5 km from Diguingué (canton Adélé). Site inaccessible especially during the rainy season by a track from Diguingué. 127 km of paved road starting from Langabou, interconnects proud to villages Adélé Yégué, head of the canton of the locality. c) "The poor sacred Tintchro" t was a massive stone considered patron deity of Tintchro.
(2) In Sotouboua Prefecture a) Sotouboua with its worship of the mountain lion worshiped (worship Foukpa) b) Sotouboua city built of successive migrations faithful to its past culture, teeming world along RN1. c) Yomaboua (slaves River (10 km) southeast of RN1). d) The natural river Fazao-Malfakaza. e) The great sacred baobab ‘Yari-Beri’, It is Fazao, located 38 km north-west of Sotouboua. It is a giant baobab is
worshiped by the people of Fazao. It is located in the village, close to the hotel. f) In Tchaoudjo (Sokodé)
The top of the water tower heights of the residence of the Sokodé Prefectiure, a panoramic view of the city and its surroundings offers eyes impregnable ramparts splendid vision of a green site.
g) The European cemetery Sokodé: h) The cavalry Sokodé Kparatao, Tchamba and Koussountou
i) The village of Yao renaissance Kopé 13 km from Sokodé:
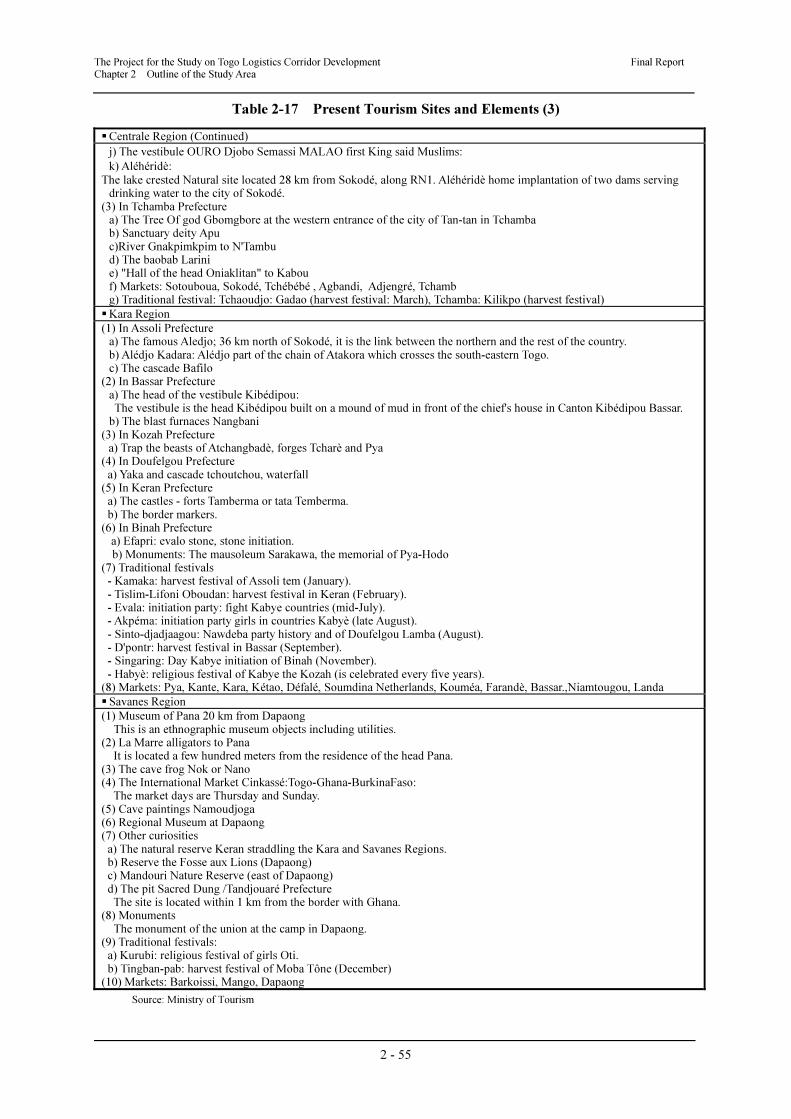
The Project for the Study on Togo Logistics Corridor Development Final Report Chapter 2 Outline of the Study Area
2 - 55
Table 2-17 Present Tourism Sites and Elements (3)
� Centrale Region (Continued)
j) The vestibule OURO Djobo Semassi MALAO first King said Muslims:
k) Aléhéridè:
The lake crested Natural site located 28 km from Sokodé, along RN1. Aléhéridè home implantation of two dams serving drinking water to the city of Sokodé.
(3) In Tchamba Prefecture a) The Tree Of god Gbomgbore at the western entrance of the city of Tan-tan in Tchamba b) Sanctuary deity Apu c)River Gnakpimkpim to N'Tambu d) The baobab Larini e) "Hall of the head Oniaklitan" to Kabou f) Markets: Sotouboua, Sokodé, Tchébébé , Agbandi, Adjengré, Tchamb g) Traditional festival: Tchaoudjo: Gadao (harvest festival: March), Tchamba: Kilikpo (harvest festival)
� Kara Region
(1) In Assoli Prefecture a) The famous Aledjo; 36 km north of Sokodé, it is the link between the northern and the rest of the country. b) Alédjo Kadara: Alédjo part of the chain of Atakora which crosses the south-eastern Togo. c) The cascade Bafilo
(2) In Bassar Prefecture a) The head of the vestibule Kibédipou: The vestibule is the head Kibédipou built on a mound of mud in front of the chief's house in Canton Kibédipou Bassar.
b) The blast furnaces Nangbani (3) In Kozah Prefecture
a) Trap the beasts of Atchangbadè, forges Tcharè and Pya (4) In Doufelgou Prefecture
a) Yaka and cascade tchoutchou, waterfall (5) In Keran Prefecture
a) The castles - forts Tamberma or tata Temberma. b) The border markers.
(6) In Binah Prefecture a) Efapri: evalo stone, stone initiation. b) Monuments: The mausoleum Sarakawa, the memorial of Pya-Hodo
(7) Traditional festivals - Kamaka: harvest festival of Assoli tem (January). - Tislim-Lifoni Oboudan: harvest festival in Keran (February). - Evala: initiation party: fight Kabye countries (mid-July). - Akpéma: initiation party girls in countries Kabyè (late August). - Sinto-djadjaagou: Nawdeba party history and of Doufelgou Lamba (August). - D'pontr: harvest festival in Bassar (September). - Singaring: Day Kabye initiation of Binah (November). - Habyè: religious festival of Kabye the Kozah (is celebrated every five years).
(8) Markets: Pya, Kante, Kara, Kétao, Défalé, Soumdina Netherlands, Kouméa, Farandè, Bassar.,Niamtougou, Landa
� Savanes Region
(1) Museum of Pana 20 km from Dapaong This is an ethnographic museum objects including utilities.
(2) La Marre alligators to Pana It is located a few hundred meters from the residence of the head Pana.
(3) The cave frog Nok or Nano (4) The International Market Cinkassé:Togo-Ghana-BurkinaFaso:
The market days are Thursday and Sunday. (5) Cave paintings Namoudjoga (6) Regional Museum at Dapaong (7) Other curiosities a) The natural reserve Keran straddling the Kara and Savanes Regions. b) Reserve the Fosse aux Lions (Dapaong) c) Mandouri Nature Reserve (east of Dapaong) d) The pit Sacred Dung /Tandjouaré Prefecture
The site is located within 1 km from the border with Ghana. (8) Monuments The monument of the union at the camp in Dapaong. (9) Traditional festivals:
a) Kurubi: religious festival of girls Oti. b) Tingban-pab: harvest festival of Moba Tône (December)
(10) Markets: Barkoissi, Mango, Dapaong
Source: Ministry of Tourism
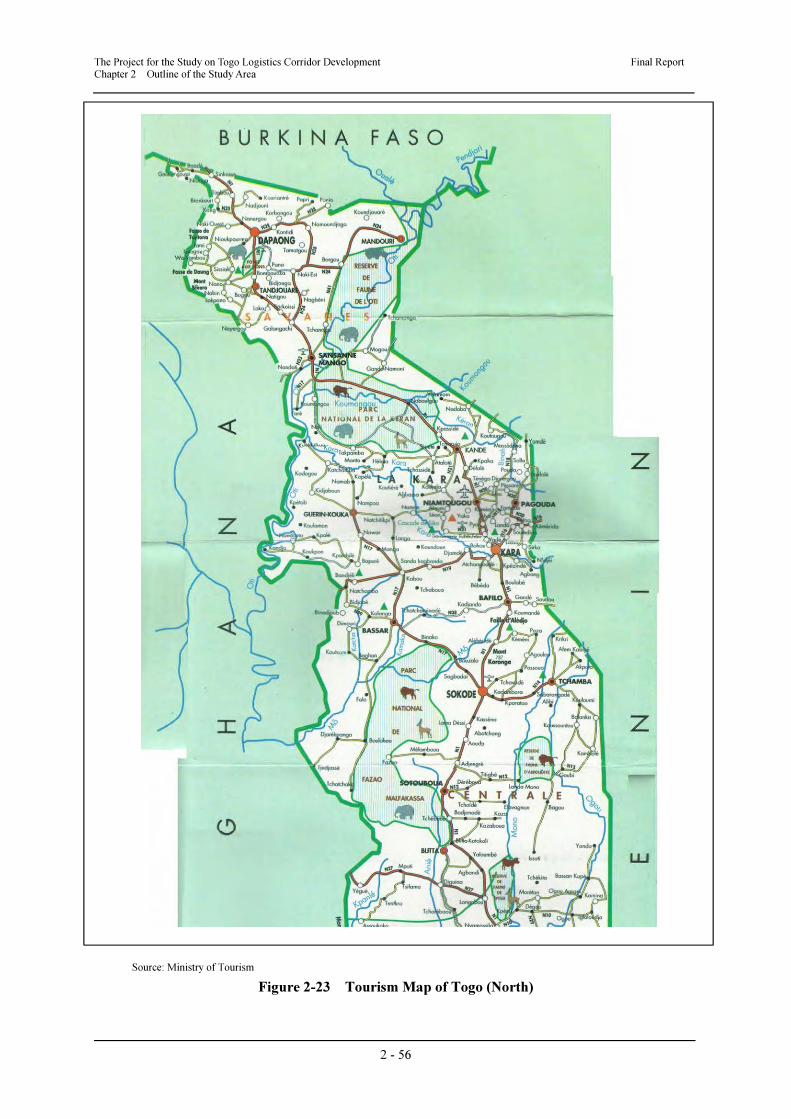
The Project for the Study on Togo Logistics Corridor Development Final Report Chapter 2 Outline of the Study Area
2 - 56
Source: Ministry of Tourism
Figure 2-23 Tourism Map of Togo (North)
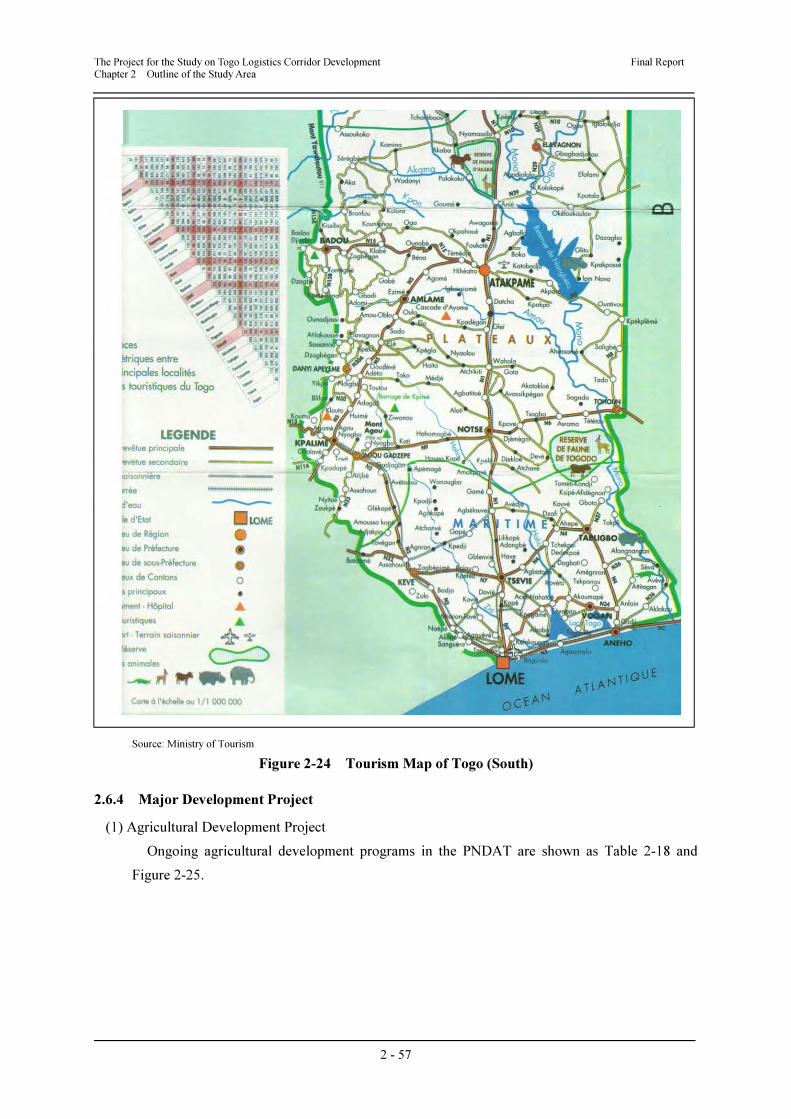
The Project for the Study on Togo Logistics Corridor Development Final Report Chapter 2 Outline of the Study Area
2 - 57
Source: Ministry of Tourism
Figure 2-24 Tourism Map of Togo (South)
2.6.4 Major Development Project
(1) Agricultural Development Project
Ongoing agricultural development programs in the PNDAT are shown as Table 2-18 and
Figure 2-25.
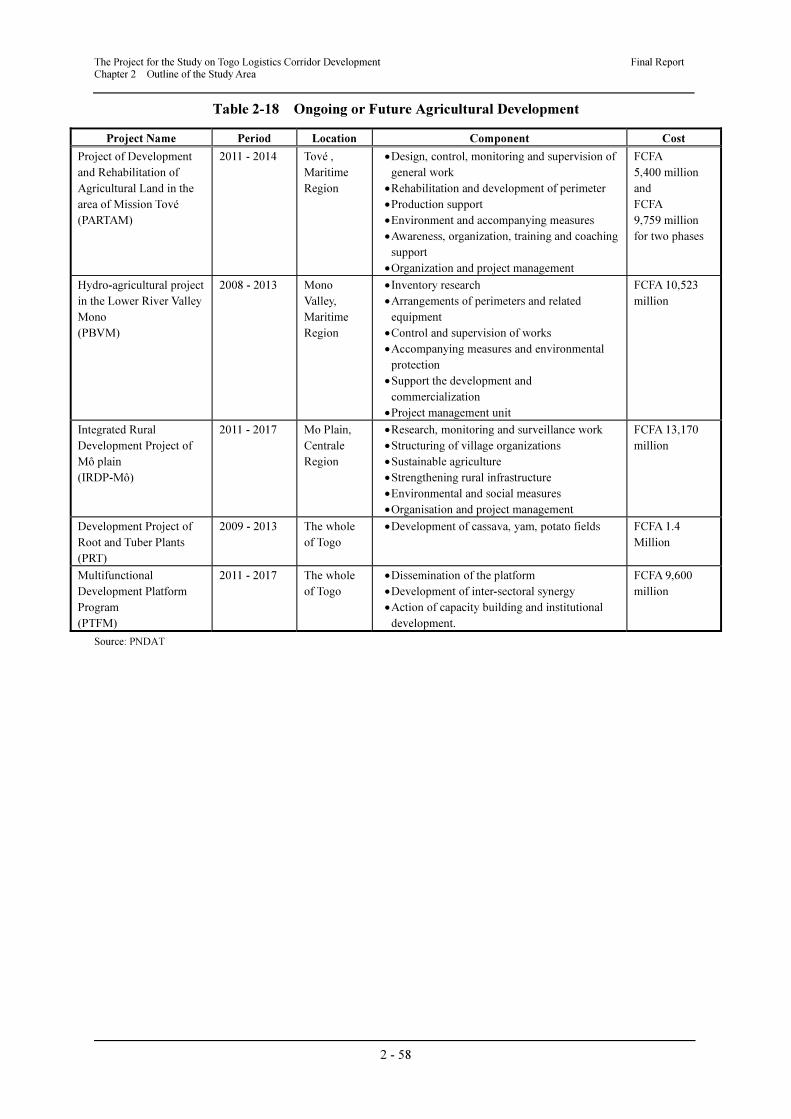
The Project for the Study on Togo Logistics Corridor Development Final Report Chapter 2 Outline of the Study Area
2 - 58
Table 2-18 Ongoing or Future Agricultural Development
Project Name Period Location Component Cost
Project of Development
and Rehabilitation of
Agricultural Land in the
area of Mission Tové
(PARTAM)
2011 - 2014 Tové ,
Maritime
Region
• Design, control, monitoring and supervision of
general work
• Rehabilitation and development of perimeter
• Production support
• Environment and accompanying measures
• Awareness, organization, training and coaching
support
• Organization and project management
FCFA
5,400 million
and
FCFA
9,759 million
for two phases
Hydro-agricultural project
in the Lower River Valley
Mono
(PBVM)
2008 - 2013 Mono
Valley,
Maritime
Region
• Inventory research
• Arrangements of perimeters and related
equipment
• Control and supervision of works
• Accompanying measures and environmental
protection
• Support the development and
commercialization
• Project management unit
FCFA 10,523
million
Integrated Rural
Development Project of
Mô plain
(IRDP-Mô)
2011 - 2017 Mo Plain,
Centrale
Region
• Research, monitoring and surveillance work
• Structuring of village organizations
• Sustainable agriculture
• Strengthening rural infrastructure
• Environmental and social measures
• Organisation and project management
FCFA 13,170
million
Development Project of
Root and Tuber Plants
(PRT)
2009 - 2013 The whole
of Togo
• Development of cassava, yam, potato fields FCFA 1.4
Million
Multifunctional
Development Platform
Program
(PTFM)
2011 - 2017 The whole
of Togo
• Dissemination of the platform
• Development of inter-sectoral synergy
• Action of capacity building and institutional
development.
FCFA 9,600
million
Source: PNDAT
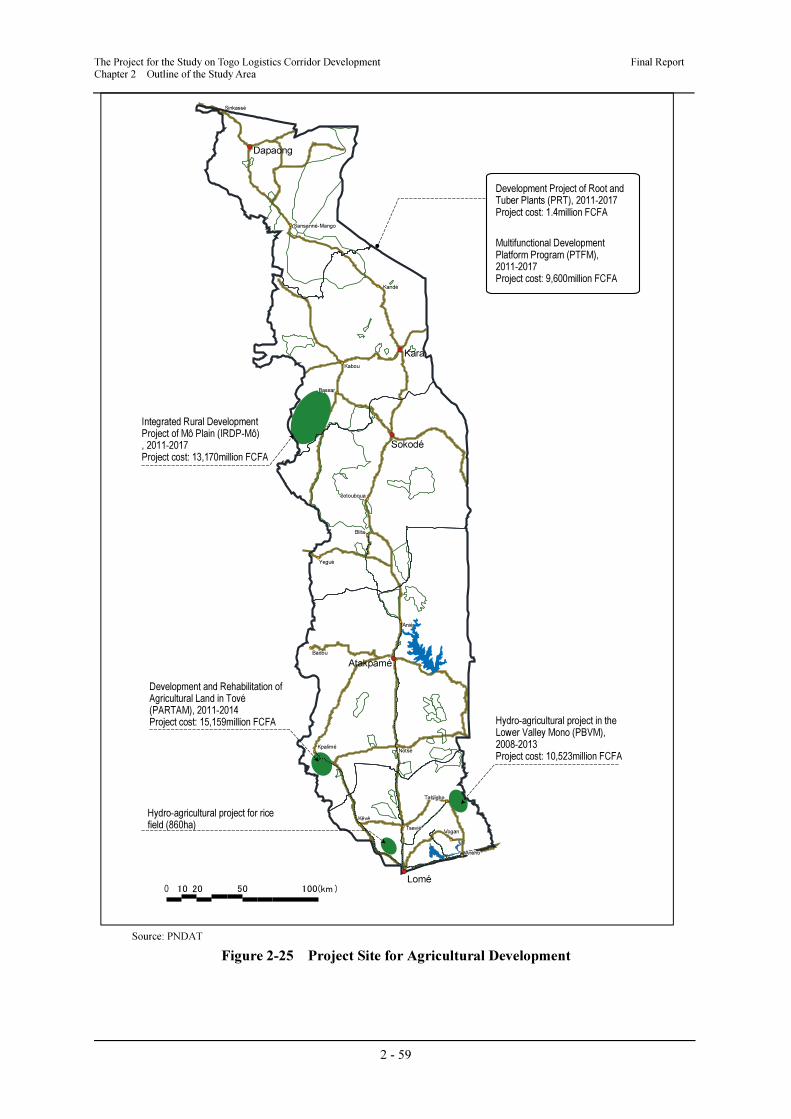
The Project for the Study on Togo Logistics Corridor Development Final Report Chapter 2 Outline of the Study Area
2 - 59
0 10 20 50 100(km )
Development and Rehabilitation ofAgricultural Land in Tové(PARTAM), 2011-2014Project cost: 15,159million FCFA
Integrated Rural DevelopmentProject of Mô Plain (IRDP-Mô), 2011-2017Project cost: 13,170million FCFA
Development Project of Root andTuber Plants (PRT), 2011-2017Project cost: 1.4million FCFA
Multifunctional DevelopmentPlatform Program (PTFM),2011-2017Project cost: 9,600million FCFA
Hydro-agricultural project in theLower Valley Mono (PBVM),2008-2013Project cost: 10,523million FCFA
Hydro-agricultural project for ricefield (860ha)
Lomé
TseviéTsevié
KévéKévé
TabligboTabligbo
VoganVogan
AnéhoAného
Atakpamé
NotséNotsé
BadouBadou
AniéAnié
KpaliméKpalimé
Sokodé
BlitaBlita
YeguéYegué
SotoubouaSotouboua
Kara
BassarBassar
KabouKabou
KandéKandé
Dapaong
Sansanné-MangoSansanné-Mango
SinkasséSinkassé
Source: PNDAT
Figure 2-25 Project Site for Agricultural Development
CHAPTER 3
CURRENT TRANSPORT
SYSTEM IN TOGO
The Project for the Study on Togo Logistics Corridor Development Final Report Chapter 3 Current Transport System in Togo
3 - 1
Chapter 3 Current Transport System in Togo
3.1 Overview of the Transport Sector
Togo has a multimodal transport system comprising four main modes of transport. These are
road, railway, air and maritime. The system is progressively being upgraded with the support of
development partners in order to improve the performance of the transport sector to enable it
support the country’s economic growth.
• Togo currently has a road network of approximately 11,672 km of which 2,376 km or 15%
is paved. One main road, completely paved since 1980, runs north from Lomé to the border
with Burkina Faso. Another runs east along the coast from Lomé to Aného and onward to
the Togo – Bénin border.
• Togo has 575 km of a metre gauge railway currently under the concession, including two
major lines from Lomé to:
� Atakpamé and Blitta (276 km).
� An 85 km spur extends to Tabligbo.
• There is an autonomous free Port at Lomé. The port not only serves Togo but also the
landlocked countries of Burkina Faso, Mali and Niger. The port is also increasingly
providing services to Bénin. A phosphate handling jetty is located at Kpemé.
• Lomé International Airport only serves as Togo’s link with West and Central Africa and
Europe at present.
• The transport sector contributes 6.5–7% of GDP with road transport accounting for a
dominant 65–70% of this contribution, followed by maritime transport with 13–17%.
3.2 Transport Policy, Planning and Coordination
In the National Strategy on Sustainable Development (SNDD: Stratégie Nationale de
Développement Durable) for the year 2030, Togo plans to establish a society based on
harmonious economic and social development, while considering the environment and
protecting its cultural heritage. The GoT’s in accelerating progress toward lasting development
for the next ten years are stated in the four strategies of the SNDD. These are: (i) development
of economic recovery and promotion of production and sustainable consumption, (ii)
acceleration of development in the social sectors and promotion of social overhead capital, (iii)
improvement of environmental protection and management of natural resources, and (iv)
provision of education and fostering of expertise for sustainable development.
Moreover, the GoT’s economic policies for the medium term from 2013 to 2017 will provide
an essential platform for the future growth of Togo. To achieve these challenges, the GoT
should introduce the following new policies: (i) acceleration of the economic growth, (ii)
employment and recruitment, (iii) enhancement the governance, (iv) reduction of regional
disparities and promotion of basic development.
Consequently, the SCAPE was established for medium-term development to achieve the
Declaration of General Politic (DPG: Déclaration de Politique Générale) of the GoT, the MDG
and the GoT’s vision of making Togo an emerging country in the next 15 to 20 years, respectful
The Project for the Study on Togo Logistics Corridor Development Final Report Chapter 3 Current Transport System in Togo
3 - 2
of human rights and promoting the State based on right.
SCAPE is premised on support for democracy, peace and national reconciliation, stability of
the macroeconomic setting, development of human capital, management of the environment,
and sustainable development.
The five strategies of SCAPE are as follows:
Strategy 1: Development of the sectors with high growth potential
Strategy 2: Development of the economic infrastructure
Strategy 3: Development of human resources, social protection and employment
Strategy 4: Enhancement of governance
Strategy 5: Promotion of balanced and sustainable developments
The concept of Strategy 2 is to introduce modern and efficient transport infrastructures
including multimodal transport: (i) maritime infrastructures (Lomé Port, Kpémé Port), (ii) road
infrastructures, (iii) railway network, and (iv) airports (Gnassingbé Eyadema International
Airport and Niamtougou International Airport). In this context, Togo should establish a strategic
plan for transportation development by 2030 of the major means of transport.
The transport development policy falls within the country’s broader economic strategic
objectives in support of the Government’s Vision 2030 and the current PRSP-II.
The development strategy for the sector therefore demonstrates the Government’s recognition
of its importance. The goals of the Government for the sector are to:
• Improve the effectiveness of the sector to support economic recovery and contribute to
growth,
• Improve the competitiveness of Togolese products on the domestic and foreign markets
through reduced transport costs and better service delivery,
• Encourage regional trade
• Improve the mobility of goods and persons for poverty reduction,
• Ensure autonomous and sustainable development of the sector.
The Government’s policy for the sector is entrusted to the MPW3 and MT. The Ministries are
specifically responsible for defining the sector policy with regard to transport infrastructure and
related programmes and actions, ensuring their implementation, as well as organising and
regulating the transport industry. The Ministries are supported by a number of implementing
agencies to ensure that the policy objectives and action plans are realised
3.3 Present Situation of Road Sub-sector
3.3.1 Administration
The MPW in Togo has overall responsibility for the road sub-sector. The MPW is in charge
of setting policy and monitoring. Implementation is carried out through the DGPW on behalf of
the Ministry. As part of the on-going reforms in the transport sector, a Directorate of Rural
Roads (DPR) in charge of the entire feeder road network has recently been created. The DPR
has been placed under the DGPW for improved coordination and overall efficiency. Figure 3-1
shows the current organisation chart of the DGPW.
3 The government organisation in this report refer to the previous organisation before the restructuring of ministries on 18th September,
2013.
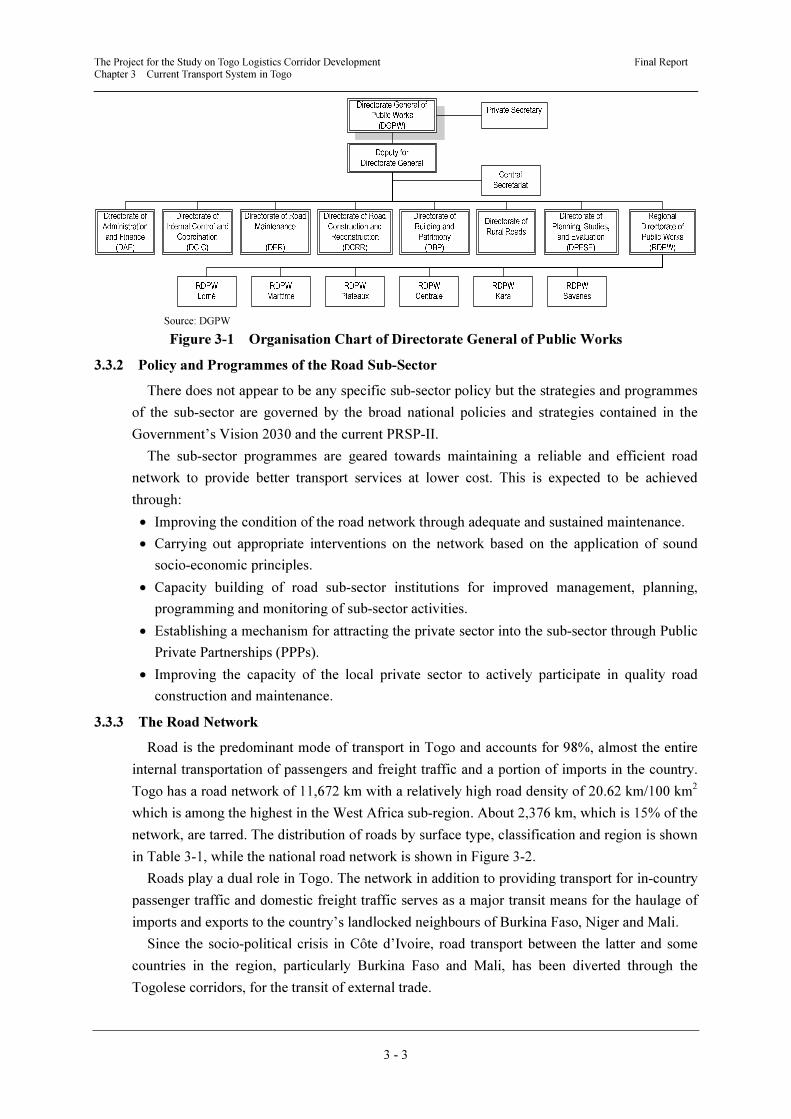
The Project for the Study on Togo Logistics Corridor Development Final Report Chapter 3 Current Transport System in Togo
3 - 3
Source: DGPW
Figure 3-1 Organisation Chart of Directorate General of Public Works
3.3.2 Policy and Programmes of the Road Sub-Sector
There does not appear to be any specific sub-sector policy but the strategies and programmes
of the sub-sector are governed by the broad national policies and strategies contained in the
Government’s Vision 2030 and the current PRSP-II.
The sub-sector programmes are geared towards maintaining a reliable and efficient road
network to provide better transport services at lower cost. This is expected to be achieved
through:
• Improving the condition of the road network through adequate and sustained maintenance.
• Carrying out appropriate interventions on the network based on the application of sound
socio-economic principles.
• Capacity building of road sub-sector institutions for improved management, planning,
programming and monitoring of sub-sector activities.
• Establishing a mechanism for attracting the private sector into the sub-sector through Public
Private Partnerships (PPPs).
• Improving the capacity of the local private sector to actively participate in quality road
construction and maintenance.
3.3.3 The Road Network
Road is the predominant mode of transport in Togo and accounts for 98%, almost the entire
internal transportation of passengers and freight traffic and a portion of imports in the country.
Togo has a road network of 11,672 km with a relatively high road density of 20.62 km/100 km2
which is among the highest in the West Africa sub-region. About 2,376 km, which is 15% of the
network, are tarred. The distribution of roads by surface type, classification and region is shown
in Table 3-1, while the national road network is shown in Figure 3-2.
Roads play a dual role in Togo. The network in addition to providing transport for in-country
passenger traffic and domestic freight traffic serves as a major transit means for the haulage of
imports and exports to the country’s landlocked neighbours of Burkina Faso, Niger and Mali.
Since the socio-political crisis in Côte d’Ivoire, road transport between the latter and some
countries in the region, particularly Burkina Faso and Mali, has been diverted through the
Togolese corridors, for the transit of external trade.
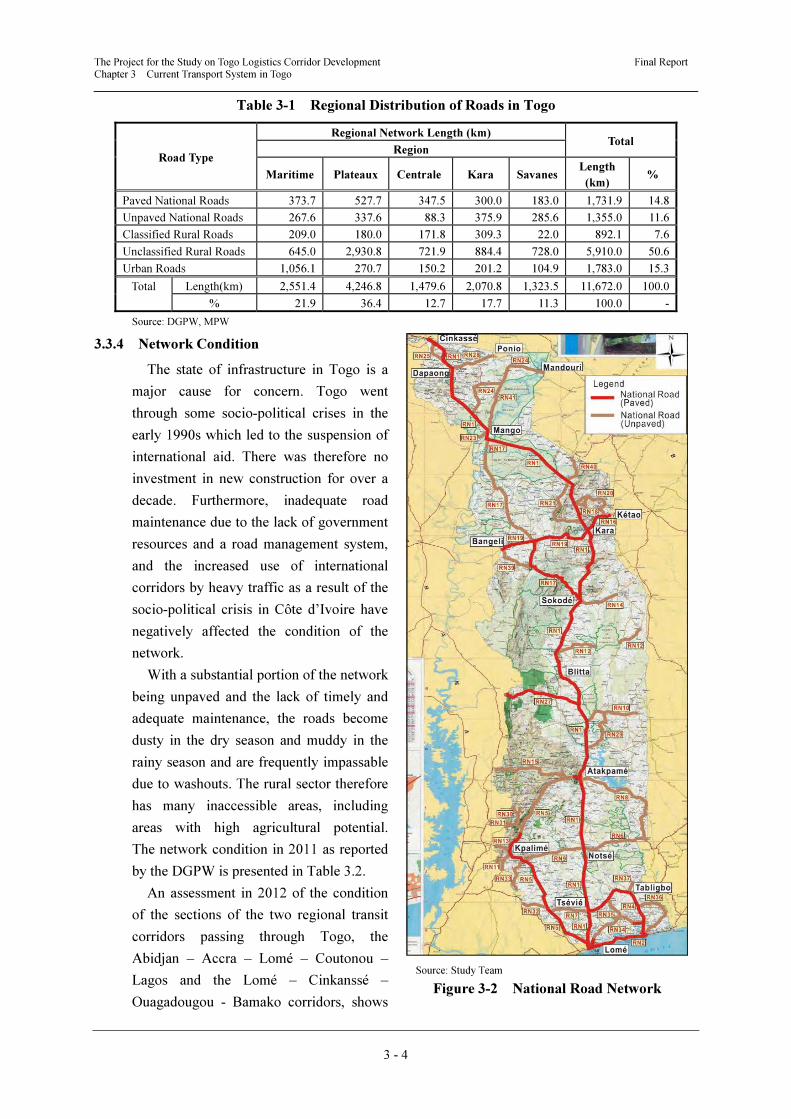
The Project for the Study on Togo Logistics Corridor Development Final Report Chapter 3 Current Transport System in Togo
3 - 4
Table 3-1 Regional Distribution of Roads in Togo
Road Type
Regional Network Length (km) Total
Region
Maritime Plateaux Centrale Kara SavanesLength
(km) %
Paved National Roads 373.7 527.7 347.5 300.0 183.0 1,731.9 14.8
Unpaved National Roads 267.6 337.6 88.3 375.9 285.6 1,355.0 11.6
Classified Rural Roads 209.0 180.0 171.8 309.3 22.0 892.1 7.6
Unclassified Rural Roads 645.0 2,930.8 721.9 884.4 728.0 5,910.0 50.6
Urban Roads 1,056.1 270.7 150.2 201.2 104.9 1,783.0 15.3
Total Length(km) 2,551.4 4,246.8 1,479.6 2,070.8 1,323.5 11,672.0 100.0
% 21.9 36.4 12.7 17.7 11.3 100.0 -
Source: DGPW, MPW
3.3.4 Network Condition
The state of infrastructure in Togo is a
major cause for concern. Togo went
through some socio-political crises in the
early 1990s which led to the suspension of
international aid. There was therefore no
investment in new construction for over a
decade. Furthermore, inadequate road
maintenance due to the lack of government
resources and a road management system,
and the increased use of international
corridors by heavy traffic as a result of the
socio-political crisis in Côte d’Ivoire have
negatively affected the condition of the
network.
With a substantial portion of the network
being unpaved and the lack of timely and
adequate maintenance, the roads become
dusty in the dry season and muddy in the
rainy season and are frequently impassable
due to washouts. The rural sector therefore
has many inaccessible areas, including
areas with high agricultural potential.
The network condition in 2011 as reported
by the DGPW is presented in Table 3.2.
An assessment in 2012 of the condition
of the sections of the two regional transit
corridors passing through Togo, the
Abidjan – Accra – Lomé – Coutonou –
Lagos and the Lomé – Cinkanssé –
Ouagadougou - Bamako corridors, shows
Source: Study Team
Figure 3-2 National Road Network
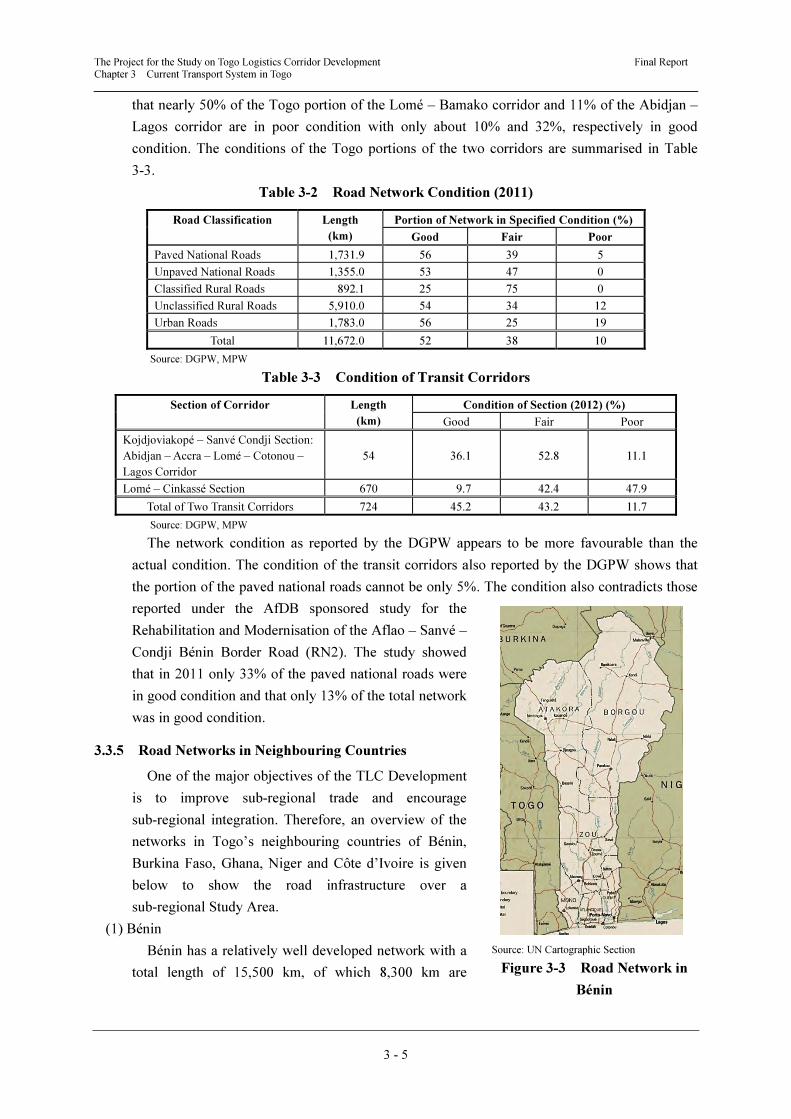
The Project for the Study on Togo Logistics Corridor Development Final Report Chapter 3 Current Transport System in Togo
3 - 5
that nearly 50% of the Togo portion of the Lomé – Bamako corridor and 11% of the Abidjan –
Lagos corridor are in poor condition with only about 10% and 32%, respectively in good
condition. The conditions of the Togo portions of the two corridors are summarised in Table
3-3.
Table 3-2 Road Network Condition (2011)
Road Classification Length
(km)
Portion of Network in Specified Condition (%)
Good Fair Poor
Paved National Roads 1,731.9 56 39 5
Unpaved National Roads 1,355.0 53 47 0
Classified Rural Roads 892.1 25 75 0
Unclassified Rural Roads 5,910.0 54 34 12
Urban Roads 1,783.0 56 25 19
Total 11,672.0 52 38 10
Source: DGPW, MPW
Table 3-3 Condition of Transit Corridors
Section of Corridor Length
(km)
Condition of Section (2012) (%)
Good Fair Poor
Kojdjoviakopé – Sanvé Condji Section:
Abidjan – Accra – Lomé – Cotonou –
Lagos Corridor
54 36.1 52.8 11.1
Lomé – Cinkassé Section 670 9.7 42.4 47.9
Total of Two Transit Corridors 724 45.2 43.2 11.7
Source: DGPW, MPW
The network condition as reported by the DGPW appears to be more favourable than the
actual condition. The condition of the transit corridors also reported by the DGPW shows that
the portion of the paved national roads cannot be only 5%. The condition also contradicts those
reported under the AfDB sponsored study for the
Rehabilitation and Modernisation of the Aflao – Sanvé –
Condji Bénin Border Road (RN2). The study showed
that in 2011 only 33% of the paved national roads were
in good condition and that only 13% of the total network
was in good condition.
3.3.5 Road Networks in Neighbouring Countries
One of the major objectives of the TLC Development
is to improve sub-regional trade and encourage
sub-regional integration. Therefore, an overview of the
networks in Togo’s neighbouring countries of Bénin,
Burkina Faso, Ghana, Niger and Côte d’Ivoire is given
below to show the road infrastructure over a
sub-regional Study Area.
(1) Bénin
Bénin has a relatively well developed network with a
total length of 15,500 km, of which 8,300 km are
Source: UN Cartographic Section
Figure 3-3 Road Network in
Bénin
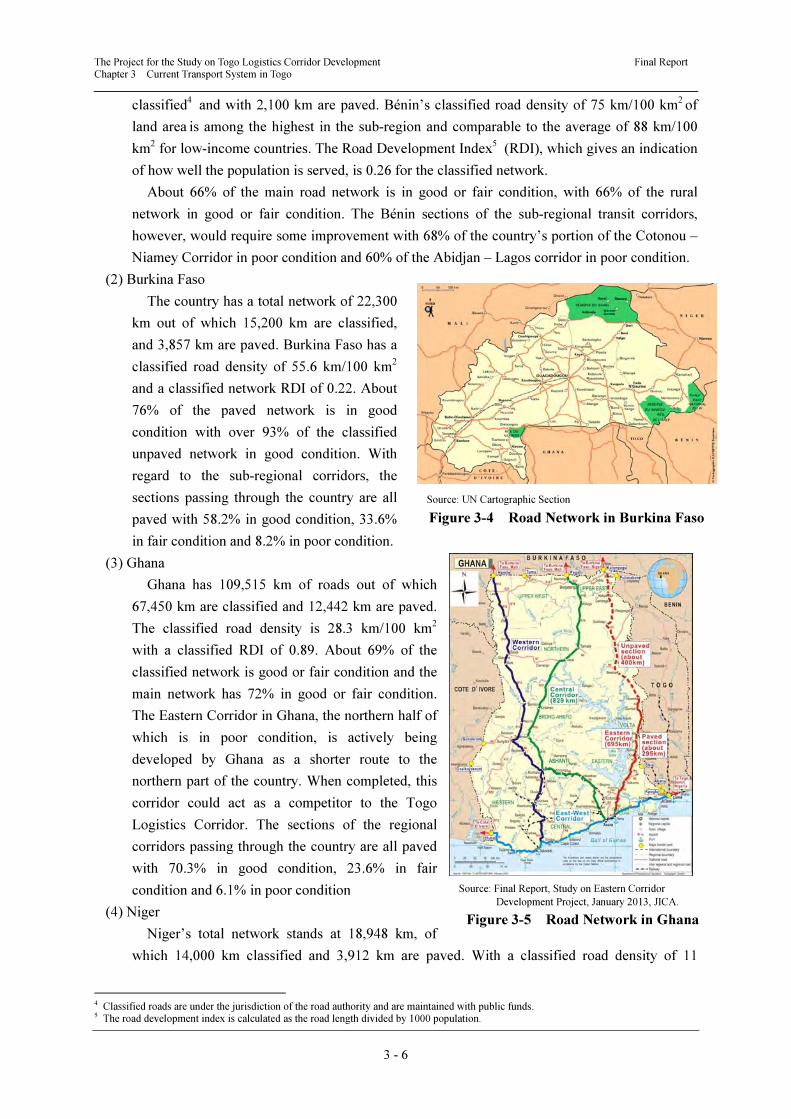
The Project for the Study on Togo Logistics Corridor Development Final Report Chapter 3 Current Transport System in Togo
3 - 6
classified4 and with 2,100 km are paved. Bénin’s classified road density of 75 km/100 km
2 of
land area is among the highest in the sub-region and comparable to the average of 88 km/100
km2 for low-income countries. The Road Development Index
5 (RDI), which gives an indication
of how well the population is served, is 0.26 for the classified network.
About 66% of the main road network is in good or fair condition, with 66% of the rural
network in good or fair condition. The Bénin sections of the sub-regional transit corridors,
however, would require some improvement with 68% of the country’s portion of the Cotonou –
Niamey Corridor in poor condition and 60% of the Abidjan – Lagos corridor in poor condition.
(2) Burkina Faso
The country has a total network of 22,300
km out of which 15,200 km are classified,
and 3,857 km are paved. Burkina Faso has a
classified road density of 55.6 km/100 km2
and a classified network RDI of 0.22. About
76% of the paved network is in good
condition with over 93% of the classified
unpaved network in good condition. With
regard to the sub-regional corridors, the
sections passing through the country are all
paved with 58.2% in good condition, 33.6%
in fair condition and 8.2% in poor condition.
(3) Ghana
Ghana has 109,515 km of roads out of which
67,450 km are classified and 12,442 km are paved.
The classified road density is 28.3 km/100 km2
with a classified RDI of 0.89. About 69% of the
classified network is good or fair condition and the
main network has 72% in good or fair condition.
The Eastern Corridor in Ghana, the northern half of
which is in poor condition, is actively being
developed by Ghana as a shorter route to the
northern part of the country. When completed, this
corridor could act as a competitor to the Togo
Logistics Corridor. The sections of the regional
corridors passing through the country are all paved
with 70.3% in good condition, 23.6% in fair
condition and 6.1% in poor condition
(4) Niger
Niger’s total network stands at 18,948 km, of
which 14,000 km classified and 3,912 km are paved. With a classified road density of 11
4 Classified roads are under the jurisdiction of the road authority and are maintained with public funds. 5 The road development index is calculated as the road length divided by 1000 population.
Source: UN Cartographic Section
Figure 3-4 Road Network in Burkina Faso
Source: Final Report, Study on Eastern Corridor
Development Project, January 2013, JICA.
Figure 3-5 Road Network in Ghana
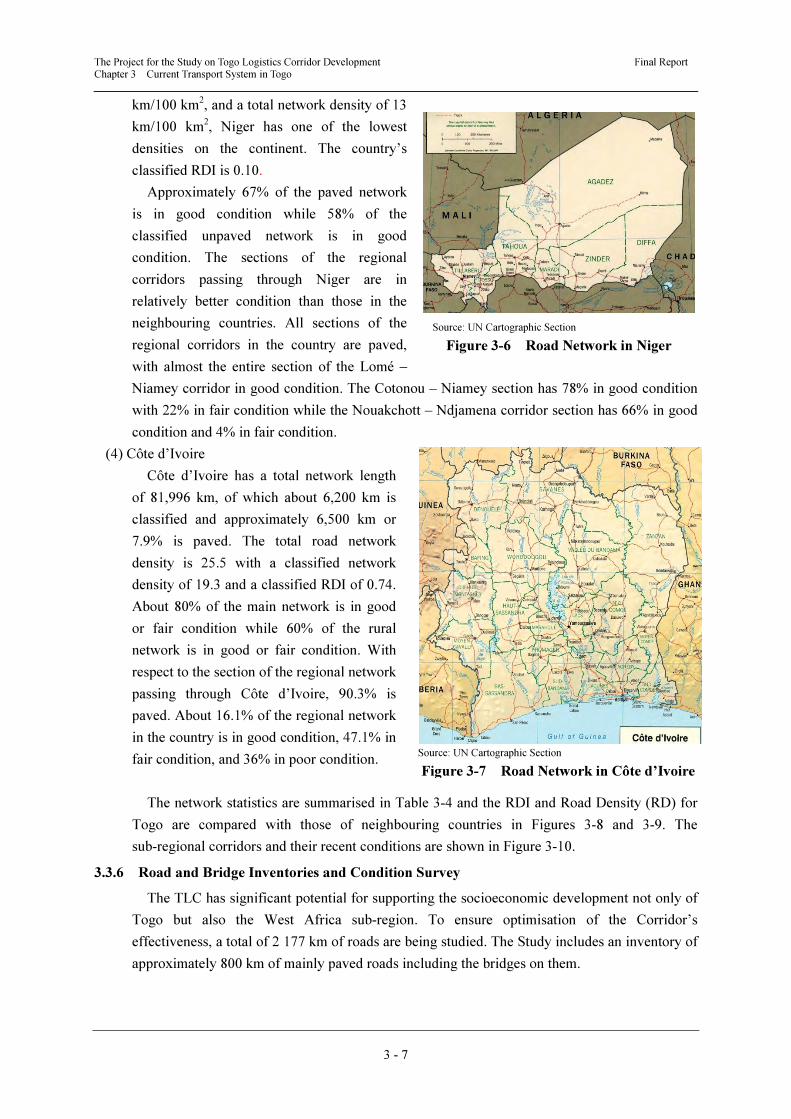
The Project for the Study on Togo Logistics Corridor Development Final Report Chapter 3 Current Transport System in Togo
3 - 7
km/100 km2, and a total network density of 13
km/100 km2, Niger has one of the lowest
densities on the continent. The country’s
classified RDI is 0.10.
Approximately 67% of the paved network
is in good condition while 58% of the
classified unpaved network is in good
condition. The sections of the regional
corridors passing through Niger are in
relatively better condition than those in the
neighbouring countries. All sections of the
regional corridors in the country are paved,
with almost the entire section of the Lomé –
Niamey corridor in good condition. The Cotonou – Niamey section has 78% in good condition
with 22% in fair condition while the Nouakchott – Ndjamena corridor section has 66% in good
condition and 4% in fair condition.
(4) Côte d’Ivoire
Côte d’Ivoire has a total network length
of 81,996 km, of which about 6,200 km is
classified and approximately 6,500 km or
7.9% is paved. The total road network
density is 25.5 with a classified network
density of 19.3 and a classified RDI of 0.74.
About 80% of the main network is in good
or fair condition while 60% of the rural
network is in good or fair condition. With
respect to the section of the regional network
passing through Côte d’Ivoire, 90.3% is
paved. About 16.1% of the regional network
in the country is in good condition, 47.1% in
fair condition, and 36% in poor condition.
The network statistics are summarised in Table 3-4 and the RDI and Road Density (RD) for
Togo are compared with those of neighbouring countries in Figures 3-8 and 3-9. The
sub-regional corridors and their recent conditions are shown in Figure 3-10.
3.3.6 Road and Bridge Inventories and Condition Survey
The TLC has significant potential for supporting the socioeconomic development not only of
Togo but also the West Africa sub-region. To ensure optimisation of the Corridor’s
effectiveness, a total of 2 177 km of roads are being studied. The Study includes an inventory of
approximately 800 km of mainly paved roads including the bridges on them.
Source: UN Cartographic Section
Figure 3-6 Road Network in Niger
Source: UN Cartographic Section
Figure 3-7 Road Network in Côte d’Ivoire
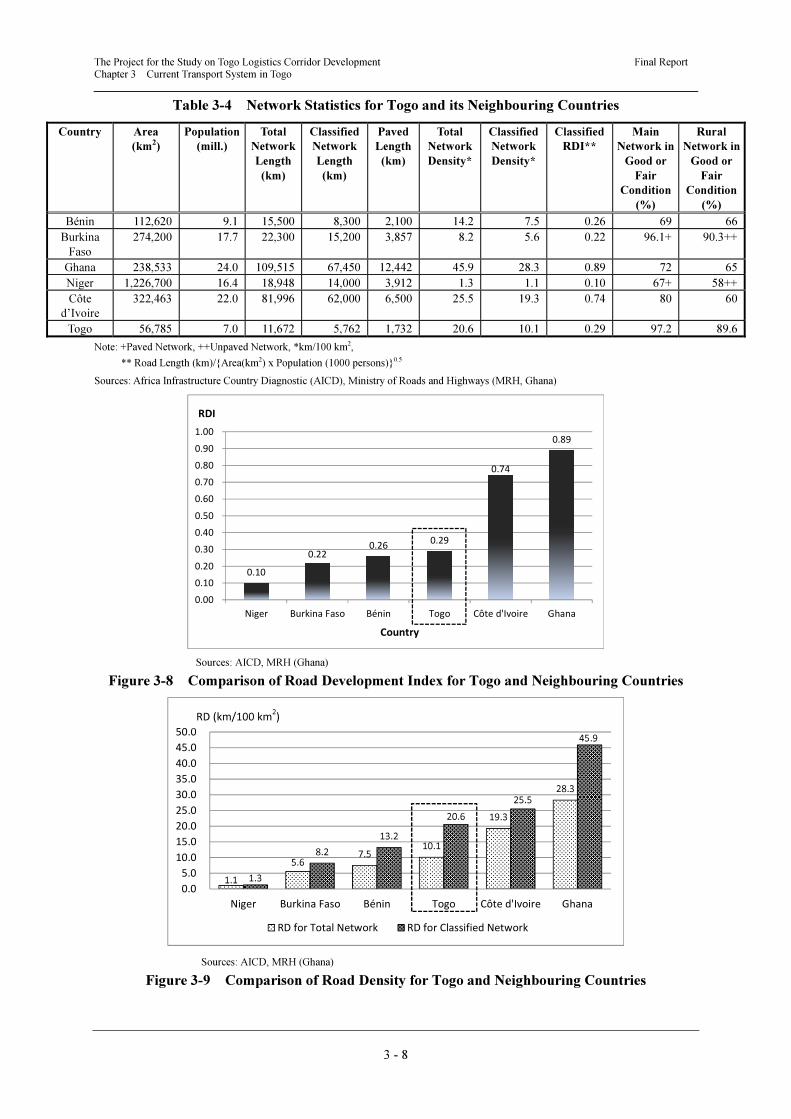
The Project for the Study on Togo Logistics Corridor Development Final Report Chapter 3 Current Transport System in Togo
3 - 8
Table 3-4 Network Statistics for Togo and its Neighbouring Countries
Country Area
(km2)
Population
(mill.)
Total
Network
Length
(km)
Classified
Network
Length
(km)
Paved
Length
(km)
Total
Network
Density*
Classified
Network
Density*
Classified
RDI**
Main
Network in
Good or
Fair
Condition
(%)
Rural
Network in
Good or
Fair
Condition
(%)
Bénin 112,620 9.1 15,500 8,300 2,100 14.2 7.5 0.26 69 66
Burkina
Faso
274,200 17.7 22,300 15,200 3,857 8.2 5.6 0.22 96.1+ 90.3++
Ghana 238,533 24.0 109,515 67,450 12,442 45.9 28.3 0.89 72 65
Niger 1,226,700 16.4 18,948 14,000 3,912 1.3 1.1 0.10 67+ 58++
Côte
d’Ivoire
322,463 22.0 81,996 62,000 6,500 25.5 19.3 0.74 80 60
Togo 56,785 7.0 11,672 5,762 1,732 20.6 10.1 0.29 97.2 89.6
Note: +Paved Network, ++Unpaved Network, *km/100 km2,
** Road Length (km)/{Area(km2) x Population (1000 persons)}0.5
Sources: Africa Infrastructure Country Diagnostic (AICD), Ministry of Roads and Highways (MRH, Ghana)
Sources: AICD, MRH (Ghana)
Figure 3-8 Comparison of Road Development Index for Togo and Neighbouring Countries
Sources: AICD, MRH (Ghana)
Figure 3-9 Comparison of Road Density for Togo and Neighbouring Countries
0.10
0.22 0.26
0.29
0.74
0.89
0.00
0.10
0.20
0.30
0.40
0.50
0.60
0.70
0.80
0.90
1.00
Niger Burkina Faso Bénin Togo Côte d'Ivoire Ghana
RDI
Country
1.1
5.67.5
10.1
19.3
28.3
1.3
8.2
13.2
20.6
25.5
45.9
0.0
5.0
10.0
15.0
20.0
25.0
30.0
35.0
40.0
45.0
50.0
Niger Burkina Faso Bénin Togo Côte d'Ivoire Ghana
RD for Total Network RD for Classified Network
RD (km/100 km2)
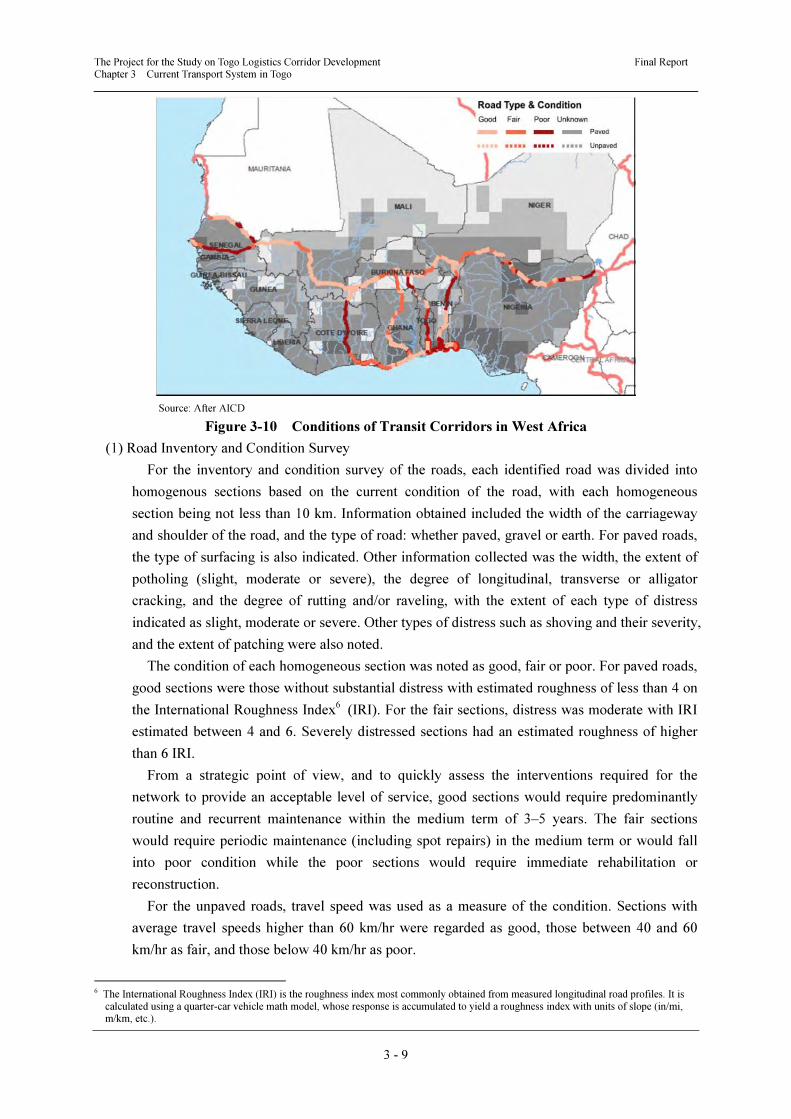
The Project for the Study on Togo Logistics Corridor Development Final Report Chapter 3 Current Transport System in Togo
3 - 9
Source: After AICD
Figure 3-10 Conditions of Transit Corridors in West Africa
(1) Road Inventory and Condition Survey
For the inventory and condition survey of the roads, each identified road was divided into
homogenous sections based on the current condition of the road, with each homogeneous
section being not less than 10 km. Information obtained included the width of the carriageway
and shoulder of the road, and the type of road: whether paved, gravel or earth. For paved roads,
the type of surfacing is also indicated. Other information collected was the width, the extent of
potholing (slight, moderate or severe), the degree of longitudinal, transverse or alligator
cracking, and the degree of rutting and/or raveling, with the extent of each type of distress
indicated as slight, moderate or severe. Other types of distress such as shoving and their severity,
and the extent of patching were also noted.
The condition of each homogeneous section was noted as good, fair or poor. For paved roads,
good sections were those without substantial distress with estimated roughness of less than 4 on
the International Roughness Index6 (IRI). For the fair sections, distress was moderate with IRI
estimated between 4 and 6. Severely distressed sections had an estimated roughness of higher
than 6 IRI.
From a strategic point of view, and to quickly assess the interventions required for the
network to provide an acceptable level of service, good sections would require predominantly
routine and recurrent maintenance within the medium term of 3–5 years. The fair sections
would require periodic maintenance (including spot repairs) in the medium term or would fall
into poor condition while the poor sections would require immediate rehabilitation or
reconstruction.
For the unpaved roads, travel speed was used as a measure of the condition. Sections with
average travel speeds higher than 60 km/hr were regarded as good, those between 40 and 60
km/hr as fair, and those below 40 km/hr as poor.
6 The International Roughness Index (IRI) is the roughness index most commonly obtained from measured longitudinal road profiles. It is
calculated using a quarter-car vehicle math model, whose response is accumulated to yield a roughness index with units of slope (in/mi, m/km, etc.).
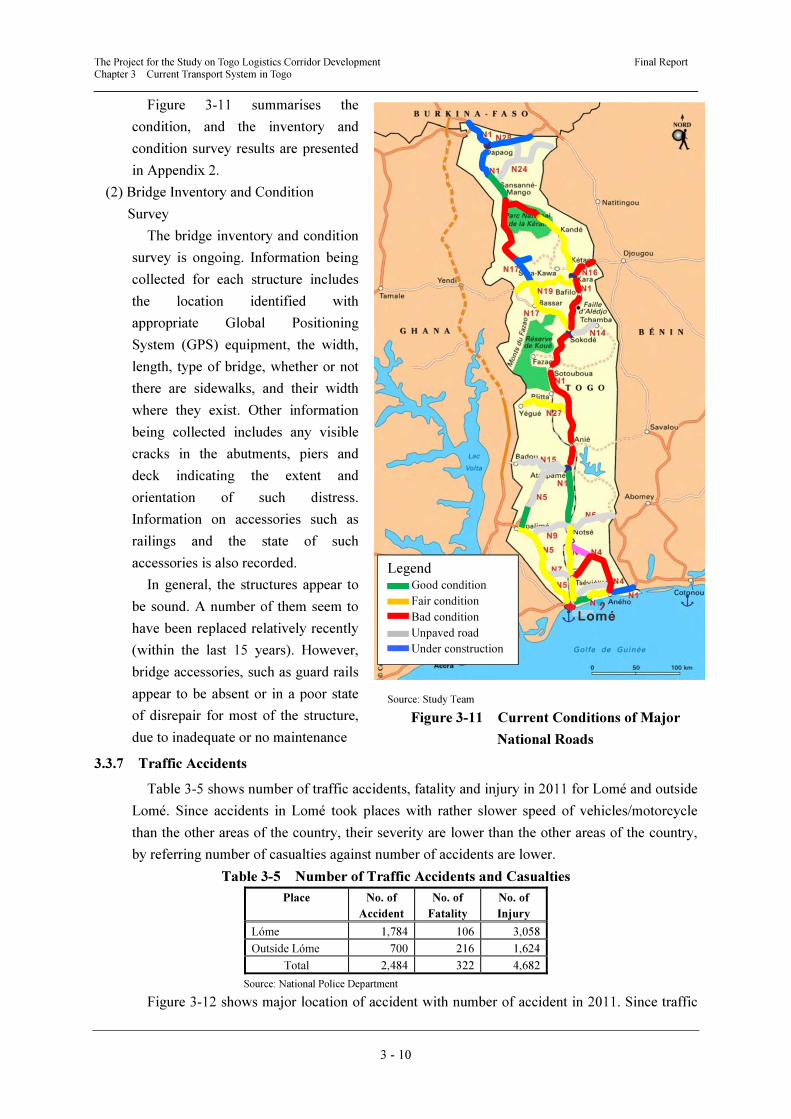
The Project for the Study on Togo Logistics Corridor Development Final Report Chapter 3 Current Transport System in Togo
3 - 10
Figure 3-11 summarises the
condition, and the inventory and
condition survey results are presented
in Appendix 2.
(2) Bridge Inventory and Condition
Survey
The bridge inventory and condition
survey is ongoing. Information being
collected for each structure includes
the location identified with
appropriate Global Positioning
System (GPS) equipment, the width,
length, type of bridge, whether or not
there are sidewalks, and their width
where they exist. Other information
being collected includes any visible
cracks in the abutments, piers and
deck indicating the extent and
orientation of such distress.
Information on accessories such as
railings and the state of such
accessories is also recorded.
In general, the structures appear to
be sound. A number of them seem to
have been replaced relatively recently
(within the last 15 years). However,
bridge accessories, such as guard rails
appear to be absent or in a poor state
of disrepair for most of the structure,
due to inadequate or no maintenance
3.3.7 Traffic Accidents
Table 3-5 shows number of traffic accidents, fatality and injury in 2011 for Lomé and outside
Lomé. Since accidents in Lomé took places with rather slower speed of vehicles/motorcycle
than the other areas of the country, their severity are lower than the other areas of the country,
by referring number of casualties against number of accidents are lower.
Table 3-5 Number of Traffic Accidents and Casualties
Place No. of
Accident
No. of
Fatality
No. of
Injury
Lóme 1,784 106 3,058
Outside Lóme 700 216 1,624
Total 2,484 322 4,682
Source: National Police Department
Figure 3-12 shows major location of accident with number of accident in 2011. Since traffic
2
LegendGood condition
Fair condition
Bad condition
Unpaved road
Under construction
Source: Study Team
Figure 3-11 Current Conditions of Major
National Roads
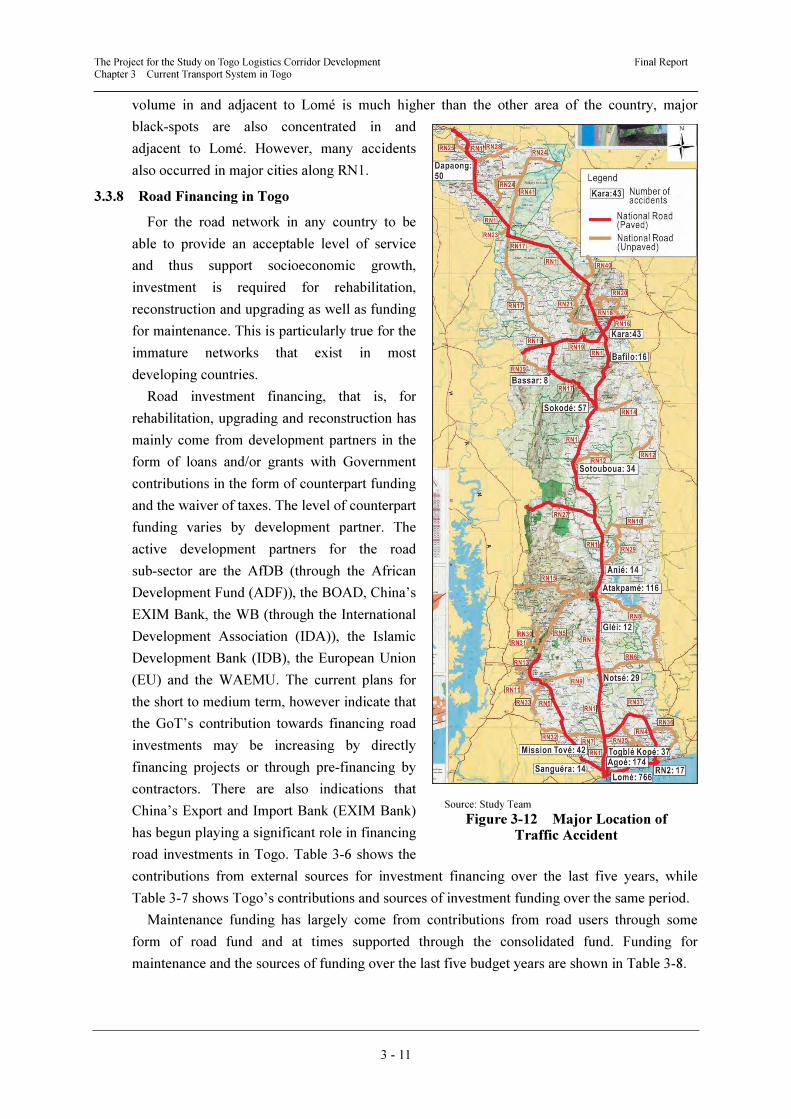
The Project for the Study on Togo Logistics Corridor Development Final Report Chapter 3 Current Transport System in Togo
3 - 11
volume in and adjacent to Lomé is much higher than the other area of the country, major
black-spots are also concentrated in and
adjacent to Lomé. However, many accidents
also occurred in major cities along RN1.
3.3.8 Road Financing in Togo
For the road network in any country to be
able to provide an acceptable level of service
and thus support socioeconomic growth,
investment is required for rehabilitation,
reconstruction and upgrading as well as funding
for maintenance. This is particularly true for the
immature networks that exist in most
developing countries.
Road investment financing, that is, for
rehabilitation, upgrading and reconstruction has
mainly come from development partners in the
form of loans and/or grants with Government
contributions in the form of counterpart funding
and the waiver of taxes. The level of counterpart
funding varies by development partner. The
active development partners for the road
sub-sector are the AfDB (through the African
Development Fund (ADF)), the BOAD, China’s
EXIM Bank, the WB (through the International
Development Association (IDA)), the Islamic
Development Bank (IDB), the European Union
(EU) and the WAEMU. The current plans for
the short to medium term, however indicate that
the GoT’s contribution towards financing road
investments may be increasing by directly
financing projects or through pre-financing by
contractors. There are also indications that
China’s Export and Import Bank (EXIM Bank)
has begun playing a significant role in financing
road investments in Togo. Table 3-6 shows the
contributions from external sources for investment financing over the last five years, while
Table 3-7 shows Togo’s contributions and sources of investment funding over the same period.
Maintenance funding has largely come from contributions from road users through some
form of road fund and at times supported through the consolidated fund. Funding for
maintenance and the sources of funding over the last five budget years are shown in Table 3-8.
Source: Study Team
Figure 3-12 Major Location of Traffic Accident
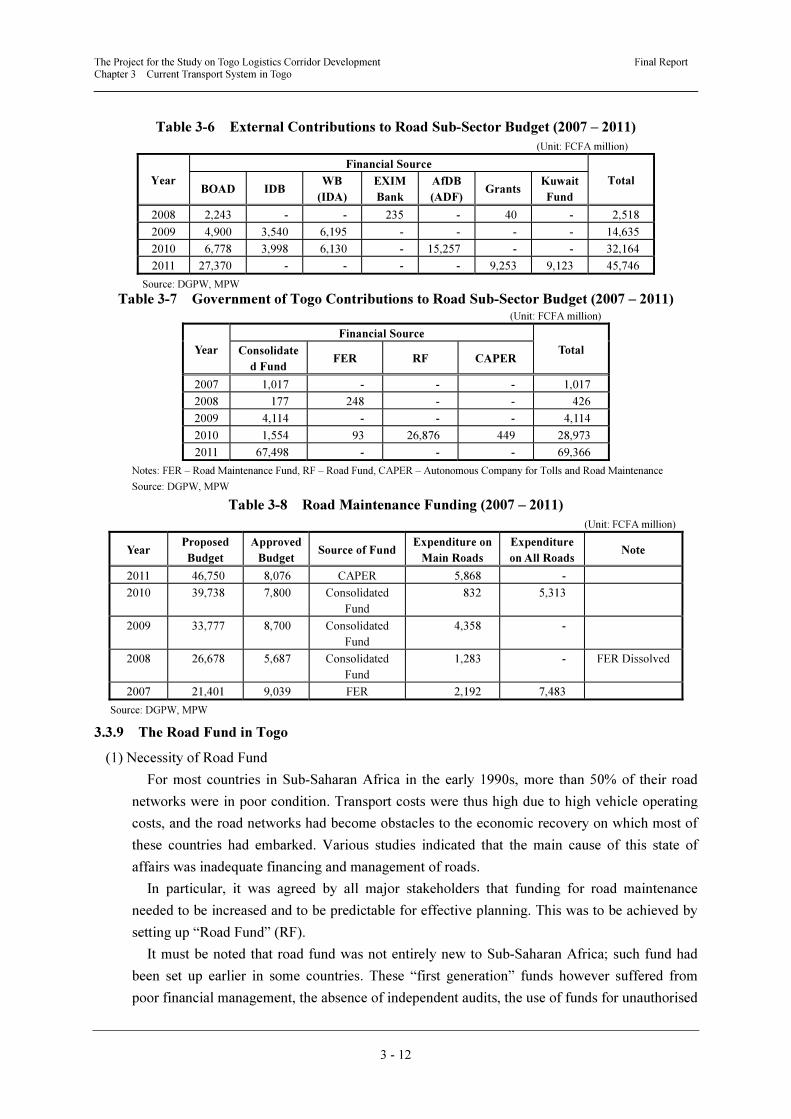
The Project for the Study on Togo Logistics Corridor Development Final Report Chapter 3 Current Transport System in Togo
3 - 12
Table 3-6 External Contributions to Road Sub-Sector Budget (2007 – 2011)
(Unit: FCFA million)
Year
Financial Source
Total BOAD IDB
WB
(IDA)
EXIM
Bank
AfDB
(ADF)Grants
Kuwait
Fund
2008 2,243 - - 235 - 40 - 2,518
2009 4,900 3,540 6,195 - - - - 14,635
2010 6,778 3,998 6,130 - 15,257 - - 32,164
2011 27,370 - - - - 9,253 9,123 45,746
Source: DGPW, MPW
Table 3-7 Government of Togo Contributions to Road Sub-Sector Budget (2007 – 2011) (Unit: FCFA million)
Year
Financial Source
Total Consolidate
d Fund FER RF CAPER
2007 1,017 - - - 1,017
2008 177 248 - - 426
2009 4,114 - - - 4,114
2010 1,554 93 26,876 449 28,973
2011 67,498 - - - 69,366
Notes: FER – Road Maintenance Fund, RF – Road Fund, CAPER – Autonomous Company for Tolls and Road Maintenance
Source: DGPW, MPW
Table 3-8 Road Maintenance Funding (2007 – 2011)
(Unit: FCFA million)
Year Proposed
Budget
Approved
Budget Source of Fund
Expenditure on
Main Roads
Expenditure
on All Roads Note
2011 46,750 8,076 CAPER 5,868 -
2010 39,738 7,800 Consolidated
Fund
832 5,313
2009 33,777 8,700 Consolidated
Fund
4,358 -
2008 26,678 5,687 Consolidated
Fund
1,283 - FER Dissolved
2007 21,401 9,039 FER 2,192 7,483
Source: DGPW, MPW
3.3.9 The Road Fund in Togo
(1) Necessity of Road Fund
For most countries in Sub-Saharan Africa in the early 1990s, more than 50% of their road
networks were in poor condition. Transport costs were thus high due to high vehicle operating
costs, and the road networks had become obstacles to the economic recovery on which most of
these countries had embarked. Various studies indicated that the main cause of this state of
affairs was inadequate financing and management of roads.
In particular, it was agreed by all major stakeholders that funding for road maintenance
needed to be increased and to be predictable for effective planning. This was to be achieved by
setting up “Road Fund” (RF).
It must be noted that road fund was not entirely new to Sub-Saharan Africa; such fund had
been set up earlier in some countries. These “first generation” funds however suffered from
poor financial management, the absence of independent audits, the use of funds for unauthorised
The Project for the Study on Togo Logistics Corridor Development Final Report Chapter 3 Current Transport System in Togo
3 - 13
expenditures, diversion of funds and weak oversight.
The new or “second generation” road fund that were being advocated had to have:
• A strong legal basis to ensure a separate road fund administration with clear rules and
regulations.
• Strong oversight with a broad-based management board, with members drawn from both the
private and public sectors.
• Sound financial management systems and lean but efficient administrative structures.
• Regular technical and financial audits
• Revenues that are incremental to the budget and derived from user charges.
(2) Road Fund in Togo
In 1997 Togo set up a Road Fund that was expected to finance road maintenance. Revenue
for the fund came mainly from a levy on petroleum products. Road tolls were introduced later
and the proceeds committed to the funds, boosting the fund’s revenues. However, although the
funding from the RF improved, the condition of the network itself stagnated since the fund was
not always used for maintenance but diverted into rehabilitation and upgrading and other
activities not originally envisaged.
The RF was dissolved in 2008 and replaced with two funds: an Autonomous Company in
charge of Road Financing (SAFER: Société Autonome de Financement de l'Entretien Routier)
which was to receive revenues from road tolls and use them for road maintenance, and a new
RF with revenues from a levy on petroleum products to be used for road investment or
development.
In 2010, the two funds were merged to form, an Autonomous Company for Tolls and Road
Maintenance (CAPER: la Compagnie Autonome des Péages et de l’Entretien Routier). CAPER
derives its revenues from a levy on petrol and diesel fuel which now stands at FCFA 35
(approximately US 7 cents) per litre and road tolls.
CAPER started operations in August 2010 with income for the year of FCFA 732 million
from only tolls. In 2011 CAPER mobilised FCFA 1,881 million from only tolls. The revenue
for 2012 is projected to be in the order of FCFA 8,200 million from tolls and levies on fuel.
CAPER has largely the characteristics of a “second-generation” road fund. It has a sound
legal basis, and also has strong oversight by a Board and Administrative Council. The law
setting up the Board and the Council does not, however, include private-sector members in
these bodies. About 95% of CAPER’s revenue goes into works with only 5% going into
administration and for paying the toll operating companies.
At current annual revenues of around FCFA 8,500 million, CAPER’s revenues do not appear
to be able to meet the maintenance needs of the network, estimated to be in the order of FCFA
25,000 million per annum.
(3) Road Funds in Neighboring Countries
The countries in the sub-region, and in fact sub-Sahara Africa (SSA), have been encouraged
or have found the need to set up Road Funds due to problems with financing road maintenance
with the result that by the mid-80s very high proportions of roads in SSA were in poor condition
retarding economic growth. The setting up of the funds was part of reforms embarked on in the
road sectors of SSA countries. The other major component of the reforms was the setting up of
The Project for the Study on Togo Logistics Corridor Development Final Report Chapter 3 Current Transport System in Togo
3 - 14
autonomous agencies for the management of roads. Earlier funds set up have now been
encouraged to upgrade to what is termed a Second Generation (2G) Fund while those which
have been set up recently or are yet to be set up have been encouraged to use the 2G model.
The key characteristics of 2G Funds are:
• Sound legal basis – separate road fund administration, clear rules and regulations.
• Agency which is a purchaser not a provider of road maintenance services.
• Strong oversight – broad based private/public board.
• Revenues incremental to the budget, coming from charges related to road use and channeled
directly to the Road Fund bank account.
• Sound financial management systems, lean efficient administrative structure.
• Regular technical and financial audits.
None of the funds set up in the sub-region fully meets the foregoing criteria in its entirety.
Road funds are not always used for maintenance and in some cases politics has been made to
play a significant role in fund disbursement. Revenues to the funds are also unable to meet the
maintenance requirements of any of the countries. There is nevertheless the recognition that the
setting up of the funds has improved road maintenance funding and consequently the condition
of road networks in the sub-region.
a) Road Funds in Ghana
Ghana has been operating a dedicated road fund since 1985. The road fund derived its
revenue from a levy on fuel, vehicle examination fees and bridge tolls. The fuel levy contributed
about 95% of the road fund revenue. The road fund, when set up contributed approximately
25% of the periodic maintenance needs of the network. Despite inflation, the fuel levy remained
constant and by 1995, the road fund was only contributing about 10% of actual periodic
maintenance requirements.
In 1997 the fund was transformed through an Act of Parliament to the current form which
though aims at a 2G fund does not meet all the criteria. A board of thirteen members supervises
the operations of the fund. Eight members of the board are from the private sector with five
from the public sector. The minister of Roads and Highways chairs the board.
The current fuel levy is approximately 6cents. The fund’s income is now around USD 140
million per annum with fuel levy contributing about 90%, road and bridge tolls – 3%, vehicle
licensing fees - 4%, and international transit fees – 1%. The fund is currently able to cover about
60% of the maintenance needs.
The inflows to the fund are estimated to cover about 60% of Ghana’s road maintenance
needs.
b) Road Funds in Benin
Benin’s Road Fund was set up in 1996 by law. The fund’s revenue comes from fuel levy
road tolls and international transit fees. Fuel levy contributes about 53% of the funds income
while road and bridge tolls contribute 23% with the remaining 5% coming from international
transit fees. The current fuel levy is 8 US Cents for gasoline and 6 cents for diesel.
The operations of the fund are supervised by a Board of 9 persons. Five of the board
members are from the private sector with the other four from the public sector. The minister of
Public Works chairs the board.
The Project for the Study on Togo Logistics Corridor Development Final Report Chapter 3 Current Transport System in Togo
3 - 15
The fund’s income is estimated to fully cover routine maintenance and 60% of periodic
maintenance of the classified network.
c) Road Funds in Niger
Niger set up is road fund in November 1999 and it is under the supervision of the Ministry of
Public Works. Revenue for the fund is made up of levy on fuel, road tolls and vehicle overload
fees. Fuel levy which is around 6 US cents for both gasoline and diesel accounts for
approximately 93% of the revenue with road tolls contributing around 6% and loading fees
contributing less than 1%. Current annual revenues are around FCFA 5 billion or USD 100
million which covers about 90% of routine maintenance and 40% of periodic maintenance
requirements.
d) Road Funds in Cote d’Ivoire
Cote d’Ivoire’s road fund derives its revenue sole from fuel levy which stands at
approximately 8 US Cents per liter for gasoline and 2 cents for diesel. The fund which was set
up around year 2000 has no clear legal basis, nor is there provision for direct transfer of Road
Fund resources to the Road Agency. In contrast to many other African countries that spread
Road Fund resources across the main, rural, and urban networks, Côte d’Ivoire allocates 90% of
Road Fund resources to the main road network and the balance to urban roads. The rural
network does not benefit from the Road Fund.
The fund currently mobilizes about USD 30 million per annum which is only about 40% of
the country’s maintenance needs.
e) Road Funds in Burkina Faso
An autonomous road fund in Burkina Faso was set up in 2007 and started operations in
January 2008.
The fund has no clear legal backing. Revenue for the fund is from fuel levy and road tolls.
Current inflows are around USD 180 million which covers approximately 60% of the needs.
Plans are ongoing to transform the fund into a second generation fund, expected to be
completed in 2013.
3.3.10 Major Findings and Problems of the Road Sub-Sector
A number of observations have been made on the road sub-sector. The Study Team’s
observations indicate that despite some progress made in recent years a number of challenges
confront the sub-sector. These include inadequate funds for investment and maintenance, the
lack of a road management system, lack of controls on axle loads, inadequate attention to road
safety, and the lack of viable alternative routes to the main north-south corridor. It is also
necessary to develop capacity within the sector. These challenges need to be systematically
tackled if the sector is to be able to support socio-economic growth. The issues and challenges
are discussed below.
(1) Inadequate Financing
The current condition of the network is a major impediment to the socio-economic growth of
the country and an obstacle to trade between Togo and its neighbouring countries. This means
that considerable investment needs to be sunk into the road sub-sector if it is to act as a catalyst
for growth. A number of factors have contributed to the current network condition with nearly
50% of the main network in poor condition, such as deferred investments as a consequence of
The Project for the Study on Togo Logistics Corridor Development Final Report Chapter 3 Current Transport System in Togo
3 - 16
the disengagement of the development partner community over a decade and the lack of
adequate and sustained maintenance.
(2) Lack of a Road Management System
Road management requires decisions to be taken regularly on the network with far-reaching
consequences. It is important that such decisions are rational and cost-effective and ultimately
provide the best service to road users within the available financial constraints. A road
management system ensures that the development and maintenance of the network provides
value-for-money for taxpayers and/or road users. However, this kind of road management
system has not been constructed in the DGPW.
(3) Lack of Control on Axle Load and Oversized Vehicles
Road infrastructure represents, by far, the single largest investment for any country and Road
Traffic Acts have been introduced in most countries stipulating permissible axle loads, axle
group combinations and vehicle dimensions to ensure that roads attain their full design lives
under normal maintenance. Even though there is a WAEMU Regulation (Reglement No.
14/2995/CM/UEMOA) that controls the single axle load (11.5 tonnes) and gross weight of
freight vehicles, as well as the maximum size of a vehicle, and the GoT ratified this regulation,
there is currently no effective axle load control or control of oversized vehicles in Togo.
(4) Inadequate Attention to Road Safety
Road accidents have serious socio-economic consequences. Apart from the pain associated
with losing close relatives, the economic cost can also be quite substantial. It is estimated that
developing countries such as Togo lose approximately 2% of GDP annually through road
accidents. Accidents in the country will increase as motorisation progresses, unless a
coordinated approach is taken to manage road safety. The Study Team’s observations suggest
that there are a number of situations which do not promote road safety. These include the lack
of by-passes for heavily populated settlements along the transit corridors including the TLC; the
high proportion of old vehicles in the traffic stream leading to the preponderance of broken-
down vehicles along the major routes; the numerous at-grade railway crossings on the road
network, and oversized freight vehicles, which are unstable for manoeuvring.
(5) Lack of Suitable Alternative Routes to the North-South Transit Corridor RN1
There are no suitable alternative routes to the main north-south route from Lomé to
Cinkanssé. This is the only route that serves all five regions of Togo, and is also extremely
important for sub-regional trade and integration since it serves the landlocked countries of
Burkina Faso, Mali, and Niger; and the northern part of Bénin. Any disruption to the route could
have serious consequences for the economies of Togo and the surrounding countries. Three
incidents related to washed away or damaged bridges on RN1 in the last 10 years caused much
inconvenience for people in Togo as well as transit transportation to/from landlocked countries.
(6) Issues related to the Organisation of Road Sub-Sector Management
The DGPW is currently embedded within the MPW. This type of organisation in charge of
not only road administration but also building and repair works does not allow for effective
management since it is not subject to any rigorous managerial discipline. Such a system of road
management of roads does not allow the clear definition of responsibilities, and hence
management structures tend to be weak and ineffective. There also tends to be a lack of
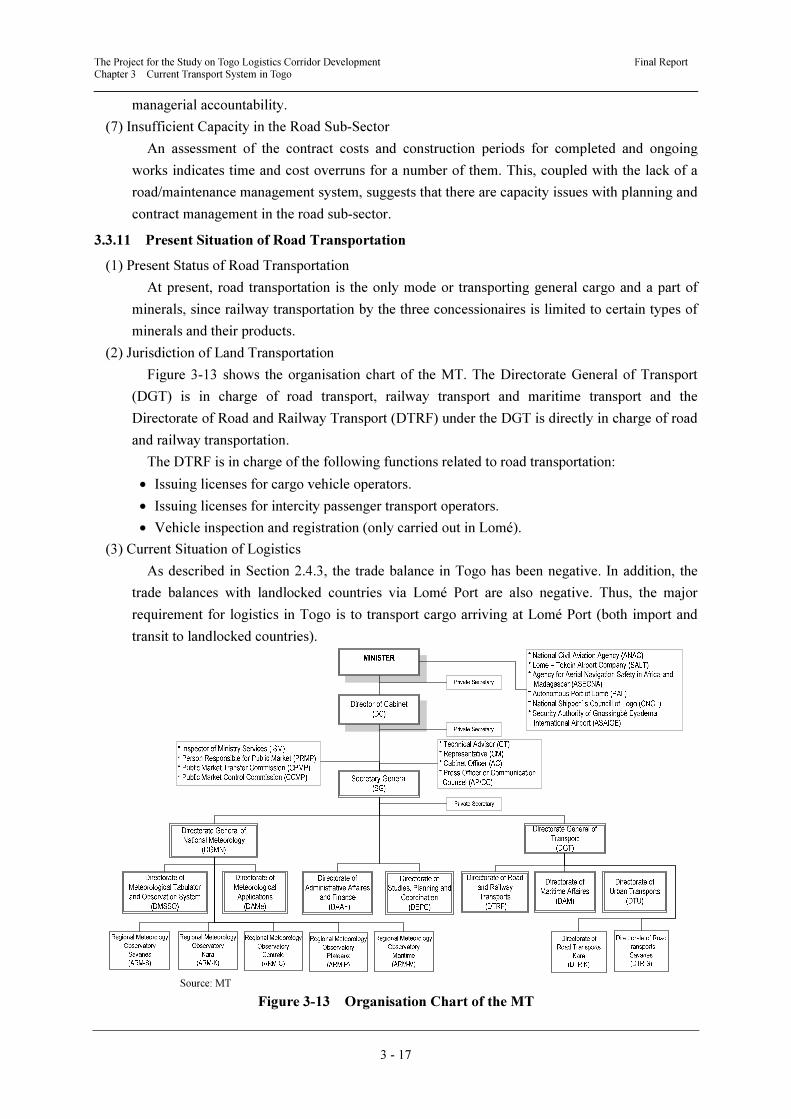
The Project for the Study on Togo Logistics Corridor Development Final Report Chapter 3 Current Transport System in Togo
3 - 17
managerial accountability.
(7) Insufficient Capacity in the Road Sub-Sector
An assessment of the contract costs and construction periods for completed and ongoing
works indicates time and cost overruns for a number of them. This, coupled with the lack of a
road/maintenance management system, suggests that there are capacity issues with planning and
contract management in the road sub-sector.
3.3.11 Present Situation of Road Transportation
(1) Present Status of Road Transportation
At present, road transportation is the only mode or transporting general cargo and a part of
minerals, since railway transportation by the three concessionaires is limited to certain types of
minerals and their products.
(2) Jurisdiction of Land Transportation
Figure 3-13 shows the organisation chart of the MT. The Directorate General of Transport
(DGT) is in charge of road transport, railway transport and maritime transport and the
Directorate of Road and Railway Transport (DTRF) under the DGT is directly in charge of road
and railway transportation.
The DTRF is in charge of the following functions related to road transportation:
• Issuing licenses for cargo vehicle operators.
• Issuing licenses for intercity passenger transport operators.
• Vehicle inspection and registration (only carried out in Lomé).
(3) Current Situation of Logistics
As described in Section 2.4.3, the trade balance in Togo has been negative. In addition, the
trade balances with landlocked countries via Lomé Port are also negative. Thus, the major
requirement for logistics in Togo is to transport cargo arriving at Lomé Port (both import and
transit to landlocked countries).
Source: MT
Figure 3-13 Organisation Chart of the MT
The Project for the Study on Togo Logistics Corridor Development Final Report Chapter 3 Current Transport System in Togo
3 - 18
In the West Africa sub-region, organisations such as shipper’s councils of each country play
the major role for the import and export of cargos and their transportation, not freight
forwarders as in other sub-regions. The shipper’s councils of Togo and related landlocked
countries are as follows:
• National Shipper’s Council of Togo (Conseil National des Chargeurs Togolais (CNCT)),
under the MT.
• Burkina Shipper’s Council (Conseil Burkinabe des Chargeurs (CBC)).
• Niger Public Transport Utilisation Concil (Conseil Nigerien des Utilisateurs des Transport
Publics (UNUT)).
• Mali Warehouse in Togo (Entrepôts Maliens au Togo (EMATO)).
The majority (60 to 70%) of unloaded containers at Lomé Port to landlocked countries are
devanning in the port area, because shippers of landlocked countries do not want to pay the high
deposit cost of a container charged by shipping companies.
3.4 Present Situation of Railway Sub-sector
3.4.1 Policy and Programmes of the Railway Sub-sector
(1) Development Policy for the Railway Sub-sector
As to the development of the railway network, the Togolese railway network is composed of
519 km of metre gauge track, of which 160 km are completely out of order or partially
dismantled (the lines of Lomé – Kpalimé and of Lomé – Aného). The present state of the
railway facilities can no longer provide the quality of service required by the African Railway
Union. The central line (Lomé – Blitta, 276 km), which should be the main route of servicing
Togo toward landlocked countries such as Burkina Faso, Mali, and Niger will become an
important link in the intra-community links of ECOWAS countries.
The GoT is conscious that development of the railway network is indispensable to facilitate
the transit and export of mining and industrial products of Togo. Since it would be more cost
competitive than the roads and offer greater transport capacity, a good railway network would
considerably improve the mobility of goods and people throughout the country.
Togo plans to increase the railway traffic considerably by 2020. To achieve this, the
rehabilitation and construction of the Lomé – Cinkassé line and the rehabilitation of the existing
network are required. The project priorities will be decided in the next year. These projects
should anticipate future growth in traffic, from both internal and external sources. The annual
volume of internal products that could be transported by rail is projected to rise from 2.3 million
tonnes in 2013, to 10 million tonnes by 2016 and close to 13 million tonnes in 2017. The Lomé–
Cinkassé railway line, designated in the common project of the WAEMU, will connect Lomé
Port to the border with Burkina Faso to provide railway transportation services to Burkina Faso,
Mali and Niger, and will encourage greater commercial trade between Togo and these countries.
(2) Division of Road and Railway Transportation
To introduce the SCAPE strategies on the railway transportation smoothly, the Railway
Division was incorporated in the DTRF in 2011 as an administrative department for the
concession and administration of the railway. It is functioning under the control of the DGT as
shown in Figure 3-13. In addition to the registration and control of road vehicles, DTRF is
The Project for the Study on Togo Logistics Corridor Development Final Report Chapter 3 Current Transport System in Togo
3 - 19
responsible for ensuring a safe, efficient and reliable railway transport system to assist the
movement of goods, people and services.
Though the division is responsible for railway concession contracts, the following
responsibilities are not fulfilled:
• Proper supervision and management of railway transport operation.
• Regulation of the railway transport system.
• Planning of railway infrastructure development.
In addition, the division should have the following functions in future:
• To be the executing organisation for rehabilitating and constructing the Lomé – Cinkassé
railway line.
• To promote railway safety and environmental protection.
• To establish the Railway Act, construction standards and operation regulations and laws.
• To monitor the operational efficiency and commercial viability of railway companies.
• To prevent adverse environmental effects of railway construction and ensure that the
infrastructure is environmentally friendly.
• To provide a long-distance passenger transport service at an affordable cost as a Public
Service Obligation (PSO).
3.4.2 Present Status of the Railway Network in Togo
(1) History
The railways of Togo are the result of cooperation between Togo and Germany and between
Togo and France. Construction was started in January 1904 with the construction of Lomé Port
by Germany. The Togo Railway (CFT: Chemins de Fer du Togo) was started by Germany in
1905, and proceeded as follows:
Lomé – Aného line : Opened in 1905 and closed in 1987.
Lomé – Kpalimé line : Constructed in 1907 and closed in 1996.
Lomé – Agbonou line : The last line constructed by Germany in 1911. The section of
Agbonou – Blitta was completed in 1933.
Lomé – Tabligbo line : The most recent line constructed by the GoT in 1978.
SNPT7 line : A private line constructed in 1968 to transport phosphate from
the mines at Aveta and Dagbati to the Kpémé Jetty.
The services operated by the German colony were organised by a French decree of 9th May,
1939 while Togo was placed under French tutelage. With the Togolese decree of 9th June, 1954,
the CFT was reorganised under the Ministry of the Public Works, Mines, Transportation,
Stations and Telecommunications. On 13th October, 1995 the National Society of the Railways
of Togo (SNCT: Nouvelle Société Cotonnière du Togo) was created to replace the CFT. In 2002,
Togo Rail S.A. (Togo Rail) succeeded the SNCT.
In 2008, concessions for the railway in Togo were awarded to two companies:
• Togo Rail, which is responsible for the Tabligbo line.
• M.M. Mining S.A. (M.M. Mining), which is responsible for the Lomé – Blitta line and the
Lomé – Kpalimé line.
7 Societe Nouvelle des Phosphates of Togo (New Phosphates Society of Togo)
The Project for the Study on Togo Logistics Corridor Development Final Report Chapter 3 Current Transport System in Togo
3 - 20
(2) Outline of the Current Concession
The concession agreement with Togo Rail was exchanged in May 2002 and is valid for 25
years, while that with M.M. Mining for the Blitta line was exchanged in July 2009. At the same
time, the right of using Lomé – Blitta line, Aného line and Kpalimé line was transferred from
Togo Rail to M.M. Mining. However, the duration of the concession of Togo Rail remains
unchanged.
There are no concession laws or regulations; instead, these concessions were defined in
Government Decree No. 2008-145/PR and Decree No. 2008-146/PR. The two decrees are
outlines below.
a) Decree No. 2008-145/PR
This decree defines the new policy for the management and rehabilitation of railway
infrastructures and rolling stock as well as the extension of the railway lines in Togo, as follows:
• All railway transportation should be conducted according to the following new policy for
the transportation sector, i.e. it should take account of the users’ needs, the securing of
safety, national development, regional economic integration, development of domestic and
international transportation, financial cost, real economic costs, and social costs.
• According to the new policy, the Togolese railway network is divided into three axes:
i. Line between Lomé – Blitta
ii. Line between Lomé – Kpalimé
iii. Lines between Lomé – Aného and Lomé – Tabligbo.
During the rehabilitation and extension of the line between Lomé and Cinkassé, two freight
handling facilities should be constructed at Blitta and Cinkassé based on the master plan
studies.
• The concession company should fulfil the following conditions:
i. Have sufficient financial capacity to invest and execute the concession.
ii. Have experience of railway freight transportation.
iii. Employ railway management staff with experience.
b) Decree No. 2008-146/PR
This decree defines the conditions of railway exploitation by Togo Rail and M.M. Mining as
shown below:
• The lines of the railway network as well as real estates and facilities belong in the public
domain and remain the property of the State. All extension and renewal lines of the railway,
real estate and facilities will be integrated into the property of the State.
• The exploitation of the lines between Lomé and Blitta and between Lomé and Kpalimé is
commissioned to M.M. Mining, not exclusively for the transportation of its products. This
concession also covers the rehabilitation of the existing railway facilities and all extensions
necessary for such exploitation.
• The exploitation of the line between Lomé and Tabligbo is commissioned to the Togo Rail
not exclusively for the transportation of its products. This concession also covers the
rehabilitation of the existing railway facilities and all extensions necessary for such
exploitation. Consequently, Togo Rail shall complete the branch line between Lomé and
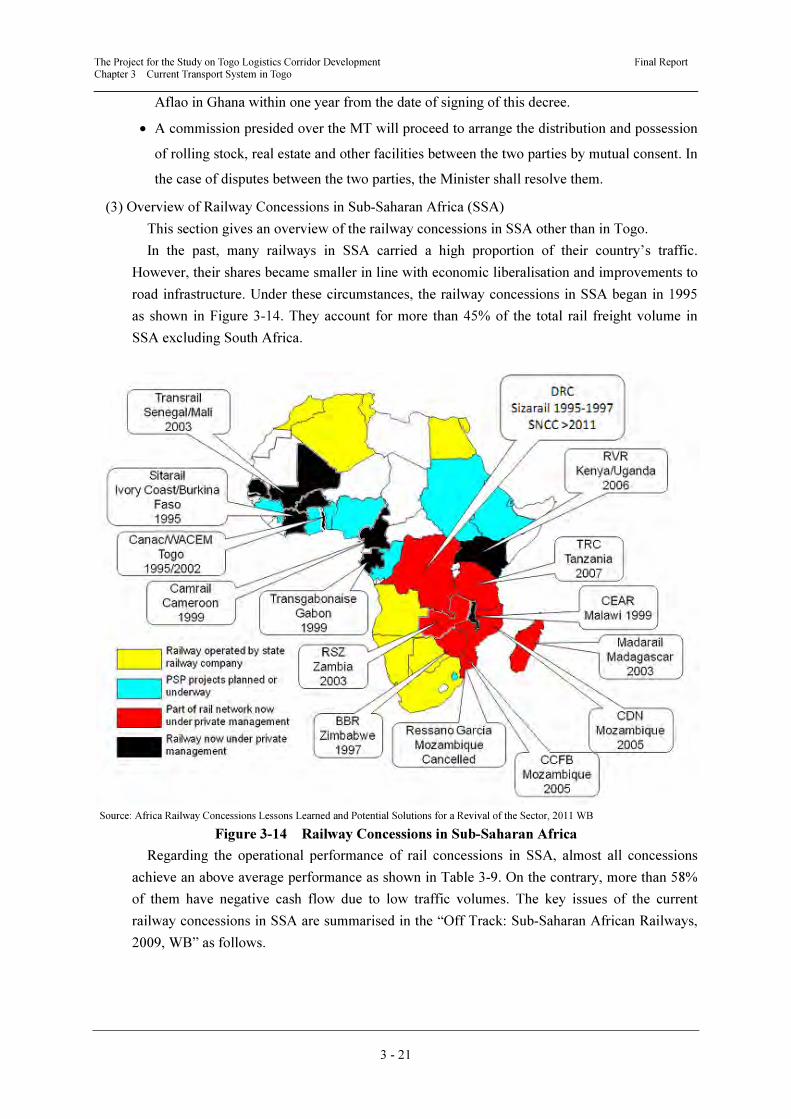
The Project for the Study on Togo Logistics Corridor Development Final Report Chapter 3 Current Transport System in Togo
3 - 21
Aflao in Ghana within one year from the date of signing of this decree.
• A commission presided over the MT will proceed to arrange the distribution and possession
of rolling stock, real estate and other facilities between the two parties by mutual consent. In
the case of disputes between the two parties, the Minister shall resolve them.
(3) Overview of Railway Concessions in Sub-Saharan Africa (SSA)
This section gives an overview of the railway concessions in SSA other than in Togo.
In the past, many railways in SSA carried a high proportion of their country’s traffic.
However, their shares became smaller in line with economic liberalisation and improvements to
road infrastructure. Under these circumstances, the railway concessions in SSA began in 1995
as shown in Figure 3-14. They account for more than 45% of the total rail freight volume in
SSA excluding South Africa.
Source: Africa Railway Concessions Lessons Learned and Potential Solutions for a Revival of the Sector, 2011 WB
Figure 3-14 Railway Concessions in Sub-Saharan Africa
Regarding the operational performance of rail concessions in SSA, almost all concessions
achieve an above average performance as shown in Table 3-9. On the contrary, more than 58%
of them have negative cash flow due to low traffic volumes. The key issues of the current
railway concessions in SSA are summarised in the “Off Track: Sub-Saharan African Railways,
2009, WB” as follows.
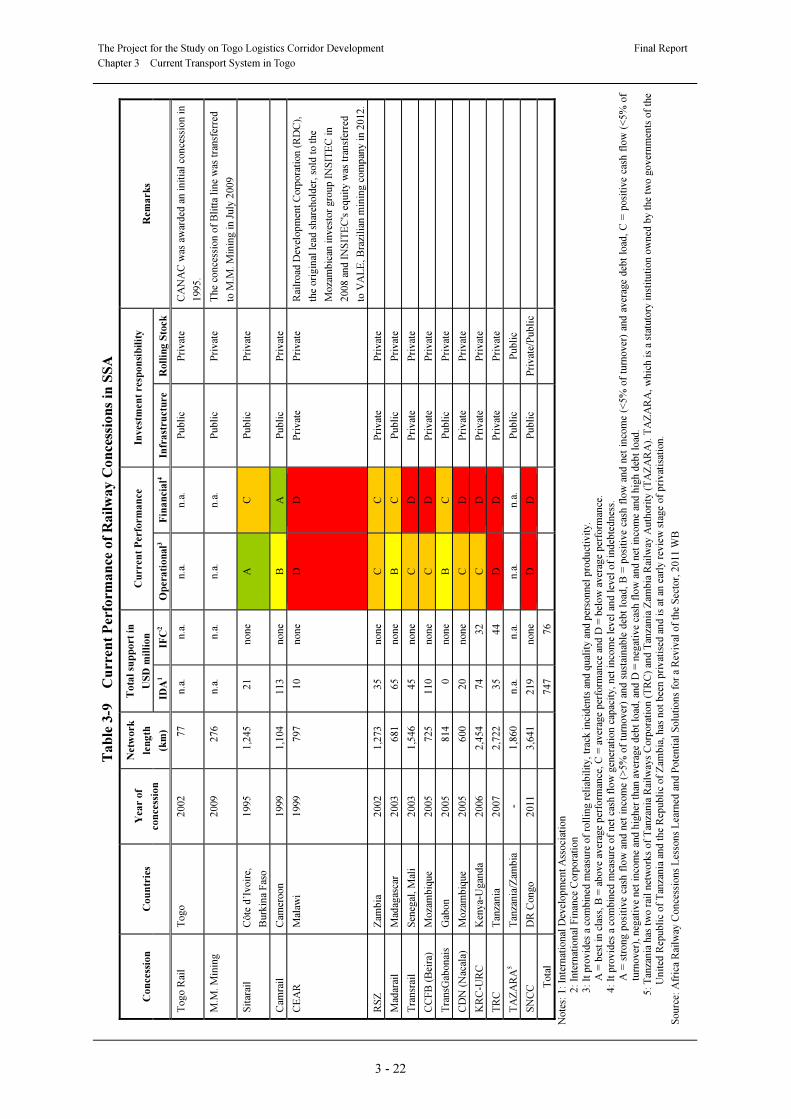
The Project for the Study on Togo Logistics Corridor Development Final Report
Chapter 3 Current Transport System in Togo
3 - 22
Tab
le 3
-9
C
urren
t P
erfo
rm
an
ce o
f R
ail
way C
on
ces
sio
ns
in S
SA
Con
cess
ion
C
ou
ntr
ies
Yea
r of
con
cess
ion
Net
work
len
gth
(km
)
Tota
l su
pp
ort
in
US
D m
illi
on
C
urr
ent
Per
form
an
ce
Inves
tmen
t re
spon
sib
ilit
y
Rem
ark
s
IDA
1
IFC
2
Op
erati
on
al3
F
inan
cial4
In
frast
ruct
ure
Roll
ing S
tock
Tog
o R
ail
Tog
o
2002
77
n.a
. n.a
. n.a
. n.a
. P
ubli
c P
rivat
e C
AN
AC
was
aw
arded
an i
nit
ial
conce
ssio
n i
n
1995.
M.M
. M
inin
g
2009
276
n.a
. n.a
. n.a
. n.a
. P
ubli
c P
rivat
e T
he
conce
ssio
n o
f B
litt
a li
ne
was
tra
nsf
erre
d
to M
.M. M
inin
g i
n J
uly
2009
Sit
arai
l C
ôte
d’I
voir
e,
Burk
ina
Fas
o
1995
1,2
45
21
none
A
C
Publi
c P
rivat
e
Cam
rail
C
amer
oon
1999
1,1
04
113
none
B
A
Publi
c P
rivat
e
CE
AR
M
alaw
i 1999
797
10
none
D
D
Pri
vat
e P
rivat
e R
ailr
oad
Dev
elopm
ent
Corp
ora
tion (
RD
C),
the
ori
gin
al l
ead s
har
ehold
er, so
ld t
o the
Moza
mbic
an i
nves
tor
gro
up I
NS
ITE
C i
n
2008 a
nd I
NS
ITE
C's
equit
y w
as t
ransf
erre
d
to V
AL
E, B
razi
lian
min
ing c
om
pan
y i
n 2
012.
RS
Z
Zam
bia
2002
1,2
73
35
none
C
C
Pri
vat
e P
rivat
e
Mad
arai
l M
adag
asca
r 2003
681
65
none
B
C
Publi
c P
rivat
e
Tra
nsr
ail
Sen
egal
, M
ali
2003
1,5
46
45
none
C
D
Pri
vat
e P
rivat
e
CC
FB
(B
eira
) M
oza
mbiq
ue
2005
725
110
none
C
D
Pri
vat
e P
rivat
e
Tra
nsG
abonai
s G
abon
2005
814
0
none
B
C
Publi
c P
rivat
e
CD
N (
Nac
ala)
M
oza
mbiq
ue
2005
600
20
none
C
D
Pri
vat
e P
rivat
e
KR
C-U
RC
K
enya-
Ugan
da
2006
2,4
54
74
32
C
D
Pri
vat
e P
rivat
e
TR
C
Tan
zania
2007
2,7
22
35
44
D
D
Pri
vat
e P
rivat
e
TA
ZA
RA
5
Tan
zania
/Zam
bia
-
1,8
60
n.a
. n.a
. n.a
. n.a
. P
ubli
c P
ubli
c
SN
CC
D
R C
ongo
2011
3,6
41
219
none
D
D
Publi
c P
rivat
e/P
ubli
c
Tota
l
747
76
Note
s: 1
: In
tern
atio
nal
Dev
elopm
ent
Ass
oci
atio
n
2:
Inte
rnat
ional
Fin
ance
Corp
ora
tion
3:
It p
rovid
es a
com
bin
ed m
easu
re o
f ro
llin
g r
elia
bil
ity, tr
ack i
nci
den
ts a
nd q
ual
ity a
nd p
erso
nnel
pro
duct
ivit
y.
A =
bes
t in
cla
ss, B
= a
bove
aver
age
per
form
ance
, C
= a
ver
age
per
form
ance
and D
= b
elo
w a
ver
age
per
form
ance
. 4:
It p
rovid
es a
com
bin
ed m
easu
re o
f net
cas
h f
low
gen
erat
ion c
apac
ity, net
inco
me
lev
el a
nd l
evel
of
indeb
tednes
s.
A =
str
ong p
osi
tive
cash
flo
w a
nd n
et i
nco
me
(>5%
of
turn
over
) an
d s
ust
ainab
le d
ebt
load
, B
= p
osi
tive
cash
flo
w a
nd n
et i
nco
me
(<5%
of
turn
over
) an
d a
ver
age
deb
t lo
ad,
C =
posi
tive
cash
flo
w (
<5%
of
turn
over
), n
egat
ive
net
inco
me
and h
igher
than
aver
age
deb
t lo
ad, an
d D
= n
egat
ive
cash
flo
w a
nd n
et inco
me
and h
igh d
ebt
load
. 5:
Tan
zania
has
tw
o r
ail
net
work
s of
Tan
zania
Rai
lways
Corp
ora
tion (
TR
C)
and T
anza
nia
Zam
bia
Rai
lway A
uth
ori
ty (
TA
ZA
RA
). T
AZ
AR
A,
whic
h i
s a
stat
uto
ry i
nst
ituti
on o
wned
by t
he
two
go
ver
nm
ents
of
the
Unit
ed R
epubli
c of
Tan
zania
and the
Rep
ubli
c of
Zam
bia
, has
not
bee
n p
rivat
ised
and i
s at
an e
arly
rev
iew
sta
ge
of
pri
vat
isat
ion.
Sourc
e: A
fric
a R
ailw
ay C
once
ssio
ns
Les
sons
Lea
rned
and P
ote
nti
al S
olu
tions
for
a R
eviv
al o
f th
e S
ecto
r, 2
011 W
B
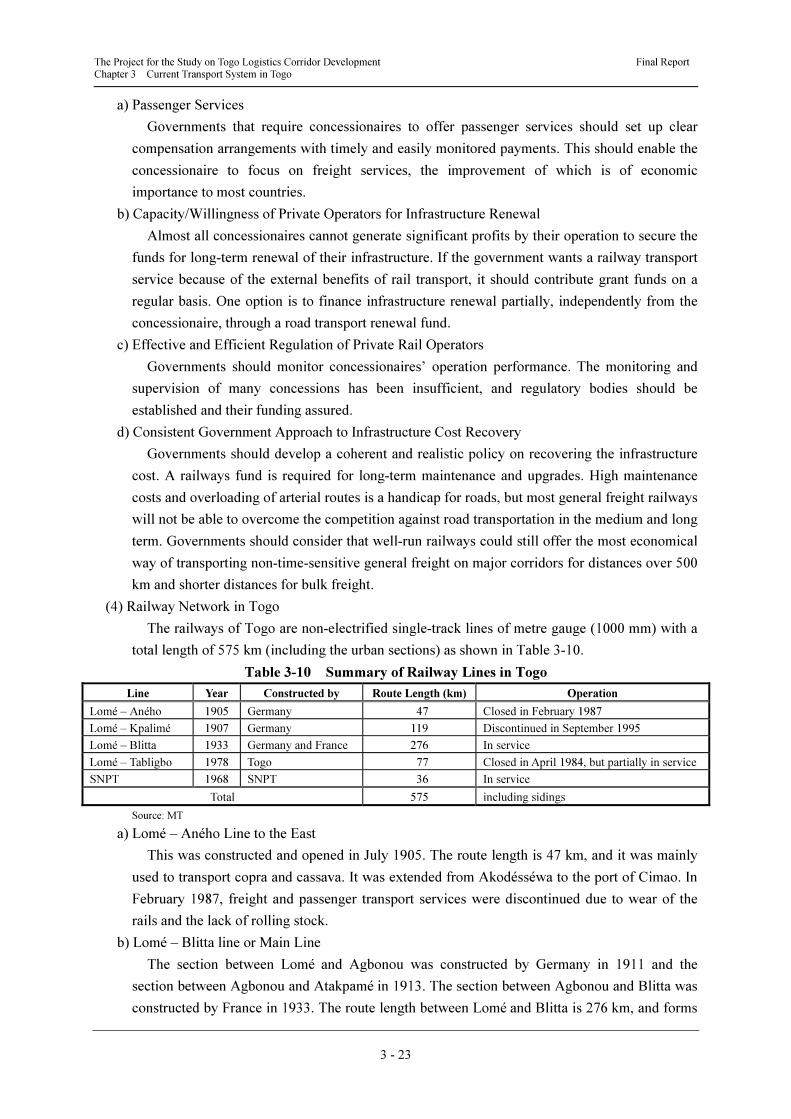
The Project for the Study on Togo Logistics Corridor Development Final Report Chapter 3 Current Transport System in Togo
3 - 23
a) Passenger Services
Governments that require concessionaires to offer passenger services should set up clear
compensation arrangements with timely and easily monitored payments. This should enable the
concessionaire to focus on freight services, the improvement of which is of economic
importance to most countries.
b) Capacity/Willingness of Private Operators for Infrastructure Renewal
Almost all concessionaires cannot generate significant profits by their operation to secure the
funds for long-term renewal of their infrastructure. If the government wants a railway transport
service because of the external benefits of rail transport, it should contribute grant funds on a
regular basis. One option is to finance infrastructure renewal partially, independently from the
concessionaire, through a road transport renewal fund.
c) Effective and Efficient Regulation of Private Rail Operators
Governments should monitor concessionaires’ operation performance. The monitoring and
supervision of many concessions has been insufficient, and regulatory bodies should be
established and their funding assured.
d) Consistent Government Approach to Infrastructure Cost Recovery
Governments should develop a coherent and realistic policy on recovering the infrastructure
cost. A railways fund is required for long-term maintenance and upgrades. High maintenance
costs and overloading of arterial routes is a handicap for roads, but most general freight railways
will not be able to overcome the competition against road transportation in the medium and long
term. Governments should consider that well-run railways could still offer the most economical
way of transporting non-time-sensitive general freight on major corridors for distances over 500
km and shorter distances for bulk freight.
(4) Railway Network in Togo
The railways of Togo are non-electrified single-track lines of metre gauge (1000 mm) with a
total length of 575 km (including the urban sections) as shown in Table 3-10.
Table 3-10 Summary of Railway Lines in Togo
Line Year Constructed by Route Length (km) Operation
Lomé – Aného 1905 Germany 47 Closed in February 1987
Lomé – Kpalimé 1907 Germany 119 Discontinued in September 1995
Lomé – Blitta 1933 Germany and France 276 In service
Lomé – Tabligbo 1978 Togo 77 Closed in April 1984, but partially in service
SNPT 1968 SNPT 36 In service
Total 575 including sidings
Source: MT
a) Lomé – Aného Line to the East
This was constructed and opened in July 1905. The route length is 47 km, and it was mainly
used to transport copra and cassava. It was extended from Akodésséwa to the port of Cimao. In
February 1987, freight and passenger transport services were discontinued due to wear of the
rails and the lack of rolling stock.
b) Lomé – Blitta line or Main Line
The section between Lomé and Agbonou was constructed by Germany in 1911 and the
section between Agbonou and Atakpamé in 1913. The section between Agbonou and Blitta was
constructed by France in 1933. The route length between Lomé and Blitta is 276 km, and forms
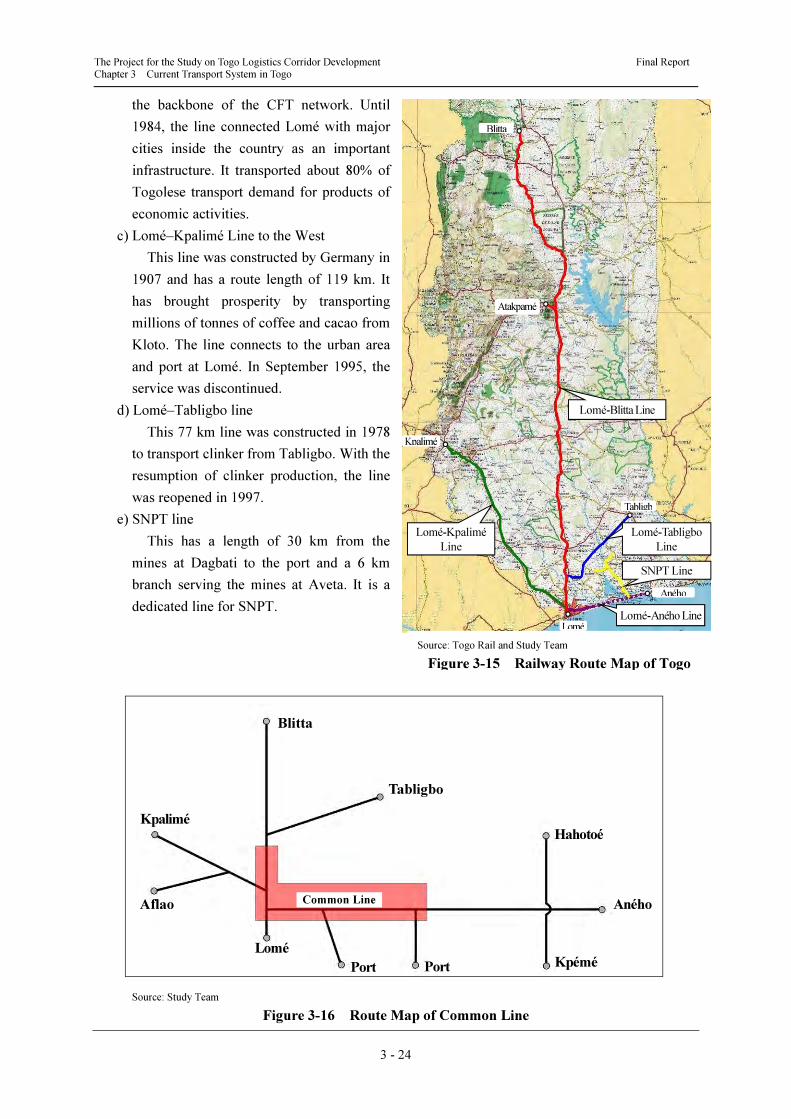
The Project for the Study on Togo Logistics Corridor Development Final Report Chapter 3 Current Transport System in Togo
3 - 24
the backbone of the CFT network. Until
1984, the line connected Lomé with major
cities inside the country as an important
infrastructure. It transported about 80% of
Togolese transport demand for products of
economic activities.
c) Lomé–Kpalimé Line to the West
This line was constructed by Germany in
1907 and has a route length of 119 km. It
has brought prosperity by transporting
millions of tonnes of coffee and cacao from
Kloto. The line connects to the urban area
and port at Lomé. In September 1995, the
service was discontinued.
d) Lomé–Tabligbo line
This 77 km line was constructed in 1978
to transport clinker from Tabligbo. With the
resumption of clinker production, the line
was reopened in 1997.
e) SNPT line
This has a length of 30 km from the
mines at Dagbati to the port and a 6 km
branch serving the mines at Aveta. It is a
dedicated line for SNPT.
Source: Study Team
Figure 3-16 Route Map of Common Line
Blitta
Tabligbo
Hahotoé
Aného
Kpémé Port Port
Lomé
Aflao Common Line
Kpalimé
Lomé-Tabligbo
Line
SNPT Line
Lomé-Aného Line
Lomé-Kpalimé
Line
Lomé-Blitta Line
Blitta
Atakpamé
Lomé
Kpalimé
Aného
Tabligb
Source: Togo Rail and Study Team
Figure 3-15 Railway Route Map of Togo
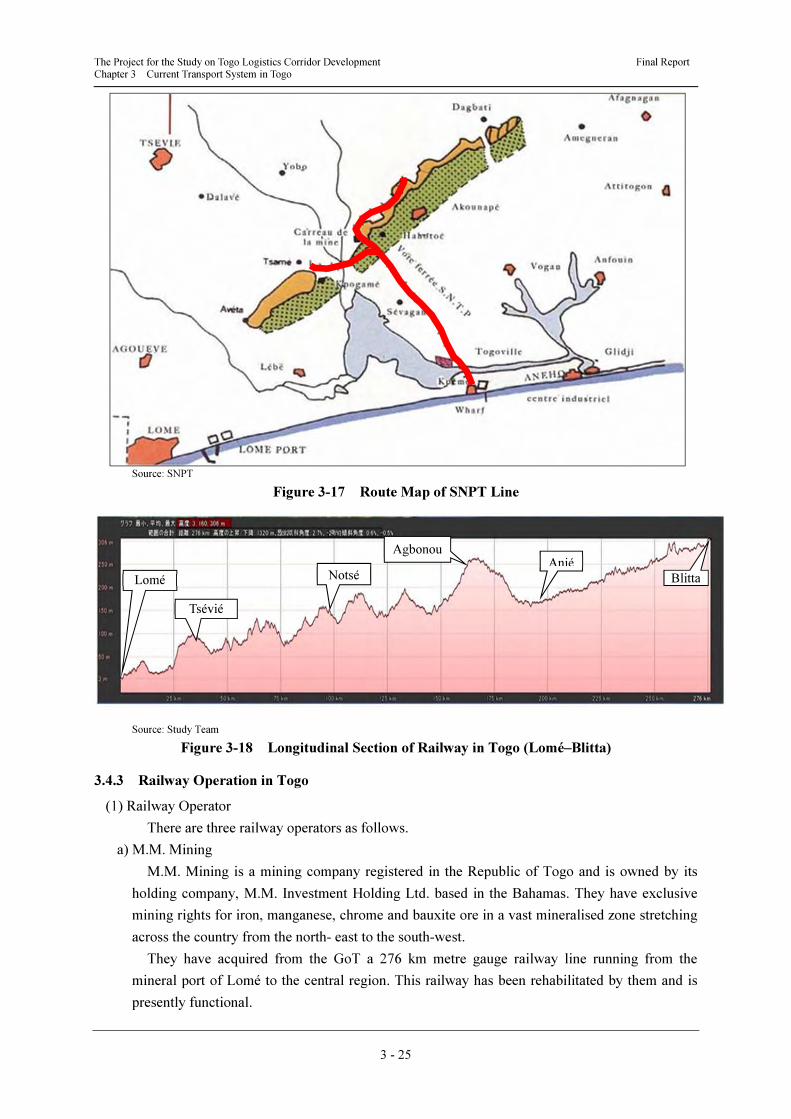
The Project for the Study on Togo Logistics Corridor Development Final Report Chapter 3 Current Transport System in Togo
3 - 25
Source: SNPT
Figure 3-17 Route Map of SNPT Line
Source: Study Team
Figure 3-18 Longitudinal Section of Railway in Togo (Lomé–Blitta)
3.4.3 Railway Operation in Togo
(1) Railway Operator
There are three railway operators as follows.
a) M.M. Mining
M.M. Mining is a mining company registered in the Republic of Togo and is owned by its
holding company, M.M. Investment Holding Ltd. based in the Bahamas. They have exclusive
mining rights for iron, manganese, chrome and bauxite ore in a vast mineralised zone stretching
across the country from the north- east to the south-west.
They have acquired from the GoT a 276 km metre gauge railway line running from the
mineral port of Lomé to the central region. This railway has been rehabilitated by them and is
presently functional.
Tsévié
BlittaLomé
Notsé
AgbonouAnié
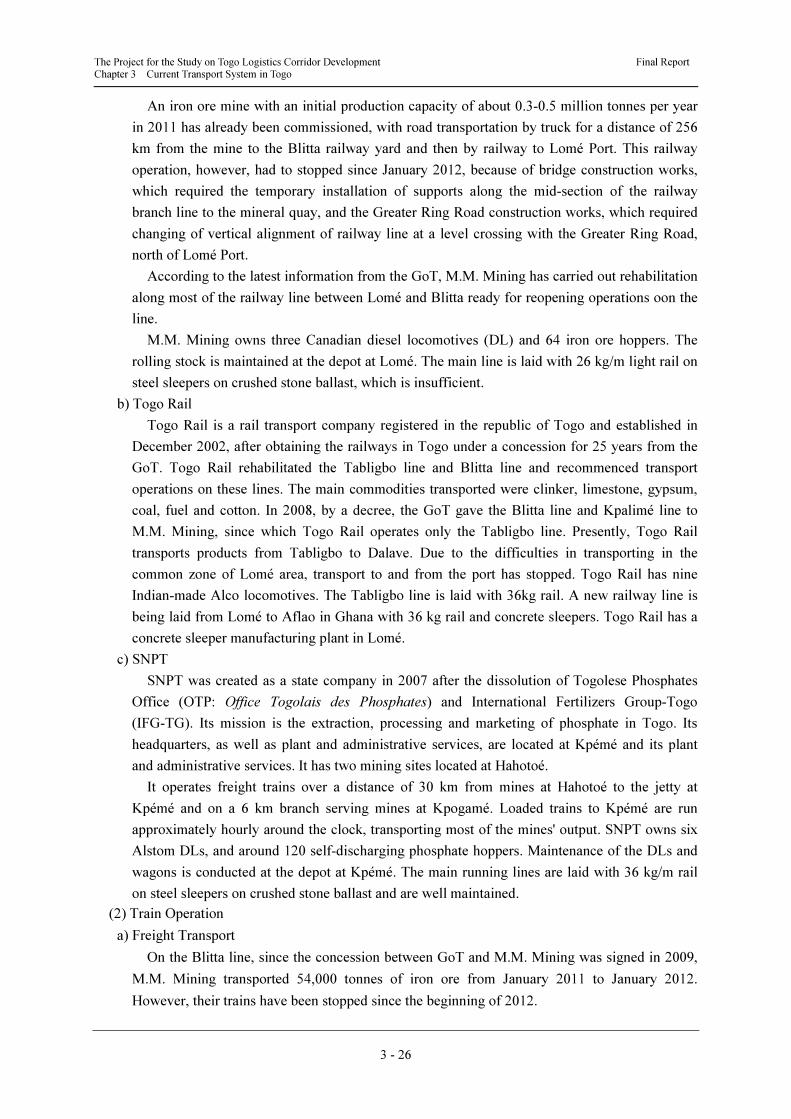
The Project for the Study on Togo Logistics Corridor Development Final Report Chapter 3 Current Transport System in Togo
3 - 26
An iron ore mine with an initial production capacity of about 0.3-0.5 million tonnes per year
in 2011 has already been commissioned, with road transportation by truck for a distance of 256
km from the mine to the Blitta railway yard and then by railway to Lomé Port. This railway
operation, however, had to stopped since January 2012, because of bridge construction works,
which required the temporary installation of supports along the mid-section of the railway
branch line to the mineral quay, and the Greater Ring Road construction works, which required
changing of vertical alignment of railway line at a level crossing with the Greater Ring Road,
north of Lomé Port.
According to the latest information from the GoT, M.M. Mining has carried out rehabilitation
along most of the railway line between Lomé and Blitta ready for reopening operations oon the
line.
M.M. Mining owns three Canadian diesel locomotives (DL) and 64 iron ore hoppers. The
rolling stock is maintained at the depot at Lomé. The main line is laid with 26 kg/m light rail on
steel sleepers on crushed stone ballast, which is insufficient.
b) Togo Rail
Togo Rail is a rail transport company registered in the republic of Togo and established in
December 2002, after obtaining the railways in Togo under a concession for 25 years from the
GoT. Togo Rail rehabilitated the Tabligbo line and Blitta line and recommenced transport
operations on these lines. The main commodities transported were clinker, limestone, gypsum,
coal, fuel and cotton. In 2008, by a decree, the GoT gave the Blitta line and Kpalimé line to
M.M. Mining, since which Togo Rail operates only the Tabligbo line. Presently, Togo Rail
transports products from Tabligbo to Dalave. Due to the difficulties in transporting in the
common zone of Lomé area, transport to and from the port has stopped. Togo Rail has nine
Indian-made Alco locomotives. The Tabligbo line is laid with 36kg rail. A new railway line is
being laid from Lomé to Aflao in Ghana with 36 kg rail and concrete sleepers. Togo Rail has a
concrete sleeper manufacturing plant in Lomé.
c) SNPT
SNPT was created as a state company in 2007 after the dissolution of Togolese Phosphates
Office (OTP: Office Togolais des Phosphates) and International Fertilizers Group-Togo
(IFG-TG). Its mission is the extraction, processing and marketing of phosphate in Togo. Its
headquarters, as well as plant and administrative services, are located at Kpémé and its plant
and administrative services. It has two mining sites located at Hahotoé.
It operates freight trains over a distance of 30 km from mines at Hahotoé to the jetty at
Kpémé and on a 6 km branch serving mines at Kpogamé. Loaded trains to Kpémé are run
approximately hourly around the clock, transporting most of the mines' output. SNPT owns six
Alstom DLs, and around 120 self-discharging phosphate hoppers. Maintenance of the DLs and
wagons is conducted at the depot at Kpémé. The main running lines are laid with 36 kg/m rail
on steel sleepers on crushed stone ballast and are well maintained.
(2) Train Operation
a) Freight Transport
On the Blitta line, since the concession between GoT and M.M. Mining was signed in 2009,
M.M. Mining transported 54,000 tonnes of iron ore from January 2011 to January 2012.
However, their trains have been stopped since the beginning of 2012.
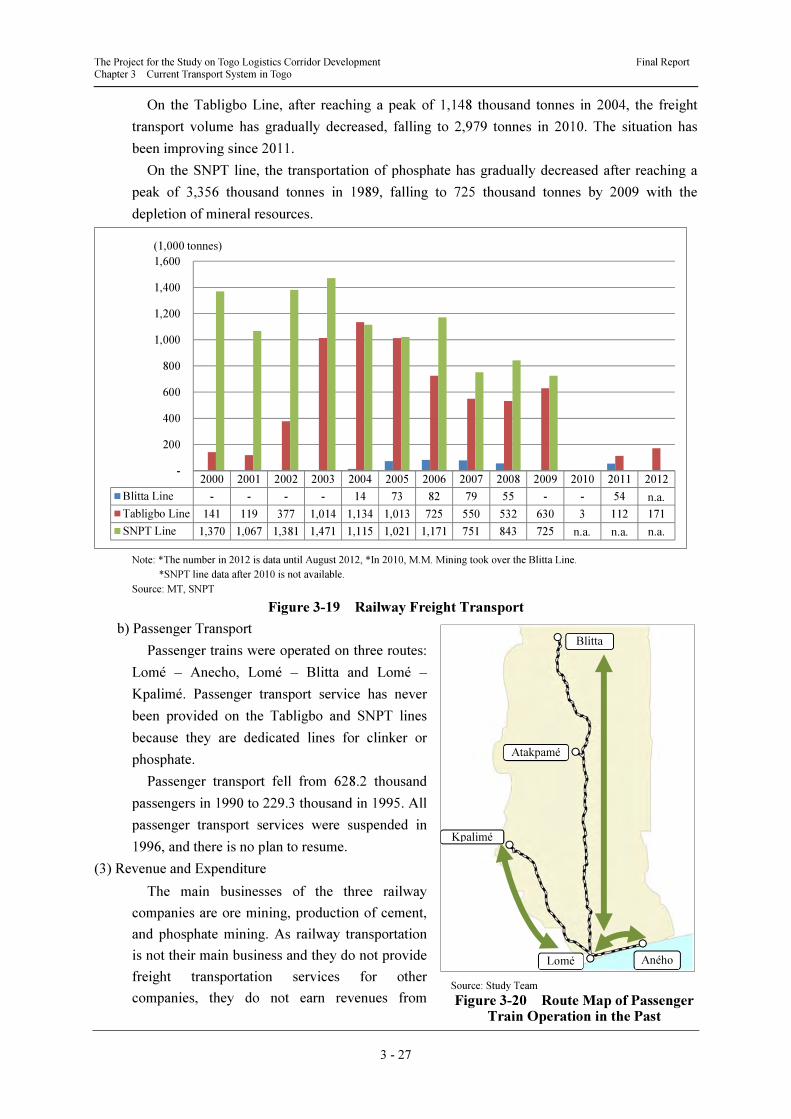
The Project for the Study on Togo Logistics Corridor Development Final Report Chapter 3 Current Transport System in Togo
3 - 27
On the Tabligbo Line, after reaching a peak of 1,148 thousand tonnes in 2004, the freight
transport volume has gradually decreased, falling to 2,979 tonnes in 2010. The situation has
been improving since 2011.
On the SNPT line, the transportation of phosphate has gradually decreased after reaching a
peak of 3,356 thousand tonnes in 1989, falling to 725 thousand tonnes by 2009 with the
depletion of mineral resources.
Note: *The number in 2012 is data until August 2012, *In 2010, M.M. Mining took over the Blitta Line.
*SNPT line data after 2010 is not available.
Source: MT, SNPT
Figure 3-19 Railway Freight Transport
b) Passenger Transport
Passenger trains were operated on three routes:
Lomé – Anecho, Lomé – Blitta and Lomé –
Kpalimé. Passenger transport service has never
been provided on the Tabligbo and SNPT lines
because they are dedicated lines for clinker or
phosphate.
Passenger transport fell from 628.2 thousand
passengers in 1990 to 229.3 thousand in 1995. All
passenger transport services were suspended in
1996, and there is no plan to resume.
(3) Revenue and Expenditure
The main businesses of the three railway
companies are ore mining, production of cement,
and phosphate mining. As railway transportation
is not their main business and they do not provide
freight transportation services for other
companies, they do not earn revenues from
2000 2001 2002 2003 2004 2005 2006 2007 2008 2009 2010 2011 2012
Blitta Line - - - - 14 73 82 79 55 - - 54
Tabligbo Line 141 119 377 1,014 1,134 1,013 725 550 532 630 3 112 171
SNPT Line 1,370 1,067 1,381 1,471 1,115 1,021 1,171 751 843 725
-
200
400
600
800
1,000
1,200
1,400
1,600
(1,000 tonnes)
n.a.
n.a.n.a. n.a.
Blitta
Atakpamé
Lomé Aného
Kpalimé
Source: Study Team
Figure 3-20 Route Map of Passenger Train Operation in the Past
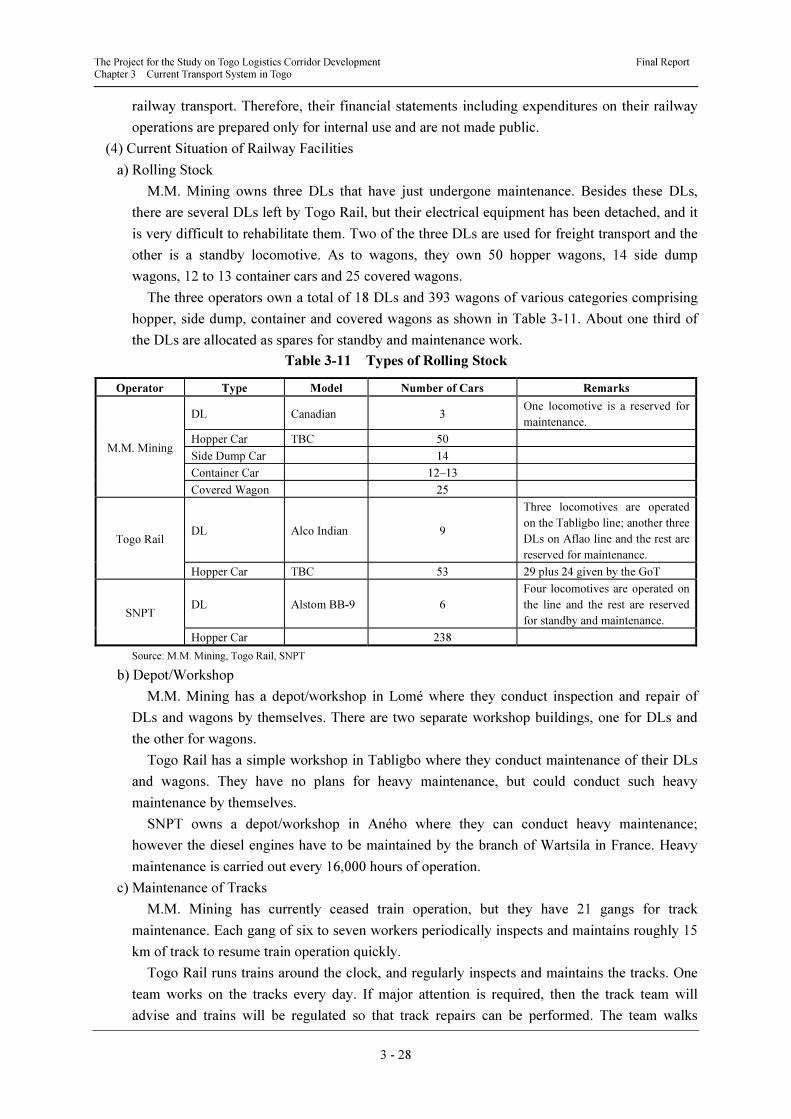
The Project for the Study on Togo Logistics Corridor Development Final Report Chapter 3 Current Transport System in Togo
3 - 28
railway transport. Therefore, their financial statements including expenditures on their railway
operations are prepared only for internal use and are not made public.
(4) Current Situation of Railway Facilities
a) Rolling Stock
M.M. Mining owns three DLs that have just undergone maintenance. Besides these DLs,
there are several DLs left by Togo Rail, but their electrical equipment has been detached, and it
is very difficult to rehabilitate them. Two of the three DLs are used for freight transport and the
other is a standby locomotive. As to wagons, they own 50 hopper wagons, 14 side dump
wagons, 12 to 13 container cars and 25 covered wagons.
The three operators own a total of 18 DLs and 393 wagons of various categories comprising
hopper, side dump, container and covered wagons as shown in Table 3-11. About one third of
the DLs are allocated as spares for standby and maintenance work.
Table 3-11 Types of Rolling Stock
Operator Type Model Number of Cars Remarks
M.M. Mining
DL Canadian 3 One locomotive is a reserved for
maintenance.
Hopper Car TBC 50
Side Dump Car 14
Container Car 12–13
Covered Wagon 25
Togo Rail DL Alco Indian 9
Three locomotives are operated
on the Tabligbo line; another three
DLs on Aflao line and the rest are
reserved for maintenance.
Hopper Car TBC 53 29 plus 24 given by the GoT
SNPT DL Alstom BB-9 6
Four locomotives are operated on
the line and the rest are reserved
for standby and maintenance.
Hopper Car 238
Source: M.M. Mining, Togo Rail, SNPT
b) Depot/Workshop
M.M. Mining has a depot/workshop in Lomé where they conduct inspection and repair of
DLs and wagons by themselves. There are two separate workshop buildings, one for DLs and
the other for wagons.
Togo Rail has a simple workshop in Tabligbo where they conduct maintenance of their DLs
and wagons. They have no plans for heavy maintenance, but could conduct such heavy
maintenance by themselves.
SNPT owns a depot/workshop in Aného where they can conduct heavy maintenance;
however the diesel engines have to be maintained by the branch of Wartsila in France. Heavy
maintenance is carried out every 16,000 hours of operation.
c) Maintenance of Tracks
M.M. Mining has currently ceased train operation, but they have 21 gangs for track
maintenance. Each gang of six to seven workers periodically inspects and maintains roughly 15
km of track to resume train operation quickly.
Togo Rail runs trains around the clock, and regularly inspects and maintains the tracks. One
team works on the tracks every day. If major attention is required, then the track team will
advise and trains will be regulated so that track repairs can be performed. The team walks
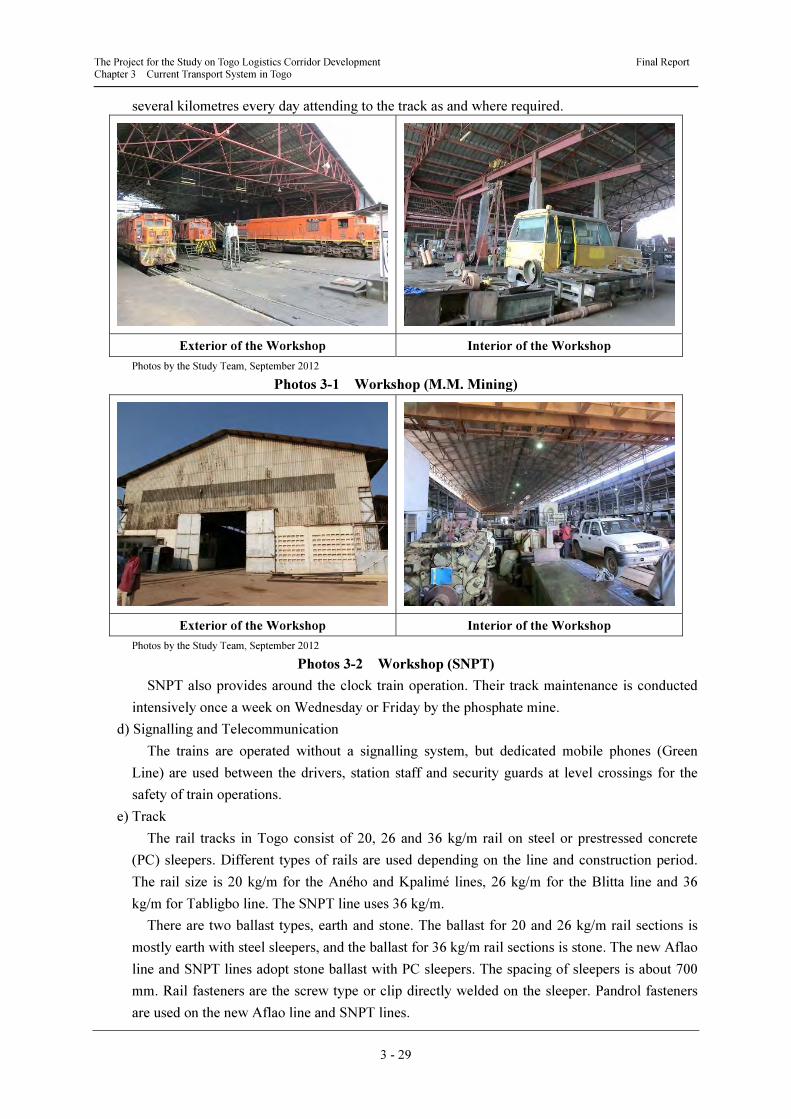
The Project for the Study on Togo Logistics Corridor Development Final Report Chapter 3 Current Transport System in Togo
3 - 29
several kilometres every day attending to the track as and where required.
Exterior of the Workshop Interior of the Workshop
Photos by the Study Team, September 2012
Photos 3-1 Workshop (M.M. Mining)
Exterior of the Workshop Interior of the Workshop
Photos by the Study Team, September 2012
Photos 3-2 Workshop (SNPT)
SNPT also provides around the clock train operation. Their track maintenance is conducted
intensively once a week on Wednesday or Friday by the phosphate mine.
d) Signalling and Telecommunication
The trains are operated without a signalling system, but dedicated mobile phones (Green
Line) are used between the drivers, station staff and security guards at level crossings for the
safety of train operations.
e) Track
The rail tracks in Togo consist of 20, 26 and 36 kg/m rail on steel or prestressed concrete
(PC) sleepers. Different types of rails are used depending on the line and construction period.
The rail size is 20 kg/m for the Aného and Kpalimé lines, 26 kg/m for the Blitta line and 36
kg/m for Tabligbo line. The SNPT line uses 36 kg/m.
There are two ballast types, earth and stone. The ballast for 20 and 26 kg/m rail sections is
mostly earth with steel sleepers, and the ballast for 36 kg/m rail sections is stone. The new Aflao
line and SNPT lines adopt stone ballast with PC sleepers. The spacing of sleepers is about 700
mm. Rail fasteners are the screw type or clip directly welded on the sleeper. Pandrol fasteners
are used on the new Aflao line and SNPT lines.
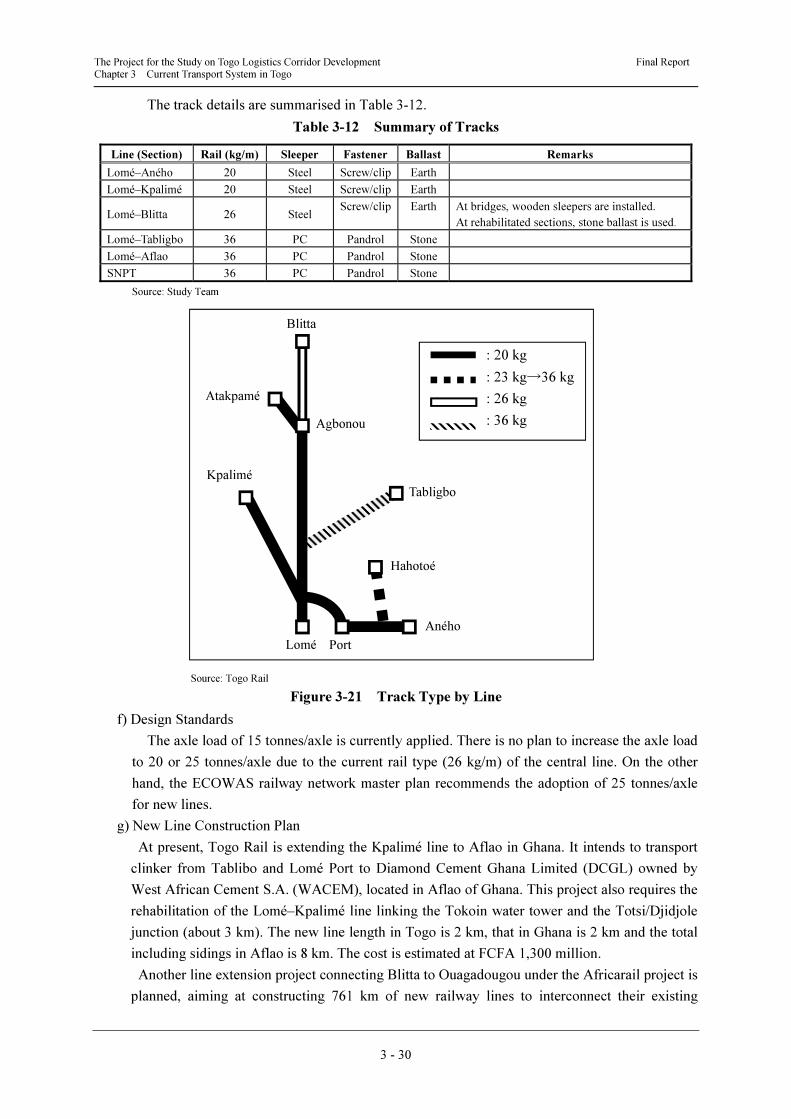
The Project for the Study on Togo Logistics Corridor Development Final Report Chapter 3 Current Transport System in Togo
3 - 30
The track details are summarised in Table 3-12.
Table 3-12 Summary of Tracks
Line (Section) Rail (kg/m) Sleeper Fastener Ballast Remarks
Lomé–Aného 20 Steel Screw/clip Earth
Lomé–Kpalimé 20 Steel Screw/clip Earth
Lomé–Blitta 26 Steel Screw/clip Earth At bridges, wooden sleepers are installed.
At rehabilitated sections, stone ballast is used.
Lomé–Tabligbo 36 PC Pandrol Stone
Lomé–Aflao 36 PC Pandrol Stone
SNPT 36 PC Pandrol Stone
Source: Study Team
Source: Togo Rail
Figure 3-21 Track Type by Line
f) Design Standards
The axle load of 15 tonnes/axle is currently applied. There is no plan to increase the axle load
to 20 or 25 tonnes/axle due to the current rail type (26 kg/m) of the central line. On the other
hand, the ECOWAS railway network master plan recommends the adoption of 25 tonnes/axle
for new lines.
g) New Line Construction Plan
At present, Togo Rail is extending the Kpalimé line to Aflao in Ghana. It intends to transport
clinker from Tablibo and Lomé Port to Diamond Cement Ghana Limited (DCGL) owned by
West African Cement S.A. (WACEM), located in Aflao of Ghana. This project also requires the
rehabilitation of the Lomé–Kpalimé line linking the Tokoin water tower and the Totsi/Djidjole
junction (about 3 km). The new line length in Togo is 2 km, that in Ghana is 2 km and the total
including sidings in Aflao is 8 km. The cost is estimated at FCFA 1,300 million.
Another line extension project connecting Blitta to Ouagadougou under the Africarail project is
planned, aiming at constructing 761 km of new railway lines to interconnect their existing
Tabligbo
PortLomé
Aného
Hahotoé
Agbonou
Kpalimé
Atakpamé
Blitta
: 20 kg
: 23 kg→36 kg
: 26 kg
: 36 kg
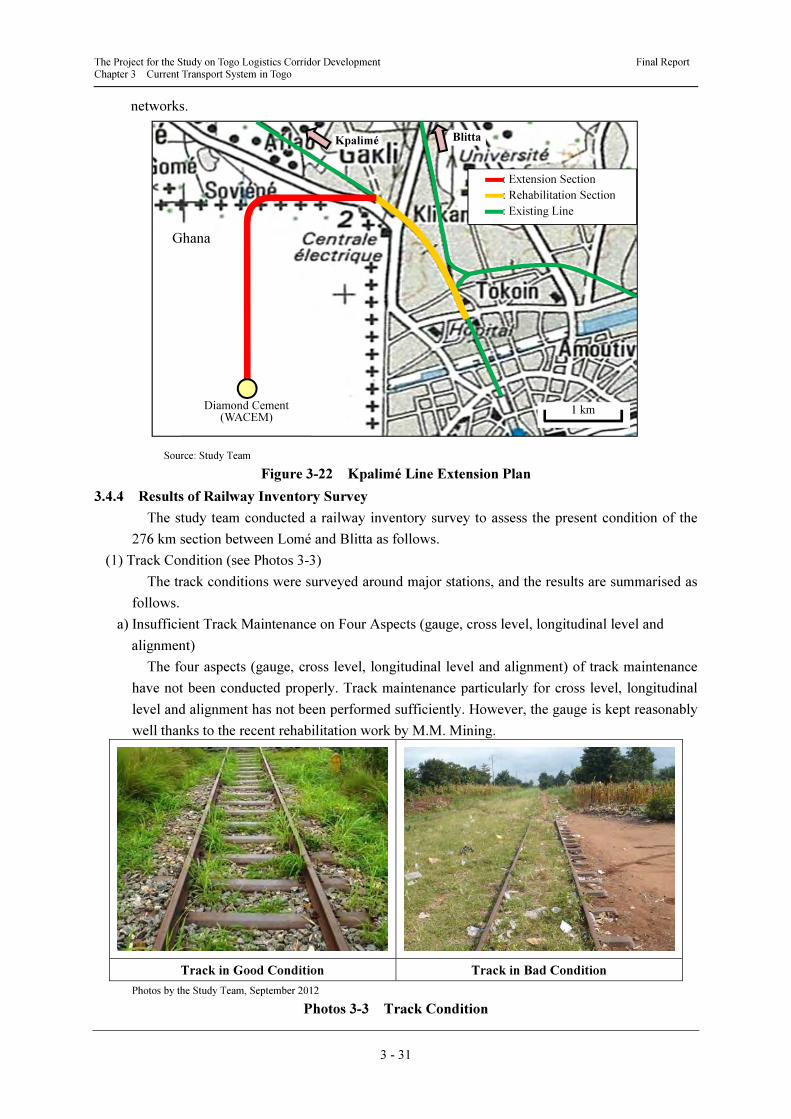
The Project for the Study on Togo Logistics Corridor Development Final Report Chapter 3 Current Transport System in Togo
3 - 31
networks.
Source: Study Team
Figure 3-22 Kpalimé Line Extension Plan
3.4.4 Results of Railway Inventory Survey
The study team conducted a railway inventory survey to assess the present condition of the
276 km section between Lomé and Blitta as follows.
(1) Track Condition (see Photos 3-3)
The track conditions were surveyed around major stations, and the results are summarised as
follows.
a) Insufficient Track Maintenance on Four Aspects (gauge, cross level, longitudinal level and
alignment)
The four aspects (gauge, cross level, longitudinal level and alignment) of track maintenance
have not been conducted properly. Track maintenance particularly for cross level, longitudinal
level and alignment has not been performed sufficiently. However, the gauge is kept reasonably
well thanks to the recent rehabilitation work by M.M. Mining.
Track in Good Condition Track in Bad Condition
Photos by the Study Team, September 2012
Photos 3-3 Track Condition
Kpalimé Blitta
Diamond Cement (WACEM)
Ghana
1 km
: Extension Section
: Rehabilitation Section
: Existing Line
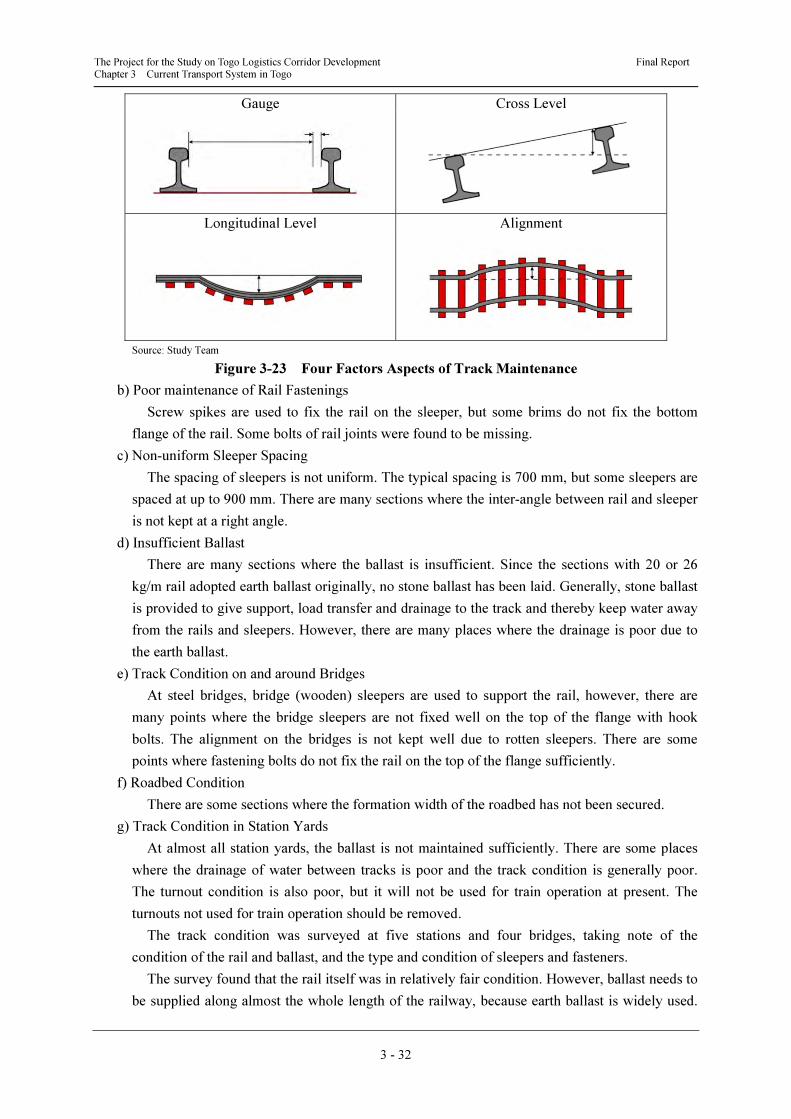
The Project for the Study on Togo Logistics Corridor Development Final Report Chapter 3 Current Transport System in Togo
3 - 32
Gauge Cross Level
Longitudinal Level Alignment
Source: Study Team
Figure 3-23 Four Factors Aspects of Track Maintenance
b) Poor maintenance of Rail Fastenings
Screw spikes are used to fix the rail on the sleeper, but some brims do not fix the bottom
flange of the rail. Some bolts of rail joints were found to be missing.
c) Non-uniform Sleeper Spacing
The spacing of sleepers is not uniform. The typical spacing is 700 mm, but some sleepers are
spaced at up to 900 mm. There are many sections where the inter-angle between rail and sleeper
is not kept at a right angle.
d) Insufficient Ballast
There are many sections where the ballast is insufficient. Since the sections with 20 or 26
kg/m rail adopted earth ballast originally, no stone ballast has been laid. Generally, stone ballast
is provided to give support, load transfer and drainage to the track and thereby keep water away
from the rails and sleepers. However, there are many places where the drainage is poor due to
the earth ballast.
e) Track Condition on and around Bridges
At steel bridges, bridge (wooden) sleepers are used to support the rail, however, there are
many points where the bridge sleepers are not fixed well on the top of the flange with hook
bolts. The alignment on the bridges is not kept well due to rotten sleepers. There are some
points where fastening bolts do not fix the rail on the top of the flange sufficiently.
f) Roadbed Condition
There are some sections where the formation width of the roadbed has not been secured.
g) Track Condition in Station Yards
At almost all station yards, the ballast is not maintained sufficiently. There are some places
where the drainage of water between tracks is poor and the track condition is generally poor.
The turnout condition is also poor, but it will not be used for train operation at present. The
turnouts not used for train operation should be removed.
The track condition was surveyed at five stations and four bridges, taking note of the
condition of the rail and ballast, and the type and condition of sleepers and fasteners.
The survey found that the rail itself was in relatively fair condition. However, ballast needs to
be supplied along almost the whole length of the railway, because earth ballast is widely used.
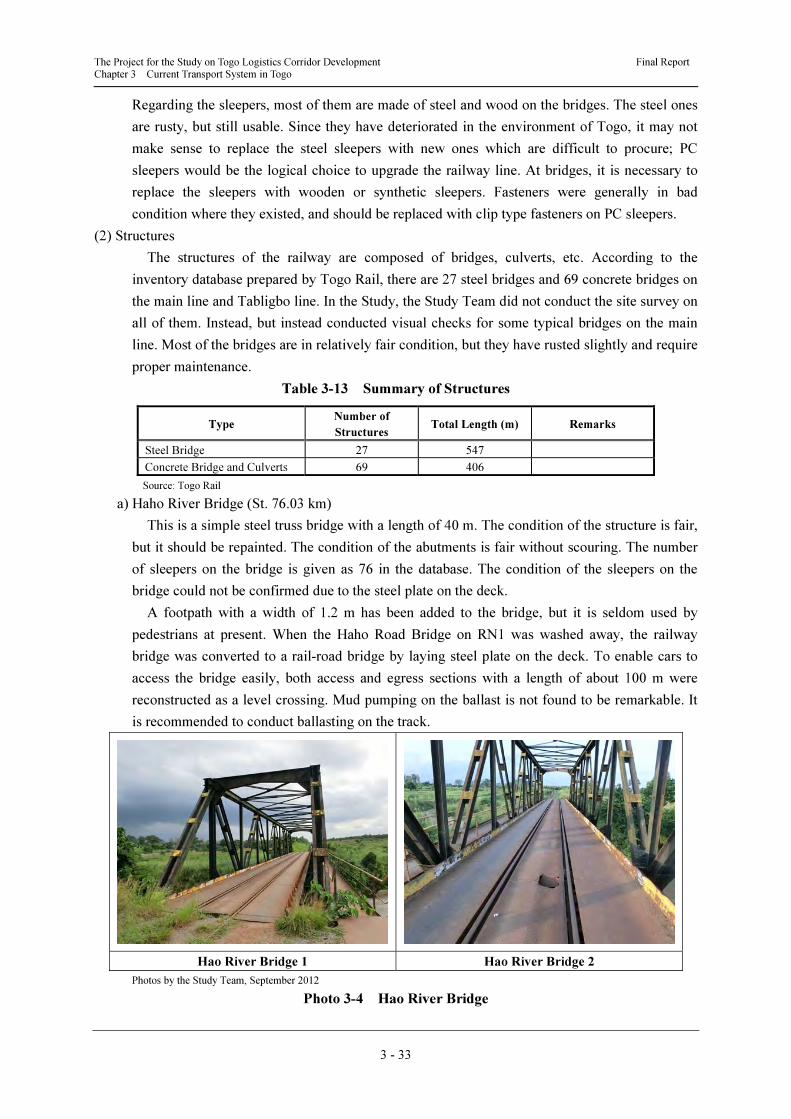
The Project for the Study on Togo Logistics Corridor Development Final Report Chapter 3 Current Transport System in Togo
3 - 33
Regarding the sleepers, most of them are made of steel and wood on the bridges. The steel ones
are rusty, but still usable. Since they have deteriorated in the environment of Togo, it may not
make sense to replace the steel sleepers with new ones which are difficult to procure; PC
sleepers would be the logical choice to upgrade the railway line. At bridges, it is necessary to
replace the sleepers with wooden or synthetic sleepers. Fasteners were generally in bad
condition where they existed, and should be replaced with clip type fasteners on PC sleepers.
(2) Structures
The structures of the railway are composed of bridges, culverts, etc. According to the
inventory database prepared by Togo Rail, there are 27 steel bridges and 69 concrete bridges on
the main line and Tabligbo line. In the Study, the Study Team did not conduct the site survey on
all of them. Instead, but instead conducted visual checks for some typical bridges on the main
line. Most of the bridges are in relatively fair condition, but they have rusted slightly and require
proper maintenance.
Table 3-13 Summary of Structures
Type Number of
Structures Total Length (m) Remarks
Steel Bridge 27 547
Concrete Bridge and Culverts 69 406
Source: Togo Rail
a) Haho River Bridge (St. 76.03 km)
This is a simple steel truss bridge with a length of 40 m. The condition of the structure is fair,
but it should be repainted. The condition of the abutments is fair without scouring. The number
of sleepers on the bridge is given as 76 in the database. The condition of the sleepers on the
bridge could not be confirmed due to the steel plate on the deck.
A footpath with a width of 1.2 m has been added to the bridge, but it is seldom used by
pedestrians at present. When the Haho Road Bridge on RN1 was washed away, the railway
bridge was converted to a rail-road bridge by laying steel plate on the deck. To enable cars to
access the bridge easily, both access and egress sections with a length of about 100 m were
reconstructed as a level crossing. Mud pumping on the ballast is not found to be remarkable. It
is recommended to conduct ballasting on the track.
Hao River Bridge 1 Hao River Bridge 2
Photos by the Study Team, September 2012
Photo 3-4 Hao River Bridge
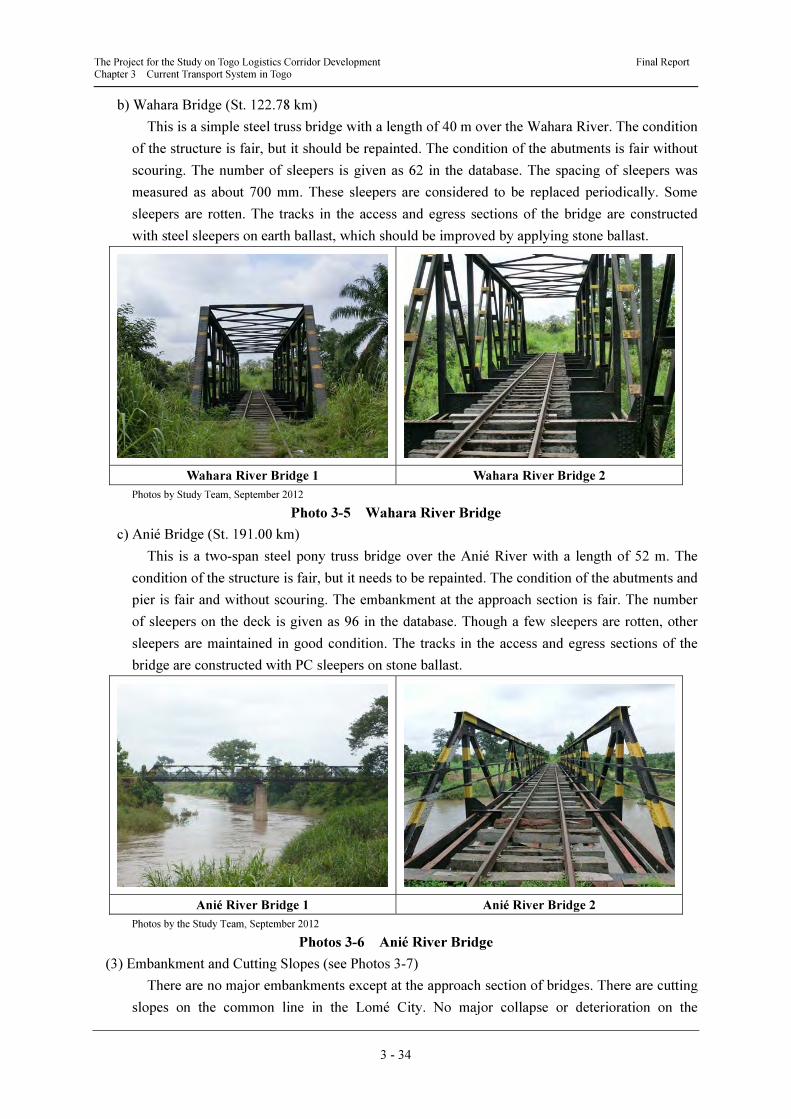
The Project for the Study on Togo Logistics Corridor Development Final Report Chapter 3 Current Transport System in Togo
3 - 34
b) Wahara Bridge (St. 122.78 km)
This is a simple steel truss bridge with a length of 40 m over the Wahara River. The condition
of the structure is fair, but it should be repainted. The condition of the abutments is fair without
scouring. The number of sleepers is given as 62 in the database. The spacing of sleepers was
measured as about 700 mm. These sleepers are considered to be replaced periodically. Some
sleepers are rotten. The tracks in the access and egress sections of the bridge are constructed
with steel sleepers on earth ballast, which should be improved by applying stone ballast.
Wahara River Bridge 1 Wahara River Bridge 2
Photos by Study Team, September 2012
Photo 3-5 Wahara River Bridge
c) Anié Bridge (St. 191.00 km)
This is a two-span steel pony truss bridge over the Anié River with a length of 52 m. The
condition of the structure is fair, but it needs to be repainted. The condition of the abutments and
pier is fair and without scouring. The embankment at the approach section is fair. The number
of sleepers on the deck is given as 96 in the database. Though a few sleepers are rotten, other
sleepers are maintained in good condition. The tracks in the access and egress sections of the
bridge are constructed with PC sleepers on stone ballast.
Anié River Bridge 1 Anié River Bridge 2
Photos by the Study Team, September 2012
Photos 3-6 Anié River Bridge
(3) Embankment and Cutting Slopes (see Photos 3-7)
There are no major embankments except at the approach section of bridges. There are cutting
slopes on the common line in the Lomé City. No major collapse or deterioration on the
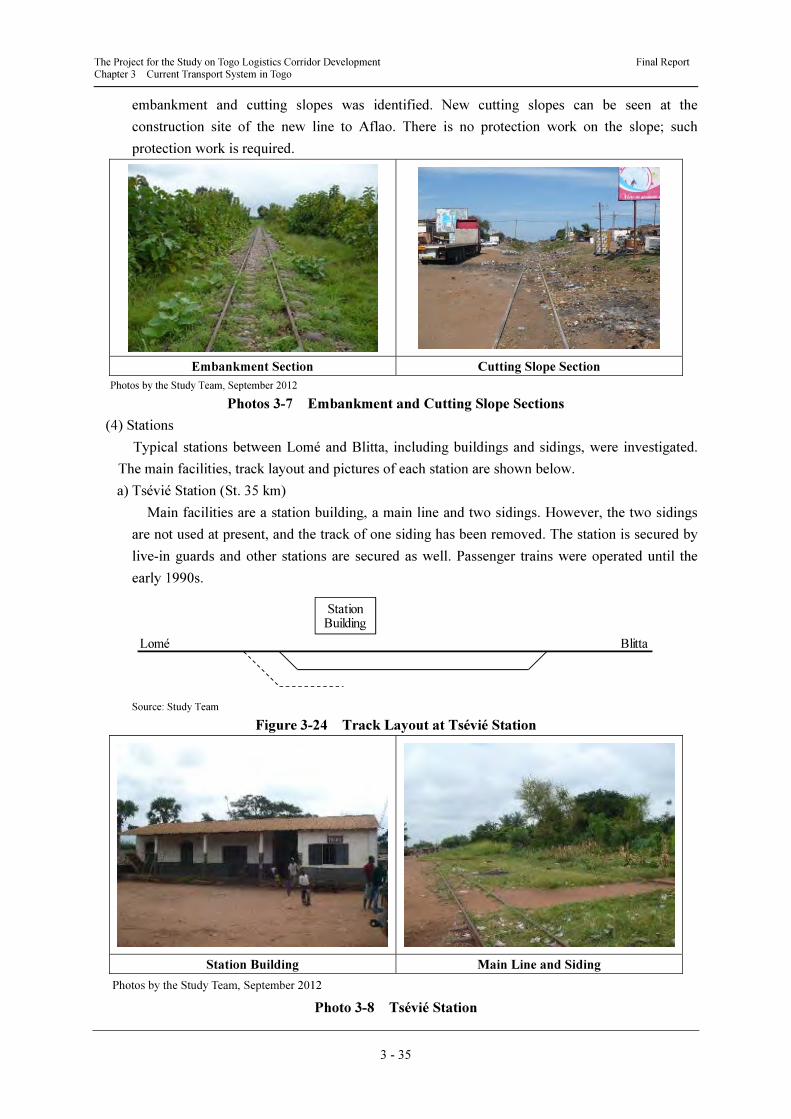
The Project for the Study on Togo Logistics Corridor Development Final Report Chapter 3 Current Transport System in Togo
3 - 35
embankment and cutting slopes was identified. New cutting slopes can be seen at the
construction site of the new line to Aflao. There is no protection work on the slope; such
protection work is required.
Embankment Section Cutting Slope Section
Photos by the Study Team, September 2012
Photos 3-7 Embankment and Cutting Slope Sections
(4) Stations
Typical stations between Lomé and Blitta, including buildings and sidings, were investigated.
The main facilities, track layout and pictures of each station are shown below.
a) Tsévié Station (St. 35 km)
Main facilities are a station building, a main line and two sidings. However, the two sidings
are not used at present, and the track of one siding has been removed. The station is secured by
live-in guards and other stations are secured as well. Passenger trains were operated until the
early 1990s.
Source: Study Team
Figure 3-24 Track Layout at Tsévié Station
Station Building Main Line and Siding
Photos by the Study Team, September 2012
Photo 3-8 Tsévié Station
Lomé Blitta
StationBuilding
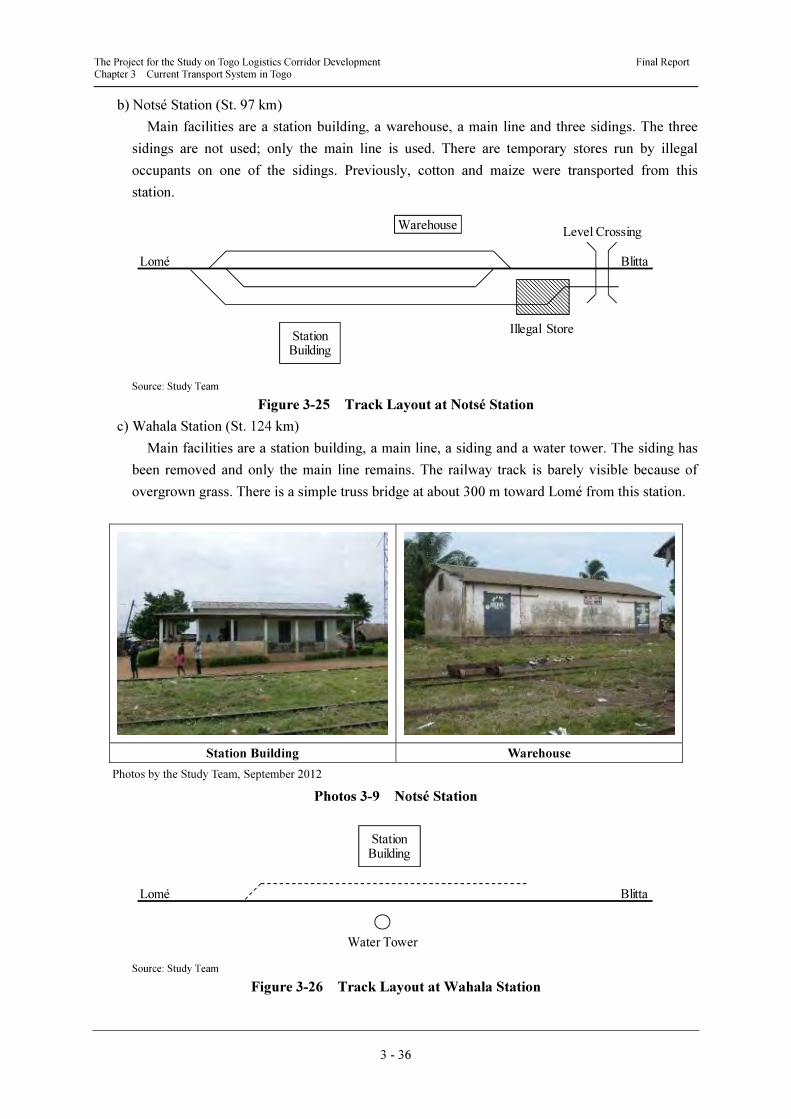
The Project for the Study on Togo Logistics Corridor Development Final Report Chapter 3 Current Transport System in Togo
3 - 36
b) Notsé Station (St. 97 km)
Main facilities are a station building, a warehouse, a main line and three sidings. The three
sidings are not used; only the main line is used. There are temporary stores run by illegal
occupants on one of the sidings. Previously, cotton and maize were transported from this
station.
Source: Study Team
Figure 3-25 Track Layout at Notsé Station
c) Wahala Station (St. 124 km)
Main facilities are a station building, a main line, a siding and a water tower. The siding has
been removed and only the main line remains. The railway track is barely visible because of
overgrown grass. There is a simple truss bridge at about 300 m toward Lomé from this station.
Station Building Warehouse
Photos by the Study Team, September 2012
Photos 3-9 Notsé Station
Source: Study Team
Figure 3-26 Track Layout at Wahala Station
Lomé Blitta
Illegal StoreStation
Building
WarehouseLevel Crossing
Lomé Blitta
StationBuilding
Water Tower
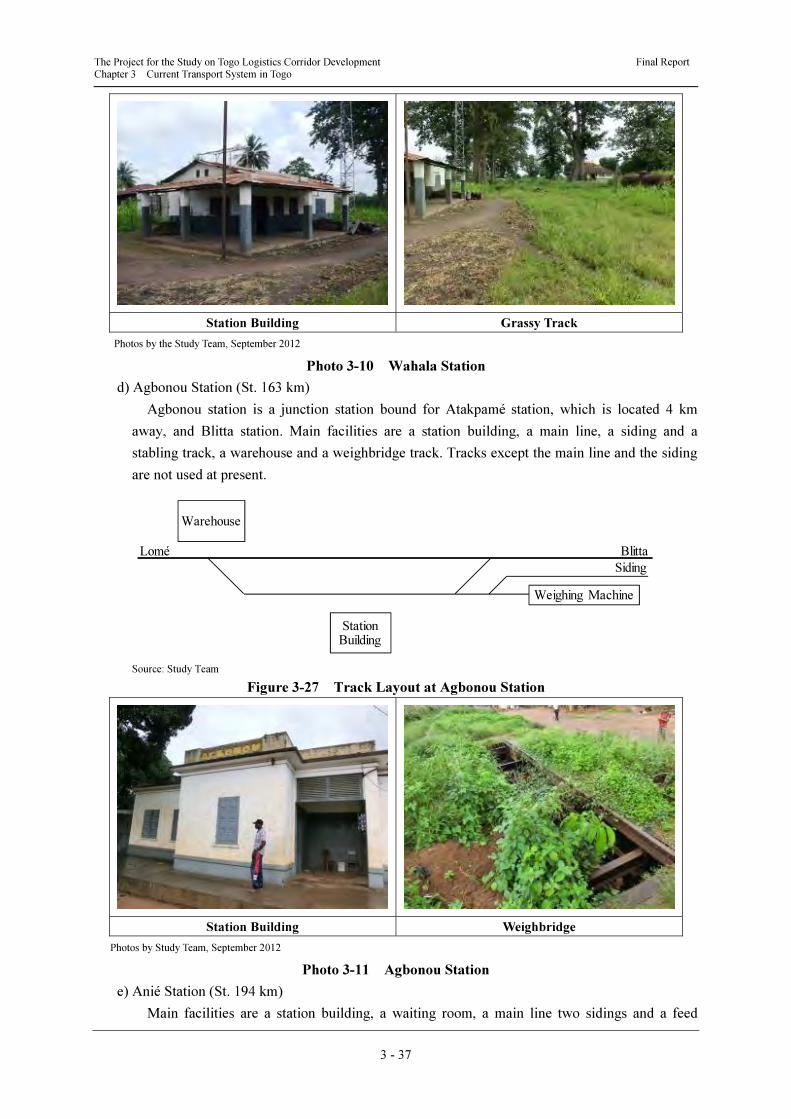
The Project for the Study on Togo Logistics Corridor Development Final Report Chapter 3 Current Transport System in Togo
3 - 37
Station Building Grassy Track
Photos by the Study Team, September 2012
Photo 3-10 Wahala Station
d) Agbonou Station (St. 163 km)
Agbonou station is a junction station bound for Atakpamé station, which is located 4 km
away, and Blitta station. Main facilities are a station building, a main line, a siding and a
stabling track, a warehouse and a weighbridge track. Tracks except the main line and the siding
are not used at present.
Source: Study Team
Figure 3-27 Track Layout at Agbonou Station
Station Building Weighbridge
Photos by Study Team, September 2012
Photo 3-11 Agbonou Station
e) Anié Station (St. 194 km)
Main facilities are a station building, a waiting room, a main line two sidings and a feed
Lomé Blitta
Warehouse
Siding
Weighing Machine
StationBuilding
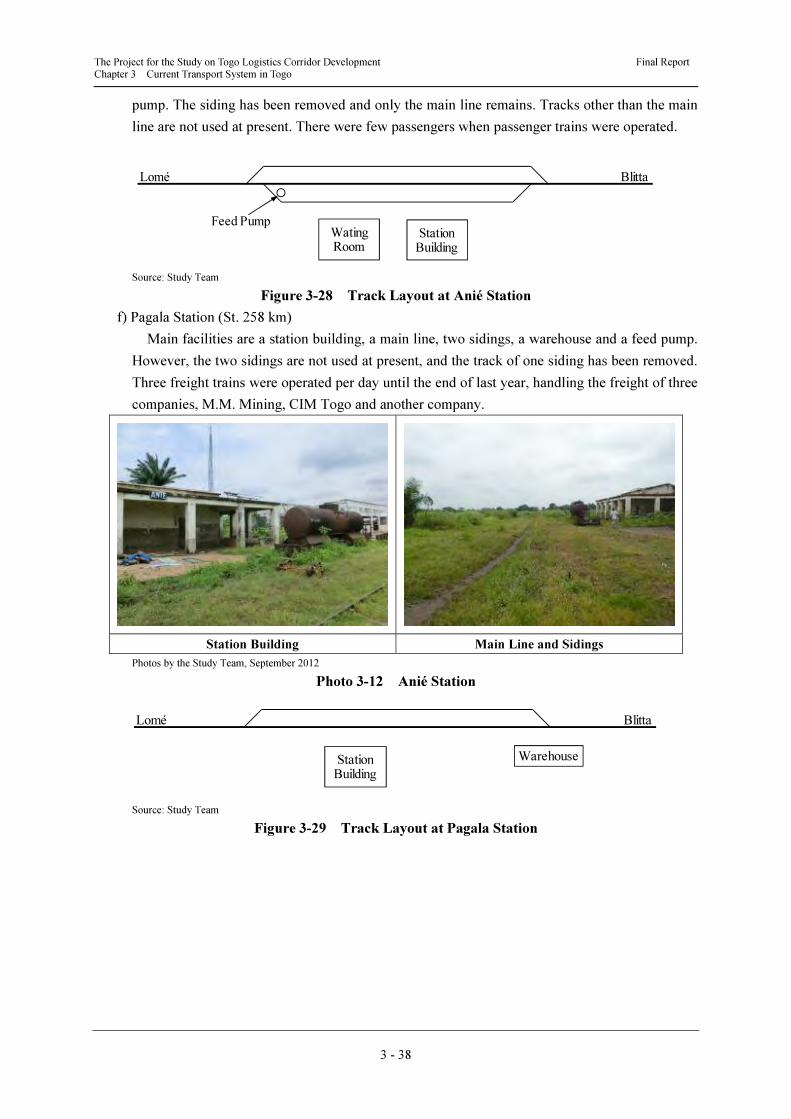
The Project for the Study on Togo Logistics Corridor Development Final Report Chapter 3 Current Transport System in Togo
3 - 38
pump. The siding has been removed and only the main line remains. Tracks other than the main
line are not used at present. There were few passengers when passenger trains were operated.
Source: Study Team
Figure 3-28 Track Layout at Anié Station
f) Pagala Station (St. 258 km)
Main facilities are a station building, a main line, two sidings, a warehouse and a feed pump.
However, the two sidings are not used at present, and the track of one siding has been removed.
Three freight trains were operated per day until the end of last year, handling the freight of three
companies, M.M. Mining, CIM Togo and another company.
Station Building Main Line and Sidings
Photos by the Study Team, September 2012
Photo 3-12 Anié Station
Source: Study Team
Figure 3-29 Track Layout at Pagala Station
Lomé Blitta
Feed PumpStation
BuildingWatingRoom
Lomé Blitta
StationBuilding
Warehouse
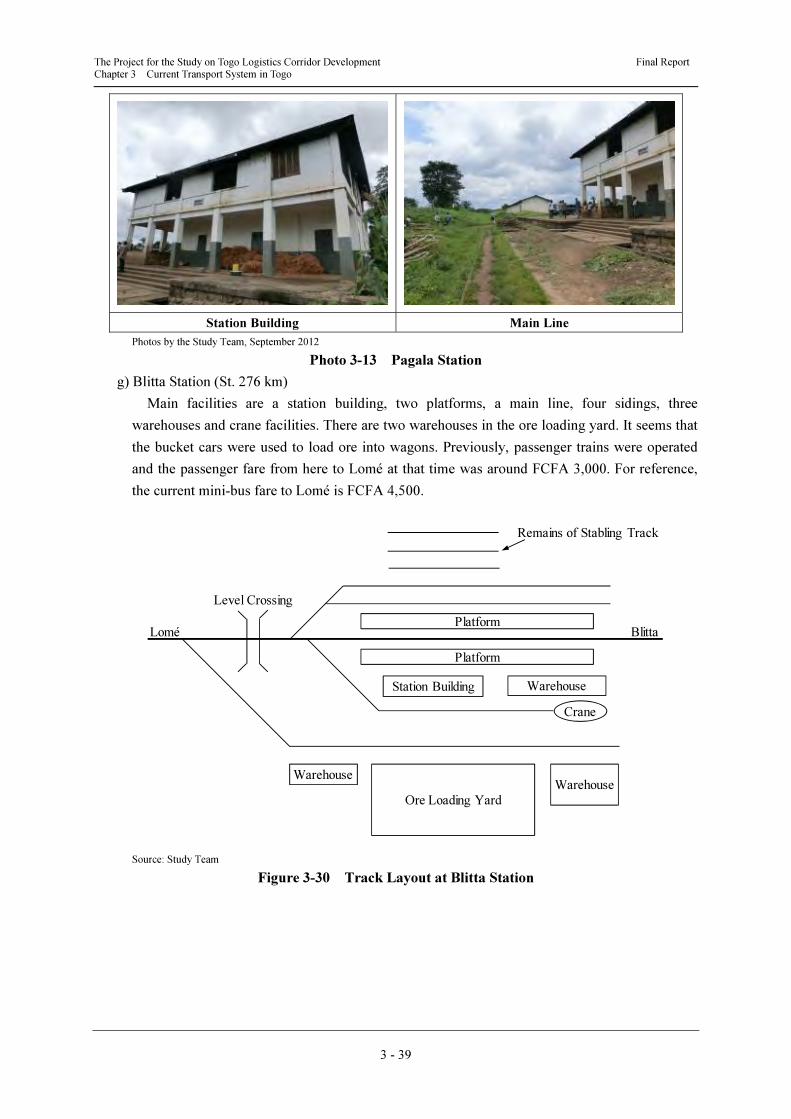
The Project for the Study on Togo Logistics Corridor Development Final Report Chapter 3 Current Transport System in Togo
3 - 39
Station Building Main Line
Photos by the Study Team, September 2012
Photo 3-13 Pagala Station
g) Blitta Station (St. 276 km)
Main facilities are a station building, two platforms, a main line, four sidings, three
warehouses and crane facilities. There are two warehouses in the ore loading yard. It seems that
the bucket cars were used to load ore into wagons. Previously, passenger trains were operated
and the passenger fare from here to Lomé at that time was around FCFA 3,000. For reference,
the current mini-bus fare to Lomé is FCFA 4,500.
Source: Study Team
Figure 3-30 Track Layout at Blitta Station
Lomé Blitta
Ore Loading Yard
WarehouseWarehouse
Remains of Stabling Track
Platform
Level Crossing
Platform
WarehouseStation Building
Crane
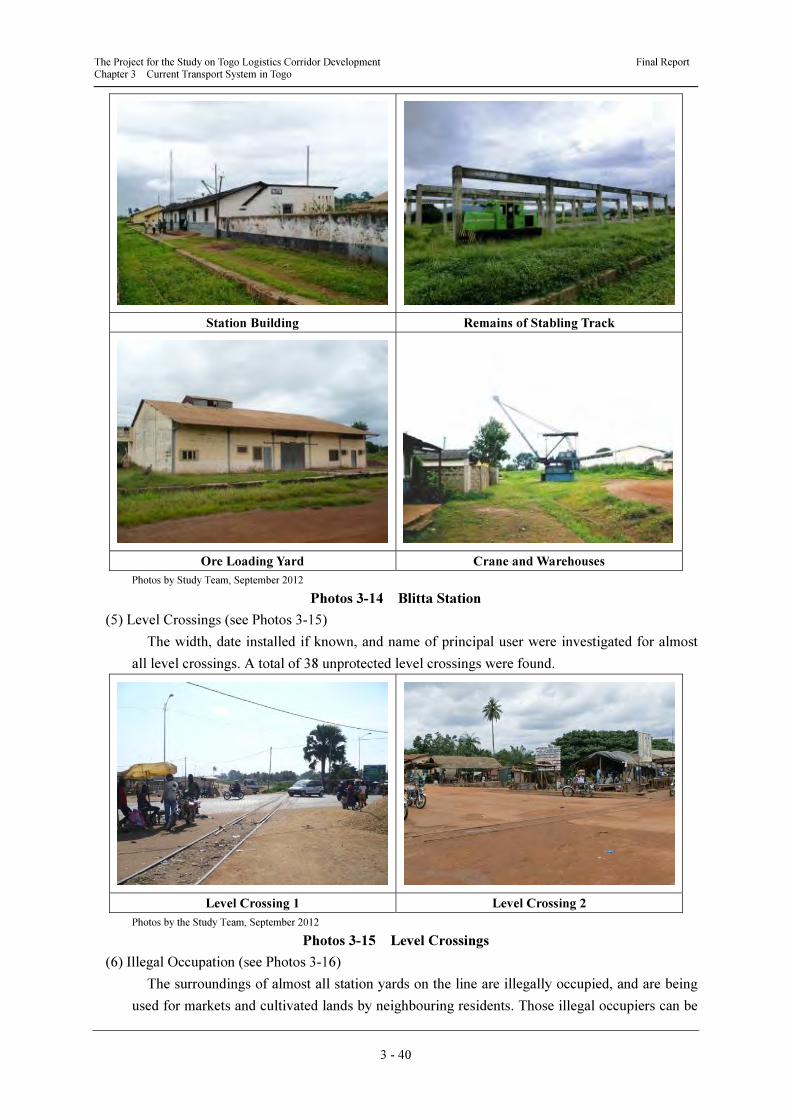
The Project for the Study on Togo Logistics Corridor Development Final Report Chapter 3 Current Transport System in Togo
3 - 40
Station Building Remains of Stabling Track
Ore Loading Yard Crane and Warehouses
Photos by Study Team, September 2012
Photos 3-14 Blitta Station
(5) Level Crossings (see Photos 3-15)
The width, date installed if known, and name of principal user were investigated for almost
all level crossings. A total of 38 unprotected level crossings were found.
Level Crossing 1 Level Crossing 2
Photos by the Study Team, September 2012
Photos 3-15 Level Crossings
(6) Illegal Occupation (see Photos 3-16)
The surroundings of almost all station yards on the line are illegally occupied, and are being
used for markets and cultivated lands by neighbouring residents. Those illegal occupiers can be
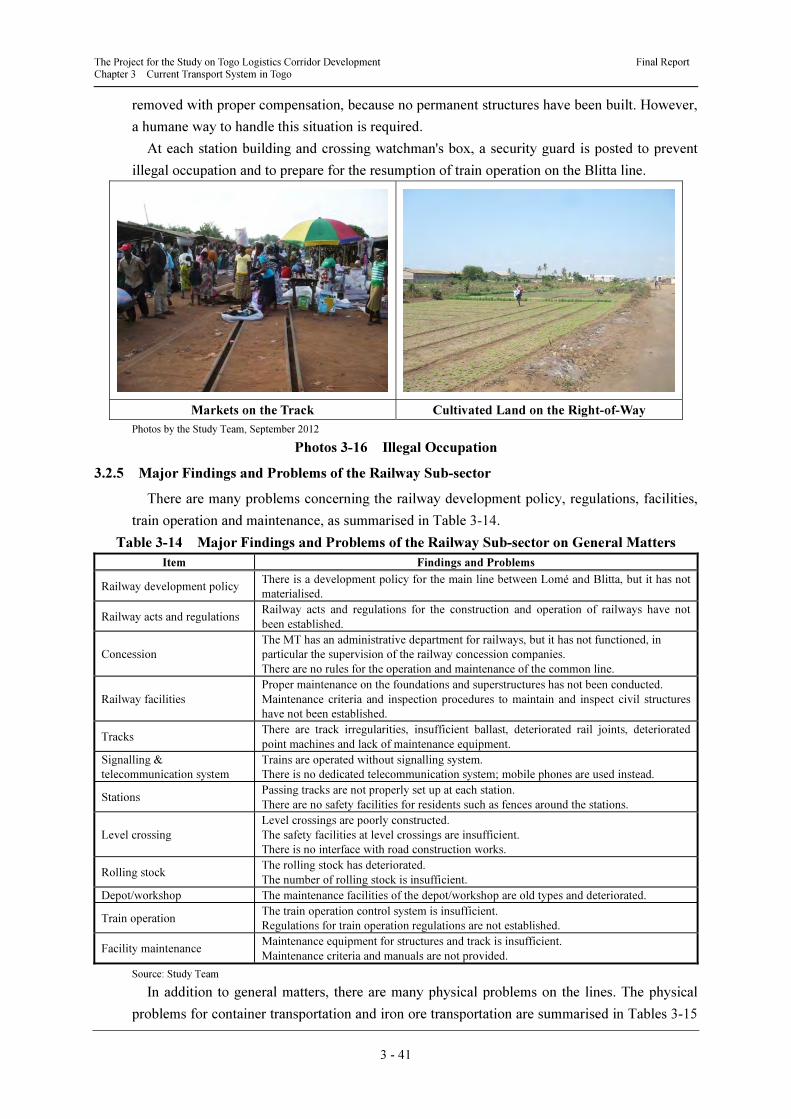
The Project for the Study on Togo Logistics Corridor Development Final Report Chapter 3 Current Transport System in Togo
3 - 41
removed with proper compensation, because no permanent structures have been built. However,
a humane way to handle this situation is required.
At each station building and crossing watchman's box, a security guard is posted to prevent
illegal occupation and to prepare for the resumption of train operation on the Blitta line.
Markets on the Track Cultivated Land on the Right-of-Way
Photos by the Study Team, September 2012
Photos 3-16 Illegal Occupation
3.2.5 Major Findings and Problems of the Railway Sub-sector
There are many problems concerning the railway development policy, regulations, facilities,
train operation and maintenance, as summarised in Table 3-14.
Table 3-14 Major Findings and Problems of the Railway Sub-sector on General Matters
Item Findings and Problems
Railway development policy There is a development policy for the main line between Lomé and Blitta, but it has not
materialised.
Railway acts and regulations Railway acts and regulations for the construction and operation of railways have not
been established.
Concession
The MT has an administrative department for railways, but it has not functioned, in
particular the supervision of the railway concession companies.
There are no rules for the operation and maintenance of the common line.
Railway facilities
Proper maintenance on the foundations and superstructures has not been conducted.
Maintenance criteria and inspection procedures to maintain and inspect civil structures
have not been established.
Tracks There are track irregularities, insufficient ballast, deteriorated rail joints, deteriorated
point machines and lack of maintenance equipment.
Signalling &
telecommunication system
Trains are operated without signalling system.
There is no dedicated telecommunication system; mobile phones are used instead.
Stations Passing tracks are not properly set up at each station.
There are no safety facilities for residents such as fences around the stations.
Level crossing
Level crossings are poorly constructed.
The safety facilities at level crossings are insufficient.
There is no interface with road construction works.
Rolling stock The rolling stock has deteriorated.
The number of rolling stock is insufficient.
Depot/workshop The maintenance facilities of the depot/workshop are old types and deteriorated.
Train operation The train operation control system is insufficient.
Regulations for train operation regulations are not established.
Facility maintenance Maintenance equipment for structures and track is insufficient.
Maintenance criteria and manuals are not provided.
Source: Study Team
In addition to general matters, there are many physical problems on the lines. The physical
problems for container transportation and iron ore transportation are summarised in Tables 3-15
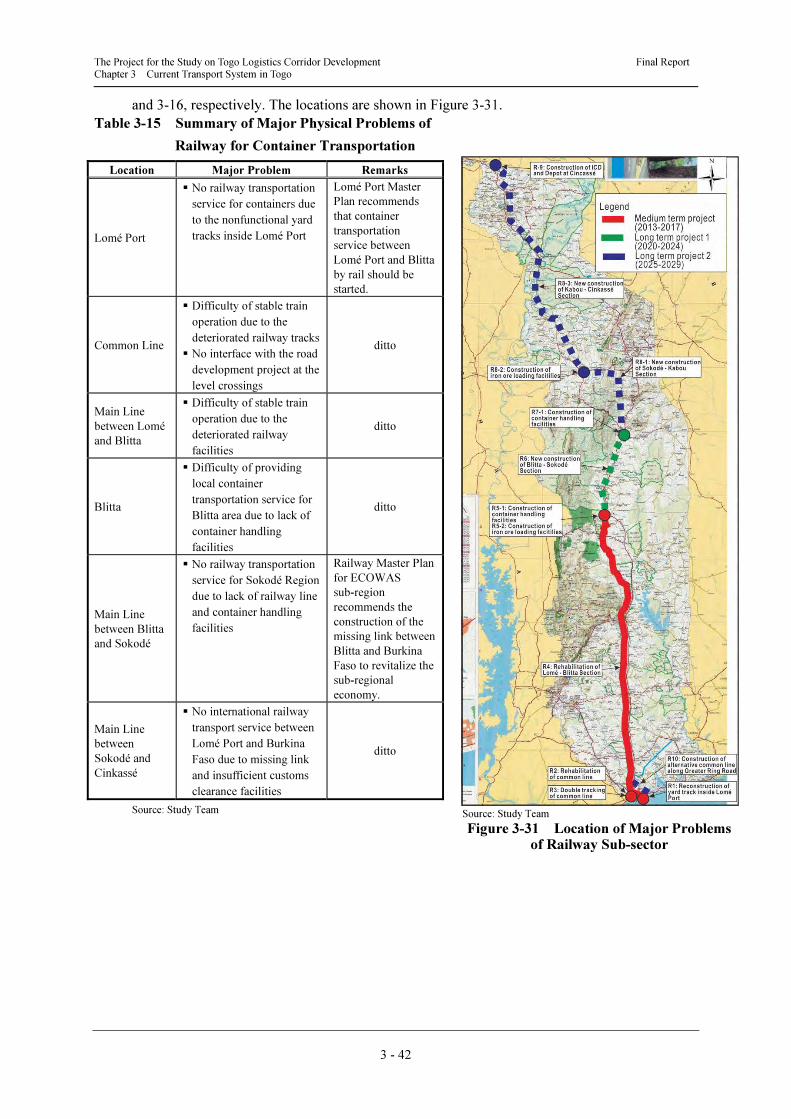
The Project for the Study on Togo Logistics Corridor Development Final Report Chapter 3 Current Transport System in Togo
3 - 42
and 3-16, respectively. The locations are shown in Figure 3-31.
Table 3-15 Summary of Major Physical Problems of
Railway for Container Transportation
Location Major Problem Remarks
Lomé Port
� No railway transportation
service for containers due
to the nonfunctional yard
tracks inside Lomé Port
Lomé Port Master
Plan recommends
that container
transportation
service between
Lomé Port and Blitta
by rail should be
started.
Common Line
� Difficulty of stable train
operation due to the
deteriorated railway tracks
� No interface with the road
development project at the
level crossings
ditto
Main Line
between Lomé
and Blitta
� Difficulty of stable train
operation due to the
deteriorated railway
facilities
ditto
Blitta
� Difficulty of providing
local container
transportation service for
Blitta area due to lack of
container handling
facilities
ditto
Main Line
between Blitta
and Sokodé
� No railway transportation
service for Sokodé Region
due to lack of railway line
and container handling
facilities
Railway Master Plan
for ECOWAS
sub-region
recommends the
construction of the
missing link between
Blitta and Burkina
Faso to revitalize the
sub-regional
economy.
Main Line
between
Sokodé and
Cinkassé
� No international railway
transport service between
Lomé Port and Burkina
Faso due to missing link
and insufficient customs
clearance facilities
ditto
Source: Study Team
Source: Study Team
Figure 3-31 Location of Major Problems of Railway Sub-sector
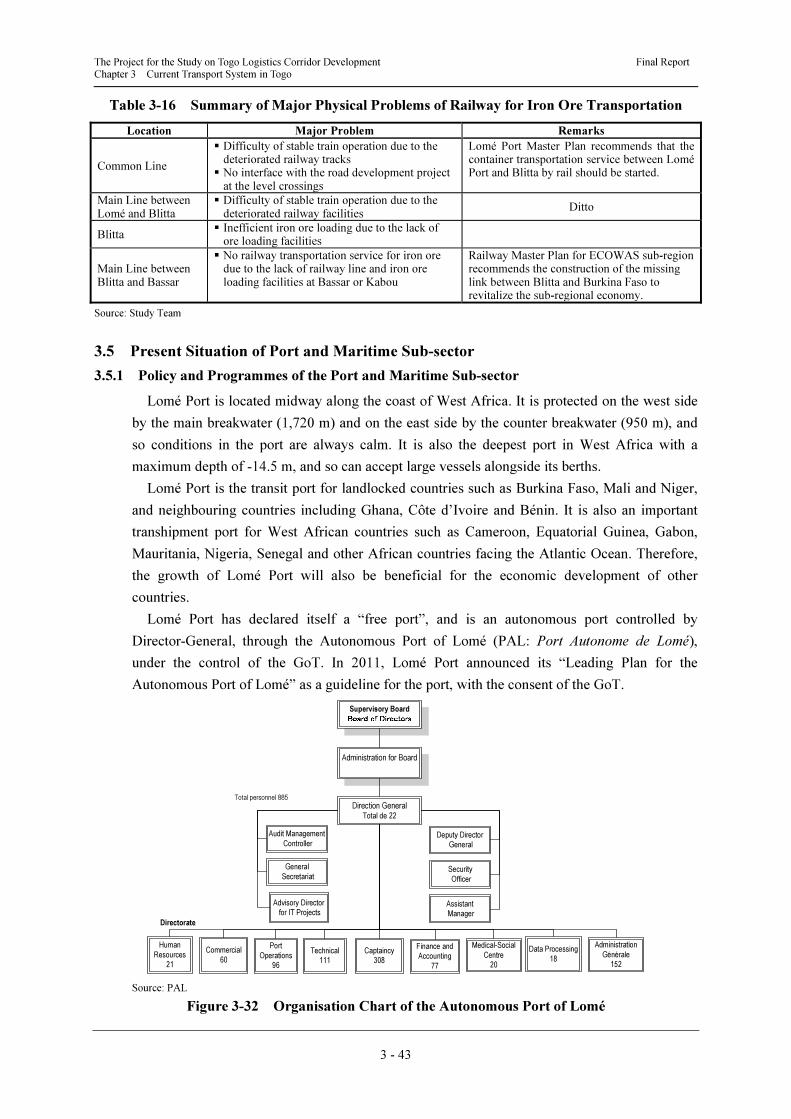
The Project for the Study on Togo Logistics Corridor Development Final Report Chapter 3 Current Transport System in Togo
3 - 43
Table 3-16 Summary of Major Physical Problems of Railway for Iron Ore Transportation
Location Major Problem Remarks
Common Line
� Difficulty of stable train operation due to the deteriorated railway tracks
� No interface with the road development project at the level crossings
Lomé Port Master Plan recommends that the container transportation service between Lomé Port and Blitta by rail should be started.
Main Line between Lomé and Blitta
� Difficulty of stable train operation due to the deteriorated railway facilities
Ditto
Blitta � Inefficient iron ore loading due to the lack of
ore loading facilities
Main Line between Blitta and Bassar
� No railway transportation service for iron ore due to the lack of railway line and iron ore loading facilities at Bassar or Kabou
Railway Master Plan for ECOWAS sub-region recommends the construction of the missing link between Blitta and Burkina Faso to revitalize the sub-regional economy.
Source: Study Team
3.5 Present Situation of Port and Maritime Sub-sector
3.5.1 Policy and Programmes of the Port and Maritime Sub-sector
Lomé Port is located midway along the coast of West Africa. It is protected on the west side
by the main breakwater (1,720 m) and on the east side by the counter breakwater (950 m), and
so conditions in the port are always calm. It is also the deepest port in West Africa with a
maximum depth of -14.5 m, and so can accept large vessels alongside its berths.
Lomé Port is the transit port for landlocked countries such as Burkina Faso, Mali and Niger,
and neighbouring countries including Ghana, Côte d’Ivoire and Bénin. It is also an important
transhipment port for West African countries such as Cameroon, Equatorial Guinea, Gabon,
Mauritania, Nigeria, Senegal and other African countries facing the Atlantic Ocean. Therefore,
the growth of Lomé Port will also be beneficial for the economic development of other
countries.
Lomé Port has declared itself a “free port”, and is an autonomous port controlled by
Director-General, through the Autonomous Port of Lomé (PAL: Port Autonome de Lomé),
under the control of the GoT. In 2011, Lomé Port announced its “Leading Plan for the
Autonomous Port of Lomé” as a guideline for the port, with the consent of the GoT.
Source: PAL
Figure 3-32 Organisation Chart of the Autonomous Port of Lomé
Direction General
Total de 22
Administration for Board
General
Secretariat
Human
Resources
21
Supervisory Board
Audit Management
Controller
Directorate
Advisory Director
for IT Projects
Deputy Director
General
Security
Officer
Assistant
Manager
Commercial
60
Port
Operations
96
Technical
111
Captaincy
308
Finance and
Accounting
77
Medical-Social
Centre
20
Administration
Générale
152
Data Processing
18
Total personnel 885
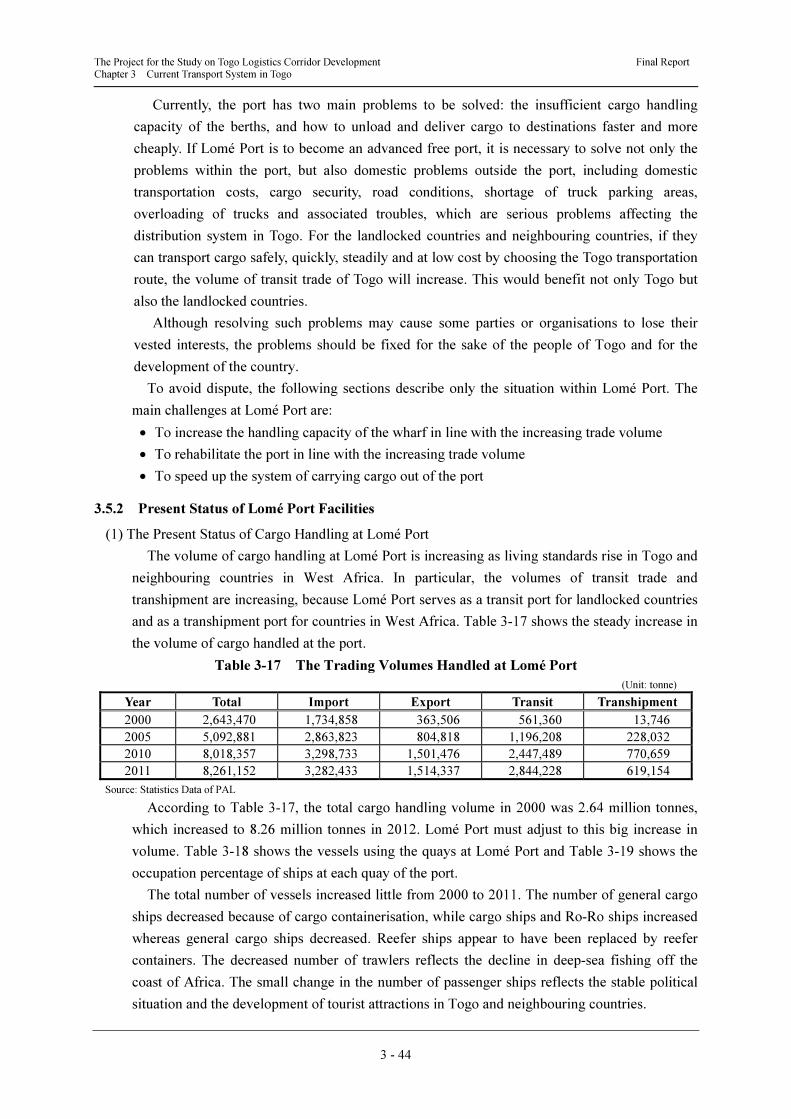
The Project for the Study on Togo Logistics Corridor Development Final Report Chapter 3 Current Transport System in Togo
3 - 44
Currently, the port has two main problems to be solved: the insufficient cargo handling
capacity of the berths, and how to unload and deliver cargo to destinations faster and more
cheaply. If Lomé Port is to become an advanced free port, it is necessary to solve not only the
problems within the port, but also domestic problems outside the port, including domestic
transportation costs, cargo security, road conditions, shortage of truck parking areas,
overloading of trucks and associated troubles, which are serious problems affecting the
distribution system in Togo. For the landlocked countries and neighbouring countries, if they
can transport cargo safely, quickly, steadily and at low cost by choosing the Togo transportation
route, the volume of transit trade of Togo will increase. This would benefit not only Togo but
also the landlocked countries.
Although resolving such problems may cause some parties or organisations to lose their
vested interests, the problems should be fixed for the sake of the people of Togo and for the
development of the country.
To avoid dispute, the following sections describe only the situation within Lomé Port. The
main challenges at Lomé Port are:
• To increase the handling capacity of the wharf in line with the increasing trade volume
• To rehabilitate the port in line with the increasing trade volume
• To speed up the system of carrying cargo out of the port
3.5.2 Present Status of Lomé Port Facilities
(1) The Present Status of Cargo Handling at Lomé Port
The volume of cargo handling at Lomé Port is increasing as living standards rise in Togo and
neighbouring countries in West Africa. In particular, the volumes of transit trade and
transhipment are increasing, because Lomé Port serves as a transit port for landlocked countries
and as a transhipment port for countries in West Africa. Table 3-17 shows the steady increase in
the volume of cargo handled at the port.
Table 3-17 The Trading Volumes Handled at Lomé Port
(Unit: tonne)
Year Total Import Export Transit Transhipment
2000 2,643,470 1,734,858 363,506 561,360 13,746
2005 5,092,881 2,863,823 804,818 1,196,208 228,032
2010 8,018,357 3,298,733 1,501,476 2,447,489 770,659
2011 8,261,152 3,282,433 1,514,337 2,844,228 619,154
Source: Statistics Data of PAL
According to Table 3-17, the total cargo handling volume in 2000 was 2.64 million tonnes,
which increased to 8.26 million tonnes in 2012. Lomé Port must adjust to this big increase in
volume. Table 3-18 shows the vessels using the quays at Lomé Port and Table 3-19 shows the
occupation percentage of ships at each quay of the port.
The total number of vessels increased little from 2000 to 2011. The number of general cargo
ships decreased because of cargo containerisation, while cargo ships and Ro-Ro ships increased
whereas general cargo ships decreased. Reefer ships appear to have been replaced by reefer
containers. The decreased number of trawlers reflects the decline in deep-sea fishing off the
coast of Africa. The small change in the number of passenger ships reflects the stable political
situation and the development of tourist attractions in Togo and neighbouring countries.
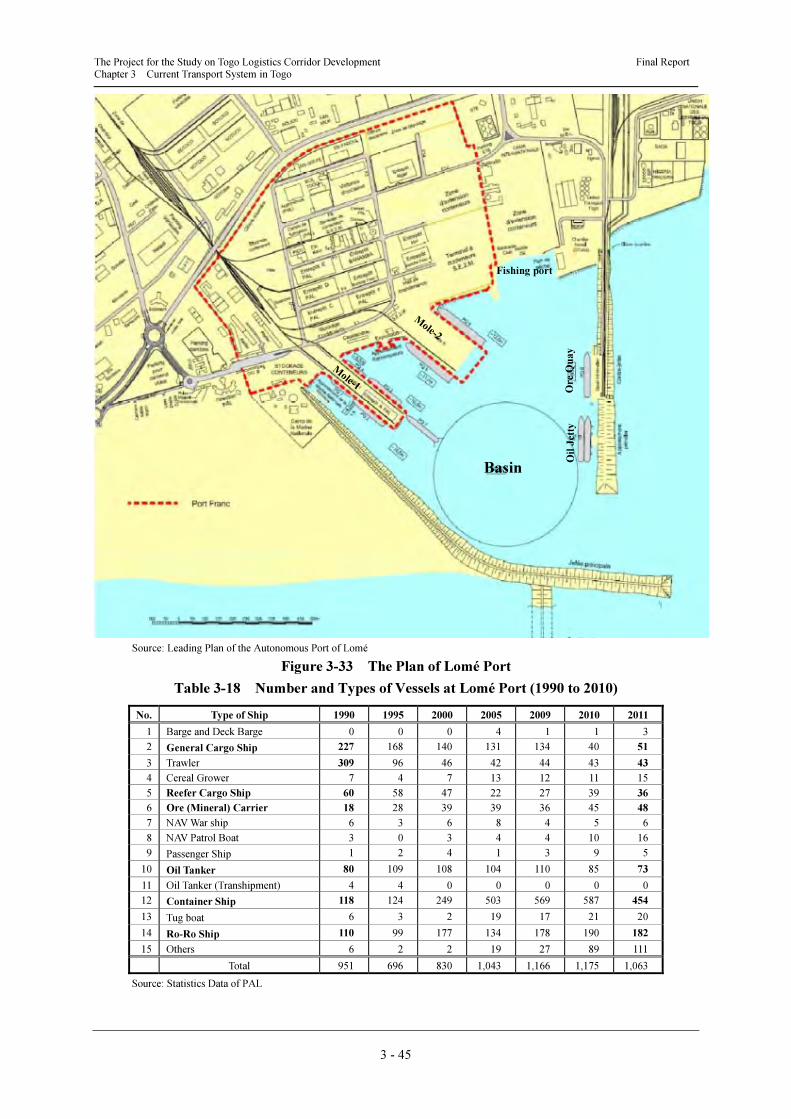
The Project for the Study on Togo Logistics Corridor Development Final Report Chapter 3 Current Transport System in Togo
3 - 45
Source: Leading Plan of the Autonomous Port of Lomé
Figure 3-33 The Plan of Lomé Port
Table 3-18 Number and Types of Vessels at Lomé Port (1990 to 2010)
No. Type of Ship 1990 1995 2000 2005 2009 2010 2011
1 Barge and Deck Barge 0 0 0 4 1 1 3
2 General Cargo Ship 227 168 140 131 134 40 51
3 Trawler 309 96 46 42 44 43 43
4 Cereal Grower 7 4 7 13 12 11 15
5 Reefer Cargo Ship 60 58 47 22 27 39 36
6 Ore (Mineral) Carrier 18 28 39 39 36 45 48
7 NAV War ship 6 3 6 8 4 5 6
8 NAV Patrol Boat 3 0 3 4 4 10 16
9 Passenger Ship 1 2 4 1 3 9 5
10 Oil Tanker 80 109 108 104 110 85 73
11 Oil Tanker (Transhipment) 4 4 0 0 0 0 0
12 Container Ship 118 124 249 503 569 587 454
13 Tug boat 6 3 2 19 17 21 20
14 Ro-Ro Ship 110 99 177 134 178 190 182
15 Others 6 2 2 19 27 89 111
Total 951 696 830 1,043 1,166 1,175 1,063
Source: Statistics Data of PAL
Oil
Jet
ty
Ore
Qu
ay
Fishing port
Basin
The Project for the Study on Togo Logistics Corridor Development Final Report Chapter 3 Current Transport System in Togo
3 - 46
Table 3-19 Occupation Percentage of Ships at Each Quay
Year PQ01 PQ02 PQ03 PQ04 PQ05 PQ06 PQ07 PQ09 PQ10
2001 52 69 59 54 58 55 34 50 37
2002 56 68 60 57 67 55 76 50 32
2003 61 53 6 59 76 70 18 86 44
2004 44 50 54 49 60 62 18 58 47
2005 53 48 71 60 73 72 20 79 43
2006 39 53.6 49.5 58 72 68.5 69 43.5 45
2007 35 58 57 38 73 72 10 80 42
2008 34 50 52 28 66 69 21 81 44
2009 40 53 60 54 65 75 85 67 38
2010 56.5 42 67 51 79.5 76.5 5.5 71 36
Source: Statistics Data of PAL
This table clearly reflects the process of cargo containerisation, and the number of container
cargo ships will increase.
(2) The present Status of Berthing Facilities at Lomé Port
The vessel berthing facilities at Lomé Port are shown in Figure 3-34.
Source: Leading Plan of the Autonomous Port of Lomé
Figure 3-34 Berthing Facilities at Lomé Port
(3) Condition at Lomé Port
Sea current: Coastal current, about one knot west to east
Height of tide: H.W.L: +1.80 m
M.W.L: +1.01m
L.W.L: +0.32 m
Basic elevation of quay top: +4.50 m
a) Wharf No. 1: L300 m × W72 m, Water depth -8 m to -10 m
• Vessel: General cargo ship, trawler
Q1
Q9:
Min
era
l B
erth
Q8:
Turning Basin
Q6
Q5Q4
Q3
Q2Q7
Fishery port
Q10:
Oil
Jet
ty
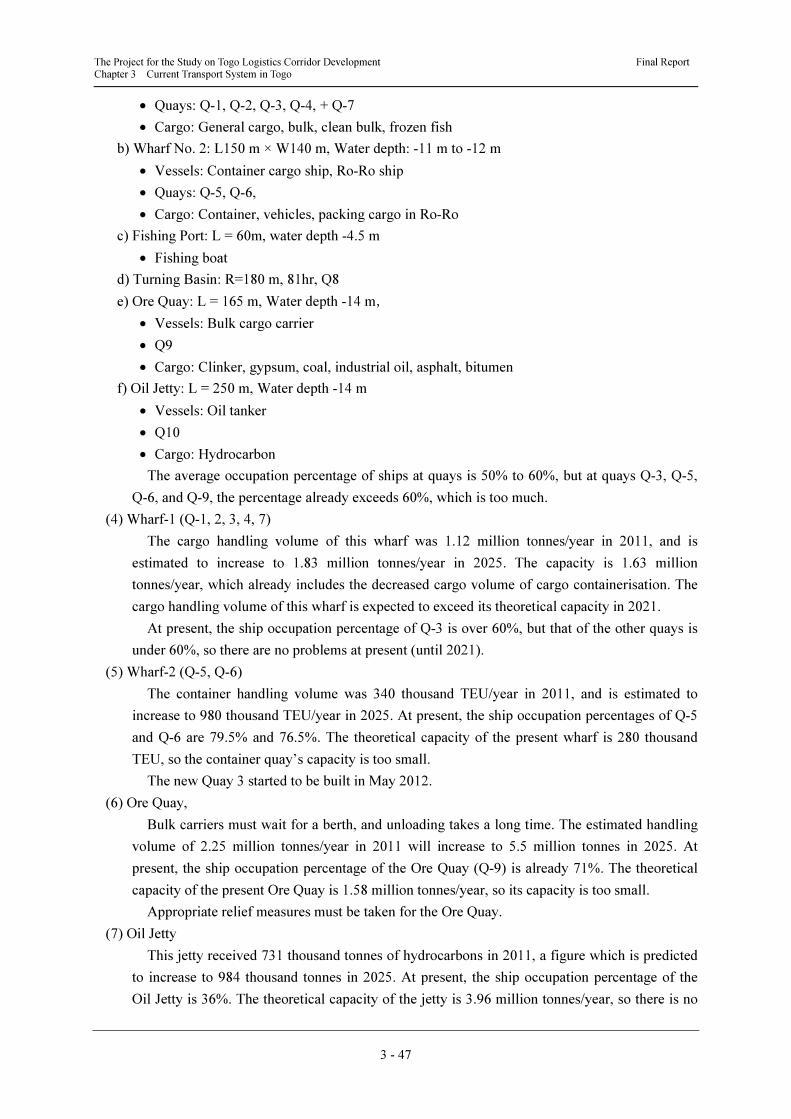
The Project for the Study on Togo Logistics Corridor Development Final Report Chapter 3 Current Transport System in Togo
3 - 47
• Quays: Q-1, Q-2, Q-3, Q-4, + Q-7
• Cargo: General cargo, bulk, clean bulk, frozen fish
b) Wharf No. 2: L150 m × W140 m, Water depth: -11 m to -12 m
• Vessels: Container cargo ship, Ro-Ro ship
• Quays: Q-5, Q-6,
• Cargo: Container, vehicles, packing cargo in Ro-Ro
c) Fishing Port: L = 60m, water depth -4.5 m
• Fishing boat
d) Turning Basin: R=180 m, 81hr, Q8
e) Ore Quay: L = 165 m, Water depth -14 m,
• Vessels: Bulk cargo carrier
• Q9
• Cargo: Clinker, gypsum, coal, industrial oil, asphalt, bitumen
f) Oil Jetty: L = 250 m, Water depth -14 m
• Vessels: Oil tanker
• Q10
• Cargo: Hydrocarbon
The average occupation percentage of ships at quays is 50% to 60%, but at quays Q-3, Q-5,
Q-6, and Q-9, the percentage already exceeds 60%, which is too much.
(4) Wharf-1 (Q-1, 2, 3, 4, 7)
The cargo handling volume of this wharf was 1.12 million tonnes/year in 2011, and is
estimated to increase to 1.83 million tonnes/year in 2025. The capacity is 1.63 million
tonnes/year, which already includes the decreased cargo volume of cargo containerisation. The
cargo handling volume of this wharf is expected to exceed its theoretical capacity in 2021.
At present, the ship occupation percentage of Q-3 is over 60%, but that of the other quays is
under 60%, so there are no problems at present (until 2021).
(5) Wharf-2 (Q-5, Q-6)
The container handling volume was 340 thousand TEU/year in 2011, and is estimated to
increase to 980 thousand TEU/year in 2025. At present, the ship occupation percentages of Q-5
and Q-6 are 79.5% and 76.5%. The theoretical capacity of the present wharf is 280 thousand
TEU, so the container quay’s capacity is too small.
The new Quay 3 started to be built in May 2012.
(6) Ore Quay,
Bulk carriers must wait for a berth, and unloading takes a long time. The estimated handling
volume of 2.25 million tonnes/year in 2011 will increase to 5.5 million tonnes in 2025. At
present, the ship occupation percentage of the Ore Quay (Q-9) is already 71%. The theoretical
capacity of the present Ore Quay is 1.58 million tonnes/year, so its capacity is too small.
Appropriate relief measures must be taken for the Ore Quay.
(7) Oil Jetty
This jetty received 731 thousand tonnes of hydrocarbons in 2011, a figure which is predicted
to increase to 984 thousand tonnes in 2025. At present, the ship occupation percentage of the
Oil Jetty is 36%. The theoretical capacity of the jetty is 3.96 million tonnes/year, so there is no
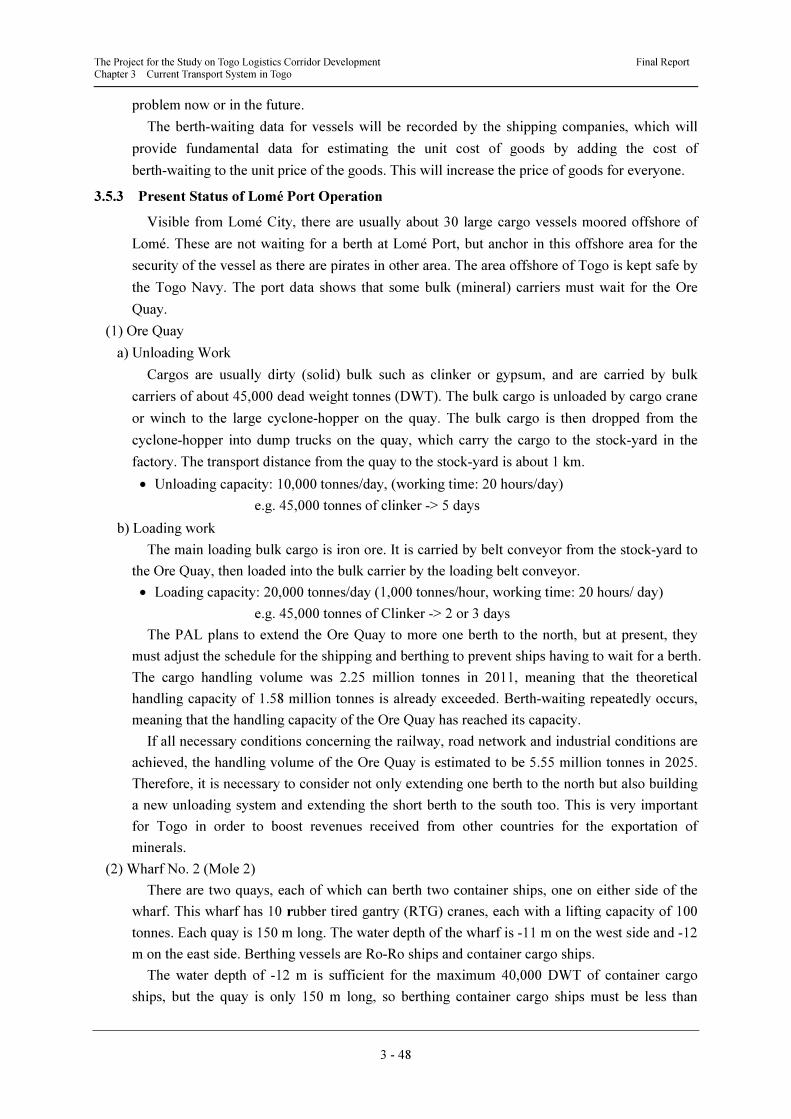
The Project for the Study on Togo Logistics Corridor Development Final Report Chapter 3 Current Transport System in Togo
3 - 48
problem now or in the future.
The berth-waiting data for vessels will be recorded by the shipping companies, which will
provide fundamental data for estimating the unit cost of goods by adding the cost of
berth-waiting to the unit price of the goods. This will increase the price of goods for everyone.
3.5.3 Present Status of Lomé Port Operation
Visible from Lomé City, there are usually about 30 large cargo vessels moored offshore of
Lomé. These are not waiting for a berth at Lomé Port, but anchor in this offshore area for the
security of the vessel as there are pirates in other area. The area offshore of Togo is kept safe by
the Togo Navy. The port data shows that some bulk (mineral) carriers must wait for the Ore
Quay.
(1) Ore Quay
a) Unloading Work
Cargos are usually dirty (solid) bulk such as clinker or gypsum, and are carried by bulk
carriers of about 45,000 dead weight tonnes (DWT). The bulk cargo is unloaded by cargo crane
or winch to the large cyclone-hopper on the quay. The bulk cargo is then dropped from the
cyclone-hopper into dump trucks on the quay, which carry the cargo to the stock-yard in the
factory. The transport distance from the quay to the stock-yard is about 1 km.
• Unloading capacity: 10,000 tonnes/day, (working time: 20 hours/day)
e.g. 45,000 tonnes of clinker -> 5 days
b) Loading work
The main loading bulk cargo is iron ore. It is carried by belt conveyor from the stock-yard to
the Ore Quay, then loaded into the bulk carrier by the loading belt conveyor.
• Loading capacity: 20,000 tonnes/day (1,000 tonnes/hour, working time: 20 hours/ day)
e.g. 45,000 tonnes of Clinker -> 2 or 3 days
The PAL plans to extend the Ore Quay to more one berth to the north, but at present, they
must adjust the schedule for the shipping and berthing to prevent ships having to wait for a berth.
The cargo handling volume was 2.25 million tonnes in 2011, meaning that the theoretical
handling capacity of 1.58 million tonnes is already exceeded. Berth-waiting repeatedly occurs,
meaning that the handling capacity of the Ore Quay has reached its capacity.
If all necessary conditions concerning the railway, road network and industrial conditions are
achieved, the handling volume of the Ore Quay is estimated to be 5.55 million tonnes in 2025.
Therefore, it is necessary to consider not only extending one berth to the north but also building
a new unloading system and extending the short berth to the south too. This is very important
for Togo in order to boost revenues received from other countries for the exportation of
minerals.
(2) Wharf No. 2 (Mole 2)
There are two quays, each of which can berth two container ships, one on either side of the
wharf. This wharf has 10 rubber tired gantry (RTG) cranes, each with a lifting capacity of 100
tonnes. Each quay is 150 m long. The water depth of the wharf is -11 m on the west side and -12
m on the east side. Berthing vessels are Ro-Ro ships and container cargo ships.
The water depth of -12 m is sufficient for the maximum 40,000 DWT of container cargo
ships, but the quay is only 150 m long, so berthing container cargo ships must be less than
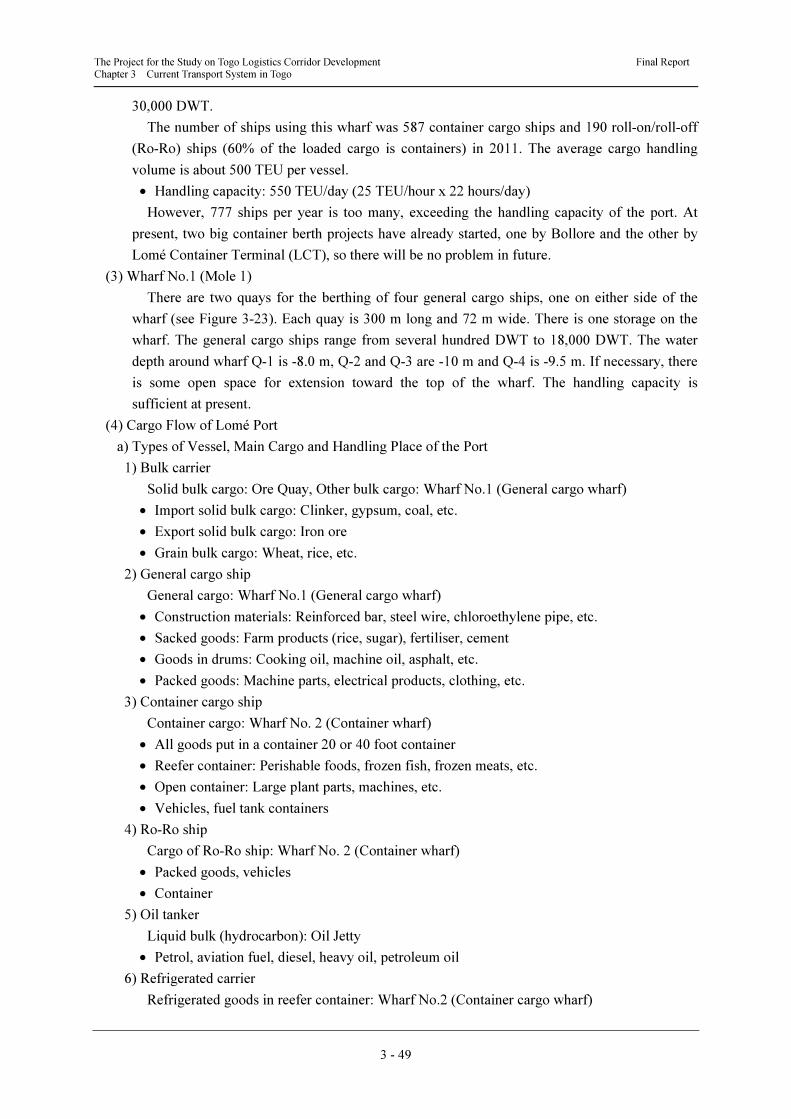
The Project for the Study on Togo Logistics Corridor Development Final Report Chapter 3 Current Transport System in Togo
3 - 49
30,000 DWT.
The number of ships using this wharf was 587 container cargo ships and 190 roll-on/roll-off
(Ro-Ro) ships (60% of the loaded cargo is containers) in 2011. The average cargo handling
volume is about 500 TEU per vessel.
• Handling capacity: 550 TEU/day (25 TEU/hour x 22 hours/day)
However, 777 ships per year is too many, exceeding the handling capacity of the port. At
present, two big container berth projects have already started, one by Bollore and the other by
Lomé Container Terminal (LCT), so there will be no problem in future.
(3) Wharf No.1 (Mole 1)
There are two quays for the berthing of four general cargo ships, one on either side of the
wharf (see Figure 3-23). Each quay is 300 m long and 72 m wide. There is one storage on the
wharf. The general cargo ships range from several hundred DWT to 18,000 DWT. The water
depth around wharf Q-1 is -8.0 m, Q-2 and Q-3 are -10 m and Q-4 is -9.5 m. If necessary, there
is some open space for extension toward the top of the wharf. The handling capacity is
sufficient at present.
(4) Cargo Flow of Lomé Port
a) Types of Vessel, Main Cargo and Handling Place of the Port
1) Bulk carrier
Solid bulk cargo: Ore Quay, Other bulk cargo: Wharf No.1 (General cargo wharf)
• Import solid bulk cargo: Clinker, gypsum, coal, etc.
• Export solid bulk cargo: Iron ore
• Grain bulk cargo: Wheat, rice, etc.
2) General cargo ship
General cargo: Wharf No.1 (General cargo wharf)
• Construction materials: Reinforced bar, steel wire, chloroethylene pipe, etc.
• Sacked goods: Farm products (rice, sugar), fertiliser, cement
• Goods in drums: Cooking oil, machine oil, asphalt, etc.
• Packed goods: Machine parts, electrical products, clothing, etc.
3) Container cargo ship
Container cargo: Wharf No. 2 (Container wharf)
• All goods put in a container 20 or 40 foot container
• Reefer container: Perishable foods, frozen fish, frozen meats, etc.
• Open container: Large plant parts, machines, etc.
• Vehicles, fuel tank containers
4) Ro-Ro ship
Cargo of Ro-Ro ship: Wharf No. 2 (Container wharf)
• Packed goods, vehicles
• Container
5) Oil tanker
Liquid bulk (hydrocarbon): Oil Jetty
• Petrol, aviation fuel, diesel, heavy oil, petroleum oil
6) Refrigerated carrier
Refrigerated goods in reefer container: Wharf No.2 (Container cargo wharf)
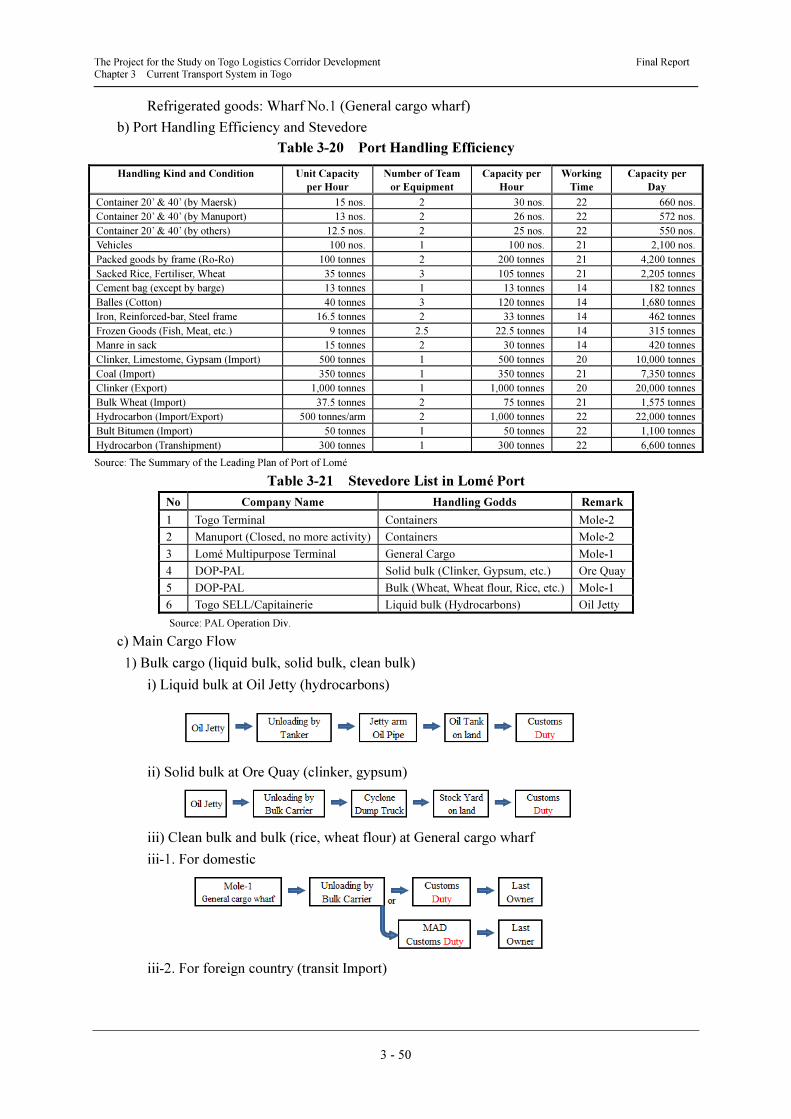
The Project for the Study on Togo Logistics Corridor Development Final Report Chapter 3 Current Transport System in Togo
3 - 50
Refrigerated goods: Wharf No.1 (General cargo wharf)
b) Port Handling Efficiency and Stevedore
Table 3-20 Port Handling Efficiency
Handling Kind and Condition Unit Capacity
per Hour
Number of Team
or Equipment
Capacity per
Hour
Working
Time
Capacity per
Day
Container 20’ & 40’ (by Maersk) 15 nos. 2 30 nos. 22 660 nos.
Container 20’ & 40’ (by Manuport) 13 nos. 2 26 nos. 22 572 nos.
Container 20’ & 40’ (by others) 12.5 nos. 2 25 nos. 22 550 nos.
Vehicles 100 nos. 1 100 nos. 21 2,100 nos.
Packed goods by frame (Ro-Ro) 100 tonnes 2 200 tonnes 21 4,200 tonnes
Sacked Rice, Fertiliser, Wheat 35 tonnes 3 105 tonnes 21 2,205 tonnes
Cement bag (except by barge) 13 tonnes 1 13 tonnes 14 182 tonnes
Balles (Cotton) 40 tonnes 3 120 tonnes 14 1,680 tonnes
Iron, Reinforced-bar, Steel frame 16.5 tonnes 2 33 tonnes 14 462 tonnes
Frozen Goods (Fish, Meat, etc.) 9 tonnes 2.5 22.5 tonnes 14 315 tonnes
Manre in sack 15 tonnes 2 30 tonnes 14 420 tonnes
Clinker, Limestome, Gypsam (Import) 500 tonnes 1 500 tonnes 20 10,000 tonnes
Coal (Import) 350 tonnes 1 350 tonnes 21 7,350 tonnes
Clinker (Export) 1,000 tonnes 1 1,000 tonnes 20 20,000 tonnes
Bulk Wheat (Import) 37.5 tonnes 2 75 tonnes 21 1,575 tonnes
Hydrocarbon (Import/Export) 500 tonnes/arm 2 1,000 tonnes 22 22,000 tonnes
Bult Bitumen (Import) 50 tonnes 1 50 tonnes 22 1,100 tonnes
Hydrocarbon (Transhipment) 300 tonnes 1 300 tonnes 22 6,600 tonnes
Source: The Summary of the Leading Plan of Port of Lomé
Table 3-21 Stevedore List in Lomé Port
No Company Name Handling Godds Remark
1 Togo Terminal Containers Mole-2
2 Manuport (Closed, no more activity) Containers Mole-2
3 Lomé Multipurpose Terminal General Cargo Mole-1
4 DOP-PAL Solid bulk (Clinker, Gypsum, etc.) Ore Quay
5 DOP-PAL Bulk (Wheat, Wheat flour, Rice, etc.) Mole-1
6 Togo SELL/Capitainerie Liquid bulk (Hydrocarbons) Oil Jetty
Source: PAL Operation Div.
c) Main Cargo Flow
1) Bulk cargo (liquid bulk, solid bulk, clean bulk)
i) Liquid bulk at Oil Jetty (hydrocarbons)
ii) Solid bulk at Ore Quay (clinker, gypsum)
iii) Clean bulk and bulk (rice, wheat flour) at General cargo wharf
iii-1. For domestic
iii-2. For foreign country (transit Import)
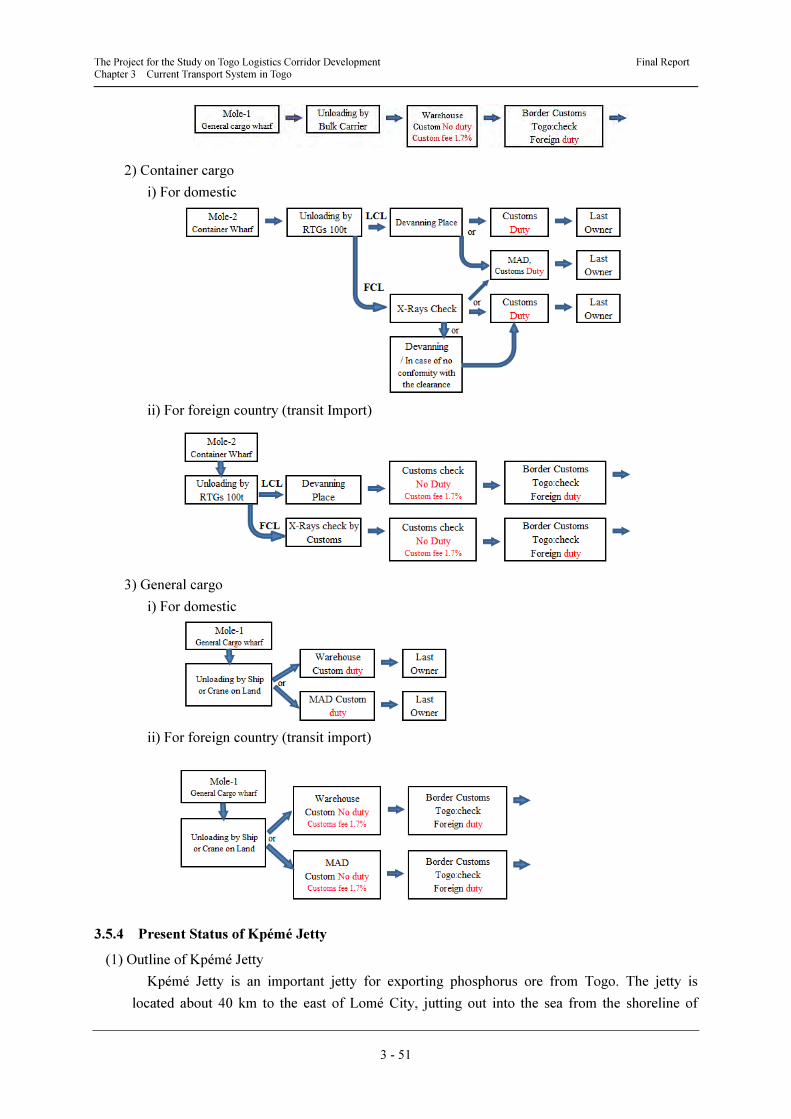
The Project for the Study on Togo Logistics Corridor Development Final Report Chapter 3 Current Transport System in Togo
3 - 51
2) Container cargo
i) For domestic
ii) For foreign country (transit Import)
3) General cargo
i) For domestic
ii) For foreign country (transit import)
3.5.4 Present Status of Kpémé Jetty
(1) Outline of Kpémé Jetty
Kpémé Jetty is an important jetty for exporting phosphorus ore from Togo. The jetty is
located about 40 km to the east of Lomé City, jutting out into the sea from the shoreline of
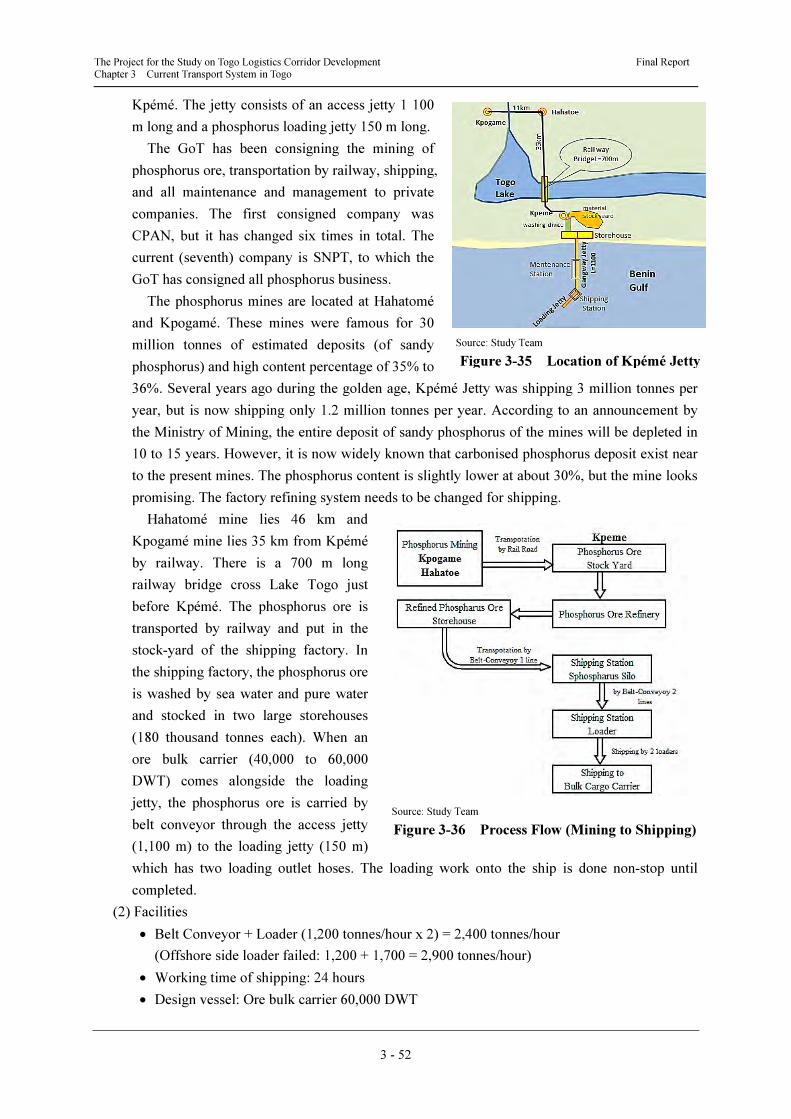
The Project for the Study on Togo Logistics Corridor Development Final Report Chapter 3 Current Transport System in Togo
3 - 52
Kpémé. The jetty consists of an access jetty 1 100
m long and a phosphorus loading jetty 150 m long.
The GoT has been consigning the mining of
phosphorus ore, transportation by railway, shipping,
and all maintenance and management to private
companies. The first consigned company was
CPAN, but it has changed six times in total. The
current (seventh) company is SNPT, to which the
GoT has consigned all phosphorus business.
The phosphorus mines are located at Hahatomé
and Kpogamé. These mines were famous for 30
million tonnes of estimated deposits (of sandy
phosphorus) and high content percentage of 35% to
36%. Several years ago during the golden age, Kpémé Jetty was shipping 3 million tonnes per
year, but is now shipping only 1.2 million tonnes per year. According to an announcement by
the Ministry of Mining, the entire deposit of sandy phosphorus of the mines will be depleted in
10 to 15 years. However, it is now widely known that carbonised phosphorus deposit exist near
to the present mines. The phosphorus content is slightly lower at about 30%, but the mine looks
promising. The factory refining system needs to be changed for shipping.
Hahatomé mine lies 46 km and
Kpogamé mine lies 35 km from Kpémé
by railway. There is a 700 m long
railway bridge cross Lake Togo just
before Kpémé. The phosphorus ore is
transported by railway and put in the
stock-yard of the shipping factory. In
the shipping factory, the phosphorus ore
is washed by sea water and pure water
and stocked in two large storehouses
(180 thousand tonnes each). When an
ore bulk carrier (40,000 to 60,000
DWT) comes alongside the loading
jetty, the phosphorus ore is carried by
belt conveyor through the access jetty
(1,100 m) to the loading jetty (150 m)
which has two loading outlet hoses. The loading work onto the ship is done non-stop until
completed.
(2) Facilities
• Belt Conveyor + Loader (1,200 tonnes/hour x 2) = 2,400 tonnes/hour
(Offshore side loader failed: 1,200 + 1,700 = 2,900 tonnes/hour)
• Working time of shipping: 24 hours
• Design vessel: Ore bulk carrier 60,000 DWT
Source: Study Team
Figure 3-35 Location of Kpémé Jetty
Source: Study Team
Figure 3-36 Process Flow (Mining to Shipping)
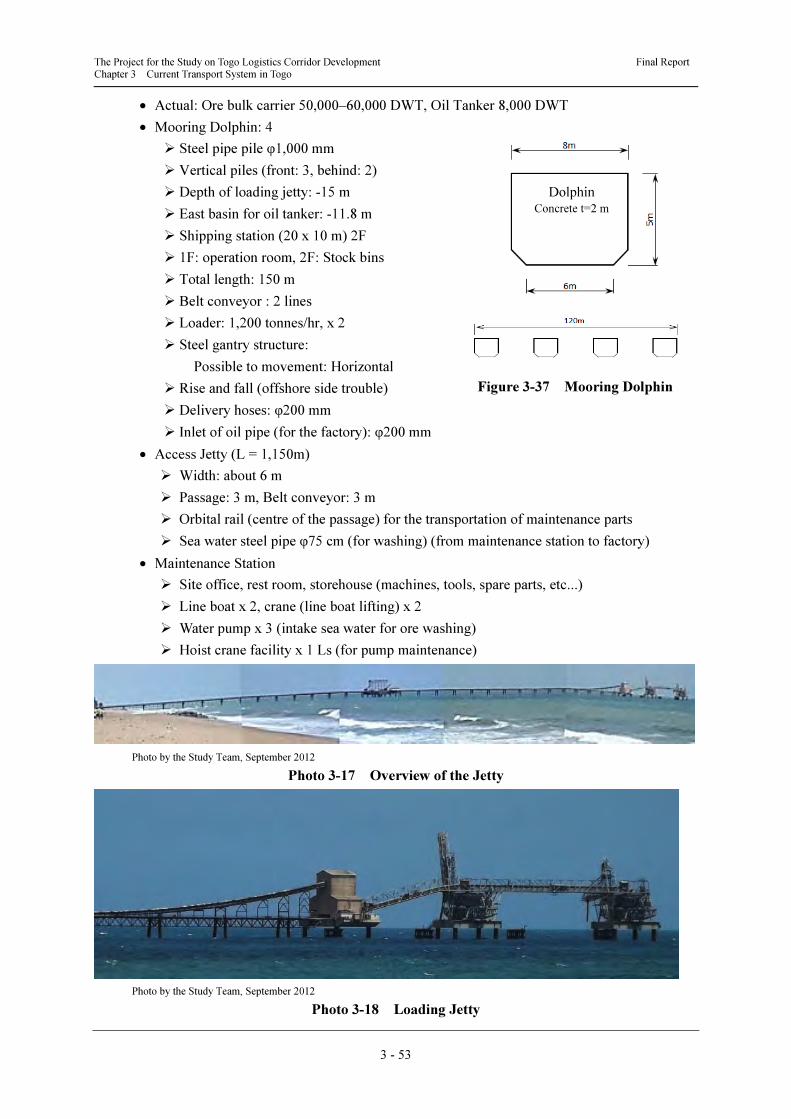
The Project for the Study on Togo Logistics Corridor Development Final Report Chapter 3 Current Transport System in Togo
3 - 53
• Actual: Ore bulk carrier 50,000–60,000 DWT, Oil Tanker 8,000 DWT
• Mooring Dolphin: 4
� Steel pipe pile φ1,000 mm
� Vertical piles (front: 3, behind: 2)
� Depth of loading jetty: -15 m
� East basin for oil tanker: -11.8 m
� Shipping station (20 x 10 m) 2F
� 1F: operation room, 2F: Stock bins
� Total length: 150 m
� Belt conveyor : 2 lines
� Loader: 1,200 tonnes/hr, x 2
� Steel gantry structure:
Possible to movement: Horizontal
� Rise and fall (offshore side trouble)
� Delivery hoses: φ200 mm
� Inlet of oil pipe (for the factory): φ200 mm
• Access Jetty (L = 1,150m)
� Width: about 6 m
� Passage: 3 m, Belt conveyor: 3 m
� Orbital rail (centre of the passage) for the transportation of maintenance parts
� Sea water steel pipe φ75 cm (for washing) (from maintenance station to factory)
• Maintenance Station
� Site office, rest room, storehouse (machines, tools, spare parts, etc...)
� Line boat x 2, crane (line boat lifting) x 2
� Water pump x 3 (intake sea water for ore washing)
� Hoist crane facility x 1 Ls (for pump maintenance)
Photo by the Study Team, September 2012
Photo 3-17 Overview of the Jetty
Photo by the Study Team, September 2012
Photo 3-18 Loading Jetty
Dolphin
Concrete t=2 m
Figure 3-37 Mooring Dolphin
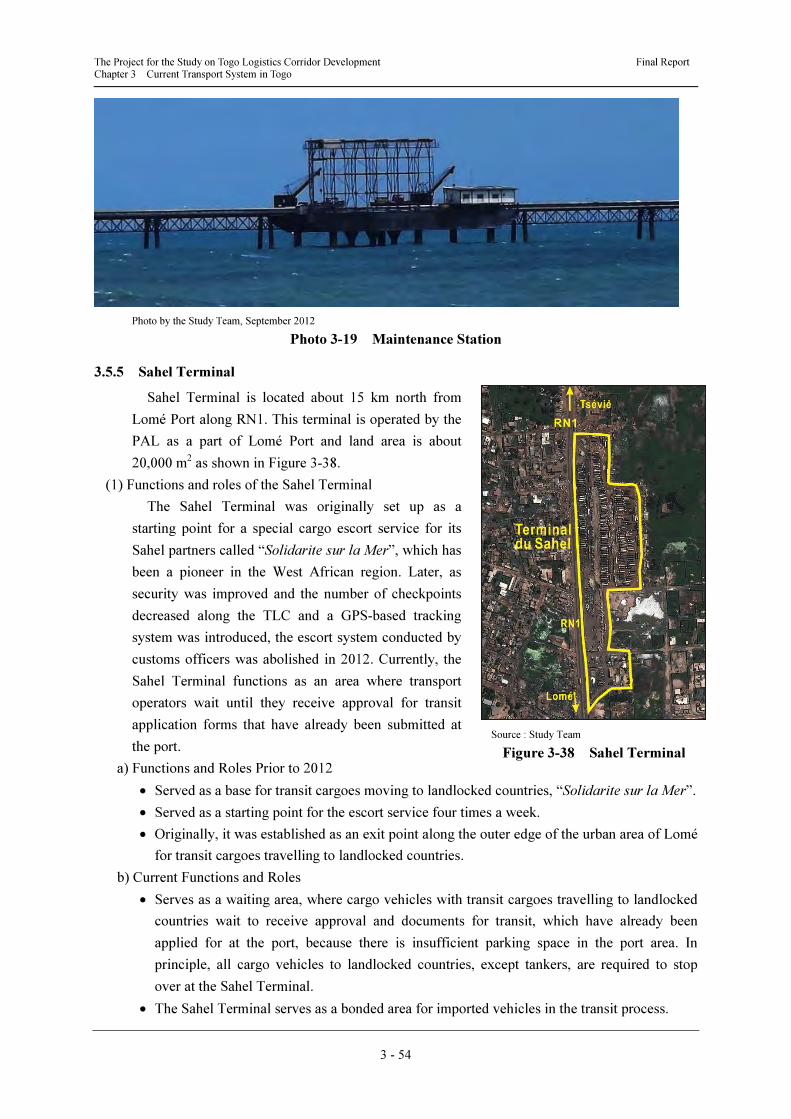
The Project for the Study on Togo Logistics Corridor Development Final Report Chapter 3 Current Transport System in Togo
3 - 54
Photo by the Study Team, September 2012
Photo 3-19 Maintenance Station
3.5.5 Sahel Terminal
Sahel Terminal is located about 15 km north from
Lomé Port along RN1. This terminal is operated by the
PAL as a part of Lomé Port and land area is about
20,000 m2 as shown in Figure 3-38.
(1) Functions and roles of the Sahel Terminal
The Sahel Terminal was originally set up as a
starting point for a special cargo escort service for its
Sahel partners called “Solidarite sur la Mer”, which has
been a pioneer in the West African region. Later, as
security was improved and the number of checkpoints
decreased along the TLC and a GPS-based tracking
system was introduced, the escort system conducted by
customs officers was abolished in 2012. Currently, the
Sahel Terminal functions as an area where transport
operators wait until they receive approval for transit
application forms that have already been submitted at
the port.
a) Functions and Roles Prior to 2012
• Served as a base for transit cargoes moving to landlocked countries, “Solidarite sur la Mer”.
• Served as a starting point for the escort service four times a week.
• Originally, it was established as an exit point along the outer edge of the urban area of Lomé
for transit cargoes travelling to landlocked countries.
b) Current Functions and Roles
• Serves as a waiting area, where cargo vehicles with transit cargoes travelling to landlocked
countries wait to receive approval and documents for transit, which have already been
applied for at the port, because there is insufficient parking space in the port area. In
principle, all cargo vehicles to landlocked countries, except tankers, are required to stop
over at the Sahel Terminal.
• The Sahel Terminal serves as a bonded area for imported vehicles in the transit process.
Source : Study Team
Figure 3-38 Sahel Terminal
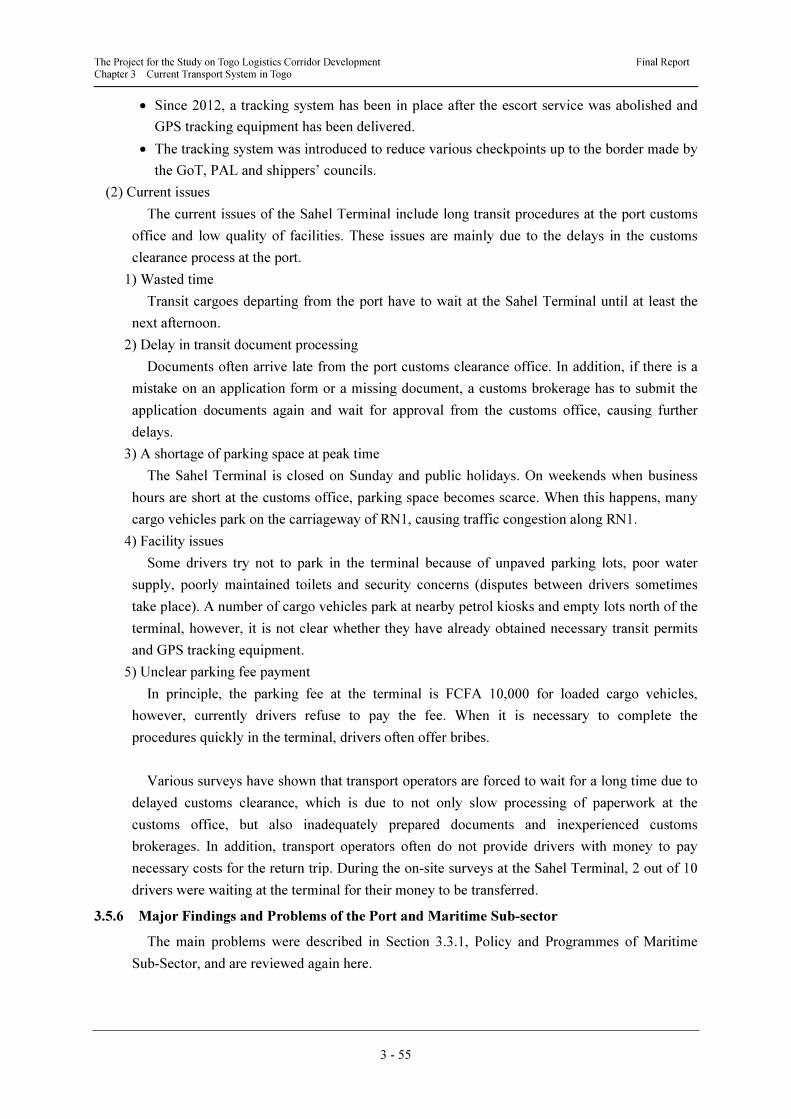
The Project for the Study on Togo Logistics Corridor Development Final Report Chapter 3 Current Transport System in Togo
3 - 55
• Since 2012, a tracking system has been in place after the escort service was abolished and
GPS tracking equipment has been delivered.
• The tracking system was introduced to reduce various checkpoints up to the border made by
the GoT, PAL and shippers’ councils.
(2) Current issues
The current issues of the Sahel Terminal include long transit procedures at the port customs
office and low quality of facilities. These issues are mainly due to the delays in the customs
clearance process at the port.
1) Wasted time
Transit cargoes departing from the port have to wait at the Sahel Terminal until at least the
next afternoon.
2) Delay in transit document processing
Documents often arrive late from the port customs clearance office. In addition, if there is a
mistake on an application form or a missing document, a customs brokerage has to submit the
application documents again and wait for approval from the customs office, causing further
delays.
3) A shortage of parking space at peak time
The Sahel Terminal is closed on Sunday and public holidays. On weekends when business
hours are short at the customs office, parking space becomes scarce. When this happens, many
cargo vehicles park on the carriageway of RN1, causing traffic congestion along RN1.
4) Facility issues
Some drivers try not to park in the terminal because of unpaved parking lots, poor water
supply, poorly maintained toilets and security concerns (disputes between drivers sometimes
take place). A number of cargo vehicles park at nearby petrol kiosks and empty lots north of the
terminal, however, it is not clear whether they have already obtained necessary transit permits
and GPS tracking equipment.
5) Unclear parking fee payment
In principle, the parking fee at the terminal is FCFA 10,000 for loaded cargo vehicles,
however, currently drivers refuse to pay the fee. When it is necessary to complete the
procedures quickly in the terminal, drivers often offer bribes.
Various surveys have shown that transport operators are forced to wait for a long time due to
delayed customs clearance, which is due to not only slow processing of paperwork at the
customs office, but also inadequately prepared documents and inexperienced customs
brokerages. In addition, transport operators often do not provide drivers with money to pay
necessary costs for the return trip. During the on-site surveys at the Sahel Terminal, 2 out of 10
drivers were waiting at the terminal for their money to be transferred.
3.5.6 Major Findings and Problems of the Port and Maritime Sub-sector
The main problems were described in Section 3.3.1, Policy and Programmes of Maritime
Sub-Sector, and are reviewed again here.
The Project for the Study on Togo Logistics Corridor Development Final Report Chapter 3 Current Transport System in Togo
3 - 56
(1) Shortage of the Quay Capacity due to Increasing Volume of Trade
a) Wharf No. 1 (general cargo ship, grain bulk carrier)
The number of vessels is decreasing year by year due to the growth of cargo containerisation.
However, most of the goods handled are foods, daily necessities and construction materials that
are essential for daily life for the people of Togo and landlocked countries. The imported goods
include those that cannot be containerised. Small and medium sized cargo ships of neighbouring
countries use this wharf. If Lomé Port becomes a hub port for West Africa, the trade volume
between Togo and neighbouring countries will increase as those countries develop. Overall, the
cargo handling volume at this wharf is likely to change slowly rather than abruptly.
If Togo and neighbouring countries develop dramatically, the trade volume at Lomé Port will
increase and the wharf will become insufficient. In this case, extension of the wharf to the
southeast should be examined, where there is enough space as shown in Figure 3-39.
Source: The Summary of the Leading Plan of Port of Lomé
Figure 3-39 Plan of the Wharf No. 1
b) Wharf No. 2 (container cargo ship, Ro-Ro ship)
The Wharf No. 2 is reaching its capacity, as is widely known by the GoT and the PAL. The
Third Quay Project was started in May 2011. In addition, the Lomé Container Terminal Project
was also started. Once the two projects are completed, the container handling capacity at Wharf
No. 2 will be sufficient.
c) Ore Quay (mineral bulk carrier)
The main goods handled are clinker, cement, gypsum, limestone and coal. Clinker accounts
for the biggest volume of imports at 74% (1.75 million tonnes) of the total volume (2.36 million
tonnes) handled by this quay in 2011. The handling volume of the quay has already reached its
limit, and ships must frequently wait for a berth.
Ore bulk carriers arriving range from 40,000 DWT to 50,000 DWT, with a length of 220 m.
There is only one berth, with a length of 165 m, which is too short. The unloading capacity is
10,000 tonnes/day, because the ore is unloaded by cargo crane and transported by dump trucks.
It takes six days to unload one ore bulk carrier of 50,000 DWT.
There are two big problems: extension of the Ore Quay, and improvement and speeding up of
the unloading system.
The Project for the Study on Togo Logistics Corridor Development Final Report Chapter 3 Current Transport System in Togo
3 - 57
d) Oil Jetty (oil tanker)
There are no problems at this jetty now or in the future.
(2) Land Facilities at the Port
There are many trucks parked along all roads in the port, and many empty trucks parked
along the roads outside of the port.
According to a local rule at Lomé Port, trucks cannot stay in the port for longer than 48 hours,
but this violates the International Ship and Port Facility Security (ISPS) standard, which is
within 24 hours. If trucks go out of the port within 48 hours, the congestion caused by parked
trucks will not happen. The wide road around the port is only 50% effective due to the parked
trucks along the road.
Possible causes of the truck congestion in the port are:
a) Time for Devanning
There are many less than container load (LCL) containers but only one devanning place in
the port because the port area is limited.
b) Time for X-rays Checking
X-ray checking takes about 20 minutes per container on the truck.
c) Time for Documentation Work of the Tariffs
Trucks often wait five days in the port to get the documents.
To solve the problem of trucks parking outside of the port, traffic rules and police control are
necessary, as well as sufficient parking area. This problem should be considered in connection
with other fields of this project. Unloaded cargo should be taken out of the port as soon as
possible.
3.6 Present Situation of Air Transport Sub-sector
3.6.1 Airport
There are two international airports and six aerodromes in Togo. Only Lomé Gnassingbe
Eyadéma International Airport is used for scheduled flights, while the domestic air route
connecting Lomé and Niamutougou International Airport (Kara) ceased operation in 2004. As a
result, all international flights use the Lomé International Airport. Table 3-22 lists the airports
and aerodromes in Togo.
Table 3-22 Outline of Airports and Aerodromes in Togo
Type Name Runway Length
(m)
Operation Terminal
Facility
International Lomé Gnassingbe Eyadéma 3,500 24 hours Yes
Niamutougou (Kara) 2,500 12 hours Yes
Aerodrome Seazambiani (Dapaong) 2,600 - No
Sansané-Mango (Mango) 2,100 - No
Bethania (Agou) 2,100 - No
Katambara (Sokodé) 2,600 - No
Kolocopé (Elavagnon Est-Mono) 2,100 - No
Akpaka (Kamina Ogou) 2,100 - No
Source: ANAC
The GoT started to construct a new international passenger terminal at Lomé International
The Project for the Study on Togo Logistics Corridor Development Final Report Chapter 3 Current Transport System in Togo
3 - 58
Airport in August 2012, with financial assistance of the EXEM Bank of China, and it is
expected to be completed by the middle of 2014. In addition, air terminal facilities at
Niamutougou International Airport, including immigration and custom facilities, are ready to
accept any flight.
3.6.2 Air Traffic
(1) Air Traffic at Lomé International Airport
Table 3-23 shows the air traffic at Lomé International Airport between 2002 and 2011. The
number of passengers has drastically increased since 2010. This increase is considered to be the
result of the establishment of ASKY Airlines, which is a purely private company with some
support from Ethiopian Airlines.
Table 3-23 Air Traffic at Lomé International Airport
Item 2002 2003 2004 2005 2006 2007 2008 2009 2010 2011
Passengers
Arrived
74,933 82,966 90,815 76,267 95,467 97,221 103,358 99,341 159,293 229,167
Passengers
Departed
81,990 88,140 95,806 80,152 95,752 99,534 104,972 102,315 159,182 241,817
Passengers
in Transit
43,323 44,557 47,836 62,547 106,550 77,480 58,766 39,423 63,709 80,624
Air Cargo
(tonne)
4,933 6,626 9,790 9,391 11,915 14,738 14,740 10,253 9,084 8,430
No. of Arrived
Aircraft
3,053 2,962 3,418 2,977 3,801 3,777 3,588 3,139 4,961 5,484
Source: ANAC
(2) Air Transportation
Seven airlines operate international flight to/from Lomé International Airport. Of these
airlines, ASKY Airlines operates 43 flights per week and uses Lomé International Airport as its
hub airport. ASKY Airlines is going to operate the Lomé – Rio de Janeiro route as a code share
flight with Ethiopian Airlines from December 2012. Also, ASKY Airlines and Ethiopian
Airlines have already studied Niamutougou Airport for the possible resumption of operation of
the Lomé – Niamutougou sector.
3.7 Summary of Transit Transport on the TLC
3.7.1 Transit Transport System
Figure 3-40 illustrates the system of transit cargo transport on an international transport
corridor, which connects a coastal country with a port and a landlocked country. Basically, this
transit transport system starts from a port, utilises road transport (possibly the railway in some
countries), involves cross-border formalities on both sides of the border, followed by road
transport again and arrives at the final customs clearance terminal in the landlocked country.
Hence, transit cargo transport related for a landlocked country requires crossing a border at least
once to gain access to/from a port.
The current situation of transit cargo transport is described below based on the fact-finding
survey by the Study Team along the TLC, which connects Lomé Port and Ouagadougou, the
capital of Burkina Faso. The situations of transit cargo transport on other international corridors
in the West African sub-region are considered to be similar to that on the TLC.
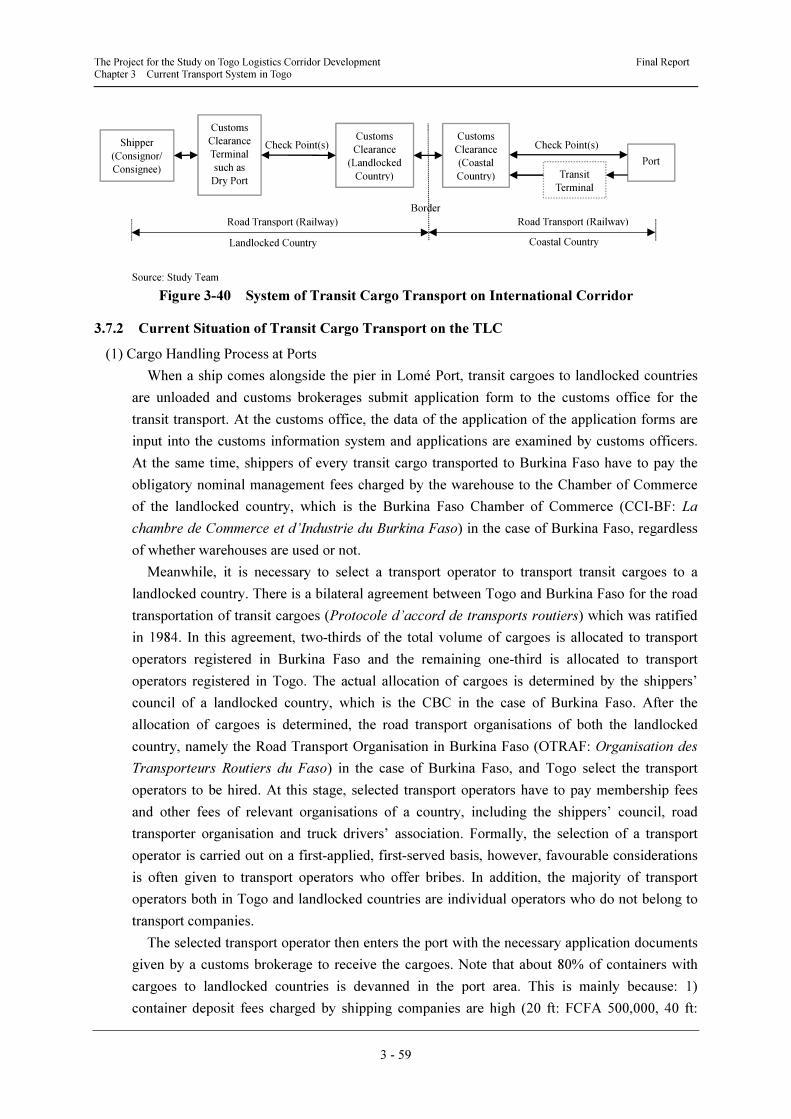
The Project for the Study on Togo Logistics Corridor Development Final Report Chapter 3 Current Transport System in Togo
3 - 59
Source: Study Team
Figure 3-40 System of Transit Cargo Transport on International Corridor
3.7.2 Current Situation of Transit Cargo Transport on the TLC
(1) Cargo Handling Process at Ports
When a ship comes alongside the pier in Lomé Port, transit cargoes to landlocked countries
are unloaded and customs brokerages submit application form to the customs office for the
transit transport. At the customs office, the data of the application of the application forms are
input into the customs information system and applications are examined by customs officers.
At the same time, shippers of every transit cargo transported to Burkina Faso have to pay the
obligatory nominal management fees charged by the warehouse to the Chamber of Commerce
of the landlocked country, which is the Burkina Faso Chamber of Commerce (CCI-BF: La
chambre de Commerce et d’Industrie du Burkina Faso) in the case of Burkina Faso, regardless
of whether warehouses are used or not.
Meanwhile, it is necessary to select a transport operator to transport transit cargoes to a
landlocked country. There is a bilateral agreement between Togo and Burkina Faso for the road
transportation of transit cargoes (Protocole d’accord de transports routiers) which was ratified
in 1984. In this agreement, two-thirds of the total volume of cargoes is allocated to transport
operators registered in Burkina Faso and the remaining one-third is allocated to transport
operators registered in Togo. The actual allocation of cargoes is determined by the shippers’
council of a landlocked country, which is the CBC in the case of Burkina Faso. After the
allocation of cargoes is determined, the road transport organisations of both the landlocked
country, namely the Road Transport Organisation in Burkina Faso (OTRAF: Organisation des
Transporteurs Routiers du Faso) in the case of Burkina Faso, and Togo select the transport
operators to be hired. At this stage, selected transport operators have to pay membership fees
and other fees of relevant organisations of a country, including the shippers’ council, road
transporter organisation and truck drivers’ association. Formally, the selection of a transport
operator is carried out on a first-applied, first-served basis, however, favourable considerations
is often given to transport operators who offer bribes. In addition, the majority of transport
operators both in Togo and landlocked countries are individual operators who do not belong to
transport companies.
The selected transport operator then enters the port with the necessary application documents
given by a customs brokerage to receive the cargoes. Note that about 80% of containers with
cargoes to landlocked countries is devanned in the port area. This is mainly because: 1)
container deposit fees charged by shipping companies are high (20 ft: FCFA 500,000, 40 ft:
Shipper
(Consignor/
Consignee)
Customs
Clearance
Terminal
such as
Dry Port
Customs
Clearance
(Landlocked
Country)
Customs
Clearance
(Coastal
Country) Transit
Terminal
Port
Check Point(s) Check Point(s)
Road Transport (Railway) Road Transport (Railway)
Landlocked Country Coastal Country
Border
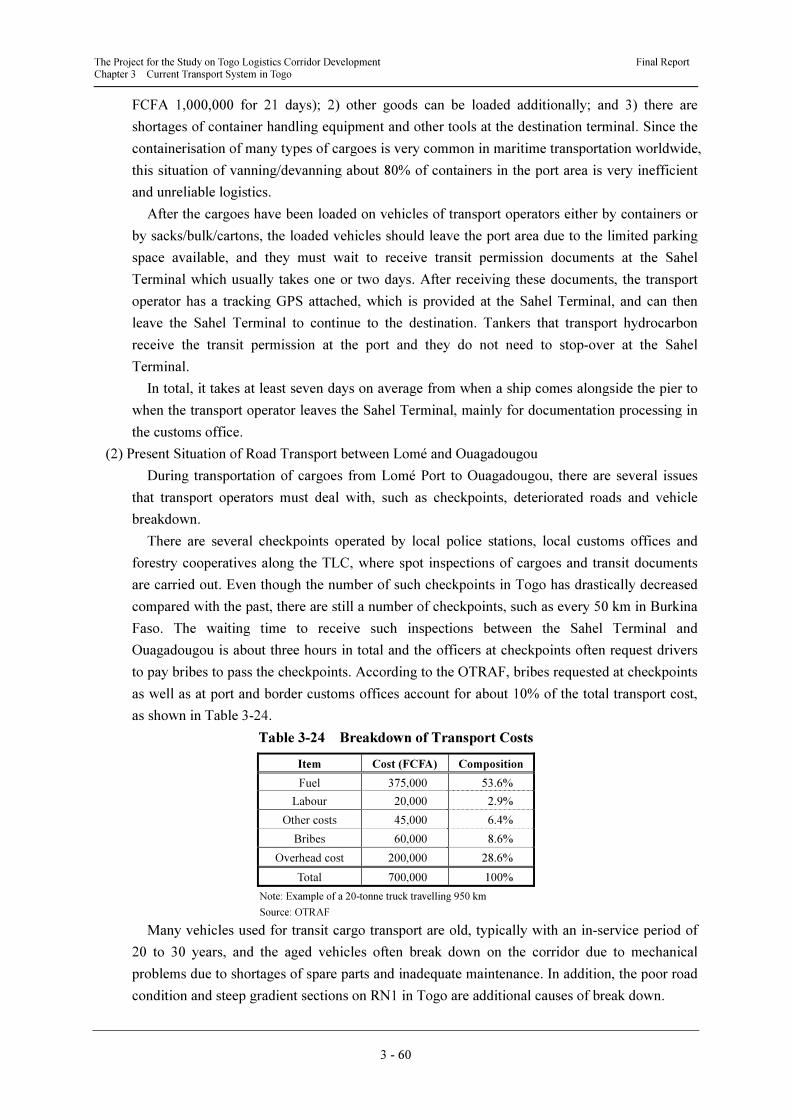
The Project for the Study on Togo Logistics Corridor Development Final Report Chapter 3 Current Transport System in Togo
3 - 60
FCFA 1,000,000 for 21 days); 2) other goods can be loaded additionally; and 3) there are
shortages of container handling equipment and other tools at the destination terminal. Since the
containerisation of many types of cargoes is very common in maritime transportation worldwide,
this situation of vanning/devanning about 80% of containers in the port area is very inefficient
and unreliable logistics.
After the cargoes have been loaded on vehicles of transport operators either by containers or
by sacks/bulk/cartons, the loaded vehicles should leave the port area due to the limited parking
space available, and they must wait to receive transit permission documents at the Sahel
Terminal which usually takes one or two days. After receiving these documents, the transport
operator has a tracking GPS attached, which is provided at the Sahel Terminal, and can then
leave the Sahel Terminal to continue to the destination. Tankers that transport hydrocarbon
receive the transit permission at the port and they do not need to stop-over at the Sahel
Terminal.
In total, it takes at least seven days on average from when a ship comes alongside the pier to
when the transport operator leaves the Sahel Terminal, mainly for documentation processing in
the customs office.
(2) Present Situation of Road Transport between Lomé and Ouagadougou
During transportation of cargoes from Lomé Port to Ouagadougou, there are several issues
that transport operators must deal with, such as checkpoints, deteriorated roads and vehicle
breakdown.
There are several checkpoints operated by local police stations, local customs offices and
forestry cooperatives along the TLC, where spot inspections of cargoes and transit documents
are carried out. Even though the number of such checkpoints in Togo has drastically decreased
compared with the past, there are still a number of checkpoints, such as every 50 km in Burkina
Faso. The waiting time to receive such inspections between the Sahel Terminal and
Ouagadougou is about three hours in total and the officers at checkpoints often request drivers
to pay bribes to pass the checkpoints. According to the OTRAF, bribes requested at checkpoints
as well as at port and border customs offices account for about 10% of the total transport cost,
as shown in Table 3-24.
Table 3-24 Breakdown of Transport Costs
Item Cost (FCFA) Composition
Fuel 375,000 53.6%
Labour 20,000 2.9%
Other costs 45,000 6.4%
Bribes 60,000 8.6%
Overhead cost 200,000 28.6%
Total 700,000 100%
Note: Example of a 20-tonne truck travelling 950 km
Source: OTRAF
Many vehicles used for transit cargo transport are old, typically with an in-service period of
20 to 30 years, and the aged vehicles often break down on the corridor due to mechanical
problems due to shortages of spare parts and inadequate maintenance. In addition, the poor road
condition and steep gradient sections on RN1 in Togo are additional causes of break down.
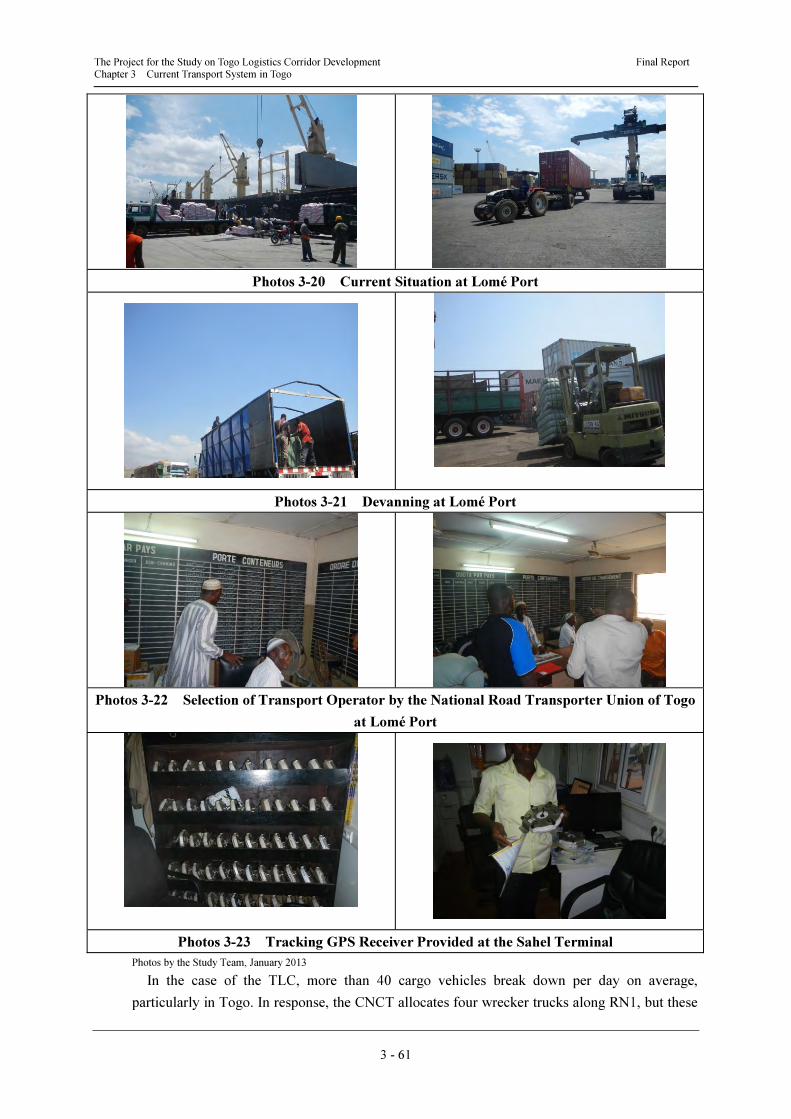
The Project for the Study on Togo Logistics Corridor Development Final Report Chapter 3 Current Transport System in Togo
3 - 61
Photos 3-20 Current Situation at Lomé Port
Photos 3-21 Devanning at Lomé Port
Photos 3-22 Selection of Transport Operator by the National Road Transporter Union of Togo
at Lomé Port
Photos 3-23 Tracking GPS Receiver Provided at the Sahel Terminal
Photos by the Study Team, January 2013
In the case of the TLC, more than 40 cargo vehicles break down per day on average,
particularly in Togo. In response, the CNCT allocates four wrecker trucks along RN1, but these
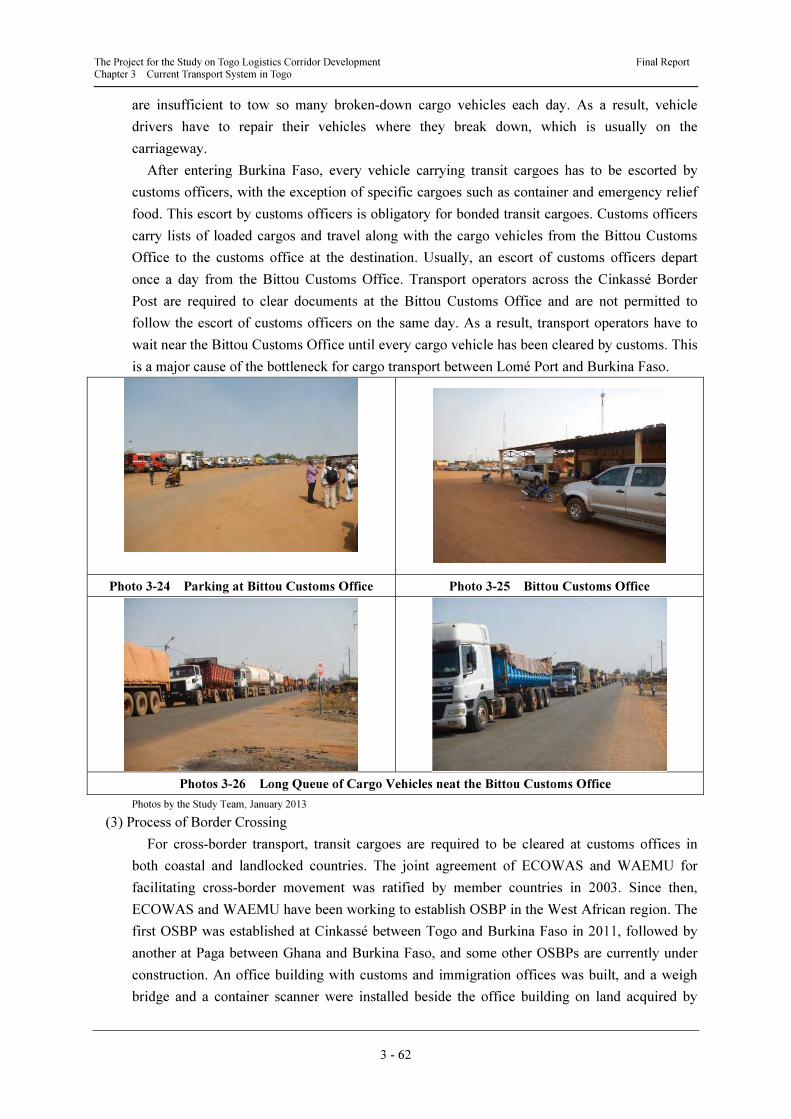
The Project for the Study on Togo Logistics Corridor Development Final Report Chapter 3 Current Transport System in Togo
3 - 62
are insufficient to tow so many broken-down cargo vehicles each day. As a result, vehicle
drivers have to repair their vehicles where they break down, which is usually on the
carriageway.
After entering Burkina Faso, every vehicle carrying transit cargoes has to be escorted by
customs officers, with the exception of specific cargoes such as container and emergency relief
food. This escort by customs officers is obligatory for bonded transit cargoes. Customs officers
carry lists of loaded cargos and travel along with the cargo vehicles from the Bittou Customs
Office to the customs office at the destination. Usually, an escort of customs officers depart
once a day from the Bittou Customs Office. Transport operators across the Cinkassé Border
Post are required to clear documents at the Bittou Customs Office and are not permitted to
follow the escort of customs officers on the same day. As a result, transport operators have to
wait near the Bittou Customs Office until every cargo vehicle has been cleared by customs. This
is a major cause of the bottleneck for cargo transport between Lomé Port and Burkina Faso.
Photo 3-24 Parking at Bittou Customs Office Photo 3-25 Bittou Customs Office
Photos 3-26 Long Queue of Cargo Vehicles neat the Bittou Customs Office
Photos by the Study Team, January 2013
(3) Process of Border Crossing
For cross-border transport, transit cargoes are required to be cleared at customs offices in
both coastal and landlocked countries. The joint agreement of ECOWAS and WAEMU for
facilitating cross-border movement was ratified by member countries in 2003. Since then,
ECOWAS and WAEMU have been working to establish OSBP in the West African region. The
first OSBP was established at Cinkassé between Togo and Burkina Faso in 2011, followed by
another at Paga between Ghana and Burkina Faso, and some other OSBPs are currently under
construction. An office building with customs and immigration offices was built, and a weigh
bridge and a container scanner were installed beside the office building on land acquired by
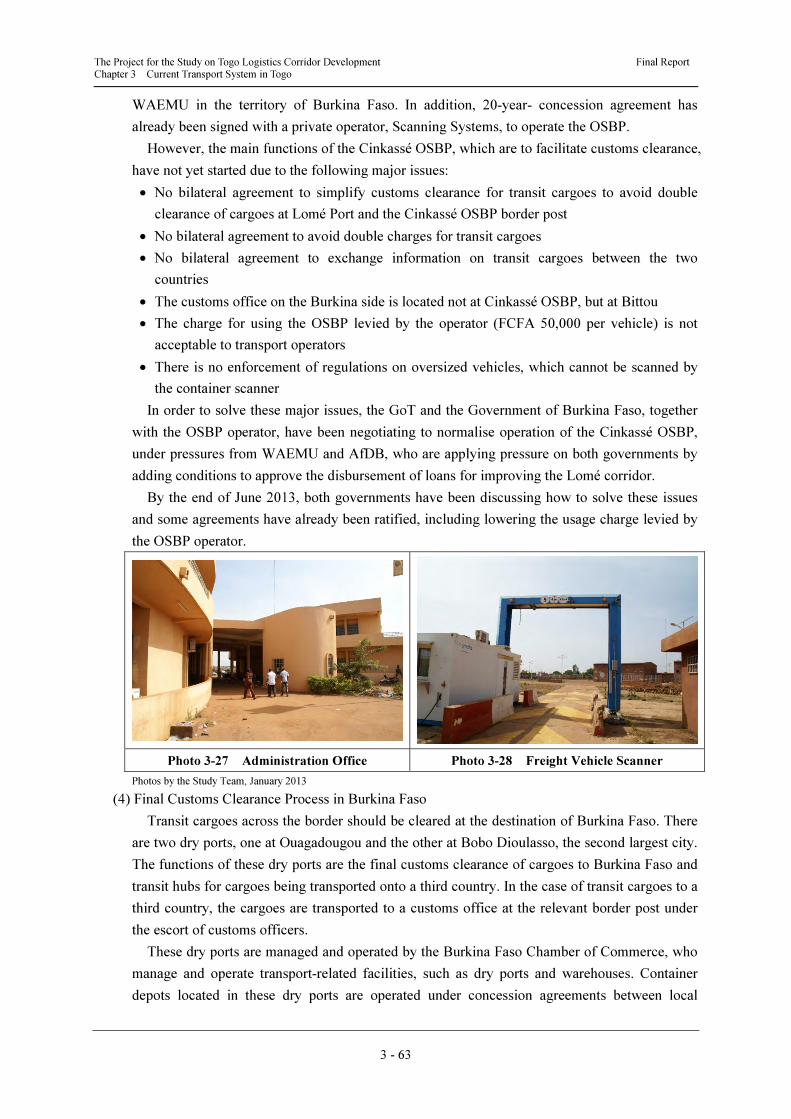
The Project for the Study on Togo Logistics Corridor Development Final Report Chapter 3 Current Transport System in Togo
3 - 63
WAEMU in the territory of Burkina Faso. In addition, 20-year- concession agreement has
already been signed with a private operator, Scanning Systems, to operate the OSBP.
However, the main functions of the Cinkassé OSBP, which are to facilitate customs clearance,
have not yet started due to the following major issues:
• No bilateral agreement to simplify customs clearance for transit cargoes to avoid double
clearance of cargoes at Lomé Port and the Cinkassé OSBP border post
• No bilateral agreement to avoid double charges for transit cargoes
• No bilateral agreement to exchange information on transit cargoes between the two
countries
• The customs office on the Burkina side is located not at Cinkassé OSBP, but at Bittou
• The charge for using the OSBP levied by the operator (FCFA 50,000 per vehicle) is not
acceptable to transport operators
• There is no enforcement of regulations on oversized vehicles, which cannot be scanned by
the container scanner
In order to solve these major issues, the GoT and the Government of Burkina Faso, together
with the OSBP operator, have been negotiating to normalise operation of the Cinkassé OSBP,
under pressures from WAEMU and AfDB, who are applying pressure on both governments by
adding conditions to approve the disbursement of loans for improving the Lomé corridor.
By the end of June 2013, both governments have been discussing how to solve these issues
and some agreements have already been ratified, including lowering the usage charge levied by
the OSBP operator.
Photo 3-27 Administration Office Photo 3-28 Freight Vehicle Scanner
Photos by the Study Team, January 2013
(4) Final Customs Clearance Process in Burkina Faso
Transit cargoes across the border should be cleared at the destination of Burkina Faso. There
are two dry ports, one at Ouagadougou and the other at Bobo Dioulasso, the second largest city.
The functions of these dry ports are the final customs clearance of cargoes to Burkina Faso and
transit hubs for cargoes being transported onto a third country. In the case of transit cargoes to a
third country, the cargoes are transported to a customs office at the relevant border post under
the escort of customs officers.
These dry ports are managed and operated by the Burkina Faso Chamber of Commerce, who
manage and operate transport-related facilities, such as dry ports and warehouses. Container
depots located in these dry ports are operated under concession agreements between local
The Project for the Study on Togo Logistics Corridor Development Final Report Chapter 3 Current Transport System in Togo
3 - 64
companies
These ports function as customs clearance points for cargo transported to these cities or
transit hubs for cargo transported to other areas of the country or third countries. If the cargo is
to be transited to any other area or country, the port in Ouagadougou or Bobo Dioulasso
becomes the starting point and the cargo will be transported to the relevant border customs
office under the escort of customs officers. These dry ports are managed and operated by the
CCI-BF in Burkina Faso. It is characteristic that the CCI-BF acts as the manager and operator of
transport-related facilities such as terminals and warehouses. Container depots located in these
inland ports are operated under concession agreements between local companies and leading
freight forwarders.
The Study Team found that in one case, a transport operator was waiting for more than one
week in the dry port to complete customs clearance procedure because the consignee did not
have enough money to clear the cargoes.
(5) Bottleneck Factors for Transit Cargo Transport
The Study Team identified the following major bottleneck factors through the fact-finding
survey in Togo and Burkina Faso.
a) Issues Related to Infrastructure
• Low level of maintenance at Lomé Port
• Deteriorated road condition on RN1 in Togo
b) Issues Related to Vehicles
• Aged freight vehicles and insufficient maintenance
• Many broken-down vehicles, which occupy the carriageway
• Many overloaded and oversized vehicles
c) Issues Related to Transit Cargo Transport Systems
• Complicated and inefficient customs clearance processes, which involve many parties
• Inappropriate and inexperienced customs brokerages, who prepare customs clearance
documents
• Customs clearance documents forms and customs data systems are not interchangeable
between Togo and Burkina Faso
• Customs clearance documents are not well maintained
• Transport operators are often requested to pay bribes at the port, the border and checkpoints
in order to pass these points without delay or cargo inspection
Of these issues, a) issues related to infrastructures are caused by shortage of funds, while b)
issues related to vehicles and c) issues related to transit cargo transport systems are key
problems. In the case of Burkina Faso, because the income and corporate tax systems are not
well established, import taxes and other levies on import/export cargoes are a stable source of
income. Also, an increase of import/export cargoes can generate more job opportunities and
higher income for private companies.
In conclusion, the transit cargo transport systems in Togo and Burkina Faso are still not
efficient and must be improved as a manner of international logistics standard.
CHAPTER 4
OUTLINE OF EXISTING
DEVELOPMENT
PROJECTS/PLANS
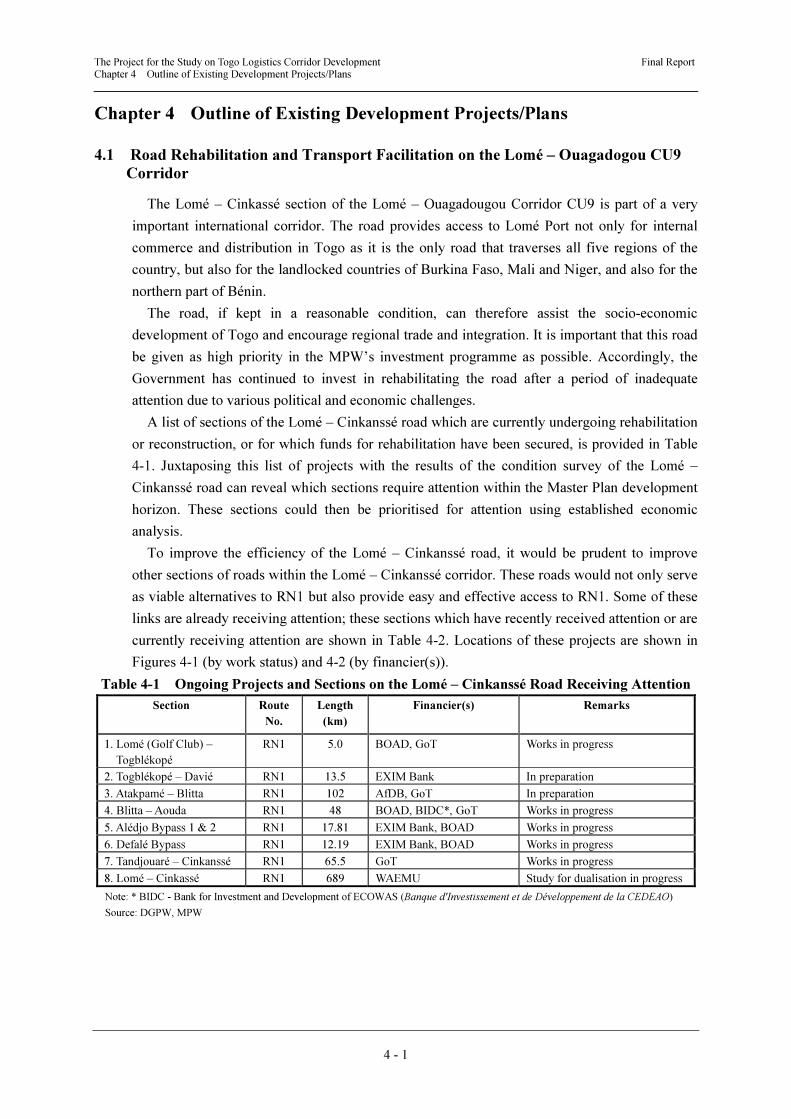
The Project for the Study on Togo Logistics Corridor Development Final Report Chapter 4 Outline of Existing Development Projects/Plans
4 - 1
Chapter 4 Outline of Existing Development Projects/Plans
4.1 Road Rehabilitation and Transport Facilitation on the Lomé – Ouagadogou CU9
Corridor
The Lomé – Cinkassé section of the Lomé – Ouagadougou Corridor CU9 is part of a very
important international corridor. The road provides access to Lomé Port not only for internal
commerce and distribution in Togo as it is the only road that traverses all five regions of the
country, but also for the landlocked countries of Burkina Faso, Mali and Niger, and also for the
northern part of Bénin.
The road, if kept in a reasonable condition, can therefore assist the socio-economic
development of Togo and encourage regional trade and integration. It is important that this road
be given as high priority in the MPW’s investment programme as possible. Accordingly, the
Government has continued to invest in rehabilitating the road after a period of inadequate
attention due to various political and economic challenges.
A list of sections of the Lomé – Cinkanssé road which are currently undergoing rehabilitation
or reconstruction, or for which funds for rehabilitation have been secured, is provided in Table
4-1. Juxtaposing this list of projects with the results of the condition survey of the Lomé –
Cinkanssé road can reveal which sections require attention within the Master Plan development
horizon. These sections could then be prioritised for attention using established economic
analysis.
To improve the efficiency of the Lomé – Cinkanssé road, it would be prudent to improve
other sections of roads within the Lomé – Cinkanssé corridor. These roads would not only serve
as viable alternatives to RN1 but also provide easy and effective access to RN1. Some of these
links are already receiving attention; these sections which have recently received attention or are
currently receiving attention are shown in Table 4-2. Locations of these projects are shown in
Figures 4-1 (by work status) and 4-2 (by financier(s)).
Table 4-1 Ongoing Projects and Sections on the Lomé – Cinkanssé Road Receiving Attention
Section
Route
No.
Length
(km)
Financier(s) Remarks
1. Lomé (Golf Club) –
Togblékopé
RN1 5.0 BOAD, GoT Works in progress
2. Togblékopé – Davié RN1 13.5 EXIM Bank In preparation
3. Atakpamé – Blitta RN1 102 AfDB, GoT In preparation
4. Blitta – Aouda RN1 48 BOAD, BIDC*, GoT Works in progress
5. Alédjo Bypass 1 & 2 RN1 17.81 EXIM Bank, BOAD Works in progress
6. Defalé Bypass RN1 12.19 EXIM Bank, BOAD Works in progress
7. Tandjouaré – Cinkanssé RN1 65.5 GoT Works in progress
8. Lomé – Cinkassé RN1 689 WAEMU Study for dualisation in progress
Note: * BIDC - Bank for Investment and Development of ECOWAS (Banque d'Investissement et de Développement de la CEDEAO)
Source: DGPW, MPW
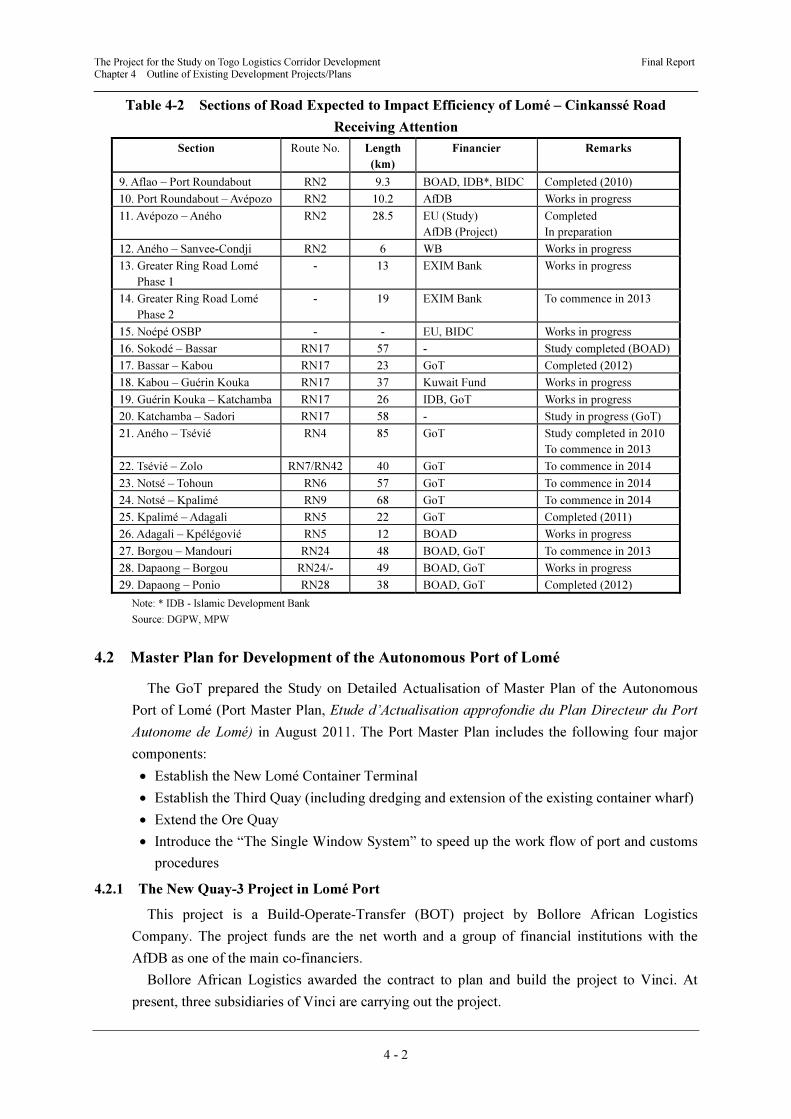
The Project for the Study on Togo Logistics Corridor Development Final Report Chapter 4 Outline of Existing Development Projects/Plans
4 - 2
Table 4-2 Sections of Road Expected to Impact Efficiency of Lomé – Cinkanssé Road
Receiving Attention
Section Route No. Length
(km)
Financier Remarks
9. Aflao – Port Roundabout RN2 9.3 BOAD, IDB*, BIDC Completed (2010)
10. Port Roundabout – Avépozo RN2 10.2 AfDB Works in progress
11. Avépozo – Aného RN2 28.5 EU (Study)
AfDB (Project)
Completed
In preparation
12. Aného – Sanvee-Condji RN2 6 WB Works in progress
13. Greater Ring Road Lomé
Phase 1
- 13 EXIM Bank Works in progress
14. Greater Ring Road Lomé
Phase 2
- 19 EXIM Bank To commence in 2013
15. Noépé OSBP - - EU, BIDC Works in progress
16. Sokodé – Bassar RN17 57 - Study completed (BOAD)
17. Bassar – Kabou RN17 23 GoT Completed (2012)
18. Kabou – Guérin Kouka RN17 37 Kuwait Fund Works in progress
19. Guérin Kouka – Katchamba RN17 26 IDB, GoT Works in progress
20. Katchamba – Sadori RN17 58 - Study in progress (GoT)
21. Aného – Tsévié RN4 85 GoT Study completed in 2010
To commence in 2013
22. Tsévié – Zolo RN7/RN42 40 GoT To commence in 2014
23. Notsé – Tohoun RN6 57 GoT To commence in 2014
24. Notsé – Kpalimé RN9 68 GoT To commence in 2014
25. Kpalimé – Adagali RN5 22 GoT Completed (2011)
26. Adagali – Kpélégovié RN5 12 BOAD Works in progress
27. Borgou – Mandouri RN24 48 BOAD, GoT To commence in 2013
28. Dapaong – Borgou RN24/- 49 BOAD, GoT Works in progress
29. Dapaong – Ponio RN28 38 BOAD, GoT Completed (2012)
Note: * IDB - Islamic Development Bank
Source: DGPW, MPW
4.2 Master Plan for Development of the Autonomous Port of Lomé
The GoT prepared the Study on Detailed Actualisation of Master Plan of the Autonomous
Port of Lomé (Port Master Plan, Etude d’Actualisation approfondie du Plan Directeur du Port
Autonome de Lomé) in August 2011. The Port Master Plan includes the following four major
components:
• Establish the New Lomé Container Terminal
• Establish the Third Quay (including dredging and extension of the existing container wharf)
• Extend the Ore Quay
• Introduce the “The Single Window System” to speed up the work flow of port and customs
procedures
4.2.1 The New Quay-3 Project in Lomé Port
This project is a Build-Operate-Transfer (BOT) project by Bollore African Logistics
Company. The project funds are the net worth and a group of financial institutions with the
AfDB as one of the main co-financiers.
Bollore African Logistics awarded the contract to plan and build the project to Vinci. At
present, three subsidiaries of Vinci are carrying out the project.
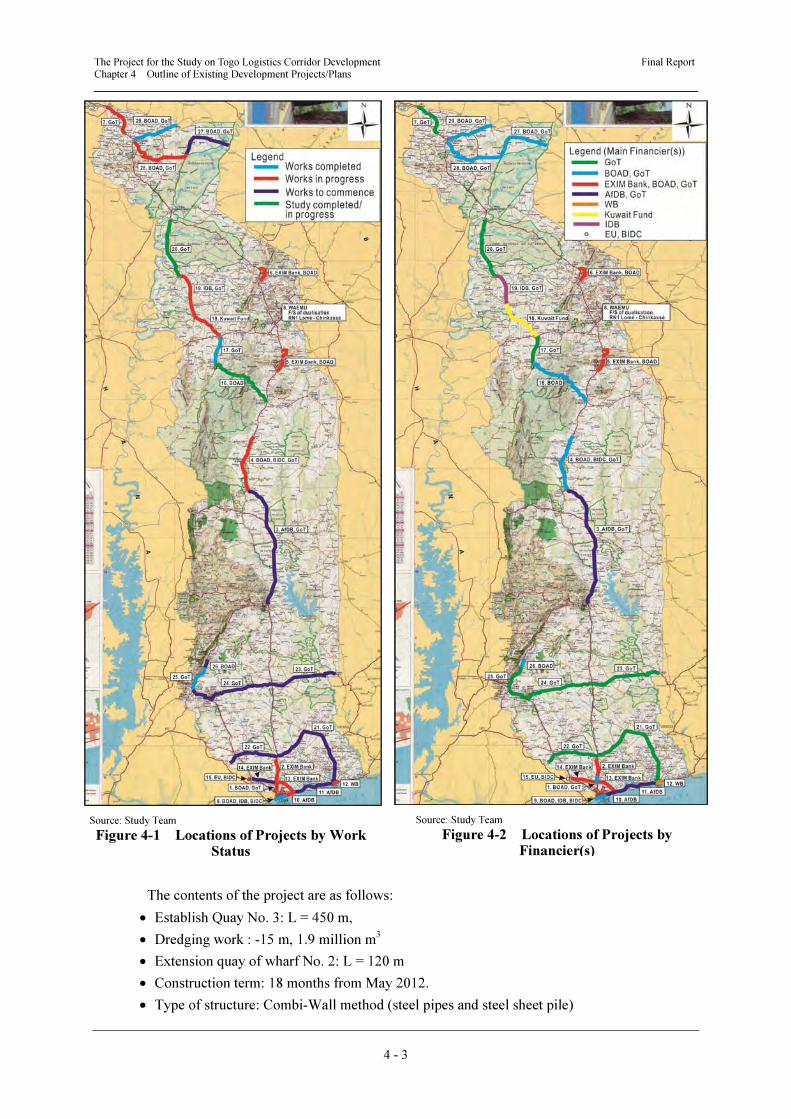
The Project for the Study on Togo Logistics Corridor Development Final Report Chapter 4 Outline of Existing Development Projects/Plans
4 - 3
The contents of the project are as follows:
• Establish Quay No. 3: L = 450 m,
• Dredging work : -15 m, 1.9 million m3
• Extension quay of wharf No. 2: L = 120 m
• Construction term: 18 months from May 2012.
• Type of structure: Combi-Wall method (steel pipes and steel sheet pile)
Source: Study Team
Figure 4-1 Locations of Projects by Work Status
Source: Study Team
Figure 4-2 Locations of Projects by Financier(s)
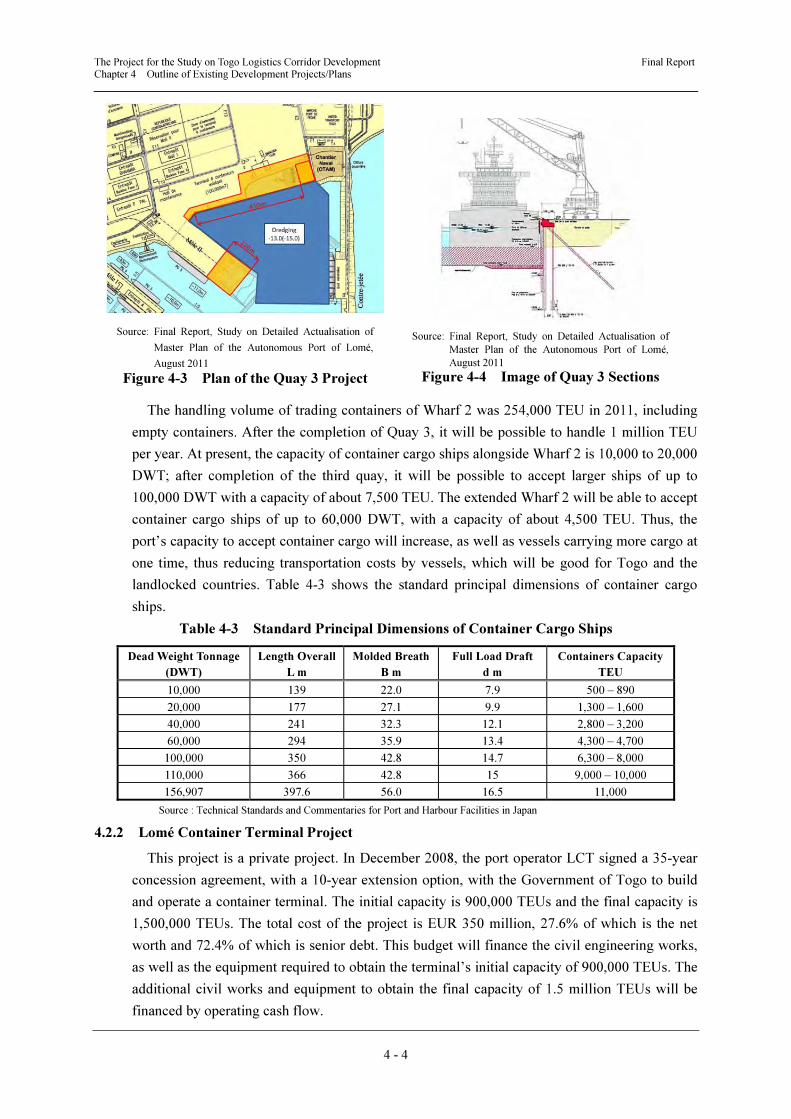
The Project for the Study on Togo Logistics Corridor Development Final Report Chapter 4 Outline of Existing Development Projects/Plans
4 - 4
The handling volume of trading containers of Wharf 2 was 254,000 TEU in 2011, including
empty containers. After the completion of Quay 3, it will be possible to handle 1 million TEU
per year. At present, the capacity of container cargo ships alongside Wharf 2 is 10,000 to 20,000
DWT; after completion of the third quay, it will be possible to accept larger ships of up to
100,000 DWT with a capacity of about 7,500 TEU. The extended Wharf 2 will be able to accept
container cargo ships of up to 60,000 DWT, with a capacity of about 4,500 TEU. Thus, the
port’s capacity to accept container cargo will increase, as well as vessels carrying more cargo at
one time, thus reducing transportation costs by vessels, which will be good for Togo and the
landlocked countries. Table 4-3 shows the standard principal dimensions of container cargo
ships.
Table 4-3 Standard Principal Dimensions of Container Cargo Ships
Dead Weight Tonnage
(DWT)
Length Overall
L m
Molded Breath
B m
Full Load Draft
d m
Containers Capacity
TEU
10,000 139 22.0 7.9 500 – 890
20,000 177 27.1 9.9 1,300 – 1,600
40,000 241 32.3 12.1 2,800 – 3,200
60,000 294 35.9 13.4 4,300 – 4,700
100,000 350 42.8 14.7 6,300 – 8,000
110,000 366 42.8 15 9,000 – 10,000
156,907 397.6 56.0 16.5 11,000
Source : Technical Standards and Commentaries for Port and Harbour Facilities in Japan
4.2.2 Lomé Container Terminal Project
This project is a private project. In December 2008, the port operator LCT signed a 35-year
concession agreement, with a 10-year extension option, with the Government of Togo to build
and operate a container terminal. The initial capacity is 900,000 TEUs and the final capacity is
1,500,000 TEUs. The total cost of the project is EUR 350 million, 27.6% of which is the net
worth and 72.4% of which is senior debt. This budget will finance the civil engineering works,
as well as the equipment required to obtain the terminal’s initial capacity of 900,000 TEUs. The
additional civil works and equipment to obtain the final capacity of 1.5 million TEUs will be
financed by operating cash flow.
Source: Final Report, Study on Detailed Actualisation of
Master Plan of the Autonomous Port of Lomé,
August 2011
Figure 4-3 Plan of the Quay 3 Project
Source: Final Report, Study on Detailed Actualisation of
Master Plan of the Autonomous Port of Lomé,
August 2011
Figure 4-4 Image of Quay 3 Sections
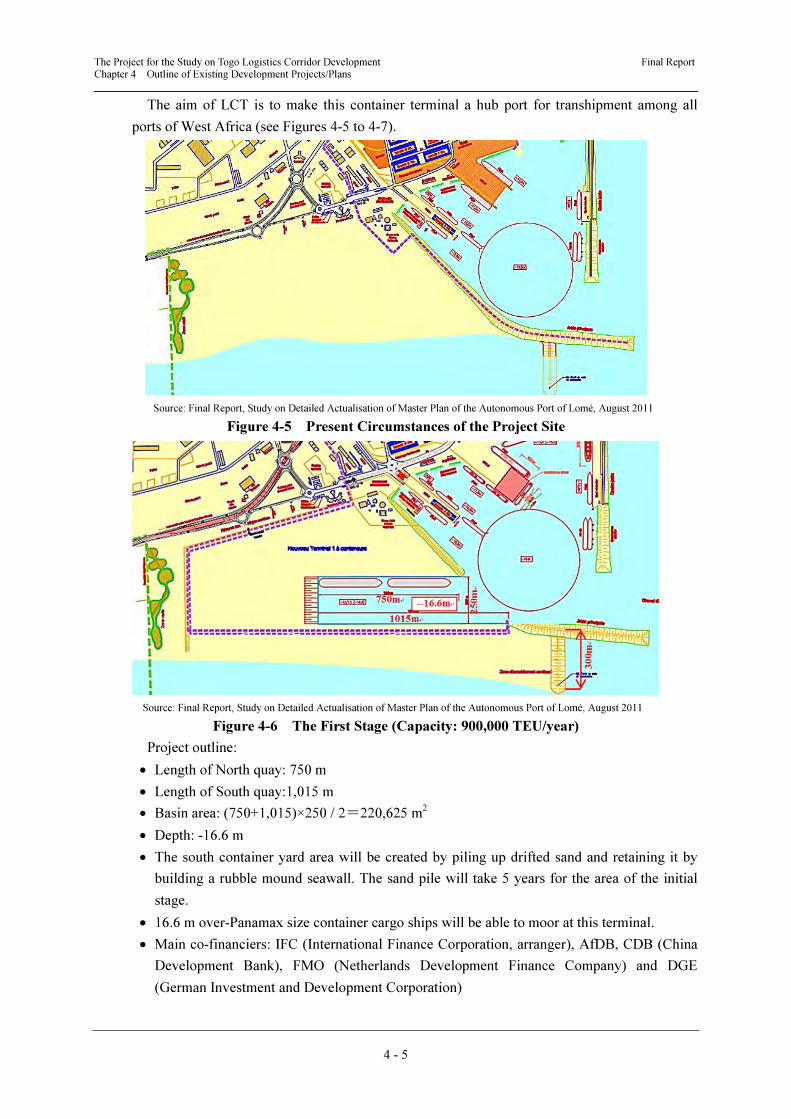
The Project for the Study on Togo Logistics Corridor Development Final Report Chapter 4 Outline of Existing Development Projects/Plans
4 - 5
The aim of LCT is to make this container terminal a hub port for transhipment among all
ports of West Africa (see Figures 4-5 to 4-7).
Source: Final Report, Study on Detailed Actualisation of Master Plan of the Autonomous Port of Lomé, August 2011
Figure 4-5 Present Circumstances of the Project Site
Source: Final Report, Study on Detailed Actualisation of Master Plan of the Autonomous Port of Lomé, August 2011
Figure 4-6 The First Stage (Capacity: 900,000 TEU/year)
Project outline:
• Length of North quay: 750 m
• Length of South quay:1,015 m
• Basin area: (750+1,015)×250 / 2=220,625 m2
• Depth: -16.6 m
• The south container yard area will be created by piling up drifted sand and retaining it by
building a rubble mound seawall. The sand pile will take 5 years for the area of the initial
stage.
• 16.6 m over-Panamax size container cargo ships will be able to moor at this terminal.
• Main co-financiers: IFC (International Finance Corporation, arranger), AfDB, CDB (China
Development Bank), FMO (Netherlands Development Finance Company) and DGE
(German Investment and Development Corporation)
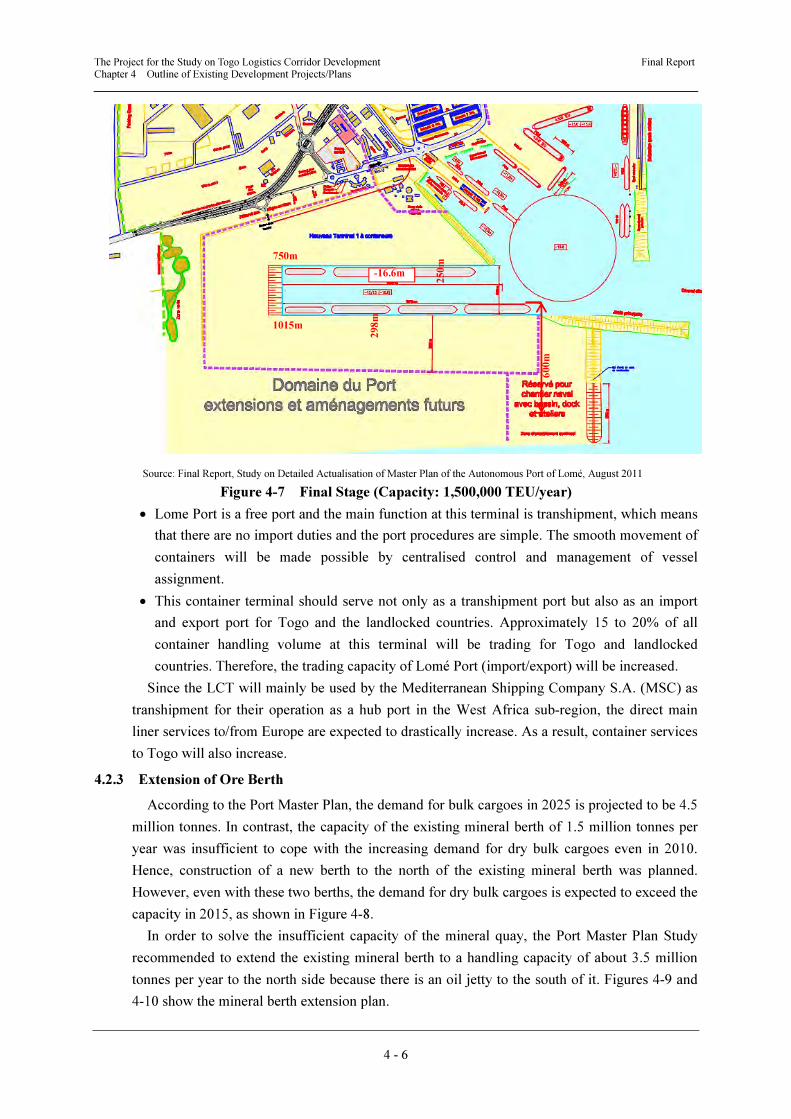
The Project for the Study on Togo Logistics Corridor Development Final Report Chapter 4 Outline of Existing Development Projects/Plans
4 - 6
Source: Final Report, Study on Detailed Actualisation of Master Plan of the Autonomous Port of Lomé, August 2011
Figure 4-7 Final Stage (Capacity: 1,500,000 TEU/year)
• Lome Port is a free port and the main function at this terminal is transhipment, which means
that there are no import duties and the port procedures are simple. The smooth movement of
containers will be made possible by centralised control and management of vessel
assignment.
• This container terminal should serve not only as a transhipment port but also as an import
and export port for Togo and the landlocked countries. Approximately 15 to 20% of all
container handling volume at this terminal will be trading for Togo and landlocked
countries. Therefore, the trading capacity of Lomé Port (import/export) will be increased.
Since the LCT will mainly be used by the Mediterranean Shipping Company S.A. (MSC) as
transhipment for their operation as a hub port in the West Africa sub-region, the direct main
liner services to/from Europe are expected to drastically increase. As a result, container services
to Togo will also increase.
4.2.3 Extension of Ore Berth
According to the Port Master Plan, the demand for bulk cargoes in 2025 is projected to be 4.5
million tonnes. In contrast, the capacity of the existing mineral berth of 1.5 million tonnes per
year was insufficient to cope with the increasing demand for dry bulk cargoes even in 2010.
Hence, construction of a new berth to the north of the existing mineral berth was planned.
However, even with these two berths, the demand for dry bulk cargoes is expected to exceed the
capacity in 2015, as shown in Figure 4-8.
In order to solve the insufficient capacity of the mineral quay, the Port Master Plan Study
recommended to extend the existing mineral berth to a handling capacity of about 3.5 million
tonnes per year to the north side because there is an oil jetty to the south of it. Figures 4-9 and
4-10 show the mineral berth extension plan.
1015m
250m
750m
-16.6m
298m
600m
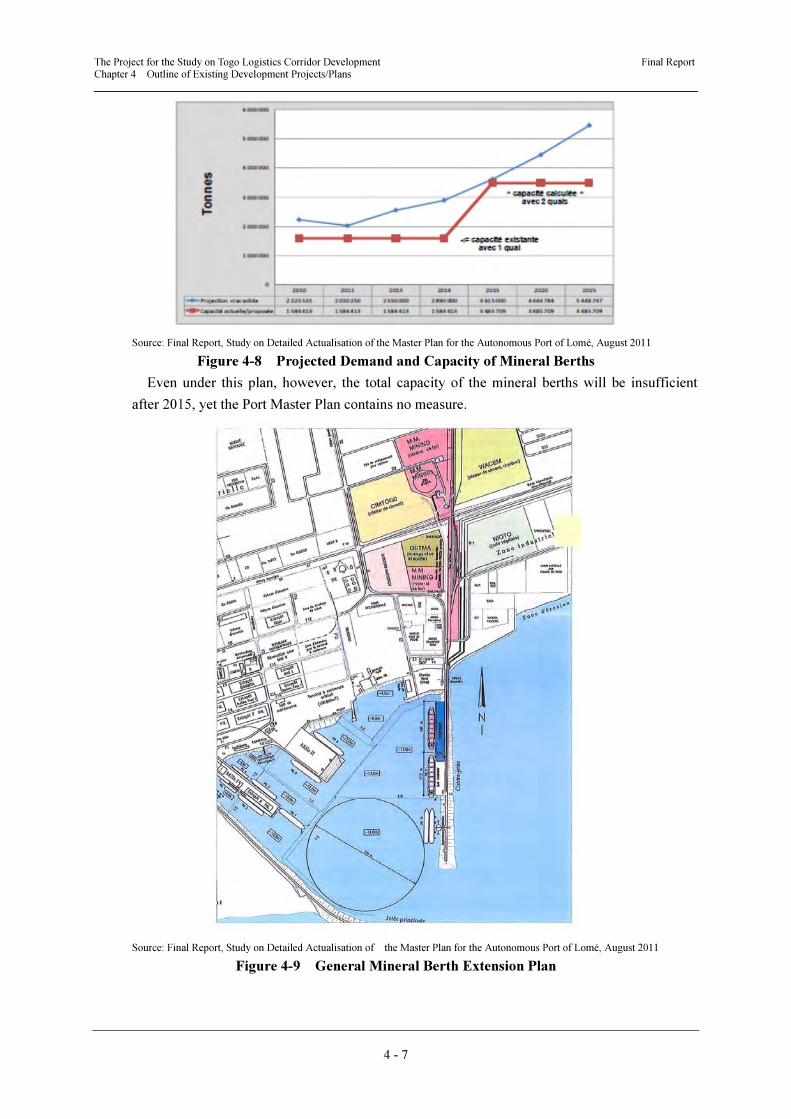
The Project for the Study on Togo Logistics Corridor Development Final Report Chapter 4 Outline of Existing Development Projects/Plans
4 - 7
Source: Final Report, Study on Detailed Actualisation of the Master Plan for the Autonomous Port of Lomé, August 2011
Figure 4-8 Projected Demand and Capacity of Mineral Berths
Even under this plan, however, the total capacity of the mineral berths will be insufficient
after 2015, yet the Port Master Plan contains no measure.
Source: Final Report, Study on Detailed Actualisation of the Master Plan for the Autonomous Port of Lomé, August 2011
Figure 4-9 General Mineral Berth Extension Plan
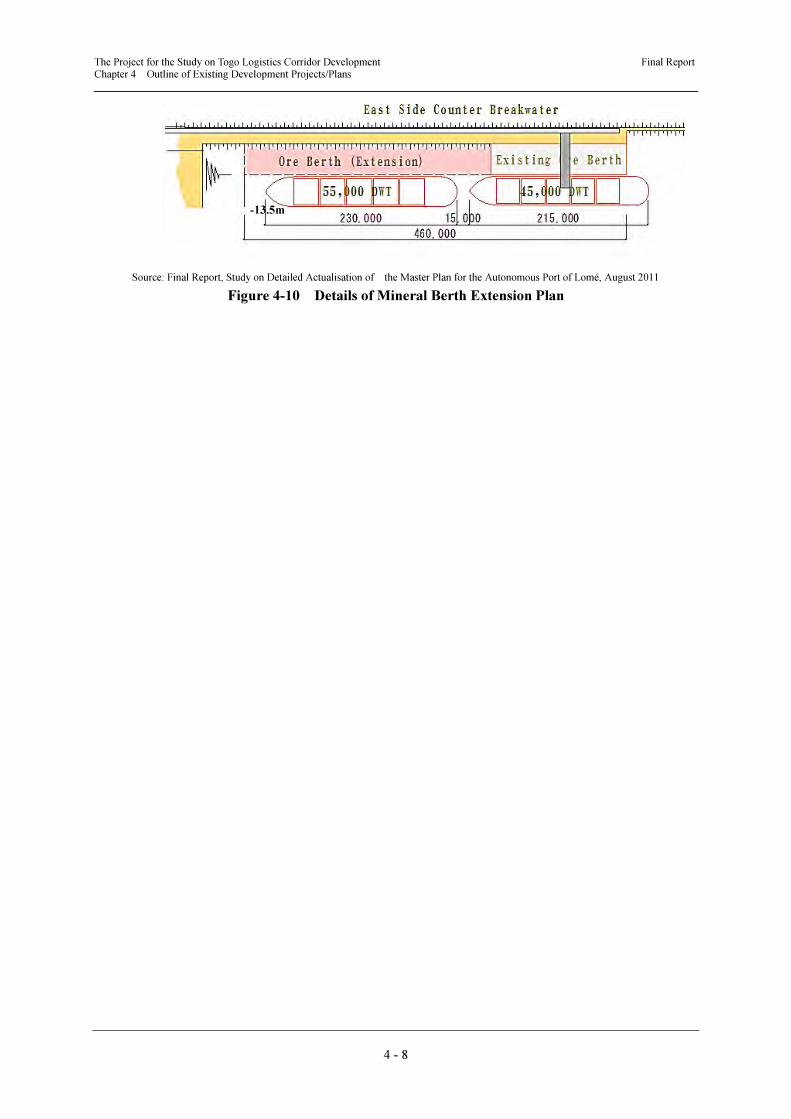
The Project for the Study on Togo Logistics Corridor Development Final Report Chapter 4 Outline of Existing Development Projects/Plans
4 - 8
Source: Final Report, Study on Detailed Actualisation of the Master Plan for the Autonomous Port of Lomé, August 2011
Figure 4-10 Details of Mineral Berth Extension Plan
-13.5m
CHAPTER 5
FUTURE TRAFFIC
DEMAND FORECAST
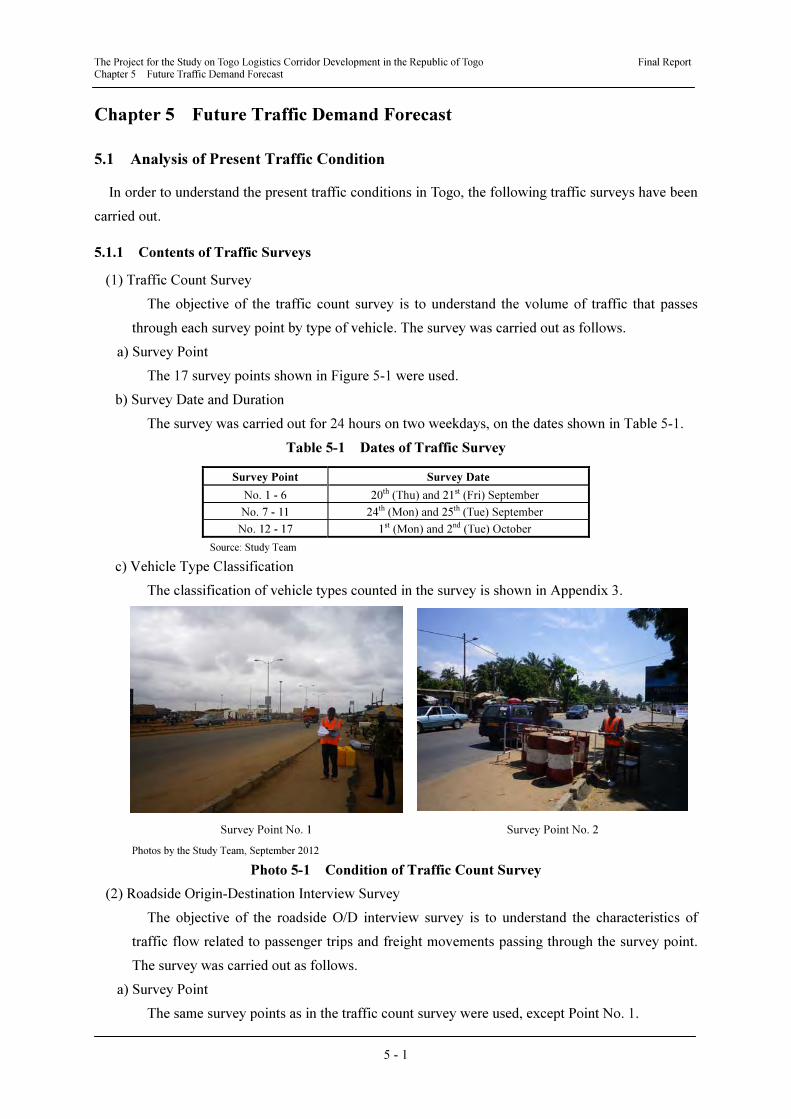
The Project for the Study on Togo Logistics Corridor Development in the Republic of Togo Final Report Chapter 5 Future Traffic Demand Forecast
5 - 1
Chapter 5 Future Traffic Demand Forecast
5.1 Analysis of Present Traffic Condition
In order to understand the present traffic conditions in Togo, the following traffic surveys have been
carried out.
5.1.1 Contents of Traffic Surveys
(1) Traffic Count Survey
The objective of the traffic count survey is to understand the volume of traffic that passes
through each survey point by type of vehicle. The survey was carried out as follows.
a) Survey Point
The 17 survey points shown in Figure 5-1 were used.
b) Survey Date and Duration
The survey was carried out for 24 hours on two weekdays, on the dates shown in Table 5-1.
Table 5-1 Dates of Traffic Survey
Survey Point Survey Date
No. 1 - 6 20th (Thu) and 21st (Fri) September
No. 7 - 11 24th (Mon) and 25th (Tue) September
No. 12 - 17 1st (Mon) and 2nd (Tue) October
Source: Study Team
c) Vehicle Type Classification
The classification of vehicle types counted in the survey is shown in Appendix 3.
Survey Point No. 1 Survey Point No. 2
Photos by the Study Team, September 2012
Photo 5-1 Condition of Traffic Count Survey
(2) Roadside Origin-Destination Interview Survey
The objective of the roadside O/D interview survey is to understand the characteristics of
traffic flow related to passenger trips and freight movements passing through the survey point.
The survey was carried out as follows.
a) Survey Point
The same survey points as in the traffic count survey were used, except Point No. 1.
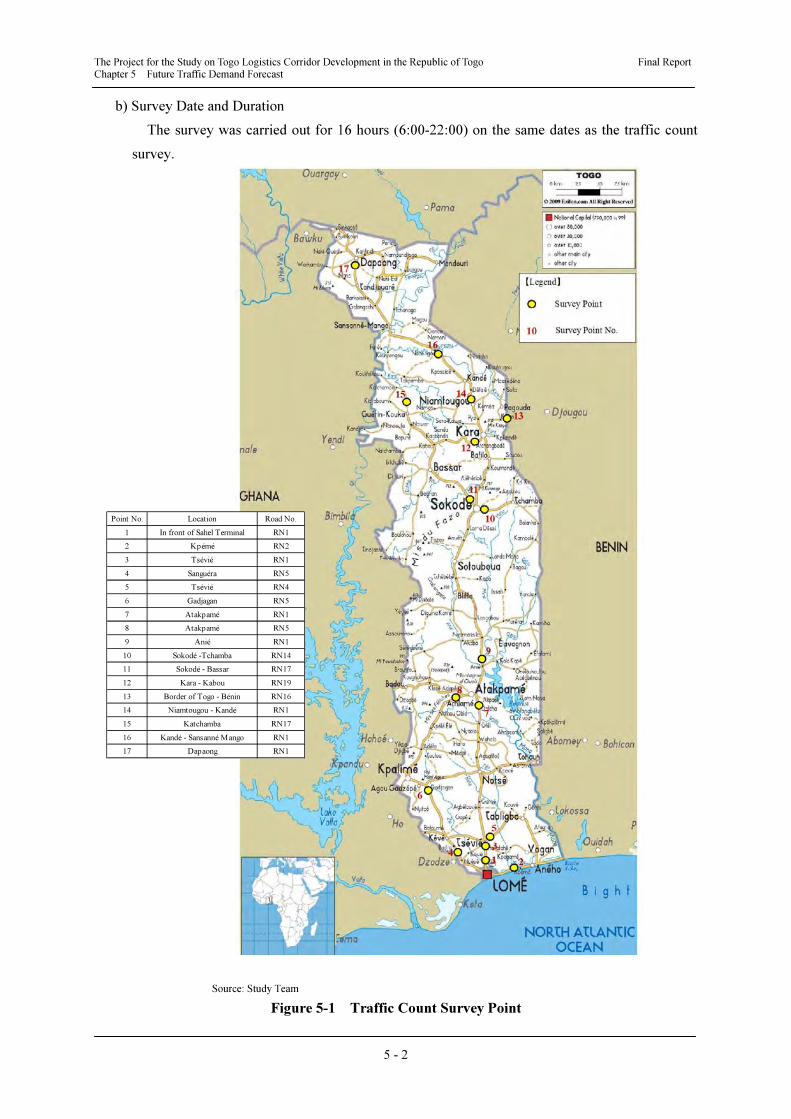
The Project for the Study on Togo Logistics Corridor Development in the Republic of Togo Final Report Chapter 5 Future Traffic Demand Forecast
5 - 2
b) Survey Date and Duration
The survey was carried out for 16 hours (6:00-22:00) on the same dates as the traffic count
survey.
Source: Study Team
Figure 5-1 Traffic Count Survey Point
Point No. Location Road No.
1 In front of Sahel Terminal RN1
2 Kpémé RN2
3 Tsévié RN1
4 Sanguéra RN5
5 Tsévié RN4
6 Gadjagan RN5
7 Atakpamé RN1
8 Atakpamé RN5
9 Anié RN1
10 Sokodé -Tchamba RN14
11 Sokodé - Bassar RN17
12 Kara - Kabou RN19
13 Border of Togo - Bénin RN16
14 Niamtougou - Kandé RN1
15 Katchamba RN17
16 Kandé - Sansanné Mango RN1
17 Dapaong RN1
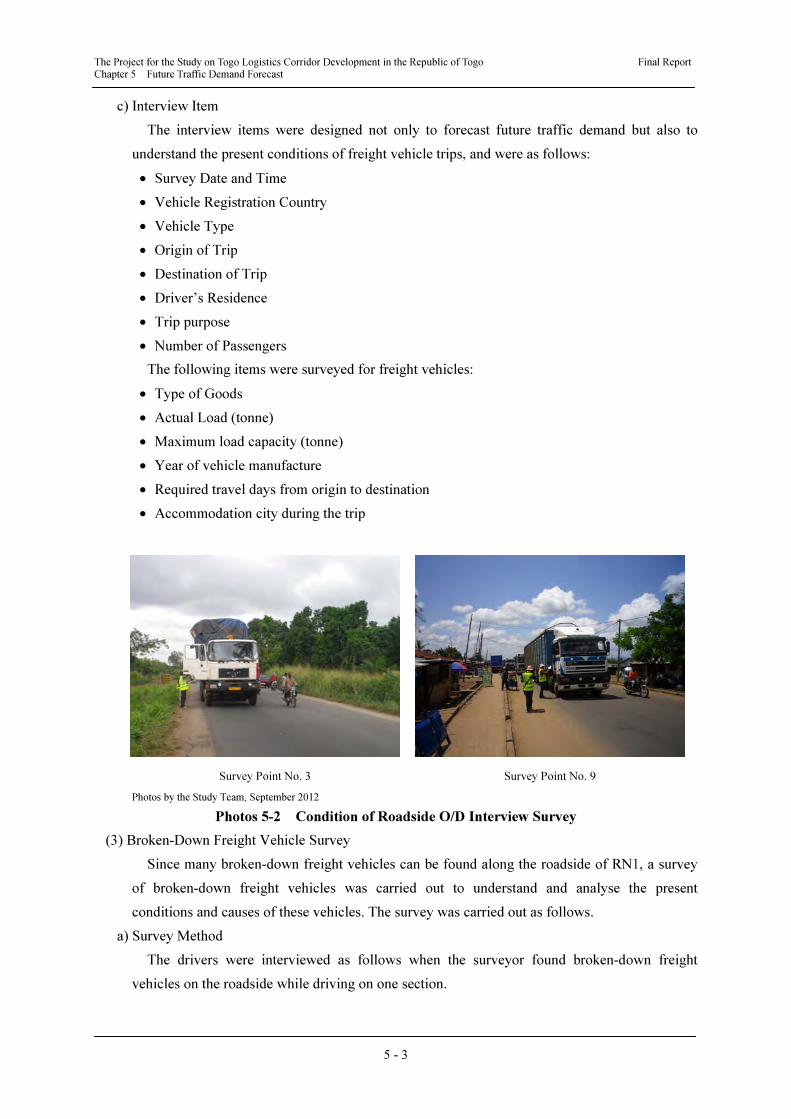
The Project for the Study on Togo Logistics Corridor Development in the Republic of Togo Final Report Chapter 5 Future Traffic Demand Forecast
5 - 3
c) Interview Item
The interview items were designed not only to forecast future traffic demand but also to
understand the present conditions of freight vehicle trips, and were as follows:
• Survey Date and Time
• Vehicle Registration Country
• Vehicle Type
• Origin of Trip
• Destination of Trip
• Driver’s Residence
• Trip purpose
• Number of Passengers
The following items were surveyed for freight vehicles:
• Type of Goods
• Actual Load (tonne)
• Maximum load capacity (tonne)
• Year of vehicle manufacture
• Required travel days from origin to destination
• Accommodation city during the trip
Survey Point No. 3 Survey Point No. 9
Photos by the Study Team, September 2012
Photos 5-2 Condition of Roadside O/D Interview Survey
(3) Broken-Down Freight Vehicle Survey
Since many broken-down freight vehicles can be found along the roadside of RN1, a survey
of broken-down freight vehicles was carried out to understand and analyse the present
conditions and causes of these vehicles. The survey was carried out as follows.
a) Survey Method
The drivers were interviewed as follows when the surveyor found broken-down freight
vehicles on the roadside while driving on one section.
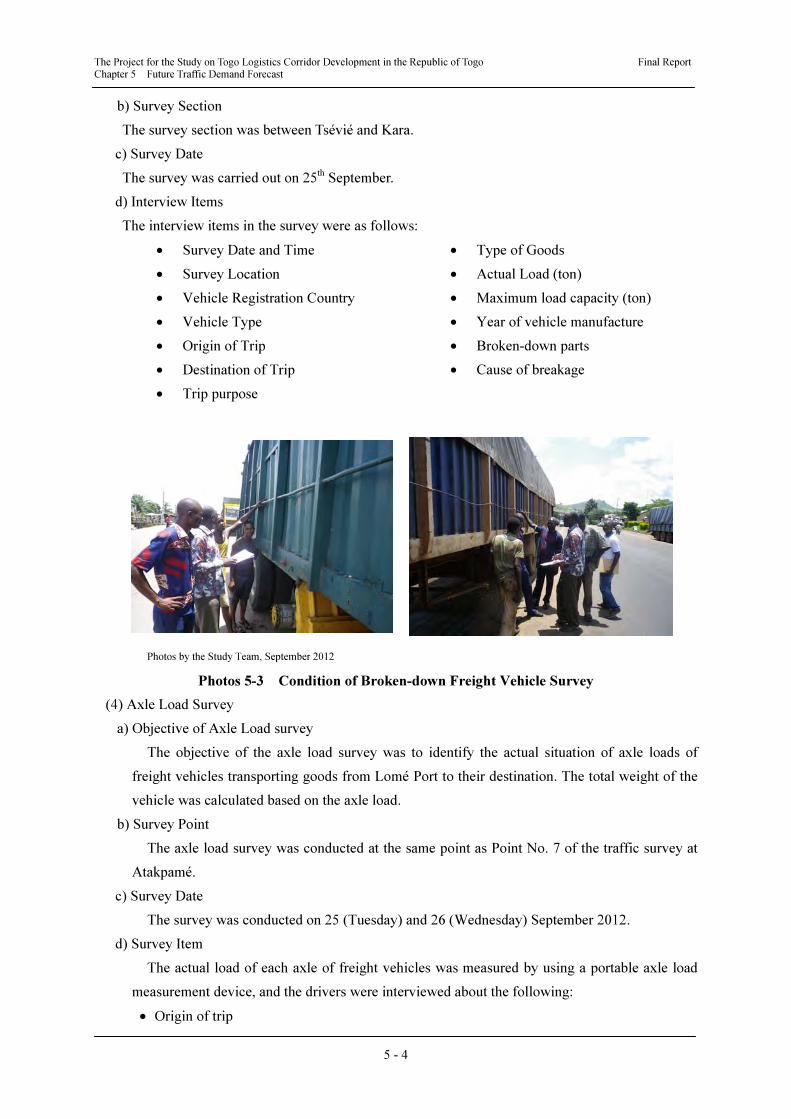
The Project for the Study on Togo Logistics Corridor Development in the Republic of Togo Final Report Chapter 5 Future Traffic Demand Forecast
5 - 4
b) Survey Section
The survey section was between Tsévié and Kara.
c) Survey Date
The survey was carried out on 25th September.
d) Interview Items
The interview items in the survey were as follows:
• Survey Date and Time
• Survey Location
• Vehicle Registration Country
• Vehicle Type
• Origin of Trip
• Destination of Trip
• Trip purpose
• Type of Goods
• Actual Load (ton)
• Maximum load capacity (ton)
• Year of vehicle manufacture
• Broken-down parts
• Cause of breakage
Photos by the Study Team, September 2012
Photos 5-3 Condition of Broken-down Freight Vehicle Survey
(4) Axle Load Survey
a) Objective of Axle Load survey
The objective of the axle load survey was to identify the actual situation of axle loads of
freight vehicles transporting goods from Lomé Port to their destination. The total weight of the
vehicle was calculated based on the axle load.
b) Survey Point
The axle load survey was conducted at the same point as Point No. 7 of the traffic survey at
Atakpamé.
c) Survey Date
The survey was conducted on 25 (Tuesday) and 26 (Wednesday) September 2012.
d) Survey Item
The actual load of each axle of freight vehicles was measured by using a portable axle load
measurement device, and the drivers were interviewed about the following:
• Origin of trip
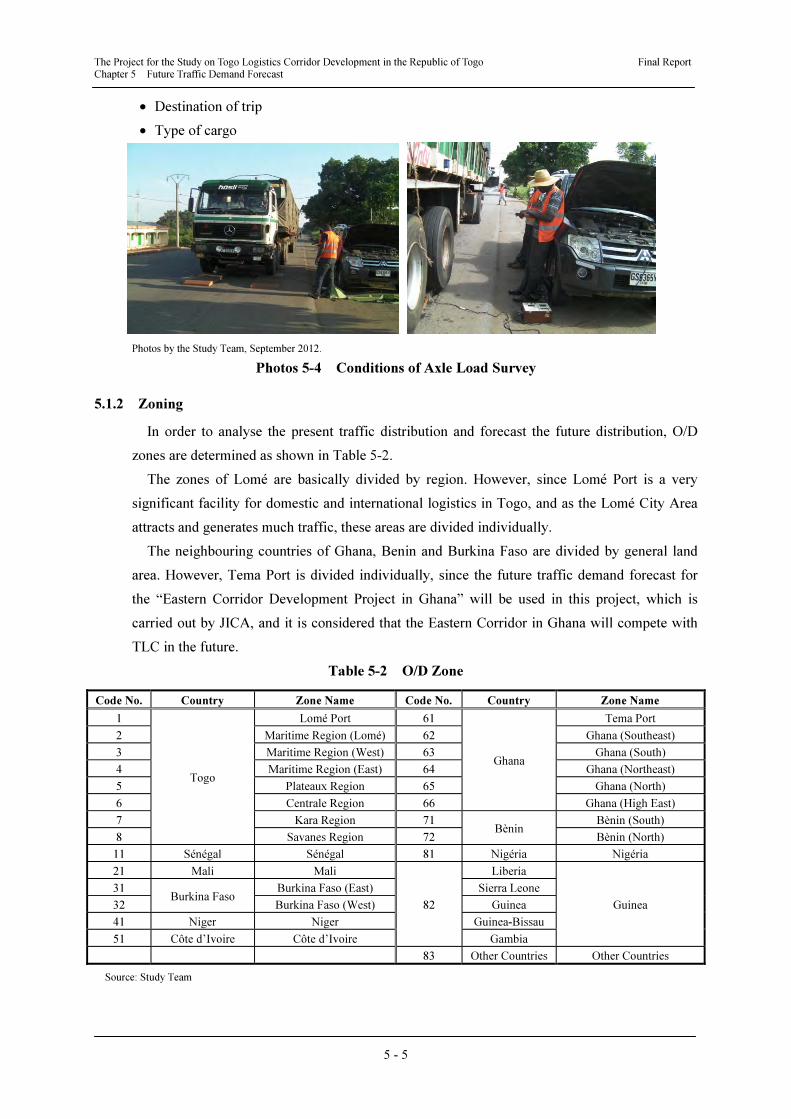
The Project for the Study on Togo Logistics Corridor Development in the Republic of Togo Final Report Chapter 5 Future Traffic Demand Forecast
5 - 5
• Destination of trip
• Type of cargo
Photos by the Study Team, September 2012.
Photos 5-4 Conditions of Axle Load Survey
5.1.2 Zoning
In order to analyse the present traffic distribution and forecast the future distribution, O/D
zones are determined as shown in Table 5-2.
The zones of Lomé are basically divided by region. However, since Lomé Port is a very
significant facility for domestic and international logistics in Togo, and as the Lomé City Area
attracts and generates much traffic, these areas are divided individually.
The neighbouring countries of Ghana, Benin and Burkina Faso are divided by general land
area. However, Tema Port is divided individually, since the future traffic demand forecast for
the “Eastern Corridor Development Project in Ghana” will be used in this project, which is
carried out by JICA, and it is considered that the Eastern Corridor in Ghana will compete with
TLC in the future.
Table 5-2 O/D Zone
Code No. Country Zone Name Code No. Country Zone Name
1
Togo
Lomé Port 61
Ghana
Tema Port
2 Maritime Region (Lomé) 62 Ghana (Southeast)
3 Maritime Region (West) 63 Ghana (South)
4 Maritime Region (East) 64 Ghana (Northeast)
5 Plateaux Region 65 Ghana (North)
6 Centrale Region 66 Ghana (High East)
7 Kara Region 71 Bènin
Bènin (South)
8 Savanes Region 72 Bènin (North)
11 Sénégal Sénégal 81 Nigéria Nigéria
21 Mali Mali
82
Liberia
Guinea
31 Burkina Faso
Burkina Faso (East) Sierra Leone
32 Burkina Faso (West) Guinea
41 Niger Niger Guinea-Bissau
51 Côte d’Ivoire Côte d’Ivoire Gambia
83 Other Countries Other Countries
Source: Study Team
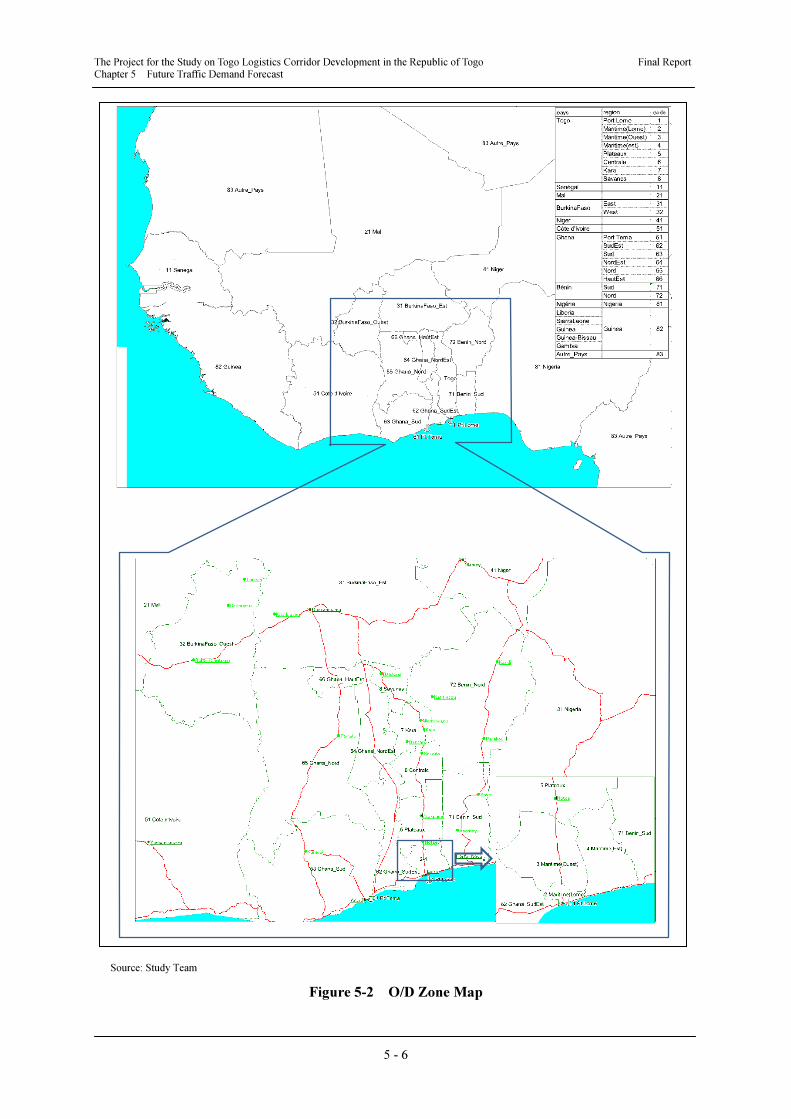
The Project for the Study on Togo Logistics Corridor Development in the Republic of Togo Final Report Chapter 5 Future Traffic Demand Forecast
5 - 6
Source: Study Team
Figure 5-2 O/D Zone Map
The Project for the Study on Togo Logistics Corridor Development in the Republic of Togo Final Report Chapter 5 Future Traffic Demand Forecast
5 - 7
5.1.3 Results of Traffic Surveys
(1) Traffic Count Survey
Figure 5-3 shows the average daily traffic (ADT) and Figure 5-4 shows the ratio of each
vehicle type at each survey point. The traffic volume and share ratio shown in both figures are
the average for two weekdays. A summary of the results of the traffic count survey is as
follows.
a) Average Daily Traffic
• Motorcycles account for more than 50% of the total volume at most survey points.
• ADT in the northern area tends to be lower than that in the southern area.
• The highest traffic volume, 9,538 vehicles per day (veh./day), was counted at survey point
No. 1, which was located in front of Sahel Terminal on RN1.
• The second-highest traffic volume, 8,316 veh./day, was counted at survey point No. 2 on
RN2 which links Lomé and Benin.
• The result at survey point No. 3 shows that approximately 5,000 veh./day passed the toll
station in Tsévié.
• The traffic volume on RN1 tends to be higher than that on other roads. However, the traffic
volume at survey point No. 13 located near the border between Togo and Benin was higher
than that in the northern survey point on RN1.
b) Traffic Ratio by Vehicle Type
• The ratio of commercial vehicles in the northern area tends to be higher than that in the
southern area.
• The ratio of commercial vehicles on RN1 was generally higher than that on other roads,
particularly in the northern area at points No. 14, 16 and 17.
• There was a high ratio of passenger cars, taxis and mini buses at most survey points.
• Regarding public transport, the ratio of buses was very low; mainly mini buses are used.
• Regarding commercial vehicles, the ratio of container trailers was less than 10% at all
survey points, lower than that of trucks and trailers.
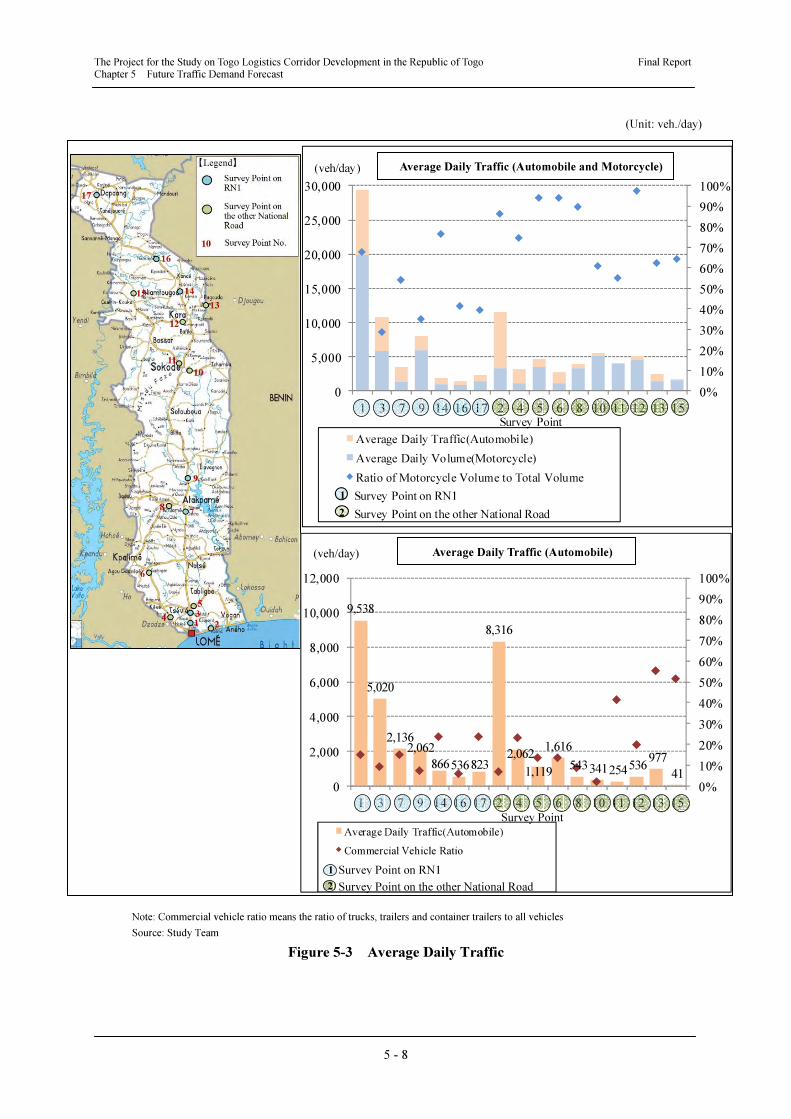
The Project for the Study on Togo Logistics Corridor Development in the Republic of Togo Final Report Chapter 5 Future Traffic Demand Forecast
5 - 8
Note: Commercial vehicle ratio means the ratio of trucks, trailers and container trailers to all vehicles
Source: Study Team
Figure 5-3 Average Daily Traffic
(Unit: veh./day)
9,538
5,020
2,1362,062
866536823
8,316
2,062
1,119
1,616
543341254536977
410%
10%
20%
30%
40%
50%
60%
70%
80%
90%
100%
0
2,000
4,000
6,000
8,000
10,000
12,000
1 3 7 9 14 16 17 2 4 5 6 8 10 11 12 13 15
Average Daily Traffic(Automobile)
Commercial Vehicle Ratio
0%
10%
20%
30%
40%
50%
60%
70%
80%
90%
100%
0
5,000
10,000
15,000
20,000
25,000
30,000
1 3 7 9 14 16 17 2 4 5 6 8 10 11 12 13 15
Average Daily Traffic(Automobile)
Average Daily Volume(Motorcycle)
Ratio of Motorcycle Volume to Total Volume
1
2
Survey Point on RN1
Survey Point on the other National Road
Survey Point
(veh/day)
Average Daily Traffic (Automobile)
Average Daily Traffic (Automobile and Motorcycle)
Survey Point on RN1
Survey Point on the other National Road
1
2
(veh/day)
Survey Point
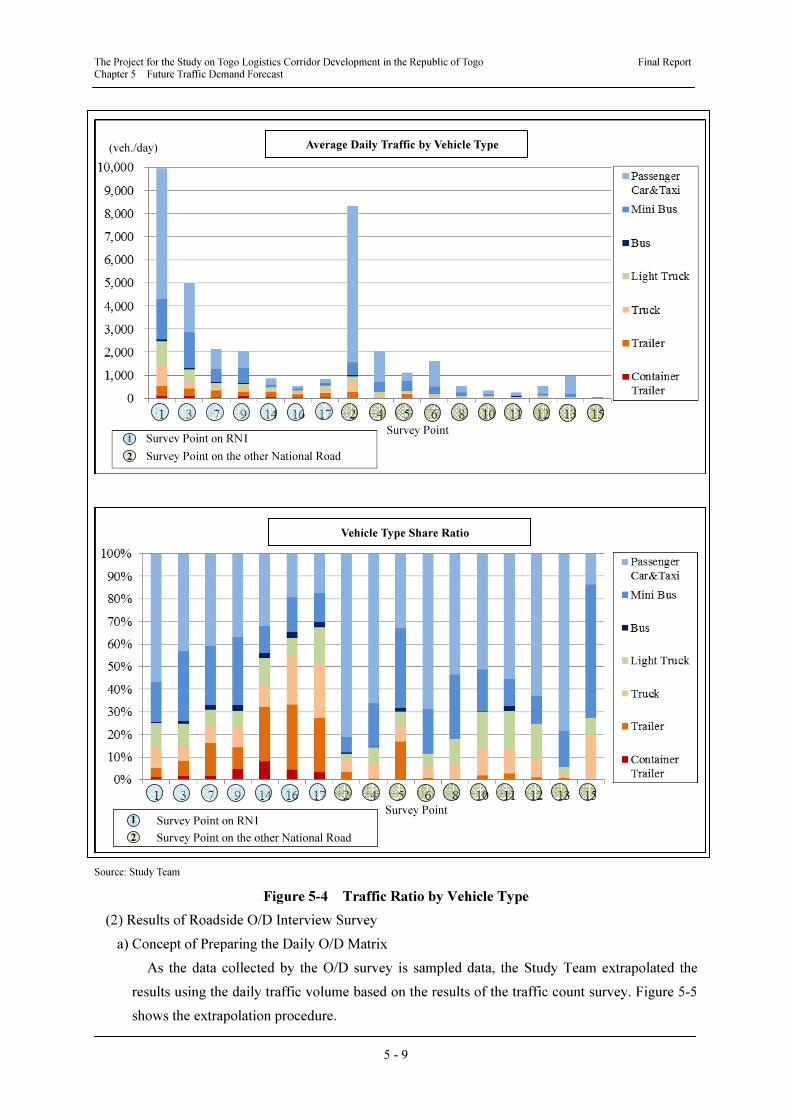
The Project for the Study on Togo Logistics Corridor Development in the Republic of Togo Final Report Chapter 5 Future Traffic Demand Forecast
5 - 9
Source: Study Team
Figure 5-4 Traffic Ratio by Vehicle Type
(2) Results of Roadside O/D Interview Survey
a) Concept of Preparing the Daily O/D Matrix
As the data collected by the O/D survey is sampled data, the Study Team extrapolated the
results using the daily traffic volume based on the results of the traffic count survey. Figure 5-5
shows the extrapolation procedure.
Vehicle Type Share Ratio
Average Daily Traffic by Vehicle Type
1 Survey Point on RN1
Survey Point on RN1
Survey Point on the other National Road
Survey Point on the other National Road
2
Survey Point
(veh./day)
2
1
Survey Point
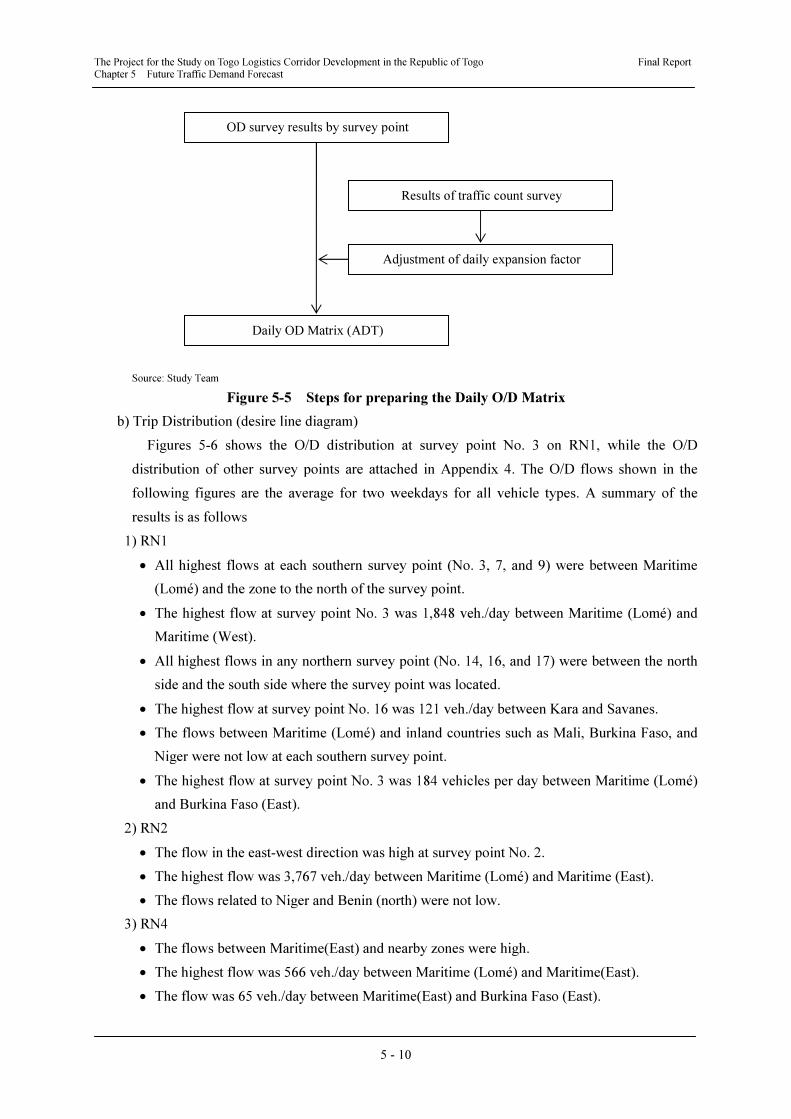
The Project for the Study on Togo Logistics Corridor Development in the Republic of Togo Final Report Chapter 5 Future Traffic Demand Forecast
5 - 10
Source: Study Team
Figure 5-5 Steps for preparing the Daily O/D Matrix
b) Trip Distribution (desire line diagram)
Figures 5-6 shows the O/D distribution at survey point No. 3 on RN1, while the O/D
distribution of other survey points are attached in Appendix 4. The O/D flows shown in the
following figures are the average for two weekdays for all vehicle types. A summary of the
results is as follows
1) RN1
• All highest flows at each southern survey point (No. 3, 7, and 9) were between Maritime
(Lomé) and the zone to the north of the survey point.
• The highest flow at survey point No. 3 was 1,848 veh./day between Maritime (Lomé) and
Maritime (West).
• All highest flows in any northern survey point (No. 14, 16, and 17) were between the north
side and the south side where the survey point was located.
• The highest flow at survey point No. 16 was 121 veh./day between Kara and Savanes.
• The flows between Maritime (Lomé) and inland countries such as Mali, Burkina Faso, and
Niger were not low at each southern survey point.
• The highest flow at survey point No. 3 was 184 vehicles per day between Maritime (Lomé)
and Burkina Faso (East).
2) RN2
• The flow in the east-west direction was high at survey point No. 2.
• The highest flow was 3,767 veh./day between Maritime (Lomé) and Maritime (East).
• The flows related to Niger and Benin (north) were not low.
3) RN4
• The flows between Maritime(East) and nearby zones were high.
• The highest flow was 566 veh./day between Maritime (Lomé) and Maritime(East).
• The flow was 65 veh./day between Maritime(East) and Burkina Faso (East).
Results of traffic count survey
Daily OD Matrix (ADT)
OD survey results by survey point
Adjustment of daily expansion factor
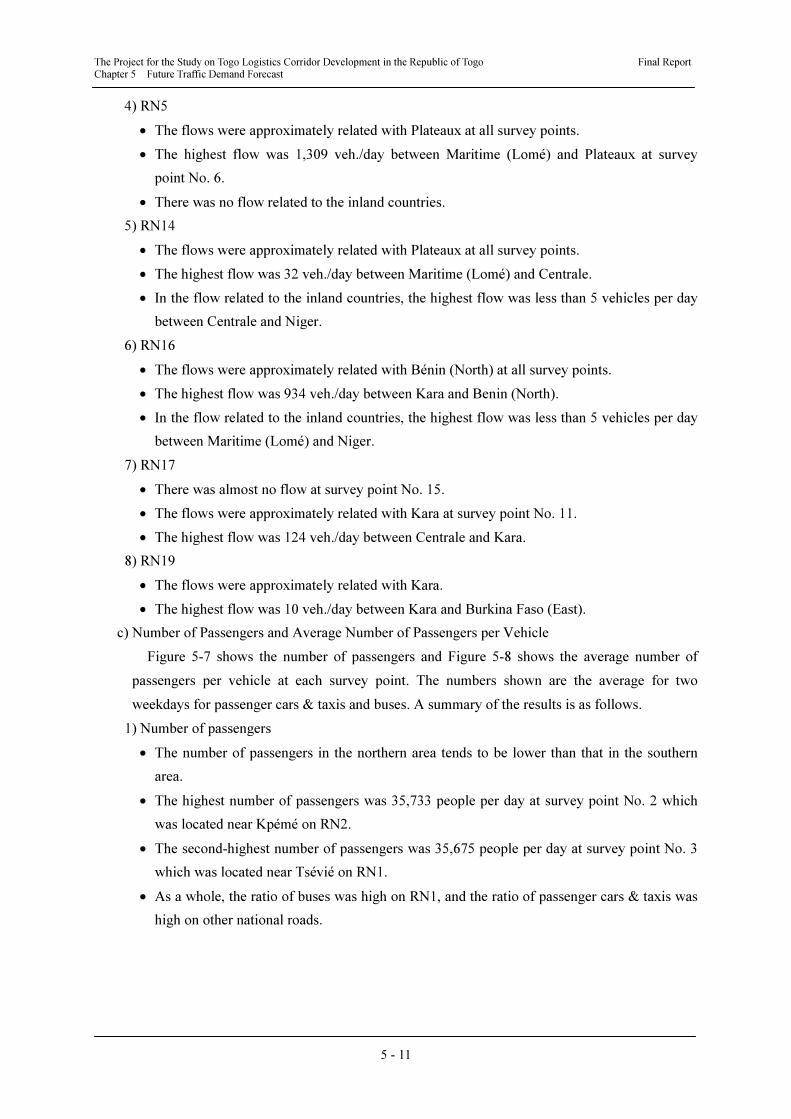
The Project for the Study on Togo Logistics Corridor Development in the Republic of Togo Final Report Chapter 5 Future Traffic Demand Forecast
5 - 11
4) RN5
• The flows were approximately related with Plateaux at all survey points.
• The highest flow was 1,309 veh./day between Maritime (Lomé) and Plateaux at survey
point No. 6.
• There was no flow related to the inland countries.
5) RN14
• The flows were approximately related with Plateaux at all survey points.
• The highest flow was 32 veh./day between Maritime (Lomé) and Centrale.
• In the flow related to the inland countries, the highest flow was less than 5 vehicles per day
between Centrale and Niger.
6) RN16
• The flows were approximately related with Bénin (North) at all survey points.
• The highest flow was 934 veh./day between Kara and Benin (North).
• In the flow related to the inland countries, the highest flow was less than 5 vehicles per day
between Maritime (Lomé) and Niger.
7) RN17
• There was almost no flow at survey point No. 15.
• The flows were approximately related with Kara at survey point No. 11.
• The highest flow was 124 veh./day between Centrale and Kara.
8) RN19
• The flows were approximately related with Kara.
• The highest flow was 10 veh./day between Kara and Burkina Faso (East).
c) Number of Passengers and Average Number of Passengers per Vehicle
Figure 5-7 shows the number of passengers and Figure 5-8 shows the average number of
passengers per vehicle at each survey point. The numbers shown are the average for two
weekdays for passenger cars & taxis and buses. A summary of the results is as follows.
1) Number of passengers
• The number of passengers in the northern area tends to be lower than that in the southern
area.
• The highest number of passengers was 35,733 people per day at survey point No. 2 which
was located near Kpémé on RN2.
• The second-highest number of passengers was 35,675 people per day at survey point No. 3
which was located near Tsévié on RN1.
• As a whole, the ratio of buses was high on RN1, and the ratio of passenger cars & taxis was
high on other national roads.
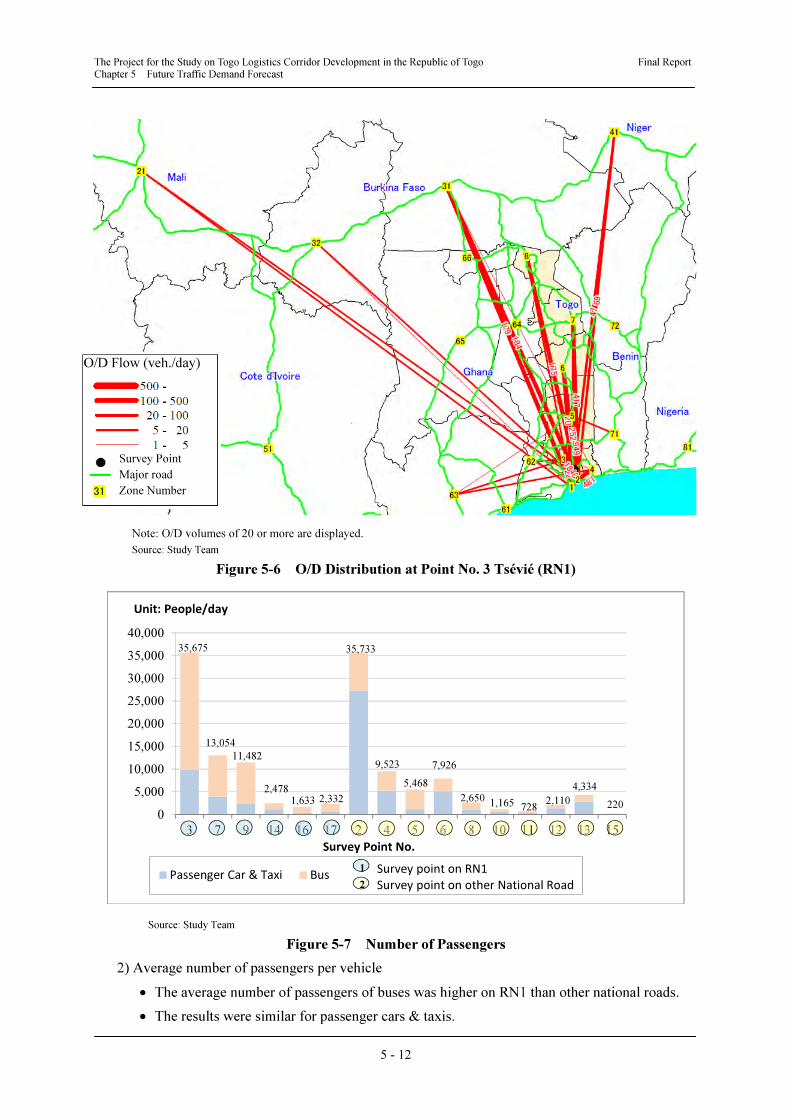
The Project for the Study on Togo Logistics Corridor Development in the Republic of Togo Final Report Chapter 5 Future Traffic Demand Forecast
5 - 12
rce: Study Team
Note: O/D volumes of 20 or more are displayed.
Source: Study Team
Figure 5-6 O/D Distribution at Point No. 3 Tsévié (RN1)
0
5,000
10,000
15,000
20,000
25,000
30,000
35,000
40,000
3 7 9 14 16 17 2 4 5 6 8 10 11 12 13 15
Passenger Car & Taxi Bus
Unit: People/day
Survey Point No.
Survey point on RN1
Survey point on other National Road
1
2
35,675
13,054
11,482
2,478
1,633 2,332
35,733
9,523
5,468
7,926
2,6501,165 728
2,110
4,334
220
Source: Study Team
Figure 5-7 Number of Passengers
2) Average number of passengers per vehicle
• The average number of passengers of buses was higher on RN1 than other national roads.
• The results were similar for passenger cars & taxis.
O/D Flow (veh./day)
Survey Point
Major road
Zone Number
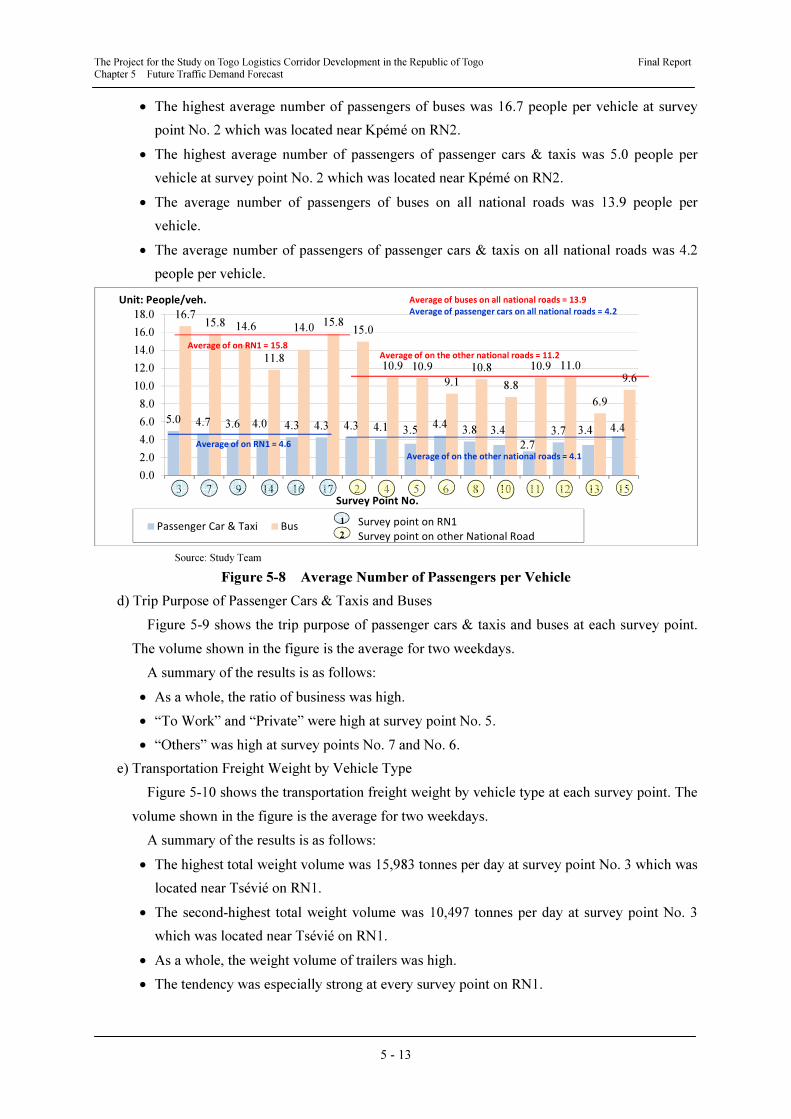
The Project for the Study on Togo Logistics Corridor Development in the Republic of Togo Final Report Chapter 5 Future Traffic Demand Forecast
5 - 13
• The highest average number of passengers of buses was 16.7 people per vehicle at survey
point No. 2 which was located near Kpémé on RN2.
• The highest average number of passengers of passenger cars & taxis was 5.0 people per
vehicle at survey point No. 2 which was located near Kpémé on RN2.
• The average number of passengers of buses on all national roads was 13.9 people per
vehicle.
• The average number of passengers of passenger cars & taxis on all national roads was 4.2
people per vehicle.
5.0 4.7 3.6 4.0 4.3 4.3 4.3 4.1 3.54.4
3.8 3.4
2.7
3.7 3.4 4.4
16.715.8 14.6
11.8
14.015.8
15.0
10.9 10.9
9.1
10.8
8.8
10.9 11.0
6.9
9.6
0.0
2.0
4.0
6.0
8.0
10.0
12.0
14.0
16.0
18.0
3 7 9 14 16 17 2 4 5 6 8 10 11 12 13 15
Passenger Car & Taxi Bus Survey point on RN1
Survey point on other National Road
1
2
Survey Point No.
Unit: People/veh. Average of buses on all national roads = 13.9
Average of passenger cars on all national roads = 4.2
Average of on the other national roads = 11.2Average of on RN1 = 15.8
Average of on RN1 = 4.6
Average of on the other national roads = 4.1
Source: Study Team
Figure 5-8 Average Number of Passengers per Vehicle
d) Trip Purpose of Passenger Cars & Taxis and Buses
Figure 5-9 shows the trip purpose of passenger cars & taxis and buses at each survey point.
The volume shown in the figure is the average for two weekdays.
A summary of the results is as follows:
• As a whole, the ratio of business was high.
• “To Work” and “Private” were high at survey point No. 5.
• “Others” was high at survey points No. 7 and No. 6.
e) Transportation Freight Weight by Vehicle Type
Figure 5-10 shows the transportation freight weight by vehicle type at each survey point. The
volume shown in the figure is the average for two weekdays.
A summary of the results is as follows:
• The highest total weight volume was 15,983 tonnes per day at survey point No. 3 which was
located near Tsévié on RN1.
• The second-highest total weight volume was 10,497 tonnes per day at survey point No. 3
which was located near Tsévié on RN1.
• As a whole, the weight volume of trailers was high.
• The tendency was especially strong at every survey point on RN1.
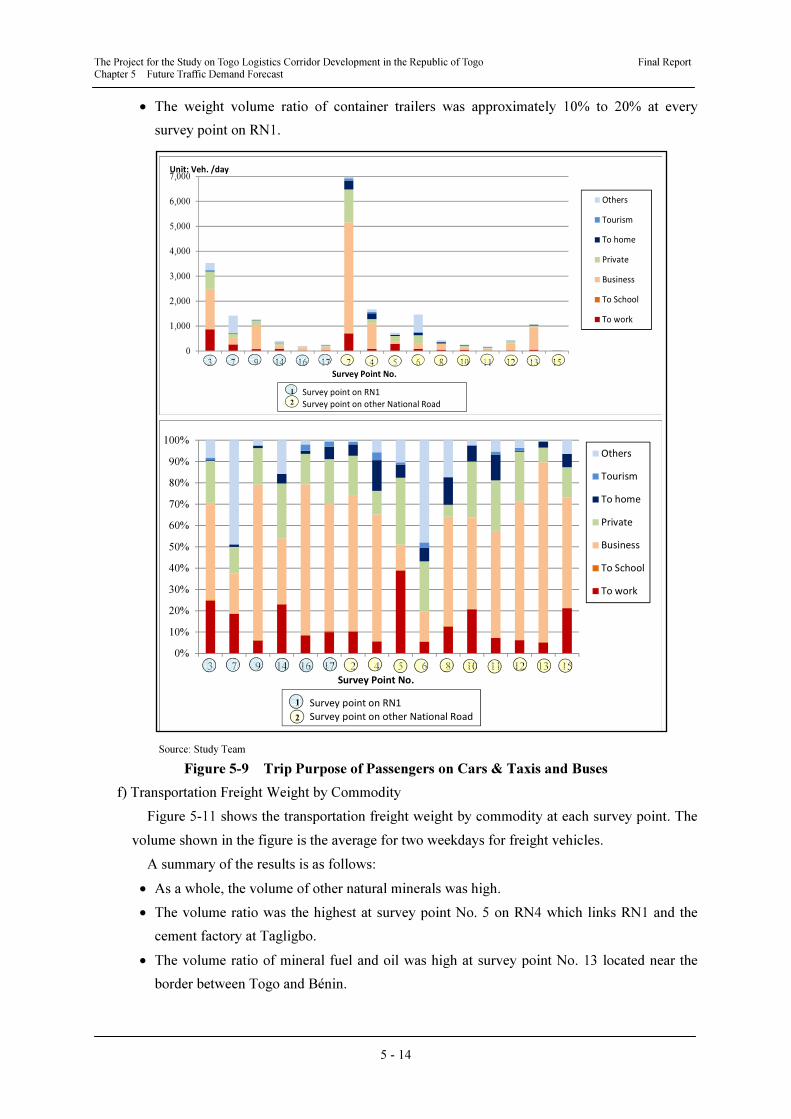
The Project for the Study on Togo Logistics Corridor Development in the Republic of Togo Final Report Chapter 5 Future Traffic Demand Forecast
5 - 14
• The weight volume ratio of container trailers was approximately 10% to 20% at every
survey point on RN1.
Source: Study Team
Figure 5-9 Trip Purpose of Passengers on Cars & Taxis and Buses
f) Transportation Freight Weight by Commodity
Figure 5-11 shows the transportation freight weight by commodity at each survey point. The
volume shown in the figure is the average for two weekdays for freight vehicles.
A summary of the results is as follows:
• As a whole, the volume of other natural minerals was high.
• The volume ratio was the highest at survey point No. 5 on RN4 which links RN1 and the
cement factory at Tagligbo.
• The volume ratio of mineral fuel and oil was high at survey point No. 13 located near the
border between Togo and Bénin.
0%
10%
20%
30%
40%
50%
60%
70%
80%
90%
100%
3 7 9 14 16 17 2 4 5 6 8 10 11 12 13 15
Others
Tourism
To home
Private
Business
To School
To work
Survey point on RN1
Survey point on other National Road
1
2
Survey Point No.
0
1,000
2,000
3,000
4,000
5,000
6,000
7,000
3 7 9 14 16 17 2 4 5 6 8 10 11 12 13 15
Others
Tourism
To home
Private
Business
To School
To work
Unit: Veh. /day
Survey point on RN1
Survey point on other National Road
1
2
Survey Point No.
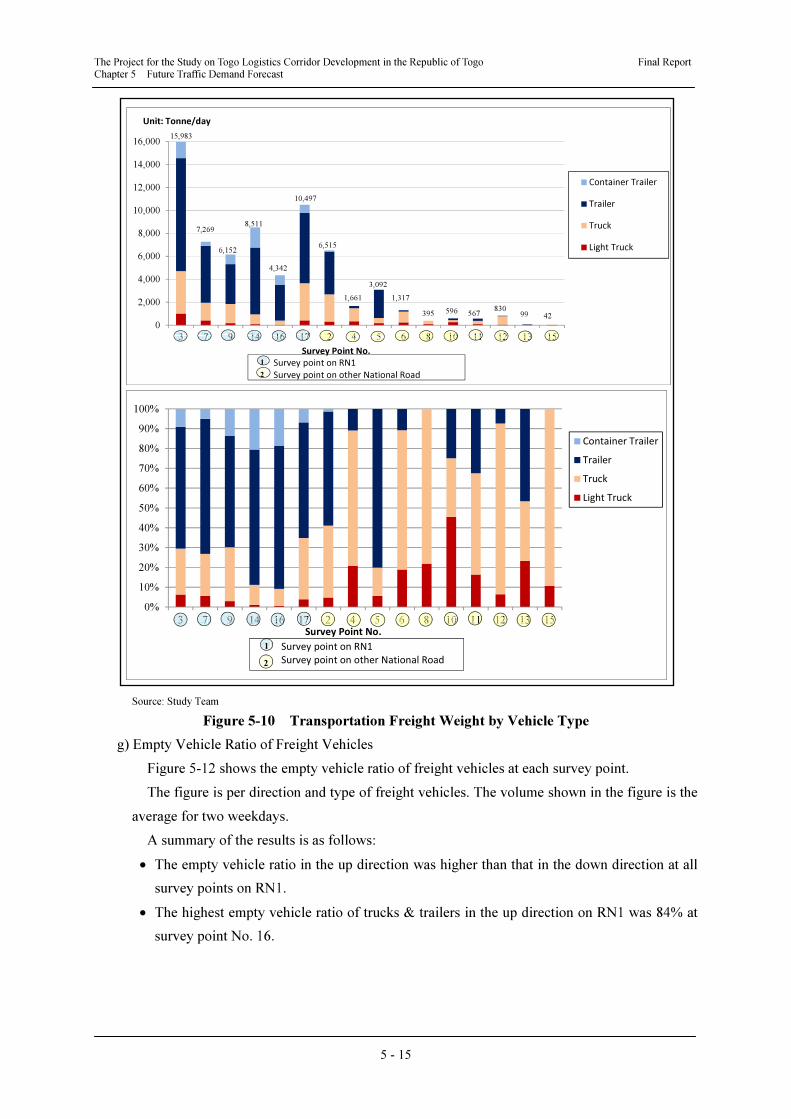
The Project for the Study on Togo Logistics Corridor Development in the Republic of Togo Final Report Chapter 5 Future Traffic Demand Forecast
5 - 15
Source: Study Team
Figure 5-10 Transportation Freight Weight by Vehicle Type
g) Empty Vehicle Ratio of Freight Vehicles
Figure 5-12 shows the empty vehicle ratio of freight vehicles at each survey point.
The figure is per direction and type of freight vehicles. The volume shown in the figure is the
average for two weekdays.
A summary of the results is as follows:
• The empty vehicle ratio in the up direction was higher than that in the down direction at all
survey points on RN1.
• The highest empty vehicle ratio of trucks & trailers in the up direction on RN1 was 84% at
survey point No. 16.
0%
10%
20%
30%
40%
50%
60%
70%
80%
90%
100%
3 7 9 14 16 17 2 4 5 6 8 10 11 12 13 15
Container Trailer
Trailer
Truck
Light Truck
Survey point on RN1
Survey point on other National Road
1
2
Survey Point No.
0
2,000
4,000
6,000
8,000
10,000
12,000
14,000
16,000
3 7 9 14 16 17 2 4 5 6 8 10 11 12 13 15
Container Trailer
Trailer
Truck
Light Truck
Unit: Tonne/day
Survey point on RN1
Survey point on other National Road
1
2
Survey Point No.
15,983
7,269
6,152
8,511
4,342
10,497
6,515
1,661
3,092
1,317
395 596 567830
99 42
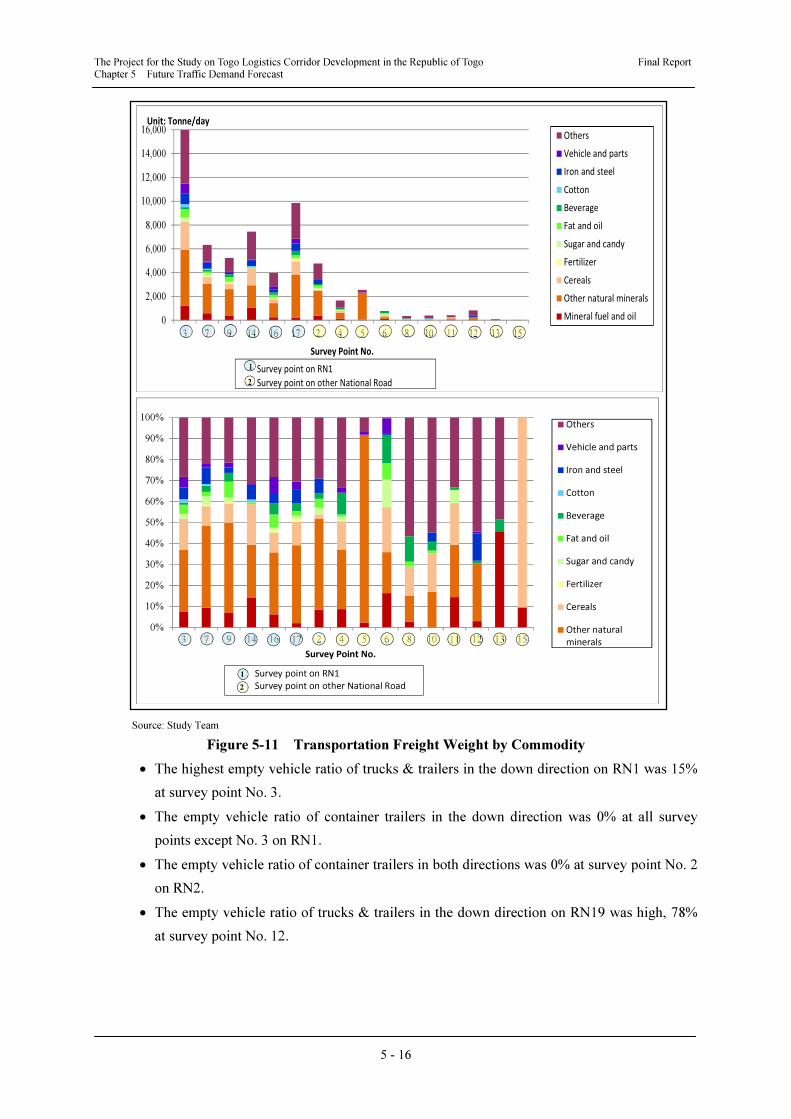
The Project for the Study on Togo Logistics Corridor Development in the Republic of Togo Final Report Chapter 5 Future Traffic Demand Forecast
5 - 16
Source: Study Team
Figure 5-11 Transportation Freight Weight by Commodity
• The highest empty vehicle ratio of trucks & trailers in the down direction on RN1 was 15%
at survey point No. 3.
• The empty vehicle ratio of container trailers in the down direction was 0% at all survey
points except No. 3 on RN1.
• The empty vehicle ratio of container trailers in both directions was 0% at survey point No. 2
on RN2.
• The empty vehicle ratio of trucks & trailers in the down direction on RN19 was high, 78%
at survey point No. 12.
0%
10%
20%
30%
40%
50%
60%
70%
80%
90%
100%
3 7 9 14 16 17 2 4 5 6 8 10 11 12 13 15
Others
Vehicle and parts
Iron and steel
Cotton
Beverage
Fat and oil
Sugar and candy
Fertilizer
Cereals
Other natural
minerals
Survey point on RN1
Survey point on other National Road
1
2
Survey Point No.
0
2,000
4,000
6,000
8,000
10,000
12,000
14,000
16,000
3 7 9 14 16 17 2 4 5 6 8 10 11 12 13 15
Others
Vehicle and parts
Iron and steel
Cotton
Beverage
Fat and oil
Sugar and candy
Fertilizer
Cereals
Other natural minerals
Mineral fuel and oil
Survey point on RN1
Survey point on other National Road
1
2
Survey Point No.
Unit: Tonne/day
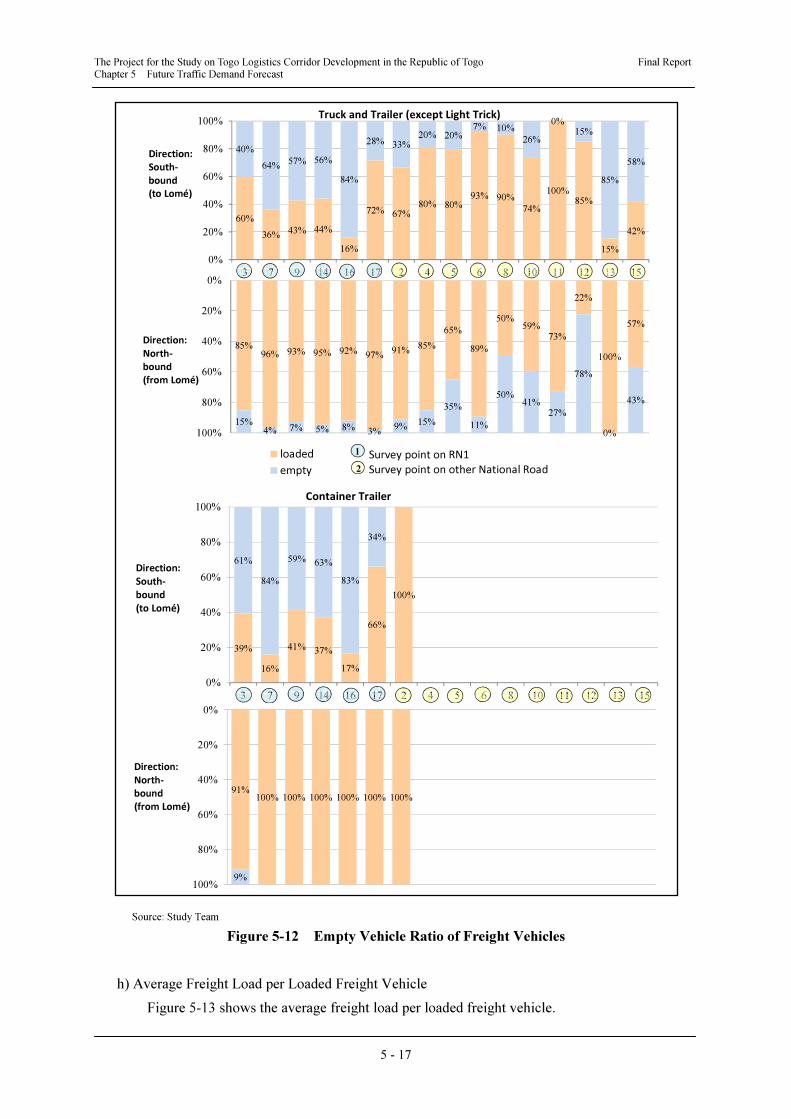
The Project for the Study on Togo Logistics Corridor Development in the Republic of Togo Final Report Chapter 5 Future Traffic Demand Forecast
5 - 17
Source: Study Team
Figure 5-12 Empty Vehicle Ratio of Freight Vehicles
h) Average Freight Load per Loaded Freight Vehicle
Figure 5-13 shows the average freight load per loaded freight vehicle.
91%100% 100% 100% 100% 100% 100%
9%
0%
20%
40%
60%
80%
100%
Direction:
North-
bound
(from Lomé)
39%
16%
41%37%
17%
66%
100%
61%
84%
59%63%
83%
34%
0%
20%
40%
60%
80%
100%
3 7 9 14 16 17 2 4 5 6 8 10 11 12 13 15
Container Trailer
Direction:
South-
bound
(to Lomé)
85%
96% 93% 95% 92%97%
91%85%
65%
89%
50%59%
73%
22%
100%
57%
15%
4% 7% 5% 8%3%
9%15%
35%
11%
50%41%
27%
78%
0%
43%
0%
20%
40%
60%
80%
100%
loaded
empty
Direction:
North-
bound
(from Lomé)
Survey point on RN1
Survey point on other National Road
1
2
60%
36%43% 44%
16%
72%67%
80% 80%
93% 90%
74%
100%
85%
15%
42%
40%
64%57% 56%
84%
28%33%
20% 20%
7% 10%
26%
0%
15%
85%
58%
0%
20%
40%
60%
80%
100%
3 7 9 14 16 17 2 4 5 6 8 10 11 12 13 15
Truck and Trailer (except Light Trick)
Direction:
South-
bound
(to Lomé)
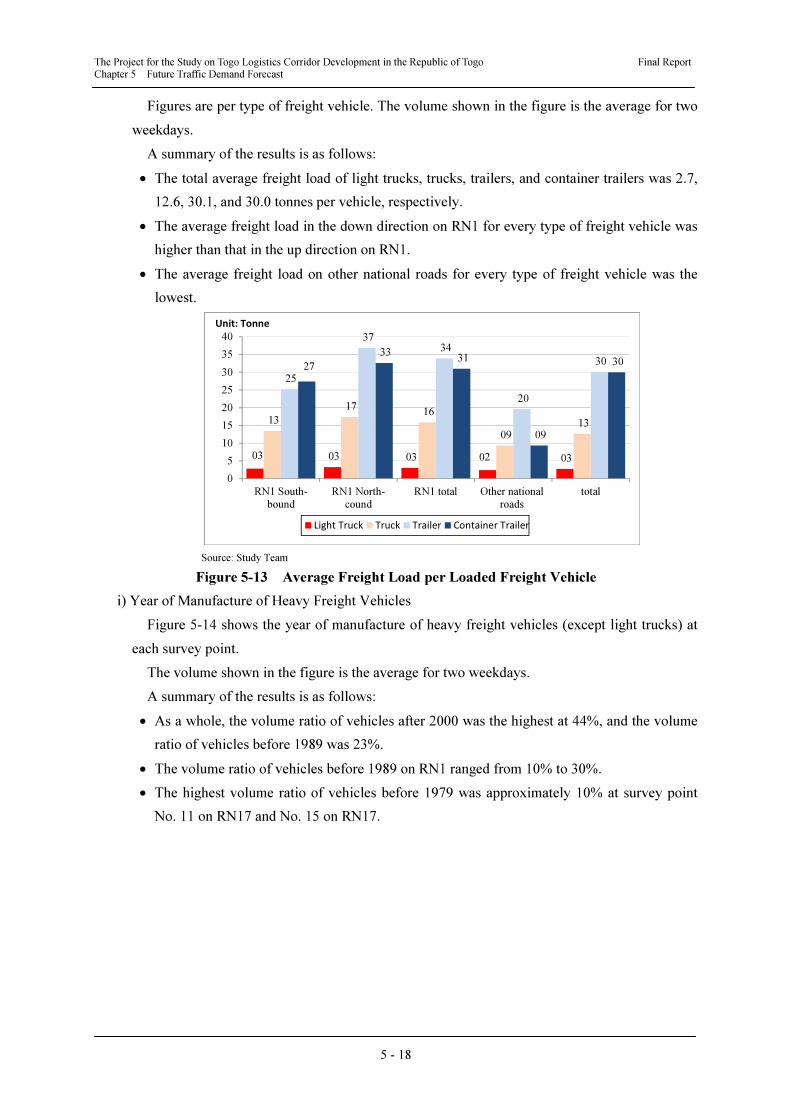
The Project for the Study on Togo Logistics Corridor Development in the Republic of Togo Final Report Chapter 5 Future Traffic Demand Forecast
5 - 18
Figures are per type of freight vehicle. The volume shown in the figure is the average for two
weekdays.
A summary of the results is as follows:
• The total average freight load of light trucks, trucks, trailers, and container trailers was 2.7,
12.6, 30.1, and 30.0 tonnes per vehicle, respectively.
• The average freight load in the down direction on RN1 for every type of freight vehicle was
higher than that in the up direction on RN1.
• The average freight load on other national roads for every type of freight vehicle was the
lowest.
03 03 03 02 03
13
1716
09
13
25
37
34
20
3027
3331
09
30
0
5
10
15
20
25
30
35
40
RN1 South-
bound
RN1 North-
cound
RN1 total Other national
roads
total
Light Truck Truck Trailer Container Trailer
Unit: Tonne
Source: Study Team
Figure 5-13 Average Freight Load per Loaded Freight Vehicle
i) Year of Manufacture of Heavy Freight Vehicles
Figure 5-14 shows the year of manufacture of heavy freight vehicles (except light trucks) at
each survey point.
The volume shown in the figure is the average for two weekdays.
A summary of the results is as follows:
• As a whole, the volume ratio of vehicles after 2000 was the highest at 44%, and the volume
ratio of vehicles before 1989 was 23%.
• The volume ratio of vehicles before 1989 on RN1 ranged from 10% to 30%.
• The highest volume ratio of vehicles before 1979 was approximately 10% at survey point
No. 11 on RN17 and No. 15 on RN17.
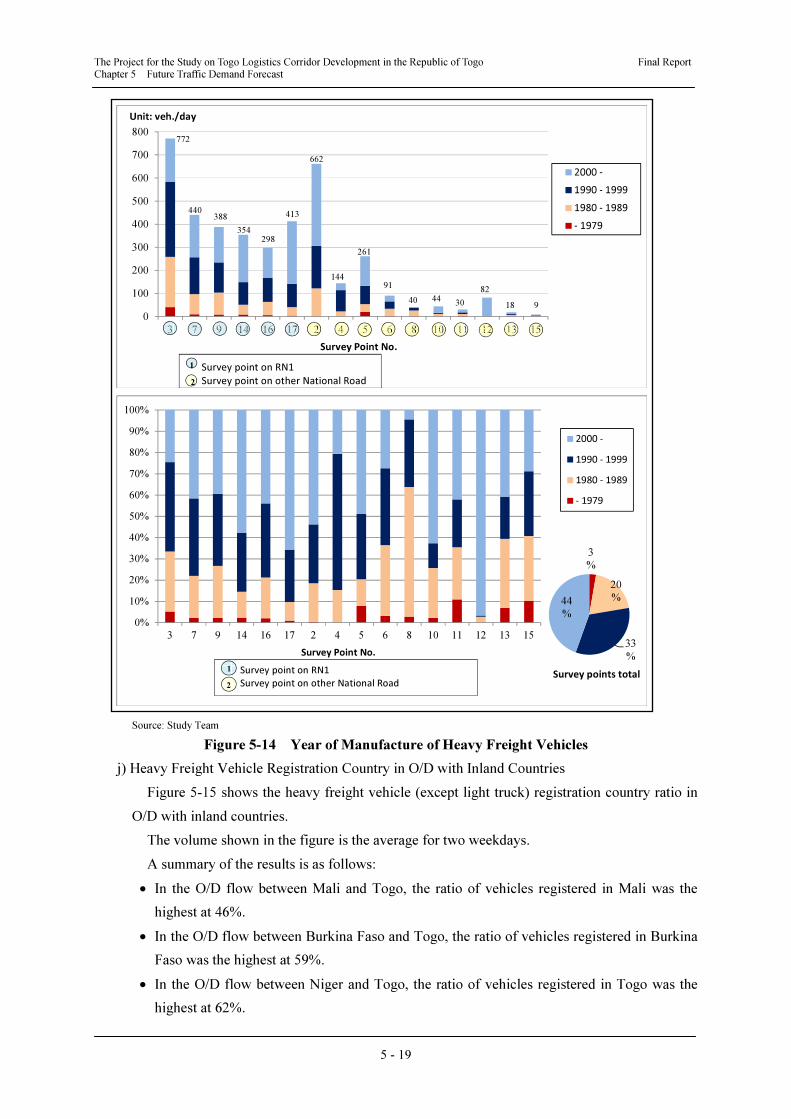
The Project for the Study on Togo Logistics Corridor Development in the Republic of Togo Final Report Chapter 5 Future Traffic Demand Forecast
5 - 19
Source: Study Team
Figure 5-14 Year of Manufacture of Heavy Freight Vehicles
j) Heavy Freight Vehicle Registration Country in O/D with Inland Countries
Figure 5-15 shows the heavy freight vehicle (except light truck) registration country ratio in
O/D with inland countries.
The volume shown in the figure is the average for two weekdays.
A summary of the results is as follows:
• In the O/D flow between Mali and Togo, the ratio of vehicles registered in Mali was the
highest at 46%.
• In the O/D flow between Burkina Faso and Togo, the ratio of vehicles registered in Burkina
Faso was the highest at 59%.
• In the O/D flow between Niger and Togo, the ratio of vehicles registered in Togo was the
highest at 62%.
0
100
200
300
400
500
600
700
800
3 7 9 14 16 17 2 4 5 6 8 10 11 12 13 15
2000 -
1990 - 1999
1980 - 1989
- 1979
Unit: veh./day
Survey point on RN1
Survey point on other National Road
1
2
Survey Point No.
772
440388
354
298
413
662
144
261
91
40 4430
82
18 9
0%
10%
20%
30%
40%
50%
60%
70%
80%
90%
100%
3 7 9 14 16 17 2 4 5 6 8 10 11 12 13 15
2000 -
1990 - 1999
1980 - 1989
- 1979
Survey point on RN1
Survey point on other National Road
1
2
Survey Point No.
3
%
20
%
33
%
44
%
Survey points total
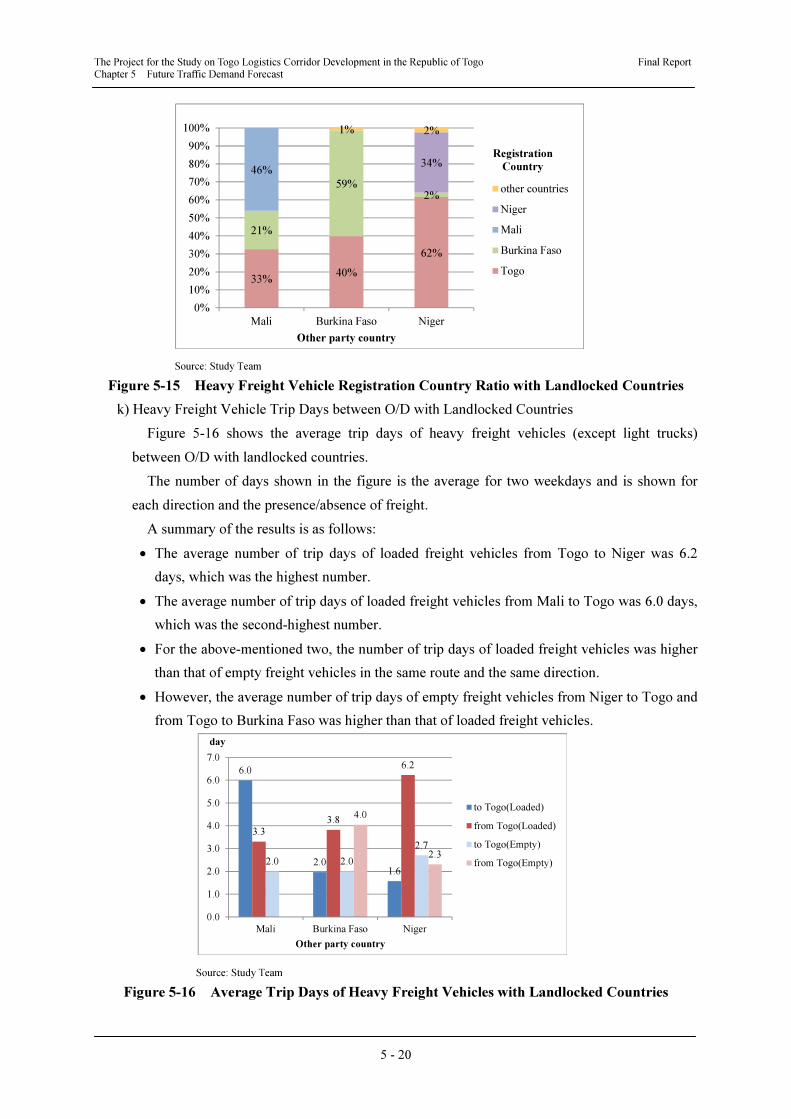
The Project for the Study on Togo Logistics Corridor Development in the Republic of Togo Final Report Chapter 5 Future Traffic Demand Forecast
5 - 20
Source: Study Team
Figure 5-15 Heavy Freight Vehicle Registration Country Ratio with Landlocked Countries
k) Heavy Freight Vehicle Trip Days between O/D with Landlocked Countries
Figure 5-16 shows the average trip days of heavy freight vehicles (except light trucks)
between O/D with landlocked countries.
The number of days shown in the figure is the average for two weekdays and is shown for
each direction and the presence/absence of freight.
A summary of the results is as follows:
• The average number of trip days of loaded freight vehicles from Togo to Niger was 6.2
days, which was the highest number.
• The average number of trip days of loaded freight vehicles from Mali to Togo was 6.0 days,
which was the second-highest number.
• For the above-mentioned two, the number of trip days of loaded freight vehicles was higher
than that of empty freight vehicles in the same route and the same direction.
• However, the average number of trip days of empty freight vehicles from Niger to Togo and
from Togo to Burkina Faso was higher than that of loaded freight vehicles.
Source: Study Team
Figure 5-16 Average Trip Days of Heavy Freight Vehicles with Landlocked Countries
33%40%
62%
21%
59%2%
46%34%
1% 2%
0%
10%
20%
30%
40%
50%
60%
70%
80%
90%
100%
Mali Burkina Faso Niger
Registration
Country
Other party country
other countries
Niger
Mali
Burkina Faso
Togo
6.0
2.01.6
3.33.8
6.2
2.0 2.0
2.7
4.0
2.3
0.0
1.0
2.0
3.0
4.0
5.0
6.0
7.0
Mali Burkina Faso Niger
day
Other party country
to Togo(Loaded)
from Togo(Loaded)
to Togo(Empty)
from Togo(Empty)
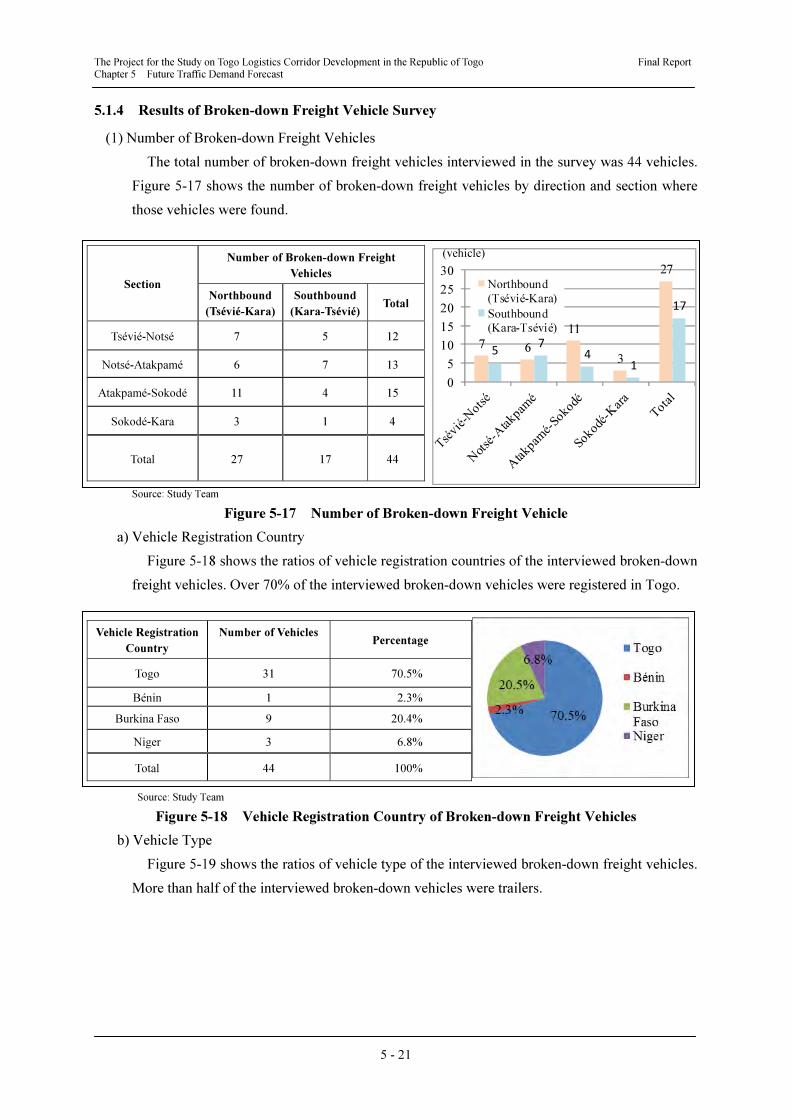
The Project for the Study on Togo Logistics Corridor Development in the Republic of Togo Final Report Chapter 5 Future Traffic Demand Forecast
5 - 21
5.1.4 Results of Broken-down Freight Vehicle Survey
(1) Number of Broken-down Freight Vehicles
The total number of broken-down freight vehicles interviewed in the survey was 44 vehicles.
Figure 5-17 shows the number of broken-down freight vehicles by direction and section where
those vehicles were found.
Source: Study Team
Figure 5-17 Number of Broken-down Freight Vehicle
a) Vehicle Registration Country
Figure 5-18 shows the ratios of vehicle registration countries of the interviewed broken-down
freight vehicles. Over 70% of the interviewed broken-down vehicles were registered in Togo.
Source: Study Team
Figure 5-18 Vehicle Registration Country of Broken-down Freight Vehicles
b) Vehicle Type
Figure 5-19 shows the ratios of vehicle type of the interviewed broken-down freight vehicles.
More than half of the interviewed broken-down vehicles were trailers.
Section
Number of Broken-down Freight
Vehicles
Northbound
(Tsévié-Kara)
Southbound
(Kara-Tsévié)Total
Tsévié-Notsé 7 5 12
Notsé-Atakpamé 6 7 13
Atakpamé-Sokodé 11 4 15
Sokodé-Kara 3 1 4
Total 27 17 44
Vehicle Registration
Country
Number of Vehicles
Percentage
Togo 31 70.5%
Bénin 1 2.3%
Burkina Faso 9 20.4%
Niger 3 6.8%
Total 44 100%
7 6
11
3
27
57
4
1
17
0
5
10
15
20
25
30
Northbound
(Tsévié-Kara)
Southbound
(Kara-Tsévié)
(vehicle)
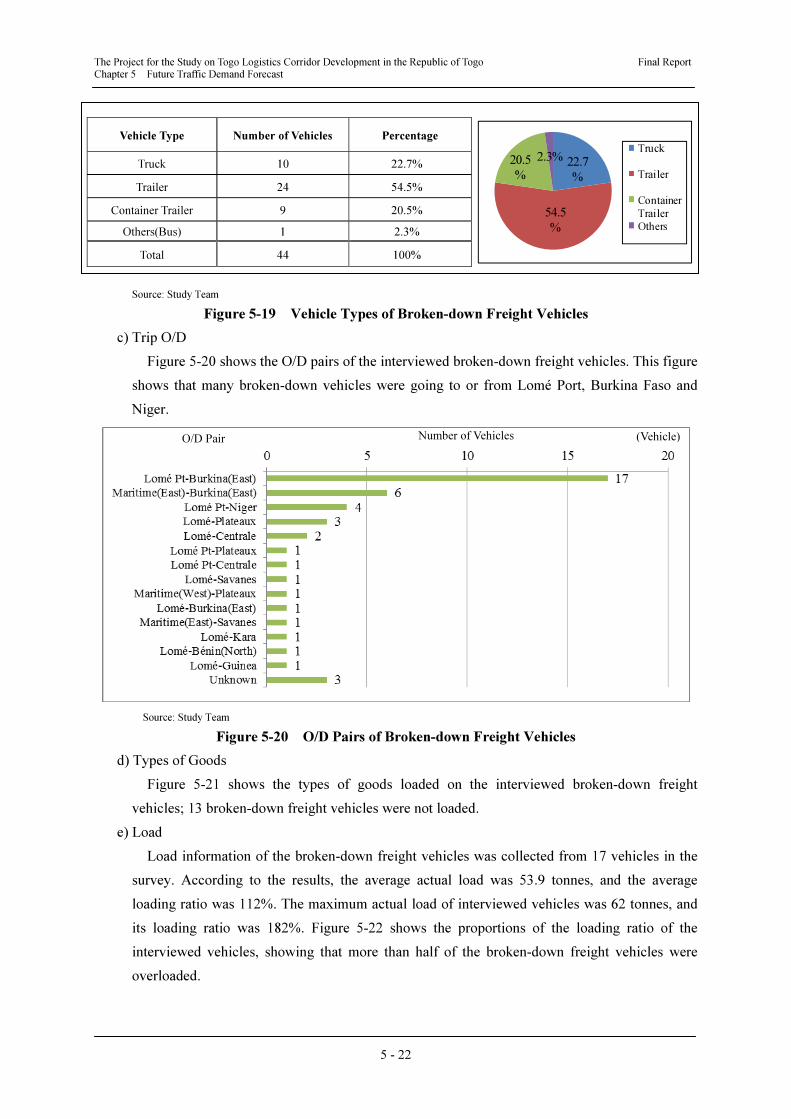
The Project for the Study on Togo Logistics Corridor Development in the Republic of Togo Final Report Chapter 5 Future Traffic Demand Forecast
5 - 22
Source: Study Team
Figure 5-19 Vehicle Types of Broken-down Freight Vehicles
c) Trip O/D
Figure 5-20 shows the O/D pairs of the interviewed broken-down freight vehicles. This figure
shows that many broken-down vehicles were going to or from Lomé Port, Burkina Faso and
Niger.
Source: Study Team
Figure 5-20 O/D Pairs of Broken-down Freight Vehicles
d) Types of Goods
Figure 5-21 shows the types of goods loaded on the interviewed broken-down freight
vehicles; 13 broken-down freight vehicles were not loaded.
e) Load
Load information of the broken-down freight vehicles was collected from 17 vehicles in the
survey. According to the results, the average actual load was 53.9 tonnes, and the average
loading ratio was 112%. The maximum actual load of interviewed vehicles was 62 tonnes, and
its loading ratio was 182%. Figure 5-22 shows the proportions of the loading ratio of the
interviewed vehicles, showing that more than half of the broken-down freight vehicles were
overloaded.
Vehicle Type Number of Vehicles Percentage
Truck 10 22.7%
Trailer 24 54.5%
Container Trailer 9 20.5%
Others(Bus) 1 2.3%
Total 44 100%
Number of VehiclesO/D Pair (Vehicle)
22.7
%
54.5
%
20.5
%
2.3%Truck
Trailer
Container
Trailer
Others
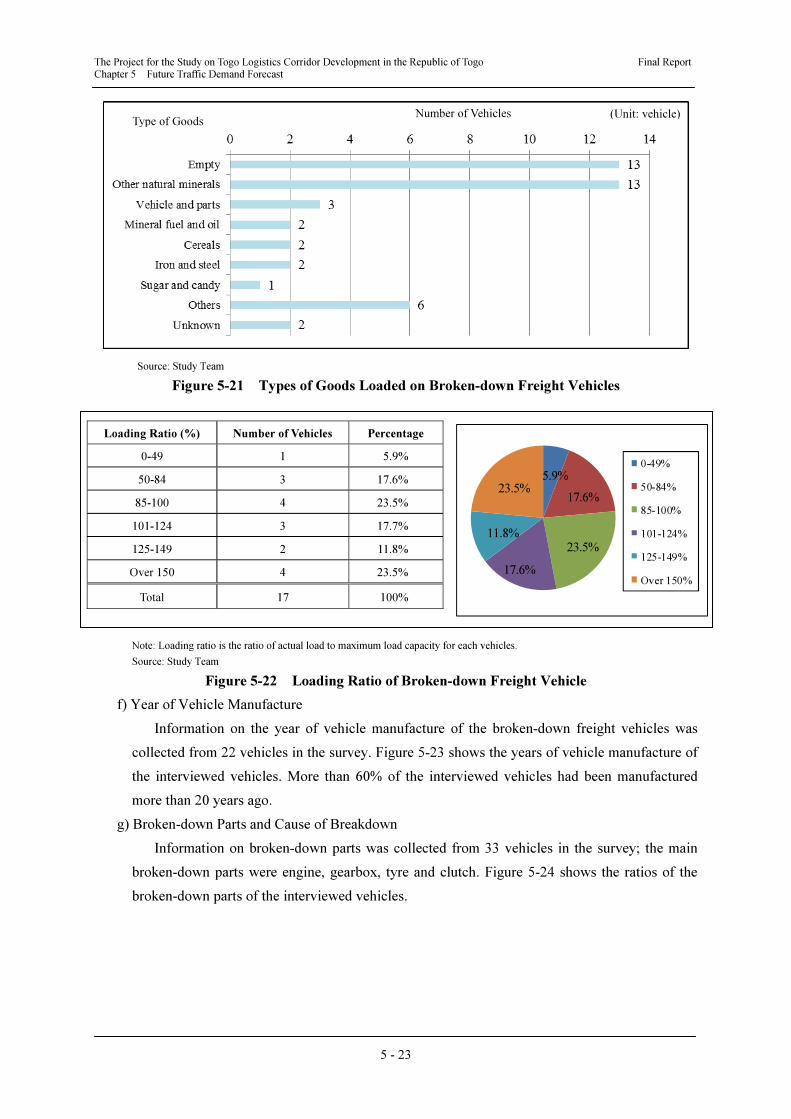
The Project for the Study on Togo Logistics Corridor Development in the Republic of Togo Final Report Chapter 5 Future Traffic Demand Forecast
5 - 23
Source: Study Team
Figure 5-21 Types of Goods Loaded on Broken-down Freight Vehicles
Note: Loading ratio is the ratio of actual load to maximum load capacity for each vehicles.
Source: Study Team
Figure 5-22 Loading Ratio of Broken-down Freight Vehicle
f) Year of Vehicle Manufacture
Information on the year of vehicle manufacture of the broken-down freight vehicles was
collected from 22 vehicles in the survey. Figure 5-23 shows the years of vehicle manufacture of
the interviewed vehicles. More than 60% of the interviewed vehicles had been manufactured
more than 20 years ago.
g) Broken-down Parts and Cause of Breakdown
Information on broken-down parts was collected from 33 vehicles in the survey; the main
broken-down parts were engine, gearbox, tyre and clutch. Figure 5-24 shows the ratios of the
broken-down parts of the interviewed vehicles.
Loading Ratio (%) Number of Vehicles Percentage
0-49 1 5.9%
50-84 3 17.6%
85-100 4 23.5%
101-124 3 17.7%
125-149 2 11.8%
Over 150 4 23.5%
Total 17 100%
Type of Goods Number of Vehicles (Unit: vehicle)
5.9%
17.6%
23.5%
17.6%
11.8%
23.5%
0-49%
50-84%
85-100%
101-124%
125-149%
Over 150%
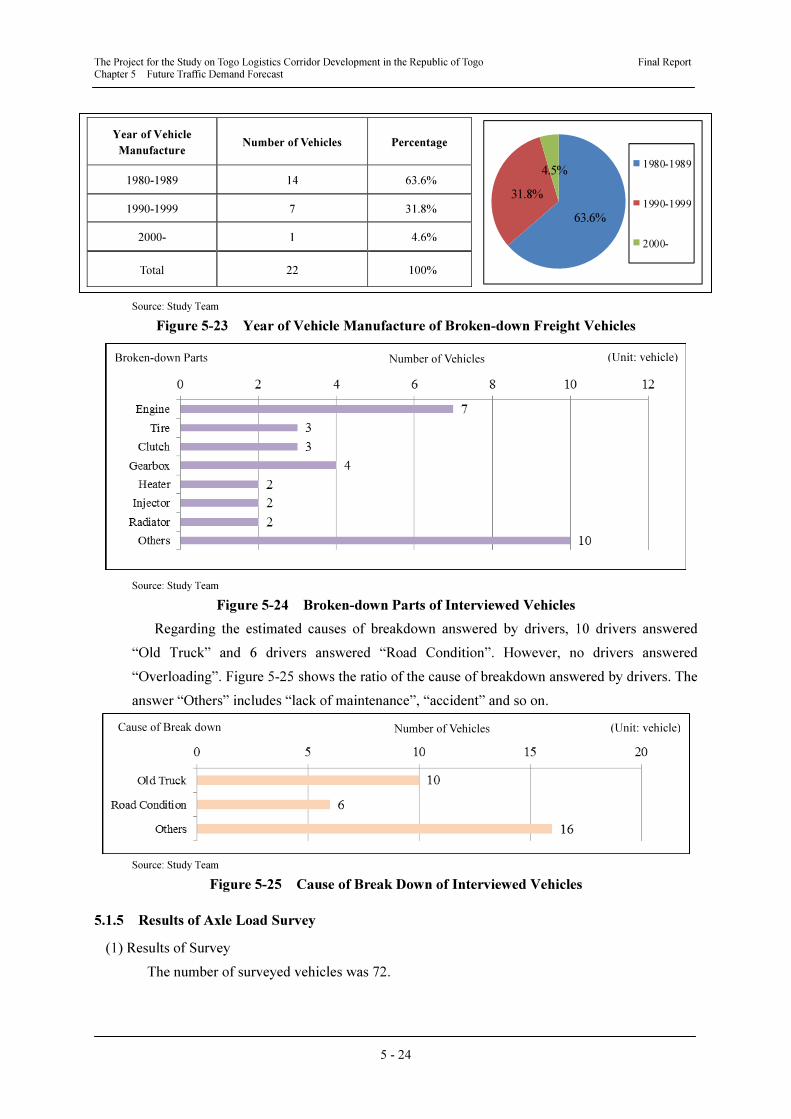
The Project for the Study on Togo Logistics Corridor Development in the Republic of Togo Final Report Chapter 5 Future Traffic Demand Forecast
5 - 24
Source: Study Team
Figure 5-23 Year of Vehicle Manufacture of Broken-down Freight Vehicles
Source: Study Team
Figure 5-24 Broken-down Parts of Interviewed Vehicles
Regarding the estimated causes of breakdown answered by drivers, 10 drivers answered
“Old Truck” and 6 drivers answered “Road Condition”. However, no drivers answered
“Overloading”. Figure 5-25 shows the ratio of the cause of breakdown answered by drivers. The
answer “Others” includes “lack of maintenance”, “accident” and so on.
Source: Study Team
Figure 5-25 Cause of Break Down of Interviewed Vehicles
5.1.5 Results of Axle Load Survey
(1) Results of Survey
The number of surveyed vehicles was 72.
Year of Vehicle
Manufacture Number of Vehicles Percentage
1980-1989 14 63.6%
1990-1999 7 31.8%
2000- 1 4.6%
Total 22 100%
63.6%
31.8%
4.5%1980-1989
1990-1999
2000-
Broken-down Parts Number of Vehicles (Unit: vehicle)
Cause of Break down Number of Vehicles (Unit: vehicle)
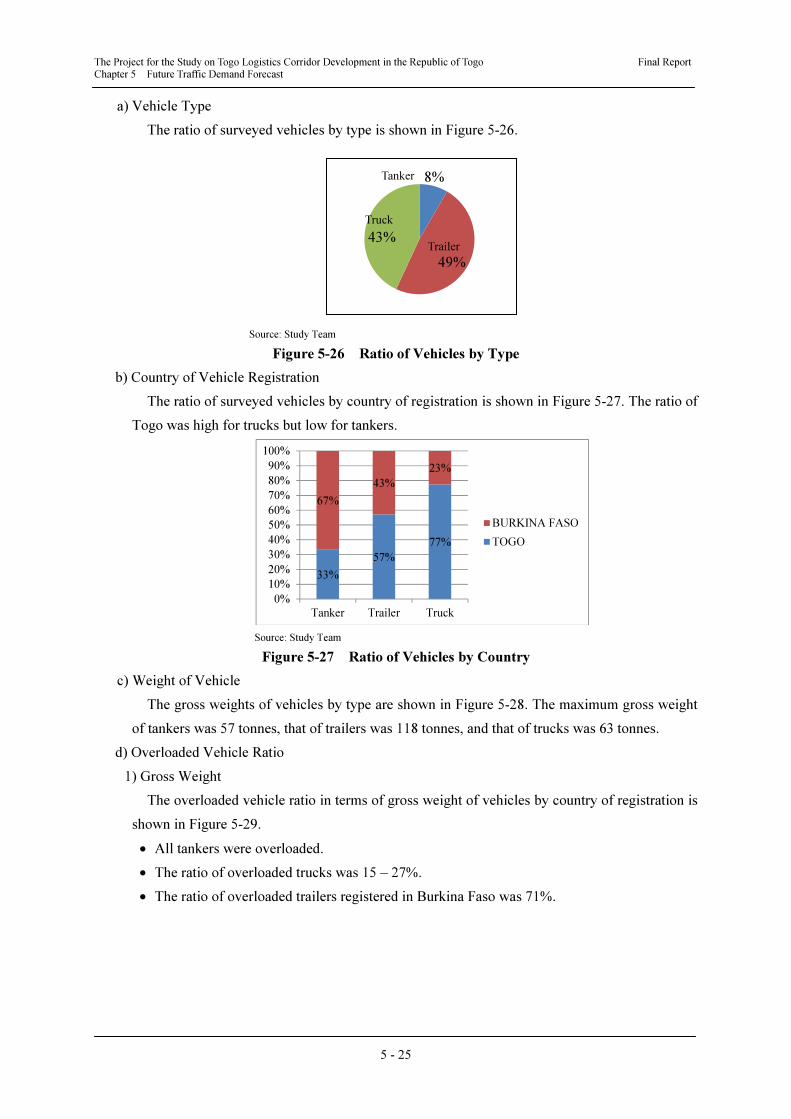
The Project for the Study on Togo Logistics Corridor Development in the Republic of Togo Final Report Chapter 5 Future Traffic Demand Forecast
5 - 25
a) Vehicle Type
The ratio of surveyed vehicles by type is shown in Figure 5-26.
8%
49%
43%
Source: Study Team
Figure 5-26 Ratio of Vehicles by Type
b) Country of Vehicle Registration
The ratio of surveyed vehicles by country of registration is shown in Figure 5-27. The ratio of
Togo was high for trucks but low for tankers.
33%
57%
77%
67%
43%
23%
0%
10%
20%
30%
40%
50%
60%
70%
80%
90%
100%
Tanker Trailer Truck
BURKINA FASO
TOGO
Source: Study Team
Figure 5-27 Ratio of Vehicles by Country
c) Weight of Vehicle
The gross weights of vehicles by type are shown in Figure 5-28. The maximum gross weight
of tankers was 57 tonnes, that of trailers was 118 tonnes, and that of trucks was 63 tonnes.
d) Overloaded Vehicle Ratio
1) Gross Weight
The overloaded vehicle ratio in terms of gross weight of vehicles by country of registration is
shown in Figure 5-29.
• All tankers were overloaded.
• The ratio of overloaded trucks was 15 – 27%.
• The ratio of overloaded trailers registered in Burkina Faso was 71%.
Truck
Trailer
Tanker
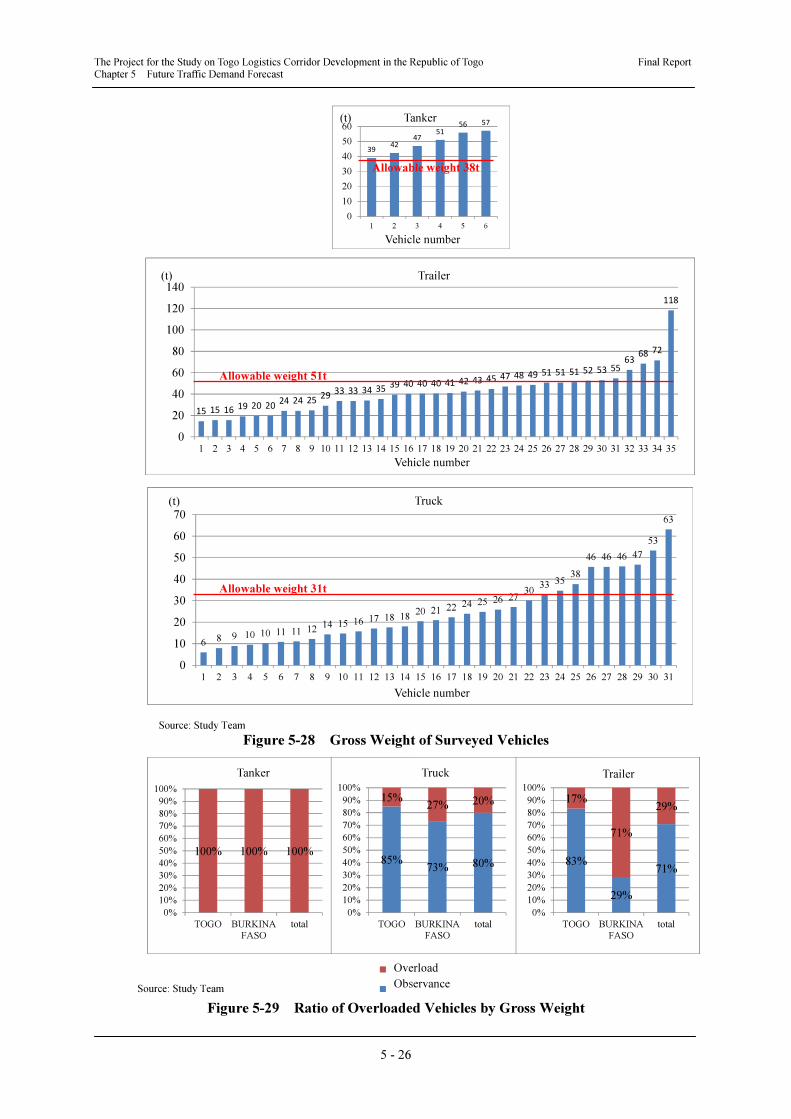
The Project for the Study on Togo Logistics Corridor Development in the Republic of Togo Final Report Chapter 5 Future Traffic Demand Forecast
5 - 26
Source: Study Team
Figure 5-28 Gross Weight of Surveyed Vehicles
100% 100% 100%
0%
10%
20%
30%
40%
50%
60%
70%
80%
90%
100%
TOGO BURKINA
FASO
total
Overload
Observance85%
73% 80%
15%27% 20%
0%
10%
20%
30%
40%
50%
60%
70%
80%
90%
100%
TOGO BURKINA
FASO
total
Overload
Observance83%
29%
71%
17%
71%
29%
0%
10%
20%
30%
40%
50%
60%
70%
80%
90%
100%
TOGO BURKINA
FASO
total
Source: Study Team
Figure 5-29 Ratio of Overloaded Vehicles by Gross Weight
Truck Trailer Tanker
Overload
Observance
15 15 1619 20 20
24 24 2529
33 33 34 3539 40 40 40 41 42 43 45 47 48 49 51 51 51 52 53 55
6368
72
118
0
20
40
60
80
100
120
140
1 2 3 4 5 6 7 8 9 10 11 12 13 14 15 16 17 18 19 20 21 22 23 24 25 26 27 28 29 30 31 32 33 34 35
68 9 10 10 11 11 12
14 15 16 17 18 1820 21 22
24 25 26 2730
3335
38
46 46 46 47
53
63
0
10
20
30
40
50
60
70
1 2 3 4 5 6 7 8 9 10 11 12 13 14 15 16 17 18 19 20 21 22 23 24 25 26 27 28 29 30 31
3942
4751
56 57
0
10
20
30
40
50
60
1 2 3 4 5 6
Trailer
Truck
Tanker
Vehicle number
Vehicle number
Vehicle number
(t)
(t)
(t)
Allowable weight 51t
Allowable weight 38t
Allowable weight 31t
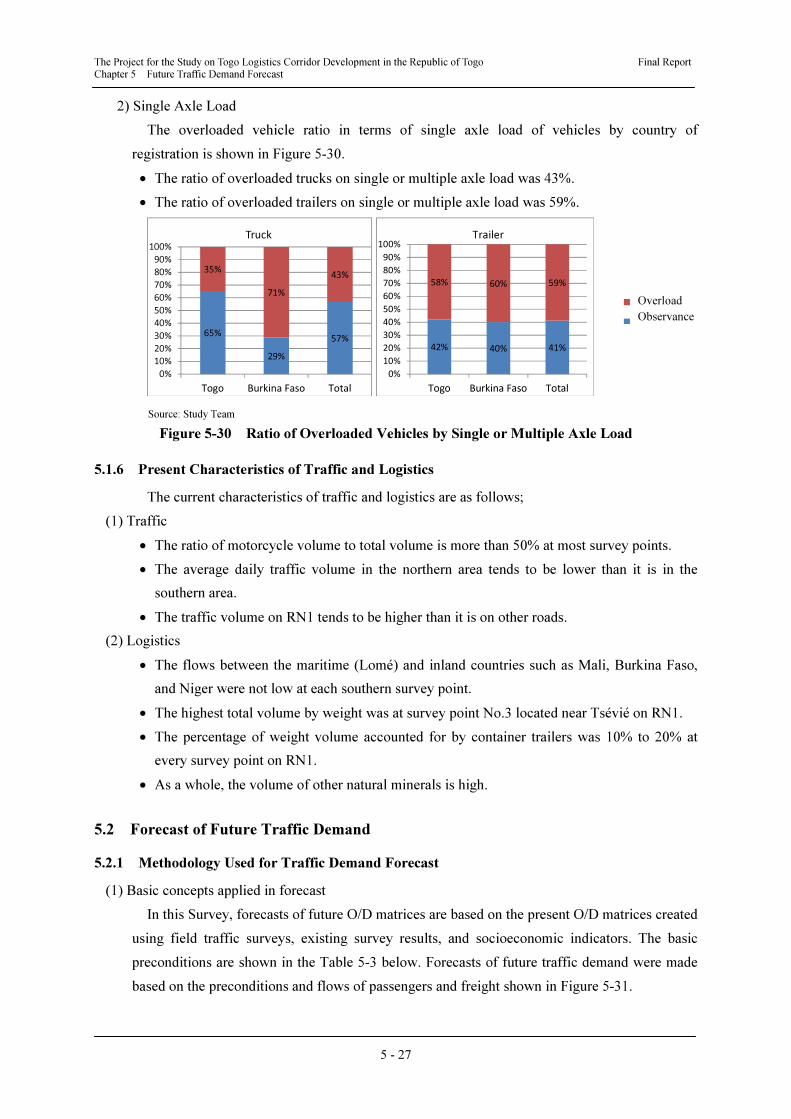
The Project for the Study on Togo Logistics Corridor Development in the Republic of Togo Final Report Chapter 5 Future Traffic Demand Forecast
5 - 27
2) Single Axle Load
The overloaded vehicle ratio in terms of single axle load of vehicles by country of
registration is shown in Figure 5-30.
• The ratio of overloaded trucks on single or multiple axle load was 43%.
• The ratio of overloaded trailers on single or multiple axle load was 59%.
Source: Study Team
Figure 5-30 Ratio of Overloaded Vehicles by Single or Multiple Axle Load
5.1.6 Present Characteristics of Traffic and Logistics
The current characteristics of traffic and logistics are as follows;
(1) Traffic
• The ratio of motorcycle volume to total volume is more than 50% at most survey points.
• The average daily traffic volume in the northern area tends to be lower than it is in the
southern area.
• The traffic volume on RN1 tends to be higher than it is on other roads.
(2) Logistics
• The flows between the maritime (Lomé) and inland countries such as Mali, Burkina Faso,
and Niger were not low at each southern survey point.
• The highest total volume by weight was at survey point No.3 located near Tsévié on RN1.
• The percentage of weight volume accounted for by container trailers was 10% to 20% at
every survey point on RN1.
• As a whole, the volume of other natural minerals is high.
5.2 Forecast of Future Traffic Demand
5.2.1 Methodology Used for Traffic Demand Forecast
(1) Basic concepts applied in forecast
In this Survey, forecasts of future O/D matrices are based on the present O/D matrices created
using field traffic surveys, existing survey results, and socioeconomic indicators. The basic
preconditions are shown in the Table 5-3 below. Forecasts of future traffic demand were made
based on the preconditions and flows of passengers and freight shown in Figure 5-31.
65%
29%
57%
35%
71%
43%
0%
10%
20%
30%
40%
50%
60%
70%
80%
90%
100%
Togo Burkina Faso Total
42% 40% 41%
58% 60% 59%
0%
10%
20%
30%
40%
50%
60%
70%
80%
90%
100%
Togo Burkina Faso Total
Truck Trailer
Overload
Observance
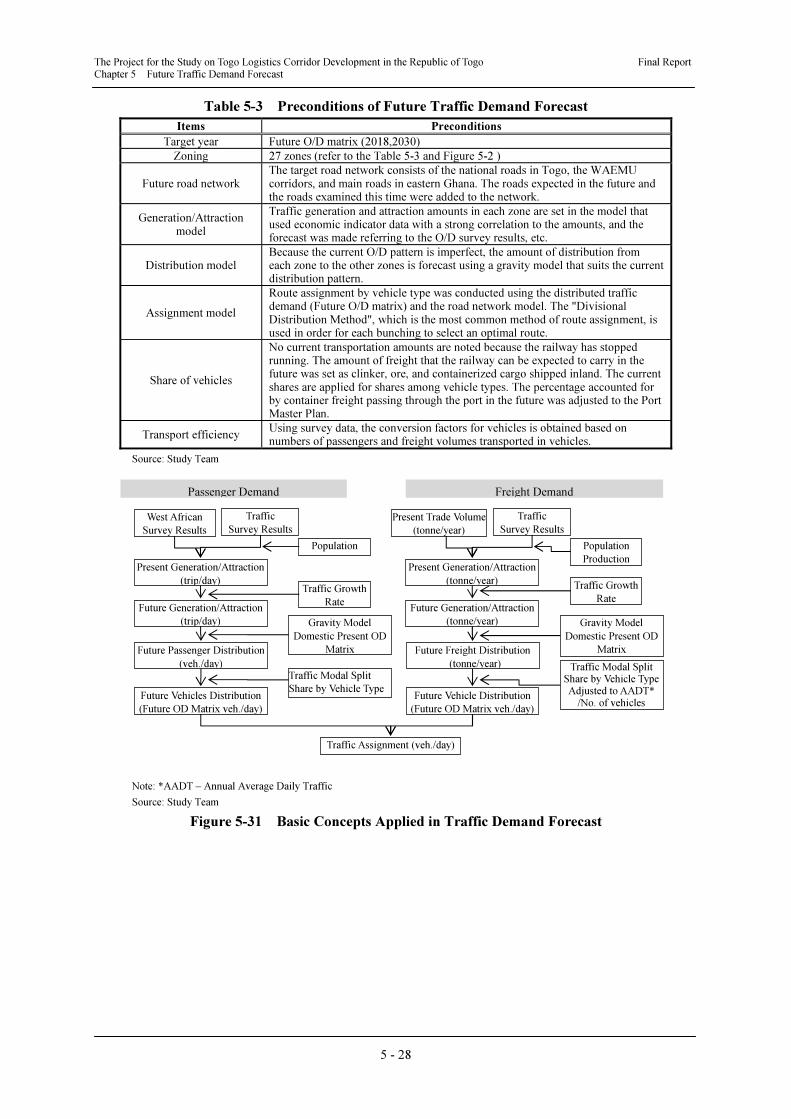
The Project for the Study on Togo Logistics Corridor Development in the Republic of Togo Final Report Chapter 5 Future Traffic Demand Forecast
5 - 28
Table 5-3 Preconditions of Future Traffic Demand Forecast
Items Preconditions
Target year Future O/D matrix (2018,2030)
Zoning 27 zones (refer to the Table 5-3 and Figure 5-2 )
Future road network The target road network consists of the national roads in Togo, the WAEMU corridors, and main roads in eastern Ghana. The roads expected in the future and the roads examined this time were added to the network.
Generation/Attraction model
Traffic generation and attraction amounts in each zone are set in the model that used economic indicator data with a strong correlation to the amounts, and the forecast was made referring to the O/D survey results, etc.
Distribution model Because the current O/D pattern is imperfect, the amount of distribution from each zone to the other zones is forecast using a gravity model that suits the current distribution pattern.
Assignment model
Route assignment by vehicle type was conducted using the distributed traffic demand (Future O/D matrix) and the road network model. The "Divisional Distribution Method", which is the most common method of route assignment, is used in order for each bunching to select an optimal route.
Share of vehicles
No current transportation amounts are noted because the railway has stopped running. The amount of freight that the railway can be expected to carry in the future was set as clinker, ore, and containerized cargo shipped inland. The current shares are applied for shares among vehicle types. The percentage accounted for by container freight passing through the port in the future was adjusted to the Port Master Plan.
Transport efficiency Using survey data, the conversion factors for vehicles is obtained based on numbers of passengers and freight volumes transported in vehicles.
Source: Study Team
Note: *AADT – Annual Average Daily Traffic
Source: Study Team
Figure 5-31 Basic Concepts Applied in Traffic Demand Forecast
West African
Survey Results
Present Generation/Attraction
(trip/day)
Traffic
Survey Results
Future Generation/Attraction
(trip/day)
Future Passenger Distribution
(veh./day)
Future Vehicles Distribution
(Future OD Matrix veh./day)
Passenger Demand
Population
Traffic Growth
Rate
Traffic Modal Split
Share by Vehicle Type
Gravity Model
Domestic Present OD
Matrix
Present Trade Volume
(tonne/year)
Present Generation/Attraction
(tonne/year)
Traffic
Survey Results
Future Generation/Attraction
(tonne/year)
Future Freight Distribution
(tonne/year)
Future Vehicle Distribution
(Future OD Matrix veh./day)
Population
Production
Traffic Growth
Rate
Gravity Model
Domestic Present OD
Matrix
Traffic Modal Split Share by Vehicle TypeAdjusted to AADT*
/No. of vehicles
Freight Demand
Traffic Assignment (veh./day)
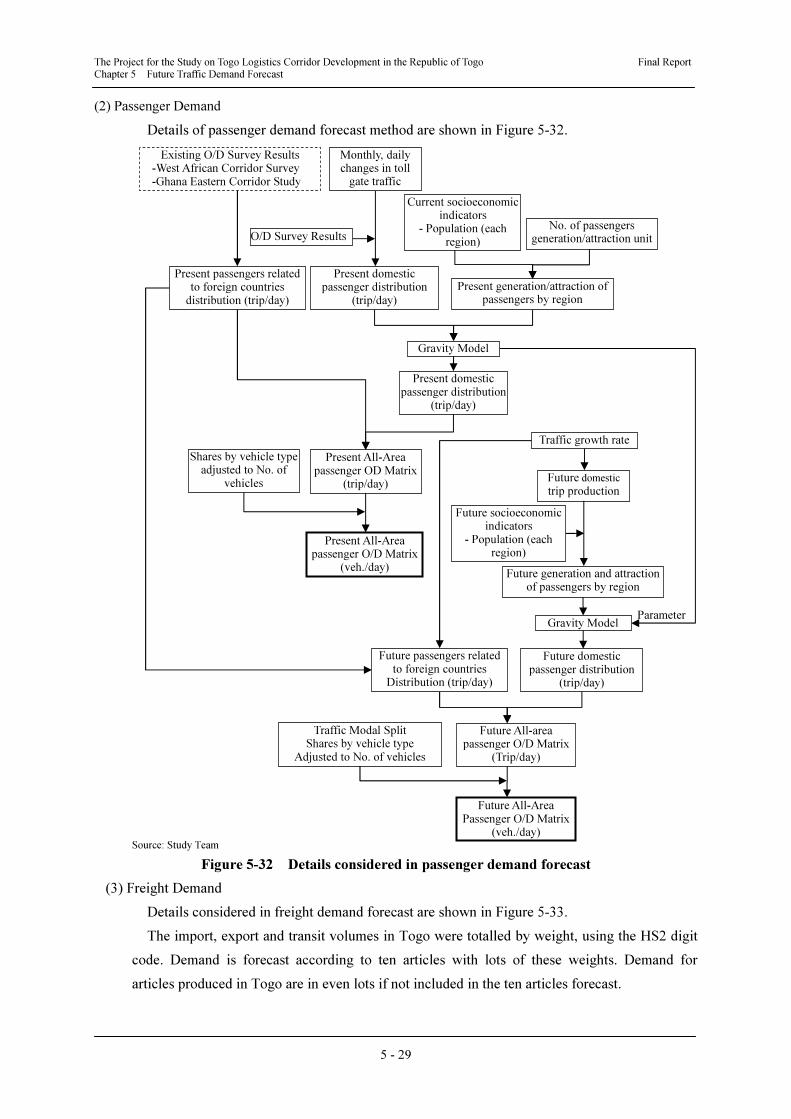
The Project for the Study on Togo Logistics Corridor Development in the Republic of Togo Final Report Chapter 5 Future Traffic Demand Forecast
5 - 29
(2) Passenger Demand
Details of passenger demand forecast method are shown in Figure 5-32.
Source: Study Team
Figure 5-32 Details considered in passenger demand forecast
(3) Freight Demand
Details considered in freight demand forecast are shown in Figure 5-33.
The import, export and transit volumes in Togo were totalled by weight, using the HS2 digit
code. Demand is forecast according to ten articles with lots of these weights. Demand for
articles produced in Togo are in even lots if not included in the ten articles forecast.
Existing O/D Survey Results -West African Corridor Survey -Ghana Eastern Corridor Study
O/D Survey Results
Monthly, daily changes in toll
gate traffic
Current socioeconomicindicators
- Population (each region)
No. of passengers generation/attraction unit
Present passengers related to foreign countries
distribution (trip/day)
Present domestic passenger distribution
(trip/day)
Present generation/attraction of passengers by region
Gravity Model
Shares by vehicle type adjusted to No. of
vehicles
Present All-Area passenger OD Matrix
(trip/day)
Present domestic passenger distribution
(trip/day)
Present All-Area passenger O/D Matrix
(veh./day)
Traffic growth rate
Future domestic trip production
Future socioeconomic indicators
- Population (each region)
Future generation and attraction of passengers by region
Gravity Model Parameter
Future domestic passenger distribution
(trip/day)
Future passengers related to foreign countries
Distribution (trip/day)
Future All-area passenger O/D Matrix
(Trip/day)
Future All-Area Passenger O/D Matrix
(veh./day)
Traffic Modal Split Shares by vehicle type
Adjusted to No. of vehicles
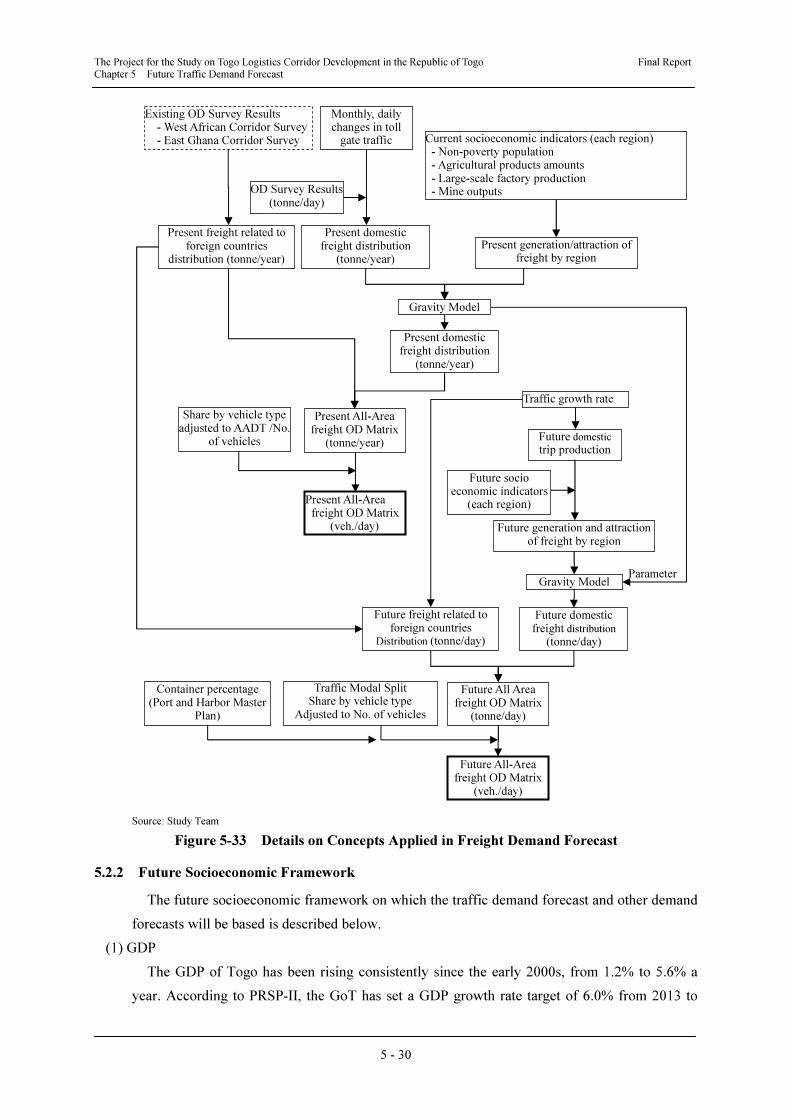
The Project for the Study on Togo Logistics Corridor Development in the Republic of Togo Final Report Chapter 5 Future Traffic Demand Forecast
5 - 30
Source: Study Team
Figure 5-33 Details on Concepts Applied in Freight Demand Forecast
5.2.2 Future Socioeconomic Framework
The future socioeconomic framework on which the traffic demand forecast and other demand
forecasts will be based is described below.
(1) GDP
The GDP of Togo has been rising consistently since the early 2000s, from 1.2% to 5.6% a
year. According to PRSP-II, the GoT has set a GDP growth rate target of 6.0% from 2013 to
Existing OD Survey Results - West African Corridor Survey - East Ghana Corridor Survey
OD Survey Results
(tonne/day)
Monthly, daily changes in toll
gate traffic Current socioeconomic indicators (each region) - Non-poverty population - Agricultural products amounts - Large-scale factory production - Mine outputs
Present freight related to foreign countries
distribution (tonne/year)
Present domestic freight distribution
(tonne/year)
Present generation/attraction of freight by region
Gravity Model
Share by vehicle type adjusted to AADT /No.
of vehicles
Present All-Areafreight OD Matrix
(tonne/year)
Present domestic freight distribution
(tonne/year)
Present All-Area freight OD Matrix
(veh./day)
Traffic growth rate
Future domestic trip production
Future socio economic indicators
(each region)
Future generation and attraction of freight by region
Gravity Model Parameter
Future domestic freight distribution
(tonne/day)
Future freight related to foreign countries
Distribution (tonne/day)
Future All Area freight OD Matrix
(tonne/day)
Future All-Areafreight OD Matrix
(veh./day)
Traffic Modal SplitShare by vehicle type
Adjusted to No. of vehicles
Container percentage (Port and Harbor Master
Plan)
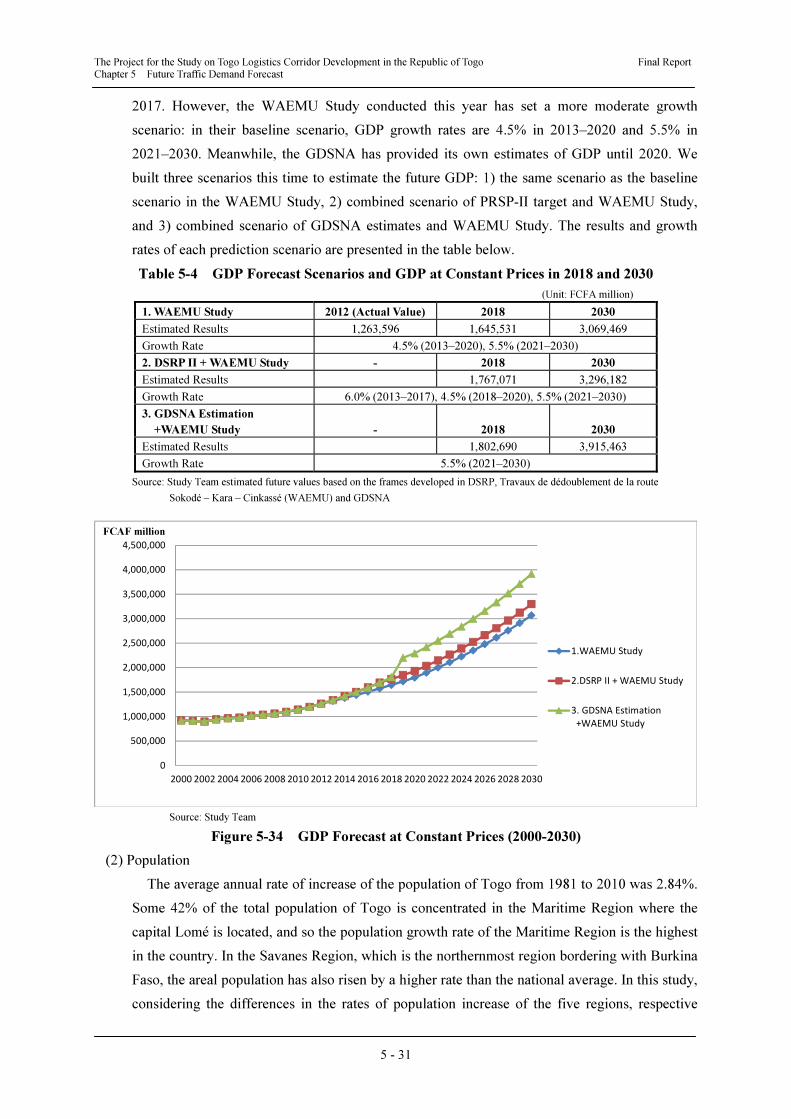
The Project for the Study on Togo Logistics Corridor Development in the Republic of Togo Final Report Chapter 5 Future Traffic Demand Forecast
5 - 31
2017. However, the WAEMU Study conducted this year has set a more moderate growth
scenario: in their baseline scenario, GDP growth rates are 4.5% in 2013–2020 and 5.5% in
2021–2030. Meanwhile, the GDSNA has provided its own estimates of GDP until 2020. We
built three scenarios this time to estimate the future GDP: 1) the same scenario as the baseline
scenario in the WAEMU Study, 2) combined scenario of PRSP-II target and WAEMU Study,
and 3) combined scenario of GDSNA estimates and WAEMU Study. The results and growth
rates of each prediction scenario are presented in the table below.
Table 5-4 GDP Forecast Scenarios and GDP at Constant Prices in 2018 and 2030
(Unit: FCFA million)
1. WAEMU Study 2012 (Actual Value) 2018 2030
Estimated Results 1,263,596 1,645,531 3,069,469
Growth Rate 4.5% (2013–2020), 5.5% (2021–2030)
2. DSRP II + WAEMU Study - 2018 2030
Estimated Results 1,767,071 3,296,182
Growth Rate 6.0% (2013–2017), 4.5% (2018–2020), 5.5% (2021–2030)
3. GDSNA Estimation
+WAEMU Study - 2018 2030
Estimated Results 1,802,690 3,915,463
Growth Rate 5.5% (2021–2030)
Source: Study Team estimated future values based on the frames developed in DSRP, Travaux de dédoublement de la route
Sokodé – Kara – Cinkassé (WAEMU) and GDSNA
0
500,000
1,000,000
1,500,000
2,000,000
2,500,000
3,000,000
3,500,000
4,000,000
4,500,000
2000 2002 2004 2006 2008 2010 2012 2014 2016 2018 2020 2022 2024 2026 2028 2030
FCAF million
1.WAEMU Study
2.DSRP II + WAEMU Study
3. GDSNA Estimation
+WAEMU Study
Source: Study Team
Figure 5-34 GDP Forecast at Constant Prices (2000-2030)
(2) Population
The average annual rate of increase of the population of Togo from 1981 to 2010 was 2.84%.
Some 42% of the total population of Togo is concentrated in the Maritime Region where the
capital Lomé is located, and so the population growth rate of the Maritime Region is the highest
in the country. In the Savanes Region, which is the northernmost region bordering with Burkina
Faso, the areal population has also risen by a higher rate than the national average. In this study,
considering the differences in the rates of population increase of the five regions, respective
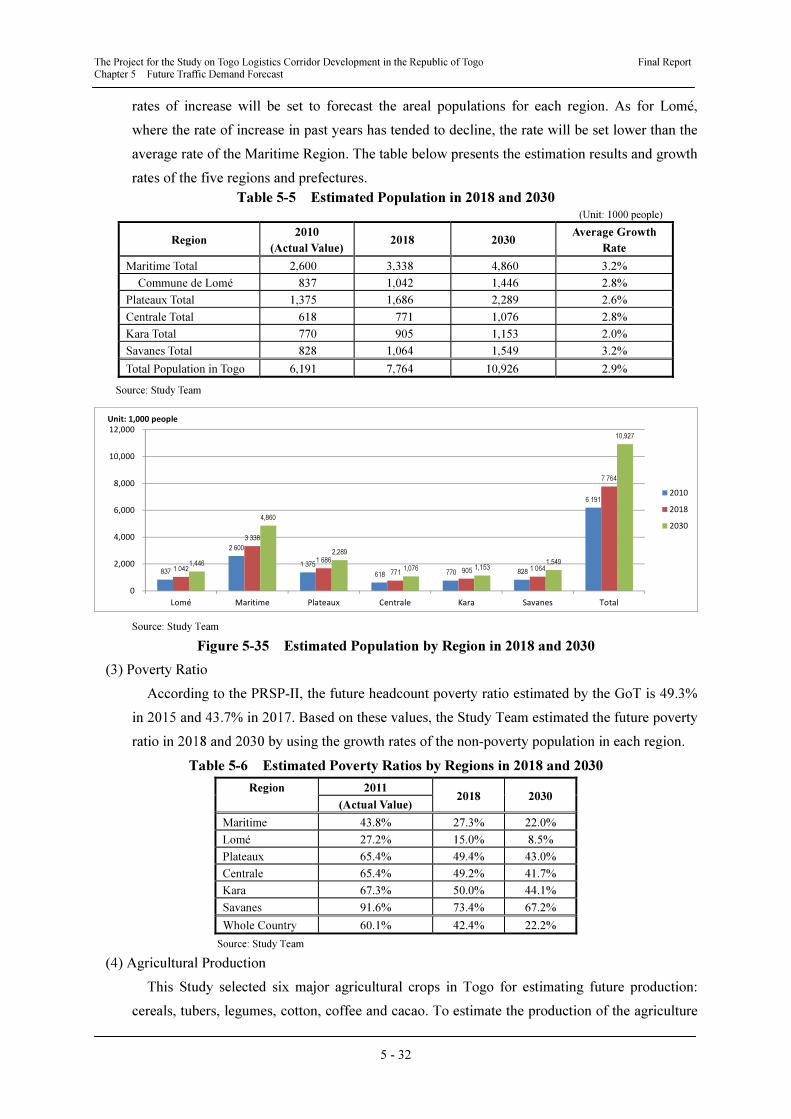
The Project for the Study on Togo Logistics Corridor Development in the Republic of Togo Final Report Chapter 5 Future Traffic Demand Forecast
5 - 32
rates of increase will be set to forecast the areal populations for each region. As for Lomé,
where the rate of increase in past years has tended to decline, the rate will be set lower than the
average rate of the Maritime Region. The table below presents the estimation results and growth
rates of the five regions and prefectures.
Table 5-5 Estimated Population in 2018 and 2030 (Unit: 1000 people)
Region 2010
(Actual Value)2018 2030
Average Growth
Rate
Maritime Total 2,600 3,338 4,860 3.2%
Commune de Lomé 837 1,042 1,446 2.8%
Plateaux Total 1,375 1,686 2,289 2.6%
Centrale Total 618 771 1,076 2.8%
Kara Total 770 905 1,153 2.0%
Savanes Total 828 1,064 1,549 3.2%
Total Population in Togo 6,191 7,764 10,926 2.9%
Source: Study Team
837
2 600
1 375
618 770 828
6 191
1 042
3 338
1 686
771 905 1 064
7 764
1,446
4,860
2,289
1,076 1,153 1,549
10,927
0
2,000
4,000
6,000
8,000
10,000
12,000
Lomé Maritime Plateaux Centrale Kara Savanes Total
2010
2018
2030
Unit: 1,000 people
Source: Study Team
Figure 5-35 Estimated Population by Region in 2018 and 2030
(3) Poverty Ratio
According to the PRSP-II, the future headcount poverty ratio estimated by the GoT is 49.3%
in 2015 and 43.7% in 2017. Based on these values, the Study Team estimated the future poverty
ratio in 2018 and 2030 by using the growth rates of the non-poverty population in each region.
Table 5-6 Estimated Poverty Ratios by Regions in 2018 and 2030
Region 2011 2018 2030
(Actual Value)
Maritime 43.8% 27.3% 22.0%
Lomé 27.2% 15.0% 8.5%
Plateaux 65.4% 49.4% 43.0%
Centrale 65.4% 49.2% 41.7%
Kara 67.3% 50.0% 44.1%
Savanes 91.6% 73.4% 67.2%
Whole Country 60.1% 42.4% 22.2%
Source: Study Team
(4) Agricultural Production
This Study selected six major agricultural crops in Togo for estimating future production:
cereals, tubers, legumes, cotton, coffee and cacao. To estimate the production of the agriculture
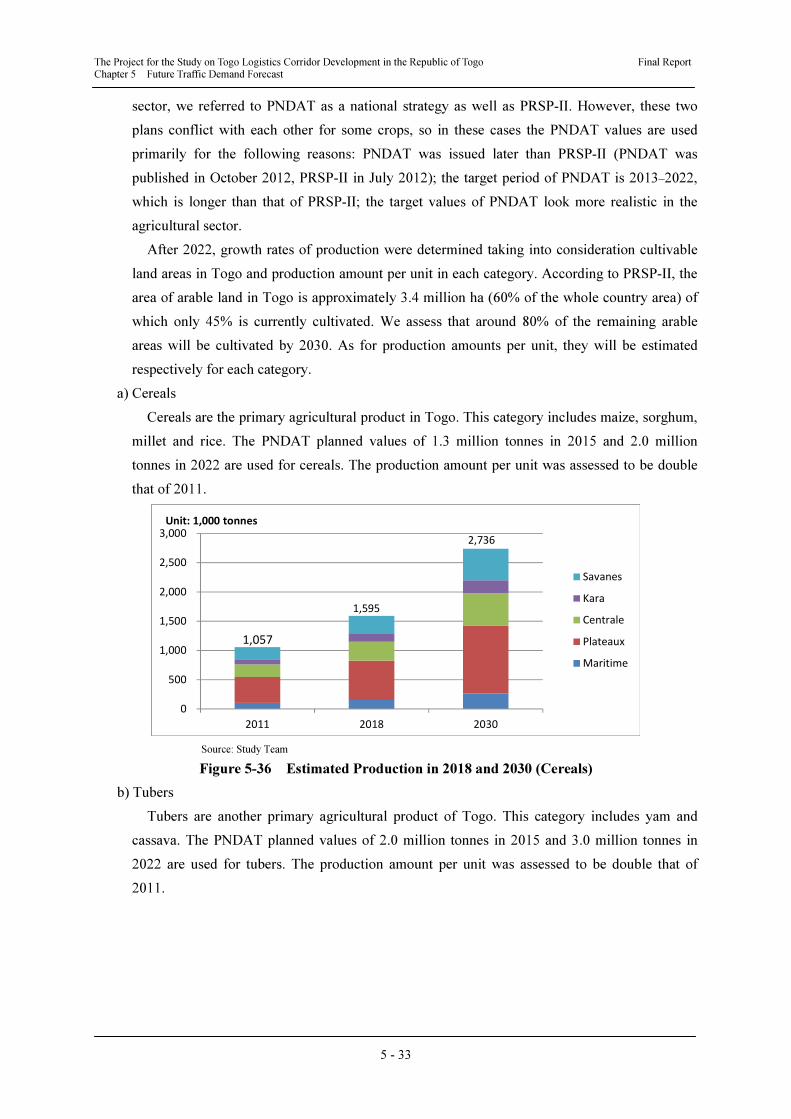
The Project for the Study on Togo Logistics Corridor Development in the Republic of Togo Final Report Chapter 5 Future Traffic Demand Forecast
5 - 33
sector, we referred to PNDAT as a national strategy as well as PRSP-II. However, these two
plans conflict with each other for some crops, so in these cases the PNDAT values are used
primarily for the following reasons: PNDAT was issued later than PRSP-II (PNDAT was
published in October 2012, PRSP-II in July 2012); the target period of PNDAT is 2013–2022,
which is longer than that of PRSP-II; the target values of PNDAT look more realistic in the
agricultural sector.
After 2022, growth rates of production were determined taking into consideration cultivable
land areas in Togo and production amount per unit in each category. According to PRSP-II, the
area of arable land in Togo is approximately 3.4 million ha (60% of the whole country area) of
which only 45% is currently cultivated. We assess that around 80% of the remaining arable
areas will be cultivated by 2030. As for production amounts per unit, they will be estimated
respectively for each category.
a) Cereals
Cereals are the primary agricultural product in Togo. This category includes maize, sorghum,
millet and rice. The PNDAT planned values of 1.3 million tonnes in 2015 and 2.0 million
tonnes in 2022 are used for cereals. The production amount per unit was assessed to be double
that of 2011.
0
500
1,000
1,500
2,000
2,500
3,000
2011 2018 2030
Savanes
Kara
Centrale
Plateaux
Maritime
1,057
1,595
2,736
Unit: 1,000 tonnes
Source: Study Team
Figure 5-36 Estimated Production in 2018 and 2030 (Cereals)
b) Tubers
Tubers are another primary agricultural product of Togo. This category includes yam and
cassava. The PNDAT planned values of 2.0 million tonnes in 2015 and 3.0 million tonnes in
2022 are used for tubers. The production amount per unit was assessed to be double that of
2011.
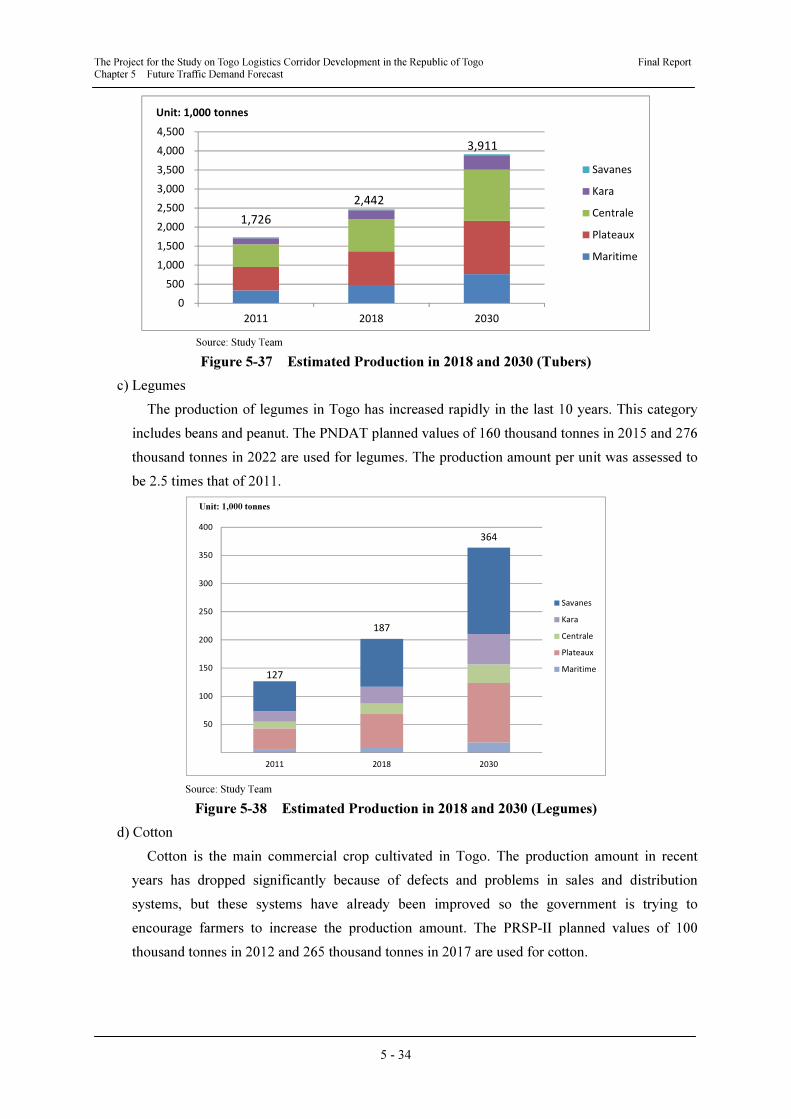
The Project for the Study on Togo Logistics Corridor Development in the Republic of Togo Final Report Chapter 5 Future Traffic Demand Forecast
5 - 34
0
500
1,000
1,500
2,000
2,500
3,000
3,500
4,000
4,500
2011 2018 2030
Savanes
Kara
Centrale
Plateaux
Maritime
Unit: 1,000 tonnes
1,726
2,442
3,911
Source: Study Team
Figure 5-37 Estimated Production in 2018 and 2030 (Tubers)
c) Legumes
The production of legumes in Togo has increased rapidly in the last 10 years. This category
includes beans and peanut. The PNDAT planned values of 160 thousand tonnes in 2015 and 276
thousand tonnes in 2022 are used for legumes. The production amount per unit was assessed to
be 2.5 times that of 2011.
127
187
364
50
100
150
200
250
300
350
400
2011 2018 2030
Unit: 1,000 tonnes
Savanes
Kara
Centrale
Plateaux
Maritime
Source: Study Team
Figure 5-38 Estimated Production in 2018 and 2030 (Legumes)
d) Cotton
Cotton is the main commercial crop cultivated in Togo. The production amount in recent
years has dropped significantly because of defects and problems in sales and distribution
systems, but these systems have already been improved so the government is trying to
encourage farmers to increase the production amount. The PRSP-II planned values of 100
thousand tonnes in 2012 and 265 thousand tonnes in 2017 are used for cotton.
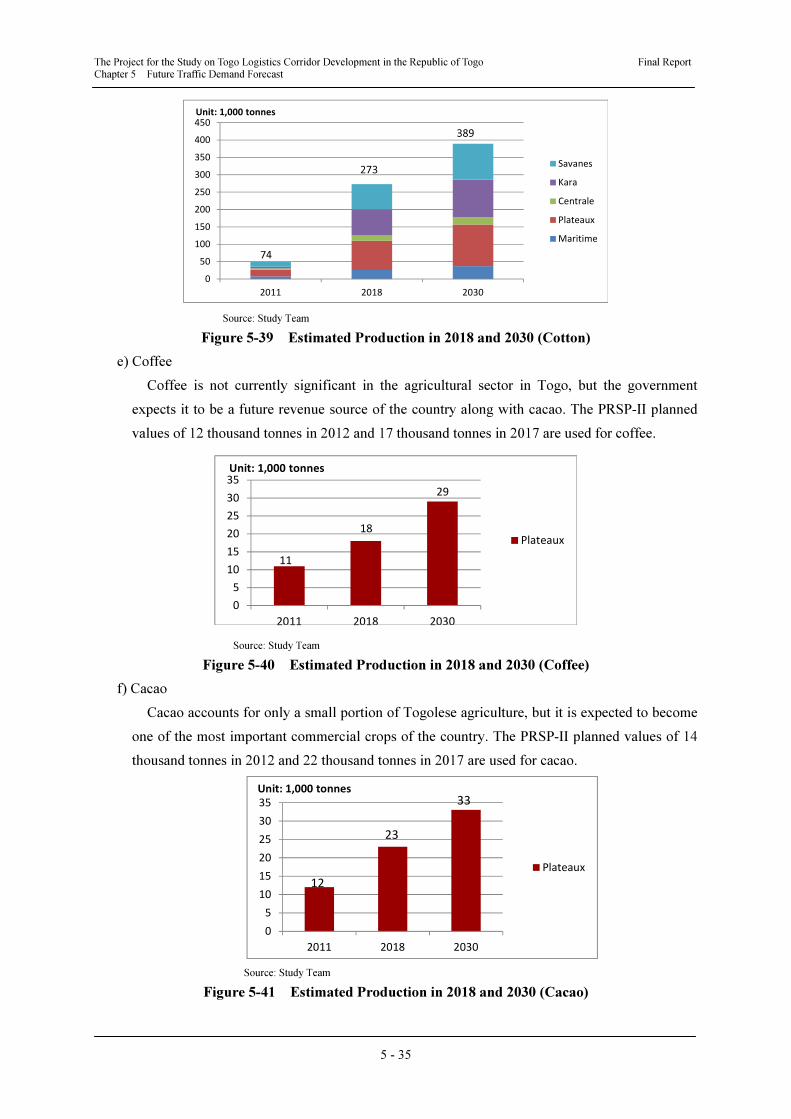
The Project for the Study on Togo Logistics Corridor Development in the Republic of Togo Final Report Chapter 5 Future Traffic Demand Forecast
5 - 35
0
50
100
150
200
250
300
350
400
450
2011 2018 2030
Savanes
Kara
Centrale
Plateaux
Maritime
Unit: 1,000 tonnes
74
273
389
Source: Study Team
Figure 5-39 Estimated Production in 2018 and 2030 (Cotton)
e) Coffee
Coffee is not currently significant in the agricultural sector in Togo, but the government
expects it to be a future revenue source of the country along with cacao. The PRSP-II planned
values of 12 thousand tonnes in 2012 and 17 thousand tonnes in 2017 are used for coffee.
0
5
10
15
20
25
30
35
2011 2018 2030
Plateaux
Unit: 1,000 tonnes
11
18
29
Source: Study Team
Figure 5-40 Estimated Production in 2018 and 2030 (Coffee)
f) Cacao
Cacao accounts for only a small portion of Togolese agriculture, but it is expected to become
one of the most important commercial crops of the country. The PRSP-II planned values of 14
thousand tonnes in 2012 and 22 thousand tonnes in 2017 are used for cacao.
0
5
10
15
20
25
30
35
2011 2018 2030
Plateaux
Unit: 1,000 tonnes
12
23
33
Source: Study Team
Figure 5-41 Estimated Production in 2018 and 2030 (Cacao)
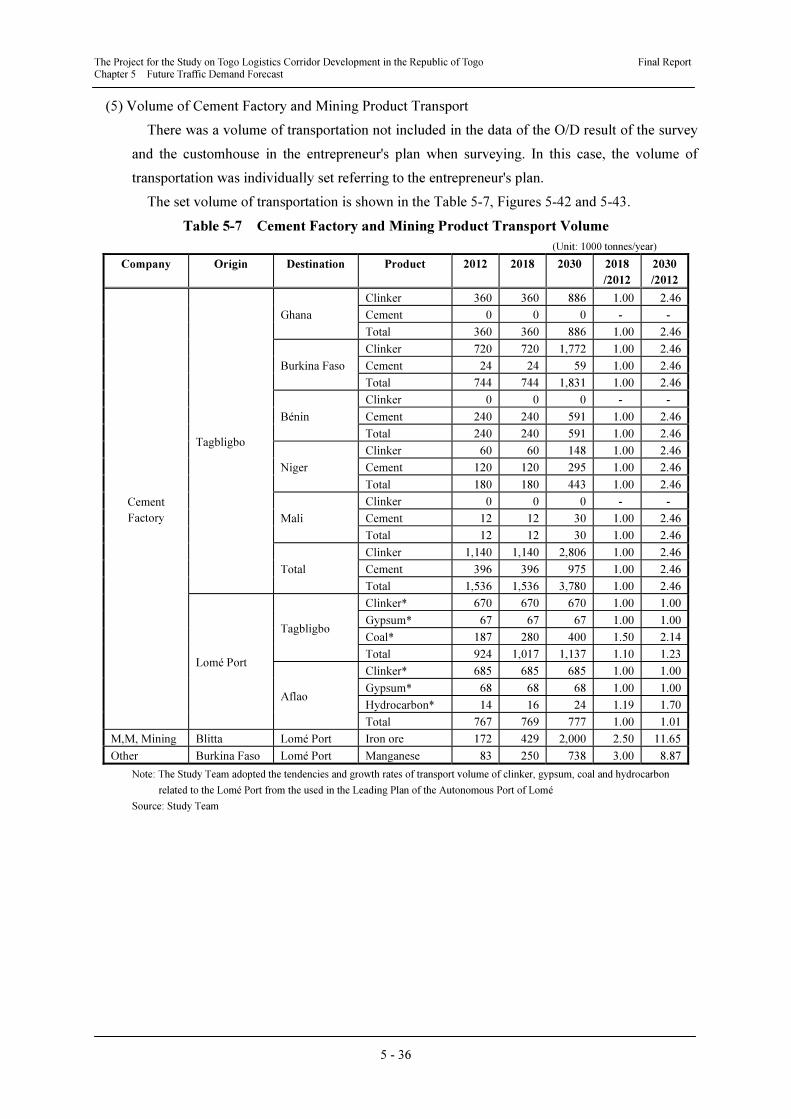
The Project for the Study on Togo Logistics Corridor Development in the Republic of Togo Final Report Chapter 5 Future Traffic Demand Forecast
5 - 36
(5) Volume of Cement Factory and Mining Product Transport
There was a volume of transportation not included in the data of the O/D result of the survey
and the customhouse in the entrepreneur's plan when surveying. In this case, the volume of
transportation was individually set referring to the entrepreneur's plan.
The set volume of transportation is shown in the Table 5-7, Figures 5-42 and 5-43.
Table 5-7 Cement Factory and Mining Product Transport Volume
(Unit: 1000 tonnes/year)
Company Origin Destination Product 2012 2018 2030 2018
/2012
2030
/2012
Cement
Factory
Tagbligbo
Ghana
Clinker 360 360 886 1.00 2.46
Cement 0 0 0 - -
Total 360 360 886 1.00 2.46
Burkina Faso
Clinker 720 720 1,772 1.00 2.46
Cement 24 24 59 1.00 2.46
Total 744 744 1,831 1.00 2.46
Bénin
Clinker 0 0 0 - -
Cement 240 240 591 1.00 2.46
Total 240 240 591 1.00 2.46
Niger
Clinker 60 60 148 1.00 2.46
Cement 120 120 295 1.00 2.46
Total 180 180 443 1.00 2.46
Mali
Clinker 0 0 0 - -
Cement 12 12 30 1.00 2.46
Total 12 12 30 1.00 2.46
Total
Clinker 1,140 1,140 2,806 1.00 2.46
Cement 396 396 975 1.00 2.46
Total 1,536 1,536 3,780 1.00 2.46
Lomé Port
Tagbligbo
Clinker* 670 670 670 1.00 1.00
Gypsum* 67 67 67 1.00 1.00
Coal* 187 280 400 1.50 2.14
Total 924 1,017 1,137 1.10 1.23
Aflao
Clinker* 685 685 685 1.00 1.00
Gypsum* 68 68 68 1.00 1.00
Hydrocarbon* 14 16 24 1.19 1.70
Total 767 769 777 1.00 1.01
M,M, Mining Blitta Lomé Port Iron ore 172 429 2,000 2.50 11.65
Other Burkina Faso Lomé Port Manganese 83 250 738 3.00 8.87
Note: The Study Team adopted the tendencies and growth rates of transport volume of clinker, gypsum, coal and hydrocarbon
related to the Lomé Port from the used in the Leading Plan of the Autonomous Port of Lomé
Source: Study Team
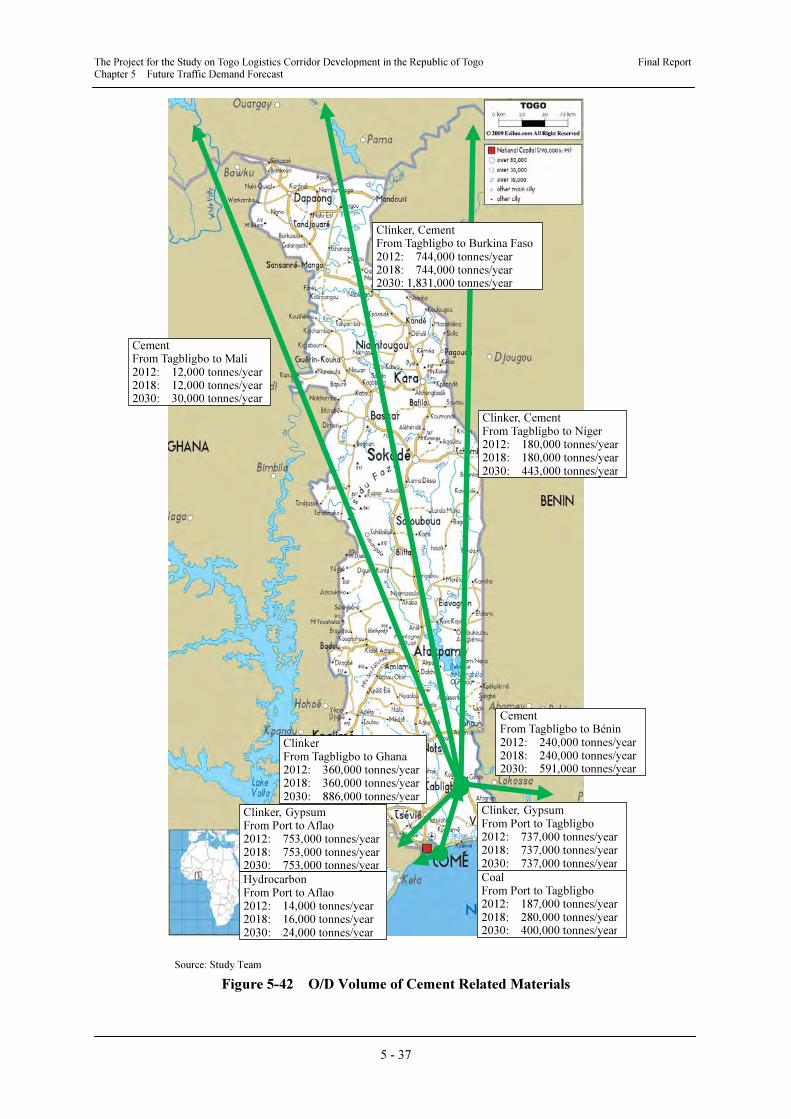
The Project for the Study on Togo Logistics Corridor Development in the Republic of Togo Final Report Chapter 5 Future Traffic Demand Forecast
5 - 37
Source: Study Team
Figure 5-42 O/D Volume of Cement Related Materials
Clinker, Cement From Tagbligbo to Niger 2012: 180,000 tonnes/year 2018: 180,000 tonnes/year 2030: 443,000 tonnes/year
Cement From Tagbligbo to Mali 2012: 12,000 tonnes/year 2018: 12,000 tonnes/year 2030: 30,000 tonnes/year
Clinker, CementFrom Tagbligbo to Burkina Faso2012: 744,000 tonnes/year 2018: 744,000 tonnes/year 2030: 1,831,000 tonnes/year
CementFrom Tagbligbo to Bénin
2012: 240,000 tonnes/year 2018: 240,000 tonnes/year 2030: 591,000 tonnes/year
Clinker From Tagbligbo to Ghana 2012: 360,000 tonnes/year2018: 360,000 tonnes/year2030: 886,000 tonnes/year
Clinker, Gypsum
From Port to Tagbligbo
2012: 737,000 tonnes/year 2018: 737,000 tonnes/year 2030: 737,000 tonnes/year
CoalFrom Port to Tagbligbo
2012: 187,000 tonnes/year 2018: 280,000 tonnes/year 2030: 400,000 tonnes/year
Clinker, Gypsum From Port to Aflao
2012: 753,000 tonnes/year2018: 753,000 tonnes/year2030: 753,000 tonnes/year
Hydrocarbon
From Port to Aflao
2012: 14,000 tonnes/year 2018: 16,000 tonnes/year 2030: 24,000 tonnes/year
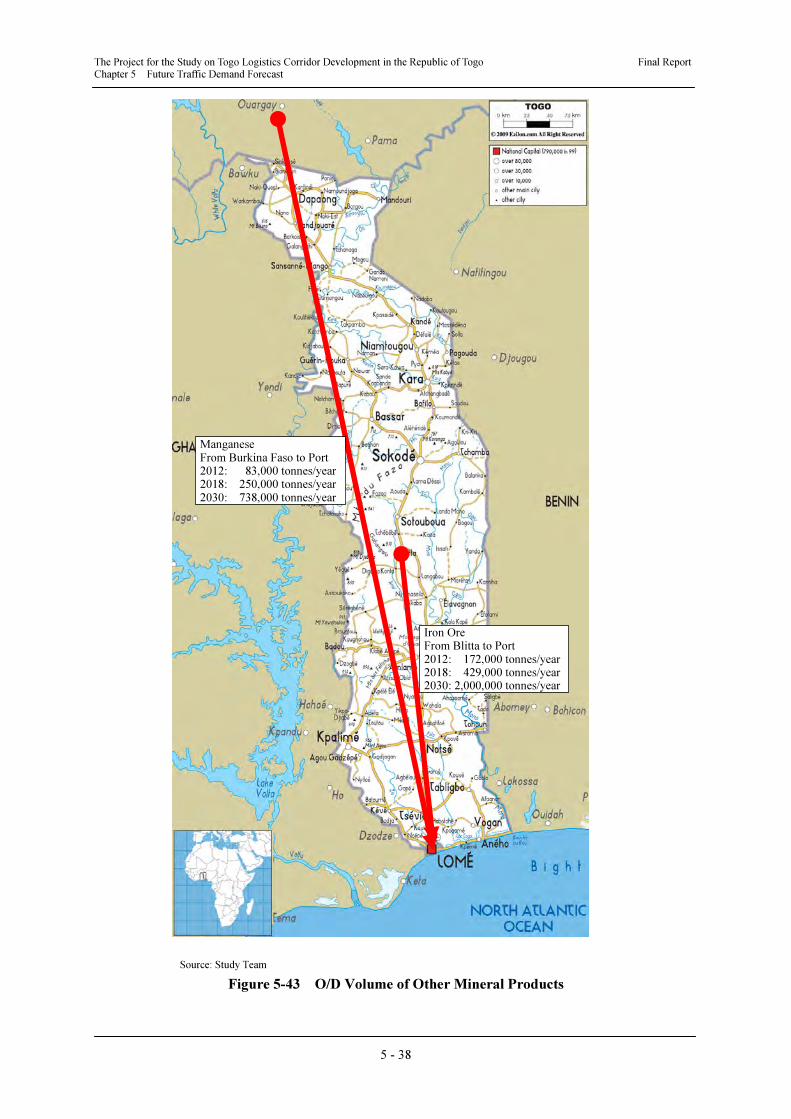
The Project for the Study on Togo Logistics Corridor Development in the Republic of Togo Final Report Chapter 5 Future Traffic Demand Forecast
5 - 38
Source: Study Team
Figure 5-43 O/D Volume of Other Mineral Products
Iron OreFrom Blitta to Port 2012: 172,000 tonnes/year 2018: 429,000 tonnes/year 2030: 2,000,000 tonnes/year
Manganese
From Burkina Faso to Port 2012: 83,000 tonnes/year2018: 250,000 tonnes/year2030: 738,000 tonnes/year
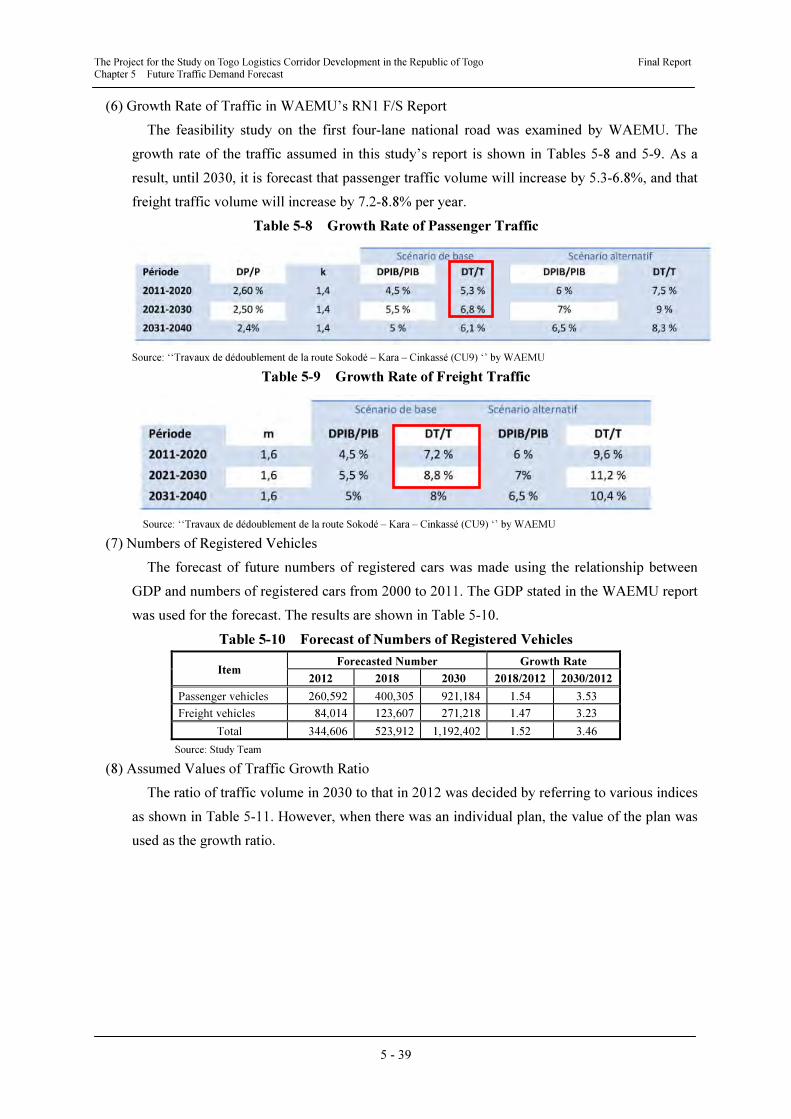
The Project for the Study on Togo Logistics Corridor Development in the Republic of Togo Final Report Chapter 5 Future Traffic Demand Forecast
5 - 39
(6) Growth Rate of Traffic in WAEMU’s RN1 F/S Report
The feasibility study on the first four-lane national road was examined by WAEMU. The
growth rate of the traffic assumed in this study’s report is shown in Tables 5-8 and 5-9. As a
result, until 2030, it is forecast that passenger traffic volume will increase by 5.3-6.8%, and that
freight traffic volume will increase by 7.2-8.8% per year.
Table 5-8 Growth Rate of Passenger Traffic
Source: ‘‘Travaux de dédoublement de la route Sokodé – Kara – Cinkassé (CU9) ‘’ by WAEMU
Table 5-9 Growth Rate of Freight Traffic
Source: ‘‘Travaux de dédoublement de la route Sokodé – Kara – Cinkassé (CU9) ‘’ by WAEMU
(7) Numbers of Registered Vehicles
The forecast of future numbers of registered cars was made using the relationship between
GDP and numbers of registered cars from 2000 to 2011. The GDP stated in the WAEMU report
was used for the forecast. The results are shown in Table 5-10.
Table 5-10 Forecast of Numbers of Registered Vehicles
Item Forecasted Number Growth Rate
2012 2018 2030 2018/2012 2030/2012
Passenger vehicles 260,592 400,305 921,184 1.54 3.53
Freight vehicles 84,014 123,607 271,218 1.47 3.23
Total 344,606 523,912 1,192,402 1.52 3.46
Source: Study Team
(8) Assumed Values of Traffic Growth Ratio
The ratio of traffic volume in 2030 to that in 2012 was decided by referring to various indices
as shown in Table 5-11. However, when there was an individual plan, the value of the plan was
used as the growth ratio.
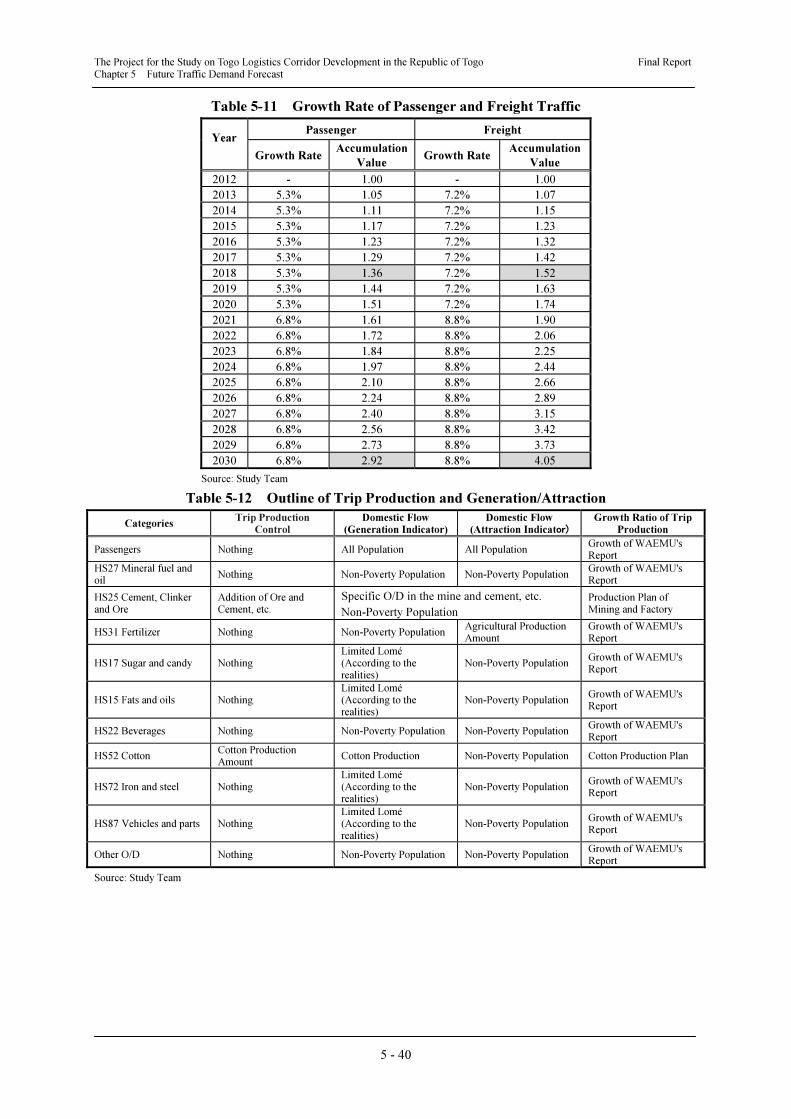
The Project for the Study on Togo Logistics Corridor Development in the Republic of Togo Final Report Chapter 5 Future Traffic Demand Forecast
5 - 40
Table 5-11 Growth Rate of Passenger and Freight Traffic
Year
Passenger Freight
Growth Rate Accumulation
Value Growth Rate
Accumulation
Value
2012 - 1.00 - 1.00
2013 5.3% 1.05 7.2% 1.07
2014 5.3% 1.11 7.2% 1.15
2015 5.3% 1.17 7.2% 1.23
2016 5.3% 1.23 7.2% 1.32
2017 5.3% 1.29 7.2% 1.42
2018 5.3% 1.36 7.2% 1.52
2019 5.3% 1.44 7.2% 1.63
2020 5.3% 1.51 7.2% 1.74
2021 6.8% 1.61 8.8% 1.90
2022 6.8% 1.72 8.8% 2.06
2023 6.8% 1.84 8.8% 2.25
2024 6.8% 1.97 8.8% 2.44
2025 6.8% 2.10 8.8% 2.66
2026 6.8% 2.24 8.8% 2.89
2027 6.8% 2.40 8.8% 3.15
2028 6.8% 2.56 8.8% 3.42
2029 6.8% 2.73 8.8% 3.73
2030 6.8% 2.92 8.8% 4.05
Source: Study Team
Table 5-12 Outline of Trip Production and Generation/Attraction
Categories Trip Production
Control Domestic Flow
(Generation Indicator)Domestic Flow
(Attraction Indicator) Growth Ratio of Trip
Production
Passengers Nothing All Population All Population Growth of WAEMU's Report
HS27 Mineral fuel and oil
Nothing Non-Poverty Population Non-Poverty Population Growth of WAEMU's Report
HS25 Cement, Clinker and Ore
Addition of Ore and Cement, etc.
Specific O/D in the mine and cement, etc.
Non-Poverty Population
Production Plan of Mining and Factory
HS31 Fertilizer Nothing Non-Poverty Population Agricultural Production Amount
Growth of WAEMU's Report
HS17 Sugar and candy Nothing Limited Lomé (According to the realities)
Non-Poverty Population Growth of WAEMU's Report
HS15 Fats and oils Nothing Limited Lomé (According to the realities)
Non-Poverty Population Growth of WAEMU's Report
HS22 Beverages Nothing Non-Poverty Population Non-Poverty Population Growth of WAEMU's Report
HS52 Cotton Cotton Production Amount
Cotton Production Non-Poverty Population Cotton Production Plan
HS72 Iron and steel Nothing Limited Lomé (According to the realities)
Non-Poverty Population Growth of WAEMU's Report
HS87 Vehicles and parts Nothing Limited Lomé (According to the realities)
Non-Poverty Population Growth of WAEMU's Report
Other O/D Nothing Non-Poverty Population Non-Poverty Population Growth of WAEMU's Report
Source: Study Team

The Project for the Study on Togo Logistics Corridor Development in the Republic of Togo Final Report Chapter 5 Future Traffic Demand Forecast
5 - 41
5.2.3 Traffic Demand Forecast for the Master Plan
(1) Top-ranked Goods
Based on the concepts outlined in section 5.2.1, the freight was totalled using the HS2 digit code.
The top-ranked goods (based on HS2 digit code) as percentages accounted for in total
import/export/transit weights are shown in the Figure 5-44. Cement accounts for the highest
percentage of shipments at 54%; together the top ten articles account for 83% of the total.
54%
7%
5%3%
3%
3%
3%
3%
1%
1% 17%
HS25:Salt; Sulphur& Cement
HS27:Mineral Fuels & Oils
HS10:Cereals
HS17:Sugars and Confectionery
HS87:Vehicles and parts
HS52:Cotton
HS15:Fats and Oils
HS72:Iron and Steel
HS31:Fertilisers
HS22:Beverages
Others
Source: Study Team
Figure 5-44 Ranking by Commodity
(2) Correction of Traffic Survey
a) Conversion to Weekly Average Daily Traffic
It is necessary to observe traffic volume continuously for more than one year in order to
obtain an ideal ADT at traffic survey points. However, such data are not available around the
target areas. Therefore, the volumes recorded in the survey of daily traffic were converted using
factors based on existing traffic volume data at tollgates collected by the CAPER in 2012.
Mon Tue Wed Thu Fri Sat Sun ave
total 94% 88% 91% 96% 117% 121% 90% 100%
Passenger car & Light truck 86% 83% 86% 93% 117% 128% 104% 100%
Minibus 105% 92% 98% 98% 121% 111% 70% 100%
Bus 121% 94% 93% 86% 131% 100% 71% 100%
Heavy truck 97% 104% 101% 106% 103% 112% 76% 100%
0%
20%
40%
60%
80%
100%
120%
140%
No.1-6*No.7-11*
No.12-17*
Source: Study Team, using CAPER data
Figure 5-45 Results of Weekly Fluctuation Factor Computation
b) Conversion to Monthly Average Daily Traffic
Monthly changes were similarly corrected based on traffic data gathered at the toll gate
(RN1: Davié); they are shown in Figure 5-46 and Table 5-13.
* A day of the week at this survey point
Tollgate: RN1 Davié
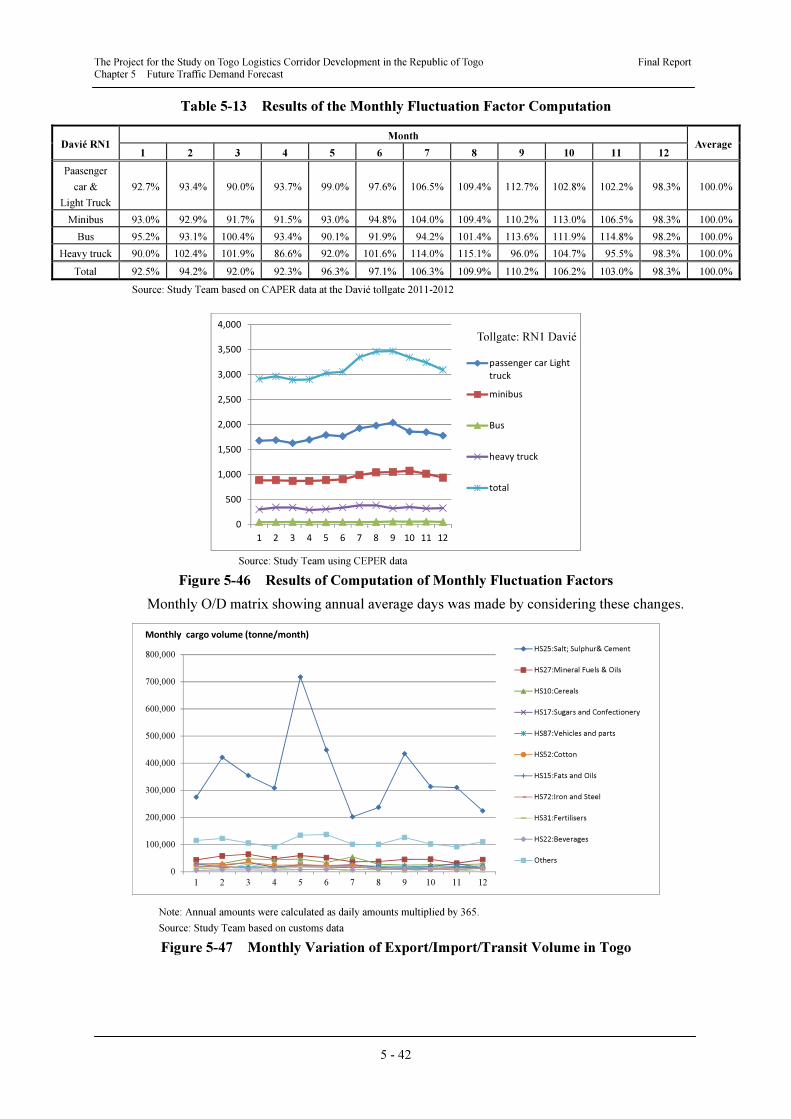
The Project for the Study on Togo Logistics Corridor Development in the Republic of Togo Final Report Chapter 5 Future Traffic Demand Forecast
5 - 42
Table 5-13 Results of the Monthly Fluctuation Factor Computation
Davié RN1 Month
Average1 2 3 4 5 6 7 8 9 10 11 12
Paasenger
car &
Light Truck
92.7% 93.4% 90.0% 93.7% 99.0% 97.6% 106.5% 109.4% 112.7% 102.8% 102.2% 98.3% 100.0%
Minibus 93.0% 92.9% 91.7% 91.5% 93.0% 94.8% 104.0% 109.4% 110.2% 113.0% 106.5% 98.3% 100.0%
Bus 95.2% 93.1% 100.4% 93.4% 90.1% 91.9% 94.2% 101.4% 113.6% 111.9% 114.8% 98.2% 100.0%
Heavy truck 90.0% 102.4% 101.9% 86.6% 92.0% 101.6% 114.0% 115.1% 96.0% 104.7% 95.5% 98.3% 100.0%
Total 92.5% 94.2% 92.0% 92.3% 96.3% 97.1% 106.3% 109.9% 110.2% 106.2% 103.0% 98.3% 100.0%
Source: Study Team based on CAPER data at the Davié tollgate 2011-2012
0
500
1,000
1,500
2,000
2,500
3,000
3,500
4,000
1 2 3 4 5 6 7 8 9 10 11 12
passenger car Light
truck
minibus
Bus
heavy truck
total
Source: Study Team using CEPER data
Figure 5-46 Results of Computation of Monthly Fluctuation Factors
Monthly O/D matrix showing annual average days was made by considering these changes.
0
100,000
200,000
300,000
400,000
500,000
600,000
700,000
800,000
1 2 3 4 5 6 7 8 9 10 11 12
HS25:Salt; Sulphur& Cement
HS27:Mineral Fuels & Oils
HS10:Cereals
HS17:Sugars and Confectionery
HS87:Vehicles and parts
HS52:Cotton
HS15:Fats and Oils
HS72:Iron and Steel
HS31:Fertilisers
HS22:Beverages
Others
Monthly cargo volume (tonne/month)
Note: Annual amounts were calculated as daily amounts multiplied by 365.
Source: Study Team based on customs data
Figure 5-47 Monthly Variation of Export/Import/Transit Volume in Togo
Tollgate: RN1 Davié
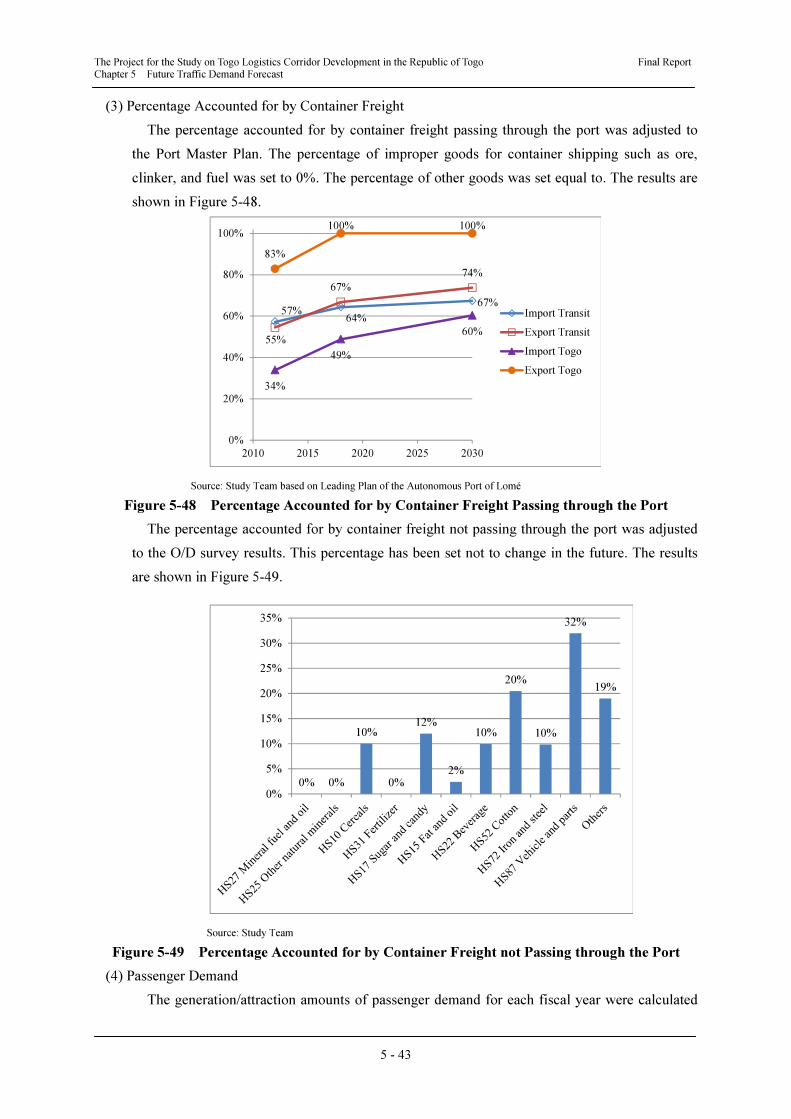
The Project for the Study on Togo Logistics Corridor Development in the Republic of Togo Final Report Chapter 5 Future Traffic Demand Forecast
5 - 43
(3) Percentage Accounted for by Container Freight
The percentage accounted for by container freight passing through the port was adjusted to
the Port Master Plan. The percentage of improper goods for container shipping such as ore,
clinker, and fuel was set to 0%. The percentage of other goods was set equal to. The results are
shown in Figure 5-48.
Source: Study Team based on Leading Plan of the Autonomous Port of Lomé
Figure 5-48 Percentage Accounted for by Container Freight Passing through the Port
The percentage accounted for by container freight not passing through the port was adjusted
to the O/D survey results. This percentage has been set not to change in the future. The results
are shown in Figure 5-49.
Source: Study Team
Figure 5-49 Percentage Accounted for by Container Freight not Passing through the Port
(4) Passenger Demand
The generation/attraction amounts of passenger demand for each fiscal year were calculated
57%64%
67%
55%
67%
74%
34%
49%
60%
83%
100% 100%
0%
20%
40%
60%
80%
100%
2010 2015 2020 2025 2030
Import Transit
Export Transit
Import Togo
Export Togo
0% 0%
10%
0%
12%
2%
10%
20%
10%
32%
19%
0%
5%
10%
15%
20%
25%
30%
35%
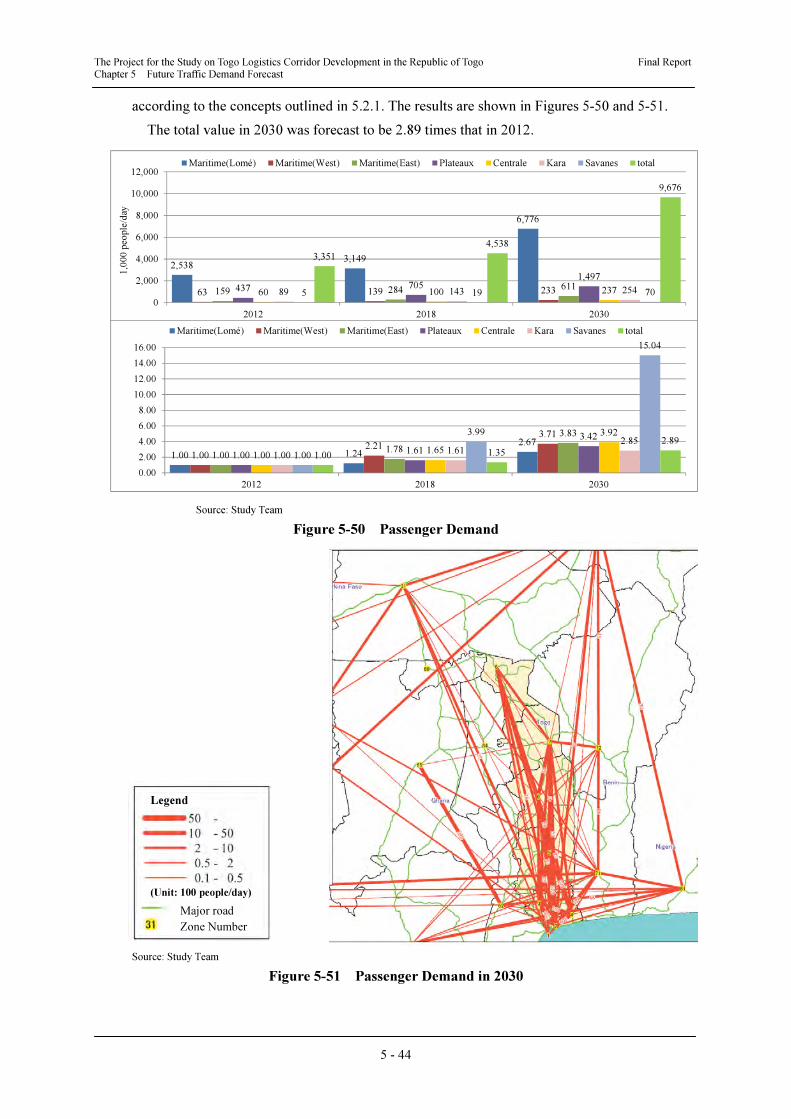
The Project for the Study on Togo Logistics Corridor Development in the Republic of Togo Final Report Chapter 5 Future Traffic Demand Forecast
5 - 44
according to the concepts outlined in 5.2.1. The results are shown in Figures 5-50 and 5-51.
The total value in 2030 was forecast to be 2.89 times that in 2012.
Source: Study Team
Figure 5-50 Passenger Demand
Source: Study Team
Figure 5-51 Passenger Demand in 2030
Legend
(Unit: 100 people/day)
2,5383,149
6,776
63 139 233159 284 611437 7051,497
60 100 23789 143 2545 19 70
3,351
4,538
9,676
0
2,000
4,000
6,000
8,000
10,000
12,000
2012 2018 2030
1,000people/day
Maritime(Lomé) Maritime(West) Maritime(East) Plateaux Centrale Kara Savanes total
1.00 1.24
2.67
1.002.21
3.71
1.001.78
3.83
1.001.61
3.42
1.001.65
3.92
1.001.61
2.85
1.00
3.99
15.04
1.00 1.35
2.89
0.00
2.00
4.00
6.00
8.00
10.00
12.00
14.00
16.00
2012 2018 2030
Maritime(Lomé) Maritime(West) Maritime(East) Plateaux Centrale Kara Savanes total
Major road
Zone Number
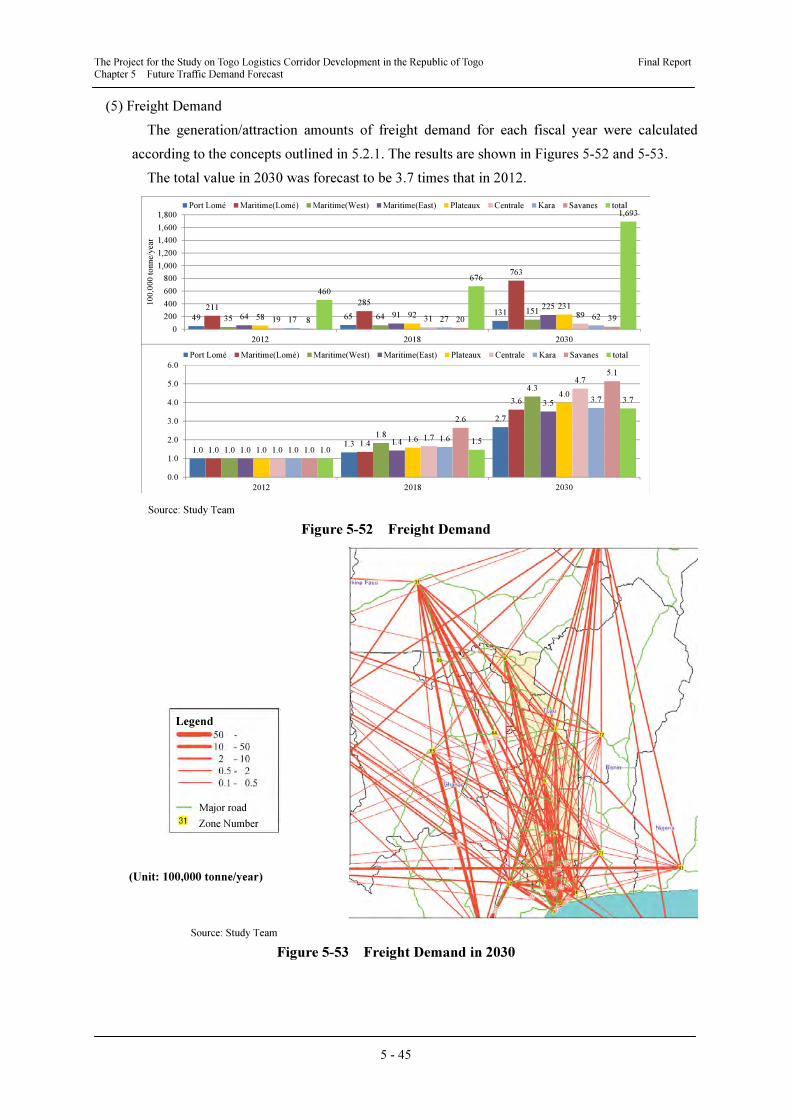
The Project for the Study on Togo Logistics Corridor Development in the Republic of Togo Final Report Chapter 5 Future Traffic Demand Forecast
5 - 45
(5) Freight Demand
The generation/attraction amounts of freight demand for each fiscal year were calculated
according to the concepts outlined in 5.2.1. The results are shown in Figures 5-52 and 5-53.
The total value in 2030 was forecast to be 3.7 times that in 2012.
49 65131
211285
763
35 64151
64 91225
58 92231
19 31 8917 27 628 20 39
460
676
1,693
0
200
400
600
800
1,000
1,200
1,400
1,600
1,800
2012 2018 2030
10
0,0
00
to
nne/
yea
r
Port Lomé Maritime(Lomé) Maritime(West) Maritime(East) Plateaux Centrale Kara Savanes total
1.0 1.3
2.7
1.0 1.4
3.6
1.0
1.8
4.3
1.0 1.4
3.5
1.0
1.6
4.0
1.0
1.7
4.7
1.0
1.6
3.7
1.0
2.6
5.1
1.0 1.5
3.7
0.0
1.0
2.0
3.0
4.0
5.0
6.0
2012 2018 2030
Port Lomé Maritime(Lomé) Maritime(West) Maritime(East) Plateaux Centrale Kara Savanes total
Source: Study Team
Figure 5-52 Freight Demand
Source: Study Team
Figure 5-53 Freight Demand in 2030
Legend
(Unit: 100,000 tonne/year)
Major road
Zone Number
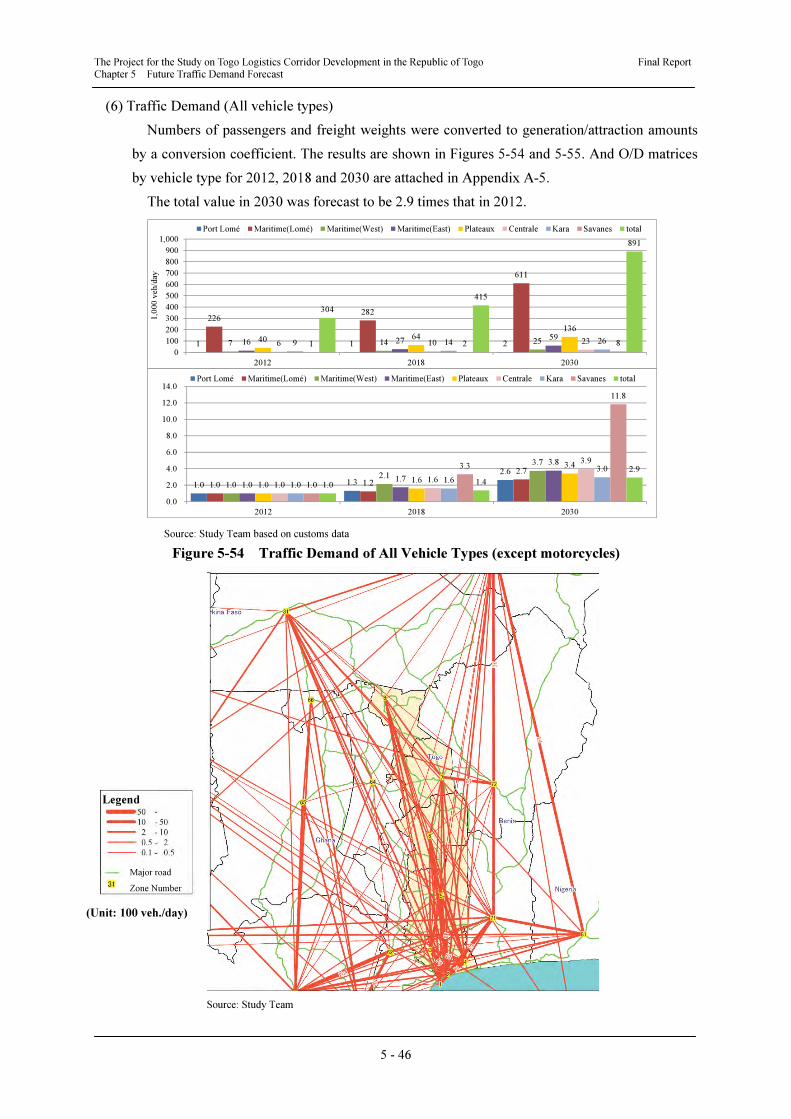
The Project for the Study on Togo Logistics Corridor Development in the Republic of Togo Final Report Chapter 5 Future Traffic Demand Forecast
5 - 46
(6) Traffic Demand (All vehicle types)
Numbers of passengers and freight weights were converted to generation/attraction amounts
by a conversion coefficient. The results are shown in Figures 5-54 and 5-55. And O/D matrices
by vehicle type for 2012, 2018 and 2030 are attached in Appendix A-5.
The total value in 2030 was forecast to be 2.9 times that in 2012.
1 1 2
226282
611
7 14 2516 27 5940 64136
6 10 239 14 261 2 8
304
415
891
0
100
200
300
400
500
600
700
800
900
1,000
2012 2018 2030
1,0
00
veh
/day
Port Lomé Maritime(Lomé) Maritime(West) Maritime(East) Plateaux Centrale Kara Savanes total
1.0 1.3
2.6
1.0 1.2
2.7
1.0 2.1
3.7
1.0 1.7
3.8
1.0 1.6
3.4
1.0 1.6
3.9
1.0 1.6
3.0
1.0
3.3
11.8
1.0 1.4
2.9
0.0
2.0
4.0
6.0
8.0
10.0
12.0
14.0
2012 2018 2030
Port Lomé Maritime(Lomé) Maritime(West) Maritime(East) Plateaux Centrale Kara Savanes total
Source: Study Team based on customs data
Figure 5-54 Traffic Demand of All Vehicle Types (except motorcycles)
Source: Study Team
Legend
(Unit: 100 veh./day)
Major road
Zone Number
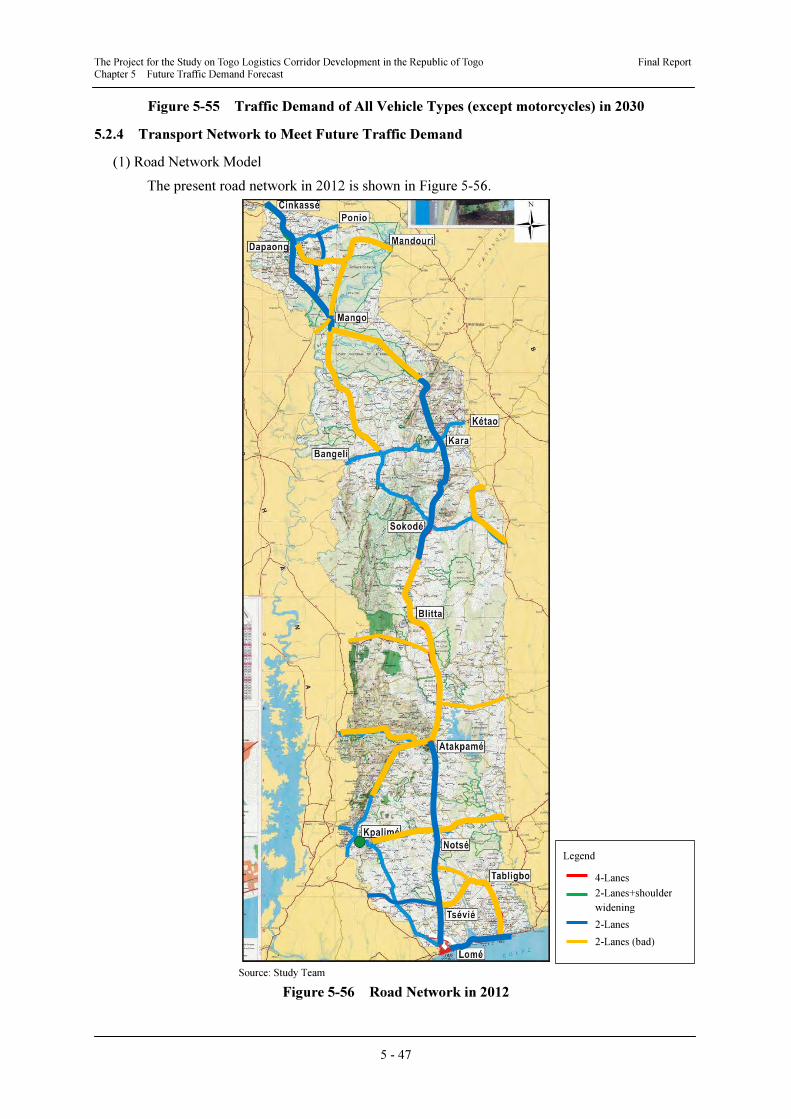
The Project for the Study on Togo Logistics Corridor Development in the Republic of Togo Final Report Chapter 5 Future Traffic Demand Forecast
5 - 47
Figure 5-55 Traffic Demand of All Vehicle Types (except motorcycles) in 2030
5.2.4 Transport Network to Meet Future Traffic Demand
(1) Road Network Model
The present road network in 2012 is shown in Figure 5-56.
Source: Study Team
Figure 5-56 Road Network in 2012
Legend
4-Lanes
2-Lanes+shoulder
widening
2-Lanes
2-Lanes (bad)
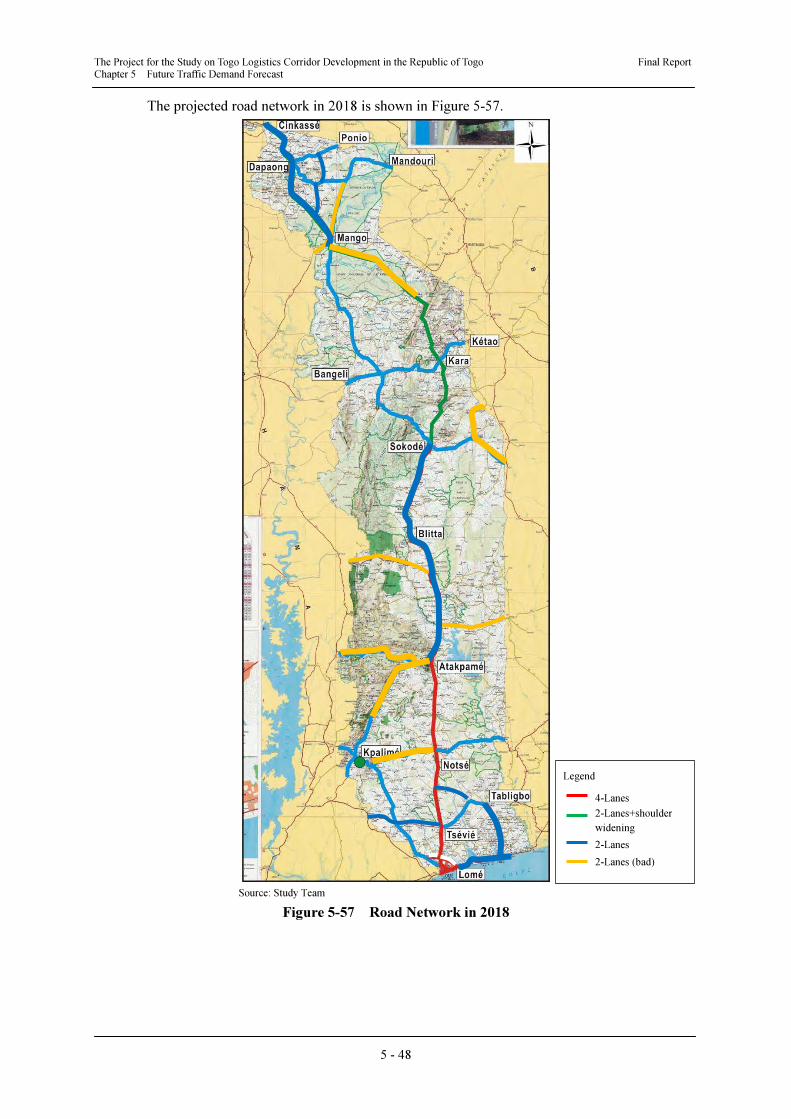
The Project for the Study on Togo Logistics Corridor Development in the Republic of Togo Final Report Chapter 5 Future Traffic Demand Forecast
5 - 48
The projected road network in 2018 is shown in Figure 5-57.
Source: Study Team
Figure 5-57 Road Network in 2018
Legend
4-Lanes
2-Lanes+shoulder
widening
2-Lanes
2-Lanes (bad)
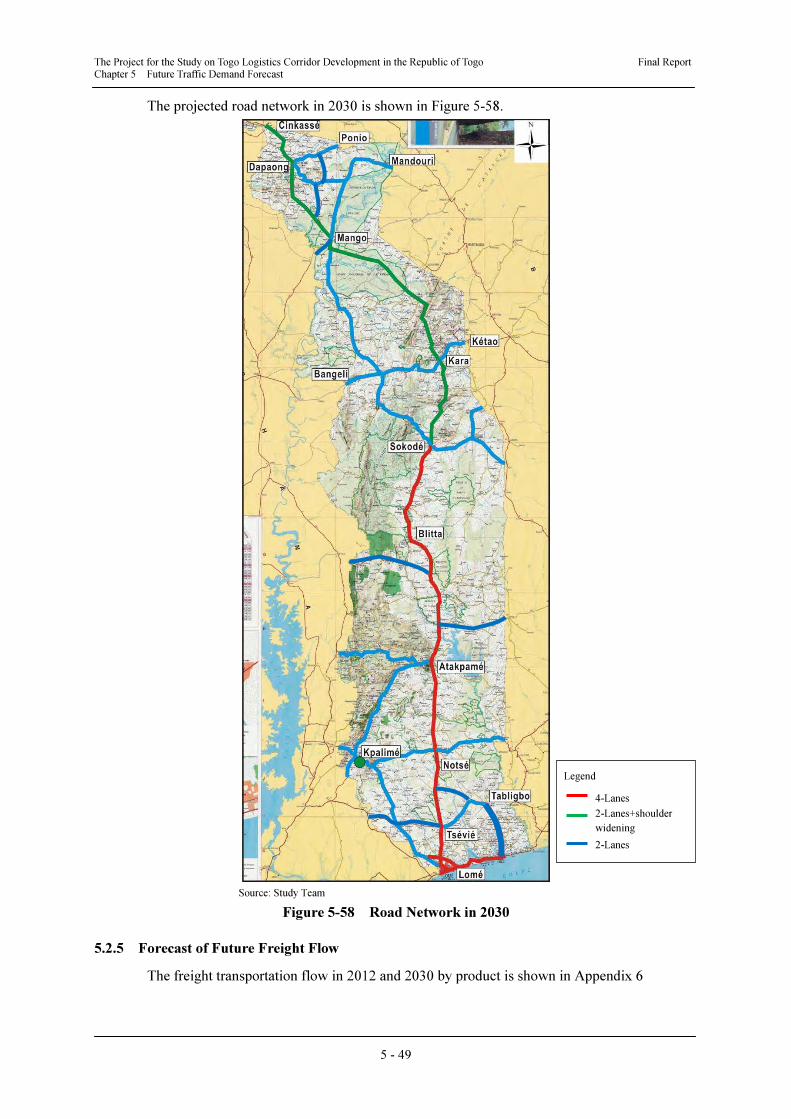
The Project for the Study on Togo Logistics Corridor Development in the Republic of Togo Final Report Chapter 5 Future Traffic Demand Forecast
5 - 49
The projected road network in 2030 is shown in Figure 5-58.
Source: Study Team
Figure 5-58 Road Network in 2030
5.2.5 Forecast of Future Freight Flow
The freight transportation flow in 2012 and 2030 by product is shown in Appendix 6
Legend
4-Lanes
2-Lanes+shoulder
widening
2-Lanes
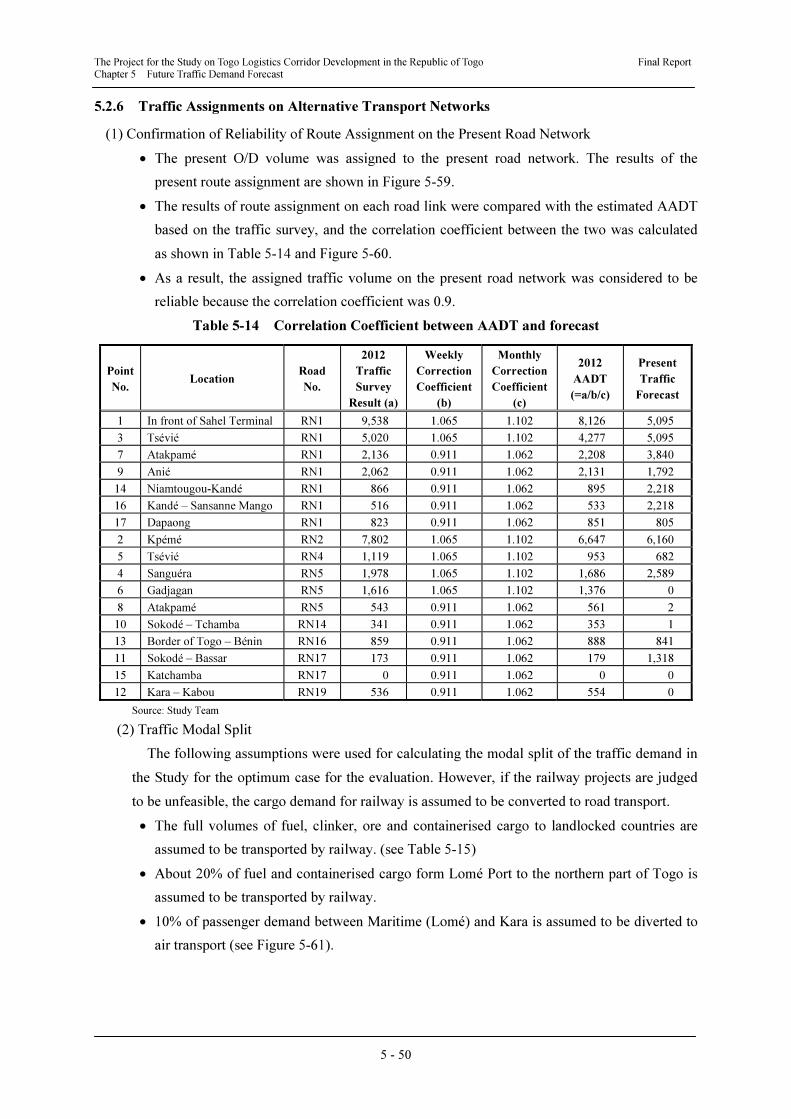
The Project for the Study on Togo Logistics Corridor Development in the Republic of Togo Final Report Chapter 5 Future Traffic Demand Forecast
5 - 50
5.2.6 Traffic Assignments on Alternative Transport Networks
(1) Confirmation of Reliability of Route Assignment on the Present Road Network
• The present O/D volume was assigned to the present road network. The results of the
present route assignment are shown in Figure 5-59.
• The results of route assignment on each road link were compared with the estimated AADT
based on the traffic survey, and the correlation coefficient between the two was calculated
as shown in Table 5-14 and Figure 5-60.
• As a result, the assigned traffic volume on the present road network was considered to be
reliable because the correlation coefficient was 0.9.
Table 5-14 Correlation Coefficient between AADT and forecast
Point
No. Location
Road
No.
2012
Traffic
Survey
Result (a)
Weekly
Correction
Coefficient
(b)
Monthly
Correction
Coefficient
(c)
2012
AADT
(=a/b/c)
Present
Traffic
Forecast
1 In front of Sahel Terminal RN1 9,538 1.065 1.102 8,126 5,095
3 Tsévié RN1 5,020 1.065 1.102 4,277 5,095
7 Atakpamé RN1 2,136 0.911 1.062 2,208 3,840
9 Anié RN1 2,062 0.911 1.062 2,131 1,792
14 Niamtougou-Kandé RN1 866 0.911 1.062 895 2,218
16 Kandé – Sansanne Mango RN1 516 0.911 1.062 533 2,218
17 Dapaong RN1 823 0.911 1.062 851 805
2 Kpémé RN2 7,802 1.065 1.102 6,647 6,160
5 Tsévié RN4 1,119 1.065 1.102 953 682
4 Sanguéra RN5 1,978 1.065 1.102 1,686 2,589
6 Gadjagan RN5 1,616 1.065 1.102 1,376 0
8 Atakpamé RN5 543 0.911 1.062 561 2
10 Sokodé – Tchamba RN14 341 0.911 1.062 353 1
13 Border of Togo – Bénin RN16 859 0.911 1.062 888 841
11 Sokodé – Bassar RN17 173 0.911 1.062 179 1,318
15 Katchamba RN17 0 0.911 1.062 0 0
12 Kara – Kabou RN19 536 0.911 1.062 554 0
Source: Study Team
(2) Traffic Modal Split
The following assumptions were used for calculating the modal split of the traffic demand in
the Study for the optimum case for the evaluation. However, if the railway projects are judged
to be unfeasible, the cargo demand for railway is assumed to be converted to road transport.
• The full volumes of fuel, clinker, ore and containerised cargo to landlocked countries are
assumed to be transported by railway. (see Table 5-15)
• About 20% of fuel and containerised cargo form Lomé Port to the northern part of Togo is
assumed to be transported by railway.
• 10% of passenger demand between Maritime (Lomé) and Kara is assumed to be diverted to
air transport (see Figure 5-61).
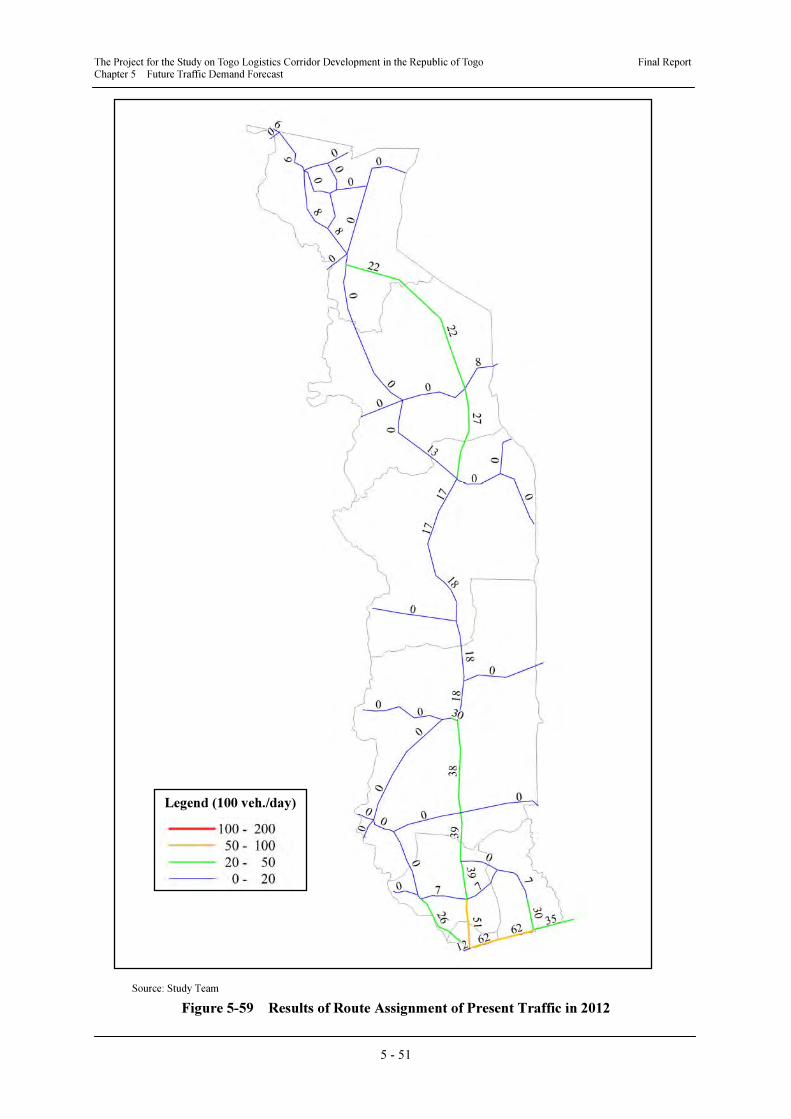
The Project for the Study on Togo Logistics Corridor Development in the Republic of Togo Final Report Chapter 5 Future Traffic Demand Forecast
5 - 51
Source: Study Team
Figure 5-59 Results of Route Assignment of Present Traffic in 2012
Legend (100 veh./day)
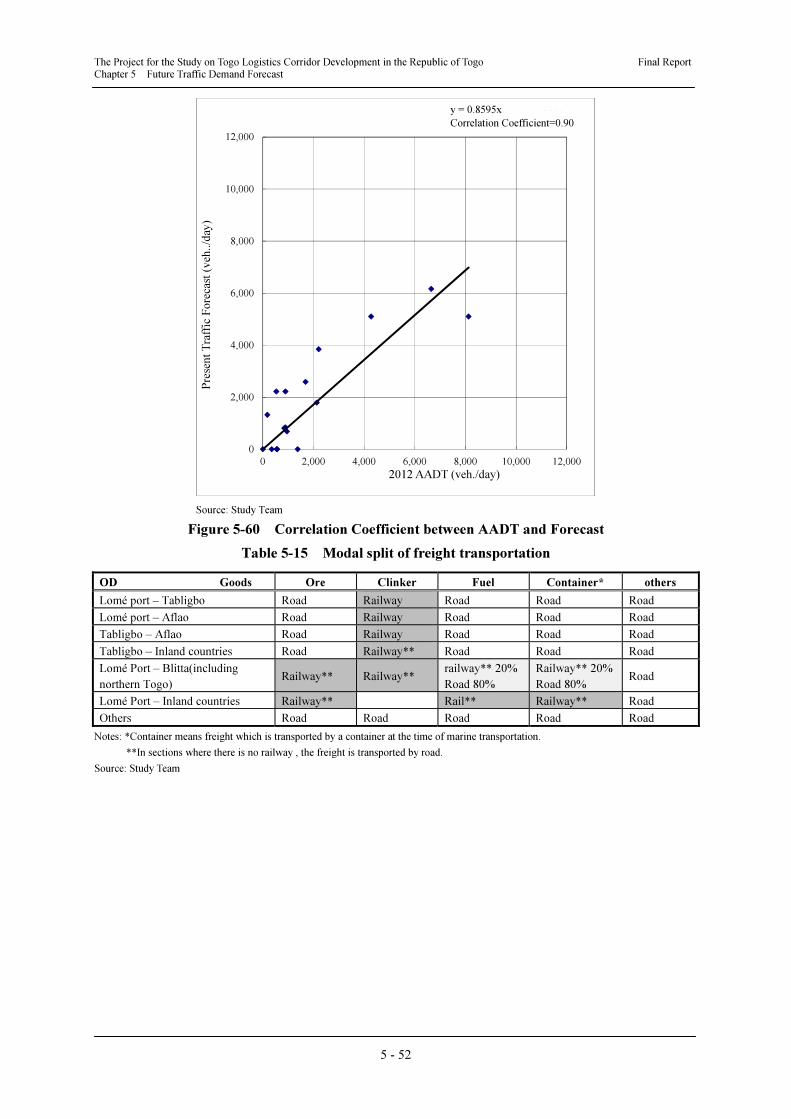
The Project for the Study on Togo Logistics Corridor Development in the Republic of Togo Final Report Chapter 5 Future Traffic Demand Forecast
5 - 52
y = 0.8595x
R² = 0.7026
0
2,000
4,000
6,000
8,000
10,000
12,000
0 2,000 4,000 6,000 8,000 10,000 12,000
再現
交通
量(台
/日
)
2012AADT(台/日)
2012現況再現と2012AADT結果の相関
Source: Study Team
Figure 5-60 Correlation Coefficient between AADT and Forecast
Table 5-15 Modal split of freight transportation
OD Goods Ore Clinker Fuel Container* others
Lomé port – Tabligbo Road Railway Road Road Road
Lomé port – Aflao Road Railway Road Road Road
Tabligbo – Aflao Road Railway Road Road Road
Tabligbo – Inland countries Road Railway** Road Road Road
Lomé Port – Blitta(including
northern Togo) Railway** Railway**
railway** 20%
Road 80%
Railway** 20%
Road 80% Road
Lomé Port – Inland countries Railway** Rail** Railway** Road
Others Road Road Road Road Road
Notes: *Container means freight which is transported by a container at the time of marine transportation.
**In sections where there is no railway , the freight is transported by road.
Source: Study Team
2012 AADT (veh./day)
Pre
sen
t T
raff
ic F
ore
cast
(v
eh../d
ay)
y = 0.8595x
Correlation Coefficient=0.90
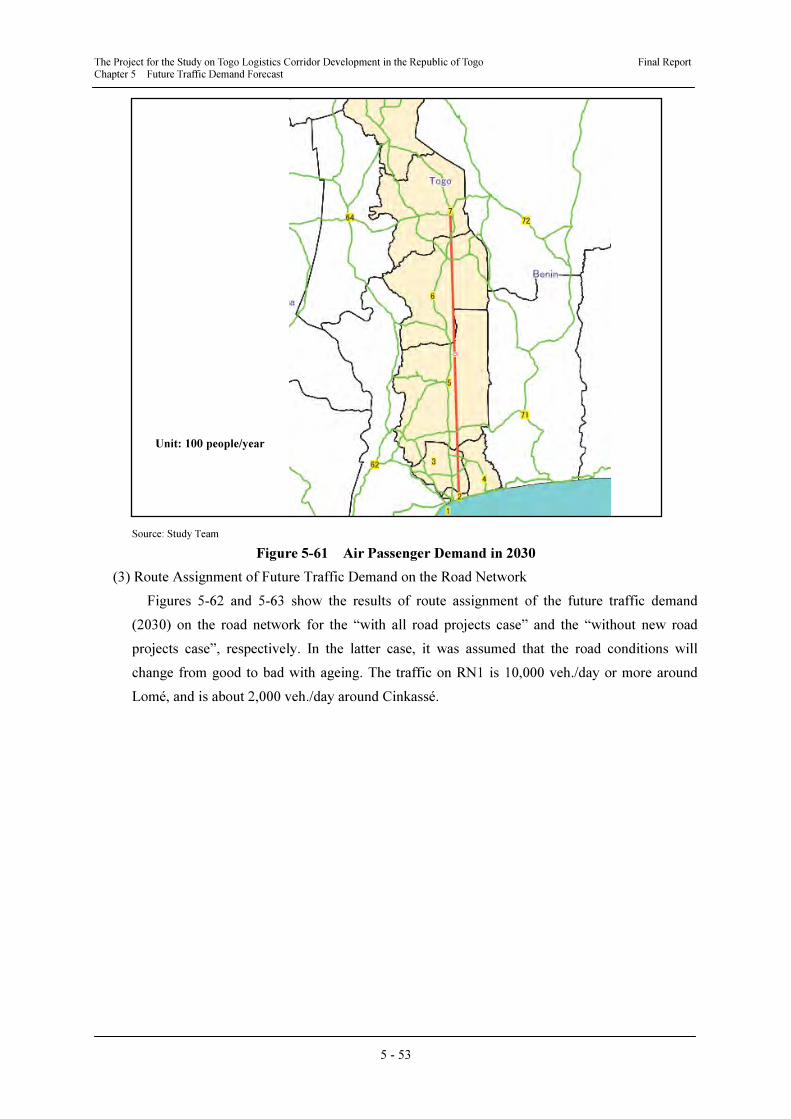
The Project for the Study on Togo Logistics Corridor Development in the Republic of Togo Final Report Chapter 5 Future Traffic Demand Forecast
5 - 53
Source: Study Team
Figure 5-61 Air Passenger Demand in 2030
(3) Route Assignment of Future Traffic Demand on the Road Network
Figures 5-62 and 5-63 show the results of route assignment of the future traffic demand
(2030) on the road network for the “with all road projects case” and the “without new road
projects case”, respectively. In the latter case, it was assumed that the road conditions will
change from good to bad with ageing. The traffic on RN1 is 10,000 veh./day or more around
Lomé, and is about 2,000 veh./day around Cinkassé.
Unit: 100 people/year
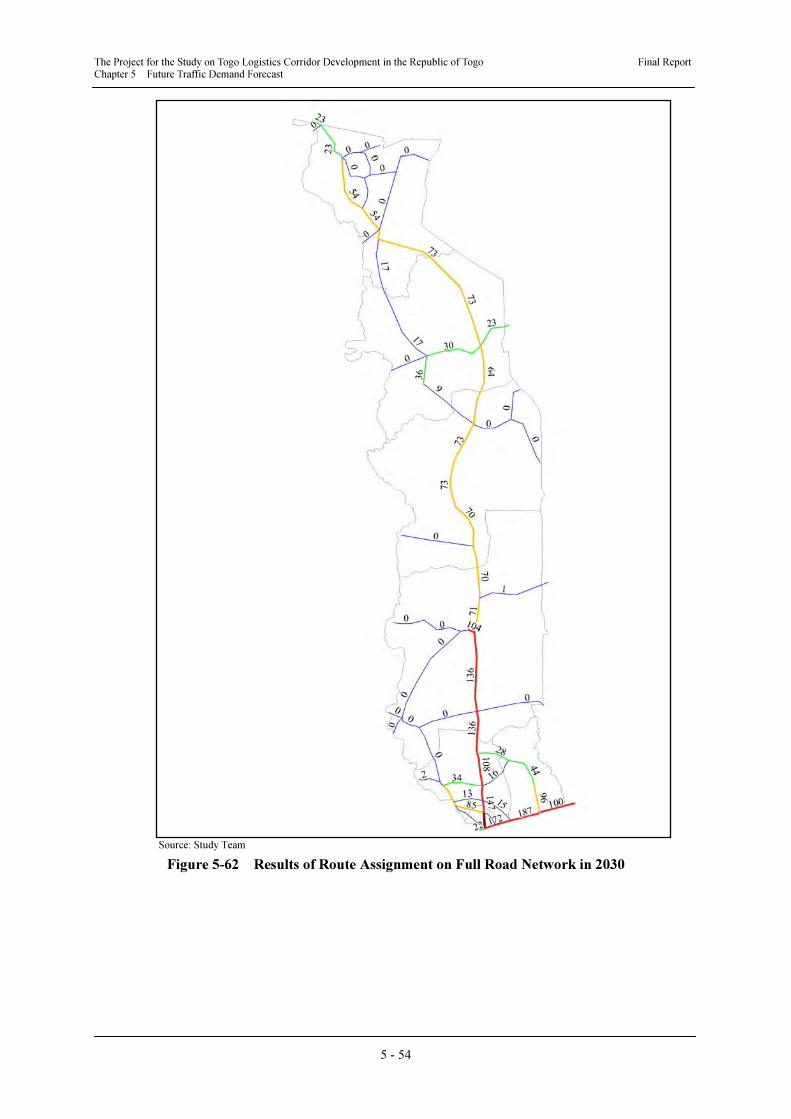
The Project for the Study on Togo Logistics Corridor Development in the Republic of Togo Final Report Chapter 5 Future Traffic Demand Forecast
5 - 54
Source: Study Team
Figure 5-62 Results of Route Assignment on Full Road Network in 2030
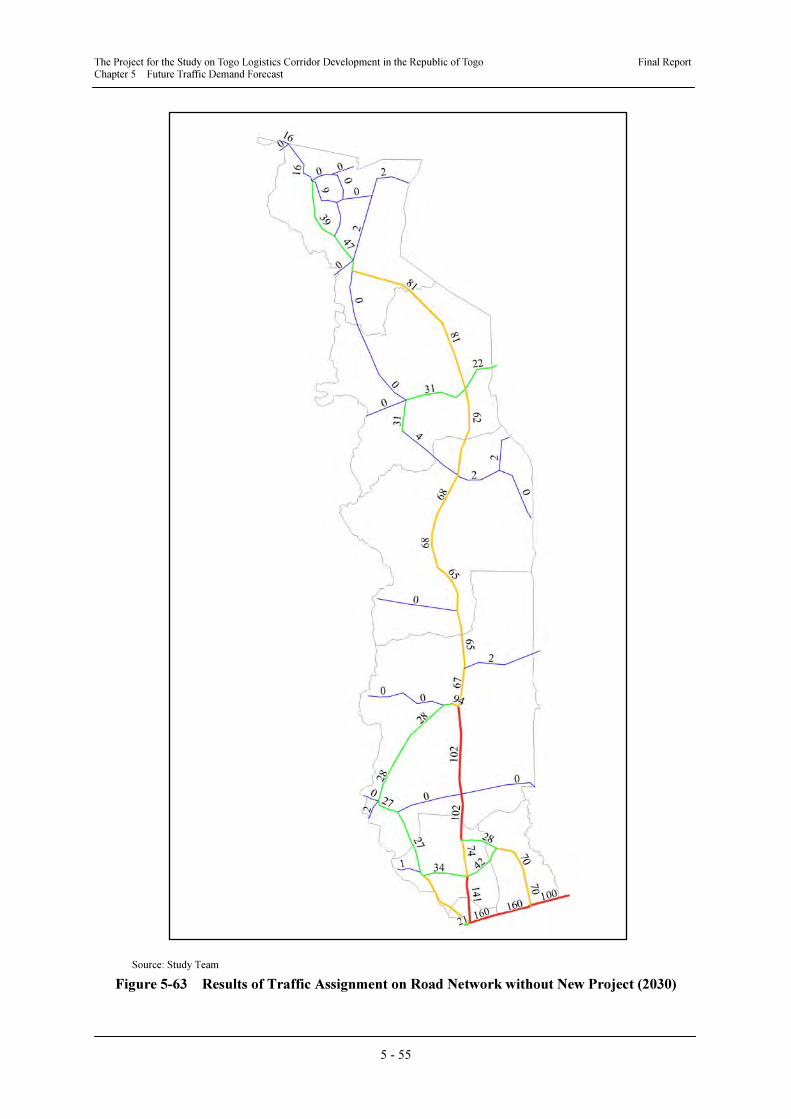
The Project for the Study on Togo Logistics Corridor Development in the Republic of Togo Final Report Chapter 5 Future Traffic Demand Forecast
5 - 55
Source: Study Team
Figure 5-63 Results of Traffic Assignment on Road Network without New Project (2030)
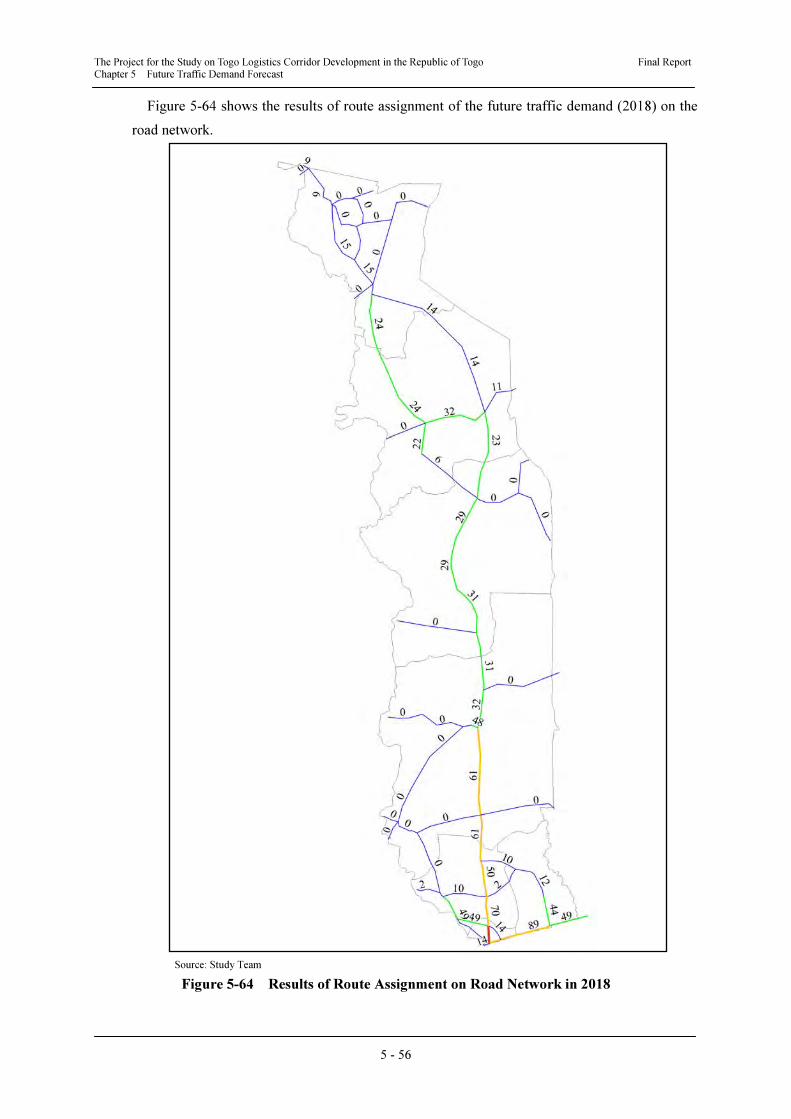
The Project for the Study on Togo Logistics Corridor Development in the Republic of Togo Final Report Chapter 5 Future Traffic Demand Forecast
5 - 56
Figure 5-64 shows the results of route assignment of the future traffic demand (2018) on the
road network.
Source: Study Team
Figure 5-64 Results of Route Assignment on Road Network in 2018
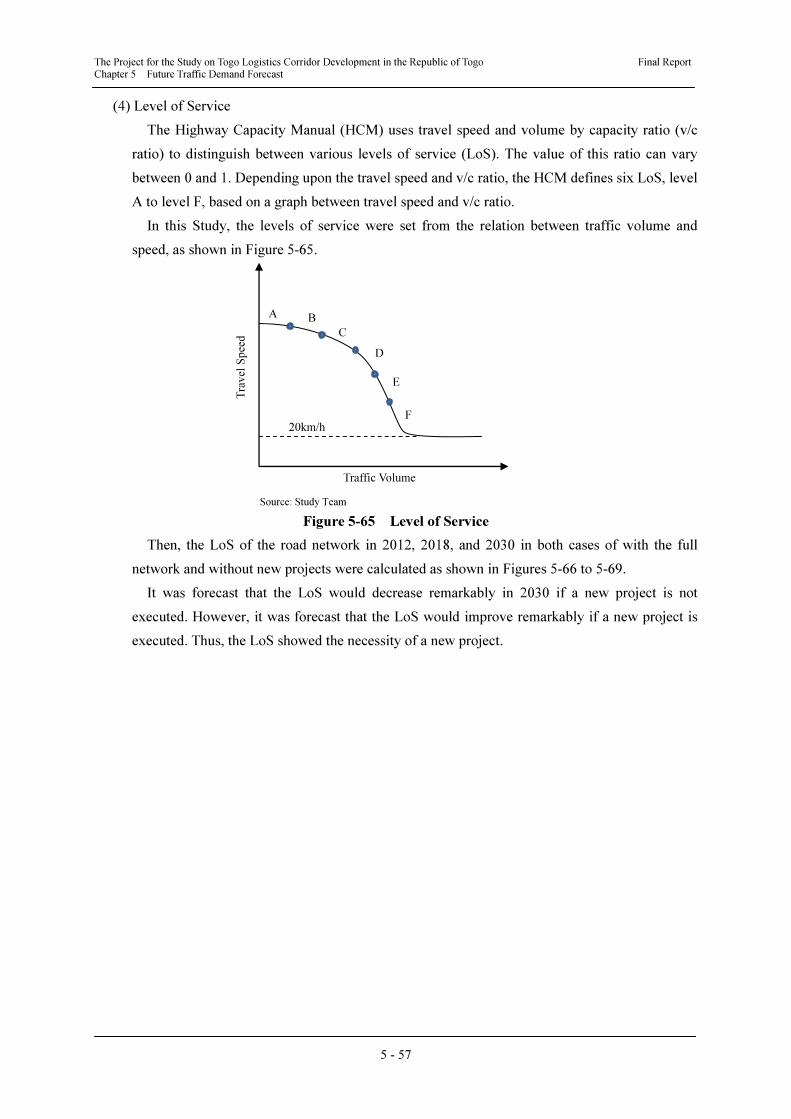
The Project for the Study on Togo Logistics Corridor Development in the Republic of Togo Final Report Chapter 5 Future Traffic Demand Forecast
5 - 57
(4) Level of Service
The Highway Capacity Manual (HCM) uses travel speed and volume by capacity ratio (v/c
ratio) to distinguish between various levels of service (LoS). The value of this ratio can vary
between 0 and 1. Depending upon the travel speed and v/c ratio, the HCM defines six LoS, level
A to level F, based on a graph between travel speed and v/c ratio.
In this Study, the levels of service were set from the relation between traffic volume and
speed, as shown in Figure 5-65.
Source: Study Team
Figure 5-65 Level of Service
Then, the LoS of the road network in 2012, 2018, and 2030 in both cases of with the full
network and without new projects were calculated as shown in Figures 5-66 to 5-69.
It was forecast that the LoS would decrease remarkably in 2030 if a new project is not
executed. However, it was forecast that the LoS would improve remarkably if a new project is
executed. Thus, the LoS showed the necessity of a new project.
Traffic Volume
Tra
vel
Sp
eed
20km/h
A B
C
D
E
F

The Project for the Study on Togo Logistics Corridor Development in the Republic of Togo Final Report Chapter 5 Future Traffic Demand Forecast
5 - 58
Source: Study Team
Figure 5-66 Level of Service of Present Traffic Forecast in 2012
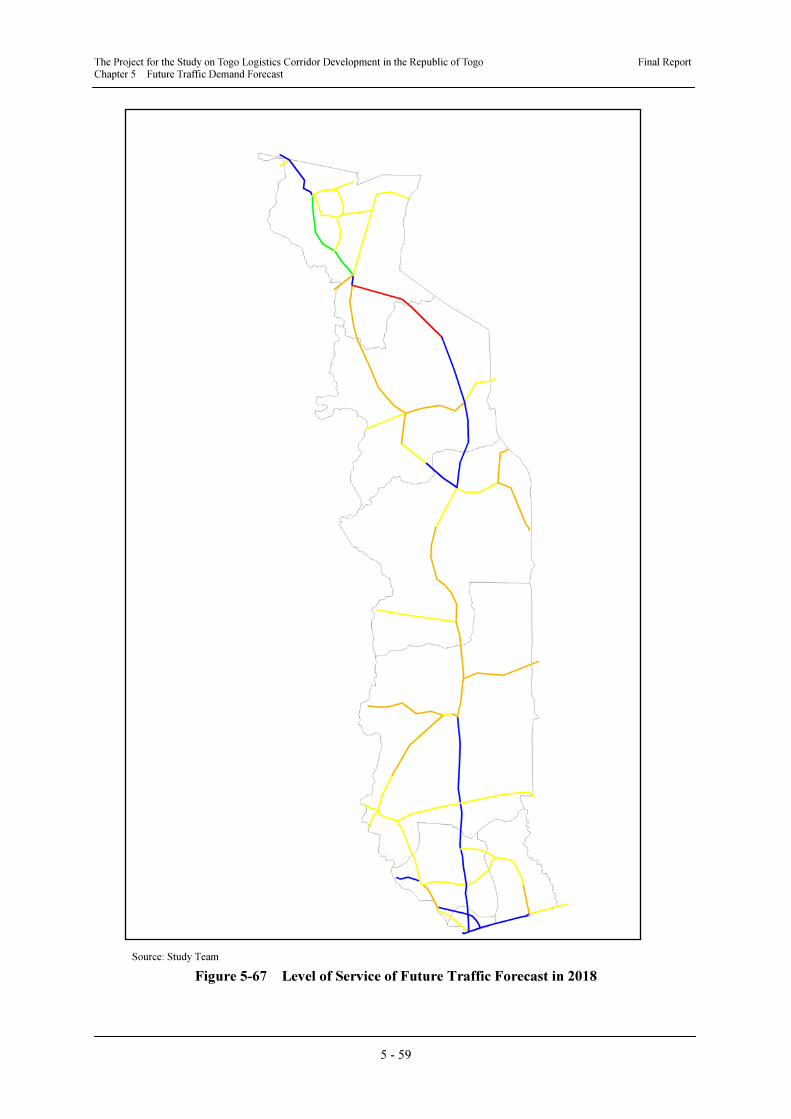
The Project for the Study on Togo Logistics Corridor Development in the Republic of Togo Final Report Chapter 5 Future Traffic Demand Forecast
5 - 59
Source: Study Team
Figure 5-67 Level of Service of Future Traffic Forecast in 2018

The Project for the Study on Togo Logistics Corridor Development in the Republic of Togo Final Report Chapter 5 Future Traffic Demand Forecast
5 - 60
Source: Study Team
Figure 5-68 Level of Service of Future Traffic Demand in 2030 with Full Road Network
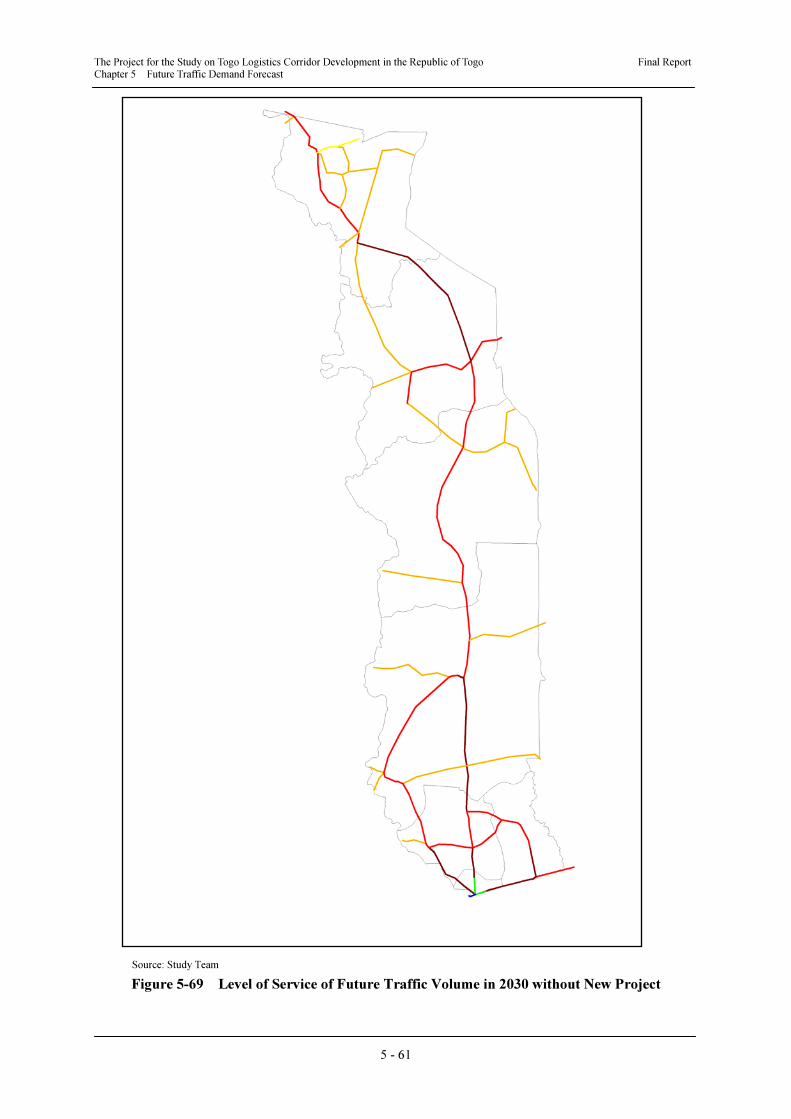
The Project for the Study on Togo Logistics Corridor Development in the Republic of Togo Final Report Chapter 5 Future Traffic Demand Forecast
5 - 61
Source: Study Team
Figure 5-69 Level of Service of Future Traffic Volume in 2030 without New Project
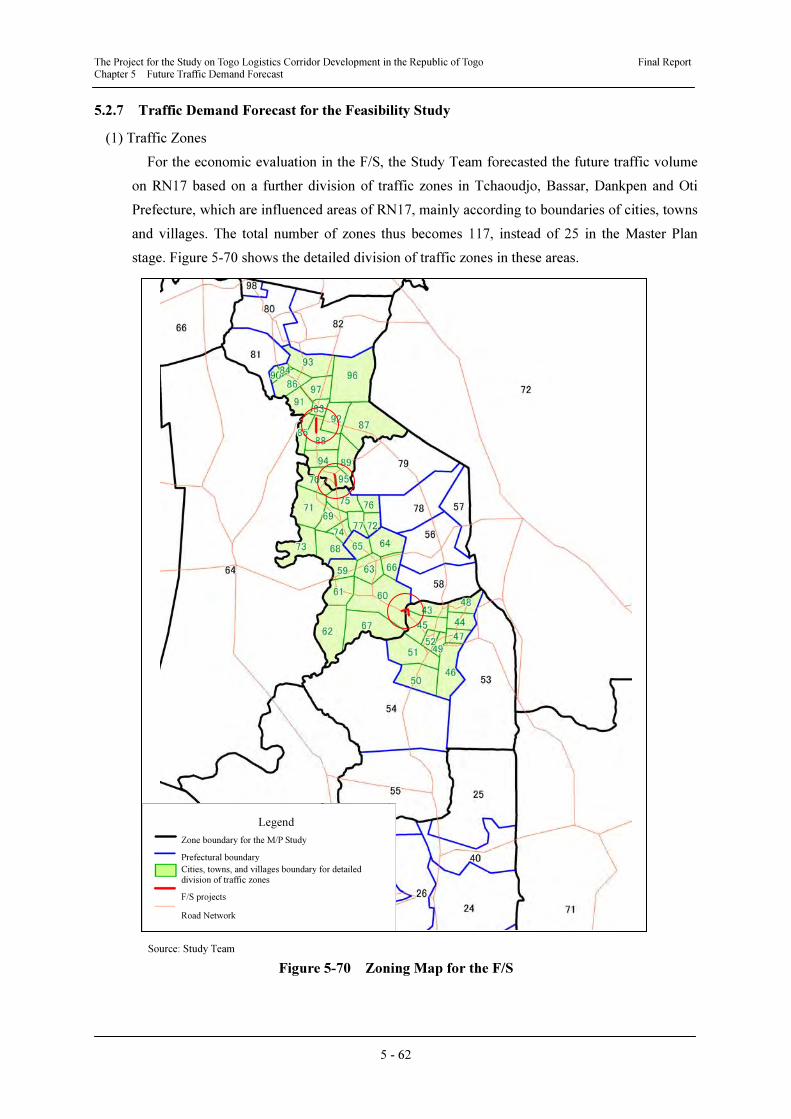
The Project for the Study on Togo Logistics Corridor Development in the Republic of Togo Final Report Chapter 5 Future Traffic Demand Forecast
5 - 62
5.2.7 Traffic Demand Forecast for the Feasibility Study
(1) Traffic Zones
For the economic evaluation in the F/S, the Study Team forecasted the future traffic volume
on RN17 based on a further division of traffic zones in Tchaoudjo, Bassar, Dankpen and Oti
Prefecture, which are influenced areas of RN17, mainly according to boundaries of cities, towns
and villages. The total number of zones thus becomes 117, instead of 25 in the Master Plan
stage. Figure 5-70 shows the detailed division of traffic zones in these areas.
Source: Study Team
Figure 5-70 Zoning Map for the F/S
Legend
Zone boundary for the M/P Study
Prefectural boundary
Cities, towns, and villages boundary for detailed division of traffic zones
F/S projects
Road Network
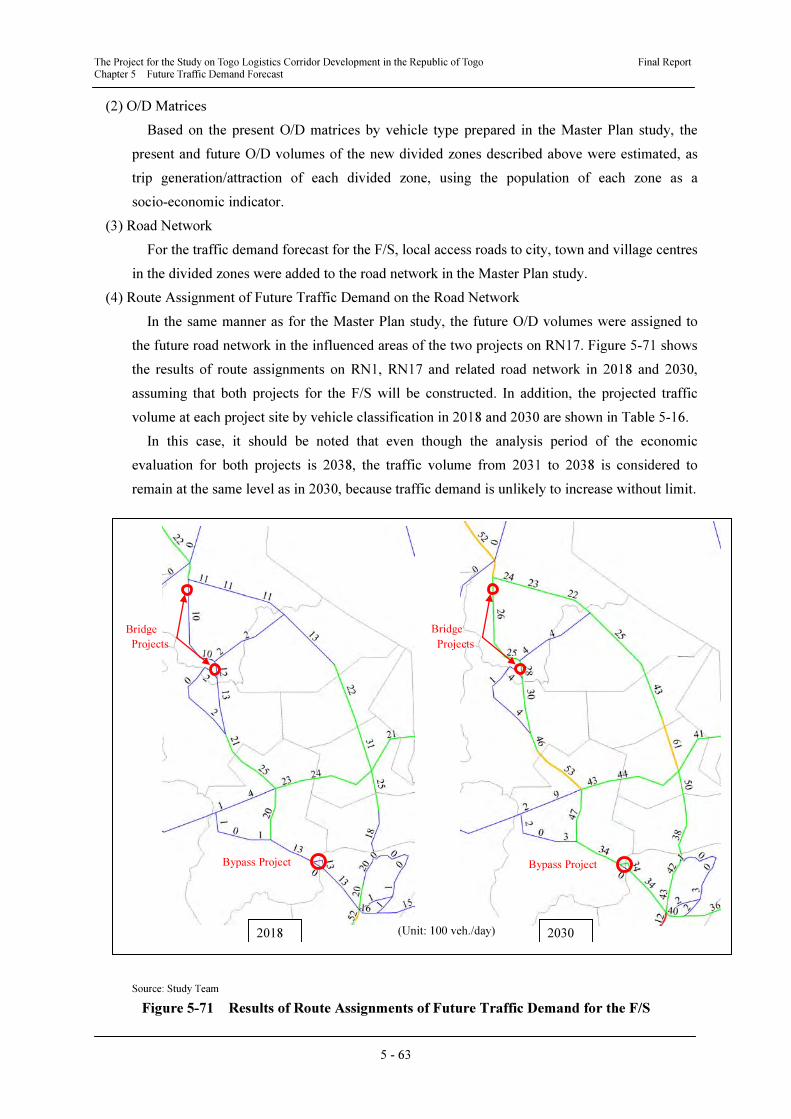
The Project for the Study on Togo Logistics Corridor Development in the Republic of Togo Final Report Chapter 5 Future Traffic Demand Forecast
5 - 63
(2) O/D Matrices
Based on the present O/D matrices by vehicle type prepared in the Master Plan study, the
present and future O/D volumes of the new divided zones described above were estimated, as
trip generation/attraction of each divided zone, using the population of each zone as a
socio-economic indicator.
(3) Road Network
For the traffic demand forecast for the F/S, local access roads to city, town and village centres
in the divided zones were added to the road network in the Master Plan study.
(4) Route Assignment of Future Traffic Demand on the Road Network
In the same manner as for the Master Plan study, the future O/D volumes were assigned to
the future road network in the influenced areas of the two projects on RN17. Figure 5-71 shows
the results of route assignments on RN1, RN17 and related road network in 2018 and 2030,
assuming that both projects for the F/S will be constructed. In addition, the projected traffic
volume at each project site by vehicle classification in 2018 and 2030 are shown in Table 5-16.
In this case, it should be noted that even though the analysis period of the economic
evaluation for both projects is 2038, the traffic volume from 2031 to 2038 is considered to
remain at the same level as in 2030, because traffic demand is unlikely to increase without limit.
Source: Study Team
Figure 5-71 Results of Route Assignments of Future Traffic Demand for the F/S
2030
Bypass Project
Bridge
Projects
2018
Bridge
Projects
Bypass Project
(Unit: 100 veh./day)
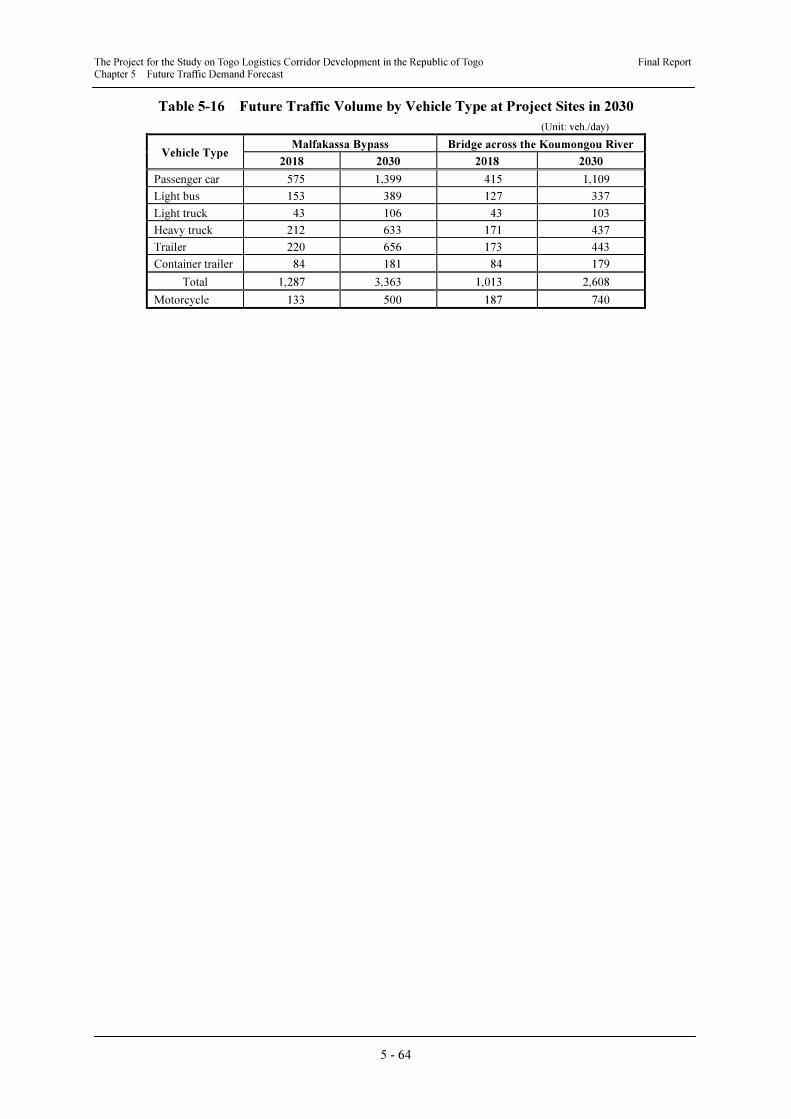
The Project for the Study on Togo Logistics Corridor Development in the Republic of Togo Final Report Chapter 5 Future Traffic Demand Forecast
5 - 64
Table 5-16 Future Traffic Volume by Vehicle Type at Project Sites in 2030
(Unit: veh./day)
Vehicle Type Malfakassa Bypass Bridge across the Koumongou River
2018 2030 2018 2030
Passenger car 575 1,399 415 1,109
Light bus 153 389 127 337
Light truck 43 106 43 103
Heavy truck 212 633 171 437
Trailer 220 656 173 443
Container trailer 84 181 84 179
Total 1,287 3,363 1,013 2,608
Motorcycle 133 500 187 740