economic development corridor study: opportunities & constraints
TRANSCRIPT

Economic Development Corridor Study: Opportunities & Constraints
Town of Cairo Greene County, New York
Prepared for:
Town of Cairo
Greene County Economic Development, Planning & Tourism
Prepared by: Delaware Engineering, D.P.C
June 2021


Economic Development Corridor Study: Opportunities & Constraints Analysis Town of Cairo, New York
Delaware Engineering, D.P.C. i
Table of Contents
1.0 EXECUTIVE SUMMARY ................................................................................................................... 1
2.0 PROJECT OVERVIEW ....................................................................................................................... 2
2.1 LOCATION ............................................................................................................................................................... 3 2.2 METHODOLOGY ....................................................................................................................................................... 4 2.3 SOCIOECONOMIC AND DEMOGRAPHIC CONDITIONS ........................................................................................................ 6 2.4 COST OF DEVELOPMENT/COMPETITIVENESS .................................................................................................................. 9 2.5 JURISDICTIONAL COOPERATION AND COORDINATION ...................................................................................................... 9 2.6 LOCAL SITING EFFORTS ............................................................................................................................................ 11 2.7 ECONOMIC BENEFIT................................................................................................................................................ 11 2.8 EXPECTED EMPLOYMENT GROWTH AND ECONOMIC BENEFITS ........................................................................................ 11 2.9 QUALITY OF LIFE INVESTMENT .................................................................................................................................. 12
3.0 ENVIRONMENTAL CHARACTERISTICS ............................................................................................ 12
3.1 WATER RESOURCES ................................................................................................................................................ 12 3.2 AIR RESOURCES ..................................................................................................................................................... 13 3.3 TERRESTRIAL AND AQUATIC ECOLOGY ........................................................................................................................ 14 3.4 COMMUNITY CHARACTER ........................................................................................................................................ 14 3.5 HISTORIC AND ARCHEOLOGICAL RESOURCES ................................................................................................................ 14
4.0 REVIEW OF LAND USE AND ZONING CODES .................................................................................. 14
5.0 IDENTIFICATION OF PROJECT SECTORS ......................................................................................... 16
6.0 ECONOMIC DEVELOPMENT SITE ANALYSIS ................................................................................... 18
6.1 ECONOMIC DEVELOPMENT SITE 1: SCHNEIDER PROPERTY .............................................................................................. 18 6.2 ECONOMIC DEVELOPMENT SITE 2: BUEL PROPERTY ...................................................................................................... 20 6.3 ECONOMIC DEVELOPMENT SITE 3: SCHOOL-OWNED/MILLER PROPERTIES ........................................................................ 22
7.0 INFRASTRUCTURE ANALYSIS ......................................................................................................... 24
7.1 POTABLE AND FIRE SUPPRESSION WATER SUPPLY ........................................................................................................ 25 7.1.1 Existing Public Water Supplies ................................................................................................................. 25 7.1.2 Potential Existing Public Water Service for Economic Development Sites .............................................. 26 7.1.3 New, On-Site Private Water Systems ........................................................................................................ 30
7.2 WASTEWATER COLLECTION AND TREATMENT .............................................................................................................. 30 7.2.1 Existing Publicly Owned Treatment Works ............................................................................................... 30 7.2.2 Potential Existing Public Sewer Service for Economic Development Sites .............................................. 31 7.2.3 New, On-Site Private wastewater Systems ................................................................................................ 32
7.3 TRANSPORTATION .................................................................................................................................................. 32 7.4 POWER ................................................................................................................................................................ 33 7.5 BROADBAND ......................................................................................................................................................... 35
8.0 POTENTIAL PROJECT IMPACTS WITH SQUARE FEET, JOBS, AND PRIVATE INVESTMENT ................. 35
9.0 MARKETING STRATEGIES AND APPROACH ................................................................................... 36
10.0 NEXT STEPS ................................................................................................................................ 37
11.0 INFRASTRUCTURE FUNDING STRATEGY ...................................................................................... 37

Town of Cairo Economic Development Corridor Study: Opportunities & Constraints Analysis
Delaware Engineering, D.P.C. ii
List of Figures
Figure 1. Study Area Figure 2. Socioeconomic & Demographic Conditions Figure 3. Main Street Zoning Map Figure 4. Site 1 Parcels Figure 5. Site 2 Parcels Figure 6. Site 3 Parcels List of Tables
Table 1. Study Area Parcels Table 2. Economic Development Site 1 Parcels Table 3. Economic Development Site 2 Parcels Table 4. Economic Development Site 3 Parcels Table 5. Town of Cairo Water Capacity Table 6. Water Line Extension Cost Estimate for Site 1 Table 7. Water Line Extension Cost Estimate for Site 2 Table 8. Water Line Extension Cost Estimate for Sites 1, 2 & 3 Table 9. Byas Test Well Cost Estimate Table 10. Byas Well Development and Water Line Extension Cost Estimate Table 11. Town of Cairo Sewer Capacity Table 12. Sewer Line Extension Cost Estimate for Site 1 Table 13. Sewer Line Extension Cost Estimate for Site 2 Table 14. Sewer Line Extension Cost Estimate for Site 3 Table 15. Sewer Line Extension Cost Estimate for Sites 1, 2 & 3 Attachments
Attachment 1. Location Map Attachment 2. Typical Development Considerations Table Attachment 3. Economic Development Corridor Study Area Map Attachment 4. Economic Development Corridor Study Selected Sites Map Attachment 5. Demographic Summary Comparison Attachment 6. Demographic Summaries and Reports for Greene County Attachment 7. Demographic Summaries and Reports for the Town of Cairo Attachment 8. Demographic Summaries and Reports for the Study Area Attachment 9. Environmental Features Map Attachment 10. FEMA Flood Map Attachment 11. Economic Development Corridor Study Zoning Map Attachment 12. Economic Development Corridor Study Land Use Map Attachment 13. Greene County Agricultural District Map Attachment 14. Economic Development Site #1: Schneider Conceptual Plan Attachment 15. Economic Development Site #2: Buel Conceptual Plan Attachment 16. Economic Development Site #3: School-Owned/Miller Conceptual Plan Attachment 17. Water System Map Attachment 18. Byas Farm Well Site Map Attachment 19. Cedar Terrace Well Site Map Attachment 20. Reservoir Well Site Map Attachment 21. Sewer System Map

Town of Cairo Economic Development Corridor Study: Opportunities & Constraints Analysis
Delaware Engineering, D.P.C. iii
Appendices
Appendix 1. Schneider Reports: Project Feasibility and Geotechnical Report Appendix 2. Water Hydraulic Analysis Appendix 3. Infrastructure Extension Plans Appendix 4. Cedar Terrace Well Evaluation Appendix 5. Energy Comparison Tables from NYSERDA

Town of Cairo Economic Development Corridor Study: Opportunities & Constraints Analysis
Delaware Engineering, D.P.C. 1
1.0 Executive Summary
The Town of Cairo Economic Development Corridor Study: Opportunities and Constraints
Analysis identifies the opportunities and constraints to economic development along the NYS
Route 23 Corridor to determine priority sites for shovel-ready investment. The Study Area is
comprised of nearly 200 individual parcels with a total area of about 1,200 acres. The geographic
limits of the Corridor extend along a one and a quarter mile stretch of NYS Route 23 between its
intersections with Bross Street in the north and County Route 23B in the south. The latitudinal
limits extend from Joel M. Austin Road N./Mountain Avenue in the west to the Catskill Creek on
the eastern edge. This Study outlines three locations for potential economic development sites and
describes in conceptual terms the environmental, regulatory and market backdrop for each.
Municipal water and sewer extensions are also explored.
The methodology for conducting this Study involved the creation of numerous detailed GIS-based
maps of assemblages of parcels adjacent to NYS Route 23 with environmental and ownership
characteristics delineated. These maps were used during project meetings conducted by
experienced economic development professionals from the Greene County Department of
Economic Development, Tourism and Planning, the Greene County IDA and Town of Cairo
Officials to determine which parcels offer the best development potential. From these meetings,
more detailed GIS-based analysis was conducted and additional work was advanced to further
refine the site selection process.
The combination of GIS-based analysis and project meetings resulted in the creation of three
potential economic development sites. The uses ranged between housing, office, commercial, high
energy, distribution, manufacturing, warehousing, food processing, and agriculture. These three
locations are the foundation of the Corridor Study. Each of the three options offer unique layouts,
scales and land use alternatives for potential development.
With few exceptions, the Study demonstrates that the NYS Route 23 Corridor is well aligned to
support and welcome the development envisioned by the Cairo community and local economic
development professionals. The few constraints will require time and funding to be addressed;

Town of Cairo Economic Development Corridor Study: Opportunities & Constraints Analysis
Delaware Engineering, D.P.C. 2
however, there are no constraints that are substantial barriers to development. Each site was
chosen due to its potential for development. The evaluation process prioritizes the sites that are
most prepared to accommodate a shovel-ready project. The Study determined that the identified
sites are highly developable from the standpoint of a number of perspectives.
Overall, the success of private sector development will provide definable benefits of private
investment, quality job creation, revitalization of communities, a growth in population, expansion
of both affordable and market housing, and investment in education, community organizations and
the overall creative economy. With this transformation, families grow, quality of life is enhanced
and the emotional commitment to community deepens as optimism for the future increases.
2.0 Project Overview
Interest in commercial and light industrial sites in Greene County (the “County”) has led to an
aggressive program for the creation of economic development sites. The majority of the industrial
park development in the County has been located in the Historic River Towns due to the
availability of flat vacant land, transportation infrastructure and access to water and wastewater
infrastructure. Future development could be located in the Valley Towns, especially along NYS
Route 23.
The Town of Cairo’s (the “Town” or “Cairo”) economic initiatives take advantage of its most
important assets: scenic beauty and small-town environment. The Town is a well-maintained
community where civic pride and positive attitudes drive a high quality of life for residents.
Forests, streams, and other natural resources are maintained and continue to contribute to the health
and welfare of the Town, County and Region as a whole. An affordable broad-based tax system
supports quality public services, a well-maintained infrastructure that allows for controlled growth
and a safe and supportive living environment. Through development and investment within the
defined Study Area, the economy of the County becomes more robust.
The Greene County IDA (the “IDA”) has demonstrated notable success in the advancement of
economic development sites that have each begun with an anchor tenant and have resulted in the
creation of substantial economic activity and employment in Greene County. Greene County’s

Town of Cairo Economic Development Corridor Study: Opportunities & Constraints Analysis
Delaware Engineering, D.P.C. 3
shovel-ready economic development sites as well as pre-planned economic development sites are
important assets for economic growth and development. However, the inventory of shovel-ready
or pre-planned sites is presently very low and a need to explore new economic development sites
has been identified. The County has identified the need for additional potential commercial and
industrial development sites as critical to maintaining and expanding job growth opportunities.
The overarching goal of the Town of Cairo Economic Development Corridor Study: Opportunities
& Constraints Analysis (the “Corridor Study” or “Study”) is to document the opportunities and
constraints of the land base and identify those sites possessing the greatest potential for economic
development. This Study is envisioned to be a vehicle to identify potential economic development
sites with excellent access to transportation and consistency with local land use plans revealing the
potential development opportunities for each site.
The Study is intended to establish the basis for next steps towards market ready site development.
The Town of Cairo has an opportunity with respect to environmentally prudent planning to support
economic development via the provision of public water and wastewater treatment along NYS
Route 23. All forms of economic development rely on the capacity, sustainability, viability, and
cost of the underlying public infrastructure. The IDA and Greene County Department of Economic
Development, Tourism and Planning (GCEDTP) undertook a County-wide Economic
Development Study in 2016. The Economic Development Corridor Study is an extension of the
2016 Study focused specifically on the Town of Cairo. This new Study identifies the opportunities
and constraints to economic development in the Town of Cairo, and specifically the defined Study
Area, to determine priority sites for shovel-ready investment and potential infrastructure
expansion.
2.1 Location
The Town of Cairo is located in the center of Greene County along the eastern edge of the Catskill
Mountain range. Cairo is 110 miles north of NYC and 20 miles south of the City of Albany. It is
bisected by NYS Highways 32 and 23. The western side of the Town is mountainous and as such
zoned as the “Mountain District” (MT). The eastern side is primarily rural residential in nature.
Commercial and industrial development is concentrated mainly in the central portion of the
hamlets of Acra, Cairo, South Cairo, Purling, Roundtop and Gayhead. The hamlet of Cairo is the

Town of Cairo Economic Development Corridor Study: Opportunities & Constraints Analysis
Delaware Engineering, D.P.C. 4
largest and includes the Main Street business district, Town Hall, Cairo-Durham Central School
and the community library. A Location Map is included as Attachment 1.
Cairo has experienced several phases of development throughout the past two centuries. Early
industries included textile mills and iron forges that relied upon the rushing creeks of the town for
power. Agricultural production of chickens, eggs and apples were predominant. As the tourist
industry in Greene County grew, Cairo saw a boom in boarding houses and resorts. The hamlet of
Cairo is experiencing new growth as new retail and service businesses move in along Main Street.
Main Street is the cultural and economic focus of the Town and is filled with businesses, historic
buildings and landscaped streets. It has a diversity of retail and service businesses that meet the
needs of local residents and provides jobs for all income and education levels. Many unique and
historic buildings and locations have been preserved through Town and County efforts.
2.2 Methodology
The methodology for conducting this Study involved the creation of numerous detailed GIS-based
maps of assemblages of parcels adjacent to NYS Route 23 with environmental and ownership
characteristics delineated. These maps were used during project meetings conducted by
experienced economic development professionals from the GCEDTP and the IDA to determine
which parcels offer the best development potential. From these meetings, a more detailed GIS-
based analysis was conducted and additional work was advanced to further refine the site selection
process.
The identification of potential economic development sites is based on the provision of
infrastructure as well as publicly available information regarding land use, zoning and other factors
such as environmental constraints (e.g., significant documented wetlands, steep slopes, flood
zones, etc.). Recommendations regarding infrastructure management and provisions was
developed with an aim at maximizing the economic development potential of the identified sites.
A Typical Development Considerations Table is included with this report (Attachment 2). This
Table was used as a reference during the siting process.

Town of Cairo Economic Development Corridor Study: Opportunities & Constraints Analysis
Delaware Engineering, D.P.C. 5
Delaware Engineering, along with GCEDTP and IDA leadership and Cairo municipal partners,
evaluated market conditions in the Region through review of the following:
• Availability of Land
• Building Activity
• Development Leads in Progress
• Mix of Industrial and Commercial Uses
The Town contains 4,358 parcels and
approximately 650 of those parcels are over 10
acres in size. As a result, the project team
established a focused Study Area and identified
properties on the market as well as vacant or
underutilized parcels. Given the identified
market conditions as well as properties on the
market and vacant or underutilized land,
Delaware Engineering developed criteria for
screening sites:
• Minimum site size (10 Acres) for
developable area (e.g., eliminate wetlands, watercourses, steep slopes)
• Maximum distance from highway access
• Zoning/Land Use
• Proximity to Water/Sewer Infrastructure
The Study Area includes much of the Central Hamlet and Main Street neighborhood where Town-
owned water and sewer infrastructure is concentrated. This locale was chosen for its proximity to
highway access, availability of infrastructure and abundance of vacant land. The Study Area
includes approximately 216 parcels and encompasses 1,200 acres of relatively flat land. The
geographic limits of the Corridor extend along a one and a quarter mile stretch of NYS Route 23
between its intersections with Bross Street in the north and County Route 23B in the south. The
latitudinal limits extend from Joel M. Austin Road N./Mountain Avenue in the west to the
Figure 1. Study Area

Town of Cairo Economic Development Corridor Study: Opportunities & Constraints Analysis
Delaware Engineering, D.P.C. 6
Coxsackie Creek on the eastern edge. An Economic Development Corridor Study Area Map is
included as Attachment 3.
The team then applied the screening criteria to properties in the Town and developed a list of sites
that match the desired criteria. With an initial list of properties identified, the next step involved
comparing the list of sites relative to opportunities and constraints in the areas of environmental,
infrastructure and zoning/land use. Tabular data with analysis along with maps identifying the
screened properties were prepared to review initial findings of the analysis. An Economic
Development Corridor Study Selected Sites Map is included as Attachment 4.
2.3 Socioeconomic and Demographic Conditions
For this Study, socioeconomic data was
obtained through the ESRI Business
Analyst’s 2020 Infogroup, Inc. ESRI Data
Allocation Method. ESRI Business
Analyst combines demographic, business,
lifestyle, spending and census data with
map-based analytics. Esri's Tapestry
Segmentation is a geodemographic
system that identifies distinctive markets
in the U.S. based on socioeconomic and
demographic characteristics to provide an
accurate, comprehensive profile of U.S.
consumers. Each year, population and
household counts are updated by ESRI.
Information provided allows for the comparison of data from the Study Area, Town, County and
New York State. This assists in exploring the workforce available and industry sectors that are
needed. Figure 2 above is included as an Attachment 5.
2.3.1 Greene County The median household income for the County is estimated to be $55,563 with a per capita income
of $30,307 (2020 data). The median disposable income in the County in 2020 was $43,588. 88%
Figure 2. Socioeconomic & Demographic Conditions

Town of Cairo Economic Development Corridor Study: Opportunities & Constraints Analysis
Delaware Engineering, D.P.C. 7
of those individuals age 16 and over are employed. The median net worth for the County is
estimated at $102,901 (Demographic Summary).
The education breakout shows that 23% of adults hold a Bachelor’s Degree or greater, 27% have
attended college below the Bachelor’s Degree level, 38% have received a high school diploma
only, and 12% have not received a high school diploma (Demographic Summary).
There is a total of 1,946 businesses within Greene County and a total of 18,668 employees
(Business Summary). 61% of the County workforce aged 25 and over hold white collar jobs, 24%
hold blue collar jobs, and 15% work in services. Countywide unemployment in 2020 was 12%.
The primary employment industry is Health Care/Social Assistance which employs 17.6% of the
County’s workforce, followed by Retail Trade and Educational Services both which employ 9.8%
of the County’s workforce (Civilian Labor Force Profile). Demographic summaries for the County
are included as Attachment 6.
2.3.2 Town of Cairo The median household income for the Town is estimated to be $52,533 with a per capita income
of $26,712 (2020 data). The median disposable income in the Town in 2020 was $40,538. 87.5%
of those individuals age 16 and over are employed. The median net worth for the Town is
estimated at $82,394.
The education breakout shows that 23% of adults 25 and over hold a Bachelor’s Degree or greater,
27% have attended college below the Bachelor’s Degree level, 38% have received a high school
diploma only, and 12% have not received a high school diploma.
There is a total of 225 businesses within the Town and a total of 1,594 employees (Business
Summary). There are 3,356 employed Town residents which indicates at least two thirds of the
employed town residents work outside of the Town. 60% of the Town’s workforce hold white
collar jobs, 26% hold blue collar jobs, and 14% work in services. The primary employment
industry is Health Care/Social Assistance which employs 18% of the Town’s workforce, followed
by Manufacturing both which employs 10.9% of the Town’s workforce (Civilian Labor Force
Profile). Demographic summaries for the Town are included as Attachment 7.

Town of Cairo Economic Development Corridor Study: Opportunities & Constraints Analysis
Delaware Engineering, D.P.C. 8
2.3.3 Study Area The median household income for the Study Area is estimated to be $42,018 with a per capita
income of $24,012 (2020 data). The median disposable income in the Study Area in 2020 was
$33,757. 85.1% of those individuals age 16 and over are employed. The median net worth for the
Study Area is estimated at $45,027 (Demographic Summary).
The education breakout shows that 12% of adults hold a Bachelor’s Degree or greater, 42% have
attended college below the Bachelor’s Degree level, 31% have received a high school diploma
only, and 15% have not received a high school diploma (Demographic Summary).
There is a total of 44 businesses within the Study Area with a total of 384 employees (Business
Summary). 59% of the workforce aged 25 and over holds white collar jobs, 23% hold blue collar
jobs, and 19% work in services. The unemployment rate is 14.9% for workers ages 16 and up.
The primary employment industry is Health Care/Social Assistance which employs 16.9% of the
Study Area’s workforce, followed by Retail Trade which employs 15.1% and then
Transportation/Warehousing at 11.6% (Civilian Labor Force Profile).
This data shows that there is need in the Study Area for additional employment opportunities.
Demographic summaries for the Study Area are included as Attachment 8.
The population of the Study Area is characterized by the two economic tapestry segments
categorized as the Cozy Country (L6) and Hometown (L12). Tapestry segmentation divides
residential areas into sections, each providing an accurate, detailed description of their respective
neighborhoods based on socioeconomic and demographic composition. This information allows
the Town and County see what customer base is within the Study Area. It also shows potential
workforce for specific industries.
There are 14 Life Mode groups within each tapestry as well as six Urbanization Groups. Life Mode
groups represent markets that share a common experience—born in the same generation or
immigration from another country—or a significant demographic trait, like affluence. The
Dominant Tapestry Map and supporting documentation is included with the Demographic
Summary in Attachment 8.

Town of Cairo Economic Development Corridor Study: Opportunities & Constraints Analysis
Delaware Engineering, D.P.C. 9
In the Study Area, Cozy Country is broken down into Salt of the Earth (6B) and The Great
Outdoors (6C). Hometown contains one subgroup of Small Town Simplicity (12C). The Salt of
the Earth subgroup includes older citizens that are entrenched in their traditional, rural lifestyle.
The median age is 44 years and two in three households are composed of married couples. The
Great Outdoors subgroup includes mostly educated empty nesters living a modest lifestyle. The
median age is 47 years and over half of the households are comprised of married couples. The
Small Town Simplicity subgroup includes young families and senior households bound by
community ties. Over half of the households are aged 55 years or older and are predominantly
single-person households.
While it is helpful to understand which industry groups currently have the highest leakage in a
market area, another method to predict economic potential is to gain a better understanding of
underserved markets through an analysis of consumer behavior – their lifestyle choices, what they
buy, how they spend their free time, and more. This is accomplished through a process called
Tapestry Segmentation.
Tapestry Segmentation classifies geographic areas into 67 unique segments based not only on
demographics (age, income, home value, occupation, etc.) but also socioeconomic data and other
consumer behavior characteristics. Tapestry Segmentation can provide valuable insights to help
identify potential customers and underserved markets.
2.4 Cost of Development/Competitiveness
The overall affordability in the Greene County market will provide economic development
officials an advantage as they compete with adjacent counties in close proximality to the NYS
Route 23 and the NYS Thruway, as well as other locations in the Northeast. Cost effective pricing
will help in the categories of land cost, construction, utilities, broadband, public water and sewer
rates, excellent access to major highway access, and labor.
2.5 Jurisdictional Cooperation and Coordination
Development within the Study Area will involve jurisdictional cooperation and coordination
among many parties, with the most notable being Greene County, the IDA and the Town of Cairo.

Town of Cairo Economic Development Corridor Study: Opportunities & Constraints Analysis
Delaware Engineering, D.P.C. 10
Additionally, the cooperation and coordination of state and regional agencies is also needed to
bring the vision of economic vitality of the Study Area to life.
Greene County has a vital role to play: County level agencies can partner to create incentives to
spur economic investment. Moreover, the Greene County legislature has the ability to support
planning efforts along the Corridor with respect to supporting extensions of infrastructures, which
is the next step recommended towards advancing the concepts presented herein towards market
ready, then shovel-ready status. In these ways, large and small, all of Greene County has an
important role to play in supporting the efforts to attract economic investment.
The Town of Cairo has a more granular role to play in supporting the development potential of the
Study Area. The Hamlet is currently a hub of land use intensity, with a public water and sewer
system that support the semi-dense development; however, it is understood that investment in the
Town’s infrastructure systems will be necessary (i.e., infrastructure extensions along NYS Route
23, Main Street, and County Route 23B). Development in the Town that utilizes infrastructure
systems will result in both financing of improvements to the infrastructure systems and an
increased customer base for the public utilities. In this way, the Town benefits from improvements
to Town water and sewer systems financed by other than Town users/tax base, and the Town
benefits an increased user base to share the costs of the infrastructure.
Further, investment in the Study Area to grow jobs and the economy will require infrastructure
including water and sewer systems. There is a point at which extensions become too costly and a
decentralized approach to infrastructure is favored. In this case, the Town can support the
development of the corridor through taking proactive approaches to creating special improvement
districts (e.g., water and sewer districts). While it is anticipated that grants and private investment
will finance the infrastructure for decentralized systems, the Town and the County (where multiple
municipalities are involved) have the authority to create special improvement districts to govern
these services.
State and regional agencies also play a role in development. Fortunately, few substantive barriers
to development have been identified and the role of state and regional agencies is anticipated to be
administrative and regulatory in nature. There are many ways in which jurisdictional cooperation

Town of Cairo Economic Development Corridor Study: Opportunities & Constraints Analysis
Delaware Engineering, D.P.C. 11
and coordination will support the growth of the business base, with the critical relationships
between the Town of Cairo and Greene County agencies at the heart of the matter.
2.6 Local Siting Efforts
It is absolutely essential to follow this process of potential site identification with a coordinated
approach to infrastructure. This coordinated engagement with the communities, exploring
maximum buildout and impacts to defined areas of interest is critical to market the potential sites
with credibility and to respond in real time to opportunities for success. It is this strong partnership
with the community, its leadership and local residents that sets the stage for victory in an
environment very competitive for valued jobs and investment. In the end, predictability of
timeframe and cost is absolutely required to engage with the site selector and commercial real
estate professionals who drive the process for corporate America.
2.7 Economic Benefit
Overall, the anticipated economic value and benefit to local residents and communities from this
initiative and anticipated economic development is substantial. This strategy to identify, gain
approvals and develop new sites to support a diverse business attraction strategy will provide the
stabilization of a local and regional economy more able to absorb downturns in any specific sector.
With the development of shovel-ready sites, a welcoming attitude, an aggressive sales strategy and
a strategic marketing approach, positive and diverse development will happen.
The success of private sector development will provide definable benefits of private investment,
quality job creation, revitalization of urban communities, a growth in population, expansion of
both affordable and market housing, and investment in education, community organizations and
the overall creative economy. With this transformation, families grow, vibrancy returns, quality
of life is enhanced and the emotional commitment to community deepens as optimism for the
future increases.
2.8 Expected Employment Growth and Economic Benefits
It is too early in the process to estimate or predict with any certainty economic growth and the
resulting economic benefits. Clarity will arise as potential economic development sites are fleshed
out in more detail and specific building size, targeted sectors and overall scale are finalized.

Town of Cairo Economic Development Corridor Study: Opportunities & Constraints Analysis
Delaware Engineering, D.P.C. 12
2.9 Quality of Life Investment
To ensure local communities and their residents benefit from the success of economic development
beyond the traditional ways (valued community partners, jobs and tax revenue), deal structures
often include several categories of potential community benefits. The magnitude and level of this
discussion is often based on several factors such as project size, level of investment, incentive
package and the type of sector involved.
Key areas of consideration include preservation of community identified open space, habitat and
sensitive environmental areas, and enhanced recreation spaces. This can include new and
expanded park and activity areas, recreation facilities and strategic collaborative educational
investments in partnership with local school districts.
3.0 Environmental Characteristics
With few exceptions, this Study Area is well aligned to support and welcome the development
envisioned in this Study. The few constraints will require time and funding to be addressed;
however, there are no constraints that should be considered substantial barriers to development.
Details are presented herein.
3.1 Water Resources
3.1.1 Streams and Watercourses The primary surface water feature within the Study Area is the Catskill Creek which creates its
eastern border. The Catskill Creek is a tributary of the Hudson River Estuary and flows from
northwest to southeast through the Town. Most of Cairo’s streams and wetlands contribute to the
Catskill Creek watershed. Development that would alter or diminish this feature is not
contemplated in this Study. See Attachment 9 for an Environmental Features Map which includes
waterbodies in the Study Area. The Study Area is highly developable without impacts to streams
and other watercourses present; therefore, none are anticipated.
3.1.2 Wetlands Wetlands are present in and around the Town of Cairo, but they are not a dominant feature in the
Study Area. Wetlands are important environmental features due to their contribution to filtering

Town of Cairo Economic Development Corridor Study: Opportunities & Constraints Analysis
Delaware Engineering, D.P.C. 13
and recharging aquifers, flood control and contributing to wildlife habitats. Before economic
development sites are disturbed, a wetland delineation should be performed to check the status and
location of wetlands on-site.
Within the study area, NYSDEC has mapped wetland check zones as areas that may contain
wetlands but need further investigation. A wetland delineation has already been prepared for one
large track of land in the Study Area. This information is included in the Environmental Features
Map. The Study Area is highly developable without impacts to wetlands present; therefore, none
are anticipated.
3.1.3 Aquifers Several aquifers are present in the Town of Cairo. Aquifers are often tapped for groundwater to be
used as a primary drinking water source. One aquifer, associated with the current Town wells, is
located just west of the Study Area. Another larger aquifer is located along the eastern side of the
Study Area and follows the Catskill Creek. According to NYS GIS data, this is a high yield aquifer
with a yield rate of >100 gallons per minute. The Study Area is highly developable without impacts
to aquifers; therefore, none are anticipated. See Attachment 9 for an Environmental Features Map
which includes aquifers in the Study Area.
3.1.4 Flood Zones None of the selected sites are located in the vicinity of FEMA Flood Zone. The Study Area is
highly developable without impacts to flooding; therefore, no adverse impacts are anticipated. See
Attachment 10 for a FEMA Flood Map.
3.2 Air Resources
The nature of the proposed uses for the sites would be considered commercial and light industrial.
While manufacturing is an option on some sites, heavy industry is not the primary focus. All air
quality standards will be enforced by the appropriate regulatory agencies. There will also be a
development-by-development site plan review process that would review any and all impacts
associated with air quality.

Town of Cairo Economic Development Corridor Study: Opportunities & Constraints Analysis
Delaware Engineering, D.P.C. 14
3.3 Terrestrial and Aquatic Ecology
There is no evidence of threatened or endangered species, Natural Communities, Rare Plants and
Animals within the Study Area and there are no Critical Environmental Areas of statewide
significance within or adjacent to the Study Area. This results in an ecologically friendly setting
for the type of development that is proposed.
3.4 Community Character
This Study Area has been chosen by the Town and County as an appropriate district for light
industrial and commercial uses. There are already significant existing businesses that would be
harmonious with the anticipated uses. There would be no effect on community character in that
the community desires this type of character within the portion of the community. In fact, future
development will provide a positive opportunity to re-develop areas where the properties are not
improved to the best use.
3.5 Historic and Archeological Resources
The Study Area shows no record of historical or archeologically significant areas within or
adjacent to the proposed economic development sites.
4.0 Review of Land Use and Zoning Codes
The Town has targeted the Study Area for light industrial and commercial use due to the historic
land use patterns in the area and as an effort to steer this type of development towards these sections
of the Town. Through the adoption of the zoning regulations for commercial development ahead
of time, the Study Area is primed for organized growth. The nature of commercial development
is that it has the potential to be impactful to the community as well as the environment. Having
zoning regulations in place will prove to provide a far smoother and more achievable path forward
for future developments. The Town of Cairo Zoning was last updated in 2017. See Attachment 11
for an Economic Development Corridor Study Area Zoning Map.

Town of Cairo Economic Development Corridor Study: Opportunities & Constraints Analysis
Delaware Engineering, D.P.C. 15
Understanding land use trends allows for
the identification of solutions for issues
and concerns raised during the
economic development process. Cairo’s
land use patterns still reflect its rural
legacy. There are concentrated areas of
development on small parcels in the
hamlets. Analysis of recent tax data
indicates that the Town has experienced
significant conversions of property to
residential parcels over the past three
decades. The majority of the property in
Cairo is categorized as residential (44%) or vacant land (32%). Residential properties also
represent the largest contribution to total assessed value with 74% of the Town’s total. While there
is a relatively small amount of commercial property, this category makes up 8% of Cairo’s total
assessed value. Commercial land uses occupy just 3 percent of total land area in Cairo. They are
mostly located in or near the hamlets. See Attachment 12 for an Economic Development Corridor
Study Area Land Use Map.
The Study Area contains active farmland and areas designated as Agricultural Districts by Greene
County. The Greene County Agricultural Development and Protection Plan, adopted in 2002,
established numerous Agricultural Districts pursuant to Agriculture and Markets Law 25AA. The
plan is intended to protect productive farmland from non-agricultural development. Land use
decisions in and adjacent to designated agricultural districts are subject to review by the Greene
County Agricultural and Farmland Protection Board. See Attachment 13 for a Greene County
Agricultural District Map.
As can be seen in the table below, the majority of parcels (via acreage and no. of parcels) in the
Study Area are classified as Residential. Commercial and Vacant land also make up a large portion
of the Study Area. One large agricultural parcel is located in the southeastern corner of the Study
Area. It encompasses 16% of the total Study Area in acreage. Community Services in the Study
Area include the Cairo-Durham Central School and three active churches. Two Public Services
Figure 3. Main Street Zoning Map

Town of Cairo Economic Development Corridor Study: Opportunities & Constraints Analysis
Delaware Engineering, D.P.C. 16
parcels are owned and operated by Central Hudson Gas & Electric. A Land Use Map is included
as Attachment 12. Table 1. Study Area Parcels
RPS Class Code No. of Parcels % as Parcels Acreage % as Acres
100 - Agricultural 1 0% 185.9 16%
200 - Residential 112 52% 336.18 29%
300 - Vacant 46 21% 319 28%
411 – Apartments (Commercial) 7 3% 14.1 1%
400 - Commercial 42 19% 235.1 21%
500 - Recreation & Entertainment 2 1% 4.61 0%
600 - Community Services 4 2% 46.1 4%
700 - Industrial 0 0% 0 0%
800 - Public Services 2 1% 2.71 0%
900 - Wild, Forest, Conservation Lands 0 0% 0 0%
TOTALS = 216 - 1,143.7 -
5.0 Identification of Project Sectors
The process to identify sectors of opportunity focused on potential site scale, building size
flexibility and available infrastructure. Also, factored into the analysis was success of attracting
similar sectors to both New York and the Northeast. The focus was to identify the sectors that this
area could be competitive to attract, combined with the compatibility of the site capabilities to
meet specific needs of identified sectors.
Upon the completion of this review, several sectors were identified as viable business types that
could be attracted to Greene County and the Town of Cairo and be accommodated by the potential
economic development sites reviewed. The business sectors matching the identified economic
development site potential are:
• Manufacturing/Assembly: Requires flexibility in site size, with public infrastructure and
power based on the type of manufacturing and intensity of process. Connection to raw

Town of Cairo Economic Development Corridor Study: Opportunities & Constraints Analysis
Delaware Engineering, D.P.C. 17
material and product delivery markets and related transportation access are also important
site location factors.
• Warehousing: Requires larger sites with minimal public infrastructure and quality
transportation access to relevant markets. Proximity to the production of product requiring
storage is important and temperature requirements for product storage can impact power
requirements.
• Commercial: A general category that can include a variety of types ranging from intense
users of infrastructure to limited demand. Overall, the site needs of this sector will be less
intensive, but still require site readiness and timeframe predictability. Again, energy
capacity and cost can be a factor depending on type of activity. A more in-depth analysis
of Northeast activity will identify specific targets and clarity of targets for marketing
purposes and detailed discussions with the regional commercial real estate community.
• Office/Supportive Space: Often the larger projects will create a need for office support
and supply chain opportunities. The scale of these opportunities will range from very small
to a significant number of potential employees and sf demand. Relatively speaking, the
infrastructure and site needs are basic and low-volume with site approvals driving interest.
• Hospitality: Upgraded hotel and meeting space connected to the needs of future business
activity and investment will provide a dynamic opportunity for this new business focused
demand. Infrastructure needs will be limited, with location near business growth more
important.
• Workforce Housing: Depending on the scale, public infrastructure with pre-approvals
will be important to support the number of units to meet the housing needs of both the
corridor and the overall growth in jobs throughout Greene County.

Town of Cairo Economic Development Corridor Study: Opportunities & Constraints Analysis
Delaware Engineering, D.P.C. 18
6.0 Economic Development Site Analysis
Main Street is the cultural and economic focus of the Town and is filled with vibrant businesses,
beautiful buildings and landscaped streets. It has a diversity of retail and service businesses that
meet the needs of local residents and provides jobs for all income and education levels.
The County is in competition with other areas in the Region and in particular those areas with
excellent highway or multi-modal access for development of industrial/commercial sites. Greene
County, as well as specifically the Town of Cairo, has leveraged highway access (the area around
Exit 21B for warehousing and distribution as well as light manufacturing) and rail access
(Schoharie Turnpike in Athens); however, existing land base that is accessible and shovel-ready
(e.g. infrastructure is permitted and in place) is very limited. The site selection industry is highly
competitive, with locations selected based on reduced cost to develop a site (e.g. no added cost to
extend infrastructure) and reduced time to construction (e.g. SEQR and all permits are in place).
Through this Study, the Town of Cairo along with GCEDTP and the IDA identified several
properties that could serve as economic development sites. This section describes each of the sites
in detail. These properties met criteria in terms of size, proximity to the Cairo Hamlet as well as
ability to connect to water and sewer infrastructure. Parcels were evaluated based on distance from
water and sewer infrastructure. A 1 mile and 2-mile buffer range was put in place to help narrow
down potential economic development sites. The concept plans for the various sites do not include
details such as landscaping or visual elements; these details will be considered during the site plan
review process for actual development proposals.
6.1 Economic Development Site 1: Schneider Property
This site consists of five large parcels totaling approximately 122 acres situated along the
northeastern side of NYS Route 23 at its intersection with NYS Route 32. A map of this site is
included as Attachment 14. The property is currently for sale and has had some interest from
industrial and commercial developers. The property is not currently connected to the water or
sewer system. While it is in very close proximity to both, extensions of the water and sewer
districts will be required. The location is very convenient and has good road frontage along NYS
Route 23. Figure 4. Site 1 Parcels

Town of Cairo Economic Development Corridor Study: Opportunities & Constraints Analysis
Delaware Engineering, D.P.C. 19
Table 2. Site 1 Parcels
Parcel Number Property Class Size (Acres)
101.00-2-38 323 - Rural Vacant 6.83
101.00-2-13.2 465 – Commercial, Professional Building 17.2
101.00-2-37.1 330 – Commercial, Vacant 54.2
101.00-2-12 322 – Residential, Vacant 22.57
101.06-3-13 416 – Commercial, Mobile Home 21.4
These parcels are located in the Commercial Route 23 (C-23) Zoning District. The purpose of this
District is to allow for mixed residential and non-retail commercial uses that would enhance, rather
than compete with, Main Street Commercial or Main Street Downtown areas. These include, for
example, professional offices, live/work developments, or small light industrial facilities.
Wetland delineations and some site plans as well as a feasibility report had been previously created
for this property by the owner. The parcels contain ACOE Jurisdictional Wetlands (Appendix 1)
that should be avoided during development. The land is divided by a Central Hudson Gas &
Electric right-of-way. This limits the development potential on-site. Economic Opportunities and
Site Challenges are summarized below.
Economic Opportunities:
• Single owner with whom to coordinate
• Flexible Mixed-Use Scale Site
• Accommodates Large, Medium & Smaller Projects
• Accommodates Small Low-Impact Projects
• Minimal Environmental Issues
• Highly Convenient Distance to Route 23 Access
• Highly Convenient Distance to I-87 Access
• Adjacent to Public Sewer Figure 4. Site 1 Parcels

Town of Cairo Economic Development Corridor Study: Opportunities & Constraints Analysis
Delaware Engineering, D.P.C. 20
• Close proximity to Public Water
• Some Parcels are within the Water District
• Significant Road Frontage
Site Challenges:
• Expense for Extension of Public Sewer &
Water
• Parcels are outside of Water/Sewer Districts
• Significant Expansion of Impervious Surface
• Power Upgrade May be needed based on
Sector
• Close Proximity to Stream/Wetlands (Per
Wetland Delineation)
As a result, of the targeted the market sectors, the best matches for this site are
manufacturing/assembly and warehousing.
6.2 Economic Development Site 2: Buel Property
This property consists of one large 21-acre parcel and several smaller adjacent parcels situated
between Main Street and NYS Route 32. A location map is included as Attachment 15. The
property is not currently connected to the water or sewer system. While it is in close proximity to
both, extensions of the water and sewer districts will be required. No wetland delineations, detailed
engineering, or site plans have been created to date.
Table 3. Site 2 Parcels
Parcel Number Property Class Size (Acres)
101.00-4-16.12 330 – Commercial, Vacant 1.34
101.00-4-16.2 330 – Commercial, Vacant 0.69
101.00-4-15 270 - Residential Mobile Home 0.42
101.00-4-29.22 330 – Commercial, Vacant 21.6

Town of Cairo Economic Development Corridor Study: Opportunities & Constraints Analysis
Delaware Engineering, D.P.C. 21
This site is located in the Commercial Zoning District. The purpose of this District is to allow for
a variety of retail, service, and commercial uses along Main Street. This District allows for larger
uses that require more space than other locations on Main Street, but promotes compatibility and
consistency with the scale, design, theme, and pedestrian atmosphere of Main Street. Economic
Opportunities and Site Challenges are summarized below.
Economic Opportunities:
• Single owner with whom to coordinate
• Flexible Mixed-Use Scale Site
• Accommodates Medium & Smaller
Projects
• Accommodates Small Low-Impact
Projects
• Minimal Environmental Issues
• Highly Convenient Distance to Route 23
Access
• Highly Convenient Distance to I-87
Access
• Significant Road Frontage
Site Challenges:
• Expense for Extension of Public Sewer & Water
• Located outside of the Water and Sewer Districts
• Parcels are outside of Water/Sewer Districts
• Significant Expansion of Impervious Surface
• Power Upgrade May be needed based on Sector
• Close Proximity to Stream/Wetlands (Per NYSDEC/NWI Mapping)
As a result, the identified market sectors best matched to this site are commercial, office/supportive
space, and hospitality.
Figure 5. Site 2 Parcels

Town of Cairo Economic Development Corridor Study: Opportunities & Constraints Analysis
Delaware Engineering, D.P.C. 22
6.3 Economic Development Site 3: School-Owned/Miller Properties
The Cairo Durham Central School District has
an underutilized piece of land located along
NYS Route 23 that is bound by a utility ROW
along the western most property line. A location
map is included as Attachment 16. It consists of
11.2 acres, which is included in a 23-acre
parcel. This parcel is located in the Hamlet
Cairo (H-C) Zoning District. The purpose of
this District is to promote the hamlet of Cairo as
the town center and principal location for
commercial, cultural and residential uses. This
District allows and promotes a mix of
residential and commercial structures that have
a building scale, dimensions and design that is
pedestrian oriented and consistent with the
traditional character of the Hamlet. Commercial development shall be carefully controlled to
protect neighboring residential properties from impact, while at the same time permitting needed
growth. Since these parcels are located within both the water and sewer districts, no extension of
the districts would be required.
Two adjacent parcels that are approximately 2.4 acres combined along NYS Route 23 that is bound
by a utility ROW along the western most property line, directly south of the School-Owned parcel,
are included in this site. The parcels are located in the Main Street Commercial Zoning District.
The purpose of this District is to promote the hamlet of Cairo as the town center and principal
location for commercial, cultural and residential uses. This District allows and promotes a mix of
residential and commercial structures that have a building scale, dimensions and design that is
pedestrian oriented and consistent with the traditional character of the Hamlet. Commercial
development shall be carefully controlled to protect neighboring residential properties from
impact, while at the same time permitting needed growth. Economic Opportunities and Site
Figure 6. Site 3 Parcels

Town of Cairo Economic Development Corridor Study: Opportunities & Constraints Analysis
Delaware Engineering, D.P.C. 23
Challenges are summarized below. No wetland delineations or detailed engineering site plans have
been created to date. Table 4. Site 3 Parcels
Parcel Number Property Class Size (Acres)
101.10-2-1 612 - Community Services, Schools 11.2 (23 total)
101.10-2-15 311 - Residential Vacant Land 1.3
101.10-2-14 311 - Residential Vacant Land 1.1
Economic Opportunities:
• Flexible Mixed-Use Scale Site
• Accommodates Small Low-Impact Projects
• Minimal Environmental Issues
• Highly Convenient Distance to Route 23 Access
• Highly Convenient Distance to I-87 Access
• Located within the Water and Sewer Districts
• Adjacent to Public Water & Sewer
Site Challenges:
• Expense for Extension of Public Sewer & Water
• Significant Expansion of Impervious Surface
• Power Upgrade May be needed based on Sector
• Two separate owners to coordinate with one being a public entity
• Parcels are in different Zoning Districts
As a result, the identified market sectors that best match the opportunities presented by this
assemblage of properties are small scale commercial, office/supportive space, small scale
hospitality and workforce housing.

Town of Cairo Economic Development Corridor Study: Opportunities & Constraints Analysis
Delaware Engineering, D.P.C. 24
7.0 Infrastructure Analysis
Public infrastructure is an important factor for economic development, providing a community the
capacity to provide for existing and future development. Improvements to existing infrastructure
require substantial financial means. The addition of new or the expansion of existing infrastructure
also requires significant public investment and can impact community character and safety. Such
expansion requires careful thought with regard to growth inducing impacts. It is untenable to
consider a built-it-and-they-will-come plan for infrastructure expansion, extension and creation as
it burdens the users of today with costs for the benefit of future users who may or may not
materialize to support the cost of debt and operations and maintenance.
Water and wastewater resources, technical capacity and financial considerations affect every town
and village in the County. Mechanisms such as shared services, expansions of service, and the
formation of new districts and service areas offer communities additional resources and technical
and financial capabilities relative to the provision of water and sewer. As a rule of thumb, every
mile of water or sewer infrastructure constructed to serve future development costs $1.5 million if
constructed by a municipality. Some savings are gained if the construction is not subject to public
bidding, perhaps 10% and the construction of both water and sewer simultaneously can provide an
economy of scale; however, such a reduction is perhaps another 10% cost savings only. The cost
to expand water and sewer plants and related infrastructure will vary greatly depending on the
nature of the systems to be expanded.
As communities contemplate capital investments and planning for infrastructure, the following
should be considered:
• Opportunities for shared services
• Source water
• Treatment facilities
• Equipment used for operations and maintenance
• Personnel
• Treatment Unit Process sizing

Town of Cairo Economic Development Corridor Study: Opportunities & Constraints Analysis
Delaware Engineering, D.P.C. 25
• For wastewater systems, collection system pump stations and forcemains as well as the
preliminary treatment should be sized sufficiently to accommodate peak hydraulic flows
as well as a growth projection
• Select technologies that are readily expandable
• Consider construction of tankage that can accommodate additional equipment in the future
for expansion
• Layout plant sites to ensure land base is available for future construction
• Ensure that extensions of distribution and collection pipelines are sized to serve a future
area, not just a single project
• Anticipate future regulatory matters and plan for flexibility to add equipment and processes
as needed without major reconstruction
7.1 Potable and Fire Suppression Water Supply
The opportunities and constraints include the provision of potable water and water for fire
suppression systems due to the nature of the development that is envisioned. The demand for
water by the potential economic development sites will vary based on build out and types of
businesses.
There are opportunities to serve a portion of the Study Area with existing municipal systems that
have been upgraded, and opportunities to create a new decentralized public water system. In
addition, smaller, isolated uses may be served by individual on-site water systems.
7.1.1 Existing Public Water Supplies The Town of Cairo owns and operates a water distribution system which relies on wells for water
supply. Water storage is provided by a new 355,564-gallon tank. This system serves the central
business area along Main Street, near the Routes 145, 32, and 23 intersections. Cairo recently
completed a water infrastructure project funded through the NYSDEC WIIA grant and loan
program. The project included: Replacement of old, clogged and leaking water pipes; installation
of water meters with remote reading capacity; and, replacement of the water tank. Future projects
include additional replacement of remaining old water mains and exploration of Water District and
water line expansion. A Water System Map is included as Attachment 17.

Town of Cairo Economic Development Corridor Study: Opportunities & Constraints Analysis
Delaware Engineering, D.P.C. 26
Table 5. Town of Cairo Water Capacity
Town of Cairo Water Capacity
Rated Capacity Current Demand Remaining Capacity (MGD)
0.216 0.12 0.096
Identification of an additional source of water has been a priority for a number of years. In an effort
to supplement the water supply the Town has made efforts for over 10 years to identify additional
groundwater sources in or around the Water District for development of an additional source of
supply. These efforts have exhausted most of the obvious opportunities and the Town has
concluded that a more concentrated and likely more costly effort will be needed.
A hydraulic analysis of the system confirms that there is enough capacity for the three sites. See
Appendix 2 for the Water Hydraulic Analysis.
7.1.2 Potential Existing Public Water Service for Economic Development Sites The economic development proposed herein is not likely to require additional water resources as
the Town system has remaining capacity. Municipal water supply for the economic development
sites is feasible with improvements which are conceptually characterized as improvements to the
transmission and distribution infrastructure. Infrastructure Extension Plans for the Economic
Development Sites are included in Appendix 3.
Table 6. Water Line Extension Cost Estimate for Site 1
Construction Component QTY Price/QTY Cost Hydrants 3 ea $8,000.00 $24,000.00 Main Extension 1,500 ft $175.00 $262,500.00 Water Meters 3 ea $300.00 $900.00 Services 3 ea $1,500.00 $4,500.00 Valves 1 ea $1,600.00 $1,600.00 Pavement 450 ton $120.00 $54,000.00 Backfill 420 cy $40.00 $16,800.00 Construction Subtotal $364,300.00 Engineering-Legal-Permits $53,700.00 Contingency $73,000.00 District Extension $32,000.00 Total Cost $523,000.00

Town of Cairo Economic Development Corridor Study: Opportunities & Constraints Analysis
Delaware Engineering, D.P.C. 27
Table 7. Water Line Extension Cost Estimate for Site 2
Construction Component QTY Price/QTY Cost Hydrants 6 ea $8,000.00 $48,000.00 Main Extension 3,000 ft $175.00 $525,000.00 Water Meters 10 ea $300.00 $3,000.00 Services 10 ea $1,500.00 $15,000.00 Valves 5 ea $1,600.00 $8,000.00 Pavement 900 ton $120.00 $108,000.00 Backfill 835 cy $40.00 $33,400.00 Construction Subtotal $740,400.00 Engineering-Legal-Permits $111,600.00 Contingency $148,000.00 District Extension $32,000.00 Total Cost $1,032,000.00
Table 8. Water Line Extension Cost Estimate for Sites 1, 2 & 3
Construction Component QTY Price/QTY Cost Hydrants 9 ea $8,000.00 $72,000.00 Main Extension 4,500 ft $175.00 $787,500.00 Water Meters 13 ea $300.00 $4,200.00 Services 13 ea $1,500.00 $21,000.00 Valves 6 ea $1,600.00 $9,600.00 Pavement 1,350 ton $120.00 $162,000.00 Backfill 1,250 cy $40.00 $50,000.00 Construction Subtotal $1,106,300.00 Engineering-Legal-Permits $166,000.00 Contingency $221,700.00 District Extension $32,000.00 Total Cost $1,526,000.00
All three sites are within close proximity to existing infrastructure. Each economic development
sites will also need on-site water distribution facilities and may also need an on-site water storage
tank and fire pump to satisfy fire flow requirements. In order to provide adequate fire protection,
on-site water storage tanks and fire pumps are likely required at each site. These costs will be bore
by the development entity specific to each site and not the Town of Cairo.

Town of Cairo Economic Development Corridor Study: Opportunities & Constraints Analysis
Delaware Engineering, D.P.C. 28
Economic Development Site 3 is located directly adjacent to existing water and sewer and is within
each Town District, therefore, no infrastructure extensions are required. It would cost
approximately $2,000 to add a service and water meter at this property.
Byas Property Well: An alternate to the use of existing municipal raw water resources within the
municipal system is the potential to develop new source capacity in wells which could increase
capacity. The County has identified an area where a new source well could be located. This parcel
of land is in the Commercial Zoning District and also in a Greene County Agricultural District. It
is currently an active farming operation located on 186 acres of land at the intersection of NYS
Route 23 and County Route 23B. A map of the potential well site is included as Attachment 18.
A constraint to well siting is property ownership. Lands controlled by the municipality are usually
best as they avoid purchasing a new site with all the complications that may entail. In evaluating
the potential of added water resources, the County approached the land owners who have stated a
willingness to consider the advancement of a test well. This entails:
• Digging a test well in the vicinity of the proposed well site
• 72-Hour Pump Test
• Evaluation of water quality and quantity data through a qualified testing lab
• Coordination with a Hydrogeologist
Table 9. Byas Test Well Cost Estimate
Construction Component Cost Install 6-inch Test Well $10,000.00 Pumping Test $5,000.00 Hydrogeologist $25,000.00 Lab Testing $2,000.00 Total $42,000.00
Since the Town has ample water capacity to supply the proposed economic development sites, this
option would only be explored if the Town wishes to replace all existing water sources with a new
source. Alternatively, if the land owner determined large scale development on the parcel was
desirable, this new well may be feasible.

Town of Cairo Economic Development Corridor Study: Opportunities & Constraints Analysis
Delaware Engineering, D.P.C. 29
Table 10. Byas Well Development and Water Line Extension Cost Estimate*
Construction Component QTY Price/QTY Cost Land Survey of Byas Site 1 ea $10,000.00 $10,000.00 Well Drilling 1 ea $50,000.00 $50,000.00
Hydrants 11 ea $8,000.00 $88,000.00 Main Extension 5,300 ft $175.00 $927,500.00 Valves 2 ea $1,600.00 $3,200.00 Site Restoration 1 ea $56,000.00 $56,000.00 Pump Station 1 ea $75,000.00 $75,000.00 Pavement 1,590 ton $120.00 $190,800.00 Backfill 1,473 cy $40.00 $58,920.00 Construction Subtotal $1,459,420.00 Engineering-Legal-Permits $218,000.00 Contingency $290,580.00 District Extension $32,000.00
Total Cost $2,000,000.00
*NOTE: Costs shown above do not include the cost of land acquisition
Cedar Terrace Well: The Cedar Terrace Well site is a privately owned parcel, previously the
Cedar Terrace Resort, located on County Route 85 in the Town of Cairo. This active well has been
shown to have an above average yield compared to other wells in the area. The well was evaluated
(Appendix 4) in 2016 as part of the Town’s Water Improvement Project and it was found that this
well has a sustainable capacity of 72,000 gallons per day but is hydraulically connected to the
current water supply well at the Town Park. There are also private residential wells located within
600 feet of the Cedar Terrace well. The potential impact on these private wells from the use of the
Cedar Terrace well has not been evaluated. If the community decided it wanted a more robust
water supply this option could be explored further with additional testing and a comprehensive
analysis of the hydraulic connections and water quality. A site map is included as Attachment 19.
Reservoir Well Rehab: The Town of Cairo relied for many years on surface water from a
reservoir built in 1898 and located on Town land west of the water district. The District’s original
water supply came directly from surface water (the Reservoir) and the water was used without
filtration. In 1991 the Town abandoned use of the reservoir and associated wells and began to rely
instead a Well at the Town Park.

Town of Cairo Economic Development Corridor Study: Opportunities & Constraints Analysis
Delaware Engineering, D.P.C. 30
This water source is permitted for 144,000 gallons per day if filtration was added. An evaluation
was performed in 2017 which shows that this water source would require costly water filtration,
rendering it a less desirable source due to costs. If the community decided it wanted a more robust
water supply this option could be explored further. The Town would be required to build a filtration
plant to comply with the federal Enhanced Surface Water Treatment Rule as well as to remove
minerals that would be an aesthetic concern. A Site Map is included as Attachment 20.
7.1.3 New, On-Site Private Water Systems On-site individual wells may also be feasible; however, information to assess the viability of each
site would be derived from site-specific analysis that is beyond the scope of this Study, and
demands will vary based on degree of build out per site and types of occupying facilities.
7.2 Wastewater Collection and Treatment
The opportunities and constraints include the collection and treatment of sewage due to the nature
of the development that is envisioned. The demand for sewage collection and treatment from
potential development will vary based on build out and types of businesses. There are opportunities
to serve the proposed sites with existing municipal systems that have been upgraded, and
opportunities to create a new decentralized public wastewater system. In addition, smaller,
isolated uses may be served by individual on-site sewer systems.
7.2.1 Existing Publicly Owned Treatment Works The Town of Cairo owns and operates a WWTP, constructed in 2000 as an alternative design gray-
water system, which utilizes on-site septic tanks, force mains, and relatively small diameter gravity
sewer installed at a shallow depth. This system serves the central business area along Main Street,
near the NYS Route 145, 32, and 23 intersections. A Sewer System Map is included as Attachment
21. Table 11. Town of Cairo Sewer Capacity
Town of Cairo Sewer Capacity
Rated Capacity Current ADF Remaining Capacity (MGD)
0.089 0.041 0.048

Town of Cairo Economic Development Corridor Study: Opportunities & Constraints Analysis
Delaware Engineering, D.P.C. 31
7.2.2 Potential Existing Public Sewer Service for Economic Development Sites As with public water supply, the economic development sites could be provided with sewage
treatment by the Town of Cairo if sewer extensions are added. It appears feasible for the sites to
be connected to the Town of Cairo sewer system without increases the capacity. All three sites are
within close proximity to existing infrastructure and all three are within the established Sewer
District. Infrastructure Extension Plans for the Economic Development Sites are included in
Appendix 3. Table 12. Sewer Line Extension Cost Estimate for Site 1
Construction Component QTY Price/QTY Cost Upgrade PS 1 ea $30,000.00 $30,000.00 Force Main 200 ft $65.00 $13,000.00 Gravity Sewer 0 ft $125.00 $0.00 Services 1 ea $1,500.00 $1,500.00 Pavement 60 ton $120.00 $7,200.00 Backfill 56 cy $40.00 $23,000.00 Construction Subtotal $74,700.00 Engineering-Legal-Permits $11,200.00 Contingency $10,800.00 Total Cost $96,700.00
Table 13. Sewer Line Extension Cost Estimate for Site 2
Construction Component QTY Price/QTY Cost Upgrade PS 1 ea $30,000.00 $30,000.00 Force Main 0 ft $65.00 $0.00 Gravity Sewer 3000 ft $125.00 $375,000.00 Services 10 ea $1,500.00 $15,000.00 Pavement 1050 ton $120.00 $126,000.00 Backfill 833 cy $40.00 $40,000.00 Construction Subtotal $586,000.00 Engineering-Legal-Permits $88,000.00 Contingency $116,000.00 Total Cost $790,000.00
Table 14. Sewer Line Extension Cost Estimate for Site 3
Construction Component QTY Price/QTY Cost Upgrade PS 1 ea $30,000.00 $30,000.00 Force Main 0 ft $65.00 $0.00 Gravity Sewer 0 ft $125.00 $0.00 Services 1 ea $1,500.00 $1,500.00 Pavement 0 ton $120.00 $0.00 Backfill 0 cy $40.00 $0.00

Town of Cairo Economic Development Corridor Study: Opportunities & Constraints Analysis
Delaware Engineering, D.P.C. 32
Construction Subtotal $31,500.00 Engineering-Legal-Permits $4,700.00 Contingency $6,300.00 Total Cost $42,500.00
Table 15. Sewer Line Extension Cost Estimate for Sites 1, 2 & 3
Construction Component QTY Price/QTY Cost Upgrade PS 1 ea $30,000.00 $30,000.00 Force Main 200 ft $65.00 $13,000.00 Gravity Sewer 3000 ft $125.00 $375,000.00 Services 11 ea $1,500.00 $16,500.00 Pavement 1110 ton $120.00 $133,200.00 Backfill 889 cy $40.00 $42,000.00 Construction Subtotal $609,700.00 Engineering-Legal-Permits $92,000.00 Contingency $121,300.00 Total Cost $823,000.00
7.2.3 New, On-Site Private wastewater Systems On-site individual sewer treatment systems may also be feasible; however, information to assess
the viability of each site would be derived from site-specific analysis that is beyond the scope of
this Study, and demands will vary based on degree of build out per types of occupying facilities.
7.3 Transportation
Greene County is located at the southern edge of the Capital Region and is within a 2-hour drive
to the New York City Metropolitan Area – it has great accessibility to major markets. One of
Greene County’s biggest assets is its direct access to the New York State Thruway (I-87), which
runs the entire length of the County’s eastern side. Travel is simple and direct and allows for the
delivery of goods for business and industry throughout the area. Exit 21 (Catskill-Cairo-Route 23)
off of the Thruway is in very close proximity to the Study Area. Route 9W remains a key
transportation access corridor while the major roadways provide direct and safe routes in and out
of Greene County. Due to the original design and construction of NYS Route 23, ample additional
capacity exists to accommodate the increase in traffic that full build out of the economic
development Sites may realize.
The Town of Cairo has strong internal and external transportation linkages. Three major State
Routes pass through Cairo and intersect in the vicinity of the Study Area. The most heavily traveled

Town of Cairo Economic Development Corridor Study: Opportunities & Constraints Analysis
Delaware Engineering, D.P.C. 33
road section in Cairo is at the intersection of NYS Routes 23 and 32. In addition, there are five
County Routes through the Hamlet, making the Study Area the central locale of Cairo’s road
network. Currently a limited access highway, State Route 23 has relatively few crossings along its
9.3-mile stretch. Most of the original State Route 23 is now designated as County Route 23B. State
Route 23 is a major east-west corridor connecting the Rip Van Winkle Bridge and New York State
Thruway to the Catskill Mountains.
7.4 Power
7.4.1 Electric The proximity of the Study Area to the South Cairo Substation is highly advantageous for those
sites located within a mile. Depending on the scale and type of development that occurs, energy
infrastructure upgrades may be required; alternative and creative approaches such as micro-grids
may be explored to meet the demands of the future businesses. Seven (7) Watts per square foot is
the average electrical usage for light industrial and commercial development.
It is anticipated that the County will need to continue its pro-active approach to encourage
investment in the electrical infrastructure by Central Hudson. The continued strategy of working
with State and local elected officials directly with the NYS Public Service Commission will
provide strong regulatory support.
7.4.2 Gas For natural gas, NYS is served by 15 different gas utility companies. The Town of Cairo is served
by Central Hudson Gas and Electric. Natural Gas is currently not available in the Study Area. The
closest community with available natural gas connections is in the Town of Catskill, Hamlet of
Jefferson Heights. This is approximately 7 miles from the Study Area and would be cost
prohibitive to bring in a natural gas pipeline for the Economic Development Sites.
Propane is readily available locally, and is an alternative to natural gas and electric power. There
are a plethora of propane gas suppliers in Greene County which supply commercial and industrial
users. Two comparison tables, authored by NYSERDA, are included as Appendix 5, which show
a comparison of annual energy prices for industrial and commercial entities in the Mid-Hudson
Region of NYS (includes Greene County and counties to the south).

Town of Cairo Economic Development Corridor Study: Opportunities & Constraints Analysis
Delaware Engineering, D.P.C. 34
7.4.3 Solar and Wind Energy The Town Board recognizes that solar and wind energy are renewable energy sources that may
reduce fossil fuel emissions and energy generated from renewable systems can be used to offset
energy demand on the grid.
Private rooftop and flush-mounted solar arrays are permitted uses in all districts. Ground-mounted
racks and freestanding private solar arrays are permitted through Special Use Permit and prohibited
in the Main Street (MS) and Hamlet-Cairo (HC) districts. Building permits are required for the
installation of all private solar arrays.
According to the National Renewable Energy Laboratory (NREL), New York State has about 4.00
kWh/m2/Day of annual average daily total solar energy. Average annual daily potential solar
energy estimates the average daily potential kilowatt hours of solar energy that could be captured
per square meter within each 12-digit HUC. This number is very low compared to the southwestern
portion of the United States.
Greene County has several Community Solar Facilities located in Cairo, Greenville, Freehold,
Palenville and Tannersville. These Facilities provide access to solar energy generation to houses
and businesses that do not have access to solar due to mitigating factors. The Cairo Community
Solar Project has ground mounted solar panels which allow residents and businesses to subscribe
or purchase solar power.
Private wind towers are permitted in all districts and building permits shall be required for
installation of any wind towers. Only one wind tower is allowed per lot at a height no more than
80 feet.
Greene County encourages the use of alternative energy and has a plethora of information on such
endeavors on their website: Clean Energy Programs and Resources Resources in Greene County,
NY- Greene Government.

Town of Cairo Economic Development Corridor Study: Opportunities & Constraints Analysis
Delaware Engineering, D.P.C. 35
7.5 Broadband
According to the Federal Communications Commission, most Greene County residents have
access to fixed broadband. The options within the Town of Cairo for broadband service include
Mid-Hudson CableVision, Mid-Hudson Data Corp., Verizon NY Inc., HughesNet, Skycasters, and
Viasat Internet. Broadband connectivity should not be a hinderance to development for any
property within the Study Area.
Speeds are available at greater than or equal to 100 megabits per second (mbps) throughout the
Study Area. This will service the needs of small businesses and medium to large enterprises
(https://map.nysbroadband.ny.gov/html5viewer/?viewer=broadband). Additionally, 5G coverage
is available through T-Mobile for the entire Study Area.
8.0 Potential Project Impacts with Square Feet, Jobs, and Private Investment
The local impacts in Greene County that result from the anticipated success of development in the
Study Area can only be generalized at this point in the process. The question is not will this project
have success in attracting a variety of business sectors with valued jobs and private investment, it
is at what scale and specific business sectors the success represents.
According to the Census Bureau’s County Business Patterns for various years, the average number
of jobs for a manufacturing facility nationally is 40 employees within an average building size of
37,000 square feet. This number of employees per establishment has risen since 2010 after a sharp
decline over the two decades prior. About 92% of industrial facilities have fewer than 100
employees and 59% of those locations have fewer than 10 employees. The percentages of workers
per size category curves from 34.5% in <100 employee establishments, 38% between 100 and 500
employee establishments, and 27.5% >1,000 employee establishments.
Industrial sectors with the largest numbers of employees per location include transportation
equipment and computer/electronic products; followed by food processing, machinery
development, chemical processing, primary metals facilities, and electrical equipment.
Town of Cairo Economic Development Corridor Study: Opportunities & Constraints Analysis
Delaware Engineering, D.P.C. 36
According to the World Bank PPI Project Database, investment in transportation, water, and
sewer infrastructure has continued to rise since 2009, while private investment in the energy
infrastructure has steadily fallen since 2009.
The only limiting obstacles to this success and eventual scale, will be the level of site readiness
achieved, quality of workforce development and skills pipeline strategies and overall capacity of
public infrastructure. Aggressively addressing these potential challenges, therefore transforming
them to advantages, will drive significant success in reaching the desired levels of economic
impact benefiting the local economy for many years to come. Any part of the ongoing process that
results in limiting the scale of development and the predictability of timeframe to get shovels in
the ground will have a negative impact on scale of opportunity and greatly reduce the ultimate goal
of attracting quality jobs and a diversification of the Greene County economic base.
The business-related square feet, good paying jobs with important benefits, and significant levels
of private investment will come. The continued advancement of “shovel-ready” sites and the
connected credibility of Greene County, leadership and economic development professionals will
demand a seat at the table as projects are considered and the best sites explored.
9.0 Marketing Strategies and Approach
The more advanced the approvals are and a defined process for a building permit is in place, the
better. The recipe for success is achieving the position to answer all relevant site and infrastructure
related questions with certainty, thus instilling confidence in advancing a project to meet a
business-mandated schedule. This “shovel-ready” process can help overcome other challenges in
competitiveness, location, labor shortages and other to-be-determined developer priorities.
Once this significant status of readiness is met, marketing material for each site can be produced
to include a strong expression of confidence by providing all relevant detail on approvals, potential
scale of development, infrastructure and flexibility to negotiate a deal beneficial to all parties.

Town of Cairo Economic Development Corridor Study: Opportunities & Constraints Analysis
Delaware Engineering, D.P.C. 37
10.0 Next Steps
The GCEDTP and Greene IDA have conducted this Opportunities and Constraints Analysis as the
first of many steps towards developing the economy of the Study Area within the Town of Cairo.
As a result of the Study that has been conducted, each viable economic development site location
should be the subject of efforts to development concept plans, conduct SEQR and advance
infrastructure.
Careful consideration was given with regards to availability of transportation and infrastructure as
well as absence of environmental constraints. Water and sewer infrastructure IS the key to
supporting existing residents and businesses, and to enhancing economic opportunities.
Mechanisms such as shared services, planning for the future, expansion of services, as well as the
formation of new special districts and service areas can offer the Town of Cairo additional
resources and technical and/or financial capabilities relative to the provisions of water and sewer.
Concept planning leads to applications for grants and low-cost financing for the construction of
site infrastructure which may include as curb cuts and roads, water and sewer extensions or
decentralized systems, and stormwater facilities designed to accommodate the most impervious
cover planned for the economic development sites. Securing this financing and constructing
infrastructure will result in Shovel-Ready sites. Sites that are truly shovel-ready are highly
marketable and the undeveloped property value is enhanced significantly as a result. With a
Shovel-Ready site, the steps for development are greatly simplified.
In order to move forward with the development of the economic development sites infrastructure
extensions and necessary improvements should be enacted.
11.0 Infrastructure Funding Strategy
The acquisition of easements, rights of way and real property to implement infrastructure
improvements can be time consuming and subject to uncertainty, so avoidance of private property
for the infrastructure is desirable, but not mandatory.

Town of Cairo Economic Development Corridor Study: Opportunities & Constraints Analysis
Delaware Engineering, D.P.C. 38
With respect to the infrastructure, studies and permits are likely needed for:
• Local Site Plan Review
• Possibly Subdivision Review
• Special Improvement Districts (Water and Sewer District Extensions)
• Wetlands and habitat
• Highway Work Permits (State, County and Town)
• Cultural resources
• Construction stormwater controls
• Infrastructure design and approval
• Water Taking Permits
• State Pollutant Discharge Elimination System (SPDES) permits


Town of Cairo Economic Development Corridor Study: Opportunities & Constraints Analysis
Delaware Engineering, D.P.C.
ATTACHMENTS


Town of Cairo Economic Development Corridor Study: Opportunities & Constraints Analysis
Delaware Engineering, D.P.C.
Attachment 1. Location Map


Town of Cairo
Town ofWindham
Town ofNew Baltimore
Town ofCoxsackie
Town of Durham
Town of Greenville
Town ofCatskill
Town of Hunter
Town of Lexington
Town ofHalcott
Town ofPrattsville
Town ofAshland
Town of Jewett
Town ofAthens
Dutche
ss C
ounty
GreeneCounty
Columbia County
COM
Prepared by: Delaware Engineering, D.P.C.Date: December 2020Source: NYS Civil Boundaries; NYS Roadways;Economic Development Corridor Study Area
Ü0 6,500 13,000 19,500
Feet
LegendEconomic Development Corridor Study AreaCounty BoundariesGreene County
Economic Development Corridor StudyTown of CairoGreene County, New York
LOCATION MAP
Study Area
Town of CairoMajor Roadways
Albany County
Columbia County
Schoharie County
Delaware County
Ulster County
Attachment 1
Attachment 1
§̈¦87
§̈¦87
£¤9W
£¤9W
UV385
UV81
UV32
UV81
UV32
UV23
UV23
UV145
UV23A
UV42
UV23A
UV23UV296
UV214


Town of Cairo Economic Development Corridor Study: Opportunities & Constraints Analysis
Delaware Engineering, D.P.C.
Attachment 2. Typical Development Considerations Table


-Tr
affi
c C
on
tro
l
Mai
nte
nan
ce
Stag
ing
of
Dev
elo
pm
ent
-R
oad
Lay
ou
t
-P
arki
ng
Are
as
-Lo
adin
g A
reas
Cir
cula
tio
nM
isce
llan
eo
us
Site
Usa
ge
Stru
ctu
res
Co
nst
ruct
ion
Sp
ecif
icat
ion
s
Uti
litie
s
De
sign
an
d A
est
he
tics
Ingr
ess
and
Egr
ess
Surf
ace
Dra
inag
e
Ero
sio
n
Eco
no
mic
Imp
act
Rec
reat
ion
Are
as
Veh
icu
lar
Ped
estr
ian
Arc
hit
ectu
ral F
eatu
res
Sign
s
Lan
dsc
apin
g
-P
edes
tria
n
-A
uto
mo
bile
-R
elat
ion
ship
to
Sit
e P
lan
s
-El
evat
ion
s
-Fu
nct
ion
al A
deq
uac
y
-W
alkw
ays
-Sa
fety
Top
ogr
aph
y
Soil
Ch
arac
teri
stic
s
Veg
etat
ion
Wild
life
Op
en S
pac
e
Fisc
al Im
pac
t
Envi
ron
men
tal I
mp
act
Faci
litie
s an
d S
ervi
ces
Ava
ilab
le
Typ
ical
De
velo
pm
en
t C
on
sid
era
tio
ns
Ad
apte
d f
rom
: Sit
e P
lan
Rev
iew
: Jam
es A
. Co
on
Lo
cal G
ove
rnm
ent
Tech
nic
al S
erie
s 2
01
2
Rel
atio
nsh
ip t
o L
oca
l Law
s (i
.e. Z
on
ing,
Co
mp
reh
ensi
ve P
lan
)
Co
mp
atib
ility
wit
h S
urr
ou
nd
ings
Acc
essi
bili
ty
Gro
un
d W
ater
s
Wet
lan
ds
Flo
od
Haz
ard
Are
as
Re
gio
nal
& L
oca
l Fac
tors
Nat
ura
l Fe
atu
res
Vis
ual
Co
mp
atib
ility
His
tori
c an
d A
rch
aeo
logi
c C
on
sid
erat
ion
s
Geo
logy


Town of Cairo Economic Development Corridor Study: Opportunities & Constraints Analysis
Delaware Engineering, D.P.C.
Attachment 3. Economic Development Corridor Study Area Map


Source: Esri, Maxar, GeoEye, Earthstar Geographics, CNES/Airbus DS, USDA, USGS, AeroGRID,IGN, and the GIS User Community
State Route 32
County Route 23B
Main StreetState Route 23
COM
Prepared by: Delaware Engineering, D.P.C.Date: December 2020Source: Greene County RPS Parcel Data;NYS Civil Boundaries;Economic Development Corridor Study Area
Ü0 260 520 780 1,040
Feet
1 inch = 875 feet
LegendEconomic Development Corridor Study AreaCairo Parcels
Economic Development Corridor StudyTown of CairoGreene County, New York
STUDY AREA MAP
Main Street
Bross Street
M. Simmons Road
Bross StreetFrero Road
Moun
tain A
venu
e
Ca t s ki ll
Cr e e k
Attachment 3
Attachment 3


Town of Cairo Economic Development Corridor Study: Opportunities & Constraints Analysis
Delaware Engineering, D.P.C.
Attachment 4. Economic Development Corridor Study Selected Sites Map


Source: Esri, Maxar, GeoEye, Earthstar Geographics, CNES/Airbus DS, USDA, USGS, AeroGRID,IGN, and the GIS User Community
State Route 23
State Route 32
CR 23B
Main Street
COM
Prepared by: Delaware Engineering, D.P.C.Date: December 2020Source: Greene County RPS Parcel Data;NYS Civil Boundaries;Economic Development Corridor Study Area
Ü0 150 300 450 600
Feet
1 inch = 500 feet
LegendEconomic Development Corridor Study AreaEconomic Development Study ParcelsCairo Parcels
Economic Development Corridor StudyTown of CairoGreene County, New York
SELECTED SITES MAP
Main Street
Economic Development Site 3:
Cairo-Durham CentralSchool-Owned Parcel
(11.2 Acres)
Two Privately-Owned Parcels(2.4 Acres)
Economic Development Site 2:Four Privately-Owned Parcels
(24 Acres)
Economic Development Site 1:Five Privately-Owned Parcels
(122 Acres)
Attachment 4
Attachment 4


Town of Cairo Economic Development Corridor Study: Opportunities & Constraints Analysis
Delaware Engineering, D.P.C.
Attachment 5. Demographic Summary Comparison


Prepared by Esri
Benchmark Town of Cairo Green County New York
INCOME
$42,018Median Household
Income
$24,012Per Capita Income
$45,027Median Net Worth
Demographic Summary
KEY FACTS
405Population
46.9
Median Age
178
Households
$33,757Median Disposable Income
3020100
HOUSEHOLD INCOME
200000+
150000-199999
100000-149999
75000-99999
50000-74999
35000-49999
25000-34999
15000-24999
0-14999
EDUCATION
15%
No HighSchoolDiploma
31%High SchoolGraduate
42%Some College
12%Bachelor's/Grad/Prof
Degree
EMPLOYMENT
59%White Collar
23%Blue Collar
19%Services
14.9%
UnemploymentRate
INCOME
$52,533 $10,515
Median HouseholdIncome
$26,712 $2,700
Per Capita Income
$82,394 $37,367
Median Net Worth
KEY FACTS
7,1026,697
Population
47.8 0.9
Median Age
3,042 2,864
Households
$40,538 $6,781
Median Disposable Income
4002000
HOUSEHOLD INCOME
200000+
150000-199999
100000-149999
75000-99999
50000-74999
35000-49999
25000-34999
15000-24999
0-14999
EDUCATION
13% 2%
No HighSchoolDiploma
35%4%
High SchoolGraduate
31%11%
Some College
20%8%
Bachelor's/Grad/ProfDegree
EMPLOYMENT
60%1%
White Collar
26%3%
Blue Collar
14%5%
Services
12.5% 2.4%
UnemploymentRate
INCOME
$55,563 $13,545
Median HouseholdIncome
$30,307 $6,295
Per Capita Income
$102,901 $57,874
Median Net Worth
KEY FACTS
49,035 48,630
Population
46.5 0.4
Median Age
20,105 19,927
Households
$43,588 $9,831
Median Disposable Income
3,0002,0001,0000
HOUSEHOLD INCOME
200000+
150000-199999
100000-149999
75000-99999
50000-74999
35000-49999
25000-34999
15000-24999
0-14999
EDUCATION
12% 3%
No HighSchoolDiploma
38%7%
High SchoolGraduate
27%15%
Some College
23%11%
Bachelor's/Grad/ProfDegree
EMPLOYMENT
61%2%
White Collar
24%1%
Blue Collar
15%4%
Services
12.0% 2.9%
UnemploymentRate
INCOME
$68,828 $26,810
Median HouseholdIncome
$38,890 $14,878
Per Capita Income
$79,925 $34,898
Median Net Worth
KEY FACTS
19,825,692 19,825,287
Population
39.3 7.6
Median Age
7,522,434 7,522,256
Households
$52,695 $18,938
Median Disposable Income
1,200,000800,000400,0000
HOUSEHOLD INCOME
200000+
150000-199999
100000-149999
75000-99999
50000-74999
35000-49999
25000-34999
15000-24999
0-14999
EDUCATION
12% 3%
No HighSchoolDiploma
26%5%
High SchoolGraduate
24%18%
Some College
38%26%
Bachelor's/Grad/ProfDegree
EMPLOYMENT
68%9%
White Collar
16%7%
Blue Collar
16%3%
Services
12.1% 2.8%
UnemploymentRate
Source: This infographic contains data provided by Esri. The vintage of the data is 2020, 2025.
©2020 Esri Page 1 of 1 December 29, 2020


Town of Cairo Economic Development Corridor Study: Opportunities & Constraints Analysis
Delaware Engineering, D.P.C.
Attachment 6. Demographic Summaries and Reports for Greene County


Demographic SummaryGreen County Prepared by Esri
Area: 657.57 square miles
Area: 657.57 square miles
DEMOGRAPHIC SUMMARYGreen County
INCOME
$55,563Median Household
Income
$30,307Per Capita Income
$102,901Median Net Worth
KEY FACTS
49,035Population
46.5
Median Age
20,105Households
$43,588Median Disposable Income
3,0002,0001,0000
HOUSEHOLD INCOME
200000+
150000-199999
100000-149999
75000-99999
50000-74999
35000-49999
25000-34999
15000-24999
0-14999
EDUCATION
12%
No HighSchool
Diploma
38%High School
Graduate
27%Some College
23%Bachelor's/Grad/Prof
Degree
EMPLOYMENT
61%White Collar
24%Blue Collar
15%Services
12.0%
UnemploymentRate
© 2020 EsriThis infographic contains data provided by Esri. The vintage of the data is 2020, 2025.
Source: This infographic contains data provided by Esri. The vintage of the data is 2020, 2025.
©2020 Esri Page 1 of 1 December 29, 2020


Graphic ProfileGreen County Prepared by EsriArea: 657.57 square miles
2020 Population by Race2020 Population by Race
50,00045,00040,00035,000
30,00025,00020,00015,000
10,0005,000
0White Black Am.Ind. Asn/Pac Other Two+
88.2%
6.1%0.4% 1.4% 1.5% 2.3%
<55-1920-2425-3435-4445-5455-6465+
2020 Population by Age2020 Population by Age
4.1%
15.5%
6.1%11.4%
11.0%
13.6%
16.3%
21.9%
2020 Percent Hispanic Origin: 6.4%
HouseholdsHouseholds
25,000
20,000
15,000
10,000
5,000
0Census 2010 2020 2025
19,823 20,105 19,796
<$100K$100-199K$200-299K$300-399K$400-499K$500K+
2020 Home Value2020 Home Value
16.4%43.7%
24.0%
9.3%
2.4%4.2%
2020-2025 Annual Growth Rate2020-2025 Annual Growth Rate
Perc
ent
1.5
1
0.5
0
-0.5
Population Households Median Household Income Owner Occupied Housing Units-0.37 -0.31
1.06
-0.28
20202025
Household IncomeHousehold Income
Perc
ent
181614121086420
<$15K $15K-$25K $25K-$35K $35K-$50K $50K-$75K $75K-$100K $100K-$150K $150K-$200K $200K+
Source: U.S. Census Bureau, Census 2010 Summary File 1. Esri forecasts for 2020 and 2025.
December 31, 2020
©2020 Esri Page 1 of 1

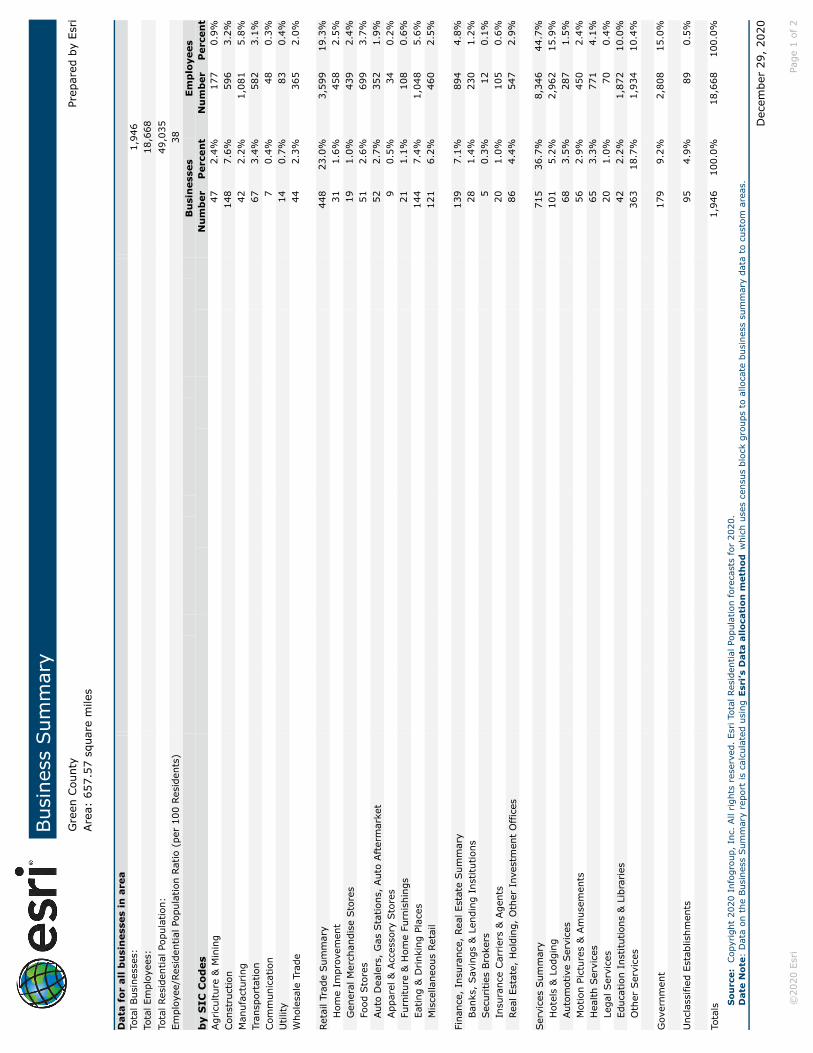
Bu s
ines
s Sum
mar
yG
reen
Cou
nty
Prep
ared
by
Esri
Are
a: 6
57.5
7 sq
uare
mile
s
Dat
a fo
r al
l bu
sin
esse
s in
are
aTo
tal B
usin
esse
s:1,
946
Tot a
l Em
ploy
ees:
18,6
68To
t al R
esid
entia
l Pop
ulat
ion:
49,0
35Em
p loy
ee/R
esid
entia
l Pop
ulat
ion
Ratio
(pe
r 10
0 Re
side
nts)
38B
usi
nes
s es
Emp
loye
esb
y S
IC C
odes
Nu
mb
erP
erce
nt
Nu
mb
erP
erce
nt
Agr
icul
ture
& M
inin
g47
2.4%
177
0.9%
Con
stru
ctio
n14
87.
6%59
63.
2%M
a nuf
actu
ring
422.
2%1,
081
5.8%
Tran
spor
tatio
n67
3.4%
582
3.1%
Co m
mun
icat
ion
70.
4%48
0.3%
Util
ity14
0.7%
830.
4%W
h ole
sale
Tra
de44
2.3%
365
2.0%
Reta
il Tr
ade
Sum
mar
y44
823
.0%
3,59
919
.3%
Hom
e Im
prov
emen
t31
1.6%
458
2.5%
Gen
eral
Mer
chan
dise
Sto
res
191.
0%43
92.
4%F o
od S
tore
s51
2.6%
699
3.7%
Aut
o D
eale
rs,
Gas
Sta
tions
, Aut
o Aft
erm
arke
t52
2.7%
352
1.9%
Ap p
arel
& A
cces
sory
Sto
res
90.
5%34
0.2%
Furn
iture
& H
ome
Furn
ishi
ngs
211.
1%10
80.
6%Ea
ting
& D
rink
ing
Plac
es14
47.
4%1,
048
5.6%
Mis
cella
neou
s Re
tail
121
6.2%
460
2.5%
Fina
nce,
Ins
uran
ce,
Real
Est
ate
Sum
mar
y13
97.
1%89
44.
8%Ba n
ks,
Sav
ings
& L
endi
ng I
nstit
utio
ns28
1.4%
230
1.2%
Sec
uriti
es B
roke
rs5
0.3%
120.
1%In
sura
nce
Car
rier
s &
Age
nts
201.
0%10
50.
6%Re
al E
stat
e, H
oldi
ng,
Oth
er I
nves
tmen
t O
ffic
es86
4.4%
547
2.9%
Ser
vice
s Sum
mar
y71
536
.7%
8,34
644
.7%
Hot
els
& L
odgi
ng10
15.
2%2,
962
15.9
%Aut
omot
ive
Ser
vice
s68
3.5%
287
1.5%
Mo t
ion
Pict
ures
& A
mus
emen
ts56
2.9%
450
2.4%
Hea
lth S
ervi
ces
653.
3%77
14.
1%Le
gal S
ervi
ces
201.
0%70
0.4%
Educ
atio
n In
stitu
tions
& L
ibra
ries
422.
2%1,
872
10.0
%O
ther
Ser
vice
s36
318
.7%
1,93
410
.4%
Gov
ernm
ent
179
9.2%
2,80
815
.0%
Unc
lass
ified
Est
ablis
hmen
ts
954.
9%89
0.5%
Tota
ls1,
946
100.
0%18
,668
100.
0%
Sou
rce:
Cop
yrig
ht 2
020
Info
grou
p, I
nc.
All
righ
ts r
eser
ved.
Esr
i Tot
al R
esid
entia
l Pop
ulat
ion
fore
cast
s fo
r 20
20.
Dat
e N
ote:
Dat
a on
the
Bus
ines
s Sum
mar
y re
port
is c
alcu
late
d us
ing
Esri
’s D
ata
allo
cati
on m
eth
odw
hich
use
s ce
nsus
blo
ck g
roup
s to
allo
cate
bus
ines
s su
mm
ary
data
to
cust
om a
reas
.
Dec
embe
r 29
, 20
20
©20
20 E
sri
Page
1 o
f 2

Bu s
ines
s Sum
mar
yG
reen
Cou
nty
Prep
ared
by
Esri
Are
a: 6
57.5
7 sq
uare
mile
s
Bu
sin
esse
sEm
pl o
yees
by
NA
ICS
Cod
esN
um
ber
Per
cen
tN
um
ber
Per
cen
tAg r
icul
ture
, Fo
rest
ry,
Fish
ing
& H
untin
g17
0.9%
560.
3%M
inin
g2
0.1%
80.
0%U
t iliti
es8
0.4%
390.
2%Con
stru
ctio
n15
27.
8%59
83.
2%M
a nuf
actu
ring
452.
3%98
55.
3%W
h ole
sale
Tra
de42
2.2%
355
1.9%
R eta
il Tr
ade
294
15.1
%2,
455
13.2
%M
o tor
Veh
icle
& P
arts
Dea
lers
361.
8%27
41.
5%F u
rnitu
re &
Hom
e Fu
rnis
hing
s Sto
res
120.
6%82
0.4%
Elec
tron
ics
& A
pplia
nce
Sto
res
90.
5%21
0.1%
Bld
g M
ater
ial &
Gar
den
Equi
pmen
t &
Sup
plie
s D
eale
rs31
1.6%
458
2.5%
Food
& B
ever
age
Sto
res
522.
7%63
43.
4%H
e alth
& P
erso
nal C
are
Sto
res
221.
1%18
81.
0%G
asol
ine
Sta
tions
160.
8%78
0.4%
Cl o
thin
g &
Clo
thin
g Acc
esso
ries
Sto
res
110.
6%44
0.2%
Sp o
rt G
oods
, H
obby
, Boo
k, &
Mus
ic S
tore
s26
1.3%
980.
5%G
ener
al M
erch
andi
se S
tore
s19
1.0%
439
2.4%
Mi s
cella
neou
s Sto
re R
etai
lers
462.
4%12
80.
7%N
onst
ore
Reta
ilers
140.
7%11
0.1%
Tran
spor
tatio
n &
War
ehou
sing
472.
4%45
82.
5%I n
form
atio
n32
1.6%
275
1.5%
F in a
nce
& I
nsur
ance
532.
7%34
71.
9%Ce n
tral
Ban
k/Cre
dit
Inte
rmed
iatio
n &
Rel
ated
Act
iviti
es28
1.4%
230
1.2%
Sec
uriti
es,
Com
mod
ity C
ontr
acts
& O
ther
Fin
anci
al
Inve
stm
ents
& O
ther
Rel
ated
Act
iviti
es5
0.3%
120.
1%In
sura
nce
Car
rier
s &
Rel
ated
Act
iviti
es;
Fund
s, T
rust
s &
O
ther
Fin
anci
al V
ehic
les
201.
0%10
50.
6%Re
a l E
stat
e, R
enta
l & L
easi
ng94
4.8%
513
2.7%
P rof
essi
onal
, Sci
entif
ic &
Tec
h Ser
vice
s94
4.8%
353
1.9%
Lega
l Ser
vice
s22
1.1%
760.
4%M
anag
emen
t of
Com
pani
es &
Ent
erpr
ises
20.
1%60
0.3%
Ad m
inis
trat
ive
& S
uppo
rt &
Was
te M
anag
emen
t &
Rem
edia
tion
Ser
vice
s54
2.8%
267
1.4%
E duc
atio
nal S
ervi
ces
402.
1%1,
882
10.1
%H
ealth
Car
e &
Soc
ial A
ssis
tanc
e10
45.
3%1,
556
8.3%
Ar t
s, E
nter
tain
men
t &
Rec
reat
ion
663.
4%55
53.
0%Ac c
omm
odat
ion
& F
ood
Ser
vice
s25
012
.8%
4,08
221
.9%
Ac c
omm
odat
ion
101
5.2%
2,96
215
.9%
Foo d
Ser
vice
s &
Drink
ing
Plac
es14
97.
7%1,
119
6.0%
Oth
er S
ervi
ces
(exc
ept
Publ
ic A
dmin
istr
atio
n)27
614
.2%
928
5.0%
Au t
o mot
ive
Repa
ir &
Mai
nten
ance
603.
1%24
81.
3%Pu
blic
Adm
inis
trat
ion
179
9.2%
2,80
815
.0%
Un c
lass
ified
Est
ablis
hmen
ts
944.
8%88
0.5%
Tota
l1,
946
100.
0%18
,668
100.
0%S
our c
e: C
opyr
ight
202
0 In
fogr
oup,
Inc
. All
righ
ts r
eser
ved.
Esr
i Tot
al R
esid
entia
l Pop
ulat
ion
fore
cast
s fo
r 20
20.
Dat
e N
ote:
Dat
a on
the
Bus
ines
s Sum
mar
y re
port
is c
alcu
late
d us
ing
Esri
’s D
ata
allo
cati
on m
eth
odw
hich
use
s ce
nsus
blo
ck g
roup
s to
allo
cate
bus
ines
s su
mm
ary
data
to
cust
om a
reas
.
Dec
embe
r 29
, 20
20
©20
20 E
sri
Page
2 o
f 2

Civilian Labor Force Profile0 Prepared by EsriArea: 657.57 square miles
2020 Labor Force
Age Group Population Employed Unemployed Unemployment
RateLabor Force
Participation RateEmployment-
Population Ratio16+ 41,735 20,393 2,772 12.0% 55.5% 48.9%16-24 5,312 2,269 517 18.6% 52.4% 42.7%25-54 17,662 11,572 1,464 11.2% 73.8% 65.5%55-64 8,002 4,561 580 11.3% 64.2% 57.0%65+ 10,759 1,991 211 9.6% 20.5% 18.5%
Industry Employed Percent US Percent Location QuotientTotal 20,393 100.0% 100.0% -
Agriculture/Forestry/Fishing 229 1.1% 1.3% 0.85Mining/Quarrying/Oil & Gas 45 0.2% 0.5% 0.40Construction 1,724 8.5% 7.4% 1.15Manufacturing 1,508 7.4% 10.6% 0.70Wholesale Trade 278 1.4% 2.5% 0.56Retail Trade 1,996 9.8% 9.7% 1.01Transportation/Warehousing 1,314 6.4% 4.7% 1.36Utilities 316 1.5% 0.9% 1.67Information 396 1.9% 1.8% 1.06Finance/Insurance 847 4.2% 4.9% 0.86Real Estate/Rental/Leasing 277 1.4% 2.1% 0.67Professional/Scientific/Tech 999 4.9% 8.2% 0.60Management of Companies 0 0.0% 0.1% 0.00Admin/Support/Waste Management 311 1.5% 3.9% 0.38Educational Services 1,990 9.8% 9.7% 1.01Health Care/Social Assistance 3,595 17.6% 15.1% 1.17Arts/Entertainment/Recreation 549 2.7% 1.6% 1.69Accommodation/Food Services 1,165 5.7% 5.6% 1.02Other Services (Excluding Public) 1,044 5.1% 4.6% 1.11Public Administration 1,810 8.9% 4.8% 1.85
Occupation Employed Percent US Percent Location QuotientTotal 20,393 100.0% 100.0% -
White Collar 11,725 57.5% 61.8% 0.93Management 1,788 8.8% 10.2% 0.86Business/Financial 481 2.4% 5.1% 0.47Computer/Mathematical 399 2.0% 3.0% 0.67Architecture/Engineering 308 1.5% 2.0% 0.75Life/Physical/Social Sciences 74 0.4% 0.9% 0.44Community/Social Service 800 3.9% 1.8% 2.17Legal 240 1.2% 1.2% 1.00Education/Training/Library 1,426 7.0% 6.4% 1.09Arts/Design/Entertainment 561 2.8% 1.8% 1.56Healthcare Practitioner1 0.3% 1.8% 0.17
1,223 6.0% 6.3% 0.95Sales and Sales Related 1,551 7.6% 9.7% 0.78Office/Administrative Support 2,874 14.1% 13.3% 1.06
Blue Collar 4,898 24.0% 21.4% 1.11Farming/Fishing/Forestry 90 0.4% 0.8% 0.50Construction/Extraction 1,212 5.9% 5.4% 1.09Installation/Maintenance/Repair 785 3.8% 3.1% 1.23Production 1,069 5.2% 5.9% 0.88Transportation/Material Moving 1,742 8.5% 6.1% 1.39
Services 3,770 18.5% 16.8% 1.10Healthcare Support 698 3.4% 2.7% 1.26Protective Service 741 3.6% 2.2% 1.64Food Preparation/Serving 867 4.3% 4.4% 0.98Building Maintenance 660 3.2% 3.9% 0.82Personal Care/Service 804 3.9% 3.6% 1.08
Data Note: Location Quotients compare the industry/occupation share of a local area's employment relative to that same share nationally. A value lower/greater than 1 indicates that the local area is less/more specialized in that industry or occupation category than the US as a whole. Explore the Esri Labor Force Learn Lesson for more information on how to use and interpret the estimates in this report.Source: Esri forecasts for 2020 and 2025.
December 23, 2020
©2020 Esri Page 1 of 1


Town of Cairo Economic Development Corridor Study: Opportunities & Constraints Analysis
Delaware Engineering, D.P.C.
Attachment 7. Demographic Summaries and Reports for the Town of Cairo


Demographic SummaryTown of Cairo Prepared by Esri
Area: 60.12 square miles
Area: 60.12 square miles
DEMOGRAPHIC SUMMARYTown of Cairo
INCOME
$52,533Median Household
Income
$26,712Per Capita Income
$82,394Median Net Worth
KEY FACTS
7,102Population
47.8
Median Age
3,042Households
$40,538Median Disposable Income
6004002000
HOUSEHOLD INCOME
200000+
150000-199999
100000-149999
75000-99999
50000-74999
35000-49999
25000-34999
15000-24999
0-14999
EDUCATION
13%
No HighSchool
Diploma
35%High School
Graduate
31%Some College
20%Bachelor's/Grad/Prof
Degree
EMPLOYMENT
60%White Collar
26%Blue Collar
14%Services
12.5%
UnemploymentRate
© 2020 EsriThis infographic contains data provided by Esri. The vintage of the data is 2020, 2025.
Source: This infographic contains data provided by Esri. The vintage of the data is 2020, 2025.
©2020 Esri Page 1 of 1 December 29, 2020


Graphic ProfileTown of Cairo Prepared by EsriArea: 60.12 square miles
2020 Population by Race2020 Population by Race
8,000
7,000
6,000
5,000
4,000
3,000
2,000
1,000
0White Black Am.Ind. Asn/Pac Other Two+
92.8%
1.6% 0.7% 1.4% 0.9% 2.5%
<55-1920-2425-3435-4445-5455-6465+
2020 Population by Age2020 Population by Age
4.3%
14.1%
4.9%12.4%
10.6%
14.4%
16.8%
22.5%
2020 Percent Hispanic Origin: 6.0%
HouseholdsHouseholds
3,500
3,000
2,500
2,000
1,500
1,000
500
0Census 2010 2020 2025
2,8173,042 3,038
<$100K$100-199K$200-299K$300-399K$400-499K$500K+
2020 Home Value2020 Home Value
16.0%50.0%
23.9%
6.6%0.4%3.0%
2020-2025 Annual Growth Rate2020-2025 Annual Growth Rate
Perc
ent
1.21
0.80.60.40.2
0-0.2-0.4
Population Households Median Household Income Owner Occupied Housing Units-0.10 -0.03
0.89
-0.10
20202025
Household IncomeHousehold Income
Perc
ent
15
10
5
0<$15K $15K-$25K $25K-$35K $35K-$50K $50K-$75K $75K-$100K $100K-$150K $150K-$200K $200K+
Source: U.S. Census Bureau, Census 2010 Summary File 1. Esri forecasts for 2020 and 2025.
December 31, 2020
©2020 Esri Page 1 of 1


Bu s
ines
s Sum
mar
yTo
wn
of C
airo
Prep
ared
by
Esri
Are
a: 6
0.12
squ
are
mile
s
Dat
a fo
r al
l bu
sin
esse
s in
are
aTo
tal B
usin
esse
s:22
5To
t al E
mpl
oyee
s:1,
594
T ota
l Res
iden
tial P
opul
atio
n:7,
102
Emp l
oyee
/Res
iden
tial P
opul
atio
n Ra
tio (
per
100
Resi
dent
s)22
Bu
sin
ess e
sEm
plo
yees
by
SIC
Cod
esN
um
ber
Per
cen
tN
um
ber
Per
cen
tAgr
icul
ture
& M
inin
g3
1.3%
171.
1%Con
stru
ctio
n19
8.4%
644.
0%M
a nuf
actu
ring
52.
2%16
1.0%
Tran
spor
tatio
n4
1.8%
221.
4%Co m
mun
icat
ion
10.
4%3
0.2%
Util
ity6
2.7%
392.
4%W
h ole
sale
Tra
de7
3.1%
674.
2%
Reta
il Tr
ade
Sum
mar
y45
20.0
%37
323
.4%
Hom
e Im
prov
emen
t6
2.7%
191.
2%G
ener
al M
erch
andi
se S
tore
s3
1.3%
171.
1%F o
od S
tore
s7
3.1%
165
10.4
%Aut
o D
eale
rs,
Gas
Sta
tions
, Aut
o Aft
erm
arke
t6
2.7%
140.
9%Ap p
arel
& A
cces
sory
Sto
res
20.
9%3
0.2%
Furn
iture
& H
ome
Furn
ishi
ngs
20.
9%5
0.3%
Eatin
g &
Drink
ing
Plac
es11
4.9%
107
6.7%
Mis
cella
neou
s Re
tail
83.
6%43
2.7%
Fina
nce,
Ins
uran
ce,
Real
Est
ate
Sum
mar
y15
6.7%
835.
2%Ba n
ks,
Sav
ings
& L
endi
ng I
nstit
utio
ns2
0.9%
150.
9%Sec
uriti
es B
roke
rs0
0.0%
00.
0%In
sura
nce
Car
rier
s &
Age
nts
00.
0%0
0.0%
Real
Est
ate,
Hol
ding
, O
ther
Inv
estm
ent
Offic
es13
5.8%
684.
3%
Ser
vice
s Sum
mar
y99
44.0
%73
446
.0%
Hot
els
& L
odgi
ng15
6.7%
996.
2%Aut
omot
ive
Ser
vice
s14
6.2%
332.
1%M
o tio
n Pi
ctur
es &
Am
usem
ents
94.
0%44
2.8%
Hea
lth S
ervi
ces
73.
1%10
26.
4%Le
gal S
ervi
ces
10.
4%6
0.4%
Educ
atio
n In
stitu
tions
& L
ibra
ries
41.
8%18
311
.5%
Oth
er S
ervi
ces
4921
.8%
267
16.8
%
Gov
ernm
ent
104.
4%16
810
.5%
Unc
lass
ified
Est
ablis
hmen
ts
114.
9%8
0.5%
Tota
ls22
510
0.0%
1,59
410
0.0%
Sou
rce:
Cop
yrig
ht 2
020
Info
grou
p, I
nc.
All
righ
ts r
eser
ved.
Esr
i Tot
al R
esid
entia
l Pop
ulat
ion
fore
cast
s fo
r 20
20.
Dat
e N
ote:
Dat
a on
the
Bus
ines
s Sum
mar
y re
port
is c
alcu
late
d us
ing
Esri
’s D
ata
allo
cati
on m
eth
odw
hich
use
s ce
nsus
blo
ck g
roup
s to
allo
cate
bus
ines
s su
mm
ary
data
to
cust
om a
reas
.
Dec
embe
r 29
, 20
20
©20
20 E
sri
Page
1 o
f 2

Bu s
ines
s Sum
mar
yTo
wn
of C
airo
Prep
ared
by
Esri
Are
a: 6
0.12
squ
are
mile
s
Bu
sin
esse
sEm
pl o
yees
by
NA
ICS
Cod
esN
um
ber
Per
cen
tN
um
ber
Per
cen
tAg r
icul
ture
, Fo
rest
ry,
Fish
ing
& H
untin
g4
1.8%
191.
2%M
inin
g0
0.0%
00.
0%U
t iliti
es2
0.9%
20.
1%Con
stru
ctio
n19
8.4%
644.
0%M
a nuf
actu
ring
41.
8%14
0.9%
Wh o
lesa
le T
rade
62.
7%62
3.9%
R eta
il Tr
ade
3314
.7%
254
15.9
%M
o tor
Veh
icle
& P
arts
Dea
lers
52.
2%11
0.7%
F urn
iture
& H
ome
Furn
ishi
ngs
Sto
res
10.
4%4
0.3%
Elec
tron
ics
& A
pplia
nce
Sto
res
10.
4%1
0.1%
Bld
g M
ater
ial &
Gar
den
Equi
pmen
t &
Sup
plie
s D
eale
rs6
2.7%
191.
2%Fo
od &
Bev
erag
e Sto
res
73.
1%15
59.
7%H
e alth
& P
erso
nal C
are
Sto
res
31.
3%35
2.2%
Gas
olin
e Sta
tions
10.
4%3
0.2%
Cl o
thin
g &
Clo
thin
g Acc
esso
ries
Sto
res
20.
9%3
0.2%
Sp o
rt G
oods
, H
obby
, Boo
k, &
Mus
ic S
tore
s0
0.0%
00.
0%G
ener
al M
erch
andi
se S
tore
s3
1.3%
171.
1%M
i sce
llane
ous
Sto
re R
etai
lers
10.
4%4
0.3%
Non
stor
e Re
taile
rs3
1.3%
20.
1%Tr
ansp
orta
tion
& W
areh
ousi
ng4
1.8%
241.
5%I n
form
atio
n3
1.3%
80.
5%F i
n anc
e &
Ins
uran
ce2
0.9%
150.
9%Ce n
tral
Ban
k/Cre
dit
Inte
rmed
iatio
n &
Rel
ated
Act
iviti
es2
0.9%
150.
9%Sec
uriti
es,
Com
mod
ity C
ontr
acts
& O
ther
Fin
anci
al
Inve
stm
ents
& O
ther
Rel
ated
Act
iviti
es0
0.0%
00.
0%In
sura
nce
Car
rier
s &
Rel
ated
Act
iviti
es;
Fund
s, T
rust
s &
O
ther
Fin
anci
al V
ehic
les
00.
0%0
0.0%
Rea l
Est
ate,
Ren
tal &
Lea
sing
156.
7%66
4.1%
P rof
essi
onal
, Sci
entif
ic &
Tec
h Ser
vice
s10
4.4%
422.
6%Le
gal S
ervi
ces
10.
4%6
0.4%
Man
agem
ent
of C
ompa
nies
& E
nter
pris
es0
0.0%
00.
0%Ad m
inis
trat
ive
& S
uppo
rt &
Was
te M
anag
emen
t &
Rem
edia
tion
Ser
vice
s7
3.1%
583.
6%E d
ucat
iona
l Ser
vice
s3
1.3%
180
11.3
%H
ealth
Car
e &
Soc
ial A
ssis
tanc
e12
5.3%
211
13.2
%Art
s, E
nter
tain
men
t &
Rec
reat
ion
104.
4%50
3.1%
Ac c
omm
odat
ion
& F
ood
Ser
vice
s27
12.0
%21
813
.7%
Ac c
omm
odat
ion
156.
7%99
6.2%
Foo d
Ser
vice
s &
Drink
ing
Plac
es12
5.3%
119
7.5%
Oth
er S
ervi
ces
(exc
ept
Publ
ic A
dmin
istr
atio
n)43
19.1
%13
18.
2%Au t
o mot
ive
Repa
ir &
Mai
nten
ance
125.
3%27
1.7%
Publ
ic A
dmin
istr
atio
n10
4.4%
168
10.5
%
Un c
lass
ified
Est
ablis
hmen
ts
114.
9%8
0.5%
Tota
l22
510
0.0%
1,59
410
0.0%
So u
rce:
Cop
yrig
ht 2
020
Info
grou
p, I
nc.
All
righ
ts r
eser
ved.
Esr
i Tot
al R
esid
entia
l Pop
ulat
ion
fore
cast
s fo
r 20
20.
Dat
e N
ote:
Dat
a on
the
Bus
ines
s Sum
mar
y re
port
is c
alcu
late
d us
ing
Esri
’s D
ata
allo
cati
on m
eth
odw
hich
use
s ce
nsus
blo
ck g
roup
s to
allo
cate
bus
ines
s su
mm
ary
data
to
cust
om a
reas
.
Dec
embe
r 29
, 20
20
©20
20 E
sri
Page
2 o
f 2

Civilian Labor Force ProfileTown of Cairo Prepared by EsriArea: 60.12 square miles
2020 Labor Force
Age Group Population Employed Unemployed Unemployment
RateLabor Force
Participation RateEmployment-
Population Ratio16+ 6,048 3,356 479 12.5% 63.4% 55.5%16-24 603 390 128 24.7% 85.9% 64.7%25-54 2,655 1,975 255 11.4% 84.0% 74.4%55-64 1,191 649 67 9.4% 60.1% 54.5%65+ 1,599 342 29 7.8% 23.2% 21.4%
Industry Employed Percent US Percent Location QuotientTotal 3,356 100.0% 100.0% -
Agriculture/Forestry/Fishing 10 0.3% 1.3% 0.23Mining/Quarrying/Oil & Gas 0 0.0% 0.5% 0.00Construction 212 6.3% 7.4% 0.85Manufacturing 367 10.9% 10.6% 1.03Wholesale Trade 0 0.0% 2.5% 0.00Retail Trade 346 10.3% 9.7% 1.06Transportation/Warehousing 336 10.0% 4.7% 2.13Utilities 0 0.0% 0.9% 0.00Information 37 1.1% 1.8% 0.61Finance/Insurance 164 4.9% 4.9% 1.00Real Estate/Rental/Leasing 27 0.8% 2.1% 0.38Professional/Scientific/Tech 234 7.0% 8.2% 0.85Management of Companies 0 0.0% 0.1% 0.00Admin/Support/Waste Management 19 0.6% 3.9% 0.15Educational Services 332 9.9% 9.7% 1.02Health Care/Social Assistance 603 18.0% 15.1% 1.19Arts/Entertainment/Recreation 85 2.5% 1.6% 1.56Accommodation/Food Services 147 4.4% 5.6% 0.79Other Services (Excluding Public) 188 5.6% 4.6% 1.22Public Administration 249 7.4% 4.8% 1.54
Occupation Employed Percent US Percent Location QuotientTotal 3,356 100.0% 100.0% -
White Collar 1,848 55.1% 61.8% 0.89Management 336 10.0% 10.2% 0.98Business/Financial 76 2.3% 5.1% 0.45Computer/Mathematical 35 1.0% 3.0% 0.33Architecture/Engineering 62 1.8% 2.0% 0.90Life/Physical/Social Sciences 0 0.0% 0.9% 0.00Community/Social Service 75 2.2% 1.8% 1.22Legal 31 0.9% 1.2% 0.75Education/Training/Library 249 7.4% 6.4% 1.16Arts/Design/Entertainment 116 3.5% 1.8% 1.94Healthcare Practitioner1 0.3% 1.8% 0.17
202 6.0% 6.3% 0.95Sales and Sales Related 150 4.5% 9.7% 0.46Office/Administrative Support 516 15.4% 13.3% 1.16
Blue Collar 860 25.6% 21.4% 1.20Farming/Fishing/Forestry 0 0.0% 0.8% 0.00Construction/Extraction 103 3.1% 5.4% 0.57Installation/Maintenance/Repair 182 5.4% 3.1% 1.74Production 114 3.4% 5.9% 0.58Transportation/Material Moving 461 13.7% 6.1% 2.25
Services 648 19.3% 16.8% 1.15Healthcare Support 170 5.1% 2.7% 1.89Protective Service 174 5.2% 2.2% 2.36Food Preparation/Serving 67 2.0% 4.4% 0.45Building Maintenance 119 3.5% 3.9% 0.90Personal Care/Service 118 3.5% 3.6% 0.97
Data Note: Location Quotients compare the industry/occupation share of a local area's employment relative to that same share nationally. A value lower/greater than 1 indicates that the local area is less/more specialized in that industry or occupation category than the US as a whole. Explore the Esri Labor Force Learn Lesson for more information on how to use and interpret the estimates in this report.Source: Esri forecasts for 2020 and 2025.
December 29, 2020
©2020 Esri Page 1 of 1


Town of Cairo Economic Development Corridor Study: Opportunities & Constraints Analysis
Delaware Engineering, D.P.C.
Attachment 8. Demographic Summaries and Reports for the Study Area


Demographic SummaryEconomic Development Corridor Study Area Prepared by Esri
Area: 1.82 square miles
Area: 1.82 square miles
DEMOGRAPHIC SUMMARYEconomic Development Corridor Study Area
INCOME
$42,018Median Household
Income
$24,012Per Capita Income
$45,027Median Net Worth
KEY FACTS
405Population
46.9
Median Age
178Households
$33,757Median Disposable Income
3020100
HOUSEHOLD INCOME
200000+
150000-199999
100000-149999
75000-99999
50000-74999
35000-49999
25000-34999
15000-24999
0-14999
EDUCATION
15%
No HighSchool
Diploma
31%High School
Graduate
42%Some College
12%Bachelor's/Grad/Prof
Degree
EMPLOYMENT
59%White Collar
23%Blue Collar
19%Services
14.9%
UnemploymentRate
© 2020 EsriThis infographic contains data provided by Esri. The vintage of the data is 2020, 2025.
Source: This infographic contains data provided by Esri. The vintage of the data is 2020, 2025.
©2020 Esri Page 1 of 1 December 31, 2020


Graphic ProfilePrepared by Esri
2020 Population by Race2020 Population by Race
450
400
350
300
250
200
150
100
50
0White Black Am.Ind. Asn/Pac Other Two+
1.9%9
2.0% 0.7% 1.2% 1.5% 2.7%
<55-1920-2425-3435-4445-5455-6465+
2020 Population by Age2020 Population by Age
4.2%
13.8%
5.2%13.5%
11.1%
13.5%
16.7%
22.1%
2020 Percent Hispanic Origin: 7.4%
HouseholdsHouseholds
200
150
100
50
0Census 2010 2020 2025
170 178 177
<$100K$100-199K$200-299K$300-399K$500K+
2020 Home Value2020 Home Value
17.5%49.2%
24.2%
6.7%
2.5%
2020-2025 Annual Growth Rate2020-2025 Annual Growth Rate
Perc
ent
4
3
2
1
0
-1
Population Households Median Household Income Owner Occupied Housing Units-0.25 -0.11
3.26
-0.33
20202025
Household IncomeHousehold Income
Perc
ent
181614121086420
<$15K $15K-$25K $25K-$35K $35K-$50K $50K-$75K $75K-$100K $100K-$150K $150K-$200K $200K+
Source: U.S. Census Bureau, Census 2010 Summary File 1. Esri forecasts for 2020 and 2025.
December 22, 2020
©2020 Esri Page 1 of 1
Study AreaArea: 1.82 square miles


Bus
ines
s Sum
mar
yPr
epar
ed b
y Es
ri
Dat
a fo
r al
l bu
sin
esse
s in
are
aTo
tal B
usin
esse
s:44
Tota
l Em
ploy
ees:
384
Tota
l Res
iden
tial P
opul
atio
n:40
5Em
ploy
ee/R
esid
entia
l Pop
ulat
ion
Ratio
(pe
r 10
0 Re
side
nts)
95B
usi
nes
ses
Emp
loye
esb
y S
IC C
odes
Nu
mb
erP
erce
nt
Nu
mb
erP
erce
nt
Agr
icul
ture
& M
inin
g0
0.0%
00.
0%Con
stru
ctio
n1
2.3%
30.
8%M
anuf
actu
ring
00.
0%2
0.5%
Tran
spor
tatio
n0
0.0%
00.
0%Com
mun
icat
ion
00.
0%0
0.0%
Util
ity1
2.3%
41.
0%W
hole
sale
Tra
de1
2.3%
164.
2%
Reta
il Tr
ade
Sum
mar
y12
27.3
%11
931
.0%
Hom
e Im
prov
emen
t1
2.3%
41.
0%G
ener
al M
erch
andi
se S
tore
s1
2.3%
61.
6%Fo
od S
tore
s2
4.5%
6115
.9%
Aut
o D
eale
rs,
Gas
Sta
tions
, Aut
o Aft
erm
arke
t1
2.3%
20.
5%App
arel
& A
cces
sory
Sto
res
00.
0%0
0.0%
Furn
iture
& H
ome
Furn
ishi
ngs
00.
0%0
0.0%
E atin
g &
Drink
ing
Plac
es3
6.8%
359.
1%M
isce
llane
ous
Reta
il3
6.8%
112.
9%
Fina
nce,
Ins
uran
ce,
Real
Est
ate
Sum
mar
y4
9.1%
266.
8%Ban
ks,
Sav
ings
& L
endi
ng I
nstit
utio
ns1
2.3%
61.
6%Sec
uriti
es B
roke
rs0
0.0%
00.
0%I n
sura
nce
Car
rier
s &
Age
nts
00.
0%0
0.0%
Real
Est
ate,
Hol
ding
, O
ther
Inv
estm
ent
Offic
es3
6.8%
205.
2%
Ser
vice
s Sum
mar
y21
47.7
%17
846
.4%
Hot
els
& L
odgi
ng1
2.3%
41.
0%Aut
omot
ive
Ser
vice
s3
6.8%
71.
8%M
otio
n Pi
ctur
es &
Am
usem
ents
24.
5%2
0.5%
Hea
lth S
ervi
ces
36.
8%40
10.4
%Le
gal S
ervi
ces
00.
0%1
0.3%
Educ
atio
n In
stitu
tions
& L
ibra
ries
12.
3%70
18.2
%O
ther
Ser
vice
s11
25.0
%55
14.3
%
Gov
ernm
ent
24.
5%34
8.9%
Unc
lass
ified
Est
ablis
hmen
ts
24.
5%2
0.5%
Tota
ls44
100.
0%38
410
0.0%
Sou
rce:
Cop
yrig
ht 2
020
Info
grou
p, I
nc.
All
righ
ts r
eser
ved.
Esr
i Tot
al R
esid
entia
l Pop
ulat
ion
fore
cast
s fo
r 20
20.
Dat
e N
ote:
Dat
a on
the
Bus
ines
s Sum
mar
y re
port
is c
alcu
late
d us
ing
Esri
’s D
ata
allo
cati
on m
eth
odw
hich
use
s ce
nsus
blo
ck g
roup
s to
allo
cate
bus
ines
s su
mm
ary
data
to
cust
om a
reas
.
Dec
embe
r 22
, 20
20
©20
20 E
sri
Page
1 o
f 2
Stu
dy A
rea
Are
a:
1.82
sq
uare
m
iles

Bus
ines
s Sum
mar
yPr
epar
ed b
y Es
ri
Bu
sin
esse
sEm
plo
yees
by
NA
ICS
Cod
esN
um
ber
Per
cen
tN
um
ber
Per
cen
tAgr
icul
ture
, Fo
rest
ry,
Fish
ing
& H
untin
g0
0.0%
00.
0%M
inin
g0
0.0%
00.
0%U
tiliti
es0
0.0%
00.
0%Con
stru
ctio
n1
2.3%
30.
8%M
anuf
actu
ring
00.
0%2
0.5%
Who
lesa
le T
rade
12.
3%16
4.2%
Reta
il Tr
ade
818
.2%
7920
.6%
Mot
or V
ehic
le &
Par
ts D
eale
rs1
2.3%
10.
3%Fu
rnitu
re &
Hom
e Fu
rnis
hing
s Sto
res
00.
0%0
0.0%
Elec
tron
ics
& A
pplia
nce
Sto
res
00.
0%0
0.0%
Bld
g M
ater
ial &
Gar
den
Equi
pmen
t &
Sup
plie
s D
eale
rs1
2.3%
41.
0%Fo
od &
Bev
erag
e Sto
res
24.
5%57
14.8
%H
ealth
& P
erso
nal C
are
Sto
res
12.
3%8
2.1%
Gas
olin
e Sta
tions
00.
0%1
0.3%
Clo
thin
g &
Clo
thin
g Acc
esso
ries
Sto
res
00.
0%0
0.0%
Spo
rt G
oods
, H
obby
, Boo
k, &
Mus
ic S
tore
s0
0.0%
00.
0%G
ener
al M
erch
andi
se S
tore
s1
2.3%
61.
6%M
isce
llane
ous
Sto
re R
etai
lers
00.
0%2
0.5%
Non
stor
e Re
taile
rs1
2.3%
10.
3%Tr
ansp
orta
tion
& W
areh
ousi
ng0
0.0%
10.
3%In
form
atio
n0
0.0%
10.
3%Fi
nanc
e &
Ins
uran
ce1
2.3%
61.
6%Cen
tral
Ban
k/Cre
dit
Inte
rmed
iatio
n &
Rel
ated
Act
iviti
es1
2.3%
61.
6%Sec
uriti
es,
Com
mod
ity C
ontr
acts
& O
ther
Fin
anci
al
Inve
stm
ents
& O
ther
Rel
ated
Act
iviti
es0
0.0%
00.
0%In
sura
nce
Car
rier
s &
Rel
ated
Act
iviti
es;
Fund
s, T
rust
s &
O
ther
Fin
anci
al V
ehic
les
00.
0%0
0.0%
Real
Est
ate,
Ren
tal &
Lea
sing
49.
1%19
4.9%
Prof
essi
onal
, Sci
entif
ic &
Tec
h Ser
vice
s2
4.5%
102.
6%Le
gal S
ervi
ces
00.
0%1
0.3%
Man
agem
ent
of C
ompa
nies
& E
nter
pris
es0
0.0%
00.
0%Adm
inis
trat
ive
& S
uppo
rt &
Was
te M
anag
emen
t &
Rem
edia
tion
Ser
vice
s1
2.3%
112.
9%Ed
ucat
iona
l Ser
vice
s1
2.3%
6817
.7%
Hea
lth C
are
& S
ocia
l Ass
ista
nce
36.
8%49
12.8
%Art
s, E
nter
tain
men
t &
Rec
reat
ion
12.
3%3
0.8%
Acc
omm
odat
ion
& F
ood
Ser
vice
s4
9.1%
4311
.2%
Acc
omm
odat
ion
12.
3%4
1.0%
Food
Ser
vice
s &
Drink
ing
Plac
es4
9.1%
3910
.2%
Oth
er S
ervi
ces
(exc
ept
Publ
ic A
dmin
istr
atio
n)11
25.0
%35
9.1%
Aut
omot
ive
Repa
ir &
Mai
nten
ance
36.
8%6
1.6%
Publ
ic A
dmin
istr
atio
n2
4.5%
348.
9%
Unc
lass
ified
Est
ablis
hmen
ts
24.
5%2
0.5%
Tota
l44
100.
0%38
410
0.0%
Sou
rce:
Cop
yrig
ht 2
020
Info
grou
p, I
nc.
All
righ
ts r
eser
ved.
Esr
i Tot
al R
esid
entia
l Pop
ulat
ion
fore
cast
s fo
r 20
20.
Dat
e N
ote:
Dat
a on
the
Bus
ines
s Sum
mar
y re
port
is c
alcu
late
d us
ing
Esri
’s D
ata
allo
cati
on m
eth
odw
hich
use
s ce
nsus
blo
ck g
roup
s to
allo
cate
bus
ines
s su
mm
ary
data
to
cust
om a
reas
.
Dec
embe
r 22
, 20
20
©20
20 E
sri
Page
2 o
f 2
Stu
dy A
rea
Are
a:
1.82
sq
uare
m
iles

Civilian Labor Force ProfilePrepared by Esri
2020 Labor Force
Age Group Population Employed Unemployed Unemployment
RateLabor Force
Participation RateEmployment-
Population Ratio16+ 346 172 30 14.9% 58.4% 49.7%16-24 35 20 9 31.0% 82.9% 57.1%25-54 155 107 16 13.0% 79.4% 69.0%55-64 68 31 4 11.4% 51.5% 45.6%65+ 90 14 1 6.7% 16.7% 15.6%
Industry Employed Percent US Percent Location QuotientTotal 172 100.0% 100.0% -
Agriculture/Forestry/Fishing 0 0.0% 1.3% 0.00Mining/Quarrying/Oil & Gas 0 0.0% 0.5% 0.00Construction 9 5.2% 7.4% 0.70Manufacturing 15 8.7% 10.6% 0.82Wholesale Trade 0 0.0% 2.5% 0.00Retail Trade 26 15.1% 9.7% 1.56Transportation/Warehousing 20 11.6% 4.7% 2.47Utilities 0 0.0% 0.9% 0.00Information 3 1.7% 1.8% 0.94Finance/Insurance 15 8.7% 4.9% 1.78Real Estate/Rental/Leasing 0 0.0% 2.1% 0.00Professional/Scientific/Tech 9 5.2% 8.2% 0.63Management of Companies 0 0.0% 0.1% 0.00Admin/Support/Waste Management 0 0.0% 3.9% 0.00Educational Services 9 5.2% 9.7% 0.54Health Care/Social Assistance 29 16.9% 15.1% 1.12Arts/Entertainment/Recreation 3 1.7% 1.6% 1.06Accommodation/Food Services 8 4.7% 5.6% 0.84Other Services (Excluding Public) 12 7.0% 4.6% 1.52Public Administration 16 9.3% 4.8% 1.94
Occupation Employed Percent US Percent Location QuotientTotal 172 100.0% 100.0% -
White Collar 91 52.9% 61.8% 0.86Management 13 7.6% 10.2% 0.75Business/Financial 3 1.7% 5.1% 0.33Computer/Mathematical 3 1.7% 3.0% 0.57Architecture/Engineering 0 0.0% 2.0% 0.00Life/Physical/Social Sciences 0 0.0% 0.9% 0.00Community/Social Service 1 0.6% 1.8% 0.33Legal 1 0.6% 1.2% 0.50Education/Training/Library 6 3.5% 6.4% 0.55Arts/Design/Entertainment 4 2.3% 1.8% 1.28Healthcare Practitioner1 0.3% 1.8% 0.17
11 6.4% 6.3% 1.02Sales and Sales Related 11 6.4% 9.7% 0.66Office/Administrative Support 38 22.1% 13.3% 1.66
Blue Collar 39 22.7% 21.4% 1.06Farming/Fishing/Forestry 0 0.0% 0.8% 0.00Construction/Extraction 5 2.9% 5.4% 0.54Installation/Maintenance/Repair 16 9.3% 3.1% 3.00Production 3 1.7% 5.9% 0.29Transportation/Material Moving 15 8.7% 6.1% 1.43
Services 43 25.0% 16.8% 1.48Healthcare Support 10 5.8% 2.7% 2.15Protective Service 9 5.2% 2.2% 2.36Food Preparation/Serving 6 3.5% 4.4% 0.80Building Maintenance 9 5.2% 3.9% 1.33Personal Care/Service 9 5.2% 3.6% 1.44
Data Note: Location Quotients compare the industry/occupation share of a local area's employment relative to that same share nationally. A value lower/greater than 1 indicates that the local area is less/more specialized in that industry or occupation category than the US as a whole. Explore the Esri Labor Force Learn Lesson for more information on how to use and interpret the estimates in this report.Source: Esri forecasts for 2020 and 2025.
December 29, 2020
©2020 Esri Page 1 of 1
Study AreaArea: 1.82 square miles

Community ProfilePrepared by Esri
Population Summary 2000 Total Population 3862010 Total Population 3922020 Total Population 405
2020 Group Quarters 32025 Total Population 400
2020-2025 Annual Rate -0.25%2020 Total Daytime Population 584
Workers 349Residents 235
Household Summary2000 Households 159
2000 Average Household Size 2.412010 Households 170
2010 Average Household Size 2.292020 Households 178
2020 Average Household Size 2.262025 Households 177
2025 Average Household Size 2.252020-2025 Annual Rate -0.11%
2010 Families 1022010 Average Family Size 2.87
2020 Families 1062020 Average Family Size 2.83
2025 Families 1042025 Average Family Size 2.852020-2025 Annual Rate -0.38%
Housing Unit Summary2000 Housing Units 192
Owner Occupied Housing Units 55.7%Renter Occupied Housing Units 27.1%Vacant Housing Units 17.2%
2010 Housing Units 206Owner Occupied Housing Units 54.9%Renter Occupied Housing Units 27.7%Vacant Housing Units 17.5%
2020 Housing Units 224Owner Occupied Housing Units 54.0%Renter Occupied Housing Units 25.4%Vacant Housing Units 20.5%
2025 Housing Units 230Owner Occupied Housing Units 51.7%Renter Occupied Housing Units 24.8%Vacant Housing Units 23.0%
Median Household Income2020 $42,0182025 $49,320
Median Home Value2020 $162,9632025 $174,038
Per Capita Income2020 $24,0122025 $26,667
Median Age2010 44.02020 46.92025 47.9
Data Note: Household population includes persons not residing in group quarters. Average Household Size is the household population divided by total households. Persons in families include the householder and persons related to the householder by birth, marriage, or adoption. Per Capita Income represents the income received by all persons aged 15 years and over divided by the total population.Source: U.S. Census Bureau, Census 2010 Summary File 1. Esri forecasts for 2020 and 2025 Esri converted Census 2000 data into 2010 geography.
December 22, 2020
©2020 Esri Page 1 of 7
Study AreaArea: 1.82 square miles

Community ProfilePrepared by Esri
2020 Households by IncomeHousehold Income Base 178
<$15,000 18.5%$15,000 - $24,999 18.5%$25,000 - $34,999 8.4%$35,000 - $49,999 8.4%$50,000 - $74,999 15.2%$75,000 - $99,999 15.2%$100,000 - $149,999 12.4%$150,000 - $199,999 3.4%$200,000+ 0.0%
Average Household Income $55,1342025 Households by Income
Household Income Base 177<$15,000 16.9%$15,000 - $24,999 17.5%$25,000 - $34,999 7.9%$35,000 - $49,999 7.9%$50,000 - $74,999 15.3%$75,000 - $99,999 16.9%$100,000 - $149,999 13.0%$150,000 - $199,999 4.0%$200,000+ 0.6%
Average Household Income $60,8012020 Owner Occupied Housing Units by Value
Total 121<$50,000 8.3%$50,000 - $99,999 9.1%$100,000 - $149,999 26.4%$150,000 - $199,999 22.3%$200,000 - $249,999 13.2%$250,000 - $299,999 10.7%$300,000 - $399,999 6.6%$400,000 - $499,999 0.0%$500,000 - $749,999 0.0%$750,000 - $999,999 2.5%$1,000,000 - $1,499,999 0.0%$1,500,000 - $1,999,999 0.0%$2,000,000 + 0.0%
Average Home Value $186,6672025 Owner Occupied Housing Units by Value
Total 119<$50,000 7.6%$50,000 - $99,999 8.4%$100,000 - $149,999 24.4%$150,000 - $199,999 21.8%$200,000 - $249,999 14.3%$250,000 - $299,999 12.6%$300,000 - $399,999 9.2%$400,000 - $499,999 0.0%$500,000 - $749,999 0.0%$750,000 - $999,999 3.4%$1,000,000 - $1,499,999 0.0%$1,500,000 - $1,999,999 0.0%$2,000,000 + 0.0%
Average Home Value $202,066
Data Note: Income represents the preceding year, expressed in current dollars. Household income includes wage and salary earnings, interest dividends, net rents, pensions, SSI and welfare payments, child support, and alimony. Source: U.S. Census Bureau, Census 2010 Summary File 1. Esri forecasts for 2020 and 2025 Esri converted Census 2000 data into 2010 geography.
December 22, 2020
©2020 Esri Page 2 of 7
Study AreaArea: 1.82 square miles

Community ProfileEC 1 Prepared by EsriArea: 1.82 square miles
2010 Population by AgeTotal 395
0 - 4 4.8%5 - 9 4.3%10 - 14 6.1%15 - 24 12.7%25 - 34 10.1%35 - 44 12.9%45 - 54 16.2%55 - 64 13.2%65 - 74 10.6%75 - 84 5.8%85 + 2.3%
18 + 80.0%2020 Population by Age
Total 4070 - 4 4.2%5 - 9 4.7%10 - 14 4.9%15 - 24 9.3%25 - 34 13.5%35 - 44 11.1%45 - 54 13.5%55 - 64 16.7%65 - 74 12.5%75 - 84 7.1%85 + 2.5%
18 + 83.5%2025 Population by Age
Total 4020 - 4 4.2%5 - 9 4.5%10 - 14 5.0%15 - 24 8.5%25 - 34 11.2%35 - 44 13.7%45 - 54 11.7%55 - 64 16.2%65 - 74 14.4%75 - 84 8.2%85 + 2.5%
18 + 83.3%2010 Population by Sex
Males 188Females 204
2020 Population by SexMales 194Females 211
2025 Population by SexMales 191Females 209
Source: U.S. Census Bureau, Census 2010 Summary File 1. Esri forecasts for 2020 and 2025 Esri converted Census 2000 data into 2010 geography.
December 22, 2020
©2020 Esri Page 3 of 7

Community ProfileEC 1 Prepared by EsriArea: 1.82 square miles
2010 Population by Race/EthnicityTotal 392
White Alone 94.1%Black Alone 1.5%American Indian Alone 0.5%Asian Alone 0.8%Pacific Islander Alone 0.0%Some Other Race Alone 1.0%Two or More Races 2.0%
Hispanic Origin 5.6%Diversity Index 20.7
2020 Population by Race/EthnicityTotal 405
White Alone 91.9%Black Alone 2.0%American Indian Alone 0.7%Asian Alone 1.2%Pacific Islander Alone 0.0%Some Other Race Alone 1.5%Two or More Races 2.7%
Hispanic Origin 7.4%Diversity Index 27.2
2025 Population by Race/EthnicityTotal 401
White Alone 90.5%Black Alone 2.2%American Indian Alone 1.0%Asian Alone 1.5%Pacific Islander Alone 0.0%Some Other Race Alone 1.5%Two or More Races 3.2%
Hispanic Origin 8.5%Diversity Index 30.4
2010 Population by Relationship and Household TypeTotal 392
In Households 99.2%In Family Households 78.3%
Householder 26.0%Spouse 18.4%Child 27.0%Other relative 3.6%Nonrelative 3.8%
In Nonfamily Households 20.9%In Group Quarters 0.8%
Institutionalized Population 0.0%Noninstitutionalized Population 0.8%
Data Note: Persons of Hispanic Origin may be of any race. The Diversity Index measures the probability that two people from the same area will be from different race/ethnic groups.Source: U.S. Census Bureau, Census 2010 Summary File 1. Esri forecasts for 2020 and 2025 Esri converted Census 2000 data into 2010 geography.
December 22, 2020
©2020 Esri Page 4 of 7

Community ProfileEC 1 Prepared by EsriArea: 1.82 square miles
2020 Population 25+ by Educational AttainmentTotal 313
Less than 9th Grade 1.3%9th - 12th Grade, No Diploma 13.4%High School Graduate 26.2%GED/Alternative Credential 4.8%Some College, No Degree 31.6%Associate Degree 10.5%Bachelor's Degree 8.0%Graduate/Professional Degree 4.2%
2020 Population 15+ by Marital StatusTotal 349
Never Married 28.7%Married 50.1%Widowed 7.7%Divorced 13.5%
2020 Civilian Population 16+ in Labor ForceCivilian Population 16+ 202 Population 16+ Employed 85.1% Population 16+ Unemployment rate 14.9%
Population 16-24 Employed 11.6%Population 16-24 Unemployment rate 31.0%Population 25-54 Employed 62.2%Population 25-54 Unemployment rate 13.0%Population 55-64 Employed 18.0%Population 55-64 Unemployment rate 11.4%Population 65+ Employed 8.1%Population 65+ Unemployment rate 6.7%
2020 Employed Population 16+ by IndustryTotal 172 Agriculture/Mining 0.0% Construction 5.2% Manufacturing 8.7% Wholesale Trade 0.0% Retail Trade 15.1% Transportation/Utilities 11.6% Information 1.7% Finance/Insurance/Real Estate 8.7% Services 40.7% Public Administration 9.3%2020 Employed Population 16+ by OccupationTotal 173 White Collar 52.9% Management/Business/Financial 9.3% Professional 15.1% Sales 6.4% Administrative Support 22.1% Services 25.0% Blue Collar 22.7% Farming/Forestry/Fishing 0.0% Construction/Extraction 2.9% Installation/Maintenance/Repair 9.3% Production 1.7% Transportation/Material Moving 8.7%
Source: U.S. Census Bureau, Census 2010 Summary File 1. Esri forecasts for 2020 and 2025 Esri converted Census 2000 data into 2010 geography.
December 22, 2020
©2020 Esri Page 5 of 7

Community ProfileEC 1 Prepared by EsriArea: 1.82 square miles
2010 Households by TypeTotal 171Households with 1 Person 32.7%Households with 2+ People 67.3%
Family Households 59.6%Husband-wife Families 42.1%
With Related Children 15.2%Other Family (No Spouse Present) 17.5%
Other Family with Male Householder 5.3%With Related Children 2.9%
Other Family with Female Householder 12.9%With Related Children 7.6%
Nonfamily Households 7.6%
All Households with Children 26.5%
Multigenerational Households 2.4%Unmarried Partner Households 10.6%
Male-female 9.4%Same-sex 1.2%
2010 Households by SizeTotal 170
1 Person Household 32.9%2 Person Household 33.5%3 Person Household 15.9%4 Person Household 10.6%5 Person Household 5.3%6 Person Household 1.2%7 + Person Household 0.6%
2010 Households by Tenure and Mortgage StatusTotal 170
Owner Occupied 66.5%Owned with a Mortgage/Loan 41.8%Owned Free and Clear 24.7%
Renter Occupied 33.5%2020 Affordability, Mortgage and Wealth
Housing Affordability Index 124Percent of Income for Mortgage 16.2%Wealth Index 47
2010 Housing Units By Urban/ Rural StatusTotal Housing Units 206
Housing Units Inside Urbanized Area 0.0%Housing Units Inside Urbanized Cluster 24.3%Rural Housing Units 75.7%
2010 Population By Urban/ Rural StatusTotal Population 392
Population Inside Urbanized Area 0.0%Population Inside Urbanized Cluster 24.5%Rural Population 75.5%
Data Note: Households with children include any households with people under age 18, related or not. Multigenerational households are families with 3 or more parent-child relationships. Unmarried partner households are usually classified as nonfamily households unless there is another member of the household related to the householder. Multigenerational and unmarried partner households are reported only to the tract level. Esri estimated block group data, which is used to estimate polygons or non-standard geography.Source: U.S. Census Bureau, Census 2010 Summary File 1. Esri forecasts for 2020 and 2025 Esri converted Census 2000 data into 2010 geography.
December 22, 2020
©2020 Esri Page 6 of 7

Community ProfileEC 1 Prepared by EsriArea: 1.82 square miles
Top 3 Tapestry Segments1. The Great Outdoors (6C)2. Small Town Simplicity (12C)3.2020 Consumer Spending
Apparel & Services: Total $ $227,892Average Spent $1,280.29Spending Potential Index 60
Education: Total $ $177,106Average Spent $994.98Spending Potential Index 56
Entertainment/Recreation: Total $ $375,881Average Spent $2,111.69Spending Potential Index 65
Food at Home: Total $ $620,553Average Spent $3,486.25Spending Potential Index 65
Food Away from Home: Total $ $412,140Average Spent $2,315.39Spending Potential Index 61
Health Care: Total $ $677,466Average Spent $3,805.99Spending Potential Index 66
HH Furnishings & Equipment: Total $ $236,309Average Spent $1,327.58Spending Potential Index 61
Personal Care Products & Services: Total $ $96,111Average Spent $539.95Spending Potential Index 59
Shelter: Total $ $2,078,010Average Spent $11,674.21Spending Potential Index 60
Support Payments/Cash Contributions/Gifts in Kind: Total $ $294,828Average Spent $1,656.34Spending Potential Index 71
Travel: Total $ $262,749Average Spent $1,476.12Spending Potential Index 61
Vehicle Maintenance & Repairs: Total $ $137,663Average Spent $773.39Spending Potential Index 67
Data Note: Consumer spending shows the amount spent on a variety of goods and services by households that reside in the area. Expenditures are shown by broad budget categories that are not mutually exclusive. Consumer spending does not equal business revenue. Total and Average Amount Spent Per Household represent annual figures. The Spending Potential Index represents the amount spent in the area relative to a national average of 100.Source: Consumer Spending data are derived from the 2017 and 2018 Consumer Expenditure Surveys, Bureau of Labor Statistics. Esri.Source: U.S. Census Bureau, Census 2010 Summary File 1. Esri forecasts for 2020 and 2025 Esri converted Census 2000 data into 2010 geography.
December 22, 2020
©2020 Esri Page 7 of 7
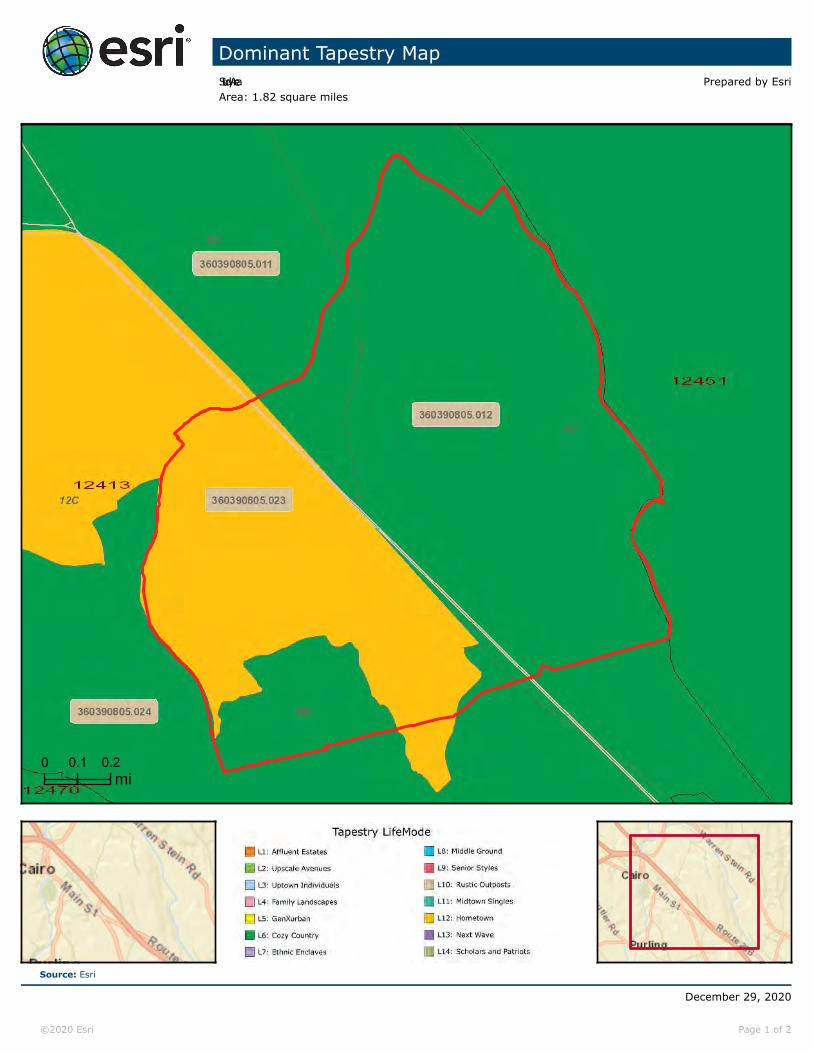
0 0.1 0.2mi
Dominant Tapestry MapPrepared by Esri
Source: Esri
December 29, 2020
©2020 Esri Page 1 of 2
Study AreaArea: 1.82 square miles

Dominant Tapestry MapPrepared by Esri
Tapestry Segmentation
Tapestry Segmentation represents the latest generation of market segmentation systems that began over 30 years ago. The68-segment Tapestry Segmentation system classifies U.S. neighborhoods based on their socioeconomic and demographiccomposition. Each segment is identified by its two-digit Segment Code. Match the two-digit segment labels on the map to thelist below. Click each segment below for a detailed description.
Source: Esri
December 29, 2020
©2020 Esri Page 2 of 2
Segment 1A (Top Tier) Segment 8C (Bright Young Professionals)Segment 1B (Professional Pride) Segment 8D (Downtown Melting Pot)Segment 1C (Boomburbs) Segment 8E (Front Porches)Segment 1D (Savvy Suburbanites) Segment 8F (Old and Newcomers)Segment 1E (Exurbanites) Segment 8G (Hardscrabble Road)Segment 2A (Urban Chic) Segment 9A (Silver & Gold)Segment 2B (Pleasantville) Segment 9B (Golden Years)Segment 2C (Pacific Heights) Segment 9C (The Elders)Segment 2D (Enterprising Professionals) Segment 9D (Senior Escapes)Segment 3A (Laptops and Lattes) Segment 9E (Retirement Communities)Segment 3B (Metro Renters) Segment 9F (Social Security Set)Segment 3C (Trendsetters) Segment 10A (Southern Satellites)Segment 4A (Soccer Moms) Segment 10B (Rooted Rural)Segment 4B (Home Improvement) Segment 10C (Diners & Miners)Segment 4C (Middleburg) Segment 10D (Down the Road)Segment 5A (Comfortable Empty Nesters) Segment 10E (Rural Bypasses)Segment 5B (In Style) Segment 11A (City Strivers)Segment 5C (Parks and Rec) Segment 11B (Young and Restless)Segment 5D (Rustbelt Traditions) Segment 11C (Metro Fusion)Segment 5E (Midlife Constants) Segment 11D (Set to Impress)Segment 6A (Green Acres) Segment 11E (City Commons)Segment 6B (Salt of the Earth) Segment 12A (Family Foundations)Segment 6C (The Great Outdoors) Segment 12B (Traditional Living)Segment 6D (Prairie Living) Segment 12C (Small Town Simplicity)Segment 6E (Rural Resort Dwellers) Segment 12D (Modest Income Homes)Segment 6F (Heartland Communities) Segment 13A (International Marketplace)Segment 7A (Up and Coming Families) Segment 13B (Las Casas)Segment 7B (Urban Villages) Segment 13C (NeWest Residents)Segment 7C (American Dreamers) Segment 13D (Fresh Ambitions)Segment 7D (Barrios Urbanos) Segment 13E (High Rise Renters)Segment 7E (Valley Growers) Segment 14A (Military Proximity)Segment 7F (Southwestern Families) Segment 14B (College Towns)Segment 8A (City Lights) Segment 14C (Dorms to Diplomas)Segment 8B (Emerald City) Segment 15 (Unclassified)
Study AreaArea: 1.82 square miles

TAPE
STRY
SEG
MEN
TATI
ON
TM
esri
.co
m/t
apes
try
Ho
useh
old
s: 3
,545
,800
Ave
rag
e H
ous
eho
ld S
ize:
2.5
9
Med
ian
Ag
e: 4
4.1
Med
ian
Ho
useh
old
Inco
me:
$56
,300
Life
Mo
de
Gro
up: C
ozy
Cou
ntry
Liv
ing
Salt
of
the
Ear
th
WH
O A
RE
WE
?Sa
lt of
the
Eart
h re
side
nts
are
entr
ench
ed in
thei
r tra
ditio
nal,
rura
l life
styl
es. C
itiz
ens
here
are
old
er, a
nd m
any
have
g
row
n ch
ildre
n th
at h
ave
mov
ed a
way
. The
y st
ill c
heris
h fa
mily
tim
e an
d a
lso
tend
ing
to
thei
r ve
get
able
gar
den
s an
d p
rep
arin
g h
omem
ade
mea
ls. R
esid
ents
em
bra
ce t
he
outd
oors
; the
y sp
end
mos
t of
the
ir fr
ee t
ime
pre
par
ing
for
thei
r nex
t fis
hing
, boa
ting,
or c
ampi
ng tr
ip. T
he m
ajor
ity h
as
at le
ast
a hi
gh
scho
ol d
iplo
ma
or s
ome
colle
ge
educ
atio
n;
man
y ha
ve e
xpan
ded
the
ir s
kill
set
dur
ing
the
ir y
ears
of
empl
oym
ent i
n th
e m
anuf
actu
ring
and
rela
ted
indu
strie
s. T
hey
may
be
exp
erts
with
DIY
pro
ject
s, b
ut t
he la
test
tec
hnol
ogy
is n
ot
thei
r fo
rte.
The
y us
e it
whe
n ab
solu
tely
nec
essa
ry,
but
see
k fa
ce-t
o-fa
ce c
onta
ct in
the
ir ro
utin
e ac
tiviti
es.
OU
R N
EIG
HB
OR
HO
OD
• Th
is la
rge
seg
men
t is
con
cent
rate
d in
the
Mid
wes
t, p
artic
ular
ly in
Ohi
o, P
enns
ylva
nia,
and
Ind
iana
.
• D
ue t
o th
eir
rura
l set
ting
, hou
seho
lds
own
two
vehi
cles
to
cove
r th
eir
long
com
mut
es,
of
ten
acro
ss c
ount
y b
ound
arie
s.
• H
ome
owne
rshi
p r
ates
are
ver
y hi
gh
(In
dex
133
). Si
ngle
-fam
ily h
omes
are
af
ford
able
, val
ued
at
25 p
erce
nt le
ss
th
an t
he n
atio
nal m
arke
t.
• N
early
tw
o in
thr
ee h
ouse
hold
s ar
e co
m
p
osed
of m
arrie
d c
oup
les;
less
tha
n ha
lf
ha
ve c
hild
ren
at h
ome.
SOC
IOE
CO
NO
MIC
TR
AIT
S•
Stea
dy
emp
loym
ent
in c
onst
ruct
ion,
m
anuf
actu
ring,
and
rela
ted
serv
ice
indu
strie
s.
• C
omp
lete
d e
duc
atio
n: 4
0% w
ith a
hig
h sc
hool
dip
lom
a on
ly.
• H
ouse
hold
inco
me
just
ove
r th
e
natio
nal m
edia
n, w
hile
net
wor
th is
near
ly d
oub
le t
he n
atio
nal m
edia
n.
• Sp
end
ing
tim
e w
ith fa
mily
the
ir to
p p
riorit
y.
• C
ost-
cons
ciou
s co
nsum
ers,
loya
l to
bra
nds
they
like
, with
a fo
cus
on b
uyin
g A
mer
ican
.
• La
st to
buy
the
late
st a
nd g
reat
est p
rodu
cts.
• Tr
y to
eat
hea
lthy,
tra
ckin
g t
he n
utrit
ion
an
d in
gre
die
nts
in t
he fo
od t
hey
pur
chas
e.
Not
e: T
he In
dex
rep
rese
nts
the
ratio
of t
he s
egm
ent
rate
to
the
US
rate
mul
tiplie
d b
y 10
0.
Con
sum
er p
refe
renc
es a
re e
stim
ated
from
dat
a b
y G
fK M
RI.
6B

TAPE
STRY
SEG
MEN
TATI
ON
TM
esri
.co
m/t
apes
try
Life
Mo
de
Gro
up: C
ozy
Cou
ntry
Liv
ing
Salt
of
the
Ear
th6B 85
+80
–84
75–7
970
–74
65–6
960
–64
55–5
950
–54
45–4
940
–44
35–3
930
–34
25–2
920
–24
15–1
910
–14
5–9
<5
8%
4%
0
4
%
8%
Mal
eFe
mal
e
Med
ian
Ho
useh
old
Inco
me
Med
ian
Net
Wo
rth
$56,100
$93,300
$56,300
$167,700
$0$1
00,000
$200
,000
$300
,000
$400
,000
$500
,000
$600
,000
EsriMed
ianHH
Income
EsriMed
ianNetW
orth
Serie
s2Serie
s1
$56,100
$93,300
$56,300
$167,700
$0$1
00,000
$200
,000
$300
,000
$400
,000
$500
,000
$600
,000
EsriMed
ianHH
Income
EsriMed
ianNetW
orth
Serie
s2Serie
s1
Ho
usin
g
Foo
d
Ap
par
el &
Ser
vice
s
Tran
spo
rtat
ion
Hea
lth
Car
e
Ent
erta
inm
ent
&R
ecre
atio
n
Ed
ucat
ion
Pen
sio
ns &
Soci
al S
ecur
ity
Oth
er
0.0%0.5%
1.0%1.5%
2.0%2.5%
3.0%3.5%
4.0%4.5%
MaleAge0-4
MaleAge5-9
MaleAge10-1
4
MaleAge15-1
9
MaleAge20-2
4
MaleAge25-2
9
MaleAge30-3
4
MaleAge35-3
9
MaleAge40-4
4
MaleAge45-4
9
MaleAge50-5
4
MaleAge55-5
9
MaleAge60-6
4
MaleAge65-6
9
MaleAge70-7
4
MaleAge75-7
9
MaleAge80-8
4
MaleAge85+
AgebySex-M
ale
Series2Series1
0.0%0.5%
1.0%1.5%
2.0%2.5%
3.0%3.5%
4.0%4.5%
FemaleAge0-
4
FemaleAge5-
9
FemaleAge10
-14
FemaleAge15
-19
FemaleAge20
-24
FemaleAge25
-29
FemaleAge30
-34
FemaleAge35
-39
FemaleAge40
-44
FemaleAge45
-49
FemaleAge50
-54
FemaleAge55
-59
FemaleAge60
-64
FemaleAge65
-69
FemaleAge70
-74
FemaleAge75
-79
FemaleAge80
-84
FemaleAge85
+
ChartTitle
Series2Series1
INC
OM
E A
ND
NE
T W
OR
THN
et w
orth
mea
sure
s to
tal h
ouse
hold
ass
ets
(hom
es, v
ehic
les,
in
vest
men
ts, e
tc.)
less
any
deb
ts, s
ecur
ed (e
.g.,
mor
tgag
es)
or
un
secu
red
(cr
ed
it c
ard
s).
Ho
use
ho
ld in
com
e a
nd
net
wo
rth
are
estim
ated
by
Esr
i.
OC
CU
PATI
ON
BY
EA
RN
ING
STh
e fi v
e o
ccup
atio
ns w
ith t
he h
ighe
st n
umb
er o
f wo
rker
s in
the
mar
ket
are
dis
pla
yed
by
med
ian
earn
ing
s. D
ata
fro
m t
he C
ensu
s B
urea
u’s
Am
eric
an C
om
mun
ity S
urve
y.
AV
ER
AG
E H
OU
SEH
OLD
BU
DG
ET
IND
EX
The
ind
ex c
om
par
es t
he a
vera
ge
amo
unt
spen
t in
thi
s m
arke
t’s h
ous
eho
ld b
udg
ets
for
hous
ing
, fo
od
, ap
par
el, e
tc.,
to t
he a
vera
ge
amo
unt
spen
t b
y al
l US
hous
eho
lds.
An
ind
exo
f 100
is a
vera
ge.
An
ind
ex o
f 120
sho
ws
that
ave
rag
e sp
end
ing
by
cons
umer
s in
thi
s m
arke
tis
20
per
cent
ab
ove
the
nat
iona
l ave
rag
e. C
ons
umer
exp
end
iture
s ar
e es
timat
ed b
y E
sri.
AG
E B
Y S
EX
(Esr
i dat
a)
Med
ian
Ag
e: 4
4.1
US:
38.
2
In
dic
ates
US
RA
CE
AN
D E
THN
ICIT
Y (E
sri d
ata)
The
Div
ersi
ty In
dex
sum
mar
izes
rac
ial a
nd e
thni
c d
iver
sity
. The
ind
ex
sho
ws
the
likel
iho
od
tha
t tw
o p
erso
ns, c
hose
n at
ran
do
m fr
om
the
sa
me
area
, bel
ong
to
diff
eren
t ra
ce o
r et
hnic
gro
ups.
The
ind
ex
rang
es fr
om
0 (n
o d
iver
sity
) to
100
(co
mp
lete
div
ersi
ty).
Div
ersi
ty In
dex
: 19.
8 U
S: 6
4.0
His
pan
ic*
Mul
tiple
Oth
er
Asi
an a
ndPa
c. Is
land
erA
mer
ican
Ind
ian
Bla
ck
Whi
te
$140
,000
$120
,000
$100
,000
$80,
000
$60,
000
$40,
000
$20,
000 0
2
00,0
00
2
40
0,00
0
6
600
,000
*His
pan
ic C
an B
e of
Any
Rac
e.
0
2
0%
40%
6
0%
80%
10
0%
0
$
100K
$
200K
$
300K
$
400K
$
500K
$
600K
+
0
$
100K
$
200K
$
300K
$
400K
$
500K
$
600K
+U
S A
vera
ge.
US
Med
ian.
Median Earnings
Wo
rker
s (A
ge
16+
)
83 88 83
91 96 90
79
87 89
0
5
0
10
0
150
200
2
50
30
0
350

Own
83.1%
Ren
t16
.9%
ChartT
itle
Own
Rent
Ho
me
Ow
ners
hip
US
Perc
enta
ge:
62.7
% O
wn
37.3
% R
ent
Po
pul
atio
n
Po
pul
atio
n G
row
th (A
nnua
l %)
Po
pul
atio
n D
ensi
ty (P
erso
ns p
er s
q. m
ile)
350
350
350
0 0 0
900,
000
-0.5
%
0
11,
000,
000
3.0%
25,0
009,27
6,40
0
0.3%
1000
Wea
lth
Ind
ex
Soci
oec
ono
mic
Sta
tus
Ind
ex
Ho
usin
g A
ffo
rdab
ility
Ind
ex
92
107
169
58
TAPE
STRY
SEG
MEN
TATI
ON
TM
esri
.co
m/t
apes
try
MA
RK
ET
PR
OFI
LE (C
onsu
mer
pre
fere
nces
are
est
imat
ed fr
om d
ata
by
GfK
MRI
)
• O
utd
oor
spor
ts a
nd a
ctiv
ities
, suc
h as
fish
ing
, boa
ting
, hun
ting
, and
over
nig
ht c
amp
ing
trip
s ar
e p
opul
ar.
• To
sup
por
t th
eir
pas
times
, tru
ck o
wne
rshi
p is
hig
h; m
any
also
ow
n an
ATV
.
• Th
ey o
wn
the
equi
pm
ent
to m
aint
ain
thei
r la
wns
and
ten
d t
o th
eir
veg
etab
le g
ard
ens.
• Re
sid
ents
oft
en t
ackl
e ho
me
rem
odel
ing
and
imp
rove
men
t jo
bs
them
selv
es.
• D
ue t
o th
eir
loca
le, t
hey
own
sate
llite
dis
hes,
and
hav
e ac
cess
to
hig
h sp
eed
inte
rnet
co
nnec
tions
like
DSL
.
• Th
ese
cons
erva
tive
cons
umer
s p
refe
r to
con
duc
t th
eir
bus
ines
s in
per
son
ra
ther
tha
n on
line.
The
y us
e an
ag
ent
to p
urch
ase
insu
ranc
e.
ESR
I IN
DE
XE
SE
sri d
evel
op
ed t
hree
ind
exes
to
dis
pla
y av
erag
e ho
useh
old
wea
lth, s
oci
oec
ono
mic
sta
tus,
an
d h
ous
ing
affo
rdab
ility
for
the
mar
ket
rela
tive
to U
S st
and
ard
s.
PO
PU
LATI
ON
CH
AR
AC
TER
ISTI
CS
Tota
l po
pul
atio
n, a
vera
ge
annu
al p
op
ulat
ion
chan
ge
sinc
e C
ensu
s 20
10, a
nd a
vera
ge
den
sity
(po
pul
atio
n p
er s
qua
re m
ile) a
re d
isp
laye
d fo
r th
e m
arke
t re
lativ
e to
the
siz
e an
d c
hang
e am
ong
all
Tap
estr
y m
arke
ts. D
ata
estim
ated
by
Esr
i.
Life
Mo
de
Gro
up: C
ozy
Cou
ntry
Liv
ing
Salt
of
the
Ear
th6B
HO
USI
NG
Med
ian
hom
e va
lue
is d
isp
laye
d fo
r m
arke
ts t
hat
are
prim
arily
o
wne
r o
ccup
ied
; ave
rag
e re
nt is
sho
wn
for
rent
er-o
ccup
ied
mar
kets
. Te
nure
and
ho
me
valu
e ar
e es
timat
ed b
y E
sri.
Ho
usin
g t
ype
and
ave
rag
e re
nt a
re fr
om
the
Cen
sus
Bur
eau’
s A
mer
ican
Co
mm
unity
Sur
vey.
Typ
ical
Ho
usin
g:
Sing
le F
amily
Med
ian
Val
ue:
$154
,300
US
Med
ian:
$20
7,30
0

Hig
h
Low
TAPE
STRY
SEG
MEN
TATI
ON
TM
esri
.co
m/t
apes
try
SEG
ME
NT
DE
NSI
TYT
his
map
illu
stra
tes
the
den
sity
and
d
istr
ibut
ion
of
the
Salt
of t
he E
arth
Ta
pes
try
Seg
men
t b
y ho
useh
old
s.
Life
Mo
de
Gro
up: C
ozy
Cou
ntry
Liv
ing
Salt
of
the
Ear
th6B
For
mo
re in
form
atio
n1-
800-
447-
9778
info
@es
ri.co
mes
ri.c
om
Co
pyr
ight
© 2
020
Esr
i. A
ll ri
ght
s re
serv
ed. E
sri,
the
Esr
i glo
be
log
o, T
apes
try,
@es
ri.c
om
, and
esr
i.co
m a
re t
rad
emar
ks, s
ervi
ce m
arks
, o
r re
gis
tere
d m
arks
of E
sri i
n th
e U
nite
d S
tate
s, t
he
Eu
rop
ean
Co
mm
uni
ty, o
r ce
rtai
n o
the
r ju
risd
icti
on
s. O
the
r co
mp
anie
s an
d
pro
duc
ts o
r se
rvic
es m
enti
one
d h
erei
n m
ay b
e tr
adem
arks
, ser
vice
mar
ks, o
r re
gis
tere
d m
arks
of t
heir
res
pec
tive
mar
k o
wne
rs.
G82
6513
ESR
I2C
1/20
ms

TAPE
STRY
SEG
MEN
TATI
ON
TM
esri
.co
m/t
apes
try
Ho
useh
old
s: 2
,305
,700
Ave
rag
e H
ous
eho
ld S
ize:
2.2
6
Med
ian
Ag
e: 4
0.8
Med
ian
Ho
useh
old
Inco
me:
$31
,500
Life
Mo
de
Gro
up: H
omet
own
Smal
l To
wn
Sim
plic
ity
WH
O A
RE
WE
?Sm
all T
own
Sim
plic
ity in
clud
es y
oung
fam
ilies
an
d s
enio
r ho
useh
old
ers
that
are
bou
nd b
y co
mm
unity
tie
s. T
he li
fest
yle
is d
own-
to-e
arth
an
d s
emiru
ral,
with
tel
evis
ion
for
ente
rtai
nmen
t an
d n
ews,
and
em
pha
sis
on c
onve
nien
ce fo
r bo
th y
oung
par
ents
and
sen
ior c
itize
ns. R
esid
ents
em
bark
on
purs
uits
incl
udin
g on
line
com
pute
r ga
mes
, ren
ting
mov
ies,
indo
or g
arde
ning
, and
ru
ral a
ctiv
ities
like
hun
ting
and
fishi
ng.
Sin
ce 1
in
4 h
ouse
hold
s is
bel
ow p
over
ty le
vel,
resi
den
ts
also
kee
p t
heir
finan
ces
sim
ple
—p
ayin
g b
ills
in
per
son
and
avo
idin
g d
ebt.
OU
R N
EIG
HB
OR
HO
OD
• Th
ey re
sid
e in
sm
all t
owns
or
sem
irura
l
neig
hbor
hood
s, m
ostly
out
sid
e
met
rop
olita
n ar
eas.
• H
omes
are
a m
ix o
f old
er s
ing
le-f
amily
hous
es (6
1%),
apar
tmen
ts, a
nd m
obile
hom
es.
• H
alf o
f all
hom
es a
re o
wne
r-oc
cup
ied
(Ind
ex 7
9).
• M
edia
n ho
me
valu
e of
$92
,300
is a
bou
t
half
the
US
med
ian.
• A
vera
ge
rent
is $
639
(Ind
ex 6
2).
• Th
is is
an
old
er m
arke
t, w
ith h
alf o
f the
hous
ehol
der
s ag
ed 5
5 ye
ars
or o
lder
,
an
d pr
edom
inan
tly s
ingl
e-pe
rson
hous
ehol
ds (I
ndex
139
).
SOC
IOE
CO
NO
MIC
TR
AIT
S•
Educ
atio
n: 6
7% w
ith h
igh
scho
ol d
iplo
ma
or
so
me
colle
ge.
• U
nem
plo
ymen
t hi
ghe
r at
7.7
% (I
ndex
141
).
• La
bor
forc
e p
artic
ipat
ion
low
er a
t 52
% (I
ndex
83)
,
whi
ch c
ould
resu
lt fr
om la
ck o
f job
s or
retir
emen
t.
• In
com
e fr
om w
ages
and
sal
arie
s (In
dex
83)
, Soc
ial
Secu
rity
(Ind
ex 1
33) o
r re
tirem
ent
(Ind
ex 1
06),
in
crea
sed
by S
uppl
emen
tal S
ecur
ity In
com
e (In
dex
183)
.
• Pr
ice-
cons
ciou
s co
nsum
ers
that
sho
p a
ccor
ding
ly,
w
ith c
oupo
ns a
t dis
coun
t cen
ters
.
• C
onne
cted
, but
not
to
the
late
st o
r g
reat
est
gad
get
s;
ke
ep t
heir
land
lines
.
• C
omm
unity
-orie
ntat
ed re
sid
ents
;
mor
e co
nser
vativ
e th
an m
idd
le-o
f-th
e-ro
ad.
• Re
ly o
n te
levi
sion
or n
ewsp
aper
s to
sta
y in
form
ed.
Not
e: T
he In
dex
rep
rese
nts
the
ratio
of t
he s
egm
ent
rate
to
the
US
rate
mul
tiplie
d b
y 10
0.
Con
sum
er p
refe
renc
es a
re e
stim
ated
from
dat
a b
y G
fK M
RI.
12C

TAPE
STRY
SEG
MEN
TATI
ON
TM
esri
.co
m/t
apes
try
Life
Mo
de
Gro
up: H
omet
own
Smal
l To
wn
Sim
plic
ity
12C
85+
80–8
475
–79
70–7
465
–69
60–6
455
–59
50–5
445
–49
40–4
435
–39
30–3
425
–29
20–2
415
–19
10–1
45–
9<5 8
%
4%
0
4%
8
%
Mal
eFe
mal
e
Med
ian
Ho
useh
old
Inco
me
Med
ian
Net
Wo
rth
$56,100
$93,300
$31,500
$15,300
$0$1
00,000
$200
,000
$300
,000
$400
,000
$500
,000
$600
,000
EsriMed
ianHH
Income
EsriMed
ianNetW
orth
Serie
s2Serie
s1
$56,100
$93,300
$31,500
$15,300
$0$1
00,000
$200
,000
$300
,000
$400
,000
$500
,000
$600
,000
EsriMed
ianHH
Income
EsriMed
ianNetW
orth
Serie
s2Serie
s1
Ho
usin
g
Foo
d
Ap
par
el &
Ser
vice
s
Tran
spo
rtat
ion
Hea
lth
Car
e
Ent
erta
inm
ent
&R
ecre
atio
n
Ed
ucat
ion
Pen
sio
ns &
Soci
al S
ecur
ity
Oth
er
!"!#$!"%#$
&"!#$&"%#$
'"!#$'"%#$
("!#$("%#$
)"!#$
!"#$%&'$%()*
!"#$%&'$%+),
!"#$%&'$%-()-*
!"#$%&'$%-+)-,
$
!"#$%&'$%.().*
!"#$%&'$%.+).,
$
!"#$%&'$%/()/*
$
!"#$%&'$%/+)/,
$
!"#$%&'$%*()**
$
!"#$%&'$%*+)*,
$
!"#$%&'$%+()+*
$
!"#$%&'$%++)+,
$
!"#$%&'$%0()0*
$
!"#$%&'$%0+)0,
$
!"#$%&'$%1()1*
$
!"#$%&'$%1+)1,
$
!"#$%&'$%2()2*
$
!"#$%&'$%2+3
&'$%45%6$7%)!"#
$
6$89$:.6$89$:-
!"!#$!"%#$
&"!#$&"%#$
'"!#$'"%#$
("!#$("%#$
)"!#$
!"#$%"&'("&)*+
!"#$%"&'("&,*-
!"#$%"&'("&.)*.
+
!"#$%"&'("&.,*.
-
!"#$%"&'("&/)*/
+
!"#$%"&'("&/,*/
-
!"#$%"&'("&0)*0
+
!"#$%"&'("&0,*0
-
!"#$%"&'("&+)*+
+
!"#$%"&'("&+,*+
-
!"#$%"&'("&,)*,
+
!"#$%"&'("&,,*,
-
!"#$%"&'("&1)*1
+
!"#$%"&'("&1,*1
-
!"#$%"&'("&2)*2
+
!"#$%"&'("&2,*2
-
!"#$%"&'("&3)*3
+
!"#$%"&'("&3,4
56$78&9:8%"
;"7:"</;"7:"<.
INC
OM
E A
ND
NE
T W
OR
THN
et w
orth
mea
sure
s to
tal h
ouse
hold
ass
ets
(hom
es, v
ehic
les,
in
vest
men
ts, e
tc.)
less
any
deb
ts, s
ecur
ed (e
.g.,
mor
tgag
es)
or
un
secu
red
(cr
ed
it c
ard
s).
Ho
use
ho
ld in
com
e a
nd
net
wo
rth
are
estim
ated
by
Esr
i.
OC
CU
PATI
ON
BY
EA
RN
ING
STh
e fi v
e o
ccup
atio
ns w
ith t
he h
ighe
st n
umb
er o
f wo
rker
s in
the
mar
ket
are
dis
pla
yed
by
med
ian
earn
ing
s. D
ata
fro
m t
he C
ensu
s B
urea
u’s
Am
eric
an C
om
mun
ity S
urve
y.
AV
ER
AG
E H
OU
SEH
OLD
BU
DG
ET
IND
EX
The
ind
ex c
om
par
es t
he a
vera
ge
amo
unt
spen
t in
thi
s m
arke
t’s h
ous
eho
ld b
udg
ets
for
hous
ing
, fo
od
, ap
par
el, e
tc.,
to t
he a
vera
ge
amo
unt
spen
t b
y al
l US
hous
eho
lds.
An
ind
exo
f 100
is a
vera
ge.
An
ind
ex o
f 120
sho
ws
that
ave
rag
e sp
end
ing
by
cons
umer
s in
thi
s m
arke
tis
20
per
cent
ab
ove
the
nat
iona
l ave
rag
e. C
ons
umer
exp
end
iture
s ar
e es
timat
ed b
y E
sri.
AG
E B
Y S
EX
(Esr
i dat
a)
Med
ian
Ag
e: 4
0.8
US:
38.
2
In
dic
ates
US
RA
CE
AN
D E
THN
ICIT
Y (E
sri d
ata)
The
Div
ersi
ty In
dex
sum
mar
izes
rac
ial a
nd e
thni
c d
iver
sity
. The
ind
ex
sho
ws
the
likel
iho
od
tha
t tw
o p
erso
ns, c
hose
n at
ran
do
m fr
om
the
sa
me
area
, bel
ong
to
diff
eren
t ra
ce o
r et
hnic
gro
ups.
The
ind
ex
rang
es fr
om
0 (n
o d
iver
sity
) to
100
(co
mp
lete
div
ersi
ty).
Div
ersi
ty In
dex
: 51.
0 U
S: 6
4.0
His
pan
ic*
Mul
tiple
Oth
er
Asi
an a
ndPa
c. Is
land
erA
mer
ican
Ind
ian
Bla
ck
Whi
te
$60,
000
$50,
000
$40,
000
$30,
000
$20,
000
$10,
000 0
5
0,00
0
10
0,00
0
150
,000
2
00,0
00
25
0,00
0
300
,000
*His
pan
ic C
an B
e of
Any
Rac
e.
0
20%
40%
60%
80%
0
$
100K
$
200K
$
300K
$
400K
$
500K
$
600K
+
0
$
100K
$
200K
$
300K
$
400K
$
500K
$
600K
+U
S A
vera
ge.
US
Med
ian.
Median Earnings
Wo
rker
s (A
ge
16+
)
56 60
53
63 63 59
45
51
57
0
5
0
10
0
150
200
2
50
30
0
350

Own
49.7%
Ren
t50
.3%
ChartT
itle
Own
Rent
Po
pul
atio
n
Po
pul
atio
n G
row
th (A
nnua
l %)
Po
pul
atio
n D
ensi
ty (P
erso
ns p
er s
q. m
ile)
350
350
350
0 0 0
900,
000
-0.5
%
0
11,
000,
000
3.0%
25,0
00
5,44
9,10
0
0.1%
1000
Wea
lth
Ind
ex
Soci
oec
ono
mic
Sta
tus
Ind
ex
Ho
usin
g A
ffo
rdab
ility
Ind
ex
71
38
164
88
Ho
me
Ow
ners
hip
US
Perc
enta
ge:
62.7
% O
wn
37.3
% R
ent
TAPE
STRY
SEG
MEN
TATI
ON
TM
esri
.co
m/t
apes
try
MA
RK
ET
PR
OFI
LE (C
onsu
mer
pre
fere
nces
are
est
imat
ed fr
om d
ata
by
GfK
MRI
)
• Sm
all T
own
Sim
plic
ity fe
atur
es a
sem
irura
l life
styl
e, c
omp
lete
with
tru
cks
and
SU
Vs
(d
omes
tic, o
f cou
rse)
, ATV
s, a
nd v
eget
able
gar
den
s.
• Re
sid
ents
enj
oy o
utd
oor
activ
ities
like
hun
ting
and
fish
ing
as
wel
l as
wat
chin
g
N
ASC
AR
and
col
leg
e fo
otb
all a
nd b
aske
tbal
l on
TV.
• A
larg
e se
nior
pop
ulat
ion
visi
t d
octo
rs a
nd h
ealth
pra
ctiti
oner
s re
gul
arly
.
• H
owev
er, a
larg
ely
sing
le p
opul
atio
n fa
vors
con
veni
ence
ove
r co
okin
g—
froz
en m
eals
and
fast
food
.
• H
ome
imp
rove
men
t is
not
a p
riorit
y, b
ut v
ehic
le m
aint
enan
ce is
.
ESR
I IN
DE
XE
SE
sri d
evel
op
ed t
hree
ind
exes
to
dis
pla
y av
erag
e ho
useh
old
wea
lth, s
oci
oec
ono
mic
sta
tus,
an
d h
ous
ing
affo
rdab
ility
for
the
mar
ket
rela
tive
to U
S st
and
ard
s.
PO
PU
LATI
ON
CH
AR
AC
TER
ISTI
CS
Tota
l po
pul
atio
n, a
vera
ge
annu
al p
op
ulat
ion
chan
ge
sinc
e C
ensu
s 20
10, a
nd a
vera
ge
den
sity
(po
pul
atio
n p
er s
qua
re m
ile) a
re d
isp
laye
d fo
r th
e m
arke
t re
lativ
e to
the
siz
e an
d c
hang
e am
ong
all
Tap
estr
y m
arke
ts. D
ata
estim
ated
by
Esr
i.
Life
Mo
de
Gro
up: H
omet
own
Smal
l To
wn
Sim
plic
ity
12C
HO
USI
NG
Med
ian
hom
e va
lue
is d
isp
laye
d fo
r m
arke
ts t
hat
are
prim
arily
o
wne
r o
ccup
ied
; ave
rag
e re
nt is
sho
wn
for
rent
er-o
ccup
ied
mar
kets
. Te
nure
and
ho
me
valu
e ar
e es
timat
ed b
y E
sri.
Ho
usin
g t
ype
and
ave
rag
e re
nt a
re fr
om
the
Cen
sus
Bur
eau’
s A
mer
ican
Co
mm
unity
Sur
vey.
Typ
ical
Ho
usin
g:
Sing
le F
amily
Med
ian
Val
ue:
$92,
300
US
Med
ian:
$20
7,30
0

Hig
h
Low
TAPE
STRY
SEG
MEN
TATI
ON
TM
esri
.co
m/t
apes
try
SEG
ME
NT
DE
NSI
TYT
his
map
illu
stra
tes
the
den
sity
and
d
istr
ibut
ion
of
the
Smal
l To
wn
Sim
plic
ity
Tap
estr
y Se
gm
ent
by
hous
eho
lds.
Life
Mo
de
Gro
up: H
omet
own
Smal
l To
wn
Sim
plic
ity
12C
For
mo
re in
form
atio
n1-
800-
447-
9778
info
@es
ri.co
mes
ri.c
om
Co
pyr
ight
© 2
020
Esr
i. A
ll ri
ght
s re
serv
ed. E
sri,
the
Esr
i glo
be
log
o, T
apes
try,
@es
ri.c
om
, and
esr
i.co
m a
re t
rad
emar
ks, s
ervi
ce m
arks
, o
r re
gis
tere
d m
arks
of E
sri i
n th
e U
nite
d S
tate
s, t
he
Eu
rop
ean
Co
mm
uni
ty, o
r ce
rtai
n o
the
r ju
risd
icti
on
s. O
the
r co
mp
anie
s an
d
pro
duc
ts o
r se
rvic
es m
enti
one
d h
erei
n m
ay b
e tr
adem
arks
, ser
vice
mar
ks, o
r re
gis
tere
d m
arks
of t
heir
res
pec
tive
mar
k o
wne
rs.
G82
6513
ESR
I2C
1/20
ms

TAPE
STRY
SEG
MEN
TATI
ON
TM
esri
.co
m/t
apes
try
Ho
useh
old
s: 1
,908
,600
Ave
rag
e H
ous
eho
ld S
ize:
2.4
4
Med
ian
Ag
e: 4
7.4
Med
ian
Ho
useh
old
Inco
me:
$56
,400
Life
Mo
de
Gro
up: C
ozy
Cou
ntry
Liv
ing
The
Gre
at O
utdo
ors
WH
O A
RE
WE
?Th
ese
neig
hbo
rho
od
s ar
e fo
und
in p
asto
ral s
etti
ngs
thro
ugho
ut t
he U
nite
d S
tate
s. C
onsu
mer
s ar
e ed
ucat
ed
emp
ty n
este
rs li
ving
an
activ
e b
ut m
odes
t lif
esty
le. T
heir
focu
s is
land
. The
y ar
e m
ore
likel
y to
inve
st in
real
est
ate
or a
vac
atio
n ho
me
than
sto
cks.
The
y ar
e ac
tive
gar
den
ers
and
par
tial
to
ho
meg
row
n an
d h
om
e-co
oke
d m
eals
. A
lthou
gh
retir
emen
t b
ecko
ns, m
ost
of t
hese
resi
den
ts s
till
wor
k, w
ith in
com
es s
light
ly a
bov
e th
e U
S le
vel.
OU
R N
EIG
HB
OR
HO
OD
• O
ver 5
5% o
f hou
seho
lds
are
mar
ried-
coup
le
fa
mili
es; 3
6% a
re c
oup
les
with
no
child
ren
livin
g a
t ho
me.
• A
vera
ge
hous
ehol
d s
ize
is s
light
ly
sm
alle
r at
2.4
4.
• Ty
pic
al o
f are
as w
ith r
ustic
ap
pea
l, th
e
ho
usin
g in
vent
ory
feat
ures
sin
gle
-fam
ily
ho
mes
(77%
) and
mob
ile h
omes
(15%
);
a si
gni
fican
t in
vent
ory
of s
easo
nal h
ousi
ng
is
ava
ilab
le (I
ndex
397
).
• Re
sid
ents
live
in s
mal
l tow
ns a
nd r
ural
com
mun
ities
thr
oug
hout
the
Wes
t, S
outh
,
and
Nor
thea
st re
gio
ns o
f the
cou
ntry
.
• M
ore
than
hal
f of a
ll ho
mes
wer
e
cons
truc
ted
bet
wee
n 19
70 a
nd 2
000.
• M
ost
hous
ehol
ds
have
one
or
two
vehi
cles
;
aver
age
trav
el ti
me
to w
ork
is s
light
ly h
ighe
r
(28
min
utes
) des
pite
a d
isp
rop
ortio
nate
num
ber
tha
t w
ork
from
hom
e (In
dex
149
).
SOC
IOE
CO
NO
MIC
TR
AIT
S•
60%
hav
e at
tend
ed c
olle
ge
or h
old
a d
egre
e.
• U
nem
plo
ymen
t is
low
er a
t 4.
8% (I
ndex
88)
,
but
so
is la
bor
forc
e p
artic
ipat
ion
at 6
0%.
• Ty
pic
al o
f nei
ghb
orho
ods
with
old
er
resi
den
ts, i
ncom
e fr
om re
tirem
ent
and
Soci
al S
ecur
ity is
com
mon
, but
resi
den
ts
al
so d
eriv
e in
com
e fr
om s
elf-
emp
loym
ent
and
inve
stm
ents
.
• Re
sid
ents
are
ver
y d
o-it-
your
self
orie
nted
and
cos
t co
nsci
ous.
• M
any
serv
ice
thei
r ow
n au
tos,
wor
k on
hom
e im
pro
vem
ent
and
rem
odel
ing
p
roje
cts,
and
mai
ntai
n th
eir
own
yard
s.
• Th
ey p
refe
r d
omes
tic t
rave
l to
trip
s ab
road
.
Not
e: T
he In
dex
rep
rese
nts
the
ratio
of t
he s
egm
ent
rate
to
the
US
rate
mul
tiplie
d b
y 10
0.
Con
sum
er p
refe
renc
es a
re e
stim
ated
from
dat
a b
y G
fK M
RI.
6C

TAPE
STRY
SEG
MEN
TATI
ON
TM
esri
.co
m/t
apes
try
Life
Mo
de
Gro
up: C
ozy
Cou
ntry
Liv
ing
The
Gre
at O
utdo
ors
6C 85+
80–8
475
–79
70–7
465
–69
60–6
455
–59
50–5
445
–49
40–4
435
–39
30–3
425
–29
20–2
415
–19
10–1
45–
9<5
8%
4%
0
4
%
8%
Mal
eFe
mal
e
Med
ian
Ho
useh
old
Inco
me
Med
ian
Net
Wo
rth
$56,100
$93,300
$56,400
$156,600
$0$1
00,000
$200
,000
$300
,000
$400
,000
$500
,000
$600
,000
EsriMed
ianHH
Income
EsriMed
ianNetW
orth
Serie
s2Serie
s1
$56,100
$93,300
$56,400
$156,600
$0$1
00,000
$200
,000
$300
,000
$400
,000
$500
,000
$600
,000
EsriMed
ianHH
Income
EsriMed
ianNetW
orth
Serie
s2Serie
s1
Ho
usin
g
Foo
d
Ap
par
el &
Ser
vice
s
Tran
spo
rtat
ion
Hea
lth
Car
e
Ent
erta
inm
ent
&R
ecre
atio
n
Ed
ucat
ion
Pen
sio
ns &
Soci
al S
ecur
ity
Oth
er
0.0%0.5%
1.0%1.5%
2.0%2.5%
3.0%3.5%
4.0%4.5%
5.0%
MaleAge0-4
MaleAge5-9
MaleAge10-
14
MaleAge15-
19
MaleAge20-
24
MaleAge25-
29
MaleAge30-
34
MaleAge35-
39
MaleAge40-
44
MaleAge45-
49
MaleAge50-
54
MaleAge55-
59
MaleAge60-
64
MaleAge65-
69
MaleAge70-
74
MaleAge75-
79
MaleAge80-
84
MaleAge85+
AgebySex-M
ale
Series2Series1
0.0%0.5%
1.0%1.5%
2.0%2.5%
3.0%3.5%
4.0%4.5%
5.0%
FemaleAge
0-4
FemaleAge
5-9
FemaleAge
10-14
FemaleAge
15-19
FemaleAge
20-24
FemaleAge
25-29
FemaleAge
30-34
FemaleAge
35-39
FemaleAge
40-44
FemaleAge
45-49
FemaleAge
50-54
FemaleAge
55-59
FemaleAge
60-64
FemaleAge
65-69
FemaleAge
70-74
FemaleAge
75-79
FemaleAge
80-84
FemaleAge
85+
ChartTitle
Series2S
eries1
INC
OM
E A
ND
NE
T W
OR
THN
et w
orth
mea
sure
s to
tal h
ouse
hold
ass
ets
(hom
es, v
ehic
les,
in
vest
men
ts, e
tc.)
less
any
deb
ts, s
ecur
ed (e
.g.,
mor
tgag
es)
or
un
secu
red
(cr
ed
it c
ard
s).
Ho
use
ho
ld in
com
e a
nd
net
wo
rth
are
estim
ated
by
Esr
i.
OC
CU
PATI
ON
BY
EA
RN
ING
STh
e fi v
e o
ccup
atio
ns w
ith t
he h
ighe
st n
umb
er o
f wo
rker
s in
the
mar
ket
are
dis
pla
yed
by
med
ian
earn
ing
s. D
ata
fro
m t
he C
ensu
s B
urea
u’s
Am
eric
an C
om
mun
ity S
urve
y.
AV
ER
AG
E H
OU
SEH
OLD
BU
DG
ET
IND
EX
The
ind
ex c
om
par
es t
he a
vera
ge
amo
unt
spen
t in
thi
s m
arke
t’s h
ous
eho
ld b
udg
ets
for
hous
ing
, fo
od
, ap
par
el, e
tc.,
to t
he a
vera
ge
amo
unt
spen
t b
y al
l US
hous
eho
lds.
An
ind
exo
f 100
is a
vera
ge.
An
ind
ex o
f 120
sho
ws
that
ave
rag
e sp
end
ing
by
cons
umer
s in
thi
s m
arke
tis
20
per
cent
ab
ove
the
nat
iona
l ave
rag
e. C
ons
umer
exp
end
iture
s ar
e es
timat
ed b
y E
sri.
AG
E B
Y S
EX
(Esr
i dat
a)
Med
ian
Ag
e: 4
7.4
US:
38.
2
In
dic
ates
US
RA
CE
AN
D E
THN
ICIT
Y (E
sri d
ata)
The
Div
ersi
ty In
dex
sum
mar
izes
rac
ial a
nd e
thni
c d
iver
sity
. The
ind
ex
sho
ws
the
likel
iho
od
tha
t tw
o p
erso
ns, c
hose
n at
ran
do
m fr
om
the
sa
me
area
, bel
ong
to
diff
eren
t ra
ce o
r et
hnic
gro
ups.
The
ind
ex
rang
es fr
om
0 (n
o d
iver
sity
) to
100
(co
mp
lete
div
ersi
ty).
Div
ersi
ty In
dex
: 35.
6 U
S: 6
4.0
His
pan
ic*
Mul
tiple
Oth
er
Asi
an a
ndPa
c. Is
land
erA
mer
ican
Ind
ian
Bla
ck
Whi
te
$140
,000
$120
,000
$100
,000
$80,
000
$60,
000
$40,
000
$20,
000 0
1
00,0
00
2
20
0,00
0
6
300
,000
*His
pan
ic C
an B
e of
Any
Rac
e.
0
2
0%
40%
6
0%
80%
10
0%
0
$
100K
$
200K
$
300K
$
400K
$
500K
$
600K
+
0
$
100K
$
200K
$
300K
$
400K
$
500K
$
600K
+U
S A
vera
ge.
US
Med
ian.
Median Earnings
Wo
rker
s (A
ge
16+
)
92 93
89
98 104
99
78
93 97
0
5
0
10
0
150
200
2
50
30
0
350

Own
77.5%
Ren
t22
.5%
ChartT
itle
Own
Rent
Ho
me
Ow
ners
hip
US
Perc
enta
ge:
62.7
% O
wn
37.3
% R
ent
Po
pul
atio
n
Po
pul
atio
n G
row
th (A
nnua
l %)
Po
pul
atio
n D
ensi
ty (P
erso
ns p
er s
q. m
ile)
350
350
350
0 0 0
900,
000
-0.5
%
0
11,
000,
000
3.0%
25,0
00
4,74
5,30
0
0.8%
1000
Wea
lth
Ind
ex
Soci
oec
ono
mic
Sta
tus
Ind
ex
Ho
usin
g A
ffo
rdab
ility
Ind
ex
122
109
113
18
TAPE
STRY
SEG
MEN
TATI
ON
TM
esri
.co
m/t
apes
try
MA
RK
ET
PR
OFI
LE (C
onsu
mer
pre
fere
nces
are
est
imat
ed fr
om d
ata
by
GfK
MRI
)
• Sa
telli
te d
ishe
s an
d r
idin
g la
wn
mow
ers
are
fam
iliar
sig
hts
in t
hese
rur
al s
ettin
gs,
alon
g w
ith m
ultip
le v
ehic
les;
four
-whe
el d
rive
truc
ks a
re p
opul
ar, t
oo.
• Re
sid
ents
are
mem
ber
s of
AA
RP a
nd v
eter
ans’
clu
bs
and
sup
por
t va
rious
civ
ic c
ause
s.
• Te
chno
log
y is
not
cen
tral
in t
heir
lives
: lig
ht u
se o
f Int
erne
t co
nnec
tivity
for
shop
pin
g
to
ent
erta
inm
ent.
• M
ost
hous
ehol
ds
have
pet
s—d
ogs
or c
ats.
• Te
levi
sion
cha
nnel
s su
ch a
s C
MT,
His
tory
, and
Fox
New
s ar
e p
opul
ar.
• Th
ey e
njoy
out
doo
r ac
tiviti
es s
uch
as h
ikin
g, h
untin
g, f
ishi
ng, a
nd b
oatin
g.
ESR
I IN
DE
XE
SE
sri d
evel
op
ed t
hree
ind
exes
to
dis
pla
y av
erag
e ho
useh
old
wea
lth, s
oci
oec
ono
mic
sta
tus,
an
d h
ous
ing
affo
rdab
ility
for
the
mar
ket
rela
tive
to U
S st
and
ard
s.
PO
PU
LATI
ON
CH
AR
AC
TER
ISTI
CS
Tota
l po
pul
atio
n, a
vera
ge
annu
al p
op
ulat
ion
chan
ge
sinc
e C
ensu
s 20
10, a
nd a
vera
ge
den
sity
(po
pul
atio
n p
er s
qua
re m
ile) a
re d
isp
laye
d fo
r th
e m
arke
t re
lativ
e to
the
siz
e an
d c
hang
e am
ong
all
Tap
estr
y m
arke
ts. D
ata
estim
ated
by
Esr
i.
Life
Mo
de
Gro
up: C
ozy
Cou
ntry
Liv
ing
The
Gre
at O
utdo
ors
6C
HO
USI
NG
Med
ian
hom
e va
lue
is d
isp
laye
d fo
r m
arke
ts t
hat
are
prim
arily
o
wne
r o
ccup
ied
; ave
rag
e re
nt is
sho
wn
for
rent
er-o
ccup
ied
mar
kets
. Te
nure
and
ho
me
valu
e ar
e es
timat
ed b
y E
sri.
Ho
usin
g t
ype
and
ave
rag
e re
nt a
re fr
om
the
Cen
sus
Bur
eau’
s A
mer
ican
Co
mm
unity
Sur
vey.
Typ
ical
Ho
usin
g:
Sing
le F
amily
Med
ian
Val
ue:
$239
,500
US
Med
ian:
$20
7,30
0

Hig
h
Low
TAPE
STRY
SEG
MEN
TATI
ON
TM
esri
.co
m/t
apes
try
SEG
ME
NT
DE
NSI
TYT
his
map
illu
stra
tes
the
den
sity
and
d
istr
ibut
ion
of
the
The
Gre
at O
utd
oo
rs
Tap
estr
y Se
gm
ent
by
hous
eho
lds.
Life
Mo
de
Gro
up: C
ozy
Cou
ntry
Liv
ing
The
Gre
at O
utdo
ors
6C
For
mo
re in
form
atio
n1-
800-
447-
9778
info
@es
ri.co
mes
ri.c
om
Co
pyr
ight
© 2
020
Esr
i. A
ll ri
ght
s re
serv
ed. E
sri,
the
Esr
i glo
be
log
o, T
apes
try,
@es
ri.c
om
, and
esr
i.co
m a
re t
rad
emar
ks, s
ervi
ce m
arks
, o
r re
gis
tere
d m
arks
of E
sri i
n th
e U
nite
d S
tate
s, t
he
Eu
rop
ean
Co
mm
uni
ty, o
r ce
rtai
n o
the
r ju
risd
icti
on
s. O
the
r co
mp
anie
s an
d
pro
duc
ts o
r se
rvic
es m
enti
one
d h
erei
n m
ay b
e tr
adem
arks
, ser
vice
mar
ks, o
r re
gis
tere
d m
arks
of t
heir
res
pec
tive
mar
k o
wne
rs.
G82
6513
ESR
I2C
1/20
ms

Town of Cairo Economic Development Corridor Study: Opportunities & Constraints Analysis
Delaware Engineering, D.P.C.
Attachment 9. Environmental Features Map


_̂
Source: Esri, Maxar, GeoEye, Earthstar Geographics, CNES/Airbus DS, USDA, USGS, AeroGRID,IGN, and the GIS User Community
State Route 23State Route 32
County Route 23B
Main Street
State Route 23
COM
Prepared by: Delaware Engineering, D.P.C.Date: December 2020Source: Greene County RPS Parcel Data;NYS Civil Boundaries; NWI Wetlands; NYSDEC Wetlands;Economic Development Corridor Study Area;NYS Aquifer Data; NYS Classified Streams
Ü0 500 1,000 1,500 2,000
Feet
1 inch = 875 feet
Legend
Environmental Features
Economic Development Corridor Study AreaEconomic Development Study ParcelsCairo Parcels
Schneider Delineated WetlandsStreamsNWI WetlandsAquifers
NYSDEC WetlandsNYSDEC Wetland Checkzones
Economic Development Corridor StudyTown of CairoGreene County, New York
ENVIRONMENTAL FEATURES MAP
Potential Site ofByas Farm Well
Site 1Site 2
Site 3
Bross StreetBr
oss S
treet
Ca t s k i ll
C r e e k
High Yeild Aquifer>100 gal/min
ACOE Delineated Wetlands(Copeland Environmental, LLC)
Attachment 9
Attachment 9


Town of Cairo Economic Development Corridor Study: Opportunities & Constraints Analysis
Delaware Engineering, D.P.C.
Attachment 10. FEMA Flood Map


_̂
Source: Esri, Maxar, GeoEye, Earthstar Geographics, CNES/Airbus DS, USDA, USGS, AeroGRID,IGN, and the GIS User Community
State Route 23
State Route 32
CR 23B
Main Street
COM
Prepared by: Delaware Engineering, D.P.C.Date: December 2020Source: Greene County RPS Parcel Data;NYS Civil Boundaries; FEMA Flood Maps;Economic Development Corridor Study Area
Ü0 280 560 840 1,120
Feet
1 inch = 930 feet
Legend
FEMA Flood Data
Economic Development Corridor Study AreaEconomic Development Study ParcelsCairo Parcels
Economic Development Corridor StudyTown of CairoGreene County, New York
FEMA FLOOD MAP
Bross Street
Floodway100-Year Flood Zone (A)500-Year Flood Zone (Z)
Bros
s Stre
et
Site 3
Site 1
Site 2
Attachment 10
Attachment 10
Potential Site ofByas Farm Well


Town of Cairo Economic Development Corridor Study: Opportunities & Constraints Analysis
Delaware Engineering, D.P.C.
Attachment 11. Economic Development Corridor Study Zoning Map


Source: Esri, Maxar, GeoEye, Earthstar Geographics, CNES/Airbus DS, USDA, USGS, AeroGRID,IGN, and the GIS User Community
COM
MS-COM
H-C
RR
RR
MS
M
M
H-C
C-MU
M
COM
COM
State Route 32
County Route 23B
Main Street
State Route 23
COM
Prepared by: Delaware Engineering, D.P.C.Date: December 2020Source: Greene County RPS Parcel Data;Town of Cairo Zoning 2017; NYS Civil Boundaries;Economic Development Corridor Study Area
Ü0 260 520 780 1,040
Feet
1 inch = 875 feet
RRRR
RR
M
Legend
Cairo Zoning
Economic Development Corridor Study AreaEconomic Development Study ParcelsCairo Parcels
CMU: Commercial Mixed UseCOM: CommercialHC: Hamlet CairoM: Municipal
MS: Main StreetMSCOM: Main Street CommercialMT: Mountain DistrictRR: Rural Residential
MT
Economic Development Corridor StudyTown of CairoGreene County, New York
ZONING MAP
Site 3
Site 1
Site 2
Attachment 11
Attachment 11


Town of Cairo Economic Development Corridor Study: Opportunities & Constraints Analysis
Delaware Engineering, D.P.C.
Attachment 12. Economic Development Corridor Study Land Use Map


Source: Esri, Maxar, GeoEye, Earthstar Geographics, CNES/Airbus DS, USDA, USGS, AeroGRID,IGN, and the GIS User Community
Bross Street
State Route 32
County Route 23B
Main Street
State Route 23
COM
Prepared by: Delaware Engineering, D.P.C.Date: December 2020Source: Greene County RPS Parcel Data;NYS Civil Boundaries;Economic Development Corridor Study Area
Ü0 260 520 780 1,040
Feet
1 inch = 875 feet
Legend
RPS Property Class
Economic Development Corridor Study AreaEconomic Development Study ParcelsCairo Parcels
Agricutural - 100Residential - 200Vacant - 300Apartments - 411
Commercial - 400Rec. & Entertainment - 500Community Services - 600Public Services - 800
Economic Development Corridor StudyTown of CairoGreene County, New York
LAND USE MAP
Bross Street
Site 3
Site 1
Site 2
Attachment 12
Attachment 12


Town of Cairo Economic Development Corridor Study: Opportunities & Constraints Analysis
Delaware Engineering, D.P.C.
Attachment 13. Greene County Agricultural District Map


Ag 124
540000
540000
550000
550000
560000
560000
570000
570000
580000
580000
590000
590000
600000
600000
4660
000
4660
000
4670
000
4670
000
4680
000
4680
000
4690
000
4690
000
4700
000
4700
000
New York State Dept ofAgriculture and Markets
GREENE COUNTY
KEYAg. District 124
MAP PROJECTIONUTM Zone 18, NAD83 meters O
5 0 54 3 2 1 miles
10,000 0 10,0005,000 meters
DISCLAIMERThis is a general reference to Agricultural Districtboundaries; not a legal substitute for actual tax parcel information.
Boundaries as certified prior to January 2013
Open Enrollment Annual Additions are not included in this data.Check with county agencies to confirm the status of individualparcels.
MAP SOURCEINFORMATIONMap created at Cornell IRIS(Institute for ResourceInformation Sciences)<http://iris.css.cornell.edu>for the NYS Department ofAgriculture and Markets
Agricultural Districts boundary data is available at CUGIR (Cornell University Geospatial Information Repository) website:<http://cugir.mannlib.cornell.edu>
Contains data copyrightedby the NYS Office of Cyber Security
Base Map: state250_bw.tif 1998Scale: 1:250,000; Countyboundaries imported from thefile nyshore.e00 from the NYSGIS Clearinghouse website: <http://gis.ny.gov>
DISTRICT 124CERTIFIED 4/27/2012 Ashland Athens Cairo Catskill Coxsackie Durham Greenville Halcott Hunter Jewett Lexington New Baltimore Prattsville Windham
DISTRICT 124
DISTRICTCERTIFICATIONand TOWNS
Agricultural Districts 2013


Town of Cairo Economic Development Corridor Study: Opportunities & Constraints Analysis
Delaware Engineering, D.P.C.
Attachment 14. Economic Development Site #1: Schneider Conceptual Plan


Town of Cairo Economic Development Corridor Study: Opportunities & Constraints Analysis
Delaware Engineering, D.P.C.
Attachment 15. Economic Development Site #2: Buel Conceptual Plan


Town of Cairo Economic Development Corridor Study: Opportunities & Constraints Analysis
Delaware Engineering, D.P.C.
Attachment 16. Economic Development Site #3: School-Owned/Miller Conceptual Plan


Town of Cairo Economic Development Corridor Study: Opportunities & Constraints Analysis
Delaware Engineering, D.P.C.
Attachment 17. Water System Map


Town of Cairo Economic Development Corridor Study: Opportunities & Constraints Analysis
Delaware Engineering, D.P.C.
Attachment 18. Byas Farm Well Site Map


!(
!(
!(
!(
!(!(
!(
!(!(
!(
$1
$1
$1
$1
$1$1
$1$1
$1
$1
$1$1
$1
$1
$1$1
$1$1 $1
$1
$1
$1
$1
$1
$1$1 $1
$1
$1
$1
$1$1
$1
$1
$1
$1
$1
$1
$1$1
_̂
Source: Esri, Maxar, GeoEye, Earthstar Geographics, CNES/Airbus DS, USDA, USGS, AeroGRID,IGN, and the GIS User Community
State R
oute
32
Coun
ty Ro
ute 23
BSta
te Ro
ute 23
COM
Prepared by: Delaware Engineering, D.P.C.Date: December 2020Source: Greene County RPS Parcel Data;NYS Civil Boundaries; NWI Wetlands;Economic Development Corridor Study Area;NYSDEC Wetlands; NYSDEC Checkzones; NYS Aquifers; NYS Classified Streams;Town of Cairo Water and Sewer Data
Ü
0 425 850
Feet
1 inch = 425 feet
LegendEconomic Development Corridor Study AreaCairo Parcels
Economic Development Corridor StudyTown of CairoGreene County, New York
Byas Farm Well Site
Potential Site ofByas Farm Well
Byas Farm Parcel
C a ts k i l l
C r e e k
Town of CairoExisting Water & Sewer Systems
High Yeild Aquifer>100 gal/min
Environmental FeaturesAquifers Water Lines
Sewer Lines
Infrastructure
Main
Stree
t
Attachment 18
Attachment 18
Proposed Water Main ExtensionLocation: Southwest side of Main Street
Diameter: 12-Inch Ductile Iron PipeLength: 5,300 Feet
*Directional Bore Under Highway*
")
Sewer Pump Station")


Town of Cairo Economic Development Corridor Study: Opportunities & Constraints Analysis
Delaware Engineering, D.P.C.
Attachment 19. Cedar Terrace Well Site Map


Source: Esri, Maxar, GeoEye, Earthstar Geographics, CNES/Airbus DS, USDA, USGS, AeroGRID,IGN, and the GIS User Community
Coun
ty Ro
ute 8
5
Main Street
COM
Prepared by: Delaware Engineering, D.P.C.Date: December 2020Source: Greene County RPS Parcel Data;NYS Civil Boundaries; NWI Wetlands;Economic Development Corridor Study Area;NYS Aquifers; NYS Classified Streams;Town of Cairo Water and Sewer Data
Ü0 125 250
Feet
1 inch = 125 feet
LegendCairo Parcels
Economic Development Corridor StudyTown of CairoGreene County, New York
Cedar Terrace Well Site
Parcel No.: 101.00-1-2.2Size: 7.9 Acres
Property Class: 411, Commercial/Apartments
Cedar Terrace Well Parcel
Cedar Terrace Well
Environmental FeaturesStreamsNWI WetlandsAquifers
Water LinesSewer Lines
Infrastructure
County Route 84
Main Street
Jero
me Av
enue
S h i n g l eK i l l
Cr e e k
_̂
AquiferUnknown Yeild
Attachment 19
Attachment 19


Town of Cairo Economic Development Corridor Study: Opportunities & Constraints Analysis
Delaware Engineering, D.P.C.
Attachment 20. Reservoir Well Site Map


Source: Esri, Maxar, GeoEye, Earthstar Geographics, CNES/Airbus DS, USDA, USGS, AeroGRID,IGN, and the GIS User Community
State Route 23
COM
Prepared by: Delaware Engineering, D.P.C.Date: December 2020Source: Greene County RPS Parcel Data; NYS Civil Boundaries; NYS Aquifers; Town of Cairo Water and Sewer Data
Ü
0 350 700
Feet
LegendCairo Parcels
Economic Development Corridor StudyTown of CairoGreene County, New York
Reservoir Well Site
Parcel: 83.00-5-10Owner: Town of CairoSize: 26.7 AcresProp. Class: 822, Public Services/Water Supply
Reservoir Well ParcelEnvironmental Features
Aquifers
Water LinesInfrastructure
Main
Stree
t
1 inch = 350 feet
State
Route
145
County
Route 8
4
Town of CairoWater Storage Tank
Reservoir
Attachment 20
Attachment 20
AquiferYeild Unknown


Town of Cairo Economic Development Corridor Study: Opportunities & Constraints Analysis
Delaware Engineering, D.P.C.
Attachment 21. Sewer System Map


Town of Cairo Economic Development Corridor Study: Opportunities & Constraints Analysis
Delaware Engineering, D.P.C.
APPENDICES


Town of Cairo Economic Development Corridor Study: Opportunities & Constraints Analysis
Delaware Engineering, D.P.C.
Appendix 1. Schneider Reports: Project Feasibility and Geotechnical Report Excerpts


REPORT C OVER PAGE
Preliminary Geotechnical Engineering Report
__________________________________________________________________________
Proposed Distribution Center Cairo, New York
November 8, 2019 Terracon Project No. JB195077
Prepared for:
NAI Platform Albany, New York
Prepared by:
Terracon Consultants-NY, Inc. Dba Dente Group
Watervliet, New York

Dente Group - A Terracon Company 594 Broadway Watervl iet, New York 12189
P (518) 266 0310 F (518) 266 9238 terracon.com
REPORT C OVER LETTER TO SIGN
November 8, 2019
NAI Platform 14 Corporate Woods Boulevard, Suite 100 Albany, New York 12210
Attn: Mr. Daniel Slote P: (518) 322-9752 E: [email protected]
Re: Preliminary Geotechnical Engineering Report Proposed Distribution Center NYS Route 23 Cairo, New York Terracon Project No. JB195077
Dear Mr. Slote:
We have completed the Preliminary Geotechnical Engineering services for the above-referenced project. This study was performed in general accordance with Dente Group proposal no. PJB195077 dated April 11, 2019. This report presents the findings of the subsurface exploration and provides geotechnical recommendations concerning earthwork and the design and construction of foundations, floor slabs, and pavements for the proposed project.
We appreciate the opportunity to be of service to you on this project. If you have any questions concerning this report or if we may be of further service, please contact us.
Sincerely, Terracon Consultants-NY, Inc.
John S. Hutchison, P.E. Fred A. Dente, P.E. Senior Engineer Principal

Responsive ■ Resourceful ■ Reliable i
REPORT TOPICS
INTRODUCTION ............................................................................................................. 1 SITE CONDITIONS ......................................................................................................... 1 PROJECT DESCRIPTION .............................................................................................. 2 SUBSURFACE CHARACTERIZATION ......................................................................... 2 GEOTECHNICAL OVERVIEW ....................................................................................... 3 SEISMIC CONSIDERATIONS ........................................................................................ 5 EARTHWORK ................................................................................................................ 6 SHALLOW FOUNDATIONS ........................................................................................... 8 FLOOR SLABS ............................................................................................................ 10 PAVEMENTS ................................................................................................................ 10 GENERAL COMMENTS ............................................................................................... 12 FIGURES ...................................................................................................................... 13
Note: This report was originally delivered in a web-based format. Orange Bold text in the report indicates a referenced section heading. The PDF version also includes hyperlinks which direct the reader to that section and clicking on the GeoReport logo will bring you back to this page. For more interactive features, please view your project online at client.terracon.com. ATTACHMENTS
EXPLORATION AND TESTING PROCEDURES PHOTOGRAPHY LOG SITE LOCATION AND EXPLORATION PLANS EXPLORATION RESULTS SUPPORTING INFORMATION
Note: Refer to each individual Attachment for a listing of contents.

Responsive ■ Resourceful ■ Reliable 1
INTRODUCTION
Preliminary Geotechnical Engineering Report Proposed Distribution Center
NYS Route 23 Cairo, New York
Terracon Project No. JB195077 November 8, 2019
INTRODUCTION
This report presents the results of our subsurface exploration and geotechnical engineering evaluation performed for the proposed Surgery Center to be located off NYS Route 23 in Cairo, New York. The purpose of these services is to provide information and geotechnical engineering recommendations relative to:
■ Subsurface soil conditions ■ Foundation design and construction
■ Groundwater conditions ■ Floor slab design and construction
■ Site preparation and earthwork ■ Seismic site classification per NYSBC ■ Excavation considerations ■ Pavement design and construction
The geotechnical engineering Scope of Services for this project included the advancement of ten test borings, to depths ranging from 1.2 to 7.0 feet below existing site grades. Note that this report is preliminary in scope, and final design should be based on a more thorough and comprehensive investigation commensurate with the scale of the project when site and grading plans are more fully developed.
Maps indicating the site and test boring locations are included as the attached Site Location and Exploration Plans, respectively.
SITE CONDITIONS
The project site is located east of NYS Route 23 and south of Bross Street in Cairo, New York. The site is some 100 acres or more in size and is for the most part wooded and undeveloped. An overhead utility line easement traverses the site along its west side. Survey mapping by others identifies some isolated wetland areas across the property, and USGS topographic mapping indicates terrain which in general slopes gently upward to the east between the elevations of roughly 400 and 430 feet across much of the site. At its northeast corner, grades drop off rather abruptly between the elevations of about 430 and 380 feet.
A representative from our office made a site reconnaissance on May 28, 2019 and collected photographs of the general site conditions. The photos are provided in our Photography Log.

Preliminary Geotechnical Engineering Report Proposed Distribution Center ■ Cairo, New York November 8, 2019 ■ Terracon Project No. JB195077
Responsive ■ Resourceful ■ Reliable 2
PROJECT DESCRIPTION
As we understand it, the project entails construction of a new, one-story, slab on grade warehouse building, along with associated concrete aprons, paved parking and stormwater management areas. Current plans show a main warehouse/distribution building with an overall plan area of about 1,100,000 ft2 and a second warehouse building with a footprint of about 100,000 ft2 south of the main building. Because the project is currently in the concept stage, a topographic survey of the site was unavailable, and proposed finished floor elevation and site grading had not yet been established. Anticipated foundation, floor loading and traffic volumes were also unavailable.
SUBSURFACE CHARACTERIZATION
We have developed a general characterization of the subsurface conditions based upon our review of the subsurface exploration, geologic setting and our understanding of the project. This characterization, termed GeoModel, forms the basis of our geotechnical analysis and evaluation of site preparation and foundation options. Conditions encountered at each exploration point are indicated on the individual test boring logs. The logs can be found in the Exploration Results section and the GeoModel can be found in the Figures section of this report.
The following model layers were identified within the subsurface profile. For a more detailed view of the model layer depths at each boring location, refer to the GeoModel.
Model Layer Layer Name General Description 1 Surface Material Topsoil
2 Glacial Till Silty sand with gravel, occasional to frequent cobbles and boulders, silt and/or clay portions occasionally predominant.
3 Weathered Rock Gray to red sandstone exhibiting significant weathering 4 Rock Gray sandstone, moderately weathered
The native soils as revealed by the test borings were glacial deposits generally composed of silty and/or gravelly sand with lesser amounts of clay, along with occasional to frequent cobbles and boulders. These soils were judged to be loose to medium dense as indicated by measured SPT N-values. The overburden soils were found to be no more than a few feet thick, and mantle bedrock at relatively shallow depth across the site.
All the boreholes completed for this study met refusal, at depths ranging from 1.2 to 6.2 feet below the existing ground surface. While the refusals appear to be an indication the bedrock surface was reached (or nearly reached), they may have been caused by cobbles and boulders overlying bedrock in some instances. It was also noted the upper few feet of bedrock were substantially weathered in places, where the drill’s augers were able to be penetrate beneath its surface.

Preliminary Geotechnical Engineering Report Proposed Distribution Center ■ Cairo, New York November 8, 2019 ■ Terracon Project No. JB195077
Responsive ■ Resourceful ■ Reliable 3
Confirmatory rock core sampling was performed at boreholes B-2 and B-6 and the core samples retrieved indicate the bedrock consists of sandstone which is relatively hard and generally thin bedded. Measured RQD ranged from 0 to 13 percent. For information purposes, the Geologic Map of New York – Hudson-Mohawk Sheet (New York State Education Department – 1970) indicates that bedrock beneath the project area generally consists of sandstones and shales of the Hamilton group.
No measurable groundwater was present in the boreholes as they were drilled or upon completion of sampling (prior to any rock coring), nor were any wet soil samples recovered. It therefore appears that groundwater was scarce or absent within the depths explored at the time of investigation.
Nevertheless, locally perched or trapped water may be present at times, and as previously noted, some isolated areas across the site are mapped as wetlands. Groundwater conditions, and the extent of any perched water, should be expected to vary with seasonal fluctuations in precipitation and runoff.
GEOTECHNICAL OVERVIEW
General
From a geotechnical perspective, the project site is considered suitable for the planned construction using conventional shallow spread foundations to support the building along with standard slab-on-grade design.
The most significant factors which will impact on the planning for the site design and construction include the bulk cut and fill work required to level the sloping site and the possible rock excavation or borrow soil import which may be necessary. Any cuts will be predominantly within glacial till soils and sandstone bedrock, both of which can be reused as site fill and backfill when following the guideline recommendations presented subsequently.
The glacial till encountered across the site, if excavated to achieve planned grades, may be reused as a source of structural and general fill (although it is noted that not much overburden is present atop the bedrock). It should be understood these soils have a substantial quantity of fine-textured sand and silt and a lesser amount clay and thus will have a very narrow moisture content within which they will be easily compactible. The soils will likely require moisture modification and possibly amendment with lime or kiln dust to bring and maintain their moisture content within ranges necessary to achieve their compaction. Should site development proceed during seasonally wet periods, it will likely be difficult to adequately dry the cut soils and the use of an imported granular fill may become necessary.

Preliminary Geotechnical Engineering Report Proposed Distribution Center ■ Cairo, New York November 8, 2019 ■ Terracon Project No. JB195077
Responsive ■ Resourceful ■ Reliable 4
Where excavated bedrock is placed as fill to raise site grades, it will likely be necessary to crush and process the material to render it suitable for reuse. The material should be screened as necessary to exclude particles larger than four (4) inches and processed such that it is suitably dense graded.
Bedrock was encountered across the site at depths in the range of one to five feet below grade. The rock appears to be weathered near the surface, and while it may be possible to remove it for shallow depths of say a few feet using a large track-mounted backhoe equipped with rock teeth, controlled blasting should be planned to achieve its economical mass removal.
Controlled blasting should be performed by a NYS licensed contractor in a manner that limits the maximum peak particle velocity (PPV) to less than two inches per second (ips) at the property limits and less than 1-½ ips at the nearest adjacent residence or at levels required by the local utility company. In addition, the peak airblast overpressure must also be limited to less than 0.014 psi at the nearest adjacent occupied structure.
Except for the wetland areas, groundwater is not expected to be encountered across widespread areas or have a significant impact in the design and construction of cuts at the site. Groundwater in wetland areas, or any perched water elsewhere (which may be found seasonally in the upper few feet of soil and at or near the bedrock surface), should be diverted from the construction areas through swales and/or interceptor trenches, or otherwise removed as necessary.
Additional Cut and Fill Considerations
The following general guidelines may be assumed for preliminary planning purposes:
The bedrock may be cut as steep as 1V on 1.5H and be globally stable, however, the rock surface may weather and ravel to the slope toe over time. For these reasons the toe of rock cut slopes should be separated from the planned roadway shoulder to create a rock ravel/fall collection ditch. Cuts in the overburden soils should not exceed 1V on 2H.
During construction, excavated rock faces should be cleaned of all loose rock and soil, and thoroughly examined for any unfavorable bed and joint orientations which could create unstable rock masses. Should such unfavorable conditions be found, they should be remediated as appropriate.
Where excavations intercept the rock/overburden interface, we recommend the overburden be stripped back from the face between about five to ten feet to allow construction of a swale to collect runoff and direct it away from the rock face. Perched groundwater may also be intercepted by the cuts planned at this site, requiring the construction of fabric lined and stone filled drainage trenches upon the overburden slopes. Swales should be provided along the toe of all excavated slopes to collect and dispose of the waters.
Fills to raise site grades should be placed in lifts not exceeding one foot thick and should be compacted to at least 95 percent of the material’s maximum dry density as determined by ASTM D1557 (Modified Proctor compaction test). Embankment slopes constructed of the cut soil or bedrock

Preliminary Geotechnical Engineering Report Proposed Distribution Center ■ Cairo, New York November 8, 2019 ■ Terracon Project No. JB195077
Responsive ■ Resourceful ■ Reliable 5
materials should be graded no steeper than about 1V on 2.5H and should be protected from erosion. Runoff should not be allowed to traverse either the filled or excavated slopes at this site at any time.
Finally, even well compacted bulk fills consolidate over time and the effects this will have on the building will be dependent upon the site grades selected and the depths of the fills to be placed. For example, well compacted granular fill 20 feet in depth may consolidate causing settlements on the order of one-quarter (1/4) inch in three to four years and three-quarters (3/4) inch settlement in 15 to 20 years. This would be in addition to the estimated foundation and slab settlements presented subsequently.
The following sections of this report provide more detailed recommendations to assist in planning for the geotechnical related aspects of the project. It is again noted that this report is preliminary in scope, and final design should be based on a more thorough and comprehensive investigation commensurate with the scale of the project when plans are more fully developed.
In any event, we should be provided with the opportunity to review plans and specifications prior to their release for bidding to confirm that our recommendations were properly understood and implemented, and to allow us to refine our recommendations, if warranted, based upon the final design.
The General Comments section provides an understanding of the report limitations.
SEISMIC CONSIDERATIONS
The seismic design requirements for buildings and other structures are based on Seismic Design Category. Site Classification is required to determine the Seismic Design Category for a structure. The Site Classification is based on the upper 100 feet of the site profile defined by a weighted average value of either shear wave velocity, standard penetration resistance, or undrained shear strength in accordance with Section 20.4 of ASCE 7 and the International Building Code (IBC).
Seismic Site Classification
Based on the soil properties encountered at the site and as described on the test boring logs, it is our professional opinion that the Seismic Site Class will likely be either B where the sandstone bedrock immediately underlies the building or Site Class C where more than ten (10) feet of soil separates the building and the bedrock surface. Subsurface explorations at this site were extended to a maximum depth of 7.0 feet. The site properties below the boring depth to 100 feet were estimated based on our experience and knowledge of geologic conditions of the general area. Additional deeper borings or geophysical testing may be performed to confirm the conditions below the current boring depth.

Preliminary Geotechnical Engineering Report Proposed Distribution Center ■ Cairo, New York November 8, 2019 ■ Terracon Project No. JB195077
Responsive ■ Resourceful ■ Reliable 6
Liquefaction
Based upon the composition and relative density of the site soils, and other factors, their liquefaction is not expected to occur in response to earthquake motions.
EARTHWORK
Earthwork is anticipated to include clearing and grubbing, bulk cuts and fills, excavations and fill/backfill placement. The following sections provide recommendations for use in the preparation of specifications for the work. The recommendations include critical quality criteria as necessary to render the site suitable for construction of foundations, floor slabs and pavements.
Construction site safety is the sole responsibility of the contractor, who controls the means, methods, and sequencing of construction operations. Under no circumstances shall the information provided herein be interpreted to mean Terracon is assuming responsibility for construction site safety, or the contractor's activities; such responsibility shall neither be implied nor inferred.
Site Preparation
If possible, site preparation should be planned during a seasonal dry period to limit the adverse impacts of perched groundwater and soft subgrade conditions on construction. The contractor should take precautions to maintain the subgrades in a relatively dry and firm condition. This may include sloping of the subgrade surfaces to promote runoff away from the site, installation of interceptor trenches or drainage swales if necessary to divert surface runoff or perched groundwater away from the site, and restricting construction equipment from travelling directly over the subgrade soils when they are wet.
Site preparation should begin with clearing and stripping of all topsoil and surficial organic matter from the building pad and pavement areas. Any existing fill should be removed from beneath new foundations, along with any remains of former structures or otherwise unsuitable materials that may be found. The Geotechnical Engineer should observe the excavations to confirm that all unacceptable materials are removed.
Prior to placing fills to raise site grades and/or after cuts are made to the plan subgrade elevations, the building and pavement subgrades should be proof-rolled using a steel drum roller with a static weight of at least ten tons. The roller should operate in its non-vibratory mode, unless requested otherwise by the Geotechnical Engineer observing the work, and travel at a speed not exceeding three feet per second (two miles per hour). Soft areas identified by the proof-rolling should be investigated to determine the cause and stabilized accordingly.

Preliminary Geotechnical Engineering Report Proposed Distribution Center ■ Cairo, New York November 8, 2019 ■ Terracon Project No. JB195077
Responsive ■ Resourceful ■ Reliable 7
Fill Material Types
For preliminary planning purposes, it may be assumed that the excavated onsite soil and bedrock materials may be reused as fill and backfill beneath building and pavement areas (within the limitations and under the parameters described herein). The suitability for reuse of the materials should be confirmed by the Geotechnical Engineer at the time of construction based upon the conditions encountered. Onsite soils may require moisture conditioning or amendment with lime, kiln dust or Portland Cement to facilitate their compaction. All grade increases for support of foundations, parking areas, and roadways at the site should be made using structural fill. Structural fill should consist of either offsite borrow, or excavated onsite soil and/or crushed bedrock materials processed as necessary. The structural fill material, whether excavated, processed or imported, should be sound and durable, and also free of deleterious materials such as organics, pyritic rock, shale, or contaminants of a chemical, mineral, or biological nature. Structural Fill should meet the following gradation: 100% finer than the 4" sieve, between 30 and 70% finer than the #4 sieve, and less than 15% finer than the #200 sieve.
Fill Compaction Requirements
Both the onsite or imported Structural Fill should be placed in uniform loose layers no more than about one-foot thick where heavy vibratory compaction equipment is used. Smaller lifts should be used where hand operated equipment is required for compaction. Each lift should be compacted to no less than 95 percent of its maximum dry density as determined by the Modified Proctor compaction test, ASTM D1557. In landscape areas, the compaction requirement may be relaxed to 90 percent of maximum dry density.
Grading and Drainage
All grades must provide effective drainage away from the building during and after construction and should be maintained throughout the life of the structure. Water retained next to the building can result in soil movements greater than those discussed in this report. Excessive movements can result in unsatisfactory differential floor slab and/or foundation movements, cracked slabs and walls, and roof leaks.
Temporary Excavation Slopes
As a minimum, temporary excavations should be performed in accordance with OSHA 29 CFR, Part 1926, Subpart P, “Excavations” and its appendices for an OSHA Type C soil, and in accordance with any applicable local and/or state regulations. The contractor should be aware that slope height, slope inclination, and excavation depth should in no instance exceed OSHA regulations. Flatter slopes than those stipulated by the regulations or temporary shoring may be required depending upon the soil conditions encountered and other external factors. OSHA

Preliminary Geotechnical Engineering Report Proposed Distribution Center ■ Cairo, New York November 8, 2019 ■ Terracon Project No. JB195077
Responsive ■ Resourceful ■ Reliable 8
regulations are strictly enforced and if they are not followed, the owner, contractor, and/or earthwork and utility subcontractor could be liable and subject to substantial penalties.
Construction Observation and Testing
The earthwork efforts should be monitored under the direction of the Geotechnical Engineer. Monitoring should include documentation of adequate removal of vegetation, topsoil, and existing fills, proof-rolling and mitigation of any unstable areas revealed by the proof-roll.
Each lift of compacted fill should be tested, evaluated, and reworked, as necessary, until approved by the Geotechnical Engineer prior to placement of additional lifts. Each lift of fill should be tested for density and water content at a frequency of at least one test for every 2,500 square feet of compacted fill in the building areas. One density and water content test should be performed for every 50 linear feet of compacted utility trench backfill.
In areas of foundation excavations, the bearing subgrade should be evaluated under the direction of the Geotechnical Engineer. If unanticipated conditions are encountered, the Geotechnical Engineer should prescribe mitigation options.
It should be understood the actual subsurface conditions that exist will only be known when the site is excavated. The continuation of the Geotechnical Engineer into the construction phase of the project will allow for validation of the subsurface conditions assumed to exist for this study and the design parameters recommended in this report, including assessing variations, providing recommendations and reviewing associated design changes.
SHALLOW FOUNDATIONS
If the site has been prepared in accordance with the requirements noted previously in Earthwork and below under the Foundation Construction Considerations, the following design parameters may be assumed.
Design Parameters – Compressive Loads
Item Description
Maximum Net Allowable Bearing Pressure 1, 2 5,000 psf
Required Bearing Stratum 3 Natural soils, structural fill or bedrock
Minimum Foundation Dimensions Columns: 36 inches Continuous: 24 inches
Ultimate Coefficient of Sliding Friction 4 0.30 (native soils) 0.45 (imported structural fill) 0.60 (bedrock)

Preliminary Geotechnical Engineering Report Proposed Distribution Center ■ Cairo, New York November 8, 2019 ■ Terracon Project No. JB195077
Responsive ■ Resourceful ■ Reliable 9
Item Description
Minimum Embedment below
Finished Grade 5
Exterior footings: 48 inches Interior footings in heated areas: 24 inches Interior footings in unheated areas: 48 inches
Estimated Total Settlement from Structural Loads 2
Less than about one (1) inch on soil Negligible on bedrock
Estimated Differential Settlement 2, 6 About 75% of total settlement
1. The maximum net allowable bearing pressure is the pressure in excess of the minimum surrounding overburden pressure at the footing base elevation. An appropriate factor of safety has been applied.
2. Values provided are for maximum loads noted in Project Description. 3. The bearing grades should be prepared per the recommendations presented below in the Foundation
Construction Considerations. 4. Can be used to compute sliding resistance where foundations are placed on suitable soil/materials. Should
be neglected for foundations subject to net uplift conditions. 5. Embedment necessary to minimize the effects of frost and/or seasonal water content variations. For sloping
ground, maintain depth below the lowest adjacent exterior grade within 5 horizontal feet of the structure. Interior footings in heated area may be seated at the 24-inch depth if allowed by local building codes.
6. Differential settlements are as measured over a span of 50 feet and will be greatest where bearing transitions from overburden to the bedrock.
Preliminary plans should include a perimeter foundation drain to collect and relieve any water which enters the backfill soils after construction is complete (until final plans and grades are available to confirm its need or elimination). The drains should consist of nominal four-inch diameter perforated PVC pipe set within ± 12 inches of crushed stone composed of ASTM C33 Blend 57 material which is wrapped with a synthetic filter fabric such as Mirafi 140N. All drains should be provided with clean outs for their maintenance.
Foundation Construction Considerations
The foundation bearing grades should be proof-compacted using a mechanical or large reversible plate tamper to densify the soils loosened by the excavation process. If groundwater seepage occurs, proof-compacting should be eliminated, and a minimum six-inch thick base of clean crushed stone placed over a geotextile fabric should be provided to establish a more uniform and stable base for construction and to assist in dewatering. The stone should be an ASTM C33 Blend 57 aggregate and the fabric a Mirafi 500X or equivalent. All final bearing grades should be relatively firm, stable, and free of loose soil, mud, water and frost.

Preliminary Geotechnical Engineering Report Proposed Distribution Center ■ Cairo, New York November 8, 2019 ■ Terracon Project No. JB195077
Responsive ■ Resourceful ■ Reliable 10
FLOOR SLABS
Floor Slab Design Parameters
Interior floor slabs should be constructed over a minimum 12-inch-thick base course of subbase stone; consideration should be given to using a thicker subbase course in areas subject to heavier loads and/or use, or in any unheated areas. The subbase should consist of a crusher run stone meeting NYSDOT Specification no. 304.12 Type 2. Where moisture sensitive floor coverings will be applied, a vapor retarder (e.g., Stego Wrap 15 mil Class A or equivalent) should be placed above or below the crushed stone per ACI 302 and/or ACI 360 guidelines.
Floor slab subgrades should be prepared as outlined in the Earthwork section herein. Under these parameters, a modulus of subgrade reaction equal to 200 pounds per cubic inch (pci) may be assumed at the top of the stone base layer for slab design purposes.
It should be understood that frost heave may occur beneath exterior sidewalks or pavements, and the heave may be differential, particularly where sidewalks and pavements meet building doorways and curbs. If these conditions exist and the potential for heaving is to be minimized, a 16-inch thick base of crushed stone with underdrains should be placed beneath the sidewalks or pavements to limit heave to generally tolerable magnitudes for most winters.
Floor Slab Construction Considerations
Even with the base course recommended above, we caution that the subgrades may not support repeated heavy construction traffic or telehandlers without suffering rutting and weaving that may be especially severe during wet seasons. If the grades are to be repeatedly traversed by these types of equipment, they should be reinforced as necessary to support them. Areas which become disturbed should be excavated and stabilized accordingly.
The Geotechnical Engineer should approve the condition of the floor slab subgrades immediately prior to placement of the floor slab subbase course. Attention should be paid to high traffic areas that were rutted and disturbed earlier, and to areas where backfilled trenches are located.
PAVEMENTS
General Pavement Comments
A critical aspect of pavement performance is site preparation. The pavement designs listed in this section assume the site will be prepared as recommended in the Earthwork section.

Preliminary Geotechnical Engineering Report Proposed Distribution Center ■ Cairo, New York November 8, 2019 ■ Terracon Project No. JB195077
Responsive ■ Resourceful ■ Reliable 11
Pavement Section Thicknesses
Two pavement sections are provided for consideration dependent upon anticipated traffic types. A Heavy Duty Section should be used for entrance drives and areas subject to repeated truck traffic, and a Light Duty section for areas subject to automobile parking and occasional delivery or service trucks only.
The pavement sections presented below were developed assuming that the subgrades consist of site or borrowed soils with a CBR equal to 10 or greater. The pavement sections assume a 20-year pavement life and 18-kip daily equivalent single axle loads of 1 for Light Duty pavements and 600 for the Heavy Duty section.
Flexible Pavement Design
Layer NYSDOT Item Number 1 Light Duty (inches)
Heavy Duty (inches)
Asphalt Concrete Top #402.127303 1.5 1.5
Asphalt Concrete Binder #402.257903 2.0 4.0
Crusher-Run Stone Base #304.12 Type 2 6 12
Processed Sand and Gravel Subbase #304.12 Type 4 12 18
Stabilization Fabric 2 NA Single ply Single ply
1. All materials should meet the current New York State Department of Transportation (NYSDOT) Standard Specifications for Construction and Materials
2. Stabilization Fabric should be Mirafi 500X or approved equivalent Rigid Portland concrete pavements in light service areas may be designed to bear upon six (6) inches of NYSDOT Type 2 crusher-run stone and the synthetic fabric recommended above. Rigid Portland concrete pavements in heavy service areas may be designed to bear upon twelve (12) inches of NYSDOT Type 2 crusher-run stone and the synthetic fabric recommended above. The rigid pavements may be designed in accord with the recommended procedures of the American Concrete Institute or Portland Cement Association using a composite modulus of subgrade reaction equal to 200 pounds per cubic inch at the top of the stone base layer. Drainage swales and/or interceptor trenches should be planned along the sides of the pavements to enhance drainage of the base materials. Accumulation of water on pavement subgrades should be avoided by grading the subgrade to a slope of at least two percent, and/or by providing

Preliminary Geotechnical Engineering Report Proposed Distribution Center ■ Cairo, New York November 8, 2019 ■ Terracon Project No. JB195077
Responsive ■ Resourceful ■ Reliable 12
underdrains. Failure to provide adequate drainage and routine maintenance as necessary will shorten pavement life.
GENERAL COMMENTS
Our analysis and opinions are based upon our understanding of the project, the geotechnical conditions in the area, and the data obtained from our site exploration. Natural variations will occur between exploration point locations or due to the modifying effects of construction or weather. The nature and extent of such variations may not become evident until during or after construction. Terracon should be retained as the Geotechnical Engineer, where noted in this report, to provide observation and testing services during pertinent construction phases. If variations appear, we can provide further evaluation and supplemental recommendations. If variations are noted in the absence of our observation and testing services on-site, we should be immediately notified so that we can provide evaluation and supplemental recommendations.
Our Scope of Services does not include either specifically or by implication any environmental or biological (e.g., mold, fungi, bacteria) assessment of the site or identification or prevention of pollutants, hazardous materials or conditions. If the owner is concerned about the potential for such contamination or pollution, other studies should be undertaken.
Our services and any correspondence or collaboration through this system are intended for the sole benefit and exclusive use of our client for specific application to the project discussed and are accomplished in accordance with generally accepted geotechnical engineering practices with no third-party beneficiaries intended. Any third-party access to services or correspondence is solely for information purposes to support the services provided by Terracon to our client. Reliance upon the services and any work product is limited to our client and is not intended for third parties. Any use or reliance of the provided information by third parties is done solely at their own risk. No warranties, either express or implied, are intended or made.
Site characteristics as provided are for design purposes and not to estimate excavation cost. Any use of our report in that regard is done at the sole risk of the excavating cost estimator as there may be variations on the site that are not apparent in the data that could significantly impact excavation cost. Any parties charged with estimating excavation costs should seek their own site characterization for specific purposes to obtain the specific level of detail necessary for costing. Site safety, and cost estimating including excavation support, dewatering requirements and design are the responsibility of others. If changes in the nature, design, or location of the project are planned, our conclusions and recommendations shall not be considered valid unless we review the changes and either verify or modify our conclusions in writing.

Prop
osed
Dis
tribu
tion
Faci
lity■
Cai
ro, N
ew Y
ork
June
10,
201
9■
Terra
con
Proj
ect N
o. J
B195
077
Res
pons
ive■
Res
ourc
eful
■R
elia
ble
P
hoto
1 –
Typ
ical
site
inte
rior
P
hoto
2 –
Typ
ical
site
inte
rior

Prop
osed
Dis
tribu
tion
Faci
lity■
Cai
ro, N
ew Y
ork
June
10,
201
9■
Terra
con
Proj
ect N
o. J
B195
077
Res
pons
ive■
Res
ourc
eful
■R
elia
ble
P
hoto
3 –
Typ
ical
site
inte
rior
Ph
oto
4 –
View
alo
ng o
verh
ead
utilit
y rig
ht-o
f-way


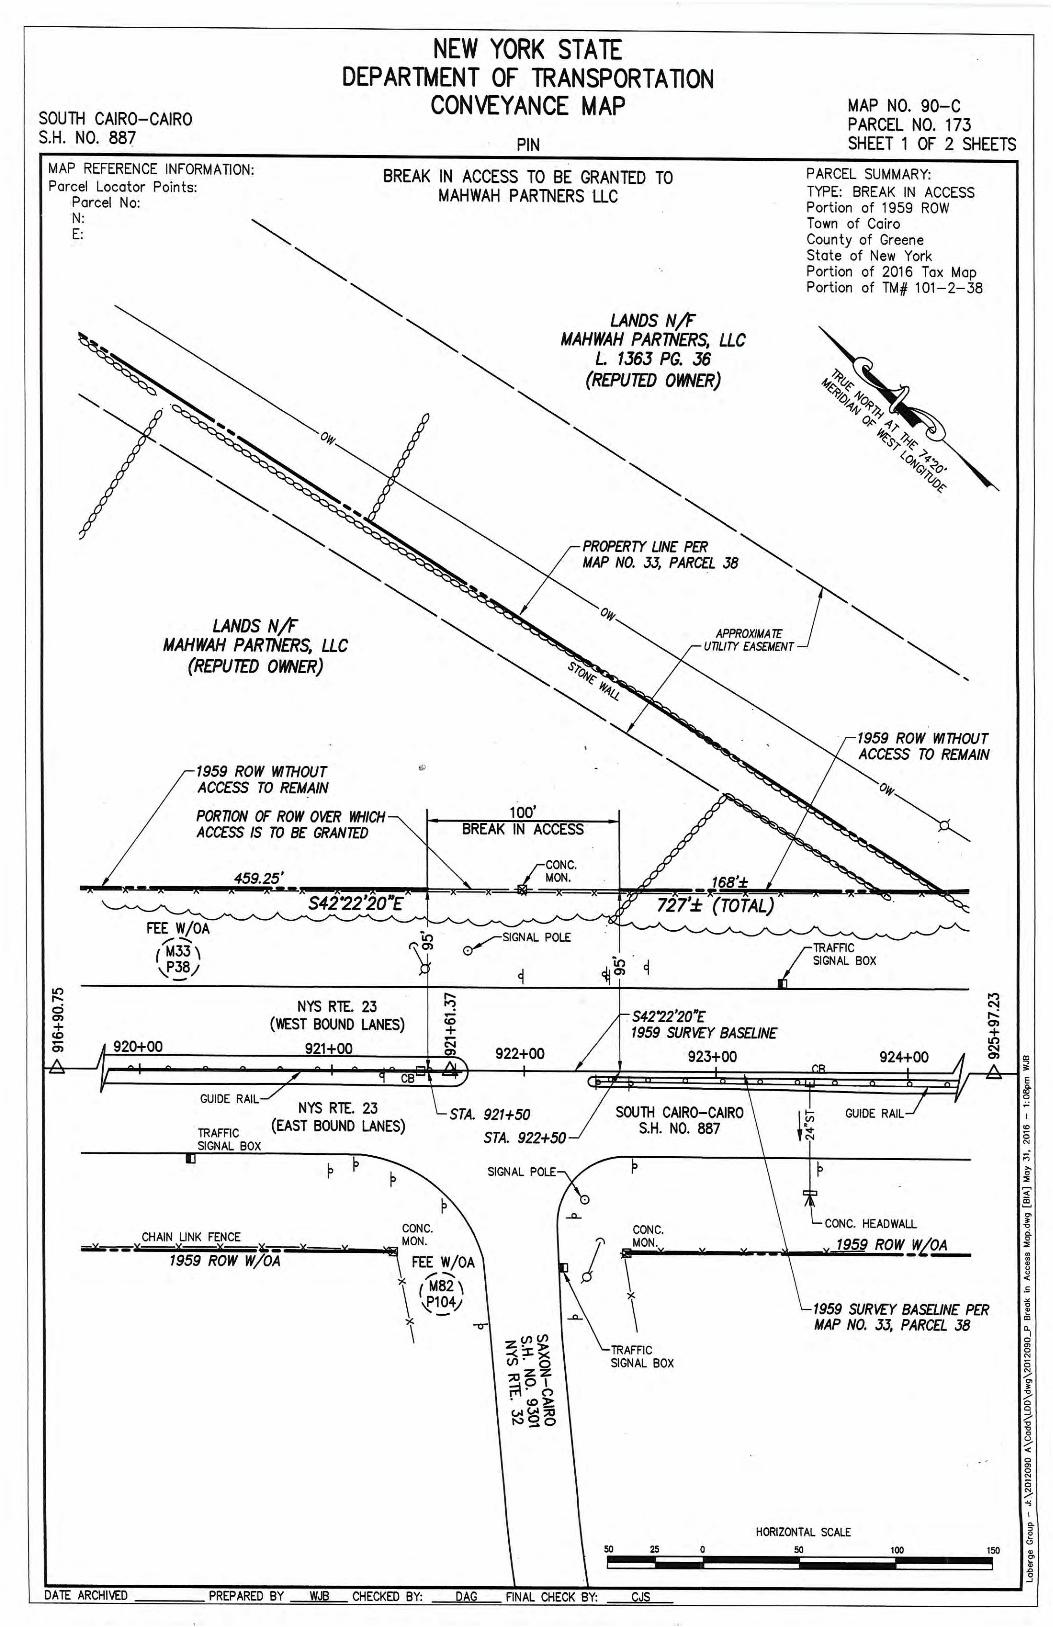


Town of Cairo Economic Development Corridor Study: Opportunities & Constraints Analysis
Delaware Engineering, D.P.C.
Appendix 2. Water Hydraulic Analysis


Town of Cairo Water System Hydraulic Analysis
Delaware Engineering, DPC
The following is a summary of the fire flow tests conducted by Delaware Engineering staff on the night of
April 19, 2021. A series of four (4) flow tests were completed. Two of which were along Main Street,
another was on the easternmost side of the system, just north of Route 23 on Bross Street, and one was
at the intersection of Klingerman Drive and Monti Drive (see attached map for reference).
The hydrant nearest the water tower appeared to be out of service and the next nearest to the water
tower looked newly installed, but the water valve was off. Therefore, the first hydrant that was flowed
was at the intersection of Klingerman Drive and Monti Drive. It was the first hydrant in the upper part of
the system where we were able to obtain flow This hydrant yielded a flow of 910 GPM. The static gauge
for this test was placed on a hydrant on Monti Drive. It was determined that this hydrant was not on the
same line as the hydrant being flowed as there was no change in pressure.
The second flow test was performed on Main Street, east of the first test. There was 450 GPM of flow and
the static hydrant showed a difference of 5 psi. It had a static pressure of 70 psi and a residual pressure
of 65 psi.
The next point of study was on Bross Street. The flow hydrant yielded 920 GPM. A difference of 10 psi was
recorded at the static hydrant, the static pressure was 55 psi and the residual pressure was 45 psi.
The final flow test that was conducted at the intersection of Main Street and Route 32. The hydrant here
had a flow of 915 GPM. The static hydrant was located on Birch Street near Lake Avenue. It was recorded
that there was a drop in pressure of 15 psi. The static pressure was observed at 60 psi and the residual
was 45 psi.
Below are the tabulated results for each of the four hydrants tested:
Klingerman Drive & Monti Drive
Flow 910 GPM
Static N/A
Residual N/A
Main Street
Flow 450 GPM
Static 70 psi
Residual 65 psi
Bross Street
Flow 920 GPM
Static 55 psi
Residual 45 psi
Main Street & Route 32
Flow 915 GPM
Static 60 psi
Residual 45 psi


Town of Cairo Economic Development Corridor Study: Opportunities & Constraints Analysis
Delaware Engineering, D.P.C.
Appendix 3. Infrastructure Extension Plans


Town of Cairo Economic Development Corridor Study: Opportunities & Constraints Analysis
Delaware Engineering, D.P.C.
Appendix 4. Cedar Terrace Well Evaluation


679 Plank Road ● Clifton Park, New York 12065 ● (518) 348-6995 ● Fax (518) 348-6966
www.alphageoscience.com
June 6, 2016 Mr. Alan Tavenner, P.E. Delaware Engineering, D.P.C. 28 Madison Avenue Extension Albany, New York 12203 Re: Cedar Terrace Pool Well Evaluation Cairo, New York Dear Alan: This correspondence was prepared by Alpha Geoscience (Alpha) at the request of Delaware Engineering, D.C. to document the evaluation of the Pool Well located at the property known as the Cedar Terrace in Cairo, New York. Alpha and a water well contractor, Titan Drilling Corporation (Titan) performed a short term pumping test to evaluate the yield and water quality of the Pool Well on May 11, 2016. A description of the well testing procedure, data collection and a summary of the results are described herein. The short term test included 3 consecutive pumping periods (steps), a water level recovery monitoring period, and a final pumping period. The first 3 steps included pumping rates of approximately 56 gallons per minute (gpm) for a 60 minute period, 77 gpm for a 60 minute period, and 101 gpm for a 290 minute period. The final pumping period was performed for 31 minutes at approximately 42 gpm for most of the pumping period. The objective of the last pumping period was to stabilize the pumping level at a depth of a water-bearing feature identified by a cascading sound within the well at approximately 45 feet below ground surface. A semi-log graph that shows drawdown data collected during the test is presented as Attachment A. Attachment B presents a 180-day drawdown projection to evaluate the potential long-term capacity of the well based on the data collected during the first 3 steps. The New York State Department of Health (NYSDOH) requires a 72-hour pumping test for a new community water system well. However, Alpha typically recommends longer duration pumping tests such as 72 hour to 120 hour tests to evaluate long-term well capacity because the potential impact of aquifer boundaries may not be seen during short-term tests. The evaluation of the potential impact of Pool Well pumping on the current water supply well (Well WS) for the Cedar Terrace property included monitoring the water level in the WS Well throughout the testing period. The WS Well was not pumping during the testing period except for a brief period at the very end of the testing. A semi-log graph that includes WS Well drawdown data and a drawdown projection is presented as Attachment C. Water quality of the Pool Well discharge was evaluated by field water quality monitoring and by laboratory analysis of routine physical and inorganic parameters. A table that includes the field
Geology
Hydrology
Remediation
Water Supply

Alan Tavenner, P.E Page 2 June 6, 2016
679 Plank Road ● Clifton Park, New York 12065 ● (518) 348-6995 ● Fax (518) 348-6966
www.alphageoscience.com
water quality data is presented as Attachment D and Attachment E presents the laboratory water quality testing results. Results Summary The results of the short term testing indicate that the Pool Well has an above average yield compared to most of the other wells in this area that Alpha has evaluated based on testing or review of well log information. There was a relatively small amount of drawdown as a result of the 56 gpm step (Attachment B). Much more drawdown was produced at the 77 gpm and 101 gpm pumping rates and the 180-day projection indicated that a rate of 101 gpm was not sustainable for longer pumping periods with the pumping level reaching the pump intake in approximately 10 days. The testing results indicated that the Pool Well and the WS Well are hydraulically connected. The data collected during the test indicate that the water level in the WS Well dropped significantly during Pool Well pumping (Attachment C). The drawdown projection indicated that pumping the Pool Well will drop the water level to the pump intake depth (estimated) in the WS Well in approximately 10 days. It is important to note that private wells on Jones Street are located within approximately 600 feet of the Pool Well based on information provided by a representative of Cairo. The potential impact on these private wells was not evaluated during this evaluation. A cascading sound was observed at both the Pool Well and the WS Well when the water level in these wells reached a depth of approximately 45 feet below ground surface. This cascading sound indicates that a water-bearing feature is present at this depth in both wells. No well logs are available for these wells so it could not be determined if this is a bedrock feature such as a fracture or leakage from the overlying unconsolidated deposits that enters the well around the bottom of the well casing. It is important to recognize that shallow ground water sources can have greater vulnerability to surface or near surface contamination sources. Additionally, shallow ground water sources can be more vulnerable to dry conditions with their yield potential decreasing significantly during dry periods. The results of the field water quality monitoring (Attachment D) and laboratory testing (Attachment E) indicate that the results met the NYSDOH water quality standards for the parameters that were tested. The water quality is more typical of a shallow ground water source compared to a deeper bedrock source based on Alpha’s experience evaluating wells in this area. The laboratory result for nitrate was below the maximum contaminant level for this parameter, but is generally higher than deeper bedrock aquifer sources. Recommendations The following recommendations are provided if the decision is made to further evaluate the Cedar Terrace site as a potential potable water source:

Alan Tavenner, P.E Page 3 June 6, 2016
679 Plank Road ● Clifton Park, New York 12065 ● (518) 348-6995 ● Fax (518) 348-6966
www.alphageoscience.com
Contact the New York State Department of Health (NYSDOH) to determine if the Pool Well or another well installed at the site can be used as a potable water source for Cairo. The regulatory requirements should be identified including, but not limited to well design (casing and grout seal) and required setback distances to potential contamination sources such as septic systems. If a new well(s) are installed at the site they may not have the same water-bearing potential as the Pool Well.
Perform a longer-term pumping test at the site such as a 72-hour to 120-hour constant rate test to evaluate long-term well yield, water quality and potential impacts of pumping on other water supplies. Water quality testing should include a full NYSDOH Part 5 analysis. A test rate of 50 gpm for the long-term test is recommended. Additional evaluation could be performed before the long term test to evaluate if a slightly higher pumping rate could be considered.
Sincerely, Alpha Geoscience
Michael D. Palleschi, CPG Senior Hydrogeologist Attachments Z:\projects\2013\13121 - 13140\13121 - Cedar Terrace\Cedar Evaluation 6-6-16.doc

0 20 40 60 80 Drawdown (feet)AT
TAC
HM
ENT
ATO
WN
OF
CAI
RO
Pool
Wel
l Wat
er L
evel
Dat
aM
ay 1
1, 2
016
Step
1 @
56 gpm
Step
2 @
77 gpm
Step
3@ 101
gpm
Recovery ‐Pu
mp Off
Final Pum
ping
Period
@ 42 gpm
Z:\p
roje
cts\
2013
\131
21 -
1314
0\13
121
- Cai
ro P
ark
Wel
l\Ced
ar T
erra
ce\P
umpi
ng T
est 5
-11-
16\C
edar
Ter
race
Poo
l Wel
l.xls
x
100
120
140
010
020
030
040
050
060
0
Elap
sed
Tim
e (m
inut
es)

0 10 20 30 40 50 60 70 80 90
Drawdown (feet)
ATTA
CH
MEN
T B
TOW
N O
F C
AIR
OC
edar
Ter
race
Poo
l Wel
l -Pr
ojec
ted
Dra
wdo
wn
May
11,
201
6180 Days
180
Day
Pro
ject
ed D
raw
dow
n at
56
gpm
~ 1
7 fe
et
180
Day
Pro
ject
ed
Dra
wdo
wn
at 7
7 gp
m ~
126
feet
Z:\p
roje
cts\
2013
\131
21 -
1314
0\13
121
- Cai
ro P
ark
Wel
l\Ced
ar T
erra
ce\P
umpi
ng T
est 5
-11-
16\C
edar
Ter
race
Poo
l Wel
l.xls
x
100
110
120
130
140
150
110
100
1000
1000
010
0000
1000
000
Elap
sed
Tim
e (m
inut
es)
180
Day
Pro
ject
ed D
raw
dow
n at
101
gpm
, Dra
wdo
wn
at
Pum
p In
take
in ~
10 D
ays
Max
imum
Ava
ilabl
e D
raw
dow
n ~1
41'
Base
d on
Ant
icip
ated
pum
p se
tting
Draft

0 10 20 30 40 50 60 70
Drawdown (feet)
ATTA
CH
MEN
T C
TOW
N O
F C
AIR
OW
S W
ell -
Proj
ecte
d D
raw
dow
nM
ay 1
1, 2
016
180 Days
180-
Day
Pro
ject
ed D
raw
dow
n B
d10
1P
i
Z:\p
roje
cts\
2013
\131
21 -
1314
0\13
121
- Cai
ro P
ark
Wel
l\Ced
ar T
erra
ce\P
umpi
ng T
est 5
-11-
16\C
edar
Ter
race
Poo
l Wel
l.xls
x
80 90 100
110
120
110
100
1000
1000
010
0000
1000
000
Elap
sed
Tim
e (m
inut
es)
Base
d on
101
gpm
Pum
ping
at
Poo
l Wel
l and
no
Pum
ping
at
WS
Wel
l, D
raw
dow
n at
Pu
mp
Inta
ke in
~ 1
0 D
ays
Max
imum
Ava
ilabl
e D
raw
dow
n ~1
05'
Base
d on
Ant
icip
ated
Pum
p Se
tting
Draft

Conductivity TDS TurbidityTime pH (us/cm) (ppm) (Visual) Remarks9:16 6.45 171 89 Clear Step 1; no odor10:24 6.23 220 114 Clear Step 2; no odor11:36 6.22 225 119 Clear Step 3; no odor12:52 6.36 234 123 Clear Step 3; no odor14:05 6.28 243 128 Clear Step 3; no odor14:52 6.40 244 129 Clear Step 3; no odor15:23 6.38 246 130 Clear Step 3; no odor
Note: Samples collected at pipe orifice
ATTACHMENT D
May 11, 2016Field Water Quality DataCedar Terrace Pool Well
TOWN OF CAIRO
Z:\projects\2013\13121 - 13140\13121 - Cairo Park Well\Cedar Terrace\Pumping Test 5-11-16\Cedar Terrace Pool Well.xlsx/Field Water Quality


Sample Information Custody InformationMatrix:Location Code:Rush Request:P.O.#:
Collected by:Received by:Analyzed by:
DRINKING WATERALPHAGEOStandard
05/11/16LBsee "By" below
MP
Laboratory Data
CEDAR POOL
Phoenix ID: BN31762
05/12/1615:3017:30
Parameter ResultRL/PQL Units Date/Time By Reference
FOR: Attn: Mr. Michael PalleschiAlpha GeoScience679 Plank RoadClifton Park, NY 12065
Analysis ReportMay 18, 2016
Date Time
587 East Middle Turnpike, P.O.Box 370, Manchester, CT 06045 Tel. (860) 645-1102 Fax (860) 645-0823
Environmental Laboratories, Inc.
SDG ID: GBN31762
Client ID:Project ID: CAIRO LSS
DILDWMCL
SecGoal
58.8Hardness (CaCO3) 0.1 05/14/16 E200.7mg/L160Alkalinity-CaCO3 20.0 05/13/16 RR/EG SM2320B-97mg/L1
35.5Chloride 3.0 05/12/16 BS/EG E300.0mg/L1 2501.30Nitrate as Nitrogen 0.05 05/12/16 20:59 BS/EG E300.0mg/L1 107.09pH 0.10 05/13/16 06:02 RR/EG SM4500-H B-00pH Units 11 6.5-8.59.5Sulfate 3.0 05/12/16 BS/EG E300.0mg/L1 250140Tot. Diss. Solids 10 05/13/16 KH SM2540C-97mg/L1 5000.99Turbidity 0.200 05/13/16 06:02 RR/EG SM2130B-01NTU1 5
< 0.0005Arsenic 0.0005 05/14/16 MA/TH E200.9/SM3113B-10mg/L1 0.0119.5Calcium 0.005 05/13/16 LK E200.7mg/L10.25Iron 0.01 05/13/16 LK E200.7mg/L1 0.32.46Magnesium 0.005 05/13/16 LK E200.7mg/L1
0.010Manganese 0.001 05/13/16 LK E200.7mg/L1 0.0530.2Sodium 1.0 05/14/16 LK E200.7mg/L10
*** Sodium exceeds Secondary Goal ***CompletedTotal Metal Digestion 05/12/16 AG/T E200.9CompletedTotal Metal Digestion 05/12/16 AG/TH/THE200.5/E200.7
Page 1 of 3 Ver 1

CEDAR POOLPhoenix I.D.: BN31762
Client ID:CAIRO LSSProject ID:
Parameter ResultRL/PQL Units Date/Time By ReferenceDIL
DWMCL
SecGoal
Comments:
Maximum Contaminant Level (Lower of): 40 CFR Part 141; Public Health Law, Section 225 Part 5, Subpart 5-1. The highest level of a contaminant that is allowed in drinking water. MCLs are enforceable standards.
Secondary DW Maximum Contaminant Level Goal (MCLG): 40 CFR Part 143. The level of a contaminant in drinking water below which there is no known or expected risk to health. MCLGs are non-enforceable public health goals.
The regulatory hold time for pH is immediately. This pH was performed in the laboratory and may be considered outside of hold-time.
Phyllis Shiller, Laboratory DirectorMay 18, 2016
1 = This parameter is not certified by NY NELAC for this matrix. NY NELAC does not offer certification for all parameters at this time.
If there are any questions regarding this data, please call Phoenix Client Services at extension 200.This report must not be reproduced except in full as defined by the attached chain of custody.
Reviewed and Released by: Phyllis Shiller, Laboratory Director
RL/PQL=Reporting/Practical Quantitation Level DIL=Dilution (analysis required diluting to evaluate) ND=Not DetectedBRL=Below Reporting Level (less than the reporting level, the lowest amount the laboratory can detect and report.)MCL = Maximum Contaminant Level MCLG = Maximum Contaminant Level Goal
Page 2 of 3 Ver 1

Sample Information Custody InformationMatrix:Location Code:Rush Request:P.O.#:
Collected by:Received by:Analyzed by:
DRINKING WATERALPHAGEOStandard
05/11/16LBsee "By" below
MP
Laboratory Data
CEDAR POOL-D
Phoenix ID: BN31763
05/12/1615:3017:30
Parameter ResultRL/PQL Units Date/Time By Reference
FOR: Attn: Mr. Michael PalleschiAlpha GeoScience679 Plank RoadClifton Park, NY 12065
Analysis ReportMay 18, 2016
Date Time
587 East Middle Turnpike, P.O.Box 370, Manchester, CT 06045 Tel. (860) 645-1102 Fax (860) 645-0823
Environmental Laboratories, Inc.
SDG ID: GBN31762
Client ID:Project ID: CAIRO LSS
DILDWMCL
SecGoal
< 0.0005Arsenic, Dissolved 0.0005 05/13/16 MA/TH E200.9mg/L1 0.010.096Iron (Dissolved) 0.011 05/13/16 LK E200.7mg/L1 0.30.006Manganese (Dissolved) 0.001 05/13/16 LK E200.7mg/L1 0.05
CompletedDissolved Metals Preparation 05/12/16 AG SW3005A
Comments:
Maximum Contaminant Level (Lower of): 40 CFR Part 141; Public Health Law, Section 225 Part 5, Subpart 5-1. The highest level of a contaminant that is allowed in drinking water. MCLs are enforceable standards.
Secondary DW Maximum Contaminant Level Goal (MCLG): 40 CFR Part 143. The level of a contaminant in drinking water below which there is no known or expected risk to health. MCLGs are non-enforceable public health goals.
Phyllis Shiller, Laboratory DirectorMay 18, 2016
If there are any questions regarding this data, please call Phoenix Client Services at extension 200.This report must not be reproduced except in full as defined by the attached chain of custody.
Reviewed and Released by: Phyllis Shiller, Laboratory Director
RL/PQL=Reporting/Practical Quantitation Level DIL=Dilution (analysis required diluting to evaluate) ND=Not DetectedBRL=Below Reporting Level (less than the reporting level, the lowest amount the laboratory can detect and report.)MCL = Maximum Contaminant Level MCLG = Maximum Contaminant Level Goal
Page 3 of 3 Ver 1

QA/QC Data
Parameter BlkBlank RL
MS%
MSD%
MSRPD
QA/QC ReportMay 18, 2016
587 East Middle Turnpike, P.O.Box 370, Manchester, CT 06045 Tel. (860) 645-1102 Fax (860) 645-0823
Environmental Laboratories, Inc.
SDG I.D.: GBN31762
LCS%
DupRPD
LCSD%
LCSRPD
%Rec
Limits
%RPD
LimitsSampleResult
DupResult
QA/QC Batch 345275 (mg/L), QC Sample No: BN30169 (BN31763)
ICP Metals - DissolvedIron 91.7BRL 90.1NC 75 - 125 20<0.011 <0.0110.011
Manganese 90.6BRL 89.1NC 75 - 125 200.002 0.0020.001
QA/QC Batch 345349A (mg/L), QC Sample No: BN30325 (BN31762)
ICP Metals - AqueousCalcium NCBRL 108 85 - 115 200.005
Iron 97.2BRL 102 85 - 115 200.01
Magnesium NCBRL 99.9 85 - 115 200.005
Manganese 97.6BRL 101 85 - 115 200.001
Sodium NCBRL 110 85 - 115 200.1
Additional: LCS acceptance range is 85-115% MS acceptance range 75-125%.
Comment:
QA/QC Batch 345423A (mg/L), QC Sample No: BN31692 (BN31762)Arsenic 99.3BRL 101 85 - 115 200.001
Additional: LCS acceptance range is 85-115% MS acceptance range 75-125%.
Comment:
Page 1 of 2

QA/QC Data
Parameter BlkBlank RL
MS%
MSD%
MSRPD
QA/QC ReportMay 18, 2016
587 East Middle Turnpike, P.O.Box 370, Manchester, CT 06045 Tel. (860) 645-1102 Fax (860) 645-0823
Environmental Laboratories, Inc.
SDG I.D.: GBN31762
LCS%
DupRPD
LCSD%
LCSRPD
%Rec
Limits
%RPD
LimitsSampleResult
DupResult
QA/QC Batch 345464 (mg/L), QC Sample No: BN30991 (BN31762)Tot. Diss. Solids BRL 93.08.80 85 - 115 2087 9510
QA/QC Batch 345510 (mg/L), QC Sample No: BN31374 (BN31762)Alkalinity-CaCO3 BRL 99.71.00 85 - 115 20103 1045.00
QA/QC Batch 345505 (pH), QC Sample No: BN31374 (BN31762)pH 98.80.70 85 - 115 207.61 7.56
QA/QC Batch 345515 (NTU), QC Sample No: BN31374 (BN31762)Turbidity 0.20 91.0NC 85 - 115 201.02 0.970.200
QA/QC Batch 345543 (mg/L), QC Sample No: BN31736 (BN31762)Chloride 94.1BRL 96.2NC<2.0 <3.03.0
Nitrate as Nitrogen 98.6BRL 98.61.30 90 - 110 200.76 0.750.05
Sulfate 94.5BRL 93.1NC 85 - 115 204.2 4.13.0
MS - Matrix SpikePhyllis Shiller, Laboratory Director
If there are any questions regarding this data, please call Phoenix Client Services at extension 200.
May 18, 2016MS Dup - Matrix Spike Duplicate
RPD - Relative Percent Difference
LCS - Laboratory Control Sample
LCSD - Laboratory Control Sample Duplicate
NC - No Criteria
Intf - Interference
Page 2 of 2

Sam
ple
Crit
eria
Exc
eede
nces
Rep
ort
Wed
nesd
ay, M
ay 1
8, 2
016
Pag
e 1
of 1
Aco
deP
hoen
ix A
naly
teC
riter
iaR
esul
tR
LS
ampN
oA
naly
sis
Uni
tsC
riter
ia
GB
N31
762
- ALP
HAG
EOC
riter
ia:
Non
e
RL
Crit
eria
Sta
te:
NY N
A-D
WS
odiu
m30
.21.
0m
g/L
BN
3176
2E
PA
/ 4
0 C
FR 1
41 D
W /
143
.3 S
econ
dary
MC
Ls0.
2
Pho
enix
Lab
orat
orie
s do
es n
ot a
ssum
e re
spon
sibi
lity
for t
he d
ata
cont
aine
d in
this
repo
rt. I
t is
prov
ided
as
an a
dditi
onal
tool
to id
entif
y re
ques
ted
crite
ria e
xcee
denc
es.
All
effo
rts a
re m
ade
to
ensu
re th
e ac
cura
cy o
f the
dat
a (o
btai
ned
from
app
ropr
iate
age
ncie
s).
A la
ck o
f exc
eede
nce
info
rmat
ion
does
not
nec
essa
rily
sugg
est c
onfo
rman
ce to
the
crite
ria.
It is
ulti
mat
ely
the
site
pr
ofes
sion
al's
resp
onsi
bilit
y to
det
erm
ine
appr
opria
te c
ompl
ianc
e.


Town of Cairo Economic Development Corridor Study: Opportunities & Constraints Analysis
Delaware Engineering, D.P.C.
Appendix 5. Energy Comparison Tables from NYSERDA


42
New York State Commercial Energy Prices in Nominal Dollars, 2002–2016
Table 4-2a. (in physical units)
Natural GDP
Year Coal Distillate1 Residual Kerosene Propane Gas Electricity Deflator2
$/Ton Cents/Gal. $/bbl Cents/Gal. Cents/Gal. $/Mcf Cents/kWh 2016=1
2002 45.11 88.39 25.90 106.92 101.68 6.42 11.79 0.7502003 41.35 109.87 34.20 134.60 120.53 8.60 12.93 0.7672004 43.94 134.78 33.70 162.14 134.47 10.11 12.98 0.7872005 48.87 188.53 47.59 214.92 151.09 11.80 14.36 0.8142006 67.67 215.40 55.26 260.15 166.73 11.91 15.51 0.8402007 64.85 236.32 61.74 289.85 193.44 11.82 15.92 0.8642008 105.50 324.51 83.43 365.31 233.36 12.87 16.79 0.8972009 136.28 206.74 62.49 281.21 188.33 10.72 15.48 0.8942010 138.86 254.51 81.10 320.90 215.73 10.87 16.31 0.9092011 135.81 340.10 109.46 379.76 245.96 9.33 15.81 0.9372012 N/A 354.55 115.43 399.87 195.09 7.84 15.06 0.9572013 N/A 344.10 105.87 400.68 192.17 8.00 15.35 0.9712014 N/A 299.51 92.73 402.84 203.22 8.31 16.12 0.9862015 N/A 199.07 49.23 224.78 122.48 6.86 15.31 0.9882016 N/A 157.30 38.35 179.15 115.17 6.18 14.45 1.000
Table 4-2b. (in $/million Btu)
Natural GDP
Year Coal Distillate1 Residual Kerosene Propane Gas Electricity Deflator2
$/MMBtu $/MMBtu $/MMBtu $/MMBtu $/MMBtu $/MMBtu $/MMBtu 2016=12002 1.92 6.38 4.12 7.92 11.82 6.26 34.55 0.7502003 1.76 7.93 5.44 9.97 13.95 8.37 37.89 0.7672004 1.87 9.73 5.36 12.01 15.61 9.84 38.04 0.7872005 2.08 13.61 7.57 15.92 17.53 11.50 42.08 0.8142006 2.88 15.59 8.79 19.27 19.43 11.65 45.46 0.8402007 2.76 17.16 9.82 21.47 21.18 11.54 46.65 0.8642008 4.49 23.58 13.27 27.06 25.55 12.59 49.22 0.8972009 5.80 15.02 9.94 20.83 20.62 10.49 45.36 0.8942010 5.91 18.50 12.90 23.77 23.62 10.63 47.79 0.9092011 5.78 24.73 17.41 28.13 26.93 9.08 46.33 0.9372012 N/A 25.79 18.36 29.62 21.36 7.60 44.13 0.9572013 N/A 25.03 16.84 29.68 21.04 7.73 45.00 0.9712014 N/A 21.79 14.75 29.84 22.25 8.04 47.25 0.9862015 N/A 14.49 7.83 16.65 13.41 6.64 44.86 0.9882016 N/A 11.45 6.10 13.27 12.61 5.99 42.35 1.000
_______________________________
1 Home heating oil. 2 To convert prices to 2016 dollars, divide the selected price by the deflator factor in the same row.

43
New York State Industrial Energy Prices in Nominal Dollars, 2002–2016
Table 4-3a. (in physical units)
Natural GDP
Year Coal Distillate1 Residual Kerosene Propane Gas Electricity Deflator2
$/Ton Cents/Gal. $/bbl Cents/Gal. Cents/Gal. $/Mcf Cents/kWh 2016=12002 51.26 88.53 25.90 81.41 105.90 5.54 5.18 0.7502003 48.42 107.93 34.20 109.76 130.56 7.35 7.14 0.7672004 52.50 127.44 33.70 137.97 147.39 8.05 7.04 0.7872005 59.97 190.19 47.59 181.85 160.92 10.75 8.23 0.8142006 77.95 218.86 55.26 213.17 177.71 10.56 9.39 0.8402007 76.91 238.52 61.74 243.27 220.66 11.43 8.71 0.8642008 90.61 327.12 83.43 306.86 264.41 12.30 9.39 0.8972009 105.75 197.66 62.49 204.39 217.46 9.53 8.37 0.8942010 116.04 263.59 81.10 251.24 225.50 8.54 8.79 0.9092011 123.02 324.56 109.46 331.56 260.39 8.19 7.83 0.9372012 133.00 342.04 115.43 346.55 200.75 6.91 6.69 0.9572013 120.89 332.42 105.87 351.41 197.28 7.44 6.59 0.9712014 117.10 312.98 92.73 332.64 210.25 8.13 6.58 0.9862015 110.68 206.62 49.23 194.54 115.72 6.62 6.31 0.9882016 100.05 154.69 38.35 152.28 107.13 5.92 6.03 1.000
Table 4-3b. (in $/million Btu)
Natural GDP
Year Coal Distillate1 Residual Kerosene Propane Gas Electricity Deflator2
$/MMBtu $/MMBtu $/MMBtu $/MMBtu $/MMBtu $/MMBtu $/MMBtu 2016=1
2002 1.92 6.39 4.12 6.03 12.31 5.40 15.17 0.7502003 1.81 7.79 5.44 8.13 15.11 7.15 20.92 0.7672004 1.96 9.20 5.36 10.22 17.11 7.84 20.63 0.7872005 2.27 13.73 7.57 13.47 18.67 10.48 24.11 0.8142006 2.97 15.84 8.79 15.79 20.71 10.33 27.53 0.8402007 2.91 17.32 9.82 18.02 24.16 11.16 25.53 0.8642008 3.44 23.77 13.27 22.73 28.95 12.04 27.53 0.8972009 4.01 14.36 9.94 15.14 23.81 9.32 24.54 0.8942010 4.44 19.16 12.90 18.61 24.69 8.35 25.76 0.9092011 4.74 23.60 17.41 24.56 28.51 7.97 22.96 0.9372012 4.73 24.88 18.36 25.67 21.98 6.70 19.62 0.9572013 4.37 24.18 16.84 26.03 21.60 7.19 19.30 0.9712014 4.24 22.77 14.75 24.64 23.02 7.87 19.28 0.9862015 4.02 15.04 7.83 14.41 12.67 6.41 18.49 0.9882016 3.60 11.26 6.10 11.28 11.73 5.74 17.67 1.000
_______________________________ 1 Home heating oil. 2 To convert prices to 2016 dollars, divide the selected price by the deflator factor in the same row.

Town of Cairo Economic Development Corridor Study: Opportunities & Constraints Analysis
Delaware Engineering, D.P.C.
Appendix 6. Marketing Flyer


122.
2 A
CR
E SC
HN
EID
ER D
EVEL
OPM
ENT
SITE
This
deve
lopm
ent s
ite c
onsis
ts o
f 5 ta
x pa
rcel
s with
122
.2 a
cres
of t
otal
are
a w
ithin
the
Tow
n of
Cai
ro.
The
site
has v
isibi
lity
for m
ore
than
4,0
00 ft
alo
ng
NYS
Rou
te 2
3. T
he p
ropo
sed
uses
for
thi
s sit
e ar
e lig
ht m
anuf
actu
ring,
di
strib
utio
n, w
areh
ousin
g, a
nd o
ffic
e us
es. T
his
site
is po
sitio
ned
with
in s
even
m
iles
of t
he e
xit
21 r
amps
for
the
NYS
Thr
uway
. I
t is
adja
cent
to
publ
ic se
wer
and
is w
ithin
clo
se p
roxi
mity
to p
ublic
wat
er.
The
zoni
ng o
n th
is sit
e is
in e
xclu
sivel
y w
ithin
the
Com
mer
cial
(CO
M) D
istric
t. A
ll of
the
prop
osed
use
s ar
e pe
rmitt
ed w
ithin
the
CO
M z
one.
DEV
ELO
PMEN
T C
APA
CITY
BU
SIN
ESS
SEC
TOR
USE
S
TOTA
L A
CREA
GE
– 12
2.2
DEV
ELO
PABL
E A
CRES
– 1
19.7
% D
EVEL
OPA
BLE
– 80
%
BUILD
ING
ARE
A –
4,25
8,42
5SF
LIGH
T M
AN
UFA
CTU
RIN
G
DIS
TRIB
UTI
ON
WA
REH
OUS
E
OFF
ICE
EC
ON
OM
IC O
PPO
RTU
NIT
IES:
1.
SI
NG
LE O
WN
ER W
ITH
WHO
M T
O C
OO
RDIN
ATE
2.
F LEX
IBLE
MIX
ED-U
SE S
CAL
E SI
TE
3.
AC
COM
MO
DATE
S LA
RGE,
MED
IUM
& S
MA
LLER
PRO
JEC
TS
4.
AC
COM
MO
DATE
S SM
ALL LO
W-IM
PAC
T PR
OJE
CTS
5.
MIN
IMAL
EN
VIR
ON
MEN
TAL IS
SUES
6.
HIG
HLY
CO
NV
ENIE
NT
DIR
ECT
ACC
ESS
FRO
M N
YS
ROU
TE 2
3
7.
HIG
HLY
CO
NV
ENIE
NT
DIS
TAN
CE
TO I-
87 A
CC
ESS
8.
AD
JAC
ENT
TO P
UBLIC
SEW
ER
9.
CLO
SE P
ROXI
MIT
Y TO
PU
BLIC
WA
TER
10.
S OM
E PA
RCEL
S A
RE W
ITH
IN T
HE
WA
TER
DIS
TRIC
T
11.
S IG
NIF
ICA
NT
ROAD
FRO
NTA
GE
FOR
MO
RE IN
FORM
ATIO
N, C
ON
TAC
T: W
ARR
EN H
ART
, DEP
UTY
CO
UN
TY A
DM
INIS
TRA
TOR
411
MA
IN S
TREE
T |
CA
TSKI
LL, N
EW Y
ORK
124
14
518.
719.
3290
|WH
ART
@D
ISC
OV
ERG
REEN
E.CO
M|W
WW
.DIS
CO
VER
GRE
ENE.C
OM

122.2 A
CR
E SC
HN
EIDER
DEV
ELOPM
ENT S
ITE
PR
ESENT Z
ON
ING
CO
MM
ERCIA
L (CO
M) D
ISTRICT
LOC
ATIO
N TO
WN
OF C
AIRO
, GREEN
E CO
UN
TY
NEA
REST IN
TERSTA
TE LO
CA
TED O
N N
Y-23 W
ITH C
LOSE PRO
XIMITY
TO I-87, EXIT 21, 7
MILES TO
INTERC
HA
NG
E
TO
TAL A
REA
4,258,425 S
QU
ARE FEET
NEA
REST C
OM
MER
CIA
L AIR
POR
T C
OLU
MBIA
CO
UN
TY AIRPO
RT, 20 M
ILES A
LBAN
Y INTERN
ATIO
NA
L AIRPO
RT, 47 M
ILES
ON-SITE B
RO
AD
BAN
D V
ERIZON
NY
INC. O
R MID-H
UD
SON
C
ABLEV
ISION/D
ATA
CO
RP.