the influence of mixed reality on satisfaction and brand
TRANSCRIPT
sustainability
Article
The Influence of Mixed Reality on Satisfaction andBrand Loyalty in Cultural Heritage Attractions:A Brand Equity Perspective
Sujin Bae 1, Timothy Hyungsoo Jung 2, Natasha Moorhouse 2, Minjeong Suh 3 andOhbyung Kwon 4,*
1 School of Management, Kyung Hee University, Seoul 02447, Korea; [email protected] Faculty of Business and Law, Manchester Metropolitan University, Manchester M15 6BG, UK;
[email protected] (T.H.J.); [email protected] (N.M.)3 Graduate school of international tourism, Hanyang University, 222, Wangsimni-ro, Seongdong-gu,
Seoul 04763, Korea; [email protected] School of Management, Kyung Hee University, Kyung Hee Dae Ro 26, Dong Dae Mun Gu,
Seoul 02447, Korea* Correspondence: [email protected]; Tel.: +82-2961-2148
Received: 30 January 2020; Accepted: 31 March 2020; Published: 8 April 2020�����������������
Abstract: Mixed reality technology is being increasingly used in cultural heritage attractions toenhance visitors’ experiences. However, how the characteristics of mixed reality affect satisfactionand brand loyalty has not been explored in previous research. The purpose of this study is toidentify factors affecting satisfaction with mixed reality experiences at cultural and artistic visitorattractions and their influence on brand loyalty, which is connected with management performance.We propose a theoretical model based on brand equity theory in the context of mixed realityexperience. Survey data were gathered from 251 respondents visiting a cultural and artistic visitorattraction in Seoul, Korea, using a stratified sampling method. Partial least squares structuralequation modeling (PLS-SEM) was employed for the data analysis. The results suggest that thecharacteristics of mixed reality (interactivity, vividness) not only influence the affective aspects(perceived immersion, perceived enjoyment) of visitors’ experiences, but also positively affect brandawareness, brand association, and brand loyalty.
Keywords: mixed reality; interactivity; vividness; brand loyalty; brand awareness; brand association;cultural heritage attractions
1. Introduction
As 5G provides very high data rates, extremely low latency, and significant improvement in users’perceived quality of service (QoS), it is expected to become more widespread in the coming yearsparticularly in urban areas [1]; hence, interest in developing mixed reality content with high useracceptance is increasing. Mixed reality content has traditionally been used for games [2], education [3],training [4], tourism [5], and cultural exhibitions [6]. Satisfaction with cultural and artistic exhibitionshas been linked to the consumption of souvenirs and visitor attractions. Accordingly, researchers haveexamined the factors affecting construction and operation of exhibitions by public institutions andprivate companies [7]. Case studies focused on planning, composition, and exhibition content havedemonstrated that visitor satisfaction with exhibition experiences can be increased by adding variousinformation technologies, including augmented reality (AR), virtual reality (VR), and holograms.Integration of mixed reality technology into cultural and artistic attractions is expected to contribute toa richer visitor experience [8].
Sustainability 2020, 12, 2956; doi:10.3390/su12072956 www.mdpi.com/journal/sustainability
Sustainability 2020, 12, 2956 2 of 22
As with any other organizations, the sustainability of cultural and artistic visitor attractionsconsists of four elements including the cultural environment (e.g., heritage preservation,new audiences), social environment (e.g., engagement, social responsibility), natural environment(e.g., green technologies, energy efficiency), and economic environment [9]. Economic aspects canbe supported by increasing visitor numbers and net growth [10]; hence, when considering factorsthat facilitate the continued operation of cultural and artistic visitor attractions, it is necessary tostudy factors affecting visitor satisfaction [11] and souvenir purchase [12]. This information is ofinterest to corporate executives and practitioners. However, empirical research is lacking on thecharacteristics of mixed reality and their connection to user satisfaction and brand loyalty in thecontext of cultural and artistic visitor attractions. Although one study examined development of theexperimental environment and proof of concept [13], the effects of the technical characteristics of mixedreality on satisfaction or purchase intention have rarely been studied [14].
The marketing efforts of cultural organizations tend to be focused on sustaining and creatingloyalty [15], which can be affected by brand equity [16–18]. Customer-based brand equity (CBBE),which can be defined as the added value of a brand to a customer [19], is said to reinforce brand loyaltyand brand preference, attract new customers, and generate greater resiliency to competitors’ marketingactions, enabling the brand to earn consistent, predictable, and higher market shares over time [20].According to early research [21,22], brand awareness, brand association, and brand loyalty are threekey attributes of brand equity that must be perceived positively by the consumer for brand equity to beachieved. Hence, brand equity is formed when a brand known to the consumer is perceived as positiveand unique with strong associations [23]. For organizations, brand equity is important because of itsability to influence positive affect and attitudes, which manifest themselves in consumer behaviorssuch as purchase intention and repeat visitation [23]. Brand equity theory has been utilized in researchconducted in both cultural (e.g., [24,25]) and technological contexts (e.g., [19]). However, to date,there is limited research employing a brand equity perspective to investigate the influence of visitors’mixed reality experience on brand equity in the context of cultural and artistic visitor attractionsthrough empirical research using quantitative approach. Therefore, this study aims to bridge thisresearch gap, and as a result, it offers important implications for managers of such organizations inaddition to making a theoretical contribution to research in this area.
More specifically, the purpose of this study is to examine how two characteristics of mixed reality(interactivity, vividness) affect the affective aspects (perceived immersion, perceived enjoyment)of visitors’ experiences of and satisfaction with cultural and artistic attractions. In addition,we investigate the effects of the characteristics of mixed reality on brand awareness, brand association,and, eventually, brand loyalty, which is connected to the management of cultural and artistic visitorattractions. We use brand equity theory as the theoretical background and conduct an empirical analysiswith visitors to a specific cultural and artistic attraction in which mixed reality has been implemented.
This paper begins with a theoretical background exploring previous literature on theimplementation of mixed reality in cultural heritage attractions, followed by an overview of brandequity theory. A justification for each of the proposed hypotheses is then presented, which is followed bythe method detailing the quantitative data collection and analysis. Finally, discussions and conclusionsincluding theoretical contributions and practical implications are offered.
2. Theoretical Background
2.1. Mixed Reality in Cultural Heritage Attractions
Cultural heritage-related curated spaces, including art galleries and museums, compete forcultural visitors’ time. They are under pressure to create appealing and individual experiences thatattract visitor’s attention [26]. Immersive technologies such as mixed reality (MR), AR, and VR havebecome increasingly used in cultural heritage attractions, providing experiences through a combinationof real and digital content [27]. Several studies focus on the application and use of both AR and VR in
Sustainability 2020, 12, 2956 3 of 22
urban cultural heritage attractions. These studies are written from various perspectives, including theimpacts of AR on urban heritage tourism (e.g., [28]), value of AR from stakeholders’ perspectives(e.g. [29]), experiential learning with AR in museums (e.g., [30,31]), AR acceptance in urban heritagetourism (e.g., [32,33]), and experiencing AR and VR in art galleries and museums (e.g., [34,35]).By comparison, fewer studies have focused on mixed reality (e.g., [5,36]), which can be defined as“the combination of virtual computer graphics and real-world elements into a virtual environment”([26] p. 89). Powered by mobile devices or HMD(Head Mounted Display)s, mixed reality can enrich theuser’s experience by providing enhanced information through multisensory modalities such as video,audio, touch, and scent. Mixed reality enhances the user’s experience of the surrounding environment.
Two characteristics of mixed reality can enhance users’ experience of a cultural heritage attraction.Feelings of presence tend to occur when a virtual environment provides high levels of interactivityand vividness [37–39]. Interactivity allows users to manipulate the virtual environment in realtime [40] and is perceived to be one of key determinants of enjoyment in interactive systems [41].Vividness (i.e., “the ability of a technology to produce a sensorially rich mediated environment”; [39]p. 80) and interactivity are two important media features of mixed reality. In AR research, vividnessand interactivity have been found to influence consumer evaluations positively through increasedimmersion [42]. In addition, AR offers increased interaction through 3D virtual objects, and systemquality has been found to enhance learning effectiveness and learner satisfaction with the learningenvironment [43].
By connecting information and material reality, mixed reality can make the invisible visible insitu, allowing visitors to experience the space, its history, and a community simultaneously [26].The stimulus-organism-response (S-O-R) model [44], which asserts that a stimulus (S) may influence anorganism (O) that in turn influences behavior (R), was one of the first models developed to investigatethe influence of atmosphere on customer behaviors; this approach continues to be used widelytoday [45] in immersive technology research (e.g., [46]), among other fields of study. As mixed realitytechnologies continue to advance, their potential applications in hybrid spaces increase and becomemore widespread [26]. Although researchers have begun to investigate how mixed reality can beintegrated into urban cultural heritage experiences (e.g., [14]), research in this area is largely still in itsinfancy, and no comprehensive framework has been developed for evaluating these novel experiencesand their multiple dimensions of adoption, usability, engagement, immersion, presence, and physicalawareness [26]. As highlighted by Trunfio and Campana [47], further investigation is also requiredinto the influence of mixed reality on visitor experience and value propositions in such spaces.
2.2. Brand Equity Theory
Brand equity has been an important marketing concept since the 1980s [48] and has recently becomean increasingly important concept for cultural organizations [49]. Many studies on customer-basedbrand equity (CBBE) rely on the models created by Aaker [21] and Keller [22,50]. Although thesetwo authors conceptualized brand equity differently, they both generally defined the concept froma consumer-based perspective [51]. Brand equity is generally considered a multidimensionalconstruct [19]. According to Aaker, it comprises brand awareness, brand association, perceived quality,brand loyalty, and other proprietary assets (e.g., patents, registered trademarks, and so on), which mustbe perceived positively by the consumer for brand equity to be achieved [21,52]. Brand awarenessplays an important role in CBBE [22]; it refers to a) consumers’ ability to recall, recognize andconnect with a brand (via brand name, logo, symbol, etc.), linking it with certain associations inmemory (depth of brand awareness), and b) the range of purchase and consumption situations inwhich the brand comes to mind (breadth of brand awareness) [53]. To create brand equity, it is alsoimportant that the brand has strong, favorable, and unique brand associations [22]. Brand associationis another component of brand equity linked to consumers’ memory of a brand [54], which providesthe basis of purchase decision-making [55]. Favorable and unique brand associations are essentialto brand image [56]; therefore, when examining brand association, many studies focus on brand
Sustainability 2020, 12, 2956 4 of 22
image (e.g., [49,57]). Overall, positive brand association and significant brand awareness contribute toa positive consumer response [19].
Empirical studies have demonstrated that the higher the brand equity, the greater theloyalty [16–18]. A brand is likely to have positive brand equity if it receives more favorable responses,that is, higher levels of brand association, awareness, preference, and familiarity [55]. The role of thebrand in creating preferences and generating value and loyalty is no doubt of interest to managersof cultural institutions [49]. Indeed, most of their marketing efforts are directed toward sustainingand increasing loyalty [15]. Research shows that when a museum’s brand is evaluated positively,customer loyalty toward the museum is greater [25]. Although CBBE has been widely discussedin tourism research [25,52,58], there has been little application of this approach to urban culturalheritage organizations, with only a few researchers investigating CBBE in the museum [24,25] andart contexts [49] and even fewer focusing on mixed reality in urban cultural heritage attractions fromthis perspective.
3. Hypotheses
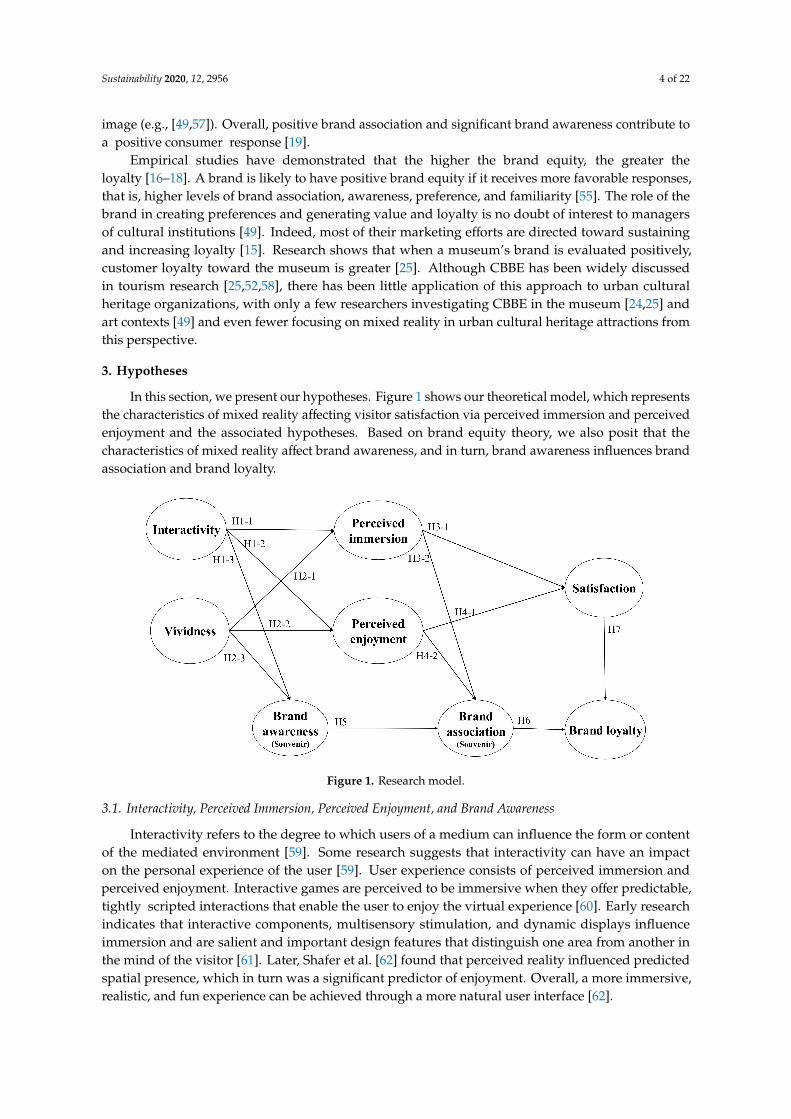
In this section, we present our hypotheses. Figure 1 shows our theoretical model, which representsthe characteristics of mixed reality affecting visitor satisfaction via perceived immersion and perceivedenjoyment and the associated hypotheses. Based on brand equity theory, we also posit that thecharacteristics of mixed reality affect brand awareness, and in turn, brand awareness influences brandassociation and brand loyalty.
Figure 1. Research model.
3.1. Interactivity, Perceived Immersion, Perceived Enjoyment, and Brand Awareness
Interactivity refers to the degree to which users of a medium can influence the form or contentof the mediated environment [59]. Some research suggests that interactivity can have an impacton the personal experience of the user [59]. User experience consists of perceived immersion andperceived enjoyment. Interactive games are perceived to be immersive when they offer predictable,tightly scripted interactions that enable the user to enjoy the virtual experience [60]. Early researchindicates that interactive components, multisensory stimulation, and dynamic displays influenceimmersion and are salient and important design features that distinguish one area from another inthe mind of the visitor [61]. Later, Shafer et al. [62] found that perceived reality influenced predictedspatial presence, which in turn was a significant predictor of enjoyment. Overall, a more immersive,realistic, and fun experience can be achieved through a more natural user interface [62].
Sustainability 2020, 12, 2956 5 of 22
Previous research also suggests a positive relationship between interactivity and perceivedenjoyment [62–64]. For instance, in Lin and Parker’s [63] study, interactivity was considered themost profound way to enhance the user experience in terms of increased presence and enjoymentin virtual environments. In the context of motion-based systems (e.g., Kinect), Shafer et al. [62]found similar results: higher interactivity increased spatial presence, perceived reality, and enjoyment.Interactivity in artistic spaces has also been found to increase audience enjoyment and creativeidentity [64]. Finally, Shin [65] proposed a model of attitudes towards 3DTV, identifying significantroles for social presence and flow, both of which affect attitude, perceived usefulness, and perceivedenjoyment. Accordingly, these factors are considered to underlie users’ expectations of 3DTV [65].
When evaluated as characteristics of an online brand community, both virtual interactivityand information quality were found to have strong effects on customer engagement [66].Customer engagement is a strong predictor of brand loyalty. As a result, many organizationsare developing brand communities to promote and communicate their offerings to customers [66].Recent research demonstrated that the more actively firms use and manage social media, the higherawareness of the brand will be [67]. Moreover, Mauroner et al. [68] found that interactivity hasa significant influence on brand recall, suggesting that interaction with an ad may lead to more intensecognitive processing of the brand message. Hence, we hypothesize the following:
H1-1: Interactivity of mixed reality will have a positive effect on perceived immersion.
H1-2: Interactivity of mixed reality will have a positive effect on perceived enjoyment.
H1-3: Interactivity of mixed reality will have a positive effect on brand awareness.
3.2. Vividness, Perceived Immersion, Perceived Enjoyment, and Brand Awareness
Vividness, also known as realness, realism, or richness [69,70], refers to the ability of a technologyto produce a sensorially rich, mediated environment ([39] p. 80). It includes not only the sensoryexperience of actual objects, but also the non-sensory experience of imaginary objects [71]. Vividness isalso perceived as a quality of brand expression rather than a quality of the brand itself. For example,in e-commerce, it is known that how a product is displayed on the web affects evaluation and sales ofthat product [72].
Vividness has a positive effect on immersion in the VR context [42]. To feel immersed,consumers must be free to interact with products, to inspect vividly and realistically generatedvirtual product images [73]. This relationship between vividness and immersion is likely also tobe present in mixed reality, where virtual objects appear as a vivid and seamless part of the actualphysical scene.
On the other hand, vividness may also have a positive effect on the enjoyment of mixed reality [74].In VR, vividness is recognized as a representative form of modality richness, which is known to havea significant effect on shopping enjoyment [75]. When it comes to e-commerce, the visual vividness ofonline websites is associated with enjoyment [76]. Similarly, McLean and Wilson [77] suggested thatperceived enjoyment obtained from technology is related to two functional elements: interactivity andvividness. We believe this will also be true in the mixed reality context.
According to earlier research, extrinsic cues of website vividness allow unfamiliar brands tocompete against familiar brands [78]. Highly vivid advertisements have been found to influence positivebrand attitudes compared with less vivid advertisements, which in turn stimulates consumers’ purchaseintentions [75]. Additionally, a positive correlation has been demonstrated between the vividnessof word of mouth communication messages and both brand awareness and brand association [62].Therefore, we present the next hypothesis as follows:
H2-1: Vividness of mixed reality will have a positive effect on perceived immersion.
H2-2: Vividness of mixed reality will have a positive effect on perceived enjoyment.
Sustainability 2020, 12, 2956 6 of 22
H2-3: Vividness of mixed reality will have a positive effect on brand awareness.
3.3. Perceived Immersion, User Satisfaction, and Brand Association
Perceived immersion refers to the degree to which a person is immersed in the content beingexperienced [61,79]. Immersion is an important factor in game experience. Denisova and Cairns [80]found that the difference between an adaptive AI group and a standard AI group at the level ofthe user reflects the specific state in which game users experience immersion. Immersion, passion,and activation are key elements of consumer brand engagement that represent the degree to whicha customer is prepared to exert relative cognitive, emotional, and behavioral resources in specificinteractions with a focal brand [81]. Highly immersive environments that reproduce perceptualrichness, thus heightening the sense of presence, have positive effects on self-endorsement [82].Self-endorsement subsequently triggers favorable attitudes toward products and brands. Priorresearch suggests that users wearing a particular brand of clothing in a highly immersive environmentprefer the brand worn by their virtual self to the brand worn by others [83].
High sensory immersion is also associated with a more favorable brand attitude, greater productknowledge, and elevated purchase intention [83]. In the context of 3D virtual worlds, presence wasfound to influence enjoyment and brand equity, which is consistent with the theory of flow, which statesthat a sense of immersion can produce hedonic outcomes and influence learning and attitudes [19].Even when AR technology is applied to a game, perceived immersion affects the satisfaction of gameparticipants [84]. In addition, perceived immersion has a positive effect on satisfaction in a merchantvirtual universe, which hyper-realistically reproduces the environment of a real shopping mall [85].Likewise, perceived immersion affects satisfaction with experience. We surmise that the same resultsmay be possible in the context of mixed reality experiences. Therefore, we state the next hypothesisas follows:
H3-1: Perceived immersion in mixed reality experiences will have a positive effect on user satisfaction.
H3-2: Perceived immersion in mixed reality will have a positive effect on brand association.
3.4. Perceived Enjoyment, User Satisfaction, and Brand Association
In the user experience domain, researchers either focus on one or two factors (e.g., previousexperience or interactivity, involvement and vividness, intention or presence, enjoyment and simulatorsickness) (e.g., [66,75,86]). For instance, Islam and Rahman [66] investigated how the uniquecharacteristics of a brand community, including information quality, system quality, virtual interactivity,and rewards, affect customer engagement and, subsequently, brand loyalty. Van Kerrebroeck et al. [75]explored the impact of VR on transformational brand appeals and found an association between thistechnology and higher perceptions of vividness and presence than regular 2D video. Finally, Virvilaiteet al. [86] studied the relationship between vividness and usefulness (word of mouth communicationmessaging) and four brand equity components (brand association, brand awareness, brand loyalty,and perceived quality) and found an overall positive effect.
Perceived enjoyment refers to the degree to which visitors who experience mixed realitycontent enjoy it [87,88]. According to the expectation-confirmation model of Shiau and Luo [89],perceived enjoyment has a positive effect on satisfaction. In addition, another study using theexpectation-confirmation model by Joo et al. [90] confirmed that perceived enjoyment has a significantpositive effect on satisfaction and sustained use intention for students using digital textbooks. In anotherstudy on learning outcomes of VR users in education, it was found that the participants’ perceivedenjoyment of the VR experience not only affected perceived learning outcomes, but also that perceivedlearning outcomes positively affected satisfaction, perceived learning, and behavioral intention [91].Prior research has indicated that enjoyment of an advertisement can affect people’s attitude towards theadvertised product [92]. Hence, we conclude that perceived enjoyment is related to attitudes towardsnew marketing systems. Recent research supports this assertion that perceived enjoyment positively
Sustainability 2020, 12, 2956 7 of 22
influences brand attitude [93]. Likewise, in the context of mixed reality experience, perceived enjoymentmay affect satisfaction. Therefore, we present the next hypothesis as follows:
H4-1: Perceived enjoyment of mixed reality content will have a positive impact on user satisfaction.
H4-2: Perceived enjoyment of mixed reality content will have a positive impact on brand association.
3.5. Brand Awareness and Brand Association
Brand awareness is a key determinant of brand equity [20,94–96]. It is defined as an individual’sability to recall and recognize a brand [97]. In the context of this study, brand awareness refers towhether consumers can recall or recognize a brand or simply whether they know about a brand at all [95].Brand awareness indicates an association in memory about a particular brand [98]; brand awarenesscan have either a positive or negative impact on brand association [99]. This is observed in manybrands, including car brands [100]. Therefore, we hypothesize as follows:
H5: Brand awareness of souvenirs in galleries with mixed reality content will have a positive impact on brandassociation.
3.6. Brand Association and Brand Loyalty
As previously mentioned, we investigate brand awareness, brand association, and brand loyaltyfrom the perspective of brand equity theory. The role of brand associations as an important element inbrand equity management has been previously studied [101]. Brand association is closely related tocustomers’ memories about a brand [96]. In brand equity theory, brand association is closely related tothe degree of loyalty to a brand felt by customers [102]. This has been observed in several contexts,including an e-brand study [96]. In our study, brand association refers to everything related to thebrand in consumers’ minds. Brand association can help consumers determine the relevance of boththe parent brand and extended brands [103]. We believe that brand association will affect brandloyalty in the context of cultural and artistic visitor attractions and mixed reality souvenir shops.Therefore, we propose the next hypothesis as follows:
H6: Brand association for a souvenir in a gallery with mixed reality content will have a positive impact on brandloyalty.
3.7. Satisfaction and Brand Loyalty
User satisfaction refers to visitors’ degree of satisfaction with the content they experience [104].In this study, brand loyalty refers to the customer’s tendency to repurchase a brand, revealed throughpurchase behavior or brand sales (e.g., actual purchases observed over time) [105,106]. Research onuser satisfaction and brand loyalty has been conducted in various contexts. For example, it was foundthat shopping mall visitor satisfaction has a positive effect on brand loyalty [107], and brand studiesin the hotel and restaurant industries have found that brand experiences are driven by customerexperience and satisfaction and have positive effects on loyalty [108]. However, there are few empiricalstudies that examine the effects on user satisfaction and brand loyalty of content display using mixedreality in the context of cultural and artistic visitor attractions. Similar to shopping and restaurantexperiences, we expect that satisfaction with mixed reality in this context will have a positive impacton brand loyalty. Therefore, we hypothesize the following:
H7: User satisfaction with mixed reality will have a positive effect on brand loyalty.
Sustainability 2020, 12, 2956 8 of 22
4. Method
4.1. Study Context
For this study, we selected a cultural and artistic visitor attraction located in Seoul in an area wheremodern and classical culture and fashion encounter each other and are well balanced. The attraction,L’atelier, is a representative IT-based theme park which substantially and most successfully adoptsinteractive media including mixed reality technologies. Hence, L’atelier can be a good benchmarkto investigate the viability of mixed reality technology for the sustainable operation of the culturalheritage attraction. L’atelier includes artwork and stories of various 19th-century Impressionist artistssuch as van Gogh and Gauguin [109]. It has recently integrated mixed reality technology to providean immersive experience using multi-sensory features that contribute to a more interactive andenjoyable visitor experience. By using this technology, visitors can experience not only paintings butalso hidden stories about various artists and the historical and cultural background relating to thepaintings. Through AI integration, visitors are able to interact via conversation with friends of theimpressionists such as van Gogh’s friend, postman Joseph Roulin. They can also experience artworkthrough a media art show on the theme of "Monet’s Garden” (e.g. visit 360 degrees, and modelssuch as trees in the actual garden appear), which was facilitated by a physical display wall used toportray holograms and projection mapping technology. Monet depicted the water lily that changeswith light; hence, the artist’s garden in the media art show is the painting created by light. There is alsoa hologram talk show based on the mystery around the death of van Gogh and a musical performance,“van Gogh’s Dream”, which is based on his life story [109]. In the musicals, actors and characters indigital works interact with real actors through dialogue.
4.2. Measures
A survey with a total of 25 measurement items was used for this study. The following items wereadopted from the literature: interactivity (e.g., “When I experienced Monet’s garden, the mixed realitywater lily leaves interacted with my movement.”) [110], vividness (e.g., “When I experienced a musical,the digital characters felt vivid.”) [111,112], perceived immersion (e.g., “While I was experiencing themixed reality content such as a musical and Monet’s garden, I was immersed in the mixed realityexperience.”) [84,113,114], perceived enjoyment (e.g., “I enjoyed my experience of mixed reality suchas the musicals and Monet’s garden.”) [115,116], brand awareness (e.g., “When I went to L’ateliersouvenir shop, I noticed a souvenir that reflects impressionist artwork.”) [117], brand association(e.g., “When I looked at impressionist souvenirs, I could easily recall my mixed reality experience atL’atelier.”) [118,119], satisfaction (e.g., “I am satisfied with the mixed reality content I experiencedat L’atelier.”) [120,121], and brand loyalty (e.g., “I am willing to purchase souvenirs from L’ateliersouvenir shop.”) [120,122]. The other items were identified through factor and reliability analyses andscored on a 7-point Likert scale. In order to avoid any material discrepancies in the survey, the initialquestionnaire was created in English and then translated to Korean by researchers who are proficientin both languages.
4.3. Data Collection
For data collection, survey responses were gathered using a tablet PC. The researchers weresituated in the café within the attraction on weekends between 21 and 29 September 2019, and surveydata were gathered from visitors after they experienced mixed reality at the attraction. A total of sixresearchers were conducting survey data collection during this time. A stratified sampling methodwas used for data collection in order to match the demographic profiles (i.e., age and gender) ofactual visitors to this cultural and artistic visitor attraction. More specifically, in order to identify thepopulation and profile of visitors, researchers consulted with the marketing manager at the visitor andartistic cultural attraction in Korea. According to data gathered between November 2017 and October2019, the majority of visitors to L’atelier are female (66% female, 33% male) aged between 20 and
Sustainability 2020, 12, 2956 9 of 22
30 years (86.7%), followed by those aged over 40 (13.3%). This was also proven during the pilot study.Based on this, sample data were collected by researchers using a stratified sampling method to matchthe population of actual visitors in terms of gender and age. Respondents experienced the attractionfor one or more hours before visiting the souvenir shop. Each visitor was approached and invitedto participate in the study at the end of their experience. Only those who volunteered to participatewere included.
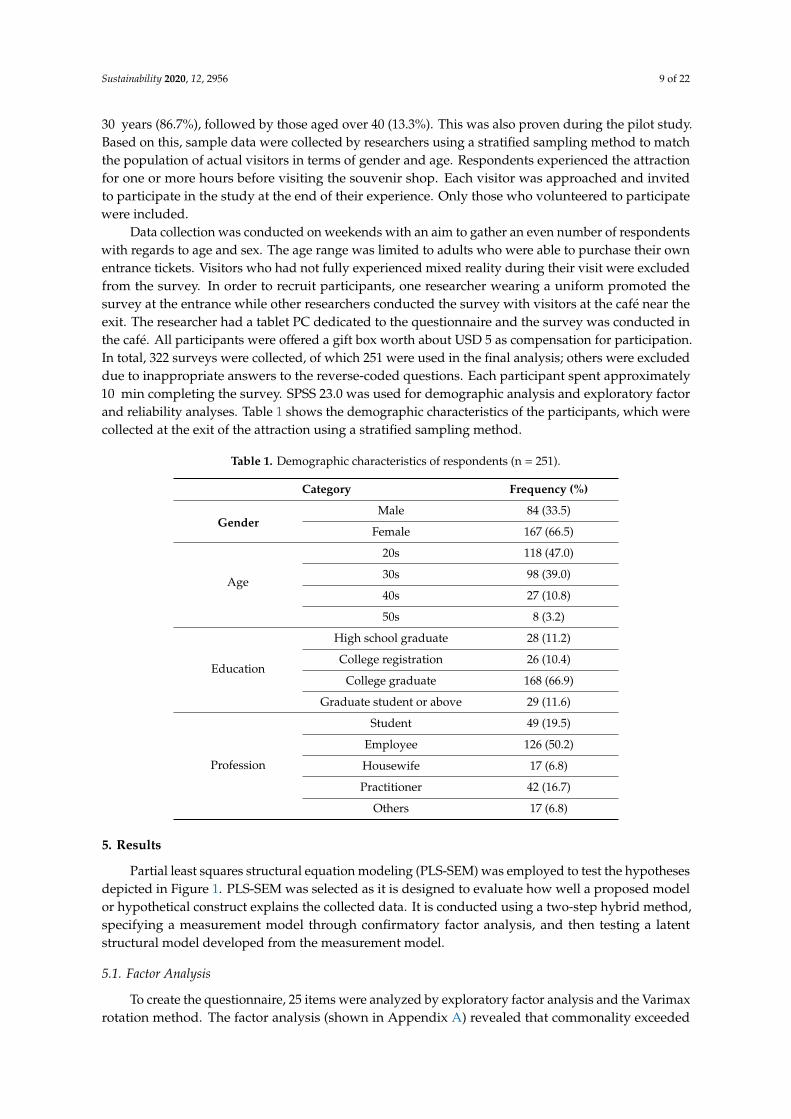
Data collection was conducted on weekends with an aim to gather an even number of respondentswith regards to age and sex. The age range was limited to adults who were able to purchase their ownentrance tickets. Visitors who had not fully experienced mixed reality during their visit were excludedfrom the survey. In order to recruit participants, one researcher wearing a uniform promoted thesurvey at the entrance while other researchers conducted the survey with visitors at the café near theexit. The researcher had a tablet PC dedicated to the questionnaire and the survey was conducted inthe café. All participants were offered a gift box worth about USD 5 as compensation for participation.In total, 322 surveys were collected, of which 251 were used in the final analysis; others were excludeddue to inappropriate answers to the reverse-coded questions. Each participant spent approximately10 min completing the survey. SPSS 23.0 was used for demographic analysis and exploratory factorand reliability analyses. Table 1 shows the demographic characteristics of the participants, which werecollected at the exit of the attraction using a stratified sampling method.
Table 1. Demographic characteristics of respondents (n = 251).
Category Frequency (%)
GenderMale 84 (33.5)
Female 167 (66.5)
Age
20s 118 (47.0)
30s 98 (39.0)
40s 27 (10.8)
50s 8 (3.2)
Education
High school graduate 28 (11.2)
College registration 26 (10.4)
College graduate 168 (66.9)
Graduate student or above 29 (11.6)
Profession
Student 49 (19.5)
Employee 126 (50.2)
Housewife 17 (6.8)
Practitioner 42 (16.7)
Others 17 (6.8)
5. Results
Partial least squares structural equation modeling (PLS-SEM) was employed to test the hypothesesdepicted in Figure 1. PLS-SEM was selected as it is designed to evaluate how well a proposed modelor hypothetical construct explains the collected data. It is conducted using a two-step hybrid method,specifying a measurement model through confirmatory factor analysis, and then testing a latentstructural model developed from the measurement model.
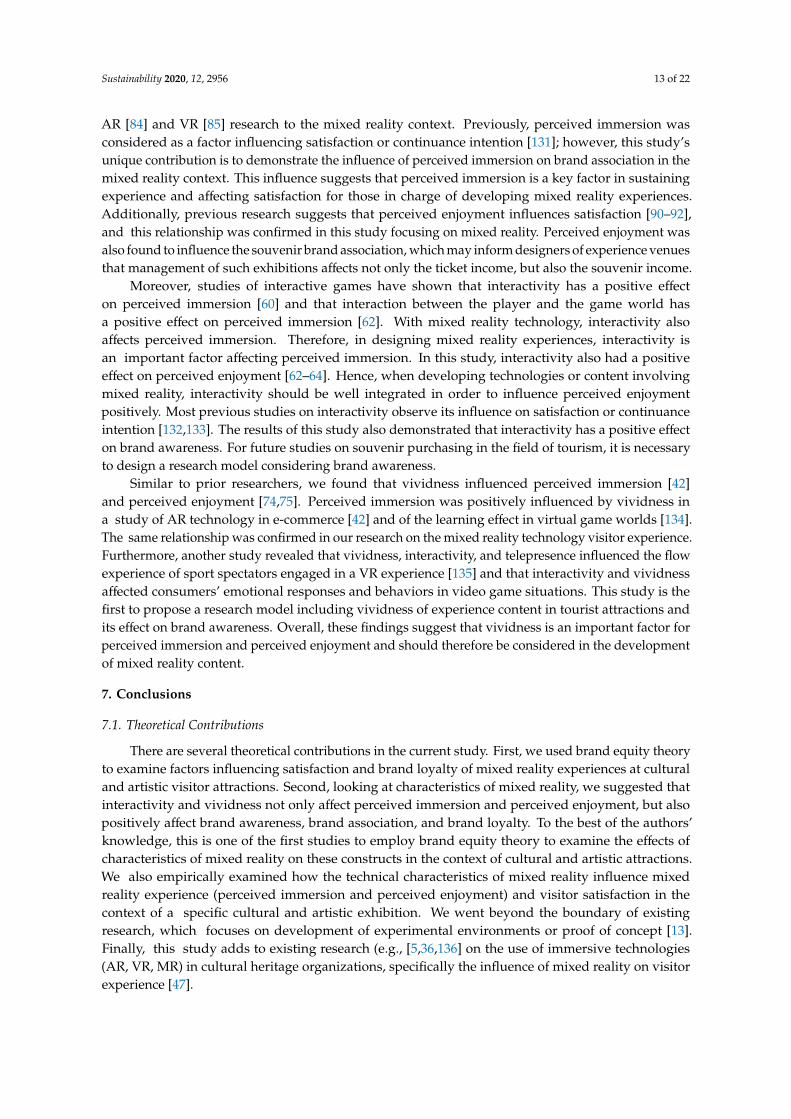
5.1. Factor Analysis
To create the questionnaire, 25 items were analyzed by exploratory factor analysis and the Varimaxrotation method. The factor analysis (shown in Appendix A) revealed that commonality exceeded
Sustainability 2020, 12, 2956 10 of 22
0.683, and factor loadings revealed eight factors, with no multiple loading items for only one factor of0.6 or more. The results of the exploratory factor analysis also revealed that the Kaiser–Meyer–Olkin(KMO) value for the sample was 0.905, which confirms that the dataset is valid for the purposes offactor analysis. In addition, the sphere formation test value for the sample was x2 = 8022.512 (df = 300,p < 0.001), and the cumulative total variance of the factors was 90.39%, which also indicates suitabilityfor factor analysis. Reliability of the eight identified factors was confirmed by Cronbach’s α coefficient,which was higher than 0.832, thus indicating high credibility [123].
5.2. Validation
Validity and feasibility of the measurement model
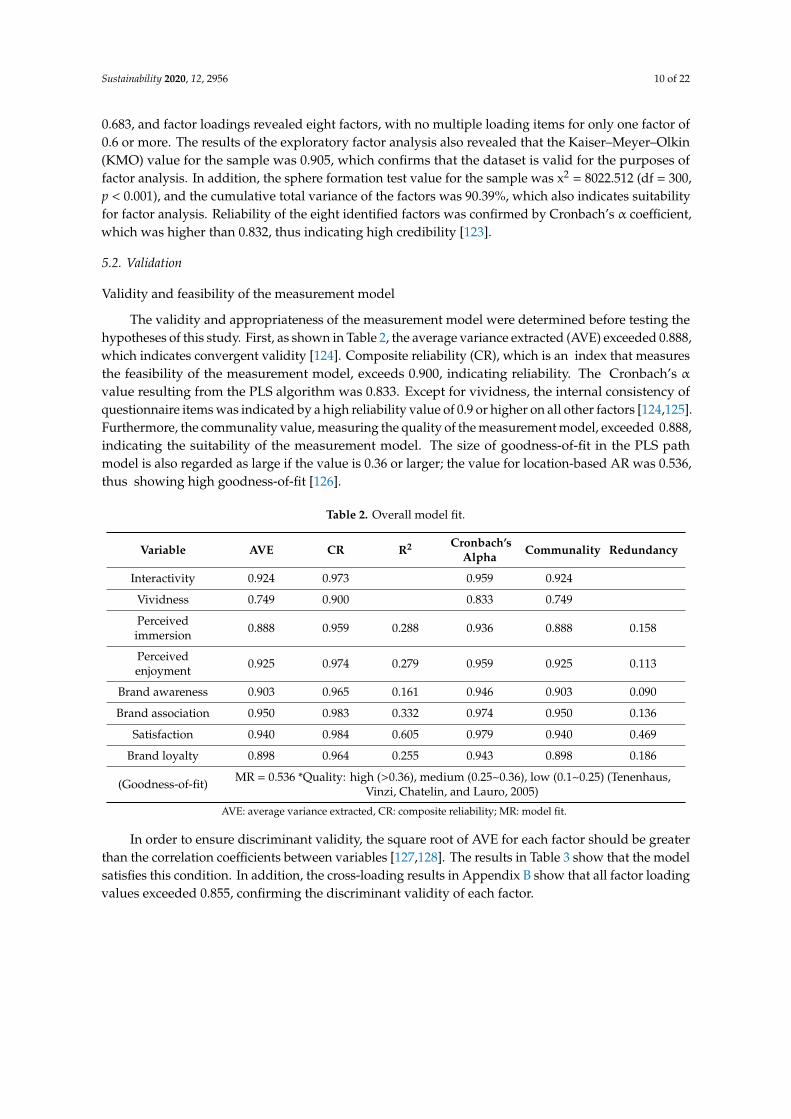
The validity and appropriateness of the measurement model were determined before testing thehypotheses of this study. First, as shown in Table 2, the average variance extracted (AVE) exceeded 0.888,which indicates convergent validity [124]. Composite reliability (CR), which is an index that measuresthe feasibility of the measurement model, exceeds 0.900, indicating reliability. The Cronbach’s α
value resulting from the PLS algorithm was 0.833. Except for vividness, the internal consistency ofquestionnaire items was indicated by a high reliability value of 0.9 or higher on all other factors [124,125].Furthermore, the communality value, measuring the quality of the measurement model, exceeded 0.888,indicating the suitability of the measurement model. The size of goodness-of-fit in the PLS pathmodel is also regarded as large if the value is 0.36 or larger; the value for location-based AR was 0.536,thus showing high goodness-of-fit [126].
Table 2. Overall model fit.
Variable AVE CR R2 Cronbach’sAlpha Communality Redundancy
Interactivity 0.924 0.973 0.959 0.924
Vividness 0.749 0.900 0.833 0.749
Perceivedimmersion 0.888 0.959 0.288 0.936 0.888 0.158
Perceivedenjoyment 0.925 0.974 0.279 0.959 0.925 0.113
Brand awareness 0.903 0.965 0.161 0.946 0.903 0.090
Brand association 0.950 0.983 0.332 0.974 0.950 0.136
Satisfaction 0.940 0.984 0.605 0.979 0.940 0.469
Brand loyalty 0.898 0.964 0.255 0.943 0.898 0.186
(Goodness-of-fit) MR = 0.536 *Quality: high (>0.36), medium (0.25~0.36), low (0.1~0.25) (Tenenhaus,Vinzi, Chatelin, and Lauro, 2005)
AVE: average variance extracted, CR: composite reliability; MR: model fit.
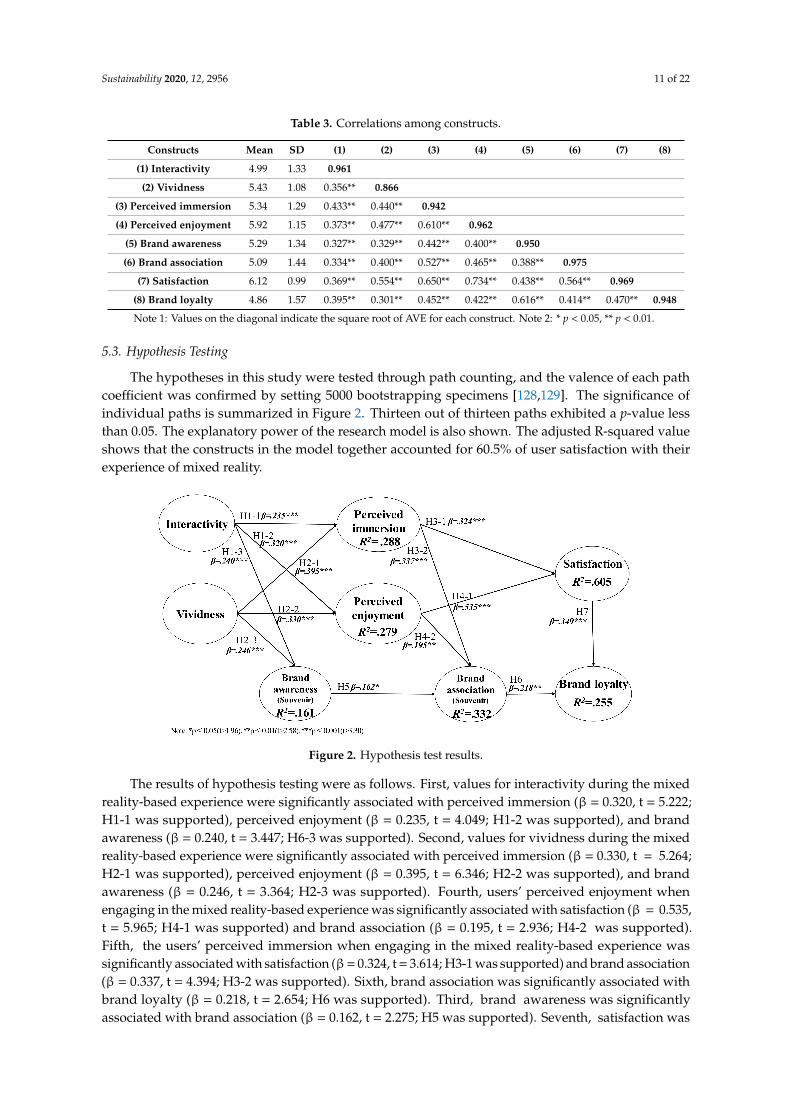
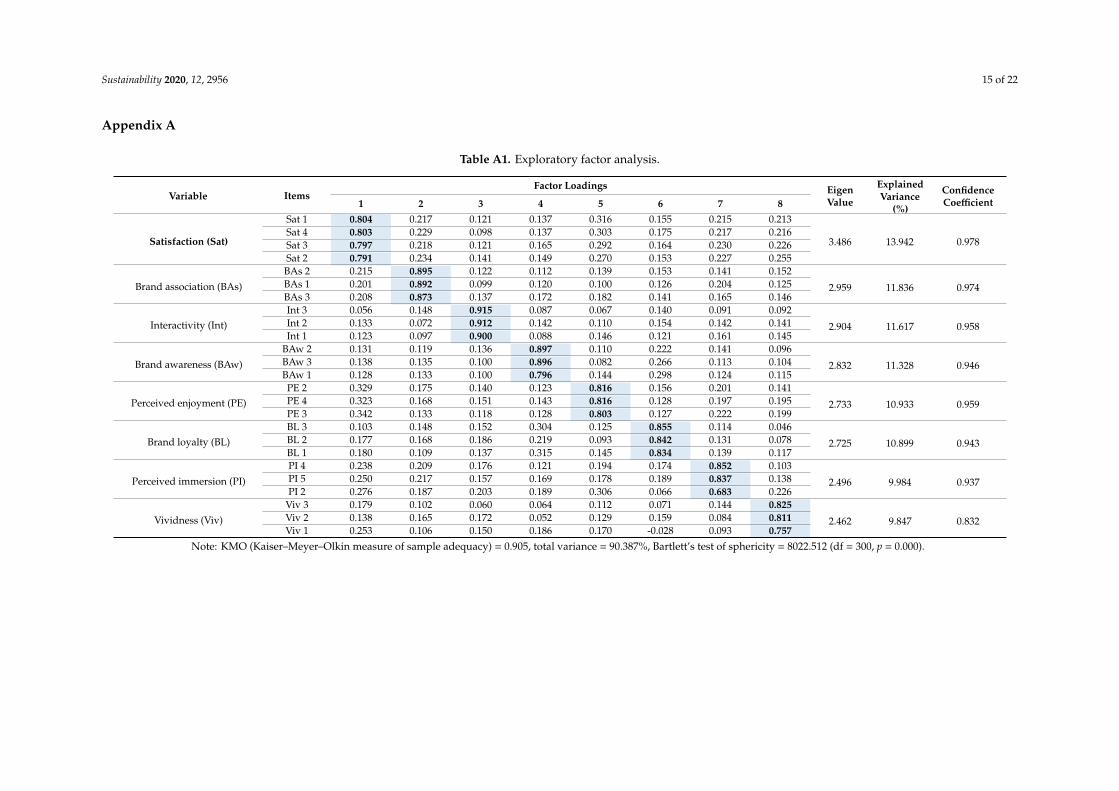
In order to ensure discriminant validity, the square root of AVE for each factor should be greaterthan the correlation coefficients between variables [127,128]. The results in Table 3 show that the modelsatisfies this condition. In addition, the cross-loading results in Appendix B show that all factor loadingvalues exceeded 0.855, confirming the discriminant validity of each factor.
Sustainability 2020, 12, 2956 11 of 22
Table 3. Correlations among constructs.
Constructs Mean SD (1) (2) (3) (4) (5) (6) (7) (8)
(1) Interactivity 4.99 1.33 0.961
(2) Vividness 5.43 1.08 0.356** 0.866
(3) Perceived immersion 5.34 1.29 0.433** 0.440** 0.942
(4) Perceived enjoyment 5.92 1.15 0.373** 0.477** 0.610** 0.962
(5) Brand awareness 5.29 1.34 0.327** 0.329** 0.442** 0.400** 0.950
(6) Brand association 5.09 1.44 0.334** 0.400** 0.527** 0.465** 0.388** 0.975
(7) Satisfaction 6.12 0.99 0.369** 0.554** 0.650** 0.734** 0.438** 0.564** 0.969
(8) Brand loyalty 4.86 1.57 0.395** 0.301** 0.452** 0.422** 0.616** 0.414** 0.470** 0.948
Note 1: Values on the diagonal indicate the square root of AVE for each construct. Note 2: * p < 0.05, ** p < 0.01.
5.3. Hypothesis Testing
The hypotheses in this study were tested through path counting, and the valence of each pathcoefficient was confirmed by setting 5000 bootstrapping specimens [128,129]. The significance ofindividual paths is summarized in Figure 2. Thirteen out of thirteen paths exhibited a p-value lessthan 0.05. The explanatory power of the research model is also shown. The adjusted R-squared valueshows that the constructs in the model together accounted for 60.5% of user satisfaction with theirexperience of mixed reality.
Figure 2. Hypothesis test results.
The results of hypothesis testing were as follows. First, values for interactivity during the mixedreality-based experience were significantly associated with perceived immersion (β = 0.320, t = 5.222;H1-1 was supported), perceived enjoyment (β = 0.235, t = 4.049; H1-2 was supported), and brandawareness (β = 0.240, t = 3.447; H6-3 was supported). Second, values for vividness during the mixedreality-based experience were significantly associated with perceived immersion (β = 0.330, t = 5.264;H2-1 was supported), perceived enjoyment (β = 0.395, t = 6.346; H2-2 was supported), and brandawareness (β = 0.246, t = 3.364; H2-3 was supported). Fourth, users’ perceived enjoyment whenengaging in the mixed reality-based experience was significantly associated with satisfaction (β = 0.535,t = 5.965; H4-1 was supported) and brand association (β = 0.195, t = 2.936; H4-2 was supported).Fifth, the users’ perceived immersion when engaging in the mixed reality-based experience wassignificantly associated with satisfaction (β= 0.324, t = 3.614; H3-1 was supported) and brand association(β = 0.337, t = 4.394; H3-2 was supported). Sixth, brand association was significantly associated withbrand loyalty (β = 0.218, t = 2.654; H6 was supported). Third, brand awareness was significantlyassociated with brand association (β = 0.162, t = 2.275; H5 was supported). Seventh, satisfaction was
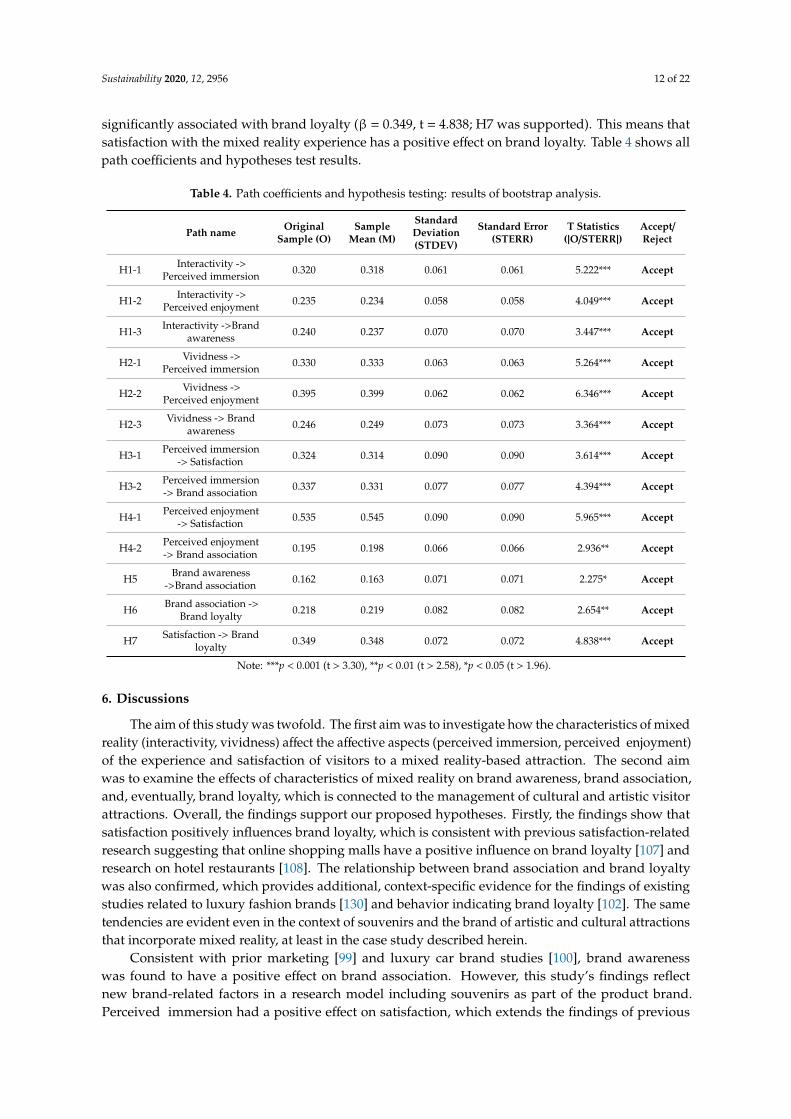
Sustainability 2020, 12, 2956 12 of 22
significantly associated with brand loyalty (β = 0.349, t = 4.838; H7 was supported). This means thatsatisfaction with the mixed reality experience has a positive effect on brand loyalty. Table 4 shows allpath coefficients and hypotheses test results.
Table 4. Path coefficients and hypothesis testing: results of bootstrap analysis.
Path name OriginalSample (O)
SampleMean (M)
StandardDeviation(STDEV)
Standard Error(STERR)
T Statistics(|O/STERR|)
Accept/Reject
H1-1 Interactivity ->Perceived immersion 0.320 0.318 0.061 0.061 5.222*** Accept
H1-2 Interactivity ->Perceived enjoyment 0.235 0.234 0.058 0.058 4.049*** Accept
H1-3 Interactivity ->Brandawareness 0.240 0.237 0.070 0.070 3.447*** Accept
H2-1 Vividness ->Perceived immersion 0.330 0.333 0.063 0.063 5.264*** Accept
H2-2 Vividness ->Perceived enjoyment 0.395 0.399 0.062 0.062 6.346*** Accept
H2-3 Vividness -> Brandawareness 0.246 0.249 0.073 0.073 3.364*** Accept
H3-1 Perceived immersion-> Satisfaction 0.324 0.314 0.090 0.090 3.614*** Accept
H3-2 Perceived immersion-> Brand association 0.337 0.331 0.077 0.077 4.394*** Accept
H4-1 Perceived enjoyment-> Satisfaction 0.535 0.545 0.090 0.090 5.965*** Accept
H4-2 Perceived enjoyment-> Brand association 0.195 0.198 0.066 0.066 2.936** Accept
H5 Brand awareness->Brand association 0.162 0.163 0.071 0.071 2.275* Accept
H6 Brand association ->Brand loyalty 0.218 0.219 0.082 0.082 2.654** Accept
H7 Satisfaction -> Brandloyalty 0.349 0.348 0.072 0.072 4.838*** Accept
Note: ***p < 0.001 (t > 3.30), **p < 0.01 (t > 2.58), *p < 0.05 (t > 1.96).
6. Discussions
The aim of this study was twofold. The first aim was to investigate how the characteristics of mixedreality (interactivity, vividness) affect the affective aspects (perceived immersion, perceived enjoyment)of the experience and satisfaction of visitors to a mixed reality-based attraction. The second aimwas to examine the effects of characteristics of mixed reality on brand awareness, brand association,and, eventually, brand loyalty, which is connected to the management of cultural and artistic visitorattractions. Overall, the findings support our proposed hypotheses. Firstly, the findings show thatsatisfaction positively influences brand loyalty, which is consistent with previous satisfaction-relatedresearch suggesting that online shopping malls have a positive influence on brand loyalty [107] andresearch on hotel restaurants [108]. The relationship between brand association and brand loyaltywas also confirmed, which provides additional, context-specific evidence for the findings of existingstudies related to luxury fashion brands [130] and behavior indicating brand loyalty [102]. The sametendencies are evident even in the context of souvenirs and the brand of artistic and cultural attractionsthat incorporate mixed reality, at least in the case study described herein.
Consistent with prior marketing [99] and luxury car brand studies [100], brand awarenesswas found to have a positive effect on brand association. However, this study’s findings reflectnew brand-related factors in a research model including souvenirs as part of the product brand.Perceived immersion had a positive effect on satisfaction, which extends the findings of previous
Sustainability 2020, 12, 2956 13 of 22
AR [84] and VR [85] research to the mixed reality context. Previously, perceived immersion wasconsidered as a factor influencing satisfaction or continuance intention [131]; however, this study’sunique contribution is to demonstrate the influence of perceived immersion on brand association in themixed reality context. This influence suggests that perceived immersion is a key factor in sustainingexperience and affecting satisfaction for those in charge of developing mixed reality experiences.Additionally, previous research suggests that perceived enjoyment influences satisfaction [90–92],and this relationship was confirmed in this study focusing on mixed reality. Perceived enjoyment wasalso found to influence the souvenir brand association, which may inform designers of experience venuesthat management of such exhibitions affects not only the ticket income, but also the souvenir income.
Moreover, studies of interactive games have shown that interactivity has a positive effecton perceived immersion [60] and that interaction between the player and the game world hasa positive effect on perceived immersion [62]. With mixed reality technology, interactivity alsoaffects perceived immersion. Therefore, in designing mixed reality experiences, interactivity isan important factor affecting perceived immersion. In this study, interactivity also had a positiveeffect on perceived enjoyment [62–64]. Hence, when developing technologies or content involvingmixed reality, interactivity should be well integrated in order to influence perceived enjoymentpositively. Most previous studies on interactivity observe its influence on satisfaction or continuanceintention [132,133]. The results of this study also demonstrated that interactivity has a positive effecton brand awareness. For future studies on souvenir purchasing in the field of tourism, it is necessaryto design a research model considering brand awareness.
Similar to prior researchers, we found that vividness influenced perceived immersion [42]and perceived enjoyment [74,75]. Perceived immersion was positively influenced by vividness ina study of AR technology in e-commerce [42] and of the learning effect in virtual game worlds [134].The same relationship was confirmed in our research on the mixed reality technology visitor experience.Furthermore, another study revealed that vividness, interactivity, and telepresence influenced the flowexperience of sport spectators engaged in a VR experience [135] and that interactivity and vividnessaffected consumers’ emotional responses and behaviors in video game situations. This study is thefirst to propose a research model including vividness of experience content in tourist attractions andits effect on brand awareness. Overall, these findings suggest that vividness is an important factor forperceived immersion and perceived enjoyment and should therefore be considered in the developmentof mixed reality content.
7. Conclusions
7.1. Theoretical Contributions
There are several theoretical contributions in the current study. First, we used brand equity theoryto examine factors influencing satisfaction and brand loyalty of mixed reality experiences at culturaland artistic visitor attractions. Second, looking at characteristics of mixed reality, we suggested thatinteractivity and vividness not only affect perceived immersion and perceived enjoyment, but alsopositively affect brand awareness, brand association, and brand loyalty. To the best of the authors’knowledge, this is one of the first studies to employ brand equity theory to examine the effects ofcharacteristics of mixed reality on these constructs in the context of cultural and artistic attractions.We also empirically examined how the technical characteristics of mixed reality influence mixedreality experience (perceived immersion and perceived enjoyment) and visitor satisfaction in thecontext of a specific cultural and artistic exhibition. We went beyond the boundary of existingresearch, which focuses on development of experimental environments or proof of concept [13].Finally, this study adds to existing research (e.g., [5,36,136] on the use of immersive technologies(AR, VR, MR) in cultural heritage organizations, specifically the influence of mixed reality on visitorexperience [47].
Sustainability 2020, 12, 2956 14 of 22
7.2. Practical Implications
This study has several interesting practical implications that can be drawn from the findings.First, the importance of immersion and enjoyment of mixed reality content is emphasized in this study,which is useful for curators and developers of cultural and artistic attractions. Second, our findingsassociated with factors affecting brand awareness, brand association, and brand equity could helpmanagers of cultural and artistic attractions to develop and create mixed reality content that is closelylinked to brand equity. This indicates that enhancing the visitor experience using new and innovativetechnologies, such as mixed reality, could lead to positive outcomes such as increased visitor numbers,thereby contributing to economic aspects of sustainability, which is particularly important for curatorsto develop appropriate mixed reality contents in order to increase brand awareness, brand association,and brand loyalty (souvenir purchase). Third, when creating content, practitioners could considerthe characteristics of mixed reality highlighted in this study to create immersive visitor experiences.This study demonstrates that perceived immersion and perceived enjoyment influence satisfactionstrongly; therefore, practitioners should focus on creating mixed reality content that provides immersiveand enjoyable experiences to contribute to the overall sustainability of the cultural and artistic visitorattraction. Although mixed reality content is being developed, it is not often used in practice. L’atelier isone of a few real-world examples where such modern technology has been integrated into a culturaland artistic visitor attraction. With a 17 billion Won investment for its mixed reality exhibitionhall development, it is considered a large-scale production cost requiring continuous managementperformance, which serves as a useful example for similar attractions aiming to produce mixed realitycontent to enhance the visitor experience. Therefore, rather than only exploring those elements thatvisitors are satisfied with, we also aimed to examine the influence on brand loyalty and purchaseintention, which contribute to increased visitor numbers and revenue generation. This is critical fromeconomic aspects of sustainability as well as for continued operation of cultural heritage attractions.
7.3. Limitations and Future Research
This study also has some limitations that provide avenues for further research. First, althoughthe sample was sufficient for the purposes of this study and allowed reasonable conclusions to bedrawn, respondents were mostly aged between 20 and 30 years old, which could be considereda limitation. However, as the data were collected with actual visitors to a specific cultural and artisticattraction, this demographic could be considered representative of those visitors who are most likelyto use mixed reality technology when visiting this type of attraction. Nevertheless, new studies couldinclude larger and more representative samples within this context to strengthen the current findings.Second, different mixed reality experiences were available for visitors to experience; there was noway of controlling which ones were included in the study. In addition, data were collected at the endof the experience; thus, we relied on respondents recalling their mixed reality experience after thefact. Further quantitative data (e.g., eye-tracking) could be gathered from respondents during themixed reality experience to provide more accurate responses to specific aspects of the experience andcomplement the survey results. Additionally, future research could extend this study’s quantitativefindings by incorporating qualitative measures to obtain in-depth understanding and insight intovisitor perspectives of mixed reality experience in cultural and artistic attractions.
Author Contributions: Conceptualization, S.B.; methodology, T.H.J. and O.K.; validation, N.M.; formal analysis,S.B. and T.H.J.; data curation, S.B.; writing—original draft preparation, S.B. and T.H.J.; writing—review andediting, N.M. and M.S.; project administration, O.K.; funding acquisition, O.K. All authors have read and agreedto the published version of the manuscript.
Funding: This work was supported by a grant from Kyung Hee University in 2019. (KHU-20191209)
Conflicts of Interest: The authors declare no conflict of interest.
Sustainability 2020, 12, 2956 15 of 22
Appendix A
Table A1. Exploratory factor analysis.
Variable ItemsFactor Loadings Eigen
Value
ExplainedVariance
(%)
ConfidenceCoefficient1 2 3 4 5 6 7 8
Satisfaction (Sat)
Sat 1 0.804 0.217 0.121 0.137 0.316 0.155 0.215 0.213
3.486 13.942 0.978Sat 4 0.803 0.229 0.098 0.137 0.303 0.175 0.217 0.216Sat 3 0.797 0.218 0.121 0.165 0.292 0.164 0.230 0.226Sat 2 0.791 0.234 0.141 0.149 0.270 0.153 0.227 0.255
Brand association (BAs)
BAs 2 0.215 0.895 0.122 0.112 0.139 0.153 0.141 0.152
2.959 11.836 0.974BAs 1 0.201 0.892 0.099 0.120 0.100 0.126 0.204 0.125BAs 3 0.208 0.873 0.137 0.172 0.182 0.141 0.165 0.146
Interactivity (Int)Int 3 0.056 0.148 0.915 0.087 0.067 0.140 0.091 0.092
2.904 11.617 0.958Int 2 0.133 0.072 0.912 0.142 0.110 0.154 0.142 0.141Int 1 0.123 0.097 0.900 0.088 0.146 0.121 0.161 0.145
Brand awareness (BAw)
BAw 2 0.131 0.119 0.136 0.897 0.110 0.222 0.141 0.096
2.832 11.328 0.946BAw 3 0.138 0.135 0.100 0.896 0.082 0.266 0.113 0.104BAw 1 0.128 0.133 0.100 0.796 0.144 0.298 0.124 0.115
Perceived enjoyment (PE)PE 2 0.329 0.175 0.140 0.123 0.816 0.156 0.201 0.141
2.733 10.933 0.959PE 4 0.323 0.168 0.151 0.143 0.816 0.128 0.197 0.195PE 3 0.342 0.133 0.118 0.128 0.803 0.127 0.222 0.199
Brand loyalty (BL)BL 3 0.103 0.148 0.152 0.304 0.125 0.855 0.114 0.046
2.725 10.899 0.943BL 2 0.177 0.168 0.186 0.219 0.093 0.842 0.131 0.078BL 1 0.180 0.109 0.137 0.315 0.145 0.834 0.139 0.117
Perceived immersion (PI)
PI 4 0.238 0.209 0.176 0.121 0.194 0.174 0.852 0.103
2.496 9.984 0.937PI 5 0.250 0.217 0.157 0.169 0.178 0.189 0.837 0.138PI 2 0.276 0.187 0.203 0.189 0.306 0.066 0.683 0.226
Vividness (Viv)
Viv 3 0.179 0.102 0.060 0.064 0.112 0.071 0.144 0.825
2.462 9.847 0.832Viv 2 0.138 0.165 0.172 0.052 0.129 0.159 0.084 0.811Viv 1 0.253 0.106 0.150 0.186 0.170 -0.028 0.093 0.757
Note: KMO (Kaiser–Meyer–Olkin measure of sample adequacy) = 0.905, total variance = 90.387%, Bartlett’s test of sphericity = 8022.512 (df = 300, p = 0.000).
Sustainability 2020, 12, 2956 16 of 22
Appendix B
Table A2. Cross-loading analysis.
Item Interactivity Vividness PerceivedImmersion
PerceivedEnjoyment
BrandAwareness
BrandAssociation Satisfaction Brand Loyalty
V01 0.964 0.368 0.453 0.397 0.305 0.327 0.384 0.372V02 0.978 0.368 0.438 0.381 0.353 0.311 0.385 0.410V03 0.941 0.298 0.366 0.302 0.285 0.326 0.296 0.360V04 0.325 0.872 0.398 0.449 0.326 0.344 0.516 0.232V05 0.352 0.870 0.381 0.405 0.281 0.374 0.465 0.315V06 0.259 0.855 0.377 0.390 0.252 0.322 0.462 0.237V07 0.428 0.477 0.902 0.624 0.425 0.486 0.638 0.382V08 0.409 0.371 0.960 0.554 0.390 0.495 0.593 0.435V09 0.401 0.406 0.963 0.555 0.436 0.511 0.611 0.462V10 0.364 0.432 0.588 0.960 0.380 0.459 0.702 0.422V11 0.347 0.475 0.594 0.958 0.379 0.428 0.710 0.393V12 0.379 0.478 0.590 0.967 0.394 0.459 0.707 0.407V13 0.305 0.320 0.424 0.395 0.911 0.372 0.421 0.594V14 0.331 0.313 0.432 0.382 0.966 0.363 0.414 0.565V15 0.300 0.314 0.409 0.362 0.971 0.374 0.413 0.595V16 0.300 0.367 0.518 0.419 0.357 0.968 0.529 0.381V17 0.325 0.398 0.496 0.451 0.362 0.978 0.551 0.409V18 0.348 0.405 0.530 0.492 0.417 0.978 0.567 0.422V19 0.358 0.528 0.628 0.722 0.414 0.539 0.971 0.449V20 0.381 0.563 0.638 0.699 0.426 0.557 0.966 0.455V21 0.364 0.540 0.640 0.712 0.441 0.544 0.971 0.464V22 0.342 0.528 0.626 0.715 0.418 0.548 0.970 0.461V23 0.369 0.322 0.449 0.433 0.617 0.384 0.480 0.955V24 0.394 0.284 0.432 0.387 0.540 0.410 0.454 0.939V25 0.364 0.246 0.403 0.381 0.594 0.385 0.404 0.949
Note: Cross-loadings for each item are higher than those for other constructs, and bold values are above the recommended cutoff value of 0.5 [126].
Sustainability 2020, 12, 2956 17 of 22
References
1. Minoli, D.; Occhiogrosso, B. Practical aspects for the integration of 5G networks and IoT applications insmart cities environments. Wirel. Commun. Mob. Comput. 2019, 5710834. [CrossRef]
2. Seaborn, K.; Edey, J.; Dolinar, G.; Whitfield, M.; Gardner, P.; Branje, C.; Fels, D.I. Accessible play in everydayspaces: Mixed reality gaming for adult powered chair users. ACM Trans. Comput. Hum. Interact. (Tochi)2016, 23, 1–28. [CrossRef]
3. Lindgren, R.; Tscholl, M.; Wang, S.; Johnson, E. Enhancing learning and engagement through embodiedinteraction within a mixed reality simulation. Comput. Educ. 2016, 95, 174–187. [CrossRef]
4. Ke, F.; Lee, S.; Xu, X. Teaching training in a mixed-reality integrated learning environment.Comput. Hum. Behav. 2016, 62, 212–220. [CrossRef]
5. Jung, T.; Tom Dieck, M.C.; Lee, H.; Chung, N. Effects of virtual reality and augmented reality onvisitor experiences in museum. In Information and Communication Technologies in Tourism 2016; Springer:Cham, Switzerland, 2016; pp. 621–635.
6. Bruno, F.; Bruno, S.; De Sensi, G.; Luchi, M.L.; Mancuso, S.; Muzzupappa, M. From 3D reconstruction tovirtual reality: A complete methodology for digital archaeological exhibition. J. Cult. Herit. 2010, 11, 42–49.[CrossRef]
7. Gretzel, U.; Sigala, M.; Xiang, Z.; Koo, C. Smart tourism: Foundations and developments. Electron. Mark.2015, 25, 179–188. [CrossRef]
8. Jarrier, E.; Bourgeon-Renault, D. Impact of mediation devices on the museum visit experience and on visitors’behavioural intentions. Int. J. Arts Manag. HEC Montréal Chair in Arts Management. 2012, 15, 18–29.
9. Stylianou-Lambert, T.; Boukas, N.; Christodoulou-Yerali, M. Museums and cultural sustainability:Stakeholders, forces, and cultural policies. Int. J. Cult. Policy 2014, 20, 566–587. [CrossRef]
10. Ren, W.; Han, F. Indicators for assessing the sustainability of built heritage attractions: An Anglo-ChineseStudy. Sustainability 2018, 10, 2504. [CrossRef]
11. Žabkar, V.; Brencic, M.M.; Dmitrovic, T. Modelling perceived quality, visitor satisfaction and behaviouralintentions at the destination level. Tour. Manag. 2010, 31, 537–546. [CrossRef]
12. Swanson, K.K.; Horridge, P.E. Travel motivations as souvenir purchase indicators. Tour. Manag. 2006, 27,671–683. [CrossRef]
13. Iqbal, H.; Tatti, F.; y Baena, F.R. Augmented-reality within computer assisted orthopedic surgery workflows:A Proof of Concept Study. Epic Ser. Health Sci. 2019, 3, 184–188.
14. Hammady, R.; Ma, M.; Strathearn, C. Ambient information visualisation and visitors’ technology acceptanceof mixed reality in museums. J. Comput. Cult. Herit. 2019, 12.
15. Garanti, Z.; Kissi, P.S. The effects of social media brand personality on brand loyalty in the Latvian bankingindustry. Int. J. Bank Mark. 2019. [CrossRef]
16. Foroudi, P.; Jin, Z.; Gupta, S.; Foroudi, M.M.; Kitchen, P.J. Perceptional components of brand equity:Configuring the Symmetrical and Asymmetrical Paths to brand loyalty and brand purchase intention.J. Bus. Res. 2018, 89, 462–474. [CrossRef]
17. Khadim, R.A.; Hanan, M.A.; Arshad, A.; Saleem, N. Revisiting antecedents of brand loyalty: Impact ofperceived social media communication with brand trust and brand equity as mediators. Acad. Strat. Manag. J.2018.
18. Juga, J.; Juntunen, J.; Paananen, M. Impact of value-adding services on quality, loyalty and brand equity inthe brewing industry. Int. J. Qual. Serv. Sci. 2018, 10, 61–71. [CrossRef]
19. Nah, F.F.H.; Eschenbrenner, B.; DeWester, D. Enhancing brand equity through flow and telepresence:A comparison of 2D and 3D virtual worlds. Mis Q. 2011, 731–747. [CrossRef]
20. Yoo, B.; Donthu, N.; Lee, S. An examination of selected marketing mix elements and brand equity.J. Acad. Mark. Sci. 2000, 28, 195–211. [CrossRef]
21. Aaker, D.A. The value of brand equity. J. Bus. Strategy 1992, 13, 27–32. [CrossRef]22. Keller, K.L. Conceptualizing, measuring, and managing customer-based brand equity. J. Mark. 1993, 57,
1–22. [CrossRef]23. Allen, D.G.; Mahto, R.V.; Otondo, R.F. Web-based recruitment: Effects of information, organizational brand,
and attitudes toward a Web site on applicant attraction. J. Appl. Psychol. 2007, 92, 1696. [CrossRef]
Sustainability 2020, 12, 2956 18 of 22
24. Colladon, A.F.; Grippa, F.; Innarella, R. Studying the association of online brand importance with museumvisitors: An application of the semantic brand score. Tour. Manag. Perspect. 2020, 33, 100588. [CrossRef]
25. Liu, C.R.; Liu, H.K.; Lin, W.R. Constructing customer-based museums brand equity model: The mediatingrole of brand value. Int. J. Tour. Res. 2015, 17, 229–238. [CrossRef]
26. Nisi, V.; Dionisio, M.; Barreto, M.; Nunes, N. A Mixed reality neighborhood tour: Understanding visitorexperience and perceptions. Entertainment Comput. 2018, 27, 89–100. [CrossRef]
27. Rahaman, H.; Champion, E.; Bekele, M. From photo to 3D to mixed reality: A complete workflow for culturalheritage visualisation and experience. Digit. Appl. Archaeol. Cult. Herit. 2019, 13, e00102. [CrossRef]
28. Jung, T.; Han, D. Augmented Reality (AR) in urban heritage tourism. E-Rev. Tour. Res. 2014, 5, 1–5.29. tom Dieck, M.C.; Jung, T. Value of augmented reality at cultural heritage sites: A stakeholder approach.
J. Destin. Mark. Manag. 2017, 6, 110–117. [CrossRef]30. Moorhouse, N.; tom Dieck, M.C.; Jung, T. An experiential view to children learning in museums with
Augmented Reality. Mus. Manag. Curatorship 2019, 34, 402–418. [CrossRef]31. tom Dieck, M.C.; Jung, T.; tom Dieck, D. Enhancing art gallery visitors’ learning experience using wearable
augmented reality: Generic learning outcomes perspective. Curr. Issues Tour. 2018, 21, 2014–2034. [CrossRef]32. tom Dieck, M.C.; Jung, T. A theoretical model of mobile augmented reality acceptance in urban heritage
tourism. Curr. Issues Tour. 2018, 21, 154–174. [CrossRef]33. Han, D.; Jung, T.; tom Dieck, M.C. Exploring visitors’ augmented reality smart glasses (ARSG) adoption in
the cultural tourism context. Leis. Stud. 2019, 38, 618–633.34. Jung, T.; Lee, H.; Chung, N.; tom Dieck, M.C. Cross-cultural differences in accepting mobile augmented
reality. Int. J. Contemp. Hosp. Manag. 2018, 30, 1621–1645. [CrossRef]35. Carrozzino, M.; Bergamasco, M. Beyond virtual museums: Experiencing immersive virtual reality in real
museums. J. Cult. Heritage 2010, 11, 452–458. [CrossRef]36. Jung, T.H.; tom Dieck, M.C. Augmented reality, virtual reality and 3D printing for the co-creation of value
for the visitor experience at cultural heritage places. J. Place Manag. Dev. 2017, 10, 140–151. [CrossRef]37. Lee, H.; Jung, T.; tom Dieck, M.C.; Chung, N. Experiencing immersive virtual reality in museums. Inf. Manag.
2020. [CrossRef]38. Han, D.; tom Dieck, M.C.; Jung, T. User experience model for augmented reality applications in the urban
heritage tourism. J. Herit. Tour. 2018, 13, 46–61. [CrossRef]39. Klein, L.R. Creating virtual product experiences: The role of telepresence. J. Interact. Mark. 2003, 17, 41–55.
[CrossRef]40. Coyle, J.R.; Thorson, E. The effects of progressive levels of interactivity and vividness in web marketing sites.
J. Advert. 2001, 30, 65–77. [CrossRef]41. Steuer, J. Defining virtual reality: Dimensions determining telepresence. J. Commun. 1992, 42, 73–93.
[CrossRef]42. Deng, X.; Unnava, H.R.; Lee, H. “Too true to be good?” when virtual reality decreases interest in actual
reality. J. Bus. Res. 2019, 100, 561–570. [CrossRef]43. Jang, Y.; Park, E. An adoption model for virtual reality games: The roles of presence and enjoyment.
Telemat. Inf. 2019, 42, 101239. [CrossRef]44. Yim, M.Y.C.; Chu, S.C.; Sauer, P.L. Is augmented reality technology an effective tool for e-commerce?
An interactivity and vividness perspective. J. Interact. Mark. 2017, 39, 89–103. [CrossRef]45. Chang, Y.J.; Chen, C.H.; Huang, W.T.; Huang, W.S. Investigating students’ perceived satisfaction, behavioral
intention, and effectiveness of English learning using augmented reality. In IEEE International Conference onMultimedia and Expo; IEEE: Piscataway, NJ, USA, 2011; pp. 1–6.
46. Mehrabian, A.; Russell, J.A.A. Approach to Environmental Psychology; The MIT Press: Cambridge, MA, USA,1974.
47. Choi, H.; Kandampully, J. The effect of atmosphere on customer engagement in upscale hotels: An applicationof SOR paradigm. Int. J. Hosp. Manag. 2019, 77, 40–50. [CrossRef]
48. Kim, M.J.; Lee, C.K.; Jung, T. Exploring consumer behavior in virtual reality tourism using an extendedstimulus-organism-response model. J. Travel Res. 2020, 59, 69–89. [CrossRef]
49. Trunfio, M.; Campana, S. A visitors’ experience model for mixed reality in the museum. Curr. Issues Tour.2019, 1–6. [CrossRef]
Sustainability 2020, 12, 2956 19 of 22
50. Lim, Y.; Weaver, P.A. Customer-based brand equity for a destination: The effect of destination image onpreference for products associated with a destination brand. Int. J. Tour. Res. 2014, 16, 223–231. [CrossRef]
51. Camarero, C.; Garrdio, M.J.; Vicente, E. Components of art exhibition brand equity for internal and externalvisitors. Tour. Manag. 2010, 31, 495–504. [CrossRef]
52. Huang, Z.J.; Cai, L.A. Modeling consumer-based brand equity for multinational hotel brands–When hostsbecome guests. Tour. Manag. 2015, 46, 431–443. [CrossRef]
53. Pappu, R.; Quester, P.G.; Cooksey, R.W. Consumer-based brand equity: Improving themeasurement–empirical evidence. J. Prod. Brand Manag. 2005, 14, 143–154. [CrossRef]
54. Dedeoglu, B.B.; Van Niekerk, M.; Weinland, J.; Celuch, K. Re-conceptualizing customer-based destinationbrand equity. J. Destin. Mark. Manag. 2019, 11, 211–230. [CrossRef]
55. Hoeffler, S.; Keller, K.L. Building brand equity through corporate societal marketing. J. Public Policy Mark.2002, 21, 78–89. [CrossRef]
56. Aaker, D.A. Managing Brand Equity; Simon and Schuster: New York, NY, USA, 2009.57. Phung, M.T.; Ly, P.T.M.; Nguyen, T.T. The effect of authenticity perceptions and brand equity on brand choice
intention. J. Bus. Res. 2019, 101, 726–736. [CrossRef]58. Qu, H.; Kim, L.H.; Im, H.H. A model of destination branding: Integrating the concepts of the branding and
destination image. Tour. Manag. 2011, 32, 465–476. [CrossRef]59. Chi, H.K.; Huang, K.C.; Nguyen, H.M. Elements of destination brand equity and destination familiarity
regarding travel intention. J. Retail. Consum. Serv. 2020, 52. [CrossRef]60. Gómez, M.; Lopez, C.; Molina, A. A model of tourism destination brand equity: The case of wine tourism
destinations in Spain. Tour. Manag. 2015, 51, 210–222. [CrossRef]61. Nakevska, M.; van der Sanden, A.; Funk, M.; Hu, J.; Rauterberg, M. Interactive storytelling in a mixed reality
environment: The effects of interactivity on user experiences. Entertain. Comput. 2017, 21, 97–104. [CrossRef]62. Douglas, Y.; Hargadon, A. The pleasure principle: Immersion, engagement, flow. In Proceedings of the
Eleventh ACM on Hypertext and Hypermedia, San Antonio, TX, USA, 30 May–3 June 2000; pp. 153–160.63. Harvey, M.L.; Loomis, R.J.; Bell, P.A.; Marino, M. The influence of museum exhibit design on immersion and
psychological flow. Env. Behav. 1998, 30, 601–627. [CrossRef]64. Shafer, D.M.; Carbonara, C.P.; Popova, L. Spatial presence and perceived reality as predictors of motion-based
video game enjoyment. Presence Teleoperators Virtual Env. 2011, 20, 591–619. [CrossRef]65. Lin, J.J.; Parker, D.E. User experience modeling and enhancement for virtual environments that employ
wide-field displays. In International Conference on Digital Human Modeling; Springer: Berlin/Heidelberg,Germany, 2007; pp. 423–433.
66. Gonzales, A.L.; Finley, T.; Duncan, S.P. (Perceived) interactivity: Does interactivity increase enjoyment andcreative identity in artistic spaces? In Proceedings of the SIGHI Conference on Human Factors in ComputingSystems, Boston, MA, USA, 25–30 April 2009; pp. 415–418.
67. Shin, D.H. 3DTV as a social platform for communication and interaction. Inf. Technol. People 2012, 25, 55–80.[CrossRef]
68. Islam, J.U.; Rahman, Z. The impact of online brand community characteristics on customer engagement:An application of Stimulus-Organism-Response paradigm. Telemat. Inf. 2017, 34, 96–109. [CrossRef]
69. Chierici, R.; Del Bosco, B.; Mazzucchelli, A.; Chiacchierini, C. Enhancing brand awareness, reputation andloyalty: The role of social media. Int. J. Bus. Manag. 2019, 14, 153–160. [CrossRef]
70. Mauroner, O.; Le, L.; Best, S. Augmented reality in advertising and brand communication: An experimentalstudy. World Acad. Sci. Eng. Technol. Int. Sch. Sci. Res. Innov. 2016, 10, 422–425.
71. Sadowski, W.; Stanney, K. Presence in virtual environments. In Human Factors and Ergonomics. Handbookof Virtual Environments: Design, Implementation, and Applications; Stanney, K.M., Ed.; Lawrence ErlbaumAssociates Publishers: Mahwah, NJ, USA, 2002; pp. 791–806.
72. Witmer, B.G.; Singer, M.J. Measuring presence in virtual environments: A presence questionnaire. Presence1998, 7, 225–240. [CrossRef]
73. Lee, N.J. The impact of international experience on student nurses’ personal and professional development.Int. Nurs. Rev. 2004, 51, 113–122. [CrossRef]
74. Jiang, Z.; Benbasat, I. The effects of presentation formats and task complexity on online consumers’ productunderstanding. Mis Quart. 2007, 475–500. [CrossRef]
Sustainability 2020, 12, 2956 20 of 22
75. Faust, F.; Roepke, G.; Catecati, T.; Araujo, F.; Ferreira, M.G.G.; Albertazzi, D. Use of augmented reality in theusability evaluation of products. Work 2012, 41 (Suppl. 1), 1164–1167. [CrossRef]
76. Tavsancil, E.; Yildirim, O.; DEMIR, S.B. Direct and indirect effects of learning strategies and reading enjoymenton PISA 2009 reading performance. Eurasian J. Educ. Res. 2019, 19, 169–190. [CrossRef]
77. Van Kerrebroeck, H.; Brengman, M.; Willems, K. When brands come to life: Experimental research on thevividness effect of Virtual Reality in transformational marketing communications. Virtual Real. 2017, 21,177–191. [CrossRef]
78. Cyr, D. Return visits: A review of how Web site design can engender visitor loyalty. J. Inf. Technol. 2014, 29,1–26. [CrossRef]
79. McLean, G.; Wilson, A. Shopping in the digital world: Examining customer engagement through augmentedreality mobile applications. Comput. Hum. Behav. 2019, 101, 210–224. [CrossRef]
80. Griffith, D.A.; Gray, C.C. The fallacy of the level playing field: The effect of brand familiarity and web sitevividness on online consumer response. J. Mark. Channels 2002, 9, 87–102. [CrossRef]
81. Lu, A.S.; Thompson, D.; Baranowski, J.; Buday, R.; Baranowski, T. Story immersion in a health videogame forchildhood obesity prevention. Games Health Res. Dev. Clin. Appl. 2012, 1, 37–44. [CrossRef] [PubMed]
82. Denisova, A.; Cairns, P. The placebo effect in digital games: Phantom perception of adaptive artificialintelligence. In Proceedings of the 2015 Annual Symposium on Computer-human Interaction in Play,London, UK, 5–7 October 2015; pp. 23–33.
83. Hollebeek, L. Exploring customer brand engagement: Definition and themes. J. Strat. Mark. 2011, 19,555–573. [CrossRef]
84. Ahn, S.J.; Bailenson, J.N. Self-endorsing versus other-endorsing in virtual environments. J. Advert. 2011, 40,93–106. [CrossRef]
85. Biocca, F.; Daugherty, T.; Chae, Z.H.; Li, H. Effect of visual sensory immersion on presence, productknowledge, attitude toward the product and purchase intention. In Proceedings of the ExperientialE-Commerce Conference.: Michigan. 27-29, East Lansing, MI, USA, 27–29 September 2001.
86. Shin, D. How does immersion work in augmented reality games? A user-centric view of immersion andengagement. Inf. Commun. Soc. 2019, 22, 1212–1229. [CrossRef]
87. Poncin, I.; Garnier, M.; Maille, V. A merchant virtual universe as an innovative retail setting: A dynamicperspective on the immersion process. In Successful Technological Integration for Competitive Advantage in Retail.Settings; IGI Global: Hershey, PA, USA, 2015; pp. 43–75.
88. Virvilaite, R.; Tumasonyte, D.; Sliburyte, L. The influence of word of mouth communication on brand equity:Receiver perspectives. Procedia-Soc. Behav. Sci. 2015, 213, 641–646. [CrossRef]
89. Ramayah, T.; Ignatius, J. Impact of perceived usefulness, perceived ease of use and perceived enjoyment onintention to shop online. Icfai J. Syst. Manag. (Ijsm) 2005, 3, 36–51.
90. Balog, A.; Pribeanu, C. The role of perceived enjoyment in the students’ acceptance of an augmentedreality teaching platform: A structural equation modelling approach. Stud. Inf. Control. 2010, 19, 319–330.[CrossRef]
91. Shiau, W.L.; Luo, M.M. Continuance intention of blog users: The impact of perceived enjoyment and userinvolvement. PACIS 2010, 85.
92. Joo, Y.J.; Park, S.; Shin, E.K. Students’ expectation, satisfaction, and continuance intention to use digitaltextbooks. Comput. Hum. Behav. 2017, 69, 83–90. [CrossRef]
93. Makransky, G.; Lilleholt, L. A structural equation modeling investigation of the emotional value of immersivevirtual reality in education. Educ. Technol. Res. Dev. 2018, 66, 1141–1164. [CrossRef]
94. Yang, Y.; Asaad, Y.; Dwivedi, Y. Examining the impact of gamification on intention of engagement and brandattitude in the marketing context. Comput. Hum. Behav. 2017, 73, 459–469. [CrossRef]
95. Mackay, M.M. Evaluation of brand equity measures: Further empirical results. J. Prod. Brand Manag. 2001, 10,38–51. [CrossRef]
96. Severi, E.; Ling, K.C. The mediating effects of brand association, brand loyalty, brand image and perceivedquality on brand equity. Asian Soc. Sci. 2013, 9, 125. [CrossRef]
97. Lloyd, D.W.; Clancy, K.J. Television program involvement and advertising response: Some unsettlingimplications for copy research. J. Consum. Mark. 1991. [CrossRef]
98. Im, H.H.; Kim, S.S.; Elliot, S.; Han, H. Conceptualizing destination brand equity dimensions froma consumer-based brand equity perspective. J. Travel Tour. Mark. 2012, 29, 385–403. [CrossRef]
Sustainability 2020, 12, 2956 21 of 22
99. Keller, K.L. Strategic Brand Management: Building, Measuring, and Managing Brand Equity; Person Education:Upper Saddle River, NJ, USA, 2008.
100. Malik, M.E.; Naeem, B.; Munawar, M. How does customer satisfaction nurture brand loyalty? EmpiricalExamination of brand trust as partial mediator. J. Basic Appl. Sci. Res. 2013, 3, 500–507.
101. Aaker, D.A. Measuring brand equity across products and markets. Calif. Manag. Rev. 1996, 38, 102–120.[CrossRef]
102. Ahn, J.; Park, J.K.; Hyun, H. Luxury product to service brand extension and brand equity transfer. J. Retail.Consum. Serv. 2018, 42, 22–28. [CrossRef]
103. Quan, N.; Chi, N.; Nhung, D.; Ngan, N.; Phong, L. The influence of website brand equity, e-brand experienceon e-loyalty: The mediating role of e-satisfaction. Manag. Sci. Lett. 2020, 10, 63–76. [CrossRef]
104. Romaniuk, J.; Nenycz-Thiel, M. Behavioral brand loyalty and consumer brand associations. J. Bus. Res.2013, 66, 67–72. [CrossRef]
105. Till, B.D.; Baack, D.; Waterman, B. Strategic brand association maps: Developing brand insight. J. Prod. BrandManag. 2011, 20, 92–100. [CrossRef]
106. Kristensen, K.; Kanji, G.K.; Dahlgaard, J.J. On measurement of customer satisfaction. Total Qual. Manag.1992, 3, 123–128. [CrossRef]
107. Hammond, K.; East, R.; Ehrenberg, A. Buying More and Buying Longer: Concepts and Applications of ConsumerLoyalty; London Business School: London, UK, 1996.
108. Brexendorf, T.O.; Mühlmeier, S.; Tomczak, T.; Eisend, M. The impact of sales encounters on brand loyalty.J. Bus. Res. 2010, 63, 1148–1155. [CrossRef]
109. Kim, J.W.; Lee, F.; Suh, Y.G. Satisfaction and loyalty from shopping mall experience and brand personality.Serv. Mark. Q. 2015, 36, 62–76. [CrossRef]
110. Nam, J.; Ekinci, Y.; Whyatt, G. Brand equity, brand loyalty and consumer satisfaction. Ann. Tour. Res.2011, 38, 1009–1030. [CrossRef]
111. L’atelier. Available online: http://www.light-atelier.com/eng/sub/0102.php (accessed on 15 January 2020).112. Mollen, A.; Wilson, H. Engagement, telepresence and interactivity in online consumer experience:
Reconciling scholastic and managerial perspectives. J. Bus. Res. 2010, 63, 919–925. [CrossRef]113. Huang, M.P.; Himle, J.; Alessi, N.E. Vivid visualization in the experience of phobia in virtual environments:
Preliminary results. Cyberpsychol. Behav. 2000, 3, 315–320. [CrossRef]114. Huang, T.L.; Tseng, C.H. Using augmented reality to reinforce vivid memories and produce a digital
interactive experience. J. Electron. Commer. Res. 2015, 16, 307.115. Mavrogeorgi, N.; Koutsoutos, S.; Yannopoulos, A.; Varvarigou, T.; Kambourakis, G. Vivid educational
experience with virtual reality. In 2009 Fourth International Multi-Conference on Computing in the GlobalInformation Technology; IEEE: Piscataway, NJ, USA, 2009; pp. 196–201.
116. Johnson-Glenberg, M.C. Immersive VR and education: Embodied design principles that include gesture andhand controls. Front. Robot. Ai 2018, 5, 81. [CrossRef]
117. Wang, Y.S.; Lin, H.H.; Liao, Y.W. Investigating the individual difference antecedents of perceived enjoymentin the acceptance of blogging. World Acad. Sci. Eng. Technol. 2010, 67, 1014–1023.
118. Yussof, A.; Ibrahim, R.; Zaman, H.; Ahmad, A.; Suhaifi, S. Users acceptance of mixed reality technology.Issues Inf. Syst. 2011, 7, 194–205.
119. Oh, H. The effect of brand class, brand awareness, and price on customer value and behavioral intentions.J. Hosp. Tour. Res. 2000, 24, 136–162. [CrossRef]
120. Low, G.S.; Lamb, C.W., Jr. The measurement and dimensionality of brand associations. J. Prod. Brand Manag.2000. [CrossRef]
121. Park, C.; Whan, D.J.; MacInnis, J.P.; Eisingerich, A.B.; Iacobucci, D. Brand attachment and brand attitudestrength: Conceptual and empirical differentiation of two critical brand equity drivers. J. Mark. 2010, 74,1–17. [CrossRef]
122. Poushneh, A.; Vasquez-Parraga, A.Z. Discernible impact of augmented reality on retail customer’s experience,satisfaction and willingness to buy. J. Retail. Consum. Serv. 2017, 34, 229–234. [CrossRef]
123. Shelstad, W.J.; Smith, D.C.; Chaparro, B.S. Gaming on the rift: How virtual reality affects game usersatisfaction. In Proceedings of the Human Factors and Ergonomics Society Annual Meeting; Sage CA, SAGEPublications: Los Angeles, CA, USA, 2017; pp. 2072–2076.
Sustainability 2020, 12, 2956 22 of 22
124. Ramaseshan, B.; Stein, A. Connecting the dots between brand experience and brand loyalty: The mediatingrole of brand personality and brand relationships. J. Brand Manag. 2014, 21, 664–683. [CrossRef]
125. Bland, J.M.; Altman, D.G. Statistics notes: Cronbach’s alpha. BMJ 1997, 314, 572. [CrossRef]126. Fornell, C.; Larcker, D.F. Structural equation models with unobservable variables and measurement error:
Algebra and statistics. J. Mark. Res. 1981, 18, 382–388. [CrossRef]127. Bagozzi, R.P.; Yi, Y. On the evaluation of structural equation models. J. Acad. Mark. Sci. 1988, 16, 74–94.
[CrossRef]128. Hair, J.F.; Sarstedt, M.; Ringle, C.M.; Mena, J.A. An assessment of the use of partial least squares structural
equation modeling in marketing research. J. Acad. Mark. Sci. 2012, 40, 414–433. [CrossRef]129. Wong, K.K.K. Partial least squares structural equation modeling (PLS-SEM) techniques using SmartPLS.
Mark. Bull. 2013, 24, 1–32.130. Tenenhaus, M.; Vinzi, V.E.; Chatelin, Y.M.; Lauro, C. PLS path modeling. Comput. Stat. Data Anal. 2005, 48,
159–205. [CrossRef]131. Hair, J.F.; Ringle, C.M.; Sarstedt, M. PLS-SEM: Indeed a silver bullet. J. Mark. Theory Pr. 2011, 19, 139–152.
[CrossRef]132. Esmaeilpour, F. The role of functional and symbolic brand associations on brand loyalty. J. Fash. Mark.
Manag. 2015, 19, 467–484. [CrossRef]133. Tan, W.K.; Lee, P.W.; Hsu, C.W. Investigation of temporal dissociation and focused immersion as moderators
of satisfaction–continuance intention relationship: Smartphone as an example. Telemat. Inf. 2015, 32, 745–754.[CrossRef]
134. Zhao, L.; Lu, Y. Enhancing perceived interactivity through network externalities: An empirical study onmicro-blogging service satisfaction and continuance intention. Decis. Support. Syst. 2012, 53, 825–834.[CrossRef]
135. Chang, Y.; Kim, M.K.; Kim, Y.; Park, M.C. Determinants of user satisfaction and continuance intention ofsmartphones: Focus on interactivity perspective. In Proceedings of the 8th International TelecommunicationsSociety (ITS) Asia-Pacific Regional Conference, Convergence in the Digital Age, ITS, Taipei, Taiwan, 26–28June 2011.
136. Liu, L.; Ip, R.; Shum, A.; Wagner, C. Learning effects of virtual game worlds: An empirical investigationof immersion, enjoyment and performance. In Proceedings of the Twentieth Americas Conference onInformation Systems, Savannah, GA, USA, 7–9 August 2014.
© 2020 by the authors. Licensee MDPI, Basel, Switzerland. This article is an open accessarticle distributed under the terms and conditions of the Creative Commons Attribution(CC BY) license (http://creativecommons.org/licenses/by/4.0/).