negative brand beliefs and brand usage - citeseerx
TRANSCRIPT
Negative brand beliefs and brand usage
Maxwell WinchesterHarper Adams University College and Ehrenberg-Bass Institute, University of South AustraliaJenni RomaniukEhrenberg-Bass Institute, University of South Australia
This research focuses on consumer brand usage segments and the responses they give to negative attributes in brand image studies. Analysis was conducted across three markets and four approaches for measuring brand beliefs with respondents who were current users, past users or had never tried a brand. The major finding of this study was that past users of a brand consistently have the highest tendency to elicit negative beliefs about brands. Further, those who have never used a brand typically have a lower propensity than current brand users to elicit negative brand beliefs. These results suggest that negative beliefs about a brand are developed as a result of purchase behaviour, rather than as mechanisms to reject a brand prior to purchase. These findings have implications for the role of negative beliefs in consideration of set formation and the trial of a new brand. They also provide insight into the patterns that may be expected when measuring and interpreting negative brand beliefs across different usage groups.
Introduction
Understanding what a brand means to consumers is important for today’s marketing managers. One mechanism for gaining insight is to measure the knowledge that consumers hold about a brand, which consists of all the thoughts, feelings and beliefs held about any brand (Keller 2003). Consumer belief measurement is considered an important part of consumer-based brand equity (CBBE) measurement because of the diagnostic information it holds (Ailawadi et al. 2003). As a result, in most large corporations today, one of the most important aspects of the marketing department’s activity is to manage and measure CBBE.
Received (in revised form): 21 February 2007
International Journal of Market Research Vol. 50 Issue 3
© 2008 The Market Research Society 355
IJMR_50_3.indb 355 04/04/2008 12:06:06

Negative brand beliefs and brand usage
356
Negative brand beliefs are statements about a brand that are considered undesirable (for example, nominating a fast-food brand as ‘too high in fat’). In contrast to their positive counterparts, negative brand beliefs have received very little attention in the academic literature (Winchester & Romaniuk 2003), and have been highlighted as an area that requires further research (Hoek et al. 2000).
Most consumer behaviour theories incorporate the idea that consumers evaluate brands according to their positive and negative aspects (e.g. Lussier & Olshavsky 1979; Ajzen & Fishbein 1980; Biehal & Chakravarti 1986; Bagozzi & Warshaw 1990; Kahn & Baron 1995; Moorthy et al. 1997). In studies where respondents are prompted with a brand and asked what beliefs they hold (such as in Krishnan 1996), both positive and negative beliefs are elicited. Similarly, when given negative beliefs and asked which brands are linked to those, customers are able to elicit brands, even in a free response context (Bird et al. 1970; Woodside & Trappey 1992; Winchester & Romaniuk 2003). While it is evident that consumers do hold negative beliefs about brands, it is not clear what the relationship is between purchase behaviour and such beliefs. Therefore, understanding the contribution these make to the consumer choice process is an important area of research.
The neglect of negative brand beliefs may be due to the assumption that negative responses follow polar opposite patterns to non-negative attributes. Therefore, if brand users are more likely to give positive beliefs about a brand (as found in studies such as Barwise & Ehrenberg 1985), then they will be less likely to give negative beliefs about brands. However, explorations of the negative side of constructs in other areas of marketing research suggest that this assumption may be unfounded. For example, dissatisfaction is now considered to be a separate construct from low satisfaction (e.g. LaBarbera & Mazursky 1983) and ad irritation is considered distinct from likeability (e.g. Greyser 1973; Aaker & Bruzzone 1985). This suggests that the negative belief side of CBBE should be the subject of a distinct exploration to test the role and contribution that negative beliefs play in the consumer choice process.
The objective of this paper is to address this by examining the interaction with past, current and no brand usage experience and consumers’ propensity to associate negative beliefs with brands. Retrieval of beliefs is a measure of accessibility, and that accessibility is an indicator of past usage of such consumer memories as it suggests past or recent refreshment and reinforcement of associative links (Anderson & Bower 1979). Therefore comparing the negative beliefs held by consumers with differing past usage
IJMR_50_3.indb 356 04/04/2008 12:06:06

International Journal of Market Research Vol. 50 Issue 3
357
experiences can help understand when negative beliefs are formed and how they contribute to the choice process. This will provide insight for those seeking to measure and interpret negative brand image beliefs.
The structure of this paper is as follows: we first review the relevant literature about the role of negative information, and propose competing hypotheses about the relationship between usage experiences with the brand and negative brand beliefs; the research method and empirical analysis follow; the implications of the results for the different theories are then discussed, as well as the limitations and future research agenda.
Negative information and consumer decision making
Most consumer behaviour theories have some element of cognition about them, in that they suggest that consumers utilise memories about brands in some way, shape or form to select brands from the wide range of alternatives. Broadly speaking, the consumer choice process can be considered to consist of two stages prior to purchase. The first is identifying suitable options of preferred brands, which constitute the consideration set (consideration); the second is to choose an option from the consideration set (selection) (Howard & Sheth 1969; Nedungadi 1990). Several theorists have proposed that negative beliefs may contribute at each of these stages in a different way, with compensatory and non-compensatory models commonly used to explain these two processes (Lussier & Olshavsky 1979; Kahn & Baron 1995; Reed 1996; Moorthy et al. 1997). For example, non-compensatory models would suggest that consumers eliminate brands during the consideration process based on negative beliefs about brands, or by assessing brands and excluding them based on the fact that they do not meet selection criteria (Kahn & Baron 1995; Laroche et al. 2003). Compensatory models, on the other hand, would suggest that negative information is utilised in conjunction with positive information to evaluate a brand (Kahn & Baron 1995; Laroche et al. 2003). Both types of model lead to different implications about how negative beliefs will fit into the process. While non-compensatory and compensatory models explain how negative perceptions may influence brand consideration and selection, there is also evidence that negative perceptions are a result of past usage of a brand. Such feedback may influence either the consideration or selection stage in the future (e.g. as outlined by Foxall 2002).
Bird et al. (1970) point out that there are three types of usage group for any brand in the market. The first is ‘current users’; these are consumers who currently have the brand in their repertoire. The second is ‘past users’;
IJMR_50_3.indb 357 04/04/2008 12:06:06

Negative brand beliefs and brand usage
358
these are consumers who have experienced the brand in the past, but no longer have the brand as part of their repertoire of preferred brands. The third is those who have not had any actual usage experience with the brand; Bird et al. (1970) refer to them as the ‘Never trieds’.
We now discuss these and then establish hypotheses for the level of negative beliefs in customer groups with different past/current usage experiences.
It is suggested that decision makers use non-compensatory models particularly when there are more than three alternatives (Lussier & Olshavsky 1979; Reed 1996) or when the motive for extra cognitive effort is low (such as in low-involvement situations) (Kahn & Baron 1995). Non-compensatory models assume that the individual does not utilise large amounts of information and looks to actively reduce options, and that negative beliefs can act as a primary method for rejecting brands, thereby culling alternatives.
Negative beliefs, utilised in this way, would remove unacceptable brands from the choices available, leaving the consumer with a smaller number of brands in their consideration set (Moorthy et al. 1997). This has implications for which customers would be expected to have higher levels of negative beliefs. If negative beliefs are utilised to reject brands prior to consideration, the consumer will never get the opportunity to experience the brand. This would mean that consumers who have never used a brand are the most likely to hold negative beliefs about that brand (Lynch et al. 1988; Keller 1993). Similarly, brands not selected in a compensatory model of decision making would also be expected to receive higher levels of response to negative beliefs than brands selected (Lussier & Olshavsky 1979; Kahn & Baron 1995). This leads to the first hypothesis:
H1: If consumers more commonly use negative beliefs to reject brands at the consideration stage, then customers who have never tried a brand will be most likely to express negative brand beliefs.
In a study of memory processes and retrieval of attribute information, Lynch et al. (1988) observed that their subjects made little attempt to retrieve and use attribute information. They indicated their findings were ‘provocative in [their] implication for the degree to which real world choices involve the sorts of multi-attribute choice rules we have studied’ (Lynch et al. 1988, p. 177). In their literature review, Biehal and Chakravati (1986) discussed ‘rejected’ brands as ones that have been
IJMR_50_3.indb 358 04/04/2008 12:06:06
International Journal of Market Research Vol. 50 Issue 3
359
negatively evaluated, while in their study they provide no evidence that such rejection happens. This study suggested that there was relatively little use of negative information for rejected brands in their brand choice scenario, a finding that is confirmed by Wänke et al. (1997).
This leads us to ask what other mechanisms might be utilised to form negative beliefs. One suggestion is that experiences from using the brand feed into the negative perceptions that consumers hold, and these perceptions feed back into the future consumer decision-making process and lead a consumer to reject a brand they have previously used at the selection stage. This would lead to the conclusion that past users of a brand would be the most likely to express negative beliefs about a brand. This was empirically evident in an early study by Bird et al. (1970), although the differences between groups were minor and methodological concerns raise doubts about their conclusion. They measured negative beliefs as the polar opposite of positive beliefs and immediately following the positive belief question (e.g. ‘Which brands are high quality?’ was then followed by ‘Which brands are low quality’). Such a method may have inhibited the likelihood of respondents responding to the negative beliefs. Also, as the study was conducted cross-sectionally in a repertoire market, past users were simply non-recent users (categorised as ‘used the brand previously, but just not in the past four weeks’), rather than having rejected the brand at selection stage. Therefore this relationship needs to be further investigated in terms of negative beliefs expressed independently of their polar opposites.
An explanation for this pattern suggests that negative beliefs are likely to further generate after ceasing to use a brand to rationalise the switching behaviour and reduce cognitive dissonance (Festinger 1957). Winchester and Romaniuk (2003) examined the differences in the negative beliefs between brand users and non-brand users, and found that while brand users were slightly more likely to express negative beliefs, there was a much greater agreement between the two usage categories than has previously been found for positive beliefs (Barwise & Ehrenberg 1985; Hoek et al. 2000). However, the mixing of the two non-brand user groups of past users and those who have never used the brand might have confounded the results. Therefore we would hypothesise the following:
H2: If consumers more commonly use negative brand beliefs to reject the brand at selection stage, then past brand users should give more negative beliefs than other user groups.
IJMR_50_3.indb 359 04/04/2008 12:06:07

Negative brand beliefs and brand usage
360
Accounting for past usage in brand image data was acknowledged as important as early as 1961, when Franklin Evans noted: ‘brand image statements are meaningless unless the brand owned by the respondent is taken into account’ (Evans 1961, p. 21). A study by Biehal and Chakravati (1986) noted that previously chosen brands were highly accessible in memory and were retrieved and chosen in a subsequent choice. This is because retrievals of recently used brands reinforce the associative links in memory, which then subsequently maintains or increases the salience of the brand and its associative links upon future occasions (Collins & Loftus 1975; Romaniuk & Sharp 2004).
This suggests that brands currently being bought are more easily retrieved for most stimuli, and such retrieval is likely to inhibit the retrieval of information for other (not currently used) brands. Further, given that most companies do not communicate negative information about their own brand, and comparative advertising that makes direct, explicit negative claims about competitor brands is still relatively rare, the source of most negative information is likely to be either past experience or negative word of mouth (WOM). Recent research into the relative incidence of negative WOM has found it to be rare relative to positive WOM (East et al. 2007), which leaves direct experience with the brand as the primary potential source of negative beliefs. This suggestion is in line with authors who argue that consumer responses are a function of behavioural history (e.g. Foxall 2002).
This line of thought would suggest that, if negative beliefs are a product of consumer experiences with the brand and that the overall experience inhibits memories (positive or negative) for other brands not currently used, then current brand users will be the most likely to express a negative belief about that brand. This leads to the following hypothesis:
H3: If the current usage experience is the dominant influence on giving responses, then those that currently use the brand will be the most likely to give negative beliefs about that brand.
Research method
One key criticism of many studies conducted in the marketing discipline that has been put forward is that there is very little replicated, generalisable research conducted (Lindsay & Ehrenberg 1993; Hubbard & Armstrong 1994). The absence of replication studies is seen to be impeding knowledge development in marketing (Hubbard et al. 1992). Hubbard et al. (1992)
IJMR_50_3.indb 360 04/04/2008 12:06:07

International Journal of Market Research Vol. 50 Issue 3
361
outline a number of consequences that can arise from not replicating studies in marketing. These consequences include type one error bias, perpetuating erroneous results. In line with the arguments put forward by authors such as Ehrenberg and Bound (1993) and Barwise (1995), this study is conducted in the empirical generalisationalist tradition: instead of relying solely on inferential statistical tests on a single sample (which increases the likelihood of promoting exceptional one-off results), this research tests the hypotheses across a number of independent markets and conditions to triangulate findings. Table 1 details the key information from each of the studies utilised in this research.
In all studies, brand usage was self-reported. Respondents were asked which of the following categories applied to their usage of each brand: (a) Currently use the brand (Current users); (b) Have used in the past but no longer do so (Past users); (c) Have never used the brand (Never tried). This method does assume that people realise when they have ceased using a brand. The specifics of each of the individual studies are discussed prior to the results.
Study 1: personal banking
This study involved a split-sample approach, where respondents were randomly allocated to one of three treatment groups. The study was designed to specifically explore response patterns to negative attributes for each measurement technique; as a result, no positive perceptions were collected. Each treatment group had a different method for measuring negative brand perceptions:
• a 5-point Likert rating scale• ranking brands from highest to lowest on that quality
Table 1 Outline of studies included in research
Study Sample Industry RespondentsMeasurement technique
No. of brands/No. of negative attributes
1 n = 404 Financial services Personal 3 different techniques
5 brands/5 attributes
2 n = 230 Irrigation products Business Open-ended 2 brands/3 attributes
3 n = 368 Fast food Personal Free-choice ‘pick any’ 5 brands/5 attributes
IJMR_50_3.indb 361 04/04/2008 12:06:07

Negative brand beliefs and brand usage
362
• a free-choice, ‘pick any’ approach where respondents were asked which, if any, brands they linked with a particular attribute and so were free to respond for any, all or no brands.
Table 2 presents an example of how the three questioning styles may be worded for a particular attribute.
Depending on which group respondents were allocated to, they were asked to rank, rate or nominate brands to five negatively worded attributes: ‘Doesn’t care about smaller customers’; ‘Stuck in the past’; ‘Bureaucratic’; ‘Poor customer service’; ‘High fees and charges’.
These three particular methods were chosen for their common use in academia and industry measurement (Barnard & Ehrenberg 1990; Driesener & Romaniuk 2006). The sample sizes were: rating = 182; ranking = 192; pick any = 230. The difference in sample size probably reflects the relative speed of the ‘pick any’ approach when compared to other measurement approaches (Driesener & Romaniuk 2006). The same five brands and five negative attributes were included in each treatment. The attributes were derived from past research conducted in the industry by the authors, and circulated to colleagues to ensure face validity that they were undesirable qualities for this market. For example, one potential attribute – ‘old-fashioned’ – was not included in the research as there was concern that as some had expressed a desire to return to old-fashioned service, the belief of being old-fashioned was not necessarily negative. All respondents were recruited randomly from an electronic telephone directory by trained market research interviewers.
Table 2 Forced-choice vs free-choice examples
Forced-choice – Scale Forced-choice – Rank Free-choice – Pick any
We would like to know if you agree or disagree with the statements on a scale of 1–5, where 1 is that you strongly disagree with the statement and 5 is that you strongly agree with the statement
‘Empire Bank is a bank that has high fees and charges’
(scale)
We are going to give you a list of banks. We would like you to rank the banks from the one that is most closely associated with the statement to the one least associated with the statement.
‘Is a bank that has high fees and charges’
(list of brands)
Which banks would you say have high fees and charges?
IJMR_50_3.indb 362 04/04/2008 12:06:07

International Journal of Market Research Vol. 50 Issue 3
363
Results: personal banking
For the rating and ranking, usage group means for each brand were calculated and compared. Table 3 presents the results. The findings of this study suggest that, regardless of which technique is used to collect brand image data, in general past users of a brand rank, rate or respond at the highest levels when presented with negative attributes. Specifically, the results indicate that, by using a scale or rank to measure responses to brand image attributes, there is far less sensitivity to differences in responses.
The results are presented by brand for each attribute across all three methods to allow direct comparison of the results. Table 3 presents the results for the attribute ‘High fees and charges’. The table presents the average response level for the pick any technique for each brand at the left of the table, the average rating given for the rating technique in the middle and the average place each brand was ranked on the right. Values that are significantly different from the highest value (shaded) are identified using a chi-squared test for the pick any method and a one-way ANOVA with Tukey’s post-test for the other two methods (* = p < 0.05 and ** = p < 0.01).
The results show that, regardless of measurement technique, Past users tend to respond, rate or rank brands higher than the other groups. This is supportive of Hypothesis 2. Regardless of measurement technique, the Never tried group tended to respond, rate or rank at the lowest levels across brands, not supporting Hypothesis 1. For one brand, Current users were equal or higher than Past users, suggesting that there can be brand-specific exceptions to the general pattern of a higher response level from Past users. The results presented in the table suggest that differences across
Table 3 Comparison of results for three measurement methods for attribute ‘High fees and charges’
Pick any Rating Ranking
Past user
Current user
Never tried
Past user
Current user
Never tried
Past user
Current user
Never tried
Empire Bank 56 52 43* 4.1 3.9 3.7 4.1 4.2 4.1Federal Bank 50 65 28** 4.0 4.0 3.6 3.5 3.5 3.4Western Pacific Bank 63 46* 28** 3.9 3.4 3.7 3.4 3.0 2.7*Oceanic Bank 48 37 35* 4.5 3.8 3.7* 2.2 2.2 2.4Knight’s Bank 43 52 30* 3.9 3.5 3.5 2.1 1.9 1.6
Mean 52 50 33 4.1 3.7 3.6 3.0 2.9 2.8
IJMR_50_3.indb 363 04/04/2008 12:06:07
Negative brand beliefs and brand usage
364
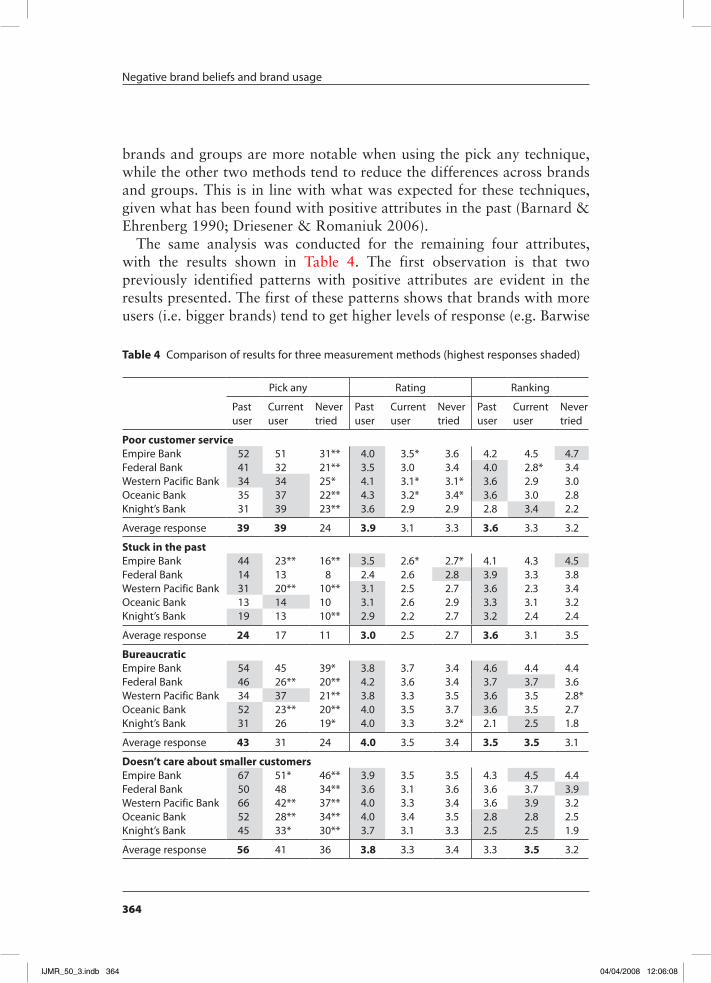
brands and groups are more notable when using the pick any technique, while the other two methods tend to reduce the differences across brands and groups. This is in line with what was expected for these techniques, given what has been found with positive attributes in the past (Barnard & Ehrenberg 1990; Driesener & Romaniuk 2006).
The same analysis was conducted for the remaining four attributes, with the results shown in Table 4. The first observation is that two previously identified patterns with positive attributes are evident in the results presented. The first of these patterns shows that brands with more users (i.e. bigger brands) tend to get higher levels of response (e.g. Barwise
Table 4 Comparison of results for three measurement methods (highest responses shaded)
Pick any Rating Ranking
Past user
Current user
Never tried
Past user
Current user
Never tried
Past user
Current user
Never tried
Poor customer serviceEmpire Bank 52 51 31** 4.0 3.5* 3.6 4.2 4.5 4.7Federal Bank 41 32 21** 3.5 3.0 3.4 4.0 2.8* 3.4Western Pacific Bank 34 34 25* 4.1 3.1* 3.1* 3.6 2.9 3.0Oceanic Bank 35 37 22** 4.3 3.2* 3.4* 3.6 3.0 2.8Knight’s Bank 31 39 23** 3.6 2.9 2.9 2.8 3.4 2.2
Average response 39 39 24 3.9 3.1 3.3 3.6 3.3 3.2
Stuck in the pastEmpire Bank 44 23** 16** 3.5 2.6* 2.7* 4.1 4.3 4.5Federal Bank 14 13 8 2.4 2.6 2.8 3.9 3.3 3.8Western Pacific Bank 31 20** 10** 3.1 2.5 2.7 3.6 2.3 3.4Oceanic Bank 13 14 10 3.1 2.6 2.9 3.3 3.1 3.2Knight’s Bank 19 13 10** 2.9 2.2 2.7 3.2 2.4 2.4
Average response 24 17 11 3.0 2.5 2.7 3.6 3.1 3.5
BureaucraticEmpire Bank 54 45 39* 3.8 3.7 3.4 4.6 4.4 4.4Federal Bank 46 26** 20** 4.2 3.6 3.4 3.7 3.7 3.6Western Pacific Bank 34 37 21** 3.8 3.3 3.5 3.6 3.5 2.8*Oceanic Bank 52 23** 20** 4.0 3.5 3.7 3.6 3.5 2.7Knight’s Bank 31 26 19* 4.0 3.3 3.2* 2.1 2.5 1.8
Average response 43 31 24 4.0 3.5 3.4 3.5 3.5 3.1
Doesn’t care about smaller customersEmpire Bank 67 51* 46** 3.9 3.5 3.5 4.3 4.5 4.4Federal Bank 50 48 34** 3.6 3.1 3.6 3.6 3.7 3.9Western Pacific Bank 66 42** 37** 4.0 3.3 3.4 3.6 3.9 3.2Oceanic Bank 52 28** 34** 4.0 3.4 3.5 2.8 2.8 2.5Knight’s Bank 45 33* 30** 3.7 3.1 3.3 2.5 2.5 1.9
Average response 56 41 36 3.8 3.3 3.4 3.3 3.5 3.2
IJMR_50_3.indb 364 04/04/2008 12:06:08

International Journal of Market Research Vol. 50 Issue 3
365
& Ehrenberg 1985). The second pattern shows that some attributes are more typical to the market in question (e.g. Loken & Ward 1990). Values that are significantly different from the highest value (shaded) are identified (* = p < 0.05 and ** = p < 0.01). Across five brands ! five attributes ! three techniques (75 different analyses) the results show that, in 61 instances (81%), Past users gave the highest (or equal) response. The next most common cases were 17 instances where Current users were the most common (23%). These tended to be concentrated in the ranking methodology. In only three instances were those who never tried the brand the most likely to elicit a negative association. This suggests strong support for Hypothesis 2, limited support for Hypothesis 3 and no support for Hypothesis 1. Negative beliefs are most likely to be given by those who have used the brand in the past, but no longer do so, or from current users of the brand. This initial analysis suggests that negative beliefs are more likely to arise as a consequence of using a brand rather than being used to reject brands prior to purchase.
Study 2: agricultural irrigation products
One of the limitations of Study 1 is that the five attributes chosen may not have represented the actual negative beliefs that consumers held. In this study, respondents were prompted for brands and asked to write in their perceptions of the positive and negative aspects of the brand (as per Krishnan 1996). Therefore the respondent rather than the researchers created the negative perceptions. The context for this research was the agricultural sector. Respondents were dealers of agricultural products, who were asked to nominate brands (from a list) they currently stock or have stocked in the past. The remaining brands were classed as never stocked. This study was conducted via a mailed self-completion survey to dealers of agricultural products. It should be noted that, due to the dominance of two major brands in the market, only these two brands were considered in the analysis.
Experienced coders classified the attributes and three groups of beliefs emerged. Positive beliefs tended to describe ‘good quality’, ‘good customer service’ and ‘good value for money’. The negative beliefs tended to describe the polar opposite attributes: ‘poor quality’, ‘poor value for money’ and ‘poor customer service’. The results (see Table 5) offer support for Hypothesis 2, in that the Past user group was the highest response group in five out of six cases. Values that are significantly different from the highest value (shaded) are identified (* = p < 0.05 and ** = p < 0.01).
IJMR_50_3.indb 365 04/04/2008 12:06:08

Negative brand beliefs and brand usage
366
For comparison and validation purposes, the results for positive percep-tions for each user group are presented, as well as the average response for positive attributes. The pattern is consistent with studies conducted previously, where the current user group responds at the highest level (Bird & Channon 1969; Bird & Ehrenberg 1970).
Study 3: fast food
We recognise that a potential influence on our results is the method used to categorise Past users. Therefore this third study included two important modifications to the measurement of current users and past users. The definition of current usage was narrowed to having bought from the brand in the last three purchases, which is likely to exclude very light/non-recent brand buyers. This allows us to see the effect of more recent brand usage experience on negative beliefs. The self-reported Past usage measure was modified to include ‘used previously but would not go back to’; this extends the Past usage categorisation to have both a behavioural and attitudinal component. Both these changes polarise the three groups into current users being regular and recent users only; Past users having both behaviourally and attitudinally rejected the brand; the Never trieds consisting of those who have never used the brand, or have not used it recently. Therefore we might expect to see greater differences between the three groups.
The context for this study was retail fast food, where 368 people were randomly recruited and interviewed by telephone about their perceptions of fast-food brands. Respondents were asked a series of brand attribute statements whose order was rotated by the interviewers, to which respondents were able to reply in a free-choice format (Joyce 1963).
Table 5 Summary results for the agricultural irrigation study
Poor quality (%)
Poor value for money (%)
Poor customer service (%)
Past user
Current user
Never tried
Past user
Current user
Never tried
Past user
Current user
Never tried
Poly Products 42 11** 15** 10 10 15 10 5* 8Agricorp 14 8* 7** 12 7 3** 8 6 7Mean response 28 9 11 11 9 9 9 6 7
Mean positive response† 39 62 24 5 6 3 9 14 9† For opposing attributes (e.g. ‘good quality’ polar opposite to ‘poor quality’)
IJMR_50_3.indb 366 04/04/2008 12:06:08

International Journal of Market Research Vol. 50 Issue 3
367
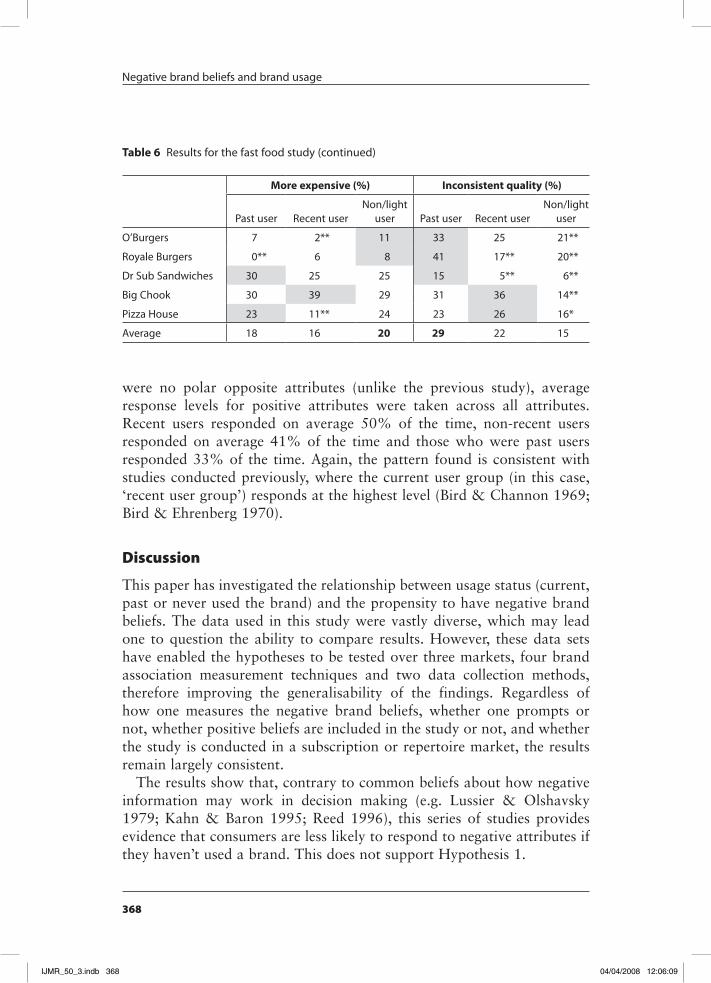
The attributes included in the study were: ‘Too high in fat’; ‘Pre-prepared’; ‘Boring range of products’; ‘More expensive’; ‘Inconsistent food quality’. Across five brands by five attributes, Past users were the highest response group in 20 instances (80%). The remaining five instances were split between recent users and non/light users (see Table 6). This is strong support for Hypothesis 2. The attributes of more expensive and inconsistent quality contained the most variable responses.
There were also inconsistent results when the negative beliefs of recent users and non-recent users were compared. This is probably an outcome of the less distinct classification between someone who would regularly buy the brand (but hadn’t within the last three purchases) and someone who has never bought the brand. This shows the importance of clearly defined usage groups when analysing the relationship between brand beliefs and usage status, and the benefit of using subscription markets for such studies (Sharp et al. 2002).
Interestingly, unlike some previous research on negative attributes (Bird & Channon 1969; Bird & Ehrenberg 1970; Woodside & Trappey 1992), high response levels could be achieved for some attributes, especially when considering the response levels of Past users. It could be that respondents view the fast-food industry poorly, or that the attributes selected for this study were more prototypical for this market (Rosch 1978; Romaniuk & Sharp 2000).
For comparison and validation purposes, the results for positive perceptions for each user group across attributes were explored. As there
Table 6 Results for the fast-food study
Too high in fat (%) Pre-prepared (%)Boring product
range (%)
Past user
Recent user
Non/light user
Past user
Recent user
Non/light user
Past user
Recent user
Non/light user
O’Burgers 77 71 68 77 62* 67 58 30** 36**
Royale Burgers 78 63* 67 56 52 59 53 23** 35**
Dr Sub Sandwiches 35 13** 18** 65 22** 24** 50 14** 14**
Big Chook 96 80 79 69 66 54* 49 13** 30**
Pizza House 65 61 60 50 42 35** 50 29** 28**
Average 70 57 58 63 49 48 54 22** 29**
(continued)
IJMR_50_3.indb 367 04/04/2008 12:06:08
Negative brand beliefs and brand usage
368
were no polar opposite attributes (unlike the previous study), average response levels for positive attributes were taken across all attributes. Recent users responded on average 50% of the time, non-recent users responded on average 41% of the time and those who were past users responded 33% of the time. Again, the pattern found is consistent with studies conducted previously, where the current user group (in this case, ‘recent user group’) responds at the highest level (Bird & Channon 1969; Bird & Ehrenberg 1970).
Discussion
This paper has investigated the relationship between usage status (current, past or never used the brand) and the propensity to have negative brand beliefs. The data used in this study were vastly diverse, which may lead one to question the ability to compare results. However, these data sets have enabled the hypotheses to be tested over three markets, four brand association measurement techniques and two data collection methods, therefore improving the generalisability of the findings. Regardless of how one measures the negative brand beliefs, whether one prompts or not, whether positive beliefs are included in the study or not, and whether the study is conducted in a subscription or repertoire market, the results remain largely consistent.
The results show that, contrary to common beliefs about how negative information may work in decision making (e.g. Lussier & Olshavsky 1979; Kahn & Baron 1995; Reed 1996), this series of studies provides evidence that consumers are less likely to respond to negative attributes if they haven’t used a brand. This does not support Hypothesis 1.
Table 6 Results for the fast food study (continued)
More expensive (%) Inconsistent quality (%)
Past user Recent userNon/light
user Past user Recent userNon/light
user
O’Burgers 7 2** 11 33 25 21**
Royale Burgers 0** 6 8 41 17** 20**
Dr Sub Sandwiches 30 25 25 15 5** 6**
Big Chook 30 39 29 31 36 14**
Pizza House 23 11** 24 23 26 16*
Average 18 16 20 29 22 15
IJMR_50_3.indb 368 04/04/2008 12:06:09

International Journal of Market Research Vol. 50 Issue 3
369
Further, while current usage does seem to have an influence (as this group frequently had a higher response level than the Never trieds), the act of behaviourally rejecting a brand seems to be the trigger for more negative beliefs, either as a prior trigger to defect or a post hoc rationalisation after the event.
These findings extend the knowledge that usage of a brand increases the propensity for a response to a positive brand attribute (Bird & Channon 1969; Bird & Ehrenberg 1970; Barwise & Ehrenberg 1985; Romaniuk & Sharp 2000), but also increases the likelihood that a negative attribute will receive a response as well. On the contrary, past studies suggest that, when a respondent ceases to use a brand (as when a ‘Current user’ becomes a ‘Past user’), their propensity to respond to a positive attribute decreases (e.g. Bird & Channon 1969; Romaniuk 2001). The research presented in this paper indicates that the opposite pattern occurs with responses to negative attributes; they appear to increase after ceasing to use a brand.
These results extend research by Romaniuk (2003), suggesting that like positive attributes, negative attributes are subject to a salience effect, in that there may be a propensity for a respondent to nominate them largely because they have experience with a brand. This is the most likely explanation for those who have never tried a brand responding generally at the lowest level, and current users responding at a higher level.
Conclusions and managerial implications
It is accepted within marketing circles that ‘the consumer may eliminate some products based strictly upon recalled (negative) overall evaluations’ (Lynch et al. 1988, p. 182). Such a theoretical basis is supported by the widely subscribed non-compensatory and compensatory decision-making theories (Lussier & Olshavsky 1979; Wright & Kriewall 1980; Kahn & Baron 1995; Reed 1996) on which some choice modelling procedures are based (Johnson et al. 1989; Swait & Adamowicz 2001). Such models assume that consumers rationally evaluate brands available prior to purchasing them, and it is these models that are usually found in marketing and consumer behaviour books (e.g. Engel et al. 1993; Solomon 1994; Kotler et al. 2001). For marketing practitioners, the results of this study suggest that consumers who have not tried a brand are not likely to hold negative beliefs about the brand. Our research shows that this common perception of how negative beliefs work is unfounded. Negative beliefs do not appear to be the barriers to purchase thought in the past (e.g. Lynch et al. 1988). Complementing research which indicates that positive
IJMR_50_3.indb 369 04/04/2008 12:06:09

Negative brand beliefs and brand usage
370
brand beliefs are driven by usage, the findings of this paper suggest that negative attributes are driven largely by usage as well, and therefore the development of negative brand beliefs by consumers is more likely to occur after purchase than prior to it. We believe that some of the past confusion in this area might have been due to the mixing up of Past users with those who have never tried the brand.
The findings in this paper highlight the complexity of the influence of past experiences with a brand on current perceptions. It would be logical to assume that because negative attributes are the polar opposite to positive attributes, the responses to negative attributes will be the polar opposite to those for positive attributes. However, this is not the case. For positive attributes the propensity to give an image response is typically ordered (from highest to lowest) as Current user, Past user, Never used the brand. For negative attributes, the order (again from highest to lowest) is Past user, Current user, Never used the brand. This is why larger-share brands, with more current and past users, typically gain more responses for attributes in brand health studies.
For both types of attribute a common factor is the low response level from those who have never tried the brand. It is not that non-users are rejecting brands or considering brands and deciding they are not good enough, but that they barely think about the brands they don’t use. This is why one of the biggest challenges in marketing is breaking through and building up brand associations and salience in non-users (Romaniuk & Sharp 2004). This is the main barrier that needs to be overcome when marketing to non-users rather than redressing negative perceptions.
From a measurement perspective, the high level of agreement in the results across the different measures and markets suggests that negative perceptions can be measured by a variety of mechanisms. The results of this study confirm that a non-response to a positive attribute in a brand image survey cannot be interpreted as a negative evaluation, nor can the reverse patterns be assumed (a brand that scores high on positive beliefs will score low on negative beliefs). Another contribution of this research is to highlight that, when including negative beliefs in brand knowledge measurement instruments, it is important to include (and use in analysis) a measure to separate out those who have never used the brand from those who have in the past but do not do so currently.
This also has implications for when both positive and negative attributes are used in multivariate analyses, and suggests that the two types of attribute should be considered and analysed separately.
IJMR_50_3.indb 370 04/04/2008 12:06:09

International Journal of Market Research Vol. 50 Issue 3
371
Limitations and future research
A possible explanation is that responses to negative image attributes could be indicative of a consumer having a bad experience with the brand and then, at some opportunity, ceasing to use it, as would be expected given the dissatisfaction literature (e.g. LaBarbera & Mazursky 1983). Further longitudinal research is required to understand whether a higher level of response to negative beliefs occurs prior to or after ceasing to use a brand.
An observation from these findings confirms the earlier research suggesting that consumers generally do not recall many negative beliefs about brands (e.g. Bird & Channon 1969; Bird et al. 1970; Woodside & Trappey 2001). It should be noted, however, that some negative attributes were responded to at quite high levels (for example, when presented with the attribute ‘Too high in fat’, the largest burger chain in the fast-food study had a 70% response rate). Further research needs to differentiate between negative attributes that might be category characteristics (i.e. shared across brands) and those that might be specific to a particular brand.
In this research we can see the systematic effect of heterogeneity in past experiences on the broad ‘user/non-user’ categorisation on image attribute responses. There may be further benefit in exploring this heterogeneity within the group of brand users to further provide context for positive image attribute results.
Finally, this research also leads to the questions ‘What is the effect of current negative perceptions from Past users on their future propensity to buy the brand previously used?’ and ‘Do these negative perceptions hamper long-term “win-back” efforts?’ This is an important area for future research.
ReferencesAaker, D.A. & Bruzzone, D.E. (1985) Causes of irritation in advertising. Journal of
Marketing, 49 (Spring), pp. 47–57.Ailawadi, K.L., Lehmann, D.R. & Neslin, S.A. (2003) Revenue premium as an
outcome measure of brand equity. Journal of Marketing, 67, 4, pp. 1–17.Ajzen, I. & Fishbein, M. (1980) Understanding Attitudes and Predicting Social
Behaviour. Englewood Cliffs, NJ: Prentice-Hall.Anderson, J.R. & Bower, G.H. (1979) Human Associative Memory. Hillsdale, NJ:
Lawrence Erlbaum.Bagozzi, R.P. & Warshaw, P.R. (1990) Trying to consume. Journal of Consumer
Research, 17 (September), pp. 127–140.
IJMR_50_3.indb 371 04/04/2008 12:06:09

Negative brand beliefs and brand usage
372
Barnard, N.R. & Ehrenberg, A.S.C. (1990) Robust measures of consumer brand beliefs. Journal of Marketing Research, 27 (November), pp. 477–484.
Barwise, P. (1995) Good empirical generalizations. Marketing Science, 14, 3 (Part 2 of 2), pp. G29–G35.
Barwise, T.P. & Ehrenberg, A.S.C. (1985) Consumer beliefs and brand usage. Journal of the Market Research Society, 27, 2 (April), pp. 81–93.
Biehal, G. & Chakravarti, D. (1986) Consumers’ use of memory and external information in choice: macro and micro perspectives. Journal of Consumer Research, 12 (March), pp. 382–405.
Bird, M. & Channon, C. (1969) Brand usage, brand image, and advertising policy – Part I. Admap, 6 (December), pp. 27–46.
Bird, M. & Ehrenberg, A.S.C. (1970) Consumer attitudes and brand usage. Journal of the Market Research Society, 12, 4, pp. 233–247.
Bird, M., Channon, C. & Ehrenberg, A.S.C. (1970) Brand image and brand usage. Journal of Marketing Research, 7 (August), pp. 307–314.
Collins, A.M. & Loftus, E.F. (1975) A spreading activation theory of semantic processing. Psychological Review, 82, 6, pp. 407–428.
Driesener, C. & Romaniuk, J. (2006) Comparing methods of brand image measurement. International Journal of Market Research, 48, 6, pp. 681–698.
East, R., Hammond, K. & Wright, M. (2007) The relative incidence of negative and positive word of mouth. International Journal of Research in Marketing, 24, 2, pp. 175–184.
Ehrenberg, A.S.C. & Bound, J.A. (1993) Predictability and prediction. Journal of the Royal Statistical Society Association, 156 (Part 2), pp. 167–206.
Engel, J.F., Blackwell, R.D. & Miniard, P.W. (1993) Consumer Behavior (7th edn). Fort Worth: Dryden Press.
Evans, F.B. (1961) The brand image myth. Business Horizons, 4 (Fall), pp. 19–28.Festinger, L. (1957) A Theory of Cognitive Dissonance. Stanford: Stanford
University Press.Foxall, G. (2002) Marketing’s attitude problem – and how to solve it. Journal of
Customer Behaviour, 1, 1, pp. 19–48.Greyser, S.A. (1973) Irritation in advertising. Journal of Advertising Research, 13, 1
(February), pp. 3–10.Hoek, J., Dunnett, J., Wright, M. & Gendall, P. (2000) Descriptive and evaluative
attributes: what relevance to marketers? Journal of Product & Brand Management, 9, 6, pp. 415–435.
Howard, J.A. & Sheth, J.N. (1969) The Theory of Buyer Behaviour. New York: Wiley.
Hubbard, R. & Armstrong, J.S. (1994) Replications and extensions in marketing: rarely published but quite contrary. International Journal of Research in Marketing, 11, pp. 233–248.
Hubbard, R., Brodie, R.J. & Armstrong, J.S. (1992) Knowledge Development in Marketing: The Role of Replication Research. Proceedings of the Sixth New Zealand Marketing Educators’ Conference, Dunedin, 17–19 November.
Johnson, E.J., Meyer, R.J. & Ghose, S. (1989) When choice models fail: compensatory models in negatively correlated environments. Journal of Market Research, 26, 3, pp. 255–270.
IJMR_50_3.indb 372 04/04/2008 12:06:09

International Journal of Market Research Vol. 50 Issue 3
373
Joyce, T. (1963) Techniques of brand image measurement. In New Developments in Research, Proceedings of the 6th Annual Market Research Society Conference, Eastbourne, pp. 45–63.
Kahn, B.E. & Baron, J. (1995) An exploratory study of choice rules favoured for high-stakes decisions. Journal of Consumer Psychology, 4 ,4, pp. 305–328.
Keller, K.L. (1993) Conceptualizing, measuring, and managing customer-based brand equity. Journal of Marketing, 57 (January), pp. 1–22.
Keller, K.L. (2003) Brand synthesis: the multidimensionality of brand knowledge. Journal of Consumer Research, 29 (March), pp. 595–601.
Kotler, P., Adam, S., Brown, L. & Armstrong, G. (2001) Principles of Marketing. Frenchs Forest, NSW: Pearson Education Australia.
Krishnan, H.S. (1996) Characteristics of memory associations: a consumer-based brand equity perspective. International Journal of Research in Marketing, 13, 4, pp. 389–405.
LaBarbera, P.A. & Mazursky, D. (1983) A longitudinal assessment of consumer satisfaction/dissatisfaction: the dynamic aspect of the cognitive process. Journal of Marketing Research, 20 (November), pp. 393–404.
Laroche, M., Kim, C. & Matsui, T. (2003) Which decision heuristics are used in consideration set formation? Journal of Consumer Marketing, 20, 3, pp. 192–209.
Lindsay, R.M. & Ehrenberg, A.S.C. (1993) The design of replicated studies. The American Statistician, 47, 3, pp. 217–228.
Loken, B. & Ward, J. (1990) Alternative approaches to understanding the determinants of typicality. Journal of Consumer Research, 17, 2, pp. 111–126.
Lussier, D.A. & Olshavsky, R.W. (1979) Task complexity and contingent processing in brand choice. Journal of Consumer Research, 6 (September), pp. 154–165.
Lynch, J.G., Jr, Marmorstein, H. & Weigold, M.F. (1988) Choices from sets including remembered brands: use of recalled attributes and prior overall evaluations. Journal of Consumer Research, 15 (September), pp. 169–184.
Moorthy, S., Ratchford, B.T. & Talukdar, D. (1997) Consumer information search revisited: theory and empirical analysis. Journal of Consumer Research, 23 (March), pp. 263–277.
Nedungadi, P. (1990) Recall and consumer consideration sets: influencing choice without altering brand evaluations. Journal of Consumer Research, 17 (December), pp. 263–276.
Reed, S.K. (1996) Cognition: Theory and Applications. Pacific Grove: Brooks/Cole Publishing.
Romaniuk, J. (2001) The brand perceptions of former users. Marketing Bulletin, 12, pp. 1–6.
Romaniuk, J. (2003) Brand attributes – ‘distribution outlets’ in the mind. Journal of Marketing Communications, 9, 2, pp. 73–92.
Romaniuk, J. & Sharp, B. (2000) Using known patterns in image data to determine brand positioning. International Journal of Market Research, 42, 2 (Spring/Summer), pp. 219–230.
Romaniuk, J. & Sharp, B. (2004) Conceptualizing and measuring brand salience. Marketing Theory, 4, 4, pp. 327–342.
IJMR_50_3.indb 373 04/04/2008 12:06:09

Negative brand beliefs and brand usage
374
Rosch, E. (1978) Principles of categorization. In: E. Rosch & B.B. Lloyd (eds) Cognition and Categorization. Hillsdale, NJ: Lawrence Erlbaum Associates, pp. 27–48.
Sharp, B., Wright, M. & Goodhardt, G. (2002) Purchase loyalty is polarised into either repertoire or subscription patterns. Australasian Marketing Journal, 10, 3, pp. 7–20.
Solomon, M.R. (1994) Consumer Behavior: Buying, Having, and Being (2nd edn). Boston: Allyn & Bacon.
Swait, J. & Adamowicz, W. (2001) The influence of task complexity on consumer choice: a latent class model of decision strategy switching. Journal of Consumer Research, 28, 1, pp. 135–148.
Wänke, M., Bohner, G. & Jurkowitsch, A. (1997) There are many reasons to drive a BMW: does imagined ease of argument generation influence attributes? Journal of Consumer Research, 24, 2, pp. 170–177.
Winchester, M. & Romaniuk, J. (2003) Evaluative and descriptive response patterns to negative image attributes. International Journal of Market Research, 45, 1, pp. 21–34.
Woodside, A. & Trappey, R.J. (1992) Finding out why customers shop your store and buy your brand: automatic cognitive processing models of primary choice. Journal of Advertising Research, 32, 6, pp. 59–78.
Woodside, A. & Trappey, R. (2001) Learning why some customers shop at less convenient stores. Journal of Business Research, 54, 2, pp. 151–159.
Wright, P. & Kriewall, M.A. (1980) State-of-mind effects on the accuracy with which utility functions predict marketplace choice. Journal of Marketing Research, 17 (August), pp. 277–293.
About the authors
Maxwell Winchester is a Senior Lecturer in Strategic Management and Marketing at Harper Adams University College, Newport, Shropshire and a Research Associate at the Ehrenberg-Bass Institute for Marketing Science, University of South Australia. His main research interests have been in the area of understanding negative brand attributes and consumer behaviour. Maxwell’s academic research interests have led to the publication of papers in the areas of wine marketing, brand management and research methodology. Aside from his academic career spanning three continents, Maxwell has held the position of Manager of Market Research for one of Australia’s largest companies and worked as a consultant throughout Europe, North America, Asia and Australasia.
Jenni Romaniuk heads the Brand Equity Research group at the Ehrenberg-Bass Institute, based at the University of South Australia. As well as publishing in IJMR, Jenni has published internationally in a wide range of marketing journals including Journal of Advertising Research and the Australasian Marketing Journal. Jenni regularly speaks at international
IJMR_50_3.indb 374 04/04/2008 12:06:09

International Journal of Market Research Vol. 50 Issue 3
375
conferences and consults to a wide range of companies around the world. Her current research interests are Brand equity, Brand salience, Advertising effectiveness and the influence of Word of Mouth on consumer behaviour.
Address correspondence to: Maxwell Winchester, Ehrenberg-Bass Institute, University of South Australia, GPO Box 2471, SA 5001 Australia.
Email: [email protected]
IJMR_50_3.indb 375 04/04/2008 12:06:10

IJMR_50_3.indb 376 04/04/2008 12:06:10